LLU WASC Educational Effectiveness Review Report
402
L O M A L I N D A U N I V E R S I T Y Pharmacy Public Health Science and Technology Nursing Religion Allied Health Professions Dentistry Medicine Educational Effectiveness Review August, 2010
-
Upload
khangminh22 -
Category
Documents
-
view
2 -
download
0
Transcript of LLU WASC Educational Effectiveness Review Report
L O M A L I N D A U N I V E R S I T Y
Pharmacy Public Health Science and Technology
Nursing Religion
Allied Health Professions Dentistry Medicine
Educational Effectiveness ReviewAugust, 2010
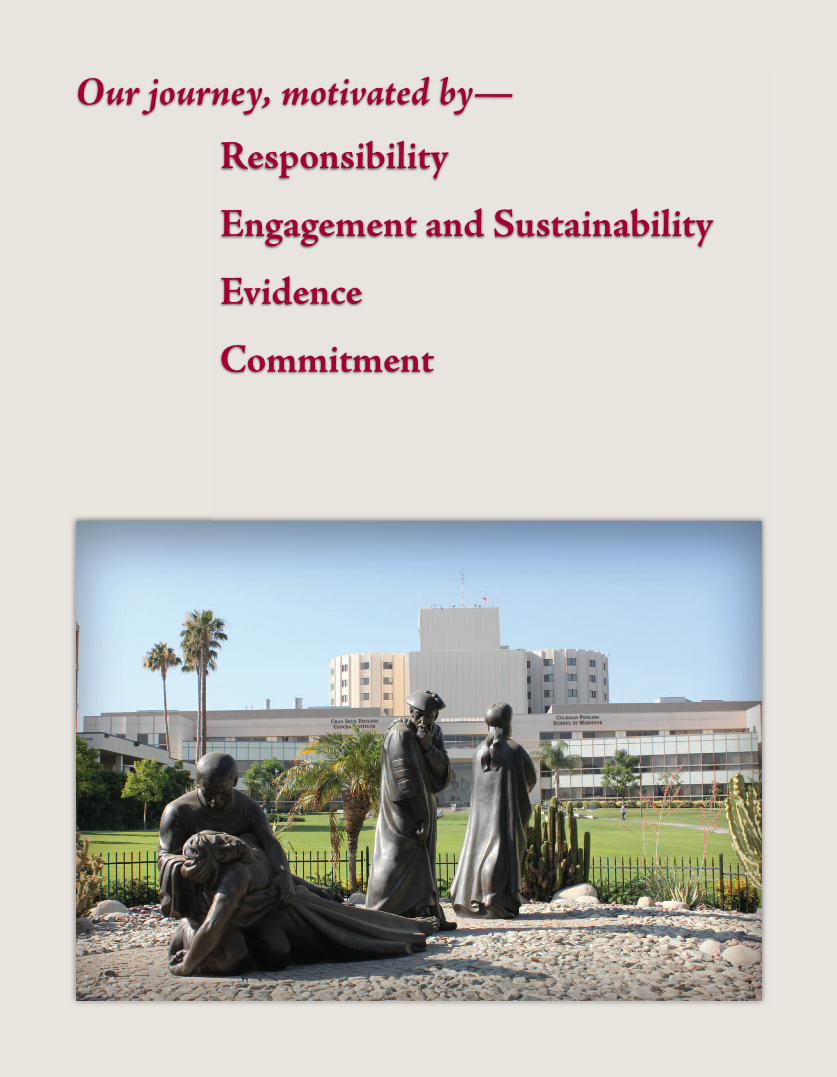
Responsibility
Engagement and Sustainability
Evidence
Commitment
Our journey, motivated by—
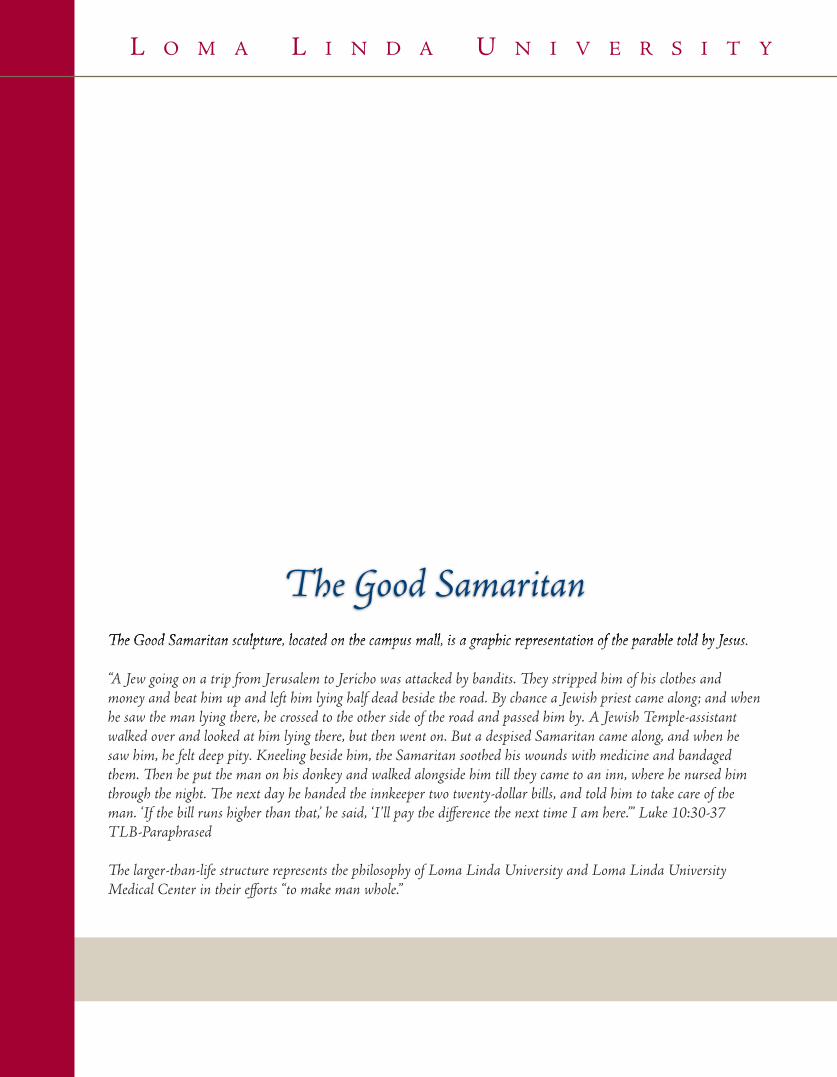
e Good Samaritan sculpture, located on the campus mall, is a graphic representation of the parable told by Jesus.
“A Jew going on a trip from Jerusalem to Jericho was attacked by bandits. ey stripped him of his clothes andmoney and beat him up and left him lying half dead beside the road. By chance a Jewish priest came along; and whenhe saw the man lying there, he crossed to the other side of the road and passed him by. A Jewish Temple-assistantwalked over and looked at him lying there, but then went on. But a despised Samaritan came along, and when hesaw him, he felt deep pity. Kneeling beside him, the Samaritan soothed his wounds with medicine and bandagedthem. en he put the man on his donkey and walked alongside him till they came to an inn, where he nursed himthrough the night. e next day he handed the innkeeper two twenty-dollar bills, and told him to take care of theman. ‘If the bill runs higher than that,’ he said, ‘I’ll pay the difference the next time I am here.’” Luke 10:30-37TLB-Paraphrased
e larger-than-life structure represents the philosophy of Loma Linda University and Loma Linda UniversityMedical Center in their efforts “to make man whole.”
The Good Samaritan
L O M A L I N D A U N I V E R S I T Y
l o m a l i n d a , C a l i f o R n i a
a u g u S t 2 0 1 0
L O M A L I N D A U N I V E R S I T Y
∫∫∫
E d u C a t i o n a l E f f E C t i v E n E S S R E v i E w
Submitted to:Accrediting Commission for Senior Colleges and Universities
Western Association of Schools and Collegesfor
Reaffirmation of Accreditation
WA S C E D U C A T I O N A L E F F E C T I V E N E S S R E V I E W R E P O R T
L O M A L I N D A U N I V E R S I T Y
Table of ContentsintRoduCtion 1
e University at a Glance 2Figure 1: EER Goals and Outcomes 1
Our Main Campus 2Off-campus Programs 2
Figure 2: Vision and Mission 2e LLU Mission and Philosophy 3
Figure 3: Cohort Student Loan Default Rate 3Institutional History 3Financial Status 4Current Reaccreditation Activities 4Organization of Report 5
RESPonSibility 5Response to WASC 5
1) Development of the central University’s functions insupport of strategic planning and the use of data instrategic planning by individual schools 6
2) Augmentation of resources of the Institutional Researchoffice, especially in areas of analytics as expected tosupport strategic planning and quality assurance 6
3) Support and enhancement of the Office of Assessment inefforts related to assessment training, integration (aggregation)of assessment data from across the Schools, and evidencethat assessment data is being used to drive continuousquality improvement of programs within the Schools 8
Institutional WASC Reaccreditation Research emes 10Transformative Learning 10
Figure 4: Mission Focused Learning Environment 11Methods and Results 11eme 1: Identity — What are we? 11eme 2: Normative culture — Who are we? 11eme 3: Mission-focused/transformative learning —
Why are we here? 12How do we monitor and assure that faith-based transformativelearning is occurring? 12
EngagEmEnt and SuStainability 13LLUAHSC Strategic Planning 13
Figure 5: Strategic Plan: Five Pillars 14Research Strategic Plan 14Educational Effectiveness Committee 15
Background 15Figure 6: Organization of Educational
Effectiveness Committee 15University Assessment Committee 17Student Learning Outcomes Committee 17Portfolio Committee 18Co-curricular Committee 18Institutional Research Committee (IRC) 19Program Review Committee 19Climate Survey Committee 20General Studies and Transfer Education Committee 20Distance Learning Committee 21Off-Campus Review and Assessment Committee 22
EvidEnCE of EduCational EffECtivEnESS univERSity-widE 22Systematic Program Review Overview
Figure 7: Assessment and CQI Plan Cycle 23
University Student Learning Outcomes 23SLO: Critical inking 24SLO: Effective Communication
Wholeness Climate Surveys 26Comparison of the Wholeness Climate Surveys(Faculty 2010, Staff 2010, and Student 2009) 26
e Wholeness Portal 26Educational Effectiveness of Co-curricular LearningOpportunities 27
Figure 8: Comparison of the Wholeness Climate Surveys 27Figure 9: Questions for Wholeness Climate
Surveys Comparison 27Assessment of Co-curricular MFL 28Comparative Survey Data 28Comparative Qualitative Data 29
Figure 10: Global Health Institute 29Findings 30e Next Steps in Co-curricular Assessment 30
Collaboration Exemplars 31Featured Exemplar of MFL 31Councils 32Student Services 33Institutes 33Community Engagement 34Inter-professional Education 36Collaboration Exemplars Conclusion 37
EvidEnCE of EduCational EffECtivEnESS within aCadEmiC PRogRamS 37Summary of the School Educational Effectiveness Reports 38
School of Allied Health Professions (SAHP) 38School of Dentistry 38School of Medicine 39School of Nursing 39School of Pharmacy 39School of Public Health 39School of Religion 39School of Science and Technology 40
Table 8.1 Highlights 40Figure 11: Table 8.1 40
School Case Studies 40Figure 12: School Case Studies 41
Academic Success 41Curricular CQI 42Enhanced Learning 42Policy CQI 43Faculty Development 43Inter-professional CQI 43Assessment 44Research 44Strategic Planning 45Global Outreach 45Case Study Conclusions 45
CommitmEnt 45Integrative Essay 45
Our Next Phase of Discovery 47In Summary 48
REfEREnCES 49
i
Appendices
WA S C E d U C A T I O N A L E F F E C T I v E N E S S R E v I E W R E p O R T 1
L O m A L I N d A U N I v E R S I T y
Wasc Educational Effectiveness Review Reportloma linda university
IntRoductIon
The goal of educational effectiveness at Loma Linda University (LLU; University) is to provide evidence thatdemonstrates the successful acquisition of knowledge by our students and graduates. is goal is founded on (or
guided by) our University-wide and program student learning outcomes (SLOs), the development of skills and bestpractices in learners, as well as the continuous improvement of the University’s educational environment that isfoundational to health care delivery and research scholarship.
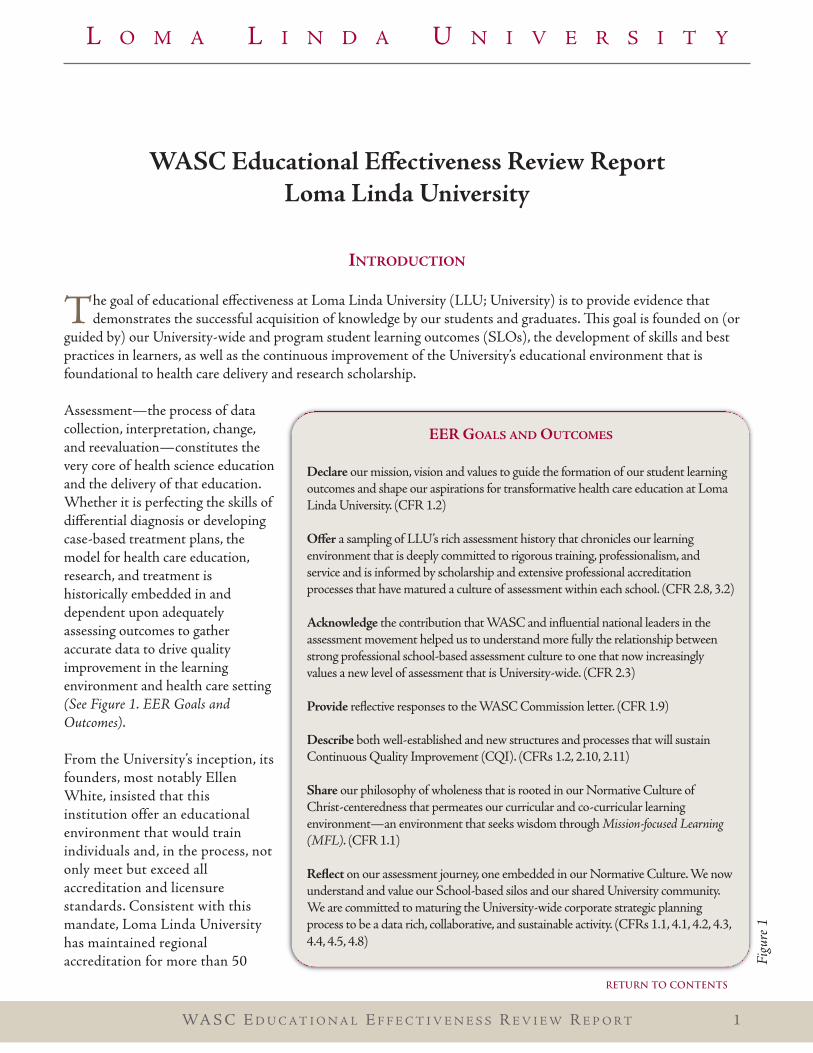
Assessment—the process of datacollection, interpretation, change,and reevaluation—constitutes thevery core of health science educationand the delivery of that education.Whether it is perfecting the skills ofdifferential diagnosis or developingcase-based treatment plans, themodel for health care education,research, and treatment ishistorically embedded in anddependent upon adequatelyassessing outcomes to gatheraccurate data to drive qualityimprovement in the learningenvironment and health care setting(See Figure 1. EER Goals andOutcomes).
From the University’s inception, itsfounders, most notably EllenWhite, insisted that thisinstitution offer an educationalenvironment that would trainindividuals and, in the process, notonly meet but exceed allaccreditation and licensurestandards. Consistent with thismandate, Loma Linda Universityhas maintained regionalaccreditation for more than 50
EER Goals and outcomEs
declare our mission, vision and values to guide the formation of our student learningoutcomes and shape our aspirations for transformative health care education at LomaLinda University. (CFR 1.2)
offer a sampling of LLU’s rich assessment history that chronicles our learningenvironment that is deeply committed to rigorous training, professionalism, andservice and is informed by scholarship and extensive professional accreditationprocesses that have matured a culture of assessment within each school. (CFR 2.8, 3.2)
acknowledge the contribution that WASC and influential national leaders in theassessment movement helped us to understand more fully the relationship betweenstrong professional school-based assessment culture to one that now increasinglyvalues a new level of assessment that is University-wide. (CFR 2.3)
Provide reflective responses to the WASC Commission letter. (CFR 1.9)
describe both well-established and new structures and processes that will sustainContinuous Quality Improvement (CQI). (CFRs 1.2, 2.10, 2.11)
share our philosophy of wholeness that is rooted in our Normative Culture ofChrist-centeredness that permeates our curricular and co-curricular learningenvironment—an environment that seeks wisdom through Mission-focused Learning(MFL). (CFR 1.1)
Reflect on our assessment journey, one embedded in our Normative Culture. We nowunderstand and value our School-based silos and our shared University community.We are committed to maturing the University-wide corporate strategic planningprocess to be a data rich, collaborative, and sustainable activity. (CFRs 1.1, 4.1, 4.2, 4.3,4.4, 4.5, 4.8)
Figu
re1
RETURN TO CONTENTS
years. moreover, the University has successfully maintained a long and rich history of accreditation with 23disciplinary-specific accrediting agencies, and one international church-accrediting agency. In addition, there arenumerous California State departments that also must give their approval for many of our programs to function.Finally, our history includes a close working relationship with Western Association of Schools and Colleges (WASC).(CFRs 1.1, 1.9)
e university at a GlanceLoma Linda University is a health sciences institution that serves more than 4,200 students of whom approximately75 percent are pursuing post-baccalaureate degrees. Our campus is academically organized into eight professionallyoriented Schools, which, by design, are fiscally semi-independent and guided by professional practices andaccreditation standards. All research-oriented graduate programs have oversight from the Faculty of Graduate Studies(FGS) in cooperation with the professional Schools in which the programs reside. Across these eight Schools there are107 degree programs (Academic Degree Programs will be available in the Exhibit Room) and more than 100 certificates,concentrations, specialties, and tracks. (CFR 2.1)
Our academic programs are guided by more than 1,831 qualified faculty (491 FTU, 305 pTU, 902 FT practice plan,and 133 pT-Other) who provide a learning environment that is professional, academic, and clinically oriented andoften integrated, translational, and inter-professional.
A significant attribute of LLU’s learning environment is its rich focus on practical, experiential, and clinical trainingthat incorporates simulation, problem-based learning, laboratory training, and diverse clinical practice sites. islearning environment assists students in developing competencies and skills required for their profession. Studentplacement opportunities for clinical experiences are diverse and numerous. Our premier learning sites for health caretraining are conveniently located on or within three miles of the main campus. Within this radius are five hospitals:Loma Linda University medical Center (LLUmC), Loma Linda University Children’s Hospital (LLUCH), EastCampus Rehabilitation Hospital, Behavioral medicine Center (BmC), and the Heart and Surgical Hospital.
Our Main Campuse main campus of the University is set on105 acres located 60 miles west of LosAngeles. e medical Center is on anadjacent 26-acre site. e Universitymaintains 149 acres of commercial,residential, and industrial property. Inaddition, the University holds 119 adjacentacres in reserve for future expansion anddevelopment. ere are also 657 acres in twoadditional locations available for futuredevelopment. e main campus consists of60 buildings with 1,320,000 square feet oftotal floor space. e medical Center maincampus complex consists of four buildingswith 1,230,000 square feet providing bothinpatient and outpatient care facilities.
Off-campus ProgramsLLU operates two branch campuses, one in
W A S C E d U C A T I O N A L E F F E C T I v E N E S S R E v I E W R E p O R T2
L O m A L I N d A U N I v E R S I T y
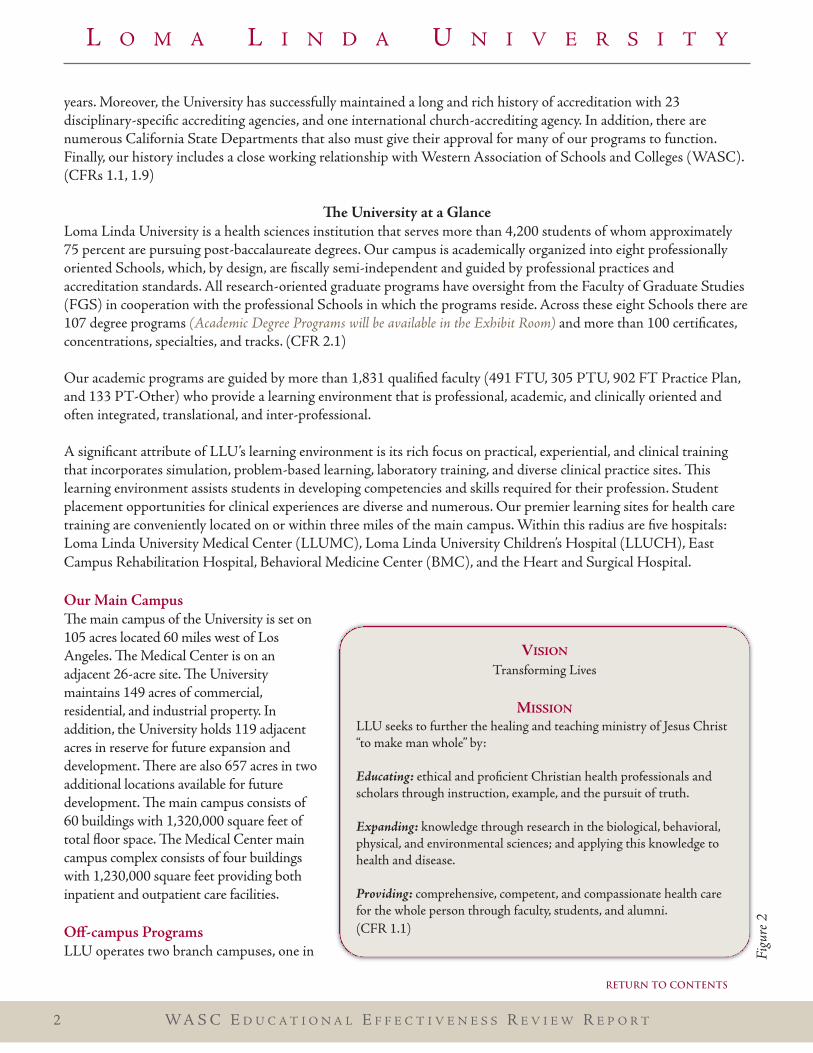
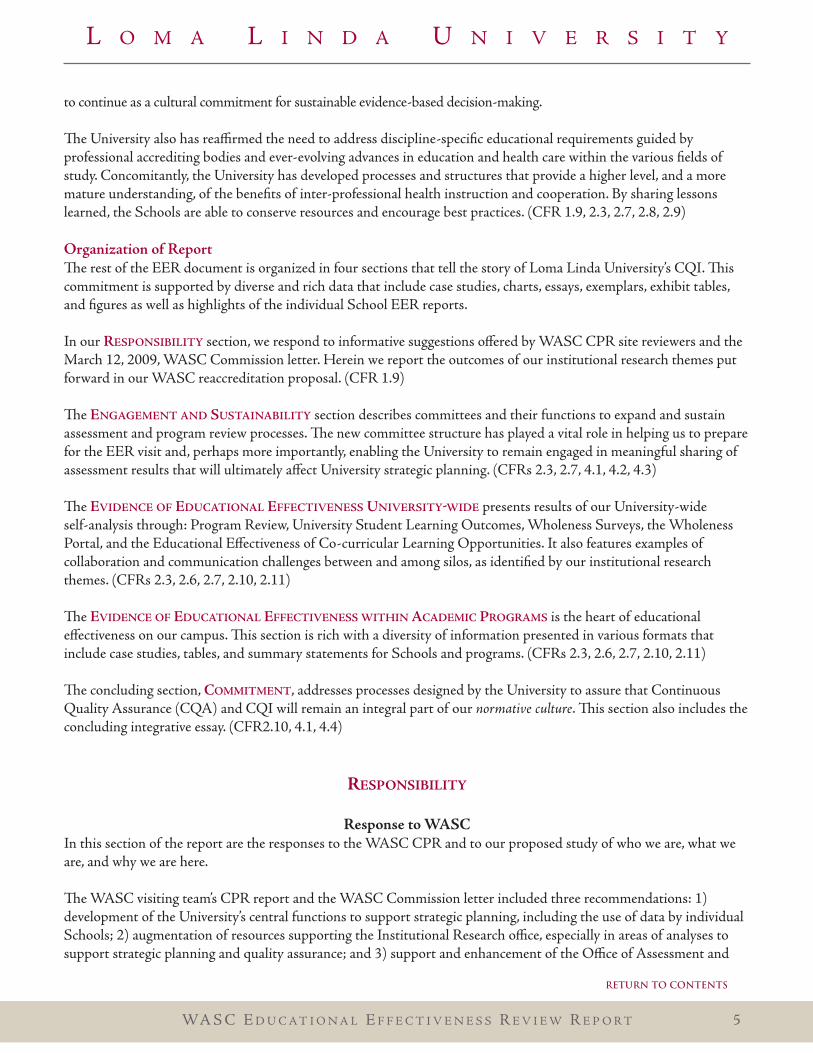
VIsIon
Transforming Lives
mIssIon
LLU seeks to further the healing and teaching ministry of Jesus Christ“to make man whole” by:
Educating: ethical and proficient Christian health professionals andscholars through instruction, example, and the pursuit of truth.
Expanding: knowledge through research in the biological, behavioral,physical, and environmental sciences; and applying this knowledge tohealth and disease.
Providing: comprehensive, competent, and compassionate health carefor the whole person through faculty, students, and alumni.(CFR 1.1)
Figu
re2
RETURN TO CONTENTS
College Heights, Canada, and a second in Riyadh, Saudi Arabia. In addition, the University offers twelve off-campus(face-to-face) degree programs and two off-campus certificate programs located in nine countries outside of the UnitedStates. Two of those programs are outside of the continental United States in Guam and Hawaii. Eleven online degreeprograms and two certificate programs are also offered. (CFRs 2.1, 3.1, 3.2, 3.6, 3.7, 3.8, 4.2)
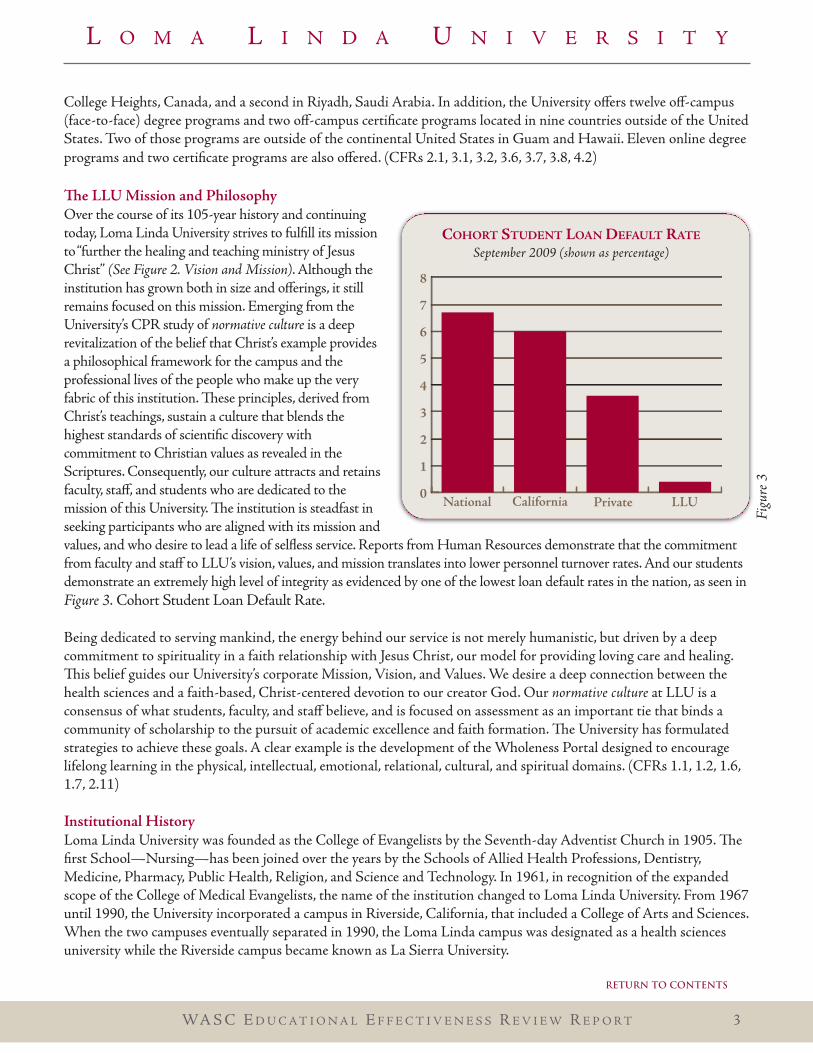
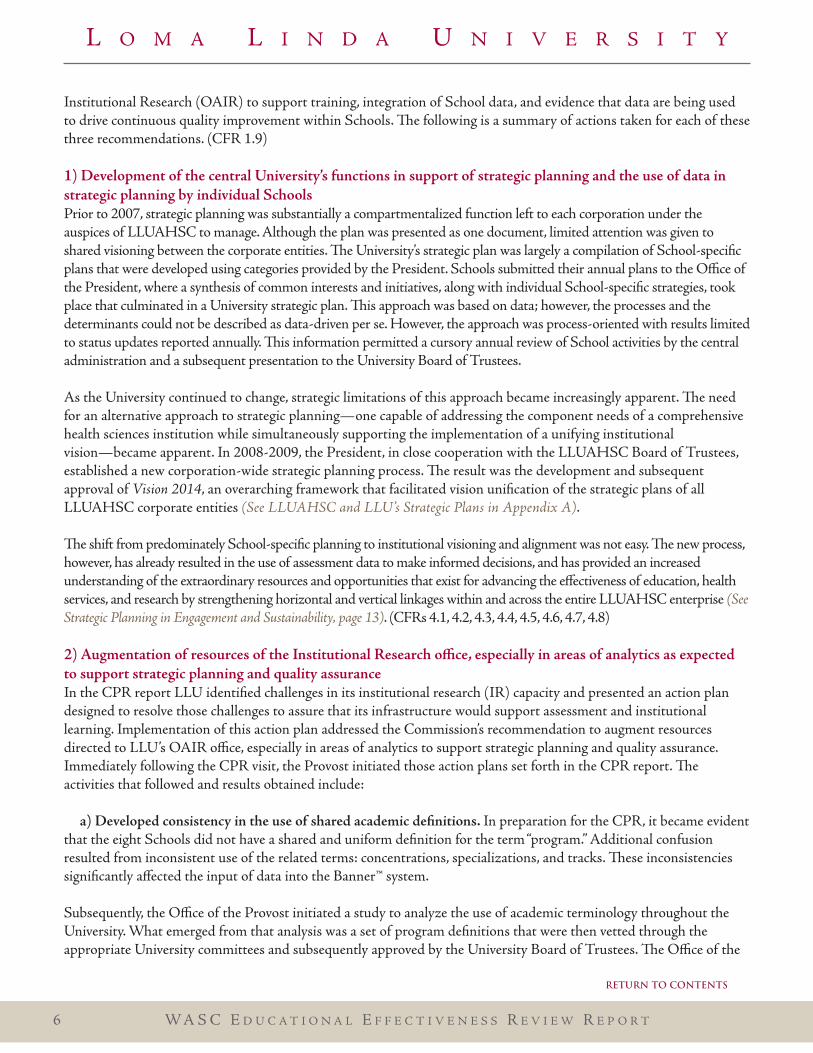
e LLU Mission and PhilosophyOver the course of its 105-year history and continuingtoday, Loma Linda University strives to fulfill its missionto“further the healing and teaching ministry of JesusChrist” (See Figure 2. Vision and Mission). Although theinstitution has grown both in size and offerings, it stillremains focused on this mission. Emerging from theUniversity’s CpR study of normative culture is a deeprevitalization of the belief that Christ’s example providesa philosophical framework for the campus and theprofessional lives of the people who make up the veryfabric of this institution. ese principles, derived fromChrist’s teachings, sustain a culture that blends thehighest standards of scientific discovery withcommitment to Christian values as revealed in theScriptures. Consequently, our culture attracts and retainsfaculty, staff, and students who are dedicated to themission of this University. e institution is steadfast inseeking participants who are aligned with its mission andvalues, and who desire to lead a life of selfless service. Reports from Human Resources demonstrate that the commitmentfrom faculty and staff to LLU’s vision, values, and mission translates into lower personnel turnover rates. And our studentsdemonstrate an extremely high level of integrity as evidenced by one of the lowest loan default rates in the nation, as seen inFigure 3. Cohort Student Loan default Rate.
Being dedicated to serving mankind, the energy behind our service is not merely humanistic, but driven by a deepcommitment to spirituality in a faith relationship with Jesus Christ, our model for providing loving care and healing.is belief guides our University’s corporate mission, vision, and values. We desire a deep connection between thehealth sciences and a faith-based, Christ-centered devotion to our creator God. Our normative culture at LLU is aconsensus of what students, faculty, and staff believe, and is focused on assessment as an important tie that binds acommunity of scholarship to the pursuit of academic excellence and faith formation. e University has formulatedstrategies to achieve these goals. A clear example is the development of the Wholeness portal designed to encouragelifelong learning in the physical, intellectual, emotional, relational, cultural, and spiritual domains. (CFRs 1.1, 1.2, 1.6,1.7, 2.11)
Institutional HistoryLoma Linda University was founded as the College of Evangelists by the Seventh-day Adventist Church in 1905. efirst School—Nursing—has been joined over the years by the Schools of Allied Health professions, dentistry,medicine, pharmacy, public Health, Religion, and Science and Technology. In 1961, in recognition of the expandedscope of the College of medical Evangelists, the name of the institution changed to Loma Linda University. From 1967until 1990, the University incorporated a campus in Riverside, California, that included a College of Arts and Sciences.When the two campuses eventually separated in 1990, the Loma Linda campus was designated as a health sciencesuniversity while the Riverside campus became known as La Sierra University.
WA S C E d U C A T I O N A L E F F E C T I v E N E S S R E v I E W R E p O R T 3
L O m A L I N d A U N I v E R S I T y
0
1
2
3
4
5
6
7
8
cohoRt studEnt loan dEfault RatE
September 2009 (shown as percentage)
National California Private LLU
Figu
re3
RETURN TO CONTENTS
e Board of Trustees is made up of Seventh-day Adventist Church officials and other Adventist members whoprovide oversight to the operations and environment of the University. In addition, the University is under theumbrella of Loma Linda University Adventist Health Sciences Center (LLUAHSC), which brings together theeducational, research, and health care entities of the campus. (CFR 3.9)
Financial StatusSince our CpR report, not only the United States but economies throughout the world have been dealing with alingering financial crisis. In the fall of 2008, Loma Linda University was confronted with economic challenges thatextended beyond our local campus. And while LLU has weathered many economic storms in its 105 years of history,the negative effects on the U.S. economy, through falling financial assets and real property values, understandably havehad a notable impact on our own operations. University administrators have been confronted with unique economicchallenges and have mounted a vigorous response to each situation.
pathways have been identified to contain costs, our management structure has been reviewed, and a new centralservices funding model has been developed and implemented within our eight Schools. e University has embarkedon a new strategic direction for asset allocation of its investment portfolio. Furthermore, a process is underway todivest individual securities and move the portfolio to outside third-party professional asset managers. New levels oftransparency and accountability have also been implemented for financial management, oversight, and reporting.
e University experienced a modest operating loss in 2009, equivalent to -2 percent of operations. While theunrealized loss from investments was more sizeable at -32 percent, this outcome was in line with national trendsresulting from turmoil and instability in both United States and international financial markets. despite theseoutcomes, the University has managed to weather this ongoing financial storm. e investment portfolio has begun torecover and financial support from tuition, new gifts, and external awards remains healthy. e Board-designated cashaccounts serve as a bulwark, while an all-funds budget and enhanced cash-flow projections have been implemented andnow notably guide decision-making at all levels.
ankfully, the demand for a Loma Linda University education has remained strong (e. g., total applicants, selectivityrates, etc.), reflecting the quality and reputation of our academic offerings and by the investments in our educationalenvironment. Our alumni reflect the values of our institution and remain engaged and committed through their givingand volunteerism. (CFRs 3.5, 4.1)
Current Reaccreditation ActivitiesFour years ago, the University began its reaccreditation journey with an institutional proposal that prompted theexploration of two research themes, both of which were inspired by achievements of the institution’s first ten decadesof service. e University sought to review and analyze elements of its culture that needed to be preserved and lookedfor ways to ensure that its mission, vision, and values could be more fully understood, articulated, and realized.erefore, the WASC proposal of may 2006 was written within the context of two reflective themes: 1) Bible-basedfaith and 2) normative culture.
e University has continued to support its Schools and their programs in refining assessment and preparing forprofessional accreditations. e cumulative educational effectiveness of LLU has emerged from eight semi-independentacademic entities (i.e., the Schools) linked together by bridges of understanding and cooperation. A new educationaleffectiveness infrastructure, program review processes, and unifying corporate strategic planning process have been createdand implemented in recent years for the purpose of strengthening University-wide educational effectiveness. is collectiveeffort has contributed to continuous quality improvement (CQI) in campus-wide educational effectiveness and is expected
W A S C E d U C A T I O N A L E F F E C T I v E N E S S R E v I E W R E p O R T4
L O m A L I N d A U N I v E R S I T y
RETURN TO CONTENTS
to continue as a cultural commitment for sustainable evidence-based decision-making.
e University also has reaffirmed the need to address discipline-specific educational requirements guided byprofessional accrediting bodies and ever-evolving advances in education and health care within the various fields ofstudy. Concomitantly, the University has developed processes and structures that provide a higher level, and a moremature understanding, of the benefits of inter-professional health instruction and cooperation. By sharing lessonslearned, the Schools are able to conserve resources and encourage best practices. (CFR 1.9, 2.3, 2.7, 2.8, 2.9)
Organization of Reporte rest of the EER document is organized in four sections that tell the story of Loma Linda University’s CQI. iscommitment is supported by diverse and rich data that include case studies, charts, essays, exemplars, exhibit tables,and figures as well as highlights of the individual School EER reports.
In our ReSPONSIbILIty section, we respond to informative suggestions offered by WASC CpR site reviewers and themarch 12, 2009, WASC Commission letter. Herein we report the outcomes of our institutional research themes putforward in our WASC reaccreditation proposal. (CFR 1.9)
e eNgAgeMeNt ANd SUStAINAbILIty section describes committees and their functions to expand and sustainassessment and program review processes. e new committee structure has played a vital role in helping us to preparefor the EER visit and, perhaps more importantly, enabling the University to remain engaged in meaningful sharing ofassessment results that will ultimately affect University strategic planning. (CFRs 2.3, 2.7, 4.1, 4.2, 4.3)
e evIdeNCe OF edUCAtIONAL eFFeCtIveNeSS UNIveRSIty-wIde presents results of our University-wideself-analysis through: program Review, University Student Learning Outcomes, Wholeness Surveys, the Wholenessportal, and the Educational Effectiveness of Co-curricular Learning Opportunities. It also features examples ofcollaboration and communication challenges between and among silos, as identified by our institutional researchthemes. (CFRs 2.3, 2.6, 2.7, 2.10, 2.11)
e evIdeNCe OF edUCAtIONAL eFFeCtIveNeSS wItHIN ACAdeMIC PROgRAMS is the heart of educationaleffectiveness on our campus. is section is rich with a diversity of information presented in various formats thatinclude case studies, tables, and summary statements for Schools and programs. (CFRs 2.3, 2.6, 2.7, 2.10, 2.11)
e concluding section, COMMItMeNt, addresses processes designed by the University to assure that ContinuousQuality Assurance (CQA) and CQI will remain an integral part of our normative culture. is section also includes theconcluding integrative essay. (CFR2.10, 4.1, 4.4)
REsPonsIbIlIty
Response to WascIn this section of the report are the responses to the WASC CpR and to our proposed study of who we are, what weare, and why we are here.
e WASC visiting team’s CpR report and the WASC Commission letter included three recommendations: 1)development of the University’s central functions to support strategic planning, including the use of data by individualSchools; 2) augmentation of resources supporting the Institutional Research office, especially in areas of analyses tosupport strategic planning and quality assurance; and 3) support and enhancement of the Office of Assessment and
WA S C E d U C A T I O N A L E F F E C T I v E N E S S R E v I E W R E p O R T 5
L O m A L I N d A U N I v E R S I T y
RETURN TO CONTENTS
Institutional Research (OAIR) to support training, integration of School data, and evidence that data are being usedto drive continuous quality improvement within Schools. e following is a summary of actions taken for each of thesethree recommendations. (CFR 1.9)
1) development of the central University’s functions in support of strategic planning and the use of data instrategic planning by individual Schoolsprior to 2007, strategic planning was substantially a compartmentalized function left to each corporation under theauspices of LLUAHSC to manage. Although the plan was presented as one document, limited attention was given toshared visioning between the corporate entities. e University’s strategic plan was largely a compilation of School-specificplans that were developed using categories provided by the president. Schools submitted their annual plans to the Office ofthe president, where a synthesis of common interests and initiatives, along with individual School-specific strategies, tookplace that culminated in a University strategic plan. is approach was based on data; however, the processes and thedeterminants could not be described as data-driven per se. However, the approach was process-oriented with results limitedto status updates reported annually. is information permitted a cursory annual review of School activities by the centraladministration and a subsequent presentation to the University Board of Trustees.
As the University continued to change, strategic limitations of this approach became increasingly apparent. e needfor an alternative approach to strategic planning—one capable of addressing the component needs of a comprehensivehealth sciences institution while simultaneously supporting the implementation of a unifying institutionalvision—became apparent. In 2008-2009, the president, in close cooperation with the LLUAHSC Board of Trustees,established a new corporation-wide strategic planning process. e result was the development and subsequentapproval of Vision 2014, an overarching framework that facilitated vision unification of the strategic plans of allLLUAHSC corporate entities (See LLUAHSC and LLU’s Strategic Plans in Appendix A).
e shift from predominately School-specific planning to institutional visioning and alignment was not easy. e new process,however, has already resulted in the use of assessment data to make informed decisions, and has provided an increasedunderstanding of the extraordinary resources and opportunities that exist for advancing the effectiveness of education, healthservices, and research by strengthening horizontal and vertical linkages within and across the entire LLUAHSC enterprise (SeeStrategic Planning in Engagement and Sustainability, page 13). (CFRs 4.1, 4.2, 4.3, 4.4, 4.5, 4.6, 4.7, 4.8)
2) Augmentation of resources of the Institutional Research office, especially in areas of analytics as expectedto support strategic planning and quality assuranceIn the CpR report LLU identified challenges in its institutional research (IR) capacity and presented an action plandesigned to resolve those challenges to assure that its infrastructure would support assessment and institutionallearning. Implementation of this action plan addressed the Commission’s recommendation to augment resourcesdirected to LLU’s OAIR office, especially in areas of analytics to support strategic planning and quality assurance.Immediately following the CpR visit, the provost initiated those action plans set forth in the CpR report. eactivities that followed and results obtained include:
a) developed consistency in the use of shared academic definitions. In preparation for the CpR, it became evidentthat the eight Schools did not have a shared and uniform definition for the term “program.” Additional confusionresulted from inconsistent use of the related terms: concentrations, specializations, and tracks. ese inconsistenciessignificantly affected the input of data into the Banner™ system.
Subsequently, the Office of the provost initiated a study to analyze the use of academic terminology throughout theUniversity. What emerged from that analysis was a set of program definitions that were then vetted through theappropriate University committees and subsequently approved by the University Board of Trustees. e Office of the
W A S C E d U C A T I O N A L E F F E C T I v E N E S S R E v I E W R E p O R T6
L O m A L I N d A U N I v E R S I T y
RETURN TO CONTENTS
provost, with the Records Office, conducted an audit of existing programs in each School using the new terminology.is verified the existence of 107 degree programs and will allow for more precise tracking of student cohorts fromadmission to degree completion and graduation.
b) e Provost commissioned the IR Committee to identify database management and institutional reportingneeds. is Committee was charged with examining existing data sets and processes, and makingrecommendations for system improvements.e IR Committee examined institutional data, including accessibility and quality, with informed decision-making inmind. members identified key performance indicators and descriptors for each data set, along with the unique codingneeds of each School.
e Committee hired an external consultant with expertise in Institutional Research to assess the strengths andlimitations of the University’s institutional research processes and reports. His analysis confirmed the Committee’sfindings and recommendations regarding institutional data needs, including recognition of the fact that LLU’s dataaccuracy issues were less egregious than originally thought. e consultant informed us that data concerns we hadwere not atypical and, in fact, could be found at many universities. Consequently, the Committee proposed a set ofrecommendations that included software upgrades and the creation of integrity reports to validate the accuracy ofwarehouse data against the source transactions systems (IR Committee Report will be available in the Evidence Room).
One improvement derived from this analysis, from the School perspective, is the availability of data from the OAIRthrough Blackboard™. ese data include student statistics and academic units taken. is information is availableshortly after registration closes for each quarter, and such information allows Schools to monitor program data andvital School statistics previously unavailable.
Of particular concern to the University administration was the accuracy of reported faculty numbers. e Committeeconcluded that, once data challenges were accounted for, the Banner™ system did provide an accurate tabulation of thetrue number of faculty members supporting the educational enterprise, a conclusion also validated by School datarecords. e Committee, however, did find challenges to data accuracy stemming from disconnects between facultyemployment procedures and faculty appointment procedures. e University confirmed that its software systems,peopleSoft™ and Banner™, did not connect to one another, a finding that provided a partial explanation for why somefaculty members were not automatically counted in the Banner™ system.
e Committee also discovered that the software bridge designed to address this challenge had been purchased butnot activated. e “bridge” between the software programs was subsequently activated, which then allowed the twosystems to interact. It was also found that data for faculty paid through non-University entities (i.e., individuals paidthrough one of the LLUAHSC clinical faculty practice groups) was not entered into the peopleSoft™ system. isissue is being addressed by the president and LLUAHSC leadership, so information about faculty members employedwithin the LLUAHSC corporations can be entered into one unifying peopleSoft™ data set to be imported intoBanner™.
Finally, the Committee recommended further refinement of faculty employment and appointment processes, and areview of faculty definitions. It was also suggested that training be provided for persons responsible for processingfaculty employment and appointments to ensure accurate and consistent data entry.
c) Institutional Research staff development. Following the CpR site visit, attention was directed to betterarticulating the central institutional research functions and needs. e IR staff has been provided with additionalsupport, including advanced training and improved networking with IR personnel from other institutions. is
WA S C E d U C A T I O N A L E F F E C T I v E N E S S R E v I E W R E p O R T 7
L O m A L I N d A U N I v E R S I T y
RETURN TO CONTENTS
engagement has given the LLU staff members an opportunity to expand their understanding of institutional dataneeds as required to inform strategic planning, assessment, and CQI. is also led to a new understanding of the needfor continuous data access to permit data-informed decision-making. e IR staff now has full access to the datawarehouse and also has direct access to data in the Banner™ system. is change now permits data queries to beperformed without the utilization of an Information Technology (IT) liaison to provide access to institutional data.
Even though not required for the EER, we chose to update the Exhibits and Tables presented in the CpR in order to see ifthe enhancements made to our data system and processes were successful. e improvements made it easier to obtain morereliable data for most of the tables; however, we have identified certain data sets that need additional attention (Exhibits andTables plus analysis will be available in the Exhibit Room). (CFRs 2.3, 2.7, 2.9, 2.10, 3.4, 4.4, 4.5, 4.6, 4.7)
3) Support and enhancement of the Office of Assessment in efforts related to assessment training, integration(aggregation) of assessment data from across the Schools, and evidence that assessment data is being used todrive continuous quality improvement of programs within the Schoolse University launched a transformative process to strengthen its overarching assessment infrastructure, andsubsequently enhanced both the support to professional programs and the utilization of program-level data tosubstantiate institutional outcomes. milestones in this transition included the establishment of an Office ofAssessment and Institutional Research (OAIR) in the fall of 2007. e original budget for the OAIR included ahalf-time director, an institutional researcher, and a full-time administrative assistant dedicated to this office.
a) New office created. In February of 2009 the OAIR was renamed the Office of Educational Effectiveness (OEE)at which time the budget was increased to provide for a full-time director. Shortly after this change, a decision wasmade to augment the resources of the OEE through the appointment of Assessment Specialists in each School. eseAssessment Specialists were appointed by each School’s respective dean and charged to serve as liaisons to improvethe linkage and communication between the OEE, central administration, committees, and programs in each School.is change led to the creation of a collaborative model enhancing both University-wide and School-specificassessment that also includes discipline-specific program review processes and outcomes.
b) Revamped committee structure. Overlapping these changes was the development of an expanded committeestructure under the Educational Effectiveness Committee (EEC). is restructuring facilitated the engagement ofmore than 100 additional faculty members and administrators from across the campus and within the various Schoolsmany of these individuals were new to assessment and program review processes. e creation of this integratedcommittee structure provides strong support for furthering the development of horizontal and vertical assessmentlinkages and shared learning campus-wide. For example, assessment of University-wide student learning outcomes isnow based on common assessment rubrics permitting analysis across Schools and programs at the differenteducational levels. yet, Schools and programs are able to expand these rubrics by adding contextualized elementsdeemed valuable to their particular programs (Sample assessment rubrics will be available in the Exhibit Room).
c) Program reviews and reporting. Substantial progress has also been made in implementing the University’ssystematic strategy for program review. e program Review Committee (pRC) was created and staffed with a capableteam of faculty and administrators. eir first task was to design an institutional plan to review all programs that didnot have the benefit of regular evaluation by external accrediting agencies or professional organizations. In less thantwo years, they created, documented, and implemented a rigorous, University-wide mechanism for program self-studyand on-site review by external specialists. At the time this report was submitted, 36 of the 39 programs withoutexternal review have begun or completed the self-study phase of the process. e remaining programs are scheduled tocomplete their self-studies by the end of 2010, and all these programs are expected to have approved ContinuousQuality Improvement plans by early 2011. At the end of this first cycle, the pRC will conduct a preliminary
W A S C E d U C A T I O N A L E F F E C T I v E N E S S R E v I E W R E p O R T8
L O m A L I N d A U N I v E R S I T y
RETURN TO CONTENTS
meta-analysis of data derived from the program reviews and online Annual program Reports (below). isinformation, including identification of best practices and lessons learned, will be shared with the EEC, UniversityAcademic Affairs Committee (UAAC), University Faculty Council (UFC), deans Council, and faculty groups.
e pRC has also improved and streamlined the mechanics of Annual program Reporting to concentrate each year ona rotating selection of quantitative and qualitative CFRs and analytics. is system also requires that all programsprovide at least one example of valuable CQI learning each year. e online system for Annual program Reporting hasbeen enhanced so that programs throughout the University have access to simple tools for comparing and analyzingthemselves in targeted ways. periodic studies will be guided by institutional needs and will be applicable to allprograms.
A third phase of the pRC’s assignment is to devise a comparable process for reviewing and assessing educationalelements in programs with regular external assessment or accreditation. e goal will be to focus on distinctiveinstitutional values, attitudes, and behaviors that may not have been in the spotlight for professional accreditors.
Cyclic program Reviews and Annual program Reporting are intended to encourage and enhance continuous datacollection, analysis, and evidence-based program enhancement. Even at this early stage, its implementation has led tomore consistent expectations for program assessment and has opened new avenues for discussion, interaction, andinformation-sharing. Significant institution-wide improvements in assessment, annual learning outcomes, student andalumni satisfaction surveys, curriculum flow charts, faculty development, student admission, retention, completion,and diversity are all expected as progressive consequences of this course of action.
d) developing a culture of assessment. Also facilitating learning in this collaborative model has been the emphasisplaced on developing both central and School-based representatives with training in educational assessment.designated assessment representatives have been sent for training and have attended related workshops. In the pasttwo years, diverse groups of administrators, faculty, and staff have participated in seven assessment workshops andattended ten IR conferences, all in an effort to assure the continued maturing of our culture of assessment.
In addition, the director of the OEE is enrolled in the WASC Assessment Leadership Academy. Schools have also investedin continued training of their representatives with regard to discipline-specific assessment, and many faculty are activelyinvolved in professional and regional accreditation agencies as site visitors, committee members, and review panelists (LLUAssessment Workshops and LLU Participants at WASC Assessment Workshops will be available in the Exhibit Room).
Another example of the support and enhancement from the OEE and its efforts related to assessment training and theintegration of assessment data across the Schools is the implementation of the software program LiveText™. As anextension of University-wide assessment, the Office of Educational Effectiveness orchestrated the selection ofLiveText™ as the institution’s web-based learning system to oversee and store student-learning data. e School ofAllied Health professions, being the School with the largest student population and greatest number of programs,piloted the application of LiveText™’s Accreditation management System™ including utilizing its e-portfolio system. Bythe WASC EER visit in October of 2010, this School will have completed a full cycle of assessment using thisassessment software system. during this period, due in part to a number of workshops and support from theinstitution’s OEE, other Schools and departments within Schools have begun to use this same learning assessmentsoftware to more fully develop, organize, and manage student-learning data. We now recognize that this program hasenhanced our ability to monitor students’ achievements and better understand the effectiveness of the Schools’curricula. In fact, LiveText™, coupled with other School and University resources, allows us to assess mastery ofstudents’ communication, collaborative learning, critical thinking, and other University-wide student learningoutcomes required in today’s globalized marketplace. (CFRs 2.3, 2.4, 2.7, 2.10, 2.11, 3.1)
WA S C E d U C A T I O N A L E F F E C T I v E N E S S R E v I E W R E p O R T 9
L O m A L I N d A U N I v E R S I T y
RETURN TO CONTENTS
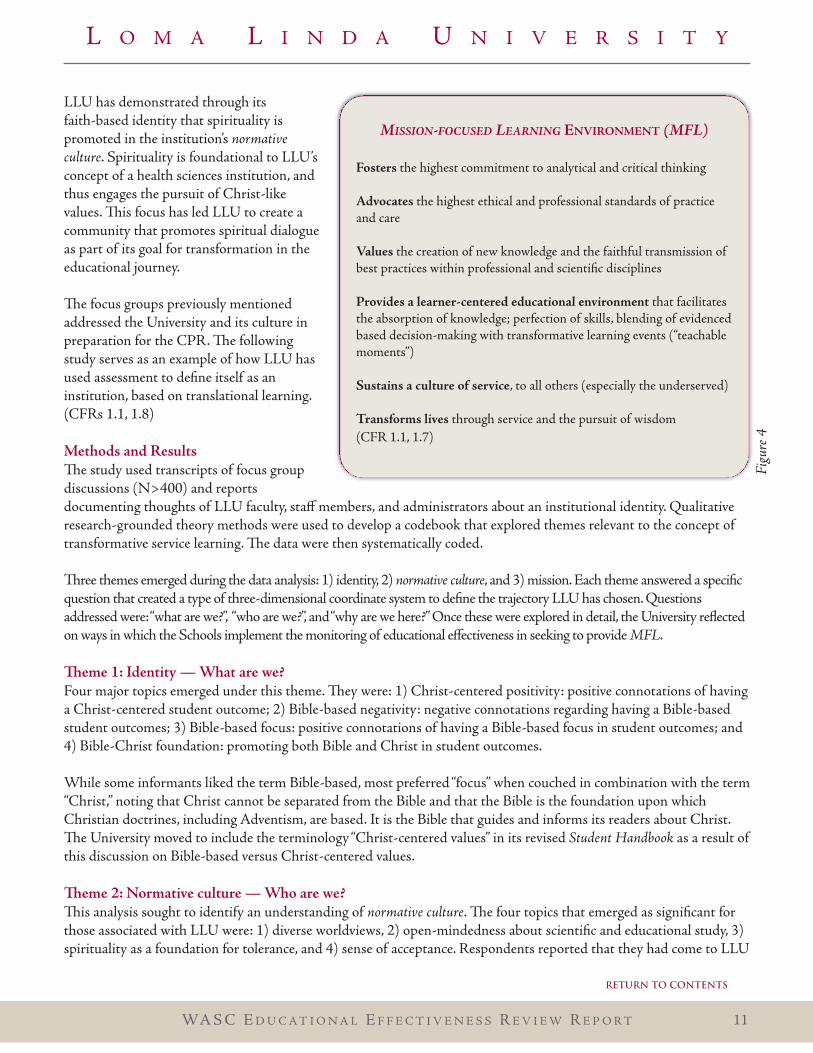
Institutional Wasc Reaccreditation Research emesAs part of our CpR, we evaluated the normative culture of our campus using a number of focus groups. e reportpresented the findings derived from this series of campus-wide discussions concerning LLU’s Christian-basednormative culture in light of the institution’s commitment to Mission-focused Learning (MFL)1 as seen in Figure 4:Mission-focused Learning Environment (MFL). e University conducted focus groups with a systematically selectedcross-section of more than 300 students, faculty, staff members, and administrators. major goals of these focusgroups were to identify perceptions of commitment to service as an integral part of health professions education andto explore the degree to which the institution’s quest for academic excellence complemented its commitment toservice.
It became clear that there exists an overwhelming dedication to the core concept of service across all groups. MFL, withservice at its core, was seen as a uniting factor at LLU, even though many felt that the“islands of excellence” of each School,at times, limited growth toward our ultimate goal of becoming“a community of shared excellence.” ose involved in thesemeetings facilitated opportunities for deliberate exchanges. Another outgrowth has been ongoing presentations of theconcept of MFL at all new employee and faculty orientations, faculty and leadership retreats, and School faculty meetings.ese activities have helped to focus our attention on the development of the Wholeness portal, the reformatting of courseevaluations to include MFL, and revisions of Schools’ annual faculty and staff reviews.
transformative LearningConsistent with “Generation m” thinking, current discussions seek to examine transformative learning with the endgoal “to make man whole.” Transformative learning is defined by Cranton (2006) as “… a process by which previouslyuncritically assimilated assumptions, beliefs, values, and perspectives are questioned and thereby become more open,permeable, and better justified.” Cranton suggested that the process does not stop there, because the process is nolonger entirely cognitive or rational. Transformative learning also must include the incorporation of the soul andimagination, and affect one’s understanding of the process (dirkx, 2001).
e modern understanding of reality assumes a separation of the physical world from one’s spiritual self (myers,2004). In contrast, transformative learning is an attempt to create a seamless junction where reality does not separatethe physical and spiritual worlds. O’Sullivan (1999) argued that for transformative education to occur, spiritualitymust be addressed in the classroom, and its inclusion must be a focus at the very heart of the educational process.
LLU has long taken an active stand on this issue, arguing through its mission and core values that meaning, faith, andknowledge-acquisition are deliberately intertwined in a professional education. Higher education values the goal ofdeveloping wisdom. An educational perspective that values and infuses this spiritual component adds a compass toknowledge-seeking that is rooted in the meaningful application of learned skills toward innovation and takingresponsibility for others.
W A S C E d U C A T I O N A L E F F E C T I v E N E S S R E v I E W R E p O R T10
L O m A L I N d A U N I v E R S I T y
1Mission-focused learning (MFL) combines the best traditions of an outcomes-based education and learning by doing, with service tocommunity. MFL combines the goals of service-learning with those of selfless volunteerism; it is motivated by the example of Jesus Christwho lived to bring hope, healing, and happiness to mankind. LLU’s commitment to MFL derives from its belief that learning transformslives. e greatest transformation comes through selfless service to others. is reinforces our core values and encourages civicresponsibility within communities. MFL, as well as service learning, utilize experiences that originate and grow from contemplation onthe meaning of events; clinical approaches; the needs of others; and the development of skills and knowledge to create a healthier societyand world. MFL is a learning approach that looks for, and plans for, teachable moments where theory and practical reality come togetherin “ah-ha” moments. LLU is committed to providing an approach to higher education that blends the professional with the personal andwhere graduates approach their health care profession not as a mere job, but as a calling to service. Such learning brings a truerunderstanding of our core values, builds character, and brings meaning to the saying “who you are is more important than what youknow.” rough MFL we prepare students for a dedicated life-long journey of service to all mankind (LLU 2008 CPR Report, p. 31).
RETURN TO CONTENTS
LLU has demonstrated through itsfaith-based identity that spirituality ispromoted in the institution’s normativeculture. Spirituality is foundational to LLU’sconcept of a health sciences institution, andthus engages the pursuit of Christ-likevalues. is focus has led LLU to create acommunity that promotes spiritual dialogueas part of its goal for transformation in theeducational journey.
e focus groups previously mentionedaddressed the University and its culture inpreparation for the CpR. e followingstudy serves as an example of how LLU hasused assessment to define itself as aninstitution, based on translational learning.(CFRs 1.1, 1.8)
Methods and Resultse study used transcripts of focus groupdiscussions (N>400) and reportsdocumenting thoughts of LLU faculty, staff members, and administrators about an institutional identity. Qualitativeresearch-grounded theory methods were used to develop a codebook that explored themes relevant to the concept oftransformative service learning. e data were then systematically coded.
ree themes emerged during the data analysis: 1) identity, 2) normative culture, and 3) mission. Each theme answered a specificquestion that created a type of three-dimensional coordinate system to define the trajectory LLU has chosen. Questionsaddressed were:“what are we?”, “who are we?”, and“why are we here?” Once these were explored in detail, the University reflectedon ways in which the Schools implement the monitoring of educational effectiveness in seeking to provide MFL.
eme 1: Identity — what are we?Four major topics emerged under this theme. ey were: 1) Christ-centered positivity: positive connotations of havinga Christ-centered student outcome; 2) Bible-based negativity: negative connotations regarding having a Bible-basedstudent outcomes; 3) Bible-based focus: positive connotations of having a Bible-based focus in student outcomes; and4) Bible-Christ foundation: promoting both Bible and Christ in student outcomes.
While some informants liked the term Bible-based, most preferred “focus” when couched in combination with the term“Christ,” noting that Christ cannot be separated from the Bible and that the Bible is the foundation upon whichChristian doctrines, including Adventism, are based. It is the Bible that guides and informs its readers about Christ.e University moved to include the terminology “Christ-centered values” in its revised Student Handbook as a result ofthis discussion on Bible-based versus Christ-centered values.
eme 2: Normative culture — who are we?is analysis sought to identify an understanding of normative culture. e four topics that emerged as significant forthose associated with LLU were: 1) diverse worldviews, 2) open-mindedness about scientific and educational study, 3)spirituality as a foundation for tolerance, and 4) sense of acceptance. Respondents reported that they had come to LLU
WA S C E d U C A T I O N A L E F F E C T I v E N E S S R E v I E W R E p O R T 11
L O m A L I N d A U N I v E R S I T y
MISSION-FOCUSED LEARNING EnVIRonmEnt (MFL)
fosters the highest commitment to analytical and critical thinking
advocates the highest ethical and professional standards of practiceand care
Values the creation of new knowledge and the faithful transmission ofbest practices within professional and scientific disciplines
Provides a learner-centered educational environment that facilitatesthe absorption of knowledge; perfection of skills, blending of evidencedbased decision-making with transformative learning events (“teachablemoments”)
sustains a culture of service, to all others (especially the underserved)
transforms lives through service and the pursuit of wisdom(CFR 1.1, 1.7)
Figu
re4
RETURN TO CONTENTS
because of its stated faith-based commitment and their desire to enrich their lives by seeking professional educationthat embraces transformation which integrates scholarship, faith, spirituality, and service.
eme 3: Mission-focused/transformative learning — why are we here?ree pertinent sub-topics under normative culture emerged most frequently across all Schools. ese were: 1)exhibiting love as modeled by Christ, 2) providing service as an extension of a faith commitment, and 3) living a lifethat integrates body, mind, and soul.
most participants suggested they were thankful that a discussion on wholeness, in light of transformative learningexpectations, had taken place at LLU and affirmed its value even if not always attainable.
How do we monitor and assure that faith-based transformative learning is occurring?e study demonstrated that transformative service-based education is clearly a core expectation held by students,faculty, and staff members. e following are examples of how the University and Schools monitor faith-basedtransformative learning.
1) University-wide student learning outcomes (SLOs). Over the past two years, the SLO sub-committee of the EducationalEffectiveness Committee (EEC), under the guidance of the University Assessment Committee, has worked to identify a set ofindicators that would measure wholeness, transformative MFL, critical thinking, verbal and oral communication, and LLU corevalues. In 2010, the subcommittee conducted a pilot study in which it developed and tested rubrics to assess these indicatorsUniversity-wide (Results may be found later in Student Learning Outcomes on page 23). (CFR 2.3)
2) wholeness Climate Survey and wholeness Portal2. LLU has developed two campus-wide systems to assesstransformative learning in relation to wholeness. eir purposes are to: 1) assess the environment in whichtransformative learning takes place using a Wholeness Climate Survey, and 2) provide a Wholeness portal for theUniversity community.
Students completed the Wholeness Climate Survey in the fall of 2009, which will be re-administered annually to newstudents and to those at the end of their programs (baseline and summative assessments).
e Wholeness portal provides a web-based resource whereby students can assess their own wholeness and pursueinformation that will help in their personal and professional growth. It began as a small site where students could trackpersonal goals. Within two years, it developed into a rich environment for students, clinicians, academicians, staff, andadministrators, and is also now open to the public. (CFRs 2.3, 2.8, 2.9, 2.10, 2.11)
3) University Strategic Plan. e University has adopted the five pillars of the new five-year LLUAHSC strategicplan, and one of these pillars is “Academic and Service Excellence” (see “Strategic planning” in the section of“Engagement and Sustainability.”) e University has also adopted MFL as a major theme with the intent to create atransformative environment resulting in life-altering wisdom. In addition to knowledge and skills, LLU wants tocontribute to positive change at both the individual and societal levels. Guided by its five-year Strategic plan, LomaLinda University will: a) begin to position itself as a leader in the science of transformational learning; b) excel inlearner-centered technologies and methods; c) develop a research-focused campus culture; and d) promote theessential nature of research as a means of creating new knowledge in basic and translational research in the pedagogicalscience of transformative learning. (CFRs 2.3, 2.8, 2.9, 4.1, 4.2, 4.3, 4.4, 4.7, 4.8)
W A S C E d U C A T I O N A L E F F E C T I v E N E S S R E v I E W R E p O R T12
L O m A L I N d A U N I v E R S I T y
2e Wholeness portal (Wp) website provides an avenue by which students can obtain information that will help in personal andprofessional growth <www.explorewholeness.com>.
RETURN TO CONTENTS
EnGaGEmEnt and sustaInabIlIty
is section addresses: 1) the University strategic planning process that involved many individuals and groups in ayearlong process; 2) the committees that have worked on assessment and educational outcomes; and 3) the futureplans for research. Engagement is demonstrated by the number of individuals who have been involved in developingthe plans, and the structures demonstrate sustainability.
As already mentioned in the introduction, the work done for the Capacity and preparatory Review (CpR) report inconjunction with the feedback from the site visit team revealed the importance of investing in a broad-based, yetrealistically parsimonious sustainable system. It was decided that, in addition to the rich available data from respectiveprofessional accreditations, LLU would develop a sustainable, interdisciplinary, faculty-owned system of monitoringand collegial feedback. As a result, the time between the CpR and now was used to work on the development of thissustainable system through a University-wide process. Under the leadership of the OEE and EEC, elevensub-committees were involved in the development of this system (See organizational chart on page 15). is resulted indeep layers of involvement with a total of more than 100 faculty from all ranks and staff working on the developmentof the system and the collection of data. In addition, they also developed review guidelines, procedures, and cycles thatstressed the inclusion of cross-disciplinary perspectives. Administration and faculty were bought into this ambitiouseffort mainly because ongoing evaluation and feedback would only occur with widespread buy-in by faculty and staff,and assurances that recommendations would be heard and result in changes.
lluahsc strategic Planningroughout its history, Loma Linda University has benefited from strategic planning as evidenced by the creation ofand growth in new academic programs, service opportunities, buildings, institutes, and corporate structures. Schools,in response to professional accreditation demands, did most of their own strategic planning. e new strategicplanning process approved by the Board in February 2009 encourages the incorporation of best practices into anintegrated plan for all LLU entities. is new process promises to increase efficiencies, effectiveness, and synergy tofulfill the mission and sustain best practices. With support from the Schools, the University’s portion of theLLUAHSC Strategic plan has placed high value on improving our service and assessment infrastructure and onevidence-based decision making (See the Strategic Plans in Appendix A). e new corporate-wide planning processprovides enhanced opportunities for the University and Schools to align goals and resources across the enterprise.
e strategic planning process for the University began in June of 2009, with the formation of a University strategicplanning committee, chaired by the provost and guided by michael Jackson, Senior vice president. e committeeapproved a collaborative and strategic planning process, which began with a scan of the internal and external environment.e committee identified, reviewed, analyzed, and discussed key academic data, assumptions, and trends.
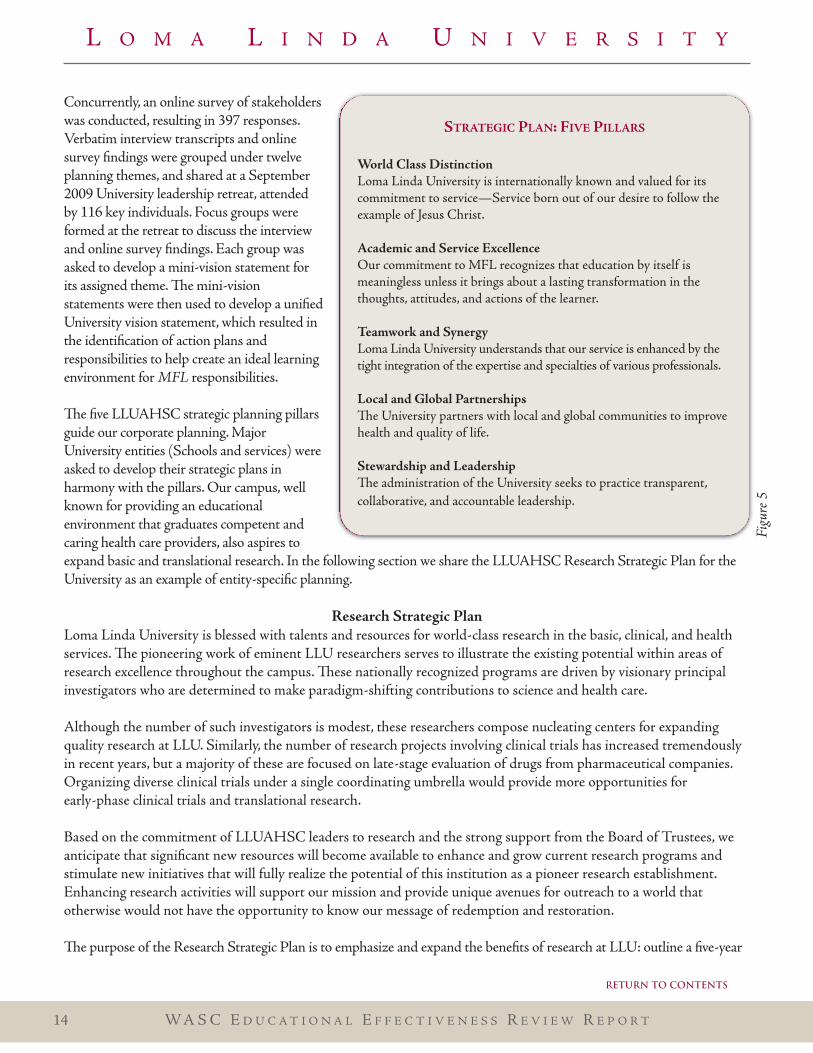
e Board of Trustees provided broad planning goals that were tendered as five planning pillars (See Figure 5. StrategicPlan: Five Pillars). e intent served as the foundation upon which all planning and implementation occurred. esefive pillars framed and directed our corporate strategic planning. Eventually this initiative became the fullness of MFL,and led to a series of action plans and identified responsibilities.
personal interviews of key University stakeholders occurred. ese stakeholders included students, faculty, staff,administration, and key community leaders. participants were informed that the University was in the process ofdeveloping a five-year Strategic plan for 2010–2014, beginning with the development of a vision statement for theUniversity’s desired future. Two questions were posed:“What attributes should LLU exhibit in 2014, as it seeks totransform lives though education?” and“What vital few priorities should the Strategic plan address to attain this vision?”
WA S C E d U C A T I O N A L E F F E C T I v E N E S S R E v I E W R E p O R T 13
L O m A L I N d A U N I v E R S I T y
RETURN TO CONTENTS
Concurrently, an online survey of stakeholderswas conducted, resulting in 397 responses.verbatim interview transcripts and onlinesurvey findings were grouped under twelveplanning themes, and shared at a September2009 University leadership retreat, attendedby 116 key individuals. Focus groups wereformed at the retreat to discuss the interviewand online survey findings. Each group wasasked to develop a mini-vision statement forits assigned theme. e mini-visionstatements were then used to develop a unifiedUniversity vision statement, which resulted inthe identification of action plans andresponsibilities to help create an ideal learningenvironment for MFL responsibilities.
e five LLUAHSC strategic planning pillarsguide our corporate planning. majorUniversity entities (Schools and services) wereasked to develop their strategic plans inharmony with the pillars. Our campus, wellknown for providing an educationalenvironment that graduates competent andcaring health care providers, also aspires toexpand basic and translational research. In the following section we share the LLUAHSC Research Strategic plan for theUniversity as an example of entity-specific planning.
Research strategic PlanLoma Linda University is blessed with talents and resources for world-class research in the basic, clinical, and healthservices. e pioneering work of eminent LLU researchers serves to illustrate the existing potential within areas ofresearch excellence throughout the campus. ese nationally recognized programs are driven by visionary principalinvestigators who are determined to make paradigm-shifting contributions to science and health care.
Although the number of such investigators is modest, these researchers compose nucleating centers for expandingquality research at LLU. Similarly, the number of research projects involving clinical trials has increased tremendouslyin recent years, but a majority of these are focused on late-stage evaluation of drugs from pharmaceutical companies.Organizing diverse clinical trials under a single coordinating umbrella would provide more opportunities forearly-phase clinical trials and translational research.
Based on the commitment of LLUAHSC leaders to research and the strong support from the Board of Trustees, weanticipate that significant new resources will become available to enhance and grow current research programs andstimulate new initiatives that will fully realize the potential of this institution as a pioneer research establishment.Enhancing research activities will support our mission and provide unique avenues for outreach to a world thatotherwise would not have the opportunity to know our message of redemption and restoration.
e purpose of the Research Strategic plan is to emphasize and expand the benefits of research at LLU: outline a five-year
W A S C E d U C A T I O N A L E F F E C T I v E N E S S R E v I E W R E p O R T14
L O m A L I N d A U N I v E R S I T y
stRatEGIc Plan: fIVE PIllaRs
World class distinctionLoma Linda University is internationally known and valued for itscommitment to service—Service born out of our desire to follow theexample of Jesus Christ.
academic and service ExcellenceOur commitment to mFL recognizes that education by itself ismeaningless unless it brings about a lasting transformation in thethoughts, attitudes, and actions of the learner.
teamwork and synergyLoma Linda University understands that our service is enhanced by thetight integration of the expertise and specialties of various professionals.
local and Global Partnershipse University partners with local and global communities to improvehealth and quality of life.
stewardship and leadershipe administration of the University seeks to practice transparent,collaborative, and accountable leadership.
Figu
re5
RETURN TO CONTENTS
vision for research, identifying opportunities for growth, and providing strategies for attaining new goals, while optimizingthe organizational structure of the Office of the vice president for Research Affairs (OvpRA) so as to accommodate theanticipated workload and proposed research initiatives (Research Strategic Plan will be available in the Exhibit Room). (CFRs2.6, 2.8, 3.2, 3.5, 3.6, 3.7, 4.1)
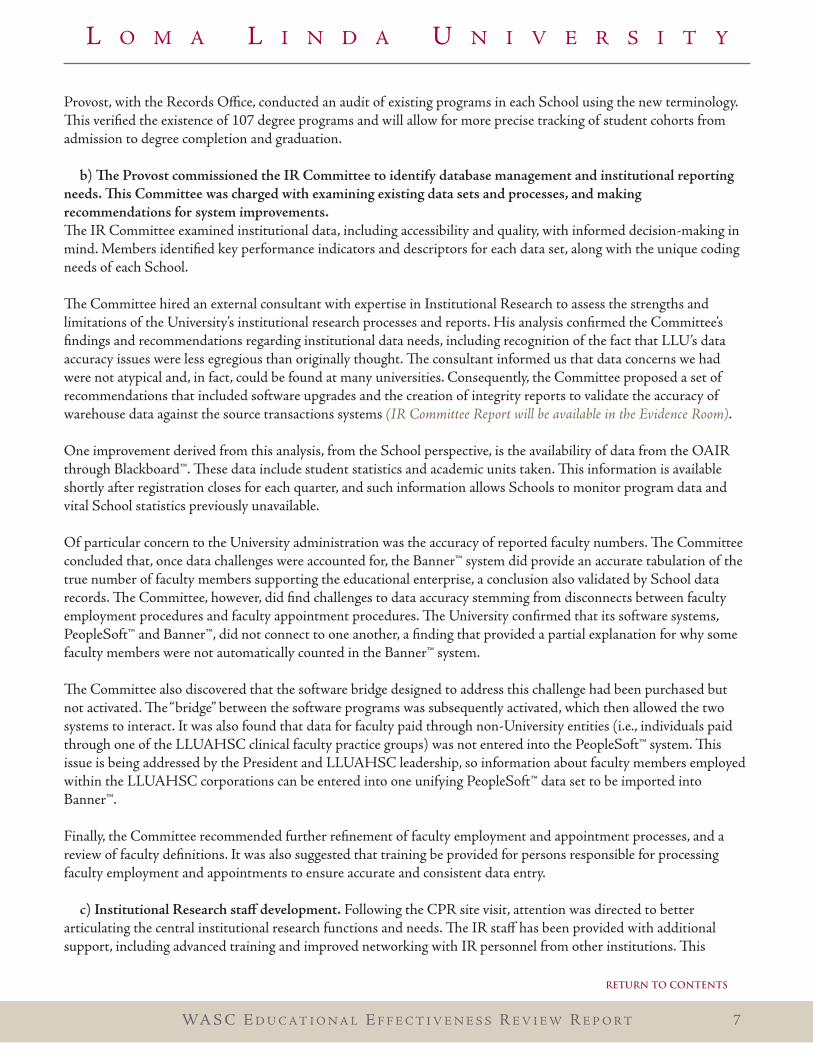
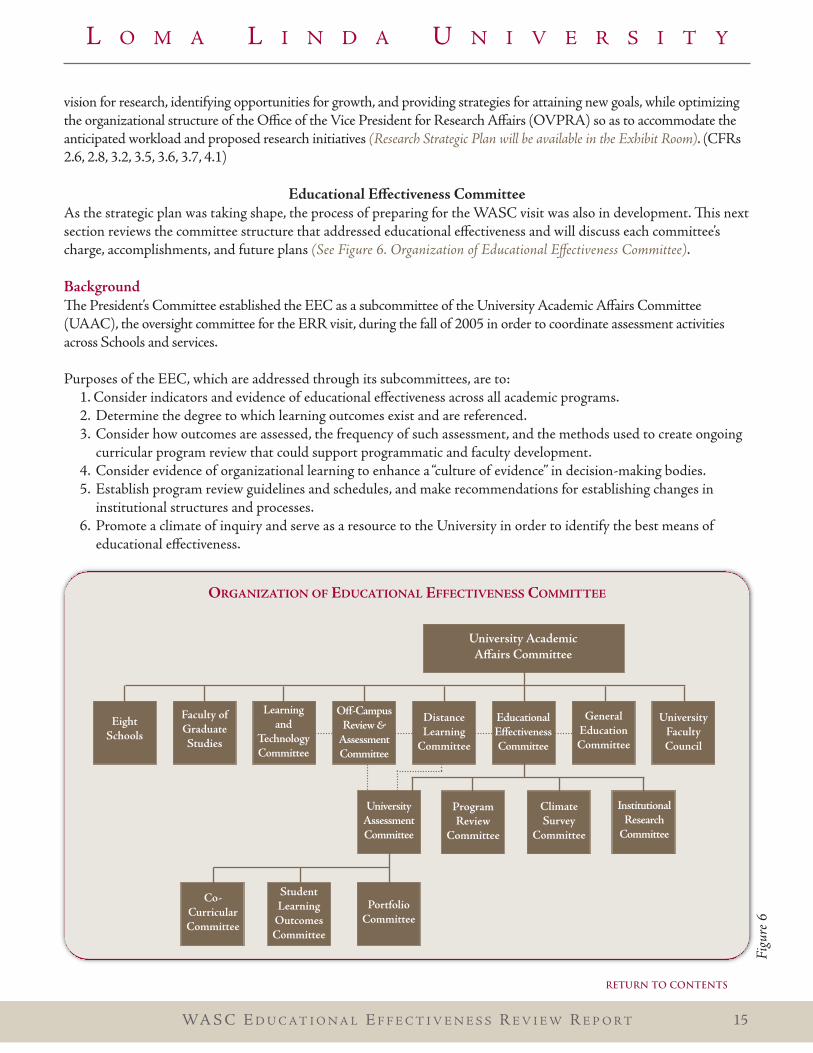
Educational Effectiveness committeeAs the strategic plan was taking shape, the process of preparing for the WASC visit was also in development. is nextsection reviews the committee structure that addressed educational effectiveness and will discuss each committee’scharge, accomplishments, and future plans (See Figure 6. Organization of Educational Effectiveness Committee).
backgrounde president’s Committee established the EEC as a subcommittee of the University Academic Affairs Committee(UAAC), the oversight committee for the ERR visit, during the fall of 2005 in order to coordinate assessment activitiesacross Schools and services.
purposes of the EEC, which are addressed through its subcommittees, are to:1. Consider indicators and evidence of educational effectiveness across all academic programs.2. determine the degree to which learning outcomes exist and are referenced.3. Consider how outcomes are assessed, the frequency of such assessment, and the methods used to create ongoing
curricular program review that could support programmatic and faculty development.4. Consider evidence of organizational learning to enhance a “culture of evidence” in decision-making bodies.5. Establish program review guidelines and schedules, and make recommendations for establishing changes in
institutional structures and processes.6. promote a climate of inquiry and serve as a resource to the University in order to identify the best means of
educational effectiveness.
WA S C E d U C A T I O N A L E F F E C T I v E N E S S R E v I E W R E p O R T 15
L O m A L I N d A U N I v E R S I T y
oRGanIzatIon of EducatIonal EffEctIVEnEss commIttEE
University AcademicAffairs Committee
educationaleffectivenessCommittee
eightSchools
Faculty ofgraduateStudies
Learningand
technologyCommittee
Off-CampusReview &
AssessmentCommittee
generaleducationCommittee
UniversityFacultyCouncil
distanceLearning
Committee
UniversityAssessmentCommittee
ProgramReview
Committee
ClimateSurvey
Committee
InstitutionalResearch
Committee
PortfolioCommittee
StudentLearning
OutcomesCommittee
Co-CurricularCommittee
Figu
re6
RETURN TO CONTENTS
7. prepare the WASC accreditation documents, the first of which was the Institutional Proposal submitted in may of2006.
As the EEC began to implement the University’s Institutional Proposal, members identified the need to address themultifaceted nature of the committee’s responsibilities by broadening input from campus constituents. Subsequently,the University established three subcommittees (Research emes, program Review, and Capacity Review).membership included representatives from all Schools, and, in the case of the Capacity Review Subcommittee,representatives from central administrative and campus-wide student services departments.
In January of 2009, the Committee was reorganized and expanded to facilitate coordinating functions and to support areporting structure for associated committees. e EEC now includes chairs and co-chairs of its subcommittees, UniversityFaculty Council representation, School representation, vice presidents, the provost, and several at-large members.
Figure 6. Organization of Educational Effectiveness Committee illustrates relationships among the EEC, itssubcommittees, and the UAAC. e solid connectors represent a direct reporting relationship, while the dashedconnectors represent a collaborative relationship.
e Committee meets monthly to receive updates from subcommittees working on various dimensions ofevaluation/assessment. Each subcommittee submits a report of its activities to the EEC annually. A summary reportdescribing accomplishments and future directions for the EEC, and brief individual reports for each of itssubcommittees, follows. (CFRs 1.9, 2.1, 2.3, 2.7, 2.12, 3.4, 3.5, 4.1, 4.4, 4.5, 4.6, 4.7)
As an oversight committee, the EEC reports all activities related to assessment, program review, and qualityimprovement to appropriate committees and University administration. In addition, the Committee serves as aconduit for communication, reporting, and discussion. e work of the Committee has been effective in advancing thepurposes of assessment and program review at LLU, including the following accomplishments:
• developed an infrastructure for assessment.• prepared faculty members to support and conduct assessment activities.• Captured data and experiences that highlight the assessment process.• Reviewed existing personnel assessment policies and procedures.• developed and/or adopted and adapted assessment tools.• Set University expectations for assessment.• Integrated use of co-curricular experiences and the Wholeness portal into student learning opportunities
and data development.• Encouraged University-wide adoption of student portfolios.• Instituted our current program review process.• Reduced redundancy of efforts in relation to assessment approaches through general meetings in which
information is shared.
rough this process EEC has learned that:• portfolio development is a valuable tool for student learning across disciplines and a means of assessment of
University and program-specific SLOs.• Time and opportunity have broken down silo walls that formerly impeded collaboration. Increased inter-School
involvement among faculty has enhanced cross-disciplinary activities that will promote institutional andprofessional collaborations.
• While the tendency is to try to use every available technology, we have found that it is imperative to evaluate theappropriateness and impact of these technologies on the culture and temperament of the faculty.
W A S C E d U C A T I O N A L E F F E C T I v E N E S S R E v I E W R E p O R T16
L O m A L I N d A U N I v E R S I T y
RETURN TO CONTENTS
• e faculty have surprisingly embraced technologies and processes adopted by the University thatparticularly/specifically enhance institutional learning.
• Never before have so many individuals in this institution participated in each step of the assessment process.Enthusiasm and support across Schools for demonstrating educational effectiveness is becoming the norm.
• Co-curricular activities contribute valuable learning experiences and can be assessed for effectiveness.• Identification of shared resources has become essential to our assessment activities.
Although continuation of the momentum in the aforementioned accomplishments provides the emphasis of the futurework of the EEC, priority will be given to continue to:
• Obtain baseline assessment data.• Support assessment through organizational structure and processes.• Encourage faculty participation in the assessment activities.
In addition to its other responsibilities, the EEC meets monthly to receive updates from subcommittees working onvarious dimensions of evaluation/assessment. Each subcommittee submits a report of its activities to the EECannually. A summary report describing the accomplishments and future directions of each of the subcommittees of theEEC follows. (Full annual reports of each subcommittee’s charge, accomplishments, and future directions will be available inthe Exhibit Room). (CFRs 1.9, 2.1, 2.3, 2.7, 2.12, 3.4, 3.5, 4.1, 4.4, 4.5, 4.6, 4.7)
University Assessment Committeee University Assessment Committee’s (UAC) charge is to guide the development of the University assessmentframework and activities; to facilitate a forum for assessment; and to provide assessment support for the Schools. eUAC reports to the EEC and ultimately the University Accreditation Steering Committee (UASC). eaccomplishments of the UAC include:
• Collaborated with the Office of Educational Effectiveness, Schools, and the University Faculty Council (UFC) toinstill a climate of assessment into their modus operandi.
• developed a forum for inter-School assessment discussion and support.• developed the concept and role of School “Assessment Specialists.”• developed assessment workshops provided by OEE; several Schools have also offered assessment workshops.
Assessment Specialists provided one-on-one help to faculty members.• developed mechanisms for data collection and reporting for program assessment.• developed a template for case studies through which each School could showcase assessment as a mechanism for change.• Initiated the University’s review of policies related to assessment of faculty and administration.
As the UAC goes forth with its work, the following future plans have been set forth:• Continue to develop and encourage campus-wide assessment.• Support professional development on assessment through workshops with assessment experts.• Continue to work with the OEE on the Assessment Strategic plan.
Student Learning Outcomes Committeee charge of the Student Learning Outcomes Committee (SLOC) is to guide the development of the University’sstudent learning outcome (SLO) assessment framework and activities; to facilitate a forum for SLO assessment; andto provide SLO assessment support for the Schools. e SLOC reports to the UAC and ultimately the EEC. ework of the SLOC has resulted in the following accomplishments:
• Established the guidelines and processes for outcome review.• Created the expectations for the outcomes documentation process.• developed rubrics for University SLOs based on the Association of American Colleges and Universities
WA S C E d U C A T I O N A L E F F E C T I v E N E S S R E v I E W R E p O R T 17
L O m A L I N d A U N I v E R S I T y
RETURN TO CONTENTS
(AAC&U) vALUE rubrics.• Created an initial one-year plan with an ongoing four-year cycle for review of the University Outcomes. data have been
collected for the three chosen outcomes that include Wholeness, Critical inking Skills, and Effective Communication(oral and written), and the structure is in place for collection of the other SLOs over the next four years.
• Allowed Schools to contextualize rubrics for individual School programs, yet still collect University-wide datacommon to all programs.
• Utilized the new Wholeness portal as an “across-campus” assessment for wholeness.• Sponsored workshops and encouraged the use of the OEE website to disseminate the rubrics and assist the
Schools with developing SLO report documents.
As the SLOC continues its work, attention will be given to the following:• Continue to oversee the documentation of the SLO process.• develop a sustainable feedback loop, ensuring ongoing quality improvement.• Foster review and analysis of SLOs in keeping with educational effectiveness.
Portfolio Committeee University’s portfolio Committee seeks to share commonalities among the various Schools in order to establishbest practices for portfolio learning and development. e work of the portfolio Committee has been effective inadvancing the use of portfolio learning at LLU through the following accomplishments:
• determined the current use and organization of portfolios across campus.• Conducted a University-wide survey to identify currently used portfolios to assess SLOs.• defined uses of portfolios in assessment.• Evaluated electronic software for University-wide assessment.• Identified University portfolio resources.• provided resources to Schools wanting to develop portfolio programs in the future, including a lecture series,
books, and dvds related to SLOs.• Recommended the inclusion of the Cultural Competency Test and the Health Sciences Reasoning Test as part of
portfolios.
As LLU continues to develop the expertise of its faculty in portfolio learning, attention will be given to:• developing periodic interactive feedback mechanisms that are incorporated into the electronic portfolio process
and support students being continuously informed of strengths and weaknesses.• development of a portfolio template.
Co-curricular Committeee Co-curricular Committee’s (CCC) charge is to guide the development of the University’s co-curricular assessmentframework and activities; to facilitate a forum for co-curricular assessment; and to provide assessment support for theco-curricular programs on campus. e CCC reports to the UAC and ultimately to the EEC. Over the past 18months, the accomplishments of the CCC have included:
• Inventoried co-curricular programs and activities on campus.• developed formal assessments, including University SLOs.• Studied the feasibility of applying for Carnegie classification for community engagement.• developed an inventory of current assessment resources.• Organized assessment materials.• developed a brief guide for co-curricular programs to develop assessment plans and activities.
W A S C E d U C A T I O N A L E F F E C T I v E N E S S R E v I E W R E p O R T18
L O m A L I N d A U N I v E R S I T y
RETURN TO CONTENTS
As the CCC continues to assure that LLU’s co-curricular learning activities are assessed and an essential core of MFL,it plans to:
• Collect and analyze existing data to document a pilot study of assessment on co-curricular activities.• develop an organizational flow chart with reporting/accountability structure for co-curricular programs.• develop a strategic plan to assess co-curricular activities.• Assist the Institute for Community partnerships to reapply for the Carnegie classification on community
engagement.• Assess, collect, and analyze data, and report findings to appropriate committees and administration.
Institutional Research Committee (IRC)e Institutional Research Committee (IRC) is charged with improving and supporting the University’s IR functions,data management, and learning systems, including the faculty appointment system, in an effort to assist theadministrators and faculty in making data-informed decisions. e work of the IRC has made a number of advances insupport of the University’s data needs, including:
• Responded to WASC concerns that we had inadequately designed and staffed our institutional researchdepartment and assessment process.
• Replaced the existing reporting solution by investing in the pentaho® Business Intelligent Suite. is will aid theinstitution in reporting, analysis, data integration, and data mining.
• directed data collection for the WASC Educational Effectiveness Review (EER) Report.• provided oversight in the development and analysis of the required data exhibits for EER Report, ACSCU
Summary data Form, IpEdS, and all other required data exhibits.• Guided the development of effective data infrastructure to support institutional learning, assessment, strategic
planning, and student support services such as:o Reconciled faculty counts.o Addressed data needs and concerns.
• Assisted in building a stronger, integrated system and process.• Assisted in resolving identified weaknesses.• Worked with the Schools to clean up their data in preparation for the required data for the EER Report.
e future work of the IRC will emphasize the following:• develop an orientation/training program for staff and faculty across all Schools responsible for processing faculty
appointments.• Eliminate the designation of “dual” primary appointments and require that each appointment be identified as
either “primary” or “secondary.”• Invest the needed financial resources to complete software design and infrastructure development.• provide academic support and function as a liaison between faculty and the LLU Interim Institutional Researcher
and institutional research functions.• Continue to work with the Schools to clean up their data preparation for professional accreditations and the EER
report.• Work to reconcile student retention data: Central’s vs. Schools’.
Program Review Committeee program Review Committee (pRC) is charged with designing and overseeing systematic program review at LLU.As part of its work, the pRC schedules program reviews, guides and analyzes the self-study process, critiques qualityimprovement plans, and monitors the implementation of CQI plans. Accomplishments of the pRC include:
• Identified CFRs appropriate for assessment at the programmatic level.• Identified the CFRs that programs need to review annually and update as necessary.
WA S C E d U C A T I O N A L E F F E C T I v E N E S S R E v I E W R E p O R T 19
L O m A L I N d A U N I v E R S I T y
RETURN TO CONTENTS
• Revised the Annual Program Report to include information relevant to the program review process and bestpractices articulated during the WASC (ARC) program Review Workshop.
• Identified the steps necessary for the program review process from self-study to CQI.• developed LLU’s program review guide based on the program review process.• developed a list of programs with and without professional accreditation or external review.• developed and implemented a program review schedule for programs that do not have external professional accreditation.• planned a multi-year cycle for program review that will include all programs with and without external review.• Initiated the program review process for 36 programs with 16 having draft CQI plans.
Although the LLU program review process has functioned in its new organization for less than two years, much hasbeen learned, and these insights are being used to refine the process for the future to include:
• Incorporate all aids for performing program reviews (forms, templates, instructions, and specialized guidance) intoa single, comprehensive guide (LLU program Review Guide)
• Encourage adoption of professional standards as SLOs, streamlining the assessment processes (economy of effort).• promote more rigorous and sustainable program record-keeping.• Champion the need for institutional memory: a centralized location for program data storage (beyond LLU’s
AmS Annual program Report tool).• provide opportunities for faculty to make confidential comments/criticisms to external reviewers as part of the
self-study process.• promote broad faculty input into the self-study—most notably making draft documents available for comments.• Centralize coordination and reporting activities to a single office.• provide timely reminders of target dates for program review activities.
Climate Survey Committeee charge of the Climate Survey Committee (CSC) is to guide the development of the University’s climateassessment framework and activities; to facilitate a forum for climate assessment; and to provide assessment feedbackfor those responsible for specific areas of campus climate. e CSC reports to the EEC and has worked to accomplishthe following activities in support of educational effectiveness at LLU:
• Collected previous LLU instruments and their data for students, faculty, and staff.• Analyzed, selected, and modified the previous LLU instrument questions for future inquiry of students, faculty,
and staff. Other instruments were also studied to ensure comprehensiveness of our questions.• Created a new climate wholeness survey in conjunction with the Center for Spiritual Life & Wholeness, based on
the previous Wholeness Inventory and the analyses of its data.• Administered a new climate wholeness survey in the fall quarter as a request during the winter quarter’s registration process.• Worked on student satisfaction questions to be asked at the appropriate times.
Beyond the EER, the CSC will focus on two areas for future tasks: Faculty and Staff, and Students.• Analyze the data, make changes as indicated by the data, and close the loop.• Share the data with the University administration.• Ascertain which committees and groups will receive the data as determined by the types of questions for which
they are responsible.• Create a rubric for which the new questions will be implemented across the students’ enrollment experience.
general Studies and transfer education Committeeis General Education Committee (GEC) functions as an advisory subcommittee to the UAAC and is charged withthe establishment of GE requirements and the review of all new undergraduate programs, as well as major revisions tothe curricula of existing programs as these apply to general education. is committee reviews variances for the
W A S C E d U C A T I O N A L E F F E C T I v E N E S S R E v I E W R E p O R T20
L O m A L I N d A U N I v E R S I T y
RETURN TO CONTENTS
transfer of academic credits for undergraduate students when questions of adherence to University policy arise. Overthe course of the last two years, the GEC has:
• Established a subcommittee to create a priority list of undergraduate topics to address campus-wide, related to:o degree Compliance Reports.o Guidelines and regulations of general education for faculty advisors.o General advisement issues.o Communication between the GEC and advising faculty.
• developed and deployed three educational workshops across campus: General Education degree Requirements,degree Compliance Reports, and General Academic Advisement.
e GEC is continuing to look toward the future needs of undergraduate education at LLU, including:• Being focused on the students and their undergraduate experience.• Enhancing communication among undergraduate students, faculty, and central services.• developing long-range strategic planning for undergraduate education.• Addressing common issues of undergraduate education across campus.• proposing to restructure the Committee. is structure would include the following three groups: a Council, an
Executive Committee, and the entire Undergraduate Faculty. e Executive Committee would provide oversightfor the following subcommittees:
o variance Subcommitteeo GE domain Requirements Subcommitteeo Additional subcommittees would be developed through communication with all members of the Council
and Undergraduate Faculty groups, as needed.
distance Learning Committeee distance Learning Committee (dLC) develops, recommends, and formalizes distance learning policies withUAAC; updates the distance learning section in the Administrative Handbook; reviews proposals for distanceeducation programs in conjunction with the Learning and Technology Committee; guides and participates in distancelearning program review; and ensures that distance-learning students get the “Loma Linda University experience;” andshares best practices in distance learning. In addition to its charge, the dLC has:
• Identified and resolved many student issues related to online learning.• developed a process of identification for online students that includes verification of student identity and securing
of exams to meet HEOA requirements.• Revised course evaluations to better meet the needs of online students.• Identified the need to improve registration procedures for online students.• Recommended a new policy for online programs related to financial aid, and adding and dropping courses.
As the dLC continues its work, it plans to:• develop, recommend, and formalize online testing for distance education.• Work in concert with the UAAC to support distance education in the University’s strategic plan.• develop and maintain a section of the Administrative Handbook for online learning.• Review new program proposals for distance education programs in conjunction with the Learning and
Technology Committee.• Assist the pRC with assessment of the distance-learning programs.• promote inclusion of distance-learning programs on the LLU website for potential and current students.• Improve mechanisms for online students to access student services on-campus.
WA S C E d U C A T I O N A L E F F E C T I v E N E S S R E v I E W R E p O R T 21
L O m A L I N d A U N I v E R S I T y
RETURN TO CONTENTS
Off-Campus Review and Assessment Committeee Off-Campus Review and Assessment Committee’s (ORAC) charge is to provide an avenue for engaging indynamic strategic planning and ongoing quality improvement of LLU’s off-campus academic programs. iscommittee offers a community to support, guide, and mentor faculty members involved in off-campus and globalprograms. In addition, ORAC has worked to strengthen and enhance off-campus programs by:
• Shared lessons learned: the first year was focused on sharing “lessons learned;” the sharing of valuable experientialknowledge is ongoing.
• Reviewed and recommended new off-campus programs to UAAC, including four new programs and twointernational cohorts (one for Hawaii/Guam, and the other for ailand), all of which were subsequentlyapproved by UAAC and the Board of Trustees. e committee mentored new program directors to theoff-campus processes.
• Started the development of a “best practices” document that will inform future approval and assessment processesfor off-campus programs.
Guided by the committee’s charge, ORAC plans to:• develop a mission for off-campus domestic and international programs that coordinates with the University
strategic plan.• Complete the “best practices” document and develop guidelines for the new program approval process.
(CFRs 2.1, 2.7, 2.8, 2.9, 2.10, 2.14, 3.4, 3.6, 3.7, 4.5, 4.7)
EVIdEncE of EducatIonal EffEctIVEnEss unIVERsIty-WIdE
e Schools provide the foundation for transformative learning where students develop new knowledge, skills, andwisdom. e University further enhances the students’ learning environment in multiple ways. is section will firstaddress more traditional or formal structures for assuring the quality of the learning environment, including: programReview, University Student Learning Outcomes, University Faculty Council, and the tone of the campus itself throughClimate Surveys. e second part of this section will address unique value-added structures that further enhancestudents’ learning experiences, including wholeness and the effectiveness of co-curricular learning opportunities andcollaboration across campus.
systematic Program Review overviewAs noted previously, beginning in 2007 the program Review Committee (pRC) began the process of planning andimplementing a sustainable and systematic program review process (See Figure 7. Assessment and CQI Plan Cycle). Asthis process became more formalized, plans were put forth to systematize scheduling program reviews, guide andanalyze the self-study process, and develop and monitor the implementation of CQI plans for all degree programs atthe University.
As a part of its initial efforts, the committee identified 39 degree programs that did not have external professionalaccreditations, and developed a schedule that would prioritize review of these programs before engaging externallyaccredited programs in the process. Of the 39 programs in the initial review phase, 36 have conducted self-studies, andexperienced reviews by experts from other institutions, and 16 have prepared CQI plans that will guide them for threeto five years. Six programs are awaiting site visits by external reviewers, and three are currently conducting theirself-studies.
Systematic reviews are now required of all programs every five to seven years. e master schedule ties the Universityreview process to external accreditation cycles when possible. e University supports programs undergoing this
W A S C E d U C A T I O N A L E F F E C T I v E N E S S R E v I E W R E p O R T22
L O m A L I N d A U N I v E R S I T y
RETURN TO CONTENTS
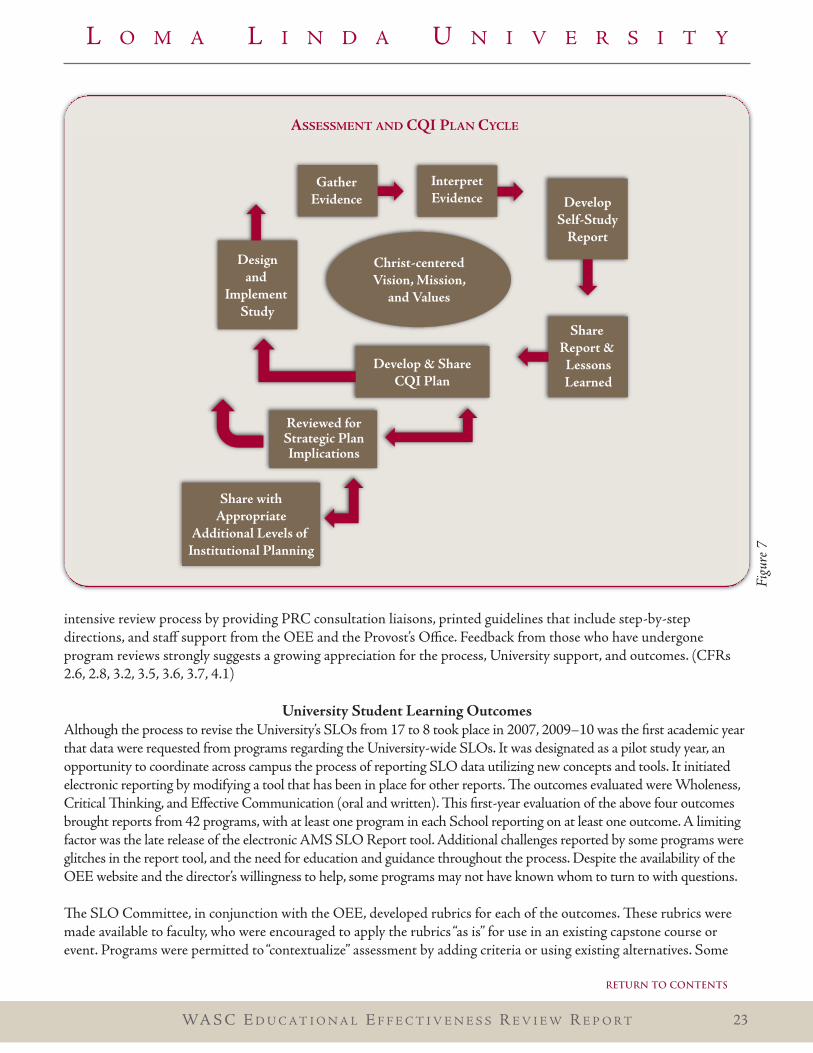
intensive review process by providing pRC consultation liaisons, printed guidelines that include step-by-stepdirections, and staff support from the OEE and the provost’s Office. Feedback from those who have undergoneprogram reviews strongly suggests a growing appreciation for the process, University support, and outcomes. (CFRs2.6, 2.8, 3.2, 3.5, 3.6, 3.7, 4.1)
university student learning outcomesAlthough the process to revise the University’s SLOs from 17 to 8 took place in 2007, 2009–10 was the first academic yearthat data were requested from programs regarding the University-wide SLOs. It was designated as a pilot study year, anopportunity to coordinate across campus the process of reporting SLO data utilizing new concepts and tools. It initiatedelectronic reporting by modifying a tool that has been in place for other reports. e outcomes evaluated were Wholeness,Critical inking, and Effective Communication (oral and written). is first-year evaluation of the above four outcomesbrought reports from 42 programs, with at least one program in each School reporting on at least one outcome. A limitingfactor was the late release of the electronic AmS SLO Report tool. Additional challenges reported by some programs wereglitches in the report tool, and the need for education and guidance throughout the process. despite the availability of theOEE website and the director’s willingness to help, some programs may not have known whom to turn to with questions.
e SLO Committee, in conjunction with the OEE, developed rubrics for each of the outcomes. ese rubrics weremade available to faculty, who were encouraged to apply the rubrics “as is” for use in an existing capstone course orevent. programs were permitted to “contextualize” assessment by adding criteria or using existing alternatives. Some
WA S C E d U C A T I O N A L E F F E C T I v E N E S S R E v I E W R E p O R T 23
L O m A L I N d A U N I v E R S I T y
assEssmEnt and cQI Plan cyclE
Figu
re7
RETURN TO CONTENTS
programs identified courses at different program levels so that assessment could be observed at baseline-beginning,middle-intermediate, and summative-capstone levels.
despite the anticipated limitations associated with new processes, there have been exemplary programs that made afull commitment to SLO assessment. All of the School of dentistry (Sd) undergraduate, graduate, professional, andcertificate programs worked together to identify courses in each program that would serve as a capstone for one or twoof the rubric criteria for each of the outcomes. e School of Nursing also gave significant attention to the integrationof the SLO rubrics into their existing and extensive assessment process, which involves surveying current students,clinical preceptors, graduating senior students, and alumni (one, three, and five years post-graduation) using separatesurveys. University SLO rubrics were integrated into the assessment in each of the related outcome areas. (CFR 2.3)
e pilot-study year for the assessment of University SLOs was a useful and informative experience that has assistedSchools in both the development and/or refinement of assessing outcomes and related processes. Although, in somecases the assessment rubrics for University-wide SLOs are sufficiently different from the outcomes assessmentmethods used by professional accrediting bodies, both are needed and demonstrate student learning. As the process forassessing University SLOs matures, the OEE and SLO Committee will continue to work with the AssessmentSpecialists in each School to enhance participation and ensure the integration and valuable reflection this type ofengaged assessment process provides.
during the 2010–2011 academic year, the rubrics for assessing technology and diversity will be implemented. eSLO Committee acknowledges that commitment and education are keys to the success of this assessment process. egoal is to have reports from ever-increasing numbers of programs moving towards complete adoption of rubrics andoutcome reporting for the start of the next quadrennial cycle. (CFRs 2.3, 2.7, 2.10, 2.11)
Additional assessment considerations specific to each of the SLOs selected for inclusion in this pilot implementationyear are described below:
SLO: Critical inkingmany programs utilized the University’s adopted rubric to assess critical thinking. programs established targets asappropriate to the level of degree programs being offered. Sixteen programs reported implementing the Critical inkingSLO during this pilot year of University-wide implementation. Fourteen of sixteen programs participating across fiveschools reported students meeting or exceeding the pre-established target. Graduate programs applied the rubric tocomprehensive examinations (School of Allied Health professions [SAHp], mS Communications Sciences and disordersexceeded its established standard), master’s theses, projects, and papers (School of Religion [SR], mA Clinical ministryreported that 59 percent met the established standard), and doctoral dissertation preparation and defense (all the phdprograms in the School of medicine [Sm], mean result exceeded the established standard with the exception of a fewstudents). In the SAHp, students in the AS physical erapy Assistant program exceeded the established standard forCritical inking as it applied to videos of the formal patient assessment processes. Alternative measures utilized to assessCritical inking included an application by the School of pharmacy (Sp), doctor of pharmacy, in which advancedstudents of the Health Sciences Reasoning Test (HSRT, Insight Assessment), were given a standardized Critical inkingskills examination adapted for health sciences students. preliminary results for Sp’s application pointed to studentperformance being below the 50th percentile. After a review of the preliminary results—coupled with a review ofless-than-desirable results found from applying the adopted rubric to an elective course activity in a sample group of thesame student cohort—Sp is developing methods to emphasize Critical inking to its students as a valuable skill. Futureassessment will provide insight as to the results of these program modifications. In addition, the School will continue toutilize HSRT, expanding testing to students at the start and completion of the doctoral program. preliminary discussionshave been held on campus regarding expanding the use of HSRT by other Schools and programs on campus, with an
W A S C E d U C A T I O N A L E F F E C T I v E N E S S R E v I E W R E p O R T24
L O m A L I N d A U N I v E R S I T y
RETURN TO CONTENTS
evaluation of the feasibility of the test’s use across a health sciences campus as a major indicator of critical thinking skills.
Critical inking is also a valuable component of the SN survey processes. means exceeding set standards were foundin the clinical preceptor, graduating student, and alumni surveys. Sd reported local and national board exam results asindicators of Critical inking skill competence. e Sd BS in dental Hygiene (BSdH) has reported passing thein-house OSCE test (> 97%) to be a valid measure of Critical inking skills. For the Sd BSdH and doctor ofdental Surgery (ddS), passage of national dental board examinations are considered evidence of Critical inking. Itshould be noted that one hundred percent (100%) of BSdH and ddS students passed their respective examinations.In addition, Sd has had for a number of years a formal review process in place for assessing the mean result of SdddS board examinations, as compared to national results. e process informs the program, providing a guide to newareas of emphasis as the examination itself evolves. (CFRs, 2.3, 2.4, 2.6, 2.7)
SLO: effective CommunicationIt was deemed appropriate to assess this particular SLO in terms of both oral and written communication. Consequently,two separate assessment rubrics were developed and data were collected from all Schools, where applicable. Each Schoolwas asked to develop a curriculum map to illustrate where the SLOs were assessed, and add the actual assessment rubric tothe corresponding course syllabi to advise students where and how they would be assessed for this particular SLO. Resultsfor Schools’ assessment of both aspects of Effective Communication follow:
Oral Communication. programs in five Schools reported application of the adopted rubric to assess oralcommunication. Evaluation occurred in courses (18 programs reported that students exceeded established standards),meeting program objectives regarding oral communication (two programs reported students exceeded the establishedstandard) and evaluation of doctoral dissertation preparation and defense. Alternative measurements of assessment showedthat, in the SN Nursing program, results also exceeded the established standard for the clinical preceptor and graduatingstudent surveys. In a sixth School, the School of public Health (SpH), doctor of public Health program identified thesuccessful passing of the dissertation defense to have demonstrated successfully meeting the outcome. (CFRs 2.3, 2.7)
written Communication. A variety of assessment methods were reported by the five primary participating Schools. eadopted rubric was employed with the result of students exceeding the set standard. Fifteen programs reported assessing courseassignments as a vehicle for determining students’ effective written communication skills. In SAHp, the mS CommunicationScience and disorders evaluated comprehensive exams, whereas the Occupational erapy doctoral program assessedpublishable manuscripts, and the BS in Clinical Laboratory Science and the mS in Radiation Science programs evaluated casestudies and comprehensive papers. e Sd, BS dental Hygiene program applied the adopted LLU rubric to assess its portfoliocapstone project. Sp’s evaluation of an elective course found that the mean of students assessed as a group for completion of agroup project exceeded the mean result for individual students. Sp plans to place greater emphasis on student’s writing skills.Finally, the SpH, doctor of public Health reported using an alternative indicator as its measure of effective writtencommunication, i.e., students’ successful passing of the program’s written comprehensive examinations. (CFRs 2.3, 2.7)
SLO: wholeness. e Wholeness SLO provided unique challenges and opportunities. Specific to the challenge is theemerging nature of our LLU definition of wholeness. Our understanding of wholeness is moving from a purely aspirationalconcept to one that is more specifically defined and therefore may be more measureable in the future. Our view of wholenesscontinues to mature as we grow our understanding of MFL and its relationship to transformative and wisdom learning.erefore measurement of Wholeness SLO is a transitional process. Over the past decade students and staff were asked variouswholeness survey questions. methods and questions were modified to improve the usefulness of the information. Before movingforward to refine rubrics for wholeness, we have placed our focus on deriving lessons learned from the more than 10 years ofsurvey data. In the following section we report some of our findings and responses by the University to address student andfaculty needs. (A full report of the survey questions, methods, and results will be available in the Evidence Room). (CFRs 2.3, 2.10, 2.11)
WA S C E d U C A T I O N A L E F F E C T I v E N E S S R E v I E W R E p O R T 25
L O m A L I N d A U N I v E R S I T y
RETURN TO CONTENTS
Wholeness climate surveysSurvey results indicate that among the five highest mean ratings by LLU students was the item “I am spiritually movedby the beauty of God’s creation,” which encouraged the revision of the University’s definition of wholeness to one thatincluded creation as one of its elements. e new wording became “Wholeness involves all aspects of one’s existenceunified through a loving relationship with God, resulting in inner rest that is expressed by: integrating mind/body/spirit,strengthening relationships, caring for creation, and healing the nations.”
Wholeness survey data, combined with low mean scores for chapel attendance on the Student Satisfaction Survey led tochanges to the structure and format of chapel. ese changes included moving the service from 8:00 to 11:00 a.m., andaltering the content and appearance of the event. e title “chapel” was revised to University@Worship to reflect thecentral focus and mission of the University. e new thematic approach addressed key components of Wholeness,University core values, spiritual integrative care, and MFL. e University added student outreach programs followingthe service. Quarterly events titled “Weeks of Renewal” had specific emphases designed to build a sense of community,and to encourage participation, plus uplift and educate students, various faculty groups, staff, and administration.
After instituting these changes, a subsequent qualitative survey evaluating student services revealed a large number ofpositive comments for the modifications made in the chapel services. Analysis of a refined Wholeness Climate Surveysuggested that all responses to the Wholeness climate and value items on the survey tended toward the positive (meanscore of 3 or higher). On a five-point Likert-type scale, with three being neutral, the three highest mean scores (4.22 -4.33) across Schools indicated that our students value LLU’s commitment to Wholeness and consider it as a part oftheir personal mission. ey appreciate the many opportunities that the University provides for service.
e two lowest mean scores (3.48 – 3.80) indicated that more attention should be placed on environmentalism andinterpersonal conversations between faculty and students concerning wholeness. Several Schools have sought ways tofoster “care for the environment” and to integrate this value into their curricula. In addition, there has been a concertedeffort throughout the campus to promote recycling. Further, there is a focus on mission work that connects withsustainability and helping others use their assets to help themselves.
e lowest score among the Wholeness surveys was the item “While at LLU a staff member, professor, or administratorat LLU has talked with me about my own wholeness” (i.e., 3.48). e University is currently addressing this issue onmultiple levels. As such, the Wholeness portal is being integrated at all levels (administration, faculty, and staff ), and isalso being integrated into some course offerings. Students and faculty alike have identified the portal as an avenuethrough which they feel those at the University care about their well-being. Some of the Schools have proposedincluding it in their strategic plans for future application (Report will be available in the Exhibit Room).
Comparison of the Wholeness Climate Surveys (Faculty 2010, Staff 2010, and Student 2009)ere were five Wholeness questions included on all three surveys (Surveys will be available in the Exhibit Room). e meanresponses to each question are similar among the three groups (See Figure 8. Comparison of the Wholeness Climate Surveysand Figure 9. Questions for Wholeness Climate Surveys Comparison). Students sense that they have opportunities to learnabout Wholeness and incorporate Wholeness principles into their lives. Faculty and Staff believe that they intentionallyincorporate the same principles into their practice and work. e lowest item among the Wholeness questions is Q3:While at LLU, a staff member, professor, or administrator at LLU has talked with me about my own wholeness. It seemsthat all three groups rank this among the lowest of all the items. It is ranked the lowest out of 22 items on the studentsurvey and is also among the lowest on the faculty and staff surveys.
e Wholeness PortalAs a result of lessons learned from the various Wholeness and climate surveys, and our deep commitment to
W A S C E d U C A T I O N A L E F F E C T I v E N E S S R E v I E W R E p O R T26
L O m A L I N d A U N I v E R S I T y
RETURN TO CONTENTS
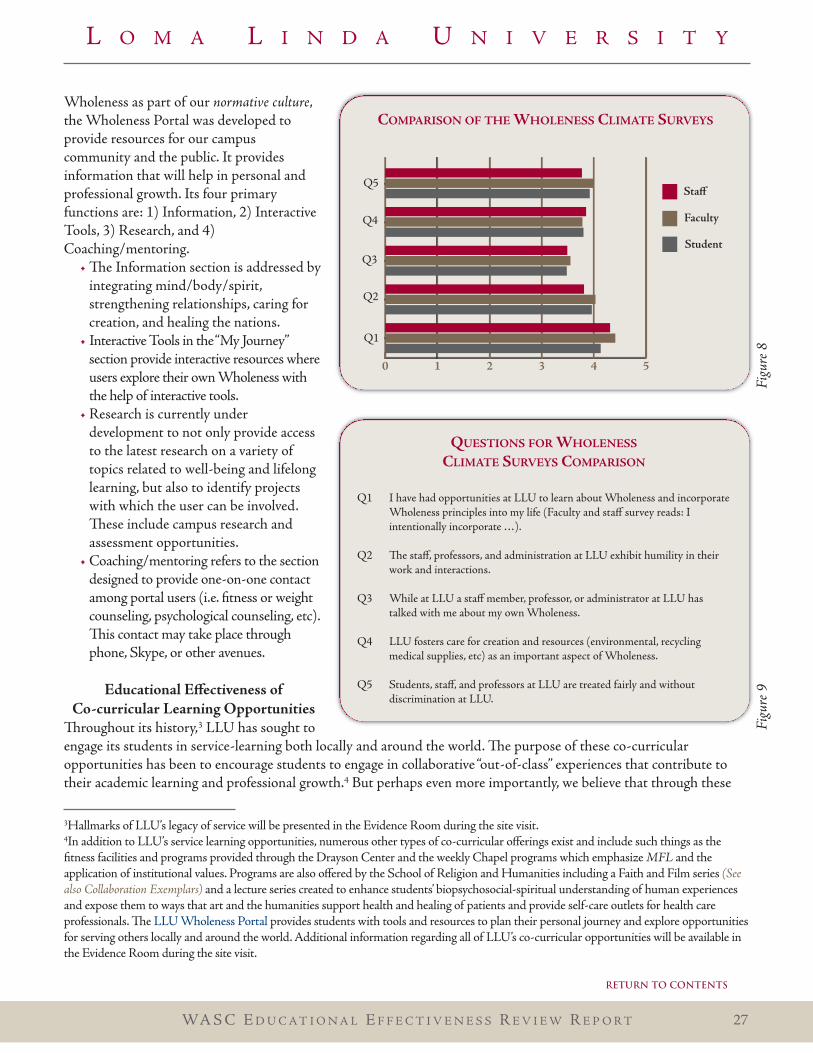
Wholeness as part of our normative culture,the Wholeness portal was developed toprovide resources for our campuscommunity and the public. It providesinformation that will help in personal andprofessional growth. Its four primaryfunctions are: 1) Information, 2) InteractiveTools, 3) Research, and 4)Coaching/mentoring.
• e Information section is addressed byintegrating mind/body/spirit,strengthening relationships, caring forcreation, and healing the nations.
• Interactive Tools in the“my Journey”section provide interactive resources whereusers explore their own Wholeness withthe help of interactive tools.
• Research is currently underdevelopment to not only provide accessto the latest research on a variety oftopics related to well-being and lifelonglearning, but also to identify projectswith which the user can be involved.ese include campus research andassessment opportunities.
• Coaching/mentoring refers to the sectiondesigned to provide one-on-one contactamong portal users (i.e. fitness or weightcounseling, psychological counseling, etc).is contact may take place throughphone, Skype, or other avenues.
Educational Effectiveness ofco-curricular learning opportunities
roughout its history,3 LLU has sought toengage its students in service-learning both locally and around the world. e purpose of these co-curricularopportunities has been to encourage students to engage in collaborative “out-of-class” experiences that contribute totheir academic learning and professional growth.4 But perhaps even more importantly, we believe that through these
WA S C E d U C A T I O N A L E F F E C T I v E N E S S R E v I E W R E p O R T 27
L O m A L I N d A U N I v E R S I T y
comPaRIson of thE WholEnEss clImatE suRVEys
0 1 2 3 4 5
Q5
Q4
Q3
Q2
Q1
Staff
Faculty
Student
Figu
re8
QuEstIons foR WholEnEss
clImatE suRVEys comPaRIson
Q1 I have had opportunities at LLU to learn about Wholeness and incorporateWholeness principles into my life (Faculty and staff survey reads: Iintentionally incorporate …).
Q2 e staff, professors, and administration at LLU exhibit humility in theirwork and interactions.
Q3 While at LLU a staff member, professor, or administrator at LLU hastalked with me about my own Wholeness.
Q4 LLU fosters care for creation and resources (environmental, recyclingmedical supplies, etc) as an important aspect of Wholeness.
Q5 Students, staff, and professors at LLU are treated fairly and withoutdiscrimination at LLU.
Figu
re9
3Hallmarks of LLU’s legacy of service will be presented in the Evidence Room during the site visit.4In addition to LLU’s service learning opportunities, numerous other types of co-curricular offerings exist and include such things as thefitness facilities and programs provided through the drayson Center and the weekly Chapel programs which emphasize MFL and theapplication of institutional values. programs are also offered by the School of Religion and Humanities including a Faith and Film series (Seealso Collaboration Exemplars) and a lecture series created to enhance students’ biopsychosocial-spiritual understanding of human experiencesand expose them to ways that art and the humanities support health and healing of patients and provide self-care outlets for health careprofessionals. e LLU Wholeness portal provides students with tools and resources to plan their personal journey and explore opportunitiesfor serving others locally and around the world. Additional information regarding all of LLU’s co-curricular opportunities will be available inthe Evidence Room during the site visit.
RETURN TO CONTENTS
self-selected experiences students can reflect on their own lives and future choices in ways that might not otherwiseoccur. rough many of these offerings, the University is able to provide a place where students can explore their ownideas. While most ideas and initiatives may be short lived, exploring ideas in safety is an important aspect of deeppersonal learning and the development of self-efficacy. Students’ engagement in these opportunities provides thegreatest predictor of lifelong learning. e goal is that no matter what the choice of career, the student will remainsympathetic, supportive, and engaged in MFL for a lifetime.
Assessment of Co-curricular MFLHistorically, the primary measures used to evaluate co-curricular offerings have included information such asutilization data, consistent positive feedback, and the identified (unofficially ranked) intrinsic value of serviceexperiences. Over time, these measures have provided us with a general perception that our co-curricular programshave provided effective and relevant learning. more recently, we have sought to improve our understanding of theimpact that co-curricular experiences have on students’ learning and personal transformation.
Because no singular measure can tell the entire story, data triangulation provided the most appropriate methodology,with the understanding that the criteria for selecting relevant data should subsequently adhere to the conditionsneeded to demonstrate strong conclusion validity.5 e result was the identification of four data sources (derived fromtwo types of data) that met these criteria and provided a broad spectrum of relevant data comparisons. e fourmeasures included: 1) selected data from the Student Climate Survey (formerly the Student Satisfaction Survey); 2)selected data from the Wholeness Climate Survey; 3) assessment data from the Students in International missionService program [SImS] Student Reflective Essay; and 4) assessment data from the Students in Community ServicesReflective Essay. description of these data sets follows:
Comparative Survey dataIn keeping with the conditions for improving conclusion validity, data were selected from two independent surveys thatutilized the same methodology, but were conducted by different researchers using predominately different samples.
1) Student Climate Survey. Starting in 1998, LLU conducted a campus-wide student satisfaction survey. As part ofthe CpR visit, this survey was resurrected and is now used systematically each year. As a result, three years of data werereviewed and item 14 (Students’ satisfaction with LLU Community and International Service Learning Opportunities,e.g., SImS, SACHS, etc.) on the survey was selected for inclusion in this study.
Students’ summative responses on item 14, for each year data was collected, surprisingly demonstrated that the resultsfor each year/cohort were exactly the same (1998, 4.2/56 [N=1639]; 2008, 4.2/5 [N= 281]; 2009 4.2/5 [N= 608].ese data demonstrate that LLU students consistently report (over a time span of 13 years) strong to very strongagreement that they are satisfied with the international and local service opportunities provided by LLU. It is alsonoteworthy that students’ responses to this question have been consistently ranked among the top two highestresponses for each administration of this instrument.
2) wholeness Climate Survey. e next data set used was taken from the Wholeness Climate Survey, an
W A S C E d U C A T I O N A L E F F E C T I v E N E S S R E v I E W R E p O R T28
L O m A L I N d A U N I v E R S I T y
5Conclusion validity is the degree to which conclusions reached about relationships in data are reasonable. e likelihood of makingcorrect conclusions is greater if attention is given to improving the conditions needed for strong conclusion validity. ese conditionsinclude: a) the exact or conceptually the same content; b) large sample size; c) reliability; d) independent samples; and e)consistent/standardized implementation of methodology.6Responses for this survey used a 5 point Likert-type scale with 1 being strongly disagree and 5 being strongly agree.
RETURN TO CONTENTS
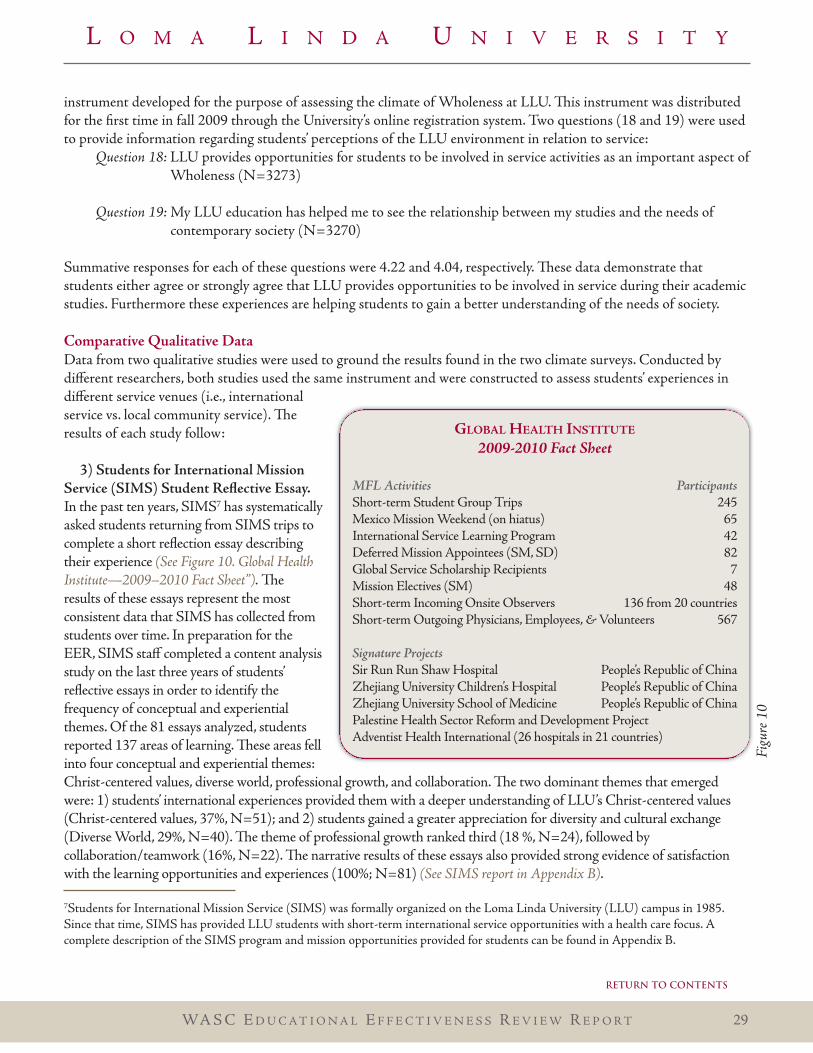
instrument developed for the purpose of assessing the climate of Wholeness at LLU. is instrument was distributedfor the first time in fall 2009 through the University’s online registration system. Two questions (18 and 19) were usedto provide information regarding students’ perceptions of the LLU environment in relation to service:
Question 18: LLU provides opportunities for students to be involved in service activities as an important aspect ofWholeness (N=3273)
Question 19: my LLU education has helped me to see the relationship between my studies and the needs ofcontemporary society (N=3270)
Summative responses for each of these questions were 4.22 and 4.04, respectively. ese data demonstrate thatstudents either agree or strongly agree that LLU provides opportunities to be involved in service during their academicstudies. Furthermore these experiences are helping students to gain a better understanding of the needs of society.
Comparative Qualitative datadata from two qualitative studies were used to ground the results found in the two climate surveys. Conducted bydifferent researchers, both studies used the same instrument and were constructed to assess students’ experiences indifferent service venues (i.e., internationalservice vs. local community service). eresults of each study follow:
3) Students for International MissionService (SIMS) Student Reflective essay.In the past ten years, SImS7 has systematicallyasked students returning from SImS trips tocomplete a short reflection essay describingtheir experience (See Figure 10. Global HealthInstitute—2009–2010 Fact Sheet”). eresults of these essays represent the mostconsistent data that SImS has collected fromstudents over time. In preparation for theEER, SImS staff completed a content analysisstudy on the last three years of students’reflective essays in order to identify thefrequency of conceptual and experientialthemes. Of the 81 essays analyzed, studentsreported 137 areas of learning. ese areas fellinto four conceptual and experiential themes:Christ-centered values, diverse world, professional growth, and collaboration. e two dominant themes that emergedwere: 1) students’ international experiences provided them with a deeper understanding of LLU’s Christ-centered values(Christ-centered values, 37%, N=51); and 2) students gained a greater appreciation for diversity and cultural exchange(diverse World, 29%, N=40). e theme of professional growth ranked third (18 %, N=24), followed bycollaboration/teamwork (16%, N=22). e narrative results of these essays also provided strong evidence of satisfactionwith the learning opportunities and experiences (100%; N=81) (See SIMS report in Appendix B).
WA S C E d U C A T I O N A L E F F E C T I v E N E S S R E v I E W R E p O R T 29
L O m A L I N d A U N I v E R S I T y
Figu
re10
Global hEalth InstItutE
2009-2010 Fact Sheet
MFL Activities ParticipantsShort-term Student Group Trips 245mexico mission Weekend (on hiatus) 65International Service Learning program 42deferred mission Appointees (Sm, Sd) 82Global Service Scholarship Recipients 7mission Electives (Sm) 48Short-term Incoming Onsite Observers 136 from 20 countriesShort-term Outgoing physicians, Employees, & volunteers 567
Signature ProjectsSir Run Run Shaw Hospital people’s Republic of ChinaZhejiang University Children’s Hospital people’s Republic of ChinaZhejiang University School of medicine people’s Republic of Chinapalestine Health Sector Reform and development projectAdventist Health International (26 hospitals in 21 countries)
7Students for International mission Service (SImS) was formally organized on the Loma Linda University (LLU) campus in 1985.Since that time, SImS has provided LLU students with short-term international service opportunities with a health care focus. Acomplete description of the SImS program and mission opportunities provided for students can be found in Appendix B.
RETURN TO CONTENTS
4) Student Community Services Reflective essay. An additional study was conducted to explore whether studentsvolunteering in LLU sponsored community (local) services would describe their experiences in similar ways to thosefound in the SImS study. Of the 24 essays returned a total of 50 responses were recorded that indicated students’reflection on the four conceptual and experiential themes. Students completing the Community Services ReflectiveEssays revealed the same rank order of the importance of the four themes as found in the SImS study.8 e narrativeresults of these essays provided strong evidence of students’ satisfaction with the learning opportunities theyexperienced (N=24; 100). e narrative results of these essays also provided strong evidence of satisfaction withstudents’ community learning opportunities and experiences (100%; N=24).
Findingsdata from the two climate surveys, the two qualitative studies, and the clear conceptual connectedness between andamong the four data sources all give evidence of strong conclusion validity.
Because of the strong and consistent data relationships identified by the triangulation of the four data sets andsubsequent high degree of conclusion validity found, we believe we can state with confidence the following regardingthe educational effectiveness of the co-curricular offerings examined, particularly as it relates to MFL:
1. Students are satisfied with the international and local service opportunities provided by LLU;2. Students perceive that these experiences help them to gain a better understanding of the needs of society; and3. LLU co-curricular offerings support students in their professional growth and provide increased opportunities
for them to reflect upon the integration of the University’s SLOs specific to Christ-centered values, diverse world,and collaboration.
e Next Steps in Co-curricular Assessmente use of data triangulation appears to be an effective and appropriate method of assessing the educationaleffectiveness of co-curricular MFL at LLU. As we move forward, the merits and application of this methodology needto be utilized to assess additional co-curricular programs. Leading out in the development of related assessmentprocesses has been and will be the Co-curriculum Committee (Co-curriculum Committee Report will be available in theExhibit Room). In addition, given its history, success,9 and years of systematically collecting and evaluating student data,SImS will continue to be used as the demonstration program supporting the development of an assessmentframework to be applied to all service-oriented co-curricular learning. As part of this process, SImS has developed anassessment matrix with performance indicators and success criteria/targets for each of the SLOs assessed throughtheir reflective essays. Interestingly, because of the use of triangulation to examine comparative data sets, it may beindicated that the SLO performance targets identified in the SImS Assessment matrix (70 percent for each SLO)may be too low. Comparative data would suggest that students’ learning/reflection related to the identified SLOs mayactually be closer to 80-84 percent. As the Co-curriculum Committee works with SImS to further develop LLU’sassessment of co-curricular learning, baseline data using the identified performance indicators and success criteria willbe evaluated, and performance targets adjusted as appropriate. It is also evident that the Co-curricular learningopportunities deepen students’ MFL experiences. Because of this, efforts are underway to increase the number ofstudents participating in these activities. Targets for student involvement now need to be determined as part of thework of the Co-curriculum Committee with the assistance of the EEC and deans.
W A S C E d U C A T I O N A L E F F E C T I v E N E S S R E v I E W R E p O R T30
L O m A L I N d A U N I v E R S I T y
8As the total N for the Community Reflective Essays was less than the N for the SImS study the percentages for each found for eachtheme are understandable different. us, the pattern of rank order preferences provides an acceptable comparison.9According to the most recent fact sheet approximately 500 LLU students participated in service-related international student travelduring 2009-10. Including repeat travelers, this indicates that an estimated 1 out of every 8 LLU students was involved in some sort ofinternational service during the past academic year.
RETURN TO CONTENTS
Finally, in support of the University’s commitment to educational effectiveness in its co-curricular mission serviceopportunities, the Global Health Institute (GHI) has conducted an evaluation of the most effective service-learningmodels. e results of this work support LLU’s use of the mentor model and the Intelligent volunteerism model (or acombination of both) when applied in the context of credible service-learning opportunities. e utilization of thesefocused approaches to service-learning not only builds capacity at strategic sites, but ultimately helps to ensure that ourprograms will not only have a lasting impact on the lives of those who choose to serve, but also on the lives of those ourstudents serve.
collaboration Exemplarse University has made numerous targeted efforts to increase purposeful collaboration across LLUAHSC entities.is objective has become a pillar of our new corporate-wide strategic plan (pillar number five). Following are venuesand activities that illustrate collegiality and that have contributed to a more productive academic environment to fulfillour mission: MFL.
Featured exemplar of MFLproTECTOR is an example of integration of the following key concepts of MFL: highest standard of scholarship;teachable moments created by reflective service; selfless volunteerism; caring for all aspects of a person’s being,community, and environment—the biopsychosocial-spiritual.
ProteCtOR: Influencing Change through wholeness in Honduras. With an extraordinarily unequaldistribution of income and massive unemployment, Honduras, the second poorest country in Central America andone of the poorest countries in the Western Hemisphere, is heavily reliant on a narrow range of exports, notablybananas and coffee, making it vulnerable to natural disasters and shifts in commodity prices. Within the country, manycommunities outside major urban areas lack stable and sustainable economic infrastructure. As a result, heavy relianceon the consumptive use of natural resources facilitates both a degradation of potentially sustainable resources, and asubsequent downward spiral into further poverty.
The turtles that migrate and live along the coasts of Honduras are an excellent example of such a natural resource.Here, turtles breed, lay eggs, and feed throughout the year. A major source of food and income for manycommunities across coastal regions of Honduras, turtle populations continue to decline and may soon, in theabsence of change, become an enviable resource for economic growth, jeopardizing their marine environment tobecome unsustainable.
In 2007, department of Earth and Biological Sciences Associate professor dr. Stephen G. dunbar formed theprotective Turtle Ecology Center for Training, Outreach, and Research (proTECTOR) as a way to facilitate sea turtleresearch in Honduras for himself and his graduate students. Initially, the organization was only focused on establishingsea turtle research and conservation efforts throughout the country.“I soon realized that I couldn’t help the turtles, themarine ecosystem, or any part of the environment if I wasn’t also working to help the communities that so heavilyrelied on consuming these invaluable resources,” says dr. dunbar.
With the support of the Honduras department of Fisheries, the department of Biodiversity, and the Hondurasministry of Environment, proTECTOR began developing relationships with communities where sea turtles wereknown to be resident, or where they were seen nesting. Although the basis of these relationships was sea turtleconservation, dr. dunbar and his Country Coordinator, ms. Lidia Salinas, soon began holding workshops thatdiscussed income opportunities for local community members that were alternatives to capturing sea turtles for meat,or harvesting the eggs for sale.
WA S C E d U C A T I O N A L E F F E C T I v E N E S S R E v I E W R E p O R T 31
L O m A L I N d A U N I v E R S I T y
RETURN TO CONTENTS
These workshops have provided an entering wedge that now affords opportunities to bring students and facultyfrom Loma Linda University to communities in which proTECTOR is working. Through proTECTOR, dr.dunbar has developed a community-wide, multi-disciplinary approach to community development, includingcommunity economics, micro-enterprise, environmental and species conservation, research, public and individualhealth issues, and aspects of social and family structure. This approach provides opportunities for medical anddental students to work alongside social work students, marriage and family therapy students, public healthstudents, and biologists.
proTECTOR is now working among six communities in Honduras, and is being invited by the Central Governmentof Honduras and by non-governmental organizations in Honduras, to move into more and more communities.proTECTOR has recently been asked to help the Foundation for Cuero y Salado Wildlife Refuge to establish aresearch system for the entire refuge. In addition, the organization has received two grants from within Honduras, tohelp establish two sea turtle research centers on the pacific coast of the country, while additional training workshopsare likely to be funded by the World Bank. With a view of wholeness that encompasses the health of the community,from its people to its environment, proTECTOR is influencing change through wholeness in Honduras. (CFRs 2.10,2.11, 2.12, 2.13, 4.1, 4.2, 4.6)
Councilse next three exemplars involve Councils that promote communication among University, School, and facultyleadership to share best practices, provide forums for collegial dialogue among all programs and schools, and generateopportunities to link assessment and strategic planning activities.
University Leadership Council. Loma Linda University is a diverse entity, with significant activity appropriatelyoccurring at the School levels. In our desire to create a united University, and give a collective sense of purpose anddirection, it seemed imperative to have a regular forum for communication and discussion across the entire campus. eprevious administrative structure provided information to the senior administrators only, with little pass-through to eitherthe department chairs in the Schools, or the support departments on campus. e University Leadership Council wasestablished, meeting monthly during the academic year, as a forum for sharing common issues and strategies. It has createdsynergy across the campus that has greatly aided in common campus understanding and purpose. Reaching across bothclinical and academic departments, support and service areas, it has provided a platform where more than 100 key leaderson campus meet monthly to get updates, discuss strategies and concerns, and share plans for the future. ULC has clearlybecome a key vehicle for LLU to grow as a university, committed to a common purpose. (CFR 4.6)
deans Council. For decades, the deans of the Schools have gathered for weekly two-hour meetings with theUniversity president and the Chief Academic Officer. ese weekly meetings function as the planning nexus of theUniversity. Approximately once per month the deans Council membership is enlarged to include all the Universityvice presidents (called presidents Committee in this configuration). e discussions that occur in these regularmeetings provide a means of communication that exemplifies the highest traditions of academic collaboration. deansCouncil is essential for our campus culture that is silo prone and professionally distinct.
ose who have participated in these meetings quickly realize that the future directions of the University are greatlyshaped by the collaboration, trust, and synergism demonstrated by this cooperative group. Issues of Universitystrategic planning, learning environment assessment, fiscal management, program growth, service-learning, communityand alumni relations, and service to local and international locations are a few examples of the important topics thatare regularly discussed, debated, and acted upon. In addition to University matters, this gathering serves as a forum forthe deans to share concerns related to their Schools and to seek advice from their peers (List of Deans Council Agendaitems will be available in the Exhibit Room).
W A S C E d U C A T I O N A L E F F E C T I v E N E S S R E v I E W R E p O R T32
L O m A L I N d A U N I v E R S I T y
RETURN TO CONTENTS
University Faculty Council. Faculty members are the fundamental guardians and architects of an educationalenvironment, and assessment is crucial to their ability to guide the CQI of effective learning. Loma Linda Universityfaculty governance functions as a two-tiered system–one level is within the Schools and the second is the campus-wideUniversity Faculty Council. is Council in recent years has reassessed its place and value with the campus. As a result,it has been renamed and has selected four primary goals: 1) policy development, review, and revision, 2) shareddecision-making, 3) effective communication, and 4) leadership development. Additionally, UFC works closely withUniversity administration to ensure that all current and future faculty-related policies meet the needs of allUniversity-wide faculty groups (See UFC report in Appendix C). (CFRs 2.4, 2.8, 2.10, 2.11, 3.3)
Student Servicese following exemplars are capacity issues to better support our learning environment. University Student Servicesprovides evidence of economies of scale achieved by our University marketing and admissions processing activities. ethird exemplar gives evidence of our Institutional commitment to CQI of Student Services.
Application Processing. e creation of a University Admissions Office has allowed for the institution tocoordinate and unify admissions processes across all Schools. is represents a major shift in quality of service andinstitutional efficiencies in that 100 percent of applications are submitted via the University’s online application portal.is permits students anywhere and anytime in the world to check on status of their application, including any missingdocumentation or needed activities. Increases in the total applicant pool and improved selectivity statistics arenoteworthy. Given that the application portal “forces” applicants to more fully and uniformly understand the missionand values of the University, it is anticipated that the self-selection that results from uniform application processes willenhance LLU’s normative culture. (CFRs 1.7, 2.10, 2.12, 2.13)
enrollment Management. e central University Office of Enrollment management has transformed the waymarketing and recruitment take place on this campus. Collaboration now includes “shared employees” in multipleSchools who devote their talents to the individual School, but also work as part of a central University team tocoordinate recruitment activities to Adventist college and university campuses, and local faith-based institutions. eunified document handling, coordinated marketing, and School alignment with uniform branding all increaseefficiency and cost-effectiveness, and provide us with an applicant pool that is self-selected for “shared values”—thevery foundation for MFL, being Christ-centered, and sustaining the institutional normative culture. (CFRs 1.7, 2.13)
Student Services taskforce. Responding to concerns from multiple Schools on the service received from centralstudent services departments, the provost established a taskforce charged to review academic support processes (i.e.,Records, Registration, and Student Financial Aid) with the goal of making them more customer friendly, and to reviewand compare academic tasks and processes in central services and parallel ones in the Schools in order to reduceduplication and inefficiencies while maintaining the highest standards of fairness and accuracy. e Taskforce includedrepresentatives from all Schools, who worked collaboratively over four months to review and make recommendationsrelative to the provost’s charge. In their final report (Student Services Taskforce Report will be available in the ExhibitRoom) the Taskforce made eight recommendations that resulted in major changes in personnel, service goals, andaccountability in the student services support departments. (CFR 2.13)
Institutese nine Institutes created at Loma Linda over the past decade include a variety of topical areas and span the entireenterprise. is follows a pattern evident in many academic health science centers where the Institute structure is usedto consolidate clinical, research, and educational activities around common themes. Our nine Institutes cover sixclinical areas, including heart, cancer, organ transplant, perinatal biology, behavioral sciences, and rehabilitation, as wellas several focused on broader issues such as global, community, and lifestyle related issues. In some cases, these are
WA S C E d U C A T I O N A L E F F E C T I v E N E S S R E v I E W R E p O R T 33
L O m A L I N d A U N I v E R S I T y
RETURN TO CONTENTS
virtual Institutes, with services dispersed at multiple locations. When Institute resources are assembled at a commonphysical site, the Institute is more effective and is capable of developing a successful business model for the clinicalservices. While each has a topical theme, they often focus most on a single element, usually clinical service. It is ourgoal to further strengthen the research and educational components of each Institute. (CFRs 1.8, 2.8, 2.9)
global Health Institute (gHI). “It was for this [sending workers overseas] that Loma Linda was brought into existence,and it is for this that we should live.” ( John A. Burden, 1907). GHI provides international service opportunities for staff,faculty, and students that are prioritized as follows: affiliation of collaborative agreement sites, Adventist HealthInternational sites, Adventist General Conference Institution sites, approved sites where LLUAHSC has a strategicinterest to build long-term partnerships and capacity, and emergency situations (e.g., Haiti). GHI provides focus,coordination, and logistical support for the many international initiatives arising from Loma Linda University Schoolsand Hospitals. Since its founding more than 100 years ago, Loma Linda University’s mission has been to make manwhole not only locally, but globally—Loma Linda University is about global service. (Global Health Institute) (SeeGHI 2009-2010 Fact Sheet in on page 29). (CFRs 2.9, 2.11)
behavioral Health Institute (bHI). e BHI was created to provide a vehicle for developing best practices in theintegration of behavioral health education, research, and practice in the pursuit of whole-person care—while alsoproviding comprehensive outpatient behavioral health services aimed at meeting the growing need for behavioralhealth care in our local community. participants in this interdisciplinary learning environment consist of faculty,clinicians, and residents/graduate students from psychiatry, marriage and Family erapy, Social Work, psychology,Nursing, and pharmacy specializing in services to multiple treatment populations through multimodal behavioraltherapies. Opened in April 2010, the BHI continues toward the realization of its mission to construct cutting-edgeinterdisciplinary education, research, and clinical methodologies and programs that support the Substance Abuse andmental Health Services Administration national agenda of recovery from mental illness. (Behavioral Health Institute)(CFRs 2.8, 2.9, 4.6, 4.7)
Community engagemente University’s desire to provide transformative learning opportunities for our students is enhanced by our Institutesas illustrated above. In addition, School-specific and University programs supported by dedicated personnel, space, andadequate budgets have focused on transformative learning. e following two exemplars are illustrative of oneUniversity and one School effort to support MFL for current and prospective students via outreach programs. eseactivities enable our Institution to grapple with key social issues, while maintaining focus on our mission to further thehealing and teaching ministry of Jesus Christ as we serve diverse populations.
Community Partnerships. Collaboration in Action: Students from different Schools cooperate for the purposes ofcommunity engagement in a program called La Escuelita. Housed at the SACHS–Norton Community Clinic in SanBernardino, La Escuelita has grown under the leadership of LLU students, faculty, and staff, and now includes a musicprogram, parent health and literacy education, parenting classes, and an after-school tutorial program in whichstudents from the Schools of medicine, dentistry, pharmacy, public Health, and Nursing donate their time to assistcommunity students in science, mathematics, and English.
Community Kids Connection Music, is a community music program designed by LLU faculty and students. eprogram utilizes musically gifted students from Loma Linda University to serve as music tutors for children from ourcommunity between the ages of 4 and 18. Students from the Schools of medicine, pharmacy, and public Health, aswell as high-school tutors between 10th and 12th grades, offer free violin, guitar, cello, and piano lessons weeklythroughout the entire year. presently these community youth have been formed into a community orchestra thatconsists of approximately 60 participants.
W A S C E d U C A T I O N A L E F F E C T I v E N E S S R E v I E W R E p O R T34
L O m A L I N d A U N I v E R S I T y
RETURN TO CONTENTS
Another program that brings students together from across Schools in service activities is the College Exodus to theHealth Professions Summer Health Internship. is program, similar to Si Se Puede for Hispanics, introducesAfrican-American High School Students from the Inland Empire and surrounding areas to the world of healthsciences and its possibilities. On average, 50 African-American high school students engage in a one-week interactivelearning environment highlighting the importance of patient care, and introducing participants to the variouscomponents of health sciences research and laboratory studies. Students also actively participate in learning and studyskills enhancement. LLU student and faculty mentors are intimately involved in mentoring capacities to afford theyouth a chance to connect with someone they can relate to and gain inspiration. is program offers the youth andtheir parents a springboard to launch themselves forward on their path to becoming a health professional. A newprogram initiated in 2010 links the Sherman Indian High School, Riverside, California, with LLU to increaseawareness of opportunities in the health science professions. e program began this summer, funded by a $50,000grant from the Bureau of Indian Education. Sixteen students spent two weeks on our campus immersed in learningabout health professions careers. (Local & Global Outreach) (CFRs 2.5, 2.8, 2.9)
educational Outreach diversity Initiative of the Center for Health disparities and Molecular Medicine. LLUsupports a robust health disparities/diversity initiative through the Center for Health disparities and molecularmedicine (CHdmm). is initiative includes a major School-wide collaborative effort with the objective of increasingdiversity among students graduating from our biomedical doctoral programs. during the last 10 years, this initiativehas established a strong pipeline of students from underrepresented groups attending local high schools anduniversities/four-year colleges. High school students (sophomores and juniors) and undergraduate underrepresentedstudents participate in summer research and supplemental education internships that enable them to acquire criticalacademic and research skills necessary to advance their academic development. Students can participate in the summerprogram more than once, and their college progress is followed in order to provide mentoring, as well as to secure andenhance their application to our doctoral programs. Students admitted into our biomedical doctoral programs aresupported through graduate research assistantships and tuition support available through LLU and NIH awards.
e LLU-CHdmm health disparities/diversity initiative has supported 131 high school students, with follow-updata for 72 students (through 2009). e data show a 98 percent college matriculation rate, including 78 percentenrolled in biomedical/behavioral science majors. is group shows a 100 percent college graduation rate (4.05 years),with 52 percent matriculated in graduate programs. e health disparities/diversity initiative has also supported 135undergraduate underrepresented students (mostly sophomores and juniors), with 92 percent retention in a sciencemajor by the junior year and 100 percent graduating from college within 4.3 years, 91 percent of these with a sciencemajor. Our data also show that 73 percent of the college graduates have enrolled in graduate schools, with 77 percentmatriculating in doctoral programs. e phd component of the health disparities/diversity initiative has supported 26phd or md-phd underrepresented students at LLU (through 2009), with 8 students graduating with phd degreesso far. Current students show excellent progress in their respective phd programs.
Each component of the initiative is subject to external evaluation with a yearly report that is used to examine whether aparticular programmatic activity requires modification or elimination. In summary, current data show that theLLU-CHdmm health disparity/diversity initiative has resulted in 98 underrepresented students matriculated intograduate programs, 85 of which have enrolled in doctoral programs (phd, md-phd, md, drpH, and ddS) at LLUand elsewhere. It is anticipated that by the end of the 2010-2011 academic year, the program will reach the milestoneof 100 students graduated from, or enrolled in, doctoral programs in the biomedical sciences.
ese educational health disparities and diversity programs are supported by awards from the NIH-National Instituteof General medical Sciences and the NIH-National Center on minority Health and Health disparities. (CFRs 2.8,2.9, 2.10, 2.11, 4.1)
WA S C E d U C A T I O N A L E F F E C T I v E N E S S R E v I E W R E p O R T 35
L O m A L I N d A U N I v E R S I T y
RETURN TO CONTENTS
Inter-professional educationduring the past few years, there has been a growing interest in inter-professional education (IpE) for diverse healthdisciplines. It is now an expectation promoted by the World Health Organization, Institute of medicine, professionalaccrediting agencies, and WASC. Schools with students rotating through the SACHS–Norton Clinic haveencouraged interactions among their students. What began as a multidisciplinary effort to assist diabetic clientsevolved into the Interdisciplinary Learning Committee. Composed of faculty from marriage and Family erapy,medicine, Nursing, Nutrition, pharmacy, the physicians Assistant program, public Health, and Social Work, thiscommittee meets monthly to plan programs that bring together students from diverse disciplines. is collaborationconstitutes a firm foundation for mentoring students using inter-professional collaborative projects. About 30 studentsmeet monthly to discuss interdisciplinary practice. Activities include work on joint projects, as well as case studies.is program, now guided by the director of the medical Simulation Center, is currently expanding to developsimulation scenarios that will be used to introduce students from the various health-related programs to integrated,multidisciplinary health care. Several exemplars are presented to illustrate our institutional efforts to provide IpE informal and informal settings for both students and faculty. you will read about learning spaces that are simultaneouslyutilized by multiple programs, curricular and co-curricular blending of students from different disciplines, facultydevelopment activities that bring diverse individuals together, research collaborations between Schools, thedevelopment of new programs that emerged only when two Schools collaborate, and the stimulating benefits ofcurricular and co-curricular offerings that develop faith through film, the effect of interdisciplinary humanities coursesin promoting mutual understanding among professions, and the added value of spiritual care workshops that reinforcethe institutional commitment to whole-person care. (CFRs 2.8, 2.9, 4.6, 4.7)
Medical Simulation Center. e medical Simulation Center offers training that bridges the gap between classroomstudies and patient care by challenging each learner to perform essential tasks and make critical decisions. A widevariety of health care providers participate in regularly scheduled simulation training. Users include Loma LindaUniversity Schools of medicine, Nursing, Allied Health professions, pharmacy, and dentistry. e collaborativelearning environment permits future clinicians to hone clinical judgment, procedural techniques, and decision-makingskills in a virtual patient care environment using age and gender-specific patient simulators—all in the context of thehealth care team. (medical Simulation Center) (CFRs 2.8, 2.9, 3.7, 4.6, 4.7)
Clinical Skills education Center. Located in the new Centennial Complex is the 8,000-square-foot ZaparaClinical Skills Education Center. e Center provides a learning environment that enables students to acquire theclinical skills, values, and behaviors appropriate for their health care profession. In addition to being the primary sitefor School of medicine Objective Structured Clinical Examinations, the Center is available to all Schools desiringhigh-quality clinical simulations using standardized patients and state-of-the-art technology in both teaching andassessment—all important to improved patient care. (CFRs 2.8, 2.9, 3.7, 4.6, 4.7)
Swatek Anatomy Laboratory. Among the largest cadaver-based labs in the country, the new Swatek AnatomyLaboratory now permits three Schools to manage their curriculum in ways that best permit the integration of cadaverdissection and lecture content. In previous years the Schools of medicine, Allied Health professions, and dentistryhad to sequence their access to cadavers due to limited space—now multiple Schools can simultaneously accesslaboratory space. (CFRs 2.8, 2.9, 3.7, 4.6, 4.7)
Humanities. Loma Linda University prizes holistic health care, and the humanities provide insight into the humancondition. Inaugurated in the Fall of 2008, the Health Care Humanities program at Loma Linda University iscommitted to offering interdisciplinary academic and professional curricula and cultural activities that integrate thehumanities—literature, history, jurisprudence, ethics, religion, philosophy, and the arts—and the health sciences.precisely because of the University’s special mission, moreover, the Health Care Humanities program encourages a
W A S C E d U C A T I O N A L E F F E C T I v E N E S S R E v I E W R E p O R T36
L O m A L I N d A U N I v E R S I T y
RETURN TO CONTENTS
pedagogy that embraces and promotes diversity with the purpose of intellectually engaging health professionals. ecourses and programs of the humanities seek to enable aspiring health professionals to critically engage and influence acomplex society. For the past two years, the humanities program has partnered with the Schools of medicine andNursing. visiting professors have taught courses in Film and Medicine and Law and Medicine. is year the programwill offer a course for nursing students, Writing for Health Care Professionals, as well as an undergraduate course forstudents needing to fulfill the humanities requirement: Survey of the Health Care Narrative. is is an interdisciplinaryliterature-based course in which students will examine stories of illness, health, and healing from creative literature.Intent on developing a relationship with the community at large, the co-curricular programs offered have includedmembers of San Bernardino County. Twenty ministers from various denominations, for example, were invited to theSchool of Religion for lunch to learn about the Art that Heals lecture series and the academic program offerings of theSchool of Religion. e humanities program also hosted a Tobacco Use Reduction Now Program for the County of SanBernardino department of public Health. panel discussions and e Art that Heals lecture series have included suchspiritually and artistically motivating figures as dr. Samuel Shem, author of e House of God; phil Zuckerman,author of Society without God: What the Least Religious Nations Can Tell Us About Contentment; and the soul-stirringmusical group Take 6. Finally, engagement of the humanities, in a dynamic health care environment, will aid LomaLinda University graduates to be leaders in making humanity whole. e humanities are our histories, ourstories—lived—and our cultural, social, religious identities. e humanities define us—human. (CFRs 2.8, 2.9)
Faith & Film. Faith & Film is an interdisciplinary program at Loma Linda University connecting faith and the artsvia the medium of film. e program launched in 2008, attempting to address a felt need on the LLU campus for aprogram connecting spirituality and the arts. us, Faith & Film was born, and is currently a stalwart among variousstudent activities. Faith & Film is currently held as a weekly, hour-long program that runs continuously during thetraditional school year. Students and faculty from all LLU Schools are invited to watch segments from a film (totaling20 to 30 minutes in length) and discuss their applications as parables for modern life. What is perhaps most uniqueabout Faith & Film is the collaborative nature of both the program’s development and its audience. Each academicquarter, a new “theme” for Faith & Film is promoted that drives film selections. A team that includes faculty fromvarious Schools and leadership from the Center for Spiritual Life & Wholeness and the LLU Campus ministriesdepartment makes selections. In addition, each film is “hosted” by a faculty moderator from the School of Religionwho does the work of pre-selecting the film clips that will be shown and inspires a subsequent discussion about thefilm chosen. ese discussions engender a milieu of learning that is unique among other campus activities because ofthe diversity of those in attendance, which includes students and faculty from the various Schools. In response to thesuccess of programs like Faith & Film, the School of Religion, Center for Spiritual Life & Wholeness, and LLUCampus ministries are working to further the development of similar programs on campus that unite both science andreligion. (Faith & Film) (CFRs 2.8, 2.9)
Collaboration exemplars ConclusionAs evidenced by the preceding exemplars, the institutional transformation that occurred over the past decade is repletewith examples that illustrate how synergies and economies of scale will prevail when not only leadership, but allstakeholders, value an integrated, bridge-building model over the inherent isolation of silos. Although the exemplarsshow tangible proof of collaboration, our successes hinge on a normative culture where the mission, values, and visionundergird the spirit of cooperation.
EVIdEncE of EducatIonal EffEctIVEnEss WIthIn acadEmIc PRoGRams
Since the establishment of Loma Linda University 105 years ago, the institution has worked to further the “healingand teaching” ministry of Jesus Christ. Each of the eight Schools seeks to provide its students with the finest
WA S C E d U C A T I O N A L E F F E C T I v E N E S S R E v I E W R E p O R T 37
L O m A L I N d A U N I v E R S I T y
RETURN TO CONTENTS
preparation. Consequently, most of the Schools hold one or more specialty accreditations that demonstrate meetingthe highest standards of a given profession. Our graduates have practiced their professions in almost every country inthe world, demonstrating, in part, institutional effectiveness in meeting the University’s mission. ese and otherexamples of how the Schools are demonstrating mission centrality and educational effectiveness are included in theSchools’ Educational Effectiveness Reports (See Schools’ Educational Effective Reports in Appendix D).
e process leading up to the WASC Educational Effectiveness visit has brought the various Schools closer togetheras they seek to improve assessment at Loma Linda University. A number of common themes related to assessmenthave become apparent as this process progressed. Some of these include: strong mission outreach both locally andinternationally that not only serves the needs of the world, but is personally transformative to students; students wellprepared for their professions as shown by rankings on the various board exams; and student-reported growth inunderstanding of values and personal spiritual growth. Specific details follow concerning evidence of assessment ineach of the Schools.
summary of the school Educational Effectiveness ReportsAssessment of growth and change in student learning is a necessary prerequisite to understanding educationaleffectiveness. In addition to its own EER report, each School completed an inventory of educational effectiveness.Table 7.1 illustrates how each School has selected, interpreted, and used student learning outcome findings to assesseducational effectiveness. Two of the Schools, Allied Health professions and pharmacy, have also included Schooloverview assessment matrices to highlight how assessment is integrated into strategic planning and implications forCQI. Each School also submitted an inventory that highlighted programs’ concurrent accreditation (e.g., professional,State). Table 8.1 contains concurrent accreditation data and key performance indicators for programs within eachSchool. ese tables, indicators, and matrices provide substantiation of the Schools’ systematic approach to theappraisal of educational effectiveness (See Tables 7.1 and 8.1 in Appendices E and F respectively).
e following are brief summaries from the eight Schools’ more detailed EER reports that demonstrate excellence intheir areas of expertise. Following are highlights.
School of Allied Health Professions (SAHP)In reviewing its strengths, the SAHp identified the following:
• Strong collaboration between the various disciplines within the School• Twelve on-going professional accreditations recognizing excellence of the programs• Awards to students by external professional organizations• Ranking of departments on national boards of the various disciplines• Students and graduates serving in mission appointments throughout the world• Continual development of new programs and majors within the various professions• Acceptance of students from other schools who lost accreditation• piloting the use of LiveText™’s Accreditation management System™ including utilizing the e-portfolio system to
better develop, organize, and manage student-learning data
School of dentistry• Continuous accreditation since 1953• Use of Applied Strategic planning since 2001• All students meet the 21 core competencies• Non-accredited programs, dental Anesthesiology and Implant dentistry, reviewed in 2008 by external evaluators• Review of all curricula within the last three years• Increased use of high-tech teaching modalities and CAd/CAm technology
W A S C E d U C A T I O N A L E F F E C T I v E N E S S R E v I E W R E p O R T38
L O m A L I N d A U N I v E R S I T y
RETURN TO CONTENTS
• Revised outcome assessment program to achieve broader review of data and efficiency of process• development of electronic educational media
School of Medicine• e Curriculum Committee has recently completed a systematic review of each course, clerkship, segment, and the
curriculum as a whole, and has established a master calendar for continued regular review• Implementation of new content/teaching mechanisms that increased test scores• Seniors annually outperform senior students from other California medical schools on a seven-case standardized
patient exam (developed by the California Consortium for the Assessment of Clinical Competence)• In spite of predictors that would indicate lesser scores, the students consistently have performed near or above the
national average on Steps 1 and 2 of the USmLE for the past five years• maintains full accreditation by the Liaison Committee on medical Education
School of Nursing• Continuous accreditation for the last 50 years• Comparison data with 90 other institutions (EBI) demonstrates that students rank the School equal to or better
on most indicators of satisfaction• Students report growth in both the academic and spiritual dimensions during their experience at LLU• Off-campus mS helps meet the needs of the Adventist Church’s nursing education system• School’s emphasis on wholeness ranked “very good” by alumni• Graduates and clinical agency personnel rate students’ Critical inking as “very good”
School of Pharmacy• pass rates for this new School are comparable to well-established institutions• Completion rate at 95 percent• 27 percent of graduates continue into post-graduate residency training programs• Strong commitment to community service by faculty and students• Global outreach including nine countries• Graduates rank balance in all areas of life and positive influence of LLU’s mission extremely high at time of exit
interview• Assignments promote Critical inking
School of Public Health• Interdisciplinary work among departments and throughout the University• values embody diversity and cultural differences while integrating wholeness• partnerships with local Native-American community, governmental entities, and others strengthen the School’s
programs• Comprehensive process to evaluate and refine the mission, goals, and objectives of the School• Strong community support for the School• Strong distance learning programs• Contribution of scholarly service to the local, regional, and global communities• diversity of faculty members
School of Religion• Creation of the School and division of Humanities since the last accreditation• development of procedures to assess religious studies within the University• Increased dialogue within and between the University and community at large regarding religious issues through
WA S C E d U C A T I O N A L E F F E C T I v E N E S S R E v I E W R E p O R T 39
L O m A L I N d A U N I v E R S I T y
RETURN TO CONTENTS
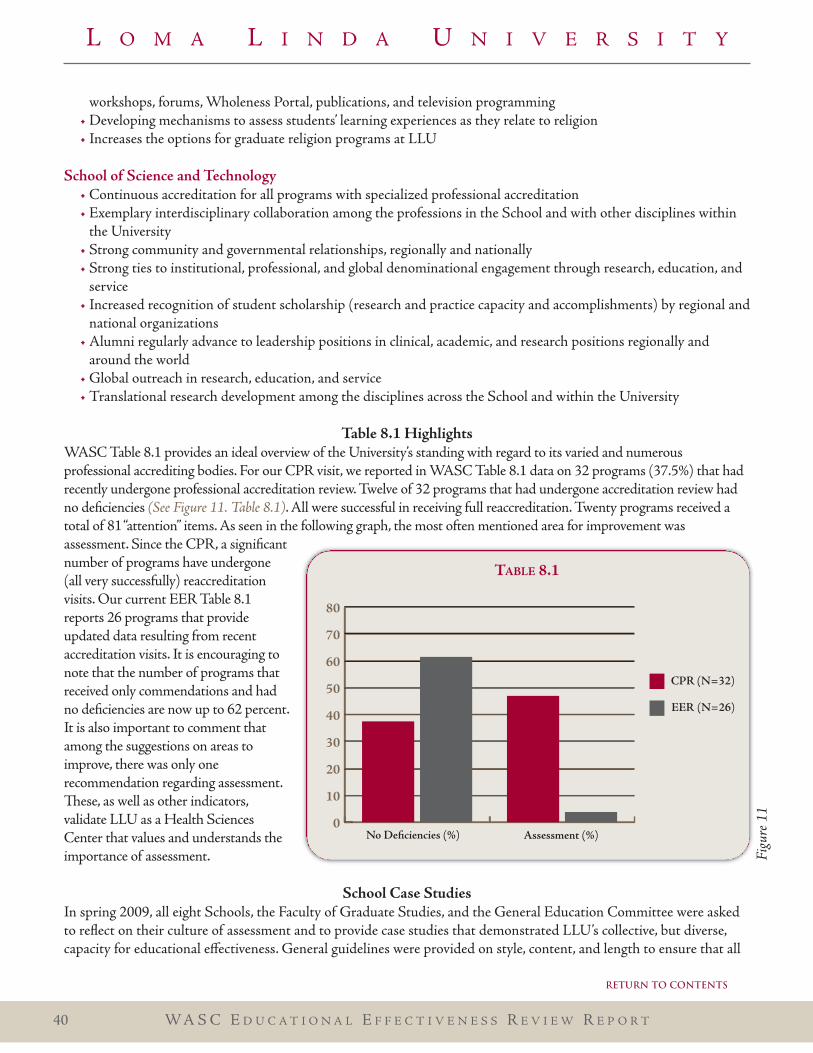
workshops, forums, Wholeness portal, publications, and television programming• developing mechanisms to assess students’ learning experiences as they relate to religion• Increases the options for graduate religion programs at LLU
School of Science and technology• Continuous accreditation for all programs with specialized professional accreditation• Exemplary interdisciplinary collaboration among the professions in the School and with other disciplines within
the University• Strong community and governmental relationships, regionally and nationally• Strong ties to institutional, professional, and global denominational engagement through research, education, and
service• Increased recognition of student scholarship (research and practice capacity and accomplishments) by regional and
national organizations• Alumni regularly advance to leadership positions in clinical, academic, and research positions regionally and
around the world• Global outreach in research, education, and service• Translational research development among the disciplines across the School and within the University
table 8.1 highlightsWASC Table 8.1 provides an ideal overview of the University’s standing with regard to its varied and numerousprofessional accrediting bodies. For our CpR visit, we reported in WASC Table 8.1 data on 32 programs (37.5%) that hadrecently undergone professional accreditation review. Twelve of 32 programs that had undergone accreditation review hadno deficiencies (See Figure 11. Table 8.1). All were successful in receiving full reaccreditation. Twenty programs received atotal of 81“attention” items. As seen in the following graph, the most often mentioned area for improvement wasassessment. Since the CpR, a significantnumber of programs have undergone(all very successfully) reaccreditationvisits. Our current EER Table 8.1reports 26 programs that provideupdated data resulting from recentaccreditation visits. It is encouraging tonote that the number of programs thatreceived only commendations and hadno deficiencies are now up to 62 percent.It is also important to comment thatamong the suggestions on areas toimprove, there was only onerecommendation regarding assessment.ese, as well as other indicators,validate LLU as a Health SciencesCenter that values and understands theimportance of assessment.
school case studiesIn spring 2009, all eight Schools, the Faculty of Graduate Studies, and the General Education Committee were askedto reflect on their culture of assessment and to provide case studies that demonstrated LLU’s collective, but diverse,capacity for educational effectiveness. General guidelines were provided on style, content, and length to ensure that all
W A S C E d U C A T I O N A L E F F E C T I v E N E S S R E v I E W R E p O R T40
L O m A L I N d A U N I v E R S I T y
tablE 8.1
0
10
20
30
40
50
60
70
80
CPR (N=32)
eeR (N=26)
No deficiencies (%) Assessment (%)
Figu
re11
RETURN TO CONTENTS
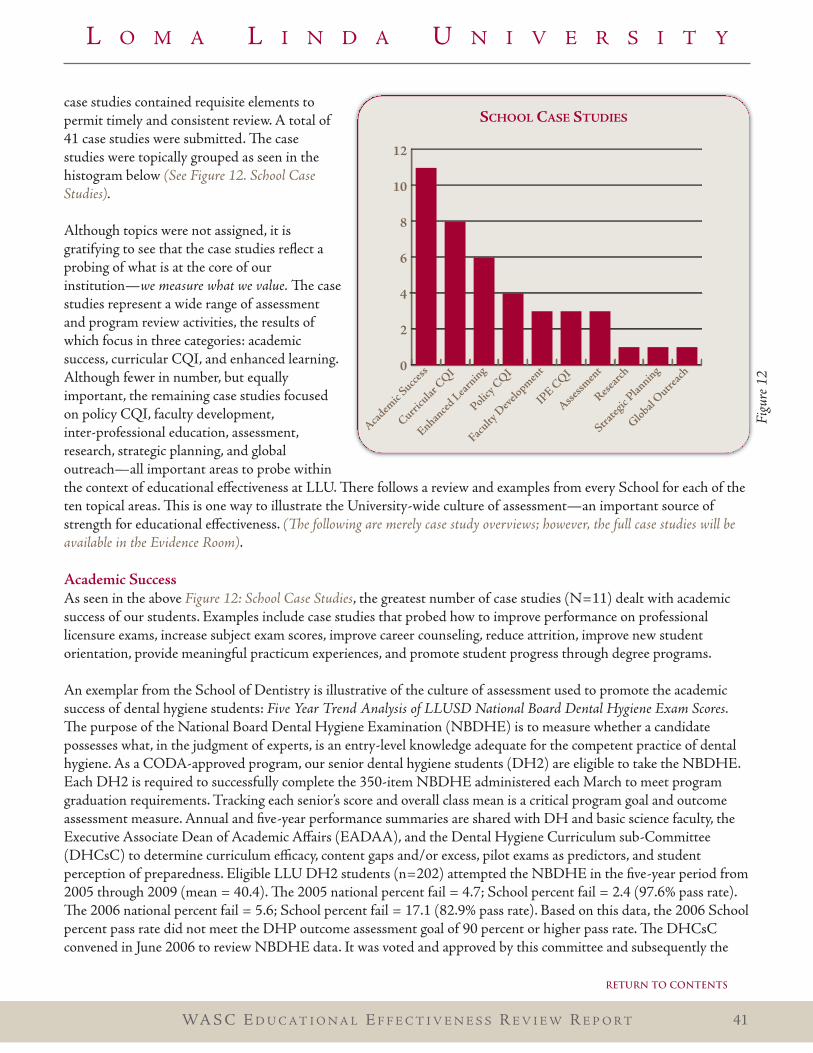
case studies contained requisite elements topermit timely and consistent review. A total of41 case studies were submitted. e casestudies were topically grouped as seen in thehistogram below (See Figure 12. School CaseStudies).
Although topics were not assigned, it isgratifying to see that the case studies reflect aprobing of what is at the core of ourinstitution—we measure what we value. e casestudies represent a wide range of assessmentand program review activities, the results ofwhich focus in three categories: academicsuccess, curricular CQI, and enhanced learning.Although fewer in number, but equallyimportant, the remaining case studies focusedon policy CQI, faculty development,inter-professional education, assessment,research, strategic planning, and globaloutreach—all important areas to probe withinthe context of educational effectiveness at LLU. ere follows a review and examples from every School for each of theten topical areas. is is one way to illustrate the University-wide culture of assessment—an important source ofstrength for educational effectiveness. (e following are merely case study overviews; however, the full case studies will beavailable in the Evidence Room).
Academic SuccessAs seen in the above Figure 12: School Case Studies, the greatest number of case studies (N=11) dealt with academicsuccess of our students. Examples include case studies that probed how to improve performance on professionallicensure exams, increase subject exam scores, improve career counseling, reduce attrition, improve new studentorientation, provide meaningful practicum experiences, and promote student progress through degree programs.
An exemplar from the School of dentistry is illustrative of the culture of assessment used to promote the academicsuccess of dental hygiene students: Five Year Trend Analysis of LLUSD National Board Dental Hygiene Exam Scores.e purpose of the National Board dental Hygiene Examination (NBdHE) is to measure whether a candidatepossesses what, in the judgment of experts, is an entry-level knowledge adequate for the competent practice of dentalhygiene. As a COdA-approved program, our senior dental hygiene students (dH2) are eligible to take the NBdHE.Each dH2 is required to successfully complete the 350-item NBdHE administered each march to meet programgraduation requirements. Tracking each senior’s score and overall class mean is a critical program goal and outcomeassessment measure. Annual and five-year performance summaries are shared with dH and basic science faculty, theExecutive Associate dean of Academic Affairs (EAdAA), and the dental Hygiene Curriculum sub-Committee(dHCsC) to determine curriculum efficacy, content gaps and/or excess, pilot exams as predictors, and studentperception of preparedness. Eligible LLU dH2 students (n=202) attempted the NBdHE in the five-year period from2005 through 2009 (mean = 40.4). e 2005 national percent fail = 4.7; School percent fail = 2.4 (97.6% pass rate).e 2006 national percent fail = 5.6; School percent fail = 17.1 (82.9% pass rate). Based on this data, the 2006 Schoolpercent pass rate did not meet the dHp outcome assessment goal of 90 percent or higher pass rate. e dHCsCconvened in June 2006 to review NBdHE data. It was voted and approved by this committee and subsequently the
WA S C E d U C A T I O N A L E F F E C T I v E N E S S R E v I E W R E p O R T 41
L O m A L I N d A U N I v E R S I T y
Figu
re12
school casE studIEs
0
2
4
6
8
10
12
Academ
icSucce
ss
Curricu
larCQI
enhanced
Learn
ing
Policy CQI
Faculty
develo
pment
IPe CQI
Assessm
ent
Researc
h
Strateg
icPlan
ning
globalOutre
ach
RETURN TO CONTENTS
Sd Curriculum Committee to create a dental Hygiene National Board Review course to span winter and springquarters of the dH2 year. Subsequent years 2007, 2008, and 2009 NBdHE national percent fail = 3.1, 4.1, and 3.0respectively; School percent fail = 0.0 respectively.
Curricular CQICurricular improvement is motivated by many factors, and a review of this case study topic (N=8) provides evidencethat curricular change has occurred as programs have altered curricula to integrate core institutional values, madeadjustments to the results of curricular mapping, filled in the content gaps to provide sufficient training as required bythe professional organizations, and revised course content to improve programmatic outcomes.
Improved Student Performance in the Master of Social work (MSw) Qualifying Review Process. As part of thecontinuous quality improvement processes expected of the mSW program by the Council on Social Work Education,the program developed and has been using an oral Qualifying Review process since the inception of the program in1994. e exam measures the extent to which students have successfully integrated all content areas of the generalistpractice curriculum (i.e, the foundation curriculum). Specific areas of evaluation include biopsychosocial-spiritualassessment skills, comprehension of foundational practice and integrative theories, intervention strategies across allfoundation practice areas, and knowledge of legal and ethical responsibilities. Results from the 2008 QualifyingReview indicated that student performance fell below the established benchmark of 70 percent in all assessed areas;particularly in respect to the overall pass rate that fell to the 50th percentile. Given the nature of students’ responses,attention was given to increasing opportunities for students to engage in active/participatory learning experiences,including experiences that would challenge them to actively conceptualize and apply the generalist practice knowledgeand skills related to biopsychosocial-spiritual assessment. To facilitate this, a generalist practice skills laboratory wasadded to SOWK 517: Foundation practice I, a critical course for learning generalist practice knowledge and skills. Inaddition, instructors in the SOWK 757A-C Field practicum seminars were required to provide students withincreased opportunities to demonstrate (in pairs) in front of the class various aspects of the assessment process.Increasing students’ opportunities for active learning also proved beneficial in addressing students’ performance anxiety.Other measures were also implemented to address possible challenges with the exam and concern for inter-raterreliability. ese changes included the development of a grading rubric, revision of scoring anchors, and the rewordingof problematic questions. Faculty were then retrained to assure that scoring of the exam was consistent and followedestablished guidelines. Student study packets were updated with the revised grading rubric. e effectiveness of thesechanges was assessed during the 2009 and 2010 academic years with significant improvements noted in theimplementation of intervention skills that went from a 63 percent pass rate in 2008 to a 75 percent pass rate in 2009to an 80.5 percent pass rate in 2010. e overall Qualifying Review pass rate went from 50 percent in 2008 to 76percent in 2009 and to 89 percent in 2010. Both of these areas exceeded the established benchmark of reaching the70th percentile for generalist practice, and indicate that the program’s proposed changes are having the desired effecton student learning.
enhanced Learningis topical collection includes those case studies that examined ways to improve learning in the classroom or clinicsetting. e six case studies examined the use of audience response technology, improved online learning experience,ways to bridge the gap between classroom instruction and clinical expectations, design of clinical learning experiences,increased use of active learning modalities, and evaluation of doctoral comprehensive requirements for theirassessment of learning.
An exemplar from the School of Allied Health professions illustrates the use of one technology to enhance learning asfound in the Assessment of Wil Alexander Wholeness Series. e focus of this case study was to find the value added instudent learning by incorporating interactive elements into a workshop series designed for students attending LLU.
W A S C E d U C A T I O N A L E F F E C T I v E N E S S R E v I E W R E p O R T42
L O m A L I N d A U N I v E R S I T y
RETURN TO CONTENTS
participants included the speakers of the 2008–2009 Wil Alexander Wholeness Series, as well as the studentsenrolled in the courses AHCJ 328, AHCJ 498, and AHCJ 519 for the 2007–2008 and 2008–2009 school years.Based on the 2008–09 course evaluations analyzed by the portfolio program faculty and staff, students did not makeas many comments about the need for more interaction in the workshops, though there was not a statisticallysignificant change in the data. Out of 100 students who answered the question, 83 percent agreed that the Turningpoint™ audience-response technology enhanced their learning experience.
Policy CQIRepresented by four case studies, the topic of policy CQI shows the importance of the systematic review of policies toensure that they are informed by and reflect the collective wisdom of stakeholders, and that the policies and associatedprocedures are understood and consistently applied by faculty and administration. Found in this case study topic arereviews of academic policy and processes for their clarity of communication and understandability across generations(e.g., millennial generation), alignment with other programmatic requirements, refinement of admissions processes,and faculty knowledge and application.
Faculty of Graduate Studies (FGS) provided a case study of academic processes as needed to maintain high academicquality in graduate programs. FGS is an example of interschool faculty cooperation to foster the quality of theresearch-oriented programs and to set minimum academic standards. Ad hoc faculty groups from all Schools createdpolicies and procedures relating to student admissions and guidance, and program administration. FGS establishedminimum entrance requirements for applicants to the research-oriented programs. ese minimum requirements haveinfluenced programs across the University to maintain quality standards. When programs have sought to change theiradmissions requirements, they have taken FGS policies into account and made changes accordingly. e FGSAdmissions Review Committee also serves as a peer-review body that oversees admissions decisions made by theprograms.
Faculty developmentree case studies were submitted that addressed faculty development issues ranging from University-wide, to School,to programmatic. ese case studies show the importance of faculty knowledge and development at multiple levels ofengagement from programmatic and School-specific classroom/teaching areas, as well as to the University’s generaleducation requirements. An example of the latter is evidenced in A Case Study on the Efficacy of the General EducationCommittee. In January of 2009, a subcommittee of the General Education Committee (GEC) developed a study posingfour questions related to faculty advisement and supervision of students’ completion of general educationrequirements: 1) do faculty know how to read degree Compliance Reports (dCRs)? 2) does the GEC need toestablish supports for assisting faculty utilizing the dCRs? 3) What is the general knowledge among faculty as to therequirements of general education at LLU? and 4) What are the general advisement issues that occur that needattention? A survey was developed, pilot tested, and then sent to 65 faculty members who are advisors ofundergraduate students. Twenty-nine surveys were returned for a response rate of 44.6 percent. Results indicated thereis a need for better communication between advisors and GEC in regard to the University requirements for aBachelor’s degree. Based on results of the study, the subcommittee recommended that three workshops be developedthat covered: 1) General Education requirements; 2) degree Compliance Reports; and 3) General EducationAcademic Advisement. Based on the results of the pre- and post-assessment of the one workshop, it appears that theGEC has developed a mechanism to keep advisors of undergraduate students informed and assist them with theiradvisement responsibilities. Two more presentations will be given and then a follow-up survey will be completed to seeif the scores have increased in the area of communication and knowledge.
Inter-professional CQIdevelopment of a division of Interdisciplinary Studies (dIS). e complexity of understanding and resolving many
WA S C E d U C A T I O N A L E F F E C T I v E N E S S R E v I E W R E p O R T 43
L O m A L I N d A U N I v E R S I T y
RETURN TO CONTENTS
social problems requires researchers to move beyond the use of single-discipline approaches to more interdisciplinaryresearch that integrates information, data, techniques, tools, perspectives, and/or theories from multiple sources. In anattempt to facilitate this type of research and interdisciplinary faculty engagement and development, the division ofInterdisciplinary Studies (dIS) was developed within the School of Science and Technology (SST). As a first steptoward more integrated research, the dIS put forth a proposal to facilitate the development of self-sustainingcommunities in Honduras through an innovative, multidisciplinary approach designed to support community needs.Given the expertise of LLU faculty in identified areas, SST was uniquely poised to provide the infrastructure for sucha project. Results thus far have been promising with the submission of a grant proposal that incorporates more thanfive disciplines from across campus and several national and international collaborators. Additionally, several fundingsources have shown interest in the model, including the Global Health Institute and World Bank, resulting in an initialseed grant of $10,000, with more than $56,000 in pending additional funds. Lessons learned through this processinclude the importance of understanding and incorporating discipline-specific language and the need for flexibility inadapting to different learning contexts and methodologies. Overall, this case study demonstrates an important step inthe development of learning environments that can sustain the engagement of both faculty and students from diverseacademic perspectives in interdisciplinary research, with all of the benefits that such a model can provide.
AssessmentAnalysis of the Wholeness definition and its Relation to Assessment. is case study is an analysis of the definition ofWholeness, its relation to assessment, and how both are connected to the School of Religion. e question raised waswhether the current definition is adequate to guide the work, programs, and assessment done at LLU in relation to thedeeper levels of assessment now required. e methods used included a quantitative analysis of responses to thedefinition on the Wholeness Inventory, a qualitative analysis of student responses, an analysis of theologicalunderpinnings of the concept, and an analysis of how the current definition affects the development of co-curricularresources such as the Wholeness portal. Utilizing the archived data from the Wholeness Inventory data set, it wasfound that almost all students responding to the Wholeness Inventory (approximately 5,000 between 2000-2007)agreed with the original definition, but did so without having sufficient alternative choices. A qualitative analysis ofstudent responses revealed agreement with the revised definition, suggesting that the inclusion of care for creation andhealing of the nations was a necessary addition. A theological analysis also identified the need for a revised definition. Assuch, using the original definition to develop the Wholeness portal became untenable, necessitating the need forrevision. e implication of this study is that revision of the definition of Wholeness affected all associated issues,programs, and assessments.
ResearchStudent and faculty involvement in research in the School of public Health. CEpH accreditation criterion 3.1 statesthat a “school shall pursue an active research program, consistent with its mission, through which its faculty andstudents contribute to the knowledge base of the public health disciplines, including research directed at improving thepractice of public health.” during its 2002 site visit, CEpH noted that there was considerable variability acrossdepartments regarding research productivity, but that the level was low throughout the School. It was also noted thatless than half of the students indicated that they were involved in research, and some mentioned that they wantedmore research opportunities. In response to these concerns, the School’s administration encouraged interested facultyby freeing up to 5-10 percent of their time, providing seed money grants for research mentoring groups, and hiring afull-time staff position for support in the research application preparation process. As a result, 24 papers from four ofthe six departments have been accepted for publication or published by mentoring faculty partnering with juniorfaculty in the last two years. Additionally, papers are in the process of being submitted by new faculty from five of thesix departments. Special attention has been paid to students by convening research meetings between them and faculty.mpH students who attended the research meeting had 3.75 greater odds of having a research position as compared tompH students who did not attend.
W A S C E d U C A T I O N A L E F F E C T I v E N E S S R E v I E W R E p O R T44
L O m A L I N d A U N I v E R S I T y
RETURN TO CONTENTS
Strategic Planninge School of pharmacy has engaged in strategic planning before; however, the dean has taken a very differentapproach to the process for the current planning cycle. e first plans were characteristically a top-down process,where administrators developed plans that were merely shared with faculty as an information item. e past two plans,while still primarily top-down in nature, engaged faculty in productive dialogue prior to their adoption. Facultydialogue resulted in members of the School community possessing a better understanding of the plan and the actionsnecessary to reach strategic goals. e current planning cycle for 2010–2014 will be the first opportunity for faculty toengage in the development of the plan from the very beginning, and now aligns with the LLUAHSC 2014 vision. eprocess for the planning cycle and the documents that will serve as the foundation for the plan are described in thiscase study.
global OutreachResponding to the global shortage of nursing has caused the School of Nursing faculty to prepare, at the master’s level,nurse educators from sister schools throughout Africa, Asia, and South America. e participants have included 49students from China, India, Indonesia, Japan, malaysia, myanmar, Nepal, pakistan, philippines, ailand, vietnam,Argentina, Bolivia, Botswana, Cameroon, Croatia, Jamaica, Kenya, malawi, mexico, Nigeria, peru, and puerto Rico.e methods involved graduate faculty who offered a four-year, off-campus (ailand and Argentina) master’s degreeprogram to 49 baccalaureate-prepared nurse leaders from these areas. e purpose of the project was to preparefaculty to teach in their home countries. is goal was reached. Forty-five of the 49 students who started the programcompleted the coursework, and all have assumed leadership roles in their home countries. Forty-two graduates arenurse educators in academic settings.
Case Study ConclusionsOver the past year, the case studies have been shared among the Schools, FGS, and various committees to the benefitof LLU’s academic community. e collective wisdom that results when individual School efforts are brought togetheris one of this institution’s greatest strengths. e unintentional collaboration that results when the professional identityand accountability of each School is respected gives depth and focus to the greater University and has led to theconclusion that:
• ere is power in case studies.• Only a limited number of faculty and administrators on campus have had access to them.• Among those who have reviewed the case studies, there is an increased appreciation for the natural tendencies of
our faculty to perform data-driven processes.• Sharing studies from the silos will have profound effects on the University.
is serendipitous result that the institution encountered as a result of reflection on the case studies has provided abetter understanding of LLU’s commitment to educational effectiveness and the related processes. (CFRs 2.7, 2.8, 2.9,2.10, 2.11, 2.12, 2.13, 3.3, 3.8, 4.1, 4.3, 4.4, 4.6, 4.7, 4.8)
commItmEnt
Integrative EssayWe began the current reaccreditation cycle in 2006 with an institutional proposal to examine two themes: Sustainingthe Normative Culture and Integrating Bible-based Faith. Both themes were deeply rooted in our University’sphilosophical and institutional history and provided an opportunity for reflection as we embarked on strategicvisioning about our future in a rapidly changing world. e inquiry that ensued led us to a deeper understanding ofMFL, which has been an integral part of our past and present, and is now the organizing framework for our
WA S C E d U C A T I O N A L E F F E C T I v E N E S S R E v I E W R E p O R T 45
L O m A L I N d A U N I v E R S I T y
RETURN TO CONTENTS
educational effectiveness and future. We have learned that it is our dedication to MFL that sustains us and makes usuniquely Loma Linda University.
Along the way to this realization other insights also took shape. We discovered that at the heart of each of our eightSchools is a profound commitment to institutional purposes that function like spokes at the center of a wheel. Insteadof independent silos, we found structural and procedural efficiencies anchored by collective collaboration. We foundnot just the desire for more community but the reality of more community. Notably, we learned that our Schools wereappropriately and adequately meeting or exceeding assessment standards as measured by 23 professional accreditingbodies that interact with our campus on a continuous basis. Lastly, we realized that in the midst of tending to theirextraordinary responsibilities, the Schools simultaneously attend to the quality standards, values, and measures ofexcellence set forth through central University processes and decision-making.
In our commitment to be a world-class learning organization, we have come to value assessment and the practice ofevidenced-based education. As we moved from the proposal phase to the CpR, we engaged large numbers of ouracademic leaders and faculty in new learning; but it was at the San Jose ARC meeting in 2007 that we heard the call toaction and the national agenda for more standardized assessment, measurable University-wide SLOs, and uniformitywithin assessment metrics. So with focused due diligence, we accelerated our efforts to develop centrally-ledassessment processes to bring about increased standardization of assessment approaches. is new focus oncentralization was assisted by our previously identified desire to reduce the isolation of School-centric silos. However,it slowly dawned on us that our strength resided in the diversity of our professionally accredited programs andSchools. Known, but never fully appreciated, was the abundance of contemporary assessment expertise that was beingimplemented in the Schools—expertise that could more effectively be brought to bear for a stronger overallinstitutional understanding and practice of assessment and educational effectiveness.
However, it should be recognized that it was at this point that our story circled back and the benefit of reflectivelearning produced a serendipitous effect. It has become clear that the depth of engagement in this three-phasereaccreditation sequence has been driven by more than the pressure of regional accreditation. As such, the awareness ofexcellence in our Schools was not a new finding. What was new and deeper was the unifying anchor that was theproduct of passage through the CpR process. It is now clearly evident that the strength and sustainability ofparticipation in assessment at LLU is driven by a unified understanding and our deep commitment to demonstrate theeducational effectiveness of MFL—that has and will continue to bring us together as an enduring Christ-centeredinstitution.
It is this conviction and learning that brought us to this point and will continue to empower our extraordinarysystematic transformation, to include the:
1. creation of uniform program definitions;2. establishment of a strong systematic program review process;3. evaluation and strengthening of institutional research and data;4. development of the Wholeness portal;5. shared engagement of Schools through designated Assessment Specialists;6. development of methodologies for assessing the educational effectiveness of co-curricular learning opportunities;7. heightened awareness of being fiscally transparent and responsible during these financial times;8. commitment to world-class status in basic, clinical, and health services research; and9. implementation of data-driven strategic planning and learning.
At this time in our journey, we can now say not only do we believe in MFL, but we also know it works. And we havenow identified the processes and have evidence to prove it.
W A S C E d U C A T I O N A L E F F E C T I v E N E S S R E v I E W R E p O R T46
L O m A L I N d A U N I v E R S I T y
RETURN TO CONTENTS
Our Next Phase of discoveryWith these developments firmly in place, LLU is now well positioned and empowered to begin the next phase of ourdiscovery. roughout the remainder of the integrative essay, attention will be drawn to actionable items that will serveto keep us focused and continue the momentum and results that were achieved through the EER process.
Specific to assessment, the Educational Effectiveness Committee, in conjunction with the University AssessmentCommittee and the Office of Educational Effectiveness, have developed a strategy and process for institutionalizing theassessment of programs at LLU.10 Supporting this strategy is the Assessment Cycle11 that provides the institution’stimeline for assessing the University-wide SLOs that were revised from 17 to 8 in 2007. is Assessment Cycleprovides LLU’s timeline for implementing the assessment of University SLOs beginning with the initial assessmentcycle in 201012, followed by a schedule for assessing the remainder of the University SLOs, as well as the schedule forinitiating the next full SLO assessment cycle.
Significant strides have also been made in the development of a University-wide systematic program review process;13
as a result, we are now able to sustain a campus-wide systematic program review process. Our confidence in thesustainability of the University’s program Review process stems in part from the impressive “buy in” that has beenwitnessed over the past two years from faculty in disciplines across the campus for whom in-depth reflection andassessment have not been the norm but have been considered unwelcome and unnecessary distractions. e faculty inthese programs have engaged and discovered the benefits of knowing—versus assuming—critical factors impacting thesuccess of their students and programs. eir participation and support including that of UFC, for what is truly aconsiderable effort have been valuable in the engagement of other faculty and programs. Further ensuring thesustainability of CQI through campus-wide systematic program review is the infrastructure that has been put intoplace through the efforts of the program Review Committee (pRC), with the assistance of the OEE and oversight ofthe EEC. e processes and infrastructure have been developed to guide faculty through the structured review process.Faculty training and consultation are also being provided by the OEE and the faculty mentors who serve as membersof the pRC.14 e pRC has also developed a program review calendar that shows when specific programs arescheduled to complete the review process. e schedule illustrates the timeline for completion of the current cycle ofprogram reviews, and projects the five-year timeline for the sequential review cycle. is review calendar is shared withprograms and posted on the OEE website. deans, department Chairs, and program directors will receive a reminderto engage in the program review process 18 months prior to the due date of the next five-year systematic programreview self-study.
Also important to sustaining the breadth and depth of assessment at LLU is the attention that has and will continueto be given to the assessment of co-curricular programs. As we have already discovered, co-curricular activities providestudents with opportunities to deepen their understanding of the University’s SLO as an aspect of MFL. Because of
WA S C E d U C A T I O N A L E F F E C T I v E N E S S R E v I E W R E p O R T 47
L O m A L I N d A U N I v E R S I T y
10Information about the assessment strategy and process is available at <www.llu.edu/central/assessment/lluslostrategy.page>.11is information is available for review at <www.llu.edu/central/assessment/slo.page>.12It should be noted that prior to 2007, University SLOs were not assessed in any comprehensive way. Following the revision of SLOsfrom 17 to 8 in 2007 considerable effort and community consensus building went into identifying and developing performancemeasures and rubrics to support the assessment of LLU’s SLOs in a manner that would permit appropriate reflections specific todisciplines while also allowing for University-wide generalizations. Once this work was completed, the initial cycle of assessment beganin 2010.13Additional information about the University’s program Review process is available at<www.llu.edu/central/assessment/programreview.page>.14OEE has developed resources that support Schools and programs and engage faculty in on-going learning about assessment andprogram review. An example of this activity can be found at<www.llu.edu/assets/assessment/documents/AWSLO_0910_Rev%2004-20-10.pdf>.
RETURN TO CONTENTS
this, efforts are underway to increase the number of LLU students participating in these voluntary activities. eCo-curricular Committee, along with the UAC, EEC, and the Schools, now needs to establish targets for the numberof LLU students that should ideally be involved in co-curricular learning. In addition, compelling methodologies havebeen developed as a result of the EER processes that provide a framework for the continued assessment of LLU’sco-curricular learning opportunities. ese methodologies will be further developed to support the assessment of allLLU sponsored co-curricular learning opportunities.
In SummaryLoma Linda University will develop and launch other initiatives as it moves forward to ensure the sustainability of itsgrowth in assessment and program reviews. e University has made a commitment to address issues including thecontinued development of assessment efficiencies that recognize the breadth of faculty commitments.
Furthermore, LLU will continue to develop its institutional research functions to facilitate the growing needs anddesires of Schools to gain increased access to valuable and much-needed program and comparative institutional data.
As an institution, we recognize that the new knowledge discovered through the EER process has given rise to a desireto engage in more research about our institution that goes beyond the requirements of any accrediting agency. As our“knowing” has increased, so has our desire to know more.
Finally, the EER process has instilled in us—our administration, faculty, staff, and students—a deeper understandingand commitment to our institutional values in all that we do. We now find ourselves renewed, more connected, andmore aware of the professional and personal transformation that our students seek and expect from this University,and that we seek and expect of ourselves. e institutional learning that we have achieved through advancing ourknowledge and practice of assessment and program review now allows us to more fully honor those expectations as westrive to “further the healing and teaching ministry of Jesus Christ—to make man whole.”
W A S C E d U C A T I O N A L E F F E C T I v E N E S S R E v I E W R E p O R T48
L O m A L I N d A U N I v E R S I T y
RETURN TO CONTENTS
REfEREncEs
Cranton, p. (2006). Understanding and promoting transformative learning: a guide for educators of adults. Jossey-Bass.Retrieved from Book Index with Reviews database.
dirkx, J. (2001). Images, Transformative Learning and the Work of Soul, Adult Learning, Vol. 12
myers, Bryant. (2004). Walking with the Poor. Ny: World vision International.
O’Sullivan, E. (1999). Transformative learning: educational vision for the 21st century. Zed Books. Retrieved from BookIndex with Reviews database.
WA S C E d U C A T I O N A L E F F E C T I v E N E S S R E v I E W R E p O R T 49
L O m A L I N d A U N I v E R S I T y
RETURN TO CONTENTS
WA S C E D U C A T I O N A L E F F E C T I V E N E S S R E V I E W R E P O R T
L O M A L I N D A U N I V E R S I T Y
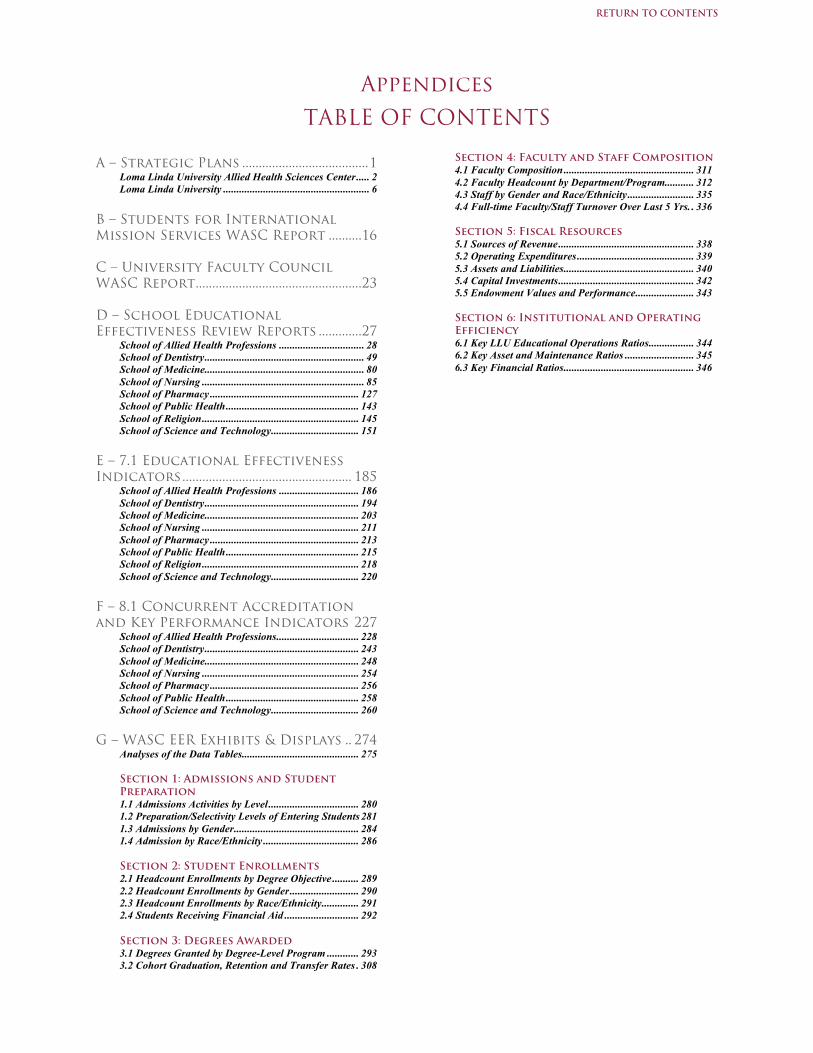
Appendices
TABLE OF CONTENTS
A – Strategic Plans ......................................1
Loma Linda University Allied Health Sciences Center..... 2 Loma Linda University ....................................................... 6
B – Students for International Mission Services WASC Report ..........16 C – University Faculty Council WASC Report..................................................23 D – School Educational Effectiveness Review Reports .............27
School of Allied Health Professions ................................ 28 School of Dentistry............................................................ 49 School of Medicine............................................................ 80 School of Nursing ............................................................. 85 School of Pharmacy ........................................................ 127 School of Public Health.................................................. 143 School of Religion........................................................... 145 School of Science and Technology................................. 151
E – 7.1 Educational Effectiveness Indicators................................................... 185
School of Allied Health Professions .............................. 186 School of Dentistry.......................................................... 194 School of Medicine.......................................................... 203 School of Nursing ........................................................... 211 School of Pharmacy ........................................................ 213 School of Public Health.................................................. 215 School of Religion........................................................... 218 School of Science and Technology................................. 220
F – 8.1 Concurrent Accreditation and Key Performance Indicators 227
School of Allied Health Professions............................... 228 School of Dentistry.......................................................... 243 School of Medicine.......................................................... 248 School of Nursing ........................................................... 254 School of Pharmacy ........................................................ 256 School of Public Health.................................................. 258 School of Science and Technology................................. 260
G – WASC EER Exhibits & Displays .. 274
Analyses of the Data Tables............................................ 275 Section 1: Admissions and Student Preparation 1.1 Admissions Activities by Level.................................. 280 1.2 Preparation/Selectivity Levels of Entering Students 281 1.3 Admissions by Gender............................................... 284 1.4 Admission by Race/Ethnicity .................................... 286 Section 2: Student Enrollments 2.1 Headcount Enrollments by Degree Objective .......... 289 2.2 Headcount Enrollments by Gender.......................... 290 2.3 Headcount Enrollments by Race/Ethnicity.............. 291 2.4 Students Receiving Financial Aid ............................ 292 Section 3: Degrees Awarded 3.1 Degrees Granted by Degree-Level Program ............ 293 3.2 Cohort Graduation, Retention and Transfer Rates . 308
Section 4: Faculty and Staff Composition 4.1 Faculty Composition ................................................. 311 4.2 Faculty Headcount by Department/Program........... 312 4.3 Staff by Gender and Race/Ethnicity......................... 335 4.4 Full-time Faculty/Staff Turnover Over Last 5 Yrs. . 336 Section 5: Fiscal Resources 5.1 Sources of Revenue................................................... 338 5.2 Operating Expenditures............................................ 339 5.3 Assets and Liabilities................................................. 340 5.4 Capital Investments................................................... 342 5.5 Endowment Values and Performance...................... 343
Section 6: Institutional and Operating Efficiency 6.1 Key LLU Educational Operations Ratios................. 344 6.2 Key Asset and Maintenance Ratios .......................... 345 6.3 Key Financial Ratios................................................. 346
RETURN TO CONTENTS

WASC Educational Effectiveness Report
Appendix A
TABLE OF CONTENTS
RETURN TO CONTENTS
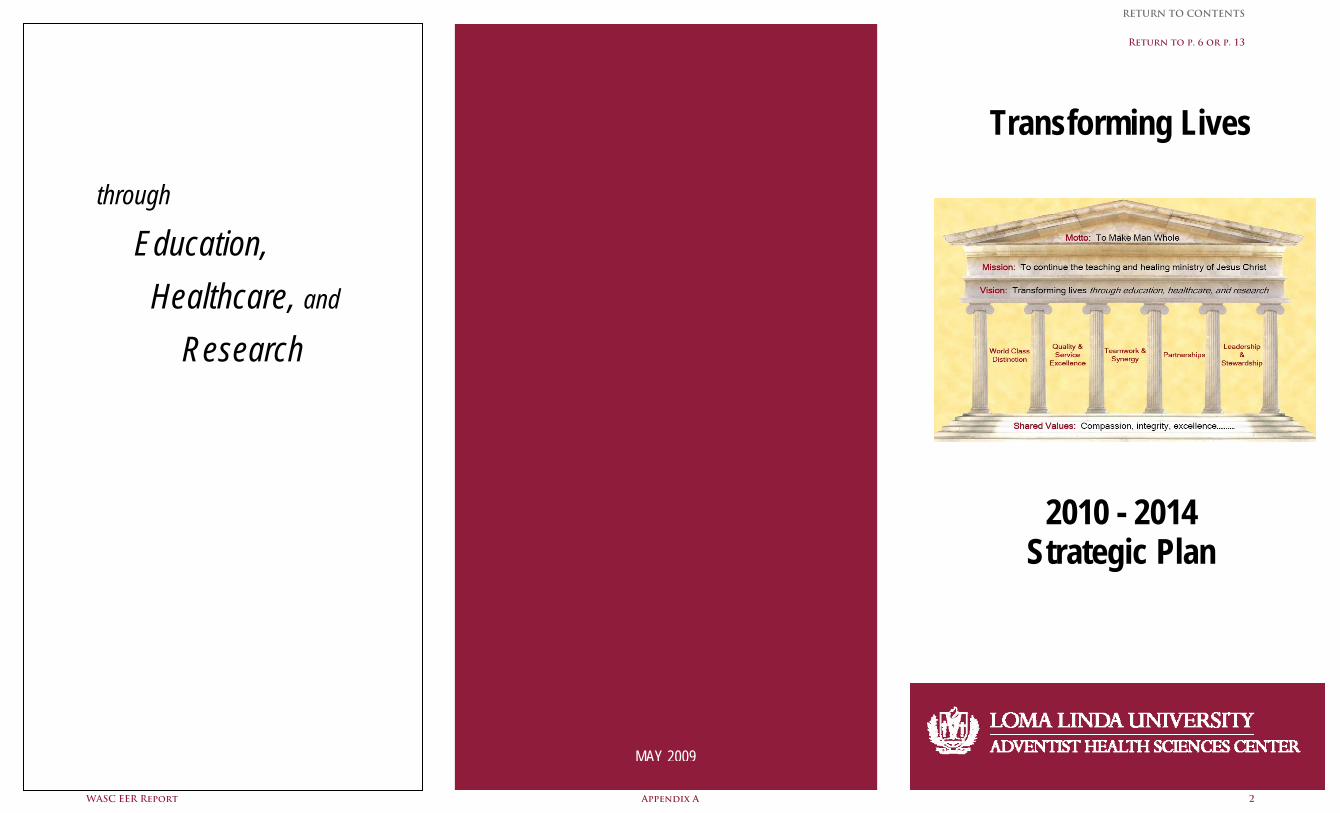
through
Education, Healthcare, and Research
Transforming Lives
2010 - 2014 Strategic Plan
MAY 2009
WASC EER Report 2Appendix A
RETURN TO CONTENTS
Return to p. 6 or p. 13
President's Message
To further strengthen and integrate the Loma Linda University Adventist Health Sciences Center (LLUAHSC), the Board of Trustees asked LLUAHSC leadership to develop a strategic plan that achieves optimal alignment and synergies among all LLUAHSC entities.
Broad planning themes and guiding principles have been developed to assist in this process. These themes and principles are intended to serve as a foundation for the University, Healthcare Ministry, and other LLUAHSC entities in the development of their plans, and to assure focus around common goals.
We have "many strengths", and can collectively work together to maximize these strengths in fulfillment of our mission, as we provide Christ-centered education and healthcare to our community. May God bless our work together, as we serve the world through our academic and healthcare ministry.
Richard Hart
OUR MISSION: To continue the teaching and healing ministry of Jesus Christ.
OUR VISION: Transforming lives through education, health care, and research.
OUR SHARED VALUES: Compassion, Integrity, Excellence………..
OUR MOTTO: To Make Man Whole.
Who We Are
Our primary responsibility is the education of more than 4,000 students, who come from diverse ethnic and cultural backgrounds. This education enables our students to acquire the foundation of knowledge, skills, values, and behaviors to succeed in their chosen academic or healthcare ministry. The University is comprised of the following schools:
School of Allied Health Professions School of Public Health School of Dentistry School of Religion School of Medicine School of Science & School of Nursing Technology School of Pharmacy Faculty of Graduate Studies
Our Medical Center has more than 900 beds available for patient care, including:
Loma Linda University Medical Center Loma Linda University Children's Hospital Loma Linda University Medical Center East Campus Loma Linda University Heart and Surgical Hospital Loma Linda University Behavioral Medicine Center
The Medical Center operates some of the largest clinical programs in the United States in areas such as neonatal care. It is recognized as the international leader in infant heart transplantation and proton treatments for cancer. Each year, the institution admits more than 33,000 inpatients and serves roughly half a million outpatients. As the only tertiary-care hospital in the area, LLUMC is the only level one regional trauma center for Inyo, Mono, Riverside, and San Bernardino counties.
Loma Linda University Health Care is a management services organization that supports the operations of the Faculty Practice Plan, which is comprised of more than 600 physicians from the following corporations:
Faculty Physicians & Surgeons of LLUSOM Faculty Medical Group of LLUSOM
Loma Linda University Health Services (LLUHS) develops and maintains shared services and infrastructure for LLUAHSC core and affiliate organizations.
2010-2014 LLUAHSC Vision
What will Loma Linda “Look Like” in 2014?
World Class Distinction in our Unique Roles There are solid programs across the disciplines, with recognized areas of distinction that cut across education, research, and patient care. These programs attract the best talent and funding, and are preferred by the students, patients, and communities that we serve.
Quality and Service Excellence In All That We Do Loma Linda provides the intellectual, social, and physical environment to attract and retain the best students, faculty, clinicians, and support teams. Learning and patient care protocols are evidence-based, with stellar (and transparent) outcomes. Loma Linda is the undisputed leader in service quality and patient/staff satisfaction.
Teamwork and Synergy to Leverage Our Unique Strengths The organization supports crosscutting collaboration and leadership across education, research, and clinical disciplines. The Health Care Ministry provides a patient centered, “one-stop” healthcare experience – Loma Linda is the “faith-based Mayo.”
A Strong Partnership with Local and Global Communities Loma Linda provides intellectual and service leadership to the broad academic community and to the various global, regional and local communities it serves. As a two-way partnership, Loma Linda is embraced and strengthened by its various constituencies through grants and philanthropic support.
Leadership and Stewardship For a strong future, attention is focused on attracting and retaining the best leadership talent consistent with Loma Linda values, and on developing the leadership needed for today and tomorrow. There is disciplined stewardship of the mission effectiveness, financial performance, and assets of the organization.
Goal Framework and Priorities
To support the LLUAHSC vision, we must strive to:
Clearly identify and develop/promote those endeavors that can be the defining and driving focus of Loma Linda’s overall image, in line with achieving our goal of World Class Distinction in Our Unique Roles.
Develop the organizational culture, structure, and tools necessary for service excellence and accountability, supporting our efforts to provide Quality and Service Excellence in All That We Do.
Develop the structures, culture and behaviors that support teamwork and synergy across the breadth of the Loma Linda enterprise, in pursuit of efforts for Teamwork and Synergy to Leverage Our Strengths.
Extend Loma Linda’s care and expertise to global, regional, and local communities; work in partnership with government, business, and civic leadership in developing sustainable funding sources. This supports our goal to build Partnerships with Local and Global Communities.
Develop leaders, structures, and processes to ensure the future strength of the organization, in accordance with our desires for strong Leadership and Stewardship for Our Future.
WASC EER Report 3Appendix A
RETURN TO CONTENTS
Accomplishments and Challenges 2004-2009
The intent of this document is to increase understanding of the context as well as content of the LLUAHSC 2010-2014 Strategic Planning effort. The following 2004-2009 achievements and challenges were shared by executive leadership at the 2009 Board Retreat.
Health Science Center - Accomplishments
Executive Leadership The establishment of the Executive Leadership Council (ELC). The ELC brings together key leadership of the major entities on a weekly basis to better coordinate strategic and operational positioning across the enterprise.
Strategic Planning The development of the LLUAHSC strategic plan to coordinate strategic alignment of the priorities, resources, and strategic mission, vision, and values of the University, Medical Center, and faculty.
LLUHS The establishment of the Loma Linda University Health Services. LLUHS incorporates services that support the operations of the entire enterprise.
Health Science Center - Challenges Economy The downturn in the nationwide economy and the impact it will have on education and health care delivery.
Grant and Research Funding The reduction in funding of educational and healthcare grants and research funding.
Declining SDA Enrollment The ongoing trend of declining enrollment in SDA colleges and the impact it will have on the number and quality of applicants coming to LLU.
Christian Mission and Values The challenge of preparing future SDA educational and healthcare leadership to advance mission and values.
Global Educational Expansion The number of under funded and under resourced medical schools, dental schools, and other health professional schools being launched globally that are requesting LLUAHSC support.
Loma Linda University - Accomplishments Integration The willingness among the eight schools, and the Faculty of Graduate Studies, to become a more integrated and collaborative university, where expertise and resources can be maximized by multi- and cross-discipline interaction.
Administrative Support The creation of the Office of Educational Effectiveness to support faculty development activities and evaluate educational effectiveness across campus..
Processing The improvement of administrative processes to facilitate the timely completion of admissions and records.
Program Approval The development of a comprehensive program approval process that examines the compatibility of objectives, financial viability, market demands, and faculty resources with spiritual values, curricular maps, and assessment matrices.
New Schools. The addition of three new schools over the last six years: Religion, Pharmacy, and Science & Technology.
Centennial Complex The soon to-be-opened 150,000 square foot Centennial Complex to house four amphitheaters, the School of Religion, the Anatomy Department, classrooms, a medical simulation lab, and the Global Gateway, the latest effort to expand distance education.
Student Enrollment The highest enrollment ever achieved, with 4,100 students.
Loma Linda University - Challenges Space The challenge of meeting the space needs of a growing university. The Centennial Complex is expected to provide room, but not fully solve the problem.
Program Growth The dilemma of how to responsibly grow the academic enterprise during uncertain times.
Process Improvement The need for continued improvement of academic and administrative processes.
University Infrastructure The need for continued funding of necessary centralized administrative functions.
Leadership Development and Succession Planning The identification of future leaders who embrace and support LLU's mission, vision and values.
Spirituality The challenge of maintaining the spiritual essence of LLU, as it expands involvement in clinics and branch campuses around the world.
Healthcare Ministry
Loma Linda University Medical Center Accomplishments
Service Excellence
Quality Leadership The creation of a new position for Vice President for Quality and Patient Safety to improve patient safety and service. This action led to a program called “Innovating Excellence", and implementation of over 2000 patient-centered initiatives. The measurement of patient satisfaction also occurred through the Gallup Corporation.
Values and Culture Leadership The creation of a new position for Vice President for Mission and Culture to further emphasize the culture and values of the organization. This initiative led to selecting five values Teamwork, Wholeness, Integrity, Compassion, and Excellence to guide the recruitment process, selection of employees aligned with the values, and recognition of outstanding employee performance.
Clinical Leadership
Pediatrics The master site and facility planning for the development of a new Pediatric and Material Children’s Hospital and ambulatory care facility.
Cardiology The purchase of Loma Linda University Heart and Surgical Hospital and the opening of the Heart Imaging Center in Colton.
Oncology The construction of a new Cancer Center that consolidated services into one area and incorporated Planetree elements into the design for a patient-centered focus.
Women’s Services The purchase of the Loma Linda Heart and Surgical Hospital with improved access and coordination of services. A Perinatal Institute was also implemented to extend subspecialty services to the region.
Rehab/Ortho/Neuro The construction of a 24-bed rehab pavilion to provide private rooms enveloped in a "healing environment. The expanded PossAbilities program for physically-challenged people.
Behavioral Health The development of a Behavioral Health Institute and the construction of an outpatient facility that integrates psychology, psychiatry, marriage and family, and social work services into a single delivery of care model of care and setting.
Transplant The continued growth in organ procurement and transplantations.
WASC EER Report 4Appendix A
RETURN TO CONTENTS
Outreach
Ambulatory Care The construction of the Highland Springs Medical Plaza, in partnership with Redlands Community Hospital and Beaver Medical Group. The 85,000-square-foot facility offers same-day surgery, urgent care, radiology, and lab testing.
New Campus Construction The construction of Loma Linda University Medical Center-Murrieta, a 107-bed acute care hospital that will open in 2010. The center is a joint venture with 80 community doctors in the Murrieta region.
Telemedicine The planning for telemedicine outreach to the region. This effort will serve rural facilities by providing clinical consults and assisting in the management of ICU patients using Loma Linda intensivists.
World Class Resources
Equipment and Facilities The acquisition of state-of-the-art equipment, and the renovation of facilities to enable the Medical Center to be on the leading edge of providing care.
Information Technology The continued updating of the information technology system, including movement toward an integrated clinical record, and a soon to be implemented computerized physician order entry system.
Profitability The realization of a 5 to 7 percent return on investments in four of the last five years of LLUMC operation.
LLUMC - Challenges Community Relationships The fostering of relationships between LLU faculty and community physicians.
Capital Access The formation of capital to support continued system growth in a declining economic environment and mandated California seismic requirements.
Medi-Cal Reimbursement The receipt of appropriate Medi-Cal reimbursement, as the largest private provider of Medi-Cal services in California.
MD Recruitment The recruitment of specialists and sub-specialists to support patient access to Medical Center service lines.
Market Share and Donations The effective marketing of services and the receipt of philanthropic funds to support service line and Medical Center initiatives.
Educational Mission The continued expansion of clinical sites for the more than 3,000 students per quarter that train at LLUMC.
FACULTY PRACTICE Accomplishments MD Recruitment and Succession Planning The establishment of the Office of Physician Recruitment. The office is a joint effort between the School of Medicine, Faculty Practice Plan, and the Medical Center.
The placement of 20 of LLU's highest ranked students and residents in a stipend program or contract to return to LLU as part of its faculty.
Clinical Practice Leadership The recruitment of new leadership to fill the chair positions for the departments of oncology, pediatrics, anesthesiology, emergency medicine, neurology, internal medicine, otolaryngology/head and neck, and plastic surgery.
Pediatrics The growth of pediatric faculty by over 100 physicians since 2006. The faculty practice plan includes representation in all pediatric surgical sub-specialties, and houses the only pediatric surgeons in the Inland Empire.
Cardiology The recruitment of two new cardiologists has enabled LLU to become a leader in cardiac MRI imaging in Southern California. The Peripheral Vascular service is also expanding, with collaboration between vascular surgeons, interventional radiologists, and cardiologists.
Otolaryngology The doubling of the size of the department since 2000 and the addition of new physicians with sub-specialty training in voice, sinus, and facial plastic surgery. The specialty will be expanded to the Highland Spring facility, and relocated to the Heart and Surgical Hospital.
Urology The program offers robotic surgery, cryosurgery, and minimally invasive surgery for kidney cancer. The specialty will expand access by opening facilities at the new surgical hospital and in the Highland Springs facility.
Plastic and Reconstructive Surgery The expansion of the program with the opening of a clinic in Riverside.
Anesthesiology A 50 percent increase in the number of anesthesiologists to accommodate operating room needs.
Transplants The continued growth of the program with a record number of kidney transplants performed in 2008.
Primary Care The development of a joint training program for family medicine and preventive medicine, and a family medicine rural track. The receipt of an award from the Academy of Family Medicine as one of the top 10 schools in the nation for medical student placement.
Ophthalmology The geographic expansion of the program from La Sierra to Banning-Beaumont.
Cost Savings The saving of over $15 million in malpractice insurance premiums the faculty practice plan.
Scientific Infrastructure The continued Investment in scientific infrastructure to promote basic science and translational research efforts.
Faculty Practice Challenges
MD Recruitment The recruitment of mission-aligned physicians to support Healthcare Ministry inpatient and ambulatory needs.
WASC EER Report 5Appendix A
RETURN TO CONTENTS
S T r A T E g i C P L A n 1
L O M A L i n d A U n i V E r S i T y
Transforming Lives for 21st Century Service
Throughout its history Loma Linda University has benefited from strategic planning as evidenced by the creationof and growth in new academic programs, service opportunities, buildings, institutes, and corporate structures.
Schools in response to professional accreditation demands did most planning. e School plans were submitted to thePresident who worked with the University Officers to prepare the University’s annual strategic plan. is changed inFebruary 2009 when the President, in close cooperation with the Board of Trustees, initiated a new corporation-wide(LLUAHSC) five-year strategic planning process that would more formally use assessment (data-driven), sharedlessons-learned and best practice motifs to integrate the planning of all LLU corporate entities. is new processpromises to effectively increase efficiencies, effectiveness and synergy to improve mission fulfillment, sustainability andattainment of best practices. e university’s portion, with support from the schools, of the LLUAHSC strategic planhas placed high value on improving our service and assessment infrastructure and on evidence-based decision making(see strategic plan’s five pillars in the following paragraphs and see Appendix A the full strategic plan documents). e newcorporate-wide planning process provides enhanced opportunities for the University and schools to align goals andresources across the enterprise.
e strategic planning process for the university began in June of 2009, with the formation of a university strategicplanning committee, chaired by the provost and guided by Mr. Michael Jackson, Senior Vice President. e committeeapproved a collaborative planning process, which began with a scan of the internal and external environment. ecommittee identified, reviewed, analyzed and discussed key academic data, assumptions, and trends.
e Board of Trustee provided broad planning goals that were offered as five planning pillars and offered with theintent that they serve as the foundation upon which all planning and implementation occurs.
Personal interviews and/or online surveys of key university stakeholders occurred. ese stakeholders includedstudents, faculty, staff, administration, and key community leaders. Participants were informed that the university wasin the process of developing a five year strategic plan for 2010 – 2014, beginning with the development of a visionstatement of the university's desired future. Two questions were posed: “What attributes should LLU exhibit in 2014,as it seeks to transform lives though education?” and “What vital few priorities should the strategic plan address toattain this vision?”
Personal interviews of all university officers and deans were conducted. Concurrently, an online survey of 4,000stakeholders occurred, resulting in 397 responses. Verbatim interview and online survey findings were grouped under12 planning themes, and shared at a September 2009 university retreat, attended by 116 key leaders.Focus groups were formed at the retreat to discuss the interview and online survey findings. Each group was asked todevelop a mini-vision statement for their assigned theme. e mini-vision statements were then used to develop aunified university vision statement.
WASC EER Report 6Appendix A
RETURN TO CONTENTS
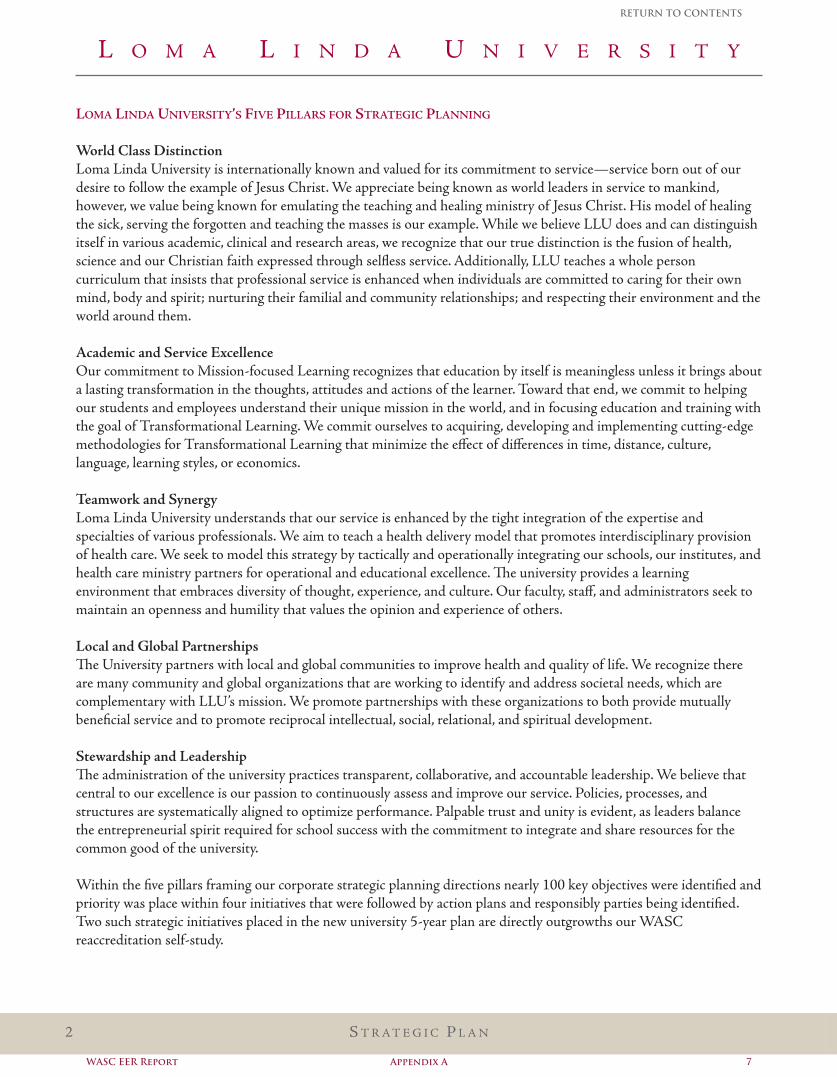
Loma Linda University’s Five PiLLars For strategic PLanning
World class distinctionLoma Linda University is internationally known and valued for its commitment to service—service born out of ourdesire to follow the example of Jesus Christ. We appreciate being known as world leaders in service to mankind,however, we value being known for emulating the teaching and healing ministry of Jesus Christ. His model of healingthe sick, serving the forgotten and teaching the masses is our example. While we believe LLU does and can distinguishitself in various academic, clinical and research areas, we recognize that our true distinction is the fusion of health,science and our Christian faith expressed through selfless service. Additionally, LLU teaches a whole personcurriculum that insists that professional service is enhanced when individuals are committed to caring for their ownmind, body and spirit; nurturing their familial and community relationships; and respecting their environment and theworld around them.
academic and service excellenceOur commitment to Mission-focused Learning recognizes that education by itself is meaningless unless it brings abouta lasting transformation in the thoughts, attitudes and actions of the learner. Toward that end, we commit to helpingour students and employees understand their unique mission in the world, and in focusing education and training withthe goal of Transformational Learning. We commit ourselves to acquiring, developing and implementing cutting-edgemethodologies for Transformational Learning that minimize the effect of differences in time, distance, culture,language, learning styles, or economics.
teamwork and synergyLoma Linda University understands that our service is enhanced by the tight integration of the expertise andspecialties of various professionals. We aim to teach a health delivery model that promotes interdisciplinary provisionof health care. We seek to model this strategy by tactically and operationally integrating our schools, our institutes, andhealth care ministry partners for operational and educational excellence. e university provides a learningenvironment that embraces diversity of thought, experience, and culture. Our faculty, staff, and administrators seek tomaintain an openness and humility that values the opinion and experience of others.
Local and global Partnershipse University partners with local and global communities to improve health and quality of life. We recognize thereare many community and global organizations that are working to identify and address societal needs, which arecomplementary with LLU’s mission. We promote partnerships with these organizations to both provide mutuallybeneficial service and to promote reciprocal intellectual, social, relational, and spiritual development.
stewardship and Leadershipe administration of the university practices transparent, collaborative, and accountable leadership. We believe thatcentral to our excellence is our passion to continuously assess and improve our service. Policies, processes, andstructures are systematically aligned to optimize performance. Palpable trust and unity is evident, as leaders balancethe entrepreneurial spirit required for school success with the commitment to integrate and share resources for thecommon good of the university.
Within the five pillars framing our corporate strategic planning directions nearly 100 key objectives were identified andpriority was place within four initiatives that were followed by action plans and responsibly parties being identified.Two such strategic initiatives placed in the new university 5-year plan are directly outgrowths our WASCreaccreditation self-study.
S T r A T E g i C P L A n2
L O M A L i n d A U n i V E r S i T y
WASC EER Report 7Appendix A
RETURN TO CONTENTS
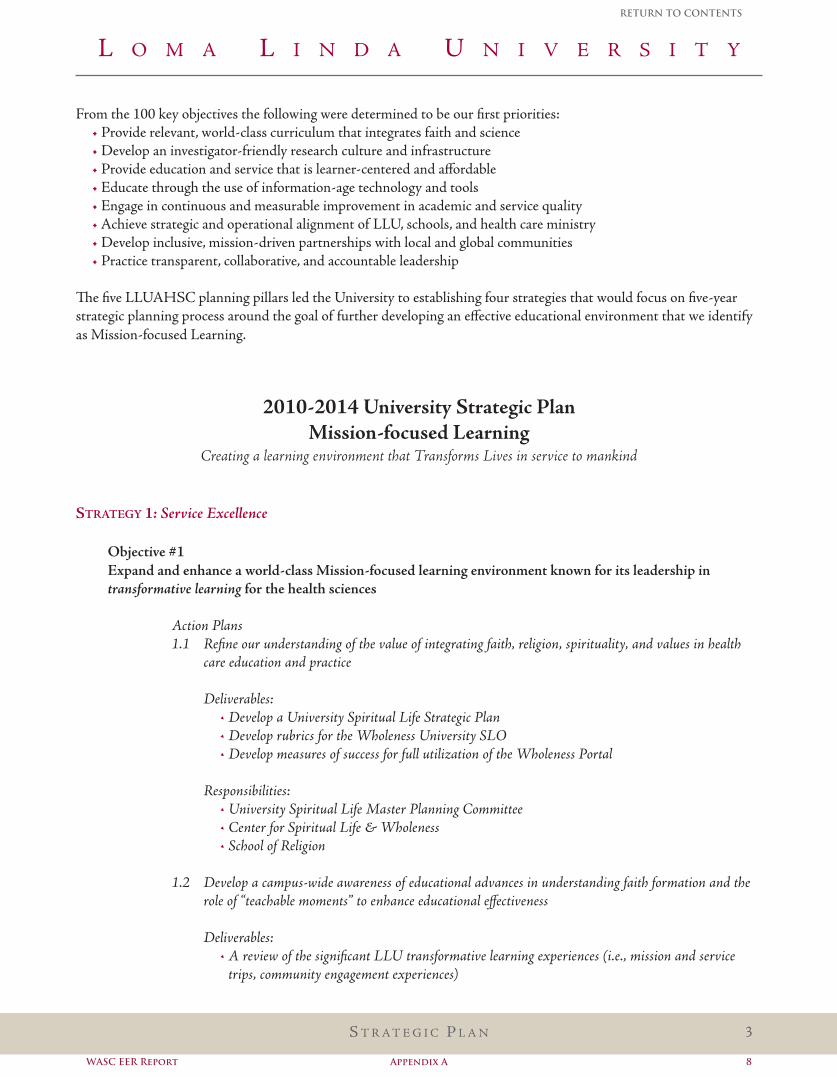
From the 100 key objectives the following were determined to be our first priorities:• Provide relevant, world-class curriculum that integrates faith and science• develop an investigator-friendly research culture and infrastructure• Provide education and service that is learner-centered and affordable• Educate through the use of information-age technology and tools• Engage in continuous and measurable improvement in academic and service quality• Achieve strategic and operational alignment of LLU, schools, and health care ministry• develop inclusive, mission-driven partnerships with local and global communities• Practice transparent, collaborative, and accountable leadership
e five LLUAHSC planning pillars led the University to establishing four strategies that would focus on five-yearstrategic planning process around the goal of further developing an effective educational environment that we identifyas Mission-focused Learning.
2010-2014 University Strategic PlanMission-focused Learning
Creating a learning environment that Transforms Lives in service to mankind
strategy 1: Service Excellence
objective #1expand and enhance a world-class mission-focused learning environment known for its leadership intransformative learning for the health sciences
Action Plans1.1 Refine our understanding of the value of integrating faith, religion, spirituality, and values in health
care education and practice
Deliverables:• Develop a University Spiritual Life Strategic Plan• Develop rubrics for the Wholeness University SLO• Develop measures of success for full utilization of the Wholeness Portal
Responsibilities:• University Spiritual Life Master Planning Committee• Center for Spiritual Life & Wholeness• School of Religion
1.2 Develop a campus-wide awareness of educational advances in understanding faith formation and therole of “teachable moments” to enhance educational effectiveness
Deliverables:• A review of the significant LLU transformative learning experiences (i.e., mission and service
trips, community engagement experiences)
S T r A T E g i C P L A n 3
L O M A L i n d A U n i V E r S i T y
WASC EER Report 8Appendix A
RETURN TO CONTENTS
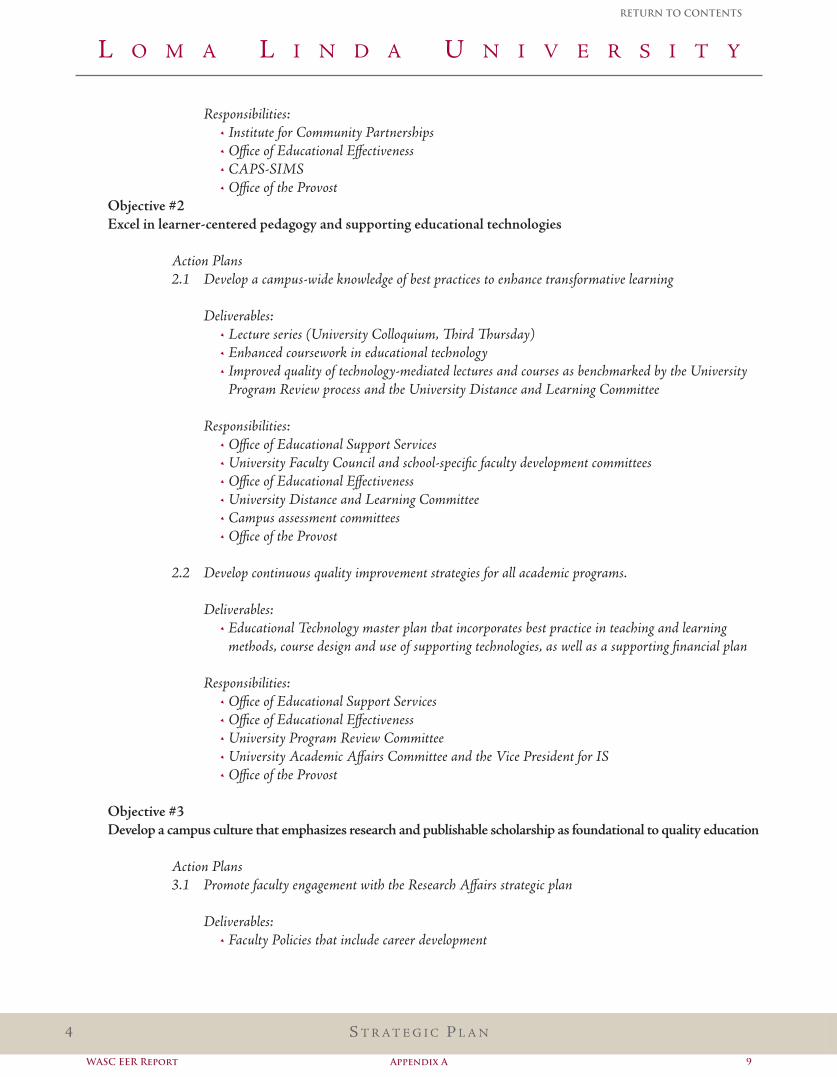
Responsibilities:• Institute for Community Partnerships• Office of Educational Effectiveness• CAPS-SIMS• Office of the Provost
objective #2excel in learner-centered pedagogy and supporting educational technologies
Action Plans2.1 Develop a campus-wide knowledge of best practices to enhance transformative learning
Deliverables:• Lecture series (University Colloquium, ird ursday)• Enhanced coursework in educational technology• Improved quality of technology-mediated lectures and courses as benchmarked by the University
Program Review process and the University Distance and Learning Committee
Responsibilities:• Office of Educational Support Services• University Faculty Council and school-specific faculty development committees• Office of Educational Effectiveness• University Distance and Learning Committee• Campus assessment committees• Office of the Provost
2.2 Develop continuous quality improvement strategies for all academic programs.
Deliverables:• Educational Technology master plan that incorporates best practice in teaching and learning
methods, course design and use of supporting technologies, as well as a supporting financial plan
Responsibilities:• Office of Educational Support Services• Office of Educational Effectiveness• University Program Review Committee• University Academic Affairs Committee and the Vice President for IS• Office of the Provost
objective #3develop a campus culture that emphasizes research and publishable scholarship as foundational to quality education
Action Plans3.1 Promote faculty engagement with the Research Affairs strategic plan
Deliverables:• Faculty Policies that include career development
S T r A T E g i C P L A n4
L O M A L i n d A U n i V E r S i T y
WASC EER Report 9Appendix A
RETURN TO CONTENTS
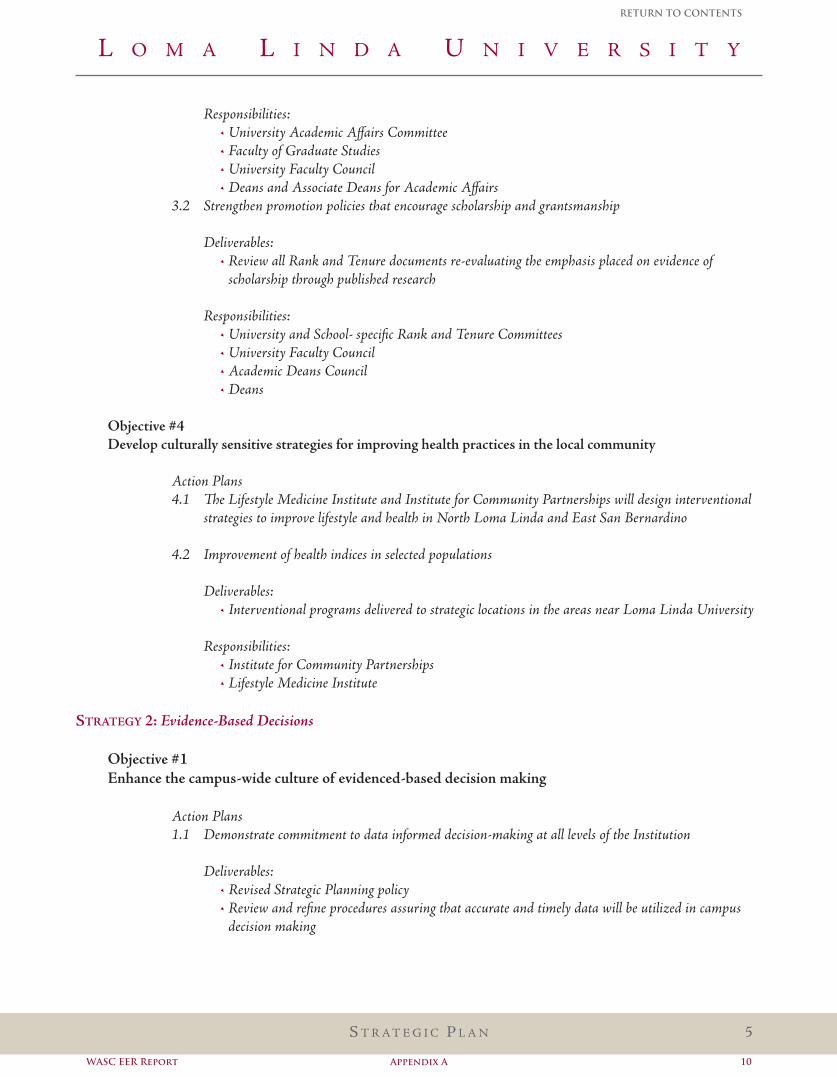
Responsibilities:• University Academic Affairs Committee• Faculty of Graduate Studies• University Faculty Council• Deans and Associate Deans for Academic Affairs
3.2 Strengthen promotion policies that encourage scholarship and grantsmanship
Deliverables:• Review all Rank and Tenure documents re-evaluating the emphasis placed on evidence of
scholarship through published research
Responsibilities:• University and School- specific Rank and Tenure Committees• University Faculty Council• Academic Deans Council• Deans
objective #4develop culturally sensitive strategies for improving health practices in the local community
Action Plans4.1 e Lifestyle Medicine Institute and Institute for Community Partnerships will design interventional
strategies to improve lifestyle and health in North Loma Linda and East San Bernardino
4.2 Improvement of health indices in selected populations
Deliverables:• Interventional programs delivered to strategic locations in the areas near Loma Linda University
Responsibilities:• Institute for Community Partnerships• Lifestyle Medicine Institute
strategy 2: Evidence-Based Decisions
objective #1enhance the campus-wide culture of evidenced-based decision making
Action Plans1.1 Demonstrate commitment to data informed decision-making at all levels of the Institution
Deliverables:• Revised Strategic Planning policy• Review and refine procedures assuring that accurate and timely data will be utilized in campus
decision making
S T r A T E g i C P L A n 5
L O M A L i n d A U n i V E r S i T y
WASC EER Report 10Appendix A
RETURN TO CONTENTS
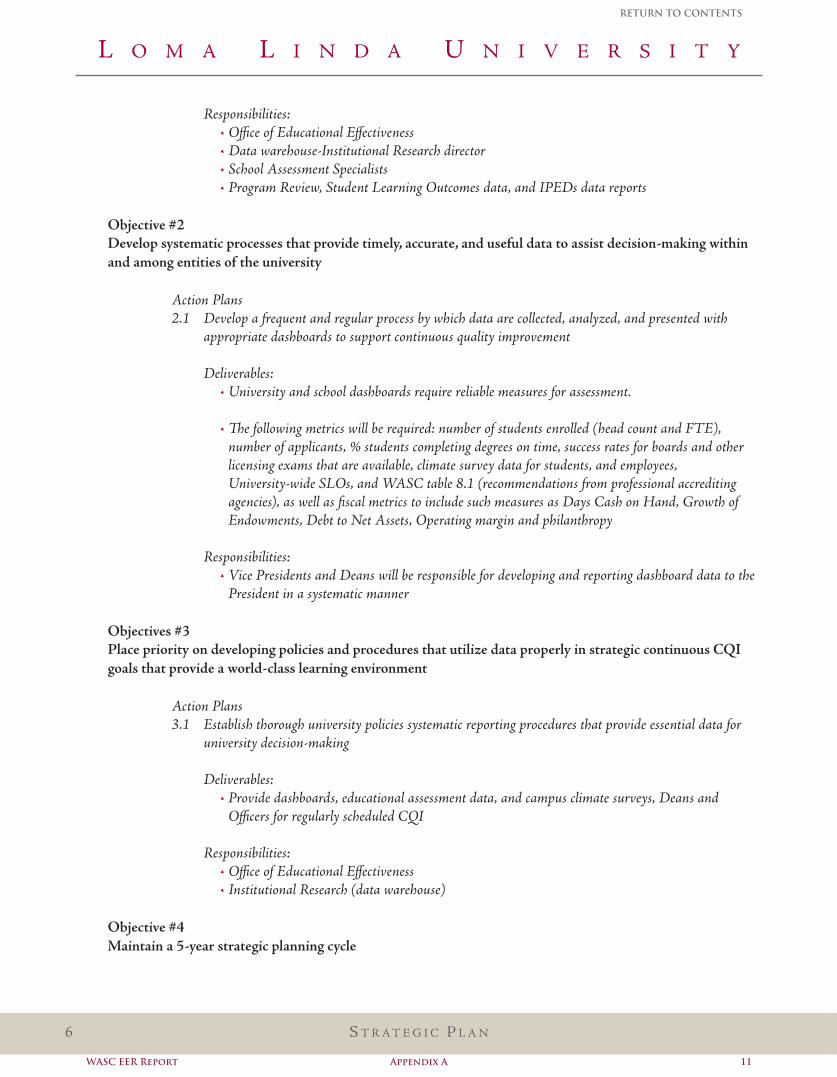
Responsibilities:• Office of Educational Effectiveness• Data warehouse-Institutional Research director• School Assessment Specialists• Program Review, Student Learning Outcomes data, and IPEDs data reports
objective #2develop systematic processes that provide timely, accurate, and useful data to assist decision-making withinand among entities of the university
Action Plans2.1 Develop a frequent and regular process by which data are collected, analyzed, and presented with
appropriate dashboards to support continuous quality improvement
Deliverables:• University and school dashboards require reliable measures for assessment.
• e following metrics will be required: number of students enrolled (head count and FTE),number of applicants, % students completing degrees on time, success rates for boards and otherlicensing exams that are available, climate survey data for students, and employees,University-wide SLOs, and WASC table 8.1 (recommendations from professional accreditingagencies), as well as fiscal metrics to include such measures as Days Cash on Hand, Growth ofEndowments, Debt to Net Assets, Operating margin and philanthropy
Responsibilities:• Vice Presidents and Deans will be responsible for developing and reporting dashboard data to the
President in a systematic manner
objectives #3Place priority on developing policies and procedures that utilize data properly in strategic continuous cQigoals that provide a world-class learning environment
Action Plans3.1 Establish thorough university policies systematic reporting procedures that provide essential data for
university decision-making
Deliverables:• Provide dashboards, educational assessment data, and campus climate surveys, Deans and
Officers for regularly scheduled CQI
Responsibilities:• Office of Educational Effectiveness• Institutional Research (data warehouse)
objective #4maintain a 5-year strategic planning cycle
S T r A T E g i C P L A n6
L O M A L i n d A U n i V E r S i T y
WASC EER Report 11Appendix A
RETURN TO CONTENTS
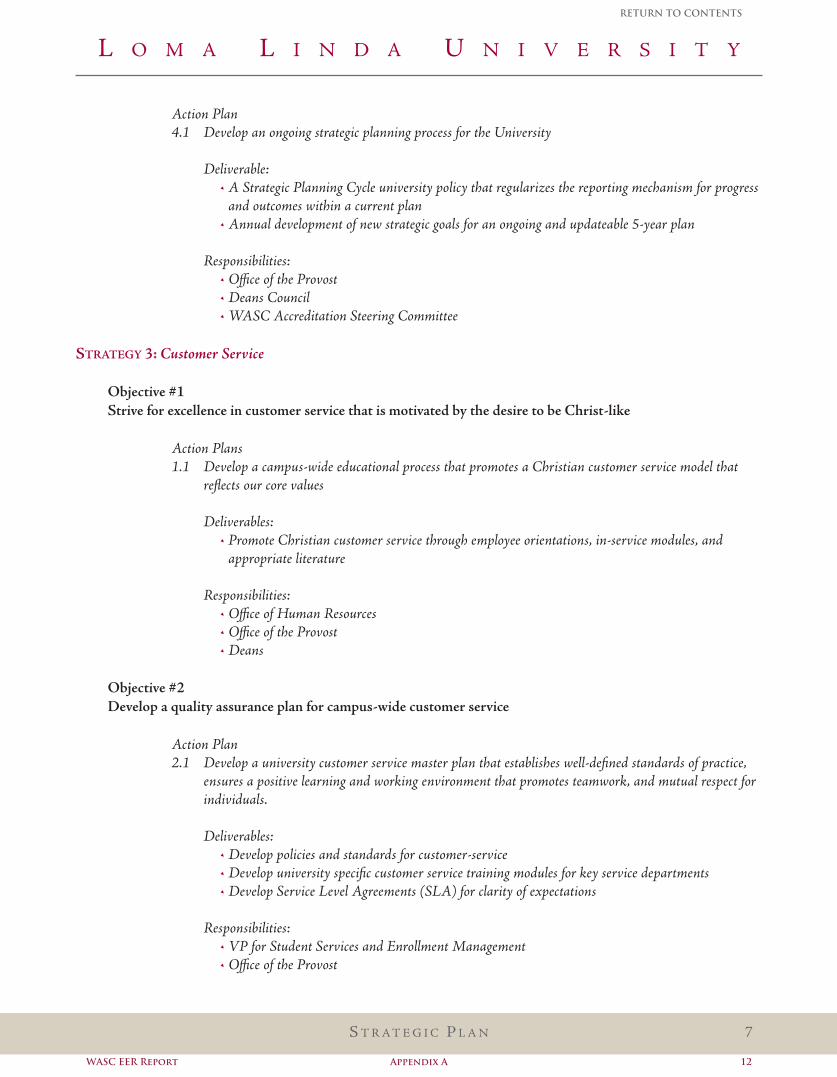
Action Plan4.1 Develop an ongoing strategic planning process for the University
Deliverable:• A Strategic Planning Cycle university policy that regularizes the reporting mechanism for progress
and outcomes within a current plan• Annual development of new strategic goals for an ongoing and updateable 5-year plan
Responsibilities:• Office of the Provost• Deans Council• WASC Accreditation Steering Committee
strategy 3: Customer Service
objective #1strive for excellence in customer service that is motivated by the desire to be christ-like
Action Plans1.1 Develop a campus-wide educational process that promotes a Christian customer service model that
reflects our core values
Deliverables:• Promote Christian customer service through employee orientations, in-service modules, and
appropriate literature
Responsibilities:• Office of Human Resources• Office of the Provost• Deans
objective #2develop a quality assurance plan for campus-wide customer service
Action Plan2.1 Develop a university customer service master plan that establishes well-defined standards of practice,
ensures a positive learning and working environment that promotes teamwork, and mutual respect forindividuals.
Deliverables:• Develop policies and standards for customer-service• Develop university specific customer service training modules for key service departments• Develop Service Level Agreements (SLA) for clarity of expectations
Responsibilities:• VP for Student Services and Enrollment Management• Office of the Provost
S T r A T E g i C P L A n 7
L O M A L i n d A U n i V E r S i T y
WASC EER Report 12Appendix A
RETURN TO CONTENTS
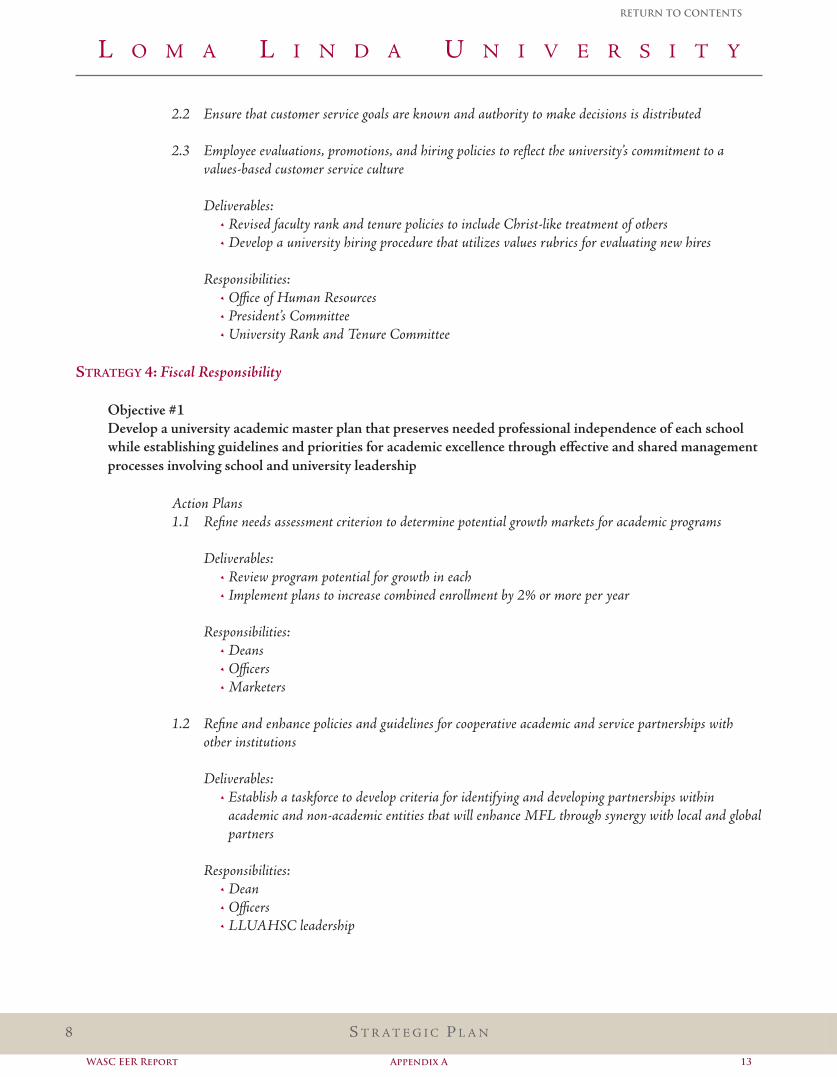
2.2 Ensure that customer service goals are known and authority to make decisions is distributed
2.3 Employee evaluations, promotions, and hiring policies to reflect the university’s commitment to avalues-based customer service culture
Deliverables:• Revised faculty rank and tenure policies to include Christ-like treatment of others• Develop a university hiring procedure that utilizes values rubrics for evaluating new hires
Responsibilities:• Office of Human Resources• President’s Committee• University Rank and Tenure Committee
strategy 4: Fiscal Responsibility
objective #1develop a university academic master plan that preserves needed professional independence of each schoolwhile establishing guidelines and priorities for academic excellence through effective and shared managementprocesses involving school and university leadership
Action Plans1.1 Refine needs assessment criterion to determine potential growth markets for academic programs
Deliverables:• Review program potential for growth in each• Implement plans to increase combined enrollment by 2% or more per year
Responsibilities:• Deans• Officers• Marketers
1.2 Refine and enhance policies and guidelines for cooperative academic and service partnerships withother institutions
Deliverables:• Establish a taskforce to develop criteria for identifying and developing partnerships within
academic and non-academic entities that will enhance MFL through synergy with local and globalpartners
Responsibilities:• Dean• Officers• LLUAHSC leadership
S T r A T E g i C P L A n�
L O M A L i n d A U n i V E r S i T y
WASC EER Report 13Appendix A
RETURN TO CONTENTS
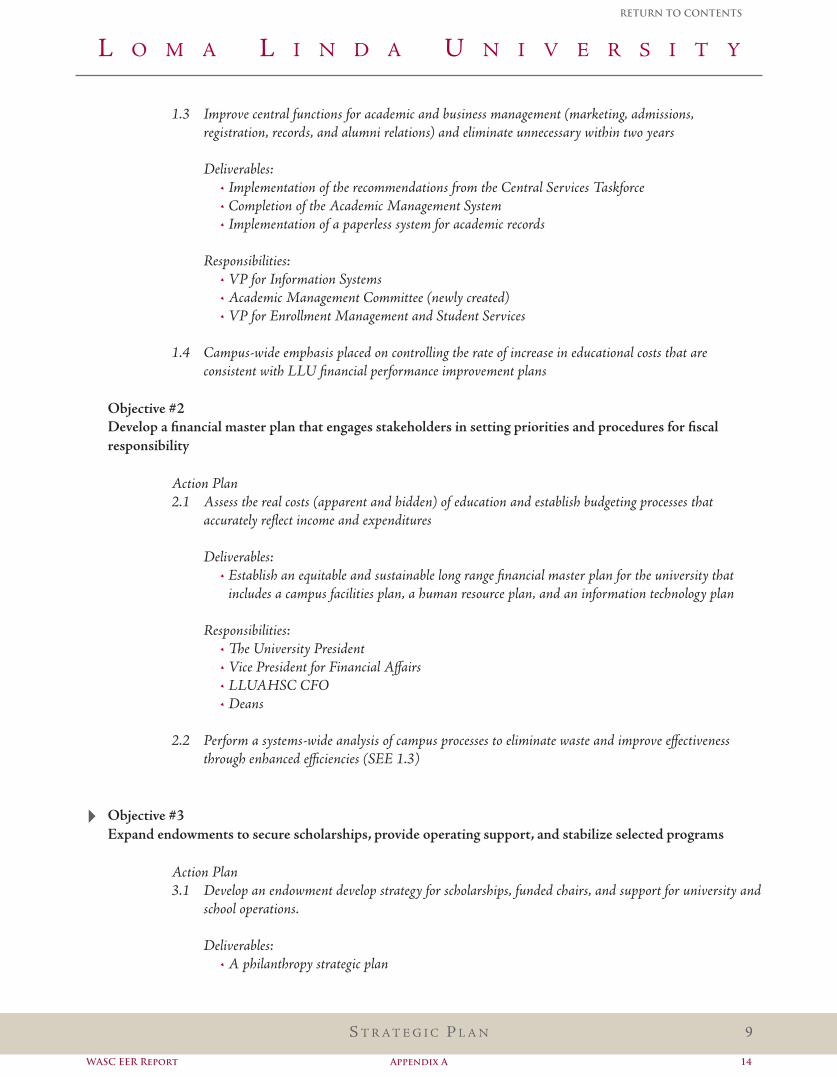
1.3 Improve central functions for academic and business management (marketing, admissions,registration, records, and alumni relations) and eliminate unnecessary within two years
Deliverables:• Implementation of the recommendations from the Central Services Taskforce• Completion of the Academic Management System• Implementation of a paperless system for academic records
Responsibilities:• VP for Information Systems• Academic Management Committee (newly created)• VP for Enrollment Management and Student Services
1.4 Campus-wide emphasis placed on controlling the rate of increase in educational costs that areconsistent with LLU financial performance improvement plans
objective #2develop a financial master plan that engages stakeholders in setting priorities and procedures for fiscalresponsibility
Action Plan2.1 Assess the real costs (apparent and hidden) of education and establish budgeting processes that
accurately reflect income and expenditures
Deliverables:• Establish an equitable and sustainable long range financial master plan for the university that
includes a campus facilities plan, a human resource plan, and an information technology plan
Responsibilities:• e University President• Vice President for Financial Affairs• LLUAHSC CFO• Deans
2.2 Perform a systems-wide analysis of campus processes to eliminate waste and improve effectivenessthrough enhanced efficiencies (SEE 1.3)
objective #3expand endowments to secure scholarships, provide operating support, and stabilize selected programs
Action Plan3.1 Develop an endowment develop strategy for scholarships, funded chairs, and support for university and
school operations.
Deliverables:• A philanthropy strategic plan
S T r A T E g i C P L A n 9
L O M A L i n d A U n i V E r S i T y
�
WASC EER Report 14Appendix A
RETURN TO CONTENTS
Responsibilities:• Office of the President,• VPs and Deans working with the Office of Advancement
S T r A T E g i C P L A n10
L O M A L i n d A U n i V E r S i T y
WASC EER Report 15Appendix A
RETURN TO CONTENTS

WASC Educational Effectiveness Report
Appendix B
TABLE OF CONTENTS
RETURN TO CONTENTS
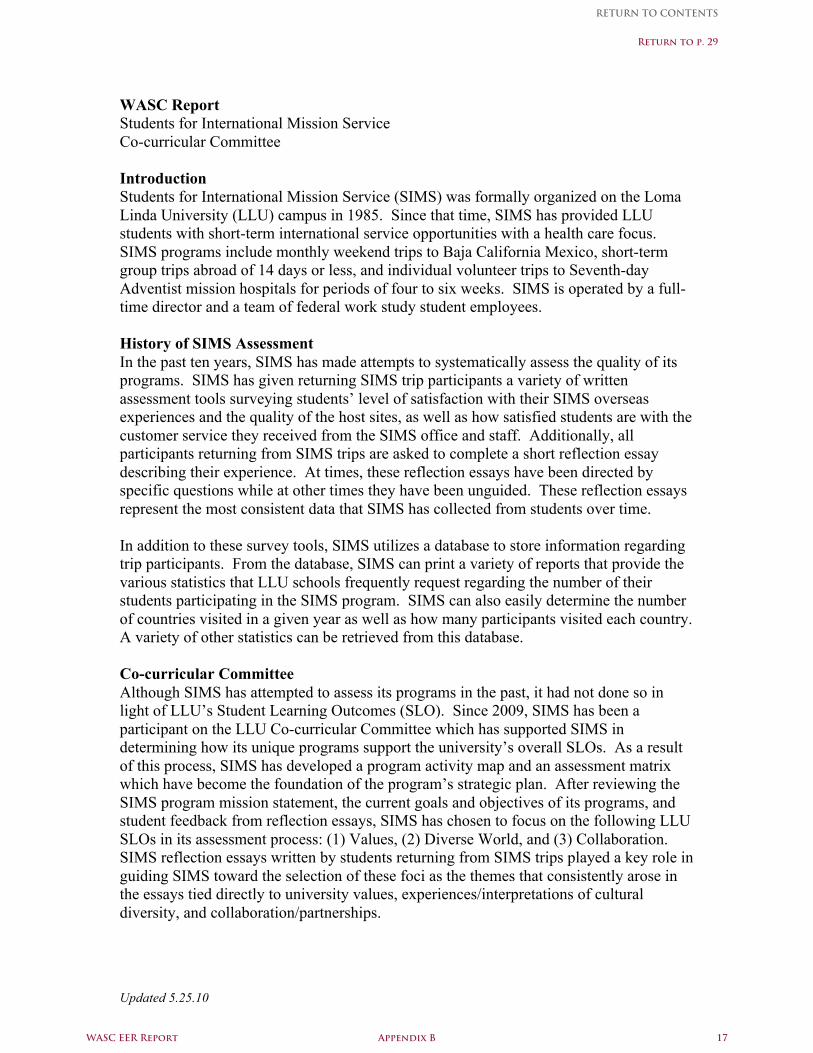
Updated 5.25.10
WASC Report Students for International Mission Service Co-curricular Committee Introduction Students for International Mission Service (SIMS) was formally organized on the Loma Linda University (LLU) campus in 1985. Since that time, SIMS has provided LLU students with short-term international service opportunities with a health care focus. SIMS programs include monthly weekend trips to Baja California Mexico, short-term group trips abroad of 14 days or less, and individual volunteer trips to Seventh-day Adventist mission hospitals for periods of four to six weeks. SIMS is operated by a full-time director and a team of federal work study student employees. History of SIMS Assessment In the past ten years, SIMS has made attempts to systematically assess the quality of its programs. SIMS has given returning SIMS trip participants a variety of written assessment tools surveying students’ level of satisfaction with their SIMS overseas experiences and the quality of the host sites, as well as how satisfied students are with the customer service they received from the SIMS office and staff. Additionally, all participants returning from SIMS trips are asked to complete a short reflection essay describing their experience. At times, these reflection essays have been directed by specific questions while at other times they have been unguided. These reflection essays represent the most consistent data that SIMS has collected from students over time. In addition to these survey tools, SIMS utilizes a database to store information regarding trip participants. From the database, SIMS can print a variety of reports that provide the various statistics that LLU schools frequently request regarding the number of their students participating in the SIMS program. SIMS can also easily determine the number of countries visited in a given year as well as how many participants visited each country. A variety of other statistics can be retrieved from this database. Co-curricular Committee Although SIMS has attempted to assess its programs in the past, it had not done so in light of LLU’s Student Learning Outcomes (SLO). Since 2009, SIMS has been a participant on the LLU Co-curricular Committee which has supported SIMS in determining how its unique programs support the university’s overall SLOs. As a result of this process, SIMS has developed a program activity map and an assessment matrix which have become the foundation of the program’s strategic plan. After reviewing the SIMS program mission statement, the current goals and objectives of its programs, and student feedback from reflection essays, SIMS has chosen to focus on the following LLU SLOs in its assessment process: (1) Values, (2) Diverse World, and (3) Collaboration. SIMS reflection essays written by students returning from SIMS trips played a key role in guiding SIMS toward the selection of these foci as the themes that consistently arose in the essays tied directly to university values, experiences/interpretations of cultural diversity, and collaboration/partnerships.
WASC EER Report Appendix B 17
RETURN TO CONTENTS
Return to p. 29
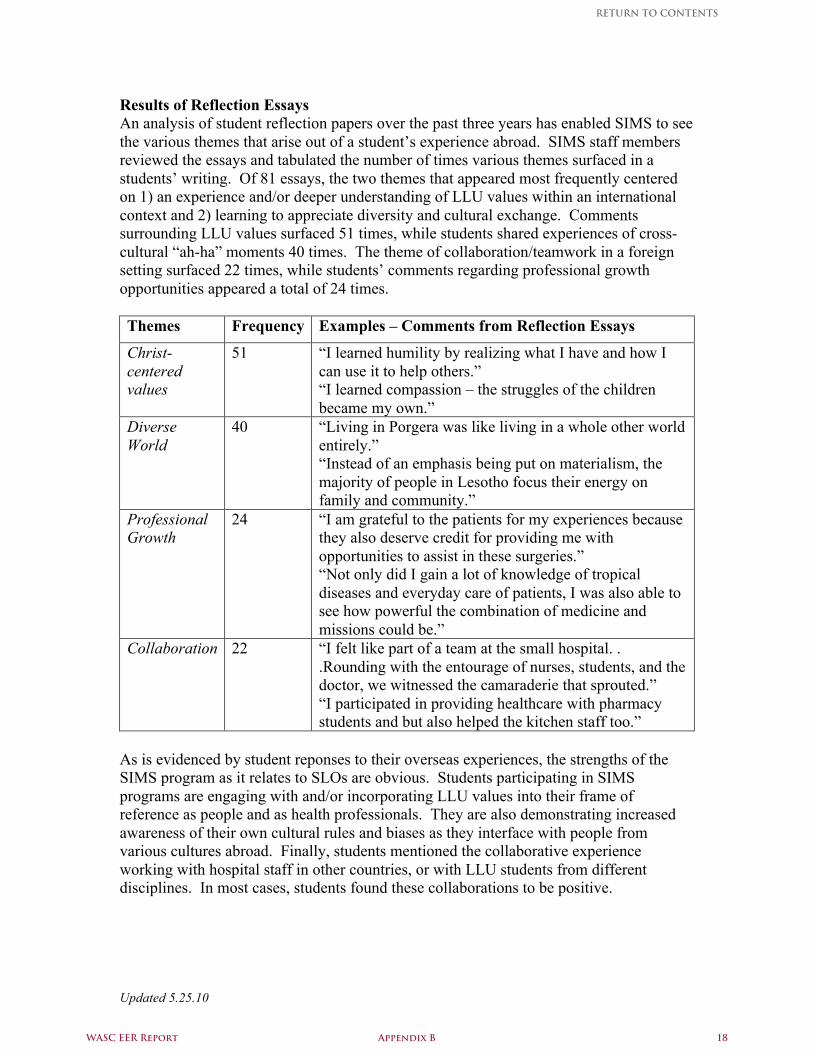
Updated 5.25.10
Results of Reflection Essays An analysis of student reflection papers over the past three years has enabled SIMS to see the various themes that arise out of a student’s experience abroad. SIMS staff members reviewed the essays and tabulated the number of times various themes surfaced in a students’ writing. Of 81 essays, the two themes that appeared most frequently centered on 1) an experience and/or deeper understanding of LLU values within an international context and 2) learning to appreciate diversity and cultural exchange. Comments surrounding LLU values surfaced 51 times, while students shared experiences of cross-cultural “ah-ha” moments 40 times. The theme of collaboration/teamwork in a foreign setting surfaced 22 times, while students’ comments regarding professional growth opportunities appeared a total of 24 times. Themes Frequency Examples – Comments from Reflection Essays
Christ-centered values
51 “I learned humility by realizing what I have and how I can use it to help others.” “I learned compassion – the struggles of the children became my own.”
Diverse World
40 “Living in Porgera was like living in a whole other world entirely.” “Instead of an emphasis being put on materialism, the majority of people in Lesotho focus their energy on family and community.”
Professional Growth
24 “I am grateful to the patients for my experiences because they also deserve credit for providing me with opportunities to assist in these surgeries.” “Not only did I gain a lot of knowledge of tropical diseases and everyday care of patients, I was also able to see how powerful the combination of medicine and missions could be.”
Collaboration 22 “I felt like part of a team at the small hospital. . .Rounding with the entourage of nurses, students, and the doctor, we witnessed the camaraderie that sprouted.” “I participated in providing healthcare with pharmacy students and but also helped the kitchen staff too.”
As is evidenced by student reponses to their overseas experiences, the strengths of the SIMS program as it relates to SLOs are obvious. Students participating in SIMS programs are engaging with and/or incorporating LLU values into their frame of reference as people and as health professionals. They are also demonstrating increased awareness of their own cultural rules and biases as they interface with people from various cultures abroad. Finally, students mentioned the collaborative experience working with hospital staff in other countries, or with LLU students from different disciplines. In most cases, students found these collaborations to be positive.
WASC EER Report Appendix B 18
RETURN TO CONTENTS
Updated 5.25.10
Creating Assessment Tools To support each SLO that has been selected, SIMS has created or is in the process of creating assessment measurement tools and data collection cycles. SIMS has initial assessment tools in place to assess (1) LLU values and (2) Collaboration. To assess values, SIMS has refined its reflection questions to offer students various themes that can guide their reflections or the possibility of writing freely and unguided. To address collaboration, SIMS has created a simple post-trip survey assessing cross-discipline interactions during the SIMS experience. With regard to our third SLO Diverse World, SIMS has the goal of developing a cultural competency training module and pre- and post-trip survey that will be completed by every SIMS participant in every program. Through its experience on the Co-Curricular Committee, SIMS has realized that cross-cultural competency in international service is an area where SIMS can make a significant contribution toward achieving LLU’s SLO Diverse World for those students who participate in a SIMS experience. Currently, preliminary research is being conducted to determine the specific content and format of the cultural competency training module. However, SIMS will be utilizing the AAC&U rubric for Intercultural Knowledge and Competence Value as a guide in assessing student learning as a result of the training module. SIMS’ goal is to create and pilot test the cross-cultural competency module by fall quarter 2010. The assessment process for this training module may follow a process as outlined below:
1. Baseline Assessment/Pre-test of Cultural Competency for all SIMS participants 2. First Intervention – SIMS Cultural Competency Training Module 3. Formative Assessment – Student learning as a result of training module 4. Second Intervention – Participation in SIMS international trip/project 5. Summative Assessment/Post-test – Student learning as a result of participation in
trip/project Implementing Assessment Tools SIMS hopes to complete and implement all new assessment tools systematically by the beginning of the 2010-2011 school year. To date, implementation of new assessment tools has proven somewhat challenging in that the tools have not yet been incorporated into SIMS regular process. As a result, some but not all SIMS participants during the 2009-2010 school year completed the new assessment tools. SIMS is exploring the possibility of using online survey formats to solicit a higher response rate from trip participants. The use of an online survey program will eliminate the challenges presented from collecting paper surveys from participants and tallying results. Additionally, SIMS is exploring ways to incentivize students to complete the assessment tools since SIMS is not in a position to require students to complete surveys post-trip. SIMS is confident that if new assessment tools are meaningful and relevant to students’ experiences and easy to access, students will be more motivated to provide feedback.
WASC EER Report Appendix B 19
RETURN TO CONTENTS
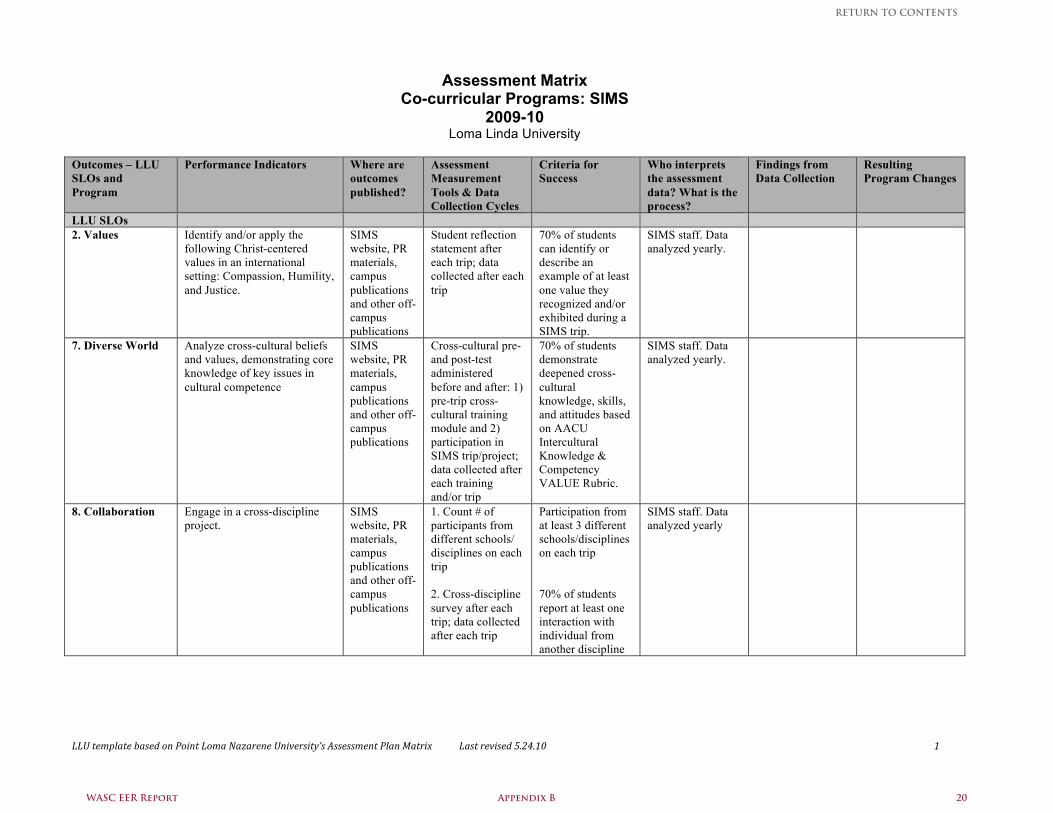
LLU template based on Point Loma Nazarene University’s Assessment Plan Matrix Last revised 5.24.10 1
Assessment Matrix Co-curricular Programs: SIMS
2009-10 Loma Linda University
Outcomes – LLU SLOs and Program
Performance Indicators Where are outcomes published?
Assessment Measurement Tools & Data Collection Cycles
Criteria for Success
Who interprets the assessment data? What is the process?
Findings from Data Collection
Resulting Program Changes
LLU SLOs 2. Values Identify and/or apply the
following Christ-centered values in an international setting: Compassion, Humility, and Justice.
SIMS website, PR materials, campus publications and other off-campus publications
Student reflection statement after each trip; data collected after each trip
70% of students can identify or describe an example of at least one value they recognized and/or exhibited during a SIMS trip.
SIMS staff. Data analyzed yearly.
7. Diverse World Analyze cross-cultural beliefs and values, demonstrating core knowledge of key issues in cultural competence
SIMS website, PR materials, campus publications and other off-campus publications
Cross-cultural pre- and post-test administered before and after: 1) pre-trip cross-cultural training module and 2) participation in SIMS trip/project; data collected after each training and/or trip
70% of students demonstrate deepened cross-cultural knowledge, skills, and attitudes based on AACU Intercultural Knowledge & Competency VALUE Rubric.
SIMS staff. Data analyzed yearly.
8. Collaboration Engage in a cross-discipline project.
SIMS website, PR materials, campus publications and other off-campus publications
1. Count # of participants from different schools/ disciplines on each trip 2. Cross-discipline survey after each trip; data collected after each trip
Participation from at least 3 different schools/disciplines on each trip 70% of students report at least one interaction with individual from another discipline
SIMS staff. Data analyzed yearly
WASC EER Report Appendix B 20
RETURN TO CONTENTS
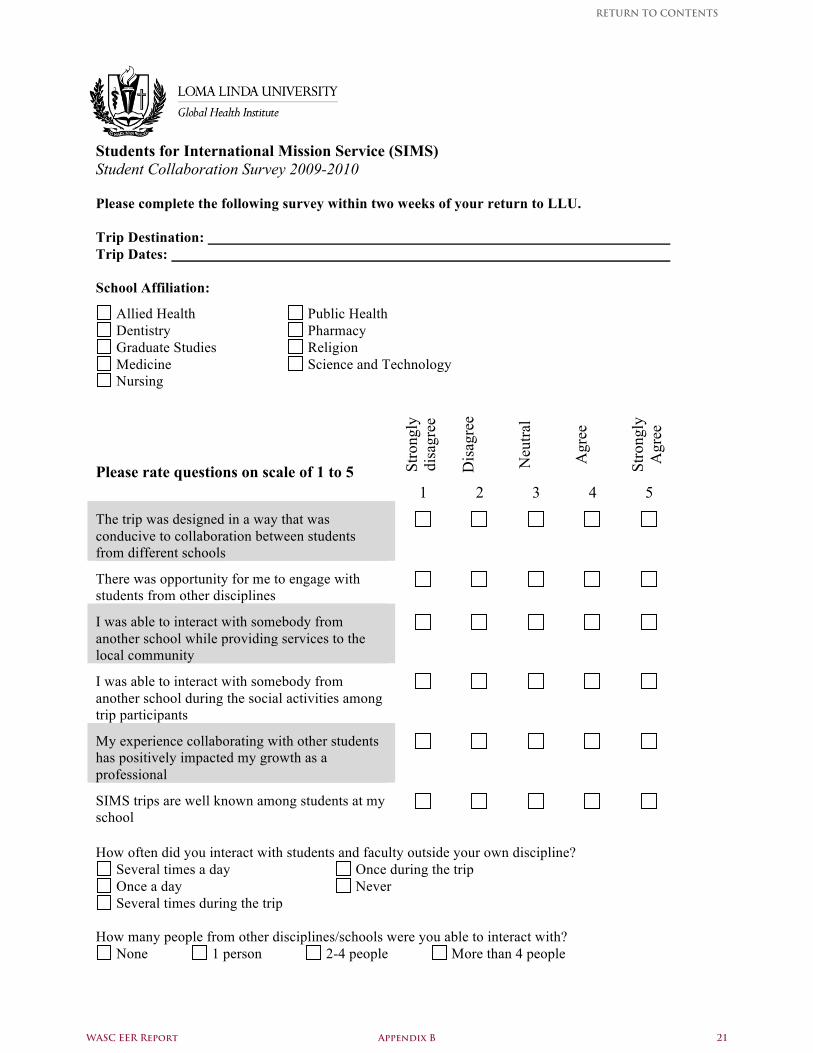
Students for International Mission Service (SIMS) Student Collaboration Survey 2009-2010 Please complete the following survey within two weeks of your return to LLU. Trip Destination: Trip Dates: School Affiliation:
Allied Health Public Health Dentistry Pharmacy Graduate Studies Religion Medicine Science and Technology Nursing
Please rate questions on scale of 1 to 5 St
rong
ly
disa
gree
Dis
agre
e
Neu
tral
Agr
ee
Stro
ngly
A
gree
1 2 3 4 5
The trip was designed in a way that was conducive to collaboration between students from different schools
There was opportunity for me to engage with students from other disciplines
I was able to interact with somebody from another school while providing services to the local community
I was able to interact with somebody from another school during the social activities among trip participants
My experience collaborating with other students has positively impacted my growth as a professional
SIMS trips are well known among students at my school
How often did you interact with students and faculty outside your own discipline?
Several times a day Once during the trip Once a day Never Several times during the trip
How many people from other disciplines/schools were you able to interact with?
None 1 person 2-4 people More than 4 people
WASC EER Report Appendix B 21
RETURN TO CONTENTS
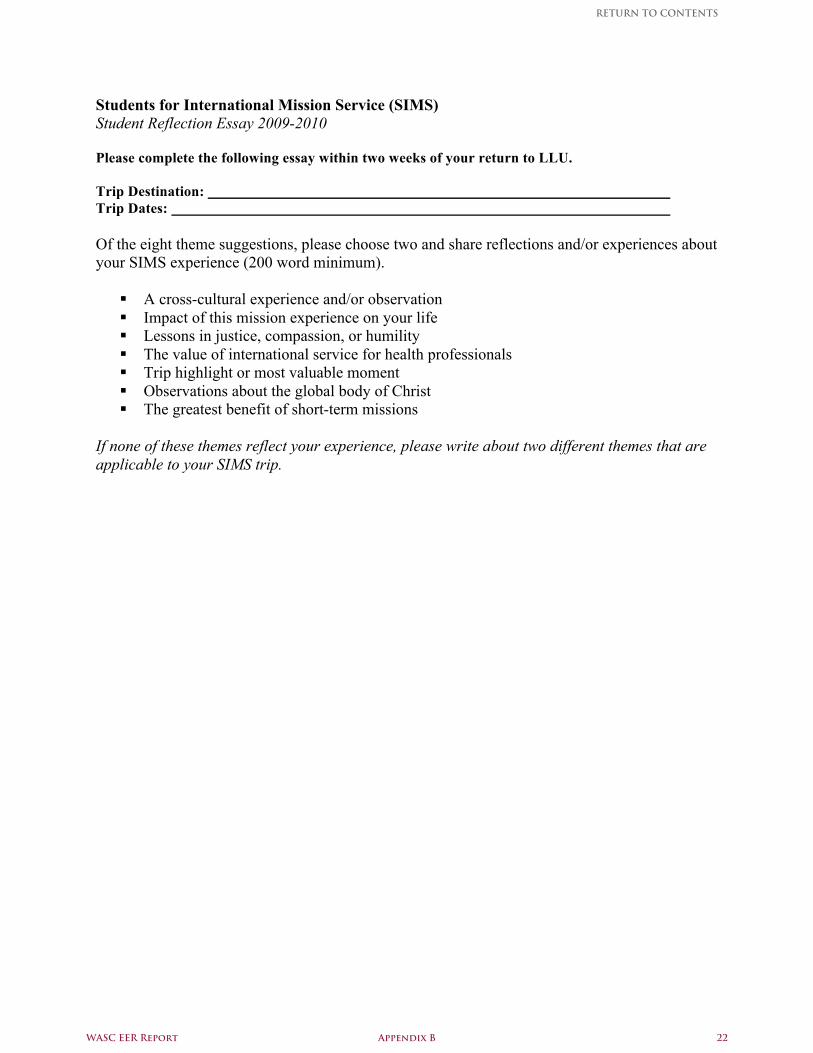
Students for International Mission Service (SIMS) Student Reflection Essay 2009-2010 Please complete the following essay within two weeks of your return to LLU. Trip Destination: Trip Dates: Of the eight theme suggestions, please choose two and share reflections and/or experiences about your SIMS experience (200 word minimum).
A cross-cultural experience and/or observation Impact of this mission experience on your life Lessons in justice, compassion, or humility The value of international service for health professionals Trip highlight or most valuable moment Observations about the global body of Christ The greatest benefit of short-term missions
If none of these themes reflect your experience, please write about two different themes that are applicable to your SIMS trip.
WASC EER Report Appendix B 22
RETURN TO CONTENTS
WASC Educational Effectiveness Report
Appendix C
TABLE OF CONTENTS
RETURN TO CONTENTS
WASC EER Update 2010
University Faculty Council
Arthur B. Marshak, EdD, Chair
Introduction
Loma Linda University has adopted a two tiered form of faculty governance to better meet the needs of its faculty and administration. The first tier, School level, adopted the traditional role of the
university wide faculty senates: program development, faculty rank, tenure and promotion, student assessment and advisement, and curricular review. This left the second tier, University level, in an identity crisis; not willing or able to take back from the Schools the traditional areas of faculty
governance, nor able to develop its own identity as an entity to serve all faculty in this specialized institution.
In 2007, University administration challenged the Inter‐School Faculty Advisory Council (IFAC), as the University tier was then known, to either re‐invent itself, or prove why it should continue to exist.
This challenge was welcomed by the faculty, and, under the leadership of the previous IFAC chair, Jan Nick, PhD, the University tier of faculty governance set about re‐inventing itself. The following is a synopsis of what took place during the last 3 years.
Name Change
In the early 1990’s, when the Loma Linda and La Sierra campuses separated, the Loma Linda
University Board of Trustees voted to name the University tier of faculty governance as the Inter‐school Faculty Advisory Council. Over the next 15‐plus years, in spite of the commendable work of the faculty leadership, this tier developed the reputation as an ineffective representative of the university‐wide
needs of the faculty. In 2009, after soliciting considerable input from faculty and administration, the name University Faculty Council (UFC), was proposed to the Board of Trustees, who voted it into
existence at the December, 2009 meeting.
Four Goals of the University Faculty Council
In addition to renaming itself, the Council, as it is now known, adopted four goals to focus its endeavors to better meet the needs of the faculty as a whole. These are:
a. Policy development, review and revision b. Shared decision‐making
c. Effective Communication d. Leadership development
These goals were accepted by the Council members. The following are some of the accomplishments achieved by the Council during the last 3 years.
WASC EER Report Appendix C 24
RETURN TO CONTENTS
Return to p. 33
a. Policy development, review and revision.
When the Inter‐school Faculty Advisory Council was formed, the Board of Trustees voted that all faculty‐related policies must be reviewed and approved by the University tier of faculty governance
prior to a final vote by the Board. Unfortunately, this did not always happen, and in 2009, Council leadership brought this to the attention of the Provost. During this past year, the Provost worked to rectify this problem, and recently appointed a policy specialist to work with him to make sure that all
university policies are processed appropriately. Council leadership looks forward to working closely with this person to ensure that all current and future faculty‐related policies best meet the needs of all faculty on campus.
b. Shared decision‐making.
A concern that central administration had shared with the Council was that there were a
number of faculty who were turning in grades late. This affected students’ abilities to obtain student loans, successfully sit for board exams, and begin their professional lives. The Council evaluated this concern, and added their support to that of university and school administrations to lower these late
grade numbers. At its May 2010 meeting, the Board of Trustees was informed that the number of courses graded late due to faculty related issues was “very small.”
c. Effective Communication
Communication on campus continues to be a problem. In an effort to provide an additional route for faculty to receive information from central administration, the Council adopted two methods
to increase such communication.
At every Council meeting, the Provost is invited to present a report from central administration. This provides an avenue for University leadership to communicate directly with faculty representatives
and to share with them information relevant to faculty, and to give faculty representatives the opportunity to ask questions of administration about campus related issues.
After Council meetings, the secretary shares with members three to five “Talking Points” which cover the important areas of the previous meeting. This provides members with an abbreviated
summary which they can add to or expand to better meet the needs of the faculty within their own schools. At the next Council meeting, there is an opportunity for members to provide feedback to the Council with comments and concerns shared with them by their faculty colleagues.
The world‐wide financial crisis has also affected Loma Linda University, so in an effort to have
faculty hear the true financial state of the University, Council leadership called a faculty forum and invited the President, the Provost, and the Chief Financial Officer to speak to the faculty. A time for questions was built in to the schedule. This forum was videotaped, and posted on the Council
Blackboard page for viewing by faculty who could not attend the forum.
d. Leadership development.
WASC EER Report Appendix C 25
RETURN TO CONTENTS
The current Provost is a former chair of the Inter‐school Faculty Advisory Council. Many administrators were promoted from the ranks of faculty, so leadership development is a priority for the
Council. In addition to inviting Council members and faculty serve on university‐wide committees to develop a better understanding of how the institution functions, University administration has gone one additional step further. During Spring Break, Loma Linda University hosted the Association of Adventist
Colleges and Universities on its campus. This is where sister institutions in North American meet once each year to discuss issues facing them and plan for ways to better meet individual and collective needs.
This year the Chair of the University Faculty Council was invited to participate in these meetings and to interact and learn from these leaders. It also gave the Chair the opportunity to see the leadership
role that Loma Linda University has in this community of scholars, and the considerable respect in which it is held. Furthermore, this was an opportunity to observe and be part of the discussion on the future of Christian higher education in North America, and to see a more national picture, rather than just a local
or regional one.
Conclusion
University‐wide faculty governance has progressed considerably since the WASC CPR visit, yet it still has further to go. Central administration is very supportive of the role of faculty governance, and with the Provost being a former chair, it understands very well how faculty can enrich the administrative
climate of the campus. President Hart is also very supportive, and is always willing to dedicate time to meet with faculty leadership and to address the needs of the faculty at large. The changes that have taken place during the last three years have been warmly welcomed by both the President and the
Provost, and they are ready and willing to assist the Council in its further development.
Communication continues to be a challenge, and more effective ways continue to be sought to enable faculty to learn what is taking place on campus. A number of avenues are currently being used by
the Council and Central Administration, and other methods may need to be utilized if these do not appear to be effective.
Loma Linda University is a high quality Christian institution with a faculty dedicated to the pursuit of excellence. It is an honor to Chair the University Faculty Council, but also a serious
responsibility to continue the work of transforming the University tier of faculty governance into an entity worthy of its faculty. By the grace of God, with the support of the faculty, and the advice and recommendations of central administration, this transformation will take place.
WASC EER Report Appendix C 26
RETURN TO CONTENTS

WASC Educational Effectiveness Report
Appendix D
TABLE OF CONTENTS
RETURN TO CONTENTS
WASC Educational Effectiveness Report
School Of Allied Health Professions
1
Our 2009 Dashboard
History The Loma Linda University, School of Allied Health Professions (SAHP) was established in its current structure in 1967. Prior to that time, the few allied health programs present on campus functioned as adjuncts within other existing schools. In 1967, those programs were consolidated within the new structure of the School of Allied Health Professions. Creating an administrative structure to organize and nurture these disparate programs seemed to endow them with a new vibrancy. As can be seen in the chart below, the first graduating class of the organized school awarded diplomas to 63 students. That number represented the cumulative growth of allied health programs in the first sixty years of the institution’s existence. By 2009, just forty‐two years later, the size of the graduating class had grown to 383. This acceleration in growth likely reflects the benefits provided by an organized central school administration. The focused structure has supported both
WASC EER Report Appendix D 28
RETURN TO CONTENTS
Return to p. 38
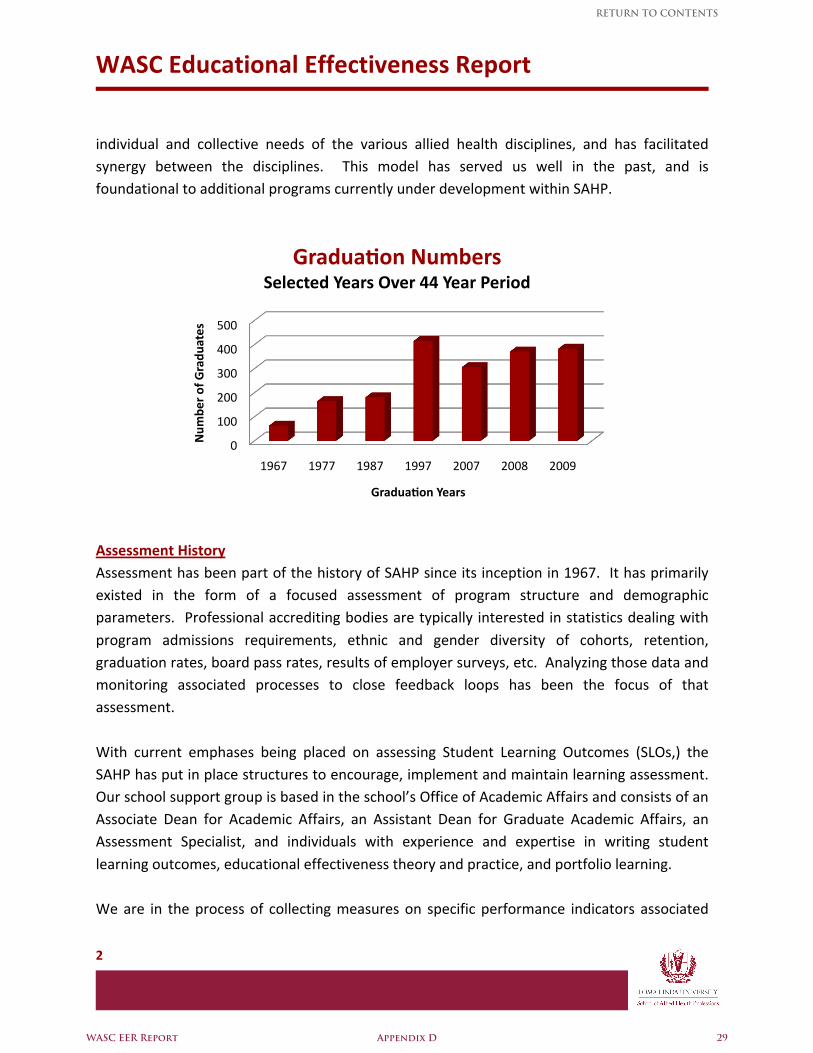
WASC Educational Effectiveness Report
2
individual and collective needs of the various allied health disciplines, and has facilitated synergy between the disciplines. This model has served us well in the past, and is foundational to additional programs currently under development within SAHP.
Assessment History Assessment has been part of the history of SAHP since its inception in 1967. It has primarily existed in the form of a focused assessment of program structure and demographic parameters. Professional accrediting bodies are typically interested in statistics dealing with program admissions requirements, ethnic and gender diversity of cohorts, retention, graduation rates, board pass rates, results of employer surveys, etc. Analyzing those data and monitoring associated processes to close feedback loops has been the focus of that assessment. With current emphases being placed on assessing Student Learning Outcomes (SLOs,) the SAHP has put in place structures to encourage, implement and maintain learning assessment. Our school support group is based in the school’s Office of Academic Affairs and consists of an Associate Dean for Academic Affairs, an Assistant Dean for Graduate Academic Affairs, an Assessment Specialist, and individuals with experience and expertise in writing student learning outcomes, educational effectiveness theory and practice, and portfolio learning. We are in the process of collecting measures on specific performance indicators associated
0
100
200
300
400
500
1967 1977 1987 1997 2007 2008 2009
Num
ber of Gradu
ates
GraduaDon Years
GraduaDon Numbers Selected Years Over 44 Year Period
WASC EER Report Appendix D 29
RETURN TO CONTENTS
WASC Educational Effectiveness Report
3
with SLOs originating from varying levels of institutional structure. Currently, learning outcomes reflecting university‐wide areas of interest, as well as those generated by SAHP and specific programs, are being assessed. A number of our programs are implementing assessment manually, while others have opted for an electronic approach, using the commercially‐available services of Live Text, Inc. Assessment of specific student learning outcomes is new to most programs in the SAHP, and represents an expansion of our school assessment practices. There is a realization this expansion will enrich our existing culture of assessment. Its value and necessity is recognized by our program directors, and as a group, we have geared up to pursue this form of educational quality control and improvement, over the long term. Accreditation History Because of the eclectic, internal disciplinary make‐up of allied health schools, those schools do not function under accreditational jurisdiction of a central accrediting body. Instead, individual programs receive accreditation from the accrediting arms of national professional organizations. Programs within the Loma Linda University, School of Allied Health Professions, currently receive accreditation oversight from twelve different professional accrediting bodies. The school itself maintains membership in the Association of Schools of Allied Health Professions (ASAHP.) As noted above, the school has realized steady, sometimes robust growth, since its inception in 1967. If not managed carefully, growth can run rough‐shod over quality control and product excellence. The commitment to excellence by our faculty, together with adherence to guidelines provided by the professional accrediting bodies, has insured high quality standards of education. Our growth has been well managed since its inception, producing not only a larger entity that embraces more departments and a greater number of programs, but one which can be proud of the excellence of its record. At no time in its 43‐year history has a program within the SAHP lost professional accreditation. Maintaining academic excellence is intrinsic to our organization. The bulleted items below are representative samples of the excellence that can be found in the Loma Linda University, School of Allied Health Professions.
WASC EER Report Appendix D 30
RETURN TO CONTENTS
WASC Educational Effectiveness Report
4
Accreditation Commendations • Clinical Laboratory Science. Accredited by the National Accrediting Agency for Clinical
Laboratory Science (NAACLS). Comments from February, 2008, accreditation report. o “The program has loyal, dedicated, diverse, and highly experienced faculty.” o “The students and faculty participate in community activities i.e., blood drives,
and health fairs.” o “The program has proposed initiatives for research, grant writing, development
of masters and MLT programs, and international collaborations.” • Cytotechnology. Accredited by Cytotechnology Programs Review Committee of the
American Society of Cytopathology, in collaboration with the Commission on Accreditation of Allied Health Education Programs (CAAHEP). Comment from July, 2010, accreditation site visit, and July 19, 2010, letter from Robert A. Goulart, M.D., Chair, Cytotechnology Programs Review Committee.
o 2003 – CPRC granted 7‐year accreditation o 2010 – Cytotechnology programs nationwide have declined from a total of 74,
to 33 in 2010. The CPRC site visitation team stated the LLU‐SAHP program was extremely important to the profession nationally. Its longevity, coupled with the commitment of SAHP to maintaining the program, is providing a level of stability and permanence critical to the discipline.
o Strong commitment from Provost, Dean and Assistant Dean of the School of Allied Health Professions towards maintaining and enhancing current cytotechnology program.
o Stability and experience of all teaching personnel, specifically both Medical Directors and Program Director.
o Extensive and detailed course syllabus with specifications with expectations of each clinical affiliate.
o Well organized and maintained study boxes from GYN and NON GYN with detailed microscopic descriptions for each slide.
o Program goals are well delineated. o The Committee applauds you and the entire staff on the numerous strengths of the
Cytotechnology Program and its continual improvement. • Communication Sciences and Disorders. Accredited by Council on Academic
Accreditation of the American Speech‐Language‐Hearing Association, and California Commission on Teacher Credentialing. Comments from September, 2007, accreditation report.
WASC EER Report Appendix D 31
RETURN TO CONTENTS
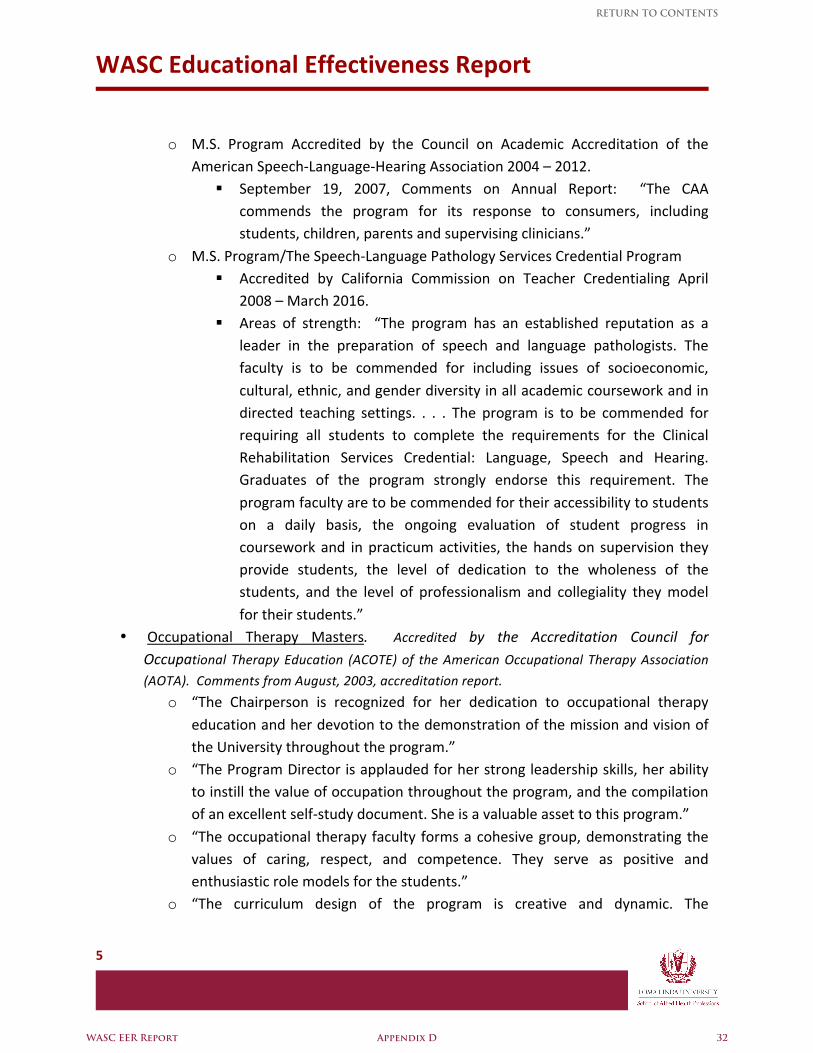
WASC Educational Effectiveness Report
5
o M.S. Program Accredited by the Council on Academic Accreditation of the American Speech‐Language‐Hearing Association 2004 – 2012.
September 19, 2007, Comments on Annual Report: “The CAA commends the program for its response to consumers, including students, children, parents and supervising clinicians.”
o M.S. Program/The Speech‐Language Pathology Services Credential Program Accredited by California Commission on Teacher Credentialing April
2008 – March 2016. Areas of strength: “The program has an established reputation as a
leader in the preparation of speech and language pathologists. The faculty is to be commended for including issues of socioeconomic, cultural, ethnic, and gender diversity in all academic coursework and in directed teaching settings. . . . The program is to be commended for requiring all students to complete the requirements for the Clinical Rehabilitation Services Credential: Language, Speech and Hearing. Graduates of the program strongly endorse this requirement. The program faculty are to be commended for their accessibility to students on a daily basis, the ongoing evaluation of student progress in coursework and in practicum activities, the hands on supervision they provide students, the level of dedication to the wholeness of the students, and the level of professionalism and collegiality they model for their students.”
• Occupational Therapy Masters. Accredited by the Accreditation Council for Occupational Therapy Education (ACOTE) of the American Occupational Therapy Association
(AOTA). Comments from August, 2003, accreditation report. o “The Chairperson is recognized for her dedication to occupational therapy
education and her devotion to the demonstration of the mission and vision of the University throughout the program.”
o “The Program Director is applauded for her strong leadership skills, her ability to instill the value of occupation throughout the program, and the compilation of an excellent self‐study document. She is a valuable asset to this program.”
o “The occupational therapy faculty forms a cohesive group, demonstrating the values of caring, respect, and competence. They serve as positive and enthusiastic role models for the students.”
o “The curriculum design of the program is creative and dynamic. The
WASC EER Report Appendix D 32
RETURN TO CONTENTS
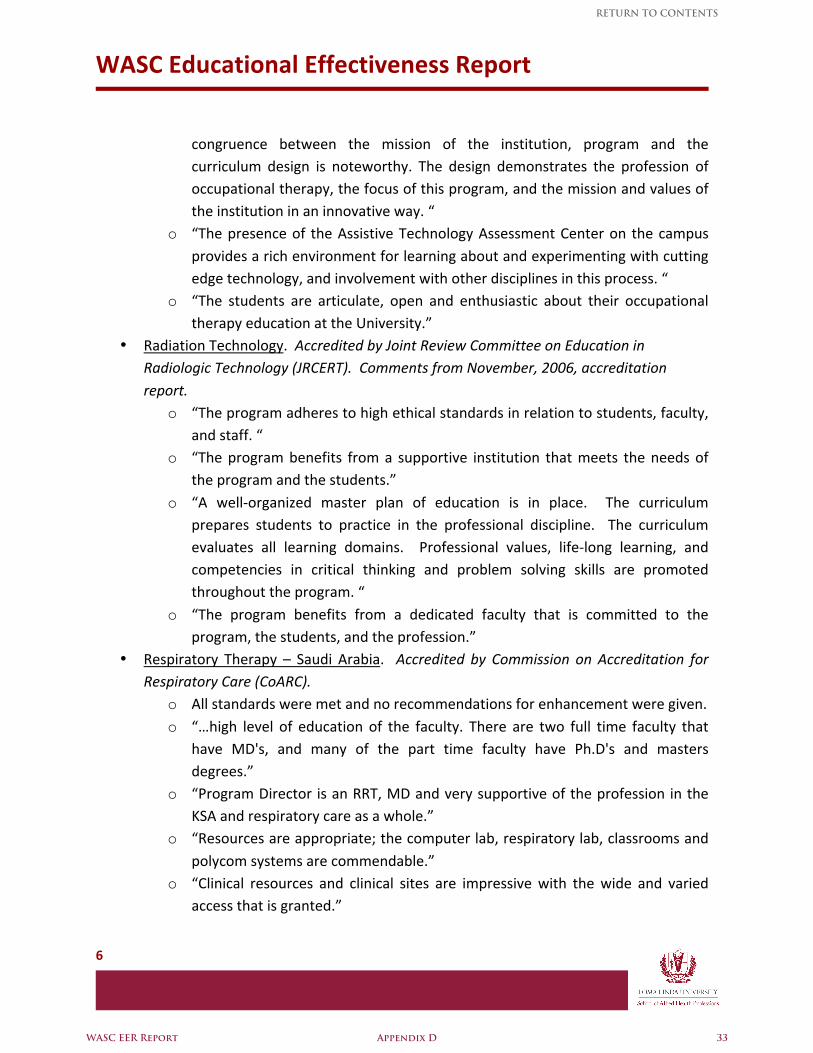
WASC Educational Effectiveness Report
6
congruence between the mission of the institution, program and the curriculum design is noteworthy. The design demonstrates the profession of occupational therapy, the focus of this program, and the mission and values of the institution in an innovative way. “
o “The presence of the Assistive Technology Assessment Center on the campus provides a rich environment for learning about and experimenting with cutting edge technology, and involvement with other disciplines in this process. “
o “The students are articulate, open and enthusiastic about their occupational therapy education at the University.”
• Radiation Technology. Accredited by Joint Review Committee on Education in Radiologic Technology (JRCERT). Comments from November, 2006, accreditation report.
o “The program adheres to high ethical standards in relation to students, faculty, and staff. “
o “The program benefits from a supportive institution that meets the needs of the program and the students.”
o “A well‐organized master plan of education is in place. The curriculum prepares students to practice in the professional discipline. The curriculum evaluates all learning domains. Professional values, life‐long learning, and competencies in critical thinking and problem solving skills are promoted throughout the program. “
o “The program benefits from a dedicated faculty that is committed to the program, the students, and the profession.”
• Respiratory Therapy – Saudi Arabia. Accredited by Commission on Accreditation for Respiratory Care (CoARC).
o All standards were met and no recommendations for enhancement were given. o “…high level of education of the faculty. There are two full time faculty that
have MD's, and many of the part time faculty have Ph.D's and masters degrees.”
o “Program Director is an RRT, MD and very supportive of the profession in the KSA and respiratory care as a whole.”
o “Resources are appropriate; the computer lab, respiratory lab, classrooms and polycom systems are commendable.”
o “Clinical resources and clinical sites are impressive with the wide and varied access that is granted.”
WASC EER Report Appendix D 33
RETURN TO CONTENTS
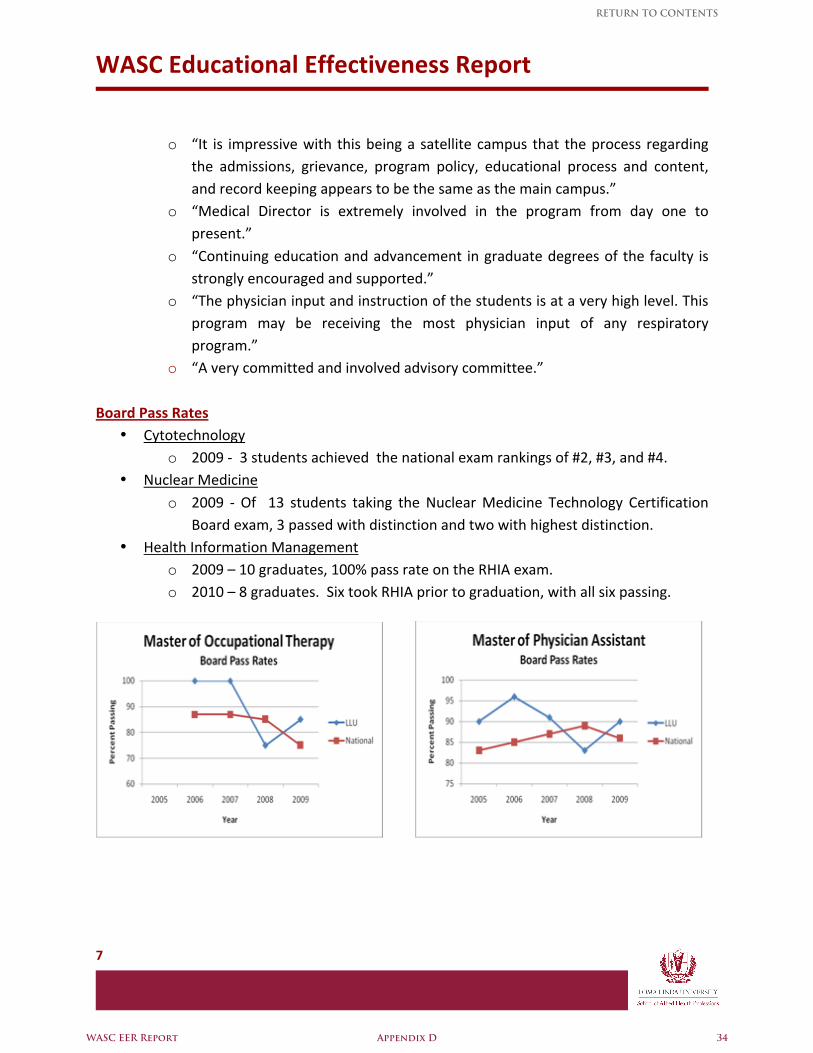
WASC Educational Effectiveness Report
7
o “It is impressive with this being a satellite campus that the process regarding the admissions, grievance, program policy, educational process and content, and record keeping appears to be the same as the main campus.”
o “Medical Director is extremely involved in the program from day one to present.”
o “Continuing education and advancement in graduate degrees of the faculty is strongly encouraged and supported.”
o “The physician input and instruction of the students is at a very high level. This program may be receiving the most physician input of any respiratory program.”
o “A very committed and involved advisory committee.” Board Pass Rates
• Cytotechnology o 2009 ‐ 3 students achieved the national exam rankings of #2, #3, and #4.
• Nuclear Medicine o 2009 ‐ Of 13 students taking the Nuclear Medicine Technology Certification
Board exam, 3 passed with distinction and two with highest distinction. • Health Information Management
o 2009 – 10 graduates, 100% pass rate on the RHIA exam. o 2010 – 8 graduates. Six took RHIA prior to graduation, with all six passing.
60 80 100
2005
2006
2007
2008
2009
Percen
t Passing
Year
Master of Physician Assistant
Board Pass Rates LLU
60 70 80 90 100
2005
2006
2007
2008
2009
Percen
t Passing
Year
Master of OccupaDonal Therapy
Board Pass Rates LLU
WASC EER Report Appendix D 34
RETURN TO CONTENTS
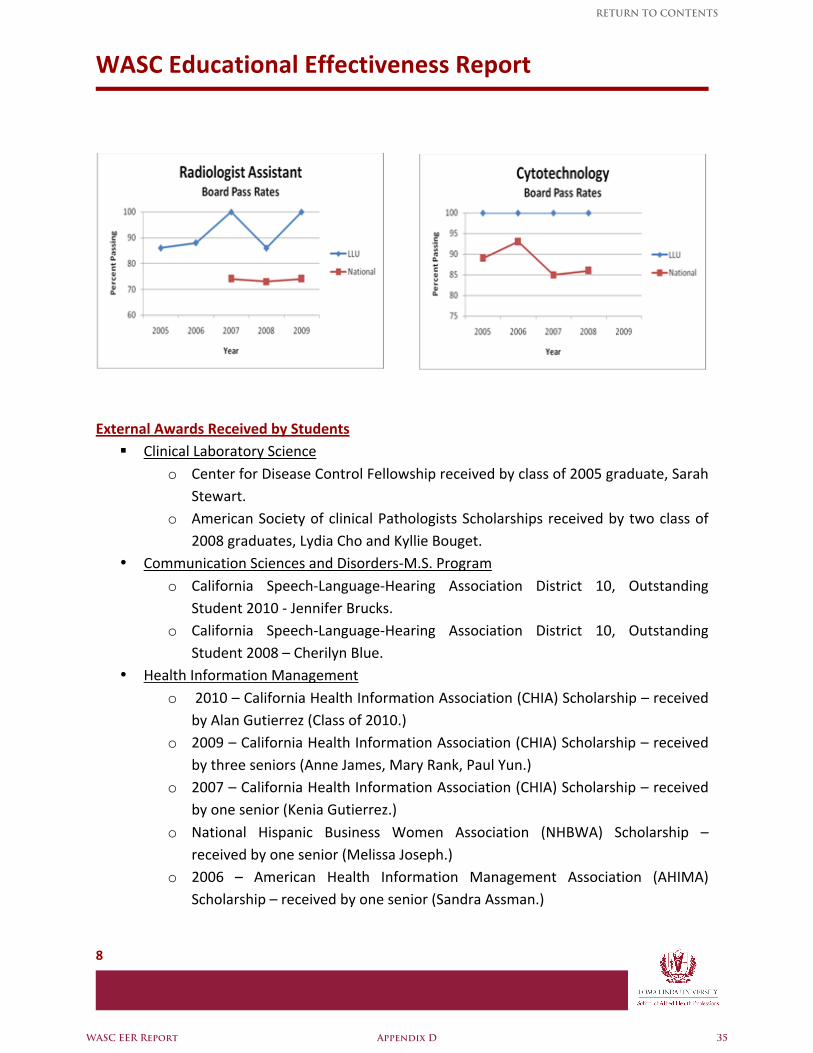
WASC Educational Effectiveness Report
8
External Awards Received by Students
Clinical Laboratory Science o Center for Disease Control Fellowship received by class of 2005 graduate, Sarah
Stewart. o American Society of clinical Pathologists Scholarships received by two class of
2008 graduates, Lydia Cho and Kyllie Bouget. • Communication Sciences and Disorders‐M.S. Program
o California Speech‐Language‐Hearing Association District 10, Outstanding Student 2010 ‐ Jennifer Brucks.
o California Speech‐Language‐Hearing Association District 10, Outstanding Student 2008 – Cherilyn Blue.
• Health Information Management o 2010 – California Health Information Association (CHIA) Scholarship – received
by Alan Gutierrez (Class of 2010.) o 2009 – California Health Information Association (CHIA) Scholarship – received
by three seniors (Anne James, Mary Rank, Paul Yun.) o 2007 – California Health Information Association (CHIA) Scholarship – received
by one senior (Kenia Gutierrez.) o National Hispanic Business Women Association (NHBWA) Scholarship –
received by one senior (Melissa Joseph.) o 2006 – American Health Information Management Association (AHIMA)
Scholarship – received by one senior (Sandra Assman.)
70
80
90
100
2005
2006
2007
2008
2009
Percen
t Passing
Year
Cytotechnology Board Pass Rates
LLU
WASC EER Report Appendix D 35
RETURN TO CONTENTS
WASC Educational Effectiveness Report
9
o California Health Information Association (CHIA) Scholarships – received by two seniors (Sandra Assman, Leah Natividad‐Beck.)
o 2005 – California Health Information Association (CHIA) Scholarship – received by one senior (Beena Nair.)
• Occupational Therapy o American Occupational Therapy Foundation (AOTF) Awards to Emily Pinkerton,
Jodi Crane. o California Foundation for Occupational Therapy (CFOT) Awards were given in
“seed money” to 3 student research groups in 2008: “Occupational Therapy Practitioners’ Use of the WII in Rehabilitation: A
Preliminary Study.” “Occupational Therapy Voluntary Credentialing for Fieldwork Educators
and Coordinators: Motivations and Challenges.” “Mothering Experience of Survivors of Domestic Violence.”
• Radiologist Assistant o 2008‐ Heidi Serrano, outstanding 1st year student was awarded the Siemens
clinical Advancement Scholarship by the American Society of Radiologic Technologist’s Education and Research Foundation.
Global Outreach
• Clinical Laboratory Science o Mission Service in the Marshall Islands by class of 2006 graduate Gaile Tamano
Rittenbach. o Tutoring elementary students by class of 2007 graduate, Lauren Smits. o Organized and coached community rugby team by class of 2008 graduate,
William Pendley. o Participation in Community Health Fairs – multiple students multiple years.
• Cytopathology o PAPS TEAM – Kenya o Grounds for Health– Viet Nam and Mexico o Two to three of our graduates have participated for about 10 years raveling to
Kenya, Viet Nam and Mexico with a team of cytotechnologists, OBGYN doctors and nurses, to help with GYN clinics performing routine exams, pap smears and biopsies. The patients travel for miles to make the clinic. Five individuals, who are from Kenya, have also been trained in GYN cytology and returned to Kenya,
WASC EER Report Appendix D 36
RETURN TO CONTENTS
WASC Educational Effectiveness Report
10
to practice. One of our graduates helped develop the PAPS TEAM and has traveled with them all 10 years.
• Health Information Management o 2010 – China (Grace Chung) – Spent two weeks at Sirr Run Run Shaw Hospital
as part of her senior affiliation. o 2009 – China (Mary Rank) – Senior Affil/Volunteer at Sir Run Run Shaw
Hospital. o 2008 – China (Lori Dao) ‐ Senior Affil/Volunteer at Sir Run Run Shaw Hospital. o 2007 ‐ China (Particia Hartman & Eric Morales) ‐ Senior Affil/Volunteer at Sir
Run Run Shaw Hospital. o 2006 – China (Sandra Assman & Kimberlee Willis.) o 2005 – China (Pauline Calla & Jared Vogt); Argentina (Maria Zamora.)
• Nutrition and Dietetics o Current students:
Julianne Penner & Lindsay Westbrook: participated in constructing new apartments for missionaries, preparing meals over a fire for the missionary team, teaching food‐safety guidelines, nutrition counseling for locals , visiting homes and refurbishing a future health center. They were able to put the nutrition/lifestyle principles learned in the classroom, into practice.
o Alumni: Leanne Krause: was one of two teachers for the Life and Health
Association training session in Slovakia in September of 2006 and March of 2007. The purpose of this training was to develop lifestyle educators in the churches of Slovakia to enable to aid in improving the lifestyle of the community by reducing the risk of diabetes, heart disease and obesity. This program has been going for 8 years and will continue for the foreseeable future. Leanne contributed to the program in that she is very personable, knows the Slovak language and is an expert in nutrition. As such she soon became a beloved part of the team. This program enables not only Leanne, but other nutrition students, to develop skills of relating to people of other cultures, dealing with vocabulary and issues in translating concepts in a way the learner can understand and apply to develop a healthy lifestyle.
• Occupational Therapy
WASC EER Report Appendix D 37
RETURN TO CONTENTS
WASC Educational Effectiveness Report
11
o The following represent SIMS mission trips by students, and some personal involvement via their church:
Emily Pinkerton and Christopher Hoyt – Mexico, SIMS, December 2008. Kimberly Evans, Amanda Turner, Emily Griswold – Brazil, SIMS, March
2008. Shane Gemoto, Emily Pinkerton – Honduras, SIMS, December 2009. Adelina Rachi – Romania, 2008, affiliated with her church. Carol Kramp – Mexico, SIMS 2007. Ipu Eliapo – Samoa, 2009, affiliated with her church.
o Students have actively participated in community activities such as cure for breast cancer walks; feeding the homeless; collecting and distributing donations of socks, coats to the homeless; participating in the census counting of homeless in Inland Empire; Habitat for Humanity projects.
o Shanna Garcia, graduating in June 2010 with post‐prof. Masters in OT – received promotion in U.S. Navy to develop mental health programs.
o En‐chi Chiu, from the OTD program accepted position as board member for Hsin‐Chu County Occupational Therapists Union in Taiwan.
o Julie Kugel, from the OTD program accepted position on Lewis County Childhood Obesity Coalition.
o Jill Landless – “I have been able to use the skills I developed in the professional rotation in a group of classes called, About Baby and Me. It's a seven week class held by a lady who has worked in the IRC system for over 35 years. Last night's class was only supposed to be about an hour and a half ‐ I was there for three and 1/2 hours. It was so neat to be able to use my OT skills within the community and I look forward to what God has in store. Originally, the group was set up for foster mothers, but the population attending are foster teen parents with babies. Some have been drug exposed and some are just preemies. It's fun for me, too, because I don't get to work with the babies at work, but I am able to play with the babies at the foster support group. It's been an eye opening experience for me. Wow!" 6‐23‐09 email communication.
• Physician Assistant o Annual PA student mission trips to Mexico. From the years 2004‐2008 LLU PA
students volunteered in different areas of Ensenada, Mexico. In addition to physical examinations medicines, clothing and food were also distributed. Over
WASC EER Report Appendix D 38
RETURN TO CONTENTS
WASC Educational Effectiveness Report
12
600 patients have benefited from these services. o Sarah Mayer (Class of 2006): Has been serving in Mexico as a missionary for
two years. Sarah opened a free community clinic in a rural area where she sees approximately 20 patients a day. She also assists providing medical care to an orphanage of approximately 150 children.
o Anthony Yvanovich (Class of 2006): volunteered in La Cruz Roja Mexicana, Tijuana, Mexico.
• Radiation Technology o The LLU‐SAHP, AS in Medical Radiography at the King Faisal Specialist Hospital
and Research Center, Riyadh, Kingdom of Saudi Arabia, opened in Winter quarter of 2010. It is the first Radiography program in the Kingdom whose students will be eligible to sit for the American Registry of Radiologic Technologists.
• Respiratory Therapy o BS Respiratory Therapy Program in Riyadh, Saudi Arabia
LLU was the 1st university in the world to graduate a Saudi citizen to pass the NBRC RRT exam (1985).
The Saudi Program Director (Richard Nelson) received an unsolicited call during January from a government department director who served recently on a medical mission during the Haj, with a graduate of our program. That respiratory care director said, "Your graduate from the Class of 2009, Mr. Ahmed Gahtani, thoroughly impressed me with his knowledge and enthusiasm. I have not met a new graduate since Mr. Khalid Al Awam (in over ten years) with his abilities. Even though Ahmed has just graduated he has taught me many things!"
Program Development
• Health Information Management o 2009 – Executive Certificate in Health Information Management – first in the
nation. o 1998 – Master of Health Information Systems – ninth in the nation and first on
the West Coast. o 1987 – Health Information Technology Progression Program – first full distance
education program at LLU. • Occupational Therapy
WASC EER Report Appendix D 39
RETURN TO CONTENTS
WASC Educational Effectiveness Report
13
o Every year, the MOT graduate students develop OT programs in collaboration with community agencies. These agencies include:
Anderson School (developmentally delayed students.) Altus Academy (emotionally disturbed and severely handicapped
children.) Jefferson Transitional Program (dual diagnosis adults.) Alternatives to Domestic Violence. Gateway (juvenile youth offenders.) Loma Linda Elementary (handwriting, academic concerns.)
• Radiation Technology o Radiologist Assistant (RA) Program online BS/BS Certificate launched in 2003
and was the first RA program in the nation. o Masters in Radiation Sciences (online) began in 2008. o Bachelor’s in Radiation Sciences went online in 2008. o Radiologist Assistant Program online Master’s degree launches in 2010. o Cardiac Electrophysiology Technologist (EPT) resident classroom AS and online
Certificate, launches 2010. These will be the only EPT programs on the West coast.
o Imaging Informatics began as a school certificate in Autumn quarter, 2008, and will transition to a University Certificate (and can be an emphasis in the BSRS) in 2011.
o AS in Medical Radiography launched in Saudi Arabia Winter of 2010. • Physician Assistant
o Only Master of Physician Assistant program at the national level, with a Spanish immersion component. One week of language and cultural experience in Cuerna Vaca, Mexico
Where are our graduates now? • Communication Sciences and Disorders
o Christina Bratlund, 2001 Masters of Speech‐Language Pathology graduate, has accepted a faculty position in the Communication Disorders Department at Central Michigan University.
• Communication Sciences and Disorders‐M.S. Program o Tina Bratlund, Class of 2001, completed PhD, James Madison University, fully
funded, now teaching at Central Michigan University.
WASC EER Report Appendix D 40
RETURN TO CONTENTS
WASC Educational Effectiveness Report
14
o Rhona Galera, Class of 2001, completed clinical doctorate, University of Pittsburg.
o Givona Sandiford, Class of 2005, currently in the SAHP’s PhD in Rehabilitation Sciences.
o LaQuisha Myna Burks, Class of 2006, just accepted to University of Mississippi, PhD in Communication Sciences and Disorders, fully funded.
• Cytopathology o 26% of our graduates are doctors, supervisors or graduate faculty. o For the past several years, our students’ research papers have been accepted
by American Society of Cytopathology for their yearly national meeting. They only accept about 200 abstracts per year.
• Health Information Management o The program has graduated 446 students since its inception in 1963:
59 are Department Directors in Health Information Management. 12 are now Educators. 3 re consultants. 1 is a hospital administrator.
o Of those graduates continuing with graduate education: 37 have earned Masters degrees 3 have earned a Doctorate
• Nutrition and Dietetics o Marjorie Geiser, Nutrition 1990, has now graduated from Cal State San
Bernardino with an MBA in Entrepreneurship. July 2009, Marjorie released her first book, "Just Jump: The No‐Fear Business Start‐up Guide for Health and Fitness Professionals". Marjorie will soon take on the newly‐elected position as Chair‐Elect of the Nutrition Entrepreneurs Dietetic Practice Group within the American Dietetic Association.
o Sylvia Klinger, MS, RD, LDN Founder of Hispanic Food Communications in Hinsdale, IL (a food
communication & culinary consulting company). Appeared on NBC, ABC, Fox News, CNN Spanish, Univision, Telemundo, America Teve, TV Axteca, Telefutura. Many appearances in popular shows such as Despierta America & Hispanics Today. A guest on numerous local Hispanic radio talk shows and currently writes for popular magazines such as Latina Magazine, Siempre Muier, Vanidades, Latino Social &
WASC EER Report Appendix D 41
RETURN TO CONTENTS
WASC Educational Effectiveness Report
15
Hispanic Business South Florida. Consultant to the Coca‐Cola Company, GlaxoSmithKline, Grain Foods
Foundation, Gorton’s Inc, Smucker’s, Ragu (unilever), McNeil Nutritionals, American Heart Association, Namaste Charter School, El Valor, Adventist Bolingbrook Hospital.
Co‐author of an article published in Journal of American Dietetic Association, titled “A Systematic Review of the Relationship between Acculturation and Diet among Latinos in the United States: Implications for Future Research.”
She received an Outstanding Dietitian of the Year award in January 2009 by the West Suburban Dietetic Association.
o Donna Galluzzo, PhD President & COO of OMNI Home Health Services, Inc with $54,000,000
annual revenue. Recipient of Republican Senatorial Medal of Freedom (1994), Vice Presidential Certificate of Commendation (1992), Honor society of Phi Lappa Phi (1989), Honor society of Agriculture Gamma Sigma Delta Award of Merit (1987), Outstanding Young Women of America (1983 & 1984), New Haven Business Times 20 Noteworthy Women (2002), Who’s Who of Women (1996), Who’s Who of Executive Professionals (1995), International Who’s Who of Professionals (1995).
o Ronda Watson VP Food & Dining at Atria Senior Living Group provides 12 million meals
per year. o Lee Tincher
Hires 600 Registered Dietitians in CA. Largest employer of RDs in the state of CA.
o Eddy Jara, DrPH DrPH from UC Berkeley and currently a faculty at SPH‐Nutrition.
o Robert Lee, DrPH, RD Faculty at Central Michigan University and co‐author with David
Nieman, DrPH, FACSM of Nutritional Assessment (main textbook in Nutrition Assessment.)
o Michael La Frano Currently in the PhD program at UC Davis, under the USDA Immunity &
Disease Prevention Research Unit.
WASC EER Report Appendix D 42
RETURN TO CONTENTS
WASC Educational Effectiveness Report
16
o Lynda Morita Chan, MBA, RD Has served as Chair of the California Dietetic Association Scholarship
Committee. Contributed to the bestselling book, The Family Nutrition Book, by
William Spears, MD and Martha Spears, RN. Her chapter on “The ABC’s of Teaching Nutrition to Your Kids” focuses on 26 nutrition ideas to help a child develop a positive approach to selection of foods.
Contributed to the Loma Linda University Diet Manual: A handbook supporting vegetarian nutrition, on the chapter for post‐gastrectomy and gastrointestinal resection surgery nutritional needs.
• Occupational Therapy o Doctorate
One alumni accepted a position as board member for Hsin‐Chu County Occupational Therapists Union in Taiwan.
Another alumni accepted position on Lewis County Childhood Obesity Coalition.
Another alumni works with “about baby and me” aimed at foster parents but attended by fostered teen moms.
Several of our alumni have done presentations at national meetings or have published.
o Masters Sharon Newton, ’88 – developing OT programs for army personnel
(mental health disorders, disaster preparedness, stress). Received Distinguished Alumna Award at SAHP Homecoming in 2005.
Diana Su‐Erickson, ’78 – OT supervisor at Pettis VA Medical center. Received Distinguished Alumna Award in 2004.
Debra Ricker, ’78 – Regional Director, Life Care. Has presented at local, state, and national conferences.
Christy Billock, ’95 – PhD (2005) Associate Professor at LLU OT Dept.; authored a chapter on spirituality in the 2009 11th edition of Willard & Spackman’s Occupational Therapy (premier OT textbook); appointed to the editorial board for American Journal of Occupational Therapy.
John Kerr, ’71 – business owner and OT consultant in geriatric care. Debbie Holmes Enix ’77, and Sonia Gomez Lopez ’83 – business owners
and OT consultants in ergonomics.
WASC EER Report Appendix D 43
RETURN TO CONTENTS
WASC Educational Effectiveness Report
17
Liane Hewitt, ’78, DrPH (2007), Associate Professor, Dept Chair and Program Director of LLU OT; Board of Directors member for Mountain Safari, Inc., and Assistive Technology Assessment Center; Body Works trainer.
Beth Aune‐Nelson, ’98, and Sydel Lacre Khoe, ’00, business owners and OT consultants in pediatrics.
36 alumni are supervising therapists in contracted S. California facilities that our LLU students use for fieldwork.
Claudia Peyton, ’80, PhD, – Dept. Chair and program director of OT program at CSU Dominguez Hills, California.
Sandra Barker Dunbar, ’82, DPA (2002) – professor and Dept. Chair at OT program at Nova Southeastern University, Florida; author of pediatric OT textbook; officer in Society for Study of Occupation; inducted into AOTA’s Roster of Fellows.
Karen Pendleton, ’68 – Assistant Professor at LLU OT dept, went to Yemen as a volunteer consultant of a community‐based rehabilitation program for landmine and traumatic injury survivors, 1999.
Julie Teal, ’78 – Owner of hand rehabilitation private practice clinic; has received grant funds for a research project in Washington state.
• Physical Therapist Assistant o Oscar Verduzco SAHP PTA 1997; PMPT 2002, spoke at San Diego Academy's
2nd annual career day on April 17th regarding the Physical Therapy profession and his experiences over the last 12 years in the field. Oscar currently practices outpatient orthopedics in San Diego Kaiser Permanent.
• Physician Assistant o Carolyn Nagel (Class of 2006): Poster presentation at the Combined
Otolaryngology Spring Meeting (COSM) in 5/2008. Ear Canal Exostoses: The relationship between surfing footedness and asymmetric growth severity.
o Lisa Turner (Class of 2007): Neurocritical Care PA Intensivist. This ICU was just recognized for excellence in the field of Neurocritical Care.
• Radiation Technology o Suzette Paredes Sanchez graduated from the AS from the BS in Radiation
Sciences in 2007. Radiology Supervisor then promoted to Chief Technologist at LLUMC. She became the Medical Imaging Manager at Sunrise Medical Center, Las Vegas. Then the Assistant Director Administrator at Kaiser Permanente,
WASC EER Report Appendix D 44
RETURN TO CONTENTS
WASC Educational Effectiveness Report
18
West Los Angeles and has now returned to the Loma Linda area as Manager of Imaging Services at Highland Springs Imaging Center, Beaumont managing all radiology modalities.
o John Ferguson is a department manager in Portland Adventist after serving in Hong Kong at the Hong Kong Adventist Hospital for many years.
o Rob Marchuk is the manager at Glendale Adventist. o Bob Darwin went into sales and was manager at the White Memorial Hospital
and is now an Educator. o Gene Reiver is now the manager and PACS administrator at Hemet Valley
Medical Center o Rob Cruise graduated from our AS and BSRS and is the manager at San
Bernardino Community Hospital. • Physical Therapy – Doctor of Science
o Mike Laymon, ’97 – Chairperson of the doctor of physical therapy (DPT) program at Azusa Pacific University in Azusa, California.
o Jan Kodat, ’97, Associate professor at California Baptist University in Riverside California.
o Nancy Darr, ’98, Associate professor in the DPT program at Belmont University in
Nashville Tennessee. o Wendy Chung, ‘98, Assistant professor in the DPT program at Azusa Pacific University
in Azusa California.
o Everett Lohman, ’89, Professor and assistant dean for graduate affairs in the School of Allied Health Professions (SAHP) at Loma Linda University in Loma Linda California.
o Susan Baker, ’99, Chair of the Allied Health & Chemistry departments at Oakwood
Adventist University. o Harvey Wallmann, ‘00, Chair of the DPT program at University of Nevada – Las Vegas
(UNLV). Former Interim Dean, School of Allied Health Sciences at UNLV.
o Eric Johnson, ’01, Professor at Loma Linda University in the Department of Physical Therapy.
o Bruce Bradley, ’01, Assistant professor at Loma Linda University in the Department of Physical Therapy.
o Bonnie Forrester, ’02, Associate professor at Loma Linda University in the Department
of Physical Therapy. o Ardith Williams‐Meyer, ’02, retired as an associate professor at Azusa Pacific
University.
o James Syms, ’05, Assistant professor at Loma Linda University in the Department of Physical Therapy.
WASC EER Report Appendix D 45
RETURN TO CONTENTS
WASC Educational Effectiveness Report
19
o Karen Brandon, ’05, instructor at Loma Linda University in the Department of Physical Therapy.
o Susan Rand, ’07, Assistant Hospital Administrator and Administration Services Analyst
at Riverside County Hospital in Moreno Valley California. o Wilton Remigio, ’10, instructor at Chapman University (clinical neuropathology)and
Western University (pathology for physical therapists, research methods, and evidence
based practice for entry‐level and transitional DPT programs) in Southern California.
Other indicators of excellence • Clinical Laboratory Sciences
o The CLS Department holds an Education and Consulting Agreement with Beckman Coulter Inc., to train new company sales associates in Clinical Laboratory Science.
o The CLS Department holds a Clinical Research and Consulting Agreement with Beckman Coulter Inc. to assist the company in new product development.
• Physical Therapy o Department was asked to transfer students, and complete teach‐out of their
degree requirements, by four different institutions when their PT programs lost accreditation.
The first group was from Traveca Nazarene College in Nashville, TN. The school lost their accreditation and they choose to close the program and the students would not be able to be taught out. One of the students in their program was a Seventh‐day Adventist – Teresa Rogers. She called and asked if she could transfer to Loma Linda to finish her PT program. She was told no that would not be possible for just one student to fit into our curriculum, but if the entire class would like to come here to finish their PT program, it would be financially feasible. So in 1994, the whole class of 22 students arrived on campus and graduated from Loma Linda University in 1995 with a Master’s degree in Physical Therapy.
This story was repeated again in 1996 when another school lost its accreditation and a group of 19 students from Southwest Baptist University in Bolivar, MO who heard about the experience of the students from Traveca Nazarene College, also transferred to Loma Linda University to finish their PT Masters degree. They also spent a year here at Loma Linda University and graduated in 1997. The Southwest
WASC EER Report Appendix D 46
RETURN TO CONTENTS
WASC Educational Effectiveness Report
20
Baptist University did get their accreditation back several years later and are now continuing to offer the Physical Therapy Doctorate degree.
Then in 1997 a group of students from Barry University in Florida heard about the Loma Linda experience and requested to come and finish their degree at Loma Linda after their school also lost accreditation; four of the senior class and sixteen of the junior class, came and finished their program at Loma Linda.
Our last Cohort of students came from Azusa Pacific University, in Azusa CA. Their school had started a new Physical Therapy program, but by the time their senior class was ready to graduate, the school had not yet been able to acquire its accreditation so they requested that they come to Loma Linda to finish their PT program. so 24 of this class graduated in 2000 with their Master’s in Physical Therapy.
• Scholarship started for PTA o Randy Isley, PTA class 1996, president of the class, was terminally ill with
cancer in 2007. His employer, along with many of his friends and former patients, decided to honor him by creating an annual scholarship award for PTA students. Because of Randy’s exceptional and widely‐established reputation for conveying a deep sense of compassion in his patient care and his friendships, the criteria for the award include a requirement that the PTA class members nominate a classmate who is known for expressing a compassionate approach to others. This award was given in 2008 and 2009 so far.
• PT Exit Survey Benchmarks o Post Professional Master of Physical Therapy
2007 – 2009: 98% Of Students Who Graduate On Time. 2009: 100% Of Graduates Who Understood The Importance of
“Balance” and “Wholeness” In Their Lives. 2007 – 2009: 98% Student Retention Rate. 2009: 91.4% BOARD PASS RATE (% First Time Takers.)
o Post Professional Doctor of Physical Therapy 2009: 87.5% Of Graduates Were Positively Influenced By LLU’s Mission,
Purpose, And 7 Core Values. 2009: 100% Of Graduates Understood The Importance Of “Balance” &
“Wholeness” In Their Lives. 2007 – 2009: 95% Of Students Graduate On Time.
WASC EER Report Appendix D 47
RETURN TO CONTENTS
WASC Educational Effectiveness Report
21
2009: 100% Of Graduates Expressed A Desire To Be Involved In The School And Program.
o Doctor of Science 1995 – 2009: 83.3% Of Alumni Reported That The DSc Program Helped
Prepare Them For Their Current Position. 1995 – 2009: 75% Of Alumni Are Currently Teaching In A Physical
Therapy Program. 1995 – 2009: 66.7% Of Alumni Currently Involved In Research Activities. 1995 – 2009 91.7% Of Graduates Were Extremely Satisfied With The
DSc Program.
WASC EER Report Appendix D 48
RETURN TO CONTENTS
WASC Educational Effectiveness Report
School Of Dentistry
1
Accreditation History
Loma Linda University School of Dentistry (LLUSD) has been fully accredited by the Commission on Dental Accreditation (CODA) since the School was founded in 1953. The most recent accreditation site visit took place in February of 2009 when all CODA approved programs once again received full
accreditation with no recommendations. A more detailed summary of each programs site visit results will be described later in this report.
Elements in the School of Dentistry Educational Effectiveness Report In the traditional view, an education effectiveness report (EER) for the School of Dentistry should include three academic processes: (1) assessment, (2) professional accreditation, and (3) academic
program reviews. However, when portraying the evolution and achievements of the School of Dentistry, a fourth process must be added that has been a hallmark of this institution from its very beginnings, that being “(4) educational innovation.” Consequently, each of these four processes will
be presented separately and explored through evidence‐based discussions of the School, its assessment results, and the outcomes that continue to evolve as a result of the School’s overall outcomes assessment committee chaired by the dean, Dr. Charles J. Goodacre.
(1) Assessment The School of Dentistry Vision, Core Values, Mission Statement, and Program Goals have been
reviewed and updated continuously since an Applied Strategic Planning initiative established these statements in 2001. The goals and specific time‐related objectives include preparing graduates with the knowledge, skills, and values required to flourish in today’s practice of dentistry. For example, one
stated goal of the dental education program is to “Provide a clinical environment where students learn to provide high quality oral health care that exceeds the patients’ expectations.” A specific objective that was developed to assist in the realization of this goal was the establishment of the pre‐doctoral
Group Practice System clinical model. The LLUSD Strategic Plan document will be available onsite. In order to ensure pre‐doctoral students are sufficiently skilled and prepared to obtain a dental license
and practice dentistry in a safe and ethical manner adhering to evidence‐based principles for the standard of care, 21 core competencies were created. Embedded in the 21 core competencies is the
requirement that each School of Dentistry graduate must be able to demonstrate the knowledge, skills, and values required by those competencies in order to properly begin the practice of general dentistry. Successfully completing the didactic curriculum and performing all required clinical
procedures at the required level of competence is regarded as a sufficient demonstration that a student has attained the knowledge and skills essential to begin their dental career. The LLUSD Competency Document is presented as Appendix 1. Exhibiting the appropriate values is evaluated in
didactic courses and in clinical settings by faculty evaluations of students.
WASC EER Report Appendix D 49
RETURN TO CONTENTS
WASC Educational Effectiveness Report
School Of Dentistry
2
Each course in the dental curriculum encompasses defined competencies and requires the use of
assessment tools to evaluate student progress. In addition, nearly all courses address different aspects of patient care management. Students are not permitted to graduate until all competency examinations have been successfully completed, and all graduation requirements have been met.
The School of Dentistry uses a combination of the following methods, evaluations, and settings to measure students’ achievement of the defined competencies and assess their knowledge and clinical skill levels:
Written examinations Preclinical performance examinations
Self‐assessment in laboratory courses Clinic instructor evaluations Clinical competency examinations
Simulated board examinations Case‐based written examinations Written course projects
Post‐treatment outcome reviews (as part of the Quality Assurance Program) Patient record review Objective Structured Clinical Examinations (OSCEs)
National Dental Board Examinations Parts I and II D4 Student Exit Survey Alumni surveys
Patient satisfaction surveys
All course directors are required to identify the LLUSD competencies addressed in their courses using our electronic online course syllabus program, so this information is readily available to students.
The LLUSD Curriculum Map (Appendix 2) was constructed to chronologically list all courses in the curriculum and identify each of the competencies addressed in every course. The LLUSD Curriculum
Map also defines how and at what level each competency is addressed in each course using the following descriptors:
Introduced – mentioned in class or discussed in a reading assignment Reinforced/Reviewed – intentionally repeated for emphasis Emphasized – the competency is a primary focus in the course
Assessed – requires the application of an assessment tool to evaluate
With the recent development and implementation of University‐wide student learning outcomes, in particular SLO 3: Critical Thinking and SLO #5: Effective Communication, the School of Dentistry has
WASC EER Report Appendix D 50
RETURN TO CONTENTS
WASC Educational Effectiveness Report
School Of Dentistry
3
incorporated the communication matrices (SLO #5) and is in the process of working with faculty to
identify courses in which the University matrix for critical thinking (SLO #3) will be the best fit. For example, developing critical thinking and problem‐solving skills is an essential priority when LLUSD graduates must possess the knowledge, skills, and values needed to begin an independent practice of
dentistry. Most didactic courses, clinical encounters, competency evaluations, and service learning experiences require some measure of critical thinking and/or problem solving. The courses in the pre‐doctoral program listed in Appendix 3 include exercises, evaluations, and activities that focus on the
development of critical thing skills related to providing comprehensive care to patients. In addition to the courses noted in Appendix 3, there are multiple exercises and projects that occur in
classes which are intended to facilitate the development of students’ critical thinking ability. For example, in Dental Neuroscience (ANAT 505), there are a number of laboratory sessions with specific problem‐solving/discussion exercises. As soon as students are exposed to the brain stem and cranial
nerves there are seven laboratory sessions where they must do neurologic localization and perform disease problem‐solving exercises. These exercises use the following three principal formats:
A) Wimbley Pair discussions – These are done by pairing all students assigning one to be student A and the other student B. Either a projection is made of a slide of a given neurologic lesion or a clinical symptom is presented that a hypothetical patient is exhibiting. Then Student A
explains to Student B what issues he or she sees, offers a differential diagnosis, and explains how that problem might be managed. Then student B is asked some specific question about the scenario at hand, and is expected to explain the issues to Student A. This method gets all
students intensely involved in every learning issue, and they must deal with these issues in collaboration with a peer. Such discussions have been found to be extremely useful. Moreover, students enjoy the exchanges after the initial awkwardness is over. The Wimbley
Pair discussions have proven to be an effective way to educate each student how to grapple with problems and develop their critical thinking skills. This is an example of how we engage our students in an “active learning” process.
B) Group problem‐solving from clinical films. The School has a library of films of approximately
40 neurological patients which demonstrate important elements of neuroanatomy that a dentist should know. Brief clips are shown of a neurologist examining a patient and listening to their story/complaint. Then the film is stopped, and the group discusses the evidence they
have thus far gleaned, usually using Wimbley Pairs discussions. The film is allowed to resume, providing students additional information at which time they are expected to then arrive at a reasonable explanation for the ensuing findings. This teaching method again gets students
involved in critical thinking about the data at hand. The instructor gives a summary of the clinical condition and the issues of importance.
WASC EER Report Appendix D 51
RETURN TO CONTENTS
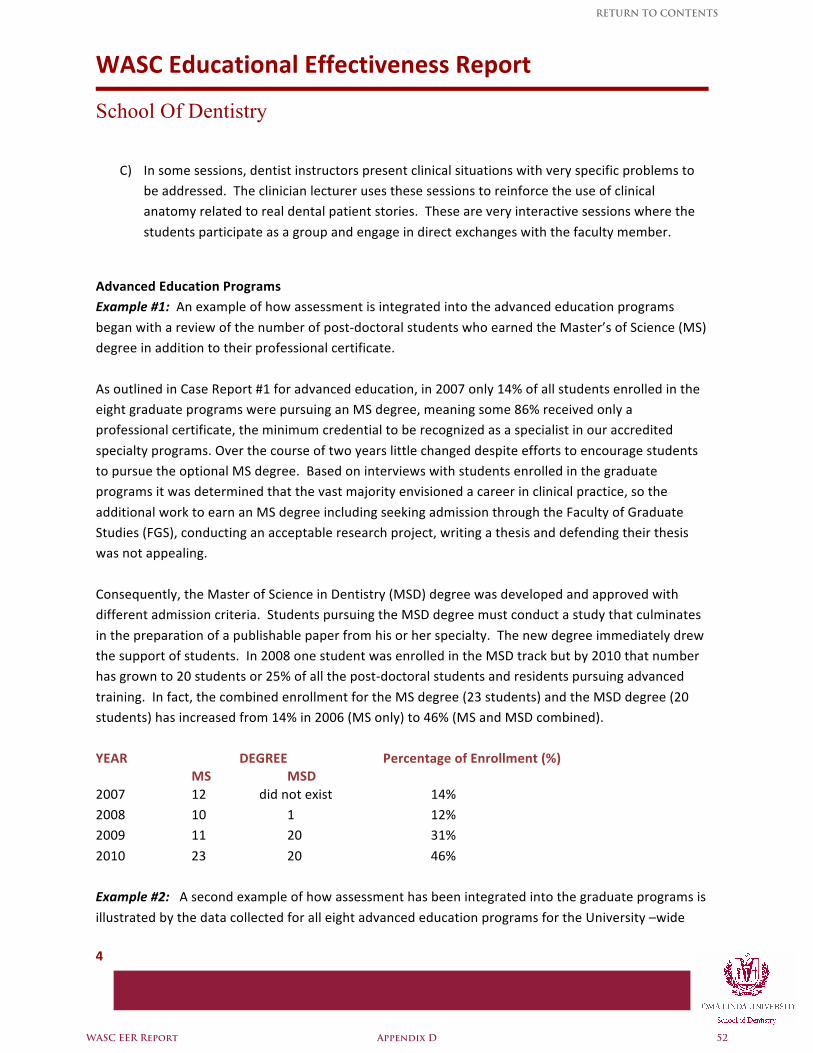
WASC Educational Effectiveness Report
School Of Dentistry
4
C) In some sessions, dentist instructors present clinical situations with very specific problems to be addressed. The clinician lecturer uses these sessions to reinforce the use of clinical anatomy related to real dental patient stories. These are very interactive sessions where the
students participate as a group and engage in direct exchanges with the faculty member.
Advanced Education Programs Example #1: An example of how assessment is integrated into the advanced education programs
began with a review of the number of post‐doctoral students who earned the Master’s of Science (MS) degree in addition to their professional certificate.
As outlined in Case Report #1 for advanced education, in 2007 only 14% of all students enrolled in the eight graduate programs were pursuing an MS degree, meaning some 86% received only a professional certificate, the minimum credential to be recognized as a specialist in our accredited
specialty programs. Over the course of two years little changed despite efforts to encourage students to pursue the optional MS degree. Based on interviews with students enrolled in the graduate programs it was determined that the vast majority envisioned a career in clinical practice, so the
additional work to earn an MS degree including seeking admission through the Faculty of Graduate Studies (FGS), conducting an acceptable research project, writing a thesis and defending their thesis was not appealing.
Consequently, the Master of Science in Dentistry (MSD) degree was developed and approved with different admission criteria. Students pursuing the MSD degree must conduct a study that culminates
in the preparation of a publishable paper from his or her specialty. The new degree immediately drew the support of students. In 2008 one student was enrolled in the MSD track but by 2010 that number has grown to 20 students or 25% of all the post‐doctoral students and residents pursuing advanced
training. In fact, the combined enrollment for the MS degree (23 students) and the MSD degree (20 students) has increased from 14% in 2006 (MS only) to 46% (MS and MSD combined).
YEAR DEGREE Percentage of Enrollment (%) MS MSD 2007 12 did not exist 14% 2008 10 1 12% 2009 11 20 31%
2010 23 20 46% Example #2: A second example of how assessment has been integrated into the graduate programs is
illustrated by the data collected for all eight advanced education programs for the University –wide
WASC EER Report Appendix D 52
RETURN TO CONTENTS
WASC Educational Effectiveness Report
School Of Dentistry
5
Student Learning Outcome #3: Critical Thinking and Student Learning Outcome #5 Communication.
The rubrics and scoring data for the two performance indicators for both SLOs are summarized and also reported separately by advanced education program. These data appear in a notebook entitled: Office of Advanced Education, University‐wide Student Learning Outcomes (SLO) Data that will be
available in the exhibit room. This notebook contains the curriculum maps for each performance indicator for the University SLOs, the assessment rubrics, and the outcome data. The outcomes data are color‐coded green where performance meets or exceeds the expected standard and yellow when
the outcome is below the expected graduate standard. Summary: The MSD degree requirement of a publishable paper requires the integration of critical
thinking (University‐wide SLO #3), a public presentation, and scientific writing (University‐wide SLO #5, Performance Indicators #1 – oral communication and Performance Indicator #2 – written communication). Students are evaluated using the SLO assessment rubrics developed by the
University and those data are reported centrally. A copy of the summary outcomes of the assessment for these two University SLOs will be provided with the School of Dentistry exhibits. The raw data are available upon request from the Office of Advanced Dental Education due to the requirement to
protect student privacy. (2) Professional Accreditation
The pre‐doctoral, dental hygiene, and six of the eight advanced education programs are subject to regular (5‐year to 7‐year cycles) assessment involving the preparation of self‐study written reports
followed by site visits made by a team from the Commission on Dental Accreditation. Although CODA policy no longer permits the inclusion of commendations in the formal accreditation report, the following is a brief summary of feedback/commendations each program received in either the exit
interview or the formal report. Advanced Education Programs No
recommendations were made regarding any of the Advanced Education Programs. There was one suggestion related to the distribution of dental assistants between the pre‐doctoral program and the
postdoctoral program. Suggestions such as this are non‐binding and the School and graduate program are not required to implement such a change.
The two specialty programs not recognized by CODA, Dental Anesthesiology and Implant Dentistry, completed self assessments and prepared self‐study reports based upon the CODA format, and scheduled program evaluations in 2008 by external evaluators recognized by their respective specialty
organizations. Both programs received very positive reports following the site‐visits. All program self‐study reports and site visit reports are available in the evidence room.
WASC EER Report Appendix D 53
RETURN TO CONTENTS
WASC Educational Effectiveness Report
School Of Dentistry
6
Dental Hygiene Programs No recommendations were made regarding any of the Dental Hygiene programs. There was one
suggestion that more quantitatively defined assessment criteria be developed. Pre‐doctoral Program
No recommendations were made for the Pre‐doctoral Program. However, four suggestions were offered for our consideration. First, the site visitors were complementary of the School’s newly revised outcomes assessment but suggested we continue to focus on the full implementation of the
new process. Consequently, the Outcomes Assessment Committee now meets at least two times per quarter and more often, if needed. Second, the site visit team was very complementary of the scope of our service learning activities but suggested the School develop a didactic component with
measurable learning objectives and outcomes. As a result, didactic content has now been developed and is being integrated into the curriculum. Third, although the practice management course was judged to be very comprehensive, there was a suggestion that the School develop a clinical component
that would permit students to observe and learn in private offices. The School is currently working with a consortium of dental manufacturers in developing an Innovation Center. The Center will be located in the School of Dentistry and will include the latest dental equipment and software available.
Students will be assigned to rotate through blocks in which they are oriented to the latest software and equipment available in the market. Fourth, the team was very supportive of the role the department chairs are playing in guiding junior faculty toward promotion but suggested there was a
need for more written evidence of that guidance in the annual faculty evaluations. Consequently, developing a strategy to become eligible for promotion is now a critical component in each faculty member’s annual evaluation.
Also noteworthy are a few examples of the specific praise the site‐visit team shared regarding School of Dentistry programs.
• “highly dedicated and satisfied faculty”
• “happy and confident students” • “curriculum management system is very strong” • “service learning program is comprehensive and very strong”
• “electronic curriculum is very impressive” • “excellent, well organized international dentist program”
(3). Academic Program Reviews
WASC EER Report Appendix D 54
RETURN TO CONTENTS
WASC Educational Effectiveness Report
School Of Dentistry
7
Advanced Education Programs
Example #1: The accreditation standards created by the Commission on Dental Accreditation in conjunction with the respective dental specialties are dynamic and thus require graduate programs to review their program curriculum on a continuous basis. Consequently, in the monthly meetings of all
the graduate program directors, the graduate “curriculum committee” is a standing agenda item and includes a forum for program changes to be proposed, discussed, and voted on for acceptance, modification, or rejection.
Aside from the outside review of accredited programs by CODA, the University developed a cycle for program reviews that began in the summer of 2010 and included an assessment by a University review
team. As part of this process, the Advanced Education Program in Dental Anesthesiology and the Advanced Education Program in Implant Dentistry, two non‐accredited programs, conducted internal self‐reviews and wrote a CODA‐like self‐assessment reports, arranged for outside experts to conduct a
comprehensive program review, responded to the report from these site visitors, and wrote a supplement to their report for the Western Association of Schools and Colleges (WASC) to demonstrate how they assess Loma Linda University‐wide Student Learning Outcome #3: Critical
Thinking and Student Learning Outcome #5: Communication. Both these reports will be included in the School’s display.
Example #2: As part of the preparations for the CODA site visit in 2007 (for the Oral and Maxillofacial Surgery programs) and 2009 (for the five remaining accredited specialty programs), the curriculum of each advanced education was reviewed. It became apparent that there was a need to differentiate
between the professional certificate curriculum and the curriculum leading to a master’s degree. As a result of the assessment, six programs adopted a new research course to satisfy the requirements of CODA Standard 6: Scholarly Activity for the award of a professional certificate. The course is entitled
XXXX 696: Scholarly Activity in Dental Anesthesiology (or Implant Dentistry, Oral and Maxillofacial Surgery, Pediatric Dentistry, Periondontics, or Prosthodontics). The remaining two programs
(Endodontics and Orthodontics) chose to continue to require XXXX 697A: Research and XXXX 697B: Research for both the certificate and the master’s degree track. The other six programs that require the Scholarly Activity course for the award of a certificate, have their students enroll in a Research A
and Research B course who are pursuing a master’s degree. As a result, the certificate and master’s degree tracks are largely separate for six of the eight programs to more clearly differentiate between the different levels of research required.
(4). Educational Innovation
WASC EER Report Appendix D 55
RETURN TO CONTENTS
WASC Educational Effectiveness Report
School Of Dentistry
8
The School of Dentistry has taken seriously the imperative that the role of an academic institution is to
not only teach what is known, but to also develop innovations in education that will improve learning effectiveness. To that end, the School of Dentistry has been recognized for a number of innovations that have impacted academic dentistry and the dental profession over the years. Ultimately, the goal
of these efforts is to not only strengthen dental education, but to also help improve the delivery of oral healthcare by the dental profession at large in the process. Examples include:
Innovations from 1960 to 1980 • First high‐speed video documenting how gold alloy fills a heated mold in the casting process • First movies demonstrating how to administer local anesthesia to dental patients (Jorgensen
Technique) • First conscious sedation protocol and technique for use in dentistry • Development of a porcelain inlay refractory die material and accompanying fabrication
technique • Development and introduction of powdered gold for gold foil restorations • Development of instruments specifically designed for the placement of gold foil restorations
• Developments of intraoral drill guides for pin‐retained restorations • The use of micro motor‐driven electric handpieces in dentistry • Development of 3‐dimensional recording of mandibular movement in resin blocks for the
Panadent Articulator • Established the first graduate program in implant dentistry • First to use data from a CT scan to produce a resin replica mandible
• Published first report in the literature describing the sinus lift procedure for dental implants
Recent Innovations • First school of dentistry to purchase and install a Cone Beam CT scan unit for student use • First school to study and develop a wide array of electronic educational programs on DVD for
students and clinicians • Ongoing clinical research on the use of bone morphogenic protein (BMP)
• Early conversion to electronic patient records for paperless administration • Early conversion to digital radiography and the use of expanded imaging (both i‐CAT and
NewTom3G)
• Integrated cone beam, visible light images, and standard radiographs into one PACS system • Incorporated CAD/CAM technology into the preclinical education of second‐year dental
students
• Routine use of cone beam assisted dental implant treatment planning into the preclinical teaching of dental students
• Routine use of cone beam assisted dental implant treatment planning in graduate programs
• Introduced mini‐implants to augment orthodontic anchorage
WASC EER Report Appendix D 56
RETURN TO CONTENTS
WASC Educational Effectiveness Report
School Of Dentistry
9
• Installed microscopes for student use in the predoctoral and graduate endodontic clinics
• The clinical use of distraction osteogenesis and development of improved distraction devices • Engaged in pilot testing projects in partnership with industry to assess emerging technologies
Summary
Analysis of institutional and program achievements with respect to program goals has been an ongoing tradition in the School of Dentistry. LLUSD has vision and mission statements and also has identified core values that support the Loma Linda University motto, “To Make Man Whole.” In the self‐study
process in 2008, a review of the mission statement assessed broad‐based input from students, faculty, staff, alumni, and administrators. The revised mission statement for LLUSD is linked with goals and objectives and addresses the four major aspects of dental education: teaching, patient care, research,
and service. In addition, there is wide dissemination and display of our mission statement throughout the School of Dentistry.
Through the School’s process of strategic planning and monitoring levels of achievement, the School is continually examining the status‐quo and finding methods for improvement. The more important factors that are measured include the quality of: the students admitted, the faculty hired, the
educational programs offered, student performance, the patient care rendered, the clinical education, and the financial management of the School.
The Outcomes Assessment Committee is a standing committee in the School of Dentistry chaired by
the Dean. The Committee is charged with continuing to evolve the comprehensive outcomes assessment program and maintain a focus on measurable criteria that are of importance to the management of the School and its programs. In 2006‐07, the Associate Dean for Academic Affairs
initiated a comprehensive re‐evaluation of the Outcomes Assessment structure, goals and measures. The result of the re‐evaluation process was a significantly modified outcomes assessment program designed to achieve a broader review of data and at the same time lend more efficiency to the
process. The Outcomes Assessment Report will be available in the exhibit room. Applying the principles of strategic planning, quality assurance, and outcomes assessment has been
vital to improving the quality of all programs in the School of Dentistry. As noted above, these processes are periodically revitalized, enhanced, and continue to impact all programs and activities in the School. This process is depicted in Appendix 4. Examples of data from the Outcomes Assessment
Report follow in Appendices 5‐7 and in Appendices 8 is the School of Dentistry Assessment Matrix.
WASC EER Report Appendix D 57
RETURN TO CONTENTS
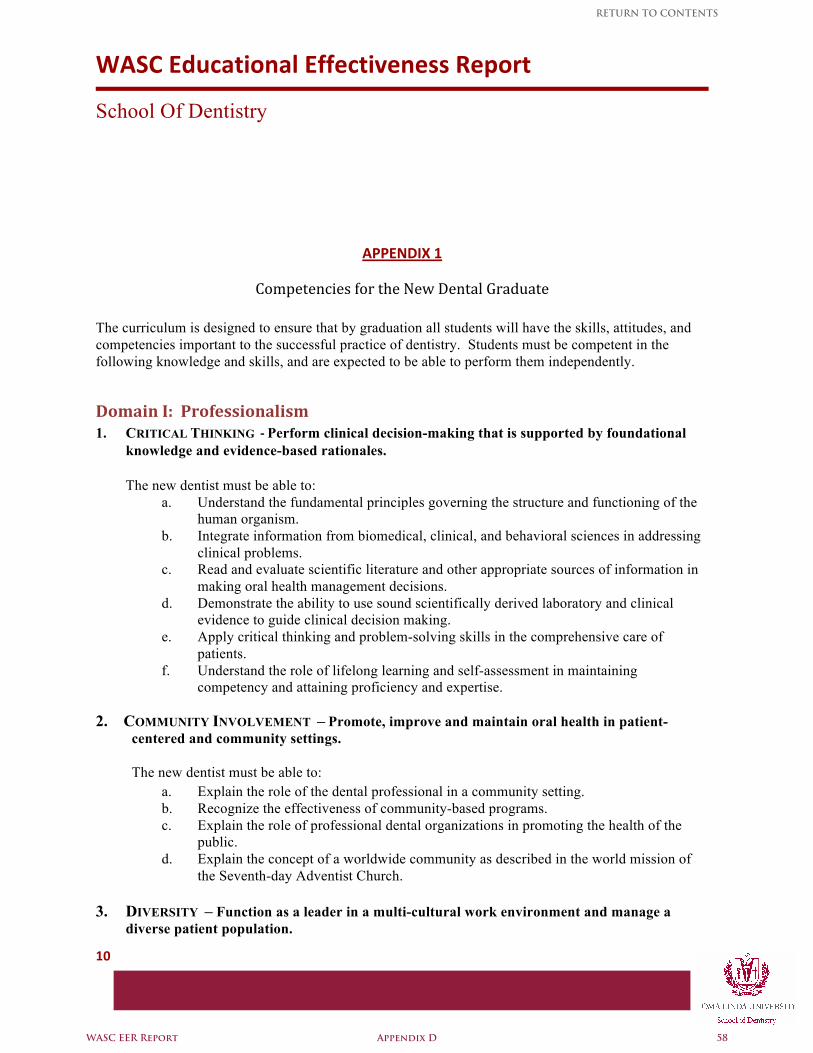
WASC Educational Effectiveness Report
School Of Dentistry
10
APPENDIX 1
Competencies for the New Dental Graduate
The curriculum is designed to ensure that by graduation all students will have the skills, attitudes, and competencies important to the successful practice of dentistry. Students must be competent in the following knowledge and skills, and are expected to be able to perform them independently.
Domain I: Professionalism 1. CRITICAL THINKING ‐ Perform clinical decision-making that is supported by foundational
knowledge and evidence-based rationales. The new dentist must be able to:
a. Understand the fundamental principles governing the structure and functioning of the human organism.
b. Integrate information from biomedical, clinical, and behavioral sciences in addressing clinical problems.
c. Read and evaluate scientific literature and other appropriate sources of information in making oral health management decisions.
d. Demonstrate the ability to use sound scientifically derived laboratory and clinical evidence to guide clinical decision making.
e. Apply critical thinking and problem-solving skills in the comprehensive care of patients.
f. Understand the role of lifelong learning and self-assessment in maintaining competency and attaining proficiency and expertise.
2. COMMUNITY INVOLVEMENT – Promote, improve and maintain oral health in patient-
centered and community settings.
The new dentist must be able to: a. Explain the role of the dental professional in a community setting. b. Recognize the effectiveness of community-based programs. c. Explain the role of professional dental organizations in promoting the health of the
public. d. Explain the concept of a worldwide community as described in the world mission of
the Seventh-day Adventist Church. 3. DIVERSITY – Function as a leader in a multi-cultural work environment and manage a
diverse patient population.
WASC EER Report Appendix D 58
RETURN TO CONTENTS
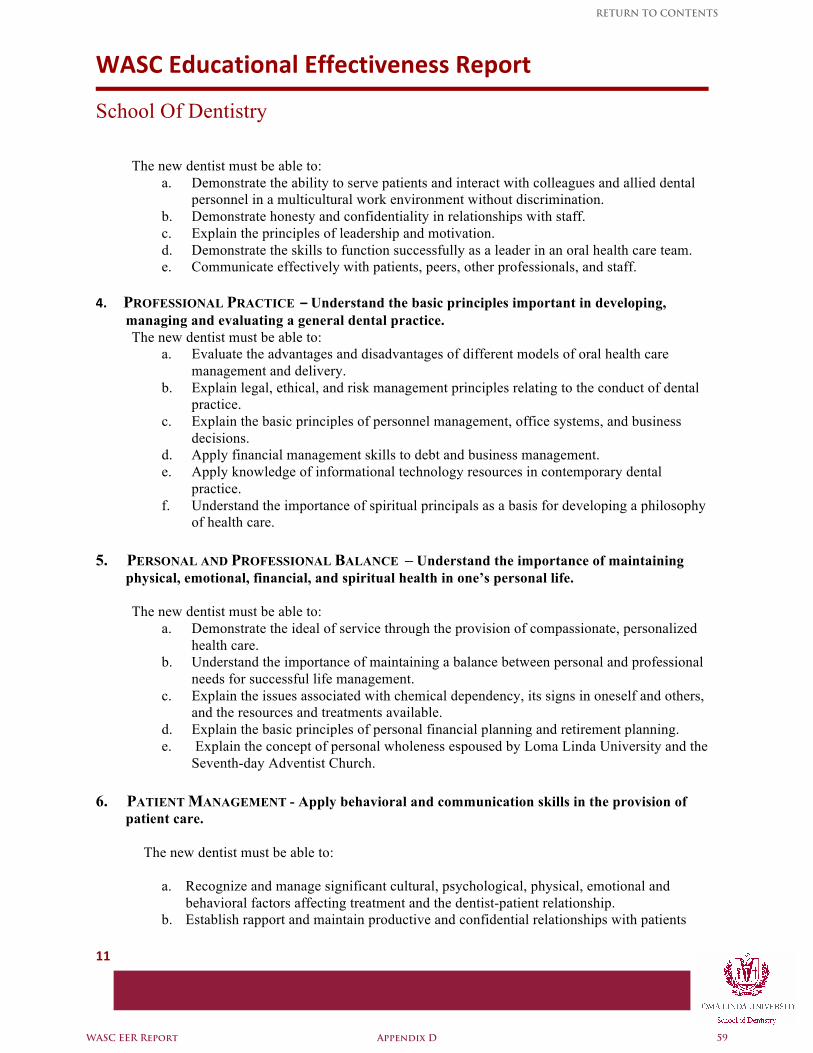
WASC Educational Effectiveness Report
School Of Dentistry
11
The new dentist must be able to:
a. Demonstrate the ability to serve patients and interact with colleagues and allied dental personnel in a multicultural work environment without discrimination.
b. Demonstrate honesty and confidentiality in relationships with staff. c. Explain the principles of leadership and motivation. d. Demonstrate the skills to function successfully as a leader in an oral health care team. e. Communicate effectively with patients, peers, other professionals, and staff.
4. PROFESSIONAL PRACTICE – Understand the basic principles important in developing,
managing and evaluating a general dental practice. The new dentist must be able to:
a. Evaluate the advantages and disadvantages of different models of oral health care management and delivery.
b. Explain legal, ethical, and risk management principles relating to the conduct of dental practice.
c. Explain the basic principles of personnel management, office systems, and business decisions.
d. Apply financial management skills to debt and business management. e. Apply knowledge of informational technology resources in contemporary dental
practice. f. Understand the importance of spiritual principals as a basis for developing a philosophy
of health care.
5. PERSONAL AND PROFESSIONAL BALANCE – Understand the importance of maintaining physical, emotional, financial, and spiritual health in one’s personal life.
The new dentist must be able to:
a. Demonstrate the ideal of service through the provision of compassionate, personalized health care.
b. Understand the importance of maintaining a balance between personal and professional needs for successful life management.
c. Explain the issues associated with chemical dependency, its signs in oneself and others, and the resources and treatments available.
d. Explain the basic principles of personal financial planning and retirement planning. e. Explain the concept of personal wholeness espoused by Loma Linda University and the
Seventh-day Adventist Church.
6. PATIENT MANAGEMENT - Apply behavioral and communication skills in the provision of patient care.
The new dentist must be able to:
a. Recognize and manage significant cultural, psychological, physical, emotional and behavioral factors affecting treatment and the dentist-patient relationship.
b. Establish rapport and maintain productive and confidential relationships with patients
WASC EER Report Appendix D 59
RETURN TO CONTENTS
WASC Educational Effectiveness Report
School Of Dentistry
12
using effective interpersonal skills. c. Recognize common behavioral disorders and understand their management.. d. Use appropriate and effective techniques to manage anxiety, distress, discomfort and
pain. e. Manage dental fear, pain and anxiety with appropriate behavioral and pharmacologic
techniques. 7. ETHICS ‐ Apply ethical principles to professional practice and personal life.
Domain II: Assessment of the Patient & the Oral Environment 8. EXAMINATION OF PATIENTS – Conduct a comprehensive examination to evaluate the
general and oral health of patients of all ages within the scope of general dentistry.
The new dentist must be able to: a. Identify the chief complaint and take a history of the present illness. b. Conduct a thorough medical history, social history, and dental history.
c. Perform an appropriate clinical and radiographic examination using diagnostic aids and tests as needed.
d. Identify patient behaviors that may contribute to orofacial problems. e. Identify biologic, pharmacologic, and social factors that may affect oral health. f. Identify signs of abuse or neglect.
g. Establish and maintain accurate patient records.
9. DIAGNOSIS - Determine a diagnosis by interpreting and correlating findings from the examination.
The new dentist must be able to: a. Identify each problem that may require treatment. b. Establish a clinical or definitive diagnosis for each disorder identified. c. Assess the impact of systemic diseases or conditions on oral health and/or delivery of
dental care. d. Recognize conditions that may require consultation with or referral to another health
care provider and generate the appropriate request. 10. TREATMENT PLANNING – Develop a comprehensive treatment plan and treatment
alternatives.
The new dentist must be able to: a. Identify treatment options for each condition diagnosed. b. Identify systemic diseases or conditions that may affect oral health or require treatment
modifications. c. Identify patient expectations and goals for treatment.
d. Explain and discuss the diagnosis, treatment options, and probable outcomes for each option with the patient or guardian.
WASC EER Report Appendix D 60
RETURN TO CONTENTS
WASC Educational Effectiveness Report
School Of Dentistry
13
e. Develop an appropriately sequenced integrated treatment plan. f. Modify the treatment plan when indicated due to unexpected circumstances,
noncompliant individuals, or for patients with special needs (such a frail, elderly or medically, mentally, or functionally compromised individuals).
g. Present the final treatment plan to the patient, including time requirements, sequence of treatment, estimated fees, payment options and other patient responsibilities in achieving treatment outcomes.
h. Secure a signed consent to treatment.
11. MANAGEMENT OF PAIN AND ANXIETY – Manage pain and anxiety with pharmacologic and non-pharmacologic methods.
The new dentist must be able to:
a. Evaluate the patient’s physical and psychological state and identify factors that may contribute to orofacial pain.
b. Manage patients with craniofacial pain and be able to differentiate pain of a non-dental origin.
12. EMERGENCY TREATMENT – Manage dental emergencies and medical emergencies that may be encountered in dental practice.
The new dentist must be able to:
a. Manage dental emergencies of infectious, inflammatory and traumatic origin. b. Provide basic life support measures for patients. c. Develop and implement an effective office strategy for preventing and managing
medical emergencies. 13. HEALTH PROMOTION AND MAINTENANCE – Provide appropriate preventive and/or
treatment regimens for patients with various dental carious states using appropriate medical and surgical treatments.
The new dentist must be able to:
a. Use accepted prevention strategies such as oral hygiene instruction, microbiologic evaluation, nutritional education and pharmacologic intervention to help patients maintain and improve their oral and systemic health.
b. Properly isolate the tooth/teeth from salivary moisture and bacterial contamination. c. Differentiate between sound enamel, hypomineralized enamel, remineralized enamel
and carious enamel. d. Develop and implement an appropriate treatment plan for enamel surfaces that can be
managed by remineralization therapies. e. Develop and implement an appropriate treatment plan for tooth surfaces with caries
involving the enamel and/or dentin. f. Remove or treat carious tooth structure and restore with appropriate materials.
WASC EER Report Appendix D 61
RETURN TO CONTENTS
WASC Educational Effectiveness Report
School Of Dentistry
14
g. Determine when a tooth has such severe carious involvement as to require extraction. 14. ASSESSMENT OF TREATMENT OUTCOMES ‐ Analyze continuously the outcomes of patient
treatment to improve the treatment. a. Perform periodic chart review and case presentations. b. Review and assess patient care outcomes.
Domain III: Restoration to Optimal Oral Health, Function & Esthetics 15. TREATMENT OF PERIODONTAL DISEASE - Evaluate and manage the treatment of periodontal
diseases.
The new dentist must be able to: a. Design and provide an appropriate oral hygiene instruction plan for the patient. b. Remove hard and soft deposits from the crown and root surfaces. c. Evaluate the outcomes of the initial phase of periodontal treatment. d. Manage the treatment of patients in the maintenance phase of therapy. e. Recognize and manage the treatment of advanced periodontal disease. f. Recognize the need for and appropriately use chemotherapeutic agents.
g. Manage the treatment of mucogingival periodontal problems. h. Manage the treatment of hard and soft tissue problems in preparation for restorative
procedures. 16. MANAGEMENT OF DISEASE OF PULPAL ORIGIN - Evaluate and manage diseases of pulpal
origin and subsequent periradicular disease.
The new dentist must be able to: a. Prevent and manage pulpal disorders through the use of indirect and direct pulp
capping and pulpotomy procedures. b. Assess case complexity of each endodontic patient. c. Manage endodontic emergencies. d. Manage non-surgical endodontic therapy on permanent teeth. e. Recognize and manage endodontic procedural accidents. f. Manage pulpal and periradicular disorders of traumatic origin. g. Manage endodontic surgical treatment. h. Manage bleaching of endodontically treated teeth. i. Evaluate outcome of endodontic treatment.
17. MANAGEMENT OF PATHOLOGIC CHANGES - Recognize and manage pathologic changes in the
tissues of the oral cavity and head and neck area.
The new dentist must be able to: a. Recognize clinical and radiographic changes that may indicate disease. b. Recognize variations of normal and developmental anomalies. c. Identify conditions that may require treatment.
WASC EER Report Appendix D 62
RETURN TO CONTENTS
WASC Educational Effectiveness Report
School Of Dentistry
15
d. Manage oral and maxillofacial pathologic conditions using pharmacologic and non-pharmacologic methods.
18. BASIC SURGICAL CARE - Provide basic surgical care.
The new dentists must be able to: a. Perform uncomplicated extractions of teeth. b. Manage surgical extraction, common intraoperative and postoperative surgical
complications. c. Manage pathological conditions such as lesions requiring biopsy, localized
odontogenic infections, and impacted third molars. d. Manage patients with dentofacial deformities or patients who can benefit from pre-
prosthetic surgery. 19. MANAGEMENT OF OCCLUSAL INSTABILITY - Recognize and manage problems related to
occlusal stability.
The new dentist must be able to: a. Recognize and manage occlusal discrepancies.
20. ASSESSMENT AND MANAGEMENT OF MAXILLARY AND MANDIBULAR SKELETO-DENTAL
DISCREPANCIES - Assess and manage maxillary and mandibular skeleto-dental discrepancies, including space maintenance, as represented in the early, mixed and permanent dentitions.
The new dentist must be able to:
a. Perform mixed dentition analyses, utilizing the Moyers and Nance methods. b. Perform a Steiner cephalometric analysis to evaluate for individual sagittal and coronal
plane skeleto-dental discrepancies compared to normative data. c. Evaluate the non-cephalometric skeleto-dental facial esthetics of the child, adolescent
or adult patient. d. Manage multidisciplinary treatment cases involving orthodontics. e. Recognize the effects of abnormal swallowing patterns, mouth breathing, bruxism, and
other parafunctional habits on the skeleto-dental structures and manage treatment. 21. RESTORATION AND REPLACEMENT OF TEETH - Manage the restoration of individual teeth
and replacement of missing teeth for proper form, function and esthetics.
The new dentist must be able to: a. Assess teeth for restorability. b. Assess esthetic and functional considerations. c. Manage preservation of space following loss of teeth or tooth structure. d. Select appropriate methods and restorative materials. e. Design fixed and removable prostheses. f. Implement appropriate treatment sequencing.
WASC EER Report Appendix D 63
RETURN TO CONTENTS
WASC Educational Effectiveness Report
School Of Dentistry
16
g. Perform biomechanically sound preparations. h. Fabricate and place biomechanically sound provisional restorations. i. Make impressions for diagnostic and treatment casts. j. Obtain anatomic and occlusal relation records for articulation of casts. k. Prepare casts and dies for the construction of restorations and prostheses. l. Manage the laboratory fabrication of restorations and prostheses. m. Evaluate and place restorations that are clinically acceptable. n. Instruct patients in follow up care of restorations and prostheses. o. Determine causes of postoperative problems after restoration and resolve such
problems.
WASC EER Report Appendix D 64
RETURN TO CONTENTS
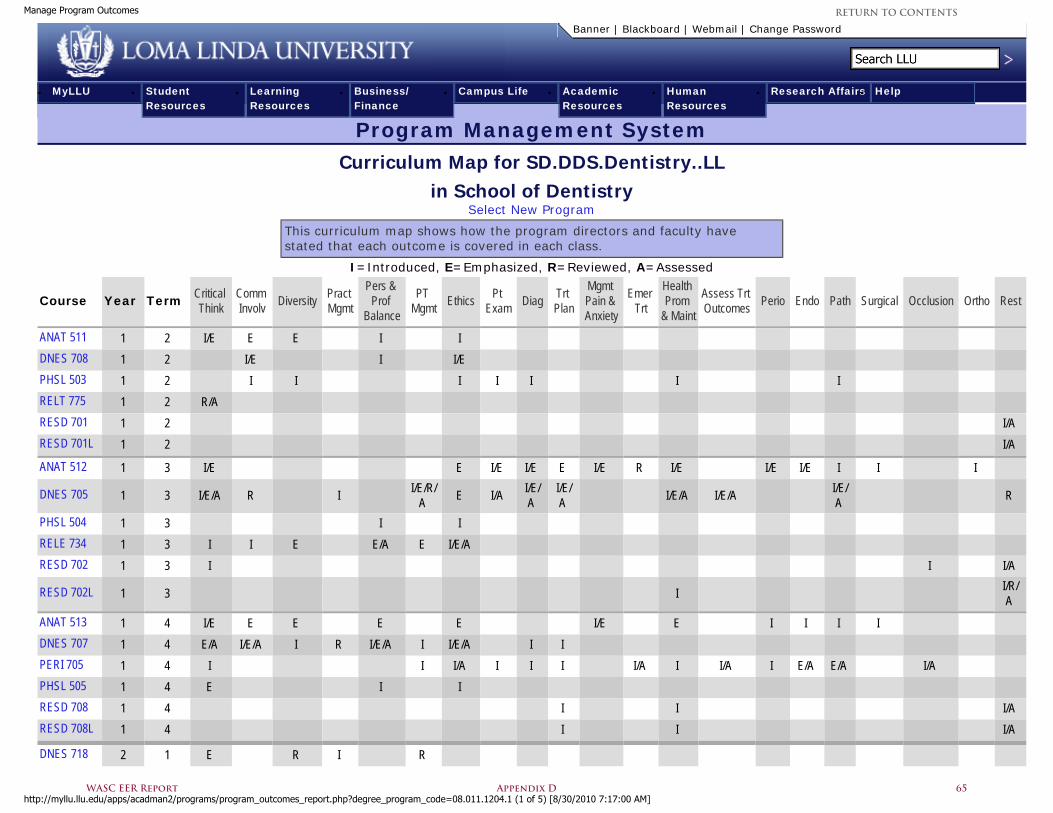
Program Management System
Curriculum Map for SD.DDS.Dentistry..LLin School of Dentistry
Select New Program
This curriculum map shows how the program directors and faculty have stated that each outcome is covered in each class.
I=Introduced, E=Emphasized, R=Reviewed, A=Assessed
Course Year Term Critical Think
Comm Involv Diversity Pract
Mgmt
Pers & Prof
Balance
PT Mgmt Ethics Pt
Exam Diag Trt Plan
Mgmt Pain & Anxiety
Emer Trt
Health Prom
& Maint
Assess Trt Outcomes Perio Endo Path Surgical Occlusion Ortho Rest
ANAT 511 1 2 I/E E E I I DNES 708 1 2 I/E I I/E PHSL 503 1 2 I I I I I I I RELT 775 1 2 R/A RESD 701 1 2 I/A RESD 701L 1 2 I/A
ANAT 512 1 3 I/E E I/E I/E E I/E R I/E I/E I/E I I I
DNES 705 1 3 I/E/A R I I/E/R/A E I/A I/E/
A I/E/A I/E/A I/E/A I/E/
A R
PHSL 504 1 3 I I RELE 734 1 3 I I E E/A E I/E/A RESD 702 1 3 I I I/A
RESD 702L 1 3 I I/R/A
ANAT 513 1 4 I/E E E E E I/E E I I I I DNES 707 1 4 E/A I/E/A I R I/E/A I I/E/A I I PERI 705 1 4 I I I/A I I I I/A I I/A I E/A E/A I/A PHSL 505 1 4 E I I RESD 708 1 4 I I I/A RESD 708L 1 4 I I I/A
DNES 718 2 1 E R I R
Manage Program Outcomes
Banner | Blackboard | Webmail | Change Password
http://myllu.llu.edu/apps/acadman2/programs/program_outcomes_report.php?degree_program_code=08.011.1204.1 (1 of 5) [8/30/2010 7:17:00 AM]
● MyLLU ● Student Resources
● Learning Resources
● Business/Finance
● Campus Life ● Academic Resources
● Human Resources
● Research Affairs● Help
WASC EER Report Appendix D 65
RETURN TO CONTENTS
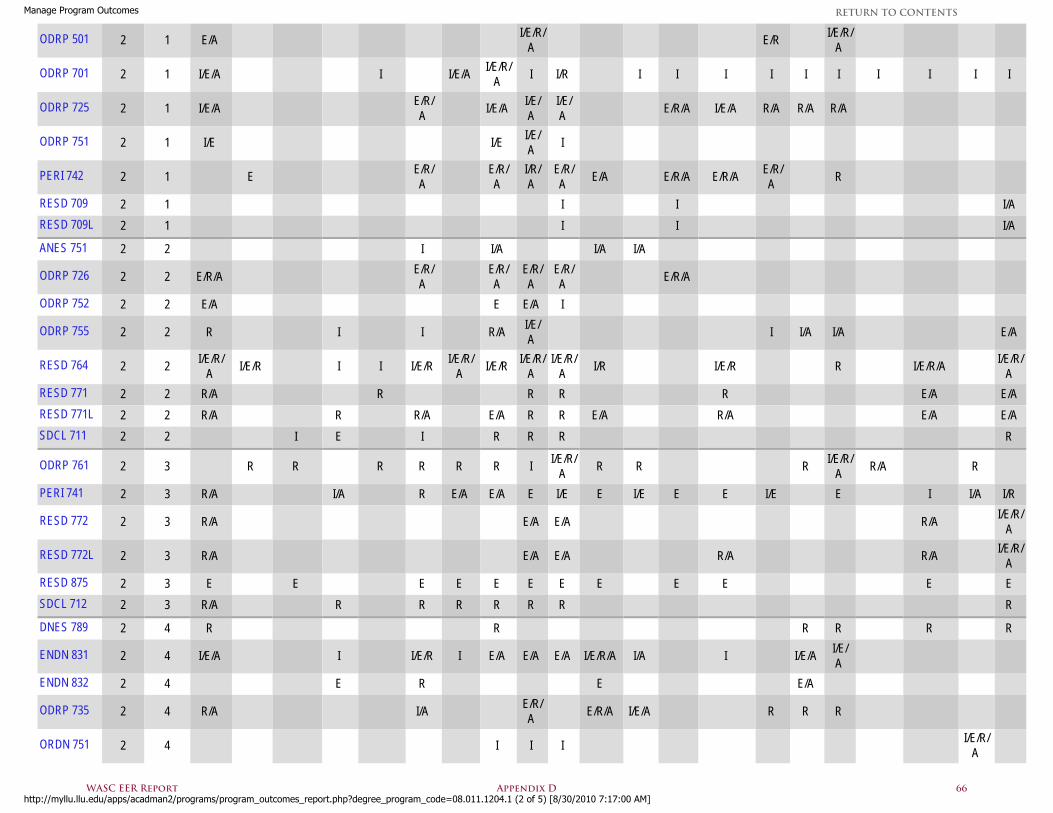
Manage Program Outcomes
ODRP 501 2 1 E/A I/E/R/A E/R I/E/R/
A
ODRP 701 2 1 I/E/A I I/E/A I/E/R/A I I/R I I I I I I I I I I
ODRP 725 2 1 I/E/A E/R/A I/E/A I/E/
A I/E/A E/R/A I/E/A R/A R/A R/A
ODRP 751 2 1 I/E I/E I/E/A I
PERI 742 2 1 E E/R/A E/R/
A I/R/A
E/R/A E/A E/R/A E/R/A E/R/
A R
RESD 709 2 1 I I I/A RESD 709L 2 1 I I I/A
ANES 751 2 2 I I/A I/A I/A
ODRP 726 2 2 E/R/A E/R/A E/R/
A E/R/A
E/R/A E/R/A
ODRP 752 2 2 E/A E E/A I
ODRP 755 2 2 R I I R/A I/E/A I I/A I/A E/A
RESD 764 2 2 I/E/R/A I/E/R I I I/E/R I/E/R/
A I/E/R I/E/R/A
I/E/R/A I/R I/E/R R I/E/R/A I/E/R/
A RESD 771 2 2 R/A R R R R E/A E/A RESD 771L 2 2 R/A R R/A E/A R R E/A R/A E/A E/A SDCL 711 2 2 I E I R R R R
ODRP 761 2 3 R R R R R R I I/E/R/A R R R I/E/R/
A R/A R
PERI 741 2 3 R/A I/A R E/A E/A E I/E E I/E E E I/E E I I/A I/R
RESD 772 2 3 R/A E/A E/A R/A I/E/R/A
RESD 772L 2 3 R/A E/A E/A R/A R/A I/E/R/A
RESD 875 2 3 E E E E E E E E E E E E SDCL 712 2 3 R/A R R R R R R R
DNES 789 2 4 R R R R R R
ENDN 831 2 4 I/E/A I I/E/R I E/A E/A E/A I/E/R/A I/A I I/E/A I/E/A
ENDN 832 2 4 E R E E/A
ODRP 735 2 4 R/A I/A E/R/A E/R/A I/E/A R R R
ORDN 751 2 4 I I I I/E/R/A
http://myllu.llu.edu/apps/acadman2/programs/program_outcomes_report.php?degree_program_code=08.011.1204.1 (2 of 5) [8/30/2010 7:17:00 AM]WASC EER Report Appendix D 66
RETURN TO CONTENTS
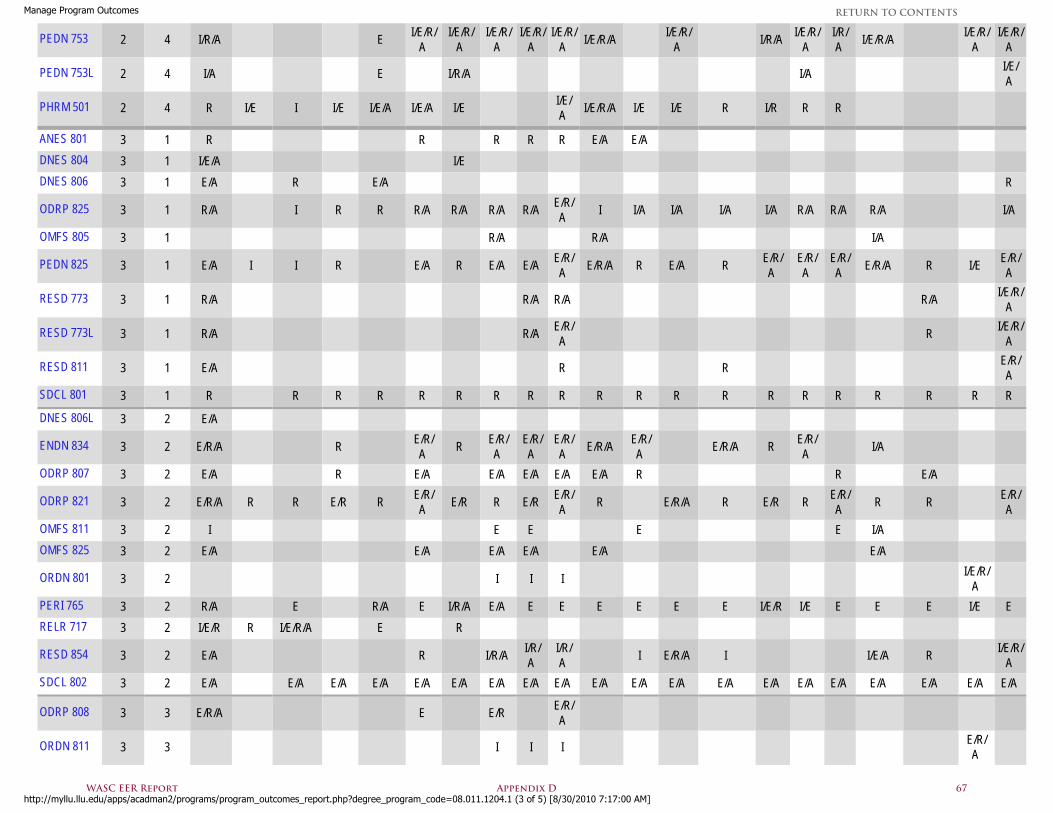
Manage Program Outcomes
PEDN 753 2 4 I/R/A E I/E/R/A
I/E/R/A
I/E/R/A
I/E/R/A
I/E/R/A I/E/R/A I/E/R/
A I/R/A I/E/R/A
I/R/A I/E/R/A I/E/R/
A I/E/R/
A
PEDN 753L 2 4 I/A E I/R/A I/A I/E/A
PHRM 501 2 4 R I/E I I/E I/E/A I/E/A I/E I/E/A I/E/R/A I/E I/E R I/R R R
ANES 801 3 1 R R R R R E/A E/A DNES 804 3 1 I/E/A I/E DNES 806 3 1 E/A R E/A R
ODRP 825 3 1 R/A I R R R/A R/A R/A R/A E/R/A I I/A I/A I/A I/A R/A R/A R/A I/A
OMFS 805 3 1 R/A R/A I/A
PEDN 825 3 1 E/A I I R E/A R E/A E/A E/R/A E/R/A R E/A R E/R/
A E/R/A
E/R/A E/R/A R I/E E/R/
A
RESD 773 3 1 R/A R/A R/A R/A I/E/R/A
RESD 773L 3 1 R/A R/A E/R/A R I/E/R/
A
RESD 811 3 1 E/A R R E/R/A
SDCL 801 3 1 R R R R R R R R R R R R R R R R R R R R
DNES 806L 3 2 E/A
ENDN 834 3 2 E/R/A R E/R/A R E/R/
A E/R/A
E/R/A E/R/A E/R/
A E/R/A R E/R/A I/A
ODRP 807 3 2 E/A R E/A E/A E/A E/A E/A R R E/A
ODRP 821 3 2 E/R/A R R E/R R E/R/A E/R R E/R E/R/
A R E/R/A R E/R R E/R/A R R E/R/
A OMFS 811 3 2 I E E E E I/A OMFS 825 3 2 E/A E/A E/A E/A E/A E/A
ORDN 801 3 2 I I I I/E/R/A
PERI 765 3 2 R/A E R/A E I/R/A E/A E E E E E E I/E/R I/E E E E I/E E RELR 717 3 2 I/E/R R I/E/R/A E R
RESD 854 3 2 E/A R I/R/A I/R/A
I/R/A I E/R/A I I/E/A R I/E/R/
A SDCL 802 3 2 E/A E/A E/A E/A E/A E/A E/A E/A E/A E/A E/A E/A E/A E/A E/A E/A E/A E/A E/A E/A
ODRP 808 3 3 E/R/A E E/R E/R/A
ORDN 811 3 3 I I I E/R/A
http://myllu.llu.edu/apps/acadman2/programs/program_outcomes_report.php?degree_program_code=08.011.1204.1 (3 of 5) [8/30/2010 7:17:00 AM]WASC EER Report Appendix D 67
RETURN TO CONTENTS
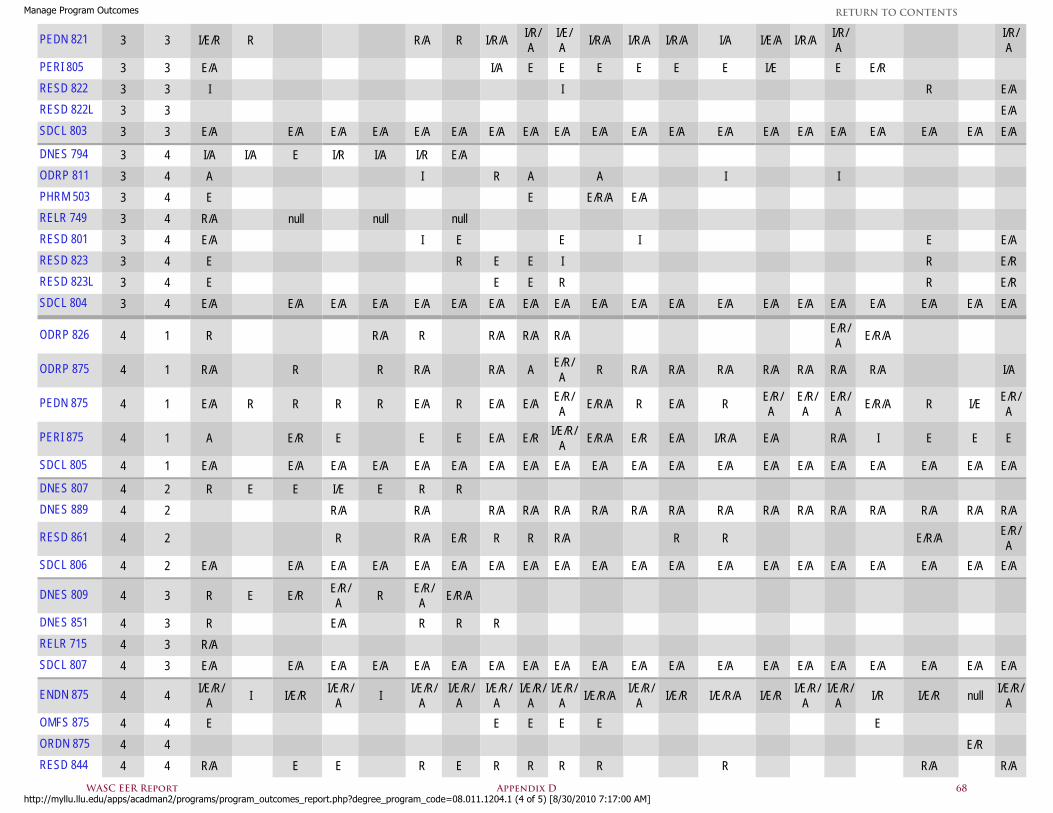
Manage Program Outcomes
PEDN 821 3 3 I/E/R R R/A R I/R/A I/R/A
I/E/A I/R/A I/R/A I/R/A I/A I/E/A I/R/A I/R/
A I/R/A
PERI 805 3 3 E/A I/A E E E E E E I/E E E/R RESD 822 3 3 I I R E/A RESD 822L 3 3 E/A SDCL 803 3 3 E/A E/A E/A E/A E/A E/A E/A E/A E/A E/A E/A E/A E/A E/A E/A E/A E/A E/A E/A E/A
DNES 794 3 4 I/A I/A E I/R I/A I/R E/A ODRP 811 3 4 A I R A A I I PHRM 503 3 4 E E E/R/A E/A RELR 749 3 4 R/A null null null RESD 801 3 4 E/A I E E I E E/A RESD 823 3 4 E R E E I R E/R RESD 823L 3 4 E E E R R E/R SDCL 804 3 4 E/A E/A E/A E/A E/A E/A E/A E/A E/A E/A E/A E/A E/A E/A E/A E/A E/A E/A E/A E/A
ODRP 826 4 1 R R/A R R/A R/A R/A E/R/A E/R/A
ODRP 875 4 1 R/A R R R/A R/A A E/R/A R R/A R/A R/A R/A R/A R/A R/A I/A
PEDN 875 4 1 E/A R R R R E/A R E/A E/A E/R/A E/R/A R E/A R E/R/
A E/R/A
E/R/A E/R/A R I/E E/R/
A
PERI 875 4 1 A E/R E E E E/A E/R I/E/R/A E/R/A E/R E/A I/R/A E/A R/A I E E E
SDCL 805 4 1 E/A E/A E/A E/A E/A E/A E/A E/A E/A E/A E/A E/A E/A E/A E/A E/A E/A E/A E/A E/A
DNES 807 4 2 R E E I/E E R R DNES 889 4 2 R/A R/A R/A R/A R/A R/A R/A R/A R/A R/A R/A R/A R/A R/A R/A R/A
RESD 861 4 2 R R/A E/R R R R/A R R E/R/A E/R/A
SDCL 806 4 2 E/A E/A E/A E/A E/A E/A E/A E/A E/A E/A E/A E/A E/A E/A E/A E/A E/A E/A E/A E/A
DNES 809 4 3 R E E/R E/R/A R E/R/
A E/R/A
DNES 851 4 3 R E/A R R R RELR 715 4 3 R/A SDCL 807 4 3 E/A E/A E/A E/A E/A E/A E/A E/A E/A E/A E/A E/A E/A E/A E/A E/A E/A E/A E/A E/A
ENDN 875 4 4 I/E/R/A I I/E/R I/E/R/
A I I/E/R/A
I/E/R/A
I/E/R/A
I/E/R/A
I/E/R/A I/E/R/A I/E/R/
A I/E/R I/E/R/A I/E/R I/E/R/A
I/E/R/A I/R I/E/R null I/E/R/
A OMFS 875 4 4 E E E E E E ORDN 875 4 4 E/R RESD 844 4 4 R/A E E R E R R R R R R/A R/A
http://myllu.llu.edu/apps/acadman2/programs/program_outcomes_report.php?degree_program_code=08.011.1204.1 (4 of 5) [8/30/2010 7:17:00 AM]WASC EER Report Appendix D 68
RETURN TO CONTENTS
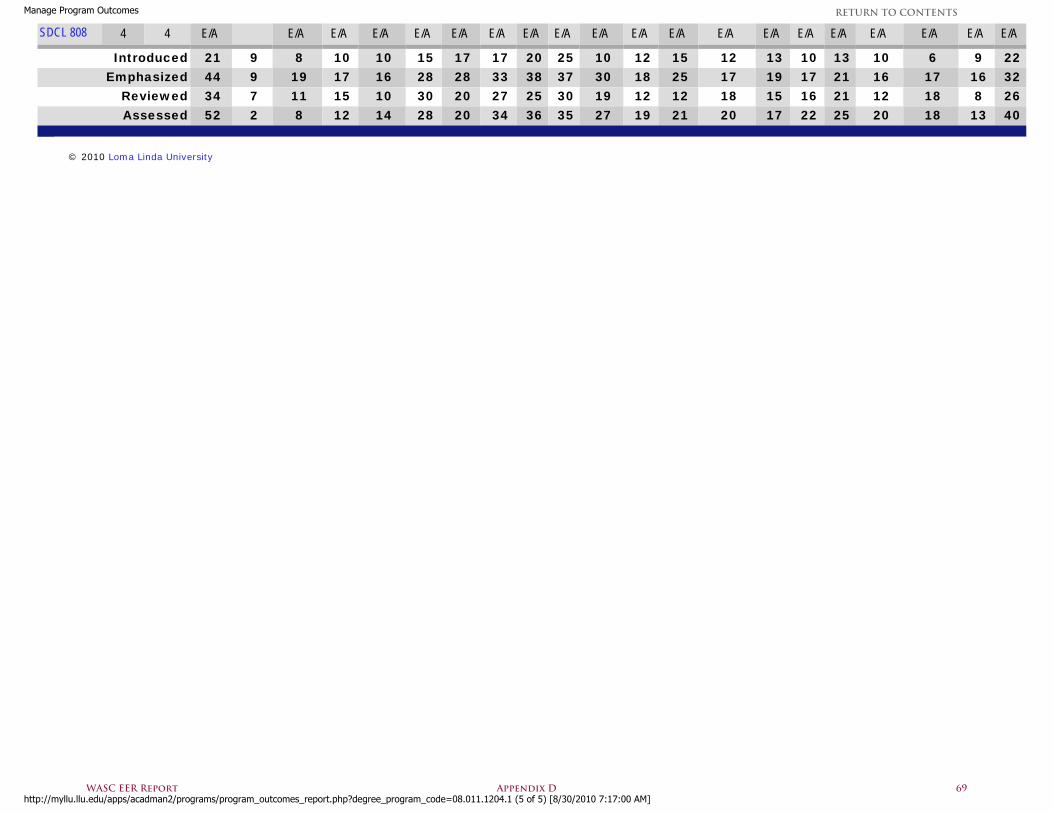
Manage Program Outcomes
SDCL 808 4 4 E/A E/A E/A E/A E/A E/A E/A E/A E/A E/A E/A E/A E/A E/A E/A E/A E/A E/A E/A E/A
Introduced 21 9 8 10 10 15 17 17 20 25 10 12 15 12 13 10 13 10 6 9 22Emphasized 44 9 19 17 16 28 28 33 38 37 30 18 25 17 19 17 21 16 17 16 32
Reviewed 34 7 11 15 10 30 20 27 25 30 19 12 12 18 15 16 21 12 18 8 26Assessed 52 2 8 12 14 28 20 34 36 35 27 19 21 20 17 22 25 20 18 13 40
© 2010 Loma Linda University
http://myllu.llu.edu/apps/acadman2/programs/program_outcomes_report.php?degree_program_code=08.011.1204.1 (5 of 5) [8/30/2010 7:17:00 AM]WASC EER Report Appendix D 69
RETURN TO CONTENTS
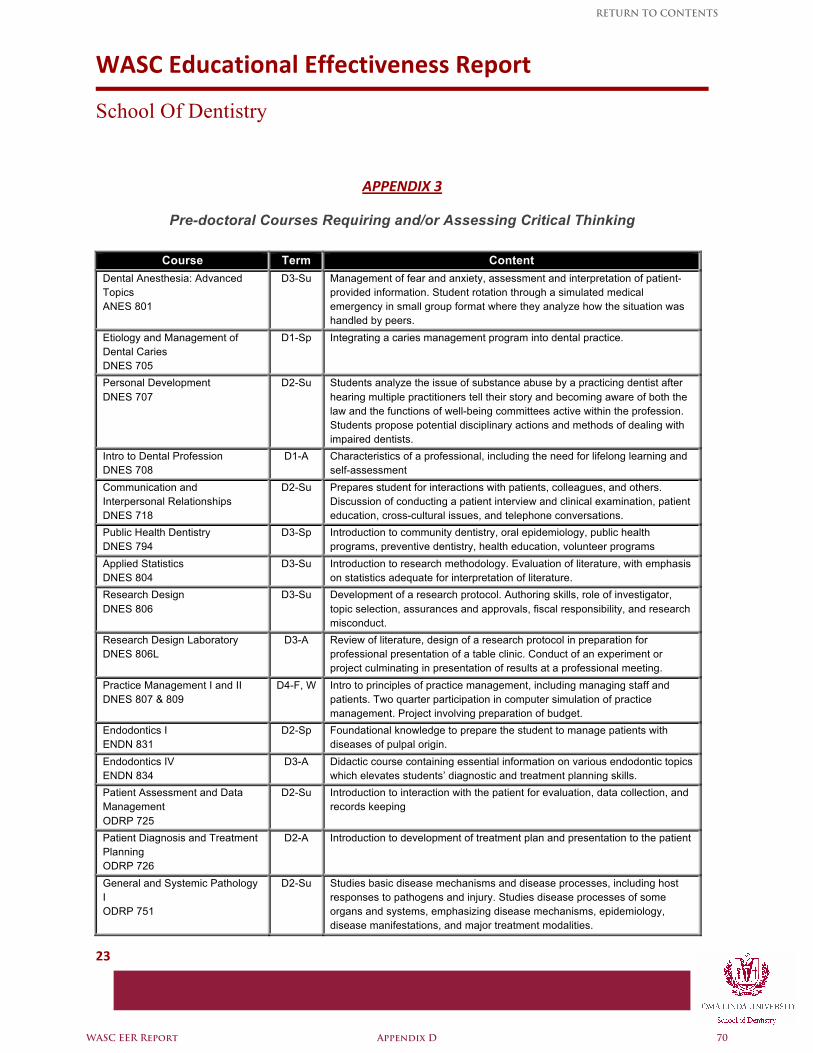
WASC Educational Effectiveness Report
School Of Dentistry
23
APPENDIX 3
Pre-doctoral Courses Requiring and/or Assessing Critical Thinking
Course Term Content Dental Anesthesia: Advanced Topics ANES 801
D3-Su Management of fear and anxiety, assessment and interpretation of patient-provided information. Student rotation through a simulated medical emergency in small group format where they analyze how the situation was handled by peers.
Etiology and Management of Dental Caries DNES 705
D1-Sp Integrating a caries management program into dental practice.
Personal Development DNES 707
D2-Su Students analyze the issue of substance abuse by a practicing dentist after hearing multiple practitioners tell their story and becoming aware of both the law and the functions of well-being committees active within the profession. Students propose potential disciplinary actions and methods of dealing with impaired dentists.
Intro to Dental Profession DNES 708
D1-A Characteristics of a professional, including the need for lifelong learning and self-assessment
Communication and Interpersonal Relationships DNES 718
D2-Su Prepares student for interactions with patients, colleagues, and others. Discussion of conducting a patient interview and clinical examination, patient education, cross-cultural issues, and telephone conversations.
Public Health Dentistry DNES 794
D3-Sp Introduction to community dentistry, oral epidemiology, public health programs, preventive dentistry, health education, volunteer programs
Applied Statistics DNES 804
D3-Su Introduction to research methodology. Evaluation of literature, with emphasis on statistics adequate for interpretation of literature.
Research Design DNES 806
D3-Su Development of a research protocol. Authoring skills, role of investigator, topic selection, assurances and approvals, fiscal responsibility, and research misconduct.
Research Design Laboratory DNES 806L
D3-A Review of literature, design of a research protocol in preparation for professional presentation of a table clinic. Conduct of an experiment or project culminating in presentation of results at a professional meeting.
Practice Management I and II DNES 807 & 809
D4-F, W Intro to principles of practice management, including managing staff and patients. Two quarter participation in computer simulation of practice management. Project involving preparation of budget.
Endodontics I ENDN 831
D2-Sp Foundational knowledge to prepare the student to manage patients with diseases of pulpal origin.
Endodontics IV ENDN 834
D3-A Didactic course containing essential information on various endodontic topics which elevates students’ diagnostic and treatment planning skills.
Patient Assessment and Data Management ODRP 725
D2-Su Introduction to interaction with the patient for evaluation, data collection, and records keeping
Patient Diagnosis and Treatment Planning ODRP 726
D2-A Introduction to development of treatment plan and presentation to the patient
General and Systemic Pathology I ODRP 751
D2-Su Studies basic disease mechanisms and disease processes, including host responses to pathogens and injury. Studies disease processes of some organs and systems, emphasizing disease mechanisms, epidemiology, disease manifestations, and major treatment modalities.
WASC EER Report Appendix D 70
RETURN TO CONTENTS
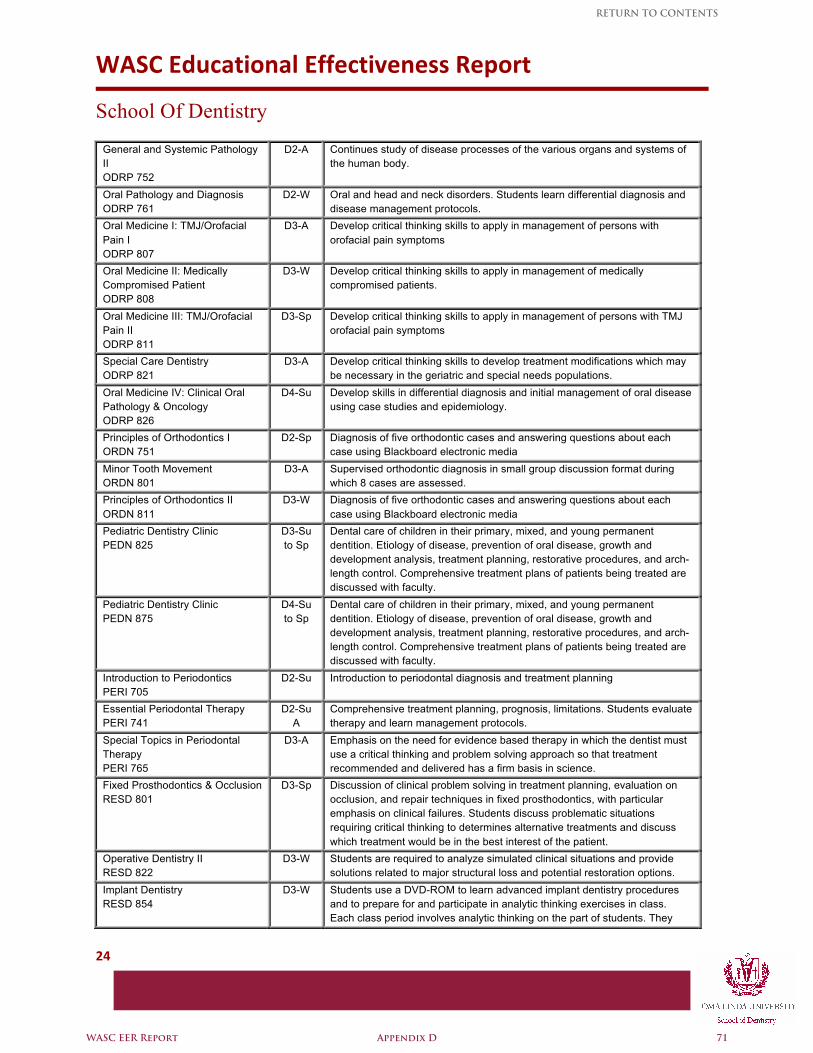
WASC Educational Effectiveness Report
School Of Dentistry
24
General and Systemic Pathology II ODRP 752
D2-A Continues study of disease processes of the various organs and systems of the human body.
Oral Pathology and Diagnosis ODRP 761
D2-W Oral and head and neck disorders. Students learn differential diagnosis and disease management protocols.
Oral Medicine I: TMJ/Orofacial Pain I ODRP 807
D3-A Develop critical thinking skills to apply in management of persons with orofacial pain symptoms
Oral Medicine II: Medically Compromised Patient ODRP 808
D3-W Develop critical thinking skills to apply in management of medically compromised patients.
Oral Medicine III: TMJ/Orofacial Pain II ODRP 811
D3-Sp Develop critical thinking skills to apply in management of persons with TMJ orofacial pain symptoms
Special Care Dentistry ODRP 821
D3-A Develop critical thinking skills to develop treatment modifications which may be necessary in the geriatric and special needs populations.
Oral Medicine IV: Clinical Oral Pathology & Oncology ODRP 826
D4-Su Develop skills in differential diagnosis and initial management of oral disease using case studies and epidemiology.
Principles of Orthodontics I ORDN 751
D2-Sp Diagnosis of five orthodontic cases and answering questions about each case using Blackboard electronic media
Minor Tooth Movement ORDN 801
D3-A Supervised orthodontic diagnosis in small group discussion format during which 8 cases are assessed.
Principles of Orthodontics II ORDN 811
D3-W Diagnosis of five orthodontic cases and answering questions about each case using Blackboard electronic media
Pediatric Dentistry Clinic PEDN 825
D3-Su to Sp
Dental care of children in their primary, mixed, and young permanent dentition. Etiology of disease, prevention of oral disease, growth and development analysis, treatment planning, restorative procedures, and arch-length control. Comprehensive treatment plans of patients being treated are discussed with faculty.
Pediatric Dentistry Clinic PEDN 875
D4-Su to Sp
Dental care of children in their primary, mixed, and young permanent dentition. Etiology of disease, prevention of oral disease, growth and development analysis, treatment planning, restorative procedures, and arch-length control. Comprehensive treatment plans of patients being treated are discussed with faculty.
Introduction to Periodontics PERI 705
D2-Su Introduction to periodontal diagnosis and treatment planning
Essential Periodontal Therapy PERI 741
D2-Su A
Comprehensive treatment planning, prognosis, limitations. Students evaluate therapy and learn management protocols.
Special Topics in Periodontal Therapy PERI 765
D3-A Emphasis on the need for evidence based therapy in which the dentist must use a critical thinking and problem solving approach so that treatment recommended and delivered has a firm basis in science.
Fixed Prosthodontics & Occlusion RESD 801
D3-Sp Discussion of clinical problem solving in treatment planning, evaluation on occlusion, and repair techniques in fixed prosthodontics, with particular emphasis on clinical failures. Students discuss problematic situations requiring critical thinking to determines alternative treatments and discuss which treatment would be in the best interest of the patient.
Operative Dentistry II RESD 822
D3-W Students are required to analyze simulated clinical situations and provide solutions related to major structural loss and potential restoration options.
Implant Dentistry RESD 854
D3-W Students use a DVD-ROM to learn advanced implant dentistry procedures and to prepare for and participate in analytic thinking exercises in class. Each class period involves analytic thinking on the part of students. They
WASC EER Report Appendix D 71
RETURN TO CONTENTS
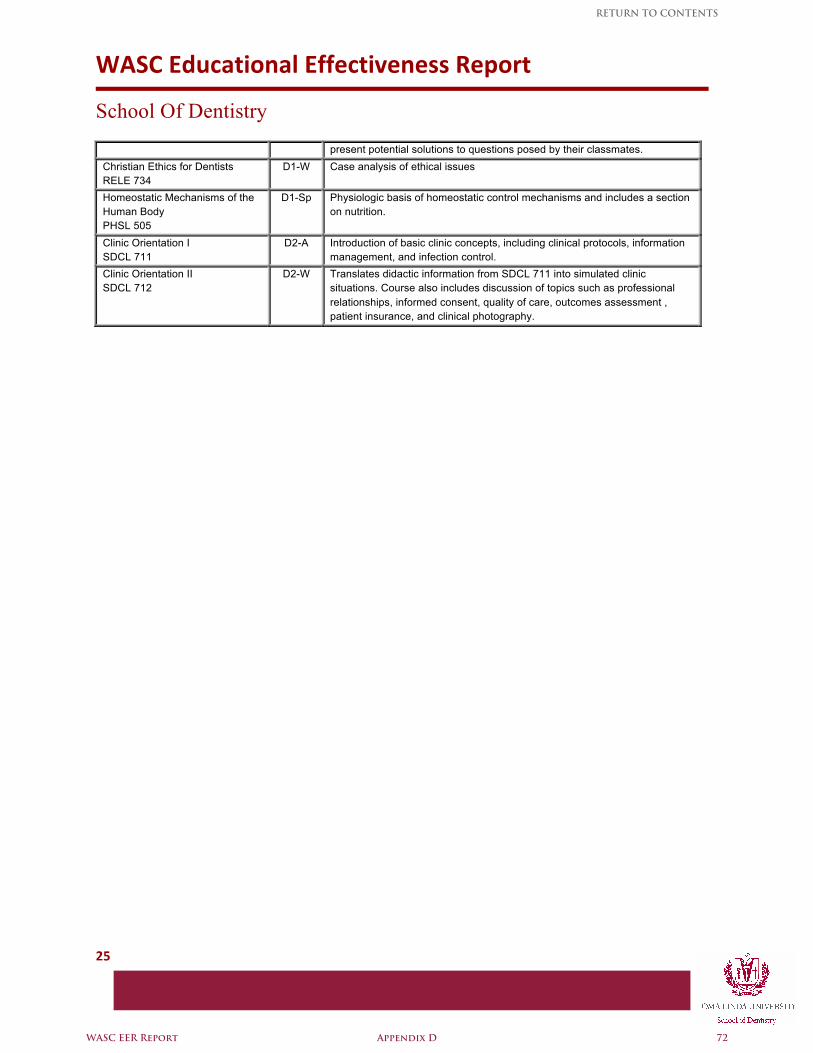
WASC Educational Effectiveness Report
School Of Dentistry
25
present potential solutions to questions posed by their classmates. Christian Ethics for Dentists RELE 734
D1-W Case analysis of ethical issues
Homeostatic Mechanisms of the Human Body PHSL 505
D1-Sp Physiologic basis of homeostatic control mechanisms and includes a section on nutrition.
Clinic Orientation I SDCL 711
D2-A Introduction of basic clinic concepts, including clinical protocols, information management, and infection control.
Clinic Orientation II SDCL 712
D2-W Translates didactic information from SDCL 711 into simulated clinic situations. Course also includes discussion of topics such as professional relationships, informed consent, quality of care, outcomes assessment , patient insurance, and clinical photography.
WASC EER Report Appendix D 72
RETURN TO CONTENTS
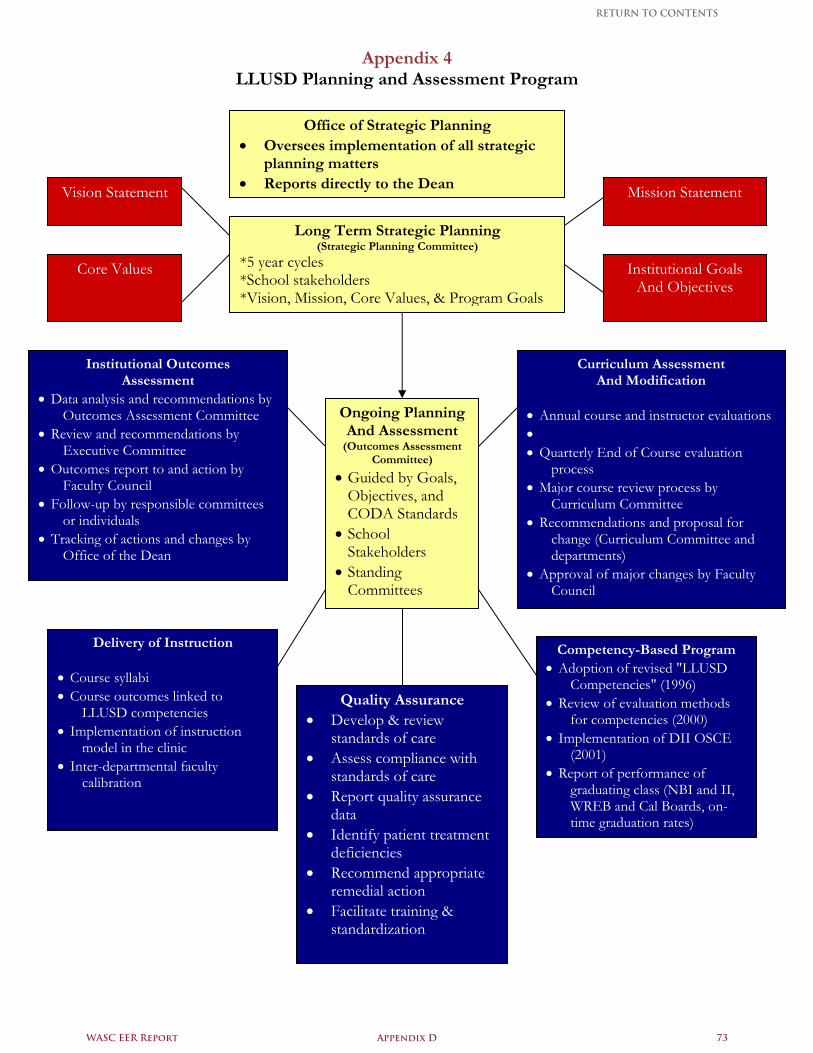
Appendix 4 LLUSD Planning and Assessment Program
Long Term Strategic Planning (Strategic Planning Committee)
*5 year cycles *School stakeholders *Vision, Mission, Core Values, & Program Goals
Ongoing Planning And Assessment
(Outcomes Assessment Committee)
• Guided by Goals, Objectives, and CODA Standards
• School Stakeholders
• Standing Committees
Mission Statement
Office of Strategic Planning • Oversees implementation of all strategic
planning matters • Reports directly to the DeanVision Statement
Institutional Goals And Objectives
Core Values
Institutional Outcomes Assessment
• Data analysis and recommendations by Outcomes Assessment Committee
• Review and recommendations by Executive Committee
• Outcomes report to and action by Faculty Council
• Follow-up by responsible committees or individuals
• Tracking of actions and changes by Office of the Dean
Curriculum Assessment And Modification
• Annual course and instructor evaluations • • Quarterly End of Course evaluation
process • Major course review process by
Curriculum Committee • Recommendations and proposal for
change (Curriculum Committee and departments)
• Approval of major changes by Faculty Council
Quality Assurance • Develop & review
standards of care • Assess compliance with
standards of care • Report quality assurance
data • Identify patient treatment
deficiencies • Recommend appropriate
remedial action • Facilitate training &
standardization
Competency-Based Program • Adoption of revised "LLUSD
Competencies" (1996) • Review of evaluation methods
for competencies (2000) • Implementation of DII OSCE
(2001) • Report of performance of
graduating class (NBI and II, WREB and Cal Boards, on-time graduation rates)
Delivery of Instruction • Course syllabi • Course outcomes linked to
LLUSD competencies • Implementation of instruction
model in the clinic • Inter-departmental faculty
calibration
WASC EER Report Appendix D 73
RETURN TO CONTENTS
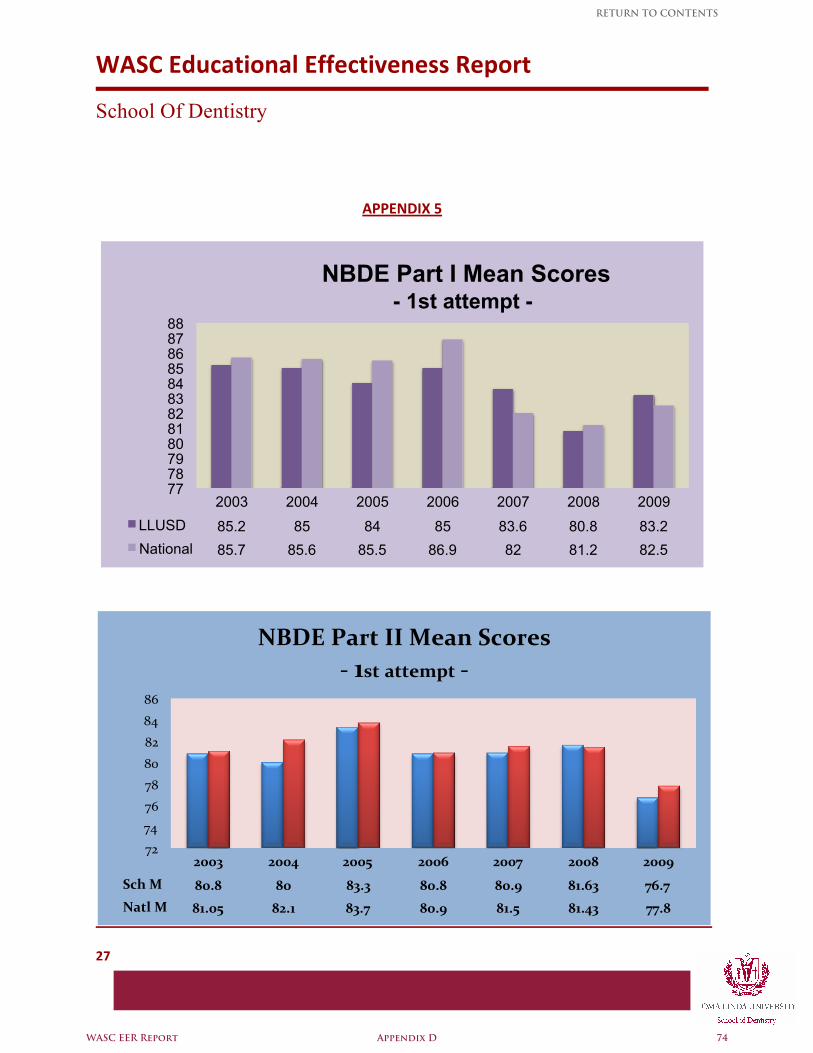
WASC Educational Effectiveness Report
School Of Dentistry
27
APPENDIX 5
2003 2004 2005 2006 2007 2008 2009 LLUSD 85.2 85 84 85 83.6 80.8 83.2 National 85.7 85.6 85.5 86.9 82 81.2 82.5
77 78 79 80 81 82 83 84 85 86 87 88
NBDE Part I Mean Scores - 1st attempt -
2003 2004 2005 2006 2007 2008 2009
Sch M 80.8 80 83.3 80.8 80.9 81.63 76.7 Natl M 81.05 82.1 83.7 80.9 81.5 81.43 77.8
72
74
76
78
80
82
84
86
NBDE Part II Mean Scores ‐ 1st attempt ‐
WASC EER Report Appendix D 74
RETURN TO CONTENTS
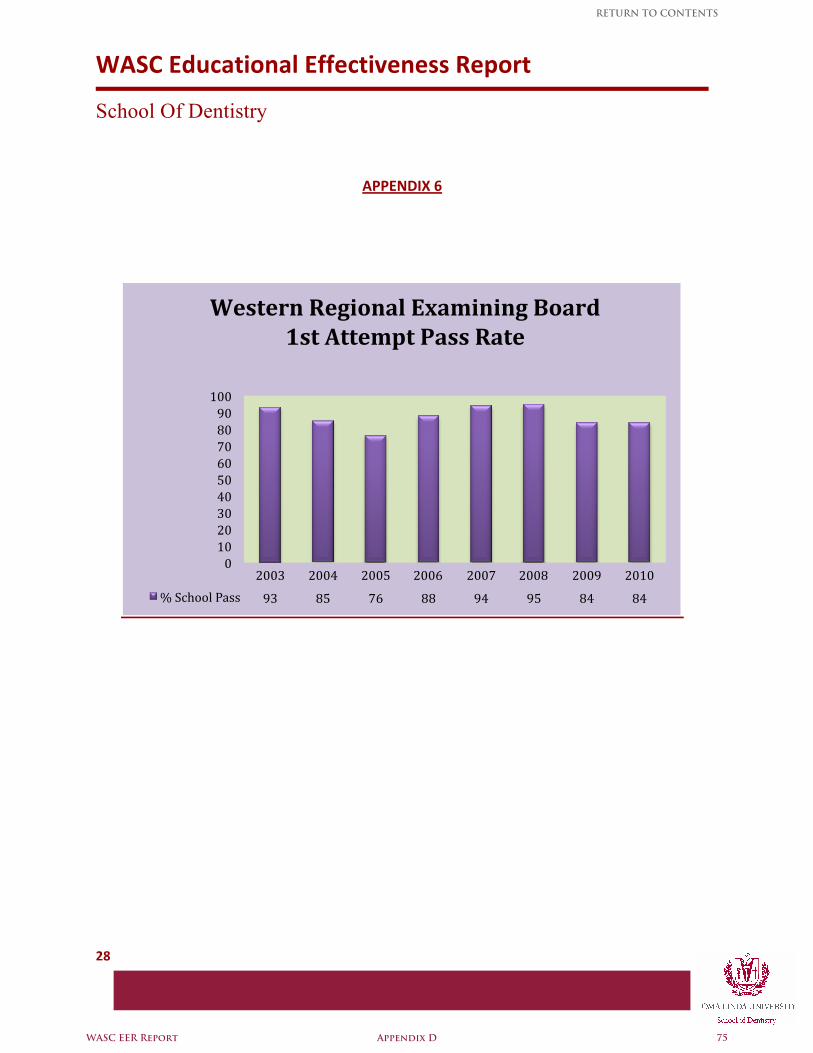
WASC Educational Effectiveness Report
School Of Dentistry
28
APPENDIX 6
2003 2004 2005 2006 2007 2008 2009 2010 % School Pass 93 85 76 88 94 95 84 84
0 10 20 30 40 50 60 70 80 90 100
Western Regional Examining Board 1st Attempt Pass Rate
WASC EER Report Appendix D 75
RETURN TO CONTENTS
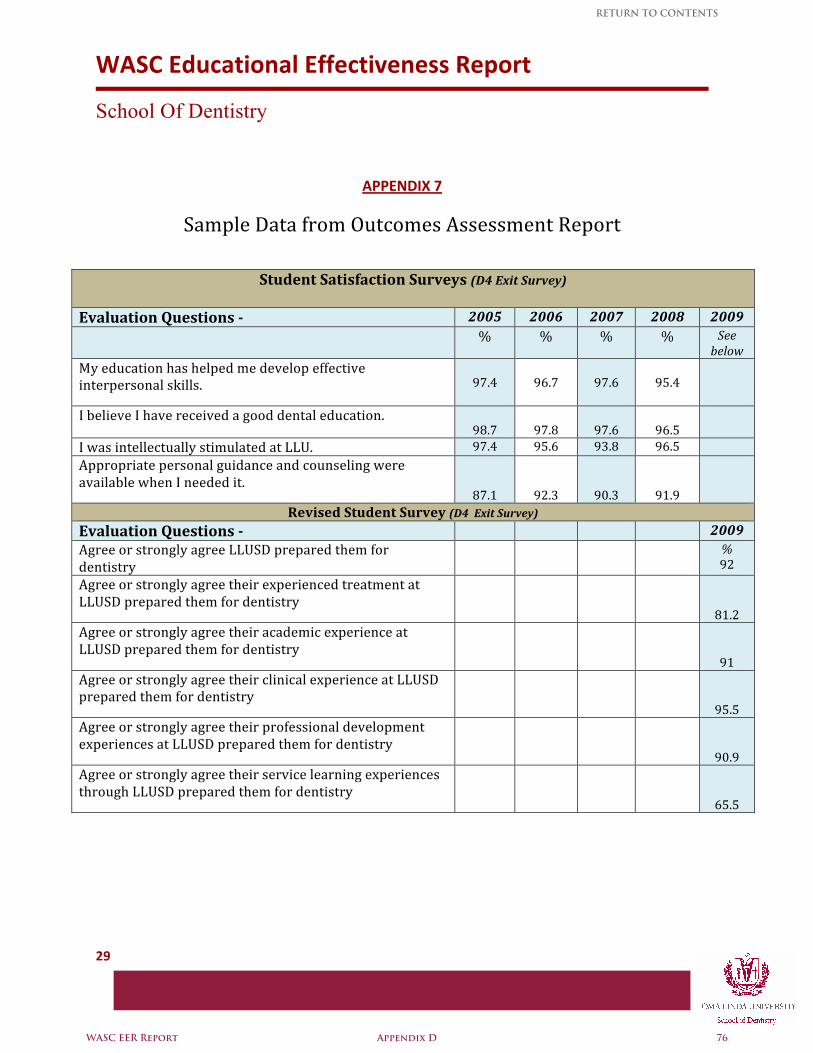
WASC Educational Effectiveness Report
School Of Dentistry
29
APPENDIX 7
Sample Data from Outcomes Assessment Report
Student Satisfaction Surveys (D4 Exit Survey)
Evaluation Questions 2005 2006 2007 2008 2009 % % % % See
below My education has helped me develop effective interpersonal skills.
97.4
96.7
97.6
95.4
I believe I have received a good dental education. 98.7
97.8
97.6
96.5
I was intellectually stimulated at LLU. 97.4 95.6 93.8 96.5 Appropriate personal guidance and counseling were available when I needed it.
87.1
92.3
90.3
91.9
Revised Student Survey (D4 Exit Survey) Evaluation Questions 2009 Agree or strongly agree LLUSD prepared them for dentistry
% 92
Agree or strongly agree their experienced treatment at LLUSD prepared them for dentistry
81.2 Agree or strongly agree their academic experience at LLUSD prepared them for dentistry
91
Agree or strongly agree their clinical experience at LLUSD prepared them for dentistry
95.5 Agree or strongly agree their professional development experiences at LLUSD prepared them for dentistry
90.9 Agree or strongly agree their service learning experiences through LLUSD prepared them for dentistry
65.5
WASC EER Report Appendix D 76
RETURN TO CONTENTS
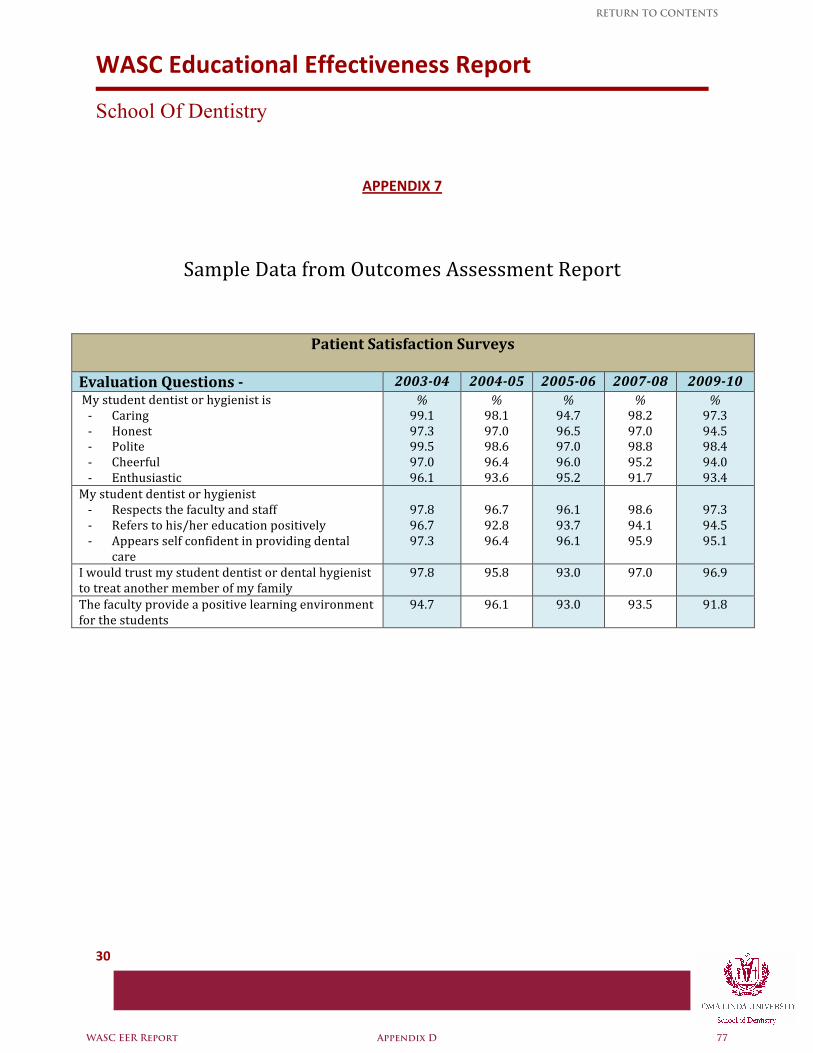
WASC Educational Effectiveness Report
School Of Dentistry
30
APPENDIX 7
Sample Data from Outcomes Assessment Report
Patient Satisfaction Surveys
Evaluation Questions 200304 200405 200506 200708 200910 My student dentist or hygienist is ‐ Caring ‐ Honest ‐ Polite ‐ Cheerful ‐ Enthusiastic
% 99.1 97.3 99.5 97.0 96.1
% 98.1 97.0 98.6 96.4 93.6
% 94.7 96.5 97.0 96.0 95.2
% 98.2 97.0 98.8 95.2 91.7
% 97.3 94.5 98.4 94.0 93.4
My student dentist or hygienist ‐ Respects the faculty and staff ‐ Refers to his/her education positively ‐ Appears self confident in providing dental
care
97.8 96.7 97.3
96.7 92.8 96.4
96.1 93.7 96.1
98.6 94.1 95.9
97.3 94.5 95.1
I would trust my student dentist or dental hygienist to treat another member of my family
97.8 95.8 93.0 97.0 96.9
The faculty provide a positive learning environment for the students
94.7 96.1 93.0 93.5 91.8
WASC EER Report Appendix D 77
RETURN TO CONTENTS
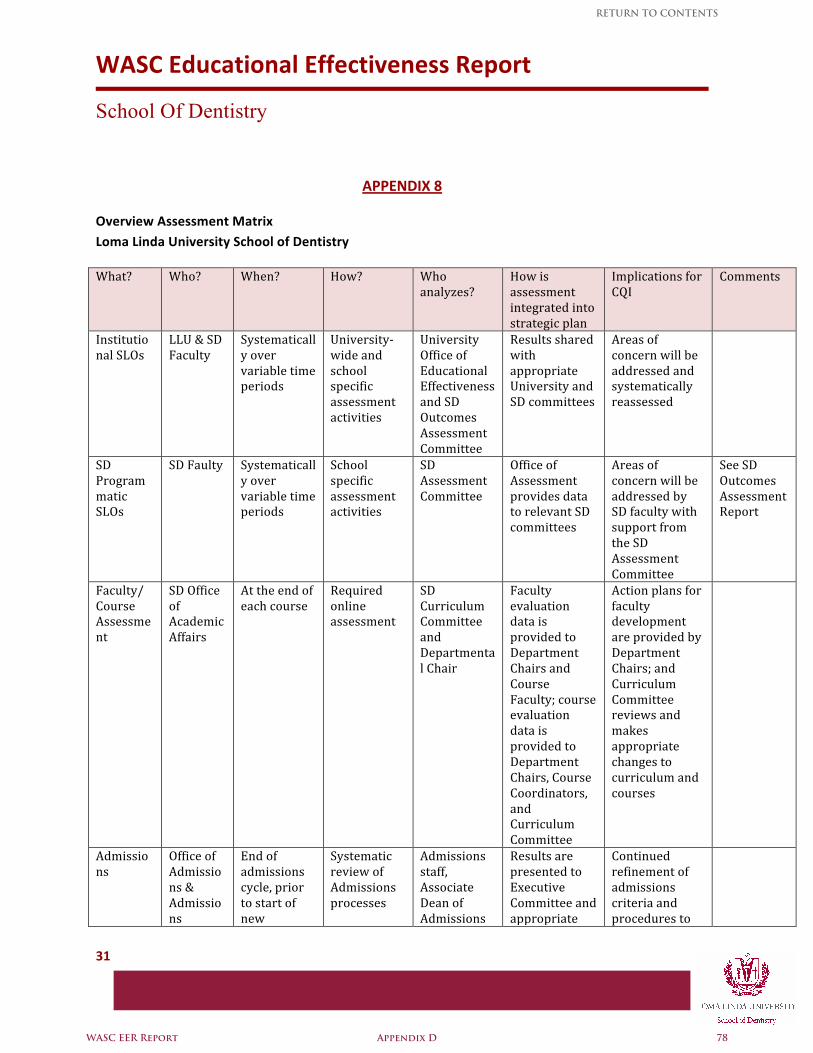
WASC Educational Effectiveness Report
School Of Dentistry
31
APPENDIX 8
Overview Assessment Matrix Loma Linda University School of Dentistry
What? Who? When? How? Who analyzes?
How is assessment integrated into strategic plan
Implications for CQI
Comments
Institutional SLOs
LLU & SD Faculty
Systematically over variable time periods
University‐wide and school specific assessment activities
University Office of Educational Effectiveness and SD Outcomes Assessment Committee
Results shared with appropriate University and SD committees
Areas of concern will be addressed and systematically reassessed
SD Programmatic SLOs
SD Faulty Systematically over variable time periods
School specific assessment activities
SD Assessment Committee
Office of Assessment provides data to relevant SD committees
Areas of concern will be addressed by SD faculty with support from the SD Assessment Committee
See SD Outcomes Assessment Report
Faculty/ Course Assessment
SD Office of Academic Affairs
At the end of each course
Required online assessment
SD Curriculum Committee and Departmental Chair
Faculty evaluation data is provided to Department Chairs and Course Faculty; course evaluation data is provided to Department Chairs, Course Coordinators, and Curriculum Committee
Action plans for faculty development are provided by Department Chairs; and Curriculum Committee reviews and makes appropriate changes to curriculum and courses
Admissions
Office of Admissions & Admissions
End of admissions cycle, prior to start of new
Systematic review of Admissions processes
Admissions staff, Associate Dean of Admissions
Results are presented to Executive Committee and appropriate
Continued refinement of admissions criteria and procedures to
WASC EER Report Appendix D 78
RETURN TO CONTENTS
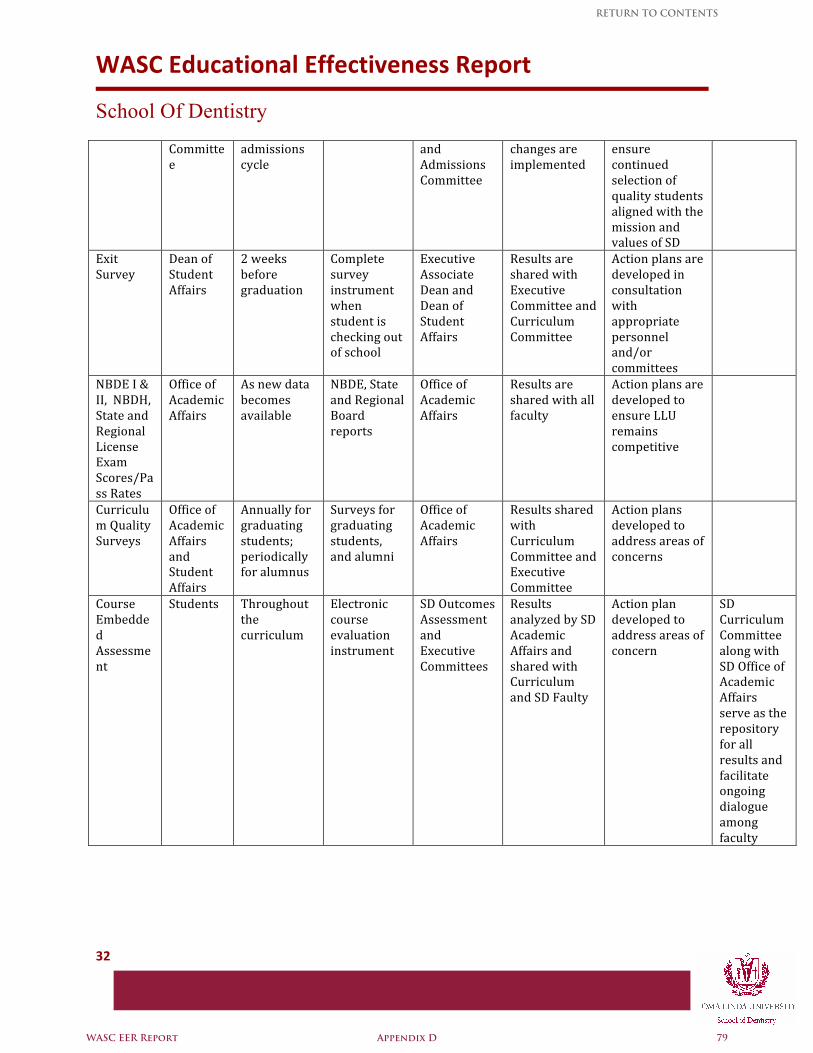
WASC Educational Effectiveness Report
School Of Dentistry
32
Committee
admissions cycle
and Admissions Committee
changes are implemented
ensure continued selection of quality students aligned with the mission and values of SD
Exit Survey
Dean of Student Affairs
2 weeks before graduation
Complete survey instrument when student is checking out of school
Executive Associate Dean and Dean of Student Affairs
Results are shared with Executive Committee and Curriculum Committee
Action plans are developed in consultation with appropriate personnel and/or committees
NBDE I & II, NBDH, State and Regional License Exam Scores/Pass Rates
Office of Academic Affairs
As new data becomes available
NBDE, State and Regional Board reports
Office of Academic Affairs
Results are shared with all faculty
Action plans are developed to ensure LLU remains competitive
Curriculum Quality Surveys
Office of Academic Affairs and Student Affairs
Annually for graduating students; periodically for alumnus
Surveys for graduating students, and alumni
Office of Academic Affairs
Results shared with Curriculum Committee and Executive Committee
Action plans developed to address areas of concerns
Course Embedded Assessment
Students Throughout the curriculum
Electronic course evaluation instrument
SD Outcomes Assessment and Executive Committees
Results analyzed by SD Academic Affairs and shared with Curriculum and SD Faulty
Action plan developed to address areas of concern
SD Curriculum Committee along with SD Office of Academic Affairs serve as the repository for all results and facilitate ongoing dialogue among faculty
WASC EER Report Appendix D 79
RETURN TO CONTENTS
Page 1 of 5
MD Program Educational Effectiveness Report Story of Assessment in the School of Medicine
June 2010
Introduction The School of Medicine Curriculum Committee is the faculty and student body charged
with curriculum development, management and evaluation. The Dean confers upon the Curriculum Committee full authority to design and manage the curriculum for the purpose of enhancing the School’s mission and ensuring satisfactory attainment of the School’s student learning outcomes. The Curriculum Committee has established a systematic schedule of review for each course and clerkship, preclinical segment, and the curriculum as a whole.
Assessment of Student Learning Outcomes
(See the Annual Program Report for data tables, etc.)
School-wide student learning outcomes closely parallel the physician competencies expected by the medical profession and the public. The yardsticks by which the school-wide educational outcomes were developed included the AAMC’s Medical School Objectives Project, the six core-competencies of the Accreditation Council for Graduate Medical Education, the CanMED2000 report of the Royal College of Physicians and Surgeons, and the Loma Linda University Medical Center Patient’s Bill of Rights.
All students must satisfy the learning outcomes to graduate and develop the general
attributes needed by physicians preparatory to their next phase of education. Individual faculty, course directors, School of Medicine administration, and the Academic Review Committee all use the educational outcomes to develop appropriate remedial activities and programs for students who fail to achieve one or more of the outcomes related to knowledge, clinical skills and professional conduct.
Basic Sciences During the basic science phase of education students are required to pass in-house faculty
generated examinations and national subject examinations, if appropriate, supplied by the National Board of Medical Examiners (NBME). These written exams ensure that all students have a satisfactory understanding of basic science knowledge and principles to pass Step I of the USMLE and make a successful transition into the clinical phase of their education. The school requires that students pass Step 1 of the USMLE to be promoted into the junior year. During the preclinical years, students receive their scores on faculty-generated exams within 24 - 48 hours after completing their examinations. Subject exam performance is reported to students within one-week of test administration. At the conclusion of each academic year, students receive a performance summary comparing their performance to other medical students in the U.S and to other students within their class. This information helps students monitor their progress as they begin to make decisions about potential careers in medicine.
Small-group problem-based learning activities and team-based learning activities afford
faculty a forum whereby they can provide valuable formative assessment to students regarding effective communication skills, teamwork, professional behavior and self-directness for life-long learning. Clinical skills are validated in small groups by physical
WASC EER Report Appendix D 80
RETURN TO CONTENTS
Page 2 of 5
diagnosis faculty and by several objective structured clinical examinations (OSCEs) that assess communication skills, auscultation skills and general physical examination skills. State of the art medical simulators are utilized to assess and develop diagnostic skills throughout the first two years.
Faculty and house staff evaluations during the freshman six-week ward rotation and during
the sophomore continuity clinic experience provide students valuable formative and summative feedback regarding their professional growth and development. Students must also self-assess their own professional growth by completing self-reflection surveys that are summarized and analyzed by personnel in the Office of the Associate Dean for Educational Affairs. Sophomore medical students review and evaluate their own video-taped medical interview with a standardized patient for the purpose of building patient rapport skills and developing empathy.
Throughout the basic science curriculum, faculty from religion, evidence-based medicine,
physical diagnosis and pathophysiology regularly evaluate organizational skills, written and oral communication skills, information gathering skills and critical thinking skills by assessing the quality of independent work that students produce to satisfy course requirements. Students receive a spectrum of formative assessments about the quality of book reports, reflective essays, and patient write-ups to ensure that students possess sufficient independent-learning skills to be successful in the clinical phase of their education.
Clinical Knowledge and Skills During the third year of medical education, students are required to pass an NBME subject exam to document their level of understanding of clinical science after completing each required clerkship. Students are deemed prepared to take the knowledge component of Step 2 USMLE when they successfully pass the Comprehensive Clinical Science Examination prepared by the NBME. Students must pass Step 2 in order to graduate. Many clerkship directors also administer faculty-generated exams (oral and written) to document that students have achieved the specified knowledge objectives of the clerkship. Students receive their subject examination scores within a week of exam administration and their clerkship grades within four-to-six weeks of clerkship completion.
Clinical skills and professional behaviors are effectively evaluated by faculty preceptors and clerkship directors through objective structured clinical examinations that are administered at the conclusion of the required clerkships. Students who receive unacceptable summative evaluations must engage in remedial activities until they can demonstrate satisfactory performance. Clinical skills are re-evaluated by the physical diagnosis faculty when every third-year student performs a complete physical examination on a patient selected by the faculty. In addition, Loma Linda seniors annually outperform senior students from the other California medical schools on a seven-case standardized patient exam developed by the California Consortium for the Assessment of Clinical Competence. Students are not permitted to graduate until they have passed the consortium’s seven-to-eight case standardized patient exam and the clinical skills component of Step 2 USMLE. This ensures that graduates consistently demonstrate the clinical skills and professional behaviors deemed necessary by medical educators throughout California and the U.S.
WASC EER Report Appendix D 81
RETURN TO CONTENTS
Page 3 of 5
Program Evaluation
(See the Annual Program Report for data tables, etc.)
The Curriculum Committee regularly monitors the effectiveness of the curriculum as a whole and its component parts. The Committee systematically reviews both in-house and national outcome measures to make decisions regarding program change. The content outlines of Steps 1 and 2 of the USMLE have been one effective yardstick by which to measure whether significant curricular redundancies or deletions exist. These content outlines, which reflect the expectations of the state licensing boards, are used extensively to design the curriculum. Similarly, student performance on the USMLE national examinations are used to measure the effectiveness of learning in relationship to their counterparts across the United States.
Program directors from around the country annually complete an evaluation instrument that compares the performance of interns who graduated from Loma Linda University School of Medicine (LLUSM) with the performance of all other interns for whom the program directors are responsible. LLUSM graduates are consistently rated as well or higher than other graduates in patient care activities and professional behavior. LLUSM graduates retrospectively evaluate their medical school experience at the conclusion of their internship. Survey results consistently show that LLUSM graduates highly value their medical education, technical skills and abilities and their capacity to integrate emotional, psychosocial and spiritual considerations into patient care. Knowledge competencies expected by the public and the Federation of State Licensing Boards are documented by requiring students to pass Steps 1 and 2 of the USMLE prior to graduating. LLUSM students consistently perform near or above the national average on Steps 1 and 2 of the USMLE for the past five years.
Medical student feedback is critical for proper evaluation of the curriculum. Students are
required to complete end-of-course evaluations on-line that are analyzed by personnel in the Office for Medical Student Education and then presented to the Curriculum Committee for its review. Focus groups and interviews are conducted to obtain feedback regarding various changes. During 2009-2010, focus group topics included testing and test week, revision of the student evaluation survey questions, and participation in the NBME Formative Assessment of Professional Behaviors Program. Elected class representatives also meet annually with the Dean and his staff during formal Dean’s dinners where the class representatives come prepared to discuss specific information that classmates wish to convey. The information obtained relating to strengths, weaknesses, and overall quality of the educational program is then presented to the curriculum committee for its consideration.
Conclusion To demonstrate the rigor and history of assessment for continuous quality improvement, we
will examine the impact of the organ systems delivery on student performance. Prior to 2005 the curriculum was organized by disciplines. The organ systems approach began in 2005 with the matriculation of the Class of 2009. Two recent LLUSM graduates were provided a significant stipend to attend and evaluate all formal didactic activities in the organ-based preclinical curriculum. Each of these physicians provided weekly and
WASC EER Report Appendix D 82
RETURN TO CONTENTS
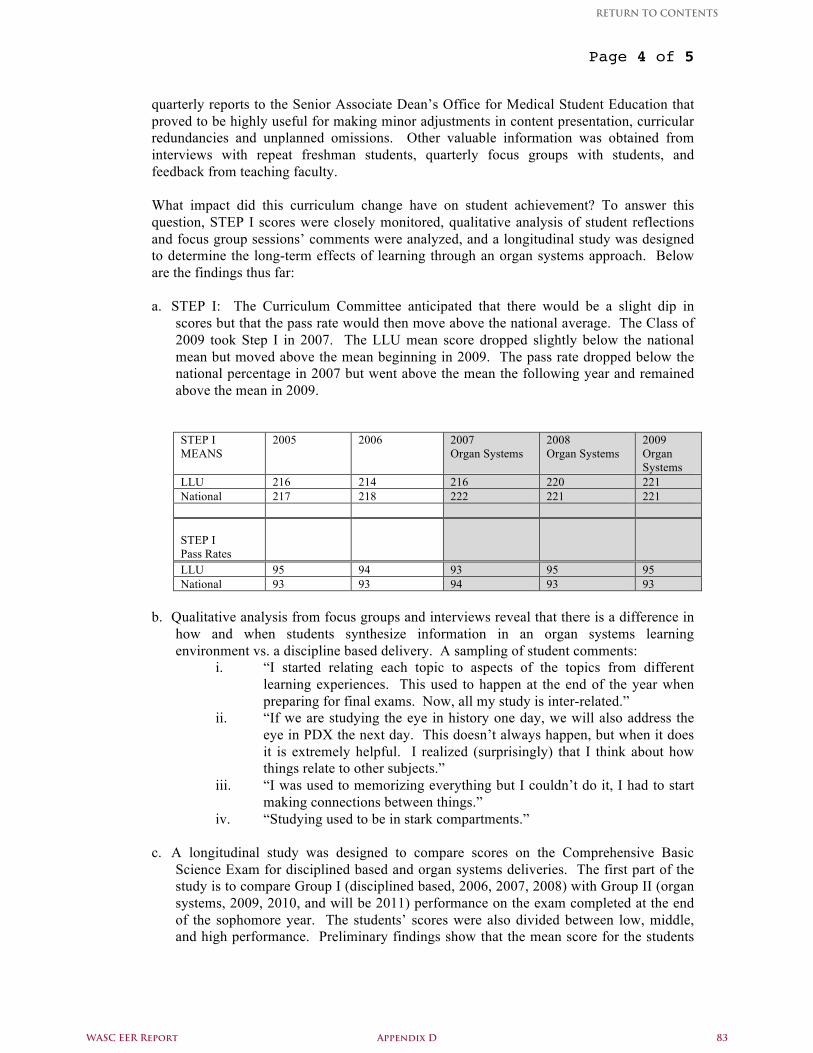
Page 4 of 5
quarterly reports to the Senior Associate Dean’s Office for Medical Student Education that proved to be highly useful for making minor adjustments in content presentation, curricular redundancies and unplanned omissions. Other valuable information was obtained from interviews with repeat freshman students, quarterly focus groups with students, and feedback from teaching faculty.
What impact did this curriculum change have on student achievement? To answer this
question, STEP I scores were closely monitored, qualitative analysis of student reflections and focus group sessions’ comments were analyzed, and a longitudinal study was designed to determine the long-term effects of learning through an organ systems approach. Below are the findings thus far:
a. STEP I: The Curriculum Committee anticipated that there would be a slight dip in
scores but that the pass rate would then move above the national average. The Class of 2009 took Step I in 2007. The LLU mean score dropped slightly below the national mean but moved above the mean beginning in 2009. The pass rate dropped below the national percentage in 2007 but went above the mean the following year and remained above the mean in 2009.
STEP I MEANS
2005 2006 2007 Organ Systems
2008 Organ Systems
2009 Organ Systems
LLU 216 214 216 220 221 National 217 218 222 221 221 STEP I Pass Rates
LLU 95 94 93 95 95 National 93 93 94 93 93
b. Qualitative analysis from focus groups and interviews reveal that there is a difference in
how and when students synthesize information in an organ systems learning environment vs. a discipline based delivery. A sampling of student comments:
i. “I started relating each topic to aspects of the topics from different learning experiences. This used to happen at the end of the year when preparing for final exams. Now, all my study is inter-related.”
ii. “If we are studying the eye in history one day, we will also address the eye in PDX the next day. This doesn’t always happen, but when it does it is extremely helpful. I realized (surprisingly) that I think about how things relate to other subjects.”
iii. “I was used to memorizing everything but I couldn’t do it, I had to start making connections between things.”
iv. “Studying used to be in stark compartments.”
c. A longitudinal study was designed to compare scores on the Comprehensive Basic Science Exam for disciplined based and organ systems deliveries. The first part of the study is to compare Group I (disciplined based, 2006, 2007, 2008) with Group II (organ systems, 2009, 2010, and will be 2011) performance on the exam completed at the end of the sophomore year. The students’ scores were also divided between low, middle, and high performance. Preliminary findings show that the mean score for the students
WASC EER Report Appendix D 83
RETURN TO CONTENTS
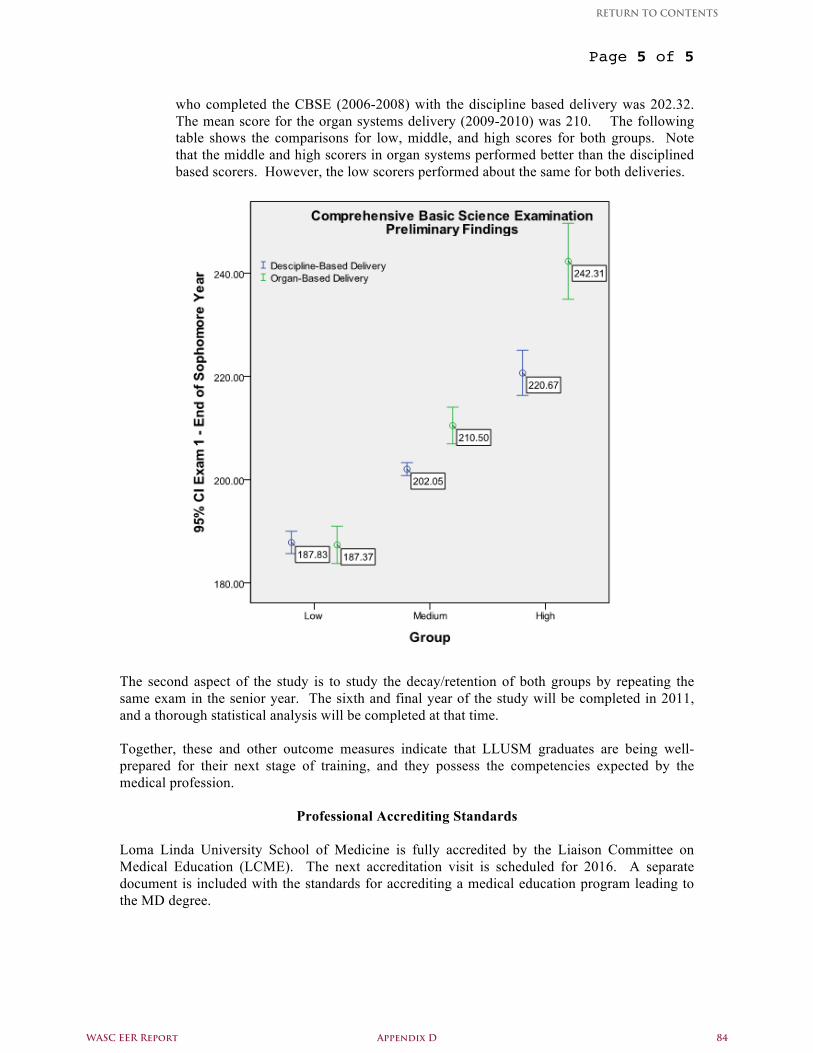
Page 5 of 5
who completed the CBSE (2006-2008) with the discipline based delivery was 202.32. The mean score for the organ systems delivery (2009-2010) was 210. The following table shows the comparisons for low, middle, and high scores for both groups. Note that the middle and high scorers in organ systems performed better than the disciplined based scorers. However, the low scorers performed about the same for both deliveries.
The second aspect of the study is to study the decay/retention of both groups by repeating the same exam in the senior year. The sixth and final year of the study will be completed in 2011, and a thorough statistical analysis will be completed at that time. Together, these and other outcome measures indicate that LLUSM graduates are being well-prepared for their next stage of training, and they possess the competencies expected by the medical profession.
Professional Accrediting Standards
Loma Linda University School of Medicine is fully accredited by the Liaison Committee on
Medical Education (LCME). The next accreditation visit is scheduled for 2016. A separate document is included with the standards for accrediting a medical education program leading to the MD degree.
WASC EER Report Appendix D 84
RETURN TO CONTENTS
WASC Educational Effectiveness Report
School Of Nursing
1
Accreditation and Approval History The School of Nursing (SN, school) was established in 1905 as the first educational program at LLU. It began as a diploma program but became a collegiate program offering a baccalaureate degree in 1949.
The School’s academic programs were accredited by the National League for Nursing (NLN) in 1951.
The School’s graduate program began in 1955 and received NLN accreditation in 1959. Accreditation for both undergraduate and graduate programs continued for nearly 50 years. In 1999, the school sought and received accreditation by the Commission on Collegiate Nursing Education (CCNE,
Commission). Standards for the accreditation of nursing programs are set by the American Association of Colleges of Nursing (AACN).
The Commission is “officially recognized by the U.S. Secretary of Education as a national accreditation
agency . . .” and “CCNE accreditation supports and encourages continuing self‐assessment by nursing programs. . . “ As such, it applies standards presented in The Essentials of Baccalaureate Education for
Professional Nursing Practice (AACN, 2008) and The Essentials of Master's Education for Advanced Practice Nursing (AACN, 1996).
The school’s nurse practitioner programs are assessed as part of the Master’s accreditation process using criteria set forth by the National Task Force on Quality Nurse Practitioner Education.
Following a self‐study, the Commission reviewed 1. program quality in terms of
a. mission and governance b. institutional commitment and resources c. curriculum d. teaching‐learning practices
2. program effectiveness in terms of a. aggregate student and faculty outcomes
The SN received the full 10‐year accreditation period (2010‐2020) subsequent to its most recent self‐study and external review (October 19‐21, 2009).
In 2002 and 2010 the school added PhD and DNP degree programs, respectively, to the graduate department. While the CCNE does not currently offer accreditation for PhD programs, it is in full
compliance with the AACN’s 2001 Indicators of Quality in Research‐focused Doctoral Programs in Nursing standards.
The DNP program began July 2010 and will be eligible for CCNE accreditation September 2011. The
WASC EER Report Appendix D 85
RETURN TO CONTENTS
WASC Educational Effectiveness Report
2
program was developed using the AACN essentials for DNP programs and includes a strong assessment component.
The Nurse Anesthesia program (MS) will begin September 2011. It is currently undergoing accreditation review (April 2010) by the Council on Accreditation of Nurse Anesthesia Educational Programs (COA) as required prior to initiation of the program. Members of the review team reported
that the program was in full compliance for 96 standards and that seven areas needed additional development. These areas are currently being addressed and will be in order prior to COA’s decision regarding accreditation.
The State of California approves undergraduate and advanced practice nursing programs through its Board of Registered Nursing (BRN, Board), a department within the Department of Consumer Affairs.
The Board’s mandate is to “ensure the program’s compliance with statutory and regulatory requirements” and to protect consumers – both those who find themselves under the care of registered nurses and those who prepare for careers by attending schools of nursing.
Following a self‐study the Board reviewed 1. evaluation protocols, findings, and outcomes of recommended changes 2. sufficiency of resources 3. program administration and faculty qualifications 4. curricula for all undergraduate and graduate programs 5. clinical facilities 6. student participation The SN received the full eight‐year approval period (2008‐2016) subsequent to its most recent self‐
study and external review (April 15‐17. 2008).
Assessment History The school has a long history of assessment engendered by and linked to external approval and accreditation expectations. The means it has used to determine success have focused on student, clinical instructor, and employer satisfaction with various learning and relational experiences, quality
of resources and support systems, availability of suitable learning experiences and facilities, and level of student performance in clinical and workplace settings. The school has also measured sudent outcomes in terms of instructor assessments of classroom and clinical performance, successful
completion of programs, passing national board and certification examinations, and employment. Sections titled “Student Learning Outcomes,” Undergraduate Student Satisfaction,” and “Graduate Student Satisfaction” present outcomes and satisfaction data.
Student Learning Outcomes Students understand and apply the University philosophy of wholeness into their personal and
WASC EER Report Appendix D 86
RETURN TO CONTENTS
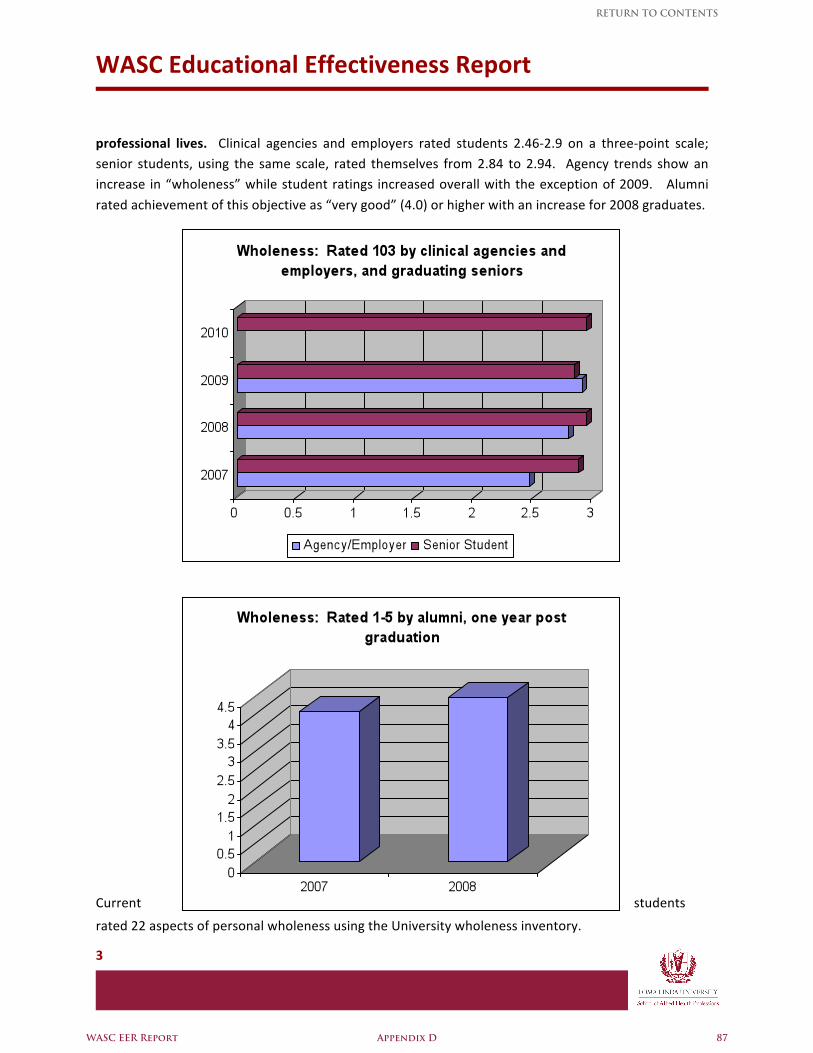
WASC Educational Effectiveness Report
3
professional lives. Clinical agencies and employers rated students 2.46‐2.9 on a three‐point scale; senior students, using the same scale, rated themselves from 2.84 to 2.94. Agency trends show an increase in “wholeness” while student ratings increased overall with the exception of 2009. Alumni
rated achievement of this objective as “very good” (4.0) or higher with an increase for 2008 graduates.
Current students
rated 22 aspects of personal wholeness using the University wholeness inventory.
WASC EER Report Appendix D 87
RETURN TO CONTENTS
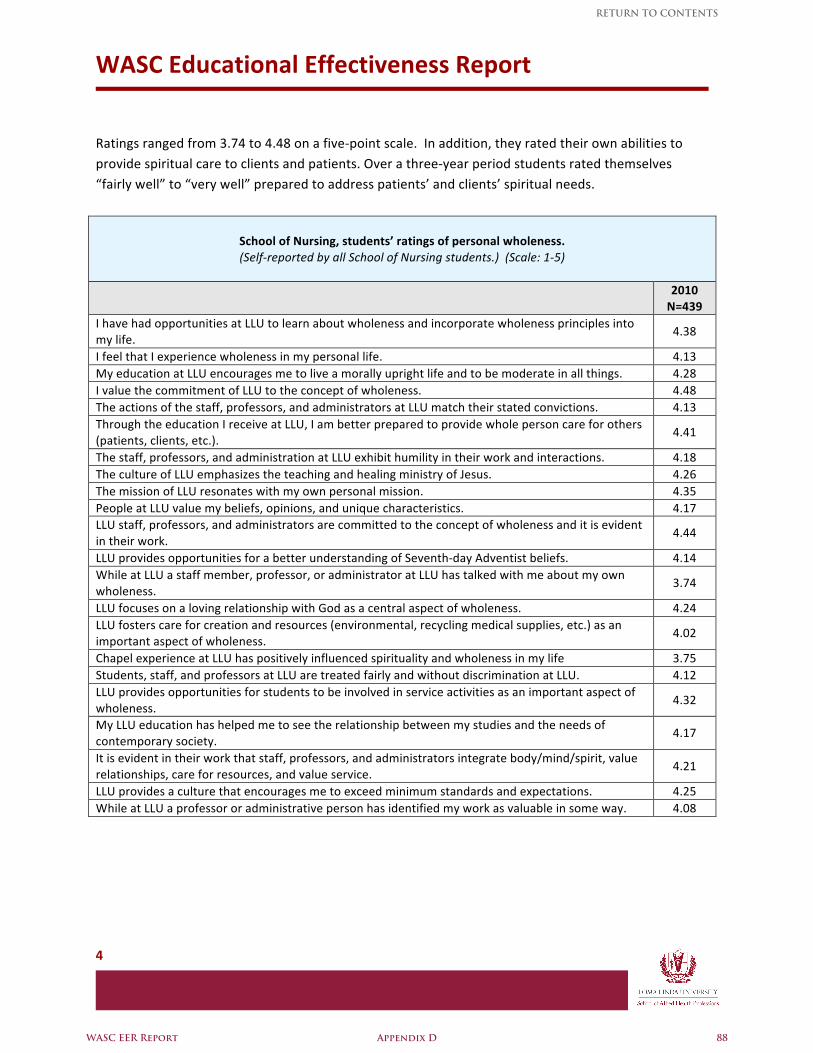
WASC Educational Effectiveness Report
4
Ratings ranged from 3.74 to 4.48 on a five‐point scale. In addition, they rated their own abilities to provide spiritual care to clients and patients. Over a three‐year period students rated themselves “fairly well” to “very well” prepared to address patients’ and clients’ spiritual needs.
School of Nursing, students’ ratings of personal wholeness. (Self‐reported by all School of Nursing students.) (Scale: 1‐5)
2010 N=439
I have had opportunities at LLU to learn about wholeness and incorporate wholeness principles into my life.
4.38
I feel that I experience wholeness in my personal life. 4.13 My education at LLU encourages me to live a morally upright life and to be moderate in all things. 4.28 I value the commitment of LLU to the concept of wholeness. 4.48 The actions of the staff, professors, and administrators at LLU match their stated convictions. 4.13 Through the education I receive at LLU, I am better prepared to provide whole person care for others (patients, clients, etc.).
4.41
The staff, professors, and administration at LLU exhibit humility in their work and interactions. 4.18 The culture of LLU emphasizes the teaching and healing ministry of Jesus. 4.26 The mission of LLU resonates with my own personal mission. 4.35 People at LLU value my beliefs, opinions, and unique characteristics. 4.17 LLU staff, professors, and administrators are committed to the concept of wholeness and it is evident in their work.
4.44
LLU provides opportunities for a better understanding of Seventh‐day Adventist beliefs. 4.14 While at LLU a staff member, professor, or administrator at LLU has talked with me about my own wholeness.
3.74
LLU focuses on a loving relationship with God as a central aspect of wholeness. 4.24 LLU fosters care for creation and resources (environmental, recycling medical supplies, etc.) as an important aspect of wholeness.
4.02
Chapel experience at LLU has positively influenced spirituality and wholeness in my life 3.75 Students, staff, and professors at LLU are treated fairly and without discrimination at LLU. 4.12 LLU provides opportunities for students to be involved in service activities as an important aspect of wholeness.
4.32
My LLU education has helped me to see the relationship between my studies and the needs of contemporary society.
4.17
It is evident in their work that staff, professors, and administrators integrate body/mind/spirit, value relationships, care for resources, and value service.
4.21
LLU provides a culture that encourages me to exceed minimum standards and expectations. 4.25 While at LLU a professor or administrative person has identified my work as valuable in some way. 4.08
WASC EER Report Appendix D 88
RETURN TO CONTENTS
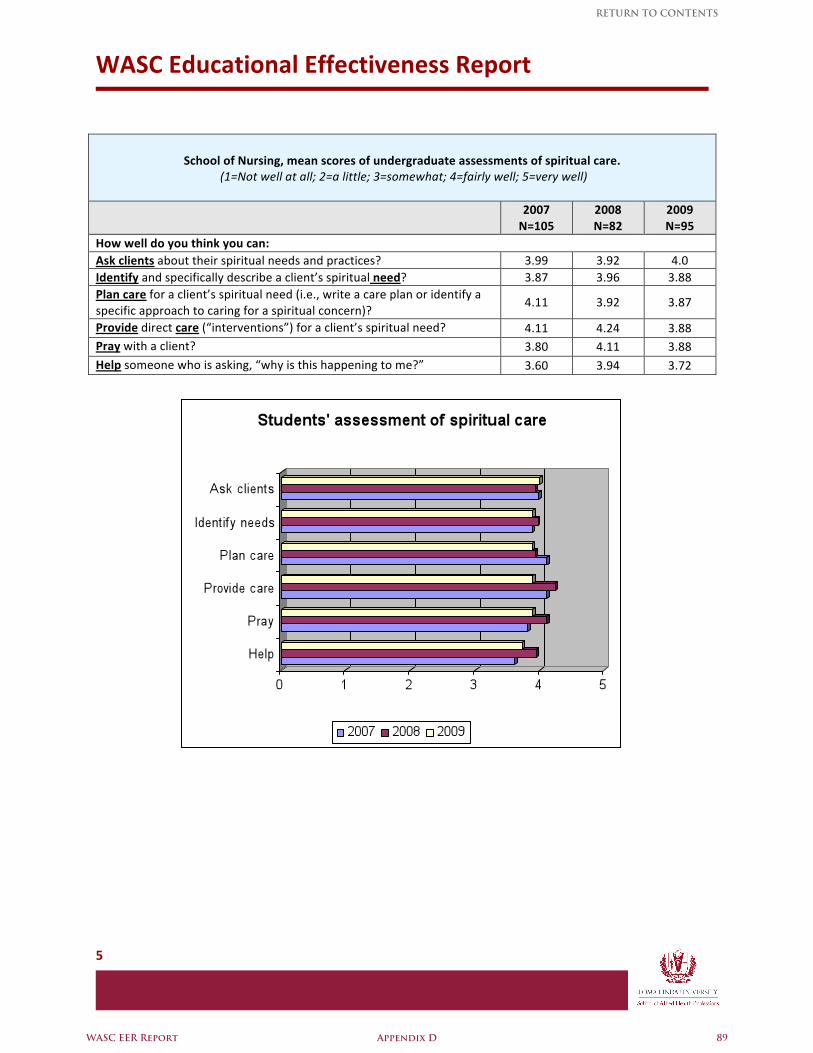
WASC Educational Effectiveness Report
5
School of Nursing, mean scores of undergraduate assessments of spiritual care.
(1=Not well at all; 2=a little; 3=somewhat; 4=fairly well; 5=very well)
2007 N=105
2008 N=82
2009 N=95
How well do you think you can: Ask clients about their spiritual needs and practices? 3.99 3.92 4.0 Identify and specifically describe a client’s spiritual need? 3.87 3.96 3.88 Plan care for a client’s spiritual need (i.e., write a care plan or identify a specific approach to caring for a spiritual concern)?
4.11 3.92 3.87
Provide direct care (“interventions”) for a client’s spiritual need? 4.11 4.24 3.88 Pray with a client? 3.80 4.11 3.88 Help someone who is asking, “why is this happening to me?” 3.60 3.94 3.72
WASC EER Report Appendix D 89
RETURN TO CONTENTS
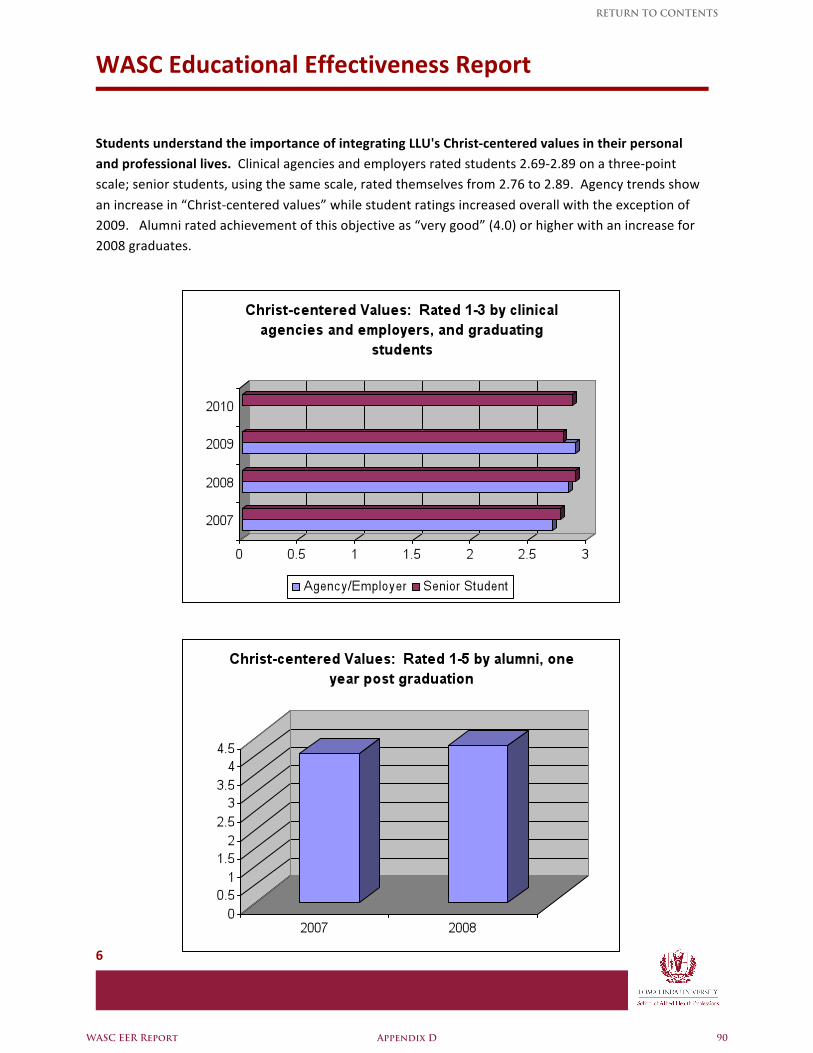
WASC Educational Effectiveness Report
6
Students understand the importance of integrating LLU's Christ‐centered values in their personal and professional lives. Clinical agencies and employers rated students 2.69‐2.89 on a three‐point scale; senior students, using the same scale, rated themselves from 2.76 to 2.89. Agency trends show
an increase in “Christ‐centered values” while student ratings increased overall with the exception of 2009. Alumni rated achievement of this objective as “very good” (4.0) or higher with an increase for 2008 graduates.
WASC EER Report Appendix D 90
RETURN TO CONTENTS
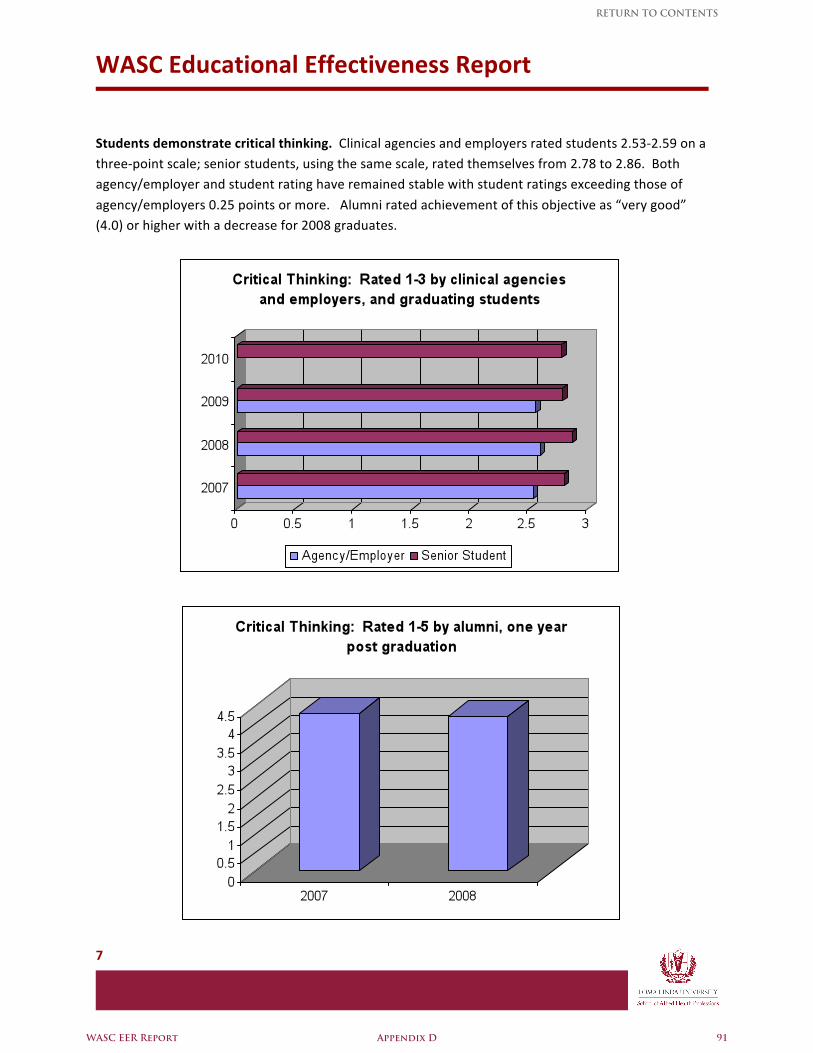
WASC Educational Effectiveness Report
7
Students demonstrate critical thinking. Clinical agencies and employers rated students 2.53‐2.59 on a three‐point scale; senior students, using the same scale, rated themselves from 2.78 to 2.86. Both agency/employer and student rating have remained stable with student ratings exceeding those of
agency/employers 0.25 points or more. Alumni rated achievement of this objective as “very good” (4.0) or higher with a decrease for 2008 graduates.
WASC EER Report Appendix D 91
RETURN TO CONTENTS
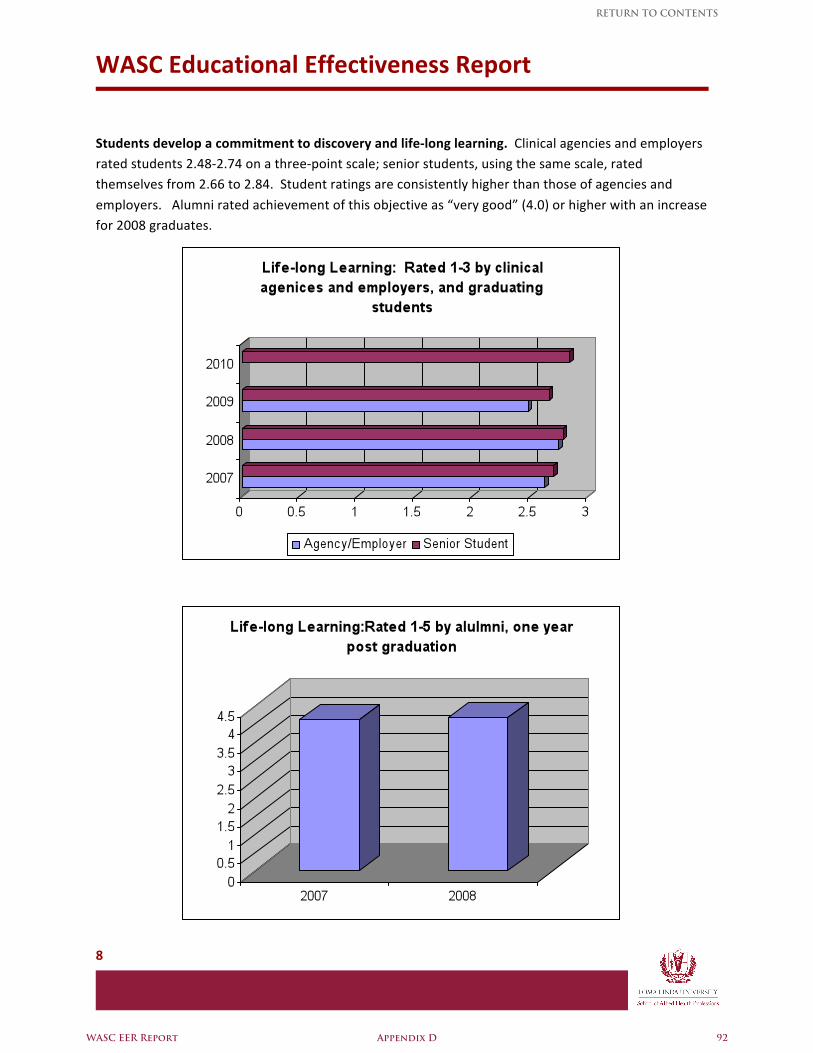
WASC Educational Effectiveness Report
8
Students develop a commitment to discovery and life‐long learning. Clinical agencies and employers rated students 2.48‐2.74 on a three‐point scale; senior students, using the same scale, rated themselves from 2.66 to 2.84. Student ratings are consistently higher than those of agencies and
employers. Alumni rated achievement of this objective as “very good” (4.0) or higher with an increase for 2008 graduates.
WASC EER Report Appendix D 92
RETURN TO CONTENTS
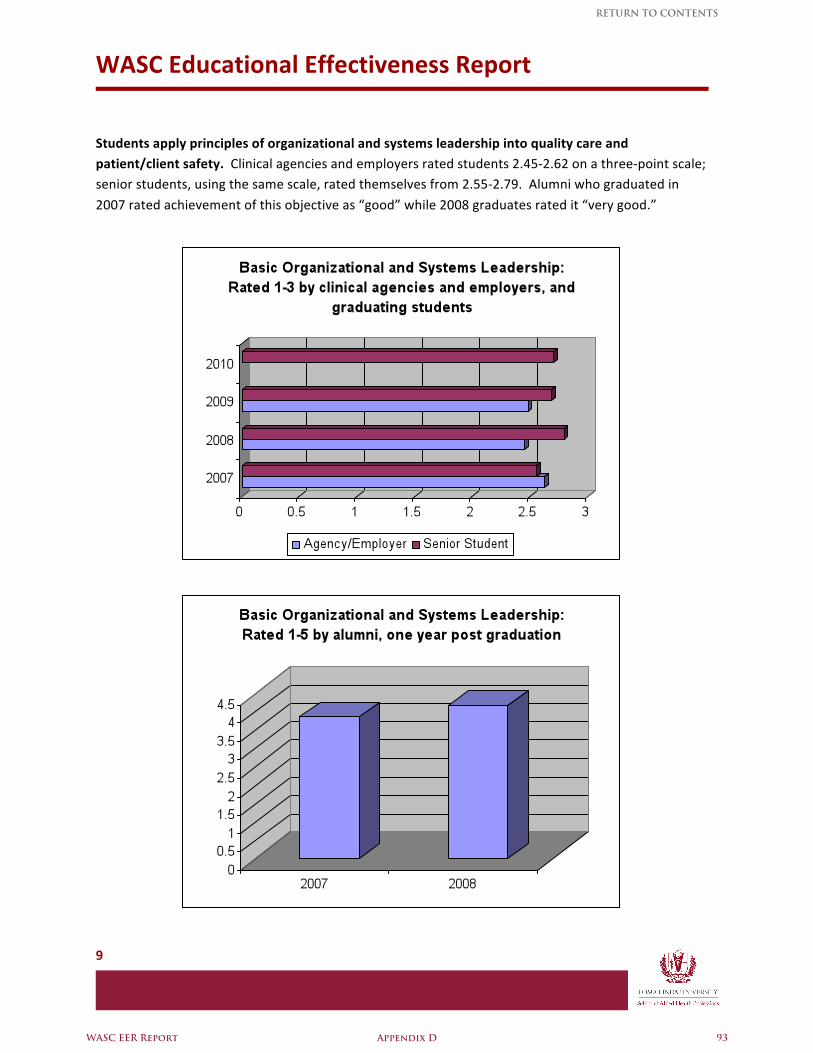
WASC Educational Effectiveness Report
9
Students apply principles of organizational and systems leadership into quality care and patient/client safety. Clinical agencies and employers rated students 2.45‐2.62 on a three‐point scale; senior students, using the same scale, rated themselves from 2.55‐2.79. Alumni who graduated in
2007 rated achievement of this objective as “good” while 2008 graduates rated it “very good.”
WASC EER Report Appendix D 93
RETURN TO CONTENTS
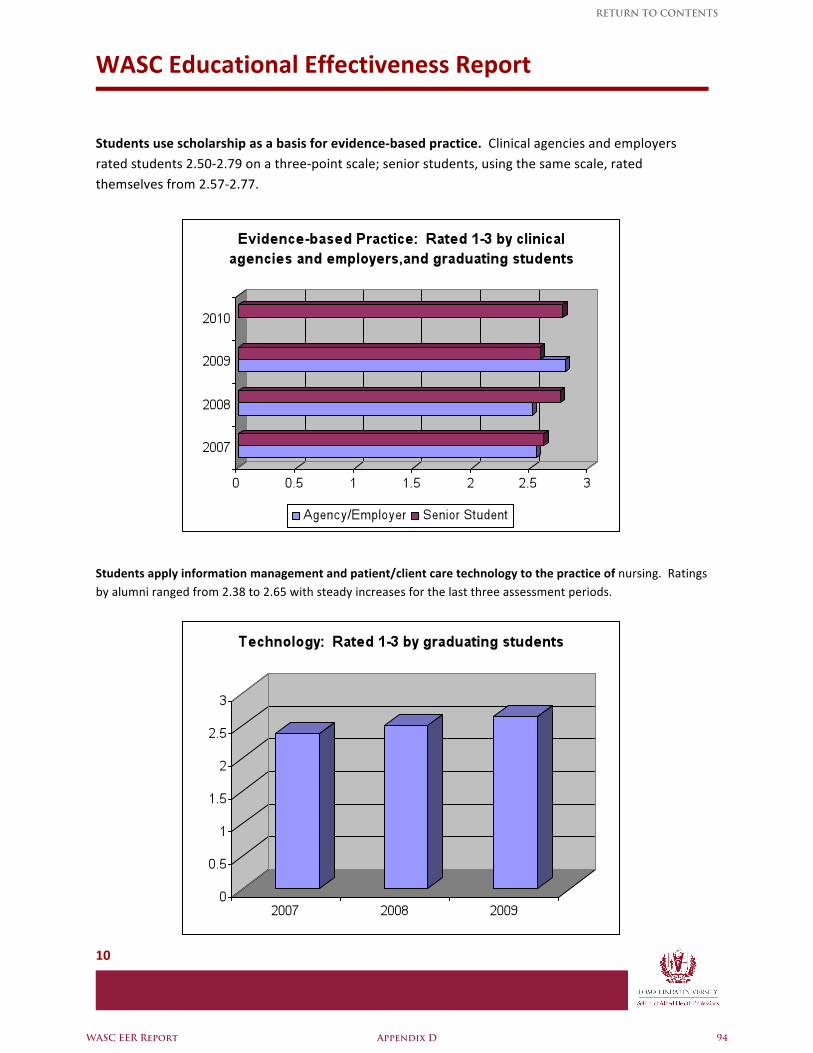
WASC Educational Effectiveness Report
10
Students use scholarship as a basis for evidence‐based practice. Clinical agencies and employers rated students 2.50‐2.79 on a three‐point scale; senior students, using the same scale, rated themselves from 2.57‐2.77.
Students apply information management and patient/client care technology to the practice of nursing. Ratings by alumni ranged from 2.38 to 2.65 with steady increases for the last three assessment periods.
WASC EER Report Appendix D 94
RETURN TO CONTENTS
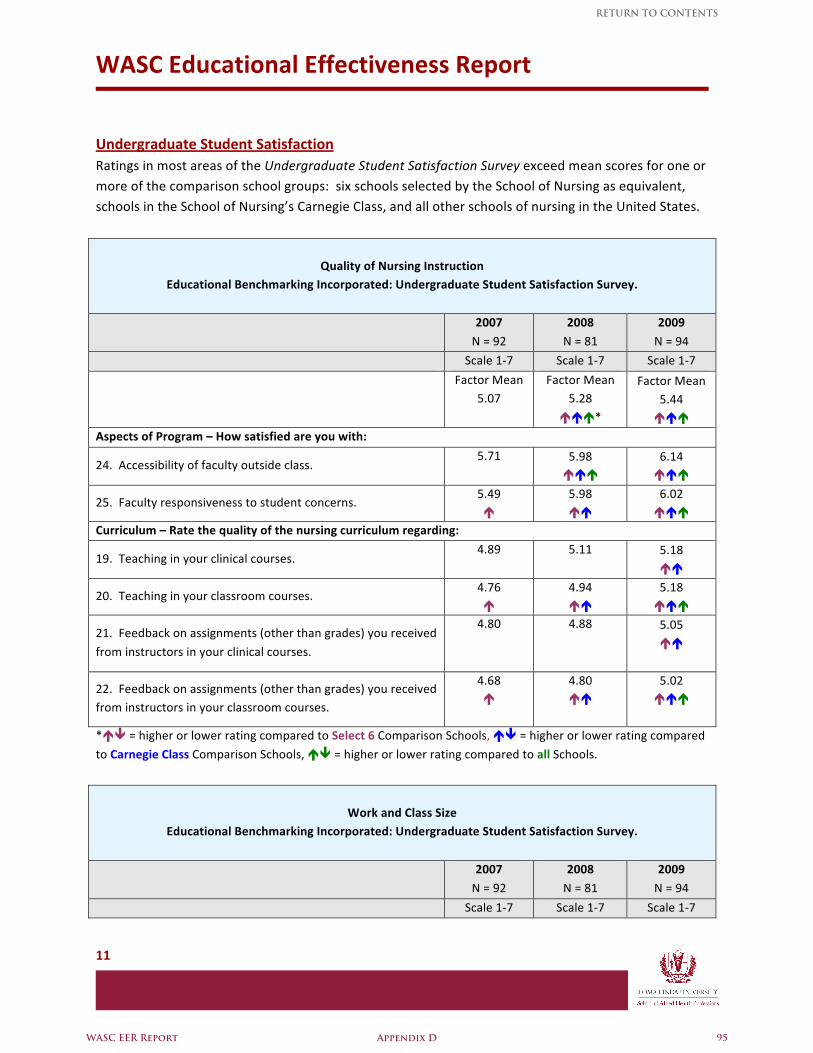
WASC Educational Effectiveness Report
11
Undergraduate Student Satisfaction Ratings in most areas of the Undergraduate Student Satisfaction Survey exceed mean scores for one or more of the comparison school groups: six schools selected by the School of Nursing as equivalent, schools in the School of Nursing’s Carnegie Class, and all other schools of nursing in the United States.
Quality of Nursing Instruction Educational Benchmarking Incorporated: Undergraduate Student Satisfaction Survey.
2007
N = 92
2008
N = 81
2009
N = 94
Scale 1‐7 Scale 1‐7 Scale 1‐7
Factor Mean 5.07
Factor Mean 5.28
*
Factor Mean 5.44
Aspects of Program – How satisfied are you with:
24. Accessibility of faculty outside class. 5.71
5.98
6.14
25. Faculty responsiveness to student concerns. 5.49
5.98
6.02
Curriculum – Rate the quality of the nursing curriculum regarding:
19. Teaching in your clinical courses. 4.89
5.11
5.18
20. Teaching in your classroom courses. 4.76
4.94
5.18
21. Feedback on assignments (other than grades) you received
from instructors in your clinical courses.
4.80
4.88
5.05
22. Feedback on assignments (other than grades) you received from instructors in your classroom courses.
4.68
4.80
5.02
* = higher or lower rating compared to Select 6 Comparison Schools, = higher or lower rating compared
to Carnegie Class Comparison Schools, = higher or lower rating compared to all Schools.
Work and Class Size Educational Benchmarking Incorporated: Undergraduate Student Satisfaction Survey.
2007
N = 92
2008
N = 81
2009
N = 94
Scale 1‐7 Scale 1‐7 Scale 1‐7
WASC EER Report Appendix D 95
RETURN TO CONTENTS
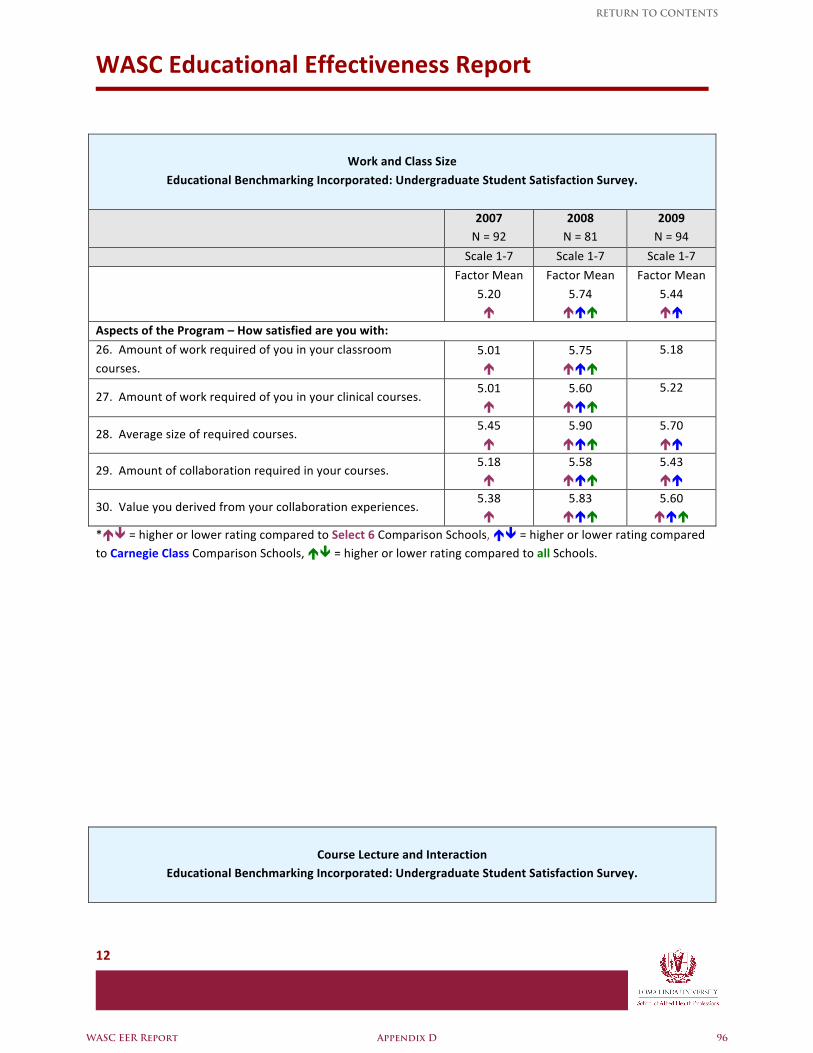
WASC Educational Effectiveness Report
12
Work and Class Size
Educational Benchmarking Incorporated: Undergraduate Student Satisfaction Survey.
2007 N = 92
2008 N = 81
2009 N = 94
Scale 1‐7 Scale 1‐7 Scale 1‐7
Factor Mean
5.20
Factor Mean
5.74
Factor Mean
5.44
Aspects of the Program – How satisfied are you with:
26. Amount of work required of you in your classroom
courses. 5.01
5.75
5.18
27. Amount of work required of you in your clinical courses. 5.01
5.60
5.22
28. Average size of required courses. 5.45
5.90
5.70
29. Amount of collaboration required in your courses. 5.18
5.58
5.43
30. Value you derived from your collaboration experiences. 5.38
5.83
5.60
* = higher or lower rating compared to Select 6 Comparison Schools, = higher or lower rating compared to Carnegie Class Comparison Schools, = higher or lower rating compared to all Schools.
Course Lecture and Interaction Educational Benchmarking Incorporated: Undergraduate Student Satisfaction Survey.
WASC EER Report Appendix D 96
RETURN TO CONTENTS
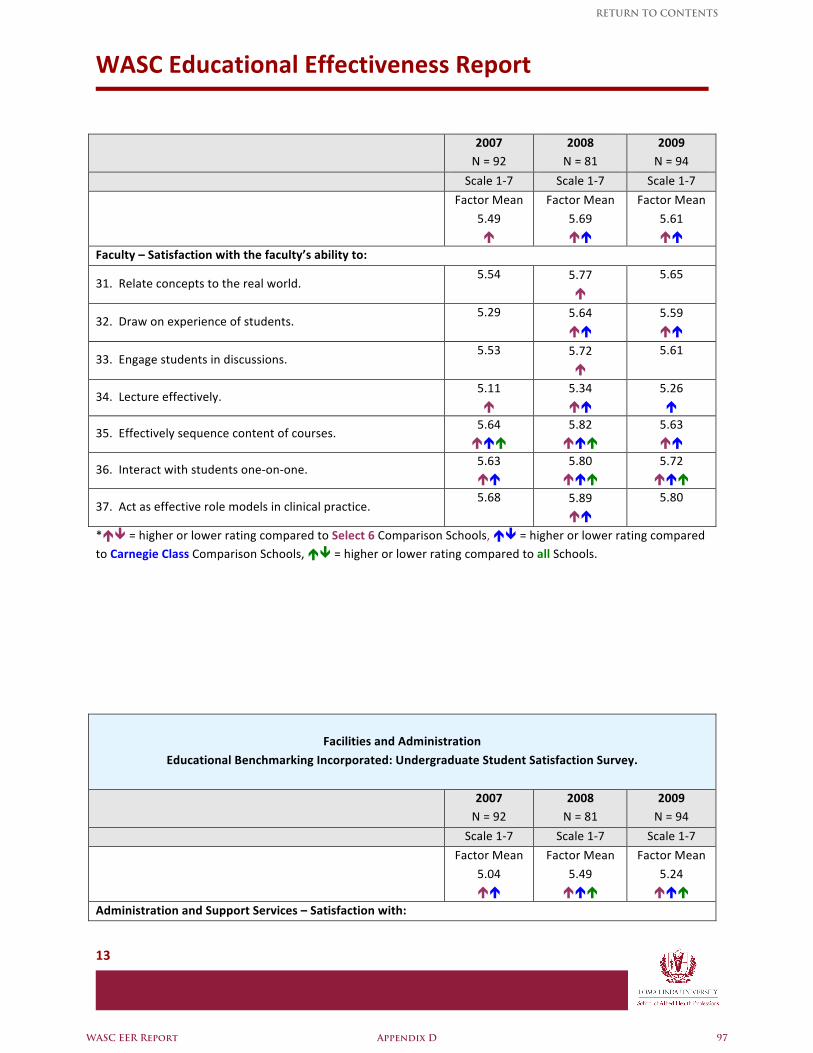
WASC Educational Effectiveness Report
13
2007 N = 92
2008 N = 81
2009 N = 94
Scale 1‐7 Scale 1‐7 Scale 1‐7
Factor Mean
5.49
Factor Mean
5.69
Factor Mean
5.61
Faculty – Satisfaction with the faculty’s ability to:
31. Relate concepts to the real world. 5.54
5.77
5.65
32. Draw on experience of students. 5.29
5.64
5.59
33. Engage students in discussions. 5.53
5.72
5.61
34. Lecture effectively. 5.11
5.34
5.26
35. Effectively sequence content of courses. 5.64
5.82
5.63
36. Interact with students one‐on‐one. 5.63
5.80
5.72
37. Act as effective role models in clinical practice. 5.68
5.89
5.80
* = higher or lower rating compared to Select 6 Comparison Schools, = higher or lower rating compared to Carnegie Class Comparison Schools, = higher or lower rating compared to all Schools.
Facilities and Administration
Educational Benchmarking Incorporated: Undergraduate Student Satisfaction Survey.
2007 N = 92
2008 N = 81
2009 N = 94
Scale 1‐7 Scale 1‐7 Scale 1‐7
Factor Mean
5.04
Factor Mean
5.49
Factor Mean
5.24
Administration and Support Services – Satisfaction with:
WASC EER Report Appendix D 97
RETURN TO CONTENTS
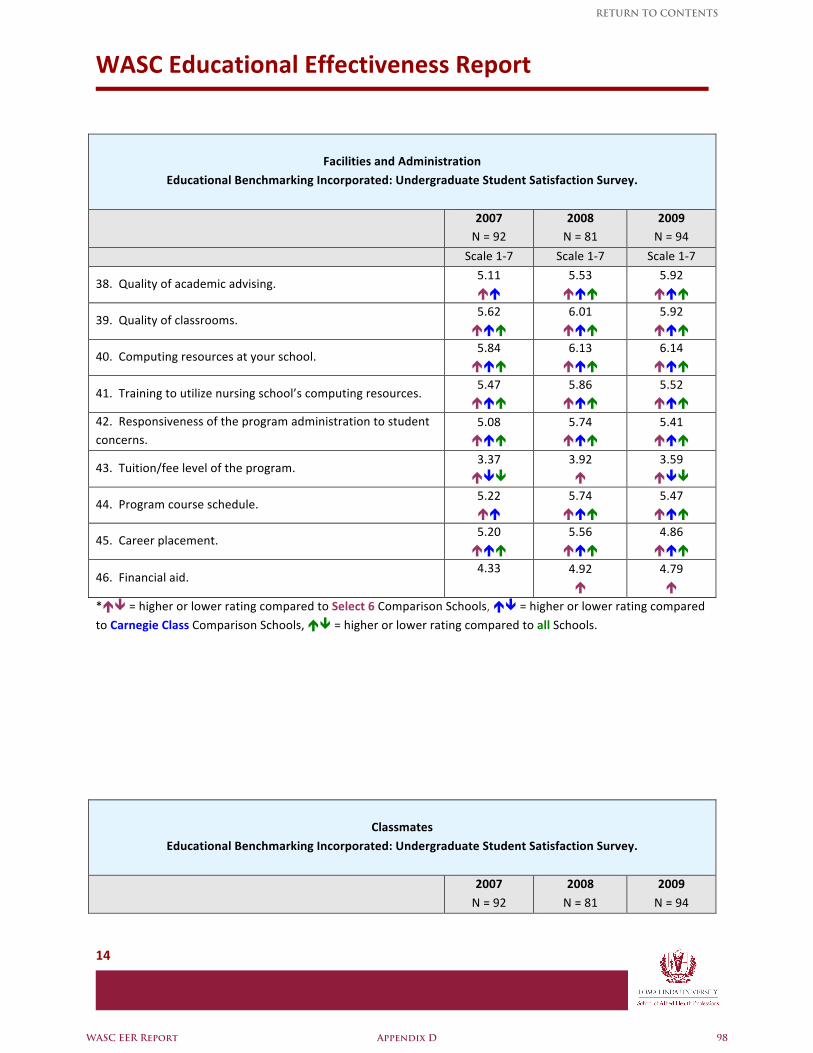
WASC Educational Effectiveness Report
14
Facilities and Administration
Educational Benchmarking Incorporated: Undergraduate Student Satisfaction Survey.
2007 N = 92
2008 N = 81
2009 N = 94
Scale 1‐7 Scale 1‐7 Scale 1‐7
38. Quality of academic advising. 5.11
5.53
5.92
39. Quality of classrooms. 5.62
6.01
5.92
40. Computing resources at your school. 5.84
6.13
6.14
41. Training to utilize nursing school’s computing resources. 5.47
5.86
5.52
42. Responsiveness of the program administration to student concerns.
5.08
5.74
5.41
43. Tuition/fee level of the program. 3.37
3.92
3.59
44. Program course schedule. 5.22
5.74
5.47
45. Career placement. 5.20
5.56
4.86
46. Financial aid. 4.33
4.92
4.79
* = higher or lower rating compared to Select 6 Comparison Schools, = higher or lower rating compared
to Carnegie Class Comparison Schools, = higher or lower rating compared to all Schools.
Classmates
Educational Benchmarking Incorporated: Undergraduate Student Satisfaction Survey.
2007
N = 92
2008
N = 81
2009
N = 94
WASC EER Report Appendix D 98
RETURN TO CONTENTS
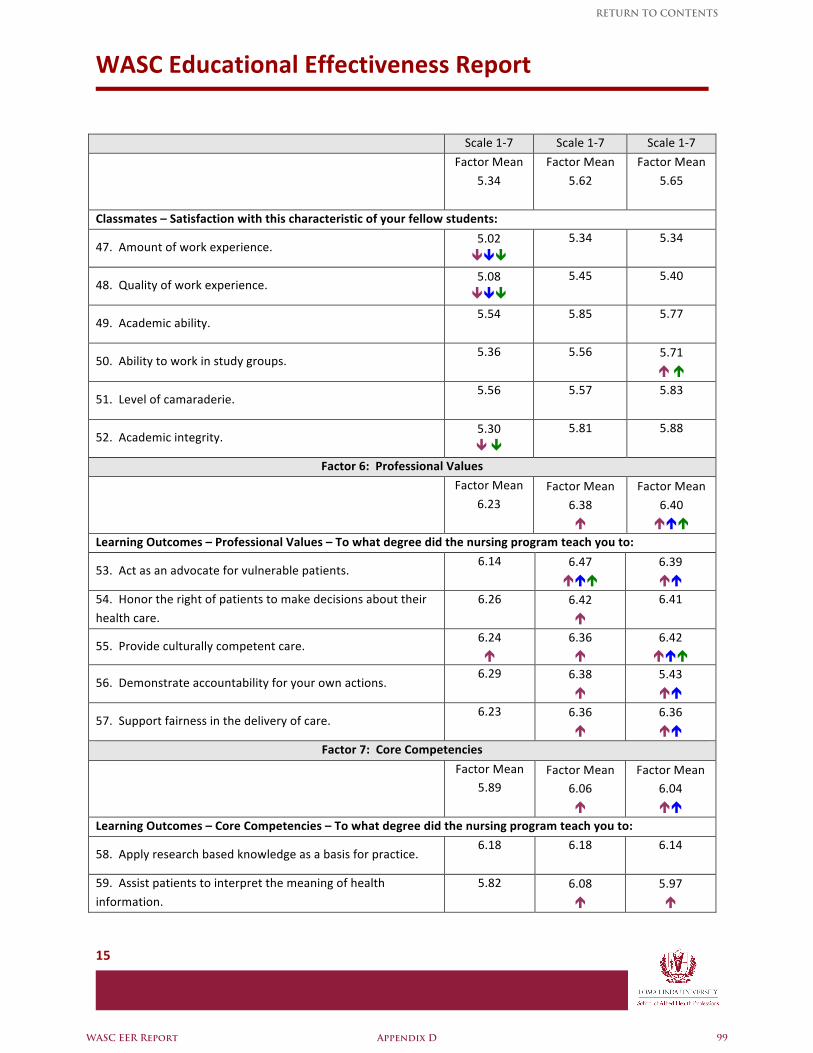
WASC Educational Effectiveness Report
15
Scale 1‐7 Scale 1‐7 Scale 1‐7
Factor Mean
5.34
Factor Mean
5.62
Factor Mean
5.65
Classmates – Satisfaction with this characteristic of your fellow students:
47. Amount of work experience. 5.02
5.34
5.34
48. Quality of work experience. 5.08
5.45
5.40
49. Academic ability. 5.54
5.85
5.77
50. Ability to work in study groups. 5.36
5.56
5.71
51. Level of camaraderie. 5.56
5.57
5.83
52. Academic integrity. 5.30
5.81
5.88
Factor 6: Professional Values
Factor Mean
6.23
Factor Mean
6.38
Factor Mean
6.40
Learning Outcomes – Professional Values – To what degree did the nursing program teach you to:
53. Act as an advocate for vulnerable patients. 6.14
6.47
6.39
54. Honor the right of patients to make decisions about their
health care.
6.26
6.42
6.41
55. Provide culturally competent care. 6.24
6.36
6.42
56. Demonstrate accountability for your own actions. 6.29
6.38
5.43
57. Support fairness in the delivery of care. 6.23
6.36
6.36
Factor 7: Core Competencies
Factor Mean 5.89
Factor Mean 6.06
Factor Mean 6.04
Learning Outcomes – Core Competencies – To what degree did the nursing program teach you to:
58. Apply research based knowledge as a basis for practice. 6.18
6.18
6.14
59. Assist patients to interpret the meaning of health
information.
5.82
6.08
5.97
WASC EER Report Appendix D 99
RETURN TO CONTENTS
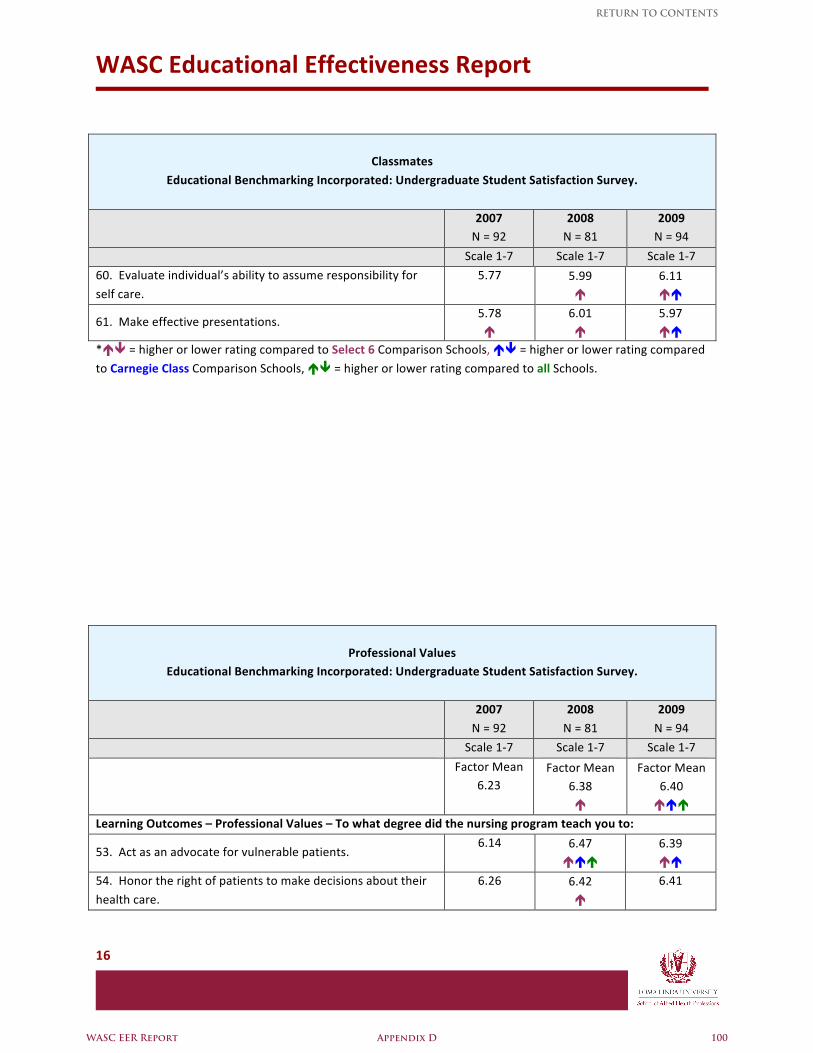
WASC Educational Effectiveness Report
16
Classmates
Educational Benchmarking Incorporated: Undergraduate Student Satisfaction Survey.
2007 N = 92
2008 N = 81
2009 N = 94
Scale 1‐7 Scale 1‐7 Scale 1‐7
60. Evaluate individual’s ability to assume responsibility for
self care.
5.77
5.99
6.11
61. Make effective presentations. 5.78
6.01
5.97
* = higher or lower rating compared to Select 6 Comparison Schools, = higher or lower rating compared
to Carnegie Class Comparison Schools, = higher or lower rating compared to all Schools.
Professional Values Educational Benchmarking Incorporated: Undergraduate Student Satisfaction Survey.
2007
N = 92
2008
N = 81
2009
N = 94
Scale 1‐7 Scale 1‐7 Scale 1‐7
Factor Mean 6.23
Factor Mean 6.38
Factor Mean 6.40
Learning Outcomes – Professional Values – To what degree did the nursing program teach you to:
53. Act as an advocate for vulnerable patients. 6.14
6.47
6.39
54. Honor the right of patients to make decisions about their
health care.
6.26
6.42
6.41
WASC EER Report Appendix D 100
RETURN TO CONTENTS
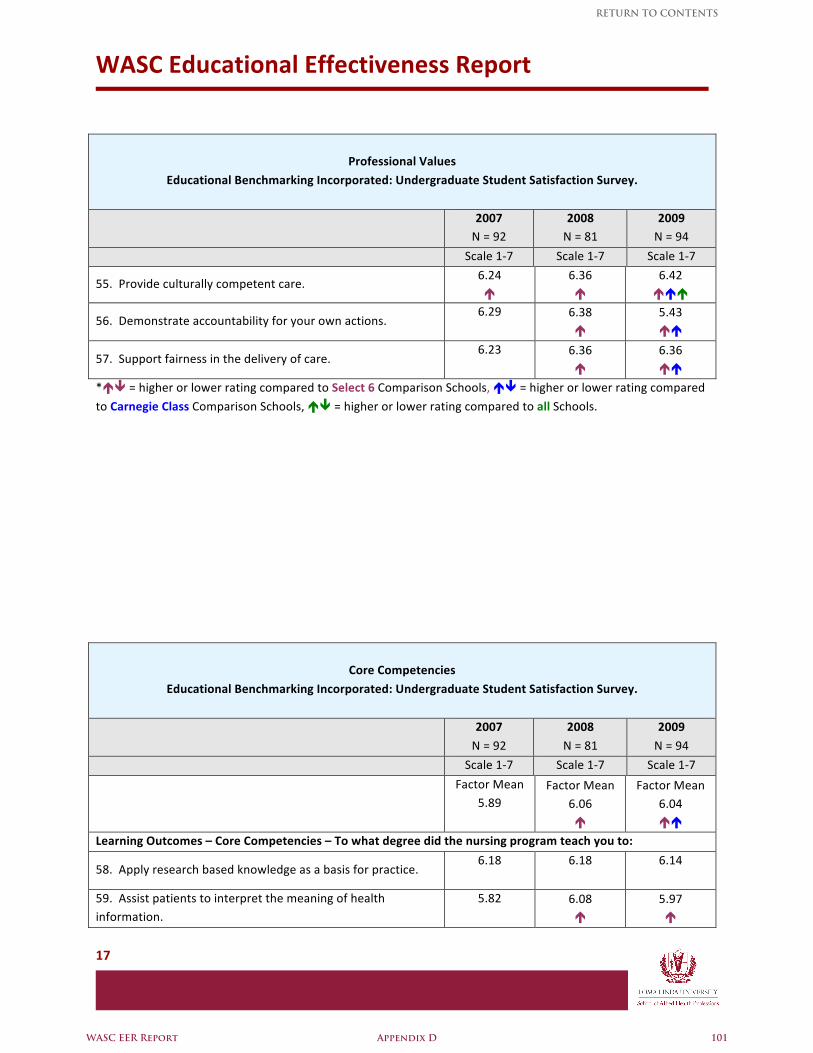
WASC Educational Effectiveness Report
17
Professional Values
Educational Benchmarking Incorporated: Undergraduate Student Satisfaction Survey.
2007 N = 92
2008 N = 81
2009 N = 94
Scale 1‐7 Scale 1‐7 Scale 1‐7
55. Provide culturally competent care. 6.24
6.36
6.42
56. Demonstrate accountability for your own actions. 6.29
6.38
5.43
57. Support fairness in the delivery of care. 6.23
6.36
6.36
* = higher or lower rating compared to Select 6 Comparison Schools, = higher or lower rating compared
to Carnegie Class Comparison Schools, = higher or lower rating compared to all Schools.
Core Competencies
Educational Benchmarking Incorporated: Undergraduate Student Satisfaction Survey.
2007
N = 92
2008
N = 81
2009
N = 94
Scale 1‐7 Scale 1‐7 Scale 1‐7
Factor Mean 5.89
Factor Mean 6.06
Factor Mean 6.04
Learning Outcomes – Core Competencies – To what degree did the nursing program teach you to:
58. Apply research based knowledge as a basis for practice. 6.18
6.18
6.14
59. Assist patients to interpret the meaning of health information.
5.82
6.08
5.97
WASC EER Report Appendix D 101
RETURN TO CONTENTS
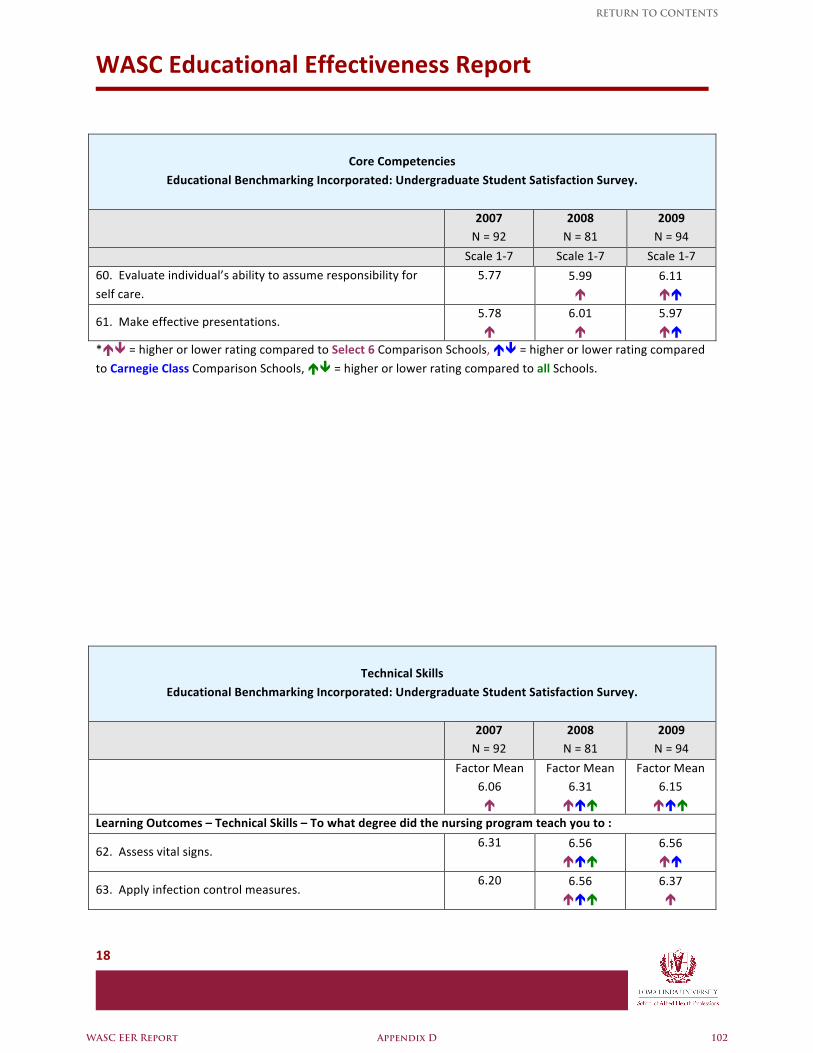
WASC Educational Effectiveness Report
18
Core Competencies
Educational Benchmarking Incorporated: Undergraduate Student Satisfaction Survey.
2007 N = 92
2008 N = 81
2009 N = 94
Scale 1‐7 Scale 1‐7 Scale 1‐7
60. Evaluate individual’s ability to assume responsibility for
self care.
5.77
5.99
6.11
61. Make effective presentations. 5.78
6.01
5.97
* = higher or lower rating compared to Select 6 Comparison Schools, = higher or lower rating compared
to Carnegie Class Comparison Schools, = higher or lower rating compared to all Schools.
Technical Skills
Educational Benchmarking Incorporated: Undergraduate Student Satisfaction Survey.
2007 N = 92
2008 N = 81
2009 N = 94
Factor Mean
6.06
Factor Mean 6.31
Factor Mean 6.15
Learning Outcomes – Technical Skills – To what degree did the nursing program teach you to :
62. Assess vital signs. 6.31
6.56
6.56
63. Apply infection control measures. 6.20
6.56
6.37
WASC EER Report Appendix D 102
RETURN TO CONTENTS
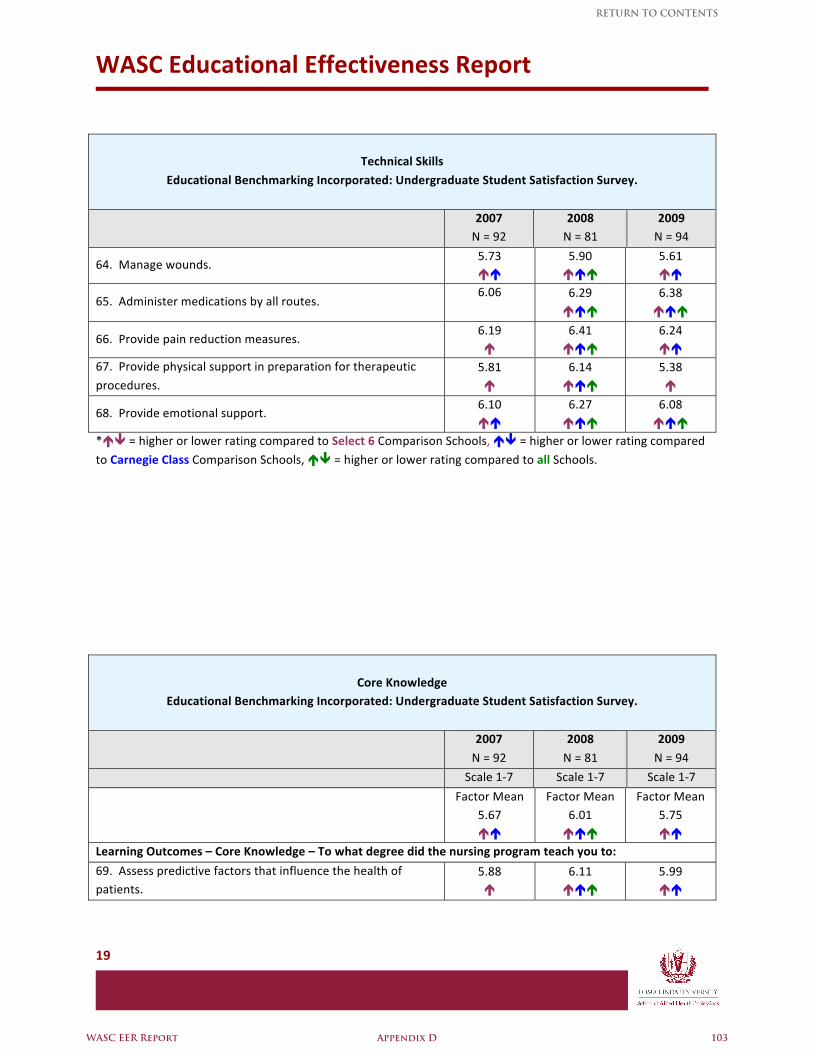
WASC Educational Effectiveness Report
19
Technical Skills
Educational Benchmarking Incorporated: Undergraduate Student Satisfaction Survey.
2007 N = 92
2008 N = 81
2009 N = 94
64. Manage wounds. 5.73
5.90
5.61
65. Administer medications by all routes. 6.06
6.29
6.38
66. Provide pain reduction measures. 6.19
6.41
6.24
67. Provide physical support in preparation for therapeutic
procedures. 5.81
6.14
5.38
68. Provide emotional support. 6.10
6.27
6.08
* = higher or lower rating compared to Select 6 Comparison Schools, = higher or lower rating compared
to Carnegie Class Comparison Schools, = higher or lower rating compared to all Schools.
Core Knowledge Educational Benchmarking Incorporated: Undergraduate Student Satisfaction Survey.
2007
N = 92
2008
N = 81
2009
N = 94
Scale 1‐7 Scale 1‐7 Scale 1‐7
Factor Mean
5.67
Factor Mean 6.01
Factor Mean 5.75
Learning Outcomes – Core Knowledge – To what degree did the nursing program teach you to:
69. Assess predictive factors that influence the health of patients.
5.88
6.11
5.99
WASC EER Report Appendix D 103
RETURN TO CONTENTS
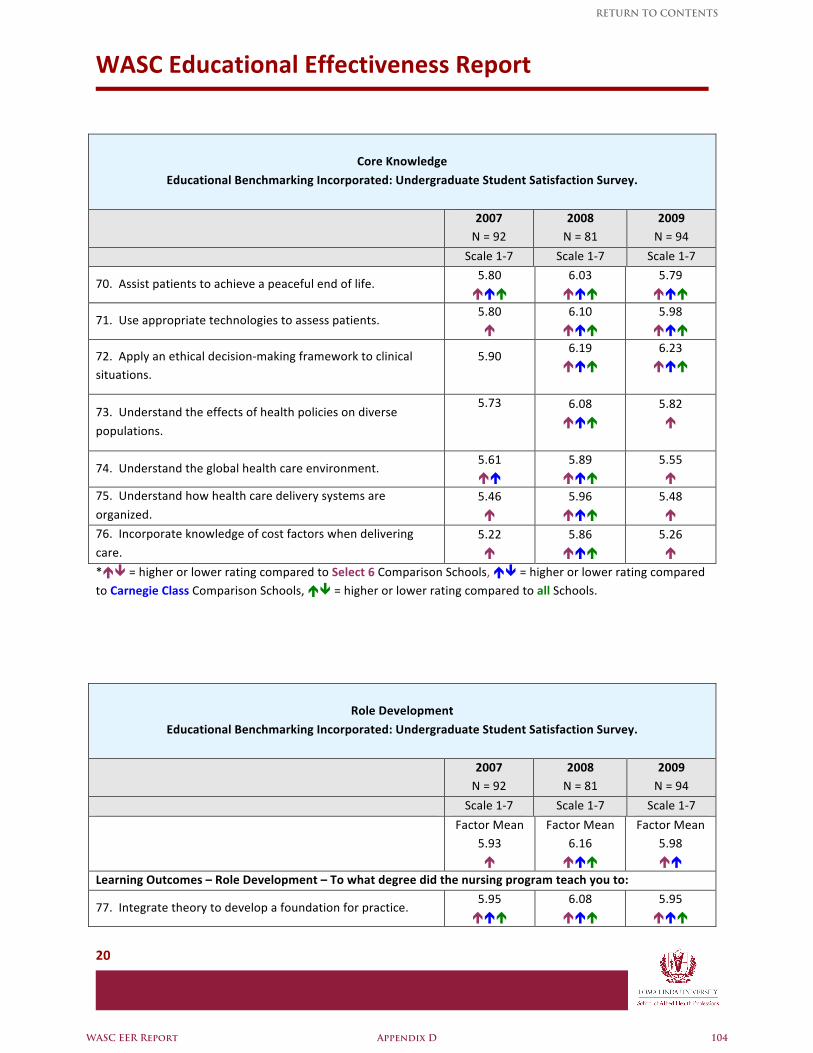
WASC Educational Effectiveness Report
20
Core Knowledge
Educational Benchmarking Incorporated: Undergraduate Student Satisfaction Survey.
2007 N = 92
2008 N = 81
2009 N = 94
Scale 1‐7 Scale 1‐7 Scale 1‐7
70. Assist patients to achieve a peaceful end of life. 5.80
6.03
5.79
71. Use appropriate technologies to assess patients. 5.80
6.10
5.98
72. Apply an ethical decision‐making framework to clinical situations.
5.90
6.19
6.23
73. Understand the effects of health policies on diverse
populations.
5.73
6.08
5.82
74. Understand the global health care environment. 5.61
5.89
5.55
75. Understand how health care delivery systems are
organized. 5.46
5.96
5.48
76. Incorporate knowledge of cost factors when delivering
care. 5.22
5.86
5.26
* = higher or lower rating compared to Select 6 Comparison Schools, = higher or lower rating compared to Carnegie Class Comparison Schools, = higher or lower rating compared to all Schools.
Role Development
Educational Benchmarking Incorporated: Undergraduate Student Satisfaction Survey.
2007 N = 92
2008 N = 81
2009 N = 94
Scale 1‐7 Scale 1‐7 Scale 1‐7
Factor Mean
5.93
Factor Mean 6.16
Factor Mean 5.98
Learning Outcomes – Role Development – To what degree did the nursing program teach you to:
77. Integrate theory to develop a foundation for practice. 5.95
6.08
5.95
WASC EER Report Appendix D 104
RETURN TO CONTENTS
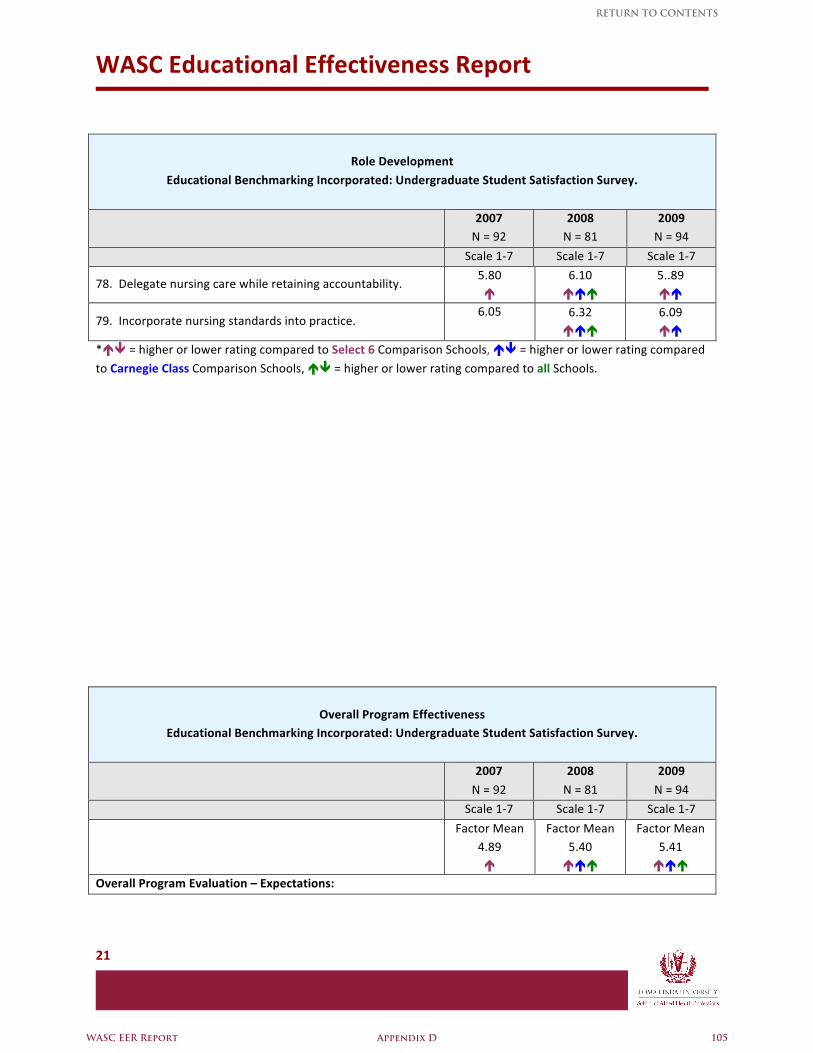
WASC Educational Effectiveness Report
21
Role Development
Educational Benchmarking Incorporated: Undergraduate Student Satisfaction Survey.
2007 N = 92
2008 N = 81
2009 N = 94
Scale 1‐7 Scale 1‐7 Scale 1‐7
78. Delegate nursing care while retaining accountability. 5.80
6.10
5..89
79. Incorporate nursing standards into practice. 6.05
6.32
6.09
* = higher or lower rating compared to Select 6 Comparison Schools, = higher or lower rating compared
to Carnegie Class Comparison Schools, = higher or lower rating compared to all Schools.
Overall Program Effectiveness Educational Benchmarking Incorporated: Undergraduate Student Satisfaction Survey.
2007
N = 92
2008
N = 81
2009
N = 94
Scale 1‐7 Scale 1‐7 Scale 1‐7
Factor Mean
4.89
Factor Mean 5.40
Factor Mean 5.41
Overall Program Evaluation – Expectations:
WASC EER Report Appendix D 105
RETURN TO CONTENTS
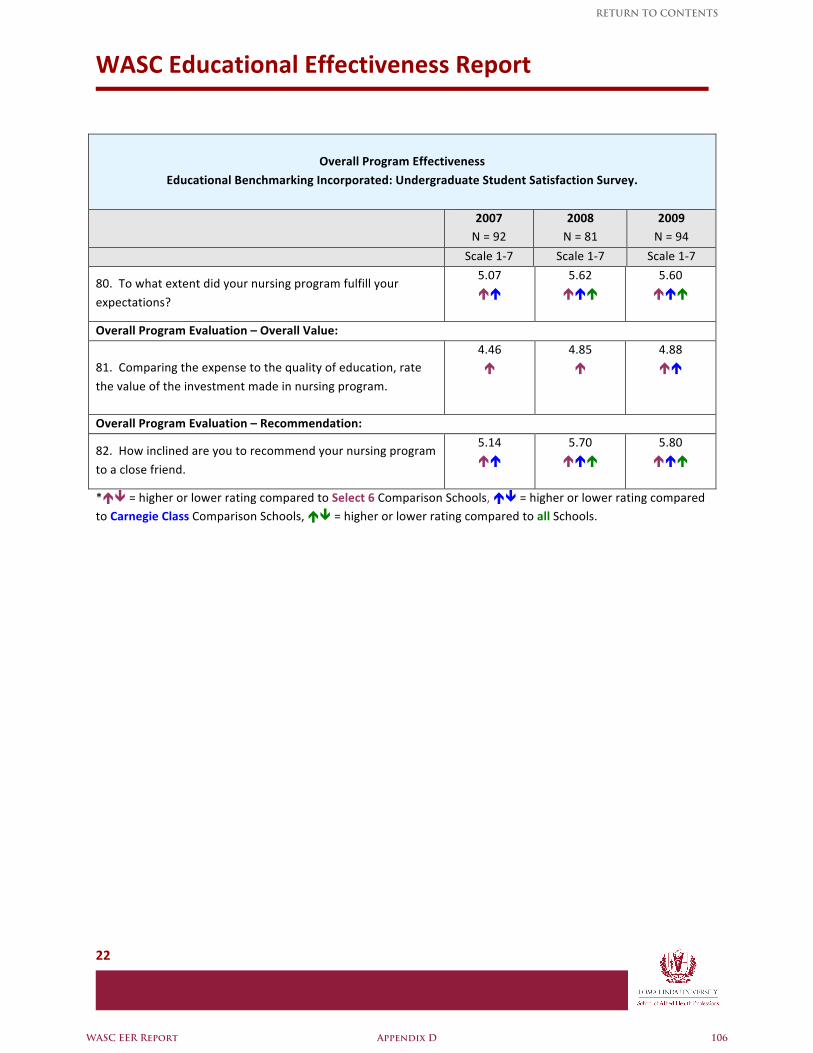
WASC Educational Effectiveness Report
22
Overall Program Effectiveness
Educational Benchmarking Incorporated: Undergraduate Student Satisfaction Survey.
2007 N = 92
2008 N = 81
2009 N = 94
Scale 1‐7 Scale 1‐7 Scale 1‐7
80. To what extent did your nursing program fulfill your
expectations?
5.07
5.62
5.60
Overall Program Evaluation – Overall Value:
81. Comparing the expense to the quality of education, rate
the value of the investment made in nursing program.
4.46
4.85
4.88
Overall Program Evaluation – Recommendation:
82. How inclined are you to recommend your nursing program
to a close friend.
5.14
5.70
5.80
* = higher or lower rating compared to Select 6 Comparison Schools, = higher or lower rating compared to Carnegie Class Comparison Schools, = higher or lower rating compared to all Schools.
WASC EER Report Appendix D 106
RETURN TO CONTENTS
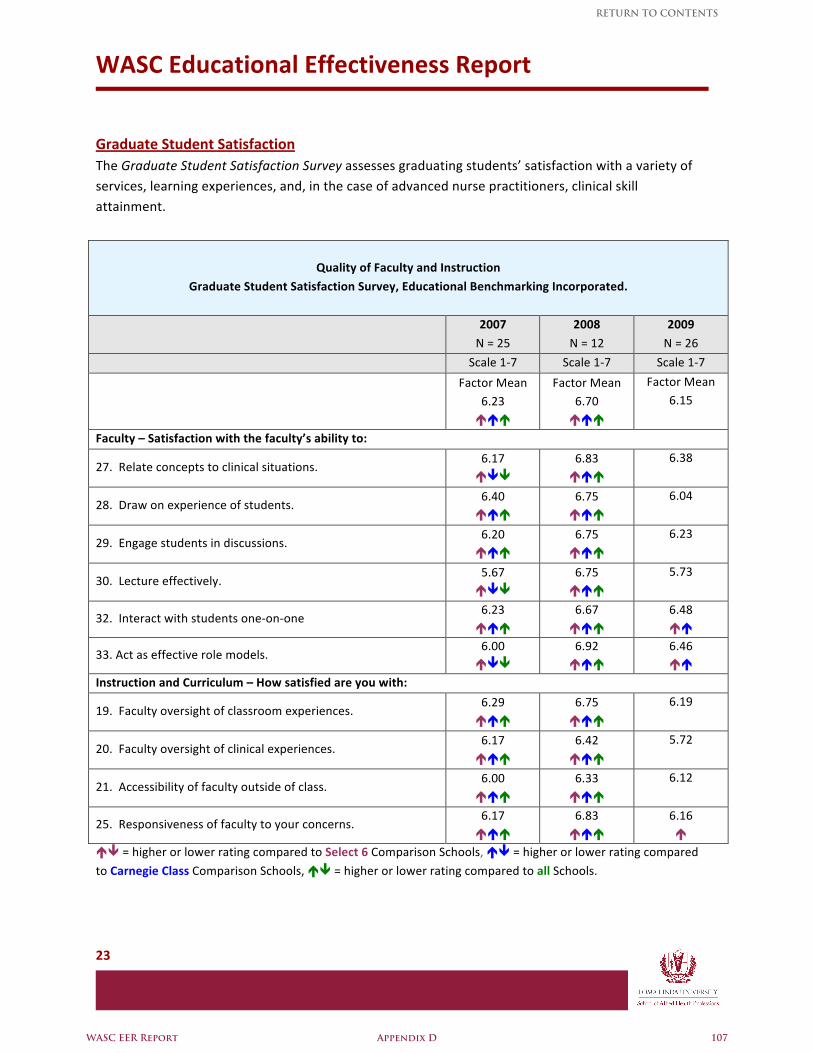
WASC Educational Effectiveness Report
23
Graduate Student Satisfaction The Graduate Student Satisfaction Survey assesses graduating students’ satisfaction with a variety of services, learning experiences, and, in the case of advanced nurse practitioners, clinical skill attainment.
Quality of Faculty and Instruction
Graduate Student Satisfaction Survey, Educational Benchmarking Incorporated.
2007
N = 25
2008
N = 12
2009
N = 26
Scale 1‐7 Scale 1‐7 Scale 1‐7
Factor Mean
6.23
Factor Mean 6.70
Factor Mean 6.15
Faculty – Satisfaction with the faculty’s ability to:
27. Relate concepts to clinical situations. 6.17
6.83
6.38
28. Draw on experience of students. 6.40
6.75
6.04
29. Engage students in discussions. 6.20
6.75
6.23
30. Lecture effectively. 5.67
6.75
5.73
32. Interact with students one‐on‐one 6.23
6.67
6.48
33. Act as effective role models. 6.00
6.92
6.46
Instruction and Curriculum – How satisfied are you with:
19. Faculty oversight of classroom experiences. 6.29
6.75
6.19
20. Faculty oversight of clinical experiences. 6.17
6.42
5.72
21. Accessibility of faculty outside of class. 6.00
6.33
6.12
25. Responsiveness of faculty to your concerns. 6.17
6.83
6.16
= higher or lower rating compared to Select 6 Comparison Schools, = higher or lower rating compared
to Carnegie Class Comparison Schools, = higher or lower rating compared to all Schools.
WASC EER Report Appendix D 107
RETURN TO CONTENTS
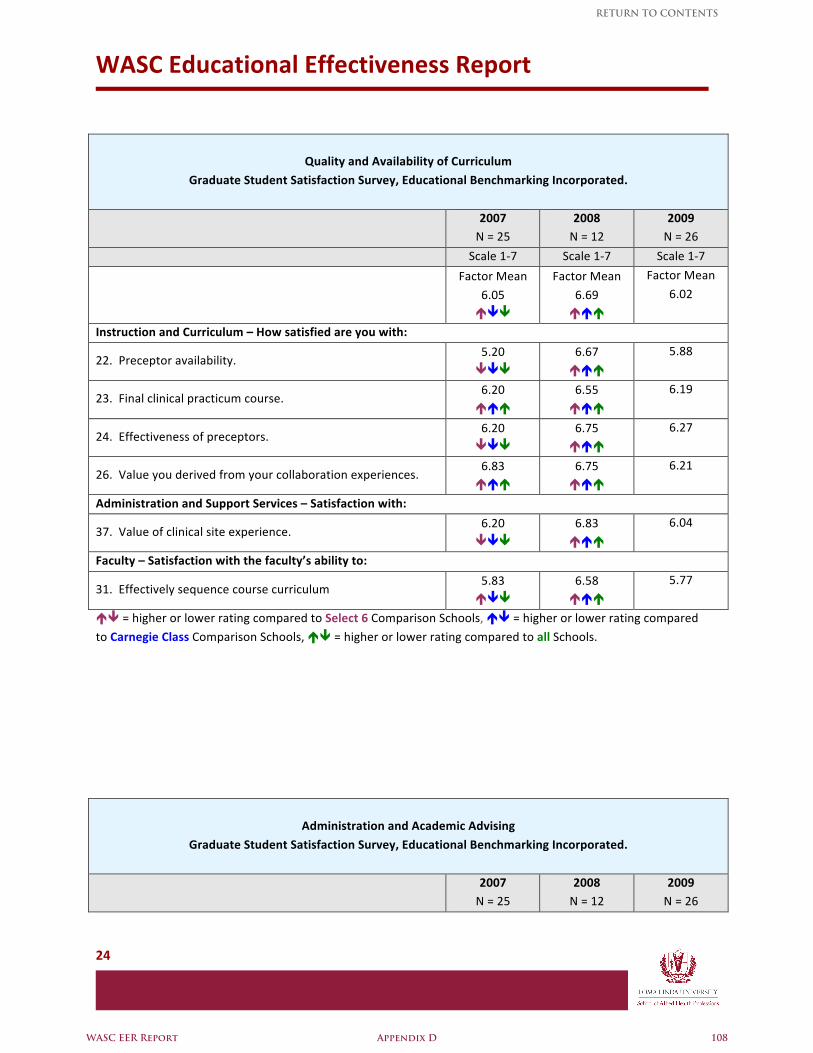
WASC Educational Effectiveness Report
24
Quality and Availability of Curriculum
Graduate Student Satisfaction Survey, Educational Benchmarking Incorporated.
2007 N = 25
2008 N = 12
2009 N = 26
Scale 1‐7 Scale 1‐7 Scale 1‐7
Factor Mean
6.05
Factor Mean
6.69
Factor Mean
6.02
Instruction and Curriculum – How satisfied are you with:
22. Preceptor availability. 5.20
6.67
5.88
23. Final clinical practicum course. 6.20
6.55
6.19
24. Effectiveness of preceptors. 6.20
6.75
6.27
26. Value you derived from your collaboration experiences. 6.83
6.75
6.21
Administration and Support Services – Satisfaction with:
37. Value of clinical site experience. 6.20
6.83
6.04
Faculty – Satisfaction with the faculty’s ability to:
31. Effectively sequence course curriculum 5.83
6.58
5.77
= higher or lower rating compared to Select 6 Comparison Schools, = higher or lower rating compared
to Carnegie Class Comparison Schools, = higher or lower rating compared to all Schools.
Administration and Academic Advising
Graduate Student Satisfaction Survey, Educational Benchmarking Incorporated.
2007 N = 25
2008 N = 12
2009 N = 26
WASC EER Report Appendix D 108
RETURN TO CONTENTS
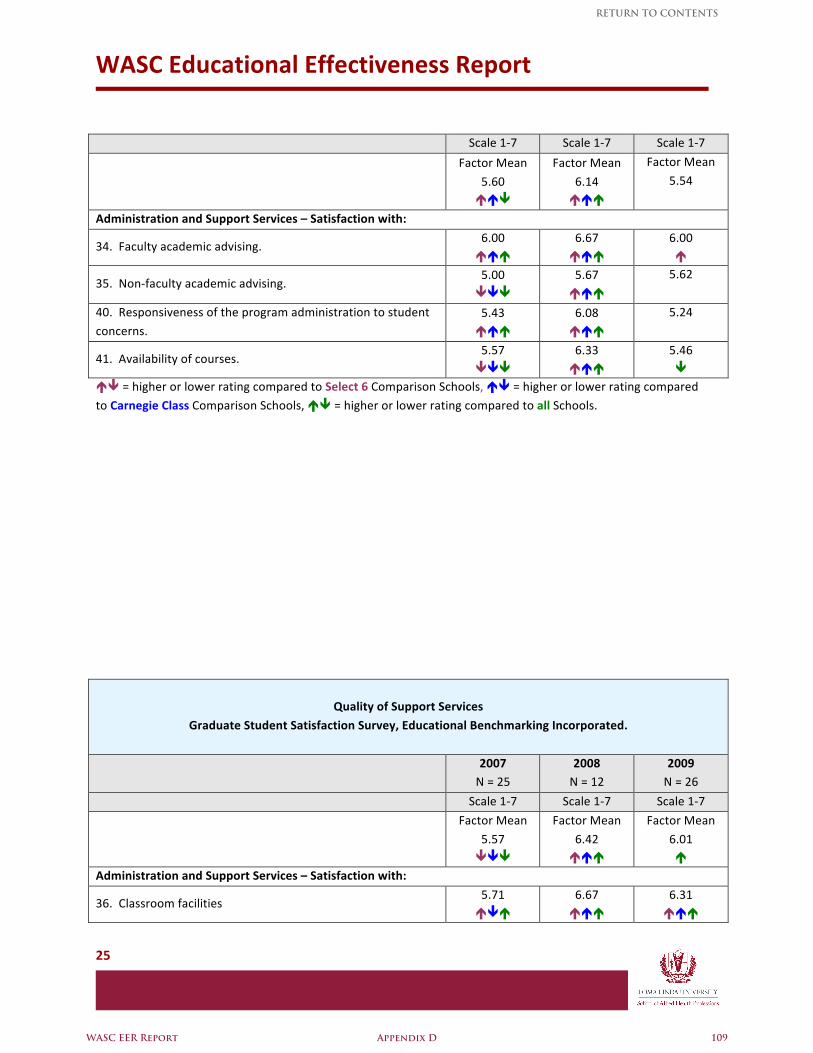
WASC Educational Effectiveness Report
25
Scale 1‐7 Scale 1‐7 Scale 1‐7
Factor Mean
5.60
Factor Mean
6.14
Factor Mean
5.54
Administration and Support Services – Satisfaction with:
34. Faculty academic advising. 6.00
6.67
6.00
35. Non‐faculty academic advising. 5.00
5.67
5.62
40. Responsiveness of the program administration to student
concerns. 5.43
6.08
5.24
41. Availability of courses. 5.57
6.33
5.46
= higher or lower rating compared to Select 6 Comparison Schools, = higher or lower rating compared
to Carnegie Class Comparison Schools, = higher or lower rating compared to all Schools.
Quality of Support Services
Graduate Student Satisfaction Survey, Educational Benchmarking Incorporated.
2007 N = 25
2008 N = 12
2009 N = 26
Scale 1‐7 Scale 1‐7 Scale 1‐7
Factor Mean
5.57
Factor Mean
6.42
Factor Mean
6.01
Administration and Support Services – Satisfaction with:
36. Classroom facilities 5.71
6.67
6.31
WASC EER Report Appendix D 109
RETURN TO CONTENTS
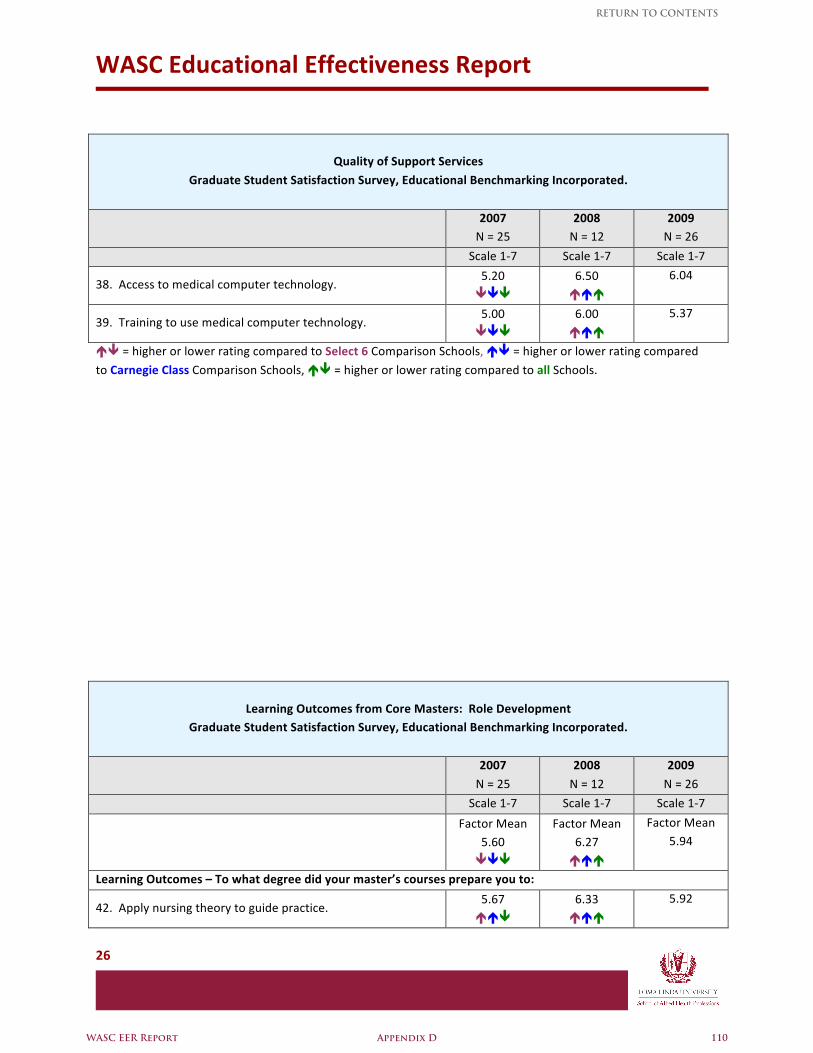
WASC Educational Effectiveness Report
26
Quality of Support Services
Graduate Student Satisfaction Survey, Educational Benchmarking Incorporated.
2007 N = 25
2008 N = 12
2009 N = 26
Scale 1‐7 Scale 1‐7 Scale 1‐7
38. Access to medical computer technology. 5.20
6.50
6.04
39. Training to use medical computer technology. 5.00
6.00
5.37
= higher or lower rating compared to Select 6 Comparison Schools, = higher or lower rating compared
to Carnegie Class Comparison Schools, = higher or lower rating compared to all Schools.
Learning Outcomes from Core Masters: Role Development Graduate Student Satisfaction Survey, Educational Benchmarking Incorporated.
2007
N = 25
2008
N = 12
2009
N = 26
Scale 1‐7 Scale 1‐7 Scale 1‐7
Factor Mean
5.60
Factor Mean 6.27
Factor Mean 5.94
Learning Outcomes – To what degree did your master’s courses prepare you to:
42. Apply nursing theory to guide practice. 5.67
6.33
5.92
WASC EER Report Appendix D 110
RETURN TO CONTENTS
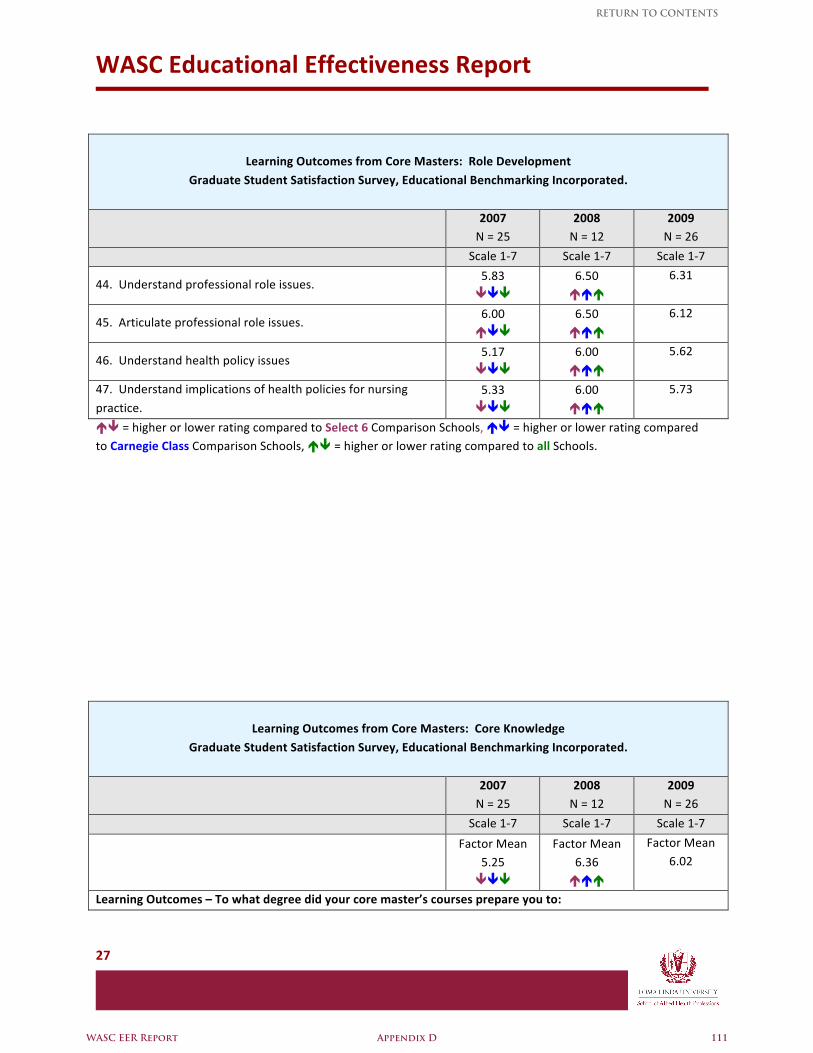
WASC Educational Effectiveness Report
27
Learning Outcomes from Core Masters: Role Development
Graduate Student Satisfaction Survey, Educational Benchmarking Incorporated.
2007 N = 25
2008 N = 12
2009 N = 26
Scale 1‐7 Scale 1‐7 Scale 1‐7
44. Understand professional role issues. 5.83
6.50
6.31
45. Articulate professional role issues. 6.00
6.50
6.12
46. Understand health policy issues 5.17
6.00
5.62
47. Understand implications of health policies for nursing
practice. 5.33
6.00
5.73
= higher or lower rating compared to Select 6 Comparison Schools, = higher or lower rating compared to Carnegie Class Comparison Schools, = higher or lower rating compared to all Schools.
Learning Outcomes from Core Masters: Core Knowledge
Graduate Student Satisfaction Survey, Educational Benchmarking Incorporated.
2007 N = 25
2008 N = 12
2009 N = 26
Scale 1‐7 Scale 1‐7 Scale 1‐7
Factor Mean
5.25
Factor Mean 6.36
Factor Mean 6.02
Learning Outcomes – To what degree did your core master’s courses prepare you to:
WASC EER Report Appendix D 111
RETURN TO CONTENTS
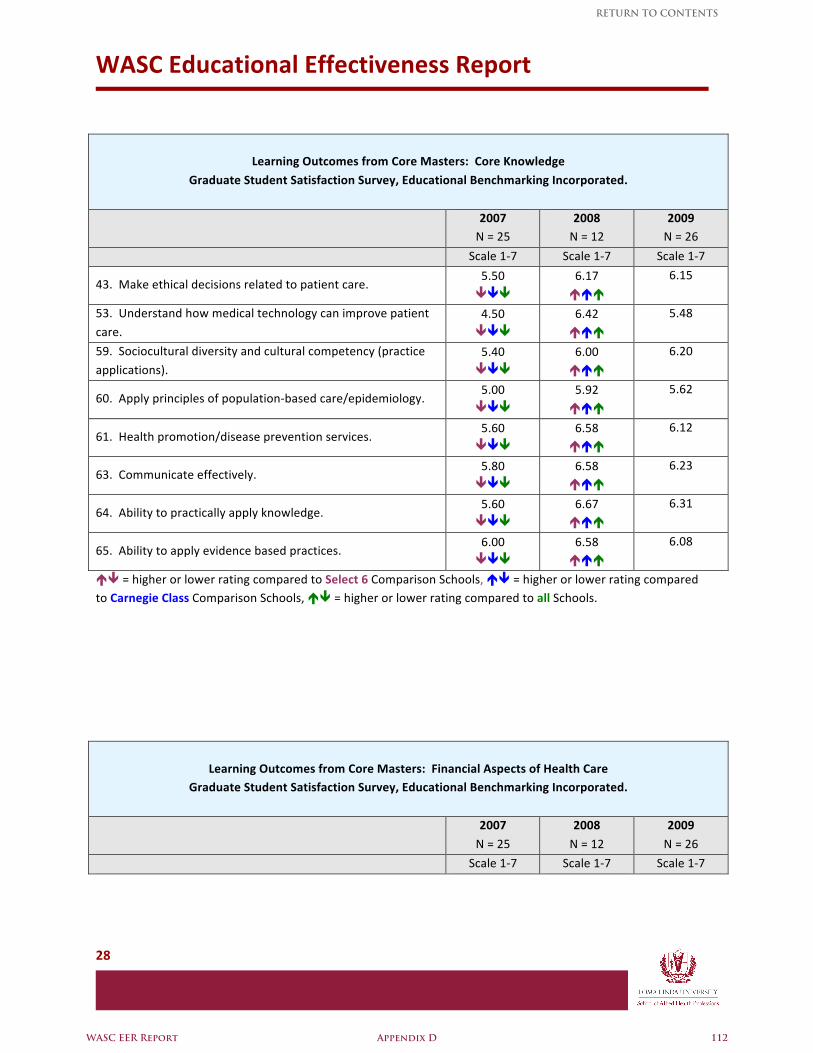
WASC Educational Effectiveness Report
28
Learning Outcomes from Core Masters: Core Knowledge
Graduate Student Satisfaction Survey, Educational Benchmarking Incorporated.
2007 N = 25
2008 N = 12
2009 N = 26
Scale 1‐7 Scale 1‐7 Scale 1‐7
43. Make ethical decisions related to patient care. 5.50
6.17
6.15
53. Understand how medical technology can improve patient
care. 4.50
6.42
5.48
59. Sociocultural diversity and cultural competency (practice
applications). 5.40
6.00
6.20
60. Apply principles of population‐based care/epidemiology. 5.00
5.92
5.62
61. Health promotion/disease prevention services. 5.60
6.58
6.12
63. Communicate effectively. 5.80
6.58
6.23
64. Ability to practically apply knowledge. 5.60
6.67
6.31
65. Ability to apply evidence based practices. 6.00
6.58
6.08
= higher or lower rating compared to Select 6 Comparison Schools, = higher or lower rating compared to Carnegie Class Comparison Schools, = higher or lower rating compared to all Schools.
Learning Outcomes from Core Masters: Financial Aspects of Health Care Graduate Student Satisfaction Survey, Educational Benchmarking Incorporated.
2007
N = 25
2008
N = 12
2009
N = 26
Scale 1‐7 Scale 1‐7 Scale 1‐7
WASC EER Report Appendix D 112
RETURN TO CONTENTS
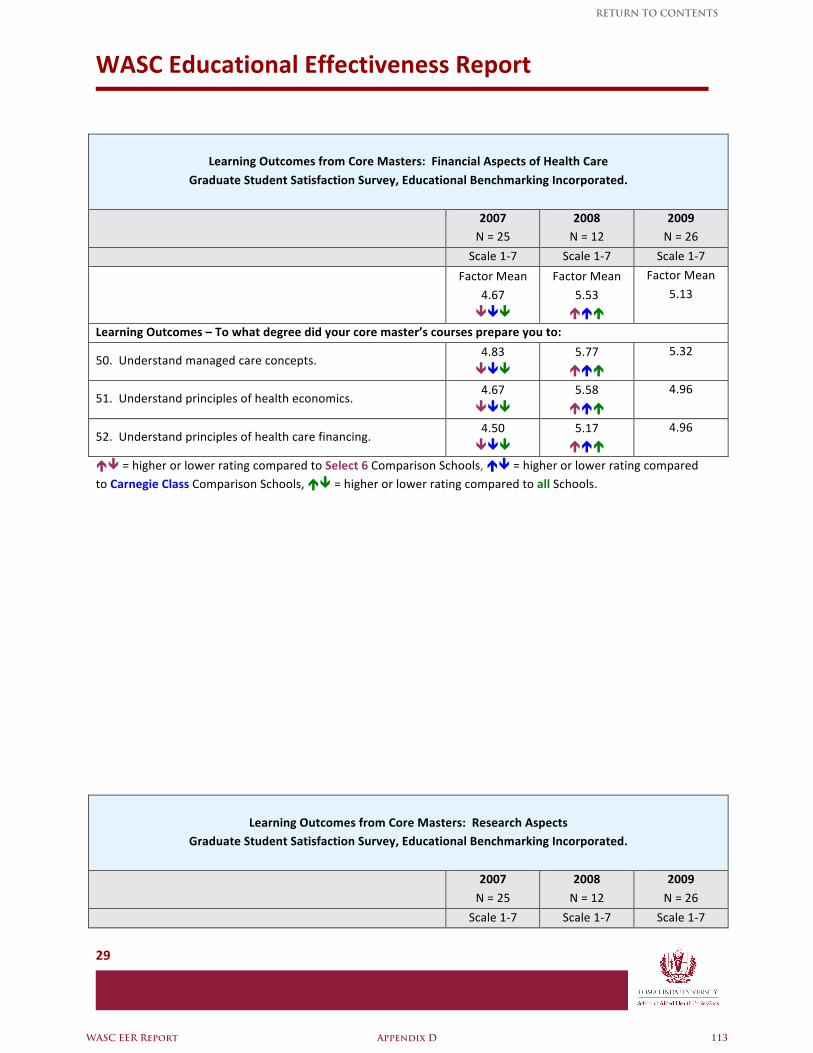
WASC Educational Effectiveness Report
29
Learning Outcomes from Core Masters: Financial Aspects of Health Care
Graduate Student Satisfaction Survey, Educational Benchmarking Incorporated.
2007 N = 25
2008 N = 12
2009 N = 26
Scale 1‐7 Scale 1‐7 Scale 1‐7
Factor Mean
4.67
Factor Mean
5.53
Factor Mean
5.13
Learning Outcomes – To what degree did your core master’s courses prepare you to:
50. Understand managed care concepts. 4.83
5.77
5.32
51. Understand principles of health economics. 4.67
5.58
4.96
52. Understand principles of health care financing. 4.50
5.17
4.96
= higher or lower rating compared to Select 6 Comparison Schools, = higher or lower rating compared to Carnegie Class Comparison Schools, = higher or lower rating compared to all Schools.
Learning Outcomes from Core Masters: Research Aspects Graduate Student Satisfaction Survey, Educational Benchmarking Incorporated.
2007
N = 25
2008
N = 12
2009
N = 26
Scale 1‐7 Scale 1‐7 Scale 1‐7
WASC EER Report Appendix D 113
RETURN TO CONTENTS
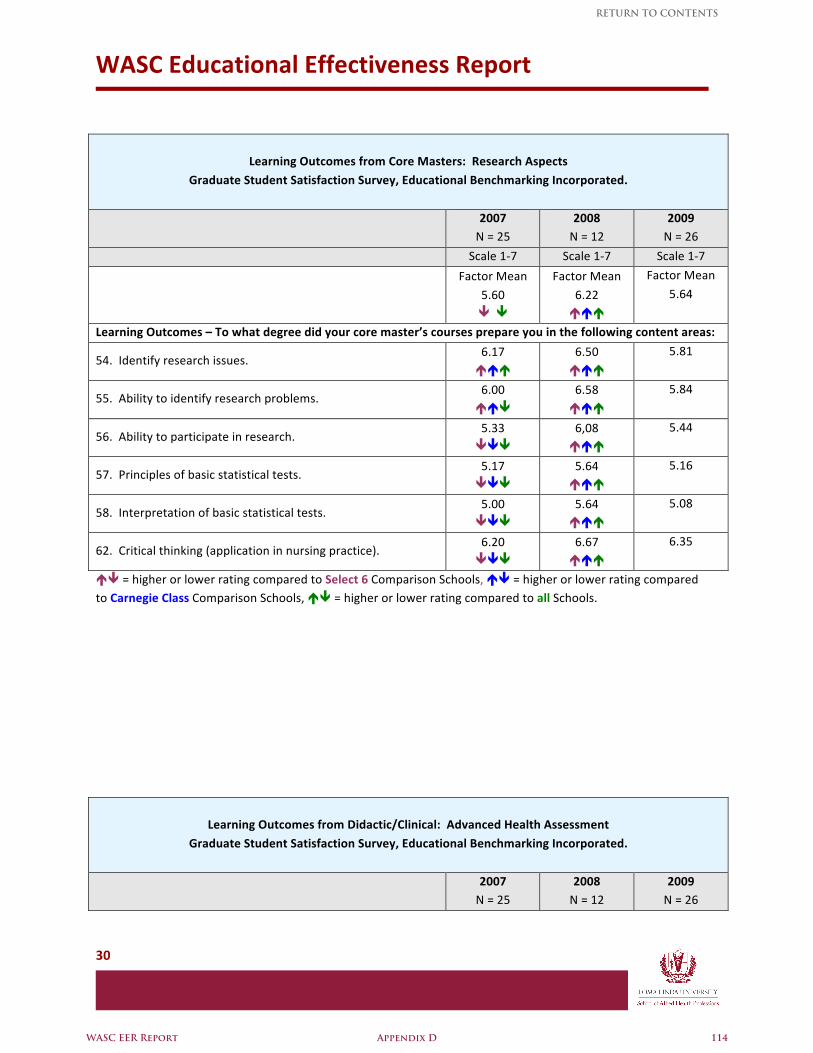
WASC Educational Effectiveness Report
30
Learning Outcomes from Core Masters: Research Aspects
Graduate Student Satisfaction Survey, Educational Benchmarking Incorporated.
2007 N = 25
2008 N = 12
2009 N = 26
Scale 1‐7 Scale 1‐7 Scale 1‐7
Factor Mean
5.60
Factor Mean
6.22
Factor Mean
5.64
Learning Outcomes – To what degree did your core master’s courses prepare you in the following content areas:
54. Identify research issues. 6.17
6.50
5.81
55. Ability to identify research problems. 6.00
6.58
5.84
56. Ability to participate in research. 5.33
6,08
5.44
57. Principles of basic statistical tests. 5.17
5.64
5.16
58. Interpretation of basic statistical tests. 5.00
5.64
5.08
62. Critical thinking (application in nursing practice). 6.20
6.67
6.35
= higher or lower rating compared to Select 6 Comparison Schools, = higher or lower rating compared to Carnegie Class Comparison Schools, = higher or lower rating compared to all Schools.
Learning Outcomes from Didactic/Clinical: Advanced Health Assessment
Graduate Student Satisfaction Survey, Educational Benchmarking Incorporated.
2007 N = 25
2008 N = 12
2009 N = 26
WASC EER Report Appendix D 114
RETURN TO CONTENTS
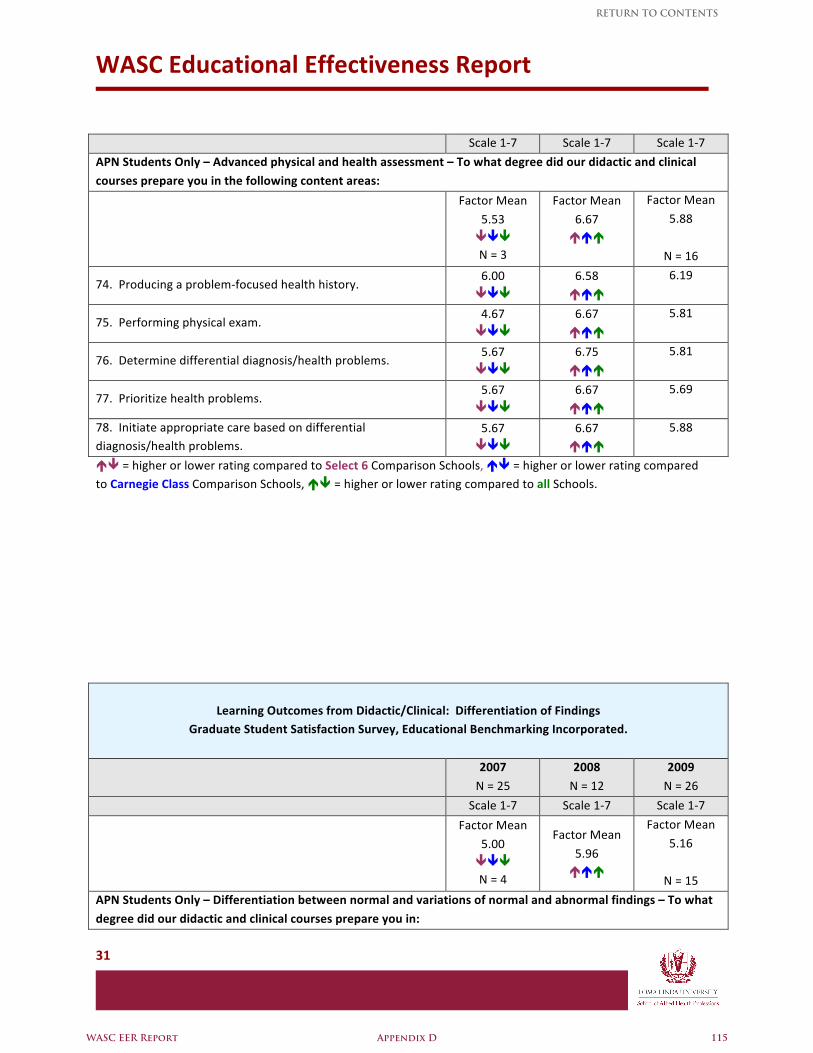
WASC Educational Effectiveness Report
31
Scale 1‐7 Scale 1‐7 Scale 1‐7
APN Students Only – Advanced physical and health assessment – To what degree did our didactic and clinical
courses prepare you in the following content areas:
Factor Mean
5.53 N = 3
Factor Mean
6.67
Factor Mean
5.88
N = 16
74. Producing a problem‐focused health history. 6.00
6.58
6.19
75. Performing physical exam. 4.67
6.67
5.81
76. Determine differential diagnosis/health problems. 5.67
6.75
5.81
77. Prioritize health problems. 5.67
6.67
5.69
78. Initiate appropriate care based on differential diagnosis/health problems.
5.67
6.67
5.88
= higher or lower rating compared to Select 6 Comparison Schools, = higher or lower rating compared to Carnegie Class Comparison Schools, = higher or lower rating compared to all Schools.
Learning Outcomes from Didactic/Clinical: Differentiation of Findings Graduate Student Satisfaction Survey, Educational Benchmarking Incorporated.
2007
N = 25
2008
N = 12
2009
N = 26
Scale 1‐7 Scale 1‐7 Scale 1‐7
Factor Mean
5.00 N = 4
Factor Mean
5.96
Factor Mean
5.16
N = 15
APN Students Only – Differentiation between normal and variations of normal and abnormal findings – To what
degree did our didactic and clinical courses prepare you in:
WASC EER Report Appendix D 115
RETURN TO CONTENTS
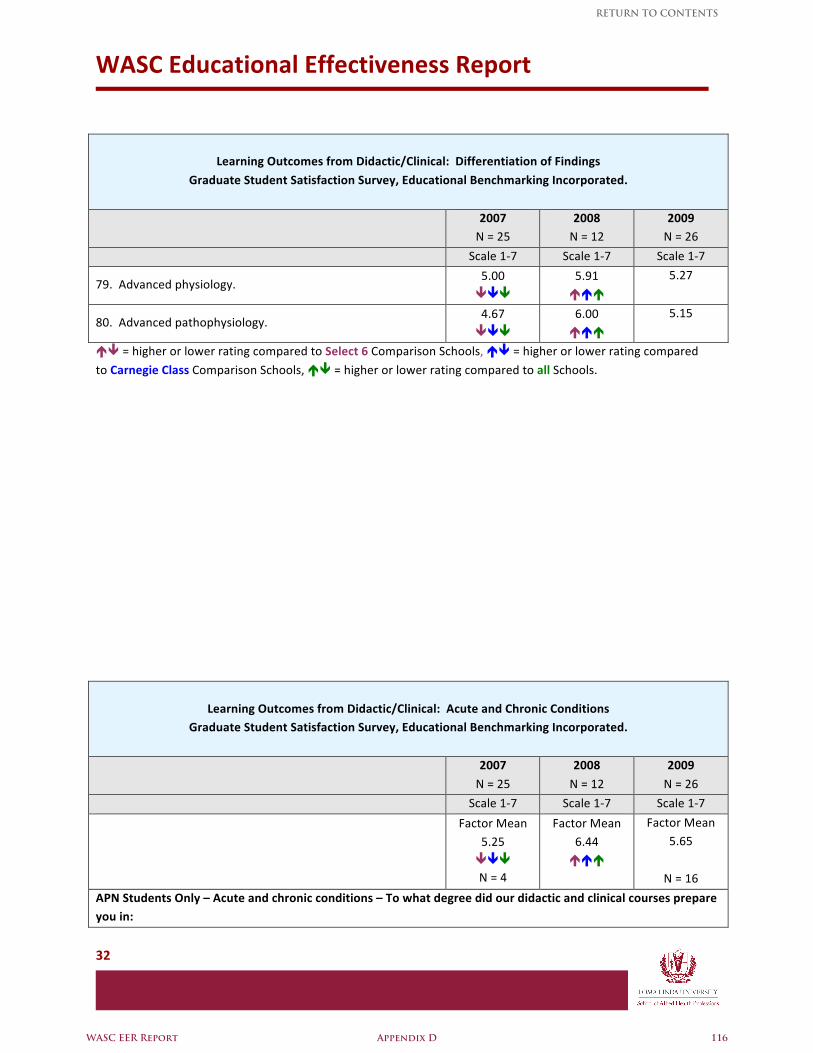
WASC Educational Effectiveness Report
32
Learning Outcomes from Didactic/Clinical: Differentiation of Findings
Graduate Student Satisfaction Survey, Educational Benchmarking Incorporated.
2007 N = 25
2008 N = 12
2009 N = 26
Scale 1‐7 Scale 1‐7 Scale 1‐7
79. Advanced physiology. 5.00
5.91
5.27
80. Advanced pathophysiology. 4.67
6.00
5.15
= higher or lower rating compared to Select 6 Comparison Schools, = higher or lower rating compared
to Carnegie Class Comparison Schools, = higher or lower rating compared to all Schools.
Learning Outcomes from Didactic/Clinical: Acute and Chronic Conditions Graduate Student Satisfaction Survey, Educational Benchmarking Incorporated.
2007
N = 25
2008
N = 12
2009
N = 26
Scale 1‐7 Scale 1‐7 Scale 1‐7
Factor Mean 5.25 N = 4
Factor Mean 6.44
Factor Mean 5.65
N = 16
APN Students Only – Acute and chronic conditions – To what degree did our didactic and clinical courses prepare you in:
WASC EER Report Appendix D 116
RETURN TO CONTENTS
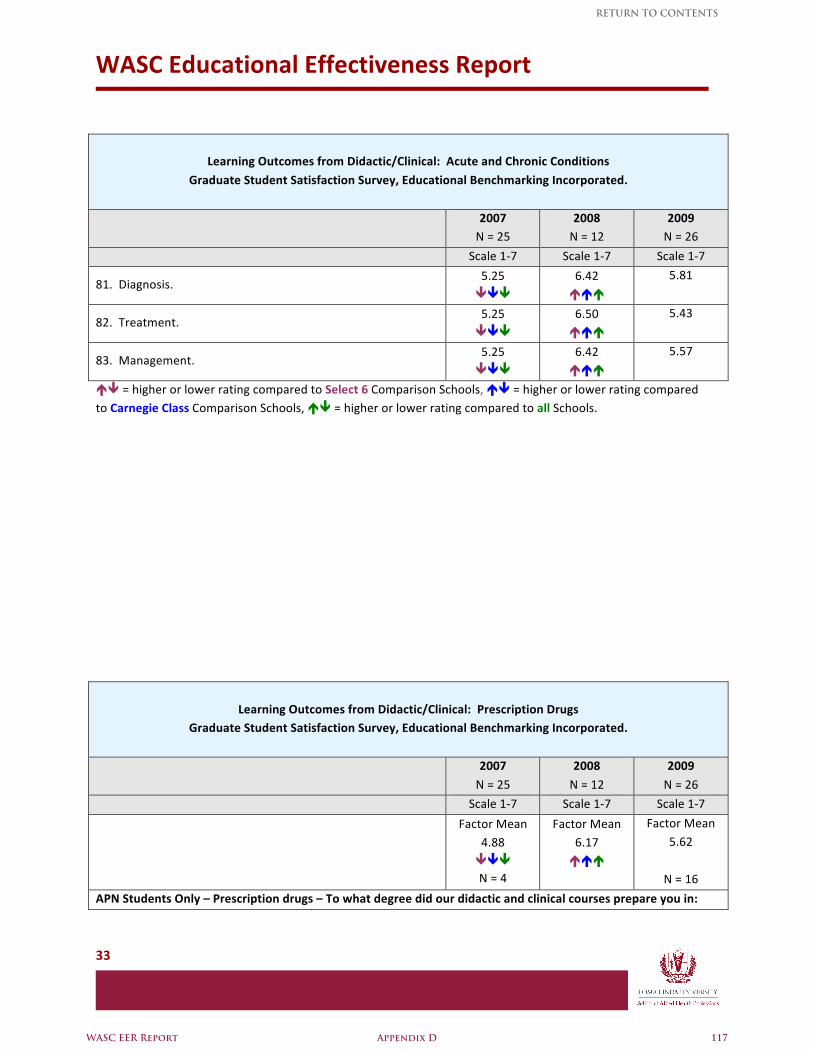
WASC Educational Effectiveness Report
33
Learning Outcomes from Didactic/Clinical: Acute and Chronic Conditions
Graduate Student Satisfaction Survey, Educational Benchmarking Incorporated.
2007 N = 25
2008 N = 12
2009 N = 26
Scale 1‐7 Scale 1‐7 Scale 1‐7
81. Diagnosis. 5.25
6.42
5.81
82. Treatment. 5.25
6.50
5.43
83. Management. 5.25
6.42
5.57
= higher or lower rating compared to Select 6 Comparison Schools, = higher or lower rating compared to Carnegie Class Comparison Schools, = higher or lower rating compared to all Schools.
Learning Outcomes from Didactic/Clinical: Prescription Drugs Graduate Student Satisfaction Survey, Educational Benchmarking Incorporated.
2007
N = 25
2008
N = 12
2009
N = 26
Scale 1‐7 Scale 1‐7 Scale 1‐7
Factor Mean 4.88 N = 4
Factor Mean 6.17
Factor Mean 5.62
N = 16
APN Students Only – Prescription drugs – To what degree did our didactic and clinical courses prepare you in:
WASC EER Report Appendix D 117
RETURN TO CONTENTS
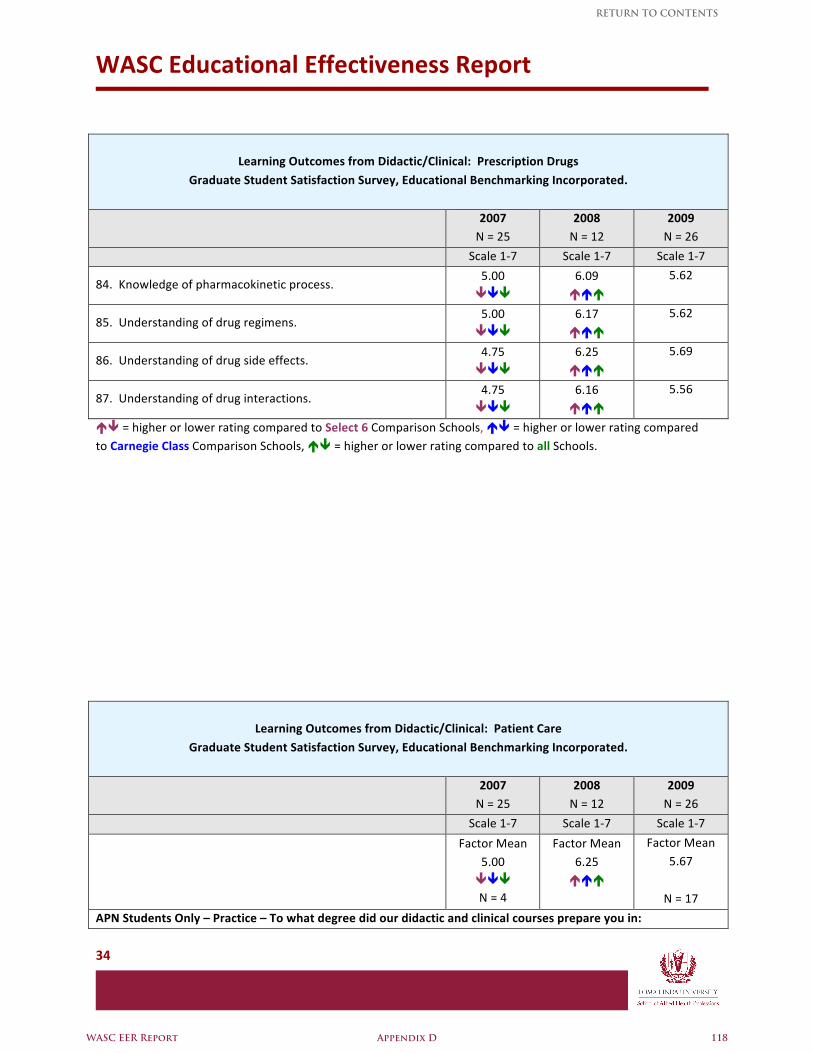
WASC Educational Effectiveness Report
34
Learning Outcomes from Didactic/Clinical: Prescription Drugs
Graduate Student Satisfaction Survey, Educational Benchmarking Incorporated.
2007 N = 25
2008 N = 12
2009 N = 26
Scale 1‐7 Scale 1‐7 Scale 1‐7
84. Knowledge of pharmacokinetic process. 5.00
6.09
5.62
85. Understanding of drug regimens. 5.00
6.17
5.62
86. Understanding of drug side effects. 4.75
6.25
5.69
87. Understanding of drug interactions. 4.75
6.16
5.56
= higher or lower rating compared to Select 6 Comparison Schools, = higher or lower rating compared to Carnegie Class Comparison Schools, = higher or lower rating compared to all Schools.
Learning Outcomes from Didactic/Clinical: Patient Care
Graduate Student Satisfaction Survey, Educational Benchmarking Incorporated.
2007 N = 25
2008 N = 12
2009 N = 26
Scale 1‐7 Scale 1‐7 Scale 1‐7
Factor Mean 5.00 N = 4
Factor Mean 6.25
Factor Mean 5.67
N = 17
APN Students Only – Practice – To what degree did our didactic and clinical courses prepare you in:
WASC EER Report Appendix D 118
RETURN TO CONTENTS
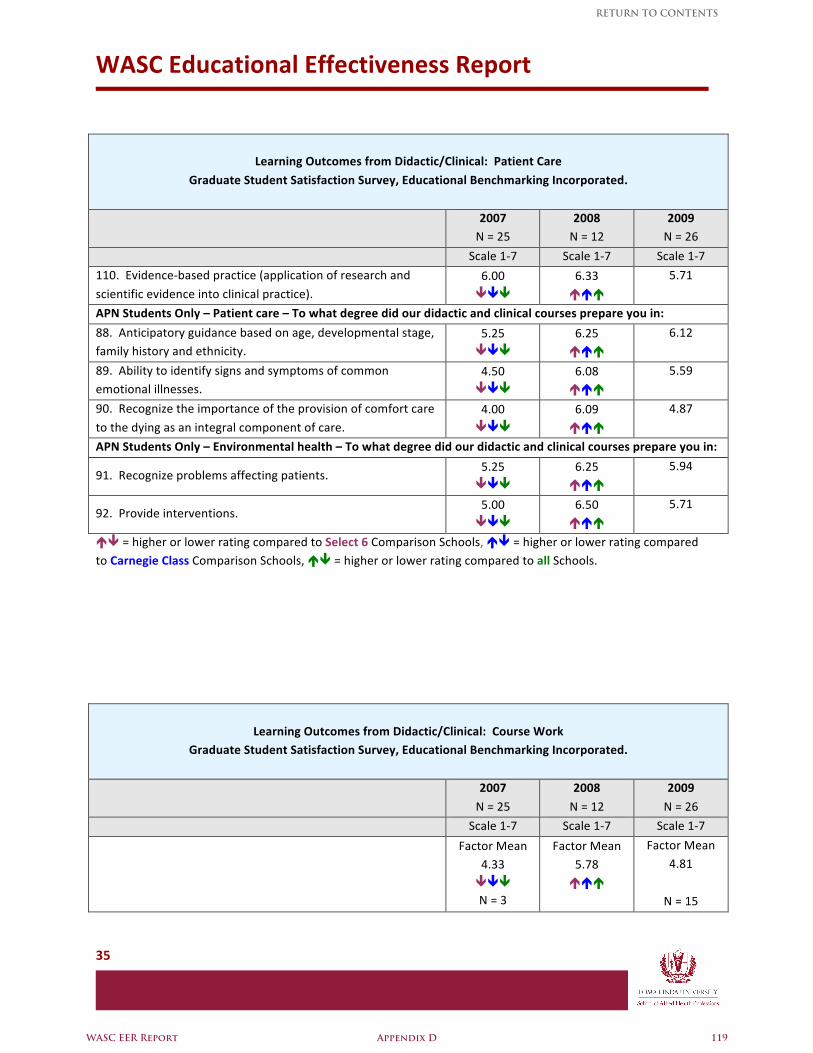
WASC Educational Effectiveness Report
35
Learning Outcomes from Didactic/Clinical: Patient Care
Graduate Student Satisfaction Survey, Educational Benchmarking Incorporated.
2007 N = 25
2008 N = 12
2009 N = 26
Scale 1‐7 Scale 1‐7 Scale 1‐7
110. Evidence‐based practice (application of research and
scientific evidence into clinical practice). 6.00
6.33
5.71
APN Students Only – Patient care – To what degree did our didactic and clinical courses prepare you in:
88. Anticipatory guidance based on age, developmental stage, family history and ethnicity.
5.25
6.25
6.12
89. Ability to identify signs and symptoms of common emotional illnesses.
4.50
6.08
5.59
90. Recognize the importance of the provision of comfort care
to the dying as an integral component of care. 4.00
6.09
4.87
APN Students Only – Environmental health – To what degree did our didactic and clinical courses prepare you in:
91. Recognize problems affecting patients. 5.25
6.25
5.94
92. Provide interventions. 5.00
6.50
5.71
= higher or lower rating compared to Select 6 Comparison Schools, = higher or lower rating compared to Carnegie Class Comparison Schools, = higher or lower rating compared to all Schools.
Learning Outcomes from Didactic/Clinical: Course Work Graduate Student Satisfaction Survey, Educational Benchmarking Incorporated.
2007
N = 25
2008
N = 12
2009
N = 26
Scale 1‐7 Scale 1‐7 Scale 1‐7
Factor Mean 4.33 N = 3
Factor Mean 5.78
Factor Mean 4.81
N = 15
WASC EER Report Appendix D 119
RETURN TO CONTENTS
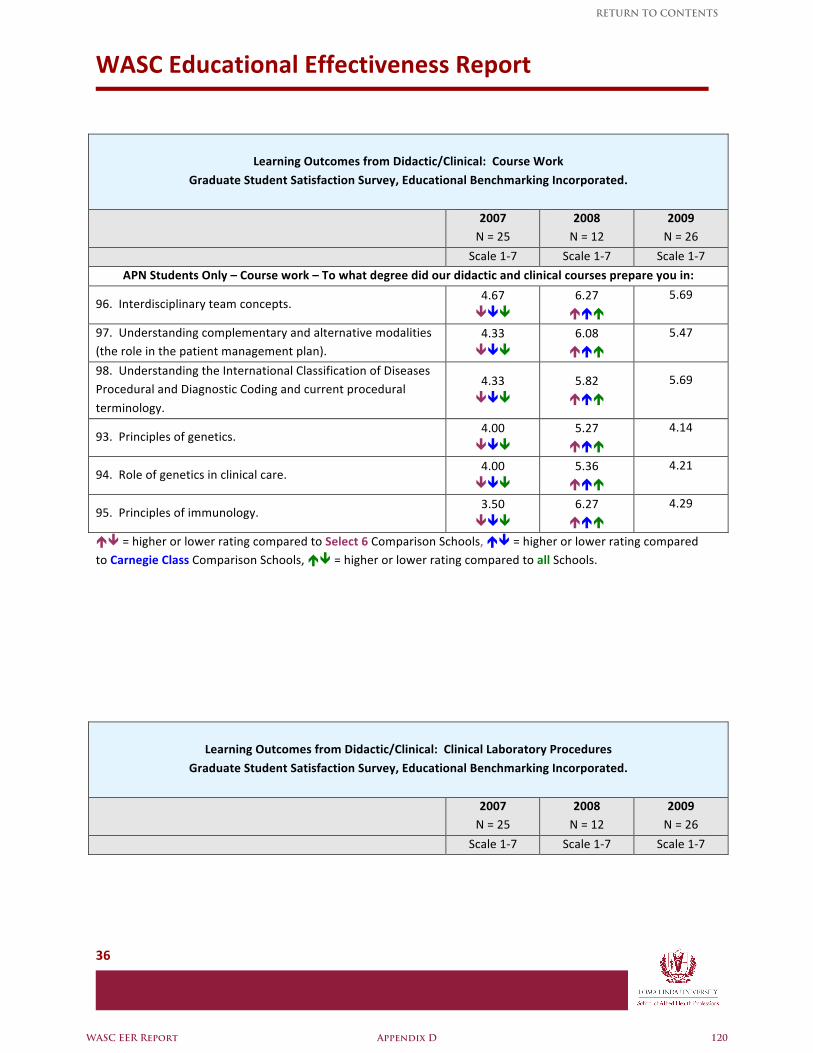
WASC Educational Effectiveness Report
36
Learning Outcomes from Didactic/Clinical: Course Work
Graduate Student Satisfaction Survey, Educational Benchmarking Incorporated.
2007 N = 25
2008 N = 12
2009 N = 26
Scale 1‐7 Scale 1‐7 Scale 1‐7
APN Students Only – Course work – To what degree did our didactic and clinical courses prepare you in:
96. Interdisciplinary team concepts. 4.67
6.27
5.69
97. Understanding complementary and alternative modalities (the role in the patient management plan).
4.33
6.08
5.47
98. Understanding the International Classification of Diseases Procedural and Diagnostic Coding and current procedural
terminology.
4.33
5.82
5.69
93. Principles of genetics. 4.00
5.27
4.14
94. Role of genetics in clinical care. 4.00
5.36
4.21
95. Principles of immunology. 3.50
6.27
4.29
= higher or lower rating compared to Select 6 Comparison Schools, = higher or lower rating compared to Carnegie Class Comparison Schools, = higher or lower rating compared to all Schools.
Learning Outcomes from Didactic/Clinical: Clinical Laboratory Procedures
Graduate Student Satisfaction Survey, Educational Benchmarking Incorporated.
2007 N = 25
2008 N = 12
2009 N = 26
Scale 1‐7 Scale 1‐7 Scale 1‐7
WASC EER Report Appendix D 120
RETURN TO CONTENTS
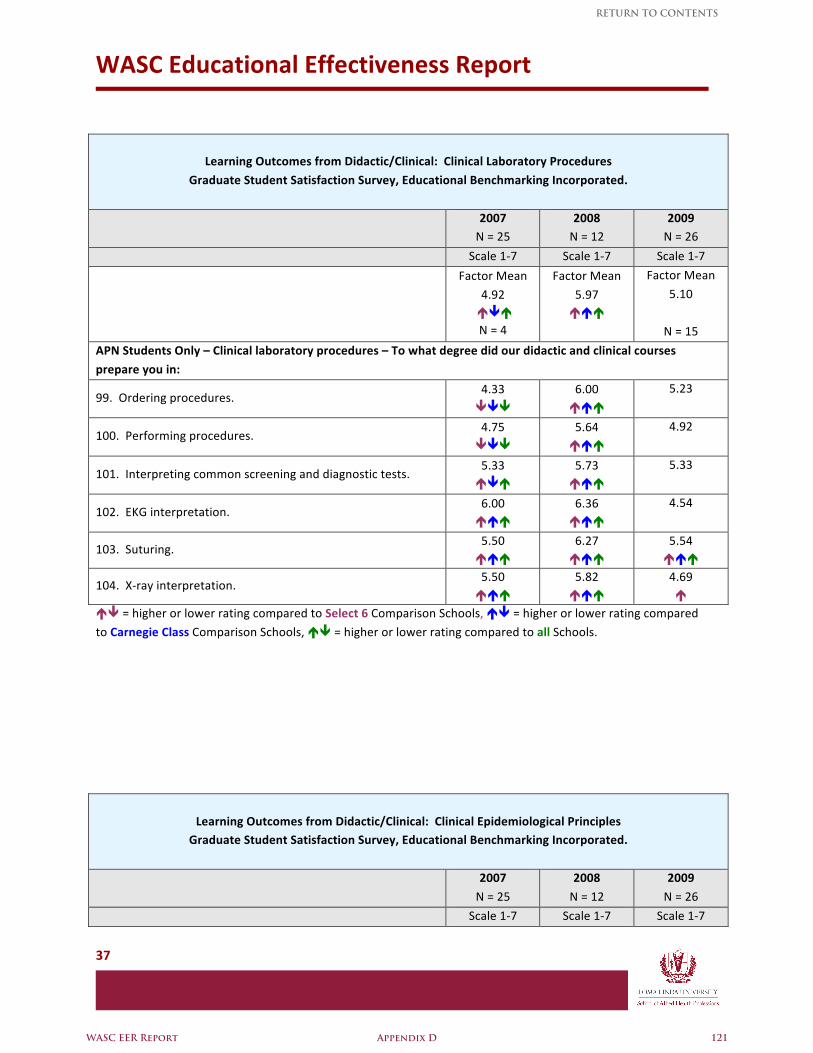
WASC Educational Effectiveness Report
37
Learning Outcomes from Didactic/Clinical: Clinical Laboratory Procedures
Graduate Student Satisfaction Survey, Educational Benchmarking Incorporated.
2007 N = 25
2008 N = 12
2009 N = 26
Scale 1‐7 Scale 1‐7 Scale 1‐7
Factor Mean
4.92 N = 4
Factor Mean
5.97
Factor Mean
5.10
N = 15
APN Students Only – Clinical laboratory procedures – To what degree did our didactic and clinical courses
prepare you in:
99. Ordering procedures. 4.33
6.00
5.23
100. Performing procedures. 4.75
5.64
4.92
101. Interpreting common screening and diagnostic tests. 5.33
5.73
5.33
102. EKG interpretation. 6.00
6.36
4.54
103. Suturing. 5.50
6.27
5.54
104. X‐ray interpretation. 5.50
5.82
4.69
= higher or lower rating compared to Select 6 Comparison Schools, = higher or lower rating compared
to Carnegie Class Comparison Schools, = higher or lower rating compared to all Schools.
Learning Outcomes from Didactic/Clinical: Clinical Epidemiological Principles Graduate Student Satisfaction Survey, Educational Benchmarking Incorporated.
2007
N = 25
2008
N = 12
2009
N = 26
Scale 1‐7 Scale 1‐7 Scale 1‐7
WASC EER Report Appendix D 121
RETURN TO CONTENTS
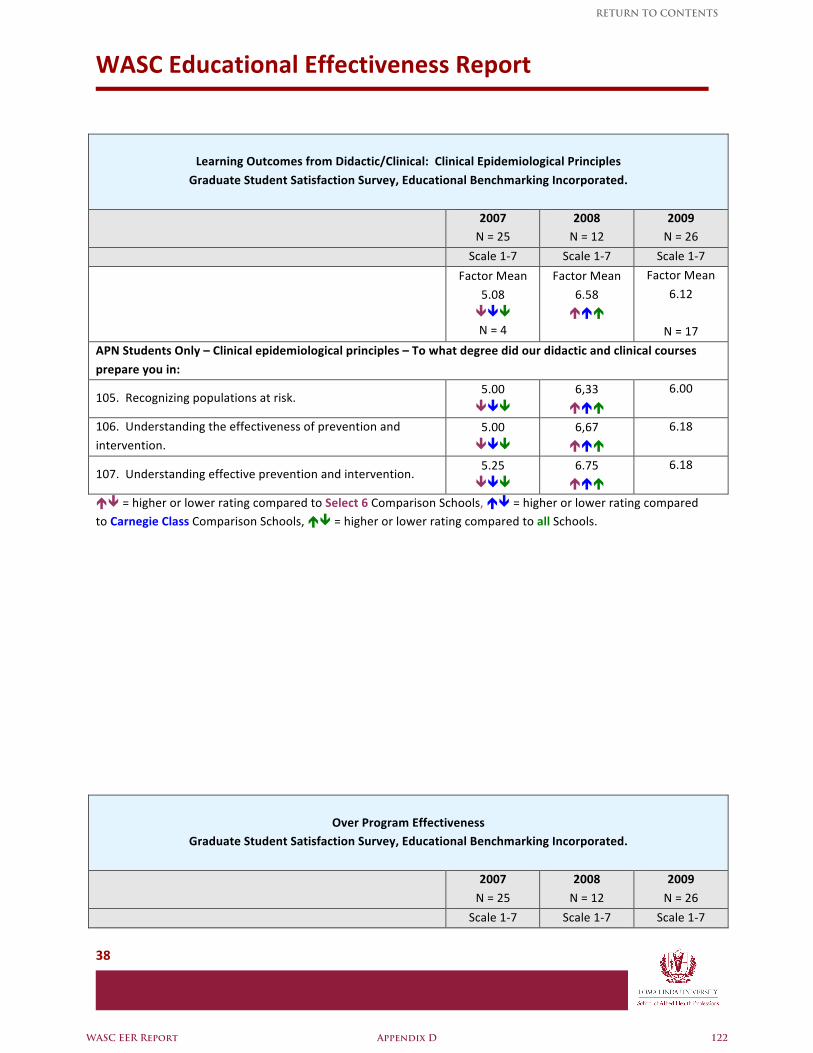
WASC Educational Effectiveness Report
38
Learning Outcomes from Didactic/Clinical: Clinical Epidemiological Principles
Graduate Student Satisfaction Survey, Educational Benchmarking Incorporated.
2007 N = 25
2008 N = 12
2009 N = 26
Scale 1‐7 Scale 1‐7 Scale 1‐7
Factor Mean
5.08 N = 4
Factor Mean
6.58
Factor Mean
6.12
N = 17
APN Students Only – Clinical epidemiological principles – To what degree did our didactic and clinical courses
prepare you in:
105. Recognizing populations at risk. 5.00
6,33
6.00
106. Understanding the effectiveness of prevention and
intervention. 5.00
6,67
6.18
107. Understanding effective prevention and intervention. 5.25
6.75
6.18
= higher or lower rating compared to Select 6 Comparison Schools, = higher or lower rating compared to Carnegie Class Comparison Schools, = higher or lower rating compared to all Schools.
Over Program Effectiveness Graduate Student Satisfaction Survey, Educational Benchmarking Incorporated.
2007
N = 25
2008
N = 12
2009
N = 26
Scale 1‐7 Scale 1‐7 Scale 1‐7
WASC EER Report Appendix D 122
RETURN TO CONTENTS
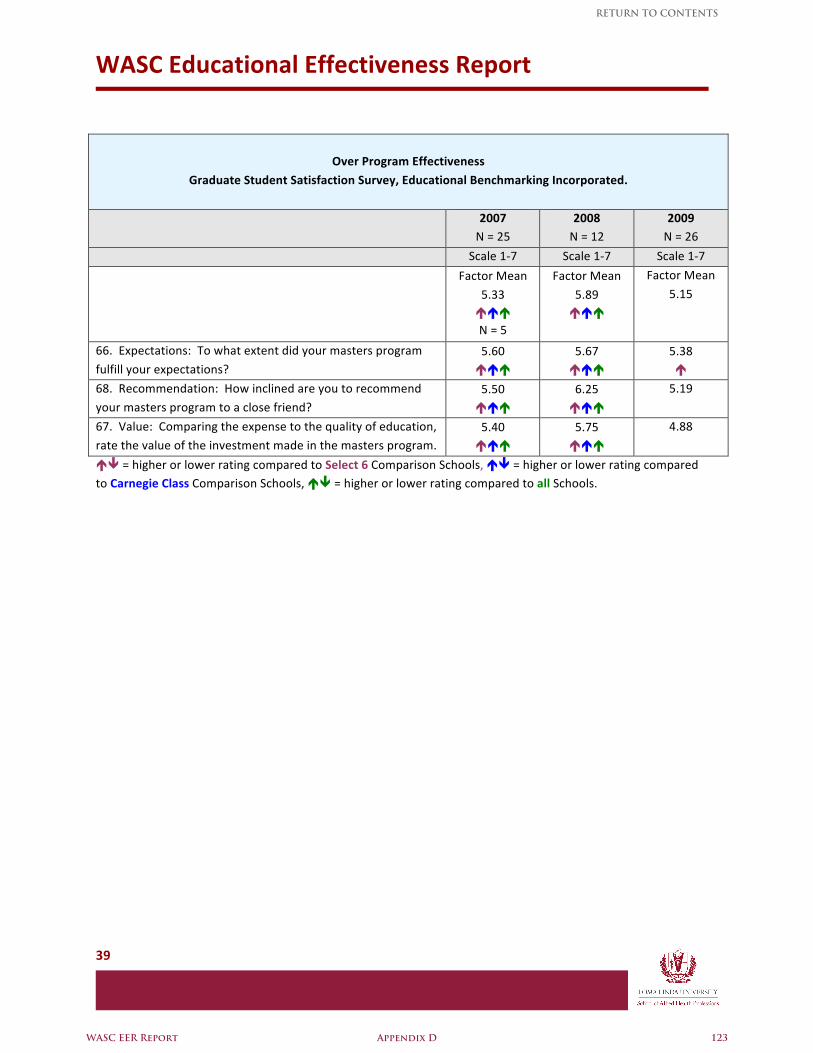
WASC Educational Effectiveness Report
39
Over Program Effectiveness
Graduate Student Satisfaction Survey, Educational Benchmarking Incorporated.
2007 N = 25
2008 N = 12
2009 N = 26
Scale 1‐7 Scale 1‐7 Scale 1‐7
Factor Mean
5.33 N = 5
Factor Mean
5.89
Factor Mean
5.15
66. Expectations: To what extent did your masters program
fulfill your expectations? 5.60
5.67
5.38
68. Recommendation: How inclined are you to recommend
your masters program to a close friend? 5.50
6.25
5.19
67. Value: Comparing the expense to the quality of education,
rate the value of the investment made in the masters program. 5.40
5.75
4.88
= higher or lower rating compared to Select 6 Comparison Schools, = higher or lower rating compared to Carnegie Class Comparison Schools, = higher or lower rating compared to all Schools.
WASC EER Report Appendix D 123
RETURN TO CONTENTS
WASC Educational Effectiveness Report
40
Student Comments I would say, after attending LLU, I have grown immensely. Before attending LLU I had an idea of what nursing was, but now I have an absolutely different outlook. At first, I didn’t understand the purpose of doing care plans that involved developmental, sociocultural, and spiritual areas. But now I understand
that to truly take care of the problem then you have to focus on the whole person. I feel the training I received here at LLU will be with me forever.
I feel that I have learned many things both academically and spiritually and throughout the program and in future I share what I have learned with my coworkers. I have tried to be an
example to my coworkers and encouraged them to also go back to school to become the best nurses they can
possibly be. When I began at Loma Linda I was not big on “touching” people that I was not familiar with. I did not
like offering myself to comfort others because I was uncomfortable. Now I am able to discuss delicate topics with patients, offer my sympathy and support, and possibly over‐use therapeutic touching. The school gave me the opportunity to develop these skills. I also was given the opportunity to participate
in community service and I am grateful for that. My experiences showed me that there is more to life than agonizing over exams or earning a paycheck. I learned I can use this career to help others and have a meaningful career
I felt that the concept of wholeness to be infused in each lecture provided. This helps the student (myself) remember what is important and why I am here.
I have learned how to assess a patient from a whole person care aspect. I have leaned that there are often more things that affect a pts physical health then just their physical health.
My understanding of wholeness has grown in that to achieve health, really is concentrating on the whole individual and all five variable's; physiological, psychological, developmental, spiritually and socio‐culturally in order to remain a health individual. Too much of an emphasis on one variable or not enough on another causes an imbalance which can make you vulnerable to stress from any one of these areas.
I do believe that God made the way for me to be here at LLU. Since here at LLU in the MS program I have gained much more knowledge and realize how much there is to learn. Being a Christian before I
came but leaving a more whole person with more faith in Christ. I could have never completed this
WASC EER Report Appendix D 124
RETURN TO CONTENTS
WASC Educational Effectiveness Report
41
program without God's help and all those he has placed in my life. Thank you. Talking to pts and knowing their concerns, frustrations and fears, as well as their hopes and aspirations
are one of the things that I love in the primary care setting. It's not only getting to know a person through their vital signs and symptoms, rather, it's knowing the person as a whole, on every aspect of the pt (and even out life) in general‐be it the physical environmental or psychological ‐ affects our life
and health in general. And as practitioners we should give careful consideration in other aspects of our pts life and not only dwell on obvious physical symptoms.
During the program, as an advanced nurse I have grown p in many parts of my life. I have extended my knowledge and confidence through ongoing advanced practice role. This program really opened my eyes and competency beyond RN's role.
I am able to apply what I learn from classes to my personal life. LLU MS program in nursing help me view problems and issues both personal and professional in a very different way. I am able to
understand my staff better and able to handle situation that used to be difficult better. The faculty was very supportive during the whole time I was at LLU. They were willing to help and
assist me. In the same token, I learned to be supportive and caring to my clients. After attending Loma Linda I have started to see life in a different way. I became more physically and
spiritually active. I worked as a nurses’ aide prior to joining LLUSN. Back then I took my patients at face value and
focused only on their physiological needs. As I went through the nursing program, I learned that there is meaning in everything my patients say and do. I learned to pick up on comments, attitudes, and even body language that my patients would display and more importantly I learned to spot and act on
needs for psychosocial and spiritual interventions. I can also say that I have grown spiritually at LLUSN. At the school of nursing I was often blessed by the daily devotionals that were read before each of my classes. They were often tailored to reflect experiences I may encounter in the clinical setting and
more importantly, the day to day challenges that I faced as the quarters progressed. At Loma Linda, I also encountered peers who were more willing and open to expressing their beliefs than I have encountered at any other educational institution I have been to. I felt loved, welcomed, and respected
at Loma Linda and in turn I was able to reflect those feelings to the patients I encountered in my clinical rotations.
I have thoroughly enjoyed my time at Loma Linda School of Nursing and a part of me is sad to leave. Loma Linda had such a positive influence on my life that I wouldn’t change any of my experiences for
anything else.
WASC EER Report Appendix D 125
RETURN TO CONTENTS
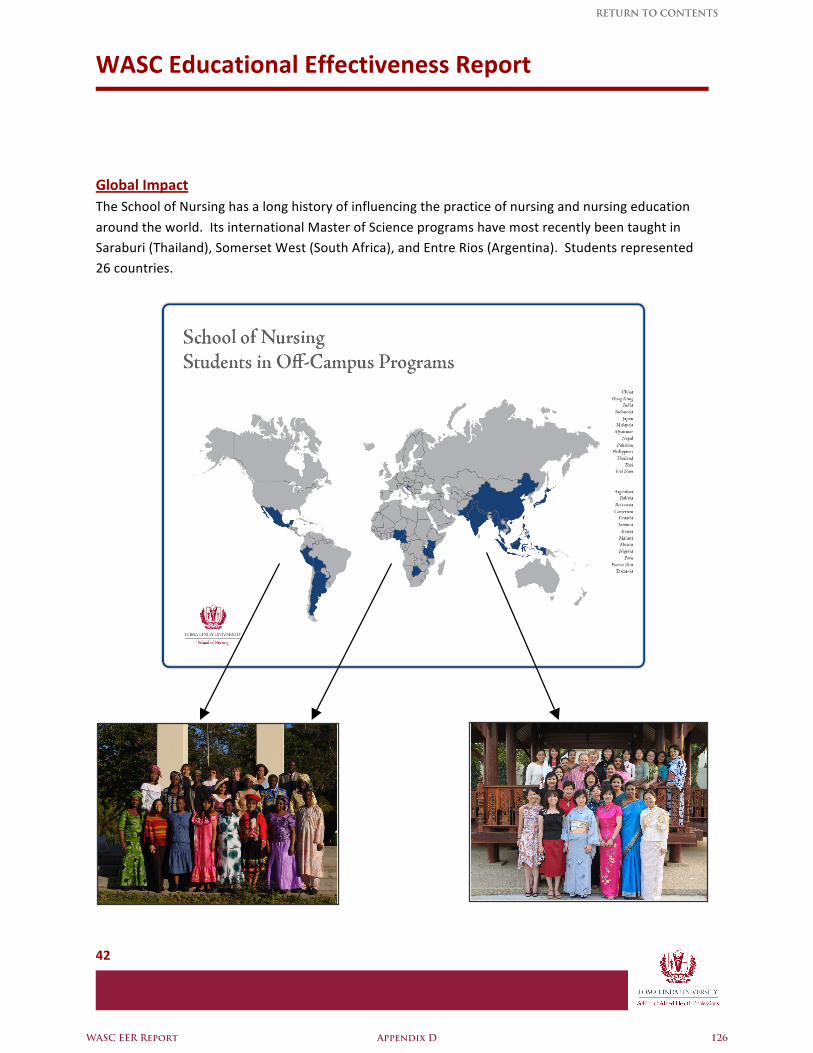
WASC Educational Effectiveness Report
42
Global Impact The School of Nursing has a long history of influencing the practice of nursing and nursing education
around the world. Its international Master of Science programs have most recently been taught in Saraburi (Thailand), Somerset West (South Africa), and Entre Rios (Argentina). Students represented 26 countries.
WASC EER Report Appendix D 126
RETURN TO CONTENTS
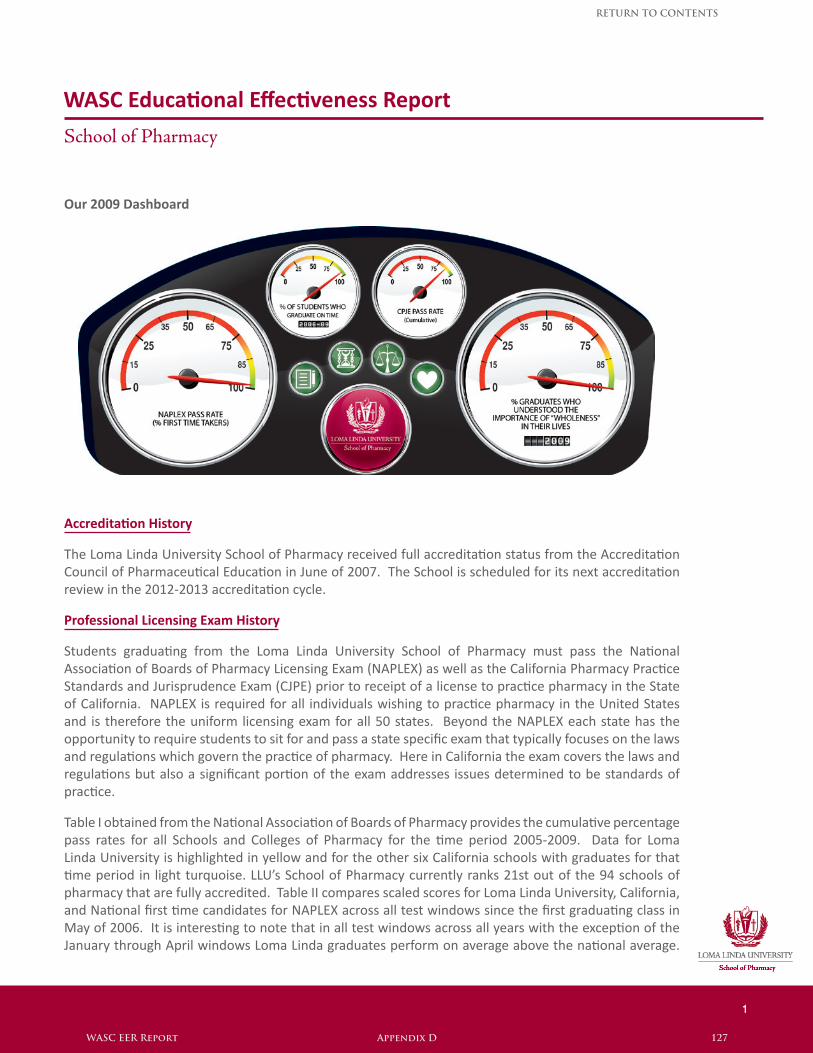
1
WASC Educational Effectiveness Report
School of Pharmacy
Our 2009 Dashboard
Accreditation History
The Loma Linda University School of Pharmacy received full accreditation status from the Accreditation Council of Pharmaceutical Education in June of 2007. The School is scheduled for its next accreditation review in the 2012-2013 accreditation cycle.
Professional Licensing Exam History
Students graduating from the Loma Linda University School of Pharmacy must pass the National Association of Boards of Pharmacy Licensing Exam (NAPLEX) as well as the California Pharmacy Practice Standards and Jurisprudence Exam (CJPE) prior to receipt of a license to practice pharmacy in the State of California. NAPLEX is required for all individuals wishing to practice pharmacy in the United States and is therefore the uniform licensing exam for all 50 states. Beyond the NAPLEX each state has the opportunity to require students to sit for and pass a state specific exam that typically focuses on the laws and regulations which govern the practice of pharmacy. Here in California the exam covers the laws and regulations but also a significant portion of the exam addresses issues determined to be standards of practice.
Table I obtained from the National Association of Boards of Pharmacy provides the cumulative percentage pass rates for all Schools and Colleges of Pharmacy for the time period 2005-2009. Data for Loma Linda University is highlighted in yellow and for the other six California schools with graduates for that time period in light turquoise. LLU’s School of Pharmacy currently ranks 21st out of the 94 schools of pharmacy that are fully accredited. Table II compares scaled scores for Loma Linda University, California, and National first time candidates for NAPLEX across all test windows since the first graduating class in May of 2006. It is interesting to note that in all test windows across all years with the exception of the January through April windows Loma Linda graduates perform on average above the national average.
WASC EER Report Appendix D 127
RETURN TO CONTENTS
WASC Educational Effectiveness Report
2
Candidates taking the NAPLEX for the first time during that testing window are in all likelihood those students who experienced academic challenges and therefore graduated late.
Table III provides the pass fail statistics for the CPJE beginning with the 4/1/06 - 9/30/06 through the most recent reporting period.
Where Our Students Go Upon Graduation
On time graduation is an important parameter for all educational institutions to track. Students, faculty, and parents alike have the expectation that when a student starts the program they will finish within a reasonable time frame. In the School of Pharmacy 95% of the students who have started the Doctor of Pharmacy Program have completed the program within the 6 year time frame considered to be on-time graduation according to IPEDS.
The School has begun to systematically track where our students choose to enter practice following graduation. Recognizing that individuals with a doctor of pharmacy degree have a wide array of employment and educational opportunities available to them we believe it is a valuable exercise to collect and analyze this data. The Faculty within the School of Pharmacy encourage students to continue their education by completing post graduate residency training prior to entering main stream practice. It is our belief that the additional clinical training received through the residency experience will better prepare them for the challenges facing the profession.
In 2008 and 2009, 14 of 51 or 27% and 12 of 55 or 22% of the graduates were accepted into post graduate residency training programs. The number of graduates electing to continue on into residency training for the Loma Linda University School of Pharmacy was comparable for the first two graduating classes which were smaller although systematic data is not available.
Presence in Our Community
A very important aspect of an education at Loma Linda University is the commitment to service. Our mission to further the teaching and healing ministries of Jesus Christ is important in both our selection of students for the program and in the manner in which we educate them once they matriculate. As a result, we strongly encourage all students to participate in outreach and service activities primarily through participation in Student Professional Organizations. Faculty as well are encouraged to engage in the community and give back to humanity through service to our local and global communities. Below are just a few highlights of service events that have impacted and shaped the School of Pharmacy faculty and students:
• Redlands Market Night: Just east of Loma Linda is the City of Redlands. Each Thursday evening the city of Redlands hosts a thriving Market Night at which vendors display and sell their goods. The city offers the non-profit organizations the opportunity to participate once a month free of charge. Our student body through the work of the American Pharmacists Association has participated on a quarterly basis over the past 3 years. Students have done blood pressure screening, smoking cessation counseling, bone density screening, and heart burn awareness activities at this event.
WASC EER Report Appendix D 128
RETURN TO CONTENTS
WASC Educational Effectiveness Report
3
• Music Outreach Program at SACHS: Under the direction of Kathryn Knecht, PhD Associate Professor of Pharmaceutical Sciences the School of Pharmacy in conjunction with the Department of Music at La Sierra University participates in the music tutoring program at SACHS clinic located in a largely Latino low-income neighborhood of San Bernardino. During 90 minute weekly sessions children in the community learn about music and the health professions offered through Loma Linda University. Periodically students in the music program come to campus and perform for the University Community at one of our weekly chapel services. Dr. Knecht has shared with the School administration that one of the teen mentors that has been involved with the program is now interested in pursuing a degree in pharmacy.
• Medicare Part D Program: The School of Pharmacy is involved in a multi-school research grant aimed at improving the public’s understanding of the drug coverage portion known as Medicare Part D. Joycelyn Mallari, PharmD trains pharmacy students to participate in educational programs that are designed to target low-income patients in the San Bernardino area.
• Immunization Training for Pharmacists: All pharmacy students in the state of California are trained to provide immunizations. Here at Loma Linda we have chosen to provide that training in the Autumn Quarter of the first year of the program. Students are trained in accordance with the American Pharmacists Association Pharmacy Based Immunization Training Program and upon completion are certified to provide immunizations in community practice and clinic settings. Pharmacist and in our case pharmacy students represent an underutilized manpower source when it comes to getting large numbers of patient immunized each year. We offer our students as a manpower resource to both our on campus student health service as well as to SACHS and other local facilities.
Making a Difference Worldwide
Loma Linda University has a strong global presence with missionary outreach activities in many parts of the poorest nations of the world. The School of Pharmacy, as one of the youngest Schools on campus, has now matured to the point where global outreach has become a part of our mission as well. Students seek an education at Loma Linda University because of the opportunity for global mission service. We have students and faculty going to Benin, Guatemala, Brazil, China, Afghanistan, Honduras, Kenya, and Ethiopia. In the summer of 2009, two students from the School of Pharmacy participated in the “Malawi Project” a program based here on the Loma Linda University campus. This global outreach program took students from eight Adventist educational institutions to Malamulo Hospital and several other locations throughout Malawi. Students spent two weeks in Malawi serving others far less fortunate than themselves.
One of the two students will graduate in May of 2010. The other student has expressed an interest in returning to Malawi this summer to continue her service commitment. Other students have also expressed interest in the opportunity to engage in this global outreach activity.
Wholeness
The Loma Linda University Motto is “To Make Man Whole.” In the School of Pharmacy we understand
WASC EER Report Appendix D 129
RETURN TO CONTENTS
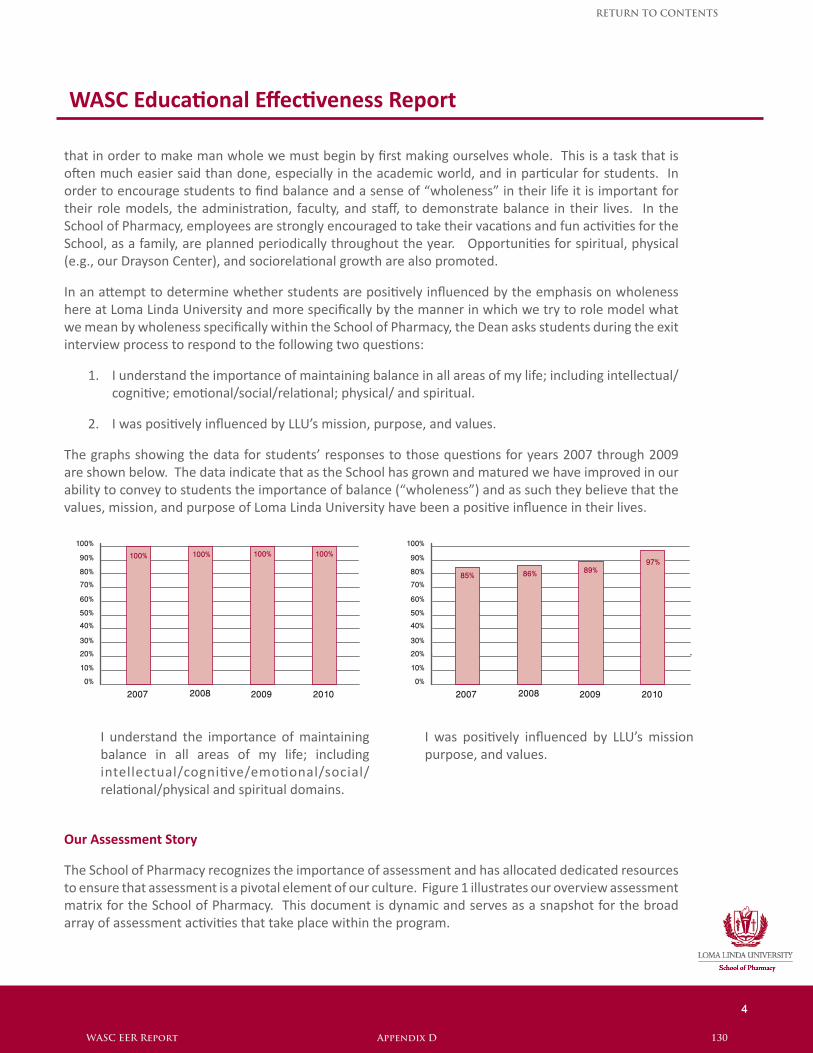
WASC Educational Effectiveness Report
4
that in order to make man whole we must begin by first making ourselves whole. This is a task that is often much easier said than done, especially in the academic world, and in particular for students. In order to encourage students to find balance and a sense of “wholeness” in their life it is important for their role models, the administration, faculty, and staff, to demonstrate balance in their lives. In the School of Pharmacy, employees are strongly encouraged to take their vacations and fun activities for the School, as a family, are planned periodically throughout the year. Opportunities for spiritual, physical (e.g., our Drayson Center), and sociorelational growth are also promoted.
In an attempt to determine whether students are positively influenced by the emphasis on wholeness here at Loma Linda University and more specifically by the manner in which we try to role model what we mean by wholeness specifically within the School of Pharmacy, the Dean asks students during the exit interview process to respond to the following two questions:
1. I understand the importance of maintaining balance in all areas of my life; including intellectual/cognitive; emotional/social/relational; physical/ and spiritual.
2. I was positively influenced by LLU’s mission, purpose, and values.
The graphs showing the data for students’ responses to those questions for years 2007 through 2009 are shown below. The data indicate that as the School has grown and matured we have improved in our ability to convey to students the importance of balance (“wholeness”) and as such they believe that the values, mission, and purpose of Loma Linda University have been a positive influence in their lives.
100%
20%
10%0%
40%
30%
70%
60%50%
90%
80%
100%
20%
10%0%
40%
30%
70%
60%50%
90%
80%
2007 2008
100%
2009
100%
2010
100% 100%
2007 2008
85%
2009
86%
2010
89%97%
I understand the importance of maintaining balance in all areas of my life; including intellectual/cognitive/emotional/social/relational/physical and spiritual domains.
I was positively influenced by LLU’s mission purpose, and values.
Our Assessment Story
The School of Pharmacy recognizes the importance of assessment and has allocated dedicated resources to ensure that assessment is a pivotal element of our culture. Figure 1 illustrates our overview assessment matrix for the School of Pharmacy. This document is dynamic and serves as a snapshot for the broad array of assessment activities that take place within the program.
WASC EER Report Appendix D 130
RETURN TO CONTENTS
WASC Educational Effectiveness Report
5
Traditional assessment metrics including faculty and course evaluations, admissions statistics, licensure exam pass rates, and national curriculum quality surveys for pharmacy school curriculum are used to monitor and assess the quality of the Loma Linda University School of Pharmacy program. Course embedded assessments are widely used and the School of Pharmacy faculty have recently embarked on an intensive curriculum mapping project that will, when finished, provide us with detailed information regarding the types and level of assessment activities occurring within our courses. Figure 2 illustrates one page of this curriculum map and the information that the process is producing.
This layered curriculum map will allow us to do many things including:
• Determine exactly how we teach a given piece of knowledge or skill necessary to achieve a student learning outcome.
• Determine how many times we teach a given piece of knowledge or skill throughout the curriculum.
• Examine the diverse ways in which we teach a given piece of knowledge or skill.
• Determine whether we give students ample opportunities to practice skills necessary to achieve a student learning outcome.
• Examine how we assess whether students do in fact have the knowledge or posses the skill necessary to achieve a student learning outcome.
• Capture assessment data, that is authentic and rich, which might otherwise be lost in the day to day workings of the program.
• Streamline the curriculum if too much redundancy on a given piece of knowledge or skill is identified.
• Augment the curriculum if too little coverage of a given piece of knowledge or skill is identified.
• Educate faculty regarding what is being taught in other classes.
• Bring faculty who teach the same skill together to create consistency in instruction.
Students in the professional curriculum leading to the doctor of pharmacy degree are assessed both formally and informally throughout their four year curriculum. These assessments occur both within the classroom and in clinical practice environments. Included here are a few examples of the level and degree of assessment that occurs.
Example: Patient Counseling Skills
First year pharmacy students in their first quarter of the program are given instruction on the standard of practice for patient medication counseling. Students are then given a drug monograph and asked to prepare outside of class to counsel a mock patient on how to appropriately take that medication.
WASC EER Report Appendix D 131
RETURN TO CONTENTS
WASC Educational Effectiveness Report
6
The Assignment: We take students into the Clinical Skills Assessment Center in the Centennial Complex and ask them to perform a mock counseling session. In an attempt to create a situation that simulates “real life” the students are given a prescription, a patient profile, reference materials, and a medication vial which they use in this activity. Students are videotaped performing the mock counseling session.
Assessment Procedures: The simulated patient completes a feedback rubric immediately following the session. Students are asked to review and reflect on their own performance of the counseling session by providing a written response to the following 3 questions:
1. Which aspects of the counseling session did I do well?
2. Which aspects of the counseling session do I need the most work on?
3. What will I do differently when I do my second sessions of counseling in a couple of weeks?
The activity is repeated a second time as an instructor graded assignment. The simulated patient completes a feedback rubric and the instructor reviews each videotaped session and completes the same rubric for an assignment grade (Figure 3).
Example: Pharmacoeconomics
In the third year of the doctor of pharmacy program students take a 3 credit hour course entitled Health Systems, Reimbursement, and Pharmacoeconomics. Pharmacoeconomics can be defined as the scientific discipline that compares the economics of one drug or drug therapy to that of another. The subject is best taught through reviewing the literature that actually makes these comparisons.
The Assignment: Students are required to critique four literature articles which address aspects of pharmacoeconomics. The critique consists of providing thorough answers to the following 14 questions:
1. Complete Title: Is the Title Appropriate?
2. Clear Objective: Is a Clear Objective stated?
3. Appropriate Alternatives: Were the Appropriate Alternatives or Comparators Considered?
4. Alternatives Described: Was a Comprehensive Description of the Competing Alternatives Given?
5. Perspective Stated: Is the Perspective of the Study Addressed?
6. Type of Study: Is the Type of Study Stated?
7. Relevant Costs: Were All the Important and Relevant Costs Included?
8. Relevant Outcomes: Were the Important or Relevant Outcomes Measured?
9. Adjustment or Discounting: Was Adjustment or Discounting Appropriate? If So, Was it Conducted?
10. Reasonable Assumptions: Are Assumptions Stated and Reasonable?
11. Sensitivity Analyses: Were Sensitivity Analyses Conducted for Important Estimates or Assumptions?
12. Limitations Addressed: Were Limitations Addressed?
WASC EER Report Appendix D 132
RETURN TO CONTENTS
WASC Educational Effectiveness Report
7
13. Appropriate Generalizations: Were Extrapolations Beyond the Population Studied Proper?
14. Unbiased Conclusions: Was an Unbiased Summary of the Results Presented?
Students complete these critiques in groups of 4-6 students which allows them the opportunity to discuss the articles with their peers as part of the critique process.
Assessment Procedures: Student group work is evaluated by the faculty and a score assigned for the group. In addition, students are required to turn in a peer evaluation form for each of the 4 article critiques (Figure 4). All students in the group receive the same grade for the critique unless more than one member of the group gives the students a peer score of less than 100%. In this situation student grades are modified based on the average percent score the student receives from their peers. For most groups all students receive 100% of the faculty score however the peer evaluation process has allowed the students to account for minimal to no effort by a student member of the group on at least one occasion.
Example: Medicinal Chemistry
Students in the doctor of pharmacy curriculum must complete a required sequence of three courses in medicinal chemistry. This example illustrates how the faculty within the school of pharmacy use informal assessment data to modify teaching approaches while courses are in progress.
In RXPS 612, ‘Principles of Medicinal Chemistry II’, we have employed some active learning assessment of the students during the class period. One of the most common examples of assessment that we utilize is a clicker-based set of questions (TurningPoint Technologies®) during the course of the lecture. The basic method that is employed is to ask a couple of questions concerning material that was just covered in the lecture, usually one lower order question (question of fact) and one higher order question that requires some application of material or the integration of current material with previously taught material.
Decisions are made regarding whether to continue on with the lecture based on how students respond to the questions. An 80% correct cutoff value is set to determine whether the material needs to be reviewed or if the lecture can continue. For example, after covering several classes of anti-hypertensive therapeutic agents, the instructor displays a theoretical angiotensin receptor blocker, provides the students with a list of four antihypertensive drug classes and asks the students to identify the correct therapeutic class. The responses showed that only 53% of students correctly identified the drug class. With a sub-80% correct response rate, the instructor was then able to stop and address the alarming responses. He quickly found out that the students did not fully understand the importance of drug structures and their association with structure-activity relationships. He was then able to prepare a mini-lecture for the next lecture session to solidify the importance of this concept and how it will be applied throughout the entire medicinal chemistry course sequence. This example of in-class assessment early in the quarter allowed us to avoid student frustration about what they think is important versus what the professor believes is important.
In contrast, many in-class questions poll above the 80% cutoff value. Even in these instances, we believe it is important to address the incorrect choices and briefly reiterate why the other answers are wrong.
WASC EER Report Appendix D 133
RETURN TO CONTENTS
WASC Educational Effectiveness Report
8
This brief explanation may aid the few students that answered incorrectly a point of clarification or at the very least, a fact point to aid them in understanding the material later.
As the School of Pharmacy continues to mature we anticipate that our ability to effectively coordinate our assessment activities will also mature. We believe that as a young program we have come a long way down the continuum from a program with assessment happening but no coordinated effort or ability to capture and effectively use the assessment data to one with a vision for our future and a plan to better employ assessment data to drive our decisions for change.
WASC EER Report Appendix D 134
RETURN TO CONTENTS
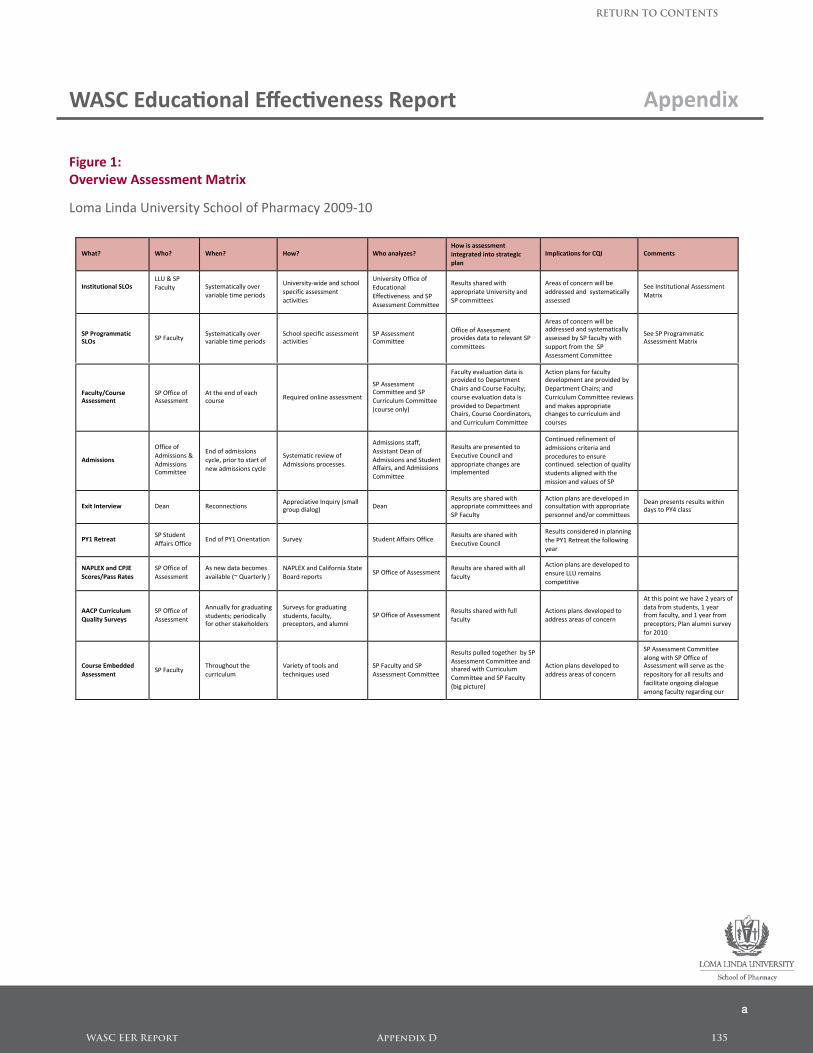
WASC Educational Effectiveness Report Appendix
Figure 1:Overview Assessment Matrix Loma Linda University School of Pharmacy 2009-10
What? Who? When? How? Whoanalyzes?Howisassessment
integratedintostrategic
plan
ImplicationsforCQI Comments
InstitutionalSLOs
LLU&SP
Faculty
Systematicallyover
variabletimeperiods
University‐wideandschool
specificassessment
activities
UniversityOfficeof
Educational
EffectivenessandSP
AssessmentCommittee
Resultssharedwith
appropriateUniversityand
SPcommittees
Areasofconcernwillbe
addressedandsystematically
assessed
SeeInstitutionalAssessment
Matrix
SPProgrammaticSLOs
SPFacultySystematicallyovervariabletimeperiods
Schoolspecificassessmentactivities
SPAssessmentCommittee
OfficeofAssessmentprovidesdatatorelevantSP
committees
Areasofconcernwillbeaddressedandsystematically
assessedbySPfacultywith
supportfromtheSP
AssessmentCommittee
SeeSPProgrammaticAssessmentMatrix
Faculty/CourseAssessment
SPOfficeofAssessment
Attheendofeachcourse
Requiredonlineassessment
SPAssessmentCommitteeandSP
CurriculumCommittee
(courseonly)
FacultyevaluationdataisprovidedtoDepartment
ChairsandCourseFaculty;
courseevaluationdatais
providedtoDepartmentChairs,CourseCoordinators,
andCurriculumCommittee
Actionplansforfacultydevelopmentareprovidedby
DepartmentChairs;and
CurriculumCommitteereviews
andmakesappropriatechangestocurriculumand
courses
Admissions
Officeof
Admissions&
AdmissionsCommittee
Endofadmissions
cycle,priortostartof
newadmissionscycle
Systematicreviewof
Admissionsprocesses.
Admissionsstaff,
AssistantDeanof
AdmissionsandStudentAffairs,andAdmissions
Committee
Resultsarepresentedto
ExecutiveCounciland
appropriatechangesareimplemented
Continuedrefinementof
admissionscriteriaand
procedurestoensurecontinuedselectionofquality
studentsalignedwiththe
missionandvaluesofSP
ExitInterview Dean ReconnectionsAppreciativeInquiry(smallgroupdialog)
DeanResultsaresharedwithappropriatecommitteesand
SPFaculty
Actionplansaredevelopedinconsultationwithappropriate
personneland/orcommittees
DeanpresentsresultswithindaystoPY4class
PY1RetreatSPStudent
AffairsOfficeEndofPY1Orientation Survey StudentAffairsOffice
Resultsaresharedwith
ExecutiveCouncil
Resultsconsideredinplanning
thePY1Retreatthefollowing
year
NAPLEXandCPJE
Scores/PassRates
SPOfficeof
Assessment
Asnewdatabecomes
available(~Quarterly)
NAPLEXandCaliforniaState
BoardreportsSPOfficeofAssessment
Resultsaresharedwithall
faculty
Actionplansaredevelopedto
ensureLLUremains
competitive
AACPCurriculum
QualitySurveys
SPOfficeof
Assessment
Annuallyforgraduating
students;periodicallyforotherstakeholders
Surveysforgraduating
students,faculty,preceptors,andalumni
SPOfficeofAssessmentResultssharedwithfull
faculty
Actionsplansdevelopedto
addressareasofconcern
Atthispointwehave2yearsof
datafromstudents,1yearfromfaculty,and1yearfrom
preceptors;Planalumnisurvey
for2010
CourseEmbedded
AssessmentSPFaculty
Throughoutthe
curriculum
Varietyoftoolsand
techniquesused
SPFacultyandSP
AssessmentCommittee
ResultspulledtogetherbySP
AssessmentCommitteeandsharedwithCurriculum
CommitteeandSPFaculty
(bigpicture)
Actionplansdevelopedto
addressareasofconcern
SPAssessmentCommittee
alongwithSPOfficeofAssessmentwillserveasthe
repositoryforallresultsand
facilitateongoingdialogue
amongfacultyregardingour
a
WASC EER Report Appendix D 135
RETURN TO CONTENTS
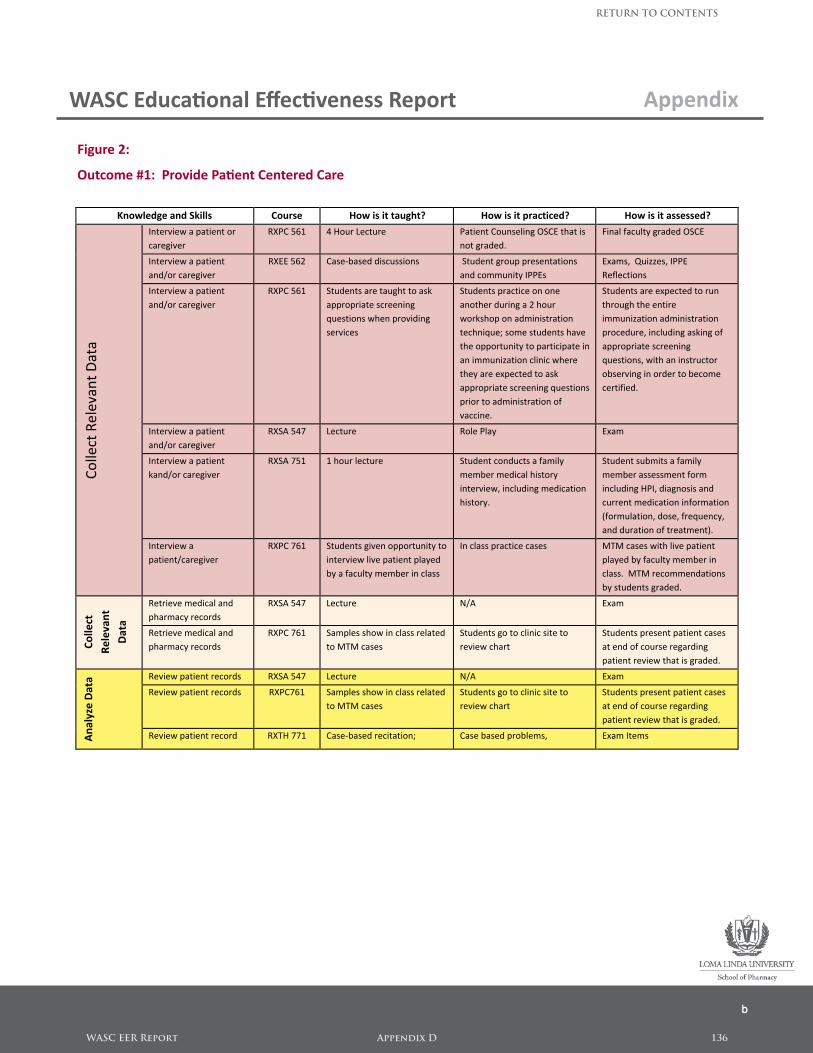
Figure 2:
Outcome #1: Provide Patient Centered Care
KnowledgeandSkills Course Howisittaught? Howisitpracticed? Howisitassessed?
Interviewapatientor
caregiver
RXPC561 4HourLecture PatientCounselingOSCEthatis
notgraded.
FinalfacultygradedOSCE
Interviewapatient
and/orcaregiver
RXEE562 Case‐baseddiscussions Studentgrouppresentations
andcommunityIPPEs
Exams,Quizzes,IPPE
Reflections
Interviewapatient
and/orcaregiver
RXPC561 Studentsaretaughttoask
appropriatescreening
questionswhenproviding
services
Studentspracticeonone
anotherduringa2hour
workshoponadministration
technique;somestudentshave
theopportunitytoparticipatein
animmunizationclinicwhere
theyareexpectedtoask
appropriatescreeningquestions
priortoadministrationof
vaccine.
Studentsareexpectedtorun
throughtheentire
immunizationadministration
procedure,includingaskingof
appropriatescreening
questions,withaninstructor
observinginordertobecome
certified.
Interviewapatient
and/orcaregiver
RXSA547 Lecture RolePlay Exam
Interviewapatient
kand/orcaregiver
RXSA751 1hourlecture Studentconductsafamily
membermedicalhistory
interview,includingmedication
history.
Studentsubmitsafamily
memberassessmentform
includingHPI,diagnosisand
currentmedicationinformation
(formulation,dose,frequency,
anddurationoftreatment).
CollectRelevantData
Interviewa
patient/caregiver
RXPC761 Studentsgivenopportunityto
interviewlivepatientplayed
byafacultymemberinclass
Inclasspracticecases MTMcaseswithlivepatient
playedbyfacultymemberin
class.MTMrecommendations
bystudentsgraded.
Retrievemedicaland
pharmacyrecords
RXSA547 Lecture N/A Exam
Collect
Relevant
Data
Retrievemedicaland
pharmacyrecords
RXPC761 Samplesshowinclassrelated
toMTMcases
Studentsgotoclinicsiteto
reviewchart
Studentspresentpatientcases
atendofcourseregarding
patientreviewthatisgraded.
Reviewpatientrecords RXSA547 Lecture N/A Exam
Reviewpatientrecords RXPC761 Samplesshowinclassrelated
toMTMcases
Studentsgotoclinicsiteto
reviewchart
Studentspresentpatientcases
atendofcourseregarding
patientreviewthatisgraded.
AnalyzeData
Reviewpatientrecord RXTH771 Case‐basedrecitation; Casebasedproblems, ExamItems
WASC Educational Effectiveness Report Appendix
b
WASC EER Report Appendix D 136
RETURN TO CONTENTS
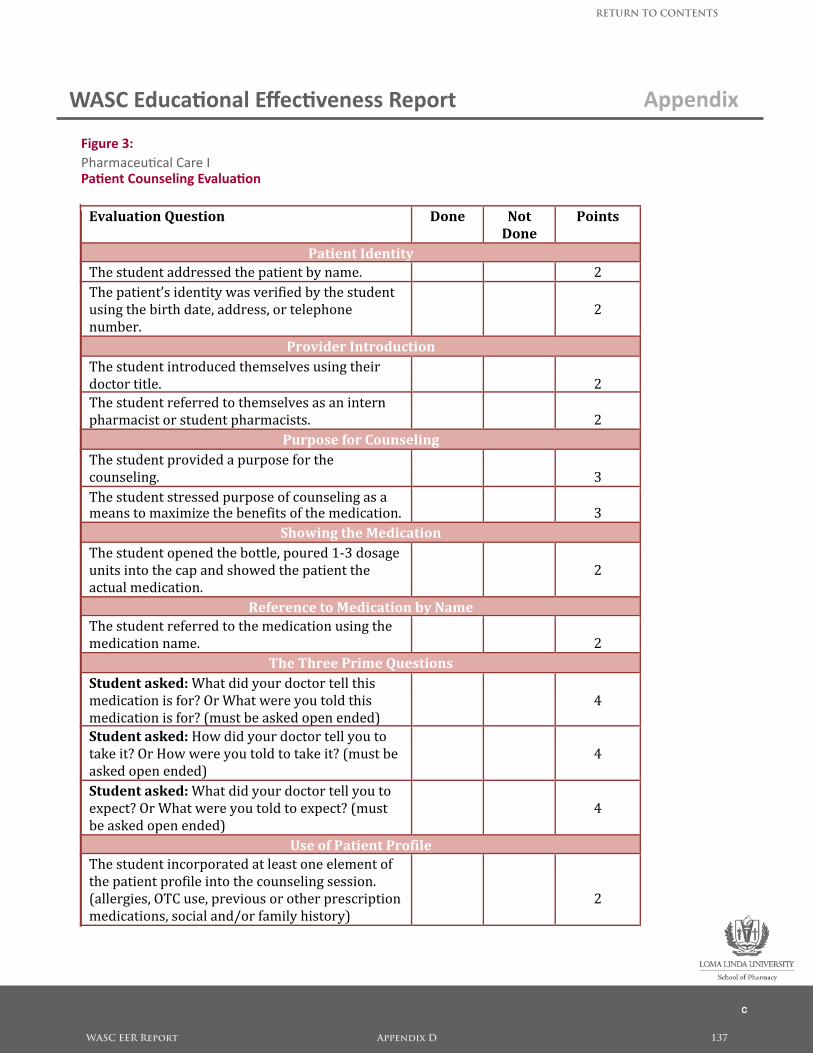
Figure 3: Pharmaceutical Care IPatient Counseling Evaluation
WASC Educational Effectiveness Report Appendix
c
EvaluationQuestion Done Not
Done
Points
PatientIdentity
Thestudentaddressedthepatientbyname. 2
Thepatient’sidentitywasverifiedbythestudent
usingthebirthdate,address,ortelephone
number.
2
ProviderIntroduction
Thestudentintroducedthemselvesusingtheir
doctortitle.
2
Thestudentreferredtothemselvesasanintern
pharmacistorstudentpharmacists.
2
PurposeforCounseling
Thestudentprovidedapurposeforthe
counseling.
3
Thestudentstressedpurposeofcounselingasameanstomaximizethebenefitsofthemedication.
3
ShowingtheMedication
Thestudentopenedthebottle,poured1‐3dosage
unitsintothecapandshowedthepatientthe
actualmedication.
2
ReferencetoMedicationbyName
Thestudentreferredtothemedicationusingthe
medicationname.
2
TheThreePrimeQuestions
Studentasked:Whatdidyourdoctortellthis
medicationisfor?OrWhatwereyoutoldthis
medicationisfor?(mustbeaskedopenended)
4
Studentasked:Howdidyourdoctortellyouto
takeit?OrHowwereyoutoldtotakeit?(mustbe
askedopenended)
4
Studentasked:Whatdidyourdoctortellyouto
expect?OrWhatwereyoutoldtoexpect?(must
beaskedopenended)
4
UseofPatientProfile
Thestudentincorporatedatleastoneelementof
thepatientprofileintothecounselingsession.
(allergies,OTCuse,previousorotherprescription
medications,socialand/orfamilyhistory)
2
TherapeuticContent
Thestudentgavethepatientappropriatedrug
information.
2
WASC EER Report Appendix D 137
RETURN TO CONTENTS
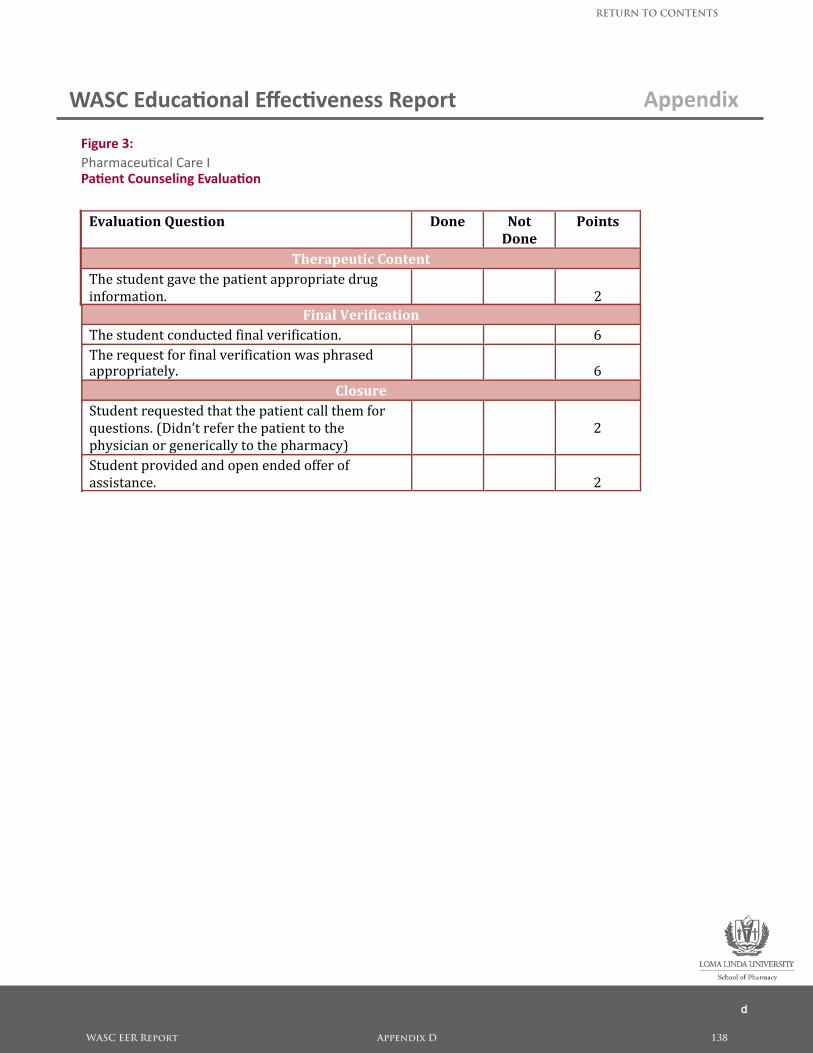
WASC Educational Effectiveness Report Appendix
Figure 3: Pharmaceutical Care IPatient Counseling Evaluation
d
EvaluationQuestion Done Not
Done
Points
PatientIdentity
Thestudentaddressedthepatientbyname. 2
Thepatient’sidentitywasverifiedbythestudent
usingthebirthdate,address,ortelephone
number.
2
ProviderIntroduction
Thestudentintroducedthemselvesusingtheir
doctortitle.
2
Thestudentreferredtothemselvesasanintern
pharmacistorstudentpharmacists.
2
PurposeforCounseling
Thestudentprovidedapurposeforthe
counseling.
3
Thestudentstressedpurposeofcounselingasameanstomaximizethebenefitsofthemedication.
3
ShowingtheMedication
Thestudentopenedthebottle,poured1‐3dosage
unitsintothecapandshowedthepatientthe
actualmedication.
2
ReferencetoMedicationbyName
Thestudentreferredtothemedicationusingthe
medicationname.
2
TheThreePrimeQuestions
Studentasked:Whatdidyourdoctortellthis
medicationisfor?OrWhatwereyoutoldthis
medicationisfor?(mustbeaskedopenended)
4
Studentasked:Howdidyourdoctortellyouto
takeit?OrHowwereyoutoldtotakeit?(mustbe
askedopenended)
4
Studentasked:Whatdidyourdoctortellyouto
expect?OrWhatwereyoutoldtoexpect?(must
beaskedopenended)
4
UseofPatientProfile
Thestudentincorporatedatleastoneelementof
thepatientprofileintothecounselingsession.
(allergies,OTCuse,previousorotherprescription
medications,socialand/orfamilyhistory)
2
TherapeuticContent
Thestudentgavethepatientappropriatedrug
information.
2
FinalVerification
Thestudentconductedfinalverification. 6
Therequestforfinalverificationwasphrasedappropriately.
6
Closure
Studentrequestedthatthepatientcallthemfor
questions.(Didn’treferthepatienttothe
physicianorgenericallytothepharmacy)
2
Studentprovidedandopenendedofferof
assistance.
2
WASC EER Report Appendix D 138
RETURN TO CONTENTS
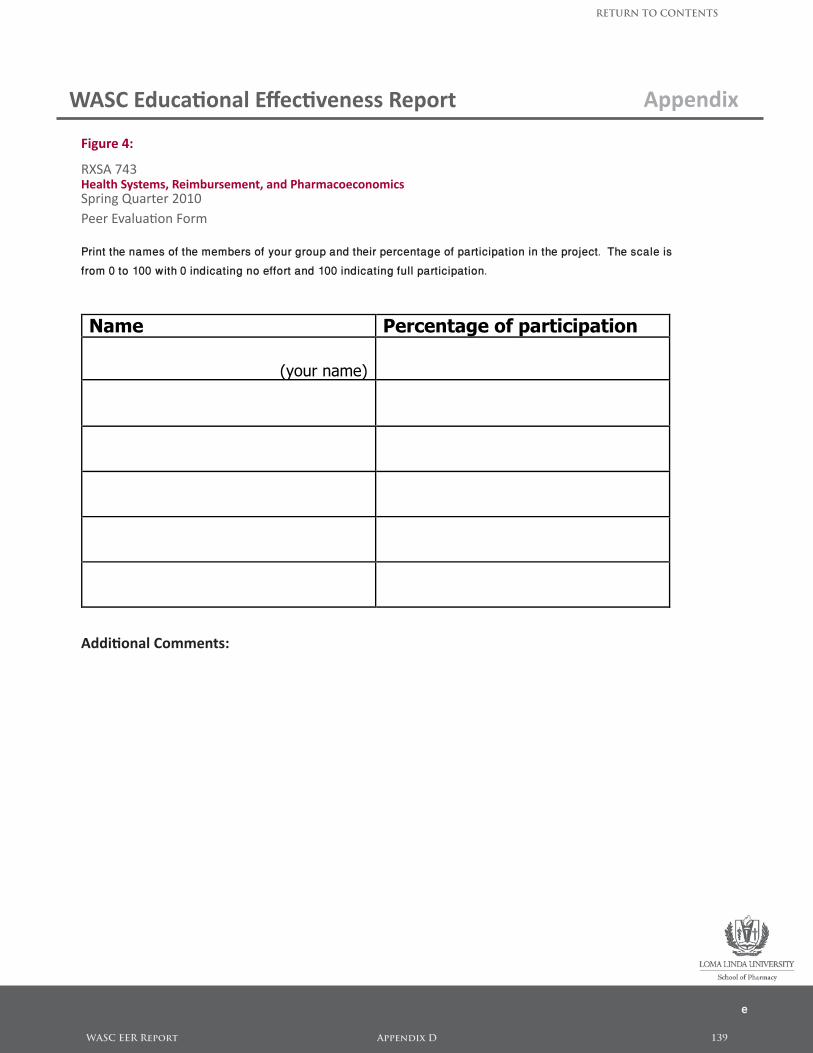
1
WASC Educational Effectiveness Report Appendix
e
Figure 4:
RXSA 743Health Systems, Reimbursement, and PharmacoeconomicsSpring Quarter 2010Peer Evaluation Form
Print the names of the members of your group and their percentage of participation in the project. The scale isfrom 0 to 100 with 0 indicating no effort and 100 indicating full participation.
Name Percentage of participation (your name)
Additional Comments:
WASC EER Report Appendix D 139
RETURN TO CONTENTS
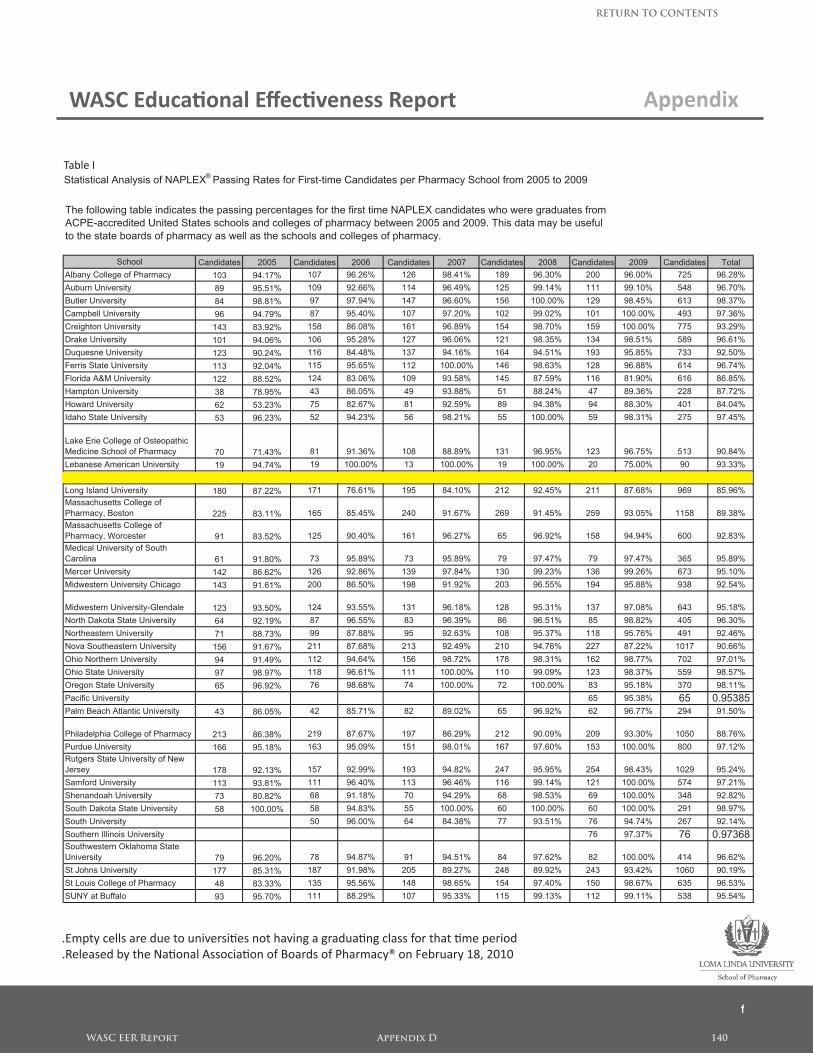
WASC Educational Effectiveness Report Appendix
Statistical Analysis of NAPLEX® Passing Rates for First-time Candidates per Pharmacy School from 2005 to 2009
The following table indicates the passing percentages for the first time NAPLEX candidates who were graduates from ACPE-accredited United States schools and colleges of pharmacy between 2005 and 2009. This data may be useful to the state boards of pharmacy as well as the schools and colleges of pharmacy.
School Candidates 2005 Candidates 2006 Candidates 2007 Candidates 2008 Candidates 2009 Candidates TotalAlbany College of Pharmacy 103 94.17% 107 96.26% 126 98.41% 189 96.30% 200 96.00% 725 96.28%Auburn University 89 95.51% 109 92.66% 114 96.49% 125 99.14% 111 99.10% 548 96.70%Butler University 84 98.81% 97 97.94% 147 96.60% 156 100.00% 129 98.45% 613 98.37%Campbell University 96 94.79% 87 95.40% 107 97.20% 102 99.02% 101 100.00% 493 97.36%Creighton University 143 83.92% 158 86.08% 161 96.89% 154 98.70% 159 100.00% 775 93.29%Drake University 101 94.06% 106 95.28% 127 96.06% 121 98.35% 134 98.51% 589 96.61%Duquesne University 123 90.24% 116 84.48% 137 94.16% 164 94.51% 193 95.85% 733 92.50%Ferris State University 113 92.04% 115 95.65% 112 100.00% 146 98.63% 128 96.88% 614 96.74%Florida A&M University 122 88.52% 124 83.06% 109 93.58% 145 87.59% 116 81.90% 616 86.85%Hampton University 38 78.95% 43 86.05% 49 93.88% 51 88.24% 47 89.36% 228 87.72%Howard University 62 53.23% 75 82.67% 81 92.59% 89 94.38% 94 88.30% 401 84.04%Idaho State University 53 96.23% 52 94.23% 56 98.21% 55 100.00% 59 98.31% 275 97.45%
Lake Erie College of Osteopathic Medicine School of Pharmacy 70 71.43% 81 91.36% 108 88.89% 131 96.95% 123 96.75% 513 90.84%Lebanese American University 19 94.74% 19 100.00% 13 100.00% 19 100.00% 20 75.00% 90 93.33%Loma Linda University 32 96.88% 37 100.00% 53 98.11% 56 96.43% 178 97.75%Long Island University 180 87.22% 171 76.61% 195 84.10% 212 92.45% 211 87.68% 969 85.96%Massachusetts College of Pharmacy, Boston 225 83.11% 165 85.45% 240 91.67% 269 91.45% 259 93.05% 1158 89.38%Massachusetts College of Pharmacy, Worcester 91 83.52% 125 90.40% 161 96.27% 65 96.92% 158 94.94% 600 92.83%Medical University of South Carolina 61 91.80% 73 95.89% 73 95.89% 79 97.47% 79 97.47% 365 95.89%Mercer University 142 86.62% 126 92.86% 139 97.84% 130 99.23% 136 99.26% 673 95.10%Midwestern University Chicago 143 91.61% 200 86.50% 198 91.92% 203 96.55% 194 95.88% 938 92.54%
Midwestern University-Glendale 123 93.50% 124 93.55% 131 96.18% 128 95.31% 137 97.08% 643 95.18%North Dakota State University 64 92.19% 87 96.55% 83 96.39% 86 96.51% 85 98.82% 405 96.30%Northeastern University 71 88.73% 99 87.88% 95 92.63% 108 95.37% 118 95.76% 491 92.46%Nova Southeastern University 156 91.67% 211 87.68% 213 92.49% 210 94.76% 227 87.22% 1017 90.66%Ohio Northern University 94 91.49% 112 94.64% 156 98.72% 178 98.31% 162 98.77% 702 97.01%Ohio State University 97 98.97% 118 96.61% 111 100.00% 110 99.09% 123 98.37% 559 98.57%Oregon State University 65 96.92% 76 98.68% 74 100.00% 72 100.00% 83 95.18% 370 98.11%
Empty cells are due to universities not having a graduating class for that time period. Released by the National Association of Boards of Pharmacy® on February 18, 2010.
Statistical Analysis of NAPLEX® Passing Rates for First-time Candidates per Pharmacy School from 2005 to 2009
School Candidates 2005 Candidates 2006 Candidates 2007 Candidates 2008 Candidates 2009 Candidates TotalPacific University 65 95.38% 65 0.95385Palm Beach Atlantic University 43 86.05% 42 85.71% 82 89.02% 65 96.92% 62 96.77% 294 91.50%
Philadelphia College of Pharmacy 213 86.38% 219 87.67% 197 86.29% 212 90.09% 209 93.30% 1050 88.76%Purdue University 166 95.18% 163 95.09% 151 98.01% 167 97.60% 153 100.00% 800 97.12%Rutgers State University of New Jersey 178 92.13% 157 92.99% 193 94.82% 247 95.95% 254 98.43% 1029 95.24%Samford University 113 93.81% 111 96.40% 113 96.46% 116 99.14% 121 100.00% 574 97.21%Shenandoah University 73 80.82% 68 91.18% 70 94.29% 68 98.53% 69 100.00% 348 92.82%South Dakota State University 58 100.00% 58 94.83% 55 100.00% 60 100.00% 60 100.00% 291 98.97%South University 50 96.00% 64 84.38% 77 93.51% 76 94.74% 267 92.14%Southern Illinois University 76 97.37% 76 0.97368Southwestern Oklahoma State University 79 96.20% 78 94.87% 91 94.51% 84 97.62% 82 100.00% 414 96.62%St Johns University 177 85.31% 187 91.98% 205 89.27% 248 89.92% 243 93.42% 1060 90.19%St Louis College of Pharmacy 48 83.33% 135 95.56% 148 98.65% 154 97.40% 150 98.67% 635 96.53%SUNY at Buffalo 93 95.70% 111 88.29% 107 95.33% 115 99.13% 112 99.11% 538 95.54%Temple University 123 79.67% 131 89.31% 131 95.42% 139 95.68% 159 98.74% 683 92.24%Texas Southern University 98 67.35% 93 82.80% 104 87.50% 118 93.22% 123 95.12% 536 86.01%Texas Tech University 73 94.52% 68 92.65% 74 97.30% 86 97.67% 81 98.77% 382 96.33%Touro University 57 96.49% 57 0.96491University of Appalachia 59 94.92% 59 0.94915University of Arizona 62 90.32% 66 100.00% 72 98.61% 79 98.73% 76 98.68% 355 97.46%University of Arkansas 79 94.94% 76 97.37% 80 98.75% 77 100.00% 95 98.95% 407 98.03%
University of California, San Diego 24 100.00% 24 100.00% 28 100.00% 52 100.00% 128 100.00%University of California, San Francisco 125 99.20% 126 99.21% 118 99.15% 130 97.69% 118 98.31% 617 98.70%University of Cincinnati-Med Center 55 96.36% 70 97.14% 63 98.41% 81 98.77% 94 96.81% 363 97.52%University of Colorado 95 93.68% 117 92.31% 122 95.90% 129 98.45% 120 97.50% 583 95.71%University of Connecticut 75 92.00% 88 94.32% 89 94.38% 103 98.06% 97 97.94% 452 95.58%University of Florida 139 93.53% 203 93.60% 300 99.00% 294 98.64% 302 98.01% 1238 97.17%University of Georgia 108 96.30% 108 100.00% 128 97.66% 133 98.50% 118 100.00% 595 98.49%University of Houston 109 90.83% 103 98.06% 97 100.00% 112 99.11% 127 99.21% 548 97.45%University of Illinois at Chicago 149 93.29% 157 90.45% 147 96.60% 158 96.84% 155 96.77% 766 94.78%University of Iowa 103 98.06% 103 96.12% 107 96.26% 103 100.00% 110 99.09% 526 97.91%University of Kansas 96 96.88% 99 96.97% 100 95.00% 101 98.02% 103 98.06% 499 96.99%
Empty cells are due to universities not having a graduating class for that time period. Released by the National Association of Boards of Pharmacy® on February 18, 2010.
f
.Empty cells are due to universities not having a graduating class for that time period
.Released by the National Association of Boards of Pharmacy® on February 18, 2010
Table I
WASC EER Report Appendix D 140
RETURN TO CONTENTS
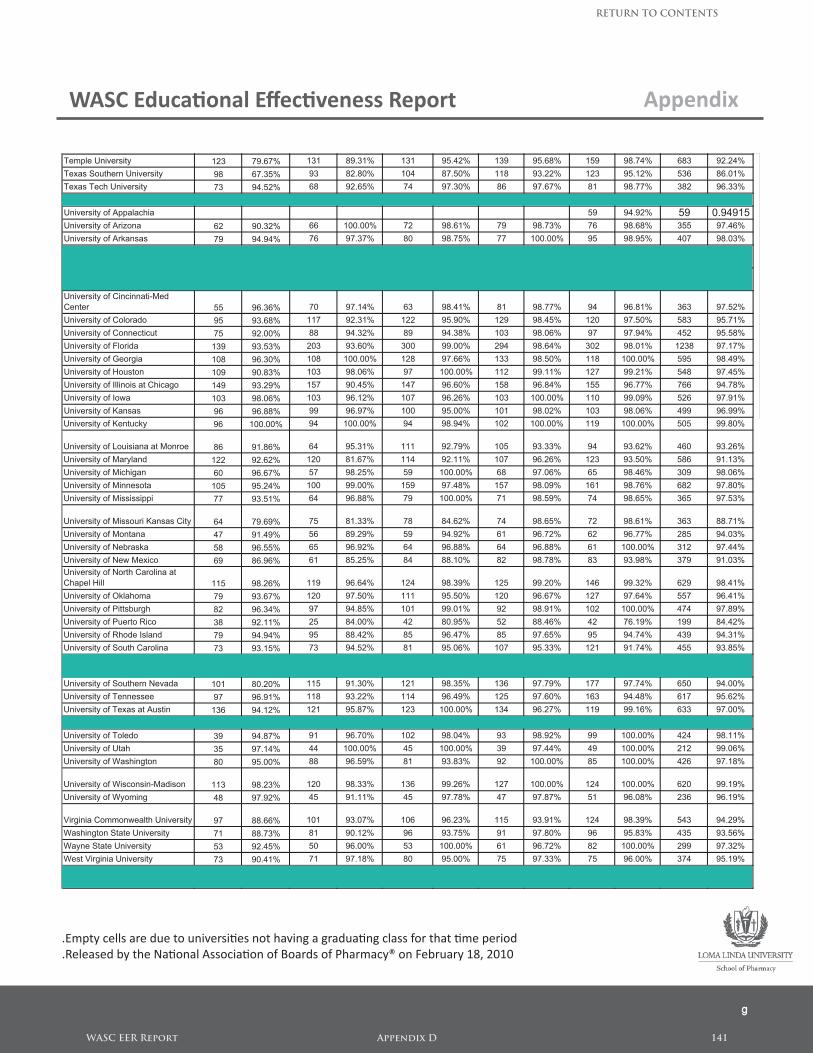
WASC Educational Effectiveness Report Appendix
Statistical Analysis of NAPLEX® Passing Rates for First-time Candidates per Pharmacy School from 2005 to 2009
School Candidates 2005 Candidates 2006 Candidates 2007 Candidates 2008 Candidates 2009 Candidates TotalPacific University 65 95.38% 65 0.95385Palm Beach Atlantic University 43 86.05% 42 85.71% 82 89.02% 65 96.92% 62 96.77% 294 91.50%
Philadelphia College of Pharmacy 213 86.38% 219 87.67% 197 86.29% 212 90.09% 209 93.30% 1050 88.76%Purdue University 166 95.18% 163 95.09% 151 98.01% 167 97.60% 153 100.00% 800 97.12%Rutgers State University of New Jersey 178 92.13% 157 92.99% 193 94.82% 247 95.95% 254 98.43% 1029 95.24%Samford University 113 93.81% 111 96.40% 113 96.46% 116 99.14% 121 100.00% 574 97.21%Shenandoah University 73 80.82% 68 91.18% 70 94.29% 68 98.53% 69 100.00% 348 92.82%South Dakota State University 58 100.00% 58 94.83% 55 100.00% 60 100.00% 60 100.00% 291 98.97%South University 50 96.00% 64 84.38% 77 93.51% 76 94.74% 267 92.14%Southern Illinois University 76 97.37% 76 0.97368Southwestern Oklahoma State University 79 96.20% 78 94.87% 91 94.51% 84 97.62% 82 100.00% 414 96.62%St Johns University 177 85.31% 187 91.98% 205 89.27% 248 89.92% 243 93.42% 1060 90.19%St Louis College of Pharmacy 48 83.33% 135 95.56% 148 98.65% 154 97.40% 150 98.67% 635 96.53%SUNY at Buffalo 93 95.70% 111 88.29% 107 95.33% 115 99.13% 112 99.11% 538 95.54%Temple University 123 79.67% 131 89.31% 131 95.42% 139 95.68% 159 98.74% 683 92.24%Texas Southern University 98 67.35% 93 82.80% 104 87.50% 118 93.22% 123 95.12% 536 86.01%Texas Tech University 73 94.52% 68 92.65% 74 97.30% 86 97.67% 81 98.77% 382 96.33%Touro University 57 96.49% 57 0.96491University of Appalachia 59 94.92% 59 0.94915University of Arizona 62 90.32% 66 100.00% 72 98.61% 79 98.73% 76 98.68% 355 97.46%University of Arkansas 79 94.94% 76 97.37% 80 98.75% 77 100.00% 95 98.95% 407 98.03%
University of California, San Diego 24 100.00% 24 100.00% 28 100.00% 52 100.00% 128 100.00%University of California, San Francisco 125 99.20% 126 99.21% 118 99.15% 130 97.69% 118 98.31% 617 98.70%University of Cincinnati-Med Center 55 96.36% 70 97.14% 63 98.41% 81 98.77% 94 96.81% 363 97.52%University of Colorado 95 93.68% 117 92.31% 122 95.90% 129 98.45% 120 97.50% 583 95.71%University of Connecticut 75 92.00% 88 94.32% 89 94.38% 103 98.06% 97 97.94% 452 95.58%University of Florida 139 93.53% 203 93.60% 300 99.00% 294 98.64% 302 98.01% 1238 97.17%University of Georgia 108 96.30% 108 100.00% 128 97.66% 133 98.50% 118 100.00% 595 98.49%University of Houston 109 90.83% 103 98.06% 97 100.00% 112 99.11% 127 99.21% 548 97.45%University of Illinois at Chicago 149 93.29% 157 90.45% 147 96.60% 158 96.84% 155 96.77% 766 94.78%University of Iowa 103 98.06% 103 96.12% 107 96.26% 103 100.00% 110 99.09% 526 97.91%University of Kansas 96 96.88% 99 96.97% 100 95.00% 101 98.02% 103 98.06% 499 96.99%
Empty cells are due to universities not having a graduating class for that time period. Released by the National Association of Boards of Pharmacy® on February 18, 2010.
Statistical Analysis of NAPLEX® Passing Rates for First-time Candidates per Pharmacy School from 2005 to 2009
School Candidates 2005 Candidates 2006 Candidates 2007 Candidates 2008 Candidates 2009 Candidates TotalUniversity of Kentucky 96 100.00% 94 100.00% 94 98.94% 102 100.00% 119 100.00% 505 99.80%
University of Louisiana at Monroe 86 91.86% 64 95.31% 111 92.79% 105 93.33% 94 93.62% 460 93.26%University of Maryland 122 92.62% 120 81.67% 114 92.11% 107 96.26% 123 93.50% 586 91.13%University of Michigan 60 96.67% 57 98.25% 59 100.00% 68 97.06% 65 98.46% 309 98.06%University of Minnesota 105 95.24% 100 99.00% 159 97.48% 157 98.09% 161 98.76% 682 97.80%University of Mississippi 77 93.51% 64 96.88% 79 100.00% 71 98.59% 74 98.65% 365 97.53%
University of Missouri Kansas City 64 79.69% 75 81.33% 78 84.62% 74 98.65% 72 98.61% 363 88.71%University of Montana 47 91.49% 56 89.29% 59 94.92% 61 96.72% 62 96.77% 285 94.03%University of Nebraska 58 96.55% 65 96.92% 64 96.88% 64 96.88% 61 100.00% 312 97.44%University of New Mexico 69 86.96% 61 85.25% 84 88.10% 82 98.78% 83 93.98% 379 91.03%University of North Carolina at Chapel Hill 115 98.26% 119 96.64% 124 98.39% 125 99.20% 146 99.32% 629 98.41%University of Oklahoma 79 93.67% 120 97.50% 111 95.50% 120 96.67% 127 97.64% 557 96.41%University of Pittsburgh 82 96.34% 97 94.85% 101 99.01% 92 98.91% 102 100.00% 474 97.89%University of Puerto Rico 38 92.11% 25 84.00% 42 80.95% 52 88.46% 42 76.19% 199 84.42%University of Rhode Island 79 94.94% 95 88.42% 85 96.47% 85 97.65% 95 94.74% 439 94.31%University of South Carolina 73 93.15% 73 94.52% 81 95.06% 107 95.33% 121 91.74% 455 93.85%
University of Southern California 174 99.43% 186 97.85% 195 95.90% 194 98.97% 182 99.45% 931 98.28%University of Southern Nevada 101 80.20% 115 91.30% 121 98.35% 136 97.79% 177 97.74% 650 94.00%University of Tennessee 97 96.91% 118 93.22% 114 96.49% 125 97.60% 163 94.48% 617 95.62%University of Texas at Austin 136 94.12% 121 95.87% 123 100.00% 134 96.27% 119 99.16% 633 97.00%University of the Pacific 204 98.04% 195 97.44% 205 99.02% 192 97.92% 216 99.54% 1012 98.42%University of Toledo 39 94.87% 91 96.70% 102 98.04% 93 98.92% 99 100.00% 424 98.11%University of Utah 35 97.14% 44 100.00% 45 100.00% 39 97.44% 49 100.00% 212 99.06%University of Washington 80 95.00% 88 96.59% 81 93.83% 92 100.00% 85 100.00% 426 97.18%
University of Wisconsin-Madison 113 98.23% 120 98.33% 136 99.26% 127 100.00% 124 100.00% 620 99.19%University of Wyoming 48 97.92% 45 91.11% 45 97.78% 47 97.87% 51 96.08% 236 96.19%
Virginia Commonwealth University 97 88.66% 101 93.07% 106 96.23% 115 93.91% 124 98.39% 543 94.29%Washington State University 71 88.73% 81 90.12% 96 93.75% 91 97.80% 96 95.83% 435 93.56%Wayne State University 53 92.45% 50 96.00% 53 100.00% 61 96.72% 82 100.00% 299 97.32%West Virginia University 73 90.41% 71 97.18% 80 95.00% 75 97.33% 75 96.00% 374 95.19%Western University of Health Sciences 89 98.88% 102 96.08% 117 98.29% 126 100.00% 130 96.15% 564 97.87%
Empty cells are due to universities not having a graduating class for that time period. Released by the National Association of Boards of Pharmacy® on February 18, 2010.
g
.Empty cells are due to universities not having a graduating class for that time period
.Released by the National Association of Boards of Pharmacy® on February 18, 2010
WASC EER Report Appendix D 141
RETURN TO CONTENTS
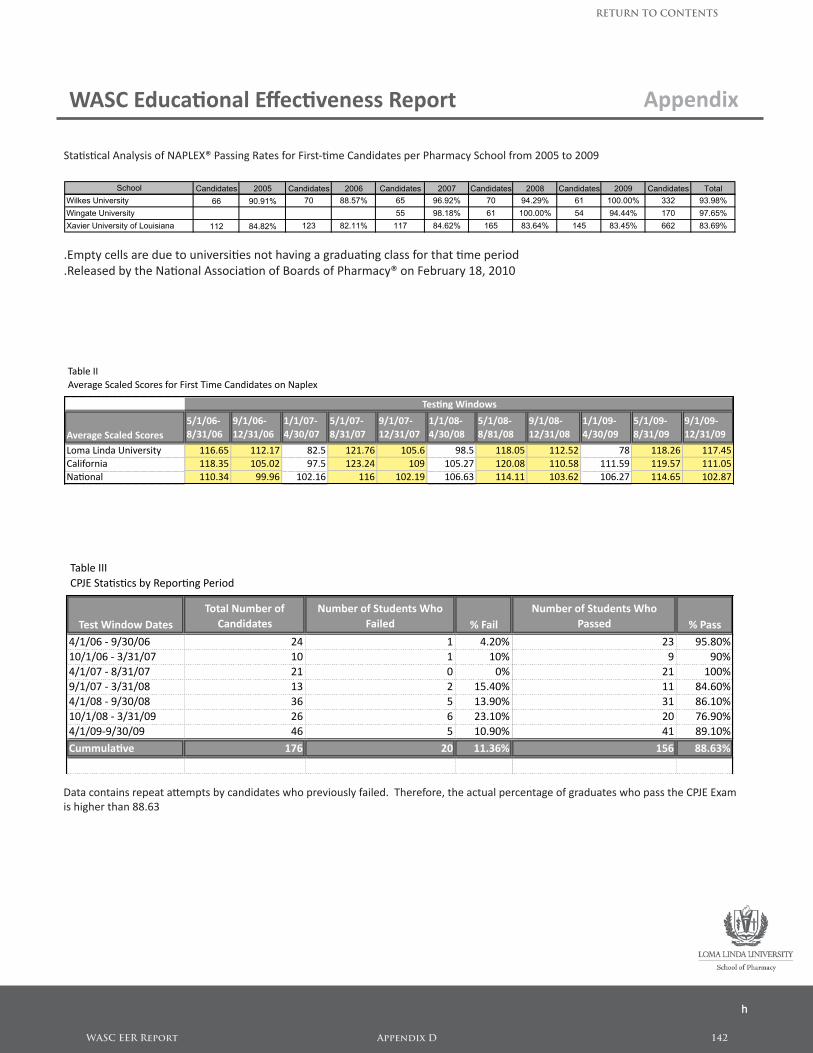
WASC Educational Effectiveness Report Appendix
TableII
AverageScaledScoresforFirstTimeCandidatesonNaplex
AverageScaledScores
5/1/06‐
8/31/06
9/1/06‐
12/31/06
1/1/07‐
4/30/07
5/1/07‐
8/31/07
9/1/07‐
12/31/07
1/1/08‐
4/30/08
5/1/08‐
8/81/08
9/1/08‐
12/31/08
1/1/09‐
4/30/09
5/1/09‐
8/31/09
9/1/09‐
12/31/09
LomaLindaUniversity 116.65 112.17 82.5 121.76 105.6 98.5 118.05 112.52 78 118.26 117.45
California 118.35 105.02 97.5 123.24 109 105.27 120.08 110.58 111.59 119.57 111.05
NaIonal 110.34 99.96 102.16 116 102.19 106.63 114.11 103.62 106.27 114.65 102.87
:es;<g=><do?s
TableIII
()*+,-a./.0/b12e345.67)e5849
TestWindowDates
TotalNumberof
Candidates
NumberofStudentsWho
Failed %Fail
NumberofStudentsWho
Passed %Pass
4/1/06‐9/30/06 24 1 4.20% 23 95.80%
10/1/06‐3/31/07 10 1 10% 9 90%
4/1/07‐8/31/07 21 0 0% 21 100%
9/1/07‐3/31/08 13 2 15.40% 11 84.60%
4/1/08‐9/30/08 36 5 13.90% 31 86.10%
10/1/08‐3/31/09 26 6 23.10% 20 76.90%
4/1/09‐9/30/09 46 5 10.90% 41 89.10%
Cummula;<e 176 20 11.36% 156 88.63%
Ha-a046-a86/5e3ea-aIeJ3-/b10a6989a-e/KL435eM84N/l1Oa8le9.TLe5eO45eP-Lea0-Nal3e50e6-a7e4O75a9Na-e/KL43a//-Le()*++QaJ8/L87Le5-La688.63%.
Statistical Analysis of NAPLEX® Passing Rates for First-time Candidates per Pharmacy School from 2005 to 2009
School Candidates 2005 Candidates 2006 Candidates 2007 Candidates 2008 Candidates 2009 Candidates TotalWilkes University 66 90.91% 70 88.57% 65 96.92% 70 94.29% 61 100.00% 332 93.98%Wingate University 55 98.18% 61 100.00% 54 94.44% 170 97.65%Xavier University of Louisiana 112 84.82% 123 82.11% 117 84.62% 165 83.64% 145 83.45% 662 83.69%
Empty cells are due to universities not having a graduating class for that time period. Released by the National Association of Boards of Pharmacy® on February 18, 2010.
h
Statistical Analysis of NAPLEX® Passing Rates for First-time Candidates per Pharmacy School from 2005 to 2009
.Empty cells are due to universities not having a graduating class for that time period
.Released by the National Association of Boards of Pharmacy® on February 18, 2010
Data contains repeat attempts by candidates who previously failed. Therefore, the actual percentage of graduates who pass the CPJE Examis higher than 88.63
WASC EER Report Appendix D 142
RETURN TO CONTENTS
Loma Linda University
School of Public Health
Educational Effectiveness Report
Loma Linda University School of Public Health is one of 44 schools accredited by the Council on Education for Public Health, an independent agency recognized by the US Department of Education to
accredit public health schools and programs. The principles of self‐evaluation, external peer review, mission, focus on outcomes, objectivity and fairness govern the accreditation process. LLU SPH received its most recent accreditation review site visit in October of 2009, and is expecting to receive notification
of the accreditation decision in late July of 2010. The following commendations were expressed by the CEPH site visit team in the exit report.
1. Site visitors saw evidence of interdisciplinary work among the different departments within the school as well as with various schools and departments throughout the University.
2. The school’s articulated set of values embody the vision, goals and values of the field of public health and focus of diversity and embracing cultural differences; the idea of wholeness—integrating spirituality with activities to impact one’s health and engaging the surrounding
community as active contributors in improving health. 3. The school is particularly rich in community‐based resources that enrich both student and
faculty experiences. There is a strong partnership with the local Native American community as
well as several government entities such as the CDC, California Department of Public Health and the San Bernardino County Department of Health.
4. Each of the school’s stated values speaks to important aspects of public health.
5. The mission, vision and goals were developed through an iterative process with internal and external stake‐holders.
6. The school has a comprehensive process to monitor, evaluate and refine, as needed, the mission, goals and objectives. There are clearly defined outcome measures and metrics linked to the goals and objectives, with assigned personnel accountable. The results of the monitoring
of goals and objectives are discussed and analyzed in a variety of settings, including the relevant standing committees of the school that have broad representation from faculty, staff and students.
7. Site visit meetings with community partners and employers documented a very strong ongoing commitment by the school’s leadership to fostering opportunity for “informal” input by these constituents, and an appreciation that the views and concerns are heard and acted upon.
8. In all areas of important self‐determination and governance, the school has autonomy and status equivalent to the other eight schools of the LLU.
9. The school carries out its administrative and academic functions largely through committee
processes that rely heavily on consensus‐building. The size of the school and its faculty accommodates this collegial approach, which seems to work effectively and efficiently.
WASC EER Report Appendix D 143
RETURN TO CONTENTS
10. The community representatives shared that the school enjoys a strong and very productive two‐way communication link with the local California community and the broader external
constituencies with which they work globally. 11. The school has partnerships with government entities, community‐based organizations and
several faith‐based organizations including educational institutions and health care systems
from the Seventh‐day Adventist Church, from which students benefit. 12. The site visit team was impressed with the level of organization and success of the school’s
distance education programs. The school has made several adjustments to its distance
programs based on feedback from students and lessons learned from each cohort and is continuing to expand the program.
13. The site visit team commended the school and its faculty for their outstanding commitment and
record of achievement in the contribution of scholarly service to the health of populations locally, regionally and globally. Supporting the current maintenance of a vigorous service program are the school’s community partners, who praised the contributions of faculty and
students. Student participation is also widespread, vigorous, and valued. The culture of service imbues the students’ experience, and the evaluation process specifically measures how well courses motivate and foster students’ engagement in service activities.
14. The diverse backgrounds of the faculty provide a unique set of faculty experiential and cultural qualifications. The school has assembled a diverse complement of adjunct and clinical faculty who bring a wealth of public health practice knowledge to students and work in many capacities
within the field such as government agencies, the global health arena, the non‐profit sector, advocacy and health services.
WASC EER Report Appendix D 144
RETURN TO CONTENTS
Loma Linda, CA July 16, 2010
Educational Effectiveness Report Final version
By Roy Branson, Academic Dean
Johnny Ramírez-Johnson, Assessment Specialist
WASC EER Report Appendix D 145
RETURN TO CONTENTS
2
INTRODUCTION Loma Linda University established the School of Religion as a school in 2007. This decision came after much discussion over the purpose of the faculty and the religion classes taught on the LLU campus. The decision to establish the then “faculty of religion” as a school came in response to the conclusion that the purpose was twofold: 1) to teach religion courses to the approximately 4000 students at LLU (general religion curriculum – GRC), and 2) to offer graduate programs in religious education. Even though two of the three graduate programs had been in existence for over ten years, neither the GRC nor the graduate programs had an accreditation or assessment process. Becoming a school provided the platform whereby an assessment process would be developed for both the GRC and the graduate programs. While the EER is typically a report on student and program outcomes, we write this report more generally on the following four areas: 1) Becoming a school, 2) Advancing Adventist thought and practice, 3) Educating university students, and 4) Assessing graduate programs. In doing this, we suggest that becoming a school, faculty development, and educating the larger LLU student body are intricately intertwined with the development of graduate programs. The first three not only take the majority of time and resources, but provide the foundation out of which the fourth (graduate programs) can arise and be sustainable. For this reason we discuss them in that order, illustrating the incredible changes in the “School” of Religion in the last five years. BECOMING A SCHOOL Loma Linda University is committed to placing values and religion at the center of its identity. To pursue this goal the university identified a fiscal and academic structure to develop, assess and sustain religion education classes and programs throughout the university. A School of Religion was created in 2007.
• Development of a structure of support necessary for expanding educational offerings. In developing a structure of support for a developing school, the following took place:
o centralizing the admissions process for all graduate programs o hiring a director of marketing o designating a director of student services o appointing an assessment officer o designating a development officer o creating an avenue of funding for student scholarships (now over
$220,000) o establishing a fund for support of faculty research (now over $200,000)
• Creation of a Division of Humanities to foster the relationship between liberal arts and professional studies. There has been much discussion at LLU regarding the almost complete absence of humanities education on the campus. In the creation of a School of Religion, the decision was made to create a Division of
WASC EER Report Appendix D 146
RETURN TO CONTENTS
3
Humanities within it, hiring the first humanities professor (within that Division) in 2009.
• Enlargement of the School of Religion library and integration into the university library system. While the SR has long had a small library holding, the number of books has doubled in the last two years and all books are now catalogued and connected to the LLU library system.
• Creation of a physical space that reflects the centrality of religion within the university and its expanding role within the community. The move to the new Centennial Complex has not only provided a better space within which to work, but the move reflects the deeper philosophy of LLU to have religion and faith at the heart of everything that happens on the campus. The centrality of the building has also encouraged increased programming from the SR for the campus and community.
• Establishment of procedures to assess graduate programs and the identification of specific goals for the general religion curriculum of the 4000 students of the university. As stated earlier, those in the SR now better understand the importance of assessment. The WASC assessment itself encouraged the kind of discussions that not only raised awareness of the need for a better assessment process in the graduate programs, but also of the need for an assessment process for the GRC (general religion curriculum). We discuss both below.
ADVANCING ADVENTIST THOUGHT AND PRACTICE One of the primary goals of the School of Religion is to bring the Adventist Community in dialogue with the culture at large. In the discussions of whether to move to school status, one of the primary questions was around the function of LLU religion professors. Should they function as “chaplains” to the students, provide academic religious education, or both? The conclusion was that the religion professor should not only do both, but also advance Adventist thought and practice within world culture.
• Questions on Doctrine Conference: Co-sponsored by the School of Religion and held at Andrews University for the purpose of greater appreciation of the significance of a volume exploring the relation of Adventists to evangelical Christians
• Revelation Seminar Project: In collaboration with the South Pacific Division (based in Australia) and the Hope Channel, produced a videotaped and televised series exploring the relevance of Revelation to modern society
• Adventist family research project: Collaboration with the General Conference of SDA on a conference (attendance 100); the development of a process for research on Adventist families and the creation of a website to house all publications written on the topic
• Adventist health and religion study: Developing and guiding the religion and minority components of the Adventist Health Study 2
• Chaplaincy Initiative: Collaboration with the General Conference of Seventh-day Adventists on establishing the LLU School of Religion as the flagship for chaplain education throughout the world church
WASC EER Report Appendix D 147
RETURN TO CONTENTS
4
• Ethics Center at the Adventist college in Florence, Italy: Collaborating in the development of its program
• First DVD Bible Study Series for women: Produced in collaboration with the General Conference of SDA
• Innovative Overseas Mission Projects: working with groups where an official SDA presence is not possible
• Teaching and support for SDA educational institutions in Argentina, Australia, Bolivia, Chile, Dominican Republic, England, Germany, Greece, Guam, Jamaica, Japan, Mexico, Peru, Philippines, Puerto Rico, Russia Saudi Arabia, Singapore, South Africa, and Thailand.
• Internet-based educational television programming: The School of Religion is involved in three programs in collaboration with Loma Linda Broadcasting Network, Intersections, Searching for Answers, and This Life!
• Spiritual Care Workshop: The development of a yearly conference for the purpose of interdisciplinary dialogue and education in whole person care (three conferences held with attendance of 75, 90 and 175 respectively)
• Wholeness Portal: website developed for the purpose of LLU student personal assessment and enrichment; enlarged to serve the global community
• Ellen White Biography Project: A several-day conference in Portland, Maine, to encourage dialogue among 66 nationally renowned scholars in American intellectual history; a substantial volume will be published on the significance of early Adventists in American history
• Publication of at least ten books in the last five years (topics include World Religion, Sabbath, Homosexuality, Revelation, Wholeness and Human Rights)
EDUCATING UNIVERSITY STUDENTS The School of Religion considers all LLU students as School of Religion students since all students are required to take one or more religion courses. In the past, assessment has focused on the professor. Now, we are taking measures to implement assessment that is focused on students and their experiences of learning. Two goals identified in relation to the study of religion among all LLU students include: 1) Developing an assessment process that addresses all student learning, and 2) Providing a variety of educational experiences that encourage interdisciplinary discussion.
• Assessment process that addresses GRC (general religion curriculum) o Clarifying religion requirements. Addressing Domain I language
regarding what counted as a religion class, whether courses could be transferred and how many courses a student would take provided overall clarity.
o Wholeness Climate Survey. The wholeness climate survey does not have questions that are specific to the religion courses; however, the overall attitudes of students to the mission, values, and LLU as a context for learning to provide whole person care is positive. In the next version of the Wholeness Climate Survey we propose to include 1-2 questions that specifically relate to religion courses.
WASC EER Report Appendix D 148
RETURN TO CONTENTS
5
o Wholeness Portal. The Wholeness Portal is now connected with several of the religion classes and will be connected to several more in the future.
o Religion Course Outcomes. Since specific students at LLU may take only 1-2 religion courses, we have the unique challenge of building an assessment process that takes into consideration minimal contact with SR courses. After months of study, the SR took an important step in defining the scope of its vision of religion taught to every student at LLU. The faculty unanimously committed itself to incorporating, in diverse ways and to varying degrees, the following five goals into every single religion course:
1. Demonstrate knowledge and competent use of Scripture. 2. Show understanding of Christian theology and history, with
specific attention to Seventh-day Adventist life and thought. 3. Explain the interaction between ethics and religious
commitments and beliefs. 4. Explore the ways in which faith relates to personal wholeness,
professional practice, and witness. 5. Describe ways in which moral advocacy can shape society.
This decision affects every religion professor, every religion course, and every student in the university. The plan for assessment of the newly designed GRC is below:
March 2010 Winter 2010 Spring 2011 Fall 201l Winter 2011
Spring 2012 Fall 2013 through Spring 2015
Began discussion of practical steps to assess the effectiveness of classes in teaching the five goals.
Make decisions regarding the relation of the five goals and the Student Learning Outcomes (SLOs).
Eighty percent of religion classes will list the five goals on the Course Outline (syllabus), and will show when and how the content of the class pays attention to the five goals.
Make decisions regarding parameters that assess student learning in relation to the five goals.
Adoption of parameters
Assessment will begin of the effectiveness of all School of Religion classes in teaching the five goals
Data regarding student learning of the five goals will be collected and analyzed.
• Providing a variety of educational experiences
o Adventism and the World Lectureship o Biblical Scholar Lectures o Faith and Film Series o Health and Faith Forum (approximately 36 forums) o Humanities Roundtables o Jack Provonsha Lecture Series (three series) o Rotating Art Exhibits in Centennial Complex o Social Issue Roundtables (four community-wide colloquiums) o Spiritual Care Workshop (three conferences) o The Art That Heals Lectureship o Wil Alexander Wholeness Lecture Series o Take 6 concert
WASC EER Report Appendix D 149
RETURN TO CONTENTS
6
The above forums, conferences, public presentations and musical event represent approximately 10,335 in attendance in these on-campus public forums. This does not include the multitude of off-campus lectures, presentations, seminars, TV programs and internet-based activities provided by the professors. This report is about “Educational Effectiveness.” Half of the above programs were evaluated through response evaluation forms leading to significant changes in the programs. The WASC process has helped us identify the need for developing educational effectiveness assessments for all of them.
ASSESSING GRADUATE PROGRAMS
• Chaplaincy Initiative. Through feedback from the students the clinical ministry faculty discovered that while the clinical ministry MA students were finding jobs in their discipline, they were not able to meet the standards necessary for professional certification. Through this feedback process, the SR has collaborated in significant ways with the General Conference to provide education for current chaplains that will lead to their endorsement by the SDA church and certified by the appropriate bodies. The clinical ministry faculty has reshaped the MA program and continues planning further educational offerings.
• Clinical Ministry MA. Student satisfaction with the Clinical Ministry Program is extremely high. When students were encouraged to anonymously make suggestions or recommendations for the program (alumni survey), all comments focused on what they already appreciated about the program. Right now, the overall satisfaction of students having graduated from the program is 4.2 out of 5.
• Revision of MA in Ethics Program. While there was no measureable assessment in place for the Ethics program, it became obvious that most students were not completing their graduate program within the expected period of time. The primary reasons were around two issues: 1) the failure to complete a publishable paper, and 2) the failure to sit for and/or pass a comprehensive exam. As a result, the ethics faculty revised the bioethics curriculum to include two capstone courses that will prepare students to take the comprehensive examination and complete a publishable paper. The new curriculum also expands the scope by allowing students to focus on a variety of subspecialties of bioethics.
• Self-evaluation of the Three Graduate Religion Programs. In the evaluation process two of the graduate programs (Bioethics and Clinical Ministry) developed an assessment grid to evaluate all publishable papers and projects of students who had completed an MA in religion. In this way we were better able to assess the critical thinking ability and learning of the students. This is a small example of the fact that where there was little assessment in place prior to the accreditation process, the SR is now fully committed not only to improving the tools necessary for assessment of the graduate programs but, more broadly, to assessing the general religion curriculum.
WASC EER Report Appendix D 150
RETURN TO CONTENTS
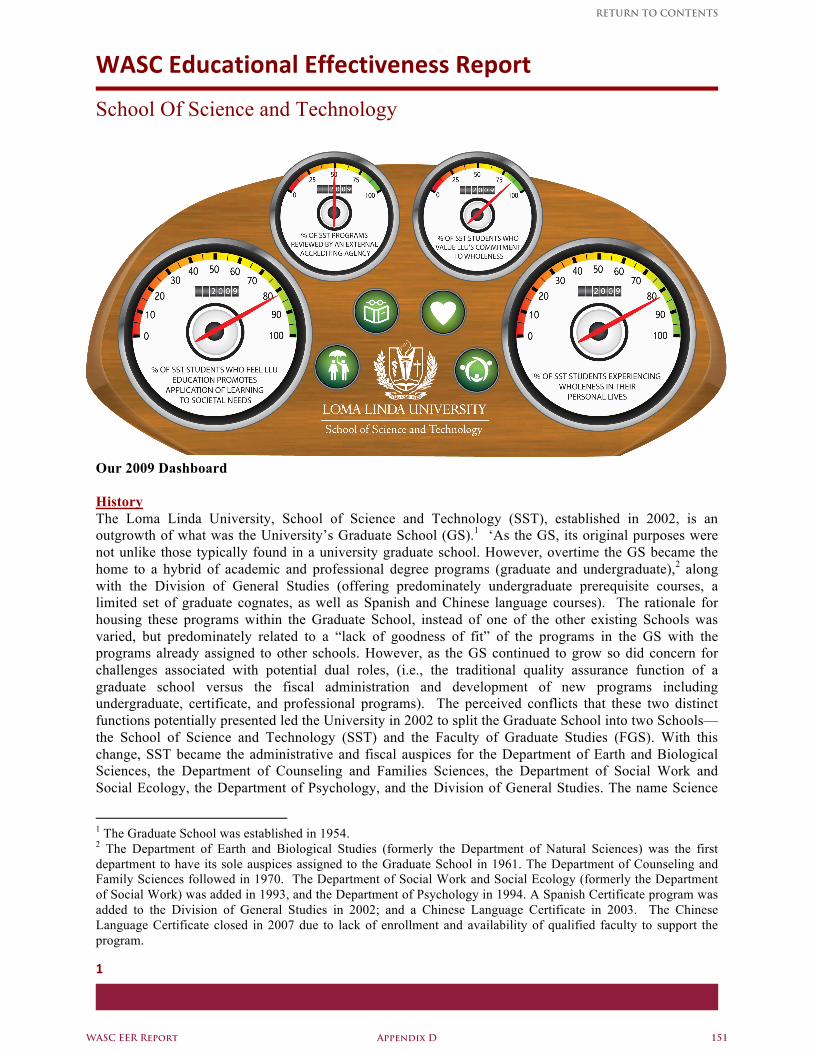
WASC Educational Effectiveness Report
School Of Science and Technology
1
Our 2009 Dashboard History The Loma Linda University, School of Science and Technology (SST), established in 2002, is an outgrowth of what was the University’s Graduate School (GS).1 ‘As the GS, its original purposes were not unlike those typically found in a university graduate school. However, overtime the GS became the home to a hybrid of academic and professional degree programs (graduate and undergraduate),2 along with the Division of General Studies (offering predominately undergraduate prerequisite courses, a limited set of graduate cognates, as well as Spanish and Chinese language courses). The rationale for housing these programs within the Graduate School, instead of one of the other existing Schools was varied, but predominately related to a “lack of goodness of fit” of the programs in the GS with the programs already assigned to other schools. However, as the GS continued to grow so did concern for challenges associated with potential dual roles, (i.e., the traditional quality assurance function of a graduate school versus the fiscal administration and development of new programs including undergraduate, certificate, and professional programs). The perceived conflicts that these two distinct functions potentially presented led the University in 2002 to split the Graduate School into two Schools—the School of Science and Technology (SST) and the Faculty of Graduate Studies (FGS). With this change, SST became the administrative and fiscal auspices for the Department of Earth and Biological Sciences, the Department of Counseling and Families Sciences, the Department of Social Work and Social Ecology, the Department of Psychology, and the Division of General Studies. The name Science
1 The Graduate School was established in 1954. 2 The Department of Earth and Biological Studies (formerly the Department of Natural Sciences) was the first department to have its sole auspices assigned to the Graduate School in 1961. The Department of Counseling and Family Sciences followed in 1970. The Department of Social Work and Social Ecology (formerly the Department of Social Work) was added in 1993, and the Department of Psychology in 1994. A Spanish Certificate program was added to the Division of General Studies in 2002; and a Chinese Language Certificate in 2003. The Chinese Language Certificate closed in 2007 due to lack of enrollment and availability of qualified faculty to support the program.
WASC EER Report Appendix D 151
RETURN TO CONTENTS
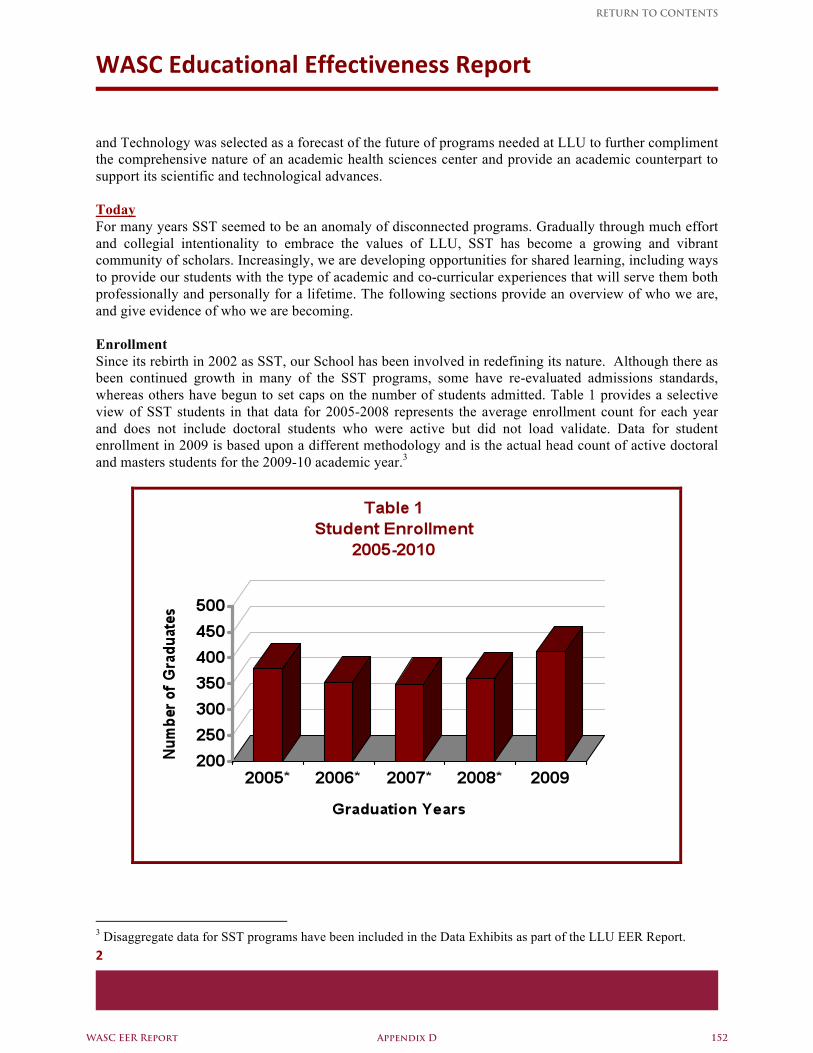
WASC Educational Effectiveness Report
2
and Technology was selected as a forecast of the future of programs needed at LLU to further compliment the comprehensive nature of an academic health sciences center and provide an academic counterpart to support its scientific and technological advances. Today For many years SST seemed to be an anomaly of disconnected programs. Gradually through much effort and collegial intentionality to embrace the values of LLU, SST has become a growing and vibrant community of scholars. Increasingly, we are developing opportunities for shared learning, including ways to provide our students with the type of academic and co-curricular experiences that will serve them both professionally and personally for a lifetime. The following sections provide an overview of who we are, and give evidence of who we are becoming. Enrollment Since its rebirth in 2002 as SST, our School has been involved in redefining its nature. Although there as been continued growth in many of the SST programs, some have re-evaluated admissions standards, whereas others have begun to set caps on the number of students admitted. Table 1 provides a selective view of SST students in that data for 2005-2008 represents the average enrollment count for each year and does not include doctoral students who were active but did not load validate. Data for student enrollment in 2009 is based upon a different methodology and is the actual head count of active doctoral and masters students for the 2009-10 academic year.3
3 Disaggregate data for SST programs have been included in the Data Exhibits as part of the LLU EER Report.
WASC EER Report Appendix D 152
RETURN TO CONTENTS
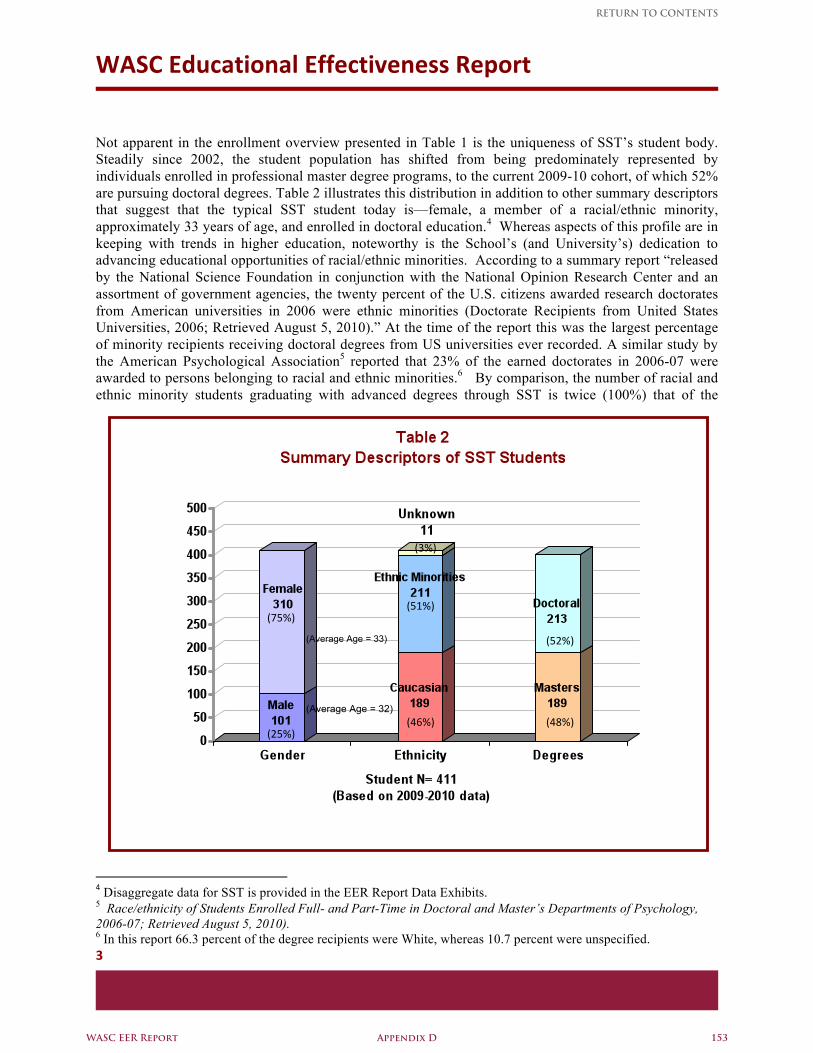
WASC Educational Effectiveness Report
3
Not apparent in the enrollment overview presented in Table 1 is the uniqueness of SST’s student body. Steadily since 2002, the student population has shifted from being predominately represented by individuals enrolled in professional master degree programs, to the current 2009-10 cohort, of which 52% are pursuing doctoral degrees. Table 2 illustrates this distribution in addition to other summary descriptors that suggest that the typical SST student today is—female, a member of a racial/ethnic minority, approximately 33 years of age, and enrolled in doctoral education.4 Whereas aspects of this profile are in keeping with trends in higher education, noteworthy is the School’s (and University’s) dedication to advancing educational opportunities of racial/ethnic minorities. According to a summary report “released by the National Science Foundation in conjunction with the National Opinion Research Center and an assortment of government agencies, the twenty percent of the U.S. citizens awarded research doctorates from American universities in 2006 were ethnic minorities (Doctorate Recipients from United States Universities, 2006; Retrieved August 5, 2010).” At the time of the report this was the largest percentage of minority recipients receiving doctoral degrees from US universities ever recorded. A similar study by the American Psychological Association5 reported that 23% of the earned doctorates in 2006-07 were awarded to persons belonging to racial and ethnic minorities.6 By comparison, the number of racial and ethnic minority students graduating with advanced degrees through SST is twice (100%) that of the
4 Disaggregate data for SST is provided in the EER Report Data Exhibits. 5 Race/ethnicity of Students Enrolled Full- and Part-Time in Doctoral and Master’s Departments of Psychology, 2006-07; Retrieved August 5, 2010). 6 In this report 66.3 percent of the degree recipients were White, whereas 10.7 percent were unspecified.
(Average Age = 33) (52%)
(48%)
(51%)
(46%)
(75%)
(25%)
(Average Age = 32)
(3%)
WASC EER Report Appendix D 153
RETURN TO CONTENTS
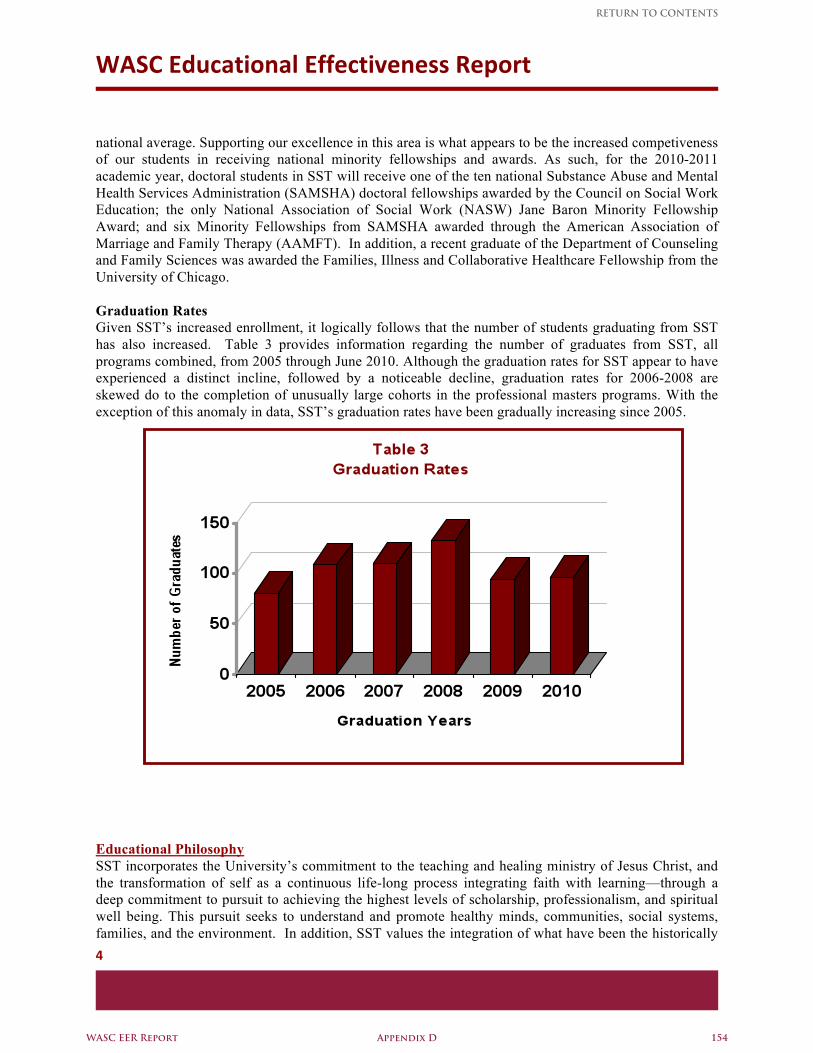
WASC Educational Effectiveness Report
4
national average. Supporting our excellence in this area is what appears to be the increased competiveness of our students in receiving national minority fellowships and awards. As such, for the 2010-2011 academic year, doctoral students in SST will receive one of the ten national Substance Abuse and Mental Health Services Administration (SAMSHA) doctoral fellowships awarded by the Council on Social Work Education; the only National Association of Social Work (NASW) Jane Baron Minority Fellowship Award; and six Minority Fellowships from SAMSHA awarded through the American Association of Marriage and Family Therapy (AAMFT). In addition, a recent graduate of the Department of Counseling and Family Sciences was awarded the Families, Illness and Collaborative Healthcare Fellowship from the University of Chicago. Graduation Rates Given SST’s increased enrollment, it logically follows that the number of students graduating from SST has also increased. Table 3 provides information regarding the number of graduates from SST, all programs combined, from 2005 through June 2010. Although the graduation rates for SST appear to have experienced a distinct incline, followed by a noticeable decline, graduation rates for 2006-2008 are skewed do to the completion of unusually large cohorts in the professional masters programs. With the exception of this anomaly in data, SST’s graduation rates have been gradually increasing since 2005. Educational Philosophy SST incorporates the University’s commitment to the teaching and healing ministry of Jesus Christ, and the transformation of self as a continuous life-long process integrating faith with learning—through a deep commitment to pursuit to achieving the highest levels of scholarship, professionalism, and spiritual well being. This pursuit seeks to understand and promote healthy minds, communities, social systems, families, and the environment. In addition, SST values the integration of what have been the historically
WASC EER Report Appendix D 154
RETURN TO CONTENTS
WASC Educational Effectiveness Report
5
separate traditions in higher education of “academic” and “professional” programs. This integration advocates for the blending of knowledge obtained through the “pure” with the “applied” sciences for the betterment of humankind. Objectives SST’s educational philosophy guides the faculty and administration to create an environment favorable to the pursuit of knowledge and meaning by:
1. Making available to students who wish to study in a Seventh-day Adventist Christian setting, the education necessary for careers in the sciences and the behavioral health professions; 2. Encouraging the development of critical thinking, scholarly judgment, the mastery of research knowledge and scientific methods; and 3. Demonstrating and engaging students in the process of responsible and scholarly communication for the purpose of applying their intellectual achievements in service to humankind.
Departments, Divisions and Programs Offered SST is home to five departments and two divisions. A brief description of each of these follows:
Department of Earth and Biological Sciences (EBS) EBS began in 1961 as an initiative started by the basic science faculty in of the School of Medicine to have a non-medical doctoral program in Biology at LLU. The basic science faculty put significant time and energy into the first years of EBS (then the Department of Biology). Additional markers in the development of the current department include:
• In 1967 La Sierra College (20 miles away, in Riverside, CA) became the undergraduate campus of LLU (LLU-Riverside) and was home to the undergraduate Biology program. The graduate program continued to be offered on the Loma Linda campus. This two campus system existed until 1990 when the campuses separated and once again became two distinct institutions (Loma Linda University—LLU and La Sierra University—LSU).
• Between 1978 and 1980 a MS and BS in geology were developed at LLU. From 1980 to 1990 these programs were in a separate Department of Geology at the Loma Linda University—Riverside campus. However in 1990 when the institution split back into two institutions, these programs merged with the LLU Department of Biology to become the Department of Natural Sciences at LLU.
• In 2004 the Department was renamed Earth and Biological Sciences (EBS) to clarify its topical content.
The Department currently offers the following degrees: • Biology – BS in Environmental Sciences, MS and PhD in Biology (The emphasis of our core biology faculty is in areas of ecology and conservation.) • Geology – BS and MS in Geology, PhD in Earth Sciences (The emphasis of these programs is sedimentary geology and paleontology.) • MS in Natural Sciences (This is a non-thesis masters program designed especially for secondary school teachers who
do not plan to pursue doctoral education. Students in this program can concentrate in either Geology or Biology.)
Department of Counseling and Family Sciences (CFS)
WASC EER Report Appendix D 155
RETURN TO CONTENTS
WASC Educational Effectiveness Report
6
Originally the named the Department of Marriage and Family Therapy, the Department began in 1972 in response to the need for a specialized knowledge to support the needs of pastors. The Department changed its name to Counseling and Family Sciences in 1990 to better represent the breadth and depth of its program offerings. Over the years the CFS has expanded to offer a number of related advanced degree and certificate programs. The Department currently offers the following degrees:
• Marital and Family Therapy—MS (US and Canada), PhD, DMFT • Family Studies—MA and PhD • MS in Counseling • MS in Child Life • Child Life Specialist Certificate • Clinical Mediation Certificate • Drug and Alcohol Counseling Certificate • Family Counseling • Family Life Education • School Counseling
Department of Social Work and Social Ecology (SWSE) Originally the named the Department of Social Work, the Department began in 1993 in response to University’s identification of the behavioral health disciplines missing from the offerings of a comprehensive academic health sciences center. The Department changed its name to Social Work and Social Ecology in 2004 to better represent the breadth and depth of its program offerings. The Department currently offers the following degrees:
• MSW—Master of Social Work • MS in Criminal Justice • MS in Gerontology • PhD in Social Policy and Social Research • Case Management Certificate—Post baccalaureate • Forensic Science Certificate—Under Review for reformulation • Program Evaluation Certificate—Under Review or reformulation • Approved/not initiated—DPA Doctorate in Public Administration • Approved/not initiated—PhD in Clinical Social Work
Department of Psychology (DP) The Department of Psychology began in 1994 in response to University’s identification of the behavioral health disciplines missing from the offerings of a comprehensive academic health sciences center. The Department currently offers the following degrees:
• PhD—Clinical Psychology • PsyD—Clinical Psychology
Department of Biophysics and Bioengineering (BPBE) The Department of Biophysics and Bioengineering was created in 2008 in response to the need for academic offerings to further the scientific and technological advances occurring in the areas of radiology and radiation medicine. The plan for this department is to begin with the development of a PhD in Biophysics and Bioengineering.
Division of General Studies
WASC EER Report Appendix D 156
RETURN TO CONTENTS
WASC Educational Effectiveness Report
7
The Division of General Studies began in 1990 following the separation of LLU from what is now LSU. The Division was created to provide a home for undergraduate courses in absence of a College of Arts and Sciences, as well as provide cognate graduate writing courses required by more than one program. Overtime Spanish and Chinese language courses were offered in response to requests by professional programs. However, as it has now been requested that these language offerings be taught with using specific clinical content, the generic offerings of language courses are no longer financially viable. As such, at present, the Division of General Studies provides limited offerings, including:
• Certificate—Spanish (to be closed December 2010 for lack of financial viability) • Writing Courses—Graduate writing courses for degree programs in SST and other schools • Limited pre-requisite courses in Human Development and Counseling
Division of Interdisciplinary Studies The Division of Interdisciplinary Studies was created in the fall of 2009 as a response to efforts by the SST faculty and administration to develop ways to enhance the collaboration between departments and disciplines within the School. As such, it is anticipated that the new Division of Interdisciplinary Studies will support capacity building in SST by providing:
• Opportunities for faculty and students from different disciplines to work together and learn from each other, thus further enhancing the growing sense of unity in the school;
• An academic context supportive of enriching and expanding existing interdisciplinary collaboration occurring in research and clinical education;
• A structure through which to develop and offer new degree and certificate programs that build on the existing courses and resources of multiple departments; and
• Opportunities to create new dual degree options for SST students that will strengthen their competitiveness in a challenging job market.
Assessment History Assessment in SST has existed as a part of its professionally accredited programs. Historically, professional accrediting agencies used the idea of assessment to engage programs in analyzing cohort trends and identifying potential challenges as it related to admissions, retention, graduation rates, racial/ethnic and gender diversity, student and alumni satisfaction, and the results of employer surveys, etc. However, in recent years, the emphasis on assessment within SST has shifted to assessing the educational effectiveness of all programs (academic and professional), while simultaneously giving attention to institutional standards. Within this shift, perhaps the greatest change has occurred as it relates to the assessment of programs that do not respond to specialized accrediting organizations. As such, 50% of SST’s programs fell into this second category and were subsequently targeted to complete intensive self-studies as part of the institution’s systematic program review process. With this added element of assessment, all of SST’s programs now engage in assessment of program and University SLOs (albeit with varying levels of development). The cumulative result of school-wide engagement in assessment represents a dramatic change as now all programs have begun to share a common understanding and appreciation for the importance and benefits of systematic program review and assessment of educational effectiveness. As this understanding deepens, faculty across the diverse programs found in SST are learning a common language of assessment; a development which has created intellectual ties across the School and is germinating a maturing culture of assessment and the shared value of continuous quality improvement. Table 7.1 (see EER Appendix) provides an overview of the assessment measures used by the SST EER featured programs. Following is a summary of the assessment measures used by these programs.
WASC EER Report Appendix D 157
RETURN TO CONTENTS
WASC Educational Effectiveness Report
8
MS and PhD in Biology • Grades achieved in courses taken • Documented reading of professional journals • Attendance at seminars and professional meetings • Completion of research-oriented course work • Development of experimental protocols • Appropriate collection and analyzes of data • Completion of a thesis and peer-reviewed manuscript/s for publication • Formal presentation of research to peers and at professional meetings • Membership to scientific societies
MS in Marital Family Therapy
• Capstone Course: MFAM 637: Case Presentation (4 measures were developed) • The Professional Paper Evaluation Survey • The Quality of the Written Case Evaluation Survey • The Quality of the Vignette Evaluation Survey • The Quality of the Presentation Evaluation Survey
• Supervisor’s Evaluation of Student • Comprehensive Examination • Case evaluations • Law and Ethics Course Grade • Graduation Form
DMFT—Doctorate in Marital Family Therapy
• Passing written qualifying examination in two domains: a) theory and practice of MFT, and b) MFT research. Qualifying examinations are blindly evaluated by at least three independent faculty members. Students must achieve a minimum score of 45 out of 60 possible points.
• Passing an oral qualifying clinical demonstration in which students present evidence of their clinical work. The presentation is evaluated by three clinical faculty members, one of whom is the Program Director.
• Completion of a capstone project that accomplishes the program outcomes in one of the following ways: a) Develops a systemic/ relational prevention, early intervention, or clinical treatment program that includes an evaluation methodology; b) Conducts a formal evaluation of an existing program, implemented in a public or private setting; c) Develops and evaluates a systemic/ relational therapeutic protocol or training program designed to address a clinical or service delivery issue; or d) Conducts a formal needs assessment for a program that results in a systemic/relational intervention that is ready for implementation.
• Accrual of 1000 hours of face-to-face clinical experience (500 must be with couples and/or families under the supervision of an AAMFT approved supervisor.)
PhD—Marital Family Therapy
• Passing written qualifying examination in two domains: a) theory and practice of MFT, and b) MFT research. Qualifying examinations are blindly evaluated by at least three independent faculty members. Students must achieve a minimum score of 45 out of 60 possible points.
WASC EER Report Appendix D 158
RETURN TO CONTENTS
WASC Educational Effectiveness Report
9
• Passing an oral qualifying clinical demonstration in which students present evidence of their clinical work through videotape illustrations and discussion of the conceptual and research frame guiding their work. The presentation is evaluated by three clinical faculty members, one of whom is the Program Director.
• Completion of a doctoral dissertation that accomplishes the program outcomes of demonstrating knowledge and skills in research such that students are able to make a contribution to the field of marital and family therapy.
PhD—Clinical Psychology
• The Comprehensive Examination ensures that students enrolled in the PhD program have reached a minimum level of both academic and clinical competency and maintains the integrity of the discipline of psychology in the department.
• Practicum supervisors complete clinical evaluations semiannually for each student enrolled in practicum. The clinical evaluation measures performance in 5 domains: General Clinical skills; Professional Behavior; Knowledge of Psychopathology; Clinical treatment; and Assessment and consultation
• Annual Student and Alumni Surveys are sent out every year at the end of the academic school year to solicit feedback from students regarding program effectiveness in multiple domains ranging from theoretical knowledge to practice skills to overall perceptions of our Clinical Ph.D. Program.
• Grading Rubrics provided and approved by the University’s Student Learning Outcome Committee were used to assess progress in the areas of critical thinking and communication.
MSW—Master of Social Work
• The Qualifying Review is designed to measure the extent to which students have integrated the content of the foundation curriculum and can demonstrate the competencies of generalist practice.
• Field Evaluation surveys capture performance in multiple domains required for competent social work practice and are completed by field supervisors who directly observe students’ work.
• The Student and Alumni Surveys measures program effectiveness in multiple domains ranging from theoretical knowledge to practice skills to overall perceptions about our MSW Program.
• Grading Rubrics provided and approved by the University’s Student Learning Outcome Committee were used to assess progress in the areas of critical thinking and communication.
• Core Assignments were used o assess student’s knowledge of students’ generalist practice ability and advanced practice concentration skills.
Accreditation History There are four professional accrediting organizations that SST interacts with in relationship to its professional programs. All of these programs have enjoyed continuous accreditation of their respective professional programs. Table 3 provides a list of these professional programs along with the associated accrediting agency that each reports to. Commendations have been included in Table 3. Table 8.1 (see EER Appendix) provides a synopsis of the results of the most recent accreditation results for programs in SST, including commendations.
WASC EER Report Appendix D 159
RETURN TO CONTENTS
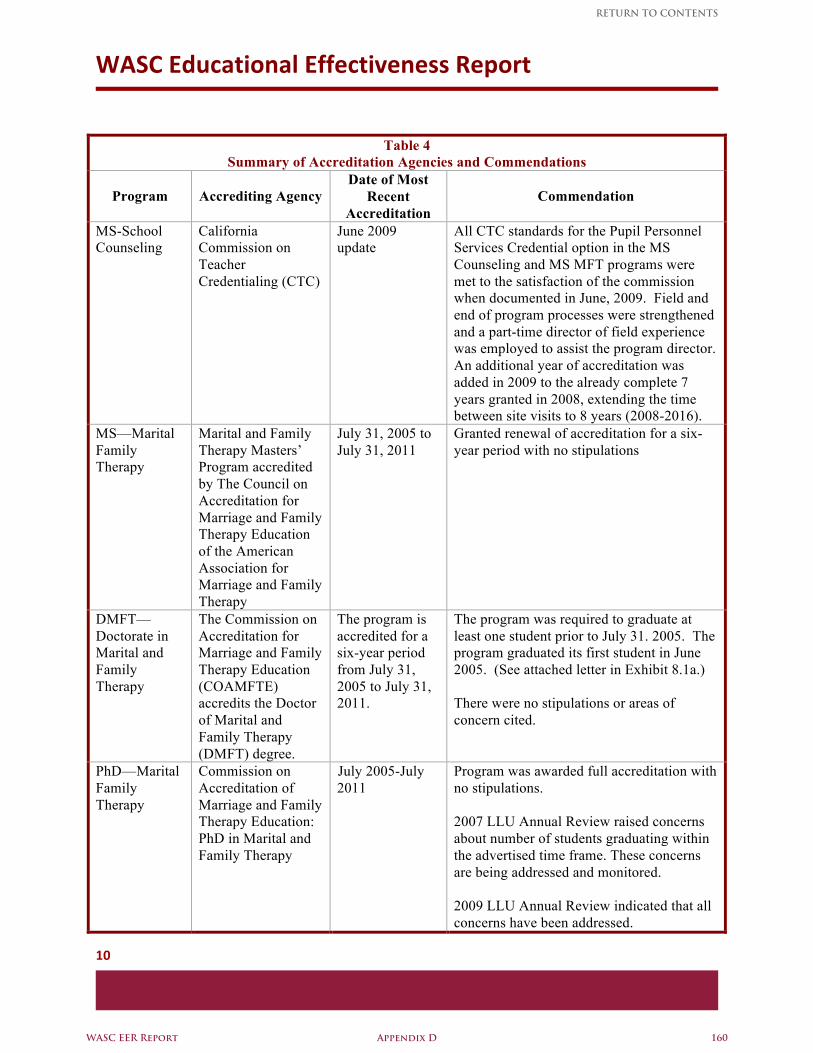
WASC Educational Effectiveness Report
10
Table 4 Summary of Accreditation Agencies and Commendations
Program Accrediting Agency Date of Most
Recent Accreditation
Commendation
MS-School Counseling
California Commission on Teacher Credentialing (CTC)
June 2009 update
All CTC standards for the Pupil Personnel Services Credential option in the MS Counseling and MS MFT programs were met to the satisfaction of the commission when documented in June, 2009. Field and end of program processes were strengthened and a part-time director of field experience was employed to assist the program director. An additional year of accreditation was added in 2009 to the already complete 7 years granted in 2008, extending the time between site visits to 8 years (2008-2016).
MS—Marital Family Therapy
Marital and Family Therapy Masters’ Program accredited by The Council on Accreditation for Marriage and Family Therapy Education of the American Association for Marriage and Family Therapy
July 31, 2005 to July 31, 2011
Granted renewal of accreditation for a six-year period with no stipulations
DMFT—Doctorate in Marital and Family Therapy
The Commission on Accreditation for Marriage and Family Therapy Education (COAMFTE) accredits the Doctor of Marital and Family Therapy (DMFT) degree.
The program is accredited for a six-year period from July 31, 2005 to July 31, 2011.
The program was required to graduate at least one student prior to July 31. 2005. The program graduated its first student in June 2005. (See attached letter in Exhibit 8.1a.) There were no stipulations or areas of concern cited.
PhD—Marital Family Therapy
Commission on Accreditation of Marriage and Family Therapy Education: PhD in Marital and Family Therapy
July 2005-July 2011
Program was awarded full accreditation with no stipulations. 2007 LLU Annual Review raised concerns about number of students graduating within the advertised time frame. These concerns are being addressed and monitored. 2009 LLU Annual Review indicated that all concerns have been addressed.
WASC EER Report Appendix D 160
RETURN TO CONTENTS
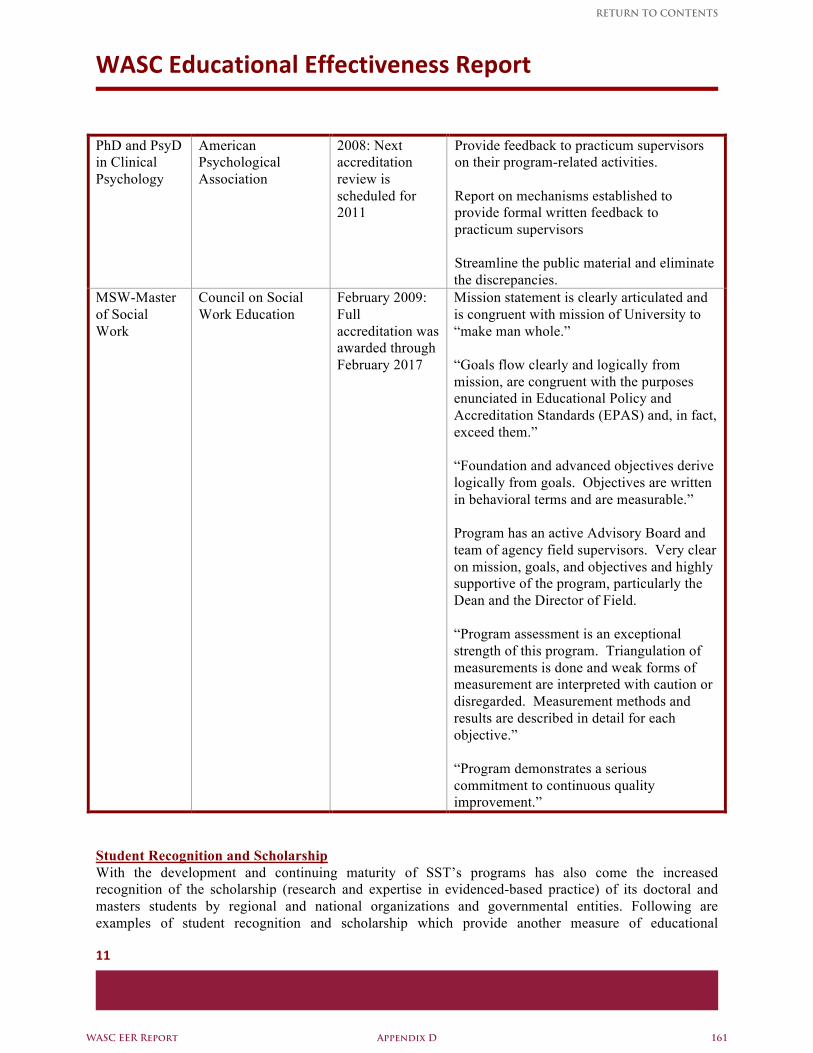
WASC Educational Effectiveness Report
11
PhD and PsyD in Clinical Psychology
American Psychological Association
2008: Next accreditation review is scheduled for 2011
Provide feedback to practicum supervisors on their program-related activities. Report on mechanisms established to provide formal written feedback to practicum supervisors Streamline the public material and eliminate the discrepancies.
MSW-Master of Social Work
Council on Social Work Education
February 2009: Full accreditation was awarded through February 2017
Mission statement is clearly articulated and is congruent with mission of University to “make man whole.” “Goals flow clearly and logically from mission, are congruent with the purposes enunciated in Educational Policy and Accreditation Standards (EPAS) and, in fact, exceed them.” “Foundation and advanced objectives derive logically from goals. Objectives are written in behavioral terms and are measurable.” Program has an active Advisory Board and team of agency field supervisors. Very clear on mission, goals, and objectives and highly supportive of the program, particularly the Dean and the Director of Field. “Program assessment is an exceptional strength of this program. Triangulation of measurements is done and weak forms of measurement are interpreted with caution or disregarded. Measurement methods and results are described in detail for each objective.” “Program demonstrates a serious commitment to continuous quality improvement.”
Student Recognition and Scholarship With the development and continuing maturity of SST’s programs has also come the increased recognition of the scholarship (research and expertise in evidenced-based practice) of its doctoral and masters students by regional and national organizations and governmental entities. Following are examples of student recognition and scholarship which provide another measure of educational
WASC EER Report Appendix D 161
RETURN TO CONTENTS
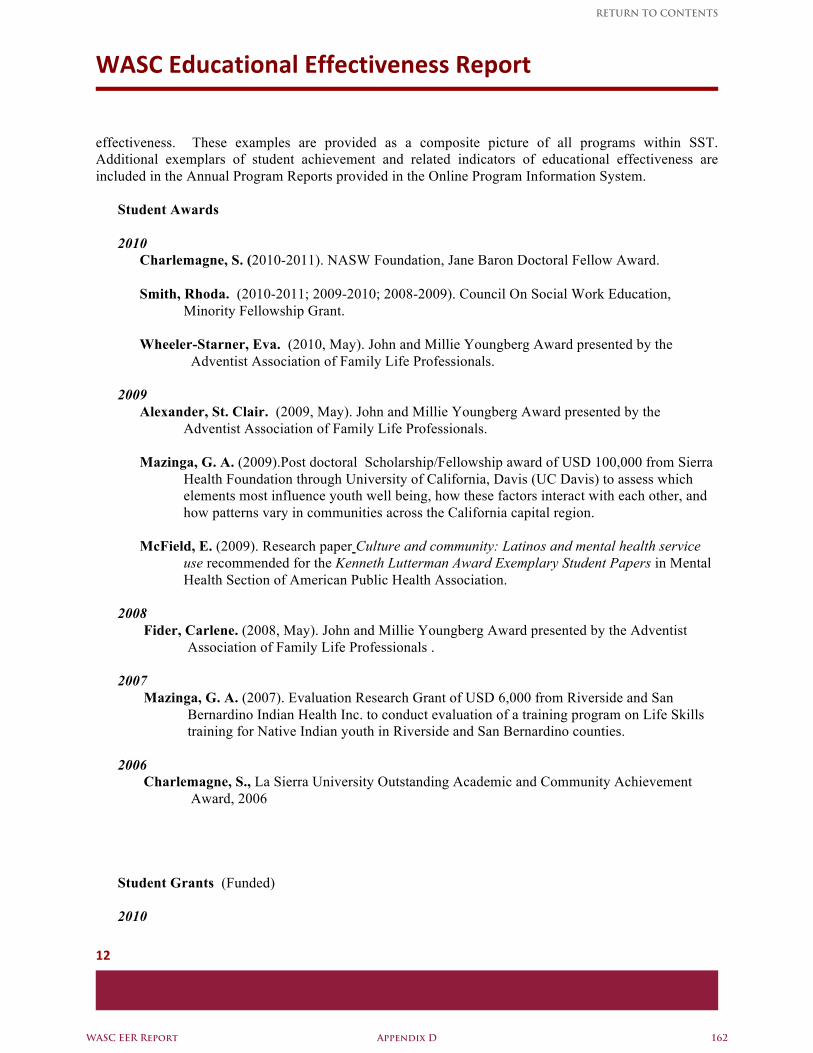
WASC Educational Effectiveness Report
12
effectiveness. These examples are provided as a composite picture of all programs within SST. Additional exemplars of student achievement and related indicators of educational effectiveness are included in the Annual Program Reports provided in the Online Program Information System.
Student Awards 2010
Charlemagne, S. (2010-2011). NASW Foundation, Jane Baron Doctoral Fellow Award. Smith, Rhoda. (2010-2011; 2009-2010; 2008-2009). Council On Social Work Education,
Minority Fellowship Grant. Wheeler-Starner, Eva. (2010, May). John and Millie Youngberg Award presented by the
Adventist Association of Family Life Professionals.
2009 Alexander, St. Clair. (2009, May). John and Millie Youngberg Award presented by the
Adventist Association of Family Life Professionals.
Mazinga, G. A. (2009).Post doctoral Scholarship/Fellowship award of USD 100,000 from Sierra Health Foundation through University of California, Davis (UC Davis) to assess which elements most influence youth well being, how these factors interact with each other, and how patterns vary in communities across the California capital region.
McField, E. (2009). Research paper Culture and community: Latinos and mental health service
use recommended for the Kenneth Lutterman Award Exemplary Student Papers in Mental Health Section of American Public Health Association.
2008
Fider, Carlene. (2008, May). John and Millie Youngberg Award presented by the Adventist Association of Family Life Professionals .
2007
Mazinga, G. A. (2007). Evaluation Research Grant of USD 6,000 from Riverside and San Bernardino Indian Health Inc. to conduct evaluation of a training program on Life Skills training for Native Indian youth in Riverside and San Bernardino counties.
2006
Charlemagne, S., La Sierra University Outstanding Academic and Community Achievement Award, 2006
Student Grants (Funded) 2010
WASC EER Report Appendix D 162
RETURN TO CONTENTS
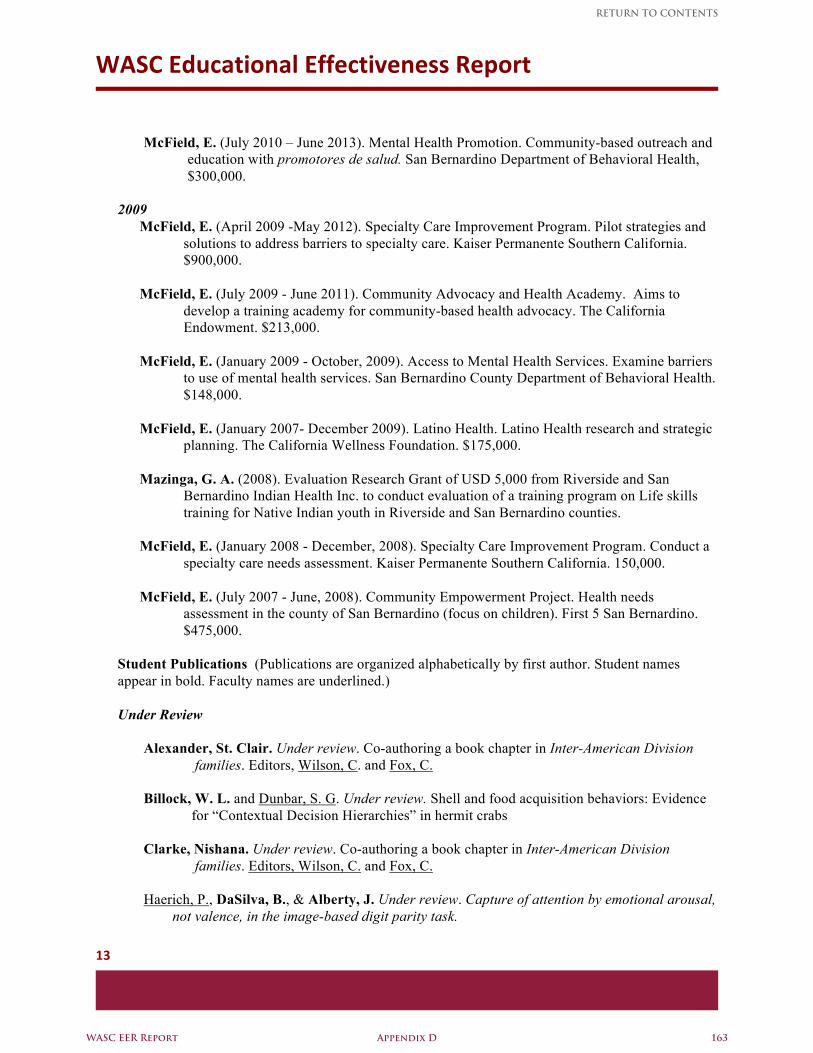
WASC Educational Effectiveness Report
13
McField, E. (July 2010 – June 2013). Mental Health Promotion. Community-based outreach and education with promotores de salud. San Bernardino Department of Behavioral Health, $300,000.
2009
McField, E. (April 2009 -May 2012). Specialty Care Improvement Program. Pilot strategies and solutions to address barriers to specialty care. Kaiser Permanente Southern California. $900,000.
McField, E. (July 2009 - June 2011). Community Advocacy and Health Academy. Aims to
develop a training academy for community-based health advocacy. The California Endowment. $213,000.
McField, E. (January 2009 - October, 2009). Access to Mental Health Services. Examine barriers
to use of mental health services. San Bernardino County Department of Behavioral Health. $148,000.
McField, E. (January 2007- December 2009). Latino Health. Latino Health research and strategic
planning. The California Wellness Foundation. $175,000. Mazinga, G. A. (2008). Evaluation Research Grant of USD 5,000 from Riverside and San
Bernardino Indian Health Inc. to conduct evaluation of a training program on Life skills training for Native Indian youth in Riverside and San Bernardino counties.
McField, E. (January 2008 - December, 2008). Specialty Care Improvement Program. Conduct a
specialty care needs assessment. Kaiser Permanente Southern California. 150,000. McField, E. (July 2007 - June, 2008). Community Empowerment Project. Health needs
assessment in the county of San Bernardino (focus on children). First 5 San Bernardino. $475,000.
Student Publications (Publications are organized alphabetically by first author. Student names appear in bold. Faculty names are underlined.) Under Review
Alexander, St. Clair. Under review. Co-authoring a book chapter in Inter-American Division
families. Editors, Wilson, C. and Fox, C. Billock, W. L. and Dunbar, S. G. Under review. Shell and food acquisition behaviors: Evidence
for “Contextual Decision Hierarchies” in hermit crabs Clarke, Nishana. Under review. Co-authoring a book chapter in Inter-American Division
families. Editors, Wilson, C. and Fox, C.
Haerich, P., DaSilva, B., & Alberty, J. Under review. Capture of attention by emotional arousal, not valence, in the image-based digit parity task.
WASC EER Report Appendix D 163
RETURN TO CONTENTS
WASC Educational Effectiveness Report
14
McKay, B. D., M. B. J. Reynolds, W. K. Hayes, and D. S. Lee. Under review. Evidence supporting the species status of the Bahama Yellow-throated Warbler (Dendroica flavescens).
Nisani, Z., and W. K. Hayes. Under review. Venom squirting behavior of Parabuthus
transvaalicus scorpions (Arachnida: Buthidae) serves a defensive role. Nyborg, T. G. Under review. Investigations of the geology and paleontology of the South
Slough National Estuary Research Reserve near Coos Bay, Oregon. Oregon Department of Geology and Mineral Industries Bulletin.
Nyborg, T., F. J. Vega, and H. Filkorn. Under review. Additions and new species of Archaeopus
(Decapoda: Retroplumindae) from the eastern Pacific Realm. Journal of Crustacean Biology.
Nyborg, T., F. J. Vega, and H. Filkorn. Under review. First record of Costacompluma
(Crustacea: Brachyura: Retroplumidae) from the Pacific Realm, Paleocene of California, USA. Universidad Nacional Autónoma de México, Instituto de Geología, Revista.
Shives, J. A., and Dunbar, S. G. Under review. Behavioral responses to burial in the hermit crab,
Pagurus samuelis: implications for the fossil record.
Zatoń, M., T. Nyborg, and M. Salamon. Under review. Fossil vertebrate regurgitates from the Middle Jurassic clays of south-central Poland. Ichnos.
In Press
Akre, T. S., R. E. Lovich, M. J. Ryan, and R.E. Ford. In press. Challenges to herpetofaunal conservation in southern Honduras: a case study from three protected areas in the Golfo de Fonseca region. In L. D. Wilson and J. Townsend (eds.), Conservation of Mesoamerican Amphibians and Reptiles.
Billock, W. L., and S. G. Dunbar. In press. Influence of motivation on behavior in the hermit
crab, Pagurus samuelis. Journal of the Marine Biological Association of the United Kingdom.
Buchheim, H. P., R. Aase, and C. Shultz. In press. Geologic map of the Nugget 7.5’
Quadrangle, Lincoln County, Wyoming. Wyoming State Geological Survey, Laramie, Wyoming. 1:24,000.
Buchheim, H. P., R. Aase, and C. Shultz. In press. Geologic map of the Fossil 7.5’ Quadrangle,
Lincoln County, Wyoming. Wyoming State Geological Survery, Laramie, Wyoming. 1:24,000.
Gill, M., Haerich, P., Westcott, K., Godenick, K., Tucker, J. In press. Cognitive performance
following modafinil versus placebo in sleep-deprived emergency physicians: a double-blind, randomized, crossover study. Academic Emergency Medicine.
Hayes, W. K., E. D. Bracey, M. R. Price, V. Robinette, E. Gren, and C. Stahala. In press.
WASC EER Report Appendix D 164
RETURN TO CONTENTS
WASC Educational Effectiveness Report
15
Population status of the Chuck-will’s-widow (caprimulgus carolinensis) in the Bahamas. Wilson Journal of Ornithology.
Kaiser, N.C., Hartoonian, N., Owen, J.E. In press. Toward a cancer-specific model of
psychological distress: Population data from the 2003-2005 National Health Interview Surveys. Journal of Cancer Survivorship.
Koneru, V., Weisman de Mamani, A., Flynn, P., Betancourt, H. In press. Acculturation and
mental health: Current findings and recommendations for future research. Applied and Preventive Psychology.
Lovich, R. E., and A. M. Bauer. In press. Saxicolous Reptiles. In M. Foster and C. Guyer (eds.),
Measuring and Monitoring Biodiversity: Standard Methods for Reptiles. Smithsonian Press, Washington, D.C.
Lovich, R. E., E. E. Ervin, and R. N. Fisher. In press. Terrestrial fauna community composition
of Arundo donax (Poaceae) root masses. Bulletin of the Southern California Academy of Science.
Lovich, R. E., L. L. Grismer, and G. D. Danemann. In press. Geographic distribution and
conservation of the herpetofauna of Baja California and its associated islands. In L. D. Wilson and J. Townsend (eds.), Conservation of Mesoamerican Amphibians and Reptiles. Eagle Mountain Publ., Eagle Mountain, Utah.
Lovich, R. E., W. Hayes, H. Mushinsky, and G. Rodda. In press. Transect sampling. In M. Foster and C. Guyer (eds.), Measuring and Monitoring Biodiversity: Standard Methods for Reptiles. Smithsonian Press, Washington, D.C.
Lovich, R. E., and C. K. Lovich. In press. Microhabitat description. In M. Foster and C. Guyer
(eds.), Measuring and Monitoring Biodiversity: Standard Methods for Reptiles. Smithsonian Press, Washington, D.C.
Nyborg, T. G., and V.L. Santucci. In press. Paleontology of Death Valley National Park. In
Rowland (ed.), Natural History of Death Valley National Park. Natural History Association Press, Death Valley California.
Owen, J.E., Boxley, L., Goldstein, M.S., Lee, J.H., Breen, N., Rowland, J.H. In press. Use of
health-related online support groups: Population data from the California Health Interview Survey Complementary and Alternative Medicine Study. Journal of Computer-Mediated Communication.
WASC EER Report Appendix D 165
RETURN TO CONTENTS
WASC Educational Effectiveness Report
16
Reynolds, M. B. J., W. K. Hayes, and J. W. Wiley. In press. Conservation taxonomy of the
Cuban Parrot (Amazona leucocephala): flight call variation. Journal of Caribbean Ornithology.
Sanders, S.L., Bantum, E.O., Owen, J.E., Thornton, A., Stanton A.L.In press. Supportive care
needs in patients with lung cancer. Psycho-Oncology.
Sjoeben, A. D., and S. G. Dunbar. In press. Temporal fluctuations of fatty acids in Pachygrapsus crassipes from southern California. Journal of Crustacean Biology.
2010
Cattich, J. & Knudson-Martin, C. (2009). Spirituality and relationship: A holistic analysis of how couples cope with diabetes. Journal of Marital and Family Therapy. 35(1), 111-124.
Dhillon, K., & Boyd, K. C. (2010). The Effect of War Stressors and Life Events on Gulf War Veterans with Chronic Fatigue Syndrome Symptoms. Military Psychology, 22, 87-97.
Hernandez, B. C., Schwenche, N., & Wilson, C. (2010). A critical review of mixed orientation
marriages. Journal of Marital and Family Therapy. 35(1), 111-124.
James, S., Charlemagne, S. J., Gilman, A.B., Alemi, Q., Smith, R., Tharayil, P., Freeman, K. (2010). Post-Discharge Services and Psychiatric Rehospitalization among Children and Youth. Administration & Policy in Mental Health & Mental Health Services Research, Online first.
James, S., Charlemagne, S., Gilman, S. (2010). Predictors and Outcomes of Post-Discharge
Service Use Among Youth Psychiatrically Hospitalized for the First Time. Presented at the 13th Annual Society for Social Work Research, San Francisco, CA. January13-17.
Knudson-Martin, C. & Silverstein, R. (2009). Suffering in silence: A qualitative meta-analysis of
post-partum depression. Journal of Marital and Family Therapy. 35(2), 145-158.
Mazinga, G. A. (2010). Geospatial Approach for New perspectives on Satisfaction with Health Services in Malawi. Ph.D. dissertation, Loma Linda University, United States -- California. Retrieved July 28, 2010, from Dissertations & Theses: A&I. (Publication No. AAT 3338562).
2009
Armstrong, A., T. Nyborg, G. A. Bishop, and À. Ossó-Morales, and F. J. Vega. 2009. Decapod crustaceans from the Paleocene of Central Texas, USA. Revista Mexicana de Ciencias Geológicas 26:745-763.
Bacchus, M. C., S. G. Dunbar, and Self-Sullivan, C. 2009. Characterization of resting holes and
their use by the Antillean Manatee (Trichechus manatus manatus) in the Drowned Cayes, Belize. Aquatic Mammals 35:62-71.
WASC EER Report Appendix D 166
RETURN TO CONTENTS
WASC Educational Effectiveness Report
17
Bantum, E., Owen, J.E. (2009). Evaluating the Validity of Computerized Content Analysis Programs for Identification of Emotional Expression in Cancer Narratives. Psychological Assessment, 21, 79-88.
Billock, W. L., and S. G. Dunbar. 2009. Influence of motivation on behavior in the hermit crab, Pagurus samuelis. Journal of the Marine Biological Association of the United Kingdom 89:775-779.
Chen, W., Hartman, R.E., Ayer, R., Marcantonio, S., Kamper, J., Tang, J., Zhang, J. (2009).
Matrix metalloproteinases inhibition provides neuroprotection against hypoxia-ischemia in the developing brain. Journal of Neurochemistry, 111(3), 726-36.
Dugan, E. A. 2009. Species account: Sceloporus orcutti. In Lizards of the American Southwest:
a Photographic Field Guide. Rio Nuevo Publishers, Tucson, Arizona. Dugan, E. A. 2009. Species account: Coleonyx switaki. In Lizards of the American Southwest: a
Photographic Field Guide. Rio Nuevo Publishers, Tucson, Arizona. Dugan, E. A. 2009. Species account: Petrosaurus mearnsi. In Lizards of the American
Southwest: a Photographic Field Guide. Rio Nuevo Publishers, Tucson, Arizona. Gonzalez-Socoloske, D., L. D. Olivera-Gomez, and R. E. Ford. 2009. Detection of free-ranging
West Indian manatees Trichechus manatus using side-scan sonar. Endangered Species Research 8:249-257.
Harless, M. L., A. D. Walde, D. K. Delaney, L. L. Pater, and W. K. Hayes. 2009. Home range,
spatial overlap, and burrow use of the Desert Tortoise in the west Mojave Desert. Copeia 2009:378-389.
Harlow, H. J., W. K. Hayes, S. Soret, R. L. Carter, E. R. Schwab, and J. Sabate. 2009. Diet and
the environment: does it matter? American Journal of Nutrition 89:1699S-1703S. Herbert, S. S., and W. K. Hayes. 2009. Denim clothing reduces venom expenditure by
rattlesnakes striking defensively at model human limbs. Annals of Emergency Medicine 54:830-836.
James, S., Charlemagne, S., Smith, R. (2009). Predicting and Preventing Psychiatric Re-
hospitalization of Children and Adolescents. Presented at the 13th Annual Conference of the Society for Social Work and Research, New Orleans LA, January 15-17.
Jones, L., and R. E. Lovich (eds.). 2009. Lizards of the American Southwest: a Photographic
Field Guide. Rio Nuevo Publishers, Tucson, Arizona. Kaiser, N., Owen., J.E., Winzelberg, A.J. (2009). The use of technology to advance adolescent
health promotion. In Adolescent Health: Understanding and Preventing Risk Behaviors. R.J. DiClemente, J.S. Santelli, R.A. Crosby (eds.), pps. 447-472. San Francisco: Jossey-Bass.
WASC EER Report Appendix D 167
RETURN TO CONTENTS
WASC Educational Effectiveness Report
18
Knudson-Martin, C., Rankin Mahoney , A., Eds. (2009). Couples, Gender, & Power: Creating Change in Intimate Relationships. New York: Springer. Students’ participation in selected chapters: Chapter 6: Carrying Equal Weight: Attunement and Responsibility Among Same Sex Couples. Naveen Jonathan. Chapter 8: Mothering: Innate Talent or Conscious Collaboration. Randi Cowdery, Carmen Knudson-Martin, and Anne Rankin Mahoney. Chapter 9: Fathering: Disengagement or Responsiveness. Dana Shawn Matta Chapter 10: Suffering in Silence: Idealized Motherhood and Postpartum Depression. Carmen Knudson-Martin and Rachelle Silverstein. Chapter 11: We-Consciousness: Creating Equality in Collectivist Culture. Karen Mui-Teng Quek. Chapter 12: Pulling Together: African American Couples Manage Social Inequalities. Randi Cowdery, Norma Scarborough, Monique Lewis, and Gita Seshadri. Chapter 13: Pushing the Gender Line: How Immigrant Couples Reconstruct Power. Jose A. Maciel and Zanetta VanPutten. Chapter 14: Keeping the Peace: Couple Relationships in Iran. Seddigheh Moghadam and Carmen Knudson-Martin. Chapter 15: Gender Discourse in Relationship Stories of Young Americans. Rik Rusovick and Carmen Knudson-Martin. Chapter 16: Relational Orientations: A Contextual Framework for Assessment and Practice. Rachelle Silverstein, Amy Tuttle, Linda Buxbaum Bass, Carmen Knudson-Martin and Douglas Huenergardt.
Nyborg, T. 2009. Copper Canyon track locality (Pliocene) conservation strategies, Death Valley
National Park, USA. Pp. 113-119 in: J. H. Lipps and B. R. C. Granier (eds.), PaleoParks—The Protection and Conservation of Fossil Sites Worldwide. Carnets de Géologie/Notebooks on Geology, Book 2009/03, Brest, France.
Owen, J.E., Bantum, E.O., Golant, M. (2009). Benefits and challenges experienced by
professional facilitators of online support groups for cancer survivors. Psycho-Oncology, 18, 144-55.
Revell, T. K., and W. K. Hayes. 2009. Desert Iguanas (Dipsosaurus dorsalis) sleep less when in
close proximity to a rattlesnake predator (Crotalus cerastes). Journal of Herpetology 43:29-37.
Reynolds, M. B. J., and W. K. Hayes. 2009. Conservation taxonomy of the Cuban Parrot
(Amazona leucocephala): variation in morphology and plumage. Journal of Caribbean Ornithology 22:1-18.
Vega, F. J., T. Nyborg, M. A. Coutiño, J. Solé, and O. Hernández-Monzón. 2009. Neogene
Crustacea from southeastern Mexico. Bulletin of the Mizunami Fossil Museum 35:51-69.
2008 Babb, R. D., and E. A. Dugan. 2008. Agkistrodon bilineatus (Mexican Cantil). Geographic
distribution. Herpetological Review 39:110.
WASC EER Report Appendix D 168
RETURN TO CONTENTS
WASC Educational Effectiveness Report
19
Bantum, E., Owen, J.E. (2008). Use of linguistics to promote coping with cancer. In Coping with Cancer. Jacobs, L.K. (ed.), p.7-12. Nova Publishers.
Dugan, E. A., Y. Cage, and K. Sharrocks. 2008. Tropidodipsas repleta. Geographic distribution.
Herpetological Review 39:244. Dugan, E. A., and A. Figueroa. 2008. Masticophis mentovarius. Attempted predation and diet.
Herpetological Review 39:471. Dugan, E. A., W. K. Hayes, and A. Figueroa. 2008. Home range size, movements, and mating
phenology of sympatric Red Diamond (Crotalus ruber) and Southern Pacific (Crotalus oreganus helleri) Rattlesnakes in southern California. Pp. 353-364 in W. K. Hayes, K. R.
Figueroa, A., E. A. Dugan, and W. K. Hayes. 2008. Behavioral ecology of neonate Southern
Pacific Rattlesnakes (Crotalus oreganus helleri) tracked with externally-attached transmitters. Pp. 365-376 in W. K. Hayes, K. R. Beaman, M. D. Cardwell, and S. P. Bush (eds.), The Biology of Rattlesnakes. Loma Linda University Press, Loma Linda, California.
Fugère, M. A., Escoto, C., Cousins, A. J., Riggs, M. L., & Haerich, P. (2008). Sexual attitudes and double standards: A literature review focusing on participant gender and ethnic background. Sexuality & Culture: An Interdisciplinary Quarterly, 12(3), 169-182.
Goldberg, S. R., J. Reyes-Velasco, C. R. Bursey, and E. A. Dugan. 2008. Porthidium hespere
(Western Hognose Viper). Endoparasites. Herpetological Review 39:99. Hayes, W. K., S. S. Herbert, J. R. Harrison, and K. L. Wiley. 2008. Spitting versus biting:
differential venom gland contraction regulates venom expenditure in the Black-necked Spitting Cobra, Naja nigricollis nigricollis. Journal of Herpetology 42:453-460.
Herbert, S. S., and W. K. Hayes. 2008. Venom expenditure by rattlesnakes and killing
effectiveness in rodent prey: do rattlesnakes expend optimal amounts of venom? Pp. 221- 228 in W. K. Hayes, K. R. Beaman, M. D. Cardwell, and S. P. Bush (eds.), The Biology of Rattlesnakes. Loma Linda University Press, Loma Linda, California.
James, S., Charlemagne, S., Gilman, A., Smith, R.L. (2008). Specialized Interventions for
Children and Transition Age Youth with Severe Emotional Disabilities-A Mental Health Curriculum Module. Disseminated by Loma Linda University on behalf of the California Social Work Education Center (CalSWEC).
Lovich, R. L. 2008. Book review: Field Guide to Amphibians and Reptiles of the San Diego
Region. Copeia 2008:728-731. Lovich, R. E., and C. R. Mahrdt. 2008. Terrestrial herpetofauna of the Bahía de Los Angeles.
Pp. 495-522 in G. Danemann and E. Ezcurra (eds.), Bahía de Los Ángeles: Recursos Naturales y Comunidad. Línea Base 2007. D. R. Pronatura Noroeste, A.C., Ensenada, Baja California, Mexico.
WASC EER Report Appendix D 169
RETURN TO CONTENTS
WASC Educational Effectiveness Report
20
Lovich, R. L., M. J. Ryan, A. P. Pessier, and B. Claypool. 2008. Infection with the fungus Batrachochytrium dendrobatidis in a non-native Lithobates berlandieri below sea level in the Coachella Valley, California, USA. Herpetological Review 39:315-317.
Nyborg, T., and J. Fam. 2008. A new genus and species of crab, Bicornisranina bocki
(Decapoda: Raninidae), from the Haslam Formation, Vancouver Island, British Columbia, Canada. Journal of Crustacean Biology 28:686-694.
Nyborg, T., and F. J. Vega. 2008. Three new species of Lophamastix species (Crustacea:
Decapoda: Blephararipodidae) from the Cenozoic of Washington. Journal of Crustacean Biology 28:361-369.
Utt, A. C., N. C. Harvey, W. K. Hayes, and R. L. Carter. 2008. The effects of rearing methods
on social behaviors of mentored captive-reared juvenile California Condors. Zoo Biology 27:1-8.
Vega, F. J., T. Nyborg, M. A. Coutiño, and O. Hernández-Monzón. 2008. Review and additions
to the Eocene decapod Crustacea from Chiapas, Mexico. Bulletin of the Mizunami Fossil Museum 34:51–71.
2007
Bantum, E., Donovan, K.A., & Owen, J.E. (2007). A systematic review of outcomes associated with psychosocial interventions for women with breast cancer. Journal of Clinical Outcomes Management, 14, 1-12.
Dugan, E. A., and S. A. Meyer. 2007. Agkistrodon bilineatus (Mexican Cantil). Reproduction. Herpetological Review 38:85-86.
Dyjack, D. T., P. Case, H. J. Marlow, S. Soret, and S. Montgomery. 2007. California’s county
and city environmental health services. Environmental Health 69:35-43. Elder, W. P., T. Nyborg, J. P. Kenworthy, and V. L. Santucci. 2007. Paleontological Resource
Inventory and Monitoring—San Francisco Bay Area Network. Natural Resource Technical Report NPS/NRPC/NRTR—2008/078. National Park Service, Fort Collins, Colorado.
Ervin, E., R. Lovich, K. Gray Lovich, N. Scott, and J. Lopez. 2007. Eleutherodactylus
stejnegerianus (Stejneger’s Robber Frog): predation. Herpetological Review 38:185 Fong, J. J., J. F. Parham, H. Shi, B. L. Stuart, and R. L. Carter. 2007. A genetic survey of
heavily exploited, endangered turtles: caveats on the conservation value of trade animals. Animal Conservation 10:452-460.
Lovich, R. E., T. Akre, J. Blackburn, T. Robison, and C. Mahrdt. 2007. Geographic distribution. Actinemys marmorata. Herpetological Review 38:216-217.
Leggitt, V. L., R. A. Cushman, Jr., H. P. Buchheim, and M. A. Loewen. 2007. Caddisfly
(Insecta: Trichoptera) cases used as unique autochthonous paleoenvironmental indicators: Eocene Lake Gosiute. The Mountain Geologist 44:1-10.
WASC EER Report Appendix D 170
RETURN TO CONTENTS
WASC Educational Effectiveness Report
21
Leggitt, V. L., R. E. Biaggi, and H. P. Buchheim. 2007. Palaeoenvironments associated with
caddisfly-dominated microbial-carbonate mounds from the Tipton Shale Member of the Green River Formation: Eocene Lake Gosiute. Sedimentology 54:661-699.
Nisani, Z., S. G. Dunbar, and W. K. Hayes. 2007. Cost of venom regeneration in Parabuthus
transvaalicus (Arachnida: Buthidae). Comparative Biochemistry and Physiology A 147:509-513.
Revell, T. K., and S. G. Dunbar. 2007. The energetic savings of sleep versus temperature in the
Desert Iguana, Dipsosaurus dorsalis, at three ecologically relevant temperatures. Comparative Biochemistry and Physiology A 148:393-398.
Vega, F. J., T. Nyborg, R. H. B. Fraaye, and B. Espinosa. 2007. Paleocene decapod crustacea
from the Rancho Nuevo Formation (parras basin-difunta group), northeastern Mexico. Journal of Paleontology 81:1432-1441.
Vega, F. J., T. G. Nyborg, A. Rojas-Briceño, P. Patarroyo, J. Luque, H. Porras-Múzquiz, and W.
Stinnesbeck. 2007. Upper Cretaceous Crustacea from Mexico and Colombia: similar faunas and environments during Turonian times. Revista Mexicana de Ciencias Geológicas 24:403-422.
2006
Beaman, K. R., and E. A. Dugan. 2006. Crotalus ruber (Red Diamond Rattlesnake). SSAR Catalogue of American Amphibians and Reptiles 840:1-17.
Betancourt, H. & Flynn, P., Hodges, M. (2006). Disparities in breast cancer screening:
Investigating the role of culture. Annals of Behavioral Medicine, Proceedings from the Society of Behavioral Medicine’s Twenty-Seventh Annual Meeting, 31, 75.
Dugan, E. A., B. Love, and M. G. Figueroa. 2006. Crotalus basiliscus (Mexican West Coast
Rattlesnake). Predation. Herpetological Review 37:231. Goldberg, S. R., C. R. Bursey, K. R. Beaman, and E. A. Dugan. 2006. Crotalus basiliscus
(Mexican West Coast Rattlesnake). Endoparasites. Herpetological Review 37:94. Lovich, R. E., T. S. Akre, M. J. Ryan, N. J. Scott, and R. E. Ford. 2006. Herpetofaunal survey of
Cerro Guanacaure, Montaña La Botija and Isla Del Tigre protected areas in southern Honduras. Report prepared for the United States Agency for International Development. 33 pp.
Mazinga, G. A. (2006). Patterns of Satisfaction with Health Services in Malawi: An Analysis
using Geographic Information Systems Technology. Global Spatial Data Infrastructure (GSDI) International Conference Proceedings Journal, Santiago, Chile, November 6 - 11.
Owen, J.E., Boxley, L., Klapow, J.C. (2006). Measurement of quality of life outcomes. In
Palliative Care and Supportive Oncology, Eds: A. Berger, J. L. Shuster, Jr., J. H. Von Roenn. New York: Lippincott Williams & Wilkins.
WASC EER Report Appendix D 171
RETURN TO CONTENTS
WASC Educational Effectiveness Report
22
Yanbin, S., O. F. Gallego, H. P. Buchheim, and R. Biaggi. 2006. Eocene conchostracans from the Laney Member of the Green River Formation, Wyoming, USA. Journal of Paleontology 80:447-454.
2005
Cohen-Maitre, S. A. & Haerich, P. (2005). Visual attention to movement and color in children with cortical visual impairment. Journal of Visual Impairment and Blindness, 99(7), 389-402.
Galbraith, M., Arechiga, A., Ramirez, J., and Pedro, L. (2005). Prostate cancer survivors’ and
partners’ self-reports of health-related quality of life, treatment of symptoms, and marital satisfaction 2.5 – 3.5 years after treatment. Oncology Nursing Forum, March 5; 32(2): E30-41.
Jeffery, J, B. Navia, G. Atkins, and J. Stout. 2005. Selective processing of calling songs by
auditory interneurons in the female cricket, Gryllus pennsylvanicus: possible roles in behavior. Journal of Experimental Zoology A Comparative Experimental Biology 303:377- 392.
Trimm, N. A., Jr., and W. K. Hayes. 2005. Distribution of nesting Audubon’s Shearwaters
(Puffinus lherminieri) on San Salvador Island, Bahamas. Pp. 137-145 in: T. McGrath and S. Buckner (Eds.), Proceedings of the 10th Symposium on the Natural History of the Bahamas. Gerace Research Center, San Salvador Island, Bahamas.
Vega, F. J., T. Nyborg, and M. Perrilliat. 2005. Mesozoic and Tertiary Decapod Crustacea of
Mexico. Pp. 65-72 in: Vega, F. J., T. G. Nyborg, M. Perrilliat, M. Montellano- Ballesteros, S. R. S. Cevallos-Ferriz, S. A. Quiroz-Barroso (eds.), Topics in Geobiology, Studies on Mexican Paleontology, volume 24. Springer, Dordrecht, The Netherlands.
Vega, F. J., T. G. Nyborg, M. Perrilliat, M. Montellano-Ballesteros, S. R. S. Cevallos-Ferriz, S.
A. Quiroz-Barroso (eds.). 2005. Topics in Geobiology, Studies on Mexican Paleontology, volume 24. Springer, Dordrecht, The Netherlands.
Professional Presentations 2010
Chesley, G. G., Vermeersch, D. A., & Zava, D. (2010, June). Impact of feedback to therapist on client psychological well-being and chronic stress: A psychoneuroimmunology approach. Poster presented at the annual meeting of the Society for Psychotherapy Research, Asilomar, CA.
Cisneros, E., Vermeersch, D. A., & Young, T. L. (2010, June). The effect of client/ therapist
feedback and the role of the therapeutic alliance on psychotherapy outcomes. Poster presented at the annual meeting of the Society for Psychotherapy Research, Asilomar, CA.
WASC EER Report Appendix D 172
RETURN TO CONTENTS
WASC Educational Effectiveness Report
23
Godenick, K. & Haerich, P. (2010, October). Emotional behavior in subclinical psychopathy. Paper presented at the annual meeting of the Society for Psychophysiologtcal Research, Berlin, Germany.
McField, E., (2010, March 11). Strategies to engage the community in all phases of research.
Workshop. Partners for Health: Communities and Researchers Working Together. Conference funded by The Association for Prevention Teaching and Research (APTR) and Centers for Disease Control. Loma Linda University, Loma Linda, CA.
Morton, K.R., Lee, J.W., & Hewett, J. (2010). Discrimination Effects on Depressive Symptoms
Moderated by Religious Support. Presentatin at the American Psychological Society, May, Boston, MA.
Stowell, S., Vermeersch, D. A., & Young, T. L. (2010, June). Psychotherapy outcome and
dropout among ethnic groups. Poster presented at the annual meeting of the Society for Psychotherapy Research, Asilomar, CA.
2009
Alexander, St. Clair. (2009, November) Research papers on relational bonds: Retired Couples Reconstruct the meaning of time together. Annual Conference of the National Council on Family Relations, Little Rock Arkansas.
Clarke, Nishana. (2009, November) Research paper on Marital harmony in retirement: The
influence of values on communication processes. Annual Conference of the National Council on Family Relations, Little Rock Arkansas.
Fider, Carlene. (2009, November) Research papers on renegotiating relationships: Maintaining
marriage post-retirement. Annual Conference of the National Council on Family Relations, Little Rock Arkansas.
McField, E., (2009, November 10). Engaging Latino communities in health advocacy.
Presentation at the 137th Annual Meeting & Exposition of the American Public Health Association. Philadelphia, PA. Abstract #206984.
McField, E., (2009, November 10). Assessing and addressing barriers to mental health services
for Latinos. Presentation at the 137th Annual Meeting & Exposition of the American Public Health Association. Philadelphia, PA. Abstract #206473.
McField, E., (2009, November 10). Approaches to increasing access and quality of mental health
services for African Americans, Asian Americans, and Latinos. Presentation at the 137th Annual Meeting & Exposition of the American Public Health Association. Philadelphia, PA. Abstract #207062.
McField, E., (2009, November 10). Using media to mobilize community and influence policy.
Presentation at the 137th Annual Meeting & Exposition of the American Public Health Association. Philadelphia, PA. Abstract #208851.
WASC EER Report Appendix D 173
RETURN TO CONTENTS
WASC Educational Effectiveness Report
24
McField, E., (2009, November 10). Culture and community: Latinos and mental health service use. Presentation at the 137th Annual Meeting & Exposition of the American Public Health Association. Philadelphia, PA. Abstract #207090.
McField, E., (2009, November 10). Technology and media: Friend or foe in community-wide
health promotion campaign? Presentation at the 137th Annual Meeting & Exposition of the American Public Health Association. Philadelphia, PA. Abstract #209140.
McField, E., Montgomery, S., Belliard, J., James, S., Schubert, C., Charlemagne, S., & Cheema,
R. (2009, November 10). Assessing and addressing barriers to mental health services for Latinos. Presentation at the 137th Annual Meeting & Exposition of the American Public Health Association. Philadelphia, PA. Abstract #206473.
McField, E., Belliard, J., Montgomery, S., James, S., Schubert, C., & Charlemagne, S. (2009,
November 10). Approaches to increasing access and quality of mental health services for African Americans, Asian Americans, and Latinos. Presentation at the 137th Annual Meeting & Exposition of the American Public Health Association. Philadelphia, PA. Abstract #207062.
McField, E., (2009, May 14-15). Using community-based participatory research to assess and
improve access to and use of mental health services among un- and under-insured Latinos. Presented at the conference Improving Health WITH Communities: The Role of Community Engagement in Clinical and Translational Research. May 14-15, 2009. National Institutes of Health. Bethesda, MD. Abstract/Poster # 0060.
McField, E., Charlemagne, S., Montgomery, S., Belliard, J., James, S., & Schubert, C. (2009,
May 14-15). Using community-based participatory research to assess and improve access to and use of mental health services among un- and under-insured Latinos. Presented at the conference Improving Health WITH Communities: The Role of Community Engagement in Clinical and Translational Research. National Institutes of Health. Bethesda, MD. Poster # 0060.
Ormseth, S., Hartoonian, N., Owen, J.E. (Aug 2009). Health care utilization and depression
among breast cancer survivors: Findings from NHIS 2003-2005. Presented at the annual meeting of the American Psychological Association in Toronto, Ontario. Division 38 award citation abstract.
2008
Arratoonian Vedda, A., Pivonka-Jones, J., Freier Randall, K., Nichols, J.G., Vermeersch, D., & Hamai, K. Y. (2008, October). Parental Readiness for Change and Involvement as a Predictor of Medical and Psychosocial Outcomes in Children Seeking Treatment for Obesity. Paper presented at the annual meeting of the American Public Health Association Meeting, San Diego, CA.
Devore, G, E., Aguirre, B, Becker, D., & Haerich, P. (2008, October). The heart recognizes
valence when recognition does not: A confirmation of binding theory with homogenous lists of positive, negative, and neutral images. Paper presented at the annual meeting of the Society for Psychophysiologtcal Research, Austin, TX.
WASC EER Report Appendix D 174
RETURN TO CONTENTS
WASC Educational Effectiveness Report
25
Haerich, P., Alberty, J., & Da Silva, B. (2008, November). Emotional image arousal, not
valence, elicits preferential attention in the digit parity task. Paper presented at the annual meeting of the Psychonomic Society, Chicago, IL.
McField, E., (2008, October 28). Improving access to specialty care: A community response.
Presentation at the 136th Annual Meeting & Exposition of the American Public Health Association. San Diego, CA. Abstract #185685.
McField, E., (2008, October 27). Community mobilization: Community leadership academies.
Presentation at the 136th Annual Meeting & Exposition of the American Public Health Association. October 27, 2008. San Diego, CA. Abstract #185638.
McField, E., (2008, October 22). Mending the safety net: Strategies to ensure continuum of care.
Workshop at the 5th Annual American Healthcare Congress. Ontario, CA. McField, E., (2008, October). Health reform. Panelist in the 2008 Presidential Forum on Health
Care. Loma Linda University. Morton, K.R., Lee, J., Ellison, C.E., Veluz, R., Wilson, C., Walsh, E., & Walters, J. (2008).
Discrimination, Religious Appraisals, and Forgiveness Independently Predict Depression in a Cohort of Black and White Adults. Society for the Scientific Study of Religion, Louisville, KY.
Morton, K.R., Lee, J., Ellison, C.E., Hewett, J., Greene, S., Bellinger, D., & Fraser, G. (2008).
Giving vs. Receiving Religious Support by Marital, Racial, and Gender Status. Society for the Scientific Study of Religion, Louisville, KY.
Owen, J.E., Bantum, E.O., Sanders, S.L., Thornton, A., & Stanton, A.L. (2008, April).
“Supportive care needs in patients with lung cancer.” Paper presented to the 29th annual meeting of the Society of Behavioral Medicine in San Diego, CA.
Truitt, K., Haerich, P., & Mar, J. (2008, May). Event-related brain potentials depict information
processing differences for food and anxiety stimuli in individuals with bulimia nervosa and anorexia nervosa during an emotional Stroop task. Paper presented at the annual meeting of the Association for Psychological Science, Chicago, IL.
2007
Fider, Carlene, Alexander, St. Clair, and Clarke, Nishana. (2007, May) Paper presentation on adolescent self-image in Jamaican and Tobago. Annual Conference of the Caribbean Studies Association, Sao Paulo, Brazil.
Devore, G. E., Gilsdorf, D., & Haerich, P. (2007, November). Binding theory predicts memory
performance in RSVP picture lists. Paper presented at the annual meeting of the Psychonomic Society, Long Beach, CA.
WASC EER Report Appendix D 175
RETURN TO CONTENTS
WASC Educational Effectiveness Report
26
Marley, S. C., Boyd, K. C., Bacchus, D. O., & Katsaros, E. P. (2007, May). Catastrophizing, Neuroticism, and Coping in Chronic Pain Patients. Paper presented at the annual meeting of the Western Psychological Association, Vancouver, Canada.
McField, E., (2007, November). Partnering to address health disparities: The Community
Action Model response. Presentation at the 135th Annual Meeting & Exposition of the American Public Health Association. November 05, 2007. Washington DC. Abstract # 158645.
Patel, S. M. & Legendre Ropacki, S.A. (2007, February). The impact of coronary artery bypass
grafting on neuropsychological functions mediated by the frontal lobes. Poster presented at the annual meeting of the International Neuropsychological Society, Portland, OR.
2006
Flynn, P., & Betancourt, H. (2006, June). A model for the study of culture and health behavior. In H. Betancourt (Chair), Investigating culture and health disparities: The case of cancer screening. Symposium conducted at the meeting of the Society for the Psychological Study of Social Issues, Long Beach, CA.
Godenick, K. L. & Haerich, P. (2006, October). Temperament and character correlates of the
startle reflex. Paper presented at the annual meeting of the Society for Psychophysiological Research.
Hodges, M., Navarrete, B., Garberoglio, C., Betancourt, H., & Flynn, P. (2006, June). Culture
and disparities in breast cancer screening. In H. Betancourt (Chair), Investigating culture and health disparities: The case of cancer screening. Symposium conducted at the meeting of the Society for the Psychological Study of Social Issues, Long Beach, CA.
Haerich, P., Devore, G. E., & Tucker, J. A. (2006, November). Effect of emotion on an image-
based AX-continuous performance task (AX-CPT). Paper presented at the annual meeting of the Psychonomic Society.
2005
Betancourt, H. & Flynn, P. (2005, July). Culture and psychological factors in breast cancer screening among Anglo and Latino women. Paper presented at the Interamerican Congress of Psychology, Buenos Aires, Argentina.
Betancourt, H. & Flynn, P. (2005, April). The role of culture in health disparities. Paper
presented at the conference on Rethinking Inequalities and Differences in Medicine, Vanderbilt University, Nashville, Tennessee
Gilsdorf, D (2005, November). Perceptual and working memory load effects on flanker task
distractor processing. Paper presented at the annual meeting of the Psychonomic Society.
Manetta, K., & Vermeersch, D. A. (2005, August). Redefining and predicting premature termination from adult psychotherapy. Poster presented at the annual meeting of the American Psychological Association, Washington, D.C.
WASC EER Report Appendix D 176
RETURN TO CONTENTS
WASC Educational Effectiveness Report
27
Mission-Focused Service Each year SST students self-select voluntary activities that deepen their academic experience by helping them merge their personal and professional selves into one identity, that of an advanced health sciences professional. The majority of students involved in these co-curricular activities are from the departments of Counseling and Family Sciences (MS, PhD, and DMFT), Psychology (PhD and PsyD), and Social Work and Social Ecology (MSW, MS, and Ph.D). Many of these individuals seek experiences in programs such as the SACHS-Norton Behavioral Health Clinic or one of the associated specialty programs designed to assist in the development and implementation of services for low income and often medically indigent individuals and families living in the surrounding vicinity. Whereas many students work in these areas as part of their academic programs, many others engage far beyond what is required. One example of this is the development of a new program, the Family Medical Home, which serves as a model one-stop health care program. The contribution and leadership of students in this new program led to the hiring of one of our doctoral students as the program director. Students also find ways to apply their knowledge to the development of unique initiatives such as:
• Providing equine assisted therapy to Navajo adolescent males to help them develop culturally-oriented rites of passage;
• Implementing family therapy and bilingual parenting classes, she serves as an advocate, engages in
community networking with other agencies;
• Developing and evaluating a co-parenting educational group to reduce custody disputes between separating and divorcing parents;
• Working with the Bernardino County Housing Authority to assess housing needs and further the
development of housing in low income communities; and
• Working with the Office of the Mayor of San Bernardino to continue, beyond academic requirements, grant development and policy analysis activities that support the needs of high risk youth.
Still other students rapidly respond to the call to serve those in need, including:
• Volunteering and successfully collecting food and funds to provide meals to over a 1000 individuals during the month of November, 2009;
• Volunteering to feed the homeless at Thanksgiving;
• Volunteering annually to conduct a toy drives and sponsor Christmas parties for the children of
incarcerated parents;
• Coordinating the collection of Christmas gifts for isolated older adults; and
• Volunteering to assist the International Behavioral Health Trauma Team with the education and delivery of services to victims of—the Old Fire in 2003, mudslides in Haiti and Dominican Republic
WASC EER Report Appendix D 177
RETURN TO CONTENTS
WASC Educational Effectiveness Report
28
in 2004, Hurricane Katrina in 2005, mudslides in Columbia and Venezuela in 2005 and 2007, the wild fires of 2007, and the El Salvador mudslides of 2010.
Alumni Leadership SST alumni regularly advance to leadership positions in clinical, academic and research positions regionally and around the world. Regionally, many of our graduates have risen to the ranks of upper level administration in health and human services within local counties. Also noteworthy are the number of alumni who head up non-profit agencies. Further, the program coordinator for the spinal cord injury program at the VA Loma Linda Healthcare System and Jerry L. Pettis Memorial VA Medical Center is a SST alumnus. Other organizations where alumni are in leadership positions include Patton Psychiatric State Hospital (a state forensic psychiatric hospital) where the Director of Utilization Review is a Program alumna, as is the Director of the Riverside Play Therapy Association. Alumni also serve in supervisory and leadership positions in the Victorville School District, the Riverside County Department of Mental Health and the San Bernardino Department of Behavioral Health. LLU has also been the beneficiary of the clinical and administrative expertise of SST graduates as a number serve in leadership positions at the University, the Medical Center, the Behavioral Medical Center, the Behavioral Health Institute and the SACHS-Norton Clinic. Many of our graduates now have careers as faculty in institutions around the world, whereas others have pursued and been successful within industry as researchers and administrators. Also, of significance is the involvement of alumni in their respective professional organizations. Faculty Excellence The SST faculty has considerable expertise congruent with the mission, goals, and the objectives of their respective programs. Through this collective expertise the faculty have developed strong ties to institutional, professional, and global denominational engagement through research, education, and service. As such, each is involved in scholarly activities based upon their areas of expertise and interest. For many, this means that they have developed strong collaborative relationships within the community, regionally, and nationally; and are highly regarded by their respective professional communities as committed educators, practitioners, and/or as researchers. This recognition has positioned our SST faculty to be viewed as a substantial resource to the University as well as governmental organizations, non-profit agencies, and other academic institutions. The rich collaborative health sciences context of LLU supports collegiality within SST and with other LLU schools. Faculty enlist and have been enlisted to participate in teaching and interdisciplinary research and practice experiences. A priority for this faculty scholarly engagement is to develop learning opportunities that involve masters and doctoral students in the research and community innovation projects. There are numerous examples of how this faculty engagement has and continues to enhance students’ education at LLU.7 For students, the ability to work with their faculty, faculty from other disciplines, as well as leaders from the professional community or other institutions, readily supports students’ post graduation employment and professional networking—while providing them a deep appreciation for interdisciplinary collegiality. For faculty, this engagement fosters ongoing community linkages within both the University and broader community. These opportunities not only support faculty
7 Examples of faculty’s engagement of students in scholarship is provided earlier in this document and can be seen in the Annual Faculty Reports (AFR) found in the Faculty Information System (FIS), and in the Annual Program Reports available through the Online Program Information System.
WASC EER Report Appendix D 178
RETURN TO CONTENTS
WASC Educational Effectiveness Report
29
staying current in their related fields but also facilitates faculty’s involvement in service activities to address local community, regional, national and international needs. Service and Global Outreach Faculty involved in the behavioral health areas of the School demonstrate strong leadership and involvement with community problem-solving, development and delivery of professional training, and support for program and clinical research within local and international settings. This foci has lead the faculty to work with the respective divisions of each county to address the needs of children, older adults, families, culture competency, anti-stigma, and consumer-directed recovery services and has led to the development of more effective systems of care for individuals with serious mental illness and their families. Other faculty have been instrumental through their applied research and engagement of students to provide needs assessments for county departments, including the San Bernardino County Housing Authority. SST faculty also serve as members of the San Bernardino County Drug Task Force Committee which is composed of community leaders from the local school districts, the Department of Probation, Juvenile Court, and the Office of the Mayor of the City of San Bernardino. The mandate of this committee is to research the impact (prevalence and associated costs) of illicit drug use among local county residents, and propose interventions directed at mitigating the impact of this epidemic. In a related area faculty are involved with and support community development and integration of knowledge and services related to the protection of drug endangered children. Further demonstrating the practice and service leadership of the faculty has been the service interdisciplinary, inter-organizational innovations which have occurred on behalf of high-risk children in the Inland Empire. A three-year collaborative program known as “Early Steps” received the 2003 Best Practice Award from the National Association of Counties. Additional opportunities for collaboration with area behavioral health agencies have also occurred with the passage of the Mental Health Services Act (MSHA) (i.e., legislation and funding dedicated to the transformation of California’s existing mental health services by advancing positive outcomes for clients through an intentional focus on the infusion of wellness and recovery). With the implementation of the MHSA, local counties and universities are working closely together to address the workforce shortage, training and education needs, and systems needs that must be addressed if recovery-oriented services are to be realized. Several faculty have been involved in these planning and problem-solving activities over the past four years. The Dean of SST is regarded as aleader in the development and implementation of mental health polices and programs that bridge the gap between services and academia. Within the campus community of Loma Linda University, SST faculty continue to demonstrate their support for and involvement in interdisciplinary collaboration. In addition to serving on University committees that emphasize academic policies, standards, institutional leadership, and the integration of faith and learning; the faculty give guidance to direct services provided by the University to the community. Examples of this service include: (a) chairing and serving on the Interdisciplinary Geriatric Council (a ) University sponsored school-community collaboration supporting information exchange and services improvement for older adults with health and related needs in the Inland Empire); (b) memberships on the Inter-professional Advisory Council and Behavioral Health Committee for the Social Action Community Health Clinic (a multi-disciplinary clinic that is a part of the University’s Norton Neighborhood Community Development Program supporting a low income area adjacent to the campus); and (c) membership on the Advisory Committee of the Adventist Community Team Services (providing emergency in-kind services for low-income families, as well as in-home supports for older adults in the
WASC EER Report Appendix D 179
RETURN TO CONTENTS
WASC Educational Effectiveness Report
30
city of Loma Linda). Faculty members are also actively involved in programs that support the leadership development of minority students including the Loma Linda University Black Alumni Association. SST faculty also continue to provide innovation and leadership in support of the University’s global mission. As evidence, the Loma Linda University International Behavioral Health Trauma Team (initiated in 1995) engages the involvement of mental health professionals from across the campus. Founded by the now Dean of SST, the Team is now co-chaired with the Chairperson of the Department of Psychiatry. This international involvement and leadership has entailed the far reaching work of the Trauma Team in providing both direct services to survivors of catastrophic natural disasters, along with training and consultation for relief workers and allied health professionals. Through her active leadership, this team has traveled to over 20 countries since its inception, provided direct services to over 3,500 individuals, and training to over 1,800 relief workers and professionals. The activities of the Team have led to sustained capacity building around the world, including the formation of a national response team for the government of Haiti, sustained community teams in India, Thailand, Malaysia, Columbia, Venezuela, and China to mention a few. Increasingly, as liability coverage and funding permits, the Team expands opportunities for alumni and students to participate. Alumni and students8 have now participated in a majority of the trips sponsored by the Trauma Team. Finally, it should be noted that the international environment of the Trauma Team is defined as including the United States. Not only was the Team on an active stand-by for 911, but was part of the service delivery system that responded to Hurricane Katrina. Closer to home, the Team was part of the response network to the Southern California “Old Fire” in 2003, and the more recent 2007 fires. In both instances an interdisciplinary group of faculty, professional clinicians at LLU, alumni, and students were brought together to support and debrief the Red Cross, lend clinical backup to county mental health services, and nurture the needs of the Loma Linda University community. The faculty in EBS emphasize their connectedness to the University, the region and world through their emphasis on conservation and biodiversity. As such, they recognize that if LLU is to have an impact on improving global health, then our institution must also have a deep concern for improving the health of the environment that people live in, and that is where EBS is a central contributor. Through this work they make use of a number of excellent field sits for teaching and research, including the local deserts, ocean and mountains. As these locations are readily within driving distance, each provides a huge field laboratory that greatly benefits the EBS programs. For example, the geology and biology programs have year round access to field sites including: Anza Borrego Desert, Death Valley, Mojave Desert, Grand Canyon, Colorado Plateau, and Salton Sea area. The EBS programs also utilize international field locations for research, which include The Bahamas, Fiji, Honduras, Peru, Costa Rica, SE Asia, and Australia. Because of the emphasis on field research, students in geology and biology students graduate with a very strong field oriented experience. The EBS program review self-study includes an impressive presentation of the wealth of field research experiences that have occurred in recent years.
8 Students from among the behavioral health disciplines at Loma Linda University have accompanied the team to Sri Lanka, India, Thailand, Malaysia, Iceland, Russia, Honduras, and Columbia.
WASC EER Report Appendix D 180
RETURN TO CONTENTS
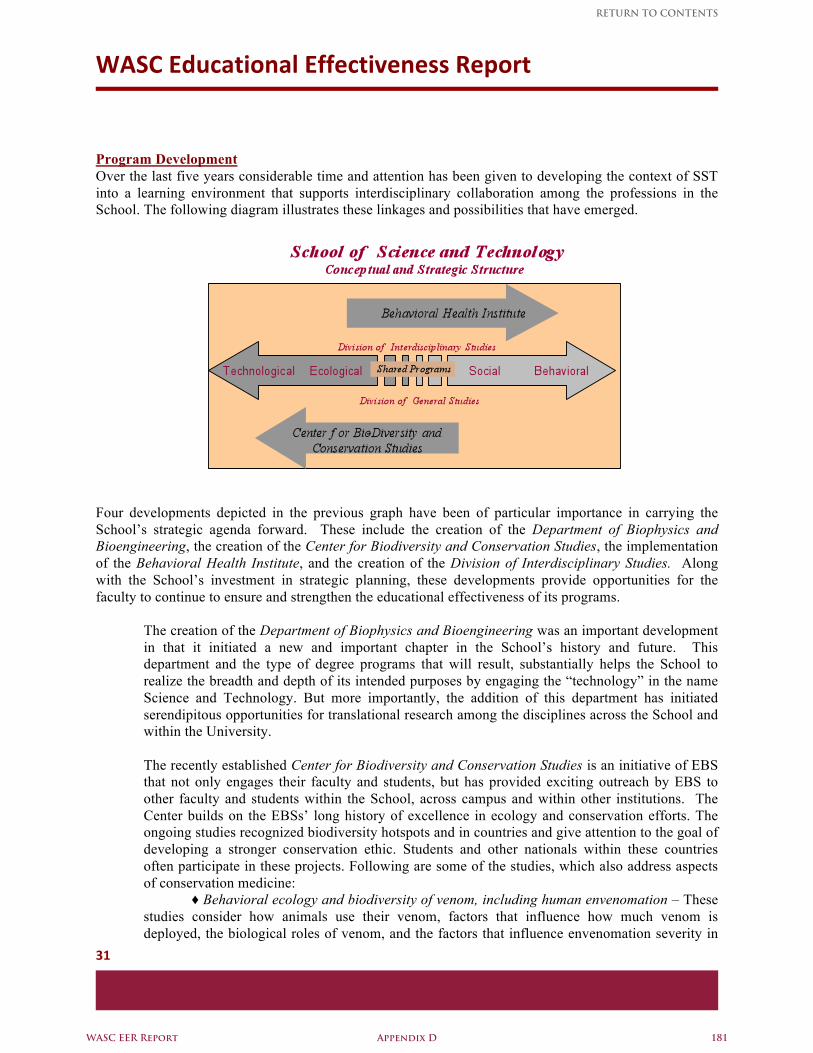
WASC Educational Effectiveness Report
31
Program Development Over the last five years considerable time and attention has been given to developing the context of SST into a learning environment that supports interdisciplinary collaboration among the professions in the School. The following diagram illustrates these linkages and possibilities that have emerged. Four developments depicted in the previous graph have been of particular importance in carrying the School’s strategic agenda forward. These include the creation of the Department of Biophysics and Bioengineering, the creation of the Center for Biodiversity and Conservation Studies, the implementation of the Behavioral Health Institute, and the creation of the Division of Interdisciplinary Studies. Along with the School’s investment in strategic planning, these developments provide opportunities for the faculty to continue to ensure and strengthen the educational effectiveness of its programs.
The creation of the Department of Biophysics and Bioengineering was an important development in that it initiated a new and important chapter in the School’s history and future. This department and the type of degree programs that will result, substantially helps the School to realize the breadth and depth of its intended purposes by engaging the “technology” in the name Science and Technology. But more importantly, the addition of this department has initiated serendipitous opportunities for translational research among the disciplines across the School and within the University. The recently established Center for Biodiversity and Conservation Studies is an initiative of EBS that not only engages their faculty and students, but has provided exciting outreach by EBS to other faculty and students within the School, across campus and within other institutions. The Center builds on the EBSs’ long history of excellence in ecology and conservation efforts. The ongoing studies recognized biodiversity hotspots and in countries and give attention to the goal of developing a stronger conservation ethic. Students and other nationals within these countries often participate in these projects. Following are some of the studies, which also address aspects of conservation medicine: ♦ Behavioral ecology and biodiversity of venom, including human envenomation – These studies consider how animals use their venom, factors that influence how much venom is deployed, the biological roles of venom, and the factors that influence envenomation severity in
WASC EER Report Appendix D 181
RETURN TO CONTENTS
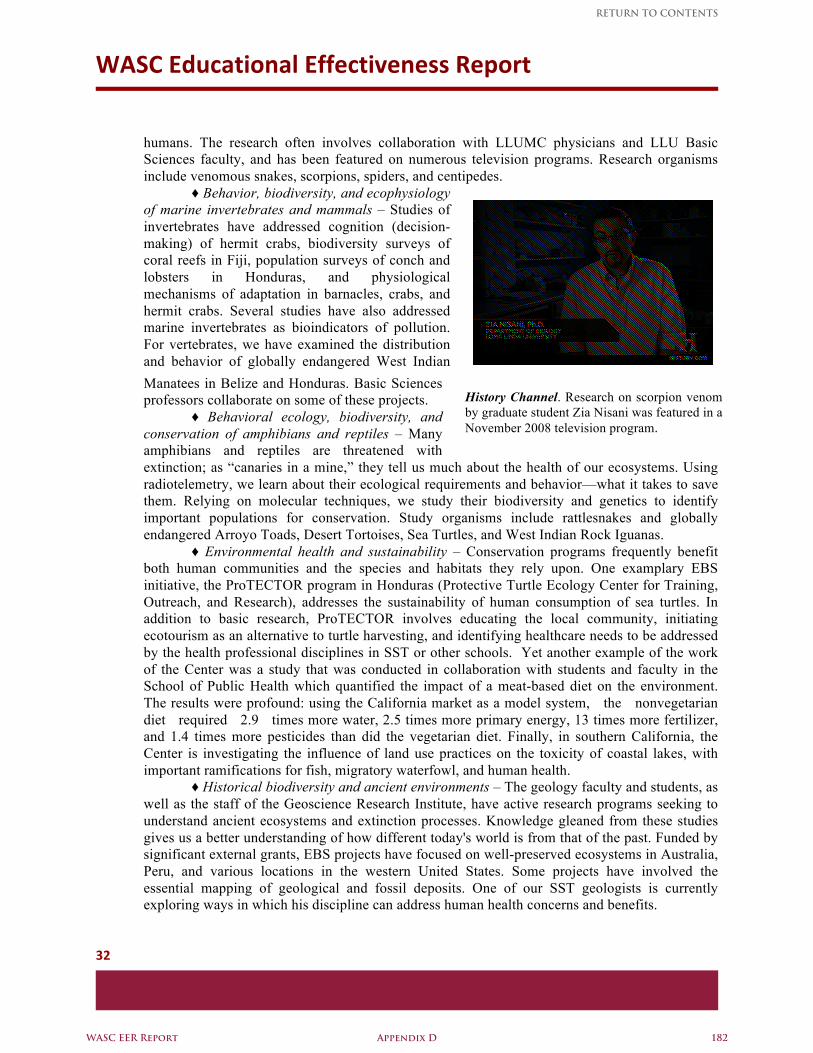
WASC Educational Effectiveness Report
32
History Channel. Research on scorpion venom by graduate student Zia Nisani was featured in a November 2008 television program.
humans. The research often involves collaboration with LLUMC physicians and LLU Basic Sciences faculty, and has been featured on numerous television programs. Research organisms include venomous snakes, scorpions, spiders, and centipedes. ♦ Behavior, biodiversity, and ecophysiology of marine invertebrates and mammals – Studies of invertebrates have addressed cognition (decision-making) of hermit crabs, biodiversity surveys of coral reefs in Fiji, population surveys of conch and lobsters in Honduras, and physiological mechanisms of adaptation in barnacles, crabs, and hermit crabs. Several studies have also addressed marine invertebrates as bioindicators of pollution. For vertebrates, we have examined the distribution and behavior of globally endangered West Indian Manatees in Belize and Honduras. Basic Sciences professors collaborate on some of these projects. ♦ Behavioral ecology, biodiversity, and conservation of amphibians and reptiles – Many amphibians and reptiles are threatened with extinction; as “canaries in a mine,” they tell us much about the health of our ecosystems. Using radiotelemetry, we learn about their ecological requirements and behavior—what it takes to save them. Relying on molecular techniques, we study their biodiversity and genetics to identify important populations for conservation. Study organisms include rattlesnakes and globally endangered Arroyo Toads, Desert Tortoises, Sea Turtles, and West Indian Rock Iguanas. ♦ Environmental health and sustainability – Conservation programs frequently benefit both human communities and the species and habitats they rely upon. One examplary EBS initiative, the ProTECTOR program in Honduras (Protective Turtle Ecology Center for Training, Outreach, and Research), addresses the sustainability of human consumption of sea turtles. In addition to basic research, ProTECTOR involves educating the local community, initiating ecotourism as an alternative to turtle harvesting, and identifying healthcare needs to be addressed by the health professional disciplines in SST or other schools. Yet another example of the work of the Center was a study that was conducted in collaboration with students and faculty in the School of Public Health which quantified the impact of a meat-based diet on the environment. The results were profound: using the California market as a model system, the nonvegetarian diet required 2.9 times more water, 2.5 times more primary energy, 13 times more fertilizer, and 1.4 times more pesticides than did the vegetarian diet. Finally, in southern California, the Center is investigating the influence of land use practices on the toxicity of coastal lakes, with important ramifications for fish, migratory waterfowl, and human health. ♦ Historical biodiversity and ancient environments – The geology faculty and students, as well as the staff of the Geoscience Research Institute, have active research programs seeking to understand ancient ecosystems and extinction processes. Knowledge gleaned from these studies gives us a better understanding of how different today's world is from that of the past. Funded by significant external grants, EBS projects have focused on well-preserved ecosystems in Australia, Peru, and various locations in the western United States. Some projects have involved the essential mapping of geological and fossil deposits. One of our SST geologists is currently exploring ways in which his discipline can address human health concerns and benefits.
WASC EER Report Appendix D 182
RETURN TO CONTENTS
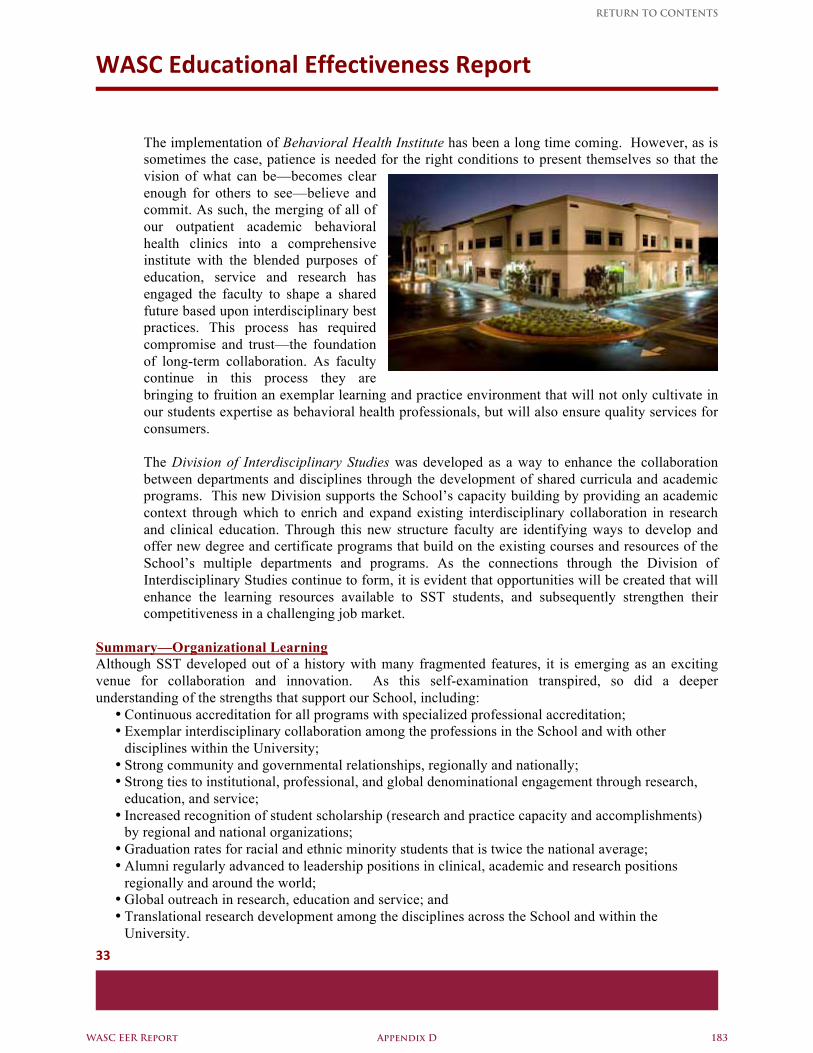
WASC Educational Effectiveness Report
33
The implementation of Behavioral Health Institute has been a long time coming. However, as is sometimes the case, patience is needed for the right conditions to present themselves so that the vision of what can be—becomes clear enough for others to see—believe and commit. As such, the merging of all of our outpatient academic behavioral health clinics into a comprehensive institute with the blended purposes of education, service and research has engaged the faculty to shape a shared future based upon interdisciplinary best practices. This process has required compromise and trust—the foundation of long-term collaboration. As faculty continue in this process they are bringing to fruition an exemplar learning and practice environment that will not only cultivate in our students expertise as behavioral health professionals, but will also ensure quality services for consumers.
The Division of Interdisciplinary Studies was developed as a way to enhance the collaboration between departments and disciplines through the development of shared curricula and academic programs. This new Division supports the School’s capacity building by providing an academic context through which to enrich and expand existing interdisciplinary collaboration in research and clinical education. Through this new structure faculty are identifying ways to develop and offer new degree and certificate programs that build on the existing courses and resources of the School’s multiple departments and programs. As the connections through the Division of Interdisciplinary Studies continue to form, it is evident that opportunities will be created that will enhance the learning resources available to SST students, and subsequently strengthen their competitiveness in a challenging job market.
Summary—Organizational Learning Although SST developed out of a history with many fragmented features, it is emerging as an exciting venue for collaboration and innovation. As this self-examination transpired, so did a deeper understanding of the strengths that support our School, including:
• Continuous accreditation for all programs with specialized professional accreditation; • Exemplar interdisciplinary collaboration among the professions in the School and with other
disciplines within the University; • Strong community and governmental relationships, regionally and nationally; • Strong ties to institutional, professional, and global denominational engagement through research,
education, and service; • Increased recognition of student scholarship (research and practice capacity and accomplishments)
by regional and national organizations; • Graduation rates for racial and ethnic minority students that is twice the national average; • Alumni regularly advanced to leadership positions in clinical, academic and research positions
regionally and around the world; • Global outreach in research, education and service; and • Translational research development among the disciplines across the School and within the
University.
WASC EER Report Appendix D 183
RETURN TO CONTENTS
WASC Educational Effectiveness Report
34
Interestingly by learning about our strengths we also discovered our shared values for learning and scholarship, and that embedded in these values are important metrics for our school that need to become part of our continuous systematic renewal, e.g., faculty engaging students in peer-reviewed publications and presentations should be considered an evaluation criteria for all doctoral program faculty. Equally important is the realization of a methodology for identifying essential metrics that provide the measureable underpinnings for evidenced-based education. This methodology will now continue to be employed as we further refine and implement our shared vision of the essential components of academic excellence. Related to this, the process of deep learning through assessment has validated what we believed should be and had proposed would be the focus of our strategic initiatives for the next five years. As such, in addition to a methodology, this inquiry helped to establish baseline data where none previously existed within our School or was available (readily or at all) from other schools or institutions to assist us in establishing benchmarks and targets for improvement. In conclusion, the result is a clearer road map for assuring data driven decision-making within our School.
WASC EER Report Appendix D 184
RETURN TO CONTENTS

WASC Educational Effectiveness Report
Appendix E
TABLE OF CONTENTS
RETURN TO CONTENTS
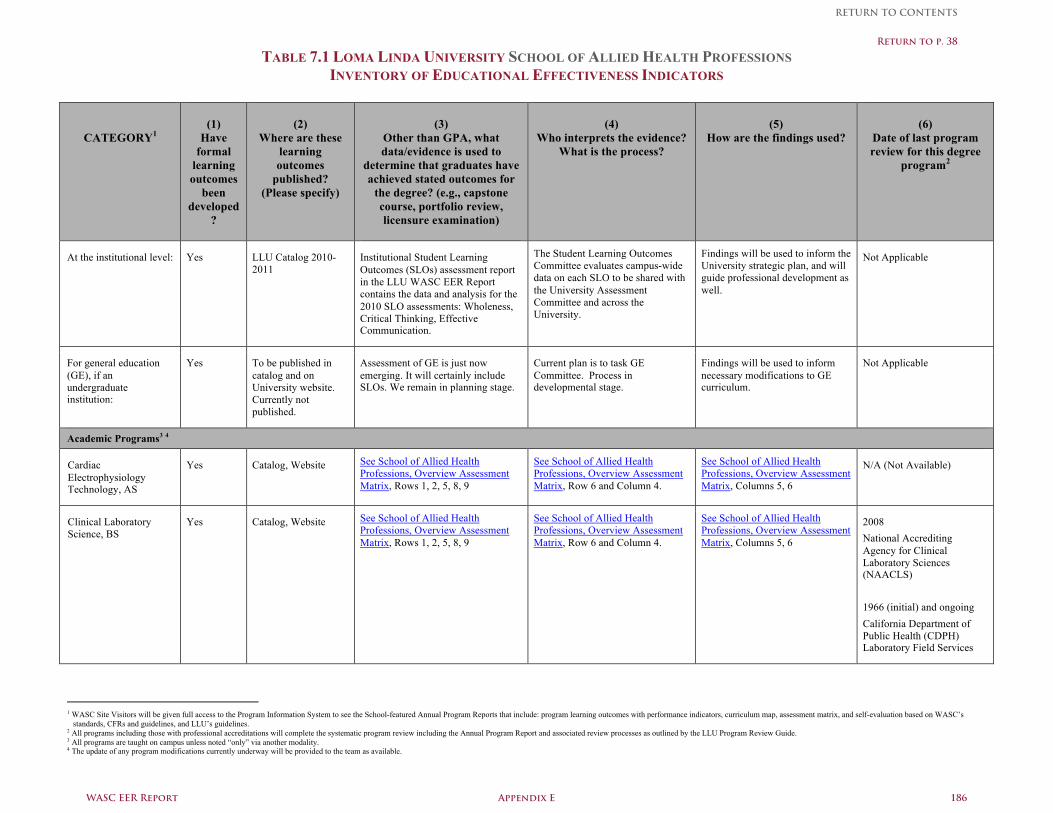
TABLE 7.1 LOMA LINDA UNIVERSITY SCHOOL OF ALLIED HEALTH PROFESSIONS INVENTORY OF EDUCATIONAL EFFECTIVENESS INDICATORS
CATEGORY1
(1)
Have formal
learning outcomes
been developed
?
(2)
Where are these learning outcomes
published? (Please specify)
(3)
Other than GPA, what data/evidence is used to
determine that graduates have achieved stated outcomes for
the degree? (e.g., capstone course, portfolio review, licensure examination)
(4)
Who interprets the evidence? What is the process?
(5)
How are the findings used?
(6)
Date of last program review for this degree
program2
At the institutional level: Yes LLU Catalog 2010-2011
Institutional Student Learning Outcomes (SLOs) assessment report in the LLU WASC EER Report contains the data and analysis for the 2010 SLO assessments: Wholeness, Critical Thinking, Effective Communication.
The Student Learning Outcomes Committee evaluates campus-wide data on each SLO to be shared with the University Assessment Committee and across the University.
Findings will be used to inform the University strategic plan, and will guide professional development as well.
Not Applicable
For general education (GE), if an undergraduate institution:
Yes To be published in catalog and on University website. Currently not published.
Assessment of GE is just now emerging. It will certainly include SLOs. We remain in planning stage.
Current plan is to task GE Committee. Process in developmental stage.
Findings will be used to inform necessary modifications to GE curriculum.
Not Applicable
Academic Programs3 4
Cardiac Electrophysiology Technology, AS
Yes Catalog, Website See School of Allied Health Professions, Overview Assessment Matrix, Rows 1, 2, 5, 8, 9
See School of Allied Health Professions, Overview Assessment Matrix, Row 6 and Column 4.
See School of Allied Health Professions, Overview Assessment Matrix, Columns 5, 6
N/A (Not Available)
Clinical Laboratory Science, BS
Yes Catalog, Website See School of Allied Health Professions, Overview Assessment Matrix, Rows 1, 2, 5, 8, 9
See School of Allied Health Professions, Overview Assessment Matrix, Row 6 and Column 4.
See School of Allied Health Professions, Overview Assessment Matrix, Columns 5, 6
2008 National Accrediting Agency for Clinical Laboratory Sciences (NAACLS) 1966 (initial) and ongoing California Department of Public Health (CDPH) Laboratory Field Services
1 WASC Site Visitors will be given full access to the Program Information System to see the School-featured Annual Program Reports that include: program learning outcomes with performance indicators, curriculum map, assessment matrix, and self-evaluation based on WASC’s
standards, CFRs and guidelines, and LLU’s guidelines. 2 All programs including those with professional accreditations will complete the systematic program review including the Annual Program Report and associated review processes as outlined by the LLU Program Review Guide. 3 All programs are taught on campus unless noted “only” via another modality. 4 The update of any program modifications currently underway will be provided to the team as available.
WASC EER Report Appendix E 186
RETURN TO CONTENTS
Return to p. 38
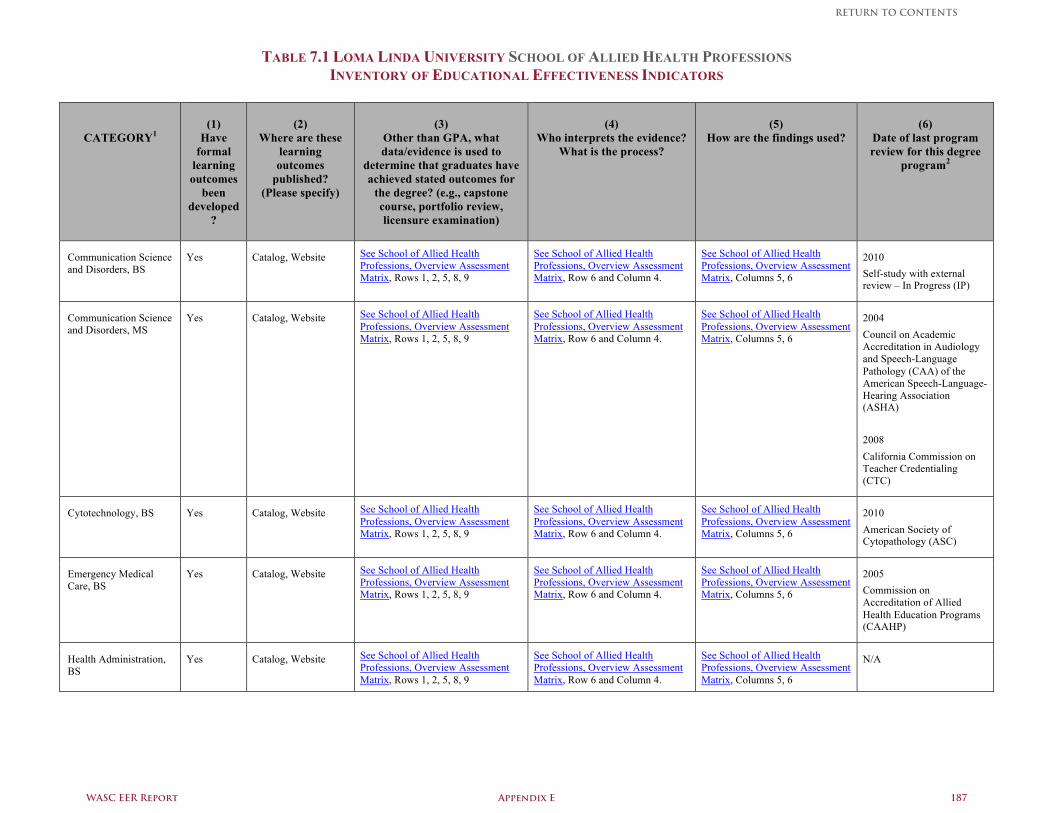
TABLE 7.1 LOMA LINDA UNIVERSITY SCHOOL OF ALLIED HEALTH PROFESSIONS INVENTORY OF EDUCATIONAL EFFECTIVENESS INDICATORS
CATEGORY1
(1)
Have formal
learning outcomes
been developed
?
(2)
Where are these learning outcomes
published? (Please specify)
(3)
Other than GPA, what data/evidence is used to
determine that graduates have achieved stated outcomes for
the degree? (e.g., capstone course, portfolio review, licensure examination)
(4)
Who interprets the evidence? What is the process?
(5)
How are the findings used?
(6)
Date of last program review for this degree
program2
Communication Science and Disorders, BS
Yes Catalog, Website See School of Allied Health Professions, Overview Assessment Matrix, Rows 1, 2, 5, 8, 9
See School of Allied Health Professions, Overview Assessment Matrix, Row 6 and Column 4.
See School of Allied Health Professions, Overview Assessment Matrix, Columns 5, 6
2010 Self-study with external review – In Progress (IP)
Communication Science and Disorders, MS
Yes Catalog, Website See School of Allied Health Professions, Overview Assessment Matrix, Rows 1, 2, 5, 8, 9
See School of Allied Health Professions, Overview Assessment Matrix, Row 6 and Column 4.
See School of Allied Health Professions, Overview Assessment Matrix, Columns 5, 6
2004 Council on Academic Accreditation in Audiology and Speech-Language Pathology (CAA) of the American Speech-Language-Hearing Association (ASHA) 2008 California Commission on Teacher Credentialing (CTC)
Cytotechnology, BS
Yes Catalog, Website See School of Allied Health Professions, Overview Assessment Matrix, Rows 1, 2, 5, 8, 9
See School of Allied Health Professions, Overview Assessment Matrix, Row 6 and Column 4.
See School of Allied Health Professions, Overview Assessment Matrix, Columns 5, 6
2010 American Society of Cytopathology (ASC)
Emergency Medical Care, BS
Yes Catalog, Website See School of Allied Health Professions, Overview Assessment Matrix, Rows 1, 2, 5, 8, 9
See School of Allied Health Professions, Overview Assessment Matrix, Row 6 and Column 4.
See School of Allied Health Professions, Overview Assessment Matrix, Columns 5, 6
2005 Commission on Accreditation of Allied Health Education Programs (CAAHP)
Health Administration, BS
Yes Catalog, Website See School of Allied Health Professions, Overview Assessment Matrix, Rows 1, 2, 5, 8, 9
See School of Allied Health Professions, Overview Assessment Matrix, Row 6 and Column 4.
See School of Allied Health Professions, Overview Assessment Matrix, Columns 5, 6
N/A
WASC EER Report Appendix E 187
RETURN TO CONTENTS
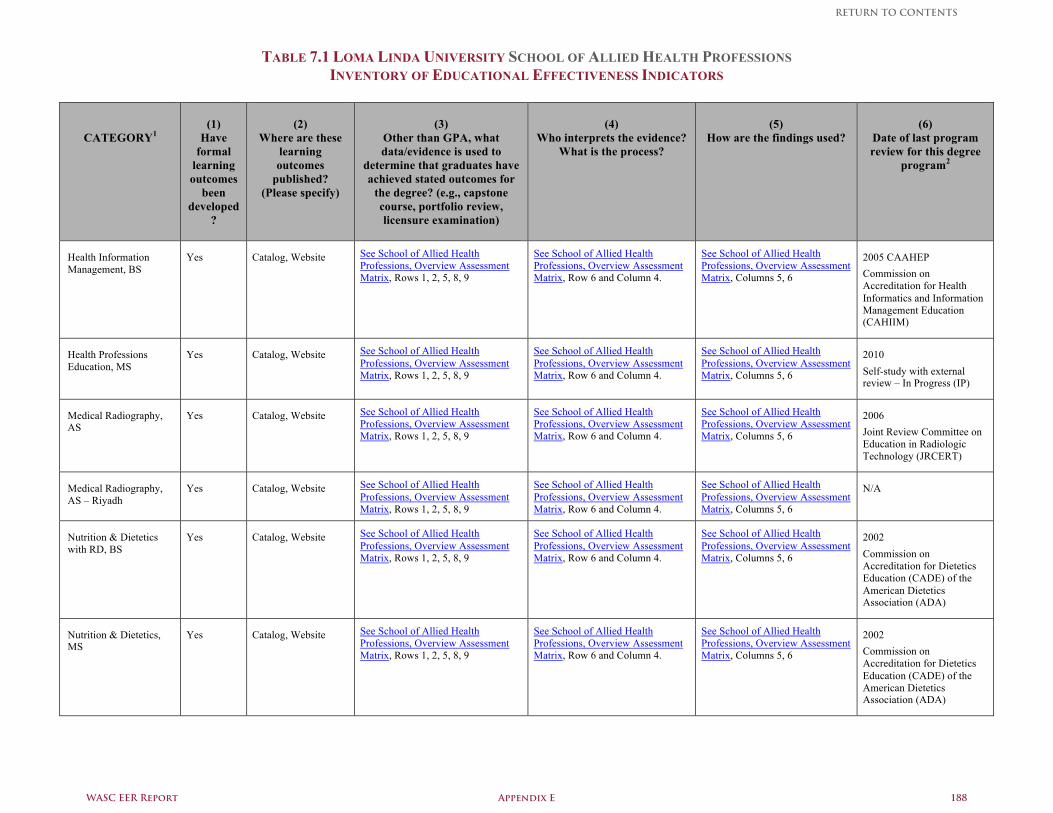
TABLE 7.1 LOMA LINDA UNIVERSITY SCHOOL OF ALLIED HEALTH PROFESSIONS INVENTORY OF EDUCATIONAL EFFECTIVENESS INDICATORS
CATEGORY1
(1)
Have formal
learning outcomes
been developed
?
(2)
Where are these learning outcomes
published? (Please specify)
(3)
Other than GPA, what data/evidence is used to
determine that graduates have achieved stated outcomes for
the degree? (e.g., capstone course, portfolio review, licensure examination)
(4)
Who interprets the evidence? What is the process?
(5)
How are the findings used?
(6)
Date of last program review for this degree
program2
Health Information Management, BS
Yes Catalog, Website See School of Allied Health Professions, Overview Assessment Matrix, Rows 1, 2, 5, 8, 9
See School of Allied Health Professions, Overview Assessment Matrix, Row 6 and Column 4.
See School of Allied Health Professions, Overview Assessment Matrix, Columns 5, 6
2005 CAAHEP Commission on Accreditation for Health Informatics and Information Management Education (CAHIIM)
Health Professions Education, MS
Yes Catalog, Website See School of Allied Health Professions, Overview Assessment Matrix, Rows 1, 2, 5, 8, 9
See School of Allied Health Professions, Overview Assessment Matrix, Row 6 and Column 4.
See School of Allied Health Professions, Overview Assessment Matrix, Columns 5, 6
2010 Self-study with external review – In Progress (IP)
Medical Radiography, AS
Yes Catalog, Website See School of Allied Health Professions, Overview Assessment Matrix, Rows 1, 2, 5, 8, 9
See School of Allied Health Professions, Overview Assessment Matrix, Row 6 and Column 4.
See School of Allied Health Professions, Overview Assessment Matrix, Columns 5, 6
2006 Joint Review Committee on Education in Radiologic Technology (JRCERT)
Medical Radiography, AS – Riyadh
Yes Catalog, Website See School of Allied Health Professions, Overview Assessment Matrix, Rows 1, 2, 5, 8, 9
See School of Allied Health Professions, Overview Assessment Matrix, Row 6 and Column 4.
See School of Allied Health Professions, Overview Assessment Matrix, Columns 5, 6
N/A
Nutrition & Dietetics with RD, BS
Yes Catalog, Website See School of Allied Health Professions, Overview Assessment Matrix, Rows 1, 2, 5, 8, 9
See School of Allied Health Professions, Overview Assessment Matrix, Row 6 and Column 4.
See School of Allied Health Professions, Overview Assessment Matrix, Columns 5, 6
2002 Commission on Accreditation for Dietetics Education (CADE) of the American Dietetics Association (ADA)
Nutrition & Dietetics, MS
Yes Catalog, Website See School of Allied Health Professions, Overview Assessment Matrix, Rows 1, 2, 5, 8, 9
See School of Allied Health Professions, Overview Assessment Matrix, Row 6 and Column 4.
See School of Allied Health Professions, Overview Assessment Matrix, Columns 5, 6
2002 Commission on Accreditation for Dietetics Education (CADE) of the American Dietetics Association (ADA)
WASC EER Report Appendix E 188
RETURN TO CONTENTS
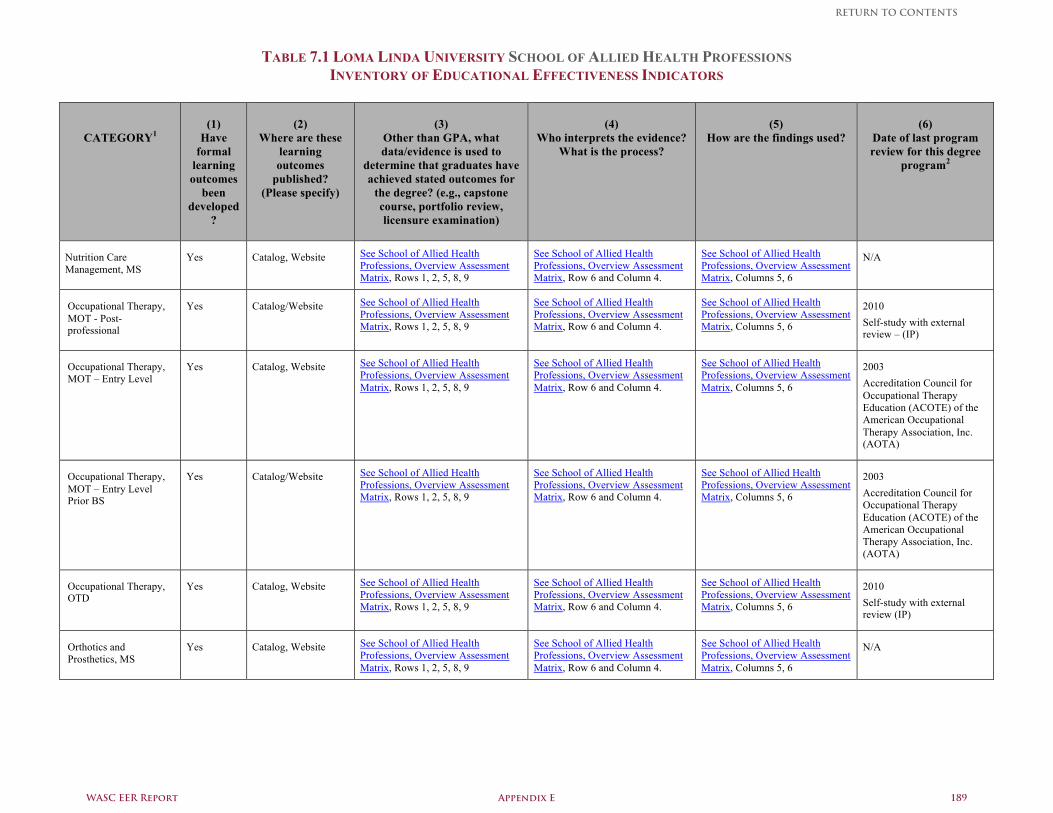
TABLE 7.1 LOMA LINDA UNIVERSITY SCHOOL OF ALLIED HEALTH PROFESSIONS INVENTORY OF EDUCATIONAL EFFECTIVENESS INDICATORS
CATEGORY1
(1)
Have formal
learning outcomes
been developed
?
(2)
Where are these learning outcomes
published? (Please specify)
(3)
Other than GPA, what data/evidence is used to
determine that graduates have achieved stated outcomes for
the degree? (e.g., capstone course, portfolio review, licensure examination)
(4)
Who interprets the evidence? What is the process?
(5)
How are the findings used?
(6)
Date of last program review for this degree
program2
Nutrition Care Management, MS
Yes Catalog, Website See School of Allied Health Professions, Overview Assessment Matrix, Rows 1, 2, 5, 8, 9
See School of Allied Health Professions, Overview Assessment Matrix, Row 6 and Column 4.
See School of Allied Health Professions, Overview Assessment Matrix, Columns 5, 6
N/A
Occupational Therapy, MOT - Post-professional
Yes Catalog/Website See School of Allied Health Professions, Overview Assessment Matrix, Rows 1, 2, 5, 8, 9
See School of Allied Health Professions, Overview Assessment Matrix, Row 6 and Column 4.
See School of Allied Health Professions, Overview Assessment Matrix, Columns 5, 6
2010 Self-study with external review – (IP)
Occupational Therapy, MOT – Entry Level
Yes Catalog, Website See School of Allied Health Professions, Overview Assessment Matrix, Rows 1, 2, 5, 8, 9
See School of Allied Health Professions, Overview Assessment Matrix, Row 6 and Column 4.
See School of Allied Health Professions, Overview Assessment Matrix, Columns 5, 6
2003 Accreditation Council for Occupational Therapy Education (ACOTE) of the American Occupational Therapy Association, Inc. (AOTA)
Occupational Therapy, MOT – Entry Level Prior BS
Yes Catalog/Website See School of Allied Health Professions, Overview Assessment Matrix, Rows 1, 2, 5, 8, 9
See School of Allied Health Professions, Overview Assessment Matrix, Row 6 and Column 4.
See School of Allied Health Professions, Overview Assessment Matrix, Columns 5, 6
2003 Accreditation Council for Occupational Therapy Education (ACOTE) of the American Occupational Therapy Association, Inc. (AOTA)
Occupational Therapy, OTD
Yes Catalog, Website See School of Allied Health Professions, Overview Assessment Matrix, Rows 1, 2, 5, 8, 9
See School of Allied Health Professions, Overview Assessment Matrix, Row 6 and Column 4.
See School of Allied Health Professions, Overview Assessment Matrix, Columns 5, 6
2010 Self-study with external review (IP)
Orthotics and Prosthetics, MS
Yes Catalog, Website See School of Allied Health Professions, Overview Assessment Matrix, Rows 1, 2, 5, 8, 9
See School of Allied Health Professions, Overview Assessment Matrix, Row 6 and Column 4.
See School of Allied Health Professions, Overview Assessment Matrix, Columns 5, 6
N/A
WASC EER Report Appendix E 189
RETURN TO CONTENTS
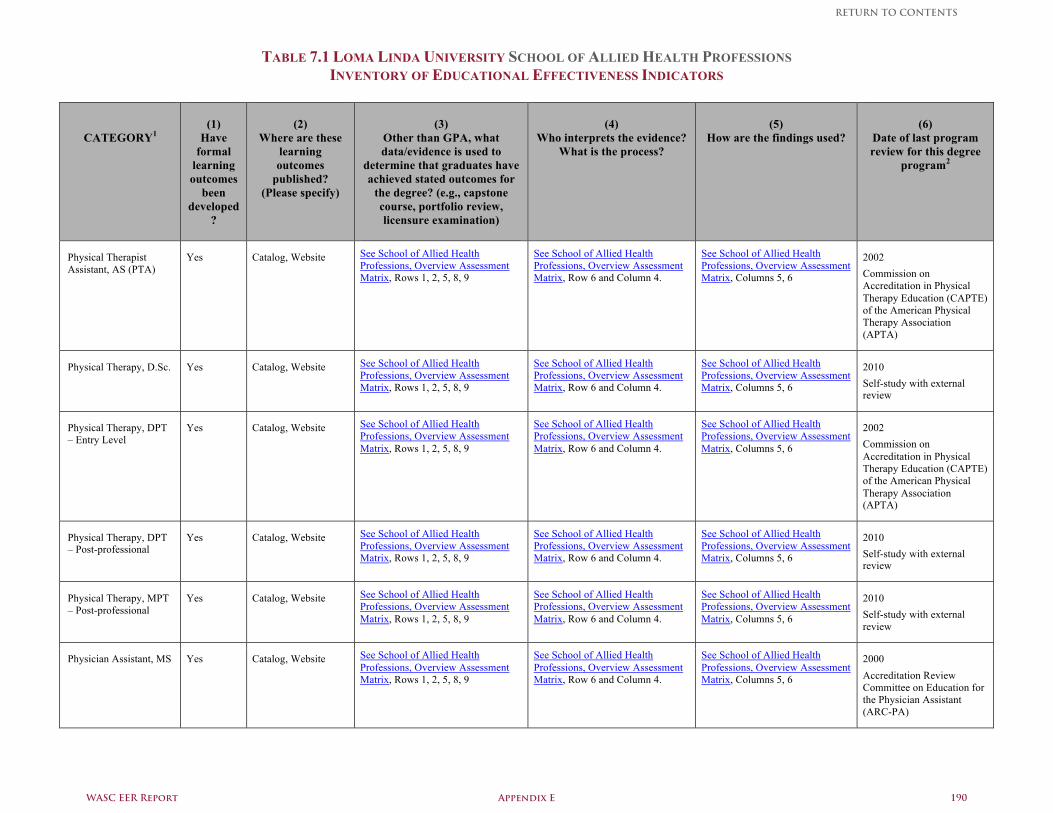
TABLE 7.1 LOMA LINDA UNIVERSITY SCHOOL OF ALLIED HEALTH PROFESSIONS INVENTORY OF EDUCATIONAL EFFECTIVENESS INDICATORS
CATEGORY1
(1)
Have formal
learning outcomes
been developed
?
(2)
Where are these learning outcomes
published? (Please specify)
(3)
Other than GPA, what data/evidence is used to
determine that graduates have achieved stated outcomes for
the degree? (e.g., capstone course, portfolio review, licensure examination)
(4)
Who interprets the evidence? What is the process?
(5)
How are the findings used?
(6)
Date of last program review for this degree
program2
Physical Therapist Assistant, AS (PTA)
Yes Catalog, Website See School of Allied Health Professions, Overview Assessment Matrix, Rows 1, 2, 5, 8, 9
See School of Allied Health Professions, Overview Assessment Matrix, Row 6 and Column 4.
See School of Allied Health Professions, Overview Assessment Matrix, Columns 5, 6
2002 Commission on Accreditation in Physical Therapy Education (CAPTE) of the American Physical Therapy Association (APTA)
Physical Therapy, D.Sc. Yes Catalog, Website See School of Allied Health Professions, Overview Assessment Matrix, Rows 1, 2, 5, 8, 9
See School of Allied Health Professions, Overview Assessment Matrix, Row 6 and Column 4.
See School of Allied Health Professions, Overview Assessment Matrix, Columns 5, 6
2010 Self-study with external review
Physical Therapy, DPT – Entry Level
Yes Catalog, Website See School of Allied Health Professions, Overview Assessment Matrix, Rows 1, 2, 5, 8, 9
See School of Allied Health Professions, Overview Assessment Matrix, Row 6 and Column 4.
See School of Allied Health Professions, Overview Assessment Matrix, Columns 5, 6
2002 Commission on Accreditation in Physical Therapy Education (CAPTE) of the American Physical Therapy Association (APTA)
Physical Therapy, DPT – Post-professional
Yes Catalog, Website See School of Allied Health Professions, Overview Assessment Matrix, Rows 1, 2, 5, 8, 9
See School of Allied Health Professions, Overview Assessment Matrix, Row 6 and Column 4.
See School of Allied Health Professions, Overview Assessment Matrix, Columns 5, 6
2010 Self-study with external review
Physical Therapy, MPT – Post-professional
Yes Catalog, Website See School of Allied Health Professions, Overview Assessment Matrix, Rows 1, 2, 5, 8, 9
See School of Allied Health Professions, Overview Assessment Matrix, Row 6 and Column 4.
See School of Allied Health Professions, Overview Assessment Matrix, Columns 5, 6
2010 Self-study with external review
Physician Assistant, MS Yes Catalog, Website See School of Allied Health Professions, Overview Assessment Matrix, Rows 1, 2, 5, 8, 9
See School of Allied Health Professions, Overview Assessment Matrix, Row 6 and Column 4.
See School of Allied Health Professions, Overview Assessment Matrix, Columns 5, 6
2000 Accreditation Review Committee on Education for the Physician Assistant (ARC-PA)
WASC EER Report Appendix E 190
RETURN TO CONTENTS
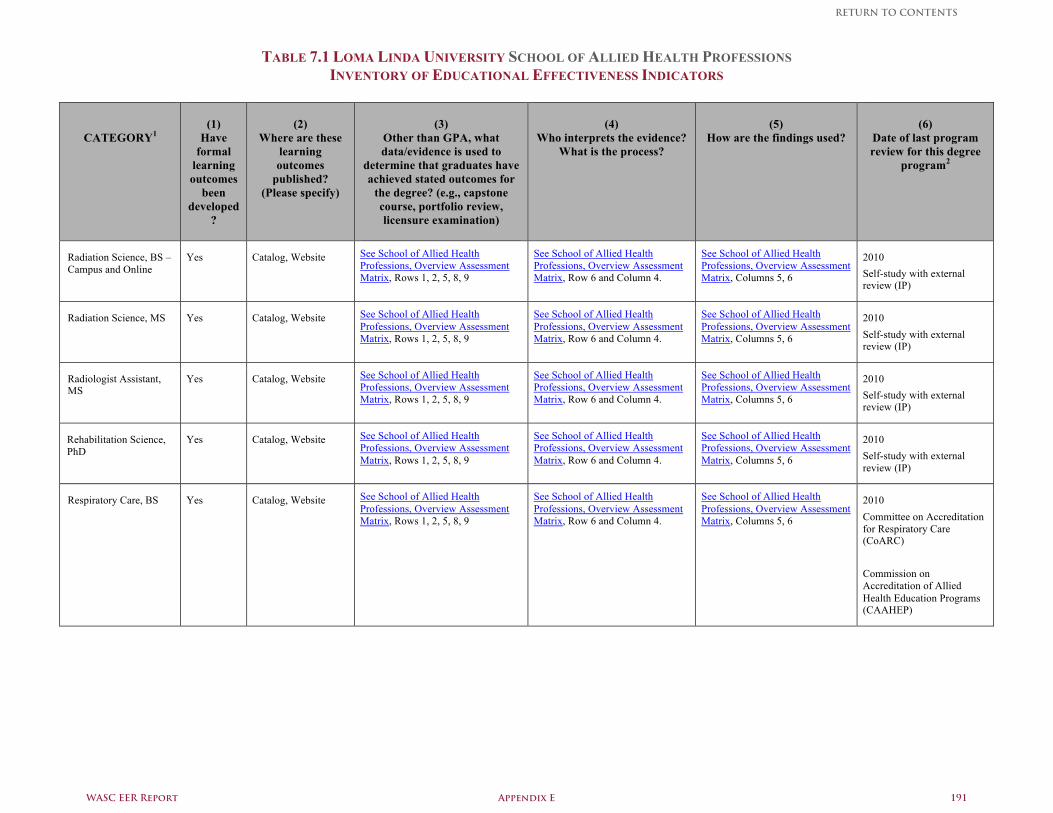
TABLE 7.1 LOMA LINDA UNIVERSITY SCHOOL OF ALLIED HEALTH PROFESSIONS INVENTORY OF EDUCATIONAL EFFECTIVENESS INDICATORS
CATEGORY1
(1)
Have formal
learning outcomes
been developed
?
(2)
Where are these learning outcomes
published? (Please specify)
(3)
Other than GPA, what data/evidence is used to
determine that graduates have achieved stated outcomes for
the degree? (e.g., capstone course, portfolio review, licensure examination)
(4)
Who interprets the evidence? What is the process?
(5)
How are the findings used?
(6)
Date of last program review for this degree
program2
Radiation Science, BS – Campus and Online
Yes Catalog, Website See School of Allied Health Professions, Overview Assessment Matrix, Rows 1, 2, 5, 8, 9
See School of Allied Health Professions, Overview Assessment Matrix, Row 6 and Column 4.
See School of Allied Health Professions, Overview Assessment Matrix, Columns 5, 6
2010 Self-study with external review (IP)
Radiation Science, MS Yes Catalog, Website See School of Allied Health Professions, Overview Assessment Matrix, Rows 1, 2, 5, 8, 9
See School of Allied Health Professions, Overview Assessment Matrix, Row 6 and Column 4.
See School of Allied Health Professions, Overview Assessment Matrix, Columns 5, 6
2010 Self-study with external review (IP)
Radiologist Assistant, MS
Yes Catalog, Website See School of Allied Health Professions, Overview Assessment Matrix, Rows 1, 2, 5, 8, 9
See School of Allied Health Professions, Overview Assessment Matrix, Row 6 and Column 4.
See School of Allied Health Professions, Overview Assessment Matrix, Columns 5, 6
2010 Self-study with external review (IP)
Rehabilitation Science, PhD
Yes Catalog, Website See School of Allied Health Professions, Overview Assessment Matrix, Rows 1, 2, 5, 8, 9
See School of Allied Health Professions, Overview Assessment Matrix, Row 6 and Column 4.
See School of Allied Health Professions, Overview Assessment Matrix, Columns 5, 6
2010 Self-study with external review (IP)
Respiratory Care, BS
Yes Catalog, Website See School of Allied Health Professions, Overview Assessment Matrix, Rows 1, 2, 5, 8, 9
See School of Allied Health Professions, Overview Assessment Matrix, Row 6 and Column 4.
See School of Allied Health Professions, Overview Assessment Matrix, Columns 5, 6
2010 Committee on Accreditation for Respiratory Care (CoARC) Commission on Accreditation of Allied Health Education Programs (CAAHEP)
WASC EER Report Appendix E 191
RETURN TO CONTENTS
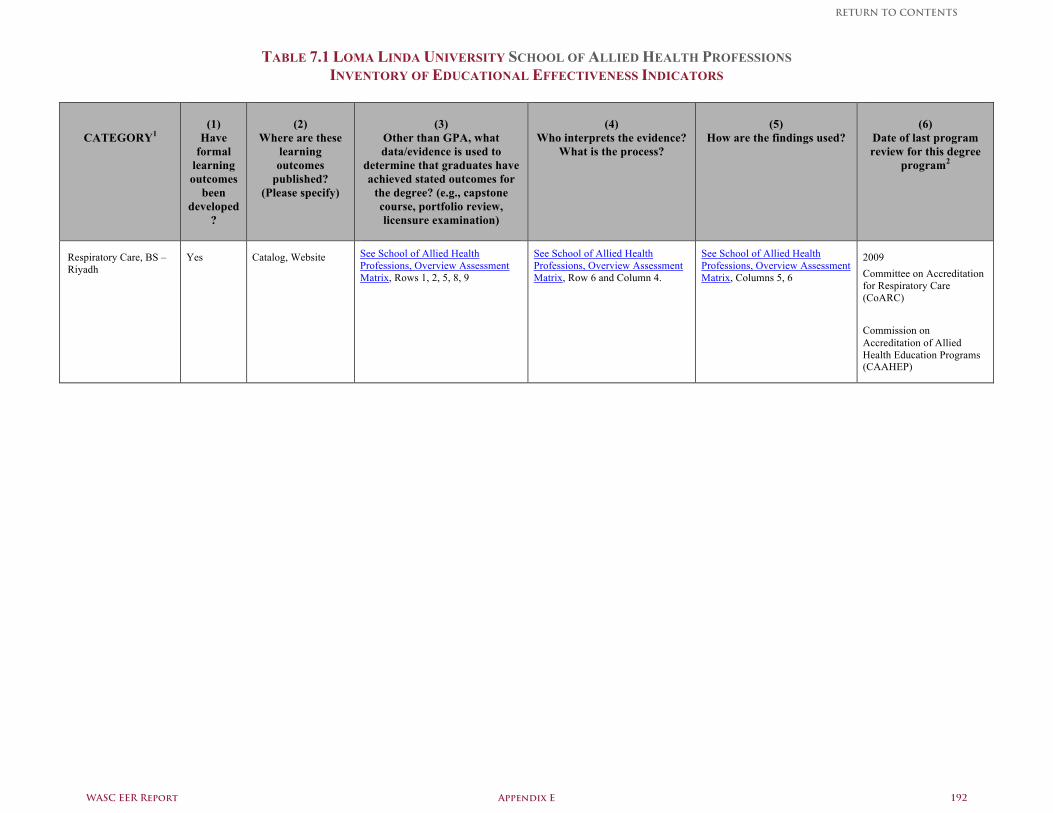
TABLE 7.1 LOMA LINDA UNIVERSITY SCHOOL OF ALLIED HEALTH PROFESSIONS INVENTORY OF EDUCATIONAL EFFECTIVENESS INDICATORS
CATEGORY1
(1)
Have formal
learning outcomes
been developed
?
(2)
Where are these learning outcomes
published? (Please specify)
(3)
Other than GPA, what data/evidence is used to
determine that graduates have achieved stated outcomes for
the degree? (e.g., capstone course, portfolio review, licensure examination)
(4)
Who interprets the evidence? What is the process?
(5)
How are the findings used?
(6)
Date of last program review for this degree
program2
Respiratory Care, BS – Riyadh
Yes Catalog, Website See School of Allied Health Professions, Overview Assessment Matrix, Rows 1, 2, 5, 8, 9
See School of Allied Health Professions, Overview Assessment Matrix, Row 6 and Column 4.
See School of Allied Health Professions, Overview Assessment Matrix, Columns 5, 6
2009 Committee on Accreditation for Respiratory Care (CoARC) Commission on Accreditation of Allied Health Education Programs (CAAHEP)
WASC EER Report Appendix E 192
RETURN TO CONTENTS
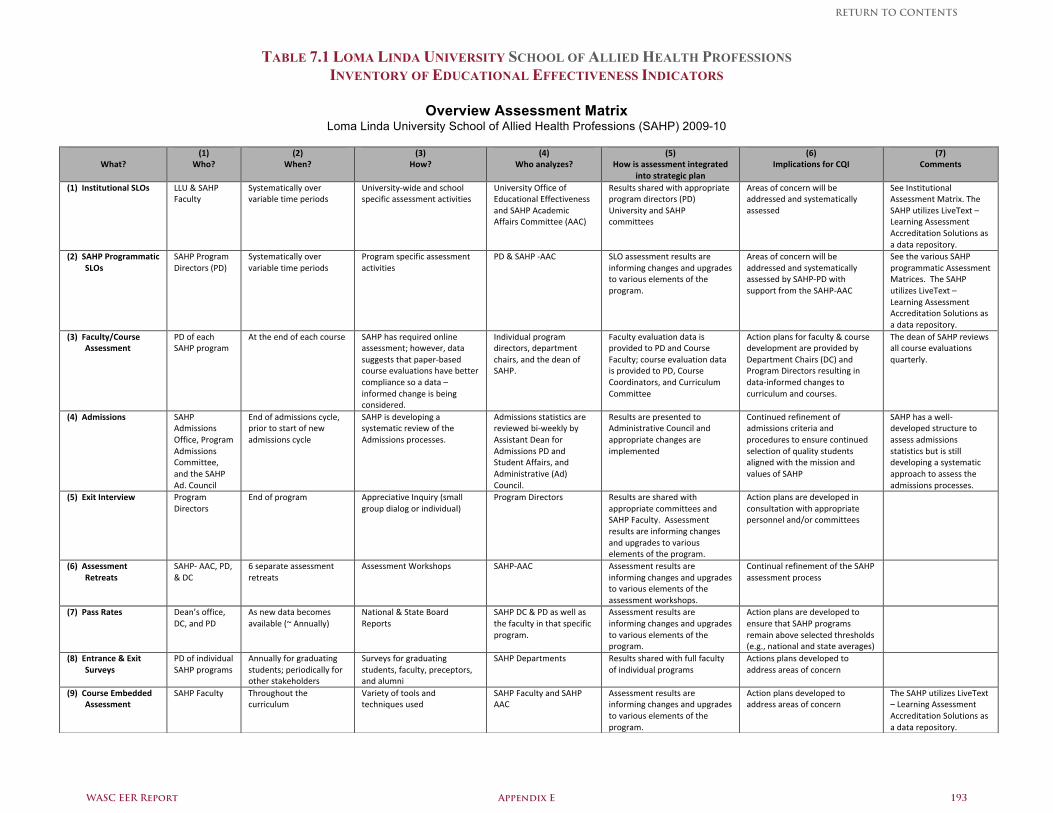
TABLE 7.1 LOMA LINDA UNIVERSITY SCHOOL OF ALLIED HEALTH PROFESSIONS INVENTORY OF EDUCATIONAL EFFECTIVENESS INDICATORS
Overview Assessment Matrix
Loma Linda University School of Allied Health Professions (SAHP) 2009-10
What?
(1) Who?
(2) When?
(3) How?
(4) Who analyzes?
(5) How is assessment integrated
into strategic plan
(6) Implications for CQI
(7) Comments
(1) Institutional SLOs
LLU & SAHP Faculty
Systematically over variable time periods
University‐wide and school specific assessment activities
University Office of Educational Effectiveness and SAHP Academic Affairs Committee (AAC)
Results shared with appropriate program directors (PD) University and SAHP committees
Areas of concern will be addressed and systematically assessed
See Institutional Assessment Matrix. The SAHP utilizes LiveText – Learning Assessment Accreditation Solutions as a data repository.
(2) SAHP Programmatic SLOs
SAHP Program Directors (PD)
Systematically over variable time periods
Program specific assessment activities
PD & SAHP ‐AAC SLO assessment results are informing changes and upgrades to various elements of the program.
Areas of concern will be addressed and systematically assessed by SAHP‐PD with support from the SAHP‐AAC
See the various SAHP programmatic Assessment Matrices. The SAHP utilizes LiveText – Learning Assessment Accreditation Solutions as a data repository.
(3) Faculty/Course Assessment
PD of each SAHP program
At the end of each course SAHP has required online assessment; however, data suggests that paper‐based course evaluations have better compliance so a data –informed change is being considered.
Individual program directors, department chairs, and the dean of SAHP.
Faculty evaluation data is provided to PD and Course Faculty; course evaluation data is provided to PD, Course Coordinators, and Curriculum Committee
Action plans for faculty & course development are provided by Department Chairs (DC) and Program Directors resulting in data‐informed changes to curriculum and courses.
The dean of SAHP reviews all course evaluations quarterly.
(4) Admissions SAHP Admissions Office, Program Admissions Committee, and the SAHP Ad. Council
End of admissions cycle, prior to start of new admissions cycle
SAHP is developing a systematic review of the Admissions processes.
Admissions statistics are reviewed bi‐weekly by Assistant Dean for Admissions PD and Student Affairs, and Administrative (Ad) Council.
Results are presented to Administrative Council and appropriate changes are implemented
Continued refinement of admissions criteria and procedures to ensure continued selection of quality students aligned with the mission and values of SAHP
SAHP has a well‐developed structure to assess admissions statistics but is still developing a systematic approach to assess the admissions processes.
(5) Exit Interview Program Directors
End of program Appreciative Inquiry (small group dialog or individual)
Program Directors Results are shared with appropriate committees and SAHP Faculty. Assessment results are informing changes and upgrades to various elements of the program.
Action plans are developed in consultation with appropriate personnel and/or committees
(6) Assessment Retreats
SAHP‐ AAC, PD, & DC
6 separate assessment retreats
Assessment Workshops SAHP‐AAC Assessment results are informing changes and upgrades to various elements of the assessment workshops.
Continual refinement of the SAHP assessment process
(7) Pass Rates Dean’s office, DC, and PD
As new data becomes available (~ Annually)
National & State Board Reports
SAHP DC & PD as well as the faculty in that specific program.
Assessment results are informing changes and upgrades to various elements of the program.
Action plans are developed to ensure that SAHP programs remain above selected thresholds (e.g., national and state averages)
(8) Entrance & Exit Surveys
PD of individual SAHP programs
Annually for graduating students; periodically for other stakeholders
Surveys for graduating students, faculty, preceptors, and alumni
SAHP Departments Results shared with full faculty of individual programs
Actions plans developed to address areas of concern
(9) Course Embedded Assessment
SAHP Faculty Throughout the curriculum
Variety of tools and techniques used
SAHP Faculty and SAHP AAC
Assessment results are informing changes and upgrades to various elements of the program.
Action plans developed to address areas of concern
The SAHP utilizes LiveText – Learning Assessment Accreditation Solutions as a data repository.
WASC EER Report Appendix E 193
RETURN TO CONTENTS
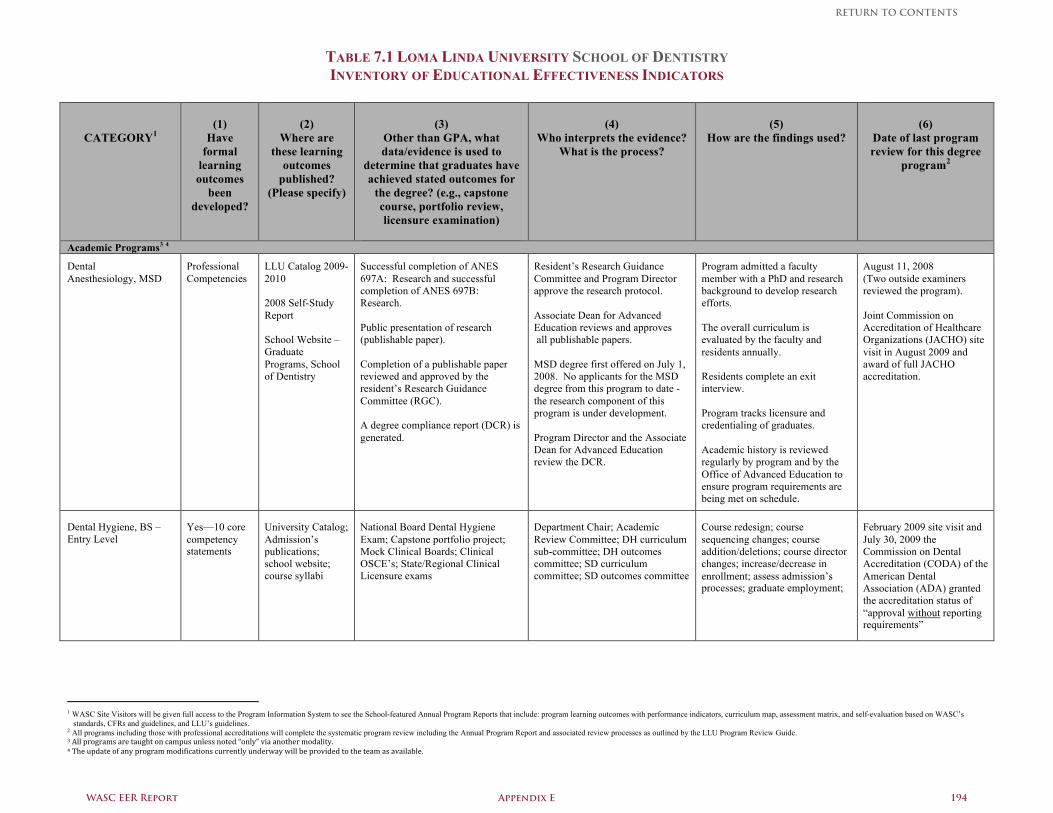
TABLE 7.1 LOMA LINDA UNIVERSITY SCHOOL OF DENTISTRY INVENTORY OF EDUCATIONAL EFFECTIVENESS INDICATORS
CATEGORY1
(1)
Have formal
learning outcomes
been developed?
(2)
Where are these learning
outcomes published?
(Please specify)
(3)
Other than GPA, what data/evidence is used to
determine that graduates have achieved stated outcomes for
the degree? (e.g., capstone course, portfolio review, licensure examination)
(4)
Who interprets the evidence? What is the process?
(5)
How are the findings used?
(6)
Date of last program review for this degree
program2
Academic Programs3 4
Dental Anesthesiology, MSD
Professional Competencies
LLU Catalog 2009-2010 2008 Self-Study Report School Website – Graduate Programs, School of Dentistry
Successful completion of ANES 697A: Research and successful completion of ANES 697B: Research. Public presentation of research (publishable paper). Completion of a publishable paper reviewed and approved by the resident’s Research Guidance Committee (RGC). A degree compliance report (DCR) is generated.
Resident’s Research Guidance Committee and Program Director approve the research protocol. Associate Dean for Advanced Education reviews and approves all publishable papers. MSD degree first offered on July 1, 2008. No applicants for the MSD degree from this program to date - the research component of this program is under development. Program Director and the Associate Dean for Advanced Education review the DCR.
Program admitted a faculty member with a PhD and research background to develop research efforts. The overall curriculum is evaluated by the faculty and residents annually. Residents complete an exit interview. Program tracks licensure and credentialing of graduates. Academic history is reviewed regularly by program and by the Office of Advanced Education to ensure program requirements are being met on schedule.
August 11, 2008 (Two outside examiners reviewed the program). Joint Commission on Accreditation of Healthcare Organizations (JACHO) site visit in August 2009 and award of full JACHO accreditation.
Dental Hygiene, BS – Entry Level
Yes—10 core competency statements
University Catalog; Admission’s publications; school website; course syllabi
National Board Dental Hygiene Exam; Capstone portfolio project; Mock Clinical Boards; Clinical OSCE’s; State/Regional Clinical Licensure exams
Department Chair; Academic Review Committee; DH curriculum sub-committee; DH outcomes committee; SD curriculum committee; SD outcomes committee
Course redesign; course sequencing changes; course addition/deletions; course director changes; increase/decrease in enrollment; assess admission’s processes; graduate employment;
February 2009 site visit and July 30, 2009 the Commission on Dental Accreditation (CODA) of the American Dental Association (ADA) granted the accreditation status of “approval without reporting requirements”
1 WASC Site Visitors will be given full access to the Program Information System to see the School-featured Annual Program Reports that include: program learning outcomes with performance indicators, curriculum map, assessment matrix, and self-evaluation based on WASC’s
standards, CFRs and guidelines, and LLU’s guidelines. 2 All programs including those with professional accreditations will complete the systematic program review including the Annual Program Report and associated review processes as outlined by the LLU Program Review Guide. 3 All programs are taught on campus unless noted “only” via another modality. 4 The update of any program modifications currently underway will be provided to the team as available.
WASC EER Report Appendix E 194
RETURN TO CONTENTS
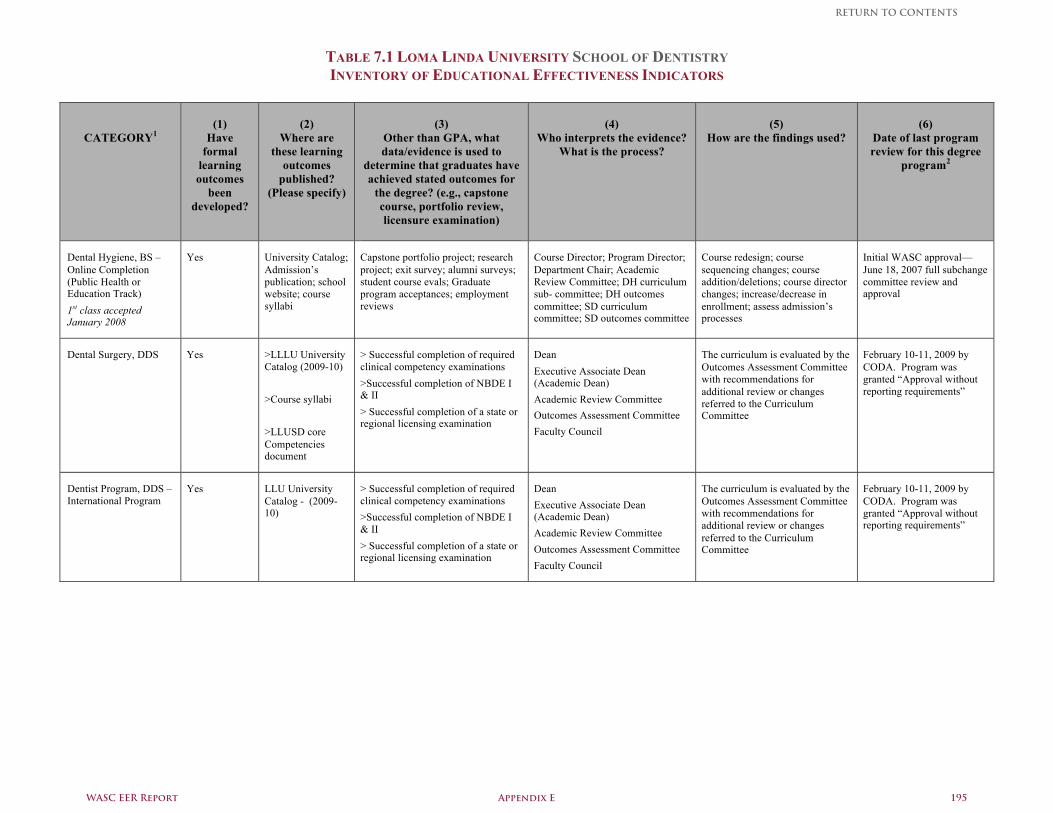
TABLE 7.1 LOMA LINDA UNIVERSITY SCHOOL OF DENTISTRY INVENTORY OF EDUCATIONAL EFFECTIVENESS INDICATORS
CATEGORY1
(1)
Have formal
learning outcomes
been developed?
(2)
Where are these learning
outcomes published?
(Please specify)
(3)
Other than GPA, what data/evidence is used to
determine that graduates have achieved stated outcomes for
the degree? (e.g., capstone course, portfolio review, licensure examination)
(4)
Who interprets the evidence? What is the process?
(5)
How are the findings used?
(6)
Date of last program review for this degree
program2
Dental Hygiene, BS – Online Completion (Public Health or Education Track) 1st class accepted January 2008
Yes University Catalog; Admission’s publication; school website; course syllabi
Capstone portfolio project; research project; exit survey; alumni surveys; student course evals; Graduate program acceptances; employment reviews
Course Director; Program Director; Department Chair; Academic Review Committee; DH curriculum sub- committee; DH outcomes committee; SD curriculum committee; SD outcomes committee
Course redesign; course sequencing changes; course addition/deletions; course director changes; increase/decrease in enrollment; assess admission’s processes
Initial WASC approval—June 18, 2007 full subchange committee review and approval
Dental Surgery, DDS Yes >LLLU University Catalog (2009-10) >Course syllabi >LLUSD core Competencies document
> Successful completion of required clinical competency examinations >Successful completion of NBDE I & II > Successful completion of a state or regional licensing examination
Dean Executive Associate Dean (Academic Dean) Academic Review Committee Outcomes Assessment Committee Faculty Council
The curriculum is evaluated by the Outcomes Assessment Committee with recommendations for additional review or changes referred to the Curriculum Committee
February 10-11, 2009 by CODA. Program was granted “Approval without reporting requirements”
Dentist Program, DDS – International Program
Yes LLU University Catalog - (2009-10)
> Successful completion of required clinical competency examinations >Successful completion of NBDE I & II > Successful completion of a state or regional licensing examination
Dean Executive Associate Dean (Academic Dean) Academic Review Committee Outcomes Assessment Committee Faculty Council
The curriculum is evaluated by the Outcomes Assessment Committee with recommendations for additional review or changes referred to the Curriculum Committee
February 10-11, 2009 by CODA. Program was granted “Approval without reporting requirements”
WASC EER Report Appendix E 195
RETURN TO CONTENTS
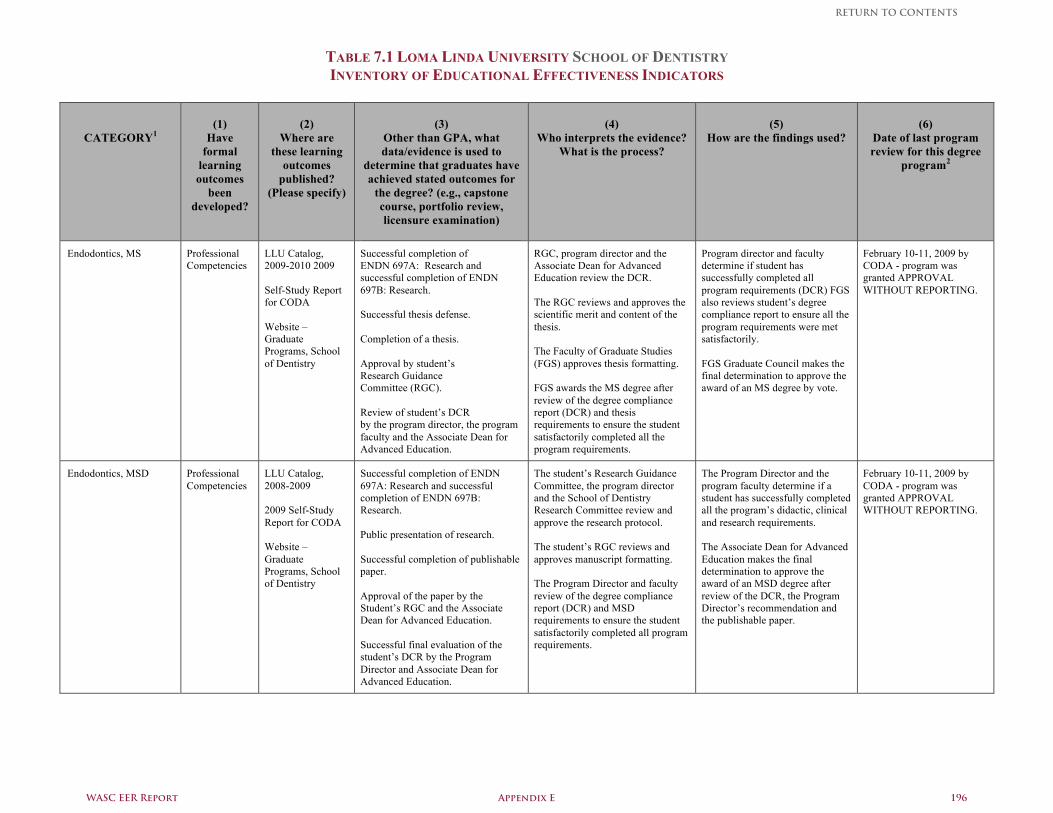
TABLE 7.1 LOMA LINDA UNIVERSITY SCHOOL OF DENTISTRY INVENTORY OF EDUCATIONAL EFFECTIVENESS INDICATORS
CATEGORY1
(1)
Have formal
learning outcomes
been developed?
(2)
Where are these learning
outcomes published?
(Please specify)
(3)
Other than GPA, what data/evidence is used to
determine that graduates have achieved stated outcomes for
the degree? (e.g., capstone course, portfolio review, licensure examination)
(4)
Who interprets the evidence? What is the process?
(5)
How are the findings used?
(6)
Date of last program review for this degree
program2
Endodontics, MS Professional Competencies
LLU Catalog, 2009-2010 2009 Self-Study Report for CODA Website – Graduate Programs, School of Dentistry
Successful completion of ENDN 697A: Research and successful completion of ENDN 697B: Research. Successful thesis defense. Completion of a thesis. Approval by student’s Research Guidance Committee (RGC). Review of student’s DCR by the program director, the program faculty and the Associate Dean for Advanced Education.
RGC, program director and the Associate Dean for Advanced Education review the DCR. The RGC reviews and approves the scientific merit and content of the thesis. The Faculty of Graduate Studies (FGS) approves thesis formatting. FGS awards the MS degree after review of the degree compliance report (DCR) and thesis requirements to ensure the student satisfactorily completed all the program requirements.
Program director and faculty determine if student has successfully completed all program requirements (DCR) FGS also reviews student’s degree compliance report to ensure all the program requirements were met satisfactorily. FGS Graduate Council makes the final determination to approve the award of an MS degree by vote.
February 10-11, 2009 by CODA - program was granted APPROVAL WITHOUT REPORTING.
Endodontics, MSD
Professional Competencies
LLU Catalog, 2008-2009 2009 Self-Study Report for CODA Website – Graduate Programs, School of Dentistry
Successful completion of ENDN 697A: Research and successful completion of ENDN 697B: Research. Public presentation of research. Successful completion of publishable paper. Approval of the paper by the Student’s RGC and the Associate Dean for Advanced Education. Successful final evaluation of the student’s DCR by the Program Director and Associate Dean for Advanced Education.
The student’s Research Guidance Committee, the program director and the School of Dentistry Research Committee review and approve the research protocol. The student’s RGC reviews and approves manuscript formatting. The Program Director and faculty review of the degree compliance report (DCR) and MSD requirements to ensure the student satisfactorily completed all program requirements.
The Program Director and the program faculty determine if a student has successfully completed all the program’s didactic, clinical and research requirements. The Associate Dean for Advanced Education makes the final determination to approve the award of an MSD degree after review of the DCR, the Program Director’s recommendation and the publishable paper.
February 10-11, 2009 by CODA - program was granted APPROVAL WITHOUT REPORTING.
WASC EER Report Appendix E 196
RETURN TO CONTENTS
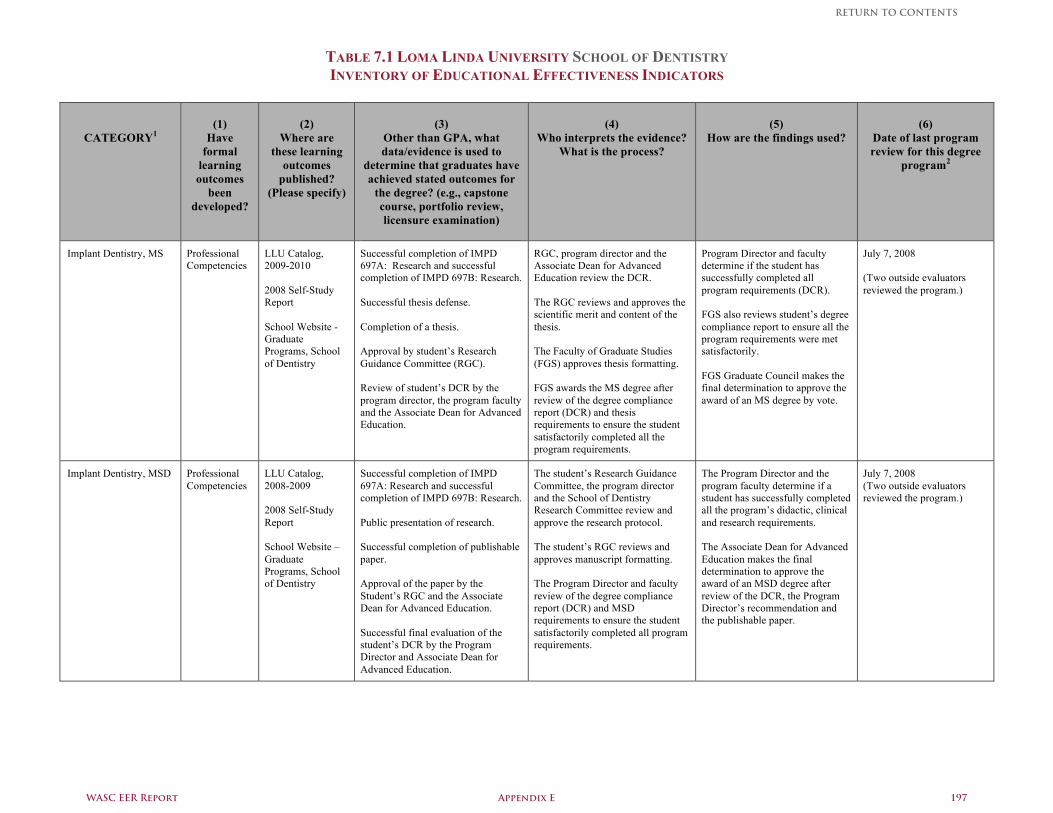
TABLE 7.1 LOMA LINDA UNIVERSITY SCHOOL OF DENTISTRY INVENTORY OF EDUCATIONAL EFFECTIVENESS INDICATORS
CATEGORY1
(1)
Have formal
learning outcomes
been developed?
(2)
Where are these learning
outcomes published?
(Please specify)
(3)
Other than GPA, what data/evidence is used to
determine that graduates have achieved stated outcomes for
the degree? (e.g., capstone course, portfolio review, licensure examination)
(4)
Who interprets the evidence? What is the process?
(5)
How are the findings used?
(6)
Date of last program review for this degree
program2
Implant Dentistry, MS Professional Competencies
LLU Catalog, 2009-2010 2008 Self-Study Report School Website - Graduate Programs, School of Dentistry
Successful completion of IMPD 697A: Research and successful completion of IMPD 697B: Research. Successful thesis defense. Completion of a thesis. Approval by student’s Research Guidance Committee (RGC). Review of student’s DCR by the program director, the program faculty and the Associate Dean for Advanced Education.
RGC, program director and the Associate Dean for Advanced Education review the DCR. The RGC reviews and approves the scientific merit and content of the thesis. The Faculty of Graduate Studies (FGS) approves thesis formatting. FGS awards the MS degree after review of the degree compliance report (DCR) and thesis requirements to ensure the student satisfactorily completed all the program requirements.
Program Director and faculty determine if the student has successfully completed all program requirements (DCR). FGS also reviews student’s degree compliance report to ensure all the program requirements were met satisfactorily. FGS Graduate Council makes the final determination to approve the award of an MS degree by vote.
July 7, 2008 (Two outside evaluators reviewed the program.)
Implant Dentistry, MSD
Professional Competencies
LLU Catalog, 2008-2009 2008 Self-Study Report School Website – Graduate Programs, School of Dentistry
Successful completion of IMPD 697A: Research and successful completion of IMPD 697B: Research. Public presentation of research. Successful completion of publishable paper. Approval of the paper by the Student’s RGC and the Associate Dean for Advanced Education. Successful final evaluation of the student’s DCR by the Program Director and Associate Dean for Advanced Education.
The student’s Research Guidance Committee, the program director and the School of Dentistry Research Committee review and approve the research protocol. The student’s RGC reviews and approves manuscript formatting. The Program Director and faculty review of the degree compliance report (DCR) and MSD requirements to ensure the student satisfactorily completed all program requirements.
The Program Director and the program faculty determine if a student has successfully completed all the program’s didactic, clinical and research requirements. The Associate Dean for Advanced Education makes the final determination to approve the award of an MSD degree after review of the DCR, the Program Director’s recommendation and the publishable paper.
July 7, 2008 (Two outside evaluators reviewed the program.)
WASC EER Report Appendix E 197
RETURN TO CONTENTS
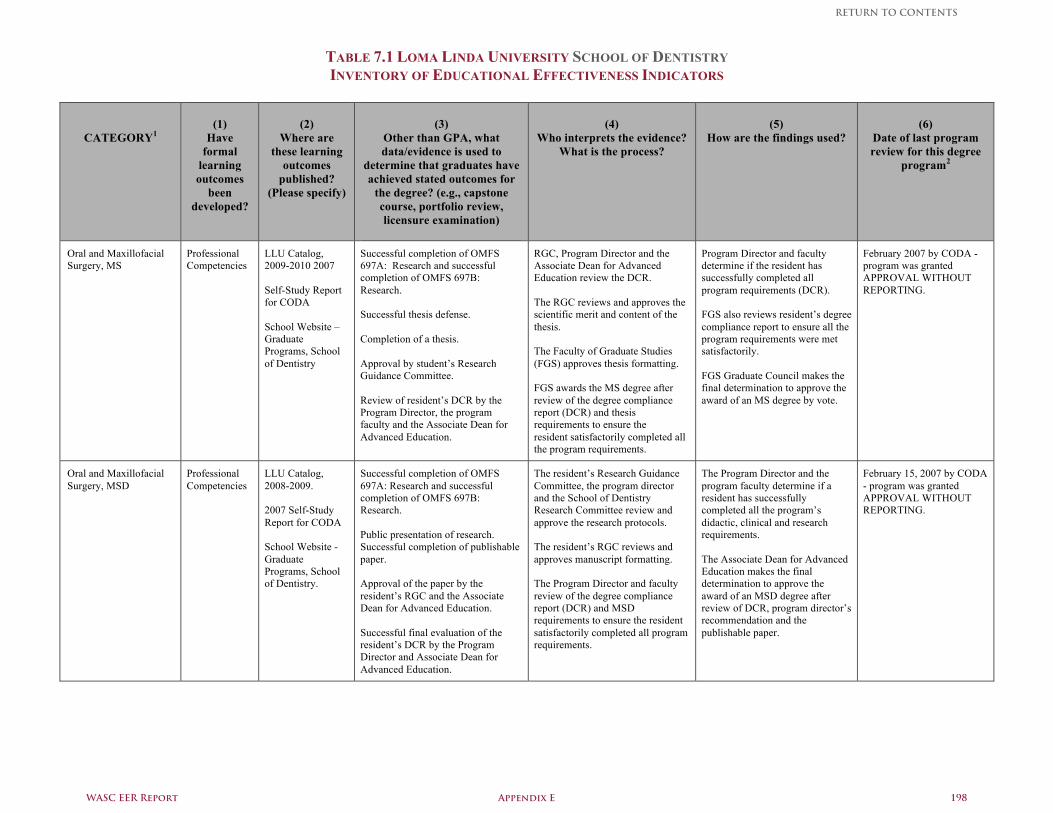
TABLE 7.1 LOMA LINDA UNIVERSITY SCHOOL OF DENTISTRY INVENTORY OF EDUCATIONAL EFFECTIVENESS INDICATORS
CATEGORY1
(1)
Have formal
learning outcomes
been developed?
(2)
Where are these learning
outcomes published?
(Please specify)
(3)
Other than GPA, what data/evidence is used to
determine that graduates have achieved stated outcomes for
the degree? (e.g., capstone course, portfolio review, licensure examination)
(4)
Who interprets the evidence? What is the process?
(5)
How are the findings used?
(6)
Date of last program review for this degree
program2
Oral and Maxillofacial Surgery, MS
Professional Competencies
LLU Catalog, 2009-2010 2007 Self-Study Report for CODA School Website – Graduate Programs, School of Dentistry
Successful completion of OMFS 697A: Research and successful completion of OMFS 697B: Research. Successful thesis defense. Completion of a thesis. Approval by student’s Research Guidance Committee. Review of resident’s DCR by the Program Director, the program faculty and the Associate Dean for Advanced Education.
RGC, Program Director and the Associate Dean for Advanced Education review the DCR. The RGC reviews and approves the scientific merit and content of the thesis. The Faculty of Graduate Studies (FGS) approves thesis formatting. FGS awards the MS degree after review of the degree compliance report (DCR) and thesis requirements to ensure the resident satisfactorily completed all the program requirements.
Program Director and faculty determine if the resident has successfully completed all program requirements (DCR). FGS also reviews resident’s degree compliance report to ensure all the program requirements were met satisfactorily. FGS Graduate Council makes the final determination to approve the award of an MS degree by vote.
February 2007 by CODA - program was granted APPROVAL WITHOUT REPORTING.
Oral and Maxillofacial Surgery, MSD
Professional Competencies
LLU Catalog, 2008-2009. 2007 Self-Study Report for CODA School Website - Graduate Programs, School of Dentistry.
Successful completion of OMFS 697A: Research and successful completion of OMFS 697B: Research. Public presentation of research. Successful completion of publishable paper. Approval of the paper by the resident’s RGC and the Associate Dean for Advanced Education. Successful final evaluation of the resident’s DCR by the Program Director and Associate Dean for Advanced Education.
The resident’s Research Guidance Committee, the program director and the School of Dentistry Research Committee review and approve the research protocols. The resident’s RGC reviews and approves manuscript formatting. The Program Director and faculty review of the degree compliance report (DCR) and MSD requirements to ensure the resident satisfactorily completed all program requirements.
The Program Director and the program faculty determine if a resident has successfully completed all the program’s didactic, clinical and research requirements. The Associate Dean for Advanced Education makes the final determination to approve the award of an MSD degree after review of DCR, program director’s recommendation and the publishable paper.
February 15, 2007 by CODA - program was granted APPROVAL WITHOUT REPORTING.
WASC EER Report Appendix E 198
RETURN TO CONTENTS
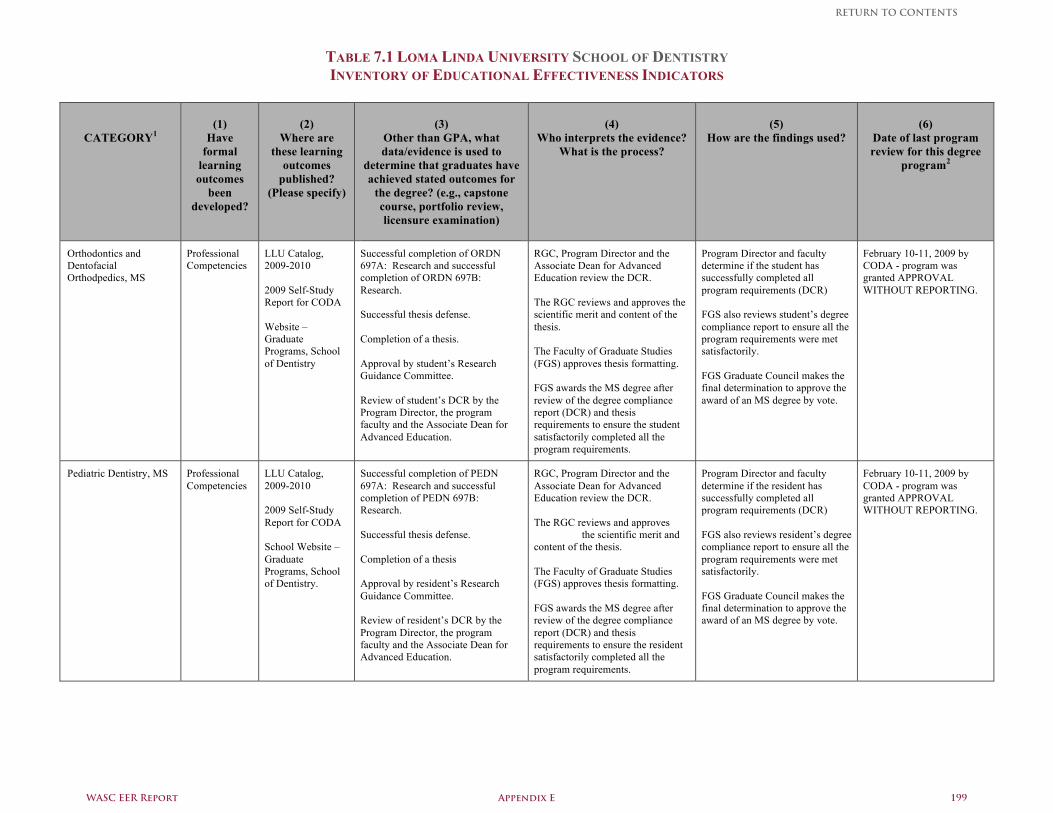
TABLE 7.1 LOMA LINDA UNIVERSITY SCHOOL OF DENTISTRY INVENTORY OF EDUCATIONAL EFFECTIVENESS INDICATORS
CATEGORY1
(1)
Have formal
learning outcomes
been developed?
(2)
Where are these learning
outcomes published?
(Please specify)
(3)
Other than GPA, what data/evidence is used to
determine that graduates have achieved stated outcomes for
the degree? (e.g., capstone course, portfolio review, licensure examination)
(4)
Who interprets the evidence? What is the process?
(5)
How are the findings used?
(6)
Date of last program review for this degree
program2
Orthodontics and Dentofacial Orthodpedics, MS
Professional Competencies
LLU Catalog, 2009-2010 2009 Self-Study Report for CODA Website – Graduate Programs, School of Dentistry
Successful completion of ORDN 697A: Research and successful completion of ORDN 697B: Research. Successful thesis defense. Completion of a thesis. Approval by student’s Research Guidance Committee. Review of student’s DCR by the Program Director, the program faculty and the Associate Dean for Advanced Education.
RGC, Program Director and the Associate Dean for Advanced Education review the DCR. The RGC reviews and approves the scientific merit and content of the thesis. The Faculty of Graduate Studies (FGS) approves thesis formatting. FGS awards the MS degree after review of the degree compliance report (DCR) and thesis requirements to ensure the student satisfactorily completed all the program requirements.
Program Director and faculty determine if the student has successfully completed all program requirements (DCR) FGS also reviews student’s degree compliance report to ensure all the program requirements were met satisfactorily. FGS Graduate Council makes the final determination to approve the award of an MS degree by vote.
February 10-11, 2009 by CODA - program was granted APPROVAL WITHOUT REPORTING.
Pediatric Dentistry, MS
Professional Competencies
LLU Catalog, 2009-2010 2009 Self-Study Report for CODA School Website – Graduate Programs, School of Dentistry.
Successful completion of PEDN 697A: Research and successful completion of PEDN 697B: Research. Successful thesis defense. Completion of a thesis Approval by resident’s Research Guidance Committee. Review of resident’s DCR by the Program Director, the program faculty and the Associate Dean for Advanced Education.
RGC, Program Director and the Associate Dean for Advanced Education review the DCR. The RGC reviews and approves the scientific merit and content of the thesis. The Faculty of Graduate Studies (FGS) approves thesis formatting. FGS awards the MS degree after review of the degree compliance report (DCR) and thesis requirements to ensure the resident satisfactorily completed all the program requirements.
Program Director and faculty determine if the resident has successfully completed all program requirements (DCR) FGS also reviews resident’s degree compliance report to ensure all the program requirements were met satisfactorily. FGS Graduate Council makes the final determination to approve the award of an MS degree by vote.
February 10-11, 2009 by CODA - program was granted APPROVAL WITHOUT REPORTING.
WASC EER Report Appendix E 199
RETURN TO CONTENTS
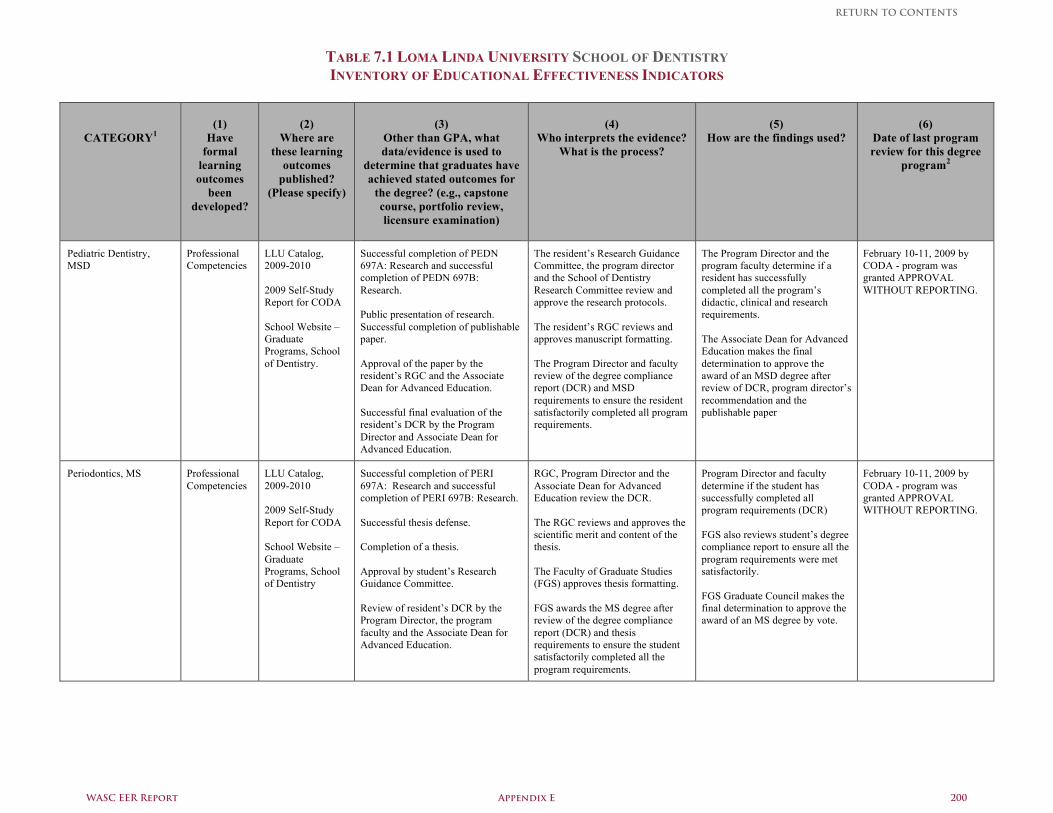
TABLE 7.1 LOMA LINDA UNIVERSITY SCHOOL OF DENTISTRY INVENTORY OF EDUCATIONAL EFFECTIVENESS INDICATORS
CATEGORY1
(1)
Have formal
learning outcomes
been developed?
(2)
Where are these learning
outcomes published?
(Please specify)
(3)
Other than GPA, what data/evidence is used to
determine that graduates have achieved stated outcomes for
the degree? (e.g., capstone course, portfolio review, licensure examination)
(4)
Who interprets the evidence? What is the process?
(5)
How are the findings used?
(6)
Date of last program review for this degree
program2
Pediatric Dentistry, MSD
Professional Competencies
LLU Catalog, 2009-2010 2009 Self-Study Report for CODA School Website – Graduate Programs, School of Dentistry.
Successful completion of PEDN 697A: Research and successful completion of PEDN 697B: Research. Public presentation of research. Successful completion of publishable paper. Approval of the paper by the resident’s RGC and the Associate Dean for Advanced Education. Successful final evaluation of the resident’s DCR by the Program Director and Associate Dean for Advanced Education.
The resident’s Research Guidance Committee, the program director and the School of Dentistry Research Committee review and approve the research protocols. The resident’s RGC reviews and approves manuscript formatting. The Program Director and faculty review of the degree compliance report (DCR) and MSD requirements to ensure the resident satisfactorily completed all program requirements.
The Program Director and the program faculty determine if a resident has successfully completed all the program’s didactic, clinical and research requirements. The Associate Dean for Advanced Education makes the final determination to approve the award of an MSD degree after review of DCR, program director’s recommendation and the publishable paper
February 10-11, 2009 by CODA - program was granted APPROVAL WITHOUT REPORTING.
Periodontics, MS
Professional Competencies
LLU Catalog, 2009-2010 2009 Self-Study Report for CODA School Website – Graduate Programs, School of Dentistry
Successful completion of PERI 697A: Research and successful completion of PERI 697B: Research. Successful thesis defense. Completion of a thesis. Approval by student’s Research Guidance Committee. Review of resident’s DCR by the Program Director, the program faculty and the Associate Dean for Advanced Education.
RGC, Program Director and the Associate Dean for Advanced Education review the DCR. The RGC reviews and approves the scientific merit and content of the thesis. The Faculty of Graduate Studies (FGS) approves thesis formatting. FGS awards the MS degree after review of the degree compliance report (DCR) and thesis requirements to ensure the student satisfactorily completed all the program requirements.
Program Director and faculty determine if the student has successfully completed all program requirements (DCR) FGS also reviews student’s degree compliance report to ensure all the program requirements were met satisfactorily. FGS Graduate Council makes the final determination to approve the award of an MS degree by vote.
February 10-11, 2009 by CODA - program was granted APPROVAL WITHOUT REPORTING.
WASC EER Report Appendix E 200
RETURN TO CONTENTS
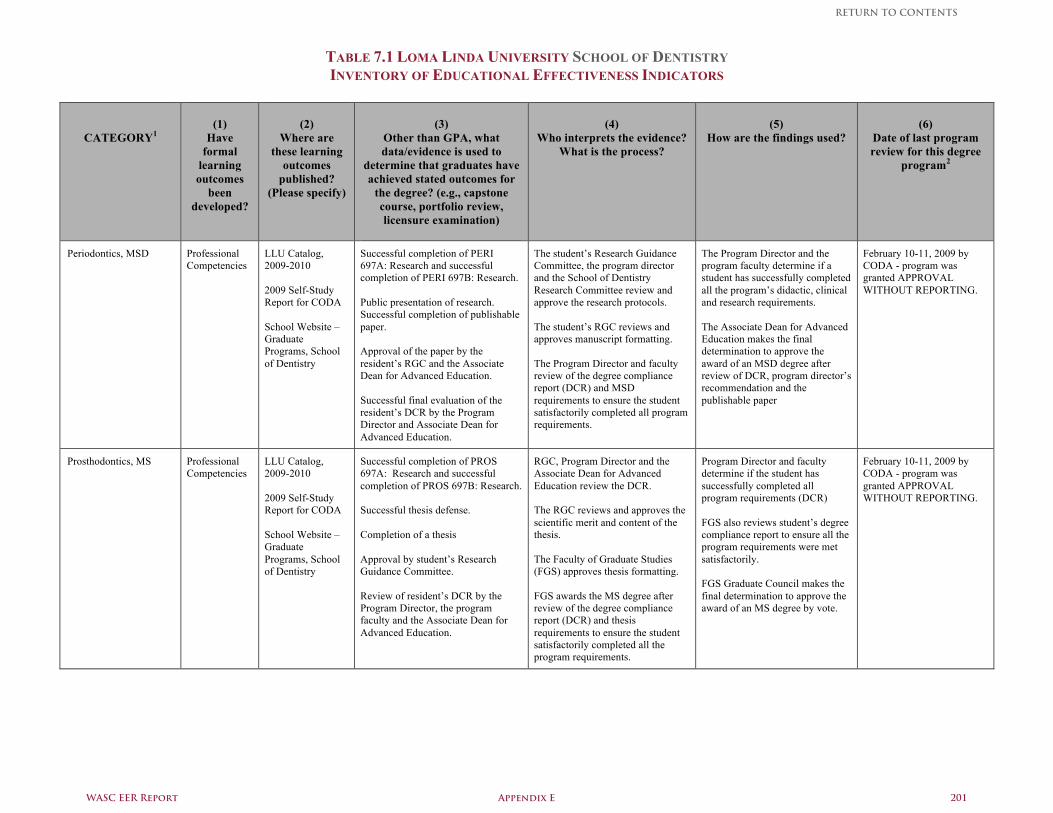
TABLE 7.1 LOMA LINDA UNIVERSITY SCHOOL OF DENTISTRY INVENTORY OF EDUCATIONAL EFFECTIVENESS INDICATORS
CATEGORY1
(1)
Have formal
learning outcomes
been developed?
(2)
Where are these learning
outcomes published?
(Please specify)
(3)
Other than GPA, what data/evidence is used to
determine that graduates have achieved stated outcomes for
the degree? (e.g., capstone course, portfolio review, licensure examination)
(4)
Who interprets the evidence? What is the process?
(5)
How are the findings used?
(6)
Date of last program review for this degree
program2
Periodontics, MSD
Professional Competencies
LLU Catalog, 2009-2010 2009 Self-Study Report for CODA School Website – Graduate Programs, School of Dentistry
Successful completion of PERI 697A: Research and successful completion of PERI 697B: Research. Public presentation of research. Successful completion of publishable paper. Approval of the paper by the resident’s RGC and the Associate Dean for Advanced Education. Successful final evaluation of the resident’s DCR by the Program Director and Associate Dean for Advanced Education.
The student’s Research Guidance Committee, the program director and the School of Dentistry Research Committee review and approve the research protocols. The student’s RGC reviews and approves manuscript formatting. The Program Director and faculty review of the degree compliance report (DCR) and MSD requirements to ensure the student satisfactorily completed all program requirements.
The Program Director and the program faculty determine if a student has successfully completed all the program’s didactic, clinical and research requirements. The Associate Dean for Advanced Education makes the final determination to approve the award of an MSD degree after review of DCR, program director’s recommendation and the publishable paper
February 10-11, 2009 by CODA - program was granted APPROVAL WITHOUT REPORTING.
Prosthodontics, MS
Professional Competencies
LLU Catalog, 2009-2010 2009 Self-Study Report for CODA School Website – Graduate Programs, School of Dentistry
Successful completion of PROS 697A: Research and successful completion of PROS 697B: Research. Successful thesis defense. Completion of a thesis Approval by student’s Research Guidance Committee. Review of resident’s DCR by the Program Director, the program faculty and the Associate Dean for Advanced Education.
RGC, Program Director and the Associate Dean for Advanced Education review the DCR. The RGC reviews and approves the scientific merit and content of the thesis. The Faculty of Graduate Studies (FGS) approves thesis formatting. FGS awards the MS degree after review of the degree compliance report (DCR) and thesis requirements to ensure the student satisfactorily completed all the program requirements.
Program Director and faculty determine if the student has successfully completed all program requirements (DCR) FGS also reviews student’s degree compliance report to ensure all the program requirements were met satisfactorily. FGS Graduate Council makes the final determination to approve the award of an MS degree by vote.
February 10-11, 2009 by CODA - program was granted APPROVAL WITHOUT REPORTING.
WASC EER Report Appendix E 201
RETURN TO CONTENTS
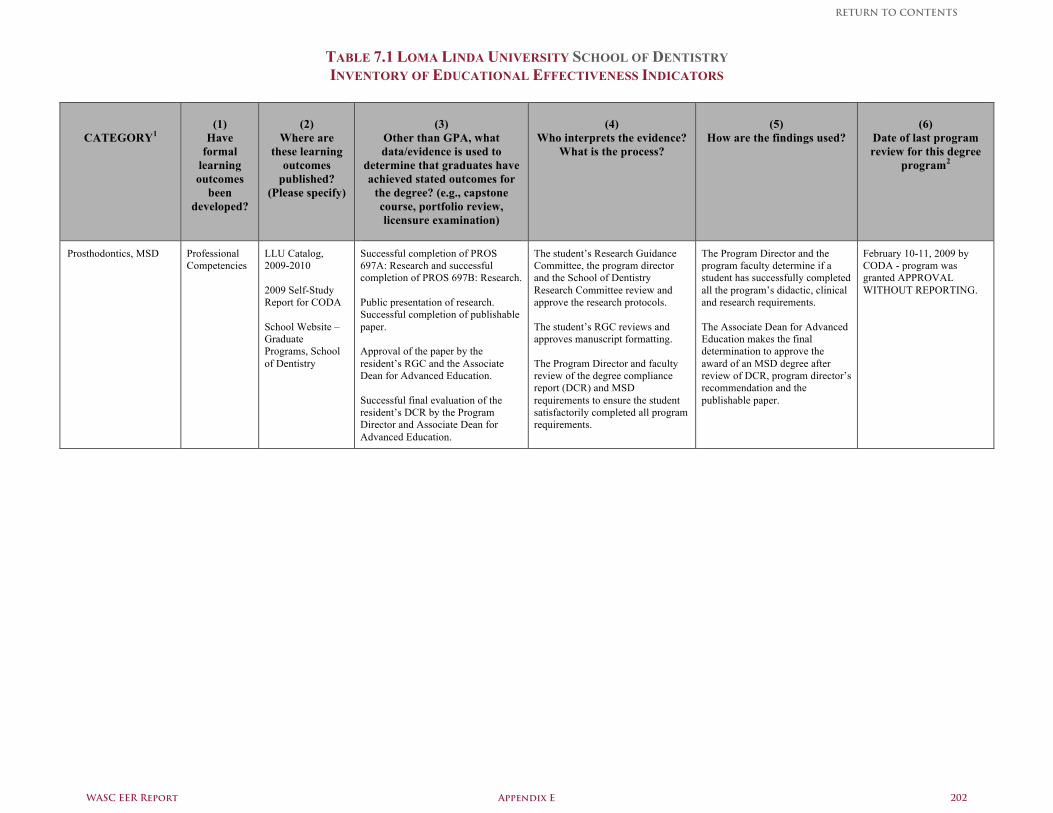
TABLE 7.1 LOMA LINDA UNIVERSITY SCHOOL OF DENTISTRY INVENTORY OF EDUCATIONAL EFFECTIVENESS INDICATORS
CATEGORY1
(1)
Have formal
learning outcomes
been developed?
(2)
Where are these learning
outcomes published?
(Please specify)
(3)
Other than GPA, what data/evidence is used to
determine that graduates have achieved stated outcomes for
the degree? (e.g., capstone course, portfolio review, licensure examination)
(4)
Who interprets the evidence? What is the process?
(5)
How are the findings used?
(6)
Date of last program review for this degree
program2
Prosthodontics, MSD
Professional Competencies
LLU Catalog, 2009-2010 2009 Self-Study Report for CODA School Website – Graduate Programs, School of Dentistry
Successful completion of PROS 697A: Research and successful completion of PROS 697B: Research. Public presentation of research. Successful completion of publishable paper. Approval of the paper by the resident’s RGC and the Associate Dean for Advanced Education. Successful final evaluation of the resident’s DCR by the Program Director and Associate Dean for Advanced Education.
The student’s Research Guidance Committee, the program director and the School of Dentistry Research Committee review and approve the research protocols. The student’s RGC reviews and approves manuscript formatting. The Program Director and faculty review of the degree compliance report (DCR) and MSD requirements to ensure the student satisfactorily completed all program requirements.
The Program Director and the program faculty determine if a student has successfully completed all the program’s didactic, clinical and research requirements. The Associate Dean for Advanced Education makes the final determination to approve the award of an MSD degree after review of DCR, program director’s recommendation and the publishable paper.
February 10-11, 2009 by CODA - program was granted APPROVAL WITHOUT REPORTING.
WASC EER Report Appendix E 202
RETURN TO CONTENTS
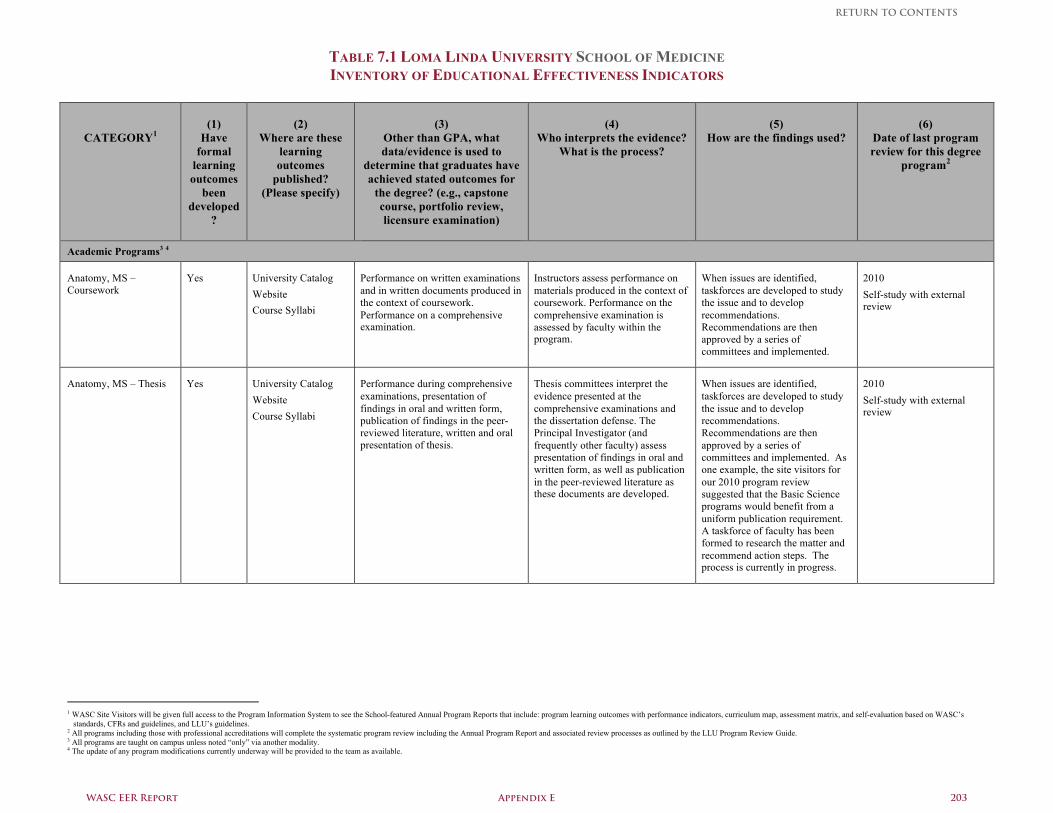
TABLE 7.1 LOMA LINDA UNIVERSITY SCHOOL OF MEDICINE INVENTORY OF EDUCATIONAL EFFECTIVENESS INDICATORS
CATEGORY1
(1)
Have formal
learning outcomes
been developed
?
(2)
Where are these learning outcomes
published? (Please specify)
(3)
Other than GPA, what data/evidence is used to
determine that graduates have achieved stated outcomes for
the degree? (e.g., capstone course, portfolio review, licensure examination)
(4)
Who interprets the evidence? What is the process?
(5)
How are the findings used?
(6)
Date of last program review for this degree
program2
Academic Programs3 4
Anatomy, MS – Coursework
Yes University Catalog Website Course Syllabi
Performance on written examinations and in written documents produced in the context of coursework. Performance on a comprehensive examination.
Instructors assess performance on materials produced in the context of coursework. Performance on the comprehensive examination is assessed by faculty within the program.
When issues are identified, taskforces are developed to study the issue and to develop recommendations. Recommendations are then approved by a series of committees and implemented.
2010 Self-study with external review
Anatomy, MS – Thesis
Yes University Catalog Website Course Syllabi
Performance during comprehensive examinations, presentation of findings in oral and written form, publication of findings in the peer-reviewed literature, written and oral presentation of thesis.
Thesis committees interpret the evidence presented at the comprehensive examinations and the dissertation defense. The Principal Investigator (and frequently other faculty) assess presentation of findings in oral and written form, as well as publication in the peer-reviewed literature as these documents are developed.
When issues are identified, taskforces are developed to study the issue and to develop recommendations. Recommendations are then approved by a series of committees and implemented. As one example, the site visitors for our 2010 program review suggested that the Basic Science programs would benefit from a uniform publication requirement. A taskforce of faculty has been formed to research the matter and recommend action steps. The process is currently in progress.
2010 Self-study with external review
1 WASC Site Visitors will be given full access to the Program Information System to see the School-featured Annual Program Reports that include: program learning outcomes with performance indicators, curriculum map, assessment matrix, and self-evaluation based on WASC’s
standards, CFRs and guidelines, and LLU’s guidelines. 2 All programs including those with professional accreditations will complete the systematic program review including the Annual Program Report and associated review processes as outlined by the LLU Program Review Guide. 3 All programs are taught on campus unless noted “only” via another modality. 4 The update of any program modifications currently underway will be provided to the team as available.
WASC EER Report Appendix E 203
RETURN TO CONTENTS
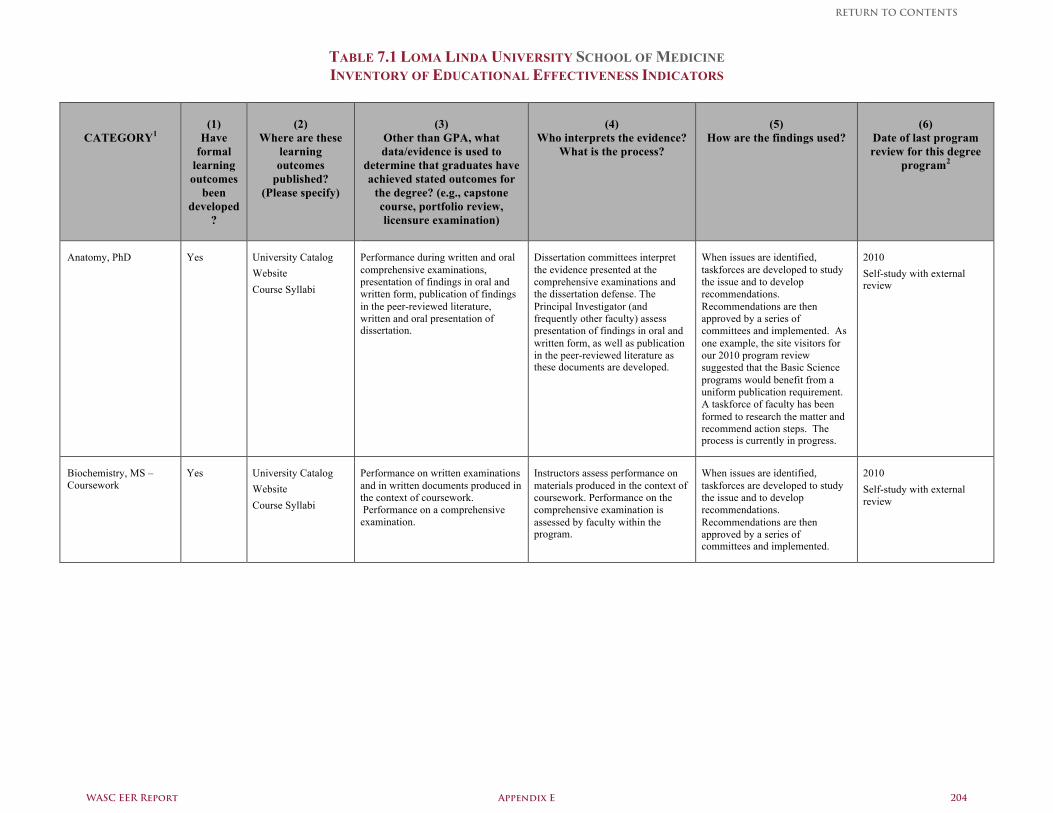
TABLE 7.1 LOMA LINDA UNIVERSITY SCHOOL OF MEDICINE INVENTORY OF EDUCATIONAL EFFECTIVENESS INDICATORS
CATEGORY1
(1)
Have formal
learning outcomes
been developed
?
(2)
Where are these learning outcomes
published? (Please specify)
(3)
Other than GPA, what data/evidence is used to
determine that graduates have achieved stated outcomes for
the degree? (e.g., capstone course, portfolio review, licensure examination)
(4)
Who interprets the evidence? What is the process?
(5)
How are the findings used?
(6)
Date of last program review for this degree
program2
Anatomy, PhD
Yes University Catalog Website Course Syllabi
Performance during written and oral comprehensive examinations, presentation of findings in oral and written form, publication of findings in the peer-reviewed literature, written and oral presentation of dissertation.
Dissertation committees interpret the evidence presented at the comprehensive examinations and the dissertation defense. The Principal Investigator (and frequently other faculty) assess presentation of findings in oral and written form, as well as publication in the peer-reviewed literature as these documents are developed.
When issues are identified, taskforces are developed to study the issue and to develop recommendations. Recommendations are then approved by a series of committees and implemented. As one example, the site visitors for our 2010 program review suggested that the Basic Science programs would benefit from a uniform publication requirement. A taskforce of faculty has been formed to research the matter and recommend action steps. The process is currently in progress.
2010 Self-study with external review
Biochemistry, MS – Coursework
Yes University Catalog Website Course Syllabi
Performance on written examinations and in written documents produced in the context of coursework. Performance on a comprehensive examination.
Instructors assess performance on materials produced in the context of coursework. Performance on the comprehensive examination is assessed by faculty within the program.
When issues are identified, taskforces are developed to study the issue and to develop recommendations. Recommendations are then approved by a series of committees and implemented.
2010 Self-study with external review
WASC EER Report Appendix E 204
RETURN TO CONTENTS
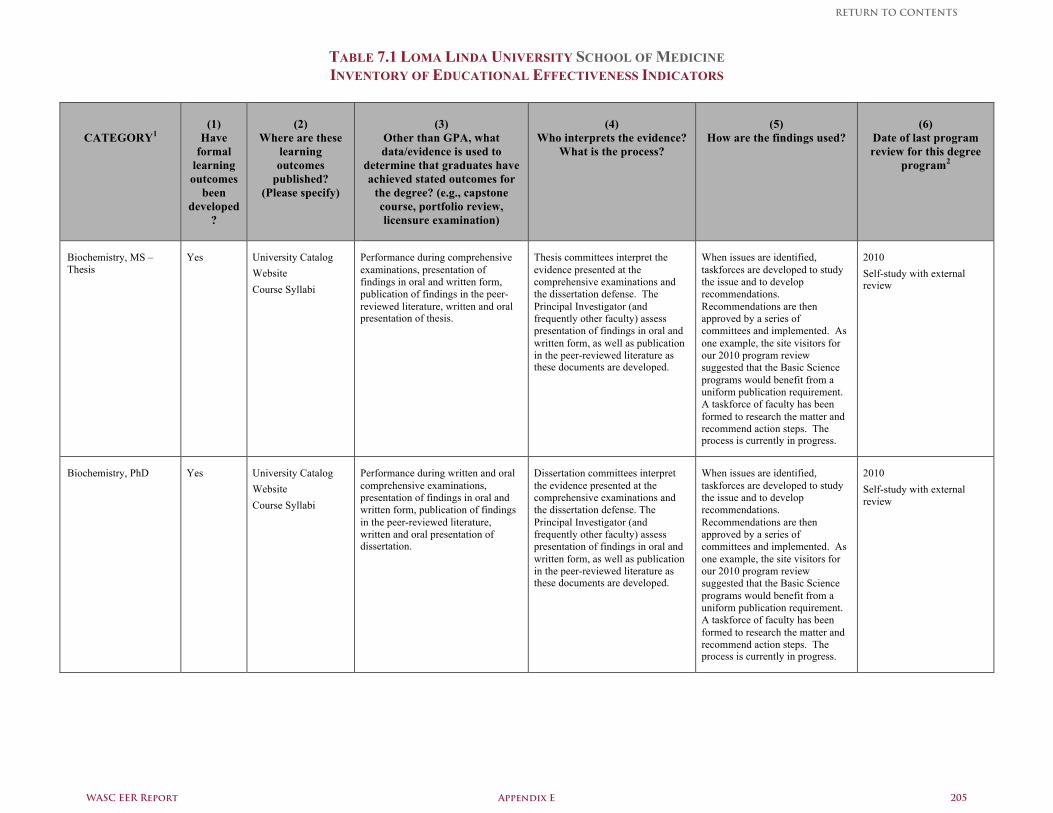
TABLE 7.1 LOMA LINDA UNIVERSITY SCHOOL OF MEDICINE INVENTORY OF EDUCATIONAL EFFECTIVENESS INDICATORS
CATEGORY1
(1)
Have formal
learning outcomes
been developed
?
(2)
Where are these learning outcomes
published? (Please specify)
(3)
Other than GPA, what data/evidence is used to
determine that graduates have achieved stated outcomes for
the degree? (e.g., capstone course, portfolio review, licensure examination)
(4)
Who interprets the evidence? What is the process?
(5)
How are the findings used?
(6)
Date of last program review for this degree
program2
Biochemistry, MS – Thesis
Yes University Catalog Website Course Syllabi
Performance during comprehensive examinations, presentation of findings in oral and written form, publication of findings in the peer-reviewed literature, written and oral presentation of thesis.
Thesis committees interpret the evidence presented at the comprehensive examinations and the dissertation defense. The Principal Investigator (and frequently other faculty) assess presentation of findings in oral and written form, as well as publication in the peer-reviewed literature as these documents are developed.
When issues are identified, taskforces are developed to study the issue and to develop recommendations. Recommendations are then approved by a series of committees and implemented. As one example, the site visitors for our 2010 program review suggested that the Basic Science programs would benefit from a uniform publication requirement. A taskforce of faculty has been formed to research the matter and recommend action steps. The process is currently in progress.
2010 Self-study with external review
Biochemistry, PhD
Yes University Catalog Website Course Syllabi
Performance during written and oral comprehensive examinations, presentation of findings in oral and written form, publication of findings in the peer-reviewed literature, written and oral presentation of dissertation.
Dissertation committees interpret the evidence presented at the comprehensive examinations and the dissertation defense. The Principal Investigator (and frequently other faculty) assess presentation of findings in oral and written form, as well as publication in the peer-reviewed literature as these documents are developed.
When issues are identified, taskforces are developed to study the issue and to develop recommendations. Recommendations are then approved by a series of committees and implemented. As one example, the site visitors for our 2010 program review suggested that the Basic Science programs would benefit from a uniform publication requirement. A taskforce of faculty has been formed to research the matter and recommend action steps. The process is currently in progress.
2010 Self-study with external review
WASC EER Report Appendix E 205
RETURN TO CONTENTS
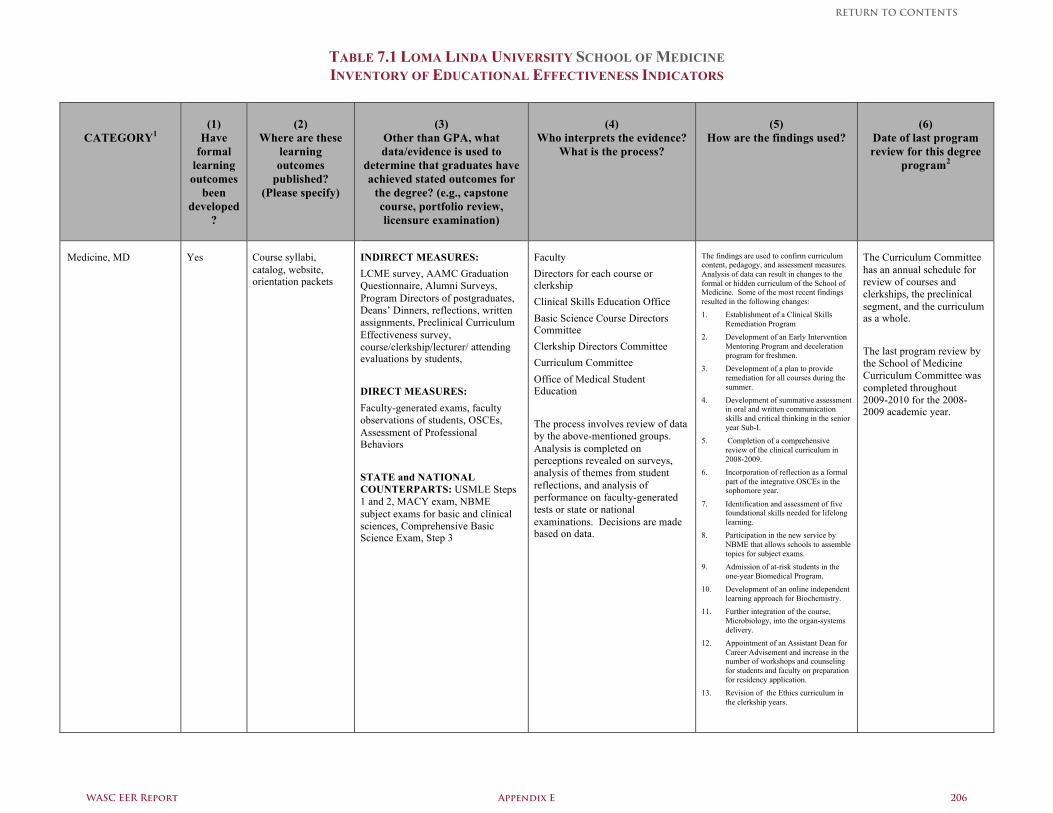
TABLE 7.1 LOMA LINDA UNIVERSITY SCHOOL OF MEDICINE INVENTORY OF EDUCATIONAL EFFECTIVENESS INDICATORS
CATEGORY1
(1)
Have formal
learning outcomes
been developed
?
(2)
Where are these learning outcomes
published? (Please specify)
(3)
Other than GPA, what data/evidence is used to
determine that graduates have achieved stated outcomes for
the degree? (e.g., capstone course, portfolio review, licensure examination)
(4)
Who interprets the evidence? What is the process?
(5)
How are the findings used?
(6)
Date of last program review for this degree
program2
Medicine, MD Yes Course syllabi, catalog, website, orientation packets
INDIRECT MEASURES: LCME survey, AAMC Graduation Questionnaire, Alumni Surveys, Program Directors of postgraduates, Deans’ Dinners, reflections, written assignments, Preclinical Curriculum Effectiveness survey, course/clerkship/lecturer/ attending evaluations by students, DIRECT MEASURES: Faculty-generated exams, faculty observations of students, OSCEs, Assessment of Professional Behaviors STATE and NATIONAL COUNTERPARTS: USMLE Steps 1 and 2, MACY exam, NBME subject exams for basic and clinical sciences, Comprehensive Basic Science Exam, Step 3
Faculty Directors for each course or clerkship Clinical Skills Education Office Basic Science Course Directors Committee Clerkship Directors Committee Curriculum Committee Office of Medical Student Education The process involves review of data by the above-mentioned groups. Analysis is completed on perceptions revealed on surveys, analysis of themes from student reflections, and analysis of performance on faculty-generated tests or state or national examinations. Decisions are made based on data.
The findings are used to confirm curriculum content, pedagogy, and assessment measures. Analysis of data can result in changes to the formal or hidden curriculum of the School of Medicine. Some of the most recent findings resulted in the following changes: 1. Establishment of a Clinical Skills
Remediation Program 2. Development of an Early Intervention
Mentoring Program and deceleration program for freshmen.
3. Development of a plan to provide remediation for all courses during the summer.
4. Development of summative assessment in oral and written communication skills and critical thinking in the senior year Sub-I.
5. Completion of a comprehensive review of the clinical curriculum in 2008-2009.
6. Incorporation of reflection as a formal part of the integrative OSCEs in the sophomore year.
7. Identification and assessment of five foundational skills needed for lifelong learning.
8. Participation in the new service by NBME that allows schools to assemble topics for subject exams.
9. Admission of at-risk students in the one-year Biomedical Program.
10. Development of an online independent learning approach for Biochemistry.
11. Further integration of the course, Microbiology, into the organ-systems delivery.
12. Appointment of an Assistant Dean for Career Advisement and increase in the number of workshops and counseling for students and faculty on preparation for residency application.
13. Revision of the Ethics curriculum in the clerkship years.
The Curriculum Committee has an annual schedule for review of courses and clerkships, the preclinical segment, and the curriculum as a whole. The last program review by the School of Medicine Curriculum Committee was completed throughout 2009-2010 for the 2008-2009 academic year.
WASC EER Report Appendix E 206
RETURN TO CONTENTS
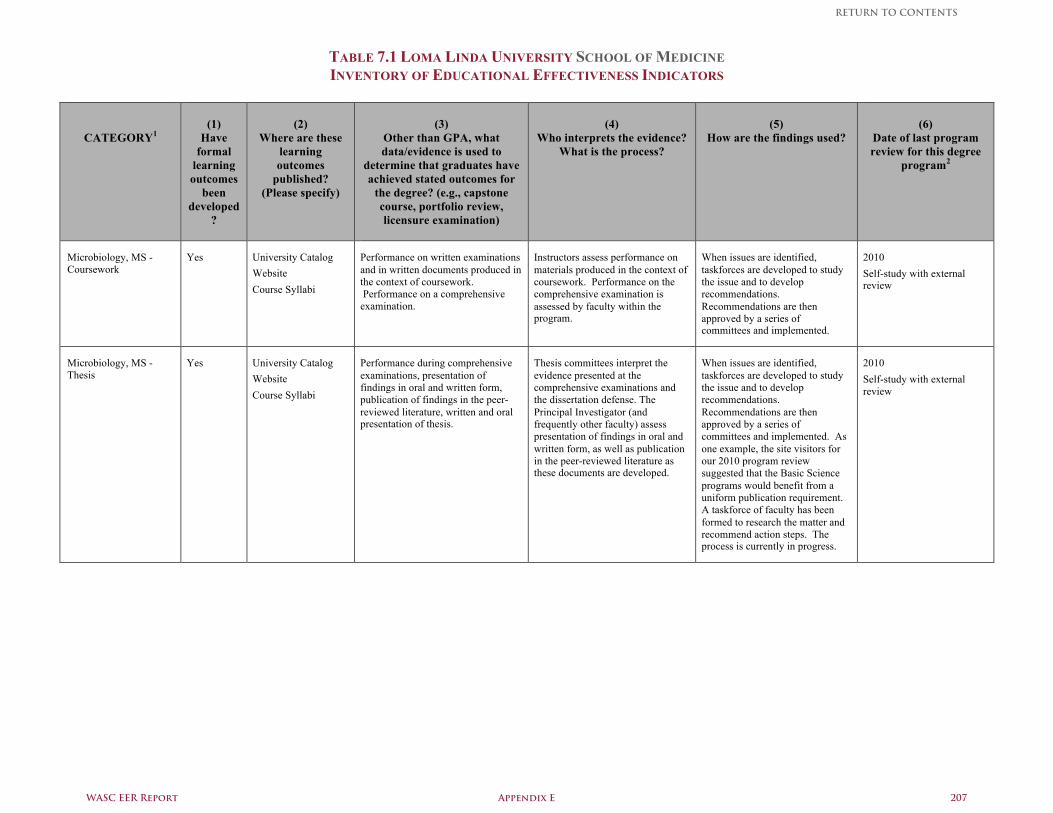
TABLE 7.1 LOMA LINDA UNIVERSITY SCHOOL OF MEDICINE INVENTORY OF EDUCATIONAL EFFECTIVENESS INDICATORS
CATEGORY1
(1)
Have formal
learning outcomes
been developed
?
(2)
Where are these learning outcomes
published? (Please specify)
(3)
Other than GPA, what data/evidence is used to
determine that graduates have achieved stated outcomes for
the degree? (e.g., capstone course, portfolio review, licensure examination)
(4)
Who interprets the evidence? What is the process?
(5)
How are the findings used?
(6)
Date of last program review for this degree
program2
Microbiology, MS - Coursework
Yes University Catalog Website Course Syllabi
Performance on written examinations and in written documents produced in the context of coursework. Performance on a comprehensive examination.
Instructors assess performance on materials produced in the context of coursework. Performance on the comprehensive examination is assessed by faculty within the program.
When issues are identified, taskforces are developed to study the issue and to develop recommendations. Recommendations are then approved by a series of committees and implemented.
2010 Self-study with external review
Microbiology, MS - Thesis
Yes University Catalog Website Course Syllabi
Performance during comprehensive examinations, presentation of findings in oral and written form, publication of findings in the peer-reviewed literature, written and oral presentation of thesis.
Thesis committees interpret the evidence presented at the comprehensive examinations and the dissertation defense. The Principal Investigator (and frequently other faculty) assess presentation of findings in oral and written form, as well as publication in the peer-reviewed literature as these documents are developed.
When issues are identified, taskforces are developed to study the issue and to develop recommendations. Recommendations are then approved by a series of committees and implemented. As one example, the site visitors for our 2010 program review suggested that the Basic Science programs would benefit from a uniform publication requirement. A taskforce of faculty has been formed to research the matter and recommend action steps. The process is currently in progress.
2010 Self-study with external review
WASC EER Report Appendix E 207
RETURN TO CONTENTS

TABLE 7.1 LOMA LINDA UNIVERSITY SCHOOL OF MEDICINE INVENTORY OF EDUCATIONAL EFFECTIVENESS INDICATORS
CATEGORY1
(1)
Have formal
learning outcomes
been developed
?
(2)
Where are these learning outcomes
published? (Please specify)
(3)
Other than GPA, what data/evidence is used to
determine that graduates have achieved stated outcomes for
the degree? (e.g., capstone course, portfolio review, licensure examination)
(4)
Who interprets the evidence? What is the process?
(5)
How are the findings used?
(6)
Date of last program review for this degree
program2
Microbiology, PhD
Yes University Catalog Website Course Syllabi
Performance during written and oral comprehensive examinations, presentation of findings in oral and written form, publication of findings in the peer-reviewed literature, written and oral presentation of dissertation.
Dissertation committees interpret the evidence presented at the comprehensive examinations and the dissertation defense. The Principal Investigator (and frequently other faculty) assess presentation of findings in oral and written form, as well as publication in the peer-reviewed literature as these documents are developed.
When issues are identified, taskforces are developed to study the issue and to develop recommendations. Recommendations are then approved by a series of committees and implemented. As one example, the site visitors for our 2010 program review suggested that the Basic Science programs would benefit from a uniform publication requirement. A taskforce of faculty has been formed to research the matter and recommend action steps. The process is currently in progress.
2010 Self-study with external review
Pharmacology, PhD
Yes University Catalog Website Course Syllabi
Performance during written and oral comprehensive examinations, presentation of findings in oral and written form, publication of findings in the peer-reviewed literature, written and oral presentation of dissertation.
Dissertation committees interpret the evidence presented at the comprehensive examinations and the dissertation defense. The Principal Investigator (and frequently other faculty) assess presentation of findings in oral and written form, as well as publication in the peer-reviewed literature as these documents are developed.
When issues are identified, taskforces are developed to study the issue and to develop recommendations. Recommendations are then approved by a series of committees and implemented. As one example, the site visitors for our 2010 program review suggested that the Basic Science programs would benefit from a uniform publication requirement. A taskforce of faculty has been formed to research the matter and recommend action steps. The process is currently in progress.
2010 Self-study with external review
WASC EER Report Appendix E 208
RETURN TO CONTENTS
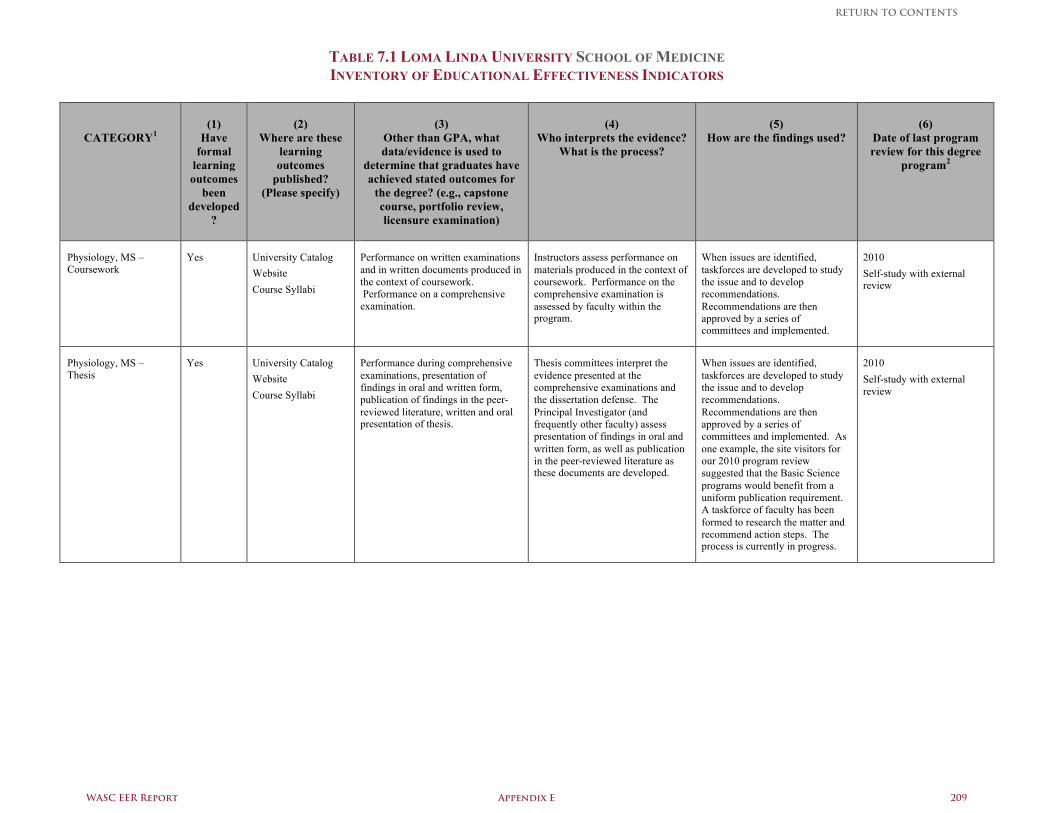
TABLE 7.1 LOMA LINDA UNIVERSITY SCHOOL OF MEDICINE INVENTORY OF EDUCATIONAL EFFECTIVENESS INDICATORS
CATEGORY1
(1)
Have formal
learning outcomes
been developed
?
(2)
Where are these learning outcomes
published? (Please specify)
(3)
Other than GPA, what data/evidence is used to
determine that graduates have achieved stated outcomes for
the degree? (e.g., capstone course, portfolio review, licensure examination)
(4)
Who interprets the evidence? What is the process?
(5)
How are the findings used?
(6)
Date of last program review for this degree
program2
Physiology, MS – Coursework
Yes University Catalog Website Course Syllabi
Performance on written examinations and in written documents produced in the context of coursework. Performance on a comprehensive examination.
Instructors assess performance on materials produced in the context of coursework. Performance on the comprehensive examination is assessed by faculty within the program.
When issues are identified, taskforces are developed to study the issue and to develop recommendations. Recommendations are then approved by a series of committees and implemented.
2010 Self-study with external review
Physiology, MS – Thesis
Yes University Catalog Website Course Syllabi
Performance during comprehensive examinations, presentation of findings in oral and written form, publication of findings in the peer-reviewed literature, written and oral presentation of thesis.
Thesis committees interpret the evidence presented at the comprehensive examinations and the dissertation defense. The Principal Investigator (and frequently other faculty) assess presentation of findings in oral and written form, as well as publication in the peer-reviewed literature as these documents are developed.
When issues are identified, taskforces are developed to study the issue and to develop recommendations. Recommendations are then approved by a series of committees and implemented. As one example, the site visitors for our 2010 program review suggested that the Basic Science programs would benefit from a uniform publication requirement. A taskforce of faculty has been formed to research the matter and recommend action steps. The process is currently in progress.
2010 Self-study with external review
WASC EER Report Appendix E 209
RETURN TO CONTENTS
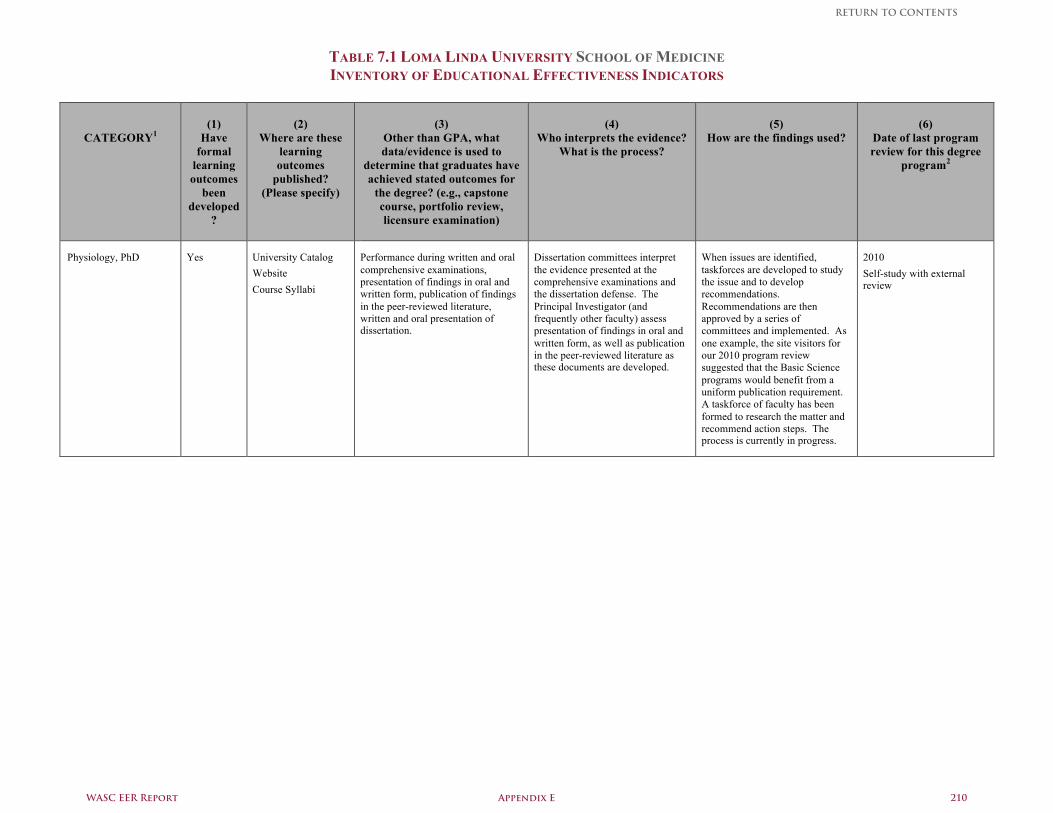
TABLE 7.1 LOMA LINDA UNIVERSITY SCHOOL OF MEDICINE INVENTORY OF EDUCATIONAL EFFECTIVENESS INDICATORS
CATEGORY1
(1)
Have formal
learning outcomes
been developed
?
(2)
Where are these learning outcomes
published? (Please specify)
(3)
Other than GPA, what data/evidence is used to
determine that graduates have achieved stated outcomes for
the degree? (e.g., capstone course, portfolio review, licensure examination)
(4)
Who interprets the evidence? What is the process?
(5)
How are the findings used?
(6)
Date of last program review for this degree
program2
Physiology, PhD
Yes University Catalog Website Course Syllabi
Performance during written and oral comprehensive examinations, presentation of findings in oral and written form, publication of findings in the peer-reviewed literature, written and oral presentation of dissertation.
Dissertation committees interpret the evidence presented at the comprehensive examinations and the dissertation defense. The Principal Investigator (and frequently other faculty) assess presentation of findings in oral and written form, as well as publication in the peer-reviewed literature as these documents are developed.
When issues are identified, taskforces are developed to study the issue and to develop recommendations. Recommendations are then approved by a series of committees and implemented. As one example, the site visitors for our 2010 program review suggested that the Basic Science programs would benefit from a uniform publication requirement. A taskforce of faculty has been formed to research the matter and recommend action steps. The process is currently in progress.
2010 Self-study with external review
WASC EER Report Appendix E 210
RETURN TO CONTENTS
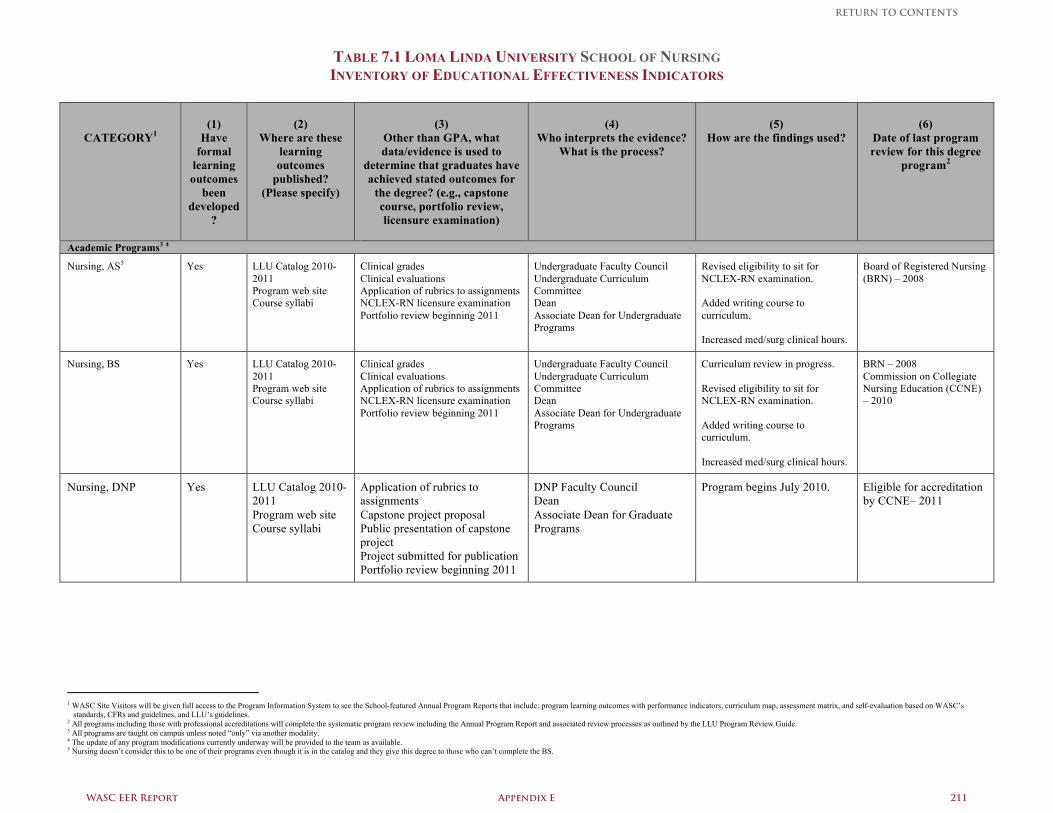
TABLE 7.1 LOMA LINDA UNIVERSITY SCHOOL OF NURSING INVENTORY OF EDUCATIONAL EFFECTIVENESS INDICATORS
CATEGORY1
(1)
Have formal
learning outcomes
been developed
?
(2)
Where are these learning outcomes
published? (Please specify)
(3)
Other than GPA, what data/evidence is used to
determine that graduates have achieved stated outcomes for
the degree? (e.g., capstone course, portfolio review, licensure examination)
(4)
Who interprets the evidence? What is the process?
(5)
How are the findings used?
(6)
Date of last program review for this degree
program2
Academic Programs3 4
Nursing, AS5 Yes LLU Catalog 2010-2011 Program web site Course syllabi
Clinical grades Clinical evaluations Application of rubrics to assignments NCLEX-RN licensure examination Portfolio review beginning 2011
Undergraduate Faculty Council Undergraduate Curriculum Committee Dean Associate Dean for Undergraduate Programs
Revised eligibility to sit for NCLEX-RN examination. Added writing course to curriculum. Increased med/surg clinical hours.
Board of Registered Nursing (BRN) – 2008
Nursing, BS
Yes LLU Catalog 2010-2011 Program web site Course syllabi
Clinical grades Clinical evaluations Application of rubrics to assignments NCLEX-RN licensure examination Portfolio review beginning 2011
Undergraduate Faculty Council Undergraduate Curriculum Committee Dean Associate Dean for Undergraduate Programs
Curriculum review in progress. Revised eligibility to sit for NCLEX-RN examination. Added writing course to curriculum. Increased med/surg clinical hours.
BRN – 2008 Commission on Collegiate Nursing Education (CCNE) – 2010
Nursing, DNP Yes LLU Catalog 2010-2011 Program web site Course syllabi
Application of rubrics to assignments Capstone project proposal Public presentation of capstone project Project submitted for publication Portfolio review beginning 2011
DNP Faculty Council Dean Associate Dean for Graduate Programs
Program begins July 2010. Eligible for accreditation by CCNE– 2011
1 WASC Site Visitors will be given full access to the Program Information System to see the School-featured Annual Program Reports that include: program learning outcomes with performance indicators, curriculum map, assessment matrix, and self-evaluation based on WASC’s
standards, CFRs and guidelines, and LLU’s guidelines. 2 All programs including those with professional accreditations will complete the systematic program review including the Annual Program Report and associated review processes as outlined by the LLU Program Review Guide. 3 All programs are taught on campus unless noted “only” via another modality. 4 The update of any program modifications currently underway will be provided to the team as available. 5 Nursing doesn’t consider this to be one of their programs even though it is in the catalog and they give this degree to those who can’t complete the BS.
WASC EER Report Appendix E 211
RETURN TO CONTENTS
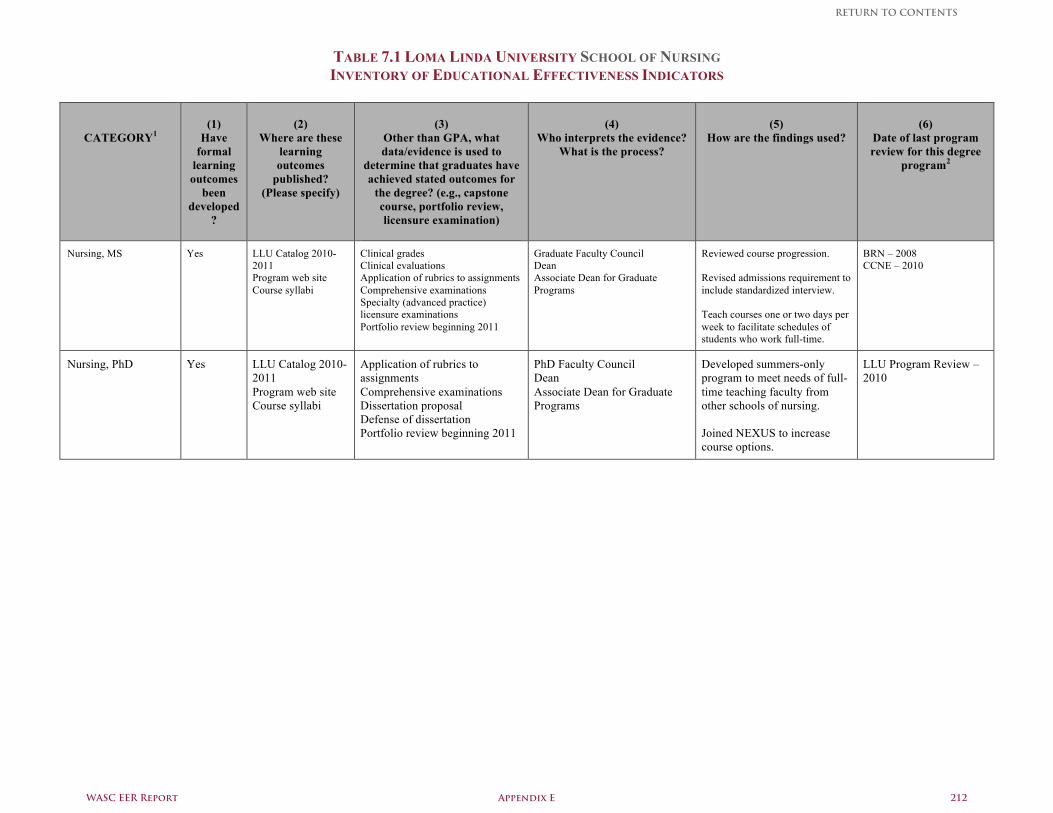
TABLE 7.1 LOMA LINDA UNIVERSITY SCHOOL OF NURSING INVENTORY OF EDUCATIONAL EFFECTIVENESS INDICATORS
CATEGORY1
(1)
Have formal
learning outcomes
been developed
?
(2)
Where are these learning outcomes
published? (Please specify)
(3)
Other than GPA, what data/evidence is used to
determine that graduates have achieved stated outcomes for
the degree? (e.g., capstone course, portfolio review, licensure examination)
(4)
Who interprets the evidence? What is the process?
(5)
How are the findings used?
(6)
Date of last program review for this degree
program2
Nursing, MS
Yes LLU Catalog 2010-2011 Program web site Course syllabi
Clinical grades Clinical evaluations Application of rubrics to assignments Comprehensive examinations Specialty (advanced practice) licensure examinations Portfolio review beginning 2011
Graduate Faculty Council Dean Associate Dean for Graduate Programs
Reviewed course progression. Revised admissions requirement to include standardized interview. Teach courses one or two days per week to facilitate schedules of students who work full-time.
BRN – 2008 CCNE – 2010
Nursing, PhD
Yes LLU Catalog 2010-2011 Program web site Course syllabi
Application of rubrics to assignments Comprehensive examinations Dissertation proposal Defense of dissertation Portfolio review beginning 2011
PhD Faculty Council Dean Associate Dean for Graduate Programs
Developed summers-only program to meet needs of full-time teaching faculty from other schools of nursing. Joined NEXUS to increase course options.
LLU Program Review – 2010
WASC EER Report Appendix E 212
RETURN TO CONTENTS
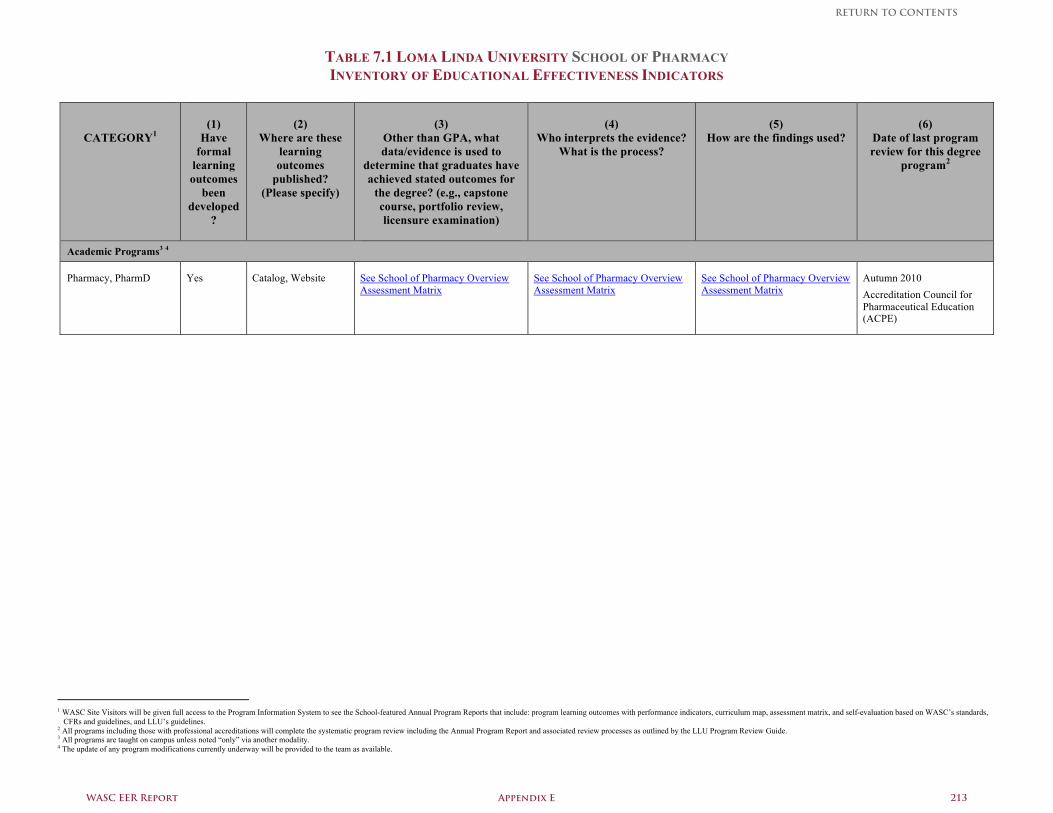
TABLE 7.1 LOMA LINDA UNIVERSITY SCHOOL OF PHARMACY INVENTORY OF EDUCATIONAL EFFECTIVENESS INDICATORS
CATEGORY1
(1)
Have formal
learning outcomes
been developed
?
(2)
Where are these learning outcomes
published? (Please specify)
(3)
Other than GPA, what data/evidence is used to
determine that graduates have achieved stated outcomes for
the degree? (e.g., capstone course, portfolio review, licensure examination)
(4)
Who interprets the evidence? What is the process?
(5)
How are the findings used?
(6)
Date of last program review for this degree
program2
Academic Programs3 4
Pharmacy, PharmD Yes Catalog, Website See School of Pharmacy Overview Assessment Matrix
See School of Pharmacy Overview Assessment Matrix
See School of Pharmacy Overview Assessment Matrix
Autumn 2010 Accreditation Council for Pharmaceutical Education (ACPE)
1 WASC Site Visitors will be given full access to the Program Information System to see the School-featured Annual Program Reports that include: program learning outcomes with performance indicators, curriculum map, assessment matrix, and self-evaluation based on WASC’s standards,
CFRs and guidelines, and LLU’s guidelines. 2 All programs including those with professional accreditations will complete the systematic program review including the Annual Program Report and associated review processes as outlined by the LLU Program Review Guide. 3 All programs are taught on campus unless noted “only” via another modality. 4 The update of any program modifications currently underway will be provided to the team as available.
WASC EER Report Appendix E 213
RETURN TO CONTENTS
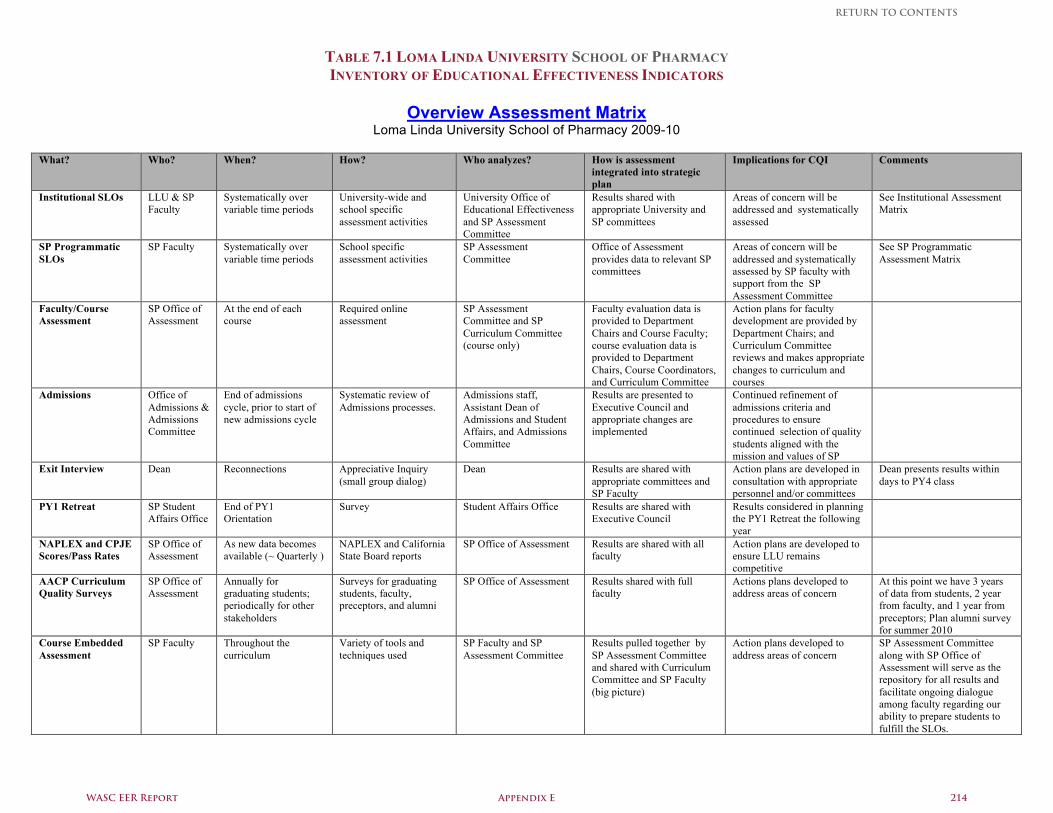
TABLE 7.1 LOMA LINDA UNIVERSITY SCHOOL OF PHARMACY INVENTORY OF EDUCATIONAL EFFECTIVENESS INDICATORS
Overview Assessment Matrix
Loma Linda University School of Pharmacy 2009-10
What? Who? When? How? Who analyzes? How is assessment integrated into strategic plan
Implications for CQI Comments
Institutional SLOs
LLU & SP Faculty
Systematically over variable time periods
University-wide and school specific assessment activities
University Office of Educational Effectiveness and SP Assessment Committee
Results shared with appropriate University and SP committees
Areas of concern will be addressed and systematically assessed
See Institutional Assessment Matrix
SP Programmatic SLOs
SP Faculty Systematically over variable time periods
School specific assessment activities
SP Assessment Committee
Office of Assessment provides data to relevant SP committees
Areas of concern will be addressed and systematically assessed by SP faculty with support from the SP Assessment Committee
See SP Programmatic Assessment Matrix
Faculty/Course Assessment
SP Office of Assessment
At the end of each course
Required online assessment
SP Assessment Committee and SP Curriculum Committee (course only)
Faculty evaluation data is provided to Department Chairs and Course Faculty; course evaluation data is provided to Department Chairs, Course Coordinators, and Curriculum Committee
Action plans for faculty development are provided by Department Chairs; and Curriculum Committee reviews and makes appropriate changes to curriculum and courses
Admissions Office of Admissions & Admissions Committee
End of admissions cycle, prior to start of new admissions cycle
Systematic review of Admissions processes.
Admissions staff, Assistant Dean of Admissions and Student Affairs, and Admissions Committee
Results are presented to Executive Council and appropriate changes are implemented
Continued refinement of admissions criteria and procedures to ensure continued selection of quality students aligned with the mission and values of SP
Exit Interview Dean Reconnections Appreciative Inquiry (small group dialog)
Dean Results are shared with appropriate committees and SP Faculty
Action plans are developed in consultation with appropriate personnel and/or committees
Dean presents results within days to PY4 class
PY1 Retreat SP Student Affairs Office
End of PY1 Orientation
Survey Student Affairs Office Results are shared with Executive Council
Results considered in planning the PY1 Retreat the following year
NAPLEX and CPJE Scores/Pass Rates
SP Office of Assessment
As new data becomes available (~ Quarterly )
NAPLEX and California State Board reports
SP Office of Assessment Results are shared with all faculty
Action plans are developed to ensure LLU remains competitive
AACP Curriculum Quality Surveys
SP Office of Assessment
Annually for graduating students; periodically for other stakeholders
Surveys for graduating students, faculty, preceptors, and alumni
SP Office of Assessment Results shared with full faculty
Actions plans developed to address areas of concern
At this point we have 3 years of data from students, 2 year from faculty, and 1 year from preceptors; Plan alumni survey for summer 2010
Course Embedded Assessment
SP Faculty Throughout the curriculum
Variety of tools and techniques used
SP Faculty and SP Assessment Committee
Results pulled together by SP Assessment Committee and shared with Curriculum Committee and SP Faculty (big picture)
Action plans developed to address areas of concern
SP Assessment Committee along with SP Office of Assessment will serve as the repository for all results and facilitate ongoing dialogue among faculty regarding our ability to prepare students to fulfill the SLOs.
WASC EER Report Appendix E 214
RETURN TO CONTENTS
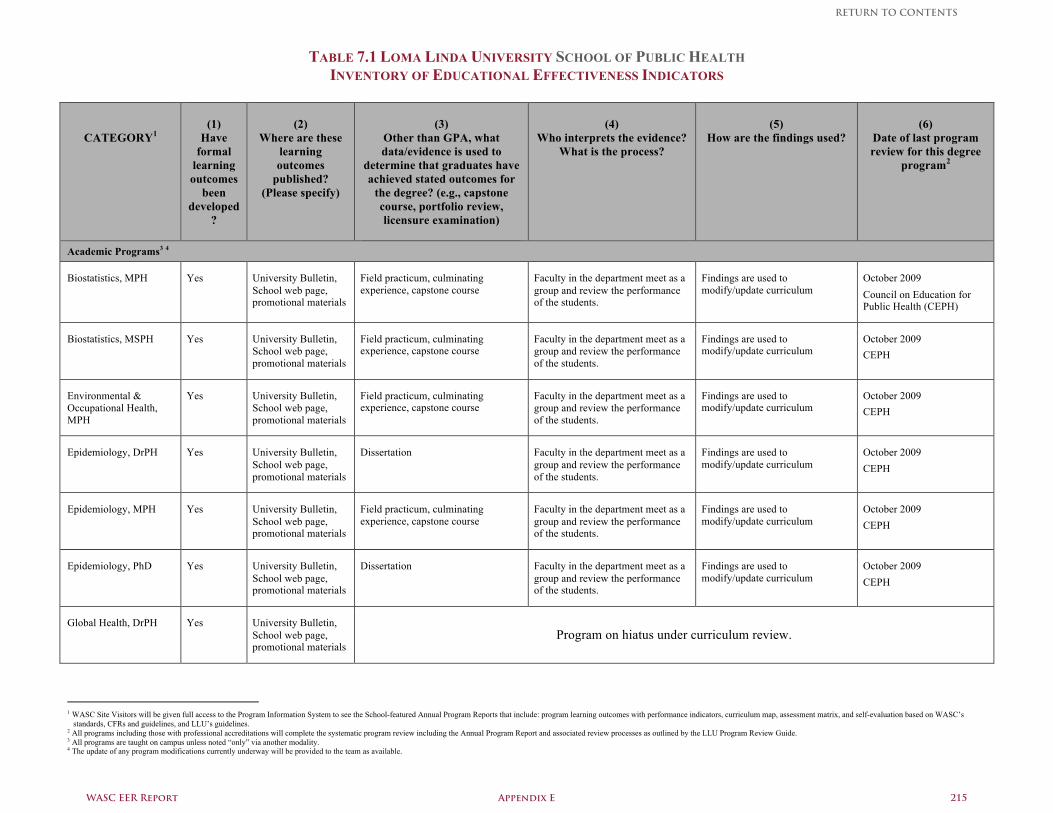
TABLE 7.1 LOMA LINDA UNIVERSITY SCHOOL OF PUBLIC HEALTH INVENTORY OF EDUCATIONAL EFFECTIVENESS INDICATORS
CATEGORY1
(1)
Have formal
learning outcomes
been developed
?
(2)
Where are these learning outcomes
published? (Please specify)
(3)
Other than GPA, what data/evidence is used to
determine that graduates have achieved stated outcomes for
the degree? (e.g., capstone course, portfolio review, licensure examination)
(4)
Who interprets the evidence? What is the process?
(5)
How are the findings used?
(6)
Date of last program review for this degree
program2
Academic Programs3 4
Biostatistics, MPH Yes University Bulletin, School web page, promotional materials
Field practicum, culminating experience, capstone course
Faculty in the department meet as a group and review the performance of the students.
Findings are used to modify/update curriculum
October 2009 Council on Education for Public Health (CEPH)
Biostatistics, MSPH Yes University Bulletin, School web page, promotional materials
Field practicum, culminating experience, capstone course
Faculty in the department meet as a group and review the performance of the students.
Findings are used to modify/update curriculum
October 2009 CEPH
Environmental & Occupational Health, MPH
Yes University Bulletin, School web page, promotional materials
Field practicum, culminating experience, capstone course
Faculty in the department meet as a group and review the performance of the students.
Findings are used to modify/update curriculum
October 2009 CEPH
Epidemiology, DrPH Yes University Bulletin, School web page, promotional materials
Dissertation Faculty in the department meet as a group and review the performance of the students.
Findings are used to modify/update curriculum
October 2009 CEPH
Epidemiology, MPH Yes University Bulletin, School web page, promotional materials
Field practicum, culminating experience, capstone course
Faculty in the department meet as a group and review the performance of the students.
Findings are used to modify/update curriculum
October 2009 CEPH
Epidemiology, PhD Yes University Bulletin, School web page, promotional materials
Dissertation Faculty in the department meet as a group and review the performance of the students.
Findings are used to modify/update curriculum
October 2009 CEPH
Global Health, DrPH
Yes University Bulletin, School web page, promotional materials
Program on hiatus under curriculum review.
1 WASC Site Visitors will be given full access to the Program Information System to see the School-featured Annual Program Reports that include: program learning outcomes with performance indicators, curriculum map, assessment matrix, and self-evaluation based on WASC’s
standards, CFRs and guidelines, and LLU’s guidelines. 2 All programs including those with professional accreditations will complete the systematic program review including the Annual Program Report and associated review processes as outlined by the LLU Program Review Guide. 3 All programs are taught on campus unless noted “only” via another modality. 4 The update of any program modifications currently underway will be provided to the team as available.
WASC EER Report Appendix E 215
RETURN TO CONTENTS
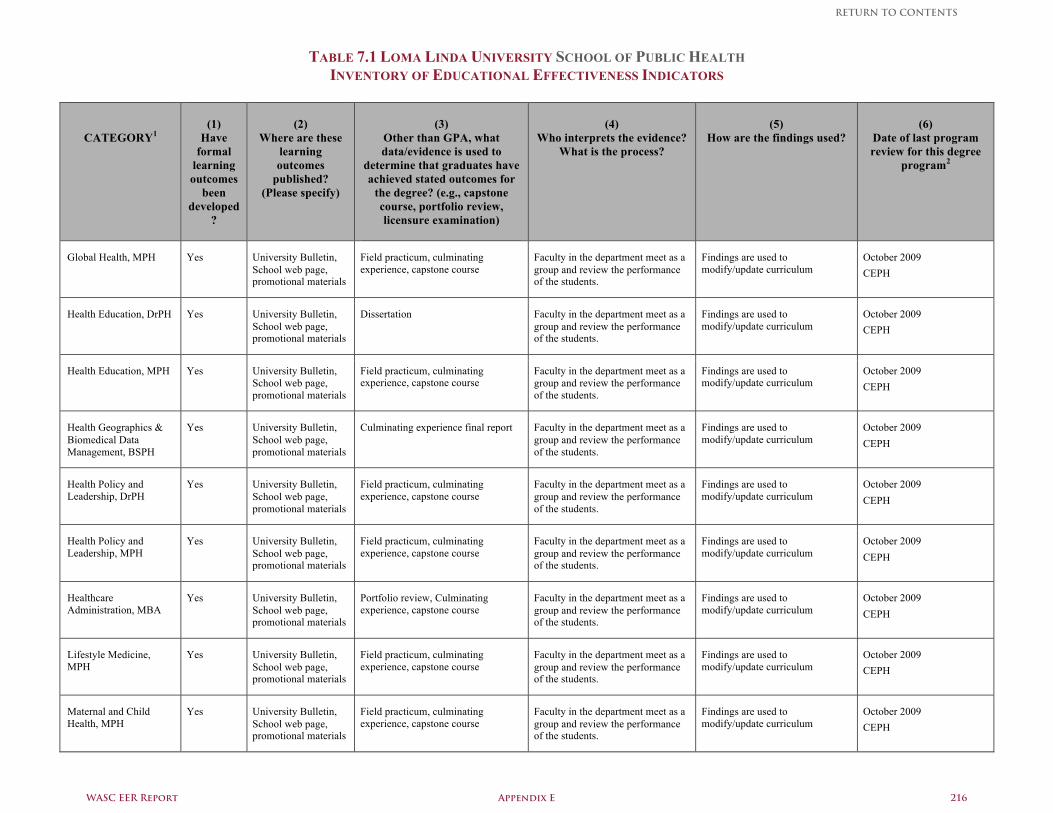
TABLE 7.1 LOMA LINDA UNIVERSITY SCHOOL OF PUBLIC HEALTH INVENTORY OF EDUCATIONAL EFFECTIVENESS INDICATORS
CATEGORY1
(1)
Have formal
learning outcomes
been developed
?
(2)
Where are these learning outcomes
published? (Please specify)
(3)
Other than GPA, what data/evidence is used to
determine that graduates have achieved stated outcomes for
the degree? (e.g., capstone course, portfolio review, licensure examination)
(4)
Who interprets the evidence? What is the process?
(5)
How are the findings used?
(6)
Date of last program review for this degree
program2
Global Health, MPH Yes University Bulletin, School web page, promotional materials
Field practicum, culminating experience, capstone course
Faculty in the department meet as a group and review the performance of the students.
Findings are used to modify/update curriculum
October 2009 CEPH
Health Education, DrPH Yes University Bulletin, School web page, promotional materials
Dissertation Faculty in the department meet as a group and review the performance of the students.
Findings are used to modify/update curriculum
October 2009 CEPH
Health Education, MPH Yes University Bulletin, School web page, promotional materials
Field practicum, culminating experience, capstone course
Faculty in the department meet as a group and review the performance of the students.
Findings are used to modify/update curriculum
October 2009 CEPH
Health Geographics & Biomedical Data Management, BSPH
Yes University Bulletin, School web page, promotional materials
Culminating experience final report Faculty in the department meet as a group and review the performance of the students.
Findings are used to modify/update curriculum
October 2009 CEPH
Health Policy and Leadership, DrPH
Yes University Bulletin, School web page, promotional materials
Field practicum, culminating experience, capstone course
Faculty in the department meet as a group and review the performance of the students.
Findings are used to modify/update curriculum
October 2009 CEPH
Health Policy and Leadership, MPH
Yes University Bulletin, School web page, promotional materials
Field practicum, culminating experience, capstone course
Faculty in the department meet as a group and review the performance of the students.
Findings are used to modify/update curriculum
October 2009 CEPH
Healthcare Administration, MBA
Yes University Bulletin, School web page, promotional materials
Portfolio review, Culminating experience, capstone course
Faculty in the department meet as a group and review the performance of the students.
Findings are used to modify/update curriculum
October 2009 CEPH
Lifestyle Medicine, MPH
Yes University Bulletin, School web page, promotional materials
Field practicum, culminating experience, capstone course
Faculty in the department meet as a group and review the performance of the students.
Findings are used to modify/update curriculum
October 2009 CEPH
Maternal and Child Health, MPH
Yes University Bulletin, School web page, promotional materials
Field practicum, culminating experience, capstone course
Faculty in the department meet as a group and review the performance of the students.
Findings are used to modify/update curriculum
October 2009 CEPH
WASC EER Report Appendix E 216
RETURN TO CONTENTS
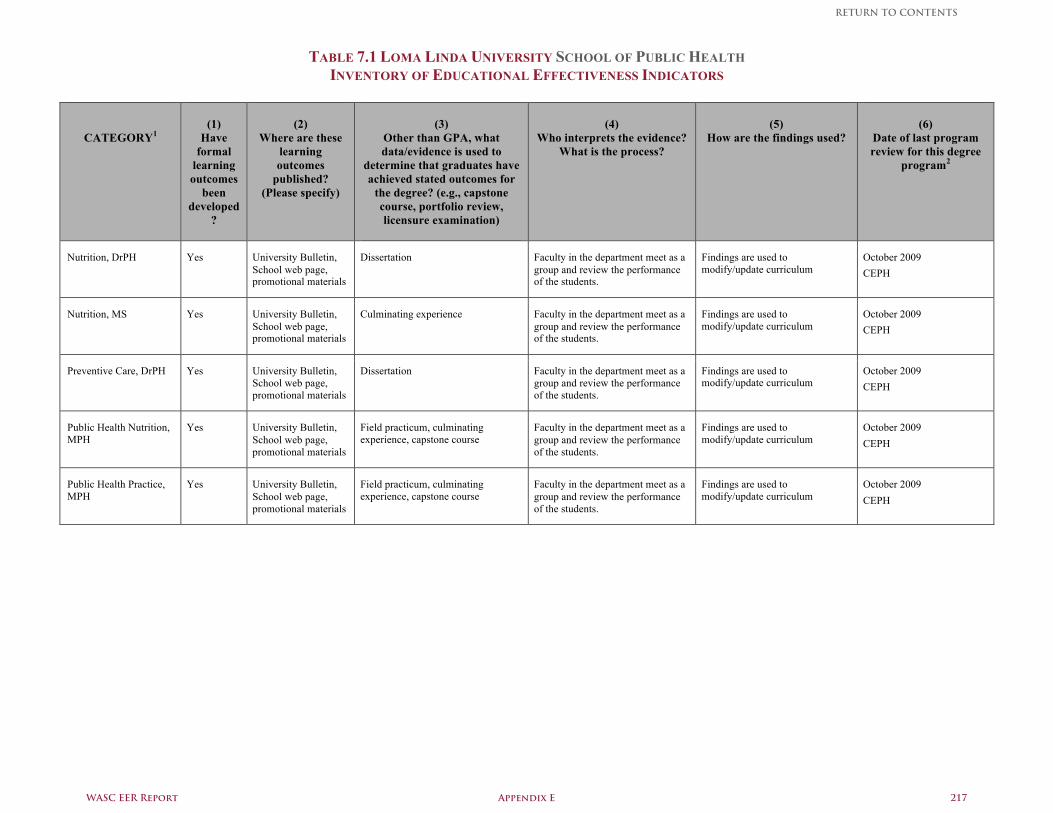
TABLE 7.1 LOMA LINDA UNIVERSITY SCHOOL OF PUBLIC HEALTH INVENTORY OF EDUCATIONAL EFFECTIVENESS INDICATORS
CATEGORY1
(1)
Have formal
learning outcomes
been developed
?
(2)
Where are these learning outcomes
published? (Please specify)
(3)
Other than GPA, what data/evidence is used to
determine that graduates have achieved stated outcomes for
the degree? (e.g., capstone course, portfolio review, licensure examination)
(4)
Who interprets the evidence? What is the process?
(5)
How are the findings used?
(6)
Date of last program review for this degree
program2
Nutrition, DrPH Yes University Bulletin, School web page, promotional materials
Dissertation Faculty in the department meet as a group and review the performance of the students.
Findings are used to modify/update curriculum
October 2009 CEPH
Nutrition, MS Yes University Bulletin, School web page, promotional materials
Culminating experience Faculty in the department meet as a group and review the performance of the students.
Findings are used to modify/update curriculum
October 2009 CEPH
Preventive Care, DrPH Yes University Bulletin, School web page, promotional materials
Dissertation Faculty in the department meet as a group and review the performance of the students.
Findings are used to modify/update curriculum
October 2009 CEPH
Public Health Nutrition, MPH
Yes University Bulletin, School web page, promotional materials
Field practicum, culminating experience, capstone course
Faculty in the department meet as a group and review the performance of the students.
Findings are used to modify/update curriculum
October 2009 CEPH
Public Health Practice, MPH
Yes University Bulletin, School web page, promotional materials
Field practicum, culminating experience, capstone course
Faculty in the department meet as a group and review the performance of the students.
Findings are used to modify/update curriculum
October 2009 CEPH
WASC EER Report Appendix E 217
RETURN TO CONTENTS
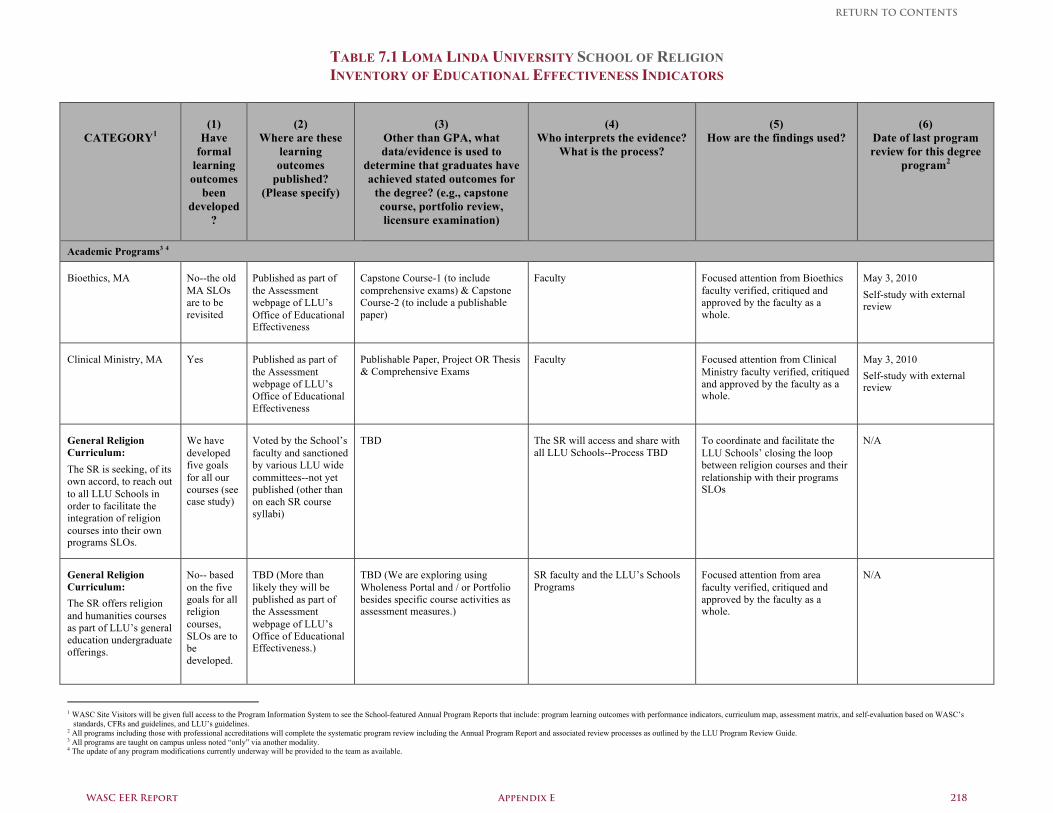
TABLE 7.1 LOMA LINDA UNIVERSITY SCHOOL OF RELIGION INVENTORY OF EDUCATIONAL EFFECTIVENESS INDICATORS
CATEGORY1
(1)
Have formal
learning outcomes
been developed
?
(2)
Where are these learning outcomes
published? (Please specify)
(3)
Other than GPA, what data/evidence is used to
determine that graduates have achieved stated outcomes for
the degree? (e.g., capstone course, portfolio review, licensure examination)
(4)
Who interprets the evidence? What is the process?
(5)
How are the findings used?
(6)
Date of last program review for this degree
program2
Academic Programs3 4
Bioethics, MA No--the old MA SLOs are to be revisited
Published as part of the Assessment webpage of LLU’s Office of Educational Effectiveness
Capstone Course-1 (to include comprehensive exams) & Capstone Course-2 (to include a publishable paper)
Faculty Focused attention from Bioethics faculty verified, critiqued and approved by the faculty as a whole.
May 3, 2010 Self-study with external review
Clinical Ministry, MA
Yes Published as part of the Assessment webpage of LLU’s Office of Educational Effectiveness
Publishable Paper, Project OR Thesis & Comprehensive Exams
Faculty Focused attention from Clinical Ministry faculty verified, critiqued and approved by the faculty as a whole.
May 3, 2010 Self-study with external review
General Religion Curriculum: The SR is seeking, of its own accord, to reach out to all LLU Schools in order to facilitate the integration of religion courses into their own programs SLOs.
We have developed five goals for all our courses (see case study)
Voted by the School’s faculty and sanctioned by various LLU wide committees--not yet published (other than on each SR course syllabi)
TBD The SR will access and share with all LLU Schools--Process TBD
To coordinate and facilitate the LLU Schools’ closing the loop between religion courses and their relationship with their programs SLOs
N/A
General Religion Curriculum: The SR offers religion and humanities courses as part of LLU’s general education undergraduate offerings.
No-- based on the five goals for all religion courses, SLOs are to be developed.
TBD (More than likely they will be published as part of the Assessment webpage of LLU’s Office of Educational Effectiveness.)
TBD (We are exploring using Wholeness Portal and / or Portfolio besides specific course activities as assessment measures.)
SR faculty and the LLU’s Schools Programs
Focused attention from area faculty verified, critiqued and approved by the faculty as a whole.
N/A
1 WASC Site Visitors will be given full access to the Program Information System to see the School-featured Annual Program Reports that include: program learning outcomes with performance indicators, curriculum map, assessment matrix, and self-evaluation based on WASC’s
standards, CFRs and guidelines, and LLU’s guidelines. 2 All programs including those with professional accreditations will complete the systematic program review including the Annual Program Report and associated review processes as outlined by the LLU Program Review Guide. 3 All programs are taught on campus unless noted “only” via another modality. 4 The update of any program modifications currently underway will be provided to the team as available.
WASC EER Report Appendix E 218
RETURN TO CONTENTS
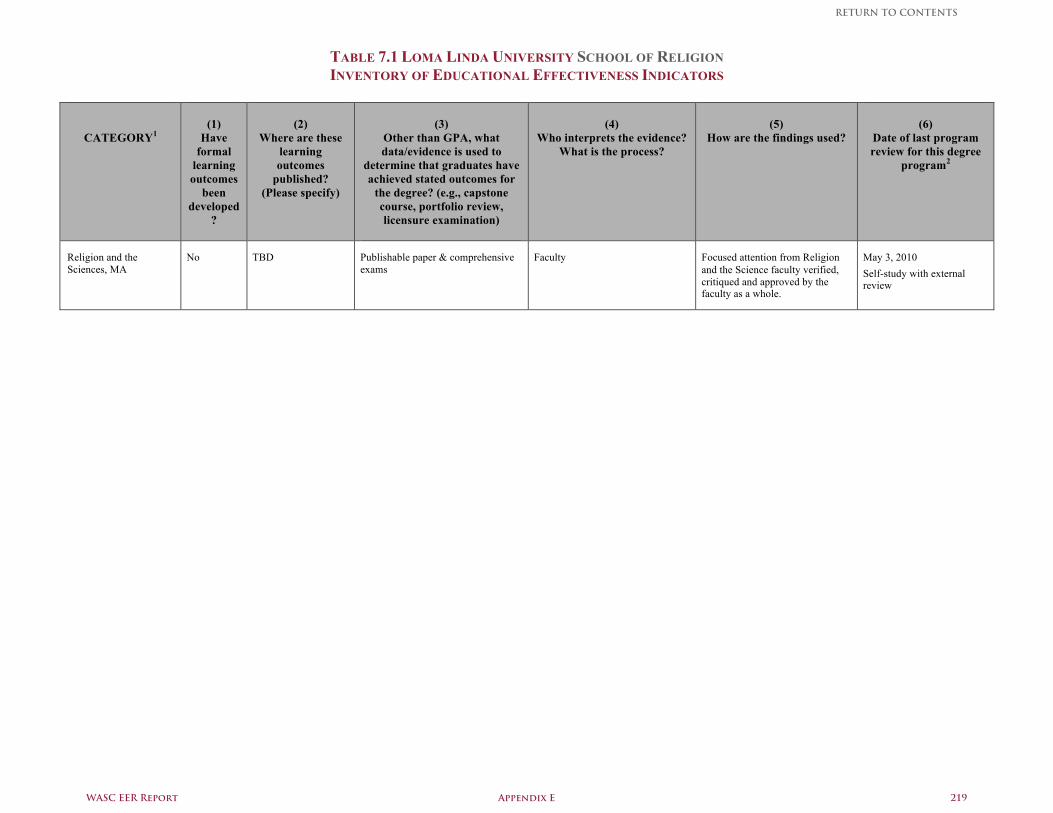
TABLE 7.1 LOMA LINDA UNIVERSITY SCHOOL OF RELIGION INVENTORY OF EDUCATIONAL EFFECTIVENESS INDICATORS
CATEGORY1
(1)
Have formal
learning outcomes
been developed
?
(2)
Where are these learning outcomes
published? (Please specify)
(3)
Other than GPA, what data/evidence is used to
determine that graduates have achieved stated outcomes for
the degree? (e.g., capstone course, portfolio review, licensure examination)
(4)
Who interprets the evidence? What is the process?
(5)
How are the findings used?
(6)
Date of last program review for this degree
program2
Religion and the Sciences, MA
No TBD Publishable paper & comprehensive exams
Faculty Focused attention from Religion and the Science faculty verified, critiqued and approved by the faculty as a whole.
May 3, 2010 Self-study with external review
WASC EER Report Appendix E 219
RETURN TO CONTENTS
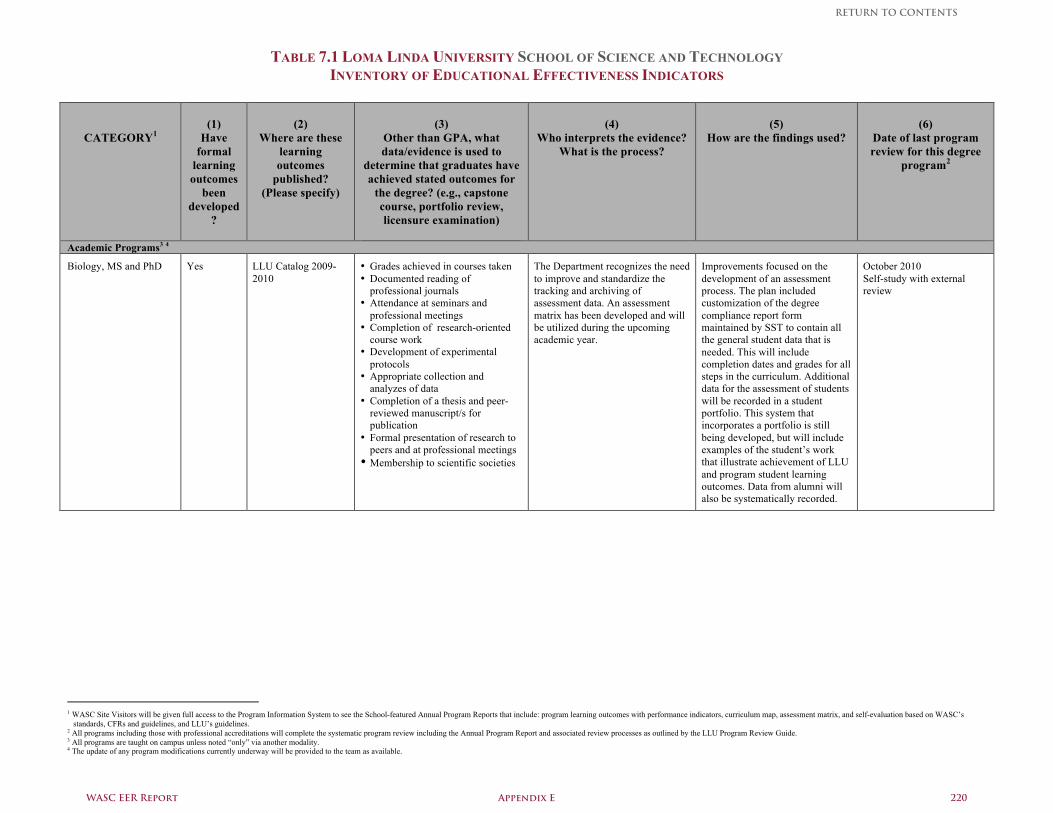
TABLE 7.1 LOMA LINDA UNIVERSITY SCHOOL OF SCIENCE AND TECHNOLOGY INVENTORY OF EDUCATIONAL EFFECTIVENESS INDICATORS
CATEGORY1
(1)
Have formal
learning outcomes
been developed
?
(2)
Where are these learning outcomes
published? (Please specify)
(3)
Other than GPA, what data/evidence is used to
determine that graduates have achieved stated outcomes for
the degree? (e.g., capstone course, portfolio review, licensure examination)
(4)
Who interprets the evidence? What is the process?
(5)
How are the findings used?
(6)
Date of last program review for this degree
program2
Academic Programs3 4
Biology, MS and PhD Yes LLU Catalog 2009-2010
• Grades achieved in courses taken • Documented reading of
professional journals • Attendance at seminars and
professional meetings • Completion of research-oriented
course work • Development of experimental
protocols • Appropriate collection and
analyzes of data • Completion of a thesis and peer-
reviewed manuscript/s for publication
• Formal presentation of research to peers and at professional meetings
• Membership to scientific societies
The Department recognizes the need to improve and standardize the tracking and archiving of assessment data. An assessment matrix has been developed and will be utilized during the upcoming academic year.
Improvements focused on the development of an assessment process. The plan included customization of the degree compliance report form maintained by SST to contain all the general student data that is needed. This will include completion dates and grades for all steps in the curriculum. Additional data for the assessment of students will be recorded in a student portfolio. This system that incorporates a portfolio is still being developed, but will include examples of the student’s work that illustrate achievement of LLU and program student learning outcomes. Data from alumni will also be systematically recorded.
October 2010 Self-study with external review
1 WASC Site Visitors will be given full access to the Program Information System to see the School-featured Annual Program Reports that include: program learning outcomes with performance indicators, curriculum map, assessment matrix, and self-evaluation based on WASC’s
standards, CFRs and guidelines, and LLU’s guidelines. 2 All programs including those with professional accreditations will complete the systematic program review including the Annual Program Report and associated review processes as outlined by the LLU Program Review Guide. 3 All programs are taught on campus unless noted “only” via another modality. 4 The update of any program modifications currently underway will be provided to the team as available.
WASC EER Report Appendix E 220
RETURN TO CONTENTS
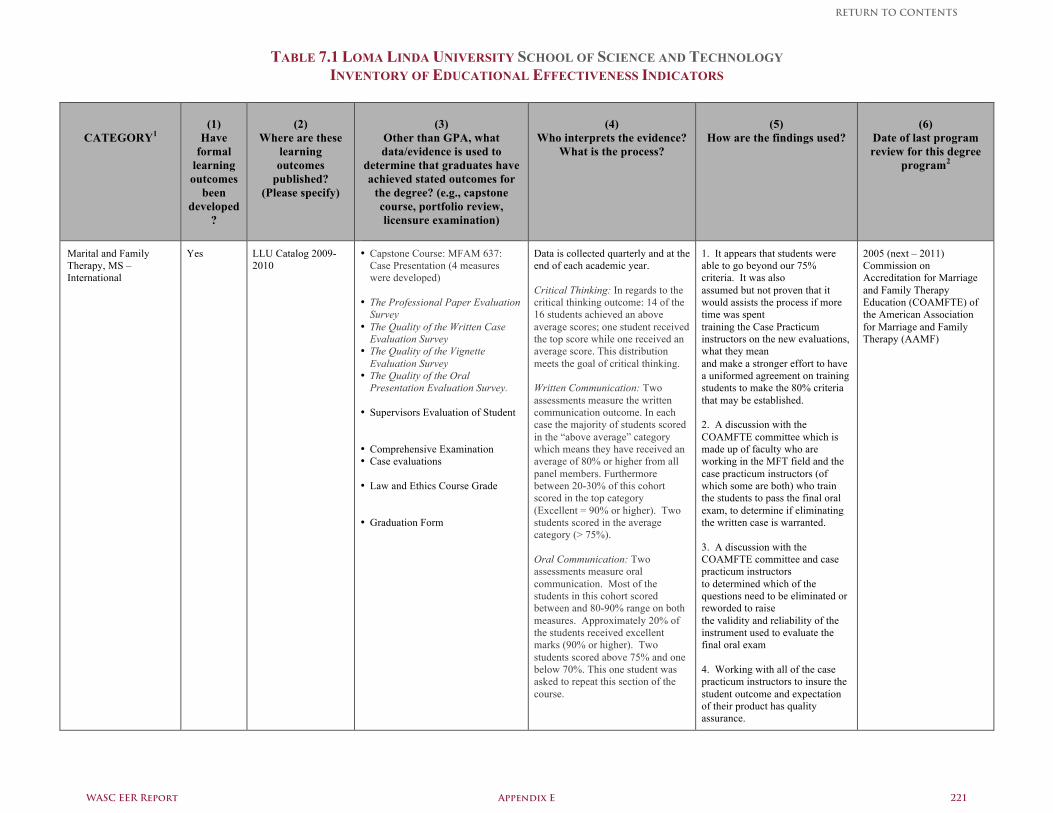
TABLE 7.1 LOMA LINDA UNIVERSITY SCHOOL OF SCIENCE AND TECHNOLOGY INVENTORY OF EDUCATIONAL EFFECTIVENESS INDICATORS
CATEGORY1
(1)
Have formal
learning outcomes
been developed
?
(2)
Where are these learning outcomes
published? (Please specify)
(3)
Other than GPA, what data/evidence is used to
determine that graduates have achieved stated outcomes for
the degree? (e.g., capstone course, portfolio review, licensure examination)
(4)
Who interprets the evidence? What is the process?
(5)
How are the findings used?
(6)
Date of last program review for this degree
program2
Marital and Family Therapy, MS – International
Yes LLU Catalog 2009-2010
• Capstone Course: MFAM 637: Case Presentation (4 measures were developed)
• The Professional Paper Evaluation
Survey • The Quality of the Written Case
Evaluation Survey • The Quality of the Vignette
Evaluation Survey • The Quality of the Oral
Presentation Evaluation Survey. • Supervisors Evaluation of Student • Comprehensive Examination • Case evaluations • Law and Ethics Course Grade • Graduation Form
Data is collected quarterly and at the end of each academic year. Critical Thinking: In regards to the critical thinking outcome: 14 of the 16 students achieved an above average scores; one student received the top score while one received an average score. This distribution meets the goal of critical thinking. Written Communication: Two assessments measure the written communication outcome. In each case the majority of students scored in the “above average” category which means they have received an average of 80% or higher from all panel members. Furthermore between 20-30% of this cohort scored in the top category (Excellent = 90% or higher). Two students scored in the average category (> 75%). Oral Communication: Two assessments measure oral communication. Most of the students in this cohort scored between and 80-90% range on both measures. Approximately 20% of the students received excellent marks (90% or higher). Two students scored above 75% and one below 70%. This one student was asked to repeat this section of the course.
1. It appears that students were able to go beyond our 75% criteria. It was also assumed but not proven that it would assists the process if more time was spent training the Case Practicum instructors on the new evaluations, what they mean and make a stronger effort to have a uniformed agreement on training students to make the 80% criteria that may be established. 2. A discussion with the COAMFTE committee which is made up of faculty who are working in the MFT field and the case practicum instructors (of which some are both) who train the students to pass the final oral exam, to determine if eliminating the written case is warranted. 3. A discussion with the COAMFTE committee and case practicum instructors to determined which of the questions need to be eliminated or reworded to raise the validity and reliability of the instrument used to evaluate the final oral exam 4. Working with all of the case practicum instructors to insure the student outcome and expectation of their product has quality assurance.
2005 (next – 2011) Commission on Accreditation for Marriage and Family Therapy Education (COAMFTE) of the American Association for Marriage and Family Therapy (AAMF)
WASC EER Report Appendix E 221
RETURN TO CONTENTS
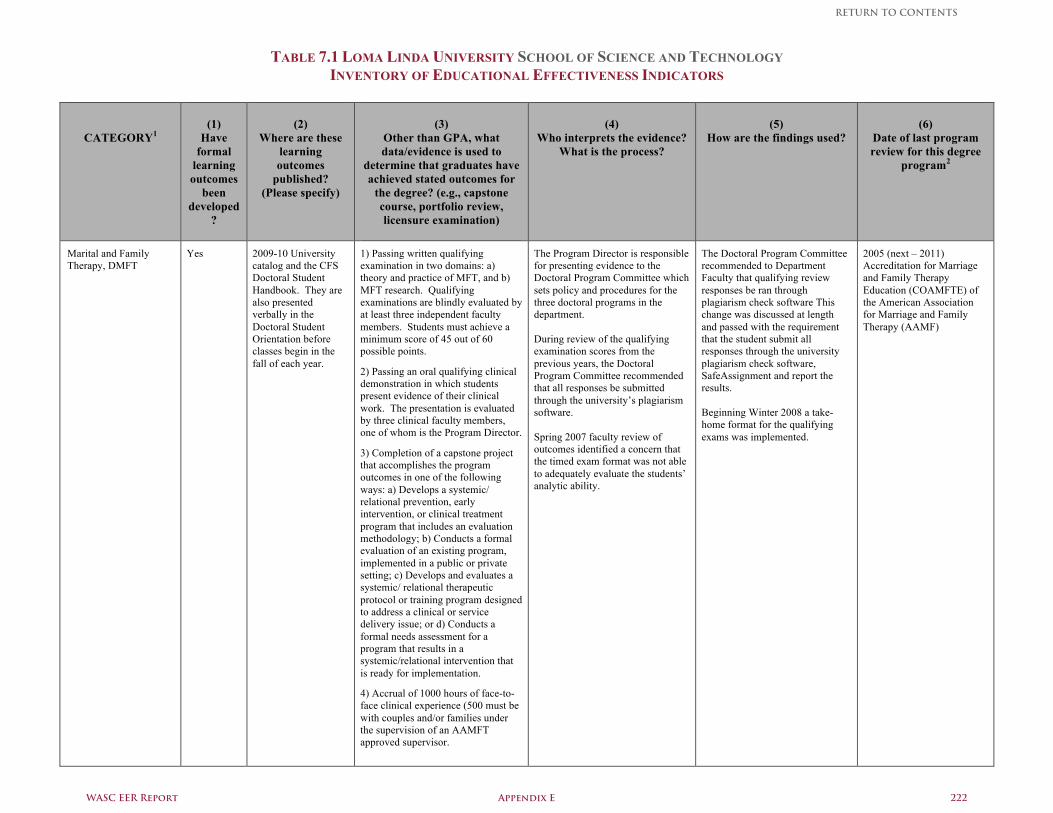
TABLE 7.1 LOMA LINDA UNIVERSITY SCHOOL OF SCIENCE AND TECHNOLOGY INVENTORY OF EDUCATIONAL EFFECTIVENESS INDICATORS
CATEGORY1
(1)
Have formal
learning outcomes
been developed
?
(2)
Where are these learning outcomes
published? (Please specify)
(3)
Other than GPA, what data/evidence is used to
determine that graduates have achieved stated outcomes for
the degree? (e.g., capstone course, portfolio review, licensure examination)
(4)
Who interprets the evidence? What is the process?
(5)
How are the findings used?
(6)
Date of last program review for this degree
program2
Marital and Family Therapy, DMFT
Yes 2009-10 University catalog and the CFS Doctoral Student Handbook. They are also presented verbally in the Doctoral Student Orientation before classes begin in the fall of each year.
1) Passing written qualifying examination in two domains: a) theory and practice of MFT, and b) MFT research. Qualifying examinations are blindly evaluated by at least three independent faculty members. Students must achieve a minimum score of 45 out of 60 possible points.
2) Passing an oral qualifying clinical demonstration in which students present evidence of their clinical work. The presentation is evaluated by three clinical faculty members, one of whom is the Program Director.
3) Completion of a capstone project that accomplishes the program outcomes in one of the following ways: a) Develops a systemic/ relational prevention, early intervention, or clinical treatment program that includes an evaluation methodology; b) Conducts a formal evaluation of an existing program, implemented in a public or private setting; c) Develops and evaluates a systemic/ relational therapeutic protocol or training program designed to address a clinical or service delivery issue; or d) Conducts a formal needs assessment for a program that results in a systemic/relational intervention that is ready for implementation.
4) Accrual of 1000 hours of face-to-face clinical experience (500 must be with couples and/or families under the supervision of an AAMFT approved supervisor.
The Program Director is responsible for presenting evidence to the Doctoral Program Committee which sets policy and procedures for the three doctoral programs in the department. During review of the qualifying examination scores from the previous years, the Doctoral Program Committee recommended that all responses be submitted through the university’s plagiarism software. Spring 2007 faculty review of outcomes identified a concern that the timed exam format was not able to adequately evaluate the students’ analytic ability.
The Doctoral Program Committee recommended to Department Faculty that qualifying review responses be ran through plagiarism check software This change was discussed at length and passed with the requirement that the student submit all responses through the university plagiarism check software, SafeAssignment and report the results. Beginning Winter 2008 a take-home format for the qualifying exams was implemented.
2005 (next – 2011) Accreditation for Marriage and Family Therapy Education (COAMFTE) of the American Association for Marriage and Family Therapy (AAMF)
WASC EER Report Appendix E 222
RETURN TO CONTENTS
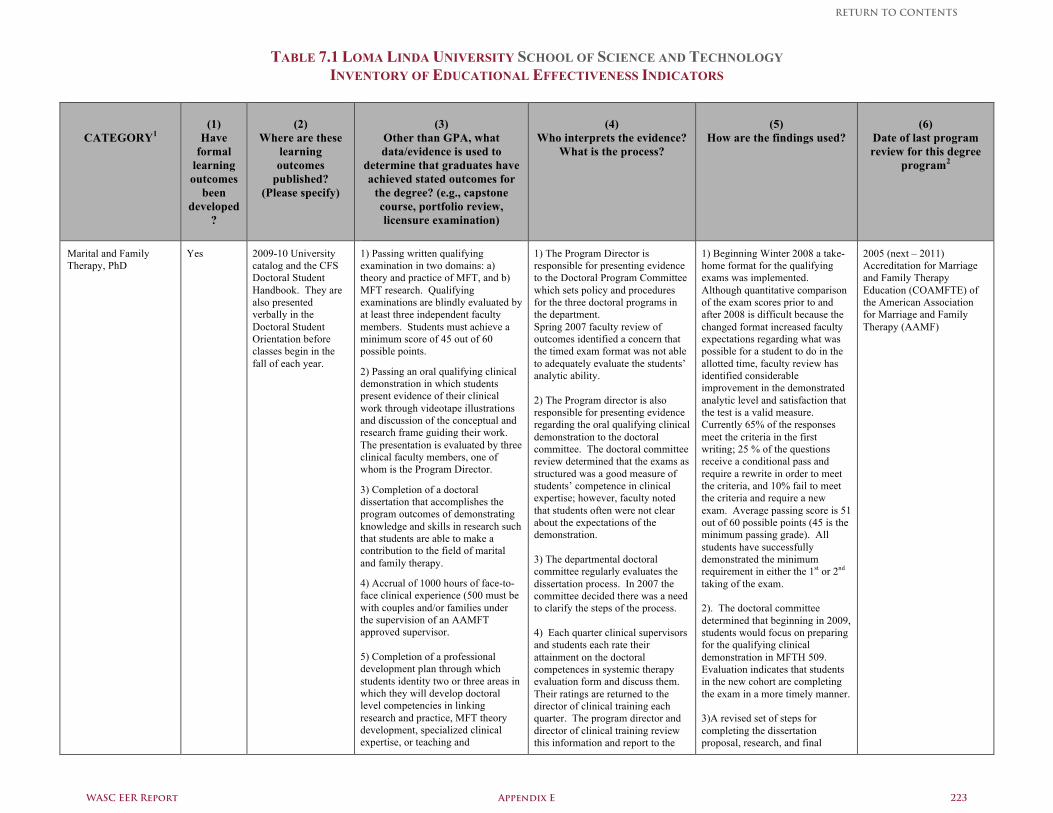
TABLE 7.1 LOMA LINDA UNIVERSITY SCHOOL OF SCIENCE AND TECHNOLOGY INVENTORY OF EDUCATIONAL EFFECTIVENESS INDICATORS
CATEGORY1
(1)
Have formal
learning outcomes
been developed
?
(2)
Where are these learning outcomes
published? (Please specify)
(3)
Other than GPA, what data/evidence is used to
determine that graduates have achieved stated outcomes for
the degree? (e.g., capstone course, portfolio review, licensure examination)
(4)
Who interprets the evidence? What is the process?
(5)
How are the findings used?
(6)
Date of last program review for this degree
program2
Marital and Family Therapy, PhD
Yes 2009-10 University catalog and the CFS Doctoral Student Handbook. They are also presented verbally in the Doctoral Student Orientation before classes begin in the fall of each year.
1) Passing written qualifying examination in two domains: a) theory and practice of MFT, and b) MFT research. Qualifying examinations are blindly evaluated by at least three independent faculty members. Students must achieve a minimum score of 45 out of 60 possible points.
2) Passing an oral qualifying clinical demonstration in which students present evidence of their clinical work through videotape illustrations and discussion of the conceptual and research frame guiding their work. The presentation is evaluated by three clinical faculty members, one of whom is the Program Director.
3) Completion of a doctoral dissertation that accomplishes the program outcomes of demonstrating knowledge and skills in research such that students are able to make a contribution to the field of marital and family therapy.
4) Accrual of 1000 hours of face-to-face clinical experience (500 must be with couples and/or families under the supervision of an AAMFT approved supervisor. 5) Completion of a professional development plan through which students identity two or three areas in which they will develop doctoral level competencies in linking research and practice, MFT theory development, specialized clinical expertise, or teaching and
1) The Program Director is responsible for presenting evidence to the Doctoral Program Committee which sets policy and procedures for the three doctoral programs in the department. Spring 2007 faculty review of outcomes identified a concern that the timed exam format was not able to adequately evaluate the students’ analytic ability. 2) The Program director is also responsible for presenting evidence regarding the oral qualifying clinical demonstration to the doctoral committee. The doctoral committee review determined that the exams as structured was a good measure of students’ competence in clinical expertise; however, faculty noted that students often were not clear about the expectations of the demonstration. 3) The departmental doctoral committee regularly evaluates the dissertation process. In 2007 the committee decided there was a need to clarify the steps of the process. 4) Each quarter clinical supervisors and students each rate their attainment on the doctoral competences in systemic therapy evaluation form and discuss them. Their ratings are returned to the director of clinical training each quarter. The program director and director of clinical training review this information and report to the
1) Beginning Winter 2008 a take-home format for the qualifying exams was implemented. Although quantitative comparison of the exam scores prior to and after 2008 is difficult because the changed format increased faculty expectations regarding what was possible for a student to do in the allotted time, faculty review has identified considerable improvement in the demonstrated analytic level and satisfaction that the test is a valid measure. Currently 65% of the responses meet the criteria in the first writing; 25 % of the questions receive a conditional pass and require a rewrite in order to meet the criteria, and 10% fail to meet the criteria and require a new exam. Average passing score is 51 out of 60 possible points (45 is the minimum passing grade). All students have successfully demonstrated the minimum requirement in either the 1st or 2nd taking of the exam. 2). The doctoral committee determined that beginning in 2009, students would focus on preparing for the qualifying clinical demonstration in MFTH 509. Evaluation indicates that students in the new cohort are completing the exam in a more timely manner. 3)A revised set of steps for completing the dissertation proposal, research, and final
2005 (next – 2011) Accreditation for Marriage and Family Therapy Education (COAMFTE) of the American Association for Marriage and Family Therapy (AAMF)
WASC EER Report Appendix E 223
RETURN TO CONTENTS
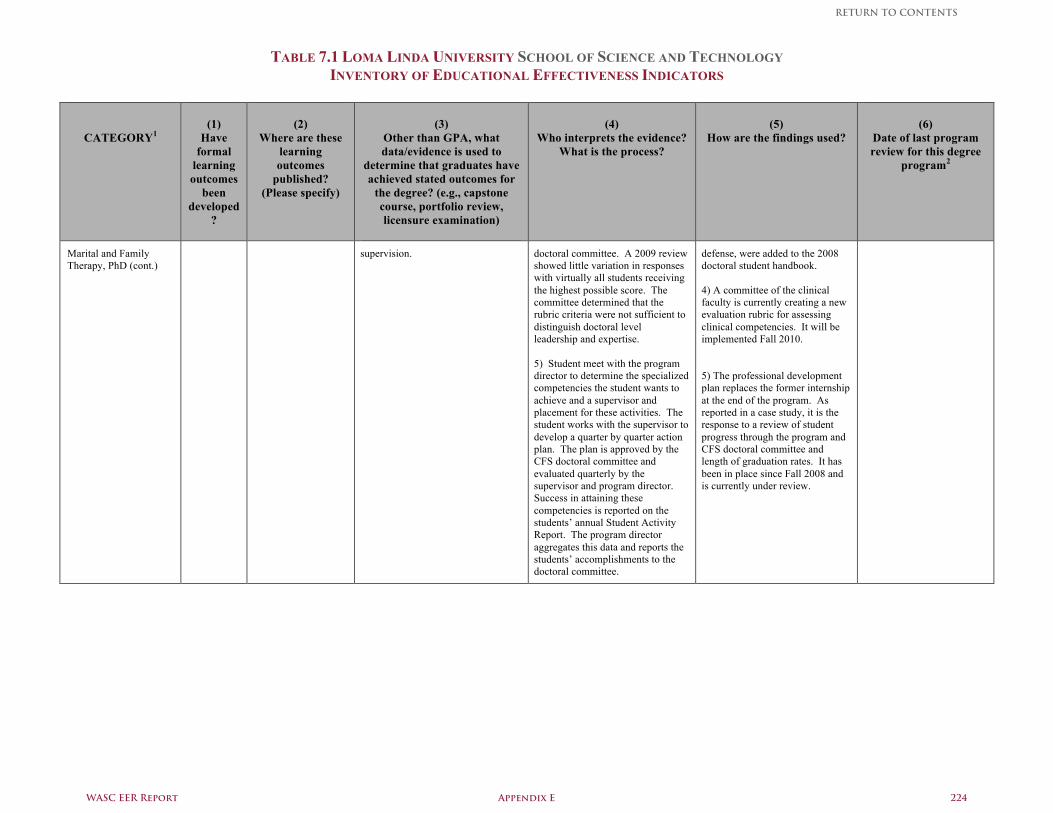
TABLE 7.1 LOMA LINDA UNIVERSITY SCHOOL OF SCIENCE AND TECHNOLOGY INVENTORY OF EDUCATIONAL EFFECTIVENESS INDICATORS
CATEGORY1
(1)
Have formal
learning outcomes
been developed
?
(2)
Where are these learning outcomes
published? (Please specify)
(3)
Other than GPA, what data/evidence is used to
determine that graduates have achieved stated outcomes for
the degree? (e.g., capstone course, portfolio review, licensure examination)
(4)
Who interprets the evidence? What is the process?
(5)
How are the findings used?
(6)
Date of last program review for this degree
program2
Marital and Family Therapy, PhD (cont.)
supervision.
doctoral committee. A 2009 review showed little variation in responses with virtually all students receiving the highest possible score. The committee determined that the rubric criteria were not sufficient to distinguish doctoral level leadership and expertise. 5) Student meet with the program director to determine the specialized competencies the student wants to achieve and a supervisor and placement for these activities. The student works with the supervisor to develop a quarter by quarter action plan. The plan is approved by the CFS doctoral committee and evaluated quarterly by the supervisor and program director. Success in attaining these competencies is reported on the students’ annual Student Activity Report. The program director aggregates this data and reports the students’ accomplishments to the doctoral committee.
defense, were added to the 2008 doctoral student handbook. 4) A committee of the clinical faculty is currently creating a new evaluation rubric for assessing clinical competencies. It will be implemented Fall 2010.
5) The professional development plan replaces the former internship at the end of the program. As reported in a case study, it is the response to a review of student progress through the program and CFS doctoral committee and length of graduation rates. It has been in place since Fall 2008 and is currently under review.
WASC EER Report Appendix E 224
RETURN TO CONTENTS
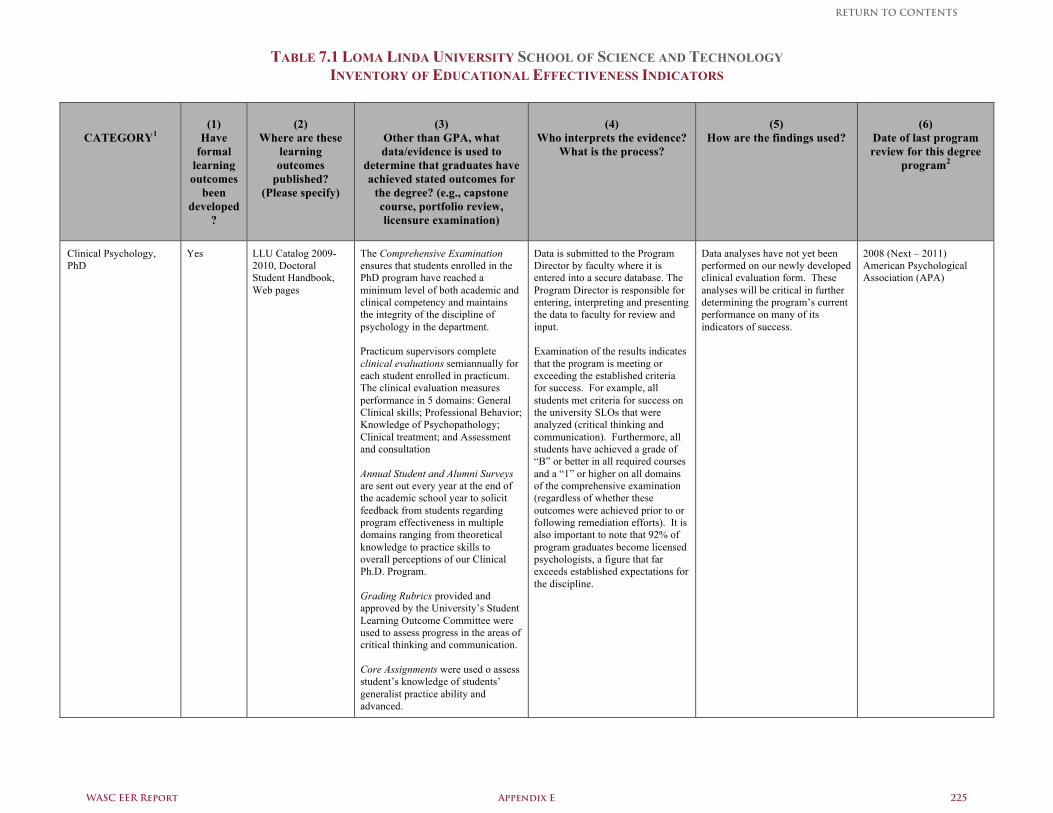
TABLE 7.1 LOMA LINDA UNIVERSITY SCHOOL OF SCIENCE AND TECHNOLOGY INVENTORY OF EDUCATIONAL EFFECTIVENESS INDICATORS
CATEGORY1
(1)
Have formal
learning outcomes
been developed
?
(2)
Where are these learning outcomes
published? (Please specify)
(3)
Other than GPA, what data/evidence is used to
determine that graduates have achieved stated outcomes for
the degree? (e.g., capstone course, portfolio review, licensure examination)
(4)
Who interprets the evidence? What is the process?
(5)
How are the findings used?
(6)
Date of last program review for this degree
program2
Clinical Psychology, PhD
Yes LLU Catalog 2009-2010, Doctoral Student Handbook, Web pages
The Comprehensive Examination ensures that students enrolled in the PhD program have reached a minimum level of both academic and clinical competency and maintains the integrity of the discipline of psychology in the department. Practicum supervisors complete clinical evaluations semiannually for each student enrolled in practicum. The clinical evaluation measures performance in 5 domains: General Clinical skills; Professional Behavior; Knowledge of Psychopathology; Clinical treatment; and Assessment and consultation
Annual Student and Alumni Surveys are sent out every year at the end of the academic school year to solicit feedback from students regarding program effectiveness in multiple domains ranging from theoretical knowledge to practice skills to overall perceptions of our Clinical Ph.D. Program. Grading Rubrics provided and approved by the University’s Student Learning Outcome Committee were used to assess progress in the areas of critical thinking and communication. Core Assignments were used o assess student’s knowledge of students’ generalist practice ability and advanced.
Data is submitted to the Program Director by faculty where it is entered into a secure database. The Program Director is responsible for entering, interpreting and presenting the data to faculty for review and input. Examination of the results indicates that the program is meeting or exceeding the established criteria for success. For example, all students met criteria for success on the university SLOs that were analyzed (critical thinking and communication). Furthermore, all students have achieved a grade of “B” or better in all required courses and a “1” or higher on all domains of the comprehensive examination (regardless of whether these outcomes were achieved prior to or following remediation efforts). It is also important to note that 92% of program graduates become licensed psychologists, a figure that far exceeds established expectations for the discipline.
Data analyses have not yet been performed on our newly developed clinical evaluation form. These analyses will be critical in further determining the program’s current performance on many of its indicators of success.
2008 (Next – 2011) American Psychological Association (APA)
WASC EER Report Appendix E 225
RETURN TO CONTENTS
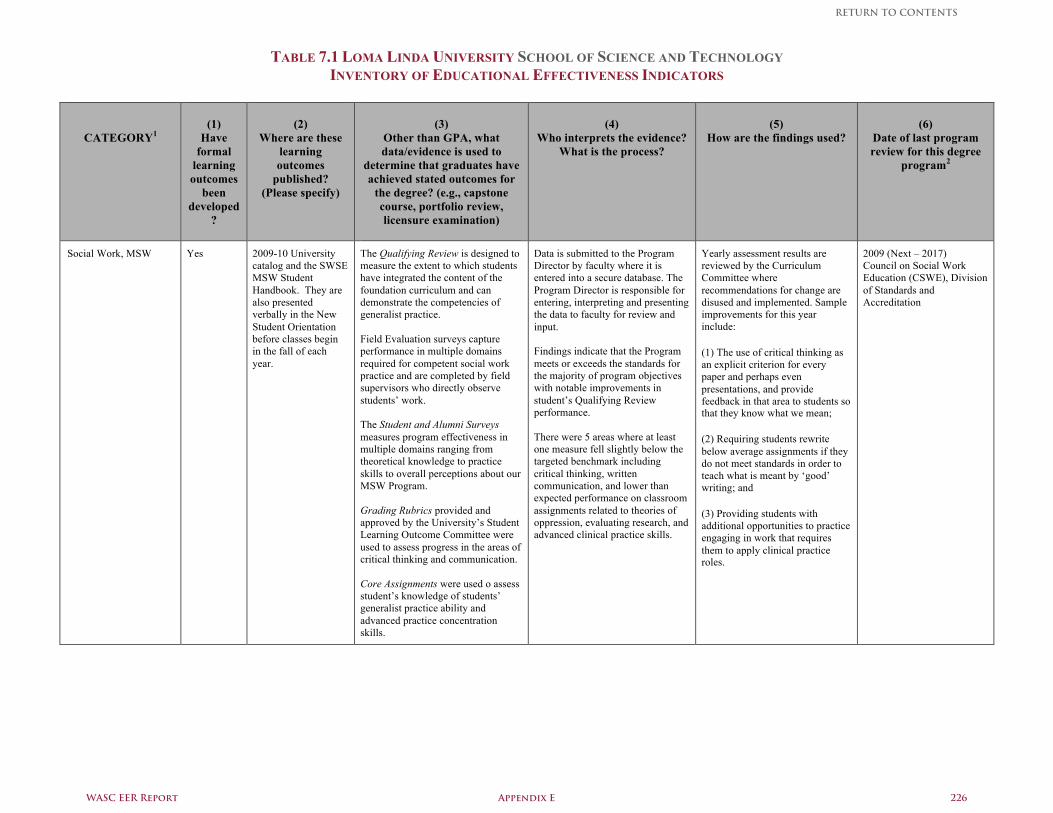
TABLE 7.1 LOMA LINDA UNIVERSITY SCHOOL OF SCIENCE AND TECHNOLOGY INVENTORY OF EDUCATIONAL EFFECTIVENESS INDICATORS
CATEGORY1
(1)
Have formal
learning outcomes
been developed
?
(2)
Where are these learning outcomes
published? (Please specify)
(3)
Other than GPA, what data/evidence is used to
determine that graduates have achieved stated outcomes for
the degree? (e.g., capstone course, portfolio review, licensure examination)
(4)
Who interprets the evidence? What is the process?
(5)
How are the findings used?
(6)
Date of last program review for this degree
program2
Social Work, MSW Yes 2009-10 University catalog and the SWSE MSW Student Handbook. They are also presented verbally in the New Student Orientation before classes begin in the fall of each year.
The Qualifying Review is designed to measure the extent to which students have integrated the content of the foundation curriculum and can demonstrate the competencies of generalist practice. Field Evaluation surveys capture performance in multiple domains required for competent social work practice and are completed by field supervisors who directly observe students’ work. The Student and Alumni Surveys measures program effectiveness in multiple domains ranging from theoretical knowledge to practice skills to overall perceptions about our MSW Program. Grading Rubrics provided and approved by the University’s Student Learning Outcome Committee were used to assess progress in the areas of critical thinking and communication. Core Assignments were used o assess student’s knowledge of students’ generalist practice ability and advanced practice concentration skills.
Data is submitted to the Program Director by faculty where it is entered into a secure database. The Program Director is responsible for entering, interpreting and presenting the data to faculty for review and input. Findings indicate that the Program meets or exceeds the standards for the majority of program objectives with notable improvements in student’s Qualifying Review performance. There were 5 areas where at least one measure fell slightly below the targeted benchmark including critical thinking, written communication, and lower than expected performance on classroom assignments related to theories of oppression, evaluating research, and advanced clinical practice skills.
Yearly assessment results are reviewed by the Curriculum Committee where recommendations for change are disused and implemented. Sample improvements for this year include:
(1) The use of critical thinking as an explicit criterion for every paper and perhaps even presentations, and provide feedback in that area to students so that they know what we mean;
(2) Requiring students rewrite below average assignments if they do not meet standards in order to teach what is meant by ‘good’ writing; and
(3) Providing students with additional opportunities to practice engaging in work that requires them to apply clinical practice roles.
2009 (Next – 2017) Council on Social Work Education (CSWE), Division of Standards and Accreditation
WASC EER Report Appendix E 226
RETURN TO CONTENTS

WASC Educational Effectiveness Report
Appendix F
TABLE OF CONTENTS
RETURN TO CONTENTS
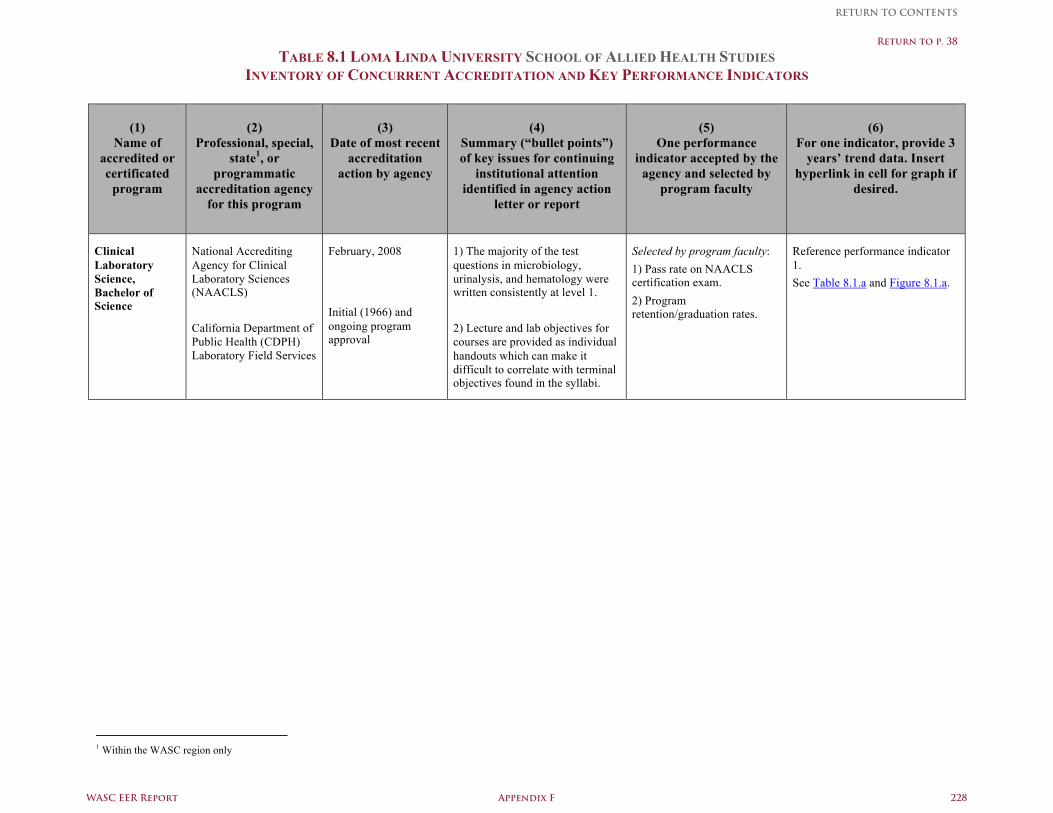
TABLE 8.1 LOMA LINDA UNIVERSITY SCHOOL OF ALLIED HEALTH STUDIES INVENTORY OF CONCURRENT ACCREDITATION AND KEY PERFORMANCE INDICATORS
(1) Name of
accredited or certificated
program
(2)
Professional, special, state1, or
programmatic accreditation agency
for this program
(3)
Date of most recent accreditation
action by agency
(4)
Summary (“bullet points”) of key issues for continuing
institutional attention identified in agency action
letter or report
(5)
One performance indicator accepted by the
agency and selected by program faculty
(6)
For one indicator, provide 3 years’ trend data. Insert
hyperlink in cell for graph if desired.
Clinical Laboratory Science, Bachelor of Science
National Accrediting Agency for Clinical Laboratory Sciences (NAACLS) California Department of Public Health (CDPH) Laboratory Field Services
February, 2008
Initial (1966) and ongoing program approval
1) The majority of the test questions in microbiology, urinalysis, and hematology were written consistently at level 1. 2) Lecture and lab objectives for courses are provided as individual handouts which can make it difficult to correlate with terminal objectives found in the syllabi.
Selected by program faculty: 1) Pass rate on NAACLS certification exam. 2) Program retention/graduation rates.
Reference performance indicator 1. See Table 8.1.a and Figure 8.1.a.
1 Within the WASC region only
WASC EER Report Appendix F 228
RETURN TO CONTENTS
Return to p. 38
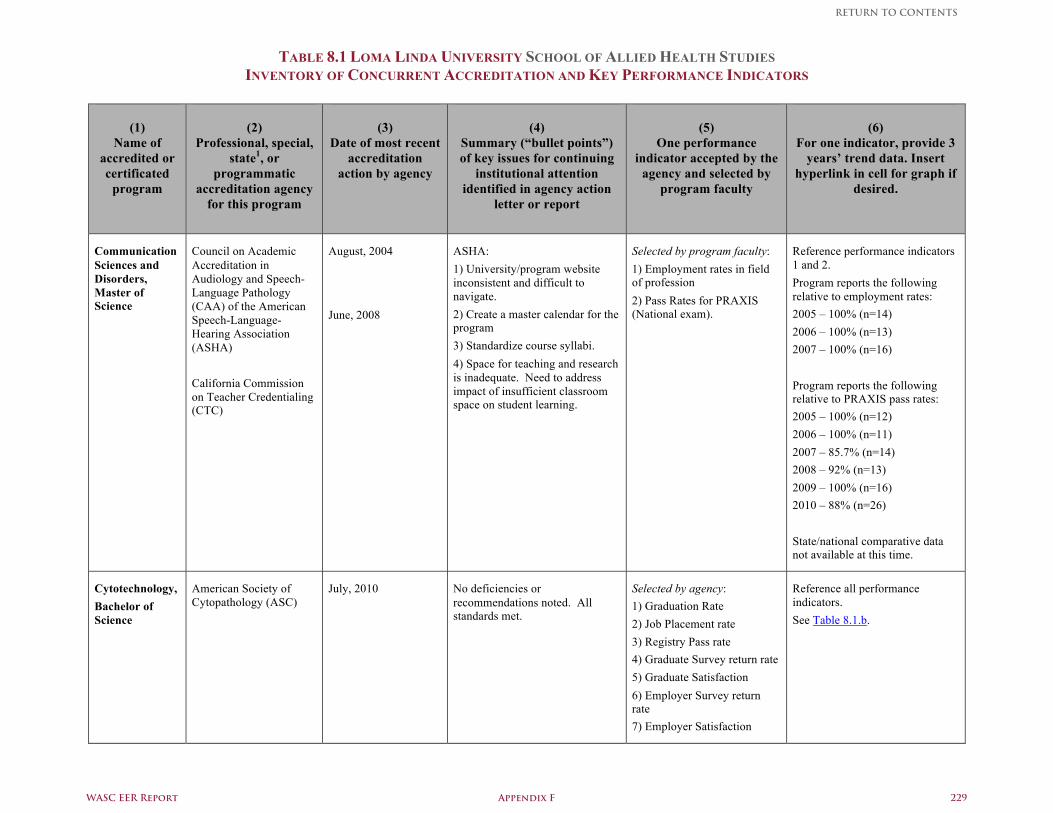
TABLE 8.1 LOMA LINDA UNIVERSITY SCHOOL OF ALLIED HEALTH STUDIES INVENTORY OF CONCURRENT ACCREDITATION AND KEY PERFORMANCE INDICATORS
(1) Name of
accredited or certificated
program
(2)
Professional, special, state1, or
programmatic accreditation agency
for this program
(3)
Date of most recent accreditation
action by agency
(4)
Summary (“bullet points”) of key issues for continuing
institutional attention identified in agency action
letter or report
(5)
One performance indicator accepted by the
agency and selected by program faculty
(6)
For one indicator, provide 3 years’ trend data. Insert
hyperlink in cell for graph if desired.
Communication Sciences and Disorders, Master of Science
Council on Academic Accreditation in Audiology and Speech-Language Pathology (CAA) of the American Speech-Language-Hearing Association (ASHA) California Commission on Teacher Credentialing (CTC)
August, 2004
June, 2008
ASHA: 1) University/program website inconsistent and difficult to navigate. 2) Create a master calendar for the program 3) Standardize course syllabi. 4) Space for teaching and research is inadequate. Need to address impact of insufficient classroom space on student learning.
Selected by program faculty: 1) Employment rates in field of profession 2) Pass Rates for PRAXIS (National exam).
Reference performance indicators 1 and 2. Program reports the following relative to employment rates: 2005 – 100% (n=14) 2006 – 100% (n=13) 2007 – 100% (n=16) Program reports the following relative to PRAXIS pass rates: 2005 – 100% (n=12) 2006 – 100% (n=11) 2007 – 85.7% (n=14) 2008 – 92% (n=13) 2009 – 100% (n=16) 2010 – 88% (n=26) State/national comparative data not available at this time.
Cytotechnology, Bachelor of Science
American Society of Cytopathology (ASC)
July, 2010 No deficiencies or recommendations noted. All standards met.
Selected by agency: 1) Graduation Rate 2) Job Placement rate 3) Registry Pass rate 4) Graduate Survey return rate 5) Graduate Satisfaction 6) Employer Survey return rate 7) Employer Satisfaction
Reference all performance indicators. See Table 8.1.b.
WASC EER Report Appendix F 229
RETURN TO CONTENTS
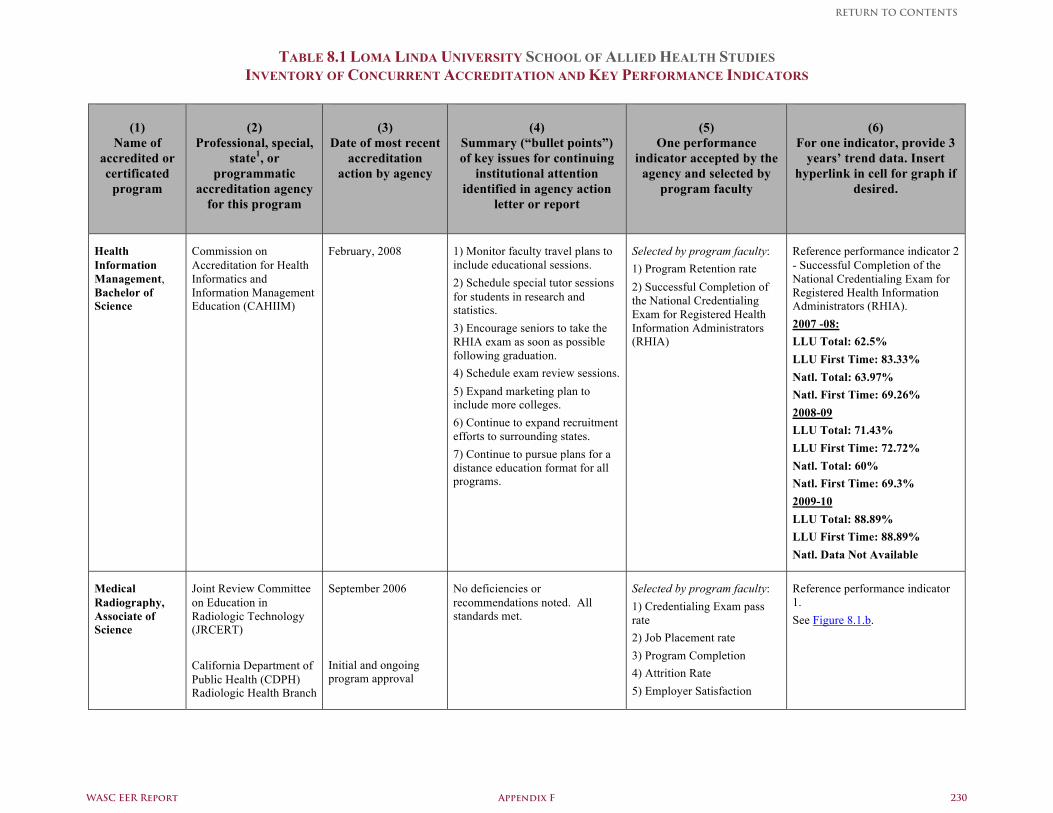
TABLE 8.1 LOMA LINDA UNIVERSITY SCHOOL OF ALLIED HEALTH STUDIES INVENTORY OF CONCURRENT ACCREDITATION AND KEY PERFORMANCE INDICATORS
(1) Name of
accredited or certificated
program
(2)
Professional, special, state1, or
programmatic accreditation agency
for this program
(3)
Date of most recent accreditation
action by agency
(4)
Summary (“bullet points”) of key issues for continuing
institutional attention identified in agency action
letter or report
(5)
One performance indicator accepted by the
agency and selected by program faculty
(6)
For one indicator, provide 3 years’ trend data. Insert
hyperlink in cell for graph if desired.
Health Information Management, Bachelor of Science
Commission on Accreditation for Health Informatics and Information Management Education (CAHIIM)
February, 2008 1) Monitor faculty travel plans to include educational sessions. 2) Schedule special tutor sessions for students in research and statistics. 3) Encourage seniors to take the RHIA exam as soon as possible following graduation. 4) Schedule exam review sessions. 5) Expand marketing plan to include more colleges. 6) Continue to expand recruitment efforts to surrounding states. 7) Continue to pursue plans for a distance education format for all programs.
Selected by program faculty: 1) Program Retention rate 2) Successful Completion of the National Credentialing Exam for Registered Health Information Administrators (RHIA)
Reference performance indicator 2 - Successful Completion of the National Credentialing Exam for Registered Health Information Administrators (RHIA). 2007 -08: LLU Total: 62.5% LLU First Time: 83.33% Natl. Total: 63.97% Natl. First Time: 69.26% 2008-09 LLU Total: 71.43% LLU First Time: 72.72% Natl. Total: 60% Natl. First Time: 69.3% 2009-10 LLU Total: 88.89% LLU First Time: 88.89% Natl. Data Not Available
Medical Radiography, Associate of Science
Joint Review Committee on Education in Radiologic Technology (JRCERT) California Department of Public Health (CDPH) Radiologic Health Branch
September 2006
Initial and ongoing program approval
No deficiencies or recommendations noted. All standards met.
Selected by program faculty: 1) Credentialing Exam pass rate 2) Job Placement rate 3) Program Completion 4) Attrition Rate 5) Employer Satisfaction
Reference performance indicator 1. See Figure 8.1.b.
WASC EER Report Appendix F 230
RETURN TO CONTENTS
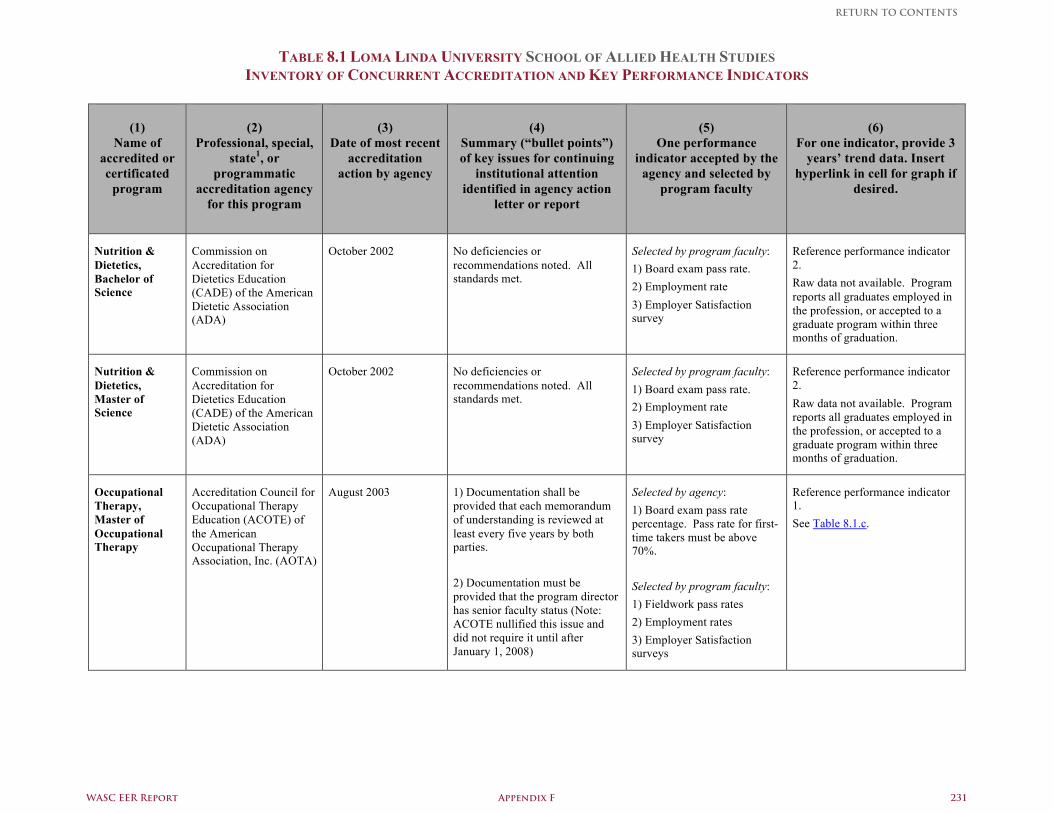
TABLE 8.1 LOMA LINDA UNIVERSITY SCHOOL OF ALLIED HEALTH STUDIES INVENTORY OF CONCURRENT ACCREDITATION AND KEY PERFORMANCE INDICATORS
(1) Name of
accredited or certificated
program
(2)
Professional, special, state1, or
programmatic accreditation agency
for this program
(3)
Date of most recent accreditation
action by agency
(4)
Summary (“bullet points”) of key issues for continuing
institutional attention identified in agency action
letter or report
(5)
One performance indicator accepted by the
agency and selected by program faculty
(6)
For one indicator, provide 3 years’ trend data. Insert
hyperlink in cell for graph if desired.
Nutrition & Dietetics, Bachelor of Science
Commission on Accreditation for Dietetics Education (CADE) of the American Dietetic Association (ADA)
October 2002
No deficiencies or recommendations noted. All standards met.
Selected by program faculty: 1) Board exam pass rate. 2) Employment rate 3) Employer Satisfaction survey
Reference performance indicator 2. Raw data not available. Program reports all graduates employed in the profession, or accepted to a graduate program within three months of graduation.
Nutrition & Dietetics, Master of Science
Commission on Accreditation for Dietetics Education (CADE) of the American Dietetic Association (ADA)
October 2002
No deficiencies or recommendations noted. All standards met.
Selected by program faculty: 1) Board exam pass rate. 2) Employment rate 3) Employer Satisfaction survey
Reference performance indicator 2. Raw data not available. Program reports all graduates employed in the profession, or accepted to a graduate program within three months of graduation.
Occupational Therapy, Master of Occupational Therapy
Accreditation Council for Occupational Therapy Education (ACOTE) of the American Occupational Therapy Association, Inc. (AOTA)
August 2003 1) Documentation shall be provided that each memorandum of understanding is reviewed at least every five years by both parties. 2) Documentation must be provided that the program director has senior faculty status (Note: ACOTE nullified this issue and did not require it until after January 1, 2008)
Selected by agency: 1) Board exam pass rate percentage. Pass rate for first-time takers must be above 70%. Selected by program faculty: 1) Fieldwork pass rates 2) Employment rates 3) Employer Satisfaction surveys
Reference performance indicator 1. See Table 8.1.c.
WASC EER Report Appendix F 231
RETURN TO CONTENTS
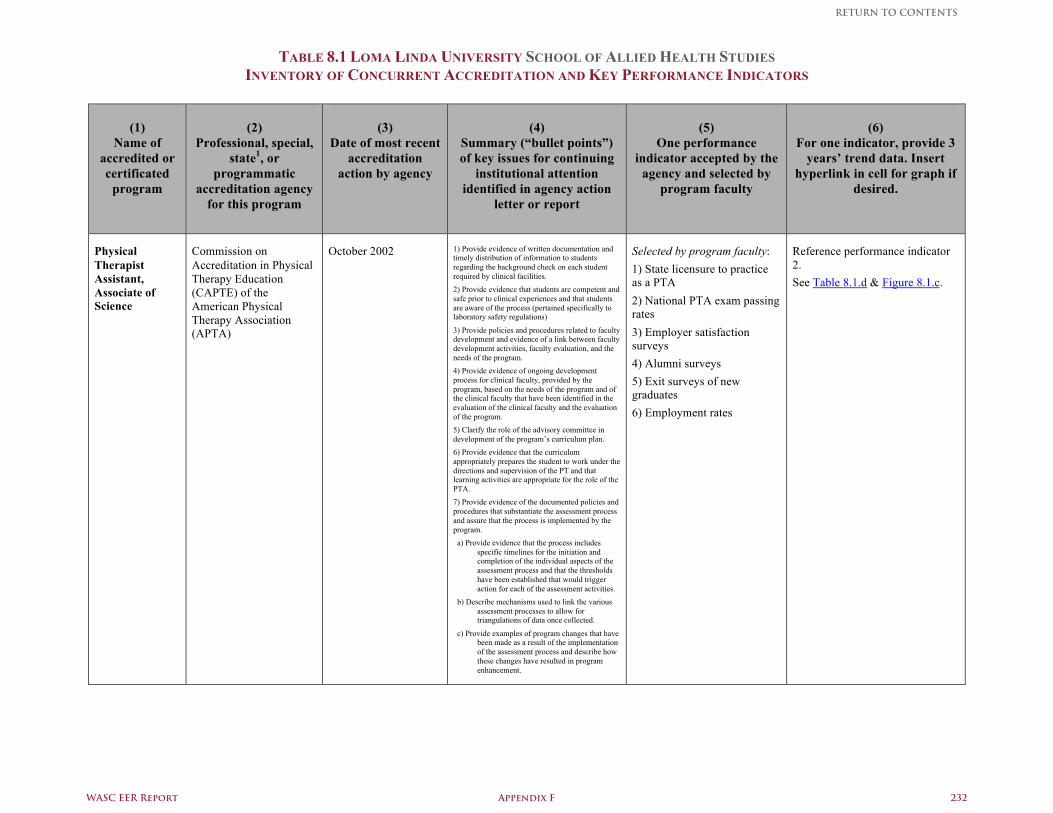
TABLE 8.1 LOMA LINDA UNIVERSITY SCHOOL OF ALLIED HEALTH STUDIES INVENTORY OF CONCURRENT ACCREDITATION AND KEY PERFORMANCE INDICATORS
(1) Name of
accredited or certificated
program
(2)
Professional, special, state1, or
programmatic accreditation agency
for this program
(3)
Date of most recent accreditation
action by agency
(4)
Summary (“bullet points”) of key issues for continuing
institutional attention identified in agency action
letter or report
(5)
One performance indicator accepted by the
agency and selected by program faculty
(6)
For one indicator, provide 3 years’ trend data. Insert
hyperlink in cell for graph if desired.
Physical Therapist Assistant, Associate of Science
Commission on Accreditation in Physical Therapy Education (CAPTE) of the American Physical Therapy Association (APTA)
October 2002 1) Provide evidence of written documentation and timely distribution of information to students regarding the background check on each student required by clinical facilities. 2) Provide evidence that students are competent and safe prior to clinical experiences and that students are aware of the process (pertained specifically to laboratory safety regulations)
3) Provide policies and procedures related to faculty development and evidence of a link between faculty development activities, faculty evaluation, and the needs of the program. 4) Provide evidence of ongoing development process for clinical faculty, provided by the program, based on the needs of the program and of the clinical faculty that have been identified in the evaluation of the clinical faculty and the evaluation of the program. 5) Clarify the role of the advisory committee in development of the program’s curriculum plan. 6) Provide evidence that the curriculum appropriately prepares the student to work under the directions and supervision of the PT and that learning activities are appropriate for the role of the PTA. 7) Provide evidence of the documented policies and procedures that substantiate the assessment process and assure that the process is implemented by the program. a) Provide evidence that the process includes
specific timelines for the initiation and completion of the individual aspects of the assessment process and that the thresholds have been established that would trigger action for each of the assessment activities.
b) Describe mechanisms used to link the various assessment processes to allow for triangulations of data once collected.
c) Provide examples of program changes that have been made as a result of the implementation of the assessment process and describe how these changes have resulted in program enhancement.
Selected by program faculty: 1) State licensure to practice as a PTA 2) National PTA exam passing rates 3) Employer satisfaction surveys 4) Alumni surveys 5) Exit surveys of new graduates 6) Employment rates
Reference performance indicator 2. See Table 8.1.d & Figure 8.1.c.
WASC EER Report Appendix F 232
RETURN TO CONTENTS
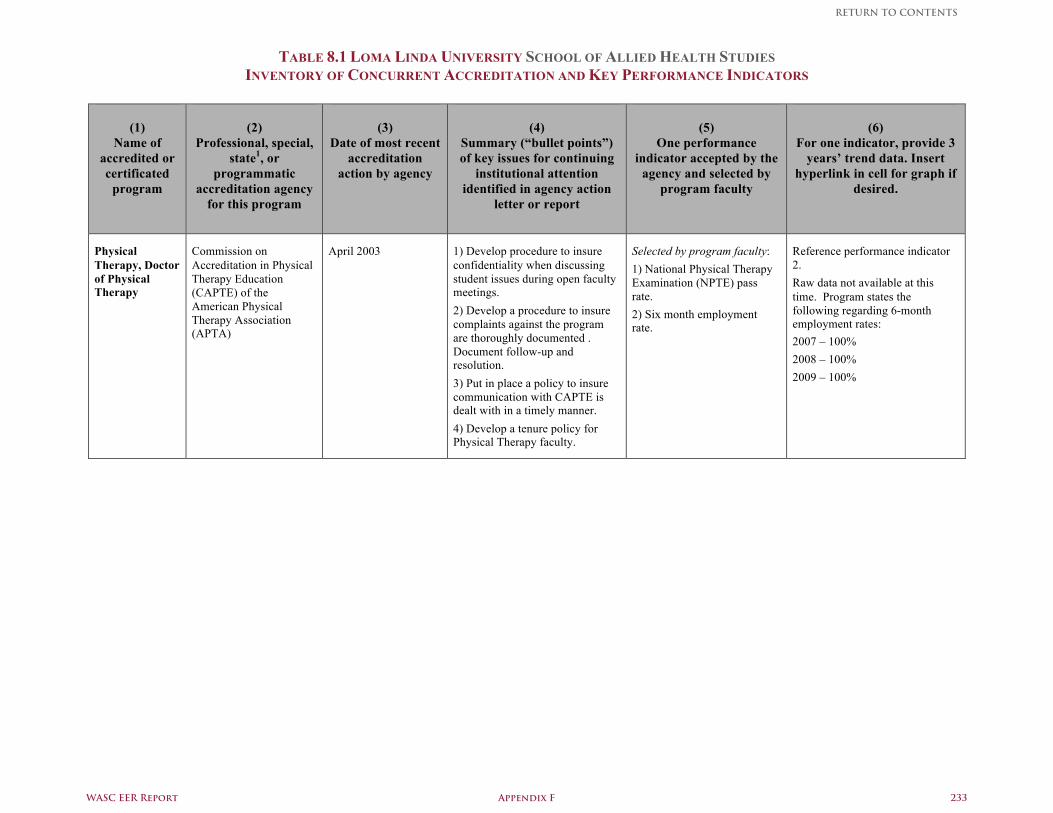
TABLE 8.1 LOMA LINDA UNIVERSITY SCHOOL OF ALLIED HEALTH STUDIES INVENTORY OF CONCURRENT ACCREDITATION AND KEY PERFORMANCE INDICATORS
(1) Name of
accredited or certificated
program
(2)
Professional, special, state1, or
programmatic accreditation agency
for this program
(3)
Date of most recent accreditation
action by agency
(4)
Summary (“bullet points”) of key issues for continuing
institutional attention identified in agency action
letter or report
(5)
One performance indicator accepted by the
agency and selected by program faculty
(6)
For one indicator, provide 3 years’ trend data. Insert
hyperlink in cell for graph if desired.
Physical Therapy, Doctor of Physical Therapy
Commission on Accreditation in Physical Therapy Education (CAPTE) of the American Physical Therapy Association (APTA)
April 2003 1) Develop procedure to insure confidentiality when discussing student issues during open faculty meetings. 2) Develop a procedure to insure complaints against the program are thoroughly documented . Document follow-up and resolution. 3) Put in place a policy to insure communication with CAPTE is dealt with in a timely manner. 4) Develop a tenure policy for Physical Therapy faculty.
Selected by program faculty: 1) National Physical Therapy Examination (NPTE) pass rate. 2) Six month employment rate.
Reference performance indicator 2. Raw data not available at this time. Program states the following regarding 6-month employment rates: 2007 – 100% 2008 – 100% 2009 – 100%
WASC EER Report Appendix F 233
RETURN TO CONTENTS
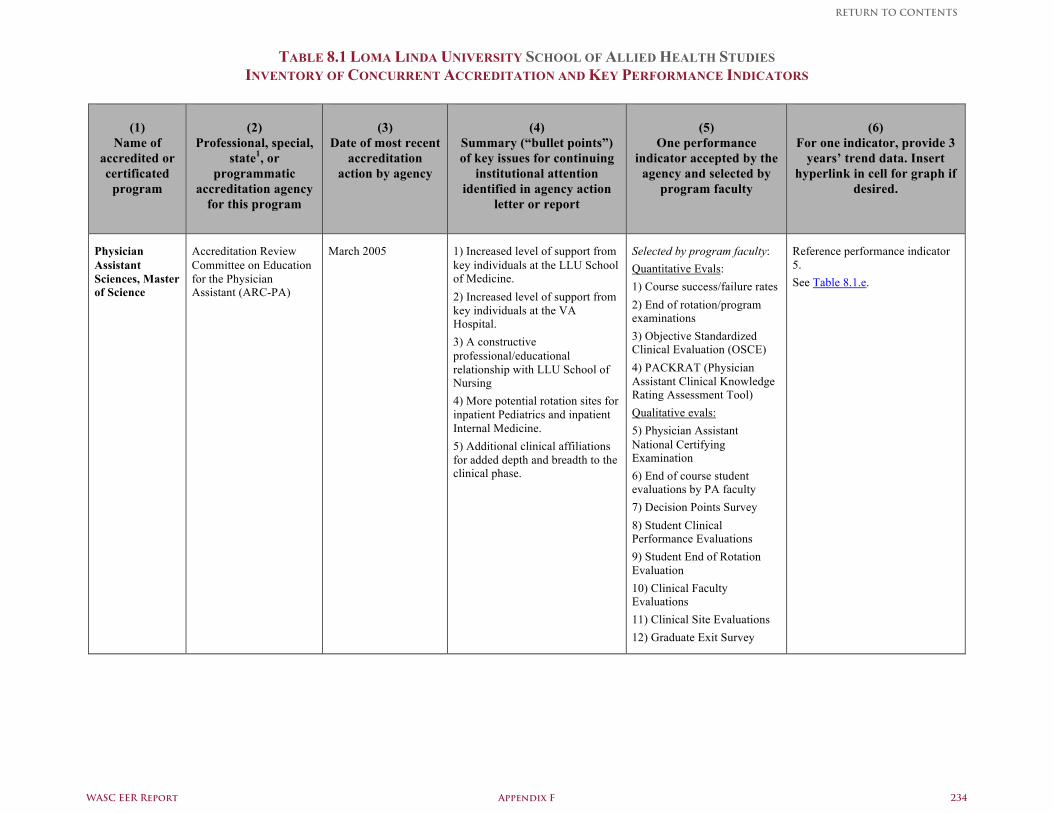
TABLE 8.1 LOMA LINDA UNIVERSITY SCHOOL OF ALLIED HEALTH STUDIES INVENTORY OF CONCURRENT ACCREDITATION AND KEY PERFORMANCE INDICATORS
(1) Name of
accredited or certificated
program
(2)
Professional, special, state1, or
programmatic accreditation agency
for this program
(3)
Date of most recent accreditation
action by agency
(4)
Summary (“bullet points”) of key issues for continuing
institutional attention identified in agency action
letter or report
(5)
One performance indicator accepted by the
agency and selected by program faculty
(6)
For one indicator, provide 3 years’ trend data. Insert
hyperlink in cell for graph if desired.
Physician Assistant Sciences, Master of Science
Accreditation Review Committee on Education for the Physician Assistant (ARC-PA)
March 2005
1) Increased level of support from key individuals at the LLU School of Medicine. 2) Increased level of support from key individuals at the VA Hospital. 3) A constructive professional/educational relationship with LLU School of Nursing 4) More potential rotation sites for inpatient Pediatrics and inpatient Internal Medicine. 5) Additional clinical affiliations for added depth and breadth to the clinical phase.
Selected by program faculty: Quantitative Evals: 1) Course success/failure rates 2) End of rotation/program examinations 3) Objective Standardized Clinical Evaluation (OSCE) 4) PACKRAT (Physician Assistant Clinical Knowledge Rating Assessment Tool) Qualitative evals: 5) Physician Assistant National Certifying Examination 6) End of course student evaluations by PA faculty 7) Decision Points Survey 8) Student Clinical Performance Evaluations 9) Student End of Rotation Evaluation 10) Clinical Faculty Evaluations 11) Clinical Site Evaluations 12) Graduate Exit Survey
Reference performance indicator 5. See Table 8.1.e.
WASC EER Report Appendix F 234
RETURN TO CONTENTS
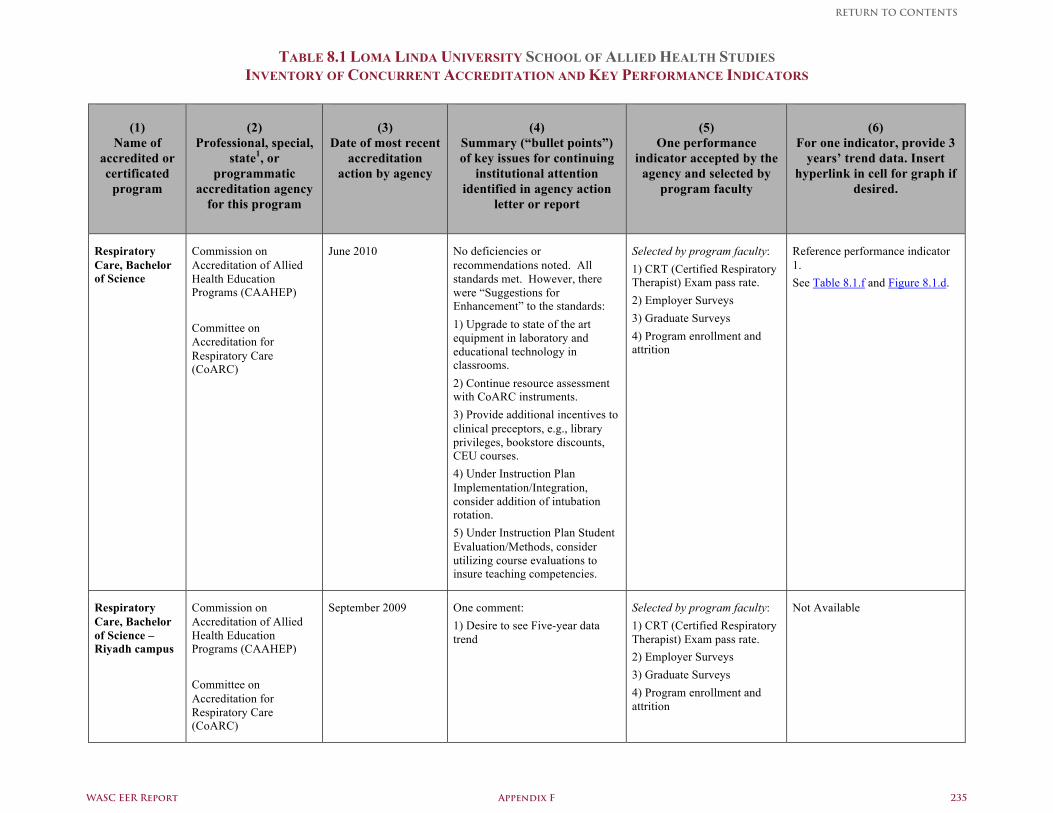
TABLE 8.1 LOMA LINDA UNIVERSITY SCHOOL OF ALLIED HEALTH STUDIES INVENTORY OF CONCURRENT ACCREDITATION AND KEY PERFORMANCE INDICATORS
(1) Name of
accredited or certificated
program
(2)
Professional, special, state1, or
programmatic accreditation agency
for this program
(3)
Date of most recent accreditation
action by agency
(4)
Summary (“bullet points”) of key issues for continuing
institutional attention identified in agency action
letter or report
(5)
One performance indicator accepted by the
agency and selected by program faculty
(6)
For one indicator, provide 3 years’ trend data. Insert
hyperlink in cell for graph if desired.
Respiratory Care, Bachelor of Science
Commission on Accreditation of Allied Health Education Programs (CAAHEP) Committee on Accreditation for Respiratory Care (CoARC)
June 2010 No deficiencies or recommendations noted. All standards met. However, there were “Suggestions for Enhancement” to the standards: 1) Upgrade to state of the art equipment in laboratory and educational technology in classrooms. 2) Continue resource assessment with CoARC instruments. 3) Provide additional incentives to clinical preceptors, e.g., library privileges, bookstore discounts, CEU courses. 4) Under Instruction Plan Implementation/Integration, consider addition of intubation rotation. 5) Under Instruction Plan Student Evaluation/Methods, consider utilizing course evaluations to insure teaching competencies.
Selected by program faculty: 1) CRT (Certified Respiratory Therapist) Exam pass rate. 2) Employer Surveys 3) Graduate Surveys 4) Program enrollment and attrition
Reference performance indicator 1. See Table 8.1.f and Figure 8.1.d.
Respiratory Care, Bachelor of Science – Riyadh campus
Commission on Accreditation of Allied Health Education Programs (CAAHEP) Committee on Accreditation for Respiratory Care (CoARC)
September 2009 One comment: 1) Desire to see Five-year data trend
Selected by program faculty: 1) CRT (Certified Respiratory Therapist) Exam pass rate. 2) Employer Surveys 3) Graduate Surveys 4) Program enrollment and attrition
Not Available
WASC EER Report Appendix F 235
RETURN TO CONTENTS
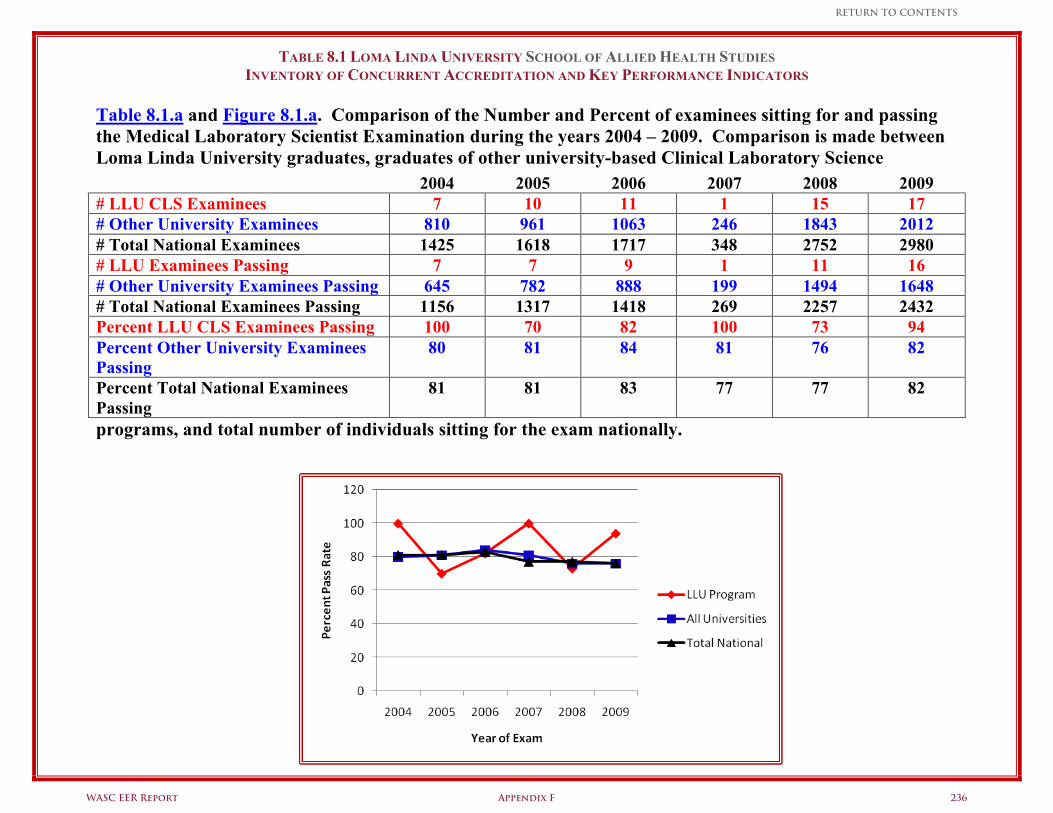
TABLE 8.1 LOMA LINDA UNIVERSITY SCHOOL OF ALLIED HEALTH STUDIES INVENTORY OF CONCURRENT ACCREDITATION AND KEY PERFORMANCE INDICATORS
Table 8.1.a and Figure 8.1.a. Comparison of the Number and Percent of examinees sitting for and passing the Medical Laboratory Scientist Examination during the years 2004 – 2009. Comparison is made between Loma Linda University graduates, graduates of other university-based Clinical Laboratory Science
programs, and total number of individuals sitting for the exam nationally.
2004 2005 2006 2007 2008 2009 # LLU CLS Examinees 7 10 11 1 15 17 # Other University Examinees 810 961 1063 246 1843 2012 # Total National Examinees 1425 1618 1717 348 2752 2980 # LLU Examinees Passing 7 7 9 1 11 16 # Other University Examinees Passing 645 782 888 199 1494 1648 # Total National Examinees Passing 1156 1317 1418 269 2257 2432 Percent LLU CLS Examinees Passing 100 70 82 100 73 94 Percent Other University Examinees Passing
80 81 84 81 76 82
Percent Total National Examinees Passing
81 81 83 77 77 82
WASC EER Report Appendix F 236
RETURN TO CONTENTS
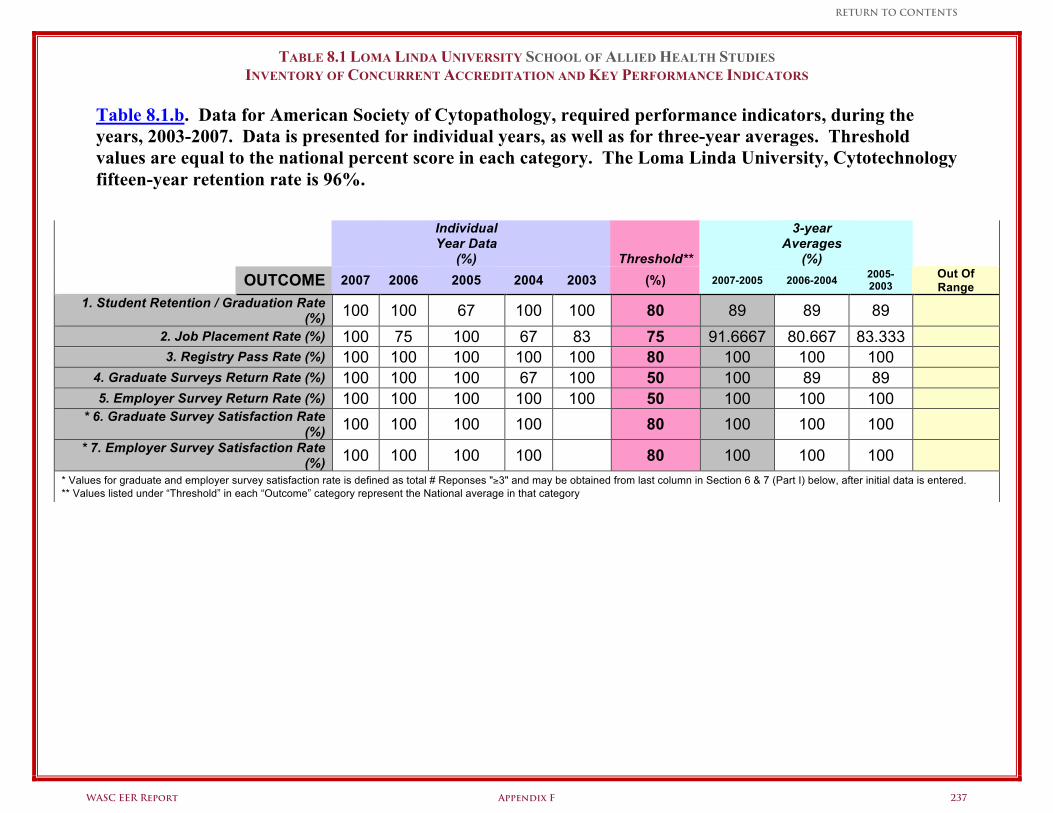
TABLE 8.1 LOMA LINDA UNIVERSITY SCHOOL OF ALLIED HEALTH STUDIES INVENTORY OF CONCURRENT ACCREDITATION AND KEY PERFORMANCE INDICATORS
Table 8.1.b. Data for American Society of Cytopathology, required performance indicators, during the years, 2003-2007. Data is presented for individual years, as well as for three-year averages. Threshold values are equal to the national percent score in each category. The Loma Linda University, Cytotechnology fifteen-year retention rate is 96%.
Individual Year Data
(%)
Threshold**
3-year Averages
(%) OUTCOME 2007 2006 2005 2004 2003 (%) 2007-2005 2006-2004 2005-
2003 Out Of Range
1. Student Retention / Graduation Rate (%) 100 100 67 100 100 80 89 89 89
2. Job Placement Rate (%) 100 75 100 67 83 75 91.6667 80.667 83.333
3. Registry Pass Rate (%) 100 100 100 100 100 80 100 100 100
4. Graduate Surveys Return Rate (%) 100 100 100 67 100 50 100 89 89
5. Employer Survey Return Rate (%) 100 100 100 100 100 50 100 100 100
* 6. Graduate Survey Satisfaction Rate (%) 100 100 100 100 80 100 100 100
* 7. Employer Survey Satisfaction Rate (%) 100 100 100 100 80 100 100 100
* Values for graduate and employer survey satisfaction rate is defined as total # Reponses "≥3" and may be obtained from last column in Section 6 & 7 (Part I) below, after initial data is entered. ** Values listed under “Threshold” in each “Outcome” category represent the National average in that category
WASC EER Report Appendix F 237
RETURN TO CONTENTS

TABLE 8.1 LOMA LINDA UNIVERSITY SCHOOL OF ALLIED HEALTH STUDIES INVENTORY OF CONCURRENT ACCREDITATION AND KEY PERFORMANCE INDICATORS
Figure 8.1.b. Percent pass rates of Loma Linda University Medical Radiography students on the American Registry of Radiologic Technologists (ARRT) credential exam during the period, 2001-2009. The Joint Review Committee on Education in Radiologic Technology (JRCERT) requires a 75% average pass rate over any 5-year period.
WASC EER Report Appendix F 238
RETURN TO CONTENTS
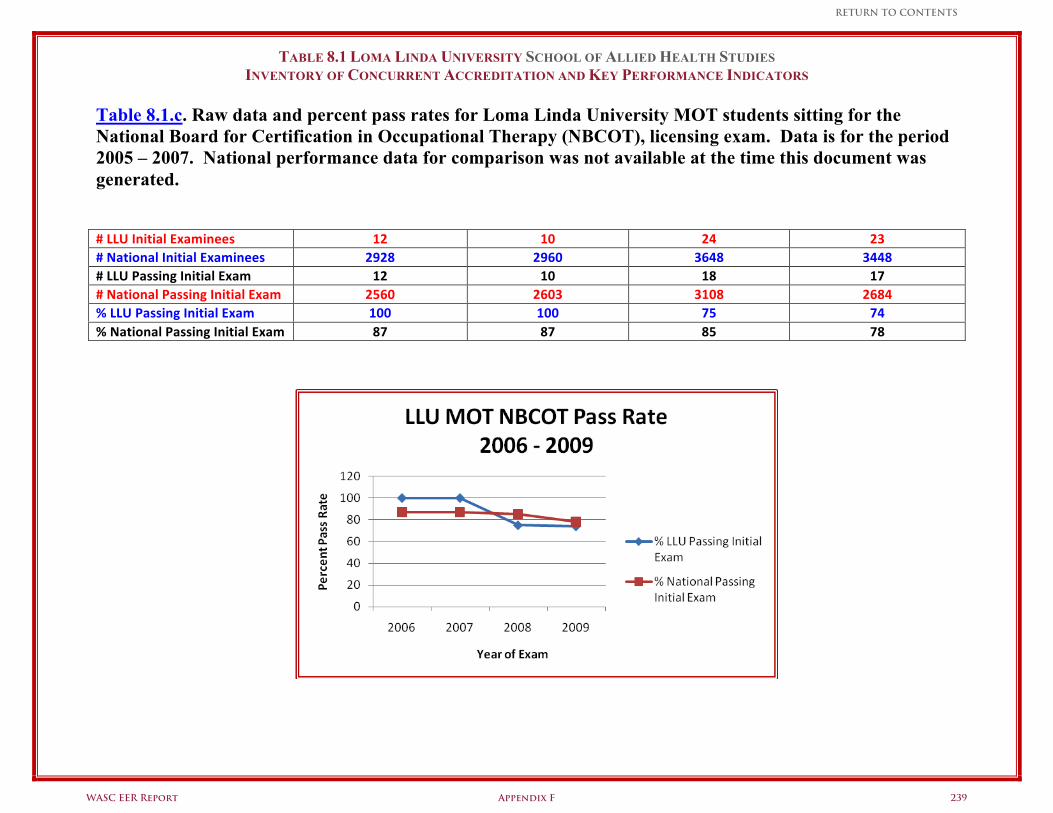
TABLE 8.1 LOMA LINDA UNIVERSITY SCHOOL OF ALLIED HEALTH STUDIES INVENTORY OF CONCURRENT ACCREDITATION AND KEY PERFORMANCE INDICATORS
Table 8.1.c. Raw data and percent pass rates for Loma Linda University MOT students sitting for the National Board for Certification in Occupational Therapy (NBCOT), licensing exam. Data is for the period 2005 – 2007. National performance data for comparison was not available at the time this document was generated.
# LLU Initial Examinees 12 10 24 23 # National Initial Examinees 2928 2960 3648 3448 # LLU Passing Initial Exam 12 10 18 17 # National Passing Initial Exam 2560 2603 3108 2684 % LLU Passing Initial Exam 100 100 75 74 % National Passing Initial Exam 87 87 85 78
WASC EER Report Appendix F 239
RETURN TO CONTENTS
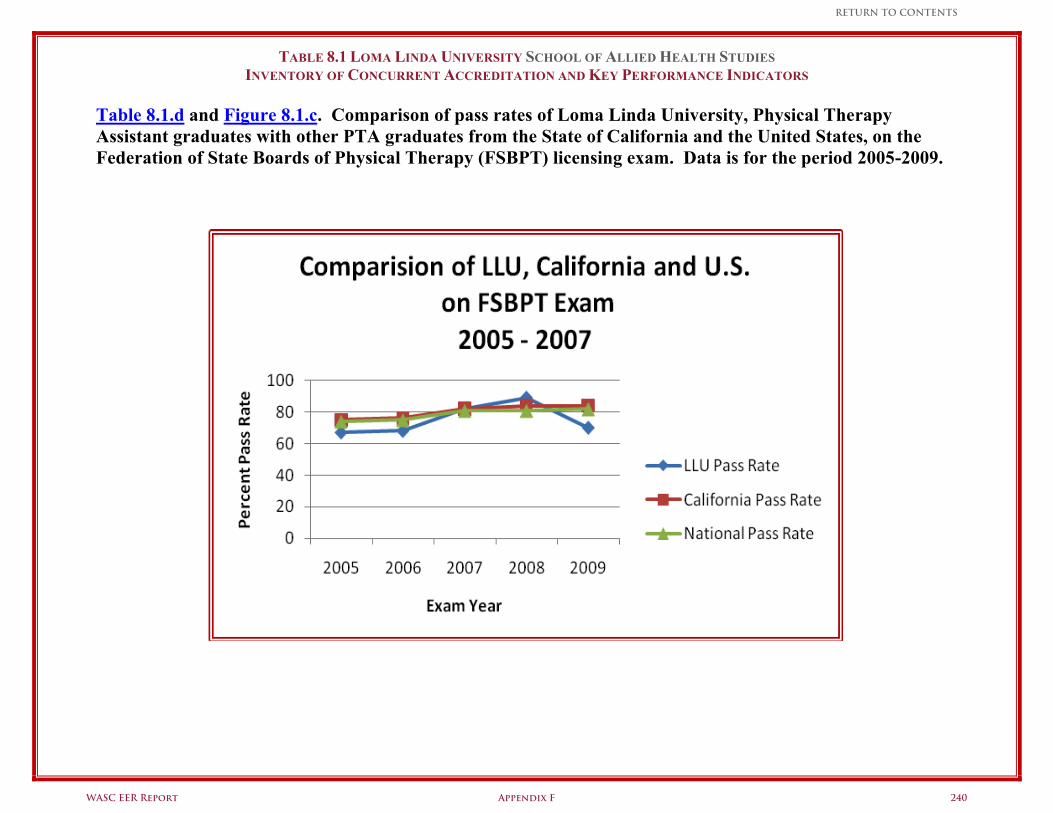
TABLE 8.1 LOMA LINDA UNIVERSITY SCHOOL OF ALLIED HEALTH STUDIES INVENTORY OF CONCURRENT ACCREDITATION AND KEY PERFORMANCE INDICATORS
Table 8.1.d and Figure 8.1.c. Comparison of pass rates of Loma Linda University, Physical Therapy Assistant graduates with other PTA graduates from the State of California and the United States, on the Federation of State Boards of Physical Therapy (FSBPT) licensing exam. Data is for the period 2005-2009.
WASC EER Report Appendix F 240
RETURN TO CONTENTS
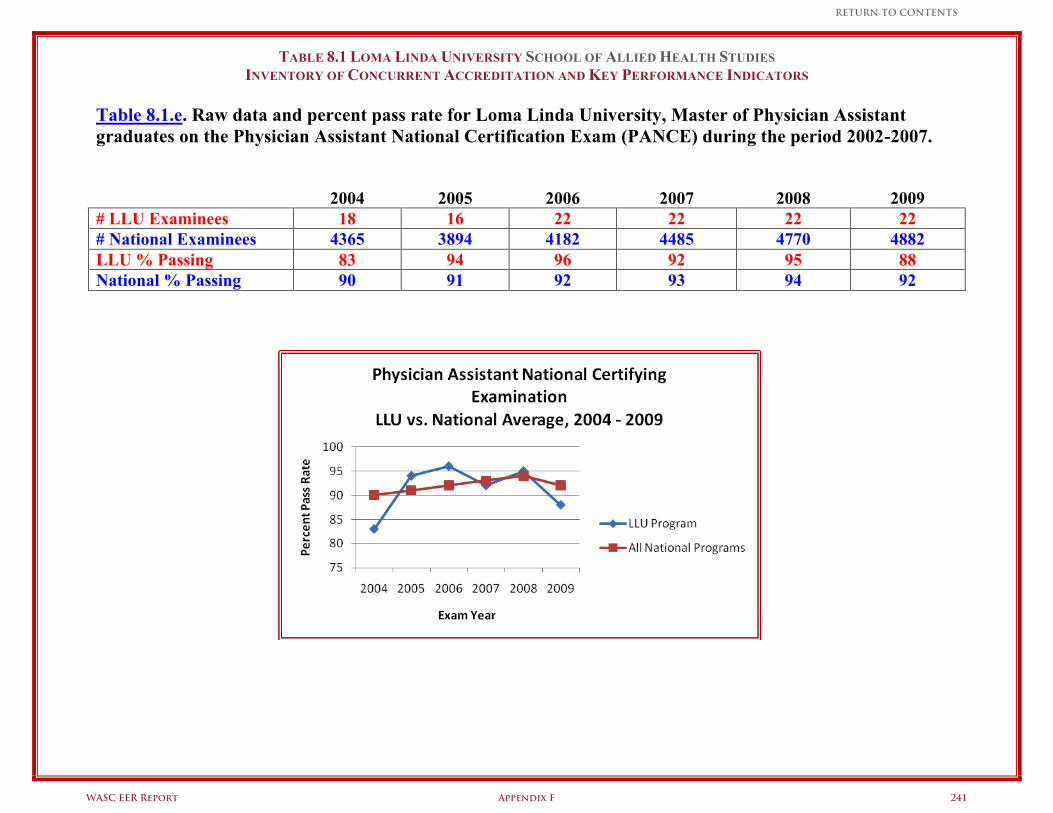
TABLE 8.1 LOMA LINDA UNIVERSITY SCHOOL OF ALLIED HEALTH STUDIES INVENTORY OF CONCURRENT ACCREDITATION AND KEY PERFORMANCE INDICATORS
Table 8.1.e. Raw data and percent pass rate for Loma Linda University, Master of Physician Assistant graduates on the Physician Assistant National Certification Exam (PANCE) during the period 2002-2007. 2004 2005 2006 2007 2008 2009 # LLU Examinees 18 16 22 22 22 22 # National Examinees 4365 3894 4182 4485 4770 4882 LLU % Passing 83 94 96 92 95 88 National % Passing 90 91 92 93 94 92
WASC EER Report Appendix F 241
RETURN TO CONTENTS
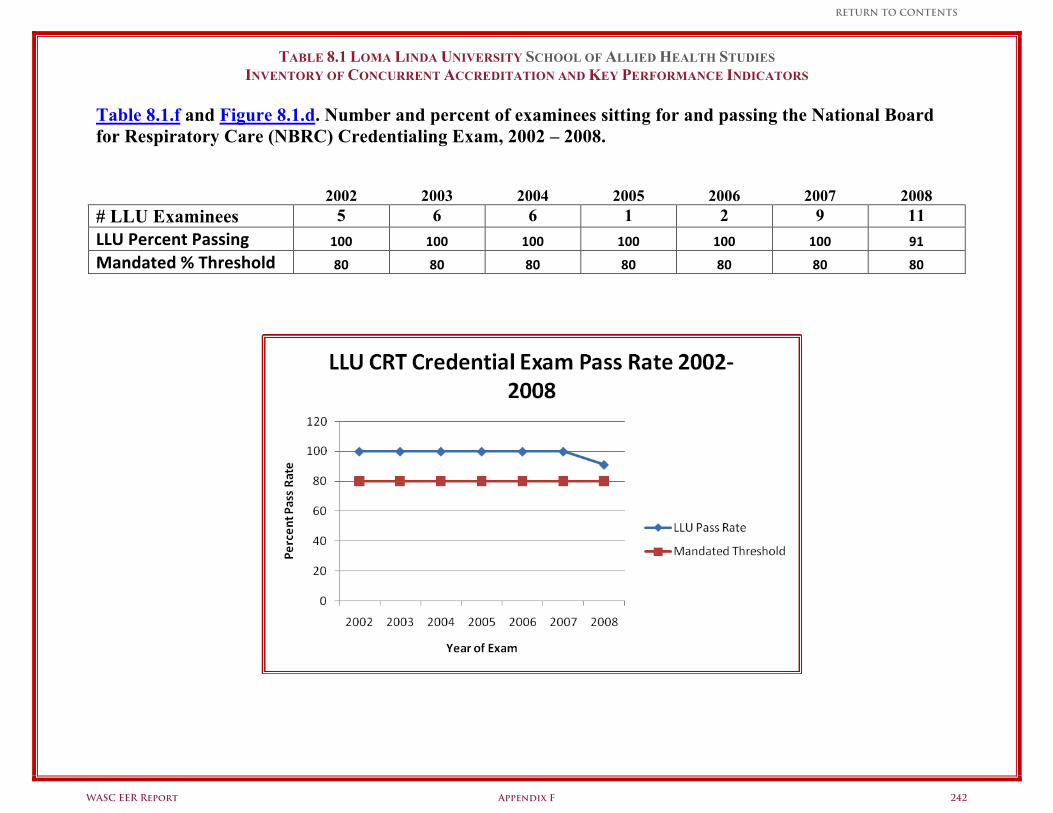
TABLE 8.1 LOMA LINDA UNIVERSITY SCHOOL OF ALLIED HEALTH STUDIES INVENTORY OF CONCURRENT ACCREDITATION AND KEY PERFORMANCE INDICATORS
Table 8.1.f and Figure 8.1.d. Number and percent of examinees sitting for and passing the National Board for Respiratory Care (NBRC) Credentialing Exam, 2002 – 2008.
2002
2003
2004
2005
2006
2007
2008 # LLU Examinees 5 6 6 1 2 9 11
LLU Percent Passing 100 100 100 100 100 100 91
Mandated % Threshold 80 80 80 80 80 80 80
WASC EER Report Appendix F 242
RETURN TO CONTENTS
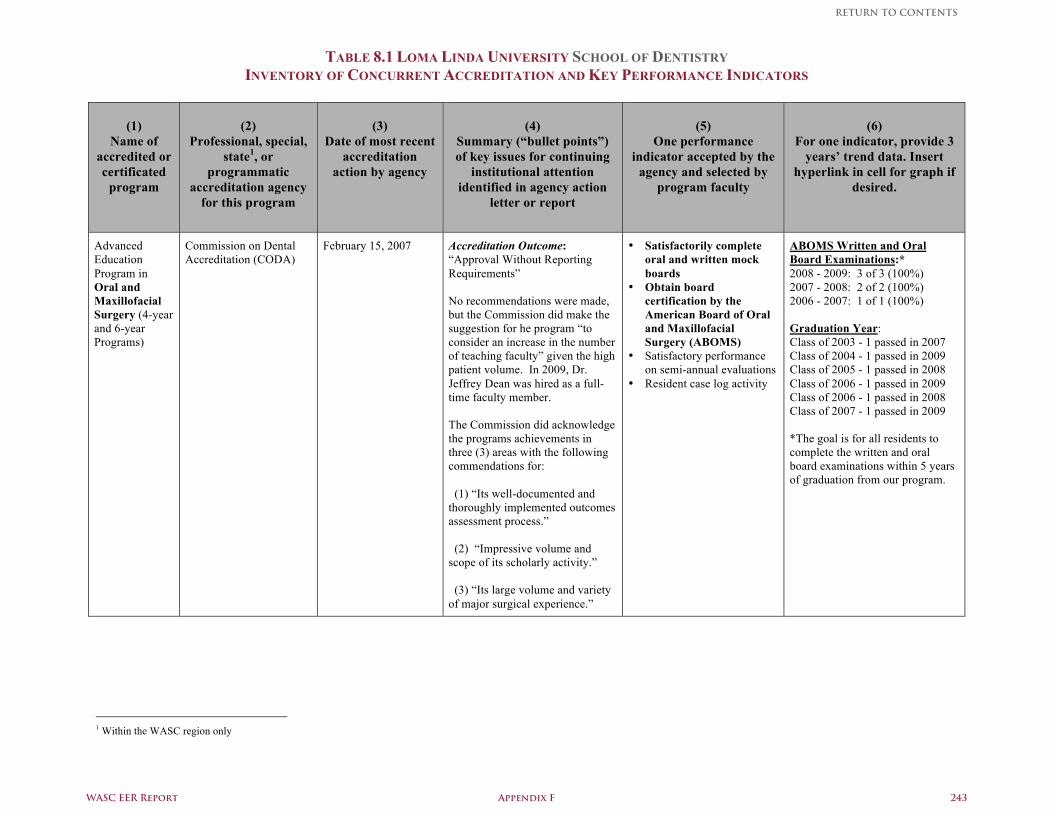
TABLE 8.1 LOMA LINDA UNIVERSITY SCHOOL OF DENTISTRY INVENTORY OF CONCURRENT ACCREDITATION AND KEY PERFORMANCE INDICATORS
(1)
Name of accredited or certificated
program
(2)
Professional, special, state1, or
programmatic accreditation agency
for this program
(3)
Date of most recent accreditation
action by agency
(4)
Summary (“bullet points”) of key issues for continuing
institutional attention identified in agency action
letter or report
(5)
One performance indicator accepted by the
agency and selected by program faculty
(6)
For one indicator, provide 3 years’ trend data. Insert
hyperlink in cell for graph if desired.
Advanced Education Program in Oral and Maxillofacial Surgery (4-year and 6-year Programs)
Commission on Dental Accreditation (CODA)
February 15, 2007
Accreditation Outcome: “Approval Without Reporting Requirements” No recommendations were made, but the Commission did make the suggestion for he program “to consider an increase in the number of teaching faculty” given the high patient volume. In 2009, Dr. Jeffrey Dean was hired as a full-time faculty member. The Commission did acknowledge the programs achievements in three (3) areas with the following commendations for: (1) “Its well-documented and thoroughly implemented outcomes assessment process.” (2) “Impressive volume and scope of its scholarly activity.” (3) “Its large volume and variety of major surgical experience.”
• Satisfactorily complete oral and written mock boards
• Obtain board certification by the American Board of Oral and Maxillofacial Surgery (ABOMS)
• Satisfactory performance on semi-annual evaluations
• Resident case log activity
ABOMS Written and Oral Board Examinations:* 2008 - 2009: 3 of 3 (100%) 2007 - 2008: 2 of 2 (100%) 2006 - 2007: 1 of 1 (100%) Graduation Year: Class of 2003 - 1 passed in 2007 Class of 2004 - 1 passed in 2009 Class of 2005 - 1 passed in 2008 Class of 2006 - 1 passed in 2009 Class of 2006 - 1 passed in 2008 Class of 2007 - 1 passed in 2009 *The goal is for all residents to complete the written and oral board examinations within 5 years of graduation from our program.
1 Within the WASC region only
WASC EER Report Appendix F 243
RETURN TO CONTENTS
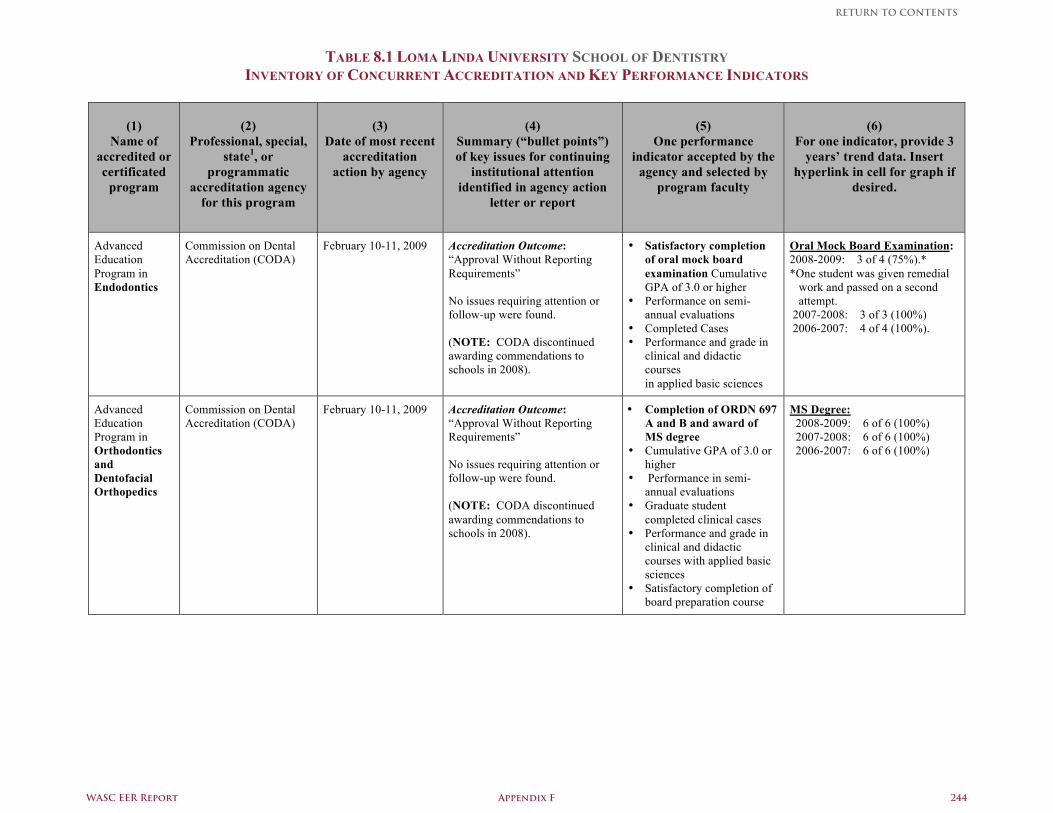
TABLE 8.1 LOMA LINDA UNIVERSITY SCHOOL OF DENTISTRY INVENTORY OF CONCURRENT ACCREDITATION AND KEY PERFORMANCE INDICATORS
(1)
Name of accredited or certificated
program
(2)
Professional, special, state1, or
programmatic accreditation agency
for this program
(3)
Date of most recent accreditation
action by agency
(4)
Summary (“bullet points”) of key issues for continuing
institutional attention identified in agency action
letter or report
(5)
One performance indicator accepted by the
agency and selected by program faculty
(6)
For one indicator, provide 3 years’ trend data. Insert
hyperlink in cell for graph if desired.
Advanced Education Program in Endodontics
Commission on Dental Accreditation (CODA)
February 10-11, 2009 Accreditation Outcome: “Approval Without Reporting Requirements” No issues requiring attention or follow-up were found. (NOTE: CODA discontinued awarding commendations to schools in 2008).
• Satisfactory completion of oral mock board examination Cumulative GPA of 3.0 or higher
• Performance on semi-annual evaluations
• Completed Cases • Performance and grade in
clinical and didactic courses in applied basic sciences
Oral Mock Board Examination: 2008-2009: 3 of 4 (75%).* *One student was given remedial work and passed on a second attempt. 2007-2008: 3 of 3 (100%) 2006-2007: 4 of 4 (100%).
Advanced Education Program in Orthodontics and Dentofacial Orthopedics
Commission on Dental Accreditation (CODA)
February 10-11, 2009
Accreditation Outcome: “Approval Without Reporting Requirements” No issues requiring attention or follow-up were found. (NOTE: CODA discontinued awarding commendations to schools in 2008).
• Completion of ORDN 697 A and B and award of MS degree
• Cumulative GPA of 3.0 or higher
• Performance in semi-annual evaluations
• Graduate student completed clinical cases
• Performance and grade in clinical and didactic courses with applied basic sciences
• Satisfactory completion of board preparation course
MS Degree: 2008-2009: 6 of 6 (100%) 2007-2008: 6 of 6 (100%) 2006-2007: 6 of 6 (100%)
WASC EER Report Appendix F 244
RETURN TO CONTENTS
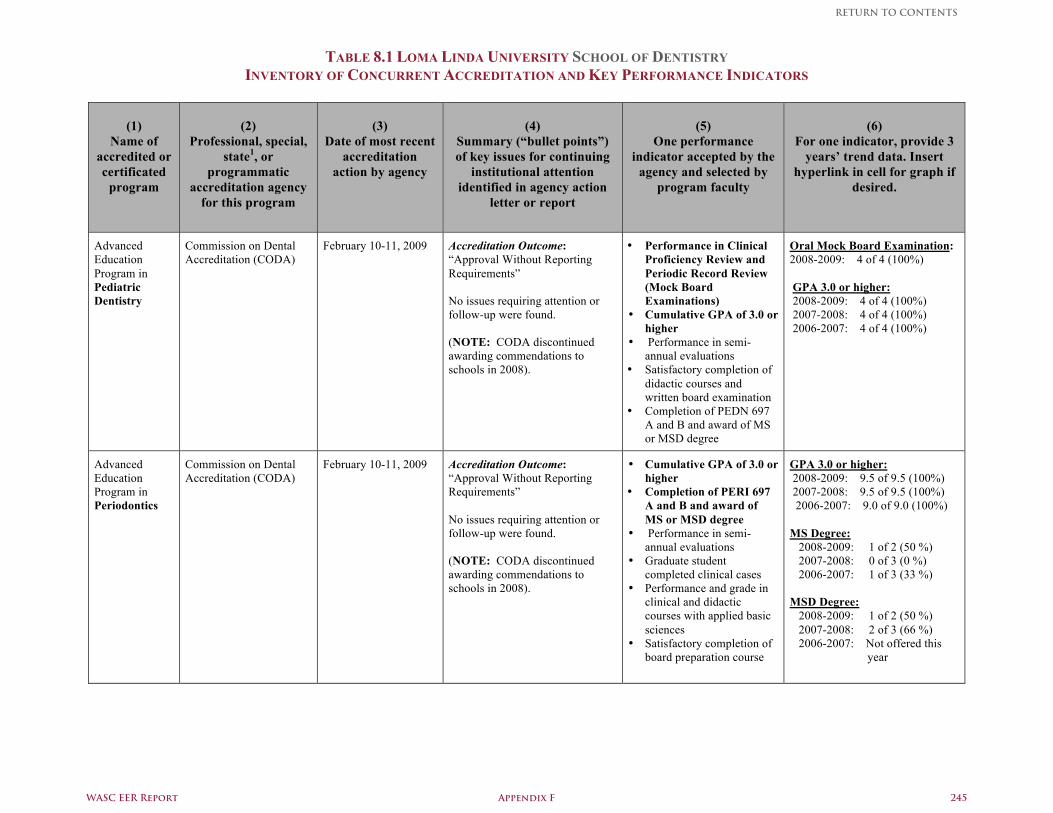
TABLE 8.1 LOMA LINDA UNIVERSITY SCHOOL OF DENTISTRY INVENTORY OF CONCURRENT ACCREDITATION AND KEY PERFORMANCE INDICATORS
(1)
Name of accredited or certificated
program
(2)
Professional, special, state1, or
programmatic accreditation agency
for this program
(3)
Date of most recent accreditation
action by agency
(4)
Summary (“bullet points”) of key issues for continuing
institutional attention identified in agency action
letter or report
(5)
One performance indicator accepted by the
agency and selected by program faculty
(6)
For one indicator, provide 3 years’ trend data. Insert
hyperlink in cell for graph if desired.
Advanced Education Program in Pediatric Dentistry
Commission on Dental Accreditation (CODA)
February 10-11, 2009 Accreditation Outcome: “Approval Without Reporting Requirements” No issues requiring attention or follow-up were found. (NOTE: CODA discontinued awarding commendations to schools in 2008).
• Performance in Clinical Proficiency Review and Periodic Record Review (Mock Board Examinations)
• Cumulative GPA of 3.0 or higher
• Performance in semi-annual evaluations
• Satisfactory completion of didactic courses and written board examination
• Completion of PEDN 697 A and B and award of MS or MSD degree
Oral Mock Board Examination: 2008-2009: 4 of 4 (100%) GPA 3.0 or higher: 2008-2009: 4 of 4 (100%) 2007-2008: 4 of 4 (100%) 2006-2007: 4 of 4 (100%)
Advanced Education Program in Periodontics
Commission on Dental Accreditation (CODA)
February 10-11, 2009
Accreditation Outcome: “Approval Without Reporting Requirements” No issues requiring attention or follow-up were found. (NOTE: CODA discontinued awarding commendations to schools in 2008).
• Cumulative GPA of 3.0 or higher
• Completion of PERI 697 A and B and award of MS or MSD degree
• Performance in semi-annual evaluations
• Graduate student completed clinical cases
• Performance and grade in clinical and didactic courses with applied basic sciences
• Satisfactory completion of board preparation course
GPA 3.0 or higher: 2008-2009: 9.5 of 9.5 (100%) 2007-2008: 9.5 of 9.5 (100%) 2006-2007: 9.0 of 9.0 (100%) MS Degree: 2008-2009: 1 of 2 (50 %) 2007-2008: 0 of 3 (0 %) 2006-2007: 1 of 3 (33 %) MSD Degree: 2008-2009: 1 of 2 (50 %) 2007-2008: 2 of 3 (66 %) 2006-2007: Not offered this year
WASC EER Report Appendix F 245
RETURN TO CONTENTS
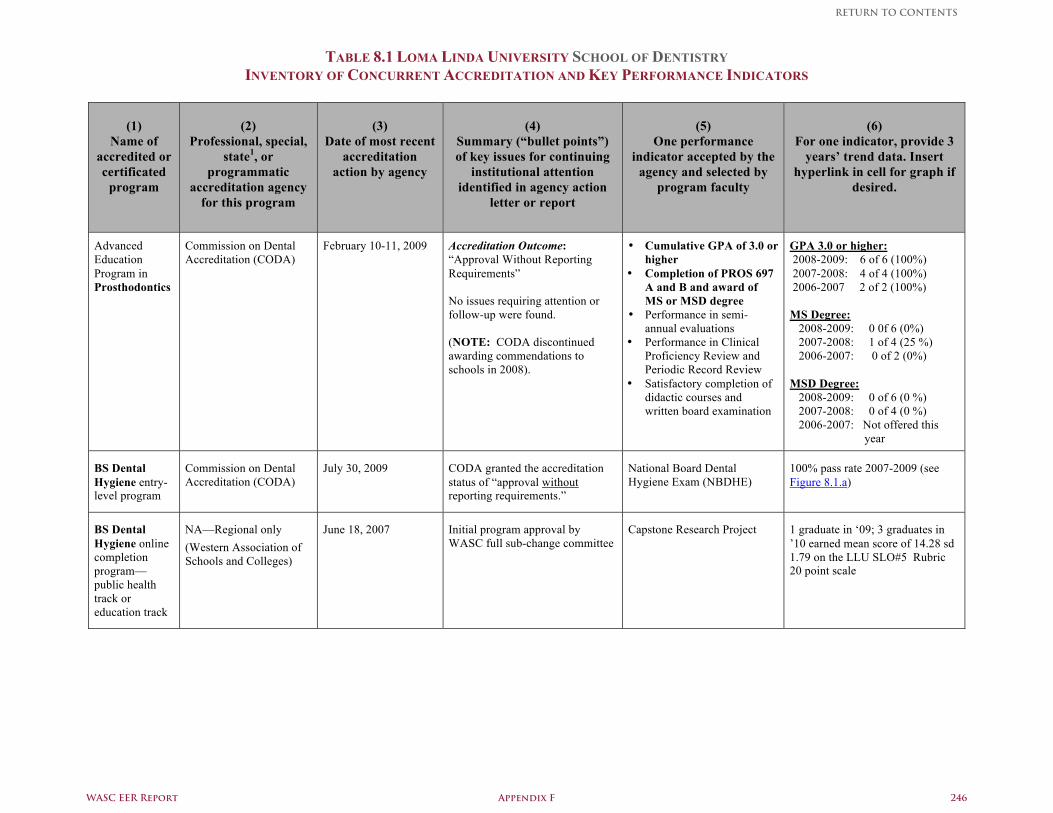
TABLE 8.1 LOMA LINDA UNIVERSITY SCHOOL OF DENTISTRY INVENTORY OF CONCURRENT ACCREDITATION AND KEY PERFORMANCE INDICATORS
(1)
Name of accredited or certificated
program
(2)
Professional, special, state1, or
programmatic accreditation agency
for this program
(3)
Date of most recent accreditation
action by agency
(4)
Summary (“bullet points”) of key issues for continuing
institutional attention identified in agency action
letter or report
(5)
One performance indicator accepted by the
agency and selected by program faculty
(6)
For one indicator, provide 3 years’ trend data. Insert
hyperlink in cell for graph if desired.
Advanced Education Program in Prosthodontics
Commission on Dental Accreditation (CODA)
February 10-11, 2009 Accreditation Outcome: “Approval Without Reporting Requirements” No issues requiring attention or follow-up were found. (NOTE: CODA discontinued awarding commendations to schools in 2008).
• Cumulative GPA of 3.0 or higher
• Completion of PROS 697 A and B and award of MS or MSD degree
• Performance in semi-annual evaluations
• Performance in Clinical Proficiency Review and Periodic Record Review
• Satisfactory completion of didactic courses and written board examination
GPA 3.0 or higher: 2008-2009: 6 of 6 (100%) 2007-2008: 4 of 4 (100%) 2006-2007 2 of 2 (100%) MS Degree: 2008-2009: 0 0f 6 (0%) 2007-2008: 1 of 4 (25 %) 2006-2007: 0 of 2 (0%) MSD Degree: 2008-2009: 0 of 6 (0 %) 2007-2008: 0 of 4 (0 %) 2006-2007: Not offered this year
BS Dental Hygiene entry-level program
Commission on Dental Accreditation (CODA)
July 30, 2009 CODA granted the accreditation status of “approval without reporting requirements.”
National Board Dental Hygiene Exam (NBDHE)
100% pass rate 2007-2009 (see Figure 8.1.a)
BS Dental Hygiene online completion program—public health track or education track
NA—Regional only (Western Association of Schools and Colleges)
June 18, 2007 Initial program approval by WASC full sub-change committee
Capstone Research Project 1 graduate in ‘09; 3 graduates in ’10 earned mean score of 14.28 sd 1.79 on the LLU SLO#5 Rubric 20 point scale
WASC EER Report Appendix F 246
RETURN TO CONTENTS
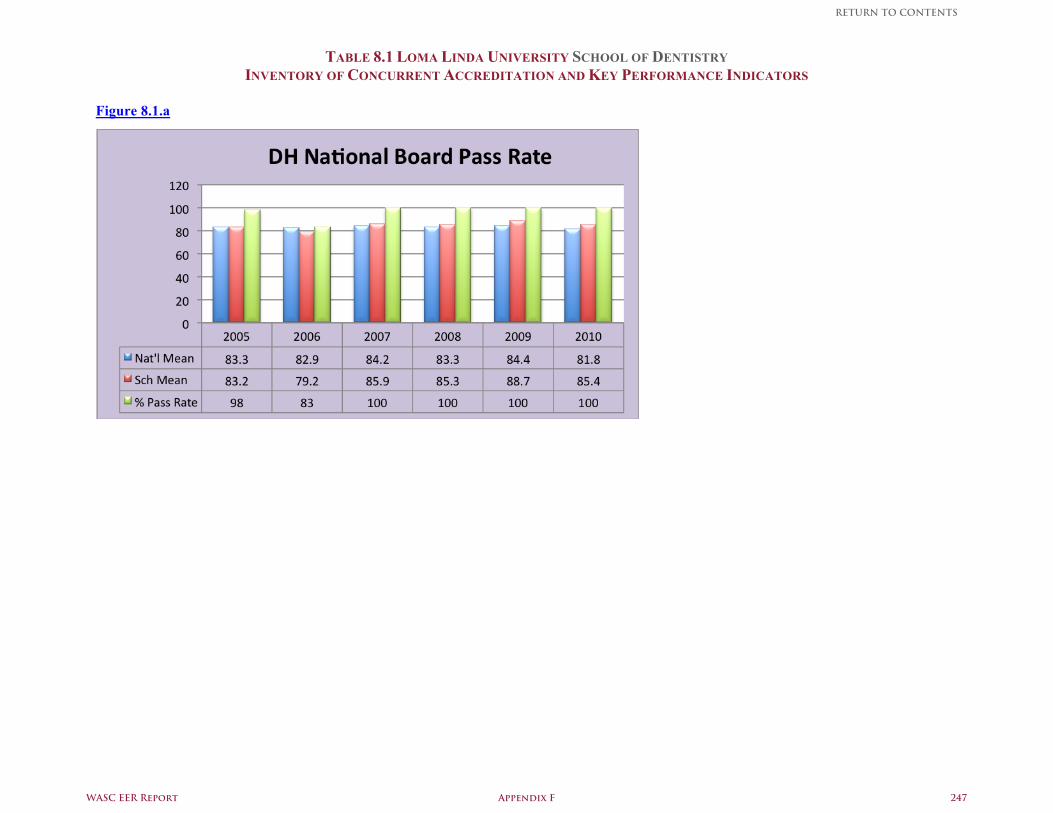
TABLE 8.1 LOMA LINDA UNIVERSITY SCHOOL OF DENTISTRY INVENTORY OF CONCURRENT ACCREDITATION AND KEY PERFORMANCE INDICATORS
Figure 8.1.a
WASC EER Report Appendix F 247
RETURN TO CONTENTS
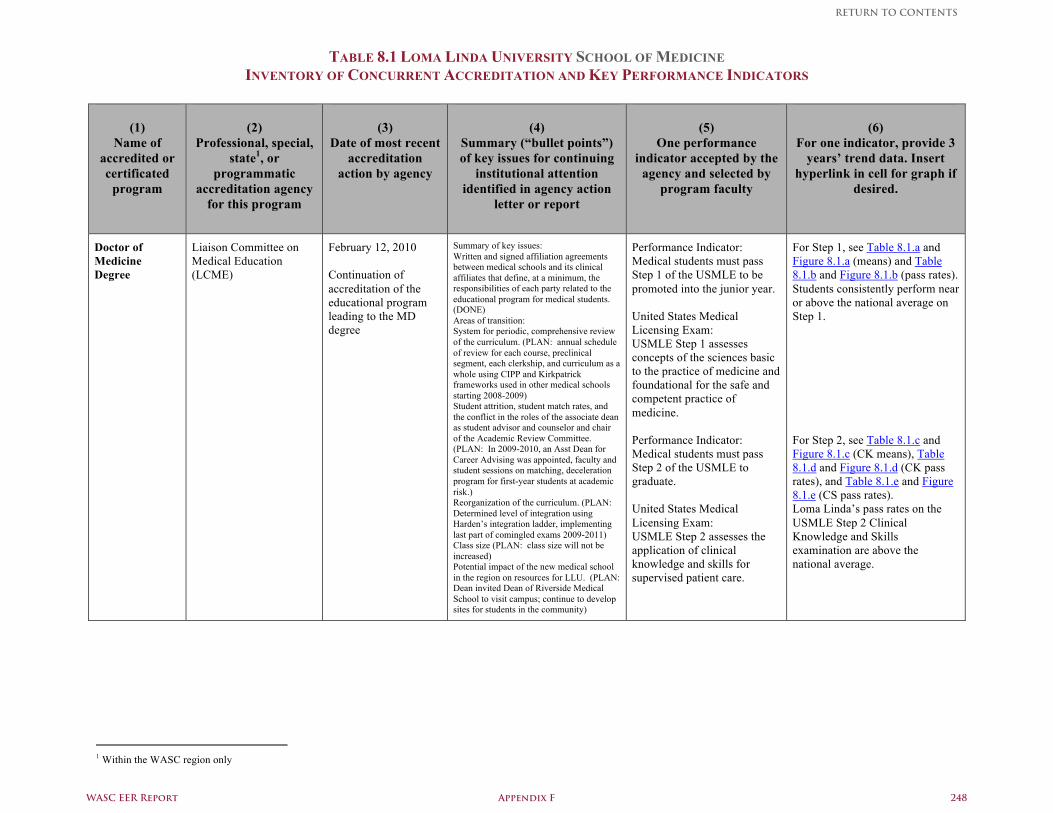
TABLE 8.1 LOMA LINDA UNIVERSITY SCHOOL OF MEDICINE INVENTORY OF CONCURRENT ACCREDITATION AND KEY PERFORMANCE INDICATORS
(1) Name of
accredited or certificated
program
(2)
Professional, special, state1, or
programmatic accreditation agency
for this program
(3)
Date of most recent accreditation
action by agency
(4)
Summary (“bullet points”) of key issues for continuing
institutional attention identified in agency action
letter or report
(5)
One performance indicator accepted by the
agency and selected by program faculty
(6)
For one indicator, provide 3 years’ trend data. Insert
hyperlink in cell for graph if desired.
Doctor of Medicine Degree
Liaison Committee on Medical Education (LCME)
February 12, 2010 Continuation of accreditation of the educational program leading to the MD degree
Summary of key issues: Written and signed affiliation agreements between medical schools and its clinical affiliates that define, at a minimum, the responsibilities of each party related to the educational program for medical students. (DONE) Areas of transition: System for periodic, comprehensive review of the curriculum. (PLAN: annual schedule of review for each course, preclinical segment, each clerkship, and curriculum as a whole using CIPP and Kirkpatrick frameworks used in other medical schools starting 2008-2009) Student attrition, student match rates, and the conflict in the roles of the associate dean as student advisor and counselor and chair of the Academic Review Committee. (PLAN: In 2009-2010, an Asst Dean for Career Advising was appointed, faculty and student sessions on matching, deceleration program for first-year students at academic risk.) Reorganization of the curriculum. (PLAN: Determined level of integration using Harden’s integration ladder, implementing last part of comingled exams 2009-2011) Class size (PLAN: class size will not be increased) Potential impact of the new medical school in the region on resources for LLU. (PLAN: Dean invited Dean of Riverside Medical School to visit campus; continue to develop sites for students in the community)
Performance Indicator: Medical students must pass Step 1 of the USMLE to be promoted into the junior year. United States Medical Licensing Exam: USMLE Step 1 assesses concepts of the sciences basic to the practice of medicine and foundational for the safe and competent practice of medicine. Performance Indicator: Medical students must pass Step 2 of the USMLE to graduate. United States Medical Licensing Exam: USMLE Step 2 assesses the application of clinical knowledge and skills for supervised patient care.
For Step 1, see Table 8.1.a and Figure 8.1.a (means) and Table 8.1.b and Figure 8.1.b (pass rates). Students consistently perform near or above the national average on Step 1. For Step 2, see Table 8.1.c and Figure 8.1.c (CK means), Table 8.1.d and Figure 8.1.d (CK pass rates), and Table 8.1.e and Figure 8.1.e (CS pass rates). Loma Linda’s pass rates on the USMLE Step 2 Clinical Knowledge and Skills examination are above the national average.
1 Within the WASC region only
WASC EER Report Appendix F 248
RETURN TO CONTENTS
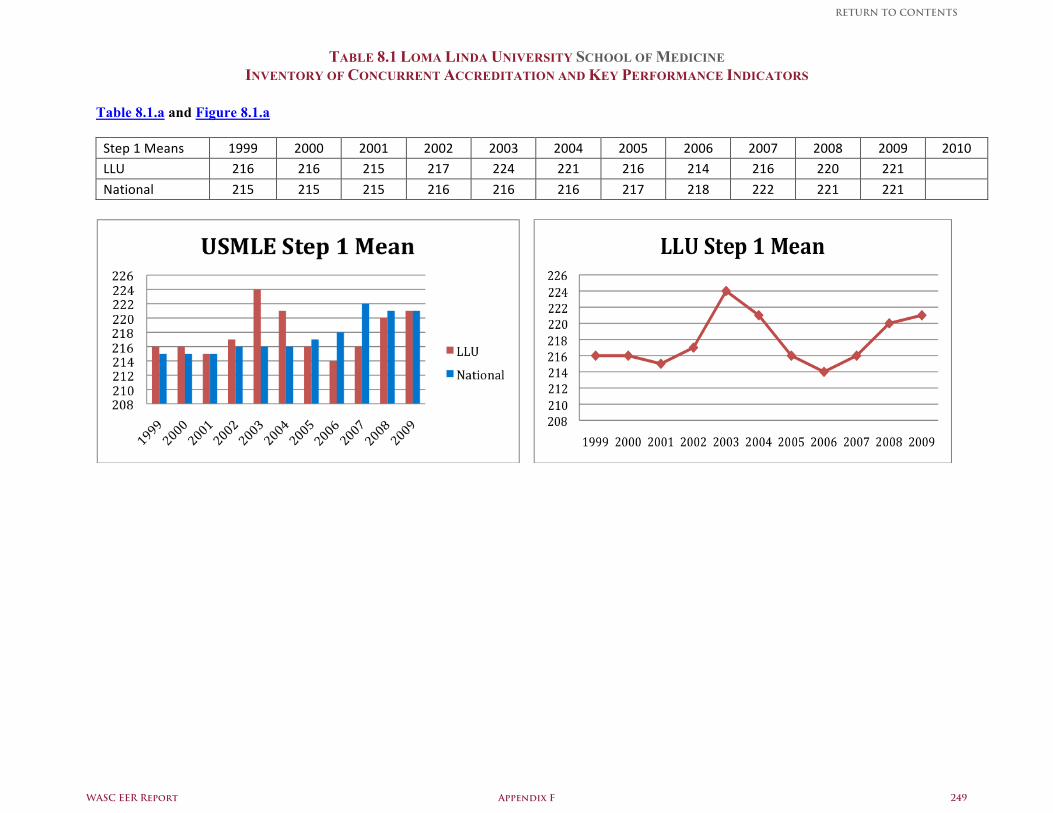
TABLE 8.1 LOMA LINDA UNIVERSITY SCHOOL OF MEDICINE INVENTORY OF CONCURRENT ACCREDITATION AND KEY PERFORMANCE INDICATORS
Table 8.1.a and Figure 8.1.a Step 1 Means 1999 2000 2001 2002 2003 2004 2005 2006 2007 2008 2009 2010 LLU 216 216 215 217 224 221 216 214 216 220 221
National 215 215 215 216 216 216 217 218 222 221 221
WASC EER Report Appendix F 249
RETURN TO CONTENTS
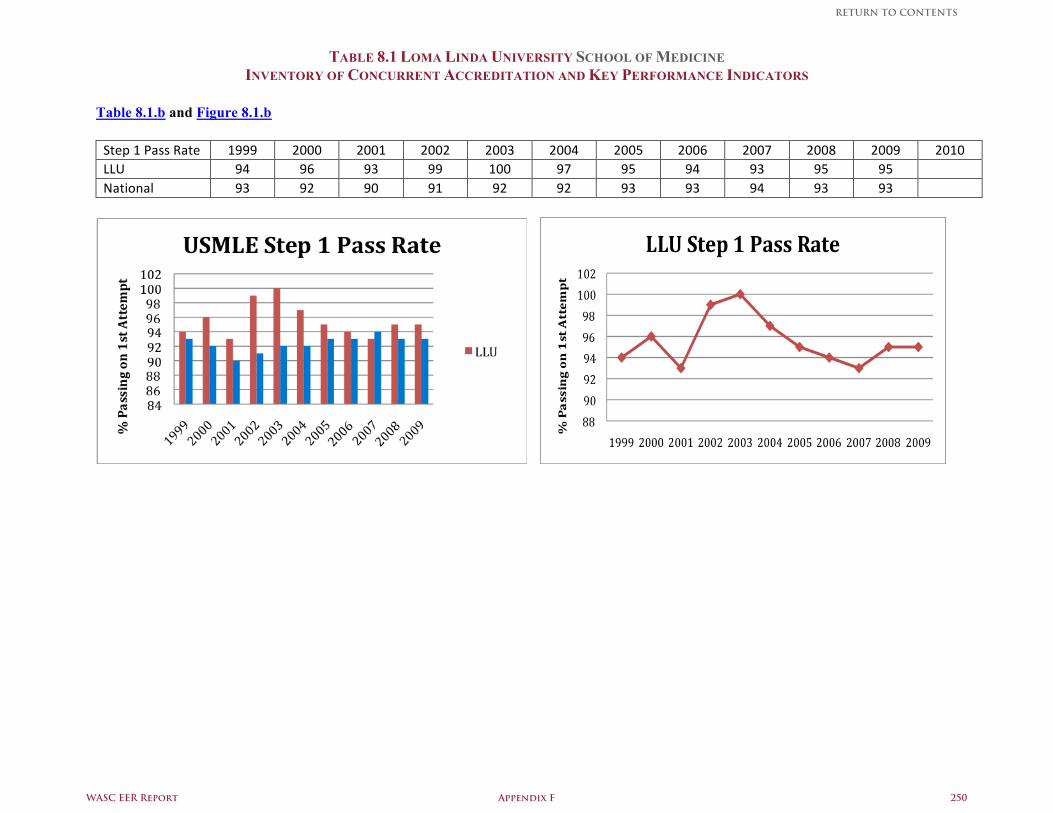
TABLE 8.1 LOMA LINDA UNIVERSITY SCHOOL OF MEDICINE INVENTORY OF CONCURRENT ACCREDITATION AND KEY PERFORMANCE INDICATORS
Table 8.1.b and Figure 8.1.b Step 1 Pass Rate 1999 2000 2001 2002 2003 2004 2005 2006 2007 2008 2009 2010 LLU 94 96 93 99 100 97 95 94 93 95 95 National 93 92 90 91 92 92 93 93 94 93 93
WASC EER Report Appendix F 250
RETURN TO CONTENTS
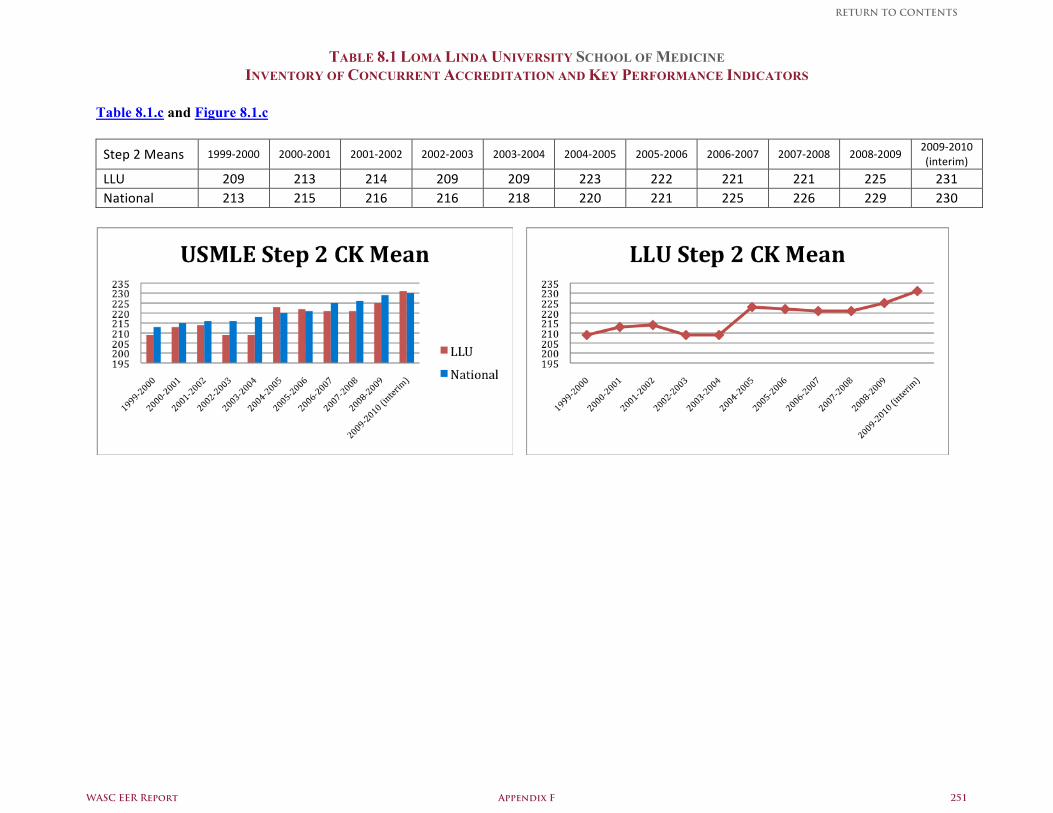
TABLE 8.1 LOMA LINDA UNIVERSITY SCHOOL OF MEDICINE INVENTORY OF CONCURRENT ACCREDITATION AND KEY PERFORMANCE INDICATORS
Table 8.1.c and Figure 8.1.c Step 2 Means 1999‐2000 2000‐2001 2001‐2002 2002‐2003 2003‐2004 2004‐2005 2005‐2006 2006‐2007 2007‐2008 2008‐2009
2009‐2010 (interim)
LLU 209 213 214 209 209 223 222 221 221 225 231 National 213 215 216 216 218 220 221 225 226 229 230
WASC EER Report Appendix F 251
RETURN TO CONTENTS
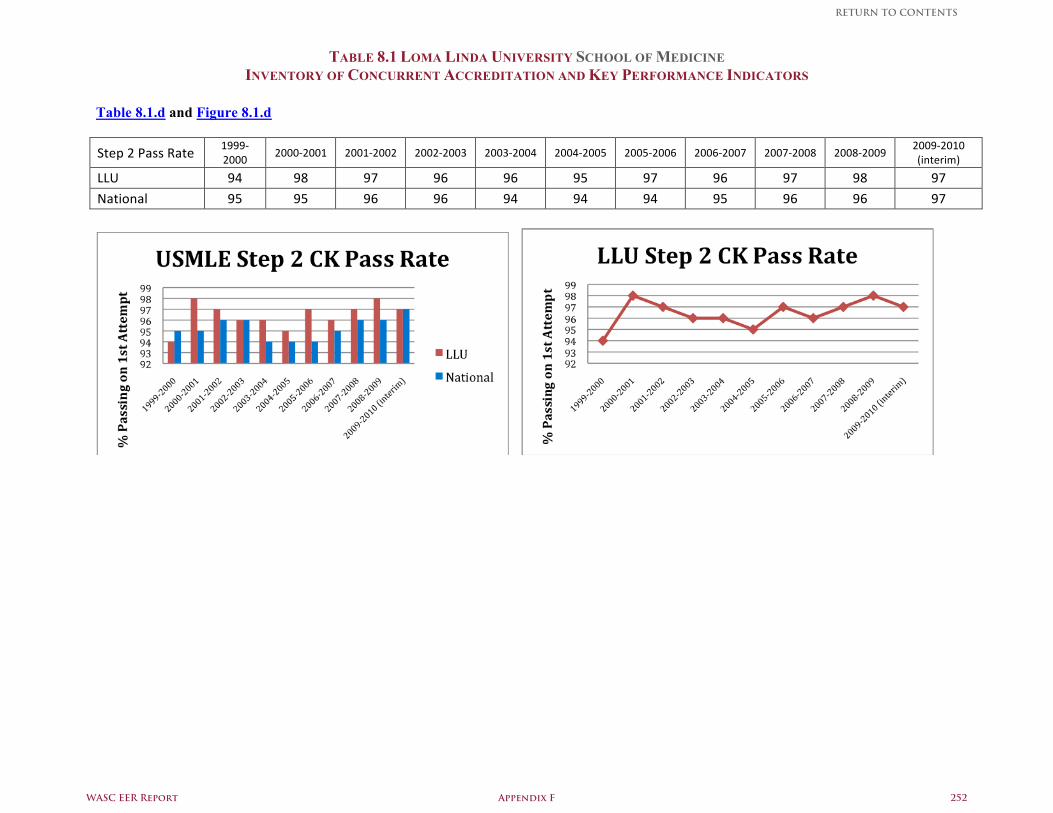
TABLE 8.1 LOMA LINDA UNIVERSITY SCHOOL OF MEDICINE INVENTORY OF CONCURRENT ACCREDITATION AND KEY PERFORMANCE INDICATORS
Table 8.1.d and Figure 8.1.d
Step 2 Pass Rate 1999‐2000
2000‐2001 2001‐2002 2002‐2003 2003‐2004 2004‐2005 2005‐2006 2006‐2007 2007‐2008 2008‐2009 2009‐2010 (interim)
LLU 94 98 97 96 96 95 97 96 97 98 97
National 95 95 96 96 94 94 94 95 96 96 97
WASC EER Report Appendix F 252
RETURN TO CONTENTS
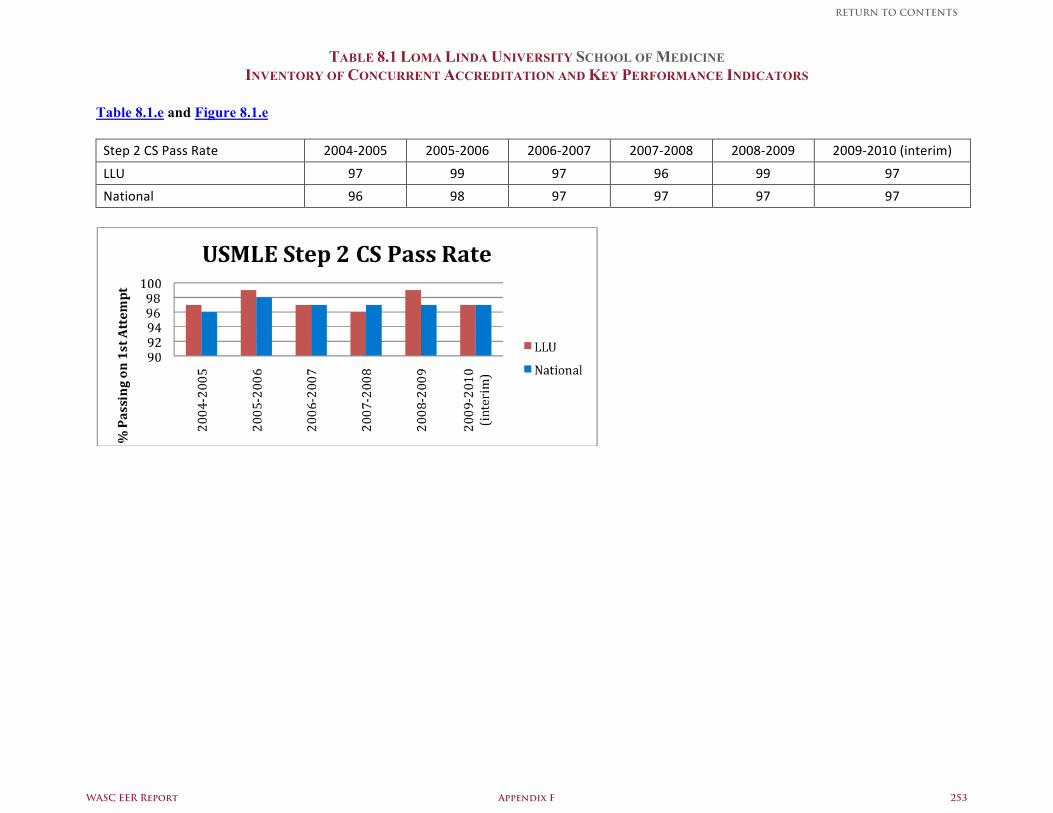
TABLE 8.1 LOMA LINDA UNIVERSITY SCHOOL OF MEDICINE INVENTORY OF CONCURRENT ACCREDITATION AND KEY PERFORMANCE INDICATORS
Table 8.1.e and Figure 8.1.e Step 2 CS Pass Rate 2004‐2005 2005‐2006 2006‐2007 2007‐2008 2008‐2009 2009‐2010 (interim)
LLU 97 99 97 96 99 97
National 96 98 97 97 97 97
WASC EER Report Appendix F 253
RETURN TO CONTENTS
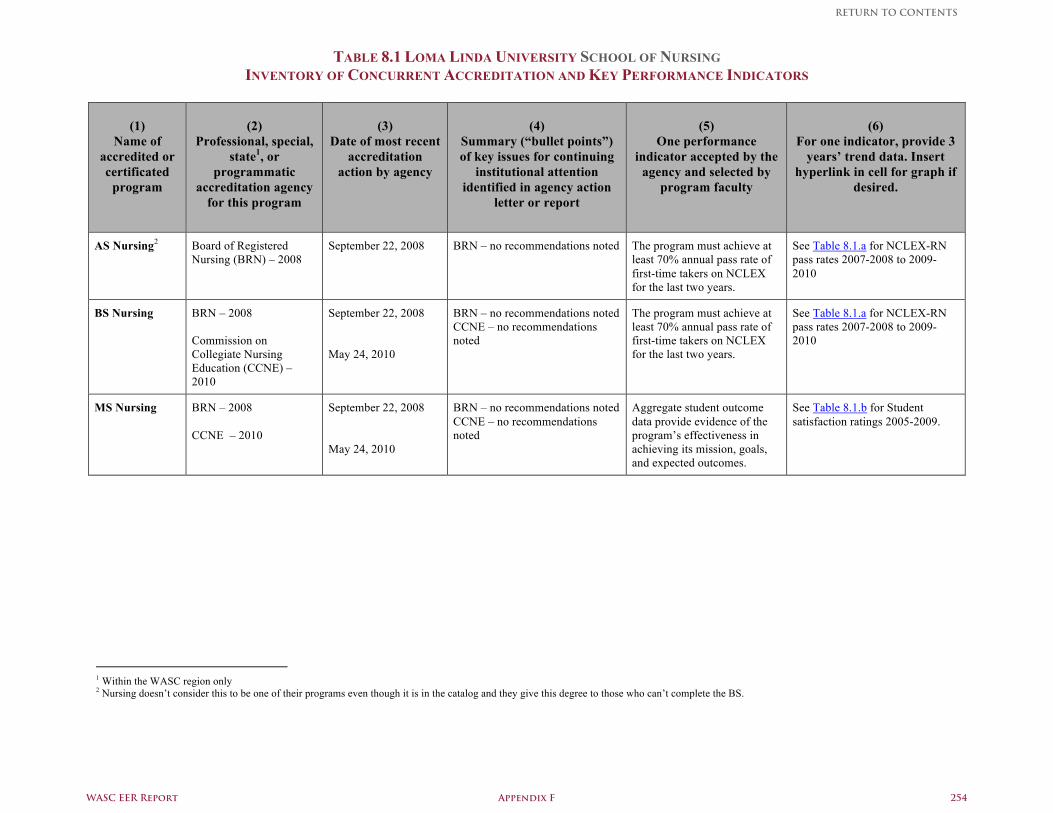
TABLE 8.1 LOMA LINDA UNIVERSITY SCHOOL OF NURSING INVENTORY OF CONCURRENT ACCREDITATION AND KEY PERFORMANCE INDICATORS
(1) Name of
accredited or certificated
program
(2)
Professional, special, state1, or
programmatic accreditation agency
for this program
(3)
Date of most recent accreditation
action by agency
(4)
Summary (“bullet points”) of key issues for continuing
institutional attention identified in agency action
letter or report
(5)
One performance indicator accepted by the
agency and selected by program faculty
(6)
For one indicator, provide 3 years’ trend data. Insert
hyperlink in cell for graph if desired.
AS Nursing2 Board of Registered Nursing (BRN) – 2008
September 22, 2008 BRN – no recommendations noted The program must achieve at least 70% annual pass rate of first-time takers on NCLEX for the last two years.
See Table 8.1.a for NCLEX-RN pass rates 2007-2008 to 2009-2010
BS Nursing
BRN – 2008 Commission on Collegiate Nursing Education (CCNE) – 2010
September 22, 2008 May 24, 2010
BRN – no recommendations noted CCNE – no recommendations noted
The program must achieve at least 70% annual pass rate of first-time takers on NCLEX for the last two years.
See Table 8.1.a for NCLEX-RN pass rates 2007-2008 to 2009-2010
MS Nursing
BRN – 2008 CCNE – 2010
September 22, 2008 May 24, 2010
BRN – no recommendations noted CCNE – no recommendations noted
Aggregate student outcome data provide evidence of the program’s effectiveness in achieving its mission, goals, and expected outcomes.
See Table 8.1.b for Student satisfaction ratings 2005-2009.
1 Within the WASC region only 2 Nursing doesn’t consider this to be one of their programs even though it is in the catalog and they give this degree to those who can’t complete the BS.
WASC EER Report Appendix F 254
RETURN TO CONTENTS
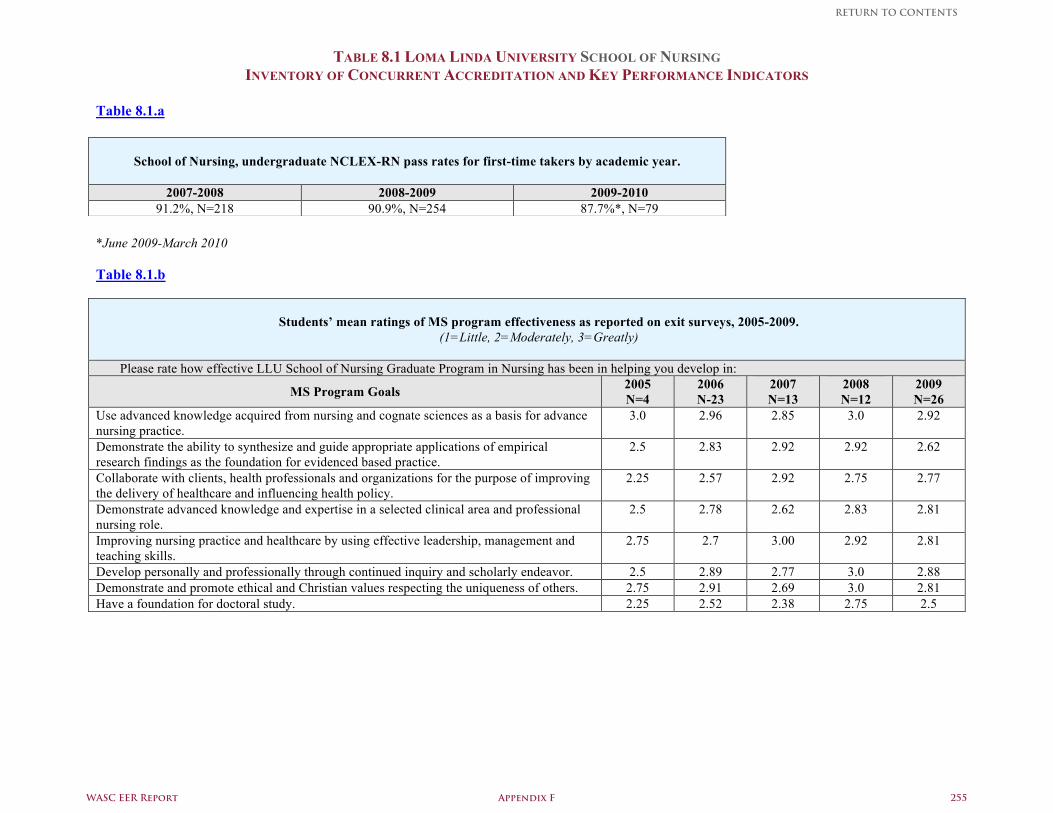
TABLE 8.1 LOMA LINDA UNIVERSITY SCHOOL OF NURSING INVENTORY OF CONCURRENT ACCREDITATION AND KEY PERFORMANCE INDICATORS
Table 8.1.a
*June 2009-March 2010 Table 8.1.b
Students’ mean ratings of MS program effectiveness as reported on exit surveys, 2005-2009. (1=Little, 2=Moderately, 3=Greatly)
Please rate how effective LLU School of Nursing Graduate Program in Nursing has been in helping you develop in:
MS Program Goals 2005 N=4
2006 N-23
2007 N=13
2008 N=12
2009 N=26
Use advanced knowledge acquired from nursing and cognate sciences as a basis for advance nursing practice.
3.0 2.96 2.85 3.0 2.92
Demonstrate the ability to synthesize and guide appropriate applications of empirical research findings as the foundation for evidenced based practice.
2.5 2.83 2.92 2.92 2.62
Collaborate with clients, health professionals and organizations for the purpose of improving the delivery of healthcare and influencing health policy.
2.25 2.57 2.92 2.75 2.77
Demonstrate advanced knowledge and expertise in a selected clinical area and professional nursing role.
2.5 2.78 2.62 2.83 2.81
Improving nursing practice and healthcare by using effective leadership, management and teaching skills.
2.75 2.7 3.00 2.92 2.81
Develop personally and professionally through continued inquiry and scholarly endeavor. 2.5 2.89 2.77 3.0 2.88 Demonstrate and promote ethical and Christian values respecting the uniqueness of others. 2.75 2.91 2.69 3.0 2.81 Have a foundation for doctoral study. 2.25 2.52 2.38 2.75 2.5
School of Nursing, undergraduate NCLEX-RN pass rates for first-time takers by academic year.
2007-2008 2008-2009 2009-2010
91.2%, N=218 90.9%, N=254 87.7%*, N=79
WASC EER Report Appendix F 255
RETURN TO CONTENTS
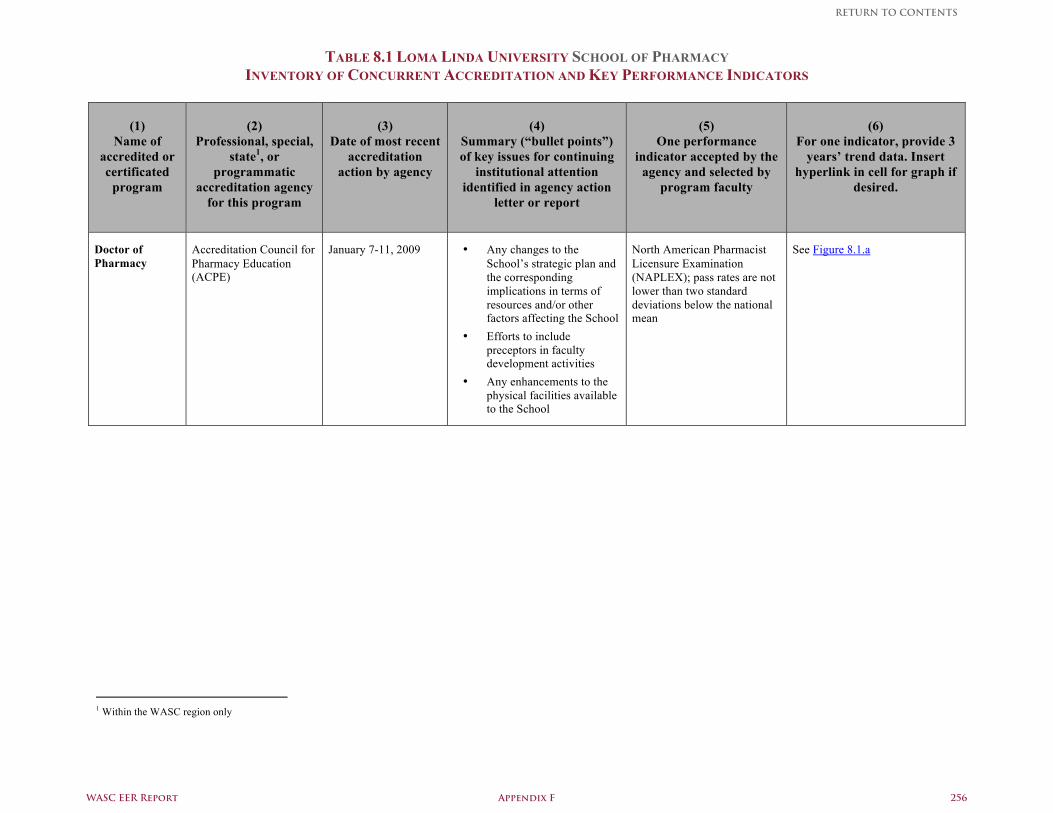
TABLE 8.1 LOMA LINDA UNIVERSITY SCHOOL OF PHARMACY INVENTORY OF CONCURRENT ACCREDITATION AND KEY PERFORMANCE INDICATORS
(1) Name of
accredited or certificated
program
(2)
Professional, special, state1, or
programmatic accreditation agency
for this program
(3)
Date of most recent accreditation
action by agency
(4)
Summary (“bullet points”) of key issues for continuing
institutional attention identified in agency action
letter or report
(5)
One performance indicator accepted by the
agency and selected by program faculty
(6)
For one indicator, provide 3 years’ trend data. Insert
hyperlink in cell for graph if desired.
Doctor of Pharmacy
Accreditation Council for Pharmacy Education (ACPE)
January 7-11, 2009 • Any changes to the School’s strategic plan and the corresponding implications in terms of resources and/or other factors affecting the School
• Efforts to include preceptors in faculty development activities
• Any enhancements to the physical facilities available to the School
North American Pharmacist Licensure Examination (NAPLEX); pass rates are not lower than two standard deviations below the national mean
See Figure 8.1.a
1 Within the WASC region only
WASC EER Report Appendix F 256
RETURN TO CONTENTS
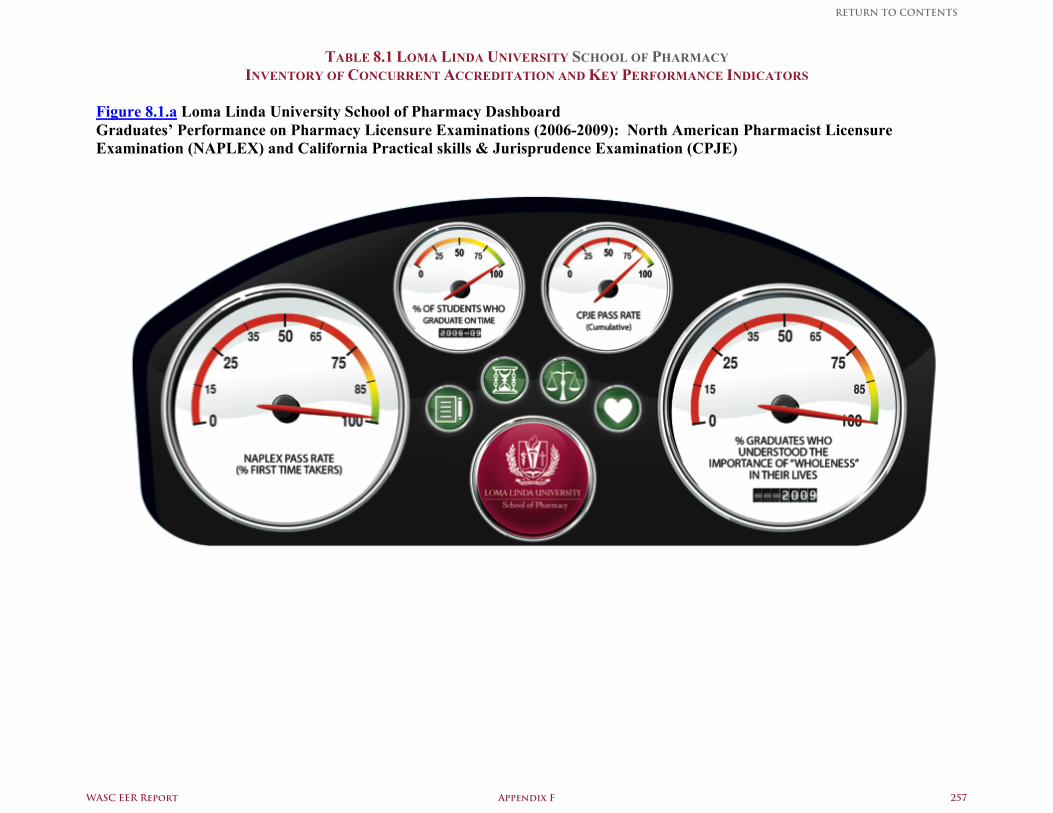
TABLE 8.1 LOMA LINDA UNIVERSITY SCHOOL OF PHARMACY INVENTORY OF CONCURRENT ACCREDITATION AND KEY PERFORMANCE INDICATORS
Figure 8.1.a Loma Linda University School of Pharmacy Dashboard Graduates’ Performance on Pharmacy Licensure Examinations (2006-2009): North American Pharmacist Licensure Examination (NAPLEX) and California Practical skills & Jurisprudence Examination (CPJE)
WASC EER Report Appendix F 257
RETURN TO CONTENTS
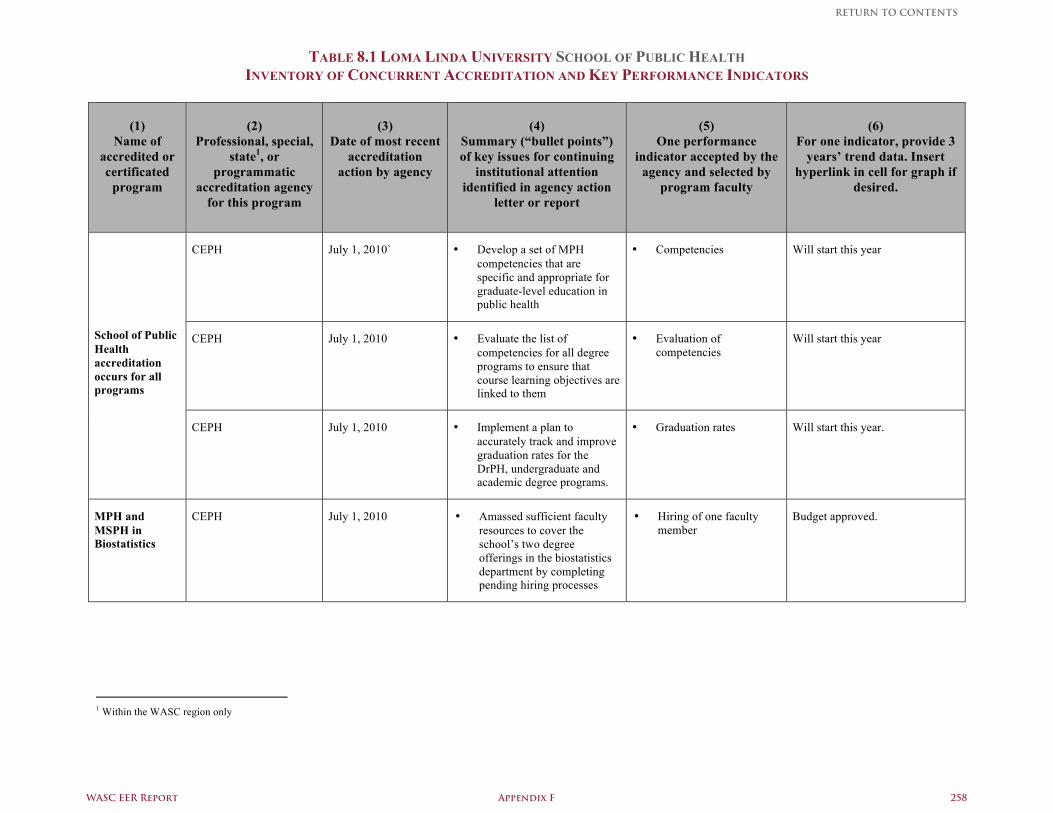
TABLE 8.1 LOMA LINDA UNIVERSITY SCHOOL OF PUBLIC HEALTH INVENTORY OF CONCURRENT ACCREDITATION AND KEY PERFORMANCE INDICATORS
(1) Name of
accredited or certificated
program
(2)
Professional, special, state1, or
programmatic accreditation agency
for this program
(3)
Date of most recent accreditation
action by agency
(4)
Summary (“bullet points”) of key issues for continuing
institutional attention identified in agency action
letter or report
(5)
One performance indicator accepted by the
agency and selected by program faculty
(6)
For one indicator, provide 3 years’ trend data. Insert
hyperlink in cell for graph if desired.
CEPH July 1, 2010` • Develop a set of MPH competencies that are specific and appropriate for graduate-level education in public health
• Competencies Will start this year
CEPH July 1, 2010 • Evaluate the list of competencies for all degree programs to ensure that course learning objectives are linked to them
• Evaluation of competencies
Will start this year School of Public Health accreditation occurs for all programs
CEPH July 1, 2010 • Implement a plan to accurately track and improve graduation rates for the DrPH, undergraduate and academic degree programs.
• Graduation rates Will start this year.
MPH and MSPH in Biostatistics
CEPH July 1, 2010 • Amassed sufficient faculty resources to cover the school’s two degree offerings in the biostatistics department by completing pending hiring processes
• Hiring of one faculty member
Budget approved.
1 Within the WASC region only
WASC EER Report Appendix F 258
RETURN TO CONTENTS
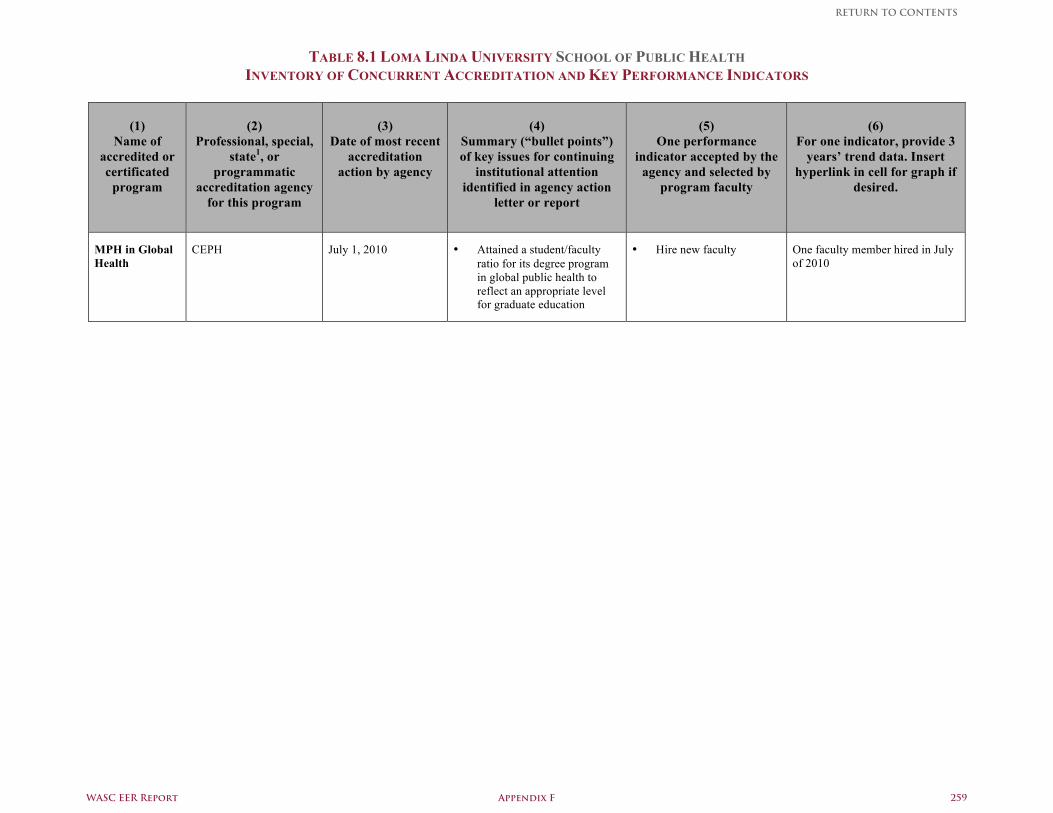
TABLE 8.1 LOMA LINDA UNIVERSITY SCHOOL OF PUBLIC HEALTH INVENTORY OF CONCURRENT ACCREDITATION AND KEY PERFORMANCE INDICATORS
(1) Name of
accredited or certificated
program
(2)
Professional, special, state1, or
programmatic accreditation agency
for this program
(3)
Date of most recent accreditation
action by agency
(4)
Summary (“bullet points”) of key issues for continuing
institutional attention identified in agency action
letter or report
(5)
One performance indicator accepted by the
agency and selected by program faculty
(6)
For one indicator, provide 3 years’ trend data. Insert
hyperlink in cell for graph if desired.
MPH in Global Health
CEPH July 1, 2010 • Attained a student/faculty ratio for its degree program in global public health to reflect an appropriate level for graduate education
• Hire new faculty One faculty member hired in July of 2010
WASC EER Report Appendix F 259
RETURN TO CONTENTS
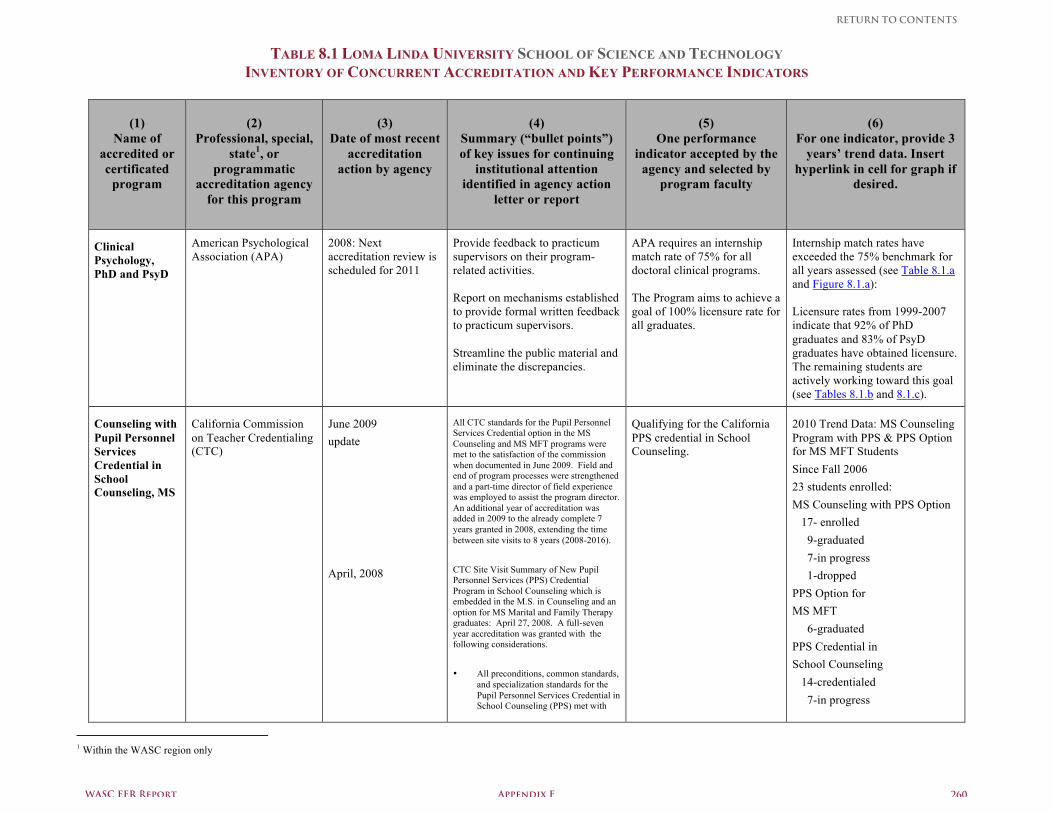
RETURN TO CONTENTS
TABLE 8.1 LOMA LINDA UNIVERSITY SCHOOL OF SCIENCE AND TECHNOLOGY
INVENTORY OF CONCURRENT ACCREDITATION AND KEY PERFORMANCE INDICATORS
WASC EER Report Appendix F
260
(1)
Name of accredited or certificated
program
(2)
Professional, special, state1, or
programmatic accreditation agency
for this program
(3)
Date of most recent accreditation
action by agency
(4)
Summary (“bullet points”) of key issues for continuing
institutional attention identified in agency action
letter or report
(5)
One performance indicator accepted by the
agency and selected by program faculty
(6)
For one indicator, provide 3 years’ trend data. Insert
hyperlink in cell for graph if desired.
Clinical Psychology, PhD and PsyD
American Psychological Association (APA)
2008: Next accreditation review is scheduled for 2011
Provide feedback to practicum supervisors on their program-related activities.
Report on mechanisms established to provide formal written feedback to practicum supervisors. Streamline the public material and eliminate the discrepancies.
APA requires an internship match rate of 75% for all doctoral clinical programs.
The Program aims to achieve a goal of 100% licensure rate for all graduates.
Internship match rates have exceeded the 75% benchmark for all years assessed (see Table 8.1.a and Figure 8.1.a): Licensure rates from 1999-2007 indicate that 92% of PhD graduates and 83% of PsyD graduates have obtained licensure. The remaining students are actively working toward this goal (see Tables 8.1.b and 8.1.c).
Counseling with Pupil Personnel Services Credential in School Counseling, MS
California Commission on Teacher Credentialing (CTC)
June 2009 update
April, 2008
All CTC standards for the Pupil Personnel Services Credential option in the MS Counseling and MS MFT programs were met to the satisfaction of the commission when documented in June 2009. Field and end of program processes were strengthened and a part-time director of field experience was employed to assist the program director. An additional year of accreditation was added in 2009 to the already complete 7 years granted in 2008, extending the time between site visits to 8 years (2008-2016). CTC Site Visit Summary of New Pupil Personnel Services (PPS) Credential Program in School Counseling which is embedded in the M.S. in Counseling and an option for MS Marital and Family Therapy graduates: April 27, 2008. A full-seven year accreditation was granted with the following considerations. • All preconditions, common standards,
and specialization standards for the Pupil Personnel Services Credential in School Counseling (PPS) met with
Qualifying for the California PPS credential in School Counseling.
2010 Trend Data: MS Counseling Program with PPS & PPS Option for MS MFT Students Since Fall 2006 23 students enrolled: MS Counseling with PPS Option 17- enrolled 9-graduated 7-in progress 1-dropped PPS Option for MS MFT 6-graduated PPS Credential in School Counseling 14-credentialed 7-in progress
1 Within the WASC region only
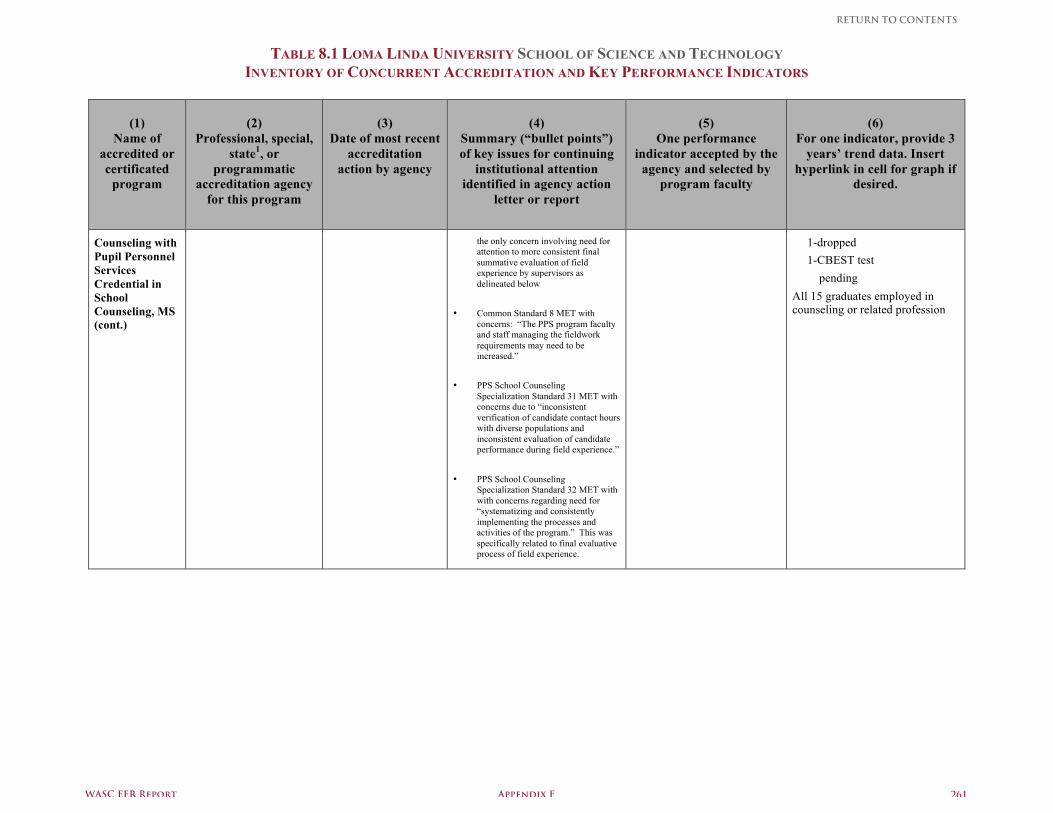
RETURN TO CONTENTS
TABLE 8.1 LOMA LINDA UNIVERSITY SCHOOL OF SCIENCE AND TECHNOLOGY
INVENTORY OF CONCURRENT ACCREDITATION AND KEY PERFORMANCE INDICATORS
WASC EER Report Appendix F
261
(1)
Name of accredited or certificated
program
(2)
Professional, special, state1, or
programmatic accreditation agency
for this program
(3)
Date of most recent accreditation
action by agency
(4)
Summary (“bullet points”) of key issues for continuing
institutional attention identified in agency action
letter or report
(5)
One performance indicator accepted by the
agency and selected by program faculty
(6)
For one indicator, provide 3 years’ trend data. Insert
hyperlink in cell for graph if desired.
Counseling with Pupil Personnel Services Credential in School Counseling, MS (cont.)
the only concern involving need for attention to more consistent final summative evaluation of field experience by supervisors as delineated below
• Common Standard 8 MET with concerns: “The PPS program faculty and staff managing the fieldwork requirements may need to be increased.”
• PPS School Counseling
Specialization Standard 31 MET with concerns due to “inconsistent verification of candidate contact hours with diverse populations and inconsistent evaluation of candidate performance during field experience.”
• PPS School Counseling
Specialization Standard 32 MET with with concerns regarding need for “systematizing and consistently implementing the processes and activities of the program.” This was specifically related to final evaluative process of field experience.
1-dropped 1-CBEST test pending All 15 graduates employed in counseling or related profession
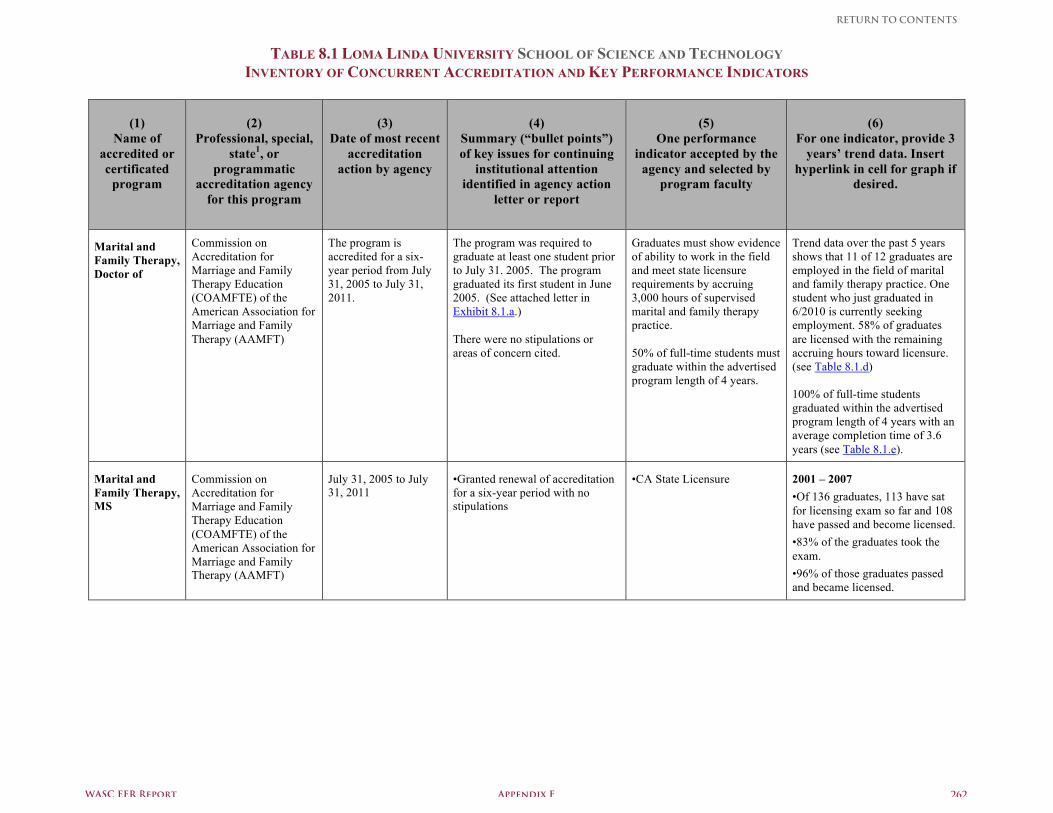
RETURN TO CONTENTS
TABLE 8.1 LOMA LINDA UNIVERSITY SCHOOL OF SCIENCE AND TECHNOLOGY
INVENTORY OF CONCURRENT ACCREDITATION AND KEY PERFORMANCE INDICATORS
WASC EER Report Appendix F
262
(1)
Name of accredited or certificated
program
(2)
Professional, special, state1, or
programmatic accreditation agency
for this program
(3)
Date of most recent accreditation
action by agency
(4)
Summary (“bullet points”) of key issues for continuing
institutional attention identified in agency action
letter or report
(5)
One performance indicator accepted by the
agency and selected by program faculty
(6)
For one indicator, provide 3 years’ trend data. Insert
hyperlink in cell for graph if desired.
Marital and Family Therapy, Doctor of
Commission on Accreditation for Marriage and Family Therapy Education (COAMFTE) of the American Association for Marriage and Family Therapy (AAMFT)
The program is accredited for a six-year period from July 31, 2005 to July 31, 2011.
The program was required to graduate at least one student prior to July 31. 2005. The program graduated its first student in June 2005. (See attached letter in Exhibit 8.1.a.) There were no stipulations or areas of concern cited.
Graduates must show evidence of ability to work in the field and meet state licensure requirements by accruing 3,000 hours of supervised marital and family therapy practice. 50% of full-time students must graduate within the advertised program length of 4 years.
Trend data over the past 5 years shows that 11 of 12 graduates are employed in the field of marital and family therapy practice. One student who just graduated in 6/2010 is currently seeking employment. 58% of graduates are licensed with the remaining accruing hours toward licensure. (see Table 8.1.d) 100% of full-time students graduated within the advertised program length of 4 years with an average completion time of 3.6 years (see Table 8.1.e).
Marital and Family Therapy, MS
Commission on Accreditation for Marriage and Family Therapy Education (COAMFTE) of the American Association for Marriage and Family Therapy (AAMFT)
July 31, 2005 to July 31, 2011
•Granted renewal of accreditation for a six-year period with no stipulations
•CA State Licensure
2001 – 2007 •Of 136 graduates, 113 have sat for licensing exam so far and 108 have passed and become licensed. •83% of the graduates took the exam. •96% of those graduates passed and became licensed.
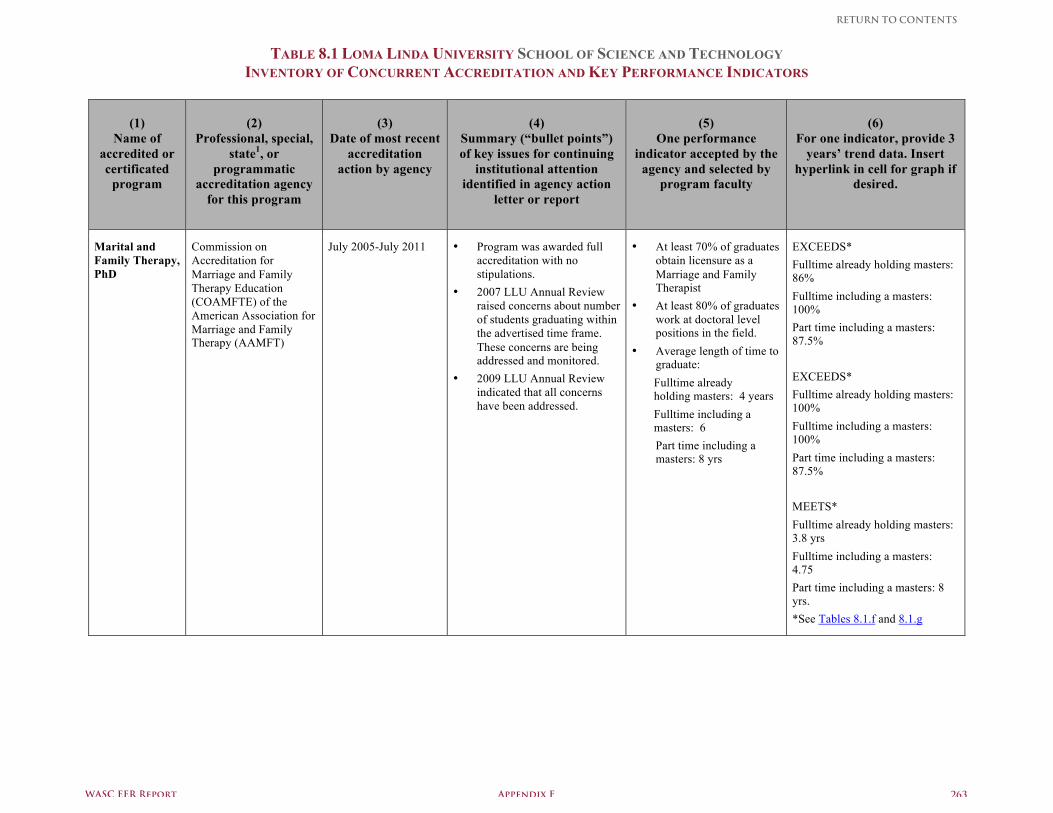
RETURN TO CONTENTS
TABLE 8.1 LOMA LINDA UNIVERSITY SCHOOL OF SCIENCE AND TECHNOLOGY
INVENTORY OF CONCURRENT ACCREDITATION AND KEY PERFORMANCE INDICATORS
WASC EER Report Appendix F
263
(1)
Name of accredited or certificated
program
(2)
Professional, special, state1, or
programmatic accreditation agency
for this program
(3)
Date of most recent accreditation
action by agency
(4)
Summary (“bullet points”) of key issues for continuing
institutional attention identified in agency action
letter or report
(5)
One performance indicator accepted by the
agency and selected by program faculty
(6)
For one indicator, provide 3 years’ trend data. Insert
hyperlink in cell for graph if desired.
Marital and Family Therapy, PhD
Commission on Accreditation for Marriage and Family Therapy Education (COAMFTE) of the American Association for Marriage and Family Therapy (AAMFT)
July 2005-July 2011 • Program was awarded full accreditation with no stipulations.
• 2007 LLU Annual Review raised concerns about number of students graduating within the advertised time frame. These concerns are being addressed and monitored.
• 2009 LLU Annual Review indicated that all concerns have been addressed.
• At least 70% of graduates obtain licensure as a Marriage and Family Therapist
• At least 80% of graduates work at doctoral level positions in the field.
• Average length of time to graduate: Fulltime already holding masters: 4 years Fulltime including a masters: 6 Part time including a masters: 8 yrs
EXCEEDS* Fulltime already holding masters: 86% Fulltime including a masters: 100% Part time including a masters: 87.5% EXCEEDS* Fulltime already holding masters: 100% Fulltime including a masters: 100% Part time including a masters: 87.5% MEETS* Fulltime already holding masters: 3.8 yrs Fulltime including a masters: 4.75 Part time including a masters: 8 yrs. *See Tables 8.1.f and 8.1.g
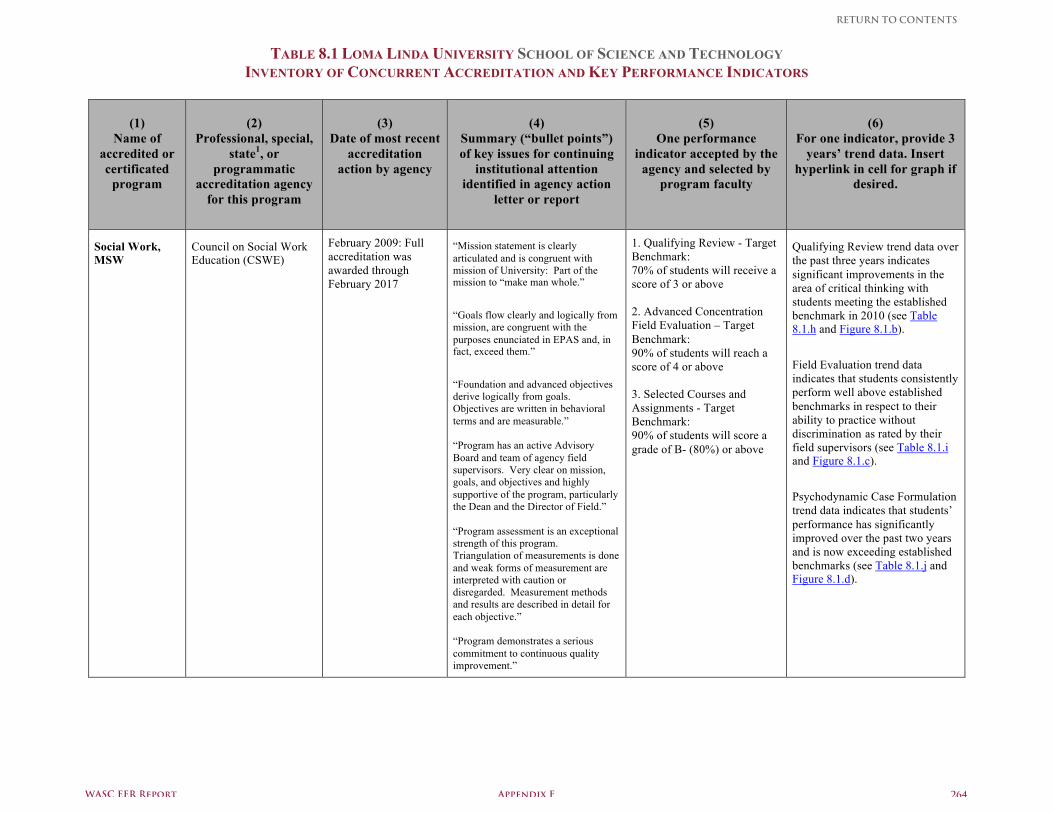
RETURN TO CONTENTS
TABLE 8.1 LOMA LINDA UNIVERSITY SCHOOL OF SCIENCE AND TECHNOLOGY
INVENTORY OF CONCURRENT ACCREDITATION AND KEY PERFORMANCE INDICATORS
WASC EER Report Appendix F
264
(1)
Name of accredited or certificated
program
(2)
Professional, special, state1, or
programmatic accreditation agency
for this program
(3)
Date of most recent accreditation
action by agency
(4)
Summary (“bullet points”) of key issues for continuing
institutional attention identified in agency action
letter or report
(5)
One performance indicator accepted by the
agency and selected by program faculty
(6)
For one indicator, provide 3 years’ trend data. Insert
hyperlink in cell for graph if desired.
Social Work, MSW
Council on Social Work Education (CSWE)
February 2009: Full accreditation was awarded through February 2017
“Mission statement is clearly articulated and is congruent with mission of University: Part of the mission to “make man whole.” “Goals flow clearly and logically from mission, are congruent with the purposes enunciated in EPAS and, in fact, exceed them.” “Foundation and advanced objectives derive logically from goals. Objectives are written in behavioral terms and are measurable.” “Program has an active Advisory Board and team of agency field supervisors. Very clear on mission, goals, and objectives and highly supportive of the program, particularly the Dean and the Director of Field.” “Program assessment is an exceptional strength of this program. Triangulation of measurements is done and weak forms of measurement are interpreted with caution or disregarded. Measurement methods and results are described in detail for each objective.” “Program demonstrates a serious commitment to continuous quality improvement.”
1. Qualifying Review - Target Benchmark: 70% of students will receive a score of 3 or above 2. Advanced Concentration Field Evaluation – Target Benchmark: 90% of students will reach a score of 4 or above 3. Selected Courses and Assignments - Target Benchmark: 90% of students will score a grade of B- (80%) or above
Qualifying Review trend data over the past three years indicates significant improvements in the area of critical thinking with students meeting the established benchmark in 2010 (see Table 8.1.h and Figure 8.1.b). Field Evaluation trend data indicates that students consistently perform well above established benchmarks in respect to their ability to practice without discrimination as rated by their field supervisors (see Table 8.1.i and Figure 8.1.c). Psychodynamic Case Formulation trend data indicates that students’ performance has significantly improved over the past two years and is now exceeding established benchmarks (see Table 8.1.j and Figure 8.1.d).
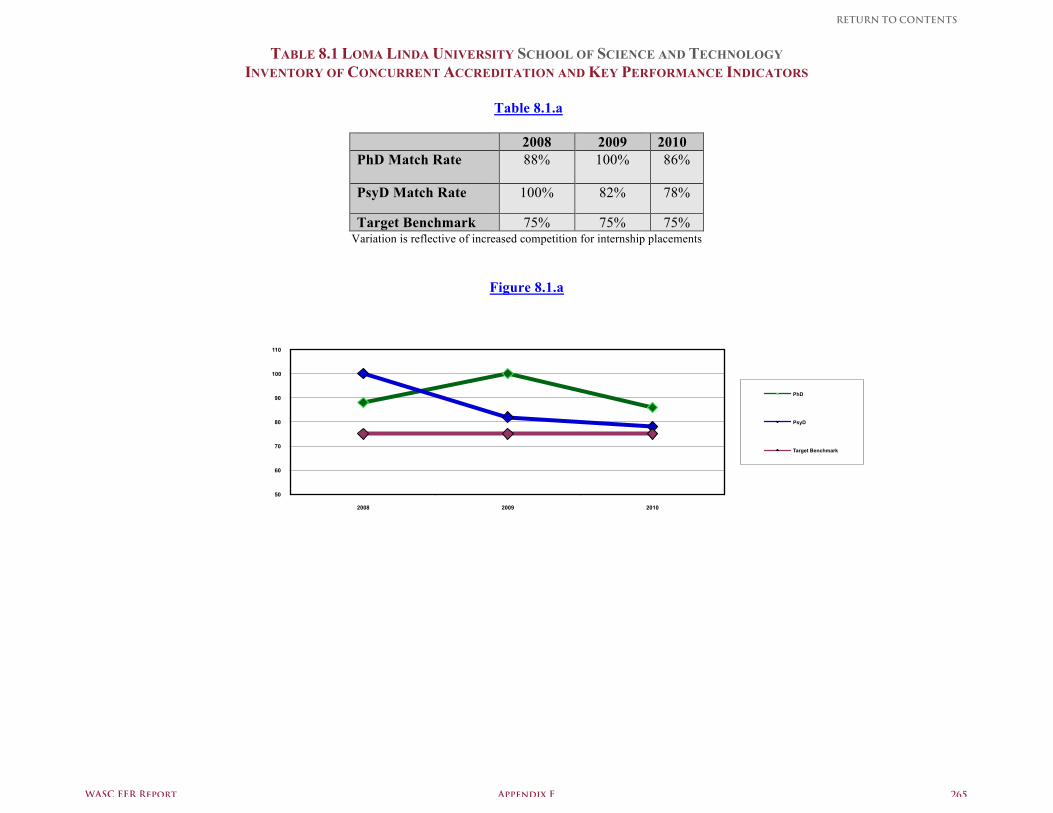
RETURN TO CONTENTS
TABLE 8.1 LOMA LINDA UNIVERSITY SCHOOL OF SCIENCE AND TECHNOLOGY
INVENTORY OF CONCURRENT ACCREDITATION AND KEY PERFORMANCE INDICATORS
WASC EER Report Appendix F
265
Table 8.1.a
2008 2009 2010 PhD Match Rate 88% 100% 86%
PsyD Match Rate 100% 82% 78%
Target Benchmark 75% 75% 75% Variation is reflective of increased competition for internship placements
Figure 8.1.a
50
60
70
80
90
100
110
2008 2009 2010
PhD
PsyD
Target Benchmark
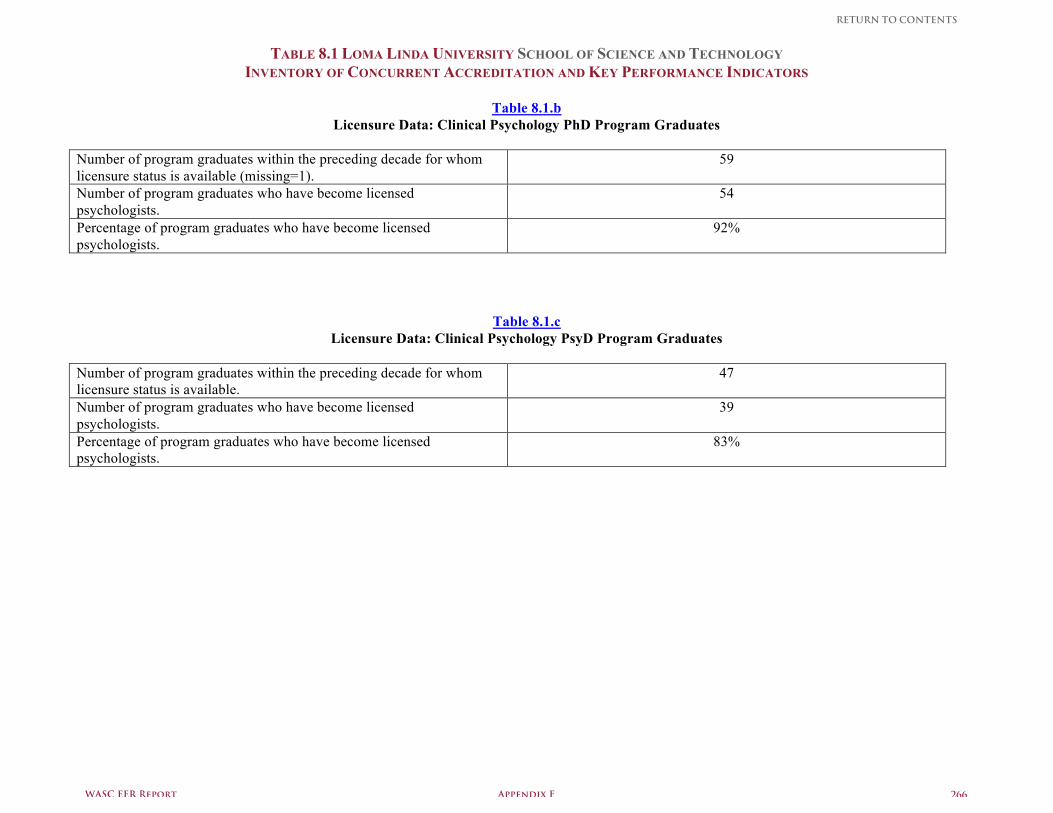
RETURN TO CONTENTS
TABLE 8.1 LOMA LINDA UNIVERSITY SCHOOL OF SCIENCE AND TECHNOLOGY
INVENTORY OF CONCURRENT ACCREDITATION AND KEY PERFORMANCE INDICATORS
WASC EER Report Appendix F
266
Table 8.1.b Licensure Data: Clinical Psychology PhD Program Graduates
Number of program graduates within the preceding decade for whom licensure status is available (missing=1).
59
Number of program graduates who have become licensed psychologists.
54
Percentage of program graduates who have become licensed psychologists.
92%
Table 8.1.c Licensure Data: Clinical Psychology PsyD Program Graduates
Number of program graduates within the preceding decade for whom licensure status is available.
47
Number of program graduates who have become licensed psychologists.
39
Percentage of program graduates who have become licensed psychologists.
83%
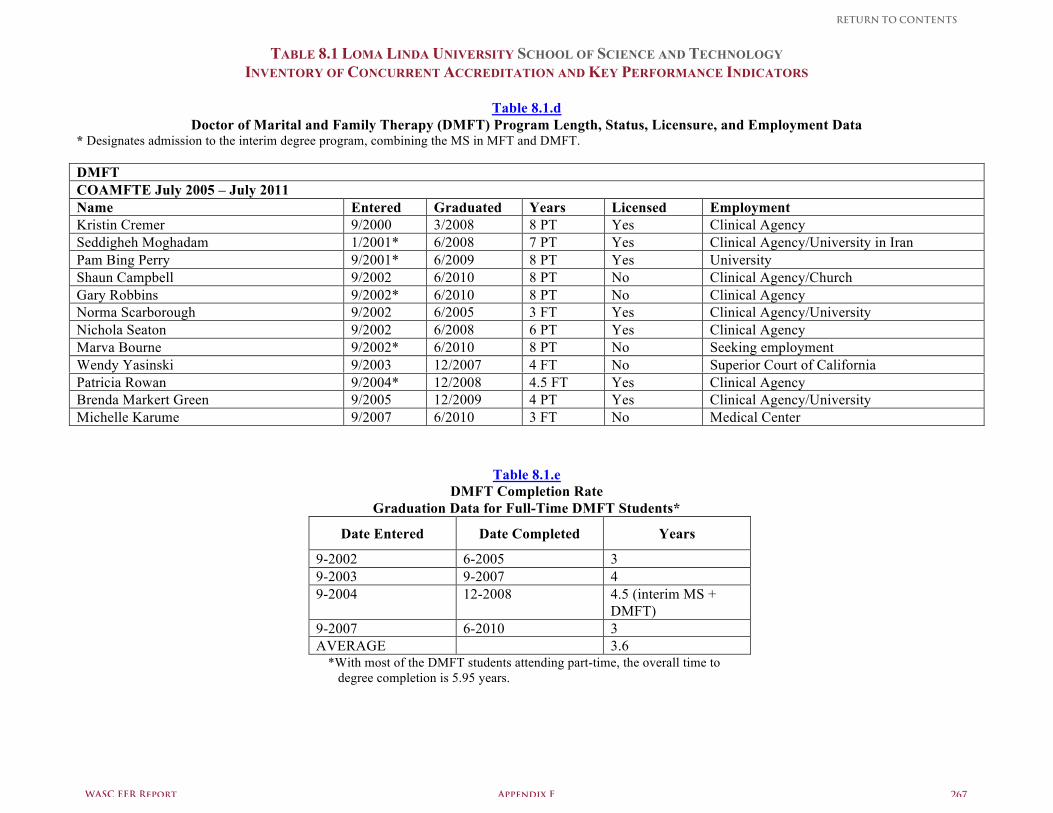
RETURN TO CONTENTS
TABLE 8.1 LOMA LINDA UNIVERSITY SCHOOL OF SCIENCE AND TECHNOLOGY
INVENTORY OF CONCURRENT ACCREDITATION AND KEY PERFORMANCE INDICATORS
WASC EER Report Appendix F
267
Table 8.1.d Doctor of Marital and Family Therapy (DMFT) Program Length, Status, Licensure, and Employment Data
* Designates admission to the interim degree program, combining the MS in MFT and DMFT.
Table 8.1.e DMFT Completion Rate
Graduation Data for Full-Time DMFT Students*
Date Entered Date Completed Years
9-2002 6-2005 3 9-2003 9-2007 4 9-2004 12-2008 4.5 (interim MS +
DMFT) 9-2007 6-2010 3 AVERAGE 3.6
*With most of the DMFT students attending part-time, the overall time to degree completion is 5.95 years.
DMFT COAMFTE July 2005 – July 2011 Name Entered Graduated Years Licensed Employment Kristin Cremer 9/2000 3/2008 8 PT Yes Clinical Agency Seddigheh Moghadam 1/2001* 6/2008 7 PT Yes Clinical Agency/University in Iran Pam Bing Perry 9/2001* 6/2009 8 PT Yes University Shaun Campbell 9/2002 6/2010 8 PT No Clinical Agency/Church Gary Robbins 9/2002* 6/2010 8 PT No Clinical Agency Norma Scarborough 9/2002 6/2005 3 FT Yes Clinical Agency/University Nichola Seaton 9/2002 6/2008 6 PT Yes Clinical Agency Marva Bourne 9/2002* 6/2010 8 PT No Seeking employment Wendy Yasinski 9/2003 12/2007 4 FT No Superior Court of California Patricia Rowan 9/2004* 12/2008 4.5 FT Yes Clinical Agency Brenda Markert Green 9/2005 12/2009 4 PT Yes Clinical Agency/University Michelle Karume 9/2007 6/2010 3 FT No Medical Center
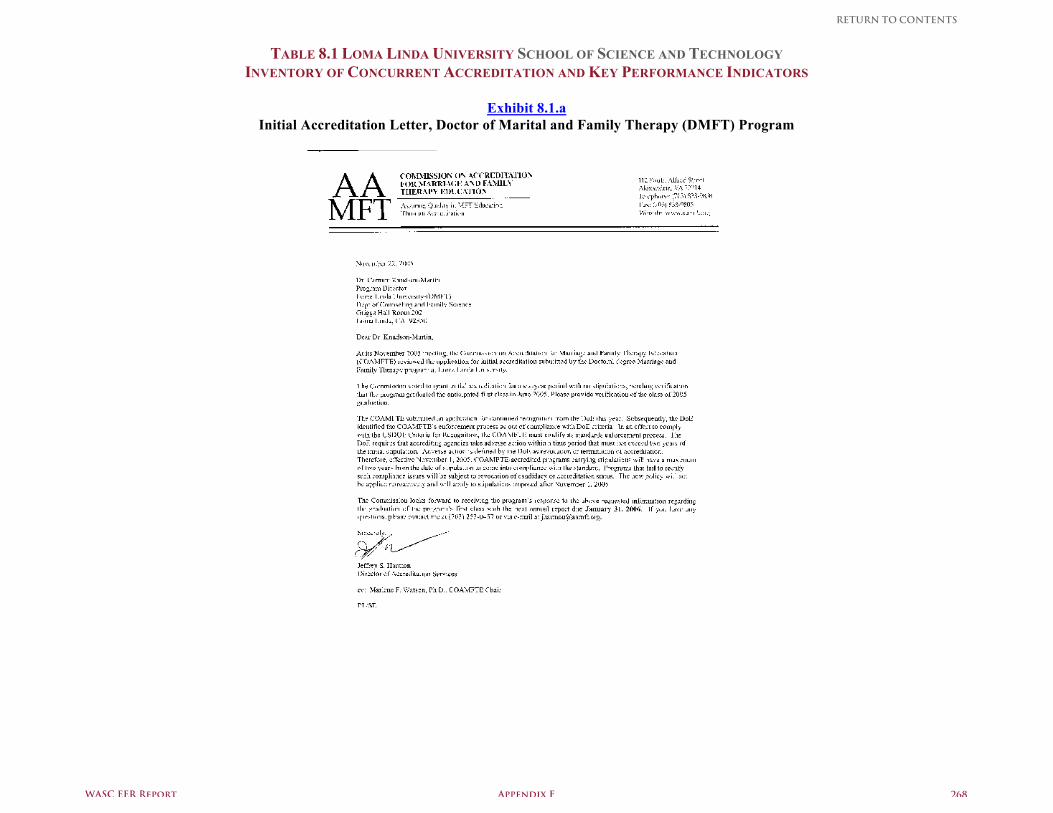
RETURN TO CONTENTS
TABLE 8.1 LOMA LINDA UNIVERSITY SCHOOL OF SCIENCE AND TECHNOLOGY
INVENTORY OF CONCURRENT ACCREDITATION AND KEY PERFORMANCE INDICATORS
WASC EER Report Appendix F
268
Exhibit 8.1.a Initial Accreditation Letter, Doctor of Marital and Family Therapy (DMFT) Program
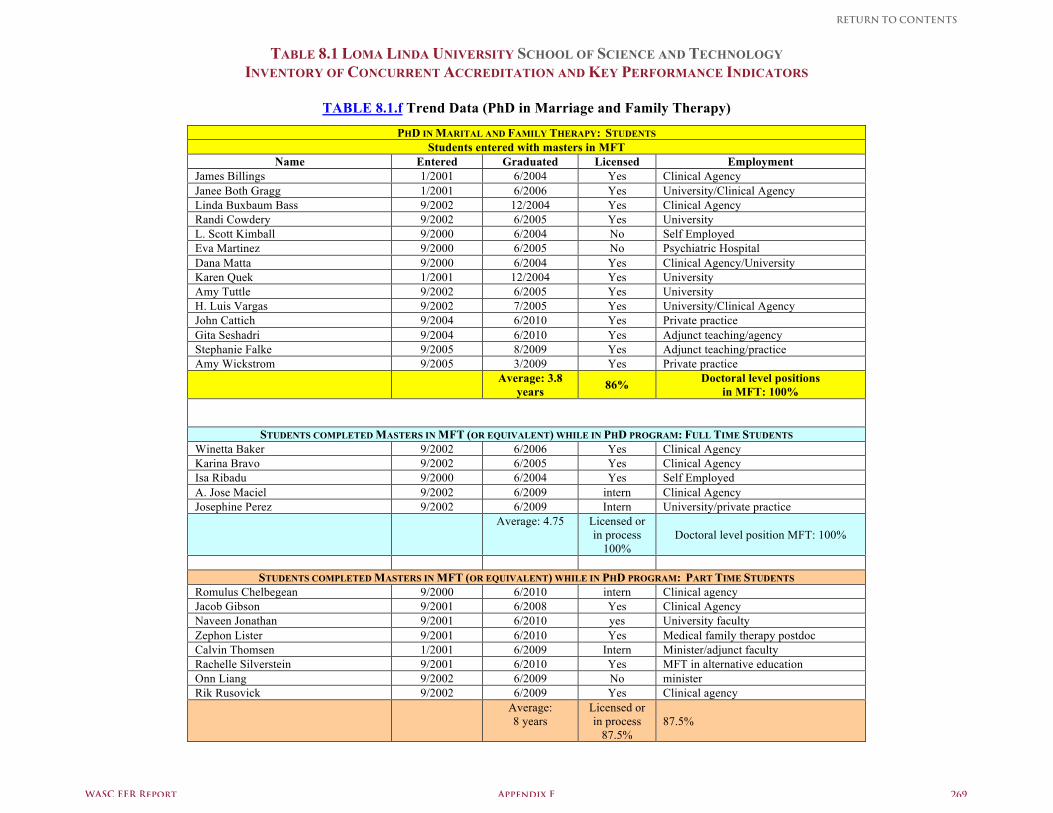
RETURN TO CONTENTS
TABLE 8.1 LOMA LINDA UNIVERSITY SCHOOL OF SCIENCE AND TECHNOLOGY
INVENTORY OF CONCURRENT ACCREDITATION AND KEY PERFORMANCE INDICATORS
WASC EER Report Appendix F
269
TABLE 8.1.f Trend Data (PhD in Marriage and Family Therapy)
PHD IN MARITAL AND FAMILY THERAPY: STUDENTS Students entered with masters in MFT
Name Entered Graduated Licensed Employment James Billings 1/2001 6/2004 Yes Clinical Agency Janee Both Gragg 1/2001 6/2006 Yes University/Clinical Agency Linda Buxbaum Bass 9/2002 12/2004 Yes Clinical Agency Randi Cowdery 9/2002 6/2005 Yes University L. Scott Kimball 9/2000 6/2004 No Self Employed Eva Martinez 9/2000 6/2005 No Psychiatric Hospital Dana Matta 9/2000 6/2004 Yes Clinical Agency/University Karen Quek 1/2001 12/2004 Yes University Amy Tuttle 9/2002 6/2005 Yes University H. Luis Vargas 9/2002 7/2005 Yes University/Clinical Agency John Cattich 9/2004 6/2010 Yes Private practice Gita Seshadri 9/2004 6/2010 Yes Adjunct teaching/agency Stephanie Falke 9/2005 8/2009 Yes Adjunct teaching/practice Amy Wickstrom 9/2005 3/2009 Yes Private practice Average: 3.8
years 86% Doctoral level positions in MFT: 100%
STUDENTS COMPLETED MASTERS IN MFT (OR EQUIVALENT) WHILE IN PHD PROGRAM: FULL TIME STUDENTS Winetta Baker 9/2002 6/2006 Yes Clinical Agency Karina Bravo 9/2002 6/2005 Yes Clinical Agency Isa Ribadu 9/2000 6/2004 Yes Self Employed A. Jose Maciel 9/2002 6/2009 intern Clinical Agency Josephine Perez 9/2002 6/2009 Intern University/private practice Average: 4.75 Licensed or
in process 100%
Doctoral level position MFT: 100%
STUDENTS COMPLETED MASTERS IN MFT (OR EQUIVALENT) WHILE IN PHD PROGRAM: PART TIME STUDENTS
Romulus Chelbegean 9/2000 6/2010 intern Clinical agency Jacob Gibson 9/2001 6/2008 Yes Clinical Agency Naveen Jonathan 9/2001 6/2010 yes University faculty Zephon Lister 9/2001 6/2010 Yes Medical family therapy postdoc Calvin Thomsen 1/2001 6/2009 Intern Minister/adjunct faculty Rachelle Silverstein 9/2001 6/2010 Yes MFT in alternative education Onn Liang 9/2002 6/2009 No minister Rik Rusovick 9/2002 6/2009 Yes Clinical agency Average:
8 years Licensed or in process
87.5% 87.5%
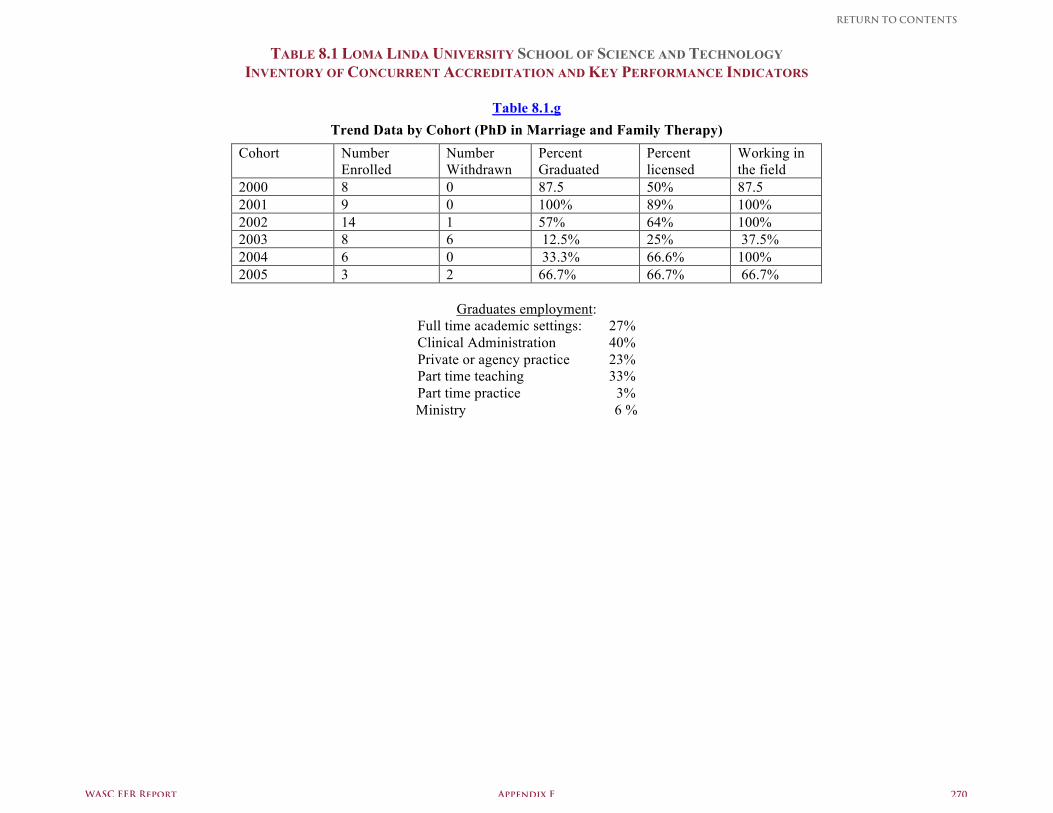
RETURN TO CONTENTS
TABLE 8.1 LOMA LINDA UNIVERSITY SCHOOL OF SCIENCE AND TECHNOLOGY
INVENTORY OF CONCURRENT ACCREDITATION AND KEY PERFORMANCE INDICATORS
WASC EER Report Appendix F
270
Table 8.1.g Trend Data by Cohort (PhD in Marriage and Family Therapy)
Cohort Number Enrolled
Number Withdrawn
Percent Graduated
Percent licensed
Working in the field
2000 8 0 87.5 50% 87.5 2001 9 0 100% 89% 100% 2002 14 1 57% 64% 100% 2003 8 6 12.5% 25% 37.5% 2004 6 0 33.3% 66.6% 100% 2005 3 2 66.7% 66.7% 66.7%
Graduates employment:
Full time academic settings: 27% Clinical Administration 40% Private or agency practice 23% Part time teaching 33% Part time practice 3% Ministry 6 %
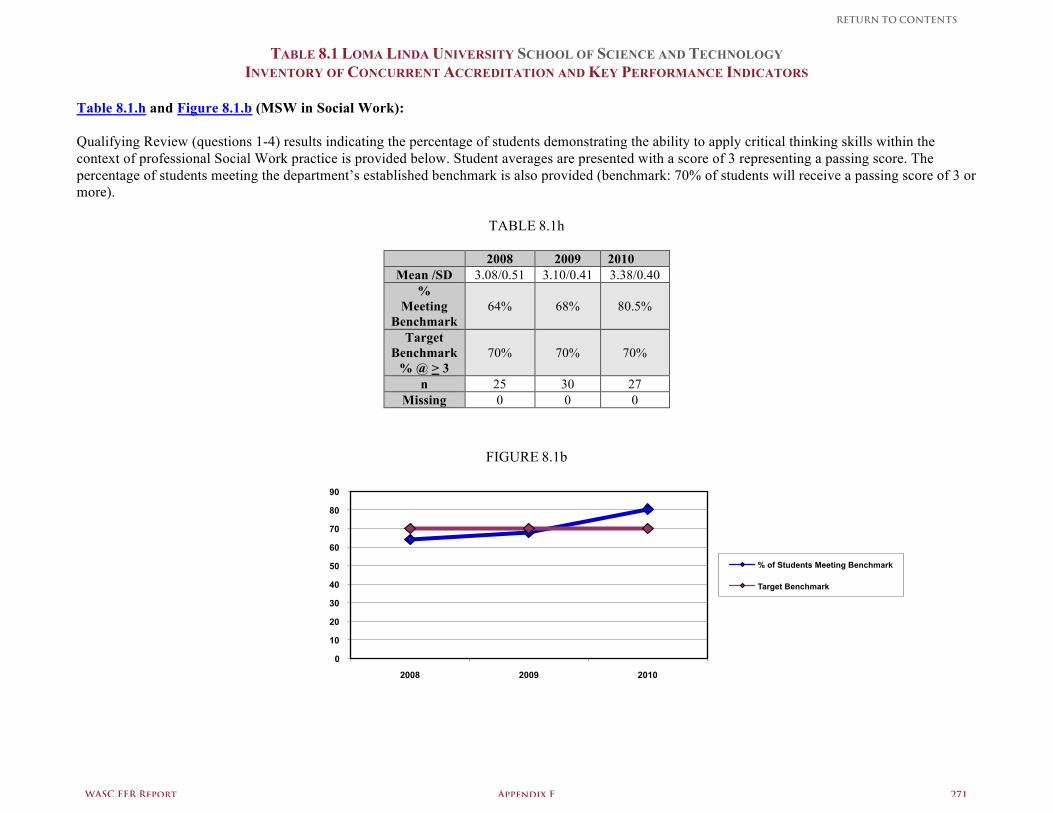
RETURN TO CONTENTS
TABLE 8.1 LOMA LINDA UNIVERSITY SCHOOL OF SCIENCE AND TECHNOLOGY
INVENTORY OF CONCURRENT ACCREDITATION AND KEY PERFORMANCE INDICATORS
WASC EER Report Appendix F
271
Table 8.1.h and Figure 8.1.b (MSW in Social Work): Qualifying Review (questions 1-4) results indicating the percentage of students demonstrating the ability to apply critical thinking skills within the context of professional Social Work practice is provided below. Student averages are presented with a score of 3 representing a passing score. The percentage of students meeting the department’s established benchmark is also provided (benchmark: 70% of students will receive a passing score of 3 or more).
TABLE 8.1h
2008 2009 2010 Mean /SD 3.08/0.51 3.10/0.41 3.38/0.40
% Meeting
Benchmark
64%
68%
80.5%
Target Benchmark
% @ > 3
70%
70%
70%
n 25 30 27 Missing 0 0 0
FIGURE 8.1b
0
10
20
30
40
50
60
70
80
90
2008 2009 2010
% of Students Meeting Benchmark
Target Benchmark
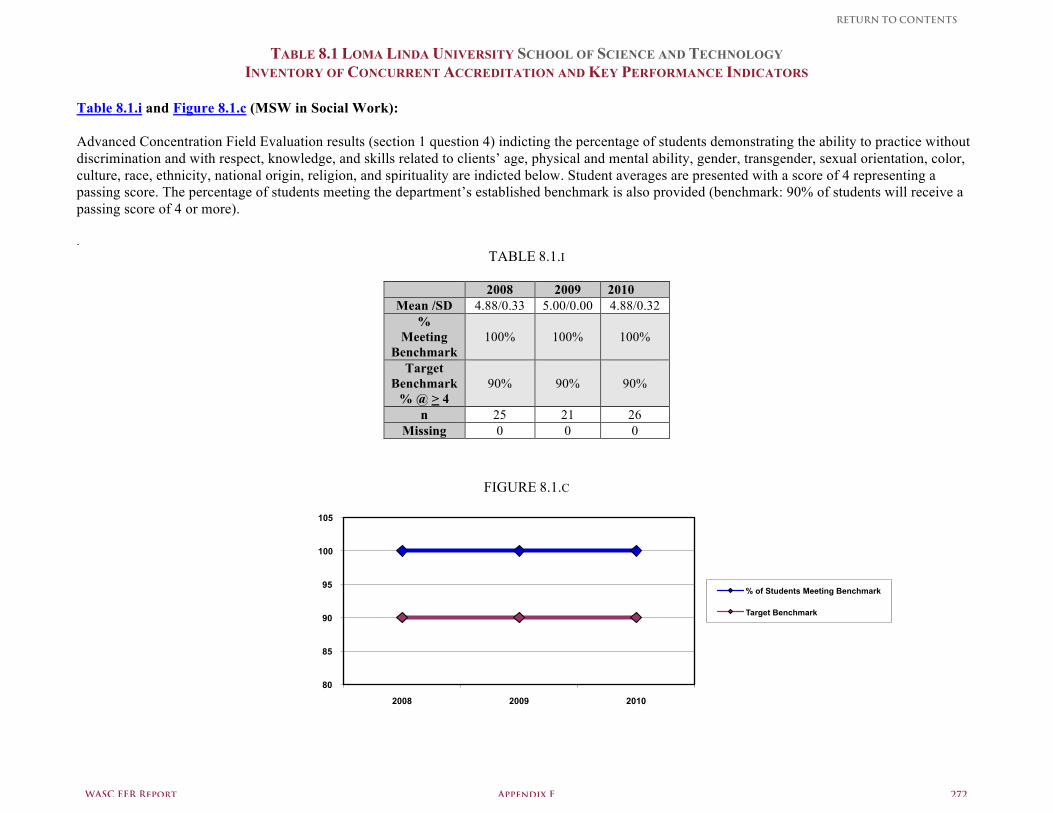
RETURN TO CONTENTS
TABLE 8.1 LOMA LINDA UNIVERSITY SCHOOL OF SCIENCE AND TECHNOLOGY
INVENTORY OF CONCURRENT ACCREDITATION AND KEY PERFORMANCE INDICATORS
WASC EER Report Appendix F
272
Table 8.1.i and Figure 8.1.c (MSW in Social Work): Advanced Concentration Field Evaluation results (section 1 question 4) indicting the percentage of students demonstrating the ability to practice without discrimination and with respect, knowledge, and skills related to clients’ age, physical and mental ability, gender, transgender, sexual orientation, color, culture, race, ethnicity, national origin, religion, and spirituality are indicted below. Student averages are presented with a score of 4 representing a passing score. The percentage of students meeting the department’s established benchmark is also provided (benchmark: 90% of students will receive a passing score of 4 or more). .
TABLE 8.1.I
2008 2009 2010 Mean /SD 4.88/0.33 5.00/0.00 4.88/0.32
% Meeting
Benchmark
100%
100%
100%
Target Benchmark
% @ > 4
90%
90%
90%
n 25 21 26 Missing 0 0 0
FIGURE 8.1.C 80
85
90
95
100
105
2008 2009 2010
% of Students Meeting Benchmark
Target Benchmark
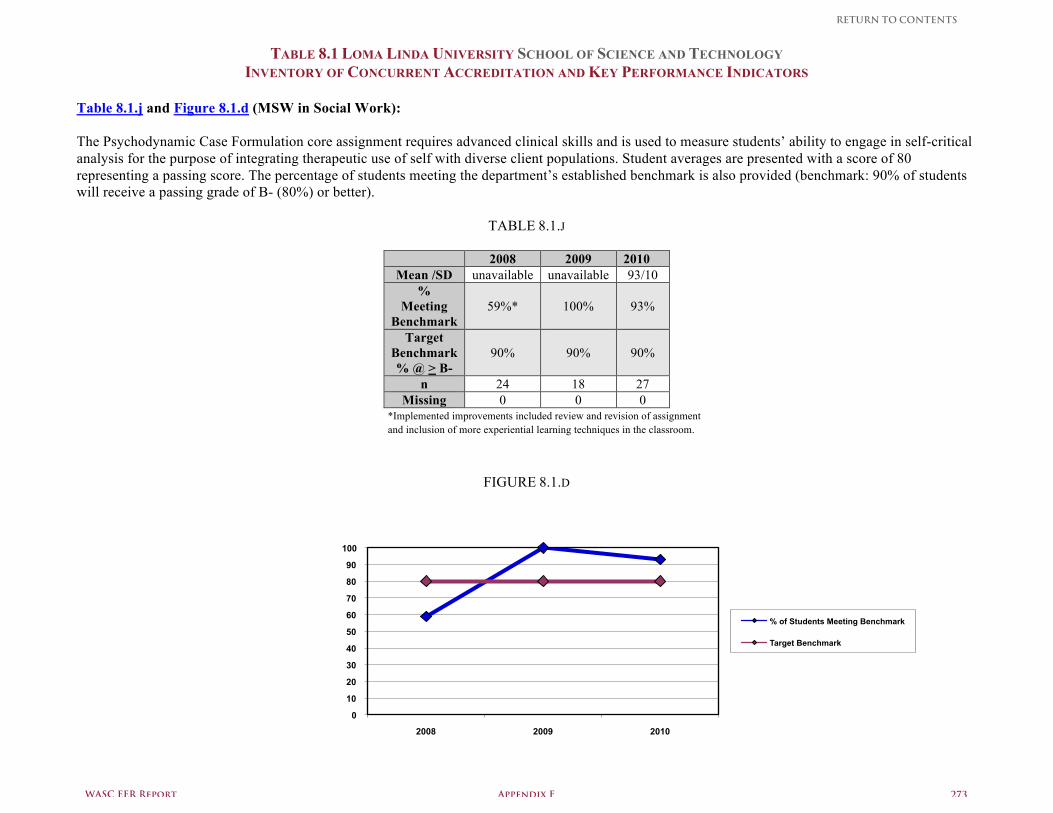
RETURN TO CONTENTS
TABLE 8.1 LOMA LINDA UNIVERSITY SCHOOL OF SCIENCE AND TECHNOLOGY
INVENTORY OF CONCURRENT ACCREDITATION AND KEY PERFORMANCE INDICATORS
WASC EER Report Appendix F
273
Table 8.1.j and Figure 8.1.d (MSW in Social Work): The Psychodynamic Case Formulation core assignment requires advanced clinical skills and is used to measure students’ ability to engage in self-critical analysis for the purpose of integrating therapeutic use of self with diverse client populations. Student averages are presented with a score of 80 representing a passing score. The percentage of students meeting the department’s established benchmark is also provided (benchmark: 90% of students will receive a passing grade of B- (80%) or better).
TABLE 8.1.J
2008 2009 2010 Mean /SD unavailable unavailable 93/10
% Meeting
Benchmark
59%*
100%
93%
Target Benchmark % @ > B-
90%
90%
90%
n 24 18 27 Missing 0 0 0
*Implemented improvements included review and revision of assignment and inclusion of more experiential learning techniques in the classroom.
FIGURE 8.1.D
0
10
20
30
40
50
60
70
80
90
100
2008 2009 2010
% of Students Meeting Benchmark
Target Benchmark

WASC Educational Effectiveness Report
Appendix G
TABLE OF CONTENTS
RETURN TO CONTENTS
Exhibits and Displays
Analyses of the Data Tables The following are highlights and summative analyses of the information found in the updated data exhibits. The data exhibits were updated to include the last two academic years. Most of the data patterns and trends of the current five-year period remain consistent with those of previous five-year period reported in the 2008 CPR data exhibits. Notably, there were applicant and enrollment increases for both Black and Hispanic students. Additional disaggregated data by programs will be presented in School Portfolios available at the time of the site visit. Overall (1.1, 1.2) Overall LLU has shown significant increases in applicants for all (including admissions and enrollments) over the past five years with a slight slowdown for 2007. Our selectivity has increased as demonstrated by a higher percentage of admitted and enrolled students with complete credentials (1.1). The number of applicants with complete credentials has increased while at the same time a lower percentage of applicants with complete credentials were admitted and enrolled. Table 1.2 demonstrates this with the preparation and selectivity levels of entering students has improved (i.e., Graduate Record Exam [GRE] scores have improved during the last two years of the five-year reporting period). Overall (1.1, 1.2) The majority of degrees offered at LLU are professional and graduate programs (approximately 75%) most of which are professionally accredited. The dramatic increase in applications in year five are substantially due to the School of Dentistry for the first time including their entire eligible applicant pools. Previously they had only reported accepted applicants. Thus the figures in year 5 are more reflective of LLU’s true applicant pool than those reported in prior years. In addition, while applicants to centralized applications systems may apply to LLU as one of several schools (one can list multiple schools), they are only counted as an LLU applicant if the individual completes a supplemental LLU application. Both the original application and the supplemental application are then imported to the centralized data system (Banner). This includes tests scores that are then also saved in Banner. Therefore data on applicants to LU that did not complete a supplemental application (either they decided not to or were not invited to do so) is not captured. With respect to applicant data reporting we found out that in the past schools had created an internal file for each applicant they received through their central application system. Once they completed their evaluation, they entered their decision in the central system. The applicant’s file, however, remained in the school, and test scores were not always entered into the central database. However, in the last three years test scores listings in the central data base have increased mainly due to the change to an electronic application function (not requiring data entry) in Banner, which now captures test scores electronically once they are electronically provided by application services. Table 1.2’s shows either stable scores or increasing scores by applicants over time. Notably, scoring has changed in several testing systems making comparisons challenging and, as noted above, much data is only available for the last 3 years due to the gains in data capturing techniques. In no area—except for the internet-based Toeffel—have scores declined over time (please note that computer based scores stayed the same and paper based actually increased over time).
WASC EER Report Appendix G 275
RETURN TO CONTENTS
Return to p. 8
Gender (1.3) The general distribution of male (one-third) to female (two-thirds) applicants has remained constant for most programs despite increased enrollment. No significant changes in gender enrollment patterns are noted. Ethnicity (1.4) LLU continues to attract a large percentage of international students (approximately 400 on F1 and J visas; approximately 10% of enrollment). In the past we had identified a challenge to better reflect the ethnic composition of our surrounding communities; this was especially true for professional programs. In response to this challenge, we have put in place a number of programs to actively recruit Hispanic and Black students into health professional programs. As a result, in year five the number of Black and Hispanic applicants for graduate degrees increased significantly compared to prior years. In prior years, if there were increases they were usually slight—in single digit numbers. For instance, the highest number of minority sub-group applicants in prior years was 16. The number of applicants for year five increased to 62 for Blacks, and 49 for Hispanics. We therefore are delighted to note that our recruitment efforts for Black and Hispanic applicants are working. Headcount Enrollments by Degree Objective (2.1) The pattern of degrees offered over time indicates decreasing enrollments for post secondary certificates < 1 year, >1 year <2 years, as well as post-masters certificates. Also school certificate and non-degree enrollments have decreased. On the other hand, >2 <4 post-secondary degrees have increased over time, as have post-baccalaureate certificates, masters degrees, doctoral degrees, and first professional degrees. Associate degrees, baccalaureate degrees, and first professional certificates remained relatively stable over the five-year period. Although enrollments have increased for the first-professional degrees (33%), and doctoral degrees (14.5%), their relative ratios remain stable. The masters degree ratios have increased slightly each year; in Fall 2007 the ratio was 19.23% rose to 24.64% in Fall 2009. This represents an increase of over 5% in enrollment. Enrollment in the undergraduate degrees decreased a little over two percent in the last two years. In Fall 2007 undergraduates represented 17.65% of the student body but dropped to 13.3% in 2009/10. Headcount Enrollment by Gender (Table 2.2) The overall pattern of gender enrollment has been relatively stable at about 40% male and 60% female. The only variation comes from more males in the professional degrees vs. more females in the graduate, undergraduate, and non-degree enrollment; this, however, remained stable over time. There have been some notable changes in the ethnicity enrollment numbers. Although the numbers of White students remained fairly constant continues, their percentage over time declined by about 4% over the last five years. Headcount Enrollment by Race/Ethnicity (2.3) The absolute numbers of Hispanic students enrolled has increased over each of the last five years although the absolute percent enrolled remained relatively stable. Hispanics students seeking a first-professional degree however increased both in absolute numbers as well as percent. (Fall 2005, 17.6%; Fall 2009, 21.2%) Similarly, enrollment for Black students increased each year, reaching 9.89% in Fall of 2008, with a slight decrease to 8.69% in the Fall of 2009. In Fall 2005 over 53% of the Black students were in graduate programs, but in Fall 2009 this percentage increased to 61.9%.
WASC EER Report Appendix G 276
RETURN TO CONTENTS
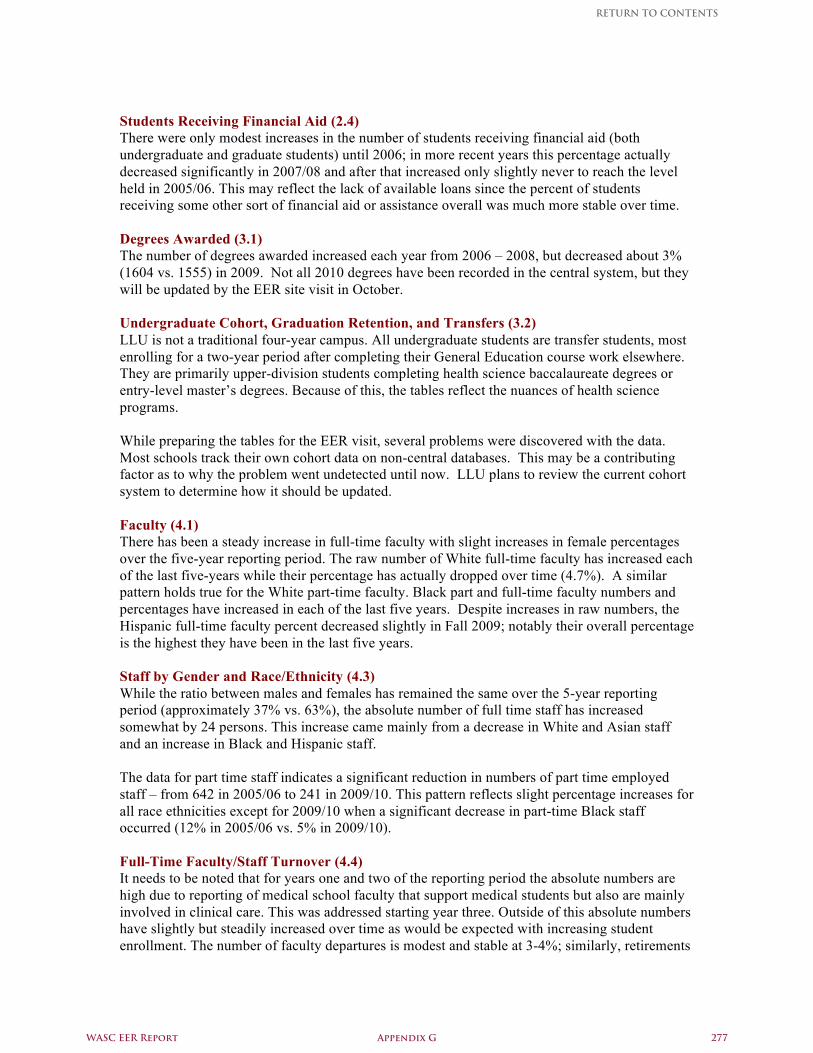
Students Receiving Financial Aid (2.4) There were only modest increases in the number of students receiving financial aid (both undergraduate and graduate students) until 2006; in more recent years this percentage actually decreased significantly in 2007/08 and after that increased only slightly never to reach the level held in 2005/06. This may reflect the lack of available loans since the percent of students receiving some other sort of financial aid or assistance overall was much more stable over time. Degrees Awarded (3.1) The number of degrees awarded increased each year from 2006 – 2008, but decreased about 3% (1604 vs. 1555) in 2009. Not all 2010 degrees have been recorded in the central system, but they will be updated by the EER site visit in October. Undergraduate Cohort, Graduation Retention, and Transfers (3.2) LLU is not a traditional four-year campus. All undergraduate students are transfer students, most enrolling for a two-year period after completing their General Education course work elsewhere. They are primarily upper-division students completing health science baccalaureate degrees or entry-level master’s degrees. Because of this, the tables reflect the nuances of health science programs. While preparing the tables for the EER visit, several problems were discovered with the data. Most schools track their own cohort data on non-central databases. This may be a contributing factor as to why the problem went undetected until now. LLU plans to review the current cohort system to determine how it should be updated. Faculty (4.1) There has been a steady increase in full-time faculty with slight increases in female percentages over the five-year reporting period. The raw number of White full-time faculty has increased each of the last five-years while their percentage has actually dropped over time (4.7%). A similar pattern holds true for the White part-time faculty. Black part and full-time faculty numbers and percentages have increased in each of the last five years. Despite increases in raw numbers, the Hispanic full-time faculty percent decreased slightly in Fall 2009; notably their overall percentage is the highest they have been in the last five years. Staff by Gender and Race/Ethnicity (4.3) While the ratio between males and females has remained the same over the 5-year reporting period (approximately 37% vs. 63%), the absolute number of full time staff has increased somewhat by 24 persons. This increase came mainly from a decrease in White and Asian staff and an increase in Black and Hispanic staff. The data for part time staff indicates a significant reduction in numbers of part time employed staff – from 642 in 2005/06 to 241 in 2009/10. This pattern reflects slight percentage increases for all race ethnicities except for 2009/10 when a significant decrease in part-time Black staff occurred (12% in 2005/06 vs. 5% in 2009/10). Full-Time Faculty/Staff Turnover (4.4) It needs to be noted that for years one and two of the reporting period the absolute numbers are high due to reporting of medical school faculty that support medical students but also are mainly involved in clinical care. This was addressed starting year three. Outside of this absolute numbers have slightly but steadily increased over time as would be expected with increasing student enrollment. The number of faculty departures is modest and stable at 3-4%; similarly, retirements
WASC EER Report Appendix G 277
RETURN TO CONTENTS
are around 1% annually. New hires in the first four reporting years were stable at about 8-9% but decreased to about 5% in year five. Staff similarly increased slightly but steadily over time yet showed a decline in new hires starting year four of the reporting period. Retirement percentages were similarly low as with faculty, but the number of departures started higher in the early reporting years, and then significantly declined in the last two years. Fiscal Resources (5.3, 5.4, 5.5, 5.6, 5.7) and Institutional Operating Efficiency (6.1-6.3) “Since our CPR report, not only the United States but economies throughout the world have been dealing with a lingering financial crisis. In the fall of 2008 Loma Linda University was confronted with economic challenges that extended beyond our local campus. And while LLU has weathered many economic storms in its 105 years of history, the negative effects on the U.S. economy, through falling financial assets and real property values, understandably have had a notable impact on our own operations. University administrators have been confronted with unique economic challenges and have mounted a vigorous response to each situation. “Pathways have been identified to contain costs, our management structure has been reviewed, and a new central services funding model has been developed and implemented within our eight Schools. The University has embarked on a new strategic direction for asset allocation of its investment portfolio. Furthermore, a process is underway to divest individual securities and move the portfolio to outside third-party professional asset managers. New levels of transparency and accountability have also been implemented for financial management, oversight, and reporting. “The University experienced a modest operating loss in 2009, equivalent to -2% of operations. While the unrealized loss from investments was more sizeable at -32%, this outcome was in line with national trends resulting from turmoil and instability in both U.S. and international financial markets. Despite these outcomes, the University has managed to weather this ongoing financial storm. The investment portfolio has begun to recover and financial support from tuition, new gifts, and external awards remains healthy. The Board-designated cash accounts serve as a bulwark while an all-funds budget and enhanced cash-flow projections have been implemented and now notably guide decision making at all levels. “Thankfully, the demand for a Loma Linda University education has remained strong (e. g., total applicants, selectivity rates, etc.) reflecting the quality and reputation of our academic offerings and by the investments in our educational environment. Our alumni reflect the values of our institution and remain engaged and committed through their giving and volunteerism (CFRs 3.5, 4.1)” (LLU 2010 Educational Effectiveness Review Report, p. 4.
Progress with Data Issues since the CPR The CPR self-study revealed data problems, and progress has been made on many of them. The quality and reliability of the data warehouse has greatly improved. Progress has been achieved primarily as a result of increased data reconciliation between and among Banner, the IR database and the independent databases maintained in the schools. Development of a more robust centralized data warehouse has been assisted by the efforts of a taskforce established in response to our CPR self-study. The taskforce populated by academic managers, faculty and IT specialists has been working to identify the primary reasons for our data difficulties. Problems identified thus far are the need for common definitions, standardized query protocols across the campus, the integration of school specific individualized databases, and full access to banner for our IR staff. We believe that data quality and accuracy are foundational to generating information and reports that are necessary for planning and decision-making. Therefore, much effort has been put toward improving data quality, access, and comparability between systems. We feel that good progress is
WASC EER Report Appendix G 278
RETURN TO CONTENTS
being made in this area because it is now easier to compile the required exhibits useful for accreditations and strategic planning. There continues, however, to be data challenges. One newly identified problem is that of cohort degree completion rates. The problem is extreme within our graduate non-block programs. Our adult learner graduate programs provide individualized academic concentrations, specializations and tracks that are guided by graduate committees and professional standards. The highly individualized academic learning environments challenge our Banner system when we attempt to identify cohorts in graduate programs. We continue to seek solutions to the problems generated by the needs of our semi-independent professional programs that require support for vastly diverse data requirements. These needs have led LLU to utilize individualized school developed databases that have not been connected to the centralized system. As we move toward a unified centralized system we are developing capacities that allow using the necessary central data in conjunction with the data requirements of the many programs. Serving all the data needs in one central location should reduce the number of non-central databases that we currently continue to have and that lead to less than optimal attention to the data tables we need for the central reports. LLU recently purchased the Pentaho Business Intelligence SuiteTM to provide additional capabilities that will help in the effort to meet the schools’ diverse reporting needs in a central system. We have made significant progress in establishing institutionally shared data and academic program definitions. Our move to common definitions and standardized data tables has been assisted by the apparent move towards more similar assessment requirements observed among all professional and regional accrediting bodies. LLU’s confidence in data consistencies in the future comes primarily from a campus-wide commitment to focus on data in our new LLUAHSC integrated approach to strategic planning.
WASC EER Report Appendix G 279
RETURN TO CONTENTS
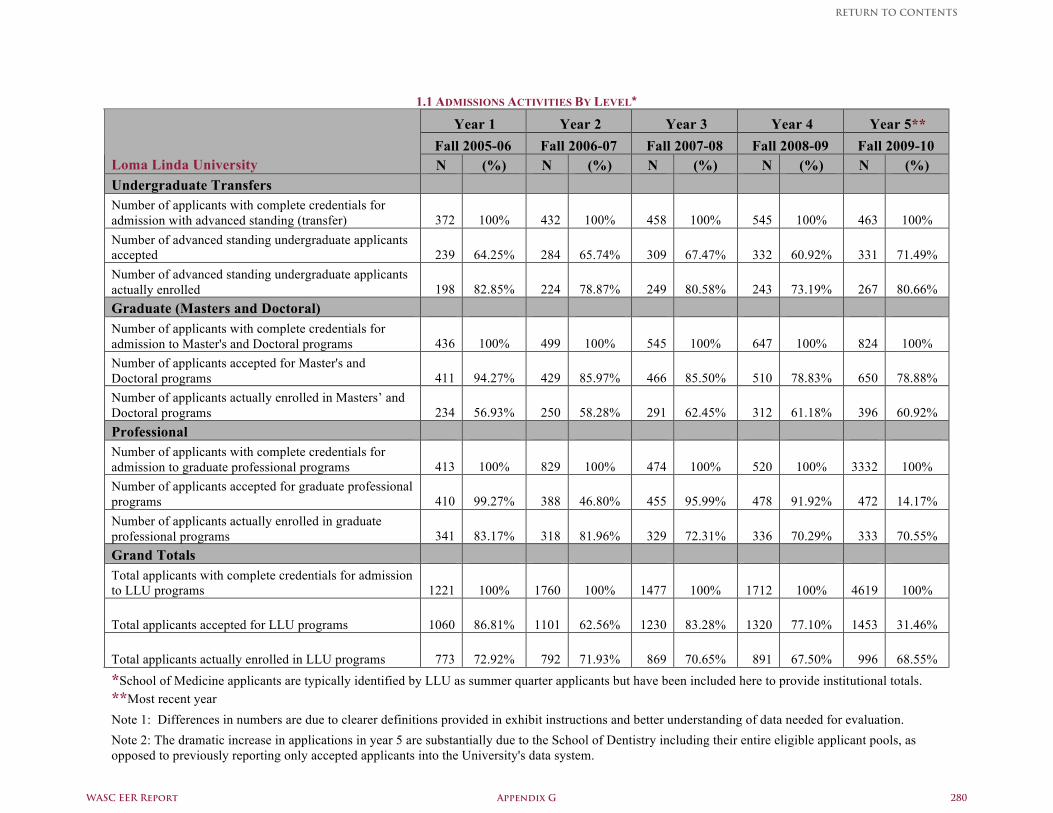
1.1 ADMISSIONS ACTIVITIES BY LEVEL*
Year 1 Year 2 Year 3 Year 4 Year 5** Fall 2005-06 Fall 2006-07 Fall 2007-08 Fall 2008-09 Fall 2009-10
Loma Linda University N (%) N (%) N (%) N (%) N (%) Undergraduate Transfers Number of applicants with complete credentials for admission with advanced standing (transfer) 372 100% 432 100% 458 100% 545 100% 463 100% Number of advanced standing undergraduate applicants accepted 239 64.25% 284 65.74% 309 67.47% 332 60.92% 331 71.49% Number of advanced standing undergraduate applicants actually enrolled 198 82.85% 224 78.87% 249 80.58% 243 73.19% 267 80.66% Graduate (Masters and Doctoral) Number of applicants with complete credentials for admission to Master's and Doctoral programs 436 100% 499 100% 545 100% 647 100% 824 100% Number of applicants accepted for Master's and Doctoral programs 411 94.27% 429 85.97% 466 85.50% 510 78.83% 650 78.88% Number of applicants actually enrolled in Masters’ and Doctoral programs 234 56.93% 250 58.28% 291 62.45% 312 61.18% 396 60.92% Professional Number of applicants with complete credentials for admission to graduate professional programs 413 100% 829 100% 474 100% 520 100% 3332 100% Number of applicants accepted for graduate professional programs 410 99.27% 388 46.80% 455 95.99% 478 91.92% 472 14.17% Number of applicants actually enrolled in graduate professional programs 341 83.17% 318 81.96% 329 72.31% 336 70.29% 333 70.55% Grand Totals Total applicants with complete credentials for admission to LLU programs 1221 100% 1760 100% 1477 100% 1712 100% 4619 100%
Total applicants accepted for LLU programs 1060 86.81% 1101 62.56% 1230 83.28% 1320 77.10% 1453 31.46%
Total applicants actually enrolled in LLU programs 773 72.92% 792 71.93% 869 70.65% 891 67.50% 996 68.55% *School of Medicine applicants are typically identified by LLU as summer quarter applicants but have been included here to provide institutional totals. **Most recent year Note 1: Differences in numbers are due to clearer definitions provided in exhibit instructions and better understanding of data needed for evaluation. Note 2: The dramatic increase in applications in year 5 are substantially due to the School of Dentistry including their entire eligible applicant pools, as opposed to previously reporting only accepted applicants into the University's data system.
WASC EER Report Appendix G 280
RETURN TO CONTENTS
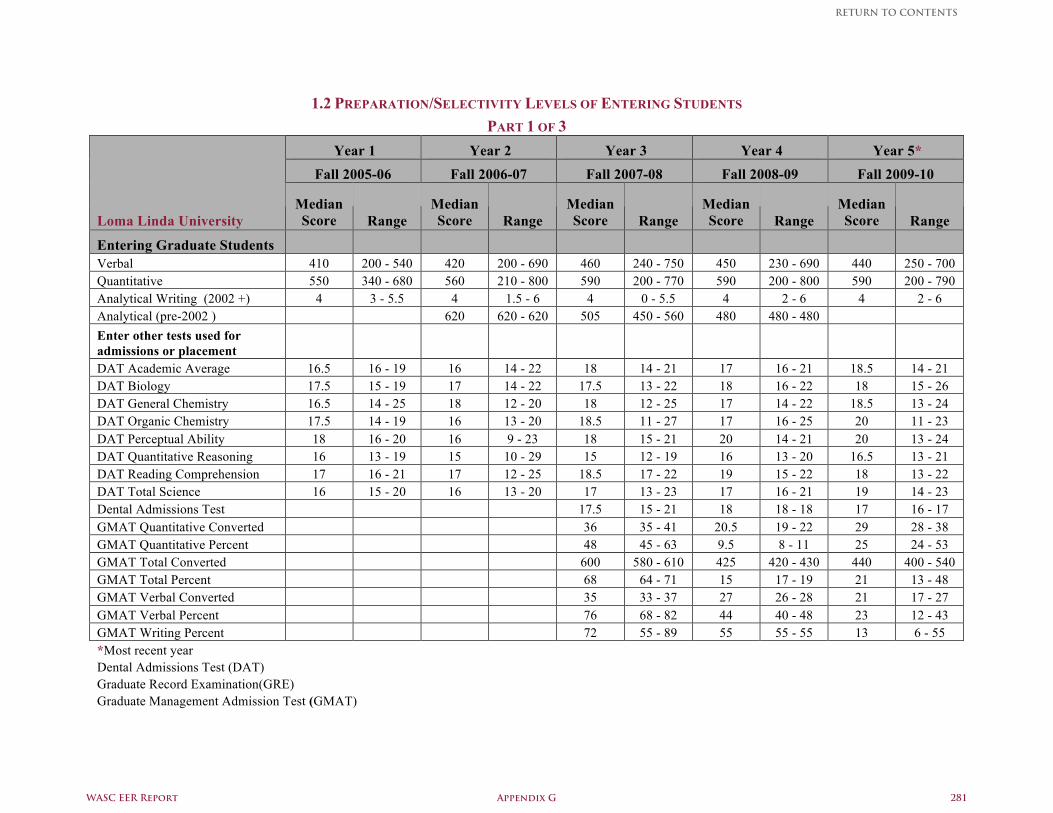
1.2 PREPARATION/SELECTIVITY LEVELS OF ENTERING STUDENTS
PART 1 OF 3 Year 1 Year 2 Year 3 Year 4 Year 5*
Fall 2005-06 Fall 2006-07 Fall 2007-08 Fall 2008-09 Fall 2009-10
Loma Linda University Median Score Range
Median Score Range
Median Score Range
Median Score Range
Median Score Range
Entering Graduate Students Verbal 410 200 - 540 420 200 - 690 460 240 - 750 450 230 - 690 440 250 - 700 Quantitative 550 340 - 680 560 210 - 800 590 200 - 770 590 200 - 800 590 200 - 790 Analytical Writing (2002 +) 4 3 - 5.5 4 1.5 - 6 4 0 - 5.5 4 2 - 6 4 2 - 6 Analytical (pre-2002 ) 620 620 - 620 505 450 - 560 480 480 - 480 Enter other tests used for admissions or placement DAT Academic Average 16.5 16 - 19 16 14 - 22 18 14 - 21 17 16 - 21 18.5 14 - 21 DAT Biology 17.5 15 - 19 17 14 - 22 17.5 13 - 22 18 16 - 22 18 15 - 26 DAT General Chemistry 16.5 14 - 25 18 12 - 20 18 12 - 25 17 14 - 22 18.5 13 - 24 DAT Organic Chemistry 17.5 14 - 19 16 13 - 20 18.5 11 - 27 17 16 - 25 20 11 - 23 DAT Perceptual Ability 18 16 - 20 16 9 - 23 18 15 - 21 20 14 - 21 20 13 - 24 DAT Quantitative Reasoning 16 13 - 19 15 10 - 29 15 12 - 19 16 13 - 20 16.5 13 - 21 DAT Reading Comprehension 17 16 - 21 17 12 - 25 18.5 17 - 22 19 15 - 22 18 13 - 22 DAT Total Science 16 15 - 20 16 13 - 20 17 13 - 23 17 16 - 21 19 14 - 23 Dental Admissions Test 17.5 15 - 21 18 18 - 18 17 16 - 17 GMAT Quantitative Converted 36 35 - 41 20.5 19 - 22 29 28 - 38 GMAT Quantitative Percent 48 45 - 63 9.5 8 - 11 25 24 - 53 GMAT Total Converted 600 580 - 610 425 420 - 430 440 400 - 540 GMAT Total Percent 68 64 - 71 15 17 - 19 21 13 - 48 GMAT Verbal Converted 35 33 - 37 27 26 - 28 21 17 - 27 GMAT Verbal Percent 76 68 - 82 44 40 - 48 23 12 - 43 GMAT Writing Percent 72 55 - 89 55 55 - 55 13 6 - 55 *Most recent year Dental Admissions Test (DAT) Graduate Record Examination(GRE) Graduate Management Admission Test (GMAT)
WASC EER Report Appendix G 281
RETURN TO CONTENTS
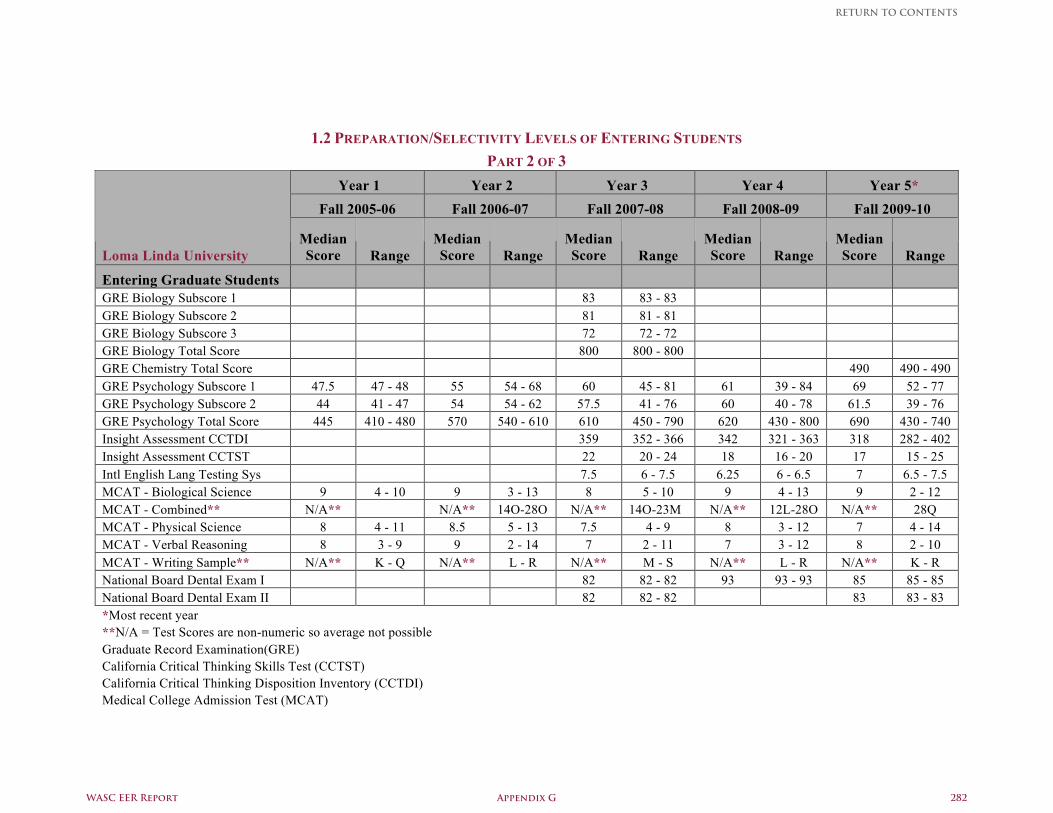
1.2 PREPARATION/SELECTIVITY LEVELS OF ENTERING STUDENTS
PART 2 OF 3 Year 1 Year 2 Year 3 Year 4 Year 5*
Fall 2005-06 Fall 2006-07 Fall 2007-08 Fall 2008-09 Fall 2009-10
Loma Linda University Median Score Range
Median Score Range
Median Score Range
Median Score Range
Median Score Range
Entering Graduate Students GRE Biology Subscore 1 83 83 - 83 GRE Biology Subscore 2 81 81 - 81 GRE Biology Subscore 3 72 72 - 72 GRE Biology Total Score 800 800 - 800 GRE Chemistry Total Score 490 490 - 490 GRE Psychology Subscore 1 47.5 47 - 48 55 54 - 68 60 45 - 81 61 39 - 84 69 52 - 77 GRE Psychology Subscore 2 44 41 - 47 54 54 - 62 57.5 41 - 76 60 40 - 78 61.5 39 - 76 GRE Psychology Total Score 445 410 - 480 570 540 - 610 610 450 - 790 620 430 - 800 690 430 - 740 Insight Assessment CCTDI 359 352 - 366 342 321 - 363 318 282 - 402 Insight Assessment CCTST 22 20 - 24 18 16 - 20 17 15 - 25 Intl English Lang Testing Sys 7.5 6 - 7.5 6.25 6 - 6.5 7 6.5 - 7.5 MCAT - Biological Science 9 4 - 10 9 3 - 13 8 5 - 10 9 4 - 13 9 2 - 12 MCAT - Combined** N/A** N/A** 14O-28O N/A** 14O-23M N/A** 12L-28O N/A** 28Q MCAT - Physical Science 8 4 - 11 8.5 5 - 13 7.5 4 - 9 8 3 - 12 7 4 - 14 MCAT - Verbal Reasoning 8 3 - 9 9 2 - 14 7 2 - 11 7 3 - 12 8 2 - 10 MCAT - Writing Sample** N/A** K - Q N/A** L - R N/A** M - S N/A** L - R N/A** K - R National Board Dental Exam I 82 82 - 82 93 93 - 93 85 85 - 85 National Board Dental Exam II 82 82 - 82 83 83 - 83 *Most recent year **N/A = Test Scores are non-numeric so average not possible Graduate Record Examination(GRE) California Critical Thinking Skills Test (CCTST) California Critical Thinking Disposition Inventory (CCTDI) Medical College Admission Test (MCAT)
WASC EER Report Appendix G 282
RETURN TO CONTENTS
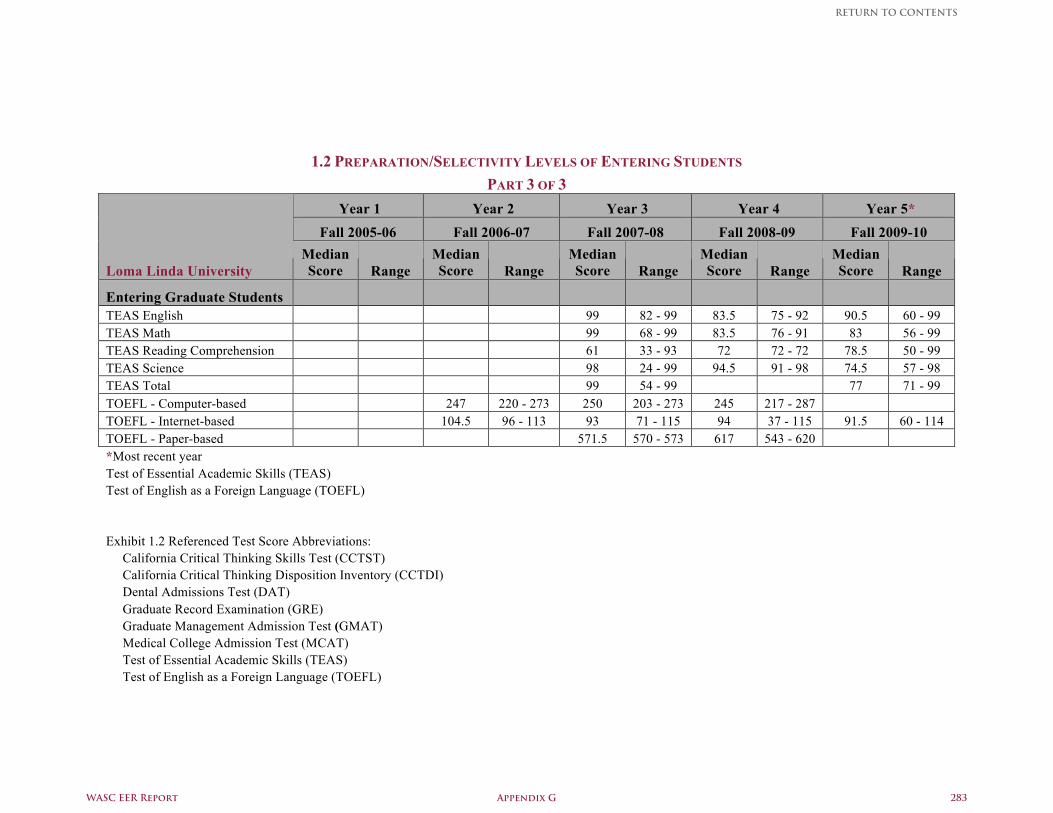
1.2 PREPARATION/SELECTIVITY LEVELS OF ENTERING STUDENTS
PART 3 OF 3 Year 1 Year 2 Year 3 Year 4 Year 5*
Fall 2005-06 Fall 2006-07 Fall 2007-08 Fall 2008-09 Fall 2009-10
Loma Linda University Median Score Range
Median Score Range
Median Score Range
Median Score Range
Median Score Range
Entering Graduate Students TEAS English 99 82 - 99 83.5 75 - 92 90.5 60 - 99 TEAS Math 99 68 - 99 83.5 76 - 91 83 56 - 99 TEAS Reading Comprehension 61 33 - 93 72 72 - 72 78.5 50 - 99 TEAS Science 98 24 - 99 94.5 91 - 98 74.5 57 - 98 TEAS Total 99 54 - 99 77 71 - 99 TOEFL - Computer-based 247 220 - 273 250 203 - 273 245 217 - 287 TOEFL - Internet-based 104.5 96 - 113 93 71 - 115 94 37 - 115 91.5 60 - 114 TOEFL - Paper-based 571.5 570 - 573 617 543 - 620 *Most recent year Test of Essential Academic Skills (TEAS) Test of English as a Foreign Language (TOEFL) Exhibit 1.2 Referenced Test Score Abbreviations: California Critical Thinking Skills Test (CCTST) California Critical Thinking Disposition Inventory (CCTDI) Dental Admissions Test (DAT) Graduate Record Examination (GRE) Graduate Management Admission Test (GMAT) Medical College Admission Test (MCAT) Test of Essential Academic Skills (TEAS) Test of English as a Foreign Language (TOEFL)
WASC EER Report Appendix G 283
RETURN TO CONTENTS
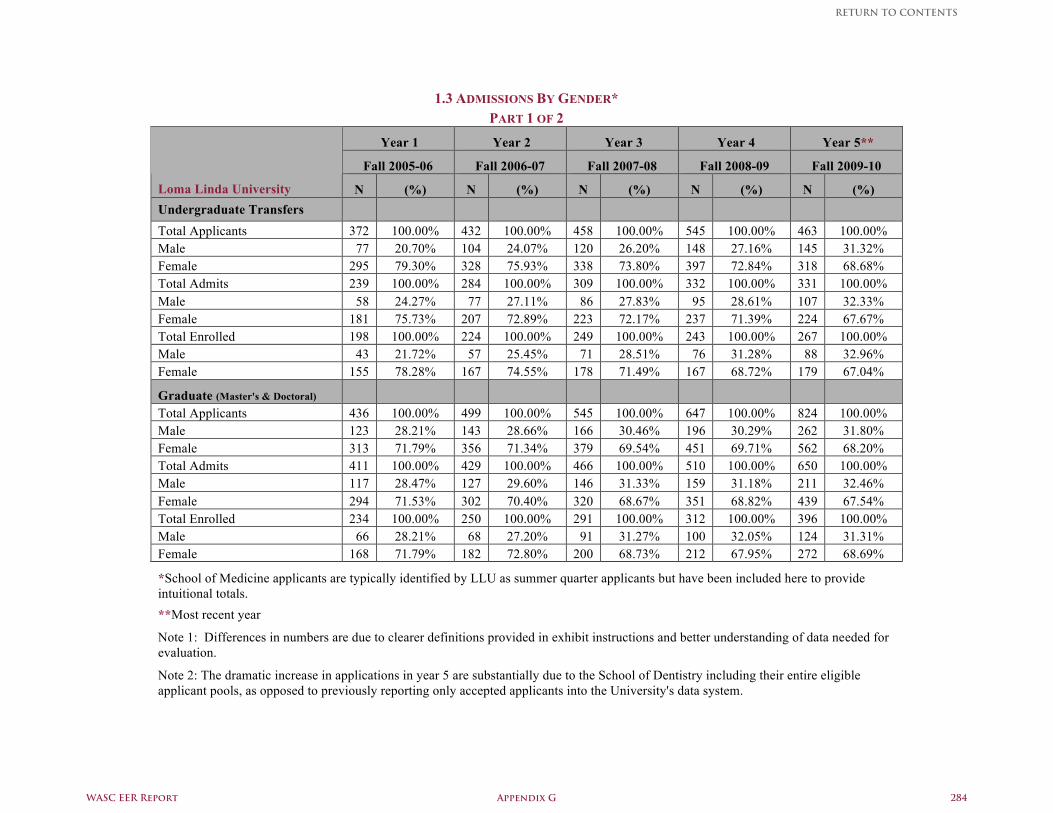
1.3 ADMISSIONS BY GENDER*
PART 1 OF 2
Year 1 Year 2 Year 3 Year 4 Year 5**
Fall 2005-06 Fall 2006-07 Fall 2007-08 Fall 2008-09 Fall 2009-10
Loma Linda University N (%) N (%) N (%) N (%) N (%) Undergraduate Transfers Total Applicants 372 100.00% 432 100.00% 458 100.00% 545 100.00% 463 100.00% Male 77 20.70% 104 24.07% 120 26.20% 148 27.16% 145 31.32% Female 295 79.30% 328 75.93% 338 73.80% 397 72.84% 318 68.68% Total Admits 239 100.00% 284 100.00% 309 100.00% 332 100.00% 331 100.00% Male 58 24.27% 77 27.11% 86 27.83% 95 28.61% 107 32.33% Female 181 75.73% 207 72.89% 223 72.17% 237 71.39% 224 67.67% Total Enrolled 198 100.00% 224 100.00% 249 100.00% 243 100.00% 267 100.00% Male 43 21.72% 57 25.45% 71 28.51% 76 31.28% 88 32.96% Female 155 78.28% 167 74.55% 178 71.49% 167 68.72% 179 67.04%
Graduate (Master's & Doctoral) Total Applicants 436 100.00% 499 100.00% 545 100.00% 647 100.00% 824 100.00% Male 123 28.21% 143 28.66% 166 30.46% 196 30.29% 262 31.80% Female 313 71.79% 356 71.34% 379 69.54% 451 69.71% 562 68.20% Total Admits 411 100.00% 429 100.00% 466 100.00% 510 100.00% 650 100.00% Male 117 28.47% 127 29.60% 146 31.33% 159 31.18% 211 32.46% Female 294 71.53% 302 70.40% 320 68.67% 351 68.82% 439 67.54% Total Enrolled 234 100.00% 250 100.00% 291 100.00% 312 100.00% 396 100.00% Male 66 28.21% 68 27.20% 91 31.27% 100 32.05% 124 31.31% Female 168 71.79% 182 72.80% 200 68.73% 212 67.95% 272 68.69%
*School of Medicine applicants are typically identified by LLU as summer quarter applicants but have been included here to provide intuitional totals. **Most recent year
Note 1: Differences in numbers are due to clearer definitions provided in exhibit instructions and better understanding of data needed for evaluation.
Note 2: The dramatic increase in applications in year 5 are substantially due to the School of Dentistry including their entire eligible applicant pools, as opposed to previously reporting only accepted applicants into the University's data system.
WASC EER Report Appendix G 284
RETURN TO CONTENTS
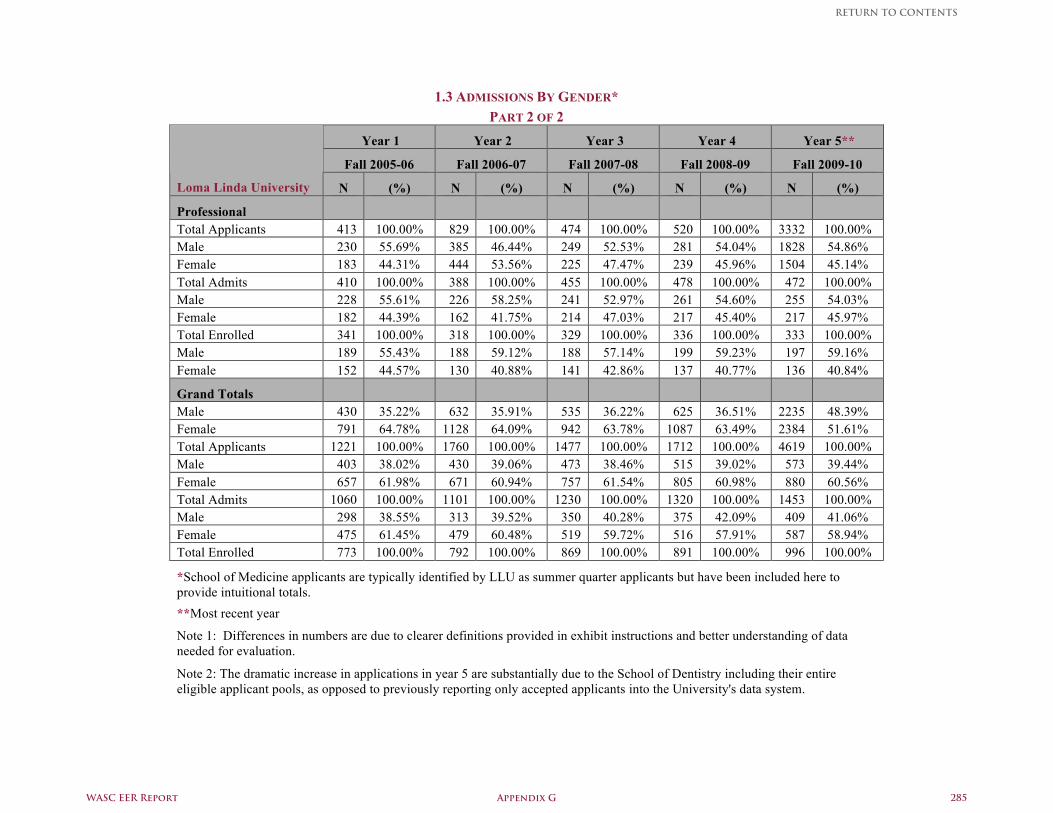
1.3 ADMISSIONS BY GENDER* PART 2 OF 2
Year 1 Year 2 Year 3 Year 4 Year 5**
Fall 2005-06 Fall 2006-07 Fall 2007-08 Fall 2008-09 Fall 2009-10
Loma Linda University N (%) N (%) N (%) N (%) N (%)
Professional Total Applicants 413 100.00% 829 100.00% 474 100.00% 520 100.00% 3332 100.00% Male 230 55.69% 385 46.44% 249 52.53% 281 54.04% 1828 54.86% Female 183 44.31% 444 53.56% 225 47.47% 239 45.96% 1504 45.14% Total Admits 410 100.00% 388 100.00% 455 100.00% 478 100.00% 472 100.00% Male 228 55.61% 226 58.25% 241 52.97% 261 54.60% 255 54.03% Female 182 44.39% 162 41.75% 214 47.03% 217 45.40% 217 45.97% Total Enrolled 341 100.00% 318 100.00% 329 100.00% 336 100.00% 333 100.00% Male 189 55.43% 188 59.12% 188 57.14% 199 59.23% 197 59.16% Female 152 44.57% 130 40.88% 141 42.86% 137 40.77% 136 40.84%
Grand Totals Male 430 35.22% 632 35.91% 535 36.22% 625 36.51% 2235 48.39% Female 791 64.78% 1128 64.09% 942 63.78% 1087 63.49% 2384 51.61% Total Applicants 1221 100.00% 1760 100.00% 1477 100.00% 1712 100.00% 4619 100.00% Male 403 38.02% 430 39.06% 473 38.46% 515 39.02% 573 39.44% Female 657 61.98% 671 60.94% 757 61.54% 805 60.98% 880 60.56% Total Admits 1060 100.00% 1101 100.00% 1230 100.00% 1320 100.00% 1453 100.00% Male 298 38.55% 313 39.52% 350 40.28% 375 42.09% 409 41.06% Female 475 61.45% 479 60.48% 519 59.72% 516 57.91% 587 58.94% Total Enrolled 773 100.00% 792 100.00% 869 100.00% 891 100.00% 996 100.00%
*School of Medicine applicants are typically identified by LLU as summer quarter applicants but have been included here to provide intuitional totals. **Most recent year
Note 1: Differences in numbers are due to clearer definitions provided in exhibit instructions and better understanding of data needed for evaluation.
Note 2: The dramatic increase in applications in year 5 are substantially due to the School of Dentistry including their entire eligible applicant pools, as opposed to previously reporting only accepted applicants into the University's data system.
WASC EER Report Appendix G 285
RETURN TO CONTENTS
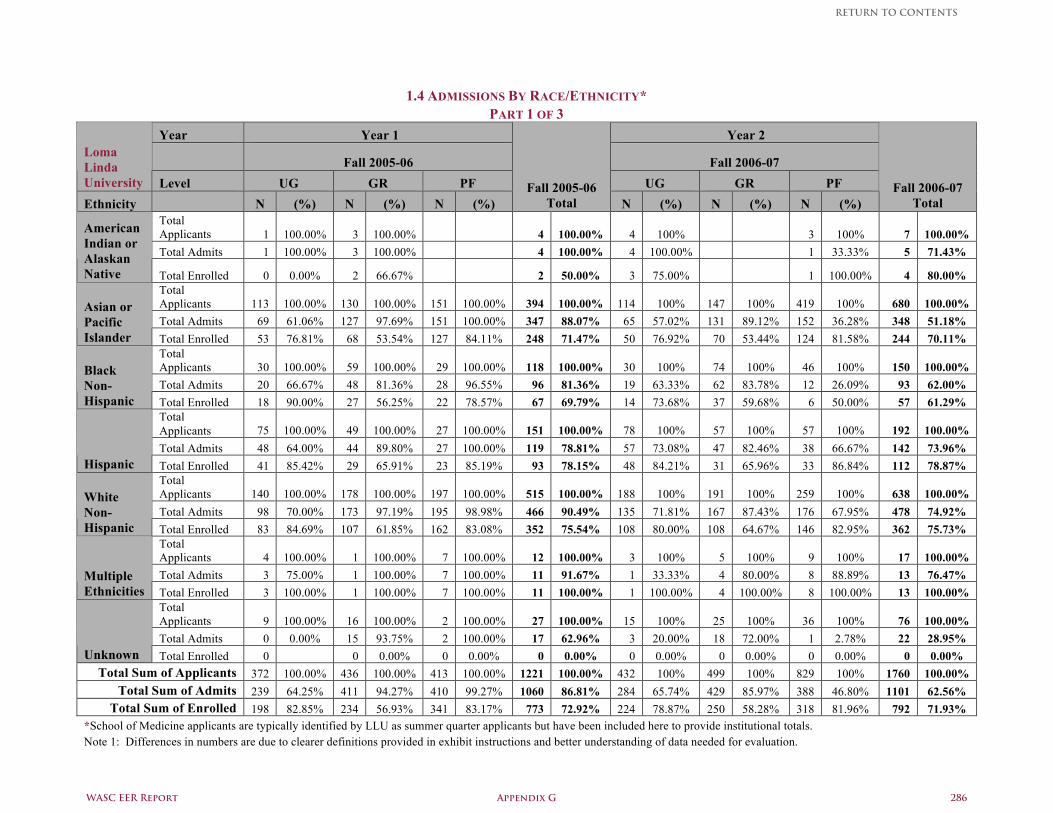
1.4 ADMISSIONS BY RACE/ETHNICITY* PART 1 OF 3
Year Year 1 Year 2
Fall 2005-06 Fall 2006-07 Loma Linda University Level UG GR PF UG GR PF Ethnicity N (%) N (%) N (%)
Fall 2005-06 Total N (%) N (%) N (%)
Fall 2006-07 Total
Total Applicants 1 100.00% 3 100.00% 4 100.00% 4 100% 3 100% 7 100.00% Total Admits 1 100.00% 3 100.00% 4 100.00% 4 100.00% 1 33.33% 5 71.43%
American Indian or Alaskan Native Total Enrolled 0 0.00% 2 66.67% 2 50.00% 3 75.00% 1 100.00% 4 80.00%
Total Applicants 113 100.00% 130 100.00% 151 100.00% 394 100.00% 114 100% 147 100% 419 100% 680 100.00% Total Admits 69 61.06% 127 97.69% 151 100.00% 347 88.07% 65 57.02% 131 89.12% 152 36.28% 348 51.18%
Asian or Pacific Islander Total Enrolled 53 76.81% 68 53.54% 127 84.11% 248 71.47% 50 76.92% 70 53.44% 124 81.58% 244 70.11%
Total Applicants 30 100.00% 59 100.00% 29 100.00% 118 100.00% 30 100% 74 100% 46 100% 150 100.00% Total Admits 20 66.67% 48 81.36% 28 96.55% 96 81.36% 19 63.33% 62 83.78% 12 26.09% 93 62.00%
Black Non-Hispanic Total Enrolled 18 90.00% 27 56.25% 22 78.57% 67 69.79% 14 73.68% 37 59.68% 6 50.00% 57 61.29%
Total Applicants 75 100.00% 49 100.00% 27 100.00% 151 100.00% 78 100% 57 100% 57 100% 192 100.00% Total Admits 48 64.00% 44 89.80% 27 100.00% 119 78.81% 57 73.08% 47 82.46% 38 66.67% 142 73.96%
Hispanic Total Enrolled 41 85.42% 29 65.91% 23 85.19% 93 78.15% 48 84.21% 31 65.96% 33 86.84% 112 78.87% Total Applicants 140 100.00% 178 100.00% 197 100.00% 515 100.00% 188 100% 191 100% 259 100% 638 100.00% Total Admits 98 70.00% 173 97.19% 195 98.98% 466 90.49% 135 71.81% 167 87.43% 176 67.95% 478 74.92%
White Non-Hispanic Total Enrolled 83 84.69% 107 61.85% 162 83.08% 352 75.54% 108 80.00% 108 64.67% 146 82.95% 362 75.73%
Total Applicants 4 100.00% 1 100.00% 7 100.00% 12 100.00% 3 100% 5 100% 9 100% 17 100.00% Total Admits 3 75.00% 1 100.00% 7 100.00% 11 91.67% 1 33.33% 4 80.00% 8 88.89% 13 76.47% Multiple
Ethnicities Total Enrolled 3 100.00% 1 100.00% 7 100.00% 11 100.00% 1 100.00% 4 100.00% 8 100.00% 13 100.00% Total Applicants 9 100.00% 16 100.00% 2 100.00% 27 100.00% 15 100% 25 100% 36 100% 76 100.00% Total Admits 0 0.00% 15 93.75% 2 100.00% 17 62.96% 3 20.00% 18 72.00% 1 2.78% 22 28.95%
Unknown Total Enrolled 0 0 0.00% 0 0.00% 0 0.00% 0 0.00% 0 0.00% 0 0.00% 0 0.00% Total Sum of Applicants 372 100.00% 436 100.00% 413 100.00% 1221 100.00% 432 100% 499 100% 829 100% 1760 100.00%
Total Sum of Admits 239 64.25% 411 94.27% 410 99.27% 1060 86.81% 284 65.74% 429 85.97% 388 46.80% 1101 62.56% Total Sum of Enrolled 198 82.85% 234 56.93% 341 83.17% 773 72.92% 224 78.87% 250 58.28% 318 81.96% 792 71.93%
*School of Medicine applicants are typically identified by LLU as summer quarter applicants but have been included here to provide institutional totals. Note 1: Differences in numbers are due to clearer definitions provided in exhibit instructions and better understanding of data needed for evaluation.
WASC EER Report Appendix G 286
RETURN TO CONTENTS
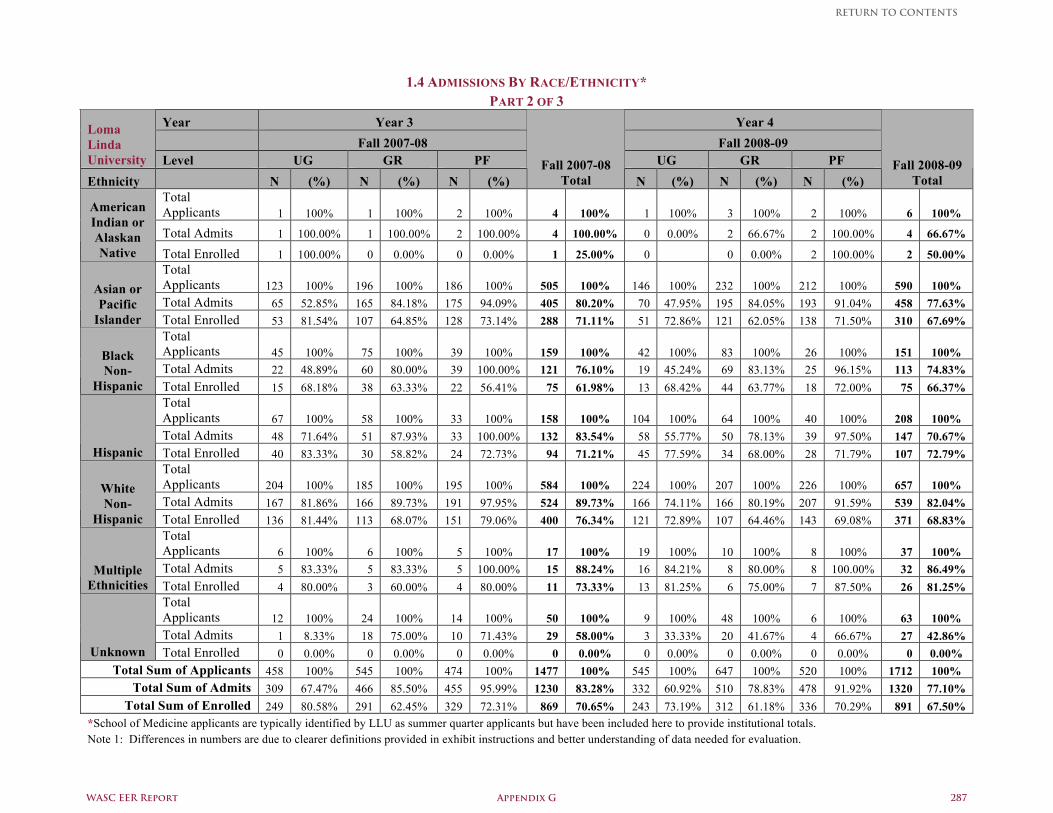
1.4 ADMISSIONS BY RACE/ETHNICITY* PART 2 OF 3
Year Year 3 Year 4 Fall 2007-08 Fall 2008-09
Loma Linda University Level UG GR PF UG GR PF Ethnicity N (%) N (%) N (%)
Fall 2007-08 Total N (%) N (%) N (%)
Fall 2008-09 Total
Total Applicants 1 100% 1 100% 2 100% 4 100% 1 100% 3 100% 2 100% 6 100%
Total Admits 1 100.00% 1 100.00% 2 100.00% 4 100.00% 0 0.00% 2 66.67% 2 100.00% 4 66.67%
American Indian or Alaskan Native Total Enrolled 1 100.00% 0 0.00% 0 0.00% 1 25.00% 0 0 0.00% 2 100.00% 2 50.00%
Total Applicants 123 100% 196 100% 186 100% 505 100% 146 100% 232 100% 212 100% 590 100% Total Admits 65 52.85% 165 84.18% 175 94.09% 405 80.20% 70 47.95% 195 84.05% 193 91.04% 458 77.63%
Asian or Pacific
Islander Total Enrolled 53 81.54% 107 64.85% 128 73.14% 288 71.11% 51 72.86% 121 62.05% 138 71.50% 310 67.69% Total Applicants 45 100% 75 100% 39 100% 159 100% 42 100% 83 100% 26 100% 151 100% Total Admits 22 48.89% 60 80.00% 39 100.00% 121 76.10% 19 45.24% 69 83.13% 25 96.15% 113 74.83%
Black Non-
Hispanic Total Enrolled 15 68.18% 38 63.33% 22 56.41% 75 61.98% 13 68.42% 44 63.77% 18 72.00% 75 66.37% Total Applicants 67 100% 58 100% 33 100% 158 100% 104 100% 64 100% 40 100% 208 100% Total Admits 48 71.64% 51 87.93% 33 100.00% 132 83.54% 58 55.77% 50 78.13% 39 97.50% 147 70.67%
Hispanic Total Enrolled 40 83.33% 30 58.82% 24 72.73% 94 71.21% 45 77.59% 34 68.00% 28 71.79% 107 72.79% Total Applicants 204 100% 185 100% 195 100% 584 100% 224 100% 207 100% 226 100% 657 100% Total Admits 167 81.86% 166 89.73% 191 97.95% 524 89.73% 166 74.11% 166 80.19% 207 91.59% 539 82.04%
White Non-
Hispanic Total Enrolled 136 81.44% 113 68.07% 151 79.06% 400 76.34% 121 72.89% 107 64.46% 143 69.08% 371 68.83% Total Applicants 6 100% 6 100% 5 100% 17 100% 19 100% 10 100% 8 100% 37 100% Total Admits 5 83.33% 5 83.33% 5 100.00% 15 88.24% 16 84.21% 8 80.00% 8 100.00% 32 86.49% Multiple
Ethnicities Total Enrolled 4 80.00% 3 60.00% 4 80.00% 11 73.33% 13 81.25% 6 75.00% 7 87.50% 26 81.25% Total Applicants 12 100% 24 100% 14 100% 50 100% 9 100% 48 100% 6 100% 63 100% Total Admits 1 8.33% 18 75.00% 10 71.43% 29 58.00% 3 33.33% 20 41.67% 4 66.67% 27 42.86%
Unknown Total Enrolled 0 0.00% 0 0.00% 0 0.00% 0 0.00% 0 0.00% 0 0.00% 0 0.00% 0 0.00% Total Sum of Applicants 458 100% 545 100% 474 100% 1477 100% 545 100% 647 100% 520 100% 1712 100%
Total Sum of Admits 309 67.47% 466 85.50% 455 95.99% 1230 83.28% 332 60.92% 510 78.83% 478 91.92% 1320 77.10% Total Sum of Enrolled 249 80.58% 291 62.45% 329 72.31% 869 70.65% 243 73.19% 312 61.18% 336 70.29% 891 67.50%
*School of Medicine applicants are typically identified by LLU as summer quarter applicants but have been included here to provide institutional totals. Note 1: Differences in numbers are due to clearer definitions provided in exhibit instructions and better understanding of data needed for evaluation.
WASC EER Report Appendix G 287
RETURN TO CONTENTS
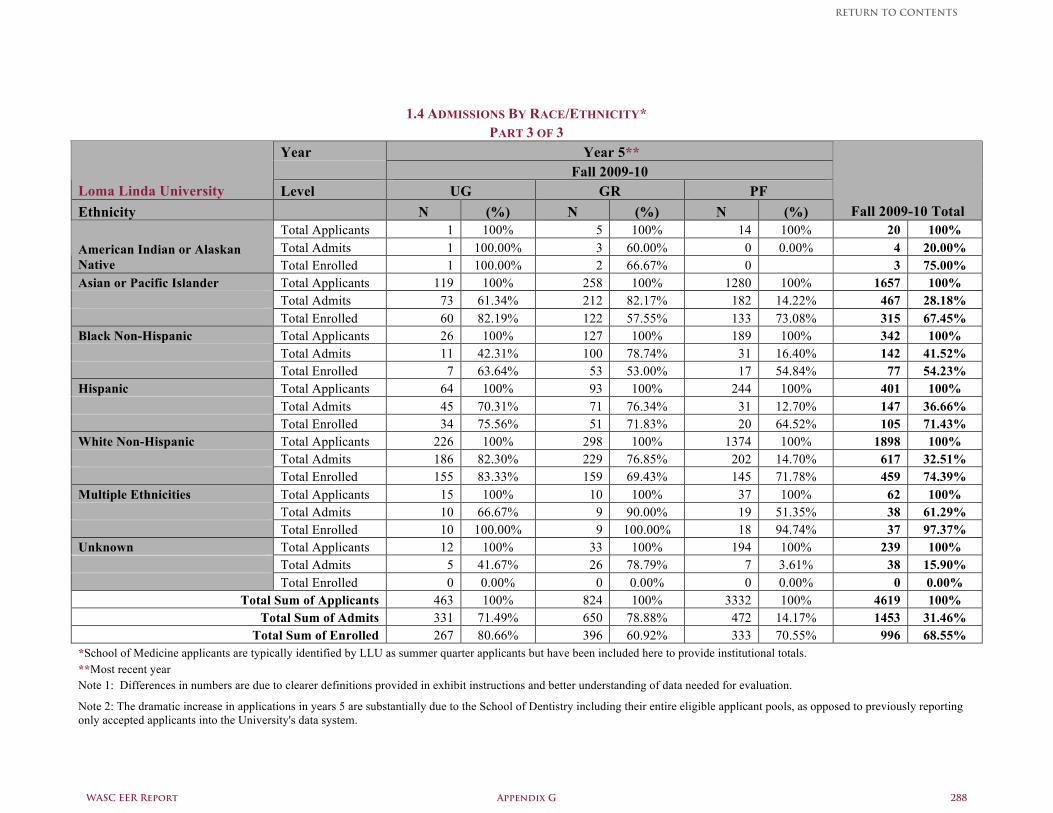
1.4 ADMISSIONS BY RACE/ETHNICITY* PART 3 OF 3
Year Year 5** Fall 2009-10
Loma Linda University Level UG GR PF Ethnicity N (%) N (%) N (%) Fall 2009-10 Total
Total Applicants 1 100% 5 100% 14 100% 20 100% Total Admits 1 100.00% 3 60.00% 0 0.00% 4 20.00% American Indian or Alaskan
Native Total Enrolled 1 100.00% 2 66.67% 0 3 75.00% Asian or Pacific Islander Total Applicants 119 100% 258 100% 1280 100% 1657 100% Total Admits 73 61.34% 212 82.17% 182 14.22% 467 28.18% Total Enrolled 60 82.19% 122 57.55% 133 73.08% 315 67.45% Black Non-Hispanic Total Applicants 26 100% 127 100% 189 100% 342 100% Total Admits 11 42.31% 100 78.74% 31 16.40% 142 41.52% Total Enrolled 7 63.64% 53 53.00% 17 54.84% 77 54.23% Hispanic Total Applicants 64 100% 93 100% 244 100% 401 100% Total Admits 45 70.31% 71 76.34% 31 12.70% 147 36.66% Total Enrolled 34 75.56% 51 71.83% 20 64.52% 105 71.43% White Non-Hispanic Total Applicants 226 100% 298 100% 1374 100% 1898 100% Total Admits 186 82.30% 229 76.85% 202 14.70% 617 32.51% Total Enrolled 155 83.33% 159 69.43% 145 71.78% 459 74.39% Multiple Ethnicities Total Applicants 15 100% 10 100% 37 100% 62 100% Total Admits 10 66.67% 9 90.00% 19 51.35% 38 61.29% Total Enrolled 10 100.00% 9 100.00% 18 94.74% 37 97.37% Unknown Total Applicants 12 100% 33 100% 194 100% 239 100% Total Admits 5 41.67% 26 78.79% 7 3.61% 38 15.90% Total Enrolled 0 0.00% 0 0.00% 0 0.00% 0 0.00%
Total Sum of Applicants 463 100% 824 100% 3332 100% 4619 100% Total Sum of Admits 331 71.49% 650 78.88% 472 14.17% 1453 31.46%
Total Sum of Enrolled 267 80.66% 396 60.92% 333 70.55% 996 68.55% *School of Medicine applicants are typically identified by LLU as summer quarter applicants but have been included here to provide institutional totals. **Most recent year Note 1: Differences in numbers are due to clearer definitions provided in exhibit instructions and better understanding of data needed for evaluation.
Note 2: The dramatic increase in applications in years 5 are substantially due to the School of Dentistry including their entire eligible applicant pools, as opposed to previously reporting only accepted applicants into the University's data system.
WASC EER Report Appendix G 288
RETURN TO CONTENTS
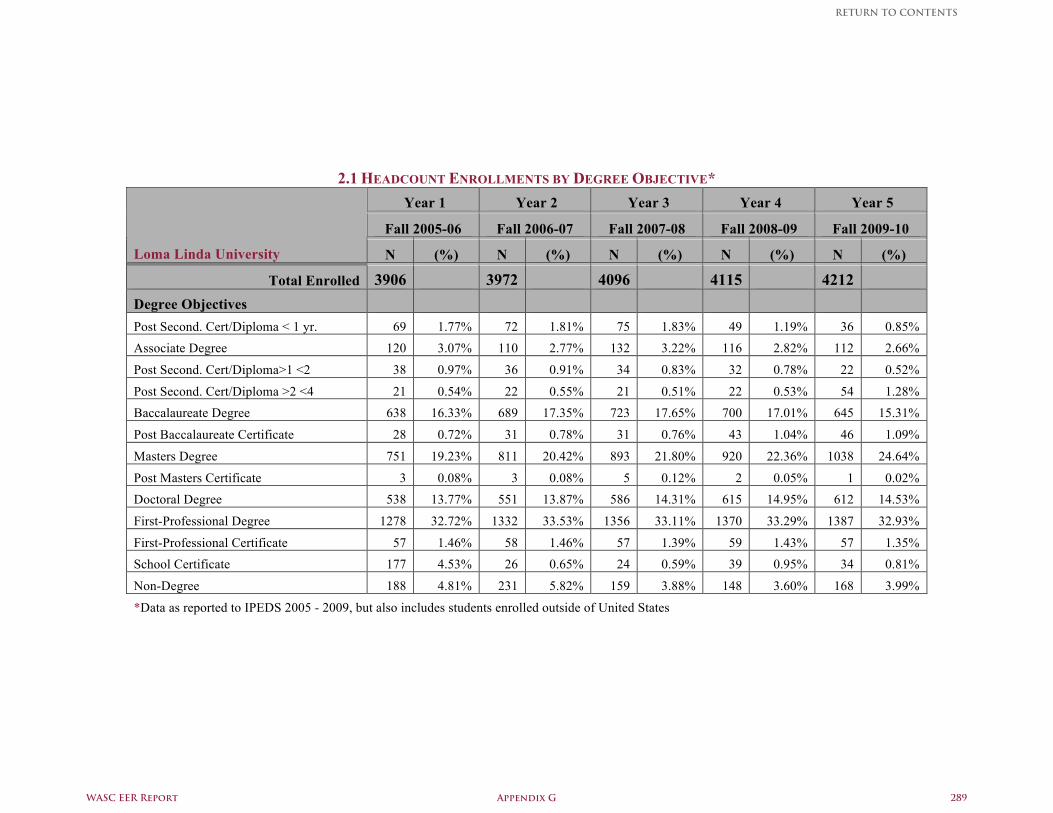
2.1 HEADCOUNT ENROLLMENTS BY DEGREE OBJECTIVE*
Year 1 Year 2 Year 3 Year 4 Year 5
Fall 2005-06 Fall 2006-07 Fall 2007-08 Fall 2008-09 Fall 2009-10
Loma Linda University N (%) N (%) N (%) N (%) N (%)
Total Enrolled 3906 3972 4096 4115 4212 Degree Objectives Post Second. Cert/Diploma < 1 yr. 69 1.77% 72 1.81% 75 1.83% 49 1.19% 36 0.85% Associate Degree 120 3.07% 110 2.77% 132 3.22% 116 2.82% 112 2.66%
Post Second. Cert/Diploma>1 <2 38 0.97% 36 0.91% 34 0.83% 32 0.78% 22 0.52%
Post Second. Cert/Diploma >2 <4 21 0.54% 22 0.55% 21 0.51% 22 0.53% 54 1.28% Baccalaureate Degree 638 16.33% 689 17.35% 723 17.65% 700 17.01% 645 15.31%
Post Baccalaureate Certificate 28 0.72% 31 0.78% 31 0.76% 43 1.04% 46 1.09%
Masters Degree 751 19.23% 811 20.42% 893 21.80% 920 22.36% 1038 24.64%
Post Masters Certificate 3 0.08% 3 0.08% 5 0.12% 2 0.05% 1 0.02% Doctoral Degree 538 13.77% 551 13.87% 586 14.31% 615 14.95% 612 14.53%
First-Professional Degree 1278 32.72% 1332 33.53% 1356 33.11% 1370 33.29% 1387 32.93%
First-Professional Certificate 57 1.46% 58 1.46% 57 1.39% 59 1.43% 57 1.35% School Certificate 177 4.53% 26 0.65% 24 0.59% 39 0.95% 34 0.81%
Non-Degree 188 4.81% 231 5.82% 159 3.88% 148 3.60% 168 3.99%
*Data as reported to IPEDS 2005 - 2009, but also includes students enrolled outside of United States
WASC EER Report Appendix G 289
RETURN TO CONTENTS
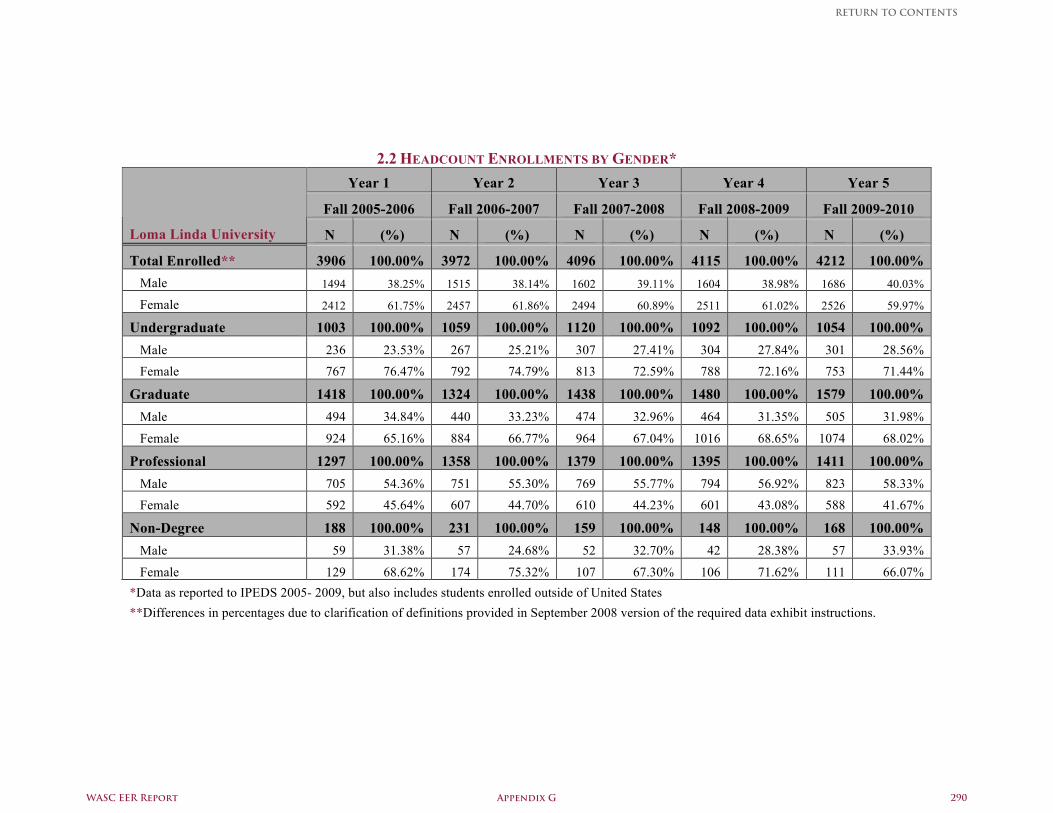
2.2 HEADCOUNT ENROLLMENTS BY GENDER*
Year 1 Year 2 Year 3 Year 4 Year 5
Fall 2005-2006 Fall 2006-2007 Fall 2007-2008 Fall 2008-2009 Fall 2009-2010
Loma Linda University N (%) N (%) N (%) N (%) N (%)
Total Enrolled** 3906 100.00% 3972 100.00% 4096 100.00% 4115 100.00% 4212 100.00% Male 1494 38.25% 1515 38.14% 1602 39.11% 1604 38.98% 1686 40.03%
Female 2412 61.75% 2457 61.86% 2494 60.89% 2511 61.02% 2526 59.97%
Undergraduate 1003 100.00% 1059 100.00% 1120 100.00% 1092 100.00% 1054 100.00% Male 236 23.53% 267 25.21% 307 27.41% 304 27.84% 301 28.56% Female 767 76.47% 792 74.79% 813 72.59% 788 72.16% 753 71.44%
Graduate 1418 100.00% 1324 100.00% 1438 100.00% 1480 100.00% 1579 100.00% Male 494 34.84% 440 33.23% 474 32.96% 464 31.35% 505 31.98%
Female 924 65.16% 884 66.77% 964 67.04% 1016 68.65% 1074 68.02%
Professional 1297 100.00% 1358 100.00% 1379 100.00% 1395 100.00% 1411 100.00% Male 705 54.36% 751 55.30% 769 55.77% 794 56.92% 823 58.33% Female 592 45.64% 607 44.70% 610 44.23% 601 43.08% 588 41.67%
Non-Degree 188 100.00% 231 100.00% 159 100.00% 148 100.00% 168 100.00% Male 59 31.38% 57 24.68% 52 32.70% 42 28.38% 57 33.93%
Female 129 68.62% 174 75.32% 107 67.30% 106 71.62% 111 66.07% *Data as reported to IPEDS 2005- 2009, but also includes students enrolled outside of United States **Differences in percentages due to clarification of definitions provided in September 2008 version of the required data exhibit instructions.
WASC EER Report Appendix G 290
RETURN TO CONTENTS
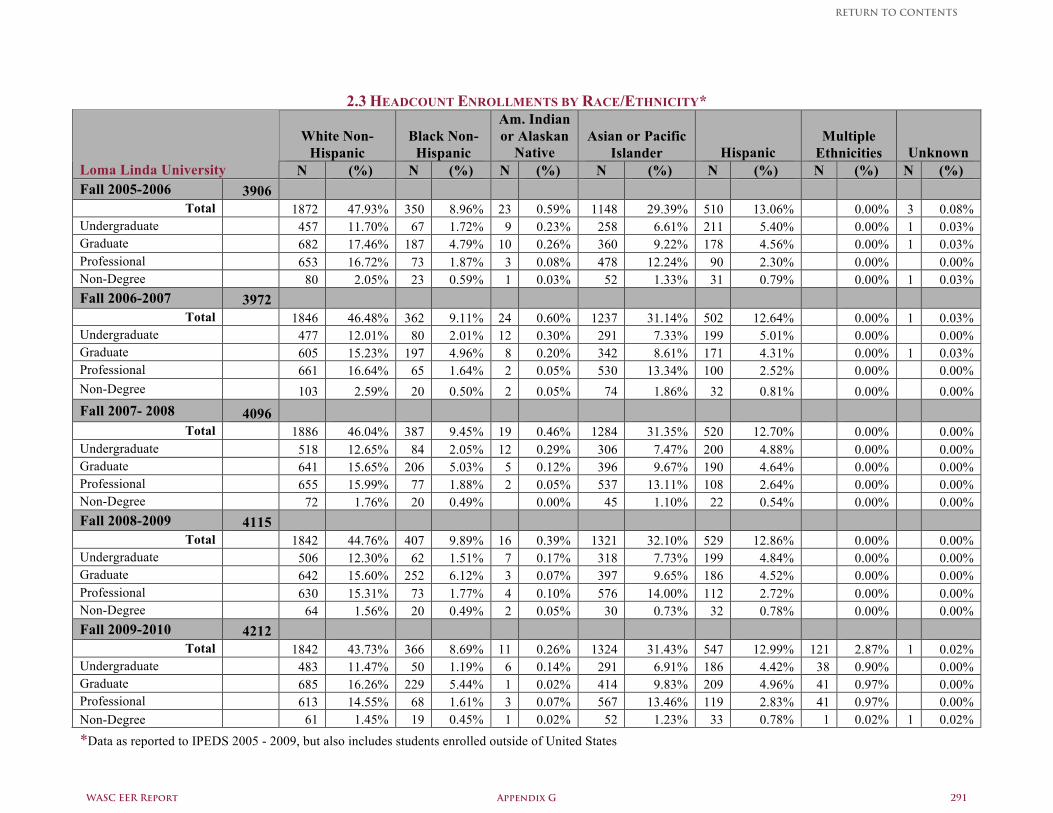
2.3 HEADCOUNT ENROLLMENTS BY RACE/ETHNICITY*
White Non-Hispanic
Black Non-Hispanic
Am. Indian or Alaskan
Native Asian or Pacific
Islander Hispanic Multiple
Ethnicities Unknown Loma Linda University N (%) N (%) N (%) N (%) N (%) N (%) N (%) Fall 2005-2006 3906
Total 1872 47.93% 350 8.96% 23 0.59% 1148 29.39% 510 13.06% 0.00% 3 0.08% Undergraduate 457 11.70% 67 1.72% 9 0.23% 258 6.61% 211 5.40% 0.00% 1 0.03% Graduate 682 17.46% 187 4.79% 10 0.26% 360 9.22% 178 4.56% 0.00% 1 0.03% Professional 653 16.72% 73 1.87% 3 0.08% 478 12.24% 90 2.30% 0.00% 0.00% Non-Degree 80 2.05% 23 0.59% 1 0.03% 52 1.33% 31 0.79% 0.00% 1 0.03% Fall 2006-2007 3972
Total 1846 46.48% 362 9.11% 24 0.60% 1237 31.14% 502 12.64% 0.00% 1 0.03% Undergraduate 477 12.01% 80 2.01% 12 0.30% 291 7.33% 199 5.01% 0.00% 0.00% Graduate 605 15.23% 197 4.96% 8 0.20% 342 8.61% 171 4.31% 0.00% 1 0.03% Professional 661 16.64% 65 1.64% 2 0.05% 530 13.34% 100 2.52% 0.00% 0.00% Non-Degree 103 2.59% 20 0.50% 2 0.05% 74 1.86% 32 0.81% 0.00% 0.00% Fall 2007- 2008 4096
Total 1886 46.04% 387 9.45% 19 0.46% 1284 31.35% 520 12.70% 0.00% 0.00% Undergraduate 518 12.65% 84 2.05% 12 0.29% 306 7.47% 200 4.88% 0.00% 0.00% Graduate 641 15.65% 206 5.03% 5 0.12% 396 9.67% 190 4.64% 0.00% 0.00% Professional 655 15.99% 77 1.88% 2 0.05% 537 13.11% 108 2.64% 0.00% 0.00% Non-Degree 72 1.76% 20 0.49% 0.00% 45 1.10% 22 0.54% 0.00% 0.00% Fall 2008-2009 4115
Total 1842 44.76% 407 9.89% 16 0.39% 1321 32.10% 529 12.86% 0.00% 0.00% Undergraduate 506 12.30% 62 1.51% 7 0.17% 318 7.73% 199 4.84% 0.00% 0.00% Graduate 642 15.60% 252 6.12% 3 0.07% 397 9.65% 186 4.52% 0.00% 0.00% Professional 630 15.31% 73 1.77% 4 0.10% 576 14.00% 112 2.72% 0.00% 0.00% Non-Degree 64 1.56% 20 0.49% 2 0.05% 30 0.73% 32 0.78% 0.00% 0.00% Fall 2009-2010 4212
Total 1842 43.73% 366 8.69% 11 0.26% 1324 31.43% 547 12.99% 121 2.87% 1 0.02% Undergraduate 483 11.47% 50 1.19% 6 0.14% 291 6.91% 186 4.42% 38 0.90% 0.00% Graduate 685 16.26% 229 5.44% 1 0.02% 414 9.83% 209 4.96% 41 0.97% 0.00% Professional 613 14.55% 68 1.61% 3 0.07% 567 13.46% 119 2.83% 41 0.97% 0.00% Non-Degree 61 1.45% 19 0.45% 1 0.02% 52 1.23% 33 0.78% 1 0.02% 1 0.02% *Data as reported to IPEDS 2005 - 2009, but also includes students enrolled outside of United States
WASC EER Report Appendix G 291
RETURN TO CONTENTS
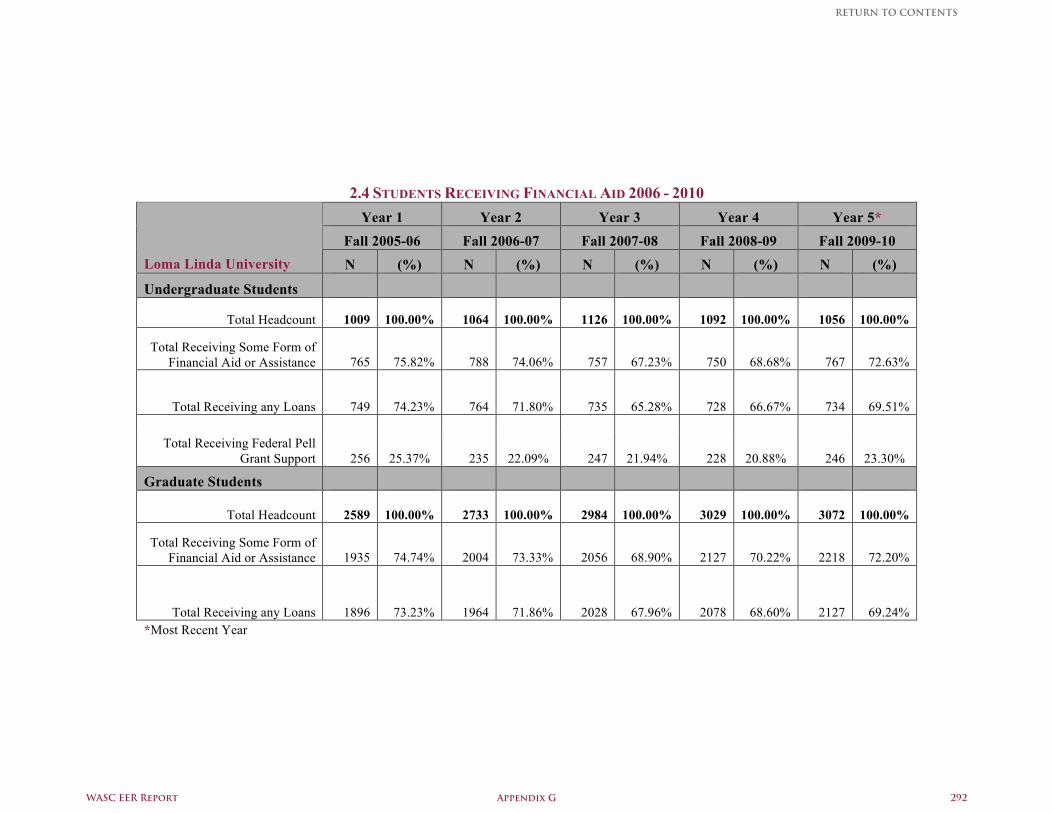
2.4 STUDENTS RECEIVING FINANCIAL AID 2006 - 2010 Year 1 Year 2 Year 3 Year 4 Year 5*
Fall 2005-06 Fall 2006-07 Fall 2007-08 Fall 2008-09 Fall 2009-10 Loma Linda University N (%) N (%) N (%) N (%) N (%)
Undergraduate Students
Total Headcount 1009 100.00% 1064 100.00% 1126 100.00% 1092 100.00% 1056 100.00%
Total Receiving Some Form of Financial Aid or Assistance 765 75.82% 788 74.06% 757 67.23% 750 68.68% 767 72.63%
Total Receiving any Loans 749 74.23% 764 71.80% 735 65.28% 728 66.67% 734 69.51%
Total Receiving Federal Pell Grant Support 256 25.37% 235 22.09% 247 21.94% 228 20.88% 246 23.30%
Graduate Students
Total Headcount 2589 100.00% 2733 100.00% 2984 100.00% 3029 100.00% 3072 100.00%
Total Receiving Some Form of Financial Aid or Assistance 1935 74.74% 2004 73.33% 2056 68.90% 2127 70.22% 2218 72.20%
Total Receiving any Loans 1896 73.23% 1964 71.86% 2028 67.96% 2078 68.60% 2127 69.24% *Most Recent Year
WASC EER Report Appendix G 292
RETURN TO CONTENTS
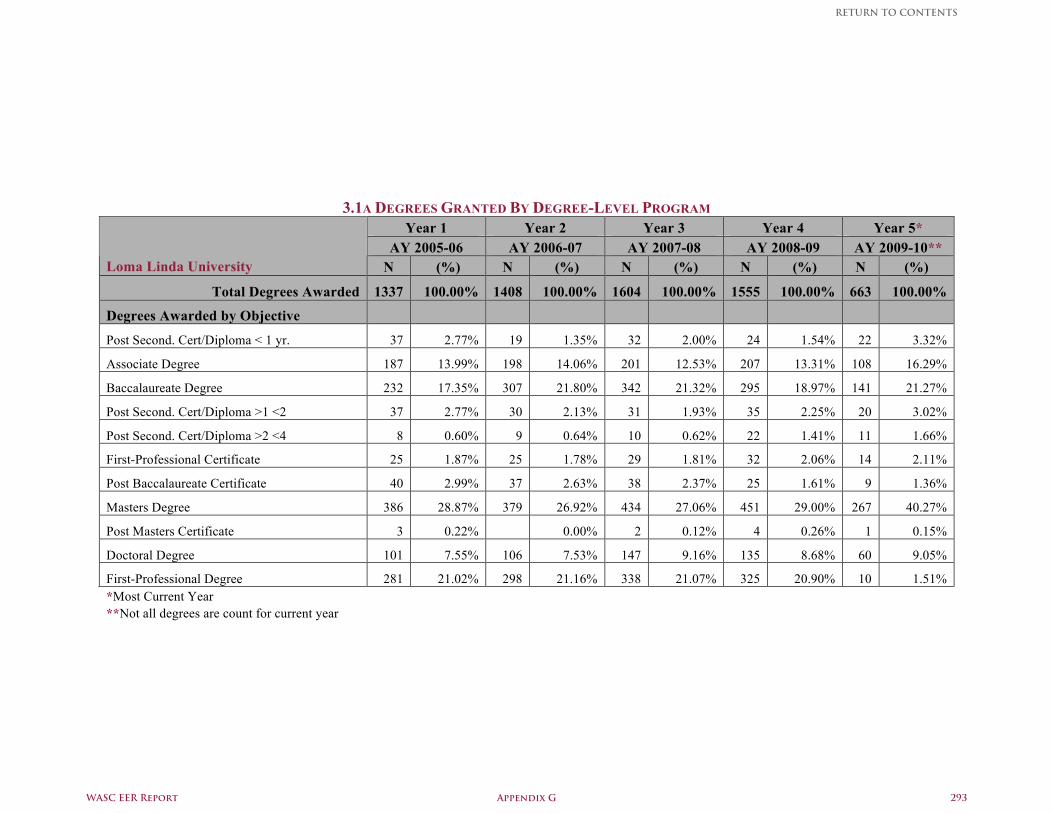
3.1A DEGREES GRANTED BY DEGREE-LEVEL PROGRAM
Year 1 Year 2 Year 3 Year 4 Year 5* AY 2005-06 AY 2006-07 AY 2007-08 AY 2008-09 AY 2009-10**
Loma Linda University N (%) N (%) N (%) N (%) N (%)
Total Degrees Awarded 1337 100.00% 1408 100.00% 1604 100.00% 1555 100.00% 663 100.00%
Degrees Awarded by Objective
Post Second. Cert/Diploma < 1 yr. 37 2.77% 19 1.35% 32 2.00% 24 1.54% 22 3.32%
Associate Degree 187 13.99% 198 14.06% 201 12.53% 207 13.31% 108 16.29%
Baccalaureate Degree 232 17.35% 307 21.80% 342 21.32% 295 18.97% 141 21.27%
Post Second. Cert/Diploma >1 <2 37 2.77% 30 2.13% 31 1.93% 35 2.25% 20 3.02%
Post Second. Cert/Diploma >2 <4 8 0.60% 9 0.64% 10 0.62% 22 1.41% 11 1.66%
First-Professional Certificate 25 1.87% 25 1.78% 29 1.81% 32 2.06% 14 2.11%
Post Baccalaureate Certificate 40 2.99% 37 2.63% 38 2.37% 25 1.61% 9 1.36%
Masters Degree 386 28.87% 379 26.92% 434 27.06% 451 29.00% 267 40.27%
Post Masters Certificate 3 0.22% 0.00% 2 0.12% 4 0.26% 1 0.15%
Doctoral Degree 101 7.55% 106 7.53% 147 9.16% 135 8.68% 60 9.05%
First-Professional Degree 281 21.02% 298 21.16% 338 21.07% 325 20.90% 10 1.51% *Most Current Year **Not all degrees are count for current year
WASC EER Report Appendix G 293
RETURN TO CONTENTS
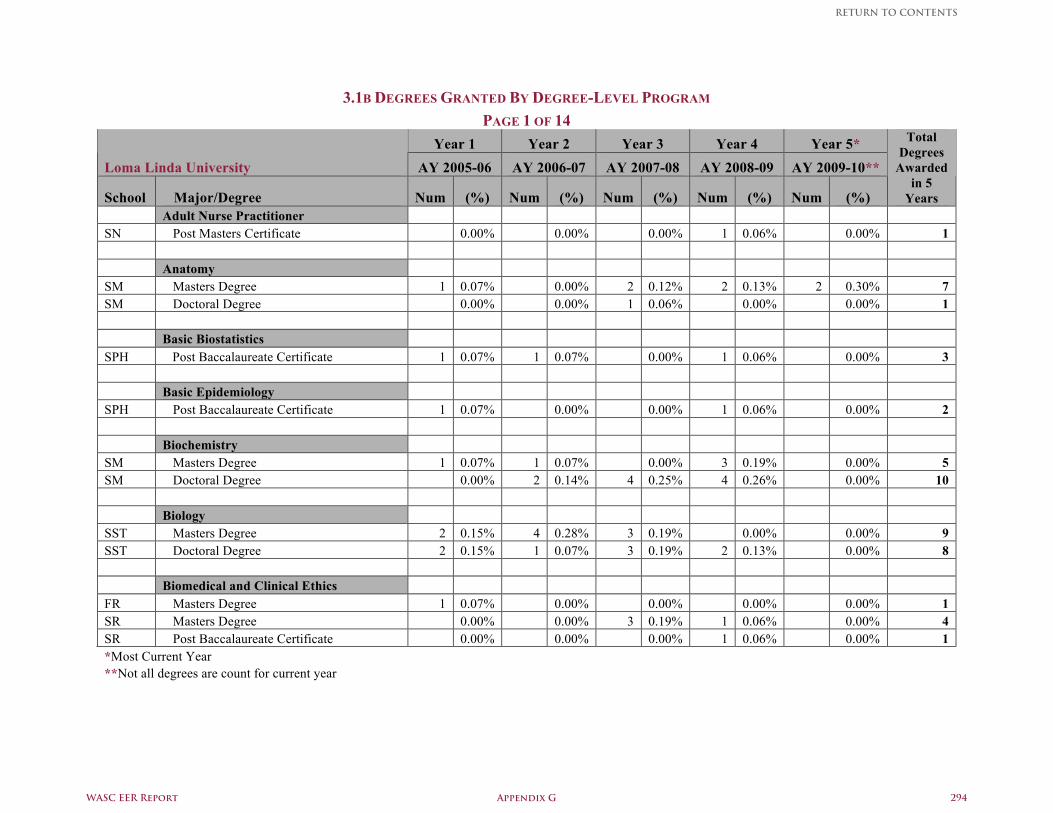
3.1B DEGREES GRANTED BY DEGREE-LEVEL PROGRAM
PAGE 1 OF 14 Year 1 Year 2 Year 3 Year 4 Year 5*
Loma Linda University AY 2005-06 AY 2006-07 AY 2007-08 AY 2008-09 AY 2009-10**
School Major/Degree Num (%) Num (%) Num (%) Num (%) Num (%)
Total Degrees
Awarded in 5
Years Adult Nurse Practitioner SN Post Masters Certificate 0.00% 0.00% 0.00% 1 0.06% 0.00% 1 Anatomy SM Masters Degree 1 0.07% 0.00% 2 0.12% 2 0.13% 2 0.30% 7 SM Doctoral Degree 0.00% 0.00% 1 0.06% 0.00% 0.00% 1 Basic Biostatistics SPH Post Baccalaureate Certificate 1 0.07% 1 0.07% 0.00% 1 0.06% 0.00% 3 Basic Epidemiology SPH Post Baccalaureate Certificate 1 0.07% 0.00% 0.00% 1 0.06% 0.00% 2 Biochemistry SM Masters Degree 1 0.07% 1 0.07% 0.00% 3 0.19% 0.00% 5 SM Doctoral Degree 0.00% 2 0.14% 4 0.25% 4 0.26% 0.00% 10 Biology SST Masters Degree 2 0.15% 4 0.28% 3 0.19% 0.00% 0.00% 9 SST Doctoral Degree 2 0.15% 1 0.07% 3 0.19% 2 0.13% 0.00% 8 Biomedical and Clinical Ethics FR Masters Degree 1 0.07% 0.00% 0.00% 0.00% 0.00% 1 SR Masters Degree 0.00% 0.00% 3 0.19% 1 0.06% 0.00% 4 SR Post Baccalaureate Certificate 0.00% 0.00% 0.00% 1 0.06% 0.00% 1 *Most Current Year **Not all degrees are count for current year
WASC EER Report Appendix G 294
RETURN TO CONTENTS
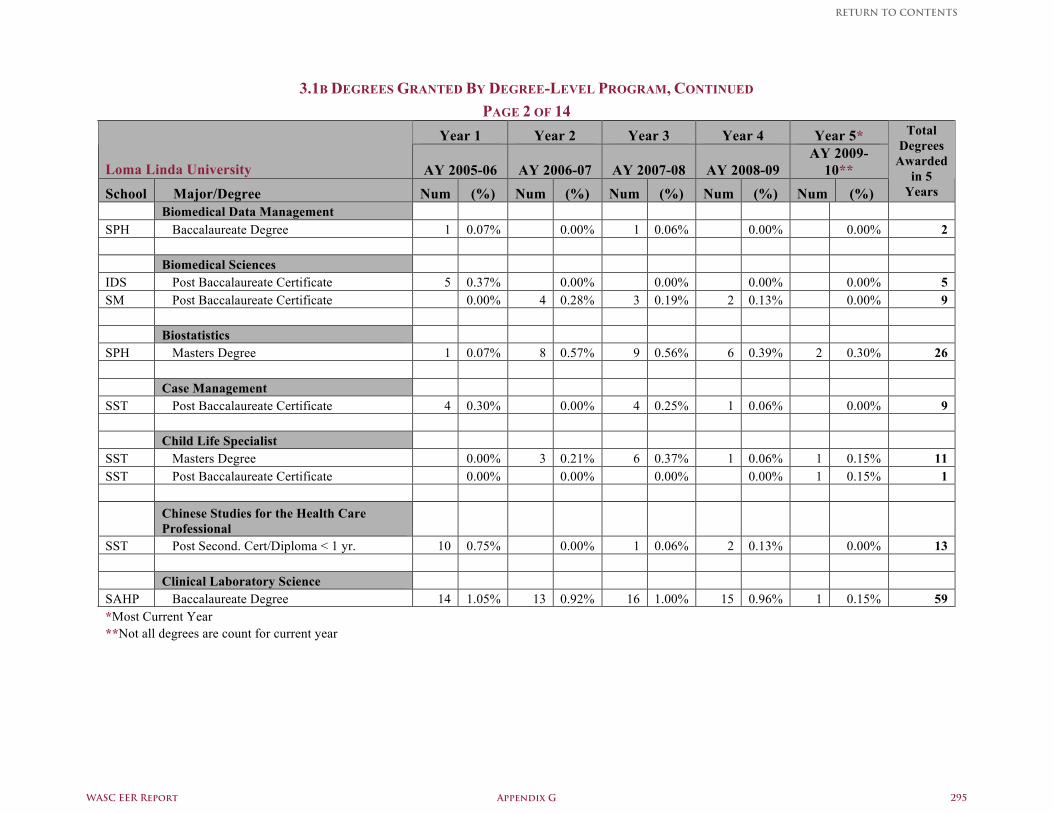
3.1B DEGREES GRANTED BY DEGREE-LEVEL PROGRAM, CONTINUED PAGE 2 OF 14
Year 1 Year 2 Year 3 Year 4 Year 5*
Loma Linda University AY 2005-06 AY 2006-07 AY 2007-08 AY 2008-09 AY 2009-
10** School Major/Degree Num (%) Num (%) Num (%) Num (%) Num (%)
Total Degrees
Awarded in 5
Years Biomedical Data Management SPH Baccalaureate Degree 1 0.07% 0.00% 1 0.06% 0.00% 0.00% 2 Biomedical Sciences IDS Post Baccalaureate Certificate 5 0.37% 0.00% 0.00% 0.00% 0.00% 5 SM Post Baccalaureate Certificate 0.00% 4 0.28% 3 0.19% 2 0.13% 0.00% 9 Biostatistics SPH Masters Degree 1 0.07% 8 0.57% 9 0.56% 6 0.39% 2 0.30% 26 Case Management SST Post Baccalaureate Certificate 4 0.30% 0.00% 4 0.25% 1 0.06% 0.00% 9 Child Life Specialist SST Masters Degree 0.00% 3 0.21% 6 0.37% 1 0.06% 1 0.15% 11 SST Post Baccalaureate Certificate 0.00% 0.00% 0.00% 0.00% 1 0.15% 1
Chinese Studies for the Health Care Professional
SST Post Second. Cert/Diploma < 1 yr. 10 0.75% 0.00% 1 0.06% 2 0.13% 0.00% 13 Clinical Laboratory Science SAHP Baccalaureate Degree 14 1.05% 13 0.92% 16 1.00% 15 0.96% 1 0.15% 59 *Most Current Year **Not all degrees are count for current year
WASC EER Report Appendix G 295
RETURN TO CONTENTS
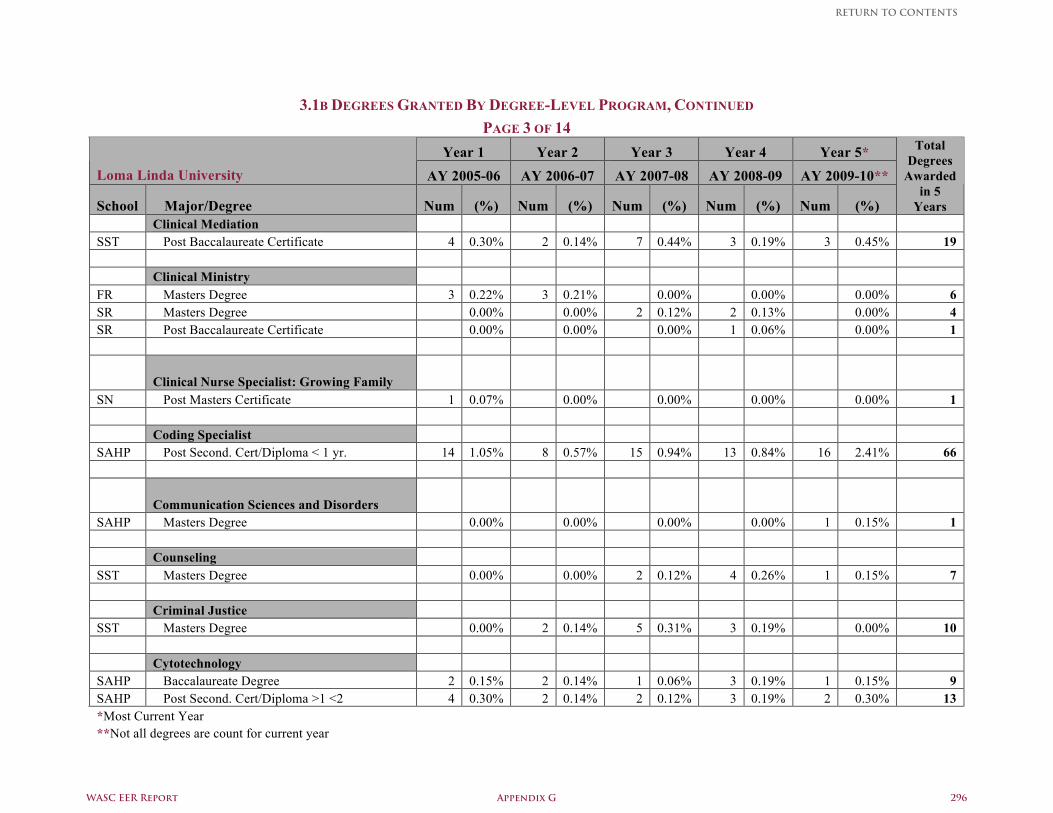
3.1B DEGREES GRANTED BY DEGREE-LEVEL PROGRAM, CONTINUED
PAGE 3 OF 14 Year 1 Year 2 Year 3 Year 4 Year 5*
Loma Linda University AY 2005-06 AY 2006-07 AY 2007-08 AY 2008-09 AY 2009-10**
School Major/Degree Num (%) Num (%) Num (%) Num (%) Num (%)
Total Degrees
Awarded in 5
Years Clinical Mediation SST Post Baccalaureate Certificate 4 0.30% 2 0.14% 7 0.44% 3 0.19% 3 0.45% 19 Clinical Ministry FR Masters Degree 3 0.22% 3 0.21% 0.00% 0.00% 0.00% 6 SR Masters Degree 0.00% 0.00% 2 0.12% 2 0.13% 0.00% 4 SR Post Baccalaureate Certificate 0.00% 0.00% 0.00% 1 0.06% 0.00% 1
Clinical Nurse Specialist: Growing Family SN Post Masters Certificate 1 0.07% 0.00% 0.00% 0.00% 0.00% 1 Coding Specialist SAHP Post Second. Cert/Diploma < 1 yr. 14 1.05% 8 0.57% 15 0.94% 13 0.84% 16 2.41% 66
Communication Sciences and Disorders SAHP Masters Degree 0.00% 0.00% 0.00% 0.00% 1 0.15% 1 Counseling SST Masters Degree 0.00% 0.00% 2 0.12% 4 0.26% 1 0.15% 7 Criminal Justice SST Masters Degree 0.00% 2 0.14% 5 0.31% 3 0.19% 0.00% 10 Cytotechnology SAHP Baccalaureate Degree 2 0.15% 2 0.14% 1 0.06% 3 0.19% 1 0.15% 9 SAHP Post Second. Cert/Diploma >1 <2 4 0.30% 2 0.14% 2 0.12% 3 0.19% 2 0.30% 13 *Most Current Year **Not all degrees are count for current year
WASC EER Report Appendix G 296
RETURN TO CONTENTS
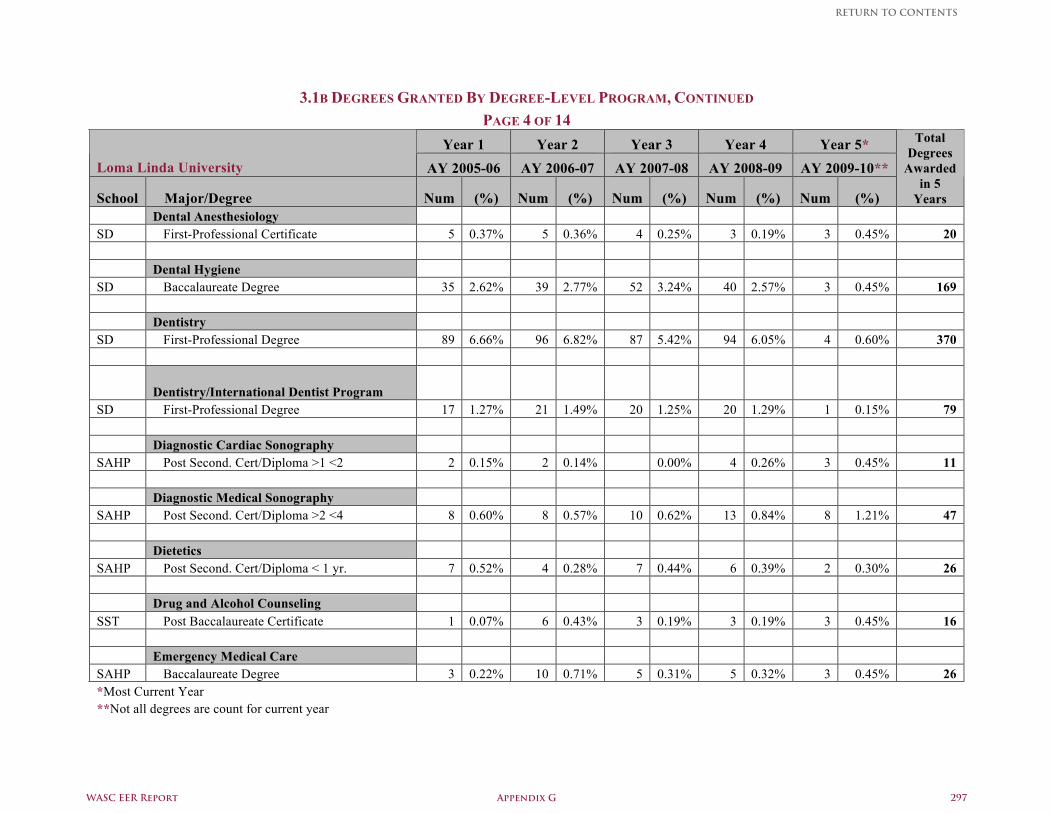
3.1B DEGREES GRANTED BY DEGREE-LEVEL PROGRAM, CONTINUED
PAGE 4 OF 14 Year 1 Year 2 Year 3 Year 4 Year 5*
Loma Linda University AY 2005-06 AY 2006-07 AY 2007-08 AY 2008-09 AY 2009-10**
School Major/Degree Num (%) Num (%) Num (%) Num (%) Num (%)
Total Degrees
Awarded in 5
Years Dental Anesthesiology SD First-Professional Certificate 5 0.37% 5 0.36% 4 0.25% 3 0.19% 3 0.45% 20 Dental Hygiene SD Baccalaureate Degree 35 2.62% 39 2.77% 52 3.24% 40 2.57% 3 0.45% 169 Dentistry SD First-Professional Degree 89 6.66% 96 6.82% 87 5.42% 94 6.05% 4 0.60% 370
Dentistry/International Dentist Program SD First-Professional Degree 17 1.27% 21 1.49% 20 1.25% 20 1.29% 1 0.15% 79 Diagnostic Cardiac Sonography SAHP Post Second. Cert/Diploma >1 <2 2 0.15% 2 0.14% 0.00% 4 0.26% 3 0.45% 11 Diagnostic Medical Sonography SAHP Post Second. Cert/Diploma >2 <4 8 0.60% 8 0.57% 10 0.62% 13 0.84% 8 1.21% 47 Dietetics SAHP Post Second. Cert/Diploma < 1 yr. 7 0.52% 4 0.28% 7 0.44% 6 0.39% 2 0.30% 26 Drug and Alcohol Counseling SST Post Baccalaureate Certificate 1 0.07% 6 0.43% 3 0.19% 3 0.19% 3 0.45% 16 Emergency Medical Care SAHP Baccalaureate Degree 3 0.22% 10 0.71% 5 0.31% 5 0.32% 3 0.45% 26 *Most Current Year **Not all degrees are count for current year
WASC EER Report Appendix G 297
RETURN TO CONTENTS
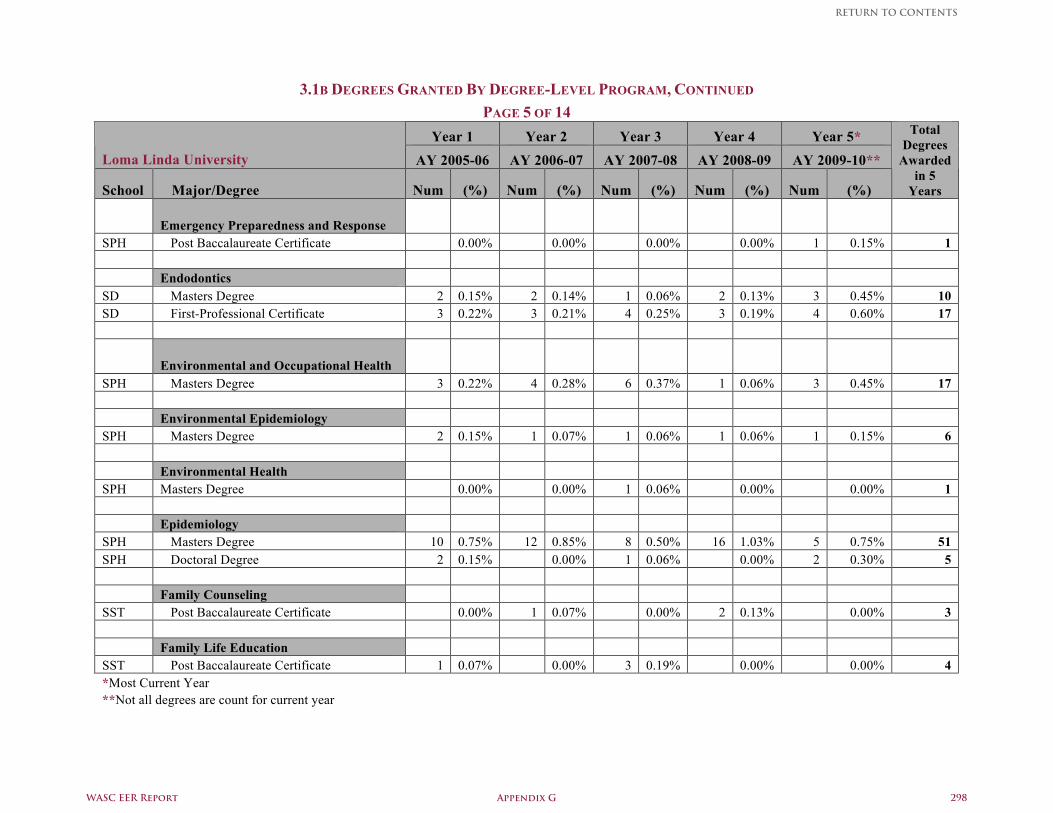
3.1B DEGREES GRANTED BY DEGREE-LEVEL PROGRAM, CONTINUED PAGE 5 OF 14
Year 1 Year 2 Year 3 Year 4 Year 5* Loma Linda University AY 2005-06 AY 2006-07 AY 2007-08 AY 2008-09 AY 2009-10**
School Major/Degree Num (%) Num (%) Num (%) Num (%) Num (%)
Total Degrees
Awarded in 5
Years
Emergency Preparedness and Response SPH Post Baccalaureate Certificate 0.00% 0.00% 0.00% 0.00% 1 0.15% 1 Endodontics SD Masters Degree 2 0.15% 2 0.14% 1 0.06% 2 0.13% 3 0.45% 10 SD First-Professional Certificate 3 0.22% 3 0.21% 4 0.25% 3 0.19% 4 0.60% 17
Environmental and Occupational Health SPH Masters Degree 3 0.22% 4 0.28% 6 0.37% 1 0.06% 3 0.45% 17 Environmental Epidemiology SPH Masters Degree 2 0.15% 1 0.07% 1 0.06% 1 0.06% 1 0.15% 6 Environmental Health SPH Masters Degree 0.00% 0.00% 1 0.06% 0.00% 0.00% 1 Epidemiology SPH Masters Degree 10 0.75% 12 0.85% 8 0.50% 16 1.03% 5 0.75% 51 SPH Doctoral Degree 2 0.15% 0.00% 1 0.06% 0.00% 2 0.30% 5 Family Counseling SST Post Baccalaureate Certificate 0.00% 1 0.07% 0.00% 2 0.13% 0.00% 3 Family Life Education SST Post Baccalaureate Certificate 1 0.07% 0.00% 3 0.19% 0.00% 0.00% 4 *Most Current Year **Not all degrees are count for current year
WASC EER Report Appendix G 298
RETURN TO CONTENTS
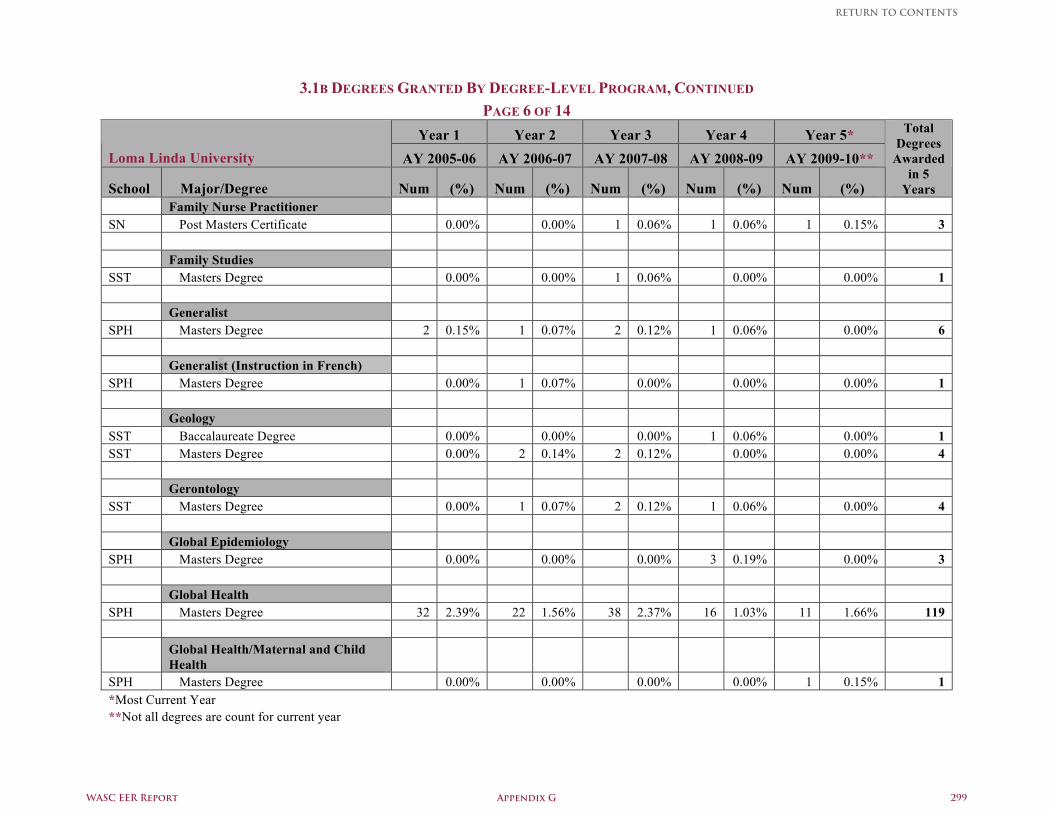
3.1B DEGREES GRANTED BY DEGREE-LEVEL PROGRAM, CONTINUED PAGE 6 OF 14
Year 1 Year 2 Year 3 Year 4 Year 5* Loma Linda University AY 2005-06 AY 2006-07 AY 2007-08 AY 2008-09 AY 2009-10**
School Major/Degree Num (%) Num (%) Num (%) Num (%) Num (%)
Total Degrees
Awarded in 5
Years Family Nurse Practitioner SN Post Masters Certificate 0.00% 0.00% 1 0.06% 1 0.06% 1 0.15% 3 Family Studies SST Masters Degree 0.00% 0.00% 1 0.06% 0.00% 0.00% 1 Generalist SPH Masters Degree 2 0.15% 1 0.07% 2 0.12% 1 0.06% 0.00% 6 Generalist (Instruction in French) SPH Masters Degree 0.00% 1 0.07% 0.00% 0.00% 0.00% 1 Geology SST Baccalaureate Degree 0.00% 0.00% 0.00% 1 0.06% 0.00% 1 SST Masters Degree 0.00% 2 0.14% 2 0.12% 0.00% 0.00% 4 Gerontology SST Masters Degree 0.00% 1 0.07% 2 0.12% 1 0.06% 0.00% 4 Global Epidemiology SPH Masters Degree 0.00% 0.00% 0.00% 3 0.19% 0.00% 3 Global Health SPH Masters Degree 32 2.39% 22 1.56% 38 2.37% 16 1.03% 11 1.66% 119
Global Health/Maternal and Child Health
SPH Masters Degree 0.00% 0.00% 0.00% 0.00% 1 0.15% 1 *Most Current Year **Not all degrees are count for current year
WASC EER Report Appendix G 299
RETURN TO CONTENTS
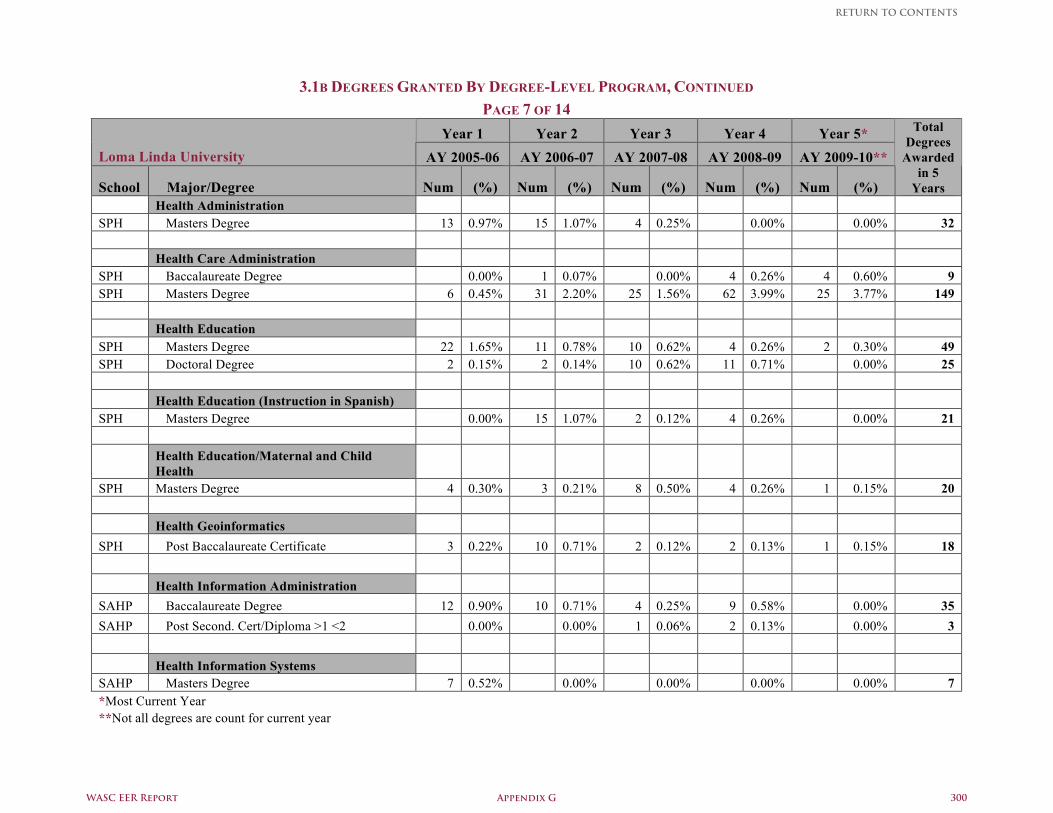
3.1B DEGREES GRANTED BY DEGREE-LEVEL PROGRAM, CONTINUED PAGE 7 OF 14
Year 1 Year 2 Year 3 Year 4 Year 5* Loma Linda University AY 2005-06 AY 2006-07 AY 2007-08 AY 2008-09 AY 2009-10**
School Major/Degree Num (%) Num (%) Num (%) Num (%) Num (%)
Total Degrees
Awarded in 5
Years Health Administration SPH Masters Degree 13 0.97% 15 1.07% 4 0.25% 0.00% 0.00% 32 Health Care Administration SPH Baccalaureate Degree 0.00% 1 0.07% 0.00% 4 0.26% 4 0.60% 9 SPH Masters Degree 6 0.45% 31 2.20% 25 1.56% 62 3.99% 25 3.77% 149 Health Education SPH Masters Degree 22 1.65% 11 0.78% 10 0.62% 4 0.26% 2 0.30% 49 SPH Doctoral Degree 2 0.15% 2 0.14% 10 0.62% 11 0.71% 0.00% 25 Health Education (Instruction in Spanish) SPH Masters Degree 0.00% 15 1.07% 2 0.12% 4 0.26% 0.00% 21
Health Education/Maternal and Child Health
SPH Masters Degree 4 0.30% 3 0.21% 8 0.50% 4 0.26% 1 0.15% 20 Health Geoinformatics SPH Post Baccalaureate Certificate 3 0.22% 10 0.71% 2 0.12% 2 0.13% 1 0.15% 18 Health Information Administration SAHP Baccalaureate Degree 12 0.90% 10 0.71% 4 0.25% 9 0.58% 0.00% 35 SAHP Post Second. Cert/Diploma >1 <2 0.00% 0.00% 1 0.06% 2 0.13% 0.00% 3 Health Information Systems SAHP Masters Degree 7 0.52% 0.00% 0.00% 0.00% 0.00% 7 *Most Current Year **Not all degrees are count for current year
WASC EER Report Appendix G 300
RETURN TO CONTENTS
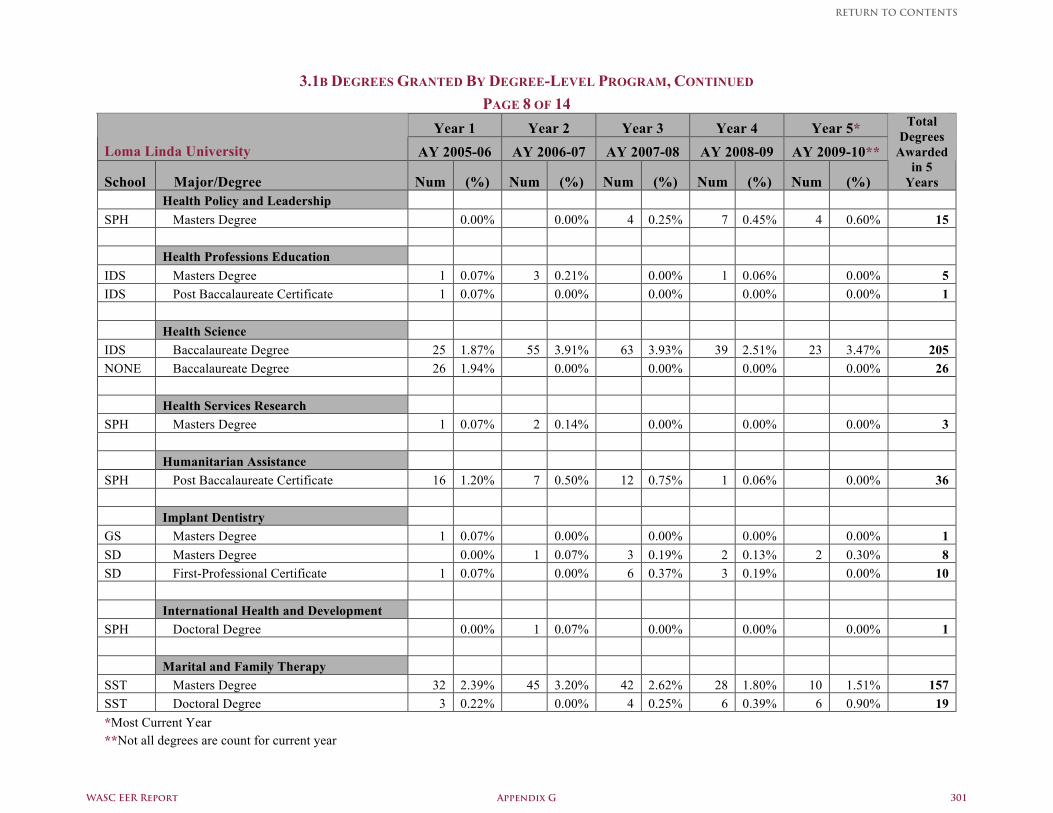
3.1B DEGREES GRANTED BY DEGREE-LEVEL PROGRAM, CONTINUED PAGE 8 OF 14
Year 1 Year 2 Year 3 Year 4 Year 5* Loma Linda University AY 2005-06 AY 2006-07 AY 2007-08 AY 2008-09 AY 2009-10**
School Major/Degree Num (%) Num (%) Num (%) Num (%) Num (%)
Total Degrees
Awarded in 5
Years Health Policy and Leadership SPH Masters Degree 0.00% 0.00% 4 0.25% 7 0.45% 4 0.60% 15 Health Professions Education IDS Masters Degree 1 0.07% 3 0.21% 0.00% 1 0.06% 0.00% 5 IDS Post Baccalaureate Certificate 1 0.07% 0.00% 0.00% 0.00% 0.00% 1 Health Science IDS Baccalaureate Degree 25 1.87% 55 3.91% 63 3.93% 39 2.51% 23 3.47% 205 NONE Baccalaureate Degree 26 1.94% 0.00% 0.00% 0.00% 0.00% 26 Health Services Research SPH Masters Degree 1 0.07% 2 0.14% 0.00% 0.00% 0.00% 3 Humanitarian Assistance SPH Post Baccalaureate Certificate 16 1.20% 7 0.50% 12 0.75% 1 0.06% 0.00% 36 Implant Dentistry GS Masters Degree 1 0.07% 0.00% 0.00% 0.00% 0.00% 1 SD Masters Degree 0.00% 1 0.07% 3 0.19% 2 0.13% 2 0.30% 8 SD First-Professional Certificate 1 0.07% 0.00% 6 0.37% 3 0.19% 0.00% 10 International Health and Development SPH Doctoral Degree 0.00% 1 0.07% 0.00% 0.00% 0.00% 1 Marital and Family Therapy SST Masters Degree 32 2.39% 45 3.20% 42 2.62% 28 1.80% 10 1.51% 157 SST Doctoral Degree 3 0.22% 0.00% 4 0.25% 6 0.39% 6 0.90% 19 *Most Current Year **Not all degrees are count for current year
WASC EER Report Appendix G 301
RETURN TO CONTENTS
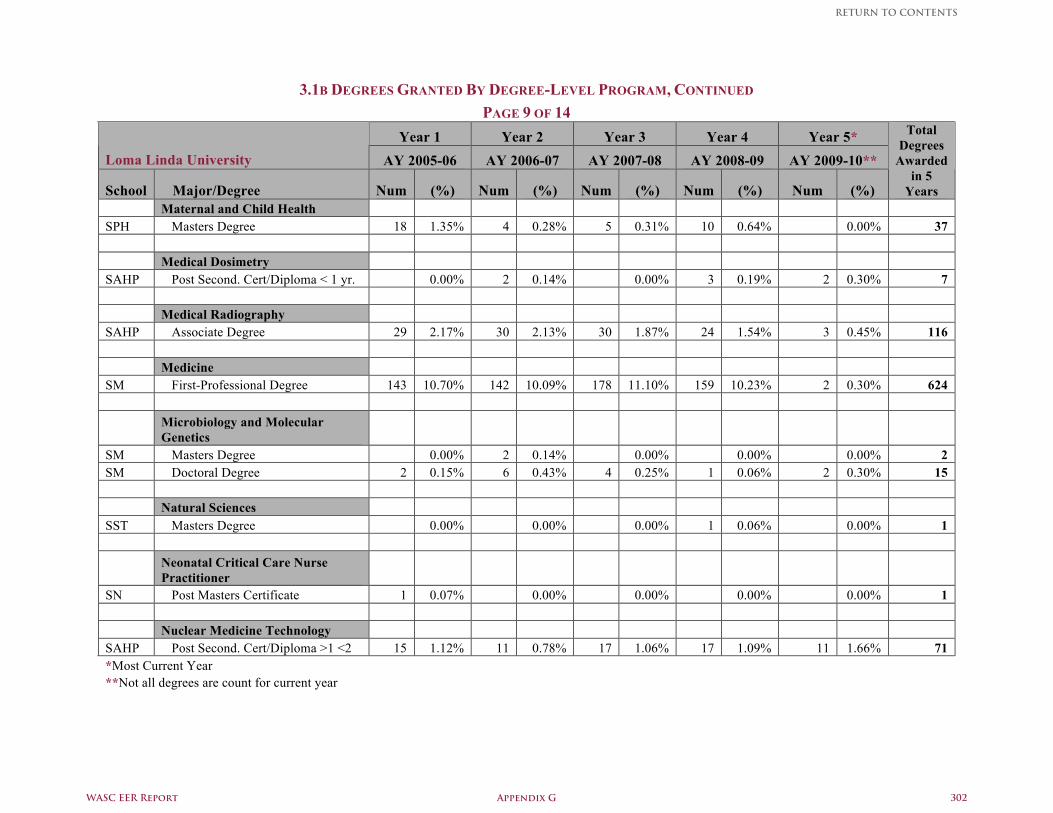
3.1B DEGREES GRANTED BY DEGREE-LEVEL PROGRAM, CONTINUED PAGE 9 OF 14
Year 1 Year 2 Year 3 Year 4 Year 5* Loma Linda University AY 2005-06 AY 2006-07 AY 2007-08 AY 2008-09 AY 2009-10**
School Major/Degree Num (%) Num (%) Num (%) Num (%) Num (%)
Total Degrees
Awarded in 5
Years Maternal and Child Health SPH Masters Degree 18 1.35% 4 0.28% 5 0.31% 10 0.64% 0.00% 37 Medical Dosimetry SAHP Post Second. Cert/Diploma < 1 yr. 0.00% 2 0.14% 0.00% 3 0.19% 2 0.30% 7 Medical Radiography SAHP Associate Degree 29 2.17% 30 2.13% 30 1.87% 24 1.54% 3 0.45% 116 Medicine SM First-Professional Degree 143 10.70% 142 10.09% 178 11.10% 159 10.23% 2 0.30% 624
Microbiology and Molecular Genetics
SM Masters Degree 0.00% 2 0.14% 0.00% 0.00% 0.00% 2 SM Doctoral Degree 2 0.15% 6 0.43% 4 0.25% 1 0.06% 2 0.30% 15 Natural Sciences SST Masters Degree 0.00% 0.00% 0.00% 1 0.06% 0.00% 1
Neonatal Critical Care Nurse Practitioner
SN Post Masters Certificate 1 0.07% 0.00% 0.00% 0.00% 0.00% 1 Nuclear Medicine Technology SAHP Post Second. Cert/Diploma >1 <2 15 1.12% 11 0.78% 17 1.06% 17 1.09% 11 1.66% 71 *Most Current Year **Not all degrees are count for current year
WASC EER Report Appendix G 302
RETURN TO CONTENTS
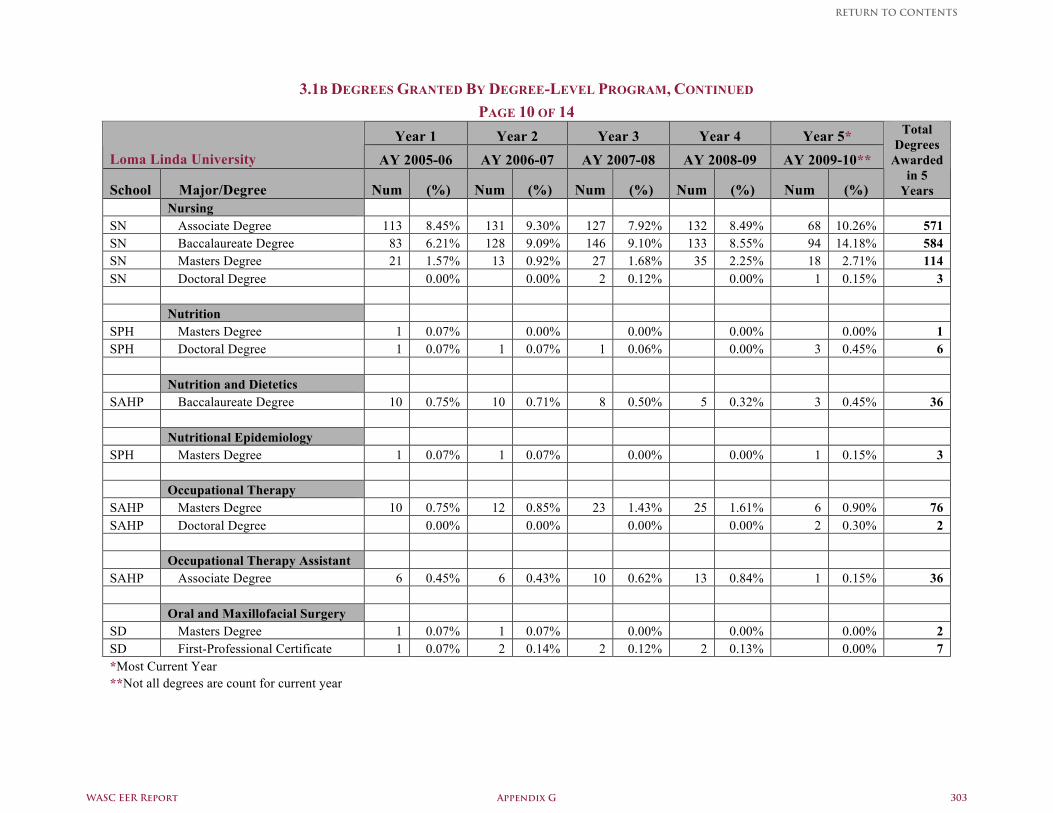
3.1B DEGREES GRANTED BY DEGREE-LEVEL PROGRAM, CONTINUED PAGE 10 OF 14
Year 1 Year 2 Year 3 Year 4 Year 5* Loma Linda University AY 2005-06 AY 2006-07 AY 2007-08 AY 2008-09 AY 2009-10**
School Major/Degree Num (%) Num (%) Num (%) Num (%) Num (%)
Total Degrees
Awarded in 5
Years Nursing SN Associate Degree 113 8.45% 131 9.30% 127 7.92% 132 8.49% 68 10.26% 571 SN Baccalaureate Degree 83 6.21% 128 9.09% 146 9.10% 133 8.55% 94 14.18% 584 SN Masters Degree 21 1.57% 13 0.92% 27 1.68% 35 2.25% 18 2.71% 114 SN Doctoral Degree 0.00% 0.00% 2 0.12% 0.00% 1 0.15% 3 Nutrition SPH Masters Degree 1 0.07% 0.00% 0.00% 0.00% 0.00% 1 SPH Doctoral Degree 1 0.07% 1 0.07% 1 0.06% 0.00% 3 0.45% 6 Nutrition and Dietetics SAHP Baccalaureate Degree 10 0.75% 10 0.71% 8 0.50% 5 0.32% 3 0.45% 36 Nutritional Epidemiology SPH Masters Degree 1 0.07% 1 0.07% 0.00% 0.00% 1 0.15% 3 Occupational Therapy SAHP Masters Degree 10 0.75% 12 0.85% 23 1.43% 25 1.61% 6 0.90% 76 SAHP Doctoral Degree 0.00% 0.00% 0.00% 0.00% 2 0.30% 2 Occupational Therapy Assistant SAHP Associate Degree 6 0.45% 6 0.43% 10 0.62% 13 0.84% 1 0.15% 36 Oral and Maxillofacial Surgery SD Masters Degree 1 0.07% 1 0.07% 0.00% 0.00% 0.00% 2 SD First-Professional Certificate 1 0.07% 2 0.14% 2 0.12% 2 0.13% 0.00% 7 *Most Current Year **Not all degrees are count for current year
WASC EER Report Appendix G 303
RETURN TO CONTENTS
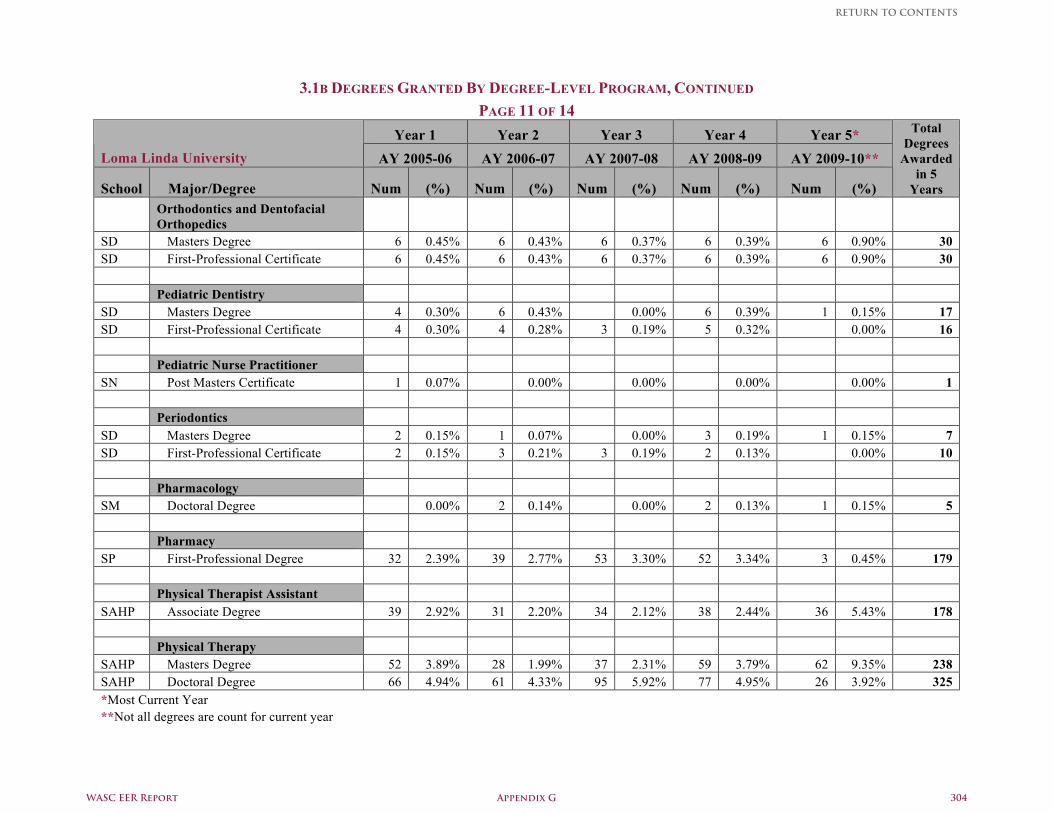
3.1B DEGREES GRANTED BY DEGREE-LEVEL PROGRAM, CONTINUED PAGE 11 OF 14
Year 1 Year 2 Year 3 Year 4 Year 5* Loma Linda University AY 2005-06 AY 2006-07 AY 2007-08 AY 2008-09 AY 2009-10**
School Major/Degree Num (%) Num (%) Num (%) Num (%) Num (%)
Total Degrees
Awarded in 5
Years
Orthodontics and Dentofacial Orthopedics
SD Masters Degree 6 0.45% 6 0.43% 6 0.37% 6 0.39% 6 0.90% 30 SD First-Professional Certificate 6 0.45% 6 0.43% 6 0.37% 6 0.39% 6 0.90% 30 Pediatric Dentistry SD Masters Degree 4 0.30% 6 0.43% 0.00% 6 0.39% 1 0.15% 17 SD First-Professional Certificate 4 0.30% 4 0.28% 3 0.19% 5 0.32% 0.00% 16 Pediatric Nurse Practitioner SN Post Masters Certificate 1 0.07% 0.00% 0.00% 0.00% 0.00% 1 Periodontics SD Masters Degree 2 0.15% 1 0.07% 0.00% 3 0.19% 1 0.15% 7 SD First-Professional Certificate 2 0.15% 3 0.21% 3 0.19% 2 0.13% 0.00% 10 Pharmacology SM Doctoral Degree 0.00% 2 0.14% 0.00% 2 0.13% 1 0.15% 5 Pharmacy SP First-Professional Degree 32 2.39% 39 2.77% 53 3.30% 52 3.34% 3 0.45% 179 Physical Therapist Assistant SAHP Associate Degree 39 2.92% 31 2.20% 34 2.12% 38 2.44% 36 5.43% 178 Physical Therapy SAHP Masters Degree 52 3.89% 28 1.99% 37 2.31% 59 3.79% 62 9.35% 238 SAHP Doctoral Degree 66 4.94% 61 4.33% 95 5.92% 77 4.95% 26 3.92% 325 *Most Current Year **Not all degrees are count for current year
WASC EER Report Appendix G 304
RETURN TO CONTENTS
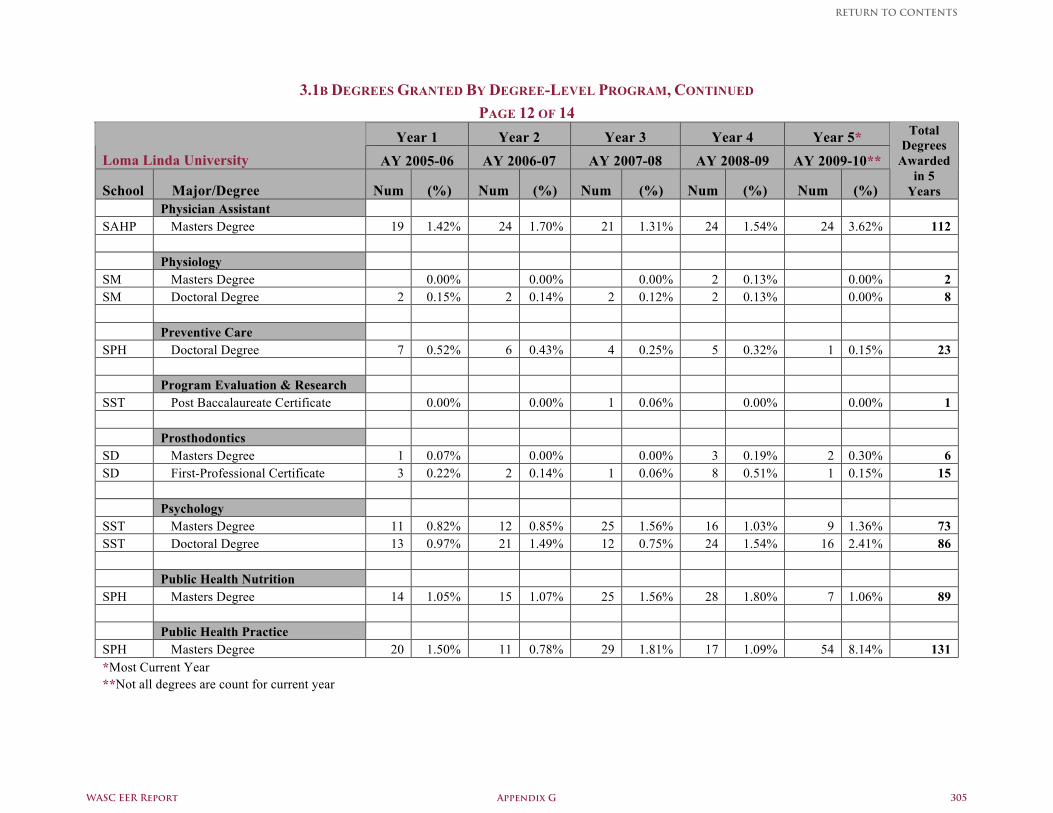
3.1B DEGREES GRANTED BY DEGREE-LEVEL PROGRAM, CONTINUED PAGE 12 OF 14
Year 1 Year 2 Year 3 Year 4 Year 5* Loma Linda University AY 2005-06 AY 2006-07 AY 2007-08 AY 2008-09 AY 2009-10**
School Major/Degree Num (%) Num (%) Num (%) Num (%) Num (%)
Total Degrees
Awarded in 5
Years Physician Assistant SAHP Masters Degree 19 1.42% 24 1.70% 21 1.31% 24 1.54% 24 3.62% 112 Physiology SM Masters Degree 0.00% 0.00% 0.00% 2 0.13% 0.00% 2 SM Doctoral Degree 2 0.15% 2 0.14% 2 0.12% 2 0.13% 0.00% 8 Preventive Care SPH Doctoral Degree 7 0.52% 6 0.43% 4 0.25% 5 0.32% 1 0.15% 23 Program Evaluation & Research SST Post Baccalaureate Certificate 0.00% 0.00% 1 0.06% 0.00% 0.00% 1 Prosthodontics SD Masters Degree 1 0.07% 0.00% 0.00% 3 0.19% 2 0.30% 6 SD First-Professional Certificate 3 0.22% 2 0.14% 1 0.06% 8 0.51% 1 0.15% 15 Psychology SST Masters Degree 11 0.82% 12 0.85% 25 1.56% 16 1.03% 9 1.36% 73 SST Doctoral Degree 13 0.97% 21 1.49% 12 0.75% 24 1.54% 16 2.41% 86 Public Health Nutrition SPH Masters Degree 14 1.05% 15 1.07% 25 1.56% 28 1.80% 7 1.06% 89 Public Health Practice SPH Masters Degree 20 1.50% 11 0.78% 29 1.81% 17 1.09% 54 8.14% 131 *Most Current Year **Not all degrees are count for current year
WASC EER Report Appendix G 305
RETURN TO CONTENTS
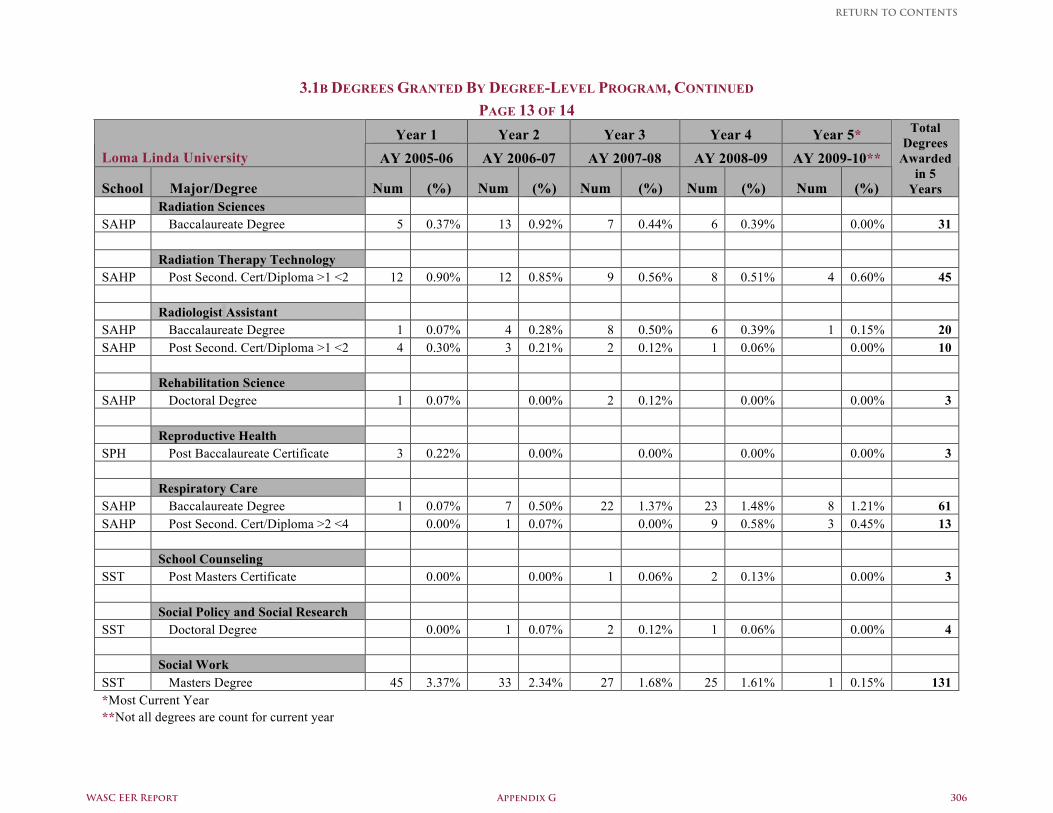
3.1B DEGREES GRANTED BY DEGREE-LEVEL PROGRAM, CONTINUED PAGE 13 OF 14
Year 1 Year 2 Year 3 Year 4 Year 5* Loma Linda University AY 2005-06 AY 2006-07 AY 2007-08 AY 2008-09 AY 2009-10**
School Major/Degree Num (%) Num (%) Num (%) Num (%) Num (%)
Total Degrees
Awarded in 5
Years Radiation Sciences SAHP Baccalaureate Degree 5 0.37% 13 0.92% 7 0.44% 6 0.39% 0.00% 31 Radiation Therapy Technology SAHP Post Second. Cert/Diploma >1 <2 12 0.90% 12 0.85% 9 0.56% 8 0.51% 4 0.60% 45 Radiologist Assistant SAHP Baccalaureate Degree 1 0.07% 4 0.28% 8 0.50% 6 0.39% 1 0.15% 20 SAHP Post Second. Cert/Diploma >1 <2 4 0.30% 3 0.21% 2 0.12% 1 0.06% 0.00% 10 Rehabilitation Science SAHP Doctoral Degree 1 0.07% 0.00% 2 0.12% 0.00% 0.00% 3 Reproductive Health SPH Post Baccalaureate Certificate 3 0.22% 0.00% 0.00% 0.00% 0.00% 3 Respiratory Care SAHP Baccalaureate Degree 1 0.07% 7 0.50% 22 1.37% 23 1.48% 8 1.21% 61 SAHP Post Second. Cert/Diploma >2 <4 0.00% 1 0.07% 0.00% 9 0.58% 3 0.45% 13 School Counseling SST Post Masters Certificate 0.00% 0.00% 1 0.06% 2 0.13% 0.00% 3 Social Policy and Social Research SST Doctoral Degree 0.00% 1 0.07% 2 0.12% 1 0.06% 0.00% 4 Social Work SST Masters Degree 45 3.37% 33 2.34% 27 1.68% 25 1.61% 1 0.15% 131 *Most Current Year **Not all degrees are count for current year
WASC EER Report Appendix G 306
RETURN TO CONTENTS
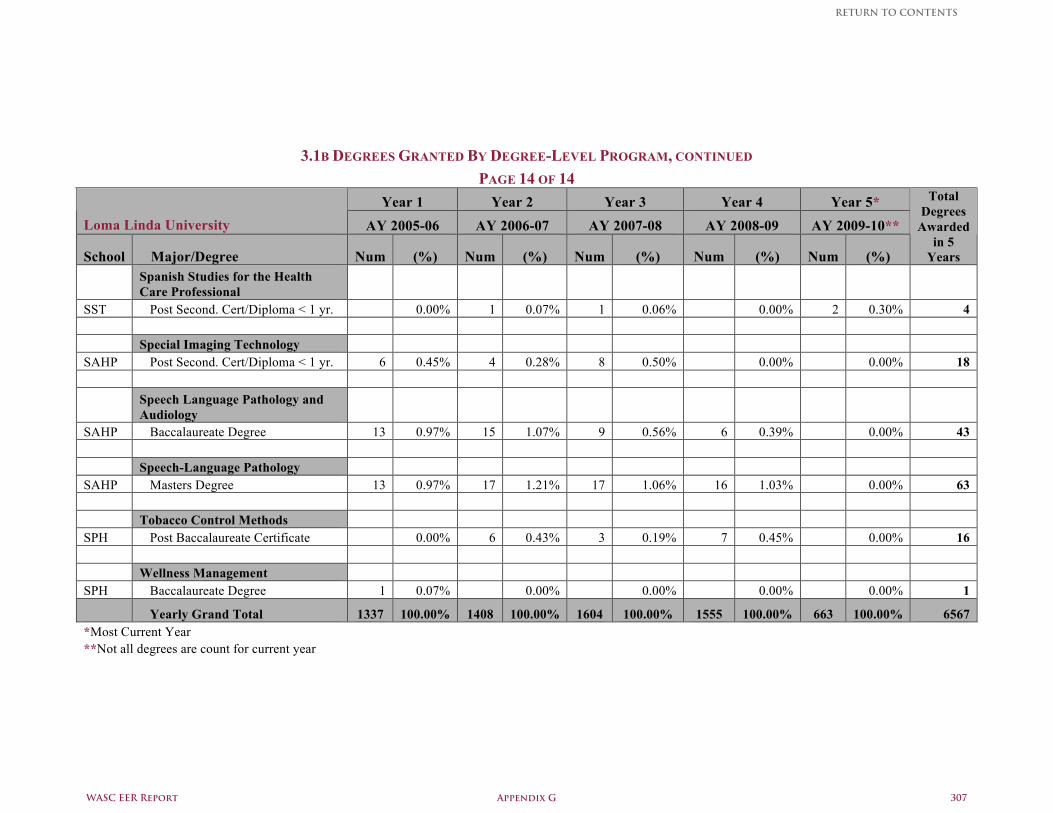
3.1B DEGREES GRANTED BY DEGREE-LEVEL PROGRAM, CONTINUED PAGE 14 OF 14
Year 1 Year 2 Year 3 Year 4 Year 5* Loma Linda University AY 2005-06 AY 2006-07 AY 2007-08 AY 2008-09 AY 2009-10**
School Major/Degree Num (%) Num (%) Num (%) Num (%) Num (%)
Total Degrees
Awarded in 5
Years
Spanish Studies for the Health Care Professional
SST Post Second. Cert/Diploma < 1 yr. 0.00% 1 0.07% 1 0.06% 0.00% 2 0.30% 4 Special Imaging Technology SAHP Post Second. Cert/Diploma < 1 yr. 6 0.45% 4 0.28% 8 0.50% 0.00% 0.00% 18
Speech Language Pathology and Audiology
SAHP Baccalaureate Degree 13 0.97% 15 1.07% 9 0.56% 6 0.39% 0.00% 43 Speech-Language Pathology SAHP Masters Degree 13 0.97% 17 1.21% 17 1.06% 16 1.03% 0.00% 63 Tobacco Control Methods SPH Post Baccalaureate Certificate 0.00% 6 0.43% 3 0.19% 7 0.45% 0.00% 16 Wellness Management SPH Baccalaureate Degree 1 0.07% 0.00% 0.00% 0.00% 0.00% 1
Yearly Grand Total 1337 100.00% 1408 100.00% 1604 100.00% 1555 100.00% 663 100.00% 6567 *Most Current Year **Not all degrees are count for current year
WASC EER Report Appendix G 307
RETURN TO CONTENTS
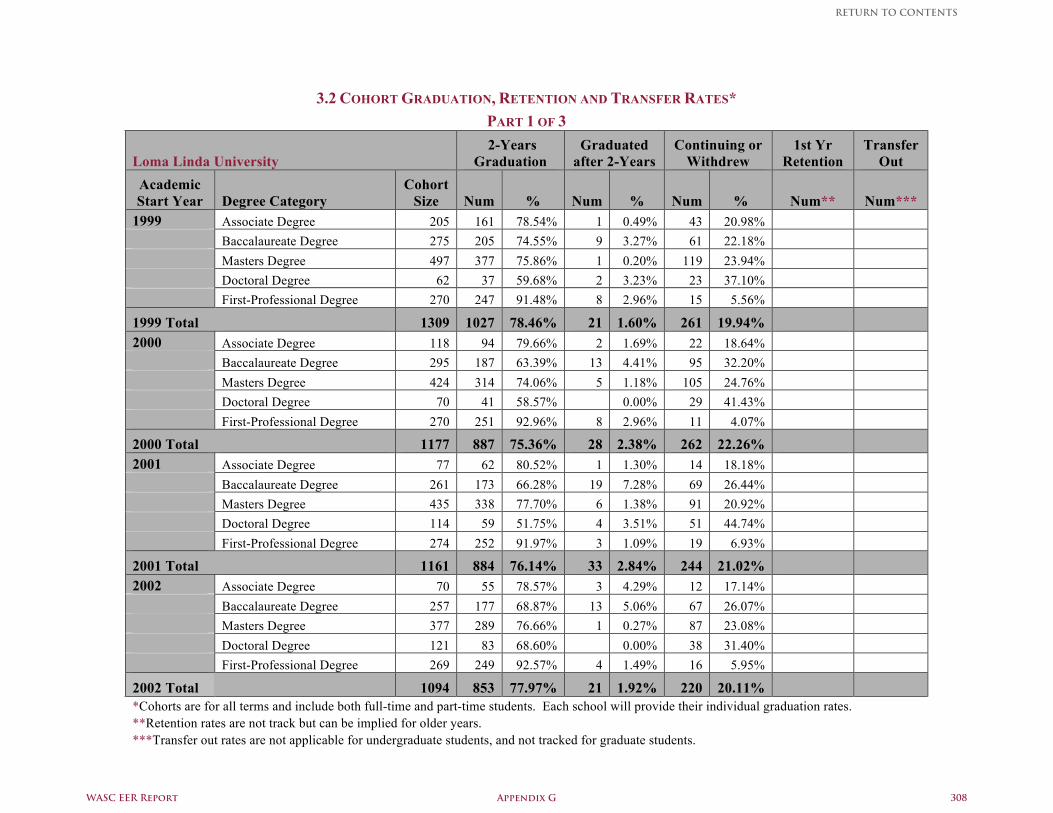
3.2 COHORT GRADUATION, RETENTION AND TRANSFER RATES* PART 1 OF 3
Loma Linda University 2-Years
Graduation Graduated
after 2-Years Continuing or
Withdrew 1st Yr
Retention Transfer
Out Academic Start Year Degree Category
Cohort Size Num % Num % Num % Num** Num***
1999 Associate Degree 205 161 78.54% 1 0.49% 43 20.98% Baccalaureate Degree 275 205 74.55% 9 3.27% 61 22.18% Masters Degree 497 377 75.86% 1 0.20% 119 23.94% Doctoral Degree 62 37 59.68% 2 3.23% 23 37.10% First-Professional Degree 270 247 91.48% 8 2.96% 15 5.56%
1999 Total 1309 1027 78.46% 21 1.60% 261 19.94% 2000 Associate Degree 118 94 79.66% 2 1.69% 22 18.64% Baccalaureate Degree 295 187 63.39% 13 4.41% 95 32.20% Masters Degree 424 314 74.06% 5 1.18% 105 24.76% Doctoral Degree 70 41 58.57% 0.00% 29 41.43% First-Professional Degree 270 251 92.96% 8 2.96% 11 4.07%
2000 Total 1177 887 75.36% 28 2.38% 262 22.26% 2001 Associate Degree 77 62 80.52% 1 1.30% 14 18.18% Baccalaureate Degree 261 173 66.28% 19 7.28% 69 26.44% Masters Degree 435 338 77.70% 6 1.38% 91 20.92% Doctoral Degree 114 59 51.75% 4 3.51% 51 44.74% First-Professional Degree 274 252 91.97% 3 1.09% 19 6.93%
2001 Total 1161 884 76.14% 33 2.84% 244 21.02% 2002 Associate Degree 70 55 78.57% 3 4.29% 12 17.14% Baccalaureate Degree 257 177 68.87% 13 5.06% 67 26.07% Masters Degree 377 289 76.66% 1 0.27% 87 23.08% Doctoral Degree 121 83 68.60% 0.00% 38 31.40% First-Professional Degree 269 249 92.57% 4 1.49% 16 5.95%
2002 Total 1094 853 77.97% 21 1.92% 220 20.11% *Cohorts are for all terms and include both full-time and part-time students. Each school will provide their individual graduation rates. **Retention rates are not track but can be implied for older years. ***Transfer out rates are not applicable for undergraduate students, and not tracked for graduate students.
WASC EER Report Appendix G 308
RETURN TO CONTENTS
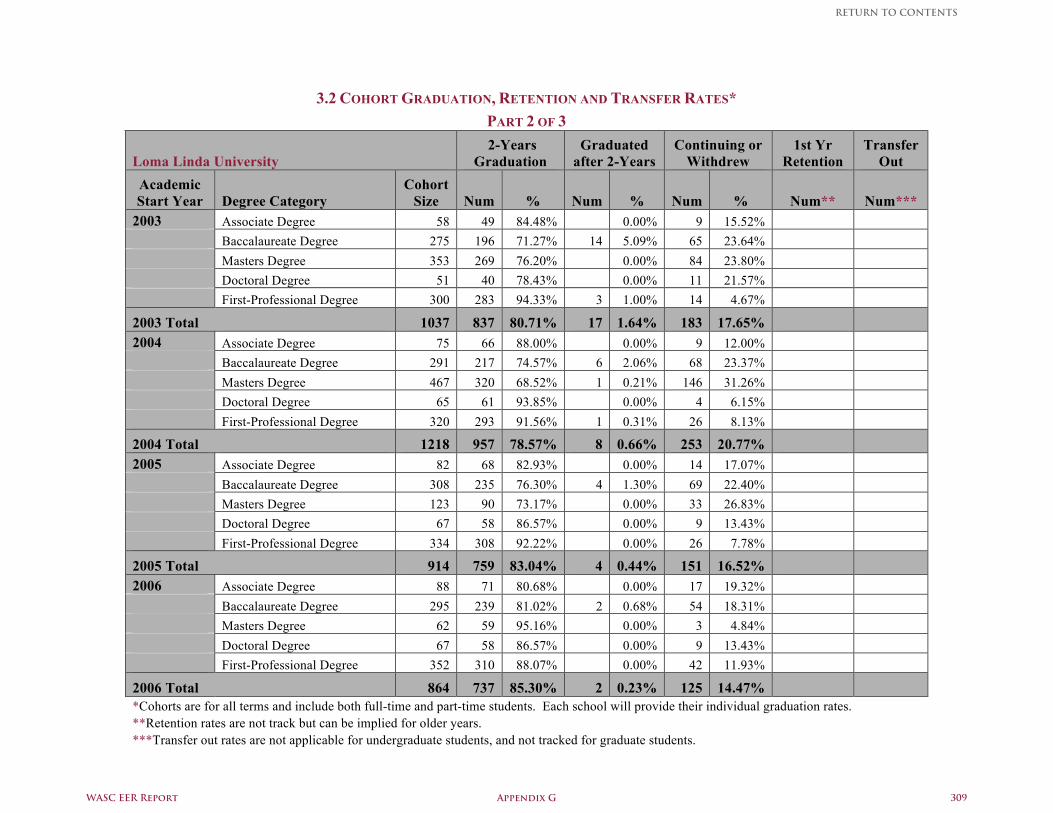
3.2 COHORT GRADUATION, RETENTION AND TRANSFER RATES* PART 2 OF 3
Loma Linda University 2-Years
Graduation Graduated
after 2-Years Continuing or
Withdrew 1st Yr
Retention Transfer
Out Academic Start Year Degree Category
Cohort Size Num % Num % Num % Num** Num***
2003 Associate Degree 58 49 84.48% 0.00% 9 15.52% Baccalaureate Degree 275 196 71.27% 14 5.09% 65 23.64% Masters Degree 353 269 76.20% 0.00% 84 23.80% Doctoral Degree 51 40 78.43% 0.00% 11 21.57% First-Professional Degree 300 283 94.33% 3 1.00% 14 4.67%
2003 Total 1037 837 80.71% 17 1.64% 183 17.65% 2004 Associate Degree 75 66 88.00% 0.00% 9 12.00% Baccalaureate Degree 291 217 74.57% 6 2.06% 68 23.37% Masters Degree 467 320 68.52% 1 0.21% 146 31.26% Doctoral Degree 65 61 93.85% 0.00% 4 6.15% First-Professional Degree 320 293 91.56% 1 0.31% 26 8.13%
2004 Total 1218 957 78.57% 8 0.66% 253 20.77% 2005 Associate Degree 82 68 82.93% 0.00% 14 17.07% Baccalaureate Degree 308 235 76.30% 4 1.30% 69 22.40% Masters Degree 123 90 73.17% 0.00% 33 26.83% Doctoral Degree 67 58 86.57% 0.00% 9 13.43% First-Professional Degree 334 308 92.22% 0.00% 26 7.78%
2005 Total 914 759 83.04% 4 0.44% 151 16.52% 2006 Associate Degree 88 71 80.68% 0.00% 17 19.32% Baccalaureate Degree 295 239 81.02% 2 0.68% 54 18.31% Masters Degree 62 59 95.16% 0.00% 3 4.84% Doctoral Degree 67 58 86.57% 0.00% 9 13.43% First-Professional Degree 352 310 88.07% 0.00% 42 11.93%
2006 Total 864 737 85.30% 2 0.23% 125 14.47% *Cohorts are for all terms and include both full-time and part-time students. Each school will provide their individual graduation rates. **Retention rates are not track but can be implied for older years. ***Transfer out rates are not applicable for undergraduate students, and not tracked for graduate students.
WASC EER Report Appendix G 309
RETURN TO CONTENTS
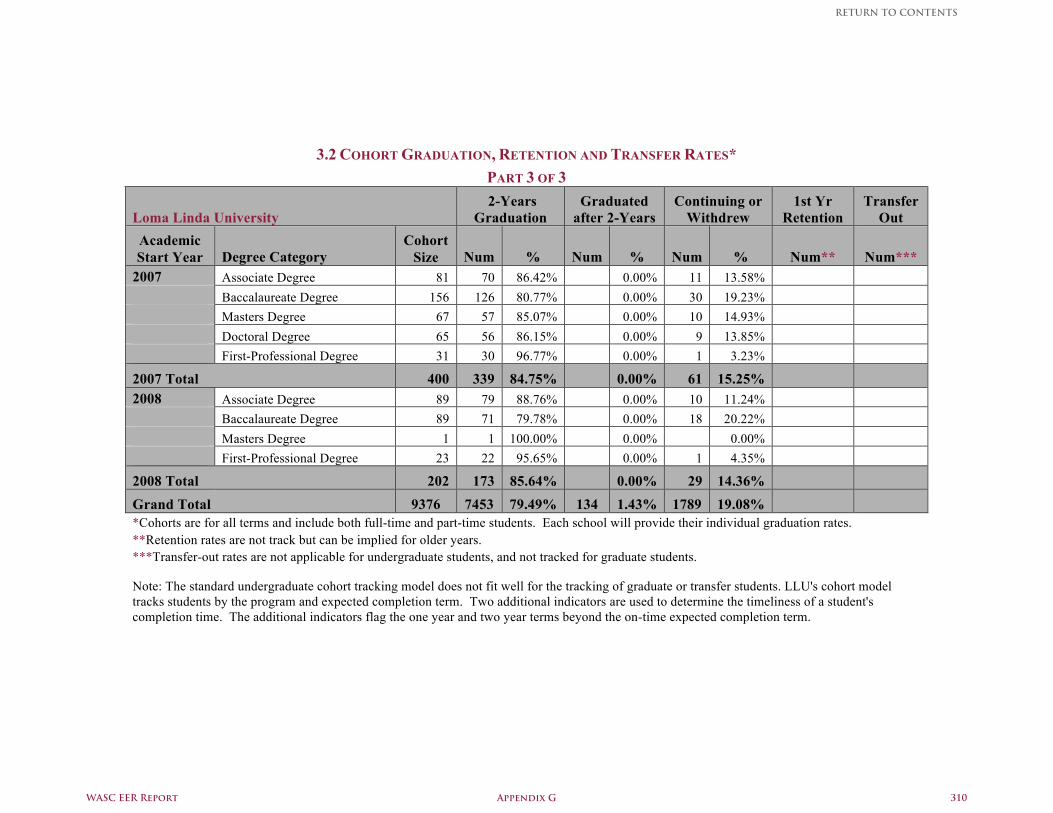
3.2 COHORT GRADUATION, RETENTION AND TRANSFER RATES*
PART 3 OF 3
Loma Linda University 2-Years
Graduation Graduated
after 2-Years Continuing or
Withdrew 1st Yr
Retention Transfer
Out Academic Start Year Degree Category
Cohort Size Num % Num % Num % Num** Num***
2007 Associate Degree 81 70 86.42% 0.00% 11 13.58% Baccalaureate Degree 156 126 80.77% 0.00% 30 19.23% Masters Degree 67 57 85.07% 0.00% 10 14.93% Doctoral Degree 65 56 86.15% 0.00% 9 13.85% First-Professional Degree 31 30 96.77% 0.00% 1 3.23%
2007 Total 400 339 84.75% 0.00% 61 15.25% 2008 Associate Degree 89 79 88.76% 0.00% 10 11.24% Baccalaureate Degree 89 71 79.78% 0.00% 18 20.22% Masters Degree 1 1 100.00% 0.00% 0.00% First-Professional Degree 23 22 95.65% 0.00% 1 4.35%
2008 Total 202 173 85.64% 0.00% 29 14.36% Grand Total 9376 7453 79.49% 134 1.43% 1789 19.08% *Cohorts are for all terms and include both full-time and part-time students. Each school will provide their individual graduation rates. **Retention rates are not track but can be implied for older years. ***Transfer-out rates are not applicable for undergraduate students, and not tracked for graduate students.
Note: The standard undergraduate cohort tracking model does not fit well for the tracking of graduate or transfer students. LLU's cohort model tracks students by the program and expected completion term. Two additional indicators are used to determine the timeliness of a student's completion time. The additional indicators flag the one year and two year terms beyond the on-time expected completion term.
WASC EER Report Appendix G 310
RETURN TO CONTENTS
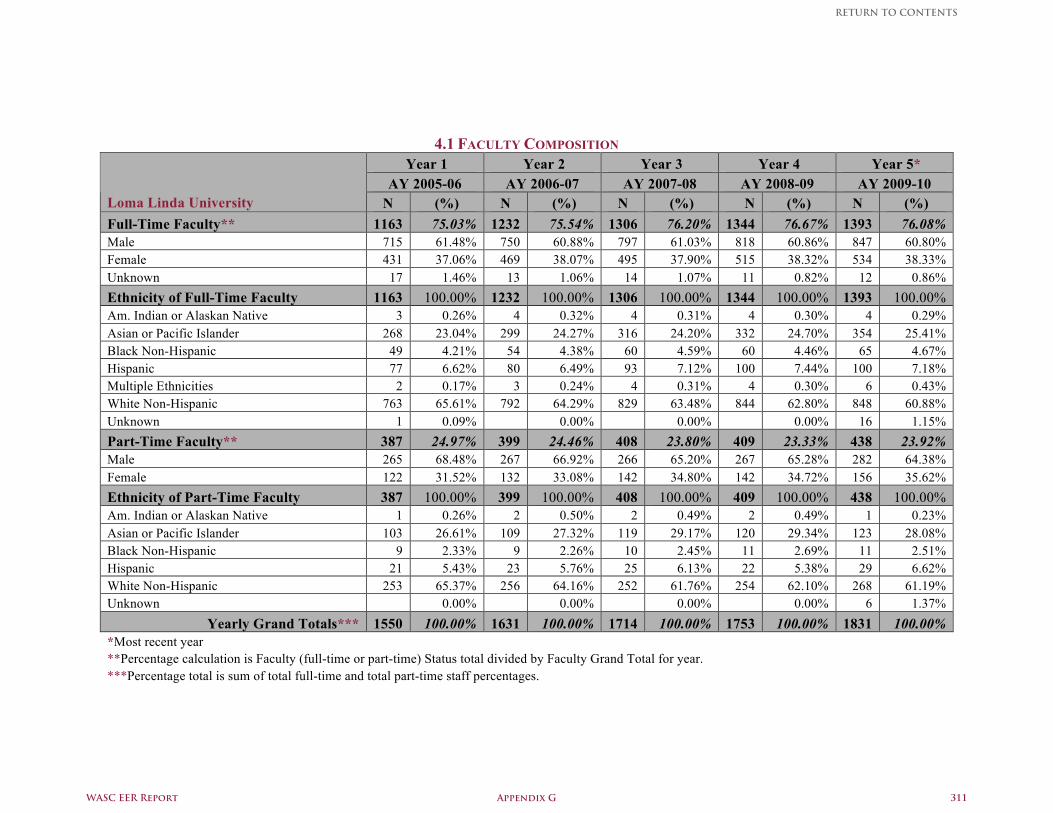
4.1 FACULTY COMPOSITION
Year 1 Year 2 Year 3 Year 4 Year 5* AY 2005-06 AY 2006-07 AY 2007-08 AY 2008-09 AY 2009-10
Loma Linda University N (%) N (%) N (%) N (%) N (%) Full-Time Faculty** 1163 75.03% 1232 75.54% 1306 76.20% 1344 76.67% 1393 76.08% Male 715 61.48% 750 60.88% 797 61.03% 818 60.86% 847 60.80% Female 431 37.06% 469 38.07% 495 37.90% 515 38.32% 534 38.33% Unknown 17 1.46% 13 1.06% 14 1.07% 11 0.82% 12 0.86% Ethnicity of Full-Time Faculty 1163 100.00% 1232 100.00% 1306 100.00% 1344 100.00% 1393 100.00% Am. Indian or Alaskan Native 3 0.26% 4 0.32% 4 0.31% 4 0.30% 4 0.29% Asian or Pacific Islander 268 23.04% 299 24.27% 316 24.20% 332 24.70% 354 25.41% Black Non-Hispanic 49 4.21% 54 4.38% 60 4.59% 60 4.46% 65 4.67% Hispanic 77 6.62% 80 6.49% 93 7.12% 100 7.44% 100 7.18% Multiple Ethnicities 2 0.17% 3 0.24% 4 0.31% 4 0.30% 6 0.43% White Non-Hispanic 763 65.61% 792 64.29% 829 63.48% 844 62.80% 848 60.88% Unknown 1 0.09% 0.00% 0.00% 0.00% 16 1.15% Part-Time Faculty** 387 24.97% 399 24.46% 408 23.80% 409 23.33% 438 23.92% Male 265 68.48% 267 66.92% 266 65.20% 267 65.28% 282 64.38% Female 122 31.52% 132 33.08% 142 34.80% 142 34.72% 156 35.62% Ethnicity of Part-Time Faculty 387 100.00% 399 100.00% 408 100.00% 409 100.00% 438 100.00% Am. Indian or Alaskan Native 1 0.26% 2 0.50% 2 0.49% 2 0.49% 1 0.23% Asian or Pacific Islander 103 26.61% 109 27.32% 119 29.17% 120 29.34% 123 28.08% Black Non-Hispanic 9 2.33% 9 2.26% 10 2.45% 11 2.69% 11 2.51% Hispanic 21 5.43% 23 5.76% 25 6.13% 22 5.38% 29 6.62% White Non-Hispanic 253 65.37% 256 64.16% 252 61.76% 254 62.10% 268 61.19% Unknown 0.00% 0.00% 0.00% 0.00% 6 1.37%
Yearly Grand Totals*** 1550 100.00% 1631 100.00% 1714 100.00% 1753 100.00% 1831 100.00% *Most recent year **Percentage calculation is Faculty (full-time or part-time) Status total divided by Faculty Grand Total for year. ***Percentage total is sum of total full-time and total part-time staff percentages.
WASC EER Report Appendix G 311
RETURN TO CONTENTS
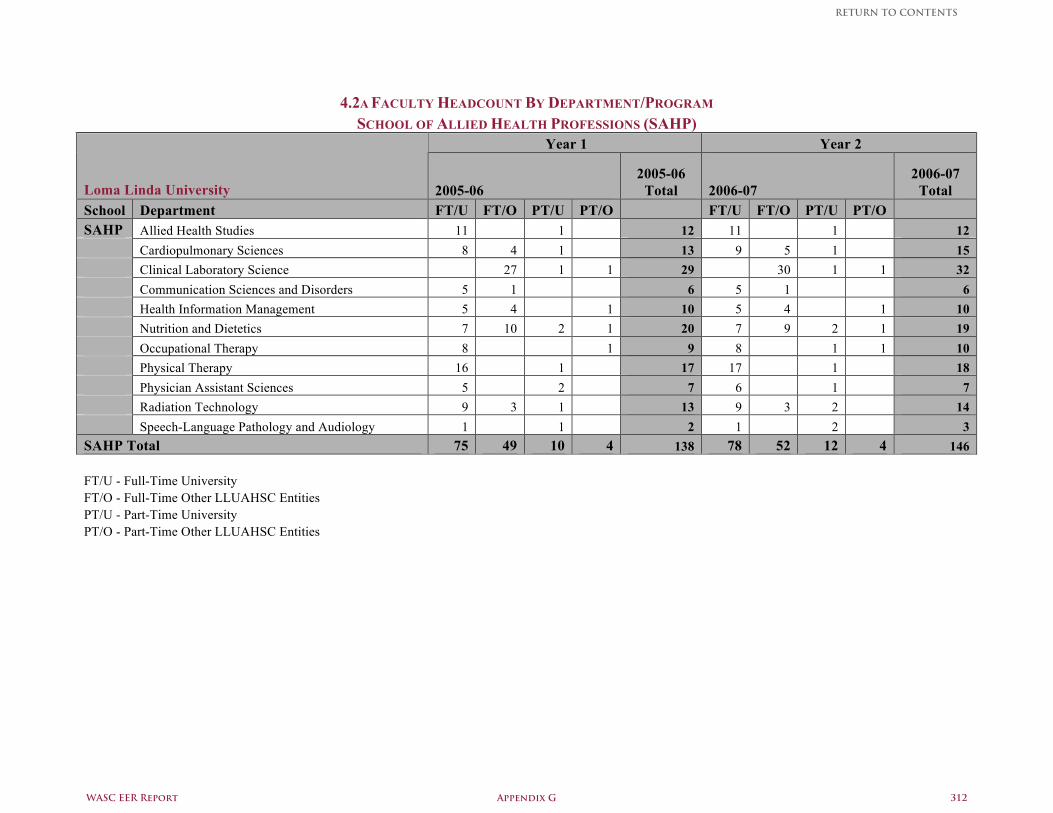
4.2A FACULTY HEADCOUNT BY DEPARTMENT/PROGRAM
SCHOOL OF ALLIED HEALTH PROFESSIONS (SAHP) Year 1 Year 2
Loma Linda University 2005-06 2005-06
Total 2006-07 2006-07
Total School Department FT/U FT/O PT/U PT/O FT/U FT/O PT/U PT/O SAHP Allied Health Studies 11 1 12 11 1 12 Cardiopulmonary Sciences 8 4 1 13 9 5 1 15 Clinical Laboratory Science 27 1 1 29 30 1 1 32 Communication Sciences and Disorders 5 1 6 5 1 6 Health Information Management 5 4 1 10 5 4 1 10 Nutrition and Dietetics 7 10 2 1 20 7 9 2 1 19 Occupational Therapy 8 1 9 8 1 1 10 Physical Therapy 16 1 17 17 1 18 Physician Assistant Sciences 5 2 7 6 1 7 Radiation Technology 9 3 1 13 9 3 2 14 Speech-Language Pathology and Audiology 1 1 2 1 2 3 SAHP Total 75 49 10 4 138 78 52 12 4 146 FT/U - Full-Time University FT/O - Full-Time Other LLUAHSC Entities PT/U - Part-Time University PT/O - Part-Time Other LLUAHSC Entities
WASC EER Report Appendix G 312
RETURN TO CONTENTS
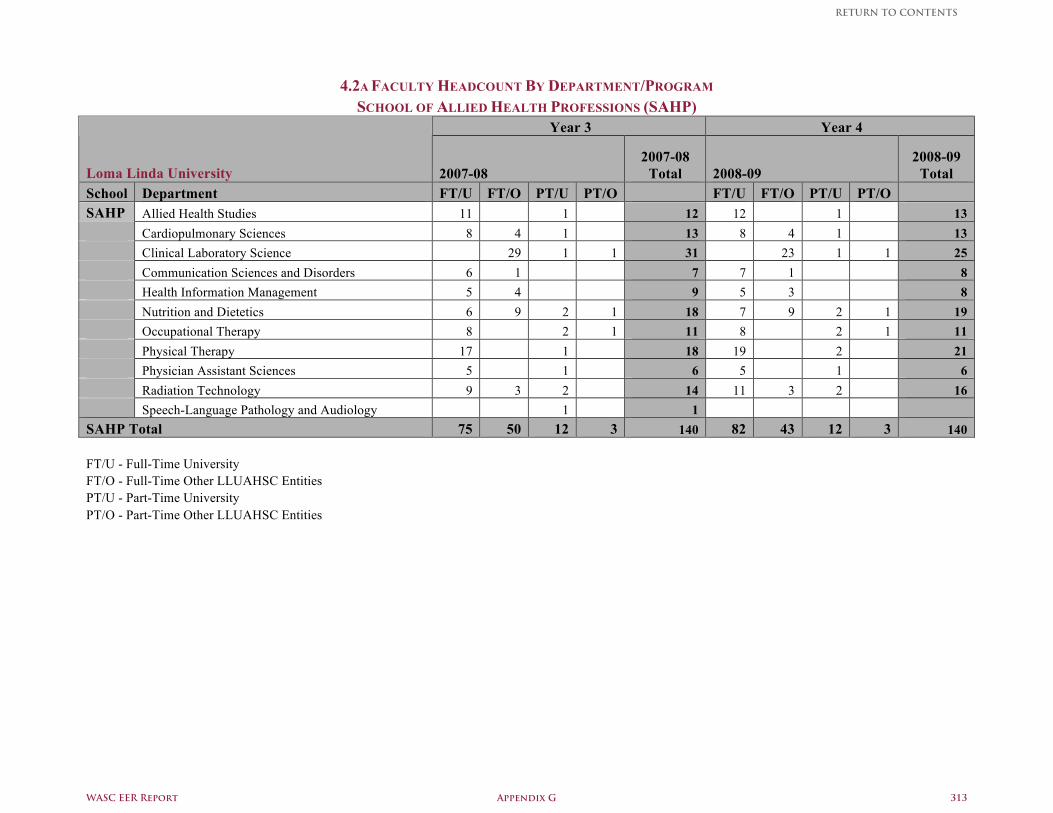
4.2A FACULTY HEADCOUNT BY DEPARTMENT/PROGRAM SCHOOL OF ALLIED HEALTH PROFESSIONS (SAHP)
Year 3 Year 4
Loma Linda University 2007-08 2007-08
Total 2008-09 2008-09
Total School Department FT/U FT/O PT/U PT/O FT/U FT/O PT/U PT/O SAHP Allied Health Studies 11 1 12 12 1 13 Cardiopulmonary Sciences 8 4 1 13 8 4 1 13 Clinical Laboratory Science 29 1 1 31 23 1 1 25 Communication Sciences and Disorders 6 1 7 7 1 8 Health Information Management 5 4 9 5 3 8 Nutrition and Dietetics 6 9 2 1 18 7 9 2 1 19 Occupational Therapy 8 2 1 11 8 2 1 11 Physical Therapy 17 1 18 19 2 21 Physician Assistant Sciences 5 1 6 5 1 6 Radiation Technology 9 3 2 14 11 3 2 16 Speech-Language Pathology and Audiology 1 1 SAHP Total 75 50 12 3 140 82 43 12 3 140 FT/U - Full-Time University FT/O - Full-Time Other LLUAHSC Entities PT/U - Part-Time University PT/O - Part-Time Other LLUAHSC Entities
WASC EER Report Appendix G 313
RETURN TO CONTENTS
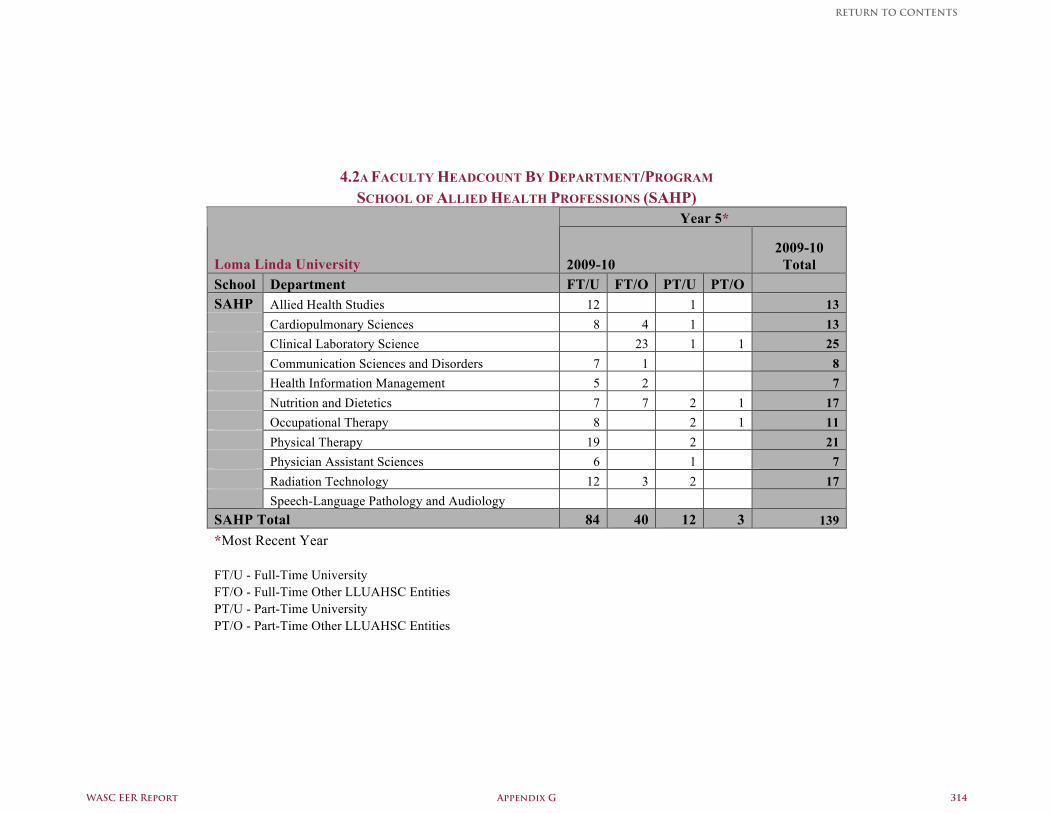
4.2A FACULTY HEADCOUNT BY DEPARTMENT/PROGRAM SCHOOL OF ALLIED HEALTH PROFESSIONS (SAHP)
Year 5*
Loma Linda University 2009-10 2009-10
Total School Department FT/U FT/O PT/U PT/O SAHP Allied Health Studies 12 1 13 Cardiopulmonary Sciences 8 4 1 13 Clinical Laboratory Science 23 1 1 25 Communication Sciences and Disorders 7 1 8 Health Information Management 5 2 7 Nutrition and Dietetics 7 7 2 1 17 Occupational Therapy 8 2 1 11 Physical Therapy 19 2 21 Physician Assistant Sciences 6 1 7 Radiation Technology 12 3 2 17 Speech-Language Pathology and Audiology SAHP Total 84 40 12 3 139 *Most Recent Year FT/U - Full-Time University FT/O - Full-Time Other LLUAHSC Entities PT/U - Part-Time University PT/O - Part-Time Other LLUAHSC Entities
WASC EER Report Appendix G 314
RETURN TO CONTENTS
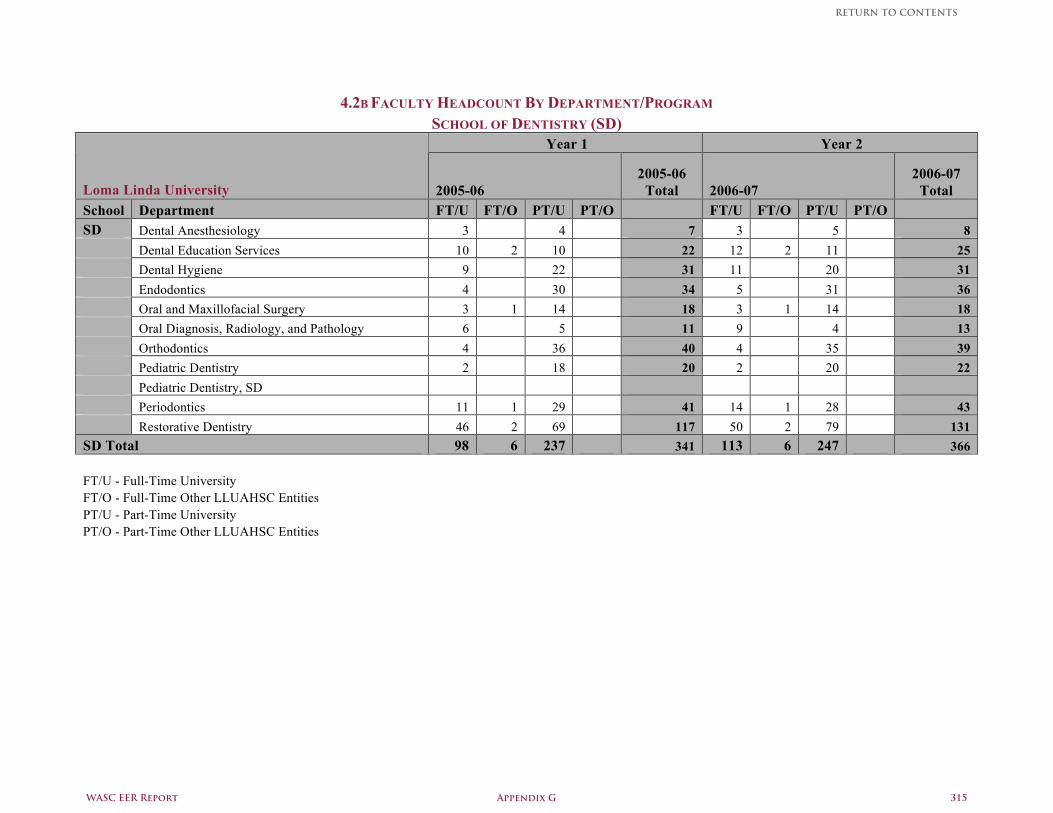
4.2B FACULTY HEADCOUNT BY DEPARTMENT/PROGRAM
SCHOOL OF DENTISTRY (SD) Year 1 Year 2
Loma Linda University 2005-06 2005-06
Total 2006-07 2006-07
Total School Department FT/U FT/O PT/U PT/O FT/U FT/O PT/U PT/O SD Dental Anesthesiology 3 4 7 3 5 8 Dental Education Services 10 2 10 22 12 2 11 25 Dental Hygiene 9 22 31 11 20 31 Endodontics 4 30 34 5 31 36 Oral and Maxillofacial Surgery 3 1 14 18 3 1 14 18 Oral Diagnosis, Radiology, and Pathology 6 5 11 9 4 13 Orthodontics 4 36 40 4 35 39 Pediatric Dentistry 2 18 20 2 20 22 Pediatric Dentistry, SD Periodontics 11 1 29 41 14 1 28 43 Restorative Dentistry 46 2 69 117 50 2 79 131 SD Total 98 6 237 341 113 6 247 366 FT/U - Full-Time University FT/O - Full-Time Other LLUAHSC Entities PT/U - Part-Time University PT/O - Part-Time Other LLUAHSC Entities
WASC EER Report Appendix G 315
RETURN TO CONTENTS
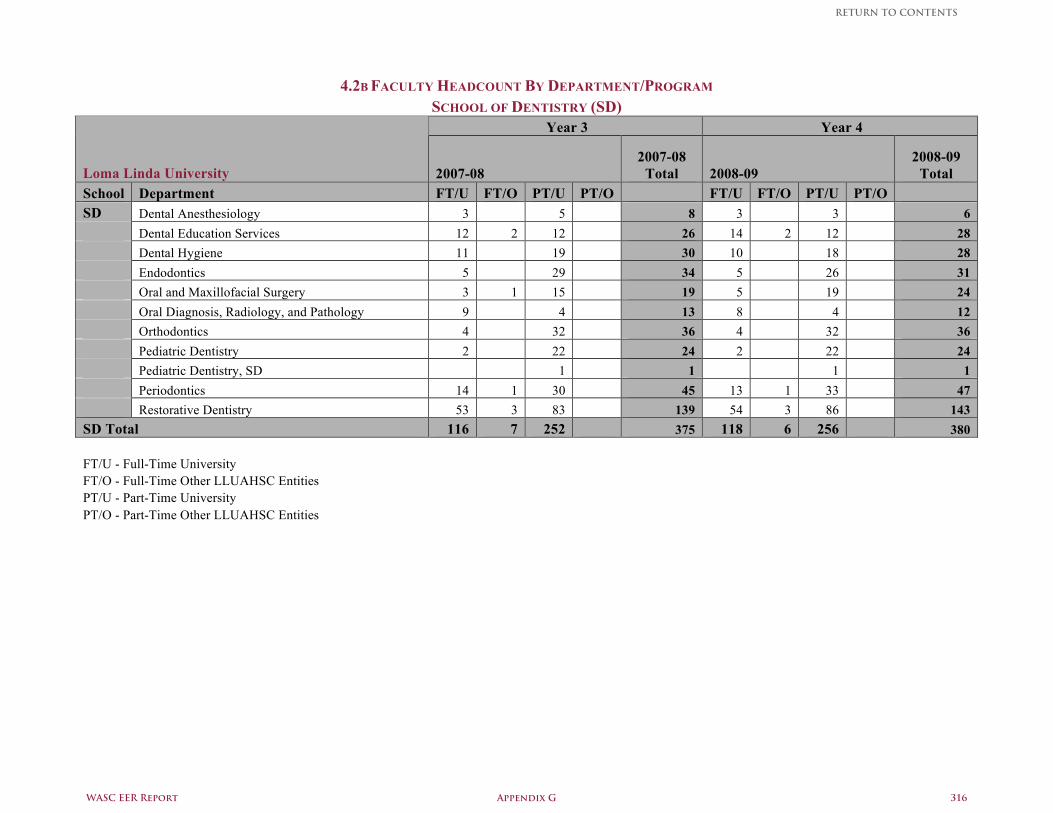
4.2B FACULTY HEADCOUNT BY DEPARTMENT/PROGRAM SCHOOL OF DENTISTRY (SD)
Year 3 Year 4
Loma Linda University 2007-08 2007-08
Total 2008-09 2008-09
Total School Department FT/U FT/O PT/U PT/O FT/U FT/O PT/U PT/O SD Dental Anesthesiology 3 5 8 3 3 6 Dental Education Services 12 2 12 26 14 2 12 28 Dental Hygiene 11 19 30 10 18 28 Endodontics 5 29 34 5 26 31 Oral and Maxillofacial Surgery 3 1 15 19 5 19 24 Oral Diagnosis, Radiology, and Pathology 9 4 13 8 4 12 Orthodontics 4 32 36 4 32 36 Pediatric Dentistry 2 22 24 2 22 24 Pediatric Dentistry, SD 1 1 1 1 Periodontics 14 1 30 45 13 1 33 47 Restorative Dentistry 53 3 83 139 54 3 86 143 SD Total 116 7 252 375 118 6 256 380 FT/U - Full-Time University FT/O - Full-Time Other LLUAHSC Entities PT/U - Part-Time University PT/O - Part-Time Other LLUAHSC Entities
WASC EER Report Appendix G 316
RETURN TO CONTENTS
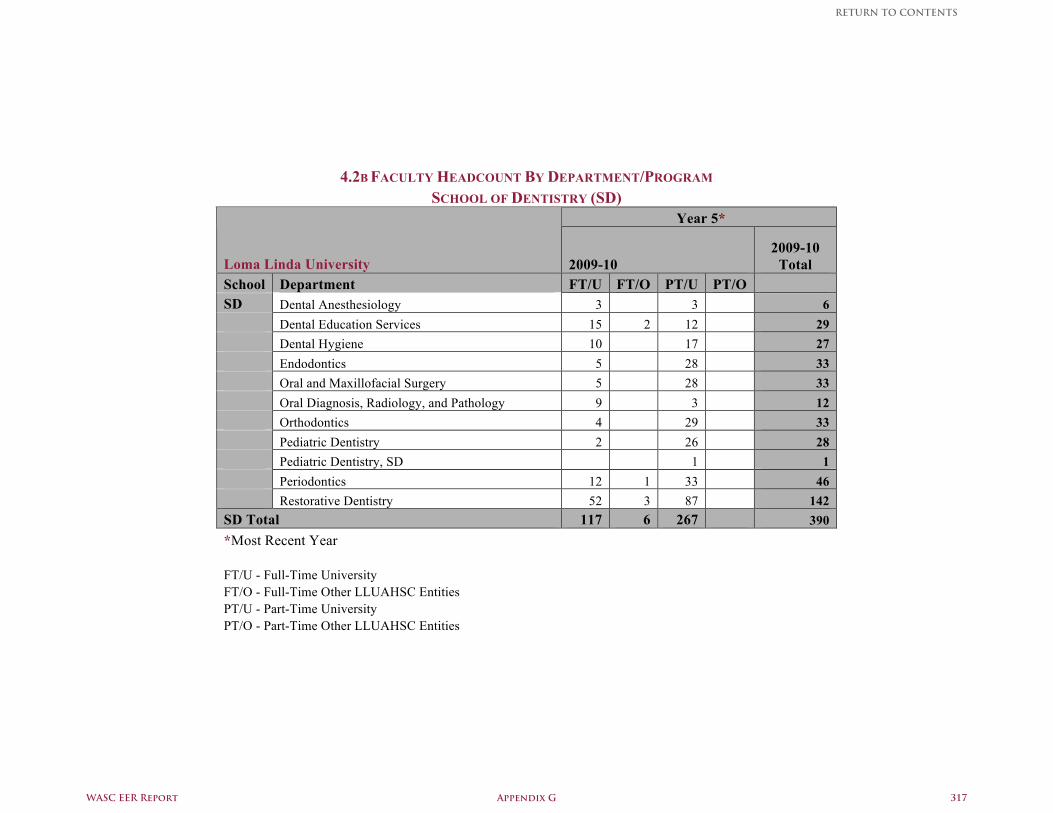
4.2B FACULTY HEADCOUNT BY DEPARTMENT/PROGRAM SCHOOL OF DENTISTRY (SD)
Year 5*
Loma Linda University 2009-10 2009-10
Total School Department FT/U FT/O PT/U PT/O SD Dental Anesthesiology 3 3 6 Dental Education Services 15 2 12 29 Dental Hygiene 10 17 27 Endodontics 5 28 33 Oral and Maxillofacial Surgery 5 28 33 Oral Diagnosis, Radiology, and Pathology 9 3 12 Orthodontics 4 29 33 Pediatric Dentistry 2 26 28 Pediatric Dentistry, SD 1 1 Periodontics 12 1 33 46 Restorative Dentistry 52 3 87 142 SD Total 117 6 267 390 *Most Recent Year FT/U - Full-Time University FT/O - Full-Time Other LLUAHSC Entities PT/U - Part-Time University PT/O - Part-Time Other LLUAHSC Entities
WASC EER Report Appendix G 317
RETURN TO CONTENTS
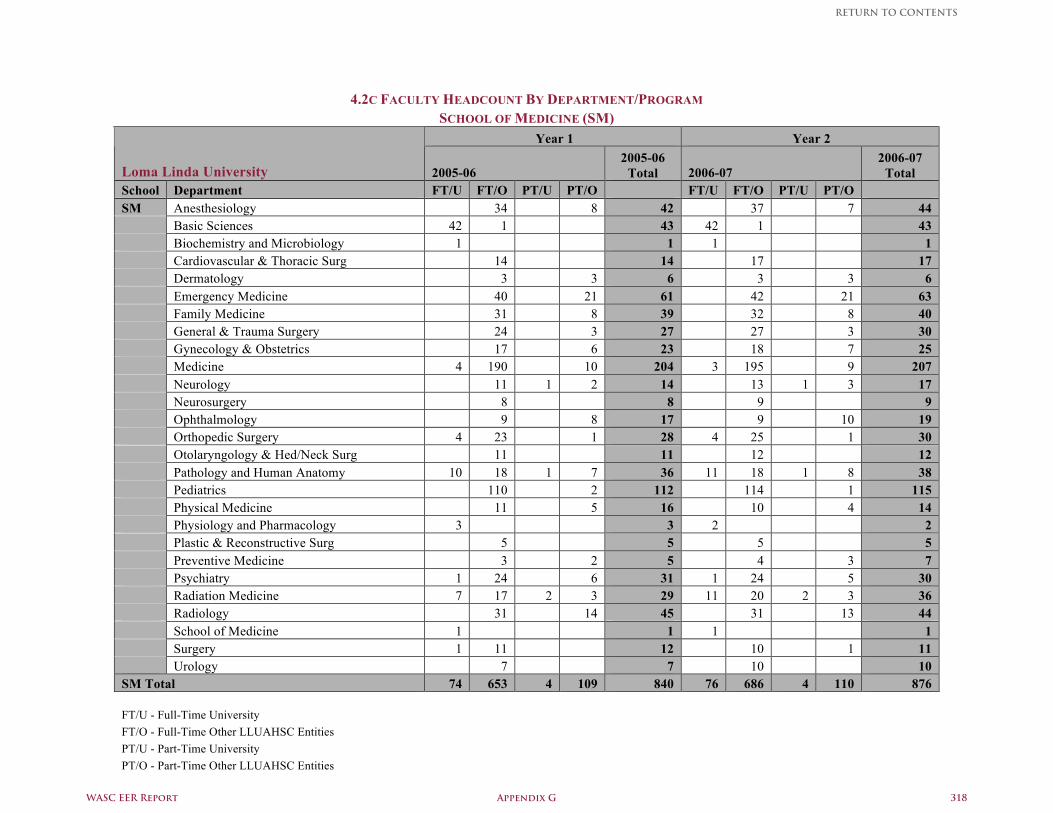
4.2C FACULTY HEADCOUNT BY DEPARTMENT/PROGRAM
SCHOOL OF MEDICINE (SM) Year 1 Year 2
Loma Linda University 2005-06 2005-06
Total 2006-07 2006-07
Total School Department FT/U FT/O PT/U PT/O FT/U FT/O PT/U PT/O SM Anesthesiology 34 8 42 37 7 44 Basic Sciences 42 1 43 42 1 43 Biochemistry and Microbiology 1 1 1 1 Cardiovascular & Thoracic Surg 14 14 17 17 Dermatology 3 3 6 3 3 6 Emergency Medicine 40 21 61 42 21 63 Family Medicine 31 8 39 32 8 40 General & Trauma Surgery 24 3 27 27 3 30 Gynecology & Obstetrics 17 6 23 18 7 25 Medicine 4 190 10 204 3 195 9 207 Neurology 11 1 2 14 13 1 3 17 Neurosurgery 8 8 9 9 Ophthalmology 9 8 17 9 10 19 Orthopedic Surgery 4 23 1 28 4 25 1 30 Otolaryngology & Hed/Neck Surg 11 11 12 12 Pathology and Human Anatomy 10 18 1 7 36 11 18 1 8 38 Pediatrics 110 2 112 114 1 115 Physical Medicine 11 5 16 10 4 14 Physiology and Pharmacology 3 3 2 2 Plastic & Reconstructive Surg 5 5 5 5 Preventive Medicine 3 2 5 4 3 7 Psychiatry 1 24 6 31 1 24 5 30 Radiation Medicine 7 17 2 3 29 11 20 2 3 36 Radiology 31 14 45 31 13 44 School of Medicine 1 1 1 1 Surgery 1 11 12 10 1 11 Urology 7 7 10 10 SM Total 74 653 4 109 840 76 686 4 110 876 FT/U - Full-Time University FT/O - Full-Time Other LLUAHSC Entities PT/U - Part-Time University PT/O - Part-Time Other LLUAHSC Entities
WASC EER Report Appendix G 318
RETURN TO CONTENTS
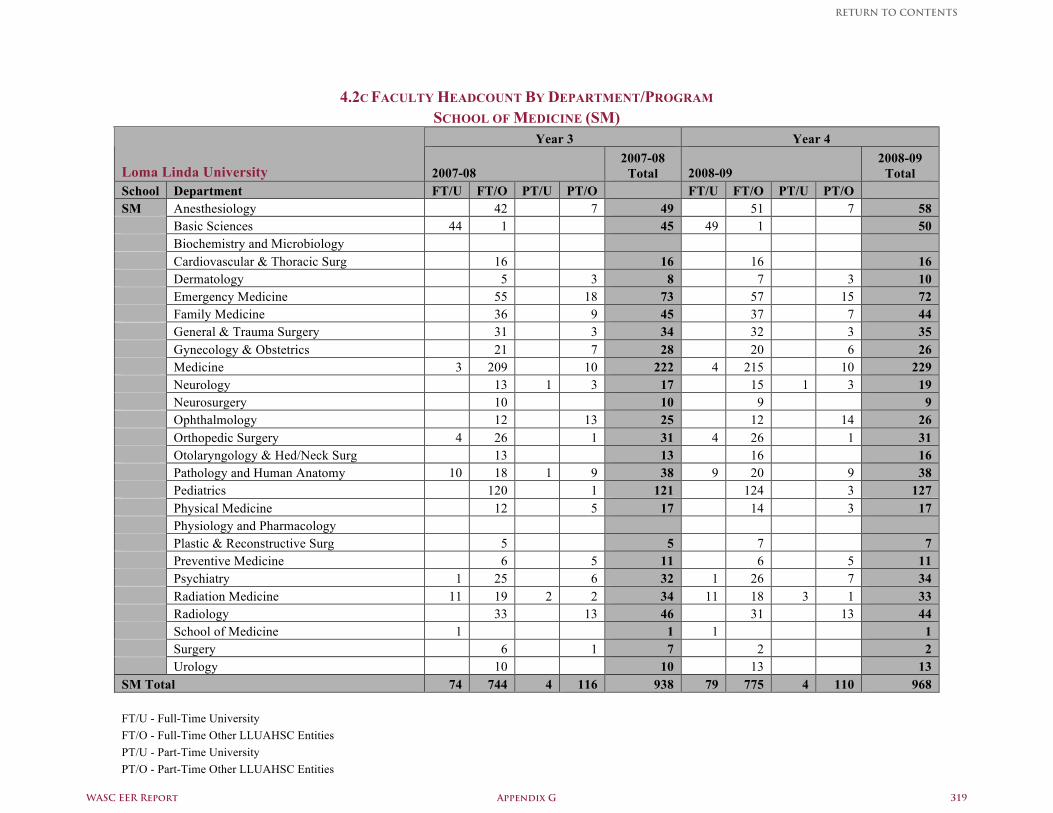
4.2C FACULTY HEADCOUNT BY DEPARTMENT/PROGRAM
SCHOOL OF MEDICINE (SM) Year 3 Year 4
Loma Linda University 2007-08 2007-08
Total 2008-09 2008-09
Total School Department FT/U FT/O PT/U PT/O FT/U FT/O PT/U PT/O SM Anesthesiology 42 7 49 51 7 58 Basic Sciences 44 1 45 49 1 50 Biochemistry and Microbiology Cardiovascular & Thoracic Surg 16 16 16 16 Dermatology 5 3 8 7 3 10 Emergency Medicine 55 18 73 57 15 72 Family Medicine 36 9 45 37 7 44 General & Trauma Surgery 31 3 34 32 3 35 Gynecology & Obstetrics 21 7 28 20 6 26 Medicine 3 209 10 222 4 215 10 229 Neurology 13 1 3 17 15 1 3 19 Neurosurgery 10 10 9 9 Ophthalmology 12 13 25 12 14 26 Orthopedic Surgery 4 26 1 31 4 26 1 31 Otolaryngology & Hed/Neck Surg 13 13 16 16 Pathology and Human Anatomy 10 18 1 9 38 9 20 9 38 Pediatrics 120 1 121 124 3 127 Physical Medicine 12 5 17 14 3 17 Physiology and Pharmacology Plastic & Reconstructive Surg 5 5 7 7 Preventive Medicine 6 5 11 6 5 11 Psychiatry 1 25 6 32 1 26 7 34 Radiation Medicine 11 19 2 2 34 11 18 3 1 33 Radiology 33 13 46 31 13 44 School of Medicine 1 1 1 1 Surgery 6 1 7 2 2 Urology 10 10 13 13 SM Total 74 744 4 116 938 79 775 4 110 968 FT/U - Full-Time University FT/O - Full-Time Other LLUAHSC Entities PT/U - Part-Time University PT/O - Part-Time Other LLUAHSC Entities
Req
uir
ed
Data
38
WASC EER Report Appendix G 319
RETURN TO CONTENTS
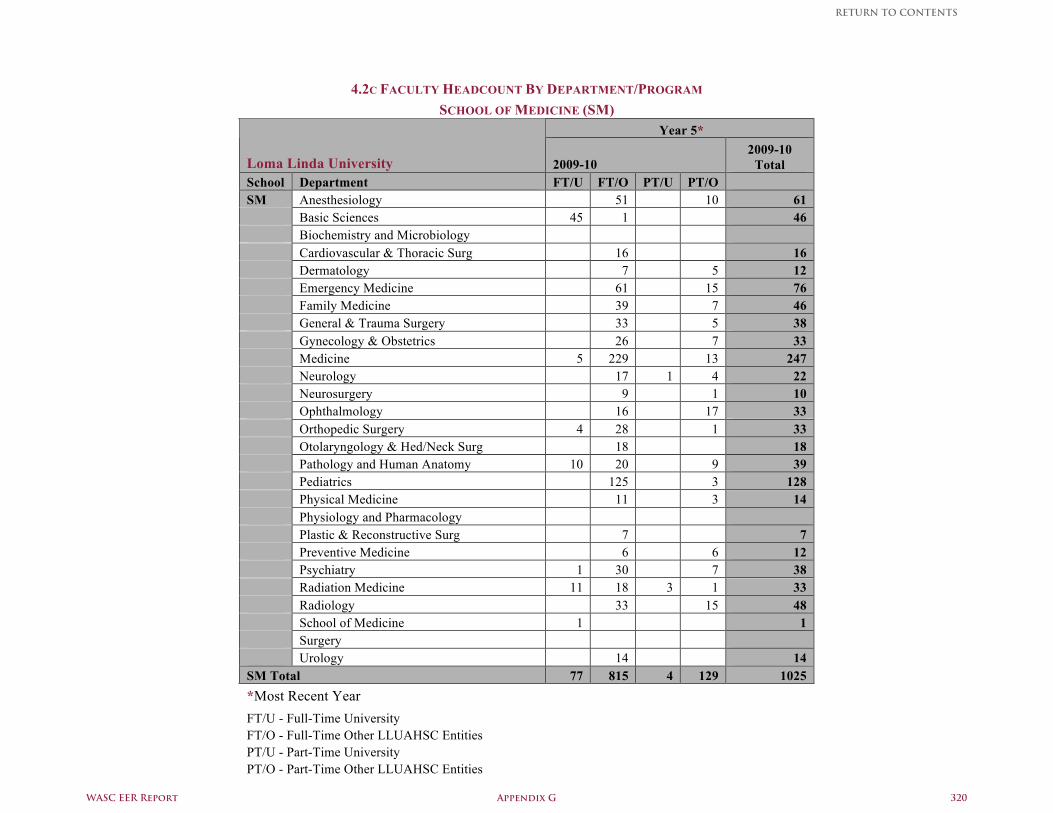
4.2C FACULTY HEADCOUNT BY DEPARTMENT/PROGRAM SCHOOL OF MEDICINE (SM)
Year 5*
Loma Linda University 2009-10 2009-10
Total School Department FT/U FT/O PT/U PT/O SM Anesthesiology 51 10 61 Basic Sciences 45 1 46 Biochemistry and Microbiology Cardiovascular & Thoracic Surg 16 16 Dermatology 7 5 12 Emergency Medicine 61 15 76 Family Medicine 39 7 46 General & Trauma Surgery 33 5 38 Gynecology & Obstetrics 26 7 33 Medicine 5 229 13 247 Neurology 17 1 4 22 Neurosurgery 9 1 10 Ophthalmology 16 17 33 Orthopedic Surgery 4 28 1 33 Otolaryngology & Hed/Neck Surg 18 18 Pathology and Human Anatomy 10 20 9 39 Pediatrics 125 3 128 Physical Medicine 11 3 14 Physiology and Pharmacology Plastic & Reconstructive Surg 7 7 Preventive Medicine 6 6 12 Psychiatry 1 30 7 38 Radiation Medicine 11 18 3 1 33 Radiology 33 15 48 School of Medicine 1 1 Surgery Urology 14 14 SM Total 77 815 4 129 1025 *Most Recent Year
FT/U - Full-Time University FT/O - Full-Time Other LLUAHSC Entities PT/U - Part-Time University PT/O - Part-Time Other LLUAHSC Entities
WASC EER Report Appendix G 320
RETURN TO CONTENTS
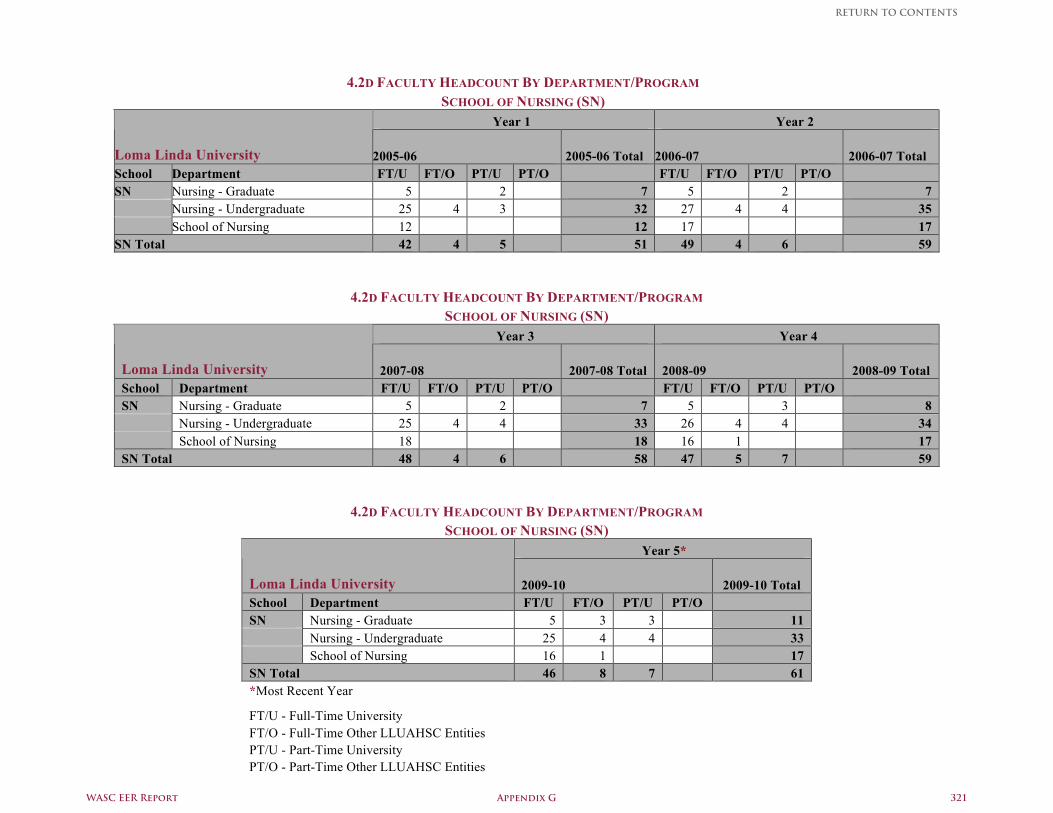
4.2D FACULTY HEADCOUNT BY DEPARTMENT/PROGRAM SCHOOL OF NURSING (SN)
Year 1 Year 2
Loma Linda University 2005-06 2005-06 Total 2006-07 2006-07 Total School Department FT/U FT/O PT/U PT/O FT/U FT/O PT/U PT/O SN Nursing - Graduate 5 2 7 5 2 7 Nursing - Undergraduate 25 4 3 32 27 4 4 35 School of Nursing 12 12 17 17 SN Total 42 4 5 51 49 4 6 59
4.2D FACULTY HEADCOUNT BY DEPARTMENT/PROGRAM SCHOOL OF NURSING (SN)
Year 3 Year 4
Loma Linda University 2007-08 2007-08 Total 2008-09 2008-09 Total School Department FT/U FT/O PT/U PT/O FT/U FT/O PT/U PT/O SN Nursing - Graduate 5 2 7 5 3 8 Nursing - Undergraduate 25 4 4 33 26 4 4 34 School of Nursing 18 18 16 1 17 SN Total 48 4 6 58 47 5 7 59
4.2D FACULTY HEADCOUNT BY DEPARTMENT/PROGRAM SCHOOL OF NURSING (SN)
Year 5*
Loma Linda University 2009-10 2009-10 Total School Department FT/U FT/O PT/U PT/O SN Nursing - Graduate 5 3 3 11 Nursing - Undergraduate 25 4 4 33 School of Nursing 16 1 17 SN Total 46 8 7 61 *Most Recent Year
FT/U - Full-Time University FT/O - Full-Time Other LLUAHSC Entities PT/U - Part-Time University PT/O - Part-Time Other LLUAHSC Entities
WASC EER Report Appendix G 321
RETURN TO CONTENTS
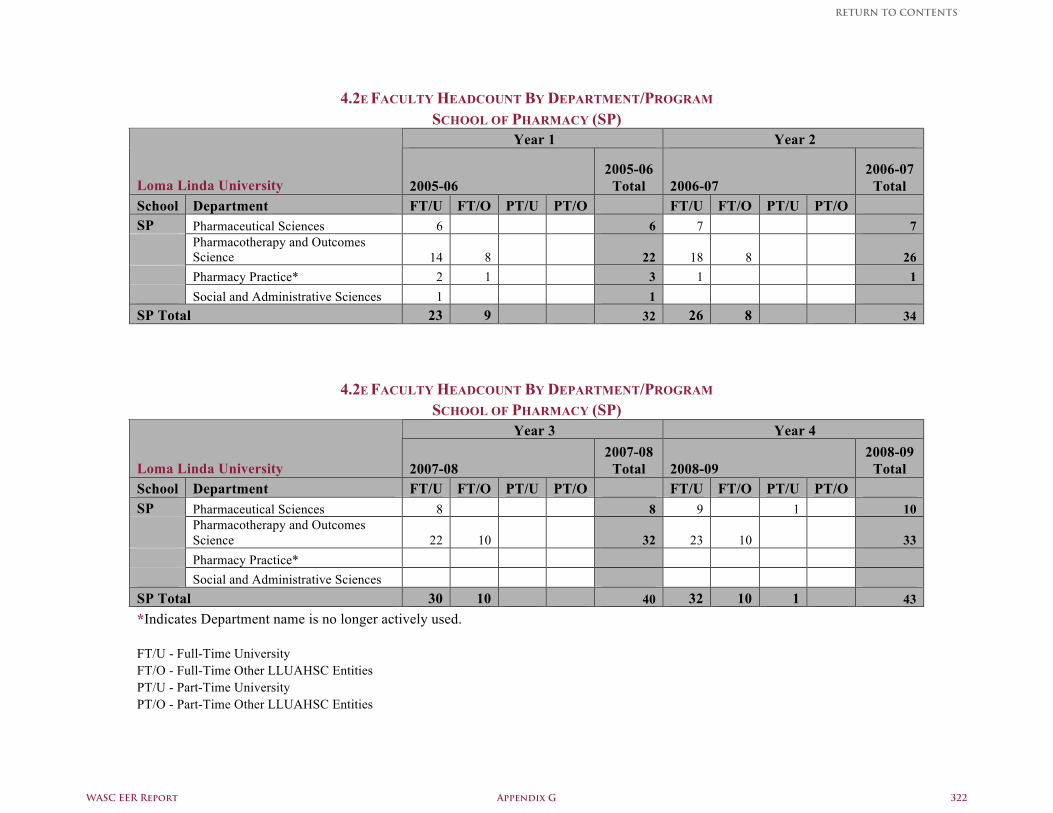
4.2E FACULTY HEADCOUNT BY DEPARTMENT/PROGRAM
SCHOOL OF PHARMACY (SP) Year 1 Year 2
Loma Linda University 2005-06 2005-06
Total 2006-07 2006-07
Total School Department FT/U FT/O PT/U PT/O FT/U FT/O PT/U PT/O SP Pharmaceutical Sciences 6 6 7 7
Pharmacotherapy and Outcomes Science 14 8 22 18 8 26
Pharmacy Practice* 2 1 3 1 1 Social and Administrative Sciences 1 1 SP Total 23 9 32 26 8 34
4.2E FACULTY HEADCOUNT BY DEPARTMENT/PROGRAM SCHOOL OF PHARMACY (SP)
Year 3 Year 4
Loma Linda University 2007-08 2007-08
Total 2008-09 2008-09
Total School Department FT/U FT/O PT/U PT/O FT/U FT/O PT/U PT/O SP Pharmaceutical Sciences 8 8 9 1 10
Pharmacotherapy and Outcomes Science 22 10 32 23 10 33
Pharmacy Practice* Social and Administrative Sciences SP Total 30 10 40 32 10 1 43 *Indicates Department name is no longer actively used. FT/U - Full-Time University FT/O - Full-Time Other LLUAHSC Entities PT/U - Part-Time University PT/O - Part-Time Other LLUAHSC Entities
WASC EER Report Appendix G 322
RETURN TO CONTENTS
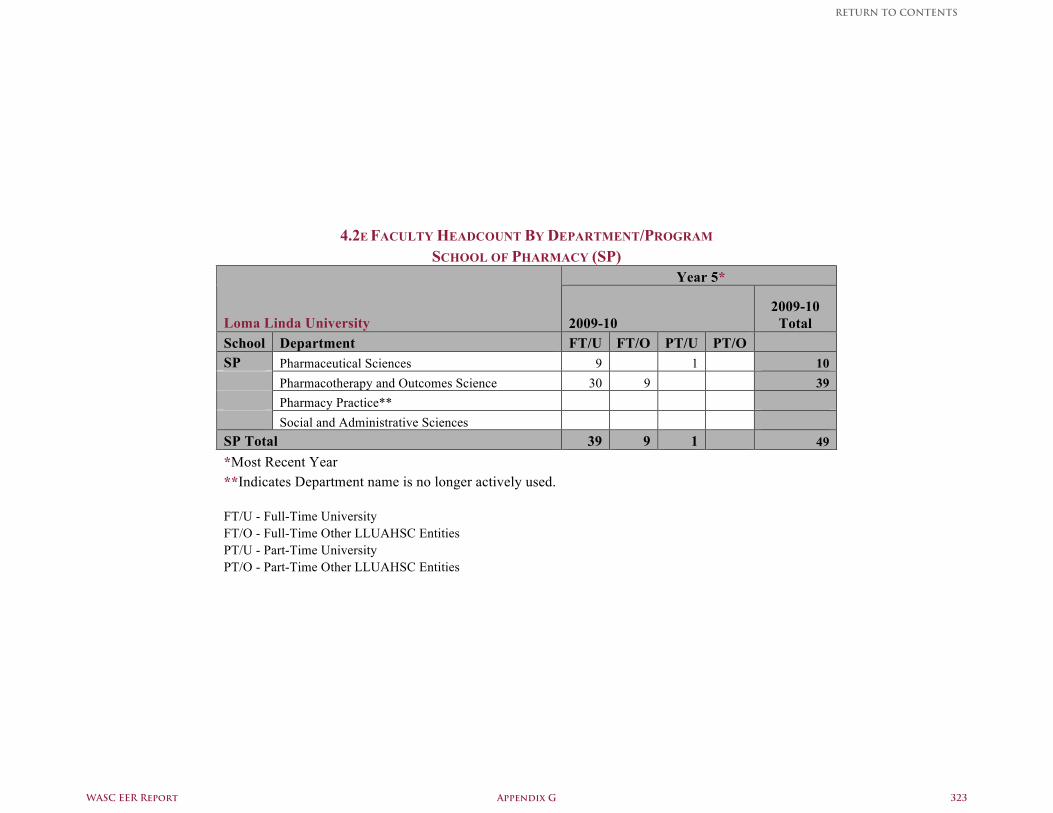
4.2E FACULTY HEADCOUNT BY DEPARTMENT/PROGRAM SCHOOL OF PHARMACY (SP)
Year 5*
Loma Linda University 2009-10 2009-10
Total School Department FT/U FT/O PT/U PT/O SP Pharmaceutical Sciences 9 1 10 Pharmacotherapy and Outcomes Science 30 9 39 Pharmacy Practice** Social and Administrative Sciences SP Total 39 9 1 49 *Most Recent Year **Indicates Department name is no longer actively used. FT/U - Full-Time University FT/O - Full-Time Other LLUAHSC Entities PT/U - Part-Time University PT/O - Part-Time Other LLUAHSC Entities
WASC EER Report Appendix G 323
RETURN TO CONTENTS
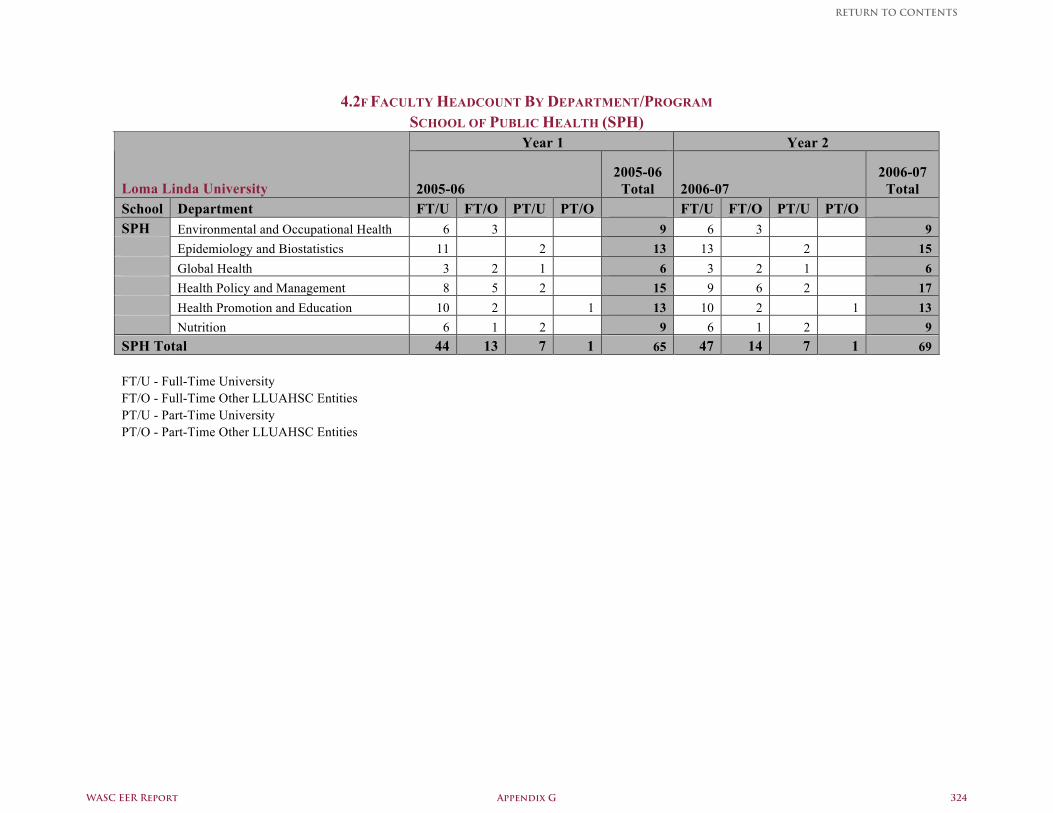
4.2F FACULTY HEADCOUNT BY DEPARTMENT/PROGRAM
SCHOOL OF PUBLIC HEALTH (SPH) Year 1 Year 2
Loma Linda University 2005-06 2005-06
Total 2006-07 2006-07
Total School Department FT/U FT/O PT/U PT/O FT/U FT/O PT/U PT/O SPH Environmental and Occupational Health 6 3 9 6 3 9 Epidemiology and Biostatistics 11 2 13 13 2 15 Global Health 3 2 1 6 3 2 1 6 Health Policy and Management 8 5 2 15 9 6 2 17 Health Promotion and Education 10 2 1 13 10 2 1 13 Nutrition 6 1 2 9 6 1 2 9 SPH Total 44 13 7 1 65 47 14 7 1 69 FT/U - Full-Time University FT/O - Full-Time Other LLUAHSC Entities PT/U - Part-Time University PT/O - Part-Time Other LLUAHSC Entities
WASC EER Report Appendix G 324
RETURN TO CONTENTS

4.2F FACULTY HEADCOUNT BY DEPARTMENT/PROGRAM
SCHOOL OF PUBLIC HEALTH (SPH) Year 3 Year 4
Loma Linda University 2007-08 2007-08
Total 2008-09 2008-09
Total School Department FT/U FT/O PT/U PT/O FT/U FT/O PT/U PT/O SPH Environmental and Occupational Health 6 3 9 7 3 10 Epidemiology and Biostatistics 13 2 15 14 2 16 Global Health 4 2 1 7 4 2 1 7 Health Policy and Management 13 6 2 21 15 6 2 23 Health Promotion and Education 11 2 1 14 9 2 1 12 Nutrition 7 1 2 10 7 1 2 10 SPH Total 54 14 7 1 76 56 14 7 1 78 FT/U - Full-Time University FT/O - Full-Time Other LLUAHSC Entities PT/U - Part-Time University PT/O - Part-Time Other LLUAHSC Entities
WASC EER Report Appendix G 325
RETURN TO CONTENTS
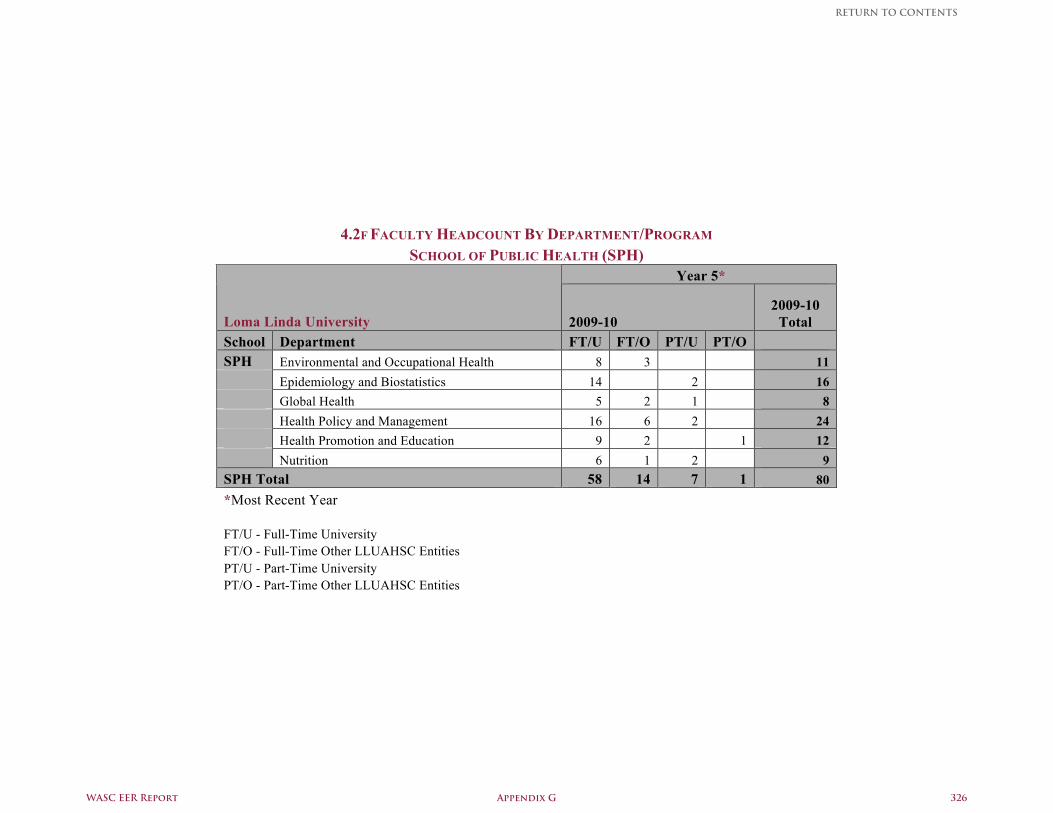
4.2F FACULTY HEADCOUNT BY DEPARTMENT/PROGRAM
SCHOOL OF PUBLIC HEALTH (SPH) Year 5*
Loma Linda University 2009-10 2009-10
Total School Department FT/U FT/O PT/U PT/O SPH Environmental and Occupational Health 8 3 11 Epidemiology and Biostatistics 14 2 16 Global Health 5 2 1 8 Health Policy and Management 16 6 2 24 Health Promotion and Education 9 2 1 12 Nutrition 6 1 2 9 SPH Total 58 14 7 1 80 *Most Recent Year FT/U - Full-Time University FT/O - Full-Time Other LLUAHSC Entities PT/U - Part-Time University PT/O - Part-Time Other LLUAHSC Entities
WASC EER Report Appendix G 326
RETURN TO CONTENTS
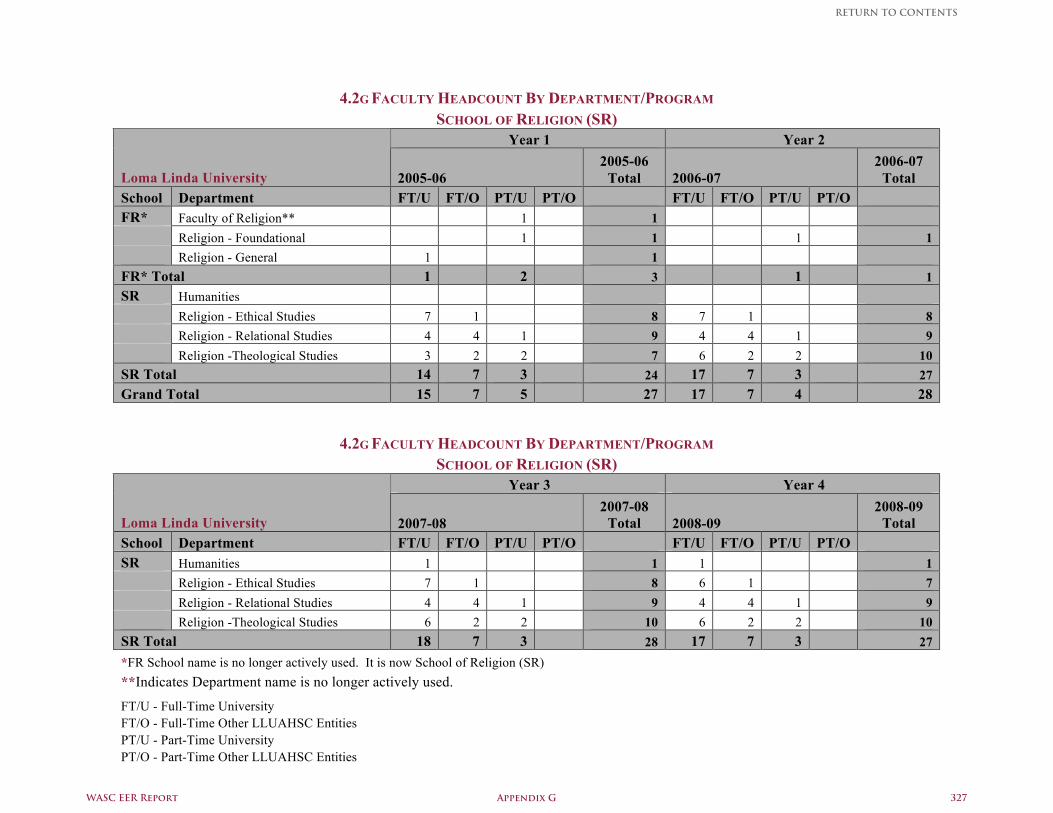
4.2G FACULTY HEADCOUNT BY DEPARTMENT/PROGRAM
SCHOOL OF RELIGION (SR) Year 1 Year 2
Loma Linda University 2005-06 2005-06
Total 2006-07 2006-07
Total School Department FT/U FT/O PT/U PT/O FT/U FT/O PT/U PT/O FR* Faculty of Religion** 1 1 Religion - Foundational 1 1 1 1 Religion - General 1 1 FR* Total 1 2 3 1 1 SR Humanities Religion - Ethical Studies 7 1 8 7 1 8 Religion - Relational Studies 4 4 1 9 4 4 1 9 Religion -Theological Studies 3 2 2 7 6 2 2 10 SR Total 14 7 3 24 17 7 3 27 Grand Total 15 7 5 27 17 7 4 28
4.2G FACULTY HEADCOUNT BY DEPARTMENT/PROGRAM
SCHOOL OF RELIGION (SR) Year 3 Year 4
Loma Linda University 2007-08 2007-08
Total 2008-09 2008-09
Total School Department FT/U FT/O PT/U PT/O FT/U FT/O PT/U PT/O SR Humanities 1 1 1 1 Religion - Ethical Studies 7 1 8 6 1 7 Religion - Relational Studies 4 4 1 9 4 4 1 9 Religion -Theological Studies 6 2 2 10 6 2 2 10 SR Total 18 7 3 28 17 7 3 27 *FR School name is no longer actively used. It is now School of Religion (SR) **Indicates Department name is no longer actively used.
FT/U - Full-Time University FT/O - Full-Time Other LLUAHSC Entities PT/U - Part-Time University PT/O - Part-Time Other LLUAHSC Entities
WASC EER Report Appendix G 327
RETURN TO CONTENTS
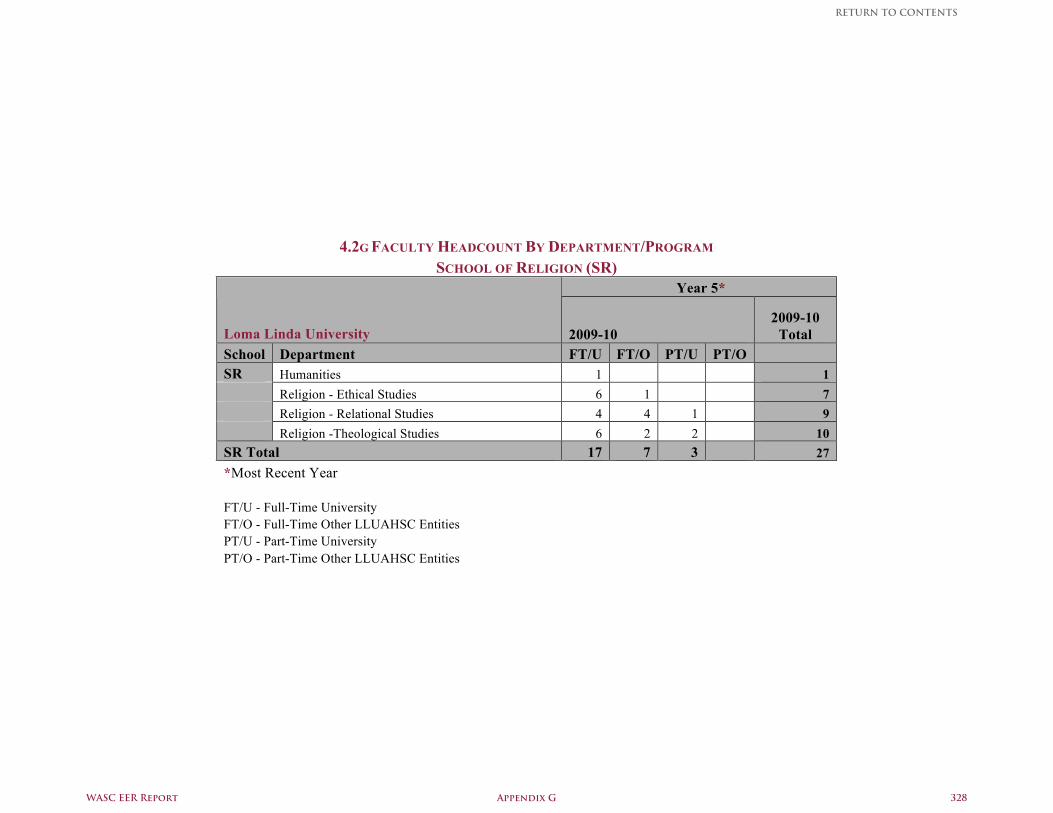
4.2G FACULTY HEADCOUNT BY DEPARTMENT/PROGRAM SCHOOL OF RELIGION (SR)
Year 5*
Loma Linda University 2009-10 2009-10
Total School Department FT/U FT/O PT/U PT/O SR Humanities 1 1 Religion - Ethical Studies 6 1 7 Religion - Relational Studies 4 4 1 9 Religion -Theological Studies 6 2 2 10 SR Total 17 7 3 27 *Most Recent Year FT/U - Full-Time University FT/O - Full-Time Other LLUAHSC Entities PT/U - Part-Time University PT/O - Part-Time Other LLUAHSC Entities
WASC EER Report Appendix G 328
RETURN TO CONTENTS
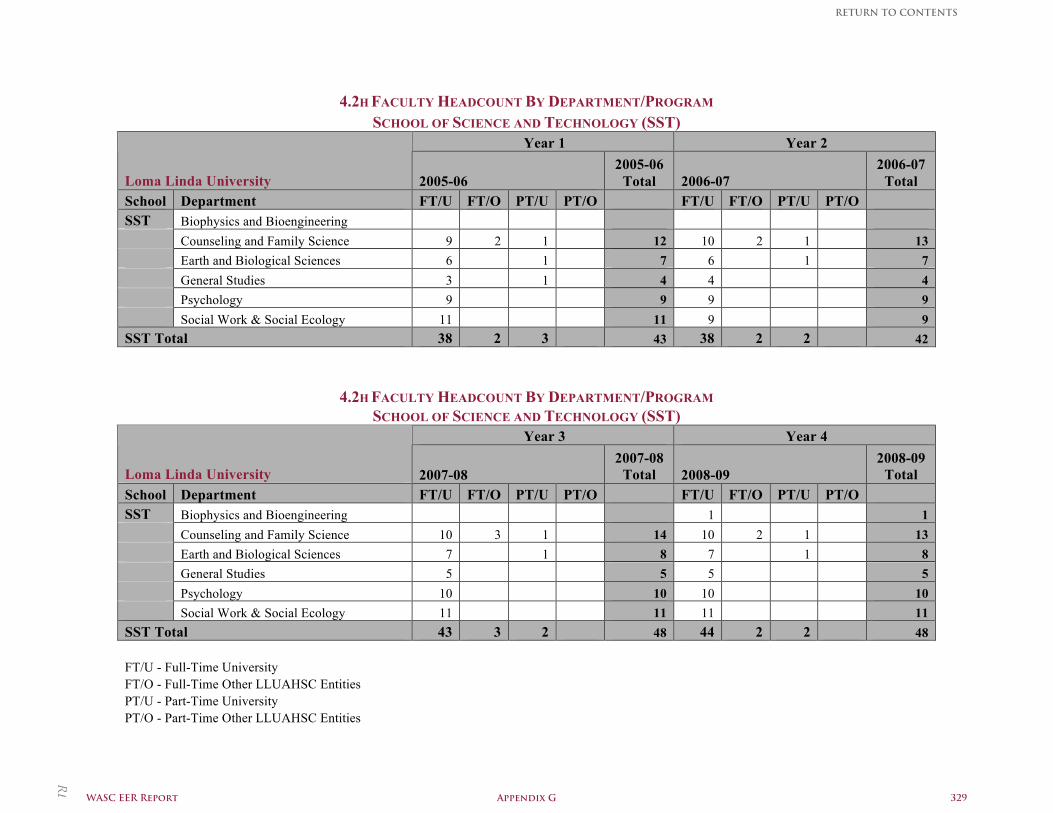
4.2H FACULTY HEADCOUNT BY DEPARTMENT/PROGRAM
SCHOOL OF SCIENCE AND TECHNOLOGY (SST) Year 1 Year 2
Loma Linda University 2005-06 2005-06
Total 2006-07 2006-07
Total School Department FT/U FT/O PT/U PT/O FT/U FT/O PT/U PT/O SST Biophysics and Bioengineering Counseling and Family Science 9 2 1 12 10 2 1 13 Earth and Biological Sciences 6 1 7 6 1 7 General Studies 3 1 4 4 4 Psychology 9 9 9 9 Social Work & Social Ecology 11 11 9 9 SST Total 38 2 3 43 38 2 2 42
4.2H FACULTY HEADCOUNT BY DEPARTMENT/PROGRAM SCHOOL OF SCIENCE AND TECHNOLOGY (SST)
Year 3 Year 4
Loma Linda University 2007-08 2007-08
Total 2008-09 2008-09
Total School Department FT/U FT/O PT/U PT/O FT/U FT/O PT/U PT/O SST Biophysics and Bioengineering 1 1 Counseling and Family Science 10 3 1 14 10 2 1 13 Earth and Biological Sciences 7 1 8 7 1 8 General Studies 5 5 5 5 Psychology 10 10 10 10 Social Work & Social Ecology 11 11 11 11 SST Total 43 3 2 48 44 2 2 48 FT/U - Full-Time University FT/O - Full-Time Other LLUAHSC Entities PT/U - Part-Time University PT/O - Part-Time Other LLUAHSC Entities
Req
uir
ed
Data
37
WASC EER Report Appendix G 329
RETURN TO CONTENTS
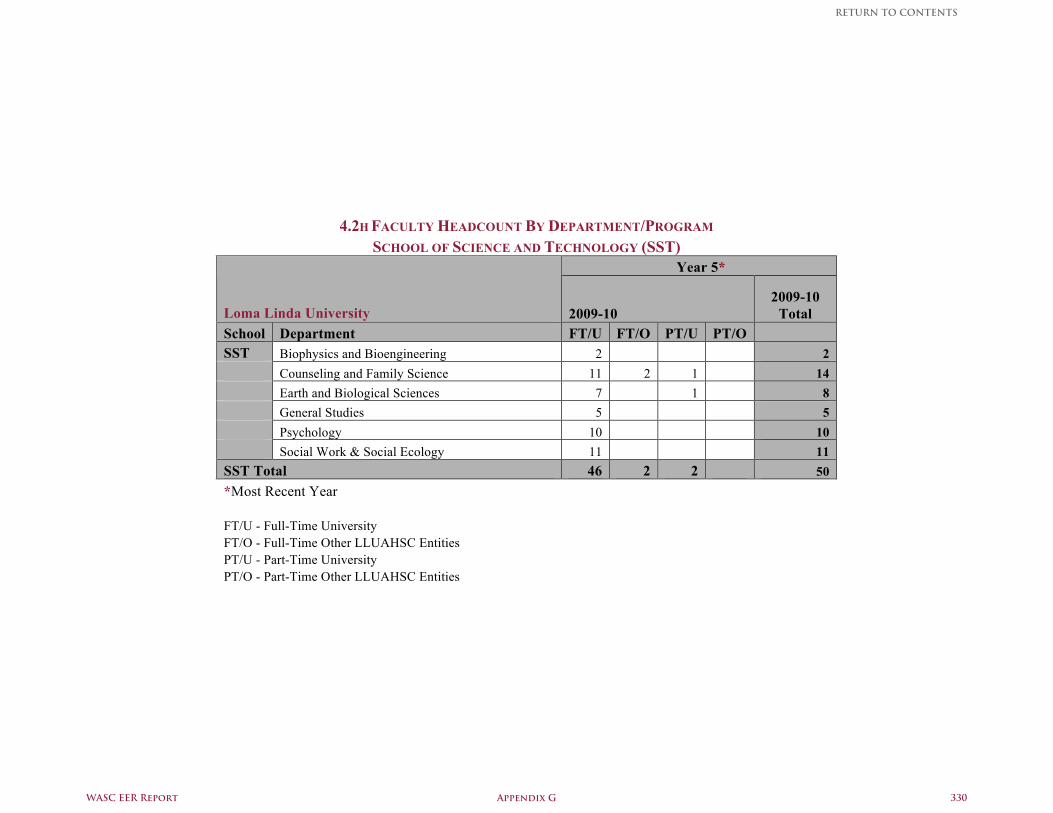
4.2H FACULTY HEADCOUNT BY DEPARTMENT/PROGRAM
SCHOOL OF SCIENCE AND TECHNOLOGY (SST) Year 5*
Loma Linda University 2009-10 2009-10
Total School Department FT/U FT/O PT/U PT/O SST Biophysics and Bioengineering 2 2 Counseling and Family Science 11 2 1 14 Earth and Biological Sciences 7 1 8 General Studies 5 5 Psychology 10 10 Social Work & Social Ecology 11 11 SST Total 46 2 2 50 *Most Recent Year FT/U - Full-Time University FT/O - Full-Time Other LLUAHSC Entities PT/U - Part-Time University PT/O - Part-Time Other LLUAHSC Entities
WASC EER Report Appendix G 330
RETURN TO CONTENTS
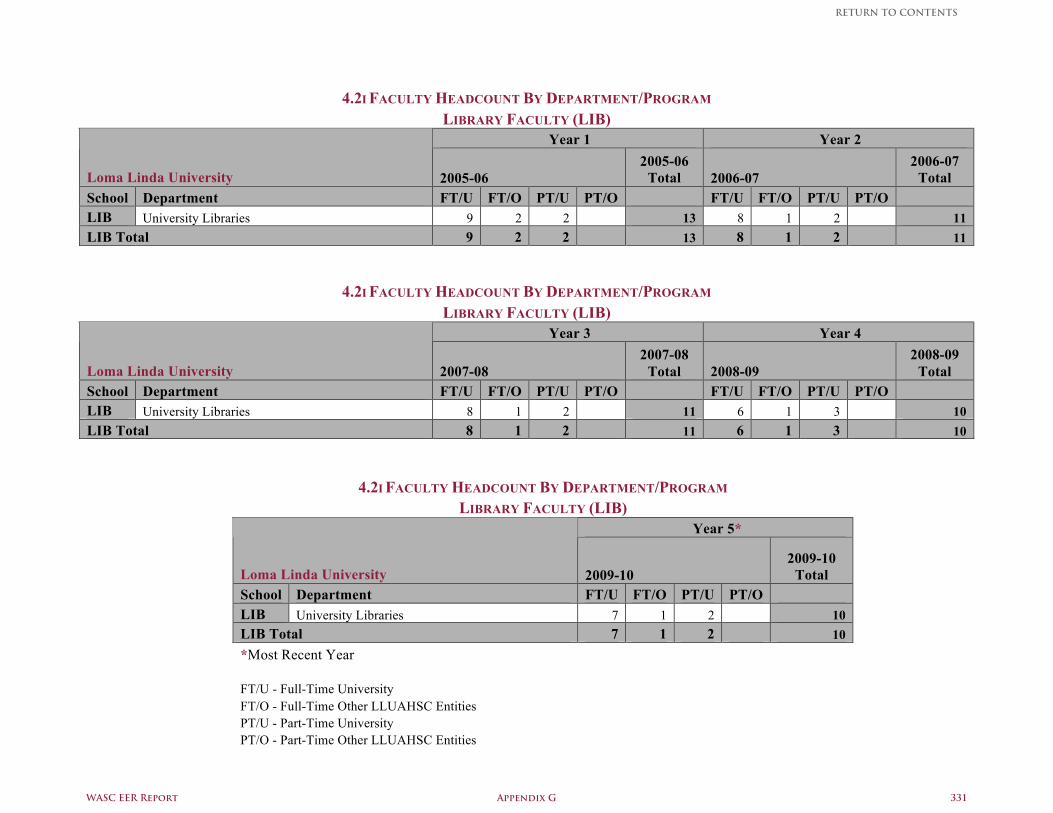
4.2I FACULTY HEADCOUNT BY DEPARTMENT/PROGRAM
LIBRARY FACULTY (LIB) Year 1 Year 2
Loma Linda University 2005-06 2005-06
Total 2006-07 2006-07
Total School Department FT/U FT/O PT/U PT/O FT/U FT/O PT/U PT/O LIB University Libraries 9 2 2 13 8 1 2 11 LIB Total 9 2 2 13 8 1 2 11
4.2I FACULTY HEADCOUNT BY DEPARTMENT/PROGRAM LIBRARY FACULTY (LIB)
Year 3 Year 4
Loma Linda University 2007-08 2007-08
Total 2008-09 2008-09
Total School Department FT/U FT/O PT/U PT/O FT/U FT/O PT/U PT/O LIB University Libraries 8 1 2 11 6 1 3 10 LIB Total 8 1 2 11 6 1 3 10
4.2I FACULTY HEADCOUNT BY DEPARTMENT/PROGRAM LIBRARY FACULTY (LIB)
Year 5*
Loma Linda University 2009-10 2009-10
Total School Department FT/U FT/O PT/U PT/O LIB University Libraries 7 1 2 10 LIB Total 7 1 2 10 *Most Recent Year FT/U - Full-Time University FT/O - Full-Time Other LLUAHSC Entities PT/U - Part-Time University PT/O - Part-Time Other LLUAHSC Entities
WASC EER Report Appendix G 331
RETURN TO CONTENTS
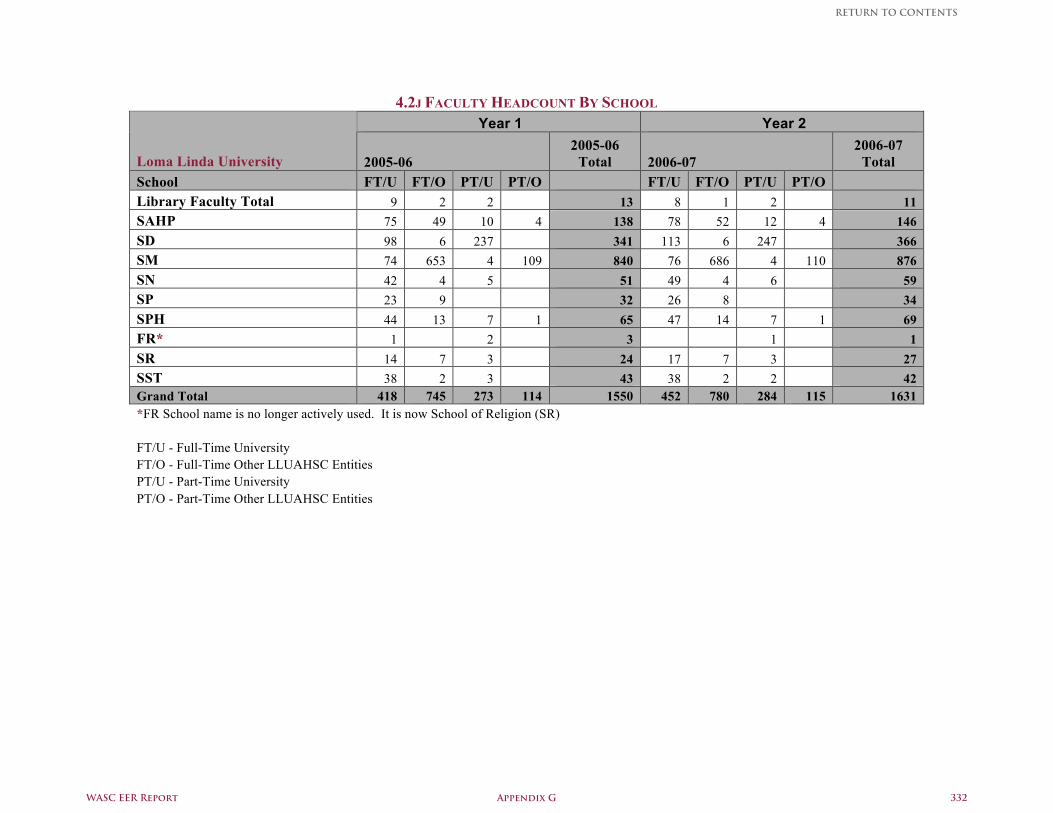
4.2J FACULTY HEADCOUNT BY SCHOOL
Year 1 Year 2
Loma Linda University 2005-06 2005-06
Total 2006-07 2006-07
Total School FT/U FT/O PT/U PT/O FT/U FT/O PT/U PT/O Library Faculty Total 9 2 2 13 8 1 2 11 SAHP 75 49 10 4 138 78 52 12 4 146 SD 98 6 237 341 113 6 247 366 SM 74 653 4 109 840 76 686 4 110 876 SN 42 4 5 51 49 4 6 59 SP 23 9 32 26 8 34 SPH 44 13 7 1 65 47 14 7 1 69 FR* 1 2 3 1 1 SR 14 7 3 24 17 7 3 27 SST 38 2 3 43 38 2 2 42 Grand Total 418 745 273 114 1550 452 780 284 115 1631 *FR School name is no longer actively used. It is now School of Religion (SR) FT/U - Full-Time University FT/O - Full-Time Other LLUAHSC Entities PT/U - Part-Time University PT/O - Part-Time Other LLUAHSC Entities
WASC EER Report Appendix G 332
RETURN TO CONTENTS
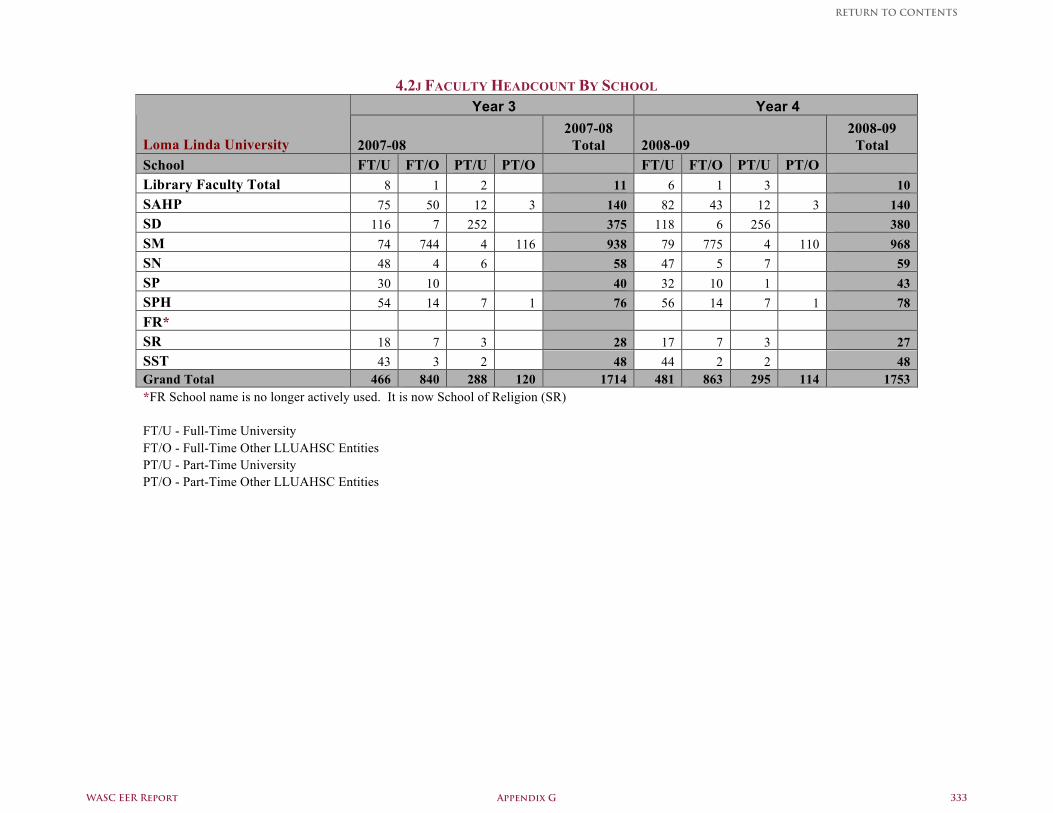
4.2J FACULTY HEADCOUNT BY SCHOOL Year 3 Year 4
Loma Linda University 2007-08 2007-08
Total 2008-09 2008-09
Total School FT/U FT/O PT/U PT/O FT/U FT/O PT/U PT/O Library Faculty Total 8 1 2 11 6 1 3 10 SAHP 75 50 12 3 140 82 43 12 3 140 SD 116 7 252 375 118 6 256 380 SM 74 744 4 116 938 79 775 4 110 968 SN 48 4 6 58 47 5 7 59 SP 30 10 40 32 10 1 43 SPH 54 14 7 1 76 56 14 7 1 78 FR* SR 18 7 3 28 17 7 3 27 SST 43 3 2 48 44 2 2 48 Grand Total 466 840 288 120 1714 481 863 295 114 1753 *FR School name is no longer actively used. It is now School of Religion (SR) FT/U - Full-Time University FT/O - Full-Time Other LLUAHSC Entities PT/U - Part-Time University PT/O - Part-Time Other LLUAHSC Entities
WASC EER Report Appendix G 333
RETURN TO CONTENTS
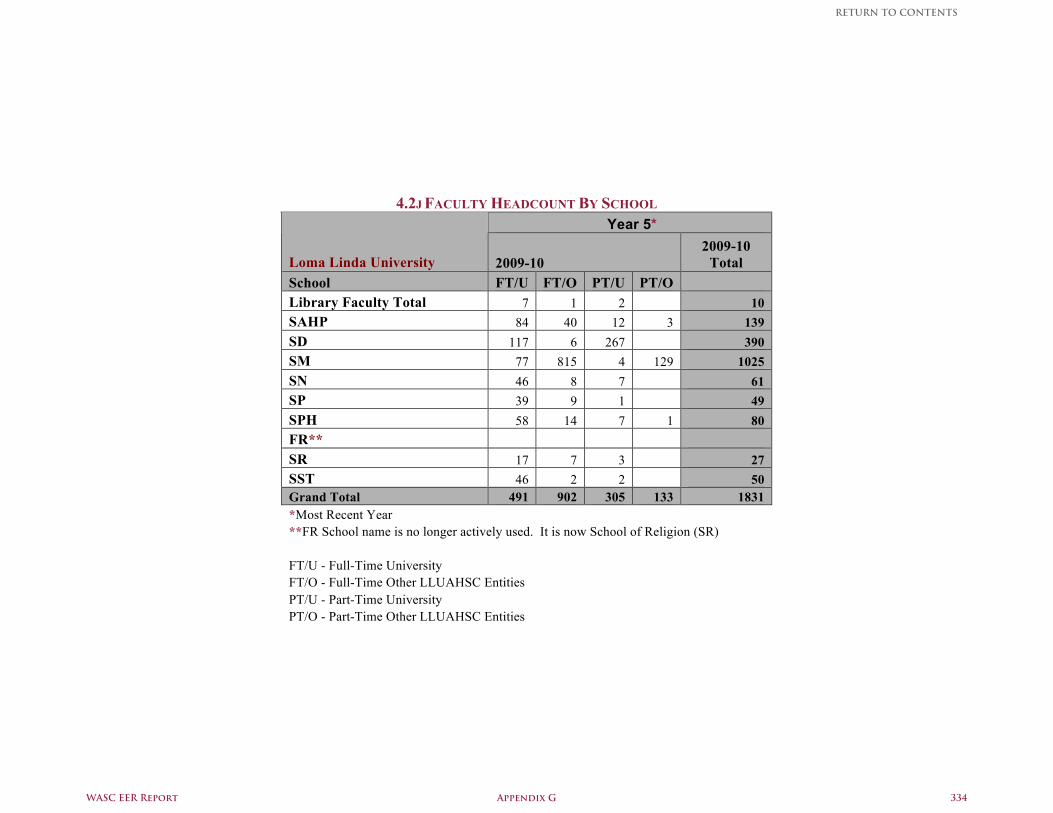
4.2J FACULTY HEADCOUNT BY SCHOOL
Year 5*
Loma Linda University 2009-10 2009-10
Total School FT/U FT/O PT/U PT/O Library Faculty Total 7 1 2 10 SAHP 84 40 12 3 139 SD 117 6 267 390 SM 77 815 4 129 1025 SN 46 8 7 61 SP 39 9 1 49 SPH 58 14 7 1 80 FR** SR 17 7 3 27 SST 46 2 2 50 Grand Total 491 902 305 133 1831 *Most Recent Year **FR School name is no longer actively used. It is now School of Religion (SR) FT/U - Full-Time University FT/O - Full-Time Other LLUAHSC Entities PT/U - Part-Time University PT/O - Part-Time Other LLUAHSC Entities
WASC EER Report Appendix G 334
RETURN TO CONTENTS
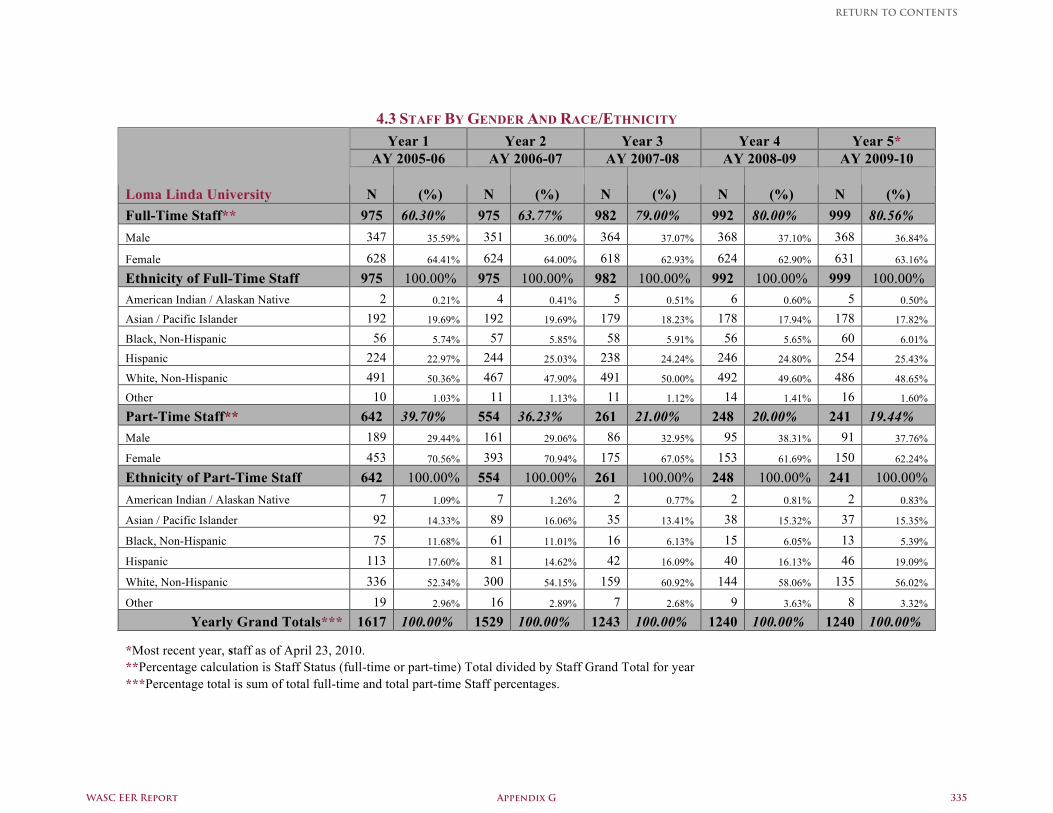
4.3 STAFF BY GENDER AND RACE/ETHNICITY Year 1 Year 2 Year 3 Year 4 Year 5*
AY 2005-06 AY 2006-07 AY 2007-08 AY 2008-09 AY 2009-10
Loma Linda University N (%) N (%) N (%) N (%) N (%) Full-Time Staff** 975 60.30% 975 63.77% 982 79.00% 992 80.00% 999 80.56% Male 347 35.59% 351 36.00% 364 37.07% 368 37.10% 368 36.84%
Female 628 64.41% 624 64.00% 618 62.93% 624 62.90% 631 63.16%
Ethnicity of Full-Time Staff 975 100.00% 975 100.00% 982 100.00% 992 100.00% 999 100.00% American Indian / Alaskan Native 2 0.21% 4 0.41% 5 0.51% 6 0.60% 5 0.50%
Asian / Pacific Islander 192 19.69% 192 19.69% 179 18.23% 178 17.94% 178 17.82%
Black, Non-Hispanic 56 5.74% 57 5.85% 58 5.91% 56 5.65% 60 6.01%
Hispanic 224 22.97% 244 25.03% 238 24.24% 246 24.80% 254 25.43%
White, Non-Hispanic 491 50.36% 467 47.90% 491 50.00% 492 49.60% 486 48.65%
Other 10 1.03% 11 1.13% 11 1.12% 14 1.41% 16 1.60%
Part-Time Staff** 642 39.70% 554 36.23% 261 21.00% 248 20.00% 241 19.44% Male 189 29.44% 161 29.06% 86 32.95% 95 38.31% 91 37.76%
Female 453 70.56% 393 70.94% 175 67.05% 153 61.69% 150 62.24%
Ethnicity of Part-Time Staff 642 100.00% 554 100.00% 261 100.00% 248 100.00% 241 100.00% American Indian / Alaskan Native 7 1.09% 7 1.26% 2 0.77% 2 0.81% 2 0.83%
Asian / Pacific Islander 92 14.33% 89 16.06% 35 13.41% 38 15.32% 37 15.35%
Black, Non-Hispanic 75 11.68% 61 11.01% 16 6.13% 15 6.05% 13 5.39%
Hispanic 113 17.60% 81 14.62% 42 16.09% 40 16.13% 46 19.09%
White, Non-Hispanic 336 52.34% 300 54.15% 159 60.92% 144 58.06% 135 56.02%
Other 19 2.96% 16 2.89% 7 2.68% 9 3.63% 8 3.32%
Yearly Grand Totals*** 1617 100.00% 1529 100.00% 1243 100.00% 1240 100.00% 1240 100.00%
*Most recent year, staff as of April 23, 2010. **Percentage calculation is Staff Status (full-time or part-time) Total divided by Staff Grand Total for year ***Percentage total is sum of total full-time and total part-time Staff percentages.
WASC EER Report Appendix G 335
RETURN TO CONTENTS
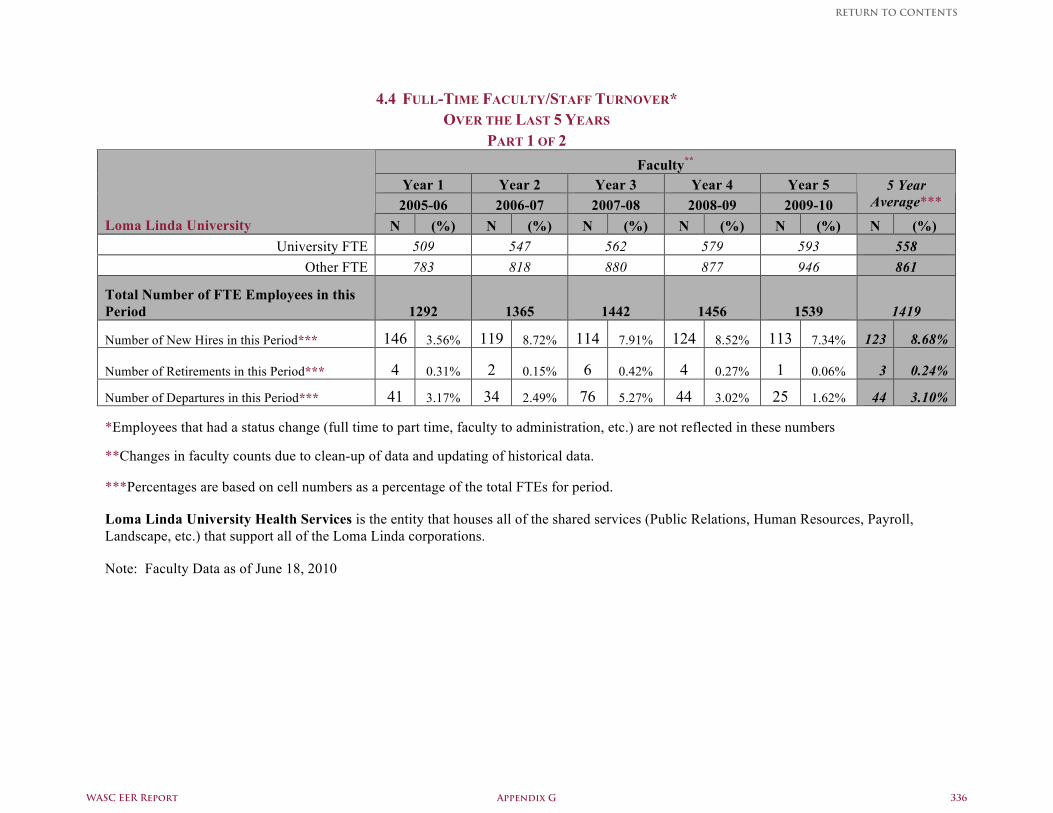
4.4 FULL-TIME FACULTY/STAFF TURNOVER*
OVER THE LAST 5 YEARS PART 1 OF 2
Faculty** Year 1 Year 2 Year 3 Year 4 Year 5 2005-06 2006-07 2007-08 2008-09 2009-10
5 Year Average***
Loma Linda University N (%) N (%) N (%) N (%) N (%) N (%) University FTE 509 547 562 579 593 558
Other FTE 783 818 880 877 946 861
Total Number of FTE Employees in this Period 1292 1365 1442 1456 1539 1419
Number of New Hires in this Period*** 146 3.56% 119 8.72% 114 7.91% 124 8.52% 113 7.34% 123 8.68%
Number of Retirements in this Period*** 4 0.31% 2 0.15% 6 0.42% 4 0.27% 1 0.06% 3 0.24%
Number of Departures in this Period*** 41 3.17% 34 2.49% 76 5.27% 44 3.02% 25 1.62% 44 3.10%
*Employees that had a status change (full time to part time, faculty to administration, etc.) are not reflected in these numbers
**Changes in faculty counts due to clean-up of data and updating of historical data.
***Percentages are based on cell numbers as a percentage of the total FTEs for period.
Loma Linda University Health Services is the entity that houses all of the shared services (Public Relations, Human Resources, Payroll, Landscape, etc.) that support all of the Loma Linda corporations.
Note: Faculty Data as of June 18, 2010
WASC EER Report Appendix G 336
RETURN TO CONTENTS
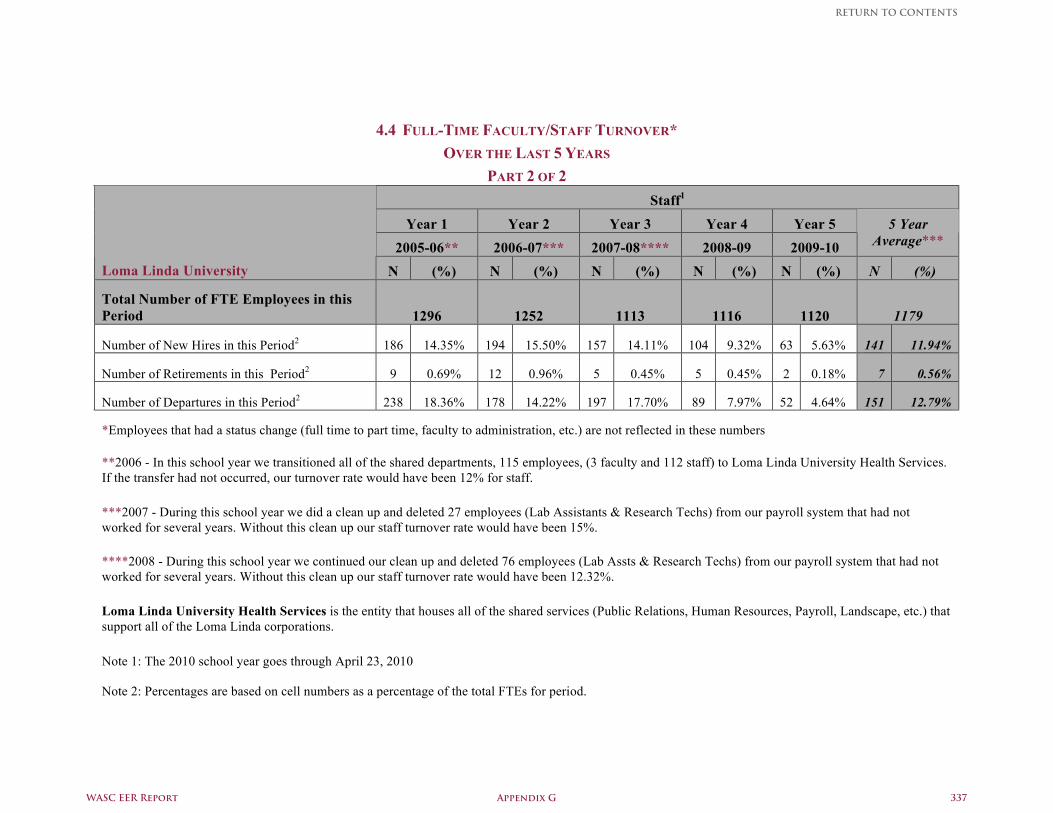
4.4 FULL-TIME FACULTY/STAFF TURNOVER*
OVER THE LAST 5 YEARS PART 2 OF 2
Staff1 Year 1 Year 2 Year 3 Year 4 Year 5
2005-06** 2006-07*** 2007-08**** 2008-09 2009-10 5 Year
Average***
Loma Linda University N (%) N (%) N (%) N (%) N (%) N (%)
Total Number of FTE Employees in this Period 1296 1252 1113 1116 1120 1179
Number of New Hires in this Period2 186 14.35% 194 15.50% 157 14.11% 104 9.32% 63 5.63% 141 11.94%
Number of Retirements in this Period2 9 0.69% 12 0.96% 5 0.45% 5 0.45% 2 0.18% 7 0.56%
Number of Departures in this Period2 238 18.36% 178 14.22% 197 17.70% 89 7.97% 52 4.64% 151 12.79%
*Employees that had a status change (full time to part time, faculty to administration, etc.) are not reflected in these numbers
**2006 - In this school year we transitioned all of the shared departments, 115 employees, (3 faculty and 112 staff) to Loma Linda University Health Services. If the transfer had not occurred, our turnover rate would have been 12% for staff.
***2007 - During this school year we did a clean up and deleted 27 employees (Lab Assistants & Research Techs) from our payroll system that had not worked for several years. Without this clean up our staff turnover rate would have been 15%.
****2008 - During this school year we continued our clean up and deleted 76 employees (Lab Assts & Research Techs) from our payroll system that had not worked for several years. Without this clean up our staff turnover rate would have been 12.32%.
Loma Linda University Health Services is the entity that houses all of the shared services (Public Relations, Human Resources, Payroll, Landscape, etc.) that support all of the Loma Linda corporations.
Note 1: The 2010 school year goes through April 23, 2010
Note 2: Percentages are based on cell numbers as a percentage of the total FTEs for period.
WASC EER Report Appendix G 337
RETURN TO CONTENTS
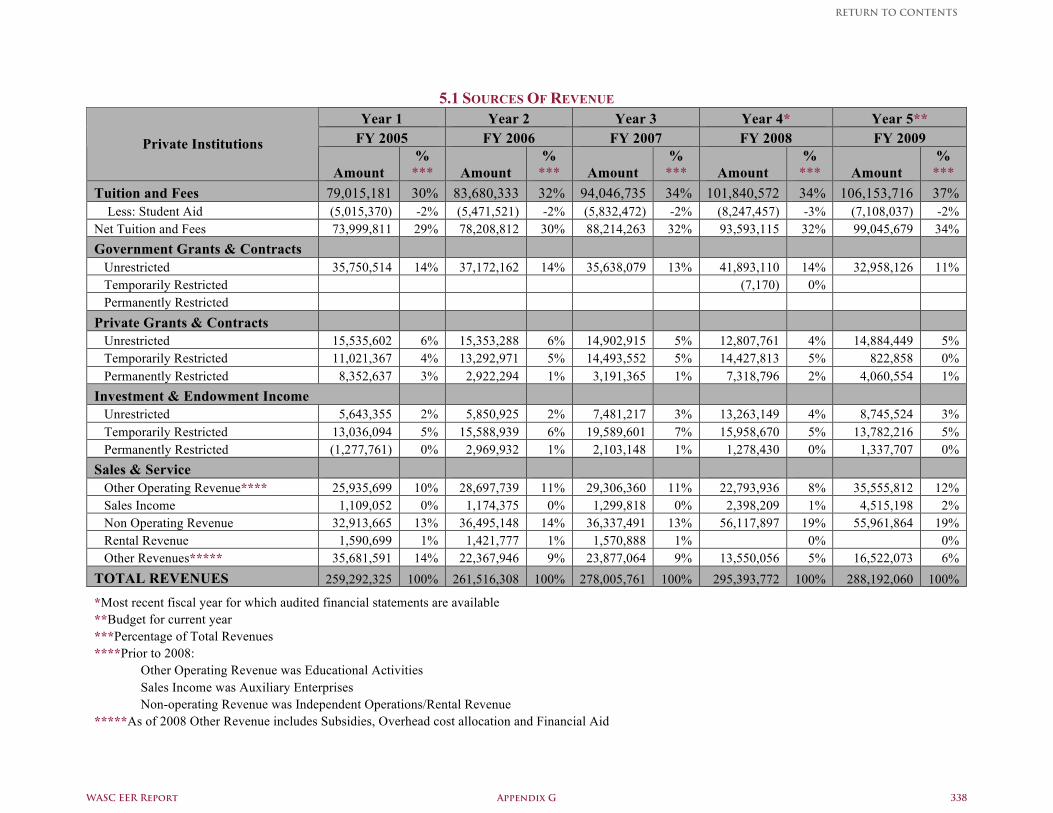
5.1 SOURCES OF REVENUE
Year 1 Year 2 Year 3 Year 4* Year 5** FY 2005 FY 2006 FY 2007 FY 2008 FY 2009 Private Institutions
Amount %
*** Amount %
*** Amount %
*** Amount %
*** Amount %
*** Tuition and Fees 79,015,181 30% 83,680,333 32% 94,046,735 34% 101,840,572 34% 106,153,716 37% Less: Student Aid (5,015,370) -2% (5,471,521) -2% (5,832,472) -2% (8,247,457) -3% (7,108,037) -2% Net Tuition and Fees 73,999,811 29% 78,208,812 30% 88,214,263 32% 93,593,115 32% 99,045,679 34% Government Grants & Contracts Unrestricted 35,750,514 14% 37,172,162 14% 35,638,079 13% 41,893,110 14% 32,958,126 11% Temporarily Restricted (7,170) 0% Permanently Restricted Private Grants & Contracts Unrestricted 15,535,602 6% 15,353,288 6% 14,902,915 5% 12,807,761 4% 14,884,449 5% Temporarily Restricted 11,021,367 4% 13,292,971 5% 14,493,552 5% 14,427,813 5% 822,858 0% Permanently Restricted 8,352,637 3% 2,922,294 1% 3,191,365 1% 7,318,796 2% 4,060,554 1% Investment & Endowment Income Unrestricted 5,643,355 2% 5,850,925 2% 7,481,217 3% 13,263,149 4% 8,745,524 3% Temporarily Restricted 13,036,094 5% 15,588,939 6% 19,589,601 7% 15,958,670 5% 13,782,216 5% Permanently Restricted (1,277,761) 0% 2,969,932 1% 2,103,148 1% 1,278,430 0% 1,337,707 0% Sales & Service Other Operating Revenue**** 25,935,699 10% 28,697,739 11% 29,306,360 11% 22,793,936 8% 35,555,812 12% Sales Income 1,109,052 0% 1,174,375 0% 1,299,818 0% 2,398,209 1% 4,515,198 2% Non Operating Revenue 32,913,665 13% 36,495,148 14% 36,337,491 13% 56,117,897 19% 55,961,864 19% Rental Revenue 1,590,699 1% 1,421,777 1% 1,570,888 1% 0% 0% Other Revenues***** 35,681,591 14% 22,367,946 9% 23,877,064 9% 13,550,056 5% 16,522,073 6% TOTAL REVENUES 259,292,325 100% 261,516,308 100% 278,005,761 100% 295,393,772 100% 288,192,060 100%
*Most recent fiscal year for which audited financial statements are available **Budget for current year ***Percentage of Total Revenues ****Prior to 2008: Other Operating Revenue was Educational Activities Sales Income was Auxiliary Enterprises Non-operating Revenue was Independent Operations/Rental Revenue *****As of 2008 Other Revenue includes Subsidies, Overhead cost allocation and Financial Aid
WASC EER Report Appendix G 338
RETURN TO CONTENTS
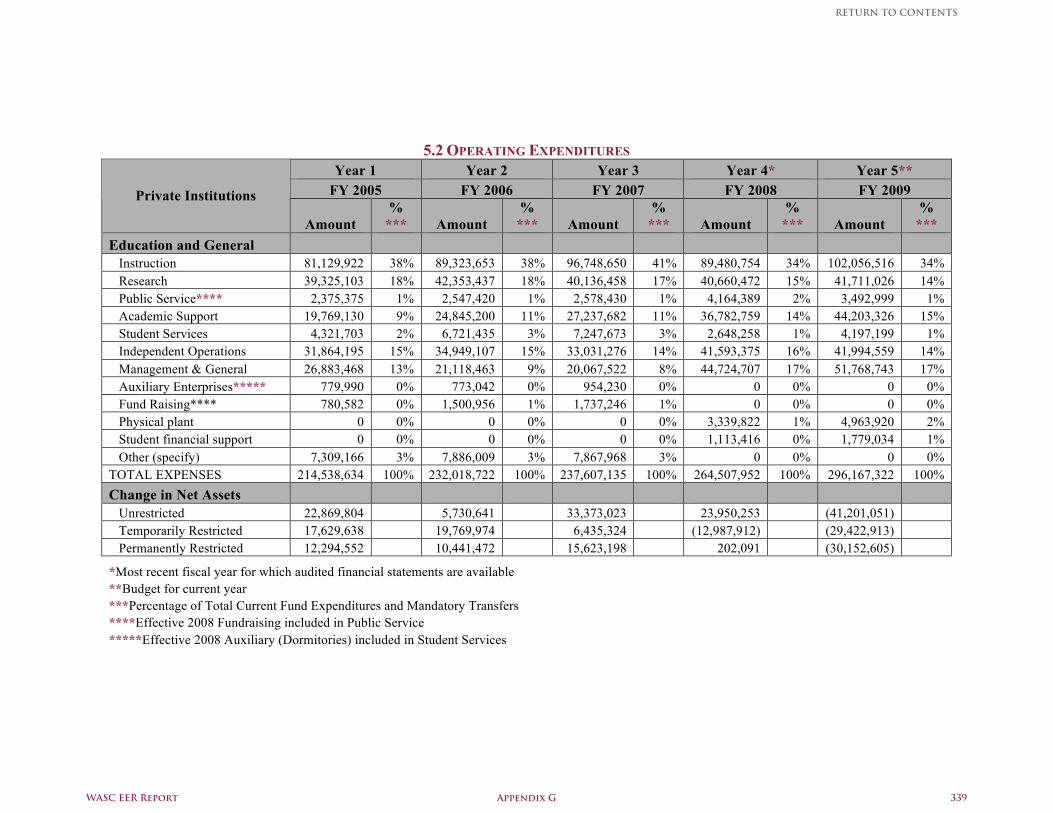
5.2 OPERATING EXPENDITURES Year 1 Year 2 Year 3 Year 4* Year 5**
FY 2005 FY 2006 FY 2007 FY 2008 FY 2009 Private Institutions
Amount %
*** Amount %
*** Amount %
*** Amount %
*** Amount %
*** Education and General Instruction 81,129,922 38% 89,323,653 38% 96,748,650 41% 89,480,754 34% 102,056,516 34% Research 39,325,103 18% 42,353,437 18% 40,136,458 17% 40,660,472 15% 41,711,026 14% Public Service**** 2,375,375 1% 2,547,420 1% 2,578,430 1% 4,164,389 2% 3,492,999 1% Academic Support 19,769,130 9% 24,845,200 11% 27,237,682 11% 36,782,759 14% 44,203,326 15% Student Services 4,321,703 2% 6,721,435 3% 7,247,673 3% 2,648,258 1% 4,197,199 1% Independent Operations 31,864,195 15% 34,949,107 15% 33,031,276 14% 41,593,375 16% 41,994,559 14% Management & General 26,883,468 13% 21,118,463 9% 20,067,522 8% 44,724,707 17% 51,768,743 17% Auxiliary Enterprises***** 779,990 0% 773,042 0% 954,230 0% 0 0% 0 0% Fund Raising**** 780,582 0% 1,500,956 1% 1,737,246 1% 0 0% 0 0% Physical plant 0 0% 0 0% 0 0% 3,339,822 1% 4,963,920 2% Student financial support 0 0% 0 0% 0 0% 1,113,416 0% 1,779,034 1% Other (specify) 7,309,166 3% 7,886,009 3% 7,867,968 3% 0 0% 0 0% TOTAL EXPENSES 214,538,634 100% 232,018,722 100% 237,607,135 100% 264,507,952 100% 296,167,322 100% Change in Net Assets Unrestricted 22,869,804 5,730,641 33,373,023 23,950,253 (41,201,051) Temporarily Restricted 17,629,638 19,769,974 6,435,324 (12,987,912) (29,422,913) Permanently Restricted 12,294,552 10,441,472 15,623,198 202,091 (30,152,605)
*Most recent fiscal year for which audited financial statements are available **Budget for current year ***Percentage of Total Current Fund Expenditures and Mandatory Transfers ****Effective 2008 Fundraising included in Public Service *****Effective 2008 Auxiliary (Dormitories) included in Student Services
WASC EER Report Appendix G 339
RETURN TO CONTENTS
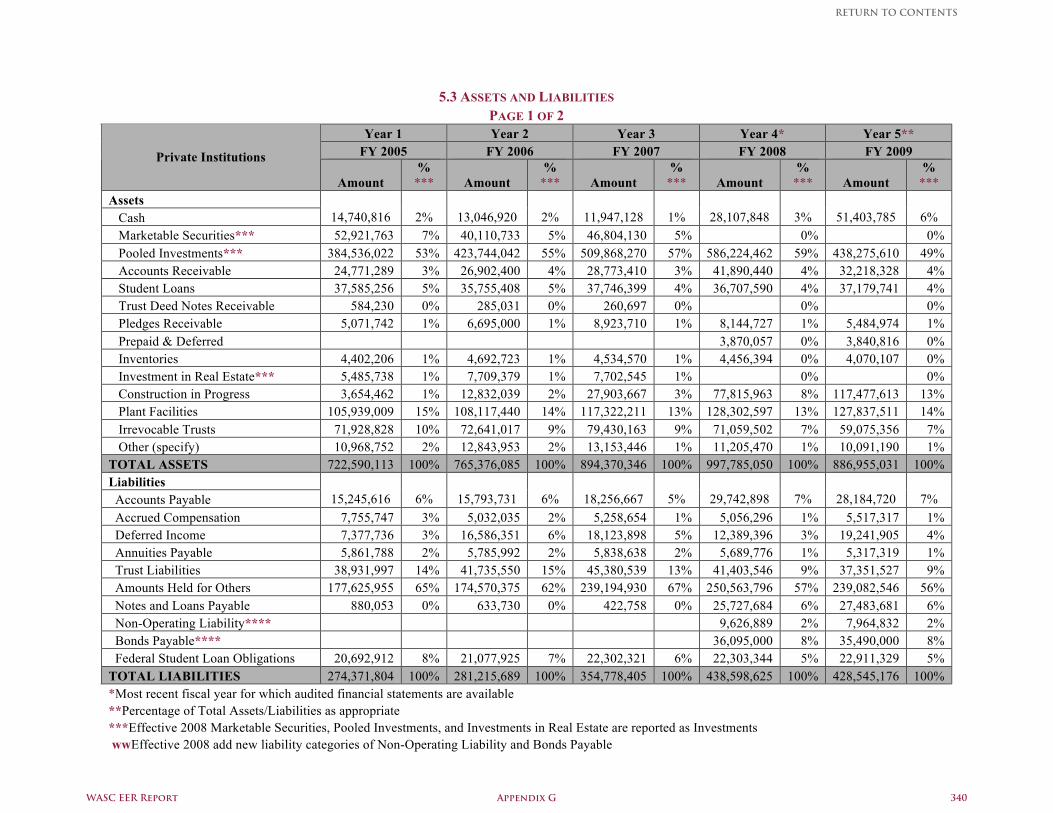
5.3 ASSETS AND LIABILITIES
PAGE 1 OF 2 Year 1 Year 2 Year 3 Year 4* Year 5**
FY 2005 FY 2006 FY 2007 FY 2008 FY 2009 Private Institutions
Amount %
*** Amount %
*** Amount %
*** Amount %
*** Amount %
*** Assets Cash 14,740,816 2% 13,046,920 2% 11,947,128 1% 28,107,848 3% 51,403,785 6% Marketable Securities*** 52,921,763 7% 40,110,733 5% 46,804,130 5% 0% 0% Pooled Investments*** 384,536,022 53% 423,744,042 55% 509,868,270 57% 586,224,462 59% 438,275,610 49% Accounts Receivable 24,771,289 3% 26,902,400 4% 28,773,410 3% 41,890,440 4% 32,218,328 4% Student Loans 37,585,256 5% 35,755,408 5% 37,746,399 4% 36,707,590 4% 37,179,741 4% Trust Deed Notes Receivable 584,230 0% 285,031 0% 260,697 0% 0% 0% Pledges Receivable 5,071,742 1% 6,695,000 1% 8,923,710 1% 8,144,727 1% 5,484,974 1% Prepaid & Deferred 3,870,057 0% 3,840,816 0% Inventories 4,402,206 1% 4,692,723 1% 4,534,570 1% 4,456,394 0% 4,070,107 0% Investment in Real Estate*** 5,485,738 1% 7,709,379 1% 7,702,545 1% 0% 0% Construction in Progress 3,654,462 1% 12,832,039 2% 27,903,667 3% 77,815,963 8% 117,477,613 13% Plant Facilities 105,939,009 15% 108,117,440 14% 117,322,211 13% 128,302,597 13% 127,837,511 14% Irrevocable Trusts 71,928,828 10% 72,641,017 9% 79,430,163 9% 71,059,502 7% 59,075,356 7% Other (specify) 10,968,752 2% 12,843,953 2% 13,153,446 1% 11,205,470 1% 10,091,190 1% TOTAL ASSETS 722,590,113 100% 765,376,085 100% 894,370,346 100% 997,785,050 100% 886,955,031 100% Liabilities Accounts Payable 15,245,616 6% 15,793,731 6% 18,256,667 5% 29,742,898 7% 28,184,720 7% Accrued Compensation 7,755,747 3% 5,032,035 2% 5,258,654 1% 5,056,296 1% 5,517,317 1% Deferred Income 7,377,736 3% 16,586,351 6% 18,123,898 5% 12,389,396 3% 19,241,905 4% Annuities Payable 5,861,788 2% 5,785,992 2% 5,838,638 2% 5,689,776 1% 5,317,319 1% Trust Liabilities 38,931,997 14% 41,735,550 15% 45,380,539 13% 41,403,546 9% 37,351,527 9% Amounts Held for Others 177,625,955 65% 174,570,375 62% 239,194,930 67% 250,563,796 57% 239,082,546 56% Notes and Loans Payable 880,053 0% 633,730 0% 422,758 0% 25,727,684 6% 27,483,681 6% Non-Operating Liability**** 9,626,889 2% 7,964,832 2% Bonds Payable**** 36,095,000 8% 35,490,000 8% Federal Student Loan Obligations 20,692,912 8% 21,077,925 7% 22,302,321 6% 22,303,344 5% 22,911,329 5% TOTAL LIABILITIES 274,371,804 100% 281,215,689 100% 354,778,405 100% 438,598,625 100% 428,545,176 100% *Most recent fiscal year for which audited financial statements are available **Percentage of Total Assets/Liabilities as appropriate ***Effective 2008 Marketable Securities, Pooled Investments, and Investments in Real Estate are reported as Investments wwEffective 2008 add new liability categories of Non-Operating Liability and Bonds Payable
WASC EER Report Appendix G 340
RETURN TO CONTENTS
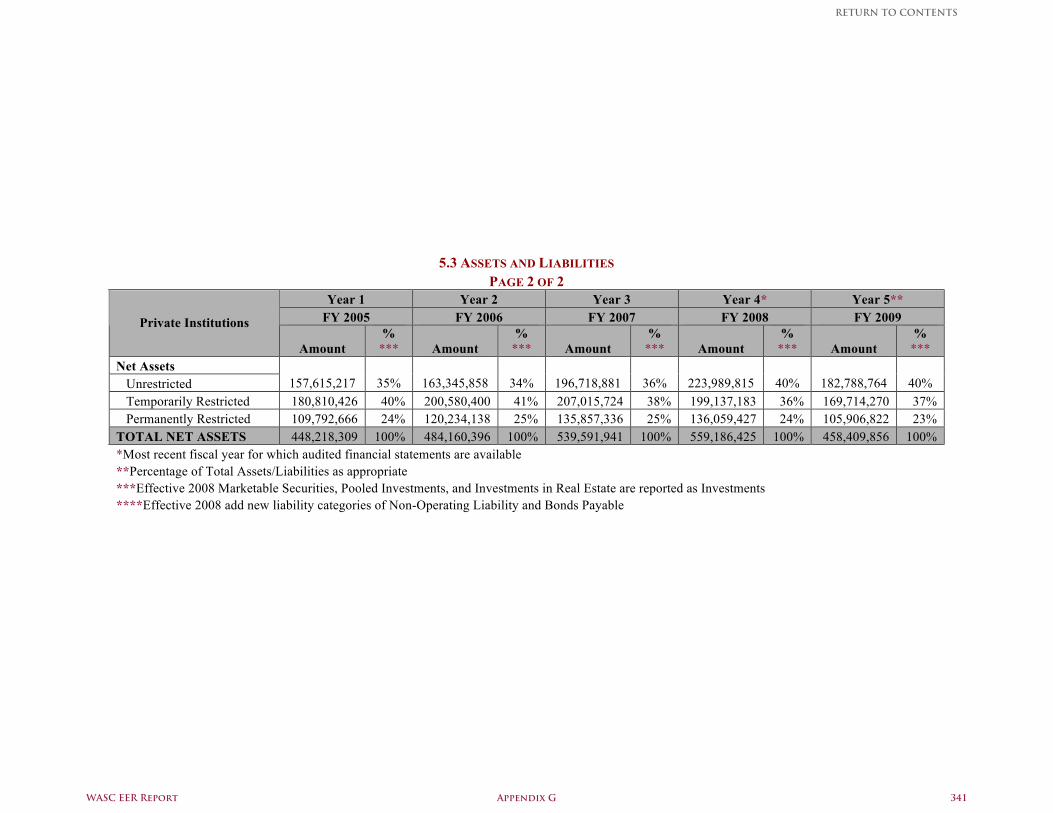
5.3 ASSETS AND LIABILITIES
PAGE 2 OF 2 Year 1 Year 2 Year 3 Year 4* Year 5**
FY 2005 FY 2006 FY 2007 FY 2008 FY 2009 Private Institutions
Amount %
*** Amount %
*** Amount %
*** Amount %
*** Amount %
*** Net Assets Unrestricted 157,615,217 35% 163,345,858 34% 196,718,881 36% 223,989,815 40% 182,788,764 40% Temporarily Restricted 180,810,426 40% 200,580,400 41% 207,015,724 38% 199,137,183 36% 169,714,270 37% Permanently Restricted 109,792,666 24% 120,234,138 25% 135,857,336 25% 136,059,427 24% 105,906,822 23% TOTAL NET ASSETS 448,218,309 100% 484,160,396 100% 539,591,941 100% 559,186,425 100% 458,409,856 100% *Most recent fiscal year for which audited financial statements are available **Percentage of Total Assets/Liabilities as appropriate ***Effective 2008 Marketable Securities, Pooled Investments, and Investments in Real Estate are reported as Investments ****Effective 2008 add new liability categories of Non-Operating Liability and Bonds Payable
WASC EER Report Appendix G 341
RETURN TO CONTENTS
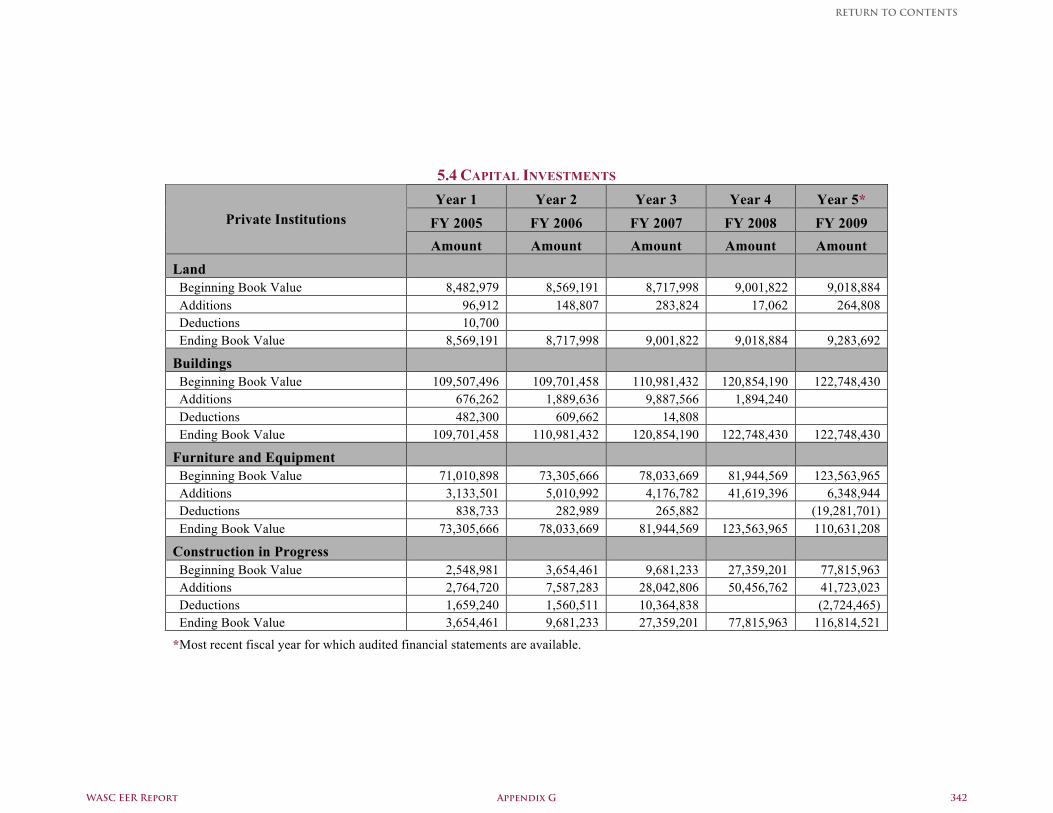
5.4 CAPITAL INVESTMENTS Year 1 Year 2 Year 3 Year 4 Year 5*
FY 2005 FY 2006 FY 2007 FY 2008 FY 2009 Private Institutions
Amount Amount Amount Amount Amount Land Beginning Book Value 8,482,979 8,569,191 8,717,998 9,001,822 9,018,884 Additions 96,912 148,807 283,824 17,062 264,808 Deductions 10,700 Ending Book Value 8,569,191 8,717,998 9,001,822 9,018,884 9,283,692
Buildings Beginning Book Value 109,507,496 109,701,458 110,981,432 120,854,190 122,748,430 Additions 676,262 1,889,636 9,887,566 1,894,240 Deductions 482,300 609,662 14,808 Ending Book Value 109,701,458 110,981,432 120,854,190 122,748,430 122,748,430
Furniture and Equipment Beginning Book Value 71,010,898 73,305,666 78,033,669 81,944,569 123,563,965 Additions 3,133,501 5,010,992 4,176,782 41,619,396 6,348,944 Deductions 838,733 282,989 265,882 (19,281,701) Ending Book Value 73,305,666 78,033,669 81,944,569 123,563,965 110,631,208
Construction in Progress Beginning Book Value 2,548,981 3,654,461 9,681,233 27,359,201 77,815,963 Additions 2,764,720 7,587,283 28,042,806 50,456,762 41,723,023 Deductions 1,659,240 1,560,511 10,364,838 (2,724,465) Ending Book Value 3,654,461 9,681,233 27,359,201 77,815,963 116,814,521
*Most recent fiscal year for which audited financial statements are available.
WASC EER Report Appendix G 342
RETURN TO CONTENTS
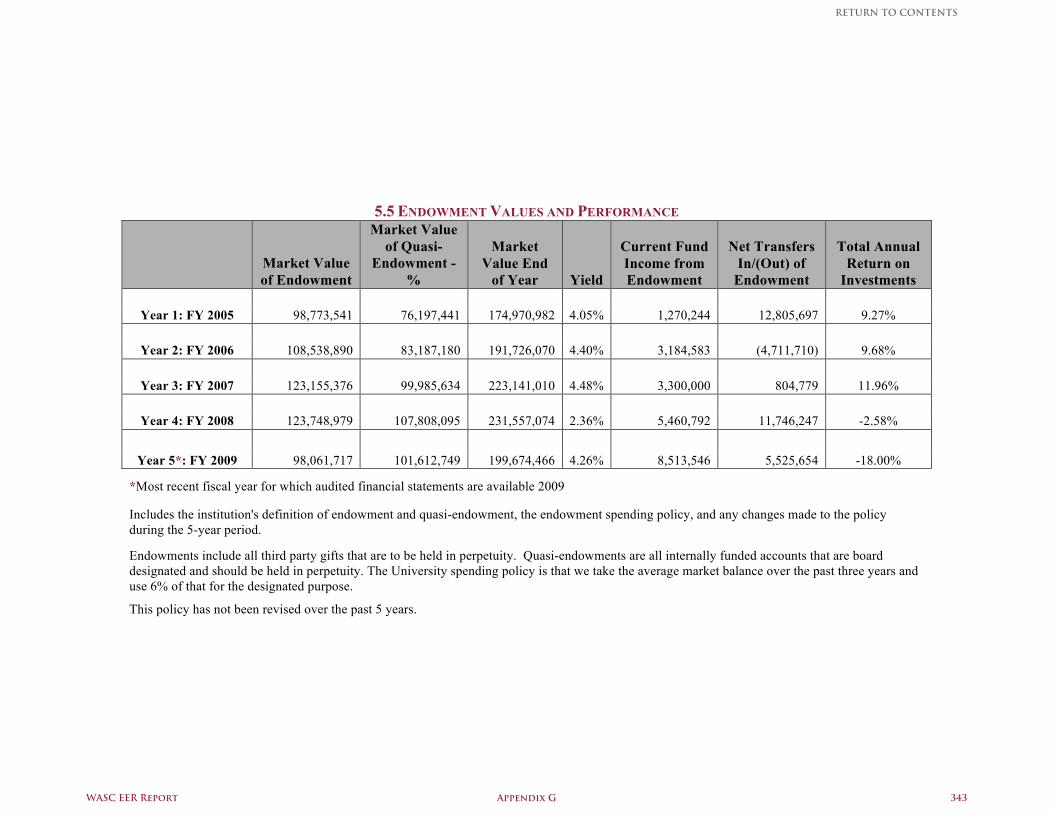
5.5 ENDOWMENT VALUES AND PERFORMANCE
Market Value of Endowment
Market Value of Quasi-
Endowment - %
Market Value End
of Year Yield
Current Fund Income from Endowment
Net Transfers In/(Out) of
Endowment
Total Annual Return on
Investments
Year 1: FY 2005 98,773,541 76,197,441 174,970,982 4.05% 1,270,244 12,805,697 9.27%
Year 2: FY 2006 108,538,890 83,187,180 191,726,070 4.40% 3,184,583 (4,711,710) 9.68%
Year 3: FY 2007 123,155,376 99,985,634 223,141,010 4.48% 3,300,000 804,779 11.96%
Year 4: FY 2008 123,748,979 107,808,095 231,557,074 2.36% 5,460,792 11,746,247 -2.58%
Year 5*: FY 2009 98,061,717 101,612,749 199,674,466 4.26% 8,513,546 5,525,654 -18.00%
*Most recent fiscal year for which audited financial statements are available 2009
Includes the institution's definition of endowment and quasi-endowment, the endowment spending policy, and any changes made to the policy during the 5-year period.
Endowments include all third party gifts that are to be held in perpetuity. Quasi-endowments are all internally funded accounts that are board designated and should be held in perpetuity. The University spending policy is that we take the average market balance over the past three years and use 6% of that for the designated purpose.
This policy has not been revised over the past 5 years.
WASC EER Report Appendix G 343
RETURN TO CONTENTS
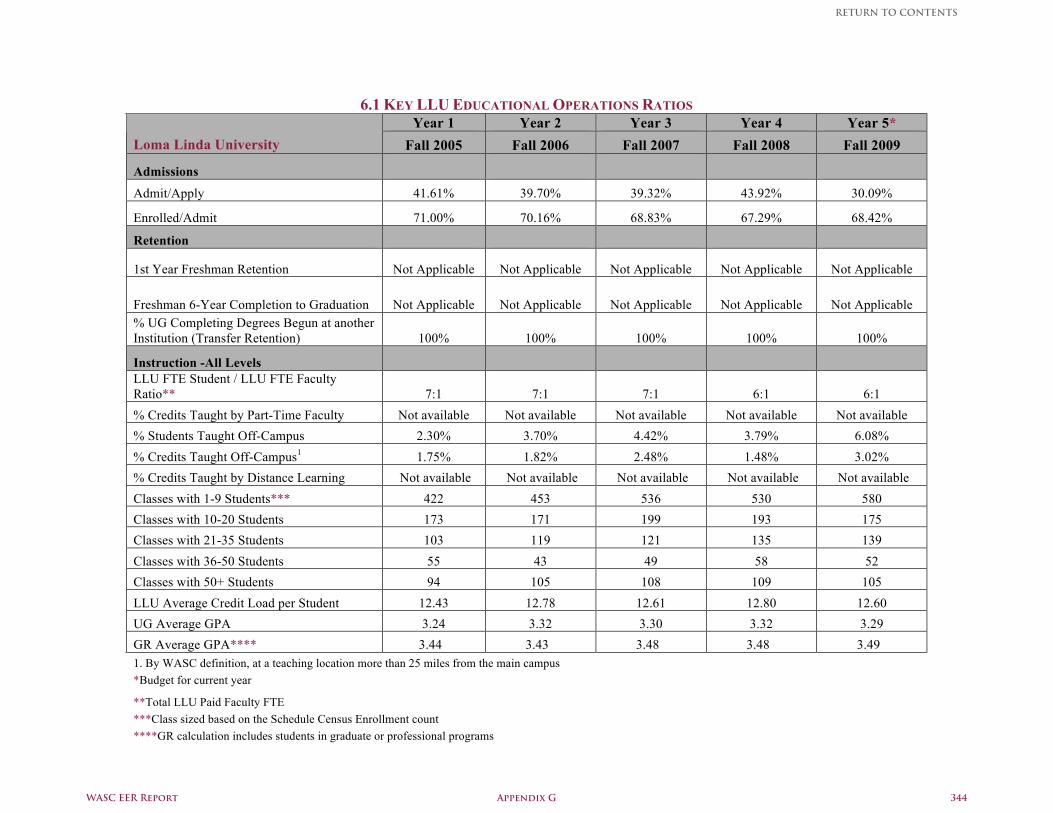
6.1 KEY LLU EDUCATIONAL OPERATIONS RATIOS Year 1 Year 2 Year 3 Year 4 Year 5*
Loma Linda University Fall 2005 Fall 2006 Fall 2007 Fall 2008 Fall 2009
Admissions
Admit/Apply 41.61% 39.70% 39.32% 43.92% 30.09%
Enrolled/Admit 71.00% 70.16% 68.83% 67.29% 68.42%
Retention
1st Year Freshman Retention Not Applicable Not Applicable Not Applicable Not Applicable Not Applicable
Freshman 6-Year Completion to Graduation Not Applicable Not Applicable Not Applicable Not Applicable Not Applicable % UG Completing Degrees Begun at another Institution (Transfer Retention) 100% 100% 100% 100% 100%
Instruction -All Levels LLU FTE Student / LLU FTE Faculty Ratio** 7:1 7:1 7:1 6:1 6:1 % Credits Taught by Part-Time Faculty Not available Not available Not available Not available Not available % Students Taught Off-Campus 2.30% 3.70% 4.42% 3.79% 6.08% % Credits Taught Off-Campus1 1.75% 1.82% 2.48% 1.48% 3.02% % Credits Taught by Distance Learning Not available Not available Not available Not available Not available Classes with 1-9 Students*** 422 453 536 530 580 Classes with 10-20 Students 173 171 199 193 175 Classes with 21-35 Students 103 119 121 135 139 Classes with 36-50 Students 55 43 49 58 52 Classes with 50+ Students 94 105 108 109 105 LLU Average Credit Load per Student 12.43 12.78 12.61 12.80 12.60 UG Average GPA 3.24 3.32 3.30 3.32 3.29 GR Average GPA**** 3.44 3.43 3.48 3.48 3.49 1. By WASC definition, at a teaching location more than 25 miles from the main campus *Budget for current year
**Total LLU Paid Faculty FTE ***Class sized based on the Schedule Census Enrollment count ****GR calculation includes students in graduate or professional programs
WASC EER Report Appendix G 344
RETURN TO CONTENTS
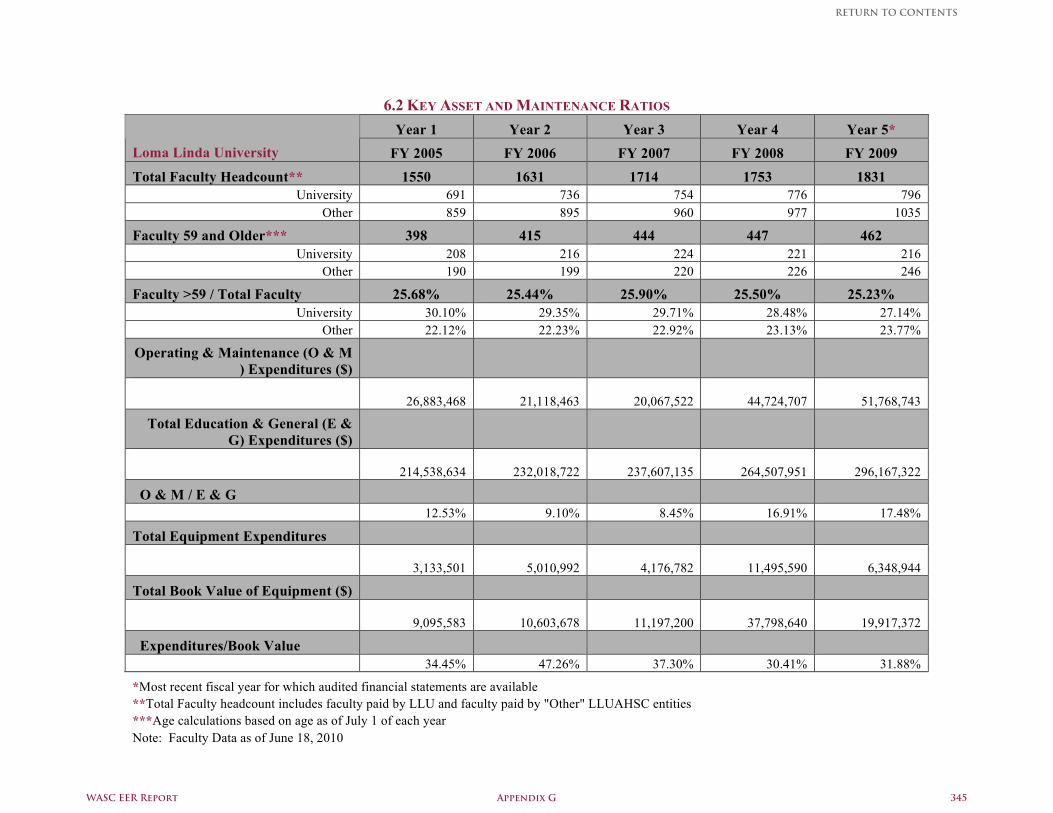
6.2 KEY ASSET AND MAINTENANCE RATIOS
Year 1 Year 2 Year 3 Year 4 Year 5* Loma Linda University FY 2005 FY 2006 FY 2007 FY 2008 FY 2009 Total Faculty Headcount** 1550 1631 1714 1753 1831
University 691 736 754 776 796 Other 859 895 960 977 1035
Faculty 59 and Older*** 398 415 444 447 462 University 208 216 224 221 216
Other 190 199 220 226 246
Faculty >59 / Total Faculty 25.68% 25.44% 25.90% 25.50% 25.23% University 30.10% 29.35% 29.71% 28.48% 27.14%
Other 22.12% 22.23% 22.92% 23.13% 23.77%
Operating & Maintenance (O & M ) Expenditures ($)
26,883,468
21,118,463
20,067,522
44,724,707
51,768,743
Total Education & General (E & G) Expenditures ($)
214,538,634
232,018,722
237,607,135
264,507,951
296,167,322
O & M / E & G 12.53% 9.10% 8.45% 16.91% 17.48%
Total Equipment Expenditures
3,133,501
5,010,992
4,176,782
11,495,590
6,348,944
Total Book Value of Equipment ($)
9,095,583
10,603,678
11,197,200
37,798,640
19,917,372
Expenditures/Book Value 34.45% 47.26% 37.30% 30.41% 31.88%
*Most recent fiscal year for which audited financial statements are available **Total Faculty headcount includes faculty paid by LLU and faculty paid by "Other" LLUAHSC entities ***Age calculations based on age as of July 1 of each year Note: Faculty Data as of June 18, 2010
WASC EER Report Appendix G 345
RETURN TO CONTENTS
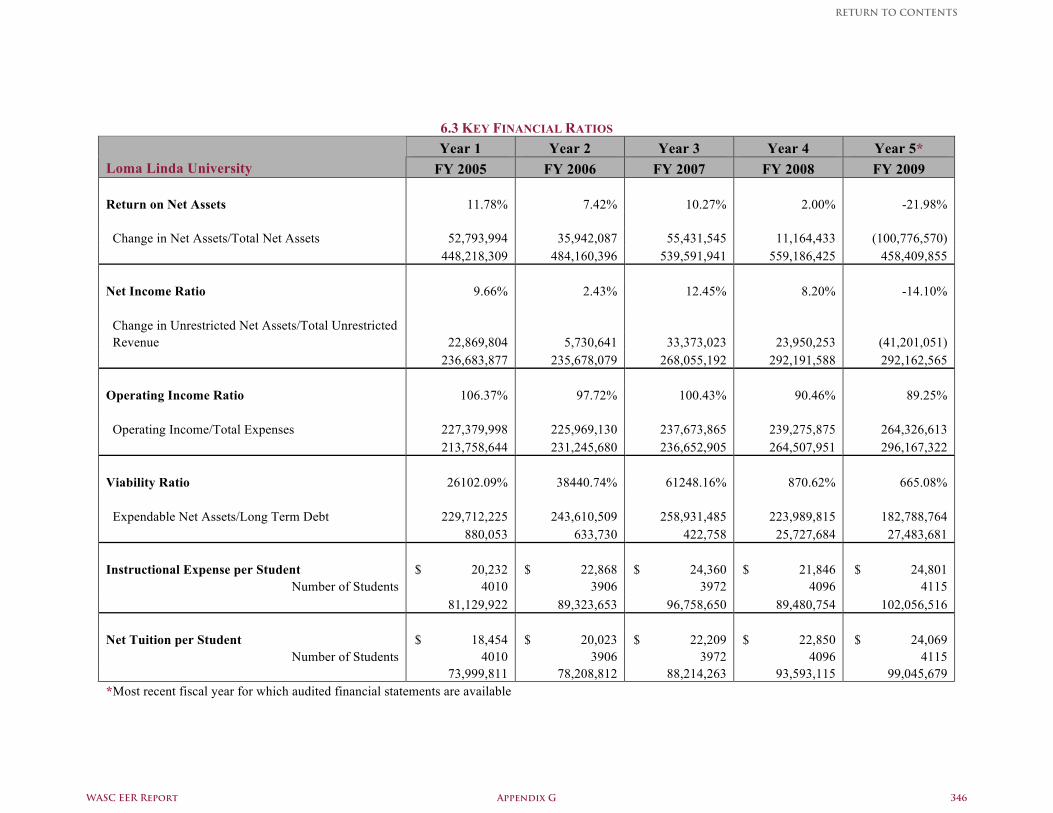
6.3 KEY FINANCIAL RATIOS Year 1 Year 2 Year 3 Year 4 Year 5*
Loma Linda University FY 2005 FY 2006 FY 2007 FY 2008 FY 2009 Return on Net Assets 11.78% 7.42% 10.27% 2.00% -21.98% Change in Net Assets/Total Net Assets 52,793,994 35,942,087 55,431,545 11,164,433 (100,776,570) 448,218,309 484,160,396 539,591,941 559,186,425 458,409,855 Net Income Ratio 9.66% 2.43% 12.45% 8.20% -14.10% Change in Unrestricted Net Assets/Total Unrestricted Revenue 22,869,804 5,730,641 33,373,023 23,950,253 (41,201,051) 236,683,877 235,678,079 268,055,192 292,191,588 292,162,565 Operating Income Ratio 106.37% 97.72% 100.43% 90.46% 89.25% Operating Income/Total Expenses 227,379,998 225,969,130 237,673,865 239,275,875 264,326,613 213,758,644 231,245,680 236,652,905 264,507,951 296,167,322 Viability Ratio 26102.09% 38440.74% 61248.16% 870.62% 665.08% Expendable Net Assets/Long Term Debt 229,712,225 243,610,509 258,931,485 223,989,815 182,788,764 880,053 633,730 422,758 25,727,684 27,483,681 Instructional Expense per Student $ 20,232 $ 22,868 $ 24,360 $ 21,846 $ 24,801
Number of Students 4010 3906 3972 4096 4115 81,129,922 89,323,653 96,758,650 89,480,754 102,056,516 Net Tuition per Student $ 18,454 $ 20,023 $ 22,209 $ 22,850 $ 24,069
Number of Students 4010 3906 3972 4096 4115 73,999,811 78,208,812 88,214,263 93,593,115 99,045,679 *Most recent fiscal year for which audited financial statements are available
WASC EER Report Appendix G 346
RETURN TO CONTENTS