LKLP Head Start Annual Report 2017-2018
59
Executive Director: Ricky Baker Head Start Director: Renee Sexton L.K.L.P. CAC/HEAD START 398 Roy Campbell Drive, Hazard, KY. 41701 L.K.L.P Head Start Annual Report 2017-2018
-
Upload
khangminh22 -
Category
Documents
-
view
4 -
download
0
Transcript of LKLP Head Start Annual Report 2017-2018

Executive Director: Ricky Baker
Head Start Director: Renee Sexton
L.K.L.P. CAC/HEAD START 398 Roy Campbell Drive, Hazard, KY. 41701
L.K.L.P Head Start Annual Report
2017-2018

LKLP Head Start
Annual Report 2017-2018
1
L.K.L.P Head Start
This report has been prepared in order to comply with the Head Start
Reauthorization Act of 2007.
L.K.L.P. Head Start Mission:
L.K.L.P. Head Start is a comprehensive child development program that seeks to
enrich the lives of our families and strengthen self-sufficiency by giving roots and
wings to our children.
Roots so they have a sense of self
Wings so they can follow their dreams.
We endeavor to do this by celebrating our Appalachian Culture. We value
families for their strengths and contributions and enter into a partnership with the families
to nurture, improve, advocate and educate their children.
L.K.L.P. Head Start has close ties with community agencies, Boards of
Education, Civic organizations, and local governments. We work with groups to improve
our community for families and children. We are proud of our collaborative agreements
with schools, local officials, social services, law enforcements, businesses, mental health
agencies, health departments, health providers and families.
The Head Start program employees 148 people: Lead Teachers, Associate
Teachers, Teacher Assistants, Family Development Assistants, Nutritional Assistants
(Cooks), Mentor/Coaches, Resource Assistants, Child Development/Mental Health
Specialists (Infant/Toddler & Preschool), Disabilities/Family/Child Development
Specialist, Health and Nutrition Specialist, Maintenance Workers, Transportation/Mentor

LKLP Head Start
Annual Report 2017-2018
2
Coach Specialist, Family & Community Partnership Manager, Education and Head Start
Director.
(A) The total amount of public and private funds received and the amount from
each source.
The total amount of Federal funds L.K.L.P. Head Start has received is $6,743,465.00
Head Start $4,150,912.00
Early Head Start $1,517,373.00
HS Duration $810,616.00
USDA $264,565.00
L.K.L.P. Head Start has received Non-Federal funds from the following:
$371,236.00
KERA $277,586.00
Stars $93,650.00

LKLP Head Start
Annual Report 2017-2018
3
(B) An explanation of budgetary expenditures and proposed budget for the fiscal
year.
Project Ending Date Budget Expenditure Balance
Federal:
Head Start 5/31/2018 4,150,912.00
4,150,912.00
0
Early Head Start 5/31/2018 1,517,373.00 1,517,373.00 0
HS Duration ( Startup) 5/31/2018 92,943.00 92,943.00 0
HS Duration FY 18 5/31/2018 810,616.00 599,650.00 210,966.00
USDA 9/30/2018 354,531.00 249,166.00 105,365.00
Total Federal Funds 6,926,375.00 6,610,044.00 316,331.00
Non-Federal Share
Head Start In-Kind 5/31/2018 1,365,376.00 1,384,565.00 -19,189.00
KERA Cash In-Kind 5/31/2018 277,586.00 277,586.00 0
Total Non-Federal Share 1,642,962.00 1,662,151.00 -19,189.00
Total Federal & Non-Federal Share 8,569,337.00 8,272,195.00 297,142.00
Other Funding:
Stars 5/31/2018 93,667.00 32,650.00 61,017.00
Total Other Funding 93,667.00 32,650.00 61,017.00
Totals 8,663,004.00 8.304.845.00 358,159.00

LKLP Head Start
Annual Report 2017-2018
4
(C) The total number of children and families served, the average monthly
enrollment (as a percentage of funded enrollment), and the percentage of eligible
children served.
o Funded Enrollment – Preschool - 549, Infant/Toddler - 112
o Number of Children served - 661
o Average monthly enrollment – Preschool 78%; Infant/Toddler 75%
(D) The results of the most recent review by the Secretary and the financial audit.
Review by the Secretary
L.K.L.P. Head Start Federal Review was conducted from 3/26/18 to 3/29/18. The
program has not yet received the results of this review.
Financial Audit
The Financial Audit was performed by Ray, Foley, Hensley & Company, PLLC
on February 8, 2018. The information presented is in accordance with the requirements
of the OMB Circular A-133, Audits of States, Local Governments, and Non-profit
Organizations. There were no identifiable deficiencies in any internal control over
compliance that would be consider to be material weaknesses.
LKLP Head Start
Annual Report 2017-2018
5
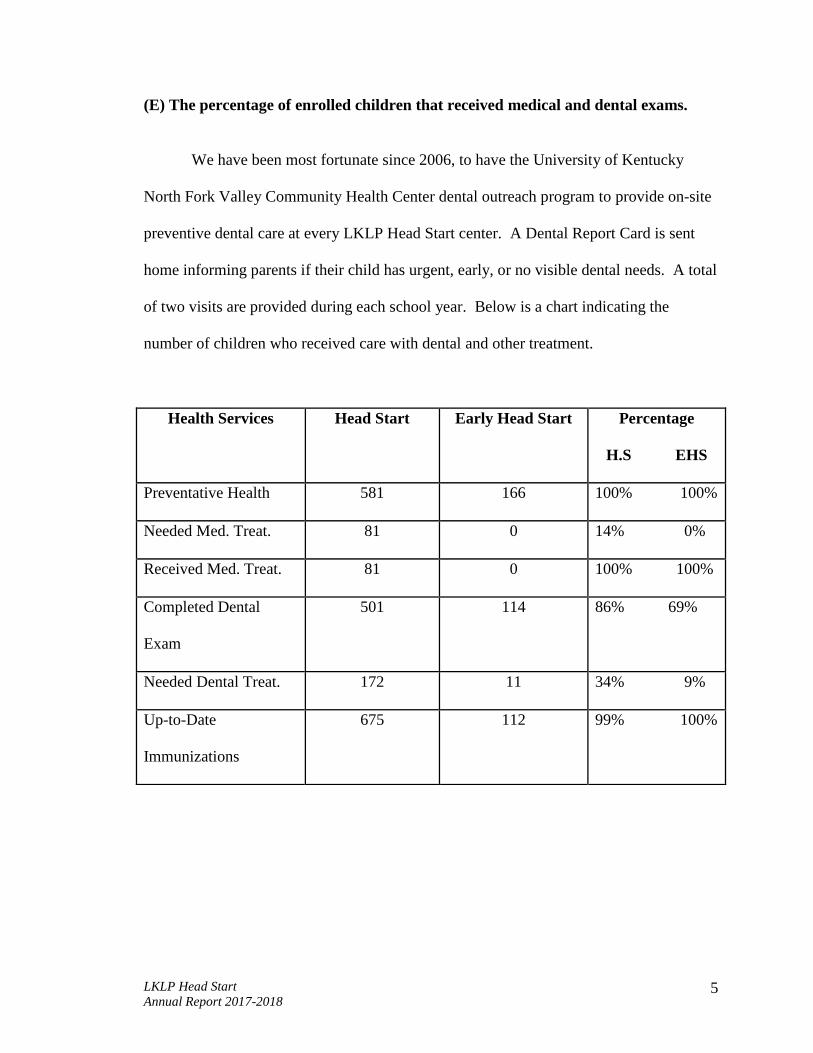
(E) The percentage of enrolled children that received medical and dental exams.
We have been most fortunate since 2006, to have the University of Kentucky
North Fork Valley Community Health Center dental outreach program to provide on-site
preventive dental care at every LKLP Head Start center. A Dental Report Card is sent
home informing parents if their child has urgent, early, or no visible dental needs. A total
of two visits are provided during each school year. Below is a chart indicating the
number of children who received care with dental and other treatment.
Health Services Head Start Early Head Start Percentage
H.S EHS
Preventative Health 581 166 100% 100%
Needed Med. Treat. 81 0 14% 0%
Received Med. Treat. 81 0 100% 100%
Completed Dental
Exam
501 114 86% 69%
Needed Dental Treat. 172 11 34% 9%
Up-to-Date
Immunizations
675 112 99% 100%

LKLP Head Start
Annual Report 2017-2018
6
(F) Information about parent involvement activities.
Parent involvement continues to be a strength of L.K.L.P. Head Start. At least
half of our staff is a current or former Head Start parent. Our program has met the
mandate of professional development while training and empowering parents.
Parents become involved with our program during parent orientation which
invites the parents to participate a Head Start day with their child; this in turn leads
parents to volunteer, gives impact to the curriculum via theme notes, home activities,
parent meetings, policy council, and training opportunities. Parents welcome staff into
their home for home visits so the teacher and family development assistant can give
individual attention to the child and family. Parents are encouraged in leadership
development by giving them a voice and opportunity to lead meetings, provide training/s,
and even as simple as sharing ideas for the classroom or program.
L.K.L.P. Head Start continues to have an increasing number of grandparents
raising their grandchildren because of drug issues and incarceration. As our economy
continues to decline, more children will be living with grandparents. Our staff is aware
of these grandparents in the communities and seeks them out to enroll their grandchildren
and to offer information on available resources. Our program provides them with
resources and helpful information in our newsletters each month and when necessary and
appropriate, we can even connect them to other resources as well.
(G) The agency’s efforts to prepare children for kindergarten.
L.K.L.P Head Start program is preparing children for School Readiness in many
ways. Our program has always focused on literacy and is one of the most important

LKLP Head Start
Annual Report 2017-2018
7
aspects of school readiness. Due to a literacy program called Reading is Fundamental
(RIF) our classrooms are stocked with an abundance of lending library books. The
lending library allows children the opportunity to check out books to take home and
enjoy with their families. Our program encourages families to get involved in literacy as
much and as often as possible. A child accessing the lending library is one way to
enhance family literacy. Another way is by providing parent trainings and workshops
regarding literacy, child development, etc. There are centers in our program who have
provided families with information to get involved with Dolly Parton’s Imagination
Library, which also provides children with books for ownership.
Having guests to come into the classrooms to read to children enhances their
knowledge of print; it also prepares them for kindergarten by the way in which they are
listening to stories being read to them. There are many read aloud guests that have
visited our classrooms this year. We had around 250 read aloud guests this year. A few
of the read aloud guests were parents, grandparents, foster parents, First Steps, Family
Resource centers, folk artists, firefighters, police officers, principals, kindergarten
teachers, nurses, miners, farmers, beauticians, bankers, and community members. The
children really enjoy re-reading the books that a special guest read to them.
Transition is also a huge factor for supporting children’s school readiness. There
are many activities/events that our program offers for transition, both from home and to
the next setting. The child's teacher performs an entry home visit to introduce themselves
as well as to get acquainted with the child and family. The centers also provides a
transition day for children which offer the opportunity for children and families to
become familiar with the Head Start atmosphere. This allows children to get introduced

LKLP Head Start
Annual Report 2017-2018
8
to the environment. During the transition day the parents are oriented by being
introduced to the program, providing them with opportunity to become familiar with the
setting as well as to ask questions. Other transition activities follow in the school year,
include visiting the kindergarten classroom, meeting the kindergarten teacher, visits to
the principal’s office, playground, cafeteria, library, and the ‘big bus’s as well as visits
from principals and teachers to the Head Start classroom. Some centers collaborate with
the Family Resource Center and/or Guidance Counselor and implement an ‘open house’
so children and parents can get together at the receiving school.
In efforts to enhance communication with the receiving kindergarten teacher, an
actual school readiness checklist for each child is sent with children’s folder information.
This checklist includes items gathered from the meetings with the local school districts
and what the Kentucky Department of Education wants children to know as they enter
into kindergarten. Our staff completed the checklist three times a year in conjunction
with the aggregation times. This checklist helped staff to realize very specific tasks and
skills that the children may need further assistance with.
L.K.L.P. Head Start has a School Readiness Committee to help ensure that our
children and families are school ready. This committee meets twice per year to discuss
hot topics in relation to regulations and expectations. Using the plan created by the
School Readiness Committee which is required aligning the Head Start Learning
Outcomes Framework and the Kentucky Department of Education’s content standards
with our Early Childhood Standards proved to be instrumental in helping our staff work
diligently to help the children and their families that we serve be school ready. This
document continues to be updated as necessary. Our program also has an Education
LKLP Head Start
Annual Report 2017-2018
9
Committee made up from classroom staff from each of our four county service area as
well as two Infant/Toddler teachers. This committee meets quarterly to discuss hot topics
and priorities of the program. The program also has a School Readiness committee
composed of the Education Committee as well as partners from LEA’s and other
community representatives. L.K.L.P. Head Start uses Teaching Strategies GOLD as our
assessment system, which aligns with the Head Start standards as well as the Kentucky
Department of Education Early Childhood Standards. School readiness depends on
making plans and adjustments to meet the individual needs of children.
In Kentucky, School Readiness means that a child enters school ready to engage
in and benefit from early learning experiences that best promote the child’s success. Our
assessment system, Teaching Strategies GOLD helps in the process of school readiness in
the fact that it is seamless, in assessing the children in our program from infant and
toddlers to preschool age. The Teaching Strategies GOLD® assessment system measures
the knowledge, skills, and behaviors that are most predictive of school success.
To assess a child's skill level, the teacher reads a progression to determine which
indicator best describes a child’s knowledge, skills, and/or behaviors based on what she
has observed in everyday experiences. The teacher seeks to answer questions: what does
the child know, what is he or she able to do?
Teachers using the Teaching Strategies GOLD® assessment tool follow a
systematic process, or cycle in order to collect the data needed. An important part of this
cycle is evaluating scores by comparing them to research-based indicators of
development and learning.
LKLP Head Start
Annual Report 2017-2018
10
This report presents the assessment data gathered for 556 children in L.K.L.P.
Head Start for the spring 2017-18 checkpoint period. Teachers at L.K.L.P. Head Start
used 64 objectives in Teaching Strategies GOLD® to report the children's skill levels for
the selected criteria.
The Teaching Strategies GOLD® assessment system measures the knowledge,
skills, and behaviors that are most predictive of school success. Thirty-six objectives are
organized into nine areas of development and learning. The first four are major areas of
child development: social-emotional, physical, language, and cognitive. The content
learning that is usually identified in early learning standards is organized into the
following five areas: literacy, mathematics, science and technology, social studies, and
the arts.
To assess a child's skill level, the teacher reads a progression to determine which
indicator best describes a child’s knowledge, skills, and/or behaviors based on what she
has observed in everyday experiences. The teacher seeks to answer questions: what does
the child know, what is he or she able to do?
Teachers using the Teaching Strategies GOLD® assessment tool follow a
systematic process, or cycle in order to collect the data needed. An important part of this
cycle is evaluating scores by comparing them to research-based indicators of
development and learning.
The children included in this report are in 57 classes in 17 sites and have the
following demographics: The majority of the children were male at 53%. 97% were
White, 1% African American and 1% was White and African American and 0% all other

LKLP Head Start
Annual Report 2017-2018
11
combinations. The ethnicity of the group was 98% not being Spanish/Hispanic/Latino,
and 0% being Mexican. Children with an IFSP was 6%, and with an IEP was 7%.
16% of the children included in this report make up the infant and toddler category (birth
to three) in our Early Head Start classrooms while. Preschool, ages 3 and 4 make up the
majority of the children at 84%.
Total Program results from Fall 2017/2018 to Spring 2017/2018
42 42 4239
33
39
18 17
22
1719 20
4947
52 51
575354
6359
57 5652
911
610 10
12
28
20 19
26 2528
0
10
20
30
40
50
60
70
Social Emotional Physical Language Cognitive Literacy Mathematics
L.K.L.P. HEAD START PROGRAM AGGREGATIONFALL TO SPRING 2017-18
Fall Below Spring Below Fall Meeting Spring Meeting Fall Exceeding Spring Exceeding
Data was gathered for the 2017-18 school program year from the fall checkpoint
to the spring. Data shows an increase in all domains of children meeting and exceeding
widely held expectations. The number of children moving from falling below to meeting
and/or exceeding were greatest in the physical and social emotional domain while literacy
and mathematics had the smallest gains.
Results show increases from 14% to 25 % of the children moving from below to
meeting and/or exceeding widely held expectations. The number of children meeting

LKLP Head Start
Annual Report 2017-2018
12
and/or exceeding widely held expectations in social emotional is 82%, physical is 83%,
language is 78%, cognitive is 83%, literacy is 81%, and mathematics is 80%. Areas
targeted after the fall aggregation were literacy and mathematics and both scores have
improved due to a greater emphasis on intentional teaching and school readiness. Even
though both scores improved, those domains remain in the bottom three along with
language that shows the least amount of growth. This data continues to drive our
emphasis on mathematics, literacy and language as planning for the 2018-19 school year
begins. Trainings will be planned emphasizing the domains that are identified with the
least amount of growth.
While comparing our data from fall 2017/2018 to spring 2017/2018 checkpoints
we had an increase in all areas program wide. We feel that our targeted trainings with
teachers and staff are to contribute to the overall increase of our children’s success.
Results show a 7% increase in language of children meeting widely held
expectations from the program from age’s birth to five. We feel that this increase is due
to increased teacher knowledge from our NCECDTL (National Center on Early
Childhood Development, Teaching, and Learning) suites, TLC (Teachers Learning
Cooperatively) work groups and an increased emphasis on school readiness with
intentional teaching in small groups. We had 18% of our children exceeding widely held
expectations in social emotional development, program wide. We feel this has increased
to our focused trainings on meeting individual children’s needs at the emotional stage of
development that they are in.
LKLP Head Start
Annual Report 2017-2018
13
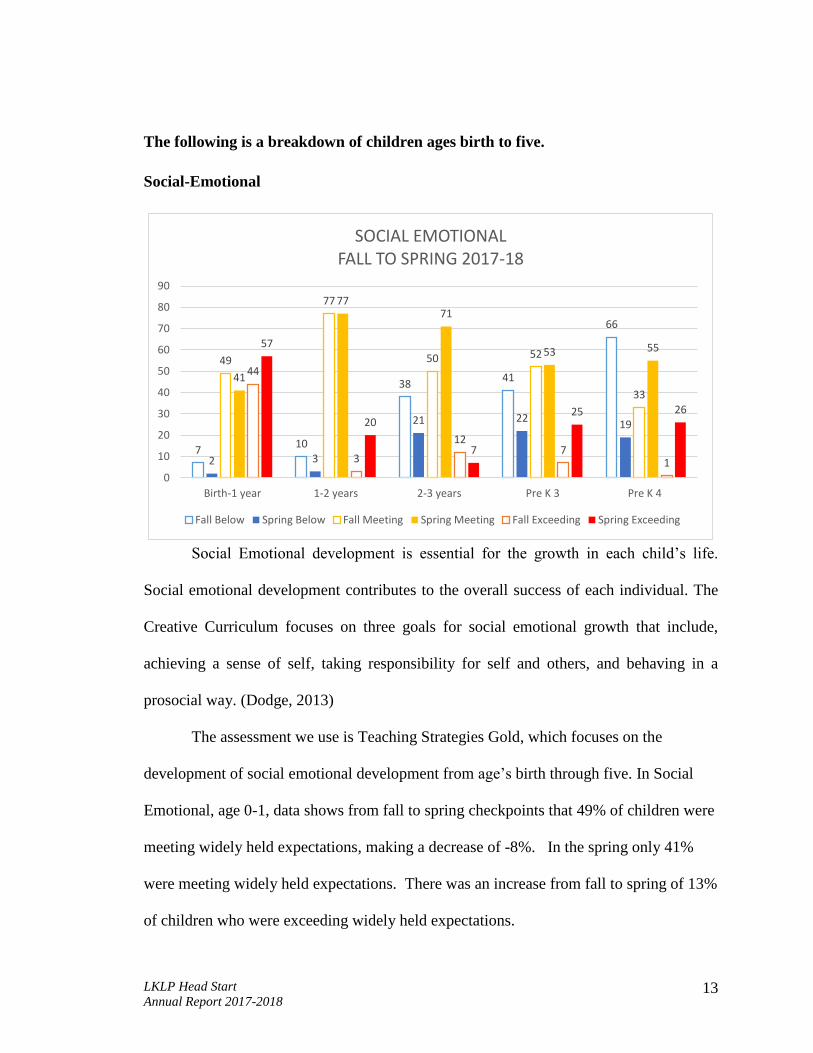
The following is a breakdown of children ages birth to five.
Social-Emotional
710
3841
66
2 3
21 2219
49
77
50 52
33
41
7771
53 55
44
3
127
1
57
20
7
25 26
0
10
20
30
40
50
60
70
80
90
Birth-1 year 1-2 years 2-3 years Pre K 3 Pre K 4
SOCIAL EMOTIONALFALL TO SPRING 2017-18
Fall Below Spring Below Fall Meeting Spring Meeting Fall Exceeding Spring Exceeding
Social Emotional development is essential for the growth in each child’s life.
Social emotional development contributes to the overall success of each individual. The
Creative Curriculum focuses on three goals for social emotional growth that include,
achieving a sense of self, taking responsibility for self and others, and behaving in a
prosocial way. (Dodge, 2013)
The assessment we use is Teaching Strategies Gold, which focuses on the
development of social emotional development from age’s birth through five. In Social
Emotional, age 0-1, data shows from fall to spring checkpoints that 49% of children were
meeting widely held expectations, making a decrease of -8%. In the spring only 41%
were meeting widely held expectations. There was an increase from fall to spring of 13%
of children who were exceeding widely held expectations.
LKLP Head Start
Annual Report 2017-2018
14
Ages 1-2 shows that from fall to spring that there was no change in the percent of
children meeting widely held expectations, as 77% were meeting widely held
expectations in the fall and 77% were meeting widely held expectations in the spring...
Data indicates with ages 2-3 there was 21% increase from fall to spring with
children in this age group meeting widely held expectations. Date reveals that 50% of
children were meeting widely held expectations in the fall while 71% of children were
meeting widely held expectations in the spring.
Data in age’s 3-4 shows that 52% of children were meeting widely held
expectations with an increase of 1% in the spring of 53%. Data revealed that 19% of
children moved up from below widely held expectations from the fall to the spring.
Age 4-5 data shows that children show an increase in meeting widely held
expectations from 33% in the fall to 55% in the spring with an increase of 22%. Data
revealed only 1% of children were exceeding widely held expectations in the fall but 26%
were exceeding widely held expectations in the spring with a 25% increase.
Overall, children from birth to age five in the L.K.L.P. Head Start program are
meeting the widely held expectations for the 2017-2018 program year. According to the
data, children are developing and progressing to the developmental milestones in the
social emotional area.
A great deal of infant and toddler staff are new employees, therefore, they are in
the process of becoming familiar with the Teaching Strategies GOLD Assessment tool
and the actual process of observing, documenting, and placing the children at the correct
level. One of LK.L.P. Head Start’s 2017-2018 program goals is to provide learning
opportunities for children in an environment that fosters skill development necessary for

LKLP Head Start
Annual Report 2017-2018
15
math and cognitive growth. To support this goal, the program seeks to strengthen staff
skills in behavior management. To meet this goal, management staff along with
community partners have provided workshops and trainings such as Social –Emotional
Development, Head Start Early Learning Outcomes Framework, and Childhood
Behaviors. Providing and continuing workshops in the field of social emotional
development which will enhance teacher knowledge along with developmental
milestones to work on for each individual child.
Infant and toddler teachers will focus on providing quality staff child interactions
which will include helping children understand their feelings. Teachers will provide
words and pictures to talk about child’s emotions. In the upcoming school year, 2018-
2019, Infant and Toddler teachers will be using the Mighty Minutes, Book Discussion
Cards, Intentional Teaching Cards, and Learning Games from the Creative Curriculum.
We recently purchased Digital Curriculum Resources that provide additional Intentional
Teaching Experiences to assist teachers in providing daily experiences that will help
children meet widely held expectations. We feel by adding these learning materials to the
Curriculum that there will be an increase of children that meet widely held expectations.
LKLP Head Start
Annual Report 2017-2018
16
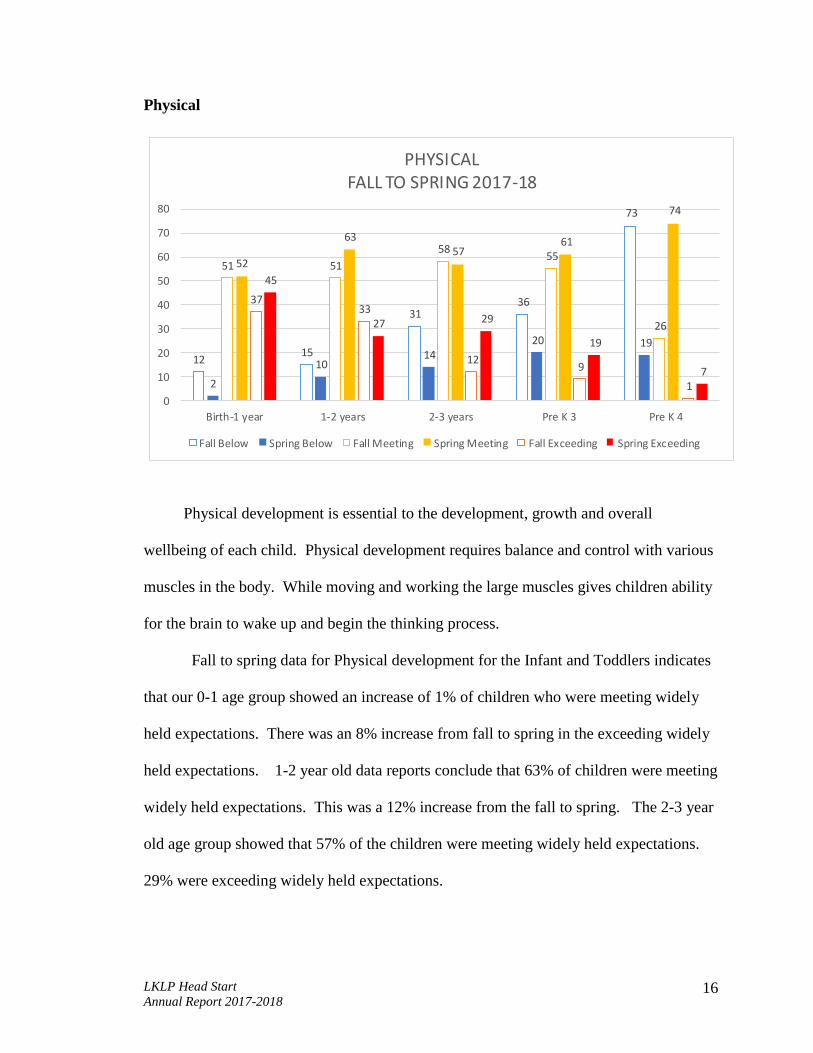
Physical
1215
3136
73
2
1014
20 19
51 51
5855
26
52
6357
61
74
3733
129
1
45
27 29
19
7
0
10
20
30
40
50
60
70
80
Birth-1 year 1-2 years 2-3 years Pre K 3 Pre K 4
PHYSICALFALL TO SPRING 2017-18
Fall Below Spring Below Fall Meeting Spring Meeting Fall Exceeding Spring Exceeding
Physical development is essential to the development, growth and overall
wellbeing of each child. Physical development requires balance and control with various
muscles in the body. While moving and working the large muscles gives children ability
for the brain to wake up and begin the thinking process.
Fall to spring data for Physical development for the Infant and Toddlers indicates
that our 0-1 age group showed an increase of 1% of children who were meeting widely
held expectations. There was an 8% increase from fall to spring in the exceeding widely
held expectations. 1-2 year old data reports conclude that 63% of children were meeting
widely held expectations. This was a 12% increase from the fall to spring. The 2-3 year
old age group showed that 57% of the children were meeting widely held expectations.
29% were exceeding widely held expectations.

LKLP Head Start
Annual Report 2017-2018
17
The preschool age group, 3-4 year olds, showed an increase of 6% increase from
the fall to spring from 55% to 61%. 19% of the children in this age group were
exceeding widely held expectations. In the 4-5 year age group from fall to spring showed
38% growth in meeting widely held expectations.
For children 0-3 years of age, Infant and Toddler teachers will select
developmentally appropriate materials for each child. Children will be offered the
opportunity to explore outdoor equipment that promotes gross motor and fine motor
development that include skills of reaching and grasping, exploring, throwing, playing in
water, riding toys, ball play, and using art materials.
The data comparing the fall and the spring checkpoints showed the largest
increase was children meeting widely held expectations in the age group of 4-5 year olds
with a 38% increase. We believe the increase is due to the intentional teaching
approaches that the teachers are implementing along with their increased focus on school
readiness and providing a quality learning environment.
The data showed a decrease in the 0-1 year old range of 10% and also a decrease
of 5% in the 1-2 year old range in children who were falling below widely held
expectations. We feel the increase of children not falling below the widely held
expectations in these age groups is due to the children’s ages as they are getting older and
more involved in the activities.

LKLP Head Start
Annual Report 2017-2018
18
Language
In our language area, data from the spring checkpoint compared to the fall
checkpoint indicates that a larger percentage of 4-5 year olds are meeting widely held
expectations compared to the other ages from birth to age 5. The most significant growth
was 4-5 year olds meeting the widely held expectations with an increase of 29%. The
language increase, we believe is partly due to the NCECDTL training suites our teachers
have been involved in to improve the quality of their classroom teachings in preschool.
Teachers are planning more intentional interactions with the children.
According to the data, for the language area, our largest downfall came in the 2-3
year old age range with 36% of children falling below widely held expectations for that
same age group. One of LKLP Head Stats 2017-2018 program goals is to provide and
implement quality learning activities for children through intentional planning in
language. Training will be targeted at preparing staff to meet this goal.

LKLP Head Start
Annual Report 2017-2018
19
Cognitive
In the cognitive area, our data comparison from the fall to spring checkpoints
once again shows a large increase in ages 4-5 years old, with an increase of children
meeting widely held expectations by 32 %. We feel that the increased knowledge that the
preschool teachers gained during our NCECDTL suites and by focusing on appropriate
intentional teaching opportunities, influenced the increase in meeting the widely held
expectations and is reflected in the school readiness skills.
The largest deficit, however, from birth to five in our cognitive area is in our 0-1
year old range as there was a 17% decrease of children meeting widely held expectations
from fall to spring. Again due to the increase in new staff in the early program, we feel
the data from the spring checkpoint is more accurate of the students abilities as the
teachers gained more knowledge in learning how to properly assess the children’s
capabilities.

LKLP Head Start
Annual Report 2017-2018
20
Literacy
In the literacy domain, comparing fall data to spring, the data shows the largest
increase is once again in the 4-5 year old range in meeting widely held expectations with
a 21% increase. Again, due to the consistent training from the NCECDTL suites and an
emphasis on children achieving school readiness, we see the increase in the school age of
children entering kindergarten.
In the 2-3 year old age group, there was an increase of 7% of children meeting
widely held expectations as 50% of children were meeting widely held expectations in
the fall and 57% of children were meeting widely held expectations in the spring. In the
3-4 year old age group there was a 19% increase of children that are exceeding widely
held expectations as 7% were exceeding widely held expectation in the fall and 26% were
exceeding widely held expectations in the spring. On average, 56% of children are
meeting widely held expectations. Teachers will work to enhance literacy skills by using
LKLP Head Start
Annual Report 2017-2018
21
expanded vocabulary, language building skills, songs and rhythms, exploring books
along with storytelling, and exploring writing materials.
Teachers will increase their knowledge in strategies and techniques of helping to
build the children’s literacy skills through provided trainings. These strategies and
techniques will include using open ended and extended sentences, expanded vocabulary,
songs and rhymes, exploring books and dialogic reading, storytelling and exploring
writing materials.
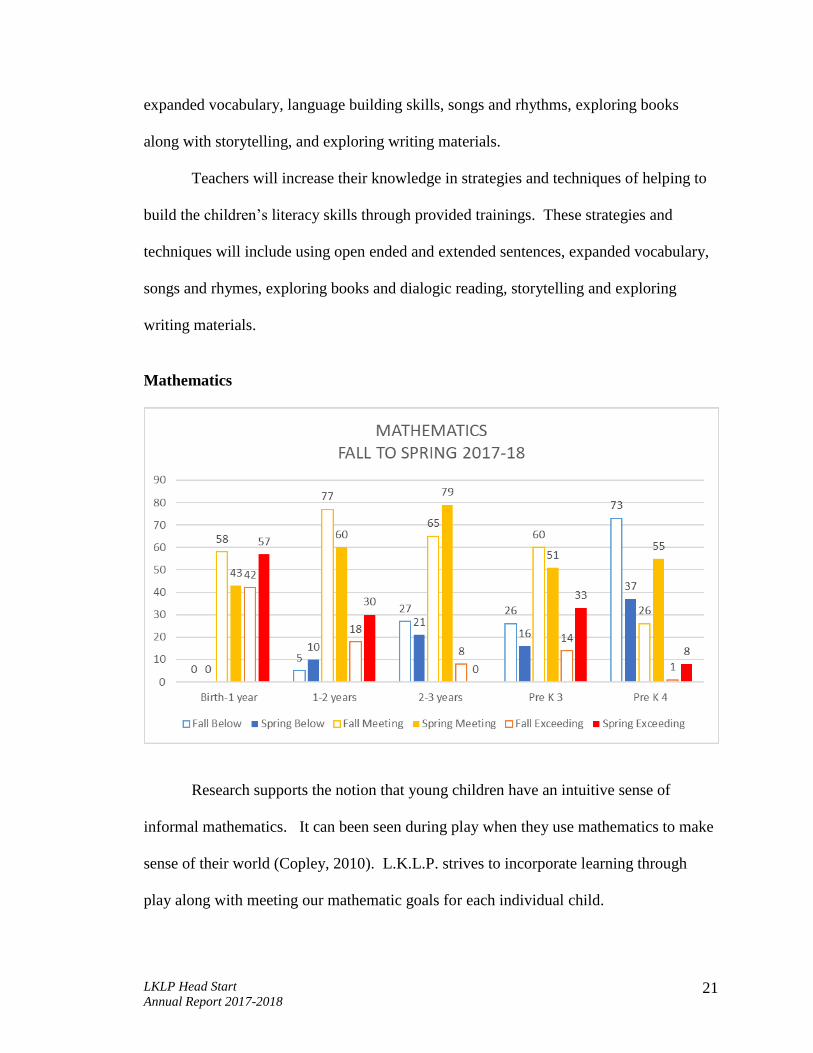
Mathematics
Research supports the notion that young children have an intuitive sense of
informal mathematics. It can been seen during play when they use mathematics to make
sense of their world (Copley, 2010). L.K.L.P. strives to incorporate learning through
play along with meeting our mathematic goals for each individual child.

LKLP Head Start
Annual Report 2017-2018
22
Our program strategies, linked to our program goals, will provide learning opportunities
for children in an environment that fosters skill development necessary for children to
gain knowledge along with growth in math skills.
2017-2018: High quality classrooms will promote skill development in math.
Classroom learning environments will improve as evidenced by the Early Childhood
Environmental Rating Scale (ECERS) and the Infant Toddler Environmental Rating
Scale (ITERS).
As a program, we have offered several trainings to staff that provide knowledge
and understanding of the importance of providing quality learning opportunities for
children in an environment that fosters skill development necessary for math growth.
Trainings offered during pre-service were “Observing with Intent”, “School Readiness”,
“Lesson Plans”, and “IFSP/IEP”. The program also conducts NCECDTL (National
Center on Early Childhood Development, Teaching, and Learning) trainings for teaching
staff every two months. Staff are also sharing ideas in PLC (Professional Learning
Community) meetings that are held every three months and TLC (Teacher’s Learning
Cooperatively) meetings held monthly. While assessing the short term goal for 2017-
2018, high quality classrooms will promote skill development in math skills.
Data collected for mathematics shows that from the fall to spring checkpoints
ages 0-1 indicates that 57% of the children in this group were exceeding the widely held
expectations.
Ages 1-2 data show that there was a 12% increase of children exceeding widely
held expectations while 18% were exceeding in the fall and 30% were exceeding in the
spring.
LKLP Head Start
Annual Report 2017-2018
23
In ages 2-3 year olds, data indicates that 79% of children in this age group were
meeting widely held expectations. This was a 14% increase from 65% in the fall.
Ages 3-4 data shows, that 53% of children are meeting widely held expectations
with an increase of 5%. There was an 18% increase in children that were exceeding
widely held expectations.
Age 4-5 data shows that 33% percent of children were exceeding widely held
expectations. This was a 19% increase from the 14% of children who were exceeding
widely held expectations in the fall...
Teachers will enforce math skills by having developmental appropriate materials
and activities that focus on number concepts, patterns and relationships, geometry and
spatial relationships, and sorting and classifying. These will be added to lesson plans
along with using the mighty minutes, intentional teaching experiences, and learning
games.
LKLP Head Start
Annual Report 2017-2018
24
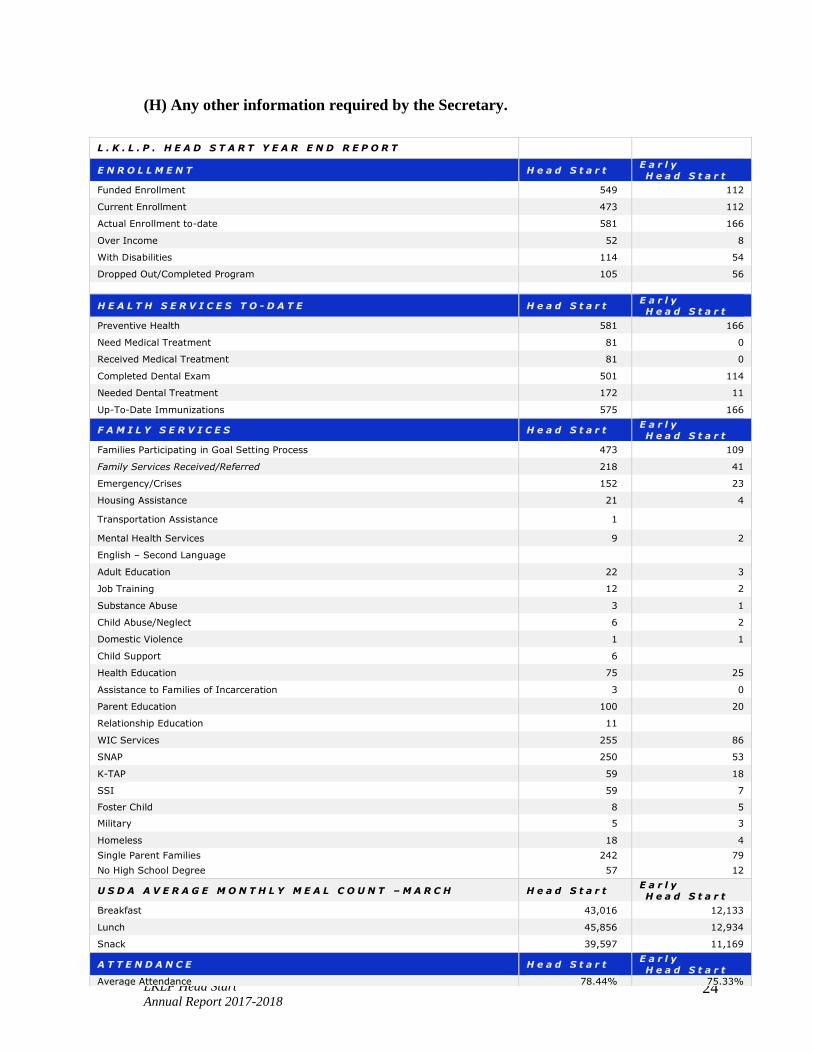
(H) Any other information required by the Secretary.
L . K . L . P . H E A D S T A R T Y E A R E N D R E P O R T
E N R O L L M E N T H e a d S t a r t E a r l y
H e a d S t a r t
Funded Enrollment 549 112
Current Enrollment 473 112
Actual Enrollment to-date 581 166
Over Income 52 8
With Disabilities 114 54
Dropped Out/Completed Program 105 56
H E A L T H S E R V I C E S T O - D A T E H e a d S t a r t E a r l y H e a d S t a r t
Preventive Health 581 166
Need Medical Treatment 81 0
Received Medical Treatment 81 0
Completed Dental Exam 501 114
Needed Dental Treatment 172 11
Up-To-Date Immunizations 575 166
F A M I L Y S E R V I C E S H e a d S t a r t E a r l y
H e a d S t a r t
Families Participating in Goal Setting Process 473 109
Family Services Received/Referred 218 41
Emergency/Crises 152 23
Housing Assistance 21 4
Transportation Assistance 1
Mental Health Services 9 2
English – Second Language
Adult Education 22 3
Job Training 12 2
Substance Abuse 3 1
Child Abuse/Neglect 6 2
Domestic Violence 1 1
Child Support 6
Health Education 75 25
Assistance to Families of Incarceration 3 0
Parent Education 100 20
Relationship Education 11
WIC Services 255 86
SNAP 250 53
K-TAP 59 18
SSI 59 7
Foster Child 8 5
Military 5 3
Homeless 18 4
Single Parent Families 242 79
No High School Degree 57 12
U S D A A V E R A G E M O N T H L Y M E A L C O U N T – M A R C H H e a d S t a r t E a r l y
H e a d S t a r t
Breakfast 43,016 12,133
Lunch 45,856 12,934
Snack 39,597 11,169
A T T E N D A N C E H e a d S t a r t E a r l y
H e a d S t a r t
Average Attendance 78.44% 75.33%
LKLP Head Start
Annual Report 2017-2018
25
Annual Self-Assessment Results
L.K.L.P. Head Start’s annual self-assessment was completed in the month of
November. The self-assessment includes a program-wide review of weekly plans,
portfolios, children’s records, and a classroom observation (by a Policy Council or
community representative).
Members of the Management Team along with Policy Council representatives,
compiled of parents, and community representatives visited all Head Start centers.
During this site visit, they conducted the full assessment based on The Office of Head
Start Monitoring Protocol as developed by the Head Start Bureau. Each Policy Council
representative or community representative conducted a classroom observation to rate
interactions, guidance, and communication, interviewed staff, and recorded findings on
the L.K.L.P. Head Start Self-Assessment Instrument. They also completed the Health
and Safety Checklist developed by the Head Start Bureau, which helps to assure that all
measures for children’s safety are in place. Each Management Team member reviewed
the records of selected children as well as their portfolios, conducted interviews with
staff, and answered basic questions that form part of the Monitoring Protocol.
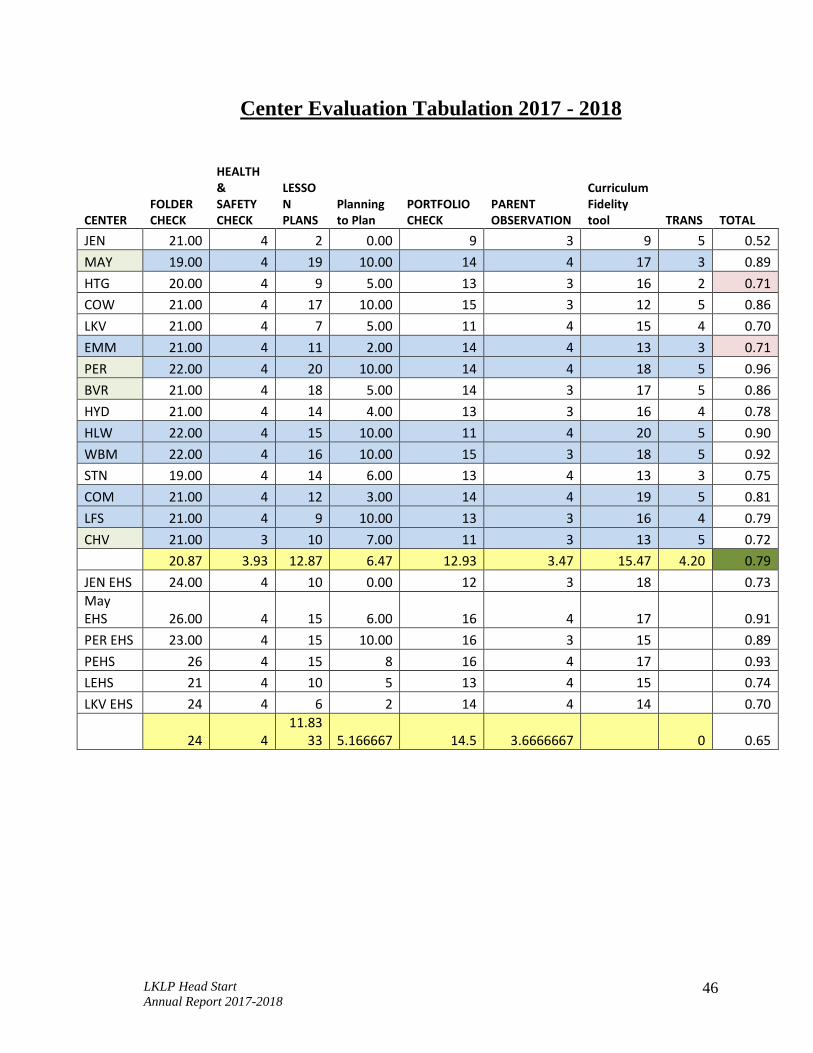
In general, L.K.L.P. Head Start is providing a safe, secure environment for
children, which supports their growth and development. Our program evaluation total for
preschool is at 79% for the 2017-2018 evaluation. In our early program, the average is
slightly higher at 82%. In particular, the atmosphere is relaxed and conducive to the
development of independence, friendships, physical growth and intellectual stimulation
through hands-on learning. L.K.L.P. Head Start gathers a wealth of information on each
child and his/her family. An overarching goal for L.K.L.P. Head Start is to continue to
LKLP Head Start
Annual Report 2017-2018
26
increase proficiency in the tracking of services and follow up on referrals in order to
ensure that both children and families are receiving optimum assistance and support.
Analysis for School Readiness Early Childhood Practices Survey
L.K.L.P. Head Start Program assesses children from age birth to 5 years using the
Teaching Strategies Gold assessment for three checkpoints during the school year for
preschool age children and 4 checkpoints for our early age children. Teaching Strategies
Gold (TSG) is an assessment system that measures the knowledge, skills and behaviors
that are most predictive of school success. TSG aligns with the Head Start Early
Learning Outcomes Framework (HSELOF) and the Kentucky Head Start Standards and
Benchmarks.
Data is collected throughout the checkpoint period by teaching staff, support staff
and parents using the 36 objectives from the TSG assessment. Within those 36 objectives
there are 73 dimensions used to assess all children. The 36 objectives are organized into
nine areas of development and learning. The first four are major areas of child
development: social-emotional, physical, language and cognitive. The content learning
areas are organized into literacy, mathematics, science and technology, social studies and
the arts. An important part of gathering data for each cycle is evaluating scores by
comparing them to research-based indicators within the TSG assessment for development
and learning. Each teacher goes through an annual interrater reliability for scoring their
classroom observations. To assess a child’s skill level, the teacher reads a progression to
determine which indicator best describes a child’s knowledge, skill or behavior based on
what was written in the observation from the child’s everyday classroom experiences.

LKLP Head Start
Annual Report 2017-2018
27
Our fall checkpoint ended on November 3, 2017, and data was collected on 552
children in the L.K.L.P. Head Start program from birth through age 5 for the 2017-2018
school year. This data represents the first cycle in the school year and will be our baseline
data to compare growth as each cycle is completed throughout the year. The 552 children
included in this report are in 56 classes at 17 centers and have the following
demographics:
*Birth to age 1 made up 8% of the children, Age 1-2, 7%; Age 2-3, 4%; Pre-K3,
53%; Pre-K4 28%
*54% of the children were male, 46% female
*98% were White, 1% African American and 1% White African American
*98% identified as not Spanish/Hispanic/Latino, and 2% were listed as unknown
*99% speak English as their primary language
*6% of the children have an IFSP (Individual Family Service Plan)
*7% of the children have an IEP (Individual Education Plan)
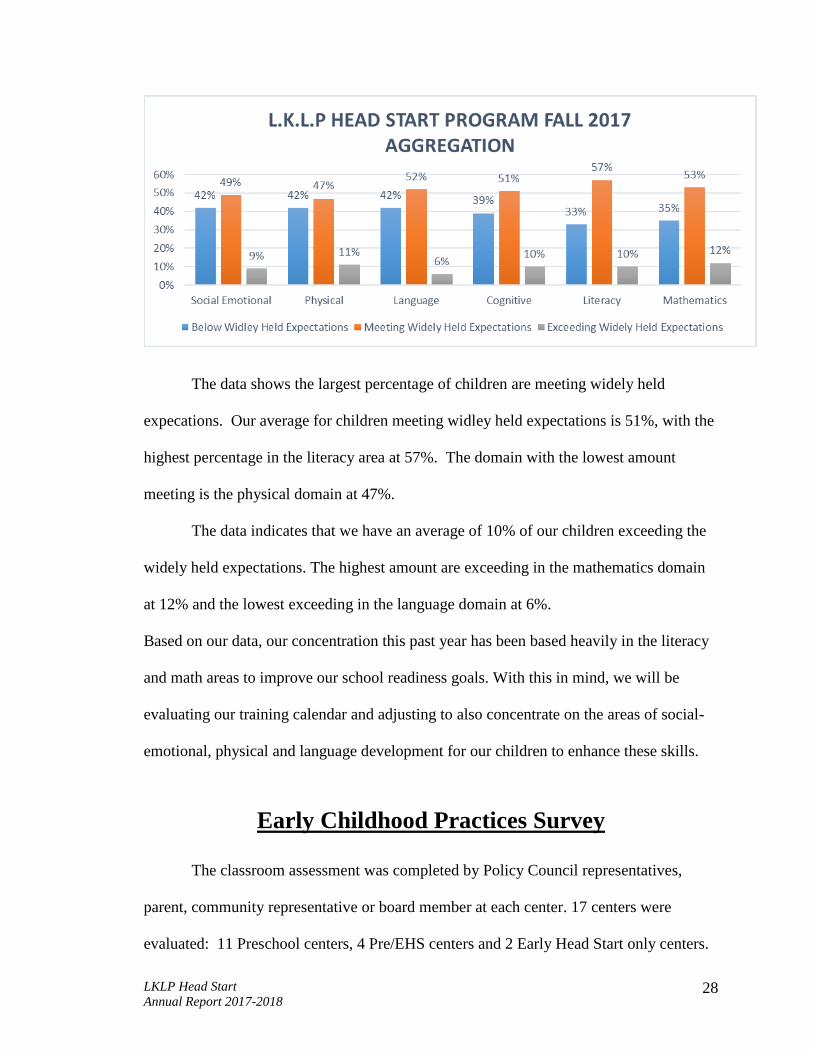
As a program, our data indicates that our highest percentage of children falling below
meeting widely held expecations are in three areas, social emotional, physical and
language development, with each being at 42% of the children. The lowest percentage
of children falling below are within the Literacy area at 33%. Our program average of
children falling below expectations is 39%.
LKLP Head Start
Annual Report 2017-2018
28
The data shows the largest percentage of children are meeting widely held
expecations. Our average for children meeting widley held expectations is 51%, with the
highest percentage in the literacy area at 57%. The domain with the lowest amount
meeting is the physical domain at 47%.
The data indicates that we have an average of 10% of our children exceeding the
widely held expectations. The highest amount are exceeding in the mathematics domain
at 12% and the lowest exceeding in the language domain at 6%.
Based on our data, our concentration this past year has been based heavily in the literacy
and math areas to improve our school readiness goals. With this in mind, we will be
evaluating our training calendar and adjusting to also concentrate on the areas of social-
emotional, physical and language development for our children to enhance these skills.
Early Childhood Practices Survey
The classroom assessment was completed by Policy Council representatives,
parent, community representative or board member at each center. 17 centers were
evaluated: 11 Preschool centers, 4 Pre/EHS centers and 2 Early Head Start only centers.

LKLP Head Start
Annual Report 2017-2018
29
Practices were observed in 3 areas: Interactions, Guidance and Communication for both
Preschool and Infant/Toddler classrooms.
Scores ranged from:
1—Not Met 2—Partially Met 3—Fully Met 4—Level of Excellence
Scores were rounded down to eliminate tenths in the total center evaluation
scores. This made tallying the scores a smoother process and gave a more consistent
picture of the whole program. Last year’s scores data included that a majority of our
Head Start centers scored a 3 in both Preschool and the early classrooms. This was
evident that the classrooms are being fully met in the areas of communication,
interactions, and guidance. There were 9 centers that scored a level 4 of excellence and
the other 8 centers a level 3 of being fully met.
The data below is the scores for the 2017-2018 school year.
Jenkins 4 Mayking 4
Mt. Heritage 3 Cowan 3
Carr Creek 4 Emmalena 4
Perkins 4 Beaver 3
Mt. View 3 Hayes Lewis 4
WB Muncy 3 Stinnett 4
Leslie Early 4 Community 4
Little Folk 3 Chavies 3
Perry Early 3
Program evaluation data shows that our program scores have increased from last
year with the majority of Preschool and Early Classrooms fully meeting a level of
excellence. 9 of the Preschool or Early Head Start centers met a level of excellence with
LKLP Head Start
Annual Report 2017-2018
30
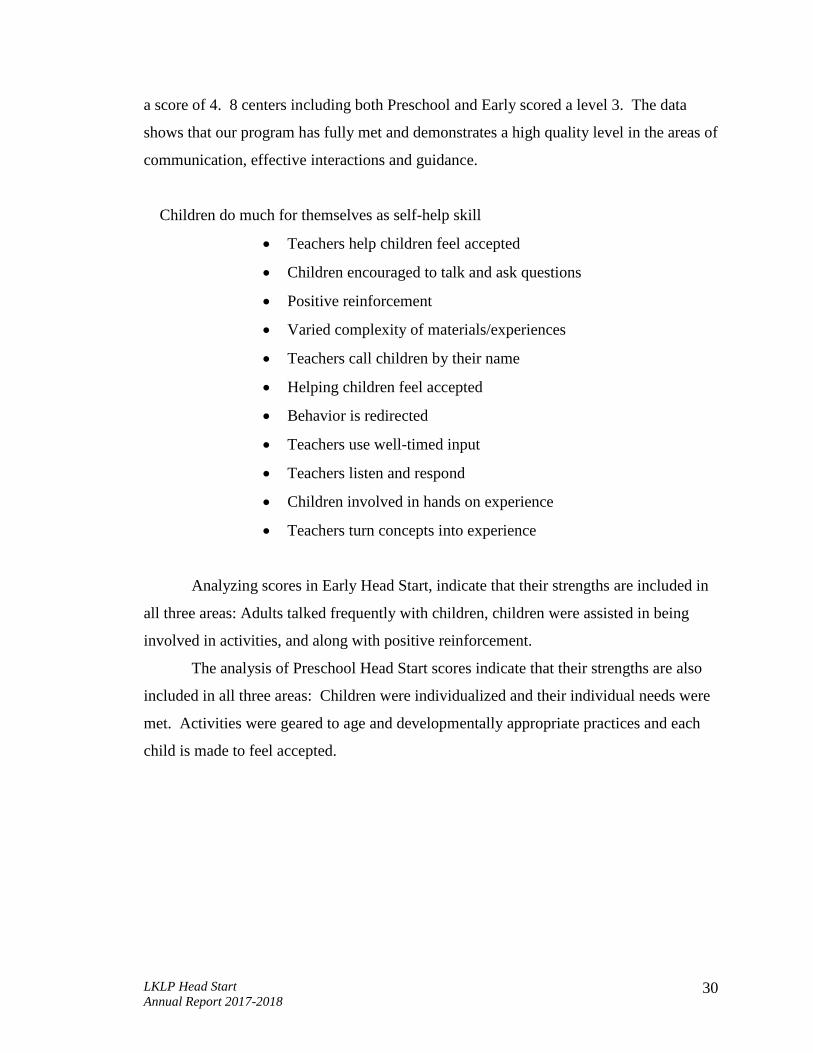
a score of 4. 8 centers including both Preschool and Early scored a level 3. The data
shows that our program has fully met and demonstrates a high quality level in the areas of
communication, effective interactions and guidance.
Children do much for themselves as self-help skill
Teachers help children feel accepted
Children encouraged to talk and ask questions
Positive reinforcement
Varied complexity of materials/experiences
Teachers call children by their name
Helping children feel accepted
Behavior is redirected
Teachers use well-timed input
Teachers listen and respond
Children involved in hands on experience
Teachers turn concepts into experience
Analyzing scores in Early Head Start, indicate that their strengths are included in
all three areas: Adults talked frequently with children, children were assisted in being
involved in activities, and along with positive reinforcement.
The analysis of Preschool Head Start scores indicate that their strengths are also
included in all three areas: Children were individualized and their individual needs were
met. Activities were geared to age and developmentally appropriate practices and each
child is made to feel accepted.
LKLP Head Start
Annual Report 2017-2018
31
Health and Safety
The Health and Safety Checklist showed 99.7% of centers performing safe and
sanitary practices, providing a safe, secure environment for children to explore and
enhance their developing skills. Children are curious by nature. It is natural for them to
explore, therefore, ensuring safe avenues for exploration is not just beneficial for their
health but also important for their development. We strive to create a safe environment
because it is not just about protecting the physical health of our children but also about
practices and procedures that promote their emotional and psychological wellbeing as
well. The evaluation indicates that one center lost points due to a concern of the
evaluator. All concerns have been addressed and been corrected or placed on
maintenance to be looked at further.

LKLP Head Start
Annual Report 2017-2018
32
Health and Safety Screener
2017-2018 Center Yes No Comments %
Jenkins 48 0 100
Mayking 48 0 100
Cowan 48 0 100
Heritage 48 0 100
Carr Creek 48 0 100
Perkins 48 0 100
Emmalena 48 0 100
Beaver 48 0 100
Lion’s Den 48 0 100
Community 48 0 100
Chavies 47 0 Some outlets not
covered
98
Little Folk Shop 48 0 100
Perry EHS 48 0 100
Mt. View 48 0 100
Hayes Lewis 48 0 100
Stinnett 48 0 100
WB Muncy 48 0 100
Leslie EHS 48 0 100
These were minor issues which were taken care of promptly.

LKLP Head Start
Annual Report 2017-2018
33
Transportation
L.K.L.P. Head Start has 16 centers that transport children on a daily basis and 1
center that uses a bus for field trips only. In pursuit of ensuring that our children are
transported in a safe manner, an evaluation was made of the required postings and paper
work that should be available for families and assessments of the center. This evaluation
was composed of members of the Management Team and a Policy Council representative
which is composed of parents, community representatives and a board member.
During monthly inspections and our annual program evaluation, we looked for the
following to be in place: current fire drills, bus attendance sheets are current, pick up and
drop off times are documented; classroom sign in sheets are current and initialed from
bus run, transportation report is available and current; and parent emergency evacuation
forms were available for the orientation days which cover safe transportation practices.
This is the third review of transportation that has been included in the Annual
Program Evaluation. 8/15 = 53% of centers had all pieces of the required forms and
practices in place and 6/15 centers had 1 or more pieces not complete or current. The
47% of centers that did not have all pieces complete would have gotten 100% credit if
they had had the Parent Emergency Evacuation Form in place or they failed to complete
the student sign-in sheet correctly. The Parent Emergency Evacuation/ Bus Safety form
is a form that is now required at Parent Orientation. The other piece of information that
was not current was the classroom sign in sheet that is required to be completed each day
as children are signed in and out of the classroom either from the bus or from a parent.
The results of the transportation evaluation in general shows that our program has
all of the procedures in place to provide a safe and secure method of transporting children

LKLP Head Start
Annual Report 2017-2018
34
to and from our Head Start Centers and has a 20% improvement rate from the results of
last year’s program evaluation. The evaluation provided information to our
management team to monitor the 38% of centers that had 1 or more pieces of information
missing or not complete, more often.
Percentage of Required Transportation Forms Completed, Current and Available
Center
Percentage of
completion
Beaver
100%
Chavies
100%
Community
100%
Cowan
100%
Emmalena
60%
Hayes Lewis
100%
Mountain
Heritage
40%
Mountain View
80%
Jenkins
100%
Carr Creek
100%
Little Folk shop
80%
Perkins
100%
Stinnett
60%
WB Muncy
100%
Mayking
60%

LKLP Head Start
Annual Report 2017-2018
35
Infant/Toddler and Teacher Interaction Observation
Spring 2017-2018 Analysis
OBSERVATION HIGHEST LOWEST AVERAGE
Discipline
7.1
3.1
5.0
Staff-Child
Interactions
7.2
6.0
6.8
Peer Interaction
7.2
4.4
5.6
Helping Children
Understand
Language
7.4
5.0
6.6
Listening and
Talking
7.2
4
6.0
0
1
2
3
4
5
6
7
Fall Spring
Discipline
Staff-ChildInteractions
Peer Interactions
Helping ChildrenUnderstand language
Listening and Talking
LKLP Head Start
Annual Report 2017-2018
36
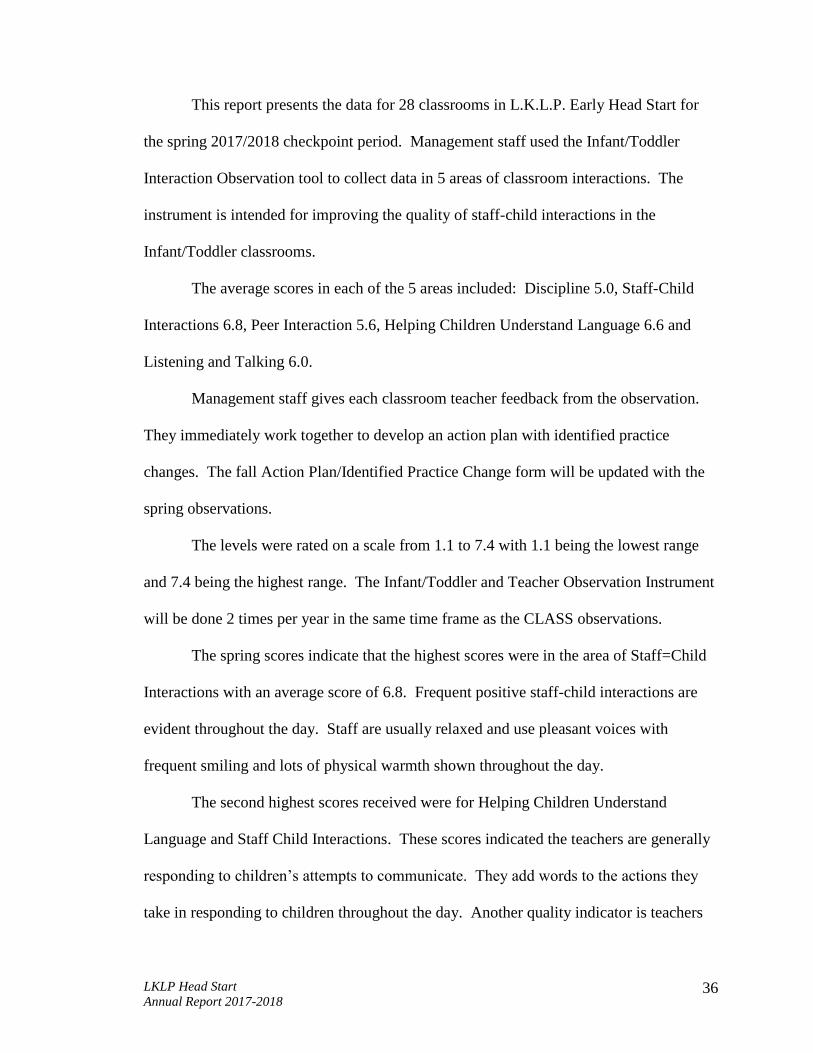
This report presents the data for 28 classrooms in L.K.L.P. Early Head Start for
the spring 2017/2018 checkpoint period. Management staff used the Infant/Toddler
Interaction Observation tool to collect data in 5 areas of classroom interactions. The
instrument is intended for improving the quality of staff-child interactions in the
Infant/Toddler classrooms.
The average scores in each of the 5 areas included: Discipline 5.0, Staff-Child
Interactions 6.8, Peer Interaction 5.6, Helping Children Understand Language 6.6 and
Listening and Talking 6.0.
Management staff gives each classroom teacher feedback from the observation.
They immediately work together to develop an action plan with identified practice
changes. The fall Action Plan/Identified Practice Change form will be updated with the
spring observations.
The levels were rated on a scale from 1.1 to 7.4 with 1.1 being the lowest range
and 7.4 being the highest range. The Infant/Toddler and Teacher Observation Instrument
will be done 2 times per year in the same time frame as the CLASS observations.
The spring scores indicate that the highest scores were in the area of Staff=Child
Interactions with an average score of 6.8. Frequent positive staff-child interactions are
evident throughout the day. Staff are usually relaxed and use pleasant voices with
frequent smiling and lots of physical warmth shown throughout the day.
The second highest scores received were for Helping Children Understand
Language and Staff Child Interactions. These scores indicated the teachers are generally
responding to children’s attempts to communicate. They add words to the actions they
take in responding to children throughout the day. Another quality indicator is teachers

LKLP Head Start
Annual Report 2017-2018
37
are skillful at interpreting children’s attempts to communicate and frequently follows
through appropriately. Teachers model positive social interactions by being warm and
affectionate and using gentle touching. They are also polite to children and not “bossy”.
Teachers facilitate positive peer interactions among children by placing baby areas where
they can see and react to others, helping toddlers find duplicate toys and include children
with disabilities. Also, teachers are talking frequently to the children using simple,
descriptive words. They are talking to children about things that are meaningful to them
and personalizing their communication by making eye contact and using the child’s
name. Positive methods of discipline are generally used and found to be effective.
Teachers try to give frequent attention to children that are behaving well.
The lowest score is for Discipline. Teachers will use positive methods of
discipline effectively. Teachers will react consistently to children’s behavior and seek
advice from other professionals concerning behavior problems. Although the scores are
the lowest, they were still in the good range.
From the fall 2017-2018 Infant Toddler Interaction Observation to the spring
2017-2018 Infant Toddler Interaction Observation growth was shown in both the Staff-
Child Interaction and Helping Children Understand Language areas. The average score
for Staff-Child Interactions for the fall observation period was 6.4 and the average score
for the spring observation period was 6.8. The average score for Helping Children
Understand Language for the fall observation period was 5.9 and the average score for
the spring observation period was 6.6.
Infant/Toddler classrooms will continue to implement the Creative Curriculum to
promote child and teacher interactions. Our multi-age classrooms also promote

LKLP Head Start
Annual Report 2017-2018
38
interactions between older and younger children. Our children are always encouraged to
express themselves and to learn independence.
C.L.A.S.S. Observation Fall Analysis 2017
Our C.L.A.S.S. observations were conducted on our preschool teachers during the
month of October 2017 by 11 C.L.A.S.S. reliable observers. In the preschool setting we
evaluated teachers using the C.L.A.S.S. (Classroom Assessment Scoring System)
observation tool.
During the preschool observation, 32 classroom teachers and co-teachers were
evaluated from 15 preschool centers. Within the group of 32 teachers/co-teachers, there
are only 17 that have more than one year of experience in a Head Start classroom and 9
teachers/co-teachers that were being assessed for the first time.
After compiling the scores as a program, the scores are following: 6.34 in the
Emotional Support Domain, 5.62 in Classroom Organization and 4.62 in Instructional
Support. These compared to the spring 2017 scores are slightly higher.
PC NC TS RSP BM PD ILF CD QF LM ES CO IS
9/29/17 -
11/29/17 6.56 1.09 5.88 6 5.88 5.78 5.19 4.53 4.66 4.69 6.34 5.62 4.62
Upon reviewing program data, it has been determined the slight increase is due to
our targeted NCECDTL (National Center on Early Childhood Development, Teaching,
and Learning) trainings, Preservice Trainings and implementing a strong coaching
program for our teachers. The coaching program has Mentor Coaches assigned to
LKLP Head Start
Annual Report 2017-2018
39
teachers that need the intensive one on one as well as new teachers and teaching staff
participating in TLC (Teachers Learning Collaboratively) groups which target specific
skills to enhance the learning environment through quality interactions
After scoring the assessments, teachers are placed in tiers to help with classroom
development and coaching. Each tier has certain pre-set requirements per our mentor
plan that must be met to be placed in a specific tier. There are four tiers; Tier 1 being of
the highest quality, then Tier 2, Tier 3 and then Tier 4. Teachers falling in tier 3 and 4
receive the most support. All tier 4 teachers will be receiving one on one coaching from
a Mentor Coach throughout the year on a regular basis. Of the 32 teachers and co-
teachers assessed, we had 7 score in Tier 1, being our highest quality tier. Tier 2 had 9,
Tier 3 had 1 and Tier 4 having 15 teachers/co-teachers, of which all but three have only
been in a Head Start classroom for a year or less.
As the year progresses, we anticipate many teachers improving on those quality
interactions therefore our C.L.A.S.S. scores will improve which in turn will yield our
children becoming even more school ready. During the year, there will be continued
targeted trainings focusing on the areas that the program scored lowest, which is
Classroom Organization, falling slightly below the National Average by .11. The Mentor
Coaches will continue intense coaching with staff that fall in Tier 3 and Tier 4 and the
TLC groups will also continue bi-weekly meetings in Letcher County. We look forward
to the spring assessment to evaluate the data after most teachers have gained more
training and teaching experience in the classrooms.
Lesson Plans - Head Start
As part of the self-assessment, the lesson plans were evaluated on the current
week during center evaluation and two previous weeks (9/25/17 and 10/23/17). Each of
the 28 Head Start classrooms were evaluated on a 20 point evaluation form and could
also get an additional bonus point if their classroom shouts their theme for the current
week. As a program, the average overall score of 64%, which is a decrease from last
year’s score. The scores were in range from 20 points down to 0 points with the

LKLP Head Start
Annual Report 2017-2018
40
following percentages: 6 classrooms had 90-100%, 7 classrooms scored between 75-
90%, and 15 fell below 75%.
After review, the lowest areas for the program were in interest areas, group
planning, large and small group and also in reflection of the weekly plans. This
information will help to plan trainings based on needed areas of improvement. One need,
in particular, is for training new staff. Of the 28 classrooms, we have 15 teachers with
one year or less of classroom experience. This is an increase in new staff from last year.
This will help as a guide during our new hire training as well. One factor suspected to
contribute to a decrease in scores is the changes made to Teaching Strategies Gold and
the technical issues experienced with the Teaching Strategies Gold program.
Management staff worked closely with Teaching Strategies Gold Representatives to
correct the issues.
Education management staff have begun weekly reviews of lesson plans and
providing teachers with immediate feedback when lesson plans are submitted. The
program will pursue more intentional trainings on use of lesson plans in the classroom
and the importance of utilizing their plans.
Lesson Plans - Early Head Start
As part of the self-assessment, the lesson plans were evaluated on the current
week’s lesson plan, during center evaluation along with two additional weeks (9/25/17
and 10/23/17). Each classroom could get a possible 20 points and also earn an additional
bonus point for their current theme of the week if their topic was visibly evident. As a
program, the average score was 59%. 6 classrooms scored between 90-100%; 8
classrooms scored between 75-90% and 14 classrooms fell below 75%.

LKLP Head Start
Annual Report 2017-2018
41
Lesson plans included age appropriate and meaningful activities and experiences
in music, nursery rhymes, reading books and outside play. The lowest areas were indoor
and outdoor experiences, daily experiences, and weekly reflections. As with the
preschool, in early we are planning the focus for the spring trainings on lesson planning.
Education management staff are providing weekly feedback and immediate follow-up as
well.
Planning to Plan
LKLP Head Start Program uses the “Planning to Plan” atlas when preparing for
the lesson plans. This includes a five week plan. The atlas provides the teachers
guidance in planning ahead and gathering materials that are of interest to the children and
will provide the children the opportunities to develop skills that assures school readiness.
The atlas consists of a percentage each week that each lesson plan needs to have
completed. Head Start staff develop the lesson plan according to children’s interest and
developmental needs.
Planning Atlas
Week 1
Lesson plan needs to be complete and
family note sent home
Week 2
¾ of the lesson plan completed
Week 3
½ of the lesson plan completed
Week 4
¼ of the lesson plan completed
Week 5
has the title and a few ideas on the
planning web
Management staff along with board members, parents, Policy Council members
and/or community representatives do a yearly program evaluation. The program
evaluation is based on a point system. The Point system for the Planning Atlas equals 2
points each week with a total of 10 points possible.
Below are points earned during the program evaluation:

LKLP Head Start
Annual Report 2017-2018
42
Center
Number of
classrooms
Number of
points earned
Beaver 2 5
Carr Creek(Preschool) 2 5
Carr Creek (Early) 4 2
Chavies 2 7
Cowan 1 10
Community 3 3
Emmalena 1 2
Hayes Lewis 1 10
Jenkins (Preschool) 2 0
Jenkins (Early) 4 0
Leslie Early 4 5
Little Folk Shop 2 10
Mayking (Preschool) 2 10
Mayking (Early) 2 6
Mountain Heritage 3 5
Mountain View 3 4
Perkins (Preschool) 1 10
Perkins (Early) 4 10
Perry Early 10 8
Stinnett 2 6
WB Muncy 1 10
We have 17 Head Start centers that include one or both Early and Preschool
settings. 7 out of the 17 Head Start centers scored the maximum amount of 10 points.
Center Evaluation visits showed a decrease in week 2 or week 3 of lesson planning with
seventeen classrooms that did not complete the ¼ goal setting plan. According to the
documentation during our program evaluation visit, there were 39 classrooms that include
early and preschool that showed a decrease in the number of lesson plans that ¾ was not
completed during week 4 and week 5.
The average score on Planning to Plan was 60% for the overall program.
Portfolios
In attempt to make our assessment system seamless the program utilizes the
assessment tool, Teaching Strategies Gold. This system spans birth through third grade.
Information can be passed to the child’s next teacher as he or she moves from an
Infant/Toddler classroom all the way through Head Start. The objectives are more

LKLP Head Start
Annual Report 2017-2018
43
predictive of future school readiness success and are linked to state early learning
standards. The teachers are focusing on the objectives that are most important to
children’s development and learning. Each individual child’s portfolio is maintained and
documented by the use of computer.
There are six areas of focus when evaluating the portfolio. Observation (are they:
written at varied times of the day, at varied settings, varied experiences and written by
various staff). Portfolio entries (are observations made in a timely manner). Profile (does
the materials and information gathered: match the child’s development and learning
report, does the goals and strategies match child needs). Shared (is there evidence that
the information from the portfolio been shared with parents). Used (was the information
gathered used for future planning). Group tracking (is the information tracked on the
whole class). The table below indicates the average percentage in each area of the
portfolio assessment process.
Results from program evaluations indicate the overall average program score for
the portfolio evaluation is 82% which has decreased from the last evaluation by 2%. It
has been determined that the decrease is due in part to the updated system that Teaching
Strategies implemented in July. Also there have been 58 new employees in addition to
the update, for whom this is their first experience with utilizing the system and observing
children. It is expected that with gained experience and knowledge, the children’s
portfolios will improve as the year moves on and using Teaching Strategies is planned to
be incorporated into the on boarding process.
Three centers scored 90% or higher in all areas. This illustrates a very high
quality of maintaining portfolios and the willingness to share gathered information with
parents as well as how well they use gathered information for planning. Nine centers are
between 80%-90% and five fell below 80%.
The following has been identified as the biggest needs during the portfolio evaluation:
*Classroom observations with labeled pictures and work samples in the
areas of Math, Cognitive and Literacy
*Timely computer entry
*Group tracking
LKLP Head Start
Annual Report 2017-2018
44
Focused attention shall be made during the next two cycles regarding staff
managing their time to input observations for the children’s portfolios. During our spring
training, there was a training specifically targeting observations including required
pictures and work samples, how to utilize the TSG tools for group tracking and
brainstorming obstacles to overcome in order to have them recorded in a timely manner.
Folder Check
Overall with Head Start and Early Head Start combined the program scored a
92% on children’s files. The lowest score was a 78% and the highest being 100%. We
had 3 centers scoring a perfect 100% and another 12 scoring in the 90 plus percentile.
Information gathered from this year’s folder check indicates that 3 preschool centers
improved one or more percent from last year’s findings. One remained the same. Overall
the preschool folder check rose 0.3% with this year’s average being 95%.
Information gathered from this year’s folder check indicate that 5 Early Head
Start centers increased one or more percent. Overall there was a 17% increase in the
Early Head Start folder check.
Upon review of 10% of children’s files, the program found that the area of health had
the most problems with the missing information being the 90 day requirements. Staff
have little control of these requirements as it is the parents who must get the children’s
medical exams. Areas of concern is following:
Children’s files need more organization
Incomplete or missing records
o Physicals with proof of lead
o Contact sheets
o Immunization Certificates, missing or expired
o Head Start Screening Form
o Unsigned release forms
o EPSDT well child summary
o Health summary report
o Dental exams
LKLP Head Start
Annual Report 2017-2018
45
o Speech screening
o Developmental screening
o Individual Curriculum and Health Services Plan
o Family Partnerships and Assessment Surveys
These areas of concern with folders will be addressed at the Family Development
meeting and also at the spring training.
LKLP Head Start
Annual Report 2017-2018
46
Center Evaluation Tabulation 2017 - 2018
CENTER FOLDER CHECK
HEALTH & SAFETY CHECK
LESSON PLANS
Planning to Plan
PORTFOLIO CHECK
PARENT OBSERVATION
Curriculum Fidelity tool TRANS TOTAL
JEN 21.00 4 2 0.00 9 3 9 5 0.52
MAY 19.00 4 19 10.00 14 4 17 3 0.89
HTG 20.00 4 9 5.00 13 3 16 2 0.71
COW 21.00 4 17 10.00 15 3 12 5 0.86
LKV 21.00 4 7 5.00 11 4 15 4 0.70
EMM 21.00 4 11 2.00 14 4 13 3 0.71
PER 22.00 4 20 10.00 14 4 18 5 0.96
BVR 21.00 4 18 5.00 14 3 17 5 0.86
HYD 21.00 4 14 4.00 13 3 16 4 0.78
HLW 22.00 4 15 10.00 11 4 20 5 0.90
WBM 22.00 4 16 10.00 15 3 18 5 0.92
STN 19.00 4 14 6.00 13 4 13 3 0.75
COM 21.00 4 12 3.00 14 4 19 5 0.81
LFS 21.00 4 9 10.00 13 3 16 4 0.79
CHV 21.00 3 10 7.00 11 3 13 5 0.72
20.87 3.93 12.87 6.47 12.93 3.47 15.47 4.20 0.79
JEN EHS 24.00 4 10 0.00 12 3 18 0.73
May EHS 26.00 4 15 6.00 16 4 17 0.91
PER EHS 23.00 4 15 10.00 16 3 15 0.89
PEHS 26 4 15 8 16 4 17 0.93
LEHS 21 4 10 5 13 4 15 0.74
LKV EHS 24 4 6 2 14 4 14 0.70
24 4 11.83
33 5.166667 14.5 3.6666667 0 0.65
LKLP Head Start
Annual Report 2017-2018
47
Identified Areas For Improvement and Improvement Plan:
Improvement to children’s portfolios making them more rich and meaningful.
o Goal: to develop a systematic approach for portfolio entry and to improve
the overall quality and usefulness of the portfolio.
o Desired Outcome: for the portfolio process to improve, for entries to be up-
to-date and recorded in a timely manner and to show ongoing growth and
development.
o Action Steps:
1) Education Committee brainstorm strategies for improving the
portfolio process.
2) Continue the one-on-one technical support.
3) Lead Teachers to review information documented on the computer.
4) Management Staff to monitor for improvements and the progress of
the implementation.
5) Classroom Staff to utilize Teaching Strategies GOLD Objectives for
Development and Learning manual as a guide to making accurate
observations
6) Management Staff will monitor implementation and improvement.
7) Classroom Staff will obtain and maintain Interrater Reliability
Credentials annually.
8) Classroom staff will be trained on writing quality observations
o Person(s) Responsible: Lead Teachers, Associate Teachers, and Management
Staff
o Resources: Management Staff, Creative Curriculum, Teaching Strategies
GOLD Objectives for Development and Learning manual
o Dates: February 2017 – August, 2018
In 2015-2016 the scores for maintaining portfolios was 76%. The goal was to see
an increase in 2016-2017 to 82%. The goal was met and surpassed by 3% to an
average of 85%. The goal for 2017-2018 was to increase by 6%. The average
score, however dropped back to 82%. All staff will participate in an additional
LKLP Head Start
Annual Report 2017-2018
48
training on classroom portfolios and observations during Spring Training. The
action steps will remain the same.
Enhance staff skills.
o Goal: to enhance staff skills in improving time management skills.
o Desired Outcomes: an improved practice in family services by identifying
and developing family goals, improved daily practices.
o Action Steps:
1) All Family Development Assistants will receive, more one-on-one
technical support from Management Staff.
o Person(s) Responsible: Family Development Assistants and Manager:
Family and Community Partnership, Family & Child Development Specialist
o Resources: Family Development credential training information,
Management Staff
o Dates: April 2017 – August 2018
In 2015-2016 time management and children’s records scored 91%. The goal was
to see a 2% increase in 2016-2017. However the score remained the same at
91%. The 2017-2018 goal was to see an additional 2% increase. There was a
slight increase to 91.94%. All Family Development Assistants will receive
additional one-on-one technical support from Management staff, Mentor Coaches
and/or Professional Development Support staff in conjunction with additional
center and group training.
Enhance staff skills
o Goal: to strengthen Family Engagement in the Seven Elements.
o Desired Outcomes: parents are engaged in their child’s learning in the
classroom and in the center
o Action Steps:
1) Present parent trainings targeting school readiness.
LKLP Head Start
Annual Report 2017-2018
49
2) Develop warm respective relationships with the parents through home
and center visits.
o Person(s) Responsible: Family Development Assistants, Family
Community Partnership Manager, Family & Child Development
Specialist, Early Childhood Development Specialist
o Resources: Family Engagement Literature, School Readiness Plan,
Family Development Plans
o Dates: June 2017- August 2018
In 2015-2016 engaging the families in the seven elements scored 23%. The goal
was to increase the scores by 5%. The goal was surpassed by 6% in 2016-2017 to
34%. In 2017-2018, the goal was to increase by 5%. It was surpassed and
increased by 18% up to 53%. The action steps will continue to be followed with
the addition of the following two:
1) All staff will participate in PFCE trainings.
2) Family Development will provide 2 Resource Fairs per year for
parents.
Improve Weekly Plans.
o Goals: to improve utilization of items in plans.
o Desired Outcomes: to improve weekly plans by utilizing items placed in the
learning centers as planned. Include more intentional goals, meaningful
small and large group activities/experiences, and weekly cooking
experiences, enhance changes to the environment and evaluating the weekly
theme every Friday.
o Action Steps
1) Use theme notes to get input from families and children.
2) Evaluate theme at the end of each week.
3) Refer to the planning atlas.

LKLP Head Start
Annual Report 2017-2018
50
4) Ongoing planning – record ideas in weekly plan as ideas are
developed.
5) Management staff will review lesson plans weekly.
6) Utilize materials in weekly plans.
7) Weekly review of lesson plans and feedback for submitted plans.
o Person(s) Responsible: Center Staff, Management Staff
o Dates: February 2017-August 2018
In 2015-2016 the scores on lesson planning for Preschool were 74% and Early
Head Start scores were 80%. The goal was to increase Preschool scores by 3%
and Early Head Start scores by 1%. The Preschool scores remained the same at
74% while the Early Head Start scores increased by 5% to 85%. The goal for
2017-2018 was for Preschool to increase by 3% and Early by 1% however there
was a decline for both Pre and Early. Preschool average was at 64% and the
average was at 59% for Early. We feel the decline is due in part to the new
planning form that TSG introduced and our large amount of new staff. We will
continue to utilize the action steps for both groups and two additional steps.
8) Education Committee will discuss and plan additional training and
support for Preschool and Early staff struggling with lesson plans.
9) Staff will increase use of Teaching Strategies Gold’s online activities.
10) Staff will get one on one technical assistance from Management staff,
Mentor Coaches and/or Professional Development staff.
11) Trainings will be provided during Pre-Service on lesson planning
Improve quality of classroom learning environment.
o Goal: to increase the number of centers who receive a bonus point during
program evaluation. (A bonus point is given when all items listed on lesson
plans are in place for children’s use and theme is “shouted” throughout the
room.)
o Desired Outcomes: to have more enhanced environments therefore, making
children’s experiences richer and fostering school readiness. CLASS scores
in Instructional Learning Formats will improve.

LKLP Head Start
Annual Report 2017-2018
51
o Action Steps:
1) To continue with teachers’ meetings
2) Input from Education Committee members
3) Brainstorm ways to enhance planning, more team planning, and more
team involvement in room/environment preparations and organize
theme/prop boxes.
4) NCECDTL Training scheduled every two months.
o Person(s) Responsible: Lead Teachers, Associate Teachers, Assistants,
Family Development Assistants, Family Development Advocates, Nutrition
Assistants, and Management staff.
o Resources: classroom resource materials, resource library, local libraries.
ECKERS and ITERS
o Dates: February 2017 – August 2018
In 2015-2016 the CLASS score in Instructional Leaning Format was 5.28. The
goal for 2016-2017 was to increase the score by .4% to 5.68. However there was
a decrease to 5.17. The goal for 2017-2018 was to increase the score by .4%.
There was an increase from 5.17% to 5.19% in the Instructional Learning Format.
Additional action steps will be taken.
5) 2 Mentor Coaches working with staff. Hire an additional Mentor
Coach.
6) Management staff will do more one on one training and support when
doing site visits.
7) Video recording CLASS visits will be utilized and shown to center
staff for their feedback.
8) Implement PLCs.
9) Implement TLCs in bimonthly meetings.
Improve teacher/child interactions
o Goal: to develop classroom quality by increasing scores on CLASS and
Infant/Toddler and Teacher Interaction Observation Tool.

LKLP Head Start
Annual Report 2017-2018
52
o Desired Outcomes: to develop techniques in Concept Development,
Quality of Feedback, Language Modeling and Peer Interactions.
o Action Steps:
1) Management team members will observe classroom staff using
CLASS and Infant/Toddler and Teacher Interaction Observation Tool
to determine the level of interactions between children and teachers as
well as interactions between children.
2) Management team will train classroom staff on mentoring process
3) Mentor and staff will implement steps of mentoring process
4) To add an additional Mentor/Coach to the coaching staff.
o Person(s) Responsible: Lead Teachers, Associate Teachers, Management
Staff, CLASS Mentor
o Resources: CLASS, Infant Toddler Teacher Observation, classroom resource
materials, local libraries and mental health consultants.
o Dates: February 2017– August 2018
In 2015-2016 the score for Instructional Support was 4.5. The goal was to
increase the score .5 to 5.0 in 2016-2017. The goal was not met, the score was
only 4.51. 2017-2018 the goal was to increase .5%. There was an increase from
the previous score to 4.62%. We will continue to follow the action steps and
include these additional steps.
5) Staff will be videoed to determine whether appropriate teacher/child
interactions are taking place.
6) Staff will give feedback on the video.
7) Staff will develop an action plan to increase their teacher/child
interactions.
8) Staff will implement the additional action steps.
9) Staff will discuss CLASS Action Plan from observation with assigned
Mentor Coach.
Improve staffs’ skills in behavior management

LKLP Head Start
Annual Report 2017-2018
53
o Goal: to develop and strengthen staffs’ knowledge and implementation of
effective, developmentally appropriate behavior management techniques and
strategies.
o Desired Outcomes: to increase scores on the Infant and Toddler Teacher
Observation and on CLASS - Behavior Management
o Action Steps:
1) Management Team members will observe classroom staff using
CLASS to determine the level of management.
2) Management team will implement, with classroom staff, the mentoring
process to reinforce best practices.
3) Training on child development.
4) Training on special needs and expected behaviors.
5) Training on strategies and techniques on developmentally appropriate
behavior management.
6) Staff will implement all aspects of active supervision.
o Person(s) Responsible: Management staff, Lead Teachers, Associate
Teachers, Mental Health Professionals.
o Resources: CLASS, Infant Toddler Teacher Observation, classroom resource
materials, local libraries, and Mental Health Professionals.
In 2015-2016 the score for discipline was 4.92. The goal was to increase the
score in 2016-2017 by .5 to 5.42. The goal was met and exceeded by .02. In
2017-2018 the goal was to increase .5%. The goal was met with 5.9%. The
current action steps will continue to be followed.
Improve school readiness skills.
o Goal: to strengthen each of the five essential domains.
o Desired Outcomes: environments will be math and print rich, family
involvement will be ongoing in school readiness experiences.
o Action Steps:
1) Staff will receive training on developmentally appropriate math and
literacy experiences.
LKLP Head Start
Annual Report 2017-2018
54
2) Staff will plan for and implement meaningful math and literacy
experiences daily
3) Families will receive training on developmentally appropriate math
and literacy experiences.
4) Families will receive training and encouragement on the importance of
their role in getting their children school ready.
o Person(s) Responsible: Management Staff, Lead Teachers, Associate
Teachers, Nutrition Assistants, and Family Development Staff
o Resources: Teaching Strategies GOLD, The Creative Curriculum,
High Five Mathematize, Everyday Counts, classroom resources, lesson
plans.
o Dates: February 2017 – August 2018
In 2015-2016 the score for school readiness in meeting widely held expectations
in Math, Cognitive and Language in Creative Curriculum Gold was 57%. The
goal for 2016-2017 was to increase the score by 10% to 67%. However, there
was a decline in the score to 53%. The action steps will continue to be
followed.with the addition of the following: The goal for 2017-2018 was to
increase by 10%, however, there was a decline to 52%. The numbers are based on
the baseline data that was gathered in the first aggregation for the year. When
looking back comparing entire years; the 2015-2016 school year is at 57%. The
action steps will continue to be followed. And in addition, the following:
1) Staff will implement training from the NCECDT Suites.
2) More one on one technical assistance will be given by Management
Staff during site visits.
Improve transportation documentation
o Goal: to improve accuracy and documentation in the use of
transportation forms.
o Desired Outcomes: sign-in and sign-out sheets will be kept with
accuracy for both morning and afternoon bus runs.
o Action Steps:
LKLP Head Start
Annual Report 2017-2018
55
1) Staff will check daily to see if sign-in and sign-out
documentation is accurate and up to date.
2) Management Team will monitor accuracy of sign-in and sign-
out sheets when doing site visits.
3) Families will be reminded to sign sheets when bringing or
picking up children.
4) Management team will conduct active supervision training.
o Person(s) Responsible: Lead Teachers, Associate Teachers, Teacher’s
Assistants, Family Development Assistants, Nutrition Assistants, Bus
Monitors and Bus Drivers.
o Resources: sign-in, sign-out sheets, Center and Management Staff
o Dates: February 2017 - February 2018
Improve staff attendance
o Goal: to improve staff attendance and commitment.
o Desired outcomes: Staff consistently in attendance in classrooms and
engaged in children’s learning
o Action Steps:
1) Staff attendance will improve
2) Staff will plan absences on days children are not in session
3) Staff will seek substitutes when they cannot be in attendance
o Person Responsible: Center Staff, Leads
o Resources: Substitutes, parents, surrounding centers
o Dates: June 2017 - August 2018
ACTION TAKEN TO DATE:
Preservice training has been provided to staff that includes developing quality
learning activities through intentional planning. Embedded Assessment,
individualization, lesson plans and disabilities were also addressed in the training.
LKLP Head Start
Annual Report 2017-2018
56
Additional collaborative efforts include interagency meetings. Also, Early
Childhood Council meetings, identify and share resource information for programs to
enhance services. Health Advisory meetings obtain and share health information with
other agencies. Transitions to schools allow us to establish rapport with children,
families and staff. TLC groups have been implemented targeting specific counties
according to their CLASS documentation. Mentor Coaches and Professional
Development Support staff are assigned to target teaching staff that have been identified
through CLASS monitoring and site visits.
To best assist staff and to cause the least amount of disruption to the program, the
management staff has provided on-site technical assistance for center staff. On-site
support has included: mentoring practices, working with families, home visits (on
occasion), and suggestions on assessment and planning practices.
Technical assistance on assessment and planning addresses the need for
developing a systematic approach for timely entry into the portfolio. Portfolio entries are
monitored through site visits and GOLD tracking. Interrater Reliability Credentials will
assure accuracy and consistency of teachers’ judgements in assessing children.
Management Team meets in June for intensive discussion of program needs,
plans, preparation and goal setting for the upcoming year.
New employees have received one-on one technical support, and individual
mentor coaching in CLASS and through the New Hire Orientation before entering the
classroom.
Each teacher has had one CLASS observation or one Infant/Toddler and Teacher
Interaction Observation. Data has been assessed to determine the staff’s strengths and
LKLP Head Start
Annual Report 2017-2018
57
weaknesses. NCECDTL Trainings have been implemented bi-monthly to improve scores
along with PLC (Professional Learning Community) meetings to identify resources and
improve services to children and families. All teaching staff within a predetermined
county is participating in the TLC (Teachers Learning Collaboratively) groups.
Mental Health Consultant has made at least one classroom observation in all the
centers.
The Governing Body and Policy Council has reviewed and approved the self-
assessment and the improvement plan.

LKLP Head Start
Annual Report 2017-2018
58
Our Mission
L.K.L.P. Head Start, a comprehensive child
development program, seeks to enrich the
lives of our families and strengthen self-
sufficiency by giving roots and wings to our
children:
Roots so they have a sense of self.
Wings so they can follow their
dreams;