Lives Saved by Vehicle Safety Technologies and Associated ...
525
DOT HS 812 069 January 2015 Lives Saved by Vehicle Safety Technologies and Associated Federal Motor Vehicle Safety Standards, 1960 to 2012 Passenger Cars and LTVs With Reviews of 26 FMVSS and the Effectiveness Of Their Associated Safety Technologies in Reducing Fatalities, Injuries, and Crashes
-
Upload
khangminh22 -
Category
Documents
-
view
0 -
download
0
Transcript of Lives Saved by Vehicle Safety Technologies and Associated ...
DOT HS 812 069 January 2015
Lives Saved by Vehicle Safety Technologies and Associated Federal Motor Vehicle Safety Standards, 1960 to 2012
Passenger Cars and LTVs With Reviews of 26 FMVSS and the Effectiveness Of Their Associated Safety Technologies in Reducing Fatalities, Injuries, and Crashes
DISCLAIMER
This publication is distributed by the U.S. Department of Transportation, National Highway Traffic Safety Administration, in the interest of information exchange. The opinions, findings, and conclusions expressed in this publication are those of the authors and not necessarily those of the Department of Transportation or the National Highway Traffic Safety Administration. The United States Government assumes no liability for its contents or use thereof. If trade or manufacturers’ names or products are mentioned, it is because they are considered essential to the object of the publication and should not be construed as an endorsement. The United States Government does not endorse products or manufacturers.
Suggested APA Format Citation:
Kahane, C. J. (2015, January). Lives saved by vehicle safety technologies and associated Federal Motor Vehicle Safety Standards, 1960 to 2012 – Passenger cars and LTVs – With reviews of 26 FMVSS and the effectiveness of their associated safety technologies in reducing fatalities, injuries, and crashes. (Report No. DOT HS 812 069). Washington, DC: National Highway Traffic Safety Administration.
i
Technical Report Documentation Page 1. Report No.
DOT HS 812 069 2. Government Accession No. 3. Recipient’s Catalog No.
4. Title and Subtitle
Lives Saved by Vehicle Safety Technologies and Associated Federal Motor Vehicle Safety Standards, 1960 to 2012 – Passenger Cars and LTVs – With Reviews of 26 FMVSS and the Effectiveness of Their Associated Safety Technologies in Reducing Fatalities, Injuries, and Crashes
5. Report Date
January 2015 6. Performing Organization Code
7. Author(s)
Charles J. Kahane, Ph.D. 8. Performing Organization Report No.
9. Performing Organization Name and Address
Office of Vehicle Safety National Highway Traffic Safety Administration Washington, DC 20590
10.
Work Unit No. (TRAIS)
11. Contract or Grant No.
12. Sponsoring Agency Name and Address
National Highway Traffic Safety Administration 1200 New Jersey Avenue SE. Washington, DC 20590
13. Type of Report and Period Covered
NHTSA Technical Report 14. Sponsoring Agency Code
15. Supplementary
Notes
16. Abstract
NHTSA began in 1975 to evaluate the effectiveness of vehicle safety technologies associated with the Feder-al Motor Vehicle Safety Standards. By June 2014, NHTSA had evaluated the effectiveness of virtually all the life-saving technologies introduced in passenger cars, pickup trucks, SUVs, and vans from about 1960 up through about 2010. A statistical model estimates the number of lives saved from 1960 to 2012 by the com-bination of these life-saving technologies. Fatality Analysis Reporting System (FARS) data for 1975 to 2012 documents the actual crash fatalities in vehicles that, especially in recent years, include many safety technol-ogies. Using NHTSA’s published effectiveness estimates, the model estimates how many people would have died if the vehicles had not been equipped with any of the safety technologies. In addition to equipment com-pliant with specific FMVSS in effect at that time, the model tallies lives saved by installations in advance of the FMVSS, back to 1960, and by non-compulsory improvements, such as pretensioners and load limiters for seat belts. FARS data has been available since 1975, but an extension of the model allows estimates of lives saved in 1960 to 1974.
A previous NHTSA study using the same methods estimated that vehicle safety technologies had saved 328,551 lives from 1960 through 2002. The agency now estimates 613,501 lives saved from 1960 through 2012. The annual number of lives saved grew from 115 in 1960, when a small number of people used lap belts, to 27,621 in 2012, when most cars and LTVs were equipped with numerous modern safety technolo-gies and belt use on the road achieved 86 percent.
17. Key Words
FARS; statistical analysis; evaluation; benefits; effec-tiveness; fatality reduction; injury reduction; crashwor-thiness; crash avoidance
18. Distribution Statement
Document is available to the public from the National Technical Information Service www.ntis.gov.
19. Security Classif. (Of this report)
Unclassified 20. Security Classif. (Of this page)
Unclassified 21. No. of Pages
525 22. Price
Form DOT F 1700.7
(8-72) Reproduction of completed page authorized
ii
TABLE OF CONTENTS A REVOLUTION IN SAFETY AND HEALTH ........................................................................x EXECUTIVE SUMMARY .................................................................................................... xvii FRAMEWORK FOR THE ANALYSIS .....................................................................................1
Basic analysis method ..........................................................................................................2 What is included and what is excluded? ..............................................................................3 List of FMVSS, safety technologies, and effectiveness evaluations ...................................4 What has changed from NHTSA’s 2004 report? ...............................................................12 Estimating lives saved by safety technologies, 1960 to 2012 ............................................13 Part 1: Review of 26 FMVSS and their effectiveness in reducing fatalities, injuries, and crashes for passenger cars and LTVs ..........................................................................14
103 Windshield defrosting and defogging systems ..........................................................15 Rear window defrosting and defogging systems .......................................................15
105 Hydraulic and electric brake systems ........................................................................18 135 Light vehicle brake systems Dual master cylinders ................................................................................................18 Front disc brakes ........................................................................................................21 Rear-wheel antilock brake systems for LTVs ............................................................22 Four-wheel antilock brake systems for passenger cars and LTVs .............................25
108 Lamps, reflective devices, and associated equipment ...............................................30 Side marker lamps......................................................................................................30 Center high mounted stop lamps................................................................................34 Retroreflective tape on heavy trailers ........................................................................38 Daytime running lights ..............................................................................................42 Amber turn signals .....................................................................................................43 LED stop lamps..........................................................................................................44
121 Air brake systems .......................................................................................................46 ABS for heavy trucks and trailers ..............................................................................46
126 Electronic stability control systems ...........................................................................48
138 Tire pressure monitoring systems ..............................................................................52
201 Occupant protection in interior impact ......................................................................55 Redesign of middle/lower instrument panels with improved occupant protection ....55 1999-2003 head injury protection upgrade ................................................................60

20
2020
20
20
20
202021
21
2122
21
21
2 HH20
3 I4 St
E
5 Gl Hi
Gl
6 DSt
7 SeSe
8 O9 Se0 Se
LaLaM3-APrFrM a19A
2 WA
3 C5 C
RULBSa
4 SiSiTC
6 RR20
iii
ead restraints ...........................................................................................................65 ead restraints for outboard front seats/original version of FMVSS No. 202 ..........65 10-2012 head restraint upgrade (not yet evaluated) ...............................................70
mpact protection for the driver from the steering control system ............................71 eering control rearward displacement nergy-absorbing and telescoping steering assembly ...............................................71
azing materials .......................................................................................................77 gh-penetration resistant windshields ......................................................................77 ass-plastic windshields ...........................................................................................80
oor locks and door retention components ...............................................................82 ronger locks, latches and hinges for side doors ......................................................82
ating systems ..........................................................................................................85 at back locks for 2-door cars with folding front seat backs ...................................85
ccupant crash protection ..........................................................................................89 at belt assemblies ...................................................................................................89 at belt assembly anchorages ...................................................................................89 p belts for front seat occupants ..............................................................................92 p belts for rear seat occupants ................................................................................97 anual 3-point lap-shoulder belts for outboard front seat occupants .......................99 point lap-shoulder belts for rear seat occupants ...................................................111 utomatic seat belts .................................................................................................113 etensioners and load limiters for seat belts ...........................................................116 ontal air bags ........................................................................................................119 anual on-off switches for passenger air bags in pickup trucks nd other vehicles with small or no rear seats ........................................................130 98-99 redesign of frontal air bag (sled-certification) ...........................................133
dvanced frontal air bags (automatic suppression or low-risk deployment) ..........136
indshield mounting ...............................................................................................139 dhesive windshield bonding ..................................................................................139
hild restraint systems .............................................................................................144 hild restraint anchorage systems ...........................................................................144 ear-facing and forward-facing child safety seats ...................................................145 pper tethers and anchorages (not yet fully evaluated) ...........................................152 ATCH (lower anchors and tethers for children – not yet fully evaluated) ............152 ooster seats (not yet fully evaluated) .....................................................................154 fety benefits of riding in the rear seat ..................................................................155
de impact protection .............................................................................................160 de door beams .......................................................................................................160 TI(d) improvement in passenger cars by structure and padding ...........................164 urtain and side air bags ..........................................................................................170
oof crush resistance ...............................................................................................175 edesign of true hardtops with B-pillars/original version of FMVSS No. 216.......175 13-2016 roof crush resistance upgrade (not yet evaluated) .................................178
iv
223 Rear impact guards for heavy trailers ......................................................................179 224 Rear impact protection for heavy trailers.................................................................179
226 Ejection mitigation ...................................................................................................182 Rollover curtains ......................................................................................................182
301 Fuel system integrity ................................................................................................185 1976-1978 upgrade: rollover, rear-impact and lateral-impact tests .........................185 2005-2009 upgrade: rear-impact and lateral-impact tests ........................................187
NCAP: New Car Assessment Program ............................................................................190 Frontal NCAP-related improvements in cars without air bags ................................191 Frontal NCAP in vehicles with air bags (not evaluated) .........................................194 Offset-frontal IIHS tests (partially evaluated) .........................................................195 Side NCAP and IIHS side impact testing (not evaluated) .......................................196 Rollover-resistance NCAP (partially evaluated) .....................................................197
SUMMARY TABLES FOR PART 1 ..............................................................................198
Table 1-2: Estimates of Fatality Reduction in NHTSA Evaluations of Safety Technologies ............................................................................................199
Table 1-3: Estimates of Injury Reduction in NHTSA Evaluations of Safety Technologies .........................................................................................................206
Table 1-4: Estimates of Crash Avoidance in NHTSA Evaluations of Safety Evaluations...........................................................................................................212
PART 2: Lives Saved by Vehicle Safety Technologies and Associated Federal Motor Vehicle Safety Standards, 1960 to 2012 ..................................................................214
Summary of the Estimation Method ................................................................................214
FINDINGS .......................................................................................................................227 Estimates of lives saved ...........................................................................................227 Net effectiveness for car/LTV occupants ................................................................233 Car/LTV occupant fatalities per 100,000,000 VMT ................................................239 Estimates of lives saved by each technology (grouped by associated FMVSS)......244 Benefits for occupants of passenger cars .................................................................252 Benefits for occupants of LTVs ...............................................................................285 Benefits for pedestrians, bicyclists, and other non-occupants .................................307 Benefits for motorcyclists ........................................................................................311 Effect of frontal air bags by seating position, occupant age, and type of air bag ....311
REFERENCES ........................................................................................................................324
v
APPENDIX A: SAS Programs Used to Estimate Lives Saved by Vehicle Safety Technologies and Associated FMVSS, 1960 to 2012 .....................................................350
Overview ..........................................................................................................................350 DESCRIPTION OF THE MAIN ANALYSIS PROGRAM LS2014 ..............................355 APPENDIX B: SUMMARIES OF PUBLISHED EVALUATION REPORTS .....................449 APPENDIX C: Year-by-Year Percentages of Cars and LTVs Equipped With Safety Technologies: New Vehicles (by MY) and All Vehicles on the Road (by CY) ..............467 APPENDIX D: Computation of Fatality Risk Indices for Diseases, 1960 to 2010 .................488

vi
LIST OF ABBREVIATIONS
ABS antilock brake system
ACIR Automotive Crash Injury Research, a crash data file of the 1950s and 1960s
ACTS Automotive Coalition for Traffic Safety (before 1999, American Coalition for Traffic Safety)
AIS abbreviated injury scale; the levels of this scale are: 0 = uninjured, 1 = minor, 2 = moderate, 3 = serious, 4 = severe, 5 = critical, and 6 = maximum
AMC American Motors Corporation
ANPRM advance notice of proposed rulemaking
ANSI American National Standards Institute
ATD anthropomorphic test device (dummy)
BMW Bayerische Motoren Werke
CATMOD categorical models procedure in SAS
CDS Crashworthiness Data System of NASS
CFR Code of Federal Regulations; up-to-date text of NHTSA regulations may be downloaded from the electronic CFR, Title 49, www.ecfr.gov/cgi-bin/text-idx?c=ecfr&tpl=/ecfrbrowse/Title49/49tab_02.tpl. Regulations other than FMVSS are referenced as Part numbers (e.g., Part 563, “Event data record-ers”). FMVSS are referenced as Part 571 followed by the FMVSS number (e.g., Part 571.103 = FMVSS No. 103, “Windshield defrosting and defogging systems”)
CHMSL center high-mounted stop lamp
CMVSS Canadian motor vehicle safety standard
CPU central processing unit
CRASH Calspan reconstruction of accident speeds on the highway
CUV crossover utility vehicle
CY calendar year
DMV department of motor vehicles

vii
DOF direction of force (a variable in CDS and other crash databases)
DRL daytime running lights
ECE Economic Commission for Europe
EMS emergency medical services
ESC electronic stability control
FARS Fatality Analysis Reporting System (a census of fatal crashes in the United States since 1975)
FHWA Federal Highway Administration
FMCSA Federal Motor Carrier Safety Administration
FMCSR Federal Motor Carrier Safety Regulation
FMH free-motion headform for testing upper interior components
FMVSS Federal Motor Vehicle Safety Standard
GAD general area of damage (a variable in CDS and other crash databases)
GES General Estimates System of NASS
GM General Motors
GSA General Services Administration of the Federal government
GTR global technical regulation
GVWR gross vehicle weight rating (specified by the manufacturer, equals the vehi-cle’s curb weight plus maximum recommended loading)
HIC head injury criterion
HPR high penetration resistant windshield
HSL Highway Safety Literature, an on-line literature database that is a subfile of the automated Transportation Research Information Service (TRIS) file, ac-cessible at trid.trb.org.
ICC Interstate Commerce Commission
ICD-10 International Classification of Diseases, 10th revision
IIHS Insurance Institute for Highway Safety
viii
LATCH lower anchors and tethers for children
LED light-emitting diode
LTV light trucks and vans (includes pickup trucks, SUVs, minivans and full-sized vans)
MCOD multiple cause of death file, a supplement to FARS since 1987, listing causes of death from the occupant’s death certificate
MDAI multidisciplinary accident investigations (a file of in-depth crash investiga-tions conducted by NHTSA and others, 1967-78)
MDB moving deformable barrier
MVMA2D Motor Vehicle Manufacturers’ Association’s 2-dimensional computer simula-tion of the occupant’s motion in a frontal crash
MY model year
NASS National Automotive Sampling System (a probability sample of police-reported crashes in the United States since 1979, investigated in detail)
NCAP New Car Assessment Program (consumer information supplied by NHTSA on the safety of new cars and LTVs, based on test results, since 1979)
NCSA National Center for Statistics and Analysis, NHTSA
NCSS National Crash Severity Study (a probability sample of police-reported towa-way crashes in seven multicounty areas, 1977-79, investigated in detail)
NHTSA National Highway Traffic Safety Administration
NMVCCS National Motor Vehicle Crash Causation Study
NOPUS National Occupant Protection Use Survey (statistics for the United States, since 1994, from a national observational survey based on a probability sam-ple)
NPRM notice of proposed rulemaking
NTSB National Transportation Safety Board
RF right front
RSEP Restraint Systems Evaluation Project (a probability sample of police-reported towaway crashes involvements of model year 1973-75 cars in five urban or multicounty areas, 1974-75, investigated in detail)
ix
RWAL rear-wheel antilock brake system
SAE Society of Automotive Engineers
SAS statistical and database management software produced by SAS Institute, Inc.
SCI Special Crash Investigations, NHTSA’s National Center for Statistics and Analysis
SID side impact dummy
SSF static stability factor (half of the vehicle’s track width divided by the height of its center of gravity)
SUV sport utility vehicle
TPMS tire pressure monitoring system
TREAD Act Transportation Recall Enhancement, Accountability, and Documentation Act
TTI thoracic trauma index
TTI(d) thoracic trauma index for the dummy in a side-impact test
TTMA Truck Trailer Manufacturers Association
UMTRI University of Michigan Transportation Research Institute
VIN Vehicle Identification Number
VMT vehicle miles of travel
VW Volkswagen
x
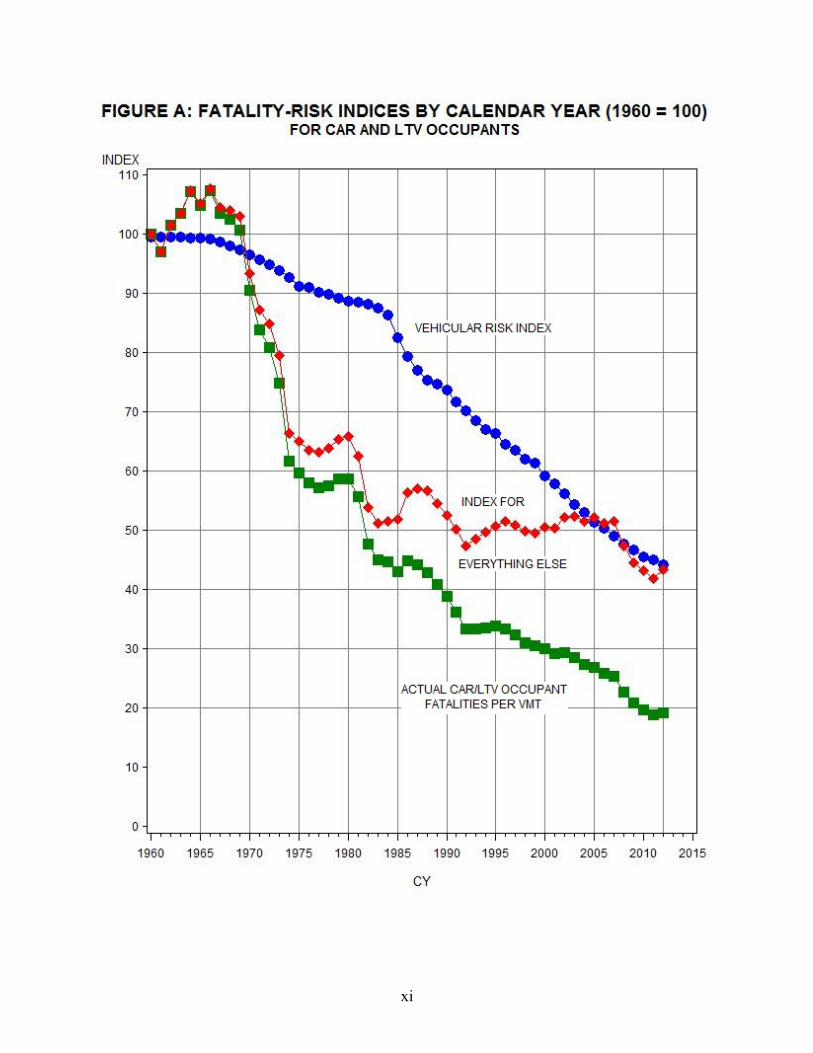
A REVOLUTION IN SAFETY AND HEALTH For occupants of cars and LTVs (pickup trucks, SUVs, and vans), the fatality rate per vehicle mile of travel dropped by an astounding 81 percent from 1960 to 2012. In CY 1960, 28,183 driv-ers and passengers died in 662 billion VMT. By 2012, only 21,696 occupants died in 2,653 bil-lion VMT. The green line and squares in Figure A track the VMT fatality rate for car/LTV occu-pants, indexed to 100 in 1960, as it descends to 19 by 2012.
At least four developments in technology and social science can take credit for some of the re-duction:
• Vehicle safety technologies such as seat belts, air bags, and electronic stability control (ESC), combined with programs to increase the use of belts and other safety equipment;
• Safer roads, including major new infrastructure such as the Interstate Highway System and gradual improvements to existing roads, such as guardrails;
• Behavioral programs to make people drive more safely; above all, laws and programs to abate drunk driving; and
• Better medicine: quicker arrival of EMS, more effective treatment in transport and at the trauma center, and any developments in surgery and medicine that made injuries more survivable than they used to be.
In addition, the past 53 years have witnessed important demographic and geographic trends that would likely have lowered the VMT fatality rate substantially even without advances in science: a shrinking population of young drivers (who have high fatality rates), a much larger share of VMT for female drivers (who have low fatality rates, specifically, a low incidence of drunk driv-ing), and population movement from rural to metropolitan areas (where fatality risk per mile is lower). At times however, demographic and geographic trends have worked in the opposite di-rection, such as a growing proportion of older drivers (who have high fatality rates) and move-ment within metropolitan areas from central cities to more sparsely populated outer suburbs.1
This report focuses exclusively on the fatality reduction attributable to vehicle safety technolo-gies introduced since 1956 (when factory-installed lap belts first became optionally available on some cars) and, from 1968 onwards, largely associated with the Federal Motor Vehicle Safety Standards and/or related programs such as safety ratings. It develops a vehicular fatality-risk index by calendar year, tracked by the blue circles in Figure A, that measures how much safer the average car or LTV on the road has become relative to a car or LTV on the road in 1955.
1 The chapter titled “Car/LTV occupant fatalities per 100,000,000 VMT” in Part 2 of this report presents additional discussion, including references, of factors (other than vehicle safety technologies) that influenced fatality rates be-tween 1960 and 2012.
xi
xii
The index stayed essentially unchanged from 1955 (100) to 1960 (99.6), but it had dropped to 44 by 2012. In other words, this report estimates that the fatality risk in the average car or LTV on the road in 2012 would be 56 percent lower than in the average vehicle on the road in 1960, even given the same exposure, drivers, roadways, and medicine. The reduction includes the effects of crash avoidance technologies such as ESC, occupant protection technologies such as seat belts and air bags, and programs to increase belt use. The report estimates that vehicle safety technol-ogies saved 613,501 lives from 1960 through 2012, including 27,621 in 2012.
The estimate of lives saved by vehicle safety technologies is not based on some kind of multivar-iate or time-series analysis of the VMT fatality rates over the years, but on a review of the occu-pant fatality cases in NHTSA’s Fatality Analysis Reporting System. Since 1975, the agency has issued 82 retrospective evaluations of individual FMVSS or related vehicle technologies, based on statistical analyses of the agency’s crash data files. The evaluations estimated the fatality-reducing effectiveness, if any, of each technology, relative to vehicles produced just before its introduction (i.e., incorporating every earlier technology, except the one being evaluated).
Thus, if a vehicle is equipped with multiple safety technologies, their combined fatality-reducing effectiveness is the composite of the individual effectiveness estimates. The individual (and the combined) effectiveness, of course, may depend on the type of crash (e.g., frontal air bags are most effective in directly frontal impacts), the occupant’s seating position and age, and whether the occupant made correct use of the technology (e.g., buckled up). But the average composite effect of the safety technologies in cars and LTVs on the road in CY 2012 is a 56-percent reduc-tion of fatality risk relative to what it would have been if the same vehicles had not been equipped with any of those technologies – if the vehicles had incorporated only the 1955 level of safety. This report considers every FARS fatality case in 2012 (and also in earlier years), identi-fies what safety technologies were in the vehicle, and estimates the hypothetical additional risk if none of those technologies had been present in the vehicle.
Figure A shows that the 56-percent reduction in the vehicular risk index from 1960 to 2012, alt-hough remarkable, does not fully explain the overall 81-percent reduction in the VMT fatality rate during those years. The red diamonds in Figure A index the effects of “everything else” – everything except the benefits of vehicle safety technologies. The “everything else” index is 43 in 2012, almost the same as the vehicular risk index (44). In other words, the net effect from 1960 to 2012 of “everything else,” a 57-percent reduction, is almost identical to the 56-percent reduction attributable to vehicle safety improvement.2 But Figure A shows the trend in the ve-hicular risk index differs from the trend in “everything else” in several important ways:
• The vehicular risk index tells a story of uninterrupted improvement; each year is lower than the one before it. The red diamonds zigzag up and down in response to demographic trends and transient phenomena such as an energy crisis, fuel-price increases, or econom-ic slowdowns.
2 The index of “everything else” is computed by dividing the VMT-rate index by the vehicular index and then multi-plying by 100. For example, in 2012, the VMT-rate index is 19, the vehicular index is 44, and the index of every-thing else is 100 x (19/44) = 43.
xiii
• The vehicular risk index changes gradually. Even a highly effective technology such as ESC needs some years to demonstrate its efficacy, some years of lead-time before it can be built into all new vehicles, and quite a few years before vehicles with ESC replace all the older vehicles on the road that do not have it. The only abrupt change (for the better) is from 1984 to 1988, when belt-use laws in the States suddenly prompted millions of people to start buckling up the belts that had already been in their vehicles for years.
• The great reduction in the index of “everything else” is from 1965, when the large cohort of baby-boomers born just after World War II began to drive until 1975, when this cohort entered their late 20s, an age when fatal-crash involvement rates are substantially lower than in adolescence. The 1965-to-1975 decade also saw major new infrastructure such as completion of many Interstate highways, extensive urbanization, and increased numbers of women working outside the home (an influx of low-risk VMT); also, toward the end of the decade, an energy crisis and the national 55 mph speed limit. In 1975, the vehicular risk index was still above 90; even though the initial FMVSS arrived in the 1960s, there were still many pre-FMVSS vehicles on the road until the mid-1970s.
• The large, steady reduction in the vehicular risk index begins after 1984 and does not stop. By contrast, the trend in the red diamonds fluctuates in response to a range of fac-tors affecting traffic volumes and risk. Factors reflected in the “everything else” index likely include the effects of economic slow-downs on the amount and type of highway travel as well as demographic trends such as an increase in the number of older drivers and the movement from central cities to outer suburbs where roadway travel is more fre-quent and speeds are higher.
In summary, from 1983 through 2012, the vehicular risk index fell from 87 to 44, while the index of “everything else” changed from 51 to 43. The effects of significant improvements in behav-ioral safety during this period are not clearly reflected in this analysis for several reasons. First, it is important to note that the effects of the sharp increase in seat belt use during this period, from less than 60 percent in 1984 to 86 percent in 2012, are incorporated in the vehicular risk index rather than in the “everything else” index. Second, the effects of other traffic safety behavioral improvements such as the reduction in the proportion of alcohol-impaired driving fatalities from more than 40 percent in 1984 to 31 percent in 2012 and other improvements such as safer road-ways and improvements to the emergency medical system are obscured by changes in demo-graphic and socioeconomic trends.
The reduction in car and LTV occupants’ fatality risk attributable to vehicle safety technologies, totaling 56 percent from 1960 through 2012, can be put in perspective by comparing it to reduc-tions in fatality risk from heart disease, cancer, and other diseases during those years, a time of legendary advances in pharmacology, surgery, and preventive medicine. For that purpose, it is necessary to identify a measure of risk from diseases that is intuitively comparable to the vehicu-lar fatality-risk index and that also can be computed from available health statistics. One im-portant characteristic of fatal crashes is that they result in premature death – i.e., certainly earli-er than a person would have died if there had been no crash. The comparison statistic for diseases would not be all deaths, but premature deaths. To the extent that 70 years has historically been considered a full life, fatality rates from diseases among people younger than 70 might at first glance appear to be a good comparison statistic.

xiv
However, an important feature of the vehicular risk index in Figure A is that the effect of demo-graphic and geographic trends has been filtered out; the meaning of the index is invariant, so to speak, from year to year. That would not be true of fatality rates from diseases for all people younger than 70. Because the birth rate generally declined after 1960, the population under 70 has included an increasing share of people over 50 and a decreasing share of young people – and that, by itself, would push fatality rates from diseases upward over time. But the fatality rates from diseases from 60 to 70 are nearly invariant measures of risk, because the average age in that limited cohort changes little over time.3 The rate in 1960 would be directly comparable to the rate in 2010. The fatality rates from diseases for people 60 to 70 years old make intuitively good comparison statistics with the vehicular risk index, even though the latter pertains to occu-pants of all ages, not just 60 to 70.
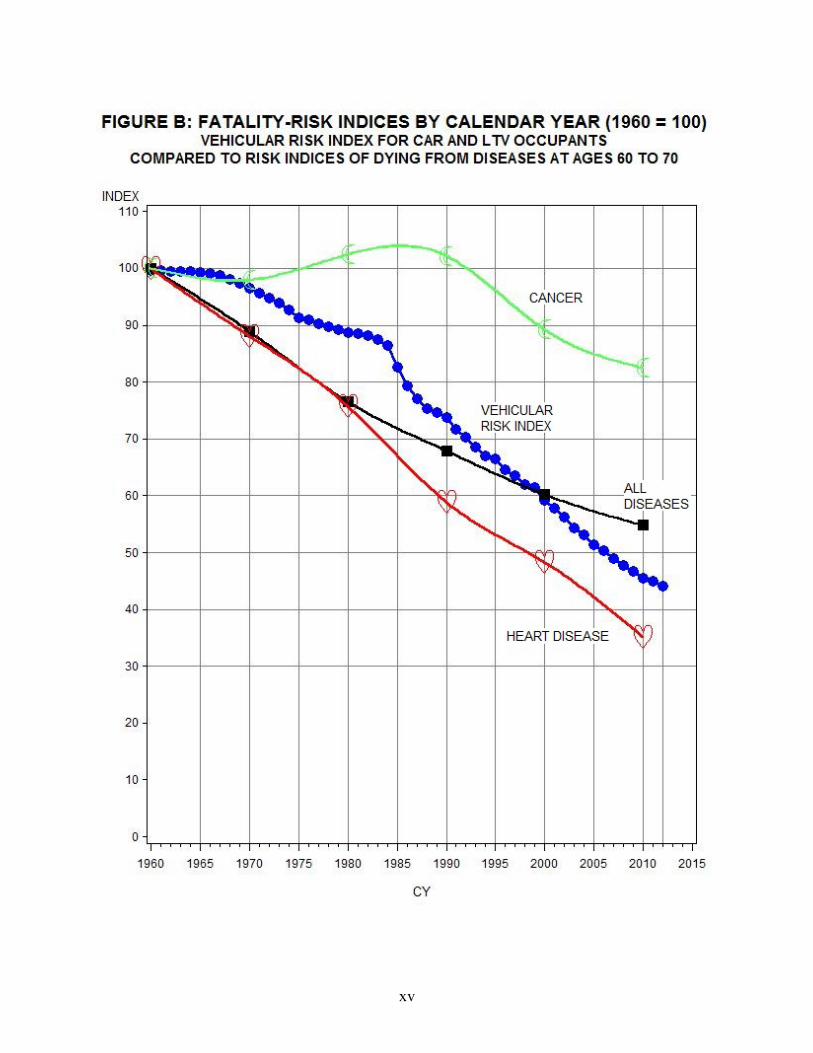
Figure B compares the vehicular fatality-risk index (unchanged from Figure A; same blue cir-cles) to the fatality rate from all diseases for people 60 to 70 years old, indexed to 100 in 1960 (black line and squares) and specifically to the approximate rates from heart disease (red line and hearts) and cancer (green line and crescents), also indexed to 100 in 1960. The indices for dis-eases are estimated at 10-year intervals from 1960 to 2010 (as described in Appendix D of this report) and interpolated.
The revolution in vehicle safety compares favorably with the revolution in health over the same 50 years. The index for all diseases fell from 100 in 1960 to 55 in 2010. In other words, the like-lihood of dying between 60 and 70 was 45-percent lower in 2010 than it was in 1960, a great re-duction in the risk of premature death. But the vehicular fatality-risk index did even better over the whole period, dropping to 46 in 2010 and 44 by 2012. The vehicle safety technologies re-duced the probability of dying in a crash by 56 percent from 1960 to 2012. Figure B shows that the risk index for all diseases initially did better than the vehicular risk index, because the first safety technologies were not widely implemented in production vehicles until the mid-to-late 1960s and then needed several years to replace the pre-FMVSS vehicles already on the road. But the vehicular index begins catching up after 1984, pulls even in about 2000, and since then has actually outpaced the reduction in fatal diseases.
Progress against heart disease has been truly extraordinary. The index was 35 in 2010, a 65-percent reduction in the risk of dying of heart disease between 60 and 70. Based on research and a deeper understanding of what causes heart disease, a remarkable combination of medicines, diet, life-style modification, and, when necessary, surgical procedures have helped prevent heart disease, while innovations in emergency care, medicine, and surgery have helped save people after heart attacks. Importantly, most of these innovations, including preventive drugs and diet, take effect relatively quickly and minimize the lag time to realize a benefit. Nevertheless, the ve-hicular risk index has not done badly in comparison. Since 1985, the vehicular risk index has de-clined in parallel to the heart disease index and mirrored the rate of decrease, year by year.
3 The median age in the United States of all people younger than 70 was 27.2 in 1960, but a substantially older 33.6 in 2010; however the median age of people between 60 and 70 was 64.7 in 1960 and a nearly identical 64.3 in 2010 (sources: www.cdc.gov/nchs/data/statab/pop6097.pdf and www.census.gov/prod/cen2010/briefs/c2010br-03.pdf).
xv
xvi
The index for deaths from cancer between 60 and 70 has not fared nearly as well in comparison to the vehicular risk index. Cancer, of course, is a complex group of diseases and the basic re-search to understand it still continues. Furthermore, an important weapon in the fight against cancer is life-style modifications such as smoking cessation. But unlike heart disease, it can take many decades of not smoking or not working around hazardous substances before a payoff of lower fatality risk – longer than the lag time to install new safety technologies into most of the vehicles on the road. Figure B shows the cancer index perhaps even became slightly worse be-fore it began to significantly improve: the index (as estimated from the data in Appendix D) went up to 102 in 1980 and 1990, possibly reflecting the long-term effects of increased numbers of new smokers in the 1940s and 1950s – people who were in their 60s by 1980 or 1990.4 The tide turned after 1990 with a 20-point drop in the index by 2010, catching up somewhat with the in-dex for all diseases, but still not quite keeping up with the rate of improvement in vehicle safety.
4 Shopland, D. R., Burns, D. M., Samet, J. M., & Gritz, E. R. (eds.) (1991, October). Strategies to Control Tobacco Use in the United States – A Blueprint for Public Health Action in the 1990s. (Smoking and Tobacco Control Mon-ograph No. 1, NIH Publication No. 92-3316, Chapter 3). Bethesda, MD: National Cancer Institute. Available at can-cercontrol.cancer.gov/Brp/tcrb/monographs/1/m1_complete.pdf
xvii
EXECUTIVE SUMMARY NHTSA began in 1975 to evaluate the effectiveness of vehicle safety technologies associated with the Federal Motor Vehicle Safety Standards. By 2004, NHTSA had evaluated virtually all of the life-saving technologies introduced in passenger cars and in LTVs (light trucks and vans – i.e., pickup trucks, SUVs, minivans and full-size vans) from about 1960 through the mid-1990s. These were retrospective evaluations with estimates of fatality-reducing effectiveness based on statistical analyses of the actual crash experience of production vehicles equipped with the tech-nologies. In October 2004, the agency issued a report estimating the number of lives saved from 1960 to 2002, year-by-year, by the combination of those life-saving technologies and by each individual technology; the estimates added up to 328,551 lives saved through 2002.5
Since 2004, NHTSA has evaluated nine additional life-saving technologies, such as ESC and curtain air bags and has acquired 10 additional years of crash data (through 2012). Although some of these technologies, including ESC and curtains were already available in production ve-hicles by 2002, they could not be included in the previous report because the vehicles had not yet accumulated enough on-the-road experience for statistical analyses. This report updates the 2004 study and estimates 613,501 cumulative lives saved from CY 1960 through 2012. The update includes not only new estimates of 281,042 lives saved from CY 2003 through 2012 (the years not included in the earlier report), but also a slight upward revision from the previous report’s estimate of 328,551 to 332,459 for CY 1960 through 2002 to account for the technologies that had begun to appear in production vehicles by 2002 but had not yet been evaluated by 2004.
Past evaluation reports estimated the effectiveness of a safety technology – a percentage reduc-tion of fatalities – by statistically analyzing crash data. An initial evaluation is based on produc-tion vehicles produced just before versus just after a make-model received that technology. Ef-fectiveness might subsequently change over time if vehicles and/or the crash environment changes; when feasible, NHTSA tracks effectiveness with follow-up evaluations of crash data based on later vehicles. These follow-up analyses show that effectiveness has remained quite stable for key safety technologies such as seat belts, frontal air bags, and ESC. But the benefits of a technology – the absolute number of lives saved in a year – readily change from year to year depending on the number of vehicles equipped with the technology, their VMT, and the crash-involvement rate of the driving population (exposure). This report will:
• Review the effectiveness estimates in past evaluations of safety technologies for cars and LTVs, describing how the technologies work and the history of the FMVSS that regulate them.
• Develop a model that uses Fatality Analysis Reporting System data and these past effec-tiveness estimates to calculate how many lives the following technologies have saved, in-dividually and in combination, in each year from 1960 to 2012:
5 Kahane, C. J. (2004, October). Lives saved by the Federal Motor Vehicle Safety Standards and other vehicle safety technologies, 1960-2002. (Report No. DOT HS 809 833). Washington, DC: National Highway Traffic Safety Ad-ministration. Available at www-nrd.nhtsa.dot.gov/Pubs/809833.PDF.
xviii
Heavy FMVSS: Safety Technologies Cars LTVs Trucks 105/135: Dual master cylinders & front disc brakes6 X X 108: Conspicuity tape for heavy trailers X7 126: Electronic stability control8 X X 201: Voluntary mid/lower instrument panel improvements X X Head-impact upgrade X X 203/204: Energy-absorbing steering assemblies X X 206: Improved door locks X X 208: Lap belts X X 3-point belts X X 2-point automatic belts9 X Voluntary NCAP-related improvements for belted occs.10 X Belt pretensioners and load limiters X X Frontal air bags (barrier-certified, sled-certified, advanced) X X 212: Adhesive windshield bonding X X 213: Child safety seats X X 214: Side door beams X X Structure and padding to meet a dynamic side-impact test X Curtain and side air bags X X 216: Roof crush resistance (eliminate true hardtops) X 226: Ejection mitigation (rollover curtains) X X 301: Fuel system integrity: rear-impact upgrade X X
In addition to safety equipment compliant with a specific FMVSS in effect at that time (and per-haps even excelling the performance requirements of that FMVSS), the model tallies lives saved by installations in advance of the FMVSS and by non-compulsory improvements shown in the preceding list, such as belt pretensioners and load limiters. The model includes car/LTV occu-pants saved by car/LTV technologies or child safety seats (99 percent of the total) plus pedestri-ans/bicyclists/motorcyclists saved by car/LTV brake improvements, motorcyclists saved by ESC, and car/LTV occupants saved by conspicuity tape on heavy trailers.
The model does not include technologies so recent that NHTSA has not yet evaluated them based on statistical analysis of crash data, such as tire pressure monitoring systems (phased in during MY 2006 to 2008). The study is limited to technologies in cars and LTVs or that save lives of car/LTV occupants; for example, motorcycle helmets are not included. It is limited to vehicle technologies. It does not estimate the effects of behavioral safety programs such as the reduction of impaired driving – except to the extent that buckle-up programs have contributed greatly to the number of lives saved by belts and child safety seats. It does not include effects of 6 Applied to cars and LTVs, but also saves pedestrians, bicyclists and motorcyclists not hit by these cars and LTVs. 7 Applied to heavy trailers, but also saves occupants of cars and LTVs that avoid collisions with these trailers. 8 Applied to cars and LTVs, but also saves motorcyclists not hit by these cars and LTVs. 9 LTVs were not equipped with 2-point automatic belts. 10 NCAP testing, the dynamic side impact test of FMVSS No. 214, and FMVSS No. 216 apply to LTVs as well as cars, but NHTSA evaluations have not identified a life-saving effectiveness for the LTVs.
xix
roadway and traffic engineering improvements (such as rumble strips), shifts in the vehicle fleet – e.g., between large and small cars or between cars and LTVs, or improvements in EMS or fol-low-up medical care. The model is limited to estimating fatality reduction by the safety technol-ogies; NHTSA does not have sufficiently complete evaluation results to develop comparable es-timates for the numbers of nonfatal injuries prevented.
How the model works: Consider 1,000 cases of driver fatalities in directly frontal multivehicle crashes in cars with 1960 technology: no energy-absorbing steering columns, all drivers unbelt-ed, and no air bags. A NHTSA evaluation estimates that energy-absorbing steering columns re-duce fatalities of drivers in frontal crashes by 12.1 percent. Thus, if these cars had been equipped with them, there would have been only 879 fatalities, a saving of 121 lives. Another evaluation estimates that 3-point belts, in cars with energy-absorbing steering columns, reduce drivers’ fa-tality risk by 42 percent in these types of crashes. If the cars had been equipped with 3-point belts in addition to energy-absorbing steering columns and the drivers had buckled up, the 879 fatalities would have diminished to 510, saving another 369 lives. A third evaluation estimates that frontal air bags reduce fatality risk by 25.3 percent for belted drivers in these types of crash-es, in cars with energy-absorbing steering columns. Frontal air bags would have cut the 510 fa-talities down to 381, saving another 129 lives.
The model uses 1975-to-2012 FARS data and performs the same calculations in reverse order: e.g., there might be 381 actual FARS cases of 3-point-belted driver fatalities in directly frontal multivehicle crashes in MY 1999 cars, all of which were equipped with frontal air bags and en-ergy-absorbing steering columns. If frontal air bags, the most recent (1990s) of these three safety technologies, had been removed from the cars, fatalities would have increased to an estimated 510. In other words, we surmise there must have been 129 potentially fatal collisions of these MY 1999 cars that did not become FARS cases because frontal air bags saved the driver’s life. If the 3-point belts, a 1970s technology, had also been removed from the cars and all the drivers had been unbelted, the fatalities would have increased to 879. Finally, if the energy-absorbing steering columns, a 1960s technology, had been replaced by rigid columns, downgrading these cars all the way back to a 1960 level of safety, fatalities would have increased to 1,000. The three technologies, in combination, saved an estimated 619 lives: 129 by air bags, 369 by 3-point belts and 121 by energy-absorbing columns. In summary, FARS cases of fatalities in vehicles equipped with modern safety technologies constitute evidence of an even larger hypothetical number of fatalities that would have occurred without those technologies. This approach “re-moves” the technologies in reverse chronological order; alternative approaches removing them in some different order would still have estimated 619 overall lives saved from 1960 to 2012, but might have allocated that total differently among the individual safety technologies.
FARS data has been available since 1975, but the FMVSS date back to January 1, 1968, and some technologies were introduced even before that. An extension of the model allows estimates of lives saved from 1960 to 1974.
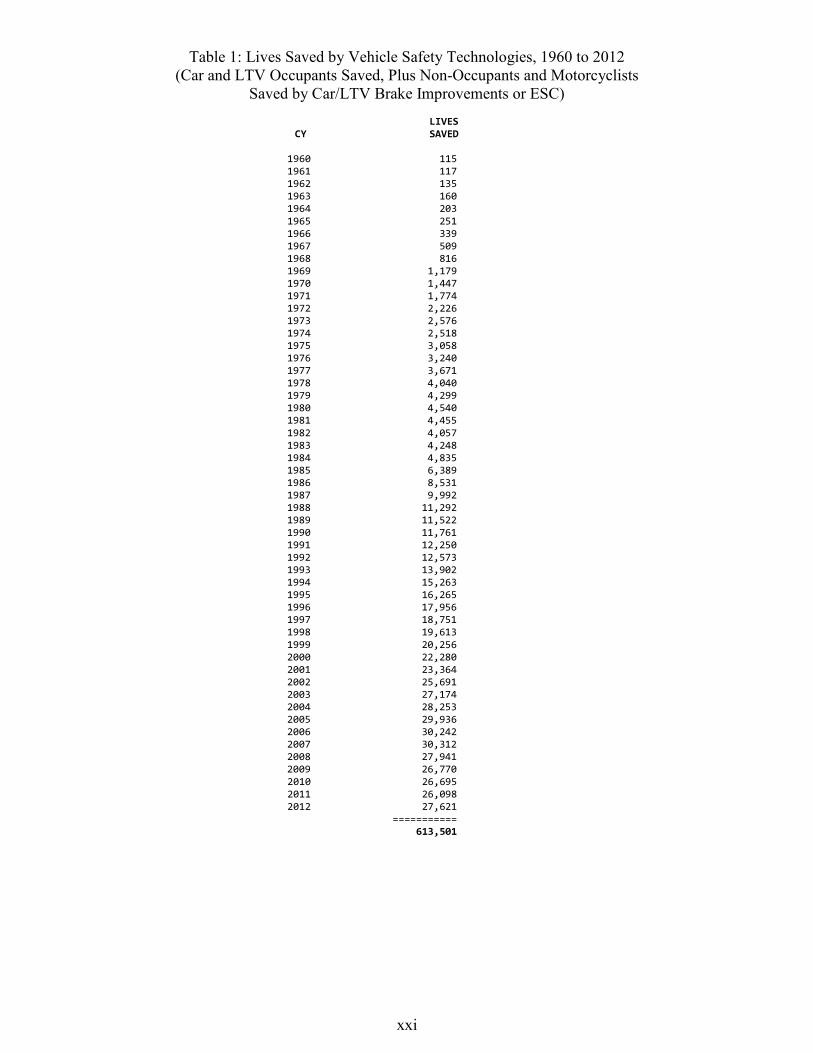
Lives saved from 1960 to 2012: Safety technologies saved an estimated 613,501 lives from 1960 through 2012. Table 1 shows that the annual number of lives saved grew from 115 in 1960, when a small number of people used lap belts, to 27,621 in 2012, when most cars and LTVs were equipped with numerous modern safety technologies and belt use on the road achieved 86 per-cent. This is a large increase from the previous NHTSA study, which estimated 328,551 lives
xx
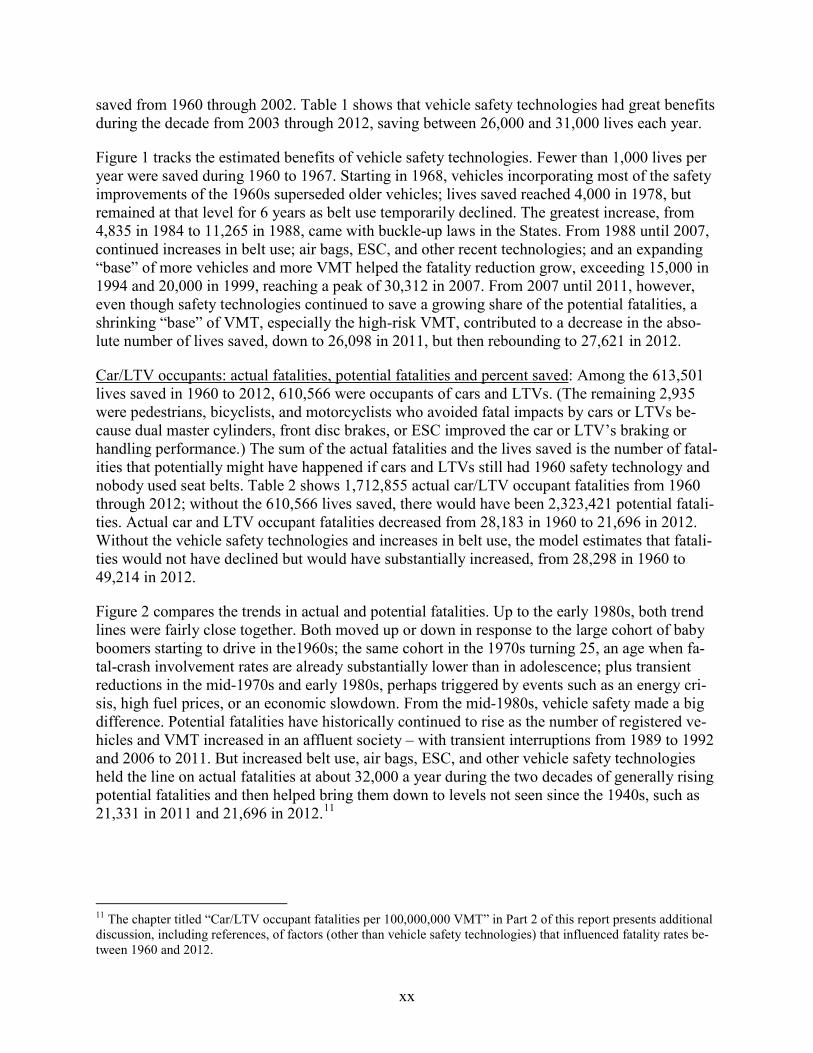
saved from 1960 through 2002. Table 1 shows that vehicle safety technologies had great benefits during the decade from 2003 through 2012, saving between 26,000 and 31,000 lives each year.
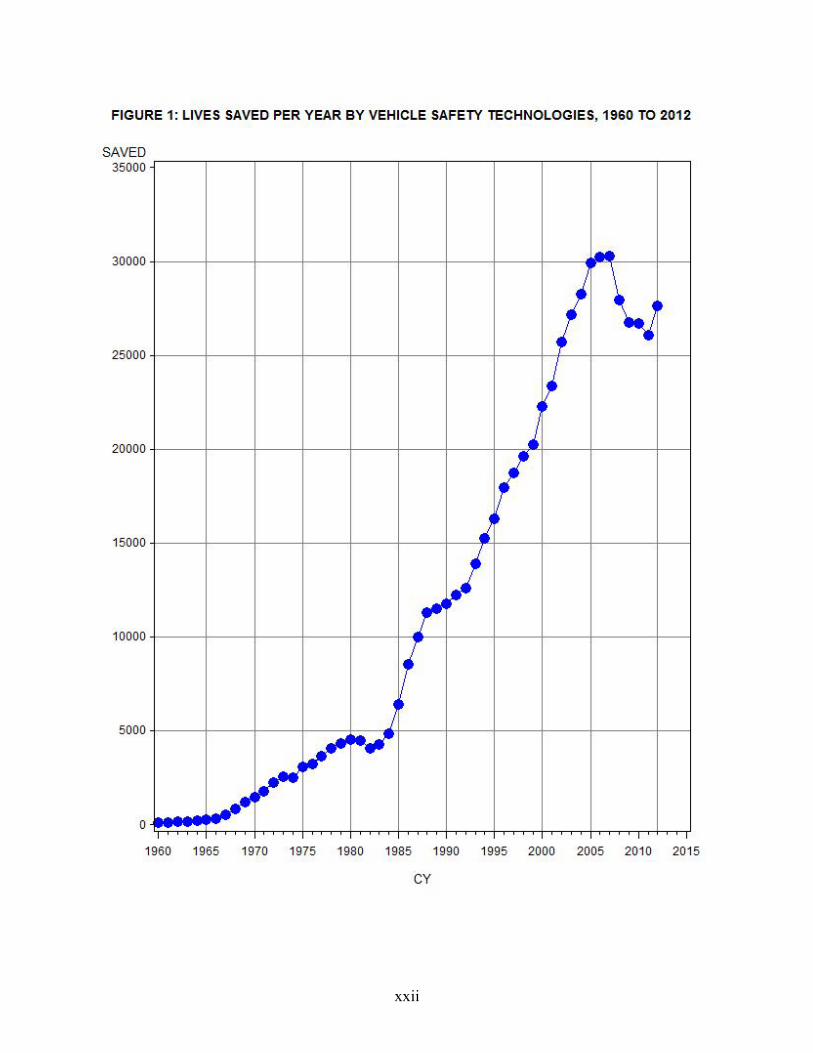
Figure 1 tracks the estimated benefits of vehicle safety technologies. Fewer than 1,000 lives per year were saved during 1960 to 1967. Starting in 1968, vehicles incorporating most of the safety improvements of the 1960s superseded older vehicles; lives saved reached 4,000 in 1978, but remained at that level for 6 years as belt use temporarily declined. The greatest increase, from 4,835 in 1984 to 11,265 in 1988, came with buckle-up laws in the States. From 1988 until 2007, continued increases in belt use; air bags, ESC, and other recent technologies; and an expanding “base” of more vehicles and more VMT helped the fatality reduction grow, exceeding 15,000 in 1994 and 20,000 in 1999, reaching a peak of 30,312 in 2007. From 2007 until 2011, however, even though safety technologies continued to save a growing share of the potential fatalities, a shrinking “base” of VMT, especially the high-risk VMT, contributed to a decrease in the abso-lute number of lives saved, down to 26,098 in 2011, but then rebounding to 27,621 in 2012.
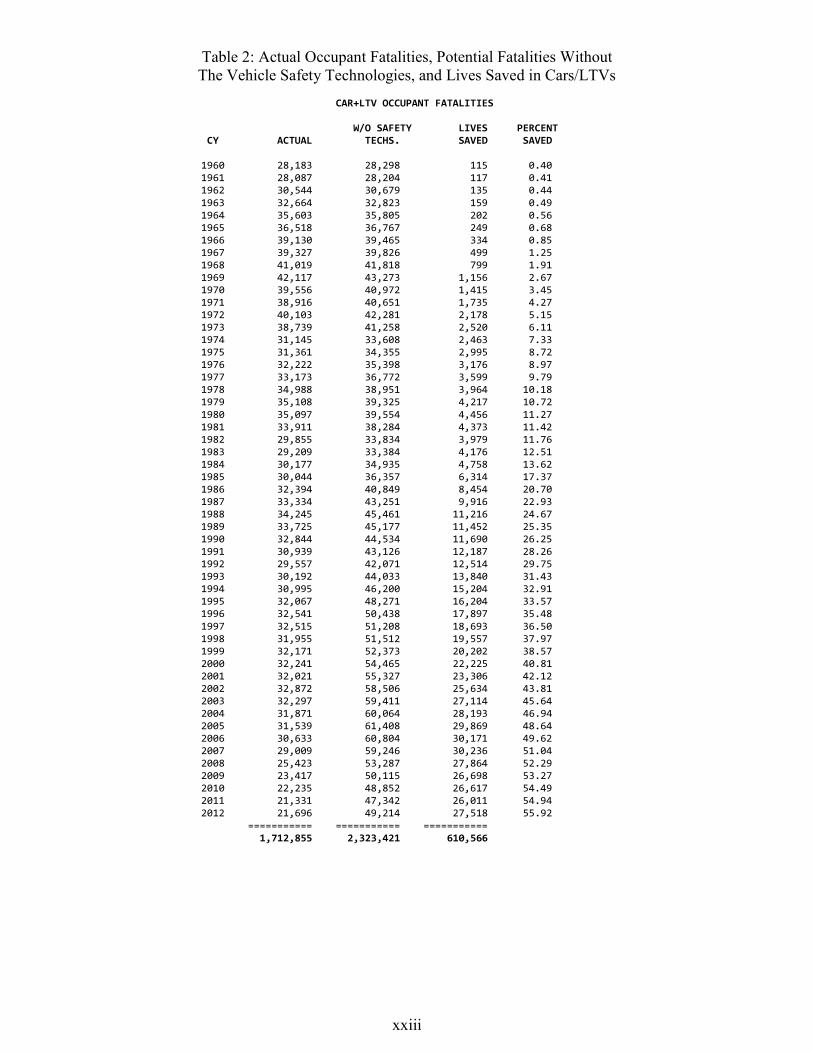
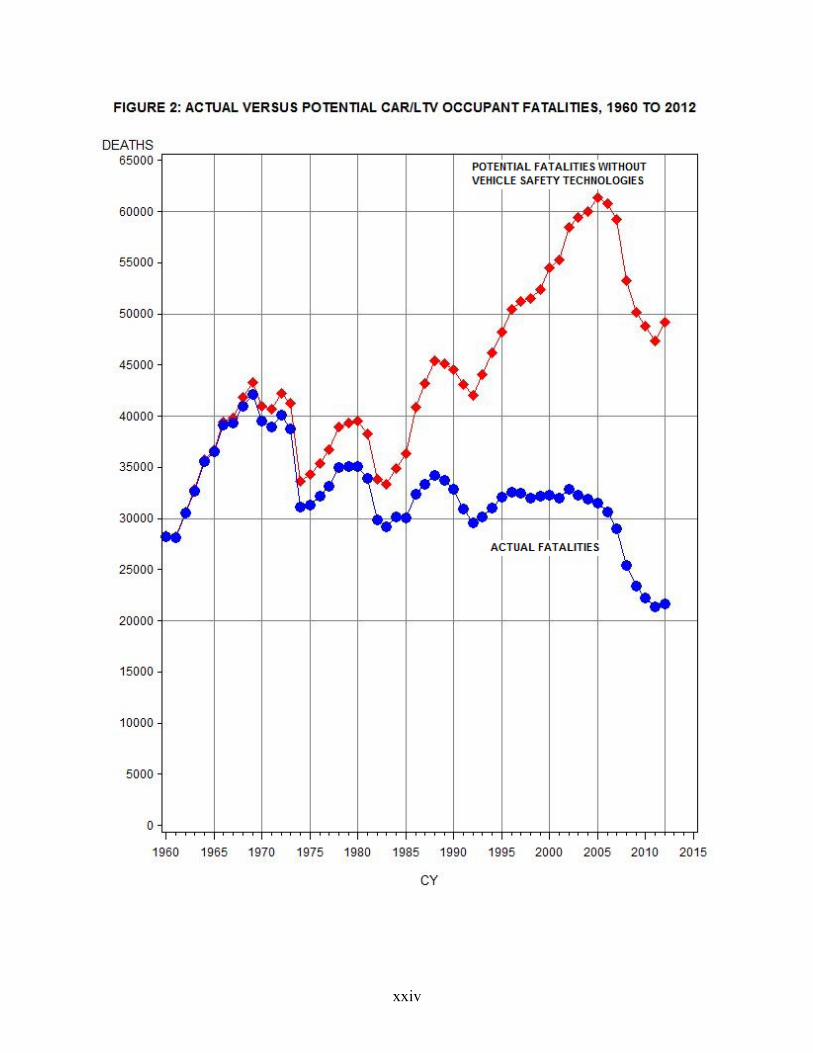
Car/LTV occupants: actual fatalities, potential fatalities and percent saved: Among the 613,501 lives saved in 1960 to 2012, 610,566 were occupants of cars and LTVs. (The remaining 2,935 were pedestrians, bicyclists, and motorcyclists who avoided fatal impacts by cars or LTVs be-cause dual master cylinders, front disc brakes, or ESC improved the car or LTV’s braking or handling performance.) The sum of the actual fatalities and the lives saved is the number of fatal-ities that potentially might have happened if cars and LTVs still had 1960 safety technology and nobody used seat belts. Table 2 shows 1,712,855 actual car/LTV occupant fatalities from 1960 through 2012; without the 610,566 lives saved, there would have been 2,323,421 potential fatali-ties. Actual car and LTV occupant fatalities decreased from 28,183 in 1960 to 21,696 in 2012. Without the vehicle safety technologies and increases in belt use, the model estimates that fatali-ties would not have declined but would have substantially increased, from 28,298 in 1960 to 49,214 in 2012.
Figure 2 compares the trends in actual and potential fatalities. Up to the early 1980s, both trend lines were fairly close together. Both moved up or down in response to the large cohort of baby boomers starting to drive in the1960s; the same cohort in the 1970s turning 25, an age when fa-tal-crash involvement rates are already substantially lower than in adolescence; plus transient reductions in the mid-1970s and early 1980s, perhaps triggered by events such as an energy cri-sis, high fuel prices, or an economic slowdown. From the mid-1980s, vehicle safety made a big difference. Potential fatalities have historically continued to rise as the number of registered ve-hicles and VMT increased in an affluent society – with transient interruptions from 1989 to 1992 and 2006 to 2011. But increased belt use, air bags, ESC, and other vehicle safety technologies held the line on actual fatalities at about 32,000 a year during the two decades of generally rising potential fatalities and then helped bring them down to levels not seen since the 1940s, such as 21,331 in 2011 and 21,696 in 2012.11
11 The chapter titled “Car/LTV occupant fatalities per 100,000,000 VMT” in Part 2 of this report presents additional discussion, including references, of factors (other than vehicle safety technologies) that influenced fatality rates be-tween 1960 and 2012.
xxi
Table 1: Lives Saved by Vehicle Safety Technologies, 1960 to 2012 (Car and LTV Occupants Saved, Plus Non-Occupants and Motorcyclists
Saved by Car/LTV Brake Improvements or ESC) LIVES CY SAVED
1960 115 1961 117 1962 135 1963 160 1964 203 1965 251 1966 339 1967 509 1968 816 1969 1,179 1970 1,447 1971 1,774 1972 2,226 1973 2,576 1974 2,518 1975 3,058 1976 3,240 1977 3,671 1978 4,040 1979 4,299 1980 4,540 1981 4,455 1982 4,057 1983 4,248 1984 4,835 1985 6,389 1986 8,531 1987 9,992 1988 11,292 1989 11,522 1990 11,761 1991 12,250 1992 12,573 1993 13,902 1994 15,263 1995 16,265 1996 17,956 1997 18,751 1998 19,613 1999 20,256 2000 22,280 2001 23,364 2002 25,691 2003 27,174 2004 28,253 2005 29,936 2006 30,242 2007 30,312 2008 27,941 2009 26,770 2010 26,695 2011 26,098 2012 27,621 =========== 613,501
xxii
xxiii
Table 2: Actual Occupant Fatalities, Potential Fatalities Without The Vehicle Safety Technologies, and Lives Saved in Cars/LTVs
CAR+LTV OCCUPANT FATALITIES W/O SAFETY LIVES PERCENT CY ACTUAL TECHS. SAVED SAVED 1960 28,183 28,298 115 0.40 1961 28,087 28,204 117 0.41 1962 30,544 30,679 135 0.44 1963 32,664 32,823 159 0.49 1964 35,603 35,805 202 0.56 1965 36,518 36,767 249 0.68 1966 39,130 39,465 334 0.85 1967 39,327 39,826 499 1.25 1968 41,019 41,818 799 1.91 1969 42,117 43,273 1,156 2.67 1970 39,556 40,972 1,415 3.45 1971 38,916 40,651 1,735 4.27 1972 40,103 42,281 2,178 5.15 1973 38,739 41,258 2,520 6.11 1974 31,145 33,608 2,463 7.33 1975 31,361 34,355 2,995 8.72 1976 32,222 35,398 3,176 8.97 1977 33,173 36,772 3,599 9.79 1978 34,988 38,951 3,964 10.18 1979 35,108 39,325 4,217 10.72 1980 35,097 39,554 4,456 11.27 1981 33,911 38,284 4,373 11.42 1982 29,855 33,834 3,979 11.76 1983 29,209 33,384 4,176 12.51 1984 30,177 34,935 4,758 13.62 1985 30,044 36,357 6,314 17.37 1986 32,394 40,849 8,454 20.70 1987 33,334 43,251 9,916 22.93 1988 34,245 45,461 11,216 24.67 1989 33,725 45,177 11,452 25.35 1990 32,844 44,534 11,690 26.25 1991 30,939 43,126 12,187 28.26 1992 29,557 42,071 12,514 29.75 1993 30,192 44,033 13,840 31.43 1994 30,995 46,200 15,204 32.91 1995 32,067 48,271 16,204 33.57 1996 32,541 50,438 17,897 35.48 1997 32,515 51,208 18,693 36.50 1998 31,955 51,512 19,557 37.97 1999 32,171 52,373 20,202 38.57 2000 32,241 54,465 22,225 40.81 2001 32,021 55,327 23,306 42.12 2002 32,872 58,506 25,634 43.81 2003 32,297 59,411 27,114 45.64 2004 31,871 60,064 28,193 46.94 2005 31,539 61,408 29,869 48.64 2006 30,633 60,804 30,171 49.62 2007 29,009 59,246 30,236 51.04 2008 25,423 53,287 27,864 52.29 2009 23,417 50,115 26,698 53.27 2010 22,235 48,852 26,617 54.49 2011 21,331 47,342 26,011 54.94 2012 21,696 49,214 27,518 55.92 =========== =========== =========== 1,712,855 2,323,421 610,566
xxiv
xxv
The overall, combined effectiveness of the vehicle safety technologies is the percentage of po-tential fatalities that were saved, as shown in the right column of Table 2. The effectiveness grew in every year from 1960 to 2012, from a humble 0.40 percent in 1960 to a very substantial 55.92-percent fatality reduction in 2012. Figure 3 charts the trend, showing:
• Not much effect before the FMVSS; • Steady growth in the early-to-mid 1970s as the early FMVSS phased in; • A slowdown in 1978 to 1982, when belt use declined prior to national buckle-up cam-
paigns; • The largest gains coming with the buckle-up laws in the mid-to-late 1980s; and • Steady progress since the late 1980s thanks to continued increases in belt use, air bags,
ESC, and other recent technologies.
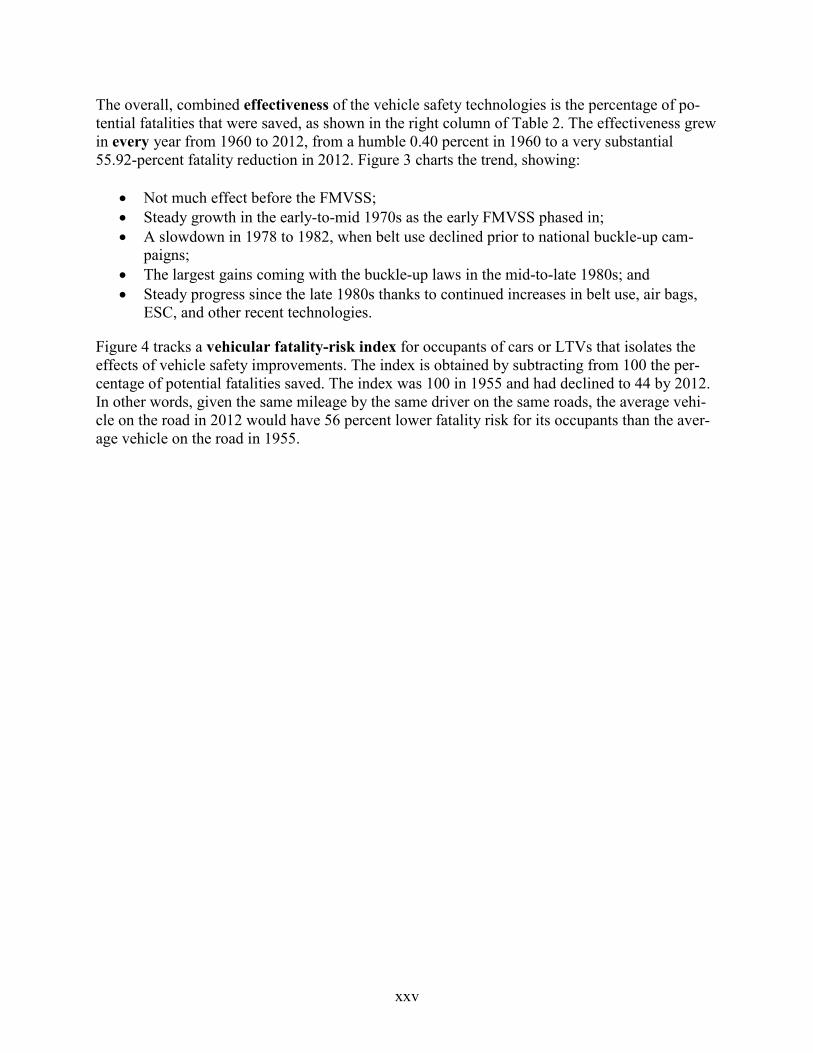
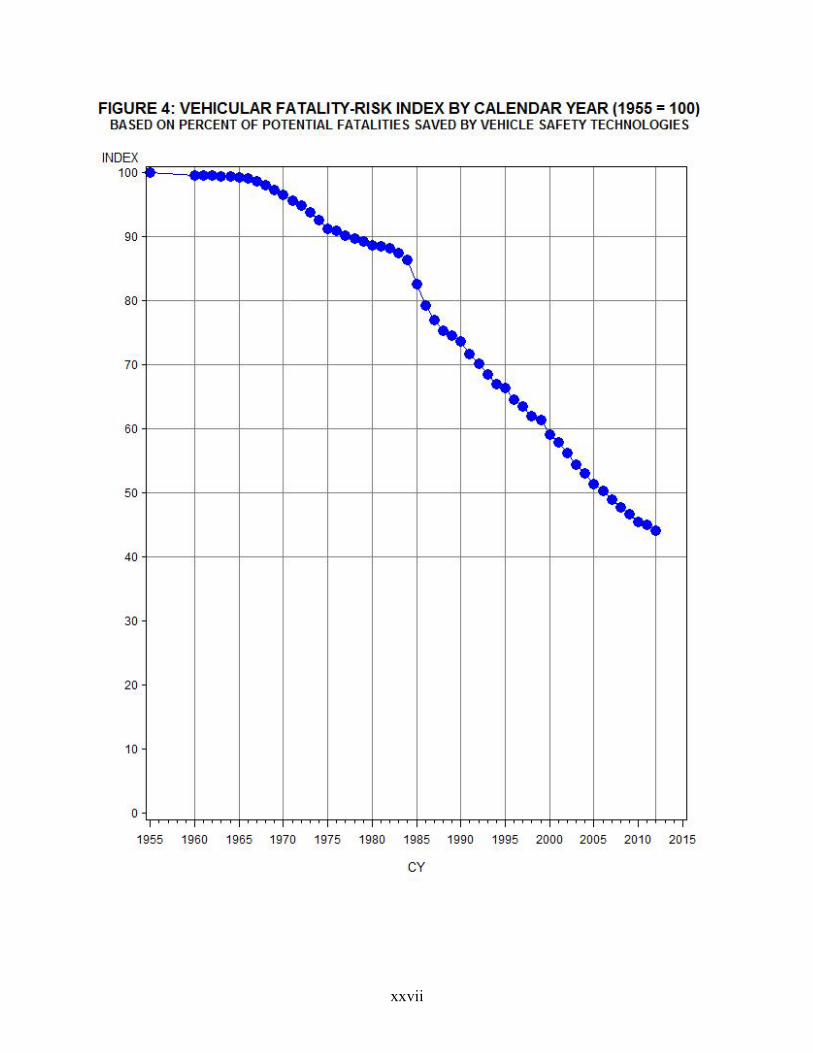
Figure 4 tracks a vehicular fatality-risk index for occupants of cars or LTVs that isolates the effects of vehicle safety improvements. The index is obtained by subtracting from 100 the per-centage of potential fatalities saved. The index was 100 in 1955 and had declined to 44 by 2012. In other words, given the same mileage by the same driver on the same roads, the average vehi-cle on the road in 2012 would have 56 percent lower fatality risk for its occupants than the aver-age vehicle on the road in 1955.

xxvi
xxvii
xxviii
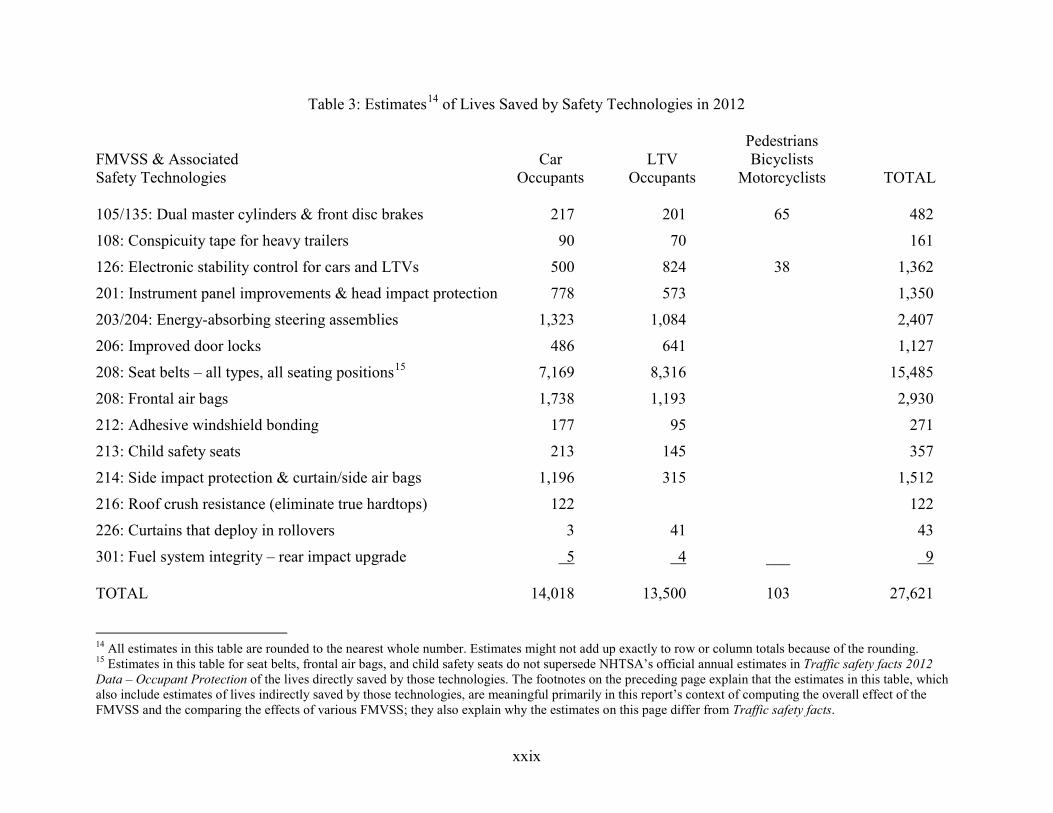
Estimates of lives saved by individual technologies (grouped by FMVSS): Car/LTV safety tech-nologies saved an estimated 27,621 lives in 2012. That total includes 14,018 car occupants and 13,500 LTV occupants. It also includes 103 pedestrians, bicyclists and motorcyclists saved by car/LTV braking improvements or by ESC. Table 3 apportions how many of those lives were saved by the various individual technologies and groups those technologies according to the FMVSS with which they appear to be most closely associated:
• Seat belts are by far the most important occupant protection, saving an estimated 15,485 lives12: over half the total of 27,621. The estimate includes seat belts of all types (3-point, lap-only, automatic), at all designated seating positions. Seat belts are designed to keep occupants within the vehicle and close to their original seating position, provide “ride-down” by gradually decelerating the occupant as the vehicle deforms and absorbs energy, and, if possible, prevent occupants from contacting harmful interior surfaces or one an-other (however, NHTSA recommends correctly installed, age-appropriate safety or booster seats for child passengers until they are at least 8 years old, unless they are at least 4’9" tall). Seat belts are especially important in LTVs, where a large proportion of unrestrained fatalities are ejections and/or rollover crashes; belts saved 8,316 lives in LTVs, over 60 percent of the 13,500 LTV occupants saved.
• Frontal air bags saved 2,930 lives in 2012, when 95 percent of cars and 91 percent of LTVs on the road were equipped with dual or driver-only frontal air bags.13 Frontal air bags have significant benefits in frontal and partially frontal impacts for nearly all occu-pants 13 and older, including the oldest drivers and passengers, by providing energy ab-sorption and ride-down and by preventing head contacts with the windshield or wind-shield header. However, a deployed frontal air bag, especially some of the pre-2007 de-signs without the advanced features of current models, can present risks to child passen-gers 12 and younger. The risk can be eliminated if the child rides in the rear seat, correct-ly restrained – or by turning off the manual on-off switch in pickup trucks or other vehi-cles where children cannot ride in a rear seat correctly restrained.
12 NHTSA’s official estimate is that belts directly saved 12,174 lives in 2012 – i.e., fatalities would have increased by 12,174 if nobody had buckled up, but otherwise the cars and LTVs on the road had remained unchanged. [Source: NCSA. (2014, March). Traffic safety facts 2012 Data – Occupant Protection. (Report No. DOT HS 811 892). Washington, DC: National Highway Traffic Safety Administration. Available at www-nrd.nhtsa.dot.gov/Pubs/811892.pdf.] This report’s estimate, 15,485 lives saved in 2012, is higher because it also includes some indirect savings: this report estimates how many additional fatalities would have occurred if all safety technologies had been removed, not just the belts, and it then apportions the total among the various individual technologies. Accounting for the lives directly saved by recent technologies such as ESC, by this report’s computa-tional method, also indirectly augments the estimates of lives saved by earlier technologies such as seat belts (as explained in Part 2 of this report). The estimates here do not supersede the agency’s official estimates of lives di-rectly saved by seat belts, frontal air bags, and safety seats. They are primarily meaningful within the context of this report: estimation of the overall effect of all the vehicle safety technologies and apportionment of the overall effect among the individual technologies. 13 NHTSA’s official estimate in Traffic safety facts 2012 Data – Occupant Protection is 2,213 lives saved directly by air bags in 2012.
xxix
Table 3: Estimates14 of Lives Saved by Safety Technologies in 2012 Pedestrians FMVSS & Associated Car LTV Bicyclists Safety Technologies Occupants Occupants Motorcyclists TOTAL 105/135: Dual master cylinders & front disc brakes 217 201 65 482
108: Conspicuity tape for heavy trailers 90 70 161
126: Electronic stability control for cars and LTVs 500 824 38 1,362
201: Instrument panel improvements & head impact protection 778 573 1,350
203/204: Energy-absorbing steering assemblies 1,323 1,084 2,407
206: Improved door locks 486 641 1,127
208: Seat belts – all types, all seating positions15 7,169 8,316 15,485
208: Frontal air bags 1,738 1,193 2,930
212: Adhesive windshield bonding 177 95 271
213: Child safety seats 213 145 357
214: Side impact protection & curtain/side air bags 1,196 315 1,512
216: Roof crush resistance (eliminate true hardtops) 122 122
226: Curtains that deploy in rollovers 3 41 43
301: Fuel system integrity – rear impact upgrade 5 4 ___ 9 TOTAL 14,018 13,500 103 27,621
14 All estimates in this table are rounded to the nearest whole number. Estimates might not add up exactly to row or column totals because of the rounding. 15 Estimates in this table for seat belts, frontal air bags, and child safety seats do not supersede NHTSA’s official annual estimates in Traffic safety facts 2012 Data – Occupant Protection of the lives directly saved by those technologies. The footnotes on the preceding page explain that the estimates in this table, which also include estimates of lives indirectly saved by those technologies, are meaningful primarily in this report’s context of computing the overall effect of the FMVSS and the comparing the effects of various FMVSS; they also explain why the estimates on this page differ from Traffic safety facts.
xxx
• Energy-absorbing steering assemblies meeting FMVSS Nos. 203 and 204 are an im-portant “built-in” safety technology that saved an estimated 2,407 lives in 2012. In the 1960s, they were the first basic protection for drivers in frontal crashes, designed to cush-ion their impact into the steering assembly. Today, the combination of energy-absorbing steering columns, seat belts and frontal air bags provides far better protection for the driver in frontal crashes.
• Three groups of technologies associated with FMVSS No. 214, “Side impact protection” saved an estimated 1,512 lives in 2012. The technologies are: (1) Side door beams in cars and LTVs meeting the original static crush test of FMVSS No. 214, which are primarily effective in side impacts with fixed objects, such as trees or poles; (2) Structures and padding added to passenger cars before or after FMVSS No. 214 was upgraded in the 1990s with a dynamic test requirement, which are primarily effective in near-side impacts by other vehicles; and (3) Curtain and side air bags, which further enhance protection in near-side impacts.16
• Electronic stability control (now required in new cars and LTVs by FMVSS No. 126) saved 1,362 lives in 2012, the first year when all new cars and LTVs had ESC – but in 2012 only 20 percent of cars and 22 percent of LTVs on the road were ESC-equipped. Benefits can be expected to grow substantially in future years as the on-road fleet ap-proaches 100 percent ESC-equipped. ESC detects when a vehicle is about to lose traction and automatically applies the brakes to individual wheels and/or reduces engine torque to help the driver stay on course. It is a highly effective crash avoidance technology.
• Two groups of technologies associated with FMVSS No. 201, “Occupant protection in interior impact” saved an estimated 1,350 lives in 2012. The technologies are: (1) Improvements to the materials and contours of middle and lower instrument panels in the late 1960s and 1970s, not specifically required by FMVSS No. 201 but historically and functionally associated with that standard to some extent; instrument panels were re-designed, using energy-absorbing materials, to decelerate occupants at a safe rate and keep them in an upright position during frontal crashes. (2) The head-impact upgrade of FMVSS No. 201, phased in during MY 1999 to 2003, which added energy-absorbing padding to pillars, roof headers, roof side rails, and other components that were sources of life-threatening head injuries.
• Improvements to door locks, latches, and hinges, generally implemented by manufactur-ers in the 1960s and regulated by industry standards subsequently incorporated into FMVSS No. 206, saved 1,127 lives in 2012. They reduce the risk of occupant ejection by keeping doors closed in rollover crashes.
• Car/LTV braking improvements directly or indirectly associated with FMVSS Nos. 105 and 135 include dual master cylinders and front disc brakes. By eliminating brake failure or helping cars and LTVs stop more effectively, they saved 482 lives in 2012, including 65 pedestrians, bicyclists or motorcyclists.
16 A “near-side” impact is a left-side impact for the driver and a right-side impact for the RF passenger.
xxxi
• Child safety seats or booster seats meeting FMVSS No. 213 saved an estimated 357 young passengers in 2012.17 Child safety seats and booster seats are the basic protection system for passengers who are too small to obtain full benefits from seat belts. Newborns should start with rear-facing seats and stay in them until their weight or height reaches a point where they should graduate to forward-facing seats, subsequently to booster seats and, finally, when they are at least 9 years old or 4’9” tall, to adult seat belts.
• Adhesive windshield bonding saved 271 lives in 2012 by keeping the windshield attached to the vehicle in severe impacts and preventing occupant ejection via the windshield por-tal. FMVSS No. 212 regulates windshield retention for cars and LTVs.
• FMVSS No. 108 requires red-and-white conspicuity tape on heavy truck trailers. The tape reflects another vehicle’s headlights strongly and it is highly visible in the dark. Alt-hough this device is furnished on heavy trailers, not cars or LTVs, it is the occupants of cars and LTVs who primarily benefit by avoiding collisions with the trailers. The tape saved an estimated 161 car and LTV occupants in 2012.
• FMVSS No. 216, “Roof crush resistance” is associated with the redesign of true hardtops as pillared hardtops or sedans during the 1970s. True hardtops had no B-pillars to support the roof, making it more susceptible to crush in a rollover. If cars were still built that way there might have been 122 additional fatalities in 2012.
• FMVSS No. 226, “Ejection mitigation” began to phase in during MY2014. Curtain air bags that deploy in rollover crashes are the key technology for meeting the standard. Rollover curtains have already been available in some production vehicles since 2002. They are effective in preventing ejection and mitigating interior impact. They saved an estimated 43 lives in 2012.
• The rear-impact test of FMVSS No. 301, “Fuel system integrity” was substantially up-graded during the past decade. The upgrade saved an estimated 9 lives in 2012: people who otherwise would have died of burns in post-crash fires.
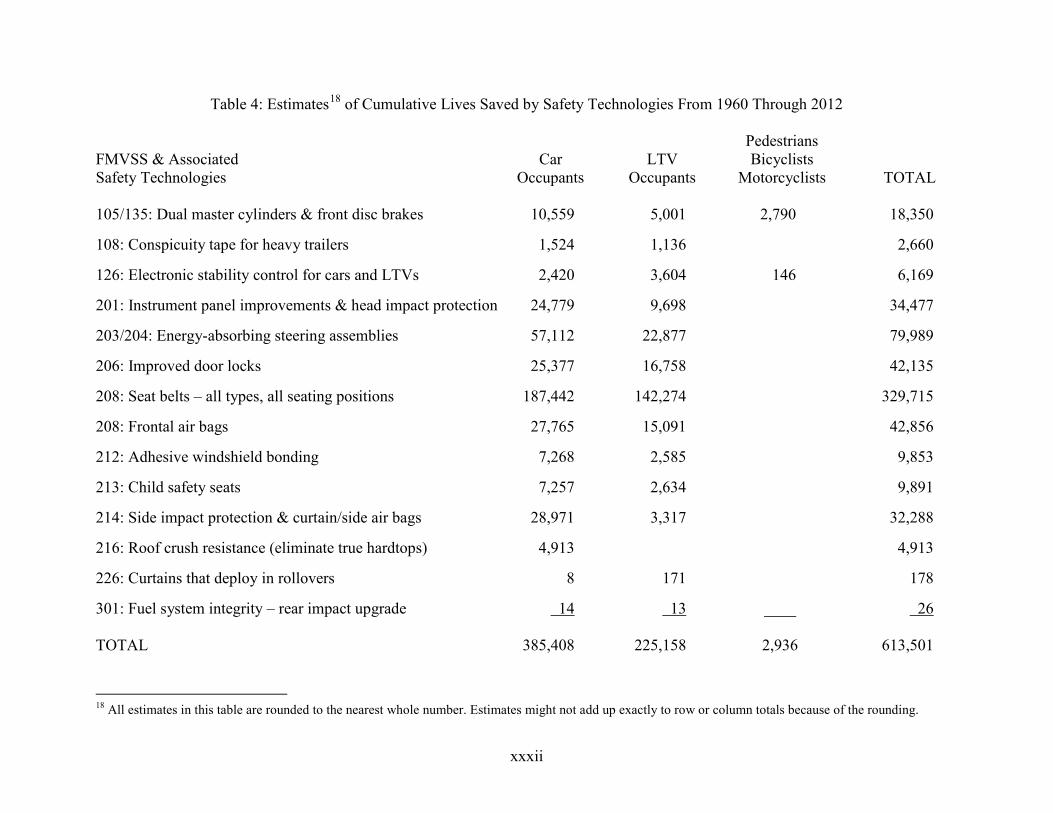
Table 4 shows cumulative lives saved from 1960 through 2012: 385,408 car occupants and 225,158 LTV occupants, plus 2,936 pedestrians, bicyclists and motorcyclists saved by car/LTV braking improvements or ESC, for an estimated total of 613,501. Seat belts (329,715) accounted for more than half the total. Frontal air bags had saved 42,856 lives by the end of 2012 and child safety seats, 9,891. The “built in” non-belt technologies regulated by or associated with the re-maining 13 FMVSS in Table 4 (Nos. 105/135, 108, 126, 201, 203/204, 206, 212, 214, 216, 226, and 301) sum to 231,039 lives saved; energy-absorbing steering assemblies, improved door locks, occupant protection in interior impact, and side impact protection have cumulatively saved the most lives.
17 NHTSA’s official estimate in Traffic safety facts 2012 Data – Occupant Protection is 284 lives saved directly by child safety seats in 2012.
xxxii
Table 4: Estimates18 of Cumulative Lives Saved by Safety Technologies From 1960 Through 2012 Pedestrians FMVSS & Associated Car LTV Bicyclists Safety Technologies Occupants Occupants Motorcyclists TOTAL 105/135: Dual master cylinders & front disc brakes 10,559 5,001 2,790 18,350
108: Conspicuity tape for heavy trailers 1,524 1,136 2,660
126: Electronic stability control for cars and LTVs 2,420 3,604 146 6,169
201: Instrument panel improvements & head impact protection 24,779 9,698 34,477
203/204: Energy-absorbing steering assemblies 57,112 22,877 79,989
206: Improved door locks 25,377 16,758 42,135
208: Seat belts – all types, all seating positions 187,442 142,274 329,715
208: Frontal air bags 27,765 15,091 42,856
212: Adhesive windshield bonding 7,268 2,585 9,853
213: Child safety seats 7,257 2,634 9,891
214: Side impact protection & curtain/side air bags 28,971 3,317 32,288
216: Roof crush resistance (eliminate true hardtops) 4,913 4,913
226: Curtains that deploy in rollovers 8 171 178
301: Fuel system integrity – rear impact upgrade 14 13 ____ 26 TOTAL 385,408 225,158 2,936 613,501
18 All estimates in this table are rounded to the nearest whole number. Estimates might not add up exactly to row or column totals because of the rounding.
xxxiii
Comments on some assumptions in the “lives saved” model: The fatality-reducing effectiveness estimates used in the model are all derived from published NHTSA evaluation reports. The mod-el only includes a technology if its estimate of fatality reduction in NHTSA evaluations is statis-tically significant. As stated above, the estimates are based on statistical analyses of crash data. An initial evaluation report usually compares fatality risk in vehicles built just before and just after make-models became equipped with the technology, statistically controlling for factors oth-er than the technology by using double-pair comparison, control groups, logistic regression, or other techniques. For some technologies, including seat belts, frontal air bags, ESC, and curtain and side air bags, the agency has performed follow-up evaluations of crash data involving later vehicles to see if effectiveness might have changed over time. The basic assumption of the model is that any group of FARS fatality cases involving vehicles equipped with a safety technology known to be effective in that type of crash may be considered evidence that there were additional crashes where that technology saved lives: these additional crashes are not on FARS because the technology made them nonfatal crashes. For example, if there are 100 belted fatality cases on FARS in a type of crash where statistical analysis shows 50-percent belt effectiveness, we surmise that there must have been another 100 people in poten-tially fatal crashes who were saved by the belt. This is a leap of faith to the extent that we cannot identify those 100 specific occupants who were “saved by the belt” – we assume they must exist, based on our effectiveness estimate. The model simulates “removing” safety equipment from a modern vehicle one piece at a time, starting with the most recent technology and working backward. Some of these technologies were introduced at about the same time, and it is not always obvious which was first: for some of the earliest ones, limited information is available about their introduction dates. Changing the order in which the technologies are “removed” would still produce the same estimate of overall lives saved, but the allocation among the individual technologies could change. The model assumes that the belt use of fatally injured occupants (not survivors) on FARS is ac-curately reported. NHTSA has long believed this to be true, based on statistical analyses compar-ing FARS data with belt use observed in surveys. In the future, conceivably, event data recorders could provide additional evidence on belt use in crash data files. Finally, when the model says vehicle safety technologies saved 613,501 lives, it estimates that this number of additional fatalities might have occurred from 1960 through 2012, without those technologies, if all other factors had stayed the same: the same increase in VMT from 1960 to 2012, the same driving behaviors. It is a hypothetical estimate. If seat belts and the other modern vehicle safety technologies had never been invented and if occupant fatalities had continued climbing toward 61,000 instead of remaining near 32,000, as shown in Table 2, the public might have demanded much stronger regulation of drivers (e.g., licensing) or the infrastructure (e.g., speed limits). Consumers might have purchased a different mix of vehicles and some people might have been more reluctant to travel during the riskiest hours (e.g., weekend nights). Those measures might have prevented at least some of the additional 613,501 fatalities – but surely not as efficiently and with as little impairment of driving enjoyment and mobility as the vehicle safe-ty technologies.
1
LIVES SAVED BY VEHICLE SAFETY TECHNOLOGIES AND ASSOCIATED FEDERAL MOTOR VEHICLE SAFETY STANDARDS, 1960 TO 2012
FRAMEWORK FOR THE ANALYSIS
NHTSA began to evaluate the effectiveness of vehicle safety technologies and associated Federal Motor Vehicle Safety Standards in 1975, well before Executive Order 12291 (February 1981), Executive Order 12866 (October 1993), Executive Order 13563 (January 2011), and the Gov-ernment Performance and Results Act of 1993 required Federal agencies to evaluate their exist-ing regulations. By June 2014, NHTSA had issued 82 retrospective evaluations of individual safety standards, programs or technologies; Appendix B of this report summarizes the results of those evaluations.19
A typical evaluation estimates the effectiveness of a safety technology – a percentage reduction of fatalities, injuries and/or crashes – by statistically analyzing crash data on vehicles produced just before versus just after receiving the technology. It may also estimate the benefits of that technology – absolute numbers of lives saved, injuries avoided, or crashes avoided per year – by applying effectiveness estimates to baseline numbers of annual fatalities, injuries or crashes. “Baselines” have typically been the year that a report was written.
NHTSA has evaluated the major crash avoidance and crashworthiness standards in effect for passenger cars and LTVs (which comprise pickup trucks, SUVs, CUVs, minivans and full-size vans) as of June 2014. The agency has also evaluated consumer information on vehicle safety such as NCAP and statistically analyzed safety technologies that are not mandatory for cars or LTVs under Federal regulations, such as pretensioners and load limiters for seat belts.
By now, the agency has evaluated virtually all the life-saving technologies introduced in cars and LTVs from about 1960 up to 2010. Having estimated the lives saved by each individual technol-ogy, we are now ready to assess the overall effect of vehicle safety improvements by essentially adding up the individual estimates. “Building up an estimate one technology at a time” is the most empirical and defensible way to estimate how many lives are saved by all the vehicle safety technologies. It is preferable to a complex statistical analysis of the long-term reduction in over-all fatality rates per 100,000,000 VMT that attempts to tease out the relative effects of vehicle, behavioral, roadway and demographic factors.
Estimating the combined net lives saved by the vehicle safety technologies, as well as the lives saved by each individual technology in each year updates a 2004 NHTSA report that presented an estimate of 328,551 lives saved from CY 1960 through 2002.20
19 “Executive Order 12291 – Federal Regulation," Federal Register 46 (February 19, 1981): 13193; “Executive Or-der 12866 – Regulatory Planning and Review," Federal Register 58 (October 4, 1993): 51735; ; “Executive Order 13563 – Improving Regulation and Regulatory Review," Federal Register 76 (January 21, 2011): 3821; Government Performance and Results Act of 1993, Public Law 103-62, August 3, 1993. 20 Kahane (2004, October).

2
Basic analysis method We will rely on the individual effectiveness estimates (percentage reductions) developed in past NHTSA evaluations. But it is not as simple as merely adding up past reports’ estimates of lives saved per year. The absolute estimates in the various reports are not directly comparable and they are no longer accurate today, because they involve many different, past baselines: typically, the baseline is the number of fatalities on FARS in the year the report was written and this number varies from year to year.
Instead, a process is needed that applies the effectiveness estimates in a consistent manner to ap-propriate “baseline” numbers of fatalities. FARS data serves as the starting point, indicating the actual number of fatalities every year from 1975 to 2012 in the fleet of cars and LTVs that was on the road. The FARS cases comprise a mix of vehicles, some built recently and meeting many of the FMVSS, others quite old and pre-FMVSS. Because the number of fatalities varies some-what from one calendar year to the next, applying the effectiveness estimates will result in esti-mates of lives saved that vary somewhat from year to year.
Every 100 actual fatality cases on FARS represent a potentially even greater number of fatalities that could have happened if the vehicles had not been equipped with any of the safety technolo-gies associated with the FMVSS. The process begins with the actual FARS fatality cases and computes how many additional fatalities there would have been if the vehicles had not been equipped with any safety technologies. The computations rely on the effectiveness estimates from past evaluations. For example, given that 3-point belts reduce fatality risk by 45 percent in cars, 100 belted FARS fatality cases are equivalent to 100/(1 - .45) = 182 fatalities without belts – i.e., we surmise there must have been 182 belted occupants involved in crashes that would have been potentially fatal without belts, but 82 of them did not become FARS fatality cases, be-cause the belts saved the occupant’s life. The process is repeated for other safety technologies until all of them have been “removed” from the vehicle – until the vehicle has been downgraded to a level of safety performance characteristic of the 1950s rather than its actual model year. The technologies are removed in the reverse chronological order that they were historically intro-duced into vehicles. At each step back into the past, the model tallies the lives saved by the latest safety technology – i.e., the additional fatalities that would have occurred if that technology had been removed. This is the process that NHTSA already uses to estimate the number of lives saved by frontal air bags, seat belts, and child safety seats, but expanded to also count the bene-fits of the other technologies associated with the FMVSS.21 “Reverse chronological order” is not the only approach that could have been used in the model; alternative approaches are considered in Part 2 of this report (Summary of the Estimation Method). However, the various techniques would have generated the same estimate of overall lives saved in 1960 to 2012, differing only in how they allocated that total among the individual safety technologies.
The model produces unbiased estimates of the lives saved by the various technologies and it is not an exercise in double counting, because the effectiveness estimates in past evaluations are based on analyses of vehicles produced just after versus just before the installation of the tech-nology in question (e.g., two MY just after versus two MY just before the installation). They es-timate the incremental effect of that technology on a vehicle that is already equipped with all of the earlier technologies. For example, NHTSA’s evaluation of frontal air bags was a study of 21 Traffic safety facts 2012 Data – Occupant Protection.
3
cars, some without air bags and some with frontal air bags, but all equipped with 3-point belts and energy-absorbing steering columns. The evaluation of 3-point belts was based on older cars equipped with energy-absorbing steering columns but not yet with air bags. The evaluation of energy-absorbing steering columns was based on even older cars without air bags or 3-point belts. These effectiveness estimates are incremental, and they may be applied in reverse-chronological sequence to estimate the total fatality reduction for the combination of the three technologies.22
What is included and what is excluded? This will be a study of the lives saved from 1960 to 2012 by vehicle safety technologies that had been implemented in large numbers cars or LTVs from approximately 1960 until 2010, or that were implemented in other vehicles but benefited occupants of cars and LTVs. The short expla-nation for limiting the study to vehicle safety technologies in general and to these vehicles and this timeframe in particular is that they are the technologies that have been evaluated by NHTSA (see Appendix B) – inclusively enough to add up the lives saved by the individual technologies and say, “Here is the overall impact of the vehicle safety program.”
The benefits of roadway improvements, behavioral safety programs such as the effort to prevent drunk driving, and EMS enhancements are not explicitly included here. One exception: the bene-fits of two vehicle safety technologies, seat belts and child safety seats, would not have been an-ywhere near what they are today without all the buckle-up programs that have increased use; the benefits of these behavioral “occupant protection programs” are implicitly and inseparably part of the benefit of seat belts and safety seats. Unlike the vehicle safety technologies, there are gen-erally no easy statistical methods to estimate the effectiveness of specific, individual behavioral or roadway programs. NHTSA does not have a comprehensive set of effectiveness estimates for behavioral or roadway programs, based directly on statistical analysis of crash data, correspond-ing to what it has for the vehicle programs.
For passenger cars, NHTSA has thoroughly evaluated the life-saving benefits of safety technolo-gies associated with the FMVSS. The set of estimates for LTVs is almost as complete and where there are some gaps, estimates can in most cases be plausibly inferred from the results for cars. The list of evaluations for motorcycles, heavy trucks, and buses is not as complete (although this is a future priority for NHTSA).
The timeframe of vehicle technologies is as up-to-date as feasible. However, some of the rules or technologies introduced after 2005 or so cannot be included because NHTSA is only now acquir-ing, or has not yet acquired enough crash data to evaluate their effectiveness in production vehi-cles. 22 Kahane, C. J. (1996, August). Fatality reduction by air bags: Analyses of accident data through early 1996. (Re-port No. DOT HS 808 470, pp. 7-9). Washington, DC: National Highway Traffic Safety Administration. Available at www-nrd.nhtsa.dot.gov/Pubs/808470.PDF; Kahane, C. J. (2000, December). Fatality reduction by safety belts for front-seat occupants of cars and light trucks. (Report No. DOT HS 809 199, pp. 5-10). Washington, DC: National Highway Traffic Safety Administration. Available at www-nrd.nhtsa.dot.gov/Pubs/809199.PDF; Kahane, C. J. (1981, January). An evaluation of Federal Motor Vehicle Safety Standards for passenger car steering assemblies. (Report No. DOT HS 805 705, pp. 197-203). Washington, DC: National Highway Traffic Safety Administration. Available at www-nrd.nhtsa.dot.gov/Pubs/805705.PDF.
4
For the beginning of the timeframe, it seems most logical to start with the technologies regulated by the initial FMVSS of January 1, 1968. Many of these technologies, however, were actually introduced some years before 1968. For a full picture of the benefits of the FMVSS-era technol-ogies, it makes sense to take the analysis back to 1960, as long as we keep separate accounts of lives saved in pre-FMVSS and FMVSS-compliant vehicles. The oldest technologies regulated by the initial FMVSS include lap belts, introduced in the late 1950s and early 1960s; improvements to door locks throughout the 1960s; and many effective devices introduced in 1965 to 1967. There does not seem to be much point in going back before 1960 or attempting to predict how many fatalities there would be today if cars still had, say, 1905 technology; in any case, NHTSA has not evaluated safety improvements that long preceded the FMVSS era, such as enclosed, metal car bodies, hydraulic brakes, safety glass, or electric headlamps.
One feature of the estimation model in Part 2 of this report is that estimates for the later technol-ogies (such as air bags or 3-point belts) are unaffected by the inclusion or exclusion of any tech-nology that preceded them. Thus, readers have the option of just subtracting the benefits for the earliest technologies on the list (e.g., lap belts or the 1960s improvements to door locks) if, in their opinion, they ought not to have been included in this report.
In 2004, NHTSA issued a report that, based on the agency’s cost analyses of individual FMVSS, estimated the total cost and weight added to cars and to LTVs by all the FMVSS, by model year, from 1968 to 2001.23 NHTSA plans to update the report to the most recent MY possible; it will be a companion to this report. A supplement to these two reports will compare overall lives saved and costs on a substantial “core” group of FMVSS for which NHTSA has evaluated effec-tiveness as well as costs.24
List of FMVSS, safety technologies, and effectiveness evaluations Part 1 of this report is a review of 26 FMVSS, plus the NCAP program that provides consumers with information about vehicle safety performance. Part 1 is grouped into 21 chapters. These FMVSS either regulate cars and/or LTVs or they regulate other vehicles/equipment but result in benefits to occupants of cars and LTVs. Part 1 reviews 53 individual safety technologies directly or indirectly associated with FMVSS/NCAP, including 44 that NHTSA has evaluated based on statistical comparisons of the crash experience of vehicles built before and after the introduction of those technologies.
Each FMVSS has a number. The 100-series are crash avoidance standards; the 200-series, crashworthiness; and the 300-series, post-crash fire prevention. Within each series, the number-ing is usually chronological.
Each chapter of Part 1 presents the rationale for a FMVSS (or a related group of FMVSS), the safety problem it addresses, and its regulatory history, including major Federal Register cita- 23Tarbet, M. J. (2004, December). Cost and weight added by the Federal Motor Vehicle Safety Standards for model years 1968-2001 in passenger cars and light trucks. (Report No. DOT HS 809 834). Washington, DC: National Highway Traffic Safety Administration. Available at www-nrd.nhtsa.dot.gov/Pubs/809834.PDF. 24 The supplementary report in 2004 was: Kahane, C. J. (2004, December). Cost per life saved by the Federal Motor Vehicle Safety Standards. (Report No. DOT HS 809 835). Washington, DC: National Highway Traffic Safety Ad-ministration. Available at www-nrd.nhtsa.dot.gov/Pubs/809835.PDF.
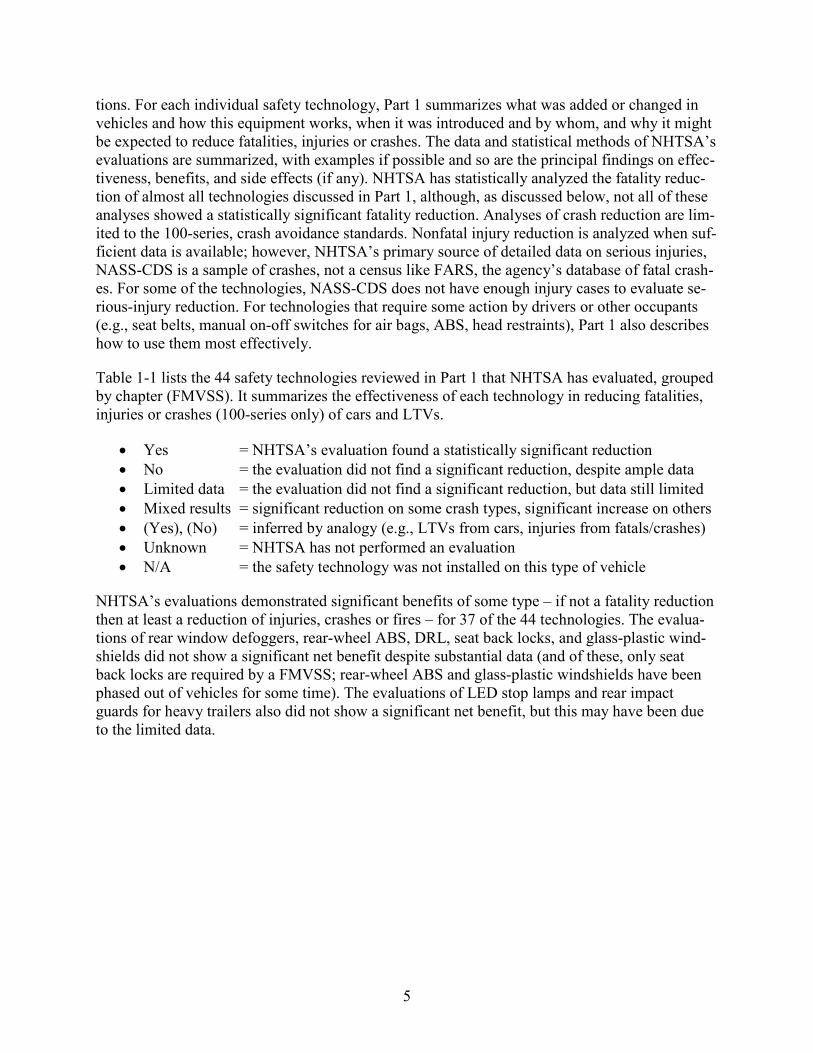
5
tions. For each individual safety technology, Part 1 summarizes what was added or changed in vehicles and how this equipment works, when it was introduced and by whom, and why it might be expected to reduce fatalities, injuries or crashes. The data and statistical methods of NHTSA’s evaluations are summarized, with examples if possible and so are the principal findings on effec-tiveness, benefits, and side effects (if any). NHTSA has statistically analyzed the fatality reduc-tion of almost all technologies discussed in Part 1, although, as discussed below, not all of these analyses showed a statistically significant fatality reduction. Analyses of crash reduction are lim-ited to the 100-series, crash avoidance standards. Nonfatal injury reduction is analyzed when suf-ficient data is available; however, NHTSA’s primary source of detailed data on serious injuries, NASS-CDS is a sample of crashes, not a census like FARS, the agency’s database of fatal crash-es. For some of the technologies, NASS-CDS does not have enough injury cases to evaluate se-rious-injury reduction. For technologies that require some action by drivers or other occupants (e.g., seat belts, manual on-off switches for air bags, ABS, head restraints), Part 1 also describes how to use them most effectively.
Table 1-1 lists the 44 safety technologies reviewed in Part 1 that NHTSA has evaluated, grouped by chapter (FMVSS). It summarizes the effectiveness of each technology in reducing fatalities, injuries or crashes (100-series only) of cars and LTVs.
• Yes = NHTSA’s evaluation found a statistically significant reduction • No = the evaluation did not find a significant reduction, despite ample data • Limited data = the evaluation did not find a significant reduction, but data still limited • Mixed results = significant reduction on some crash types, significant increase on others • (Yes), (No) = inferred by analogy (e.g., LTVs from cars, injuries from fatals/crashes) • Unknown = NHTSA has not performed an evaluation • N/A = the safety technology was not installed on this type of vehicle
NHTSA’s evaluations demonstrated significant benefits of some type – if not a fatality reduction then at least a reduction of injuries, crashes or fires – for 37 of the 44 technologies. The evalua-tions of rear window defoggers, rear-wheel ABS, DRL, seat back locks, and glass-plastic wind-shields did not show a significant net benefit despite substantial data (and of these, only seat back locks are required by a FMVSS; rear-wheel ABS and glass-plastic windshields have been phased out of vehicles for some time). The evaluations of LED stop lamps and rear impact guards for heavy trailers also did not show a significant net benefit, but this may have been due to the limited data.
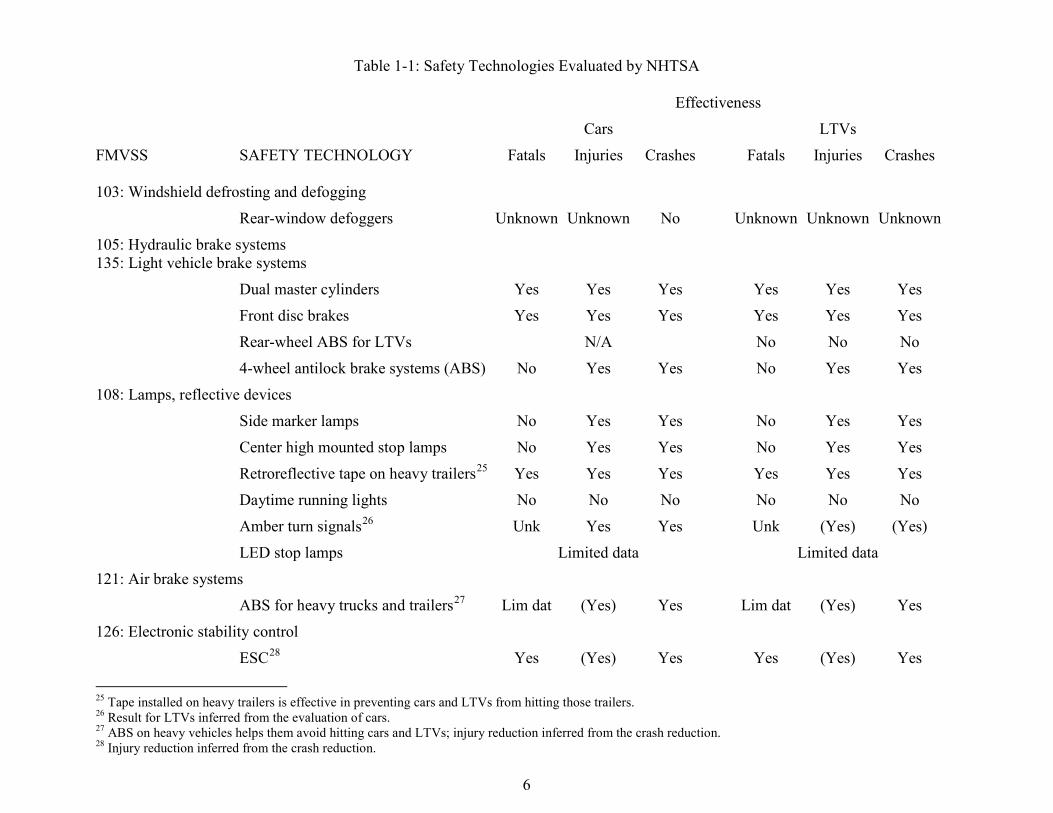
6
Table 1-1: Safety Technologies Evaluated by NHTSA Effectiveness
Cars LTVs
FMVSS SAFETY TECHNOLOGY Fatals Injuries Crashes Fatals Injuries Crashes 103: Windshield defrosting and defogging
Rear-window defoggers Unknown Unknown No Unknown Unknown Unknown
105: Hydraulic brake systems 135: Light vehicle brake systems
Dual master cylinders Yes Yes Yes Yes Yes Yes
Front disc brakes Yes Yes Yes Yes Yes Yes
Rear-wheel ABS for LTVs N/A No No No
4-wheel antilock brake systems (ABS) No Yes Yes No Yes Yes
108: Lamps, reflective devices
Side marker lamps No Yes Yes No Yes Yes
Center high mounted stop lamps No Yes Yes No Yes Yes
Retroreflective tape on heavy trailers25 Yes Yes Yes Yes Yes Yes
Daytime running lights No No No No No No
Amber turn signals26 Unk Yes Yes Unk (Yes) (Yes)
LED stop lamps Limited data Limited data
121: Air brake systems
ABS for heavy trucks and trailers27 Lim dat (Yes) Yes Lim dat (Yes) Yes
126: Electronic stability control
ESC28 Yes (Yes) Yes Yes (Yes) Yes
25 Tape installed on heavy trailers is effective in preventing cars and LTVs from hitting those trailers. 26 Result for LTVs inferred from the evaluation of cars. 27 ABS on heavy vehicles helps them avoid hitting cars and LTVs; injury reduction inferred from the crash reduction. 28 Injury reduction inferred from the crash reduction.
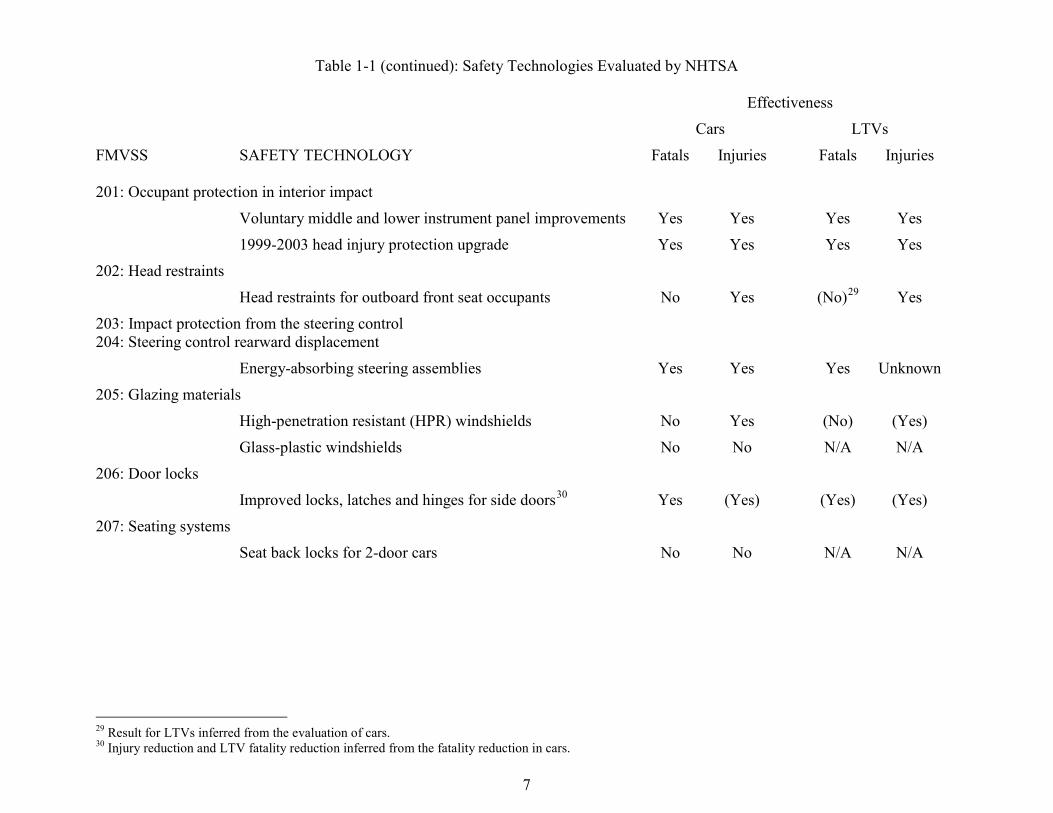
7
Table 1-1 (continued): Safety Technologies Evaluated by NHTSA Effectiveness
Cars LTVs
FMVSS SAFETY TECHNOLOGY Fatals Injuries Fatals Injuries 201: Occupant protection in interior impact
Voluntary middle and lower instrument panel improvements Yes Yes Yes Yes
1999-2003 head injury protection upgrade Yes Yes Yes Yes
202: Head restraints
Head restraints for outboard front seat occupants No Yes (No)29 Yes
203: Impact protection from the steering control 204: Steering control rearward displacement
Energy-absorbing steering assemblies Yes Yes Yes Unknown
205: Glazing materials
High-penetration resistant (HPR) windshields No Yes (No) (Yes)
Glass-plastic windshields No No N/A N/A
206: Door locks
Improved locks, latches and hinges for side doors30 Yes (Yes) (Yes) (Yes)
207: Seating systems
Seat back locks for 2-door cars No No N/A N/A
29 Result for LTVs inferred from the evaluation of cars. 30 Injury reduction and LTV fatality reduction inferred from the fatality reduction in cars.
8
Table 1-1 (continued): Safety Technologies Evaluated by NHTSA Effectiveness
Cars LTVs
FMVSS SAFETY TECHNOLOGY Fatals Injuries Fatals Injuries 208: Occupant crash protection 209: Seat belt assemblies 210: Seat belt assembly anchorages
Lap belts for front seat occupants Yes Yes Yes (Yes)31
Lap belts for rear seat occupants Yes Yes Yes (Yes)
Manual 3-point belts for outboard front seat occupants Yes Yes Yes (Yes)
3-point belts for rear seat occupants Yes Yes Yes (Yes)
Automatic seat belts Yes Unknown N/A N/A
Pretensioners and load limiters for seat belts Yes Unknown Yes32 Unknown
Barrier-certified frontal air bags33 Yes Yes Yes Yes
Manual on-off switches for passenger air bags Mixed results34
Sled-certified frontal air bags35 Yes (Yes) Yes (Yes)
Advanced frontal air bags36 Yes (Yes) Yes (Yes)
212: Windshield mounting
Adhesive windshield bonding37 Yes Yes (Yes) (Yes)
31 “(Yes)” indicates result for LTV injuries inferred from the results for passenger car injuries and LTV fatalities (lap belts and 3-point belts, front and rear seats). 32 Fatality reduction in CUVs and minivans. 33 Except that fatalities increased for certain groups of child passengers in cars and LTVs. 34 Prevents harm if the switch is turned off for child passengers; thwarts the benefit of the air bag if the switch is turned off for adult passengers. 35 Significantly reduce fatality and injury risk relative to no frontal air bags; also significantly reduce risk for child passengers relative to barrier-certified air bags while preserving the effectiveness of barrier-certified air bags for adult and adolescent occupants. 36 Significantly reduce fatality and injury risk relative to no frontal air bags; significantly reduce risk for child passengers relative to barrier-certified air bags while preserving the effectiveness of barrier- and sled-certified air bags for adult and adolescent occupants; by allowing phase-out of manual on-off switches, reduced risk of switches being turned off for adult passengers. 37 “(Yes)” indicates results for LTVs inferred from corresponding results for cars.
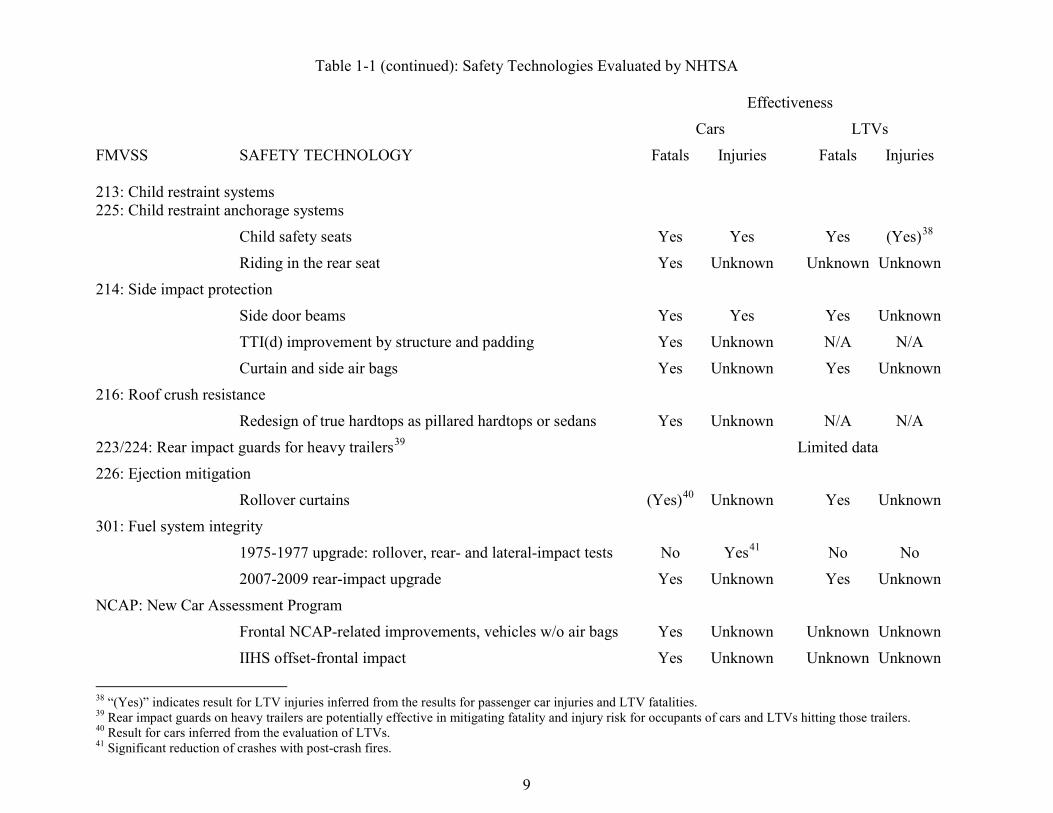
9
Table 1-1 (continued): Safety Technologies Evaluated by NHTSA Effectiveness
Cars LTVs
FMVSS SAFETY TECHNOLOGY Fatals Injuries Fatals Injuries 213: Child restraint systems 225: Child restraint anchorage systems
Child safety seats Yes Yes Yes (Yes)38
Riding in the rear seat Yes Unknown Unknown Unknown
214: Side impact protection
Side door beams Yes Yes Yes Unknown
TTI(d) improvement by structure and padding Yes Unknown N/A N/A
Curtain and side air bags Yes Unknown Yes Unknown
216: Roof crush resistance
Redesign of true hardtops as pillared hardtops or sedans Yes Unknown N/A N/A
223/224: Rear impact guards for heavy trailers39 Limited data
226: Ejection mitigation
Rollover curtains (Yes)40 Unknown Yes Unknown
301: Fuel system integrity
1975-1977 upgrade: rollover, rear- and lateral-impact tests No Yes41 No No
2007-2009 rear-impact upgrade Yes Unknown Yes Unknown
NCAP: New Car Assessment Program
Frontal NCAP-related improvements, vehicles w/o air bags Yes Unknown Unknown Unknown
IIHS offset-frontal impact Yes Unknown Unknown Unknown
38 “(Yes)” indicates result for LTV injuries inferred from the results for passenger car injuries and LTV fatalities. 39 Rear impact guards on heavy trailers are potentially effective in mitigating fatality and injury risk for occupants of cars and LTVs hitting those trailers. 40 Result for cars inferred from the evaluation of LTVs. 41 Significant reduction of crashes with post-crash fires.
10
The evaluations showed a statistically significant fatality reduction for 31 technologies. The ef-fectiveness estimates for those 31 technologies are the basis for the model that estimates lives saved by vehicle safety technologies in Part 2 of this report. The evaluations of ABS for cars and LTVs, amber rear turn signals, ABS for heavy vehicles, head restraints, HPR windshields, and the 1975-to1977 upgrade of FMVSS No. 301 showed significant reductions of crashes or nonfa-tal injuries, but they did not show a significant fatality reduction. The effectiveness estimates in Part 1 may be found in published NHTSA reports. Those NHTSA publications are cited in foot-notes and listed in the References at the end of this report. Moreover, Appendix B provides cap-sule summaries of 82 evaluations published as of June 2014, in reverse chronological order.
The effectiveness of a safety technology can vary over time if there are changes in the design of that technology, in the crash environment, or in other features of vehicles (such as installation of other safety technologies). Effectiveness should be reevaluated periodically if feasible. The ini-tial evaluation is often straightforward, statistically comparing vehicles just before versus just after a technology was introduced. Follow-up evaluations of later model-year vehicles may re-quire more complicated statistical tools, because these vehicles may not be directly comparable to the vehicles produced just before the technology was introduced. For many technologies, NHTSA has published only one evaluation; this report assumes the effectiveness in specific crash types has stayed about the same in subsequent years. However, for quite a few technolo-gies, NHTSA has completed one or more follow-up evaluations.
• Technologies with especially large potential benefits: 3-point belts for outboard front seat occupants, frontal air bags, ESC;
• Safety devices whose design has changed over the years: frontal air bags, curtain and side air bags, child safety seats;
• Technologies whose effectiveness might vary as the crash environment or other features vehicles change: 3-point belts, side impact protection by structure and padding; and
• Crash avoidance technologies whose effectiveness may change over time as a result of drivers’ knowledge or familiarity with them: ABS, CHMSL, ESC.
The follow-up evaluations showed that the fatality-reducing effectiveness of 3-point belts for outboard front seat occupants, frontal air bags, ESC, and the other technologies listed above have not changed significantly over time. Belt effectiveness has remained stable despite the numerous changes in vehicle design and the crash environment.
Part 1 also summarizes the vehicle modifications and rationale for nine safety technologies that are already available in production cars and/or LTVs, but NHTSA has not yet fully studied the reduction of fatalities, injuries, or crashes, based on statistical analysis of crash data.
• FMVSS No. 138 – tire pressure monitoring systems (TPMS) • 2010-to-2012 head restraint upgrade of FMVSS No. 202 • Tethers or attachments for child safety seats and their anchorages in the vehicle • Booster seats (analysis, so far, is limited to nonfatal injuries) • 2013-to-2016 roof crush resistance upgrade of FMVSS No. 216 • Frontal NCAP-related modifications in vehicles with air bags • Modifications related to Side NCAP or IIHS side impact testing • Rollover resistance NCAP-related modifications
11
Furthermore, the statistical evaluations of side impact protection by structure and padding and of curtain/side air bags have so far been limited to front seat occupants, because data on rear seat occupants is still quite limited – i.e., the estimates of lives saved by vehicle safety technologies will not count any rear seat occupants saved by these two technologies. Later on, when there is sufficient FARS data distinguishing between booster seats and other child safety seats, NHTSA will obtain separate estimates of fatality reduction for booster seats, but for the time being, the agency will assume a single effectiveness number for child safety seats and booster seats.
In addition to the 26 FMVSS reviewed in Part 1, there are 24 other FMVSS (in effect as of June 2014) that regulate new cars, new LTVs, or car/LTV components that have not been evaluated by NHTSA. The evaluation of FMVSS No. 139, “New pneumatic radial tires for light vehicles” will be combined with the future evaluation of the effect of TPMS on crash rates. The following FMVSS definitely or quite possibly resulted in tangible changes to vehicles, but were not evalu-ated because existing or potentially available data does not adequately identify what vehicles were modified; or because the type of crashes/injuries mitigated by the FMVSS cannot be sin-gled out in available data (or cannot be identified at all); or because there is currently little hope of obtaining enough data for a statistically meaningful analysis of the effect, if any, that could reasonably be expected for that FMVSS.
• 114: Theft protection • 116: Motor vehicle brake fluids • 118: Power-operated windows • 124: Accelerator control systems • 125: Warning devices • 129: New non-pneumatic tires for passenger cars • 219: Windshield zone intrusion • 302: Flammability of interior materials • 303: Fuel system integrity of compressed natural gas vehicles • 304: Compressed natural gas fuel container integrity • 305: Electric-powered vehicles: electrolyte spillage and electrical shock protection • 401: Interior trunk release
The following standards have not been evaluated even though they may regulate vehicle subsys-tems that are important for safety (e.g., tires, mirrors). The agency believes they probably did not result in extensive changes to those subsystems or does not know if they have resulted in chang-es. In many cases, the FMVSS may have largely incorporated other organizations’ standards or industry-wide practices that vehicles had already been meeting for quite some time before 1968.
• 101: Controls and displays • 102: Transmission shift lever sequence • 104: Windshield wiping and washing systems • 106: Brake hoses • 109: New pneumatic tires • 110: Tire selection and rims • 111: Rearview mirrors • 113: Hood latch systems
12
• 117: Retreaded pneumatic tires • 119: New pneumatic tires for vehicles other than passenger cars • 120: Tire selection and rims for vehicles other than passenger cars
Part 1 ends with Tables 1-2, 1-3 and 1-4 summarizing the effectiveness of safety technologies: their estimated percentage reductions in fatalities, nonfatal injuries and crashes (always specify-ing to what group of crashes/injuries these percentages apply). Tables 1-3 and 1-4 also specify estimated numbers of nonfatal injuries and crash prevented per year, if such estimates appeared in a NHTSA evaluation report. However, those individual estimates of benefits do not add up to the overall annual crash avoidance and nonfatal-injury reduction by all the technologies, because the agency has not estimated them for all technologies. NHTSA does not have enough “building blocks” to develop models for overall crash avoidance and injury reduction comparable to the analysis of fatal crashes in Part 2 of this report. Furthermore, these individual estimates, in gen-eral, are not directly comparable, because the various evaluation reports compute them using dif-ferent baseline years.
What has changed from NHTSA’s 2004 report? As stated above, NHTSA issued a report in 2004 that estimated vehicle safety technologies had saved 328,551 lives from CY 1960 through 2002.42 This report updates the estimates through 2012 by incorporating FARS data from 2003 through 2012 into the analysis and by including the effects of safety technologies that NHTSA has evaluated since the previous report.
The effectiveness estimates for the 31 technologies with statistically significant fatality reduc-tions drive the current model to estimate lives saved. Only 22 of those technologies were consid-ered in the model of the 2004 report. Seven of the remaining nine were already available in some production vehicles of MY 2002 or earlier – ESC, curtain and side air bags, the head-impact up-grade of FMVSS No. 201, belt pretensioners and load limiters, manual switches for passenger air bags, redesigned frontal air bags, and rollover curtains – but NHTSA did not yet have estimates of fatality reduction based on crash data. The other two technologies – advanced frontal air bags and the 50 mph rear-impact test for FMVSS No. 301 – were still in the future. Furthermore, the earlier report’s effectiveness estimate for side-impact structures and padding is superseded by a 2007 analysis. (The earlier report’s estimates for car/LTV ABS are also superseded, by a 2009 analysis, but only for nonfatal crashes and injuries; it will not affect the computation of lives saved.)
The estimates of lives saved in the current report are identical to the 2004 report from CY 1960 (115 lives saved) through CY 1985 (6,389 lives saved). Small differences begin in 1986 (8,531 lives saved here, 8,523 in the earlier report). The current report has new estimates of the effects of side-impact structures and padding. These improvements began gradually on a voluntary basis in MY 1986, even though the upgrade to FMVSS No. 214 did not phase in until MY 1994 to 1997. Because technologies whose effects are included here but not in the earlier report – ESC, curtain and side air bags, etc. – proliferated after 1995, the current report’s estimates of lives saved become progressively somewhat higher than the earlier report’s (e.g., 25,691 versus 24,561 in 2002). 42 Kahane (2004, October).
13
Estimating lives saved by safety technologies, 1960 to 2012 Part 2 of this report focuses on the safety technologies that have significantly reduced fatality risk. The individual effectiveness estimates and the basic analysis method, described above, are applied to FARS data to estimate how many lives were saved from 1960 to 2012. The tables in Part 2 also estimate how many lives were saved.
• In each calendar year • By each individual safety technology • Technologies grouped by associated FMVSS • By vehicle type:
o Car occupants o LTV occupants o Pedestrians and motorcyclists saved by car/LTV braking improvements or ESC
• Distinguishing between lives saved by technologies compliant with FMVSS that were in effect at the time and “voluntary” saves such as:
o Improvements introduced before the effective date of a FMVSS o Technologies not required for meeting any FMVSS, although perhaps indirectly
associated with a FMVSS because they address the same general safety problem
Part 2 compares the actual number of fatalities from 1960 to 2012, or in any specific year to the number that potentially would have occurred, given the same driving exposure, if none of the cars and LTVs had been equipped with any of the safety technologies. It computes the percent-age of the potential fatalities that were saved by the technologies. Part 2 also compares the trends in fatalities per 100,000,000 VMT – with and without the vehicle safety technologies.
Every life-saving technology in Table 1-1 is included in Part 2. Child passengers’ “riding in the rear seat,” although listed in Table 1-1, is not included in Part 2 because it is not a technology, but the objective of a behavioral safety initiative. Just as Part 2 does not count lives saved by the recent shift of child passengers from front to rear seats among the “benefits of the vehicle safety technologies,” it does not count the effects of other market shifts between existing vehicle types, such as between:
• 2-door cars and 4-door cars; • Large cars and small cars; • Passenger cars and LTVs; or • Truck-based SUVs and CUVs.
While these shifts can and do affect the number of fatalities, they cannot be considered benefits of new safety technologies of the FMVSS era. Part 2 considers only their implicit effects on the year-to-year changes in actual and potential fatalities.
14
PART 1
Review of 26 Federal Motor Vehicle Safety Standards And the New Car Assessment Program
Comprising 53 Safety Technologies
And Their Effectiveness in Reducing Fatalities, Injuries and Crashes for Passenger
Cars and LTVs Following the review of the FMVSS and NCAP, Tables 1-2, 1-3 and 1-4 summarize the fatality-, injury- and crash-reducing effectiveness (percentage reductions) of the safety technologies. Ta-bles 1-3 and 1-4 also summarize annual benefits of individual technologies: injuries and crashes avoided per year. Part 2 of this report estimates the annual fatality reduction, for each technology individually and for all of them together.
15
FMVSS No. 103, “Windshield defrosting and defogging systems” A vehicle modification whose safety benefits have been evaluated by NHTSA is grouped with this standard merely because the functions are similar:
• Rear window defrosting and defogging systems
FMVSS No. 103 regulates windshield defrosting and defogging. One of NHTSA’s initial safety standards, effective on January 1, 1968, it required passenger cars and SUVs to have windshield defroster/defoggers and it set performance requirements for them, incorporating SAE Recom-mended Practices dating back to 1964. Cars and LTVs had windshield defroster/ defoggers well before 1968. They remained unchanged during the mid-to-late 1960s.43
FMVSS No. 103 has never required or proposed to require rear-window defoggers. Their devel-opment has been voluntary on the part of the industry, in response to customer demand. Drivers obviously want a clear rear window, and they like a device that clears it for them automatically, so they do not have to wipe or scrape it repeatedly.
History of rear window defoggers: Ward’s Automotive Yearbooks44 began to include rear win-dow defoggers in MY 1973 among their statistics for factory-installed equipment in domestic cars by make-model. In that year, 16 percent of new cars were equipped with them; presumably, they were offered in smaller numbers some years before that. Installations grew steadily in the 1970s and 1980s. By 1992, over 90 percent of new cars were equipped with them. By MY 2001, they were standard equipment on most cars, SUVs and minivans, but not pickup trucks or full-size vans; 94 percent of new cars were equipped with them.45
How they work: Current rear-window defoggers are grids of electric wires attached to the rear window. The wires are thin enough not to obstruct vision. Controlled by a switch on the instru-ment panel, they heat up to evaporate condensation or melt ice and snow. The switch automati-cally turns off after a certain number of minutes, in order to save wear and tear on the system, and the driver has to turn it back on if the window is not clear. During the 1970s some defoggers consisted of an electric heater and blower-motor. That type was gone by 1982.
Rear-window defoggers are potentially useful when: (1) environmental factors such as rain, snow or cold fog or ice up the window; (2) the driver turns on the switch. In warm, dry, sunny conditions, windows are normally clear and defoggers are not needed. The situations that might put condensation, snow or ice on the window include any kind of precipitation; early morning hours when water vapor in the outside air condenses as dew; and very cold weather that can make water vapor inside the vehicle condense on windows. Whereas rear-window defoggers rap-
43 Federal Register 32 (February 3, 1967): 2414; Up-to-date text of NHTSA regulations may be downloaded from the electronic Code of Federal Regulations, Title 49, www.ecfr.gov/cgi-bin/text-idx?c=ecfr&tpl=/ecfrbrowse/Title49/49tab_02.tpl. Regulations other than FMVSS are referenced as Part numbers (e.g., Part 563, “Event data recorders”). FMVSS are referenced as Part 571 followed by the FMVSS number (e.g., Part 571.103 = FMVSS No. 103, “Windshield defrosting and defogging systems”). 44 Southfield, MI: Penton Media, Inc. 45 Morgan, C. (2004, March). Evaluation of rear window defrosting and defogging systems. (Report No. DOT HS 809 724, pp. 1-4). Washington, DC: National Highway Traffic Safety Administration. Available at www-nrd.nhtsa.dot.gov/Pubs/809724.PDF.
16
idly dispel condensation, they cannot melt large amounts of ice, but they make it easier to scrape off.
Expected benefits: Based on the preceding descriptions of how rear-window defoggers work, here are some hypotheses of the types of crashes where statistical analyses might show benefits. This discussion of “expected benefits” as well as similarly titled discussions in most of the FMVSS chapters of Part 1 of this report are akin to opening statements in a jury trial. They are not a presentation of facts or evidence; rather, they set the stage and help identify what types of statistical analyses of crash data would be most useful for demonstrating effectiveness and bene-fits.
Rear-window defoggers might help prevent collisions by allowing a driver to see through the back window, either directly or via the inside rear-view mirror – but only when there are envi-ronmental conditions that are fogging or icing up the windows, and when the driver has activated the defoggers. Specifically, there are two maneuvers where a driver must know, or at least ought to know what is behind the vehicle. The maneuvers could result in rear-impact collisions if per-formed in an unsafe manner:
• Backing up: obviously, the driver needs to know what is directly behind the vehicle, and that is much easier if he or she can look through a rear window that has been cleared by a defogger. Without a defogger (and before the advent of rear-mounted video cameras), the driver’s alternative strategies would be relying on outside mirrors, getting out of the car to look around/wipe the window, or just backing up a short distance very slowly and hop-ing for the best.
• Changing lanes: good, defensive driving includes periodic scanning to the rear of the ve-hicle to know if it will be safe to change lanes should it suddenly become necessary. Ob-viously, this is easiest with a correctly positioned inside rear-view mirror and a clear window. Without them, the driver would have to rely more on outside mirrors, change lanes with less confidence that it is safe, or even forego lane changes unless they are ab-solutely necessary.
Analysis of crash avoidance – passenger cars: NHTSA’s study, published in 2004, used crash data from Michigan (1981-91) and Florida (1986-99). The basic analysis method was to compare the number of rear-impacts involving either of the pre-crash maneuvers where rear-window defoggers might be effective – backing up or changing lanes – to the number of rear-impact in-volvements where the vehicle had been standing still for some time and was hit by somebody else. The latter are a control group, because the drivers did nothing to cause the crash, and rear-window defoggers would not have prevented it. Did the ratio of impacts while backing up or changing lanes to impacts while standing still decrease with rear window defoggers – in the types of environmental conditions when defoggers might be in use (precipitation, early morning, winter)?46
This is a difficult statistical analysis. Neither the police-reported data elements nor the VIN in-cluded on the Michigan and Florida files indicate if any specific vehicle was equipped with rear-window defoggers. The VIN only identifies the make-model and the model year. Ward’s Auto-
46 Ibid., pp. 9-14.
17
motive Yearbooks indicate the percentage of vehicles with rear-window defoggers by make-model and MY. However, unlike most other safety technologies that went from 0 to 100 or near-100 percent of vehicles from one MY to the next, rear-window defoggers increased their market share of nearly all make-models gradually, a few percent more each year. That precluded a rela-tively simple 3-way contingency table analysis (yes/no defogger, impact type, environmental condition) and necessitated logistic regressions on each State’s data. The dependent variable was the type of rear impact (backing-up or changing-lanes versus control group). The independent variables were the proportion of vehicles of that make-model and MY equipped with defoggers, the environmental conditions (precipitation, early morning or winter versus none of the above), vehicle age, driver age/gender, calendar year, and the specific make-model. However, the key independent variable was the interaction term between rear-window defogger and adverse envi-ronmental conditions. If defoggers are effective, there should be a significant reduction in back-ing-up/changing-lanes involvements under adverse environmental conditions.47
The statistical analyses showed little or no effect for defoggers in either State. The evaluation was unable to conclude that rear-window defoggers reduce police-reported crashes. It may be that the complexity of the analysis, necessitated by the data, made it harder to identify an effect. It may also be that rear-window defoggers are not that essential to bottom-line safety. As ex-plained in “Expected Benefits,” drivers usually have alternative strategies to compensate for the absence of a defogger: more reliance on outside mirrors, getting out of the car to look around or wipe the window when that can be done safely, or simply backing up and changing lanes less frequently/more gradually. These alternatives are, at best, inconvenient and sometimes unnerv-ing. Therefore, we would expect most drivers will continue wanting to have rear-window defog-gers on their vehicles.48
47 Ibid., pp. 4-8 and 14-17. 48 Ibid., pp. v-vi and 18-27.
18
FMVSS No. 105, “Hydraulic and electric brake systems” FMVSS No. 135, “Light vehicle brake systems” NHTSA has evaluated four innovative braking technologies for passenger vehicles:
• Dual master cylinders, • Front disc brakes, • Rear-wheel antilock (RWAL) brake systems for LTVs, and • Four-wheel antilock brake systems (ABS) for passenger cars and LTVs.
The goal of dual master cylinders is to provide dual hydraulic circuits, so that a fault in one hy-draulic system will not lead to a catastrophic loss of all braking power. They have been standard equipment on most passenger cars since MY 1967. Front disc brakes enhance a driver’s control by providing a more linear pedal “feel” than drum brakes. They are also less prone to “fade” from overheating or exposure to water. They have been standard on most cars since MY 1977. Rear-wheel antilock (RWAL) brake systems are designed to prevent rear-wheel lockup and loss of control during braking. Four-wheel antilock brake systems (ABS) do what RWAL does and additionally allow drivers to keep control of a vehicle and steer it during severe braking. From approximately 1993 through 2004, antilock brakes were installed as standard or optional equip-ment on approximately 70 percent of new cars (4-wheel) and LTVs (4-wheel or rear-wheel). However, 4-wheel ABS gradually superseded RWAL in LTVs; RWAL was gone by 2004. ABS installations again began to increase in MY 2005 and reached 100 percent of new cars and LTVs in MY 2012.
FMVSS No. 105 regulated all hydraulic brake systems until 2000-2002, when it was superseded by FMVSS No. 135 for vehicles with GVWR up to 3500 kg.49 FMVSS No. 105 is a performance standard, specifying stopping distances or deceleration rates for a series of stopping tests under various conditions. It does not prescribe technologies. However, dual master cylinders satisfied the FMVSS No. 105 requirement for a dual or split braking system. Front disc brakes helped ve-hicles pass the fade and water-recovery tests added to FMVSS No. 105, effective September 1, 1975. FMVSS No. 135 is a standard harmonized with requirements in other countries; it is equivalent to the current European standard ECE R13-H. It also upgrades some requirements of FMVSS No. 105 – e.g., it lowers the maximum allowable pedal effort in a case of partial systems failure – while retaining other features of FMVSS No. 105. ABS has never been required for ve-hicles with a GVWR less than 10,000 pounds, but Congress asked NHTSA in 1991 to consider an ABS requirement in FMVSS No. 105. However, FMVSS No. 126 required ESC in all new cars and LTVs in MY 2012. Because, to date, every ESC system includes within it the compo-nents needed to perform ABS functions, FMVSS No. 126 has de facto put ABS into all new cars and LTVs. NHTSA’s evaluations of these four technologies will now be discussed, one-by-one.
Dual master cylinders Regulatory history: Before it was superseded by FMVSS No. 135 in 2000-2002, FMVSS No. 105 applied to all motor vehicles with hydraulic brakes. The first version of FMVSS No. 105 49 49 CFR, Parts 571.105 and 571.135. However, after 2002, FMVSS No. 105 continued to apply to vehicles with a GVWR greater than 3,500 kg.
19
was one of NHTSA’s initial safety standards, with an effective date of January 1, 1968, for pas-senger cars. To a large extent, it incorporated SAE Recommended Practices dating back to 1966. FMVSS Nos. 105 and 135 allow two alternatives for hydraulic brakes: (1) Vehicles may have a “split service brake system” – i.e., “a brake system consisting of two or more subsystems actuat-ed by a single control, designed so that a single failure in any subsystem (such as a leakage-type failure of a pressure component of a hydraulic subsystem…) does not impair the operation of any other subsystem” that enables the vehicle to stop within a specified distance even “in the event of any one rupture or leakage type of failure in any component of the service brake system.” Dual or tandem master cylinders met the requirement. (2) Alternatively, vehicles may have a single hydraulic circuit if they can meet even more stringent stopping tests in the partial failure mode.50 Dual master cylinders were installed on 9 percent of MY 1962 and 1963 cars, 7 percent of MY 1964 and 1965 cars, and most new cars from MY 1967 onwards. It is likely that dual master cyl-inders were also installed in LTVs at about the same time (although FMVSS No. 105 was only extended to LTVs effective September 1, 1983).51
How dual master cylinders work: Without dual master cylinders, a significant loss of pressure in the hydraulic system due to a leak can result in a complete, catastrophic loss of braking power. Moreover, when there is a slow leak that will eventually lead to a loss of pressure, the vehicle does not send an early warning that can be easily understood by the average driver. The Indiana Tri-Level Study of the Causes of Accidents suggested that approximately 2 percent of all crashes in cars with 1960s technology were caused by some type of catastrophic brake failure, most commonly hydraulic failures.52
A dual braking system consists of two separate hydraulic circuits – typically split front-and-rear in rear-wheel-drive cars, or diagonally in front-wheel-drive cars. Both circuits are activated by the brake pedal through one master cylinder that has two chambers, called a “dual master cylin-der.” If one of the circuits fails, the other is still available. The car can be stopped from high speeds, although of course not as quickly as when both circuits are intact. A second important feature is that the dual master cylinder has a sensor to detect the relative pressure in the cham-bers. If there is an imbalance, it activates a warning light on the instrument panel. It is an unam-biguous early warning that the brake system needs repair.53 Expected benefits Dual master cylinders should prevent many of the crashes involving cata-strophic brake failure, specifically those due to failures in the hydraulic system. Possible excep-tions could include certain types of failure within the master cylinder or cases where the driver ignores the warning light. Since catastrophic brake failures can occur in fatal and injury crashes, dual master cylinders ought to have an effect on fatalities and injuries. Moreover, when brake
50 Ibid., Part 571.105 S4, S5.1.2.1 and S5.1.2.2; Federal Register 32 (February 3, 1967): 2414; SAE. (1967). 1967 SAE Handbook. New York: Society of Automotive Engineers., pp. 856-857. 51 Kahane, C. J. (1983, February). A preliminary evaluation of two braking improvements for passenger cars – Dual master cylinders and front disc brakes. (Report No. DOT HS 806 359, pp. 1-7). Washington, DC: National Highway Traffic Safety Administration. Available at www-nrd.nhtsa.dot.gov/Pubs/806359.PDF; Federal Register 46 (January 2, 1981): 55. 52 Treat, J. R., Tumbas, N. S., McDonald, S. T., Shinar, D., Hume, R. D., Mayer, R. E., Stansifer, R. L., &Castellan, N. J.. (1977). A tri-level study of the causes of traffic accidents, Vol. 1. (Report No. DOT HS 805 085). Washington, DC: National Highway Traffic Safety Administration. 53 The sensor in some vehicles also detects low fluid level in the master cylinder reservoirs.
20
failure in one vehicle results in a collision with another vehicle or pedestrian, preventing the brake failure in that one vehicle will prevent the fatalities or injuries of every crash partner, in-cluding the other vehicles’ occupants and pedestrians.
Crash avoidance – passenger cars: NHTSA’s evaluation was published in 1983. It is based on crash data from North Carolina (1971 to 1981) and Texas (1972, 1974, and 1977).54 The data allow comparison of the proportion of crash involvements in which “defective brakes” are a “contributing factor” for cars with single versus dual master cylinders. However, it is important to control for vehicle age, since the rate of brake defects increases strongly as a vehicle ages. The analysis method is linear regressions of the proportion of crash involvements (in a given MY and CY) in which defective brakes are a contributing factor, by percentage of cars with dual master cylinders, vehicle age, and other control variables. The regressions attributed an unequivocal, statistically significant reduction of brake defects upon the introduction of dual master cylinders. The effectiveness estimate is a 0.7-percent reduction of all police-reported crashes involving at least one car, when all cars are equipped with dual master cylinders.55 The incidence of “defec-tive brakes” was reduced by approximately 35 percent (0.7/2.0). Using 1979 to 1980 as the “baseline” years, the evaluation estimated that dual master cylinders would prevent 40,000 po-lice-reported crashes per year when all cars on the road were equipped with them.56
Injury reduction – passenger cars: Estimates of injury reduction were obtained by limiting the preceding analyses of North Carolina and Texas data to injury-producing crashes – i.e., crashes where at least one occupant in any of the involved vehicles (not necessarily the vehicle equipped with a dual master cylinder) was injured.57 The regression showed virtually the same effective-ness in injury-producing crashes as in property-damage crashes. The evaluation estimated that dual master cylinders prevent 0.7 percent of injury-producing crashes, resulting in a reduction of 24,000 injuries per year.58
Fatality reduction – passenger cars: The preceding regression analyses were also performed with 1975-81 FARS data.59 They showed a statistically significant reduction for dual master cyl-inders, proportionately about the same as in the nonfatal crashes. The evaluation assumed that brake defects are a contributing factor in similar percentages of fatal and nonfatal crashes (i.e., 2 percent of crashes, in cars without dual master cylinders). It estimated that dual master cylinders prevent 0.7 percent of fatal crashes that involve passenger cars, saving 260 lives per year.60
LTVs: The 1983 evaluation addressed only passenger cars. However, FMVSS No. 105 also ap-plies to LTVs. Both types of vehicles use fairly similar hydraulic braking technology. It seems likely that dual master cylinders could have about the same effect in LTVs as in cars: a 0.7-percent reduction of crashes, injuries and fatalities.
54 Kahane (1983, February), pp. 15-38. 55 Ibid., p. 43; 90 percent confidence bounds: 0.58 to 0.82 percent. 56 Ibid., pp. 55-57; 90 percent confidence bounds: 33,000 to 47,000 crashes prevented. 57 Ibid., pp. 28-29. 58 Ibid., pp. 55-57; 90 percent confidence bounds: 19,000 to 28,000 injuries prevented. 59 Ibid., pp. 38-40. 60 Ibid., pp. 55-57; 90 percent confidence bounds: 220 to 310 lives saved.
21
Front disc brakes Regulatory history: Front disc brakes began to appear on domestic passenger cars in MY 1965. Consumers welcomed the new technology. It jumped from 13 percent of new cars in 1968 to 86 percent by 1973. In 1970, NHTSA proposed FMVSS No. 105a, incorporating more stringent stopping distance, fade- and water-recovery tests than the original FMVSS No. 105, with a pro-posed effective date of October 1, 1972. After several revisions, this regulation took effect for passenger cars on January 1, 1976, and LTVs on September 1, 1983. Although some cars with four-wheel drum brakes could and did pass the new tests, it was easier to meet them with front disc brakes. Furthermore, the superior self-adjusting characteristics of disc brakes allowed for increased vehicle stability during the high-speed stopping tests in FMVSS No. 105. By MY 1978, most cars and LTVs produced for sale in the United States were equipped with front disc brakes. (FMVSS No. 105 or 135 have never explicitly required disc brakes.)61
How front disc brakes work: Disc brakes are calipers equipped with abrasive pads that squeeze rotors, metal plates parallel to the wheels that rotate with the wheels. Drum brakes are shoes with abrasive linings that press against the insides of drums that rotate with the wheels. Whereas drum brakes readily heat up from overuse or fill up with water upon immersion, resulting in losses of braking ability, disc brakes are ventilated to dissipate heat or shed water quickly. Furthermore, drum brakes have a “self-energizing capability” (friction building up more rapidly than pedal pressure) that makes drivers prone to lock the wheels. Disc brakes have a more linear relation-ship between pedal pressure and vehicle deceleration, making it easier for drivers to deliver just the right amount of pressure short of locking the wheels.62
Expected benefits: Front disc brakes might prevent some crashes involving catastrophic brake failure, especially on mountain roads, where brakes could fade from overuse on the downhills, or on flooded roads, where water gets into the wheels. If drivers use the more linear pedal feel to advantage, that could manifest itself in two ways in the crash data: if locking the wheels is re-ported as “defective brakes,” a reduction in lockup could result in fewer reported brake defects. If drivers can better optimize their deceleration rate short of lockup, they will stop in a shorter distance, possibly reducing the risk of frontally hitting other vehicles in the rear. Since brake failures/defects can occur in fatal and injury crashes, front disc brakes could have an effect on fatalities and injuries. Moreover, when brake failure in one vehicle results in a collision with an-other vehicle or pedestrian, preventing the brake failure in that one vehicle will prevent the fatali-ties or injuries of every crash partner, including the other vehicles’ occupants and pedestrians.
Crash avoidance – passenger cars: NHTSA’s 1983 evaluation has several analyses of the pro-portion of crash involvements in which “defective brakes” are a “contributing factor” for cars with drum versus front disc brakes. The most reliable one is based on North Carolina data (1971 to 1981). It subdivides the data by make-model as well as MY, since front disc brakes were in-
61 Ibid., p. 7; Federal Register 35 (November 11, 1970): 17345, 37 (September 2, 1972): 17970, 38 (May 18, 1973): 13017, 39 (February 22, 1974): 6708, 40 (June 9, 1975): 24525, 46 (January 2, 1981): 55; Ward’s Automotive Year-book. (1975 to 1979). Detroit: Ward’s Communications. 62 Ibid., pp. 6-10; Ballard, C., & Andrade, D. (1976). Systems and hardware effects of FMVSS 105-75. (Paper No. 760216). Warrendale, PA: Society of Automotive Engineers; Kahane, C. J., & Ichter, K. D. (1984). Statistical eval-uation of brake safety improvements for passenger cars. (Paper No. 841236). Warrendale, PA: Society of Automo-tive Engineers.
22
troduced earlier in some models than in others.63 The analysis method is a linear regression of the proportion of crash involvements (in a given make-model, MY, and CY) in which defective brakes are a contributing factor, by percentage of cars with front disc brakes, vehicle age, and other control variables. The regressions attributed a statistically significant reduction of brake defects upon the introduction of front disc brakes, equivalent to a 0.17-percent reduction of all police-reported crashes involving at least one car.64 Using 1979 to 1980 as the “baseline” years, the evaluation estimated that front disc brakes would prevent 9,800 police-reported crashes per year when all cars on the road were equipped with them.65 Other analyses of North Carolina data showed reductions of “defective brake” crashes on hilly and wet roads with front disc brakes, but not necessarily greater reductions than on other roads.66 The analysis of front-to-rear crashes at-tributed to front disc brakes a 0.2-percent reduction in the likelihood of being the striking car, but this was not statistically significant.67
Injury reduction – passenger cars: Estimates of injury reduction were obtained by limiting the preceding analysis of North Carolina data (by make-model) to injury-producing crashes.68 The regression showed virtually the same effectiveness in injury-producing crashes as in property-damage crashes. The evaluation estimated that front disc brakes prevent 0.17 percent of injury-producing crashes, resulting in a reduction of 5,700 injuries per year.69
Fatality reduction – passenger cars: Regression analyses of 1975-to-1981 FARS data (not sub-divided by make-model) attributed a statistically significant 0.55-percent reduction of “defective brake” involvements to front disc brakes.70 However, the evaluation estimated, more conserva-tively, that front disc brakes would have proportionately the same effect in fatal as in nonfatal crashes: a 0.17-percent reduction of fatal crashes that involve passenger cars, saving 64 lives per year.71
LTVs: The 1983 evaluation addressed only passenger cars. However, front disc brakes have su-perseded front-wheel drum brakes in LTVs as well as in passenger cars. Both types of vehicles use fairly similar hydraulic braking technology. It seems likely that front disc brakes could have about the same effect in LTVs as in cars: a 0.17-percent reduction of crashes, injuries and fatali-ties.
Rear-wheel antilock (RWAL) brake systems for LTVs Regulatory history and voluntary installations: No type of antilock brake system (ABS) has ever been required for passenger vehicles with GVWR less than 10,000 pounds. However, the Highway Safety Act of 1991, Section 2507 instructed NHTSA to consider requiring ABS in pas-senger vehicles. NHTSA published an ANPRM at the beginning of 1994 asking for information
63 Kahane (1983, February), pp. 26-28. 64 Ibid., p. 44; 90 percent confidence bounds: 0.10 to 0.24 percent. 65 Ibid., pp. 55-57; 90 percent confidence bounds: 5,800 to 13,800 crashes prevented. 66 Ibid., pp. 29-31. 67 Ibid., pp. 45-47. 68 Ibid., pp. 28-29. 69 Ibid., pp. 55-57; 90 percent confidence bounds: 3,400 to 8,100 injuries prevented. 70 Ibid., pp. 38-40. 71 Ibid., pp. 55-57; 90 percent confidence bounds: 38 to 90 lives saved.
23
about the effectiveness and potential benefits of ABS technologies.72 Based on responses to the 1994 ANPRM, including statistical studies by NHTSA and others that failed to show significant net benefits for voluntarily installed ABS, NHTSA issued a second ANPRM in 1996 deferring indefinitely the ABS requirement.73
Rear-wheel antilocks were installed as standard equipment in 1987 Ford F-Series pickup trucks, Bronco and Bronco II. In 1988 to 1990, they were phased into most domestic pickup trucks and SUVs as well as many vans as standard equipment. During the 1990s, 4-wheel ABS increasingly superseded RWAL; by MY 2004, no new domestic LTVs were equipped with RWAL.74
How RWAL works: The fundamental safety problem addressed by any ABS system is that few drivers are able to modulate pressure on the brake pedal optimally, given a sudden emergency situation or unexpectedly slippery surface. If excess pedal pressure locks the rear wheels, the ve-hicle can lose control. LTVs are especially prone to rear-wheel lockup when they are not heavily loaded. RWAL senses if any of the rear wheels have locked, and if so, quickly releases the brakes on that wheel and lets it start rolling again. Cycles of releasing, holding and reapplying brakes are repeated many times per second. RWAL, however, will not prevent front-wheel lock-up or assure steering control during braking. If the front wheels lock while the rear wheels turn, the truck will just slow down on a straight line, without yawing. NHTSA conducted stopping tests on five surfaces with RWAL-equipped trucks, and also for the same trucks with the RWAL disabled. RWAL substantially but not completely reduced the frequency and severity of yawing in spike stops. That benefit, however, was offset by a slight (6 to 18%) increase in stopping dis-tances on four of the surfaces.75
Expected benefits: If RWAL prevents or substantially reduces yawing, it will help keep trucks from running off a straight road. By keeping the truck on the road, it may prevent the rollovers or impacts with fixed objects or pedestrians that can occur after a vehicle has left the road. Side im-pacts with fixed objects are especially characteristic of vehicles that have yawed out of control. RWAL would be less effective if the driving task requires steering as well as braking (e.g., on a curved road). It will not affect yawing caused by reasons other than brake-induced rear-wheel lockup (e.g., going around a curve too quickly). To the extent that RWAL is associated with a slight increase in stopping distances, there could be an adverse effect on multivehicle crashes that require a truck to stop in time to avoid hitting another vehicle.
Crash avoidance: NHTSA’s initial evaluation published in 1993 and based on crash data from Florida (1990 to 1991), Michigan (1990 to 1991), and Pennsylvania (1989 to 1991) showed some statistically significant reductions of nonfatal rollovers and side impacts with fixed objects in 72 Federal Register 59 (January 4, 1994): 281. 73 Federal Register 61 (July 12, 1996): 36698. 74 Kahane, C. J. (1993, December). Preliminary evaluation of the effectiveness of rear-wheel antilock brake systems for light trucks. (NHTSA Docket No. 70-27-GR-026, p. 15). Washington, DC: National Highway Traffic Safety Administration. Available at www-nrd.nhtsa.dot.gov/Pubs/7027GR.PDF; Kahane, C. J., & Dang, J. N. (2009, Au-gust). The long-term effect of ABS in passenger cars and LTVs. (Report No. DOT HS 811 182, pp. 5-7). Washing-ton, DC: National Highway Traffic Safety Administration. Available at www-nrd.nhtsa.dot.gov/Pubs/811182.PDF. 75 Kahane (1993, December), pp. 7-14; Hiltner, E., Arehart, C., & Radlinski, R. (1991). Light vehicle ABS perfor-mance evaluation. (Report No. DOT HS 807 813). Washington, DC: National Highway Traffic Safety Administra-tion; Arehart, C., Radlinski, R., & Hiltner, E. (1992). Light vehicle ABS performance evaluation – Phase II. (Report No. DOT HS 807 924). Washington, DC: National Highway Traffic Safety Administration.
24
LTVs equipped with RWAL.76 However, in 2009, NHTSA issued a follow-up evaluation based on GES data (a national sample) from 1995 to 2007 and comprising a larger list of LTV make-models that had been equipped with RWAL at some point. The follow-up study shows negligible effect for RWAL overall and it does not show a statistically significant effect in any specific type of crashes, such as rollovers.77 Involvements in crashes of interest where RWAL might potential-ly be effective are compared to a control group of crash involvements in which RWAL would not likely have been a factor. The control group consists of vehicles involved in multivehicle crashes that were stopped, parked, entering or leaving a parking space, backing up, or moving at 10 mph or less prior to the collision; were struck in the rear; or the crash occurred on a dry road and their driver was not culpable. Here are the counts of unweighted GES cases (to provide an idea of the sample sizes) and nationally weighted counts (used for computing the overall effect of RWAL).
GES 1995 to 2007 Crash Involvements Control Risk of Interest Group Ratio Unweighted Cases Last 2 MY without RWAL 6,971 6,260 First 2 MY with RWAL 8,334 7,465 Weighted Counts Last 2 MY without RWAL 847,914 813,267 1.043 First 2 MY with RWAL 1,006,270 940,476 1.070
The weighted counts show a negligible increase in crashes involvements of interest, relative to the control group, in the LTVs with RWAL.
Fatality reduction: Statistical analyses by the same method of 1995-to-2007 FARS data showed a 4-percent reduction of fatal crash involvements with RWAL, relative to the control group, an effect that is not statistically significant.78 Because FARS is a national census, it is not necessary to weight the cases; the analysis may be performed directly on the actual case counts.
FARS 1995 to 2007 Crash Involvements Control Risk of Interest Group Ratio Last 2 MY without RWAL 8,722 3,577 2.438 First 2 MY with RWAL 9,840 4,185 2.351
Collisions with pedestrian and bicyclists were the only subgroup of crashes where the analysis showed a statistically significant change relative to the control group: a 15-percent reduction with RWAL. It is not clear why RWAL would be directly of help if a pedestrian suddenly ap-
76 Kahane (1993, December), pp. 19-44. 77 Kahane & Dang (2009, August), pp. 57-60. 78 Ibid., pp. 33-38.
25
pears in front of the driver. The goal of RWAL is to prevent rear-wheel lockup that could result in a loss of control and lane departure. It has little effect on stopping distance or ability to steer the vehicle while braking. Perhaps over time drivers of LTVs equipped with RWAL have be-come acclimatized to braking immediately and aggressively, as they have become less afraid that it could result in rear-wheel lockup that would be dangerous for them. That extra braking effort may be just enough to avoid hitting some pedestrians. However, by the same logic, a reduction in collisions with other vehicles might be expected, but none was observed.
Four-wheel antilock brake systems for passenger cars and LTVs Regulatory history and voluntary installations: As described above, during the 1990s NHTSA considered, but then deferred any requirement for ABS on passenger vehicles with GVWR less than 10,000 pounds. But eventually FMVSS No. 126 required ESC in cars and LTVs by MY 2012. Because, to date, every ESC system can perform ABS functions, all new cars and LTVs now have 4-wheel ABS.
Modern 4-wheel ABS was first offered as standard equipment in 1985 on some lines of BMW, Lincoln and Mercedes and in 1986 on Chevrolet Corvette. Availability of ABS increased gradu-ally from 1987 to 1990 and dramatically in 1991 and 1992, when it became standard on the ma-jority of GM cars. From 1994 to 2001, about 60 to 65 percent of new passenger cars were equipped with ABS. At that time, ABS was usually standard on the larger and more expensive cars, optional and not too frequently sold on small economy cars. Four-wheel ABS installations for LTVs began in 1989 on some GM Astro/Safari minivans, Jeep Cherokee and Jeep Wagoneer. The market share for 4-wheel ABS in new LTVs steadily increased during the 1990s, as RWAL was phased out, and had reached about 90 percent by 2004.79
How ABS works: Few drivers are able to modulate pressure on the brake pedal optimally, given a sudden emergency situation or unexpectedly slippery surface. If excess pedal pressure locks only the front wheels, the vehicle will continue in a straight path, but the driver will be unable to steer it and avoid obstacles. If it locks the rear wheels, the vehicle can lose control. ABS senses if any of the four wheels have locked, and if so, quickly releases the brakes on that wheel and lets it start rolling again. Cycles of releasing, holding and reapplying brakes are repeated many times per second.
ABS activation causes noise and pedal vibration in some vehicles, and steering may not be as easy as in normal operation. Nevertheless, a reasonably alert driver familiar with the system will maintain pressure on the pedal, stop in a minimum distance and be able to steer the vehicle throughout the crash avoidance maneuver. During the mid-1990s, the safety community worked hard to inform the public about the correct use of ABS (“Don’t let up on the brakes”; “Stomp, stay, and steer”).80
79 Kahane, C. J. (1994, December). Preliminary evaluation of the effectiveness of antilock brake systems for passen-ger cars. (Report No. DOT HS 808 206, pp. 9 and 119-128). Washington, DC: National Highway Traffic Safety Administration. Available at www-nrd.nhtsa.dot.gov/Pubs/808206.PDF; Kahane & Dang (2009, August), pp. 5-7; Kahane (1993, December), p. 15. 80 Kahane & Dang (2009, August), pp. 11-12.
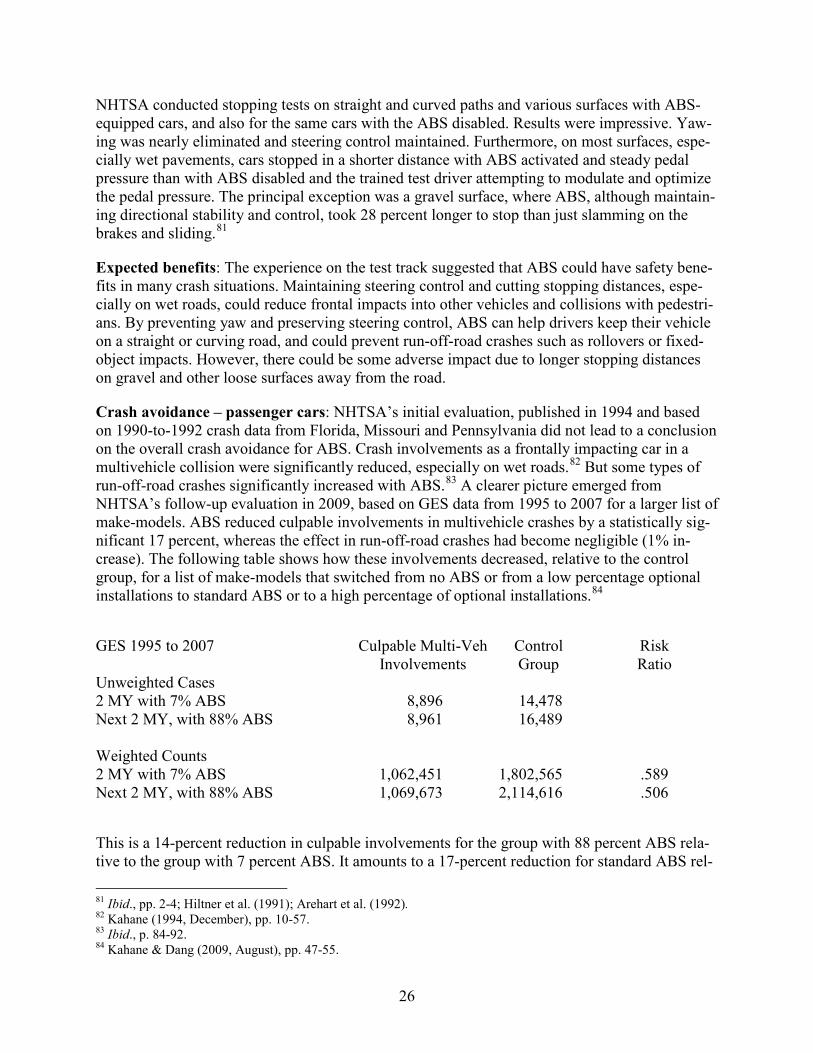
26
NHTSA conducted stopping tests on straight and curved paths and various surfaces with ABS-equipped cars, and also for the same cars with the ABS disabled. Results were impressive. Yaw-ing was nearly eliminated and steering control maintained. Furthermore, on most surfaces, espe-cially wet pavements, cars stopped in a shorter distance with ABS activated and steady pedal pressure than with ABS disabled and the trained test driver attempting to modulate and optimize the pedal pressure. The principal exception was a gravel surface, where ABS, although maintain-ing directional stability and control, took 28 percent longer to stop than just slamming on the brakes and sliding.81
Expected benefits: The experience on the test track suggested that ABS could have safety bene-fits in many crash situations. Maintaining steering control and cutting stopping distances, espe-cially on wet roads, could reduce frontal impacts into other vehicles and collisions with pedestri-ans. By preventing yaw and preserving steering control, ABS can help drivers keep their vehicle on a straight or curving road, and could prevent run-off-road crashes such as rollovers or fixed-object impacts. However, there could be some adverse impact due to longer stopping distances on gravel and other loose surfaces away from the road.
Crash avoidance – passenger cars: NHTSA’s initial evaluation, published in 1994 and based on 1990-to-1992 crash data from Florida, Missouri and Pennsylvania did not lead to a conclusion on the overall crash avoidance for ABS. Crash involvements as a frontally impacting car in a multivehicle collision were significantly reduced, especially on wet roads.82 But some types of run-off-road crashes significantly increased with ABS.83 A clearer picture emerged from NHTSA’s follow-up evaluation in 2009, based on GES data from 1995 to 2007 for a larger list of make-models. ABS reduced culpable involvements in multivehicle crashes by a statistically sig-nificant 17 percent, whereas the effect in run-off-road crashes had become negligible (1% in-crease). The following table shows how these involvements decreased, relative to the control group, for a list of make-models that switched from no ABS or from a low percentage optional installations to standard ABS or to a high percentage of optional installations.84
GES 1995 to 2007 Culpable Multi-Veh Control Risk Involvements Group Ratio Unweighted Cases 2 MY with 7% ABS 8,896 14,478 Next 2 MY, with 88% ABS 8,961 16,489 Weighted Counts 2 MY with 7% ABS 1,062,451 1,802,565 .589 Next 2 MY, with 88% ABS 1,069,673 2,114,616 .506
This is a 14-percent reduction in culpable involvements for the group with 88 percent ABS rela-tive to the group with 7 percent ABS. It amounts to a 17-percent reduction for standard ABS rel- 81 Ibid., pp. 2-4; Hiltner et al. (1991); Arehart et al. (1992). 82 Kahane (1994, December), pp. 10-57. 83 Ibid., p. 84-92. 84 Kahane & Dang (2009, August), pp. 47-55.
27
ative to no ABS (confidence bounds: 13 to 22%). Overall, a statistically significant 6-percent re-duction in police-reported crash involvements can be attributed to ABS (confidence bounds: 4 to 8%).
Fatality reduction – passenger cars: Initial statistical analyses in the United States and Sweden showed statistically significant increases in fatal run-off-road crashes, especially rollovers and side impacts with fixed objects, offset by reductions in collisions with other vehicles on wet roads and in collisions with pedestrians and bicyclists. The studies did not attribute an overall fatality reduction to ABS.85 Hypotheses for the observed increases in run-off-road crashes fo-cused especially on drivers inexperienced with ABS letting up on the brake pedal. As stated above, the safety community worked in the mid-1990s to inform the public about the correct use of ABS. Three statistical analyses issued in 2000 to 2002 showed some alleviation of the in-crease in run-off-road crashes.86
NHTSA’s follow-up evaluation in 2009 is based on 38,251 FARS cases from 1995 to 2007: sub-stantially more cases and a larger list of make-models than previous studies. It does not show a statistically significant overall effect for ABS. The observed reduction of fatal crash involve-ments relative to the control group is 1 percent (confidence bounds: -2 to 4%). However, there is a statistically significant 9 percent increase in run-off-road crashes, offset by a statistically signif-icant 13-percent reduction of collisions with pedestrians and bicyclists and a non-significant 4-percent reduction of culpable involvements in multivehicle crashes.87
Crash avoidance – LTVs: Numerous LTV make-models were initially equipped with RWAL in the late 1980s and then upgraded to 4-wheel ABS about 5 model years later. Correspondingly, NHTSA’s 2009 report analyzes the effect of 4-wheel ABS for LTVs in two steps: first, the effect of RWAL relative to no ABS (discussed above); then, the effect of switching from RWAL to 4-wheel ABS. The crash avoidance for 4-wheel ABS relative to no ABS is the composite of these two intermediate effects. Overall, a statistically significant 8-percent reduction in police-reported crash involvements is attributed to ABS (confidence bounds: 3 to 11%). That includes a statisti-cally significant 20-percent reduction of culpable involvements in multivehicle crashes (confi-dence bounds: 12 to 28%) and a non-significant 11-percent reduction of run-off-road crashes (confidence bounds: -2 to 22%).88
85 Kahane (1994, December); Hertz, E., Hilton, J., & Johnson, D. M. (1995b). An analysis of the crash experience of passenger cars equipped with antilock braking systems. (Report No. DOT HS 808 279). Washington, DC: National Highway Traffic Safety Administration; Farmer, C. M., Lund, A. K., Trempel, R. E., & Braver, E. R. (1996). Fatal crashes of passenger vehicles before and after adding antilock brake systems. Arlington, VA: Insurance Institute for Highway Safety; Kullgren, A., Lie, A., & Tingvall, C. (1994). The effectiveness of ABS in real life accidents. Pro-ceedings of the Fourteenth International Technical Conference on the Enhanced Safety of Vehicles. (Paper No. 94-S4-O-07). Washington, DC: National Highway Traffic Safety Administration. 86 Hertz, E. (2000). Analysis of the crash experience of vehicles equipped with all wheel antilock braking systems (ABS) – A second update including vehicles with optional ABS. (Report No. DOT HS 809 144). Washington, DC: National Highway Traffic Safety Administration; Farmer, C. M. (2001). New evidence concerning fatal crashes of passenger vehicles before and after adding antilock braking systems. Accident Analysis and Prevention, 33, pp. 361-369; Harless, D. W., & Hoffer, G. E. (2002). The antilock braking system anomaly: A drinking driver problem? Ac-cident Analysis and Prevention, 34, pp. 333-341. 87 Kahane & Dang (2009, August), pp. 17-28. 88 Ibid., pp. 60-65.
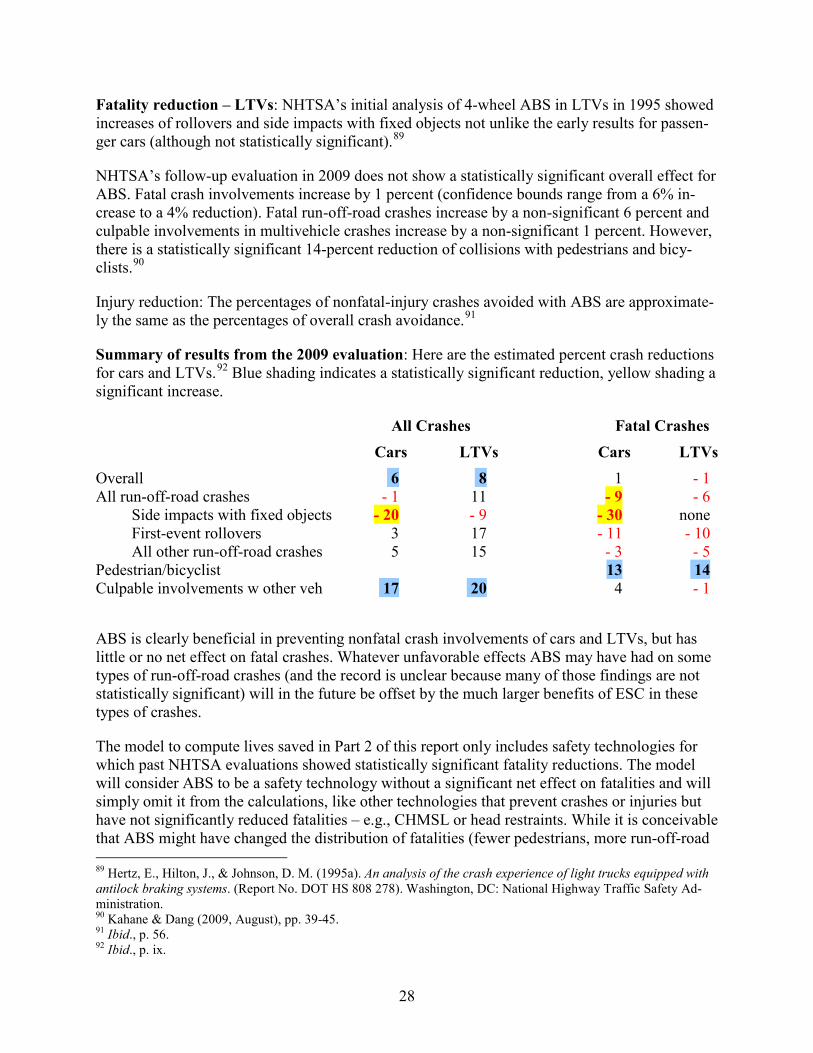
28
Fatality reduction – LTVs: NHTSA’s initial analysis of 4-wheel ABS in LTVs in 1995 showed increases of rollovers and side impacts with fixed objects not unlike the early results for passen-ger cars (although not statistically significant).89
NHTSA’s follow-up evaluation in 2009 does not show a statistically significant overall effect for ABS. Fatal crash involvements increase by 1 percent (confidence bounds range from a 6% in-crease to a 4% reduction). Fatal run-off-road crashes increase by a non-significant 6 percent and culpable involvements in multivehicle crashes increase by a non-significant 1 percent. However, there is a statistically significant 14-percent reduction of collisions with pedestrians and bicy-clists.90
Injury reduction: The percentages of nonfatal-injury crashes avoided with ABS are approximate-ly the same as the percentages of overall crash avoidance.91
Summary of results from the 2009 evaluation: Here are the estimated percent crash reductions for cars and LTVs.92 Blue shading indicates a statistically significant reduction, yellow shading a significant increase.
All Crashes Fatal Crashes Cars LTVs Cars LTVs Overall 6 8 1 - 1 All run-off-road crashes - 1 11 - 9 - 6 Side impacts with fixed objects - 20 - 9 - 30 none First-event rollovers 3 17 - 11 - 10 All other run-off-road crashes 5 15 - 3 - 5 Pedestrian/bicyclist 13 14 Culpable involvements w other veh 17 20 4 - 1
ABS is clearly beneficial in preventing nonfatal crash involvements of cars and LTVs, but has little or no net effect on fatal crashes. Whatever unfavorable effects ABS may have had on some types of run-off-road crashes (and the record is unclear because many of those findings are not statistically significant) will in the future be offset by the much larger benefits of ESC in these types of crashes.
The model to compute lives saved in Part 2 of this report only includes safety technologies for which past NHTSA evaluations showed statistically significant fatality reductions. The model will consider ABS to be a safety technology without a significant net effect on fatalities and will simply omit it from the calculations, like other technologies that prevent crashes or injuries but have not significantly reduced fatalities – e.g., CHMSL or head restraints. While it is conceivable that ABS might have changed the distribution of fatalities (fewer pedestrians, more run-off-road 89 Hertz, E., Hilton, J., & Johnson, D. M. (1995a). An analysis of the crash experience of light trucks equipped with antilock braking systems. (Report No. DOT HS 808 278). Washington, DC: National Highway Traffic Safety Ad-ministration. 90 Kahane & Dang (2009, August), pp. 39-45. 91 Ibid., p. 56. 92 Ibid., p. ix.

29
crashes), such changes are too tenuous to include in the model, because the observed effects for the various crash types are in many cases not statistically significant.
30
FMVSS No. 108, “Lamps, reflective devices, and associated equipment” NHTSA has evaluated six innovative lighting and conspicuity technologies for vehicles. The first three are required and regulated by FMVSS No. 108. The last three are not required by a NHTSA regulation, but are available on large numbers of production vehicles.
• Side marker lamps • Center high mounted stop lamps • Retroreflective tape on heavy trailers • Daytime running lights • Amber rear turn signals • LED stop lamps and CHMSL
The goal of side marker lamps is to make the sides of vehicles more visible in the dark, and to prevent nighttime angle collisions. They have been standard equipment on all cars and LTVs since MY 1970. CHMSL are designed to enhance the effect of stop lamps and reduce front-to-rear collisions, by day and night. They have been standard on cars since model year 1986 and were phased into LTVs during MY 1991 to 1994. Retroreflective tape makes heavy trailers more visible from the side and the rear, in the dark, so other vehicles will not hit them. It has been standard on new trailers over 10,000 pounds GVWR since December 1, 1993, and also has been required as a retrofit on older trailers still on the road since June 1, 2001. Daytime running lights potentially make vehicles more visible from the front, in the daytime. Amber turn signals may be considered both a safety and a styling feature. Their safety goal is to facilitate a following driv-er’s recognition whether the driver ahead is already braking (red stop lamp) or merely intends to turn sometime soon (amber). They have been standard equipment on numerous make-models since the 1960s or earlier. LED stop lamps and CHMSL light up faster than incandescent bulbs, providing an earlier signal to a following driver to slow down. Selected make-models have been equipped with them since 2000.
The second paragraph of FMVSS No. 108 states, “The purpose of this standard is to reduce traf-fic accidents … by providing adequate illumination of the roadway and by enhancing the con-spicuity of motor vehicles … so that their presence is perceived and their signals understood, both in daylight and in darkness.”93 FMVSS No. 108 regulates many lamps, reflectors, bulbs and flashers on the vehicle exterior, and the systems for controlling them. Most of those devices ex-isted well before NHTSA, were specified in SAE standards subsequently incorporated into FMVSS No. 108, and remained unchanged or at most, underwent gradual or subtle changes after 1968. The above technologies are five exceptions where a fundamentally new safety device was required or became available. NHTSA’s evaluations of these five technologies will now be dis-cussed, one-by-one.
Side marker lamps Regulatory history: FMVSS No. 108, one of NHTSA’s initial safety standards, took effect for vehicles over 80 inches wide (large trucks and buses) on January 1, 1968. It was extended to pas-senger cars and LTVs, effective January 1, 1969. Side marker lamps and/or reflectors were re- 93 49 CFR, Part 571.108.
31
quired from the start. Vehicles must have two combination lamp/reflectors on each side, an am-ber one as close as possible to the front and a red one close as possible to the rear. (Vehicles more than 30 feet long require an additional amber lamp/reflector at the midpoint.) However, to give manufacturers of cars and LTVs some more lead time, the standard allowed use of just a lamp, or just a reflector, in lieu of a lamp/reflector, during CY 1969. Since January 1, 1970, all cars and LTVs must have four lamp/reflectors. The side marker lamp requirement primarily in-corporates SAE Recommended Practice J592. Although issued by the SAE in 1964, it did not immediately put side marker lamps on all domestic cars and LTVs, because it was only a Rec-ommended Practice, not a Standard. Instead, the proportion of new cars and LTVs with side marker lamps increased gradually from 5 percent in MY 1964 to 13 percent in 1967, then jumped to 88 percent in 1968 and reached 100 percent in 1970.94
How side marker lamps work: Before side marker lamps, a car or LTV was very hard to see from the side, in the dark. A vehicle entering a right-angle intersection, or pulling out of a drive-way onto unlit or weakly illuminated roads was virtually invisible to cross traffic, or at least did not provide any visual cues to catch the attention of other drivers. Headlamps, in particular, focus their beams straight ahead and may barely be visible from the side (unless the approaching vehi-cle is still a substantial distance to the left or right, and there are no vision obstructions such as trees or buildings).
Side marker lamps make cars visible from the side, in the dark and enable other drivers to avoid collisions. Moreover, the use of amber in the front and red in the back sends a visual cue: “You are approaching the side of a vehicle – here’s how big it is, and it’s not necessarily getting out of your way.” The two colors distinguish the front of a car (white or amber light) from its rear (red light). Side marker lamps are on whenever the parking lights are on, and when they are not (e.g., on a parked vehicle), the reflectors throw back some of the light from other vehicles’ headlamps.
Two systems have been used to meet the standard. One makes the existing parking lamps and tail lamps visible from the side by designing their lens/reflectors to “wrap around” the sides of the vehicle. The other approach is to install dedicated side marker lamps, separate from the parking lamps and tail lamps. Both methods are acceptable under FMVSS No. 108 and are believed to be essentially equivalent. FMVSS No. 108, like SAE Recommended Practice J592, requires at least 0.62 candela for amber side marker lamps, and 0.25 candela for red ones, as measured from 9 specified observation points. That makes them considerably less bright than, for example, tail lamps, let alone stop lamps. Side marker lamp/reflectors are too dim to make vehicles more con-spicuous by day, and perhaps even to be seen from a long enough distance, in the dark, to avoid high-speed, potentially fatal collisions.95
Expected benefits: Side marker lamps ought to reduce the number of angle collisions in reduced lighting conditions: dark not lighted, dark lighted, dawn or dusk. The definition of an “angle” collision varies but generally includes crashes where two vehicles approach one another at an
94 Kahane, C. J. (1983, July). An evaluation of side marker lamps for cars, trucks and buses. (Report No. DOT HS 806 430, pp. 1-7 and 29-32). Washington, DC: National Highway Traffic Safety Administration. Available at www-nrd.nhtsa.dot.gov/Pubs/806430.PDF; Federal Register 32 (February 3, 1967): 2414, 32 (December 16, 1967): 18033; SAE. (1983). 1983 SAE Handbook, Vol. 2, Warrendale, PA: Society of Automotive Engineers. 95 Kahane (1983, July), pp. 1-7 and 29-32; Cole, B. L., Dain, S. J., & Fisher, A. J. (1977). Study of motor vehicle signal systems. (HSL Publication No. DOT HS 022 690). Melbourne: Road Safety Information Service.
32
angle, typically 90°, or where the front of one vehicle hits the side of the other. The lamps should have little or no effect on daytime crashes. When two vehicles approach at an angle in the dark, the potential benefit of the lamps likely depends on the pre-crash scenario. Typically, if vehicle 1 proceeds on a road while vehicle 2 slowly enters an intersection from a side street or pulls/backs out of a driveway, a side marker lamp on vehicle 2 would likely help driver 1 see vehicle 2, whereas a side marker lamp on vehicle 1 would probably not be noticed by driver 2 (who, if at-tentive, would likely already have seen the headlamps of vehicle 1). Occasionally, if vehicles 1 and 2 approach a perpendicular intersection at about the same speed, lamps on either one of the vehicles might help the other driver avoid a crash. When the lamps prevent a crash, they not only save the lamp-equipped vehicle from damage, but also the other vehicle that would have been in the crash. Furthermore, if any occupant of either vehicle would have been injured, these injuries are prevented. As stated above, it is doubtful if the lamps would have much effect on fatal crash-es.
Crash avoidance: NHTSA’s evaluation was published in 1983. It is based on crash data from North Carolina (1971 to 1980) and Texas (1972 to 1974).96 The data allow a tally of vehicle in-volvements in angle collisions under reduced-light conditions. They also allow counting a con-trol group of involvements in daytime angle collisions. The database created for the evaluation only identifies the model year of the crash-involved “case” vehicle. It does not identify the model year of the “other” vehicle in the collision – i.e., it is unknown if the other vehicle is equipped with side marker lamps. It also does not provide any details on the pre-crash scenario: whether it is a crash where side marker lamps might primarily be helpful on the case vehicle (e.g., the case vehicle was pulling out of a driveway), or primarily be helpful on the other vehicle, or be about equally helpful on both vehicles (e.g., both approaching an intersection at about equal speed). Tallies of case vehicles in these angle collisions are compared for MY 1967 case vehicles, when only 13 percent of cars, trucks and buses had side marker lamps, and MY 1968 case vehicles, when 88 percent of cars, trucks and buses were equipped with the lamps:
Angle Collisions Ratio of Night97 Day Night/Day NORTH CAROLINA MY 1967 (13% with side marker lamps) 5,971 20,755 .288 MY 1968 (88% with side marker lamps) 7,075 26,351 .268 TEXAS MY 1967 (13% with side marker lamps) 7,738 30,324 .255 MY 1968 (88% with side marker lamps) 8,715 36,618 .238
In both States, the ratio of nighttime to daytime crashes is a statistically significant 6.7 percent lower in the MY 1968 case vehicles. The arithmetic in the preceding tables works out to 8.8 per-
96 Kahane (1983, July), pp. 39-48. 97 Includes dark not lighted, dark lighted, dawn and dusk.
33
cent fewer nighttime angle collisions when the case vehicle has the lamps than when the case vehicle does not have the lamps.98 With this database, where there are no details on the crash configuration, it is unknown if the lamps would have been more useful on the case vehicle or on the other vehicle. In close to half the crashes on this database, lamps would have been helpful primarily on the other vehicle, not the case vehicle. The data shows an 8.8-percent crash reduc-tion merely from adding the lamps to the case vehicle (even though, in close to half of the crash-es, lamps would primarily have been helpful on the other vehicle). That means 16.8 percent few-er nighttime angle collisions when both vehicles have the lamps than when neither has them.99 Nearly identical effectiveness estimates were obtained when the data was expanded to two, three, or four model years before and after the 1968 shift to side marker lamps, or in regression anal-yses of the ratio of nighttime to daytime angle-collision involvements by presence of side marker lamps and other factors such as vehicle age.100 The evaluation concluded that the best estimate of side marker lamp effectiveness, based on one of these regressions, is a 16.8-percent reduction of nighttime angle collisions when both vehicles have the lamps.101 Using 1979 to 1980 as the “baseline” years, the evaluation estimated that side marker lamps would prevent 106,000 police-reported nighttime angle collisions per year when all cars, trucks and buses on the road were equipped with the lamps.102
Injury reduction: Estimates of injury reduction were obtained by limiting the preceding anal-yses of North Carolina and Texas data to injury-producing crashes – i.e., crashes where at least one occupant in any of the involved vehicles (not necessarily the vehicle equipped with side marker lamps) was injured. All of these analyses show a somewhat stronger reduction of injury-producing crashes than property-damage-only crashes. The evaluation’s best estimate of side marker lamp effectiveness is a 21-percent reduction of injury-producing nighttime angle colli-sions when both vehicles have the lamps.103 The evaluation estimated that side marker lamps would prevent 93,000 injuries in nighttime angle collisions per year.104
Fatality reduction: When the preceding contingency-table and regression analyses were per-formed with 1975-to-1981 FARS data, they did not show any reduction of fatal angle collisions, in the dark, with side marker lamps. A case-by-case review of Multidisciplinary Accident Inves-tigations (MDAI) showed that the great majority of fatal nighttime angle collisions (but not near-ly so many nonfatal collisions) involved at least one of these two factors that would make the lamps unlikely to help prevent a crash: (1) a vehicle traveling at least 50 mph, too fast for the driver to see the relatively dim lamps in time to take evasive action; (2) two vehicles approaching at right angles at relatively similar speeds, where drivers ought to see each other’s headlamps more easily than the side marker lamps. In addition, many nighttime fatal crashes involve alco-hol-impaired drivers who are not likely to be alert to the lamps. The evaluation concluded that
98 (1 - .067) = [.88(1-.088) + .12] / [.13(1-.088) + .87] 99 .168 = 1 – [(1-.088)(1-.088)]; the database differs from those in other crash avoidance analyses because it does not identify which of the two vehicles involved in a crash could have benefited from the lamps; in the CHMSL analysis, for example, the database identifies a rear-impacted vehicle that could benefit from CHMSL and a frontally-impacting vehicle where CHMSL are irrelevant. 100 Ibid., pp. 69-85. 101 Ibid., pp. 120-122; 90 percent confidence bounds: 10 to 22 percent. 102 Ibid., pp. 136-139; 90 percent confidence bounds: 65,000 to 149,000 crashes prevented. 103 Ibid., pp. 48-53, 86-89, and 123; 90 percent confidence bounds: 12 to 29%. 104 Ibid., pp. 141-143; 90 percent confidence bounds: 51,000 to 132,000 injuries prevented.
34
side marker lamps, although highly effective in reducing nonfatal crashes and their injuries, have little effect in fatal crashes.105
Center high-mounted stop lamps Regulatory history: After much experimental research (1974 to 1979), on-the-road testing (1976 to 1979) and regulatory analysis, NHTSA amended FMVSS No. 108 in October 1983 to require CHMSL on new passenger cars, effective September 1, 1985. CHMSL were standard equipment on all MY 1986 cars; also on 1985 Cadillacs. In addition, consumers welcomed the lamps, purchased about 4,000,000 retrofit kits and installed them on their pre-1986 cars. An April 1991 amendment extended the CHMSL requirement to pickup trucks, vans and SUVs manufactured on or after September 1, 1993. All LTVs had the lamps in MY 1994, some make-models as early as 1991.106
How CHMSL work: Stop lamps are a basic tool for preventing rear-impact collisions, daytime and nighttime. When a driver applies the brake pedal, the lamps alert the following driver to slow down immediately, maintain a safe distance, and be ready to stop. Conventional stop lamps by themselves, without supplementary CHMSL are less than optimal for accomplishing their mis-sion. They are low and off toward the sides of the vehicle, not where the following driver is look-ing most of the time. During quick scanning, they might be confused with adjacent taillights and turn signals, and misinterpreted to mean a car is proceeding or turning, rather than slowing down.
NHTSA and the insurance industry tested various configurations of experimental stop lamps, in the laboratory and on the road, and concluded that the best system supplemented the two existing stop lamps with a third red lamp, mounted in the center of the vehicle, and if possible higher than the other two. A report by NHTSA staff on The Technical Basis for CHMSL summarized test findings: the central and raised location of CHMSL puts them in the area where the following driver most often glances; it separates them from tail lamps and turn signals and minimizes con-fusion; the high mounting might make it visible through the windows of a following vehicle and enable the driver of the third vehicle in a chain to react to the first vehicle’s braking; and the three lamps form a triangle that might be an additional cue to get a driver’s attention and a warn-ing to keep a safe following distance. As a consequence, CHMSL significantly reduced the aver-age time for drivers to apply their brakes in response to the signal from the vehicle in front of them.107
Road tests with fleets of taxicabs and telephone-company cars were very encouraging, showing a 35-percent reduction of rear-impact collisions in the CHMSL-equipped cars relative to control-
105 Ibid., pp. 62-66, 100-112 and 125-130; Cole, Dain, & Fisher (1977). 106 Kahane, C. J., & Hertz, E. (1998, March). The long-term effectiveness of center high mounted stop lamps in pas-senger cars and light trucks. (Report No. DOT HS 808 696, pp. 1-2, 9 and 62-63). Washington, DC: National Highway Traffic Safety Administration. Available at www-nrd.nhtsa.dot.gov/Pubs/808696.PDF; Federal Register 48 (October 18, 1983): 48235, 56 (April 19, 1991): 16015; NHTSA. (1983). Final Regulatory Impact Analysis, Fed-eral Motor Vehicle Safety Standard 108, Center High-Mounted Stop Lamps. (NHTSA Docket No. 81-02-N02-001). Washington, DC: National Highway Traffic Safety Administration. 107 Kahane & Hertz (1998, March), pp. 1-2; Digges, K. H., Nicholson, R. M., & Rouse, E. J. (1985). The technical basis for the center high mounted stoplamp. (Paper No. 851240). Warrendale, PA: Society of Automotive Engi-neers.
35
group cars with conventional stop lamps. They paved the way for the CHMSL regulation by suggesting the lamps would be highly beneficial and cost-effective.108
Two questions arose during the CHMSL rulemaking in the early 1980s. One was if the high ef-fectiveness in the fleet tests would persist after the lamps became standard equipment on millions of vehicles, or if drivers would gradually become acclimatized to the lamps and less conscious of them. This would be examined by repeated evaluations of CHMSL for about 10 years after they became standard on passenger cars. The other was if CHMSL would be effective on pickup trucks, where they would likely be on top of the cab, far away from all other lamps, or on full-sized vans, where they might be above the following driver’s usual line of vision. As a conse-quence, CHMSL were required on passenger cars as of September 1, 1985, but the requirement was not extended to LTVs until September 1, 1993, after additional research satisfied NHTSA that they would be effective there.109
Expected benefits: CHMSL ought to reduce the probability of being struck in the rear by anoth-er vehicle, daytime or nighttime.110 That will help prevent simple two-vehicle front-to-rear colli-sions and chain collisions involving three or more vehicles. When the lamps prevent a crash, they not only save the struck, CHMSL-equipped vehicle from damage, but also the striking vehi-cle. Furthermore, if any occupant of either vehicle would have been injured, these injuries are prevented. To the extent that fatal rear-impact crashes involve much higher speeds and different crash conditions from the nonfatal ones, it is not clear if the lamps would have much effect, if any, on fatal crashes.
Crash avoidance – passenger cars: NHTSA evaluated CHMSL in 1987, 1989, and 1998; only the last evaluation, which superseded the earlier results, will be discussed here.111 It is based on 1986-to-1995 crash data from eight States: Florida, Indiana, Maryland, Missouri, Pennsylvania, Texas, Utah, and Virginia. These State files identify each crash-involved car’s MY and impact site (rear impact versus other). The basic contingency tables compare the last model year(s) be-fore CHMSL became standard equipment to the first model years they were standard. They tally how many cars were struck in the rear, and how many cars were involved in any other kind of
108 Kahane & Hertz (1998, March), pp. 2-3; Kohl, J. S., & Baker, C. (1978). Field test evaluation of rear lighting systems. (Report No. DOT HS 803 467). Washington, DC: National Highway Traffic Safety Administration; Rausch, A., Wong, J. I., & Kirkpatrick, M. (1981). A field test of two single center high-mounted brake light sys-tems. (NHTSA Docket No. 81-02-N01-031). Arlington, VA: Insurance Institute for Highway Safety; Reilly, R. E., Kurke, D. S., & Buckenmaier, C. C. (1980). Validation of the reduction of rear end collisions by a high mounted auxiliary stoplamp. (Report No. DOT HS 805 360). Washington, DC: National Highway Traffic Safety Administra-tion. 109 (1983). Evaluation plan for center high-mounted stop lamps. (NHTSA Docket No. 81-02-N02-002). Washington, DC: National Highway Traffic Safety Administration; NHTSA. (1991). Final regulatory impact analysis, amend-ment to FMVSS 108 to require center high-mounted stop lamps on light trucks and buses. (NHTSA Docket No. 81-02-N10-001). Washington, DC: National Highway Traffic Safety Administration. 110 Unlike side marker lamps in angle collisions, CHMSL are beneficial only on the struck vehicle. When two vehi-cles approach at a 90-degree angle, either driver may see the other vehicle’s side marker lamps, but when two vehi-cles travel in the same direction, only the following driver can see the other vehicle’s CHMSL. 111 Kahane & Hertz (1998, March), pp. 7-41; Kahane, C. J. (1987, March). The effectiveness of center high mounted stop lamps: A preliminary evaluation. (Report No. DOT HS 807 076). Washington, DC: National Highway Traffic Safety Administration. Available at www-nrd.nhtsa.dot.gov/Pubs/HS807076.PDF; Kahane, C. J. (1989, July). An evaluation of center high mounted stop lamps based on 1987 data. (Report No. DOT HS 807 442). Washington, DC: National Highway Traffic Safety Administration. Available at www-nrd.nhtsa.dot.gov/Pubs/807442.PDF.
36
impact (the control group). The following example is based on Florida data for CY 1987, com-paring the crash experience of MY 1985 and 1986 cars:
Collision Involvements Ratio of Florida, CY 1987 crashes Rear Impacts Others Rear/Other MY 1985 ( 10% with CHMSL112) 6,773 22,959 .295 MY 1986 (100% with CHMSL) 7,161 25,989 .276
In this example, the ratio of rear impacts to other-type crash involvements is a statistically signif-icant 6.6 percent lower in the MY 1986 cars than in the 1985 cars, indicating a benefit for CHMSL. However, this analysis understates the effectiveness of CHMSL because it does not adjust for vehicle age. Newer cars in general have relatively more rear impacts (and are less of-ten the striking vehicle), inflating the “ratio of rear/other crashes.” The evaluation developed a regression analysis that adjusted for vehicle age and yielded unbiased estimates of the effective-ness of CHMSL. The effect was positive and statistically significant in each of the eight States. When the results from the eight States are combined, the weighted-average effectiveness of CHMSL is statistically significant in each separate CY. However, the effect was highest in 1987, dropped in half by 1989, and then leveled off:
Calendar Rear Impact Reduction Calendar Rear Impact Reduction Year by CHMSL (%) Year by CHMSL (%) 1986 5.1 1991 5.0 1987 8.5 1992 5.0 1988 7.2 1993 3.2 1989 4.3 1994 3.4 1990 5.3 1995 3.9
Effectiveness dropped significantly in 1988 and 1989, but there was no statistically significant downward trend after 1989. The average effectiveness in 1989-95, 4.3 percent, may be consid-ered the long-term effectiveness of CHMSL. The initial and long-term effectiveness estimates, and their 90 percent confidence bounds,113 are:
112 Assumed to be equipped with CHMSL retrofit kits (not explicitly noted in the crash data). 113 Kahane & Hertz (1998, March), pp. 39-40 and 81-83 computes 95 percent confidence bounds; they have been scaled back to 90 percent confidence bounds here (by taking ± 1.645 rather than ± 1.96 standard deviations), for consistency with most of the other NHTSA evaluations.
37
Rear Impact Reduction 90% Confidence Calendar Year Group by CHMSL (%) Bounds 1986 5.1 2.9 to 7.3 1987 8.5 6.6 to 10.5 1988 7.2 5.2 to 9.1 1989-95 (long-term effect) 4.3 3.1 to 5.5
The decline in effectiveness to 4.3 percent long-term from 8.5 percent in 1987 (and from 35 per-cent in the test fleets of taxicabs and telephone-company cars) is consistent with the hypothesis that motorists would become acclimatized to the lamps. CHMSL are no longer startling, but their good location continues to make them effective.
More detailed analyses of data from five States (Florida, Maryland, Missouri, Pennsylvania, and Utah) show CHMSL effective in the dark but even more so in daytime. They are effective re-gardless whether the following driver is young or old, male or female. In general, the simpler the crash scene, and the less a driver is distracted by other lights or traffic features, the more effec-tive the CHMSL – e.g., at locations away from traffic signals, in rural areas, in simple two-vehicle collisions.114
Injury reduction – passenger cars: Detailed analyses from five States show CHMSL are al-most equally effective in preventing nonfatal-injury and property-damage crashes. In other words, the lamps’ long-term effect will be to prevent 4.3 percent of the nonfatal injuries to occu-pants of any of the vehicles involved in front-to-rear collisions, including occupants of the strik-ing, frontally-impacting vehicles.115
Fatality reduction – passenger cars: When the basic crash avoidance analysis was performed with 1986-to-1995 FARS data, it did not show a statistically significant reduction of fatal rear-impact collisions with CHMSL in any specific CY, or in all of the CY combined. The lamps had little or no effect on fatal crashes at any time during 1986 to 1995. A closer look at the data re-veals that, in the majority of fatal rear impacts, the struck vehicle was not slowing or braking at all prior to the impact: the CHMSL was not activated and could not have had an effect.116
Effectiveness – LTVs: Pickup trucks, vans and SUVs received CHMSL in 1991, 1992, 1993 or 1994, depending on the make-model. NHTSA analyzed 1994-to-1996 crash data from six States that record the impact site and the VIN, allowing identification of make-model and MY: Florida, Maryland, Missouri, North Carolina, Pennsylvania and Utah. The crash avoidance analysis, simi-lar to the one for passenger cars, estimated that CHMSL in LTVs reduced rear impacts by a sta-tistically significant 5.0 percent. The 90 percent confidence bounds are 1.0 to 8.7 percent. For practical and statistical purposes, this is more or less the same as the 4.3 percent long-term effec-
114 Kahane & Hertz (1998, March), pp. 43-53. 115 Ibid., pp. 53-54. 116 Ibid., pp. 54-60.
38
tiveness estimate for passenger cars. The data did not show any significant variations in CHMSL effectiveness between pickup trucks, vans and SUVs.117
Summary of benefits: Using 1994 as the “baseline” year, and based on a 4.3 percent long-term effectiveness in LTVs as well as cars, the evaluation estimated that CHMSL would prevent 92,000 to 137,000 police-reported rear-impact crashes per year, plus 102,000 unreported crashes, when all cars and LTVs on the road are equipped with the lamps. That will save 43,000 to 55,000 people from injury in the police-reported crashes, and 15,000 in the unreported crashes, for a total of 58,000 to 70,000 injuries avoided per year. At 1994 costs and prices, the value of the property damage avoided, even without counting anything for the injuries prevented, far ex-ceeds the consumer cost of CHMSL, making them a highly cost-effective safety device.118
Retroreflective tape on heavy trailers Regulatory history: After extensive research, on-the-road testing and analysis, NHTSA amend-ed FMVSS No. 108 in December 1992 to require retroreflective tape or sheeting, or reflex reflec-tors, on the sides and rear of heavy trailers (i.e., at least 80 inches wide and with GVWR over 10,000 pounds), effective December 1, 1993. Retroreflective tape has been used almost exclu-sively for meeting the standard, and it is the subject of NHTSA’s evaluation. On new trailers manufactured on or after December 1, 1993, the tape outlines the bottom of the sides of the trail-ers, and the top corners, bottom and underride guard of the rear of the trailers. It is applied in a pattern of alternating red and white segments to the side, rear and underride guard, and in white to the upper rear corners. FMVSS No. 108, like other FMVSS, applies to new vehicles at the time they are manufactured or imported.119
In addition, the Federal Motor Carrier Safety Administration and its predecessor, the Bureau of Motor Carrier Safety within the Federal Highway Administration issued a regulation in March 1999 requiring all heavy trailers on the road on or after June 1, 2001, including older trailers manufactured before December 1, 1993, to have a conspicuity treatment. The FMCSA regulation allows older trailers some flexibility on the location and colors of the tape. Before 1992, quite a few manufacturers voluntarily equipped their trailers with tape, but not always according to the pattern subsequently chosen by NHTSA. In other words, FMCSA accepts those patterns for the time being and did not require an immediate retrofit to the NHTSA pattern. However, as of June 1, 2009, FMCSA required all heavy trailers on the road to have the NHTSA pattern: many pre-1993 trailers had been retired by then, but if not, they would have needed a retrofit. Furthermore, the FMCSA regulation applies to trailers-in-use. Conspicuity treatments have to be maintained “good-as-new” and may be inspected as long as trailers are on the road. When tape deteriorates or peels over time, it must be repaired or replaced.120
117 Ibid., pp. 61-70. 118 Ibid., pp. 71-75. 119 Morgan, C. (2001, March). The effectiveness of retroreflective tape on heavy trailers. (Report No. DOT HS 809 222). Washington, DC: National Highway Traffic Safety Administration. Available at www-nrd.nhtsa.dot.gov/Pubs/809222.PDF; Federal Register 57 (December 10, 1992): 58406. 120 Federal Register 64 (March 31, 1999): 15587.
39
Although these regulations do not apply directly to passenger cars and LTVs, they are included here because their benefits – lives saved, injuries and damages avoided – will accrue primarily to the occupants of the passenger vehicles that are at risk of hitting the trailers.
How retroreflective tape works: Heavy trailers are quite difficult for drivers of other vehicles to see in the dark, and even harder to recognize for what they are. The surfaces of most trailers are not shiny and are barely seen until they suddenly loom up, too close to stop in time. Tail lamps, clearance lamps and side marker lamps theoretically outline a trailer, but they are isolated points of light on a large surface. Drivers might not see enough of them at the same time to un-derstand, “There’s a heavy trailer in front of me.” Collisions of passenger vehicles into heavy trailers are intrinsically dangerous, day or night, because of the weight and height mismatch of the vehicles. In the dark, those collisions were resulting in over 500 fatalities per year during the 1980s.
Human-factors research suggested that continuous or semi-continuous retroreflective tape with alternating red and white segments would highlight and identify trailers. The tape reflects a car’s headlights strongly and it is highly visible in the dark. The red and white pattern flags its bearer as a heavy trailer. Since the pattern extends around the sides and rear, a driver can identify a trailer as soon as the headlamps shine on any part of the tape. The standard-length segments in alternating colors additionally help drivers gauge their distance from the trailer and their rate of approach.121
A 1983-to-1985 road test of 1,910 trailers equipped with tape and 1,910 control-group trailers showed statistically significant reductions of side and rear impacts with the tape, 21 percent in the dark and, interestingly, 16 percent in daylight. NHTSA proceeded with the rulemaking, pre-dicted a 15-to-25 percent reduction of side and rear impacts in the dark but, conservatively, did not presume a reduction of daylight crashes.122
Expected benefits: As stated above, retroreflective tape ought to reduce impacts by other vehi-cles into the side or rear of a heavy trailer, in the dark. The tape should not affect single-vehicle crashes of tractor-trailers or crashes where a truck frontally runs into a car. Highest effectiveness is expected on unlighted roads, where a trailer is least visible without the tape, and the reflection from the tape stands out the most strongly relative to the background. Less benefit is expected on lighted roads, or in twilight, because trailers are more visible, and the tape does not stand out as
121 Burger, W.J., et al. (1981). Improved commercial vehicle conspicuity and signalling systems, Task I – Accident analysis and functional requirements. (Report No. DOT HS 806 100). Washington, DC: National Highway Traffic Safety Administration; Ziedman, K., et al. (1981). Improved commercial vehicle conspicuity and signalling systems, Task II – Analyses, experiments and design recommendations. (Report No. DOT HS 806 098). Washington, DC: National Highway Traffic Safety Administration. The research indicated that the tape did not have to be fully con-tinuous on the sides of trailers – as little as 50 percent coverage accomplished safety objectives – and FMVSS No. 108 accordingly requires at least 50 percent coverage on the sides and continuous tape on the rear; however, many trailers have fully continuous coverage on the sides and rear. 122 Burger, W.J., Mulholland, M. U., & Smith, R. L. (1985). Improved commercial vehicle conspicuity and signal-ling systems, Task III – Field test evaluation of vehicle reflectorization effectiveness. (Report No. DOT HS 806 923). Washington, DC: National Highway Traffic Safety Administration; NHTSA. (1991). Preliminary Regulatory Eval-uation – Proposed Amendment to FMVSS No. 108 to Require Retroreflective Material on the Side and Rears of Heavy Trailers. (NHTSA Docket No. 80-02-N09). Washington, DC: National Highway Traffic Safety Administra-tion.

40
much. Even less benefit, if any, is expected in daylight, because trailers are easily visible without the tape, although the red and white pattern might help as an additional warning.
When the tape prevents a crash, it prevents the injuries to the occupants of any of the vehicles that would have been involved in the crash: the vehicle striking the trailer as well as the tractor pulling the trailer. Of course, most of those injuries would have been in the striking vehicle, and most of the striking vehicles would have been cars or LTVs. Unlike side marker lamps and CHMSL, there is every reason to hope that the tape will save lives, since impacts of passenger vehicles into trailers can easily be fatal at the speeds and sighting distances where the tape is likely to be effective.
The tape might be more effective in rear impacts than side impacts, if only because in most rear-impacts the passenger vehicle’s headlights would point at the trailer, and the driver of the pas-senger vehicle is culpable for not slowing down or stopping in time – whereas in many side im-pacts the passenger vehicle’s headlights might not point at the trailer (e.g., sideswipes), or they might not illuminate the trailer soon enough for the car/LTV driver to take action (e.g., high-speed intersection collisions), or trailer conspicuity is not an issue because the truck driver’s ac-tion (e.g., sudden lane departure) precipitates the crash.
Crash avoidance: NHTSA’s evaluation was published in 2001. The analysis classifies crash in-volvements of heavy trailers (and the tractors that pull them) according to three binomial pa-rameters: (1) tape-equipped versus unequipped trailer; (2) dark versus daytime crash; (3) rear- or side-impact versus control group crash (where trailer visibility is not an issue – single-vehicle crashes and frontal impacts by tractor trailers). Since none of NHTSA’s crash data at hand identi-fied whether trailers had retroreflective tape, NHTSA worked out agreements with Florida and Pennsylvania State police to supplement their reports on crashes involving tractor trailers from 1997 to 1999 with a special form for each trailer specifying whether it was equipped with tape and describing the condition of the tape.123
The basic analysis124 is a three-dimensional contingency table of the crash involvements of heavy trailers by the three binomial parameters. Here are the combined results for Florida and Pennsylvania:
123 Morgan (2001, March), pp. 7-21. 124 Ibid., pp. 23-37.
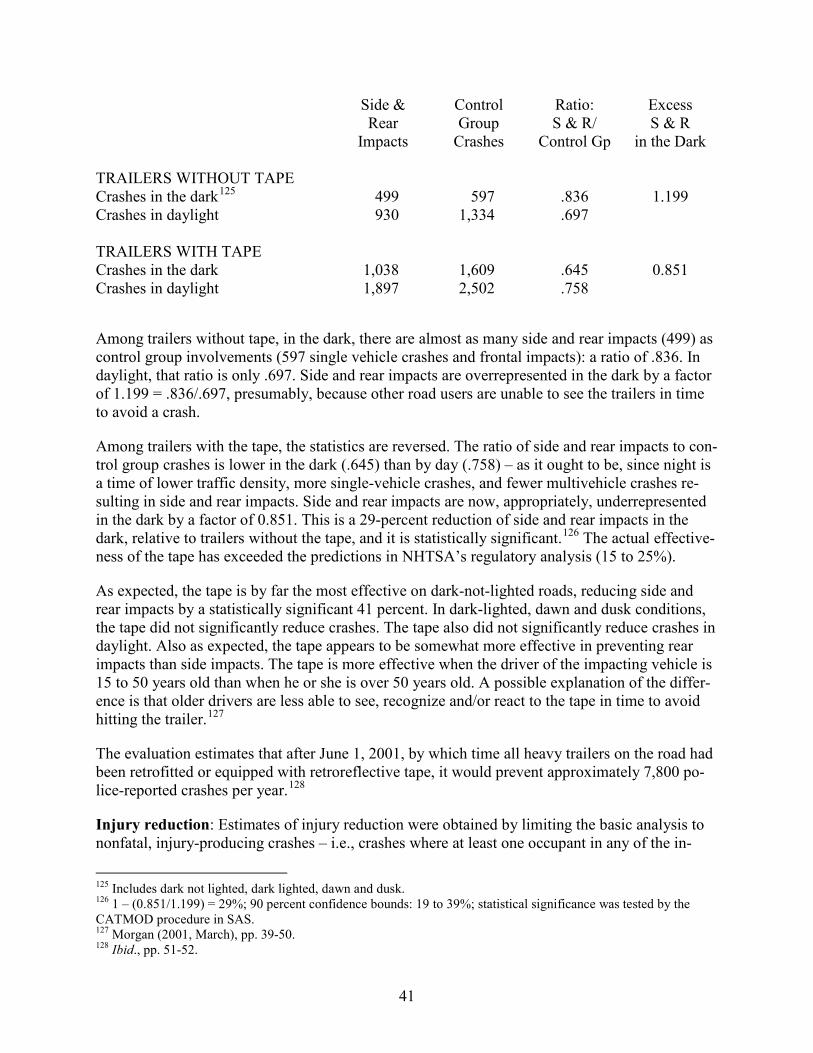
41
Side & Control Ratio: Excess Rear Group S & R/ S & R Impacts Crashes Control Gp in the Dark TRAILERS WITHOUT TAPE Crashes in the dark125 499 597 .836 1.199 Crashes in daylight 930 1,334 .697 TRAILERS WITH TAPE Crashes in the dark 1,038 1,609 .645 0.851 Crashes in daylight 1,897 2,502 .758
Among trailers without tape, in the dark, there are almost as many side and rear impacts (499) as control group involvements (597 single vehicle crashes and frontal impacts): a ratio of .836. In daylight, that ratio is only .697. Side and rear impacts are overrepresented in the dark by a factor of 1.199 = .836/.697, presumably, because other road users are unable to see the trailers in time to avoid a crash.
Among trailers with the tape, the statistics are reversed. The ratio of side and rear impacts to con-trol group crashes is lower in the dark (.645) than by day (.758) – as it ought to be, since night is a time of lower traffic density, more single-vehicle crashes, and fewer multivehicle crashes re-sulting in side and rear impacts. Side and rear impacts are now, appropriately, underrepresented in the dark by a factor of 0.851. This is a 29-percent reduction of side and rear impacts in the dark, relative to trailers without the tape, and it is statistically significant.126 The actual effective-ness of the tape has exceeded the predictions in NHTSA’s regulatory analysis (15 to 25%).
As expected, the tape is by far the most effective on dark-not-lighted roads, reducing side and rear impacts by a statistically significant 41 percent. In dark-lighted, dawn and dusk conditions, the tape did not significantly reduce crashes. The tape also did not significantly reduce crashes in daylight. Also as expected, the tape appears to be somewhat more effective in preventing rear impacts than side impacts. The tape is more effective when the driver of the impacting vehicle is 15 to 50 years old than when he or she is over 50 years old. A possible explanation of the differ-ence is that older drivers are less able to see, recognize and/or react to the tape in time to avoid hitting the trailer.127
The evaluation estimates that after June 1, 2001, by which time all heavy trailers on the road had been retrofitted or equipped with retroreflective tape, it would prevent approximately 7,800 po-lice-reported crashes per year.128
Injury reduction: Estimates of injury reduction were obtained by limiting the basic analysis to nonfatal, injury-producing crashes – i.e., crashes where at least one occupant in any of the in-
125 Includes dark not lighted, dark lighted, dawn and dusk. 126 1 – (0.851/1.199) = 29%; 90 percent confidence bounds: 19 to 39%; statistical significance was tested by the CATMOD procedure in SAS. 127 Morgan (2001, March), pp. 39-50. 128 Ibid., pp. 51-52.
42
volved vehicles (usually a passenger vehicle that hit the heavy trailer) was injured. The tape is especially effective, reducing injury-producing side and rear impacts in the dark by a statistically significant 44 percent. The evaluation estimates that retroreflective tape is preventing approxi-mately 3,100 to 5,000 nonfatal injuries per year.129
Fatality reduction: When these Florida and Pennsylvania analyses are limited to the fatal crash-es, they show a statistically significant reduction of side and rear impacts in the dark, with tape. NHTSA’s 2001 evaluation estimates that retroreflective tape would save 191 to 350 lives per year.130
Daytime running lights (DRL) Canada, the five Scandinavian countries, and other lands have required DRL for new cars and LTVs (starting with Sweden in 1977) to make the front of the vehicle more conspicuous during the day, especially in northern lands where the sun does not shine so strongly. “Being equipped with DRL” might simply mean running with the headlamps on at all times or the DRL might be separate front lamps, usually less powerful than the headlamps. In 1990, GM petitioned NHTSA to allow DRL on new cars and LTVs sold in the United States. On January 11, 1993, NHTSA amended FMVSS No. 108 to allow DRL on new vehicles. They began to appear on some GM vehicles in MY 1995 and on all of them by MY 1997. During MY 1997 to 2005, 25 to 30 percent of new cars and LTVs were DRL-equipped. GM again petitioned in 2001, this time to mandate rather than merely allow DRL on new vehicles. In 2008, NHTSA evaluated the crash-reducing effectiveness of DRL based on 2000-to-2005 data from FARS and from nine State crash files. Daytime involvements in two-vehicle crashes (excluding front-to-rear impacts, where the con-spicuity of the frontally impacting vehicle would usually not be an issue) are compared to nighttime involvements in such crashes, relative to the corresponding day-to-night ratios for con-trol-group, single-vehicle crash involvements – for vehicles of the first two MY equipped with DRL relative to vehicles of the last two MY without DRL (three-dimensional contingency table analysis, similar to the evaluation of retroreflective tape). None of the analyses showed a statisti-cally significant effect for DRL; the observed overall effect was a non-significant 0.1-percent reduction of daytime involvements in two-vehicle crashes. On June 29, 2009, the agency denied the GM petition to mandate DRL in the United States.131
Amber rear turn signals History of amber turn signals: Europe, Japan, Australia, and other countries have long required amber rear turn signals. Before the FMVSS, most cars and LTVs sold in the United States were equipped with red turn signals, but some with amber. FMVSS No. 108 allows a choice of red or
129 Ibid., pp. 48-49 and 52; the 44 percent estimate includes dark not lighted, dark lighted, dawn and dusk conditions; 3,100 to 5,000 is not an interval estimate, but two point estimates, one based on 29% effectiveness (result for analy-sis of crashes of all severities), the other based on 44 percent. 130 Ibid., pp. 48-49 and 52-53; 191 and 350 are two point estimates, based on 29% and 44 percent effectiveness, re-spectively, as in the analysis of nonfatal injuries. 131 Wang, J. (2008, September). The effectiveness of daytime running lights for passenger vehicles. (Report No. DOT HS 811 029). Washington, DC: National Highway Traffic Safety Administration. Available at www-nrd.nhtsa.dot.gov/Pubs/811029.pdf; Federal Register 58 (January 11, 1993): 3500, 74 (June 29, 2009): 30993.

43
amber. Since the 1970s, a substantial proportion of vehicles have had amber turn signals. But red signals have also remained common, perhaps because they allow sharing of components between the stop lamp and the turn signal or because they are perceived by some as a styling feature. In fact, numerous make-models have switched back and forth between amber and red signals over the years.132
How amber turn signals work: If vehicles’ stop lamps and turn signals are the same color (red), the driver of a following vehicle, upon first seeing a bright red light, may be uncertain whether the lead driver is already braking or merely signaling an intention to turn sometime in the near future (although the CHMSL helps because it only lights up for braking). The driver of the fol-lowing vehicle may hesitate while trying to discern whether the lamp stays on (braking) or flash-es (turning) and lose precious time before applying brakes. But if vehicles have different colors for stop lamps (red) and turn signals (amber), the following driver will know almost immediately if the lead vehicle is braking (red). Furthermore, the driver will be alert that the vehicle will turn sometime soon and will know almost immediately not to swerve or pass the lead vehicle on the side to which it intends to turn.133
Crash avoidance: NHTSA’s evaluation was published in 2009. It is based on 33 “switch groups”: make-models that switched turn-signal colors sometime between MY 1983 and 2005 (28 cars and 5 LTVs, 20 switching from red to amber and 13 from amber to red). It uses crash data from 14 State files (Alabama, Florida, Georgia, Illinois, Indiana, Kentucky, Maryland, Michigan, Missouri, North Carolina, Nebraska, Pennsylvania, Texas, and Utah) for the calendar years they are available at NHTSA: from 1989 to 2006, or a subset of those years, depending on the State. This is far more data than previous analyses.134
The statistical analysis considers front-to-rear crashes in which the driver of the rear-impacted vehicle was turning or preparing to turn. The crash involvements of interest are the rear-impacted vehicles in these collisions, specifically, those belonging to any of the 33 switch groups, within 2 MY before or after the switch year. Control group involvements are the frontally impacting vehi-cles in these collisions, likewise belonging to the switch groups. The “cleanest” analysis is lim-ited to the 11 of the 33 switch groups where nothing changed from one MY to the next except the color of the lens housing the turn signal: the lighting configuration and the remainder of the vehicle stayed essentially the same. A contingency table compares the rear impacts and control-group involvements with red and amber turn signals in the 14 States.135
132 Allen, K. (2009, April). The effectiveness of amber rear turn signals for reducing rear impacts. (Report No. DOT HS 811 115, pp. 1 and 6). Washington, DC: National Highway Traffic Safety Administration. Available at www-nrd.nhtsa.dot.gov/Pubs/811115.PDF; Stern, D. (2012). Preventing crashes with amber turn signals. Teaneck, NJ: Allpar, LLC. Available at www.acarplace.com/cars/turn-signals. 133 Allen (2009, April), pp. 1-2; Luoma, J., Flannagan, M. J., Sivak, M., Aoki, M., & Traube, E. C. (1997). Effects of turn-signal color on reaction times to brake signals. Ergonomics, 40, pp. 62-68. 134 Allen (2009, April). 135 Ibid., p. 12.
44
Rear-Impacted Control Risk 14 State Files While Turning Group Ratio Red turn signals 7,219 7,061 1.022 Amber turn signals 6,629 6,848 .968
This is a statistically significant 5.3-percent reduction in rear impacts, while turning, for the ve-hicles with the amber turn signals. A broader analysis comprising all 33 switch groups supports the result: when the 33 groups are analyzed one-by-one, the risk ratio is lower with the amber turn signals in 24 of the 33 groups (significantly more than half of them). The median of the 33 effectiveness estimates is 8.4 percent and the mean is 4.9 percent.136
Injury reduction: When the preceding contingency table is limited to crashes that resulted in injuries, the observed effectiveness for amber turn signals rises from 5.3 to 8.3 percent, but the estimate is not statistically significant at the two-sided .05 level because of the limited amount of data; it is borderline significant at the one-sided .05 level.137 It may be reasonable to assume the injury reduction for amber turn signals is similar to the overall crash reduction (5.3%).
Fatality reduction: NHTSA has not performed corresponding analyses of fatal crashes based on FARS data. Given that side marker lamps and CHMSL had little effect on fatal crashes, the agency will not assume that amber turn signals are effective in reducing fatalities.
LED stop lamps and CHMSL History of LED stop lamps and CHMSL: FMVSS No. 108 specifies optical performance standards for lamps, not their design or technology. Light-emitting diodes are an available tech-nology that may be advantageous for durability or styling, but may have cost implications. LED tail lamps date back to the 1990s. However, the 2000 Cadillac DeVille was the first vehicle with LED stop lamps and CHMSL. By 2009, over a million production cars or LTVs had been equipped with LED stop lamps and LED CHMSL.138
How LED stop lamps work: A potential safety advantage of LED stop lamps and CHMSL is that they have a faster “rise time” than current incandescent lamps – i.e., a shorter lag from the application of the brake until the light becomes visible to a human observer. The rise-time to 90 percent of full output is about 60 nanoseconds for LEDs, while it is about 140 milliseconds for incandescent bulbs. Logically, if two lamps are equal in all other respects, the one with the faster rise time must have a safety benefit of alerting a following driver earlier that he or she must slow down. Laboratory tests confirmed that the faster rise time for LED stop lamps translated into quicker response by test subjects.139
136 Ibid., p. 10. 137 Ibid., pp. 12-13. 138 Greenwell, N. K. (2013, February). Effectiveness of LED stop lamps for reducing rear-end crashes: Analyses of State crash data. (Report No. DOT HS 811 712, p. 1). Washington, DC: National Highway Traffic Safety Admin-istration. Available at www-nrd.nhtsa.dot.gov/Pubs/811712.PDF. 139 Ibid., pp. 1-2.
45
Crash avoidance: NHTSA’s evaluation was published in 2013. It is based on 17 “switch groups”: make-models that switched from incandescent stop lamps and CHMSL to LED stop lamps and CHMSL, or vice-versa sometime between MY 2000 and 2008 (14 cars and 3 LTVs, 15 switching to LEDs and 2 returning to incandescent bulbs). It uses crash data from 12 State files (Alabama, Florida, Georgia, Illinois, Kentucky, Maryland, Michigan, Missouri, Nebraska, New Jersey, North Carolina, and Pennsylvania) for calendar years they are available at NHTSA: from 1998 to 2009, or a subset of those years, depending on the State.
The statistical analysis considers all types of front-to-rear crashes involving two vehicles. The crash involvements of interest are the rear-impacted vehicles in these collisions, specifically, the rear-impacted vehicles belonging to any of the 17 switch groups, within 2 MY before or after the switch year. Control group involvements are the frontally impacting vehicles in these collisions, likewise belonging to the switch groups. The basic contingency-table analysis for the 17 switch groups shows a statistically significant 3.6-percent reduction in rear impacts, relative to control-group involvements, for the vehicles with LED stop lamps and CHMSL.140
However, there are three issues that preclude an unequivocal attribution of the overall reduction to the LED stop lamps and CHMSL: (1) There is not a single “clean” switch group where noth-ing changed from one MY to the next except the light source (in the analysis of amber turn sig-nals, by contrast, there were 11 “clean” switch groups); (2) a large proportion of the data comes from a single high-sales model that substantially changed the rear lighting configuration when it changed to LED; and (3) when the 17 groups are analyzed one-by-one, the risk ratio is lower with LED stop lamps and CHMSL in only 8 of the 17 groups, not even half (in contrast to the analysis of amber turn signals, where it was lower in 24 of 33 groups, an overwhelming majori-ty). The report concludes that “the real-world crash data does not demonstrate that LED stop lamps and LED CHMSL are more beneficial than incandescent lamps, but also fails to rule out such a possibility.”141
140 Ibid., Table 6 on p. 20. 141 Ibid., p. 22.
46
FMVSS No. 121, “Air brake systems” This standard regulates one safety technology for heavy vehicles with GVWR over 10,000 pounds that has been evaluated by NHTSA and that could potentially benefit occupants of cars and LTVs if it enables the drivers of the heavy vehicles to avoid hitting the cars or LTVs:
• Antilock brake systems for heavy trucks and trailers
Antilock brakes are designed to prevent wheel lockup and to allow drivers to keep control of a vehicle and steer it during severe braking. ABS became a requirement between 1997 and 1999, depending on the type of vehicle, but was available on some commercial vehicles before that time.
Regulatory history: FMVSS No. 121 originally went into effect for trucks, buses, and trailers on January 1, 1975, specifying performance standards and tests for air brake systems. In 1996, NHTSA issued final rules amending FMVSS No. 121 (and also FMVSS No. 105) to require ABS and a malfunction indicator lamp(s) on all new vehicles with GVWR greater than 10,000 pounds. The ABS requirement went into effect for air-brake truck tractors manufactured on or after March 1, 1997, for air-brake trailers and single-unit trucks manufactured on or after March 1, 1998, and for hydraulic-brake trucks manufactured on or after March 1, 1999. The require-ment for the malfunction indicator lamp on the vehicle went into effect simultaneously with the ABS requirement; furthermore, starting March 1, 2001, the truck tractor was required to display, within the cab, a malfunction indicator lamp for each trailer attached to it.142
How ABS works, expected benefits: ABS for heavy vehicles involves similar technology and capabilities as ABS for cars and LTVs. ABS senses if any of the wheels have locked, and if so, quickly releases the brakes on that wheel and lets it start rolling again. Cycles of releasing, hold-ing and reapplying brakes are repeated many times per second. Locked wheels may result in loss of directional control, loss of steering control, and/or suboptimal stopping distances. Thus, ABS might help maintain directional stability and control during braking and possibly reduce stopping distances on some road surfaces, especially on wet roads. ABS may prevent crashes involving loss of control, skidding, jackknife, or inability to stop in time to avoid hitting another vehicle. Occupants of cars and LTVs might obtain a benefit from ABS on heavy vehicles if, as a conse-quence, the drivers of the heavy vehicles are able to avoid hitting the cars or LTVs.
Crash avoidance: NHTSA’s evaluation, published in 2010, is similar to the studies of ABS in cars and LTVs in that it compares crashes of interest to a control group of crash involvements where ABS is less likely to have any effect.143 Here, however, there are four possible combina-tions of technologies on tractor-trailer combinations: ABS on the tractor, on the trailer, on both, or on neither. The statistical comparison of these four alternatives is based on Florida data from 1998 to 2007 and special supplementary data collected by the North Carolina State Highway Pa-trol from 2005 to 2007. Those are the only databases that indicate the MY of the trailer and/or whether it was equipped with ABS. This analysis shows that ABS on the tractor, with or without
142 49 CFR, Part 571.121; Federal Register 61 (May 31, 1996): 27290. 143 Allen, K. (2010, July). The effectiveness of ABS in heavy truck tractors and trailers. (Report No. DOT HS 811 339). Washington, DC: National Highway Traffic Safety Administration. Available at www-nrd.nhtsa.dot.gov/Pubs/811339.pdf.
47
ABS on the trailer, significantly reduces involvements in some types of crashes, especially jack-knife and collisions with fixed objects.144 A second analysis, focusing only on whether the trac-tor is equipped with ABS, allows extending the database to include Georgia, Missouri, Ohio, and Wisconsin files (which report the MY of the tractor, but not the trailer). This analysis estimates a statistically significant 10-percent reduction of culpable involvements in multivehicle crashes, relative to the control group, when the tractor is equipped with ABS. In other words, occupants of cars and LTVs are benefiting because ABS helps tractor-trailers avoid hitting the cars or LTVs. The analysis also shows a 53-percent reduction in jackknife, 21 percent fewer rollovers, and 15 percent fewer collisions with fixed objects when the tractor is equipped with ABS; these reductions are all statistically significant.145
Fatality reduction: Analysis of 1995-to-2007 FARS data, similar to the above but also control-ling for rural/urban, speed limit (less than 55 mph, 55+), and light condition (daylight, other) ex-plores the effect of ABS on the tractor in fatal crash involvements. The analysis estimates a 4.5-percent reduction of culpable involvements in multivehicle crashes, relative to the control group, but it is not statistically significant (confidence bounds, -1.6 to 10.2%).146 Given the limited fa-tal-crash data, NHTSA cannot yet conclude whether the effect of ABS on fatal culpable in-volvements is similar to its effect on nonfatal culpable involvements (10%), or smaller, or nonex-istent. The model to compute lives saved in Part 2 of this report will not attribute any fatality re-duction for car or LTV occupants to ABS enabling heavy vehicles not to hit the cars or LTVs. (The analysis, however, does show a statistically significant 23 percent reduction in fatal single-vehicle rollovers for ABS on truck tractors, but this, by itself, does not save lives of car or LTV occupants.)
144 Ibid., pp. 2-10. 145 Ibid., Table 13 on p. 16. 146 Ibid., Table 23 on p. 28.
48
FMVSS No. 126, “Electronic stability control systems” This standard regulates one safety technology for cars and LTVs:
• Electronic stability control (ESC)
ESC systems detect when a vehicle is about to lose traction and automatically apply the brakes to individual wheels and/or reduce engine torque to help the driver stay on course. They are a high-ly effective crash avoidance technology. ESC was first offered on selected MY 1997 cars. By MY 2012, all new cars and LTVs were equipped with ESC.
Regulatory history: Voluntary installations of ESC after 1997 soon established evidence, first individual cases and then statistics, of remarkable effectiveness in preventing rollovers, fixed-object impacts, and other crashes involving loss of control. On April 6, 2007, NHTSA issued FMVSS No. 126 to require ESC on passenger cars, multipurpose vehicles, trucks, and buses with a GVWR of 10,000 pounds or less: all new vehicles by MY 2012, with a phase-in comprising 55 percent of MY 2009 sales, 75 percent of MY 2010, and 95 percent of MY 2011.147
Installation history: Mercedes-Benz first offered ESC in 1997 as standard equipment on top-of-the-line subseries or as an option on other subseries of its S and SL luxury cars. The next year, BMW was the first with ESC standard on an entire make-model, its 700-series. By 2000, it was standard on most BMW and Mercedes cars, Cadillac Seville and a few other GM luxury models, Lexus LS and GS, and Acura RL. Among SUVs, ESC was standard on Mercedes ML in 1999, on Lexus LX in 2000, followed by Toyota 4Runner and Landcruiser and Lexus RX the next year. Also in 2001, NHTSA’s annual Buying a Safer Car brochures began to inform the public which make-models are equipped with ESC.148 ESC was installed on 7.4 percent of vehicles sold in MY 2003. ESC sales expanded year-to-year, at first primarily on SUVs and the more expen-sive cars. By MY 2007, over half of new LTVs were equipped with ESC, but still less than 25 percent of cars. By MY 2009, the industry was well ahead of the phase-in schedule for FMVSS No. 126; over 80 percent of new LTVs had ESC that year. By MY 2010 or 2011, ESC had be-come standard on most pickup trucks and inexpensive cars.149
How ESC works: ESC systems detect and automatically assist drivers in oversteer and under-steer situations that lead to loss of control and occur especially in unfavorable conditions such as rain, snow, sleet, or ice. “Oversteer” is when the vehicle turns more than the driver wants. “Un-dersteer” is when the vehicle turns less than the driver tells it to. Sensors monitor the speed of each wheel, the steering wheel angle, and the yaw rate and lateral acceleration of the vehicle. The yaw rate is the rate of change of the vehicle’s heading. The system compares the measured yaw rate of the vehicle to the driver’s intended rate of change of heading (as evidenced by the steering wheel angle) consistent with the speed and lateral acceleration of the vehicle. For exam-ple, a yaw rate measurement greater than that consistent with the speed and lateral acceleration 147 49 CFR, Part 571.126; Federal Register 72 (April 6, 2007): 17236. 148 Available for 2000 to 2005 at icsw.nhtsa.gov/safe_car_new/ (click on SaferCar2000, SaferCar2001, BASC2002, BASC2003, BASC2004, or BASC2005) and for 2006 to 2010 at www.safercar.gov/Vehicle+Shoppers/Resources/Buying+a+Safer+Car+brochures. 149 Sivinski, R. (2011, June). Crash prevention effectiveness of light-vehicle electronic stability control: An update of the 2007 NHTSA evaluation. (Report No. DOT HS 811 486, pp. 1-2). Washington, DC: National Highway Traffic Safety Administration. Available at www-nrd.nhtsa.dot.gov/Pubs/811486.pdf.
49
of the vehicle indicates oversteer. ESC rapidly and automatically intervenes to correct the vehicle heading by applying the brakes to individual wheels and possibly reducing engine torque to help the driver stay on the road. If the vehicle was experiencing the onset of oversteer in a left curve, ESC would momentarily apply the brake to the right front wheel to counteract the excessive yaw rate and stabilize the vehicle. Some systems may then slow down the vehicle to a speed more appropriate for conditions. All current vehicles with ESC are also equipped with ABS and trac-tion control systems; the ESC to a large extent builds on ABS technology and shares ABS com-ponents.150
Expected benefits: ESC would appear to be most effective in preventing single-vehicle run-off-road crashes including rollovers and collisions with fixed objects. That is because many of them involve a loss of directional stability or control during the pre-crash sequence of events. For ex-ample, if adverse conditions on the road trigger a skid, ESC could stabilize the vehicle and pre-vent the entire off-road excursion. Even if a careless driver has already drifted off the road with two wheels, ESC may help maintain directional control and stability, making it easier for the driver to get back on the road and avoid a crash. Presumably, ESC would have much less effect on collision involvements on the road with other vehicles, pedestrians or animals, because a smaller proportion of these crashes are preceded by a loss of directional stability. A unique fea-ture of ESC that could make it especially effective is that it can activate without any action by a driver (unlike, for example, ABS, which cannot activate unless the driver applies the brakes).
Fatality reduction – passenger cars: NHTSA has monitored ESC since it first became available on production vehicles and has issued four statistical analyses over the years as crash data accu-mulated and ESC installation spread from luxury vehicles to all new cars and LTVs.151 Similar to the analyses of ABS for cars and LTVs, contingency table compares the numbers of FARS crash involvements of interest in the first model years with ESC to the last years without it, relative to the numbers of control-group crash involvements on FARS – in this case, for a selected list of make-models that switched from not having ESC to being equipped with ESC. Non-culpable in-volvements in multivehicle crashes on dry roads are the control group. The four groups of crash-es of interest are: (1) first-event rollovers; (2) collisions with pedestrians, bicyclists, or other non-occupants; (3) all other single-vehicle crashes; and (4) culpable involvements in multivehicle crashes.
The following table from the most recent analysis, based on FARS data from 1994 to 2011, demonstrates the profound reduction of fatal first-event rollovers with ESC, relative to the con-trol group. (It is limited to make-models that became equipped with ESC but not with rollover curtains, in order to avoid counting the benefit of the curtains as part of the benefit of ESC).
150 Dang, J. N. (2004, September). Preliminary results analyzing the effectiveness of electronic stability control (ESC) systems. (Report No. DOT HS 809 790). Washington, DC: National Highway Traffic Safety Administration. Available at www-nrd.nhtsa.dot.gov/Pubs/809790.PDF. 151 Dang (2004, September); Dang, J. N. (2007, July). statistical analysis of the effectiveness of electronic stability control (ESC) systems – Final report. (Report No. DOT HS 810 794). Washington, DC: National Highway Traffic Safety Administration. Available at www-nrd.nhtsa.dot.gov/Pubs/810794.pdf; Sivinski (2011, June); Kahane, C. J. (2014, May). Updated estimates of fatality reduction by ESC. (Report No. DOT HS 812 020). Washington, DC: National Highway Traffic Safety Administration. Available at www-nrd.nhtsa.dot.gov/Pubs/812020.pdf.
50
FARS 1994 to 2011 First-Event Control Risk Rollovers Group Ratio Last 3 MY without ESC 353 1,437 .2457 First 3 MY with ESC 98 986 .0994
This is a statistically significant 60-percent reduction of fatal first-event rollovers, relative to the control group (confidence bounds, 49 to 68%). ESC does not have a statistically significant ef-fect on fatal collisions with pedestrians and bicyclists. In all other fatal single-vehicle crashes (mostly impact with fixed objects after running off the road), the reduction for ESC is a statisti-cally significant 31 percent (confidence bounds, 22 to 39%). ESC reduces culpable involvements in fatal multivehicle crashes by a statistically significant 16 percent (confidence bounds, 4 to 26%).152
Crash avoidance – passenger cars: NHTSA’s 2011 evaluation, based on GES data from 1997 to 2009, generates national estimates of the effect of ESC on police-reported crash involvements by methods similar to the above FARS analysis. ESC reduces first-event rollovers by a statisti-cally significant 72 percent. The observed effects on other types of single-vehicle crashes and on culpable involvements in multivehicle crashes are not statistically significant.153
However, NHTSA’s 2007 evaluation does show a statistically significant 45-percent reduction in run-off-road crashes that are not rollovers and a statistically significant 13-percent reduction in culpable involvements in multivehicle crashes (as well as a statistically significant 64% reduc-tion in rollovers). The 2007 evaluation is based on crash data from seven State files (California, Florida, Illinois, Kentucky, Missouri, Pennsylvania, and Wisconsin) for CY 1997 to 2003 (or the subset of those years available at NHTSA, depending on the State).154
Fatality reduction – LTVs: NHTSA’s most recent analysis, based on FARS data from 1994 to 2011 shows even higher effectiveness for LTVs than for passenger cars – e.g., the following ta-ble of fatal first-event rollovers (again limited to make-models that became equipped with ESC but not with rollover curtains).
FARS 1994 to 2011 First-Event Control Risk Rollovers Group Ratio Last 3 MY without ESC 857 1,995 .4296 First 3 MY with ESC 104 931 .1117
It is a statistically significant 74-percent reduction of fatal first-event rollovers, relative to the control group (confidence bounds, 68 to 79%). ESC does not have a statistically significant ef-fect on fatal collisions with pedestrians and bicyclists. In all other fatal single-vehicle crashes,
152 Kahane (2014, May). 153 Sivinski (2011, June), p. iv. 154 Dang (2007, July), p. 39.
51
the reduction for ESC is a statistically significant 45 percent (confidence bounds, 39 to 51%). ESC reduces culpable involvements in fatal multivehicle crashes by a statistically significant 16 percent (confidence bounds, 8 to 24%).155
Crash avoidance – LTVs: NHTSA’s 2011 evaluation, based on GES data, estimates statistically significant reductions in first-event rollovers (64%) and impacts with fixed objects (67%). The observed effect on culpable involvements in multivehicle crashes is not statistically signifi-cant.156 However, NHTSA’s 2007 evaluation, based on State data, does show a statistically sig-nificant 13 percent drop in culpable involvements in multivehicle crashes (as well as reductions of 64 percent in rollovers and 69 percent in impacts with fixed objects, both statistically signifi-cant).157
155 Kahane (2014, May). 156 Sivinski (2011, June), p. iv. 157 Dang (2007, July), p. 41.
52
FMVSS No. 138, “Tire pressure monitoring systems” This standard regulates a safety technology for cars and LTVs for which NHTSA has evaluated on-the-road performance, but has not yet evaluated the effect on safety:
• Tire pressure monitoring systems
When properly calibrated, TPMS warns the driver if one or more tires are inflated to a pressure that is 25 percent or more below the recommended level. Underinflation can adversely affect traction and fuel economy. TPMS first became available in the United States in MY 1997. By MY 2008, all new cars and LTVs were equipped with TPMS, as required by FMVSS No. 138.
Regulatory history: Section 13 of the TREAD Act of 2000 directed NHTSA to upgrade tire per-formance, including a requirement for systems that warn the driver when a tire is significantly underinflated – a situation that poses a safety risk, increasing the chance of skidding, hydroplan-ing, longer stopping distances, and crashes due to flat tires and blowouts. On April 8, 2005, NHTSA issued a new safety standard, FMVSS No. 138, “Tire pressure monitoring systems,” re-quiring TPMS in all new cars and LTVs with GVWR up to 10,000 pounds built after September 1, 2007 (MY 2008). The two-year phase-in period required TPMS on 20 percent of MY 2006 vehicles and 70 percent of MY 2007.158 A vehicle’s TPMS must warn the driver when one or more of the vehicle’s tires is severely underinflated – i.e., has fallen to 25 percent or more below the nominal pressure to which the TPMS has been calibrated. Ordinarily, the TPMS should be calibrated to the “placard” pressure recommended by the manufacturer for that vehicle. The dis-play, a warning light on the instrument panel, must activate within 20 minutes of underinflated travel at speeds of 50 to 100 km/h and must remain illuminated until the underinflation is reme-died. The system must also have a malfunction lamp in addition to a low-pressure warning lamp that alerts the driver if the vehicle’s TPMS is not functioning properly.
The industry installed TPMS ahead of the phase-in schedule for FMVSS No. 138. It was stand-ard equipment on over 20 percent of new cars and LTVs in MY 2004 and over 30 percent in MY 2005 and 2006.159
How TPMS works: Two TPMS technologies have appeared in production vehicles: direct and indirect systems. Direct TPMS uses a battery-powered pressure sensor and a radio transmitter inside each tire that periodically broadcasts the tire pressure to a central processing unit in the vehicle. The sensors are most often located on the interior end of a tire’s valve stems. Some di-rect systems, in addition to the warning light, display the actual pressure of each tire on the dash, allowing the driver to diagnose overinflation as well as underinflation. The batteries have a finite life, variously estimated to range from 3 to 12 years or from 50,000 to 100,000 miles. When one or more batteries expire, the entire wheel sensor must be replaced for each battery. Sensors may potentially be damaged as a result of improperly replacing, exchanging, or filling tires or after hitting road hazards. If the owner has snow tires mounted on separate wheels for seasonal use,
158 49 CFR, Part 571.138; Federal Register 70 (April 8, 2005): 18136. 159 Sivinski, R. (2012, November, p. 3). Evaluation of the effectiveness of TPMS in proper tire pressure mainte-nance. (Report No. DOT HS 811 681). Washington, DC: National Highway Traffic Safety Administration. Availa-ble at www-nrd.nhtsa.dot.gov/Pubs/811681.pdf.
53
they would need their own sensors. The systems may need to be recalibrated after replacing tires and possibly other situations.
In vehicles equipped with ABS, indirect TPMS relies on the ABS system, which has sensors that continually monitor the speed of the four wheels. If one tire has low pressure, it would have a smaller diameter and rotate more often than the other wheels, triggering the warning light if the difference in speeds is large enough. Early indirect systems were installed on some vehicles be-fore FMVSS No. 138 went into full effect (September 1, 2007). These systems were unable to detect, for example, if all four wheels were equally underinflated (because the four wheels’ speeds would all be the same); these systems would not have met FMVSS No. 138, which re-quires a warning if one or more tires are underinflated. Starting MY 2009, however, some vehi-cles have indirect systems compliant with FMVSS No. 138 because they can integrate infor-mation from the ABS, ESC and other sensors to recognize when multiple tires are underinflated. Indirect systems do not have batteries that need replacement or sensors inside the valve stems that could be damaged, but they do need recalibration in some situations.160
Expected benefits: Underinflation is the most common cause of tire failure. Underinflated tires experience a greater amount of sidewall flexion than properly inflated tires, resulting in de-creased fuel economy, sluggish handling, longer stopping distances, increased stress to tire com-ponents, and heat buildup that can lead to catastrophic failure of the tire, such as cracking, com-ponent separation, or blowout. These catastrophic failures can cause loss of vehicle control and may result in a crash. If the warnings from TPMS influence drivers to maintain proper inflation, there should be a reduction in crash involvements attributable to catastrophic tire failures and perhaps also in other crash involvements attributable to excessive stopping distances or unsuc-cessful evasive maneuvers due to sluggish handling.
On-the-road performance: During CY 2011, NHTSA sponsored a survey by the NASS teams. They measured tire pressure in all four tires on a probability sample of 6,103 vehicles (4,391 of which were equipped with TPMS) of MY 2004 to 2011. The survey found a large, statistically significant gain in proper tire inflation with direct TPMS. MY 2004-to-2007 cars and LTVs equipped with direct TPMS were 56 percent less likely (confidence bounds, 36 to 69%) to have one or more severely underinflated tires – i.e., 25 percent or more below the vehicle manufactur-er’s recommended cold tire pressure – than vehicles of the same age without any TPMS.161 Moreover, because there is more air in the tires of vehicles equipped with TPMS, NHTSA esti-mates that, on the average, over the first eight years of a vehicle’s lifetime, TPMS will save 9 gallons of fuel in passenger cars and 28 gallons in LTVs.162 NHTSA has not yet analyzed crash data to evaluate the safety effects of TPMS, but the on-the-road performance augurs well for the future safety evaluation.
The survey, however, also indicated that TPMS was substantially more effective in reducing un-derinflation in MY 2006 and 2007 vehicles (relative to vehicles without TPMS of the same MY) than in MY 2004 and 2005, which were 6 to 7 years old at the time of the CY 2011 survey. There are several possible explanations for the lower effectiveness in the somewhat older vehi-
160 Ibid., pp. 2-3. 161 Ibid., Table 3 on p. 18. 162 Ibid., pp. 30-36.

54
cles, including the possibility that there might not be functional TPMS systems in all of the tires of these older vehicles. Owners might not have replaced expired batteries or otherwise not main-tained and properly calibrated their systems. NHTSA is currently developing an additional sur-vey to assess the frequency and causes of vehicles having a TPMS system that is not functional, as well as the costs associated with repair and maintenance of these systems, as a function of ve-hicles’ age and mileage.
55
FMVSS No. 201, “Occupant protection in interior impact” This standard is indirectly associated with one vehicle modification whose safety benefits NHTSA evaluated and directly associated with another that the agency also evaluated:
• Redesign of middle and lower instrument panels with improved occupant protec-tion, and
• 1999-2003 head injury protection upgrade.
There are also some connections between FMVSS No. 201 and curtain air bags, but that technol-ogy is covered in the chapter on FMVSS No. 214. The first paragraph of FMVSS No. 201 says, “This standard specifies requirements to afford impact protection for occupants.”163 Primarily, FMVSS No. 201 consists of performance requirements limiting the amount of force allowed when a headform is impacted into various sections of the vehicle interior that are frequently con-tacted by occupants’ heads during crashes. FMVSS No. 201 was one of NHTSA’s initial safety standards, effective for passenger cars on January 1, 1968. It was extended to pickup trucks, vans and SUVs up to 10,000 pounds GVWR, effective September 1, 1981. More recently, perfor-mance requirements for cars and LTVs were upgraded by adding a 15 mph free-motion head-form (FMH) impact test of the upper interior components, with a phase-in from September 1, 1998, to September 1, 2002.
NHTSA believes that most passenger cars met the original head-impact requirements of FMVSS No. 201 quite a few years before their effective date of January 1, 1968. The substantial vehicle modifications close to 1968 were in the middle and lower instrument panel, frequently areas of contact with the occupant’s torso and knees. These areas had been contemplated, but ultimately not included for regulation by FMVSS No. 201.
Redesign of middle and lower instrument panels with improved occupant protection Regulatory history: Instrument panel tops that were padded in some form were standard or op-tional on most passenger cars by 1963. SAE issued Recommended Practice J921, defining a 15 mph headform impact test with the instrument panel, in June 1965. NHTSA’s original, Decem-ber 1966 NPRM for FMVSS No. 201 incorporated the SAE Recommended Practice and extend-ed it to other likely head contact areas such as seat backs, sun visors, armrests and other projec-tions in head impact areas. The August 16, 1967 final rule finalized specifications for instrument panels, seat backs, sun visors, and armrests. The final rule set a peak deceleration of 80 g’s over 3 milliseconds for impact tests of instrument panels and seat backs and certain design criteria for the sun visor and armrest components. Most cars were apparently meeting the various head-impact requirements of FMVSS No. 201 well before 1968.164
163 49 CFR, Part 571.201. 164 Kahane, C. J. (1988, January). An evaluation of occupant protection in frontal interior impact for unrestrained front seat occupants of cars and light trucks. (Report No. DOT HS 807 203, pp. 2-3). Washington, DC: National Highway Traffic Safety Administration. Available at www-nrd.nhtsa.dot.gov/Pubs/807203.PDF; Campbell, B. J. (1963). A study of injuries related to padding on instrument panels. (Report No. VJ-1823-R2). Buffalo: Cornell Aeronautical Laboratory; Federal Register 31 (December 3, 1966): 15212; 1967 SAE Handbook, pp. 881-884.
56
On the other hand, this NPRM also contemplated force limits for “knee” and “child” impact are-as – i.e., the lower and middle instrument panel areas anterior to an adult RF passenger’s chest and legs (and that a small child’s head might also contact) – but they did not become part of FMVSS No. 201. In 1970, NHTSA again proposed a knee impact test, but did not issue a final rule. Thus, even though FMVSS No. 201 never actually regulated the middle and lower instru-ment panels, the repeated proposals to do so may have influenced the ultimately voluntary im-provements to crashworthiness in those areas.165
NHTSA’s 1970 NPRM also proposed to extend the original FMVSS No. 201 requirements to LTVs. That part of the proposal was adopted and took effect on September 1, 1981.166
Vehicle modifications and their purpose: In the 1960s, most RF passengers were unre-strained.167 Safety researchers such as Daniel at Ford and Wilson at GM grasped that the instru-ment panel was the principal energy-absorbing “ride-down” mechanism for the unrestrained pas-senger in a frontal impact. They believed that the panel should decelerate the occupant as com-pletely, but gradually as possible, at no time applying a dangerous level of force to the occupant. For the most part, instrument panels of the 1960s were too rigid and needed to be softened – but not so much that the occupant would break through to the even more rigid structures in front of the panel. Daniel believed panels with 1,200 pounds maximum force deflection for the chest in a 20 mph impact, and 1,400 pounds optimum for the knees in a 12 mph impact could protect even unrestrained occupants in 30 mph barrier impacts.168
A second objective was to “tune” the relative rigidity of the middle and lower instrument panels so that the occupant would remain upright during a frontal impact. For example, an excessively rigid lower panel might cause the occupant to pitch forward, head first. A third objective was to bring the panel as close to the occupant as possible and extend it downwards, consistent with the occupant’s comfort. The sooner contact begins and the more extensive the engagement with the occupant’s knees, the more gradual the ride-down.
Happily, the new insight on the design of the panel coincided with the increasing practicability and economy of plastics or thinner steel rather than heavy steel panels for assembling interior components.
NHTSA measured the geometry and force deflection characteristics of instrument panels in 21 cars ranging from MY 1965 to 1983. The analysis confirmed that manufacturers significantly
165 Kahane (1988, January), pp. 2-3; Williams, A.F., Wong, J., & O’Neill, B. (1979). Occupant protection in interior impacts – An analysis of FMVSS No. 201. Proceedings of the Twenty-Third Conference of the American Associa-tion for Automotive Medicine. Morton Grove, IL: American Association for Automotive Medicine; Federal Register 31 (December 3, 1966): 15212, 35 (September 25, 1970): 14936. 166 Federal Register 44 (November 29, 1979): 68470. 167 Even as late as 1977 to 1979, belt use by sub-teen, teenage, and adult RF passengers was only 3 to 7 percent; see Phillips, B. M. (1980, May). Safety belt usage among drivers. (Report No. DOT HS 805 398, pp. 44-50). Washing-ton, DC: National Highway Traffic Safety Administration. Available at www-nrd.nhtsa.dot.gov/Pubs/HS805398.PDF. 168 Kahane (1988, January), pp. 9-15; Daniel, R. P. (1970). Vehicle interior safety constraint systems. 1970 Interna-tional Automobile Safety Conference Compendium. (Paper No. 700423). New York: Society of Automotive Engi-neers; Wilson, R. A. (1969). Evaluating knee-to-instrument panel impacts. Thirteenth Stapp Car Crash Conference. (Paper No. 690801). New York: Society of Automotive Engineers.
57
changed instrument panel design in the directions that their researchers believed to be safety-favorable, especially in the late 1960s and continuing into the early 1970s. Panels became less rigid, extended downwards, and were contoured in a manner that occupants would feel comfort-able sitting closer to them.169
The implementation dates for these changes in LTVs are unknown. However, other safety im-provements of that era, such as 3-point belts and energy-absorbing steering assemblies, typically appeared in LTVs about 5 to 10 years after cars. That suggests the panels may have been modi-fied in LTVs more or less throughout the 1970s, which also was the decade between the NPRM to extend FMVSS No. 201 to LTVs (1970) and its final effective date (September 1, 1981).
Expected benefits: Since the instrument panel was by far the most common source of life-threatening as well as moderate injury for unrestrained RF passengers in frontal crashes, the im-provements of the late 1960s and early 1970s could be expected to reduce injuries and fatali-ties.170
Injury reduction – passenger cars: NHTSA’s study, published in 1988, uses data from the 1977-to-1979 National Crash Severity Study.171 It compares non-minor (AIS ≥ 2) injury rates, due to instrument panel contact, per 100 front seat passengers involved in frontal towaway crashes, for four MY groups of cars: 1960-to-1966, 1967-to-1970, 1971-to-1974 and 1975-to-1978. After controlling for delta V (an indicator of crash severity), the three later MY groups each have significantly lower injury rates from instrument-panel contacts than the 1960-to-1966 cars. The reductions are 23, 36 and 21 percent relative to the 1960-to-1966 group, respectively. The average reduction for all 1967-to-1978 cars, relative to the 1960-to-1966 cars, is a statistical-ly significant 29 percent.172 The differences among the three post-standard groups (1967-to-1970, 1971-to-1974 and 1975-to-1978) are not statistically significant. The reduction of injuries due to contact with the instrument panel is not offset by any increase of injuries from other sources. Using 1982 as the “baseline” year, the evaluation estimates that when the pre-1967 cars are phased out and all cars on the road have the improved instrument panels, AIS ≥ 2 injuries to RF passengers will decrease by an estimated 8,000 per year.173
The 1988 study also documents computer simulations of frontal crashes that are consistent with the NCSS results. MVMA2D is a computer program to simulate an occupant’s motion and com-pute the injury-criterion scores for contacts with the vehicle interior in a straight-ahead frontal crash. As stated above, NHTSA measured the geometry and force-deflection characteristics of instrument panels (and other structures) in 21 cars ranging from MY 1965 to 1983. This data was used to set up MVMA2D, which was run six times for each car to simulate the motion of an un-belted RF passenger: for 50th percentile male, 5th percentile female and 95th percentile male dummies, each at 25 mph and 30 mph frontal barrier impacts. In each of these 126 simulations,
169 Kahane (1988, January), pp. 43-109. 170 Ibid., pp. xxvii and 15-20. 171 Kahane, C. J., Smith, R. A., & Tharp, K. J. (1977). The National Crash Severity Study. Report on the Sixth Inter-national Technical Conference on Experimental Safety Vehicles. (Report No. DOT HS 802 501, pp. 493-515). Washington, DC: National Highway Traffic Safety Administration. 172 90 percent confidence bounds: 10 to 48 percent. 173 Kahane (1988, January), pp. 21-41.
58
MVMA2D estimates the head injury criterion (HIC), the chest g’s and deflection, the femur load, and six other injury criteria for the head, chest and neck.174
Injury scores are compared on a nonparametric basis175 – i.e., the analysis shows if one group of cars is significantly safer than another, but does not estimate the percentage reduction of injury risk. The trends are the same as in the NCSS data. The 1969-to-1971 cars and the 1976-to-1983 cars both have significantly lower overall injury risk than the 1965-to-1966 cars. The average injury risk in MY 1976 to 1983 is slightly but not significantly lower than in 1969 to 1971. Inju-ry risk to the head/neck, chest, and femur are all lower in MY 1969 to 1971 and 1976 to 1983 than in 1965 to 1966.
Moreover, the MVMA2D simulations generate results that are consistent with researchers’ intui-tion about what sort of panel modifications would benefit safety. Reductions in the rigidity of the middle and lower panels and lengthening the panels by extending them downwards and towards the occupant are associated with significant injury reductions.
Injury reduction – LTVs: NHTSA analyzed overall AIS ≥ 2 injury rates per 100 unrestrained RF passengers in frontal towaway crashes in 1982-to-1985 NASS and 1977-to-1979 NCSS data. In those days, LTVs accounted for a smaller share of the market than they do now, and there were not enough cases to adjust the rates for delta V or other factors or to single out injuries due to contact with the instrument panel.176 The analysis does not show a clear reduction in the injury rates. In NASS, the injury rate for MY 1971-to-1974 LTVs is 43 percent lower than in 1966-to-1970 LTVs. But the reduction relative to MY 1966-to-1970 subsequently dwindles to 29 percent in 1975 to 1978, 5 percent in 1979 to 1981, and 16 percent in 1982 to 1985. In NCSS, the MY 1971-to-1974 LTVs have 33 percent lower injury rate than 1961-to-1970 LTVs, but the 1975-to-1978 LTVs have the highest rate, 24 percent higher than in 1961 to 1970. While the reductions in MY 1971 to 1974 are effects in the right direction, the subsequent trends toward higher injury rates are inconsistent with the idea that panel improvements continued throughout the 1970s. Small samples and an inability to control for delta V or other factors made it difficult to obtain statistically meaningful results.177
Fatality reduction – passenger cars: The fatality “risk index” of RF passengers in frontal crashes is computed by model year (1964 to 1984), based on a three-step analysis of CY 1975-to-1984 FARS data. The first step is the computation of an absolute risk index for drivers. The analysis compares the ratio of driver fatalities in head-on (front-to-front) collisions between cars of two different model years. For example, in head-on collisions between MY 1975 and 1979 cars, 37 drivers of the MY 1975 cars and 90 drivers of the MY 1979 cars were fatalities. In these unadjusted data, relative vehicle mass is the dominant factor: since many of the MY 1979 cars had been downsized, they had higher risk in the head-on collisions with the MY 1975 cars. Next, a logistic regression estimates the expected fatality risk of each driver in a head-on collision, giv-
174 Ibid., pp. 43-109 and 205-220. 175 Using a weighted average of the normalized rank order scores for the various criteria, for the six simulations on each car. 176 LTVs constituted 22 percent of the light vehicles on the road in 1980 and 44 percent in 2011: NHTSA. (2013). Traffic safety facts 2011. (Report No. DOT HS 811 754, pp. 24 and 26). Washington, DC: National Highway Traffic Safety Administration. Available at www-nrd.nhtsa.dot.gov/Pubs/811754AR.pdf 177 Ibid., pp. 165-173.
59
en only the curb weights of the two cars and the age, gender and belt use of the two drivers. In each model year’s cars, the actual number of fatalities in the head-on collisions is compared to the number that would have been expected, based on their own and their collision partners’ curb weight, driver age, gender and belt use. The fatality risk index is the ratio of actual to expected fatalities (normalized to 100). The fatality risk index for drivers averages 117.3 in MY 1964-to-1966, drops sharply to 103 by 1968-to-1970, and remains close to 100 throughout 1973 to 1984.178
The second step is the computation of a risk index for RF passengers relative to drivers. It is based on the ratio of RF passenger to driver fatalities in frontal impacts (including, but not lim-ited to head-on collisions) in cars of a given model year that were occupied by a RF passenger as well as a driver, both unrestrained. For example, in frontal impacts of MY 1975 cars with both seats occupied, 1410 RF passengers and 1472 drivers were fatalities. Next, a logistic regression predicts the fatality risk of each driver and each passenger in these impacts, given only the age and gender of the two occupants and the exact impact location (pure frontal, left front, right front – i.e., FARS principal impact points 12, 11, or 1, respectively). In each model year’s cars, the actual ratio of RF to driver fatalities is compared to the predicted ratio, based on the two occu-pants’ age/gender and the impact location. The fatality risk index is the actual ratio divided by the predicted ratio (normalized to 100).
The relative risk index is 120-125 in MY 1960-to-1965, drops sharply in the late 1960s, and con-tinues decreasing slowly, leveling out at close to 100 in 1975 to 1984. In other words, the RF seat was at one time substantially more dangerous than the driver’s seat. But the safety gap was closed, despite the introduction of energy-absorbing steering assemblies that benefited only driv-ers. Something(s) that is even more effective than the energy-absorbing steering assemblies must have been introduced for passengers.179
The third and last step is computing the absolute fatality risk index for RF passengers. It is the product of the driver and the passenger-relative-to-driver indices. This index averages 135.7 in MY 1964-to-1966, 109.1 in 1968-to-1970, and 99.7 in 1973-to-1984. The drop from 135.7 to 109.1 is a 20-percent reduction, equivalent to 665 lives saved per year. The more gradual change from 109.1 to 99.7 is an additional 9-percent reduction, equivalent to 235 lives saved per year.180
The aforementioned design changes to instrument panels was the most important crashworthi-ness improvement for unrestrained RF passengers in frontal crashes and must have accounted for many of these 665 + 235 = 900 lives saved per year, but it is difficult to estimate how many can be attributed specifically to this as opposed to other automotive safety improvements of that time period. The trend in the fatality risk index closely parallels the trends in the NCSS data and MVMA2D simulations: a strong improvement in the late 1960s, with some additional improve-ments in the early 1970s and leveling out after that. That is consistent with the hypothesis (but not a proof) that the fatality reduction largely reflects the instrument-panel improvements. It is
178 Ibid., pp. 111-140; the drop from 117.3 to 103, a 12 percent reduction, corresponds closely to the effectiveness estimate for energy-absorbing steering assemblies – i.e., energy-absorbing steering assemblies significantly reduced the fatality risk of unrestrained drivers in frontal crashes in 1967-68, and no other vehicle modification in 1964-84 had any large effect (see also the FMVSS Nos. 203/204 chapter). 179 Ibid., pp. 140-153. 180 Ibid., pp. 153-156 and 161.
60
estimated from NCSS data that before 1967, 616 RF passengers per year received fatal injuries from contact with the instrument panel, while Huelke’s in-depth investigations suggested the number could be twice as high. If the fatality reduction for improved panels is the same as the AIS ≥ 2 injury reduction, 29 percent, that would amount to annually preventing 180-360 fatali-ties due to contact with the instrument panel. However, the MVMA2D simulations suggest that the benefits of improved panels are not limited to preventing injuries directly caused by contact with the panel: by providing “ride-down” and keeping the occupant upright, they can reduce the severity of contacts with other interior surfaces. Other safety standards that benefited unre-strained passengers in frontal impacts, such as FMVSS Nos. 205 or 212 are unlikely to have saved more than 100 RF passengers per year. Taking all these considerations into account, NHTSA estimated that improved panels account for approximately 400 to 700 of the 900 pas-senger lives saved per year in frontal crashes. The point estimate is 550; it is equivalent to a 16-percent reduction of unrestrained RF passenger fatalities in frontal impacts.181
Fatality reduction – LTVs: Using 1975-to-1984 FARS data, NHTSA developed fatality risk indices for drivers and RF passengers of LTVs, analogous to the indices for cars. The absolute risk index for RF passengers dropped from an average of 127 in model years 1966-to-1968 to an average of 98 in 1975-to-1980. The drop was sharpest in 1969-to-1975 and gradually leveled out afterwards. That is a 23-percent fatality reduction during the decade when instrument panels were modified in LTVs, similar to the long-term overall reduction in the risk index for car pas-sengers. It suggests that the effectiveness of improved panels may be about the same in LTVs and cars: a 16-percent reduction of unrestrained RF passenger fatalities in frontal impacts.182
1999-2003 head injury protection upgrade Regulatory history: On August 14, 1995, NHTSA issued a final rule extending the head injury protection requirements of FMVSS No. 201. The existing requirements of FMVSS No. 201 re-mained for the original target areas. However, a new list of target areas in the vehicle’s upper interior includes the A-, B- and other pillars, the front and rear roof headers, the roof side rails, and the upper roof, among others. These structures were sources of life-threatening head injuries in existing vehicles. The impact speed for the free-motion headform (FMH) impact test for the new areas is 15 mph, as in the original FMVSS No. 201, but for these new targets, HIC may not exceed 1000 for any 36-millisecond period. Impacts could be directed from a range of vertical and horizontal angles, not just head-on. Manufacturers were offered a choice of several alterna-tive phase-in schedules from September 1, 1998, to September 1, 2002. For example, they could certify the new requirements on at least 10 percent of cars and LTVs manufactured from Sep-tember 1, 1998, through August 31, 1999; at least 25 percent of cars and LTVs manufactured from September 1, 1999, through August 31, 2000; at least 40 percent of cars and LTVs manu-factured from September 1, 2000, through August 31, 2001; at least 70 percent of cars and LTVs
181 Ibid., pp. 15-18, 38-39, 92-106 and 161-163; Huelke, D. F., & Gikas, P. W. (1968, November/December). Causes of death in automobile accidents. Police, 13, pp. 81-89; see also the chapters for FMVSS Nos. 205 and 212 later in this report. 182 Kahane (1988, January), pp. 174-197.

61
manufactured from September 1, 2001 through August 31, 2002; and all cars and LTVs manu-factured on or after September 1, 2002.183
On August 4, 1998, NHTSA amended the rule to facilitate the introduction of curtain air bags. Recognizing that the 15 mph headform test might be a problem in target areas where an un-deployed air bag is stored (and, furthermore, an inappropriate test if the bag usually deploys at that speed), NHTSA offered an alternative compliance procedure. Manufacturers have the option to reduce the speed of the headform test to 12 mph on target areas where the bag is stored, pro-vided they can also meet an 18 mph lateral (90-degree) crash test for the full vehicle into a pole – with HIC < 1000. The pole test simulates a head impact with the deployed bag.184
Vehicle modifications: The principal modifications are the addition of energy-absorbing pad-ding in the target areas and the addition of curtain air bags. In most make-models of cars and LTVs, padding came first, during the MY 1999-to-2003 phase-in period for the head-impact up-grade of FMVSS No. 201. Curtains usually came later; only 8 percent of MY 2003 cars and LTVs, approximately half of MY 2007 vehicles, but 93 percent of MY 2011 vehicles were equipped with curtains.185 It is generally unknown to what extent the padding stayed the same in vehicles after the curtains arrived. Some modification or even discontinuation of the padding may occur in components that house the curtains, such as the roof side rails, or possibly in areas that may be protected by curtains, such as pillars. Modification is less likely in areas not protect-ed by curtains, such as the roof interior, although it may have been modified here and there to make room for the undeployed curtains. NHTSA studied the pillar components in three make-models certified to the head-impact upgrade of FMVSS No. 201, before and after these models were equipped with curtains; the average cost of the components was slightly higher in the vehi-cles with the curtains, suggesting (although not proving) that energy-absorbing materials were not downgraded, at least on these three models, after curtains became available.186
The chapter on FMVSS No. 214 presents analyses of the effectiveness of curtain air bags (over and above the benefits of padding – i.e., the fatality reduction for a vehicle with curtains and cer-tified to FMVSS No. 201 relative to a vehicle without curtains but also certified to FMVSS No. 201). The remainder of the discussion in this chapter is limited to the design of the energy-absorbing padding and its effectiveness in vehicles not yet equipped with curtains.
The “padding” or “foam” used for the head-impact upgrade is not a soft cushion. It is rigid to the touch, but deformable enough to limit force to a level where the risk of head injury is relatively low. Approaches used to meet the head-impact upgrade include composite plastic foam padding,
183 Federal Register 60 (August 18, 1995): 43031. 184 Federal Register 63 (August 4, 1998): 41451. 185 Kahane, C. J. (2014, January). Updated estimates of fatality reduction by curtain and side air bags in side im-pacts and preliminary analyses of rollover curtains. (Report No. DOT HS 811 882, p. 6). Washington, DC: National Highway Traffic Safety Administration. Available at www-nrd.nhtsa.dot.gov/Pubs/811882.pdf. 186 Kahane, C. J. (2011, November). Evaluation of the 1999-2003 head impact upgrade of FMVSS No. 201 – Upper-interior components: effectiveness of energy-absorbing materials without head-protection air bags. (Report No. DOT HS 811 538, p. 17). Washington, DC: National Highway Traffic Safety Administration. Available at www-nrd.nhtsa.dot.gov/Pubs/811538.PDF; Ludtke, N. F., Osen, W., Gladstone, R., & Lieberman, W. (2004, December). Perform cost and weight analysis, head protection air bag systems, FMVSS 201. (Report No. DOT HS 809 842; NHTSA Docket No. NHTSA-2011-0066-0007, pp. 3-47 to 3-54 and Appendix A). Washington, DC: National Highway Traffic Safety Administration.
62
injection-molded ribs in parallel or egg-crate-like (honeycomb) configurations, possibly supple-mented with ridges of composite plastic materials molded into the foam; crushable tubes; thicker roof liners; stretchable fabric materials; and configuration changes of the outer trim parts to al-low for the flexing of these parts under load to absorb some of the impact energy. The ribs are thin-walled panels with parallel sides molded with the wall configuration in line with the direc-tion of the expected impact load. Among the target areas, a 2006 NHTSA study indicated that A-pillars were substantially modified in almost all vehicles. B-pillars and the interior lining of the roof were almost always modified. The other pillars, roof side rails, the front header and the rear header changed less often.187
Test performance: NHTSA compared HIC(d) – the HIC score on the 15 mph headform impact test – at matching target locations in the same or similar make-models before and after the up-grade of FMVSS No. 201.188 To do so, NHTSA purposively selected 15 compliance test reports of high-sales models of cars and LTVs, comprising a variety of body types and manufacturers. A contractor performed identical headform impact tests, at the same locations as in the compliance tests on 15 pre-upgrade vehicles of the same (or similar) make-models. In all, there were 154 matched pairs of impact test locations in pre- and post-upgrade vehicles. HIC(d) averaged 909.9 in 154 head impact tests on pre-upgrade vehicles, ranging from as low as 426 to as high as 1767. In compliance tests of post-upgrade vehicles, the 154 impacts to matching locations in the same make-models resulted in a range of HIC(d) from 373 to 986 and an average of 667.5. That is a statistically significant average improvement of 242.4 units of HIC per test.
Furthermore, HIC(d) exceeded 1000 in 47 of the 154 locations tested in pre-upgrade vehicles, but was less than 1000 in each of the 154 locations in the post-upgrade vehicles. Only 2 of the 15 pre-upgrade vehicles, but all of the post-upgrade vehicles had HIC(d) ≤ 1000 at each location.
HIC(d) was reduced by an average of 476 units in impacts with the A-pillar, 61 in impacts with the B-pillar, 105 with other pillars, 279 with the upper roof and 245 with the roof side rail. All of these improvements were statistically significant. There was a non-significant average increase of HIC(d) by 35 in impacts with the front or rear header. Performance improvement was the largest on the A-pillar, where pre-upgrade performance was the poorest. In the pre-upgrade vehi-cles, HIC(d) averaged 1154 for the A-pillar, 737 for the B-pillar, 747 for other pillars, 930 for the roof side rail, 941 for upper roof and 543 for the front and rear header. After FMVSS No. 201, HIC(d) averaged 679 for the A-pillar, 676 for the B-pillar, 642 for other pillars, 684 for the roof side rail, 662 for upper roof and 578 for the front and rear header. In other words, post-upgrade HIC(d) was nearly uniform at about 650 across the upper interior, with larger improvements on the components where HIC(d) was originally higher.189
Expected benefits: Head injuries due to contacts with upper-interior components of the vehicle (pillars, headers, roof side rails, and the roof interior) were one of the most frequent types of se-vere injury. Also, the vast majority of the severe injuries involving upper-interior contact were head injuries. Specifically, before the upgrade to FMVSS No. 201, head injuries due to contacts 187 Kahane, C. J., & Tarbet, M. J. (2006, November). HIC test results before and after the 1999-2003 head impact upgrade of FMVSS 201. (Report No. DOT HS 810 739, pp. 7-14). Washington, DC: National Highway Traffic Safe-ty Administration. Available at www-nrd.nhtsa.dot.gov/Pubs/810739.PDF. 188 Ibid., pp. 14-24. 189 Ibid., pp. 19-21.
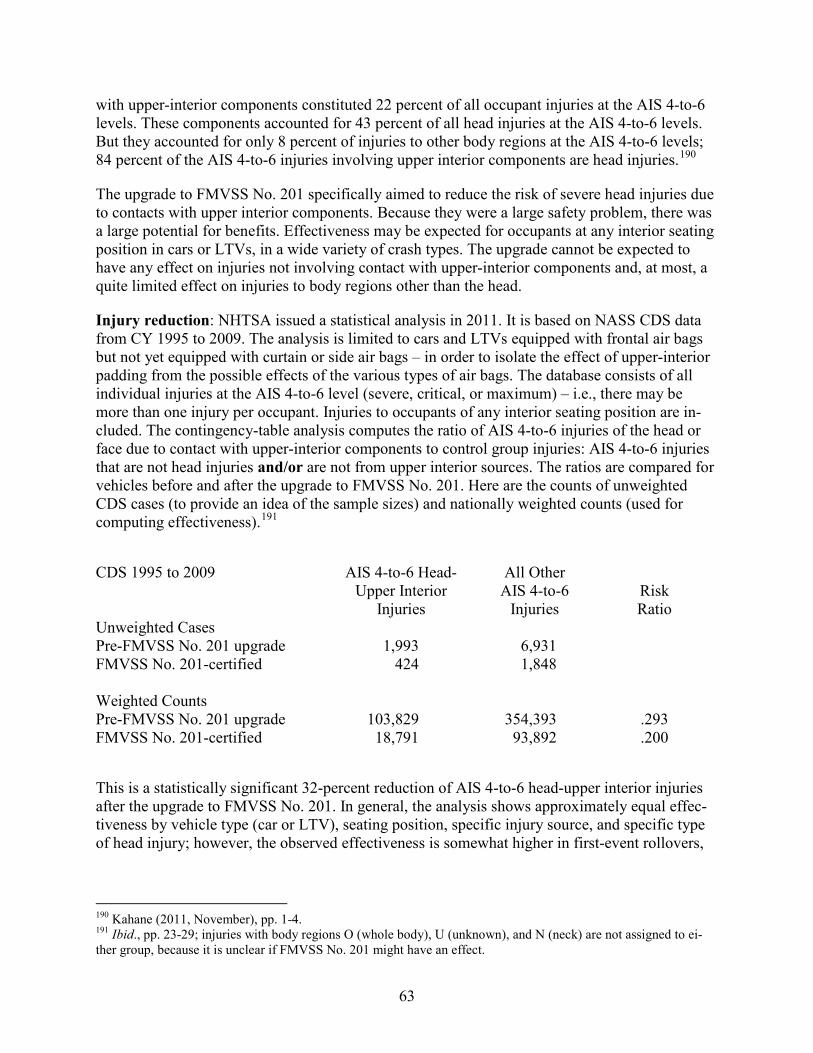
63
with upper-interior components constituted 22 percent of all occupant injuries at the AIS 4-to-6 levels. These components accounted for 43 percent of all head injuries at the AIS 4-to-6 levels. But they accounted for only 8 percent of injuries to other body regions at the AIS 4-to-6 levels; 84 percent of the AIS 4-to-6 injuries involving upper interior components are head injuries.190
The upgrade to FMVSS No. 201 specifically aimed to reduce the risk of severe head injuries due to contacts with upper interior components. Because they were a large safety problem, there was a large potential for benefits. Effectiveness may be expected for occupants at any interior seating position in cars or LTVs, in a wide variety of crash types. The upgrade cannot be expected to have any effect on injuries not involving contact with upper-interior components and, at most, a quite limited effect on injuries to body regions other than the head.
Injury reduction: NHTSA issued a statistical analysis in 2011. It is based on NASS CDS data from CY 1995 to 2009. The analysis is limited to cars and LTVs equipped with frontal air bags but not yet equipped with curtain or side air bags – in order to isolate the effect of upper-interior padding from the possible effects of the various types of air bags. The database consists of all individual injuries at the AIS 4-to-6 level (severe, critical, or maximum) – i.e., there may be more than one injury per occupant. Injuries to occupants of any interior seating position are in-cluded. The contingency-table analysis computes the ratio of AIS 4-to-6 injuries of the head or face due to contact with upper-interior components to control group injuries: AIS 4-to-6 injuries that are not head injuries and/or are not from upper interior sources. The ratios are compared for vehicles before and after the upgrade to FMVSS No. 201. Here are the counts of unweighted CDS cases (to provide an idea of the sample sizes) and nationally weighted counts (used for computing effectiveness).191
CDS 1995 to 2009 AIS 4-to-6 Head- All Other Upper Interior AIS 4-to-6 Risk Injuries Injuries Ratio Unweighted Cases Pre-FMVSS No. 201 upgrade 1,993 6,931 FMVSS No. 201-certified 424 1,848 Weighted Counts Pre-FMVSS No. 201 upgrade 103,829 354,393 .293 FMVSS No. 201-certified 18,791 93,892 .200
This is a statistically significant 32-percent reduction of AIS 4-to-6 head-upper interior injuries after the upgrade to FMVSS No. 201. In general, the analysis shows approximately equal effec-tiveness by vehicle type (car or LTV), seating position, specific injury source, and specific type of head injury; however, the observed effectiveness is somewhat higher in first-event rollovers,
190 Kahane (2011, November), pp. 1-4. 191 Ibid., pp. 23-29; injuries with body regions O (whole body), U (unknown), and N (neck) are not assigned to ei-ther group, because it is unclear if FMVSS No. 201 might have an effect.
64
in head impacts with the A-pillar or roof interior (where HIC was most strongly reduced in head-form tests), and against concussions.192
Fatality reduction: A supplement to FARS called the Multiple Cause of Death (MCOD) file catalogs, for fatally injured people, the injuries designated on their death certificate as having “contributed to the fatality.” FARS-MCOD specifies body regions of injuries, but it does not specify injury sources. Thus, the data can identify head injuries but it cannot single out the head injuries due to upper-interior contact. NHTSA analyzed the FARS-MCOD files for CY 1999 to 2007, which use the ICD-10 classification of injuries and diseases.193 The contingency-table analysis computes the ratio of head injuries to injuries of other body regions. The ratios are com-pared for vehicles before and after the upgrade to FMVSS No. 201. The analysis shows a statisti-cally significant 6.4-percent reduction of head injuries that “contributed to the fatality” after the upgrade to FMVSS No. 201. The result is consistent with the above findings on AIS 4-to-6 inju-ries due to upper-interior contact.194
Based on the CDS and FARS-MCOD results and taking into account the proportion of occupant fatalities primarily attributable to head injuries from upper-interior contacts before the upgrade, NHTSA estimated that the energy-absorbing padding associated with the 1999-to-2003 upgrade of FMVSS No. 201 reduced overall occupant fatality risk by an estimated 4.28 percent (confi-dence bounds, 2.0 to 6.2%).195 This estimate can be taken literally for cars and LTVs produced soon after the upgrade, before the make-models were also equipped with curtain air bags: it is the energy-absorbing materials that are saving the lives. Later on, in vehicles with curtains, the situa-tion is not so clear. If a life is saved, to what extent is it saved by the curtain and to what extent by the energy-absorbing materials? That could depend on the type of crash (e.g., whether or not it deploys the curtain), whether the padding was modified or discontinued upon addition of the curtains, the interior component contacted, and/or how and where the occupant’s head contacts it – information often not available on the crash database. The “lives saved” model in Part 2 of this report, as explained in the “Summary of the Estimation Method” at the beginning of Part 2 sim-plifies the computation in this case, as well as in other cases involving combinations of technolo-gies. It attributes to the FMVSS No. 201 upgrade the above-calculated 4.28-percent reduction in fatality risk in all post-upgrade vehicles, including those with curtains; it attributes to curtains the additional reduction in fatality risk of a vehicle equipped with curtains relative to a vehicle equipped with the energy-absorbing materials but not the curtains. These are the effectiveness estimates that are available from the crash data. It could be argued that this method understates the lives saved by the curtains and overstates lives saved by padding (although the two add up to the right total), but it would be difficult to quantify how many should be reallocated to the cur-tains.
192 Ibid., pp. 29-33. 193 WHO. (2005). International Statistical Classification of Diseases and Health Related Problems, Tenth Revision – ICD-10, Second Edition. Geneva: World Health Organization. Available at www.who.int/classifications/icd/en. 194 Ibid., pp. 37-42; injuries to the neck or to multiple or unspecified body regions are excluded because it is unclear if FMVSS No. 201 might have an effect; the database is limited to cars and LTVs with frontal air bags but without curtain or side air bags. 195 Ibid., pp. 48-50.
65
FMVSS No. 202, “Head restraints” This standard is associated with a vehicle modification whose safety benefits have been evaluat-ed by NHTSA and with an upgrade that phased in during MY 2010 to 2012:
• Head restraints for outboard front seats • 2010-2012 head restraint upgrade (not yet evaluated)
Head restraints aim to mitigate injury risk in rear impacts, cushioning the heads of drivers, RF passengers, and, in some vehicles, rear seat passengers. They were introduced in passenger cars over model years 1964 to 1969 and in LTVs over a longer period, extending until 1992. The first paragraph of FMVSS No. 202 states, “This standard specifies requirements for head restraints to reduce the frequency and severity of neck injury in rear-end and other collisions.”196
Head restraints for outboard front seats/original version of FMVSS No. 202 Regulatory history: FMVSS No. 202, applying at first only to the driver’s and RF seats of pas-senger cars, was proposed in December 1967, became a final rule in February 1968 and had an effective date of January 1, 1969. It incorporates parts of General Services Administration Standard 515/22, effective October 1967 for Federally purchased vehicles. The extension of FMVSS No. 202 to the driver’s and RF seats of LTVs with GVWR up to 10,000 pounds was is-sued in September 1989 and took effect on September 1, 1991.197
How head restraints work: “Whiplash” is by far the most frequent injury in rear-impact crash-es. It is common even in low-speed, non-towaway crashes. It results from strains, tears or micro-scopic damage to muscles, tendons, ligaments, vertebra or nerves in or near the neck. The most familiar symptoms are pain or stiffness in the neck and upper back. Also common are pain or weakness in the arms or shoulders, and symptoms involving the central nervous system, such as headache, sight or hearing disturbances. Symptoms may appear immediately or not for several days. They may end in a day or two or they may go on, continually or intermittently, for a long time, even years.198
The first causal mechanism identified for whiplash was hyperextension of the neck. In a rear im-pact, a low, pre-FMVSS No. 202 seat back holds the occupant’s back in place but the head jerks
196 49 CFR, Part 571.202. 197 Kahane, C. J. (1982, February). An evaluation of head restraints - Federal Motor Vehicle Safety Standard 202. (Report No. DOT HS 806 108, pp. 104-106). Washington, DC: National Highway Traffic Safety Administration. Available at www-nrd.nhtsa.dot.gov/Pubs/806108.PDF; Walz, M. C. (2001, April). The effectiveness of head re-straints in light trucks. (Report No. DOT HS 809 247, p. 1). Washington, DC: National Highway Traffic Safety Administration. Available at www-nrd.nhtsa.dot.gov/Pubs/809247.PDF; Federal Register 31 (March 8, 1966): 4096, 31 (July 15, 1966): 9637, 32 (December 28, 1967): 20865, 33 (February 14, 1968): 2945, 54 (September 25, 1989): 39183. 198 Kahane (1982, February), pp. 80-83; Walz (2001, April), pp. 2-5; Mertz, H.J., Jr., & Patrick, L.M. (1967). Inves-tigation of the kinematics and kinetics of whiplash. Proceedings of Eleventh Stapp Car Crash Conference. New York: Society of Automotive Engineers; States, J. D., Korn, M. W., & Massengill, J. B. (1969). The enigma of whiplash injuries. Proceedings of the Thirteenth Annual Conference of the American Association of Automotive Medicine. Morton Grove, IL: American Association of Automotive Medicine; Accident Analkysis and Prevention. (2000, March). Accident Analysis and Prevention, 32.
66
backward, over the top of the seat back, twisting the neck and injuring it. The remedy was to de-velop a head restraint that effectively makes the seat back higher, keeps the head upright and in line with the torso, and prevents twisting of the neck. However, subsequent research suggests that hyperextension is by no means the only mechanism of whiplash; other causes may include the longitudinal movement of the head relative to the torso, or rapid changes in spinal column pressure during the impact.
Research on rear impacts and development of prototype head restraints began at the University of California, Los Angeles in the mid-1950s. The manufacturers have developed three main types of head restraints for production vehicles:
• Adjustable head restraints that may be lifted or lowered to suit the occupant. The head re-straint should be lifted until the top of the restraint is at least level with the tops of the oc-cupant’s ears, or preferably as high as it can go without blocking the driver’s vision. Some head restraints can also be adjusted forwards and backwards; if so, they should be moved forward as far as possible consistent with the occupant’s comfort.
• Integral head restraints, such as “captain’s chairs” or other seat backs that extend upwards behind the driver’s head.
• Fixed head restraints, such as padded tubes, shaped like an inverted “U,” attached to the top of the seat back.
The test for FMVSS No. 202 requires the top of the head restraint to reach at least 27.5 inches above the “seating reference point” (the level of the seat cushion when the seat is occupied). That height provides adequate support for the head and neck of occupants up to 5’10” tall. If it is an adjustable head restraint, it only needs to achieve this height in the “up” position. The restraint must be able to withstand a static force of 200 pounds in the rearward direction, or meet a dy-namic test.199
In actual pre-standard cars, the median seat back, without a head restraint, was 23 inches tall, well below the level that would be set by FMVSS No. 202. In actual cars of the 1970s, the medi-an integral or fixed head restraint – and the median adjustable head restraint in the “up” position – reached 29 inches, exceeding the FMVSS No. 202 requirement. However, at that time occu-pants left 75 percent of adjustable head restraints in the “down” position, at a median height of 26 inches, and did not obtain full protection if they were 5’8” or taller. Integral or fixed head re-straints predominated on small cars with bucket seats, but were becoming infrequent on bench or split-bench seats. In all, 30 percent of cars had integral or fixed head restraints, while 70 percent had adjustable head restraints in the 1970s. Although adjustable head restraints were often mis-positioned, consumers seemed to prefer them. A 1974 NHTSA proposal to require integral or fixed head restraints for drivers, increase height requirements, and establish a minimum height for adjustable restraints in the “down” position was not adopted. 200
199 Kahane (1982, February), pp. 103-107; Severy, D. M., Brink, H. M., & Baird, J. D. (1968). Backrest and head restraint design for rear-end collision protection. (Paper No. 680079). New York: Society of Automotive Engineers; 49 CFR, Part 571.202. 200 Kahane (1982, February), pp. 113-123 and 257-259; Federal Register 39 (March 19, 1974): 10268.
67
By the mid-1990s, the situation had deteriorated in some ways and improved in others. Just 12 percent of new cars had integral or fixed head restraints. On the other hand, occupants were now leaving only 50 percent of the adjustable restraints “down,” and the median height of adjustable head restraints in the “down” position had improved to 27 inches – close to the FMVSS No. 202 requirement for the “up” position. Also, integral head restraints predominated in LTVs.201
Some questions about head restraints have been raised time and again during the past 30 years. (1) Are integral/fixed restraints more effective than adjustable head restraints, as used (often in-correctly adjusted), and if so, why do more cars not have integral or fixed restraints? (2) Should head restraints be increased in height (both in the “up” and the “down” positions) to protect tall-er-than-average occupants? How much? Would consumers accept them? (3) How important is it for the head restraint to be close to the head? Should head restraints be adjustable backwards and forwards, and/or should FMVSS No. 202 specify a maximum longitudinal distance from the head restraint to the head? (4) In combination with a head restraint, is a rigid seat back or a flexi-ble seat back more desirable for mitigating whiplash? (5) Will head restraints be less effective in pickup trucks with conventional cabs than in other vehicles to the extent that the back wall of the cab, immediately behind the front seat, provides some degree of protection?202
Some passenger cars were equipped with head restraints as early as 1964, well before the Janu-ary 1, 1969 effective date. However, only 3 percent of model year 1967 cars and 12 percent of model year 1968 cars had them. In model year 1969, as FMVSS No. 202 took effect in mid-year, 88 percent of cars were equipped with them. The extension of FMVSS No. 202 to LTVs was proposed in 1988 and took effect in September 1991. Most models of domestic pickup trucks were first equipped with head restraints between the proposal and the effective date (model years 1989-92). By contrast, the majority of vans and SUVs were already equipped with head restraints or high seat backs potentially meeting FMVSS No. 202 as early as model year 1983.203
Expected benefits: Drivers and RF passengers can expect to receive benefits primarily in rear-impact crashes, since other impacts are far less likely to propel occupants backwards, directly toward the head restraint. “Whiplash” is usually a complaint-of-pain injury, seldom life-threatening, but it can manifest itself in many body regions. A significant fatality reduction, or a significant reduction in lacerations or related injuries is not anticipated. There is likely to be a reduction of minor/moderate non-bleeding injuries to the neck, the head and quite possibly the arms and back, even in crashes of low severity (non-towaways).
Injury reduction – passenger cars: NHTSA’s analysis, published in 1982, is based on 1972, 1974 and 1977 Texas data.204 Texas files have records on every crash-involved driver, injured or not, and permit computation of the overall injury rate per 100 drivers in rear-impact crashes. In-jury rates are compared for model year 1968, when only 6 percent of cars had adjustable and 6 percent had integral head restraints, and model year 1969, when 81 percent of cars had adjusta-ble, and 7 percent had integral head restraints:
201 NHTSA. (1996). Head restraints – Identification of issues relevant to regulation, design, and effectiveness. Washington, DC: National Highway Traffic Safety Administration. Available at www.nhtsa.dot.gov/cars/rules/crashworthy/ headrest/status9/status9.html#28), pp. 19-23. 202 Walz (2001, April), pp. 2-5. 203 Kahane (1982, February), p. 104; Walz (2001, April), p. 2. 204 Kahane (1982, February), pp. 181-197.
68
N of n Percent Drivers Injured Injured Model year 1968 ( 6% with adj. head restraints) 20,214 1,531 7.57 Model year 1969 (81% with adj. head restraints) 23,051 1,605 6.96
The injury rate is significantly lower in the 1969 cars. The arithmetic works out to a 10.4-percent injury reduction for adjustable head restraints relative to no head restraints. An identical estimate was obtained when the reduction in rear-impact injury rates was measured relative to a control group of side impacts, over a wider range of “before” and “after” model years.
Next, the analysis compared a group of 1970-to-1977 make-models equipped almost exclusively (96%) with integral restraints to another group of make-models equipped with 97 percent adjust-able head restraints.205 In Texas, the injury rates in rear impacts were:
N of n Percent Drivers Injured Injured Models with 97% adjustable head restraints 17,758 1,394 7.85 Models with 96% integral head restraints 21,205 1,552 7.32
The injury rate is significantly lower in the make-models with primarily integral head restraints. It works out to a 7.3-percent injury reduction for integral relative to adjustable head restraints. The injury reduction for integral head restraints relative to no head restraints at all is 16.9 percent – i.e., 1 - [(1 - .104)(1 - .073)]. Head restraints have significantly reduced the frequency of whip-lash in crashes, but they have not nearly eliminated this type of injury.
Using 1979 as the “baseline” year, the evaluation estimated that an on-the-road fleet with 100 percent adjustable head restraints would prevent 52,000 injuries per year in passenger cars, but a fleet with 100 percent integral or fixed head restraints would prevent 85,000 injuries per year.206
Fatality reduction – passenger cars: In-depth investigations of fatal rear-impact crashes showed that most of the fatalities involved fire, occupant ejection or catastrophic intrusion: mechanisms unlikely to be influenced much, one way or the other, by head restraints. NHTSA analyzed 1975-80 FARS data by various techniques: rear-impact fatalities, before and after FMVSS No. 202, relative to control groups of fatalities in other crash modes; regression anal-yses; rear-impact fatality rates per million vehicle years. None of these analyses showed a statis-tically significant effect for head restraints.207
205 Ibid., pp. 212-225. 206 Ibid., pp. 237-245; 90 percent confidence bounds for effectiveness of adjustable head restraints: 4.0 to 16.8 per-cent, for integral head restraints: 9.1 to 24.7 percent; for benefits of adjustable head restraints: 17,000 to 87,000 inju-ries prevented, for integral head restraints: 40,000 to 130,000 injuries prevented per year. 207 Ibid., pp. 91-95 and 161-177.
69
Injury reduction – LTVs: NHTSA’s 2001 evaluation of head restraints for LTVs used CY 1993-to-1998 data from eight States: Florida, Indiana, Maryland, Missouri, North Carolina, Pennsylvania, Texas and Utah. Statistics were based on seven domestic make-models of pickup trucks that shifted during MY 1990-to-1992 from few or no head restraints in one model year to 100 percent or near-100 percent equipped with head restraints in the next year. Injury rates were compared for the first two model years with head restraints and the last two years before head restraints. Vans and SUVs were mostly equipped with head restraints from the start of produc-tion, precluding computation of “before” injury rates, and could not be included in the analyses. Injury rates were computed for drivers and RF passengers in rear-impact crashes and for a con-trol group of frontal crash involvements.208 Injury rates for the combined eight State date files were:
N of n Percent Occupants Injured Injured
REAR IMPACTS Last 2 MY before head restraints 43,520 11,500 26.42 First 2 MY with head restraints 50,434 12,307 24.40
FRONTAL IMPACTS Last 2 MY before head restraints 98,541 23,581 23.93 First 2 MY with head restraints 106,417 24,631 23.15
Clearly, the injury reduction is greater in the rear impacts (where head restraints are effective) than in the frontal impacts (where head restraints ought to have no effect, and any difference be-tween the “before” and “after” is due to various biases in the data). When the data is weighted by the number of registered pickup trucks in each State, rather than merely aggregated, and after corrections for the small percentages of trucks in the “before” group that already had head re-straints and for those in the “after” group that still did not, this works out to a statistically signifi-cant 6.1-percent injury reduction for head restraints in rear impacts (relative to the control group). Using 1999 as the “baseline” year, the evaluation estimated that when all LTVs on the road (pickups, vans and SUVs) are equipped with head restraints, they will prevent 14,900 inju-ries per year.209
It is unknown why head restraints are more effective in passenger cars (10.4 – 16.9%) than in LTVs (6.1%). Perhaps the large mass and extensive rear structure of LTVs, especially pickup trucks, offers a degree of protection in rear impacts that makes it less necessary to have head re-straints. Also, this evaluation did not show a significant difference in the effectiveness of adjust-able versus integral head restraints in pickup trucks.210
208 Walz (2001, April), pp. 9-27 and 41-46. 209 Ibid., pp. 65-68; 90 percent confidence bounds for effectiveness: 3.5 to 8.7 percent; for benefits: 8,300 to 21,700 injuries prevented, per year. 210 Ibid., pp. 58-63 and 68-69.
70
Fatality reduction – LTVs: NHTSA’s 2001 evaluation does not analyze fatal crashes separate-ly. However, it is reasonable to infer that, just as in passenger cars, head restraints have little or no effect on fatalities in LTVs.
2010-2012 head restraint upgrade (not yet evaluated) Biomechanics research during the 1990s, statistical analyses, and observational studies suggested that head restraints could be more effective if they were (1) high, even in their lowest position, and stay locked in position and (2) close to the occupant’s head. On December 14, 2004, NHTSA amended FMVSS No. 202 to raise the outboard front seat’s height requirement in the head restraint’s highest position from 700 mm (27.5 inches) to 800 mm (31.5 inches) and to add a new requirement that the restraint must be at least 750 mm (29.5 inches) high in its lowest po-sition; also that the restraint should stay locked in position and cannot be lowered simply by pushing down on it. The rearward distance from the back of the head to the restraint (“backset”) has to be less than 55 mm. As an alternative to the preceding height requirements, the head re-straint (adjusted to its mid-height position) and seat assembly may demonstrate acceptable per-formance on a 17.3 km/h rear-impact sled test, as evidenced by HIC no more than 500 and angu-lar rotation of the dummy head no more than 12°. The new requirements were phased in during MY 2010 to 2011 at the outboard front seats.211 The Insurance Institute for Highway Safety has rated head restraints since 1995, based on their geometry and the dummy’s kinematics and neck forces in a rear impact with a 10 mph velocity change.212
By 2000, manufacturers were equipping rear seats with head restraints on many vehicles. The upgraded standard does not mandate head restraints for the outboard rear seats, but if they are so equipped they must be at least 750 mm high in their lowest position or meet the dynamic per-formance requirements. The rear seat requirements phased in during MY 2011 to 2012. Active head restraints that move closer to the backs of occupants' heads in rear-end crashes are another technology that is now standard equipment on many vehicles.
The goals of the upgrade are to provide whiplash protection for tall occupants, safeguard people of average height even if they leave adjustable restraints in the “down” position, and protect rear seat passengers. NHTSA plans to evaluate the upgrade by statistical analyses of crash data from States that identify the body region of the injury as well as the MY, make, and model of the ve-hicle and the impact location. These files can be used to compute neck injury rates per 100 occu-pants involved in rear impacts:
• Before and after the upgrade of head restraints in the front seat; • Before and after the installation of head restraints in the rear seat; and • With and without active head restraints.
211 Federal Register 69 (December 14, 2004): 74848; Federal Register 72 (May 4, 2007): 25514. 212 www.iihs.org/iihs/ratings/ratings-info/rear-head-restraints-test.

71
FMVSS No. 203, “Impact protection for the driver from the steering control system” FMVSS No. 204, “Steering control rearward displacement” These two standards regulate one safety technology:
• Energy-absorbing and telescoping steering assembly
It is a basic protection for drivers in frontal crashes, designed to cushion their impact into the steering assembly. It was introduced in passenger cars from MY 1967 to 1968 and in LTVs over a longer period, extending approximately from 1970 to 1982.
The first paragraph of FMVSS No. 203 states, “This standard specifies requirements for steering control systems that will minimize chest, neck, and facial injuries to the driver as a result of im-pact.” FMVSS No. 204 “specifies requirements limiting the rearward displacement of the steer-ing control into the passenger compartment to reduce the likelihood of chest, neck or head inju-ry.”213
Regulatory history: FMVSS Nos. 203 and 204, applying at first only to passenger cars, were among NHTSA’s initial safety standards, with a NPRM in December 1966, a final rule in Febru-ary 1967 and an effective date of January 1, 1968. They basically incorporate General Services Administration Standard 515/4a, effective October 1967, for Federally purchased vehicles, and draw on SAE Recommended Practices J850 and J944. FMVSS Nos. 203 and 204 were extended to LTVs with GVWR up to 10,000 pounds, effective September 1, 1981.214
How it works: Before FMVSS Nos. 203 and 204, the steering assembly was by far the most common source of fatal or serious injuries for drivers in frontal crashes. The pre-standard steer-ing column was essentially a rigid pole attached to the vehicle’s front structure. When drivers’ forward momentum propelled them into the column, it did not “give.” Even worse, when the front structure deformed rearwards in a frontal impact, it pushed the column upwards and back-wards toward the driver.215
The safety technology associated with FMVSS Nos. 203 and 204 consists of devices that arrest, absorb or deflect the rearward motion of the column in crashes and that deform at a safe level of force upon impact by the driver. The single, rigid column was replaced by assemblies of concen-tric tubes. The inner tube slides within the outer tube (telescopes) to make the assembly shorter in case of impact. Usually there are two telescoping sections, each about eight inches long: one in the engine compartment to prevent frontal damage to the vehicle from translating into rear-ward displacement of the steering wheel, and one in the passenger compartment to allow the driver to compress the steering assembly forward. The telescoping section in the passenger com-
213 49 CFR, Parts 571.203 and 571.204. 214 Kahane, C. J. (1981, January); Federal Register 31 (March 8, 1966): 4091, 31 (July 15, 1966): 9631, 31 (Decem-ber 3, 1966): 15212, 32 (February 3, 1967): 2414, 44 (November 29, 1979): 68470; SAE. (1968). 1968 SAE Hand-book. New York: Society of Automotive Engineers, pp. 915-916 and 923-925. 215 Kahane (1981, January), pp. 67-80; Huelke, D. F., & Gikas, P. W. (1968). How do they die? Medical engineering data from on-scene investigation of fatal automobile accidents. Highway Vehicle Safety. New York: Society of Au-tomotive Engineers; Voight, G., & Wilfert, K. (1969). Mechanisms of injury to unrestrained drivers in head-on col-lisions. (Paper No. 690811). New York: Society of Automotive Engineers.
72
partment, however, does not slide freely but contains retardant devices such as crushable mesh that collapse at a safe, controlled force level, absorbing the energy of the driver’s impact. The manufacturers developed about five distinct types of energy-absorbing devices.216
The shear capsule, which brackets the column to the instrument panel, is a one-way gate that re-sists the rearward movement of the column due to vehicle damage but freely allows the forward movement of the column upon driver impact. The assembly may contain universal joints to give it a flexible Z-shape, further isolating the steering-wheel area from damages within the engine compartment. Some vehicles may have a deformable canister in the steering wheel instead of/in addition to a telescoping column in the passenger compartment. Steering wheel rims and spokes may also be deformable. Manufacturers padded steering-wheel hubs and removed hazardous ap-purtenances such as horn rings.
In the test for FMVSS No. 203, a body block simulating an adult torso (the “black tuffy”), mov-ing straight ahead, impacts a steering assembly mounted at the manufacturer’s installation angle. The steering assembly is intact and has been removed from the vehicle. At an impact speed of 22 feet per second, the force on the body block may not exceed 2,500 pounds. The test approach and the design of most columns have raised several issues over the years: (1) Columns are well-designed to compress under axial (straight-ahead) impacts, but there are questions about their performance in off-center impacts; (2) The driver might have an easier time compressing an in-tact column (as in the test) than one that has been damaged or displaced during the vehicle im-pact phase; (3) A force level of 2,500 pounds may be acceptable for the healthy adult torso but excessive for older adults or when the head or abdomen contacts the steering wheel; a 1970 pro-posal for a more stringent requirement was not adopted; (4) It was difficult for some full-sized vans to meet FMVSS No. 203 since their steering columns were nearly vertical, perpendicular to the motion of the body block; the lead-time allowed for extending FMVSS No. 203 to LTVs es-sentially permitted the phase-out of vans with near-vertical columns.217
FMVSS No. 204 is tested in the 30 mph or 35 mph, full-vehicle impact with a frontal barrier that simultaneously tests FMVSS Nos. 208, 219 and 301 as well. The steering assembly is not al-lowed to intrude more than 5 inches rearward, into the passenger compartment in a 30 mph test; if the barrier test is conducted at 35 mph and intrusion does not exceed 5 inches that, too, demon-strates compliance with FMVSS No. 204. Vertical or sideways motion is permitted and has been substantial in a few test vehicles. That has also raised questions about the ability of these dis-placed or damaged columns to compress upon impact by the driver.
Vehicles equipped with dual or driver-only frontal air bags – specifically, at this time, vehicles required to meet S5.1 of FMVSS No. 208 by means other than a seat belt (the unbelted test spec-ified by S5.1.2), which currently includes all new cars and LTVs up to 8,500 pounds GVWR – are exempt from the FMVSS No. 203 test. However, they continue to have energy-absorbing
216 Kahane (1981, January), pp. 87-93; Marquis, D.P. (1967). The General Motors energy absorbing column. (Paper No. 670039). New York: Society of Automotive Engineers; Huelke, D. F. (1969). Accident investigations of perfor-mance characteristics of energy absorbing steering columns. (Paper No. 690184). New York: Society of Automo-tive Engineers. 217 Kahane (1981, January), pp. 93-99; Hill, A. (1978). Steering wheel oscillations and vertical movements in 30 mph barrier impacts. (Report No. DOT HS 803 606). Washington, DC: National Highway Traffic Safety Admin-istration.
73
steering columns that, in combination with air bags, are still important for providing “crush space” and cushioning the driver’s impact. The FMVSS No. 208 test, which measures the driv-er’s injury risk in a 30 mph or 35 mph crash, implicitly tests the performance of the energy-absorbing steering assembly as part of the overall safety system.
The manufacturers were developing energy-absorbing and telescoping steering assemblies before NHTSA existed. All MY 1967 GM, Chrysler and American Motors cars built in the United States or Canada were equipped with them. All MY 1968 passenger cars had them, even though the standards did not take effect until mid-model year (January 1, 1968). Implementation in LTVs took place over a longer period and is not as clearly documented: the Volkswagen “bus” apparently had them in 1970, all Jeep and GM LTVs in 1973, and other LTVs in later years, some not until the effective date, September 1, 1981.218
Expected benefits: Only drivers can expect to receive benefits, since passengers rarely make significant contact with the steering assembly. Benefits are primarily in frontal crashes, since other impacts rarely propel the driver into the steering assembly directly and with enough force to compress the column. The principal benefit would be expected for injuries caused by driver contact with the steering assembly. The largest reductions are expected for chest injuries, alt-hough head, neck and abdominal injuries could be mitigated as a result of less steering-column intrusion, more deformable steering wheels, and removal of hazardous appurtenances. The larg-est reductions are expected for unbelted drivers, since belts absorb much of the driver’s momen-tum prior to contact with the steering assembly.
Fatality reduction – passenger cars: NHTSA’s analysis, published in 1981, was its first com-prehensive evaluation of a FMVSS. It is based on 1975-to-1979 FARS data.219 Since FARS data does not indicate the source or body region of fatal injuries, or provide information on nonfatal crashes to allow computation of fatality rates, they are best suited for comparing overall fatality risk of drivers in frontal crashes, before and after FMVSS Nos. 203/204, relative to a control group. One possible control group is the passenger fatalities in these same frontal crashes. The 1975-to-1979 FARS statistics are:
Driver Passenger Risk 1975-to-1979 FARS Frontals Frontals Ratio Model year 1966 (“before”) 2,119 1,048 2.022 Model year 1968 (“after”) 2,573 1,463 1.759
218 Kahane (1981, January), p. 92; NHTSA. (1977). Multidisciplinary accident investigation data file, editing manu-al and reference information, Vol. 2. (Report No. DOT HS 802 412). Washington, DC: National Highway Traffic Safety Administration; Motor Vehicle Manufacturers Association. (1978). 1978 model year passenger car and truck accident investigator’s manual. Detroit: Author; Ludtke, N. F. (1980). 1980 and 1979 Ford F-150 weight and cost analysis. Third Automotive Fuel Economy Research Contractors’ Coordination Meeting – Summary Report. (Report No. DOT HS 805 875). Washington, DC: National Highway Traffic Safety Administration; NHTSA. (1978). Pre-liminary evaluation of the proposed extension of standards no. 201, 203 and 204 to light trucks, buses, and multi-purpose vehicles, Washington, DC: National Highway Traffic Safety Administration, Office of Plans and Policy. 219 Kahane (1981, January), pp. 197-203.
74
This is a statistically significant 13-percent fatality reduction for the drivers, relative to the pas-sengers, in MY 1968: 1 – [(2,573/2,119) / (1,463/1,048)] = .13.
Another control group is driver fatalities in side or rear impacts. The 1975-to-1979 FARS statis-tics are:
Driver Driver Risk 1975-to-1979 FARS Frontals Side/Rear Ratio Model year 1966 (“before”) 2,119 1,103 1.921 Model year 1968 (“after”) 2,573 1,508 1.706
This is a statistically significant 11.1-percent fatality reduction in frontals, relative to side and rear impacts, in model year 1968: 1 – [(2,573/2,119) / (1,508/1,103)] = .111.
The average of these two estimates is a 12.1-percent fatality reduction for drivers in frontal crashes. Using 1978 as the “baseline” year, the evaluation estimated that energy-absorbing steer-ing assemblies would eventually save 1,300 lives per year in passenger cars, when all cars on the road met FMVSS Nos. 203 and 204. Only seat belts and frontal air bags currently save more lives.220
These estimates of effectiveness and benefits can be taken literally for cars and LTVs without frontal air bags: it is the energy-absorbing steering assemblies that are saving the lives. Later on, when vehicles were equipped frontal air bags but also continued to have the energy-absorbing steering assemblies, the situation is not so clear. The combination of these technologies creates a system that provides ride-down for drivers and saves many lives, but it is difficult to tease out the relative contributions of the air bag and the energy-absorbing steering assembly. The “lives saved” model in Part 2 of this report, as explained in the “Summary of the Estimation Method” at the beginning of Part 2 simplifies the apportionment in this case, as well as in other cases involv-ing combinations of technologies. The model first estimates the additional fatalities for “remov-ing” the frontal air bags but leaving in place the earlier technology (the energy-absorbing steer-ing assemblies); then it estimates another increment in fatalities for also “removing” the earlier technology. It attributes to air bags the additional reduction in fatality risk of a vehicle equipped with air bags plus energy-absorbing assemblies relative to a vehicle equipped with the energy-absorbing materials but not the air bags. It then continues to attribute the above-calculated 12.1-percent fatality reduction for drivers in frontal crashes to energy-absorbing steering assemblies.
Injury reduction – passenger cars: NHTSA’s 1981 analysis uses data from NCSS, the prede-cessor of NASS. This data specifies, like NASS, the severity, body region and contact source of injuries. The injury rate – the number of fatal or hospitalizing injuries due to contact with the steering assembly per 100 drivers involved in frontal towaway crashes – was computed for cars with energy-absorbing steering assemblies and compared to the rate in cars without the assem-blies. These injury rates were controlled for factors such as driver age and gender by multidi-
220 90 percent confidence bounds for effectiveness: 8.5 to 15.5 percent; for benefits: 900 to 1800 lives saved.
75
mensional contingency table analysis, a predecessor of the logistic regression method widely used today.221
The analysis showed a statistically significant 38.4-percent reduction of fatal or hospitalizing in-juries due to contact with the steering assembly. Using 1978 as the “baseline” year, the evalua-tion estimated that energy-absorbing steering assemblies would prevent 23,000 nonfatal hospital-izations per year when all cars on the road met FMVSS Nos. 203 and 204.222
The NCSS data did not show any one of the five types of energy-absorbing columns to be signif-icantly more effective, or less effective than the other types, nor did the data show a significant difference between energy-absorbing columns and energy-absorbing canisters in the steering wheel. In other words, the United States data did not duplicate the results of a British study find-ing much higher effectiveness for the canisters and much better performance under non-axial loading.223
NHTSA’s evaluation and other analyses showed many frontal crashes in which compression of the column was slight or minimal, especially in the presence of non-axial forces. These results, however, tended to be inconclusive because of the difficulty of establishing cause-and-effect re-lationships. It is difficult to determine if columns were “binding” and causing injury to drivers, or if the compression of the column was slight because it was not strongly impacted by the driv-er. The effect, if any, of vehicle damage on the column’s ability to compress in response to occu-pant loading is also unclear. In other words, the data did not point to an unequivocal need or method for strengthening the FMVSS No. 203 regulation, and the issue eventually became moot with the introduction of air bags and with higher use of seat belts.224
The NCSS data demonstrated the exceptional success of FMVSS No. 204. Intrusion of the steer-ing column in any direction (rearward, upward or sideways) was reduced by 68 percent in frontal towaway crashes and rearward intrusion, in particular, was reduced by 81 percent.225
The introduction of energy-absorbing and telescoping steering assemblies, along with deforma-ble steering wheels, padded hubs, and removal of hazardous appurtenances, reduced injuries to all body regions: chest, abdomen, and head/neck. It did not have any undesirable side effects, such as increased driver injuries due to contacts with other parts of the vehicle (windshield, in-strument panel, etc.).226
221 Ibid., pp. 138-197; Kahane, Smith, & Tharp (1977). 222 90 percent confidence bounds for effectiveness: 28 to 48 percent; for benefits: 14,900 to 33,500 hospitalizations prevented. 223 Kahane (1981, January), pp. 226-236; Gloyns, P. F., & Mackay, G. M. (1974). Impact performance of some de-signs of steering assembly in real accidents and under test conditions. Proceedings of Eighteenth Stapp Car Crash Conference. Warrendale, PA: Society of Automotive Engineers. 224 Kahane (1981, January), pp. 249-269; Garrett, J. W., & Hendricks, D.L. (1975). Factors influencing the perfor-mance of the energy absorbing steering column in accidents. Report on the Fifth International Technical Conference on Experimental Safety Vehicles. Washington, DC: National Highway Traffic Safety Administration; Horsch, J. D., Petersen, K. R., & Viano, D. C. (1982). Laboratory study of factors influencing the performance of energy absorb-ing steering systems. (Paper No. 820475). Warrendale, PA: Society of Automotive Engineers. 225 Kahane (1981, January), pp. 220-226. 226 Ibid., pp. 239-248.
76
Fatality reduction – LTVs: NHTSA’s 1988 evaluation of occupant protection in frontal interior impact addresses the effect of energy-absorbing steering assemblies in LTVs. Since there was uncertainty about exactly when these assemblies were first installed, a direct “before-after” com-parison, as shown above for cars, seemed unsuitable. Instead, a more extended time-series analy-sis considered head-on collisions between early- and late-model vehicles. The analysis controlled for vehicle weight, driver age and gender. Who fared better: the driver of the late-model truck or the early-model truck? This analysis indicated a 16-percent reduction in fatality risk for unre-strained drivers in frontal crashes during the model years that energy-absorbing steering assem-blies were primarily installed in LTVs (1973-80). The corresponding analysis for passenger cars showed a 12-percent reduction in fatality risk during the model years that those assemblies were installed in cars (1967-68). Since the results are quite similar (well within sampling-error bounds), NHTSA concludes that energy-absorbing steering assemblies are as effective in LTVs as in passenger cars – i.e., an estimated 12.1-percent fatality reduction for drivers in frontal crashes.227
Injury reduction – LTVs: NHTSA’s crash files, at the time of the 1988 evaluation, did not have enough data for a statistically meaningful analysis of the injury-reducing effectiveness of energy-absorbing steering assemblies in LTVs.228
227 Kahane (1988, January), pp. xxx-xxxii, xxxiv and 192-194. 228 Ibid., pp. 165-173.
77
FMVSS No. 205, “Glazing materials” This standard regulates automotive glazing. NHTSA has evaluated two innovative safety tech-nologies for glazing:
• High penetration resistant (HPR) windshields • Glass-plastic windshields
HPR windshields, an essential protection against facial lacerations, have been standard equip-ment in motor vehicles since MY 1966. Glass-plastic windshields, although originally envi-sioned as even better protection against lacerations, were only installed on a few make-models of passenger cars during 1985 to 1987 and then discontinued.
FMVSS No. 205 states, “The purpose of this standard is to reduce injuries resulting from impact to glazing surfaces, to ensure a necessary degree of transparency in motor vehicle windows for driver visibility, and to minimize the possibility of occupants being thrown through the vehicle windows in collisions.”229 FMVSS No. 205 regulates all automotive glazing, including wind-shields, side and rear windows, etc. However, during the 1965-to-2012 timeframe the only prom-inent innovations NHTSA evaluated pertained to windshields. These two evaluations will now be discussed, one-by-one.
High penetration resistant (HPR) windshields Regulatory history: FMVSS No. 205 applies to all motor vehicles. The first version of FMVSS No. 205 was one of NHTSA’s initial safety standards, with a NPRM issued in December 1966, a final rule issued in February 1967 and an effective date of January 1, 1968. It primarily incorpo-rated the American National Standards Institute (ANSI) Safety Code Z26.1 (July 1966) and SAE Standard J938, (October 1965). ANSI has periodically updated Code Z26.1 and NHTSA has amended FMVSS No. 205 on several occasions to incorporate updated codes. Currently, based on a final rule the agency issued in July 2003, FMVSS No. 205 incorporates the 1996 edition of Code Z26.1. However, in July 2005, NHTSA also issued FMVSS No. 205(a), based on the 1977 and 1980 editions of Code Z26.1; at this time, replacement glazing for vehicles built before No-vember 1, 2006, may conform to either FMVSS No. 205 or FMVSS No. 205(a), but glazing for vehicles built after that date must conform to FMVSS No. 205. 230
How HPR windshields work: Laminated “safety” windshields, comprised of a thin sheet of plastic sandwiched between two layers of glass, date back to 1927 in the United States. Never-theless, the pre-HPR laminated windshield caused large numbers of facial lacerations requiring surgical care. The glass layers readily broke and tore through the plastic layer in moderately se-vere frontal crashes with head-impact speeds around 13 mph. The HPR windshield incorporated
229 49 CFR, Part 571.205. 230 Kahane, C. J. (1985, February). An evaluation of windshield glazing and installation methods for passenger cars. (Report No. DOT HS 806 693, pp. 1-2). Washington, DC: National Highway Traffic Safety Administration. Availa-ble at www-nrd.nhtsa.dot.gov/Pubs/806693.PDF; Federal Register 31 (March 8, 1966): 4091, 31 (July 15, 1966): 9631, 31 (December 3, 1966): 15212, 32 (February 3, 1967): 2414, 68 (July 25, 2003): 43964, 70 (July 12, 2005): 39959; American National Standards Institute. (1966). Safety code for safety glazing materials for glazing motor vehicles operating on land highways, Standard Z26.1. New York: Author; 1968 SAE Handbook.
78
two strategies to improve performance. (1) The plastic (polyvinyl butyral) layer was made twice as thick as in the pre-HPR windshield to increase its tear resistance and energy absorption. (2) Even more important, the bond between the glass and the plastic layers was loosened by adding moisture to the plastic; as a result, the plastic flexed away from the glass pane rather than being torn by the glass. This allowed the windshield to bulge without tearing, at a force level low enough to avoid serious blunt-impact trauma, upon head-impacts ranging up to 22-29 mph, a quite severe crash. A test specified in FMVSS No. 205 states that a 5-pound steel ball must not penetrate the windshield at 19 mph – i.e., fast enough that pre-HPR windshields fail but slow enough that HPR windshields succeed. The glass and auto manufacturers developed HPR wind-shields before NHTSA existed. All 1965 Ford Thunderbirds and all domestic passenger cars be-ginning in model year 1966 have HPR windshields.231
Expected benefits: Drivers and front seat passengers can expect to benefit in frontal crashes that propel them into the windshield. The zone of benefits is for head impacts between 13 and 22-29 mph, where the pre-HPR windshield tears but the HPR windshield remains intact while crum-pling and bulging. The most common benefit ought to be a reduction of “non-minor” (AIS ≥ 2) facial lacerations from torn glass – injuries that cause disfigurement, extend into the subcutane-ous tissue or require more than first aid or simple closure. There should be a large reduction in serious injuries to the eyes, lips or tongue that occur, in pre-HPR windshields, when the occu-pant’s head rebounds through the break in the windshield. There may be a reduction in fractures to the nose or facial bones caused by edges of broken windshields. There would likely be a smaller reduction of minor lacerations, since they can occur even without tears in the windshield. Blunt impact trauma is less likely to be mitigated. Fatal head injuries are hardly ever due to windshield contact alone, and unlikely to be affected by the HPR windshield.232
Injury reduction – passenger cars: In 1985, NHTSA published a statistical evaluation of the effectiveness of HPR windshields. It uses data from NCSS, the predecessor of NASS. The data specify, like NASS, the severity (AIS), body region, lesion and contact source of injuries. The injury rate – the number of AIS ≥ 2 lacerations of the face or head due to contact with the wind-shield, per 1000 front seat occupants involved in frontal towaway crashes – was computed for cars of the first model years with HPR windshields and compared to the rate in cars of the last model years with pre-HPR windshields.233 For example, a comparison of cars of the first five years with HPR windshields and the last five years without them showed a dramatic, statistically significant 74-percent injury reduction with HPR:
231 Kahane (1985, February), pp. 5-11; Patrick, L.M., & Daniel, B.P. (1966). Comparison of standard and experi-mental windshields. Eighth Stapp Car Crash and Field Demonstration Conference. Detroit: Wayne State University Press; Rieser, R.G., & Michaels, G.E. (1966). Factors in the development and evaluation of safer glazing. Ninth Stapp Car Crash Conference. Minneapolis: University of Minnesota; Widman, J.C. (1965). Recent developments in penetration resistance of windshield glass. (Paper No. 650474). New York: Society of Automotive Engineers. 232 Kahane (1985, February), pp. 8-9. 233 Kahane (1985, February), pp. 77-80; Kahane, Smith, & Tharp (1977).

79
AIS ≥ 2 N of Lacerations per Lacerations Occupants 1000 Occupants Model year 1961-65 (“before”) 38 4,958 7.66 Model year 1966-70 (“after”) 52 26,110 1.99
Nearly identical reductions were observed when the data was limited to four, three, two or just one model year before and after the shift to HPR. The 74-percent injury reduction is one of the highest ever observed for any of the FMVSS. After 1966, there was an almost miraculous reduc-tion of disfiguring facial injuries in motor vehicle crashes.234 Using 1982 as the “baseline” year, the evaluation estimated that HPR windshields would prevent 39,000 AIS ≥ 2 lacerations per year when all cars on the road were equipped with them.235
HPR windshields reduce facial fractures involving windshield contact by 56 percent, preventing 8,000 fractures per year. In all, the windshields prevent 47,000 AIS 2-4 injuries per year236 (39,000 lacerations plus 8,000 fractures). Many of these injuries involved the eyes, nose or mouth. HPR windshields reduced injuries to the eyes, nose or mouth involving contact with windshields by 72 percent, preventing 19,000 such injuries per year.237
HPR windshields were also effective in preventing minor (AIS 1) facial lacerations due to wind-shield contact, reducing them by a statistically significant 25 percent. However, HPR wind-shields had little or no observed effect on concussions, contusions or complaints of pain.238
NHTSA also analyzed 1974 New York State crash data to corroborate the NCSS results. These data indicate the body region and lesion of an occupant’s most severe injury, but not the contact source. Severity of nonfatal injuries is indicated by a three-letter severity scale (A, B, C; assigned by investigating officers, based on a list written criteria) but not the AIS. Facial injuries with lev-el A (severe) bleeding in frontal crashes [from any contact source] were reduced by approximate-ly 50 percent with HPR windshields; facial fractures by 25-30 percent. In other words, the New York results support the NCSS findings.239
Fatality reduction – passenger cars: NHTSA’s 1985 analysis is based on 1975-to-1982 FARS data. Since FARS does not indicate the source or body region of fatal injuries, or provide infor-mation on nonfatal crashes to allow computation of fatality rates, it is best suited for comparing overall fatality risk of front seat occupants in frontal crashes before and after HPR windshields, relative to a control group of non-frontal fatalities. Since energy-absorbing steering columns were introduced in some cars in MY 1967 and in all by 1968, 1 or 2 years after the HPR wind-shield, the analysis must either be limited to MY 1966 and earlier, or it must somehow control
234 Huelke, D. F., Grabb, W.C., Dingman, R.O., & Oneal, R.M. (1968, June). The new automotive windshield and its effectiveness in reducing facial lacerations. Plastic and Reconstructive Surgery, 41. 235 90 percent confidence bounds for effectiveness: 65 to 83 percent; for benefits: 25,000 to 53,000 lacerations pre-vented. See Kahane (1985, February), pp. 127-128 and 225-235. 236 90 percent confidence bounds: 31,000 to 62,000 injuries. 237 90 percent confidence bounds: 9,700 to 29,000 injuries. 238 Ibid., pp. 77-95 and 225-235. 239 Ibid., pp. 101-116.
80
for the energy-absorbing column. NHTSA used a log-linear regression of the frontal/non-frontal fatality ratio, by calendar year and model year, with independent variables: HPR windshield, en-ergy-absorbing column, vehicle age, and calendar year. The effect attributed to the HPR wind-shield was negligible, and it was not statistically significant. The evaluation concluded that the HPR windshield, although highly effective in reducing nonfatal injuries, has little effect on fa-talities.240
Injury and fatality reduction – LTVs NHTSA’s 1985 evaluation only addressed the perfor-mance of windshields in passenger cars. However, since the mechanisms of injuries involving windshield contact are presumably similar in cars and LTVs, the effectiveness estimates for cars are probably appropriate for LTVs as well.
Glass-plastic windshields Since facial lacerations are so often due to contact with shattered, torn or crumpled glass, it would seem preferable to line the interior surface of the windshield with shatterproof, energy-absorbing plastic. However, glass is scratch-resistant and its long-term optical qualities are far superior to most plastics, making it essential for windshields and other windows that drivers must look through. Circa 1980, glass manufacturers developed a polyurethane sheet that was transparent and durable enough for use as a windshield’s inner lining. In 1983, NHTSA amended FMVSS No. 205 to permit the use of glass-plastic glazing at the option of the motor vehicle manufacturer. The amendment includes numerous tests to assure that the plastic would resist scratching, clouding and corrosion by chemicals.241
It was hoped that glass-plastic windshields, by largely eliminating any exposure of occupants to glass surfaces in frontal crashes, would substantially reduce laceration injuries relative to the conventional HPR windshield, especially the minor (AIS 1) lacerations where the HPR wind-shield did not have as large an effect as it did on AIS ≥ 2 lacerations.
Glass-plastic windshields were standard equipment in Cadillac Seville from MY 1985 to 1987 and in Cadillac Eldorado, Buick Riviera, and Oldsmobile Toronado in MY 1986 and 1987 as well as in substantial test fleets of several manufacturers: over 200,000 cars in all. The inner lin-ing was applied to the HPR laminated windshield and made the glass-plastic windshield a four-ply material. However, the manufacturers discontinued installing glass-plastic windshields after 1987, largely because of durability problems in day-to-day use and high replacement costs. An additional consideration at that time, perhaps, was that increased use of seat belts and installation of air bags would soon be reducing the frequency of occupant contacts with the windshield, an-yway.242
240 Ibid., pp. 122-127. 241 Parsons, G. G. (1993, November). An evaluation of the effects of glass-plastic windshield glazing in passenger cars. (Report No. DOT HS 808 062, Chapter 1). Washington, DC: National Highway Traffic Safety Administration. Available at www-nrd.nhtsa.dot.gov/Pubs/808062.PDF; Federal Register 48 (November 16, 1983): 52065; 49 CFR, Part 571.205; NHTSA. (1983, September). Final regulatory evaluation, anti-lacerative glazing, FMVSS 205. Wash-ington, DC: National Highway Traffic Safety Administration, Office of Plans and Policy. 242 Parsons (1993, November), Chapters 3 and 4.
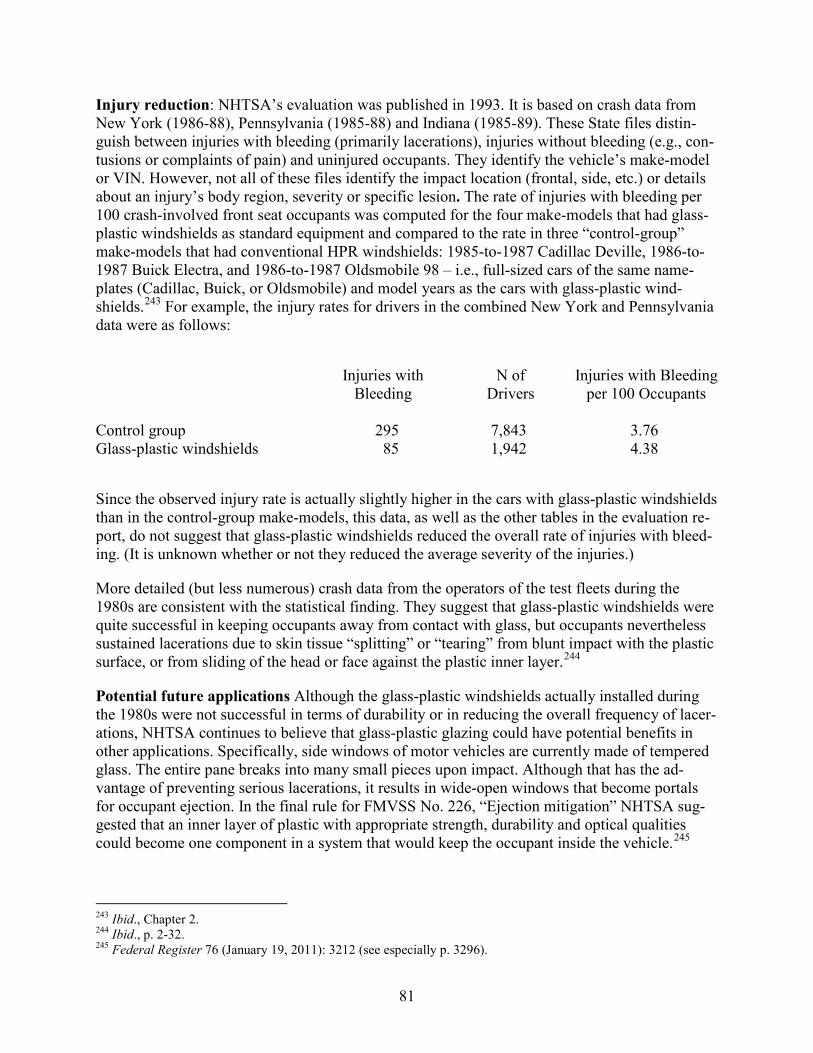
81
Injury reduction: NHTSA’s evaluation was published in 1993. It is based on crash data from New York (1986-88), Pennsylvania (1985-88) and Indiana (1985-89). These State files distin-guish between injuries with bleeding (primarily lacerations), injuries without bleeding (e.g., con-tusions or complaints of pain) and uninjured occupants. They identify the vehicle’s make-model or VIN. However, not all of these files identify the impact location (frontal, side, etc.) or details about an injury’s body region, severity or specific lesion. The rate of injuries with bleeding per 100 crash-involved front seat occupants was computed for the four make-models that had glass-plastic windshields as standard equipment and compared to the rate in three “control-group” make-models that had conventional HPR windshields: 1985-to-1987 Cadillac Deville, 1986-to-1987 Buick Electra, and 1986-to-1987 Oldsmobile 98 – i.e., full-sized cars of the same name-plates (Cadillac, Buick, or Oldsmobile) and model years as the cars with glass-plastic wind-shields.243 For example, the injury rates for drivers in the combined New York and Pennsylvania data were as follows:
Injuries with N of Injuries with Bleeding Bleeding Drivers per 100 Occupants Control group 295 7,843 3.76 Glass-plastic windshields 85 1,942 4.38
Since the observed injury rate is actually slightly higher in the cars with glass-plastic windshields than in the control-group make-models, this data, as well as the other tables in the evaluation re-port, do not suggest that glass-plastic windshields reduced the overall rate of injuries with bleed-ing. (It is unknown whether or not they reduced the average severity of the injuries.)
More detailed (but less numerous) crash data from the operators of the test fleets during the 1980s are consistent with the statistical finding. They suggest that glass-plastic windshields were quite successful in keeping occupants away from contact with glass, but occupants nevertheless sustained lacerations due to skin tissue “splitting” or “tearing” from blunt impact with the plastic surface, or from sliding of the head or face against the plastic inner layer.244
Potential future applications Although the glass-plastic windshields actually installed during the 1980s were not successful in terms of durability or in reducing the overall frequency of lacer-ations, NHTSA continues to believe that glass-plastic glazing could have potential benefits in other applications. Specifically, side windows of motor vehicles are currently made of tempered glass. The entire pane breaks into many small pieces upon impact. Although that has the ad-vantage of preventing serious lacerations, it results in wide-open windows that become portals for occupant ejection. In the final rule for FMVSS No. 226, “Ejection mitigation” NHTSA sug-gested that an inner layer of plastic with appropriate strength, durability and optical qualities could become one component in a system that would keep the occupant inside the vehicle.245
243 Ibid., Chapter 2. 244 Ibid., p. 2-32. 245 Federal Register 76 (January 19, 2011): 3212 (see especially p. 3296).
82
FMVSS No. 206, “Door locks and door retention components” This standard regulates one safety technology that has been evaluated by NHTSA:
• Stronger locks, latches and hinges for side doors
The first paragraph of FMVSS No. 206 states unequivocally that its purpose is to prevent occu-pant ejections: “This standard specifies requirements for door locks and door retention compo-nents including latches, hinges and other supporting means, to minimize the likelihood of occu-pants being thrown from the vehicle as a result of impact.”246 FMVSS No. 206 took effect for doors on the side of passenger cars on January 1, 1968, multipurpose passenger vehicles on Jan-uary 1, 1970, and other LTVs on January 1, 1972.247 Extensions of FMVSS No. 206 to back doors of vehicles (effective MY 1998) and to sliding doors (effective MY 2011) have not yet been evaluated by NHTSA.
Regulatory history: Self-regulation of side door locks, latches and hinges by the industry began in November 1962, well before NHTSA existed, with SAE Standard J839, “Passenger Car Side Door Latch Systems.” In 1965, SAE substantially upgraded J839 to J839b, nearly doubling the strength requirements, and introduced another standard, J934, “Vehicle Passenger Door Hinge Systems.” J839b and J934 were essentially incorporated into FMVSS No. 206, one of NHTSA’s initial safety standards, with a NPRM in December 1966, a final rule in February 1967 and an effective date of January 1, 1968.248
What happened: Safety researchers in the 1950s learned that car doors were forced open in many crashes, especially rollovers; that occupants were often ejected via the opened doors; and that being “thrown clear” in a crash was not an advantage but a terrible risk, especially in rollo-vers, where an occupant could be wedged between the car and the ground. Safety door latches were introduced in the 1955 and 1956 domestic cars to assure that doors would not pop open when occupants on the inside, or objects/ground on the outside brushed against door handles dur-ing crashes. During about 1962 to 1968, the manufacturers began an almost continuous process of strengthening latches and hinges in their various make-models. Doors can open in crashes if latches or hinges are pulled apart by impact damage, or if latches and hinges are pulled loose from their supporting structures. The net effect of these cumulative improvements was a dra-matic reduction of door-opening, as seen in Automotive Crash Injury Research (ACIR), a crash data file of the 1950s and 60s:249
246 49 CFR, Part 571.206. 247 Federal Register 32 (February 3, 1967): 2414, 34 (January 24, 1969): 1150. 248 Kahane, C. J. (1989, November). An evaluation of door locks and roof crush resistance of passenger cars – Fed-eral Motor Vehicle Safety Standards 206 and 216. (Report No. DOT HS 807 489, pp. 2-4). Washington, DC: Na-tional Highway Traffic Safety Administration. Available at www-nrd.nhtsa.dot.gov/Pubs/807489.PDF; SAE. (1965). 1965 SAE Handbook. New York: Society of Automotive Engineers, p. 893; SAE. (1967). 1967 SAE Hand-book, pp. 904-906; Federal Register 31 (March 8, 1966): 4091, 31 (July 15, 1966): 9631, 31 (December 3, 1966): 15212, 32 (February 3, 1967): 2414. 249 Kahane (1989, November), pp. 27-30; Garrett, J. W. (1964). The safety performance of 1962-63 automobile door latches and comparison with earlier latch designs. (Report No. VJ-1823-R7). Buffalo: Cornell Aeronautical Labora-tory; Garrett, J. W. (1969). Comparison of door opening frequency in 1967-68 cars with earlier model U.S. cars. (Report No. DOT HS 800 231). Washington, DC: National Highway Traffic Safety Administration.
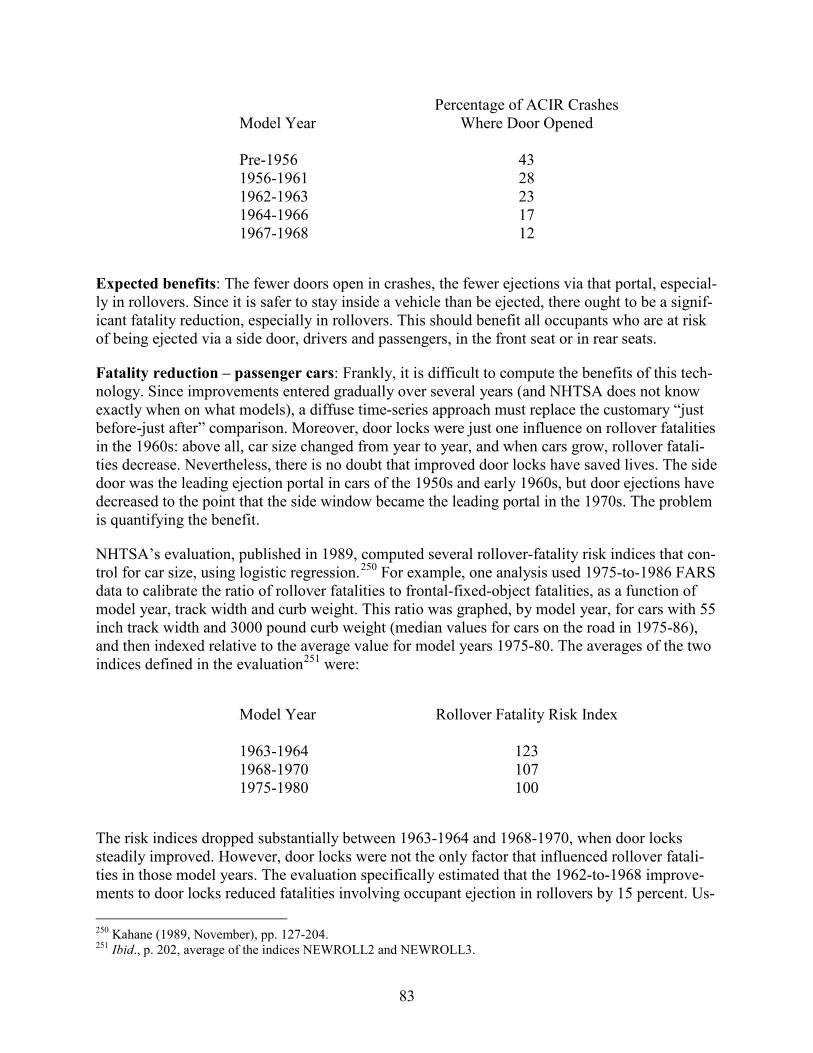
83
Percentage of ACIR Crashes Model Year Where Door Opened Pre-1956 43 1956-1961 28 1962-1963 23 1964-1966 17 1967-1968 12
Expected benefits: The fewer doors open in crashes, the fewer ejections via that portal, especial-ly in rollovers. Since it is safer to stay inside a vehicle than be ejected, there ought to be a signif-icant fatality reduction, especially in rollovers. This should benefit all occupants who are at risk of being ejected via a side door, drivers and passengers, in the front seat or in rear seats.
Fatality reduction – passenger cars: Frankly, it is difficult to compute the benefits of this tech-nology. Since improvements entered gradually over several years (and NHTSA does not know exactly when on what models), a diffuse time-series approach must replace the customary “just before-just after” comparison. Moreover, door locks were just one influence on rollover fatalities in the 1960s: above all, car size changed from year to year, and when cars grow, rollover fatali-ties decrease. Nevertheless, there is no doubt that improved door locks have saved lives. The side door was the leading ejection portal in cars of the 1950s and early 1960s, but door ejections have decreased to the point that the side window became the leading portal in the 1970s. The problem is quantifying the benefit.
NHTSA’s evaluation, published in 1989, computed several rollover-fatality risk indices that con-trol for car size, using logistic regression.250 For example, one analysis used 1975-to-1986 FARS data to calibrate the ratio of rollover fatalities to frontal-fixed-object fatalities, as a function of model year, track width and curb weight. This ratio was graphed, by model year, for cars with 55 inch track width and 3000 pound curb weight (median values for cars on the road in 1975-86), and then indexed relative to the average value for model years 1975-80. The averages of the two indices defined in the evaluation251 were:
Model Year Rollover Fatality Risk Index 1963-1964 123 1968-1970 107 1975-1980 100
The risk indices dropped substantially between 1963-1964 and 1968-1970, when door locks steadily improved. However, door locks were not the only factor that influenced rollover fatali-ties in those model years. The evaluation specifically estimated that the 1962-to-1968 improve-ments to door locks reduced fatalities involving occupant ejection in rollovers by 15 percent. Us- 250 Kahane (1989, November), pp. 127-204. 251 Ibid., p. 202, average of the indices NEWROLL2 and NEWROLL3.
84
ing 1982 as the “baseline” year, the evaluation estimated these improvements were saving ap-proximately 400 lives per year.252
Injury reduction – passenger cars: NHTSA’s evaluation does not include any analysis or esti-mate of the effect of door locks on nonfatal injuries. However, other studies such as NHTSA’s 1985 evaluation of windshields suggest that occupant ejections cause similar numbers of serious nonfatal injuries (AIS 3-5) and fatalities.253 It is likely that the improvements to door locks, latches and hinges are about as effective in reducing serious injuries as fatalities, and that they are preventing comparable numbers of AIS 3-5 injuries and fatalities.
Fatality and injury reduction – LTVs: NHTSA’s 1989 evaluation only addressed the perfor-mance of door locks in passenger cars. Since FMVSS No. 206 was extended to LTVs a few years after it took effect for cars, and since the door components of trucks and cars are similar, it seems plausible that the gradual improvement of door locks in cars was matched by a compara-ble effort in LTVs, with a similar effectiveness in reducing fatalities associated with door ejec-tions. However, National Crash Severity Study (NCSS) data show that, proportionately, the door is the ejection route in only 2/3 as often in LTV rollovers as in car rollovers. Thus, the overall reduction of ejection fatalities in rollovers, estimated to be 15 percent in cars, would be 10 per-cent in LTVs.254
FMVSS No. 206 extensions: On September 28, 1995, NHTSA issued a final rule, effective Sep-tember 1, 1997, extending FMVSS No. 206 to hinged back doors of passenger cars and multi-purpose vehicles, including hatchbacks, station wagons, SUVs, and passenger vans.255 On Feb-ruary 6, 2007, NHTSA issued another final rule amending FMVSS No. 206 in order to add and update requirements and test procedures and to harmonize with the world’s first global technical regulation (GTR) for motor vehicles. The final rule added a new full vehicle test procedure and performance requirements for sliding side and back doors, added secondary latched position re-quirements for doors other than hinged side doors and back doors, provided a new optional test procedure for assessing inertial forces, and extended the application of the standard to buses with GVWR of less than 10,000 pounds, including 12-to-15 passenger vans. The final rule also elimi-nated an exclusion from the requirements of the standard for doors equipped with wheelchair platform lifts. The upgrades became effective on September 1, 2010 (early compliance was per-mitted).256 NHTSA has not yet evaluated these extensions of FMVSS No. 206.
252 Ibid., pp. xxix and 222-225. 253 Kahane (1985, February), pp. 161-163. 254 An analysis of MY 1990-2003 cars and LTVs in 1995-2003 NASS data confirms the dramatic, long-term reduc-tion in ejections via the open door. In NCSS, the open door accounted for 32 percent of ejections in car rollovers, 20 percent in LTVs. In NASS, the open door accounted for just 8 percent of ejections in car rollovers, 7 percent in LTVs. Thus, our conclusions that FMVSS 206-related technology reduced overall rollover fatality risk by 15 percent in cars and 10 percent in LTVs may even be a little bit conservative if the long-term, continuing improvement of doors is taken into account. 255 Federal Register 32 (February 3, 1967): 2414, 34 (January 24, 1969): 1150, 60 (September 28, 1995): 50124. 256 Federal Register 72 (February 6, 2007): 5385, 74 (July 20, 2009): 35131.
85
FMVSS No. 207, “Seating systems” “This standard establishes [a variety of strength] requirements for seats, their attachment assem-blies, and their installation to minimize the possibility of their failure by forces acting on them as a result of vehicle impact.”257 It is, however, linked with just one tangible safety modification that has been evaluated by NHTSA:
• Seat back locks for 2-door cars with folding front seat backs
The locks are designed to mitigate injury risk in frontal impacts by keeping seat backs upright and in place during a crash. They are supposed to prevent seat backs from folding over and push-ing on front seat occupants and to keep unrestrained rear seat occupants in the rear seat area. They were introduced in 2-door passenger cars primarily in MY 1967 and 1968.
Regulatory history: FMVSS No. 207, one of NHTSA’s initial safety standards, took effect for passenger cars on January 1, 1968, and was later extended to trucks, buses and multipurpose ve-hicles, effective on January 1, 1972. Except for the seat-back-lock requirement, FMVSS No. 207 largely incorporated SAE Recommended Practice J879, which had been in place since Novem-ber 1963. Thus, the locks were the only substantial modification in domestic cars during the time frame of the FMVSS No. 207 rulemaking.258
How seat back locks are supposed to work: Two-door cars generally need front seat backs that fold down and out of the way to give passengers room to get in and out of the rear seat. Without a locking system, these seat backs are likely to fold over in frontal crashes, even at low severi-ties. That could potentially increase injury risk for front seat occupants in a frontal crash by add-ing some or all of the mass of the 25-to-35 pound seat backs to that of the occupants themselves, thereby increasing their momentum as they contact structures at the front of the passenger com-partment. The locks could be even more beneficial if there are unrestrained rear seat occupants. In a car without the locks, the rear seat passenger could move forward with the seat back, adding even more mass to the front seat occupant. Additionally, the seat back can act as a ramp for the rear seat passenger as it folds over, causing the rear seat occupant to then vault head-first into the front seat compartment and contact the windshield or header or make head-to-head contact with the front seat occupants. With the locks, a seat back should remain upright and prevent these ac-tions from the rear seat occupant.259
However, for seat back locks to be effective, they must be able to withstand the impact forces to which they are exposed in crashes. FMVSS No. 207 (which makes no explicit claim of effec-tiveness when rear seat passengers are present) requires the locks to withstand a forward load of
257 49 CFR, Part 571.207. 258 Kahane, C. J. (1987, February). A preliminary evaluation of seat back locks. (Report No. DOT HS 807 067, pp. 2-3). Washington, DC: National Highway Traffic Safety Administration. Available at www-nrd.nhtsa.dot.gov/Pubs/807067.PDF; Federal Register 31 (December 3, 1966): 15212, 32 (February 3, 1967): 2414, 36 (December 2, 1971): 22902; 1968 SAE Handbook, pp. 954-955. 259 Kahane (1987, February), pp. 10-12; Severy, D. M., Brink, H.M., Baird, J. D., & Blaisdell, D. M. (1969). Safer seat designs. Thirteenth Stapp Car Crash Conference. New York: Society of Automotive Engineers, pp. 323-325.
86
20 times the weight of the seat back.260 If the 150-pound weight of an unrestrained adult rear-seat passenger is added to the 25-to-35 pound weight of the seat back, even a crash with accel-eration levels below 10 g’s could produce loads exceeding the FMVSS No. 207 level. In the 1970s, approximately 99 percent of adult rear-seat passengers were unrestrained; in 2012, about 25 percent were unrestrained.261
Manufacturers have developed two types of seat back locks for production vehicles:
• Manual seat back locks: occupants disengage the lock by operating a lever or pressing a button (not necessarily in a convenient location) every time they need to move the seat out of the way.
• Automatic inertial seat back locks that allow free movement of the seat back during nor-mal vehicle operation and only lock up during impacts, road bumps, or emergency brak-ing. The technology is similar to inertial locking retractors for seat belts.
Volkswagen and Opel installed manual seat back locks in their MY 1966 cars; GM, Fiat, Renault and Datsun in 1967; and Ford and Chrysler in the full MY 1968 – all before the January 1, 1968, effective date. Automatic seat back locks are obviously more convenient for passengers and they have completely superseded the manual type in domestic cars since about 1980. In addition to being more convenient, automatic locks preclude an imaginable (but unsubstantiated) safety problem: during a fire, immersion or other emergency egress situation, rear seat passengers could be delayed while they locate and operate manual locks, but can exit immediately from cars with automatic locks that allow free movement of the seat back.262
Potential benefits: Drivers and RF passengers might experience a reduction of fatalities and/or injuries in frontal crashes, when the rear seat is unoccupied, provided that a locked seat back im-poses a smaller load on them than a freely moving, pre-FMVSS No. 207 seat back. When the rear seat is occupied, both outboard front seat occupants and outboard rear seat occupants might experience a more substantial reduction of fatalities and injuries in frontal crashes, provided that the locks are able to withstand the impact force of the rear seat occupant. In addition, upright seat backs might help contain rear seat occupants within their seating area and reduce their risk of ejection from the car in a frontal crash.
Evaluation findings: NHTSA’s study, published in 1987, includes statistical analyses of crash data comparing injury and fatality rates in 2-door cars just before and after the introduction of seat back locks; sled tests simulating frontal crashes of seat systems with and without the locks, to study the effect of the locks on occupant force levels and kinematics; and a review of in-depth
260 49 CFR, Part 571.207 S4.3.2.1: “Once engaged, the restraining device for a forward-facing seat shall not release or fail when a forward longitudinal force, in newtons, equal to 20 times the mass of the hinged or folding portion of the seat in kilograms multiplied by 9.8 is applied through the center of gravity of that portion of the seat.” 261 Phillips (1980, May), pp. 47-50; Pickrell, T. M. (2014, January). Occupant restraint use in 2012: Results from the National Occupant Protection Use Survey Controlled Intersection Study. (Report No. DOT HS 811 872, pp 6-8). Washington, DC: National Highway Traffic Safety Administration. Available at www-nrd.nhtsa.dot.gov/Pubs/811872.pdf. 262 Kahane (1987, February), pp. 4-5 and 11-12.
87
crash investigations to determine the ability of seat back locks to endure impact forces, as a func-tion of delta V.
Crash data analyses: Injury rates per 100 crash-involved occupants are computed for domestic 2-door cars of the model year(s) just before and just after the introduction of manual seat back locks (GM in 1967, Ford and Chrysler in 1968). Corresponding rates are computed for a control group of 4-door cars of these same model years (i.e., just before and after seat back locks were introduced in the 2-door cars made by that manufacturer). Four-door cars are a useful control group because they received all of the safety improvements that 2-door cars received during that time frame – except seat back locks. In other words, did the injury reduction in 2-door cars (after versus before seat back locks) surpass the corresponding reduction in 4-door cars? Injury rates were computed from 1973-to-1977 Washington State data, 1972-to-1974 Texas data and 1974 New York State data.263 Similarly, fatality rates per million vehicle registration years are com-puted from 1975-to-1985 FARS data and R. L. Polk registration data (their “National Vehicle Population Profile”).264
None of these analyses showed a statistically significant reduction of injury or fatality rates in 2-door cars above and beyond the corresponding reduction in 4-door cars. There was no observed benefit for front seat occupants, regardless of whether the seat behind them was unoccupied, oc-cupied by an adult (unrestrained or belted), or occupied by a child. There was no reduction of injury or fatality rates, or of ejection, for rear seat occupants, adults or children.
Sled tests: NHTSA sponsored 28 sled tests involving 84 unrestrained, 50th percentile Part 572 dummies.265 Fourteen of these tests used a sled buck that simulated the passenger compartment of a 1981 domestic sedan with operational seat back locks: speeds ranged from 15 to 30 mph, impacts were full-frontal or oblique-frontal; dummies occupied the outboard front seats in all tests and the outboard rear seats in eight tests. The other 14 tests exactly replicated the above se-ries, except that the seat back locks were removed to allow the seat backs to pivot freely in the crash (as they would have in a pre-FMVSS No. 207 car). That provided 42 matched pairs of dummies tested under identical conditions, except one of them had the seat back lock and the other did not. HIC, chest g’s, femur loads, mean strain criterion, total laceration index and other measures were computed for each dummy.
The statistical analysis of the 42 matched pairs considers the average difference of the injury cri-terion in the test with seat back locks and in the corresponding test without seat back locks. These average differences were not significantly different from zero for any of the injury criteria. In other words, the dummies had the same average injury severity with and without the seat back locks. When the matched pairs were divided into three principal subgroups – front seat occupants with nobody sitting behind them, front seat occupants with somebody sitting behind them, and rear seat occupants – there was no significant benefit for seat back locks in any subgroup.
263 Ibid., pp. 55-96. 264 Ibid., pp. 97-135. 265 Ibid., pp. 21-54.
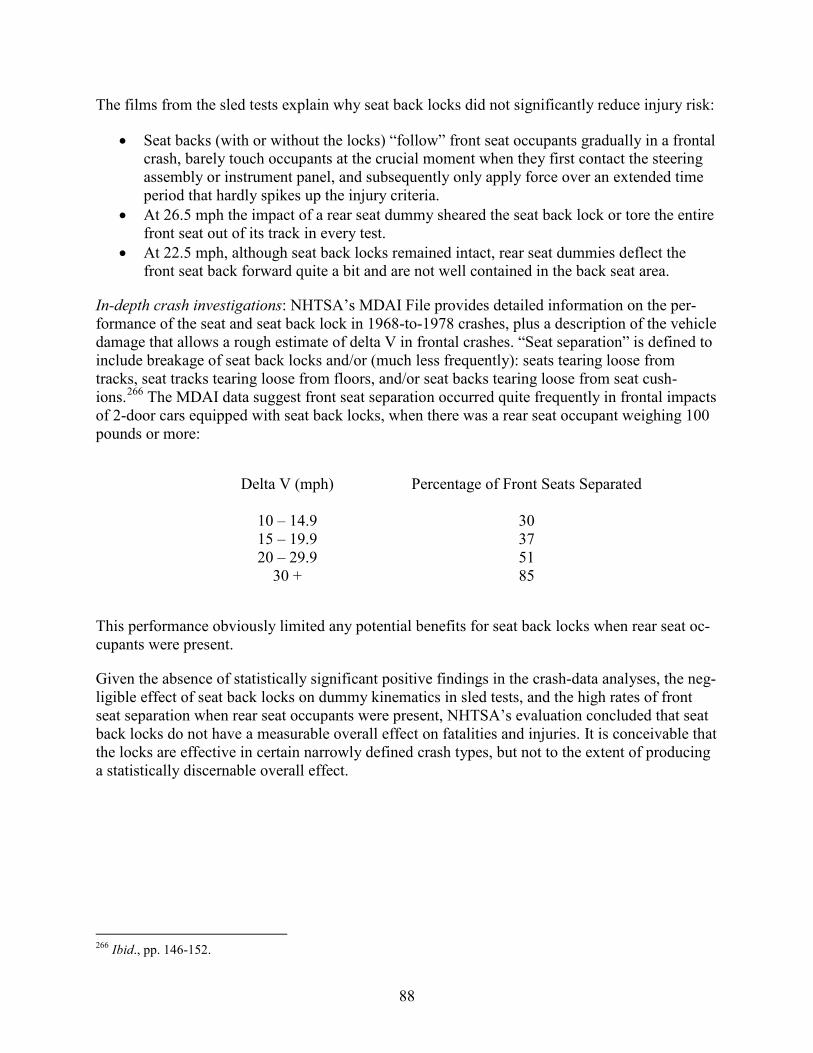
88
The films from the sled tests explain why seat back locks did not significantly reduce injury risk:
• Seat backs (with or without the locks) “follow” front seat occupants gradually in a frontal crash, barely touch occupants at the crucial moment when they first contact the steering assembly or instrument panel, and subsequently only apply force over an extended time period that hardly spikes up the injury criteria.
• At 26.5 mph the impact of a rear seat dummy sheared the seat back lock or tore the entire front seat out of its track in every test.
• At 22.5 mph, although seat back locks remained intact, rear seat dummies deflect the front seat back forward quite a bit and are not well contained in the back seat area.
In-depth crash investigations: NHTSA’s MDAI File provides detailed information on the per-formance of the seat and seat back lock in 1968-to-1978 crashes, plus a description of the vehicle damage that allows a rough estimate of delta V in frontal crashes. “Seat separation” is defined to include breakage of seat back locks and/or (much less frequently): seats tearing loose from tracks, seat tracks tearing loose from floors, and/or seat backs tearing loose from seat cush-ions.266 The MDAI data suggest front seat separation occurred quite frequently in frontal impacts of 2-door cars equipped with seat back locks, when there was a rear seat occupant weighing 100 pounds or more:
Delta V (mph) Percentage of Front Seats Separated 10 – 14.9 30 15 – 19.9 37 20 – 29.9 51 30 + 85
This performance obviously limited any potential benefits for seat back locks when rear seat oc-cupants were present.
Given the absence of statistically significant positive findings in the crash-data analyses, the neg-ligible effect of seat back locks on dummy kinematics in sled tests, and the high rates of front seat separation when rear seat occupants were present, NHTSA’s evaluation concluded that seat back locks do not have a measurable overall effect on fatalities and injuries. It is conceivable that the locks are effective in certain narrowly defined crash types, but not to the extent of producing a statistically discernable overall effect.
266 Ibid., pp. 146-152.
89
FMVSS No. 208, “Occupant crash protection” FMVSS No. 209, “Seat belt assemblies” FMVSS No. 210, “Seat belt assembly anchorages” These three standards regulate seat belts. FMVSS No. 208 also regulates frontal crash protection in general and requires frontal air bags. Seat belts and frontal air bags are probably the two best-known systems to protect occupants from death and injury in crashes. Six somewhat distinct belt technologies and four air bag technologies have been evaluated by NHTSA.
SEAT BELTS • Lap belts for front seat occupants • Lap belts for rear seat occupants • Manual 3-point lap-shoulder belts for outboard front seat occupants • 3-point lap-shoulder belts for rear seat occupants • Automatic seat belts • Pretensioners and load limiters for seat belts (not required by FMVSS No. 208)
FRONTAL AIR BAGS • Frontal air bags • Manual on-off switches for passenger air bags in pickup trucks and other vehicles
with small or no rear seats • 1998-1999 redesign of frontal air bag (sled-certification) • Advanced frontal air bags (automatic suppression or low-risk deployment)
Seat belts are the basic protection system for all occupants (except children in safety seats in-stalled in the vehicle with tethers and anchors), in most types of crashes, designed to keep occu-pants within the vehicle and close to their original seating position, provide “ride-down” by gradually decelerating the occupant as the vehicle deforms and absorbs energy, and, if possible, prevent occupants from contacting harmful interior surfaces or one another. Lap belts for out-board front seat occupants were first offered as options in MY 1956 and have been standard on passenger cars since 1964. Shoulder harnesses were added in MY 1968 or 1969 in passenger cars; modern 3-point lap-shoulder belts became standard in MY 1974. Automatic belts that re-quire no action by the occupant were furnished on many cars starting in MY 1987, but had been phased out by 1997.
Frontal air bags are an effective supplemental protection system for outboard front seat occu-pants in frontal and partially frontal crashes. They significantly added to the energy absorption and ride-down offered by previously existing structures (seat belts, energy-absorbing steering columns and deformable instrument panels). They may also help prevent head contacts with the windshield, windshield header, among other components.
FMVSS No. 208 “specifies performance requirements for the protection of vehicle occupants in crashes.” FMVSS No. 209 “specifies requirements for seat belt assemblies.” FMVSS No. 210 “establishes requirements for seat belt assembly anchorages to insure their proper location and to
90
reduce the likelihood of their failure.” The three standards work together as a single unit to pro-tect occupants in crashes.267
Overview of regulatory history: Here are the highlights of the long regulatory history of FMVSS Nos. 208, 209 and 210 – the amendments most associated with tangible changes in oc-cupant protection technology. In many cases, manufacturers implemented the new technologies a few years or even many years before the effective dates. Not included are: numerous primarily technical or interpretative amendments; proposals and rules that were cancelled or changed be-fore they took effect.
FMVSS Nos. 208, 209 and 210 were among NHTSA’s initial safety standards, with a NPRM in December 1966, a final rule in February 1967, and an effective date of January 1, 1968. FMVSS No. 208 originally required lap belts at each designated seating position in passenger cars only, plus shoulder belts at the outboard front seats if lap belts alone could not prevent dummies from contacting the windshield header in static tests. Most new passenger cars received shoulder belts at that time. FMVSS No. 209 specified performance requirements for the belts themselves, while FMVSS No. 210 specified requirements for the anchorages that secure the belt systems to the vehicle.268
NHTSA extended the original FMVSS No. 208 requirements to LTVs up to 10,000 pounds GVWR, effective July 1, 1971. The extension did not result in much immediate change, because most LTV make-models had been equipped with lap belts by 1968 or earlier and continued to have only lap belts up to the mid-1970s.269
Responding to (1) the inadequate restraint provided by lap belts alone for the head and torso, (2) the inadequate restraint provided by loosely worn belts and (3) low belt use, NHTSA amend-ed FMVSS No. 208, effective January 1, 1972270:
• To require shoulder belts at the outboard front seats of all passenger cars (dropping the test of contact with the windshield header). Shoulder belts at that time could still be sepa-rate or integral with the lap belt.
• To require emergency-locking or automatic-locking retractors. • To require a warning to sound when the lap belts at the outboard front seats were not
buckled. • To permit an automatic restraint system, such as air bags or automatic belts, as an alterna-
tive to the manual shoulder belt and the buzzer. • To include, for the first time, a 30 mph frontal barrier test (on which manual belts must
remain intact, and optional automatic systems must meet injury criteria on the dummies).
Responding to (1) very low use of the separate shoulder belt and (2) continued low use of lap belts, NHTSA amended FMVSS No. 208, effective September 1, 1973, to require271:
267 49 CFR, Parts 571.208, 571.209 and 571.210. 268 Federal Register 31 (December 3, 1966): 15212, 32 (February 3, 1967): 2414. 269 Federal Register 35 (September 30, 1970): 15222. 270 Federal Register 36 (March 10, 1971): 4600; 49 CFR, Part 571.208 S4.1.1. 271 Federal Register 38 (June 20, 1973): 16072; 49 CFR, Part 571.208 S4.1.2.
91
• Integral, 3-point lap-shoulder belts at the outboard front seats of passenger cars (or, alter-natively, automatic protection).
• Ignition interlocks whereby belts at the outboard front seats must be buckled before a car can be started.
NHTSA amended FMVSS No. 208, effective October 29, 1974, to delete the ignition-interlock requirement. Taking its place was a 4-to-8 second visible and audible warning if the driver was unbelted.272
As part of its effort to bring safety requirements for LTVs up to the same level as cars, NHTSA amended FMVSS No. 208 to require integral, 3-point lap-shoulder belts (or, alternatively, auto-matic protection) at the outboard front seats of most LTVs effective January 1, 1976, and all LTVs with GVWR up to 10,000 pounds effective September 1, 1981.273
Low use of manual belts continued into the early 1980s. On July 17, 1984, NHTSA amended FMVSS No. 208 to phase automatic protection, such as air bags or automatic belts, into the out-board front seats of passenger cars between September 1, 1986, and September 1, 1989. To en-courage the development of air bags, NHTSA exempted the RF seat from the automatic protec-tion requirement until August 31, 1993, in cars with driver air bags. NHTSA, the manufacturers and the safety community dedicated themselves to a successful effort to encourage buckle-up laws in the States. Comfort and convenience standards for belts were also added to FMVSS No. 208, effective September 1, 1986. During the implementation of automatic protection, automatic belts initially predominated, then driver air bags with manual 3-point belts, and, after September 1, 1993, dual air bags with manual 3-point belts.274
The superior protection of lap-shoulder belts, as compared to lap belts alone, was extended to the outboard rear seats. Cars had to have 3-point belts, effective December 11, 1989, and LTVs, starting September 1, 1991.275 Lap-shoulder belts were extended to all rear designated seating positions for passenger cars and light trucks, including the rear middle seats, but excluding side-facing seats, effective September 1, 2005.276 The center front seats may be equipped with lap belts or lap/shoulder belts.
Automatic protection was to be phased into the outboard front seats of LTVs with GVWR 8,500 pounds or less from September 1, 1994, to September 1, 1997. Manufacturers used air bags with manual belts in LTVs; none had automatic belts after September 1, 1994, and very few before.277
On-the-road experience and consumer reaction soon demonstrated that the combination of man-ual 3-point belts with air bags was the most effective and desirable system. All cars manufac- 272 Federal Register 39 (October 31, 1974): 38380, 39 (December 6, 1974): 42692. 273 Federal Register 40 (July 9, 1975): 28805; 49 CFR, Part 571.208 S4.2.1. 274 Federal Register 46 (January 8, 1981): 2064, 49 (July 17, 1984): 28962, 50 (August 23, 1985): 34152; 49 CFR, Parts 571.208 S4.1.3, 4.1.4 and S7.4 275 From December 11, 1989 to August 31, 1990, cars were allowed separate lap and shoulder belts as an alternative to 3-point belts, but nobody exercised that option; Federal Register 54 (June 14, 1989): 25275, 54 (November 2, 1989): 46257; 49 CFR, Parts 571.208 S4.1.4.2 and S4.2.4. The requirement does not apply to some types of seats/vehicles. 276 Federal Register 68 (December 8, 2004): 70904. 277 Federal Register 56 (March 26, 1991): 12472; 49 CFR, Part 571.208 S4.2.5.
92
tured after September 1, 1997, and all LTVs after September 1, 1998, were required to have manual 3-point belts and air bags for the driver and the RF passenger. Automatic belts were phased out.278
Air bags of the early 1990s presented risks to infants, children under the age of 12, and certain other individuals. NHTSA urged that high-risk individuals travel in the rear seat when possible. The agency also amended FMVSS No. 208 with measures to reduce risk when these people must travel in the front seat:
• Effective June 22, 1995, NHTSA permitted manual on-off switches for the passenger air bag in pickup trucks without rear seats or other vehicles that cannot accommodate child safety seats in the rear seat. This facilitated the implementation of passenger air bags in pickup trucks. Effective January 19, 1998, NHTSA also enabled people who must transport high-risk individuals in the front seats of any vehicle to obtain aftermarket on-off switches at their own expense.279
• Effective March 19, 1997, the agency temporarily relaxed some aspects of the frontal im-pact test in order to facilitate the introduction of “redesigned” air bags that deploy less forcefully.280
• From September 1, 2003 to September 1, 2006, “advanced” air bags were phased in that do not deploy at all (“suppression”) or deploy only at a low level of force (“low-risk de-ployment”) if a small child is present or if an older child/small adult is out-of-position and close to the air bag.281
Lap belts for front seat occupants History: Ford and Chrysler began to offer lap belts at the outboard front seats as an option on some of their 1956 models. Even before then, consumers were outfitting their vehicles with af-termarket lap belts; the American Medical Association and the National Safety Council, among others recommended belts in cars. In 1961, Wisconsin required lap belts at the outboard front seats in all new cars sold there; New York State required anchorages to allow installation of af-termarket belts. By 1964, about half of the States had such laws. During that time, SAE issued Recommended Practices J4 for belts and J787 for anchorages; they were the starting points for FMVSS Nos. 209 and 210. The domestic manufacturers phased in lap belts at the outboard front seating positions of all new cars by 1964 or 1965, extending to the center front seat by 1968. FMVSS No. 208 took effect in passenger cars on January 1, 1968, and in LTVs on July 1, 1971, requiring a shoulder belt on an outboard front seat if a dummy restrained by just a lap belt could reach the windshield header. Lap-shoulder belts superseded lap belts at the outboard front seats,
278 Federal Register 58 (September 2, 1993): 46551; 49 CFR, Part 571.208 S4.1.5.3 and S4.2.6.2. 279 Federal Register 60 (May 23, 1995): 27233, 62 (November 21, 1997): 62406; 49 CFR, Part 571.208 S4.5.4 and Part 595. 280 Federal Register 62 (March 19, 1997): 12960; 49 CFR, Part 571.208 S13. 281 Federal Register 65 (May 12, 2000): 30679; 49 CFR, Part 571.208 S14.
93
immediately in passenger cars during MY 1968, more gradually in LTVs during 1969-81. How-ever, center front seats continue to be equipped with just lap belts.282
How lap belts work: The principal benefit of a lap belt is to reduce greatly the likelihood of total ejection of an occupant from the vehicle during a crash. Ejection increases fatality risk in a crash by a factor of nearly four, all else being equal, because the ground is a less forgiving surface than the vehicle interior, and because the occupant may be caught between his or her own vehicle, the ground, and/or other vehicles. During 1977 to 1999, 28 percent of unrestrained fatalities in cars, and 48 percent in LTVs were ejectees; the percentages may have been higher before improved door locks (FMVSS No. 206).283
There was also hope, initially, that lap belts would be valuable for preventing, or reducing the severity of contacts with the vehicle interior, or with other occupants. These hopes were only partially realized – e.g., in far-side or oblique frontal impacts, where the interior is furthest from the occupant. However, in direct frontal crashes, lap belts do not necessarily prevent head con-tacts with the interior. Furthermore, restraining the lower torso but not the thorax can have two effects that potentially increase rather than mitigate injury. Concentration of the occupant’s force on the lap belt can result in abdominal injury, especially if the belt rides up from the pelvis to the waist (“submarining”). The head and chest can jackknife forwards and downwards at a high ve-locity.284
Expected benefits: Substantial fatality reduction should be expected in rollovers, where the ma-jority of unrestrained fatalities are ejectees. Fatality and injury reduction may be expected in far-side and oblique frontal crashes, and in crashes with multiple harmful events, where occupants are ejected or tossed around within the vehicle. Possible adverse effects, especially in frontal crashes, could detract from overall effectiveness. Lap belts should be more effective in LTVs than in cars, since there are more rollovers, more ejections, and more space within the vehicle.
Early effectiveness studies: Early analyses were usually based on fatalities or injuries per 100 crash-involved occupants. For example, if 10 percent of unrestrained occupants were injured, and 5 percent of lap-belted occupants, the effectiveness estimate was 50 percent. These studies estimated reductions of fatalities and/or serious injuries ranging from 35 percent upwards to 78
282 (1986). Performance of lap belts in 26 frontal crashes. (Report No. NTSB/SS-86/03, pp. 225-230). Washington, DC: National Transportation Safety Board; 1965 SAE Handbook, pp. 868-872; Federal Register 32 (February 3, 1967): 2414, 35 (September 30, 1970): 15222. 283 Kahane (2000, December), pp. 31-33; Evans, L. (1991). Traffic safety and the driver. New York: Van Nostrand Reinhold, pp. 52-54; Sikora, J. J. (1986). Relative risk of death for ejected occupants in fatal traffic accidents. (Re-port No. DOT HS 807 096). Washington, DC: National Highway Traffic Safety Administration. 284 Performance of Lap Belts in 26 Frontal Crashes; whereas that report focuses on rear seat occupants, the conclu-sions are also pertinent to front seat occupants.

94
percent. Researchers grasped that several factors were definitely or possibly inflating the effec-tiveness attributed to belts:285
• People who buckle up also tend to drive more carefully than those who do not. They have less severe crashes, thus, lower injury rates per 100 crash involvements.
• Additional bias in favor of belts may occur if uninjured, unrestrained people report them-selves, or are reported as belt users. That would lower the injury rate in the “belted” pop-ulation, and raise it for the “unrestrained.”
• Statistically meaningful results on fatality reduction are difficult to achieve because there are relatively few fatality cases on individual State crash files.
NHTSA’s Restraint Systems Evaluation Project of 1974 to 1975 addressed the first two factors. Multidisciplinary teams investigated a probability sample of towaway crashes involving 21,000 outboard front seat occupants. Detailed information about vehicle damage made it possible to adjust the injury rates for differences in crash severity, using multidimensional contingency table analysis. Investigators were trained to report belt use as accurately as possible, based on an ex-tensive checklist of evidence from the vehicle, driver interviews, the police report, and medical information. RSEP estimated that lap belts reduce moderate (AIS ≥ 2) injuries by 31 percent and serious (AIS ≥ 3) injuries by 46 percent.286
In 1984, in support of the rulemaking on automatic protection, NHTSA supplemented the RSEP data with NCSS plus all available NASS data. The additional data permitted a more extensive and realistic adjustment for crash severity, producing somewhat lower, but statistically signifi-cant injury reductions. They remain NHTSA’s most reliable statistical results, and they will be discussed below. Based on these analyses and other studies available at that time, NHTSA’s best estimates were that lap belts reduce fatalities by 30 to 40 percent, AIS 2-to-5 (moderate to criti-cal) injuries by 25 to 35 percent, and AIS 1 (minor) injuries by 10 percent, for front seat occu-pants of passenger cars.287
285 NHTSA. (1976). Safety belt usage – A review of effectiveness studies – Suggestions for State programs. (Report No. DOT HS 801 988). Washington, DC: National Highway Traffic Safety Administration; Tourin, B., & Garrett, J. W. (1960). Safety belt effectiveness in rural California Automobile Accidents. Buffalo: Cornell Aeronautical Labora-tory; Levine, D. N., & Campbell, B. J. (1971). Effectiveness of lap seat belts and the energy absorbing steering col-umn in the reduction of injuries. (HSL Publication No. 00221617). Chapel Hill, NC: Highway Safety Research Cen-ter, University of North Carolina; Kahane, C. J. (1974). Usage and effectiveness of seat and shoulder belts in rural Pennsylvania accidents. (Report No. DOT HS 801 398). Washington, DC: National Highway Traffic Safety Admin-istration. 286 Reinfurt, D. W., Silva, C. Z., & Seila, A. F. (1976, September). A statistical analysis of seat belt effectiveness in 1973-75 model cars involved in towaway crashes, volume 1. (Report No. DOT HS 802 035, pp. vii-viii). Washing-ton, DC: National Highway Traffic Safety Administration. Available at www-nrd.nhtsa.dot.gov/Pubs/HS802035.PDF. 287 Kahane, C. J. (1984b). Addendum to "Seat belt effectiveness estimates using data adjusted for damage type.” (NHTSA Docket No. 74-14-N35-229-05). Washington, DC: National Highway Traffic Safety Administration; NHTSA. (1984). Final regulatory impact analysis, amendment to Federal Motor Vehicle Safety Standard 208, pas-senger car front seat occupant protection. (Report No. DOT HS 806 572, p. IV-2). Washington, DC: National Highway Traffic Safety Administration.
95
Fatality reduction – passenger cars: Double-pair comparison, as originally applied by Evans to study lap-shoulder belts, greatly facilitated the estimation of fatality reduction.288 Double-pair comparison allows the direct use of FARS data that have a much higher N of fatalities than NASS or State files. It implicitly adjusts or controls for the differences in the severity of crashes involving belted and unrestrained occupants. Until 1985, before buckle-up laws, FARS data was accurate or at least unbiased in the reporting of belt use.
A double-pair analysis of lap-belt effectiveness uses the technique developed in NHTSA’s eval-uation of 3-point belts (and similar to Evans’).289 The analysis is based on MY 1956-to-1973 cars (before 3-point belts) in CY 1975-to-1985 FARS data. It is limited to cars with a driver and a RF passenger (and perhaps other passengers). The driver, or the RF passenger, or both were fatally injured. Lap-belted and unrestrained drivers and RF passengers age 14 to 97 are included. The 34,889 vehicle cases tabulate as follows:
Vehicles Driver Died Driver Survived Both RF Survived RF Died Died Both unrestrained 13,064 14,781 5,926 Driver unrestrained, RF lap-belted 111 93 32 Driver lap-belted, RF unrestrained 104 201 73 Both lap-belted 178 261 65
This can be tabulated as fatality cases rather than vehicle cases, by adding the “both died” col-umn to each of the preceding columns:
Fatalities Driver RF Driver/RF Fatalities Fatalities Risk Ratio Both unrestrained 18,990 20,707 0.917 Driver unrestrained, RF lap-belted 143 125 1.144 Driver lap-belted, RF unrestrained 177 274 0.646 Both lap-belted 243 326 0.745
It is clear that (1) the overwhelming majority of people killed in CY 1975-to-1985 crashes were unrestrained; (2) in these older cars, unrestrained drivers are at slightly lower risk than their RF passengers; and (3) people who buckled up with lap belts reduced their risk. The four rows of data allow a total of four double-pair comparisons, two for computing the effectiveness of belts for drivers, and two for RF passengers. The first comparison for the driver is based on the first and third rows of data:
288 Evans, L. (1986a). Double pair comparison - A new method to determine how occupant characteristics affect fatality risk in traffic crashes. Accident Analysis and Prevention, 18, pp. 217-227; Evans, L. (1986b). The effective-ness of safety belts in preventing fatalities. Accident Analysis and Prevention, 18, pp. 229-241. 289 Kahane (2000, December), pp. 5-10.
96
Driver RF Driver/RF Fatalities Fatalities Risk Ratio Driver unrestrained RF unrestrained 18,990 20,707 0.917 Driver lap-belted RF unrestrained 177 274 0.646
In both pairs, the driver’s fatality risk is compared to the same control group: the unrestrained RF passenger. The unrestrained driver has slightly lower fatality risk than the unrestrained RF pas-senger in the same crash, the lap-belted driver, substantially lower. The fatality reduction for lap belts is: 1 - (0.646/0.917) = 30 percent.
The other comparison for the driver is based on the second and fourth rows of data:
Driver RF Driver/RF Fatalities Fatalities Risk Ratio Driver unrestrained RF lap-belted 143 125 1.144 Driver lap-belted RF lap-belted 243 326 0.745
Here, the control group is the lap-belted RF passenger. The unrestrained driver has higher fatality risk than the lap-belted RF passenger in the same crash, the lap-belted driver, lower. The fatality reduction is: 1 - (0.745/1.144) = 35 percent. The effectiveness estimates for drivers are similar with the two control groups.
The first double-pair comparison to estimate belt effectiveness for the RF passenger is obtained by using the first two rows of data, reversing the order of the columns and computing the RF/Driver rather than the Driver/RF risk ratio:
RF Driver RF/Driver Fatalities Fatalities Risk Ratio RF unrestrained Driver unrestrained 20,707 18,990 1.090 RF lap-belted Driver unrestrained 125 143 0.874
The control group is the unrestrained driver. The fatality reduction for the lap-belted RF passen-ger is: 1 - (0.874/1.090) = 20 percent. The second estimate uses the last two rows of data:
RF Driver RF/Driver Fatalities Fatalities Risk Ratio RF unrestrained Driver lap-belted 274 177 1.548 RF lap-belted Driver lap-belted 326 243 1.342
97
The control group is the lap-belted driver. The fatality reduction for the lap-belted RF passenger is: 1 - (1.342/1.548) = 13 percent. Again, the two control groups produce similar estimates. Also, lap-belt effectiveness is lower for the RF passenger than for the driver.
NHTSA’s 2000 evaluation of 3-point belts develops a weighting procedure that combines the two driver estimates and the two RF-passenger estimates into a single number, the overall, aver-age fatality reduction for front-seat lap belts in passenger cars: 27 percent.
By crash mode, the estimated fatality reduction for lap belts is: 43 percent in rollovers, 22 per-cent in frontals, and 21 percent in side impacts, rear impacts and other crashes.
Fatality reduction – LTVs: Based on a similar double-pair comparison analysis for LTVs, the fatality reduction by lap belts for front seat occupants averaged 48 percent. There were not enough FARS cases for statistically meaningful separate analyses by crash mode. That is very close to a previous NHTSA estimate of 50-percent fatality reduction by lap belts in the center front seat of LTVs, not obtained directly from crash data, but inferred by examining the relation-ships between other estimates: lap-belt versus 3-point-belt effectiveness in cars and 3-point belt effectiveness in LTVs versus cars.290
Injury reduction – passenger cars: As stated above, NHTSA analyzed a database in 1984 that combined the RSEP, the NCSS, plus all available NASS cases. Injury rates were computed per 100 towaway-involved occupants: unrestrained, lap-belted, and lap-shoulder belted. The rates were adjusted for differences in impact location (front, side, rollover) and damage severity (CDC extent zone), using a Mantel-Haenszel model, a simpler approach than the logistic regression method widely used today. Lap belts reduced the adjusted overall (AIS ≥ 1) injury rate by 8 per-cent, moderate (AIS ≥ 2) injuries by 22 percent and severe (AIS ≥ 3) injuries by 33 percent.291
Injury reduction – LTVs: NHTSA has not analyzed the injury reduction for lap belts for out-board front seat occupants of LTVs. However, the agency estimated that lap belts in the center front seat of LTVs reduce AIS 2-5 injuries by 55 percent and AIS 1 injuries by 10 percent. The estimate was not obtained directly from crash data, but inferred by examining the relationships between other estimates: lap-belt versus 3-point-belt effectiveness in cars, 3-point belt effective-ness in LTVs versus cars, and fatality reduction versus injury reduction.292
Lap belts for rear seat occupants History: The domestic manufacturers were providing lap belts at the outboard rear seating posi-tions by MY 1967. FMVSS No. 208 required seat belts at all rear seats, including the center rear seat and the third row of seats in a station wagon, effective January 1, 1968, in passenger cars and July 1, 1971 in LTVs. As late as MY 1987, over 90 percent of new cars and LTVs had lap
290 NHTSA. (1990). Final regulatory impact analysis, extension of the automatic restraint requirements of FMVSS 208 to trucks, buses and multi-purpose passenger vehicles. (NHTSA Docket No. 74-14-N70-001, p. 23). Washing-ton, DC: National Highway Traffic Safety Administration. 291 Kahane (1984b); 90 percent confidence bounds for effectiveness: AIS ≥ 1 injuries, 6 to 13 percent; AIS ≥ 2 inju-ries, 13 to 42 percent; AIS ≥ 3 injuries, 20 to 76 percent. 292 Final regulatory impact analysis, extension of the automatic restraint requirements of FMVSS 208 to trucks, bus-es and multi-purpose passenger vehicles, p. 23.
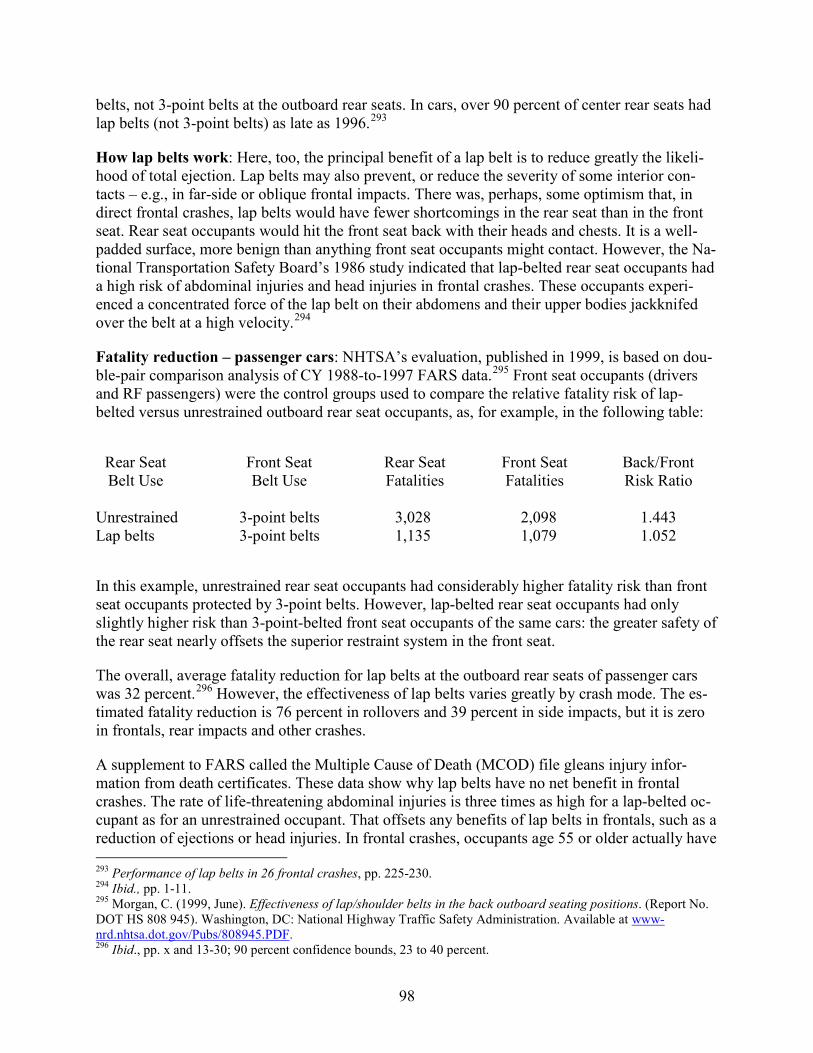
98
belts, not 3-point belts at the outboard rear seats. In cars, over 90 percent of center rear seats had lap belts (not 3-point belts) as late as 1996.293
How lap belts work: Here, too, the principal benefit of a lap belt is to reduce greatly the likeli-hood of total ejection. Lap belts may also prevent, or reduce the severity of some interior con-tacts – e.g., in far-side or oblique frontal impacts. There was, perhaps, some optimism that, in direct frontal crashes, lap belts would have fewer shortcomings in the rear seat than in the front seat. Rear seat occupants would hit the front seat back with their heads and chests. It is a well-padded surface, more benign than anything front seat occupants might contact. However, the Na-tional Transportation Safety Board’s 1986 study indicated that lap-belted rear seat occupants had a high risk of abdominal injuries and head injuries in frontal crashes. These occupants experi-enced a concentrated force of the lap belt on their abdomens and their upper bodies jackknifed over the belt at a high velocity.294
Fatality reduction – passenger cars: NHTSA’s evaluation, published in 1999, is based on dou-ble-pair comparison analysis of CY 1988-to-1997 FARS data.295 Front seat occupants (drivers and RF passengers) were the control groups used to compare the relative fatality risk of lap-belted versus unrestrained outboard rear seat occupants, as, for example, in the following table:
Rear Seat Front Seat Rear Seat Front Seat Back/Front Belt Use Belt Use Fatalities Fatalities Risk Ratio Unrestrained 3-point belts 3,028 2,098 1.443 Lap belts 3-point belts 1,135 1,079 1.052
In this example, unrestrained rear seat occupants had considerably higher fatality risk than front seat occupants protected by 3-point belts. However, lap-belted rear seat occupants had only slightly higher risk than 3-point-belted front seat occupants of the same cars: the greater safety of the rear seat nearly offsets the superior restraint system in the front seat.
The overall, average fatality reduction for lap belts at the outboard rear seats of passenger cars was 32 percent.296 However, the effectiveness of lap belts varies greatly by crash mode. The es-timated fatality reduction is 76 percent in rollovers and 39 percent in side impacts, but it is zero in frontals, rear impacts and other crashes.
A supplement to FARS called the Multiple Cause of Death (MCOD) file gleans injury infor-mation from death certificates. These data show why lap belts have no net benefit in frontal crashes. The rate of life-threatening abdominal injuries is three times as high for a lap-belted oc-cupant as for an unrestrained occupant. That offsets any benefits of lap belts in frontals, such as a reduction of ejections or head injuries. In frontal crashes, occupants age 55 or older actually have 293 Performance of lap belts in 26 frontal crashes, pp. 225-230. 294 Ibid., pp. 1-11. 295 Morgan, C. (1999, June). Effectiveness of lap/shoulder belts in the back outboard seating positions. (Report No. DOT HS 808 945). Washington, DC: National Highway Traffic Safety Administration. Available at www-nrd.nhtsa.dot.gov/Pubs/808945.PDF. 296 Ibid., pp. x and 13-30; 90 percent confidence bounds, 23 to 40 percent.
99
higher fatality risk with lap belts than unrestrained; they have exceptionally high risk of ab-dominal injury with lap belts.297
Fatality reduction – LTVs: NHTSA’s 1999 evaluation similarly analyzes vans and SUVs. The fatality reduction by lap belts for rear seat occupants averaged 63 percent.298 By crash mode, the estimated fatality reduction for lap belts is: 80 percent in rollovers, 44 percent in frontals, and 64 percent in side impacts, rear impacts and other crashes. A high percentage of rear seat passenger fatalities in LTVs are ejectees, even in frontals.
Injury reduction – passenger cars: A 1987 NHTSA report estimated the effectiveness of lap belts in reducing nonfatal injuries, based on double-pair comparison analyses of CY 1982-to-1985 Pennsylvania crash data. Compared to unrestrained rear seat occupants, lap belts reduced fatal-and-serious (K + A) injury risk by 37 percent, moderate-to-fatal (K + A + B) injury risk by 33 percent, and overall (K + A + B + C) injury risk by 11 percent.299
Injury reduction – LTVs: The agency has not analyzed crash data to estimate the injury reduc-tion for lap belts in LTVs. However, a NHTSA Regulatory Impact Analysis in 1990 projected that lap belts in rear seats of LTVs could reduce AIS 2-to-5 injuries by 35.5 percent and AIS 1 injuries by 5.5 percent. Here, the agency assumed the same effectiveness in cars and LTVs; in retrospect, the AIS 2-to-5 effectiveness (35.5%) would appear to be an underestimate for the LTVs.300
Manual 3-point lap-shoulder belts for outboard front seat occupants History: Volvo introduced 3-point lap-shoulder belts as standard equipment at the outboard front seats in Sweden in 1959 and in the United States in 1963. In 1968, Volkswagen and, apparently, Audi, BMW and Mercedes made 3-point belts standard. At that time, the domestic and, apparent-ly, the Japanese manufacturers installed separate lap and shoulder belts in all new cars. Retractor systems were required effective January 1, 1972, and had been phased in by MY 1972. Effective January 1, 1968, FMVSS No. 208 originally required shoulder belts at the outboard front seats only if lap belts alone could not prevent contact with the windshield header. Effective January 1, 1972, FMVSS No. 208 required shoulder belts on all passenger cars, and effective September 1, 1973, shoulder belts had to be integral with the lap belt. Thus, from model year 1974 onwards, all passenger cars, except those with automatic belts, have had the modern system of integral 3-point belts with automatic locking retractors at the outboard front seats.301
297 Ibid., pp. xi-xiii, 47-52 and 99-111. 298 Ibid., pp. xii and 83-97; 90 percent confidence bounds, 52 to 71 percent. 299Kahane, C. J. (1987b). Fatality and injury reducing effectiveness of lap belts for back seat occupants. Restraint technologies: Rear seat occupant protection. (Paper No. 870486, Publication No. SP-691, pp. 45-52). Warrendale, PA: Society of Automotive Engineers; 90 percent confidence bounds for effectiveness: K + A injuries, 23 to 51 per-cent; K + A + B injuries, 26 to 40 percent; all injuries, 7 to 15 percent. 300 Final regulatory impact analysis, extension of the automatic restraint requirements of FMVSS 208 to trucks, bus-es and multi-purpose passenger vehicles, p. 23; NHTSA. (1989). Final regulatory evaluation, rear seat lap shoulder belts in passenger cars. (NHTSA Docket No. 87-08-N03-001, p. IV-1). Washington, DC: National Highway Traffic Safety Administration. 301 Performance of lap belts in 26 frontal crashes, pp. 225-230; Federal Register 32 (February 3, 1967): 2414, 36 (March 10, 1971): 4600, 38 (June 20, 1973): 16072; 49 CFR, Part 571.208 S4.1.1 and S4.1.2.
100
LTVs were equipped with 3-point belts later than cars, but they went directly from lap belts to 3-point belts, skipping separate lap and shoulder belts. FMVSS No. 208 required 3-point belts at outboard front seats effective January 1, 1976, for all LTVs with GVWR up to 10,000 pounds except forward-control vehicles and some other types, and effective September 1, 1981, on the forward-control vehicles. However, Volkswagen had introduced 3-point belts by 1969. NCSS and NASS data indicate that other manufacturers began to phase them in during 1972, 1973 or 1974. The phase-in was completed in pickup trucks and SUVs by January 1, 1976, and in vans by MY 1980.302
How 3-point belts work: The combination of a lap and shoulder belt furnishes at least as much protection against ejection as a lap belt alone, and possibly more, because the shoulder strap might sometimes prevent partial ejection through the side window. But lap-shoulder belts also significantly reduce the injury severity of occupants who remain within the vehicle and they avoid most of the additional injury risks associated with lap belts. The lap-shoulder belt is the basic protection system for most outboard front seat occupants in most types of crashes.303 Ideal-ly, belts provide “ride-down” by linking the occupant to the vehicle structure. They gradually decelerate the occupant as the vehicle deforms and absorbs energy and as the belts themselves “give” a little – but not so much as to allow forceful contacts with interior surfaces. Lap-shoulder belts, especially in combination with frontal air bags, can keep the occupant in an upright, seated position and reduce the risk of flexion/tension injuries. Lap-shoulder belts often accomplish these missions, especially in directly frontal, large-overlap impacts with in-position occupants who are not exceptionally vulnerable due to their age or other factors. However, the belts cannot always prevent head contacts with interior surfaces, such as in oblique impacts; may sometimes place large force on the occupant in severe crashes; and are less effective if the passenger com-partment is damaged, as in a near-side impact or a small-overlap frontal impact.
Separate shoulder belts were uncomfortable and inconvenient; only about 15 to 25 percent of the people who buckled the lap belt also fastened the separate shoulder harness. The most important feature of the integral 3-point belt is that everybody who buckled up received the protection of both the shoulder and the lap restraint, except for a small percentage of occupants who misused the shoulder belt by running it behind their backs or under their arms. Furthermore, the public did not consider the double belt excessively burdensome, because use of 3-point belts was as high as or higher than use of the lap belt alone.304 Technological advances made the 3-point belt acceptable to the public. Most important was the locking retractor. Whereas “airline style” lap belts would be merely inconvenient in cars and LTVs, a shoulder belt that is not self-adjusting would be unacceptable because drivers must lean forward or sideways in the course of normal driving (and passengers also desire some flexibility). The locking retractor is a system that spools out more webbing when occupants wish to move around during normal driving, locks the spool when it senses a crash or other sudden decelerations (e.g., driving over potholes), and picks up excessive slack in the belt. Slack is comfortable, up to a point, in normal driving operations, but most undesirable in a crash because it defeats the early engagement of the occupant with the belts. The system had to be fine-tuned. Belts should never feel too tight or too loose, lock too
302 Federal Register 40 (July 9, 1975): 28805; 49 CFR, Part 571.208 S4.2.1. 303 Even when children must ride in the front seat, their safety seats or booster seats are installed with the 3-point belt. 304 Reinfurt, Silva, & Seila (1976, September), p. 18; Phillips (1980, May), pp. 4-5.
101
seldom or too often, or allow excessive slack. NHTSA’s comfort and convenience standards for belts addressed these issues.305
Two problems with 3-point belts were excessive slack in some crashes, and large restraining force on some occupants in other crashes. Pretensioners and load-limiters, discussed later, ad-dress those shortcomings.
Belt use trends for outboard front seat occupants: Seat belt use in the United States has in-creased from about 11 percent in 1979-to-1982 to 86 percent in 2012. This has saved more lives than any other vehicle safety program. For many years, now, the vast majority of people are us-ing the basic occupant protection that has been in their vehicles since the 1970s. The National Occupant Protection Use Surveys (NOPUS) of 1994, 1996, 1998, and every year since 2000, give unbiased estimates of belt use by outboard front seat occupants of cars and LTVs on the na-tion’s streets, roads and highways during daylight hours, based on direct observation of a proba-bility sample of vehicles and roadways. While unbiased, NOPUS results can have sampling er-ror; 95 percent confidence bounds were initially + 4 percent but in recent years have shrunk to less than + 2 percent.306
305 Federal Register 46 (January 8, 1981): 2064, 50 (August 23, 1985): 34152; 49 CFR, Part 571.208 S7.4 306 Bondy, N., & Utter, D. (1997, April). Observed safety belt use in 1996. Washington, DC: National Highway Traffic Safety Administration. Available at www-nrd.nhtsa.dot.gov/Pubs/97820.PDF; Bondy, N., & Utter, D. (2001, February). Observed safety belt use, fall 2000 National Occupant Protection Use Survey. Washington, DC: National Highway Traffic Safety Administration. Available at www-nrd.nhtsa.dot.gov/Pubs/01010.pdf; Glassbrenner, D. (2002, September). Safety belt and helmet use in 2002 – Overall results. (Report No. DOT HS 809 500). Washing-ton, DC: National Highway Traffic Safety Administration. Available at www-nrd.nhtsa.dot.gov/Pubs/809500.pdf; Glassbrenner, D. (2003, September). Safety belt use in 2003. (Report No. DOT HS 809 646). Washington, DC: Na-tional Highway Traffic Safety Administration. Available at www-nrd.nhtsa.dot.gov/Pubs/809646.pdf; Glassbrenner, D. (2004, September). Safety belt use in 2004 – Overall results. (Report No. DOT HS 809 783). Washington, DC: National Highway Traffic Safety Administration. Available at www-nrd.nhtsa.dot.gov/Pubs/809783.pdf; Glassbren-ner, D. (2005, August). Safety belt use in 2005 – Overall results. (Report No. DOT HS 809 932). Washington, DC: National Highway Traffic Safety Administration. Available at www-nrd.nhtsa.dot.gov/Pubs/809932.pdf; Glassbren-ner, D., & Ye, J. Y. (2006, November). Seat belt use in 2006 – Overall results. (Report No. DOT HS 810 677). Washington, DC: National Highway Traffic Safety Administration. Available at www-nrd.nhtsa.dot.gov/Pubs/810677.pdf; Glassbrenner, D., & Ye, J. Y. (2007, September). Seat belt use in 2007 – Over-all results. (Report No. DOT HS 810 841). Washington, DC: National Highway Traffic Safety Administration. Available at www-nrd.nhtsa.dot.gov/Pubs/810841.pdf; Pickrell, T. M., & Ye, J. Y. (2008, September). Seat belt use in 2008 – Overall results. (Report No. DOT HS 811 036). Washington, DC: National Highway Traffic Safety Ad-ministration. Available at www-nrd.nhtsa.dot.gov/Pubs/811036.pdf Pickrell, T. M., & Ye, J. Y. (2009, September). Seat belt use in 2009 – Overall results. (Report No. DOT HS 811 200). Washington, DC: National Highway Traffic Safety Administration. Available at www-nrd.nhtsa.dot.gov/Pubs/811200.pdf; Pickrell, T. M., & Ye, J. Y. (2010, September). Seat belt use in 2010 – Overall results. (Report No. DOT HS 811 378). Washington, DC: National Highway Traffic Safety Administration. Available at www-nrd.nhtsa.dot.gov/Pubs/811378.pdf; Pickrell, T. M., & Ye, J. Y. (2011, November). Seat belt use in 2011 – Overall results. (Report No. DOT HS 811 544). Washington, DC: National Highway Traffic Safety Administration. Available at www-nrd.nhtsa.dot.gov/Pubs/811544.pdf; Pick-rell, T. M., & Ye, T. J. (2012, November). Seat belt use in 2012 – Overall results. (Report No. DOT HS 811 691). Washington, DC: National Highway Traffic Safety Administration. Available at www-nrd.nhtsa.dot.gov/Pubs/811691.pdf.
102
From 1976 to 1991, NHTSA estimated national seat belt use by drivers in the 19-City Survey.307 Unlike NOPUS, the basic estimate for the 19-City Survey is for drivers only and does not in-clude RF passengers; a separate group of observations comprised passengers at the RF and other seating positions.
The point estimates generated by the 19-City Survey are not directly comparable to NOPUS, be-cause of the different sampling frame (e.g., they do not include RF passengers) and also do not have estimates of sampling error because they are not a national probability sample.308 The fol-lowing table and graph track the 19-City estimates of belt use in the United States from 1976 to 1991 and the NOPUS estimates from 1994 to 2012.
307 Stowell, C., & Bryant, J. (1977, December). Safety belt usage: Survey of the traffic population. (Report No. DOT HS 803 354). Washington, DC: National Highway Traffic Safety Administration. Available at www-nrd.nhtsa.dot.gov/Pubs/HS803354.pdf (this initial survey encompassed only 15 of the 19 cities); Phillips (1980, May); Phillips, B. M. (1983, May). Restraint system usage in the traffic population. (Report No. DOT HS 806 424). Washington, DC: National Highway Traffic Safety Administration. Available at www-nrd.nhtsa.dot.gov/Pubs/HS806424.pdf; Perkins, D. D., Cynecki, M. J., & Goryl, M. E. (1984, July). Restraint system usage in the traffic population. (Report No. DOT HS 806 582). Washington, DC: National Highway Traffic Safety Administration. Available at www-nrd.nhtsa.dot.gov/Pubs/HS806582.pdf; Goryl, M. E., & Cynecki, M. J. (1985, March). Restraint system usage in the traffic population. (Report No. DOT HS 806 714). Washington, DC: National Highway Traffic Safety Administration. Available at www-nrd.nhtsa.dot.gov/Pubs/HS806714.pdf; Goryl, M. E. (1986, May). Restraint system usage in the traffic population. (Report No. DOT HS 806 987). Washington, DC: National Highway Traffic Safety Administration. Available at www-nrd.nhtsa.dot.gov/Pubs/HS806987.pdf; Goryl, M. E., & Bowman, B. L. (1987, March). Restraint system usage in the traffic population. (Report No. DOT HS 807 080). Washington, DC: National Highway Traffic Safety Administration. Available at www-nrd.nhtsa.dot.gov/Pubs/807080.pdf; Bowman, B. L., & Rounds, D. A. (1988, August). Restraint system usage in the traffic population 1987 annual report. (Report No. DOT HS 807 342). Washington, DC: National Highway Traffic Safety Administration. Available at www-nrd.nhtsa.dot.gov/Pubs/807342.pdf; Bowman, B. L., & Rounds, D. A. (1989, June). Restraint system usage in the traffic population 1988 annual report. (Report No. DOT HS 807 447). Washington, DC: National Highway Traffic Safety Administration. Available at www-nrd.nhtsa.dot.gov/Pubs/807447.pdf; Datta, T.K., & Guzek, P. (1990, June). Restraint system use in 19 U.S. cities 1989 annual report. (Report No. DOT HS 807 595). Washington, DC: National Highway Traffic Safety Administra-tion. Available at www-nrd.nhtsa.dot.gov/Pubs/807595.pdf; Datta, T. K., & Guzek, P. (1991, July). Restraint system use in 19 U.S. cities 1990 annual report. (Report No. DOT HS 808 147). Washington, DC: National Highway Traf-fic Safety Administration. Available at www-nrd.nhtsa.dot.gov/Pubs/808147.pdf; Datta, T. K., & Guzek, P. (1992, March). Restraint system use in 19 U.S. cities 1991 annual report. (Report No. DOT HS 808 148). Washington, DC: National Highway Traffic Safety Administration. Available at www-nrd.nhtsa.dot.gov/Pubs/808148.pdf. 308 NOPUS and the 19-City Survey never overlapped. However, both studies overlapped with a NHTSA computa-tion of national averages based on individual State surveys during the 1990s. These averages cannot be considered unbiased estimates of the nation’s belt use for various reasons – e.g., the exclusion of pickup trucks (which have lower belt use) in up to half the State surveys before 1997. In 1991, belt use was 51 percent in the 19-City Survey and averaged 58 percent in the State surveys; in 1994, belt use was 58 percent in NOPUS and averaged 66 percent in the State surveys. Thus, the State survey averages exceed the 19-city and NOPUS estimates by approximately the same amounts (7 or 8 percentage points) in 1991 and 1994, respectively. See also Kahane (2000, December), pp. 63 and 75-76.
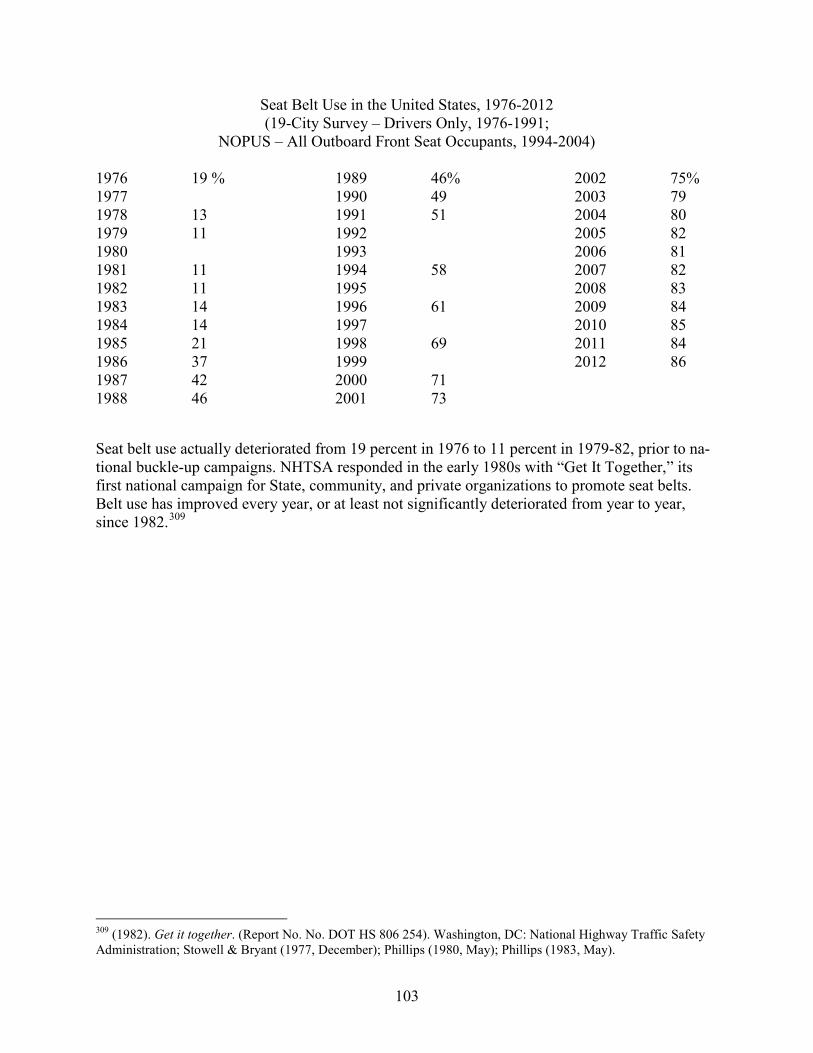
103
Seat Belt Use in the United States, 1976-2012 (19-City Survey – Drivers Only, 1976-1991;
NOPUS – All Outboard Front Seat Occupants, 1994-2004) 1976 19 % 1989 46% 2002 75% 1977 1990 49 2003 79 1978 13 1991 51 2004 80 1979 11 1992 2005 82 1980 1993 2006 81 1981 11 1994 58 2007 82 1982 11 1995 2008 83 1983 14 1996 61 2009 84 1984 14 1997 2010 85 1985 21 1998 69 2011 84 1986 37 1999 2012 86 1987 42 2000 71 1988 46 2001 73
Seat belt use actually deteriorated from 19 percent in 1976 to 11 percent in 1979-82, prior to na-tional buckle-up campaigns. NHTSA responded in the early 1980s with “Get It Together,” its first national campaign for State, community, and private organizations to promote seat belts. Belt use has improved every year, or at least not significantly deteriorated from year to year, since 1982.309
309 (1982). Get it together. (Report No. No. DOT HS 806 254). Washington, DC: National Highway Traffic Safety Administration; Stowell & Bryant (1977, December); Phillips (1980, May); Phillips (1983, May).
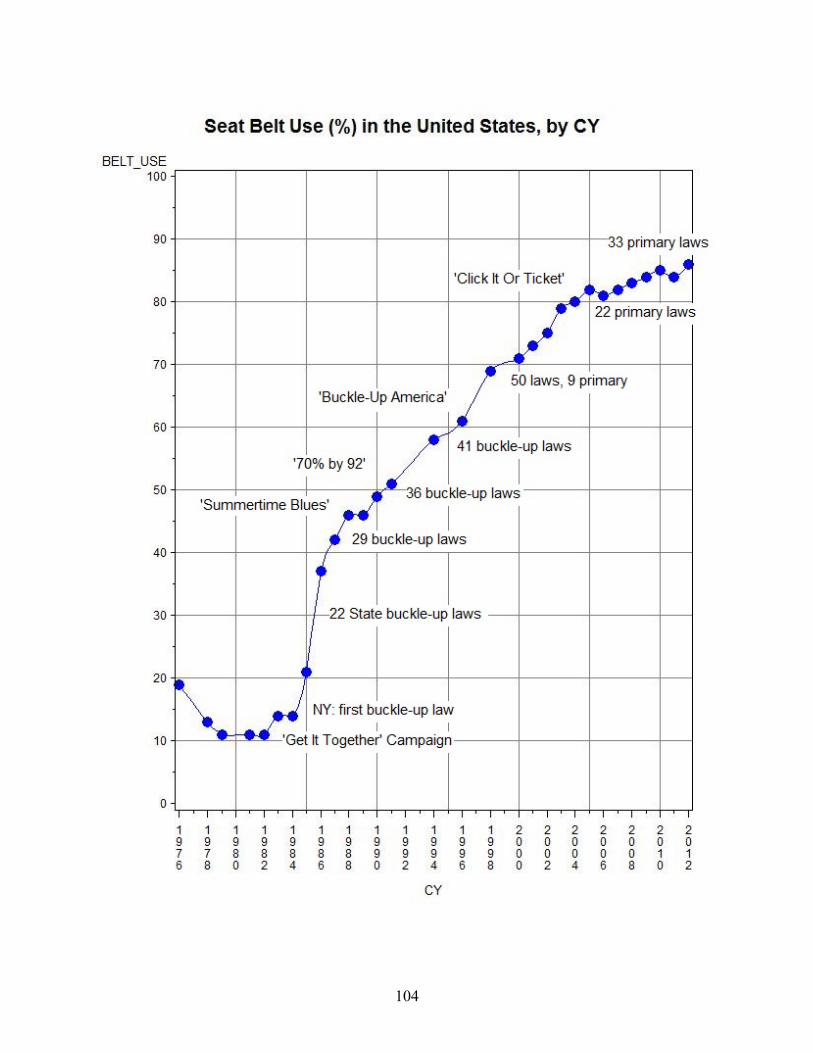
104
105
The greatest jump in belt use took place from 1984 to 1987 as buckle-up laws took effect in 29 States, including all ten most populous States. New York’s law was the first, effective December 1, 1984, followed by New Jersey, Illinois and Michigan. Simultaneous with the July 1984 deci-sion on automatic crash protection, NHTSA, the manufacturers – through their Automotive Coa-lition for Traffic Safety (ACTS) – and the safety community dedicated themselves to a success-ful effort to encourage buckle-up laws in the States. By 1995, 49 States, the District of Columbia, and Puerto Rico had buckle-up laws.310
Even though most of the States had buckle-up laws by 1990, belt use continued to increase from 49 percent in 1990 to 80 percent in 2004 to 86 percent in 2012. Sustained national campaigns, spearheaded by DOT/NHTSA and supported by States, communities and the private sector, have played an important role. They combine public information and education about the life-saving benefits of belts, law enforcement by States and communities, and additional information to make the public aware of the enforcement programs. Campaigns include “70% By 92” and “Avoid The Summertime Blues” in the early 1990s, “Buckle-Up America” starting in the late 1990s, and “Click It or Ticket” from 2003 onwards. There has also been a push for “primary” buckle-up laws that allow police to make a traffic stop solely upon observation of a belt law vio-lation; 33 States and the District of Columbia had primary laws in 2012, up from 9 States in 1993 and 22 in 2004. After 30 years of cumulative and sustained education about seat belts, more and more Americans have been buckling up since childhood and view seat belts as a basic part of riding in vehicles.311
Early effectiveness studies: NHTSA’s Restraint Systems Evaluation Project (RSEP) of 1974 and 1975 was the first statistical analysis in the United States with a large sample of crash-involved occupants who wore lap-shoulder belts. After controlling for damage location and se-verity, occupant age and vehicle weight, RSEP estimated that lap-shoulder belts reduce moderate
310 (1996). Third report to Congress – Effectiveness of occupant protection systems and their use. (Report No. DOT HS 808 537). Washington, DC: National Highway Traffic Safety Administration; NHTSA. (1999, May). Fourth report to Congress – Effectiveness of occupant protection systems and their use. (Report No. DOT HS 808 919). Washington, DC: National Highway Traffic Safety Administration. Available at www-nrd.nhtsa.dot.gov/Pubs/808-919.pdf. 311 Hedlund, J., Gilbert, S. H., Ledingham, K., & Preusser D. (2008, August). How States achieve high seat belt use rates. Washington, DC: National Highway Traffic Safety Administration. Available at www-nrd.nhtsa.dot.gov/Pubs/810962.PDF; NHTSA. (1991). Buckle up: Avoid the summertime blues. (Report No. No. DOT HS 041 653). Washington, DC: National Highway Traffic Safety Administration; JAMA. (1992, July). 70 by 92: Increased safety-belt use. Journal of the American Medical Association, 268, p. 318; NHTSA. (1997). Buckle Up America. (Report No. No. DOT HS 808 628). Washington, DC: National Highway Traffic Safety Administra-tion; IIHS. (2001, November). ’Click It or Ticket’ expands beyond North Carolina. Status Report, 36, p. 4. Arling-ton, VA: Insurance Institute for Highway Safety; Eby, D.W., Vivoda, J. M., & Fordyce, T. A. (1999). Direct obser-vation of safety belt use in Michigan: Fall 1999. (Report No. UMTRI-99-33). Ann Arbor, MI: University of Michi-gan Transportation Research Institute; State seat belt laws. Washington, DC: Governors Highway Safety Associa-tion. Available at www.ghsa.org/html/stateinfo/laws/seatbelt_laws.html; Pickrell & Ye (2012, November); for in-formation about Click It or Ticket see also the NHTSA Web sites, www.nhtsa.gov/Driving+Safety/Occupant+Protection and www.nhtsa.gov/Driving+Safety/Research+&+Evaluation/Click+It+or+Ticket+Seat+Belt+Mobilization+Evaluation+Reports.
106
(AIS ≥ 2) and severe (AIS ≥ 3) injuries by 57 percent. RSEP hinted that fatality reduction might be close to 60 percent.312
By 1984, during the rulemaking on automatic protection, NHTSA realized that fatality reduction had to be somewhat lower than 60 percent. Buckle-up laws outside the United States were saving lives, but not as many as would be predicted based on 60 percent effectiveness. A review of 781 unrestrained fatalities in NCSS suggested that belts would have had little effect in nearly half of the cases. The agency performed two new analyses of belt effectiveness. RSEP data was supple-mented with NCSS data plus all available NASS cases. The additional data permitted a more ex-tensive adjustment for crash severity, and showed a statistically significant 49-percent reduction of fatalities and 45-percent reduction of serious (AIS ≥ 3) injuries. NHTSA compared the in-crease in belt use with the fatality reduction in 11 nations or Canadian Provinces that enacted buckle-up laws. The fatality reduction, on the average, suggested belts were 47 percent effective when used. In 1984, based on these analyses, NHTSA lowered its “best estimates” to 40-to-50 percent fatality reduction, 45-to-55 percent AIS 2-to-5 reduction, and 10 percent AIS 1 reduc-tion.313
Expected benefits: Large fatality reductions should be expected in rollovers, where the majority of unrestrained fatalities are ejectees. Substantial fatality and injury reduction may be expected in direct-frontal, oblique-frontal and far-side crashes, except in impacts too severe for belts to effec-tively protect against contacts with interior surfaces. Effectiveness will be lowest in near-side impacts or other catastrophic crashes that reduce the space available to the occupant within the vehicle. Lap-shoulder belts should be more effective in LTVs than in cars, overall and specifical-ly in side impacts, since there are more rollovers, more ejections, and fewer catastrophic damag-es.
Fatality reduction – passenger cars: Evans’ double-pair comparison analyses of 1986 were an important advance in the estimation of fatality reduction. They confirmed NHTSA’s estimate that effectiveness was in the 40’s.314 Double-pair comparison allows the direct use of FARS data. It implicitly controls for crash severity. Until 1985, before buckle-up laws, FARS data was accu-rate or at least unbiased in the reporting of belt use. NHTSA’s current estimate of overall belt effectiveness, in its 2000 evaluation, is based on a double-pair analysis of MY 1975-to-1986 cars in CY 1977-to-1985 FARS data. It is limited to cars with a driver and an RF passenger (and per-haps other passengers). The driver, or the RF passenger, or both were fatally injured. Only 3-point-belted and unrestrained drivers and RF passengers, age 14-97, are included. This basic ta-ble demonstrates the life-saving benefit of 3-point belts.315
312 Reinfurt, Silva, & Seila (1976, September), pp. iv-viii; Safety belt usage – A review of effectiveness studies – Suggestions for State programs. 313 Final regulatory impact analysis, Amendment to Federal Motor Vehicle Safety Standard 208, passenger car front seat occupant protection, pp. IV-2 – IV-16; Kahane, C. J. (1984a). Estimates of fatality reduction for air bags and lap/shoulder belts based on case by case analysis of unrestrained fatalities. (NHTSA Docket No. 74-14-N35-012) Washington, DC: National Highway Traffic Safety Administration; Kahane (1984b), 90 percent confidence bounds for effectiveness: fatalities, 37 to 68 percent; AIS ≥ 3 injuries, 38 to 55 percent. 314 Evans (1986a); Evans (1986b). 315 Kahane (2000, December), pp. 5-10.
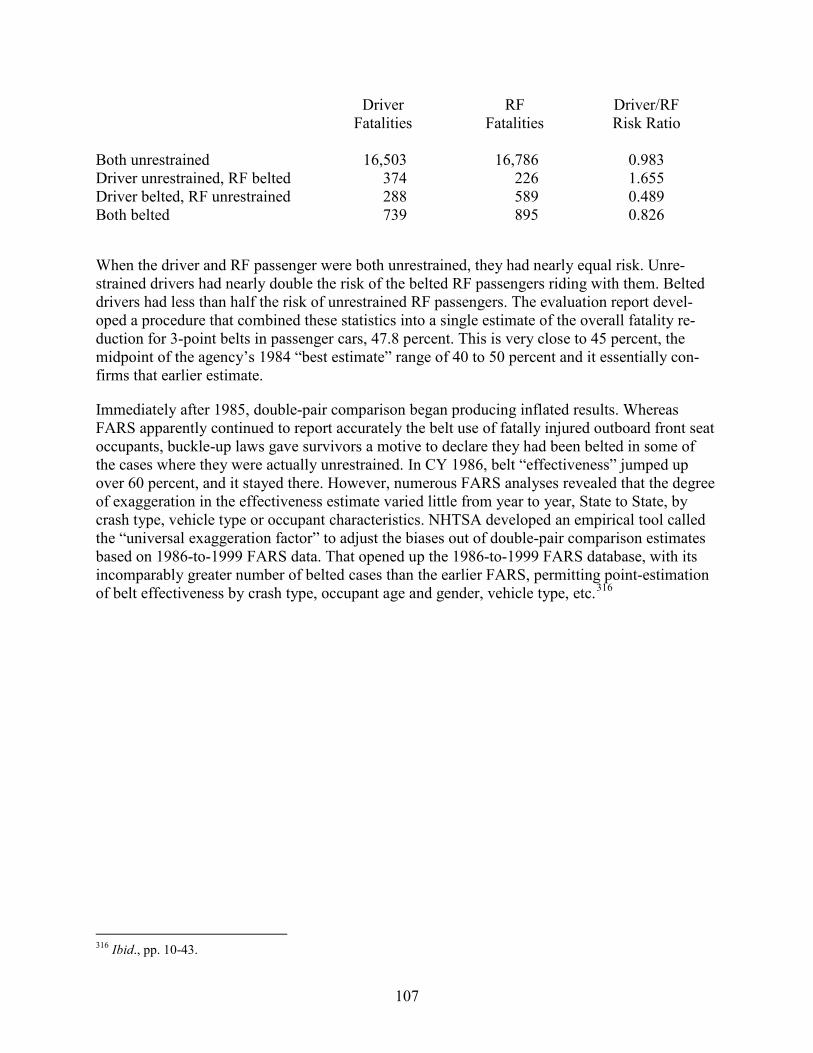
107
Driver RF Driver/RF Fatalities Fatalities Risk Ratio Both unrestrained 16,503 16,786 0.983 Driver unrestrained, RF belted 374 226 1.655 Driver belted, RF unrestrained 288 589 0.489 Both belted 739 895 0.826
When the driver and RF passenger were both unrestrained, they had nearly equal risk. Unre-strained drivers had nearly double the risk of the belted RF passengers riding with them. Belted drivers had less than half the risk of unrestrained RF passengers. The evaluation report devel-oped a procedure that combined these statistics into a single estimate of the overall fatality re-duction for 3-point belts in passenger cars, 47.8 percent. This is very close to 45 percent, the midpoint of the agency’s 1984 “best estimate” range of 40 to 50 percent and it essentially con-firms that earlier estimate.
Immediately after 1985, double-pair comparison began producing inflated results. Whereas FARS apparently continued to report accurately the belt use of fatally injured outboard front seat occupants, buckle-up laws gave survivors a motive to declare they had been belted in some of the cases where they were actually unrestrained. In CY 1986, belt “effectiveness” jumped up over 60 percent, and it stayed there. However, numerous FARS analyses revealed that the degree of exaggeration in the effectiveness estimate varied little from year to year, State to State, by crash type, vehicle type or occupant characteristics. NHTSA developed an empirical tool called the “universal exaggeration factor” to adjust the biases out of double-pair comparison estimates based on 1986-to-1999 FARS data. That opened up the 1986-to-1999 FARS database, with its incomparably greater number of belted cases than the earlier FARS, permitting point-estimation of belt effectiveness by crash type, occupant age and gender, vehicle type, etc.316
316 Ibid., pp. 10-43.
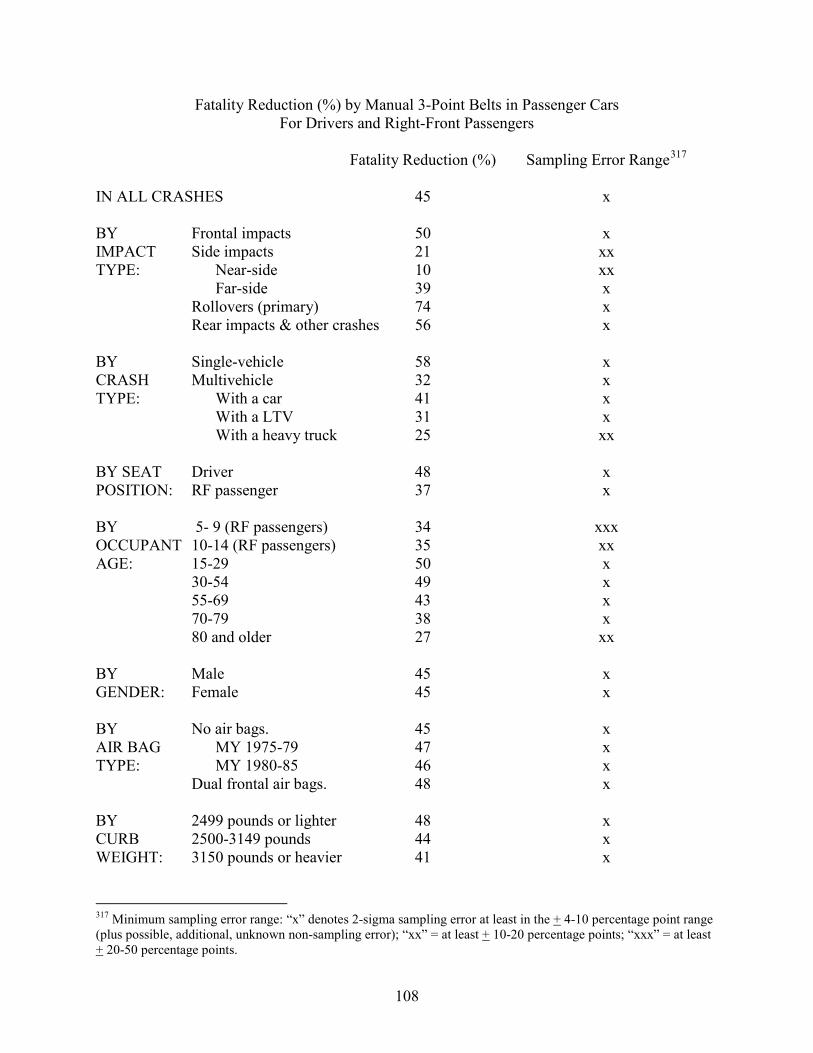
108
Fatality Reduction (%) by Manual 3-Point Belts in Passenger Cars For Drivers and Right-Front Passengers
Fatality Reduction (%) Sampling Error Range317 IN ALL CRASHES 45 x BY Frontal impacts 50 x IMPACT Side impacts 21 xx TYPE: Near-side 10 xx Far-side 39 x Rollovers (primary) 74 x Rear impacts & other crashes 56 x BY Single-vehicle 58 x CRASH Multivehicle 32 x TYPE: With a car 41 x With a LTV 31 x With a heavy truck 25 xx BY SEAT Driver 48 x POSITION: RF passenger 37 x BY 5- 9 (RF passengers) 34 xxx OCCUPANT 10-14 (RF passengers) 35 xx AGE: 15-29 50 x 30-54 49 x 55-69 43 x 70-79 38 x 80 and older 27 xx BY Male 45 x GENDER: Female 45 x BY No air bags. 45 x AIR BAG MY 1975-79 47 x TYPE: MY 1980-85 46 x Dual frontal air bags. 48 x BY 2499 pounds or lighter 48 x CURB 2500-3149 pounds 44 x WEIGHT: 3150 pounds or heavier 41 x
317 Minimum sampling error range: “x” denotes 2-sigma sampling error at least in the + 4-10 percentage point range (plus possible, additional, unknown non-sampling error); “xx” = at least + 10-20 percentage points; “xxx” = at least + 20-50 percentage points.
109
Three-point belts are most effective in rollovers (74%), but they are also highly effective in frontals (50%), far-side impacts (39%) and all crash types except near-side impacts (10%). They are effective in single- and multivehicle crashes (but especially the single-vehicle crashes, where most of the rollovers are); slightly more effective for drivers (48%) than RF passengers (37%); beneficial for all age groups, but especially at 15 to 54; equally effective for males and females; consistently beneficial from MY 1975 onwards, including in cars without air bags and with air bags; and effective in cars of all sizes.
Fatality reduction – LTVs: In 1989 the agency concluded, based on double-pair comparison analyses by Partyka, that the overall fatality-reducing effectiveness of 3-point belts in LTVs was greater than in cars and that it was close to 60 percent.318 NHTSA’s 2000 evaluation reconfirms that estimate and provides more detailed estimates of belt effectiveness in LTVs by crash type, occupant age and gender, vehicle type, etc. Belts are exceedingly effective in rollovers (80%), but they are also very effective in all other types of crashes, including even near-side impacts (41%), because LTVs are better able than cars to resist catastrophic damage in side impacts. They are effective in single-vehicle crashes and multivehicle crashes (but least so in impacts with heavy trucks); beneficial for all age groups; consistently effective from MY 1980 onwards, in-cluding in LTVs without air bags and with air bags; and beneficial in pickup trucks, vans and SUVs:319
318 Final regulatory impact analysis, extension of the automatic restraint requirements of FMVSS 208 to trucks, bus-es and multi-purpose passenger vehicles, p. 23; Partyka, S. C. (1988a). Belt Effectiveness in pickup trucks and pas-senger cars by crash direction and accident year (May 1988). Papers on adult seat belts - Effectiveness and use. (Report No. DOT HS 807 285, pp. 99-102). Washington, DC: National Highway Traffic Safety Administration. 319 Kahane (2000, December), pp. 10-43.
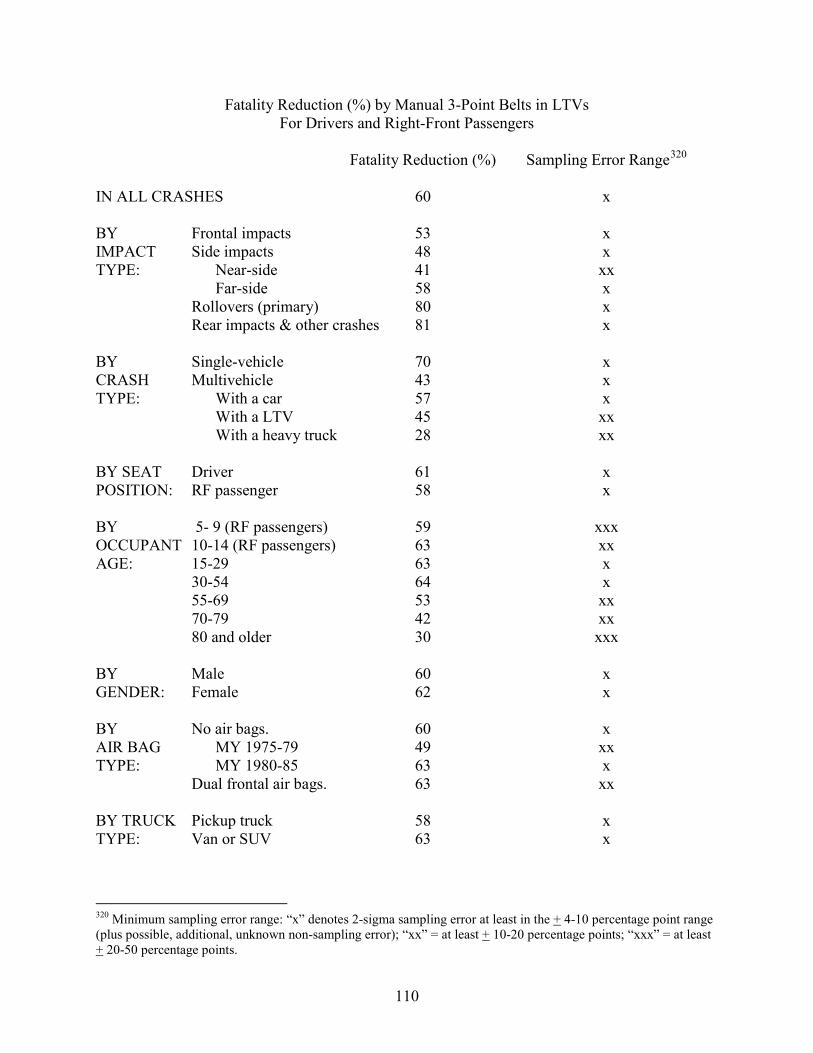
110
Fatality Reduction (%) by Manual 3-Point Belts in LTVs For Drivers and Right-Front Passengers
Fatality Reduction (%) Sampling Error Range320 IN ALL CRASHES 60 x BY Frontal impacts 53 x IMPACT Side impacts 48 x TYPE: Near-side 41 xx Far-side 58 x Rollovers (primary) 80 x Rear impacts & other crashes 81 x BY Single-vehicle 70 x CRASH Multivehicle 43 x TYPE: With a car 57 x With a LTV 45 xx With a heavy truck 28 xx BY SEAT Driver 61 x POSITION: RF passenger 58 x BY 5- 9 (RF passengers) 59 xxx OCCUPANT 10-14 (RF passengers) 63 xx AGE: 15-29 63 x 30-54 64 x 55-69 53 xx 70-79 42 xx 80 and older 30 xxx BY Male 60 x GENDER: Female 62 x BY No air bags. 60 x AIR BAG MY 1975-79 49 xx TYPE: MY 1980-85 63 x Dual frontal air bags. 63 xx BY TRUCK Pickup truck 58 x TYPE: Van or SUV 63 x
320 Minimum sampling error range: “x” denotes 2-sigma sampling error at least in the + 4-10 percentage point range (plus possible, additional, unknown non-sampling error); “xx” = at least + 10-20 percentage points; “xxx” = at least + 20-50 percentage points.
111
Injury reduction – passenger cars: As stated above, NHTSA analyzed a database in 1984 that combined the RSEP, NCSS, plus all available NASS cases. Injury rates were computed per 100 towaway-involved occupants: unrestrained, lap-belted, and lap-shoulder belted. The rates were adjusted for differences in impact location (front, side, rollover) and damage severity (CDC ex-tent zone), using a Mantel-Haenszel model, a simpler approach than the logistic regression method widely used today. Lap-shoulder belts reduced the adjusted overall (AIS ≥ 1) injury rate by 13 percent, moderate (AIS ≥ 2) injuries by 46 percent and severe (AIS ≥ 3) injuries by 45 per-cent.321
Injury reduction – LTVs: NHTSA has not statistically analyzed the injury reduction by 3-point belts for outboard front seat occupants of LTVs. However, the agency estimated that they reduce AIS 2-5 injuries by 65 percent and AIS 1 injuries by 10 percent. The estimate was inferred by examining the relationships between other estimates: 3-point belt fatality reduction in LTVs ver-sus cars, and fatality reduction versus injury reduction in cars.322
3-point lap-shoulder belts for rear seat occupants History: Volvo made 3-point belts standard at the outboard rear seating positions in MY 1971, and Mercedes made them standard in MY 1974. The 1982 Honda Accord was the first high-sales make-model equipped with 3-point belts. The majority of new cars had them at least one or two years before the December 11, 1989, effective date specified in FMVSS No. 208. The first LTVs with 3-point belts were some Isuzu Troopers in 1987, all Troopers and all full-sized GM vans in 1988. FMVSS No. 208 required them in all LTVs starting September 1, 1991. Retrofit kits could be purchased for many earlier vehicles equipped only with lap belts at the outboard rear seating positions.323
“Anton’s Law,” P.L. 107-318 (December 4, 2002) directed NHTSA to issue a regulation requir-ing 3-point belts for each rear seating position – i.e., including center rear seats – in passenger motor vehicles with a GVWR of 10,000 pounds or less. On December 8, 2004, NHTSA amend-ed FMVSS No. 208 to require the phase-in of 3-point belts in center rear seats in all new passen-ger vehicles to start on September 1, 2005, and to be completed by September 1, 2007.324 Manu-facturers began installing 3-point belts at center rear seats well in advance of the new require-ment, starting with Volvo and Saab in MY 1994 and extending to high-sales vehicles such as Ford Taurus and Toyota Camry by MY 1997. By 2001, the majority of new passenger cars had 3-point belts at the center rear seats; the majority of LTVs had them by 2003.
321 Kahane (1984b); 90 percent confidence bounds for effectiveness: AIS ≥ 1 injuries, 9 to 17 percent; AIS ≥ 2 inju-ries, 40 to 54 percent; AIS ≥ 3 injuries, 38 to 55 percent. 322 Final regulatory impact analysis, extension of the automatic restraint requirements of FMVSS 208 to trucks, bus-es and multi-purpose passenger vehicles, p. 23. 323 Federal Register 54 (June 14, 1989): 25275, 54 (November 2, 1989): 46257; 49 CFR, Parts 571.208 S4.1.4.2 and S4.2.4; from December 11, 1989 to August 31, 1990, cars were allowed separate lap and shoulder belts as an alter-native to 3-point belts, but nobody exercised that option; NHTSA. (1992). Lap/shoulder belt kits for rear seats. (Re-port No. No. DOT HS 807 881). Washington, DC: National Highway Traffic Safety Administration; for additional information about retrofit kits see Document Nos. 001, 002, 003, 005, 016, 018-H and 035 in NHTSA Docket No. 89-01-N01 and Nos. 006, 007, 008, 009, 011, 012, 014, and 015 in NHTSA Docket No. 89-01-N03. 324 Federal Register 69 (December 8, 2004): 70904; 49 CFR, Parts 571.208 S4.1.5.5 and S4.2.7.

112
How 3-point belts in rear seats work – expected benefits: As in the front seat, a lap and shoul-der belt in the rear seat ought to provide excellent protection against ejection, provide “ride-down,” keep occupants in an upright, seated position and reduce the severity of interior contacts. They should be effective in most crash modes, including frontals (but less so in severe near-side impacts or other catastrophic crashes). They should greatly alleviate the problem of abdominal injuries experienced with lap belts alone.
Fatality reduction – passenger cars: NHTSA’s 1999 evaluation is based on double-pair com-parison analysis of 1988-to-1997 FARS data. Front seat occupants (drivers and RF passengers) were the control groups used to compare the relative fatality risk of belted versus unrestrained outboard rear seat occupants in the following table:325
Rear Seat Front Seat Rear Seat Front Seat Rear/Front Belt Use Occupant Protection Fatalities Fatalities Risk Ratio Unrestrained Unrestrained 4,953 7,248 0.683 3-point belts Unrestrained 119 344 0.346 Unrestrained Frontal air bag 650 820 0.793 3-point belts Frontal air bag 49 148 0.331 Unrestrained 3-point belts 3,028 2,098 1.443 3-point belts 3-point belts 807 880 0.917 Unrestrained 3-pt. + air bag 670 371 1.806 3-point belts 3-pt. + air bag 431 490 0.880
In each of these four comparisons with a control group, the rear seat occupants protected with 3-point belts had substantially lower risk than the unrestrained rear seat occupants. For example, relative to unrestrained front seat occupants, unrestrained rear seat occupants had a risk ratio of 0.683, belted rear seat occupants just 0.346. The overall, average fatality reduction for 3-point belts at the outboard rear seats of passenger cars was 44 percent.326
The preceding table also shows that the rear seat was a safer place to ride than the front seat of cars of the 1990s. Unrestrained rear seat occupants had 32 percent lower fatality risk than unre-strained front seat occupants of the same car, and they had lower fatality risk than unbelted front seat occupants in cars with air bags. Rear seat occupants using 3-point belts had lower fatality risk than front seat occupants using 3-point belts, even if the car was also equipped with an air bag in the front seat. (For additional discussion, see the FMVSS No. 213 chapter.)
Three-point belts are effective in all crash modes, including frontals. The estimated fatality re-duction is: 77 percent in rollovers, 42 percent in side impacts, 29 percent in frontals, and 31 per-cent in rear impacts and other crashes. 325 Morgan (1999, June), p. 19. 326 Ibid., pp. x and 13-30; 90 percent confidence bounds, 38 to 50 percent.
113
Analyses of the FARS-MCOD file showed that 3-point belts reduce the risk of life-threatening abdominal injuries by 52 percent and head injuries by 47 percent relative to lap belts only, in frontal crashes. (Occupants wearing 3-point belts, however, still have higher risk of abdominal injury than unrestrained people, but their risk of head injury is 63% lower.) Three-point belts are beneficial for occupants of all age groups, including those 55 or older.327
Fatality reduction – LTVs: NHTSA’s 1999 evaluation analyzes vans and SUVs. Three-point belts are highly effective: the fatality reduction for rear seat occupants averaged 73 percent.328 By crash mode, the estimated fatality reduction is: 84 percent in rollovers, 50 percent in frontals, and 70 percent in side impacts, rear impacts and other crashes.
Injury reduction – passenger cars: NHTSA’s 1999 study did not attempt to obtain point esti-mates of the effectiveness of 3-point belts in reducing nonfatal injuries, because belt use ap-peared to be substantially overreported in available State crash files. However, an “as-used” analysis of 1990-to-1996 Pennsylvania data showed outboard rear seat occupants of cars equipped with 3-point belts (regardless of whether or not these occupants wore the belts) had a statistically significant 12 percent fewer moderate-to-fatal (K + A + B) injury rate in frontal crashes than occupants of cars equipped with lap belts only. In 1990-to-1996 Florida data, the reduction was 6 percent, also statistically significant.329 In 1989, the agency had projected that 3-point belts in rear seats of cars could reduce AIS 2-to-5 injuries by 45-55 percent and AIS 1 inju-ries by 10 percent. The estimate was not obtained directly from crash data, but inferred by exam-ining the relationships between other estimates: lap-belt versus 3-point-belt effectiveness in the front seat of cars, lap belt effectiveness in the rear seat versus the front, and fatality reduction versus injury reduction.330
Injury reduction – LTVs: The agency has not analyzed crash data to estimate the injury reduc-tion for 3-point belts in LTVs. NHTSA’s Regulatory Impact Analysis in 1990 projected that 3-point belts in rear seats of LTVs could reduce AIS 2-to-5 injuries by 50 percent and AIS 1 inju-ries by 5.5 percent. Here, the agency assumed the same effectiveness in cars and LTVs; in retro-spect, the AIS 2-to-5 number might be an underestimate for the LTVs.331
Automatic seat belts Types of automatic belts – how they work: There have been two fundamentally different types of automatic seat belts for outboard front seat occupants of passenger cars: 2-point and 3-point. A 2-point automatic belt was a diagonal torso belt, running from the roof rail or the top of the door down to a floor anchor near the center of the car. An entirely separate manual lap belt and/or knee bolster had to be added for lower-torso restraint. Motorized 2-point belts were an-chored to a track on the roof rail. A motor automatically rolled the anchor backward, moving the 327 Ibid., pp. xi-xiii, 47-52 and 99-111. 328 Ibid., pp. xii and 83-97; 90 percent confidence bounds, 64 to 79%. 329 Ibid., pp. 75-82. 330 Final regulatory evaluation, rear seat lap shoulder belts in passenger cars, pp. IV-1 – IV-26. 331 Final regulatory impact analysis, extension of the automatic restraint requirements of FMVSS 208 to trucks, bus-es and multi-purpose passenger vehicles, p. 23; Final regulatory evaluation, rear seat lap shoulder belts in passen-ger cars, p. IV-1.
114
torso belt into place, when the ignition was turned on, and rolled it forward, away from the occu-pant, when he or she prepared to leave the car. All motorized belt systems came with a manual lap belt. Non-motorized 2-point belts were anchored to the door. They were designed to move into place when the door shut and away when it opened. Before 1990, some of the non-motorized systems did not come with a lap belt. All 2-point belts could be loosened for emergency egress, by a device that spools the belt out temporarily and/or by a buckle that could be permanently dis-connected or reconnected as the occupant wished.
Automatic 3-point belts, when in use, closely resemble manual 3-point belts, but they are an-chored to the door rather than the roof rail/B-pillar and fashioned so as to move into place around the occupant when the door shuts and move away when the door opens. They also have a buckle somewhere – e.g., close to the anchor point at the center of the car. If the occupant so chooses, he or she may unbuckle it and let the belts retract; thereafter, the belts may be manually buckled and unbuckled just like conventional, manual 3-point belts, each time he or she rides in the car.
To qualify as automatic crash protection under FMVSS No. 208, cars with automatic belts had to meet that standard’s 30 mph frontal test requirement. Manual lap belts were not compulsory since the automatic belt, by itself, satisfied the FMVSS No. 208 requirement for a belt system.332
History: Twelve model years before FMVSS No. 208 required automatic protection on any ve-hicle, Volkswagen introduced non-motorized 2-point belts, with knee bolsters but no lap belt, as part of a popular option package on their MY 1975 Rabbit. From 1975 to 1984, approximately 30 percent of Rabbits were sold with automatic belts, comprising nearly 400,000 cars. Toyota made the motorized 2-point belt standard on all Cressidas, starting in 1981, accounting for over 200,000 cars in MY 1981 to 1986.333
The phase-in of automatic protection began on September 1, 1986. During model year 1987, the first year of the phase-in, 91 percent of the cars with automatic protection had automatic belts (only 9% had air bags), and in MY 1988, 93 percent. Starting in 1989, sales of cars with air bags steadily gained relative to automatic belts. Nevertheless, in MY 1990, the first year after FMVSS No. 208 was fully phased in, over 70 percent of the cars had automatic belts, comprising over 6 million cars. Sales of cars with automatic belts decreased each year after 1990. By 1997, one year before FMVSS No. 208 required it, all new cars had dual air bags and manual 3-point belts – but not before 31 million cars with automatic belts were sold. Close to 20 million of them were still on the road as of CY 2003 and over 7 million as late as CY 2011. Over the years, sales of automatic 2-point belts (17 million cars) slightly outnumbered automatic 3-point belts (14 mil-lion cars). LTVs were not equipped with automatic belts.
Automatic belt use: In 1983 and 1984, when NHTSA developed the automatic protection re-quirement of FMVSS No. 208, automatic belts were a promising alternative. Manual belt use was 14 percent, whereas automatic belt use was observed to be 96 percent in the Toyota Cressida (motorized) and 75 percent in the Volkswagen Rabbit (non-motorized 2-point) in the 19-City Study.334 State buckle-up laws quickly narrowed the gap between manual and automatic belt use. 332 49 CFR, Parts 571.208 S4.1.2.1 and S4.5.3. 333 Final regulatory impact analysis, amendment to Federal Motor Vehicle Safety Standard 208, passenger car front seat occupant protection, pp. II-3 and IV-23. 334 Perkins, Cynecki, & Goryl (1984, July), p. 16.
115
In the 19-city survey of 1991, manual belt use in MY 1987-to-1990 cars had risen to 56 percent, while automatic belt use was 91 to 97 percent in cars with motorized 2-point belts, 74 percent with non-motorized 2-point belts, and 64 percent with 3-point belts.335 In the 1994 NOPUS, use of manual belts in late-model (MY 1989-to-1994) cars was up to 69 percent, exactly the same as 3-point automatic belts; use of 2-point automatic belts was not much higher: 78 percent for mo-torized, 75 percent for non-motorized.336 NHTSA believes that, during most of the 1990s, use rates of manual and automatic 3-point belts were almost equal, increasing from year to year, while use of 2-point belts was close to 84 percent, changing little from year to year.337
In 1987, the Insurance Institute for Highway Safety observed 253 parked, unoccupied cars with 3-point automatic belts. Already at that early date, over 99 percent of them had been unbuckled and allowed to retract toward the door; functionally rendering them a manual belt system. It is little wonder, then, that automatic 3-point belts had the same use rates as manual within a few years after their introduction. By contrast, over 95 percent of the 753 2-point belts in their survey were still connected in the “automatic” mode (although that percentage must have decreased in later years).338
All of the preceding statistics for 2-point belts are use rates for the automatic shoulder belt. However, most of those cars, except for some early non-motorized systems, also had a manual lap belt. Lap belt use has been lower than shoulder belt use, but it is unclear by how much. (Lap belt use is, among other things, more difficult to observe than shoulder belts.) Lap belt use was only 29 percent in a 1989-90 North Carolina observational survey, 43 percent in a 1987 IIHS study, but 69 percent in 1992 Michigan observations. Shoulder belt use was over 90 percent in all three of these surveys.339
Expected benefits: Automatic 3-point belts closely resemble manual 3-point belts and may pro-vide equally good protection. One caveat is that, being door-mounted, they might release in a crash that damages and opens the door, and allow more ejections than manual 3-point belts. Sim-ilarly, an automatic 2-point belt in combination with the manual lap belt may be functionally equivalent to a manual 3-point belt and equally effective. Without the lap belt, it stands to reason that 2-point belts would be less effective overall, but it is not clear where benefits would be re-duced. Since the vehicle must meet the FMVSS No. 208 frontal barrier test without the lap belt, effectiveness could still be high in frontal crashes. However, without the lap belt, occupants might be more prone to slide beneath the shoulder belt (submarining) and they might not be as well protected from ejection.
335 (1992). Evaluation of the effectiveness of occupant protection, interim report. (Report No. DOT HS 807 843, pp. 11-17). Washington, DC: National Highway Traffic Safety Administration. Available at www-nrd.nhtsa.dot.gov/Pubs/807843.pdf. 336 The 1994 NOPUS controlled-intersection survey was the only one to record license plates and obtain VINs from DMVs; NHTSA decoded the VINs to identify the model year and type of occupant protection. 337 Kahane (2000, December), pp. 41 and 52-55. 338 Williams, A. F., Wells, J. K., Lund, A. K., & Teed, N. (1989, October). Observed use of automatic seat belts in 1987 cars. Accident Analysis and Prevention, 21, pp. 427-433. 339 Ibid.; Hunter, W.W., et al. (1990). Analysis of occupant restraint issues from state accident data. (Report No. HSRC-TR75, Chapter 6). Chapel Hill, NC: Highway Safety Research Center, University of North Carolina; Streff, F. M., Molnar, L. J., & Christoff, C. (1994). Automatic safety belt use in Michigan: A two-year follow-up. Journal of Safety Research, 25, pp. 215-219; Schmidt, R. A., Young, D. E., & Ayres, T. J. (1998, March). Automobile seat belts: Usage patterns in automatic belt systems. Human Factors, 40, pp. 126-135.

116
Fatality reduction, automatic 3-point belts: NHTSA’s 2000 evaluation estimated the fatality reduction for automatic 3-point belts, based on the same double-pair comparison analysis of 1986-to-1999 FARS data used for manual belts. Automatic and manual belts are equally effec-tive: they reduce fatalities by 45 percent.340 Furthermore, an analysis of 1986-to-1991 FARS data did not show any significant increases in occupant ejections as make-models shifted from manu-al belts to automatic 3-point belts during 1987 to 1989.341 Automatic and manual 3-point belts appear to have essentially the same effectiveness and use rates.
Fatality reduction, automatic 2-point belts: The 2000 study estimated a 32 percent overall fa-tality reduction for automatic 2-point belts. That is significantly less than the 45 percent effec-tiveness of manual 3-point belts. However, this 32 percent effect is an average, comprising peo-ple who did not buckle the manual lap belt as well as those who did. (FARS data cannot be relied on to identify use of the lap belt.) If lap belt use has been as low as suggested by the North Caro-lina survey – less than one-third of shoulder belt use – it is easy to see how net effectiveness could drop to 32 percent. But if lap belt use were as high as the Michigan survey – over two-thirds of shoulder belt use – it would imply: (a) these systems are not very effective without the lap belt and/or (b) these systems, even with the lap belt, are not as effective as 3-point belts.342 In any case, given recent use rates for manual belts, such as 86 percent in 2012, the combination of manual belts with air bags is clearly more beneficial than any automatic belt system.
Pretensioners and load limiters for seat belts Pretensioners and load limiters are technologies designed to make seat belts more effective. Pre-tensioners retract the seat belt to remove excess slack almost instantly upon sensing the vehicle has crashed, typically by firing a pyrotechnic device. When forces on the shoulder belt rise above a predetermined level, load limiters allow the belt to give or yield while controlling the tension in the belt, typically by spooling it out of the retractor, to avoid concentrating too much force on the occupant’s chest.
History: NHTSA has never required installation of these technologies, but encouraged it by list-ing the makes and models of vehicles that offer them in its annual Buying a Safer Car brochures from 1997343 and, subsequently, on the Internet at www.safercar.gov. Furthermore, addition of these technologies usually improved vehicles’ performance on NHTSA’s NCAP tests (see be-low). Mercedes-Benz introduced pretensioners in the front seats of their S-class cars in 1981. Volvo introduced load limiters on its 850 series in 1995. The introduction of pretensioners was spread over many years, although most models received them sometime between 1998 and 2006. Load limiters mostly entered the new-vehicle fleet between 1997 and 2002. By MY 2002, ap-proximately 63 percent of new cars and LTVs were already being equipped with pretensioners and 84 percent with load limiters. All new cars were equipped with pretensioners by MY 2006 340 Kahane (2000, December), pp. 40-41; the point estimate for the 3-point automatic belts was actually 48 percent; since it was not significantly different from the 45 percent estimate for manual belts, the two systems may be con-sidered equally effective, since they essentially work the same way. 341 Evaluation of the effectiveness of occupant protection, interim report, pp. 43-46. 342 Kahane (2000, December), pp. 40-41. 343 Available for 2000 to 2005 at icsw.nhtsa.gov/safe_car_new/ (click on SaferCar2000, SaferCar2001, BASC2002, BASC2003, BASC2004, or BASC2005) and for 2006 to 2010 at www.safercar.gov/Vehicle+Shoppers/Resources/Buying+a+Safer+Car+brochures.
117
and load limiters by MY 2007 at outboard front seats. All new LTVs were equipped with preten-sioners and load limiters by MY 2008 at the outboard front seating positions. Before 2007, a moderate number of vehicles were equipped with load limiters, but not pretensioners – or vice-versa – but no such vehicles were produced in MY 2007 or later.344
How pretensioners and load limiters work: In a crash, a seat belt needs to firmly engage the occupant's pelvis, clavicle, and rib cage to restrict occupant motion within the vehicle such that injurious contacts with other interior components are minimized. This process needs to occur early in the crash in order to couple the occupant to the decelerating vehicle and provide the most controlled ride-down. Any slack in the seat belt works against this process. Pretensioners are typ-ically pyrotechnic devices in the belt-buckle assemblies triggered by the same crash sensors that control deployment of the vehicle's air bags. Gas produced by the pyrotechnic device may propel a piston that pulls down on the buckle or drive a turbine that rewinds the retractor, thus removing slack in the seat belt before any significant occupant motion begins. In minor collisions, the seat belt pretensioners may be fired without the air bags being deployed. In more serious crashes, both the pretensioners and the air bags will be deployed.
A load limiter is designed to allow the seat belt force applied to the chest to rise to a pre-determined point where the injury risk is still relatively low. The seat belt is then allowed to spool out of the retractor in a controlled manner, maintaining a constant restraining force as it absorbs energy. In a severe impact, where the extension of the belt could be substantial, a frontal, side, or curtain air bag would in many cases work in conjunction with the belt and arrest the oc-cupant's motion. Load limiters in recent vehicles typically use a torsion bar built into the seat belt retractor. The torsion bar is a metal rod that will twist when sufficient torque is applied. In minor collisions, the torsion bar will hold its shape and the seat belt retractor will lock normally. But, when the force applied by the webbing reaches the design limit, the torsion bar twists and allows the webbing to spool out of the retractor.345
Pretensioners and load limiters ought to work best together. The belt engages the occupant as soon as possible, but forces do not reach a dangerous level, allowing a long, gradual ride-down. Removing the slack early with a pretensioner allows more room for belt extension with the load limiter.
Test performance: NHTSA may have indirectly encouraged the installation of pretensioners and load limiters through its frontal NCAP test, a 35 mph impact into a rigid barrier with belted dummies. It soon became apparent that vehicles could improve their test results by adding pre-tensioners and load limiters to their belt systems. In 2003, NHTSA published a statistical analy-sis tracking the improvements in NCAP results for various makes and models over the preceding five model years. In the models that added pretensioners and load limiters, HIC was reduced (i.e., improved) by an average of 232 units, chest acceleration by 6.6 g's, and chest deflection by 10.6 mm, for drivers and RF passengers. Each of these reductions was statistically significant. This was already a promising indication that pretensioners and load limiters make belts more ef-
344 Kahane, C. J. (2013, November). Effectiveness of pretensioners and load limiters for enhancing fatality reduction by seat belts. (Report No. DOT HS 811 835, pp. 1-3). Washington, DC: National Highway Traffic Safety Admin-istration. Available at www-nrd.nhtsa.dot.gov/Pubs/811835.PDF. 345 Ibid., pp. 1-3.
118
fective in at least one type of crash: collinear full-frontal impacts.346 However, excessive slack or excessive belt forces would likely be harmful in other types of impacts, too; pulling in slack and limiting belt forces could have benefits in a variety of crash types.
Fatality reduction: Pretensioners and load limiters are only effective if people buckle up. They have no effect on unrestrained occupants. If these technologies save lives, they would only save lives of belted occupants. In other words, the observed fatality reduction for belt users (relative to the unrestrained occupants) ought to be higher in vehicles equipped with pretensioners and load limiters than in comparable vehicles with neither. Fatality reduction is estimated by double-pair comparison analyses, as in the earlier sections of this chapter, based on crash cases of vehi-cles with a driver and a RF passenger, at least one or possibly both fatally injured. Much data is needed, because the objective here is not merely to show that belts save lives but to detect a dif-ference in the results for two separate effectiveness analyses: one for vehicles with pretensioners and load limiters, the other for comparison vehicles with neither. FARS data for 1986 to 2011 has enough applicable crash cases: 16,642 FARS vehicles equipped with both technologies and 27,389 comparison vehicles equipped with dual frontal air bags, but neither pretensioners nor load limiters. NHTSA’s evaluation, issued in 2013, performs two separate double-pair compari-sons, one on the 16,642 cases another on the 27,389 comparison vehicles. Subsequently, a pro-cedure in SAS called CATMOD347 statistically tests whether the observed belt-effectiveness es-timates with pretensioners and load limiters are “approximately the same” as the estimates for belts equipped with neither or whether 3-point belts are significantly more effective when they are equipped with pretensioners and load limiters.
The analyses show that the combination of pretensioners and load limiters has significantly en-hanced belt effectiveness in passenger cars, CUVs and minivans. Specifically, the estimated fa-tality reduction by belts for drivers is 53 percent if the belts have pretensioners and load limiters, 45 percent if not; for RF passengers, 51 percent and 39 percent, respectively. What this means is that a belted driver or RF passenger has, on the average, an estimated 12.8 percent lower fatality risk if the belt is equipped with a pretensioner and a load limiter than if it is not equipped with either (95% confidence bounds: 2.6% to 23.0%). The analyses of the currently available data do not yet show a significant effect for pretensioners and load limiters in truck-based LTVs (pickup trucks, SUVs with body-and-frame construction, and full-sized vans). Although there is enough data for statistically significant results for cars, CUVs, and minivans, the relatively wide confi-dence bounds demonstrate that effectiveness of pretensioners and load limiters cannot yet be es-timated precisely; it may be advisable to rerun the analyses in about 4 or 5 years when more data will be available. Pretensioners and load limiters are definitely beneficial in frontal impacts of cars, CUVs and minivans, as evidenced by statistically significant results if the preceding analy-sis is limited to frontal impacts. It is also possible that they have some benefits in side impacts and rollovers; however, separate, individual analyses of side impacts or rollovers do not yield statistically significant results as in the frontals.348
346 Walz, M. C. (2003, March). NCAP test improvements with pretensioners and load limiters. (Report No. DOT HS 809 562). Washington, DC: National Highway Traffic Safety Administration. Available at www-nrd.nhtsa.dot.gov/Pubs/809562.PDF. 347 CATMOD is a logistic regression that may include categorical independent variables and it tests each variable (and their interactions’) contributions to the dependent variable. 348 Kahane (2013, November), pp. iv, 11-21, and 26-31.
119
Injury reduction: NHTSA has not statistically analyzed the effect of pretensioners and load lim-iters on nonfatal injuries.
Frontal air bags From 1985 to 2012, there have essentially been three generations of frontal air bags. First, there were barrier-certified air bags through MY 1997 (1998 or even 1999 in a few make-models), so called because FMVSS No. 208 included a 30 mph crash test with unrestrained dummies into a rigid barrier. Next, manufacturers sled-certified their air bags after NHTSA allowed the option of a 30 mph sled test with unrestrained dummies rather than the barrier test, starting March 19, 1997 (and implemented in MY 1998 or shortly thereafter); the parameters selected for the sled test resulted in lower deceleration than the typical barrier test, facilitating the introduction of “redesigned” air bags that deploy less forcefully, with less risk for child passengers.349 Ad-vanced frontal air bags phased in from September 1, 2003 to September 1, 2006. They do not deploy at all for children (“suppression”) or deploy only at a low level of force (“low-risk de-ployment”). The descriptions of frontal air bags in this section generally apply to all three gener-ations although some focus on the barrier-certified type. The statistical analyses, however, are primarily based on barrier-certified air bags of MY 1985 to 1997; the next two sections analyze the differences between barrier-certified and more recent air bags.
How frontal air bags work: A system of dual frontal air bags – one for the driver and one for the RF passenger – includes sensors at various locations in the vehicle that send an electrical sig-nal if they experience a substantial deceleration and velocity change from a frontal direction. A control module commands the air bags to deploy if these signals imply that the vehicle has been in a relatively severe frontal impact. Early air bag assemblies included an inflator with a pre-scribed amount of sodium azide propellant that generated nitrogen gas upon ignition of a squib. Other systems may have had a cylinder of compressed argon gas or mixture of inert gases that expanded under heat generated by the ignited squib to inflate a bag made of coated nylon fabric. Current inflator technology includes compressed gas and/or organic propellant that has all but replaced the older inflator systems with sodium azide. All bags have vents to release the gas gradually after a deployment as the occupant interacts with the bag. Many have tethers (internal straps) that limit how far the bag can deploy toward the occupant and make it spread outward, over a larger area. These assemblies are located in the steering wheel hub for the driver and in the instrument panel for the passenger. A driver-only air bag system has all of these components except the passenger bag assembly.
In a severe frontal crash such as a 30 mph or 35 mph barrier impact, even while the front bumper comes to an immediate stop against the barrier and the sheet metal deforms, the occupants re-main in their seats for about the first 50 milliseconds, and the compartment interior continues forward at close to 30 mph as if nothing had happened yet. In the next 50-75 milliseconds, the compartment is slowed to a stop. Belted occupants load the seat belt, but unrestrained occupants would continue to move forward at close to 30 to 35 mph, fly out of their seats, and strike the steering assembly, instrument panel and other structures at a high relative speed.
349 Federal Register 62 (March 19, 1997): 12960; 49 CFR, Part 571.208 S13.
120
The technological marvel of the air bag is that it has fully deployed during those first 50 milli-seconds, just before a correctly positioned occupant makes initial contact with it. In that time, the sensors detect the crash, the control module sends signals to fire the propellant or open the cylin-ders, and gas is generated or released at high enough pressure for the bags to burst through “doors” in the steering wheel hub and instrument panel, and to fill up entirely. As the occupant begins to move forward, he or she will almost immediately contact an energy-absorbing surface that is ideally “tuned”: soft enough to cushion the head and neck without serious injury, yet rigid enough to absorb, in combination with the seat belt, much of the torso’s kinetic energy.
The air bag is one key component in a chain of deformable devices that allow the occupant to “ride down” from 35 mph to 0 mph as gradually as possible, remaining in an upright position. The other components are: the continuing crumple of the sheet metal in the front of the vehicle even after the occupant moves out of the seat; the compression of the energy-absorbing steering assembly, facilitated by transmission of force through the air bag; deformation of the instrument panel by the knees; and the “give” in the seat belt system (especially with load limiters) and the seat structure.
Air bags usually deploy rapidly and with great force in order to get their job done in less than 50 milliseconds – although many advanced frontal air bags now have a capability for low-risk de-ployment when the control system senses that a full deployment is not warranted. For adequate gas pressure (energy-absorbing capability) in the fully deployed bag, there must be much higher gas pressure and temperature as the bag begins to deploy. Initial bag velocities of 200 mph or more were not unusual in the 1985-to-1997 generation of air bags. Whereas air bags are of great value to the correctly positioned occupant, they can increase risk for an out-of-position occupant who is close to the air bag module (e.g., within 4 inches) at the moment of deployment.
How do people get close to the air bag? Infants in rear-facing child safety seats would be close to the air bag module at all times, and must never be placed in the front seat of a vehicle with a passenger air bag that is “on.” Other people may simply have been out of position pre-crash or they may have been jostled forward from their seats during hard braking, bumps on or off the road, and/or minor impacts before the one that deploys the bag. A correctly worn seat belt or forward-facing safety seat and/or the inertial weight of an adult reduce the tendency to slide for-wards. Thus, unrestrained children 1 to 12 years old are especially vulnerable. Drivers of short stature are at higher risk of being out of position and in the path of a deploying air bag. Tempo-rary proximity to the air bag can result from leaning forward to adjust the radio or other controls.
The only two guaranteed methods to stay away from an air bag are to ride in the rear seat or to turn the on-off switch “off,” if one is available. NHTSA recommends that children up to age 12 ride in the rear seat if possible; it is the safest place in the vehicle for child passengers. Risk can be greatly reduced, although not totally eliminated, by using seat belts/forward-facing safety seats, moving the passenger seat rearward, and moving adjustable pedals rearward if this feature is available. For the overwhelming majority of occupants 13 or older who wear seat belts, the risk of serious injury from air bags is so negligible relative to their potential benefits that they should not even consider obtaining an aftermarket on-off switch.
Seat belts remain the primary occupant protection system and need to be worn in vehicles with air bags. In side impacts, rear impacts and first-event rollovers, frontal air bags generally do not
121
deploy, and even if they do, they have limited benefits. Deployments of frontal air bags are, of course, beneficial in relatively severe frontal crashes, but there is no guarantee that an air bag will deploy in a particular crash. Air bags are designed to deploy in frontal impacts with force levels equivalent to a full-frontal barrier impact at 8-to-14 mph or more. However, deployments occasionally happen at lower speeds and sometimes do not take place at substantially higher del-ta V. This is not an evidence of malfunction; rather, the sensors take into account various aspects of the crash pulse and do not simply measure delta V. Frontal air bags do not prevent ejection and they may have limited benefits if a frontal impact is followed by a rollover, side impact, fire or immersion. They deflate rapidly after deploying and may not be as helpful in multiple im-pacts. Notwithstanding these caveats, air bag systems usually deploy when they are needed, do not deploy when they are not needed, and seldom malfunction. The manufacturers and NHTSA constantly review the performance of the systems and promptly correct problems that may de-velop over time.350
History: Air bags to cushion occupants in frontal crashes were conceptualized in the 1950s. Pro-totypes were built and tested in the early 1960s. NHTSA announced in 1969 it was considering air bags or other automatic protection, especially in view of low belt use, and issued its first NPRM for automatic protection in 1970. The original January 1, 1972, effective date was post-poned or cancelled several times for reasons such as revision of the test requirements, alternative proposals for occupant protection, risk to children/out-of-position occupants and lack of indus-try/public support. However, NHTSA’s July 17, 1984, rule to phase automatic protection into the outboard front seats passenger cars was successfully implemented from 1986 to 1989.351
On-the-road experience began in 1972 and 1973: 831 MY 1972 Mercury Montereys with frontal air bags for the RF passenger and 1000 MY 1973 Chevrolet Impalas with dual frontal air bags. These cars were driven by corporate personnel or leased to corporate fleets. In MY 1974 and 1975, the general public bought 10,281 full-size Buicks, Cadillacs, and Oldsmobiles with option-al dual frontal air bags. No air bags were offered on new cars from MY 1976 to 1983. During MY 1985 (or possibly in late MY 1984), driver air bags of the next design generation (1984 to 1997) began to appear in some Mercedes models for sale to the public and in 5,000 Ford Tempos purchased by the Federal government. Driver air bags were standard on all 1986 Mercedes.352
350 (1997). Air bags & on-off switches: Information for an informed decision. (Report No. DOT HS 808 629). Wash-ington, DC: National Highway Traffic Safety Administration. Available at www.safercar.gov/Vehicle+Shoppers/Air+Bags/ON-OFF+Switch+FAQ; Fifth/Sixth report to Congress – Effective-ness of occupant protection systems and their use. (Report No. DOT HS 809 442, pp. 2-3). Washington, DC: Na-tional Highway Traffic Safety Administration. Available at www-nrd.nhtsa.dot.gov/Pubs/809-442.pdf. 351 Clark, C., Blechschmidt, C., & Gordon, F. (1966). Impact protection with the ‘Airstop’ restraint system. Eighth Stapp Car Crash and Field Demonstration Conference. Detroit: Wayne State University Press; Federal Register 34 (July 2, 1969): 11148, 35 (May 7, 1970): 7187, 42 (July 5, 1977): 34289, 46 (October 29, 1981): 53419, 49 (July 17, 1984): 28962; Air bag chronology. USA Today, July 13, 1999. 352 Final regulatory impact analysis, amendment to Federal Motor Vehicle Safety Standard 208, passenger car front seat occupant protection, p. IV-40; Smith, R. A., & Kahane, C. J. (1975). 1974 accident experience with air cushion restraint systems. (Paper No. 750190). Warrendale, PA: Society of Automotive Engineers; Bloch, B. (1998). Ad-vanced designs for side impact and rollover protection. Sixteenth International Technical Conference on the En-hanced Safety of Vehicles. (Report No. DOT HS 808 759, p. 1780). Washington, DC: National Highway Traffic Safety Administration; NHTSA. (1986). Recent air bag field performance. Washington, DC: National Highway Traffic Safety Administration, National Center for Statistics and Analysis; Kahane (1996, August), p. 89.
122
The FMVSS No. 208 phase-in of automatic protection began on September 1, 1986. To help get frontal air bags into cars, recognizing that the development of passenger air bags was taking longer than driver air bags, NHTSA exempted the RF seat from the automatic protection re-quirement until August 31, 1993, in cars with driver air bags. During MY 1987 and 1988, fewer than 10 percent of cars with automatic protection had air bags, while over 90 percent had auto-matic belts. The public, however, soon expressed a preference for air bags. In mid-1988, Chrys-ler committed itself to shift from automatic belts to frontal air bags within the next few years. By 1990 to 1991 all domestic manufacturers made frontal air bags standard at the driver’s seat on some models with high sales; in 1992 to 1993 driver air bags peaked at 49 percent of new car sales. Starting September 1, 1993, cars could not have just a driver air bag and manual belts, but they could have a driver air bag and an automatic belt for the RF passenger; in fact 25 percent of MY 1994 cars had that configuration.353
Dual frontal air bags were available on Porsche in 1987 to 1989 and standard in 1990. They be-came available on a few other models in 1990 or 1991, were in 5 percent of MY 1992 cars and 14 percent of MY 1993, including, for example, all the Chrysler LH cars. By MY 1994, the manufacturers placed dual air bags in 58 percent of their cars, and in 1995, 90 percent. All new cars had dual frontal air bags with manual 3-point belts from MY 1997 onward, one year in ad-vance of the FMVSS No. 208 requirement.354
Chrysler equipped some MY 1991 and all 1992 minivans with driver air bags. Chrysler and Toyota minivans were the first with dual frontal air bags, in MY 1994. The FMVSS No. 208 phase-in of automatic protection into LTVs started on September 1, 1994. By then, the majority of LTVs at least had driver air bags and 16 percent had dual air bags. Most SUVs and vans had dual air bags by MY 1996 or 1997, two to three years in advance of the FMVSS No. 208 re-quirement. In pickup trucks without rear seats, and in other vehicles that could not accommodate a child restraint in the rear seat, however, passenger air bags would have posed a risk to children obligated to ride in the front seat. After NHTSA permitted on-off switches for the passenger air bag in such vehicles, effective June 22, 1995, dual air bags with the switches began to appear in 1996 Ford Rangers, and were standard in all pickup trucks with GVWR < 8,500, excluding crew-cab models, by MY 1998. LTVs with GVWR over 8,500 pounds are exempt from the automatic protection requirement and in some cases do not have air bags.355
Expected benefits: Based on the preceding descriptions of how frontal air bags work, here are some hypotheses of the types of crashes where statistical analyses would likely show benefits. Frontal air bags ought to be quite effective in frontal crashes, the closer to directly frontal, the more effective. They should substantially reduce life-threatening head and chest injuries in these crashes. They should be effective, but to a lesser extent, in oblique frontal crashes, because oc-cupants are often injured by components off to the side, not in a trajectory to the air bag. Air bags ought to save lives of belted as well as unrestrained occupants, because seat belts alone cannot prevent all contacts with the compartment interior in frontal crashes. 353 Federal Register 49 (July 17, 1984): 28962, 55 (January 17, 1990): 1586; 49 CFR, Parts 571.208 S4.1.4; Kahane (1996, August), pp. 77-95. 354 Federal Register 58 (September 2, 1993): 46551; 49 CFR, Part 571.208 S4.1.5.3; Kahane (1996, August), pp. 77-95. 355 Federal Register 56 (March 26, 1991): 12472, 58 (September 2, 1993): 46551, 60 (May 23, 1995): 27233; 49 CFR, Part 571.208 S4.2.5, 4.2.6.2 and S4.5.4; Kahane (1996, August), pp. 97-101.
123
Frontal air bags will have no effect in crashes where they do not deploy, including most 90-degree side impacts, rear impacts and rollovers. Frontal air bags generally will not block occu-pant ejection from the vehicle, except possibly through the windshield portal. When frontal crashes are followed by other harmful events such as secondary impacts, rollovers or fires, the air bags might not prevent injuries associated with the subsequent events. Intuitively, air bags would be less effective in catastrophic crashes where the integrity of the occupant compartment is lost.
Frontal air bags for RF passengers would clearly be dangerous to infants in rear-facing safety seats in the front seat of a vehicle and they could also increase the net fatality risk for some other types of child passengers. As of January 1, 2009, NHTSA reported 29 confirmed cases of infants in rear-facing safety seats and 162 other children who received fatal injuries from air bag de-ployments in relatively low-speed crashes.356 However, the latter is not necessarily the “net” in-crease, since air bags may have saved some children in other crashes.
Early predictions of fatality reduction: In 1974, NHTSA predicted that air bags would reduce overall fatality risk by 32 percent relative to an unrestrained occupant, and that air bags would save 9,000 lives per year. In 1977, after the energy crisis, 55 mph speed limit and other factors had dramatically reduced overall traffic fatalities, NHTSA upped the effectiveness estimate for air bags to 40 percent and still predicted they would save 9,000 lives per year. Because air bags protected dummies in 35 mph frontal barrier crashes, the analyses assumed that air bags would essentially eliminate fatalities in frontal crashes on the highway with delta V ≤ 35 mph (57 to 65 percent of all unrestrained frontal fatalities) – regardless of what contact points or injury mecha-nisms were actually causing the fatalities. The analyses also assumed air bags would have some benefits in side impacts, rear impacts and rollovers if these crashes included a secondary frontal impact or a frontal-force component in the main impact.357
During the 1984 rulemaking on automatic protection, NHTSA revisited air bag effectiveness, based on the agency’s data systems created during 1977 to 1984. Two NHTSA analysts inde-pendently reviewed approximately 800 unrestrained outboard-front-seat fatality cases on the NCSS file (all types of crashes – not limited to frontal impacts). Both studies concluded that 72 to 77 percent of these crash fatalities would not likely have been mitigated, even if the vehicles had been equipped with frontal air bags, because the injuries were principally attributed to con-tacts with the vehicle’s side interior or other non-frontal areas, ejection through side doors or windows, catastrophic damage to the vehicle interior, fire, or immersion. Thus, the overall fatali-ty reduction for air bags could not exceed 23 to 28 percent and presumably would be some frac-
356 (2009, January). Special crash investigations – Counts of frontal air bag related fatalities and seriously injured persons. (Report No. DOT HS 811 104). Washington, DC: National Highway Traffic Safety Administration. Avail-able at www-nrd.nhtsa.dot.gov/Pubs/811104.pdf. 357 Final regulatory impact analysis, amendment to Federal Motor Vehicle Safety Standard 208, passenger car front seat occupant protection, pp. IV-37 – IV-39; NHTSA. (1974). Analysis of Effects of Proposed Changes to Passen-ger Car Requirements of FMVSS 208. (NHTSA Docket No. 74-14-N01-104). Washington, DC: National Highway Traffic Safety Administration; NHTSA. (1977). Standard No. 208 – Passive restraint amendment, explanation of rulemaking action. (NHTSA Docket No. 74-14-N10-011; Report No. DOT HS 802 523). Washington, DC: National Highway Traffic Safety Administration.
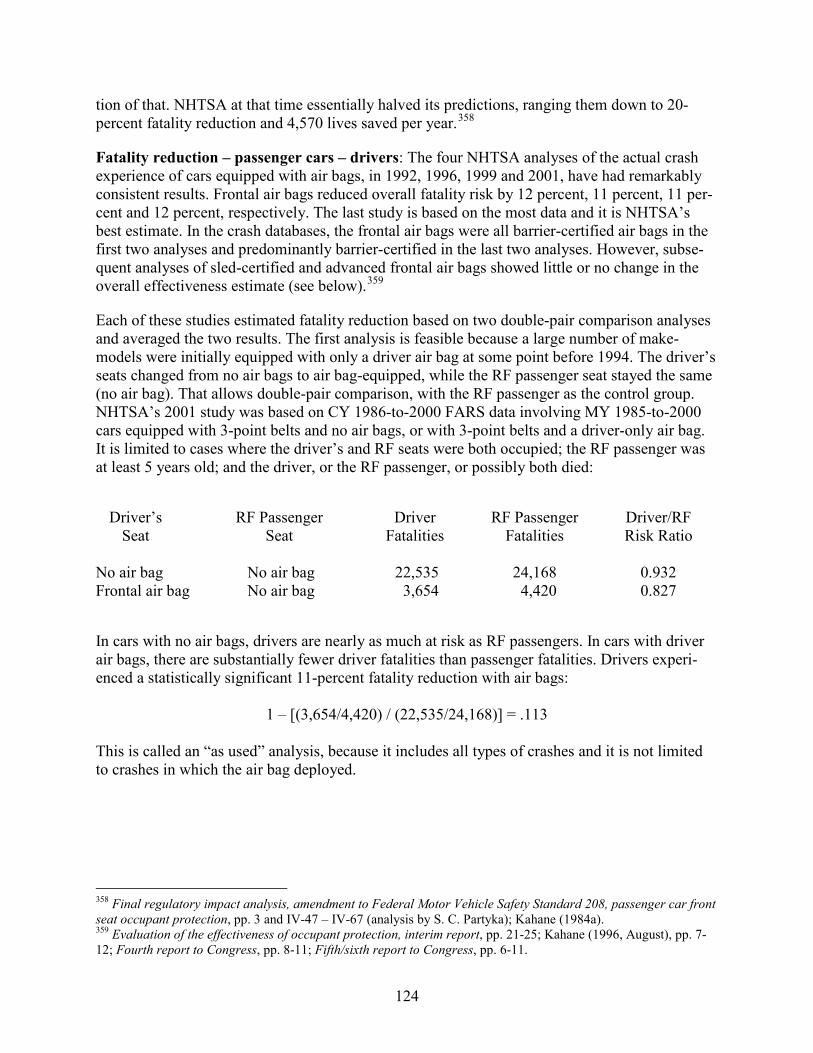
124
tion of that. NHTSA at that time essentially halved its predictions, ranging them down to 20-percent fatality reduction and 4,570 lives saved per year.358
Fatality reduction – passenger cars – drivers: The four NHTSA analyses of the actual crash experience of cars equipped with air bags, in 1992, 1996, 1999 and 2001, have had remarkably consistent results. Frontal air bags reduced overall fatality risk by 12 percent, 11 percent, 11 per-cent and 12 percent, respectively. The last study is based on the most data and it is NHTSA’s best estimate. In the crash databases, the frontal air bags were all barrier-certified air bags in the first two analyses and predominantly barrier-certified in the last two analyses. However, subse-quent analyses of sled-certified and advanced frontal air bags showed little or no change in the overall effectiveness estimate (see below).359
Each of these studies estimated fatality reduction based on two double-pair comparison analyses and averaged the two results. The first analysis is feasible because a large number of make-models were initially equipped with only a driver air bag at some point before 1994. The driver’s seats changed from no air bags to air bag-equipped, while the RF passenger seat stayed the same (no air bag). That allows double-pair comparison, with the RF passenger as the control group. NHTSA’s 2001 study was based on CY 1986-to-2000 FARS data involving MY 1985-to-2000 cars equipped with 3-point belts and no air bags, or with 3-point belts and a driver-only air bag. It is limited to cases where the driver’s and RF seats were both occupied; the RF passenger was at least 5 years old; and the driver, or the RF passenger, or possibly both died:
Driver’s RF Passenger Driver RF Passenger Driver/RF Seat Seat Fatalities Fatalities Risk Ratio No air bag No air bag 22,535 24,168 0.932 Frontal air bag No air bag 3,654 4,420 0.827
In cars with no air bags, drivers are nearly as much at risk as RF passengers. In cars with driver air bags, there are substantially fewer driver fatalities than passenger fatalities. Drivers experi-enced a statistically significant 11-percent fatality reduction with air bags:
1 – [(3,654/4,420) / (22,535/24,168)] = .113 This is called an “as used” analysis, because it includes all types of crashes and it is not limited to crashes in which the air bag deployed.
358 Final regulatory impact analysis, amendment to Federal Motor Vehicle Safety Standard 208, passenger car front seat occupant protection, pp. 3 and IV-47 – IV-67 (analysis by S. C. Partyka); Kahane (1984a). 359 Evaluation of the effectiveness of occupant protection, interim report, pp. 21-25; Kahane (1996, August), pp. 7-12; Fourth report to Congress, pp. 8-11; Fifth/sixth report to Congress, pp. 6-11.
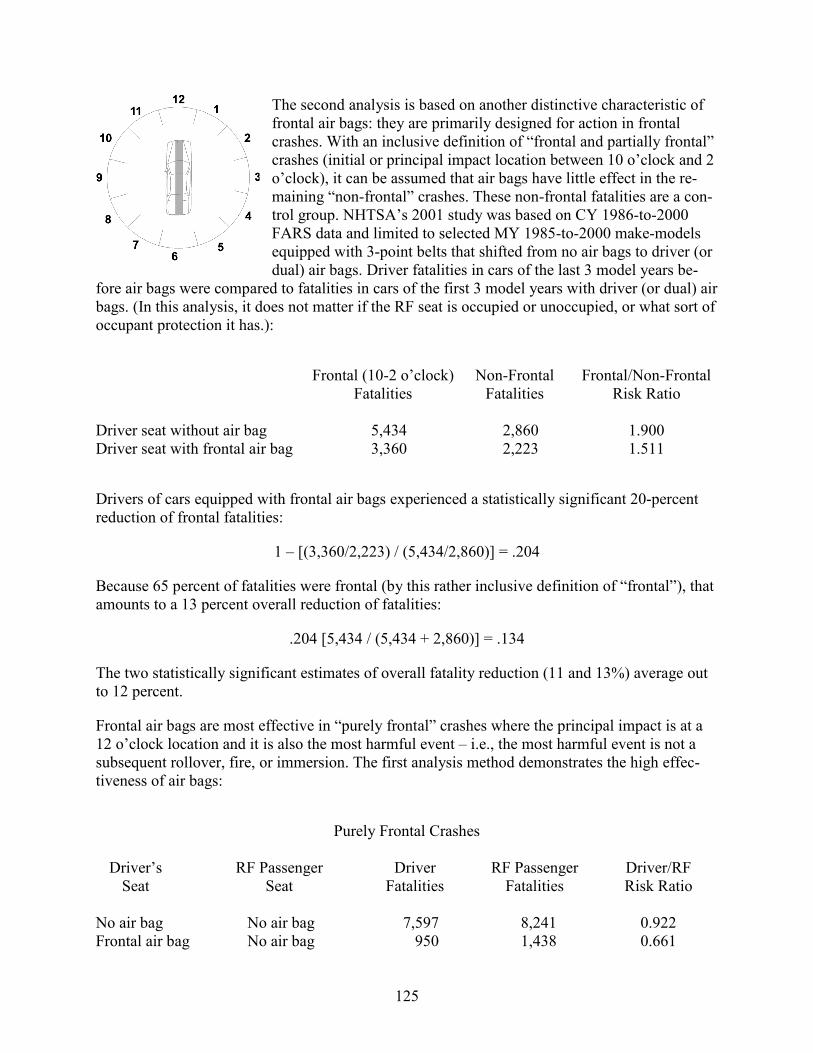
125
The second analysis is based on another distinctive characteristic of frontal air bags: they are primarily designed for action in frontal crashes. With an inclusive definition of “frontal and partially frontal” crashes (initial or principal impact location between 10 o’clock and 2 o’clock), it can be assumed that air bags have little effect in the re-maining “non-frontal” crashes. These non-frontal fatalities are a con-trol group. NHTSA’s 2001 study was based on CY 1986-to-2000 FARS data and limited to selected MY 1985-to-2000 make-models equipped with 3-point belts that shifted from no air bags to driver (or dual) air bags. Driver fatalities in cars of the last 3 model years be-
fore air bags were compared to fatalities in cars of the first 3 model years with driver (or dual) air bags. (In this analysis, it does not matter if the RF seat is occupied or unoccupied, or what sort of occupant protection it has.):
Frontal (10-2 o’clock) Non-Frontal Frontal/Non-Frontal Fatalities Fatalities Risk Ratio Driver seat without air bag 5,434 2,860 1.900 Driver seat with frontal air bag 3,360 2,223 1.511
Drivers of cars equipped with frontal air bags experienced a statistically significant 20-percent reduction of frontal fatalities:
1 – [(3,360/2,223) / (5,434/2,860)] = .204
Because 65 percent of fatalities were frontal (by this rather inclusive definition of “frontal”), that amounts to a 13 percent overall reduction of fatalities:
.204 [5,434 / (5,434 + 2,860)] = .134
The two statistically significant estimates of overall fatality reduction (11 and 13%) average out to 12 percent.
Frontal air bags are most effective in “purely frontal” crashes where the principal impact is at a 12 o’clock location and it is also the most harmful event – i.e., the most harmful event is not a subsequent rollover, fire, or immersion. The first analysis method demonstrates the high effec-tiveness of air bags:
Purely Frontal Crashes Driver’s RF Passenger Driver RF Passenger Driver/RF Seat Seat Fatalities Fatalities Risk Ratio No air bag No air bag 7,597 8,241 0.922 Frontal air bag No air bag 950 1,438 0.661
126
The average for the two analysis methods is a 29-percent fatality reduction in purely frontal crashes. Effectiveness drops off steeply as the impact moves away from purely frontal. When the principal impact is at an 11 o’clock or 1 o’clock location and is also the most harmful event, frontal air bags reduce fatality risk by 15 percent; when the principal impact/most harmful event is at a 10 o’clock or 2 o’clock location, fatality reduction for frontal air bags is 6 percent. When the principal impact is 3 o’clock to 9 o’clock or to the top of the car, or when the most harmful event is a rollover, fire, immersion or other non-collision, effectiveness is zero.
Enough data was available to obtain statistically significant estimates of fatality reduction for subpopulations of drivers:
Fatality Reduction (%) by Frontal Air Bags in Purely Frontal Crashes, Drivers of Passenger Cars Fatality Reduction (%) IN ALL PURELY FRONTAL CRASHES 29 BY 14-29 29 OCCUPANT 30-55 30 AGE: 56-69 30 70 and older 20 BY Male 29 GENDER: Female 29 BY Belted 21 BELT USE: Unbelted 34 BY 2,778 pounds or lighter 30 CURB 2,779-3,119 pounds 28 WEIGHT: 3,120 pounds or heavier 26
Air bags are about equally effective for young and middle-aged drivers (29 to 30%) and perhaps slightly less effective for drivers 70 or older (20%). As of January 1, 2009, NHTSA reported 92 confirmed cases of adult drivers, including 31 who were 70 or older, who had received fatal inju-ries from air bag deployments in relatively low-speed crashes – but, clearly, the lives saved by air bags in more severe crashes far exceed these losses, in all age groups.360 Air bags are equally effective for male and female drivers, and about equally effective in cars of various sizes. They are quite effective for unrestrained drivers (34%), but also provide significant supplemental pro-tection for belted drivers (21%). Since 3-point belts, by themselves, reduce fatality risk by 50 percent in frontal crashes (see above), the combination of 3-point belts with air bags reduces fa-tality risk by an estimated 61 percent in purely frontal crashes:
360 Special crash investigations – Counts of frontal air bag related fatalities.
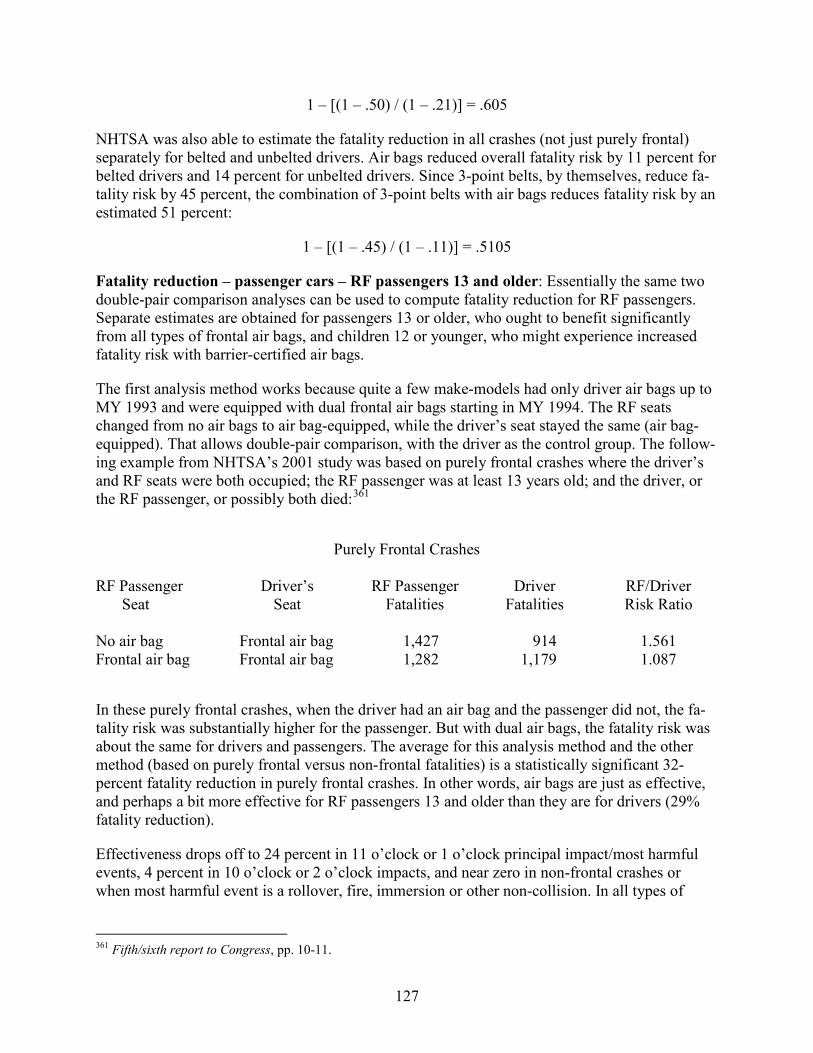
127
1 – [(1 – .50) / (1 – .21)] = .605
NHTSA was also able to estimate the fatality reduction in all crashes (not just purely frontal) separately for belted and unbelted drivers. Air bags reduced overall fatality risk by 11 percent for belted drivers and 14 percent for unbelted drivers. Since 3-point belts, by themselves, reduce fa-tality risk by 45 percent, the combination of 3-point belts with air bags reduces fatality risk by an estimated 51 percent:
1 – [(1 – .45) / (1 – .11)] = .5105
Fatality reduction – passenger cars – RF passengers 13 and older: Essentially the same two double-pair comparison analyses can be used to compute fatality reduction for RF passengers. Separate estimates are obtained for passengers 13 or older, who ought to benefit significantly from all types of frontal air bags, and children 12 or younger, who might experience increased fatality risk with barrier-certified air bags.
The first analysis method works because quite a few make-models had only driver air bags up to MY 1993 and were equipped with dual frontal air bags starting in MY 1994. The RF seats changed from no air bags to air bag-equipped, while the driver’s seat stayed the same (air bag-equipped). That allows double-pair comparison, with the driver as the control group. The follow-ing example from NHTSA’s 2001 study was based on purely frontal crashes where the driver’s and RF seats were both occupied; the RF passenger was at least 13 years old; and the driver, or the RF passenger, or possibly both died:361
Purely Frontal Crashes RF Passenger Driver’s RF Passenger Driver RF/Driver Seat Seat Fatalities Fatalities Risk Ratio No air bag Frontal air bag 1,427 914 1.561 Frontal air bag Frontal air bag 1,282 1,179 1.087
In these purely frontal crashes, when the driver had an air bag and the passenger did not, the fa-tality risk was substantially higher for the passenger. But with dual air bags, the fatality risk was about the same for drivers and passengers. The average for this analysis method and the other method (based on purely frontal versus non-frontal fatalities) is a statistically significant 32-percent fatality reduction in purely frontal crashes. In other words, air bags are just as effective, and perhaps a bit more effective for RF passengers 13 and older than they are for drivers (29% fatality reduction).
Effectiveness drops off to 24 percent in 11 o’clock or 1 o’clock principal impact/most harmful events, 4 percent in 10 o’clock or 2 o’clock impacts, and near zero in non-frontal crashes or when most harmful event is a rollover, fire, immersion or other non-collision. In all types of
361 Fifth/sixth report to Congress, pp. 10-11.
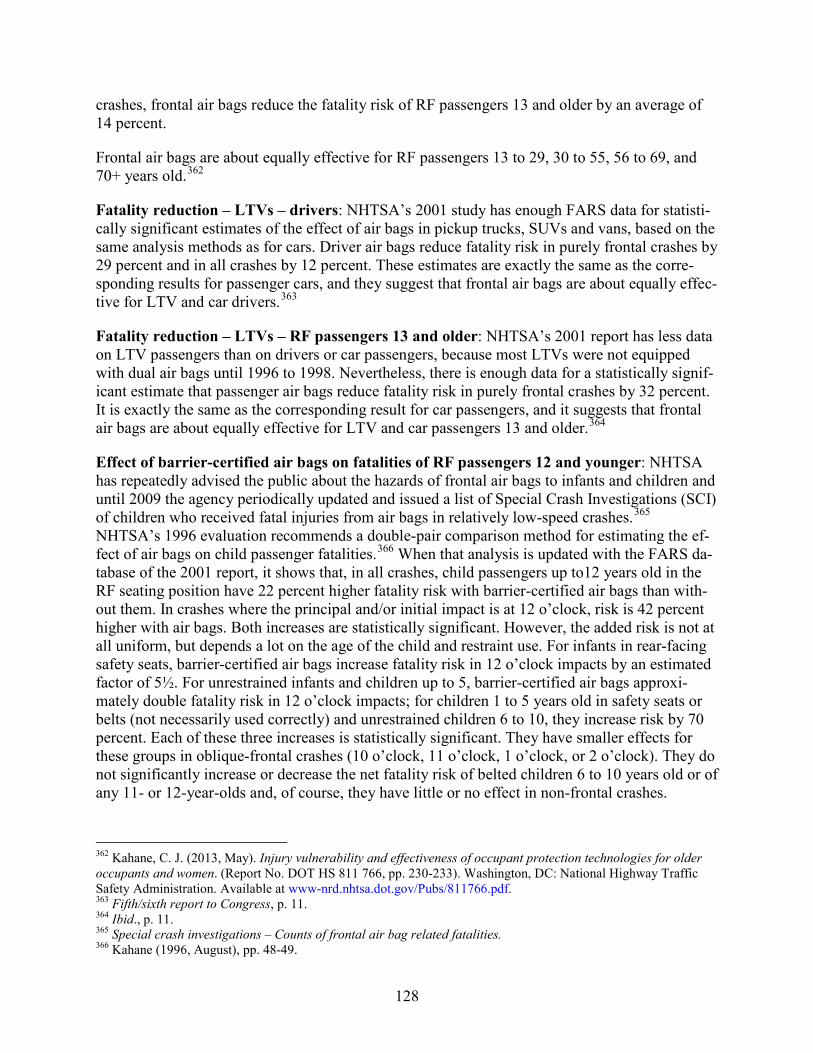
128
crashes, frontal air bags reduce the fatality risk of RF passengers 13 and older by an average of 14 percent.
Frontal air bags are about equally effective for RF passengers 13 to 29, 30 to 55, 56 to 69, and 70+ years old.362
Fatality reduction – LTVs – drivers: NHTSA’s 2001 study has enough FARS data for statisti-cally significant estimates of the effect of air bags in pickup trucks, SUVs and vans, based on the same analysis methods as for cars. Driver air bags reduce fatality risk in purely frontal crashes by 29 percent and in all crashes by 12 percent. These estimates are exactly the same as the corre-sponding results for passenger cars, and they suggest that frontal air bags are about equally effec-tive for LTV and car drivers.363
Fatality reduction – LTVs – RF passengers 13 and older: NHTSA’s 2001 report has less data on LTV passengers than on drivers or car passengers, because most LTVs were not equipped with dual air bags until 1996 to 1998. Nevertheless, there is enough data for a statistically signif-icant estimate that passenger air bags reduce fatality risk in purely frontal crashes by 32 percent. It is exactly the same as the corresponding result for car passengers, and it suggests that frontal air bags are about equally effective for LTV and car passengers 13 and older.364
Effect of barrier-certified air bags on fatalities of RF passengers 12 and younger: NHTSA has repeatedly advised the public about the hazards of frontal air bags to infants and children and until 2009 the agency periodically updated and issued a list of Special Crash Investigations (SCI) of children who received fatal injuries from air bags in relatively low-speed crashes.365 NHTSA’s 1996 evaluation recommends a double-pair comparison method for estimating the ef-fect of air bags on child passenger fatalities.366 When that analysis is updated with the FARS da-tabase of the 2001 report, it shows that, in all crashes, child passengers up to12 years old in the RF seating position have 22 percent higher fatality risk with barrier-certified air bags than with-out them. In crashes where the principal and/or initial impact is at 12 o’clock, risk is 42 percent higher with air bags. Both increases are statistically significant. However, the added risk is not at all uniform, but depends a lot on the age of the child and restraint use. For infants in rear-facing safety seats, barrier-certified air bags increase fatality risk in 12 o’clock impacts by an estimated factor of 5½. For unrestrained infants and children up to 5, barrier-certified air bags approxi-mately double fatality risk in 12 o’clock impacts; for children 1 to 5 years old in safety seats or belts (not necessarily used correctly) and unrestrained children 6 to 10, they increase risk by 70 percent. Each of these three increases is statistically significant. They have smaller effects for these groups in oblique-frontal crashes (10 o’clock, 11 o’clock, 1 o’clock, or 2 o’clock). They do not significantly increase or decrease the net fatality risk of belted children 6 to 10 years old or of any 11- or 12-year-olds and, of course, they have little or no effect in non-frontal crashes.
362 Kahane, C. J. (2013, May). Injury vulnerability and effectiveness of occupant protection technologies for older occupants and women. (Report No. DOT HS 811 766, pp. 230-233). Washington, DC: National Highway Traffic Safety Administration. Available at www-nrd.nhtsa.dot.gov/Pubs/811766.pdf. 363 Fifth/sixth report to Congress, p. 11. 364 Ibid., p. 11. 365 Special crash investigations – Counts of frontal air bag related fatalities. 366 Kahane (1996, August), pp. 48-49.
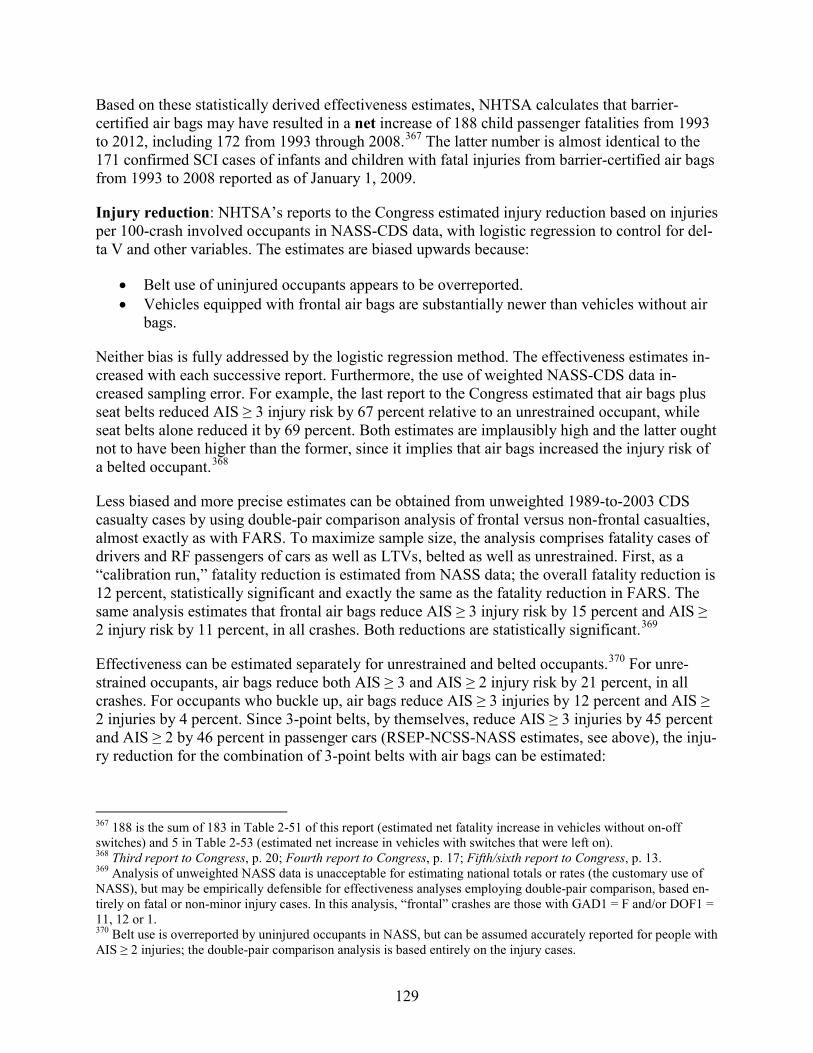
129
Based on these statistically derived effectiveness estimates, NHTSA calculates that barrier-certified air bags may have resulted in a net increase of 188 child passenger fatalities from 1993 to 2012, including 172 from 1993 through 2008.367 The latter number is almost identical to the 171 confirmed SCI cases of infants and children with fatal injuries from barrier-certified air bags from 1993 to 2008 reported as of January 1, 2009.
Injury reduction: NHTSA’s reports to the Congress estimated injury reduction based on injuries per 100-crash involved occupants in NASS-CDS data, with logistic regression to control for del-ta V and other variables. The estimates are biased upwards because:
• Belt use of uninjured occupants appears to be overreported. • Vehicles equipped with frontal air bags are substantially newer than vehicles without air
bags.
Neither bias is fully addressed by the logistic regression method. The effectiveness estimates in-creased with each successive report. Furthermore, the use of weighted NASS-CDS data in-creased sampling error. For example, the last report to the Congress estimated that air bags plus seat belts reduced AIS ≥ 3 injury risk by 67 percent relative to an unrestrained occupant, while seat belts alone reduced it by 69 percent. Both estimates are implausibly high and the latter ought not to have been higher than the former, since it implies that air bags increased the injury risk of a belted occupant.368
Less biased and more precise estimates can be obtained from unweighted 1989-to-2003 CDS casualty cases by using double-pair comparison analysis of frontal versus non-frontal casualties, almost exactly as with FARS. To maximize sample size, the analysis comprises fatality cases of drivers and RF passengers of cars as well as LTVs, belted as well as unrestrained. First, as a “calibration run,” fatality reduction is estimated from NASS data; the overall fatality reduction is 12 percent, statistically significant and exactly the same as the fatality reduction in FARS. The same analysis estimates that frontal air bags reduce AIS ≥ 3 injury risk by 15 percent and AIS ≥ 2 injury risk by 11 percent, in all crashes. Both reductions are statistically significant.369
Effectiveness can be estimated separately for unrestrained and belted occupants.370 For unre-strained occupants, air bags reduce both AIS ≥ 3 and AIS ≥ 2 injury risk by 21 percent, in all crashes. For occupants who buckle up, air bags reduce AIS ≥ 3 injuries by 12 percent and AIS ≥ 2 injuries by 4 percent. Since 3-point belts, by themselves, reduce AIS ≥ 3 injuries by 45 percent and AIS ≥ 2 by 46 percent in passenger cars (RSEP-NCSS-NASS estimates, see above), the inju-ry reduction for the combination of 3-point belts with air bags can be estimated:
367 188 is the sum of 183 in Table 2-51 of this report (estimated net fatality increase in vehicles without on-off switches) and 5 in Table 2-53 (estimated net increase in vehicles with switches that were left on). 368 Third report to Congress, p. 20; Fourth report to Congress, p. 17; Fifth/sixth report to Congress, p. 13. 369 Analysis of unweighted NASS data is unacceptable for estimating national totals or rates (the customary use of NASS), but may be empirically defensible for effectiveness analyses employing double-pair comparison, based en-tirely on fatal or non-minor injury cases. In this analysis, “frontal” crashes are those with GAD1 = F and/or DOF1 = 11, 12 or 1. 370 Belt use is overreported by uninjured occupants in NASS, but can be assumed accurately reported for people with AIS ≥ 2 injuries; the double-pair comparison analysis is based entirely on the injury cases.

130
PASSENGER CARS Fatality AIS ≥ 3 AIS ≥ 2 ALL CRASHES Reduction (%) Reduction (%) Reduction (%) 3-point belt plus frontal air bag 51 52 48
Frontal air bag alone 14 21 21
3-point belt alone 45 45 46
In purely frontal crashes,371 frontal air bags reduced AIS ≥ 3 injuries by 32 percent and AIS ≥ 2 injuries by 23 percent. For unbelted occupants alone, these reductions are 39 percent and 38 per-cent, respectively. For occupants who buckle up, they are 27 percent and 10 percent, respective-ly. In other words, the AIS ≥ 3 and AIS ≥ 2 injury reductions for frontal air bags are generally similar (and sometimes even a little higher) than the fatality reductions, with the one exception that frontal air bags apparently do not have that large an effect on the AIS ≥ 2 injuries of belted occupants.
Manual on-off switches for passenger air bags in pickup trucks and other vehicles with small or no rear seats History: NHTSA recognized that barrier-certified passenger air bags of the early 1990s were absolutely incompatible with rear-facing child safety seats and also presented risks to child pas-sengers and certain other individuals. NHTSA urged that children and other high-risk passengers travel in the rear seat when possible. The agency also amended FMVSS No. 208 with measures to reduce risk when these people must travel in the front seat. Effective June 22, 1995, more than three years before the September 1, 1998, effective date for dual air bags in all LTVs, NHTSA permitted (but did not require) on-off switches for the passenger air bag in pickup trucks without rear seats or other vehicles that could not accommodate rear-facing child safety seats in the rear seat. This facilitated the implementation of passenger air bags in pickup trucks, beginning with some Ford Rangers in MY 1996 and extending to every make-model of pickup trucks with pas-senger air bags by 1998: excluding full crew cabs, but including all 2-door cabs and those 3-door and 4-door cabs with rear seats not designed to accommodate a rear-facing child safety seat. Other vehicles with on-off switches, because they have no rear seat or only a limited rear seat have included sporty cars such as Ford Thunderbird, Chevrolet Corvette, and Mazda Miata; sporty SUVs such as Jeep Wrangler; and cargo vans such as Dodge Ram. Effective January 19, 1998, NHTSA also enabled people who must transport high-risk individuals in the front seats of any vehicle to obtain aftermarket on-off switches at their own expense.372
Advanced frontal air bags, phased in by September 1, 2006, do not deploy or have low-risk de-ployments if the RF passenger weighs less than a certain amount. Essentially, they are automatic on-off switches that made the manual switches largely redundant, although FMVSS No. 208 re-tains the option of manual switches, even in vehicles with advanced air bags, until September 1,
371 GAD1 = F, DOF1 = 12, and this event is a collision with another vehicle or a fixed object. 372 Federal Register 60 (May 23, 1995): 27233, 62 (November 21, 1997): 62406; 49 CFR, Part 571.208 S4.5.4 and Part 595.

131
2015.373 After the successful phase-in of advanced air bags, the manufacturers steadily phased out the manual switches – e.g., GM Silverado and Sierra pickup trucks in MY 2003, Ford F-150 and Nissan Frontier in 2005, and Chevrolet Corvette in 2006.
As of July 1, 2011, there were approximately 14,000,000 vehicles on the road with factory-equipped on-off switches, including 13,200,000 pickup trucks and 800,000 other vehicles with-out rear seats that accommodate rear-facing child safety seats. This number gradually decreased from a peak of 14,400,000 in 2005 and 2006, as existing vehicles were retired and ever fewer new vehicles had the switches.374
Aftermarket switches are much rarer – e.g., in August 2002, only 12,513 vehicles were known to have aftermarket switches.375
How switches work: A manual on-off switch is usually located on the driver’s part of the in-strument panel, but well over to the right where both the driver and the passenger can see it. A key (often the ignition key) or key-like object operates it. The switch has two settings, “air bag on” and “air bag off.” It remains at its current setting until somebody uses the key to change it. When the switch is “off,” a light on the dashboard advises “air bag off.”
Public use and understanding of the switches: During July-November 2000, NHTSA spon-sored a survey of 3,182 pickup trucks (including 617 with child passengers) at 79 sites in 4 States. “Since the recommended switch setting depends on who is in the front seat at the mo-ment, the survey was performed while the vehicles were occupied.” Investigators observed the actual setting of the switch and recorded the passenger’s age. Then they interviewed the driver to find out his or her awareness of the switch and its current setting, and the driver’s own criteria for turning the switch on or off.376 NHTSA recommends turning the switch “off” if there is a child passenger 12 or younger in the front seat. With very rare exceptions, it should be “on” if the passenger(s) are 13 or older. The principal finding of the survey was that many switches were “on” for child passengers in the RF seat, especially 7-to-12 year olds, while quite a few were “off” for passengers 13 or older (the percentage of switches at the recommended setting is shown in bold type)377:
373 Federal Register 77 (August 30, 2012): 52619. 374 Based on analyses of registration data for make-models known to be equipped with the switches. 375 Morgan, C. (2003, November). Results of the survey on the use of passenger air bag on-off switches. (Report No. DOT HS 809 689, pp. v and 4-5) Washington, DC: National Highway Traffic Safety Administration. Available at www-nrd.nhtsa.dot.gov/Pubs/809689.PDF. 376 Ibid., pp. 4-8. 377 Ibid., pp. 13-15 and 22; the report’s statistics for infants in rear-facing seats, forward-facing seats and unre-strained are combined here, but cases of infants in the center-front seat are not included in the table.
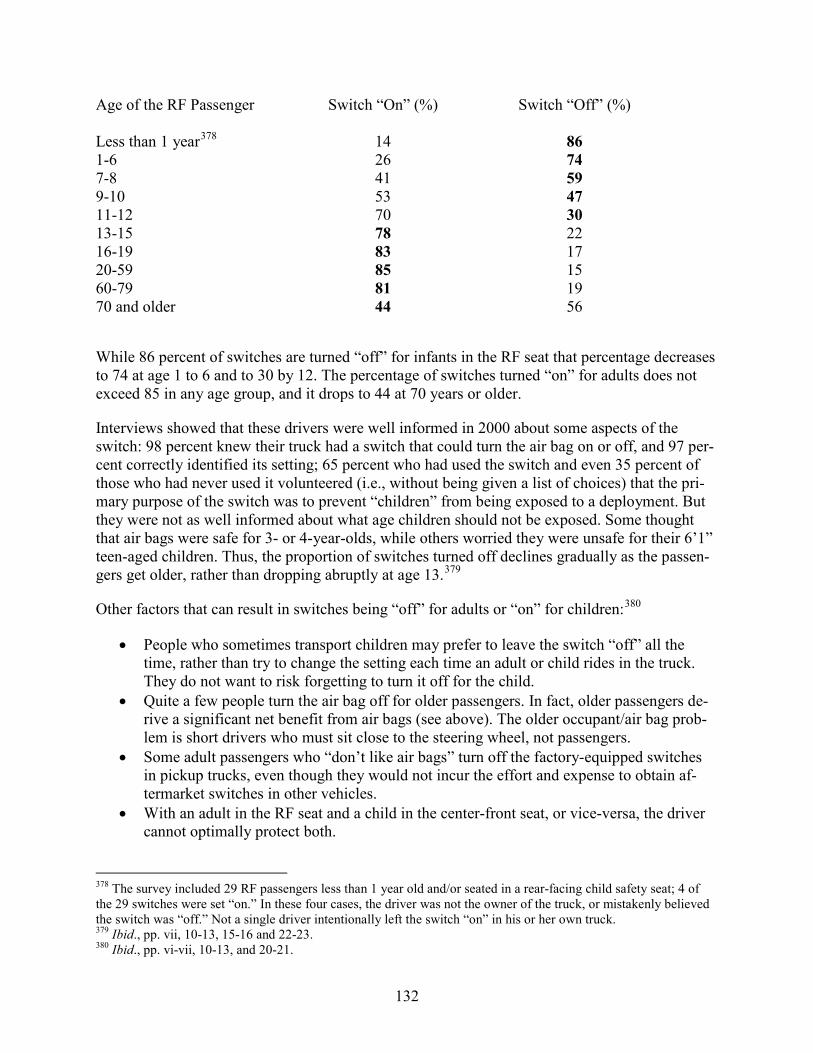
132
Age of the RF Passenger Switch “On” (%) Switch “Off” (%) Less than 1 year378 14 86 1-6 26 74 7-8 41 59 9-10 53 47 11-12 70 30 13-15 78 22 16-19 83 17 20-59 85 15 60-79 81 19 70 and older 44 56
While 86 percent of switches are turned “off” for infants in the RF seat that percentage decreases to 74 at age 1 to 6 and to 30 by 12. The percentage of switches turned “on” for adults does not exceed 85 in any age group, and it drops to 44 at 70 years or older.
Interviews showed that these drivers were well informed in 2000 about some aspects of the switch: 98 percent knew their truck had a switch that could turn the air bag on or off, and 97 per-cent correctly identified its setting; 65 percent who had used the switch and even 35 percent of those who had never used it volunteered (i.e., without being given a list of choices) that the pri-mary purpose of the switch was to prevent “children” from being exposed to a deployment. But they were not as well informed about what age children should not be exposed. Some thought that air bags were safe for 3- or 4-year-olds, while others worried they were unsafe for their 6’1” teen-aged children. Thus, the proportion of switches turned off declines gradually as the passen-gers get older, rather than dropping abruptly at age 13.379
Other factors that can result in switches being “off” for adults or “on” for children:380
• People who sometimes transport children may prefer to leave the switch “off” all the time, rather than try to change the setting each time an adult or child rides in the truck. They do not want to risk forgetting to turn it off for the child.
• Quite a few people turn the air bag off for older passengers. In fact, older passengers de-rive a significant net benefit from air bags (see above). The older occupant/air bag prob-lem is short drivers who must sit close to the steering wheel, not passengers.
• Some adult passengers who “don’t like air bags” turn off the factory-equipped switches in pickup trucks, even though they would not incur the effort and expense to obtain af-termarket switches in other vehicles.
• With an adult in the RF seat and a child in the center-front seat, or vice-versa, the driver cannot optimally protect both.
378 The survey included 29 RF passengers less than 1 year old and/or seated in a rear-facing child safety seat; 4 of the 29 switches were set “on.” In these four cases, the driver was not the owner of the truck, or mistakenly believed the switch was “off.” Not a single driver intentionally left the switch “on” in his or her own truck. 379 Ibid., pp. vii, 10-13, 15-16 and 22-23. 380 Ibid., pp. vi-vii, 10-13, and 20-21.
133
• People who borrow somebody else’s truck may be unfamiliar with the switch or reluctant to change its setting.
Effect on fatalities: Manual on-off switches were a necessary and fairly successful interim measure that made it possible to offer life-saving passenger air bags in pickup trucks as early as 1996, while allowing the opportunity to protect infants and children from those air bags. Without the switches, passenger air bags might not have been feasible in pickup trucks or other vehicles without a full rear seat until the phase-in of automatic suppression or low-risk deployment tech-nology in MY 2004 to 2007. Table 2-52 of this report estimates that the combination of passen-ger air bags and manual on-off switches in MY 1996-to-2011 pickup trucks had saved 453 adults by the end of CY 2012.
On the other hand, the combination of air bags and switches has not fully achieved the potential benefits it could accrue if they were always at the recommended setting. Table 2-52 estimates that 114 adults had died through 2012 because the switches were turned off.
Of course, the purpose of the switches is to protect infants and children from air bag deploy-ments. On January 1, 2009, SCI had 6 cases of infants and children with fatal injuries from air bags in vehicles where the switch was left “on.” Their ages ranged from 2 months to 8 years.381 The statistical analysis of FARS data in Table 2-53, based on the estimated effects of air bags and the percentages of switches left “on,” produces a similar estimate: it concludes that the com-bination of air bags and manual on-off switches may have resulted in a net increase of 8 child passenger fatalities from 1996 to 2012. Without the switches, air bags in these vehicles would have increased child passenger fatalities by a net 30; the public saved 22 of these potential fatali-ties by turning the switches “off.” (As described in the preceding section, this statistical analysis, based primarily on crash data for vehicles with barrier-certified air bags, showed a significant increase in fatality risk for restrained children up to 5 years old and unrestrained children up to 10 years old and no significant effects for restrained children 6 to 12 years old or unrestrained children 11 to 12 years old.)
Thus, from 1996 to 2012, the combination of air bags and switches saved an estimated 453 adults in pickup trucks, with a net increase of 8 child passenger fatalities. Over the years, information and education campaigns have urged owners of pickup trucks to turn switches “off” for child passengers and leave them “on” for adults.
1998-99 redesign of frontal air bag (sled-certification) History: Frontal air bags can harm occupants positioned near the air bag module at the time of deployment because the air bags reach peak force when they begin to deploy. Early designs of air bags involved a trade-off between supplying enough gas to absorb a substantial portion of the kinetic energy of a large, unrestrained person versus not exposing an out-of-position, nearby oc-cupant to a highly forceful deployment. In the early 1980s, when belt use was less than 20 per-cent, the unrestrained occupant was a priority. FMVSS No. 208 included a 30 mph barrier-crash test with unrestrained dummies. By the mid-1990s, the majority of occupants were buckling up and injuries to out-of-position occupants had become an issue. NHTSA had long warned con- 381 Special crash investigations – Counts of frontal air bag related fatalities.
134
sumers not to place an infant’s rear-facing safety seat in the front seat of a vehicle equipped with passenger air bags, because the infant would be close to the air bag at all times. By late 1995, it was evident that not only infants, but also children and even some adults were injured by air bags. Statistical analyses showed a significant increase in overall fatality risk with air bags for children up to 12 years old. Children slid forward toward the air bag during pre-crash braking, especially if they were unrestrained or on the lap of another passenger. Short drivers often sat close to the air bag located in the steering wheel. Any occupant could approach an air bag by leaning forward, for instance, to adjust the radio or air-conditioning. By late 1995, NHTSA had identified 30 fatalities due to contact with barrier-certified air bags in otherwise survivable crashes (that number had grown to 264 fatalities due to contact with barrier-certified air bags by the beginning of 2009).382
In October 1995, NHTSA began a series of actions to reduce and eventually eliminate the ad-verse effect of air bags for infants, children and other high-risk occupants while retaining, to the largest extent possible, the great life-saving benefits of air bags for most people. Specifically, on March 19, 1997, NHTSA amended FMVSS No. 208, effective immediately (i.e., in time to allow implementation in MY 1998 or, at the latest MY 1999), relaxing some aspects of the frontal im-pact test for the unrestrained dummy in order to facilitate the introduction of “redesigned” air bags that deploy less forcefully. Instead of a barrier-crash test with an actual vehicle, manufac-turers could use a sled test with a deceleration pulse stipulated in FMVSS No. 208, resembling the deceleration of a typical large passenger car in a barrier impact – i.e., relatively gradual.383
How air bags were redesigned: In approximately 84 percent of driver air bags and 70 percent of passenger bags, suppliers achieved less forceful deployments by literally “depowering” the air bags: removing some of the gas-generating propellant. Others replaced or supplemented the pro-pellant with a cylinder of stored argon gas. The gas can be vented at different rates, depending on the occupant’s belt use and the crash severity. The peak pressure and rise rate are two measures of how forcefully air bags deploy: upon sled certification, the peak pressure decreased by an av-erage of 13 percent for both driver and passenger bags, while the rise rate decreased by an aver-age of 24 percent on the driver’s side and by 18 percent on the passenger side. The rearward ex-tent of the deployment was abbreviated by reducing the volume of the air bag or by adding teth-ers to shackle its movement. Approximately 70 percent of new vehicles were sled-certified for the entire 1998 model year, and 99 percent by model year 1999.384
Effect on fatalities – drivers and RF passengers 13 and older: The second analysis in the sec-tion on frontal air bags compared the ratio of frontal-impact to non-frontal fatalities for drivers in vehicles equipped with barrier-certified air bags to drivers of vehicles without any air bags. The analysis found a statistically significant 20 percent risk reduction for barrier-certified air bags in the frontal impacts. The same method can be used to compare cars and LTVs of the first three
382 Ibid. 383 Federal Register 62 (March 19, 1997): 12960; Code of Federal Regulations, Title 49, Part 571.208 S13. 384 Kahane, C. J. (2006, August). An evaluation of the 1998-1999 redesign of frontal air bags. (Report No. DOT HS 810 685, pp. 1-3 and 11-18). Washington, DC: National Highway Traffic Safety Administration. Available at www-nrd.nhtsa.dot.gov/Pubs/810685.PDF.
135
sled-certified MY to the last three MY before sled-certification, based on FARS data from CY 1997 to 2004:385
Frontal (11-1 o’clock) Non-Frontal Frontal/Non-Frontal Drivers of Cars and LTVs Fatalities Fatalities Risk Ratio Barrier-certified 9,273 7,169 1.293 Sled-certified 7,629 5,911 1.291
Here, the frontal/non-frontal risk ratio for drivers is almost identical (0.2% difference) with bar-rier-certified and sled-certified air bags. For belted drivers, the risk ratio is 5 percent lower with sled-certified than with barrier-certified air bags; for unrestrained drivers, 5 percent higher. However, neither of these changes is statistically significant. For all RF passengers 13 and older the risk-ratio is 5 percent lower with sled-certified than with barrier-certified air bags; for belted RF passengers, 5 percent lower; for unrestrained passengers, 7 percent lower. None of these changes is statistically significant, either. In other words, sled-certified air bags preserved the life-saving benefits of barrier-certified air bags for drivers and for RF passengers 13 years and older.386
Effect on fatalities of RF passengers 12 and younger: The 191 confirmed SCI cases, reported as of January 1, 2009, of infants and children with fatal injuries from air bags in relatively low-speed crashes include 171 with barrier-certified passenger air bags, 20 with sled-certified air bags, and none with advanced air bags.387 However, to quantify the effect of redesigning air bags, it is appropriate to compare fatality rates per million registration years for the same time period, specifically SCI-case fatalities per billion vehicle registration years of cars and LTVs in CY 1998 to 2003:
Calendar SCI Fatalities Vehicle SCI Fatalities Years Cars and LTVs < 13 Years Old Years per Billion Years 1998-2003 Barrier-certified 75 213,481,330 353.0 1998-2003 Sled-certified 15 243,523,549 61.6
This is an 83-percent reduction in child passengers’ risk of sustaining fatal injuries from air bags. In other words, the redesign of frontal air bag did not completely eliminate such risk but reduced it dramatically. Because there is still some risk, NHTSA continued to recommend that children ride in the rear seat, if possible, until they turn 13 years old.388
385 Ibid., p. 41. 386 Ibid., pp. xiii and 45-68. 387 Special crash investigations – Counts of frontal air bag related fatalities. 388 Kahane (2006, August), pp. 27-29.

136
The preceding analysis focused on SCI cases. A more general analysis is based on CY 1986-to-2011 FARS data and uses double-pair comparison, with driver fatalities as the control group. Child passengers’ overall fatality risk was not significantly different between sled-certified air bags and no air bags in any of the three groups of vulnerable child passengers. That is quite a contrast to barrier-certified air bags, where fatality risk was significantly higher, sometimes much higher than with no air bags, for all three groups.
Tables 2-51, 2-53 and 2-54 of this report show that sled-certified air bags may have contributed to 32 child-passenger fatalities, but that number could have increased to 221 with barrier-certified air bags – i.e., redesigned air bags saved an estimated 189 child passengers.
Advanced frontal air bags (automatic suppression or low-risk deployment) History and technology: On May 12, 2000, the agency added a section S14 to FMVSS No. 208 to phase in “advanced” frontal air bags from September 1, 2003, to September 1, 2006. GM full-size pickup trucks and SUVs, Honda Odyssey, and Acura MDX already certified to advanced air bags in MY 2003, one year before the phase-in. The options for advanced air bags are: that they do not deploy at all for children (“suppression”), deploy only at a low level of force (“low-risk deployment”), or track an occupant’s motion and suppress the air bag if they are too close (“dy-namic automatic suppression”). However, as of 2013, no vehicle employed dynamic automatic suppression. The predominant option is suppression, based on a weight sensor in the RF seat that automatically switches off the air bag unless it detects a mass greater than a predetermined threshold. Some manufacturers use weight sensors with two thresholds: suppression upon sens-ing low mass, low-risk deployment for an intermediate range of mass (e.g., a range that includes the average weight of a 6-year-old child), and normal deployment above that range. Air bags cer-tified to comply with the S14 requirements of FMVSS No. 208 are formally called “certified-advanced compliant” air bags or, simply, “advanced” air bags.
During this timeframe, NHTSA also modified and in some cases strengthened selected perfor-mance requirements in FMVSS No. 208. The agency reinstated a barrier crash test with an un-belted 50th percentile adult male ATD (dummy), in place of the sled test; however, the maxi-mum speed for that test is now in a range of 20 to 25 mph (as compared to the range of 0 to 30 mph in the original barrier test and the sled test with a 28-to-30 mph velocity change). NHTSA may conduct the test with a barrier that is perpendicular to the vehicle’s line of travel or tilted at any angle up to 30° in either direction to simulate an oblique crash. For the first time, the stand-ard tests performance for small-stature adults represented by a belted 5th percentile female Hy-brid III ATD in a 30 mph perpendicular-barrier test. The test with the belted 50th percentile male ATD was upgraded from 30 mph to 35 mph, phasing in from September 1, 2007, to September 1, 2010. On August 31, 2006, the agency amended FMVSS No. 208 to likewise upgrade the test with the belted 5th percentile female from 30 mph to 35 mph, phasing in from September 1, 2009, to September 1, 2012. During the 2000s, in addition to designing to the amended regula-tions, manufacturers also introduced features to tailor deployments to the needs of the occupant. The features include multistage inflators to allow various alternative force levels for deploy-
137
ments, seat-belt use sensors that can influence whether or how forcefully the air bag should de-ploy, and seat-track sensors that can detect if an occupant is sitting close to the air bag.389
Effect on fatalities – drivers and RF passengers 13 and older: The analysis in the preceding section can be moved forward in time to compare cars and LTVs of the first three MY with ad-vanced air bags to the last three MY that these make-models had sled-certified, but not yet certi-fied-advanced compliant air bags. The data is FARS from CY 2003 to 2011. One change from the earlier analyses is that non-occupant fatalities (pedestrians and bicyclists struck and fatally injured by the vehicles in question) form the control group rather than non-frontal fatalities. This control group is preferable here, because many cars and LTVs were, at approximately the same time, receiving curtain or side air bags that reduce risk in non-frontal crashes, making those crashes not a true control group. The table here includes both drivers and RF passengers 13 and older:390
Drivers & RF Passengers Frontal (11-1 o’clock) Non-Occupant Frontal/Non-Frontal of Cars and LTVs Fatalities Fatalities Risk Ratio Sled-certified 3,004 1,348 2.229 Advanced frontal air bags 2,573 1,186 2.170
The frontal/non-occupant risk ratio is 2.7 percent lower with advanced air bags than with sled-certified air bags. It is not a statistically significant difference. That estimate comprises all driv-ers and RF passengers of cars and LTVs. The corresponding estimates for subgroups of the data are: cars, 6.7-percent fatality reduction with advanced air bags; LTVs, 2.5 percent increase; driv-ers, 3.6-percent reduction; RF passengers, 1.8-percent increase. None of those effects are statisti-cally significant, either. In other words, advanced air bags preserved the life-saving benefits of sled-certified (and barrier-certified air bags) for drivers and for RF passengers 13 years and old-er.391
Effect on fatalities of RF passengers 12 and younger: As stated above, there is not a single SCI case of an infant or a child with fatal injuries from advanced frontal air bags in a relatively low-speed crash. This is evidence that the suppression and/or low-risk deployment features of advanced air bags have been highly effective for children, with one possible caveat: SCI investi-gations are triggered if a police agency or other person notifies NHTSA that a crash of interest has occurred. Child passenger fatalities involving air bags have become such rare events (thanks to the unprecedented educational effort to have children 12 and younger ride in the rear seats, as well as to sled-certified and advanced air bags) that the issue may have largely faded from public 389 49 CFR, Part 572.208 S14; Federal Register 65 (May 12, 2000): 30679, 71 (August 31, 2006): 57168; Green-well, N. K. (2013, July). Evaluation of the certified-advanced air bags. (Report No. DOT HS 811 834, pp. 1-4). Washington, DC: National Highway Traffic Safety Administration. Available at www-nrd.nhtsa.dot.gov/Pubs/811834.pdf; Bean, J.D., Kahane, C. J., Mynatt, M., Rudd, R.W., Rush, C.J., & Wiacek, C. (2009, September). Fatalities in frontal crashes despite seat belts and air bags. (Report No. DOT HS 811 202, p. 7). Washington, DC: National Highway Traffic Safety Administration. Available at www-nrd.nhtsa.dot.gov/pubs/811102.pdf 390 Greenwell (2013, July), p. 8. 391 Ibid., pp. 9-16.
138
awareness. Reporting to SCI may have become less complete because the events have become so rare.
A more general analysis considers all child fatalities who are RF passengers in frontal impacts in CY 2004-to-2011 FARS – regardless of the source of the injuries (not specified in FARS), the severity of the impact, or whether the air bag deployed. There are 15 such fatality cases with sled-certified air bags, 12 with advanced air bags. The fatality rate per billion vehicle registration years is 218 with the sled-certified air bags, 207 with the advanced air bags. That is not a statisti-cally significant difference. However, both of these rates are much lower than the 992 fatalities per billion registration years in CY 1998 to 2004 with barrier-certified air bags.392 NHTSA con-tinues to recommend that children up to age 12 ride in the rear seat if possible.
Table 2-54 of this report shows that advanced frontal air bags directly saved lives two ways: (1) If the child passengers in the crashes had instead been exposed to barrier-certified air bags there would have been an estimated 24 child-passenger fatalities; (2) By allowing the phase-out of manual on-off switches, advanced air bags have eliminated situations where the air bag was turned off for adult passengers, which could have resulted in 16 additional fatalities.
392 Greenwell (2013, July), pp. 16-17; Kahane (2006, August), pp. 80-81.
139
FMVSS No. 212, “Windshield mounting” This standard is associated with one safety technology that has been evaluated by NHTSA:
• Adhesive windshield bonding
FMVSS No. 212 is a performance standard requiring vehicles to retain not less than 75 percent of the windshield periphery (50 percent in vehicles with automatic occupant protection) after a 30 mph frontal barrier collision test.393 The purpose of windshield retention is to prevent occu-pant ejection. FMVSS No. 212 took effect for passenger cars on January 1, 1970, two years after NHTSA’s initial group of safety standards and it was extended to most LTVs, vans and multi-purpose vehicles up to 10,000 pounds GVWR, effective September 1, 1978.394
Bonding of the windshield directly to its frame with adhesives gradually (1963 to 1983) super-seded the earlier method of first enclosing the windshield in a rubber gasket and then attaching the gasket to the frame. Thus, the shift to adhesive bonding began in some vehicles well before anybody anticipated FMVSS No. 212, but rubber gaskets persisted in other make-models for quite a few years after the standard. Although rubber gaskets are generally a looser installation than adhesive bonding, they can be designed to meet FMVSS No. 212, as evidenced by the use of rubber gaskets in some post-standard vehicles well after 1970. However, NHTSA’s evaluation estimates the effects and benefits of the shift from rubber gaskets to adhesive bonding in all make-models of passenger cars, regardless of whether the shift took place in that make-model before, on, or after the effective date of FMVSS No. 212.
How adhesive bonding works: Before 1963, windshields were sealed inside a rubber gasket or molding that, in turn, was attached and sealed to the frame. It was a relatively loose attachment. In low-speed impacts, the rubber gasket had some energy-absorbing “give.” At higher speeds, the gasket could partly or completely tear away from the frame, beginning during the initial ve-hicle collision and deformation, and continuing as occupants impact the windshield. The ad-vantages of gaskets are their durability, water- and sound-proofing, and perhaps, with pre-HPR windshields395 (pre-1966), hope that windshields that “give” or “pop out” would be less prone to lacerate occupants. However, the important disadvantage of too loose an installation is that oc-cupants are more likely to be ejected via the then-open windshield portal. Such ejections almost always follow partial or complete separation of the windshield bond. Hardly ever are occupants ejected through the glazing while the bond remains intact.396
In the early 1960s, General Motors found that butyl rubber tape could be used to attach wind-shields directly to the frame, making a firmer bond than rubber gaskets, apparently at lower cost, with acceptable durability, water- and sound-proofing. GM began using the tape on some 1963 Buick Specials and Oldsmobile F-85’s and on all their domestic passenger cars by 1968, well before the FMVSS No. 212 effective date. In 1973, GM shifted from butyl tape to a polyurethane sealant, perhaps an even stronger adhesive bond. Ford began adhesive bonding in 1965 on full-
393 49 CFR, Part 571.212. 394 Kahane (2005, February), p. 3; Federal Register 33 (August 16, 1968): 11652, 41 (August 30, 1976): 36493, 42 (July 5, 1977): 34288. 395 Please see the chapter on FMVSS 205, earlier in this report. 396 Kahane (2005, February), pp. 8 and 11-17.
140
sized cars but continued using rubber gaskets on some car models through 1977; Chrysler started in 1969 but continued gaskets on some models through 1976. Obviously, the cars with rubber gaskets from 1970 onwards could and did meet FMVSS No. 212: the American rubber-gasket installation was hardly a “pop-out” windshield.397
Overseas manufacturers mostly continued to use rubber gaskets until the late 1970s. However, Volkswagen (and perhaps other German manufacturers) had loose enough bonds that specific actions were needed to comply with FMVSS No. 212. VW began to install continuous plastic clips between the gasket and the frame’s pinchweld flange in 1970. It appears that Japanese manufacturers had shifted to adhesive bonding, or to a rubber gasket installation as tight as adhe-sive bonding by MY 1980, and European manufacturers at most a few years after that.398
Pickup trucks, vans and SUVs also kept rubber gaskets during most of the 1970s, and in many cases after FMVSS No. 212 was extended to LTVs (September 1, 1978). Manufacturers may have been especially concerned that operation on rough roads could accelerate deterioration of adhesive bonds, as compared to rubber gaskets.399 Adhesive bonding was gradually phased in during approximately 1978 to 1985.400 The final transition to adhesive bonding may have been spurred by anticipation of safety benefits, cost advantages with the second-generation sealants, and a 1976 rule allowing NHTSA to conduct the FMVSS No. 212 test in a wider range of tem-peratures, from 15 to 110° Fahrenheit: the performance of rubber gaskets can vary widely with temperature, adhesive bonding, less so.401
Expected benefits; concerns about a possible increase in lacerations: Windshields installed in domestic cars with adhesive bonding are expected to have a lower percentage of bond separation, in frontal crashes, at any speed, than windshields mounted with rubber gaskets in those domestic make-models. Similarly, German cars meeting FMVSS No. 212, with plastic clips between the rubber gasket and the frame, are expected to have less bond separation than pre-FMVSS No. 212 German cars also with rubber gaskets, but without the clips.
As a consequence, front seat occupants (drivers, RF passengers, and center front passengers) should have a significantly lower risk of ejection via the windshield portal – in domestic cars af-ter the switch to adhesive bonding and in German cars after the addition of plastic clips to the rubber gaskets. Since an ejected occupant has substantially higher risk of fatality and serious in-
397 Manuals published by National Auto Glass Specifications, Inc., are the definitive source of information on when make-models shifted to adhesive bonding; however, they do not list all make-models (Ibid., pp. 13-14). That neces-sitates assigning approximate dates for other make-models, based on more tentative sources. 398 Mazda and Volvo used adhesive bonding from 1970 (Ibid., p. 14); Ebay offers extensive “windshield seals,” “windshield gaskets,” “windshield rubber” or “windshield weatherstrips” for domestic cars in model years when they had rubber gaskets, and for imported cars in the 1970s, but few after 1980; an analysis of NCSS data suggests that Japanese cars of the 1970s with rubber gaskets had about the same probability of ≥ 25% bond separation in frontal crashes as domestic cars with adhesive bonding. 399 Ibid., p. 15. 400 Richard Humphrey, while manager of GM’s Washington Liaison Office for Safety Regulations, informed the author that GM phased adhesive bonding into their LTVs specifically during MY 1978 to 1985; Ebay offers rubber gaskets for a wide variety of LTVs up to approximately MY 1985, but after that only for SUVs with removable windshields (such as Jeep Wrangler). 401 Federal Register 41 (August 30, 1976): 36493.
141
jury than a non-ejected occupant under the same crash conditions, that should result in a reduc-tion of fatalities and serious injuries.402
Conversely, if adhesive bonding makes windshields less prone to “give” or “pop out” from oc-cupants’ head impacts by occupants, it is conceivable that facial lacerations could increase. Spe-cifically, a 1968 statistical study by Fargo of cars with pre-HPR windshields showed significant-ly higher laceration rates with adhesive bonding than with rubber gaskets.403 At that time, there were insufficient crash cases of cars with HPR windshields to compare laceration rates with rub-ber gaskets versus adhesive bonding.
Effect on windshield bond separation in crashes: NHTSA’s 1985 analysis uses data from NCSS, a predecessor of NASS.404 Investigators measured the percentage of bond separation and computed the delta V in actual towaway crashes. Linear regression calibrated the average per-centage of bond separation in frontal impacts, as a function of delta V, by windshield installation method. For example, in frontal crashes with delta V = 30 mph, the average percentage of bond separation was:
Windshield Average Bond Installation Pre or Post Separation at Manufacturer Method FMVSS No. 212? ΔV 30 mph (%) U.S.-based405 rubber gasket pre 22 post 23 butyl tape pre 16 post 15 polyurethane post 14 Germany406 rubber gasket pre 59 post 37
For cars manufactured in North America by U.S.-based companies, both types of adhesive bond-ing substantially reduced bond separation at 30 mph, relative to rubber gaskets. Within each method, separation rates were about the same before and after FMVSS No. 212. In German cars, the plastic clips added to the rubber gaskets in response to FMVSS No. 212 greatly reduced bond separation, although to a level that was still higher than pre-standard domestic cars. Similarly, at all other speeds, adhesive bonding reduced the percentage of bond separation in domestic cars, and the plastic clips reduced it in German cars.
402 Sikora (1986). 403 Fargo, R. B. (1968). Windshield glazing as an injury factor in automobile accidents. Buffalo: Cornell Aeronauti-cal Laboratory. 404 Kahane (1985, February), pp. 143-154; Kahane, Smith, & Tharp (1977). 405 I.e., GM, Ford, Chrysler, or AMC (at the time of NCSS). 406 I.e., cars manufactured in Germany for sale in the United States.
142
Effect on occupant ejection via the windshield portal: Combining the 1977-to-1979 NCSS data with the earlier 1968-to-1978 MDAI data generates a large file with information on the windshield installation method for each case vehicle. It specifies whether occupants were ejected and, if so, via what portal. For cars manufactured by U.S.-based companies, the rate of ejection via the windshield portal per 100 crash-involved front seat occupants was 68 percent lower with adhesive bonding than with rubber gaskets. However, after examining ejections via the wind-shield portal relative to a control group of ejections via other portals, the evaluation concluded that, more realistically, a 50-percent reduction of ejection via the windshield portal could be at-tributed to adhesive bonding. Similarly, for cars built in Germany for sale in the United States, the installation of plastic clips within the rubber gaskets reduced ejection via the windshield por-tal by an estimated 50 percent.407
Fatality reduction – passenger cars: The great advantage of preventing ejection is that, all else being equal, an occupant is safer remaining inside the vehicle than being ejected from it. Yet, not every ejection prevented is a life saved. A portion of ejectees would have sustained fatal injuries from interior components even if they had stayed within the car.408 This is especially true of the windshield portal, where an estimated 70 percent of the fatally injured ejectees in the NCSS and MDAI data had already received mortal wounds from the steering assembly, instrument panel, windshield header and/or other components before the ejection, and would likely have died even if they had not been ejected. In other words, reducing ejection-fatality cases by 100 means saving 30 lives (the other 70 would still not survive). The 50-percent reduction of ejection attributed to adhesive bonding in cars built by U.S.-based companies and to plastic clips in German cars cor-responds to saving 15 percent of the fatalities who were ejected via the windshield portal before these safety improvements. Using 1982 as the “baseline” year, the evaluation estimated that ad-hesive bonding would be saving 105 lives per year in cars built by U.S.-based companies and plastic clips, 7 lives per year in German cars by the time all cars built before these safety im-provements had been phased out.409
Serious injury reduction – passenger cars: Likewise, 30 percent of the people ejected via the windshield portal who survived but sustained one or more serious, nonfatal AIS 3-to-5 injuries received all of these injuries after exiting the vehicle, while 70 percent suffered at least one such injury prior to the ejection. Thus, as above, a 50-percent reduction of ejection corresponds to a 15-percent injury reduction. Again using 1982 as the “baseline” year, the evaluation estimated that adhesive bonding would eventually save 160 people from AIS 3-to-5 injury per year in cars built by U.S.-based companies and plastic clips, 11 AIS 3-to-5 casualties per year in German cars.
Effect on lacerations – passenger cars: As stated above, if adhesive-bonded windshields “gave” less upon head impacts by occupants, facial lacerations could have increased. Fargo’s 1968 study of pre-HPR windshields showed significantly higher laceration rates with adhesive bonding than with rubber gaskets and raised a worry this could persist with HPR windshields (1966 and later). NHTSA extensively analyzed crash data from NCSS, New York (1974) and Texas (1972 to 1974) on cars equipped with HPR windshields. Cars with adhesive bonding and 407 Kahane (1985 Windshields), pp. 154-161. 408 Sikora (1986). 409 Ibid., pp. 161-163, 179-182 and 236-243; 90 percent confidence bounds for life-saving effectiveness: 7 to 22 per-cent; for lives saved in domestic cars: 35 to 175.
143
rubber gaskets had equally low rates of facial lacerations and other type of minor-moderate inju-ries involving windshield contact. Windshield penetration by occupant impact was no more common with adhesive bonding than with rubber gaskets. NHTSA concluded that adhesive bonding does not have any side effect of increasing minor-moderate injuries in cars with HPR windshields. Incidentally, the NHTSA analysis confirmed Fargo’s finding that adhesive bonding was associated with higher injury rates in cars with pre-HPR windshields, now phased out except for occasional “historic” vehicles.410
Effectiveness – LTVs: NHTSA’s 1985 evaluation only addressed the performance of windshield bonding in passenger cars. However, if the kinematics of occupant ejection via the windshield portal were similar in cars and LTVs, the estimated reduction (50%) for this type of ejection from cars might be appropriate for LTVs as well.
410 Ibid., pp. 185-220.
144
FMVSS No. 213, “Child restraint systems” FMVSS No. 225, “Child restraint anchorage systems” These two standards work together to protect child passengers. FMVSS No. 213 regulates child safety seats, safety equipment that is not part of the vehicle. FMVSS No. 225 regulates vehicles, specifically the anchors whereby safety seats are secured in the vehicle. FMVSS No. 213 took effect on April 1, 1971, but FMVSS No. 225 did not begin to phase in until September 1, 1999. Four technologies to advance child passenger safety – by reducing fatality and injury risk and/or by making child passenger protection easier and more convenient – have been evaluated, or will be evaluated by NHTSA. A fifth “technology” that has always been available – riding in the rear seat – is not related to any particular FMVSS but will be discussed here because it has important benefits for child passengers:
• Rear-facing and forward-facing child safety seats • Upper tethers and anchorages (not yet fully evaluated) • LATCH (lower anchors and tethers for children – not yet fully evaluated) • Booster seats (not yet fully evaluated) • Riding in the rear seat
Child safety seats and booster seats are the basic protection systems for passengers who are too small to obtain full benefits from seat belts. Newborns start with rear-facing seats, graduate to forward-facing seats, booster seats and, finally, seat belts. Rear-facing and forward-facing child safety seats originally were secured in a vehicle at one place by a lap belt (or the lap and shoul-der belt going through the same slot). The vehicle’s lower anchors now offer a harder-to-misuse alternative to the vehicle’s belts as a method of securing rear- and forward-facing seats in the ve-hicle. Forward-facing seats now have an upper tether, which can be used whether the child safety seat is installed with the vehicle belt or lower anchors, securing the top of the child safety seat at a second place, significantly reducing the tendency of these seats to move or rotate in crashes. Booster seats are typically secured by the lap and shoulder belt going around the child while seated and securing the child to the booster seat while at the same time securing the child and booster seat to the vehicle. The rear seat is intrinsically safer than the front seat, given equal safe-ty equipment, because severe frontal impacts are more common than severe rear impacts and it is safer to sit further away from the point of impact.
FMVSS No. 213 “specifies requirements for child restraint systems … to reduce the number of children killed or injured.” FMVSS No. 225 “establishes requirements for child restraint anchor-age systems to ensure their proper location and strength for the effective securing of child re-straints, to reduce the likelihood of the anchorage systems’ failure, and to increase the likelihood that child restraints are properly secured and thus more fully achieve their potential effective-ness.”411
411 49 CFR, Parts 571.213 and 571.225.

145
Rear-facing and forward-facing child safety seats History: Early child seats and car beds, dating back to 1933, were designed for comfortable transportation, not crash protection. The first safety seats include the Ford Astro-Guard (1965) and Tot-Guard (1967) and the GM “Love” infant and child seats (1970). NHTSA issued FMVSS No. 213, effective April 1, 1971, to establish performance criteria for any device marketed as a “safety car seat,” and to discourage the marketing of non-safety devices for use in vehicles. This version of FMVSS No. 213 required that safety seats be designed for attachment within a car by the car’s seat belts, and it set limits for forward motion under a static load, but it did not include a dynamic test simulating a crash. By the mid-1970s, frontal 30 mph sled testing by the Consumers Union and others demonstrated that some seats offered substantially less protection than others. NHTSA revised FMVSS No. 213, effective January 1, 1981, incorporating the 30 mph test. The seat must remain structurally intact during the test, limit the forward motion of the dummy, and also limit the head injury criterion (HIC) to 1000 and chest acceleration to 60 g’s on the 3-year-old dummy.412
How safety seats work: The goal of safety seats is to provide small children with the same pro-tection, or better, that adults obtain from seat belts and the other safety equipment built into a vehicle. They are designed to keep children within the vehicle and close to their original seating position, prevent contacts with harmful interior surfaces or other occupants and provide “ride-down” by gradually decelerating the child as the vehicle deforms and absorbs energy. Key ter-minology is the “excursion” of the head and knee, the greatest distance that those parts of a dummy extend forward from the seat back at any time during the 30 mph test. Excursion is al-lowed by the looseness of the devices that secure the seat to the vehicle and the dummy within the seat, and by the tendency of seats to tilt or rotate during the test. Obviously, the less the ex-cursion, the lower the probability of contacting any part of the vehicle interior.
There are three principal types of safety seats (or three modes of safety seat installation): rear-facing, forward-facing, and booster seats. The last type is discussed in a separate section of this chapter. It is important that the type of safety seat and its installation be appropriate for a child’s weight and height. Children should not “graduate” to the next type of seat until their weight and/or height exceeds the limit specified by the seat manufacturer for that mode of use. Infor-mation on child safety seats is available at www.safercar.gov/parents/CarSeats.htm on NHTSA’s web site. The following chart was available at www.nhtsa.gov/DOT/NHTSA/Traffic%20Injury%20Control/Articles/Associated%20Files/4StepsFlyer.pdf as of June 2014:
412 Radovich, V. G. (1983). Development of infant and child restraint regulations and their application. SAE Child Injury and Restraint Conference Proceedings. (Paper No. 831655, Publication No. P-135, pp. 101-111). Warrendale, PA: Society of Automotive Engineers; Kahane, C. J. (1986, February). An evaluation of child passenger safety: the effectiveness and benefits of safety seats. (Report No. DOT HS 806 890, pp. 2-4). Washington, DC: National High-way Traffic Safety Administration. Available at www-nrd.nhtsa.dot.gov/Pubs/806890.PDF; Federal Register 35 (September 23, 1970): 14778, 44 (December 13, 1979): 72131; Consumer Reports.(1972, August). Consumer Re-ports, 37, p. 484.
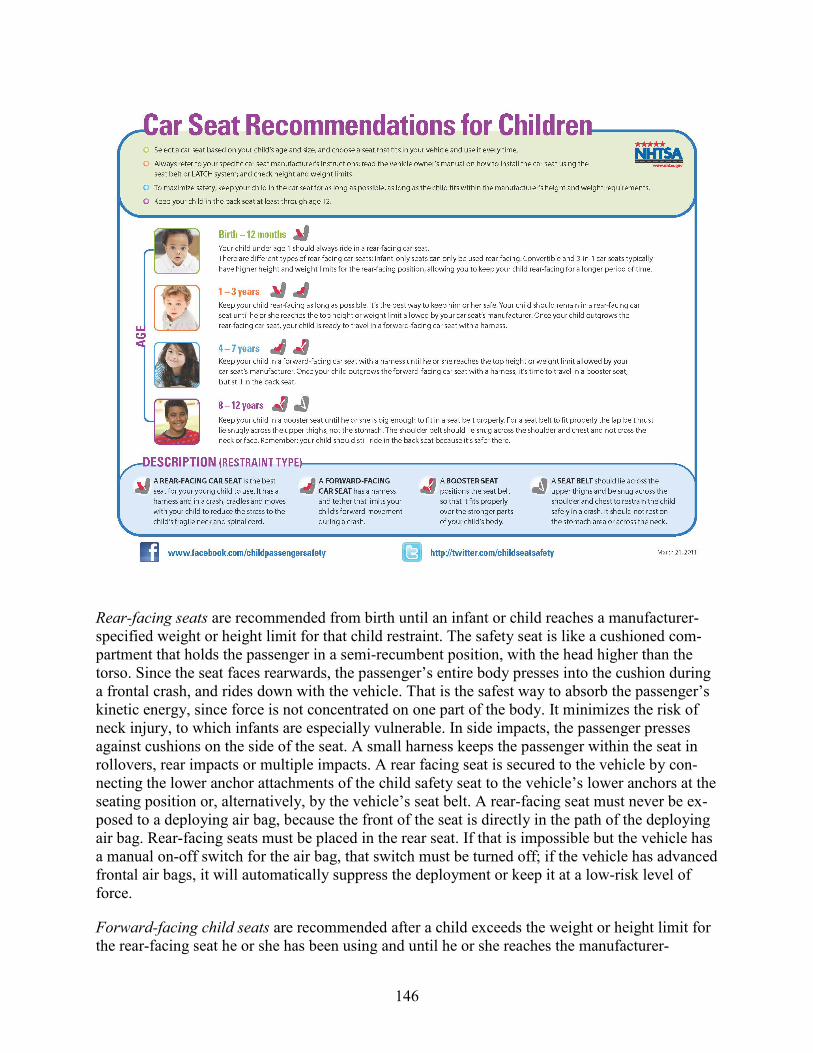
146
Rear-facing seats are recommended from birth until an infant or child reaches a manufacturer-specified weight or height limit for that child restraint. The safety seat is like a cushioned com-partment that holds the passenger in a semi-recumbent position, with the head higher than the torso. Since the seat faces rearwards, the passenger’s entire body presses into the cushion during a frontal crash, and rides down with the vehicle. That is the safest way to absorb the passenger’s kinetic energy, since force is not concentrated on one part of the body. It minimizes the risk of neck injury, to which infants are especially vulnerable. In side impacts, the passenger presses against cushions on the side of the seat. A small harness keeps the passenger within the seat in rollovers, rear impacts or multiple impacts. A rear facing seat is secured to the vehicle by con-necting the lower anchor attachments of the child safety seat to the vehicle’s lower anchors at the seating position or, alternatively, by the vehicle’s seat belt. A rear-facing seat must never be ex-posed to a deploying air bag, because the front of the seat is directly in the path of the deploying air bag. Rear-facing seats must be placed in the rear seat. If that is impossible but the vehicle has a manual on-off switch for the air bag, that switch must be turned off; if the vehicle has advanced frontal air bags, it will automatically suppress the deployment or keep it at a low-risk level of force.
Forward-facing child seats are recommended after a child exceeds the weight or height limit for the rear-facing seat he or she has been using and until he or she reaches the manufacturer-
147
specified weight or height limit for that forward-facing seat. The safety seat is like an armchair. The child sits up in it; the child’s head and torso are protected in back and, to some extent, on each side by the seat’s shell and cushion; the child’s legs hang down over the edge of the seat. Typically a 5-point harness, fitting over both shoulders, hips and abdomen, restrains the child in rollovers, frontals and side impacts, without concentrating force on one part of the body. The back of the seat and its cushion protect the child from whiplash in rear impacts.
Until August 31, 2002, the vehicle’s lap belt secured the safety seat to the vehicle. Belts were routed through the frame of the child seat, as specified by the manufacturer, or less frequently around the seat and the child. Beginning September 1, 2002, child safety seats must have lower attachments for use in new vehicles equipped with LATCH anchorages, but must also be secura-ble by lap belts in older vehicles. Effective January 1, 1981, FMVSS No. 213 limited forward head excursion to 32 inches and knee excursion to 36 inches on the 30 mph frontal test, meas-ured from the seatback pivot point (at the lower-rear edge of the seatback). Those levels are suf-ficient to prevent contact with interior surfaces in an average-sized passenger car. As of Septem-ber 1, 1999, FMVSS No. 213 has further limited head excursion to 720 mm (28.35 inches), providing an additional margin of safety. All forward facing child seats in the market are equipped with an upper tether to meet the limited head excursion requirement. Before that, some seats were equipped with upper tethers on a voluntary basis dating back to 1970. The advantage of the upper tether is that it reduces the tilting or rotation of the seat during a crash, because it is firmly attached to the vehicle at the top as well as the bottom.
FMVSS No. 213 also sets numerous other requirements for seats, including a limit of 1000 HIC and 60 chest g’s on the 3-year-old dummy and maintenance of structural integrity in the 30 mph test, clear labeling of instructions for their use, convenient seat registration, and a requirement that the force needed to open harness buckles is in a range that adults can conveniently open them but small children cannot open them.413
Safety seat use trends: In 1979, NHTSA’s first national survey indicated that 45 percent of in-fants less than 1 year old and 9 percent of toddlers 1 to 4 years old rode in some kind of child “seat.” Half of these “seats” were not secured by the car’s belt, hardly protecting the child (many of them were probably not safety seats designed to FMVSS No. 213). However, Tennessee had recently become the first State with a child passenger protection law, effective January 1, 1978. Rhode Island followed in 1980, West Virginia in 1981 and ten States in 1982. By June 1, 1985, every State and the District of Columbia had a law to protect child passengers. In NHTSA’s 19-City Study, safety seat use rose quickly during the 1980s, exceeding 80 percent for infants and toddlers by the end of the decade. By 2002, NOPUS showed that 99 percent of infants less than a year old and 94 percent of toddlers 1 to 4 years old were in some kind of restraint (not necessari-ly age-appropriate or correctly used). In 2009, the corresponding rates were 98 percent of infants and 96 percent of toddlers 1 to 3 years old. Many of the laws initially allowed children to “grad-uate” too early from safety seats to the vehicle’s belts, but as of 2011, 48 States and the District
413 49 CFR, Part 571.213 S5.1.3. and Figure 1B; Kahane (1986, February), p. 3.

148
of Columbia require children to be in a safety seat or booster seat at least up to their sixth birth-day.414
Safety seat misuse: For full benefits, safety seats should be installed correctly in the vehicle and children properly harnessed within the seat. Misuse is a potential problem because there are many styles of seats, and the mode of use can also vary by the age of the child, the type of vehi-cle, or even by seating position within the same vehicle. NHTSA’s evaluation of child passenger safety reviewed 957 observations during 1984 of children less than 5 years old riding in safety seats:415
• 40 percent of the seats were correctly used, exactly as recommended by the manufacturer or very close to that.
• 18 percent were “grossly” misused: the seat was not secured to the vehicle by a belt or tether and/or the seat’s harness or shield was not used. In a crash, the child would imme-diately become a projectile and derive little or no protection from the seat.
• 42 percent were “partially” misused, substantively differing from the method recom-mended by the manufacturer. Depending on the type of misuse, effectiveness could be slightly or seriously degraded. Typical misuse modes include:
o Incorrectly routing the lap belt through/around the frame, where the frame is weaker or where it will allow more excursion.
o Using a seat in the forward facing mode for an infant who should be in a rear-facing seat.
o Not attaching the upper tether, if one is available.
NHTSA, other government and private organizations and the safety-seat manufacturers have made an effort to design seats that are easy to install and use correctly, to provide clear instruc-tions that are prominently displayed on the seat, and to establish a national network of instructors who can advise people about the type of seat they need for their child and their vehicle, and show them how to install it correctly. The public may find an instruction station close to their home at www.nhtsa.gov/apps/cps/index.htm.
A 2002 survey of safety seats in actual use by 5,527 child passengers showed that gross misuse of seats had greatly decreased since 1984, but misuse of safety seats remained a problem. Ap-proximately 2 percent were not secured by the vehicle’s belt and 3 percent did not have the safe-
414 Lawless, E. W., & Siani, T. A. (1983). The state of the art of child passenger safety legislation in North America. SAE Child Injury and Restraint Conference Proceedings. (Paper No. 831650, Publication No. P-135, pp. 229-242). Warrendale, PA: Society of Automotive Engineers; Kahane (1986, February), pp. 4-5; Phillips (1980, May); Phillips (1983, May); Perkins, Cynecki, & Goryl (1984, July); Goryl & Cynecki (1985, March); Goryl (1986, May); Goryl & Bowman (1987, March); Bowman & Rounds (1988, August); Bowman & Rounds (1989, June); Datta & Guzek (1990, June); Datta & Guzek (1991, July); Datta & Guzek (1992, March); NHTSA. (2000). Traffic safety facts 1999 – Children. (Report No. DOT HS 809 087, p. 5). Washington, DC: National Highway Traffic Safety Administration. Available at www-nrd.nhtsa.dot.gov/Pubs/99Children.pdf; Glassbrenner, D. (2003, February). The use of child re-straints in 2002. (Report No. DOT HS 809 555). Washington, DC: National Highway Traffic Safety Administration. Available at www-nrd.nhtsa.dot.gov/Pubs/809-555.pdf; Pickrell, T. M., & Ye, J. Y. (2010a, September). The 2009 National Survey of the Use of Booster Seats. (Report No. DOT HS 811 377). Washington, DC: National Highway Traffic Safety Administration. Available at www-nrd.nhtsa.dot.gov/Pubs/811377.pdf; Traffic safety facts 2011, pp. 186-193. 415 Kahane (1986, February), pp. 30-47, especially p. 45.
149
ty seat’s harness connected (a big reduction from 18 percent gross misuse in the earlier survey). Misrouting of the vehicle’s belt, once quite common, had decreased to about 3 percent or less. On the other hand, the majority of seats showed some type(s) of misuse, especially loose or mis-positioned harnesses, loose belts, and/or use of the seat in a mode inappropriate to the age or size of the child (e.g., too-early graduation to the forward-facing mode).416
Initial results from NHTSA’s 2011 national survey of safety seats in actual use by 4,167 child passengers suggest the four most frequent installation mistakes were: (1) Use of the wrong har-ness slot; (2) The harness retainer or chest clip incorrectly positioned or not used at all; (3) Loose safety-seat installation (more than two inches of side-to-side or front-to-back movement); (4) Loose harness strap (more than two inches of slack).417
Expected benefits: Here are hypotheses for what might be expected in statistical analyses of ef-fectiveness. Qualitatively, correctly used safety seats ought to have the same types of benefits for child passengers that seat belts have for adults. Quantitatively, we might expect even higher ef-fectiveness, because safety seats might do a better job preventing child passengers’ contacts with the vehicle interior than seat belts do for adults, and because their typically 5-point harnesses will more evenly spread forces than a lap-shoulder belt. Conceptually, misuse of safety seats could diminish the observed, “as used” effectiveness in crash data – i.e., because the restrained popula-tion includes the actual mix of correctly-used and misused seats, effectiveness might be lower than if all children were correctly restrained. It is unclear how large a factor that might have been in recent years, when few seats were grossly misused. “As used” effectiveness can increase over time if the proportion of correctly used seats increases.
Fatality reduction – passenger cars: In 1984, at about the same time that Evans developed the “double-pair comparison” method to estimate belt effectiveness, Partyka at NHTSA inde-pendently developed essentially the same method to estimate safety seat effectiveness. NHTSA expanded and updated the analysis in its 1986 evaluation, in 1988, and finally in 1996. The last study provides NHTSA’s current estimates of the “as used” fatality reduction by child safety seats. It is based on 1988-to-1994 FARS data. The analysis of safety seats resembles the proce-dures used to estimate the effectiveness of seat belts, especially rear seat belts (see the FMVSS No. 208 chapter). For example, in cars with unrestrained drivers, the fatality ratio of unrestrained children to their drivers is compared to the fatality ratio of children in safety seats to their driv-ers. “Safety seat users” include those that FARS reported in “child safety seats” or “child safety seats used improperly.” Since the percentage of seats “used improperly” is far lower in FARS than in observational surveys, a substantial but unknown percentage of the children that FARS merely reported “in safety seats” were also in improperly used seats. Thus, the two groups have been combined to provide an overall, “as used” effectiveness estimate. For infants less than 1
416 Decina, L. E., & Lococo, K. H. (2004, January) Misuse of child restraints. (Report No. DOT HS 809 671, pp. 33-34). Washington, DC: National Highway Traffic Safety Administration. Available at www.nhtsa.gov/Research/Human+Factors/Seatbelt+and+Child+Seat+Use. 417 (2012, September). Traffic safety facts research note: National child restraint use special study. (Report No. DOT HS 811 679). Washington, DC: National Highway Traffic Safety Administration. Available at www-nrd.nhtsa.dot.gov/Pubs/811679.pdf
150
year old, safety seats reduced overall fatality risk by a statistically significant 71 percent. For toddlers 1 to 4 years old, the seats reduced fatality risk by a statistically significant 54 percent.418
The preceding “as used” estimates include misused seats. In 1983, the Tennessee Highway Patrol estimated that correctly used safety seats could reduce fatality risk by 71 percent. The estimate was not based on statistical analysis comparing fatality rates of restrained and unrestrained chil-dren, but on a detailed case-by-case analysis of 51 unrestrained fatalities, judging what would have happened if the children had been protected by safety seats. This estimate is not used in the model to compute lives saved (Part 2 of this report), because it is not based on a statistical analy-sis and because the FARS data does not have detailed information on the correct use of safety seats. Nevertheless, it continues to appear plausible, especially given that the preceding “as used” estimates including misused seats are not much lower.419
Over the years, a modest proportion of toddlers 1 to 4 years old, especially at the higher ages have only been restrained by the vehicle’s belts, not by a safety seat (e.g., 2% of toddlers in 1977 to 1979, 3% in 1991, and 8% in 2009).420 The restraint is essentially a lap belt only, for even if the seat is equipped with a 3-point belt, the shoulder harness will not fit across the torso of a child that small, and it will offer little protection. NHTSA urges that children under 4’9’’, and certainly children less than 5 years old not be restrained with belts alone, but with a FMVSS No. 213 seat appropriate to their weight and height. Nevertheless, belts have some benefits for chil-dren under 5. NHTSA’s 1986 evaluation, based on a double-pair comparison analysis of 1975-to-1984 FARS data, estimates that lap belts reduce fatality risk of toddlers 1 to 4 years old by 33 percent. That is substantially lower than the 54 percent “as used” effectiveness of the actual mix of correctly used and misused safety seats, let alone the effectiveness of correctly used safety seats. It is about the same as the effectiveness of lap belts for adults (27% in the front seat and 32% in the rear seat – see the FMVSS No. 208 chapter).421
Fatality reduction – LTVs: NHTSA’s 1996 study also showed statistically significant fatality reductions for child safety seats in LTVs. For infants less than 1 year old, safety seats reduced overall fatality risk by 58 percent. For toddlers 1 to 4 years old, the reduction was 59 percent. The study showed a 48-percent fatality reduction by lap belts for toddlers 1 to 4 years old. This is the same as the estimated effectiveness of lap belts for adults in the front seat.422
418 Evans (1986a); Partyka, S. C. (1984b). Restraint use and fatality risk for infants and toddlers. Washington, DC: National Highway Traffic Safety Administration, National Center for Statistics and Analysis; Kahane (1986, Febru-ary), pp. 140-163; Partyka, S. C. (1988b). Lives saved by child restraints from 1982 through 1987. (Report No. 807 371). Washington, DC: National Highway Traffic Safety Administration; Hertz, E. (1996, December). Revised esti-mates of child restraint effectiveness. Washington, DC: National Highway Traffic Safety Administration. Available at www-nrd.nhtsa.dot.gov/Pubs/96855.PDF. (This is a summary report that does not show the detailed analyses, but they are set up the same way as in Partyka’s 1988 report). 419 (1983). 51 young lives. (HSL Report No. No. DOT HS 034 896). Nashville, TN: Tennessee Highway Patrol; Ka-hane (1986, February), pp. 96-99. 420 Phillips (1980, May), p. 33; Datta & Guzek (1992, March), p. 29; Pickrell & Ye (2010a, September) shows 4 percent use for 1-to-3 year olds (p. 20) and 20 percent for 4-year-olds (p. 6). 421 Kahane (1986, February), pp. 161-164; this data is entirely before 1986 – i.e., before State buckle-up laws began to bias belt-use reporting in FARS. 422 Hertz (1996, December).
151
Fatality reduction – recent findings: In 2013, NHTSA released estimates of fatality reduction by child safety seats (combining rear-facing, forward-facing, and booster seats), based on FARS data from 1995 to 2009. The analysis method is a double-pair comparison, similar to the analysis by Hertz. Fatality reduction is estimated for all types of crashes; also, separately for frontal im-pacts without rollover and for side impacts without rollover. The analysis combines crash data for cars and LTVs, producing a single estimate.423
Crash Type Child’s Age Fatality Reduction (%) All crashes less than 1 year 71 1 to 3 years 57 4 to 7 years 58 Frontal impacts less than 4 years 53 (w/o rollover) 4 to 7 years 43 Side impacts less than 4 years 42 (w/o rollover) 4 to 7 years 51
The analysis shows statistically significant fatality reductions for children in each age group – in all crashes, in frontal impacts, and in side impacts. The overall fatality reduction for infants less than a year old (71%) and toddlers 1 to 3 years old (57%) are quite similar to the Hertz results (71% in cars and 54% in LTVs for infants, 54% in cars and 59% in LTVs for toddlers 1 to 4 years old). The new results also suggest that safety seats are about equally effective for 1-to-3 year olds (57%) and 4-to-7 year olds (58%).
Injury reduction – passenger cars: NHTSA’s 1986 evaluation furnished three sets of estimates of injury reduction by safety seats in passenger cars. In a file that combined all available detailed investigations of crashes selected by probability sampling – the 1974-to-1975 RSEP, the 1977-to-1979 NCSS, the 1979 pilot test of NASS at the NCSS sites, and the 1979-to-1983 NASS – the rate of fatal or hospitalizing injuries per 100 children less than 6 years old involved in towaway crashes was 56 percent lower for children in safety seats than for unrestrained children. The re-duction was statistically significant. However, it is an overestimate of the overall “as used” effec-tiveness, because these investigators classified children in grossly misused seats as “unre-strained.” If they had been classified as safety seat users, injury reduction would have been an estimated 46 percent in 1984.424
An analysis of 1981-to-1983 Pennsylvania crashes computed injury rates per 100 children, ad-justing for the child’s age and seating position. Compared to unrestrained children, safety seats reduced fatal-and-serious (K + A) injury risk by 43 percent, moderate-to-fatal (K + A + B) injury risk by 45 percent, and overall (K + A + B + C) injury risk by 31 percent. Here, too, many chil- 423 Sullivan, L. K., Louden, A. E., & Echemendia, C. G. (2013, December). Child restraint side impact test proce-dure development. (Docket No. NHTSA-2014-0012-0002, pp. 1-4). Washington, DC: National Highway Traffic Safety Administration. 424 Kahane (1986, February), pp. xxxiv and 201-214.
152
dren in grossly misused seats may have been classified as “unrestrained.” The 1986 report con-cludes that K + A + B injury reduction would have been closer to 37 percent if they had all been classified as safety seat users.425
As part of the 1986 evaluation, NHTSA conducted 36 frontal or oblique-frontal sled tests, each with 3 or 4 3-year-old dummies, at speeds ranging from 11 to 35 mph. Dummies were unre-strained, or in safety seats of four different types – correctly used, grossly misused, or in various modes of partial misuse. NHTSA calibrated the probability of hospitalizing head or torso injury as a function of speed for the unrestrained dummy – and various seat types/use modes. A math-ematical model computed overall effectiveness from the calibrated relationships. Correctly used, the various types of safety seats reduced the risk of hospitalizing injuries in frontal crashes by an average of 61 percent, relative to the unrestrained dummy. The average effectiveness of the par-tially misused seats was 38 percent. Not surprisingly, the dummies in grossly misused seats had the same injury risk as unrestrained dummies. When correct use, partial misuse and gross misuse were weighted by their frequency of occurrence in the observational survey, the average “as used” effectiveness of safety seats in frontal crashes was 40 percent.426
Injury reduction – LTVs: NHTSA has not statistically analyzed the injury reduction by safety seats for children who are occupants of LTVs. However, given that the analysis by Hertz showed quite similar fatality-reducing effectiveness for safety seats in cars and LTVs, it seems possible that their injury-reducing effect in LTVs might also be similar to their effect in cars.
Upper tethers and anchorages (not yet fully evaluated) LATCH (lower anchors and tethers for children – not yet fully evaluated) On March 5, 1999, NHTSA published a final rule amending FMVSS No. 213 to require safety seats to have lower anchorage attachments and a means (such as a top tether on a forward-facing seat) to meet more stringent excursion limits. The final rule also established FMVSS No. 225 to require motor vehicles to have anchorages for attaching the child safety seat lower anchorage connector and tether hook. On forward-facing child safety seats (with a few exceptions), testing with upper tethers with reduced excursion requirements became effective on September 1, 1999, and testing with installation using lower attachments became effective on September 1, 2002. In motor vehicles, the phase-in of upper tether anchorages extended from September 1, 1999, to September 1, 2000, and the lower anchorages from September 1, 2000, to September 1, 2002. A vehicle with three or more designated forward-facing rear seating positions is required to have tether anchorages in at least three of those positions and lower anchorages in at least two of those positions. The objectives of the regulation are to secure seats more tightly in the vehicle, make their installation easier and more uniform, and reduce the probability of misuse.427
Forward-facing safety seats with upper tethers have been available dating back to 1970. Upper tethers reduce the tilting or rotation of the seat during a crash, because they provide a second at-tachment of the seat to the vehicle (in addition to the lap belt or lower anchor attachments). Sled 425 Ibid., pp. xxxiv and 169-184; rates were adjusted for age and seating position by multidimensional contingency table analysis. 426 Ibid., pp. 235-305, especially p. 301. 427 Federal Register 64 (March 5, 1999): 10786; 49 CFR, Parts 571.213 S5.9 and 571.225 S4.
153
testing shows unequivocally that tethered seats, when correctly used, have less head excursion than other types. However, observational surveys showed that most seats did not have tethers, and among those that did, only 15 percent of tethers were attached in 1984, in part because many vehicles did not have tether anchorages. FMVSS No. 225 requires vehicles to have tether an-chorages; forward-facing child safety seats have been equipped with upper tethers ever since the more stringent excursion limits of FMVSS No. 213 went into effect.428
The method of securing a rear-facing or forward-facing safety seat by the vehicle’s seat belts can vary considerably from seat to seat and from vehicle to vehicle, creating opportunities for mis-use. The fit of the belts is often loose, especially if the seat should be secured with an additional locking clip to prevent spooling of the belt, but the locking clip is not used. The lower anchors of the LATCH system – the lower anchor in the vehicle and attachment on the rear-facing or for-ward-facing safety seat – establishes an alternative, more uniform attachment system that does not rely on the seat belt or on a locking clip. Lower anchor installation is an alternative but it does not supplant the earlier method of securing safety seats with the vehicle’s seat belts; either method, carried out per instructions, is satisfactory.
In 2005, NHTSA conducted a survey of 1,121 children from birth to age 4 in child safety seats riding in the rear seats of vehicles to observe how seats were installed and used and to ask the drivers about their knowledge and opinions of LATCH.429 Key findings were:
• 55 percent use of upper tethers (for forward-facing safety seats at seating positions equipped with upper anchors) – much higher than the 15 percent in 1984;
• 60 percent use of lower anchors (for rear-facing and forward-facing safety seats at seating positions equipped with the anchors – i.e., 40 percent were still attached with the belts, even though anchors were available);
• In 13 percent of the observations, the child safety seat was placed in a seating position in the vehicle not equipped with lower anchors and where the seat belt was the only way to secure the child safety seat to the vehicle;
• 81 percent of the drivers who used the upper tether to attach the safety seat said the teth-ers were easy to use; 74 percent of drivers who used lower anchors said they were easy to use;
• 75 percent of drivers who had used lower anchors on some occasions and seat belts on other occasions to attach safety seats preferred the anchors; and
• 61 percent of upper-tether nonusers and 55 percent of lower-anchor nonusers cited their lack of knowledge – not knowing what they were, that they were available in the vehicle,
428 Bayer, A. R., Jr., & Peterson, B. S. (1978). Child restraint systems testing. (Report No. DOT HS 803 408). Wash-ington, DC: National Highway Traffic Safety Administration; Kelleher, B. J., & Walsh, M. J. (1978). Sled Test Comparisons of Child Restraint Performance. Twenty-Second Stapp Car Crash Conference. (Paper No. 780903). Warrendale, PA: Society of Automotive Engineers; Kelleher, B. J., Walsh, M. J., Dance, D. M., & Gardner, W. T. (1983). An experimental study of the effects of child restraint improper installation and crash protection for larger size children. SAE Child Injury and Restraint Conference Proceedings. (Paper No. 831602, Publication No. P-135, pp. 31-51). Warrendale, PA: Society of Automotive Engineers, 1983; Radovich (1983); Kahane (1986, February), pp. xliv, 30-47 and 106-134. 429 Decina, L. E., Lococo, K. H., & Doyle, C. T. (2006, December). Child restraint use survey – LATCH use and misuse. (Report No. DOT HS 810 679). Washington, DC: National Highway Traffic Safety Administration. Availa-ble at www-nrd.nhtsa.dot.gov/Pubs/810679.PDF.
154
the importance of using them, or how to properly use them - as the reason for not using them.
NHTSA is analyzing the results of a follow-up survey to find out if consumers have become more familiar with LATCH as these systems have become more widespread in the vehicle fleet. The agency also intends to analyze crash data to see if upper tethers have made forward-facing safety seats more effective.
Booster seats (not yet fully evaluated) Booster seats are recommended after a child exceeds the weight or height limit for the forward-facing seat he or she has been using and until he or she reaches the manufacturer-specified weight limit for that booster seat or a height of 4’9’’. Booster seats essentially raise the child up high enough that the vehicle’s manual 3-point belt fits over one shoulder and diagonally across the thorax, as it would for an adult. The lap portion of the 3-point belt should fit snugly around the hips. When the 3-point belt is thus correctly positioned, it should provide greater benefits for these children than a seat belt alone without the booster seat. Some booster seats also have their own shields or 5-point harnesses for use by children at the lower end of the weight range. Some booster seats have their own seat backs, while others use the vehicle’s seat back.430
Booster seats have been available to the public since 1981, but early use rates were low.431 Dur-ing the mid-1990s, NHTSA and the safety community increased emphasis on protecting children who had outgrown forward-facing seats but were not yet tall enough for optimum results with a 3-point belt. In January 1996, FMVSS No. 213 began to use a dummy simulating a 6-year-old child to test seats with higher weight limits, such as booster seats; starting 2005, the dummy had to be the Hybrid III type.432 The TREAD Act of 2000 and Anton’s Law of 2002 have provisions to enhance occupant protection for children in this age group. On February 27, 2012, NHTSA issued a final rule amending FMVSS No. 213 with specifications for a 10-year-old dummy to test seats designed for children weighing over 65 pounds.433 Over the years, most of the States amended their child passenger protection laws to increase the age when a child may graduate from a safety seat to seat belts alone. As of 2011, 7 State laws require the use of a safety seat for children up to and including 8 years old and 20 State laws require the use of a safety seat for children up to and including 7-year-olds.434
NHTSA plans to evaluate the fatality-reducing effectiveness of booster seats, based on FARS data, by the same method it used for rear-facing and forward-facing safety seats. There is not yet sufficient data for the analysis because FARS only began coding booster seats as a separate cate-gory of restraint use in 2008; furthermore, FARS relies on State crash data for information and many States have not yet begun or only recently began to classify booster seats as a separate cat-egory. 430 NHTSA. (2005, September). A parent’s guide to buying and using booster seats. (Report No. DOT HS 809 503). Washington, DC: National Highway Traffic Safety Administration. Available at buckleup.mt.gov/docs/nhtsa-guide-buying-boosters.pdf. 431 Kahane (1986, February), pp. 64-68. 432 Federal Register 60 (July 6, 1995): 35126; Federal Register 69 (July 16, 2004): 42595. 433 Federal Register 77 (February 27, 2012): 11651. 434 Traffic safety facts 2011, pp. 186-193.
155
However, in 2010, NHTSA released preliminary statistical analyses of nonfatal injury rates, based on data through 2007 from three States that pioneered reporting of booster seats as a sepa-rate category: Kansas, Nebraska and Washington. Among 4-to-8 year olds there is evidence of reduced risk of injury when restrained by booster seats rather than just by 3-point belts. The es-timated magnitude of this effect is a 14-percent reduction in risk of any type of injury for the booster seats relative to the 3-point belts. Conversely, among 3- and 4-year-olds there is some evidence of increased risk of injury with booster seats rather than with the more age-appropriate forward-facing seats, although there is not enough data to draw statistical conclusions.435 Until NHTSA is able to analyze FARS data on booster seats, the agency will assume that their fatality reduction for 5-to-8 year olds is about the same as the effectiveness of forward-facing seats for 1-to-4 year olds. NHTSA’s most recent analysis of FARS, although the data did not yet permit ana-lyzing booster seats as a separate category from rear-facing or forward-facing seats, does show that the fatality reduction for safety seats (whatever type they may have been) is about the same for 1-to-3 year old and 4-to-7 year old children (57% and 58%, respectively).436
Safety benefits of riding in the rear seat Why the rear seat can be safer: The closer the occupant sits to the point of impact, the greater the risk of fatal injury. That is because fatal crashes often result in severe damage, but rarely to the entire vehicle. They can demolish the portion of the passenger compartment closest to the impact, while the furthest portion remains nearly intact. A frontal impact is twice as dangerous for front seat occupants as rear seat occupants, whereas a rear impact is twice as dangerous for the rear seat occupants.437 But this is not a trade-off. High-speed frontal impacts are far more common than high-speed rear impacts, resulting in greater overall fatality risk to front seat occu-pants:
• Collisions with fixed objects are usually frontal impacts, unless the vehicle has yawed out of control, and even then they are rarely rear impacts.
• When two vehicles collide, usually at least one of them and sometimes both have frontal damage, but rear-to-rear collisions are rare.
• Head-on collisions often involve a dangerous closing speed because the two vehicles are moving in opposite directions; rear impacts are often of low severity because both vehi-cles are moving in the same direction.
For example, during 2011, there were 10,770 occupants of cars and LTVs fatally injured in frontal impacts and only 1,113 in rear impacts.438 A second advantage for the unrestrained rear seat occupant in a frontal crash is that he or she will contact the back of the front seat, a more benign surface than the steering assembly, instrument panel, or windshield header contacted by the unrestrained front seat occupant. This advantage may be lost to some extent if both occupants are correctly restrained. Nevertheless, a rear seat occupant, restrained or unrestrained, ought to
435 Sivinski, R. (2010, July). Booster seat effectiveness estimates based on CDS and State data. (Report No. DOT HS 811 338). Washington, DC: National Highway Traffic Safety Administration. Available at www-nrd.nhtsa.dot.gov/Pubs/811338.pdf. 436 Sullivan, Louden, & Echemendia (2013, December), pp. 1-4. 437 Evans (1991), pp. 47-51. 438 Traffic safety facts 2011, p. 109.
156
have lower fatality risk than a front seat occupant with the same safety equipment. On the other hand, for many years, the front seat has been the first place to get new safety equipment (3-point belts, pretensioners, and load limiters), and sometimes the only place (frontal air bags, as of June 2014).
Fatality reduction: Evans analyzed fatality risk of passenger car occupants 16 or older by seat-ing position, based on FARS data from 1975 to 1985, when almost no cars were equipped with air bags and 94 percent of the fatally injured occupants were unrestrained. He demonstrated that unrestrained drivers and adult RF passengers of passenger cars had almost exactly the same fatal-ity risk in a crash. In other words, in crashes where both seats were occupied by people of the same age and gender, the ratio of driver to RF passenger fatalities was 1:1. But outboard rear seat occupants had 26 percent lower fatality risk than drivers and RF passengers of the same age and gender. Center rear seat occupants had 37 percent lower fatality risk than drivers and RF passen-gers: the center rear seat has an additional safety advantage, because it is far away from the sides as well as the front of the car.439
Children, too, can be substantially safer in the rear seat. In NHTSA’s 1986 evaluation, double-pair comparison analyses of 1975-to-1984 FARS data showed that an unrestrained child less than 5 years old had 27 percent lower fatality risk in the rear seat than in the front seat. For a child in a safety seat, the fatality risk was 20 percent lower in the rear seat than in the front seat: not as large an effect as for the unrestrained child, but still substantial.440
These benefits persisted in later vehicles without air bags. Three NHTSA publications in 1996 and 1997 cite an analysis of 1988-to-1994 FARS data showing that both restrained children and unrestrained children experienced a 26 [or 27] percent reduction in fatality risk in the rear seat relative to the front seat.441
The following analysis of MY 1981-to-1995 passenger cars without air bags in 1991-to-1999 FARS data supplies more detailed results. Children of all ages and adolescents, restrained as well as unrestrained, obtained a substantial benefit for riding in an outboard rear seat rather than the RF seat, and an even larger fatality reduction if they traveled in the center rear seat. Specifically, children up to 12 years old, both restrained and unrestrained, experienced statistically significant fatality reductions close to 30 percent for moving from the RF seat to an outboard rear seat, and close to 45 percent for moving from the RF seat to the center rear seat:
439 Evans (1991), pp. 47-51; Kahane (2000, December), p. 6. 440 Kahane (1986, February), pp. xxxiv and 164-167; in the double-pair comparison, the fatality ratio of children to their drivers is compared for children in the front seat and children in the rear seat. 441 Hertz (1996, December); Federal Register 62 (November 21, 1997): 62406, Footnote 23; Air bags & on-off switches; the supporting analysis is not available, and it is unknown if it included children < 5 years old or < 13 years old, or if it was limited to passenger cars or included LTVs.
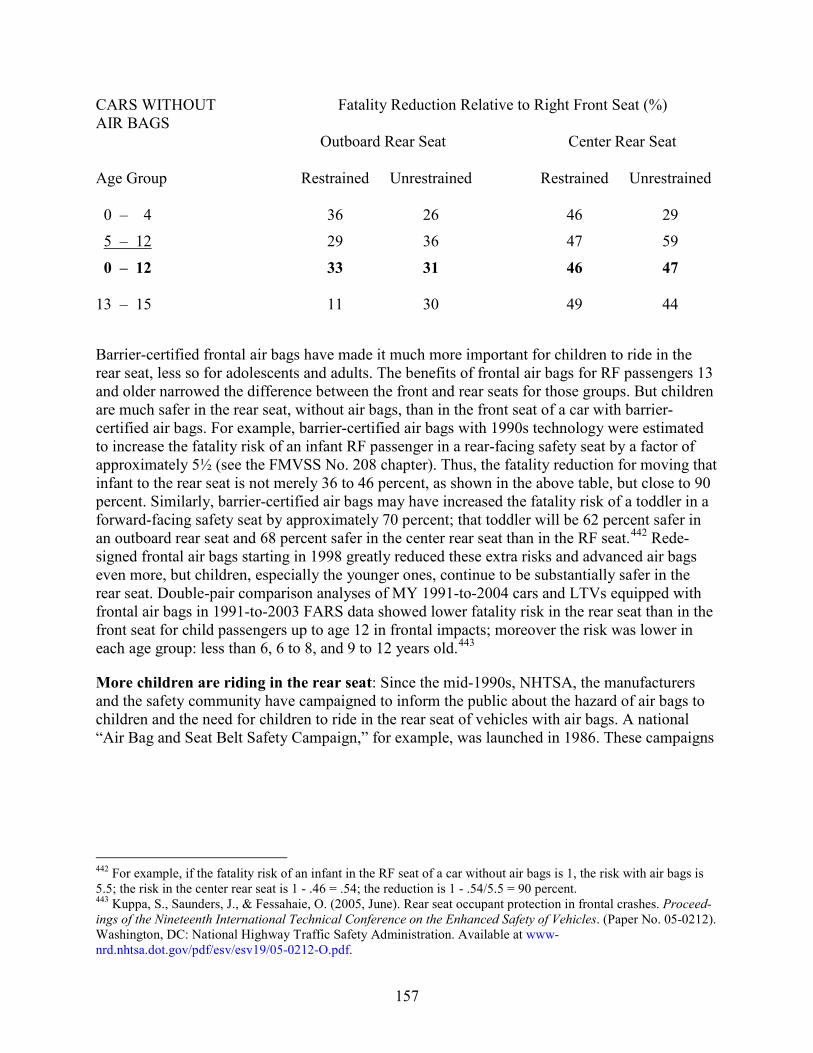
157
CARS WITHOUT Fatality Reduction Relative to Right Front Seat (%) AIR BAGS Outboard Rear Seat Center Rear Seat Age Group Restrained Unrestrained Restrained Unrestrained 0 – 4 36 26 46 29
5 – 12 29 36 47 59
0 – 12 33 31 46 47 13 – 15 11 30 49 44
Barrier-certified frontal air bags have made it much more important for children to ride in the rear seat, less so for adolescents and adults. The benefits of frontal air bags for RF passengers 13 and older narrowed the difference between the front and rear seats for those groups. But children are much safer in the rear seat, without air bags, than in the front seat of a car with barrier-certified air bags. For example, barrier-certified air bags with 1990s technology were estimated to increase the fatality risk of an infant RF passenger in a rear-facing safety seat by a factor of approximately 5½ (see the FMVSS No. 208 chapter). Thus, the fatality reduction for moving that infant to the rear seat is not merely 36 to 46 percent, as shown in the above table, but close to 90 percent. Similarly, barrier-certified air bags may have increased the fatality risk of a toddler in a forward-facing safety seat by approximately 70 percent; that toddler will be 62 percent safer in an outboard rear seat and 68 percent safer in the center rear seat than in the RF seat.442 Rede-signed frontal air bags starting in 1998 greatly reduced these extra risks and advanced air bags even more, but children, especially the younger ones, continue to be substantially safer in the rear seat. Double-pair comparison analyses of MY 1991-to-2004 cars and LTVs equipped with frontal air bags in 1991-to-2003 FARS data showed lower fatality risk in the rear seat than in the front seat for child passengers up to age 12 in frontal impacts; moreover the risk was lower in each age group: less than 6, 6 to 8, and 9 to 12 years old.443
More children are riding in the rear seat: Since the mid-1990s, NHTSA, the manufacturers and the safety community have campaigned to inform the public about the hazard of air bags to children and the need for children to ride in the rear seat of vehicles with air bags. A national “Air Bag and Seat Belt Safety Campaign,” for example, was launched in 1986. These campaigns
442 For example, if the fatality risk of an infant in the RF seat of a car without air bags is 1, the risk with air bags is 5.5; the risk in the center rear seat is 1 - .46 = .54; the reduction is 1 - .54/5.5 = 90 percent. 443 Kuppa, S., Saunders, J., & Fessahaie, O. (2005, June). Rear seat occupant protection in frontal crashes. Proceed-ings of the Nineteenth International Technical Conference on the Enhanced Safety of Vehicles. (Paper No. 05-0212). Washington, DC: National Highway Traffic Safety Administration. Available at www-nrd.nhtsa.dot.gov/pdf/esv/esv19/05-0212-O.pdf.
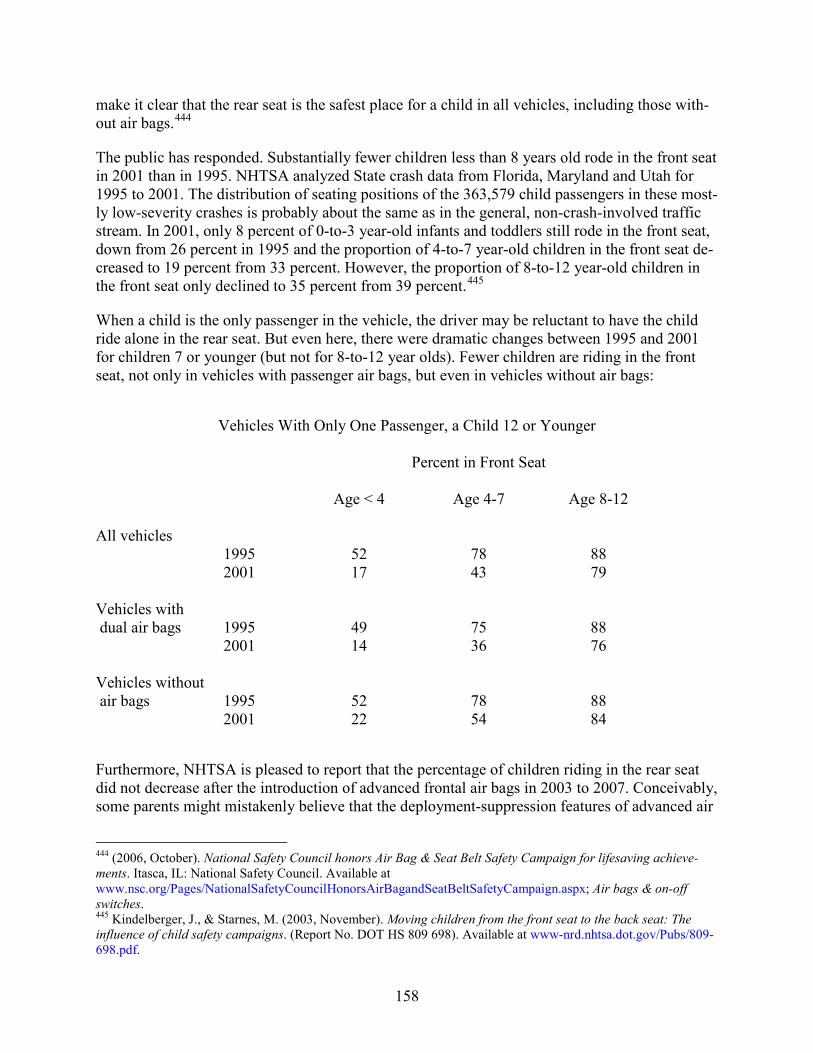
158
make it clear that the rear seat is the safest place for a child in all vehicles, including those with-out air bags.444
The public has responded. Substantially fewer children less than 8 years old rode in the front seat in 2001 than in 1995. NHTSA analyzed State crash data from Florida, Maryland and Utah for 1995 to 2001. The distribution of seating positions of the 363,579 child passengers in these most-ly low-severity crashes is probably about the same as in the general, non-crash-involved traffic stream. In 2001, only 8 percent of 0-to-3 year-old infants and toddlers still rode in the front seat, down from 26 percent in 1995 and the proportion of 4-to-7 year-old children in the front seat de-creased to 19 percent from 33 percent. However, the proportion of 8-to-12 year-old children in the front seat only declined to 35 percent from 39 percent.445
When a child is the only passenger in the vehicle, the driver may be reluctant to have the child ride alone in the rear seat. But even here, there were dramatic changes between 1995 and 2001 for children 7 or younger (but not for 8-to-12 year olds). Fewer children are riding in the front seat, not only in vehicles with passenger air bags, but even in vehicles without air bags:
Vehicles With Only One Passenger, a Child 12 or Younger Percent in Front Seat Age < 4 Age 4-7 Age 8-12 All vehicles 1995 52 78 88 2001 17 43 79 Vehicles with dual air bags 1995 49 75 88 2001 14 36 76 Vehicles without air bags 1995 52 78 88 2001 22 54 84
Furthermore, NHTSA is pleased to report that the percentage of children riding in the rear seat did not decrease after the introduction of advanced frontal air bags in 2003 to 2007. Conceivably, some parents might mistakenly believe that the deployment-suppression features of advanced air
444 (2006, October). National Safety Council honors Air Bag & Seat Belt Safety Campaign for lifesaving achieve-ments. Itasca, IL: National Safety Council. Available at www.nsc.org/Pages/NationalSafetyCouncilHonorsAirBagandSeatBeltSafetyCampaign.aspx; Air bags & on-off switches. 445 Kindelberger, J., & Starnes, M. (2003, November). Moving children from the front seat to the back seat: The influence of child safety campaigns. (Report No. DOT HS 809 698). Available at www-nrd.nhtsa.dot.gov/Pubs/809-698.pdf.

159
bags have eliminated all concerns about the safety of the front seat – whereas, as explained above, the rear seat can be a safer place for child passengers for numerous reasons besides air bags. A statistical analysis of CY 2004-to-2010 crash data from Florida, Georgia, Michigan, New York State, Washington State, and Wisconsin shows that the percentage of children sitting in the rear seat is nearly identical for vehicles with advanced air bags and earlier vehicles with redesigned, but not certified-advanced air bags.446
446 Greenwell (2013, July), pp. 22-23.
160
FMVSS No. 214, “Side impact protection” This standard is associated with three vehicle modifications whose safety benefits have been evaluated by NHTSA:
• Side door beams • TTI(d) improvement in passenger cars by structure and padding • Curtain and side air bags
Before 1969, the side doors of passenger cars were nearly empty shells of sheet metal, and of-fered little protection to occupants in side impacts. Side door beams, running longitudinally in-side the door, were a first step to provide some crush resistance and structural strength, but they were not enough to resist a high-speed impact by another vehicle. NHTSA, the manufacturers and the safety community researched additional structural improvements to resist crush and they designed padding to cushion the occupant. They developed a dynamic crash test, a dummy, and an injury criterion called TTI(d) – thoracic trauma index (dummy) – to measure how well a vehi-cle protects its occupants. Side air bags provide additional cushioning for the occupant’s thorax and pelvis; they further improve TTI(d) performance. Curtain air bags and side air bags with head protection cushion the occupant’s head in side impacts.
The second paragraph of FMVSS No. 214 says, “The purpose of this standard is to reduce the risk of serious and fatal injury … in side impact crashes by specifying strength requirements for side doors [and] limiting the forces, deflections, and accelerations measured on anthropomorphic dummies in test crashes.”447 First, FMVSS No. 214 set strength requirements for doors, effective January 1, 1973, in passenger cars and extended to pickup trucks, vans, buses and SUVs up to 10,000 pounds GVWR, effective September 1, 1993. Next, it added a dynamic crash test re-quirement, phased in for passenger cars from September 1, 1993, to September 1, 1996, and ef-fective for LTVs up to 6,000 pounds GVWR on September 1, 1998. Most recently, it added a crash test of a 20 mph side impact with a pole, with phase-in scheduled from September 1, 2010, to September 1, 2014.
Side door beams History: During the 1960s, the manufacturers conducted research and tests to improve side im-pact protection. Hedeen and Campbell at GM developed side door beams, and the company also developed a static test for measuring a door’s crush resistance. The beams were installed in MY 1969 full-size GM cars. The test procedure became SAE Recommended Practice J367 in March 1970, but it did not specify pass-fail criteria. NHTSA announced its intention to regulate side door strength with an ANPRM in October 1968, followed by several NPRMs. The final rule is-sued in October 1970, with an effective date of January 1, 1973, built upon the SAE practice and added pass-fail criteria. A rigid steel cylinder is gradually forced into the middle of the door. The top of the cylinder is nearly level with the bottom of the window and the bottom of the cylinder is 5 inches above lowest point of the door. The cylinder must encounter an average crush re-sistance of at least 2,250 pounds during the first 6 inches of crush, an average of 3,500 pounds over the first 12 inches, and a peak of at least 7,000 pounds or twice the vehicle’s curb weight
447 49 CFR, Part 571.214.
161
(whichever is less) somewhere in the first 18 inches. Most domestic cars were equipped with the beams at some point during MY 1969 to 1973 and, of course, all cars had them after January 1, 1973 (mid-MY 1973).448
LTVs, with their higher sills and more rigid construction, are more robust than cars when they are hit in the side by another vehicle, but they share cars’ vulnerability in side impacts with fixed objects. As part of its effort to bring safety requirements for LTVs up to the same level as cars, NHTSA extended the static strength test of FMVSS No. 214 to LTVs, effective September 1, 1993. Most LTVs received side door beams in MY 1994, but a few make-models in MY 1991, 1992 or 1993.449
What they are and how they work: The side door beam “is a metal bar of channel design, typi-cally 8 inches wide and with channels 2 inches deep. It is located inside [each side] door, close to the outside surface, about 10 inches above the sill. It runs the length of the door, being attached to the door frame vertical members at the hinge and latch ends of the door. … In some vehicles, the beam is accompanied by a beam cover, stiffener … mounting flanges … [and/or] a local rein-forcement of the B-pillar at the floor level.”450 “Channel design” resembles fluting or corduroy, running from the front to the rear of the beam, and it is a feature that adds strength to metal struc-tures. In MY 1979 to 1981, the weight of the beams ranged from 5 to 7 pounds per door in 4-door cars, and 10 to 21 pounds per door in 2-door cars.451
In a direct side impact by another vehicle, the front of the striking vehicle will push the door structure of the struck vehicle inwards until it hits the occupant’s torso at close to that vehicle’s original impact speed. Injury risk is high under these circumstances. Therefore, any additional structure in the struck vehicle that engages the striking vehicle is welcome. By putting some crush on the front of the striking vehicle and/or transmitting force to the remainder of the struck vehicle and accelerating it sideways, the structure can reduce the amount of intrusion toward the occupant, slow down the rate of that intrusion, and possibly reduce the risk of serious injury.
Whereas any added strength is welcome, it is obvious that a 5-to-21 pound beam, stretching from one end of the door to the other without much support in the middle, has limited power to resist a severe and perpendicular impact into the middle of the door by a 2,000-to-5,000 pound vehicle. The 10-inch gap between the beam and the sill is an additional weak point. The beams might be somewhat effective in lower-speed impacts. NHTSA’s 1982 evaluation found that side door
448 Kahane, C. J. (1982, November). An evaluation of side structure improvements in response to Federal Motor Vehicle Safety Standard 214. (Report No. DOT HS 806 314, pp. 100-108). Washington, DC: National Highway Traffic Safety Administration. Available at www-nrd.nhtsa.dot.gov/Pubs/806314.PDF; Hedeen, C. E., & Campbell, D. D. (1969). Side impact structures. (Paper No. 690003). New York: Society of Automotive Engineers; Federal Register 33 (October 5, 1968): 14971, 33 (December 11, 1968): 18386, 35 (January 21, 1970): 813, 35 (April 23, 1970): 6513, 35 (October 30, 1970): 16801; SAE. (1971). 1971 SAE Handbook. New York: Society of Automotive Engineers, pp. 962-963. 449 Walz, M. C. (2004, February). Evaluation of FMVSS 214 side impact protection for light trucks: Crush re-sistance requirements for side doors. (Report No. DOT HS 809 719). Washington, DC: National Highway Traffic Safety Administration. Available at www-nrd.nhtsa.dot.gov/Pubs/809719.PDF; Federal Register 56 (June 14, 1991): 27427. 450 Kahane (1982, November), p. 106. 451 Ibid., p. 380.
162
beams reduced the depth of maximum crush from an average of 10 inches to 8 inches in com-partment-centered towaway impacts by another vehicle.452
A hypothesis is that the beam might be especially effective when the impact has a strongly frontal component of force, especially in typical side impacts with fixed objects where a vehicle is traveling forward and skidding off the road at the same time. The side of the vehicle contacts the pole or tree, but the direction of force is oblique frontal. Rather than merely absorbing ener-gy, the beam acts like an internal “guard rail” to deflect the vehicle and allow it to slide past the pole or tree, with a longer, shallower crush pattern and, ultimately, a lower delta V. Furthermore, the simultaneous contact of the fixed object with the high beam and the low sill, rather than just the sill, keeps the vehicle upright and reduces the risk of damage to the “greenhouse” area of the occupant compartment (above the window sills). Indeed, NHTSA’s 1982 evaluation showed that side door beams significantly changed damage patterns in side impacts with fixed objects. The ratio of the maximum depth of crush to the width of crush decreased from .24 to .15. There was less damage to the occupant compartment and more to the fenders. There was less greenhouse damage. Integrity of the side doors was better preserved.453
Expected benefits: Given the effects of side door beams on damage patterns and severity, it would not be a surprise if beams were found to reduce fatalities in single-vehicle crashes, but not in multivehicle crashes. They might reduce nonfatal injuries in the less severe multivehicle crashes. Since the beams affect the overall damage pattern to the vehicle in single-vehicle crash-es and help reduce the severity of the crash, the reduction in delta V might benefit the far-side as well as the near-side occupants. Because there is a beam in every side door on a vehicle, drivers, front seat passengers and rear seat passengers can benefit.
Fatality reduction – passenger cars: NHTSA’s analysis, published in 1982, was based on 1975-to-1981 FARS data.454 This data is best suited for comparing overall fatality risk of occu-pants of outboard seats (i.e., next to a door: drivers; right front, left rear, and right rear passen-gers) in side impacts, before and after the installation of side door beams, relative to a control group of fatalities in frontal impacts. In one analysis, the data encompassed cars of the first 2 MY with beams (e.g., 1969 and 1970 Chevrolet Impala, 1973 and 1974 Chevrolet Nova) versus cars of the same or equivalent make-models in the last two MY before beams (e.g., 1967 and 1968 Chevrolet Impala, 1971 and 1972 Chevrolet Nova). Frontal crashes are an acceptable con-trol group because there were few innovations that affected fatality risk in frontal impacts during those model years; specifically, every car in the analysis was equipped with energy-absorbing steering assemblies. The 1975-to-1981 FARS statistics for fatalities in single-vehicle crashes were455:
452 Ibid., p. 301. 453 Ibid., pp. 33-43 and 281-329. 454 Ibid., pp. 22-25 and 143-182. 455 Ibid., p. 157.
163
SINGLE-VEHICLE Side-Impact Frontal Risk CRASHES Fatalities Fatalities Ratio Last 2 MY before beams 2,505 4,325 .579 First 2 MY with beams 2,137 4,303 .497
This is a statistically significant 14-percent fatality reduction in single-vehicle side impacts with side door beams: 1 – [(2,137/2,505) / (4,303/4,325)] = .143.456
Analyses by other techniques confirmed the 14-percent fatality reduction.457 Effectiveness was nearly identical in near-side impacts (14%) and far-side impacts (15%). When “single-vehicle side impacts” were limited to collisions with a single fixed object (and impacts by trains, rollo-vers with principally side damage and complex off-road excursions were excluded), effective-ness rose to 23 percent.458
Using 1980 as the “baseline” year, the evaluation estimated that side door beams would eventu-ally save 480 lives per year in single-vehicle crashes of passenger cars, when all cars on the road were equipped with them. When NHTSA subsequently added the dynamic crash test and, later, the pole test to FMVSS No. 214, resulting in possible further modification of side structure as well as addition of padding or air bags, the agency still retained the static test requirement, in part, to assure that, whatever the benefits of the new requirements, the already existing benefits of side door beams in single-vehicle crashes would also be preserved.459
By contrast, none of the analyses showed a statistically significant effect for side door beams on fatalities in multivehicle crashes. Point estimates were close to zero.
Fatality reduction – LTVs: Similar analyses were performed with 1989-to-2001 FARS data to estimate the effect of side door beams in LTVs, where they were introduced in MY 1994 or shortly before that. In single-vehicle side impacts, side door beams reduced fatality risk by a sta-tistically significant 19 percent. The reduction was larger in near-side impacts (25%) than in far-side impacts (11%). Using 1999 to 2002 as the “baseline” years, the evaluation estimated that side door beams would eventually save 151 lives per year in single-vehicle side impacts of LTVs, when all LTVs on the road have the beams.460
This evaluation, too, did not show a statistically significant effect for side door beams on fatali-ties in multivehicle crashes. Point estimates by all analysis methods were close to zero.
Injury reduction – passenger cars: NHTSA’s 1982 evaluation used data NCSS, the predeces-sor of NASS. The injury rate – the number of fatal or hospitalizing injuries per 100 occupants involved in side-impact towaway crashes – was computed for cars with side door beams and 456 90 percent confidence bounds: 7 to 21 percent. 457 Other techniques included: limiting the data to the first year with beams and the last year without them; regres-sion of the ratio of side to frontal fatalities by beam status, vehicle age and other factors. 458 Ibid., pp. 157 and 354. 459 Ibid., pp. 385-388; 90 percent confidence bounds: 300-660. 460 Walz (2004, February); 95 percent confidence bounds for effectiveness: 4 to 32 percent; for lives saved per year: 22-285.
164
compared to the rate in cars without the beams. These injury rates were controlled for belt use, rural/urban, speed limit, frame or unibody construction, or other factors by multidimensional contingency table analysis, a predecessor of the logistic regression method widely used today. Also, in some analyses, the data was limited to cars produced 2 (or 5) MY just before and after the make-model was equipped with the beams.461
In single-vehicle side impact crashes, the analyses showed a statistically significant 25-percent reduction of fatal or hospitalizing injuries for side door beams.462
At the nonfatal level, beams were also effective in some multivehicle crashes. When a vehicle was struck in the side by another vehicle and the damage was centered in the occupant compart-ment area, side door beams reduced near-side occupants’ rate of hospitalizing injuries by a statis-tically significant 25 percent. But for far-side occupants in all multivehicle crashes, and for near-side occupants when the damage was not centered on the compartment, the effect of side door beams was close to zero.463
Using 1980 as the “baseline” year, the evaluation estimated that side door beams would prevent 4,550 nonfatal hospitalizations per year in single-vehicle crashes and 4,920 in multivehicle crashes when all cars on the road are equipped with the beams. That adds up to 9,470 nonfatal hospitalizations prevented per year.464
Injury reduction – LTVs: NHTSA has not analyzed the effect of side door beams on nonfatal injuries in LTVs. Databases such as NCSS or NASS-CDS with detailed information on nonfatal injuries have considerably fewer side-impact cases for LTVs than for passenger cars.
TTI(d) improvement in passenger cars by structure and padding History of the FMVSS No. 214 upgrade: By the late 1970s, if not earlier, researchers suspected that side door beams alone were insufficient to significantly attenuate intrusion in a severe side impact by another vehicle and reduce fatality risk to the near-side occupant of the struck car. At a public Side Impact Conference on January 31, 1980, NHTSA outlined its plans to upgrade FMVSS No. 214 with a dynamic test.465
Unlike the early FMVSS that largely incorporated other organizations’ test procedures and exist-ing safety technologies, the FMVSS No. 214 upgrade necessitated many years of research, anal-
461 Kahane (1982, November), pp. 183-266; Kahane, Smith, & Tharp (1977). 462 Kahane (1982, November), pp. 12 and 25-33; 90 percent confidence bounds: 11 to 35 percent. 463 Ibid., pp. 10, 12, 25-33 and 186; 90 percent confidence bounds: 6 to 38 percent; damage to the side of a car is “centered on the compartment” if the centerpoint of the damage (CRASH program parameter D) is in a range from 15 inches behind to 45 inches ahead of the longitudinal centerpoint of the car. 464 Ibid., pp. 15, and 388-397; 90 percent confidence bounds: 4,300 to 14,700 hospitalizations prevented. 465 NHTSA. (1980). Side impact conference. (Report No. DOT HS 805 614). Washington, DC: National Highway Traffic Safety Administration.
165
ysis and testing by NHTSA and the safety community to develop comprehensive and self-sufficient science:466
• A review of crash data, indicating that the archetypal side impact fatality in the 1980’s involved a fast-moving car striking a slow-moving car in the door, at a right angle: a typ-ical intersection collision.
• A review of injury data, indicating that a large proportion of the nearside occupants’ life-threatening injuries occurred when the sides of their torsos contacted the interior side sur-face (most frequently the door) of the car. (Head injuries are also a frequent cause of fa-talities in side impacts, but were not the principal focus of this rulemaking; they are ad-dressed by FMVSS No. 201 and by curtain air bags.)
• The thoracic trauma index (TTI) was found to be an excellent predictor of thoracic injury severity in experimental side impacts to cadavers.467 TTI = ½ (GR + GLS), where GR is the greater of the peak accelerations of either the upper or the lower rib, expressed in g’s and GLS is the lower spine (T12 vertebra) peak acceleration. Pelvic g’s are an additional injury criterion, but TTI is the key predictor of life-threatening injuries.
• Development of a side impact dummy (SID) on which TTI (as well as pelvic g’s) can be reliably measured in a side impact test configuration. The injury score measured on the dummy is called TTI(d).
• A moving deformable barrier (MDB) was developed to represent a generic 3,000-pound passenger vehicle. The test procedure simulates a MDB moving 30 mph hitting, at a right angle, the door area of a subject vehicle, traveling 15 mph. (It is accomplished by having the MDB travel at 33.54 mph at an angle of 63° with respect to the longitudinal centerline of a stationary test vehicle. The wheels of the MDB are “crabbed” 27° toward the rear of the test vehicle to obtain a right-angle contact.468)
• Testing various production MY 1980-to-1988 passenger cars to learn the baseline distri-bution of TTI(d). Some baseline testing continued after the final rule was issued in 1990, up to MY 1993, just before the phase-in period for the MDB test requirement.
• Two technologies were demonstrated that, singly or in combination could significantly reduce TTI(d) from its baseline levels in production vehicles:
o Structure modifications such as substantially strengthening pillars, sills, roof rails, seats or cross-members of a car, and stronger overlap between doors and pil-lars, sills, etc., to slow down and reduce the extent of door intrusion into the pas-senger compartment.
466 Kahane, C. J. (2007, January). An evaluation of side impact protection – FMVSS 214 TTI(d) improvements and side air bags. (Report No. DOT HS 810 748, pp. 11-12). Washington, DC: National Highway Traffic Safety Admin-istration. Available at www-nrd.nhtsa.dot.gov/Pubs/810748.PDF. 467 (1990). Final regulatory impact analysis - New requirements for passenger cars to meet a dynamic side impact test FMVSS 214. (NHTSA Report No. DOT HS 807 641). Washington, DC: National Highway Traffic Safety Ad-ministration. 468 The goal is to simulate a typical 90° intersection collision in which the full front of a fast-moving vehicle (the MDB) hits the side of a slower-moving vehicle. A crash test with two moving vehicles would be quite complicated; instead, the same effect is achieved by having the side-impacted test vehicle stationary and the MDB towed into the test vehicle. The MDB must be towed at an oblique angle to the test vehicle to obtain the correct resultant direction of force. In order to have the flat front of the MDB hit the side of the test vehicle, the MDB cannot be pointed in the direction it travels but has to be tilted toward one side and advance diagonally. This is called “crabbing” because some species of crabs walk that way.
166
o Energy-absorbing foam padding in the door cavity positioned to interact with an occupant’s thoracic region can cushion the impact forces the thorax.
• Regulatory analysis469 to estimate the lives saved by decreasing TTI(d) to various levels, and the extent of vehicle modifications needed to secure those levels.
On October 30, 1990, NHTSA issued the final rule amending FMVSS No. 214 to phase in a dy-namic test of side impact protection during MY 1994 to 1997. FMVSS No. 214 recognizes the greater difficulty of protecting occupants in 2-door cars: it allows TTI(d) up to 90 in 2-door cars, but limits 4-door cars to 85. FMVSS No. 214 also includes test limits on pelvic g’s and has door retention requirements to reduce occupant ejection. At least 10 percent of passenger cars pro-duced between September 1, 1993, and August 31, 1994, had to meet the standard; at least 25 percent of cars produced between September 1, 1994, and August 31, 1995; at least 40 percent of cars between September 1, 1995, and August 31, 1996; and all cars after September 1, 1996. During that phase-in period, manufacturers declared (“certified”) what make-models complied with FMVSS No. 214. NHTSA advised the public on what models were certified.470
The dynamic test requirement of FMVSS No. 214 has also applied to LTVs up to 6,000 pounds GVWR since September 1, 1998; TTI(d) may not exceed 85 (same as 4-door cars).471 NHTSA has little evidence that LTVs required or received substantial modifications in structure or pad-ding to meet FMVSS No. 214. The relatively high, rigid floors of these vehicles, plus the side door beams already in them (see above) were usually adequate for compliance with the dynamic test. Statistical analyses of crash data did not show any significant fatality reductions after the dynamic test requirement went into effect for LTVs. Thus, the remainder of this section focuses on passenger cars.472
Voluntary improvements before MY 1994: The development of FMVSS No. 214 from 1980 to 1993 was an iterative process with feedback between NHTSA and the manufacturers, and exten-sive public participation. Manufacturers could test TTI(d) in their existing vehicles and compare it to levels proposed for FMVSS No. 214 or achieved by competitors in tests by public organiza-tions.
TTI(d) in 2-door cars averaged 110 for those MY 1981-to-1990 cars that were tested and the re-sults made public. It ranged as high as 131. Manufacturers had voluntarily improved to an aver-age 97 by MY 1993, the year before the phase-in for FMVSS No. 214 – much closer to, but still somewhat above the 90 allowed by the future standard. The best score among the tested pre-standard 2-door cars was 82. There was relatively less improvement in 4-door cars: from 80 in MY 1981 to 1990 down to 74 in MY 1993; furthermore, even the earlier average is better than the 85 eventually permitted by the future standard. Two-door cars are intrinsically more vulnera-ble than 4-door cars in side impacts, because the door of a 2-door car is usually much longer than the front door of a 4-door car. Impacting vehicles are less likely to strike pillars, more likely to hit the long, weakly supported door area between pillars. In any case, manufacturers took steps to 469 Ibid. 470 Federal Register 55 (October 30, 1990): 45752; NHTSA hails safety features in model year 1994 passenger cars and light trucks and vans, Press Release No. NHTSA 38-93, U. S. Department of Transportation, Office of the As-sistant Secretary for Public Affairs, Washington, 1993. 471 Federal Register 60 (July 28, 1995): 38749. 472 Kahane (2007, January), pp. 33-34 and 63-65.
167
redesign some of the worst performers, especially among 2-door cars, before FMVSS No. 214 took effect. For example, one manufacturer ran a cross member across the A-pillars through the dash, reinforced the B-pillar at the sill level and added some floor stiffeners.473
Improvements from MY 1994 to 1997: In MY 1997, the average TTI(d) of 2-door cars was 72 and of 4-door cars, 64. These averages are well below (better than) the requirements of FMVSS No. 214 (90 and 85, respectively) and the average levels in MY 1993 (97 and 74). After 1997, TTI(d) stayed about the same in cars without side air bags.474
Structural modifications and padding were the principal technologies used to meet FMVSS No. 214 before side air bags. The manufacturers provided NHTSA with detailed lists and diagrams showing what changes were made to achieve compliance during the phase-in period. The infor-mation suggests that make-models accounting for approximately 56 percent of new cars received substantial structural modifications, usually accompanied with padding; 27 percent of the fleet received padding only, or padding with minor structural modifications; whereas 17 percent of cars remained essentially unchanged from previous years, implying that even the pre-1994 mod-els of these cars could have met FMVSS No. 214.475
NHTSA also reviewed TTI(d) test results for pre-standard vehicles to post-standard compliance tests of the same make-models. Specifically, the agency identified 15 relatively high-sales make-models (eight 2-door cars and seven 4-door cars) that substantially improved TTI(d) from an ear-lier to a later MY. TTI(d) improved by an average of 23 units. The statistical analysis of the ef-fect of TTI(d) improvement after MY 1993 is based on these 15 make-models.476
Fatality reduction – passenger cars: NHTSA’s 1999 and 2007 evaluations both try to estimate the percentage fatality reduction given a 1-unit improvement in TTI(d). The 1999 evaluation is based on crash data for pre-standard vehicles of MY 1980 to 1992, whereas the 2007 evaluation concentrates on 15 make-models that substantially improved TTI(d) after 1993. The earlier result is used to estimate the effect of TTI(d) improvement when TTI(d) is in a range of 90 or more, while the latter serves to estimate the effect when TTI(d) is in the range below 90.477
The 1999 evaluation used a cross-sectional approach, rather than a “before-after” analysis, to es-timate the benefit of TTI(d) improvements. It compared the side-impact fatality risk of cars with good TTI(d) scores for their body type (namely, < 102 for 2-door cars and < 78 for 4-door cars) to cars with poor scores for their body type (namely, > 115 for 2-door and > 95 for 4-door). At that time NHTSA had TTI(d) scores for 43 pre-standard (MY 1980 to 1992) make-model-MY combinations, 17 of which were 2-door cars and 26 were 4-door. The evaluation gathered 1980-to-1998 FARS cases of outboard front seat occupant fatalities in each of these 43 make-model-MY combinations, including cars from earlier/later model years and corporate “twins” of essen-
473 Kahane, C. J. (1999, October). Evaluation of FMVSS 214 - Side impact protection: Dynamic performance re-quirement; Phase 1: Correlation of TTI(d) with fatality risk in actual side impact collisions of model year 1981-1993 passenger cars. (Report No. DOT HS 809 004, pp. vii, 6 and 19-23). Washington, DC: National Highway Traffic Safety Administration. Available at www-nrd.nhtsa.dot.gov/Pubs/809004.PDF. 474 Kahane (2007, January), pp. 17-29. 475 Kahane (1999, October), pp. vii and 139-143. 476 Kahane (2007, January), pp. 35-46, especially Table 2-1a on p. 40. 477 Ibid., pp. 65-68.
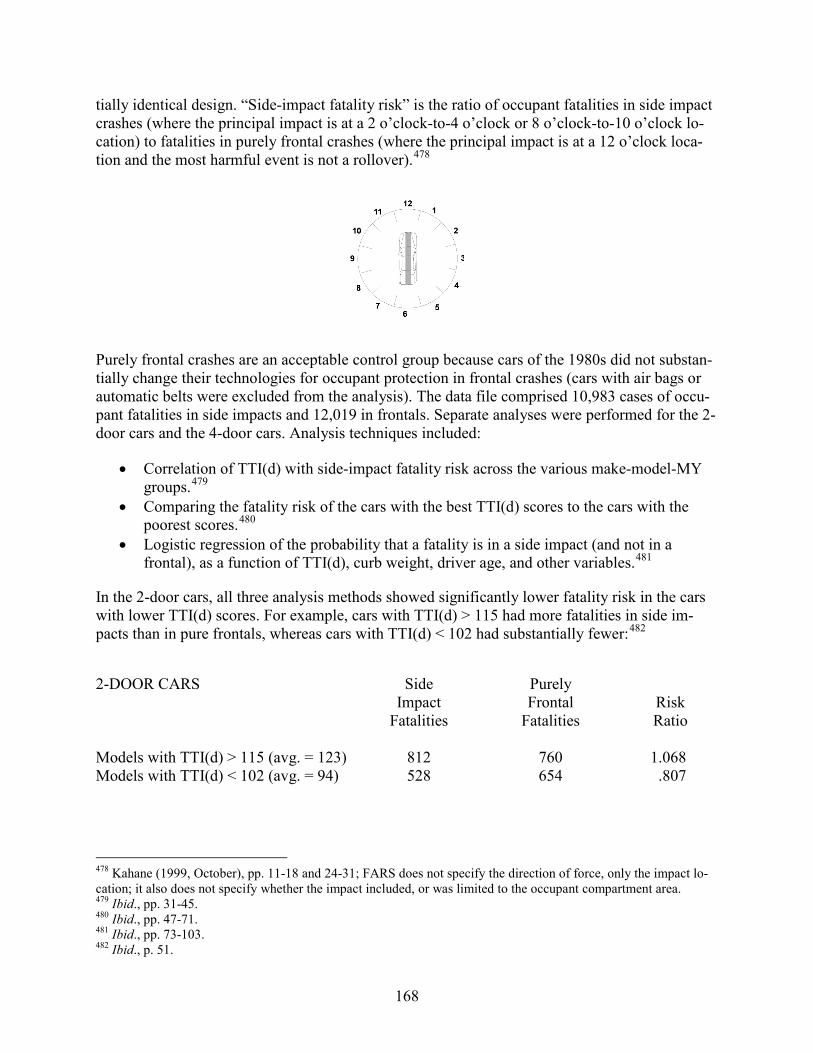
168
tially identical design. “Side-impact fatality risk” is the ratio of occupant fatalities in side impact crashes (where the principal impact is at a 2 o’clock-to-4 o’clock or 8 o’clock-to-10 o’clock lo-cation) to fatalities in purely frontal crashes (where the principal impact is at a 12 o’clock loca-tion and the most harmful event is not a rollover).478
Purely frontal crashes are an acceptable control group because cars of the 1980s did not substan-tially change their technologies for occupant protection in frontal crashes (cars with air bags or automatic belts were excluded from the analysis). The data file comprised 10,983 cases of occu-pant fatalities in side impacts and 12,019 in frontals. Separate analyses were performed for the 2-door cars and the 4-door cars. Analysis techniques included:
• Correlation of TTI(d) with side-impact fatality risk across the various make-model-MY groups.479
• Comparing the fatality risk of the cars with the best TTI(d) scores to the cars with the poorest scores.480
• Logistic regression of the probability that a fatality is in a side impact (and not in a frontal), as a function of TTI(d), curb weight, driver age, and other variables.481
In the 2-door cars, all three analysis methods showed significantly lower fatality risk in the cars with lower TTI(d) scores. For example, cars with TTI(d) > 115 had more fatalities in side im-pacts than in pure frontals, whereas cars with TTI(d) < 102 had substantially fewer:482
2-DOOR CARS Side Purely Impact Frontal Risk Fatalities Fatalities Ratio Models with TTI(d) > 115 (avg. = 123) 812 760 1.068 Models with TTI(d) < 102 (avg. = 94) 528 654 .807
478 Kahane (1999, October), pp. 11-18 and 24-31; FARS does not specify the direction of force, only the impact lo-cation; it also does not specify whether the impact included, or was limited to the occupant compartment area. 479 Ibid., pp. 31-45. 480 Ibid., pp. 47-71. 481 Ibid., pp. 73-103. 482 Ibid., p. 51.
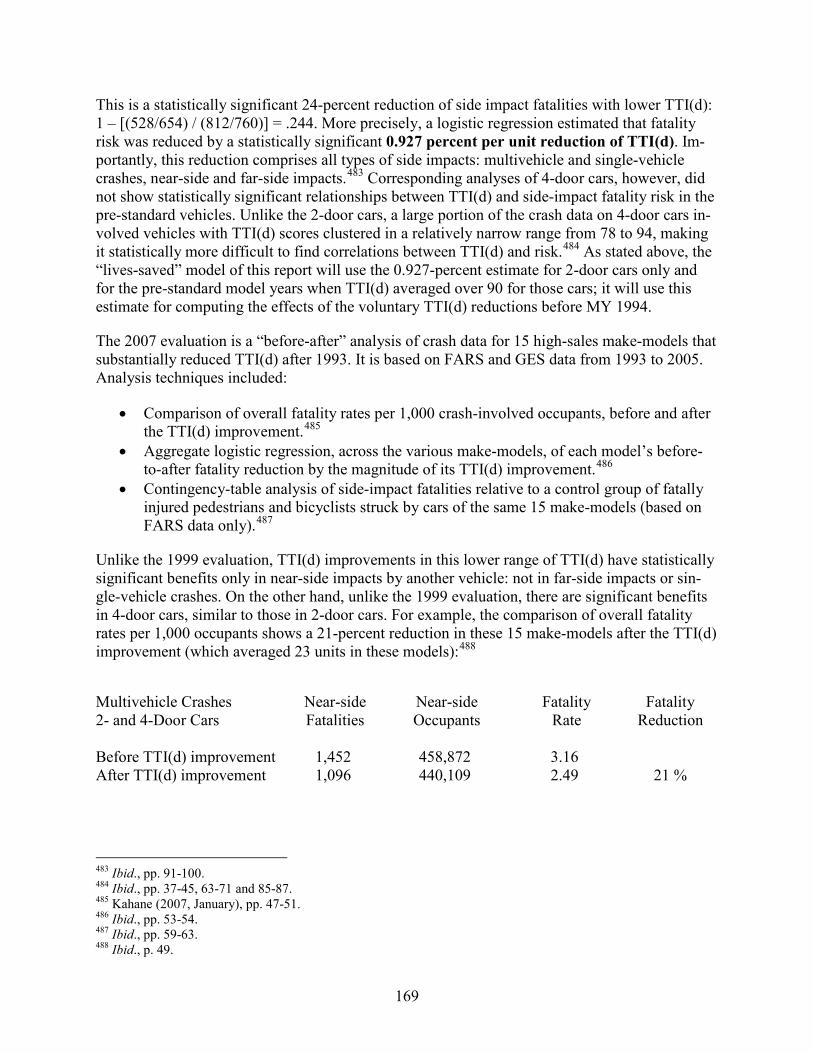
169
This is a statistically significant 24-percent reduction of side impact fatalities with lower TTI(d): 1 – [(528/654) / (812/760)] = .244. More precisely, a logistic regression estimated that fatality risk was reduced by a statistically significant 0.927 percent per unit reduction of TTI(d). Im-portantly, this reduction comprises all types of side impacts: multivehicle and single-vehicle crashes, near-side and far-side impacts.483 Corresponding analyses of 4-door cars, however, did not show statistically significant relationships between TTI(d) and side-impact fatality risk in the pre-standard vehicles. Unlike the 2-door cars, a large portion of the crash data on 4-door cars in-volved vehicles with TTI(d) scores clustered in a relatively narrow range from 78 to 94, making it statistically more difficult to find correlations between TTI(d) and risk.484 As stated above, the “lives-saved” model of this report will use the 0.927-percent estimate for 2-door cars only and for the pre-standard model years when TTI(d) averaged over 90 for those cars; it will use this estimate for computing the effects of the voluntary TTI(d) reductions before MY 1994.
The 2007 evaluation is a “before-after” analysis of crash data for 15 high-sales make-models that substantially reduced TTI(d) after 1993. It is based on FARS and GES data from 1993 to 2005. Analysis techniques included:
• Comparison of overall fatality rates per 1,000 crash-involved occupants, before and after the TTI(d) improvement.485
• Aggregate logistic regression, across the various make-models, of each model’s before-to-after fatality reduction by the magnitude of its TTI(d) improvement.486
• Contingency-table analysis of side-impact fatalities relative to a control group of fatally injured pedestrians and bicyclists struck by cars of the same 15 make-models (based on FARS data only).487
Unlike the 1999 evaluation, TTI(d) improvements in this lower range of TTI(d) have statistically significant benefits only in near-side impacts by another vehicle: not in far-side impacts or sin-gle-vehicle crashes. On the other hand, unlike the 1999 evaluation, there are significant benefits in 4-door cars, similar to those in 2-door cars. For example, the comparison of overall fatality rates per 1,000 occupants shows a 21-percent reduction in these 15 make-models after the TTI(d) improvement (which averaged 23 units in these models):488
Multivehicle Crashes Near-side Near-side Fatality Fatality 2- and 4-Door Cars Fatalities Occupants Rate Reduction Before TTI(d) improvement 1,452 458,872 3.16 After TTI(d) improvement 1,096 440,109 2.49 21 %
483 Ibid., pp. 91-100. 484 Ibid., pp. 37-45, 63-71 and 85-87. 485 Kahane (2007, January), pp. 47-51. 486 Ibid., pp. 53-54. 487 Ibid., pp. 59-63. 488 Ibid., p. 49.
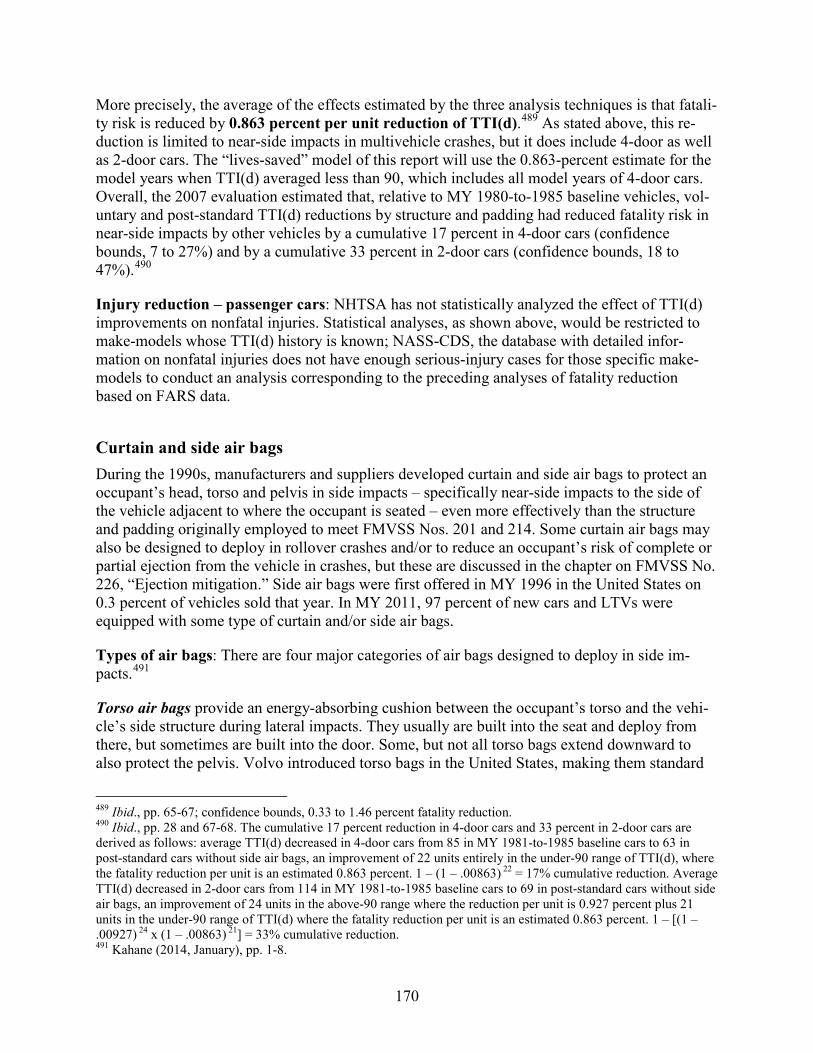
170
More precisely, the average of the effects estimated by the three analysis techniques is that fatali-ty risk is reduced by 0.863 percent per unit reduction of TTI(d).489 As stated above, this re-duction is limited to near-side impacts in multivehicle crashes, but it does include 4-door as well as 2-door cars. The “lives-saved” model of this report will use the 0.863-percent estimate for the model years when TTI(d) averaged less than 90, which includes all model years of 4-door cars. Overall, the 2007 evaluation estimated that, relative to MY 1980-to-1985 baseline vehicles, vol-untary and post-standard TTI(d) reductions by structure and padding had reduced fatality risk in near-side impacts by other vehicles by a cumulative 17 percent in 4-door cars (confidence bounds, 7 to 27%) and by a cumulative 33 percent in 2-door cars (confidence bounds, 18 to 47%).490
Injury reduction – passenger cars: NHTSA has not statistically analyzed the effect of TTI(d) improvements on nonfatal injuries. Statistical analyses, as shown above, would be restricted to make-models whose TTI(d) history is known; NASS-CDS, the database with detailed infor-mation on nonfatal injuries does not have enough serious-injury cases for those specific make-models to conduct an analysis corresponding to the preceding analyses of fatality reduction based on FARS data.
Curtain and side air bags During the 1990s, manufacturers and suppliers developed curtain and side air bags to protect an occupant’s head, torso and pelvis in side impacts – specifically near-side impacts to the side of the vehicle adjacent to where the occupant is seated – even more effectively than the structure and padding originally employed to meet FMVSS Nos. 201 and 214. Some curtain air bags may also be designed to deploy in rollover crashes and/or to reduce an occupant’s risk of complete or partial ejection from the vehicle in crashes, but these are discussed in the chapter on FMVSS No. 226, “Ejection mitigation.” Side air bags were first offered in MY 1996 in the United States on 0.3 percent of vehicles sold that year. In MY 2011, 97 percent of new cars and LTVs were equipped with some type of curtain and/or side air bags.
Types of air bags: There are four major categories of air bags designed to deploy in side im-pacts.491
Torso air bags provide an energy-absorbing cushion between the occupant’s torso and the vehi-cle’s side structure during lateral impacts. They usually are built into the seat and deploy from there, but sometimes are built into the door. Some, but not all torso bags extend downward to also protect the pelvis. Volvo introduced torso bags in the United States, making them standard
489 Ibid., pp. 65-67; confidence bounds, 0.33 to 1.46 percent fatality reduction. 490 Ibid., pp. 28 and 67-68. The cumulative 17 percent reduction in 4-door cars and 33 percent in 2-door cars are derived as follows: average TTI(d) decreased in 4-door cars from 85 in MY 1981-to-1985 baseline cars to 63 in post-standard cars without side air bags, an improvement of 22 units entirely in the under-90 range of TTI(d), where the fatality reduction per unit is an estimated 0.863 percent. 1 – (1 – .00863) 22 = 17% cumulative reduction. Average TTI(d) decreased in 2-door cars from 114 in MY 1981-to-1985 baseline cars to 69 in post-standard cars without side air bags, an improvement of 24 units in the above-90 range where the reduction per unit is 0.927 percent plus 21 units in the under-90 range of TTI(d) where the fatality reduction per unit is an estimated 0.863 percent. 1 – [(1 – .00927) 24 x (1 – .00863) 21] = 33% cumulative reduction. 491 Kahane (2014, January), pp. 1-8.
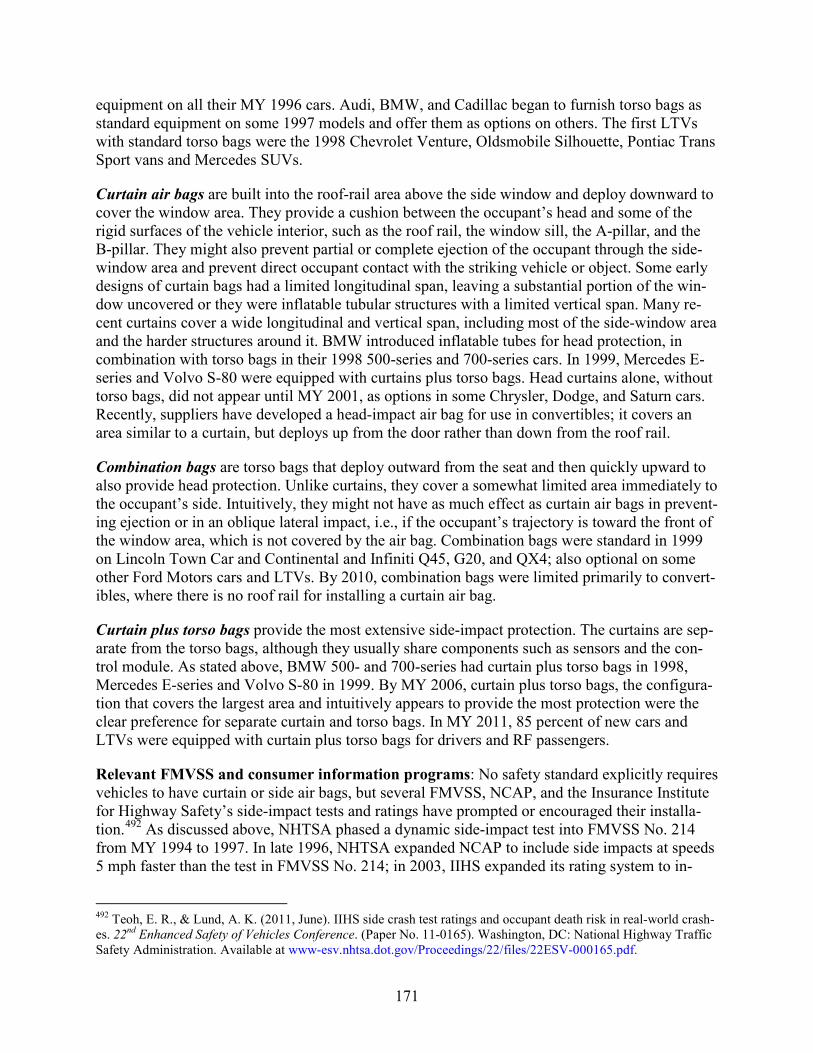
171
equipment on all their MY 1996 cars. Audi, BMW, and Cadillac began to furnish torso bags as standard equipment on some 1997 models and offer them as options on others. The first LTVs with standard torso bags were the 1998 Chevrolet Venture, Oldsmobile Silhouette, Pontiac Trans Sport vans and Mercedes SUVs.
Curtain air bags are built into the roof-rail area above the side window and deploy downward to cover the window area. They provide a cushion between the occupant’s head and some of the rigid surfaces of the vehicle interior, such as the roof rail, the window sill, the A-pillar, and the B-pillar. They might also prevent partial or complete ejection of the occupant through the side-window area and prevent direct occupant contact with the striking vehicle or object. Some early designs of curtain bags had a limited longitudinal span, leaving a substantial portion of the win-dow uncovered or they were inflatable tubular structures with a limited vertical span. Many re-cent curtains cover a wide longitudinal and vertical span, including most of the side-window area and the harder structures around it. BMW introduced inflatable tubes for head protection, in combination with torso bags in their 1998 500-series and 700-series cars. In 1999, Mercedes E-series and Volvo S-80 were equipped with curtains plus torso bags. Head curtains alone, without torso bags, did not appear until MY 2001, as options in some Chrysler, Dodge, and Saturn cars. Recently, suppliers have developed a head-impact air bag for use in convertibles; it covers an area similar to a curtain, but deploys up from the door rather than down from the roof rail.
Combination bags are torso bags that deploy outward from the seat and then quickly upward to also provide head protection. Unlike curtains, they cover a somewhat limited area immediately to the occupant’s side. Intuitively, they might not have as much effect as curtain air bags in prevent-ing ejection or in an oblique lateral impact, i.e., if the occupant’s trajectory is toward the front of the window area, which is not covered by the air bag. Combination bags were standard in 1999 on Lincoln Town Car and Continental and Infiniti Q45, G20, and QX4; also optional on some other Ford Motors cars and LTVs. By 2010, combination bags were limited primarily to convert-ibles, where there is no roof rail for installing a curtain air bag.
Curtain plus torso bags provide the most extensive side-impact protection. The curtains are sep-arate from the torso bags, although they usually share components such as sensors and the con-trol module. As stated above, BMW 500- and 700-series had curtain plus torso bags in 1998, Mercedes E-series and Volvo S-80 in 1999. By MY 2006, curtain plus torso bags, the configura-tion that covers the largest area and intuitively appears to provide the most protection were the clear preference for separate curtain and torso bags. In MY 2011, 85 percent of new cars and LTVs were equipped with curtain plus torso bags for drivers and RF passengers.
Relevant FMVSS and consumer information programs: No safety standard explicitly requires vehicles to have curtain or side air bags, but several FMVSS, NCAP, and the Insurance Institute for Highway Safety’s side-impact tests and ratings have prompted or encouraged their installa-tion.492 As discussed above, NHTSA phased a dynamic side-impact test into FMVSS No. 214 from MY 1994 to 1997. In late 1996, NHTSA expanded NCAP to include side impacts at speeds 5 mph faster than the test in FMVSS No. 214; in 2003, IIHS expanded its rating system to in-
492 Teoh, E. R., & Lund, A. K. (2011, June). IIHS side crash test ratings and occupant death risk in real-world crash-es. 22nd Enhanced Safety of Vehicles Conference. (Paper No. 11-0165). Washington, DC: National Highway Traffic Safety Administration. Available at www-esv.nhtsa.dot.gov/Proceedings/22/files/22ESV-000165.pdf.
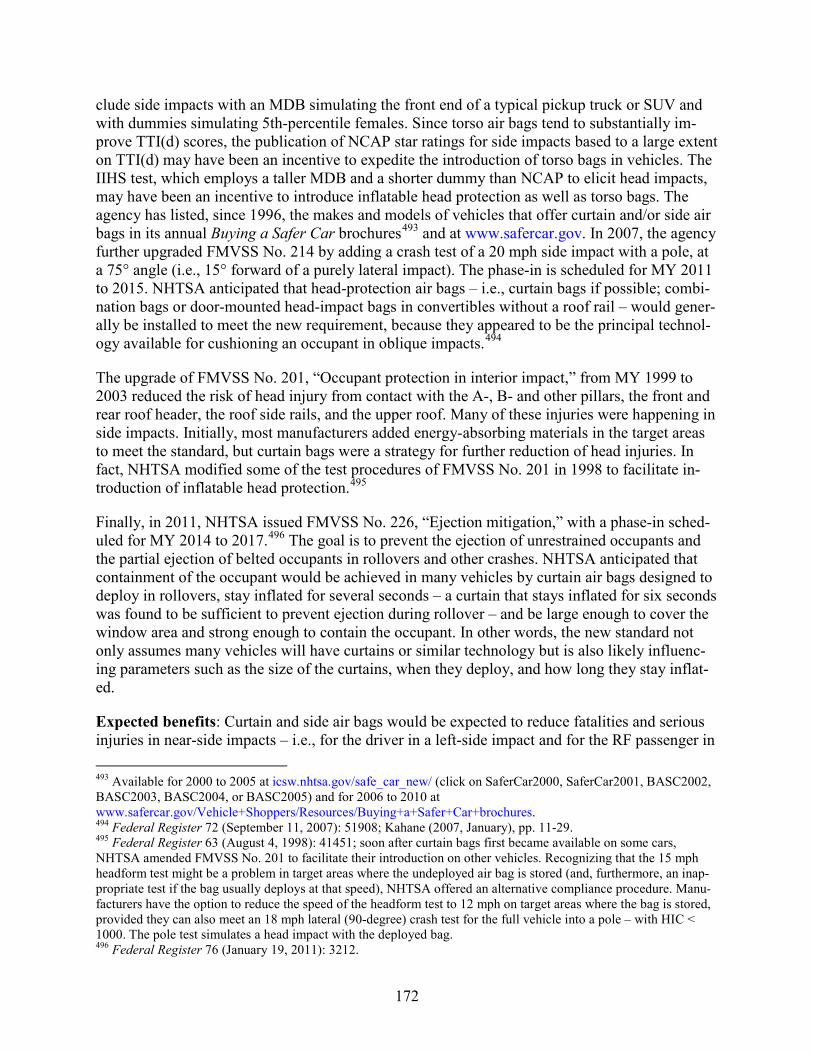
172
clude side impacts with an MDB simulating the front end of a typical pickup truck or SUV and with dummies simulating 5th-percentile females. Since torso air bags tend to substantially im-prove TTI(d) scores, the publication of NCAP star ratings for side impacts based to a large extent on TTI(d) may have been an incentive to expedite the introduction of torso bags in vehicles. The IIHS test, which employs a taller MDB and a shorter dummy than NCAP to elicit head impacts, may have been an incentive to introduce inflatable head protection as well as torso bags. The agency has listed, since 1996, the makes and models of vehicles that offer curtain and/or side air bags in its annual Buying a Safer Car brochures493 and at www.safercar.gov. In 2007, the agency further upgraded FMVSS No. 214 by adding a crash test of a 20 mph side impact with a pole, at a 75° angle (i.e., 15° forward of a purely lateral impact). The phase-in is scheduled for MY 2011 to 2015. NHTSA anticipated that head-protection air bags – i.e., curtain bags if possible; combi-nation bags or door-mounted head-impact bags in convertibles without a roof rail – would gener-ally be installed to meet the new requirement, because they appeared to be the principal technol-ogy available for cushioning an occupant in oblique impacts.494
The upgrade of FMVSS No. 201, “Occupant protection in interior impact,” from MY 1999 to 2003 reduced the risk of head injury from contact with the A-, B- and other pillars, the front and rear roof header, the roof side rails, and the upper roof. Many of these injuries were happening in side impacts. Initially, most manufacturers added energy-absorbing materials in the target areas to meet the standard, but curtain bags were a strategy for further reduction of head injuries. In fact, NHTSA modified some of the test procedures of FMVSS No. 201 in 1998 to facilitate in-troduction of inflatable head protection.495
Finally, in 2011, NHTSA issued FMVSS No. 226, “Ejection mitigation,” with a phase-in sched-uled for MY 2014 to 2017.496 The goal is to prevent the ejection of unrestrained occupants and the partial ejection of belted occupants in rollovers and other crashes. NHTSA anticipated that containment of the occupant would be achieved in many vehicles by curtain air bags designed to deploy in rollovers, stay inflated for several seconds – a curtain that stays inflated for six seconds was found to be sufficient to prevent ejection during rollover – and be large enough to cover the window area and strong enough to contain the occupant. In other words, the new standard not only assumes many vehicles will have curtains or similar technology but is also likely influenc-ing parameters such as the size of the curtains, when they deploy, and how long they stay inflat-ed.
Expected benefits: Curtain and side air bags would be expected to reduce fatalities and serious injuries in near-side impacts – i.e., for the driver in a left-side impact and for the RF passenger in 493 Available for 2000 to 2005 at icsw.nhtsa.gov/safe_car_new/ (click on SaferCar2000, SaferCar2001, BASC2002, BASC2003, BASC2004, or BASC2005) and for 2006 to 2010 at www.safercar.gov/Vehicle+Shoppers/Resources/Buying+a+Safer+Car+brochures. 494 Federal Register 72 (September 11, 2007): 51908; Kahane (2007, January), pp. 11-29. 495 Federal Register 63 (August 4, 1998): 41451; soon after curtain bags first became available on some cars, NHTSA amended FMVSS No. 201 to facilitate their introduction on other vehicles. Recognizing that the 15 mph headform test might be a problem in target areas where the undeployed air bag is stored (and, furthermore, an inap-propriate test if the bag usually deploys at that speed), NHTSA offered an alternative compliance procedure. Manu-facturers have the option to reduce the speed of the headform test to 12 mph on target areas where the bag is stored, provided they can also meet an 18 mph lateral (90-degree) crash test for the full vehicle into a pole – with HIC < 1000. The pole test simulates a head impact with the deployed bag. 496 Federal Register 76 (January 19, 2011): 3212.
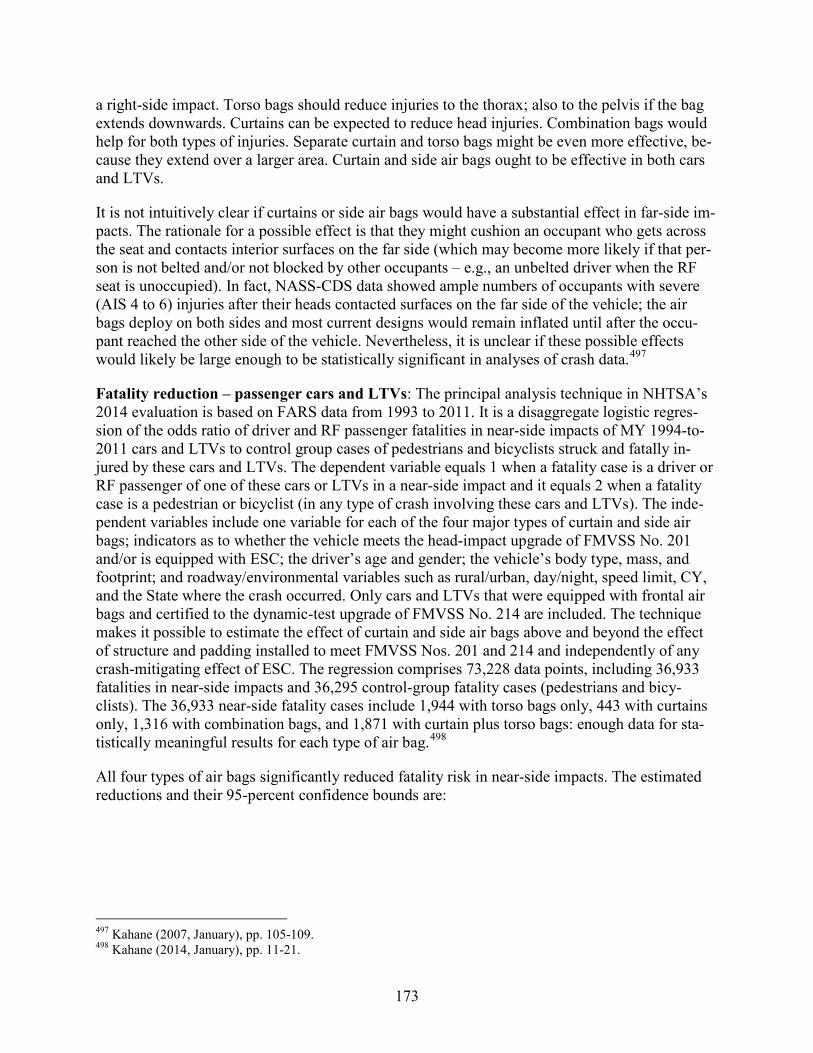
173
a right-side impact. Torso bags should reduce injuries to the thorax; also to the pelvis if the bag extends downwards. Curtains can be expected to reduce head injuries. Combination bags would help for both types of injuries. Separate curtain and torso bags might be even more effective, be-cause they extend over a larger area. Curtain and side air bags ought to be effective in both cars and LTVs.
It is not intuitively clear if curtains or side air bags would have a substantial effect in far-side im-pacts. The rationale for a possible effect is that they might cushion an occupant who gets across the seat and contacts interior surfaces on the far side (which may become more likely if that per-son is not belted and/or not blocked by other occupants – e.g., an unbelted driver when the RF seat is unoccupied). In fact, NASS-CDS data showed ample numbers of occupants with severe (AIS 4 to 6) injuries after their heads contacted surfaces on the far side of the vehicle; the air bags deploy on both sides and most current designs would remain inflated until after the occu-pant reached the other side of the vehicle. Nevertheless, it is unclear if these possible effects would likely be large enough to be statistically significant in analyses of crash data.497
Fatality reduction – passenger cars and LTVs: The principal analysis technique in NHTSA’s 2014 evaluation is based on FARS data from 1993 to 2011. It is a disaggregate logistic regres-sion of the odds ratio of driver and RF passenger fatalities in near-side impacts of MY 1994-to-2011 cars and LTVs to control group cases of pedestrians and bicyclists struck and fatally in-jured by these cars and LTVs. The dependent variable equals 1 when a fatality case is a driver or RF passenger of one of these cars or LTVs in a near-side impact and it equals 2 when a fatality case is a pedestrian or bicyclist (in any type of crash involving these cars and LTVs). The inde-pendent variables include one variable for each of the four major types of curtain and side air bags; indicators as to whether the vehicle meets the head-impact upgrade of FMVSS No. 201 and/or is equipped with ESC; the driver’s age and gender; the vehicle’s body type, mass, and footprint; and roadway/environmental variables such as rural/urban, day/night, speed limit, CY, and the State where the crash occurred. Only cars and LTVs that were equipped with frontal air bags and certified to the dynamic-test upgrade of FMVSS No. 214 are included. The technique makes it possible to estimate the effect of curtain and side air bags above and beyond the effect of structure and padding installed to meet FMVSS Nos. 201 and 214 and independently of any crash-mitigating effect of ESC. The regression comprises 73,228 data points, including 36,933 fatalities in near-side impacts and 36,295 control-group fatality cases (pedestrians and bicy-clists). The 36,933 near-side fatality cases include 1,944 with torso bags only, 443 with curtains only, 1,316 with combination bags, and 1,871 with curtain plus torso bags: enough data for sta-tistically meaningful results for each type of air bag.498
All four types of air bags significantly reduced fatality risk in near-side impacts. The estimated reductions and their 95-percent confidence bounds are:
497 Kahane (2007, January), pp. 105-109. 498 Kahane (2014, January), pp. 11-21.
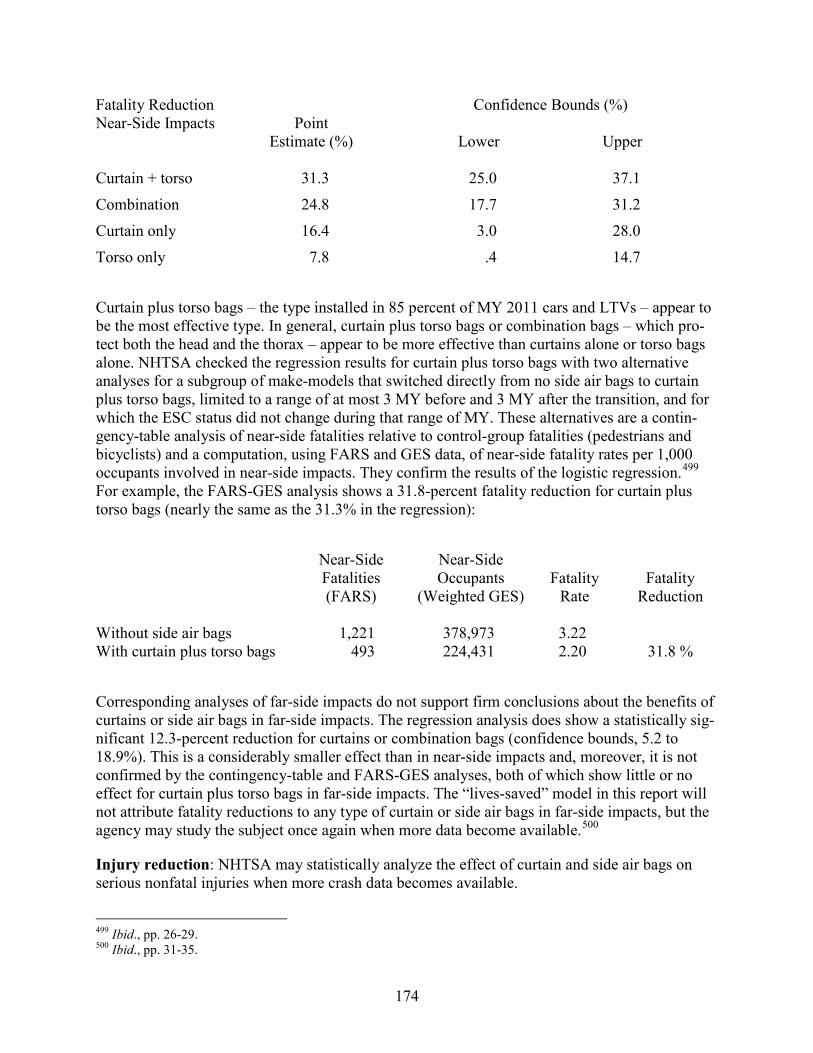
174
Fatality Reduction Confidence Bounds (%) Near-Side Impacts Point Estimate (%) Lower Upper Curtain + torso 31.3 25.0 37.1
Combination 24.8 17.7 31.2
Curtain only 16.4 3.0 28.0
Torso only 7.8 .4 14.7
Curtain plus torso bags – the type installed in 85 percent of MY 2011 cars and LTVs – appear to be the most effective type. In general, curtain plus torso bags or combination bags – which pro-tect both the head and the thorax – appear to be more effective than curtains alone or torso bags alone. NHTSA checked the regression results for curtain plus torso bags with two alternative analyses for a subgroup of make-models that switched directly from no side air bags to curtain plus torso bags, limited to a range of at most 3 MY before and 3 MY after the transition, and for which the ESC status did not change during that range of MY. These alternatives are a contin-gency-table analysis of near-side fatalities relative to control-group fatalities (pedestrians and bicyclists) and a computation, using FARS and GES data, of near-side fatality rates per 1,000 occupants involved in near-side impacts. They confirm the results of the logistic regression.499 For example, the FARS-GES analysis shows a 31.8-percent fatality reduction for curtain plus torso bags (nearly the same as the 31.3% in the regression):
Near-Side Near-Side Fatalities Occupants Fatality Fatality (FARS) (Weighted GES) Rate Reduction Without side air bags 1,221 378,973 3.22 With curtain plus torso bags 493 224,431 2.20 31.8 %
Corresponding analyses of far-side impacts do not support firm conclusions about the benefits of curtains or side air bags in far-side impacts. The regression analysis does show a statistically sig-nificant 12.3-percent reduction for curtains or combination bags (confidence bounds, 5.2 to 18.9%). This is a considerably smaller effect than in near-side impacts and, moreover, it is not confirmed by the contingency-table and FARS-GES analyses, both of which show little or no effect for curtain plus torso bags in far-side impacts. The “lives-saved” model in this report will not attribute fatality reductions to any type of curtain or side air bags in far-side impacts, but the agency may study the subject once again when more data become available.500
Injury reduction: NHTSA may statistically analyze the effect of curtain and side air bags on serious nonfatal injuries when more crash data becomes available.
499 Ibid., pp. 26-29. 500 Ibid., pp. 31-35.

175
FMVSS No. 216, “Roof crush resistance” This standard is associated with a vehicle modification whose safety benefits have been evaluat-ed by NHTSA and with an upgrade that is currently (June 2014) phasing in:
• Redesign of true hardtops as pillared hardtops or sedans • 2013-2016 roof crush resistance upgrade (not yet evaluated)
FMVSS No. 216 is a performance standard limiting the amount of crush allowed when a load is gradually applied to the roof of a vehicle. The purpose of FMVSS No. 216 “is to reduce deaths and injuries due to the crushing of the roof into the occupant compartment in rollover crash-es.”501 FMVSS No. 216 took effect for passenger cars on September 1, 1973. It was extended to most pickup trucks, vans and SUVs up to 6,000 pounds GVWR, effective September 1, 1993.502 The upgraded standard, specifying heavier loads, is called FMVSS No. 216a; it began to phase in on September 1, 2012, full compliance for all new vehicles up to 10,000 pounds GVWR by MY 2016.503
Redesign of true hardtops with B-pillars/original version of FMVSS No. 216 Most passenger cars built since September 1, 1973, have easily complied with the original ver-sion of FMVSS No. 216. It is also believed most cars built before that date could have met the standard. It was primarily full-sized true hardtops of the late 1960s and early 1970s that had typi-cally borderline or worse performance. This body style was phased out – redesigned as a pillared hardtop or sedan – a few years before or after FMVSS No. 216 took effect in 1973. Although some true hardtops were built after 1973 and did meet FMVSS No. 216, they were pretty much gone by the late 1970s. NHTSA evaluated the safety benefits of the redesign, regardless of FMVSS No. 216’s role in motivating it.
As for LTVs, NHTSA believes they met FMVSS No. 216 well before 1993, and that there were no substantial changes in roof design around that time. For that reason, NHTSA does not plan to evaluate the 1993 version of FMVSS No. 216 for LTVs.
Regulatory history: In October 1967, almost six years before the eventual effective date of FMVSS No. 216, NHTSA issued an ANPRM broaching possible limits on the intrusion of a ve-hicle’s roof, front, side and rear structures into the passenger compartment during crashes. The roof intrusion portion of the ANPRM was a starting point for FMVSS No. 216. The industry de-veloped a procedure for measuring static roof crush resistance, SAE Recommended Practice J374, dated December 1968, without defining specific pass-fail levels. Soon after, the new gen-eration of hardtops with more vulnerable roof structures spurred NHTSA to issue FMVSS No. 216, with a NPRM in January 1971, a final rule in December 1971 and an effective date of Sep-tember 1, 1973. The FMVSS largely incorporates the J374 procedure and sets a 5-inch limit on
501 49 CFR, Part 571.216. 502 Federal Register 36 (December 8, 1971): 23299, 56 (April 17, 1991): 15510. 503 Federal Register 74 (May 12, 2009): 22347.
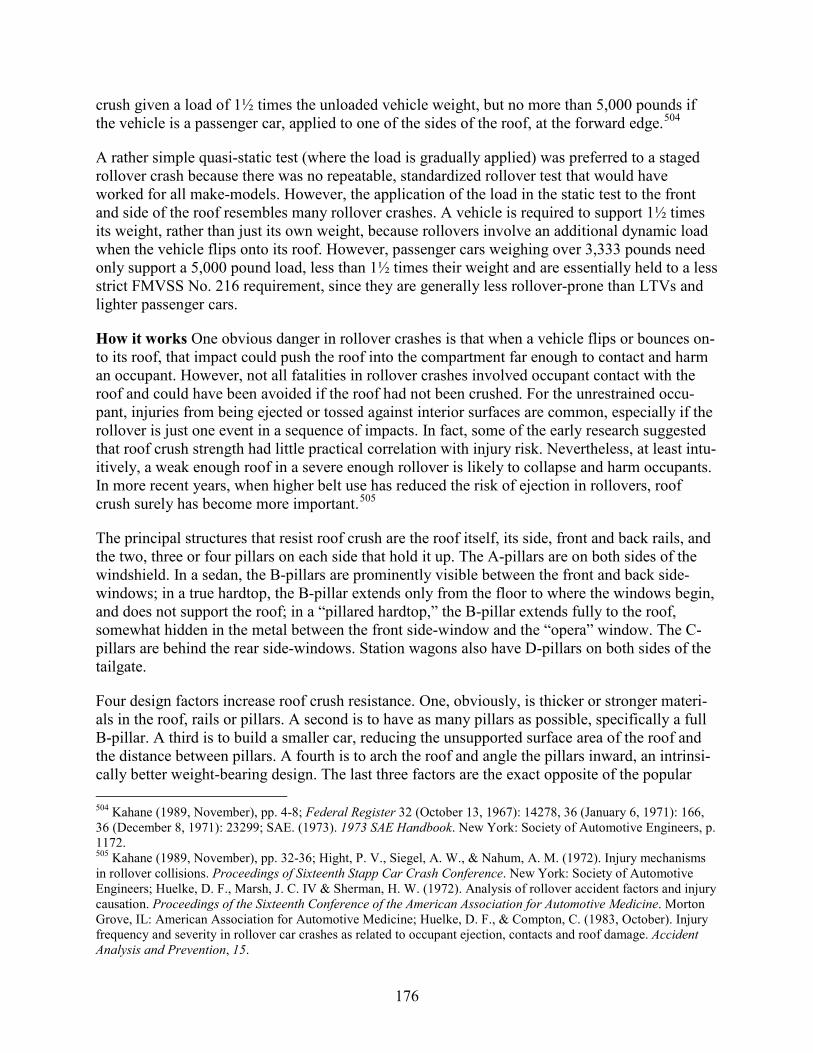
176
crush given a load of 1½ times the unloaded vehicle weight, but no more than 5,000 pounds if the vehicle is a passenger car, applied to one of the sides of the roof, at the forward edge.504
A rather simple quasi-static test (where the load is gradually applied) was preferred to a staged rollover crash because there was no repeatable, standardized rollover test that would have worked for all make-models. However, the application of the load in the static test to the front and side of the roof resembles many rollover crashes. A vehicle is required to support 1½ times its weight, rather than just its own weight, because rollovers involve an additional dynamic load when the vehicle flips onto its roof. However, passenger cars weighing over 3,333 pounds need only support a 5,000 pound load, less than 1½ times their weight and are essentially held to a less strict FMVSS No. 216 requirement, since they are generally less rollover-prone than LTVs and lighter passenger cars.
How it works One obvious danger in rollover crashes is that when a vehicle flips or bounces on-to its roof, that impact could push the roof into the compartment far enough to contact and harm an occupant. However, not all fatalities in rollover crashes involved occupant contact with the roof and could have been avoided if the roof had not been crushed. For the unrestrained occu-pant, injuries from being ejected or tossed against interior surfaces are common, especially if the rollover is just one event in a sequence of impacts. In fact, some of the early research suggested that roof crush strength had little practical correlation with injury risk. Nevertheless, at least intu-itively, a weak enough roof in a severe enough rollover is likely to collapse and harm occupants. In more recent years, when higher belt use has reduced the risk of ejection in rollovers, roof crush surely has become more important.505
The principal structures that resist roof crush are the roof itself, its side, front and back rails, and the two, three or four pillars on each side that hold it up. The A-pillars are on both sides of the windshield. In a sedan, the B-pillars are prominently visible between the front and back side-windows; in a true hardtop, the B-pillar extends only from the floor to where the windows begin, and does not support the roof; in a “pillared hardtop,” the B-pillar extends fully to the roof, somewhat hidden in the metal between the front side-window and the “opera” window. The C-pillars are behind the rear side-windows. Station wagons also have D-pillars on both sides of the tailgate.
Four design factors increase roof crush resistance. One, obviously, is thicker or stronger materi-als in the roof, rails or pillars. A second is to have as many pillars as possible, specifically a full B-pillar. A third is to build a smaller car, reducing the unsupported surface area of the roof and the distance between pillars. A fourth is to arch the roof and angle the pillars inward, an intrinsi-cally better weight-bearing design. The last three factors are the exact opposite of the popular 504 Kahane (1989, November), pp. 4-8; Federal Register 32 (October 13, 1967): 14278, 36 (January 6, 1971): 166, 36 (December 8, 1971): 23299; SAE. (1973). 1973 SAE Handbook. New York: Society of Automotive Engineers, p. 1172. 505 Kahane (1989, November), pp. 32-36; Hight, P. V., Siegel, A. W., & Nahum, A. M. (1972). Injury mechanisms in rollover collisions. Proceedings of Sixteenth Stapp Car Crash Conference. New York: Society of Automotive Engineers; Huelke, D. F., Marsh, J. C. IV & Sherman, H. W. (1972). Analysis of rollover accident factors and injury causation. Proceedings of the Sixteenth Conference of the American Association for Automotive Medicine. Morton Grove, IL: American Association for Automotive Medicine; Huelke, D. F., & Compton, C. (1983, October). Injury frequency and severity in rollover car crashes as related to occupant ejection, contacts and roof damage. Accident Analysis and Prevention, 15.
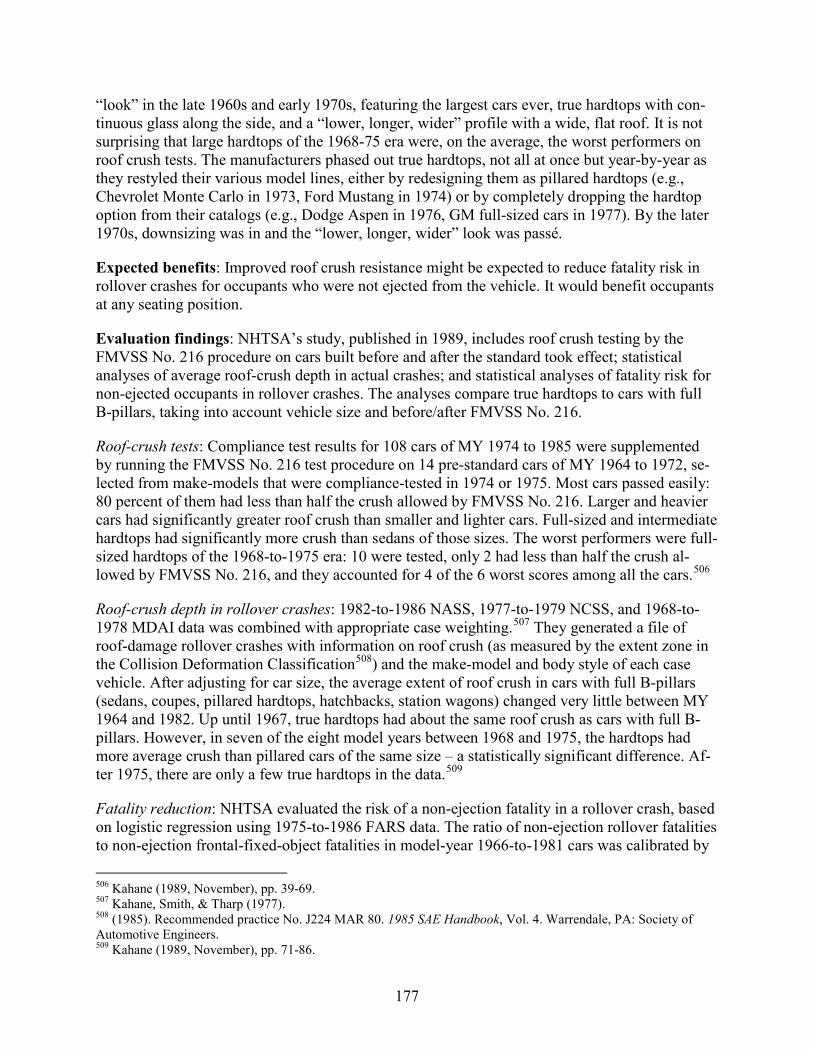
177
“look” in the late 1960s and early 1970s, featuring the largest cars ever, true hardtops with con-tinuous glass along the side, and a “lower, longer, wider” profile with a wide, flat roof. It is not surprising that large hardtops of the 1968-75 era were, on the average, the worst performers on roof crush tests. The manufacturers phased out true hardtops, not all at once but year-by-year as they restyled their various model lines, either by redesigning them as pillared hardtops (e.g., Chevrolet Monte Carlo in 1973, Ford Mustang in 1974) or by completely dropping the hardtop option from their catalogs (e.g., Dodge Aspen in 1976, GM full-sized cars in 1977). By the later 1970s, downsizing was in and the “lower, longer, wider” look was passé.
Expected benefits: Improved roof crush resistance might be expected to reduce fatality risk in rollover crashes for occupants who were not ejected from the vehicle. It would benefit occupants at any seating position.
Evaluation findings: NHTSA’s study, published in 1989, includes roof crush testing by the FMVSS No. 216 procedure on cars built before and after the standard took effect; statistical analyses of average roof-crush depth in actual crashes; and statistical analyses of fatality risk for non-ejected occupants in rollover crashes. The analyses compare true hardtops to cars with full B-pillars, taking into account vehicle size and before/after FMVSS No. 216.
Roof-crush tests: Compliance test results for 108 cars of MY 1974 to 1985 were supplemented by running the FMVSS No. 216 test procedure on 14 pre-standard cars of MY 1964 to 1972, se-lected from make-models that were compliance-tested in 1974 or 1975. Most cars passed easily: 80 percent of them had less than half the crush allowed by FMVSS No. 216. Larger and heavier cars had significantly greater roof crush than smaller and lighter cars. Full-sized and intermediate hardtops had significantly more crush than sedans of those sizes. The worst performers were full-sized hardtops of the 1968-to-1975 era: 10 were tested, only 2 had less than half the crush al-lowed by FMVSS No. 216, and they accounted for 4 of the 6 worst scores among all the cars.506
Roof-crush depth in rollover crashes: 1982-to-1986 NASS, 1977-to-1979 NCSS, and 1968-to-1978 MDAI data was combined with appropriate case weighting.507 They generated a file of roof-damage rollover crashes with information on roof crush (as measured by the extent zone in the Collision Deformation Classification508) and the make-model and body style of each case vehicle. After adjusting for car size, the average extent of roof crush in cars with full B-pillars (sedans, coupes, pillared hardtops, hatchbacks, station wagons) changed very little between MY 1964 and 1982. Up until 1967, true hardtops had about the same roof crush as cars with full B-pillars. However, in seven of the eight model years between 1968 and 1975, the hardtops had more average crush than pillared cars of the same size – a statistically significant difference. Af-ter 1975, there are only a few true hardtops in the data.509
Fatality reduction: NHTSA evaluated the risk of a non-ejection fatality in a rollover crash, based on logistic regression using 1975-to-1986 FARS data. The ratio of non-ejection rollover fatalities to non-ejection frontal-fixed-object fatalities in model-year 1966-to-1981 cars was calibrated by
506 Kahane (1989, November), pp. 39-69. 507 Kahane, Smith, & Tharp (1977). 508 (1985). Recommended practice No. J224 MAR 80. 1985 SAE Handbook, Vol. 4. Warrendale, PA: Society of Automotive Engineers. 509 Kahane (1989, November), pp. 71-86.
178
B-pillar status (true hardtop, full B-pillar), FMVSS No. 216 status (pre-1971, 1971-74 transition, post-1974), track width and curb weight. This ratio was a statistically significant 15 percent higher in true hardtops than in pillared cars of the same size, before 1976. In other words, phas-ing out the true hardtops has saved lives. The analysis showed little or no effect for FMVSS No. 216 in cars with full B-pillars – i.e., the safety benefit derived from phasing out true hardtops, not from any changes within the pillared cars. After controlling for car size, the average non-ejection rollover fatality risk in cars of the late 1970s, nearly all equipped with full B-pillars, was 7.4 percent lower than in cars of the early 1970s, a near 50-50 mix of hardtops and sedans.510 Using 1982 as the “baseline” year, the evaluation estimated the phasing out of true hardtops saved approximately 110 lives per year.511
2013-2016 roof crush resistance upgrade (not yet evaluated) In 2009, NHTSA upgraded FMVSS No. 216 to establish or increase strength requirements for the passenger compartment roof in some vehicles; the upgraded standard is called FMVSS No. 216a.512 Before the upgrade, the standard applied only to vehicles up to 6,000 pounds GVWR and the test involved loading the roof with 1½ times the vehicle’s unloaded vehicle weight (and no more than 5,000 pounds if the vehicle is a passenger car). The upgrade extends the standard to vehicles up to 10,000 pounds GVWR; test weight is 3 times the unloaded vehicle weight for ve-hicles under 6,000 pounds GVWR; it is 1½ times the unloaded vehicle weight for vehicles from 6,000 to 10,000 pounds GVWR. The phase-in schedule for the upgrade began with at least 25 percent of new MY 2013 vehicles, 50 percent for MY 2014, 75 percent for MY 2015, and full compliance for all new vehicles by MY 2016.
NHTSA plans to evaluate the upgrade by roof crush testing and statistical analyses of crash data. The upgraded roof crush test of FMVSS No. 216 will be performed on selected pre-standard ve-hicles and their crush measurements compared to compliance-test results for post-standard vehi-cles of the same makes and models. Statistical analyses of FARS and GES data will compare fa-tality risk in rollover crashes before and after the upgrade. Analyses of FARS-MCOD and GES data will compare head- and neck-injury risk in rollovers before and after the upgrade.
510 Ibid., pp. 159-167. 511 Ibid., pp. 214-217. 512 Federal Register 74 (May 12, 2009): 22347.
179
FMVSS No. 223, “Rear impact guards for heavy trailers” FMVSS No. 224, “Rear impact protection for heavy trailers” These two standards regulate one safety technology for heavy trailers with GVWR over 10,000 pounds that has been partially evaluated by NHTSA and that is primarily designed to protect the occupants of cars and LTVs that collide with the rear of the trailers:
• Underride guards for heavy trailers
The bodies of heavy trailers usually ride fairly high above the ground. The front ends of LTVs and especially passenger cars are relatively low. When the front of a car or LTV hits the rear of a trailer, there is a risk that the car’s hood will underride the trailer, with little structural engage-ment. The trailer can intrude into the passenger compartment of the car or LTV, with great dan-ger to the occupants. The underride guard is attached to the rear of the trailer and extends below the body of the trailer. It is designed to engage the hood of the car or LTV and prevent underride. Ideally, the underride guard should extend low enough to engage even small cars, be wide enough to catch impacts near the corners of the trailer, and be strong enough to not fold or break out of the way upon impact.
History: NHTSA issued FMVSS Nos. 223 and 224 in January 1996. FMVSS No. 223 specifies the height, width, length, and strength requirements for rear impact guards for trailers and semi-trailers; FMVSS No. 224 establishes requirements for the installation of rear-impact guards on trailers and semi-trailers with GVWR of 10,000 pounds or more manufactured on or after Janu-ary 24, 1998. FMVSS Nos. 223 and 224 do not apply to pole trailers, pulpwood trailers, low-chassis vehicles, special purpose vehicles, “wheels back” vehicles, or temporary living quarters – generally because these vehicles ride closer to the ground than van-type trailers or because the “wheels back” feature prevents underride from occurring, since striking vehicles contact those wheels and do not underride the back of the vehicle.513
However, the Truck Trailer Manufacturers Association (TTMA) had already issued a voluntary Recommended Practice RP 92-94 in April 1994 that included all the essential elements of the subsequent NHTSA standards except for the energy absorption requirement. Subsequently, Transport Canada issued CMVSS No. 223, “Rear impact guards,” effective in 2005, which not only encompasses FMVSS Nos. 223 and 224 but also sets somewhat higher strength require-ments than those FMVSS.514 Before 1998, trailers and semi-trailers were Federally regulated by Federal Motor Carrier Safety Regulations (FMCSR) that incorporated specifications for rear-impact guards developed by the Interstate Commerce Commission in 1952.515 The ICC guards were substantially narrower and smaller than those required by the current NHTSA standard and the TTMA recommended practice. The ICC guards were not required to meet strength tests.
In other words, there are five generations of underride guards: (1) The original state of no guards at all, which had ended by 1952; (2) The narrow ICC/FMCSR guard from 1952 to approximately 1994; (3) A transition circa 1994 to the TTMA guard which has the dimensions of current guards but not necessarily their strength; (4) Certification to the strength requirements of FMVSS Nos. 513 49 CFR, Parts 571.223 and 571.224; Federal Register 61 (January 24, 1996): 2004. 514 laws-lois.justice.gc.ca/PDF/C.R.C.,_c._1038.pdf. 515 www.fmcsa.dot.gov/rules-regulations/administration/fmcsr/fmcsrruletext.aspx?reg=393.86.
180
223 and 224 in 1998, although some earlier guards might have met those requirements; and (5) Certification to even greater strength requirements of CMVSS No. 223 in 2005; although not mandatory in the United States, current trailers are designed to the Canadian requirements to al-low operation throughout North America.
Expected benefits: Passenger compartment intrusion increases fatality and injury risk in frontal impacts. Successful underride guards would reduce the likelihood of intrusion when cars or LTVs impact the rear of heavy trailers, without otherwise changing the distribution of delta v in those crashes. That should result in fewer deaths and serious injuries. The underride guards would have little or no effect in crashes where the car or LTV contacts the sides of the trailer or the truck that is pulling the trailer.
Fatality and serious-injury reduction: NHTSA’s evaluation, published in 2010, compares oc-cupant fatalities in cars and LTVs when these vehicles impact the rear of heavy trailers to fatali-ties in a control group of crashes where the cars impact some other part of the trailer or impact the tractor.516 Two almost insuperable impediments to evaluation precluded statistically mean-ingful results: (1) FARS and most other databases available to NHTSA do not record the MY or VIN of trailers, leaving no clue as to the design of their underride guards; (2) The gradual evolu-tion of standards for underride guards does not allow a simple before-after or all-versus-nothing comparison. As of 2010, Florida was the only State crash file available to NHTSA that recorded the trailers’ MY and VIN. The analysis is based on Florida data from CY 1989 to 2006; of course, the number of fatality cases in a single State is limited. The two categories of trailers considered are MY 1998 and later, which would include guards certified to FMVSS and/or CMVSS Nos. 223 and 224; and MY 1980 to 1993, before the TTMA voluntary standard, which would probably be mostly the narrow ICC/FMCSR guards. The technique is a multidimensional contingency-table analysis of car/LTV occupants’ odds of survival in rear impacts versus other impacts, in crashes with MY 1998+ versus MY 1980-to-1993 trailers – using a SAS procedure called CATMOD to estimate if the newer guards have reduced risk in rear impacts relative to the other crashes and also to control for the CY of the crash (because crash distributions in Florida have changed over time). The analysis estimates a 27-percent reduction in rear-impact fatalities with the newer trailers, but the estimate falls short of statistical significance, due to the limited data (chi-square = 0.88, where 3.84 is needed for significance at the two-sided .05 level). A cor-responding analysis of the risk of fatalities and serious injuries (categories K and A in the Florida data) shows 6.5 percent lower risk with the newer guards, likewise not statistically significant.
Although the observed estimates are positive, the limited data and lack of statistical significance do not permit a conclusion that the newer guards have reduced fatalities or serious injuries. The model to compute lives saved in Part 2 of this report will not attribute any fatality reduction for car or LTV occupants to improved underride guards for heavy trailers. In a 2009 NHTSA analy-sis of 122 NASS-CDS fatality cases in frontal impacts, despite seat belt use and air bags, of cars and LTVs of MY 2000 or later, 12 of the 122 fatalities involve rear underride of a heavy trailer
516 Allen, K. (2010, October). The effectiveness of underride guards for heavy trailers. (Report No. DOT HS 811 375, pp. 16-22). Washington, DC: National Highway Traffic Safety Administration. Available at www-nrd.nhtsa.dot.gov/Pubs/811375.pdf.

181
(although this data does not describe the type of underride guard on the trailer, which may have been built before FMVSS Nos. 223 and 224, or how the guard performed in the crash).517
517 Bean et al. (2009, September), pp. 33-39.
182
FMVSS No. 226, “Ejection mitigation” This standard is associated with one safety technology that has been evaluated by NHTSA:
• Rollover curtains
FMVSS No. 226 is a performance standard in which a headform is propelled toward various tar-gets in side glazing areas. The goal is to prevent ejection of unrestrained occupants and to pre-vent the partial ejection of belted occupants in rollovers and other crashes. The standard began to phase in during MY 2014. NHTSA anticipates that curtain air bags that deploy in rollovers will be the principal technology used to meet the standard. Rollover curtains began to appear in pro-duction vehicles in MY 2002 and were in 45 percent of new vehicles by MY 2011; however, ear-ly versions of rollover curtains were most likely not compliant with the future performance re-quirements of FMVSS No. 226. It is also conceivable that another technology, laminated glass-plastic glazing, could be employed for side windows, but so far it has not appeared in production vehicles. The standard only allows laminated glazing as a supplement to rollover curtains in movable side windows. However, fixed side windows could have laminated glass as the sole countermeasure.
Regulatory history: NHTSA issued FMVSS No. 226 on January 19, 2011. A headform pro-pelled toward various targets in glazing areas may not extend more than 100 mm beyond a verti-cal reference plane defined by the original point of contact of the headform and the interior sur-face of the unbroken vehicle glazing. The test is performed with any tempered glass removed and any laminated glass broken so as to reproduce realistic real world conditions. The standard ap-plies to cars and LTVs with GVWR up to 10,000 pounds, except convertibles and some other vehicles. The phase-in period includes 25 percent of new vehicles produced from September 1, 2013, through August 31, 2014; 50 percent from September 1, 2014, through August 31, 2015; 75 percent from September 1, 2015, through August 31, 2016; and all new vehicles starting Sep-tember 1, 2016.518 But manufacturers began installing rollover curtains well in advance of the phase-in. As stated above, 45 percent of new vehicles had rollover curtains in MY 2011, includ-ing 79 percent of new LTVs (where rollovers have been more of a safety issue) and 9 percent of passenger cars (which are less rollover-prone).
How rollover curtains work: The standard defines a “deployable ejection mitigation device” – e.g., a curtain air bag that is designed to deploy in rollovers, stay inflated for 6 seconds,519 and be large enough to cover the side-window area and strong enough to contain the occupant, as evi-denced by successful testing with the headform impacts. Curtains would be needed on all side windows, including both front and rear seats, back to at least the third row.520 A curtain air bag designed for side impacts can be upgraded to a rollover curtain by adding a rollover sensor in the vehicle and modifying the electronic control module that sends the signal to deploy. Curtains that deploy in rollovers first became available on 2002 Ford Explorers and Mercury Mountaineers (although agency testing indicates that these early curtains would not have met all the require-
518 49 CFR, Part 571.226; Federal Register 76 (January 19, 2011): 3212. 519 Investigations of rollover crashes show that vehicles may transverse long distances and roll over several times; unbelted occupants are often ejected at the end of the rollover sequences, whose duration ranges up to six seconds. 520 In vehicles with more than three rows of seats, the standard applies to the first three rows of seats and to 600 mm beyond the third row of seats; see 49 CFR Part 571.226 S5.2.1.2(a).

183
ments of future FMVSS No. 226). As more side-impact curtains have been upgraded to rollover curtains over the past 12 years, curtains have generally been designed to cover a larger area and stay inflated longer.
Expected benefits: Rollover curtains should reduce occupant ejections in first-event rollover crashes. Keeping occupants within the vehicle – preventing ejection of unbelted occupants and averting partial ejection of belted occupants – will save lives and prevent serious injuries, be-cause ejection increases fatality risk in a crash by a factor of nearly four, all else being equal.521 But the benefit of rollover curtains need not be limited to preventing ejections. A well-designed curtain that deploys in rollovers could mitigate injury severity in head impacts with structures such as pillars, roof side rails, and side window sills – just as curtains that deploy in side impacts mitigate head injuries in near-side impacts. The principal analysis will address overall fatality risk in first-event rollovers.
Benefits are not necessarily limited to first-event rollovers. There could also be an effect in sub-sequent-event rollovers after frontal impacts, to the extent that injuries are due to ejection or oc-cur during the rollover sequence after the initial impact. Rollover curtains could even have an incremental benefit over non-rollover curtains in side impacts. The issue here is not the rollover sensor, because the side impact has already deployed the curtains. The issue is whether the other features that tend to be characteristic of rollover curtains, such as covering a larger area and/or staying inflated for a longer time might save some occupants, especially those who are ejected or injured in a subsequent rollover. These types of curtains might also mitigate injuries in oblique or small-overlap frontal impacts if they deploy in those types of impacts.
Fatality reduction: NHTSA’s 2014 evaluation is based on FARS data from 1999 to 2011. The principal analysis is a disaggregate logistic regression of the odds ratio of driver and RF passen-ger fatalities in first-event rollovers of MY 2000-to-2011 CUVs and truck-based SUVs to control group cases of pedestrians and bicyclists struck and fatally injured by these CUVs and SUVs. Cars, pickup trucks, and vans are excluded from the analyses because few of them had rollover curtains until near the end of that timeframe. It is important to note that this preliminary evalua-tion includes all types of curtains that deploy in rollovers; it is not limited to those that certified, or could have certified to FMVSS No. 226.
The dependent variable equals 1 when a fatality case is a driver or RF passenger of one of these vehicles in a first-event rollover and it equals 2 when a fatality case is a pedestrian or bicyclist (in any type of crash involving these CUVs and SUVs). The key independent variable is the presence or absence of rollover curtains (the presence or absence of other types of air bags is un-important, because they would not ordinarily deploy in a first-event rollover). The other inde-pendent variables are indicators as to whether the vehicle meets the head-impact upgrade of FMVSS No. 201 and/or is equipped with ESC; the driver’s age and gender; the vehicle’s body type, mass, and footprint; and roadway/environmental variables such as rural/urban, day/night, speed limit, CY, and the State where the crash occurred.522 The technique makes it possible to estimate the effect of rollover curtains above and beyond the effect of structure and padding in- 521 Sikora (1986). 522 However, the driver’s belt use is not an independent variable: belt use might not be accurately reported for the usually surviving and often uninjured drivers of the vehicles that hit pedestrians or bicyclists; see Kahane (2000, December), pp. 10-19 and Kahane (2014, January, pp. 31-32).
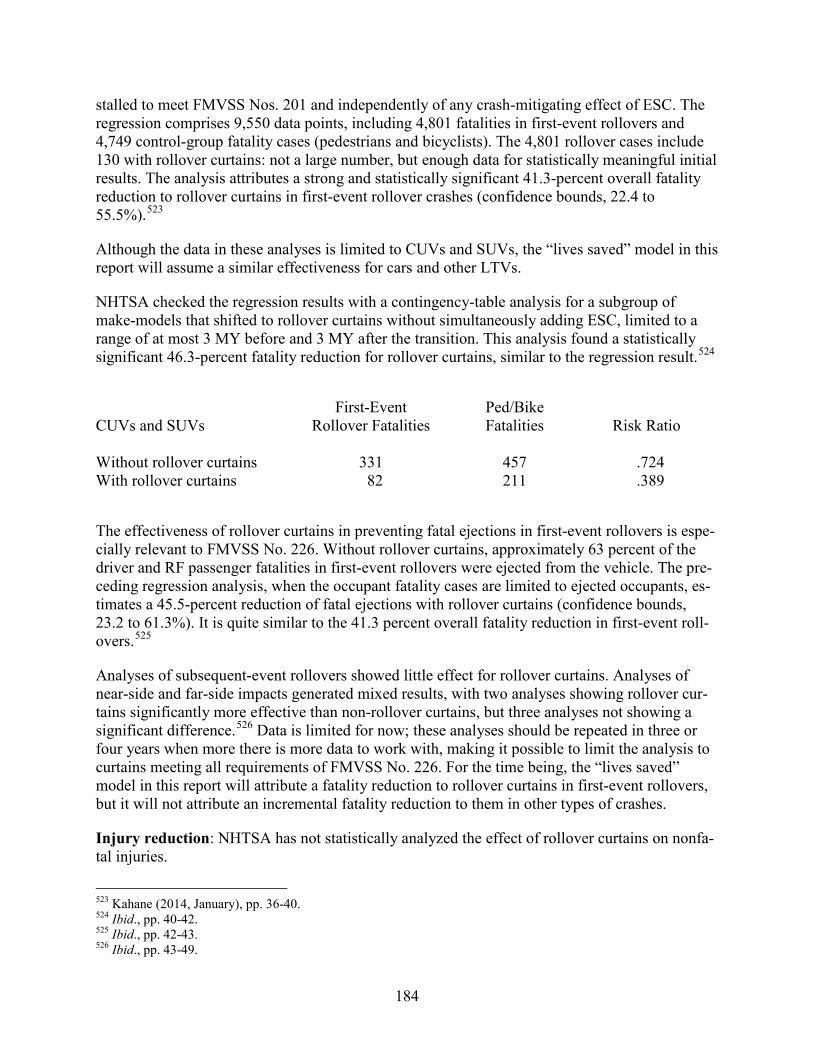
184
stalled to meet FMVSS Nos. 201 and independently of any crash-mitigating effect of ESC. The regression comprises 9,550 data points, including 4,801 fatalities in first-event rollovers and 4,749 control-group fatality cases (pedestrians and bicyclists). The 4,801 rollover cases include 130 with rollover curtains: not a large number, but enough data for statistically meaningful initial results. The analysis attributes a strong and statistically significant 41.3-percent overall fatality reduction to rollover curtains in first-event rollover crashes (confidence bounds, 22.4 to 55.5%).523
Although the data in these analyses is limited to CUVs and SUVs, the “lives saved” model in this report will assume a similar effectiveness for cars and other LTVs.
NHTSA checked the regression results with a contingency-table analysis for a subgroup of make-models that shifted to rollover curtains without simultaneously adding ESC, limited to a range of at most 3 MY before and 3 MY after the transition. This analysis found a statistically significant 46.3-percent fatality reduction for rollover curtains, similar to the regression result.524
First-Event Ped/Bike CUVs and SUVs Rollover Fatalities Fatalities Risk Ratio Without rollover curtains 331 457 .724 With rollover curtains 82 211 .389
The effectiveness of rollover curtains in preventing fatal ejections in first-event rollovers is espe-cially relevant to FMVSS No. 226. Without rollover curtains, approximately 63 percent of the driver and RF passenger fatalities in first-event rollovers were ejected from the vehicle. The pre-ceding regression analysis, when the occupant fatality cases are limited to ejected occupants, es-timates a 45.5-percent reduction of fatal ejections with rollover curtains (confidence bounds, 23.2 to 61.3%). It is quite similar to the 41.3 percent overall fatality reduction in first-event roll-overs.525
Analyses of subsequent-event rollovers showed little effect for rollover curtains. Analyses of near-side and far-side impacts generated mixed results, with two analyses showing rollover cur-tains significantly more effective than non-rollover curtains, but three analyses not showing a significant difference.526 Data is limited for now; these analyses should be repeated in three or four years when more there is more data to work with, making it possible to limit the analysis to curtains meeting all requirements of FMVSS No. 226. For the time being, the “lives saved” model in this report will attribute a fatality reduction to rollover curtains in first-event rollovers, but it will not attribute an incremental fatality reduction to them in other types of crashes.
Injury reduction: NHTSA has not statistically analyzed the effect of rollover curtains on nonfa-tal injuries.
523 Kahane (2014, January), pp. 36-40. 524 Ibid., pp. 40-42. 525 Ibid., pp. 42-43. 526 Ibid., pp. 43-49.
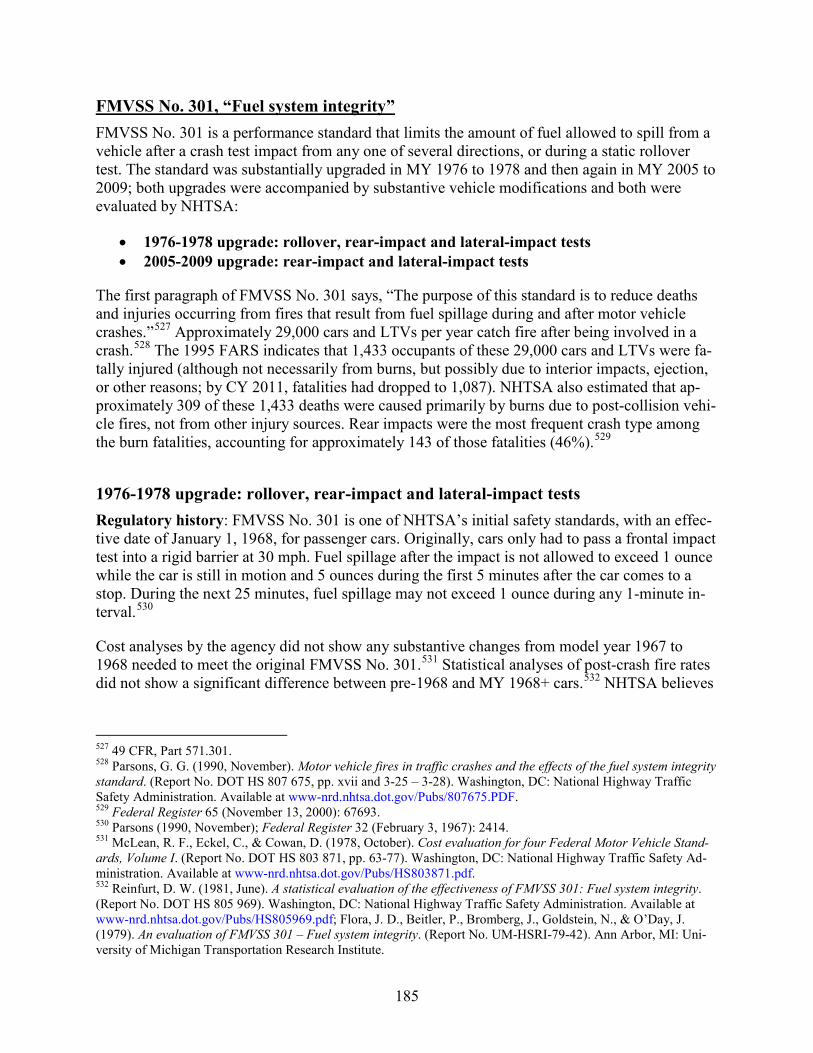
185
FMVSS No. 301, “Fuel system integrity” FMVSS No. 301 is a performance standard that limits the amount of fuel allowed to spill from a vehicle after a crash test impact from any one of several directions, or during a static rollover test. The standard was substantially upgraded in MY 1976 to 1978 and then again in MY 2005 to 2009; both upgrades were accompanied by substantive vehicle modifications and both were evaluated by NHTSA:
• 1976-1978 upgrade: rollover, rear-impact and lateral-impact tests • 2005-2009 upgrade: rear-impact and lateral-impact tests
The first paragraph of FMVSS No. 301 says, “The purpose of this standard is to reduce deaths and injuries occurring from fires that result from fuel spillage during and after motor vehicle crashes.”527 Approximately 29,000 cars and LTVs per year catch fire after being involved in a crash.528 The 1995 FARS indicates that 1,433 occupants of these 29,000 cars and LTVs were fa-tally injured (although not necessarily from burns, but possibly due to interior impacts, ejection, or other reasons; by CY 2011, fatalities had dropped to 1,087). NHTSA also estimated that ap-proximately 309 of these 1,433 deaths were caused primarily by burns due to post-collision vehi-cle fires, not from other injury sources. Rear impacts were the most frequent crash type among the burn fatalities, accounting for approximately 143 of those fatalities (46%).529
1976-1978 upgrade: rollover, rear-impact and lateral-impact tests Regulatory history: FMVSS No. 301 is one of NHTSA’s initial safety standards, with an effec-tive date of January 1, 1968, for passenger cars. Originally, cars only had to pass a frontal impact test into a rigid barrier at 30 mph. Fuel spillage after the impact is not allowed to exceed 1 ounce while the car is still in motion and 5 ounces during the first 5 minutes after the car comes to a stop. During the next 25 minutes, fuel spillage may not exceed 1 ounce during any 1-minute in-terval.530
Cost analyses by the agency did not show any substantive changes from model year 1967 to 1968 needed to meet the original FMVSS No. 301.531 Statistical analyses of post-crash fire rates did not show a significant difference between pre-1968 and MY 1968+ cars.532 NHTSA believes
527 49 CFR, Part 571.301. 528 Parsons, G. G. (1990, November). Motor vehicle fires in traffic crashes and the effects of the fuel system integrity standard. (Report No. DOT HS 807 675, pp. xvii and 3-25 – 3-28). Washington, DC: National Highway Traffic Safety Administration. Available at www-nrd.nhtsa.dot.gov/Pubs/807675.PDF. 529 Federal Register 65 (November 13, 2000): 67693. 530 Parsons (1990, November); Federal Register 32 (February 3, 1967): 2414. 531 McLean, R. F., Eckel, C., & Cowan, D. (1978, October). Cost evaluation for four Federal Motor Vehicle Stand-ards, Volume I. (Report No. DOT HS 803 871, pp. 63-77). Washington, DC: National Highway Traffic Safety Ad-ministration. Available at www-nrd.nhtsa.dot.gov/Pubs/HS803871.pdf. 532 Reinfurt, D. W. (1981, June). A statistical evaluation of the effectiveness of FMVSS 301: Fuel system integrity. (Report No. DOT HS 805 969). Washington, DC: National Highway Traffic Safety Administration. Available at www-nrd.nhtsa.dot.gov/Pubs/HS805969.pdf; Flora, J. D., Beitler, P., Bromberg, J., Goldstein, N., & O’Day, J. (1979). An evaluation of FMVSS 301 – Fuel system integrity. (Report No. UM-HSRI-79-42). Ann Arbor, MI: Uni-versity of Michigan Transportation Research Institute.
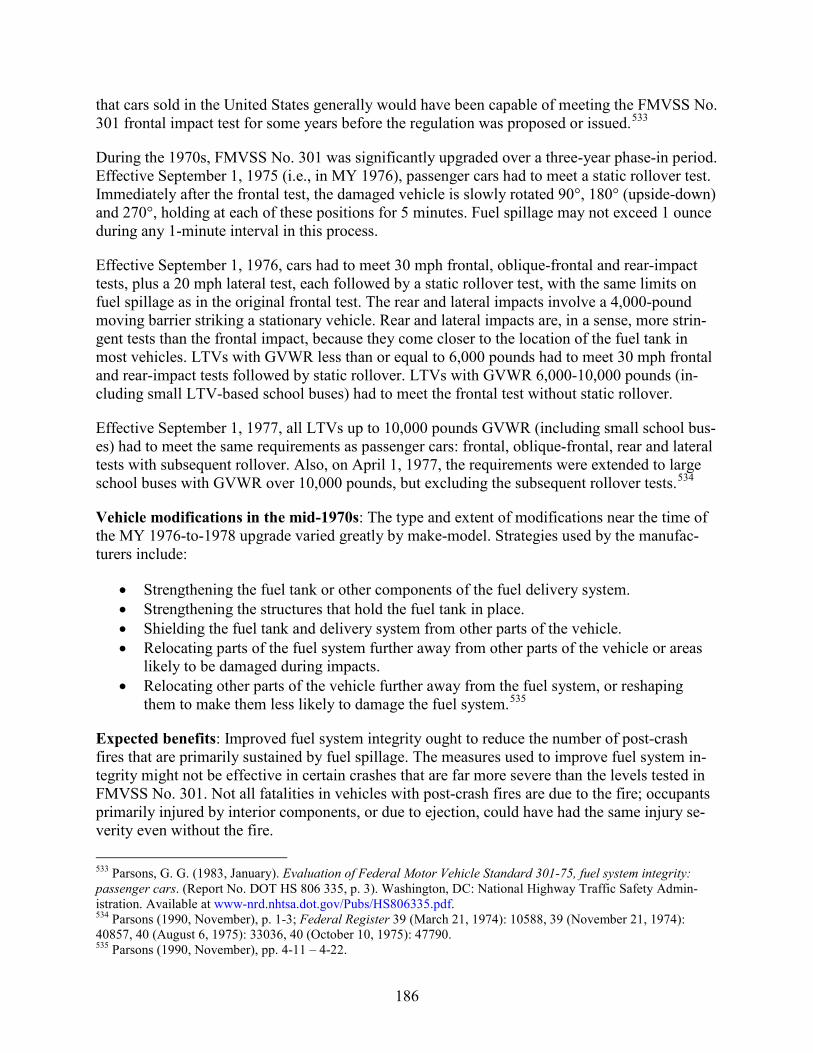
186
that cars sold in the United States generally would have been capable of meeting the FMVSS No. 301 frontal impact test for some years before the regulation was proposed or issued.533
During the 1970s, FMVSS No. 301 was significantly upgraded over a three-year phase-in period. Effective September 1, 1975 (i.e., in MY 1976), passenger cars had to meet a static rollover test. Immediately after the frontal test, the damaged vehicle is slowly rotated 90°, 180° (upside-down) and 270°, holding at each of these positions for 5 minutes. Fuel spillage may not exceed 1 ounce during any 1-minute interval in this process.
Effective September 1, 1976, cars had to meet 30 mph frontal, oblique-frontal and rear-impact tests, plus a 20 mph lateral test, each followed by a static rollover test, with the same limits on fuel spillage as in the original frontal test. The rear and lateral impacts involve a 4,000-pound moving barrier striking a stationary vehicle. Rear and lateral impacts are, in a sense, more strin-gent tests than the frontal impact, because they come closer to the location of the fuel tank in most vehicles. LTVs with GVWR less than or equal to 6,000 pounds had to meet 30 mph frontal and rear-impact tests followed by static rollover. LTVs with GVWR 6,000-10,000 pounds (in-cluding small LTV-based school buses) had to meet the frontal test without static rollover.
Effective September 1, 1977, all LTVs up to 10,000 pounds GVWR (including small school bus-es) had to meet the same requirements as passenger cars: frontal, oblique-frontal, rear and lateral tests with subsequent rollover. Also, on April 1, 1977, the requirements were extended to large school buses with GVWR over 10,000 pounds, but excluding the subsequent rollover tests.534
Vehicle modifications in the mid-1970s: The type and extent of modifications near the time of the MY 1976-to-1978 upgrade varied greatly by make-model. Strategies used by the manufac-turers include:
• Strengthening the fuel tank or other components of the fuel delivery system. • Strengthening the structures that hold the fuel tank in place. • Shielding the fuel tank and delivery system from other parts of the vehicle. • Relocating parts of the fuel system further away from other parts of the vehicle or areas
likely to be damaged during impacts. • Relocating other parts of the vehicle further away from the fuel system, or reshaping
them to make them less likely to damage the fuel system.535
Expected benefits: Improved fuel system integrity ought to reduce the number of post-crash fires that are primarily sustained by fuel spillage. The measures used to improve fuel system in-tegrity might not be effective in certain crashes that are far more severe than the levels tested in FMVSS No. 301. Not all fatalities in vehicles with post-crash fires are due to the fire; occupants primarily injured by interior components, or due to ejection, could have had the same injury se-verity even without the fire. 533 Parsons, G. G. (1983, January). Evaluation of Federal Motor Vehicle Standard 301-75, fuel system integrity: passenger cars. (Report No. DOT HS 806 335, p. 3). Washington, DC: National Highway Traffic Safety Admin-istration. Available at www-nrd.nhtsa.dot.gov/Pubs/HS806335.pdf. 534 Parsons (1990, November), p. 1-3; Federal Register 39 (March 21, 1974): 10588, 39 (November 21, 1974): 40857, 40 (August 6, 1975): 33036, 40 (October 10, 1975): 47790. 535 Parsons (1990, November), pp. 4-11 – 4-22.
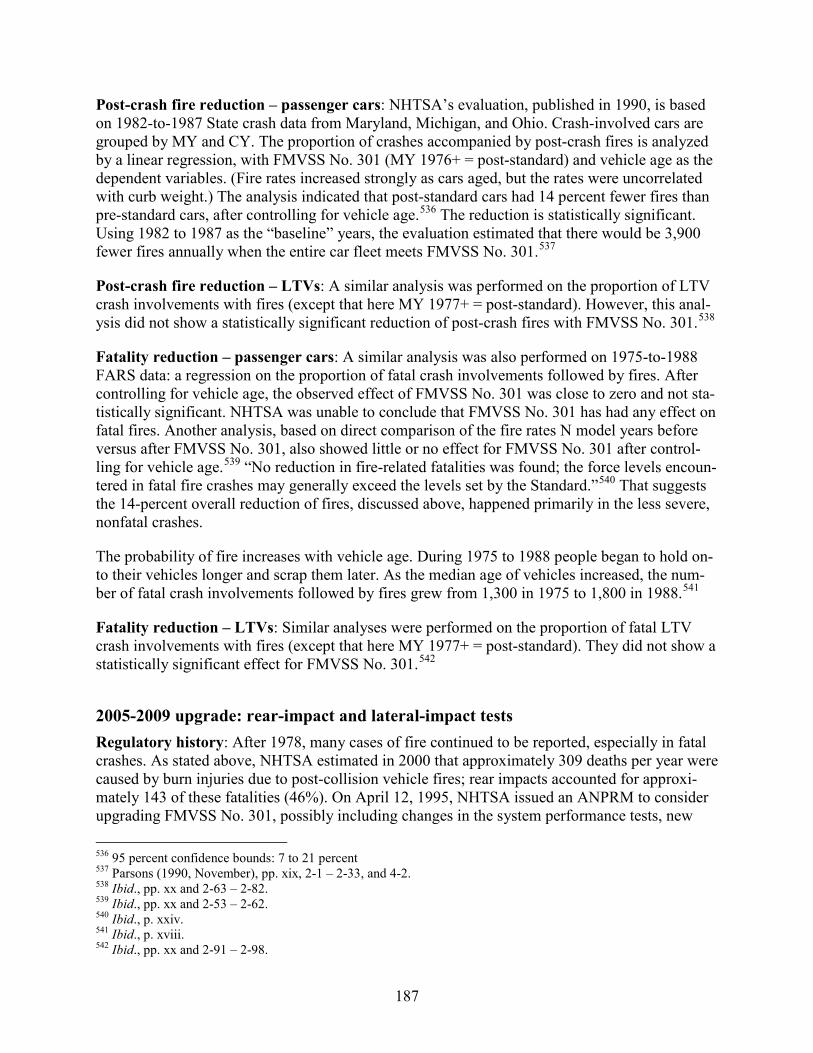
187
Post-crash fire reduction – passenger cars: NHTSA’s evaluation, published in 1990, is based on 1982-to-1987 State crash data from Maryland, Michigan, and Ohio. Crash-involved cars are grouped by MY and CY. The proportion of crashes accompanied by post-crash fires is analyzed by a linear regression, with FMVSS No. 301 (MY 1976+ = post-standard) and vehicle age as the dependent variables. (Fire rates increased strongly as cars aged, but the rates were uncorrelated with curb weight.) The analysis indicated that post-standard cars had 14 percent fewer fires than pre-standard cars, after controlling for vehicle age.536 The reduction is statistically significant. Using 1982 to 1987 as the “baseline” years, the evaluation estimated that there would be 3,900 fewer fires annually when the entire car fleet meets FMVSS No. 301.537
Post-crash fire reduction – LTVs: A similar analysis was performed on the proportion of LTV crash involvements with fires (except that here MY 1977+ = post-standard). However, this anal-ysis did not show a statistically significant reduction of post-crash fires with FMVSS No. 301.538
Fatality reduction – passenger cars: A similar analysis was also performed on 1975-to-1988 FARS data: a regression on the proportion of fatal crash involvements followed by fires. After controlling for vehicle age, the observed effect of FMVSS No. 301 was close to zero and not sta-tistically significant. NHTSA was unable to conclude that FMVSS No. 301 has had any effect on fatal fires. Another analysis, based on direct comparison of the fire rates N model years before versus after FMVSS No. 301, also showed little or no effect for FMVSS No. 301 after control-ling for vehicle age.539 “No reduction in fire-related fatalities was found; the force levels encoun-tered in fatal fire crashes may generally exceed the levels set by the Standard.”540 That suggests the 14-percent overall reduction of fires, discussed above, happened primarily in the less severe, nonfatal crashes.
The probability of fire increases with vehicle age. During 1975 to 1988 people began to hold on-to their vehicles longer and scrap them later. As the median age of vehicles increased, the num-ber of fatal crash involvements followed by fires grew from 1,300 in 1975 to 1,800 in 1988.541
Fatality reduction – LTVs: Similar analyses were performed on the proportion of fatal LTV crash involvements with fires (except that here MY 1977+ = post-standard). They did not show a statistically significant effect for FMVSS No. 301.542
2005-2009 upgrade: rear-impact and lateral-impact tests Regulatory history: After 1978, many cases of fire continued to be reported, especially in fatal crashes. As stated above, NHTSA estimated in 2000 that approximately 309 deaths per year were caused by burn injuries due to post-collision vehicle fires; rear impacts accounted for approxi-mately 143 of these fatalities (46%). On April 12, 1995, NHTSA issued an ANPRM to consider upgrading FMVSS No. 301, possibly including changes in the system performance tests, new 536 95 percent confidence bounds: 7 to 21 percent 537 Parsons (1990, November), pp. xix, 2-1 – 2-33, and 4-2. 538 Ibid., pp. xx and 2-63 – 2-82. 539 Ibid., pp. xx and 2-53 – 2-62. 540 Ibid., p. xxiv. 541 Ibid., p. xviii. 542 Ibid., pp. xx and 2-91 – 2-98.
188
tests of individual components, and criteria to address environmental and vehicle-aging effects on the integrity of the fuel system.543 On November 6, 2000, after reviewing the research and the public comments to the ANPRM, NHTSA issued, an NPRM limiting the upgrade to more strin-gent rear- and lateral-impact test procedures for vehicles up to 10,000 pounds GVWR.544
NHTSA issued a final rule on December 1, 2003.545 It replaced the September 1, 1976, rear-impact test (30 mph by a 4,000-pound rigid barrier and 100 percent overlap) with a 50 mph im-pact by a 3,000-pound MDB. The new test is not across the entire rear of the test vehicle but overlaps just 70 percent of it, starting from the side with the fuel filler. Thus, the lower mass and deformable face of the MDB make the new test somewhat less severe, but the much higher speed and less-than-full overlap make it much more severe. The test is more severe for lighter vehicles, because of the finite mass of the MDB (conservation of momentum). The lateral impact of Sep-tember 1, 1976, (20 mph by a 4,000-pound rigid barrier) is superseded by adding a fuel-retention requirement to the already existing compliance test for FMVSS No. 214: a 33.5 mph lateral im-pact by a 3,000-pound deformable barrier. The rear-impact test phased in 40 percent of cars and LTVs produced from September 1, 2006, to August 31, 2007 (i.e., MY 2007); 70 percent of cars and LTVs produced from September 1, 2007, to August 31, 2008; and all cars and LTVs pro-duced on or after September 1, 2008. The lateral test phased in two years earlier, from MY 2005 to 2007.
Expected benefits: NHTSA stated in 2003 that the new rear-impact test would be a major up-grade, as evidenced by test results for 13 selected cars and LTVs of MY 1996 to 1999. Six of the 13, including 6 of the 11 with curb weight less than 3,500 pounds failed the proposed new test. In 2012, NHTSA tested an additional 16 vehicles of MY 1996 to 2000; 10 of these also failed the new test. In all, 16 of the 29 MY 1996-to-2000 vehicles, including 15 of the 25 with curb weight less than 3,500 pounds failed the rear-impact test that phased in during MY 2007 to 2009. NHTSA does not have detailed information on how vehicles were modified between MY 2000 and MY 2009 to meet the rear-impact upgrade. However, based on the failure modes observed in the tests of pre-standard vehicles, NHTSA believes that the principal modifications have been to the design and packaging (surrounding protective structures) of the fuel filler neck and the fuel tank. NHTSA concluded that bringing all new vehicles into compliance with the new rear-impact test would prevent fire-related fatalities and injuries. By contrast, the agency stated that the new lateral-impact requirement would have considerably less effect on safety, as evidenced by only one failure in over 100 tests of pre-standard vehicles to the new requirement. A primary goal of the new lateral-impact requirement was to eliminate regulatory burden by incorporating FMVSS No. 301 into the existing compliance test for FMVSS No. 214, rather than requiring a separate crash test.546
543 Federal Register 60 (April 12, 1995): 18566. 544 Federal Register 65 (November 13, 2000): 67693. 545 Federal Register 68 (December 1, 2003): 67068. 546 (2003, November). Final regulatory impact analysis, FMVSS No. 301 upgrade. (Docket No. NHTSA-2003-16523-002, Chapter III). Washington, DC: National Highway Traffic Safety Administration; Pai, J. (2014, June). Evaluation of FMVSS No. 301, “fuel system integrity,” as upgraded in 2005 to 2009. (Report No. DOT HS 812 038). Washington, DC: National Highway Traffic Safety Administration. Available at www-nrd.nhtsa.dot.gov/Pubs/812038.pdf.
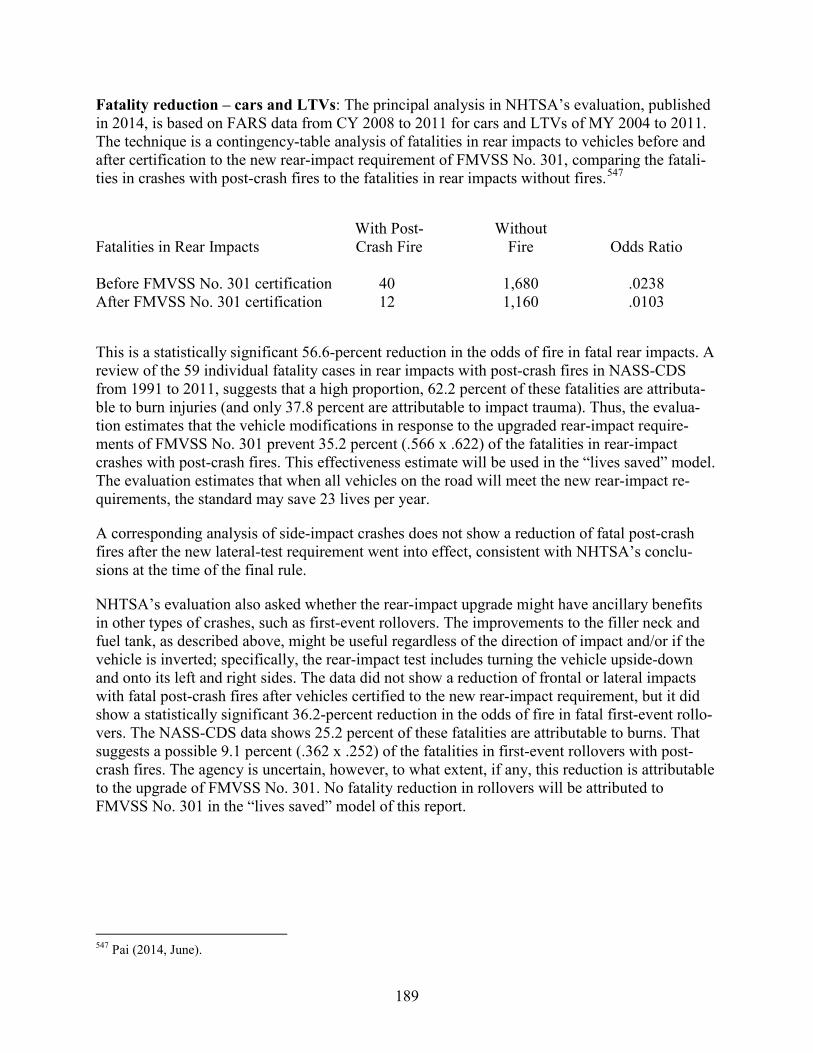
189
Fatality reduction – cars and LTVs: The principal analysis in NHTSA’s evaluation, published in 2014, is based on FARS data from CY 2008 to 2011 for cars and LTVs of MY 2004 to 2011. The technique is a contingency-table analysis of fatalities in rear impacts to vehicles before and after certification to the new rear-impact requirement of FMVSS No. 301, comparing the fatali-ties in crashes with post-crash fires to the fatalities in rear impacts without fires.547
With Post- Without Fatalities in Rear Impacts Crash Fire Fire Odds Ratio Before FMVSS No. 301 certification 40 1,680 .0238 After FMVSS No. 301 certification 12 1,160 .0103
This is a statistically significant 56.6-percent reduction in the odds of fire in fatal rear impacts. A review of the 59 individual fatality cases in rear impacts with post-crash fires in NASS-CDS from 1991 to 2011, suggests that a high proportion, 62.2 percent of these fatalities are attributa-ble to burn injuries (and only 37.8 percent are attributable to impact trauma). Thus, the evalua-tion estimates that the vehicle modifications in response to the upgraded rear-impact require-ments of FMVSS No. 301 prevent 35.2 percent (.566 x .622) of the fatalities in rear-impact crashes with post-crash fires. This effectiveness estimate will be used in the “lives saved” model. The evaluation estimates that when all vehicles on the road will meet the new rear-impact re-quirements, the standard may save 23 lives per year.
A corresponding analysis of side-impact crashes does not show a reduction of fatal post-crash fires after the new lateral-test requirement went into effect, consistent with NHTSA’s conclu-sions at the time of the final rule.
NHTSA’s evaluation also asked whether the rear-impact upgrade might have ancillary benefits in other types of crashes, such as first-event rollovers. The improvements to the filler neck and fuel tank, as described above, might be useful regardless of the direction of impact and/or if the vehicle is inverted; specifically, the rear-impact test includes turning the vehicle upside-down and onto its left and right sides. The data did not show a reduction of frontal or lateral impacts with fatal post-crash fires after vehicles certified to the new rear-impact requirement, but it did show a statistically significant 36.2-percent reduction in the odds of fire in fatal first-event rollo-vers. The NASS-CDS data shows 25.2 percent of these fatalities are attributable to burns. That suggests a possible 9.1 percent (.362 x .252) of the fatalities in first-event rollovers with post-crash fires. The agency is uncertain, however, to what extent, if any, this reduction is attributable to the upgrade of FMVSS No. 301. No fatality reduction in rollovers will be attributed to FMVSS No. 301 in the “lives saved” model of this report.
547 Pai (2014, June).
190
NCAP: New Car Assessment Program NHTSA’s New Car Assessment Program is not a regulation or a standard, but a program of test-ing the crashworthiness and crash avoidance capabilities of new cars and LTVs and publishing the results for the public. NCAP began in 1978 with frontal crash testing of MY 1979 passenger cars. LTVs were first tested in MY 1983. In 1995, the Insurance Institute for Highway Safety began its own program of crash testing and public information, based on an offset-frontal impact. NCAP expanded to side impact testing in MY 1997 and IIHS started testing vehicles in side im-pacts, using a somewhat different procedure, in 2003. NCAP began to provide information on the rollover resistance of vehicles in MY 2001. Five major categories of NCAP and IIHS infor-mation have been available since 2003 or earlier. So far, NHTSA has only fully evaluated, based on retrospective statistical analyses of crash data, the first of these rating systems and the vehicle modifications in response to them:
• Frontal NCAP-related improvements in cars without air bags, • Frontal NCAP in vehicles with air bags (not evaluated), • Offset-frontal IIHS tests (partially evaluated), • Side NCAP and IIHS side impact testing (not evaluated), and • Rollover-resistance NCAP (partially evaluated).
In NCAP’s frontal-impact test the full front of the vehicle crashes into a rigid barrier at 35 mph, the same as the current test speed for FMVSS No. 208. However, the NCAP test was originally 5 mph faster than the test speed in FMVSS Nos. 204, 208, 212, 219, and 301, the NHTSA regula-tions that set basic performance requirements in frontal impacts, which were tested at 30 mph until September 1, 2007. NCAP’s side-impact test, at 38.5 mph is 5 mph faster than the 33.5 mph dynamic test in FMVSS No. 214. One purpose of NCAP or IIHS testing, of course, is to enable consumers to compare the performance of different vehicles they might want to buy. Manufac-turers know what the NCAP tests are and they have the option to design their vehicles for opti-mum performance in the tests. Even though NCAP has no “pass-fail” criteria, manufacturers have improved performance over the years by introducing, modifying or fine-tuning safety equipment. For example, voluntary introductions of technologies such as pretensioners and load-limiters for seat belts (not required by any FMVSS as of June 2014) have improved performance on NCAP tests. When consumers and manufacturers respond to the information, the end result is a fleet of vehicles with better test performance.
In addition to those five rating systems, IIHS and NHTSA have offered other ratings or infor-mation, especially during the past few years. These, too, have not yet been retrospectively evalu-ated by statistical analyses of crash data. IIHS began testing and rating head restraints in 1995,548 roof strength in 2009,549 vehicle performance in small-overlap frontal impacts in 2012,550 and front crash prevention systems (such as forward collision warning) in 2013.551 For MY 2012, NCAP added an overall vehicle score; an oblique pole test at 20 mph with a 5th-percentile fe-male driver dummy; information on the availability of ESC, forward collision warning systems, 548 www.iihs.org/iihs/ratings/ratings-info/rear-head-restraints-test. 549 www.iihs.org/iihs/news/desktopnews/roof-strength-is-focus-of-new-rating-system-4-of-12-small-suvs-evaluated-earn-top-marks. 550 www.iihs.org/iihs/ratings/ratings-info/frontal-crash-tests. 551 www.iihs.org/iihs/ratings/ratings-info/front-crash-prevention-tests.
191
and lane departure warning systems; and injury criteria for chest deflection, femur load, and neck tension and compression. On the existing frontal and side impact tests, NCAP shifted from a 50th percentile male dummy to a 5th-percentile female dummy in the RF seating position (frontal) and rear seating position (side impact).552
Frontal NCAP-related improvements in cars without air bags NCAP history and procedure: Title II of the Motor Vehicle Information and Cost Savings Act of 1973 authorized NHTSA to develop consumer information on the crashworthiness of passen-ger vehicles. The agency developed a 35 mph frontal impact test into a rigid barrier with belted dummies at the driver’s and RF seats. The test setup was essentially identical to the one used in NHTSA’s basic frontal crashworthiness standards at that time, except 5 mph faster. (Subsequent-ly, phasing in from September 1, 2007, to September 1, 2010, the speed of the test in FMVSS No. 208 with the belted 50th percentile male dummy was raised from 30 mph to 35 mph, equal to the NCAP test speed.) The same injury criteria as in FMVSS No. 208 – originally the head injury criterion, chest g’s and femur load – were measured on the dummies.553
In MY 1979, the first year of testing, fewer than 25 percent of the cars were able to meet the FMVSS No. 208 criteria (HIC < 1,000, chest g’s < 60 and femur load < 2,500 pounds on each leg) in the 35 mph test. (Of course, the only requirement of FMVSS No. 208 at that time was for vehicles with automatic occupant protection to meet those criteria at 30 mph.) By MY 1986 to 1991, over 60 percent of passenger cars met the FMVSS No. 208 criteria at 35 mph. Manufac-turers had begun “designing to 35 mph” a large proportion of their vehicles. Specifically, during the first four years of NCAP, 1979 to 1982, HIC averaged 1,052 and chest g’s 54.9. By MY 1983, modifications that improved NCAP performance had worked their way through the pro-duction cycle. In MY 1983 to 1986, average HIC had dropped to 915 and chest g’s even more so, to 46.8. In MY 1987 to 1991 HIC continued to improve to 827, while chest g’s remained about the same, at 46.5.554
Vehicle modifications and their purpose: NHTSA’s films and other data from NCAP tests are public information. Manufacturers, if they chose, had the opportunity to study results of the ini-tial NCAP tests of their MY 1979-to-1981 cars. They could identify the contacts that were driv-ing up HIC or chest g’s on the dummies and they could test out a variety of remedies by running their own 35 mph impacts. Subsequent modifications were not limited to a single, specific tech-nology, but included adjusting the belt system, the steering assembly, the instrument panel, and the seat structure, taking into account how belted dummies interacted with those systems in 35 mph tests. For example, manufacturers:
552 Federal Register 73 (July 11, 2008): 40016, 76 (July 29, 2011): 45453; chest deflection superseded chest peak g’s; furthermore HIC15 (the highest value of HIC during any 15 millisecond duration) superseded HIC36 (measured over a 36 millisecond duration). 553 The Motor Vehicle Information and Cost Savings Act of 1973, Public Law 92-513, as amended, 15 United States Code 1912-2012. 554 Kahane, C. J. (1994, January). Correlation of NCAP performance with fatality risk in actual head-on collisions. (Report No. DOT HS 808 061, pp. 1-2). Washington, DC: National Highway Traffic Safety Administration. Availa-ble at www-nrd.nhtsa.dot.gov/Pubs/808061.PDF; before MY 2012, HIC was measured over a 36 millisecond dura-tion (HIC36).
192
• Reduced spool-out of the seat belts in crashes. Excessive spool-out allowed head impacts with frontal components. Strategies to reduce spool-out included adding a web-locking mechanism, relocating the D-ring, modifying the retractor or shortening the belts;
• Found ways to reduce upward movement of the steering assembly in crashes and keep it away from the driver’s head;
• Reduced dashboard intrusion into the occupant compartment; • Stiffened the front seat cushion; and • Realigned the seats relative to the steering assembly and instrument panel to provide ad-
ditional ride-down space for occupants.555
Expected benefits: Strategies to optimize the performance of belted dummies in 35 mph frontal barrier impacts might likely have the largest benefits for belted occupants in frontal crashes, gen-erally, and especially in frontal crashes that have a velocity change (delta V) in the vicinity of 35 mph (i.e., severe, but not extreme) and resemble an impact with a flat barrier (hitting a wide ob-ject or another vehicle, with plenty of overlap).
Fatality reduction – passenger cars: In 1994, NHTSA published a study of the Correlation of NCAP Performance with Fatality Risk in Actual Head-On Collisions. It was based on 1979-to-1992 FARS data, specifically head-on collisions of two passenger cars of MY 1979 to 1991, each with a belted driver, resulting in a fatality to one or to both of the drivers. Head-on colli-sions are ideally suited for studying frontal crashworthiness differences between two cars. Both cars are subjected to essentially the same frontal collision. It does not matter if one of them had a "safe" driver and the other, an "unsafe" driver; at the moment they collide head-on, how safely anybody was driving before the crash is nearly irrelevant to what happens in the crash. Which driver dies and which driver survives depends primarily on the intrinsic relative crashworthiness of the two cars, their relative weights, and the age and gender of the two drivers (which influence their vulnerability to injury).556
If car 1 and car 2 have the same weight and are equally crashworthy and both drivers are the same age and gender the likelihood of a driver fatality in a head-on collision would be expected to be equal in car 1 and car 2. When vehicle weight and/or driver age/gender are not the same, the expected fatality risk for each driver is calibrated from the FARS data by a logistic regres-sion. The expected fatality risk for driver 1 is
exp[.616 - 5.427(log W 1 - log W 2 ) + .0531(A 1 -A 2 ) + .34(F 1 -F 2 )] 1 + exp[.616 - 5.427(log W 1 - log W 2 ) + .0531(A 1 -A 2 ) + .34(F 1 -F 2 )]
where W 1 is the curb weight of car 1, A 1 is the age of driver 1, F 1 is 1 if driver 1 is female, 0 if male, and the various numbers are the regression coefficients (betas). The expected fatality risk for driver 2 is
555 Hackney, J., & Quarles, V. (1982). The New Car Assessment Program – Status and Effect. Ninth International Technical Conference on Experimental Safety Vehicles. (Report No. DOT HS 806 341, pp. 809-82). Washington, DC: National Highway Traffic Safety Administration; Hackney, J., & Ellison, C. (1986). A review of the effects of belts systems, steering assemblies, and structural design on the safety performance of vehicles in the New Car As-sessment Program. Tenth International Technical Conference on Experimental Safety Vehicles. (Report No. DOT HS 806 916, pp. 380-413). Washington, DC: National Highway Traffic Safety Administration. 556 Kahane (2013, May), pp. x-xi.
193
exp[.616 + 5.427(log W 1 - log W 2 ) - .0531(A 1 -A 2 ) - .34(F 1 -F 2 )] 1 + exp[.616 + 5.427(log W 1 - log W 2 ) - .0531(A 1 -A 2 ) - .34(F 1 -F 2 )]
For example, given 100 fatal head-on collisions between 3,000-pound cars driven by belted, 20-year-old males and 2,500-pound cars driven by belted, 50-year-old females, the formulas predict 9 deaths among the young males in the heavier cars and 97 deaths among the older females in the lighter cars (for a total of 106 fatalities in the 100 collisions, since some of them resulted in fatal-ities to both drivers).557
Cars with average crashworthiness will experience an actual number of fatalities close to what is predicted by the formulas. If a group of cars consistently experiences fewer driver fatalities than expected in their head-on collisions, then this group of cars is more crashworthy than the average car of similar mass. More generally, given a set of head-on collisions between one group of cars A and another group of cars B, it is possible to compare the crashworthiness of the two groups. For example, if the actual fatalities in the crashes and the sums of the expected probabilities of fatality (based on the formulas) are as follows:
Head-On Collisions between Groups A and B Car Group A Car Group B Actual fatalities 60 100 Expected fatalities 68 92
Then the fatality reduction for Group A relative to Group B is
1 - [ (60/68) / (100/92) ] = 18.8 percent
Specifically, NHTSA’s evaluation compares actual and expected fatalities when Group A con-sists of cars with good scores on one or more NCAP parameters and Group B consists of cars with poor scores. For example, in 125 head-on collisions between cars with chest g’s ≤ 56 on the NCAP test (a group averaging 44.6 chest g’s on the test) and cars with chest g’s > 56 (averaging 63.4 chest g’s), with both drivers belted, the actual number of driver fatalities relative to the ex-pected was 18.7 percent lower in the cars with the good scores than in the cars with the poor scores. The evaluation also considered many other sets of head-on collisions between groups of make-models with good and poor NCAP scores, where “good” and “poor” were defined on the basis of a single injury criterion – HIC, chest g’s or femur load – or on various combinations of those criteria. Consistently, the actual fatality risk (relative to expected – i.e., after controlling for vehicle weight, driver age and gender) was significantly lower in the make-models with the bet-ter NCAP scores.558
As stated above, the average NCAP performance of new cars improved substantially between MY 1979 and MY 1991, with the largest improvement coming around 1983 to 1986. Therefore,
557 Kahane (1994, January), p. 9. 558 Ibid., pp. 79-118.
194
we would expect a corresponding reduction over time of fatality risk in head-on collisions. In-deed, NHTSA’s evaluation showed that MY 1983-to-1986 cars had a statistically significant 20-percent reduction of fatality risk, relative to MY 1979-to-1982 cars, for belted drivers in car-to-car head-on collisions.559
NHTSA’s evaluation is based entirely on analyses of belted drivers in head-on crashes between two cars. The data was limited almost entirely to cars without air bags. It is unknown if the 20-percent fatality reduction in these crashes would extend to other types of crashes. There might be a similar effect for belted drivers in frontal impacts with the side or rear of another passenger car (i.e., car-to-car, but not head-on) and – more tenuously – in frontal impacts with LTVs, heavy trucks or fixed objects, all of which are usually more rigid than cars. The results are least likely to extend to unbelted drivers, or any kind of non-frontal impacts. Also, these results for drivers of cars without air bags need not apply to passengers, or to drivers of cars with air bags. Howev-er, the “lives saved” model in this report will only attribute a potential benefit to NCAP when the belted driver of a passenger car without air bags frontally impacts another passenger car.
Frontal NCAP in vehicles with air bags (not evaluated) The preceding scenario of NCAP in cars without air bags uniquely combines three features that, together, provide confidence that the benefits shown by the analysis can be attributed to NCAP and are not double-counting the effects of other safety improvements:
• The improvements took place in the 1980s, well after the introduction of 3-point belts (MY 1974) and before the introduction of frontal air bags – i.e., during an extended peri-od without any substantial new regulations or other programs to improve frontal crash-worthiness;
• It is known how manufacturers modified the vehicles during the early 1980s (see above list) and it is reasonably clear that improved NCAP performance was a reason for the modifications; and
• The analysis based on head-on collisions is especially suited for identifying differences in crashworthiness, without confounding factors such as where and how well vehicles of different make-models are driven.
Because the remaining test programs do not present all three of these features, NHTSA declines to attribute specific benefits to them in the “lives saved” model of this report, even if analyses show the better-performing vehicles are safer, because it might result in double-counting the ef-fects of other technologies and regulations.
The proportion of new vehicles equipped with air bags increased greatly from 1990 onwards. The relationship between NCAP scores and fatality risk in actual head-on collisions in vehicles with air bags may be different from the result found in NHTSA’s 1994 evaluation of MY 1979-to-1991 cars, mostly without air bags, described above. Other developments in frontal NCAP not considered in the 1994 evaluation include the extensive test results and crash data now available on LTVs, and the five-star rating system initiated in 1994 to make NCAP results more useful to
559 Ibid., pp. xvi and 129-142.
195
the public.560 Crash data involving head-on collisions of cars and LTVs equipped with driver or dual air bags could potentially be analyzed, using the five-star rating system to distinguish be-tween “good” and “poor” NCAP performance. NHTSA, however, has already evaluated several technologies that arrived after 1990 and that protect occupants in frontal impacts: redesigned frontal air bags, advanced air bags, pretensioners and load limiters, and the head-impact upgrade of FMVSS No. 201. Some of these technologies directly contributed to better NCAP results.561 Thus, the benefits found in a potential evaluation of NCAP might double-count the effects at-tributed to those technologies in the other evaluations.
Offset-frontal IIHS tests (partially evaluated) In 1995, IIHS began testing and issuing information on vehicles’ performance in offset-frontal impacts (subsequently renamed “moderate-overlap” impacts). The tests are run at 40 mph (5 mph higher than frontal NCAP), but into a barrier with a deformable, energy-absorbing face. The im-pact is “offset” in that the contact area between the test vehicle and the barrier extends only 40 percent across the front of the test vehicle, from the left corner to just short of the centerline. The test simulates a typical head-on crash in which a vehicle strays only partially into the lane of an oncoming vehicle. Each vehicle receives a rating of “good,” “acceptable,” “marginal,” or “poor” for its overall performance and on four specifics: structural integrity, head protection, chest pro-tection, and occupant kinematics.562 In MY 2000, only 24 percent of new vehicles achieved a “good” overall rating, with 35 percent “acceptable,” 20 percent “marginal,” and 21 percent “poor.” By MY 2007, 86 percent of new vehicles rated good, with 13 percent acceptable, under 1 percent marginal, and no poor ratings at all. Because the offset concentrates force on the left side of the test vehicle rather than spreading it across the entire front, the test provides valuable in-formation on the vehicle’s structural integrity. Vehicles “with poor or marginal performance on the IIHS offset test, especially structural performance … tend to allow more instrument-panel, toe-pan or floor-pan intrusion and deformation than the latest designs [with good or acceptable performance].”563
Farmer’s statistical analysis of relative fatality risk in actual crashes between passenger cars with good and poor frontal-offset ratings, controlling for covariates such as the mass of the vehicles and the age of the drivers and based on the fairly limited data available in 2005, shows a 34-percent lower fatality risk for the driver of the good-rated vehicle across all crashes; the reduc-tion is 74 percent in head-on crashes.564 More generally, NHTSA’s 2012 evaluation of relation-ships between mass, footprint, and fatality risk includes IIHS test performance as a covariate. That process generates estimates of the association between test performance and fatal-crash risk
560 Hackney, J. R., & Kahane, C. J. (1995). The New Car Assessment Program: Five Star Rating System and vehicle safety performance characteristics. (Paper No. 950888). Warrendale, PA: Society of Automotive Engineers; NHTSA. (1993). New Car Assessment Program: Response to the NCAP FY 1992 congressional requirements – re-port to the Congress. Washington, DC: National Highway Traffic Safety Administration. 561 Walz (2003). 562 Farmer, C. M. (2005). Relationships of frontal offset crash test results to real-world driver fatality ratings. Traffic Injury Prevention, 6, pp. 31-37; IIHS. (2012, December). Moderate overlap frontal crashworthiness evaluation crash test protocol (Version XIV). Arlington, VA: Insurance Institute for Highway Safety. Available at www.iihs.org/iihs/ratings/technical-information/technical-protocols. 563 Bean et al. (2009, September), pp. 6-8 and 15. 564 Farmer, (2005).
196
per billion VMT, while controlling for the driver’s age and gender; the car’s mass, and footprint; and roadway/environmental variables such as rural/urban, day/night, speed limit, CY, and the State where the crash occurred. In collisions of passenger cars with fixed objects or with other vehicles (excluding motorcycles), cars with marginal or poor overall performance have a statisti-cally significant 10-percent higher fatal-crash rate than cars with good or acceptable overall per-formance. Cars with poor structural performance had a statistically significant 14-percent higher fatal-crash rate than cars with good or acceptable structural performance (and an 8%-increase for marginal relative to good or acceptable performance).565
Given the evidence that structural integrity of the passenger compartment in frontal impacts has improved in vehicles over the past 20 years (1994 to 2014), it might be possible to estimate a specific fatality reduction in frontal impacts for improved structures. NHTSA, however, does not currently have enough information to quantify the effect; it is also possible that some of the pre-ceding effectiveness estimates for occupant-protection technologies introduced during that peri-od, such as pretensioners, load limiters, and advanced air bags, may to some extent include the effects of improved vehicle structures.
Side NCAP and IIHS side impact testing (not evaluated) After September 1, 1996, when all cars were required to meet a dynamic side impact test as part of FMVSS No. 214, NHTSA expanded NCAP to provide consumer information on vehicle per-formance in side impacts. In the NCAP tests, the MDB strikes the side of the target vehicle at 38.5 mph, 5 mph faster than in the FMVSS No. 214 test. The agency uses a five-star rating sys-tem for outboard front seat occupants and outboard rear seat occupants. Before MY 2012, the rating was based on the TTI(d) scores for the dummies in the tests. (Effective MY 2012, the agency modified the injury criteria used to computed the star rating and also added a pole test.566) As discussed in the chapter on FMVSS No. 214, the principal tool for reducing TTI(d) after MY 1997 was to install side air bags.567
In 2003, IIHS expanded its rating system to include side impacts in which a 3,300-pound MDB simulating the front end of a typical pickup truck or SUV impacts the side of the test vehicle at 31 mph and at a 90° angle. The dummies in the test vehicles simulate 5th-percentile females (near-side, front and rear seats). Each vehicle receives a rating of “good,” “acceptable,” “margin-al,” or “poor” for its overall performance, its structural integrity, and its protection of dummies’ head, neck, thorax, pelvis, and legs. The IIHS test, which employs a taller MDB and a shorter dummy than NCAP to elicit head impacts, may have been an incentive to introduce inflatable head protection as well as torso bags.568 To the extent that Side NCAP and the IIHS side impact ratings may have encouraged and expedited the installation of curtain and/or side air bags, they have made valuable contributions to safety – but the “lives saved” model of this report already
565 Kahane, C. J. (2012, August). Relationships between fatality risk, mass, and footprint in model year 2000-2007 passenger cars and LTVs – Final report. (Report No. DOT HS 811 665, pp. 77-79). Washington, DC: National Highway Traffic Safety Administration. Available at www-nrd.nhtsa.dot.gov/Pubs/811665.PDF. 566 Federal Register 73 (July 11, 2008): 40016, 76 (July 29, 2011): 45453. 567 See also Kahane (2007, January), pp. 17-29, especially Figures 1-11 and 1-12. 568 Teoh & Lund (2011, June).
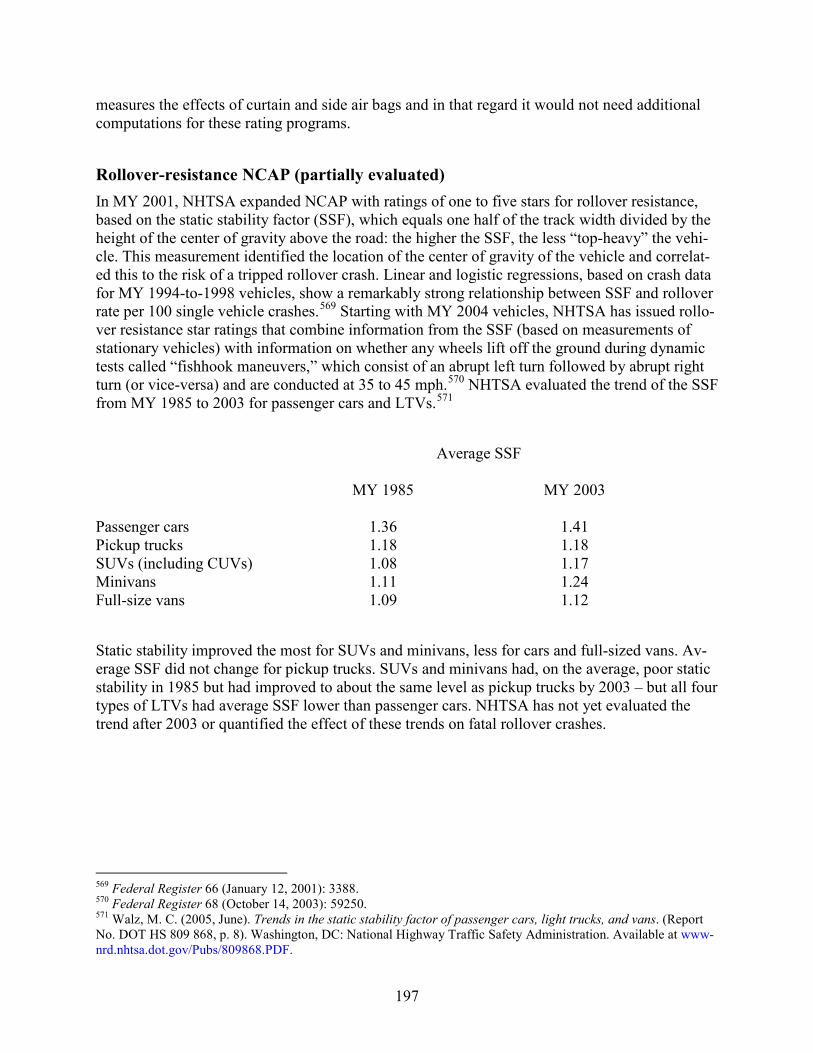
197
measures the effects of curtain and side air bags and in that regard it would not need additional computations for these rating programs.
Rollover-resistance NCAP (partially evaluated) In MY 2001, NHTSA expanded NCAP with ratings of one to five stars for rollover resistance, based on the static stability factor (SSF), which equals one half of the track width divided by the height of the center of gravity above the road: the higher the SSF, the less “top-heavy” the vehi-cle. This measurement identified the location of the center of gravity of the vehicle and correlat-ed this to the risk of a tripped rollover crash. Linear and logistic regressions, based on crash data for MY 1994-to-1998 vehicles, show a remarkably strong relationship between SSF and rollover rate per 100 single vehicle crashes.569 Starting with MY 2004 vehicles, NHTSA has issued rollo-ver resistance star ratings that combine information from the SSF (based on measurements of stationary vehicles) with information on whether any wheels lift off the ground during dynamic tests called “fishhook maneuvers,” which consist of an abrupt left turn followed by abrupt right turn (or vice-versa) and are conducted at 35 to 45 mph.570 NHTSA evaluated the trend of the SSF from MY 1985 to 2003 for passenger cars and LTVs.571
Average SSF MY 1985 MY 2003 Passenger cars 1.36 1.41 Pickup trucks 1.18 1.18 SUVs (including CUVs) 1.08 1.17 Minivans 1.11 1.24 Full-size vans 1.09 1.12
Static stability improved the most for SUVs and minivans, less for cars and full-sized vans. Av-erage SSF did not change for pickup trucks. SUVs and minivans had, on the average, poor static stability in 1985 but had improved to about the same level as pickup trucks by 2003 – but all four types of LTVs had average SSF lower than passenger cars. NHTSA has not yet evaluated the trend after 2003 or quantified the effect of these trends on fatal rollover crashes.
569 Federal Register 66 (January 12, 2001): 3388. 570 Federal Register 68 (October 14, 2003): 59250. 571 Walz, M. C. (2005, June). Trends in the static stability factor of passenger cars, light trucks, and vans. (Report No. DOT HS 809 868, p. 8). Washington, DC: National Highway Traffic Safety Administration. Available at www-nrd.nhtsa.dot.gov/Pubs/809868.PDF.

198
SUMMARY TABLES FOR PART 1 Tables 1-2, 1-3 and 1-4 summarize the effectiveness estimates for safety technologies obtained in past evaluation reports, as discussed in the preceding chapters of Part 1. Table 1-2 summarizes the estimated percentage reductions in fatalities; Table 1-3, nonfatal injuries; and Table 1-4, crashes (always specifying to what group of crashes/injuries/fatalities these percentages apply – but for more detail, refer back to the preceding chapters). The effectiveness estimates in Table 1-2 are also used in this report’s model to assess lives saved by vehicle safety technologies from 1960 to 2012. When NHTSA has evaluated a safety technology more than once (e.g., CHMSL), the latest estimates are the ones shown in Tables 1-2, 1-3 and 1-4. Tables 1-3 and 1-4 also summarize the estimated annual benefits of nonfatal injury reduction and crash avoidance, as stated in NHTSA’s evaluation reports. However, those estimates of benefits, in general, are not directly comparable and do not add up to the overall crash avoidance and inju-ry reduction by all the FMVSS in, say, 2002. NHTSA does not have enough “building blocks” to develop models for overall crash avoidance and injury reduction comparable to the analysis of fatal crashes in Part 2 of this report.
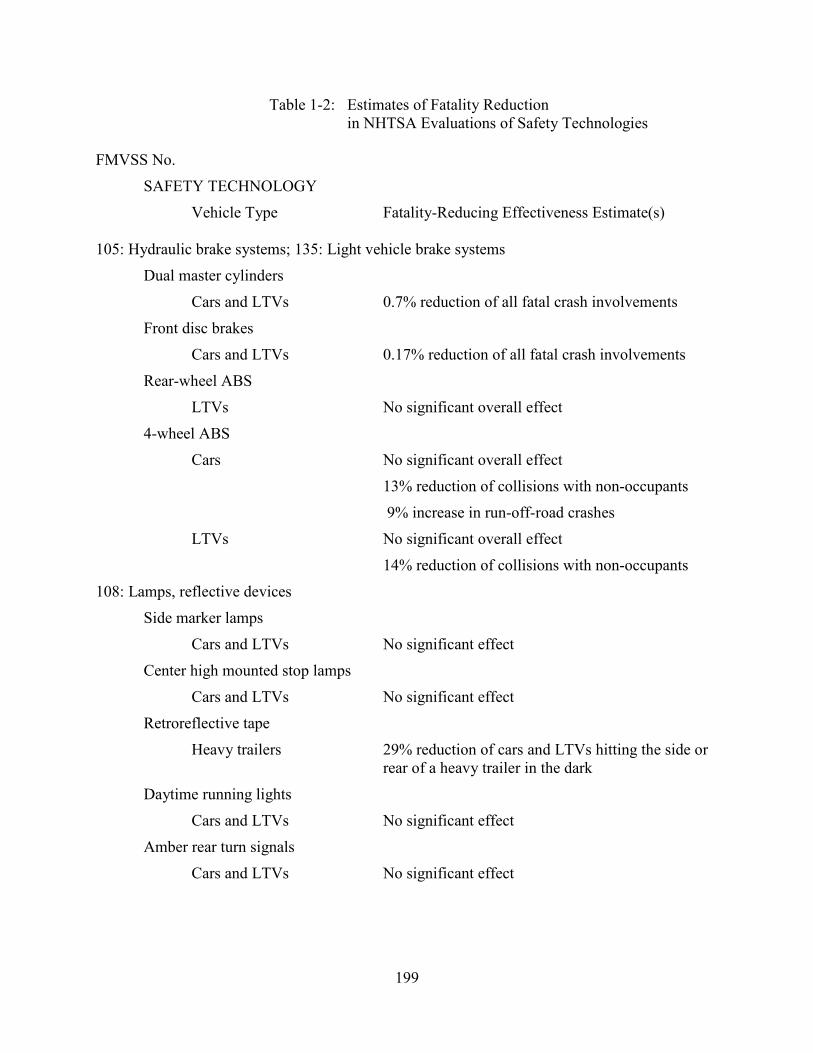
Table 1-2: Estimates of Fatality Reduction in NHTSA Evaluations of Safety Technologies FMVSS No.
SAFETY TECHNOLOGY
Vehicle Type Fatality-Reducing Effectiveness Estimate(s)
199
105: Hydraulic brake systems; 135: Light vehicle brake systems
Dual master cylinders
Cars and LTVs 0.7% reduction of all fatal crash involvements
Front disc brakes
Cars and LTVs 0.17% reduction of all fatal crash involvements
Rear-wheel ABS
LTVs No significant overall effect
4-wheel ABS
Cars No significant overall effect
13% reduction of collisions with non-occupants
9% increase in run-off-road crashes
LTVs No significant overall effect
14% reduction of collisions with non-occupants
108: Lamps, reflective devices
Side marker lamps
Cars and LTVs No significant effect
Center high mounted stop lamps
Cars and LTVs No significant effect
Retroreflective tape
Heavy trailers 29% reduction of cars and LTVs hitting the side or rear of a heavy trailer in the dark
Daytime running lights
Cars and LTVs No significant effect
Amber rear turn signals
Cars and LTVs No significant effect
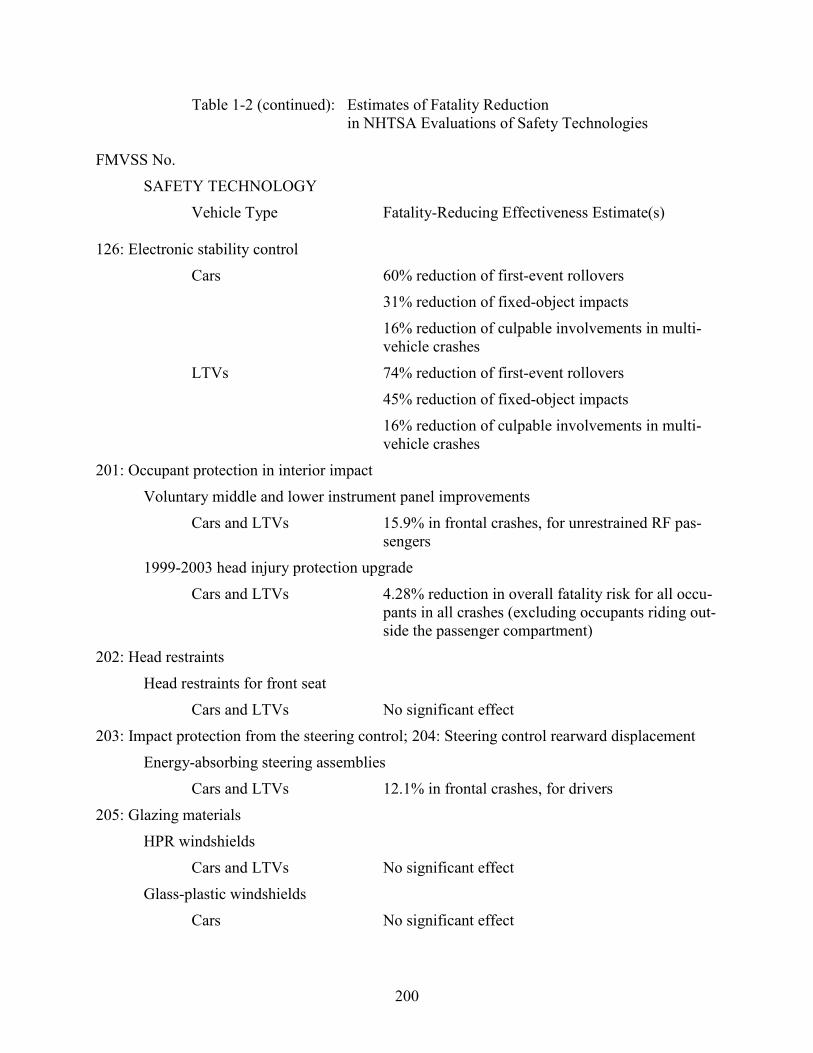
Table 1-2 (continued): Estimates of Fatality Reduction in NHTSA Evaluations of Safety Technologies FMVSS No.
SAFETY TECHNOLOGY
Vehicle Type Fatality-Reducing Effectiveness Estimate(s)
200
126: Electronic stability control
Cars 60% reduction of first-event rollovers
31% reduction of fixed-object impacts
16% reduction of culpable involvements in multi-vehicle crashes
LTVs 74% reduction of first-event rollovers
45% reduction of fixed-object impacts
16% reduction of culpable involvements in multi-vehicle crashes
201: Occupant protection in interior impact
Voluntary middle and lower instrument panel improvements
Cars and LTVs 15.9% in frontal crashes, for unrestrained RF pas-sengers
1999-2003 head injury protection upgrade
Cars and LTVs 4.28% reduction in overall fatality risk for all occu-pants in all crashes (excluding occupants riding out-side the passenger compartment)
202: Head restraints
Head restraints for front seat
Cars and LTVs No significant effect
203: Impact protection from the steering control; 204: Steering control rearward displacement
Energy-absorbing steering assemblies
Cars and LTVs 12.1% in frontal crashes, for drivers
205: Glazing materials
HPR windshields
Cars and LTVs No significant effect
Glass-plastic windshields
Cars No significant effect
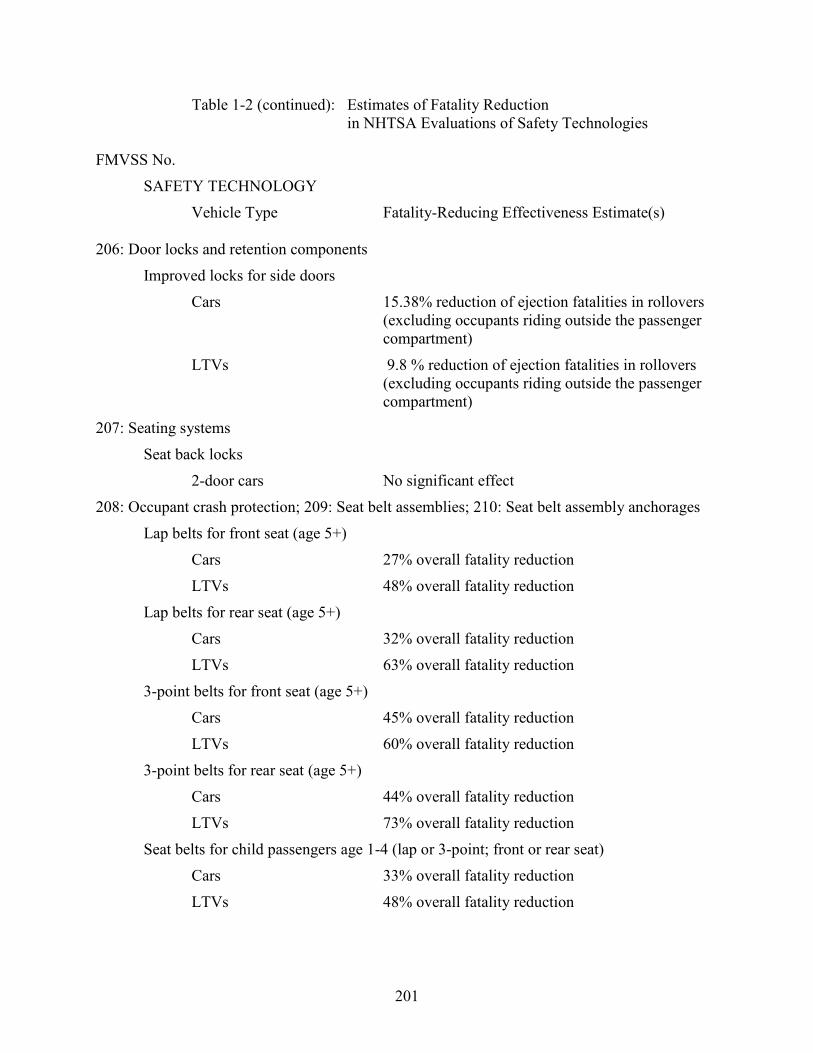
Table 1-2 (continued): Estimates of Fatality Reduction in NHTSA Evaluations of Safety Technologies FMVSS No.
SAFETY TECHNOLOGY
Vehicle Type Fatality-Reducing Effectiveness Estimate(s)
201
206: Door locks and retention components
Improved locks for side doors
Cars 15.38% reduction of ejection fatalities in rollovers (excluding occupants riding outside the passenger compartment)
LTVs 9.8 % reduction of ejection fatalities in rollovers (excluding occupants riding outside the passenger compartment)
207: Seating systems
Seat back locks
2-door cars No significant effect
208: Occupant crash protection; 209: Seat belt assemblies; 210: Seat belt assembly anchorages
Lap belts for front seat (age 5+)
Cars 27% overall fatality reduction
LTVs 48% overall fatality reduction
Lap belts for rear seat (age 5+)
Cars 32% overall fatality reduction
LTVs 63% overall fatality reduction
3-point belts for front seat (age 5+)
Cars 45% overall fatality reduction
LTVs 60% overall fatality reduction
3-point belts for rear seat (age 5+)
Cars 44% overall fatality reduction
LTVs 73% overall fatality reduction
Seat belts for child passengers age 1-4 (lap or 3-point; front or rear seat)
Cars 33% overall fatality reduction
LTVs 48% overall fatality reduction
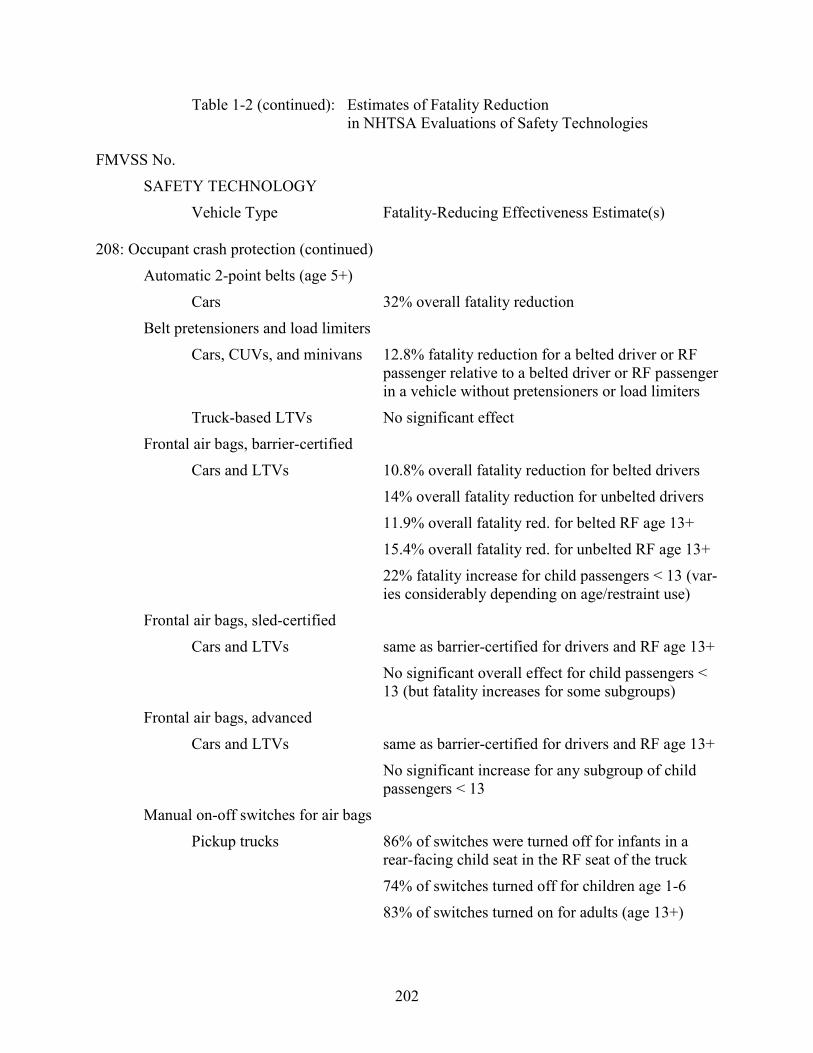
Table 1-2 (continued): Estimates of Fatality Reduction in NHTSA Evaluations of Safety Technologies FMVSS No.
SAFETY TECHNOLOGY
Vehicle Type Fatality-Reducing Effectiveness Estimate(s)
202
208: Occupant crash protection (continued)
Automatic 2-point belts (age 5+)
Cars 32% overall fatality reduction
Belt pretensioners and load limiters
Cars, CUVs, and minivans 12.8% fatality reduction for a belted driver or RF passenger relative to a belted driver or RF passenger in a vehicle without pretensioners or load limiters
Truck-based LTVs No significant effect
Frontal air bags, barrier-certified
Cars and LTVs 10.8% overall fatality reduction for belted drivers
14% overall fatality reduction for unbelted drivers
11.9% overall fatality red. for belted RF age 13+
15.4% overall fatality red. for unbelted RF age 13+
22% fatality increase for child passengers < 13 (var-ies considerably depending on age/restraint use)
Frontal air bags, sled-certified
Cars and LTVs same as barrier-certified for drivers and RF age 13+
No significant overall effect for child passengers < 13 (but fatality increases for some subgroups)
Frontal air bags, advanced
Cars and LTVs same as barrier-certified for drivers and RF age 13+
No significant increase for any subgroup of child passengers < 13
Manual on-off switches for air bags
Pickup trucks 86% of switches were turned off for infants in a rear-facing child seat in the RF seat of the truck
74% of switches turned off for children age 1-6
83% of switches turned on for adults (age 13+)
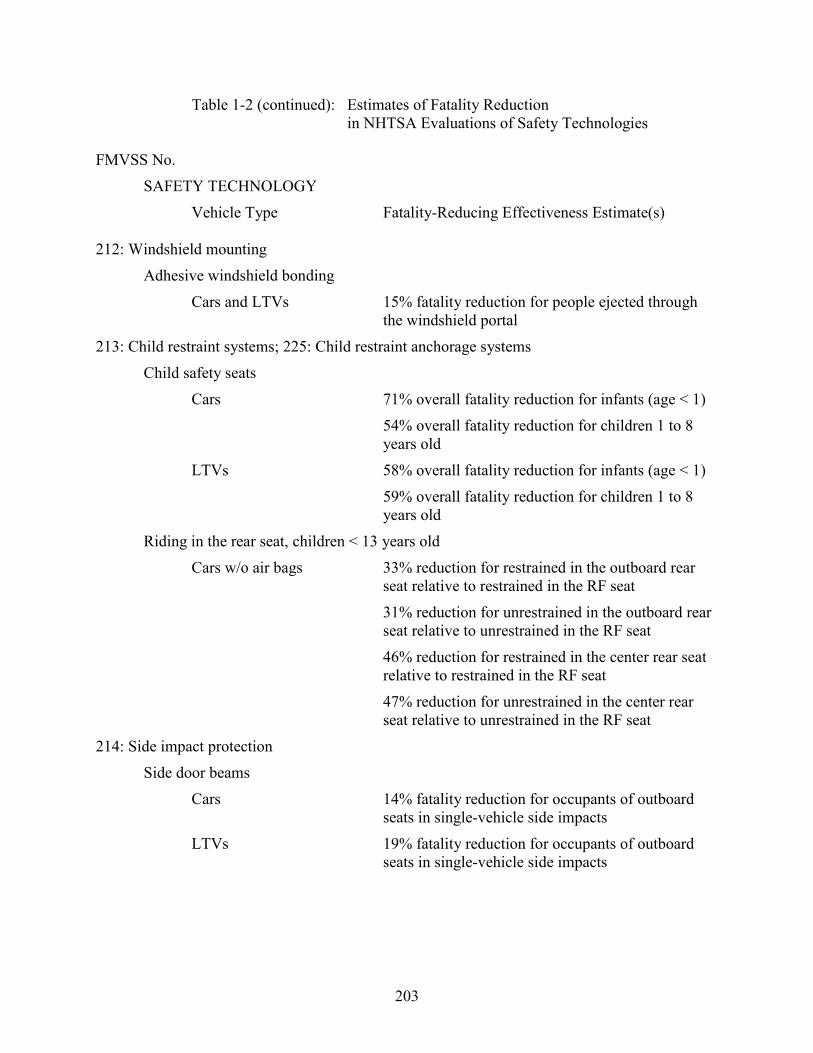
Table 1-2 (continued): Estimates of Fatality Reduction in NHTSA Evaluations of Safety Technologies FMVSS No.
SAFETY TECHNOLOGY
Vehicle Type Fatality-Reducing Effectiveness Estimate(s)
203
212: Windshield mounting
Adhesive windshield bonding
Cars and LTVs 15% fatality reduction for people ejected through the windshield portal
213: Child restraint systems; 225: Child restraint anchorage systems
Child safety seats
Cars 71% overall fatality reduction for infants (age < 1)
54% overall fatality reduction for children 1 to 8 years old
LTVs 58% overall fatality reduction for infants (age < 1)
59% overall fatality reduction for children 1 to 8 years old
Riding in the rear seat, children < 13 years old
Cars w/o air bags 33% reduction for restrained in the outboard rear seat relative to restrained in the RF seat
31% reduction for unrestrained in the outboard rear seat relative to unrestrained in the RF seat
46% reduction for restrained in the center rear seat relative to restrained in the RF seat
47% reduction for unrestrained in the center rear seat relative to unrestrained in the RF seat
214: Side impact protection
Side door beams
Cars 14% fatality reduction for occupants of outboard seats in single-vehicle side impacts
LTVs 19% fatality reduction for occupants of outboard seats in single-vehicle side impacts
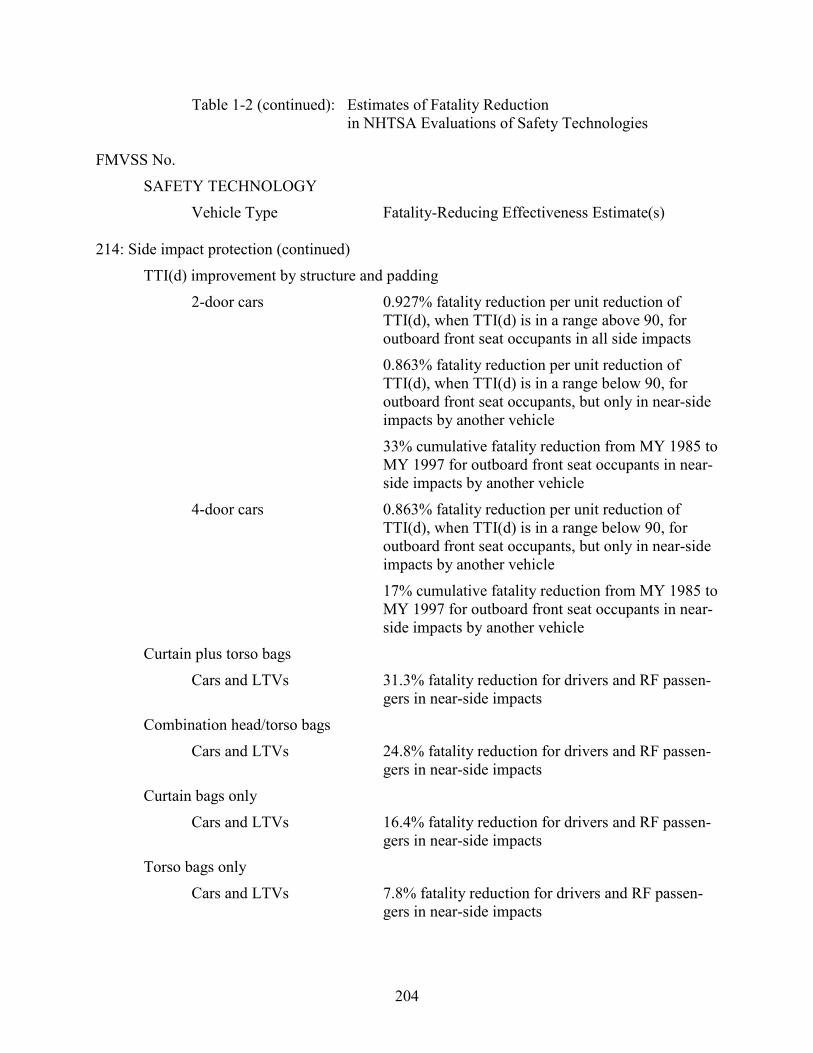
Table 1-2 (continued): Estimates of Fatality Reduction in NHTSA Evaluations of Safety Technologies FMVSS No.
SAFETY TECHNOLOGY
Vehicle Type Fatality-Reducing Effectiveness Estimate(s)
204
214: Side impact protection (continued)
TTI(d) improvement by structure and padding
2-door cars 0.927% fatality reduction per unit reduction of TTI(d), when TTI(d) is in a range above 90, for outboard front seat occupants in all side impacts
0.863% fatality reduction per unit reduction of TTI(d), when TTI(d) is in a range below 90, for outboard front seat occupants, but only in near-side impacts by another vehicle
33% cumulative fatality reduction from MY 1985 to MY 1997 for outboard front seat occupants in near-side impacts by another vehicle
4-door cars 0.863% fatality reduction per unit reduction of TTI(d), when TTI(d) is in a range below 90, for outboard front seat occupants, but only in near-side impacts by another vehicle
17% cumulative fatality reduction from MY 1985 to MY 1997 for outboard front seat occupants in near-side impacts by another vehicle
Curtain plus torso bags
Cars and LTVs 31.3% fatality reduction for drivers and RF passen-gers in near-side impacts
Combination head/torso bags
Cars and LTVs 24.8% fatality reduction for drivers and RF passen-gers in near-side impacts
Curtain bags only
Cars and LTVs 16.4% fatality reduction for drivers and RF passen-gers in near-side impacts
Torso bags only
Cars and LTVs 7.8% fatality reduction for drivers and RF passen-gers in near-side impacts
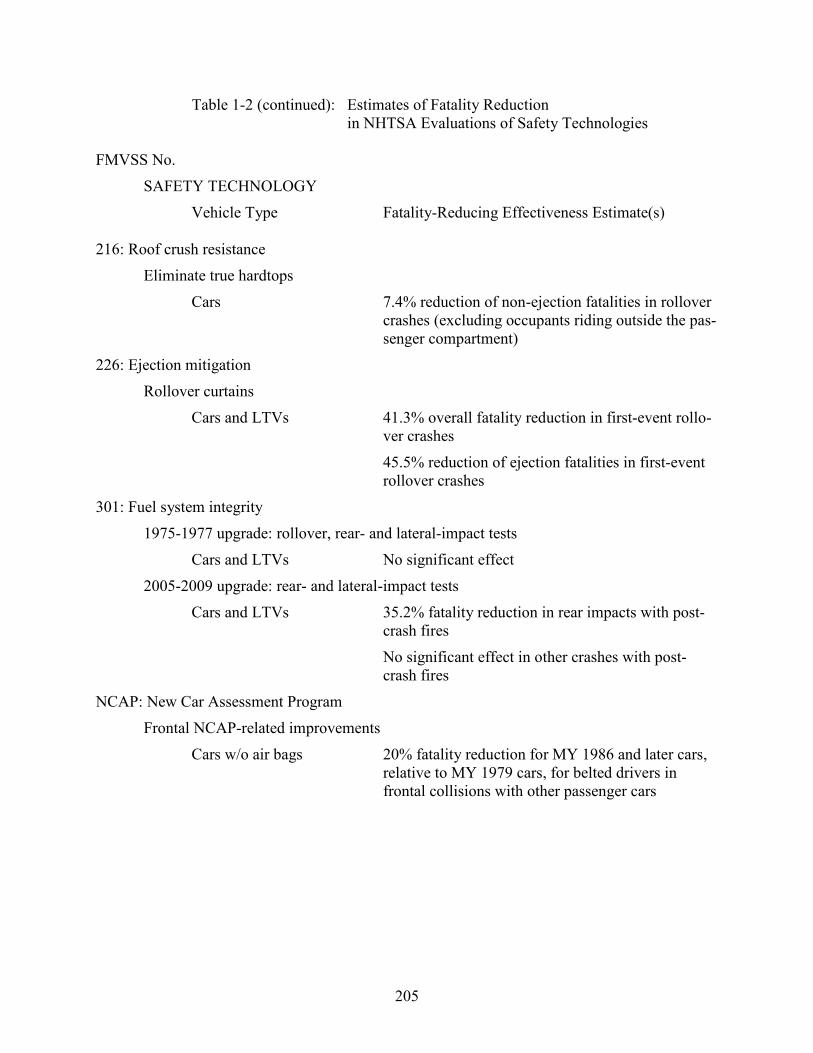
Table 1-2 (continued): Estimates of Fatality Reduction in NHTSA Evaluations of Safety Technologies FMVSS No.
SAFETY TECHNOLOGY
Vehicle Type Fatality-Reducing Effectiveness Estimate(s)
205
216: Roof crush resistance
Eliminate true hardtops
Cars 7.4% reduction of non-ejection fatalities in rollover crashes (excluding occupants riding outside the pas-senger compartment)
226: Ejection mitigation
Rollover curtains
Cars and LTVs 41.3% overall fatality reduction in first-event rollo-ver crashes
45.5% reduction of ejection fatalities in first-event rollover crashes
301: Fuel system integrity
1975-1977 upgrade: rollover, rear- and lateral-impact tests
Cars and LTVs No significant effect
2005-2009 upgrade: rear- and lateral-impact tests
Cars and LTVs 35.2% fatality reduction in rear impacts with post-crash fires
No significant effect in other crashes with post-crash fires
NCAP: New Car Assessment Program
Frontal NCAP-related improvements
Cars w/o air bags 20% fatality reduction for MY 1986 and later cars, relative to MY 1979 cars, for belted drivers in frontal collisions with other passenger cars
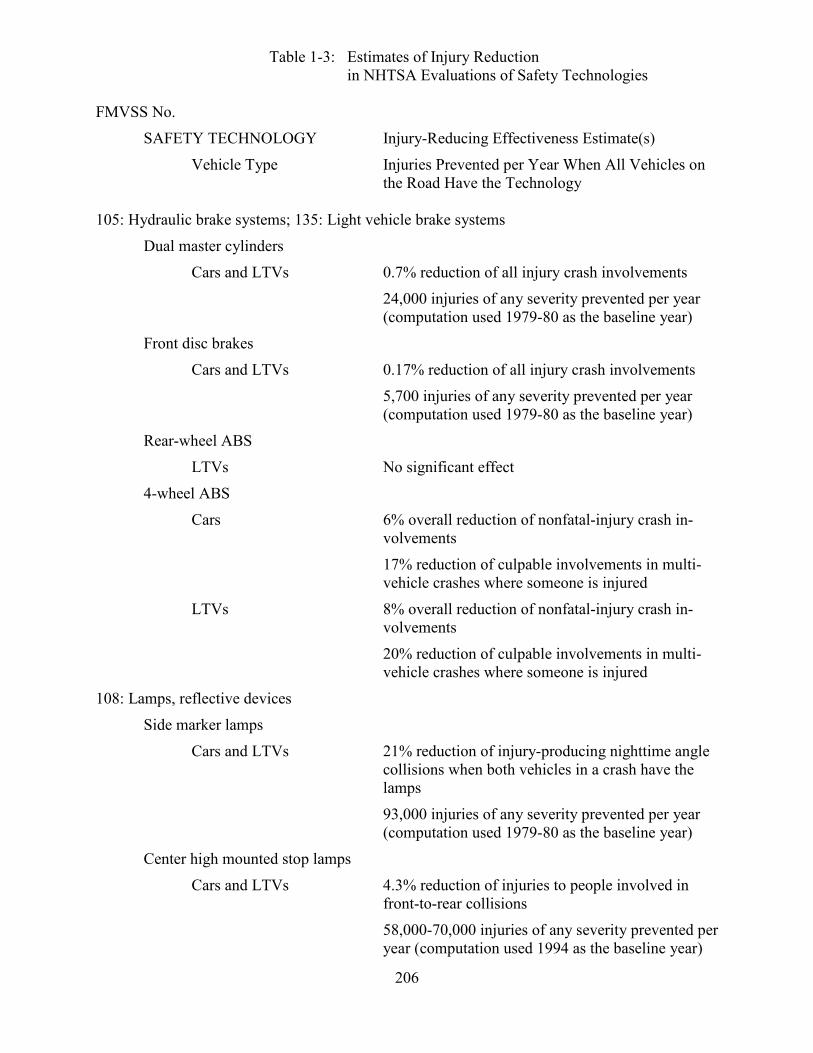
Table 1-3: Estimates of Injury Reduction in NHTSA Evaluations of Safety Technologies FMVSS No.
SAFETY TECHNOLOGY Injury-Reducing Effectiveness Estimate(s)
Vehicle Type Injuries Prevented per Year When All Vehicles on the Road Have the Technology
206
105: Hydraulic brake systems; 135: Light vehicle brake systems
Dual master cylinders
Cars and LTVs 0.7% reduction of all injury crash involvements
24,000 injuries of any severity prevented per year (computation used 1979-80 as the baseline year)
Front disc brakes
Cars and LTVs 0.17% reduction of all injury crash involvements
5,700 injuries of any severity prevented per year (computation used 1979-80 as the baseline year)
Rear-wheel ABS
LTVs No significant effect
4-wheel ABS
Cars 6% overall reduction of nonfatal-injury crash in-volvements
17% reduction of culpable involvements in multi-vehicle crashes where someone is injured
LTVs 8% overall reduction of nonfatal-injury crash in-volvements
20% reduction of culpable involvements in multi-vehicle crashes where someone is injured
108: Lamps, reflective devices
Side marker lamps
Cars and LTVs 21% reduction of injury-producing nighttime angle collisions when both vehicles in a crash have the lamps
93,000 injuries of any severity prevented per year (computation used 1979-80 as the baseline year)
Center high mounted stop lamps
Cars and LTVs 4.3% reduction of injuries to people involved in front-to-rear collisions
58,000-70,000 injuries of any severity prevented per year (computation used 1994 as the baseline year)

Table 1-3 (continued): Estimates of Injury Reduction in NHTSA Evaluations of Safety Technologies FMVSS No.
SAFETY TECHNOLOGY Injury-Reducing Effectiveness Estimate(s)
Vehicle Type Injuries Prevented per Year When All Vehicles on the Road Have the Technology
207
108: Lamps, reflective devices (continued)
Retroreflective tape
Heavy trailers 29% reduction of cars and LTVs hitting the side or rear of a heavy trailer in the dark
3,100-5,000 injuries of any severity prevented per year (computation used 2001 as the baseline year)
Daytime running lights
Cars and LTVs No significant effect
Amber rear turn signals
Cars and LTVs 5.3% reduction of injuries to people involved in front-to-rear impacts where the lead vehicle is turn-ing or preparing to turn
121: Air brake systems
ABS for heavy truck-tractors 10% reduction of culpable involvements in multi-vehicle crashes where someone is injured
126: Electronic stability control
Cars 72% reduction of first-event rollovers
45% reduction of fixed-object impacts
13% reduction of culpable involvements in multi-vehicle crashes
LTVs 64% reduction of first-event rollovers
67% reduction of fixed-object impacts
13% reduction of culpable involvements in multi-vehicle crashes
201: Occupant protection in interior impact
Voluntary middle and lower instrument panel improvements
Cars 29% reduction of AIS ≥ 2 injuries from instrument panel contact in frontal crashes, for RF passengers
8,000 AIS ≥ 2 injuries prevented per year (computa-tion used 1982 as the baseline year)
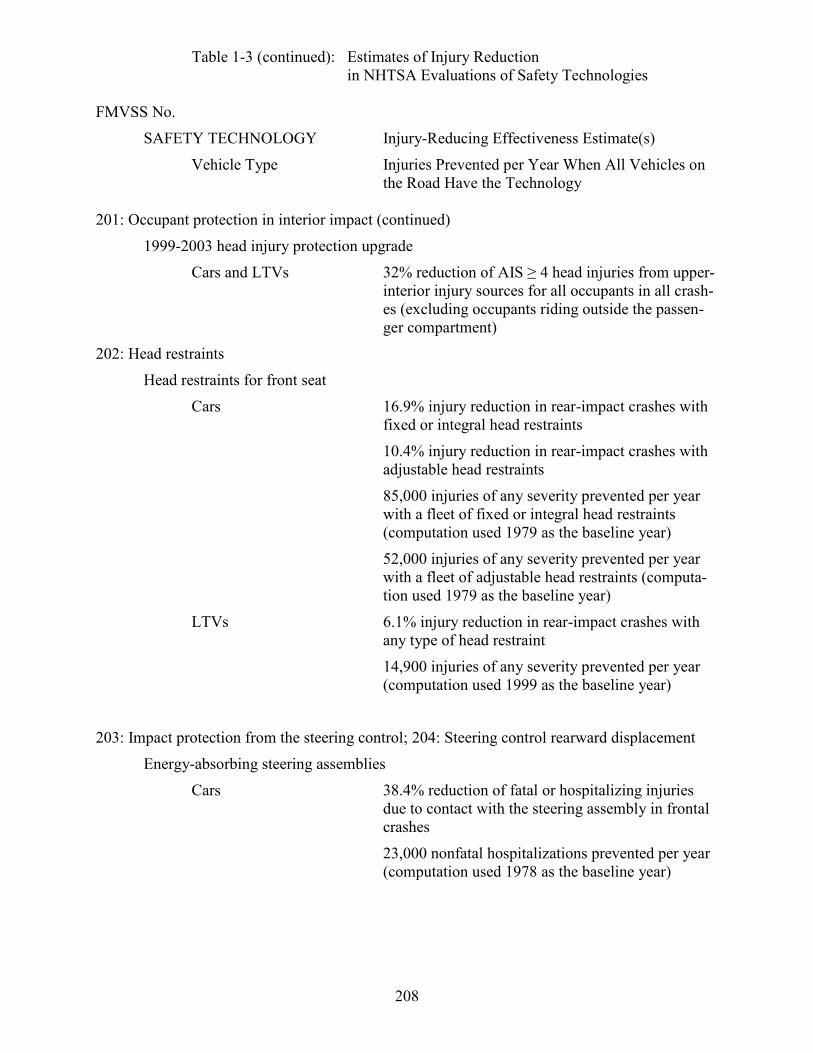
Table 1-3 (continued): Estimates of Injury Reduction in NHTSA Evaluations of Safety Technologies FMVSS No.
SAFETY TECHNOLOGY Injury-Reducing Effectiveness Estimate(s)
Vehicle Type Injuries Prevented per Year When All Vehicles on the Road Have the Technology
208
201: Occupant protection in interior impact (continued)
1999-2003 head injury protection upgrade
Cars and LTVs 32% reduction of AIS ≥ 4 head injuries from upper-interior injury sources for all occupants in all crash-es (excluding occupants riding outside the passen-ger compartment)
202: Head restraints
Head restraints for front seat
Cars 16.9% injury reduction in rear-impact crashes with fixed or integral head restraints
10.4% injury reduction in rear-impact crashes with adjustable head restraints
85,000 injuries of any severity prevented per year with a fleet of fixed or integral head restraints (computation used 1979 as the baseline year)
52,000 injuries of any severity prevented per year with a fleet of adjustable head restraints (computa-tion used 1979 as the baseline year)
LTVs 6.1% injury reduction in rear-impact crashes with any type of head restraint
14,900 injuries of any severity prevented per year (computation used 1999 as the baseline year)
203: Impact protection from the steering control; 204: Steering control rearward displacement
Energy-absorbing steering assemblies
Cars 38.4% reduction of fatal or hospitalizing injuries due to contact with the steering assembly in frontal crashes
23,000 nonfatal hospitalizations prevented per year (computation used 1978 as the baseline year)
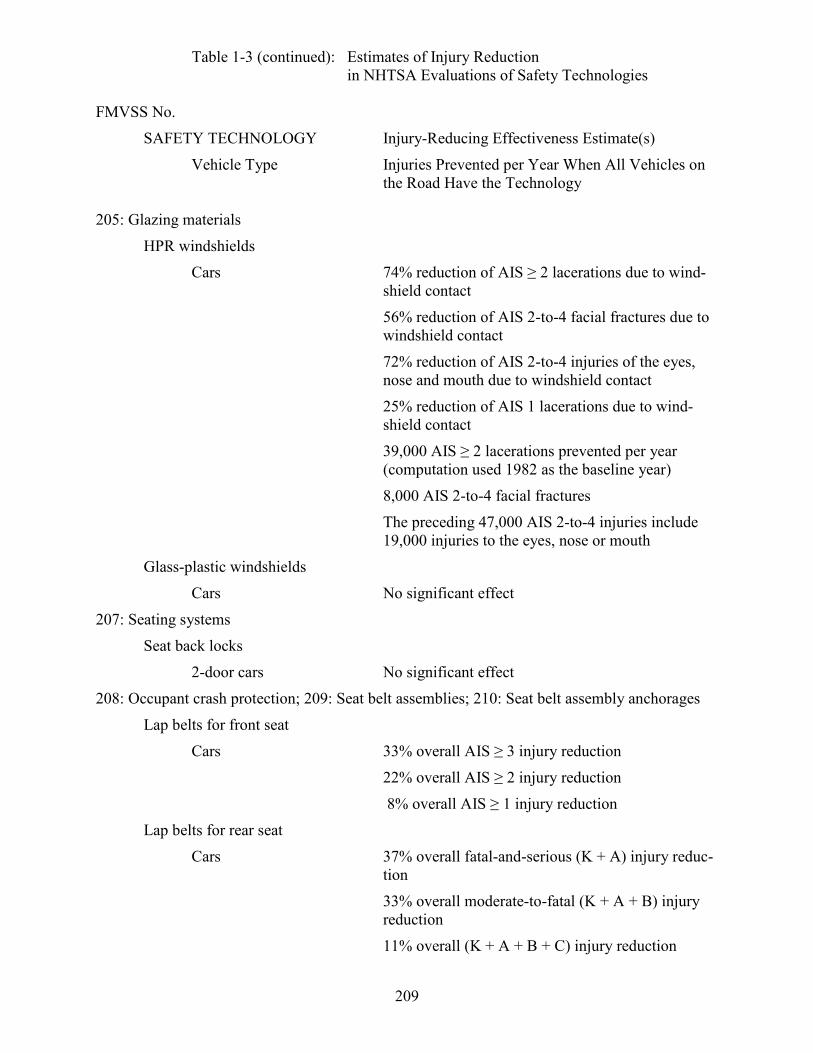
Table 1-3 (continued): Estimates of Injury Reduction in NHTSA Evaluations of Safety Technologies FMVSS No.
SAFETY TECHNOLOGY Injury-Reducing Effectiveness Estimate(s)
Vehicle Type Injuries Prevented per Year When All Vehicles on the Road Have the Technology
209
205: Glazing materials
HPR windshields
Cars 74% reduction of AIS ≥ 2 lacerations due to wind-shield contact
56% reduction of AIS 2-to-4 facial fractures due to windshield contact
72% reduction of AIS 2-to-4 injuries of the eyes, nose and mouth due to windshield contact
25% reduction of AIS 1 lacerations due to wind-shield contact
39,000 AIS ≥ 2 lacerations prevented per year (computation used 1982 as the baseline year)
8,000 AIS 2-to-4 facial fractures
The preceding 47,000 AIS 2-to-4 injuries include 19,000 injuries to the eyes, nose or mouth
Glass-plastic windshields
Cars No significant effect
207: Seating systems
Seat back locks
2-door cars No significant effect
208: Occupant crash protection; 209: Seat belt assemblies; 210: Seat belt assembly anchorages
Lap belts for front seat
Cars 33% overall AIS ≥ 3 injury reduction
22% overall AIS ≥ 2 injury reduction
8% overall AIS ≥ 1 injury reduction
Lap belts for rear seat
Cars 37% overall fatal-and-serious (K + A) injury reduc-tion
33% overall moderate-to-fatal (K + A + B) injury reduction
11% overall (K + A + B + C) injury reduction
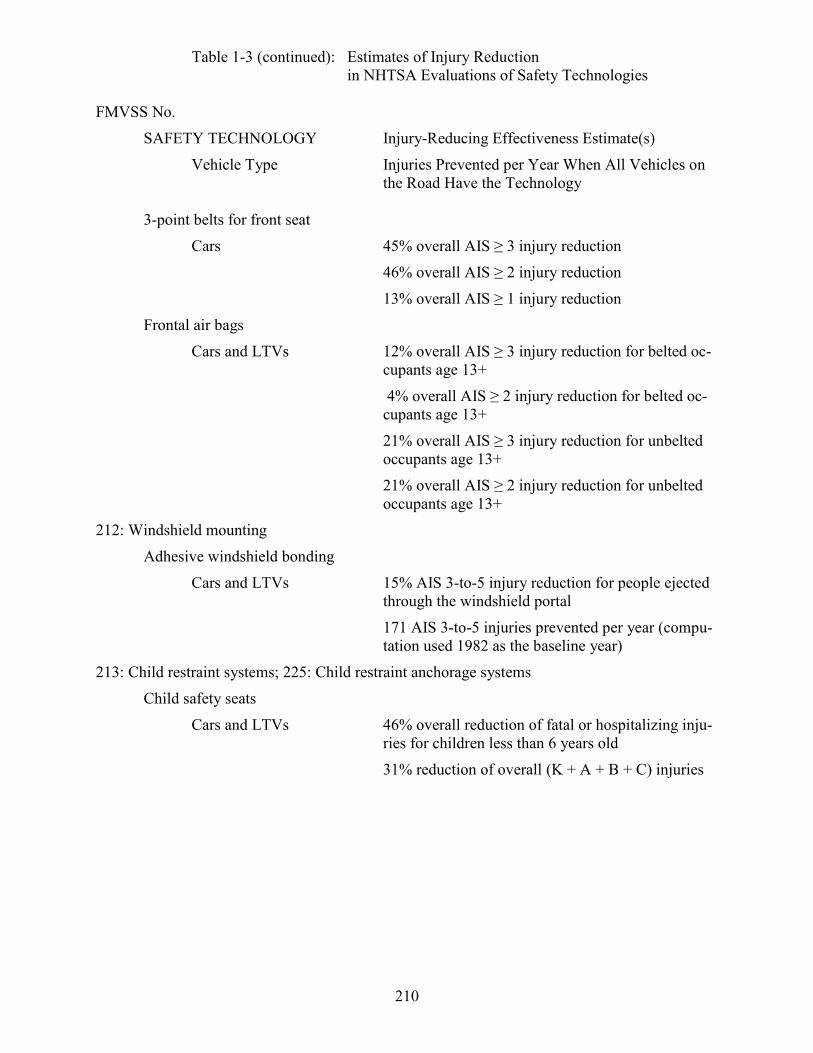
Table 1-3 (continued): Estimates of Injury Reduction in NHTSA Evaluations of Safety Technologies FMVSS No.
SAFETY TECHNOLOGY Injury-Reducing Effectiveness Estimate(s)
Vehicle Type Injuries Prevented per Year When All Vehicles on the Road Have the Technology
210
3-point belts for front seat
Cars 45% overall AIS ≥ 3 injury reduction
46% overall AIS ≥ 2 injury reduction
13% overall AIS ≥ 1 injury reduction
Frontal air bags
Cars and LTVs 12% overall AIS ≥ 3 injury reduction for belted oc-cupants age 13+
4% overall AIS ≥ 2 injury reduction for belted oc-cupants age 13+
21% overall AIS ≥ 3 injury reduction for unbelted occupants age 13+
21% overall AIS ≥ 2 injury reduction for unbelted occupants age 13+
212: Windshield mounting
Adhesive windshield bonding
Cars and LTVs 15% AIS 3-to-5 injury reduction for people ejected through the windshield portal
171 AIS 3-to-5 injuries prevented per year (compu-tation used 1982 as the baseline year)
213: Child restraint systems; 225: Child restraint anchorage systems
Child safety seats
Cars and LTVs 46% overall reduction of fatal or hospitalizing inju-ries for children less than 6 years old
31% reduction of overall (K + A + B + C) injuries
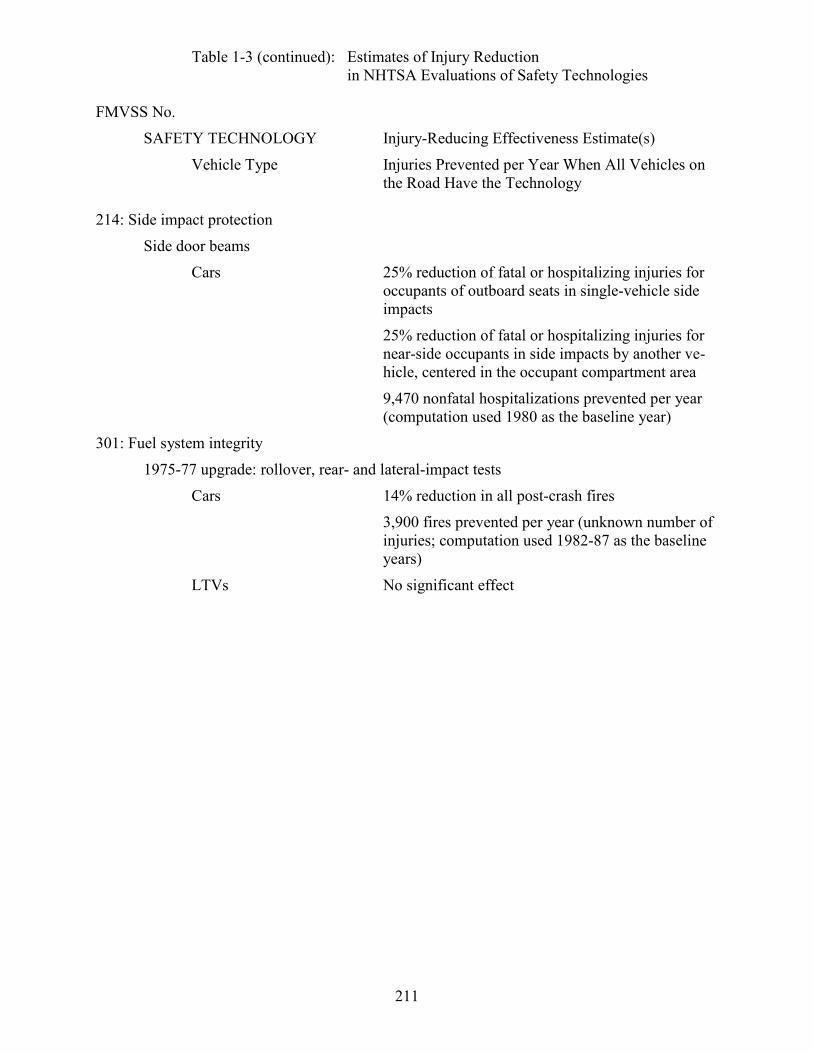
Table 1-3 (continued): Estimates of Injury Reduction in NHTSA Evaluations of Safety Technologies FMVSS No.
SAFETY TECHNOLOGY Injury-Reducing Effectiveness Estimate(s)
Vehicle Type Injuries Prevented per Year When All Vehicles on the Road Have the Technology
211
214: Side impact protection
Side door beams
Cars 25% reduction of fatal or hospitalizing injuries for occupants of outboard seats in single-vehicle side impacts
25% reduction of fatal or hospitalizing injuries for near-side occupants in side impacts by another ve-hicle, centered in the occupant compartment area
9,470 nonfatal hospitalizations prevented per year (computation used 1980 as the baseline year)
301: Fuel system integrity
1975-77 upgrade: rollover, rear- and lateral-impact tests
Cars 14% reduction in all post-crash fires
3,900 fires prevented per year (unknown number of injuries; computation used 1982-87 as the baseline years)
LTVs No significant effect
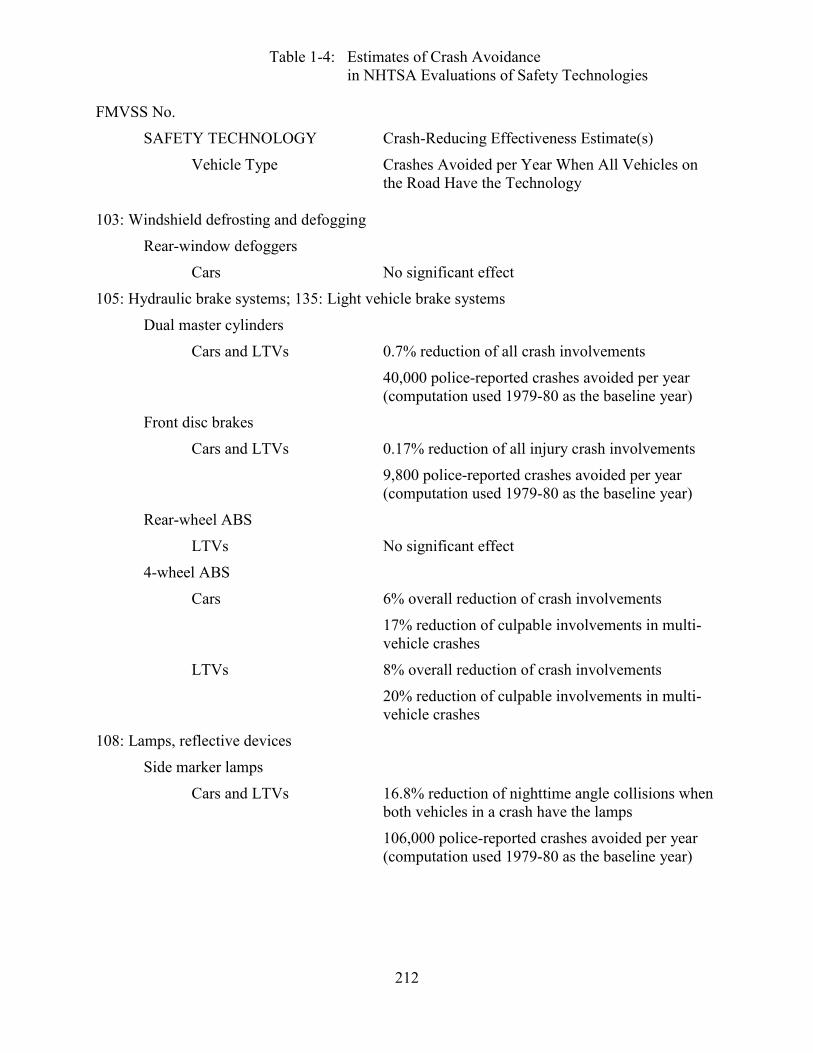
Table 1-4: Estimates of Crash Avoidance in NHTSA Evaluations of Safety Technologies FMVSS No.
SAFETY TECHNOLOGY Crash-Reducing Effectiveness Estimate(s)
Vehicle Type Crashes Avoided per Year When All Vehicles on the Road Have the Technology
212
103: Windshield defrosting and defogging
Rear-window defoggers
Cars No significant effect
105: Hydraulic brake systems; 135: Light vehicle brake systems
Dual master cylinders
Cars and LTVs 0.7% reduction of all crash involvements
40,000 police-reported crashes avoided per year (computation used 1979-80 as the baseline year)
Front disc brakes
Cars and LTVs 0.17% reduction of all injury crash involvements
9,800 police-reported crashes avoided per year (computation used 1979-80 as the baseline year)
Rear-wheel ABS
LTVs No significant effect
4-wheel ABS
Cars 6% overall reduction of crash involvements
17% reduction of culpable involvements in multi-vehicle crashes
LTVs 8% overall reduction of crash involvements
20% reduction of culpable involvements in multi-vehicle crashes
108: Lamps, reflective devices
Side marker lamps
Cars and LTVs 16.8% reduction of nighttime angle collisions when both vehicles in a crash have the lamps
106,000 police-reported crashes avoided per year (computation used 1979-80 as the baseline year)
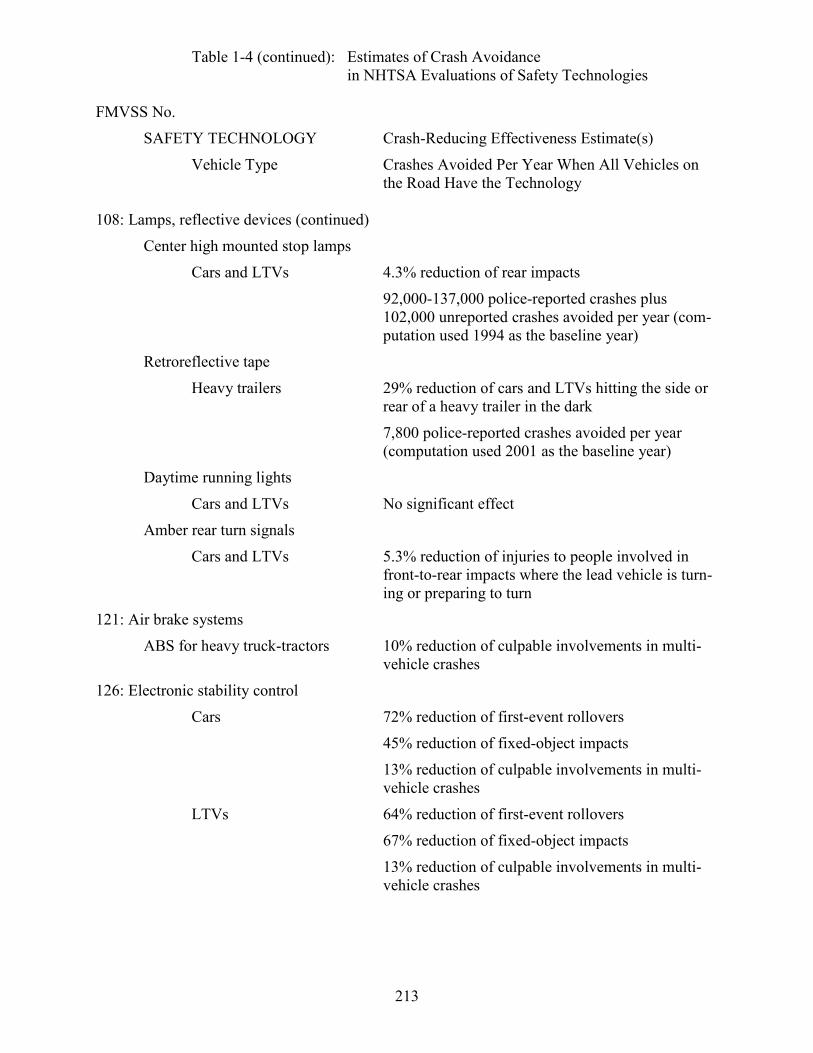
Table 1-4 (continued): Estimates of Crash Avoidance in NHTSA Evaluations of Safety Technologies FMVSS No.
SAFETY TECHNOLOGY Crash-Reducing Effectiveness Estimate(s)
Vehicle Type Crashes Avoided Per Year When All Vehicles on the Road Have the Technology
213
108: Lamps, reflective devices (continued)
Center high mounted stop lamps
Cars and LTVs 4.3% reduction of rear impacts
92,000-137,000 police-reported crashes plus 102,000 unreported crashes avoided per year (com-putation used 1994 as the baseline year)
Retroreflective tape
Heavy trailers 29% reduction of cars and LTVs hitting the side or rear of a heavy trailer in the dark
7,800 police-reported crashes avoided per year (computation used 2001 as the baseline year)
Daytime running lights
Cars and LTVs No significant effect
Amber rear turn signals
Cars and LTVs 5.3% reduction of injuries to people involved in front-to-rear impacts where the lead vehicle is turn-ing or preparing to turn
121: Air brake systems
ABS for heavy truck-tractors 10% reduction of culpable involvements in multi-vehicle crashes
126: Electronic stability control
Cars 72% reduction of first-event rollovers
45% reduction of fixed-object impacts
13% reduction of culpable involvements in multi-vehicle crashes
LTVs 64% reduction of first-event rollovers
67% reduction of fixed-object impacts
13% reduction of culpable involvements in multi-vehicle crashes
214
PART 2
Lives Saved by Vehicle Safety Technologies and Associated Federal Motor Vehicle Safety Standards, 1960 to 2012
Summary of the Estimation Method
From 1960 to 2012, over 2.3 million people died in motor vehicle crashes in the United States. Starting in 1975, FARS has furnished detailed information on over 1.6 millionof these fatality cases. Using FARS data, we have built a model from which we can estimate how many addition-al people would have died had it not been for the vehicle safety technologies affecting passenger cars and LTVs. We can also estimate how many lives have been saved by each technology, year-by-year, from 1960 through 2012. The analysis updates a report issued by NHTSA in 2004 that estimated vehicle safety technologies had saved 328,551 lives from CY 1960 through 2002.572 The estimates are updated through 2012 by incorporating FARS data from 2003 through 2012 into the analysis and by including the effects of safety technologies that NHTSA has evaluated since the previous report.
Each 100 actual fatality cases in FARS represent a potentially even greater number of fatalities that could have happened if the vehicles had not been equipped with any safety technologies. The actual fatality cases are the starting point for a model to estimate the lives saved by vehicle safety technologies. The model is similar to the technique that NHTSA has been using since 1993 to estimate the number of lives saved each year by seat belts, frontal air bags and child safety seats.573 That technique is essentially expanded to the other safety standards.
For example, FARS might have records of 100 driver fatalities, wearing seat belts, in MY 2001 cars equipped with frontal air bags, in frontal multivehicle crashes with primary impact point 12 o’clock (i.e., directly frontal). The NHTSA evaluations reviewed in Part 1 of this report estimate that frontal air bags reduce fatality risk for belted drivers by 25.3 percent in 12 o’clock frontal crashes. Thus, if the cars had not been equipped with air bags, there would have been not 100 but
100/(1 – .253) = 134 potential fatalities.
In other words, the existence of these 100 actual fatality cases with frontal air bags in FARS im-plies that the MY 2001 vehicles were involved in 134 crashes potentially fatal to their drivers. However, 34 of those potentially fatal crashes did not become FARS fatality cases because the air bag saved the driver’s life.
572 Kahane (2004, October). 573 Traffic safety facts 2012 data – Occupant protection; Kahane (1996, August), pp. 19-20; Glassbrenner, D., & Starnes, M. (2009, December). Lives saved calculations for seat belts and frontal air bags. (Report No. DOT HS 811 206). Washington, DC: National Highway Traffic Safety Administration. Available at www-nrd.nhtsa.dot.gov/Pubs/811206.pdf.
215
Three-point belts reduce drivers’ fatality risk by an estimated 42 percent in multivehicle frontal impacts. If seat belts as well as air bags had been removed from those cars, the number of poten-tial fatalities would have increased from 134 to
134/(1 – .42) = 231 potential fatalities.
That implies the use of seat belts saved 231 – 134 = 97 lives. But the benefits of the safety tech-nologies do not stop here. Even after stripping the air bags and 3-point belts, these MY 2001 cars would still have had energy-absorbing steering assemblies to protect their drivers. Those assem-blies reduce drivers’ fatality risk in frontal collisions by an estimated 12.1 percent. If the energy-absorbing steering assemblies in these cars had been replaced by pre-1968 rigid columns, there would have been not 231 but
231/(1 – .121) = 263 potential fatalities.
The energy-absorbing columns saved an implicit 263 – 231 = 32 lives. The 100 actual fatality cases in FARS imply the existence of 263 potentially fatal crash cases. They imply that the three safety technologies (frontal air bags, seat belts, energy-absorbing columns) saved a combined total of 163 lives: 34 by frontal air bags, 97 by seat belts and 32 by energy-absorbing columns.
The process works the same in reverse: consider a population of MY 1966 cars, not equipped with energy-absorbing columns, 3-point belts or frontal air bags, involved in 12 o’clock frontal multivehicle crashes, resulting in fatalities to 263 drivers. If these cars had been equipped with energy-absorbing columns (introduced in 1967 to 1968) but not yet 3-point belts (introduced primarily in 1974) or frontal air bags (introduced in 1985 to 1997), the columns would have re-duced the fatalities by 12.1 percent, from 263 to 231. If, in addition, the cars had been equipped with 3-point belts and the drivers had buckled up, the belts would have reduced those fatalities by 42 percent, from 231 to 134. Finally, the addition of frontal air bags would have reduced the remaining fatalities by 25.3 percent, from 134 to 100.
In other words, the model begins with numbers of actual FARS fatality cases and inflates those numbers step-by-step, using the effectiveness estimates from the NHTSA evaluations document-ed in Part 1 of this report, until all FMVSS and safety technologies relevant to this type of crash have been “removed” from the vehicle – until the vehicle has been downgraded to a level of safety performance characteristic of the 1950s rather than its actual model year. The effects of safety technologies are “removed” in the reverse chronological order that they were historically introduced into vehicles. Starting, say, with an MY 2012 vehicle, we first “remove” the relevant safety device most recently introduced, say in 2006, and downgrade the vehicle to the MY 2005 level of safety; next, the device introduced, say in 1996, diminishing the vehicle to the MY 1995 level, and so on until the vehicle is degraded to 1950s technologies without any of the modern safety devices. At each step into the past, the model tallies the lives [or fractions of lives] saved by the latest safety technology – i.e., the additional fatalities that would have occurred if that technology had been removed.
The model produces unbiased estimates of the lives saved by the various technologies, and it is not an exercise in double counting, because each of the effectiveness estimates in Part 1 is based on analyses of vehicles produced just after versus just before the introduction of the technology
216
in question.574 For example, the evaluation of frontal air bags was limited to data on MY 1985 and later cars, some without air bags and some with frontal air bags, but all equipped with 3-point belts and energy-absorbing steering columns. Thus, the above effectiveness estimate is no more than the incremental effect of frontal air bags, given that a car already has energy-absorbing steering columns and that the driver buckled up. Similarly, the effectiveness estimate for 3-point belts was based on MY 1975-to-1986 cars always equipped with energy-absorbing steering columns but almost never with air bags. It measured the incremental effect of belts, giv-en that cars already had the columns, but not air bags. The evaluation of energy-absorbing steer-ing columns was limited to data on MY 1966-to-1968 cars, without air bags or 3-point belts, and measured the effect of the column for an (almost always) unrestrained driver of a pre-standard car. In other words, these effectiveness estimates are each incremental, and may be applied in sequence, as shown above, to estimate the total fatality reduction for the combination of the three technologies.575
One factor that simplifies the model is that in most cases only a few technologies apply to any specific crash situation. For example, the energy-absorbing steering column only benefits drivers in frontal crashes, and its effect will never need to be combined with, say, the benefit of rear seat belts. In addition, the safety technologies that have little or no effect on fatalities (even though they significantly reduced nonfatal injuries or crashes), such as head restraints or CHMSL, do not need to be addressed in this model.
The model requires enough information about each FARS case of an occupant fatality in a pas-senger car or LTV to determine which safety technologies were present in the vehicle, and what effect, if any, each of these technologies would have had, given the type of crash and the type of occupant. In other words, the following data elements are needed to apply the model to an indi-vidual fatality case.
Vehicle • Vehicle type: car or LTV (pickup, SUV, CUV, minivan or full-size van) • Model year • Make-model, if possible • Impact locations – principal and initial • Most harmful event
Occupant • Seating position • Age • Restraint system use • Was the occupant ejected?
574 Even though the analyses are based on vehicles produced just after versus just before the FMVSS, they usually include crashes involving these vehicles over a number of calendar years after the FMVSS. Specifically, in the case of crash avoidance standards, vehicles have been on the road long enough for drivers to adapt to the technologies, if that is an issue. 575 Kahane (1996, August), pp. 7-9; Kahane (2000, December), pp. 5-10; Kahane, (1981, January), pp. 197-203.
217
Crash • Calendar year • Single- or multivehicle • First harmful event/manner of collision • Light condition
Crash avoidance technologies are more complicated because their life-saving benefits are not limited to the occupants of the vehicles equipped with them. Dual master cylinders and front disc brakes in passenger cars and LTVs benefit not only the occupants of the vehicles equipped with these technologies but also the pedestrians, bicyclists and motorcyclists who are not struck by those vehicles as a result of their safety contributions; ESC in cars and LTVs also similarly bene-fits motorcyclists. Conspicuity tape has only been installed on heavy truck trailers, but it saves occupants of cars and LTVs who, as a consequence, do not strike the trailers. This “full” ac-counting of the benefits of the FMVSS and other safety technologies for cars and LTVs includes not only the lives saved in cars and LTVs by car/LTV technologies or child safety seats (which turn out to be 99 percent of the total), but also the non-occupants and motorcyclists saved by car/LTV technologies and the car/LTV occupants saved by technologies in other vehicles (heavy trailers) – any technology where cars/LTVs produce and/or receive benefits. For that purpose it is necessary to know, for each non-occupant or motorcyclist fatality, the model year/type of the vehicle that struck it, and for each car/LTV occupant fatality in impacts with heavy trucks, the model year and impact location on the heavy truck, and the light conditions at the time of the crash.
The model does not address the benefits of safety technologies in vehicles other than cars and LTVs aside from the benefits to occupants of the cars/LTVs struck by those other vehicles. For example, it does not include motorcyclist lives saved by motorcycle helmets.
The model also does not estimate fatality reductions (or increases) due to shifts between existing vehicle types or seating positions such as: between cars and LTVs, large cars and small cars, 2-door and 4-door cars, or between the front seat and the rear seat. They are not “new safety tech-nologies” but merely shifts between existing vehicle designs. However, the effects of these shifts on safety may account for some of the year-to-year changes in the “base” of actual and potential fatalities.
The model consists of three principal sections:
Preprocessor to adjust for missing data elements: As listed above, the model requires complete information for a core group of data elements to determine which safety equipment was in the case vehicle and the effect, if any, this equipment had on fatality risk, given the type of crash, the occupant’s seat position, and other factors. However, FARS cases may have “unknown” codes for one or more of these data elements, in which case the original FARS data need to be trans-formed to a file that has complete information on the core data elements and whose case weights add up to the same number of fatalities as in the original file. There are two strategies to adjust for missing data:
• Vehicle type and vehicle model year are rarely missing. In the well under 1 percent of occupant fatality cases where they are missing, the remaining data elements rarely pro-
218
vide clues for an educated guess at the vehicle type or model year. The strategy here is to omit the cases with missing data and to give the leftover cases a weight factor slightly higher than 1 so that their weights add up to the original fatality total.
• More frequently unknown are the vehicle impact location/crash type (2% of car/LTV oc-cupant fatalities), occupant seating position (2%), and restraint use (14%). Other varia-bles and knowledge of their typical distributions can help to determine, case-by-case, the likely distributions of the unknowns. For example, if the “manner of collision” is front-to-rear (multivehicle), the impact location/crash type is most likely a frontal or a rear im-pact and unlikely to be a side impact or rollover. If the most harmful event is a collision with a tree, the impact location is very likely frontal, possibly a side impact, but unlikely to be a rear impact. A passenger with unknown seating position was more likely to have been in the rear seat if he or she was a child than if an adult and more likely to have oc-cupied an “unenclosed part of the vehicle” if the vehicle was a pickup truck than if it was a minivan. An adult with unknown restraint use from a crash that happened in 2012 was more likely to have been belted than if the crash happened in 1980.
Several regression analyses estimate the distribution of impact type, seating position and belt use as a function of other core variables, based on the calibration dataset of cases with known values on all the core variables. For example, when the fatality is a non-ejected driver 50 or older, the vehicle is a passenger car, and the first harmful event is an impact with a tree or highway sign, the distribution of these fatalities by impact type is 76 percent frontal, 19 percent side, 3 percent rollover and 2 percent rear/other. The strategy here is to replace the FARS fatality case of the 50+ year-old car driver who hit a tree with unknown vehicle-impact location by four new cases, each of which retain the values of the other core variables: one with a frontal impact, one with a side impact, one rollover and one rear/other impact. If the original case had a weight factor of 1, the new cases will have weight factors of .76, .19, .03, and .01, respectively.
The two strategies generate a file of fatality cases with non-missing values on all the core varia-bles. Data inconsistencies are also corrected – e.g., “lap and shoulder belts used” is changed to “lap belt used” if a seat was only equipped with lap belts.
Calculation of lives saved, 1975-2012: The model runs through each of the actual fatality cases and removes the safety technologies from the vehicle in the reverse chronological order that they were implemented in the fleet, inflating the case weight factor as each technology is removed. In the example at the beginning of this discussion, if the case of the belted driver fatality in the MY 2001 car in a directly frontal, multivehicle crash has a case weight of 1, that case weight would have been inflated to 1.34 after removing the frontal air bag, 2.31 after removing the seat belts, and 2.63 after removing the energy-absorbing column, because the combination of energy-absorbing columns, seat belts and frontal air bags are estimated to reduce 2.63 fatalities to 1 fa-tality in this type of crash. Thus, this actual fatality case contributes evidence of .34 lives saved by air bags, .97 by seat belts and .32 by energy-absorbing columns, totaling up to 1.63 lives saved by all the technologies. Benefits are summed and tabulated by technology (sometimes grouped by associated FMVSS), by vehicle type, by CY, and by whether the technology was compliant with a standard already in effect or was voluntarily furnished by the manufacturer at the time the vehicle was built.
219
The chronological order of the safety technologies is based on their median installation (or im-plementation) years, generally the first model year in which 50 percent or more of new vehicles were equipped with the technology (but in a few cases, such as child safety seats, the first CY in which the use rate reached 50%). Table 2-1 shows the chronological order of the 31 safety im-provements for passenger cars that NHTSA has evaluated to date and the analysis showed a sta-tistically significant reduction of fatality risk.
Table C-1 in Appendix C of this report shows the percentages of new cars, in each model year, equipped with the various technologies. It pinpoints (in bold red print) the median installation year. For example, lap belts for outboard front seat occupants were offered on some new cars as early as 1956, and were required on all new cars after FMVSS No. 208 took effect on January 1, 1968. However, NCSS and NASS data show that 1962 is the first MY in which 50 percent of new cars [involved in towaway crashes] were equipped with lap belts. A description, regulatory history and effectiveness estimate for every safety improvement in Table 2-1 may be found in Part 1 of this report, within the chapter whose FMVSS number matches the code number for that technology (or in the “NCAP” chapter).
NHTSA’s initial safety standards took effect on January 1, 1968, but the manufacturers had al-ready implemented some of the safety technologies several years earlier. Three-point seat belts and side door beams were the major innovations of the 1970s. Frontal air bags and the side-impact upgrade by structure and padding highlighted improvements in the 1990s. Major technol-ogies reaching 50 percent of the new-car market between 2000 and 2010 include the head-impact upgrade, curtain and side air bags, seat belt pretensioners/load limiters, and ESC.
Three subsequent enhancements to frontal air bags – manual on-off switches, the 1998-to-1999 redesign (sled-certification), and advanced air bags (automatic suppression or low-risk deploy-ment) – are treated by the model’s chronological listing as if they are parts of a single technolo-gy, frontal air bags, whose median installation year was 1992. After the model estimates the number of lives saved by frontal air bags, it then allocates those savings to first-generation, rede-signed, or advanced air bags and also computes the effects of on-off switches on fatalities. Simi-larly, the model treats curtain and side air bags as a single technology in the chronological list-ing, but then separately calculates lives saved for the various types of side air bags.
Two of the 31 technologies are not applied to the cars themselves. Child safety seats are add-on equipment and conspicuity tape is applied to heavy trailers to help car drivers see the trailers at night and avoid collisions with them. For these two, rather than a median installation year, Table 2-1 identifies a median implementation year: the first CY when over 50 percent of children 4 or younger rode in safety seats (1985), and the first CY when over 50 percent of heavy trailers on the road were treated with tape (1996).
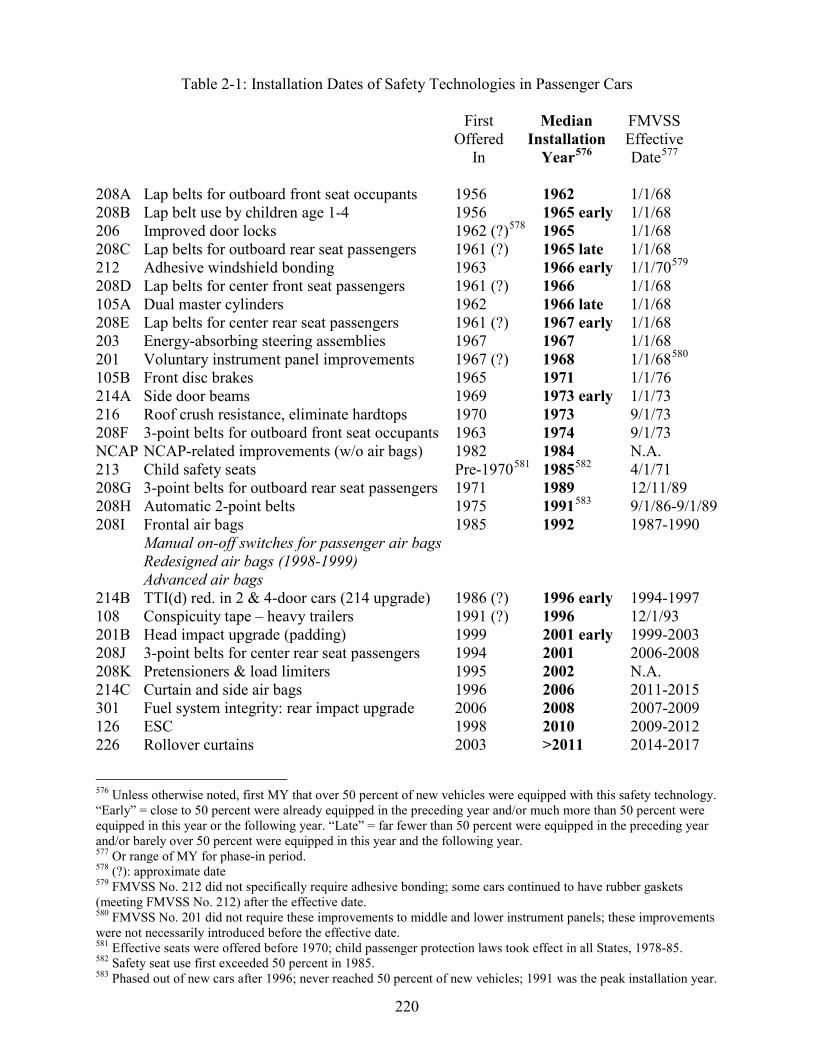
220
Table 2-1: Installation Dates of Safety Technologies in Passenger Cars First Median FMVSS Offered Installation Effective In Year576 Date577 208A Lap belts for outboard front seat occupants 1956 1962 1/1/68 208B Lap belt use by children age 1-4 1956 1965 early 1/1/68 206 Improved door locks 1962 (?)578 1965 1/1/68 208C Lap belts for outboard rear seat passengers 1961 (?) 1965 late 1/1/68 212 Adhesive windshield bonding 1963 1966 early 1/1/70579 208D Lap belts for center front seat passengers 1961 (?) 1966 1/1/68 105A Dual master cylinders 1962 1966 late 1/1/68 208E Lap belts for center rear seat passengers 1961 (?) 1967 early 1/1/68 203 Energy-absorbing steering assemblies 1967 1967 1/1/68 201 Voluntary instrument panel improvements 1967 (?) 1968 1/1/68580 105B Front disc brakes 1965 1971 1/1/76 214A Side door beams 1969 1973 early 1/1/73 216 Roof crush resistance, eliminate hardtops 1970 1973 9/1/73 208F 3-point belts for outboard front seat occupants 1963 1974 9/1/73 NCAP NCAP-related improvements (w/o air bags) 1982 1984 N.A. 213 Child safety seats Pre-1970581 1985582 4/1/71 208G 3-point belts for outboard rear seat passengers 1971 1989 12/11/89 208H Automatic 2-point belts 1975 1991583 9/1/86-9/1/89 208I Frontal air bags 1985 1992 1987-1990 Manual on-off switches for passenger air bags Redesigned air bags (1998-1999) Advanced air bags 214B TTI(d) red. in 2 & 4-door cars (214 upgrade) 1986 (?) 1996 early 1994-1997 108 Conspicuity tape – heavy trailers 1991 (?) 1996 12/1/93 201B Head impact upgrade (padding) 1999 2001 early 1999-2003 208J 3-point belts for center rear seat passengers 1994 2001 2006-2008 208K Pretensioners & load limiters 1995 2002 N.A. 214C Curtain and side air bags 1996 2006 2011-2015 301 Fuel system integrity: rear impact upgrade 2006 2008 2007-2009 126 ESC 1998 2010 2009-2012 226 Rollover curtains 2003 >2011 2014-2017
576 Unless otherwise noted, first MY that over 50 percent of new vehicles were equipped with this safety technology. “Early” = close to 50 percent were already equipped in the preceding year and/or much more than 50 percent were equipped in this year or the following year. “Late” = far fewer than 50 percent were equipped in the preceding year and/or barely over 50 percent were equipped in this year and the following year. 577 Or range of MY for phase-in period. 578 (?): approximate date 579 FMVSS No. 212 did not specifically require adhesive bonding; some cars continued to have rubber gaskets (meeting FMVSS No. 212) after the effective date. 580 FMVSS No. 201 did not require these improvements to middle and lower instrument panels; these improvements were not necessarily introduced before the effective date. 581 Effective seats were offered before 1970; child passenger protection laws took effect in all States, 1978-85. 582 Safety seat use first exceeded 50 percent in 1985. 583 Phased out of new cars after 1996; never reached 50 percent of new vehicles; 1991 was the peak installation year.
221
“Reverse chronological order” is just one of several general methods that could have been used to allocate lives saved among the safety technologies in those crashes where more than one tech-nology is beneficial (e.g., frontal air bags, seat belts and energy-absorbing steering columns for drivers in frontal crashes). Furthermore, “median installation year” is just one of several specific methods that could have been used to order the standards chronologically. However, in consider-ing other allocation methods or orderings, it is important to note that all methods should produce the same estimate of overall lives saved (the primary objective of this report), only changing the allocation of the lives saved among the individual standards. In the example at the beginning of this section, all methods would agree that the combination of frontal air bags, seat belts, and energy-absorbing steering columns saved 163 lives in the crashes where drivers were protected by all three. They would only differ on how to allocate these 163 lives among air bags, belts, and energy-absorbing columns – a more theoretical issue because these drivers are being saved by the combination of all three devices, and there is no obvious way to pinpoint who was saved by what.
The reverse-chronological method is intuitively straightforward. It views each (at that time) new safety technology as building upon the baseline of previously existing technologies, and it allo-cates to the new technology only the benefits relative to that baseline: it computes how many lives are saved if technology Z is added to cars that already have X and Y. Another advantage is that the effectiveness estimates in NHTSA evaluations are computed on that basis and enter di-rectly into the model this report uses to estimate total lives saved.
A less attractive feature of the reverse-chronological method is that the allocation between tech-nologies depends on their chronological order. In general, moving a standard earlier in the chronological order will increase the benefits allocated to that standard and take some away from the standards that follow (leaving unchanged, however, the total lives saved by the combination of these standards). Two technologies might, in some intuitive way, be equally effective, but the model would allocate more lives saved to the earlier one.
An alternative approach that could allocate independently of chronological order is based on the effectiveness of each technology acting alone. For example, X alone might reduce fatality risk by 30 percent and Y alone by 10 percent. If the combination of X and Y saves 1,000 lives, 750 of them are allocated to X and 250 to Y (based on the ratio of their free-standing effectiveness es-timates). That approach is feasible if there are data on vehicles that have only X and other vehi-cles that have only Y (e.g., seat belts without frontal air bags, and air bags with unrestrained drivers). But it is essentially impossible for most of the non-belt technologies in this report, be-cause they were introduced in nearly all vehicles in the same sequence: first X, then Y. For ex-ample, we know the effectiveness of energy-absorbing columns without frontal air bags, but it is impossible to estimate, from crash data, the effectiveness of air bags without energy-absorbing columns, because there are no vehicles with air bags and rigid columns.
Even within the reverse-chronological method, there are alternatives to using the median installa-tion year. The median year is fine if technologies X and Y were each introduced over relatively short, non-overlapping timeframes – e.g., energy-absorbing steering columns (1967-to-1968) and frontal air bags (1985-to-1996). It also works for the non-belt technologies in Tables 2-1 and 2-2, because even though some technologies were introduced at about the same time, they usually do
222
not apply to the same occupant or crash type – e.g., energy-absorbing steering columns for driv-ers and improved instrument panels for passengers.
A problem arises with seat belts, whose use has gradually increased over the years. Some people began to buckle up long before cars had air bags but others only started a few years ago. Theoret-ically, we should ascertain when each individual started buckling up to decide the “order” of seat belts and frontal air bags for that individual. FARS, however, only tells us if a fatality was belt-ed, but it does not say in what year that person first started buckling up. We only know that 3-point belts became available in all new cars in MY 1974, that most States had buckle-up laws by 1987, and that on-the-road belt use exceeded 50 percent by 1991. Whatever year we use as the “median” implementation year for seat belts, it is before the median installation year for frontal air bags (1992) and after the median installation years for all the early “built-in” safety technolo-gies up to side door beams, preserving the sequence in Table 2-1.
Another issue with the reverse-chronological method is that new technologies may eclipse older technologies to some extent. For example, curtain air bags may have made some of the earlier energy-absorbing padding unnecessary for head impact protection and may even have resulted in removal of some of the padding (see the discussion in the FMVSS Nos. 201 and 214 chapters in Part 1). NHTSA’s evaluations estimate (1) the fatality reduction with curtains (plus whatever padding remains in the vehicle) relative to a vehicle without the curtains but with all the padding needed to certify to FMVSS No. 201; and (2) the fatality reduction with padding relative to a ve-hicle with neither curtains nor padding. The reverse-chronological method first “transforms” a vehicle with curtains into a vehicle without curtains but with FMVSS No. 201 padding; then it “removes” the padding. The “lives saved” model will attribute a benefit to curtains based on ef-fectiveness estimate (1) and a benefit to padding based on estimate (2). This method, in theory, may understate the lives saved by the curtains and overstates lives saved by padding (although the two add up to the right total), because in many cases it is the curtains that cushion the head impacts while the padding is not significantly contacted or is not even in the vehicle at that im-pact location – but it would be difficult to quantify how many of the lives saved should be reallo-cated from the padding to the curtains. Thus, as in the preceding issues, we will stay with the re-verse-chronological method, which directly applies the effectiveness estimates based on the sta-tistical analyses.
Similar situations where new technologies may partially eclipse older ones (although in these cases the older technology remains in the vehicle and usually continues to contribute to the over-all life-saving effect) include:
• Side air bags and the padding introduced to certify to FMVSS No. 214, • Frontal air bags and energy-absorbing steering columns, and • 3-point belts and redesigned mid- and lower instrument panels at the RF seating position.
Here, too, the lives-saved model uses the reverse-chronological method.
NHTSA’s 2004 report, which estimated lives saved from CY 1960 through 2002, only includes 22 of the 31 technologies listed in Table 2-1. Seven of the nine technologies not included in the 2004 report were already available in some production vehicles of MY 2002 or earlier – ESC, curtain and side air bags, the head-impact upgrade of FMVSS No. 201, belt pretensioners and
223
load limiters, manual switches for passenger air bags, redesigned frontal air bags, and rollover curtains – but NHTSA did not yet have estimates of fatality reduction based on crash data. The other two technologies – advanced frontal air bags and the 50 mph rear-impact test for FMVSS No. 301 – were still in the future. Furthermore, the earlier report’s effectiveness estimate for side-impact structures and padding is superseded by a 2007 analysis.
The estimates of lives saved in the current report will be identical to the 2004 report from CY 1960 through 1985. Small differences will begin in 1986: the current model has new estimates of the effects of side-impact structures and padding, improvements that began gradually on a volun-tary basis in MY 1986, even though the upgrade to FMVSS No. 214 did not phase in until MY 1994 to 1997. Because technologies whose effects are included here but not in the earlier report – ESC, curtain and side air bags, etc. – proliferated after 1995, the current model’s estimates of lives saved will become, year by year, progressively somewhat higher than the earlier report’s. The next chapter (“Findings”) will show that the current report estimates 332,459 lives saved cumulative from 1960 through 2002, which is slightly higher than the 328,551 estimated in NHTSA’s 2004 report. CY by CY, the increases range from 8 additional lives saved in 1986 (8,531 in the current report, 8,523 in the 2004 report) to 1,130 in 2002 (25,691 versus 24,561).
These increments in lives saved, however, are not limited to the seven newer safety measures, but will even accrue to some of the 22 original technologies. This can be demonstrated by recon-sidering the earlier example of 100 driver fatalities, wearing seat belts, in MY 2001 cars equipped with frontal air bags, involved in 12 o’clock impacts in multivehicle crashes. The pre-vious model estimated that the 100 actual fatalities corresponded to 263 potential fatalities with-out the FMVSS, of which frontal air bags saved 34 lives, belt use saved 97 lives, and energy-absorbing steering columns saved 32 lives: adding up to 163 lives saved.
But these particular MY 2001 cars were also equipped with ESC (not considered in the previous model) and they were the culpable vehicles in these crash involvements. ESC reduces the risk of culpable involvements in fatal collisions with other vehicles by an estimated 16 percent. If the cars had not been ESC-equipped, there would have been not 100 but
100/(1 – .16) = 119 potential fatalities.
If the cars had also not been equipped with frontal air bags, there would have been not 119 but
119/(1 – .253) = 159 potential fatalities.
If the drivers had not been belted, that would have increased to
159/(1 – .42) = 275 potential fatalities.
If rigid columns had replaced the energy-absorbing steering columns that would have increased to
275/(1 – .121) = 313 potential fatalities.
In other words, the new model will estimate 213 lives saved (i.e., 313 potential minus 100 actual fatalities) rather than 163 lives saved. The new total includes not only the 19 lives saved by ESC,
224
but also 40 rather than 34 lives saved by frontal air bags, 116 rather than 97 lives saved by belts, and 38 rather than 32 lives saved by energy-absorbing steering columns.
Table 2-2 shows the chronological order of the 27 life-saving improvements for LTVs. Table C-3 in Appendix C lists percentages of new LTVs, by MY, equipped with the various technolo-gies, identifying the median installation year in bold red print. The 27 technologies for LTVs are the same improvements as for cars, but excluding
• Automatic belts (never installed in LTVs); • NCAP-related improvements in LTVs without frontal air bags (not evaluated for LTVs);
and • The original FMVSS No. 216, “Roof crush resistance” and the dynamic-test upgrade of
FMVSS No. 214, “Side impact protection.” NHTSA has little evidence that LTVs re-quired or received substantial modifications to meet those regulations.
Many of the earlier FMVSS were not extended to LTVs until several years after they had been in effect for cars. More recently, some technologies became widely available a few years earlier in LTVs than in cars (ESC, rollover curtains) or vice-versa (side air bags, 3-point belts for center rear seats). As a result, the chronological order of the technologies in LTVs is slightly different from cars. In both LTVs and cars, though, 3-point belts for drivers and RF passengers were in-stalled before frontal air bags but after energy-absorbing steering columns and voluntary instru-ment-panel improvements.
Tables C-2 (cars) and C-4 (LTVs) of Appendix C show the percentages of vehicles on the road, by calendar year, equipped with the various safety technologies. There is a multiyear lag from when a safety improvement first appears in new vehicles until the majority of vehicles on the road will have it; older vehicles without the device may continue in service many years before they are retired. As of CY 2012, for example, 95 percent of cars on the road had frontal air bags, but only 42 percent had some kind of curtain or side air bags, and only 20 percent had ESC.
If two technologies were implemented at the same time and benefited the same people in the same types of crashes, there is a danger of double-counting the benefits – i.e., attributing the joint benefit to each of the individual technologies. However, the history of the safety measures, as shown in Tables 2-1 and 2-2 and the analysis methods in most NHTSA evaluations (with control groups) minimize that danger. Major technologies usually came in several years apart, but even when two were introduced at once, they did not benefit the same people because:
• They applied to different seating positions (e.g., front seat belts and rear seat belts); • They applied to different crash types (e.g., side impacts and frontal impacts); • Belt technologies only benefit belted occupants, while other technologies can benefit un-
restrained occupants; or • 100-series FMVSS can be evaluated for their crash avoidance benefits, while 200-series
FMVSS do not have such benefits.
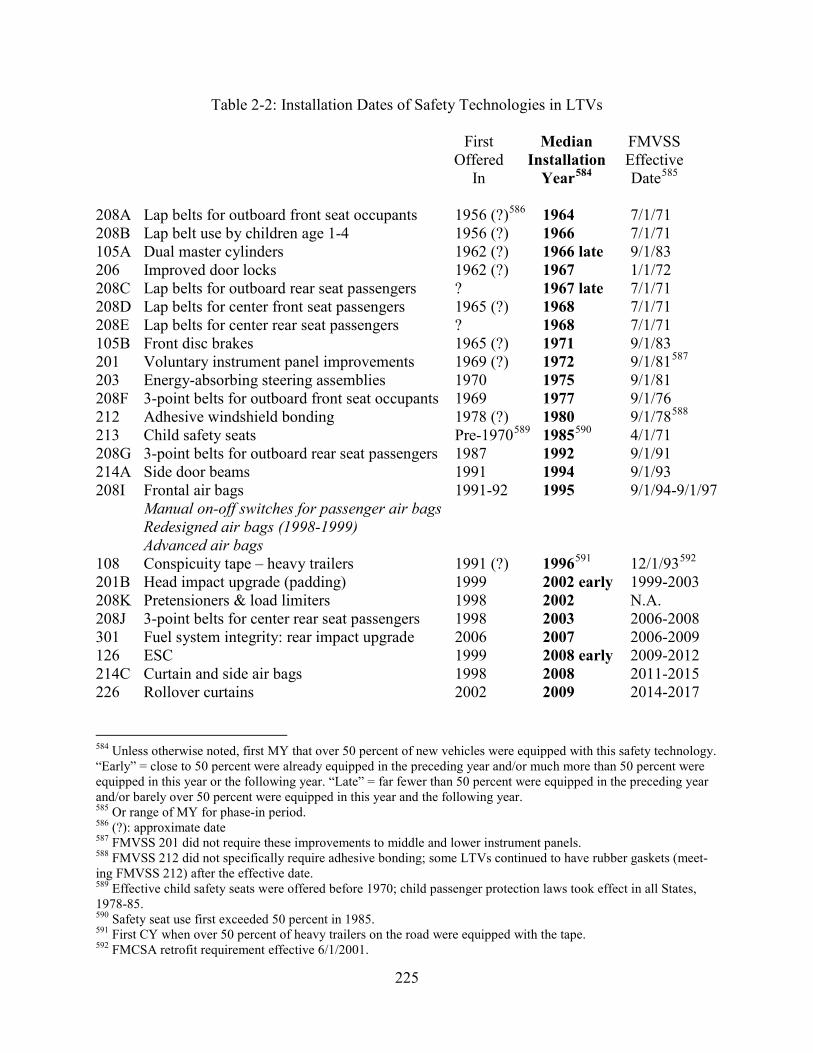
225
Table 2-2: Installation Dates of Safety Technologies in LTVs First Median FMVSS Offered Installation Effective In Year584 Date585 208A Lap belts for outboard front seat occupants 1956 (?)586 1964 7/1/71 208B Lap belt use by children age 1-4 1956 (?) 1966 7/1/71 105A Dual master cylinders 1962 (?) 1966 late 9/1/83 206 Improved door locks 1962 (?) 1967 1/1/72 208C Lap belts for outboard rear seat passengers ? 1967 late 7/1/71 208D Lap belts for center front seat passengers 1965 (?) 1968 7/1/71 208E Lap belts for center rear seat passengers ? 1968 7/1/71 105B Front disc brakes 1965 (?) 1971 9/1/83 201 Voluntary instrument panel improvements 1969 (?) 1972 9/1/81587 203 Energy-absorbing steering assemblies 1970 1975 9/1/81 208F 3-point belts for outboard front seat occupants 1969 1977 9/1/76 212 Adhesive windshield bonding 1978 (?) 1980 9/1/78588 213 Child safety seats Pre-1970589 1985590 4/1/71 208G 3-point belts for outboard rear seat passengers 1987 1992 9/1/91 214A Side door beams 1991 1994 9/1/93 208I Frontal air bags 1991-92 1995 9/1/94-9/1/97 Manual on-off switches for passenger air bags Redesigned air bags (1998-1999) Advanced air bags 108 Conspicuity tape – heavy trailers 1991 (?) 1996591 12/1/93592 201B Head impact upgrade (padding) 1999 2002 early 1999-2003 208K Pretensioners & load limiters 1998 2002 N.A. 208J 3-point belts for center rear seat passengers 1998 2003 2006-2008 301 Fuel system integrity: rear impact upgrade 2006 2007 2006-2009 126 ESC 1999 2008 early 2009-2012 214C Curtain and side air bags 1998 2008 2011-2015 226 Rollover curtains 2002 2009 2014-2017 584 Unless otherwise noted, first MY that over 50 percent of new vehicles were equipped with this safety technology. “Early” = close to 50 percent were already equipped in the preceding year and/or much more than 50 percent were equipped in this year or the following year. “Late” = far fewer than 50 percent were equipped in the preceding year and/or barely over 50 percent were equipped in this year and the following year. 585 Or range of MY for phase-in period. 586 (?): approximate date 587 FMVSS 201 did not require these improvements to middle and lower instrument panels. 588 FMVSS 212 did not specifically require adhesive bonding; some LTVs continued to have rubber gaskets (meet-ing FMVSS 212) after the effective date. 589 Effective child safety seats were offered before 1970; child passenger protection laws took effect in all States, 1978-85. 590 Safety seat use first exceeded 50 percent in 1985. 591 First CY when over 50 percent of heavy trailers on the road were equipped with the tape. 592 FMCSA retrofit requirement effective 6/1/2001.
226
Postprocessor to estimate lives saved in 1960-1974: FARS data only exists from 1975. However, the FMVSS date back to 1968 and some of them incorporate technologies available well before that. The postprocessor extends the estimation model back to the years before FARS existed, specifically 1960 to 1974.
The National Safety Council’s Accident Facts tally the number of fatalities in motor vehicle crashes each year in the United States and apportion the fatalities among car occupants, “truck” occupants, motorcyclists, pedestrians/bicyclists, and several other categories.593 For CY 1975 to 1980, when FARS and Accident Facts are both available, it is possible to compare the total fa-talities for the two data sources (which use slightly different definitions of “motor vehicle crash fatality”) and the number in each category and thereby establish ratios of FARS to Accident Facts case counts. These ratios are applied to the Accident Facts counts for each earlier year to estimate a hypothetical number of FARS fatality cases if FARS had existed that year.
The postprocessor essentially recreates a FARS file for each year from 1960 to 1974, with just the core variables needed to operate the model. It runs these files through the basic model to es-timate how many additional people would have died had it not been for the FMVSS and other vehicle safety technologies affecting passenger cars and LTVs.
The core variables are the number of vehicles in the crash (1, 2+); the vehicle’s impact type (front, side, rollover, rear/other) and MY; and the occupant’s age group (0, 1-4, 5+), seating posi-tion, belt/safety seat use, and ejection status. The joint distribution of the core variables is in-ferred from 1975-to-1980 FARS. Specifically, all the variables except MY, belt use, and safety seat use are assumed to have the same distribution in earlier years as on 1975-to-1980 FARS. The distribution of vehicle age is also assumed not to change, and the distribution of vehicles by model year is obtained by noting that MY = CY – vehicle age.
Belt use depends on the vehicle’s MY and the occupant’s seating position, based on trends seen in 1975-to-1980 FARS data; safety seat use depends on the child’s age and the CY. The various assumptions add uncertainty to this part of the model, but it does not matter so much because, as we shall see, fewer than 3 percent of the lives saved from 1960 to 2012 were saved during 1960 to 1974. A file is created with one cell for each possible combination of values of the core varia-bles, and with cell fatality counts that add up to the number of FARS cases if FARS had existed that year. For example, suppose this process had created a cell count of 100 “would-have-been” FARS cases of unbelted drivers in frontal crashes of MY 1968 cars in CY 1972. All MY 1968 cars were equipped with energy-absorbing steering assemblies that reduce drivers’ fatality risk in frontal collisions by 12.1 percent. If the energy-absorbing steering assemblies in these cars had been re-placed by pre-1968 rigid columns, there would have been not 100 but 100/(1 – .121) = 114 po-tential fatalities. The energy-absorbing columns saved an implicit 114 – 100 = 14 lives in this cell. Appendix A of this report contains step-by-step descriptions of the preprocessor and the main model. It also discusses the auxiliary programs needed to run the model.
593 For example, (1978). Accident facts 1978 edition. Chicago: National Safety Council, pp. 56 and 58.
227
FINDINGS Estimates of lives saved Table 2-3 shows that safety technologies regulated by the FMVSS or introduced on a voluntary basis saved an estimated 613,501 lives during the 53 years from 1960 to 2012. The annual num-ber of lives saved grew from 115 in 1960, when a small number of people used lap belts, to 27,621 in 2012, when most cars and LTVs were equipped with numerous modern safety technol-ogies and belt use on the road achieved 86 percent.594 The number of lives saved grew every year except 1974, 1981 to 1982, and 2008 to 2011 when, among other things, transient phenomena (possibly triggered by an energy crisis, a fuel-price increase, or an economic slowdown) substan-tially reduced baseline crashes from the previous year.
The total of 613,501 includes 65,563 lives saved by voluntary improvements and 547,938 saved by technologies compliant with FMVSS that were in effect at the time. “Voluntary” improve-ments include those introduced before the actual effective date of a FMVSS (e.g., energy-absorbing steering assemblies before January 1, 1968) and distinct technologies that were never required for meeting a FMVSS (such as belt pretensioners and load limiters).
On the other hand, technologies compliant with a specific FMVSS in effect at the time are cred-ited in Table 2-3 to the “FMVSS in effect,” even if the manufacturer selected a technology that excelled the minimum requirements of the FMVSS. For example, lives saved by a frontal air bag in a 1998 car are credited to the air bag FMVSS, regardless of whether that car scored a HIC of 1000 (the minimum requirement) or 200 (exceptionally good performance) on the FMVSS No. 208 test. The number of lives saved is computed from fatality-reducing effectiveness estimates based on statistical analyses of crash data involving production vehicles as actually equipped. In almost all cases, the statistical analyses did not (and could not) differentiate between the basic benefit of minimally complying with a FMVSS and the additional benefits when actual vehicles excelled the minimum requirements. Thus, both benefits are included in “FMVSS in effect” col-umn of Table 2-3 and subsequent tables – but it is implicit that these columns may include por-tions, of unknown magnitude, that are also voluntary in a sense.
Furthermore, if the FMVSS was phased in over several model years (the customary NHTSA practice since the mid-1980s), the beginning of the phase-in is considered the “actual effective date of the FMVSS” in these computations.
594 Every number in Tables 2-3 through 2-54 has been rounded to the nearest integer to make it look like counts of people, even though the lives-saved model can generate fractions of lives saved. Because of the rounding, the col-umns of printed numbers might not always add exactly to the totals at the ends of tables.
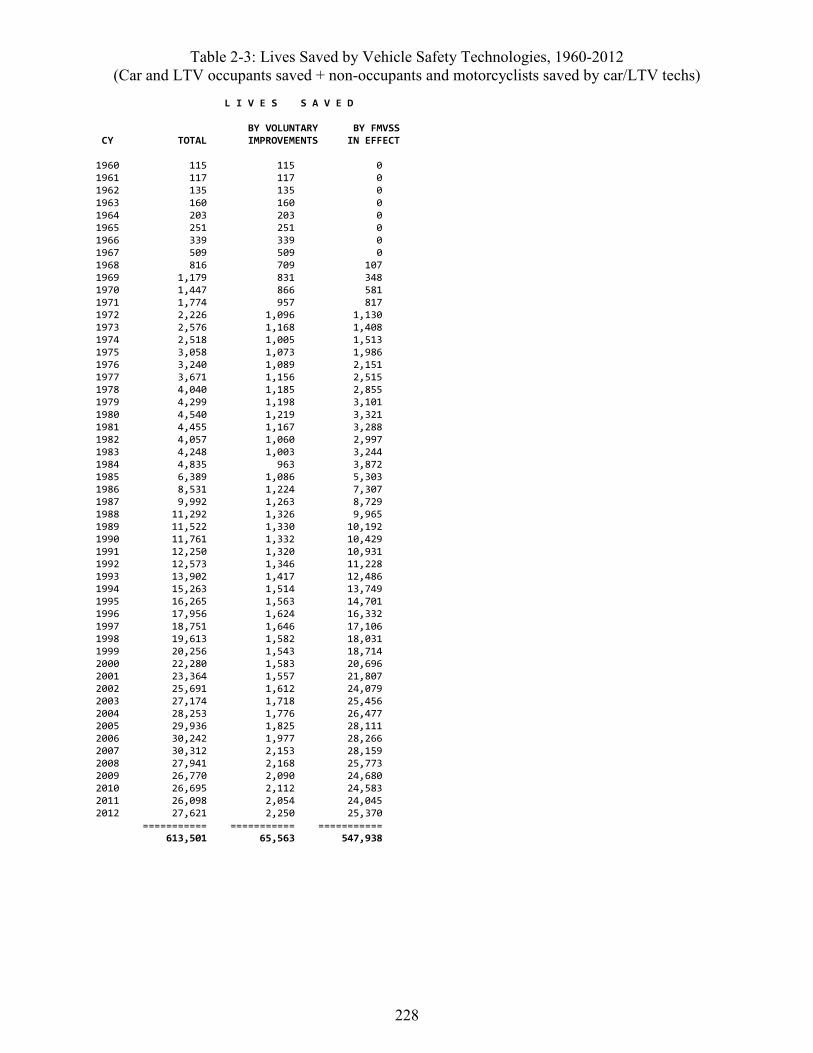
228
Table 2-3: Lives Saved by Vehicle Safety Technologies, 1960-2012 (Car and LTV occupants saved + non-occupants and motorcyclists saved by car/LTV techs)
L I V E S S A V E D BY VOLUNTARY BY FMVSS CY TOTAL IMPROVEMENTS IN EFFECT 1960 115 115 0 1961 117 117 0 1962 135 135 0 1963 160 160 0 1964 203 203 0 1965 251 251 0 1966 339 339 0 1967 509 509 0 1968 816 709 107 1969 1,179 831 348 1970 1,447 866 581 1971 1,774 957 817 1972 2,226 1,096 1,130 1973 2,576 1,168 1,408 1974 2,518 1,005 1,513 1975 3,058 1,073 1,986 1976 3,240 1,089 2,151 1977 3,671 1,156 2,515 1978 4,040 1,185 2,855 1979 4,299 1,198 3,101 1980 4,540 1,219 3,321 1981 4,455 1,167 3,288 1982 4,057 1,060 2,997 1983 4,248 1,003 3,244 1984 4,835 963 3,872 1985 6,389 1,086 5,303 1986 8,531 1,224 7,307 1987 9,992 1,263 8,729 1988 11,292 1,326 9,965 1989 11,522 1,330 10,192 1990 11,761 1,332 10,429 1991 12,250 1,320 10,931 1992 12,573 1,346 11,228 1993 13,902 1,417 12,486 1994 15,263 1,514 13,749 1995 16,265 1,563 14,701 1996 17,956 1,624 16,332 1997 18,751 1,646 17,106 1998 19,613 1,582 18,031 1999 20,256 1,543 18,714 2000 22,280 1,583 20,696 2001 23,364 1,557 21,807 2002 25,691 1,612 24,079 2003 27,174 1,718 25,456 2004 28,253 1,776 26,477 2005 29,936 1,825 28,111 2006 30,242 1,977 28,266 2007 30,312 2,153 28,159 2008 27,941 2,168 25,773 2009 26,770 2,090 24,680 2010 26,695 2,112 24,583 2011 26,098 2,054 24,045 2012 27,621 2,250 25,370 =========== =========== =========== 613,501 65,563 547,938
229
Of course, before January 1, 1968, every life saved was due to a “voluntary” improvement – or at least one not required by the Federal government, although some States required seat belts in new cars well before 1968. After 1968, lives saved by voluntary improvements have gradually escalated from approximately 1,000 to just over 2,000 per year, comprising modifications to in-strument panels, pretensioners and load limiters, TTI(d) reductions before the FMVSS No. 214 upgrade, NCAP-related changes, and numerous improvements introduced before, sometimes well before a FMVSS took effect. Specifically, ESC and curtain and side air bags became avail-able in the late 1990s but the corresponding FMVSS did not phase in until MY 2009 to 2015. The benefits of voluntary improvements continue as long as the vehicles remain on the road, long past the FMVSS effective date. For example, the energy-absorbing columns in MY 1967 cars, produced before the January 1, 1968, effective date, started generating “voluntary” benefits in late 1966, when those cars first began to sell, and continued to generate them as long as any of those cars were still on the road, even in 2012.
By contrast, the number of lives saved by technologies compliant with FMVSS in effect has grown dramatically from a modest start of 107 in 1968. They accounted for 25,370 of the 27,621 total lives saved in 2012.
Any non-belt technology “built into” new cars or LTVs takes years to build up substantial bene-fits. At first, only the newest vehicles on the road have the technology. Only after 6 years (for the initial FMVSS) to 12 years (for the most recent technologies, because vehicles last longer now) are they in the majority of vehicles on the road. By contrast, any program to increase belt use, such as buckle-up laws, can have an immediate large effect on lives saved. The belts are already in the vehicles; the program immediately increases the number of people who use them.
If the estimated lives saved in Table 2-3 are added up from 1960 through just 2002, the total is 332,459. This is slightly higher than the 328,551 estimated in NHTSA’s 2004 report, which only went up to CY 2002.595 As explained in the preceding chapter, estimates increased from CY 1986 onwards, especially toward 2002, because the current report includes technologies such as ESC, curtain and side air bags, and head impact protection, for which effectiveness had not yet been fully evaluated in 2004. Essentially, the new numbers correct a slight underestimate in the earlier report. But the principal difference between the 613,501 lives saved in Table 2-3 and the 328,551 in the 2004 report is what happened from CY 2003 through 2012 (not included in the earlier report): an average of 28,104 lives saved per year.
595 Kahane (2004, October), p. xii.
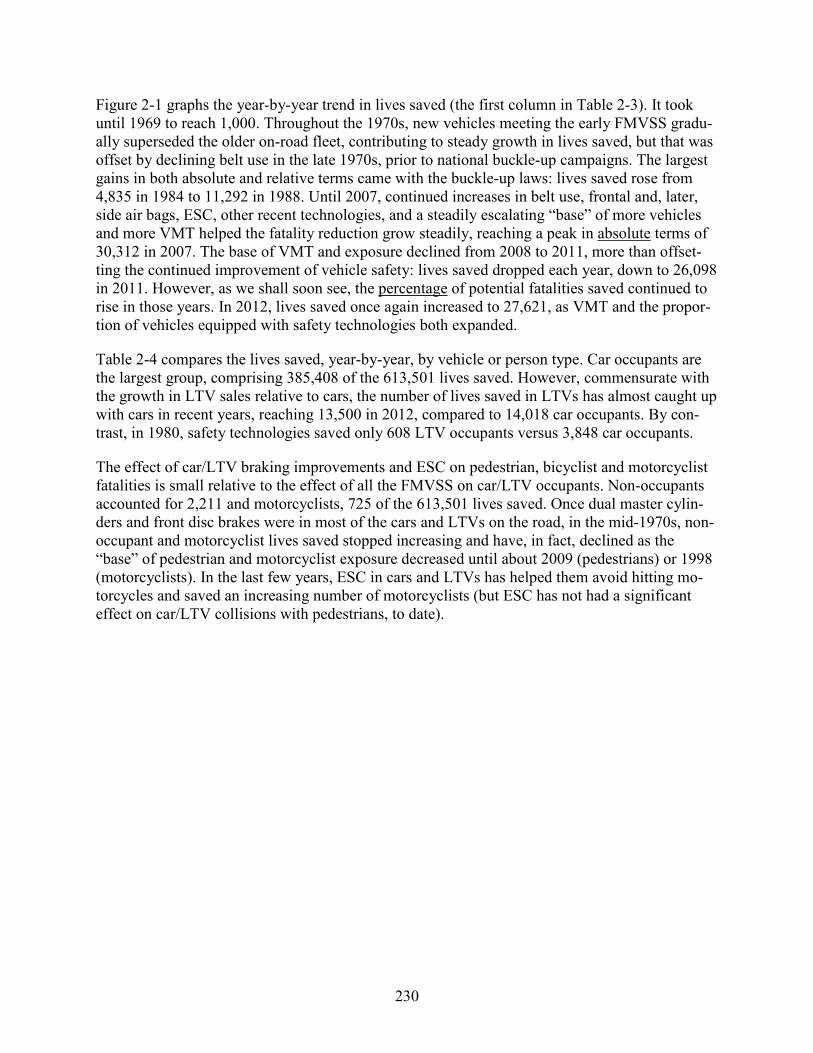
230
Figure 2-1 graphs the year-by-year trend in lives saved (the first column in Table 2-3). It took until 1969 to reach 1,000. Throughout the 1970s, new vehicles meeting the early FMVSS gradu-ally superseded the older on-road fleet, contributing to steady growth in lives saved, but that was offset by declining belt use in the late 1970s, prior to national buckle-up campaigns. The largest gains in both absolute and relative terms came with the buckle-up laws: lives saved rose from 4,835 in 1984 to 11,292 in 1988. Until 2007, continued increases in belt use, frontal and, later, side air bags, ESC, other recent technologies, and a steadily escalating “base” of more vehicles and more VMT helped the fatality reduction grow steadily, reaching a peak in absolute terms of 30,312 in 2007. The base of VMT and exposure declined from 2008 to 2011, more than offset-ting the continued improvement of vehicle safety: lives saved dropped each year, down to 26,098 in 2011. However, as we shall soon see, the percentage of potential fatalities saved continued to rise in those years. In 2012, lives saved once again increased to 27,621, as VMT and the propor-tion of vehicles equipped with safety technologies both expanded.
Table 2-4 compares the lives saved, year-by-year, by vehicle or person type. Car occupants are the largest group, comprising 385,408 of the 613,501 lives saved. However, commensurate with the growth in LTV sales relative to cars, the number of lives saved in LTVs has almost caught up with cars in recent years, reaching 13,500 in 2012, compared to 14,018 car occupants. By con-trast, in 1980, safety technologies saved only 608 LTV occupants versus 3,848 car occupants.
The effect of car/LTV braking improvements and ESC on pedestrian, bicyclist and motorcyclist fatalities is small relative to the effect of all the FMVSS on car/LTV occupants. Non-occupants accounted for 2,211 and motorcyclists, 725 of the 613,501 lives saved. Once dual master cylin-ders and front disc brakes were in most of the cars and LTVs on the road, in the mid-1970s, non-occupant and motorcyclist lives saved stopped increasing and have, in fact, declined as the “base” of pedestrian and motorcyclist exposure decreased until about 2009 (pedestrians) or 1998 (motorcyclists). In the last few years, ESC in cars and LTVs has helped them avoid hitting mo-torcycles and saved an increasing number of motorcyclists (but ESC has not had a significant effect on car/LTV collisions with pedestrians, to date).
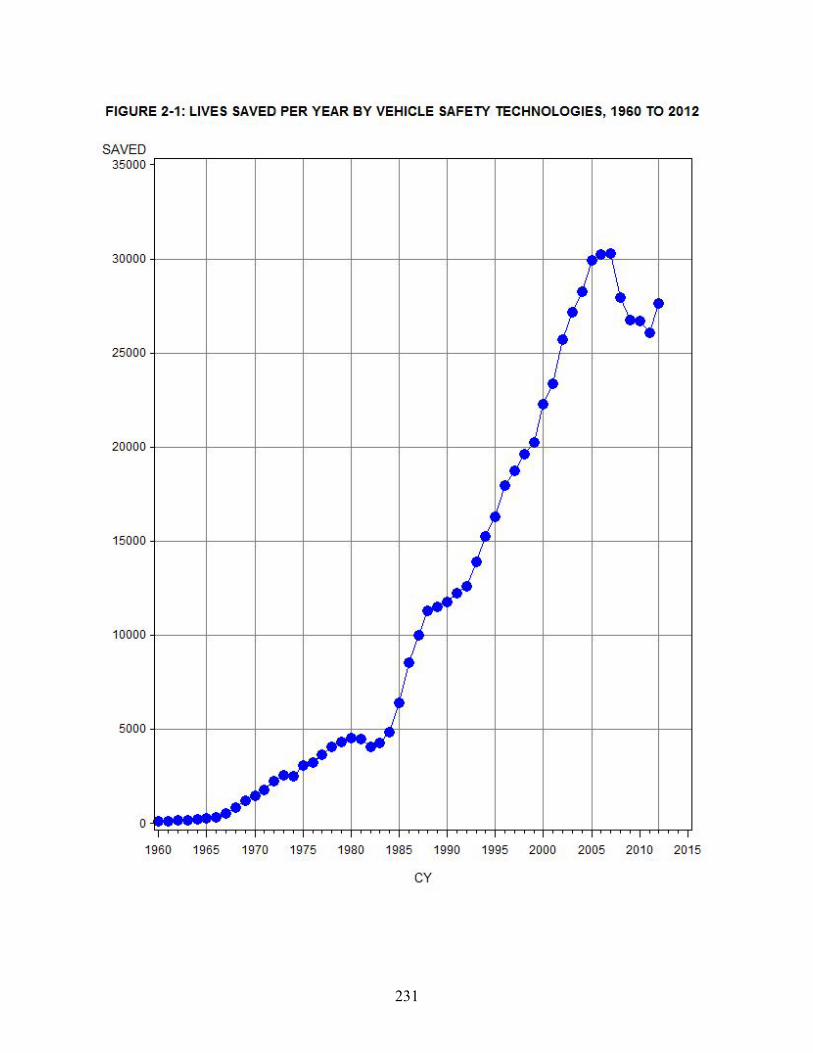
231
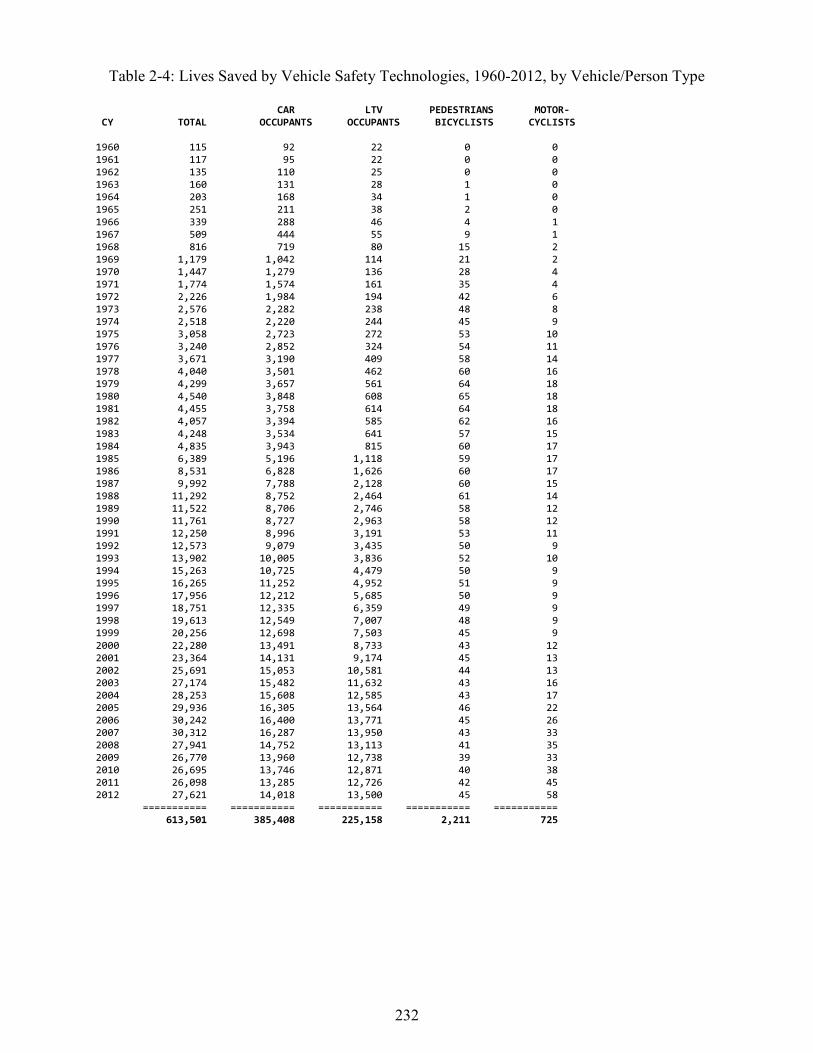
232
Table 2-4: Lives Saved by Vehicle Safety Technologies, 1960-2012, by Vehicle/Person Type
CAR LTV PEDESTRIANS MOTOR- CY TOTAL OCCUPANTS OCCUPANTS BICYCLISTS CYCLISTS 1960 115 92 22 0 0 1961 117 95 22 0 0 1962 135 110 25 0 0 1963 160 131 28 1 0 1964 203 168 34 1 0 1965 251 211 38 2 0 1966 339 288 46 4 1 1967 509 444 55 9 1 1968 816 719 80 15 2 1969 1,179 1,042 114 21 2 1970 1,447 1,279 136 28 4 1971 1,774 1,574 161 35 4 1972 2,226 1,984 194 42 6 1973 2,576 2,282 238 48 8 1974 2,518 2,220 244 45 9 1975 3,058 2,723 272 53 10 1976 3,240 2,852 324 54 11 1977 3,671 3,190 409 58 14 1978 4,040 3,501 462 60 16 1979 4,299 3,657 561 64 18 1980 4,540 3,848 608 65 18 1981 4,455 3,758 614 64 18 1982 4,057 3,394 585 62 16 1983 4,248 3,534 641 57 15 1984 4,835 3,943 815 60 17 1985 6,389 5,196 1,118 59 17 1986 8,531 6,828 1,626 60 17 1987 9,992 7,788 2,128 60 15 1988 11,292 8,752 2,464 61 14 1989 11,522 8,706 2,746 58 12 1990 11,761 8,727 2,963 58 12 1991 12,250 8,996 3,191 53 11 1992 12,573 9,079 3,435 50 9 1993 13,902 10,005 3,836 52 10 1994 15,263 10,725 4,479 50 9 1995 16,265 11,252 4,952 51 9 1996 17,956 12,212 5,685 50 9 1997 18,751 12,335 6,359 49 9 1998 19,613 12,549 7,007 48 9 1999 20,256 12,698 7,503 45 9 2000 22,280 13,491 8,733 43 12 2001 23,364 14,131 9,174 45 13 2002 25,691 15,053 10,581 44 13 2003 27,174 15,482 11,632 43 16 2004 28,253 15,608 12,585 43 17 2005 29,936 16,305 13,564 46 22 2006 30,242 16,400 13,771 45 26 2007 30,312 16,287 13,950 43 33 2008 27,941 14,752 13,113 41 35 2009 26,770 13,960 12,738 39 33 2010 26,695 13,746 12,871 40 38 2011 26,098 13,285 12,726 42 45 2012 27,621 14,018 13,500 45 58 =========== =========== =========== =========== =========== 613,501 385,408 225,158 2,211 725

233
Net effectiveness for car/LTV occupants Table 2-5 concentrates on the occupant fatalities in cars and LTVs. The first column is the actual number of occupant fatalities. There were an estimated 1,712,855 actual occupant fatalities in cars and LTVs from CY 1960 through 2012.596 The next column estimates how many fatalities would have happened from 1960 to 2012 if none of the safety technologies had existed: 2,323,421.597 The third column, equal to column 2 minus column 1, is the lives saved by the safety technologies: 610,566 from 1960 through 2012. The fourth column is the overall effec-tiveness of the existing safety technologies in each calendar year: the lives saved divided by the number of fatalities there would have been without any safety improvements. The effectiveness grew in every year from 1960 to 2012, from a humble 0.40 percent in 1960 to a very substantial 55.92-percent fatality reduction in 2012. There were 21,696 actual car/LTV occupant fatalities in 2012, but there would have been 49,214 without the safety technologies. The 27,518 lives saved represent 55.92 percent of the potential fatalities.
Three graphs help to illustrate the trends in actual fatalities, potential fatalities and effectiveness. Figure 2-2 compares the actual car/LTV occupant fatalities (blue circles) to the potential fatali-ties that could have happened without the safety technologies (red diamonds). Actual fatalities remained fairly level, usually in the low 30,000s, throughout 1960 to 2006. Only in 1968 to 1972, when large numbers of baby-boomers were young drivers, did they crest just over 40,000. But from 2006 to 2011, actual fatalities dropped from 30,633 to 21,331. By contrast, potential fatalities doubled from 28,298 in 1960 to a peak of 61,408 in 2005. They have experienced a long-term rising trend, with transient interruptions in the mid-1970s, the early 1980s, from 1990 to 1992 and from 2008 to 2011. The interruptions were perhaps triggered by external events such as an energy crisis, a fuel-price increase, an economic slowdown, or a societal drive for health and safety (e.g., when the post-war baby-boomers reached their 40s, circa 1990). Periods of prosperity such as the later 1980s and most of the 1990s saw large rises in potential fatalities, commensurate with rising VMT, vehicle sales, and trips for both work and recreation.
Until the mid-1970s, there is little distance between the blue circles and the red diamonds on Figure 2-2. Then a gap opens between them, and it really widens after buckle-up laws were en-acted in the mid-1980s. From that time until 2005, the potential fatalities continue to grow, but the FMVSS and other safety technologies have held the line on actual fatalities, working a little harder each year, keeping them in the low 30,000s year after year. From 2005 to 2011, potential fatalities dropped from 61,408 to 47,342, but the proportional reduction in actual fatalities was even larger. In 2012, potential fatalities resumed their historical upward trajectory (from 47,342 to 49,214) but actual fatalities increased only slightly (from 21,331 to 21,696).
596 This is the sum of the ORIGWT values in the programs LS2004 and OLDFA24 (see Appendix A). 597 This is the sum of WEIGHTFA in LS2004 and OLDFA24, the inflated values of ORIGWT after all the safety technologies are “removed,” one-by-one, from the vehicles (see Appendix A).

234
Table 2-5: Actual Occupant Fatalities, Potential Fatalities Without The Vehicle Safety Technologies, and Lives Saved in Cars/LTVs
CAR+LTV OCCUPANT FATALITIES W/O SAFETY LIVES PERCENT CY ACTUAL TECHS. SAVED SAVED 1960 28,183 28,298 115 0.40 1961 28,087 28,204 117 0.41 1962 30,544 30,679 135 0.44 1963 32,664 32,823 159 0.49 1964 35,603 35,805 202 0.56 1965 36,518 36,767 249 0.68 1966 39,130 39,465 334 0.85 1967 39,327 39,826 499 1.25 1968 41,019 41,818 799 1.91 1969 42,117 43,273 1,156 2.67 1970 39,556 40,972 1,415 3.45 1971 38,916 40,651 1,735 4.27 1972 40,103 42,281 2,178 5.15 1973 38,739 41,258 2,520 6.11 1974 31,145 33,608 2,463 7.33 1975 31,361 34,355 2,995 8.72 1976 32,222 35,398 3,176 8.97 1977 33,173 36,772 3,599 9.79 1978 34,988 38,951 3,964 10.18 1979 35,108 39,325 4,217 10.72 1980 35,097 39,554 4,456 11.27 1981 33,911 38,284 4,373 11.42 1982 29,855 33,834 3,979 11.76 1983 29,209 33,384 4,176 12.51 1984 30,177 34,935 4,758 13.62 1985 30,044 36,357 6,314 17.37 1986 32,394 40,849 8,454 20.70 1987 33,334 43,251 9,916 22.93 1988 34,245 45,461 11,216 24.67 1989 33,725 45,177 11,452 25.35 1990 32,844 44,534 11,690 26.25 1991 30,939 43,126 12,187 28.26 1992 29,557 42,071 12,514 29.75 1993 30,192 44,033 13,840 31.43 1994 30,995 46,200 15,204 32.91 1995 32,067 48,271 16,204 33.57 1996 32,541 50,438 17,897 35.48 1997 32,515 51,208 18,693 36.50 1998 31,955 51,512 19,557 37.97 1999 32,171 52,373 20,202 38.57 2000 32,241 54,465 22,225 40.81 2001 32,021 55,327 23,306 42.12 2002 32,872 58,506 25,634 43.81 2003 32,297 59,411 27,114 45.64 2004 31,871 60,064 28,193 46.94 2005 31,539 61,408 29,869 48.64 2006 30,633 60,804 30,171 49.62 2007 29,009 59,246 30,236 51.04 2008 25,423 53,287 27,864 52.29 2009 23,417 50,115 26,698 53.27 2010 22,235 48,852 26,617 54.49 2011 21,331 47,342 26,011 54.94 2012 21,696 49,214 27,518 55.92 =========== =========== =========== 1,712,855 2,323,421 610,566
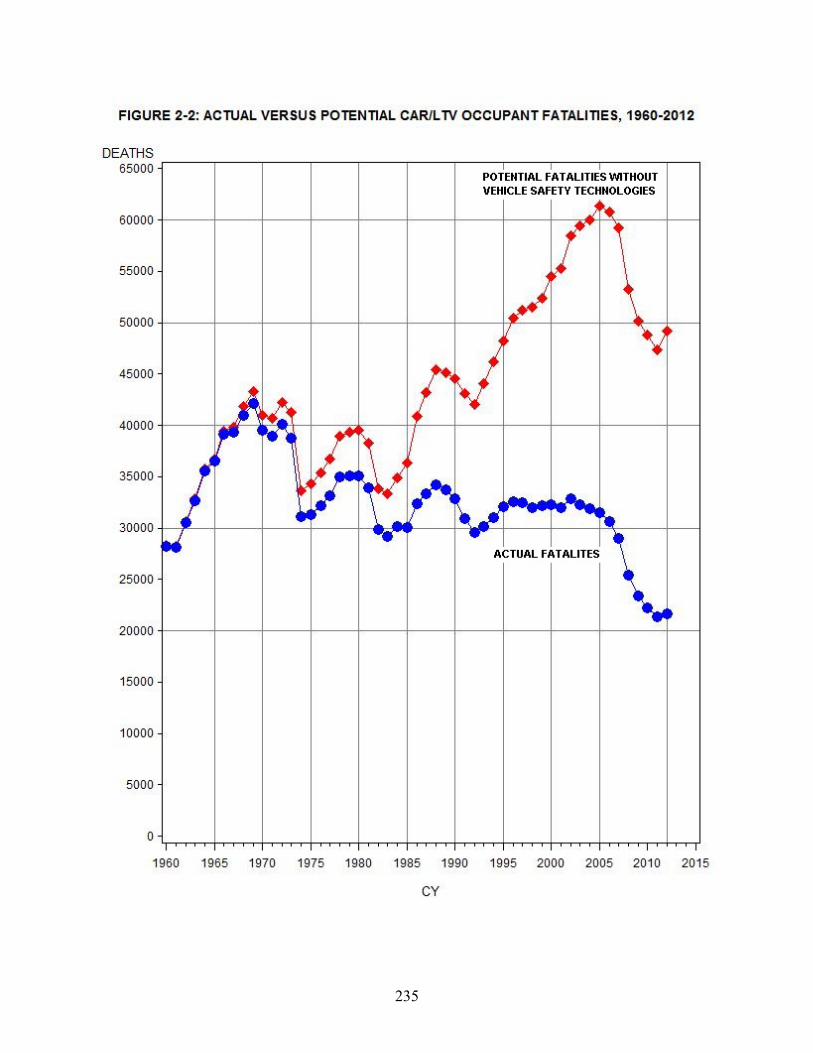
235
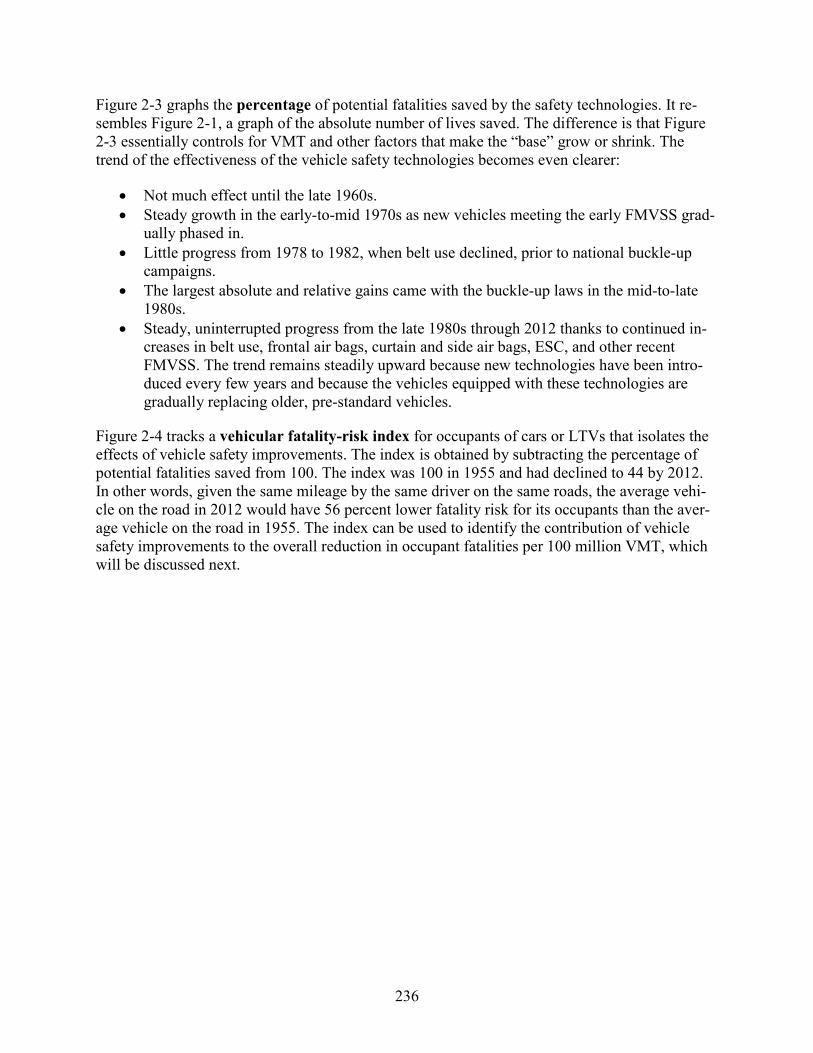
236
Figure 2-3 graphs the percentage of potential fatalities saved by the safety technologies. It re-sembles Figure 2-1, a graph of the absolute number of lives saved. The difference is that Figure 2-3 essentially controls for VMT and other factors that make the “base” grow or shrink. The trend of the effectiveness of the vehicle safety technologies becomes even clearer:
• Not much effect until the late 1960s. • Steady growth in the early-to-mid 1970s as new vehicles meeting the early FMVSS grad-
ually phased in. • Little progress from 1978 to 1982, when belt use declined, prior to national buckle-up
campaigns. • The largest absolute and relative gains came with the buckle-up laws in the mid-to-late
1980s. • Steady, uninterrupted progress from the late 1980s through 2012 thanks to continued in-
creases in belt use, frontal air bags, curtain and side air bags, ESC, and other recent FMVSS. The trend remains steadily upward because new technologies have been intro-duced every few years and because the vehicles equipped with these technologies are gradually replacing older, pre-standard vehicles.
Figure 2-4 tracks a vehicular fatality-risk index for occupants of cars or LTVs that isolates the effects of vehicle safety improvements. The index is obtained by subtracting the percentage of potential fatalities saved from 100. The index was 100 in 1955 and had declined to 44 by 2012. In other words, given the same mileage by the same driver on the same roads, the average vehi-cle on the road in 2012 would have 56 percent lower fatality risk for its occupants than the aver-age vehicle on the road in 1955. The index can be used to identify the contribution of vehicle safety improvements to the overall reduction in occupant fatalities per 100 million VMT, which will be discussed next.
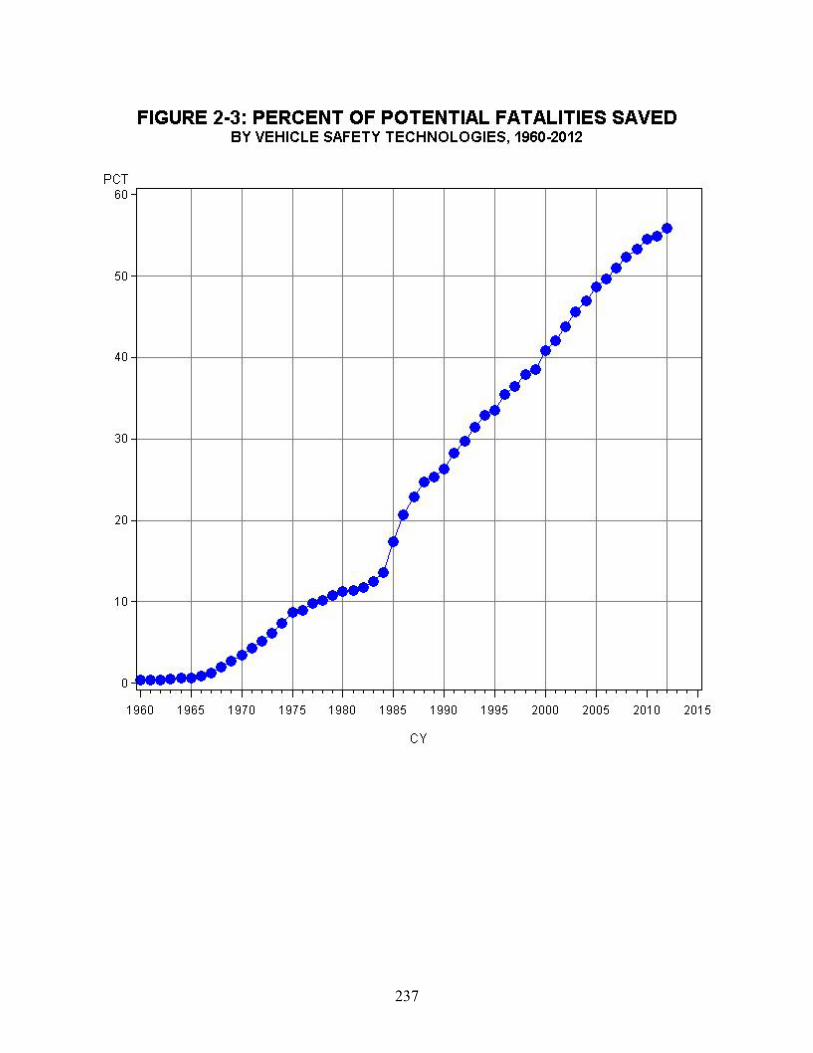
237
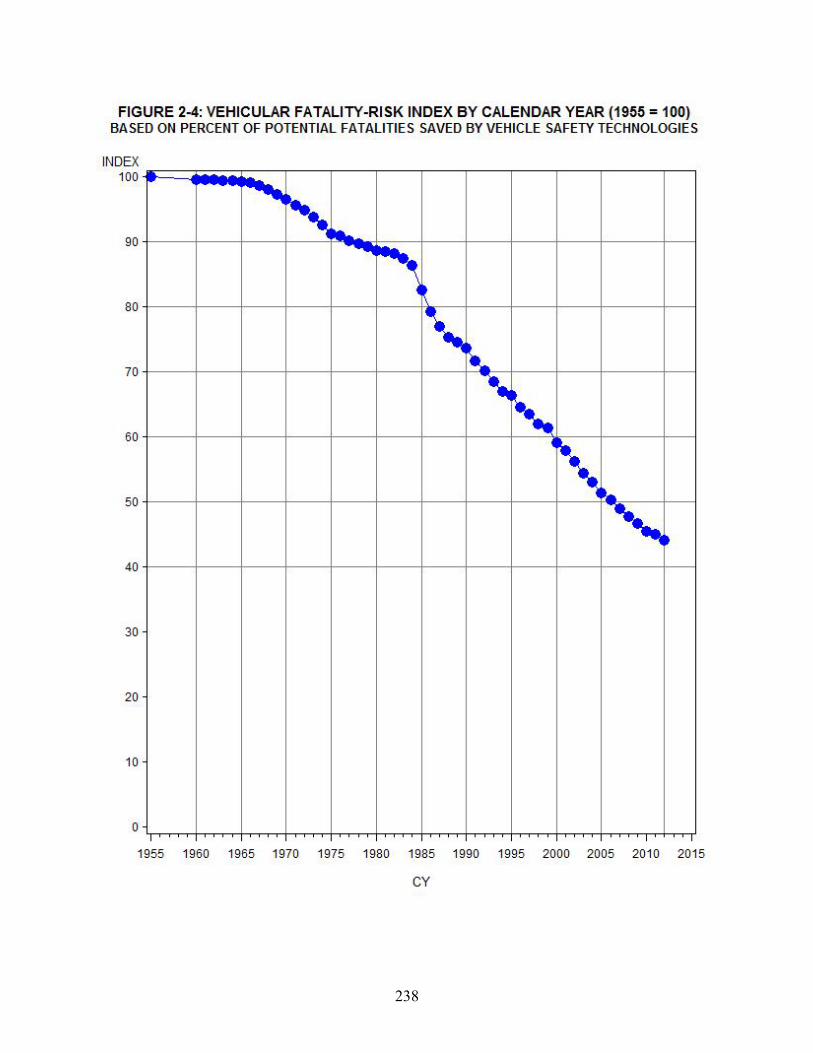
238
239
Car/LTV occupant fatalities per 100,000,000 VMT A detailed analysis of fatality rates per 100,000,000 VMT comparing the strength of vehicle, be-havioral, environmental, and demographic factors is beyond the scope of this report, which con-centrates on estimating the lives saved by vehicle safety technologies. Nevertheless, it is interest-ing to look at the trends in occupant fatality rates per 100,000,000 VMT – with and without the vehicle safety technologies.
Table 2-6 shows the VMT of passenger cars plus LTVs in 1960 to 2012 and computes the rates of actual and potential fatalities per 100,000,000 miles in each calendar year.598 America has be-come an increasingly mobile society and VMT has grown every year except the energy-crisis years of 1974 and 1979-to-1980 and from 2007 to 2011. Even in those years it decreased just slightly. The actual fatality rate of car/LTV occupants has dramatically fallen from 4.26 fatalities per 100,000,000 miles in 1960 to 0.82 in 2012: a reduction of almost 81 percent. Without the vehicle safety technologies, the potential fatality rates would have been 4.28 in 1960 and 1.86 in 2012, a reduction of 57 percent – the combined effect of “everything else” other than vehicle safety improvements that might have influenced VMT fatality rates between 1960 and 2012. “Everything else” includes the effects of actual safety or health improvements outside the vehi-cle, such as safer roads, programs to reduce drunk driving, or better trauma care; it also includes effects of demographic shifts such as reductions in the young-driver population or greater urban-ization. Vehicle safety improved by 56 percent over that time span, as demonstrated by the per-centage of potential fatalities saved and the vehicular risk index (Figures 2-3 and 2-4). In other words, over the entire time span from 1960 to 2012, vehicle safety improvements and “every-thing else” made almost identical contributions to the overall 81-percent reduction in the VMT fatality rate.
.81 = 1 – [(1-.57) x (1-.56)]
But these contributions came at different times: most of the benefits of vehicle safety improve-ments came after 1984 and a large portion of “everything else” had arrived by 1983. Figure 2-5 shows the difference in the trends of the actual and potential fatality rates. From 1960 to the mid-1970s there was little difference between the actual and potential rates, because the vehicle tech-nologies were not yet saving that many lives. There were large changes in the fatality rate for reasons unrelated to the vehicle safety technologies. From 1960 to 1964, the fatality rate actually increased as the first great cohort of baby-boomers, born immediately after World War 2, began to drive.
598 Traffic safety facts 2011, p. 24 specifies VMT for cars in 1975 to 2011 and p. 26 for LTVs; add them to obtain the left column of Table 2-6. VMT estimates were obtained from FHWA. P. 17 shows VMT for all vehicles on the road in 1966 to 2011, also obtained from FHWA. In 1975 to 80, cars + LTVs accounted for 92.4 percent of total VMT, and this percentage is assumed also for years before 1975. Accident facts 1974 edition, p. 59 tabulates VMT back to 1960 and earlier, also obtained from FHWA but with a slightly different definition. In 1966 to 1973 the Traffic safety facts VMT is 99.6 percent of the Accident facts VMT and this percentage is also assumed for years before 1966. Total VMT for 2012 is estimated in NHTSA (2013, November) Traffic safety facts research note – 2012 motor vehicle crashes. (Report No. DOT HS 811 856). Washington, DC: National Highway Traffic Safety Administration. Available at www-nrd.nhtsa.dot.gov/Pubs/811856.pdf. It has been allocated to cars, LTVs, and oth-er vehicles based on the 2010-to-2011 trends.

240
Table 2-6: Actual and Potential Occupant Fatalities in Cars/LTVs per 100,000,000 Miles VMT POTENTIAL FATALITIES ACTUAL FATALITIES W/O SAFETY TECHNOLOGIES VMT CY (108 MILES) N RATE N RATE 1960 6,617 28,183 4.26 28,298 4.28 1961 6,791 28,087 4.14 28,203 4.15 1962 7,058 30,544 4.33 30,679 4.35 1963 7,408 32,664 4.41 32,823 4.43 1964 7,794 35,603 4.57 35,805 4.59 1965 8,172 36,518 4.47 36,767 4.50 1966 8,560 39,131 4.57 39,465 4.61 1967 8,911 39,327 4.41 39,825 4.47 1968 9,392 41,019 4.37 41,818 4.45 1969 9,817 42,117 4.29 43,273 4.41 1970 10,260 39,556 3.86 40,972 3.99 1971 10,898 38,916 3.57 40,650 3.73 1972 11,647 40,103 3.44 42,280 3.63 1973 12,137 38,739 3.19 41,258 3.40 1974 11,841 31,145 2.63 33,608 2.84 1975 12,347 31,360 2.54 34,356 2.78 1976 13,040 32,222 2.47 35,397 2.71 1977 13,598 33,173 2.44 36,772 2.70 1978 14,259 34,988 2.45 38,952 2.73 1979 14,055 35,108 2.50 39,325 2.80 1980 14,025 35,098 2.50 39,554 2.82 1981 14,297 33,911 2.37 38,284 2.68 1982 14,679 29,855 2.03 33,834 2.30 1983 15,227 29,209 1.92 33,384 2.19 1984 15,850 30,177 1.90 34,934 2.20 1985 16,378 30,043 1.83 36,357 2.22 1986 16,941 32,394 1.91 40,849 2.41 1987 17,729 33,335 1.88 43,250 2.44 1988 18,725 34,246 1.83 45,461 2.43 1989 19,377 33,725 1.74 45,176 2.33 1990 19,828 32,843 1.66 44,535 2.25 1991 20,076 30,940 1.54 43,126 2.15 1992 20,784 29,557 1.42 42,071 2.02 1993 21,205 30,192 1.42 44,033 2.08 1994 21,707 30,995 1.43 46,200 2.13 1995 22,283 32,067 1.44 48,271 2.17 1996 22,864 32,541 1.42 50,438 2.21 1997 23,533 32,515 1.38 51,208 2.18 1998 24,179 31,955 1.32 51,513 2.13 1999 24,701 32,171 1.30 52,373 2.12 2000 25,233 32,240 1.28 54,465 2.16 2001 25,700 32,021 1.25 55,327 2.15 2002 26,245 32,872 1.25 58,507 2.23 2003 26,560 32,297 1.22 59,411 2.24 2004 27,271 31,871 1.17 60,064 2.20 2005 27,495 31,539 1.15 61,408 2.23 2006 27,730 30,633 1.10 60,804 2.19 2007 26,910 29,009 1.08 59,246 2.20 2008 26,302 25,422 .97 53,287 2.03 2009 26,332 23,417 .89 50,115 1.90 2010 26,485 22,235 .84 48,852 1.84 2011 26,466 21,331 .81 47,343 1.79 2012 26,530 21,696 .82 49,214 1.86
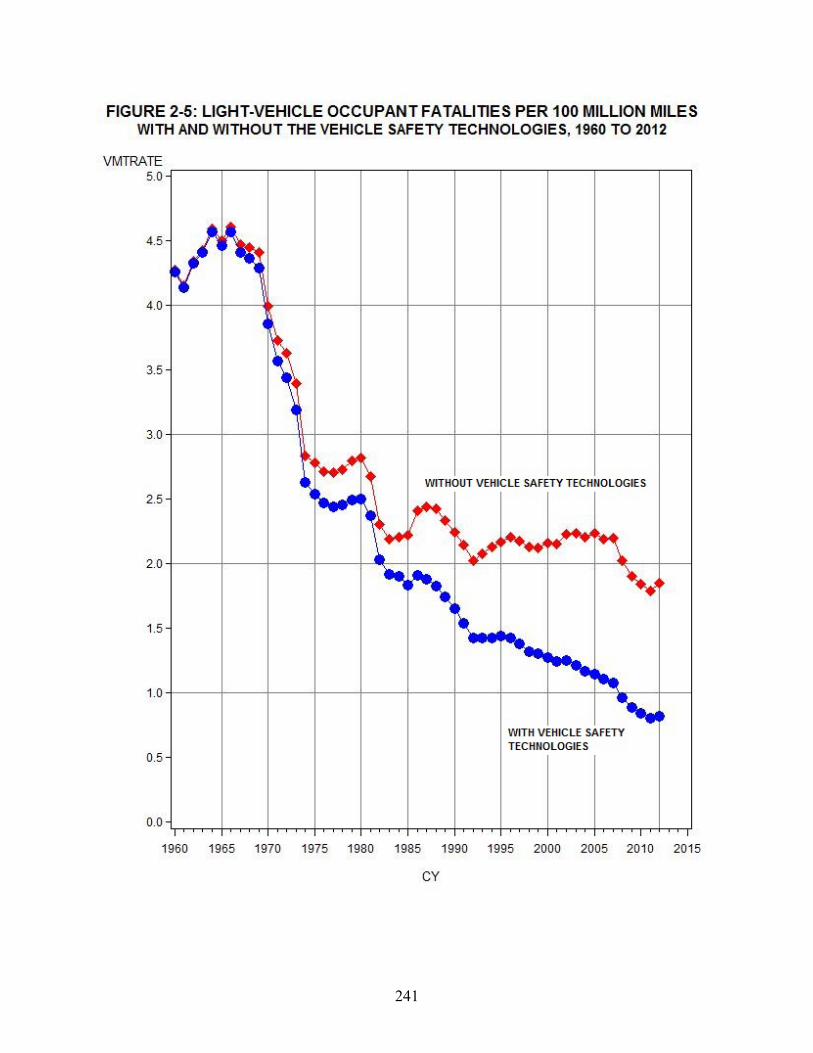
241
242
From 1966 to 1977, the actual and potential rates fell dramatically (the potential rate from 4.61 to 2.70), partly because of major infrastructure improvements such as the Interstate Highway Sys-tem,599 but also because of demographic and external factors that began to act at various times, such as:
• An increasingly urbanized and suburban population, with an increasing share of the VMT involved in relatively low-risk commuting and urban trips;600
• A rising proportion of female drivers, who have lower fatal crash rates (specifically, a lower incidence of drunk driving);601
• In the 1970s, the first cohort of baby-boomers passed age 25, their most dangerous driv-ing years behind them;602 and
• Toward the end of that period, the 55 mph speed limit,603 the energy crisis, and an eco-nomic slowdown.604
From about 1983 until 2007, the paradigm shifts. The potential fatality rate stayed rather flat at about 2.2, whereas the actual fatality rate improved from 1.92 to 1.08. In other words, in the ab-sence of vehicle safety technologies and belt-use increases, if all other factors influencing the
599 Interstate highways accounted for 3.7 percent of the nation’s VMT in 1960 (www.fhwa.dot.gov/policyinformation/statistics/vm03.cfm?vm_year=1960), 14.4 percent in 1970 (www.fhwa.dot.gov/policyinformation/statistics/vm03.cfm?vm_year=1970), 19.4 percent in 1980, and 24.3 percent in 2010 (www.fhwa.dot.gov/policyinformation/statistics/2010/vm202.cfm); the fatality rate per VMT is 50 percent lower on Interstate highways than on principal arterial roads (www.fhwa.dot.gov/policyinformation/statistics/2009/fi30.cfm). 600 The proportion of the United States population living in non-metropolitan areas decreased from 37 percent in 1960 (www2.census.gov/prod2/statcomp/documents/1961-02.pdf) to 17 percent in 2010 (www.census.gov/prod/2011pubs/12statab/pop.pdf); the fatality rate per VMT is 50 percent lower on urban roads than on rural roads of the same functional class (www.fhwa.dot.gov/policyinformation/statistics/2009/fi30.cfm). 601 The percentage of licensed drivers who are females increased from 41.8 percent in 1965 (Highway statistics 1965. Washington, DC: Federal Highway Administration) to 50.3 percent in 2010 (www.fhwa.dot.gov/policyinformation/statistics/2010/pdf/dl20.pdf); the fatal-crash involvement rate per VMT of female drivers (50 or younger) is 40 percent lower than for male drivers of the same age (Kahane, C. J. (2003, Octo-ber). Vehicle weight, fatality risk and crash compatibility of model year 1991-99 passenger cars and light trucks. (Report No. DOT HS 809 662, p. 71). Washington, DC: National Highway Traffic Safety Administration. Available at www-nrd.nhtsa.dot.gov/Pubs/809662.PDF). 602 The percentage of licensed drivers younger than 25 was 18.4 percent in 1960 (Accident facts, 1961. Chicago: National Safety Council), reached 22.1 percent in 1969 (Gish, R. E. (1973, April). National Personal Transportation Survey – Characteristics of licensed drivers. Washington, DC: Federal Highway Administration. Available at www.fhwa.dot.gov/ohim/1969/s.pdf.), but had dropped to 13.3 percent by 2009 (www.census.gov/compendia/statab/2012/tables/12s1114.pdf); the fatal-crash involvement rate per VMT is 2.5 times as high for an 18-year-old driver as for a 30-year-old driver of the same gender (Kahane [2003, October], p. 71). 603 Kahane, C. J. (1975). Lower speed limits, reduced speeds, fewer deaths. (Report No. DOT HS 801 667). Wash-ington, DC: National Highway Traffic Safety Administration; Johnson, P., Klein, T. M., Levy, P., & Maxwell, D. (1980, October). The effectiveness of the 55 mph national maximum speed limit as a life saving benefit. (Report No. DOT HS 805 694). Washington, DC: National Highway Traffic Safety Administration. Available at ntl.bts.gov/lib/30000/30300/30319/805694.pdf; NHTSA. (1989, January). The effects of the 65 mph speed limit dur-ing 1987. (Report No. DOT HS 807 369). Washington, DC: National Highway Traffic Safety Administration. Available at ntl.bts.gov/lib/25000/25800/25819/DOT-HS-807-369.pdf. 604 Partyka, S. C. (1984a). Simple models of fatality trends using employment and population data. Accident Analy-sis and Prevention, 16, pp. 211-222; Partyka, S. C. (1991). Simple models of fatality trends revisited seven years later. Accident Analysis and Prevention, 23, pp. 423-430.

243
fatality rate had stayed the same, the fatality rate would also have stayed about the same. During those years, there were some factors that tended to reduce the potential fatality rate while other offsetting factors increased it:
• Effective programs to reduce drunk driving helped to reduce the fatality rate;605 • A growing and increasingly mobile population of crash-prone, physically vulnerable old-
er drivers contributed to increasing the rate;606 • A reduction in the average size and mass of passenger cars on the road as pre-downsized
vehicles were retired, followed by an influx of rollover-prone and aggressive LTVs may have contributed to increasing the rate;607 and
• An increasingly prosperous society, with more recreational driving destinations and a greater hurry to get there, may have increased the rate.608
The effects of significant improvements in behavioral safety during this period are not clearly reflected in this analysis for several reasons. First, it is important to note that the effects of the sharp increase in seat belt use during this period, from less than 60 percent in 1984 to 86 percent in 2012, are incorporated in the vehicular risk index rather than in the “everything else” index. Second, the effects of other traffic safety behavioral improvements such as the reduction in the proportion of alcohol-impaired driving fatalities from more than 40 percent in 1984 to 31 percent in 2012 and other improvements such as safer roadways and improvements to the emergency medical system are obscured by changes in demographic and socioeconomic trends.
But the steady increase in belt use, air bags, and other vehicle safety technology helped preserve the long-term downward trend in the actual fatality rate. From 2007 to 2011 the potential fatality rate dropped from 2.20 to 1.79 and the actual fatality rate from 1.08 to 0.81, proportionally an even greater decrease.
It is evident from trend lines such as Figures 2-2 and 2-5 that there have been several periods lasting approximately 2 to 5 years during which fatalities in crashes decreased substantially more than the decrease (if any) in VMT: the mid-1970s, the early 1980s, the early 1990s, and from 2007 to 2011. A detailed investigation of these transient phenomena is outside the scope of this report. They were possibly triggered by events such as an energy crisis, a fuel-price increase, or an economic slowdown. For some years afterwards, fatalities drop faster than VMT, perhaps be-cause: (1) The reduction in high-risk VMT such as nighttime driving in search of recreation is greater than the reduction in low-risk VMT such as driving to work or basic shopping; (2) The reduction in VMT among higher-risk young and old drivers is greater than for adults 25 to 60 years old, who are less affected by the events; or (3) Some individuals could be influenced by the events to drive more carefully.
605 Dang, J. N. (2008, May). Statistical analysis of alcohol-related driving trends, 1982-2005. (Report No. DOT HS 810 942). Washington, DC: National Highway Traffic Safety Administration. Available at www-nrd.nhtsa.dot.gov/Pubs/810942.PDF. 606 The percentage of licensed drivers 65 and older was 6.7 percent in 1960 (Accident facts, 1961) and had climbed to 15.6 percent by 2009 (www.census.gov/compendia/statab/2012/tables/12s1114.pdf); the fatal-crash involvement rate per VMT is 1.6 times as high for a 70-year-old driver and 2.5 times as high for an 80-year-old driver as for a 50-year-old driver of the same gender (Kahane (2003, October), p. 71). 607 Kahane, (1988, January), pp. 187-190; Kahane (2003, October), Chapters 3, 5, and 6. 608 Partyka (1984a); Partyka (1991).
244
Suffice it to say that, after 2007, vehicle-safety technologies combined with other factors to bring light-vehicle occupant fatalities down to low levels not seen since the 1940s – and that these ve-hicle-safety technologies will continue protecting occupants even if the other factors should at some point return to the trends seen before 2007.
Estimates of lives saved by each technology (grouped by associated FMVSS) Tables 2-7, 2-8 and 2-9 apportion the 613,501 lives saved from 1960 to 2012 among the various safety technologies (grouped by the FMVSS with which they are most closely associated).
Table 2-7 indicates that seat belts saved 329,715 occupants of cars and LTVs in 1960 to 2012, including 15,485 in 2012. The estimate comprises seat belts of all types – lap/shoulder, lap only, and automatic 2-point – at all seating positions, front and rear, outboard and center. It also in-cludes the effects of voluntary NCAP-related belt improvements and voluntarily installed preten-sioners and load limiters.
Lap belts were saving about 500 lives a year in the early 1970s. The transition to 3-point belts in the mid-1970s increased that to about 800. In the mid-1980s, buckle-up laws had a huge impact, raising lives saved to 6,000 per year by 1989 and, for the first time since 1970, putting belts far ahead of any other FMVSS in number of lives saved. From 1990 to 2005, continuing, successful programs to increase belt use, and the expanding “base” of VMT, vehicles, and potentially fatal crashes has kept the “saved by the belt” number growing every year; it leveled off after 2005 be-cause the “base” of potentially fatal crashes shrank, even though belt use continued to rise. Fur-thermore, belts are especially effective in LTVs (because many potentially fatal crashes are roll-overs and/or ejections); the growing LTV population means belts are saving more people. The 329,715 lives saved by belts are just over half of the total of 613,501; the 15,485 saved in 2012 are likewise somewhat over half of the total of 27,621 saved in that year.
It is important to note that the estimates in Table 2-7 do not supersede the agency’s official es-timates of lives saved by seat belts, frontal air bags, and safety seats, generated by NHTSA’s Na-tional Center for Statistics and Analysis in its annual compendia of Traffic Safety Facts – Occu-pant Protection. The official numbers measure the lives directly saved by belts, frontal air bags, and safety seats – namely, the additional fatalities that would have occurred if nobody had used belts or safety seats and if all frontal air bags had been removed, but otherwise the cars and LTVs on the road had remained unchanged.609
609 Glassbrenner & Starnes (2009, December).
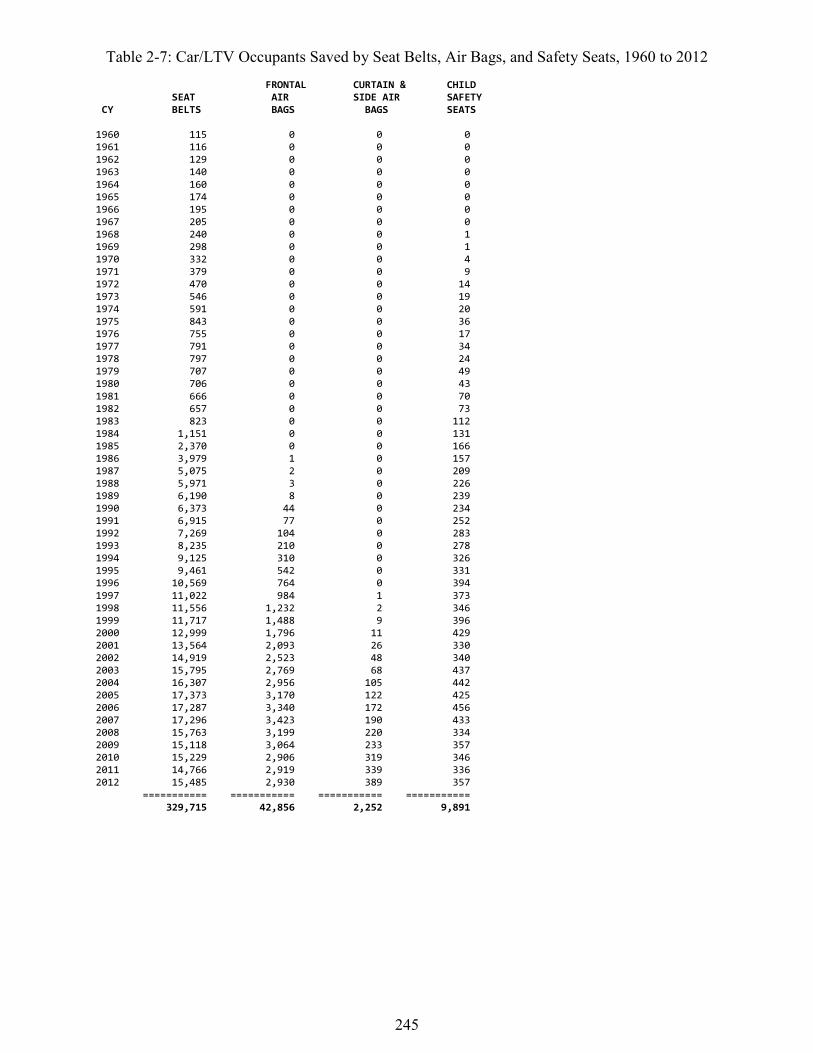
245
Table 2-7: Car/LTV Occupants Saved by Seat Belts, Air Bags, and Safety Seats, 1960 to 2012 FRONTAL CURTAIN & CHILD SEAT AIR SIDE AIR SAFETY CY BELTS BAGS BAGS SEATS 1960 115 0 0 0 1961 116 0 0 0 1962 129 0 0 0 1963 140 0 0 0 1964 160 0 0 0 1965 174 0 0 0 1966 195 0 0 0 1967 205 0 0 0 1968 240 0 0 1 1969 298 0 0 1 1970 332 0 0 4 1971 379 0 0 9 1972 470 0 0 14 1973 546 0 0 19 1974 591 0 0 20 1975 843 0 0 36 1976 755 0 0 17 1977 791 0 0 34 1978 797 0 0 24 1979 707 0 0 49 1980 706 0 0 43 1981 666 0 0 70 1982 657 0 0 73 1983 823 0 0 112 1984 1,151 0 0 131 1985 2,370 0 0 166 1986 3,979 1 0 157 1987 5,075 2 0 209 1988 5,971 3 0 226 1989 6,190 8 0 239 1990 6,373 44 0 234 1991 6,915 77 0 252 1992 7,269 104 0 283 1993 8,235 210 0 278 1994 9,125 310 0 326 1995 9,461 542 0 331 1996 10,569 764 0 394 1997 11,022 984 1 373 1998 11,556 1,232 2 346 1999 11,717 1,488 9 396 2000 12,999 1,796 11 429 2001 13,564 2,093 26 330 2002 14,919 2,523 48 340 2003 15,795 2,769 68 437 2004 16,307 2,956 105 442 2005 17,373 3,170 122 425 2006 17,287 3,340 172 456 2007 17,296 3,423 190 433 2008 15,763 3,199 220 334 2009 15,118 3,064 233 357 2010 15,229 2,906 319 346 2011 14,766 2,919 339 336 2012 15,485 2,930 389 357 =========== =========== =========== =========== 329,715 42,856 2,252 9,891
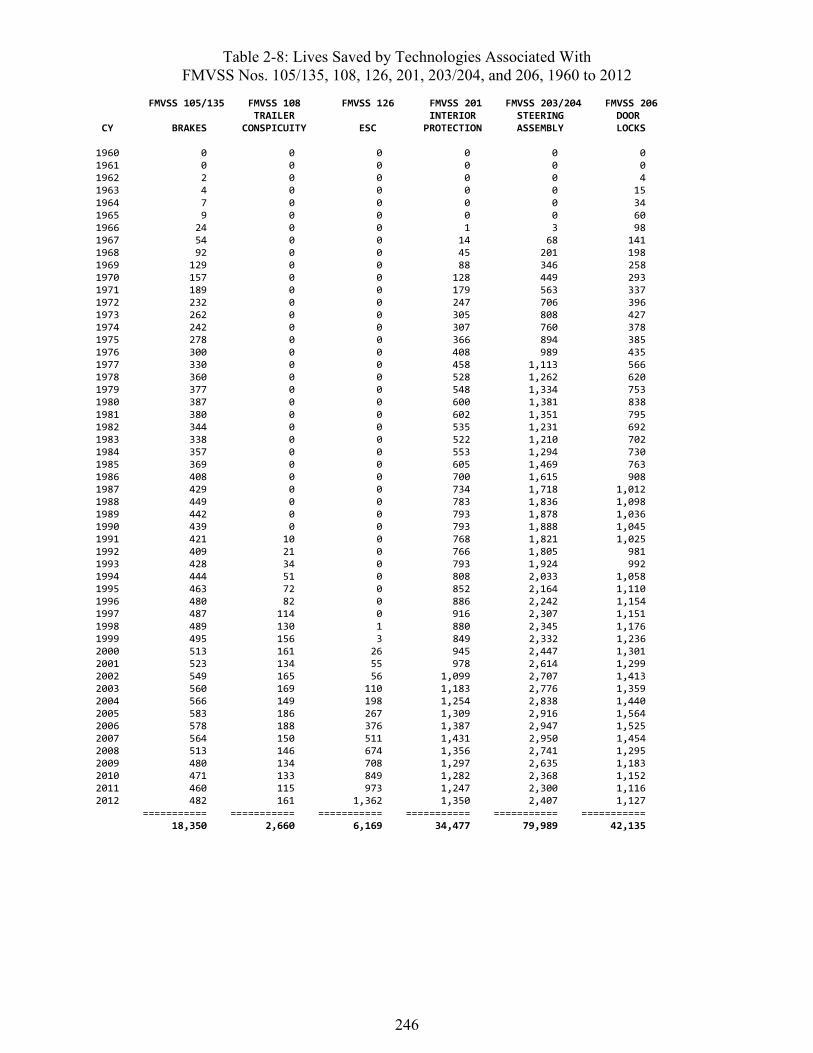
246
Table 2-8: Lives Saved by Technologies Associated With FMVSS Nos. 105/135, 108, 126, 201, 203/204, and 206, 1960 to 2012
FMVSS 105/135 FMVSS 108 FMVSS 126 FMVSS 201 FMVSS 203/204 FMVSS 206 TRAILER INTERIOR STEERING DOOR CY BRAKES CONSPICUITY ESC PROTECTION ASSEMBLY LOCKS 1960 0 0 0 0 0 0 1961 0 0 0 0 0 0 1962 2 0 0 0 0 4 1963 4 0 0 0 0 15 1964 7 0 0 0 0 34 1965 9 0 0 0 0 60 1966 24 0 0 1 3 98 1967 54 0 0 14 68 141 1968 92 0 0 45 201 198 1969 129 0 0 88 346 258 1970 157 0 0 128 449 293 1971 189 0 0 179 563 337 1972 232 0 0 247 706 396 1973 262 0 0 305 808 427 1974 242 0 0 307 760 378 1975 278 0 0 366 894 385 1976 300 0 0 408 989 435 1977 330 0 0 458 1,113 566 1978 360 0 0 528 1,262 620 1979 377 0 0 548 1,334 753 1980 387 0 0 600 1,381 838 1981 380 0 0 602 1,351 795 1982 344 0 0 535 1,231 692 1983 338 0 0 522 1,210 702 1984 357 0 0 553 1,294 730 1985 369 0 0 605 1,469 763 1986 408 0 0 700 1,615 908 1987 429 0 0 734 1,718 1,012 1988 449 0 0 783 1,836 1,098 1989 442 0 0 793 1,878 1,036 1990 439 0 0 793 1,888 1,045 1991 421 10 0 768 1,821 1,025 1992 409 21 0 766 1,805 981 1993 428 34 0 793 1,924 992 1994 444 51 0 808 2,033 1,058 1995 463 72 0 852 2,164 1,110 1996 480 82 0 886 2,242 1,154 1997 487 114 0 916 2,307 1,151 1998 489 130 1 880 2,345 1,176 1999 495 156 3 849 2,332 1,236 2000 513 161 26 945 2,447 1,301 2001 523 134 55 978 2,614 1,299 2002 549 165 56 1,099 2,707 1,413 2003 560 169 110 1,183 2,776 1,359 2004 566 149 198 1,254 2,838 1,440 2005 583 186 267 1,309 2,916 1,564 2006 578 188 376 1,387 2,947 1,525 2007 564 150 511 1,431 2,950 1,454 2008 513 146 674 1,356 2,741 1,295 2009 480 134 708 1,297 2,635 1,183 2010 471 133 849 1,282 2,368 1,152 2011 460 115 973 1,247 2,300 1,116 2012 482 161 1,362 1,350 2,407 1,127 =========== =========== =========== =========== =========== =========== 18,350 2,660 6,169 34,477 79,989 42,135
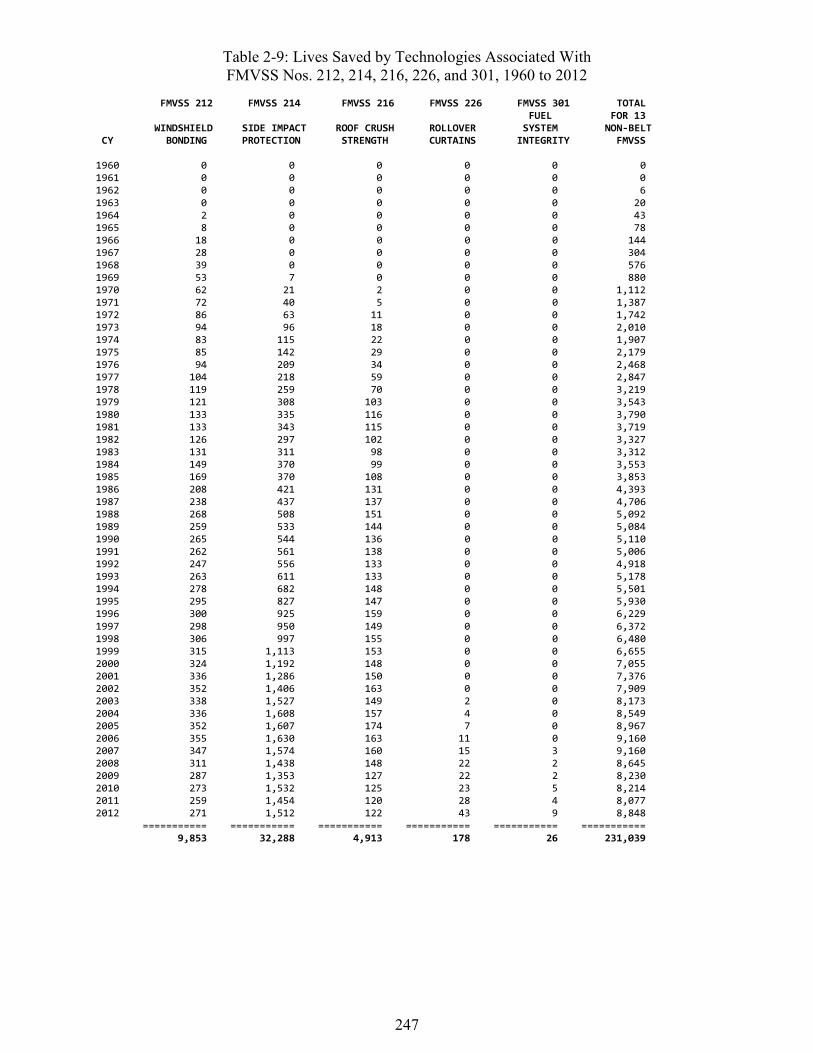
247
Table 2-9: Lives Saved by Technologies Associated With FMVSS Nos. 212, 214, 216, 226, and 301, 1960 to 2012
FMVSS 212 FMVSS 214 FMVSS 216 FMVSS 226 FMVSS 301 TOTAL FUEL FOR 13 WINDSHIELD SIDE IMPACT ROOF CRUSH ROLLOVER SYSTEM NON-BELT CY BONDING PROTECTION STRENGTH CURTAINS INTEGRITY FMVSS 1960 0 0 0 0 0 0 1961 0 0 0 0 0 0 1962 0 0 0 0 0 6 1963 0 0 0 0 0 20 1964 2 0 0 0 0 43 1965 8 0 0 0 0 78 1966 18 0 0 0 0 144 1967 28 0 0 0 0 304 1968 39 0 0 0 0 576 1969 53 7 0 0 0 880 1970 62 21 2 0 0 1,112 1971 72 40 5 0 0 1,387 1972 86 63 11 0 0 1,742 1973 94 96 18 0 0 2,010 1974 83 115 22 0 0 1,907 1975 85 142 29 0 0 2,179 1976 94 209 34 0 0 2,468 1977 104 218 59 0 0 2,847 1978 119 259 70 0 0 3,219 1979 121 308 103 0 0 3,543 1980 133 335 116 0 0 3,790 1981 133 343 115 0 0 3,719 1982 126 297 102 0 0 3,327 1983 131 311 98 0 0 3,312 1984 149 370 99 0 0 3,553 1985 169 370 108 0 0 3,853 1986 208 421 131 0 0 4,393 1987 238 437 137 0 0 4,706 1988 268 508 151 0 0 5,092 1989 259 533 144 0 0 5,084 1990 265 544 136 0 0 5,110 1991 262 561 138 0 0 5,006 1992 247 556 133 0 0 4,918 1993 263 611 133 0 0 5,178 1994 278 682 148 0 0 5,501 1995 295 827 147 0 0 5,930 1996 300 925 159 0 0 6,229 1997 298 950 149 0 0 6,372 1998 306 997 155 0 0 6,480 1999 315 1,113 153 0 0 6,655 2000 324 1,192 148 0 0 7,055 2001 336 1,286 150 0 0 7,376 2002 352 1,406 163 0 0 7,909 2003 338 1,527 149 2 0 8,173 2004 336 1,608 157 4 0 8,549 2005 352 1,607 174 7 0 8,967 2006 355 1,630 163 11 0 9,160 2007 347 1,574 160 15 3 9,160 2008 311 1,438 148 22 2 8,645 2009 287 1,353 127 22 2 8,230 2010 273 1,532 125 23 5 8,214 2011 259 1,454 120 28 4 8,077 2012 271 1,512 122 43 9 8,848 =========== =========== =========== =========== =========== =========== 9,853 32,288 4,913 178 26 231,039
248
The somewhat more hypothetical estimates in Table 2-7, meaningful primarily within the context of this report, include some indirect as well as the direct savings. This report estimates the total additional fatalities that would have occurred if all safety technologies had been removed – not just the belts, safety seats and frontal air bags, but also, for example, ESC. It then apportions the total among the various individual technologies, based on a computational process that simulates the effect of “removing” the technologies one-by-one in reverse chronological order, as ex-plained in the “Summary of the Estimation Method” at the beginning of Part 2 of this report.
The estimates in Traffic Safety Facts and in Table 2-7 track closely until the mid-1990s (with discrepancies on the order of 1% due to slight differences in the computational details) because, until then, 3-point belts, frontal air bags, and child safety seats were essentially the most recent safety technologies. After 1995, even more recent technologies such as ESC, curtain and side air bags, and head impact protection cause the estimates in Table 2-7 to gradually pull away from those in Traffic Safety Facts. As explained in the “Summary of the Estimation Method,” the new technologies not only save lives themselves but also indirectly augment this report’s estimates of lives saved by earlier technologies such as seat belts (because “removing” the newer technology augments the baseline fatalities prior to estimating the effect of removing the earlier technology). For a simple example, in a type of crash where ESC and belts each reduce fatality risk by 50 per-cent, Traffic Safety Facts would infer from the presence on FARS of a single belted fatality in a vehicle, that there would have been two fatalities if belts were removed – i.e., one life saved di-rectly by belts, regardless of whether this vehicle had been equipped with ESC or not. But in this report, ESC is removed first, leaving two belted fatalities without ESC (augmented baseline), which in turn become four unbelted fatalities if the belts are also removed – i.e., two lives saved by belts. Furthermore, as stated above, Table 2-7 includes (and Traffic Safety Facts does not in-clude) the effects of pretensioners and load limiters in its computation of lives saved by seat belts.
Thus, in 1996, the official estimate of 10,414 lives directly saved by belts is close to the 10,569 in Table 2-7; by 2003, they have diverged to 15,095 and 15,795; and by 2012, to 12,174 lives directly saved versus 15,485 lives directly or indirectly saved by belts.610
According to Table 2-7, the various types of frontal air bags saved 42,856 lives from 1986 through 2012, including 2,930 in 2012. These are the net lives saved – i.e., the benefits for adults and adolescents (13 and older) are to a small extent offset by increased risk to certain subgroups of child passengers from air bags that do not have suppression or low-risk deployment features; see Tables 2-49 through 2-54. By CY 2012, about 95 percent of the passenger cars on the road and 91 percent of the LTVs were equipped with frontal air bags (see Tables C-2 and C-4 in Ap-pendix C). In other words, when the proportion of vehicles with air bags gets close to 100 per-cent, air bags will save somewhat over 3,000 lives per year, if the “base” of potential fatalities remains similar to 2012 levels.
610 Traffic safety facts 2001 – Occupant protection. (Report No. DOT HS 809 474). Washington, DC: National Highway Traffic Safety Administration. Available www-nrd.nhtsa.dot.gov/Pubs/809474.pdf; Traffic safety facts 2012 data – Occupant protection.
249
The various types of curtain and side air bags have saved an estimated 2,252 lives from 1996 to 2012, including 389 in 2012. In that year, 42 percent of cars and 28 percent of LTVs on the road were equipped with some type of curtain and/or side air bags.
Child safety seats (including infant, toddler, convertible, and booster seats) have been saving 326 to 456 lives per year since 1994. They have been available and have saved 9,891 lives since the late 1960s. Benefits really began to increase after the States enacted child passenger protection laws in 1978 to 1985 and followed them up with campaigns to increase use.
Tables 2-8 and 2-9 estimate the lives saved by all the vehicle technologies other than seat belts, frontal air bags and safety seats, grouping them into 11 columns based on the 13 FMVSS associ-ated with them (FMVSS Nos. 105/135 and 203/204 each constitute a single column). Important-ly, the right column of Table 2-9 shows that, together, these “built-in,” non-belt technologies saved an estimated 231,039 lives from 1960 through 2012, a substantial portion of the 613,501 lives saved by all the technologies. (The “FMVSS 214” column in Table 2-9 includes curtain and side air bags; without them, the total for FMVSS No. 214 would decrease from 32,288 to 30,036 and the total for the 13 FMVSS from 231,039 to 228,787).
The right column of Table 2-9 shows these technologies were saving 3,000 lives per year by the late 1970s, by which time most cars of the pre-FMVSS era had been retired. The savings contin-ued to grow, reaching a peak of 9,160 in both 2006 and 2007, as new technologies were intro-duced, most pre-FMVSS LTVs were retired, and the “base” of vehicles, VMT and potentially fatal crashes continued to grow. The estimate had fallen back to 8,077 by 2011, despite vehicles with new technologies replacing less protective vehicles, because the base of potential fatalities shrank, but it had returned to 8,848 by 2012. Each of the 11 individual columns exhibit years of strong increases in lives saved when the FMVSS is introduced or upgraded, followed by more gradual increases until about 2007 and some decline after that until 2011 unless new technolo-gies under that FMVSS rapidly entered the fleet in recent years (e.g., FMVSS No. 126, “Elec-tronic stability control”).
Braking improvements directly or indirectly associated with FMVSS Nos. 105 and 135 include dual master cylinders, implemented in the early-to-mid 1960s, and front disc brakes, introduced during 1965 to 1977. The first column of Table 2-8 shows these technologies began saving lives in 1962. Benefits grew rapidly from 1967 to 1980 as vehicles with dual master cylinders replaced older vehicles without them in the on-road fleet. Benefits continued to grow from 1980 to 2005 as the “base” of potentially fatal crashes kept expanding. They saved an estimated 18,350 lives in 1962 to 2012, including 482 in 2012. The people who owe their lives to these safety improve-ments are not limited to occupants of the cars and LTVs equipped with them. When a car or LTV, as a consequence of these improvements, avoids hitting another car/LTV, a pedestrian, bi-cyclist, or motorcyclist, it may prevent a fatality among any of those groups.
The life-saving technology associated with FMVSS No. 108 is the red-and-white conspicuity tape on heavy truck trailers. Although this device is furnished on heavy trailers, not cars or LTVs, it is the occupants of cars and LTVs who primarily benefit, because it helps them avoid hitting the trailers in the dark. The tape began to appear on substantial numbers of trailers by 1991, and it has saved an estimated 2,660 car/LTV occupants, including 161 in 2012.
250
ESC, voluntarily introduced as standard equipment on one make-model in 1998 and required on all new vehicles in MY 2012 by FMVSS No. 126, saved 6,169 lives from 1998 through 2012, including 1,362 in 2,012. ESC on cars and LTVs benefits not only the occupants of those vehi-cles but also some motorcyclists when ESC on a car or LTV helps the driver avoid hitting the motorcycle. In CY 2012, only 20 percent of cars and 22 percent of LTVs on the road were ESC-equipped. Thus, ESC will likely save far more than 1,362 lives per year as those percentages rise.
Improvements to middle and lower instrument panels, not actually required by FMVSS No. 201, “Occupant protection in interior impact” but historically and functionally associated with that standard to some extent, began to appear in cars in the later 1960s and in LTVs a few years after that. Then, in MY 1999 to 2003, NHTSA upgraded the standard’s head impact protection. Table 2-8 shows an initial surge in lives saved in the 1970s and another surge after 2000. The two technologies have saved an estimated 34,477 lives, including 1,350 in 2012.
Energy-absorbing steering assemblies meeting FMVSS Nos. 203 and 204 were one of the most important “built-in” early safety technologies. They significantly reduced the fatality risk of drivers in frontal crashes, and have saved an estimated 79,989 lives in cars and LTVs, including 2,407 in 2012. Energy-absorbing column and well-designed instrument panels continue to be important components of the overall occupant protection system in today’s vehicles with frontal air bags and they continue to save lives. Specifically, as explained in the “Summary of the Esti-mation Method,” our model first computes by how much fatalities would increase if the most recent technologies such as air bags were “removed” from today’s vehicles, and then by how much more they would increase if the earlier technologies such as energy-absorbing columns were also “removed.”
Improvements to door locks, latches, hinges and other components regulated by FMVSS No. 206 have significantly reduced door ejections in rollover crashes, saving an estimated 42,135 lives from 1962 to 2012, including 1,127 in 2012. Increases in the population of then relatively rollo-ver-prone LTVs expanded the “base” of potentially fatal crashes addressed by this technology between 1999 and 2005.
FMVSS No. 212, “Windshield mounting,” is the first standard addressed in Table 2-9. The intro-duction of adhesive windshield bonding extended from 1963 in some cars until approximately 1985 in some LTVs. As a result, the benefits for FMVSS No. 212 built up more gradually than some other standards. Adhesive bonding has significantly reduced occupant ejections via the windshield portal, saving an estimated 9,853 lives from 1964 to 2012, including 271 in 2012.
The estimates of benefits associated with FMVSS No. 214, “Side impact protection,” are based on technologies that entered at different times: side door beams for passenger cars (1969 to 1973); TTI(d) reduction by structure and padding in passenger cars (related to the FMVSS up-grade that phased in during MY 1994 to 1997, but including voluntary improvements back to 1986); side door beams for LTVs (mostly 1994); and curtain and side air bags (available on some vehicles since 1996). Each new technology increased benefits, reaching 1,512 lives saved in 2012, and a total of 32,288 from 1969 to 2012.
FMVSS No. 216, “Roof crush resistance,” is associated with the redesign of true hardtops as pil-lared hardtops or sedans during the 1970s. The elimination of these hardtops with low, flat, vul-

251
nerable roofs saved lives; if cars were still built that way there would have been 4,913 additional fatalities, including an estimated 122 in 2012.
Curtains that deploy in rollovers began to appear on LTVs in 2002, well in advance of FMVSS No. 226, “Ejection mitigation.” They were still fairly rare on passenger cars as of MY 2012. They had saved 178 lives from 2002 to 2012, including 43 in 2012.
The most recent rear-impact upgrade of FMVSS No. 301, “Fuel system integrity,” phased in dur-ing MY 2007 to 2009. It had saved an estimated 26 lives by 2012, including 9 in that year. Alt-hough it is the smallest total among these 11 FMVSS, it is unique because every one of those fatalities was due to burns. Ranked by their estimates of lives saved from 1960 through 2012, 14 groups of safety technologies line up as follows:
Lives Saved in 1960 to 2012 208/209/210 Seat belts 329,715 203/204 Energy-absorbing steering assemblies 79,989 208 Frontal air bags 42,856 206 Door locks, latches and hinges 42,135 201 Occupant protection in interior impact 34,477 214 Side impact protection (incl. side air bags) 32,288 105/135 Dual master cylinders/front disc brakes 18,350 213 Child safety seats 9,891 212 Adhesive windshield bonding 9,853 126 ESC 6,169 216 Roof crush resistance 4,913 108 Trailer conspicuity tape 2,660 226 Rollover curtains 178 301 Fuel system integrity 26 613,501
Seat belts are first by far, followed by an early occupant-protection standard dating back to Janu-ary 1, 1968, for passenger cars. Frontal air bags, a substantially later arrival ranks third despite not having had nearly as many years of accumulated benefits. Ranked by their estimates of lives saved in 2012 alone, the 14 groups line up as follows:
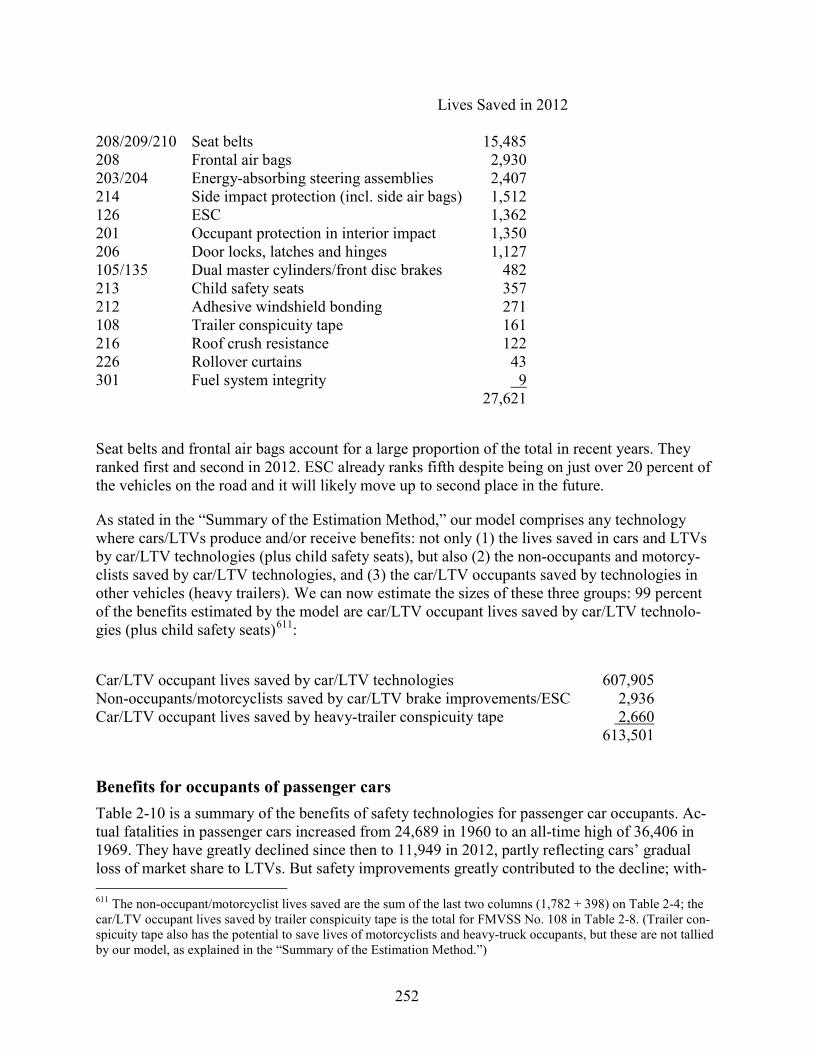
252
Lives Saved in 2012 208/209/210 Seat belts 15,485 208 Frontal air bags 2,930 203/204 Energy-absorbing steering assemblies 2,407 214 Side impact protection (incl. side air bags) 1,512 126 ESC 1,362 201 Occupant protection in interior impact 1,350 206 Door locks, latches and hinges 1,127 105/135 Dual master cylinders/front disc brakes 482 213 Child safety seats 357 212 Adhesive windshield bonding 271 108 Trailer conspicuity tape 161 216 Roof crush resistance 122 226 Rollover curtains 43 301 Fuel system integrity 9 27,621
Seat belts and frontal air bags account for a large proportion of the total in recent years. They ranked first and second in 2012. ESC already ranks fifth despite being on just over 20 percent of the vehicles on the road and it will likely move up to second place in the future.
As stated in the “Summary of the Estimation Method,” our model comprises any technology where cars/LTVs produce and/or receive benefits: not only (1) the lives saved in cars and LTVs by car/LTV technologies (plus child safety seats), but also (2) the non-occupants and motorcy-clists saved by car/LTV technologies, and (3) the car/LTV occupants saved by technologies in other vehicles (heavy trailers). We can now estimate the sizes of these three groups: 99 percent of the benefits estimated by the model are car/LTV occupant lives saved by car/LTV technolo-gies (plus child safety seats)611:
Car/LTV occupant lives saved by car/LTV technologies 607,905 Non-occupants/motorcyclists saved by car/LTV brake improvements/ESC 2,936 Car/LTV occupant lives saved by heavy-trailer conspicuity tape 2,660 613,501
Benefits for occupants of passenger cars Table 2-10 is a summary of the benefits of safety technologies for passenger car occupants. Ac-tual fatalities in passenger cars increased from 24,689 in 1960 to an all-time high of 36,406 in 1969. They have greatly declined since then to 11,949 in 2012, partly reflecting cars’ gradual loss of market share to LTVs. But safety improvements greatly contributed to the decline; with- 611 The non-occupant/motorcyclist lives saved are the sum of the last two columns (1,782 + 398) on Table 2-4; the car/LTV occupant lives saved by trailer conspicuity tape is the total for FMVSS No. 108 in Table 2-8. (Trailer con-spicuity tape also has the potential to save lives of motorcyclists and heavy-truck occupants, but these are not tallied by our model, as explained in the “Summary of the Estimation Method.”)
253
out them, fatalities would only have fallen from 37,449 in 1969 to 25,967 in 2012. Safety tech-nologies saved 385,408 car occupants from 1960 through 2012, including 14,018 in 2012. Vol-untary improvements such as better instrument panels, TTI(d) reductions in 2-door cars and de-signs to new FMVSS before their effective date have been saving between 600 and 1,300 lives a year since 1968; however, most of the lives saved (340,451) are by safety technologies compliant with FMVSS in effect at that time.
The proportion of potential fatalities saved by safety technologies has grown from 0.37 percent in 1960, when 92 car occupants were saved by lap belts, to 53.98 percent in 2012. The largest boost (from 14.32 to 25.35%) came from 1984 to 1988, when buckle-up laws took effect in most of the States, but there have been continued, steady gains since with belt use increasing and im-portant non-belt technologies phasing in one after another, including frontal air bags, side impact protection, head impact protection, and ESC.
VMT data is available for passenger cars from 1975 to 2012.612 They make it possible to com-pute occupant fatality rates per 100,000,000 VMT, as shown in Table 2-11 and Figure 2-6. Without the safety technologies, the fatality rate would potentially have remained nearly flat, close to 2.2, from about 1983 until 2007 (with possibly a rising trend in the mid-1980s as new, downsized cars continued to replace the pre-downsized fleet). But thanks to the safety improve-ments, the actual fatality rate trended steadily downward from 1.93 in 1983 to 1.06 in 2007. Spe-cifically, the buckle-up laws enacted in the mid-1980s more than cancelled any upward trend in the potential fatality rate. From 2007 to 2011, the potential fatality rate dropped from 2.10 to 1.67 and the actual fatality rate from 1.06 to 0.78 (proportionately, an even steeper decline). The rates were 1.74 and 0.80 in 2012.
At this point, we can review the lives saved by 31 individual safety technologies for passenger cars. Table 2-1 lists them in a chronological order based on the “median installation year”: the first year that at least 50 percent of new cars had the technology. Our presentation will follow the same order: from oldest to newest (even though the computer models generating the estimates actually analyze the technologies in reverse chronological order). Table 2-12 covers the two ear-liest technologies, 208A – lap belts for outboard front seat occupants (age 5 and older), and 208B – lap belt use (at any seating position) by children 1 to 4 years old.
612 Traffic safety facts 2011, p. 24 specifies VMT for cars in 1975 to 2011; the estimate of total VMT in Traffic safe-ty facts research note – 2012 motor vehicle crashes has been allocated to cars, LTVs, and other vehicles based on the 2010-to-2011 trends.
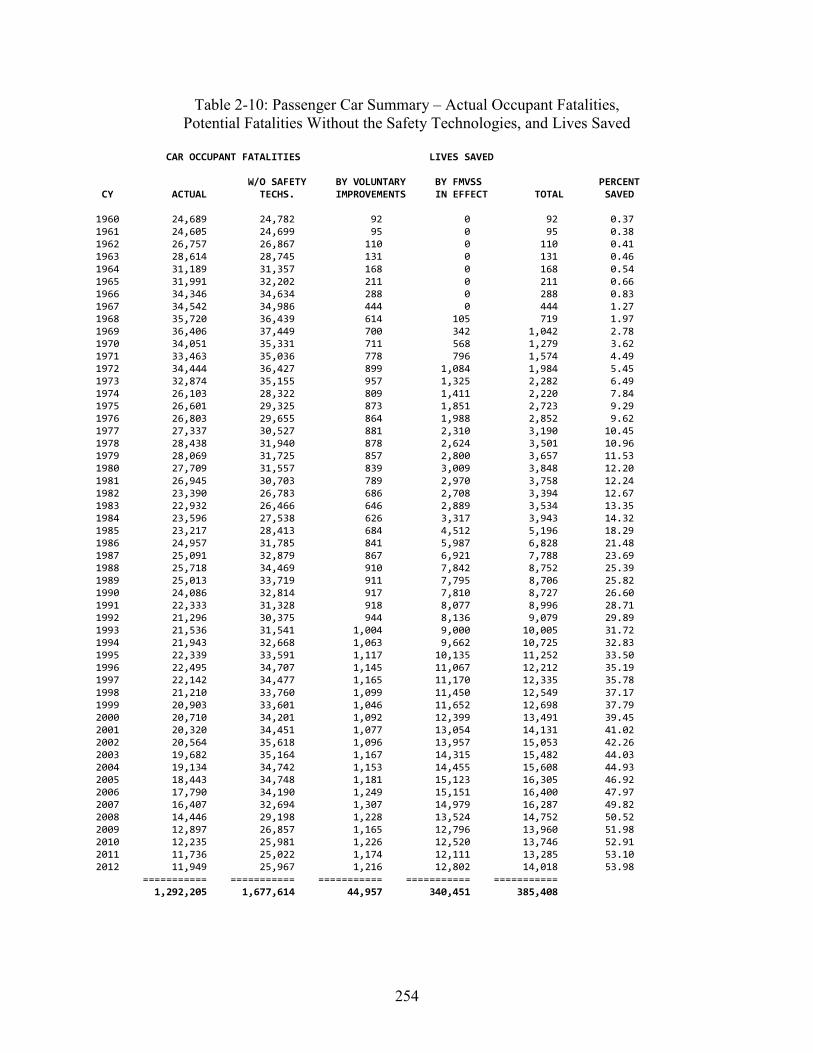
254
Table 2-10: Passenger Car Summary – Actual Occupant Fatalities, Potential Fatalities Without the Safety Technologies, and Lives Saved
CAR OCCUPANT FATALITIES LIVES SAVED W/O SAFETY BY VOLUNTARY BY FMVSS PERCENT CY ACTUAL TECHS. IMPROVEMENTS IN EFFECT TOTAL SAVED 1960 24,689 24,782 92 0 92 0.37 1961 24,605 24,699 95 0 95 0.38 1962 26,757 26,867 110 0 110 0.41 1963 28,614 28,745 131 0 131 0.46 1964 31,189 31,357 168 0 168 0.54 1965 31,991 32,202 211 0 211 0.66 1966 34,346 34,634 288 0 288 0.83 1967 34,542 34,986 444 0 444 1.27 1968 35,720 36,439 614 105 719 1.97 1969 36,406 37,449 700 342 1,042 2.78 1970 34,051 35,331 711 568 1,279 3.62 1971 33,463 35,036 778 796 1,574 4.49 1972 34,444 36,427 899 1,084 1,984 5.45 1973 32,874 35,155 957 1,325 2,282 6.49 1974 26,103 28,322 809 1,411 2,220 7.84 1975 26,601 29,325 873 1,851 2,723 9.29 1976 26,803 29,655 864 1,988 2,852 9.62 1977 27,337 30,527 881 2,310 3,190 10.45 1978 28,438 31,940 878 2,624 3,501 10.96 1979 28,069 31,725 857 2,800 3,657 11.53 1980 27,709 31,557 839 3,009 3,848 12.20 1981 26,945 30,703 789 2,970 3,758 12.24 1982 23,390 26,783 686 2,708 3,394 12.67 1983 22,932 26,466 646 2,889 3,534 13.35 1984 23,596 27,538 626 3,317 3,943 14.32 1985 23,217 28,413 684 4,512 5,196 18.29 1986 24,957 31,785 841 5,987 6,828 21.48 1987 25,091 32,879 867 6,921 7,788 23.69 1988 25,718 34,469 910 7,842 8,752 25.39 1989 25,013 33,719 911 7,795 8,706 25.82 1990 24,086 32,814 917 7,810 8,727 26.60 1991 22,333 31,328 918 8,077 8,996 28.71 1992 21,296 30,375 944 8,136 9,079 29.89 1993 21,536 31,541 1,004 9,000 10,005 31.72 1994 21,943 32,668 1,063 9,662 10,725 32.83 1995 22,339 33,591 1,117 10,135 11,252 33.50 1996 22,495 34,707 1,145 11,067 12,212 35.19 1997 22,142 34,477 1,165 11,170 12,335 35.78 1998 21,210 33,760 1,099 11,450 12,549 37.17 1999 20,903 33,601 1,046 11,652 12,698 37.79 2000 20,710 34,201 1,092 12,399 13,491 39.45 2001 20,320 34,451 1,077 13,054 14,131 41.02 2002 20,564 35,618 1,096 13,957 15,053 42.26 2003 19,682 35,164 1,167 14,315 15,482 44.03 2004 19,134 34,742 1,153 14,455 15,608 44.93 2005 18,443 34,748 1,181 15,123 16,305 46.92 2006 17,790 34,190 1,249 15,151 16,400 47.97 2007 16,407 32,694 1,307 14,979 16,287 49.82 2008 14,446 29,198 1,228 13,524 14,752 50.52 2009 12,897 26,857 1,165 12,796 13,960 51.98 2010 12,235 25,981 1,226 12,520 13,746 52.91 2011 11,736 25,022 1,174 12,111 13,285 53.10 2012 11,949 25,967 1,216 12,802 14,018 53.98 =========== =========== =========== =========== =========== 1,292,205 1,677,614 44,957 340,451 385,408
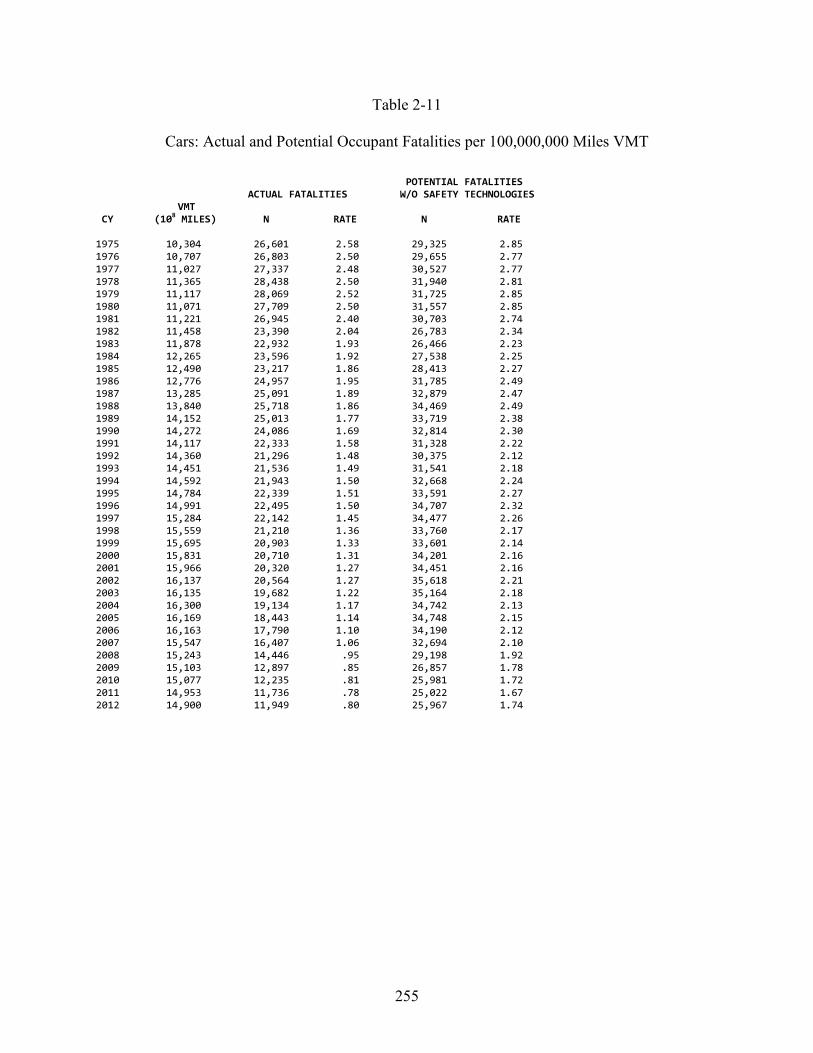
255
Table 2-11
Cars: Actual and Potential Occupant Fatalities per 100,000,000 Miles VMT POTENTIAL FATALITIES ACTUAL FATALITIES W/O SAFETY TECHNOLOGIES VMT CY (108 MILES) N RATE N RATE 1975 10,304 26,601 2.58 29,325 2.85 1976 10,707 26,803 2.50 29,655 2.77 1977 11,027 27,337 2.48 30,527 2.77 1978 11,365 28,438 2.50 31,940 2.81 1979 11,117 28,069 2.52 31,725 2.85 1980 11,071 27,709 2.50 31,557 2.85 1981 11,221 26,945 2.40 30,703 2.74 1982 11,458 23,390 2.04 26,783 2.34 1983 11,878 22,932 1.93 26,466 2.23 1984 12,265 23,596 1.92 27,538 2.25 1985 12,490 23,217 1.86 28,413 2.27 1986 12,776 24,957 1.95 31,785 2.49 1987 13,285 25,091 1.89 32,879 2.47 1988 13,840 25,718 1.86 34,469 2.49 1989 14,152 25,013 1.77 33,719 2.38 1990 14,272 24,086 1.69 32,814 2.30 1991 14,117 22,333 1.58 31,328 2.22 1992 14,360 21,296 1.48 30,375 2.12 1993 14,451 21,536 1.49 31,541 2.18 1994 14,592 21,943 1.50 32,668 2.24 1995 14,784 22,339 1.51 33,591 2.27 1996 14,991 22,495 1.50 34,707 2.32 1997 15,284 22,142 1.45 34,477 2.26 1998 15,559 21,210 1.36 33,760 2.17 1999 15,695 20,903 1.33 33,601 2.14 2000 15,831 20,710 1.31 34,201 2.16 2001 15,966 20,320 1.27 34,451 2.16 2002 16,137 20,564 1.27 35,618 2.21 2003 16,135 19,682 1.22 35,164 2.18 2004 16,300 19,134 1.17 34,742 2.13 2005 16,169 18,443 1.14 34,748 2.15 2006 16,163 17,790 1.10 34,190 2.12 2007 15,547 16,407 1.06 32,694 2.10 2008 15,243 14,446 .95 29,198 1.92 2009 15,103 12,897 .85 26,857 1.78 2010 15,077 12,235 .81 25,981 1.72 2011 14,953 11,736 .78 25,022 1.67 2012 14,900 11,949 .80 25,967 1.74
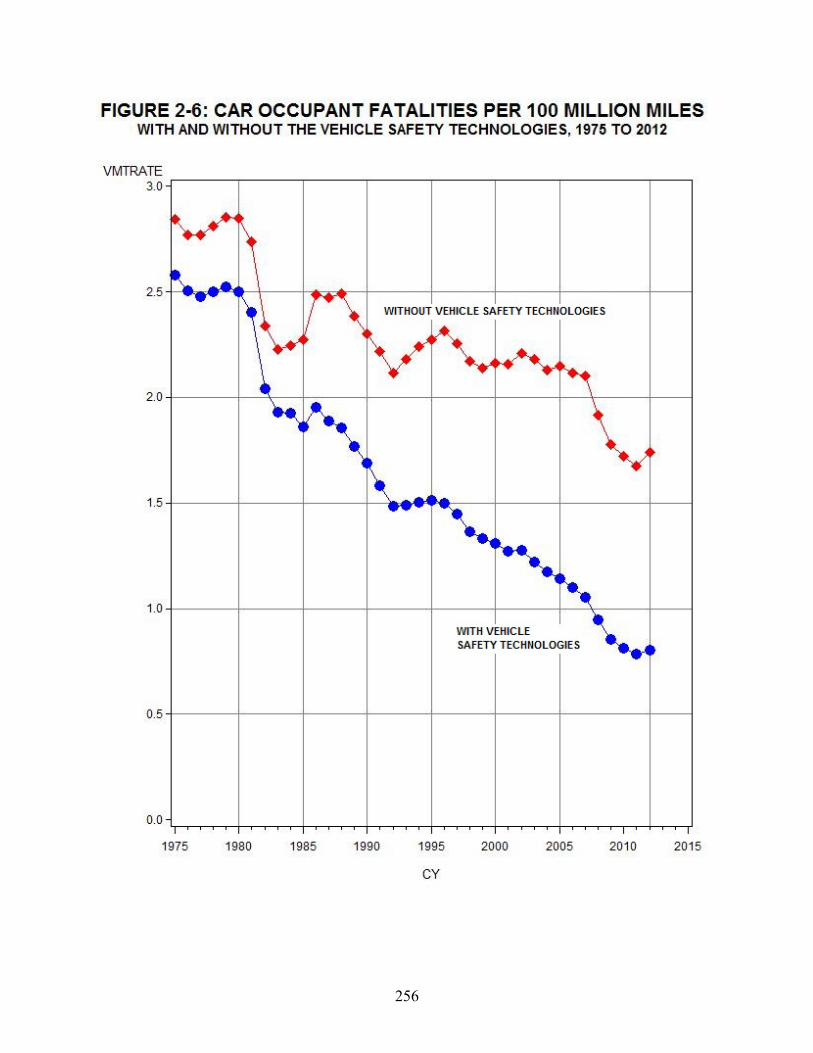
256
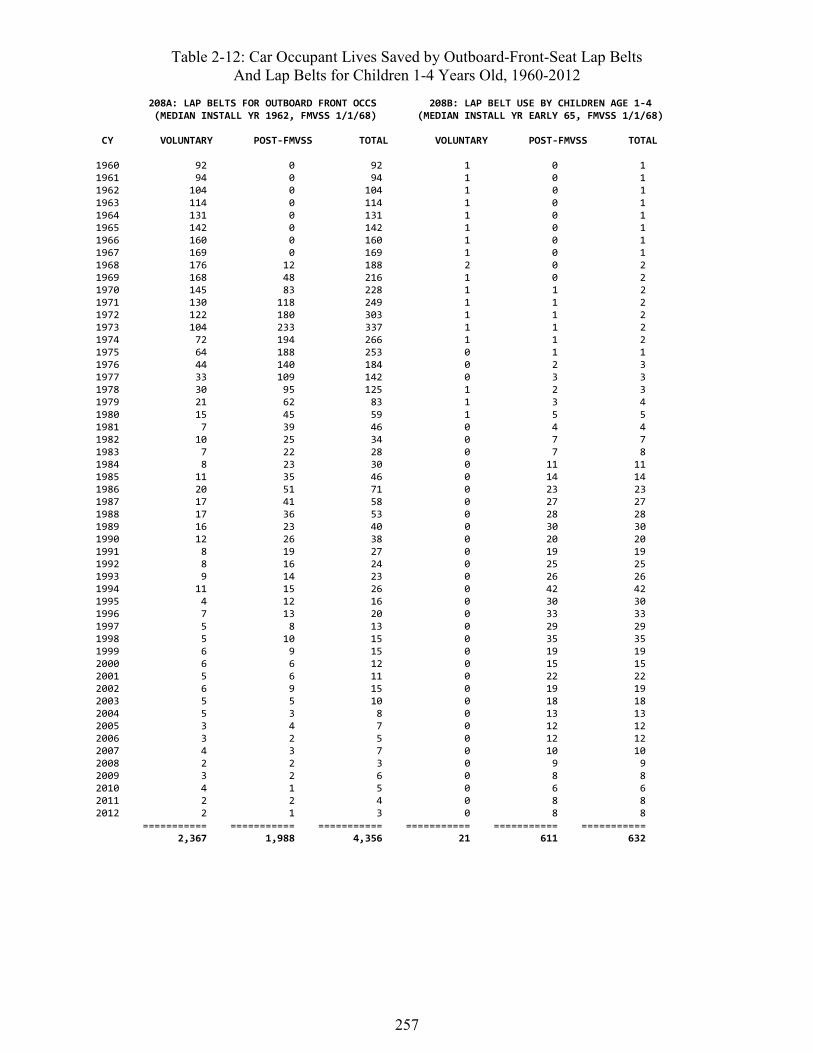
257
Table 2-12: Car Occupant Lives Saved by Outboard-Front-Seat Lap Belts And Lap Belts for Children 1-4 Years Old, 1960-2012
208A: LAP BELTS FOR OUTBOARD FRONT OCCS 208B: LAP BELT USE BY CHILDREN AGE 1-4 (MEDIAN INSTALL YR 1962, FMVSS 1/1/68) (MEDIAN INSTALL YR EARLY 65, FMVSS 1/1/68) CY VOLUNTARY POST-FMVSS TOTAL VOLUNTARY POST-FMVSS TOTAL 1960 92 0 92 1 0 1 1961 94 0 94 1 0 1 1962 104 0 104 1 0 1 1963 114 0 114 1 0 1 1964 131 0 131 1 0 1 1965 142 0 142 1 0 1 1966 160 0 160 1 0 1 1967 169 0 169 1 0 1 1968 176 12 188 2 0 2 1969 168 48 216 1 0 2 1970 145 83 228 1 1 2 1971 130 118 249 1 1 2 1972 122 180 303 1 1 2 1973 104 233 337 1 1 2 1974 72 194 266 1 1 2 1975 64 188 253 0 1 1 1976 44 140 184 0 2 3 1977 33 109 142 0 3 3 1978 30 95 125 1 2 3 1979 21 62 83 1 3 4 1980 15 45 59 1 5 5 1981 7 39 46 0 4 4 1982 10 25 34 0 7 7 1983 7 22 28 0 7 8 1984 8 23 30 0 11 11 1985 11 35 46 0 14 14 1986 20 51 71 0 23 23 1987 17 41 58 0 27 27 1988 17 36 53 0 28 28 1989 16 23 40 0 30 30 1990 12 26 38 0 20 20 1991 8 19 27 0 19 19 1992 8 16 24 0 25 25 1993 9 14 23 0 26 26 1994 11 15 26 0 42 42 1995 4 12 16 0 30 30 1996 7 13 20 0 33 33 1997 5 8 13 0 29 29 1998 5 10 15 0 35 35 1999 6 9 15 0 19 19 2000 6 6 12 0 15 15 2001 5 6 11 0 22 22 2002 6 9 15 0 19 19 2003 5 5 10 0 18 18 2004 5 3 8 0 13 13 2005 3 4 7 0 12 12 2006 3 2 5 0 12 12 2007 4 3 7 0 10 10 2008 2 2 3 0 9 9 2009 3 2 6 0 8 8 2010 4 1 5 0 6 6 2011 2 2 4 0 8 8 2012 2 1 3 0 8 8 =========== =========== =========== =========== =========== =========== 2,367 1,988 4,356 21 611 632
258
Lap belts at the driver and RF seats were offered in some new cars as early as 1956 and were ret-rofitted into some cars even older than that. (Part 1 of this report discusses the availability and effectiveness of each safety technology, in this case the section on “lap belts for front seat occu-pants” in the chapter on FMVSS No. 208.) By MY 1962, over half of new cars were equipped with lap belts; States were passing laws requiring lap belts on new cars sold there. Lap belts re-duce fatality risk by an average of 27 percent. FMVSS No. 208, like other initial safety stand-ards, went into effect on January 1, 1968. Any lap-belt installation before January 1, 1968 – i.e., before mid-model year 1968 – is considered a “voluntary” installation, at least from a Federal point of view (although State laws might have required it) and any life saved by belts in a pre-MY 1968 or early-MY 1968 car is counted as a voluntary save in Table 2-12. Voluntary saves grow from 92 in 1960 to 176 in 1968 as more cars became equipped with belts. These cars, how-ever, remained on the road after 1968 and their lap belts continued to accrue voluntary saves eve-ry year up to and including 2012, but in ever dwindling numbers as more and more were retired.
Most cars built from January 1, 1968, until August 31, 1973, had separate lap and shoulder belts. Here, our model counts fatality reductions among people who wore only the lap belt as “saved by the lap belt” and tallies them in the “post-FMVSS” column of Table 2-12. But fatality reduc-tions among people who wore both belts are counted with “saved by lap/shoulder belts” in Table 2-18, technology 208F. The number of post-FMVSS saves grew from 12 in 1968 to 233 in 1973 and generally declined after that as the MY 1968-to-1973 cars were retired. The sum of volun-tary and post-FMVSS saves, in the third column of Table 2-12, peaked at 337 in 1973 and to-taled 4,356 from 1960 to 2012. Relatively low use and low effectiveness limited the number of lives saved by lap belts.
NHTSA strongly urges that children 1 to 4 years old ride in child safety seats appropriate for their weight, size, and age, in the rear seat of the vehicle. Nevertheless, there have historically been some parents or caregivers who placed small children in seat belts without a safety seat. While that is not nearly as safe as a child safety seat, it does reduce fatality risk, to some extent, relative to an unrestrained child. Technology 208B counts any child 1 to 4 years old saved by belts (but not in a child safety seat) at any seating position. It counts them as “saved by lap belts” regardless of whether that seat was equipped with a lap belt only, a 3-point belt, or separate lap and shoulder belts, because the shoulder portion of the belt is of little value to a small child who is not in a safety seat. Lap belts reduce the fatality risk of 1-to-4 year old children by an average of 33 percent. Belts, without a safety seat, are assumed to have little or no value for infants (less than 1 year old); the model calculates no savings for infants. Lives saved in cars built before Jan-uary 1, 1968, are “voluntary” saves, and they can accrue as long as such cars remain in service; savings in cars built on or after January 1, 1968, are counted as “post-FMVSS.” This technology had quite limited benefits before States enacted child passenger protection laws in the early 1980s. From then until 2002, belts saved 15 to 42 lives a year. Some early State laws specifically permitted a belt in lieu of a safety seat for young children; in other cases, the adults transporting the child may simply have decided on their own to use belts rather than a safety seat. After 2000, more and more States revised their laws to disallow premature graduation; belt use by small children declined relative to safety seats. In cars, belts have saved a total of 632 children 1 to 4 years old.
Table 2-13 tallies savings by FMVSS No. 206 (improved door locks) and by technology 208B (lap belts for outboard rear seat passengers 5 and older). A series of improvements to door locks
259
in approximately 1962 to 1968 makes that the earliest non-belt technology evaluated by NHTSA. The evaluation estimated a 15-percent reduction of fatalities in rollovers. Benefits grew rapidly to about 500 lives saved per year as cars with the new technology replaced older cars; after that they gradually escalated to 713 in 2005 as the “base” of VMT and potentially fatal crashes grew larger and as smaller, more rollover-prone cars replaced full-size cars. As explained in the “Summary of the Estimation Method,” our model first “removes” all safety technologies that came after FMVSS No. 206, most importantly 3-point belts. The 713 lives saved in 2005 are an estimate of the difference between a hypothetical fleet of cars equipped only with lap belts for outboard front seat occupants, lap belts for children, and improved door locks (208A, 208B, and 206) and another fleet with lap belts for children and front-outboard occupants, but not improved door locks (only 208A and 208B) – i.e., the benefit of FMVSS No. 206 in a fleet where nobody has 3-point belts. As with the other technologies, all lives saved in cars built before the January 1, 1968, effective date are “voluntary” saves. Benefits declined after 2005 as the on-road vehicle fleet gradually shifted from cars to LTVs. Improved door locks saved an estimated 25,377 car occupants from 1960 to 2012.
Lap belts were available at the outboard rear seats of most new cars by 1965 or 1966 and were required effective January 1, 1968. In the 1980s, 3-point belts increasingly superseded lap belts. FMVSS No. 208 required lap/shoulder belts effective December 11, 1989. Lap belts are estimat-ed to reduce fatality risk by an average of 32 percent for rear seat occupants 5 and older. They achieved their largest benefit, 116 lives saved, in 1988, just before the shift to 3-point belts but after buckle-up laws, although primarily applicable to front seat occupants, began to have a fa-vorable influence on the rear seat occupants as well. These lap belts saved an estimated 1,420 lives from 1960 to 2012. By 2012, most vehicles equipped with lap belts had been retired.

260
Table 2-13: Car Occupant Lives Saved by Improved Door Locks And Lap Belts for Outboard Rear Seat Occupants, 1960-2012
206: IMPROVED DOOR LOCKS 208C: LAP BELTS FOR OUTBOARD REAR SEAT OCCS (MEDIAN INSTALL YR 1965, FMVSS 1/1/68) (MEDIAN INSTALL YR LATE 65, FMVSS 1/1/68) CY VOLUNTARY POST-FMVSS TOTAL VOLUNTARY POST-FMVSS TOTAL 1960 0 0 0 0 0 0 1961 0 0 0 0 0 0 1962 4 0 4 0 0 0 1963 13 0 13 0 0 0 1964 30 0 30 1 0 1 1965 52 0 52 2 0 2 1966 86 0 86 3 0 3 1967 123 0 123 4 0 4 1968 152 21 173 4 0 5 1969 157 67 224 4 1 6 1970 143 110 253 4 2 6 1971 139 151 291 4 3 7 1972 141 199 340 4 6 10 1973 129 232 361 4 9 13 1974 95 221 316 3 10 13 1975 74 248 322 5 12 17 1976 68 290 357 2 13 15 1977 69 392 461 4 21 25 1978 60 445 505 3 20 22 1979 53 536 589 0 12 12 1980 41 609 650 0 10 10 1981 29 590 619 1 13 13 1982 24 506 530 0 13 13 1983 20 511 532 0 29 30 1984 15 533 549 0 30 30 1985 15 553 568 0 65 65 1986 12 652 664 0 87 88 1987 10 710 721 1 88 89 1988 9 769 778 1 115 116 1989 5 703 708 1 109 109 1990 5 704 709 0 83 83 1991 5 675 681 0 77 77 1992 3 626 628 1 64 65 1993 2 629 631 0 65 65 1994 3 650 653 2 64 65 1995 2 679 681 1 67 68 1996 2 686 687 0 47 47 1997 2 643 644 0 42 42 1998 1 636 637 0 39 39 1999 1 665 666 0 18 18 2000 1 678 679 0 39 39 2001 1 672 673 0 15 15 2002 0 710 711 0 12 12 2003 1 633 633 0 6 6 2004 1 647 647 0 16 16 2005 1 712 713 0 6 6 2006 0 690 690 0 10 10 2007 0 656 656 0 3 3 2008 0 569 570 0 1 1 2009 1 513 514 0 5 5 2010 1 489 489 3 2 5 2011 0 477 477 0 2 2 2012 0 486 486 0 2 2 =========== =========== =========== =========== =========== =========== 1,802 23,575 25,377 62 1,357 1,420
261
Table 2-14 considers adhesive windshield bonding and lap belts for center front seat passengers. Adhesive windshield bonding is a technology that was often employed to comply with the per-formance requirements set forth by FMVSS No. 212, but not explicitly mandated by that stand-ard. Its introduction extended from MY 1963 through the effective date of January 1, 1970 until approximately 1980, although the majority of new cars had it by MY 1966. Adhesive bonding significantly reduces the risk of ejection through the windshield portal. Lives saved in cars built before January 1, 1970 are counted as voluntary saves, all others as post-FMVSS saves. The number of lives saved gradually rose over 200 per year as the “base” of VMT and potentially fatal crashes increased, but dropped back after 2005 with the shift from cars to LTVs. Adhesive bonding saved an estimated 7,268 lives from 1960 to 2012.
The center front seat, like all designated seating positions, had to be equipped with lap belts by January 1, 1968, and often was equipped before that. Many cars do not have a center front seat, especially in recent years. Even when they do, it is usually unoccupied and belt use is low. Nev-ertheless, over five decades, an estimated 94 car occupants can thank this technology for saving their lives.
Table 2-15 addresses dual master cylinders (105A) and lap belts for center rear seat passengers (5 and older). Both technologies were required effective January 1, 1968, and often introduced a few years before that. Dual master cylinders reduce the risk of a fatal crash involvement by an estimated 0.7 percent. As the “base” of potentially fatal crashes grew, benefits also grew to a peak of 242 car occupants saved in 2002 and a total of 8,834 from 1960 to 2012.
Lap belts reduce the fatality risk of center rear seat passengers by about 32 percent. Benefits in-creased in the 1980s as belt use increased and in the 1990s as more children 5 to 12 years old moved to the rear seat. In the later 1990s, manufacturers began phasing in 3-point belts and the numbers for lap belts dwindled after that. Lap belts saved an estimated 259 center rear seat pas-sengers from 1960 to 2012.
Table 2-16 analyzes two basic “built-in” protections for front seat occupants in frontal crashes: energy-absorbing/telescoping steering assemblies to protect drivers (FMVSS Nos. 203 and 204), and voluntary modifications to middle and lower instrument panels, protecting passengers (called “201A” in this report because it is the first of two technologies associated with FMVSS No. 201). Energy-absorbing columns were introduced in the majority of cars in MY 1967 – i.e., late CY 1966 – and FMVSS Nos. 203 and 204 took effect on January 1, 1968. Thus, lives saved in the MY 1967 and early MY 1968 cars are counted as voluntary saves. The technology reduced drivers’ fatality risk in frontal crashes by an estimated 12.1 percent. NHTSA’s evaluation report, using 1978 as the baseline year, said FMVSS Nos. 203 and 204 would be saving 1,300 lives per year when all cars on the road met the standards. In fact, estimated benefits reached 1,300 in 1986 and reached a peak of 1,724 in 2005 as the base of VMT and potentially fatal crashes ex-panded. Subsequent reduction in the exposure base, including the shift from cars to LTVs, had returned benefits to the 1,300 level by 2011 and 2012. Energy-absorbing and telescoping col-umns continue to be a critical component of the overall frontal energy-management and crash-protection system, even in today’s cars with frontal air bags and high belt use. With 57,112 lives saved from 1966 through 2012, energy-absorbing steering assemblies clearly rank first in cumu-lative benefits among the non-belt technologies for passenger cars.
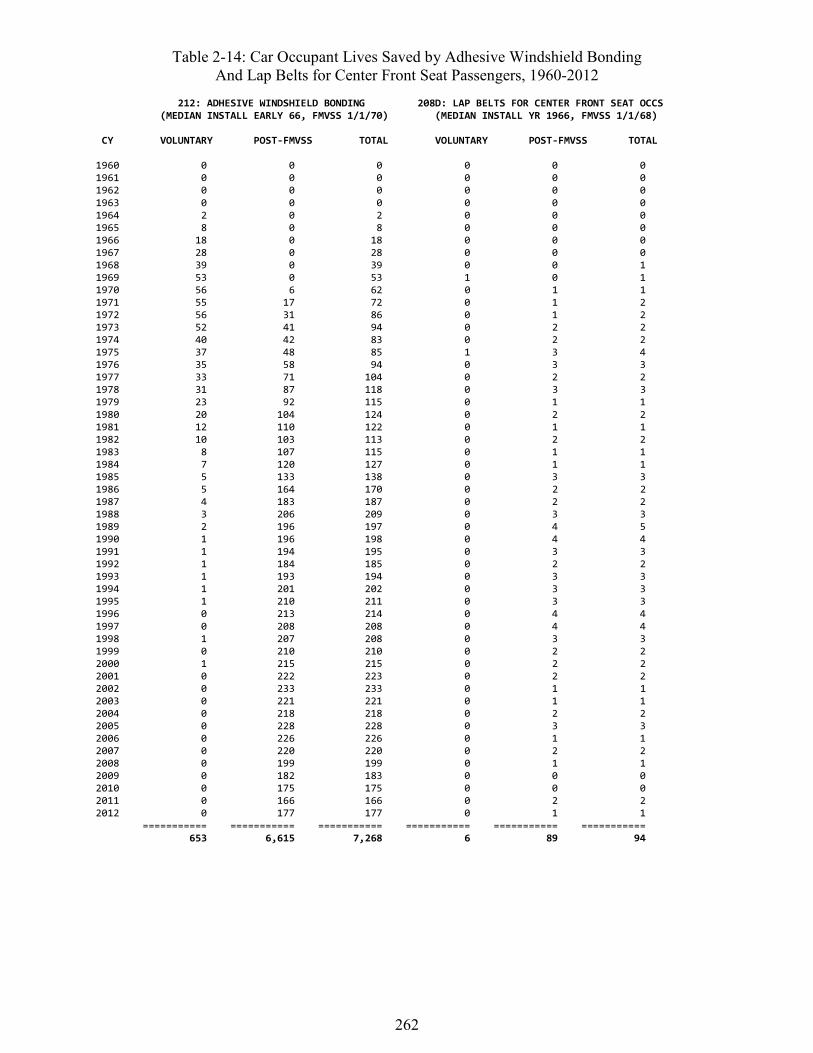
262
Table 2-14: Car Occupant Lives Saved by Adhesive Windshield Bonding And Lap Belts for Center Front Seat Passengers, 1960-2012
212: ADHESIVE WINDSHIELD BONDING 208D: LAP BELTS FOR CENTER FRONT SEAT OCCS (MEDIAN INSTALL EARLY 66, FMVSS 1/1/70) (MEDIAN INSTALL YR 1966, FMVSS 1/1/68) CY VOLUNTARY POST-FMVSS TOTAL VOLUNTARY POST-FMVSS TOTAL 1960 0 0 0 0 0 0 1961 0 0 0 0 0 0 1962 0 0 0 0 0 0 1963 0 0 0 0 0 0 1964 2 0 2 0 0 0 1965 8 0 8 0 0 0 1966 18 0 18 0 0 0 1967 28 0 28 0 0 0 1968 39 0 39 0 0 1 1969 53 0 53 1 0 1 1970 56 6 62 0 1 1 1971 55 17 72 0 1 2 1972 56 31 86 0 1 2 1973 52 41 94 0 2 2 1974 40 42 83 0 2 2 1975 37 48 85 1 3 4 1976 35 58 94 0 3 3 1977 33 71 104 0 2 2 1978 31 87 118 0 3 3 1979 23 92 115 0 1 1 1980 20 104 124 0 2 2 1981 12 110 122 0 1 1 1982 10 103 113 0 2 2 1983 8 107 115 0 1 1 1984 7 120 127 0 1 1 1985 5 133 138 0 3 3 1986 5 164 170 0 2 2 1987 4 183 187 0 2 2 1988 3 206 209 0 3 3 1989 2 196 197 0 4 5 1990 1 196 198 0 4 4 1991 1 194 195 0 3 3 1992 1 184 185 0 2 2 1993 1 193 194 0 3 3 1994 1 201 202 0 3 3 1995 1 210 211 0 3 3 1996 0 213 214 0 4 4 1997 0 208 208 0 4 4 1998 1 207 208 0 3 3 1999 0 210 210 0 2 2 2000 1 215 215 0 2 2 2001 0 222 223 0 2 2 2002 0 233 233 0 1 1 2003 0 221 221 0 1 1 2004 0 218 218 0 2 2 2005 0 228 228 0 3 3 2006 0 226 226 0 1 1 2007 0 220 220 0 2 2 2008 0 199 199 0 1 1 2009 0 182 183 0 0 0 2010 0 175 175 0 0 0 2011 0 166 166 0 2 2 2012 0 177 177 0 1 1 =========== =========== =========== =========== =========== =========== 653 6,615 7,268 6 89 94
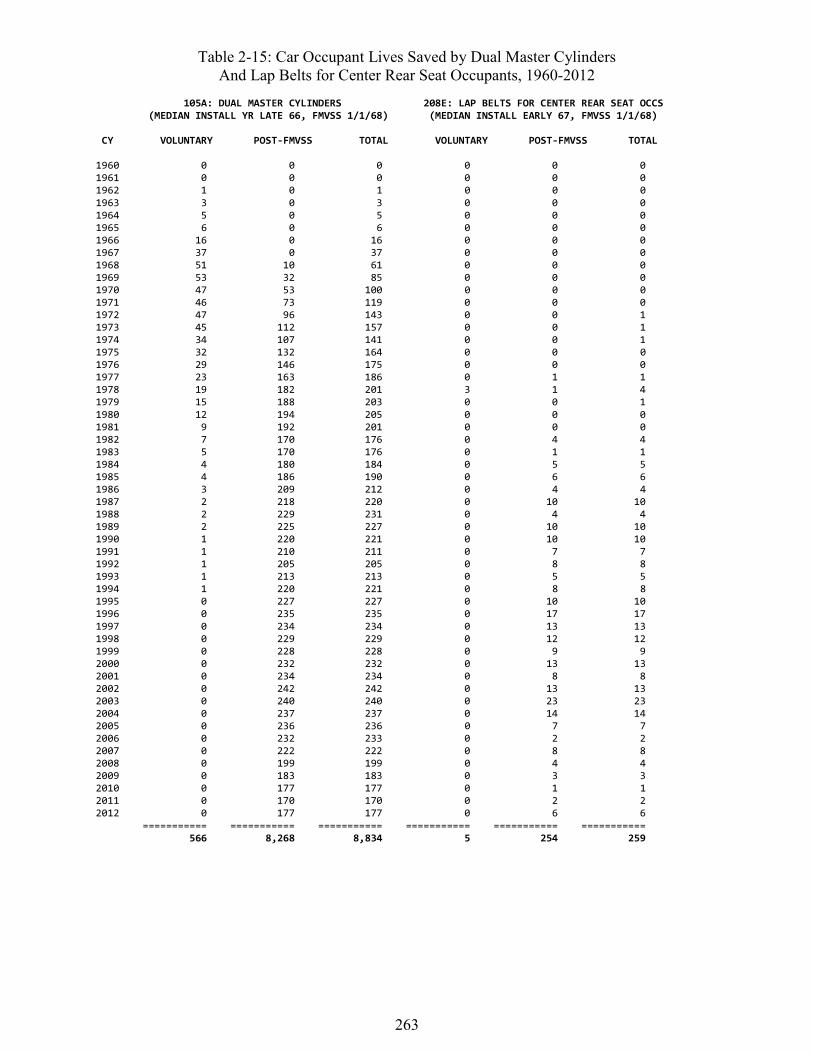
263
Table 2-15: Car Occupant Lives Saved by Dual Master Cylinders And Lap Belts for Center Rear Seat Occupants, 1960-2012
105A: DUAL MASTER CYLINDERS 208E: LAP BELTS FOR CENTER REAR SEAT OCCS (MEDIAN INSTALL YR LATE 66, FMVSS 1/1/68) (MEDIAN INSTALL EARLY 67, FMVSS 1/1/68) CY VOLUNTARY POST-FMVSS TOTAL VOLUNTARY POST-FMVSS TOTAL 1960 0 0 0 0 0 0 1961 0 0 0 0 0 0 1962 1 0 1 0 0 0 1963 3 0 3 0 0 0 1964 5 0 5 0 0 0 1965 6 0 6 0 0 0 1966 16 0 16 0 0 0 1967 37 0 37 0 0 0 1968 51 10 61 0 0 0 1969 53 32 85 0 0 0 1970 47 53 100 0 0 0 1971 46 73 119 0 0 0 1972 47 96 143 0 0 1 1973 45 112 157 0 0 1 1974 34 107 141 0 0 1 1975 32 132 164 0 0 0 1976 29 146 175 0 0 0 1977 23 163 186 0 1 1 1978 19 182 201 3 1 4 1979 15 188 203 0 0 1 1980 12 194 205 0 0 0 1981 9 192 201 0 0 0 1982 7 170 176 0 4 4 1983 5 170 176 0 1 1 1984 4 180 184 0 5 5 1985 4 186 190 0 6 6 1986 3 209 212 0 4 4 1987 2 218 220 0 10 10 1988 2 229 231 0 4 4 1989 2 225 227 0 10 10 1990 1 220 221 0 10 10 1991 1 210 211 0 7 7 1992 1 205 205 0 8 8 1993 1 213 213 0 5 5 1994 1 220 221 0 8 8 1995 0 227 227 0 10 10 1996 0 235 235 0 17 17 1997 0 234 234 0 13 13 1998 0 229 229 0 12 12 1999 0 228 228 0 9 9 2000 0 232 232 0 13 13 2001 0 234 234 0 8 8 2002 0 242 242 0 13 13 2003 0 240 240 0 23 23 2004 0 237 237 0 14 14 2005 0 236 236 0 7 7 2006 0 232 233 0 2 2 2007 0 222 222 0 8 8 2008 0 199 199 0 4 4 2009 0 183 183 0 3 3 2010 0 177 177 0 1 1 2011 0 170 170 0 2 2 2012 0 177 177 0 6 6 =========== =========== =========== =========== =========== =========== 566 8,268 8,834 5 254 259
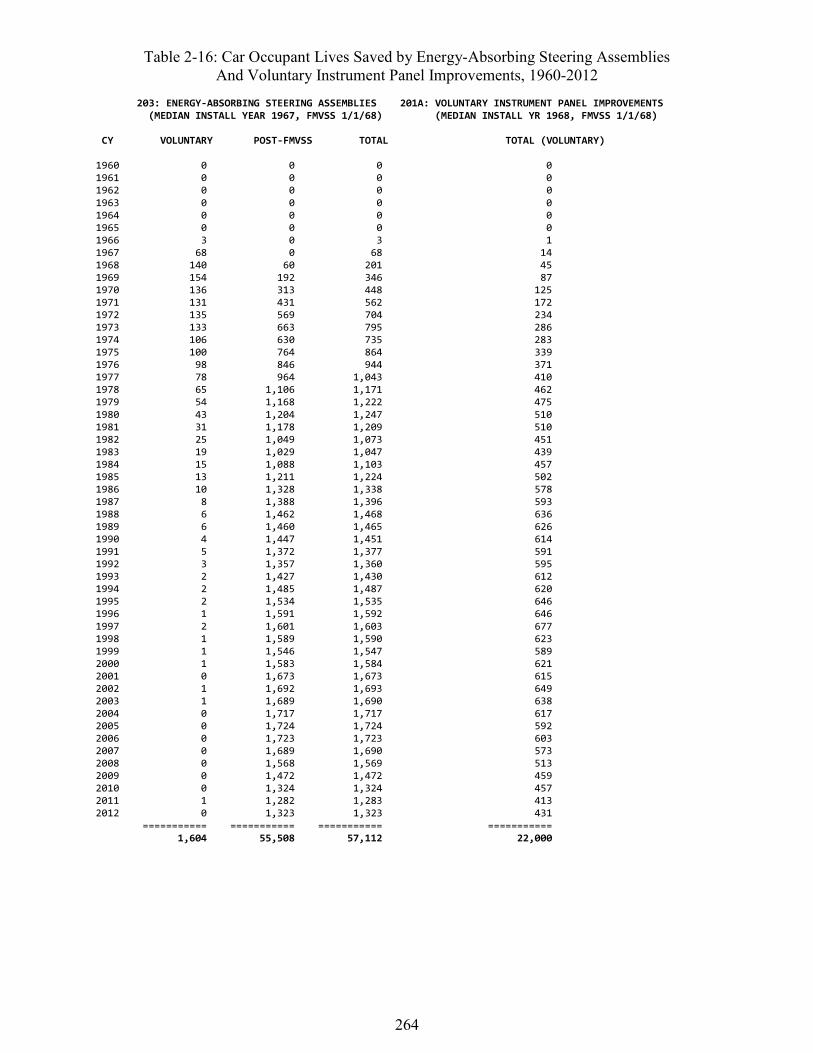
264
Table 2-16: Car Occupant Lives Saved by Energy-Absorbing Steering Assemblies And Voluntary Instrument Panel Improvements, 1960-2012
203: ENERGY-ABSORBING STEERING ASSEMBLIES 201A: VOLUNTARY INSTRUMENT PANEL IMPROVEMENTS (MEDIAN INSTALL YEAR 1967, FMVSS 1/1/68) (MEDIAN INSTALL YR 1968, FMVSS 1/1/68) CY VOLUNTARY POST-FMVSS TOTAL TOTAL (VOLUNTARY) 1960 0 0 0 0 1961 0 0 0 0 1962 0 0 0 0 1963 0 0 0 0 1964 0 0 0 0 1965 0 0 0 0 1966 3 0 3 1 1967 68 0 68 14 1968 140 60 201 45 1969 154 192 346 87 1970 136 313 448 125 1971 131 431 562 172 1972 135 569 704 234 1973 133 663 795 286 1974 106 630 735 283 1975 100 764 864 339 1976 98 846 944 371 1977 78 964 1,043 410 1978 65 1,106 1,171 462 1979 54 1,168 1,222 475 1980 43 1,204 1,247 510 1981 31 1,178 1,209 510 1982 25 1,049 1,073 451 1983 19 1,029 1,047 439 1984 15 1,088 1,103 457 1985 13 1,211 1,224 502 1986 10 1,328 1,338 578 1987 8 1,388 1,396 593 1988 6 1,462 1,468 636 1989 6 1,460 1,465 626 1990 4 1,447 1,451 614 1991 5 1,372 1,377 591 1992 3 1,357 1,360 595 1993 2 1,427 1,430 612 1994 2 1,485 1,487 620 1995 2 1,534 1,535 646 1996 1 1,591 1,592 646 1997 2 1,601 1,603 677 1998 1 1,589 1,590 623 1999 1 1,546 1,547 589 2000 1 1,583 1,584 621 2001 0 1,673 1,673 615 2002 1 1,692 1,693 649 2003 1 1,689 1,690 638 2004 0 1,717 1,717 617 2005 0 1,724 1,724 592 2006 0 1,723 1,723 603 2007 0 1,689 1,690 573 2008 0 1,568 1,569 513 2009 0 1,472 1,472 459 2010 0 1,324 1,324 457 2011 1 1,282 1,283 413 2012 0 1,323 1,323 431 =========== =========== =========== =========== 1,604 55,508 57,112 22,000
265
NHTSA proposed in 1966 and again in 1970 that FMVSS No. 201 regulate the force-deflection characteristics of middle and lower instrument panels, but those requirements were not included in any final rule.613 Nevertheless, by the mid-1970s, manufacturers had voluntarily remodeled the panels, using newly available materials, to absorb passenger impacts at a safer and more con-trolled force level. That has resulted in a 15.9-percent fatality reduction for unrestrained RF pas-sengers in frontal impacts. It saved an estimated 22,000 lives from late CY 1966 through 2012. The benefits for this technology are about one-third of the benefits for energy-absorbing steering assemblies principally because only one-third of crash-involved cars have a RF passenger, while all have a driver.
Table 2-17 addresses front disc brakes (105B) and side door beams (214A). Front disc brakes are well suited for meeting tests added to FMVSS No. 105 effective January 1, 1976, but were never explicitly required by that standard. Consumers preferred them to drum brakes. Their introduc-tion extended from MY 1965 until 1977, but the majority of new cars had them by 1971. Front disc brakes reduce the risk of a fatal crash involvement by an estimated 0.17 percent. They have been saving approximately 50 car occupants per year (closer to 40 after 2008), and a total of 1,725 from 1960 to 2012.
Side door beams were introduced in some cars as early as MY 1969, four years before the Janu-ary 1, 1973, effective date of FMVSS No. 214. This technology aims to enhance crashworthiness and structural integrity in side impacts. While there are significant injury reductions in all types of side impacts, fatality reduction has been limited to single-vehicle crashes, such as side impacts with poles or trees after a car has run off the road and gone out of control. Side door beams re-duce these fatalities by 14 percent, saving an average of 450 lives per year after most cars on the road were equipped with them, and an estimated total of 15,602 from 1969 through 2012.
Table 2-18 covers FMVSS No. 216, roof crush resistance and the big one: 3-point belts for out-board front seat occupants, age 5+ (208F). The visible change associated with FMVSS No. 216 was the redesign of true hardtops as pillared hardtops or sedans. Nevertheless, many hardtops could and did meet FMVSS No. 216. The transition to pillared hardtops and sedans extended from approximately MY 1970 through the FMVSS No. 216 effective date of September 1, 1973, until about 1977. Pillared cars do a significantly better job of protecting non-ejected occupants in rollover crashes, saving a peak 174 lives in 2005 and an estimated 4,913 in 1960 to 2012.
613 Kahane (1988, January), pp. 2-3; Federal Register 31 (December 3, 1966): 15212, 35 (September 25, 1970): 14936.
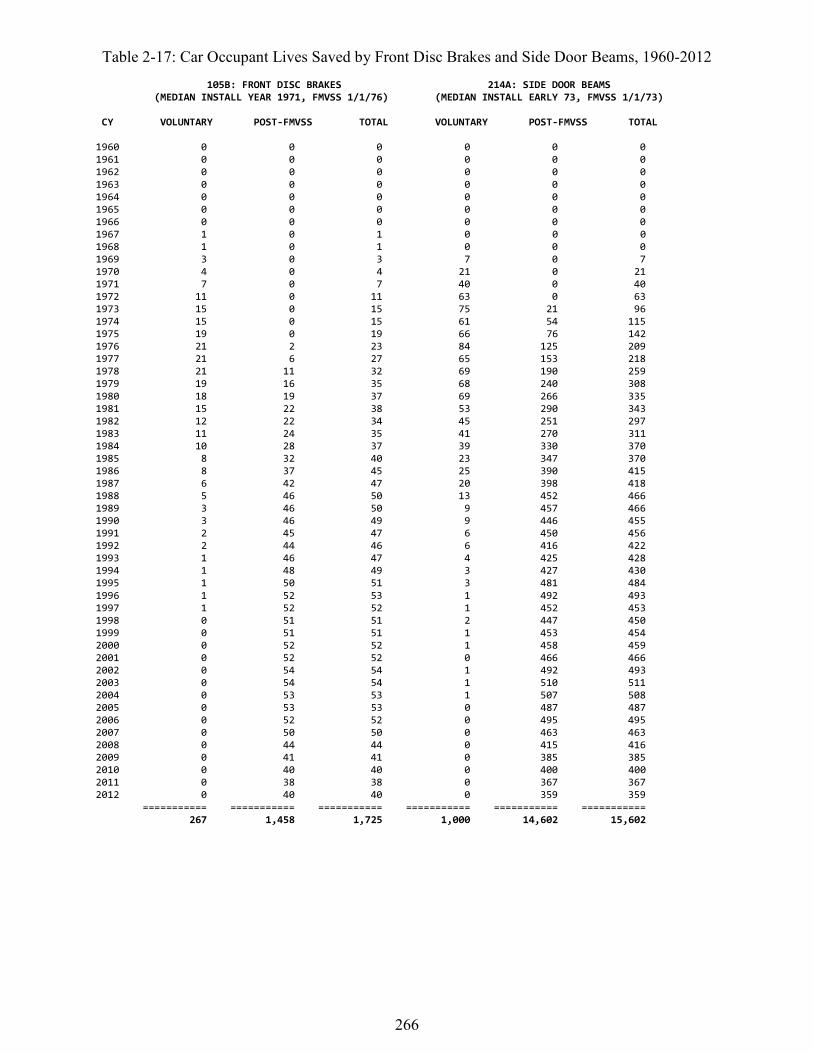
266
Table 2-17: Car Occupant Lives Saved by Front Disc Brakes and Side Door Beams, 1960-2012 105B: FRONT DISC BRAKES 214A: SIDE DOOR BEAMS (MEDIAN INSTALL YEAR 1971, FMVSS 1/1/76) (MEDIAN INSTALL EARLY 73, FMVSS 1/1/73) CY VOLUNTARY POST-FMVSS TOTAL VOLUNTARY POST-FMVSS TOTAL 1960 0 0 0 0 0 0 1961 0 0 0 0 0 0 1962 0 0 0 0 0 0 1963 0 0 0 0 0 0 1964 0 0 0 0 0 0 1965 0 0 0 0 0 0 1966 0 0 0 0 0 0 1967 1 0 1 0 0 0 1968 1 0 1 0 0 0 1969 3 0 3 7 0 7 1970 4 0 4 21 0 21 1971 7 0 7 40 0 40 1972 11 0 11 63 0 63 1973 15 0 15 75 21 96 1974 15 0 15 61 54 115 1975 19 0 19 66 76 142 1976 21 2 23 84 125 209 1977 21 6 27 65 153 218 1978 21 11 32 69 190 259 1979 19 16 35 68 240 308 1980 18 19 37 69 266 335 1981 15 22 38 53 290 343 1982 12 22 34 45 251 297 1983 11 24 35 41 270 311 1984 10 28 37 39 330 370 1985 8 32 40 23 347 370 1986 8 37 45 25 390 415 1987 6 42 47 20 398 418 1988 5 46 50 13 452 466 1989 3 46 50 9 457 466 1990 3 46 49 9 446 455 1991 2 45 47 6 450 456 1992 2 44 46 6 416 422 1993 1 46 47 4 425 428 1994 1 48 49 3 427 430 1995 1 50 51 3 481 484 1996 1 52 53 1 492 493 1997 1 52 52 1 452 453 1998 0 51 51 2 447 450 1999 0 51 51 1 453 454 2000 0 52 52 1 458 459 2001 0 52 52 0 466 466 2002 0 54 54 1 492 493 2003 0 54 54 1 510 511 2004 0 53 53 1 507 508 2005 0 53 53 0 487 487 2006 0 52 52 0 495 495 2007 0 50 50 0 463 463 2008 0 44 44 0 415 416 2009 0 41 41 0 385 385 2010 0 40 40 0 400 400 2011 0 38 38 0 367 367 2012 0 40 40 0 359 359 =========== =========== =========== =========== =========== =========== 267 1,458 1,725 1,000 14,602 15,602
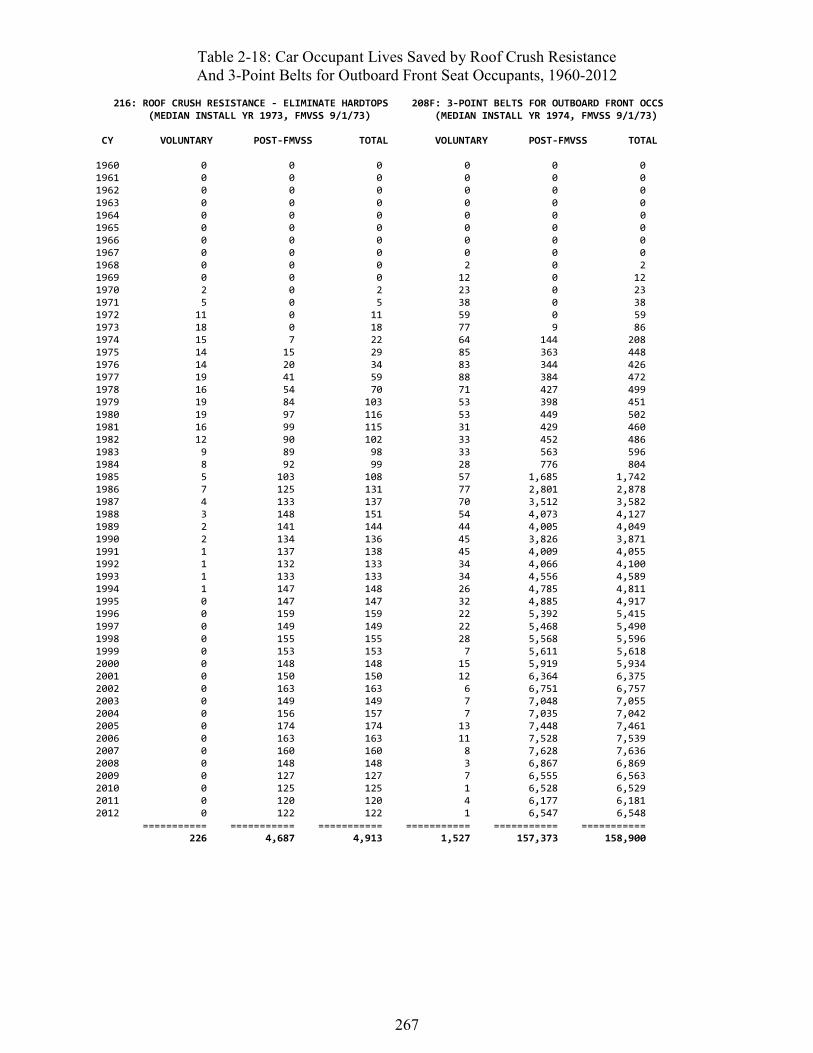
267
Table 2-18: Car Occupant Lives Saved by Roof Crush Resistance And 3-Point Belts for Outboard Front Seat Occupants, 1960-2012
216: ROOF CRUSH RESISTANCE - ELIMINATE HARDTOPS 208F: 3-POINT BELTS FOR OUTBOARD FRONT OCCS (MEDIAN INSTALL YR 1973, FMVSS 9/1/73) (MEDIAN INSTALL YR 1974, FMVSS 9/1/73) CY VOLUNTARY POST-FMVSS TOTAL VOLUNTARY POST-FMVSS TOTAL 1960 0 0 0 0 0 0 1961 0 0 0 0 0 0 1962 0 0 0 0 0 0 1963 0 0 0 0 0 0 1964 0 0 0 0 0 0 1965 0 0 0 0 0 0 1966 0 0 0 0 0 0 1967 0 0 0 0 0 0 1968 0 0 0 2 0 2 1969 0 0 0 12 0 12 1970 2 0 2 23 0 23 1971 5 0 5 38 0 38 1972 11 0 11 59 0 59 1973 18 0 18 77 9 86 1974 15 7 22 64 144 208 1975 14 15 29 85 363 448 1976 14 20 34 83 344 426 1977 19 41 59 88 384 472 1978 16 54 70 71 427 499 1979 19 84 103 53 398 451 1980 19 97 116 53 449 502 1981 16 99 115 31 429 460 1982 12 90 102 33 452 486 1983 9 89 98 33 563 596 1984 8 92 99 28 776 804 1985 5 103 108 57 1,685 1,742 1986 7 125 131 77 2,801 2,878 1987 4 133 137 70 3,512 3,582 1988 3 148 151 54 4,073 4,127 1989 2 141 144 44 4,005 4,049 1990 2 134 136 45 3,826 3,871 1991 1 137 138 45 4,009 4,055 1992 1 132 133 34 4,066 4,100 1993 1 133 133 34 4,556 4,589 1994 1 147 148 26 4,785 4,811 1995 0 147 147 32 4,885 4,917 1996 0 159 159 22 5,392 5,415 1997 0 149 149 22 5,468 5,490 1998 0 155 155 28 5,568 5,596 1999 0 153 153 7 5,611 5,618 2000 0 148 148 15 5,919 5,934 2001 0 150 150 12 6,364 6,375 2002 0 163 163 6 6,751 6,757 2003 0 149 149 7 7,048 7,055 2004 0 156 157 7 7,035 7,042 2005 0 174 174 13 7,448 7,461 2006 0 163 163 11 7,528 7,539 2007 0 160 160 8 7,628 7,636 2008 0 148 148 3 6,867 6,869 2009 0 127 127 7 6,555 6,563 2010 0 125 125 1 6,528 6,529 2011 0 120 120 4 6,177 6,181 2012 0 122 122 1 6,547 6,548 =========== =========== =========== =========== =========== =========== 226 4,687 4,913 1,527 157,373 158,900

268
FMVSS No. 208 has required manual, integral 3-point belts at the driver’s and RF seats in all cars without automatic protection since September 1, 1973, and in all cars since September 1, 1997. From January 1, 1972, until August 31, 1973, FMVSS No. 208 required lap and shoulder belts at these positions in all cars, but manufacturers could choose between integral 3-point belts or separate lap and shoulder belts. From January 1, 1968, until December 31, 1971, this require-ment applied only to cars where a lap belt was insufficient to prevent a dummy from contacting the windshield header (but, in reality, manufacturers equipped all their cars with separate or inte-gral lap/shoulder belts).
The model developed for this study counts as “voluntary” saves by technology 208F:
• All people (5 and older) saved by integral 3-point belts installed before September 1, 1973 – primarily in cars imported from Europe.
• Lives saved among occupants who used both the lap and the shoulder belts, in cars with separate lap and shoulder belts built before September 1, 1973.
However, as stated earlier, people who wore only the lap belt in cars with separate belts are counted as “saved by lap belts” (208A).
The model counts as “post-FMVSS” saves by technology 208F:
• All people (5 and older) saved by manual, integral 3-point belts installed on or after Sep-tember 1, 1973, regardless of whether these integral belts were used correctly or incor-rectly (e.g., wearing the shoulder portion of the belt behind the back, essentially obtaining protection from the lap portion only).
• Lives saved by automatic 3-point belts. Although they are automatic belts, they have had use patterns and effectiveness nearly identical to manual 3-point belts.
As stated above, any child 1 to 4 years old saved by a belt, without a safety seat, is counted as “saved by lap belts” (208B), even if the belt was a 3-point belt, because the shoulder portion is intrinsically of little value to a child that small.
Three-point belts are the most important available occupant protection in most crash modes, re-ducing fatality risk by an average of 45 percent in passenger cars, when they are used. They were saving about 500 lives per year in 1977 to 1983 as declining belt use more or less offset the growing proportion of the fleet equipped with 3-point belts. Buckle-up laws in most States phe-nomenally increased the benefits of belts to 4,127 lives saved by 1988. Continued increases in belt use and moderate growth in the “base” of VMT and potentially fatal crashes raised that to a peak of 7,636 lives saved in 2007. After that, the shrinking base of car registrations and VMT offset further increases in belt use. Belts saved an estimated 6,548 lives in 2012 and a cumulative 158,900 from 1960 through 2012. Both numbers are somewhat under half the overall benefits of the FMVSS in passenger cars (14,018 and 385,408, respectively – see Table 2-10).
Table 2-19 estimates lives saved by voluntary NCAP-related improvements and child safety seats/booster seats (FMVSS No. 213). Since 1979, NCAP has advised the public about the injury performance of belted dummies in 35-mph frontal impact tests. During the early-to-mid 1980s, manufacturers substantially improved NCAP performance, modifying belt systems, steering as-

269
semblies, instrument panels and/or seat structures. For cars without air bags, NHTSA’s evalua-tion estimated a 20-percent reduction of fatality risk for belted drivers in frontal impacts with other cars. NHTSA has not evaluated the relationship of NCAP scores with fatality risk in cars with air bags; the model limits its estimate of a benefit to cars without air bags. Lives saved by vehicle modifications associated with NCAP performance have saved an estimated 1,156 lives from 1983 to 2012; the estimates peaked at 79 in 1993 and had declined to almost nothing by 2012 because, by then, over 95 percent of cars on the road had driver air bags. Because NCAP is not a FMVSS and any modifications to improve performance were voluntary on the part of the manufacturers, all benefits are counted as voluntary saves.
FMVSS No. 213 regulates the performance of child safety seats, including booster seats. How-ever, the seats themselves are usually not part of a new vehicle. They must be purchased or ac-quired separately. At first, that was a voluntary decision for parents. During 1978 to 1985, every State enacted laws requiring a safety seat for child passengers up to a certain age. Subsequently, most of the States revised their laws to increase the age up to which a child must be in a child safety seat or booster seat rather than merely buckled up with the car’s seat belts. The model counts as a “voluntary” save by child safety seats:
• Any child saved before a child passenger protection law was in effect in that State; and • Any child saved who was older than the range of ages included in that State’s law.
The model counts as an “obligatory” save any child saved by a child safety seat or booster seat in a State where a law was in effect, and that law required a child of that age to be in a safety seat or booster seat.
However, any child saved by a belt, without a safety seat, is counted in one of the “saved by belts” categories, depending on the child’s age and seating position, and is not counted as saved by a safety seat.
NHTSA’s evaluation estimates that safety seats reduce fatality risk in passenger cars by 71 per-cent for infants and by 54 percent for toddlers; the model also assumes the latter effect for boost-er seats. Safety seats and booster seats saved an estimated 7,257 lives from 1960 through 2012, of which 6,163 were children obligated by a State law to be in a safety seat or booster seat, while 723 were voluntary saves before State laws or involving a child old enough that the law in effect at the time allowed belts in lieu of a safety seat. Benefits peaked at 336 in 2000, but dropped af-ter 2001 because the exposure “base” of children in potentially fatal crashes shrank – in part be-cause more and more children are placed in the safer rear seat to avoid exposure to air bags, and because many children are now transported in minivans or SUVs rather than cars.
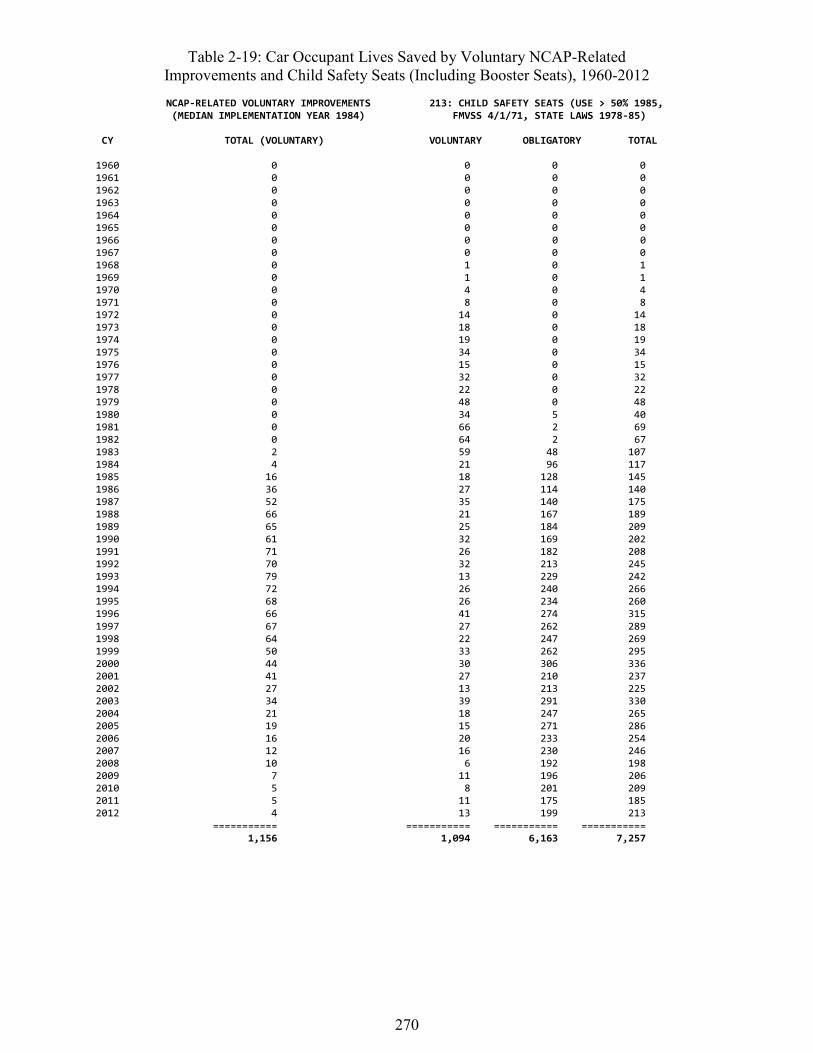
270
Table 2-19: Car Occupant Lives Saved by Voluntary NCAP-Related Improvements and Child Safety Seats (Including Booster Seats), 1960-2012
NCAP-RELATED VOLUNTARY IMPROVEMENTS 213: CHILD SAFETY SEATS (USE > 50% 1985, (MEDIAN IMPLEMENTATION YEAR 1984) FMVSS 4/1/71, STATE LAWS 1978-85) CY TOTAL (VOLUNTARY) VOLUNTARY OBLIGATORY TOTAL 1960 0 0 0 0 1961 0 0 0 0 1962 0 0 0 0 1963 0 0 0 0 1964 0 0 0 0 1965 0 0 0 0 1966 0 0 0 0 1967 0 0 0 0 1968 0 1 0 1 1969 0 1 0 1 1970 0 4 0 4 1971 0 8 0 8 1972 0 14 0 14 1973 0 18 0 18 1974 0 19 0 19 1975 0 34 0 34 1976 0 15 0 15 1977 0 32 0 32 1978 0 22 0 22 1979 0 48 0 48 1980 0 34 5 40 1981 0 66 2 69 1982 0 64 2 67 1983 2 59 48 107 1984 4 21 96 117 1985 16 18 128 145 1986 36 27 114 140 1987 52 35 140 175 1988 66 21 167 189 1989 65 25 184 209 1990 61 32 169 202 1991 71 26 182 208 1992 70 32 213 245 1993 79 13 229 242 1994 72 26 240 266 1995 68 26 234 260 1996 66 41 274 315 1997 67 27 262 289 1998 64 22 247 269 1999 50 33 262 295 2000 44 30 306 336 2001 41 27 210 237 2002 27 13 213 225 2003 34 39 291 330 2004 21 18 247 265 2005 19 15 271 286 2006 16 20 233 254 2007 12 16 230 246 2008 10 6 192 198 2009 7 11 196 206 2010 5 8 201 209 2011 5 11 175 185 2012 4 13 199 213 =========== =========== =========== =========== 1,156 1,094 6,163 7,257
271
Table 2-20 considers two of the more recent belt technologies: 3-point belts for outboard rear seat occupants (208G) and automatic 2-point belts for outboard front seat occupants (208H). FMVSS No. 208 has required lap/shoulder belts at outboard rear seats since December 11, 1989614 and quite a few make-models were voluntarily equipped with 3-point belts one year, two years, or even many years before that date. Three-point belts are quite effective for rear seat oc-cupants, reducing fatality risk by an average of 44 percent (as compared to 32% for the lap belt only). Belt use, occupancy of the rear seat and the proportion of cars on the road equipped with 3-point belts have steadily increased since 1990, pushing benefits to a peak of 319 lives saved in 2002. Numbers decreased after 2005 with the shift from cars to LTVs, reaching 231 lives saved in 2012 and a total of 4,612 from 1960 to 2012.
Automatic 2-point belts were introduced on a voluntary basis in the Volkswagen Rabbit (non-motorized) starting in 1975 and the Toyota Cressida (motorized) starting in 1981. Quite a few make-models were equipped with them during the MY 1987-to-1989 phase-in period for auto-matic protection under FMVSS No. 208 and in the early 1990s. Consumers indicated a clear preference for the more effective combination of air bags and manual 3-point belts; automatic 2-point belts were gone from new cars by MY 1996, two years before FMVSS No. 208 required air bags and manual 3-point belts in all cars.
Automatic 2-point belts are less effective than 3-point belts, in part because the manual lap belt that accompanies them is often not used. Fatality reduction is an estimated 32 percent with auto-matic 2-point belts (versus 45% with 3-point belts). During the 1980s the lower effectiveness was more than offset by a much higher use rate for the 2-point belts; by 2002, use of 3-point belts had largely caught up with the automatic use rate. Lives saved by automatic 2-point belts peaked at 985 in CY 1996 and subsequently declined as no new cars were equipped with them and the existing fleet was retired. Through 2012, automatic 2-point belts had saved an estimated 14,068 lives.
614 A choice of 3-point belts or separate lap and shoulder belts was allowed from December 11, 1989, to August 31, 1990, whereas 3-point belts were required starting September 1, 1990; in reality, all cars have been equipped with 3-point belts since before December 11, 1989.

272
Table 2-20: Car Occupant Lives Saved by 3-Point Belts for Outboard Rear Seat Occupants And Automatic 2-Point Belts, 1960-2012
208G: 3-POINT BELTS FOR OUTBOARD REAR SEAT OCCS 208H: AUTOMATIC 2-POINT BELTS (MEDIAN INSTALL YR 1989, FMVSS 12/11/89) (PEAK YEAR 1991, PHASE-IN BEGAN 9/1/86) CY VOLUNTARY POST-FMVSS TOTAL VOLUNTARY POST-FMVSS TOTAL 1960 0 0 0 0 0 0 1961 0 0 0 0 0 0 1962 0 0 0 0 0 0 1963 0 0 0 0 0 0 1964 0 0 0 0 0 0 1965 0 0 0 0 0 0 1966 0 0 0 0 0 0 1967 0 0 0 0 0 0 1968 0 0 0 0 0 0 1969 0 0 0 0 0 0 1970 0 0 0 0 0 0 1971 0 0 0 0 0 0 1972 0 0 0 0 0 0 1973 0 0 0 0 0 0 1974 0 0 0 0 0 0 1975 0 0 0 0 0 0 1976 0 0 0 1 0 1 1977 0 0 0 5 0 5 1978 0 0 0 6 0 6 1979 1 0 1 5 0 5 1980 0 0 0 5 0 5 1981 0 0 0 7 0 7 1982 0 0 0 5 0 5 1983 1 0 1 8 0 8 1984 3 0 3 11 0 11 1986 8 0 8 16 0 16 1987 15 0 15 9 28 37 1988 13 0 13 16 102 118 1989 23 4 27 14 191 205 1990 23 18 41 16 418 434 1991 36 46 83 7 556 563 1992 26 58 84 15 620 636 1993 28 69 97 15 771 786 1994 23 115 138 15 913 928 1995 23 125 148 7 923 930 1996 29 149 178 5 979 985 1997 23 157 180 6 912 917 1998 32 212 244 10 859 869 1999 19 152 171 5 873 878 2000 22 216 239 5 822 827 2001 17 236 253 3 766 769 2002 14 286 299 9 736 746 2003 17 239 255 2 645 647 2004 6 254 260 2 581 583 2005 11 308 319 4 504 508 2006 7 260 267 1 438 439 2007 2 258 260 0 329 329 2008 2 205 207 0 234 235 2009 3 200 203 1 211 211 2010 2 175 177 0 152 152 2011 1 205 206 1 139 140 2012 1 230 231 0 114 114 =========== =========== =========== =========== =========== =========== 433 4,178 4,612 252 13,816 14,068
273
Table 2-21 estimates net lives saved by frontal air bags (208I), including separate estimates for the three major types or “generations” of air bags: barrier-certified (until the late 1990s), sled-certified (late 1990s to mid-2000s), and certified-advanced (since the mid-2000s). Frontal air bags are effective in reducing the fatality risk of adults and adolescents (13 and older) in frontal and partially frontal crashes. Benefits are to a numerically small extent offset by increased risk to certain subgroups of child passengers (12 and younger). Some of the vehicles have manual on-off switches for passenger air bags, which can also affect net benefits in several ways. NHTSA’s evaluations indicate that the three major types of air bags are about equally effective for adults and adolescents, but can differ substantially for child passengers. Effectiveness for adults and adolescents varies by crash type and seating position, but averaged over all crashes, driver air bags reduce the fatality risk of belted occupants by 11 percent, and unbelted occupants by 14 percent. At the end of this chapter, Tables 2-49 through 2-54 furnish more detailed analyses that estimate effects separately by type of air bag, occupant age group, and seating position; they also explore the effects of the manual switches.
Mercedes offered air bags on a voluntary basis in MY 1985 and 1986. After the FMVSS No. 208 phase-in of automatic protection began on September 1, 1986, other manufacturers began to of-fer driver or dual air bags, building up to 100 percent of new cars by MY 1997. Only the 1985 and 1986 Mercedes air bags are included in the voluntary saves on Table 2-21. All other air bags, supplied either during or after the phase-in period, have their benefits listed in the “Post-FMVSS” column. The number of lives saved by air bags grew rapidly, commensurate with the proportion of registered cars equipped with air bags, peaking at 2,110 in 2006. It then gradually decreased to 1,738 in 2012 after the downturn in VMT and the market shift from cars to LTVs. Frontal air bags had saved an estimated 27,765 lives in passenger cars from 1985 through 2012.
Initially, all frontal air bags were barrier-certified. In late CY 1997 (i.e., early MY 1998), sled-certified air bags begin to appear and, after 2005, lives saved by barrier-certified air bags dwin-dle as cars with those early systems are retired. The first advanced air bags show up in 2004. Eventually, advanced air bags will supersede barrier-certified and sled-certified in the on-road fleet, and all the benefits will gradually shift to advanced air bags.
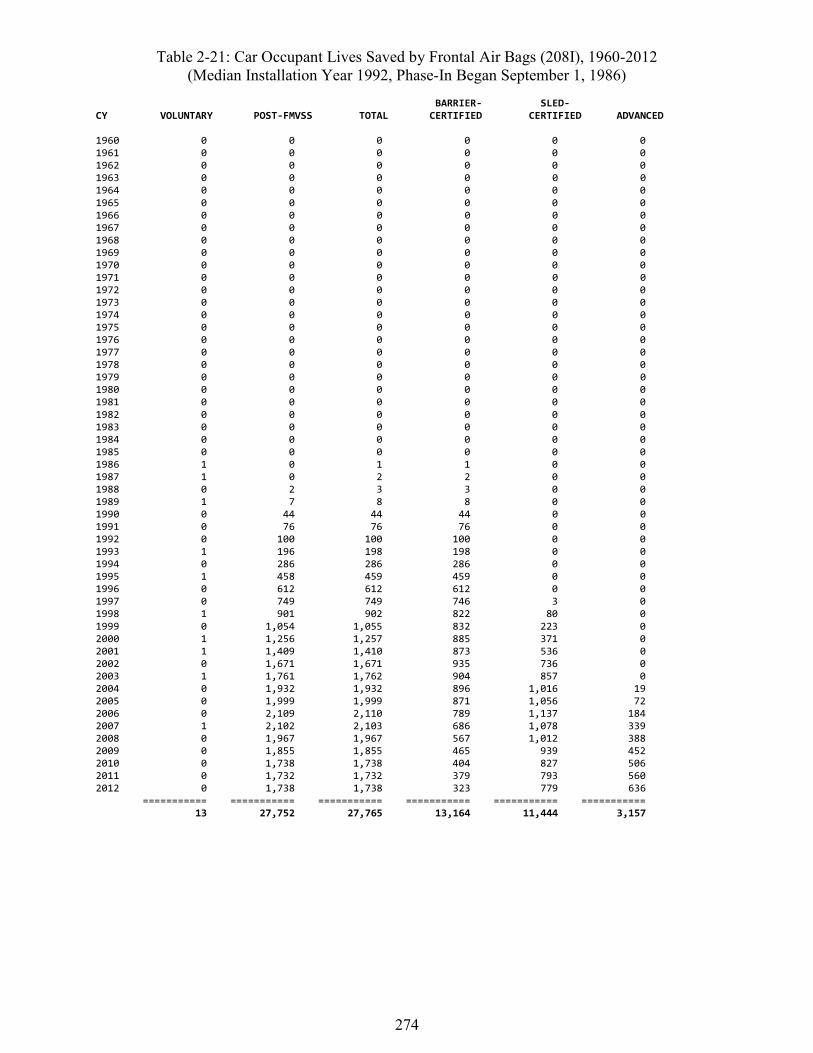
274
Table 2-21: Car Occupant Lives Saved by Frontal Air Bags (208I), 1960-2012 (Median Installation Year 1992, Phase-In Began September 1, 1986)
BARRIER- SLED- CY VOLUNTARY POST-FMVSS TOTAL CERTIFIED CERTIFIED ADVANCED 1960 0 0 0 0 0 0 1961 0 0 0 0 0 0 1962 0 0 0 0 0 0 1963 0 0 0 0 0 0 1964 0 0 0 0 0 0 1965 0 0 0 0 0 0 1966 0 0 0 0 0 0 1967 0 0 0 0 0 0 1968 0 0 0 0 0 0 1969 0 0 0 0 0 0 1970 0 0 0 0 0 0 1971 0 0 0 0 0 0 1972 0 0 0 0 0 0 1973 0 0 0 0 0 0 1974 0 0 0 0 0 0 1975 0 0 0 0 0 0 1976 0 0 0 0 0 0 1977 0 0 0 0 0 0 1978 0 0 0 0 0 0 1979 0 0 0 0 0 0 1980 0 0 0 0 0 0 1981 0 0 0 0 0 0 1982 0 0 0 0 0 0 1983 0 0 0 0 0 0 1984 0 0 0 0 0 0 1985 0 0 0 0 0 0 1986 1 0 1 1 0 0 1987 1 0 2 2 0 0 1988 0 2 3 3 0 0 1989 1 7 8 8 0 0 1990 0 44 44 44 0 0 1991 0 76 76 76 0 0 1992 0 100 100 100 0 0 1993 1 196 198 198 0 0 1994 0 286 286 286 0 0 1995 1 458 459 459 0 0 1996 0 612 612 612 0 0 1997 0 749 749 746 3 0 1998 1 901 902 822 80 0 1999 0 1,054 1,055 832 223 0 2000 1 1,256 1,257 885 371 0 2001 1 1,409 1,410 873 536 0 2002 0 1,671 1,671 935 736 0 2003 1 1,761 1,762 904 857 0 2004 0 1,932 1,932 896 1,016 19 2005 0 1,999 1,999 871 1,056 72 2006 0 2,109 2,110 789 1,137 184 2007 1 2,102 2,103 686 1,078 339 2008 0 1,967 1,967 567 1,012 388 2009 0 1,855 1,855 465 939 452 2010 0 1,738 1,738 404 827 506 2011 0 1,732 1,732 379 793 560 2012 0 1,738 1,738 323 779 636 =========== =========== =========== =========== =========== =========== 13 27,752 27,765 13,164 11,444 3,157

275
Table 2-22 addresses two technologies that came in a few years after frontal air bags: side impact protection by structure and padding (214B) and conspicuity tape for heavy trailers (108). Con-spicuity tape is installed on heavy trailers, but benefits car occupants by helping car drivers to identify and avoid striking heavy vehicles at night.
A dynamic test for FMVSS No. 214 phased in from September 1, 1993, to September 1, 1996 to improve occupant protection when a car is struck in the side by another vehicle. The crash test measures a thoracic trauma index TTI(d) on the dummy seated in the vehicle adjacent to the im-pact location. NHTSA’s evaluation quantifies the fatality-reducing effectiveness per unit reduc-tion in the TTI(d) score. The new test procedure was the product of many years of research. Dur-ing the decade before the phase-in manufacturers tried out the test procedure on their vehicles. From about MY 1986 onward they began to voluntarily modify vehicle structures in a way that gradually improved fleet-average TTI(d). A second, large increment of TTI(d) reduction by structure and padding came with certification to the upgraded standard in MY 1994 to 1997. NHTSA’s evaluation estimates that, relative to MY 1985 baseline vehicles, voluntary and post-standard TTI(d) reductions by structure and padding had reduced fatality risk of front seat occu-pants in near-side impacts by other vehicles by a cumulative 17 percent in 4-door cars and by a cumulative 33 percent in 2-door cars. (NHTSA has not evaluated the effect for rear seat occu-pants.) The effect is greater in 2-door cars because they started from a substantially higher base-line TTI(d). The resulting estimated fatality reductions in MY 1986-to-1996 cars not yet certified to the new test requirement (which are fractions of the 17% or 33% effects) are tallied in the “voluntary” column of Table 2-22. They peaked at 301 in 1997 and then dwindled as all new cars certified to the new test requirement and pre-certified cars were retired. The reductions in MY 1994-to-2012 certified cars are tallied in the “post-FMVSS” column. Overall (voluntary plus post-FMVSS), structure and padding had saved 11,672 lives from 1986 through 2012, including 565 in 2012. Benefits peaked at 793 in 2005 and then declined with the market shift from cars to LTVs.
FMVSS No. 108 has required conspicuity tape on new heavy trailers (i.e., with GVWR over 10,000 pounds) since December 1, 1993. The Federal Motor Carrier Safety Administration re-quired all heavy trailers on the road, even those built before December 1, 1993, to be equipped or retrofitted with tape by June 1, 2001. When trailers are equipped with tape, they are easier to see in the dark and cars are 29 percent less likely to hit them. The model615 counts as a “voluntary” save by conspicuity tape:
• Any car occupant saved when his or her car, before June 1, 2001, avoided hitting a trailer built before December 1, 1993, yet equipped or retrofitted with tape.
The model counts as “post-standard” saves:
• Any car occupant saved when his or her car, at any time, avoided hitting a trailer built af-ter December 1, 1993 and any car occupant saved when his or her car, after June 1, 2001, avoided hitting any trailer.
615 Because FARS does not report the MY of trailers, the model can only assess the probability of the following three scenarios based on the CY and month of the crash.
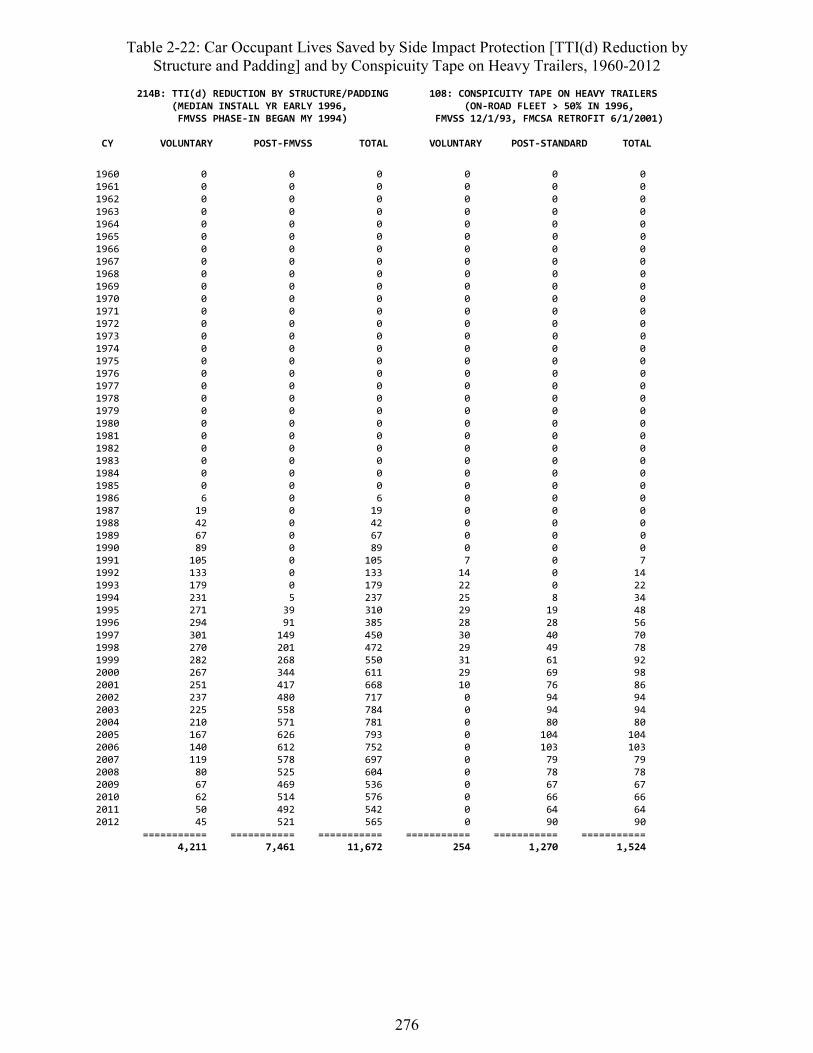
276
Table 2-22: Car Occupant Lives Saved by Side Impact Protection [TTI(d) Reduction by Structure and Padding] and by Conspicuity Tape on Heavy Trailers, 1960-2012
214B: TTI(d) REDUCTION BY STRUCTURE/PADDING 108: CONSPICUITY TAPE ON HEAVY TRAILERS (MEDIAN INSTALL YR EARLY 1996, (ON-ROAD FLEET > 50% IN 1996, FMVSS PHASE-IN BEGAN MY 1994) FMVSS 12/1/93, FMCSA RETROFIT 6/1/2001) CY VOLUNTARY POST-FMVSS TOTAL VOLUNTARY POST-STANDARD TOTAL
1960 0 0 0 0 0 0 1961 0 0 0 0 0 0 1962 0 0 0 0 0 0 1963 0 0 0 0 0 0 1964 0 0 0 0 0 0 1965 0 0 0 0 0 0 1966 0 0 0 0 0 0 1967 0 0 0 0 0 0 1968 0 0 0 0 0 0 1969 0 0 0 0 0 0 1970 0 0 0 0 0 0 1971 0 0 0 0 0 0 1972 0 0 0 0 0 0 1973 0 0 0 0 0 0 1974 0 0 0 0 0 0 1975 0 0 0 0 0 0 1976 0 0 0 0 0 0 1977 0 0 0 0 0 0 1978 0 0 0 0 0 0 1979 0 0 0 0 0 0 1980 0 0 0 0 0 0 1981 0 0 0 0 0 0 1982 0 0 0 0 0 0 1983 0 0 0 0 0 0 1984 0 0 0 0 0 0 1985 0 0 0 0 0 0 1986 6 0 6 0 0 0 1987 19 0 19 0 0 0 1988 42 0 42 0 0 0 1989 67 0 67 0 0 0 1990 89 0 89 0 0 0 1991 105 0 105 7 0 7 1992 133 0 133 14 0 14 1993 179 0 179 22 0 22 1994 231 5 237 25 8 34 1995 271 39 310 29 19 48 1996 294 91 385 28 28 56 1997 301 149 450 30 40 70 1998 270 201 472 29 49 78 1999 282 268 550 31 61 92 2000 267 344 611 29 69 98 2001 251 417 668 10 76 86 2002 237 480 717 0 94 94 2003 225 558 784 0 94 94 2004 210 571 781 0 80 80 2005 167 626 793 0 104 104 2006 140 612 752 0 103 103 2007 119 578 697 0 79 79 2008 80 525 604 0 78 78 2009 67 469 536 0 67 67 2010 62 514 576 0 66 66 2011 50 492 542 0 64 64 2012 45 521 565 0 90 90 =========== =========== =========== =========== =========== =========== 4,211 7,461 11,672 254 1,270 1,524
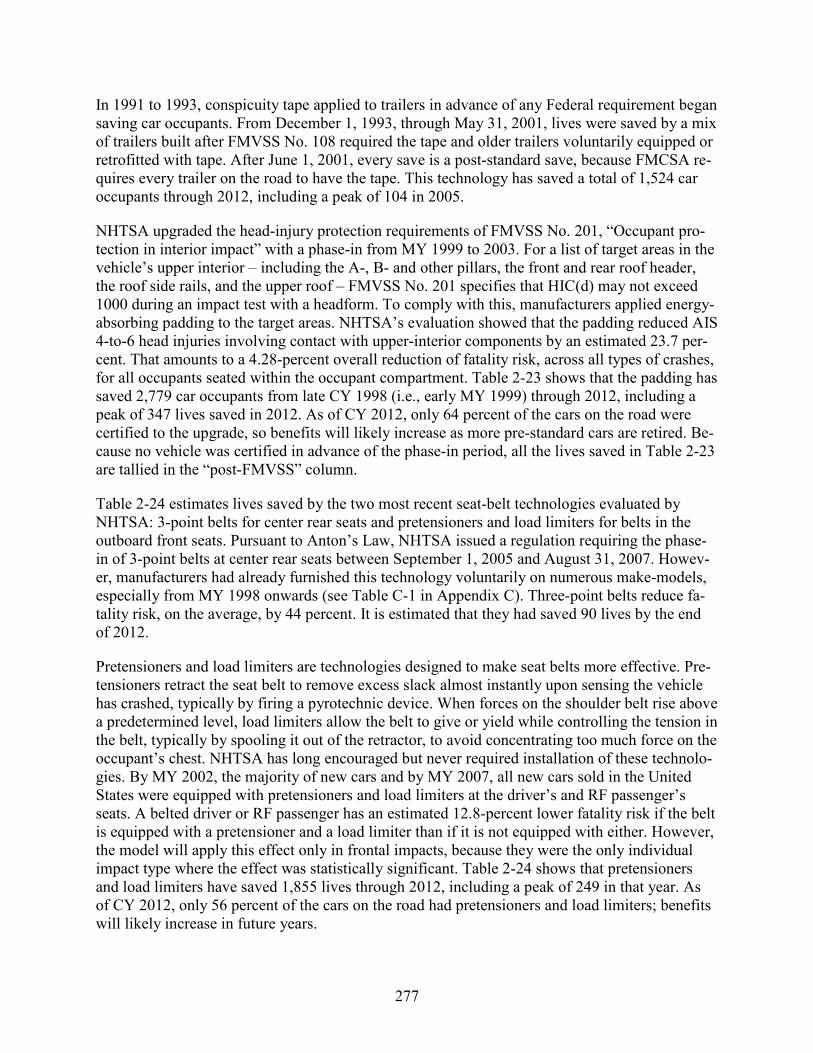
277
In 1991 to 1993, conspicuity tape applied to trailers in advance of any Federal requirement began saving car occupants. From December 1, 1993, through May 31, 2001, lives were saved by a mix of trailers built after FMVSS No. 108 required the tape and older trailers voluntarily equipped or retrofitted with tape. After June 1, 2001, every save is a post-standard save, because FMCSA re-quires every trailer on the road to have the tape. This technology has saved a total of 1,524 car occupants through 2012, including a peak of 104 in 2005.
NHTSA upgraded the head-injury protection requirements of FMVSS No. 201, “Occupant pro-tection in interior impact” with a phase-in from MY 1999 to 2003. For a list of target areas in the vehicle’s upper interior – including the A-, B- and other pillars, the front and rear roof header, the roof side rails, and the upper roof – FMVSS No. 201 specifies that HIC(d) may not exceed 1000 during an impact test with a headform. To comply with this, manufacturers applied energy-absorbing padding to the target areas. NHTSA’s evaluation showed that the padding reduced AIS 4-to-6 head injuries involving contact with upper-interior components by an estimated 23.7 per-cent. That amounts to a 4.28-percent overall reduction of fatality risk, across all types of crashes, for all occupants seated within the occupant compartment. Table 2-23 shows that the padding has saved 2,779 car occupants from late CY 1998 (i.e., early MY 1999) through 2012, including a peak of 347 lives saved in 2012. As of CY 2012, only 64 percent of the cars on the road were certified to the upgrade, so benefits will likely increase as more pre-standard cars are retired. Be-cause no vehicle was certified in advance of the phase-in period, all the lives saved in Table 2-23 are tallied in the “post-FMVSS” column.
Table 2-24 estimates lives saved by the two most recent seat-belt technologies evaluated by NHTSA: 3-point belts for center rear seats and pretensioners and load limiters for belts in the outboard front seats. Pursuant to Anton’s Law, NHTSA issued a regulation requiring the phase-in of 3-point belts at center rear seats between September 1, 2005 and August 31, 2007. Howev-er, manufacturers had already furnished this technology voluntarily on numerous make-models, especially from MY 1998 onwards (see Table C-1 in Appendix C). Three-point belts reduce fa-tality risk, on the average, by 44 percent. It is estimated that they had saved 90 lives by the end of 2012.
Pretensioners and load limiters are technologies designed to make seat belts more effective. Pre-tensioners retract the seat belt to remove excess slack almost instantly upon sensing the vehicle has crashed, typically by firing a pyrotechnic device. When forces on the shoulder belt rise above a predetermined level, load limiters allow the belt to give or yield while controlling the tension in the belt, typically by spooling it out of the retractor, to avoid concentrating too much force on the occupant’s chest. NHTSA has long encouraged but never required installation of these technolo-gies. By MY 2002, the majority of new cars and by MY 2007, all new cars sold in the United States were equipped with pretensioners and load limiters at the driver’s and RF passenger’s seats. A belted driver or RF passenger has an estimated 12.8-percent lower fatality risk if the belt is equipped with a pretensioner and a load limiter than if it is not equipped with either. However, the model will apply this effect only in frontal impacts, because they were the only individual impact type where the effect was statistically significant. Table 2-24 shows that pretensioners and load limiters have saved 1,855 lives through 2012, including a peak of 249 in that year. As of CY 2012, only 56 percent of the cars on the road had pretensioners and load limiters; benefits will likely increase in future years.
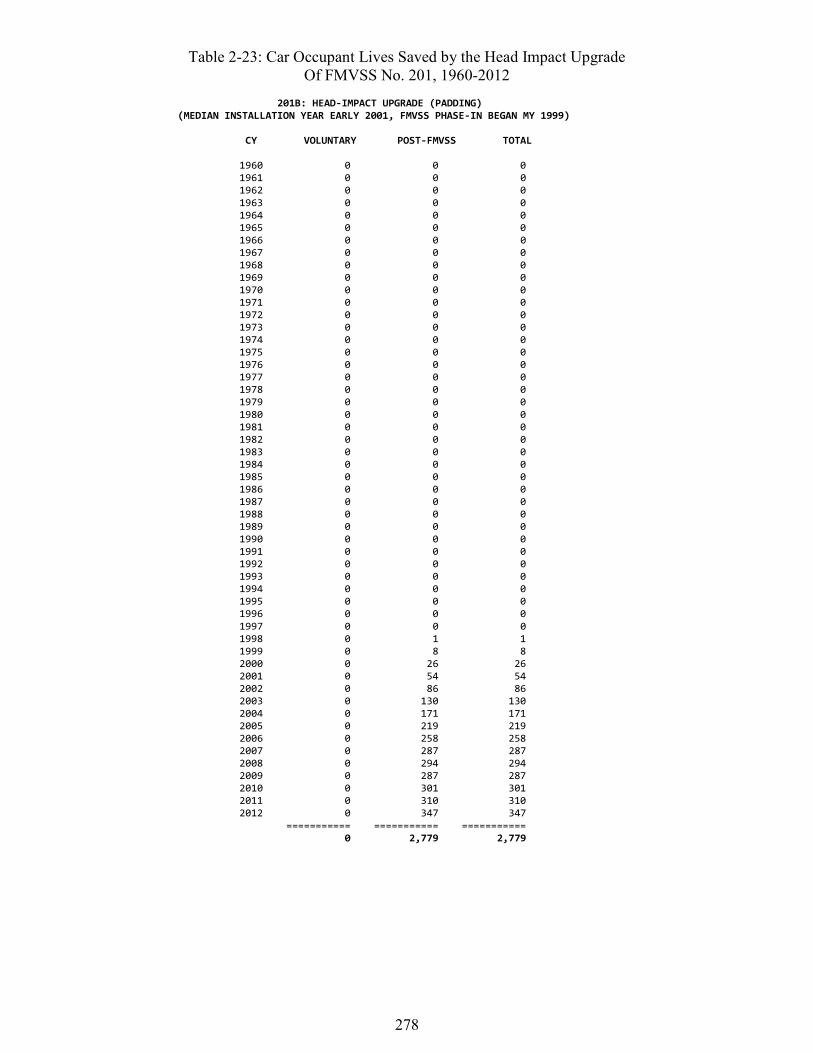
278
Table 2-23: Car Occupant Lives Saved by the Head Impact Upgrade Of FMVSS No. 201, 1960-2012
201B: HEAD-IMPACT UPGRADE (PADDING) (MEDIAN INSTALLATION YEAR EARLY 2001, FMVSS PHASE-IN BEGAN MY 1999)
CY VOLUNTARY POST-FMVSS TOTAL 1960 0 0 0 1961 0 0 0 1962 0 0 0 1963 0 0 0 1964 0 0 0 1965 0 0 0 1966 0 0 0 1967 0 0 0 1968 0 0 0 1969 0 0 0 1970 0 0 0 1971 0 0 0 1972 0 0 0 1973 0 0 0 1974 0 0 0 1975 0 0 0 1976 0 0 0 1977 0 0 0 1978 0 0 0 1979 0 0 0 1980 0 0 0 1981 0 0 0 1982 0 0 0 1983 0 0 0 1984 0 0 0 1985 0 0 0 1986 0 0 0 1987 0 0 0 1988 0 0 0 1989 0 0 0 1990 0 0 0 1991 0 0 0 1992 0 0 0 1993 0 0 0 1994 0 0 0 1995 0 0 0 1996 0 0 0 1997 0 0 0 1998 0 1 1 1999 0 8 8 2000 0 26 26 2001 0 54 54 2002 0 86 86 2003 0 130 130 2004 0 171 171 2005 0 219 219 2006 0 258 258 2007 0 287 287 2008 0 294 294 2009 0 287 287 2010 0 301 301 2011 0 310 310 2012 0 347 347 =========== =========== =========== 0 2,779 2,779
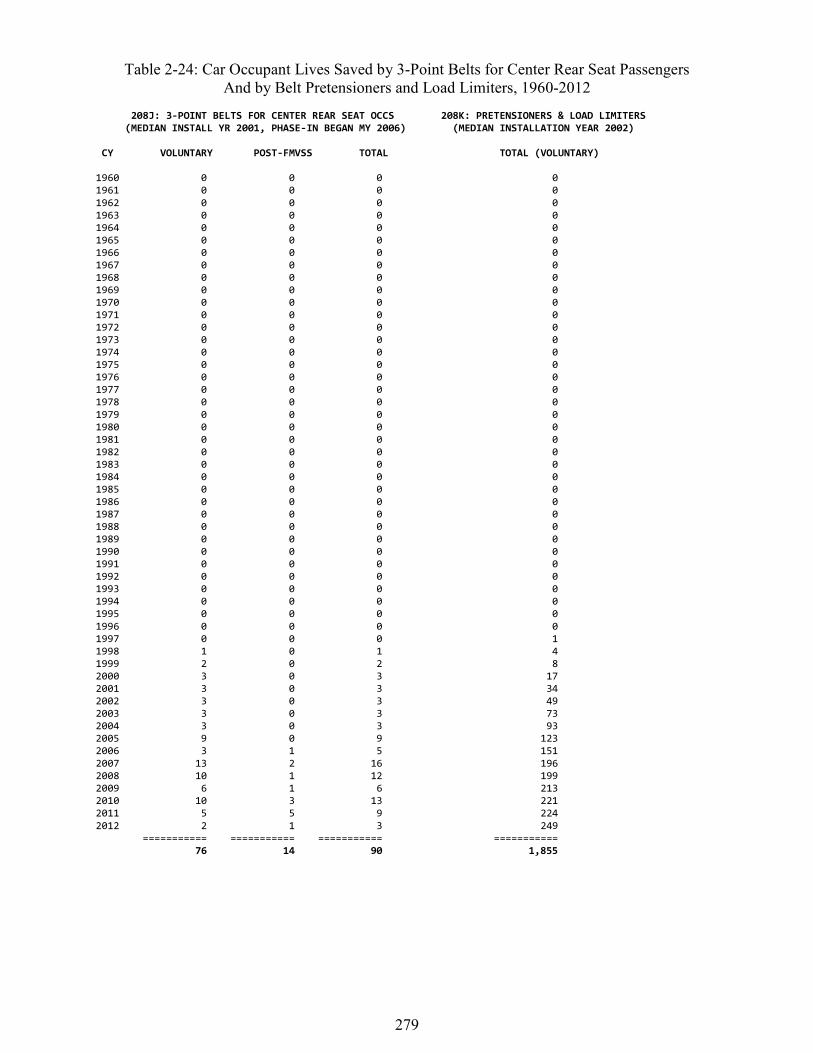
279
Table 2-24: Car Occupant Lives Saved by 3-Point Belts for Center Rear Seat Passengers And by Belt Pretensioners and Load Limiters, 1960-2012
208J: 3-POINT BELTS FOR CENTER REAR SEAT OCCS 208K: PRETENSIONERS & LOAD LIMITERS (MEDIAN INSTALL YR 2001, PHASE-IN BEGAN MY 2006) (MEDIAN INSTALLATION YEAR 2002) CY VOLUNTARY POST-FMVSS TOTAL TOTAL (VOLUNTARY) 1960 0 0 0 0 1961 0 0 0 0 1962 0 0 0 0 1963 0 0 0 0 1964 0 0 0 0 1965 0 0 0 0 1966 0 0 0 0 1967 0 0 0 0 1968 0 0 0 0 1969 0 0 0 0 1970 0 0 0 0 1971 0 0 0 0 1972 0 0 0 0 1973 0 0 0 0 1974 0 0 0 0 1975 0 0 0 0 1976 0 0 0 0 1977 0 0 0 0 1978 0 0 0 0 1979 0 0 0 0 1980 0 0 0 0 1981 0 0 0 0 1982 0 0 0 0 1983 0 0 0 0 1984 0 0 0 0 1985 0 0 0 0 1986 0 0 0 0 1987 0 0 0 0 1988 0 0 0 0 1989 0 0 0 0 1990 0 0 0 0 1991 0 0 0 0 1992 0 0 0 0 1993 0 0 0 0 1994 0 0 0 0 1995 0 0 0 0 1996 0 0 0 0 1997 0 0 0 1 1998 1 0 1 4 1999 2 0 2 8 2000 3 0 3 17 2001 3 0 3 34 2002 3 0 3 49 2003 3 0 3 73 2004 3 0 3 93 2005 9 0 9 123 2006 3 1 5 151 2007 13 2 16 196 2008 10 1 12 199 2009 6 1 6 213 2010 10 3 13 221 2011 5 5 9 224 2012 2 1 3 249 =========== =========== =========== =========== 76 14 90 1,855
280
Table 2-25 enumerates the lives saved by the four major types of curtain and side air bags for drivers and RF passengers in near-side impacts. Starting MY 1996, manufacturers voluntarily introduced curtain and/or side air bags to improve on the head and/or side impact protection of-fered by structure and padding to meet the upgrades of FMVSS Nos. 201 and 214. Torso bags were first offered in MY 1996, head curtains plus torso bags in 1998, combination head-torso bags in 1999, and curtains alone in 2001. In 2007, NHTSA further upgraded FMVSS No. 214 by adding a crash test of a 20 mph oblique side impact with a pole, with phase-in scheduled for MY 2011 to 2015. NHTSA anticipated that head-protection air bags would generally be installed to meet the new requirement, because they are the principal technology available for cushioning an occupant in an oblique impact. By MY 2006, the majority of new cars had curtain and/or side air bags. By far the greatest number of these was equipped with curtains plus torso bags. By 2010, torso bags alone had phased out and combination bags were limited to convertibles where there is no roof to place a curtain. In MY 2011, 93 percent of new cars were equipped with curtains plus torso bags.
NHTSA’s evaluation measures the fatality-reducing effect of curtain and side air bags above and beyond the structures and padding already in the vehicle for meeting FMVSS Nos. 201 and 214. Each of the four major types of air bags significantly reduces fatality risk for drivers and RF pas-sengers in near-side impacts: curtain plus torso bags by an estimated 31 percent, combination bags by 25 percent, curtains only by 16 percent, and torso bags only by 8 percent. Table 2-25 estimates that curtain and side air bags saved 1,697 lives from 1996 through 2012, including 272 in 2012. That includes 1,626 by voluntary installations before the phase-in of the pole test in FMVSS No. 214 began in MY 2011 and 71 “post-FMVSS” saves in MY 2011-to-2013 cars. Curtain plus torso bags accounted for the large majority of the lives saved (1,035) because they are the most effective type and also the most common type since MY 2004; their benefits contin-ue to increase, while the numbers for the other three types have begun tapering down.
Table 2-26 addresses the benefits of the rear impact upgrade of FMVSS No. 301, “Fuel system integrity” and the lives saved by ESC. The 50 mph offset-rear impact test phased into FMVSS No. 301 in MY 2007 to 2009; however, manufacturers voluntarily certified that some of their cars already met the new requirement in MY 2006 (benefits for these MY 2006 cars are counted in the “voluntary” column). NHTSA’s evaluation finds a statistically significant 35-percent fatal-ity reduction in rear-impact crash involvements with post-crash fires. All of the lives saved are people who would have died from burns. The upgrade saved an estimated 14 lives through 2012, including 5 in that year. Benefits are likely to increase, because only 23 percent of the cars on the road in 2012 were post-standard.
ESC is a crucial life-saving technology that had already prevented an estimated 2,415 fatalities through CY 2012. BMW first offered ESC as standard equipment on its 700-series cars in 1998 and, subsequently, the manufacturers voluntarily introduced ESC on steadily increasing numbers of cars. In 2007, NHTSA issued FMVSS No. 126 to require ESC on all new cars and LTVs, with a phase-in from MY 2009 to 2012. By MY 2010, the majority, in fact 75 percent of new cars had ESC.
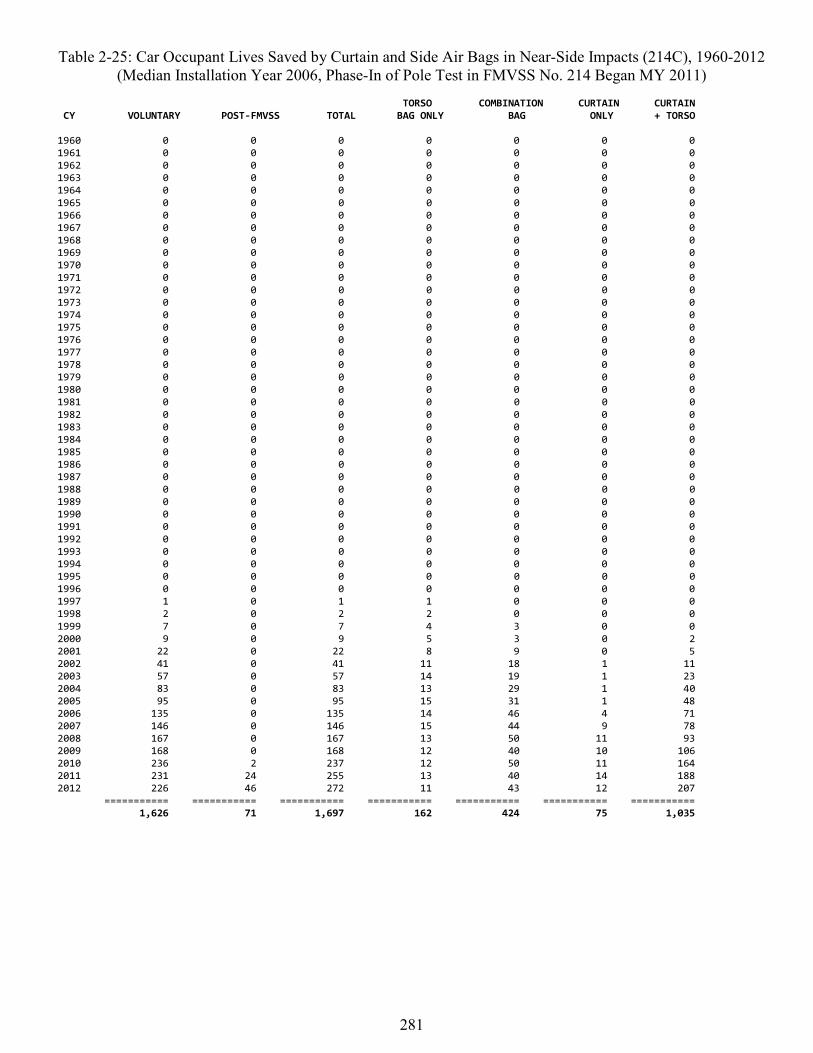
281
Table 2-25: Car Occupant Lives Saved by Curtain and Side Air Bags in Near-Side Impacts (214C), 1960-2012 (Median Installation Year 2006, Phase-In of Pole Test in FMVSS No. 214 Began MY 2011)
TORSO COMBINATION CURTAIN CURTAIN CY VOLUNTARY POST-FMVSS TOTAL BAG ONLY BAG ONLY + TORSO 1960 0 0 0 0 0 0 0 1961 0 0 0 0 0 0 0 1962 0 0 0 0 0 0 0 1963 0 0 0 0 0 0 0 1964 0 0 0 0 0 0 0 1965 0 0 0 0 0 0 0 1966 0 0 0 0 0 0 0 1967 0 0 0 0 0 0 0 1968 0 0 0 0 0 0 0 1969 0 0 0 0 0 0 0 1970 0 0 0 0 0 0 0 1971 0 0 0 0 0 0 0 1972 0 0 0 0 0 0 0 1973 0 0 0 0 0 0 0 1974 0 0 0 0 0 0 0 1975 0 0 0 0 0 0 0 1976 0 0 0 0 0 0 0 1977 0 0 0 0 0 0 0 1978 0 0 0 0 0 0 0 1979 0 0 0 0 0 0 0 1980 0 0 0 0 0 0 0 1981 0 0 0 0 0 0 0 1982 0 0 0 0 0 0 0 1983 0 0 0 0 0 0 0 1984 0 0 0 0 0 0 0 1985 0 0 0 0 0 0 0 1986 0 0 0 0 0 0 0 1987 0 0 0 0 0 0 0 1988 0 0 0 0 0 0 0 1989 0 0 0 0 0 0 0 1990 0 0 0 0 0 0 0 1991 0 0 0 0 0 0 0 1992 0 0 0 0 0 0 0 1993 0 0 0 0 0 0 0 1994 0 0 0 0 0 0 0 1995 0 0 0 0 0 0 0 1996 0 0 0 0 0 0 0 1997 1 0 1 1 0 0 0 1998 2 0 2 2 0 0 0 1999 7 0 7 4 3 0 0 2000 9 0 9 5 3 0 2 2001 22 0 22 8 9 0 5 2002 41 0 41 11 18 1 11 2003 57 0 57 14 19 1 23 2004 83 0 83 13 29 1 40 2005 95 0 95 15 31 1 48 2006 135 0 135 14 46 4 71 2007 146 0 146 15 44 9 78 2008 167 0 167 13 50 11 93 2009 168 0 168 12 40 10 106 2010 236 2 237 12 50 11 164 2011 231 24 255 13 40 14 188 2012 226 46 272 11 43 12 207 =========== =========== =========== =========== =========== =========== =========== 1,626 71 1,697 162 424 75 1,035
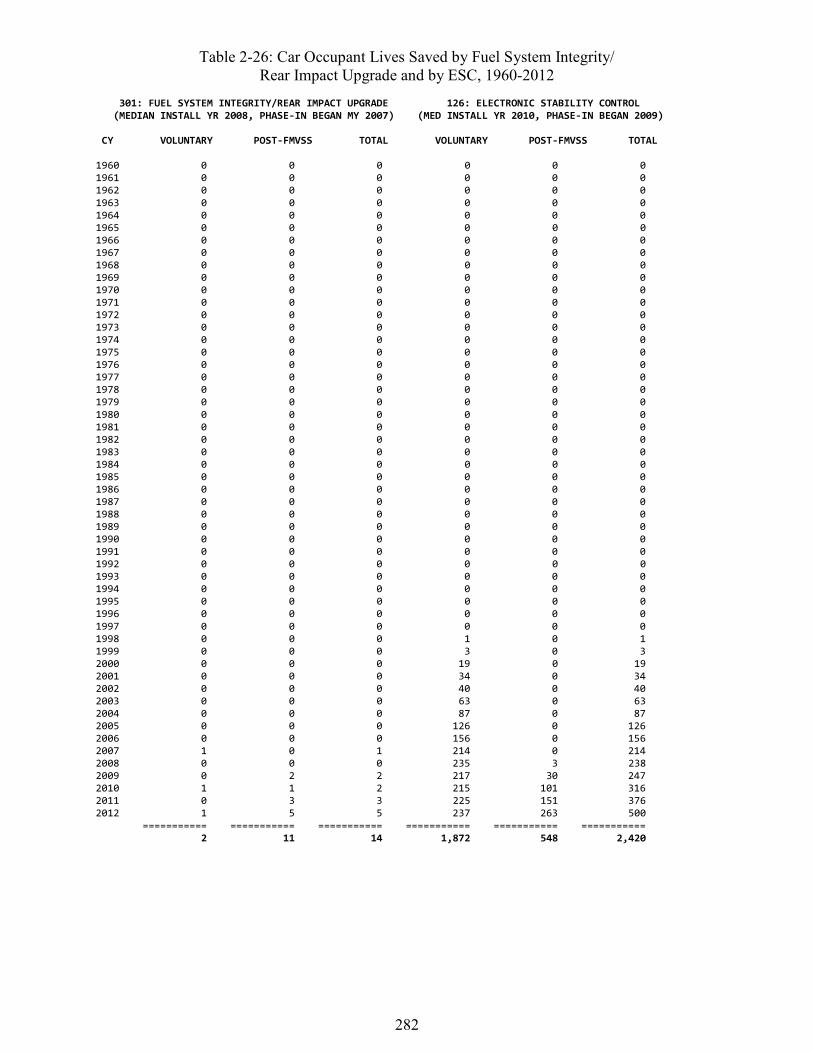
282
Table 2-26: Car Occupant Lives Saved by Fuel System Integrity/ Rear Impact Upgrade and by ESC, 1960-2012
301: FUEL SYSTEM INTEGRITY/REAR IMPACT UPGRADE 126: ELECTRONIC STABILITY CONTROL (MEDIAN INSTALL YR 2008, PHASE-IN BEGAN MY 2007) (MED INSTALL YR 2010, PHASE-IN BEGAN 2009) CY VOLUNTARY POST-FMVSS TOTAL VOLUNTARY POST-FMVSS TOTAL 1960 0 0 0 0 0 0 1961 0 0 0 0 0 0 1962 0 0 0 0 0 0 1963 0 0 0 0 0 0 1964 0 0 0 0 0 0 1965 0 0 0 0 0 0 1966 0 0 0 0 0 0 1967 0 0 0 0 0 0 1968 0 0 0 0 0 0 1969 0 0 0 0 0 0 1970 0 0 0 0 0 0 1971 0 0 0 0 0 0 1972 0 0 0 0 0 0 1973 0 0 0 0 0 0 1974 0 0 0 0 0 0 1975 0 0 0 0 0 0 1976 0 0 0 0 0 0 1977 0 0 0 0 0 0 1978 0 0 0 0 0 0 1979 0 0 0 0 0 0 1980 0 0 0 0 0 0 1981 0 0 0 0 0 0 1982 0 0 0 0 0 0 1983 0 0 0 0 0 0 1984 0 0 0 0 0 0 1985 0 0 0 0 0 0 1986 0 0 0 0 0 0 1987 0 0 0 0 0 0 1988 0 0 0 0 0 0 1989 0 0 0 0 0 0 1990 0 0 0 0 0 0 1991 0 0 0 0 0 0 1992 0 0 0 0 0 0 1993 0 0 0 0 0 0 1994 0 0 0 0 0 0 1995 0 0 0 0 0 0 1996 0 0 0 0 0 0 1997 0 0 0 0 0 0 1998 0 0 0 1 0 1 1999 0 0 0 3 0 3 2000 0 0 0 19 0 19 2001 0 0 0 34 0 34 2002 0 0 0 40 0 40 2003 0 0 0 63 0 63 2004 0 0 0 87 0 87 2005 0 0 0 126 0 126 2006 0 0 0 156 0 156 2007 1 0 1 214 0 214 2008 0 0 0 235 3 238 2009 0 2 2 217 30 247 2010 1 1 2 215 101 316 2011 0 3 3 225 151 376 2012 1 5 5 237 263 500 =========== =========== =========== =========== =========== =========== 2 11 14 1,872 548 2,420
283
NHTSA’s evaluation indicates that ESC reduces first-event rollovers of cars by 60 percent, other single-vehicle crashes (not involving pedestrians or bicyclists) by 31 percent, and culpable in-volvements in multivehicle crashes by 16 percent. Table 2-26 estimates that ESC saved 2,420 lives from 1998 through 2012, including 500 in 2012. Benefits in cars up to MY 2008, before the phase-in of FMVSS No. 126 began are counted in the “voluntary” column; benefits in MY 2009 and later cars are in the “post-FMVSS” column. Because only 20 percent of the cars on the road in 2012 were equipped with ESC, benefits may be expected to increase rapidly in the coming years as new cars with ESC replace older cars without it.
Curtains that deploy in rollovers are the most recent technology evaluated by NHTSA. Manufac-turers began to offer rollover curtains on selected LTVs in MY 2002 and selected cars in 2003. However, the installation of rollover curtains in cars has lagged behind LTVs, understandably so, because rollover crashes are more of an issue with LTVs. In 2011, 9 percent of new cars and 1 percent of cars on the road were equipped with rollover curtains. In that year, NHTSA issued FMVSS No. 226, “Ejection mitigation,” with a phase-in scheduled for MY 2014 to 2017; the agency anticipates that rollover curtains will be the principal technology for meeting the new standard. NHTSA’s evaluation estimates that rollover curtains reduce occupants’ fatality risk by 41 percent in first-event rollovers. Table 2-27 shows that rollover curtains had saved 8 lives through 2012. All of the saves are in the “voluntary” column because the phase-in of FMVSS No. 226 did not begin until MY 2014. This concludes the review of the lives saved by the indi-vidual technologies in passenger cars.
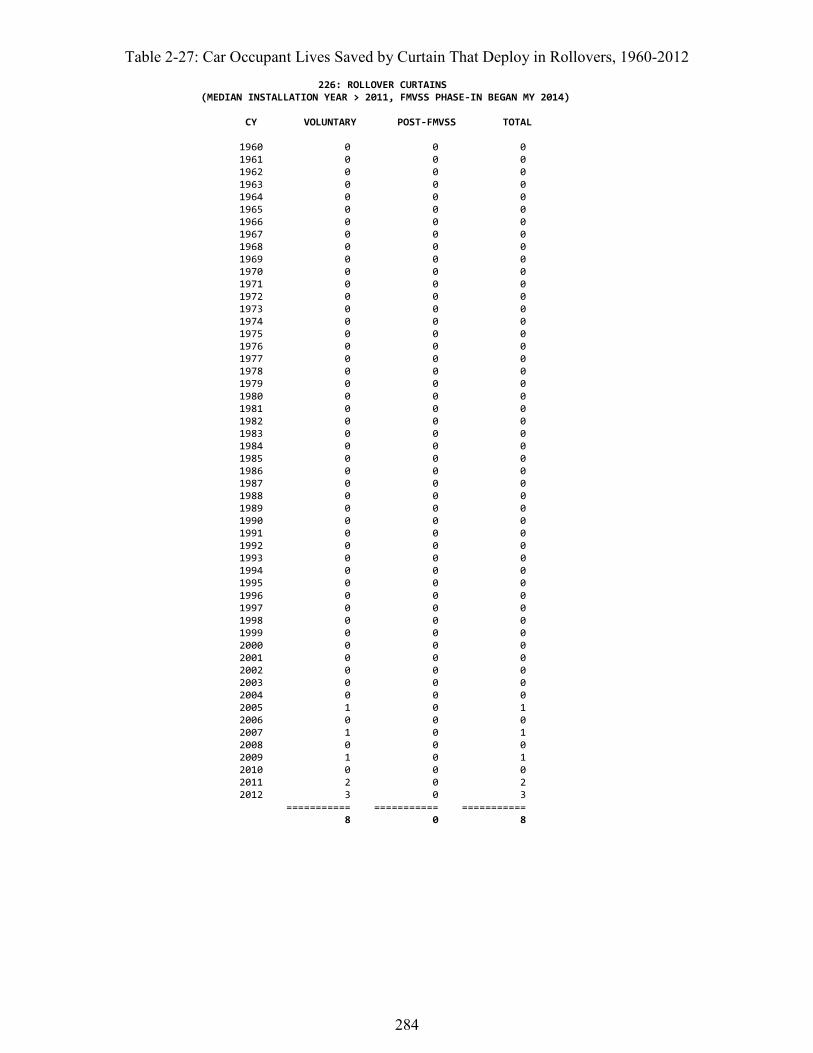
284
Table 2-27: Car Occupant Lives Saved by Curtain That Deploy in Rollovers, 1960-2012 226: ROLLOVER CURTAINS (MEDIAN INSTALLATION YEAR > 2011, FMVSS PHASE-IN BEGAN MY 2014)
CY VOLUNTARY POST-FMVSS TOTAL 1960 0 0 0 1961 0 0 0 1962 0 0 0 1963 0 0 0 1964 0 0 0 1965 0 0 0 1966 0 0 0 1967 0 0 0 1968 0 0 0 1969 0 0 0 1970 0 0 0 1971 0 0 0 1972 0 0 0 1973 0 0 0 1974 0 0 0 1975 0 0 0 1976 0 0 0 1977 0 0 0 1978 0 0 0 1979 0 0 0 1980 0 0 0 1981 0 0 0 1982 0 0 0 1983 0 0 0 1984 0 0 0 1985 0 0 0 1986 0 0 0 1987 0 0 0 1988 0 0 0 1989 0 0 0 1990 0 0 0 1991 0 0 0 1992 0 0 0 1993 0 0 0 1994 0 0 0 1995 0 0 0 1996 0 0 0 1997 0 0 0 1998 0 0 0 1999 0 0 0 2000 0 0 0 2001 0 0 0 2002 0 0 0 2003 0 0 0 2004 0 0 0 2005 1 0 1 2006 0 0 0 2007 1 0 1 2008 0 0 0 2009 1 0 1 2010 0 0 0 2011 2 0 2 2012 3 0 3 =========== =========== =========== 8 0 8
285
Benefits for occupants of LTVs Table 2-28 is a summary of the benefits of safety technologies for LTV occupants. Actual fatali-ties in LTVs have rather steadily increased from 3,494 in 1960 to a peak of 13,096 in 2005, re-flecting the growing market share of LTVs. But without the safety improvements they would have increased much more, from 3,516 in 1960 to 26,660 in 2005. Actual fatalities fell from 13,096 in 2005 to 9,595 by 2011 before rebounding slightly to 9,747 in 2012, reflecting the na-tionwide downturn in VMT and driving exposure. Without the safety improvements, they would only have fallen from 26,660 to 22,321 and rebounded to 23,247. Safety technologies saved 225,158 LTV occupants from 1960 through 2012, including 13,500 in 2012. Most of the lives saved (205,233) are by safety technologies directly associated with FMVSS in effect at that time. Voluntary improvements such as better instrument panels and compliance with FMVSS before their effective date have been saving from 400 to 1,000 lives a year since the mid-1990s.
The proportion of potential fatalities saved has grown from 0.63 percent in 1960, when 22 LTV occupants were saved by lap belts, to 58.07 percent in 2012. The latter is even higher than the corresponding proportion saved in cars (53.98% according to Table 2-10). That is primarily be-cause seat belts are even more effective in LTVs than in cars – because fatal crashes of LTVs are more likely to involve rollover and/or ejection, and belts are especially effective in those situa-tions. ESC is another technology that is even more effective in LTVs than in cars.
Indeed, the largest boosts in the percentage saved came from 1984 to 1988 (from 11.02% to 22.42%), when buckle-up laws took effect in most of the States, and from 1995 to 2002 (33.73% to 46.23%) when belt use, historically lower in LTVs, especially in pickup trucks, rapidly caught up to the use rate in cars; frontal air bags also contributed. The steady gains after 2002 (from 46.23% to 58.07% in 2012) reflect the growing availability of ESC and curtain air bags plus more belt use.
VMT data is available for LTVs from 1975 to 2012.616 Occupant fatality rates per 100,000,000 VMT are shown in Table 2-29 and Figure 2-7. The trends are somewhat different from cars, be-cause LTVs are a less homogeneous group of vehicles. Originally, the majority of LTVs were pickup trucks. The introduction of minivans in the mid-1980s, a new type of vehicle with excep-tionally low fatality rates, helped to lower the average potential fatality rate for all LTVs from 2.33 in 1987 to 1.82 in 1992; the actual fatality rate fell even more sharply, from 1.86 to 1.29. After 1992, the market share for SUVs increased steadily relative to minivans and pickup trucks. Without the safety technologies, the potential fatality rate would have increased from 1.82 to 2.33 in 2003, back to the 1987 level. But thanks to increased belt use and other safety improve-ments, the actual fatality rate continued dropping from 1.29 to 1.21. Increased belt use and frontal air bags made it possible to accommodate the shift to SUVs without an increase of actual fatality rates per 100,000,000 VMT. The potential fatality rate leveled from 2003 (2.33) to 2007 (2.34) and had dropped to 2.00 by 2012 (still higher than the 1.82 in 1992). During that time, the actual rate fell from 1.21 in 2003 to 1.11 in 2007 to 0.84 in 2012, thanks to the additional contri-butions of ESC, curtain air bags, and other new technologies.
616 Traffic safety facts 2011, p. 26 specifies VMT for LTVs in 1975 to 2011; the estimate of total VMT in Traffic safety facts research note – 2012 motor vehicle crashes has been allocated to cars, LTVs, and other vehicles based on the 2010-to-2011 trends.
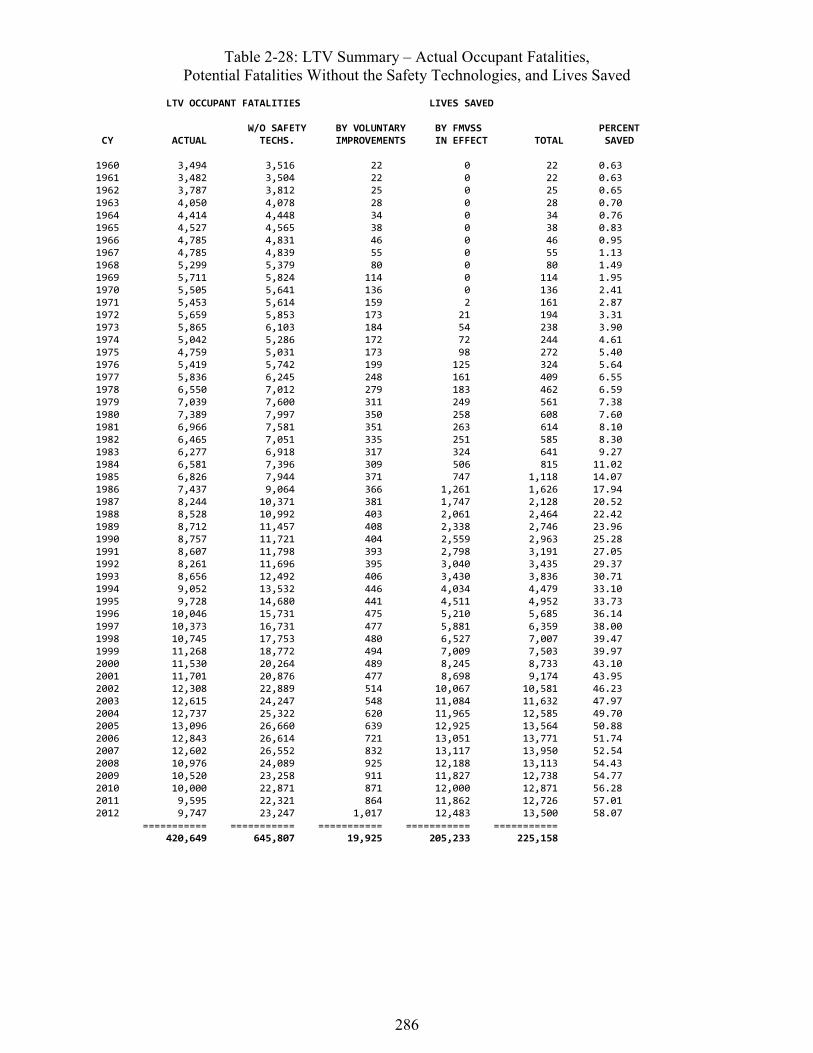
286
Table 2-28: LTV Summary – Actual Occupant Fatalities, Potential Fatalities Without the Safety Technologies, and Lives Saved
LTV OCCUPANT FATALITIES LIVES SAVED W/O SAFETY BY VOLUNTARY BY FMVSS PERCENT CY ACTUAL TECHS. IMPROVEMENTS IN EFFECT TOTAL SAVED 1960 3,494 3,516 22 0 22 0.63 1961 3,482 3,504 22 0 22 0.63 1962 3,787 3,812 25 0 25 0.65 1963 4,050 4,078 28 0 28 0.70 1964 4,414 4,448 34 0 34 0.76 1965 4,527 4,565 38 0 38 0.83 1966 4,785 4,831 46 0 46 0.95 1967 4,785 4,839 55 0 55 1.13 1968 5,299 5,379 80 0 80 1.49 1969 5,711 5,824 114 0 114 1.95 1970 5,505 5,641 136 0 136 2.41 1971 5,453 5,614 159 2 161 2.87 1972 5,659 5,853 173 21 194 3.31 1973 5,865 6,103 184 54 238 3.90 1974 5,042 5,286 172 72 244 4.61 1975 4,759 5,031 173 98 272 5.40 1976 5,419 5,742 199 125 324 5.64 1977 5,836 6,245 248 161 409 6.55 1978 6,550 7,012 279 183 462 6.59 1979 7,039 7,600 311 249 561 7.38 1980 7,389 7,997 350 258 608 7.60 1981 6,966 7,581 351 263 614 8.10 1982 6,465 7,051 335 251 585 8.30 1983 6,277 6,918 317 324 641 9.27 1984 6,581 7,396 309 506 815 11.02 1985 6,826 7,944 371 747 1,118 14.07 1986 7,437 9,064 366 1,261 1,626 17.94 1987 8,244 10,371 381 1,747 2,128 20.52 1988 8,528 10,992 403 2,061 2,464 22.42 1989 8,712 11,457 408 2,338 2,746 23.96 1990 8,757 11,721 404 2,559 2,963 25.28 1991 8,607 11,798 393 2,798 3,191 27.05 1992 8,261 11,696 395 3,040 3,435 29.37 1993 8,656 12,492 406 3,430 3,836 30.71 1994 9,052 13,532 446 4,034 4,479 33.10 1995 9,728 14,680 441 4,511 4,952 33.73 1996 10,046 15,731 475 5,210 5,685 36.14 1997 10,373 16,731 477 5,881 6,359 38.00 1998 10,745 17,753 480 6,527 7,007 39.47 1999 11,268 18,772 494 7,009 7,503 39.97 2000 11,530 20,264 489 8,245 8,733 43.10 2001 11,701 20,876 477 8,698 9,174 43.95 2002 12,308 22,889 514 10,067 10,581 46.23 2003 12,615 24,247 548 11,084 11,632 47.97 2004 12,737 25,322 620 11,965 12,585 49.70 2005 13,096 26,660 639 12,925 13,564 50.88 2006 12,843 26,614 721 13,051 13,771 51.74 2007 12,602 26,552 832 13,117 13,950 52.54 2008 10,976 24,089 925 12,188 13,113 54.43 2009 10,520 23,258 911 11,827 12,738 54.77 2010 10,000 22,871 871 12,000 12,871 56.28 2011 9,595 22,321 864 11,862 12,726 57.01 2012 9,747 23,247 1,017 12,483 13,500 58.07 =========== =========== =========== =========== =========== 420,649 645,807 19,925 205,233 225,158
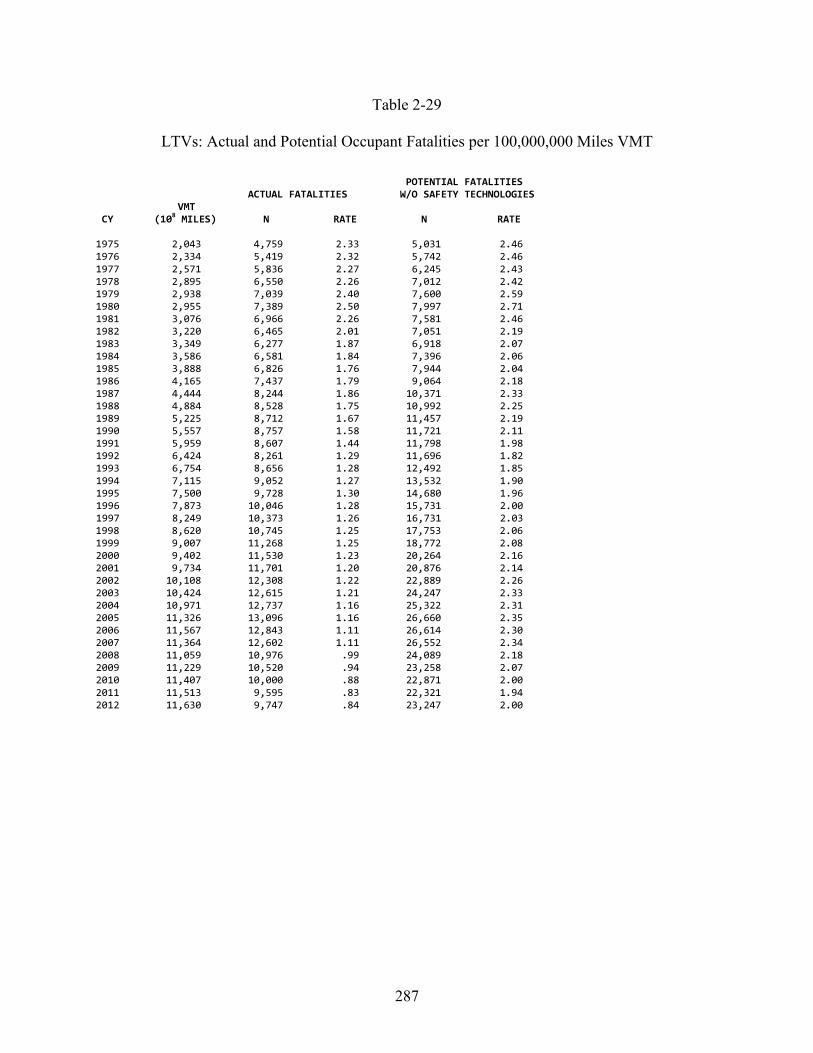
287
Table 2-29
LTVs: Actual and Potential Occupant Fatalities per 100,000,000 Miles VMT POTENTIAL FATALITIES ACTUAL FATALITIES W/O SAFETY TECHNOLOGIES VMT CY (108 MILES) N RATE N RATE 1975 2,043 4,759 2.33 5,031 2.46 1976 2,334 5,419 2.32 5,742 2.46 1977 2,571 5,836 2.27 6,245 2.43 1978 2,895 6,550 2.26 7,012 2.42 1979 2,938 7,039 2.40 7,600 2.59 1980 2,955 7,389 2.50 7,997 2.71 1981 3,076 6,966 2.26 7,581 2.46 1982 3,220 6,465 2.01 7,051 2.19 1983 3,349 6,277 1.87 6,918 2.07 1984 3,586 6,581 1.84 7,396 2.06 1985 3,888 6,826 1.76 7,944 2.04 1986 4,165 7,437 1.79 9,064 2.18 1987 4,444 8,244 1.86 10,371 2.33 1988 4,884 8,528 1.75 10,992 2.25 1989 5,225 8,712 1.67 11,457 2.19 1990 5,557 8,757 1.58 11,721 2.11 1991 5,959 8,607 1.44 11,798 1.98 1992 6,424 8,261 1.29 11,696 1.82 1993 6,754 8,656 1.28 12,492 1.85 1994 7,115 9,052 1.27 13,532 1.90 1995 7,500 9,728 1.30 14,680 1.96 1996 7,873 10,046 1.28 15,731 2.00 1997 8,249 10,373 1.26 16,731 2.03 1998 8,620 10,745 1.25 17,753 2.06 1999 9,007 11,268 1.25 18,772 2.08 2000 9,402 11,530 1.23 20,264 2.16 2001 9,734 11,701 1.20 20,876 2.14 2002 10,108 12,308 1.22 22,889 2.26 2003 10,424 12,615 1.21 24,247 2.33 2004 10,971 12,737 1.16 25,322 2.31 2005 11,326 13,096 1.16 26,660 2.35 2006 11,567 12,843 1.11 26,614 2.30 2007 11,364 12,602 1.11 26,552 2.34 2008 11,059 10,976 .99 24,089 2.18 2009 11,229 10,520 .94 23,258 2.07 2010 11,407 10,000 .88 22,871 2.00 2011 11,513 9,595 .83 22,321 1.94 2012 11,630 9,747 .84 23,247 2.00
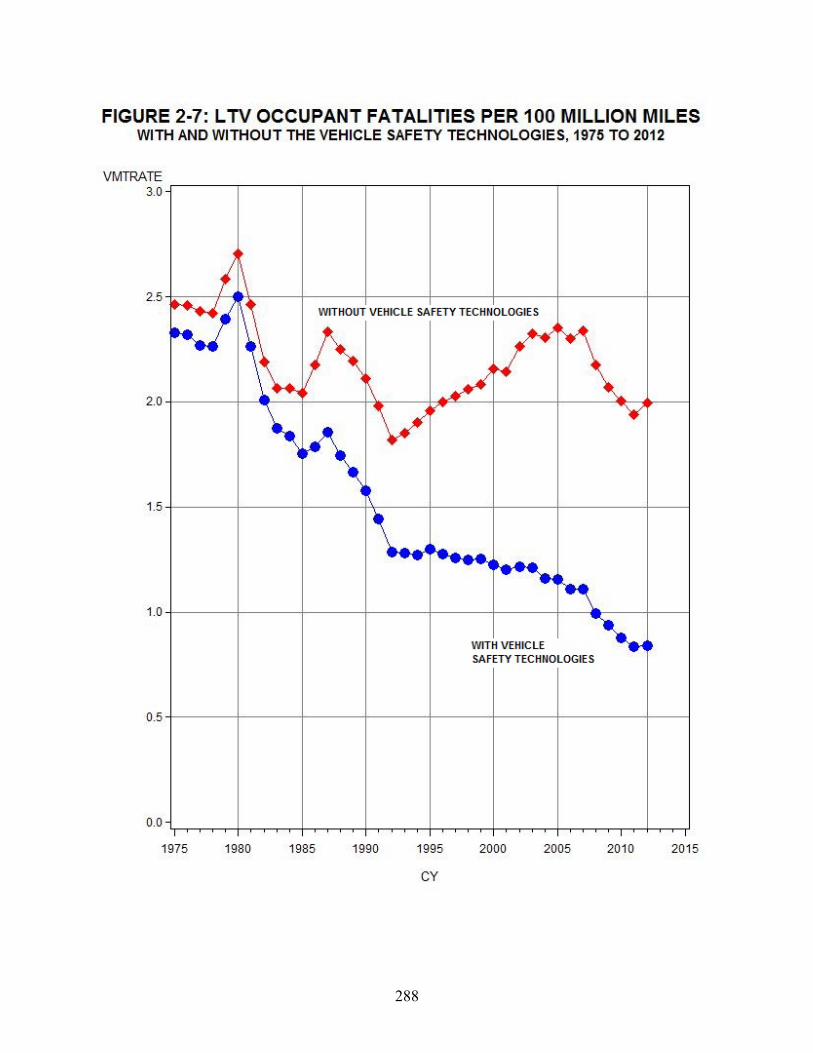
288
289
Lives saved by 27 individual safety technologies for LTVs will now be discussed in chronologi-cal order as listed in Table 2-2, based on the “median installation year.” Table 2-30 covers the two earliest technologies, 208A – lap belts for outboard front seat occupants (5 and older), and 208B – lap belt use (at any seating position) by children 1 to 4 years old. By MY 1964, over half of new LTVs were equipped with lap belts; FMVSS No. 208 required them in LTVs as of July 1, 1971. Lap belts are more effective in LTVs than in cars, reducing fatality risk by 48 percent (ver-sus 27% in cars). Although some LTV make-models received 3-point belts in the early 1970s, most kept lap belts through MY 1975 and some even until 1980. Some of those LTVs were still on the road in 2012. Thus, the number of lives saved by lap belts reached a peak of 110 in 1986, after buckle-up laws increased use, and it did not decline that much in the 1990s. In all, lap belts have saved an estimated 2,792 outboard front seat occupants age 5 or older.
Seat belts, without a safety seat, reduce the fatality risk of 1-to-4 year old children by an average of 48 percent in LTVs, and are assumed to have little or no value for infants less than a year old. Belts have saved an estimated 408 children 1 to 4 years old, at all seating positions, in LTVs.
Table 2-31 tallies the benefits of dual master cylinders (105A) and improved door locks (206). Dual master cylinders were not required until FMVSS No. 105 was extended to LTVs, effective September 1, 1983. But they were introduced much earlier, presumably at about the same time as in cars, often a few years before 1968. They reduce the risk of a fatal crash involvement by an estimated 0.7 percent, saving a total of 4,099 LTV occupants in from 1960 to 2012, including 163 in 2012. The number of lives saved grew year by year until 2005 as the “base” of registered LTVs, their VMT, and potentially fatal crashes continued to grow.
FMVSS No. 206 took effect on January 1, 1972 in LTVs, four years later than in cars. The model assumes that door lock improvements in LTVs started at about the same time as in cars, MY 1962, but extended until MY 1972, the year the standard took effect in LTVs. In cars, NHTSA’s evaluation estimated a 15-percent reduction of fatalities in rollovers. However, NCSS data show that the proportion of ejections that are through the door portal is smaller in LTVs than in cars. The effectiveness in LTVs is estimated to be 10 percent. Despite that lower effectiveness, the benefits of improved door locks in LTVs are estimated to be substantial, because so many poten-tially fatal LTV crashes involve rollover and ejection: 16,758 lives saved from 1960 through 2012, including 641 in 2012.
Table 2-32 looks at the benefits of lap belts for occupants 5 and older at the outboard rear seating position (208C) and the center front seating position (208D). Lap belts were required at all des-ignated seating positions in LTVs on July 1, 1971. FMVSS No. 208 upgraded to 3-point belts at the outboard rear seats in LTVs starting September 1, 1991. Even lap belts alone are quite effec-tive in the rear seats of LTVs, reducing fatality risk by an average of 63 percent. They achieved their largest benefit, 80 lives saved, in 1993, just after the shift to 3-point belts, and saved an es-timated 1,163 lives from 1960 to 2012, with dwindling numbers in recent years as LTVs with lap belts only were retired.
The center front seat is more frequently occupied in pickup trucks, especially those that have a wide bench seat in the front and no rear seats at all, than in cars. As a consequence, here is a technology that has saved more lives in LTVs (279) than in cars (94) during 1960 to 2012.
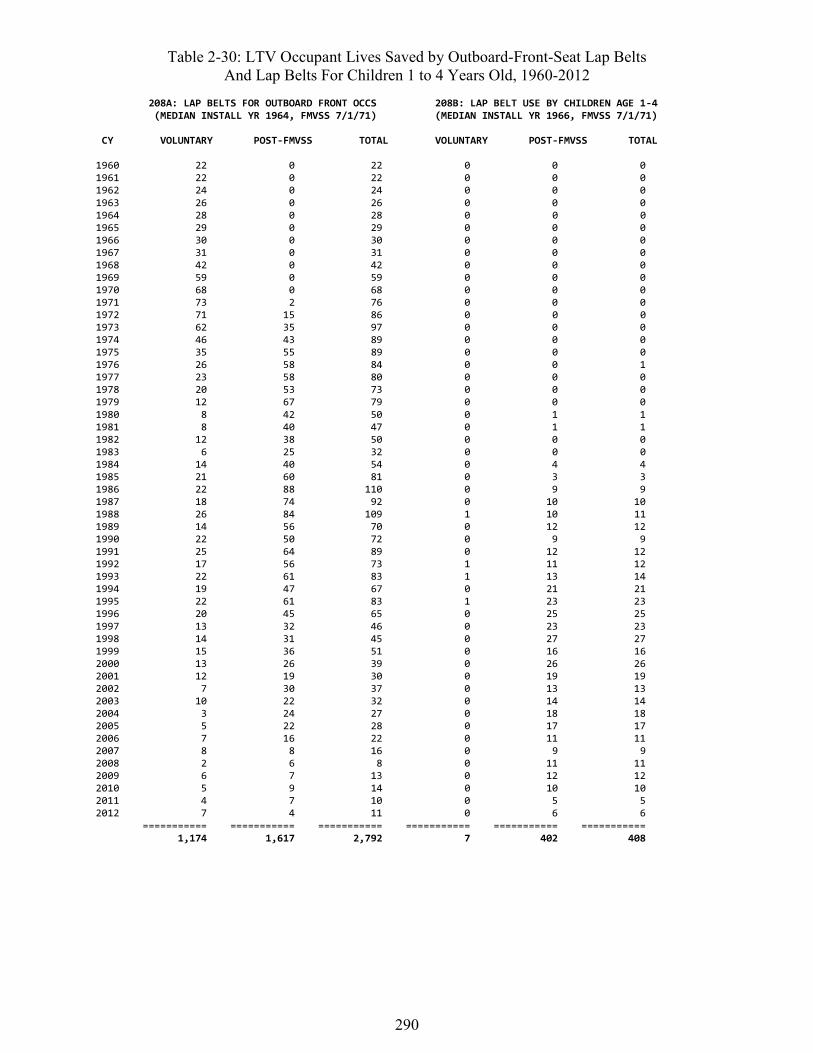
290
Table 2-30: LTV Occupant Lives Saved by Outboard-Front-Seat Lap Belts And Lap Belts For Children 1 to 4 Years Old, 1960-2012
208A: LAP BELTS FOR OUTBOARD FRONT OCCS 208B: LAP BELT USE BY CHILDREN AGE 1-4 (MEDIAN INSTALL YR 1964, FMVSS 7/1/71) (MEDIAN INSTALL YR 1966, FMVSS 7/1/71) CY VOLUNTARY POST-FMVSS TOTAL VOLUNTARY POST-FMVSS TOTAL 1960 22 0 22 0 0 0 1961 22 0 22 0 0 0 1962 24 0 24 0 0 0 1963 26 0 26 0 0 0 1964 28 0 28 0 0 0 1965 29 0 29 0 0 0 1966 30 0 30 0 0 0 1967 31 0 31 0 0 0 1968 42 0 42 0 0 0 1969 59 0 59 0 0 0 1970 68 0 68 0 0 0 1971 73 2 76 0 0 0 1972 71 15 86 0 0 0 1973 62 35 97 0 0 0 1974 46 43 89 0 0 0 1975 35 55 89 0 0 0 1976 26 58 84 0 0 1 1977 23 58 80 0 0 0 1978 20 53 73 0 0 0 1979 12 67 79 0 0 0 1980 8 42 50 0 1 1 1981 8 40 47 0 1 1 1982 12 38 50 0 0 0 1983 6 25 32 0 0 0 1984 14 40 54 0 4 4 1985 21 60 81 0 3 3 1986 22 88 110 0 9 9 1987 18 74 92 0 10 10 1988 26 84 109 1 10 11 1989 14 56 70 0 12 12 1990 22 50 72 0 9 9 1991 25 64 89 0 12 12 1992 17 56 73 1 11 12 1993 22 61 83 1 13 14 1994 19 47 67 0 21 21 1995 22 61 83 1 23 23 1996 20 45 65 0 25 25 1997 13 32 46 0 23 23 1998 14 31 45 0 27 27 1999 15 36 51 0 16 16 2000 13 26 39 0 26 26 2001 12 19 30 0 19 19 2002 7 30 37 0 13 13 2003 10 22 32 0 14 14 2004 3 24 27 0 18 18 2005 5 22 28 0 17 17 2006 7 16 22 0 11 11 2007 8 8 16 0 9 9 2008 2 6 8 0 11 11 2009 6 7 13 0 12 12 2010 5 9 14 0 10 10 2011 4 7 10 0 5 5 2012 7 4 11 0 6 6 =========== =========== =========== =========== =========== =========== 1,174 1,617 2,792 7 402 408
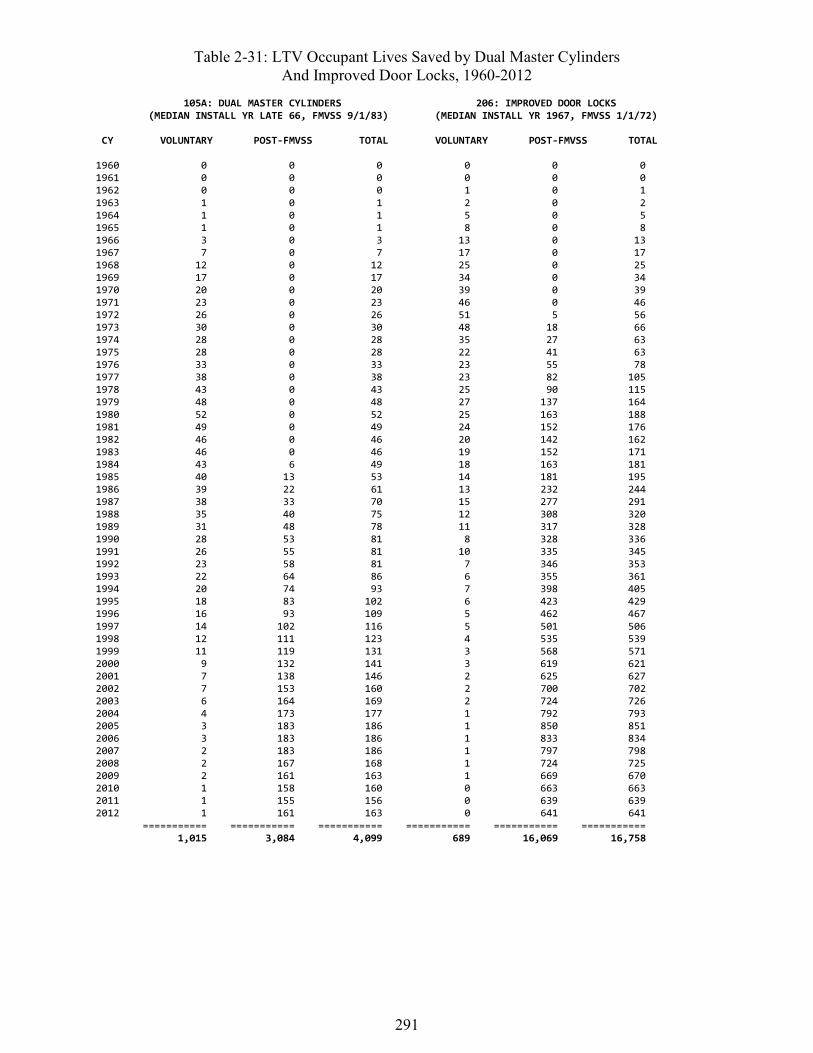
291
Table 2-31: LTV Occupant Lives Saved by Dual Master Cylinders And Improved Door Locks, 1960-2012
105A: DUAL MASTER CYLINDERS 206: IMPROVED DOOR LOCKS (MEDIAN INSTALL YR LATE 66, FMVSS 9/1/83) (MEDIAN INSTALL YR 1967, FMVSS 1/1/72) CY VOLUNTARY POST-FMVSS TOTAL VOLUNTARY POST-FMVSS TOTAL 1960 0 0 0 0 0 0 1961 0 0 0 0 0 0 1962 0 0 0 1 0 1 1963 1 0 1 2 0 2 1964 1 0 1 5 0 5 1965 1 0 1 8 0 8 1966 3 0 3 13 0 13 1967 7 0 7 17 0 17 1968 12 0 12 25 0 25 1969 17 0 17 34 0 34 1970 20 0 20 39 0 39 1971 23 0 23 46 0 46 1972 26 0 26 51 5 56 1973 30 0 30 48 18 66 1974 28 0 28 35 27 63 1975 28 0 28 22 41 63 1976 33 0 33 23 55 78 1977 38 0 38 23 82 105 1978 43 0 43 25 90 115 1979 48 0 48 27 137 164 1980 52 0 52 25 163 188 1981 49 0 49 24 152 176 1982 46 0 46 20 142 162 1983 46 0 46 19 152 171 1984 43 6 49 18 163 181 1985 40 13 53 14 181 195 1986 39 22 61 13 232 244 1987 38 33 70 15 277 291 1988 35 40 75 12 308 320 1989 31 48 78 11 317 328 1990 28 53 81 8 328 336 1991 26 55 81 10 335 345 1992 23 58 81 7 346 353 1993 22 64 86 6 355 361 1994 20 74 93 7 398 405 1995 18 83 102 6 423 429 1996 16 93 109 5 462 467 1997 14 102 116 5 501 506 1998 12 111 123 4 535 539 1999 11 119 131 3 568 571 2000 9 132 141 3 619 621 2001 7 138 146 2 625 627 2002 7 153 160 2 700 702 2003 6 164 169 2 724 726 2004 4 173 177 1 792 793 2005 3 183 186 1 850 851 2006 3 183 186 1 833 834 2007 2 183 186 1 797 798 2008 2 167 168 1 724 725 2009 2 161 163 1 669 670 2010 1 158 160 0 663 663 2011 1 155 156 0 639 639 2012 1 161 163 0 641 641 =========== =========== =========== =========== =========== =========== 1,015 3,084 4,099 689 16,069 16,758
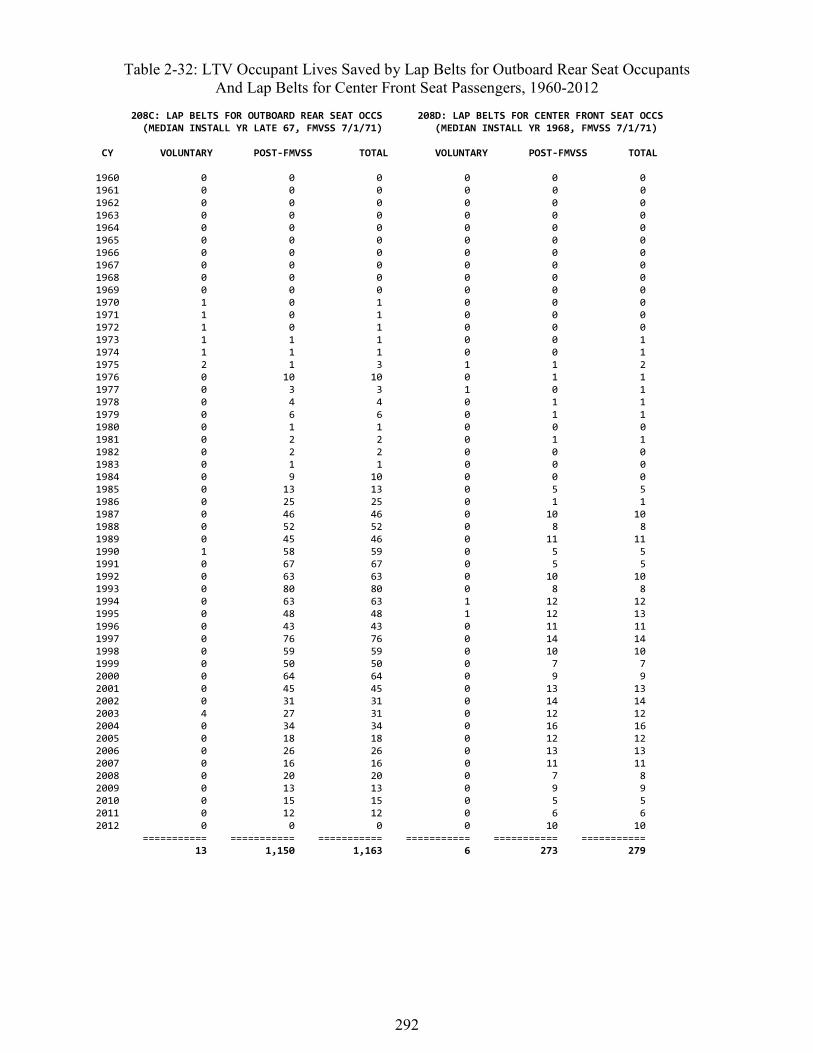
292
Table 2-32: LTV Occupant Lives Saved by Lap Belts for Outboard Rear Seat Occupants And Lap Belts for Center Front Seat Passengers, 1960-2012
208C: LAP BELTS FOR OUTBOARD REAR SEAT OCCS 208D: LAP BELTS FOR CENTER FRONT SEAT OCCS (MEDIAN INSTALL YR LATE 67, FMVSS 7/1/71) (MEDIAN INSTALL YR 1968, FMVSS 7/1/71) CY VOLUNTARY POST-FMVSS TOTAL VOLUNTARY POST-FMVSS TOTAL 1960 0 0 0 0 0 0 1961 0 0 0 0 0 0 1962 0 0 0 0 0 0 1963 0 0 0 0 0 0 1964 0 0 0 0 0 0 1965 0 0 0 0 0 0 1966 0 0 0 0 0 0 1967 0 0 0 0 0 0 1968 0 0 0 0 0 0 1969 0 0 0 0 0 0 1970 1 0 1 0 0 0 1971 1 0 1 0 0 0 1972 1 0 1 0 0 0 1973 1 1 1 0 0 1 1974 1 1 1 0 0 1 1975 2 1 3 1 1 2 1976 0 10 10 0 1 1 1977 0 3 3 1 0 1 1978 0 4 4 0 1 1 1979 0 6 6 0 1 1 1980 0 1 1 0 0 0 1981 0 2 2 0 1 1 1982 0 2 2 0 0 0 1983 0 1 1 0 0 0 1984 0 9 10 0 0 0 1985 0 13 13 0 5 5 1986 0 25 25 0 1 1 1987 0 46 46 0 10 10 1988 0 52 52 0 8 8 1989 0 45 46 0 11 11 1990 1 58 59 0 5 5 1991 0 67 67 0 5 5 1992 0 63 63 0 10 10 1993 0 80 80 0 8 8 1994 0 63 63 1 12 12 1995 0 48 48 1 12 13 1996 0 43 43 0 11 11 1997 0 76 76 0 14 14 1998 0 59 59 0 10 10 1999 0 50 50 0 7 7 2000 0 64 64 0 9 9 2001 0 45 45 0 13 13 2002 0 31 31 0 14 14 2003 4 27 31 0 12 12 2004 0 34 34 0 16 16 2005 0 18 18 0 12 12 2006 0 26 26 0 13 13 2007 0 16 16 0 11 11 2008 0 20 20 0 7 8 2009 0 13 13 0 9 9 2010 0 15 15 0 5 5 2011 0 12 12 0 6 6 2012 0 0 0 0 10 10 =========== =========== =========== =========== =========== =========== 13 1,150 1,163 6 273 279
293
Table 2-33 considers lap belts for center rear seat passengers (208E) and front disc brakes (105B). Center-rear seats are occupied fairly often in vans and large SUVs and lap belts are quite effective, reducing fatality risk by an estimated 63 percent. The belts saved 736 lives from 1960 to 2012, reaching a peak of 65 lives saved in 2000 and then gradually dwindling as more and more LTVs were equipped with 3-point belts at the center rear seats.
The model assumes front disc brakes were introduced in LTVs at about the same time as in cars – i.e., during MY 1965 to 1977 – even though FMVSS No. 105 did not apply to LTVs until Sep-tember 1, 1983.617 Front disc brakes reduce the risk of a fatal crash involvement by an estimated 0.17 percent. They saved an estimated 902 LTV occupants in 1960 to 2012.
Table 2-34 analyzes voluntary modifications to middle and lower instrument panels (201A) and energy-absorbing steering assemblies (203), two basic “built-in” protections in frontal crashes. Instrument panels of LTVs were redesigned over several years, from about MY 1969 to 1976. That resulted in a 15.9-percent fatality reduction for unrestrained RF passengers in frontal im-pacts. It saved an estimated 7,564 lives through CY 2012, averaging about 300 per year after 2000.
FMVSS Nos. 203 and 204 were not extended to LTVs until September 1, 1981. However, ener-gy-absorbing columns were introduced in some LTVs as early as 1970, and in the majority by MY 1975 or 1976, but in some not until MY 1982. Energy-absorbing steering assemblies have saved 22,877 lives through CY 2012, including 1,084 in 2012. They rank first in cumulative benefits among the non-belt technologies for LTVs, as well as for passenger cars.
Table 2-35 estimates the benefits of 3-point belts for outboard front seat occupants (208F) and adhesive windshield bonding (212). FMVSS No. 208 required 3-point belts at the outboard front seats of most LTVs on January 1, 1976, but on some not until September 1, 1981. However, some make-models received 3-point belts well before January 1, 1976. Seat belt use is critically important in LTVs, because a high proportion of potentially fatal crashes involve rollover and/or ejection, and because belts are also highly effective in the other crash modes. Three-point belts reduce fatality risk by an average of 60 percent in LTVs, when they are used. Fortunately, belt use is as high in SUVs and vans as in cars.618 Three-point belts saved an estimated 128,376 driv-ers and RF passengers from 1960 through 2012, including 7,675 in 2012. Both of these numbers are more than half the overall benefits of all the LTV safety technologies in the same time peri-od, and so are the estimates for each individual year from 1988 to 2012.
Adhesive windshield bonding gradually superseded the older installation method using rubber gaskets during approximately 1978 to 1985 in LTVs. The model assumes that adhesive bonding has the same effect on ejection fatalities in LTVs as in cars: NCSS data show that the proportion of ejections that are via the windshield portal was about the same in LTVs with rubber gaskets as in cars with rubber gaskets. Adhesive bonding has saved an estimated 2,585 lives through CY 2012, including 95 in 2012.
617 Ward’s Automotive Yearbooks show nearly identical percentages of U.S. cars, U.S. LTVs and imported cars with front disc brakes in MY 1975 to 1977 and have no information for U.S. LTVs and imported cars before MY 1975. 618 Glassbrenner (2003, September).
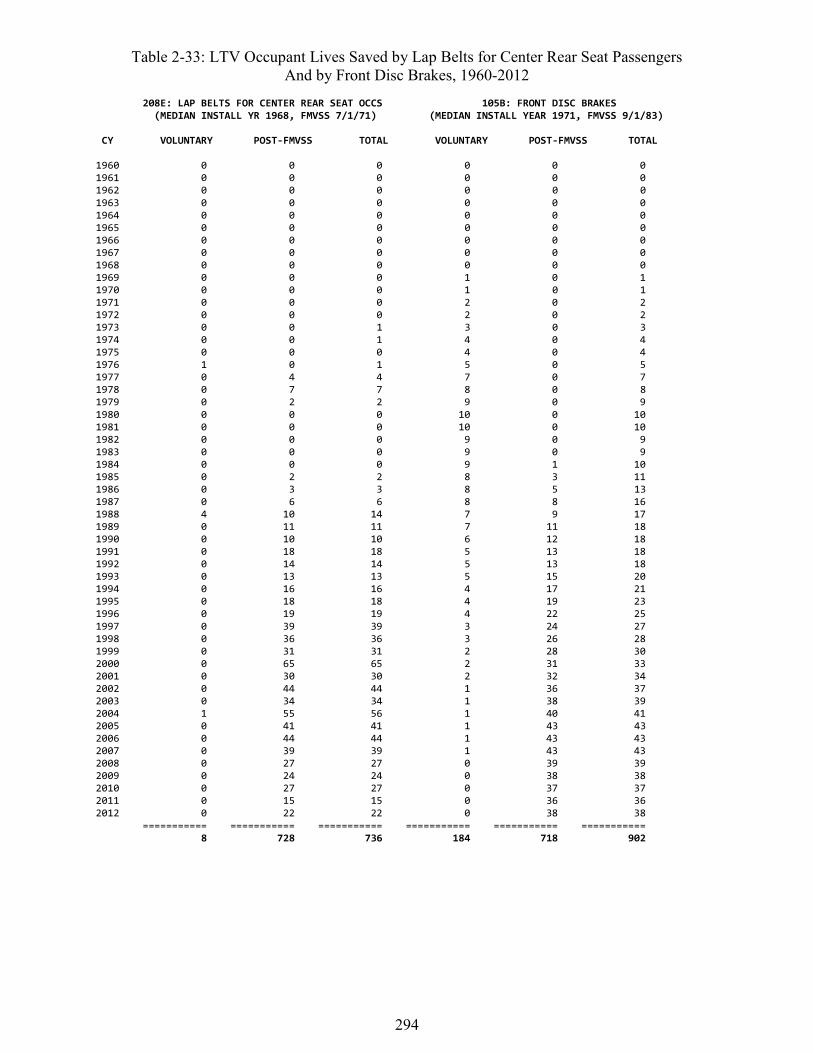
294
Table 2-33: LTV Occupant Lives Saved by Lap Belts for Center Rear Seat Passengers And by Front Disc Brakes, 1960-2012
208E: LAP BELTS FOR CENTER REAR SEAT OCCS 105B: FRONT DISC BRAKES (MEDIAN INSTALL YR 1968, FMVSS 7/1/71) (MEDIAN INSTALL YEAR 1971, FMVSS 9/1/83) CY VOLUNTARY POST-FMVSS TOTAL VOLUNTARY POST-FMVSS TOTAL 1960 0 0 0 0 0 0 1961 0 0 0 0 0 0 1962 0 0 0 0 0 0 1963 0 0 0 0 0 0 1964 0 0 0 0 0 0 1965 0 0 0 0 0 0 1966 0 0 0 0 0 0 1967 0 0 0 0 0 0 1968 0 0 0 0 0 0 1969 0 0 0 1 0 1 1970 0 0 0 1 0 1 1971 0 0 0 2 0 2 1972 0 0 0 2 0 2 1973 0 0 1 3 0 3 1974 0 0 1 4 0 4 1975 0 0 0 4 0 4 1976 1 0 1 5 0 5 1977 0 4 4 7 0 7 1978 0 7 7 8 0 8 1979 0 2 2 9 0 9 1980 0 0 0 10 0 10 1981 0 0 0 10 0 10 1982 0 0 0 9 0 9 1983 0 0 0 9 0 9 1984 0 0 0 9 1 10 1985 0 2 2 8 3 11 1986 0 3 3 8 5 13 1987 0 6 6 8 8 16 1988 4 10 14 7 9 17 1989 0 11 11 7 11 18 1990 0 10 10 6 12 18 1991 0 18 18 5 13 18 1992 0 14 14 5 13 18 1993 0 13 13 5 15 20 1994 0 16 16 4 17 21 1995 0 18 18 4 19 23 1996 0 19 19 4 22 25 1997 0 39 39 3 24 27 1998 0 36 36 3 26 28 1999 0 31 31 2 28 30 2000 0 65 65 2 31 33 2001 0 30 30 2 32 34 2002 0 44 44 1 36 37 2003 0 34 34 1 38 39 2004 1 55 56 1 40 41 2005 0 41 41 1 43 43 2006 0 44 44 1 43 43 2007 0 39 39 1 43 43 2008 0 27 27 0 39 39 2009 0 24 24 0 38 38 2010 0 27 27 0 37 37 2011 0 15 15 0 36 36 2012 0 22 22 0 38 38 =========== =========== =========== =========== =========== =========== 8 728 736 184 718 902
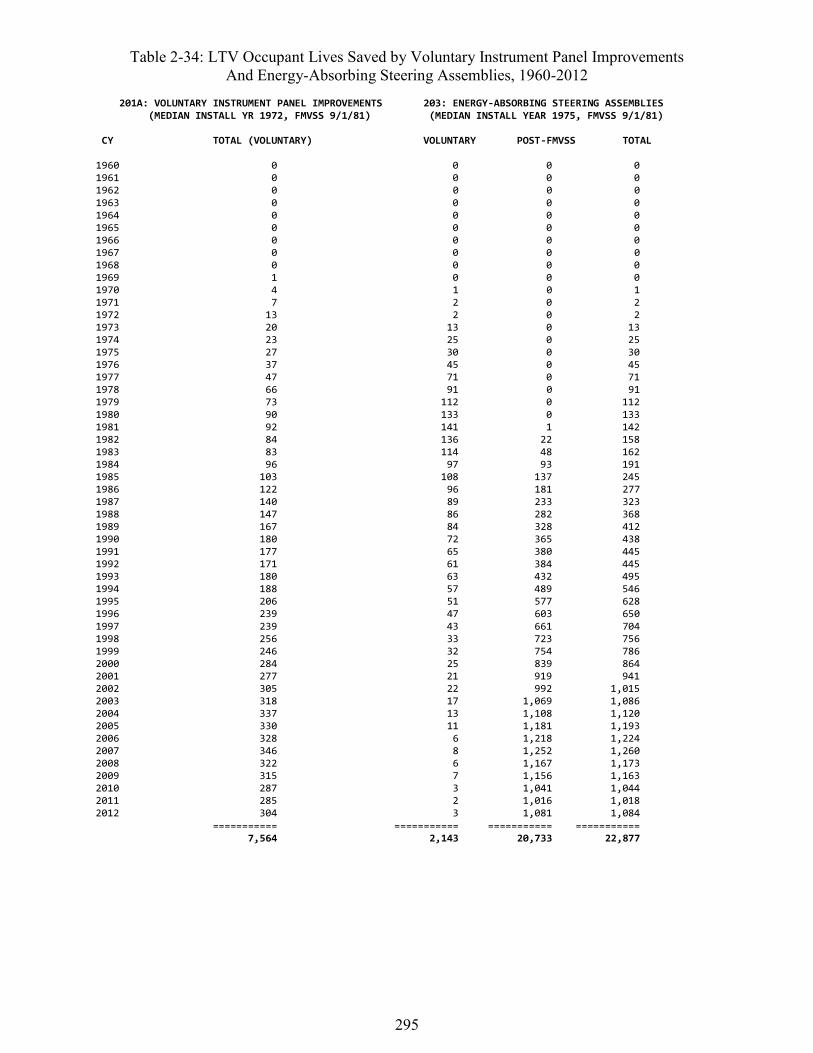
295
Table 2-34: LTV Occupant Lives Saved by Voluntary Instrument Panel Improvements And Energy-Absorbing Steering Assemblies, 1960-2012
201A: VOLUNTARY INSTRUMENT PANEL IMPROVEMENTS 203: ENERGY-ABSORBING STEERING ASSEMBLIES (MEDIAN INSTALL YR 1972, FMVSS 9/1/81) (MEDIAN INSTALL YEAR 1975, FMVSS 9/1/81) CY TOTAL (VOLUNTARY) VOLUNTARY POST-FMVSS TOTAL 1960 0 0 0 0 1961 0 0 0 0 1962 0 0 0 0 1963 0 0 0 0 1964 0 0 0 0 1965 0 0 0 0 1966 0 0 0 0 1967 0 0 0 0 1968 0 0 0 0 1969 1 0 0 0 1970 4 1 0 1 1971 7 2 0 2 1972 13 2 0 2 1973 20 13 0 13 1974 23 25 0 25 1975 27 30 0 30 1976 37 45 0 45 1977 47 71 0 71 1978 66 91 0 91 1979 73 112 0 112 1980 90 133 0 133 1981 92 141 1 142 1982 84 136 22 158 1983 83 114 48 162 1984 96 97 93 191 1985 103 108 137 245 1986 122 96 181 277 1987 140 89 233 323 1988 147 86 282 368 1989 167 84 328 412 1990 180 72 365 438 1991 177 65 380 445 1992 171 61 384 445 1993 180 63 432 495 1994 188 57 489 546 1995 206 51 577 628 1996 239 47 603 650 1997 239 43 661 704 1998 256 33 723 756 1999 246 32 754 786 2000 284 25 839 864 2001 277 21 919 941 2002 305 22 992 1,015 2003 318 17 1,069 1,086 2004 337 13 1,108 1,120 2005 330 11 1,181 1,193 2006 328 6 1,218 1,224 2007 346 8 1,252 1,260 2008 322 6 1,167 1,173 2009 315 7 1,156 1,163 2010 287 3 1,041 1,044 2011 285 2 1,016 1,018 2012 304 3 1,081 1,084 =========== =========== =========== =========== 7,564 2,143 20,733 22,877

296
Table 2-35: LTV Occupant Lives Saved by 3-Point Belts for Outboard Front Seat Occupants And by Adhesive Windshield Bonding, 1960-2012
208F: 3-POINT BELTS FOR OUTBOARD FRONT OCCS 212: ADHESIVE WINDSHIELD BONDING (MEDIAN INSTALL YR 1977, FMVSS 1/1/76) (MEDIAN INSTALL YR 1980, FMVSS 9/1/78) CY VOLUNTARY POST-FMVSS TOTAL VOLUNTARY POST-FMVSS TOTAL 1960 0 0 0 0 0 0 1961 0 0 0 0 0 0 1962 0 0 0 0 0 0 1963 0 0 0 0 0 0 1964 0 0 0 0 0 0 1965 0 0 0 0 0 0 1966 0 0 0 0 0 0 1967 0 0 0 0 0 0 1968 0 0 0 0 0 0 1969 1 0 1 0 0 0 1970 2 0 2 0 0 0 1971 3 0 3 0 0 0 1972 4 0 4 0 0 0 1973 5 0 5 0 0 0 1974 9 0 9 0 0 0 1975 23 0 23 0 0 0 1976 26 0 26 0 0 0 1977 37 13 50 0 0 0 1978 23 28 51 1 0 1 1979 28 34 61 2 3 5 1980 27 43 70 2 7 9 1981 25 56 82 1 9 11 1982 20 33 53 1 12 13 1983 35 81 116 1 15 16 1984 27 157 184 1 21 22 1985 67 289 356 1 29 30 1986 63 642 705 1 38 39 1987 64 973 1,037 1 50 51 1988 72 1,169 1,241 1 58 59 1989 83 1,413 1,496 1 61 61 1990 76 1,576 1,652 1 66 67 1991 45 1,747 1,792 1 67 67 1992 62 1,954 2,016 1 62 62 1993 50 2,232 2,283 1 68 69 1994 80 2,645 2,726 0 76 76 1995 49 2,930 2,978 0 83 84 1996 63 3,472 3,535 0 85 86 1997 55 3,790 3,846 0 90 90 1998 41 4,222 4,262 0 99 99 1999 55 4,394 4,449 0 105 105 2000 48 5,289 5,336 0 108 108 2001 35 5,506 5,541 0 113 113 2002 38 6,250 6,289 0 119 119 2003 16 7,041 7,057 0 117 117 2004 13 7,477 7,490 0 118 118 2005 15 8,052 8,067 0 124 124 2006 9 8,069 8,077 0 129 129 2007 23 8,026 8,049 0 127 128 2008 13 7,565 7,578 0 112 112 2009 9 7,196 7,205 0 105 105 2010 8 7,499 7,507 0 98 98 2011 7 7,383 7,390 0 93 93 2012 2 7,673 7,675 0 95 95 =========== =========== =========== =========== =========== =========== 1,456 126,920 128,376 21 2,564 2,585
297
Table 2-36 considers child safety seats, including booster seats (213) and 3-point belts for out-board rear seat occupants (208G). NHTSA’s evaluation estimates that safety seats reduce fatality risk in LTVs by 58 percent for infants and by 59 percent for toddlers. The latter effect will also be assumed for booster seats until NHTSA is able to evaluate them in more detail. Safety seats saved an estimated 2,634 lives in 1960 to 2012, of which 2,285 were children obligated by a State law to be in a safety seat, while 350 were voluntary saves before State laws or involving children older than the age up to which the law in effect at that time required a safety seat.
FMVSS No. 208 has required lap/shoulder belts at outboard rear seats of LTVs since September 1, 1991, but most LTVs were voluntarily equipped with 3-point belts a few years before that date. Three-point belts are highly effective for rear seat occupants, reducing fatality risk by an average of 73 percent. Belt use, occupancy of the rear seat and the proportion of LTVs on the road equipped with 3-point belts have increased rapidly, pushing benefits to a peak of 621 lives saved in 2007 and a total of 7,821 cumulative through 2012.
Table 2-37 estimates lives saved by side door beams (214A). The side door strength test of FMVSS No. 214 was extended to LTVs effective September 1, 1993. Most LTVs were first equipped with side door beams in MY 1994, but on a few models they were voluntarily intro-duced in 1991 to 1993. Side door beams reduce fatality risk in single-vehicle side impacts by 19 percent. They saved an estimated 2,940 lives in 1991 to 2012, including 242 in 2012; annual benefits rose until 2010 as LTVs with side door beams replaced the pre-standard fleet.
Table 2-38 estimates net lives saved by frontal air bags (208I), including separate estimates for the three major types or “generations” of air bags: barrier-certified (until the late 1990s), sled-certified (late 1990s to mid-2000s), and certified-advanced (since the mid-2000s). Frontal air bags have approximately the same effects in cars and LTVs. They significantly reduce the fatali-ty risk of adults and adolescents (13 and older) in frontal and partially frontal crashes. Benefits of barrier-certified and sled-certified air bags are to a numerically small extent offset by increased risk to certain subgroups of child passengers (12 and younger). Especially before advanced air bags, many pickup trucks and some cargo vans and sporty SUVs had manual on-off switches for passenger air bags. Turning the switch “off” can prevent harm to a child passenger, but takes away the benefit of air bags from an adult passenger. At the end of this chapter, Tables 2-49 through 2-54 furnish more detailed analyses effects separately by type of air bag, occupant age group, and seating position; they also explore the effects of the manual switches.
The FMVSS No. 208 phase-in period for automatic protection in LTVs extended from Septem-ber 1, 1994, to August 30, 1997. LTVs equipped with driver or dual air bags before September 1, 1994, account for the voluntary saves on Table 2-38 – e.g., Chrysler equipped some MY 1991 and all 1992 minivans with driver air bags. All other air bags, supplied either during or after the phase-in period, have their benefits listed in the “Post-FMVSS” column. Frontal air bags had saved a net estimated 15,091 lives in LTVs from 1991 through 2012, including 1,193 in 2012. The number of lives saved by air bags grew rapidly at first, commensurate with the proportion of LTVs on the road equipped with air bags, peaking at 1,320 in 2007.
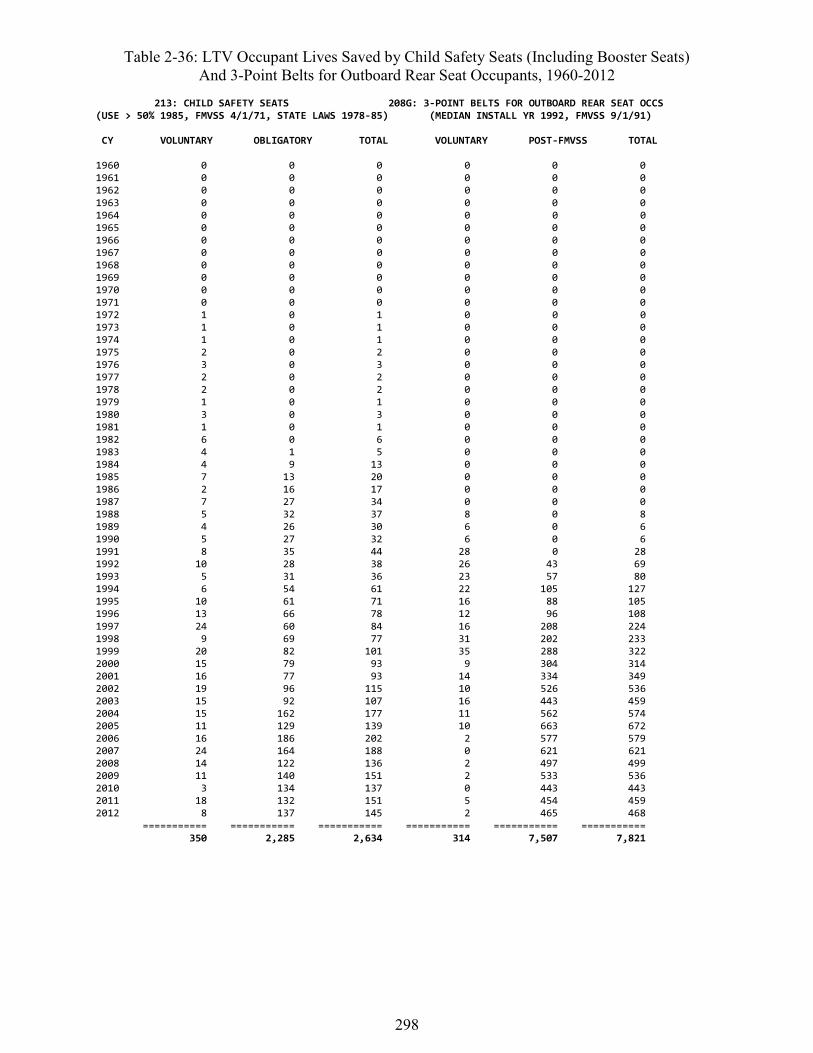
298
Table 2-36: LTV Occupant Lives Saved by Child Safety Seats (Including Booster Seats) And 3-Point Belts for Outboard Rear Seat Occupants, 1960-2012
213: CHILD SAFETY SEATS 208G: 3-POINT BELTS FOR OUTBOARD REAR SEAT OCCS (USE > 50% 1985, FMVSS 4/1/71, STATE LAWS 1978-85) (MEDIAN INSTALL YR 1992, FMVSS 9/1/91) CY VOLUNTARY OBLIGATORY TOTAL VOLUNTARY POST-FMVSS TOTAL 1960 0 0 0 0 0 0 1961 0 0 0 0 0 0 1962 0 0 0 0 0 0 1963 0 0 0 0 0 0 1964 0 0 0 0 0 0 1965 0 0 0 0 0 0 1966 0 0 0 0 0 0 1967 0 0 0 0 0 0 1968 0 0 0 0 0 0 1969 0 0 0 0 0 0 1970 0 0 0 0 0 0 1971 0 0 0 0 0 0 1972 1 0 1 0 0 0 1973 1 0 1 0 0 0 1974 1 0 1 0 0 0 1975 2 0 2 0 0 0 1976 3 0 3 0 0 0 1977 2 0 2 0 0 0 1978 2 0 2 0 0 0 1979 1 0 1 0 0 0 1980 3 0 3 0 0 0 1981 1 0 1 0 0 0 1982 6 0 6 0 0 0 1983 4 1 5 0 0 0 1984 4 9 13 0 0 0 1985 7 13 20 0 0 0 1986 2 16 17 0 0 0 1987 7 27 34 0 0 0 1988 5 32 37 8 0 8 1989 4 26 30 6 0 6 1990 5 27 32 6 0 6 1991 8 35 44 28 0 28 1992 10 28 38 26 43 69 1993 5 31 36 23 57 80 1994 6 54 61 22 105 127 1995 10 61 71 16 88 105 1996 13 66 78 12 96 108 1997 24 60 84 16 208 224 1998 9 69 77 31 202 233 1999 20 82 101 35 288 322 2000 15 79 93 9 304 314 2001 16 77 93 14 334 349 2002 19 96 115 10 526 536 2003 15 92 107 16 443 459 2004 15 162 177 11 562 574 2005 11 129 139 10 663 672 2006 16 186 202 2 577 579 2007 24 164 188 0 621 621 2008 14 122 136 2 497 499 2009 11 140 151 2 533 536 2010 3 134 137 0 443 443 2011 18 132 151 5 454 459 2012 8 137 145 2 465 468 =========== =========== =========== =========== =========== =========== 350 2,285 2,634 314 7,507 7,821
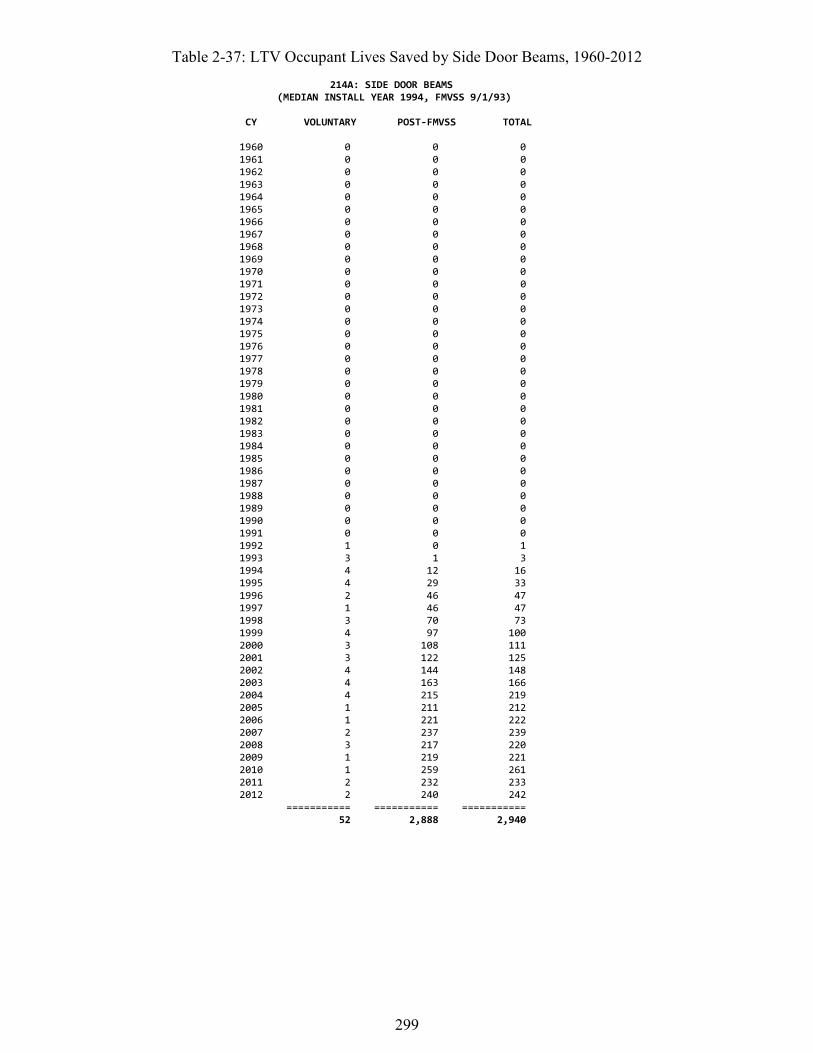
299
Table 2-37: LTV Occupant Lives Saved by Side Door Beams, 1960-2012 214A: SIDE DOOR BEAMS (MEDIAN INSTALL YEAR 1994, FMVSS 9/1/93)
CY VOLUNTARY POST-FMVSS TOTAL 1960 0 0 0 1961 0 0 0 1962 0 0 0 1963 0 0 0 1964 0 0 0 1965 0 0 0 1966 0 0 0 1967 0 0 0 1968 0 0 0 1969 0 0 0 1970 0 0 0 1971 0 0 0 1972 0 0 0 1973 0 0 0 1974 0 0 0 1975 0 0 0 1976 0 0 0 1977 0 0 0 1978 0 0 0 1979 0 0 0 1980 0 0 0 1981 0 0 0 1982 0 0 0 1983 0 0 0 1984 0 0 0 1985 0 0 0 1986 0 0 0 1987 0 0 0 1988 0 0 0 1989 0 0 0 1990 0 0 0 1991 0 0 0 1992 1 0 1 1993 3 1 3 1994 4 12 16 1995 4 29 33 1996 2 46 47 1997 1 46 47 1998 3 70 73 1999 4 97 100 2000 3 108 111 2001 3 122 125 2002 4 144 148 2003 4 163 166 2004 4 215 219 2005 1 211 212 2006 1 221 222 2007 2 237 239 2008 3 217 220 2009 1 219 221 2010 1 259 261 2011 2 232 233 2012 2 240 242 =========== =========== =========== 52 2,888 2,940
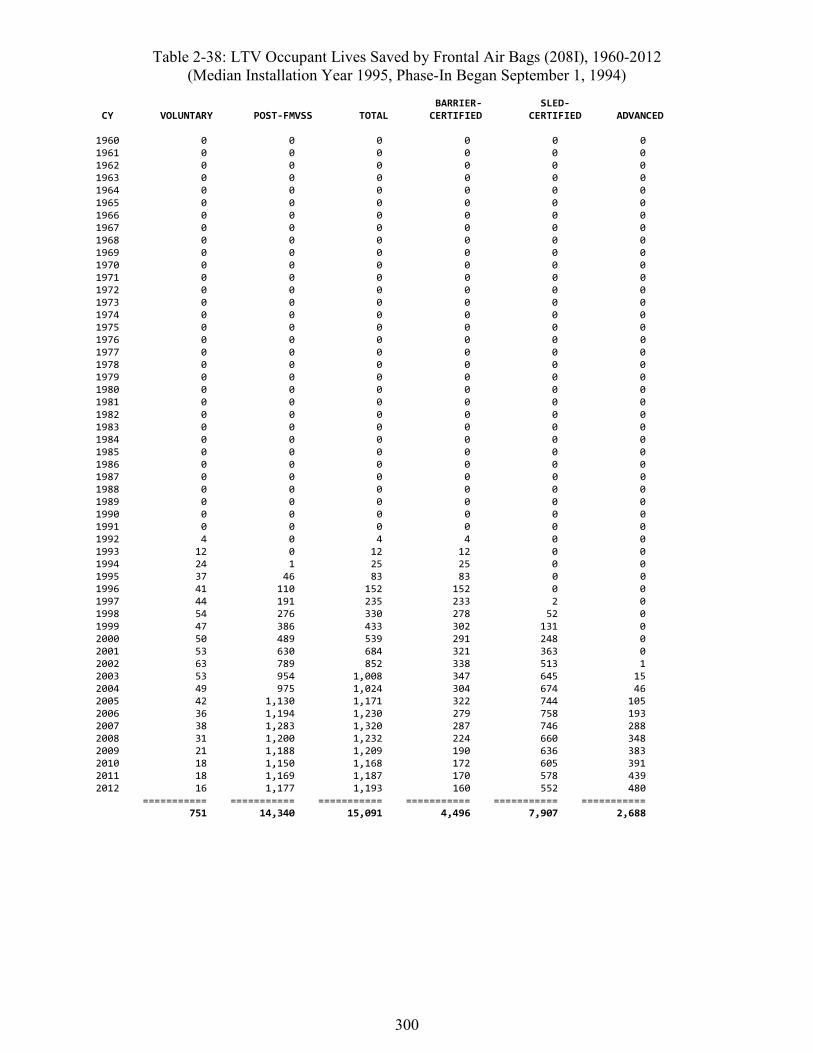
300
Table 2-38: LTV Occupant Lives Saved by Frontal Air Bags (208I), 1960-2012 (Median Installation Year 1995, Phase-In Began September 1, 1994)
BARRIER- SLED- CY VOLUNTARY POST-FMVSS TOTAL CERTIFIED CERTIFIED ADVANCED 1960 0 0 0 0 0 0 1961 0 0 0 0 0 0 1962 0 0 0 0 0 0 1963 0 0 0 0 0 0 1964 0 0 0 0 0 0 1965 0 0 0 0 0 0 1966 0 0 0 0 0 0 1967 0 0 0 0 0 0 1968 0 0 0 0 0 0 1969 0 0 0 0 0 0 1970 0 0 0 0 0 0 1971 0 0 0 0 0 0 1972 0 0 0 0 0 0 1973 0 0 0 0 0 0 1974 0 0 0 0 0 0 1975 0 0 0 0 0 0 1976 0 0 0 0 0 0 1977 0 0 0 0 0 0 1978 0 0 0 0 0 0 1979 0 0 0 0 0 0 1980 0 0 0 0 0 0 1981 0 0 0 0 0 0 1982 0 0 0 0 0 0 1983 0 0 0 0 0 0 1984 0 0 0 0 0 0 1985 0 0 0 0 0 0 1986 0 0 0 0 0 0 1987 0 0 0 0 0 0 1988 0 0 0 0 0 0 1989 0 0 0 0 0 0 1990 0 0 0 0 0 0 1991 0 0 0 0 0 0 1992 4 0 4 4 0 0 1993 12 0 12 12 0 0 1994 24 1 25 25 0 0 1995 37 46 83 83 0 0 1996 41 110 152 152 0 0 1997 44 191 235 233 2 0 1998 54 276 330 278 52 0 1999 47 386 433 302 131 0 2000 50 489 539 291 248 0 2001 53 630 684 321 363 0 2002 63 789 852 338 513 1 2003 53 954 1,008 347 645 15 2004 49 975 1,024 304 674 46 2005 42 1,130 1,171 322 744 105 2006 36 1,194 1,230 279 758 193 2007 38 1,283 1,320 287 746 288 2008 31 1,200 1,232 224 660 348 2009 21 1,188 1,209 190 636 383 2010 18 1,150 1,168 172 605 391 2011 18 1,169 1,187 170 578 439 2012 16 1,177 1,193 160 552 480 =========== =========== =========== =========== =========== =========== 751 14,340 15,091 4,496 7,907 2,688
301
Initially, all air bags were barrier-certified. In late CY 1997 (i.e., early MY 1998), sled-certified air bags began to appear and, after 2005, lives saved by barrier-certified air bags dwindled as LTVs with those early systems were retired. The first advanced air bags were introduced in late CY 2002 (i.e., early MY 2003), when GM and Honda certified to advanced air bags in selected models, one year before the phase-in. Eventually, advanced air bags will supersede barrier-certified and sled-certified in the on-road fleet, and all the benefits will gradually shift to ad-vanced air bags.
Table 2-39 analyzes conspicuity tape for heavy trailers (108) and the head-impact upgrade of FMVSS No. 201 (208B). When heavy trailers are equipped with the red-and-white tape, they are easier to see in the dark, and LTVs are 29 percent less likely to hit them. The tape has saved a total of 1,136 LTV occupants through 2012, including 70 in 2012.
The head-impact upgrade of FMVSS No. 201 phased in from MY 1999 to 2003. Effectiveness in LTVs is approximately the same as in cars, amounting to a 4.28-percent overall reduction of fa-tality risk, across all types of crashes, for all occupants seated within the occupant compartment. Table 2-39 shows that padding installed to meet the upgrade saved 2,134 LTV occupants from 1999 through 2012, including a peak of 269 in 2012. Benefits may increase after 2012, because only 61 percent of the LTVs on the road that year were certified to the upgrade. Because no ve-hicle was certified in advance of the phase-in period, all the lives saved in Table 2-39 are tallied in the “post-FMVSS” column.
Table 2-40 analyzes the two most recent seat-belt technologies evaluated by NHTSA: belt pre-tensioners and load limiters (208K) and 3-point belts for center rear seat passengers (208J). Pre-tensioners and load limiters are technologies designed to make seat belts more effective. By MY 2002, the majority of new LTVs and by MY 2008, all new LTVs sold in the United States were voluntarily equipped with pretensioners and load limiters at the driver’s and RF passenger’s seats. NHTSA’s evaluation suggests that the effect in CUVs and minivans is about the same as in cars, namely, a 12.8-percent fatality reduction that our model will apply for belted drivers and RF passengers, but only in frontal impacts. The model will not tally any benefits for pickup trucks, full-size vans, or pickup-truck-based SUVs, because the evaluation did not find a statisti-cally significant effect. Pretensioners and load limiters have saved 531 lives in CUVs and minivans through 2012, including a peak of 80 in 2012.
NHTSA upgraded FMVSS No. 208 to phase in 3-point belts at center rear seats between Sep-tember 1, 2005 and August 31, 2007.619 However, manufacturers had already furnished this technology voluntarily on selected LTVs as early as MY 1998. Three-point belts reduce fatality risk in the rear seat of LTVs, on the average, by 73 percent. It is estimated that they had saved 168 lives by the end of 2012.
619 In a typical minivan, the two seats in the second row are considered “outboard” seats and have been equipped with 3-point belts since MY 1992 or earlier. Only the middle seat in the third row is considered a “center” seat.
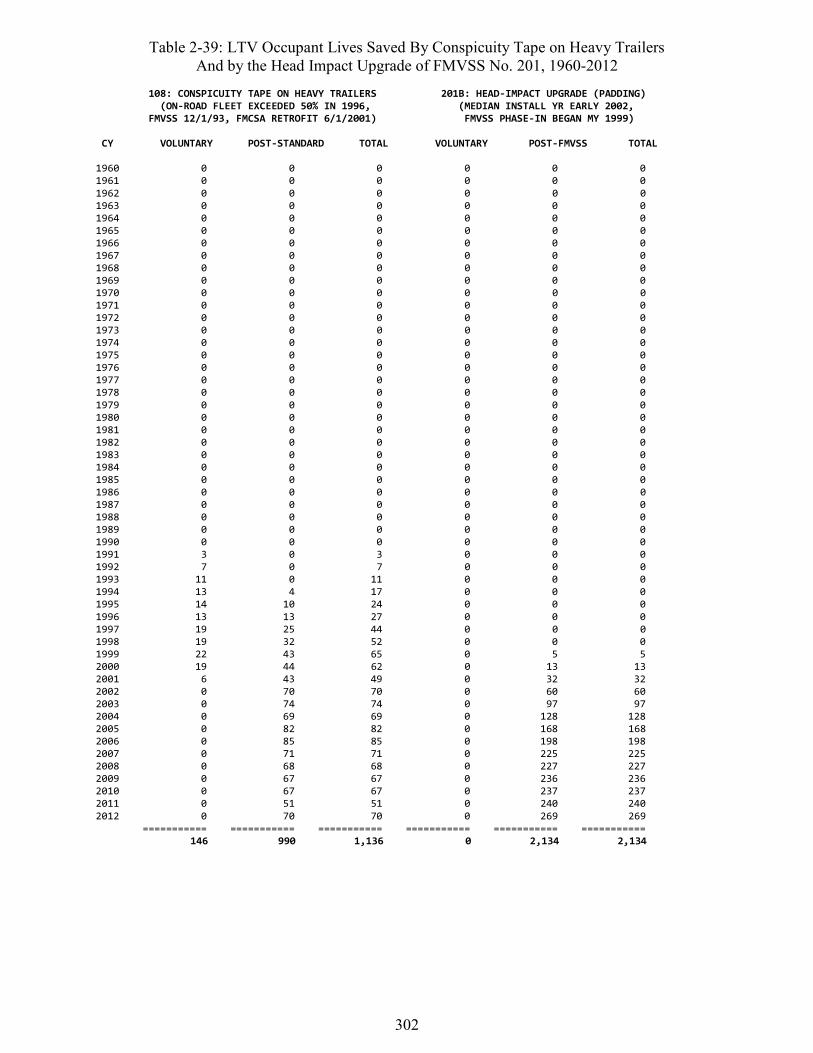
302
Table 2-39: LTV Occupant Lives Saved By Conspicuity Tape on Heavy Trailers And by the Head Impact Upgrade of FMVSS No. 201, 1960-2012
108: CONSPICUITY TAPE ON HEAVY TRAILERS 201B: HEAD-IMPACT UPGRADE (PADDING) (ON-ROAD FLEET EXCEEDED 50% IN 1996, (MEDIAN INSTALL YR EARLY 2002, FMVSS 12/1/93, FMCSA RETROFIT 6/1/2001) FMVSS PHASE-IN BEGAN MY 1999) CY VOLUNTARY POST-STANDARD TOTAL VOLUNTARY POST-FMVSS TOTAL 1960 0 0 0 0 0 0 1961 0 0 0 0 0 0 1962 0 0 0 0 0 0 1963 0 0 0 0 0 0 1964 0 0 0 0 0 0 1965 0 0 0 0 0 0 1966 0 0 0 0 0 0 1967 0 0 0 0 0 0 1968 0 0 0 0 0 0 1969 0 0 0 0 0 0 1970 0 0 0 0 0 0 1971 0 0 0 0 0 0 1972 0 0 0 0 0 0 1973 0 0 0 0 0 0 1974 0 0 0 0 0 0 1975 0 0 0 0 0 0 1976 0 0 0 0 0 0 1977 0 0 0 0 0 0 1978 0 0 0 0 0 0 1979 0 0 0 0 0 0 1980 0 0 0 0 0 0 1981 0 0 0 0 0 0 1982 0 0 0 0 0 0 1983 0 0 0 0 0 0 1984 0 0 0 0 0 0 1985 0 0 0 0 0 0 1986 0 0 0 0 0 0 1987 0 0 0 0 0 0 1988 0 0 0 0 0 0 1989 0 0 0 0 0 0 1990 0 0 0 0 0 0 1991 3 0 3 0 0 0 1992 7 0 7 0 0 0 1993 11 0 11 0 0 0 1994 13 4 17 0 0 0 1995 14 10 24 0 0 0 1996 13 13 27 0 0 0 1997 19 25 44 0 0 0 1998 19 32 52 0 0 0 1999 22 43 65 0 5 5 2000 19 44 62 0 13 13 2001 6 43 49 0 32 32 2002 0 70 70 0 60 60 2003 0 74 74 0 97 97 2004 0 69 69 0 128 128 2005 0 82 82 0 168 168 2006 0 85 85 0 198 198 2007 0 71 71 0 225 225 2008 0 68 68 0 227 227 2009 0 67 67 0 236 236 2010 0 67 67 0 237 237 2011 0 51 51 0 240 240 2012 0 70 70 0 269 269 =========== =========== =========== =========== =========== ===========
146 990 1,136 0 2,134 2,134
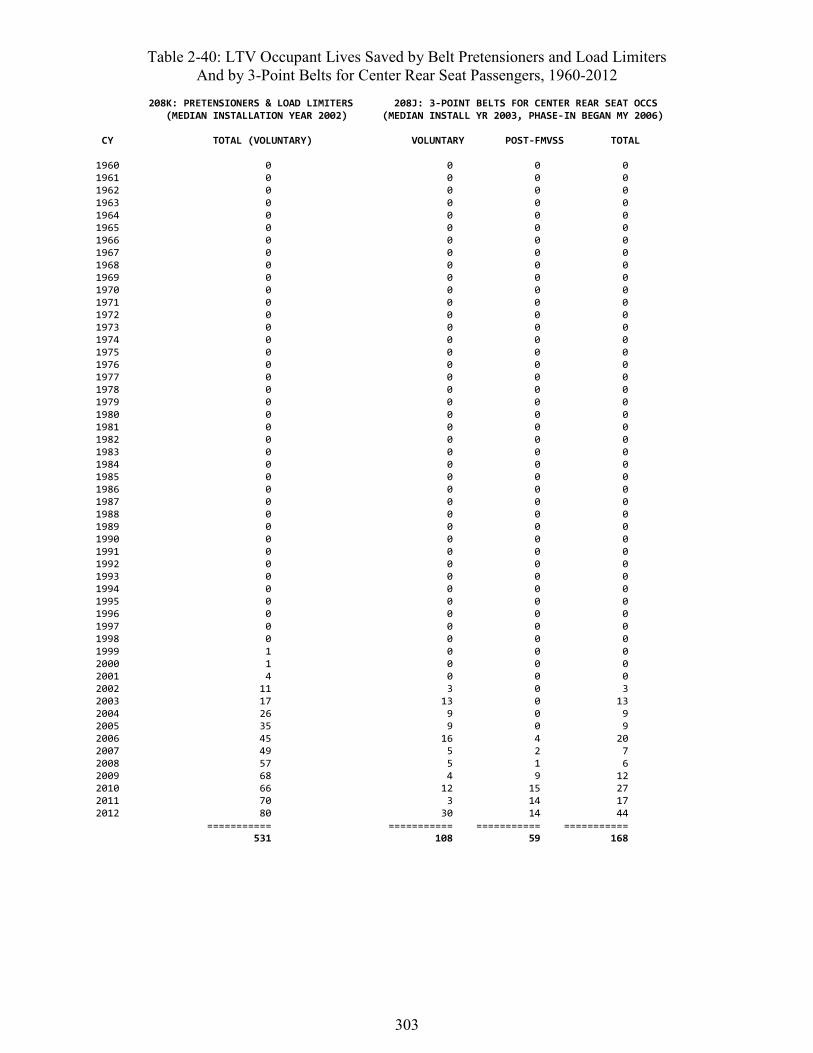
303
Table 2-40: LTV Occupant Lives Saved by Belt Pretensioners and Load Limiters And by 3-Point Belts for Center Rear Seat Passengers, 1960-2012
208K: PRETENSIONERS & LOAD LIMITERS 208J: 3-POINT BELTS FOR CENTER REAR SEAT OCCS (MEDIAN INSTALLATION YEAR 2002) (MEDIAN INSTALL YR 2003, PHASE-IN BEGAN MY 2006) CY TOTAL (VOLUNTARY) VOLUNTARY POST-FMVSS TOTAL 1960 0 0 0 0 1961 0 0 0 0 1962 0 0 0 0 1963 0 0 0 0 1964 0 0 0 0 1965 0 0 0 0 1966 0 0 0 0 1967 0 0 0 0 1968 0 0 0 0 1969 0 0 0 0 1970 0 0 0 0 1971 0 0 0 0 1972 0 0 0 0 1973 0 0 0 0 1974 0 0 0 0 1975 0 0 0 0 1976 0 0 0 0 1977 0 0 0 0 1978 0 0 0 0 1979 0 0 0 0 1980 0 0 0 0 1981 0 0 0 0 1982 0 0 0 0 1983 0 0 0 0 1984 0 0 0 0 1985 0 0 0 0 1986 0 0 0 0 1987 0 0 0 0 1988 0 0 0 0 1989 0 0 0 0 1990 0 0 0 0 1991 0 0 0 0 1992 0 0 0 0 1993 0 0 0 0 1994 0 0 0 0 1995 0 0 0 0 1996 0 0 0 0 1997 0 0 0 0 1998 0 0 0 0 1999 1 0 0 0 2000 1 0 0 0 2001 4 0 0 0 2002 11 3 0 3 2003 17 13 0 13 2004 26 9 0 9 2005 35 9 0 9 2006 45 16 4 20 2007 49 5 2 7 2008 57 5 1 6 2009 68 4 9 12 2010 66 12 15 27 2011 70 3 14 17 2012 80 30 14 44 =========== =========== =========== =========== 531 108 59 168

304
Table 2-41 addresses the benefits of the rear impact upgrade of FMVSS No. 301, “Fuel system integrity” and the lives saved by ESC. The 50 mph offset-rear impact test phased into FMVSS No. 301 in MY 2007 to 2009; however, there was an option of already certifying in MY 2006 (benefits counted in the “voluntary” column). NHTSA’s evaluation finds similar effects for cars and LTVs (35% fatality reduction in rear impacts with post-crash fires). The upgrade saved an estimated 13 lives through 2012, including 4 in that year. Benefits are likely to increase, because only 21 percent of the LTVs on the road in 2012 were certified to the upgraded standard.
ESC first appeared on selected LTV models in MY 1999 and 2000. Its extraordinary success in these early installations encouraged manufacturers to extend ESC to other LTV models even sooner than to cars. By MY 2008, well over half of new LTVs had ESC. FMVSS No. 126 phased in from MY 2009 to 2012. NHTSA’s evaluation finds ESC even more effective for preventing single-vehicle crashes of LTVs than for cars: it reduces first-event rollovers by 74 percent, other single-vehicle crashes (not involving pedestrians or bicyclists) by 45 percent; it also reduces cul-pable involvements in multivehicle crashes by 16 percent. This is good news, because, historical-ly, rollovers and run-off-road crashes have been more of an issue in LTVs than in cars. Table 2-41 estimates that ESC saved 3,604 lives from 1999 through 2012, including 824 in 2012. (Bene-fits up to MY 2008, before the phase-in of FMVSS No. 126 are counted in the “voluntary” col-umn; benefits in MY 2009 and later LTVs are “post-FMVSS”.) Because only 22 percent of the LTVs on the road as of 2012 were equipped with ESC, benefits should increase in subsequent years.
Table 2-42 enumerates the lives saved by the four major types of curtain and side air bags for LTV drivers and RF passengers in near-side impacts. Torso bags were the first type offered on LTVs, beginning with GM minivans and Mercedes SUVs in MY 1998. By MY 2008, the majori-ty of new LTVs had some type of curtain and/or side air bags, by MY 2011, 95 percent. By far the greatest number of these was equipped with curtains plus torso bags. The oblique pole-test upgrade of FMVSS No. 214 phases in from MY 2011 to 2015.
NHTSA’s evaluation indicates that all four types of curtain and side air bags are effective in near-side impacts and that the effectiveness is about the same in LTVs as in cars. Table 2-42 es-timates that curtain and side air bags saved 377 lives from 1998 through 2012, including 73 in 2012. That includes 170 by curtain plus torso bags, 105 by combination bags, 49 by curtain bags only, and 53 by torso bags only. Although effectiveness is about the same in LTVs as in cars, the absolute number of lives saved in much lower in LTVs (377 versus 1,697) because: (1) LTVs are considerably less vulnerable than cars in near-side impacts and (2) installation in LTVs lagged somewhat behind cars. Benefits are likely to increase in the future, because, as of CY 2012, only 28 percent of the LTVs on the road were equipped with some type of curtain or side air bags.

305
Table 2-41: LTV Occupant Lives Saved by Fuel System Integrity/ Rear Impact Upgrade and by ESC, 1960-2012
301: FUEL SYSTEM INTEGRITY/REAR IMPACT UPGRADE 126: ESC (MED INSTALL YR EARLY 2008, (MED INSTALL YR 2007, PHASE-IN BEGAN MY 2007) FMVSS PHASE-IN BEGAN 2009) CY VOLUNTARY POST-FMVSS TOTAL VOLUNTARY POST-FMVSS TOTAL 1960 0 0 0 0 0 0 1961 0 0 0 0 0 0 1962 0 0 0 0 0 0 1963 0 0 0 0 0 0 1964 0 0 0 0 0 0 1965 0 0 0 0 0 0 1966 0 0 0 0 0 0 1967 0 0 0 0 0 0 1968 0 0 0 0 0 0 1969 0 0 0 0 0 0 1970 0 0 0 0 0 0 1971 0 0 0 0 0 0 1972 0 0 0 0 0 0 1973 0 0 0 0 0 0 1974 0 0 0 0 0 0 1975 0 0 0 0 0 0 1976 0 0 0 0 0 0 1977 0 0 0 0 0 0 1978 0 0 0 0 0 0 1979 0 0 0 0 0 0 1980 0 0 0 0 0 0 1981 0 0 0 0 0 0 1982 0 0 0 0 0 0 1983 0 0 0 0 0 0 1984 0 0 0 0 0 0 1985 0 0 0 0 0 0 1986 0 0 0 0 0 0 1987 0 0 0 0 0 0 1988 0 0 0 0 0 0 1989 0 0 0 0 0 0 1990 0 0 0 0 0 0 1991 0 0 0 0 0 0 1992 0 0 0 0 0 0 1993 0 0 0 0 0 0 1994 0 0 0 0 0 0 1995 0 0 0 0 0 0 1996 0 0 0 0 0 0 1997 0 0 0 0 0 0 1998 0 0 0 0 0 0 1999 0 0 0 0 0 0 2000 0 0 0 7 0 7 2001 0 0 0 21 0 21 2002 0 0 0 15 0 15 2003 0 0 0 45 0 45 2004 0 0 0 109 0 109 2005 0 0 0 138 0 138 2006 0 0 0 214 0 214 2007 1 2 2 284 0 284 2008 0 2 2 413 8 421 2009 0 0 0 399 46 445 2010 2 2 4 384 128 512 2011 0 1 1 373 196 569 2012 0 4 4 468 357 824 =========== =========== =========== =========== =========== ===========
2 10 13 2,869 735 3,604

306
Table 2-42: LTV Occupant Lives Saved by Curtain and Side Air Bags in Near-Side Impacts (214C), 1960-2012 (Median Installation Year 2008, Phase-In of Pole Test in FMVSS No. 214 Began MY 2011)
TORSO COMBINATION CURTAIN CURTAIN CY VOLUNTARY POST-FMVSS TOTAL BAG ONLY BAG ONLY + TORSO 1960 0 0 0 0 0 0 0 1961 0 0 0 0 0 0 0 1962 0 0 0 0 0 0 0 1963 0 0 0 0 0 0 0 1964 0 0 0 0 0 0 0 1965 0 0 0 0 0 0 0 1966 0 0 0 0 0 0 0 1967 0 0 0 0 0 0 0 1968 0 0 0 0 0 0 0 1969 0 0 0 0 0 0 0 1970 0 0 0 0 0 0 0 1971 0 0 0 0 0 0 0 1972 0 0 0 0 0 0 0 1973 0 0 0 0 0 0 0 1974 0 0 0 0 0 0 0 1975 0 0 0 0 0 0 0 1976 0 0 0 0 0 0 0 1977 0 0 0 0 0 0 0 1978 0 0 0 0 0 0 0 1979 0 0 0 0 0 0 0 1980 0 0 0 0 0 0 0 1981 0 0 0 0 0 0 0 1982 0 0 0 0 0 0 0 1983 0 0 0 0 0 0 0 1984 0 0 0 0 0 0 0 1985 0 0 0 0 0 0 0 1986 0 0 0 0 0 0 0 1987 0 0 0 0 0 0 0 1988 0 0 0 0 0 0 0 1989 0 0 0 0 0 0 0 1990 0 0 0 0 0 0 0 1991 0 0 0 0 0 0 0 1992 0 0 0 0 0 0 0 1993 0 0 0 0 0 0 0 1994 0 0 0 0 0 0 0 1995 0 0 0 0 0 0 0 1996 0 0 0 0 0 0 0 1997 0 0 0 0 0 0 0 1998 0 0 0 0 0 0 0 1999 1 0 1 0 1 0 0 2000 1 0 1 1 1 0 0 2001 3 0 3 2 1 0 0 2002 7 0 7 2 4 0 0 2003 9 0 9 3 5 0 0 2004 18 0 18 5 10 1 2 2005 20 0 20 5 8 3 4 2006 26 0 26 5 10 3 8 2007 29 0 29 5 9 4 12 2008 31 0 31 4 8 5 13 2009 44 0 44 4 12 7 20 2010 57 1 58 6 12 8 33 2011 51 6 56 5 12 7 32 2012 54 19 73 5 13 9 46 =========== =========== =========== =========== =========== =========== =========== 351 26 377 53 105 49 170
307
Curtains that deploy in rollovers are the latest technology evaluated by NHTSA. Ford began to offer rollover curtains on the Explorer and Mountaineer in MY 2002. Subsequently, the manu-facturers furnished numerous LTV models with rollover curtains, either by adding rollover sen-sors to existing curtains or including the sensors immediately when they added curtains. By MY 2009, the majority of new LTVs had rollover curtains and by MY 2011, 83 percent (much higher percentages than in cars, where, historically, rollovers have been less of an issue). However, giv-en the longevity of LTVs and the slow turnover of the fleet, only 15 percent of the LTVs on the road in CY 2012 had rollover curtains. FMVSS No. 226, “Ejection mitigation” phases in from MY 2014 to 2017. NHTSA’s evaluation estimates that rollover curtains reduce occupants’ fatali-ty risk by 41 percent in first-event rollovers. Table 2-43 shows that rollover curtains had saved 171 lives from 2002 through 2012, including 41 in 2012. All of the saves are in the “voluntary” column because the phase-in of FMVSS No. 226 did not begin until MY 2014.
Benefits for pedestrians, bicyclists, and other non-occupants Table 2-44 is a summary of the non-occupant lives saved by car/LTV safety technologies, specif-ically braking improvements. The computation is straightforward: dual master cylinders reduce fatal crash involvements, including collisions with non-occupants by 0.70 percent, front disc brakes by 0.17 percent. Thus, when all cars and LTVs on the road are equipped with dual master cylinders and front disc brakes, 0.87 percent of potential non-occupant fatalities will be avoided. Indeed, the right column of Table 2-44 shows that the proportion of potential fatalities saved had reached 0.85 percent by 1987 and was converging on 0.87 percent by 2000. For example, in 2012, there were 5,156 actual pedestrian, bicyclist and other non-occupant fatalities in collisions with cars or LTVs. Without the braking improvements there would have been 5,202; the brakes prevented 45 fatalities, 0.87 percent of 5,202.
Non-occupant fatalities in collisions with cars/LTVs peaked at 9,277 in 1972 and greatly de-clined until 2009, reaching a low of 4,417, before rebounding somewhat to 5,156 by 2012. Brak-ing improvements in cars and LTVs have played a relatively small role in the decline. They have prevented an estimated 2,211 of 353,436 potential fatalities. Furthermore, the absolute number of lives saved has decreased from a peak of 65 in 1980 to 45 in 2012 because the “base” of non-occupant exposure to potentially fatal crash situations has shrunk. Table 2-45 apportions the non-occupant lives saved between the two brake technologies: dual master cylinders saved an esti-mated 1,841 lives from 1960 through 2012; front disc brakes, 370.
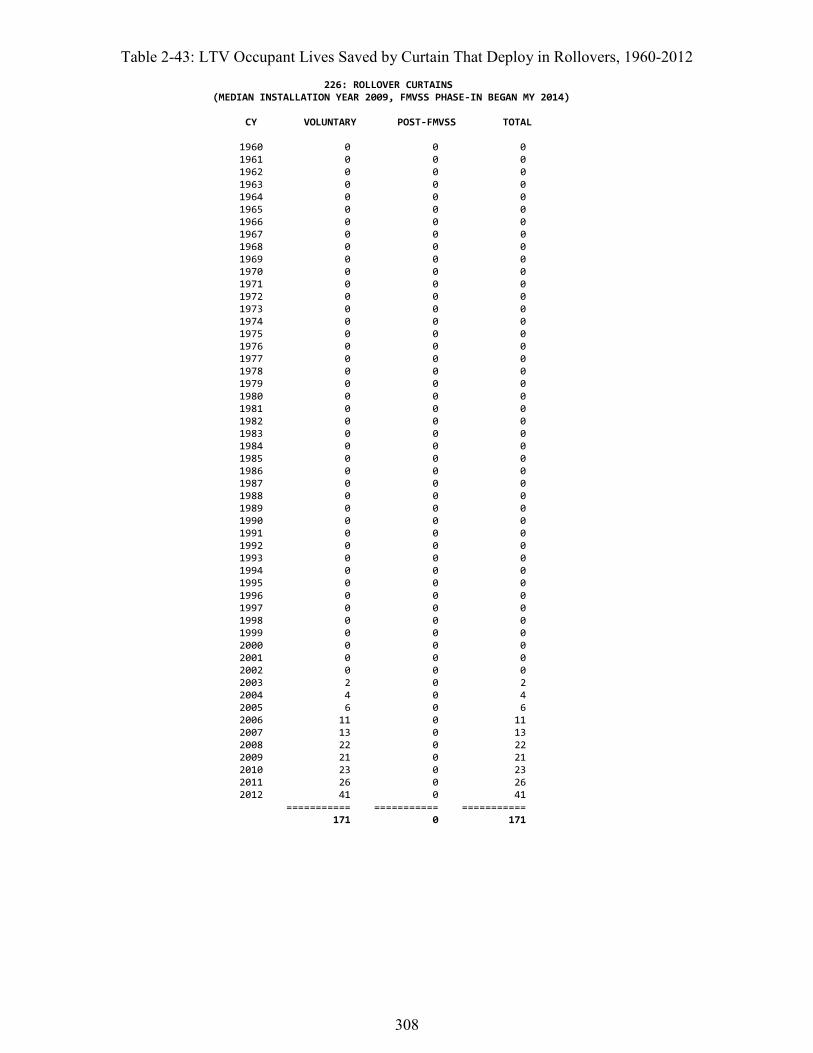
308
Table 2-43: LTV Occupant Lives Saved by Curtain That Deploy in Rollovers, 1960-2012 226: ROLLOVER CURTAINS (MEDIAN INSTALLATION YEAR 2009, FMVSS PHASE-IN BEGAN MY 2014)
CY VOLUNTARY POST-FMVSS TOTAL 1960 0 0 0 1961 0 0 0 1962 0 0 0 1963 0 0 0 1964 0 0 0 1965 0 0 0 1966 0 0 0 1967 0 0 0 1968 0 0 0 1969 0 0 0 1970 0 0 0 1971 0 0 0 1972 0 0 0 1973 0 0 0 1974 0 0 0 1975 0 0 0 1976 0 0 0 1977 0 0 0 1978 0 0 0 1979 0 0 0 1980 0 0 0 1981 0 0 0 1982 0 0 0 1983 0 0 0 1984 0 0 0 1985 0 0 0 1986 0 0 0 1987 0 0 0 1988 0 0 0 1989 0 0 0 1990 0 0 0 1991 0 0 0 1992 0 0 0 1993 0 0 0 1994 0 0 0 1995 0 0 0 1996 0 0 0 1997 0 0 0 1998 0 0 0 1999 0 0 0 2000 0 0 0 2001 0 0 0 2002 0 0 0 2003 2 0 2 2004 4 0 4 2005 6 0 6 2006 11 0 11 2007 13 0 13 2008 22 0 22 2009 21 0 21 2010 23 0 23 2011 26 0 26 2012 41 0 41 =========== =========== =========== 171 0 171
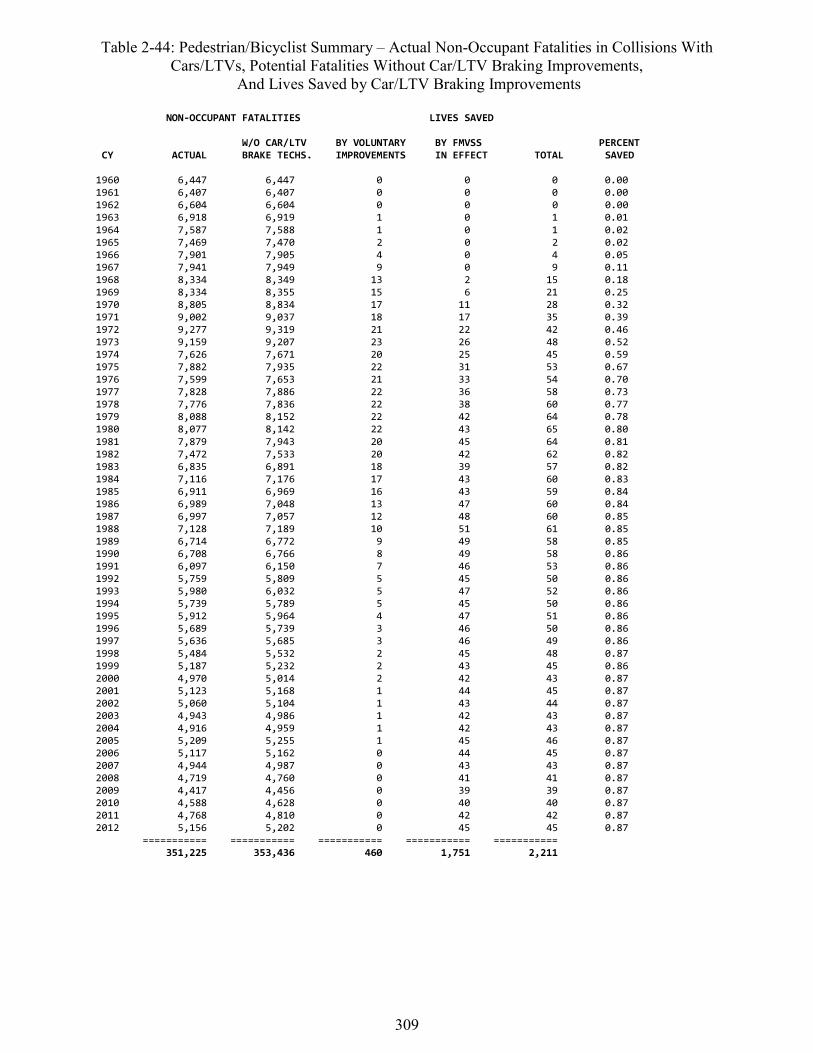
309
Table 2-44: Pedestrian/Bicyclist Summary – Actual Non-Occupant Fatalities in Collisions With Cars/LTVs, Potential Fatalities Without Car/LTV Braking Improvements,
And Lives Saved by Car/LTV Braking Improvements
NON-OCCUPANT FATALITIES LIVES SAVED W/O CAR/LTV BY VOLUNTARY BY FMVSS PERCENT CY ACTUAL BRAKE TECHS. IMPROVEMENTS IN EFFECT TOTAL SAVED 1960 6,447 6,447 0 0 0 0.00 1961 6,407 6,407 0 0 0 0.00 1962 6,604 6,604 0 0 0 0.00 1963 6,918 6,919 1 0 1 0.01 1964 7,587 7,588 1 0 1 0.02 1965 7,469 7,470 2 0 2 0.02 1966 7,901 7,905 4 0 4 0.05 1967 7,941 7,949 9 0 9 0.11 1968 8,334 8,349 13 2 15 0.18 1969 8,334 8,355 15 6 21 0.25 1970 8,805 8,834 17 11 28 0.32 1971 9,002 9,037 18 17 35 0.39 1972 9,277 9,319 21 22 42 0.46 1973 9,159 9,207 23 26 48 0.52 1974 7,626 7,671 20 25 45 0.59 1975 7,882 7,935 22 31 53 0.67 1976 7,599 7,653 21 33 54 0.70 1977 7,828 7,886 22 36 58 0.73 1978 7,776 7,836 22 38 60 0.77 1979 8,088 8,152 22 42 64 0.78 1980 8,077 8,142 22 43 65 0.80 1981 7,879 7,943 20 45 64 0.81 1982 7,472 7,533 20 42 62 0.82 1983 6,835 6,891 18 39 57 0.82 1984 7,116 7,176 17 43 60 0.83 1985 6,911 6,969 16 43 59 0.84 1986 6,989 7,048 13 47 60 0.84 1987 6,997 7,057 12 48 60 0.85 1988 7,128 7,189 10 51 61 0.85 1989 6,714 6,772 9 49 58 0.85 1990 6,708 6,766 8 49 58 0.86 1991 6,097 6,150 7 46 53 0.86 1992 5,759 5,809 5 45 50 0.86 1993 5,980 6,032 5 47 52 0.86 1994 5,739 5,789 5 45 50 0.86 1995 5,912 5,964 4 47 51 0.86 1996 5,689 5,739 3 46 50 0.86 1997 5,636 5,685 3 46 49 0.86 1998 5,484 5,532 2 45 48 0.87 1999 5,187 5,232 2 43 45 0.86 2000 4,970 5,014 2 42 43 0.87 2001 5,123 5,168 1 44 45 0.87 2002 5,060 5,104 1 43 44 0.87 2003 4,943 4,986 1 42 43 0.87 2004 4,916 4,959 1 42 43 0.87 2005 5,209 5,255 1 45 46 0.87 2006 5,117 5,162 0 44 45 0.87 2007 4,944 4,987 0 43 43 0.87 2008 4,719 4,760 0 41 41 0.87 2009 4,417 4,456 0 39 39 0.87 2010 4,588 4,628 0 40 40 0.87 2011 4,768 4,810 0 42 42 0.87 2012 5,156 5,202 0 45 45 0.87 =========== =========== =========== =========== =========== 351,225 353,436 460 1,751 2,211
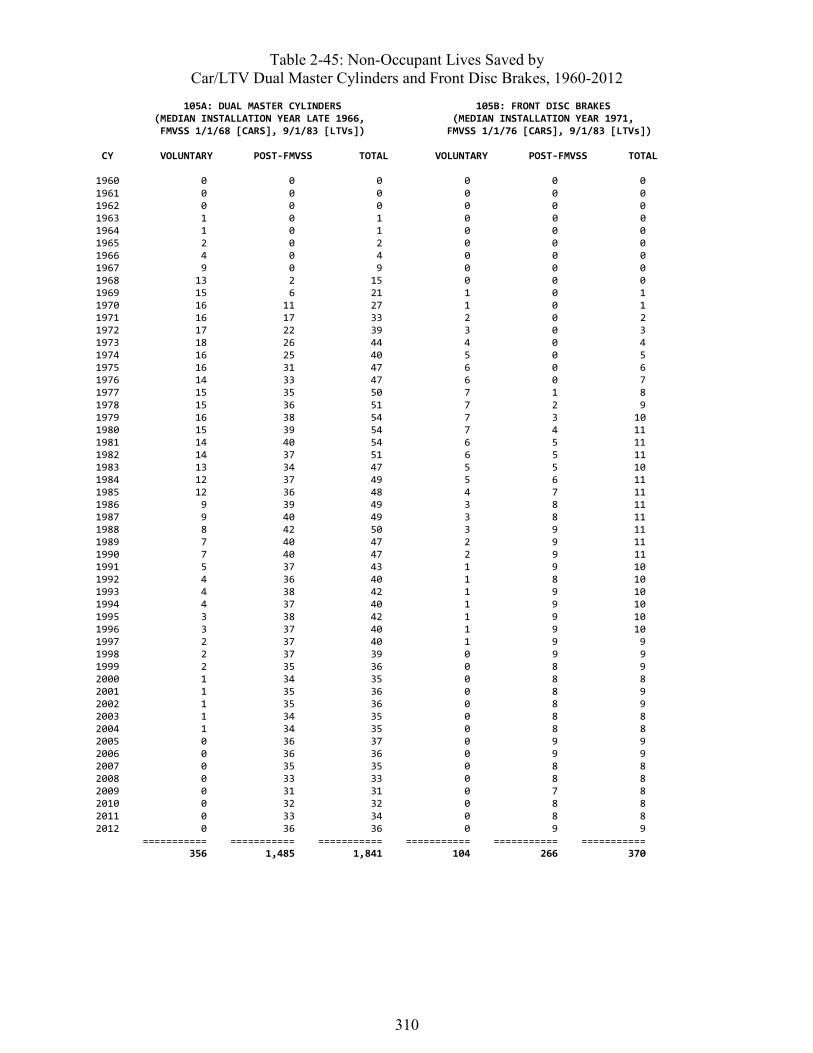
310
Table 2-45: Non-Occupant Lives Saved by Car/LTV Dual Master Cylinders and Front Disc Brakes, 1960-2012
105A: DUAL MASTER CYLINDERS 105B: FRONT DISC BRAKES (MEDIAN INSTALLATION YEAR LATE 1966, (MEDIAN INSTALLATION YEAR 1971, FMVSS 1/1/68 [CARS], 9/1/83 [LTVs]) FMVSS 1/1/76 [CARS], 9/1/83 [LTVs]) CY VOLUNTARY POST-FMVSS TOTAL VOLUNTARY POST-FMVSS TOTAL 1960 0 0 0 0 0 0 1961 0 0 0 0 0 0 1962 0 0 0 0 0 0 1963 1 0 1 0 0 0 1964 1 0 1 0 0 0 1965 2 0 2 0 0 0 1966 4 0 4 0 0 0 1967 9 0 9 0 0 0 1968 13 2 15 0 0 0 1969 15 6 21 1 0 1 1970 16 11 27 1 0 1 1971 16 17 33 2 0 2 1972 17 22 39 3 0 3 1973 18 26 44 4 0 4 1974 16 25 40 5 0 5 1975 16 31 47 6 0 6 1976 14 33 47 6 0 7 1977 15 35 50 7 1 8 1978 15 36 51 7 2 9 1979 16 38 54 7 3 10 1980 15 39 54 7 4 11 1981 14 40 54 6 5 11 1982 14 37 51 6 5 11 1983 13 34 47 5 5 10 1984 12 37 49 5 6 11 1985 12 36 48 4 7 11 1986 9 39 49 3 8 11 1987 9 40 49 3 8 11 1988 8 42 50 3 9 11 1989 7 40 47 2 9 11 1990 7 40 47 2 9 11 1991 5 37 43 1 9 10 1992 4 36 40 1 8 10 1993 4 38 42 1 9 10 1994 4 37 40 1 9 10 1995 3 38 42 1 9 10 1996 3 37 40 1 9 10 1997 2 37 40 1 9 9 1998 2 37 39 0 9 9 1999 2 35 36 0 8 9 2000 1 34 35 0 8 8 2001 1 35 36 0 8 9 2002 1 35 36 0 8 9 2003 1 34 35 0 8 8 2004 1 34 35 0 8 8 2005 0 36 37 0 9 9 2006 0 36 36 0 9 9 2007 0 35 35 0 8 8 2008 0 33 33 0 8 8 2009 0 31 31 0 7 8 2010 0 32 32 0 8 8 2011 0 33 34 0 8 8 2012 0 36 36 0 9 9 =========== =========== =========== =========== =========== =========== 356 1,485 1,841 104 266 370
311
Benefits for motorcyclists Table 2-46 summarizes motorcyclist lives saved by car/LTV braking improvements. Until 1997, the computation is similar to Table 2-44: when all cars and LTVs on the road are equipped with dual master cylinders and front disc brakes, 0.87 percent of potential motorcyclist fatalities in collisions between cars/LTVs and motorcycles will be avoided. In 1997, for example, 1,004 mo-torcyclists were actually killed in collisions with cars or LTVs. Without the braking improve-ments in the cars/LTVs there would have been 1,013; the brakes saved 9 lives, 0.87 percent of 1,013. However, starting 1998, ESC in cars and LTVs adds benefits for motorcyclists. NHTSA’s evaluation of ESC for cars and LTVs shows a 16-percent reduction of culpable involvements by cars and LTVs in collisions with other vehicles (which include motorcycles), but no significant effect on collisions of cars and LTVs with pedestrians or bicyclists. By 2012, the combination of braking improvements and the ESC in cars and LTVs on the road in that year saved 58 lives, 2.54 percent of the 2,260 potential fatalities.
As the popularity of motorcycles has risen and fallen over the years, so have motorcyclist fatali-ties in collisions with cars/LTVs: rising from 388 in 1960 to 2,327 in 1980, falling to 1,003 in 1996, returning to 2,328 by 2008 as many baby-boomers took up motorcycling again, and declin-ing slightly after 2008. Motorcycle helmets (a safety technology outside the scope of this report) also have a major impact on fatalities. Braking improvements and ESC in cars and LTVs have played a relatively small role. They have prevented an estimated 725 of 79,219 potential fatali-ties. Table 2-47 shows that dual master cylinders in cars/LTVs saved an estimated 478 motorcy-clists in 1960 to 2012; front disc brakes, 101. Table 2-48 shows ESC in cars and LTVs has saved 146 motorcyclists from 1998 through 2012.
Effect of frontal air bags by seating position, occupant age, and type of air bag The analysis model developed for this report permits more detailed estimates of the net effect of frontal air bags on various population subgroups. Tables 2-7, 2-21 and 2-32 show that frontal air bags had saved a net total of 42,856 lives by the end of CY 2012, including 27,765 in passenger cars and 15,091 in LTVs. Table 2-49 shows that 35,849 of the lives saved were drivers. The computation of benefits is simpler for drivers than for RF passengers. Even though SCI shows individual cases where air bags have harmed drivers, the statistical analysis of FARS data shows a net fatality reduction for every age/gender group and vehicle type. The model applies the effec-tiveness estimates – ranging from 33 percent for unbelted drivers in directly frontal impacts (12 o’clock) down to 5 percent for belted drivers in side impacts partially frontal force (10 o’clock or 2 o’clock) to zero in entirely non-frontal impacts – to the actual FARS cases of driver fatalities in vehicles equipped with air bags, inflating these cases to determine how many additional fatalities there would have been without air bags. Moreover, effectiveness for drivers is approximately the same in cars and LTVs and for barrier-certified, sled-certified, and advanced air bags. Table 2-49 estimates that frontal air bags saved 22,844 car drivers and 13,005 LTV drivers. The number of lives saved grew year by year until 2007, as vehicles with driver or dual air bags replaced older vehicles without air bags, declined slightly in 2008 to 2010, and then leveled off.
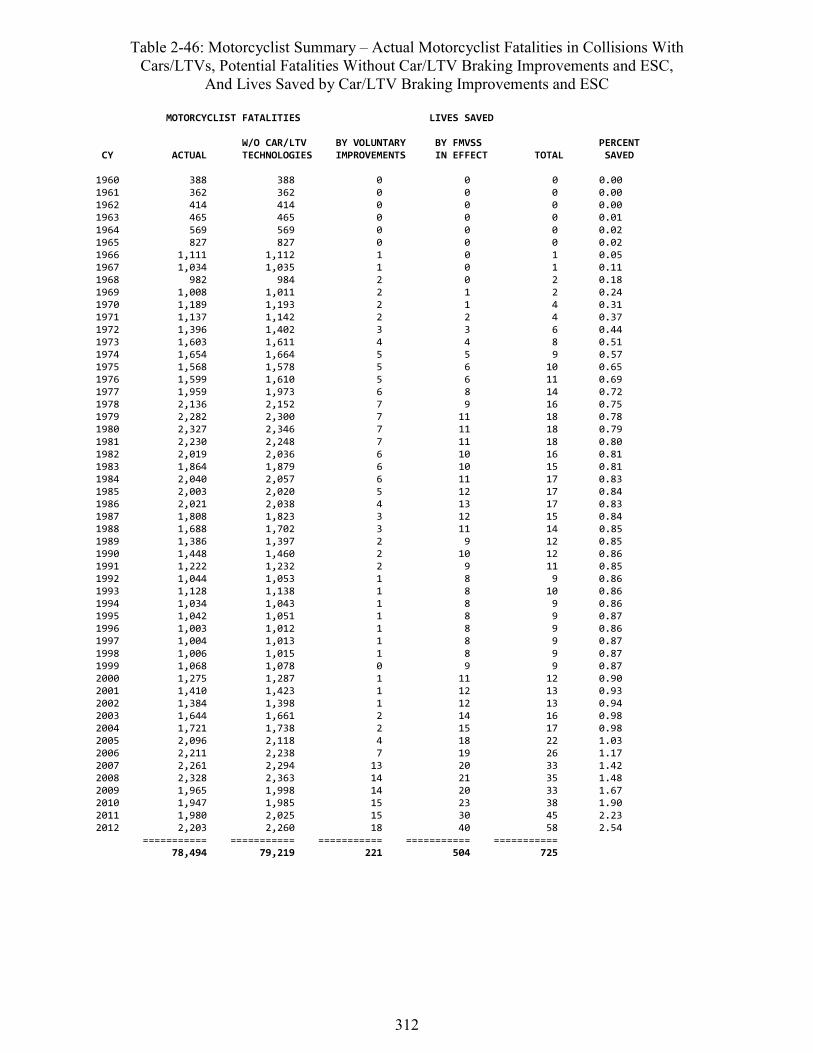
312
Table 2-46: Motorcyclist Summary – Actual Motorcyclist Fatalities in Collisions With Cars/LTVs, Potential Fatalities Without Car/LTV Braking Improvements and ESC,
And Lives Saved by Car/LTV Braking Improvements and ESC
MOTORCYCLIST FATALITIES LIVES SAVED W/O CAR/LTV BY VOLUNTARY BY FMVSS PERCENT CY ACTUAL TECHNOLOGIES IMPROVEMENTS IN EFFECT TOTAL SAVED 1960 388 388 0 0 0 0.00 1961 362 362 0 0 0 0.00 1962 414 414 0 0 0 0.00 1963 465 465 0 0 0 0.01 1964 569 569 0 0 0 0.02 1965 827 827 0 0 0 0.02 1966 1,111 1,112 1 0 1 0.05 1967 1,034 1,035 1 0 1 0.11 1968 982 984 2 0 2 0.18 1969 1,008 1,011 2 1 2 0.24 1970 1,189 1,193 2 1 4 0.31 1971 1,137 1,142 2 2 4 0.37 1972 1,396 1,402 3 3 6 0.44 1973 1,603 1,611 4 4 8 0.51 1974 1,654 1,664 5 5 9 0.57 1975 1,568 1,578 5 6 10 0.65 1976 1,599 1,610 5 6 11 0.69 1977 1,959 1,973 6 8 14 0.72 1978 2,136 2,152 7 9 16 0.75 1979 2,282 2,300 7 11 18 0.78 1980 2,327 2,346 7 11 18 0.79 1981 2,230 2,248 7 11 18 0.80 1982 2,019 2,036 6 10 16 0.81 1983 1,864 1,879 6 10 15 0.81 1984 2,040 2,057 6 11 17 0.83 1985 2,003 2,020 5 12 17 0.84 1986 2,021 2,038 4 13 17 0.83 1987 1,808 1,823 3 12 15 0.84 1988 1,688 1,702 3 11 14 0.85 1989 1,386 1,397 2 9 12 0.85 1990 1,448 1,460 2 10 12 0.86 1991 1,222 1,232 2 9 11 0.85 1992 1,044 1,053 1 8 9 0.86 1993 1,128 1,138 1 8 10 0.86 1994 1,034 1,043 1 8 9 0.86 1995 1,042 1,051 1 8 9 0.87 1996 1,003 1,012 1 8 9 0.86 1997 1,004 1,013 1 8 9 0.87 1998 1,006 1,015 1 8 9 0.87 1999 1,068 1,078 0 9 9 0.87 2000 1,275 1,287 1 11 12 0.90 2001 1,410 1,423 1 12 13 0.93 2002 1,384 1,398 1 12 13 0.94 2003 1,644 1,661 2 14 16 0.98 2004 1,721 1,738 2 15 17 0.98 2005 2,096 2,118 4 18 22 1.03 2006 2,211 2,238 7 19 26 1.17 2007 2,261 2,294 13 20 33 1.42 2008 2,328 2,363 14 21 35 1.48 2009 1,965 1,998 14 20 33 1.67 2010 1,947 1,985 15 23 38 1.90 2011 1,980 2,025 15 30 45 2.23 2012 2,203 2,260 18 40 58 2.54 =========== =========== =========== =========== =========== 78,494 79,219 221 504 725

313
Table 2-47: Motorcyclist Lives Saved by Car/LTV Dual Master Cylinders and Front Disc Brakes, 1960-2012
105A: DUAL MASTER CYLINDERS 105B: FRONT DISC BRAKES (MEDIAN INSTALLATION YEAR LATE 1966, (MEDIAN INSTALLATION YEAR 1971, FMVSS 1/1/68 [CARS], 9/1/83 [LTVs]) FMVSS 1/1/76 [CARS], 9/1/83 [LTVs]) CY VOLUNTARY POST-FMVSS TOTAL VOLUNTARY POST-FMVSS TOTAL 1960 0 0 0 0 0 0 1961 0 0 0 0 0 0 1962 0 0 0 0 0 0 1963 0 0 0 0 0 0 1964 0 0 0 0 0 0 1965 0 0 0 0 0 0 1966 1 0 1 0 0 0 1967 1 0 1 0 0 0 1968 2 0 2 0 0 0 1969 2 1 2 0 0 0 1970 2 1 4 0 0 0 1971 2 2 4 0 0 0 1972 3 3 6 0 0 0 1973 3 4 7 1 0 1 1974 4 5 9 1 0 1 1975 4 6 9 1 0 1 1976 4 6 10 1 0 1 1977 4 8 12 2 0 2 1978 5 9 14 2 1 2 1979 5 10 15 2 1 3 1980 5 10 15 2 1 3 1981 5 10 15 2 1 3 1982 5 9 14 2 1 3 1983 4 8 13 2 1 3 1984 4 10 14 2 1 3 1985 4 10 14 1 2 3 1986 3 11 14 1 2 3 1987 2 10 13 1 2 3 1988 2 9 12 1 2 3 1989 2 8 10 1 2 2 1990 2 8 10 0 2 2 1991 1 7 9 0 2 2 1992 1 6 7 0 1 2 1993 1 7 8 0 2 2 1994 1 7 7 0 2 2 1995 1 7 7 0 2 2 1996 1 6 7 0 2 2 1997 1 7 7 0 2 2 1998 0 7 7 0 2 2 1999 0 7 8 0 2 2 2000 0 9 9 0 2 2 2001 0 10 10 0 2 2 2002 0 9 10 0 2 2 2003 0 11 12 0 3 3 2004 0 12 12 0 3 3 2005 0 15 15 0 4 4 2006 0 15 16 0 4 4 2007 0 16 16 0 4 4 2008 0 16 17 0 4 4 2009 0 14 14 0 3 3 2010 0 14 14 0 3 3 2011 0 14 14 0 3 3 2012 0 16 16 0 4 4 =========== =========== =========== =========== =========== =========== 90 388 478 27 74 101

314
Table 2-48: Motorcyclist Lives Saved by ESC in Cars and LTVs, 1960-2012 126: ELECTRONIC STABILITY CONTROL (MEDIAN INSTALLATION YEAR 2010 [CARS], EARLY 2008 [LTVs]; FMVSS PHASE-IN BEGAN MY 2009)
CY VOLUNTARY POST-FMVSS TOTAL 1960 0 0 0 1961 0 0 0 1962 0 0 0 1963 0 0 0 1964 0 0 0 1965 0 0 0 1966 0 0 0 1967 0 0 0 1968 0 0 0 1969 0 0 0 1970 0 0 0 1971 0 0 0 1972 0 0 0 1973 0 0 0 1974 0 0 0 1975 0 0 0 1976 0 0 0 1977 0 0 0 1978 0 0 0 1979 0 0 0 1980 0 0 0 1981 0 0 0 1982 0 0 0 1983 0 0 0 1984 0 0 0 1985 0 0 0 1986 0 0 0 1987 0 0 0 1988 0 0 0 1989 0 0 0 1990 0 0 0 1991 0 0 0 1992 0 0 0 1993 0 0 0 1994 0 0 0 1995 0 0 0 1996 0 0 0 1997 0 0 0 1998 0 0 0 1999 0 0 0 2000 0 0 0 2001 1 0 1 2002 1 0 1 2003 2 0 2 2004 2 0 2 2005 4 0 4 2006 7 0 7 2007 13 0 13 2008 14 0 15 2009 14 2 16 2010 15 6 21 2011 15 13 28 2012 18 20 38 =========== =========== =========== 104 41 146
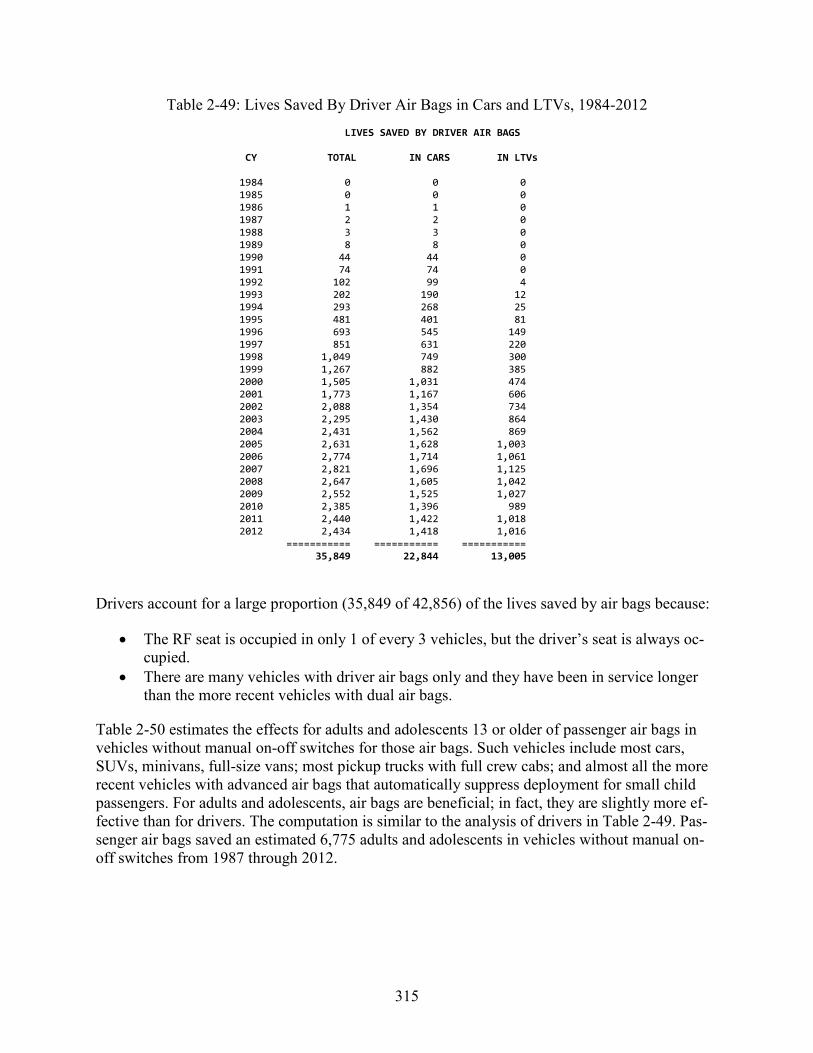
315
Table 2-49: Lives Saved By Driver Air Bags in Cars and LTVs, 1984-2012
LIVES SAVED BY DRIVER AIR BAGS CY TOTAL IN CARS IN LTVs 1984 0 0 0 1985 0 0 0 1986 1 1 0 1987 2 2 0 1988 3 3 0 1989 8 8 0 1990 44 44 0 1991 74 74 0 1992 102 99 4 1993 202 190 12 1994 293 268 25 1995 481 401 81 1996 693 545 149 1997 851 631 220 1998 1,049 749 300 1999 1,267 882 385 2000 1,505 1,031 474 2001 1,773 1,167 606 2002 2,088 1,354 734 2003 2,295 1,430 864 2004 2,431 1,562 869 2005 2,631 1,628 1,003 2006 2,774 1,714 1,061 2007 2,821 1,696 1,125 2008 2,647 1,605 1,042 2009 2,552 1,525 1,027 2010 2,385 1,396 989 2011 2,440 1,422 1,018 2012 2,434 1,418 1,016 =========== =========== =========== 35,849 22,844 13,005
Drivers account for a large proportion (35,849 of 42,856) of the lives saved by air bags because:
• The RF seat is occupied in only 1 of every 3 vehicles, but the driver’s seat is always oc-cupied.
• There are many vehicles with driver air bags only and they have been in service longer than the more recent vehicles with dual air bags.
Table 2-50 estimates the effects for adults and adolescents 13 or older of passenger air bags in vehicles without manual on-off switches for those air bags. Such vehicles include most cars, SUVs, minivans, full-size vans; most pickup trucks with full crew cabs; and almost all the more recent vehicles with advanced air bags that automatically suppress deployment for small child passengers. For adults and adolescents, air bags are beneficial; in fact, they are slightly more ef-fective than for drivers. The computation is similar to the analysis of drivers in Table 2-49. Pas-senger air bags saved an estimated 6,775 adults and adolescents in vehicles without manual on-off switches from 1987 through 2012.
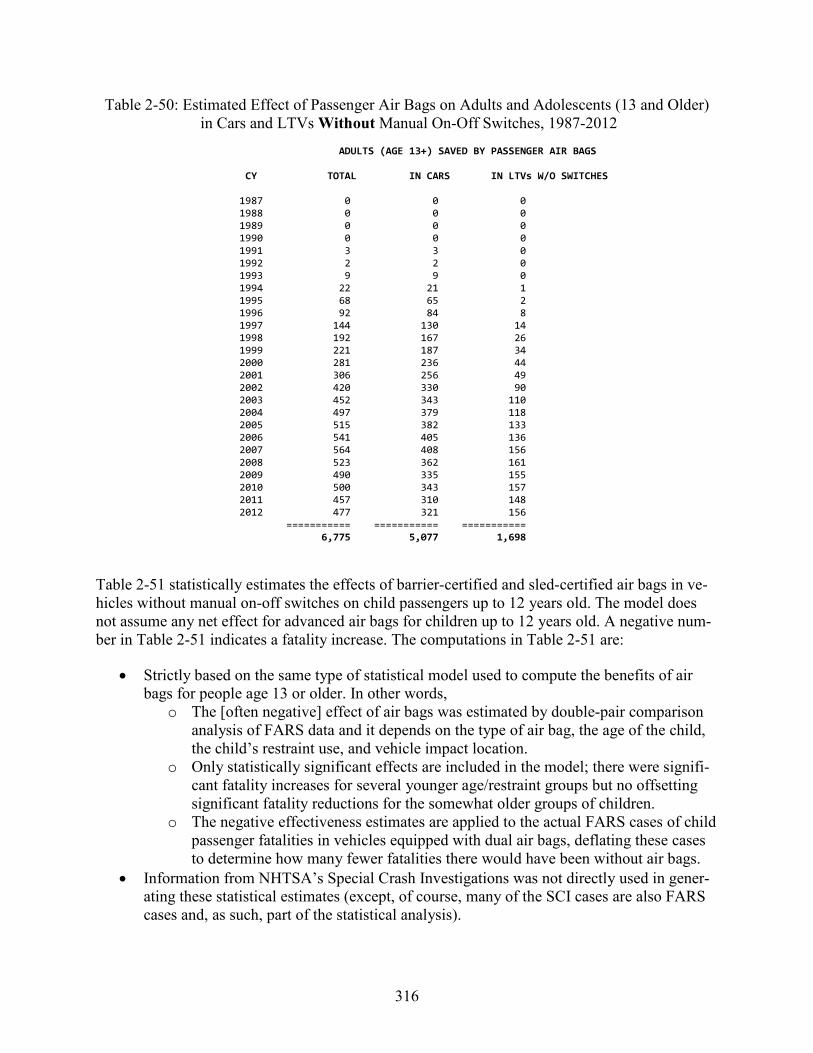
316
Table 2-50: Estimated Effect of Passenger Air Bags on Adults and Adolescents (13 and Older) in Cars and LTVs Without Manual On-Off Switches, 1987-2012
ADULTS (AGE 13+) SAVED BY PASSENGER AIR BAGS CY TOTAL IN CARS IN LTVs W/O SWITCHES 1987 0 0 0 1988 0 0 0 1989 0 0 0 1990 0 0 0 1991 3 3 0 1992 2 2 0 1993 9 9 0 1994 22 21 1 1995 68 65 2 1996 92 84 8 1997 144 130 14 1998 192 167 26 1999 221 187 34 2000 281 236 44 2001 306 256 49 2002 420 330 90 2003 452 343 110 2004 497 379 118 2005 515 382 133 2006 541 405 136 2007 564 408 156 2008 523 362 161 2009 490 335 155 2010 500 343 157 2011 457 310 148 2012 477 321 156 =========== =========== =========== 6,775 5,077 1,698
Table 2-51 statistically estimates the effects of barrier-certified and sled-certified air bags in ve-hicles without manual on-off switches on child passengers up to 12 years old. The model does not assume any net effect for advanced air bags for children up to 12 years old. A negative num-ber in Table 2-51 indicates a fatality increase. The computations in Table 2-51 are:
• Strictly based on the same type of statistical model used to compute the benefits of air bags for people age 13 or older. In other words,
o The [often negative] effect of air bags was estimated by double-pair comparison analysis of FARS data and it depends on the type of air bag, the age of the child, the child’s restraint use, and vehicle impact location.
o Only statistically significant effects are included in the model; there were signifi-cant fatality increases for several younger age/restraint groups but no offsetting significant fatality reductions for the somewhat older groups of children.
o The negative effectiveness estimates are applied to the actual FARS cases of child passenger fatalities in vehicles equipped with dual air bags, deflating these cases to determine how many fewer fatalities there would have been without air bags.
• Information from NHTSA’s Special Crash Investigations was not directly used in gener-ating these statistical estimates (except, of course, many of the SCI cases are also FARS cases and, as such, part of the statistical analysis).
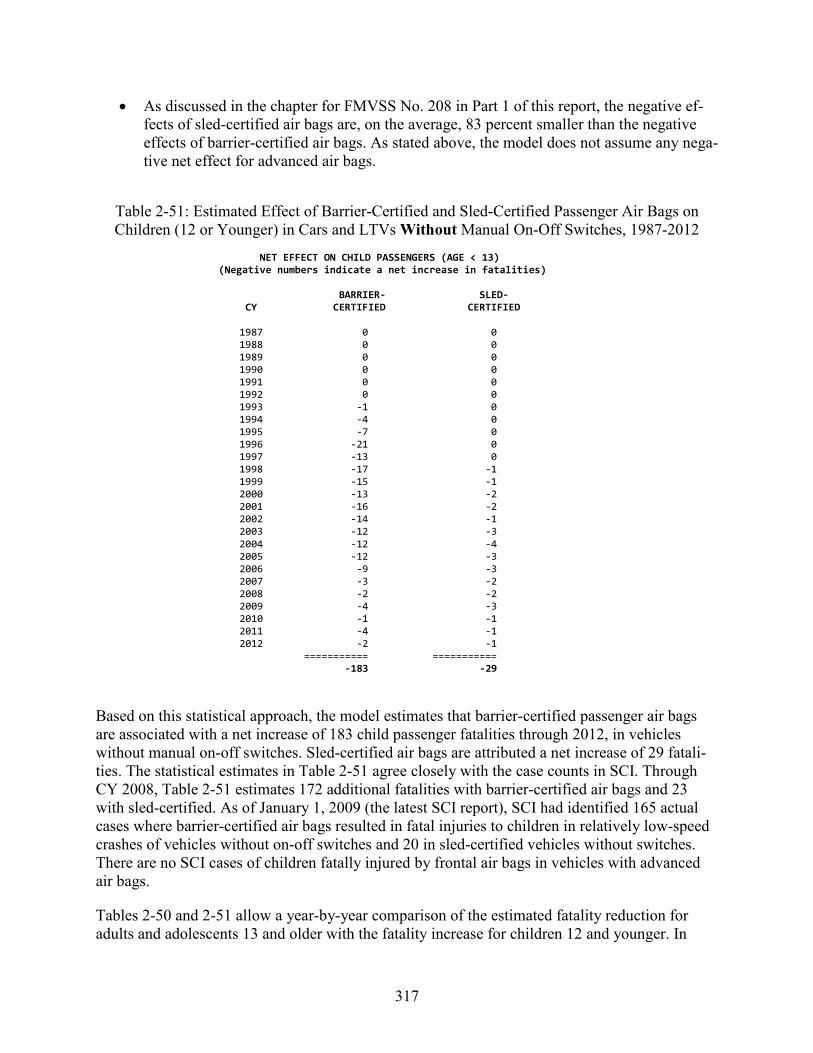
317
• As discussed in the chapter for FMVSS No. 208 in Part 1 of this report, the negative ef-fects of sled-certified air bags are, on the average, 83 percent smaller than the negative effects of barrier-certified air bags. As stated above, the model does not assume any nega-tive net effect for advanced air bags.
Table 2-51: Estimated Effect of Barrier-Certified and Sled-Certified Passenger Air Bags on Children (12 or Younger) in Cars and LTVs Without Manual On-Off Switches, 1987-2012
NET EFFECT ON CHILD PASSENGERS (AGE < 13) (Negative numbers indicate a net increase in fatalities)
BARRIER- SLED- CY CERTIFIED CERTIFIED 1987 0 0 1988 0 0 1989 0 0 1990 0 0 1991 0 0 1992 0 0 1993 -1 0 1994 -4 0 1995 -7 0 1996 -21 0 1997 -13 0 1998 -17 -1 1999 -15 -1 2000 -13 -2 2001 -16 -2 2002 -14 -1 2003 -12 -3 2004 -12 -4 2005 -12 -3 2006 -9 -3 2007 -3 -2 2008 -2 -2 2009 -4 -3 2010 -1 -1 2011 -4 -1 2012 -2 -1 =========== =========== -183 -29
Based on this statistical approach, the model estimates that barrier-certified passenger air bags are associated with a net increase of 183 child passenger fatalities through 2012, in vehicles without manual on-off switches. Sled-certified air bags are attributed a net increase of 29 fatali-ties. The statistical estimates in Table 2-51 agree closely with the case counts in SCI. Through CY 2008, Table 2-51 estimates 172 additional fatalities with barrier-certified air bags and 23 with sled-certified. As of January 1, 2009 (the latest SCI report), SCI had identified 165 actual cases where barrier-certified air bags resulted in fatal injuries to children in relatively low-speed crashes of vehicles without on-off switches and 20 in sled-certified vehicles without switches. There are no SCI cases of children fatally injured by frontal air bags in vehicles with advanced air bags.
Tables 2-50 and 2-51 allow a year-by-year comparison of the estimated fatality reduction for adults and adolescents 13 and older with the fatality increase for children 12 and younger. In
318
1996, passenger air bags saved 92 adults and adolescents, but child passenger fatalities increased by an estimated 21. That is a ratio of 4.4 adults saved per child passenger fatality. In 2002, a much larger number of vehicles with dual air bags on the road saved 420 adult lives, but child passenger fatalities attributable to barrier- or sled-certified air bags had decreased to 15. That is a ratio of 28 adults saved per child passenger fatality. In 2012, the 477 adults saved and 3 child fatalities are a ratio of 159 to 1. The enormous improvements in the ratio can be attributed two factors: (1) The shift from barrier-certified to sled-certified to advanced air bags; (2) The public, to a large extent, has moved child passengers to the rear seat; consequently, the exposure of small children to air bags has been greatly reduced.
Tables 2-52 and 2-53 estimate the effects of passenger air bags in pickup trucks and other vehi-cles with manual on-off switches and also the effect of the switches. Table 2-52 considers adult and adolescent passengers, Table 2-53, child passengers. The switches have generally been standard, factory-installed equipment in vehicles without a rear seat large enough to accommo-date rear-facing child safety seats, including 2-door pickup trucks; crew-cab pickups with a lim-ited rear seat; cars, SUVs, or cargo vans without any rear seat; and sporty cars with a small rear seat. Immediately or a few years after the shift to advanced air bags with automatic deployment suppression, the manufacturers phased out the manual switches; FMVSS No. 208 does not per-mit manual switches in MY 2012 or later vehicles.
Ideally, switches would always be “on” for passengers 13 and older, securing for them the bene-fits of air bags and “off” for child passengers up to 12, assuring that children would never be ex-posed to air bags. In reality, though, NHTSA’s survey in 2000 indicated that switches were turned off, for example, for 22 percent of 13-to-15 year olds, 15 percent of adults 20 to 59, and 56 percent of people 70 or older. Switches were turned on for 14 percent of infants, 26 percent of 1-to-6 year olds, and 70 percent of 11- and12-year-olds. The statistical model for this report fac-tors in the probability that the switch was on and the effectiveness of air bags, given the occu-pant’s age, the vehicle’s impact location, and the type of air bag to estimate how the actual num-ber of fatalities in FARS would have changed:
• If the vehicles had passenger air bags and no switches – or if they did have switches, but they were left on all the time (these are the same).
• If the vehicles did not have passenger air bags – or if they did have air bags and the switches were left off all the time (these are the same).

319
Table 2-52: Estimated Effect of Passenger Air Bags on Adults and Adolescents (13 and Older) in Vehicles With Manual On-Off Switches, 1995-2012
(Positive numbers indicate lives saved; negative numbers indicate net increases in fatalities.
Block print indicates actual effects of air bags with switches ‘on’; Italics indicate hypothetical effects)
ACTUAL LIVES SAVED LIVES SAVED IF POTENTIAL SAVINGS LOST BY AIR BAGS WITH ALL SWITCHES BECAUSE SWITCHES CY SWITCHES ‘ON’ HAD BEEN ‘ON’ WERE TURNED OFF 1995 0 0 0 1996 0 0 0 1997 2 3 -0 1998 9 11 -2 1999 17 21 -4 2000 25 32 -7 2001 33 42 -9 2002 31 38 -7 2003 38 47 -10 2004 44 55 -11 2005 41 51 -10 2006 37 45 -8 2007 43 54 -11 2008 33 41 -8 2009 30 37 -8 2010 23 29 -6 2011 26 33 -7 2012 22 29 -7 =========== =========== =========== 453 567 -114
Table 2-52 estimates that passenger air bags in vehicles with manual switches actually saved 453 people 13 or older. In other words, the switches were left on for these occupants; the air bags de-ployed and saved their lives. However, if in these same vehicles the switch had been correctly left on for every occupant 13 or older (or if vehicles had passenger air bags and no switches), the number of people (13 or older) saved by air bags would have been 567 rather than 453. In other words, 114 of the 567 potential saves were lost because an air bag was turned off for a person 13 or older. There are two ways of looking at these statistics. On the one hand, it could be said that inappropriate use of the switches cost 114 lives. More positively, it could be argued that, without some device such as the switches to protect child passengers, dual air bags simply could not have been mandated in pickup trucks or other vehicles without a full rear seat; in that sense, the switches saved 453 adults who, otherwise, would not have had the protection of frontal air bags.
In the first column of Table 2-53, the statistical method used by our model estimates that frontal air bags increased child passenger fatalities by 8 in vehicles with manual switches because the switches were incorrectly left on: 5 of them in vehicles with barrier-certified air bags, 3 sled-certified. Again, the statistical estimates are compatible with SCI, which had 6 actual cases as of January 1, 2009 of children with fatal injuries from air bags in pickup trucks where the switches were left on.
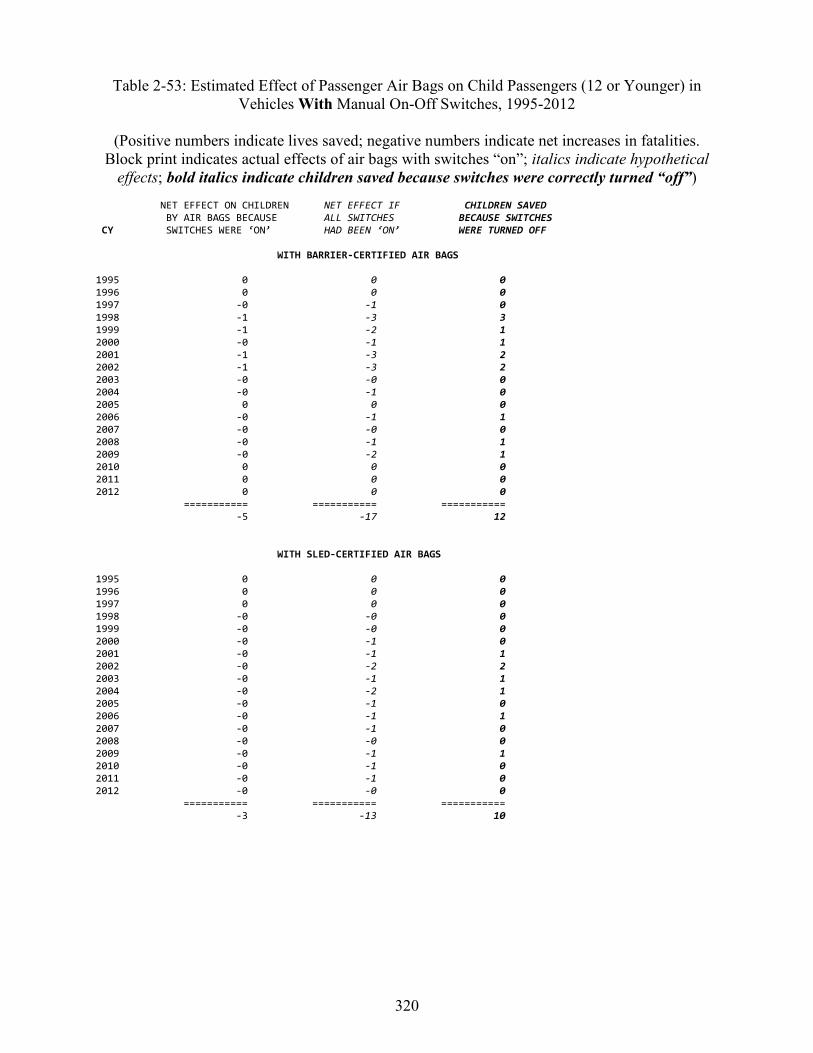
320
Table 2-53: Estimated Effect of Passenger Air Bags on Child Passengers (12 or Younger) in Vehicles With Manual On-Off Switches, 1995-2012
(Positive numbers indicate lives saved; negative numbers indicate net increases in fatalities.
Block print indicates actual effects of air bags with switches “on”; italics indicate hypothetical effects; bold italics indicate children saved because switches were correctly turned “off”)
NET EFFECT ON CHILDREN NET EFFECT IF CHILDREN SAVED BY AIR BAGS BECAUSE ALL SWITCHES BECAUSE SWITCHES CY SWITCHES WERE ‘ON’ HAD BEEN ‘ON’ WERE TURNED OFF WITH BARRIER-CERTIFIED AIR BAGS 1995 0 0 0 1996 0 0 0 1997 -0 -1 0 1998 -1 -3 3 1999 -1 -2 1 2000 -0 -1 1 2001 -1 -3 2 2002 -1 -3 2 2003 -0 -0 0 2004 -0 -1 0 2005 0 0 0 2006 -0 -1 1 2007 -0 -0 0 2008 -0 -1 1 2009 -0 -2 1 2010 0 0 0 2011 0 0 0 2012 0 0 0 =========== =========== =========== -5 -17 12 WITH SLED-CERTIFIED AIR BAGS 1995 0 0 0 1996 0 0 0 1997 0 0 0 1998 -0 -0 0 1999 -0 -0 0 2000 -0 -1 0 2001 -0 -1 1 2002 -0 -2 2 2003 -0 -1 1 2004 -0 -2 1 2005 -0 -1 0 2006 -0 -1 1 2007 -0 -1 0 2008 -0 -0 0 2009 -0 -1 1 2010 -0 -1 0 2011 -0 -1 0 2012 -0 -0 0 =========== =========== =========== -3 -13 10

321
The statistical model also considers the hypothetical situation that all switches had been left on (or that all the vehicles actually equipped with switches instead had air bags but no switches). The second column of Table 2-53 estimates that air bags would have increased child passenger fatalities by 30 (17 barrier-certified and 13 sled-certified) rather than 8. In other words, 22 poten-tial fatalities to children were avoided because air bags were correctly turned off (third column). Essentially, the switch was turned off in three-quarters of the situations (22 of 30) where it need-ed to be off – i.e., especially for infants and toddlers.
The statistics for adults and children – Tables 2-52 and 2-53 – can be compared:
• As actually used by the public in 1995 to 2012, the combination of passenger air bags with manual on-off switches saved an estimated 453 adults at a cost of 8 child-passenger fatalities. That is a ratio of 56.6 adult lives saved per child passenger fatality: not too dif-ferent from the ratios after 2000 in vehicles with full rear seats and no switches (where children can escape harm from air bags simply by riding in the rear seat, an option not available in pickup trucks without rear seats).
• Air bags without switches, hypothetically, would have saved an estimated 567 adults at a cost of 30 child passenger fatalities. That would have been a much worse ratio of 18.9 adult lives saved per child passenger fatality: comparable to some of the ratios before 1998 in vehicles without switches, before the public became well aware of the risks of air bags to small children.
• If these pickup trucks and other vehicles had not been equipped with passenger air bags at all, the statistics would have been, of course, zero adults saved and zero children harmed by frontal air bags.
• If the public had been fully aware of the correct way to use the switches, or if the manual switches had already been superseded by advanced systems that automatically trigger or suppress deployment depending on the size and location of the occupant, the statistics could have been 567 adults saved and zero children harmed.
The statistics in Table 2-50 and 2-51 for vehicles without switches can be combined with the es-timates for vehicles with switches in Tables 2-52 and 2-53.
• In all vehicles, passenger air bags saved 6,775 + 453 = 7,228 people 13 or older from 1987 through 2012.
• Child passenger fatalities increased by an estimated 183 + 29 + 5 + 3 = 220. • Net lives saved by passenger air bags were 7,228 – 220 = 7,008.
Finally, Table 2-54 quantifies three tangible benefits of sled-certified and advanced air bags for RF passengers through 2012 – by estimating hypothetical additional fatalities that would have occurred if the vehicles had instead been equipped with barrier-certified air bags. Of course, in additional to these benefits there is the intangible boon that the 1998-to-1999 redesign and the 2004-to-2007 shift to advanced air bags preserved public confidence that frontal air bags are a safe and effective technology.

322
Table 2-54: Hypothetical Additional Fatalities if Sled-Certified or Advanced Air Bags for RF Passengers Had Still Been Barrier-Certified Air Bags, 1995-2012
A D D I T I O N A L F A T A L I T I E S I F CHILDREN EXPOSED TO CHILDREN EXPOSED TO ADULTS/ADOLESCENTS IN VEHICLES W/O FULL SLED-CERTIFIED AIR BAGS ADVANCED AIR BAGS REAR SEATS WITH ADVANCED AIR BAGS & NO HAD BEEN EXPOSED TO HAD BEEN EXPOSED TO SWITCHES HAD BEEN EXPOSED TO SLED- OR CY BARRIER-CERTIFIED BARRIER-CERTIFIED BARRIER-CERTIFIED PLUS MANUAL SWITCHES 1995 0 0 0 1996 0 0 0 1997 0 0 0 1998 4 0 0 1999 4 0 0 2000 13 0 0 2001 13 0 0 2002 10 0 0 2003 17 0 0 2004 26 0 1 2005 22 1 1 2006 21 3 2 2007 11 6 2 2008 9 3 2 2009 22 1 2 2010 7 1 2 2011 5 4 2 2012 7 4 2 =========== =========== =========== 189 24 16
The first column of Table 2-54 tallies the benefits for child passengers of the shift from barrier-certified to sled-certified air bags. Tables 2-51 and 2-53 showed that sled-certified air bags still present some risk to small children, resulting in an increase of 32 (29 plus 3) fatalities through 2012. But NHTSA’s evaluations show the risk is, on the average, 83 percent lower with sled-certified than with barrier-certified air bags. If all those sled-certified air bags had performance equivalent to the earlier barrier-certified air bags, and everything else had stayed the same, there would have been yet another 189 fatalities.
The second column of Table 2-54 performs a similar computation for advanced air bags. Their suppression and low-risk deployment features have minimized the added risk for child passen-gers. If the advanced air bags in FARS cases through 2012 had instead been barrier-certified air bags and everything else stayed the same, there would have been 24 additional child-passenger fatalities.
Advanced air bags also have a benefit for adults and adolescents, estimated in the last column of Table 2-54. Make-models without a full rear seat, if equipped with passenger air bags that are not certified-advanced, also need manual on-off switches to make it feasible to transport children. These switches are incorrectly turned off for some adults and adolescents, depriving them of the protection of a frontal air bag. The automatic suppression feature of advanced air bags allowed phasing out the manual switches, which had occurred in all of those make-models immediately after the shift to advanced air bags, or a few years later, but in all cases by MY 2012. If the vehi-cles in those makes and models, now with advanced air bags and no switches, had instead been equipped with a sled- or barrier-certified air bag and a manual switch, there would have been an

323
estimated 16 additional fatalities because the switch would have been turned off for some of the adult or adolescent passengers.
324
REFERENCES 70 by 92: Increased safety-belt use. (1992, July). Journal of the American Medical Association, 268, p. 318.
Accident Analysis and Prevention, 32 (2000, March). (Entire issue on head restraints and occu-pant injury in rear impacts).
Accident facts. (Annual publication). Chicago: National Safety Council.
Air bag chronology. USA Today, July 13, 1999.
Allen, K. (2009, April). The effectiveness of amber rear turn signals for reducing rear impacts. (Report No. DOT HS 811 115). Washington, DC: National Highway Traffic Safety Administra-tion. Available at www-nrd.nhtsa.dot.gov/Pubs/811115.PDF
Allen, K. (2010, July). The effectiveness of ABS in heavy truck tractors and trailers. (Report No. DOT HS 811 339). Washington, DC: National Highway Traffic Safety Administration. Availa-ble at www-nrd.nhtsa.dot.gov/Pubs/811339.pdf
Allen, K. (2010, October). The Effectiveness of Underride Guards for Heavy Trailers. (Report No. DOT HS 811 375). Washington, DC: National Highway Traffic Safety Administration. Available at www-nrd.nhtsa.dot.gov/Pubs/811375.pdf
American National Standards Institute. (1966). Safety Code for Safety Glazing Materials for Glazing Motor Vehicles Operating on Land Highways, Standard Z26.1. New York: Author.
Anton’s Law. Public Law 107-318, December 4, 2002.
Arehart, C., Radlinski, R., & Hiltner, E. (1992). Light vehicle ABS performance evaluation – Phase II. (Report No. DOT HS 807 924). Washington, DC: National Highway Traffic Safety Administration.
Ballard, C., & Andrade, D. (1976). Systems and hardware effects of FMVSS 105-75. (Paper No. 760216) Warrendale, PA: Society of Automotive Engineers.
Bayer, A. R., Jr., & Peterson, B. S. (1978). Child restraint systems testing. (Report No. DOT HS 803 408). Washington, DC: National Highway Traffic Safety Administration.
Bean, J. D., Kahane, C. J., Mynatt, M., Rudd, R. W., Rush, C. J., & Wiacek, C. (2009, Septem-ber). Fatalities in frontal crashes despite seat belts and air bags. (Report No. DOT HS 811 202). Washington, DC: National Highway Traffic Safety Administration. Available at www-nrd.nhtsa.dot.gov/pubs/811102.pdf
Bloch, B. (1998). Advanced designs for side impact and rollover protection. Sixteenth Interna-tional Technical Conference on the Enhanced Safety of Vehicles. (Report No. DOT HS 808 759, p. 1780). Washington, DC: National Highway Traffic Safety Administration.
325
Bondy, N., & Utter, D. (1997, April). Observed safety belt use in 1996. Washington, DC: Na-tional Highway Traffic Safety Administration. Available at www-nrd.nhtsa.dot.gov/Pubs/97820.PDF
Bondy, N., & Utter, D. (2001, February). Observed safety belt use, fall 2000 National Occupant Protection Use Survey. Washington, DC: National Highway Traffic Safety Administration. Available at www-nrd.nhtsa.dot.gov/Pubs/01010.pdf
Bowman, B. L., & Rounds, D. A. (1988, August). Restraint system usage in the traffic popula-tion 1987 annual report. (Report No. DOT HS 807 342). Washington, DC: National Highway Traffic Safety Administration. Available at www-nrd.nhtsa.dot.gov/Pubs/807342.pdf
Bowman, B. L., & Rounds, D. A. (1989, June). Restraint system usage in the traffic population 1988 annual report. (Report No. DOT HS 807 447). Washington, DC: National Highway Traffic Safety Administration. Available at www-nrd.nhtsa.dot.gov/Pubs/807447.pdf
Burger, W. J., Smith, R. L., Ziedman, K., Mulholland, M. U., Bardales, M. C., & Sharkey, T. J. (1981). Improved commercial vehicle conspicuity and signalling systems, Task I – Accident analysis and functional requirements. (Report No. DOT HS 806 100). Washington, DC: National Highway Traffic Safety Administration.
Burger, W.J., Mulholland, M. U., & Smith, R. L. (1985). Improved Commercial Vehicle Con-spicuity and Signalling Systems, Task III – Field Test Evaluation of Vehicle Reflectorization Ef-fectiveness. (Report No. DOT HS 806 923). Washington, DC: National Highway Traffic Safety Administration.
Campbell, B. J. (1963). A study of injuries related to padding on instrument panels. (Report No. VJ-1823-R2). Buffalo, NY: Cornell Aeronautical Laboratory.
Clark, C., Blechschmidt, C., & Gordon, F. (1966). Impact protection with the “Airstop” restraint system. Eighth Stapp Car Crash and Field Demonstration Conference. Detroit: Wayne State University Press.
Code of Federal Regulations, Title 49. Available at www.ecfr.gov/cgi-bin/text-idx?c=ecfr&tpl=/ecfrbrowse/Title49/49tab_02.tpl
Cole, B. L., Dain, S. J., & Fisher, A. J. (1977). Study of motor vehicle signal systems. Mel-bourne: Road Safety Information Service.
Consumer Reports, 37. (1972, August).
Dang, J. N. (2004, September). Preliminary results analyzing the effectiveness of electronic sta-bility control (ESC) systems. (Report No. DOT HS 809 790). Washington, DC: National High-way Traffic Safety Administration. Available at www-nrd.nhtsa.dot.gov/Pubs/809790.PDF
Dang, J. N. (2007, July). Statistical analysis of the effectiveness of electronic stability control (ESC) Systems – Final report. (Report No. DOT HS 810 794). Washington, DC: National High-way Traffic Safety Administration. Available at www-nrd.nhtsa.dot.gov/Pubs/810794.pdf
326
Dang, J. N. (2008, May). Statistical analysis of alcohol-related driving trends, 1982-2005. (Re-port No. DOT HS 810 942). Washington, DC: National Highway Traffic Safety Administration. Available at www-nrd.nhtsa.dot.gov/Pubs/810942.PDF
Daniel, R. P. (1970). Vehicle interior safety constraint systems. 1970 International Automobile Safety Conference Compendium. (Paper No. 700423). Warrendale, PA: Society of Automotive Engineers.
Datta, T. K., & Guzek, P. (1990, June). Restraint system use in 19 U.S. cities 1989 annual report. (Report No. DOT HS 807 595). Washington, DC: National Highway Traffic Safety Administra-tion. Available at www-nrd.nhtsa.dot.gov/Pubs/807595.pdf
Datta, T. K., & Guzek, P. (1991, July). Restraint system use in 19 U.S. cities 1990 annual report. (Report No. DOT HS 808 147). Washington, DC: National Highway Traffic Safety Administra-tion. Available at www-nrd.nhtsa.dot.gov/Pubs/808147.pdf
Datta, T. K., & Guzek, P. (1992, March). Restraint system use in 19 U.S. cities 1991 annual re-port. (Report No. DOT HS 808 148). Washington, DC: National Highway Traffic Safety Admin-istration. Available at www-nrd.nhtsa.dot.gov/Pubs/808148.pdf
Decina, L. E., & Lococo, K. H. (2004, January) Misuse of child restraints. (Report No. DOT HS 809 671). Washington, DC: National Highway Traffic Safety Administration. Available at www.nhtsa.gov/Research/Human+Factors/Seatbelt+and+Child+Seat+Use
Decina, L. E., Lococo, K. H., & Doyle, C. T. (2006, December). Child Restraint Use Survey – LATCH use and misuse. (Report No. DOT HS 810 679). Washington, DC: National Highway Traffic Safety Administration. Available at www-nrd.nhtsa.dot.gov/Pubs/810679.PDF
Digges, K. H., Nicholson, R. M., & Rouse, E. J. (1985). The technical basis for the center high mounted stoplamp. (Paper No. 851240). Warrendale, PA: Society of Automotive Engineers.
Eby, D.W., Vivoda, J. M., & Fordyce, T. A. (1999). Direct observation of safety belt use in Michigan: Fall 1999. (Report No. UMTRI-99-33). Ann Arbor, MI: University of Michigan Transportation Research Institute.
Evans, L. (1986a). Double pair comparison - A new method to determine how occupant charac-teristics affect fatality risk in traffic crashes. Accident Analysis and Prevention, 18, pp. 217-227.
Evans, L. (1986b). The effectiveness of safety belts in preventing fatalities. Accident Analysis and Prevention, 18, pp. 229-241.
Evans, L. (1991). Traffic safety and the driver. New York: Van Nostrand Reinhold.
Fargo, R. B. (1968). Windshield glazing as an injury factor in automobile accidents. Buffalo: Cornell Aeronautical Laboratory.
Farmer, C. M. (2001). New evidence concerning fatal crashes of passenger vehicles before and after adding antilock braking systems. Accident Analysis and Prevention, 33, pp. 361-369.
327
Farmer, C. M. (2005). Relationships of frontal offset crash test results to real-world driver fatali-ty ratings. Traffic Injury Prevention, 6, pp. 31-37.
Farmer, C. M., Lund, A. K., Trempel, R. E., & Braver, E. R. (1996). Fatal crashes of passenger vehicles before and after adding antilock brake systems. Arlington, VA: Insurance Institute for Highway Safety.
Federal Register Notices:
31 (March 8, 1966): 4091, GSA proposes safety standards for Federally purchased vehi-cles.
31 (July 15, 1966): 9631, GSA final rule, safety standards for Federally purchased vehi-cles.
31 (December 3, 1966): 15212, NPRM for the initial FMVSS.
32 (February 3, 1967): 2414, final rule for the initial FMVSS, including among others FMVSS Nos. 103, 105, 108, 201, 203, 204, 205, 206, 207, 208, 209, 210 and 301.
32 (October 13, 1967): 14278, ANPRM to consider regulations to limit roof crush and in-trusion.
32 (December 16, 1967): 18033, final rule extending FMVSS No. 108 to cars and LTVs.
32 (December 28, 1967): 20865, NPRM to establish FMVSS No. 202 for passenger cars.
33 (February 14, 1968): 2945, final rule establishing FMVSS No. 202 for passenger cars.
33 (August 16, 1968): 11652, final rule establishing FMVSS No. 212 for passenger cars.
33 (October 5, 1968): 14971, ANPRM announcing the intention to regulate side door strength.
33 (December 11, 1968): 18386, first NPRM proposing FMVSS No. 214.
34 (January 24, 1969): 1150, final rule extending FMVSS No. 206 to trucks, buses and multipurpose passenger vehicles.
34 (July 2, 1969): 11148, initial ANPRM to consider air bags or other automatic protec-tion.
35 (January 21, 1970): 813, second NPRM proposing FMVSS No. 214.
35 (April 23, 1970): 6513, third NPRM proposing FMVSS No. 214.
35 (May 7, 1970): 7187, initial NPRM for automatic occupant protection, did not become a final rule.
328
35 (September 23, 1970): 14778, final rule establishing FMVSS No. 213.
35 (September 30, 1970): 15222, final rule extending the original FMVSS No. 208 to LTVs.
35 (September 25, 1970): 14936, NPRM proposing to add a knee impact test to FMVSS No. 201, never became a final rule.
35 (October 30, 1970): 16801, final rule establishing FMVSS No. 214 (side door strength, passenger cars).
35 (November 11, 1970): 17345, original NPRM to establish FMVSS No. 105a for pas-senger cars, effective October 1, 1972.
36 (January 6, 1971): 166, NPRM to establish FMVSS No. 216 for passenger cars.
36 (March 10, 1971): 4600, final rule amending FMVSS No. 208 to require shoulder belts and warning buzzers in all cars, and to permit automatic occupant protection.
36 (December 2, 1971): 22902, final rule extending FMVSS No. 207 to LTVs.
36 (December 8, 1971): 23299, final rule establishing FMVSS No. 216 for passenger cars.
37 (September 2, 1972): 17970, original final rule establishing FMVSS No. 105a in pas-senger cars and LTVs, effective September 1, 1974 (subsequently revised).
38 (May 18, 1973): 13017, delays FMVSS No. 105a to September 1, 1975 (subsequently revised).
38 (June 20, 1973): 16072, final rule amending FMVSS No. 208 to require integral 3-point belts and ignition interlocks in passenger cars.
39 (February 22, 1974): 6708, renames FMVSS No. 105a to FMVSS No. 105-75 and limits it to passenger cars (subsequently revised).
39 (March 19, 1974): 10268, NPRM proposing to upgrade FMVSS No. 202, including fixed head restraints for drivers, never became a final rule.
39 (March 21, 1974): 10588, final rule adding lateral and rear impact tests to FMVSS No. 301 and extending the standard to LTVs.
39 (October 31, 1974): 38380, final rule amending FMVSS No. 208 to delete the inter-lock requirement.
39 (November 21, 1974): 40857, minor revisions to FMVSS No. 301 final rule of March 21, 1974.
329
39 (December 6, 1974): 42692, final rule amending FMVSS No. 208 to require a 4-8 second audible warning on belt use.
40 (June 9, 1975): 24525, final rule for FMVSS No. 105-75 in passenger cars, effective January 1, 1976.
40 (July 9, 1975): 28805, final rule amending FMVSS No. 208, extending 3-point belts to LTVs.
40 (August 6, 1975): 33036, revises fuel spillage requirements in FMVSS No. 301 final rule of March 21, 1974.
40 (October 10, 1975): 47790, revises effective dates in FMVSS No. 301 final rule of March 21, 1974.
41 (August 30, 1976): 36493, final rule extending FMVSS No. 212 to LTVs and also amending the standard, allowing NHTSA to test at a wider range of temperatures.
42 (July 5, 1977): 34288, postpones until September 1, 1978 the effective date of the ex-tension of FMVSS No. 212 to LTVs.
42 (July 5, 1977): 34289, final rule requiring automatic occupant protection, rescinded in 1981 before its effective date.
44 (November 29, 1979): 68470, final rule extending FMVSS Nos. 201, 203 and 204 to LTVs.
44 (December 13, 1979): 72131, final rule adding a 30 mph test to FMVSS No. 213.
46 (January 2, 1981): 55, final rule extending FMVSS No. 105 to LTVs
46 (January 8, 1981): 2064, final rule amending FMVSS No. 208 to add comfort and convenience standards for seat belts.
46 (February 19, 1981): 13193, Executive Order 12291 – Federal Regulation.
46 (October 29, 1981): 53419, rescission of 1977 final rule requiring automatic occupant protection.
48 (October 18, 1983): 48235, final rule amending FMVSS No. 108 to require CHMSL on passenger cars.
48 (November 16, 1983): 52065, final rule amending FMVSS No. 205 to permit the op-tional use of glass-plastic glazing.
49 (July 17, 1984): 28962, final rule amending FMVSS No. 208 to require automatic oc-cupant protection in passenger cars.

330
50 (August 23, 1985): 34152, final rule amending FMVSS No. 208 to postpone belt com-fort and convenience standards to September 1, 1986.
54 (June 14, 1989): 25275, final rule amending FMVSS No. 208 to require 3-point belts at the outboard rear seats of cars.
54 (September 25, 1989): 39183, final rule extending FMVSS No. 202 to LTVs.
54 (November 2, 1989): 46257, final rule amending FMVSS No. 208 to require 3-point belts at the outboard rear seats of LTVs.
55 (January 17, 1990): 1586, NHTSA evaluation plan for automatic occupant protection.
55 (October 30, 1990): 45752, final rule upgrading FMVSS No. 214, adding a dynamic side impact test for passenger cars.
56 (March 26, 1991): 12472, final rule amending FMVSS No. 208 to extend automatic protection to LTVs.
56 (April 17, 1991): 15510, final rule extending FMVSS No. 216 to LTVs.
56 (April 19, 1991): 16015, final rule amending FMVSS No. 108 to require CHMSL on LTVs.
56 (June 14, 1991): 27427, final rule extending FMVSS No. 214 side door strength re-quirement to LTVs.
57 (December 10, 1992): 58406, final rule amending FMVSS No. 108 to require con-spicuity tape on heavy trailers.
58 (January 11, 1993): 3500, final rule amending FMVSS No. 108 to permit DRL on cars and LTVs.
58 (September 2, 1993): 46551, final rule amending FMVSS No. 208 to require manual 3-point belts and dual air bags in cars and LTVs.
58 (October 4, 1993): 51735, Executive Order 12866 – Regulatory Planning and Review.
59 (January 4, 1994): 281, ANPRM asking for information about the effectiveness and potential benefits of ABS technologies.
60 (April 12, 1995): 18566, ANPRM to consider upgrading FMVSS No. 301.
60 (May 23, 1995): 27233, final rule amending FMVSS No. 208 to allow manual on-off switches for passenger air bags in pickup trucks and other vehicles with small or no rear seats.
60 (July 6, 1995): 35126, final rule amending FMVSS No. 213 to use a 6-year-old dum-my to test seats with higher weight limits.
331
60 (July 28, 1995): 38749, final rule extending the FMVSS No. 214 dynamic side impact test to LTVs.
60 (August 18, 1995): 43031, final rule – head-impact upgrade of FMVSS No. 201.
60 (September 28, 1995): 50124, final rule extending FMVSS No. 206 to the back doors of vehicles.
61 (January 24, 1996): 2004, final rule establishing FMVSS Nos. 223 and 224 to require and set performance standards for underride guards for heavy trailers.
61 (May 31, 1996): 27290, final rule amending FMVSS No. 121 to require ABS for vehi-cles with air brakes.
61 (July 12, 1996): 36698, ANPRM deferring indefinitely the ABS requirement for cars and LTVs.
62 (March 19, 1997): 12960, final rule modifying the FMVSS No. 208 test to permit air bags that deploy less forcefully.
62 (November 21, 1997): 62406, sets up procedures enabling the public to obtain after-market on-off switches for air bags.
63 (August 4, 1998): 41451, final rule reducing the FMVSS No. 201 test speed from 15 mph to 12 mph on target areas where a head air bag is stored.
64 (March 5, 1999): 10786, final rule establishing FMVSS No. 225 and amending FMVSS No. 213 to require upper and lower tethers on child safety seats.
64 (March 31, 1999): 15587, Federal Motor Carrier Safety Regulation (final rule) requir-ing all heavy trailers on the road on or after June 1, 2001 to be equipped or retrofitted with conspicuity tape.
65 (May 12, 2000): 30679, final rule amending FMVSS No. 208 to require advanced frontal air bags.
65 (November 13, 2000): 67693, NPRM to upgrade the rear- and lateral-impact test pro-cedures of FMVSS No. 301.
66 (January 4, 2001): 967, NPRM to upgrade FMVSS No. 202.
66 (January 12, 2001): 3388, establishes NHTSA’s rollover resistance ratings based on the static stability factor.
68 (July 25, 2003): 43964, final rule updating FMVSS No. 205 to incorporate the 1996 edition of ANSI Code Z26.1.
68 (October 14, 2003): 59250, modifies NHTSA’s rollover resistance ratings by consid-ering results of a fishhook maneuver in addition to the static stability factor.
332
68 (December 1, 2003): 67068, final rule upgrading the rear- and lateral-impact test pro-cedures of FMVSS No. 301.
69 (July 16, 2004): 42595: final rule amending FMVSS No. 213 to require Hybrid III dummies for testing safety seats.
69 (December 8, 2004): 70904, final rule requiring 3-point belts for center rear seats.
69 (December 14, 2004): 74848, final rule upgrading FMVSS No. 202, “Head restraints.”
70 (April 8, 2005): 18136, final rule for FMVSS No. 138, “Tire pressure monitoring sys-tems.”
70 (July 12, 2005): 39959, final rule establishing FMVSS No. 205(a), based on the 1977 and 1980 editions of ANSI Code Z26.1, as an alternative to FMVSS No. 205 in some sit-uations.
71 (August 31, 2006): 57168, amends FMVSS No. 208 to increase the test speed for the belted 5th percentile female dummy from 30 mph to 35 mph.
72 (April 6, 2007): 17236, final rule for FMVSS No. 126, “Electronic stability control systems.”
72 (May 4, 2007): 25514, some amendments to the final rule upgrading FMVSS No. 202, “Head restraints.”
72 (February 6, 2007): 5385, final rule extending FMVSS No. 206 to sliding doors of ve-hicles and harmonizing with GTR.
72 (September 11, 2007): 51908, final rule adding a pole test to FMVSS No. 214, “Side impact protection.”
73 (July 11, 2008): 40016, NPRM to add new features to NCAP, including overall rating, pole test, information on crash avoidance technologies, 5th-percentile female dummies at some positions, and additional injury criteria.
74 (May 12, 2009): 22347, final rule upgrading FMVSS No. 216, “Roof crush re-sistance.”
74 (June 29, 2009): 30993, denial of petition to mandate DRL for new cars and LTVs.
74 (July 20, 2009): 35131, response to petitions for reconsideration, sets September 1, 2010, as the effective date for final rule extending FMVSS No. 206 to sliding doors of vehicles.
76 (January 19, 2011): 3212, final rule for FMVSS No. 226, “Ejection mitigation.”
76 (January 21, 2011): 3821, Executive Order 13563 – Improving Regulation and Regu-latory Review.

333
76 (July 29, 2011): 45453, final rule to add new features to NCAP, including overall rat-ing, pole test, information on crash avoidance technologies, 5th-percentile female dum-mies at some positions, and additional injury criteria.
77 (February 27, 2012): 11651, final rule amending FMVSS No. 213 to set specifications for a 10-year-old dummy to test seats for larger children.
77 (August 30, 2012): 52619, final rule extending the option of manual on-off switches for frontal air bags at the RF seating position until September 1, 2015.
Flora, J. D., Beitler, P., Bromberg, J., Goldstein, N., & O’Day, J. (1979). An evaluation of FMVSS 301 – Fuel system integrity. (Report No. UM-HSRI-79-42). Ann Arbor, MI: University of Michigan Transportation Research Institute.
Garrett, J. W. (1964). The safety performance of 1962-63 automobile door latches and compari-son with earlier latch designs. (Report No. VJ-1823-R7). Buffalo, NY: Cornell Aeronautical La-boratory.
Garrett, J. W. (1969). Comparison of door opening frequency in 1967-68 cars with earlier model U.S. cars. (Report No. DOT HS 800 231). Washington, DC: National Highway Traffic Safety Administration.
Garrett, J. W., & Hendricks, D. L. (1975). Factors influencing the performance of the energy ab-sorbing steering column in accidents. Report on the Fifth International Technical Conference on Experimental Safety Vehicles. Washington, DC: National Highway Traffic Safety Administra-tion.
Gish, R. E. (1973, April). National Personal Transportation Survey – Characteristics of licensed drivers. Washington, DC: Federal Highway Administration. Available at www.fhwa.dot.gov/ohim/1969/s.pdf
Gloyns, P. F., & Mackay, G. M. (1974). Impact performance of some designs of steering assem-bly in real accidents and under test conditions. Proceedings of Eighteenth Stapp Car Crash Con-ference. Warrendale, PA: Society of Automotive Engineers.
Glassbrenner, D. (2003, February). The use of child restraints in 2002. (Report No. DOT HS 809 555). Washington, DC: National Highway Traffic Safety Administration. Available at www-nrd.nhtsa.dot.gov/Pubs/809-555.pdf
Glassbrenner, D. (2002, September). Safety belt and helmet use in 2002 – Overall results. (Re-port No. DOT HS 809 500). Washington, DC: National Highway Traffic Safety Administration. Available at www-nrd.nhtsa.dot.gov/Pubs/809500.pdf
Glassbrenner, D. (2003, September). Safety belt use in 2003. (Report No. DOT HS 809 646). Washington, DC: National Highway Traffic Safety Administration. Available at www-nrd.nhtsa.dot.gov/Pubs/809646.pdf
334
Glassbrenner, D. (2004, September). Safety belt use in 2004 – Overall results. (Report No. DOT HS 809 783). Washington, DC: National Highway Traffic Safety Administration. Available at www-nrd.nhtsa.dot.gov/Pubs/809783.pdf
Glassbrenner, D. (2005, August). Safety belt use in 2005 – Overall Results. (Report No. DOT HS 809 932). Washington, DC: National Highway Traffic Safety Administration. Available at www-nrd.nhtsa.dot.gov/Pubs/809932.pdf
Glassbrenner, D., & Starnes, M. (2009, December). Lives saved calculations for seat belts and frontal air bags. (Report No. DOT HS 811 206). Washington, DC: National Highway Traffic Safety Administration. Available at www-nrd.nhtsa.dot.gov/Pubs/811206.pdf
Glassbrenner, D., & Ye, J. Y. (2006, November). Seat belt use in 2006 – Overall results. (Report No. DOT HS 810 677). Washington, DC: National Highway Traffic Safety Administration. Available at www-nrd.nhtsa.dot.gov/Pubs/810677.pdf
Glassbrenner, D., & Ye, J. Y. (2007, September). Seat belt use in 2007 – Overall results. (Report No. DOT HS 810 841). Washington, DC: National Highway Traffic Safety Administration. Available at www-nrd.nhtsa.dot.gov/Pubs/810841.pdf
Goryl, M. E. (1986, May). Restraint system usage in the traffic population. (Report No. DOT HS 806 987). Washington, DC: National Highway Traffic Safety Administration. Available at www-nrd.nhtsa.dot.gov/Pubs/HS806987.pdf
Goryl, M. E., & Bowman, B. L. (1987, March). Restraint system usage in the traffic population. (Report No. DOT HS 807 080). Washington, DC: National Highway Traffic Safety Administra-tion. Available at www-nrd.nhtsa.dot.gov/Pubs/807080.pdf
Goryl, M. E., & Cynecki, M. J. (1985, March). Restraint system usage in the traffic population. (Report No. DOT HS 806 714). Washington, DC: National Highway Traffic Safety Administra-tion. Available at www-nrd.nhtsa.dot.gov/Pubs/HS806714.pdf
Government Performance and Results Act of 1993. Public Law 103-62, August 3, 1993.
Greenwell, N. K. (2013, February). Effectiveness of LED stop lamps for reducing rear-end crashes: Analyses of State crash data. (Report No. DOT HS 811 712). Washington, DC: Nation-al Highway Traffic Safety Administration. Available at www-nrd.nhtsa.dot.gov/Pubs/811712.PDF
Greenwell, N. K. (2013, July). Evaluation of the certified-advanced air bags. (Report No. DOT HS 811 834). Washington, DC: National Highway Traffic Safety Administration. Available at www-nrd.nhtsa.dot.gov/Pubs/811834.pdf
Hackney, J., & Ellison, C. (1986). A review of the effects of belts systems, steering assemblies, and structural design on the safety performance of vehicles in the New Car Assessment Program. Tenth International Technical Conference on Experimental Safety Vehicles. (Report No. DOT HS 806 916, pp. 380-413). Washington, DC: National Highway Traffic Safety Administration.
335
Hackney, J. R., & Kahane, C. J. (1995). The New Car Assessment Program: Five Star Rating System and vehicle safety performance characteristics. (Paper No. 950888). Warrendale, PA: Society of Automotive Engineers.
Hackney, J., & Quarles, V. (1982). The New Car Assessment Program – Status and effect. Ninth International Technical Conference on Experimental Safety Vehicles. (Report No. DOT HS 806 341, pp. 809-82). Washington, DC: National Highway Traffic Safety Administration.
Harless, D. W., & Hoffer, G. E. (2002). The antilock braking system anomaly: A drinking driver problem? Accident Analysis and Prevention, 34, pp. 333-341.
Hedeen, C. E., & Campbell, D. D. (1969). Side impact structures. (Paper No. 690003). New York: Society of Automotive Engineers.
Hedlund, J., Gilbert, S. H., Ledingham, K., & Preusser D. (2008, August). How States achieve high seat belt use rates. Washington, DC: National Highway Traffic Safety Administration. Available at www-nrd.nhtsa.dot.gov/Pubs/810962.PDF
Hertz, E. (2000). Analysis of the crash experience of vehicles equipped with all wheel antilock braking systems (ABS) – A second update including vehicles with optional ABS. (Report No. DOT HS 809 144). Washington, DC: National Highway Traffic Safety Administration.
Hertz, E. (1996, December). Revised estimates of child restraint effectiveness. Washington, DC: National Highway Traffic Safety Administration. Available at www-nrd.nhtsa.dot.gov/Pubs/96855.PDF
Hertz, E., Hilton, J., & Johnson, D. M. (1995a). An analysis of the crash experience of light trucks equipped with antilock braking systems. (Report No. DOT HS 808 278). Washington, DC: National Highway Traffic Safety Administration.
Hertz, E., Hilton, J., & Johnson, D. M. (1995b). An analysis of the crash experience of passenger cars equipped with antilock braking systems. (Report No. DOT HS 808 279). Washington, DC: National Highway Traffic Safety Administration.
Hight, P.V., Siegel, A.W., & Nahum, A.M. (1972). Injury mechanisms in rollover collisions. Proceedings of Sixteenth Stapp Car Crash Conference. New York: Society of Automotive Engi-neers.
Hill, A. (1978). Steering wheel oscillations and vertical movements in 30 mph barrier impacts. (Report No. DOT HS 803 606). Washington, DC: National Highway Traffic Safety Administra-tion.
Hiltner, E., Arehart, C., & Radlinski, R. (1991). Light vehicle ABS performance evaluation. (Re-port No. DOT HS 807 813). Washington, DC: National Highway Traffic Safety Administration.
Horsch, J. D., Petersen, K. R., & Viano, D. C. (1982). Laboratory study of factors influencing the performance of energy absorbing steering systems. (Paper No. 820475). Warrendale, PA: Socie-ty of Automotive Engineers.
336
Huelke, D. F. (1969). Accident investigations of performance characteristics of energy absorb-ing steering columns. (Paper No. 690184). Warrendale, PA: Society of Automotive Engineers.
Huelke, D. F., & Compton, C. (1983, October). Injury frequency and severity in rollover car crashes as related to occupant ejection, contacts and roof damage. Accident Analysis and Preven-tion, 15.
Huelke, D. F., & Gikas, P. W. (1968, November/December). Causes of death in automobile ac-cidents. Police, 13, pp. 81-89.
Huelke, D. F., & Gikas, P. W. (1968). How do they die? Medical engineering data from on-scene investigation of fatal automobile accidents. Highway Vehicle Safety. New York: Society of Au-tomotive Engineers.
Huelke, D. F., Grabb, W.C., Dingman, R.O., & Oneal, R.M. (1968, June). The new automotive windshield and its effectiveness in reducing facial lacerations. Plastic and Reconstructive Sur-gery, 41.
Huelke, D. F., Marsh, J.C. IV & Sherman, H.W. (1972). Analysis of rollover accident factors and injury causation. Proceedings of the Sixteenth Conference of the American Association for Au-tomotive Medicine. Morton Grove, IL: American Association for Automotive Medicine.
Hunter, W.W. et al. (1990). Analysis of occupant restraint issues from state accident data. (Re-port No. HSRC-TR75). Chapel Hill, NC: Highway Safety Research Center, University of North Carolina.
Insurance Institute for Highway Safety. (2001, November). ‘Click It or Ticket’ expands beyond North Carolina. Status Report, 36, p. 4. Arlington, VA: Author.
IIHS. (2012, December). Moderate Overlap Frontal Crashworthiness Evaluation Crash Test Protocol (Version XIV). Arlington, VA: Author. Available at www.iihs.org/iihs/ratings/technical-information/technical-protocols
Johnson, P., Klein, T. M., Levy, P., & Maxwell, D. (1980, October). The effectiveness of the 55 mph national maximum speed limit as a life saving benefit. (Report No. DOT HS 805 694). Washington, DC: National Highway Traffic Safety Administration. Available at ntl.bts.gov/lib/30000/30300/30319/805694.pdf
Kahane, C. J. (1974). Usage and effectiveness of seat and shoulder belts in rural Pennsylvania accidents. (Report No. DOT HS 801 398). Washington, DC: National Highway Traffic Safety Administration.
Kahane, C. J. (1975). Lower speed limits, reduced speeds, fewer deaths. (Report No. DOT HS 801 667). Washington, DC: National Highway Traffic Safety Administration.
Kahane, C. J. (1981, January). An evaluation of Federal Motor Vehicle Safety Standards for pas-senger car steering assemblies. (Report No. DOT HS 805 705). Washington, DC: National Highway Traffic Safety Administration. Available at www-nrd.nhtsa.dot.gov/Pubs/805705.PDF
337
Kahane, C. J. (1982, February). An evaluation of head restraints - Federal Motor Vehicle Safety Standard 202. (Report No. DOT HS 806 108). Washington, DC: National Highway Traffic Safe-ty Administration. Available at www-nrd.nhtsa.dot.gov/Pubs/806108.PDF
Kahane, C. J. (1982, November). An evaluation of side structure improvements in response to Federal Motor Vehicle Safety Standard 214. (Report No. DOT HS 806 314). Washington, DC: National Highway Traffic Safety Administration. Available at www-nrd.nhtsa.dot.gov/Pubs/806314.PDF
Kahane, C. J. (1983, February). A preliminary evaluation of two braking improvements for pas-senger cars – Dual master cylinders and front disc brakes. (Report No. DOT HS 806 359). Washington, DC: National Highway Traffic Safety Administration. Available at www-nrd.nhtsa.dot.gov/Pubs/806359.PDF
Kahane, C. J. (1983, July). An evaluation of side marker lamps for cars, trucks and buses. (Re-port No. DOT HS 806 430). Washington, DC: National Highway Traffic Safety Administration. Available at www-nrd.nhtsa.dot.gov/Pubs/806430.PDF
Kahane, C. J. (1984a). Estimates of fatality reduction for air bags and lap/shoulder belts based on case by case analysis of unrestrained fatalities. (NHTSA Docket No. 74-14-N35-012). Wash-ington, DC: National Highway Traffic Safety Administration.
Kahane, C. J. (1984b). Addendum to "Seat belt effectiveness estimates using data adjusted for damage type.” (NHTSA Docket No. 74-14-N35-229-05). Washington, DC: National Highway Traffic Safety Administration.
Kahane, C. J. (1985, February). An evaluation of windshield glazing and installation methods for passenger cars. (Report No. DOT HS 806 693). Washington, DC: National Highway Traffic Safety Administration. Available at www-nrd.nhtsa.dot.gov/Pubs/806693.PDF
Kahane, C. J. (1986, February). An evaluation of child passenger safety: The effectiveness and benefits of safety seats. (Report No. DOT HS 806 890). Washington, DC: National Highway Traffic Safety Administration. Available at www-nrd.nhtsa.dot.gov/Pubs/806890.PDF
Kahane, C. J. (1987, February). A preliminary evaluation of seat back locks. (Report No. DOT HS 807 067). Washington, DC: National Highway Traffic Safety Administration. Available at www-nrd.nhtsa.dot.gov/Pubs/807067.PDF
Kahane, C. J. (1987, March). The effectiveness of center high mounted stop lamps: A preliminary evaluation. (Report No. DOT HS 807 076). Washington, DC: National Highway Traffic Safety Administration. Available at www-nrd.nhtsa.dot.gov/Pubs/HS807076.PDF
Kahane, C. J. (1987b). Fatality and injury reducing effectiveness of lap belts for back seat occu-pants. Restraint Technologies: Rear Seat Occupant Protection. (Paper No. 870486, Publication No. SP-691). Warrendale, PA: Society of Automotive Engineers.
338
Kahane, C. J. (1988, January). An evaluation of occupant protection in frontal interior impact for unrestrained front seat occupants of cars and light trucks. (Report No. DOT HS 807 203). Washington, DC: National Highway Traffic Safety Administration. Available at www-nrd.nhtsa.dot.gov/Pubs/807203.PDF
Kahane, C. J. (1989, July). An evaluation of center high mounted stop lamps based on 1987 data. (Report No. DOT HS 807 442). Washington, DC: National Highway Traffic Safety Administra-tion. Available at www-nrd.nhtsa.dot.gov/Pubs/807442.PDF
Kahane, C. J. (1989, November). An evaluation of door locks and roof crush resistance of pas-senger cars – Federal Motor Vehicle Safety Standards 206 and 216. (Report No. DOT HS 807 489). Washington, DC: National Highway Traffic Safety Administration. Available at www-nrd.nhtsa.dot.gov/Pubs/807489.PDF
Kahane, C. J. (1993, December). Preliminary evaluation of the effectiveness of rear-wheel anti-lock brake systems for light trucks. (NHTSA Docket No. 70-27-GR-026). Washington, DC: Na-tional Highway Traffic Safety Administration. Available at www-nrd.nhtsa.dot.gov/Pubs/7027GR.PDF
Kahane, C. J. (1994, January). Correlation of NCAP performance with fatality risk in actual head-on collisions. (Report No. DOT HS 808 061). Washington, DC: National Highway Traffic Safety Administration. Available at www-nrd.nhtsa.dot.gov/Pubs/808061.PDF
Kahane, C. J. (1994, December). Preliminary evaluation of the effectiveness of antilock brake systems for passenger cars. (Report No. DOT HS 808 206). Washington, DC: National Highway Traffic Safety Administration. Available at www-nrd.nhtsa.dot.gov/Pubs/808206.PDF
Kahane, C. J. (1996, August). Fatality reduction by air bags: analyses of accident data through early 1996. (Report No. DOT HS 808 470). Washington, DC: National Highway Traffic Safety Administration. Available at www-nrd.nhtsa.dot.gov/Pubs/808470.PDF
Kahane, C. J. (1999, October). Evaluation of FMVSS 214 - Side impact protection: Dynamic per-formance requirement; Phase 1: Correlation of TTI(d) with fatality risk in actual side impact collisions of model year 1981-1993 passenger cars. (Report No. DOT HS 809 004). Washington, DC: National Highway Traffic Safety Administration. Available at www-nrd.nhtsa.dot.gov/Pubs/809004.PDF
Kahane, C. J. (2000, December). Fatality reduction by safety belts for front-seat occupants of cars and light trucks. (Report No. DOT HS 809 199). Washington, DC: National Highway Traf-fic Safety Administration. Available at www-nrd.nhtsa.dot.gov/Pubs/809199.PDF
Kahane, C. J. (2003, October). Vehicle weight, fatality risk and crash compatibility of model year 1991-99 passenger cars and light trucks. (Report No. DOT HS 809 662). Washington, DC: Na-tional Highway Traffic Safety Administration. Available at www-nrd.nhtsa.dot.gov/Pubs/809662.PDF
339
Kahane, C. J. (2004, October). Lives saved by the Federal Motor Vehicle Safety Standards and other vehicle safety technologies, 1960-2002. (Report No. DOT HS 809 833). Washington, DC: National Highway Traffic Safety Administration. Available at www-nrd.nhtsa.dot.gov/Pubs/809833.PDF
Kahane, C. J. (2004, December). Cost per life saved by the Federal Motor Vehicle Safety Stand-ards. (Report No. DOT HS 809 835). Washington, DC: National Highway Traffic Safety Ad-ministration. Available at www-nrd.nhtsa.dot.gov/Pubs/809835.PDF
Kahane, C. J. (2006, August). An evaluation of the 1998-1999 redesign of frontal air bags. (Re-port No. DOT HS 810 685). Washington, DC: National Highway Traffic Safety Administration. Available at www-nrd.nhtsa.dot.gov/Pubs/810685.PDF
Kahane, C. J. (2007, January). An evaluation of side impact protection – FMVSS 214 TTI(d) Im-provements and Side Air Bags. (Report No. DOT HS 810 748). Washington, DC: National Highway Traffic Safety Administration. Available at www-nrd.nhtsa.dot.gov/Pubs/810748.PDF
Kahane, C. J. (2011, November). Evaluation of the 1999-2003 head impact upgrade of FMVSS No. 201 – Upper-interior components: Effectiveness of energy-absorbing materials without head-protection air bags. (Report No. DOT HS 811 538). Washington, DC: National Highway Traffic Safety Administration. Available at www-nrd.nhtsa.dot.gov/Pubs/811538.PDF
Kahane, C. J. (2012, August). Relationships between fatality risk, mass, and footprint in model year 2000-2007 passenger cars and LTVs – Final report. (Report No. DOT HS 811 665). Wash-ington, DC: National Highway Traffic Safety Administration. Available at www-nrd.nhtsa.dot.gov/Pubs/811665.PDF
Kahane, C. J. (2013, May). Injury vulnerability and effectiveness of occupant protection technol-ogies for older occupants and women. (Report No. DOT HS 811 766). Washington, DC: Nation-al Highway Traffic Safety Administration. Available at www-nrd.nhtsa.dot.gov/Pubs/811766.pdf
Kahane, C. J. (2013, November). Effectiveness of pretensioners and load limiters for enhancing fatality reduction by seat belts. (Report No. DOT HS 811 835). Washington, DC: National Highway Traffic Safety Administration. Available at www-nrd.nhtsa.dot.gov/Pubs/811835.PDF
Kahane, C. J. (2014, January). Updated estimates of fatality reduction by curtain and side air bags in side impacts and preliminary analyses of rollover curtains. (Report No. DOT HS 811 882). Washington, DC: National Highway Traffic Safety Administration. Available at www-nrd.nhtsa.dot.gov/Pubs/811882.pdf
Kahane, C. J. (2014, May). Updated estimates of fatality reduction by ESC. (Report No. DOT HS 812 020). Washington, DC: National Highway Traffic Safety Administration. Available at www-nrd.nhtsa.dot.gov/Pubs/812020.pdf
Kahane, C. J., & Dang, J. N. (2009, August). The long-term effect of ABS in passenger cars and LTVs. (Report No. DOT HS 811 182). Washington, DC: National Highway Traffic Safety Ad-ministration. Available at www-nrd.nhtsa.dot.gov/Pubs/811182.PDF
340
Kahane, C. J., & Hertz, E. (1998, March). The long-term effectiveness of center high mounted stop lamps in passenger cars and light trucks. (Report No. DOT HS 808 696). Washington, DC: National Highway Traffic Safety Administration. Available at www-nrd.nhtsa.dot.gov/Pubs/808696.PDF
Kahane, C. J., & Ichter, K. D. (1984). Statistical evaluation of brake safety improvements for passenger cars. (Paper No. 841236). Warrendale, PA: Society of Automotive Engineers.
Kahane, C. J., Smith, R. A., & Tharp, K. J. (1977). The National Crash Severity Study. Report on the Sixth International Technical Conference on Experimental Safety Vehicles. (Report No. DOT HS 802 501, pp. 493-515). Washington, DC: National Highway Traffic Safety Administra-tion.
Kahane, C. J., & Tarbet, M. J. (2006, November). HIC test results before and after the 1999-2003 head impact upgrade of FMVSS 201. (Report No. DOT HS 810 739). Washington, DC: National Highway Traffic Safety Administration. Available at www-nrd.nhtsa.dot.gov/Pubs/810739.PDF
Kelleher, B. J., & Walsh, M. J. (1978). Sled test comparisons of child restraint performance. Twenty-Second Stapp Car Crash Conference. (Paper No. 780903). Warrendale, PA: Society of Automotive Engineers.
Kelleher, B. J., Walsh, M. J., Dance, D. M., & Gardner, W. T. (1983). An experimental study of the effects of child restraint improper installation and crash protection for larger size children. SAE Child Injury and Restraint Conference Proceedings. (Paper No. 831602, Publication No. P-135, pp. 31-51). Warrendale, PA: Society of Automotive Engineers, 1983.
Kindelberger, J., & Starnes, M. (2003, November). Moving children from the front seat to the back seat: The influence of child safety campaigns. (Report No. DOT HS 809 698). Available at www-nrd.nhtsa.dot.gov/Pubs/809-698.pdf
Kohl, J. S., & Baker, C. (1978). Field test evaluation of rear lighting systems. (Report No. DOT HS 803 467). Washington, DC: National Highway Traffic Safety Administration.
Kullgren, A., Lie, A., & Tingvall, C. (1994). The effectiveness of ABS in real life accidents. Proceedings of the Fourteenth International Technical Conference on the Enhanced Safety of Vehicles. (Paper No. 94-S4-O-07). Washington, DC: National Highway Traffic Safety Admin-istration.
Kuppa, S., Saunders, J., & Fessahaie, O. (2005, June). Rear seat occupant protection in frontal crashes. Proceedings of the Nineteenth International Technical Conference on the Enhanced Safety of Vehicles. (Paper No. 05-0212). Washington, DC: National Highway Traffic Safety Administration. Available at www-nrd.nhtsa.dot.gov/pdf/esv/esv19/05-0212-O.pdf
Lawless, E. W., & Siani, T. A. (1983). The state of the art of child passenger safety legislation in North America. SAE Child Injury and Restraint Conference Proceedings. (Paper No. 831650, Report No. No. P-135, pp. 229-242). Warrendale, PA: Society of Automotive Engineers.
341
Levine, D. N., & Campbell, B. J. (1971). Effectiveness of lap seat belts and the energy absorbing steering column in the reduction of injuries. (HSL Publication No. 00221617). Chapel Hill, NC: Highway Safety Research Center, University of North Carolina.
Ludtke, N. F. (1980). 1980 and 1979 Ford F-150 weight and cost analysis. Third Automotive Fuel Economy Research Contractors’ Coordination Meeting – Summary Report. (Report No. DOT HS 805 875). Washington, DC: National Highway Traffic Safety Administration.
Ludtke, N. F., Osen, W., Gladstone, R., & Lieberman, W. (2004, December). Perform cost and weight analysis, head protection air bag systems, FMVSS 201. (Report No. DOT HS 809 842; NHTSA Docket No. NHTSA-2011-0066-0007). Washington, DC: National Highway Traffic Safety Administration
Luoma, J., Flannagan, M. J., Sivak, M., Aoki, M., & Traube, E. C. (1997). Effects of turn-signal color on reaction times to brake signals. Ergonomics, 40, pp. 62-68.
Marquis, D. P. (1967). The General Motors energy absorbing column. (Paper No. 670039). War-rendale, PA: Society of Automotive Engineers.
McLean, R. F., Eckel, C., & Cowan, D. (1978, October). Cost evaluation for four Federal Motor Vehicle Standards, Volume I. (Report No. DOT HS 803 871). Washington, DC: National High-way Traffic Safety Administration. Available at www-nrd.nhtsa.dot.gov/Pubs/HS803871.pdf
Mertz, H. J., Jr., & Patrick, L. M. (1967). Investigation of the kinematics and kinetics of whip-lash. Proceedings of Eleventh Stapp Car Crash Conference. New York: Society of Automotive Engineers.
Morgan, C. (1999, June). Effectiveness of lap/shoulder belts in the back outboard seating posi-tions. (Report No. DOT HS 808 945). Washington, DC: National Highway Traffic Safety Ad-ministration. Available at www-nrd.nhtsa.dot.gov/Pubs/808945.PDF
Morgan, C. (2001, March). The effectiveness of retroreflective tape on heavy trailers. (Report No. DOT HS 809 222). Washington, DC: National Highway Traffic Safety Administration. Available at www-nrd.nhtsa.dot.gov/Pubs/809222.PDF
Morgan, C. (2003, November). Results of the survey on the use of passenger air bag on-off switches. (Report No. DOT HS 809 689) Washington, DC: National Highway Traffic Safety Administration. Available at www-nrd.nhtsa.dot.gov/Pubs/809689.PDF
Morgan, C. (2004, March). Evaluation of rear window defrosting and defogging systems. (Re-port No. DOT HS 809 724). Washington, DC: National Highway Traffic Safety Administration. Available at www-nrd.nhtsa.dot.gov/Pubs/809724.PDF
The Motor Vehicle Information and Cost Savings Act of 1973. Public Law 92-513, as amended, 15 United States Code 1912-2012.
Motor Vehicle Manufacturers Association. (1978). 1978 Model Year Passenger Car and Truck Accident Investigator’s Manual. Detroit: Author.
342
National Highway Traffic Safety Administration. (1974). Analysis of effects of proposed changes to passenger car requirements of FMVSS 208. (NHTSA Docket No. 74-14-N01-104). Washing-ton, DC: Author.
NHTSA. (1976). Safety belt usage – A review of effectiveness studies – Suggestions for State programs. (Report No. DOT HS 801 988). Washington, DC: Author.
NHTSA. (1977). Multidisciplinary accident investigation data file, editing manual and reference information, Vol. 2. (Report No. DOT HS 802 412). Washington, DC: Author.
NHTSA. (1977). Standard No. 208 – Passive restraint amendment, Explanation of rulemaking action. (NHTSA Docket No. 74-14-N10-011; Report No. DOT HS 802 523). Washington, DC: Author.
NHTSA. (1978). Preliminary evaluation of the proposed extension of standards No. 201, 203 and 204 to light trucks, buses, and multipurpose vehicles. Washington, DC: Author.
NHTSA. (1980). Side impact conference. (Report No. DOT HS 805 614). Washington, DC: Au-thor.
NHTSA. (1982). Get it together. (Report No. No. DOT HS 806 254). Washington, DC: Author.
NHTSA. (1983). Evaluation plan for center high-mounted stop lamps. (NHTSA Docket No. 81-02-N02-002). Washington, DC: Author.
NHTSA. (1983, September). Final regulatory evaluation, anti-lacerative glazing, FMVSS 205. Washington, DC: Author.
NHTSA. (1983). Final regulatory impact analysis, Federal Motor Vehicle Safety Standard 108, center high-mounted stop lamps. (NHTSA Docket No. 81-02-N02-001). Washington, DC: Au-thor.
NHTSA. (1984). Final regulatory impact analysis, amendment to Federal Motor Vehicle Safety Standard 208, passenger car front seat occupant protection. (NHTSA Report No. DOT HS 806 572). Washington, DC: Author.
NHTSA. (1986). Recent air bag field performance. Washington, DC: Author, National Center for Statistics and Analysis.
NHTSA. (1989, January). The effects of the 65 mph speed limit during 1987. (Report No. DOT HS 807 369). Washington, DC: Author. Available at ntl.bts.gov/lib/25000/25800/25819/DOT-HS-807-369.pdf
NHTSA. (1989). Final regulatory evaluation, rear seat lap shoulder belts in passenger cars. (NHTSA Docket No. 87-08-N03-001). Washington, DC: Author.

343
NHTSA. (1990). Final regulatory impact analysis, extension of the automatic restraint require-ments of FMVSS 208 to trucks, buses and multi-purpose passenger vehicles. (NHTSA Docket No. 74-14-N70-001). Washington, DC: Author.
NHTSA. (1990). Final regulatory impact analysis - New requirements for passenger cars to meet a dynamic side impact test FMVSS 214. (Report No. DOT HS 807 641). Washington, DC: Author.
NHTSA. (1991). Buckle up: Avoid the summertime blues. (Report No. No. DOT HS 041 653). Washington, DC: Author.
NHTSA. (1991). Final regulatory impact analysis, amendment to FMVSS 108 to require center high-mounted stop lamps on light trucks and buses. (NHTSA Docket No. 81-02-N10-001). Washington, DC: Author.
NHTSA. (1991). Preliminary regulatory evaluation – Proposed amendment to FMVSS No. 108 to require retroreflective material on the side and rears of heavy trailers. (NHTSA Docket No. 80-02-N09). Washington, DC: Author.
NHTSA. (1992). Evaluation of the effectiveness of occupant protection, interim report. (Report No. DOT HS 807 843). Washington, DC: Author. Available at www-nrd.nhtsa.dot.gov/Pubs/807843.pdf
NHTSA. (1992). Lap/shoulder belt kits for rear seats. (Report No. No. DOT HS 807 881). Washington, DC: Author.
NHTSA. (1993). New Car Assessment Program: Response to the NCAP FY 1992 congressional requirements – Report to the Congress. Washington, DC: Author.
NHTSA. (Annual publication, 1996 to 2010). Buying a safer car. Washington, DC: Author. Available for 2000 to 2005 at icsw.nhtsa.gov/safe_car_new/ (click on SaferCar2000, Saf-erCar2001, BASC2002, BASC2003, BASC2004, or BASC2005) and for 2006 to 2010 at www.safercar.gov/Vehicle+Shoppers/Resources/Buying+a+Safer+Car+brochures
NHTSA. (1996). Head restraints – Identification of issues relevant to regulation, design, and effectiveness. Washington, DC: Author. Available at www.nhtsa.dot.gov/cars/rules/crashworthy/ headrest/status9/status9.html#28
NHTSA. (1996). Third report to Congress – Effectiveness of occupant protection systems and their use. (Report No. DOT HS 808 537). Washington, DC: Author.
NHTSA. (1997). Air bags & on-off switches: Information for an informed decision. (Report No. No. DOT HS 808 629). Washington, DC: Author. Available at www.safercar.gov/Vehicle+Shoppers/Air+Bags/ON-OFF+Switch+FAQ
NHTSA. (1997). Buckle up America. (Report No. No. DOT HS 808 628). Washington, DC: Author.

344
NHTSA. (1999, May). Fourth report to Congress – Effectiveness of occupant protection systems and their use. (Report No. DOT HS 808 919). Washington, DC: Author. Available at www-nrd.nhtsa.dot.gov/Pubs/808-919.pdf
NHTSA. (2000). Children. (Traffic Safety Facts 1999. Report No. DOT HS 809 087). Washing-ton, DC: Author. Available at www-nrd.nhtsa.dot.gov/Pubs/99Children.pdf
NHTSA. (2001, November). Fifth/sixth report to Congress – Effectiveness of occupant protec-tion systems and their use. (Report No. DOT HS 809 442). Washington, DC: Author. Available at www-nrd.nhtsa.dot.gov/Pubs/809-442.pdf
NHTSA. (2002). Occupant protection. (Traffic Safety Facts 2001. Report No. DOT HS 809 474). Washington, DC: Author. Available www-nrd.nhtsa.dot.gov/Pubs/809474.pdf
NHTSA. (2003, November). Final regulatory impact analysis, FMVSS No. 301 upgrade. (Dock-et No. NHTSA-2003-16523-002). Washington, DC: Author.
NHTSA. (2005, September). A parent’s guide to buying and using booster seats. (Report No. DOT HS 809 503). Washington, DC: National Highway Traffic Safety Administration. Availa-ble at buckleup.mt.gov/docs/nhtsa-guide-buying-boosters.pdf
NHTSA. (2009, January). Special crash investigations – Counts of frontal air bag related fatali-ties and Seriously Injured Persons. (Report No. DOT HS 811 104). Washington, DC: Author. Available at www-nrd.nhtsa.dot.gov/Pubs/811104.pdf
NHTSA. (2012, September). National child restraint use special study. (Traffic Safety Facts Re-search Note. Report No. DOT HS 811 679). Washington, DC: Author. Available at www-nrd.nhtsa.dot.gov/Pubs/811679.pdf
NHTSA. (2013, November). 2012 motor vehicle crashes. (Traffic Safety Facts Research Note. Report No. DOT HS 811 856). Washington, DC: Author. Available at www-nrd.nhtsa.dot.gov/Pubs/811856.pdf
NHTSA. (2013). Traffic safety facts 2011. (Report No. DOT HS 811 754). Washington, DC: Au-thor. Available at www-nrd.nhtsa.dot.gov/Pubs/811754AR.pdf
NHTSA. (2014, March). Occupant protection. (Traffic Safety Facts 2012 Data. Report No. DOT HS 811 892). Washington, DC: Author. Available www-nrd.nhtsa.dot.gov/Pubs/811892.pdf
National Safety Council. (2006, October). National Safety Council honors Air Bag & Seat Belt Safety Campaign for lifesaving achievements. Itasca, IL: Author. Available at www.nsc.org/Pages/NationalSafetyCouncilHonorsAirBagandSeatBeltSafetyCampaign.aspx
National Transportation Safety Board. (1986). Performance of lap belts in 26 frontal crashes. (Report No. NTSB/SS-86/03). Washington, DC: Author.
345
Pai, J. (2014, June). Evaluation of FMVSS No. 301, “fuel system integrity,” as upgraded in 2005 to 2009. (Report No. DOT HS 812 038). Washington, DC: National Highway Traffic Safety Administration. Available at www-nrd.nhtsa.dot.gov/Pubs/812038.pdf.
Parsons, G. G. (1983, January). Evaluation of Federal Motor Vehicle Standard 301-75, fuel sys-tem integrity: passenger cars. (Report No. DOT HS 806 335). Washington, DC: National High-way Traffic Safety Administration. Available at www-nrd.nhtsa.dot.gov/Pubs/HS806335.pdf
Parsons, G. G. (1990, November). Motor vehicle fires in traffic crashes and the effects of the fuel system integrity standard. (Report No. DOT HS 807 675). Washington, DC: National Highway Traffic Safety Administration. Available at www-nrd.nhtsa.dot.gov/Pubs/807675.PDF
Parsons, G. G. (1993, November). An evaluation of the effects of glass-plastic windshield glazing in passenger cars. (Report No. DOT HS 808 062). Washington, DC: National Highway Traffic Safety Administration. Available at www-nrd.nhtsa.dot.gov/Pubs/808062.PDF
Partyka, S. C. (1984a). Simple models of fatality trends using employment and population data. Accident Analysis and Prevention, 16, pp. 211-222.
Partyka, S. C. (1984b). Restraint use and fatality risk for infants and toddlers. Washington, DC: National Highway Traffic Safety Administration.
Partyka, S. C. (1988a, May). Belt effectiveness in pickup trucks and passenger cars by crash di-rection and accident year. Papers on Adult Seat Belts - Effectiveness and Use. (Report No. DOT HS 807 285). Washington, DC: National Highway Traffic Safety Administration.
Partyka, S. C. (1988b). Lives saved by child restraints from 1982 through 1987. (Report No. 807 371). Washington, DC: National Highway Traffic Safety Administration.
Partyka, S. C. (1991). Simple models of fatality trends revisited seven years later. Accident Anal-ysis and Prevention, 23, pp. 423-430.
Patrick, L. M., & Daniel, B. P. (1966). Comparison of standard and experimental windshields. Eighth Stapp Car Crash and Field Demonstration Conference. Detroit: Wayne State University Press.
Perkins, D. D., Cynecki, M. J., & Goryl, M. E. (1984, July). Restraint system usage in the traffic population. (Report No. DOT HS 806 582). Washington, DC: National Highway Traffic Safety Administration. Available at www-nrd.nhtsa.dot.gov/Pubs/HS806582.pdf
Phillips, B. M. (1980, May). Safety belt usage among drivers. (Report No. DOT HS 805 398). Washington, DC: National Highway Traffic Safety Administration. Available at www-nrd.nhtsa.dot.gov/Pubs/HS805398.pdf
Phillips, B. M. (1983, May). Restraint system usage in the traffic population. (Report No. DOT HS 806 424). Washington, DC: National Highway Traffic Safety Administration. Available at www-nrd.nhtsa.dot.gov/Pubs/HS806424.pdf

346
Pickrell, T. M. (2014, January). Occupant restraint use in 2012: Results from the National Oc-cupant Protection Use Survey Controlled Intersection Study. (Report No. DOT HS 811 872). Washington, DC: National Highway Traffic Safety Administration. Available at www-nrd.nhtsa.dot.gov/Pubs/811872.pdf
Pickrell, T. M., & Ye, J. Y. (2008, September). Seat belt use in 2008 – Overall results. (Report No. DOT HS 811 036). Washington, DC: National Highway Traffic Safety Administration. Available at www-nrd.nhtsa.dot.gov/Pubs/811036.pdf
Pickrell, T. M., & Ye, J. Y. (2009, September). Seat belt use in 2009 – Overall results. (Report No. DOT HS 811 200). Washington, DC: National Highway Traffic Safety Administration. Available at www-nrd.nhtsa.dot.gov/Pubs/811200.pdf
Pickrell, T. M., & Ye, J. Y. (2010a, September). The 2009 National Survey of the Use of Booster Seats. (Report No. DOT HS 811 377). Washington, DC: National Highway Traffic Safety Ad-ministration. Available at www-nrd.nhtsa.dot.gov/Pubs/811377.pdf
Pickrell, T. M., & Ye, J. Y. (2010b, September). Seat belt use in 2010 – Overall results. (Report No. DOT HS 811 378). Washington, DC: National Highway Traffic Safety Administration. Available at www-nrd.nhtsa.dot.gov/Pubs/811378.pdf
Pickrell, T. M., & Ye, J. Y. (2011, November). Seat belt use in 2011 – Overall results. (Report No. DOT HS 811 544). Washington, DC: National Highway Traffic Safety Administration. Available at www-nrd.nhtsa.dot.gov/Pubs/811544.pdf
Pickrell, T. M., & Ye, T. J. (2012, November). Seat belt use in 2012 – Overall results. (Report No. DOT HS 811 691). Washington, DC: National Highway Traffic Safety Administration. Available at www-nrd.nhtsa.dot.gov/Pubs/811691.pdf
Radovich, V. G. (1983). Development of infant and child restraint regulations and their applica-tion. SAE Child Injury and Restraint Conference Proceedings. (Paper No. 831655, Publication No. P-135). Warrendale, PA: Society of Automotive Engineers.
Rausch, A., Wong, J. I., & Kirkpatrick, M. (1981). A field test of two single center high-mounted brake light systems. (NHTSA Docket No. 81-02-N01-031). Arlington, VA: Insurance Institute for Highway Safety.
Reilly, R. E., Kurke, D. S., & Buckenmaier, C. C. (1980). Validation of the reduction of rear end collisions by a high mounted auxiliary stoplamp. (Report No. DOT HS 805 360). Washington, DC: National Highway Traffic Safety Administration.
Reinfurt, D. W. (1981, June). A statistical evaluation of the effectiveness of FMVSS 301: Fuel system integrity. (Report No. DOT HS 805 969). Washington, DC: National Highway Traffic Safety Administration. Available at www-nrd.nhtsa.dot.gov/Pubs/HS805969.pdf
347
Reinfurt, D. W., Silva, C. Z., & Seila, A. F. (1976, September). A statistical analysis of seat belt effectiveness in 1973-75 model cars involved in towaway crashes, Volume 1. (Report No. DOT HS 802 035). Washington, DC: National Highway Traffic Safety Administration. Available at www-nrd.nhtsa.dot.gov/Pubs/HS802035.PDF
Rieser, R. G., & Michaels, G. E. (1966). Factors in the development and evaluation of safer glaz-ing. Ninth Stapp Car Crash Conference. Minneapolis: University of Minnesota Press.
Schmidt, R. A., Young, D. E., & Ayres, T. J. (1998, March). Automobile seat belts: Usage pat-terns in automatic belt systems. Human Factors, 40, pp. 126-135.
Severy, D. M., Brink, H. M., & Baird, J. D. (1968). Backrest and head restraint design for rear-end collision protection. (Paper No. 680079). Warrendale, PA: Society of Automotive Engineers.
Severy, D. M., Brink, H. M., Baird, J. D., & Blaisdell, D. M. (1969). Safer seat designs. Thir-teenth Stapp Car Crash Conference. New York: Society of Automotive Engineers.
Shopland, D. R., Burns, D. M., Samet, J. M., & Gritz, E. R., eds. (1991, October). Strategies to control tobacco use in the United States – A blueprint for public health action in the 1990s. (Smoking and Tobacco Control Monograph No. 1, NIH Publication No. 92-3316). Bethesda, MD: National Cancer Institute. Available at cancercon-trol.cancer.gov/Brp/tcrb/monographs/1/m1_complete.pdf
Sikora, J. J. (1986). Relative risk of death for ejected occupants in fatal traffic accidents. (Report No. DOT HS 807 096). Washington, DC: National Highway Traffic Safety Administration.
Sivinski, R. (2010, July). Booster seat effectiveness estimates based on CDS and State data. (Re-port No. DOT HS 811 338). Washington, DC: National Highway Traffic Safety Administration. Available at www-nrd.nhtsa.dot.gov/Pubs/811338.pdf
Sivinski, R. (2011, June). Crash prevention effectiveness of light-vehicle electronic stability con-trol: An update of the 2007 NHTSA evaluation. (Report No. DOT HS 811 486). Washington, DC: National Highway Traffic Safety Administration. Available at www-nrd.nhtsa.dot.gov/Pubs/811486.pdf
Sivinski, R. (2012, November). Evaluation of the effectiveness of TPMS in proper tire pressure maintenance. (Report No. DOT HS 811 681). Washington, DC: National Highway Traffic Safety Administration. Available at www-nrd.nhtsa.dot.gov/Pubs/811681.pdf
Smith, R. A., & Kahane, C. J. (1975). 1974 accident experience with air cushion restraint sys-tems. (Paper No. 750190). Warrendale, PA: Society of Automotive Engineers.
Society of Automotive Engineers. (Annual publication). SAE Handbook. Warrendale, PA: Au-thor.
State Seat Belt Laws. (n.a.). Washington, DC: Governors Highway Safety Association. Available at www.ghsa.org/html/stateinfo/laws/seatbelt_laws.html
348
States, J. D., Korn, M. W., & Massengill, J. B. (1969). The enigma of whiplash injuries. Pro-ceedings of the Thirteenth Annual Conference of the American Association of Automotive Medi-cine. Morton Grove, IL: American Association of Automotive Medicine.
Stern, D. (2012). Preventing crashes with amber turn signals. Teaneck, NJ: Allpar, LLC. Avail-able at www.acarplace.com/cars/turn-signals
Stowell, C., & Bryant, J. (1977, December). Safety BELT USage: Survey of the traffic popula-tion. (Report No. DOT HS 803 354). Washington, DC: National Highway Traffic Safety Admin-istration. Available at www-nrd.nhtsa.dot.gov/Pubs/HS803354.pdf
Streff, F. M., Molnar, L. J., & Christoff, C. (1994). Automatic safety belt use in Michigan: A two-year follow-up. Journal of Safety Research, 25, pp. 215-219.
Sullivan, L. K., Louden, A. E., & Echemendia, C. G. (2013, December). Child restraint side im-pact test procedure development. (Docket No. NHTSA-2014-0012-0002). Washington, DC: Na-tional Highway Traffic Safety Administration.
Tarbet, M. J. (2004, December). Cost and weight added by the Federal Motor Vehicle Safety Standards for model years 1968-2001 in passenger cars and light trucks. (Report No. DOT HS 809 834). Washington, DC: National Highway Traffic Safety Administration. Available at www-nrd.nhtsa.dot.gov/Pubs/809834.PDF
Tennessee Highway Patrol. (1983). 51 Young Lives: A case-by-case synopsis of fatal accidents involving children under age four. State of Tennessee 1979, 1980, 1981, 1982. (Report No. No. DOT HS 034 896). Washington, DC: National Highway Traffic Safety Administration.
Teoh, E. R., & Lund, A. K. (2011, June). IIHS side crash test ratings and occupant death risk in real-world crashes. 22nd Enhanced Safety of Vehicles Conference. (Paper No. 11-0165). Wash-ington, DC: National Highway Traffic Safety Administration. Available at www-esv.nhtsa.dot.gov/Proceedings/22/files/22ESV-000165.pdf
Tourin, B., & Garrett, J. W. (1960). Safety Belt Effectiveness in Rural California Automobile Ac-cidents. Buffalo: Cornell Aeronautical Laboratory.
Treat, J. R., Tumbas, N. S., McDonald, S. T., Shinar, D., Hume, R. D., R.E. Mayer, R. E., … & Castellan, N. J. (1977). A tri-level study of the causes of traffic accidents, Vol. 1. (Report No. DOT HS 805 085). Washington, DC: National Highway Traffic Safety Administration. Voight, G., & Wilfert, K. (1969). Mechanisms of injury to unrestrained drivers in head-on colli-sions. (Paper No. 690811). Warrendale, PA: Society of Automotive Engineers.
Walz, M. C. (2001, April). The effectiveness of head restraints in light trucks. (Report No. DOT HS 809 247). Washington, DC: National Highway Traffic Safety Administration. Available at www-nrd.nhtsa.dot.gov/Pubs/809247.PDF
349
Walz, M. C. (2003, March). NCAP Test Improvements with pretensioners and load limiters. (Report No. DOT HS 809 562). Washington, DC: National Highway Traffic Safety Administra-tion. Available at www-nrd.nhtsa.dot.gov/Pubs/809562.PDF
Walz, M. C. (2004, February). Evaluation of FMVSS 214 side impact protection for light trucks: Crush resistance requirements for side doors. (Report No. DOT HS 809 719). Washington, DC: National Highway Traffic Safety Administration. Available at www-nrd.nhtsa.dot.gov/Pubs/809719.PDF
Walz, M. C. (2005, June). Trends in the static stability factor of passenger cars, light trucks, and vans. (Report No. DOT HS 809 868). Washington, DC: National Highway Traffic Safety Ad-ministration. Available at www-nrd.nhtsa.dot.gov/Pubs/809868.PDF
Wang, J. (2008, September). The effectiveness of daytime running lights for passenger vehicles. (Report No. DOT HS 811 029). Washington, DC: National Highway Traffic Safety Administra-tion. Available at www-nrd.nhtsa.dot.gov/Pubs/811029.pdf
Ward’s automotive yearbook. (Annual publication). Southfield, MI: Penton Media, Inc.
Widman, J. C. (1965). Recent developments in penetration resistance of windshield glass. (Paper No. 650474). Warrendale, PA: Society of Automotive Engineers.
Williams, A. F., Wells, J. K., Lund, A. K., & Teed, N. (1989, October). Observed use of auto-matic seat belts in 1987 cars. Accident Analysis and Prevention, 21, pp. 427-433.
Williams, A. F., Wong, J., & O’Neill, B. (1979). Occupant protection in interior impacts – An analysis of FMVSS No. 201. Proceedings of the Twenty-Third Conference of the American As-sociation for Automotive Medicine. Morton Grove, IL: American Association for Automotive Medicine.
Wilson, R. A. (1969). Evaluating knee-to-instrument panel impacts. Thirteenth Stapp Car Crash Conference. (Paper No. 690801). Warrendale, PA: Society of Automotive Engineers.
World Health Organization. (2005). International statistical classification of diseases and health related problems, tenth revision – ICD-10, Second edition. Geneva: Author. Available at www.who.int/classifications/icd/en
Ziedman, K., Burger, W. J., Smith, R. L., Mulholland, M. U., & Sharkey, T. J. (1981). Improved commercial vehicle conspicuity and signalling systems, Task II – Analyses, experiments and de-sign recommendations. (Report No. DOT HS 806 098). Washington, DC: National Highway Traffic Safety Administration.
350
APPENDIX A
SAS Programs Used to Estimate Lives Saved by Vehicle Safety Technologies and Associated FMVSS, 1960 To 2012
Overview LS2014CR1, LS2014CR2, and LS2014CR3 are the programs that create a census file called LSM2014C of the 1,625,528 fatality cases in FARS for CY 1975 through 2012, on file as of De-cember 31, 2013.620 It includes all fatalities: non-occupants as well as vehicle occupants; occu-pants of heavy trucks, unknown vehicles, and other types of vehicles as well as occupants of cars and LTVs. It includes necessary data elements about the person who was the fatality and about the crash. It contains data elements about a vehicle: the vehicle occupied by the fatality, if the fatality was an occupant, or the vehicle that hit the non-occupant. Vehicle data include an analy-sis of the VIN, based on a series of programs developed and maintained by NHTSA staff since 1991 for use in FMVSS evaluations and other vehicle safety analyses. If the crash is a 2-vehicle crash, data elements are obtained on the “other” vehicle. From CY 1975 to 1985, LSM2014C is identical to LSM2004, the file used in the NHTSA’s 2004 report that estimated lives saved from 1960 until 2002.621
LS2014CR1 uses the FARS data from CY 1975 through 2012 to create an initial file LSM2014A of 1,625,528 fatality cases. LS2014CR1 creates a record for every fatally injured person on FARS. If the person is a non-occupant, it identifies the VEH_NO of the vehicle that struck the non-occupant. It appends some variables from the accident-level file for that ST_CASE. It ap-pends variables from the vehicle-level file or non-transport-vehicle-level for that ST_CASE and VEH_NO (i.e., the VEH_NO of the vehicle that the occupant was riding in or that struck the non-occupant). The 2012 FARS no longer has the IMPACT2 variable (principal damage loca-tion). To establish continuity with earlier years, another file called IMP20, created by a program called CRSH_TEST3 helps impute an IMPACT2 based on the IMPACT1 and MDAREAS vari-ables on 2012 FARS. LS2014CR1 uses a file called FARS_A21 created by NHTSA’s VIN-decode programs, to append the make-model codes, vehicle type, information about outboard front seat belts, frontal air bags, and curtain/side air bags for all the MY 1981-to-2011 cars and MY 1985-to-2011 LTVs that these programs consider to have fully valid VINs. If the ST_CASE and VEH_NO are not on FARS_A21, it defines the vehicle type based on the first three charac-ters of the VIN, if possible, and otherwise on the BODY_TYP. If the crash involved two vehi-cles, it appends information on the other vehicle; furthermore, if the other vehicle is a tractor-trailer, it appends additional data elements relevant to conspicuity tape, such as what part of the tractor-trailer was hit.
620 On that day FARS had been complete for the full year 2012 for some time, but selected cases may still be revised in the future. 621 Kahane (2004, October), Appendix A.
351
LS2014CR2 creates LSM2014B from LSM2014A. Both are files of 1,625,528 fatality cases, but the new file adds information, when possible, for some vehicles that did not have fully decoded VINs on FARS_A21: (1) vehicles where the FARS variable MOD_YR does not agree with the tenth character of the VIN, but the remainder of the VIN is plausible (in which case, MOD_YR is replaced by the VIN-based MY); (2) not-in-transport vehicles; (3) vehicles for which FARS has a MAK_MOD but no VIN; and (4) MY 2012 and 2013 vehicles. Based on the decoded VIN or MAK_MOD, the program defines, to the extent possible, make-model codes and information on belts and air bags comparable to FARS_A21. For car/LTV occupant fatalities in FARS after 1992, the make-model is completely unknown in only 0.3 percent of the cases.
LS2014CR3 uses LSM2014B (for CY 1986 to 2012) and the LSM2004 file created for the 2004 report (for CY 1975 to 1985) to generate LSM2014C, the main analysis file. It is still a census of 1,625,528 fatality cases. The program adds information on whether vehicles (MY 1992 and later) certify to the upgrades of FMVSS Nos. 201, 214, and 301; and if they have ESC, pretensioners and load limiters, sled-certified air bags, or advanced air bags. If any of these parameters are en-tirely unknown for a make-model in a particular MY, LS2014 will assume they are not equipped with it; if it is unknown for a specific vehicle but the percentage optionally equipped is known for that make-model and MY (e.g., for ESC), LS2014 will use that percentage as the probability the vehicle is so equipped.
LS2014 is the main program that:
• Selects the fatality cases from LSM2014C that were occupants of cars, occupants of LTVs, non-occupants struck by cars /LTVs, or motorcyclists struck by cars/LTVs.
• Adjusts for missing data on vehicle type or vehicle MY. • Replaces each case with unknown impact type, seating position or belt/safety seat use by
a set of cases, one for each possible value of those variables, weighted by the probability of occurrence of that value – based on analyses of the distribution of these variables, when they are known, as a function of other variables on the file.
• “Removes” the safety technologies from each case vehicle, one-by-one, in the reverse chronological order that they were installed, calculating the increase in the fatality risk, if any, as a consequence.
• Tallies, for the entire file, the number of additional fatalities there would have been if none of the vehicles had been equipped with any safety technologies, and apportions the additional fatalities by safety standard/technology, by vehicle type, by CY (1975 to 2012), and by whether the technology was mandated by a standard already in effect or was voluntarily furnished by the manufacturer at the time the vehicle was built.
LS2014 includes both the “preprocessor” and the “main model” described in the “Summary of the Estimation Method” chapter of Part 2 of this report. Before LS2014 can be successfully oper-ated, it is necessary to run nine auxiliary programs that provide the information the preprocessor needs to adjust or distribute the unknowns.
LS_UNK14 finds the proportion of cases in each CY where the case vehicle type and/or its mod-el year are unknown, and it develops the factors to adjust the weights of the remaining cases after these cases are deleted from the analysis.
352
MC_ESC14 considers motorcyclist fatalities in two-vehicle crashes. If the other vehicle is a car or LTV, it identifies (1) if the car or LTV is culpable and (2) if it is equipped with ESC (yes, no, or optional percentage). It creates MCESC, which has a variable CULP_ESC if the car or LTV was culpable and it had standard or optional ESC. CULP_ESC = 1 if ESC was standard, other-wise it is the percentage of that make-model and MY equipped with optional ESC.
L_CRSH14 creates four files, NEWCRSH1, NEWCRSH2, NEWCRSH3 and NEWCRSH4 that state the probability distribution of CY 2003-to-2012 fatalities by crash type/impact location as a function of other variables. LS2014 will use these files, as well as the files CRSH1, CRSH2, CRSH3 and CRSH4 developed in the previous report for CY 1975-to-2002 fatalities to impute crash type/impact locations on LSM2014C cases where they are unknown. For example in single-vehicle crashes, a multinomial logistic regression (CATMOD) calibrates the probability that the crash type/impact location was frontal, side, rollover or rear/other as a function of the specific object struck, the vehicle type, the occupant’s age, and the occupant’s ejection status, based on cases where everything is known, and it stores these probabilities in NEWCRSH1.
L_SEAT14 creates a file, NEWSEAT1 that states the probability distribution, calibrated by CATMOD, of CY 2003-to-2012 passenger fatalities by seating position as a function of the pas-senger’s age, the vehicle type and the crash type/impact location. LS2014 will use this file, as well as the file SEAT1 developed in the previous report for CY 1975-to-2002 fatalities, to impute seating positions when they are completely unknown, or when they are just partially known (e.g., front seat, unknown location).
L3PT14 is a binomial logistic regression (PROC LOGIST) of belt use by outboard front seat oc-cupants 6 years or older in vehicles with integral 3-point belts (including automatic 3-point belts) at the outboard front seating positions, for fatality cases in CY 2003 to 2012 where the belt use is not reported as “unknown.” It calibrates belt use (yes or no) as a function of the CY, the occu-pant’s age and gender, the vehicle type, vehicle age, crash type/impact location, and seating posi-tion (driver or RF). The regression equation is copied into LS2014, where it will impute the belt use of occupants for whom it is unknown on 2003-to-2012 FARS. L3PT4 is the corresponding program to impute belt use in the previous report and it is still used for 1975-to-2002 FARS.
LBK3PT14 similarly calibrates belt use from 2003 to 2012 for outboard rear seat passengers and center rear seat passengers age 6+, in vehicles with integral 3-point belts at the applicable seating position, as a function of the CY, the occupant’s age and gender, the vehicle type, vehicle age, crash type/impact location, and seating position (outboard or center). LBK3PT4 from the previ-ous report is used to impute belt use from 1975 to 2002.
L2PT14 calibrates use of automatic 2-point shoulder belts from 2003 to 2012 at the outboard front seats for occupants age 6+, as a function of the type of automatic 2-point belt (motorized or non-motorized), the occupant’s age and gender, the vehicle age, crash type/impact location, and seating position (driver or RF). The analysis does not investigate whether the manual lap belt, if one exists, was also used. L2PT4 from the previous report imputes automatic belt use up to CY 2002.
L_LAP14 calibrates belt use from CY 2003 to 2012 of occupants age 6+ at seating positions equipped with lap belts only or with separate lap and shoulder belts (center front in all model
353
years; outboard front, outboard rear and center rear before the shift to integral 3-point belts), as a function of the CY, the occupant’s age and gender, the vehicle type, vehicle age, crash type/impact location, and seating position (driver, center front, right front, outboard rear, or cen-ter rear). In the cars with separate lap and shoulder belts, it merely calibrates if any belt was used, and it does not distinguish between the lap belt, the shoulder belt, or both. L_LAP4 from the previous report imputes lap belt use from CY 1975 to 2002.
LKIDRES14 comprises two logistic regressions and performs two calibrations of restraint sys-tems use from CY 2003 to 2012 by child passengers 0 to 5 years old. The first regression, ex-cluding only the passengers whose restraint use was completely unknown (codes 9 and 99), cali-brates the proportion that used any type of restraint (belts, safety seats, or “used, type not speci-fied”) versus no restraint at all. The second regression, limited to restrained children where the type of restraint was also known, calibrates the proportion in safety seats versus belts. Both re-gression equations, as well as those from the three preceding programs, are copied into LS2004. LKIDRES4 from the previous report performs the two corresponding logistic regressions for CY 1975 to 2002 and imputes restraint use.
OLDFA24, a program already written for the 2004 report, is the postprocessor that estimates lives saved in CY 1960 to 1974. It uses information from Accident Facts and other programs written in 2004 to estimate:
• How many fatalities there would have been on FARS in each calendar year, from 1960 to 1974, if FARS had existed.
• How many of them would have been car occupants, LTV occupants, or non-occupants and motorcyclists struck by cars or LTVs.
• The model-year distribution of the cars and LTVs in these crashes and, for the occupant fatalities, their distribution by the vehicle’s impact location/crash type and whether or not the occupant was ejected.
• How many of the occupants were belted and how many of the vehicles were equipped with the various safety technologies that existed before 1975.
Having created these hypothetical populations of fatal crash cases, OLDFA24 runs through the same model as LS2014, removing the safety technologies from the case vehicles in the reverse chronological order that they were installed, calculating the increase in the fatality risk, if any, as a consequence, and tallying the number of additional fatalities there would have been if none of the vehicles had been equipped with any safety technologies in 1960-74.
LIFE6012 combines the estimates from LS2014 and OLDFA24 to provide a single printout of the lives saved, year-by-year, from 1960 through 2012, apportioned by FMVSS/technology, by vehicle type, and by whether the technology was mandated by a standard already in effect or was voluntarily furnished by the manufacturer at the time the vehicle was built. LIFE6012 needs to run immediately after LS2014 and OLDFA24 (without closing SAS).
TRND6012 computes occupant fatality rates per 100,000,000 VMT, based on VMT totals de-rived from Traffic Safety Facts 2011, Traffic Safety Facts Research Note: 2012 Motor Vehicle Crashes, and Accident Facts. It also generates all the graphs in this report.
354
FMVSS_PCT generates the tables in Appendix C showing the percentage of new vehicles by MY and the percentage of vehicles on the road by CY equipped with various technologies. (NCNA2084, a program written for the 2004 report, helps generate information used in FMVSS_PCT for the early belt technologies, based on NCSS and NASS data.) FMVSS_PCT identifies the median installation years for the various safety technologies. It confirmed that they are listed in the correct reverse-chronological order in LS2014. FMVSS_PCT needs to run soon after LS2014 (without closing SAS).
This overview is followed by a complete listing, with commentary, of the SAS program LS2014. A complete listing and commentary for the program OLDFA24 may be found on pp. 357-395 of NHTSA’s 2004 report (available at www-nrd.nhtsa.dot.gov/Pubs/809833.PDF).622 All the other programs are much shorter, generally self-explanatory, or are discussed within the commentary on LS2014.
622 Kahane (2004, October).

355
DESCRIPTION OF THE MAIN ANALYSIS PROGRAM LS2014 Files used to run this program (file locations entered into ‘ ‘ depend on the computer system where the program will be run): LIBNAME LIBRARY ' ‘; LIBNAME LSM2014C ' '; LIBNAME MCESC ' '; LIBNAME CRSH1 ' '; LIBNAME CRSH2 ' '; LIBNAME CRSH3 ' '; LIBNAME CRSH4 ' '; LIBNAME NEWCRSH1 ' '; LIBNAME NEWCRSH2 ' '; LIBNAME NEWCRSH3 ' '; LIBNAME NEWCRSH4 ' '; LIBNAME SEAT1 ' '; LIBNAME NEWSEAT1 ' '; OPTION NOCENTER NOFMTERR OBS=5000000 LS=210 PAGESIZE=68; /* PROGRAM NAME: LS2014.SAS UPDATED: 01/24/2014 */ /* LIVES SAVED BY FMVSS IN 1975-2012, CARS, LTVs, PEDS, MOTORCYCLES */
Codes for impact location/crash type (CRSH): PROC FORMAT; VALUE CRSH 1='FRONTAL' 2='SIDE IMPACT' 3='ROLLOVER (PRIMARY)' 4='REAR & OTHER' 9='UNKNOWN';
Codes for vehicle type: PROC FORMAT; VALUE VTYP 1='PASSENGER CAR' 2='LTV' 3='BIG TRUCK, BUS' 4='MOTORCYCLE' 5='OTHER' 9='UNKNOWN'; PROC FORMAT; VALUE CYGP 1='1975-81' 2='1982-90' 3='1991-2012'; PROC FORMAT; VALUE MY 1900-1954='PRE-1955' 9999='UNKNOWN';
Codes for streamlined seating position variable (SEAT2): PROC FORMAT; VALUE NEWSEAT 11='DRIVER' 12='CENTER FRONT' 13='RIGHT FRONT' 18='OTHER FRONT' 19='UNK FRONT' 21='OUTBOARD REAR' 22='CENTER REAR' 28='OTHER REAR' 29='UNK REAR' 51='OTHER ENCLOSED' 52='UNENCLOSED' 99='UNK PASSENGER'; PROC FORMAT; VALUE NEWVTYP 1='CONVERTIBLE' 2='2-DOOR CAR' 4='4-DOOR CAR' 6='STATION WAGON' 9='CAR, UNK STYLE' 11='PICKUP TRUCK' 12='S U V' 13='VAN' 19='TRUCK, UNK STYLE';
Codes for streamlined restraint use variables (REST2 and REST3): PROC FORMAT; VALUE NEWREST 0='UNRESTRAINED' 1='SHOULDER BELT ONLY' 2='LAP BELT ONLY' 3='LAP+SHOULDER BELT' 4='CHILD SAFETY SEAT' 7='2-PT AUTOMATIC BELT' 8='USED, TYPE NOT SPECIFIED' 99='UNKNOWN IF USED';
Special codes for analysis of air bags and child passengers: PROC FORMAT; VALUE KCRSH 1='12:00 IMPACT1 OR 2' 2='11,1:00' 3='10,2:00' 4='NONFRONTAL'; PROC FORMAT; VALUE RESTGP 1='INFANT IN CRD' 2='INFANT NOT IN CRD' 3='AGE 1-5 UNRESTRAINED' 4='AGE 1-5 IN CRD' 5='AGE 1-5 BELTED' 6='AGE 6-10 UNRESTRAINED' 7='AGE 6-10 BELTED' 8='AGE 11-12 UNRESTRAINED' 9='AGE 11-12 BELTED'; RUN;
The preprocessor section of LS2014 starts here. Selects from LSM2014C, the census of fatality cases, those fatalities that were occupants of cars or LTVs (OCC1), non-occupants struck by cars or LTVs (PED1) or motorcyclists struck by cars or LTVs (MC1).
356
/* ------------------------------------------------------------------------- */ /* ------------------------------------------------------------------------- */ /* SUBDIVIDES THE FATALITIES INTO (1) OCCUPANTS OF CARS/LTVs */ /* (2) NONOCCUPANTS KILLED BY CARS/LTVS (3) MOTORCYCLISTS KILLED BY CAR/LTVs */ /* ADJUSTS ALL NUMBERS UPWARD FOR MISSING DATA ON VEHICLE TYPE OR MODEL YEAR */ /* MY = 0-9 IN CY < 1982 ARE HIGHLY SUSPECT AND WILL BE CONSIDERED MISSING */ /* ------------------------------------------------------------------------- */ /* ------------------------------------------------------------------------- */ DATA OCC1(KEEP=ORIGWT WEIGHTFA CY MY VTYP IMPACT1 IMPACT2 ROLLOVER HARM_EV MAN_COLL BOD2 TRKTYP BODY_TYP V1-V8 AGE SEX VE_FORMS CYGP NEWVTYP EJECTION SEAT_POS REST_USE AUT_REST PER_TYP LGT_COND CRSH PASSIVE MAK2 MM2 CG MAKE MAK_MOD PER_NO OVTYP OIMPACT2 OVCONFIG STATE MONTH M_HARM TAPECASE AIR_BAG BELT22 BOD3 CAC CURT_TORS DR_CF1 DR_CF2 DR_CF3 DR_CF4 DR_SF1 DR_SF2 DR_SF3 DR_SF4 ESC FIRE_EXP FMVSS201 FMVSS214 FMVSS301 MAK3 MM3 MY_FARS NEW_COMBO NEW_CURTAIN NEW_TORSO PRETENLL P_CRASH1 REDES ROLLCURT VEH_MAN VE_TOTAL XBOD2 XMAK2 XMM2 XMY TRAV_SP) PED1(KEEP=ORIGWT WEIGHTFA CY XMY VTYP) MC1(KEEP=ORIGWT WEIGHTFA CY ST_CASE VEH_NO OMY OVTYP); SET LSM2014C.LSM2014C;
Deletes cases with unknown vehicle type, unknown model year, or that did not involve a car/LTV. Note: XMY is the “working” model year on LSM2014C and it is the one that will be used throughout this program. Similarly, XMM2 is the working make-model variable on that file. IF VTYP=. THEN VTYP=9; IF VTYP IN (1,2) OR (VTYP=4 AND OVTYP IN (1,2)); IF VTYP IN (1,2) AND (XMY GT CY+1 OR XMY=9999 OR 0 LE XMY LE 1909) THEN DELETE; IF VTYP=4 AND (OMY GT CY+1 OR OMY=9999 OR OMY=. OR 0 LE OMY LE 1909) THEN DELETE; IF VTYP=4 THEN GOTO MCWATE; IF PER_TYP IN (1,2,9) THEN GOTO OCCWATE; /* DELETE (AND ADJUST FOR) PARKED-VEHICLE OCC IN CY 1975-2004 SINCE VTYP/MY UNKNOWN */ IF (CY LE 1981 AND PER_TYP=5) OR (CY IN (1982:2004) AND PER_TYP=3) THEN DELETE; /* ------------------------------------------------------------------------- */ /* ADJUSTMENT FACTORS FOR NONOCCUPANTS - OBTAINED BY RUNNING LS_UNK14 */ /* ------------------------------------------------------------------------- */
Creates the two weight-factor variables, ORIGWT and WEIGHTFA that will stay with each fatality case as it proceeds through the model. ORIGWT is the original weight assigned to each fatality case. WEIGHTFA is the inflated weight denoting how many fatalities there would have been if safety tech-nologies were removed from the vehicle. Throughout the preprocessor, WEIGHTFA = ORIGWT. Having deleted all the cases with unknown vehicle type or model year, must give all the remaining cases an ORIGWT higher than 1, so that the ORIGWTs will add up to the original fatality count, in-cluding an allowance for all cases deleted due to missing XMY, and an allowance for a portion of the cases with unknown vehicle type – as computed by the program LS_UNK14. For example, suppose there are 10,000 fatality cases in cars/LTVs with known MY, 100 cases in cars/LTVs with unknown MY, and 200 fatality cases in vehicles of unknown type. Assume also that, when the vehicle type is known, 80 percent are cars/LTVs and 20 percent are heavy trucks, motorcy-cles or other known types. Then the inflation factor computed by LS_UNK14 would be:
[10,000 + 100 + (.80x200)] / 10,000 = 1.026 The vehicle’s model year or type is unknown in 9-19 percent of pedestrian crashes, primarily because many of them are hit-and-run.
357
IF CY=1975 THEN WEIGHTFA=1.15080; ELSE IF CY=1976 THEN WEIGHTFA=1.16331; ELSE IF CY=1977 THEN WEIGHTFA=1.16595; ELSE IF CY=1978 THEN WEIGHTFA=1.16998; ELSE IF CY=1979 THEN WEIGHTFA=1.17921; ELSE IF CY=1980 THEN WEIGHTFA=1.18698; ELSE IF CY=1981 THEN WEIGHTFA=1.20951; ELSE IF CY=1982 THEN WEIGHTFA=1.13142; ELSE IF CY=1983 THEN WEIGHTFA=1.11566; ELSE IF CY=1984 THEN WEIGHTFA=1.11156; ELSE IF CY=1985 THEN WEIGHTFA=1.12026; ELSE IF CY=1986 THEN WEIGHTFA=1.11675; ELSE IF CY=1987 THEN WEIGHTFA=1.11661; ELSE IF CY=1988 THEN WEIGHTFA=1.11150; ELSE IF CY=1989 THEN WEIGHTFA=1.12336; ELSE IF CY=1990 THEN WEIGHTFA=1.11176; ELSE IF CY=1991 THEN WEIGHTFA=1.11633; ELSE IF CY=1992 THEN WEIGHTFA=1.10640; ELSE IF CY=1993 THEN WEIGHTFA=1.10764; ELSE IF CY=1994 THEN WEIGHTFA=1.10666; ELSE IF CY=1995 THEN WEIGHTFA=1.10142; ELSE IF CY=1996 THEN WEIGHTFA=1.10452; ELSE IF CY=1997 THEN WEIGHTFA=1.09975; ELSE IF CY=1998 THEN WEIGHTFA=1.09372; ELSE IF CY=1999 THEN WEIGHTFA=1.09176; ELSE IF CY=2000 THEN WEIGHTFA=1.09530; ELSE IF CY=2001 THEN WEIGHTFA=1.10463; ELSE IF CY=2002 THEN WEIGHTFA=1.10775; ELSE IF CY=2003 THEN WEIGHTFA=1.10558; ELSE IF CY=2004 THEN WEIGHTFA=1.10881; ELSE IF CY=2005 THEN WEIGHTFA=1.11887; ELSE IF CY=2006 THEN WEIGHTFA=1.11554; ELSE IF CY=2007 THEN WEIGHTFA=1.10483; ELSE IF CY=2008 THEN WEIGHTFA=1.10672; ELSE IF CY=2009 THEN WEIGHTFA=1.09630; ELSE IF CY=2010 THEN WEIGHTFA=1.09645; ELSE IF CY=2011 THEN WEIGHTFA=1.09908; ELSE IF CY=2012 THEN WEIGHTFA=1.09269; ORIGWT=WEIGHTFA; OUTPUT PED1; RETURN; /* ------------------------------------------------------------------------- */ /* ADJUSTMENT FACTORS FOR MOTORCYCLISTS - OBTAINED BY RUNNING LS_UNK14 */ /* ------------------------------------------------------------------------- */ MCWATE: IF CY=1975 THEN WEIGHTFA=1.03029; ELSE IF CY=1976 THEN WEIGHTFA=1.03235; ELSE IF CY=1977 THEN WEIGHTFA=1.02838; ELSE IF CY=1978 THEN WEIGHTFA=1.01218; ELSE IF CY=1979 THEN WEIGHTFA=1.00780; ELSE IF CY=1980 THEN WEIGHTFA=1.00795; ELSE IF CY=1981 THEN WEIGHTFA=1.01466; ELSE IF CY=1982 THEN WEIGHTFA=1.01772; ELSE IF CY=1983 THEN WEIGHTFA=1.01923; ELSE IF CY=1984 THEN WEIGHTFA=1.02307; ELSE IF CY=1985 THEN WEIGHTFA=1.02295; ELSE IF CY=1986 THEN WEIGHTFA=1.01925; ELSE IF CY=1987 THEN WEIGHTFA=1.02438; ELSE IF CY=1988 THEN WEIGHTFA=1.01733; ELSE IF CY=1989 THEN WEIGHTFA=1.01430; ELSE IF CY=1990 THEN WEIGHTFA=1.02179; ELSE IF CY=1991 THEN WEIGHTFA=1.02657; ELSE IF CY=1992 THEN WEIGHTFA=1.00806; ELSE IF CY=1993 THEN WEIGHTFA=1.01338; ELSE IF CY=1994 THEN WEIGHTFA=1.01456; ELSE IF CY=1995 THEN WEIGHTFA=1.01058; ELSE IF CY=1996 THEN WEIGHTFA=1.01134; ELSE IF CY=1997 THEN WEIGHTFA=1.01541; ELSE IF CY=1998 THEN WEIGHTFA=1.01121; ELSE IF CY=1999 THEN WEIGHTFA=1.01471; ELSE IF CY=2000 THEN WEIGHTFA=1.01026; ELSE IF CY=2001 THEN WEIGHTFA=1.01652; ELSE IF CY=2002 THEN WEIGHTFA=1.01278; ELSE IF CY=2003 THEN WEIGHTFA=1.01447; ELSE IF CY=2004 THEN WEIGHTFA=1.01478; ELSE IF CY=2005 THEN WEIGHTFA=1.01976; ELSE IF CY=2006 THEN WEIGHTFA=1.01166; ELSE IF CY=2007 THEN WEIGHTFA=1.01797; ELSE IF CY=2008 THEN WEIGHTFA=1.00905; ELSE IF CY=2009 THEN WEIGHTFA=1.01489; ELSE IF CY=2010 THEN WEIGHTFA=1.01409; ELSE IF CY=2011 THEN WEIGHTFA=1.01328; ELSE IF CY=2012 THEN WEIGHTFA=1.01986; ORIGWT=WEIGHTFA; OUTPUT MC1; RETURN; /* ------------------------------------------------------------------------- */ /* ADJUSTMENT FACTORS FOR CAR/LTV OCCUPANTS - OBTAINED BY RUNNING LS_UNK14 */ /* INCLUDES OCCUPANTS OF PARKED VEHICLES UNTIL CY 2004 */ /* ------------------------------------------------------------------------- */
In recent years, the vehicle type and model year have been known in well over 99 percent of the occu-pant fatality cases on FARS. OCCWATE: IF CY=1975 THEN WEIGHTFA=1.02596; ELSE IF CY=1976 THEN WEIGHTFA=1.02452; ELSE IF CY=1977 THEN WEIGHTFA=1.02496; ELSE IF CY=1978 THEN WEIGHTFA=1.01685; ELSE IF CY=1979 THEN WEIGHTFA=1.01236; ELSE IF CY=1980 THEN WEIGHTFA=1.01104; ELSE IF CY=1981 THEN WEIGHTFA=1.01537; ELSE IF CY=1982 THEN WEIGHTFA=1.01228; ELSE IF CY=1983 THEN WEIGHTFA=1.00685; ELSE IF CY=1984 THEN WEIGHTFA=1.00814; ELSE IF CY=1985 THEN WEIGHTFA=1.01133; ELSE IF CY=1986 THEN WEIGHTFA=1.00816; ELSE IF CY=1987 THEN WEIGHTFA=1.00888; ELSE IF CY=1988 THEN WEIGHTFA=1.00633; ELSE IF CY=1989 THEN WEIGHTFA=1.00794; ELSE IF CY=1990 THEN WEIGHTFA=1.00637; ELSE IF CY=1991 THEN WEIGHTFA=1.00580; ELSE IF CY=1992 THEN WEIGHTFA=1.00435; ELSE IF CY=1993 THEN WEIGHTFA=1.00641; ELSE IF CY=1994 THEN WEIGHTFA=1.00494; ELSE IF CY=1995 THEN WEIGHTFA=1.00546; ELSE IF CY=1996 THEN WEIGHTFA=1.00640; ELSE IF CY=1997 THEN WEIGHTFA=1.00619; ELSE IF CY=1998 THEN WEIGHTFA=1.00470; ELSE IF CY=1999 THEN WEIGHTFA=1.00450; ELSE IF CY=2000 THEN WEIGHTFA=1.00394; ELSE IF CY=2001 THEN WEIGHTFA=1.00405; ELSE IF CY=2002 THEN WEIGHTFA=1.00505;

358
ELSE IF CY=2003 THEN WEIGHTFA=1.00517; ELSE IF CY=2004 THEN WEIGHTFA=1.00425; ELSE IF CY=2005 THEN WEIGHTFA=1.00523; ELSE IF CY=2006 THEN WEIGHTFA=1.00359; ELSE IF CY=2007 THEN WEIGHTFA=1.00271; ELSE IF CY=2008 THEN WEIGHTFA=1.00223; ELSE IF CY=2009 THEN WEIGHTFA=1.00297; ELSE IF CY=2010 THEN WEIGHTFA=1.00287; ELSE IF CY=2011 THEN WEIGHTFA=1.00335; ELSE IF CY=2012 THEN WEIGHTFA=1.00360; ORIGWT=WEIGHTFA; /* DEFINES THE CRASH CONFIGURATION */
The CRSH variable (1 = frontal, 2 = side, 3 = rollover, 4 = rear/other) is critically important because the effectiveness of many of the safety technologies varies by crash type. First-harmful-event fires, immersions and other non-collision types are included in the rear/other category. If the principal im-pact (IMPACT2) is unknown, rely on the initial impact (IMPACT1). Some FARS variables have been added, deleted, or changed over the years. CRSH is defined so as to preserve continuity. The fractional values of IMPACT2 (e.g., 8.5) exist only in 2012, where there is no IMPACT2 in FARS, just an im-puted value that sometimes falls halfway between two clock points. IF IMPACT2=13 OR HARM_EV=1 OR (CY=2012 AND IMPACT2=24 AND ROLLOVER IN (1,2,9)) THEN CRSH=3; ELSE IF 2 LE HARM_EV LE 6 THEN CRSH=4; ELSE IF 5 LE IMPACT2 LE 7 THEN CRSH=4; ELSE IF IMPACT2 IN (8,8.5,9,9.5,10,26,61:63) THEN CRSH=2; /* NEW VALUES OF IMPACT2 FOR SIDE IMPACTS START-ING 2010 */ ELSE IF IMPACT2 IN (2,2.5,3,3.5,4,81:83) THEN CRSH=2; ELSE IF IMPACT2 IN (.5,1,11,11.5,12) THEN CRSH=1; /* NEW VALUES OF IMPUTED IMPACT2 STARTING 2012 */ ELSE IF HARM_EV=7 THEN CRSH=4; ELSE IF IMPACT1=13 THEN CRSH=3; ELSE IF 5 LE IMPACT1 LE 7 THEN CRSH=4; ELSE IF IMPACT1 IN (8:10,61:63) THEN CRSH=2; ELSE IF IMPACT1 IN (2:4,81:83) THEN CRSH=2; ELSE IF IMPACT1 IN (1,11,12) THEN CRSH=1; /* (HEAD-ON COLLISION INVOLVMENTS ARE ASSUMED TO BE FRONTAL IMPACTS) */ ELSE IF MAN_COLL=2 THEN CRSH=1; ELSE CRSH=9; /* DEFINES THE CALENDAR YEAR GROUPS (MAJOR CHANGES IN FARS DATA DEFINITIONS) */ IF 1975 LE CY LE 1981 THEN CYGP=1; ELSE IF 1982 LE CY LE 1990 THEN CYGP=2; ELSE IF CY GE 1991 THEN CYGP=3; /* DEFINES THE VEHICLE BODY TYPE (N OF CAR DOORS, PICKUP, SUV, VAN) */ IF VTYP=1 THEN DO; IF BOD2 IN (1,2,4,6,9) THEN NEWVTYP=BOD2; ELSE IF BOD2 IN (3,7) THEN NEWVTYP=2; ELSE IF BOD2 IN (5,8) THEN NEWVTYP=4; ELSE IF CYGP=1 THEN DO; IF BODY_TYP IN (1,2,6,9) THEN NEWVTYP=BODY_TYP; ELSE IF BODY_TYP=3 THEN NEWVTYP=4; ELSE NEWVTYP=9; END; ELSE IF CYGP IN (2,3) THEN DO; IF BODY_TYP IN (1,2,4,6,9) THEN NEWVTYP=BODY_TYP; ELSE IF BODY_TYP=3 THEN NEWVTYP=2; ELSE IF CY GE 2010 AND BODY_TYP=17 THEN NEWVTYP=2; ELSE IF BODY_TYP=5 THEN NEWVTYP=4; ELSE NEWVTYP=9; END; END; ELSE IF VTYP=2 THEN DO; IF TRKTYP IN (1,2) THEN NEWVTYP=11; ELSE IF TRKTYP IN (3,4) THEN NEWVTYP=12; ELSE IF TRKTYP IN (5,6) THEN NEWVTYP=13; ELSE IF TRKTYP IN (7,8,9) THEN NEWVTYP=19; ELSE IF CYGP=1 THEN DO; IF BODY_TYP=50 THEN NEWVTYP=11; ELSE IF BODY_TYP IN (43,52) THEN NEWVTYP=12; ELSE IF BODY_TYP=51 THEN NEWVTYP=13; ELSE NEWVTYP=19; END; ELSE IF CYGP=2 THEN DO; IF BODY_TYP IN (50,51) THEN NEWVTYP=11; ELSE IF BODY_TYP IN (12,55,56) THEN NEWVTYP=12; ELSE IF BODY_TYP=40 THEN NEWVTYP=13; ELSE NEWVTYP=19; END;
359
ELSE IF CYGP=3 THEN DO; IF BODY_TYP IN (30,31,32,39) THEN NEWVTYP=11; ELSE IF BODY_TYP IN (14,15,16,19) THEN NEWVTYP=12; ELSE IF BODY_TYP IN (20,21) THEN NEWVTYP=13; ELSE NEWVTYP=19; END; END; OUTPUT OCC1; RUN;
Next is the main analysis section for non-occupant fatalities: pedestrians, bicyclists and other non-motorists that were struck by cars or LTVs. Two safety technologies, dual master cylinders (105A) and front disc brakes (105B) saved non-occupant lives because they enabled car/LTV drivers to avoid hit-ting the non-occupants. The model is simpler here because it involves just those two technologies, but the setup is basically the same as for car and LTV occupant fatalities. /* ------------------------------------------------------------------ */ /* ------------------------------------------------------------------ */ /* ANALYZES EFFECT OF BRAKE IMPROVEMENTS ON NONOCCUPANT FATALITIES */ /* ------------------------------------------------------------------ */ /* ------------------------------------------------------------------ */ DATA PED2; SET PED1; /* IMPLEMENTATION OF FRONT DISC BRAKES IN THE VEHICLES THAT HIT THESE PEDESTRIANS */
Proceed in reverse chronological order: disc brakes first because they were installed later. Ideally, we should determine if the vehicle (that hit the pedestrian) was equipped with front disc brakes. However, we do not know whether specific vehicles were equipped or not equipped. We only know, based on the vehicle’s model year, what percent of vehicles were equipped in that model year. PS105B + PV105B is the percentage of vehicles, in any given model year, that had front disc brakes; PS105B are the instal-lations after FMVSS No. 105 was amended, effective January 1, 1976 in cars and September 1, 1983, in LTVs, to include performance tests most easily met with disc brakes; PV105B are any disc-brake installations before the standard was amended. PS = “proportion, standard” PV = “proportion volun-tary” IF XMY GE 1984 THEN DO; PS105B=1; PV105B=0; END; ELSE IF XMY LE 1964 THEN DO; PS105B=0; PV105B=0; END; ELSE IF XMY=1965 THEN DO; PS105B=0; PV105B=.02; END; ELSE IF XMY=1966 THEN DO; PS105B=0; PV105B=.03; END; ELSE IF XMY=1967 THEN DO; PS105B=0; PV105B=.06; END; ELSE IF XMY=1968 THEN DO; PS105B=0; PV105B=.13; END; ELSE IF XMY=1969 THEN DO; PS105B=0; PV105B=.28; END; ELSE IF XMY=1970 THEN DO; PS105B=0; PV105B=.41; END; ELSE IF XMY=1971 THEN DO; PS105B=0; PV105B=.63; END; ELSE IF XMY=1972 THEN DO; PS105B=0; PV105B=.74; END; ELSE IF XMY=1973 THEN DO; PS105B=0; PV105B=.86; END; ELSE IF XMY=1974 THEN DO; PS105B=0; PV105B=.84; END; ELSE IF XMY=1975 THEN DO; PS105B=0; PV105B=.93; END; ELSE IF XMY=1976 AND CY=1975 THEN DO; PS105B=0; PV105B=.99; END; ELSE IF XMY=1976 AND VTYP=1 THEN DO; PS105B=.50; PV105B=.49; END; ELSE IF XMY=1976 AND VTYP=2 THEN DO; PS105B=0; PV105B=.99; END; ELSE IF 1977 LE XMY LE 1983 AND VTYP=1 THEN DO; PS105B=1; PV105B=0; END; ELSE IF 1977 LE XMY LE 1983 AND VTYP=2 THEN DO; PS105B=0; PV105B=1; END;
Thus, for example, in MY 1971, PV105B = .63 because 63 percent of cars (and we assume also LTVs) were equipped with front disc brakes, voluntarily, before the amendment to FMVSS No. 105. Note that PV105B > 0 even in MY 1976, because nearly half of MY 1976 cars were produced before January 1,1976. /* IMPLEMENTATION OF DUAL MASTER CYLINDERS IN THE VEHICLES THAT HIT THESE PEDESTRIANS */ IF XMY GE 1984 THEN DO; PS105A=1; PV105A=0; END; ELSE IF XMY LE 1961 THEN DO; PS105A=0; PV105A=0; END; ELSE IF XMY IN (1962,1963) THEN DO; PS105A=0; PV105A=.09; END; ELSE IF XMY IN (1964,1965) THEN DO; PS105A=0; PV105A=.07; END; ELSE IF XMY=1966 THEN DO; PS105A=0; PV105A=.54; END; ELSE IF XMY=1967 THEN DO; PS105A=0; PV105A=1; END;

360
ELSE IF XMY=1968 AND VTYP=1 THEN DO; PS105A=.5; PV105A=.5; END; ELSE IF XMY=1968 AND VTYP=2 THEN DO; PS105A=0; PV105A=1; END; ELSE IF 1969 LE XMY LE 1983 AND VTYP=1 THEN DO; PS105A=1; PV105A=0; END; ELSE IF 1969 LE XMY LE 1983 AND VTYP=2 THEN DO; PS105A=0; PV105A=1; END;
Here is the basic routine for estimating lives saved by a safety technology, specifically non-occupant lives saved by front disc brakes. All effectiveness estimates are derived from NHTSA evaluation re-ports and discussed in Part 1 of this report. NHTSA’s evaluation estimated that front disc brakes re-duced fatal crash involvements by 0.17 percent. Effectiveness, E = .0017. P = PS105B + PV105B is the probability that the case vehicle was equipped with front disc brakes (based on its model year). Up to this point in the model, this case has a weight of WEIGHTFA fatalities, renamed OLDWTFA. There would have been OLDWTFA / (1 – E x P) fatalities if the vehicle had no front disc brakes at all rather than a P probability of disc brakes. That becomes the new value of WEIGHTFA. S = OLDWTFA x E x P / (1 – E x P) is the difference between the new WEIGHTFA and the OLDWTFA, and it is the in-crease in fatalities that would have occurred in the complete absence of front disc brakes. S is appor-tioned between lives saved by post-standard installations of disc brakes (PLS105B) and voluntary in-stallations of disc brakes (PLV105B). The new value of WEIGHTFA here will become the old value (OLDWTFA) in the next step (dual master cylinders). PLV105B: “P” = pedestrian, “L” = lives saved, “V” = voluntary, “105B” = front disc brakes /* PEDESTRIAN LIVES SAVED BY FRONT DISC BRAKES */ OLDWTFA=WEIGHTFA; IF PS105B GT 0 OR PV105B GT 0 THEN DO; E=.0017; P=PS105B+PV105B; S=OLDWTFA*E*P / (1 - E*P); PLS105B=S*PS105B/P; PLV105B=S*PV105B/P; WEIGHTFA=OLDWTFA+PLS105B+PLV105B; END; ELSE DO; PLS105B=0; PLV105B=0; END;
NHTSA’s evaluation estimated that dual master cylinders reduced fatal crash involvements by 0.7 per-cent. /* PEDESTRIAN LIVES SAVED BY DUAL MASTER CYLINDERS */ OLDWTFA=WEIGHTFA; IF PS105A GT 0 OR PV105A GT 0 THEN DO; E=.007; P=PS105A+PV105A; S=OLDWTFA*E*P / (1 - E*P); PLS105A=S*PS105A/P; PLV105A=S*PV105A/P; WEIGHTFA=OLDWTFA+PLS105A+PLV105A; END; ELSE DO; PLS105A=0; PLV105A=0; END; PLS=PLS105A+PLS105B; PLV=PLV105A+PLV105B; PL105A=PLS105A+PLV105A; PL105B=PLS105B+PLV105B; PL=PLS+PLV;
At this point, the model has “removed” all applicable safety technologies from the vehicles, and WEIGHTFA indicates the implicit number of non-occupant fatalities in the absence of front disc brakes and dual master cylinders on the case car/LTV. RUN;
Adds up the actual fatality cases (ORIGWT), the estimate of how many fatalities there would have been if all safety technologies had been removed from the vehicles (WEIGHTFA), and the lives saved by each technology, by calendar year. PLV = total non-occupant lives saved (voluntary installations). PLS = total non-occupant lives saved (post-standard installations). PL = PLV + PLS = total non-occupant lives saved by all technologies.
361
PROC MEANS SUM NOPRINT DATA=PED2; BY CY; VAR ORIGWT WEIGHTFA PLV105B PLS105B PL105B PLV105A PLS105A PL105A PLV PLS PL; OUTPUT OUT=PED3 SUM=P_ORIGWT P_WTFA PLV105B PLS105B PL105B PLV105A PLS105A PL105A PLV PLS PL;
Prints out the totals for each calendar year, and the sum for all years, 1975 to 2012. PROC PRINT DATA=PED3; FORMAT P_ORIGWT P_WTFA PLV105B PLS105B PL105B PLV105A PLS105A PL105A PLV PLS PL 9.0; ID CY; VAR P_ORIGWT P_WTFA PLV105B PLS105B PL105B PLV105A PLS105A PL105A PLV PLS PL; SUM P_ORIGWT P_WTFA PLV105B PLS105B PL105B PLV105A PLS105A PL105A PLV PLS PL; TITLE1 'PEDESTRIANS SAVED BY CAR/LTV DISC BRAKES AND DUAL MASTER CYLINDERS, 1975-2012'; TITLE2 ' '; TITLE3 '...105B = FRONT DISC BRAKES (MEDIAN INSTALLATION YEAR 1971, FMVSS EFFECTIVE 1/1/76 OR 9/1/83)'; TITLE4 '...105A = DUAL MASTER CYLINDERS (MEDIAN INSTALLATION YEAR LATE 1966, FMVSS EFFECTIVE 1/1/68 OR 9/1/83)'; TITLE5 '...V = VOLUNTARY INSTALLATIONS, BEFORE EFFECTIVE DATE'; TITLE6 '...S = STANDARD INSTALLATIONS, AFTER EFFECTIVE DATE'; TITLE7 'P_ORIGWT = ACTUAL PED/BIKE/NONMOTORIST FATALITIES'; TITLE8 'P_WTFA = FATALITIES THAT WOULD HAVE OCCURRED WITHOUT THESE SAFETY IMPROVEMENTS'; TITLE9 'PL = OVERALL PED/BIKE/NONMOTORIST LIVES SAVED BY BRAKE IMPROVEMENTS IN CARS/LTVs'; RUN; /* ------------------------------------------------------------------ */ /* ------------------------------------------------------------------ */ /* EFFECT OF CAR/LTV ESC & BRAKE IMPROVEMENTS ON MOTORCYCLIST FATALS */ /* ------------------------------------------------------------------ */ /* ------------------------------------------------------------------ */
Next is the main analysis for motorcyclist fatalities in collisions with cars/LTVs. The model is similar as the one for non-occupants, except that ESC in cars and LTVs reduces collisions with motorcycles and that lives-saved estimates are named “MLV105B” instead of “PLV105B,” etc. (“M” = motorcy-clist) OMY = the model year of the car/LTV that hit the motorcycle. First step is to merge the data with MCESC, the file that indicates if a car or LTV equipped with ESC hit a motorcycle and if that car or LTV was culpable. DATA MC1A; MERGE MC1(IN=MCYCLE) MCESC.MCESC; BY CY ST_CASE; /* ADD INFO ON WHETHER THE CAR/LTV THAT HIT THE MC HAD ESC & WAS CULPABLE */ IF MCYCLE; RUN; DATA MC2; SET MC1A; /* IMPLEMENTATION OF ESC IN THE VEHICLES THAT HIT THESE MOTORCYCLES */ MS126=0; MV126=0; IF OMY GE 2009 AND CULP_ESC GT 0 THEN MS126=CULP_ESC; /* GENERAL RULE: PHASE-IN PERIOD ALREADY COUNTS AS "POST-STANDARD" */ ELSE IF 1998 LE OMY LE 2008 AND CULP_ESC GT 0 THEN MV126=CULP_ESC; /* IMPLEMENTATION OF FRONT DISC BRAKES IN THE VEHICLES THAT HIT THESE MOTORCYCLES */ IF OMY GE 1984 THEN DO; MS105B=1; MV105B=0; END; ELSE IF OMY LE 1964 THEN DO; MS105B=0; MV105B=0; END; ELSE IF OMY=1965 THEN DO; MS105B=0; MV105B=.02; END; ELSE IF OMY=1966 THEN DO; MS105B=0; MV105B=.03; END; ELSE IF OMY=1967 THEN DO; MS105B=0; MV105B=.06; END; ELSE IF OMY=1968 THEN DO; MS105B=0; MV105B=.13; END; ELSE IF OMY=1969 THEN DO; MS105B=0; MV105B=.28; END; ELSE IF OMY=1970 THEN DO; MS105B=0; MV105B=.41; END; ELSE IF OMY=1971 THEN DO; MS105B=0; MV105B=.63; END; ELSE IF OMY=1972 THEN DO; MS105B=0; MV105B=.74; END; ELSE IF OMY=1973 THEN DO; MS105B=0; MV105B=.86; END; ELSE IF OMY=1974 THEN DO; MS105B=0; MV105B=.84; END; ELSE IF OMY=1975 THEN DO; MS105B=0; MV105B=.93; END; ELSE IF OMY=1976 AND CY=1975 THEN DO; MS105B=0; MV105B=.99; END; ELSE IF OMY=1976 AND OVTYP=1 THEN DO; MS105B=.50; MV105B=.49; END; ELSE IF OMY=1976 AND OVTYP=2 THEN DO; MS105B=0; MV105B=.99; END; ELSE IF 1977 LE OMY LE 1983 AND OVTYP=1 THEN DO; MS105B=1; MV105B=0; END; ELSE IF 1977 LE OMY LE 1983 AND OVTYP=2 THEN DO; MS105B=0; MV105B=1; END; /* IMMLEMENTATION OF DUAL MASTER CYLINDERS IN THE VEHICLES THAT HIT THESE MOTORCYCLES */ IF OMY GE 1984 THEN DO; MS105A=1; MV105A=0; END;
362
ELSE IF OMY LE 1961 THEN DO; MS105A=0; MV105A=0; END; ELSE IF OMY IN (1962,1963) THEN DO; MS105A=0; MV105A=.09; END; ELSE IF OMY IN (1964,1965) THEN DO; MS105A=0; MV105A=.07; END; ELSE IF OMY=1966 THEN DO; MS105A=0; MV105A=.54; END; ELSE IF OMY=1967 THEN DO; MS105A=0; MV105A=1; END; ELSE IF OMY=1968 AND OVTYP=1 THEN DO; MS105A=.5; MV105A=.5; END; ELSE IF OMY=1968 AND OVTYP=2 THEN DO; MS105A=0; MV105A=1; END; ELSE IF 1969 LE OMY LE 1983 AND OVTYP=1 THEN DO; MS105A=1; MV105A=0; END; ELSE IF 1969 LE OMY LE 1983 AND OVTYP=2 THEN DO; MS105A=0; MV105A=1; END; /* MOTORCYLIST LIVES SAVED BY ESC */ OLDWTFA=WEIGHTFA; IF MS126 GT 0 OR MV126 GT 0 THEN DO; IF OVTYP=2 THEN E=.1615; ELSE E=.1607; /* NEW ESTIMATES OF ESC EFFECTIVENESS IN PREVENTING CULPABLE IN-VOLVEMENTS IN MULTIVEH CRASHES */ P=MS126+MV126; S=OLDWTFA*E*P / (1 - E*P); MLS126=S*MS126/P; MLV126=S*MV126/P; WEIGHTFA=OLDWTFA+MLS126+MLV126; END; ELSE DO; MLS126=0; MLV126=0; END; /* MOTORCYLIST LIVES SAVED BY FRONT DISC BRAKES */ OLDWTFA=WEIGHTFA; IF MS105B GT 0 OR MV105B GT 0 THEN DO; E=.0017; P=MS105B+MV105B; S=OLDWTFA*E*P / (1 - E*P); MLS105B=S*MS105B/P; MLV105B=S*MV105B/P; WEIGHTFA=OLDWTFA+MLS105B+MLV105B; END; ELSE DO; MLS105B=0; MLV105B=0; END; /* MOTORCYCLIST LIVES SAVED BY DUAL MASTER CYLINDERS */ OLDWTFA=WEIGHTFA; IF MS105A GT 0 OR MV105A GT 0 THEN DO; E=.007; P=MS105A+MV105A; S=OLDWTFA*E*P / (1 - E*P); MLS105A=S*MS105A/P; MLV105A=S*MV105A/P; WEIGHTFA=OLDWTFA+MLS105A+MLV105A; END; ELSE DO; MLS105A=0; MLV105A=0; END; MLS=MLS126+MLS105A+MLS105B; MLV=MLV126+MLV105A+MLV105B; ML105A=MLS105A+MLV105A; ML105B=MLS105B+MLV105B; ML126=MLS126+MLV126; ML=MLS+MLV; RUN; PROC MEANS SUM NOPRINT DATA=MC2; BY CY; VAR ORIGWT WEIGHTFA MLV126 MLS126 ML126 MLV105B MLS105B ML105B MLV105A MLS105A ML105A MLV MLS ML; OUTPUT OUT=MC3 SUM=M_ORIGWT M_WTFA MLV126 MLS126 ML126 MLV105B MLS105B ML105B MLV105A MLS105A ML105A MLV MLS ML; RUN; PROC PRINT DATA=MC3; FORMAT M_ORIGWT M_WTFA MLV126 MLS126 ML126 MLV105B MLS105B ML105B MLV105A MLS105A ML105A MLV MLS ML 9.0; ID CY; VAR M_ORIGWT M_WTFA MLV126 MLS126 ML126 MLV105B MLS105B ML105B MLV105A MLS105A ML105A MLV MLS ML; SUM M_ORIGWT M_WTFA MLV126 MLS126 ML126 MLV105B MLS105B ML105B MLV105A MLS105A ML105A MLV MLS ML; TITLE1 'MOTORCYCLISTS SAVED BY CAR/LTV ESC, DISC BRAKES AND DUAL MASTER CYLINDERS, 1975-2012'; TITLE2 ' '; TITLE3 '...126 = ESC (MEDIAN INSTALLATION YEAR 2010, FMVSS EFFECTIVE 9/1/2011)'; TITLE4 '...105B = FRONT DISC BRAKES (MEDIAN INSTALLATION YEAR 1971, FMVSS EFFECTIVE 1/1/1976 OR 9/1/1983)'; TITLE5 '...105A = DUAL MASTER CYLINDERS (MEDIAN INSTALLATION YEAR LATE 1966, FMVSS EFFECTIVE 1/1/1968 OR 9/1/1983)'; TITLE6 '...V = VOLUNTARY INSTALLATIONS, BEFORE EFFECTIVE DATE'; TITLE7 '...S = STANDARD INSTALLATIONS, AFTER EFFECTIVE DATE'; TITLE8 'M_ORIGWT = ACTUAL MOTORCYLIST FATALITIES IN COLLISIONS WITH A CAR OR LTV'; TITLE9 'M_WTFA = FATALITIES THAT WOULD HAVE OCCURRED WITHOUT THESE SAFETY IMPROVEMENTS'; TITLE10 'ML = OVERALL MOTORCYCLIST LIVES SAVED BY ESC AND BRAKE IMPROVEMENTS IN CARS/LTVs'; RUN;
The program now turns to car/LTV occupant fatalities, and it returns to the pre-processor section, split-ting cases with unknown crash mode, seating position or restraint use into two or more cases with known, imputed values for these variables.

363
/* ------------------------------------------------------------------ */ /* ------------------------------------------------------------------ */ /* THE ANALYSIS OF OCCUPANT FATALITIES BEGINS HERE */ /* FIRST TASK IS TO IMPUTE ALL UNKOWN CRASHMODES, SEAT POS, BELT USE */ /* ------------------------------------------------------------------ */ /* ------------------------------------------------------------------ */ proc freq data=occ1; weight origwt; format crsh crsh.; tables crsh; TITLE 'UNKNOWN CRSH IN OCC1'; run;
Checks that distribution of CRSH has continuity from year to year despite changes in the FARS varia-bles: proc freq data=occ1; weight origwt; format crsh crsh.; tables cy * crsh / nocol nopercent; run;
Splits the file OCC1 into OCC2, UNKCRSH1, and NEW_UNKCRSH1. OCC2 are the cases with known impact location/crash type (CRSH) and are left alone. UNKCRSH1 contains the CY 1975-2002 cases with unknown crash mode (CRSH = 9); UNKCRSH2 contains the CY 2003-2012 cases. DATA OCC2 UNKCRSH1 NEW_UNKCRSH1; SET OCC1; IF CRSH=9 THEN DO; IF 1975 LE CY LE 2002 THEN OUTPUT UNKCRSH1; ELSE OUTPUT NEW_UNKCRSH1; END; ELSE OUTPUT OCC2; RUN; /* ------------------------------------------------------------------ */ /* ------------------------------------------------------------------ */ /* DISTRIBUTES AND IMPUTES CRASH MODES WHEN THEY ARE UNKNOWN */ /* SEPARATE IMPUTATIONS FOR FIXED OBJECT, ANGLE, REAR-END AND OTHER */ /* CRASHES USING CATMOD MODELS CREATED BY L_CRSH4 OR L_CRASH14.SAS */ /* (HEAD-ON COLLISION INVOLVMENTS ARE ASSUMED TO BE FRONTAL IMPACTS) */ /* */ /* SEPARATE IMPUTATIONS FOR CY 1975-2002 AND CY 2003-2012 */ /* ------------------------------------------------------------------ */ /* ------------------------------------------------------------------ */ /* ------------------------------------------------------------------ */ /* IMPUTATION FOR CY 1975-2002: SAME AS IN 2004 REPORT (L_CRSH4.SAS) */ /* ------------------------------------------------------------------ */
UNKCRSH1, in turn, is split into FIXOBJ, ANGLE, REAR, OTH; the first consists of single-vehicle crashes with unknown crash mode; the second, multivehicle crashes described as “angle collisions” (MAN_COLL = 1,3); the third, rear-end collisions; the fourth, all other crash involvements. Defines various subgroups of first harmful event and seating position/age/gender. These groupings, together with vehicle type and occupant ejection, are good predictors of whether the impact was frontal, side, rollover, or rear/other. DATA FIXOBJ ANGLE REAR OTH; SET UNKCRSH1; IF HARM_EV IN (10,11,12,14,18,24,30,34,35,42,43,99) THEN EVENT1=HARM_EV; ELSE IF HARM_EV IN (8,9,15,44,47) THEN EVENT1=99; ELSE IF HARM_EV=13 THEN EVENT1=12; ELSE IF HARM_EV IN (16,19,22,48) THEN EVENT1=34; ELSE IF HARM_EV=17 THEN EVENT1=18; ELSE IF HARM_EV IN (20,23,26) THEN EVENT1=24; ELSE IF HARM_EV IN (21,25,32,36,37,38,39,46) THEN EVENT1=35; ELSE IF HARM_EV IN (27,29,40) THEN EVENT1=42; ELSE IF HARM_EV=28 THEN EVENT1=30; ELSE IF HARM_EV IN (31,33,41) THEN EVENT1=43; ELSE IF HARM_EV=45 THEN EVENT1=14; ELSE IF HARM_EV=49 THEN EVENT1=11; ELSE EVENT1=99;
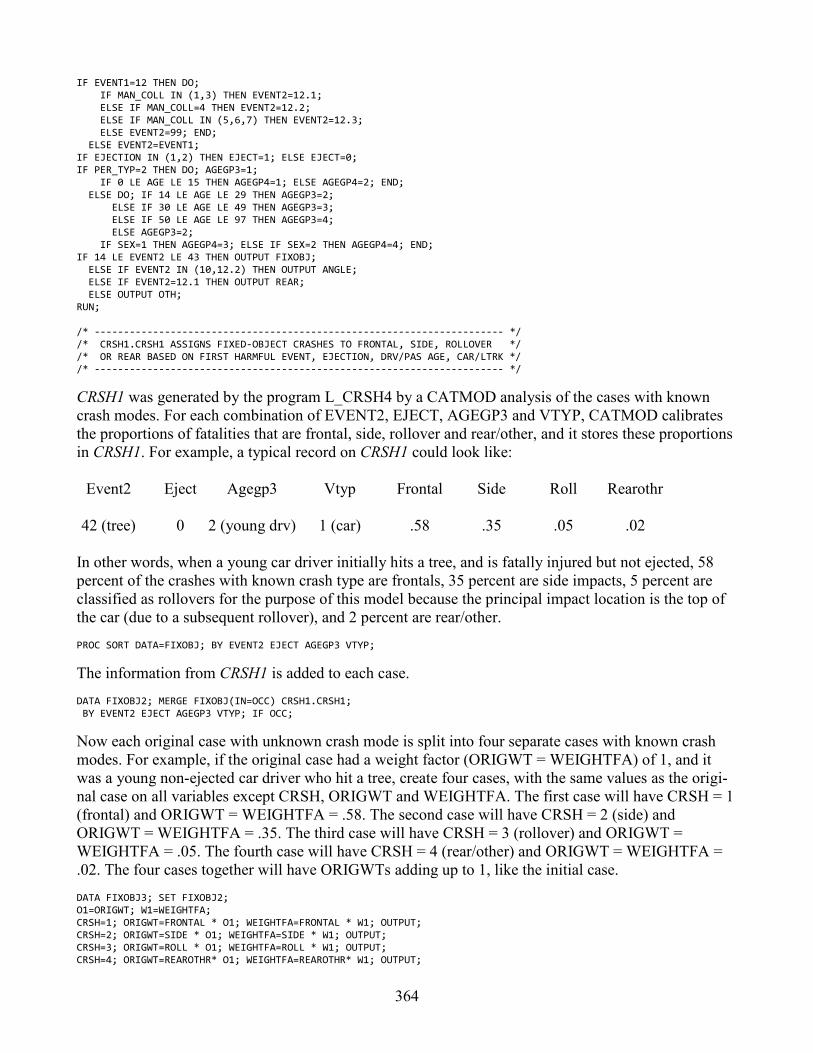
364
IF EVENT1=12 THEN DO; IF MAN_COLL IN (1,3) THEN EVENT2=12.1; ELSE IF MAN_COLL=4 THEN EVENT2=12.2; ELSE IF MAN_COLL IN (5,6,7) THEN EVENT2=12.3; ELSE EVENT2=99; END; ELSE EVENT2=EVENT1; IF EJECTION IN (1,2) THEN EJECT=1; ELSE EJECT=0; IF PER_TYP=2 THEN DO; AGEGP3=1; IF 0 LE AGE LE 15 THEN AGEGP4=1; ELSE AGEGP4=2; END; ELSE DO; IF 14 LE AGE LE 29 THEN AGEGP3=2; ELSE IF 30 LE AGE LE 49 THEN AGEGP3=3; ELSE IF 50 LE AGE LE 97 THEN AGEGP3=4; ELSE AGEGP3=2; IF SEX=1 THEN AGEGP4=3; ELSE IF SEX=2 THEN AGEGP4=4; END; IF 14 LE EVENT2 LE 43 THEN OUTPUT FIXOBJ; ELSE IF EVENT2 IN (10,12.2) THEN OUTPUT ANGLE; ELSE IF EVENT2=12.1 THEN OUTPUT REAR; ELSE OUTPUT OTH; RUN; /* ---------------------------------------------------------------------- */ /* CRSH1.CRSH1 ASSIGNS FIXED-OBJECT CRASHES TO FRONTAL, SIDE, ROLLOVER */ /* OR REAR BASED ON FIRST HARMFUL EVENT, EJECTION, DRV/PAS AGE, CAR/LTRK */ /* ---------------------------------------------------------------------- */
CRSH1 was generated by the program L_CRSH4 by a CATMOD analysis of the cases with known crash modes. For each combination of EVENT2, EJECT, AGEGP3 and VTYP, CATMOD calibrates the proportions of fatalities that are frontal, side, rollover and rear/other, and it stores these proportions in CRSH1. For example, a typical record on CRSH1 could look like: Event2 Eject Agegp3 Vtyp Frontal Side Roll Rearothr 42 (tree) 0 2 (young drv) 1 (car) .58 .35 .05 .02 In other words, when a young car driver initially hits a tree, and is fatally injured but not ejected, 58 percent of the crashes with known crash type are frontals, 35 percent are side impacts, 5 percent are classified as rollovers for the purpose of this model because the principal impact location is the top of the car (due to a subsequent rollover), and 2 percent are rear/other. PROC SORT DATA=FIXOBJ; BY EVENT2 EJECT AGEGP3 VTYP;
The information from CRSH1 is added to each case. DATA FIXOBJ2; MERGE FIXOBJ(IN=OCC) CRSH1.CRSH1; BY EVENT2 EJECT AGEGP3 VTYP; IF OCC;
Now each original case with unknown crash mode is split into four separate cases with known crash modes. For example, if the original case had a weight factor (ORIGWT = WEIGHTFA) of 1, and it was a young non-ejected car driver who hit a tree, create four cases, with the same values as the origi-nal case on all variables except CRSH, ORIGWT and WEIGHTFA. The first case will have CRSH = 1 (frontal) and ORIGWT = WEIGHTFA = .58. The second case will have CRSH = 2 (side) and ORIGWT = WEIGHTFA = .35. The third case will have CRSH = 3 (rollover) and ORIGWT = WEIGHTFA = .05. The fourth case will have CRSH = 4 (rear/other) and ORIGWT = WEIGHTFA = .02. The four cases together will have ORIGWTs adding up to 1, like the initial case. DATA FIXOBJ3; SET FIXOBJ2; O1=ORIGWT; W1=WEIGHTFA; CRSH=1; ORIGWT=FRONTAL * O1; WEIGHTFA=FRONTAL * W1; OUTPUT; CRSH=2; ORIGWT=SIDE * O1; WEIGHTFA=SIDE * W1; OUTPUT; CRSH=3; ORIGWT=ROLL * O1; WEIGHTFA=ROLL * W1; OUTPUT; CRSH=4; ORIGWT=REAROTHR* O1; WEIGHTFA=REAROTHR* W1; OUTPUT;
365
/* ---------------------------------------------------------------------- */ /* CRSH2.CRSH2 ASSIGNS MULTIVEH ANGLE COLLISIONS TO FRONTAL, SIDE, ROLL */ /* OR REAR BASED ON FIRST HARMFUL EVENT, EJECTION, DRV/PAS AGE, CAR/LTRK */ /* ---------------------------------------------------------------------- */ PROC SORT DATA=ANGLE; BY EVENT2 EJECT AGEGP4 VTYP; DATA ANGLE2; MERGE ANGLE(IN=OCC) CRSH2.CRSH2; BY EVENT2 EJECT AGEGP4 VTYP; IF OCC; DATA ANGLE3; SET ANGLE2; O1=ORIGWT; W1=WEIGHTFA; CRSH=1; ORIGWT=FRONTAL * O1; WEIGHTFA=FRONTAL * W1; OUTPUT; CRSH=2; ORIGWT=SIDE * O1; WEIGHTFA=SIDE * W1; OUTPUT; CRSH=3; ORIGWT=ROLL * O1; WEIGHTFA=ROLL * W1; OUTPUT; CRSH=4; ORIGWT=REAROTHR* O1; WEIGHTFA=REAROTHR* W1; OUTPUT; /* ---------------------------------------------------------------------- */ /* CRSH3.CRSH3 ASSIGNS MULTIVEH REAR-END COLLSNS TO FRONTAL, SIDE, ROLL */ /* OR REAR BASED ON EJECTION, DRV/PAS AGE, CAR/LTRK */ /* ---------------------------------------------------------------------- */ PROC SORT DATA=REAR; BY EVENT2 EJECT AGEGP4 VTYP; DATA REAR2; MERGE REAR(IN=OCC) CRSH3.CRSH3; BY EVENT2 EJECT AGEGP4 VTYP; IF OCC; DATA REAR3; SET REAR2; O1=ORIGWT; W1=WEIGHTFA; CRSH=1; ORIGWT=FRONTAL * O1; WEIGHTFA=FRONTAL * W1; OUTPUT; CRSH=2; ORIGWT=SIDE * O1; WEIGHTFA=SIDE * W1; OUTPUT; CRSH=3; ORIGWT=ROLL * O1; WEIGHTFA=ROLL * W1; OUTPUT; CRSH=4; ORIGWT=REAROTHR* O1; WEIGHTFA=REAROTHR* W1; OUTPUT; /* ---------------------------------------------------------------------- */ /* CRSH4.CRSH4 ASSIGNS OTHER-EVENT CRASHES TO FRONTAL, SIDE, ROLLOVER */ /* OR REAR BASED ON FIRST HARMFUL EVENT, EJECTION */ /* ---------------------------------------------------------------------- */ PROC SORT DATA=OTH; BY EVENT2 EJECT; DATA OTH2; MERGE OTH(IN=OCC) CRSH4.CRSH4; BY EVENT2 EJECT; IF OCC; DATA OTH3; SET OTH2; O1=ORIGWT; W1=WEIGHTFA; CRSH=1; ORIGWT=FRONTAL * O1; WEIGHTFA=FRONTAL * W1; OUTPUT; CRSH=2; ORIGWT=SIDE * O1; WEIGHTFA=SIDE * W1; OUTPUT; CRSH=3; ORIGWT=ROLL * O1; WEIGHTFA=ROLL * W1; OUTPUT; CRSH=4; ORIGWT=REAROTHR* O1; WEIGHTFA=REAROTHR* W1; OUTPUT;
UNKCRSH2 contains all the newly created CY 1975-2002 cases with known crash modes. DATA UNKCRSH2; SET FIXOBJ3 ANGLE3 REAR3 OTH3; DROP EVENT1 EVENT2 AGEGP3 AGEGP4 FRONTAL SIDE ROLL REAROTHR EJECT O1 W1 N; RUN;
Imputation for CY 2003 to 2012 is the same as above, except it uses the imputation factors from the files NEWCRSH1-NEWCRSH4 instead of CRSH1-CRSH4. /* ------------------------------------------------------------------ */ /* IMPUTATION FOR CY 2003-2012: NEW MODELS FROM L_CRSH14.SAS */ /* ------------------------------------------------------------------ */ DATA FIXOBJ ANGLE REAR OTH; SET NEW_UNKCRSH1; IF HARM_EV IN (10,11,12,14,18,24,30,34,35,42,43,99) THEN EVENT1=HARM_EV; ELSE IF HARM_EV IN (8,9,15,44,47) THEN EVENT1=99; ELSE IF HARM_EV=13 THEN EVENT1=12; ELSE IF HARM_EV IN (16,19,22,48,58) THEN EVENT1=34; ELSE IF HARM_EV=17 THEN EVENT1=18; ELSE IF HARM_EV IN (20,23,26,52,57) THEN EVENT1=24; ELSE IF HARM_EV IN (21,25,32,36,37,38,39,46) THEN EVENT1=35; ELSE IF HARM_EV IN (27,29,40,59) THEN EVENT1=42; ELSE IF HARM_EV=28 THEN EVENT1=30;
366
ELSE IF HARM_EV IN (31,33,41,53) THEN EVENT1=43; ELSE IF HARM_EV=45 THEN EVENT1=14; ELSE IF HARM_EV=49 THEN EVENT1=11; ELSE EVENT1=99; IF EVENT1=12 THEN DO; IF MAN_COLL IN (1,10) THEN EVENT2=12.1; ELSE IF MAN_COLL IN (3:6) THEN EVENT2=12.2; ELSE IF MAN_COLL IN (7:9) THEN EVENT2=12.3; ELSE EVENT2=99; END; ELSE EVENT2=EVENT1; IF EJECTION IN (1:3) THEN EJECT=1; ELSE EJECT=0; IF PER_TYP=2 THEN DO; AGEGP3=1; IF 0 LE AGE LE 15 THEN AGEGP4=1; ELSE AGEGP4=2; END; ELSE DO; IF 14 LE AGE LE 29 THEN AGEGP3=2; ELSE IF 30 LE AGE LE 49 THEN AGEGP3=3; ELSE IF 50 LE AGE LE 97 THEN AGEGP3=4; ELSE AGEGP3=2; IF SEX=1 THEN AGEGP4=3; ELSE IF SEX=2 THEN AGEGP4=4; END; IF 14 LE EVENT2 LE 43 THEN OUTPUT FIXOBJ; ELSE IF EVENT2 IN (10,12.2) THEN OUTPUT ANGLE; ELSE IF EVENT2=12.1 THEN OUTPUT REAR; ELSE OUTPUT OTH; RUN; /* ---------------------------------------------------------------------- */ /* NEWCRSH1.NEWCRSH1 ASSIGNS FIX-OBJ CRASHES TO FRONTAL, SIDE, ROLLOVER */ /* OR REAR BASED ON FIRST HARMFUL EVENT, EJECTION, DRV/PAS AGE, CAR/LTV */ /* ---------------------------------------------------------------------- */ PROC SORT DATA=FIXOBJ; BY EVENT2 EJECT AGEGP3 VTYP; DATA FIXOBJ2; MERGE FIXOBJ(IN=OCC) NEWCRSH1.NEWCRSH1; BY EVENT2 EJECT AGEGP3 VTYP; IF OCC; DATA FIXOBJ3; SET FIXOBJ2; O1=ORIGWT; W1=WEIGHTFA; CRSH=1; ORIGWT=FRONTAL * O1; WEIGHTFA=FRONTAL * W1; OUTPUT; CRSH=2; ORIGWT=SIDE * O1; WEIGHTFA=SIDE * W1; OUTPUT; CRSH=3; ORIGWT=ROLL * O1; WEIGHTFA=ROLL * W1; OUTPUT; CRSH=4; ORIGWT=REAROTHR* O1; WEIGHTFA=REAROTHR* W1; OUTPUT; /* ---------------------------------------------------------------------- */ /* NEWCRSH2.NEWCRSH2 ASSIGNS MULTIVEH ANGLE COLLISIONS */ /* TO FRONTAL, SIDE, ROLLOVER, OR REAR */ /* BASED ON FIRST HARMFUL EVENT, EJECTION, DRV/PAS AGE, CAR/LTV */ /* ---------------------------------------------------------------------- */ PROC SORT DATA=ANGLE; BY EVENT2 EJECT AGEGP4 VTYP; DATA ANGLE2; MERGE ANGLE(IN=OCC) NEWCRSH2.NEWCRSH2; BY EVENT2 EJECT AGEGP4 VTYP; IF OCC; DATA ANGLE3; SET ANGLE2; O1=ORIGWT; W1=WEIGHTFA; CRSH=1; ORIGWT=FRONTAL * O1; WEIGHTFA=FRONTAL * W1; OUTPUT; CRSH=2; ORIGWT=SIDE * O1; WEIGHTFA=SIDE * W1; OUTPUT; CRSH=3; ORIGWT=ROLL * O1; WEIGHTFA=ROLL * W1; OUTPUT; CRSH=4; ORIGWT=REAROTHR* O1; WEIGHTFA=REAROTHR* W1; OUTPUT; /* ---------------------------------------------------------------------- */ /* NEWCRSH3.NEWCRSH3 ASSIGNS MULTIVEH REAR-END COLLSNS TO FRONTAL, SIDE, */ /* ROLL, OR REAR BASED ON EJECTION, DRV/PAS AGE, CAR/LTV */ /* ---------------------------------------------------------------------- */ PROC SORT DATA=REAR; BY EVENT2 EJECT AGEGP4 VTYP; DATA REAR2; MERGE REAR(IN=OCC) NEWCRSH3.NEWCRSH3; BY EVENT2 EJECT AGEGP4 VTYP; IF OCC; DATA REAR3; SET REAR2; O1=ORIGWT; W1=WEIGHTFA; CRSH=1; ORIGWT=FRONTAL * O1; WEIGHTFA=FRONTAL * W1; OUTPUT; CRSH=2; ORIGWT=SIDE * O1; WEIGHTFA=SIDE * W1; OUTPUT; CRSH=3; ORIGWT=ROLL * O1; WEIGHTFA=ROLL * W1; OUTPUT; CRSH=4; ORIGWT=REAROTHR* O1; WEIGHTFA=REAROTHR* W1; OUTPUT;

367
/* ---------------------------------------------------------------------- */ /* NEWCRSH4.NEWCRSH4 ASSIGNS OTHER-EVENT CRASHES TO FRONTAL, SIDE, */ /* ROLLOVER, OR REAR BASED ON FIRST HARMFUL EVENT, EJECTION */ /* ---------------------------------------------------------------------- */ PROC SORT DATA=OTH; BY EVENT2 EJECT; DATA OTH2; MERGE OTH(IN=OCC) NEWCRSH4.NEWCRSH4; BY EVENT2 EJECT; IF OCC; DATA OTH3; SET OTH2; O1=ORIGWT; W1=WEIGHTFA; CRSH=1; ORIGWT=FRONTAL * O1; WEIGHTFA=FRONTAL * W1; OUTPUT; CRSH=2; ORIGWT=SIDE * O1; WEIGHTFA=SIDE * W1; OUTPUT; CRSH=3; ORIGWT=ROLL * O1; WEIGHTFA=ROLL * W1; OUTPUT; CRSH=4; ORIGWT=REAROTHR* O1; WEIGHTFA=REAROTHR* W1; OUTPUT;
NEW_UNKCRSH2 contains all the newly created CY 2003-2012 cases with known crash modes. DATA NEW_UNKCRSH2; SET FIXOBJ3 ANGLE3 REAR3 OTH3; DROP EVENT1 EVENT2 AGEGP3 AGEGP4 FRONTAL SIDE ROLL REAROTHR EJECT O1 W1 N; RUN;
UNKCRSH2 and NEW_UNKCRSH2 are appended to OCC2, the original cases with known crash modes, creating OCC3, a file on which all cases have known crash modes. DATA OCC3; SET OCC2 UNKCRSH2 NEW_UNKCRSH2;
The next step is to replace unknown seating positions with known seating positions. All drivers (PER_TYP = 1) are assumed to be in the left-front seat. Passengers (PER_TYP = 2) might have an un-known seating position. A special case is vehicles where multiple people were ejected and killed, and it is unknown who was the driver (PER_TYP = 9). /* WHEN THERE ARE MULTIPLE (EJECTED) OCCUPANTS, UNKNOWN WHO WAS THE DRIVER, */ /* ARBITRARILY SAY PER_NO 1 IS THE DRIVER, SINCE IT HARDLY AFFECTS OUR MODEL */ IF PER_TYP=9 THEN DO; IF 0 LE AGE LE 14 THEN PER_TYP=2; ELSE IF SEAT_POS NE 1 AND SEAT_POS NE 11 AND SEAT_POS NE 19 AND SEAT_POS NE 99 THEN PER_TYP=2; ELSE IF PER_NO=1 THEN PER_TYP=1; ELSE PER_TYP=2; END;
Before the imputation of seating positions, some simplifications of the SEAT_POS variable on FARS are needed. (For example, before 1982, FARS coded seating positions 1, 2, 3, 4, 5, 6 rather than 11, 12, 13, 21, 22, 23.) /* ------------------------------------------------------------------------------ */ /* STREAMLINES SEAT_POS CATEGORIES AND MAKES UNIFORM ACROSS 3 GENERATIONS OF FARS */ /* IN VANS, ETC., 3rd AND 4th ROW OF SEATS ARE TREATED AS REAR SEATS */ /* ------------------------------------------------------------------------------ */ IF PER_TYP=1 AND 0 LE AGE LE 9 THEN DO; PER_TYP=2; SEAT_POS=17; END; ELSE IF PER_TYP=1 THEN SEAT_POS=11; ELSE IF PER_TYP=2 AND ((CYGP IN (2,3) AND SEAT_POS=11) OR (CYGP=1 AND SEAT_POS=1)) THEN SEAT_POS=17; ELSE IF PER_TYP=2 AND CYGP=1 THEN DO; IF 2 LE SEAT_POS LE 3 THEN SEAT_POS=SEAT_POS+10; ELSE IF 4 LE SEAT_POS LE 6 THEN SEAT_POS=SEAT_POS+17; ELSE IF 7 LE SEAT_POS LE 9 THEN SEAT_POS=SEAT_POS+24; ELSE IF SEAT_POS=10 THEN SEAT_POS=18; ELSE IF SEAT_POS=11 THEN SEAT_POS=28; ELSE IF SEAT_POS=12 THEN SEAT_POS=38; ELSE IF SEAT_POS=13 THEN SEAT_POS=51; ELSE IF SEAT_POS=14 THEN SEAT_POS=50; ELSE IF SEAT_POS=15 THEN SEAT_POS=55; END; IF VTYP=1 THEN DO; IF SEAT_POS IN (11,12,13,18,19,51,99) THEN SEAT2=SEAT_POS; ELSE IF SEAT_POS=17 THEN SEAT2=18; ELSE IF SEAT_POS IN (21,23) THEN SEAT2=21;

368
ELSE IF SEAT_POS IN (22,31,32,33) THEN SEAT2=22; ELSE IF SEAT_POS IN (28,38,41,42,43,48,49) THEN SEAT2=28; ELSE IF SEAT_POS IN (29,39) THEN SEAT2=29; ELSE IF SEAT_POS IN (50,52,53,54,55) THEN SEAT2=52; ELSE IF SEAT_POS=98 AND CY GE 2010 THEN SEAT2=99; END; /* NEW CODE FOR SEATING POSITION */ ELSE DO; IF SEAT_POS IN (11,12,13,18,19,51,99) THEN SEAT2=SEAT_POS; ELSE IF SEAT_POS=17 THEN SEAT2=18; ELSE IF SEAT_POS IN (21,23,31,33,41,43) THEN SEAT2=21; ELSE IF SEAT_POS IN (22,32,42) THEN SEAT2=22; ELSE IF SEAT_POS IN (28,38,48) THEN SEAT2=28; ELSE IF SEAT_POS IN (29,39,49) THEN SEAT2=29; ELSE IF SEAT_POS IN (50,52,53,54,55) THEN SEAT2=52; ELSE IF SEAT_POS=98 AND CY GE 2010 THEN SEAT2=99; END; RUN;
The SEAT2 codes are: 11=driver 12=center front 13=right front 18=other front 19=unknown front 21=outboard rear 22=center rear 28=other rear 29=unknown rear 51=other enclosed 52=unenclosed 99=unknown passenger. Note: a child sitting on the driver’s lap is coded 18, “other front.” proc freq data=occ3; weight origwt; format crsh crsh.; tables crsh; TITLE 'CRSH DISTRIBUTION IN OCC3 AFTER IMPUTING AND DISTRIBUTING UNKNOWNS'; run;
Check for year-to-year continuity: proc freq data=occ3; weight origwt; format crsh crsh.; tables cy * crsh / nocol nopercent; run; proc freq data=occ3; weight origwt; format seat2 newseat.; tables seat2; TITLE 'UNKNOWN SEAT2 IN OCC3'; run;
The imputation of seating position is quite similar to the procedure for imputing crash modes. The file OCC3 is split into OCC4, UNKSEAT1, and NEW_UNKSEAT1. OCC4 are the cases with known seat-ing position (SEAT2) and are left alone. UNKSEAT1 contains the cases with unknown seating posi-tion (SEAT2 = 19, 29, 99) in CY 1975 to 2002, NEW_UNKSEAT1 in 2003 to 2012. DATA OCC4 UNKSEAT1 NEW_UNKSEAT1; SET OCC3; IF SEAT2 IN (19,29,99) THEN DO; IF 1975 LE CY LE 2002 THEN OUTPUT UNKSEAT1; ELSE OUTPUT NEW_UNKSEAT1; END; ELSE OUTPUT OCC4; RUN; /* ------------------------------------------------------------------ */ /* DISTRIBUTES AND IMPUTES PASSENGER SEATING POSITIONS WHEN UNKNOWN. */ /* SEPARATE IMPUTATIONS FOR TOTALLY UNKNOWN, FRONT-UNKNOWN AND */ /* REAR-UNKNOWN PASSENGERS, BASED ON CATMOD MODELS */ /* */ /* SEPARATELY FOR 1975-2002 (L_SEAT4) & 2003-2012 (L_SEAT14) */ /* ------------------------------------------------------------------ */ /* ------------------------------------------------------------------ */ /* IMPUTATION FOR CY 1975-2002: SAME AS IN 2004 REPORT (L_SEAT4.SAS) */ /* ------------------------------------------------------------------ */
UNKSEAT1 is further split into the cases where the seating position is entirely unknown (SEAT2 = 99) and the cases where it is known that the occupant was in the front seat, or in a rear seat, but the ex-act location is unknown. DATA USEAT119 USEAT129 USEAT199; SET UNKSEAT1; IF AGE=0 THEN AGEGP2=1; ELSE IF 1 LE AGE LE 4 THEN AGEGP2=2; ELSE IF 5 LE AGE LE 10 THEN AGEGP2=3; ELSE IF 11 LE AGE LE 15 THEN AGEGP2=4; ELSE IF 16 LE AGE LE 19 THEN AGEGP2=5; ELSE IF 20 LE AGE LE 29 THEN AGEGP2=6;

369
ELSE IF 30 LE AGE LE 97 THEN AGEGP2=7; ELSE AGEGP2=6; IF SEAT2=19 THEN OUTPUT USEAT119; ELSE IF SEAT2=29 THEN OUTPUT USEAT129; ELSE IF SEAT2=99 THEN OUTPUT USEAT199; RUN;
The program L_SEAT4 uses CATMOD to calibrate the distribution of passengers’ known seating po-sitions by detailed vehicle type (NEWVTYP), passengers’ age group (AGEGP2), and CRSH. On a file SEAT1, it stores the proportions of passengers who are in the center-front seat, the RF seat, and at any of the other known seating positions included in SEAT2, and it stores them in the data elements SEAT12, SEAT13, etc. These are the proportions that will be imputed if the seating position is com-pletely unknown. However, if we know the passenger was in the front seat, but we do not know exactly where, we can impute them by the proportions SEAT12 / (SEAT12 + SEAT13 + SEAT18), etc. DATA PSEAT19; SET SEAT1.SEAT1; P1=SEAT12+SEAT13+SEAT18; SEAT12=SEAT12/P1; SEAT13=SEAT13/P1; SEAT18=SEAT18/P1; KEEP NEWVTYP AGEGP2 CRSH SEAT12 SEAT13 SEAT18; DATA PSEAT29; SET SEAT1.SEAT1; P2=SEAT21+SEAT22+SEAT28; SEAT21=SEAT21/P2; SEAT22=SEAT22/P2; SEAT28=SEAT28/P2; KEEP NEWVTYP AGEGP2 CRSH SEAT21 SEAT22 SEAT28; RUN;
Just as in the imputation of crash modes, split each case with unknown seating position into multiple cases with known seating position, each weighted by the probability that the passenger was in that po-sition. PROC SORT DATA=USEAT119; BY NEWVTYP AGEGP2 CRSH; DATA USEAT219; MERGE USEAT119(IN=OCC) PSEAT19; BY NEWVTYP AGEGP2 CRSH; IF OCC; DATA USEAT319; SET USEAT219; O1=ORIGWT; W1=WEIGHTFA; SEAT2=12; ORIGWT=SEAT12 * O1; WEIGHTFA=SEAT12 * W1; OUTPUT; SEAT2=13; ORIGWT=SEAT13 * O1; WEIGHTFA=SEAT13 * W1; OUTPUT; SEAT2=18; ORIGWT=SEAT18 * O1; WEIGHTFA=SEAT18 * W1; OUTPUT; PROC SORT DATA=USEAT129; BY NEWVTYP AGEGP2 CRSH; DATA USEAT229; MERGE USEAT129(IN=OCC) PSEAT29; BY NEWVTYP AGEGP2 CRSH; IF OCC; DATA USEAT329; SET USEAT229; O1=ORIGWT; W1=WEIGHTFA; SEAT2=21; ORIGWT=SEAT21 * O1; WEIGHTFA=SEAT21 * W1; OUTPUT; SEAT2=22; ORIGWT=SEAT22 * O1; WEIGHTFA=SEAT22 * W1; OUTPUT; SEAT2=28; ORIGWT=SEAT28 * O1; WEIGHTFA=SEAT28 * W1; OUTPUT; PROC SORT DATA=USEAT199; BY NEWVTYP AGEGP2 CRSH; DATA USEAT299; MERGE USEAT199(IN=OCC) SEAT1.SEAT1; BY NEWVTYP AGEGP2 CRSH; IF OCC; DATA USEAT399; SET USEAT299; O1=ORIGWT; W1=WEIGHTFA; SEAT2=12; ORIGWT=SEAT12 * O1; WEIGHTFA=SEAT12 * W1; OUTPUT; SEAT2=13; ORIGWT=SEAT13 * O1; WEIGHTFA=SEAT13 * W1; OUTPUT; SEAT2=18; ORIGWT=SEAT18 * O1; WEIGHTFA=SEAT18 * W1; OUTPUT; SEAT2=21; ORIGWT=SEAT21 * O1; WEIGHTFA=SEAT21 * W1; OUTPUT; SEAT2=22; ORIGWT=SEAT22 * O1; WEIGHTFA=SEAT22 * W1; OUTPUT; SEAT2=28; ORIGWT=SEAT28 * O1; WEIGHTFA=SEAT28 * W1; OUTPUT; SEAT2=51; ORIGWT=SEAT51 * O1; WEIGHTFA=SEAT51 * W1; OUTPUT; SEAT2=52; ORIGWT=SEAT52 * O1; WEIGHTFA=SEAT52 * W1; OUTPUT;
UNKSEAT2 contains all the newly created cases with known seating positions in CY 1975 to 2002.

370
DATA UNKSEAT2; SET USEAT319 USEAT329 USEAT399; DROP AGEGP2 SEAT12 SEAT13 SEAT18 SEAT21 SEAT22 SEAT28 SEAT51 SEAT52 O1 W1; RUN;
Imputation for CY 2003 to 2012 is similar, except it uses imputation factors from the file NEWSEAT1 instead of SEAT1 and it creates NEW_UNKSEAT2. /* ------------------------------------------------------------------ */ /* IMPUTATION FOR CY 2003-2012: BASED ON L_SEAT14.SAS */ /* ------------------------------------------------------------------ */ DATA USEAT119 USEAT129 USEAT199; SET NEW_UNKSEAT1; IF AGE=0 THEN AGEGP2=1; ELSE IF 1 LE AGE LE 4 THEN AGEGP2=2; ELSE IF 5 LE AGE LE 10 THEN AGEGP2=3; ELSE IF 11 LE AGE LE 15 THEN AGEGP2=4; ELSE IF 16 LE AGE LE 19 THEN AGEGP2=5; ELSE IF 20 LE AGE LE 29 THEN AGEGP2=6; ELSE IF 30 LE AGE LE 97 THEN AGEGP2=7; ELSE AGEGP2=6; IF SEAT2=19 THEN OUTPUT USEAT119; ELSE IF SEAT2=29 THEN OUTPUT USEAT129; ELSE IF SEAT2=99 THEN OUTPUT USEAT199; RUN; DATA PSEAT19; SET NEWSEAT1.NEWSEAT1; P1=SEAT12+SEAT13+SEAT18; SEAT12=SEAT12/P1; SEAT13=SEAT13/P1; SEAT18=SEAT18/P1; KEEP NEWVTYP AGEGP2 CRSH SEAT12 SEAT13 SEAT18; DATA PSEAT29; SET NEWSEAT1.NEWSEAT1; P2=SEAT21+SEAT22+SEAT28; SEAT21=SEAT21/P2; SEAT22=SEAT22/P2; SEAT28=SEAT28/P2; KEEP NEWVTYP AGEGP2 CRSH SEAT21 SEAT22 SEAT28; RUN; PROC SORT DATA=USEAT119; BY NEWVTYP AGEGP2 CRSH; DATA USEAT219; MERGE USEAT119(IN=OCC) PSEAT19; BY NEWVTYP AGEGP2 CRSH; IF OCC; DATA USEAT319; SET USEAT219; O1=ORIGWT; W1=WEIGHTFA; SEAT2=12; ORIGWT=SEAT12 * O1; WEIGHTFA=SEAT12 * W1; OUTPUT; SEAT2=13; ORIGWT=SEAT13 * O1; WEIGHTFA=SEAT13 * W1; OUTPUT; SEAT2=18; ORIGWT=SEAT18 * O1; WEIGHTFA=SEAT18 * W1; OUTPUT; PROC SORT DATA=USEAT129; BY NEWVTYP AGEGP2 CRSH; DATA USEAT229; MERGE USEAT129(IN=OCC) PSEAT29; BY NEWVTYP AGEGP2 CRSH; IF OCC; DATA USEAT329; SET USEAT229; O1=ORIGWT; W1=WEIGHTFA; SEAT2=21; ORIGWT=SEAT21 * O1; WEIGHTFA=SEAT21 * W1; OUTPUT; SEAT2=22; ORIGWT=SEAT22 * O1; WEIGHTFA=SEAT22 * W1; OUTPUT; SEAT2=28; ORIGWT=SEAT28 * O1; WEIGHTFA=SEAT28 * W1; OUTPUT; PROC SORT DATA=USEAT199; BY NEWVTYP AGEGP2 CRSH; DATA USEAT299; MERGE USEAT199(IN=OCC) NEWSEAT1.NEWSEAT1; BY NEWVTYP AGEGP2 CRSH; IF OCC; DATA USEAT399; SET USEAT299; O1=ORIGWT; W1=WEIGHTFA; SEAT2=12; ORIGWT=SEAT12 * O1; WEIGHTFA=SEAT12 * W1; OUTPUT; SEAT2=13; ORIGWT=SEAT13 * O1; WEIGHTFA=SEAT13 * W1; OUTPUT; SEAT2=18; ORIGWT=SEAT18 * O1; WEIGHTFA=SEAT18 * W1; OUTPUT; SEAT2=21; ORIGWT=SEAT21 * O1; WEIGHTFA=SEAT21 * W1; OUTPUT; SEAT2=22; ORIGWT=SEAT22 * O1; WEIGHTFA=SEAT22 * W1; OUTPUT; SEAT2=28; ORIGWT=SEAT28 * O1; WEIGHTFA=SEAT28 * W1; OUTPUT; SEAT2=51; ORIGWT=SEAT51 * O1; WEIGHTFA=SEAT51 * W1; OUTPUT; SEAT2=52; ORIGWT=SEAT52 * O1; WEIGHTFA=SEAT52 * W1; OUTPUT; DATA NEW_UNKSEAT2; SET USEAT319 USEAT329 USEAT399; DROP AGEGP2 SEAT12 SEAT13 SEAT18 SEAT21 SEAT22 SEAT28 SEAT51 SEAT52 O1 W1; RUN;
371
UNKSEAT2 and NEW_UNKSEAT2 are appended to OCC4, the original cases with known seating positions, creating OCC5, a file on which all cases have known seating positions (and crash modes).
The next step is to replace unknown belt (or safety seat) use with known restraint use. Before the im-putation of restraint use, it is necessary to determine exactly what sort(s) of belt systems were installed at each seat. For outboard front seats of cars starting in MY 1981 and LTVs in 1985, a detailed VIN analysis has already been performed on the FARS cases, and the information is stored in the variable PASSIVE that is already on the file LSM2004 and carried over to OCC5. For the other vehicles/seating positions, restraint availability is determined from the VIN-based make-model codes MAK2, CG and MM2, or from the FARS codes MAKE and MAK_MOD. The information is encoded in the variables FTLS (for the outboard front seats), BKLS (for the outboard rear seats), and the already existing varia-ble BELT22 (for the center rear seats). In vans, the “rear” seats include the third and fourth rows as well as the second. The “lap belts only” code really means “lap belts only, if anything.” Center-front seats in all cars and third seats in station wagons are assumed to have lap belts only. /* ------------------------------------------------------------------ */ /* FTLS: 3=OUTBOARD FRONT SEATS HAVE 3-POINT BELTS */ /* 2=AUTOMATIC 2-POINT BELTS */ /* 1=LAP BELTS ONLY */ /* 4=3-POINT BELTS FOR DRIVER, AUTOMATIC 2-POINT BELTS FOR RF */ /* 5=SEPARATE MANUAL LAP AND TORSO BELTS */ /* 6=MIX OF 3-POINT BELTS AND LAP-ONLY BELTS */ /* 7=MIX OF SEPARATE LAP AND TORSO BELTS AND LAP-ONLY BELTS */ /* 8=MIX OF 3-POINT BELTS AND 2-POINT AUTOMATIC BELTS */ /* */ /* BKLS: 3=OUTBOARD REAR SEATS HAVE 3-POINT BELTS */ /* 1=LAP BELTS ONLY */ /* */ /* CBKLS: NOW A SEPARATE VARIABLE BELT22 ALREADY ON LSM2014C */ /* */ /* CENTER FRONT SEATS AND STATION-WAGON 3RD SEATS: LAP BELT ONLY */ /* OTHER (NONSTANDARD) SEATS HAVE NO BELTS AT ALL */ /* KIDS UNDER 6 CAN ONLY USE SAFETY SEATS OR LAP BELTS */ /* PEOPLE AGE 10 OR OLDER ARE NEVER IN CHILD SAFETY SEATS */ /* ------------------------------------------------------------------ */ DATA OCC5; SET OCC4 UNKSEAT2 NEW_UNKSEAT2;
The program now edits the original restraint use code on FARS, REST_USE in three steps, generating REST1, then REST2, then REST3, comprising the following codes: 0=unrestrained 1=shoulder belt only 2=lap belt only 3=lap + shoulder belt 4=child safety seat 7=2-pt automatic belt 8=used, type not specified 99=unknown if used. /* ------------------------------------------------------------------ */ /* STREAMLINE REST_USE CODES AND DISALLOW IMPLAUSIBLE CODES */ /* ------------------------------------------------------------------ */
REST1 is a slight streamlining of REST_USE, changing codes used in earlier versions of FARS to cur-rent codes. Children < 6 years old will be considered protected by “lap belts only” when FARS says they wore lap and shoulder belts. IF REST_USE=13 AND PER_TYP=2 AND 0 LE AGE LE 5 THEN REST1=2; ELSE IF REST_USE=13 THEN REST1=8; ELSE IF REST_USE=14 THEN REST1=4; ELSE IF CY GE 2008 AND REST_USE IN (10,11,12) THEN REST1=4; /* NEW CODES FOR SAFETY SEATS STARTING IN 2008 FARS */ ELSE IF REST_USE=9 THEN REST1=99; ELSE IF CY GE 2010 AND REST_USE=7 THEN REST1=0; /* NEW CODE FOR UNBELTED OCCUPANTS STARTING IN 2010 FARS */ ELSE REST1=REST_USE; IF (1977 LE CY LE 1979 AND AUT_REST=5) OR (1980 LE CY LE 1989 AND AUT_REST=1) THEN REST1=7;
372
REST2 edits REST1, taking into account what types of belts were actually in the vehicle and modify-ing implausible codes. Anybody age 10 or older will be considered to have unknown restraint use if FARS says they were in a child safety seat. “Motorcycle helmet” will always be recoded “unknown” for car/LTV occupants. People in non-designated seating positions (e.g., unenclosed areas) are as-sumed to be unrestrained. IF SEAT2 IN (17,18,28,51,52) THEN REST2=0; ELSE IF REST1 IN (5,6,15,16,17,96,97,98) THEN REST2=99; ELSE IF REST1=4 AND AGE GE 10 THEN REST2=99; ELSE REST2=REST1;
Belt type installed in outboard front seats, passenger cars. In 1969-73, VW, Audi, BMW, Mercedes and Volvo are assumed to have 3-point belts, while other makes had separate lap and shoulder belts. /* ------------------------------------------------------------------ */ /* TYPE OF BELTS AT THE OUTBOARD FRONT SEATING POSITIONS */ /* ------------------------------------------------------------------ */ IF VTYP=1 THEN DO; IF PASSIVE IN (303,404,606,707,1303,1404,1606,1313) THEN FTLS=2; ELSE IF PASSIVE IN (1003,1004,1006) THEN FTLS=4; ELSE IF MAK_MOD IN (3006,3036,30036) AND 1975 LE XMY LE 1980 THEN FTLS=8; ELSE IF 1974 LE XMY LE 2013 THEN FTLS=3; ELSE IF 1969 LE XMY LE 1973 AND MAKE IN (30,32,34,42,51) THEN FTLS=3; ELSE IF 1965 LE XMY LE 1968 AND MAKE=51 THEN FTLS=3; ELSE IF 1969 LE XMY LE 1973 THEN FTLS=5; ELSE IF XMY=1968 AND MAKE IN (30,32,34,42) THEN FTLS=6; ELSE IF XMY=1968 THEN FTLS=7; ELSE FTLS=1; END;
Belt type installed in outboard front seats, LTVs. All LTVs had 3-point belts from MY 1981 onwards. All pickup trucks from 1977 onwards. All LTVs had only lap belts (if anything) up to 1968; SUVs and vans up to 1973. In 1969-80, LTVs could have lap belts, or 3-point belts, or a mix of the two, depend-ing on the make, MY and vehicle type. In the absence of specific evidence, a mix of the two is as-sumed. ELSE IF VTYP=2 THEN DO; IF 1981 LE XMY LE 2013 THEN FTLS=3; ELSE IF XMY LE 1968 THEN FTLS=1; ELSE IF MAKE=30 THEN FTLS=3; ELSE IF NEWVTYP=11 THEN DO; IF 1977 LE XMY LE 1980 THEN FTLS=3; ELSE IF 2 LE MAKE LE 29 AND 1974 LE XMY LE 1976 THEN FTLS=6; ELSE IF 2 LE MAKE LE 29 THEN FTLS=1; ELSE IF 31 LE MAKE LE 84 AND 1975 LE XMY LE 1976 THEN FTLS=3; ELSE IF 31 LE MAKE LE 84 AND 1972 LE XMY LE 1974 THEN FTLS=6; ELSE IF 31 LE MAKE LE 84 THEN FTLS=1; ELSE IF 1972 LE XMY LE 1976 THEN FTLS=6; ELSE FTLS=1; END; ELSE IF NEWVTYP=12 THEN DO; IF 1969 LE XMY LE 1973 THEN FTLS=1; ELSE IF MAKE IN (1,2,3,29,84) THEN FTLS=6; ELSE IF MAKE IN (7,9,20,23) AND 1974 LE XMY LE 1976 THEN FTLS=6; ELSE IF MAKE IN (7,9,20,23) THEN FTLS=3; ELSE IF MAKE=12 AND 1974 LE XMY LE 1977 THEN FTLS=6; ELSE IF MAKE=12 THEN FTLS=3; ELSE IF MAKE=49 AND 1974 LE XMY LE 1975 THEN FTLS=1; ELSE IF MAKE=49 THEN FTLS=3; ELSE FTLS=6; END; ELSE IF 1969 LE XMY LE 1973 THEN FTLS=1; ELSE IF 1974 LE XMY LE 1979 THEN FTLS=6; ELSE IF XMY=1980 THEN FTLS=3; END;
TY = first model year with 3-point belts at the back outboard seats. These dates are documented in NHTSA’s evaluation of rear seat belts.
373
/* ------------------------------------------------------------------ */ /* TRANSITION YEAR TO 3-POINT BELTS IN THE OUTBOARD REAR SEATS */ /* ------------------------------------------------------------------ */ IF MAK2=51 OR (MAK2=. AND MAKE=51) THEN TY=1971; ELSE IF VTYP=1 AND (MAK2=42 OR (MAK2=. AND MAKE=42)) THEN TY=1974; ELSE IF MM2=39032 THEN TY=1977; ELSE IF VTYP=1 AND (MAK2 IN (34,44,45,47) OR MAK2=. AND MAKE IN (34,44,45,47)) THEN TY=1981; ELSE IF MM2 IN (37032,32035) THEN TY=1982; ELSE IF MM2=30041 OR MAK2=32 OR (MAK2=. AND MAKE=32) THEN TY=1983; ELSE IF MAK2=56 OR (MAK2=. AND MAKE=56) THEN TY=1986; ELSE IF MM2=30040 THEN TY=1985; ELSE IF MM2=54032 THEN TY=1986; ELSE IF MM2 IN (35039,54032,61031,39031) THEN TY=1987; ELSE IF MM2 IN (6018,7018,12017,14017,13005,18005,19005,19014,21005,20019, 30042,30044,54031,37031,37033,41035,41037,41043,41044,46044,49040,49035, 60031,22031) OR (MM2=19003 AND CG=18042) OR (CG=18052 AND MM2 IN (18002,21002,22002)) THEN TY=1988; ELSE IF MM2 IN (7017,9017,7019,9019,12004,14004,18016,20016,22016,20009,22009, 18017,20017,21017,22017,18003,19003,21003,18018,21018,22018,18020,20020,21020, 22020,35042,35032,41034,49032,49034,49033,49038,7034,9034,52035,6035,52031, 7044,9044,52034,10034,20034,53034,55033) OR CG IN (18039,18040,18048) THEN TY=1989; ELSE IF VTYP=1 THEN TY=1990; ELSE IF CG=38301 AND V7='8' THEN TY=1987; ELSE IF CG IN (18402,18403,38301,38303,38304) THEN TY=1988; ELSE IF CG IN (18301,18303,18304,18401,41401,49301,49302,49401,52301,53302,53303) THEN TY=1989; ELSE IF CG IN (18302,18404,18405,35301) THEN TY=1990; ELSE IF CG IN (1303,1304,1305,6301,6402,6403,6405,6406,18305,49303,49402) THEN TY=1991; ELSE IF VTYP=2 THEN TY=1992; IF XMY GE TY THEN BKLS=3; ELSE BKLS=1; DROP TY; RUN; proc freq data=occ5; weight origwt; format seat2 newseat.; tables seat2; TITLE 'SEAT2 IN OCC5 AFTER IMPUTING AND DISTRIBUTING UNKNOWNS'; run; proc freq data=occ5; weight origwt; format rest2 newrest.; tables rest2; TITLE 'UNKNOWN REST2 IN OCC5'; run;
OCC5 is split into OCC6, UNKBELT1, and NEW_UNKBELT1. OCC6 are the cases with known re-straint use (REST2) and are left alone. UNKBELT1 contains the CY 1975-2002 cases with unknown restraint use (REST2 = 99), plus child passengers known to be restrained, but unknown if they were in a safety seat or just belts. NEW_UNKBELT1 contains the CY 2003-2012 cases DATA OCC6 UNKBELT1 NEW_UNKBELT1; SET OCC5; IF REST2=99 OR (0 LE AGE LE 5 AND PER_TYP=2 AND REST2=8) THEN DO; IF 1975 LE CY LE 2002 THEN OUTPUT UNKBELT1; ELSE OUTPUT NEW_UNKBELT1; END; ELSE OUTPUT OCC6; RUN; /* ------------------------------------------------------------------ */ /* DISTRIBUTES AND IMPUTES BELT USE WHEN UNKNOWN; SEPARATELY FOR */ /* FRONT-SEAT 3-POINT, AUTOMATIC 2-POINT, REAR-SEAT 3-POINT, LAP, */ /* INFANT-TODDLER (IN 2 STEPS: USED/NOT-USED BELT/SAFETY-SEAT) */ /* */ /* SEPARATE IMPUTATIONS FOR CY 1975-2002 AND 2003-2012 */ /* ------------------------------------------------------------------ */ /* ------------------------------------------------------------------ */ /* IMPUTATION FOR CY 1975-2002 BASED ON LOGISTIC REGRESSION MODELS */ /* FROM L3PT4, L2PT4, LBK3PT4, L_LAP4, & LKIDRES4 */ /* (CARRYOVER FROM 2004 REPORT) */ /* ------------------------------------------------------------------ */
374
UNKBELT1 is further subdivided into: occupants of outboard front seats equipped with 3-point belts (UNK3PT1), with 2-point automatic belts (UNK2PT1), rear seats equipped with 3-point belts (UNKBK31), any seats equipped with lap belts or separate lap and shoulder belts (UNKLAP1), child passengers < 6 years old with completely unknown restraint use (UNKKID1), and child passengers < 6 known to be restrained, but unknown what type of restraint (UNKKID2). FTLS = 8 is primarily 3-point belts with some 2-point, and is sent to UNK3PT1; other mixes are sent to UNKLAP1. /* ------------------------------------------------------------------ */ /* DISTRIBUTES AND IMPUTES BELT USE WHEN UNKNOWN; SEPARATELY FOR */ /* FRONT-SEAT 3-POINT, AUTOMATIC 2-POINT, REAR-SEAT 3-POINT, LAP, */ /* INFANT-TODDLER (IN 2 STEPS: USED/NOT-USED BELT/SAFETY-SEAT) */ /* BASED ON LOGISTIC REGRESSION MODELS FROM L3PT4, L2PT4, LBK3PT4, */ /* L_LAP4, & LKIDRES4 */ /* ------------------------------------------------------------------ */ DATA UNK3PT1 UNK2PT1 UNKBK31 UNKLAP1 UNKKID1 UNKKID2; SET UNKBELT1; GENDER=SEX; IF GENDER NE 2 THEN GENDER=1; IF 0 LE AGE LE 97 THEN NEWAGE=AGE; ELSE NEWAGE=30; IF PER_TYP=1 AND AGE LT 14 THEN NEWAGE=30; IF 0 LE AGE LE 5 AND PER_TYP=2 AND REST2=8 THEN OUTPUT UNKKID2; ELSE IF SEAT2=11 THEN DO; IF FTLS=2 THEN OUTPUT UNK2PT1; ELSE IF FTLS IN (3,4,8) THEN OUTPUT UNK3PT1; ELSE OUTPUT UNKLAP1; END; ELSE IF SEAT2=13 THEN DO; IF 0 LE AGE LE 5 THEN OUTPUT UNKKID1; ELSE IF FTLS IN (2,4) THEN OUTPUT UNK2PT1; ELSE IF FTLS IN (3,8) THEN OUTPUT UNK3PT1; ELSE OUTPUT UNKLAP1; END; ELSE IF SEAT2=21 THEN DO; IF 0 LE AGE LE 5 THEN OUTPUT UNKKID1; ELSE IF BKLS=3 THEN OUTPUT UNKBK31; ELSE OUTPUT UNKLAP1; END; ELSE IF SEAT2=22 THEN DO; IF 0 LE AGE LE 5 THEN OUTPUT UNKKID1; ELSE IF BELT22=1 THEN OUTPUT UNKBK31; ELSE OUTPUT UNKLAP1; END; ELSE IF SEAT2=12 THEN DO; IF 0 LE AGE LE 5 THEN OUTPUT UNKKID1; ELSE OUTPUT UNKLAP1; END; RUN;
The program L3PT4 is a logistic regression that calibrates belt use of outboard front seat occupants in vehicles with 3-point belts, based on cases where belt use is known, as a function of the calendar year, the occupant’s age and gender, the vehicle type, vehicle age, crash mode and seating position. The code here defines the independent variables used in L3PT4 and copies the regression equation obtained there, in order to impute the belt use of occupants for whom it is unknown on FARS. /* IMPUTES FRONT-SEAT 3-POINT BELT USE BASED ON LOGISTIC REGRESSION EQUATION */ DATA UNK3PT2; SET UNK3PT1; IF NEWAGE GE 17 THEN FEMALE=GENDER-1; ELSE IF 6 LE NEWAGE LE 13 THEN FEMALE=.5; ELSE IF 14 LE NEWAGE LE 16 THEN FEMALE=.5*GENDER-.25; PRETEEN=0; TEEN=0; ADULT=0; OLD=0; IF 6 LE NEWAGE LE 12 THEN PRETEEN=1; ELSE IF 13 LE NEWAGE LE 20 THEN TEEN=20-NEWAGE; ELSE IF 30 LE NEWAGE LE 79 THEN ADULT=NEWAGE-30; ELSE IF 80 LE NEWAGE LE 97 THEN OLD=1; CONVRTBL=0; TWODOOR=0; STAWAGON=0; UNK_CAR=0; PICKUP=0; SUV=0; VAN=0; UNK_LTRK=0; IF NEWVTYP=1 THEN CONVRTBL=1; ELSE IF NEWVTYP=2 THEN TWODOOR=1; ELSE IF NEWVTYP=6 THEN STAWAGON=1; ELSE IF NEWVTYP=9 THEN UNK_CAR=1; ELSE IF NEWVTYP=11 THEN PICKUP=1; ELSE IF NEWVTYP=12 THEN SUV=1;

375
ELSE IF NEWVTYP=13 THEN VAN=1; ELSE IF NEWVTYP=19 THEN UNK_LTRK=1; CY7576=0; CY7778=0; CY7980=0; CY81=0; CY82=0; CY83=0; CY84=0; CY85=0; CY86=0; CY87=0; CY88=0; CY89=0; CY90=0; CY91=0; CY92=0; CY93=0; CY94=0; CY95=0; CY96=0; CY97=0; CY98=0; CY2000=0; CY2001=0; CY2002=0; IF CY IN (1975,1976) THEN CY7576=1; ELSE IF CY IN (1977,1978) THEN CY7778=1; ELSE IF CY IN (1979,1980) THEN CY7980=1; ELSE IF CY=1981 THEN CY81=1; ELSE IF CY=1982 THEN CY82=1; ELSE IF CY=1983 THEN CY83=1; ELSE IF CY=1984 THEN CY84=1; ELSE IF CY=1985 THEN CY85=1; ELSE IF CY=1986 THEN CY86=1; ELSE IF CY=1987 THEN CY87=1; ELSE IF CY=1988 THEN CY88=1; ELSE IF CY=1989 THEN CY89=1; ELSE IF CY=1990 THEN CY90=1; ELSE IF CY=1991 THEN CY91=1; ELSE IF CY=1992 THEN CY92=1; ELSE IF CY=1993 THEN CY93=1; ELSE IF CY=1994 THEN CY94=1; ELSE IF CY=1995 THEN CY95=1; ELSE IF CY=1996 THEN CY96=1; ELSE IF CY=1997 THEN CY97=1; ELSE IF CY=1998 THEN CY98=1; ELSE IF CY=2000 THEN CY2000=1; ELSE IF CY=2001 THEN CY2001=1; ELSE IF CY=2002 THEN CY2002=1; RTFRONT=0; IF SEAT2=13 THEN RTFRONT=1; SIDE=0; ROLL=0; REAROTHR=0; IF CRSH=2 THEN SIDE=1; ELSE IF CRSH=3 THEN ROLL=1; ELSE IF CRSH=4 THEN REAROTHR=1; VEH_AGE=CY-XMY; IF VEH_AGE LT 0 THEN VEH_AGE=0; Z=-.2954+.7226*PRETEEN+.0292*TEEN+.0202*ADULT+.9100*OLD+.4728*FEMALE; Z=Z-.1273*CONVRTBL-.2593*TWODOOR+.1047*STAWAGON-.0414*UNK_CAR; Z=Z-.7998*PICKUP-.3697*SUV-.1141*VAN-.4421*UNK_LTRK-.0647*VEH_AGE; Z=Z-2.4205*CY7576-2.9491*CY7778-3.2598*CY7980-3.3202*CY81-3.2030*CY82; Z=Z-2.9786*CY83-2.6736*CY84-1.8587*CY85-1.3004*CY86-1.0471*CY87; Z=Z-.9215*CY88-.8555*CY89-.7852*CY90-.6234*CY91-.4971*CY92-.3323*CY93; Z=Z-.2301*CY94-.2192*CY95-.1221*CY96-.0760*CY97-.0047*CY98; Z=Z+.1102*CY2000+.1544*CY2001+.2124*CY2002; Z=Z+.4169*SIDE-.4605*ROLL+.1482*REAROTHR-.0332*RTFRONT;
Based on the logistic regression equation, BELTED is the probability that the occupant was belted; UNBELTED is the probability they were unrestrained. Each case with unknown belt use is split into two cases with known belt use: one yes, weighted by the probability that the occupant was belted; the other no, weighted by UNBELTED. BELTED=EXP(Z)/(1+EXP(Z)); UNBELTED=1-BELTED; O1=ORIGWT; W1=WEIGHTFA; REST2=0; ORIGWT=UNBELTED* O1; WEIGHTFA=UNBELTED* W1; OUTPUT; REST2=8; ORIGWT= BELTED * O1; WEIGHTFA= BELTED * W1; OUTPUT; RUN; /* IMPUTES AUTOMATIC 2-POINT BELT USE BASED ON LOGISTIC REGRESSION EQUATION */ DATA UNK2PT2; SET UNK2PT1; IF PASSIVE IN (606,707,1606) THEN MOTOR=0; ELSE MOTOR=1; IF NEWAGE GE 17 THEN FEMALE=GENDER-1; ELSE IF 6 LE NEWAGE LE 13 THEN FEMALE=.5; ELSE IF 14 LE NEWAGE LE 16 THEN FEMALE=.5*GENDER-.25; PRETEEN=0; TEEN=0; ADULT=0; OLD=0; IF 6 LE NEWAGE LE 12 THEN PRETEEN=1; ELSE IF 13 LE NEWAGE LE 20 THEN TEEN=20-NEWAGE; ELSE IF 30 LE NEWAGE LE 79 THEN ADULT=NEWAGE-30; ELSE IF 80 LE NEWAGE LE 97 THEN OLD=1; RTFRONT=0; IF SEAT2=13 THEN RTFRONT=1; SIDE=0; ROLL=0; REAROTHR=0; IF CRSH=2 THEN SIDE=1; ELSE IF CRSH=3 THEN ROLL=1; ELSE IF CRSH=4 THEN REAROTHR=1; VEH_AGE=CY-XMY; IF VEH_AGE LT 0 THEN VEH_AGE=0; Z=-.2911+.6194*MOTOR+.5819*PRETEEN+.0323*TEEN+.0289*ADULT+1.4860*OLD+.4928*FEMALE; Z=Z-.0199*VEH_AGE+.1496*SIDE-.7183*ROLL-.0317*REAROTHR-.0732*RTFRONT; BELTED=EXP(Z)/(1+EXP(Z)); UNBELTED=1-BELTED; O1=ORIGWT; W1=WEIGHTFA; REST2=0; ORIGWT=UNBELTED* O1; WEIGHTFA=UNBELTED* W1; OUTPUT; REST2=8; ORIGWT= BELTED * O1; WEIGHTFA= BELTED * W1; OUTPUT; RUN;

376
/* IMPUTES REAR-SEAT 3-POINT BELT USE BASED ON LOGISTIC REGRESSION EQUATION */ DATA UNKBK32; SET UNKBK31; IF NEWAGE GE 17 THEN FEMALE=GENDER-1; ELSE IF 6 LE NEWAGE LE 13 THEN FEMALE=.5; ELSE IF 14 LE NEWAGE LE 16 THEN FEMALE=.5*GENDER-.25; PRETEEN=0; TEEN=0; ADULT=0; OLD=0; IF 6 LE NEWAGE LE 12 THEN PRETEEN=1; ELSE IF 13 LE NEWAGE LE 20 THEN TEEN=20-NEWAGE; ELSE IF 30 LE NEWAGE LE 79 THEN ADULT=NEWAGE-30; ELSE IF 80 LE NEWAGE LE 97 THEN OLD=1; TWODOOR=0; VAN=0; OTHR_TRK=0; IF NEWVTYP IN (1,2) THEN TWODOOR=1; ELSE IF NEWVTYP=9 THEN TWODOOR=.5; ELSE IF NEWVTYP IN (11,12,19) THEN OTHR_TRK=1; ELSE IF NEWVTYP=13 THEN VAN=1; CY7589=0; CY9094=0; CY9599=0; IF 1975 LE CY LE 1989 THEN CY7589=1; ELSE IF 1990 LE CY LE 1994 THEN CY9094=1; ELSE IF 1995 LE CY LE 1999 THEN CY9599=1; SIDE=0; ROLL=0; REAROTHR=0; IF CRSH=2 THEN SIDE=1; ELSE IF CRSH=3 THEN ROLL=1; ELSE IF CRSH=4 THEN REAROTHR=1; VEH_AGE=CY-XMY; IF VEH_AGE LT 0 THEN VEH_AGE=0; CENREAR=0; IF SEAT2=22 THEN CENREAR=1; Z=-1.4715+1.5495*PRETEEN+.1042*TEEN+.0294*ADULT+1.3595*OLD+.3314*FEMALE; Z=Z-.1506*TWODOOR+.0012*VAN-.3215*OTHR_TRK-.0303*VEH_AGE; Z=Z-.7777*CY7589-.4001*CY9094-.2469*CY9599; Z=Z+.2107*SIDE-.6045*ROLL+.2894*REAROTHR-.6754*CENREAR; BELTED=EXP(Z)/(1+EXP(Z)); UNBELTED=1-BELTED; O1=ORIGWT; W1=WEIGHTFA; REST2=0; ORIGWT=UNBELTED* O1; WEIGHTFA=UNBELTED* W1; OUTPUT; REST2=8; ORIGWT= BELTED * O1; WEIGHTFA= BELTED * W1; OUTPUT; RUN; /* IMPUTES LAP BELT USE BASED ON LOGISTIC REGRESSION EQUATION */ DATA UNKLAP2; SET UNKLAP1; PRE_STD=0; IF SEAT2 IN (11,13) AND XMY LT 1964 THEN PRE_STD=1; ELSE IF SEAT2=21 AND XMY LT 1966 THEN PRE_STD=1; ELSE IF SEAT2 IN (12,22) AND XMY LT 1968 THEN PRE_STD=1; IF NEWAGE GE 17 THEN FEMALE=GENDER-1; ELSE IF 6 LE NEWAGE LE 13 THEN FEMALE=.5; ELSE IF 14 LE NEWAGE LE 16 THEN FEMALE=.5*GENDER-.25; PRETEEN=0; TEEN=0; ADULT=0; OLD=0; IF 6 LE NEWAGE LE 12 THEN PRETEEN=1; ELSE IF 13 LE NEWAGE LE 20 THEN TEEN=20-NEWAGE; ELSE IF 30 LE NEWAGE LE 79 THEN ADULT=NEWAGE-30; ELSE IF 80 LE NEWAGE LE 97 THEN OLD=1; TWODOOR=0; PICKUP=0; SUV_VAN=0; IF NEWVTYP IN (1,2) THEN TWODOOR=1; ELSE IF NEWVTYP=9 THEN TWODOOR=.63; ELSE IF NEWVTYP=11 THEN PICKUP=1; ELSE IF NEWVTYP IN (12,13) THEN SUV_VAN=1; ELSE IF NEWVTYP=19 THEN DO; PICKUP=.72; SUV_VAN=.28; END; CY7579=0; CY8084=0; CY8589=0; CY9094=0; CY9599=0; IF 1975 LE CY LE 1979 THEN CY7579=1; ELSE IF 1980 LE CY LE 1984 THEN CY8084=1; ELSE IF 1985 LE CY LE 1989 THEN CY8589=1; ELSE IF 1990 LE CY LE 1994 THEN CY9094=1; ELSE IF 1995 LE CY LE 1999 THEN CY9599=1; CENFRONT=0; RTFRONT=0; OUTBRD_R=0; CENREAR=0; IF SEAT2=12 THEN CENFRONT=1; ELSE IF SEAT2=13 THEN RTFRONT=1; ELSE IF SEAT2=21 THEN OUTBRD_R=1; ELSE IF SEAT2=22 THEN CENREAR=1; SIDE=0; ROLL=0; REAROTHR=0; IF CRSH=2 THEN SIDE=1; ELSE IF CRSH=3 THEN ROLL=1; ELSE IF CRSH=4 THEN REAROTHR=1; VEH_AGE=CY-XMY; IF VEH_AGE LT 0 THEN VEH_AGE=0;

377
Z=-.3189+1.1862*PRETEEN+.0323*TEEN+.0204*ADULT+1.1997*OLD; Z=Z-.2945*PRE_STD-1.2292*CENFRONT-.1795*RTFRONT-.7338*OUTBRD_R-1.6522*CENREAR; Z=Z+.4191*FEMALE-.0717*TWODOOR-.8322*PICKUP-.0642*SUV_VAN-.0535*VEH_AGE; Z=Z-3.0443*CY7579-3.2209*CY8084-1.4020*CY8589-.7785*CY9094-.3090*CY9599; Z=Z+.0432*SIDE-.1522*ROLL+.0675*REAROTHR; BELTED=EXP(Z)/(1+EXP(Z)); UNBELTED=1-BELTED; O1=ORIGWT; W1=WEIGHTFA; REST2=0; ORIGWT=UNBELTED* O1; WEIGHTFA=UNBELTED* W1; OUTPUT; REST2=8; ORIGWT= BELTED * O1; WEIGHTFA= BELTED * W1; OUTPUT; RUN;
The imputation procedure for child passengers < 6 years old is performed in two steps. First, each case with completely unknown restraint use is split into two cases based on the first logistic regression equation in LKIDRES4: one unrestrained, one restrained, type unknown. Next, the restrained cases generated from this procedure, plus the already existing cases of children that were restrained, type un-known are split into two cases based on the second equation in LKIDRES4: one in a safety seat, one in a lap belt only. /* IMPUTES RESTRAINED AND UNRESTRAINED INFANTS/TODDLERS */ DATA UNKKID3 UNKKID4; SET UNKKID1 UNKKID2(IN=KID2); INFANT=0; AGE1=0; AGE2=0; AGE3=0; AGE4=0; IF NEWAGE=0 THEN INFANT=1; ELSE IF NEWAGE=1 THEN AGE1=1; ELSE IF NEWAGE=2 THEN AGE2=1; ELSE IF NEWAGE=3 THEN AGE3=1; ELSE IF NEWAGE=4 THEN AGE4=1; IF VTYP=2 THEN LTRK=1; ELSE LTRK=0; CY7576=0; CY7778=0; CY7980=0; CY81=0; CY82=0; CY83=0; CY84=0; CY85=0; CY86=0; CY87=0; CY88=0; CY89=0; CY90=0; CY91=0; CY92=0; CY93=0; CY94=0; CY95=0; CY96=0; CY97=0; CY98=0; CY2000=0; CY2001=0; CY2002=0; IF CY IN (1975,1976) THEN CY7576=1; ELSE IF CY IN (1977,1978) THEN CY7778=1; ELSE IF CY IN (1979,1980) THEN CY7980=1; ELSE IF CY=1981 THEN CY81=1; ELSE IF CY=1982 THEN CY82=1; ELSE IF CY=1983 THEN CY83=1; ELSE IF CY=1984 THEN CY84=1; ELSE IF CY=1985 THEN CY85=1; ELSE IF CY=1986 THEN CY86=1; ELSE IF CY=1987 THEN CY87=1; ELSE IF CY=1988 THEN CY88=1; ELSE IF CY=1989 THEN CY89=1; ELSE IF CY=1990 THEN CY90=1; ELSE IF CY=1991 THEN CY91=1; ELSE IF CY=1992 THEN CY92=1; ELSE IF CY=1993 THEN CY93=1; ELSE IF CY=1994 THEN CY94=1; ELSE IF CY=1995 THEN CY95=1; ELSE IF CY=1996 THEN CY96=1; ELSE IF CY=1997 THEN CY97=1; ELSE IF CY=1998 THEN CY98=1; ELSE IF CY=2000 THEN CY2000=1; ELSE IF CY=2001 THEN CY2001=1; ELSE IF CY=2002 THEN CY2002=1; IF SEAT2 IN (12,13,21,22); CENFRONT=0; RTFRONT=0; CENREAR=0; IF SEAT2=12 THEN CENFRONT=1; ELSE IF SEAT2=13 THEN RTFRONT=1; ELSE IF SEAT2=22 THEN CENREAR=1; SIDE=0; ROLL=0; REAROTHR=0; IF CRSH=2 THEN SIDE=1; ELSE IF CRSH=3 THEN ROLL=1; ELSE IF CRSH=4 THEN REAROTHR=1; IF KID2 THEN DO; OUTPUT UNKKID4; RETURN; END; ELSE DO; Z=.3711+.7837*INFANT+.8726*AGE1+.5193*AGE2+.1485*AGE3+.1024*AGE4; Z=Z-.0472*LTRK-3.4784*CY7576-3.5735*CY7778-3.0285*CY7980; Z=Z-2.7536*CY81-2.4664*CY82-2.0078*CY83-1.5532*CY84-1.1660*CY85; Z=Z-1.1936*CY86-1.0132*CY87-1.0726*CY88-1.0026*CY89- .9834*CY90; Z=Z-.7092*CY91-.5285*CY92-.6801*CY93-.3309*CY94-.2090*CY95; Z=Z-.0455*CY96-.0201*CY97+.0808*CY98; Z=Z+.2306*CY2000+.1098*CY2001+.1525*CY2002; Z=Z+.2874*SIDE-.5541*ROLL-.2060*REAROTHR; Z=Z-1.4496*CENFRONT-.7022*RTFRONT-.7946*CENREAR; BELTED=EXP(Z)/(1+EXP(Z)); UNBELTED=1-BELTED; O1=ORIGWT; W1=WEIGHTFA; REST2=0; ORIGWT=UNBELTED* O1; WEIGHTFA=UNBELTED* W1; OUTPUT UNKKID3; REST2=8; ORIGWT= BELTED * O1; WEIGHTFA= BELTED * W1; OUTPUT UNKKID4; END; RUN;
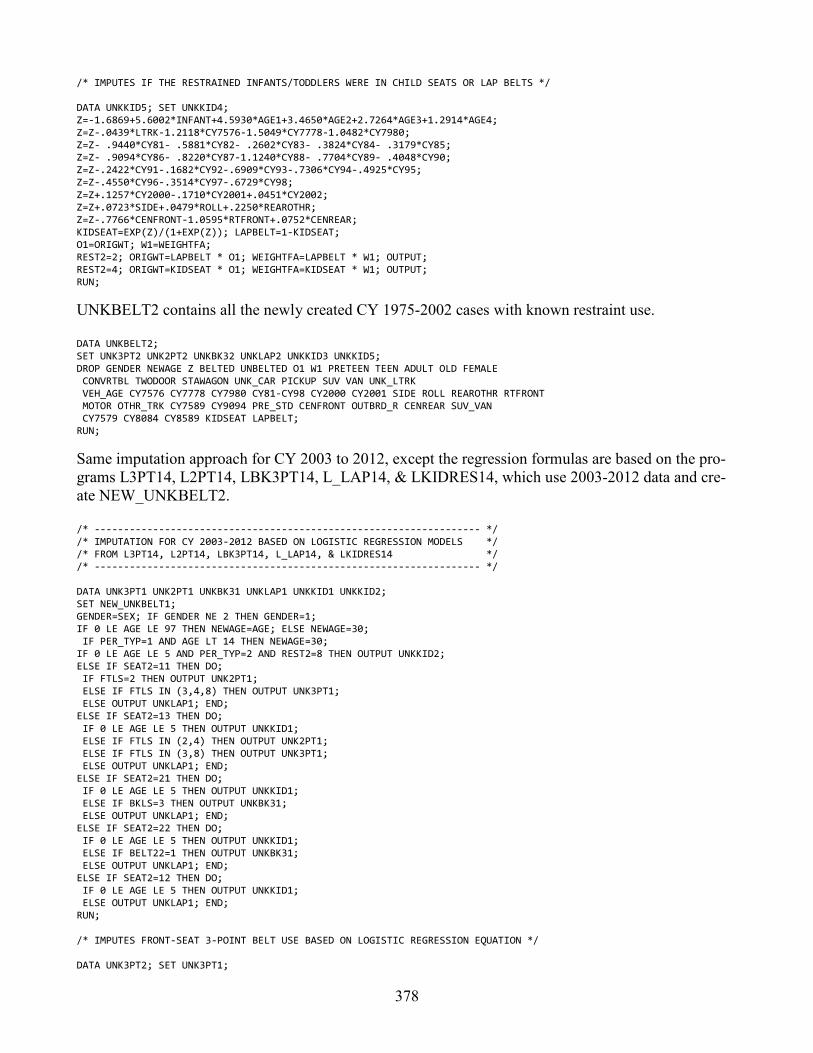
378
/* IMPUTES IF THE RESTRAINED INFANTS/TODDLERS WERE IN CHILD SEATS OR LAP BELTS */ DATA UNKKID5; SET UNKKID4; Z=-1.6869+5.6002*INFANT+4.5930*AGE1+3.4650*AGE2+2.7264*AGE3+1.2914*AGE4; Z=Z-.0439*LTRK-1.2118*CY7576-1.5049*CY7778-1.0482*CY7980; Z=Z- .9440*CY81- .5881*CY82- .2602*CY83- .3824*CY84- .3179*CY85; Z=Z- .9094*CY86- .8220*CY87-1.1240*CY88- .7704*CY89- .4048*CY90; Z=Z-.2422*CY91-.1682*CY92-.6909*CY93-.7306*CY94-.4925*CY95; Z=Z-.4550*CY96-.3514*CY97-.6729*CY98; Z=Z+.1257*CY2000-.1710*CY2001+.0451*CY2002; Z=Z+.0723*SIDE+.0479*ROLL+.2250*REAROTHR; Z=Z-.7766*CENFRONT-1.0595*RTFRONT+.0752*CENREAR; KIDSEAT=EXP(Z)/(1+EXP(Z)); LAPBELT=1-KIDSEAT; O1=ORIGWT; W1=WEIGHTFA; REST2=2; ORIGWT=LAPBELT * O1; WEIGHTFA=LAPBELT * W1; OUTPUT; REST2=4; ORIGWT=KIDSEAT * O1; WEIGHTFA=KIDSEAT * W1; OUTPUT; RUN;
UNKBELT2 contains all the newly created CY 1975-2002 cases with known restraint use. DATA UNKBELT2; SET UNK3PT2 UNK2PT2 UNKBK32 UNKLAP2 UNKKID3 UNKKID5; DROP GENDER NEWAGE Z BELTED UNBELTED O1 W1 PRETEEN TEEN ADULT OLD FEMALE CONVRTBL TWODOOR STAWAGON UNK_CAR PICKUP SUV VAN UNK_LTRK VEH_AGE CY7576 CY7778 CY7980 CY81-CY98 CY2000 CY2001 SIDE ROLL REAROTHR RTFRONT MOTOR OTHR_TRK CY7589 CY9094 PRE_STD CENFRONT OUTBRD_R CENREAR SUV_VAN CY7579 CY8084 CY8589 KIDSEAT LAPBELT; RUN;
Same imputation approach for CY 2003 to 2012, except the regression formulas are based on the pro-grams L3PT14, L2PT14, LBK3PT14, L_LAP14, & LKIDRES14, which use 2003-2012 data and cre-ate NEW_UNKBELT2. /* ------------------------------------------------------------------ */ /* IMPUTATION FOR CY 2003-2012 BASED ON LOGISTIC REGRESSION MODELS */ /* FROM L3PT14, L2PT14, LBK3PT14, L_LAP14, & LKIDRES14 */ /* ------------------------------------------------------------------ */ DATA UNK3PT1 UNK2PT1 UNKBK31 UNKLAP1 UNKKID1 UNKKID2; SET NEW_UNKBELT1; GENDER=SEX; IF GENDER NE 2 THEN GENDER=1; IF 0 LE AGE LE 97 THEN NEWAGE=AGE; ELSE NEWAGE=30; IF PER_TYP=1 AND AGE LT 14 THEN NEWAGE=30; IF 0 LE AGE LE 5 AND PER_TYP=2 AND REST2=8 THEN OUTPUT UNKKID2; ELSE IF SEAT2=11 THEN DO; IF FTLS=2 THEN OUTPUT UNK2PT1; ELSE IF FTLS IN (3,4,8) THEN OUTPUT UNK3PT1; ELSE OUTPUT UNKLAP1; END; ELSE IF SEAT2=13 THEN DO; IF 0 LE AGE LE 5 THEN OUTPUT UNKKID1; ELSE IF FTLS IN (2,4) THEN OUTPUT UNK2PT1; ELSE IF FTLS IN (3,8) THEN OUTPUT UNK3PT1; ELSE OUTPUT UNKLAP1; END; ELSE IF SEAT2=21 THEN DO; IF 0 LE AGE LE 5 THEN OUTPUT UNKKID1; ELSE IF BKLS=3 THEN OUTPUT UNKBK31; ELSE OUTPUT UNKLAP1; END; ELSE IF SEAT2=22 THEN DO; IF 0 LE AGE LE 5 THEN OUTPUT UNKKID1; ELSE IF BELT22=1 THEN OUTPUT UNKBK31; ELSE OUTPUT UNKLAP1; END; ELSE IF SEAT2=12 THEN DO; IF 0 LE AGE LE 5 THEN OUTPUT UNKKID1; ELSE OUTPUT UNKLAP1; END; RUN; /* IMPUTES FRONT-SEAT 3-POINT BELT USE BASED ON LOGISTIC REGRESSION EQUATION */ DATA UNK3PT2; SET UNK3PT1;

379
IF NEWAGE GE 17 THEN FEMALE=GENDER-1; ELSE IF 6 LE NEWAGE LE 13 THEN FEMALE=.5; ELSE IF 14 LE NEWAGE LE 16 THEN FEMALE=.5*GENDER-.25; PRETEEN=0; TEEN=0; ADULT=0; OLD=0; IF 6 LE NEWAGE LE 12 THEN PRETEEN=1; ELSE IF 13 LE NEWAGE LE 20 THEN TEEN=20-NEWAGE; ELSE IF 30 LE NEWAGE LE 79 THEN ADULT=NEWAGE-30; ELSE IF 80 LE NEWAGE LE 97 THEN OLD=1; CONVRTBL=0; TWODOOR=0; STAWAGON=0; UNK_CAR=0; PICKUP=0; SUV=0; VAN=0; UNK_LTRK=0; IF NEWVTYP=1 THEN CONVRTBL=1; ELSE IF NEWVTYP=2 THEN TWODOOR=1; ELSE IF NEWVTYP=6 THEN STAWAGON=1; ELSE IF NEWVTYP=9 THEN UNK_CAR=1; ELSE IF NEWVTYP=11 THEN PICKUP=1; ELSE IF NEWVTYP=12 THEN SUV=1; ELSE IF NEWVTYP=13 THEN VAN=1; ELSE IF NEWVTYP=19 THEN UNK_LTRK=1; CY2004=0; CY2005=0; CY2006=0; CY2007=0; CY2008=0; CY2009=0; CY2010=0; CY2011=0; CY2012=0; IF CY=2004 THEN CY2004=1; ELSE IF CY=2005 THEN CY2005=1; ELSE IF CY=2006 THEN CY2006=1; ELSE IF CY=2007 THEN CY2007=1; ELSE IF CY=2008 THEN CY2008=1; ELSE IF CY=2009 THEN CY2009=1; ELSE IF CY=2010 THEN CY2010=1; ELSE IF CY=2011 THEN CY2011=1; ELSE IF CY=2012 THEN CY2012=1; RTFRONT=0; IF SEAT2=13 THEN RTFRONT=1; SIDE=0; ROLL=0; REAROTHR=0; IF CRSH=2 THEN SIDE=1; ELSE IF CRSH=3 THEN ROLL=1; ELSE IF CRSH=4 THEN REAROTHR=1; VEH_AGE=CY-XMY; IF VEH_AGE LT 0 THEN VEH_AGE=0; Z=-.3301+.8845*PRETEEN+.0723*TEEN+.0260*ADULT+1.3019*OLD+.4328*FEMALE; Z=Z+.0143*CONVRTBL-.1102*TWODOOR+.1951*STAWAGON-.2871*UNK_CAR; Z=Z-.6507*PICKUP-.3576*SUV-.0934*VAN-.5956*UNK_LTRK-.0407*VEH_AGE; Z=Z+.0590*CY2004+.0763*CY2005+.1175*CY2006+.1726*CY2007+.1537*CY2008; Z=Z+.2329*CY2009+.3171*CY2010+.3133*CY2011+.3470*CY2012; Z=Z+.4141*SIDE-.4559*ROLL+.1510*REAROTHR+.0305*RTFRONT; BELTED=EXP(Z)/(1+EXP(Z)); UNBELTED=1-BELTED; O1=ORIGWT; W1=WEIGHTFA; REST2=0; ORIGWT=UNBELTED* O1; WEIGHTFA=UNBELTED* W1; OUTPUT; REST2=8; ORIGWT= BELTED * O1; WEIGHTFA= BELTED * W1; OUTPUT; RUN; /* IMPUTES AUTOMATIC 2-POINT BELT USE BASED ON LOGISTIC REGRESSION EQUATION */ DATA UNK2PT2; SET UNK2PT1; IF PASSIVE IN (606,707,1006,1606) THEN MOTOR=0; ELSE MOTOR=1; IF NEWAGE GE 17 THEN FEMALE=GENDER-1; ELSE IF 6 LE NEWAGE LE 13 THEN FEMALE=.5; ELSE IF 14 LE NEWAGE LE 16 THEN FEMALE=.5*GENDER-.25; PRETEEN=0; TEEN=0; ADULT=0; OLD=0; IF 6 LE NEWAGE LE 12 THEN PRETEEN=1; ELSE IF 13 LE NEWAGE LE 20 THEN TEEN=20-NEWAGE; ELSE IF 30 LE NEWAGE LE 79 THEN ADULT=NEWAGE-30; ELSE IF 80 LE NEWAGE LE 97 THEN OLD=1; RTFRONT=0; IF SEAT2=13 THEN RTFRONT=1; SIDE=0; ROLL=0; REAROTHR=0; IF CRSH=2 THEN SIDE=1; ELSE IF CRSH=3 THEN ROLL=1; ELSE IF CRSH=4 THEN REAROTHR=1; VEH_AGE=CY-XMY; IF VEH_AGE LT 0 THEN VEH_AGE=0; Z=-.6405+.2666*MOTOR+.9827*PRETEEN+.0693*TEEN+.0264*ADULT+1.6522*OLD+.3554*FEMALE; Z=Z+.0321*VEH_AGE+.2200*SIDE-.7342*ROLL-.0231*REAROTHR-.0336*RTFRONT; BELTED=EXP(Z)/(1+EXP(Z)); UNBELTED=1-BELTED; O1=ORIGWT; W1=WEIGHTFA; REST2=0; ORIGWT=UNBELTED* O1; WEIGHTFA=UNBELTED* W1; OUTPUT; REST2=8; ORIGWT= BELTED * O1; WEIGHTFA= BELTED * W1; OUTPUT; RUN; /* IMPUTES REAR-SEAT 3-POINT BELT USE BASED ON LOGISTIC REGRESSION EQUATION */ DATA UNKBK32; SET UNKBK31; IF NEWAGE GE 17 THEN FEMALE=GENDER-1; ELSE IF 6 LE NEWAGE LE 13 THEN FEMALE=.5; ELSE IF 14 LE NEWAGE LE 16 THEN FEMALE=.5*GENDER-.25; PRETEEN=0; TEEN=0; ADULT=0; OLD=0;

380
IF 6 LE NEWAGE LE 12 THEN PRETEEN=1; ELSE IF 13 LE NEWAGE LE 20 THEN TEEN=20-NEWAGE; ELSE IF 30 LE NEWAGE LE 79 THEN ADULT=NEWAGE-30; ELSE IF 80 LE NEWAGE LE 97 THEN OLD=1; TWODOOR=0; VAN=0; OTHR_TRK=0; IF NEWVTYP IN (1,2) THEN TWODOOR=1; ELSE IF NEWVTYP=9 THEN TWODOOR=.5; ELSE IF NEWVTYP IN (11,12,19) THEN OTHR_TRK=1; ELSE IF NEWVTYP=13 THEN VAN=1; CY0608=0; CY0912=0; IF 2006 LE CY LE 2008 THEN CY0608=1; ELSE IF 2009 LE CY LE 2012 THEN CY0912=1; SIDE=0; ROLL=0; REAROTHR=0; IF CRSH=2 THEN SIDE=1; ELSE IF CRSH=3 THEN ROLL=1; ELSE IF CRSH=4 THEN REAROTHR=1; VEH_AGE=CY-XMY; IF VEH_AGE LT 0 THEN VEH_AGE=0; CENREAR=0; IF SEAT2=22 THEN CENREAR=1; Z=-1.4160+1.7773*PRETEEN+.1264*TEEN+.0305*ADULT+1.5817*OLD+.3170*FEMALE; Z=Z-.1508*TWODOOR-0.0586*VAN-.4501*OTHR_TRK-.0377*VEH_AGE; Z=Z+.2172*CY0608+.3897*CY0912; Z=Z+.2822*SIDE-.5554*ROLL+.3564*REAROTHR-.9219*CENREAR; BELTED=EXP(Z)/(1+EXP(Z)); UNBELTED=1-BELTED; O1=ORIGWT; W1=WEIGHTFA; REST2=0; ORIGWT=UNBELTED* O1; WEIGHTFA=UNBELTED* W1; OUTPUT; REST2=8; ORIGWT= BELTED * O1; WEIGHTFA= BELTED * W1; OUTPUT; RUN; /* IMPUTES LAP BELT USE BASED ON LOGISTIC REGRESSION EQUATION */ DATA UNKLAP2; SET UNKLAP1; PRE_STD=0; IF SEAT2 IN (11,13) AND XMY LT 1964 THEN PRE_STD=1; ELSE IF SEAT2=21 AND XMY LT 1966 THEN PRE_STD=1; ELSE IF SEAT2 IN (12,22) AND XMY LT 1968 THEN PRE_STD=1; IF NEWAGE GE 17 THEN FEMALE=GENDER-1; ELSE IF 6 LE NEWAGE LE 13 THEN FEMALE=.5; ELSE IF 14 LE NEWAGE LE 16 THEN FEMALE=.5*GENDER-.25; PRETEEN=0; TEEN=0; ADULT=0; OLD=0; IF 6 LE NEWAGE LE 12 THEN PRETEEN=1; ELSE IF 13 LE NEWAGE LE 20 THEN TEEN=20-NEWAGE; ELSE IF 30 LE NEWAGE LE 79 THEN ADULT=NEWAGE-30; ELSE IF 80 LE NEWAGE LE 97 THEN OLD=1; TWODOOR=0; PICKUP=0; SUV_VAN=0; IF NEWVTYP IN (1,2) THEN TWODOOR=1; ELSE IF NEWVTYP=9 THEN TWODOOR=.63; ELSE IF NEWVTYP=11 THEN PICKUP=1; ELSE IF NEWVTYP IN (12,13) THEN SUV_VAN=1; ELSE IF NEWVTYP=19 THEN DO; PICKUP=.72; SUV_VAN=.28; END; CY0608=0; CY0912=0; IF 2006 LE CY LE 2008 THEN CY0608=1; ELSE IF 2009 LE CY LE 2012 THEN CY0912=1; CENFRONT=0; RTFRONT=0; OUTBRD_R=0; CENREAR=0; IF SEAT2=12 THEN CENFRONT=1; ELSE IF SEAT2=13 THEN RTFRONT=1; ELSE IF SEAT2=21 THEN OUTBRD_R=1; ELSE IF SEAT2=22 THEN CENREAR=1; SIDE=0; ROLL=0; REAROTHR=0; IF CRSH=2 THEN SIDE=1; ELSE IF CRSH=3 THEN ROLL=1; ELSE IF CRSH=4 THEN REAROTHR=1; VEH_AGE=CY-XMY; IF VEH_AGE LT 0 THEN VEH_AGE=0; Z=-.9533+1.8735*PRETEEN+.0504*TEEN+.0282*ADULT+1.5075*OLD; Z=Z-.7446*PRE_STD-0.7579*CENFRONT+.0681*RTFRONT-1.0133*OUTBRD_R-1.4237*CENREAR; Z=Z+.3207*FEMALE-.0618*TWODOOR-.6806*PICKUP-.2776*SUV_VAN-.0117*VEH_AGE; Z=Z+.0115*CY0608+.2717*CY0912; Z=Z+.1322*SIDE-.4537*ROLL+.3580*REAROTHR; BELTED=EXP(Z)/(1+EXP(Z)); UNBELTED=1-BELTED; O1=ORIGWT; W1=WEIGHTFA; REST2=0; ORIGWT=UNBELTED* O1; WEIGHTFA=UNBELTED* W1; OUTPUT; REST2=8; ORIGWT= BELTED * O1; WEIGHTFA= BELTED * W1; OUTPUT; RUN;
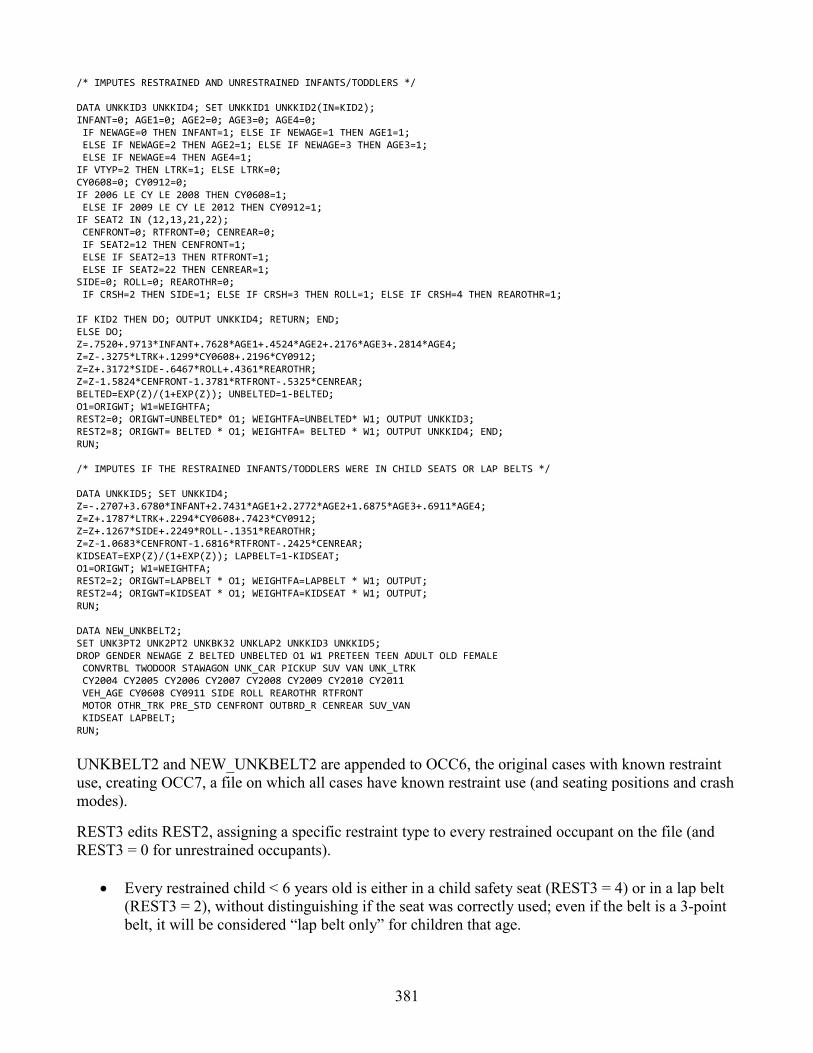
381
/* IMPUTES RESTRAINED AND UNRESTRAINED INFANTS/TODDLERS */ DATA UNKKID3 UNKKID4; SET UNKKID1 UNKKID2(IN=KID2); INFANT=0; AGE1=0; AGE2=0; AGE3=0; AGE4=0; IF NEWAGE=0 THEN INFANT=1; ELSE IF NEWAGE=1 THEN AGE1=1; ELSE IF NEWAGE=2 THEN AGE2=1; ELSE IF NEWAGE=3 THEN AGE3=1; ELSE IF NEWAGE=4 THEN AGE4=1; IF VTYP=2 THEN LTRK=1; ELSE LTRK=0; CY0608=0; CY0912=0; IF 2006 LE CY LE 2008 THEN CY0608=1; ELSE IF 2009 LE CY LE 2012 THEN CY0912=1; IF SEAT2 IN (12,13,21,22); CENFRONT=0; RTFRONT=0; CENREAR=0; IF SEAT2=12 THEN CENFRONT=1; ELSE IF SEAT2=13 THEN RTFRONT=1; ELSE IF SEAT2=22 THEN CENREAR=1; SIDE=0; ROLL=0; REAROTHR=0; IF CRSH=2 THEN SIDE=1; ELSE IF CRSH=3 THEN ROLL=1; ELSE IF CRSH=4 THEN REAROTHR=1; IF KID2 THEN DO; OUTPUT UNKKID4; RETURN; END; ELSE DO; Z=.7520+.9713*INFANT+.7628*AGE1+.4524*AGE2+.2176*AGE3+.2814*AGE4; Z=Z-.3275*LTRK+.1299*CY0608+.2196*CY0912; Z=Z+.3172*SIDE-.6467*ROLL+.4361*REAROTHR; Z=Z-1.5824*CENFRONT-1.3781*RTFRONT-.5325*CENREAR; BELTED=EXP(Z)/(1+EXP(Z)); UNBELTED=1-BELTED; O1=ORIGWT; W1=WEIGHTFA; REST2=0; ORIGWT=UNBELTED* O1; WEIGHTFA=UNBELTED* W1; OUTPUT UNKKID3; REST2=8; ORIGWT= BELTED * O1; WEIGHTFA= BELTED * W1; OUTPUT UNKKID4; END; RUN; /* IMPUTES IF THE RESTRAINED INFANTS/TODDLERS WERE IN CHILD SEATS OR LAP BELTS */ DATA UNKKID5; SET UNKKID4; Z=-.2707+3.6780*INFANT+2.7431*AGE1+2.2772*AGE2+1.6875*AGE3+.6911*AGE4; Z=Z+.1787*LTRK+.2294*CY0608+.7423*CY0912; Z=Z+.1267*SIDE+.2249*ROLL-.1351*REAROTHR; Z=Z-1.0683*CENFRONT-1.6816*RTFRONT-.2425*CENREAR; KIDSEAT=EXP(Z)/(1+EXP(Z)); LAPBELT=1-KIDSEAT; O1=ORIGWT; W1=WEIGHTFA; REST2=2; ORIGWT=LAPBELT * O1; WEIGHTFA=LAPBELT * W1; OUTPUT; REST2=4; ORIGWT=KIDSEAT * O1; WEIGHTFA=KIDSEAT * W1; OUTPUT; RUN; DATA NEW_UNKBELT2; SET UNK3PT2 UNK2PT2 UNKBK32 UNKLAP2 UNKKID3 UNKKID5; DROP GENDER NEWAGE Z BELTED UNBELTED O1 W1 PRETEEN TEEN ADULT OLD FEMALE CONVRTBL TWODOOR STAWAGON UNK_CAR PICKUP SUV VAN UNK_LTRK CY2004 CY2005 CY2006 CY2007 CY2008 CY2009 CY2010 CY2011 VEH_AGE CY0608 CY0911 SIDE ROLL REAROTHR RTFRONT MOTOR OTHR_TRK PRE_STD CENFRONT OUTBRD_R CENREAR SUV_VAN KIDSEAT LAPBELT; RUN;
UNKBELT2 and NEW_UNKBELT2 are appended to OCC6, the original cases with known restraint use, creating OCC7, a file on which all cases have known restraint use (and seating positions and crash modes).
REST3 edits REST2, assigning a specific restraint type to every restrained occupant on the file (and REST3 = 0 for unrestrained occupants).
• Every restrained child < 6 years old is either in a child safety seat (REST3 = 4) or in a lap belt (REST3 = 2), without distinguishing if the seat was correctly used; even if the belt is a 3-point belt, it will be considered “lap belt only” for children that age.
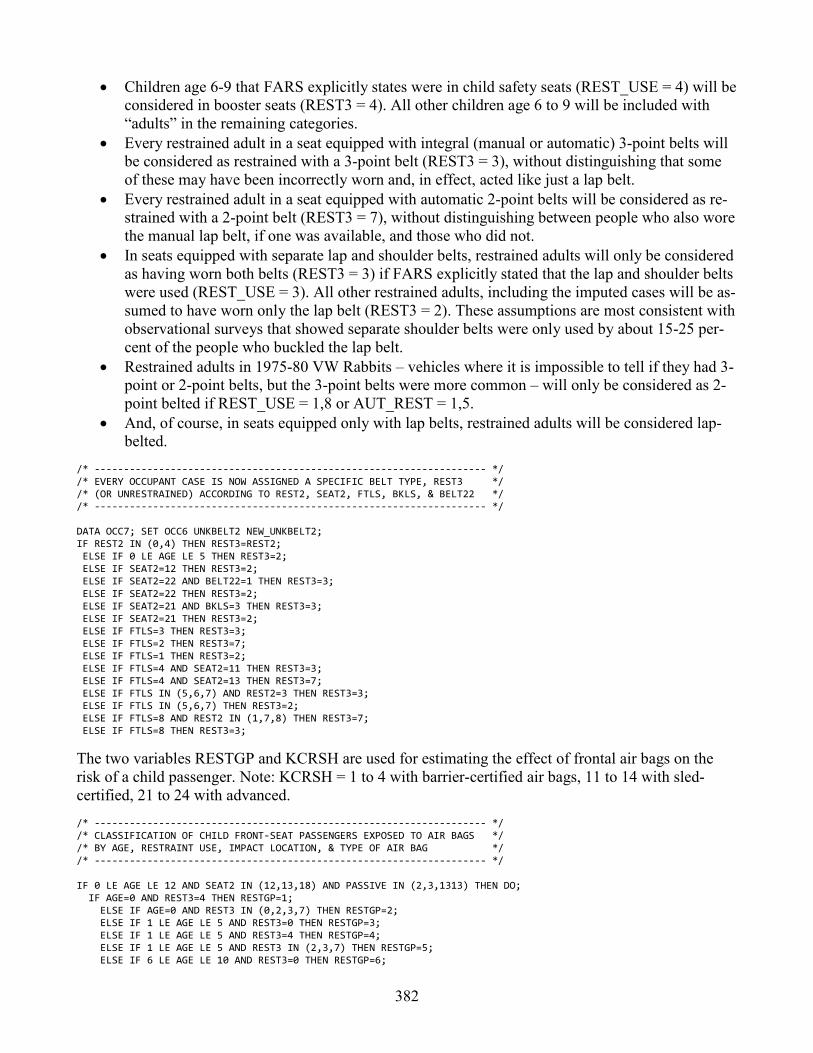
382
• Children age 6-9 that FARS explicitly states were in child safety seats (REST_USE = 4) will be considered in booster seats (REST3 = 4). All other children age 6 to 9 will be included with “adults” in the remaining categories.
• Every restrained adult in a seat equipped with integral (manual or automatic) 3-point belts will be considered as restrained with a 3-point belt (REST3 = 3), without distinguishing that some of these may have been incorrectly worn and, in effect, acted like just a lap belt.
• Every restrained adult in a seat equipped with automatic 2-point belts will be considered as re-strained with a 2-point belt (REST3 = 7), without distinguishing between people who also wore the manual lap belt, if one was available, and those who did not.
• In seats equipped with separate lap and shoulder belts, restrained adults will only be considered as having worn both belts (REST3 = 3) if FARS explicitly stated that the lap and shoulder belts were used (REST_USE = 3). All other restrained adults, including the imputed cases will be as-sumed to have worn only the lap belt (REST3 = 2). These assumptions are most consistent with observational surveys that showed separate shoulder belts were only used by about 15-25 per-cent of the people who buckled the lap belt.
• Restrained adults in 1975-80 VW Rabbits – vehicles where it is impossible to tell if they had 3-point or 2-point belts, but the 3-point belts were more common – will only be considered as 2-point belted if REST_USE = 1,8 or AUT_REST = 1,5.
• And, of course, in seats equipped only with lap belts, restrained adults will be considered lap-belted.
/* ------------------------------------------------------------------- */ /* EVERY OCCUPANT CASE IS NOW ASSIGNED A SPECIFIC BELT TYPE, REST3 */ /* (OR UNRESTRAINED) ACCORDING TO REST2, SEAT2, FTLS, BKLS, & BELT22 */ /* ------------------------------------------------------------------- */ DATA OCC7; SET OCC6 UNKBELT2 NEW_UNKBELT2; IF REST2 IN (0,4) THEN REST3=REST2; ELSE IF 0 LE AGE LE 5 THEN REST3=2; ELSE IF SEAT2=12 THEN REST3=2; ELSE IF SEAT2=22 AND BELT22=1 THEN REST3=3; ELSE IF SEAT2=22 THEN REST3=2; ELSE IF SEAT2=21 AND BKLS=3 THEN REST3=3; ELSE IF SEAT2=21 THEN REST3=2; ELSE IF FTLS=3 THEN REST3=3; ELSE IF FTLS=2 THEN REST3=7; ELSE IF FTLS=1 THEN REST3=2; ELSE IF FTLS=4 AND SEAT2=11 THEN REST3=3; ELSE IF FTLS=4 AND SEAT2=13 THEN REST3=7; ELSE IF FTLS IN (5,6,7) AND REST2=3 THEN REST3=3; ELSE IF FTLS IN (5,6,7) THEN REST3=2; ELSE IF FTLS=8 AND REST2 IN (1,7,8) THEN REST3=7; ELSE IF FTLS=8 THEN REST3=3;
The two variables RESTGP and KCRSH are used for estimating the effect of frontal air bags on the risk of a child passenger. Note: KCRSH = 1 to 4 with barrier-certified air bags, 11 to 14 with sled-certified, 21 to 24 with advanced. /* ------------------------------------------------------------------- */ /* CLASSIFICATION OF CHILD FRONT-SEAT PASSENGERS EXPOSED TO AIR BAGS */ /* BY AGE, RESTRAINT USE, IMPACT LOCATION, & TYPE OF AIR BAG */ /* ------------------------------------------------------------------- */ IF 0 LE AGE LE 12 AND SEAT2 IN (12,13,18) AND PASSIVE IN (2,3,1313) THEN DO; IF AGE=0 AND REST3=4 THEN RESTGP=1; ELSE IF AGE=0 AND REST3 IN (0,2,3,7) THEN RESTGP=2; ELSE IF 1 LE AGE LE 5 AND REST3=0 THEN RESTGP=3; ELSE IF 1 LE AGE LE 5 AND REST3=4 THEN RESTGP=4; ELSE IF 1 LE AGE LE 5 AND REST3 IN (2,3,7) THEN RESTGP=5; ELSE IF 6 LE AGE LE 10 AND REST3=0 THEN RESTGP=6;
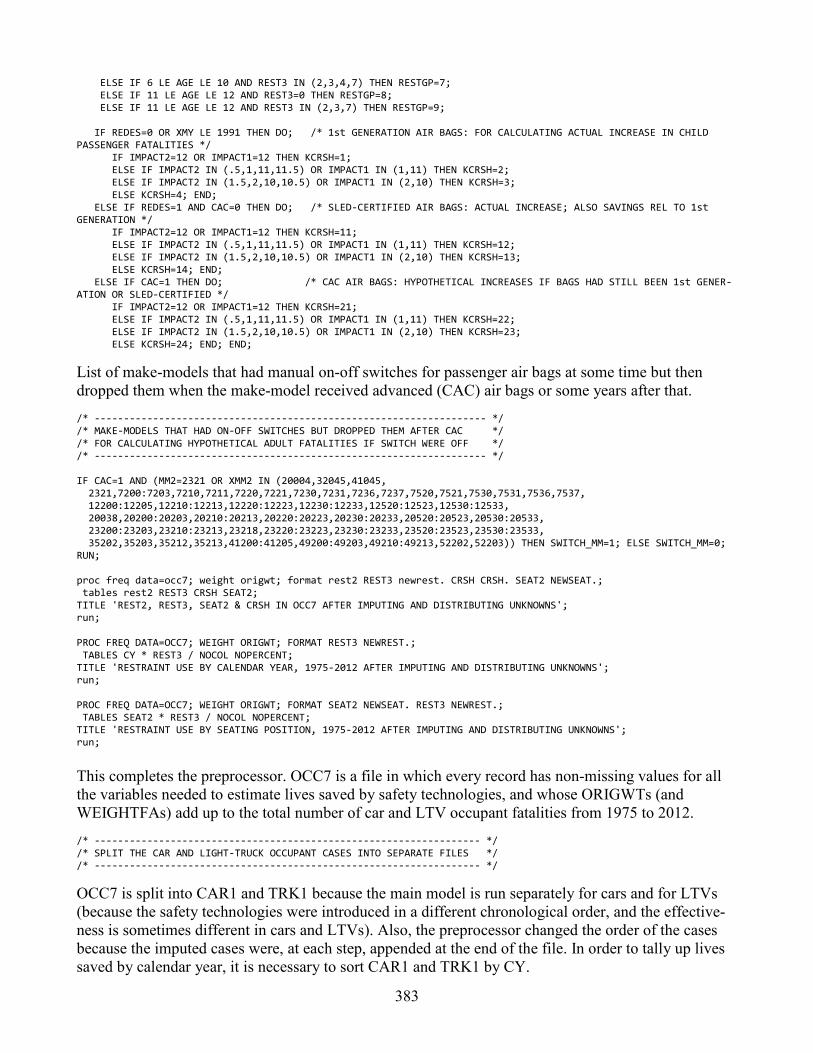
383
ELSE IF 6 LE AGE LE 10 AND REST3 IN (2,3,4,7) THEN RESTGP=7; ELSE IF 11 LE AGE LE 12 AND REST3=0 THEN RESTGP=8; ELSE IF 11 LE AGE LE 12 AND REST3 IN (2,3,7) THEN RESTGP=9; IF REDES=0 OR XMY LE 1991 THEN DO; /* 1st GENERATION AIR BAGS: FOR CALCULATING ACTUAL INCREASE IN CHILD PASSENGER FATALITIES */ IF IMPACT2=12 OR IMPACT1=12 THEN KCRSH=1; ELSE IF IMPACT2 IN (.5,1,11,11.5) OR IMPACT1 IN (1,11) THEN KCRSH=2; ELSE IF IMPACT2 IN (1.5,2,10,10.5) OR IMPACT1 IN (2,10) THEN KCRSH=3; ELSE KCRSH=4; END; ELSE IF REDES=1 AND CAC=0 THEN DO; /* SLED-CERTIFIED AIR BAGS: ACTUAL INCREASE; ALSO SAVINGS REL TO 1st GENERATION */ IF IMPACT2=12 OR IMPACT1=12 THEN KCRSH=11; ELSE IF IMPACT2 IN (.5,1,11,11.5) OR IMPACT1 IN (1,11) THEN KCRSH=12; ELSE IF IMPACT2 IN (1.5,2,10,10.5) OR IMPACT1 IN (2,10) THEN KCRSH=13; ELSE KCRSH=14; END; ELSE IF CAC=1 THEN DO; /* CAC AIR BAGS: HYPOTHETICAL INCREASES IF BAGS HAD STILL BEEN 1st GENER-ATION OR SLED-CERTIFIED */ IF IMPACT2=12 OR IMPACT1=12 THEN KCRSH=21; ELSE IF IMPACT2 IN (.5,1,11,11.5) OR IMPACT1 IN (1,11) THEN KCRSH=22; ELSE IF IMPACT2 IN (1.5,2,10,10.5) OR IMPACT1 IN (2,10) THEN KCRSH=23; ELSE KCRSH=24; END; END;
List of make-models that had manual on-off switches for passenger air bags at some time but then dropped them when the make-model received advanced (CAC) air bags or some years after that. /* ------------------------------------------------------------------- */ /* MAKE-MODELS THAT HAD ON-OFF SWITCHES BUT DROPPED THEM AFTER CAC */ /* FOR CALCULATING HYPOTHETICAL ADULT FATALITIES IF SWITCH WERE OFF */ /* ------------------------------------------------------------------- */ IF CAC=1 AND (MM2=2321 OR XMM2 IN (20004,32045,41045, 2321,7200:7203,7210,7211,7220,7221,7230,7231,7236,7237,7520,7521,7530,7531,7536,7537, 12200:12205,12210:12213,12220:12223,12230:12233,12520:12523,12530:12533, 20038,20200:20203,20210:20213,20220:20223,20230:20233,20520:20523,20530:20533, 23200:23203,23210:23213,23218,23220:23223,23230:23233,23520:23523,23530:23533, 35202,35203,35212,35213,41200:41205,49200:49203,49210:49213,52202,52203)) THEN SWITCH_MM=1; ELSE SWITCH_MM=0; RUN; proc freq data=occ7; weight origwt; format rest2 REST3 newrest. CRSH CRSH. SEAT2 NEWSEAT.; tables rest2 REST3 CRSH SEAT2; TITLE 'REST2, REST3, SEAT2 & CRSH IN OCC7 AFTER IMPUTING AND DISTRIBUTING UNKNOWNS'; run; PROC FREQ DATA=OCC7; WEIGHT ORIGWT; FORMAT REST3 NEWREST.; TABLES CY * REST3 / NOCOL NOPERCENT; TITLE 'RESTRAINT USE BY CALENDAR YEAR, 1975-2012 AFTER IMPUTING AND DISTRIBUTING UNKNOWNS'; run; PROC FREQ DATA=OCC7; WEIGHT ORIGWT; FORMAT SEAT2 NEWSEAT. REST3 NEWREST.; TABLES SEAT2 * REST3 / NOCOL NOPERCENT; TITLE 'RESTRAINT USE BY SEATING POSITION, 1975-2012 AFTER IMPUTING AND DISTRIBUTING UNKNOWNS'; run;
This completes the preprocessor. OCC7 is a file in which every record has non-missing values for all the variables needed to estimate lives saved by safety technologies, and whose ORIGWTs (and WEIGHTFAs) add up to the total number of car and LTV occupant fatalities from 1975 to 2012. /* ------------------------------------------------------------------ */ /* SPLIT THE CAR AND LIGHT-TRUCK OCCUPANT CASES INTO SEPARATE FILES */ /* ------------------------------------------------------------------ */
OCC7 is split into CAR1 and TRK1 because the main model is run separately for cars and for LTVs (because the safety technologies were introduced in a different chronological order, and the effective-ness is sometimes different in cars and LTVs). Also, the preprocessor changed the order of the cases because the imputed cases were, at each step, appended at the end of the file. In order to tally up lives saved by calendar year, it is necessary to sort CAR1 and TRK1 by CY.

384
DATA CAR1 TRK1; SET OCC7; IF VTYP=1 THEN OUTPUT CAR1; ELSE OUTPUT TRK1; RUN; PROC SORT DATA=CAR1; BY CY; RUN; PROC SORT DATA=TRK1; BY CY; RUN; /* ------------------------------------------------------------------ */ /* ------------------------------------------------------------------ */ /* THE OCCUPANT CASES ARE NOW FREE OF UNKNOWNS ON ANY VARIABLES */ /* AND WEIGHTED TO TOTAL UP TO THE ORIGINAL SAMPLE SIZE */ /* */ /* WE MAY NOW CALCULATE THE LIVES SAVED BY THE VEHICLE SAFETY */ /* STANDARDS IN THE REVERSE ORDER OF THEIR IMPLEMENTATION */ /* */ /* PASSENGER CARS FIRST */ /* ------------------------------------------------------------------ */ /* ------------------------------------------------------------------ */
When the notes mention “NHTSA evaluations” and “effectiveness estimates,” they are generally dis-cussed in Part 1 of this report, in the chapter for that FMVSS and subsection for that technology. Foot-notes/references are provided here only for analyses not discussed in Part 1.
Three “tags” of information accompany each case as it processes through the model:
• ORIGWT, the original case weight defined by the preprocessor, remains unchanged in the main model.
• WEIGHTFA, the inflated case weight, grows as safety technologies are “removed” from the vehicle. The existence of ORIGWT fatalities in a vehicle equipped with safety technologies implies that there would have been WEIGHTFA fatalities if the vehicle had no safety technolo-gies at all, in the sense that the combined effectiveness of these technologies would reduce WEIGHTFA fatalities to ORIGWT fatalities.
• EJECT2, the probability that an occupant was ejected. Initially, EJECT2 is either 1 (if the oc-cupant was ejected) or 0 (if not ejected or unknown623). However, some safety technologies, such as belts, can reduce the probability of ejection, whereas other technologies, such as im-proved door locks, are effective only if the occupant was ejected. Thus, it is necessary to track the occupant’s changing probability of ejection as technologies are removed from the vehicle one-by-one.
DATA CAR2; SET CAR1; IF EJECTION IN (1,2) OR (CY GE 2008 AND EJECTION=3) THEN EJECT2=1; ELSE EJECT2=0; /* NEW VALUE FOR EJECTION */
Curtains that deploy in rollovers, already available in many LTVs and some passenger cars even before the phase-in of FMVSS No. 226, “Ejection mitigation,” are the most recent safety technology for which an effectiveness estimate is available, so they will be the first technology that the model “re-moves” from the car. The basic procedure of the model was discussed in detail, above, in the analysis the effect of brake improvements on pedestrian crashes. /* ------------------------------------------------------------------ */ /* 226 ROLLOVER CURTAINS */ /* MEDIAN INSTALLATION YEAR: AFTER 2011 PHASE-IN STARTS MY 2014 */ /* ------------------------------------------------------------------ */
623 Tabulation of EJECTION by calendar year suggests that, in the early years, especially 1975-76, “unknown” essentially means not ejected. From 1985 onward, well under 1 percent are unknown if ejected.
385
The variable ROLLCURT on LSM2014C equals 1 if the car has rollover curtains, 0 if it does not, or some fraction x if they were optional equipment (not VIN-identifiable) on that proportion of the cars of that make-model and model year. Because it is still before the MY 2014 start of the phase-in of FMVSS No. 226, PS226 = 0 in 1975 to 2013, and only PV2226 can be > 0. PV226 = ROLLCURT if the occupant was a driver or RF passenger in a first-event rollover and PV226 = 0 for all other occu-pants. Because NHTSA’s evaluation only showed the curtains were effective in first-event rollovers, it is necessary to have a detailed definition of such rollovers rather than using CRSH = 3 (which would have included some subsequent-event rollovers). /* IDENTIFIES CARS WITH ROLLOVER CURTAINS: DRIVERS & RF PASSENGERS IN FIRST-EVENT ROLLOVERS */ PV226=0; PS226=0; IF ROLLCURT GT 0 AND SEAT2 IN (11,13) AND ((HARM_EV=1 AND VE_FORMS=1) OR (VE_FORMS=1 AND M_HARM=1 AND HARM_EV IN (33,34,38,41,44,48,53,54,59,60,72))) THEN PV226=ROLLCURT;
NHTSA’s evaluation found a 41.3-percent reduction in fatalities in first-event rollovers. /* LIVES SAVED IN FIRST-EVENT ROLLOVERS BY ROLLOVER CURTAINS */ OLDWTFA=WEIGHTFA; IF PV226 OR PS226 GT 0 THEN DO; IF CY GE 2005 AND PER_TYP=3 AND AIR_BAG IN (.,0,20,28:32,97:99) THEN E=0; /* OCCUPANT OF A PARKED OR NON-TRANSPORT CAR: ASSUME NO BENEFIT UNLESS FARS SAYS DEPLOYMENT */ ELSE E=.413; P=PV226+PS226; S=OLDWTFA*E*P / (1 - E*P); CLS226=S*PS226/P; CLV226=S*PV226/P; WEIGHTFA=OLDWTFA+CLS226+CLV226; END; ELSE DO; CLV226=0; CLS226=0; END; CL226=CLS226+CLV226; CLS=CLS226; CLV=CLV226; CL=CL226;
CLV2226: “C” = car, “L” = lives saved, “V” = voluntary, “226” = rollover curtain Note: CLS226, CLV226, CL226 are lives saved by rollover curtains; these results are stored and not changed again in this data step. WEIGHTFA, CLS, CLV, and CL are variables that will be changed repeatedly in this data step, at each point adding the fatalities attributable to removing a safety technol-ogy. /* ------------------------------------------------------------------ */ /* 126 ELECTRONIC STABILITY CONTROL */ /* MEDIAN INSTALLATION YEAR: 2010 PHASE-IN STARTED MY 2009 */ /* ------------------------------------------------------------------ */
ESC is a variable on LSM2014C whose values are always 0, 1, or a fraction in between. The phase-in of FMVSS No. 126 began in MY 2009. /* IDENTIFIES CARS WITH ESC */ PV126=0; PS126=0; IF ESC GT 0 THEN DO; IF 1998 LE XMY LE 2008 THEN PV126=ESC; ELSE IF 2009 LE XMY LE 2013 THEN PS126=ESC; END;
NHTSA’s evaluation has fatal-crash reduction estimates for (1) first-event rollovers (59.54%); (2) all other single-vehicle crashes without non-occupants involved (31.26%); and (3) culpable involvements in multivehicle crashes (16.07%). /* LIVES SAVED BY ESC IN CRASHES WHERE ESC IS BENEFICIAL */ OLDWTFA=WEIGHTFA; IF PV126 OR PS126 GT 0 THEN DO; /* IDENTIFY FIRST-EVENT ROLLOVERS, OTHER RUN-OFF-ROAD CRASHES, AND CULPABLE MULTI-VEHICLE INVOLVEMENTS */ DRCF=0; /* IN MULTI-VEHICLE CRASHES, DRCF=0 MEANS NOT CULPABLE, DRCF=1 MEANS CULPABLE */ IF CY LE 2009 AND (DR_CF1 IN (3,6,8,26,27,28,30,31,33,35,36,38,39,44,46,47,48,50,51,57,58,79,87)
386
OR DR_CF2 IN (3,6,8,26,27,28,30,31,33,35,36,38,39,44,46,47,48,50,51,57,58,79,87) OR DR_CF3 IN (3,6,8,26,27,28,30,31,33,35,36,38,39,44,46,47,48,50,51,57,58,79,87) OR DR_CF4 IN (3,6,8,26,27,28,30,31,33,35,36,38,39,44,46,47,48,50,51,57,58,79,87)) THEN DRCF=1; ELSE IF CY GE 2010 AND (DR_SF1 IN (6,8,18,26:30,33:36,38,39,41,47,48,50,51,57,58) OR DR_SF2 IN (6,8,18,26:30,33:36,38,39,41,47,48,50,51,57,58) OR DR_SF3 IN (6,8,18,26:30,33:36,38,39,41,47,48,50,51,57,58) OR DR_SF4 IN (6,8,18,26:30,33:36,38,39,41,47,48,50,51,57,58)) THEN DRCF=1; IF HARM_EV=1 AND VE_FORMS=1 THEN ESC_CRSH=1; /* FIRST-EVENT ROLLOVER */ ELSE IF VE_FORMS=1 AND M_HARM=1 AND HARM_EV IN (33,34,38,41,44,48,53,54,58,59,60,72) THEN ESC_CRSH=1; /* ALSO "1st EVENT ROLLOVER": CURB, DITCH, FENCE, SHRUBBERY, PAVEMENT IRREGULARITY, SNOWBANK, MAILBOX, FALLING CARGO, GROUND, CARGO SHIFT IS 1st EVENT AND ROLLOVER IS MOST HARMFUL EVENT */ ELSE IF HARM_EV IN (8,9,11,49) THEN ESC_CRSH=0; /* PED/BIKE/ANIMAL (ESC NOT EFFECTIVE) */ ELSE IF VE_FORMS=1 AND HARM_EV IN (14,17,19,20,21,22,23,25,26,27,28,29,30,31,32,35,36,37,39,40,42,43,46,50,52,57,59) THEN ESC_CRSH=2; /* RUN-OFF ROAD CRASH THAT IS NOT A 1st EVENT ROLLOVER */ /* FIXED-OBJECT COLLISIONS: 1st IMPACT WITH PARKED VEH, BOULDER, BUILDING, IMPACT ATTENUATOR, BRIDGE (ANY PART), BARRIER (ANY TYPE), HIGHWAY SIGN POST, OVERHEAD SIGN, LIGHT SUPPORT, UTILITY POLE, OTHER POST/POLE, CULVERT, EMBANKMENT (ANY MATERIAL), WALL, FIRE HYDRANT, TREE, OTHER FIXED OBJECT, TRAFFIC SIGNAL SUPPORT, BRIDGE OVER-HEAD STRUCTURE - REGARDLESS OF SUBSEQUENT EVENTS */ ELSE IF VE_FORMS=1 AND HARM_EV IN (24,33,34,38,41,44,48,53,57,58) AND M_HARM IN (24,33,34,38,41,48,52,53,57,14,17,19:23,25:32,35:37,39,40,42,43,46,50) THEN ESC_CRSH=2; /* ALSO FIXED-OBJECT COLLISION: GUARDRAIL FACE, CURB, DITCH, FENCE, SHRUBBERY, PAVEMENT IRREGULARITY, SNOWBANK, GUARDRAIL END, MAILBOX, CABLE BARRIER IS 1st EVENT AND MOST HARMFUL EVENT IS ONE OF THESE EXCEPT PAVEMENT IRREG-ULARITY) OR ONE OF THE FIXED OBJECTS LISTED ABOVE */ ELSE IF VE_FORMS=1 AND HARM_EV IN (3,24,52,33,34,38,41,53) THEN ESC_CRSH=2; /* RAN-OFF-ROAD, NOT NECESSARILY FIXED OBJECT OR 1st EVENT ROLLOVER: IMMERSION, VARIOUS OFF-ROAD OBJECTS */ ELSE IF CY LE 2009 AND (VEH_MAN IN (4,7) OR TRAV_SP=0) THEN ESC_CRSH=0; /* STOPPED/PARKED (ESC NOT EFFECTIVE) */ ELSE IF CY GE 2010 AND (P_CRASH1 IN (5,7) OR TRAV_SP=0) THEN ESC_CRSH=0; /* STOPPED/PARKED (ESC NOT EFFECTIVE) */ ELSE IF CY GE 2005 AND PER_TYP=3 THEN ESC_CRSH=0; /* OCCS OF PARKED VEHS (ESC NOT EFFECTIVE) */ ELSE IF CY LE 2009 AND (VEH_MAN IN (3,6,8,15) OR 1 LE TRAV_SP LE 10) THEN ESC_CRSH=0; /* BACKING/PARKING/LO-SPEED (ESC NOT EFFECTIVE) */ ELSE IF CY GE 2010 AND (P_CRASH1 IN (4,8,9,13) OR 1 LE TRAV_SP LE 10) THEN ESC_CRSH=0; /* BACKING/PARKING/LO-SPEED (ESC NOT EFFECTIVE) */ ELSE IF IMPACT1 IN (5,6,7) THEN ESC_CRSH=0; /* REAR-END STRUCK (ESC NOT EFFECTIVE) */ ELSE IF DRCF=1 THEN ESC_CRSH=3; /* CULPABLE VEHICLE IN A MULTI-VEHICLE CRASH */ IF ESC_CRSH=1 THEN E=.5954; /* CARS: NEW ESTIMATE OF ESC EFFECTIVENESS IN FIRST-EVENT ROLLO-VERS */ ELSE IF ESC_CRSH=2 THEN E=.3126; /* CARS: NEW ESTIMATE OF ESC EFFECTIVENESS IN OTHER RUN-OFF-ROAD CRASHES */ ELSE IF ESC_CRSH=3 THEN E=.1607; /* CARS: NEW ESTIMATE OF ESC EFFECTIVENESS IN CULPABLE MULTI-VEHICLE INVOLVEMENTS */ ELSE E=0; P=PV126+PS126; S=OLDWTFA*E*P / (1 - E*P); CLS126=S*PS126/P; CLV126=S*PV126/P; WEIGHTFA=OLDWTFA+CLS126+CLV126; END; ELSE DO; CLV126=0; CLS126=0; END; CL126=CLS126+CLV126; CLS=CLS+CLS126; CLV=CLV+CLV126; CL=CL+CL126;
Note how CLS126 is added to the previous CLS, cumulating lives saved by ESC and the previous safe-ty technology. /* ------------------------------------------------------------------ */ /* 301 FUEL SYSTEM INTEGRITY - REAR IMPACT UPGRADE */ /* MEDIAN INSTALLATION YEAR: 2008 PHASE-IN STARTED MY 2007 */ /* ------------------------------------------------------------------ */ /* IDENTIFIES CARS CERTIFIED TO FMVSS 301 REAR-IMPACT UPGRADE: REAR IMPACTS WITH FIRE */ PV301=0; PS301=0; IF (5 LE IMPACT2 LE 7 OR (CRSH=4 AND IMPACT1 IN (5,6,7))) AND FIRE_EXP=1 AND FMVSS301=1 THEN DO; IF XMY=2006 THEN PV301=1; ELSE IF 2007 LE XMY LE 2013 THEN PS301=1; END;
387
35.19-percent fatality reduction in rear impacts with post-crash fires: /* LIVES SAVED IN REAR-IMPACT FIRES BY FMVSS 301 REAR-IMPACT UPGRADE */ OLDWTFA=WEIGHTFA; IF PV301 OR PS301 GT 0 THEN DO; E=.3519; P=PV301+PS301; S=OLDWTFA*E*P / (1 - E*P); CLS301=S*PS301/P; CLV301=S*PV301/P; WEIGHTFA=OLDWTFA+CLS301+CLV301; END; ELSE DO; CLV301=0; CLS301=0; END; CL301=CLS301+CLV301; CLS=CLS+CLS301; CLV=CLV+CLV301; CL=CL+CL301; /* ------------------------------------------------------------------ */ /* 214C CURTAIN & SIDE AIR BAGS (POLE TEST UPGRADE FOR FMVSS 214) */ /* MEDIAN INSTALLATION YEAR: 2006 PHASE-IN STARTED MY 2011 */ /* ------------------------------------------------------------------ */
The model will estimate overall lives saved by curtain and/or side air bags (CL214C) and also the lives saved by each specific type of air bag(s): torso only, combination, curtain only, and curtain plus torso. /* IDENTIFIES CARS WITH CURATAIN AND/OR SIDE AIR BAGS: DRIVERS & RF PASSENGERS IN NEARSIDE IMPACTS */ P_TORSO=0; P_COMBO=0; P_CURTAIN=0; P_CURT_TORS=0; IF 1910 LE XMY LE 1995 THEN GOTO BYP214C; IF NEW_TORSO=0 AND NEW_COMBO=0 AND NEW_CURTAIN=0 AND CURT_TORS=0 THEN GOTO BYP214C; IF 1 LE HARM_EV LE 6 THEN GOTO BYP214C;
Special routine for not-in-transport vehicles: cannot assume any air bag is effective unless FARS ex-plicitly said there was a deployment, because if the vehicle had been parked with the ignition off, the air bags would not have deployed. IF CY GE 2005 AND PER_TYP=3 AND AIR_BAG IN (.,0,20,28:32,97:99) THEN GOTO BYP214C; /* OCCUPANT OF A PARKED CAR: ASSUME NO BENEFIT UNLESS FARS SAYS DEPLOYMENT */
The evaluations for many of the recent technologies each use slightly different classifications of crash types. In each case, these classifications are preserved here. However, this can on rare occasions lead to one crash fitting into the “effectiveness zone” of two separate technologies that, intuitively, are mu-tually exclusive. We do not want the model to count lives saved for both technologies. For example, should the FARS case qualify as one where rollover curtains and side-impact curtains might both be effective, we take only the life-saving for the rollover curtain (whose effectiveness is higher) and do not add anything extra for the fact that this rollover curtain also deploys in side impacts. IF CL226 GT 0 THEN GOTO BYP214C; /* IF WE HAVE TREATED THIS CASE AS A ROLLOVER, ABOVE, WE WILL NOT TREAT IT AS A NEARSIDE IMPACT, TOO */
Defining near-side impacts (the type of crash where curtain and side air bags save lives): IF IMPACT1 IN (8,9,10,61:63) AND IMPACT2 IN (2,2.5,3,3,5,4,26,81:83) THEN GOTO BYP214C; IF IMPACT1 IN (2,3,4,81:83) AND IMPACT2 IN (8,8.5,9,9.5,10,26,61:63) THEN GOTO BYP214C; /* WE WILL NOT COUNT A BENEFIT IN VEHICLES HIT ON BOTH SIDES */ IF (NEW_TORSO GT 0 OR NEW_COMBO GT 0 OR NEW_CURTAIN GT 0 OR CURT_TORS GT 0) AND ((SEAT2=11 AND (IMPACT1 IN (8,9,10,61:63) OR IMPACT2 IN (8,8.5,9,9.5,10,61:63))) OR (SEAT2=13 AND (IMPACT1 IN (2,3,4,81:83) OR IMPACT2 IN (2,2.5,3,3.5,4,81:83)))) THEN DO; P_TORSO=NEW_TORSO; P_COMBO=NEW_COMBO; P_CURTAIN=NEW_CURTAIN; P_CURT_TORS=CURT_TORS; END; ELSE GOTO BYP214C;
Separate effectiveness estimates and lives saved for each type of curtain or side air bag: torso bag only (7.8% fatality reduction), combination bag (24.8%), curtain only (16.4%), curtain plus torso (31.3%)
388
/* LIVES SAVED IN NEARSIDE IMPACTS BY CURTAIN AND/OR SIDE AIR BAGS */ OLDWTFA=WEIGHTFA; C_TORSO=OLDWTFA*.078*P_TORSO / (1 - .078*P_TORSO); /* FATALITY REDUCTION FOR TORSO BAG ONLY: 7.8% */ C_COMBO=OLDWTFA*.248*P_COMBO / (1 - .248*P_COMBO); /* FATALITY REDUCTION FOR COMBO BAG: 24.8% */ C_CURTAIN=OLDWTFA*.164*P_CURTAIN / (1 - .164*P_CURTAIN); /* FATALITY REDUCTION FOR CURTAIN ONLY: 16.4% */ C_CURT_TORS=OLDWTFA*.313*P_CURT_TORS / (1 - .313*P_CURT_TORS); /* FATALITY REDUCTION FOR CURTAIN + TORSO: 31.3% */ IF XMY IN (2011,2012,2013) THEN DO; CLS214C=C_TORSO+C_COMBO+C_CURTAIN+C_CURT_TORS; CLV214C=0; END; ELSE IF 1996 LE XMY LE 2010 THEN DO; CLV214C=C_TORSO+C_COMBO+C_CURTAIN+C_CURT_TORS; CLS214C=0; END; WEIGHTFA=OLDWTFA+CLS214C+CLV214C; GOTO TALLY214C; BYP214C: CLV214C=0; CLS214C=0; C_TORSO=0; C_COMBO=0; C_CURTAIN=0; C_CURT_TORS=0; TALLY214C: CL214C=CLS214C+CLV214C; CLS=CLS+CLS214C; CLV=CLV+CLV214C; CL=CL+CL214C; /* ------------------------------------------------------------------ */ /* 208K VOLUNTARY INSTALLATION OF PRETENSIONERS & LOAD LIMITERS */ /* MEDIAN INSTALLATION YEAR: 2002 */ /* ------------------------------------------------------------------ */ /* IDENTIFIES CARS WITH PRETENSIONERS & LOAD LIMITERS AT THE OUTBOARD FRONT SEATS */ PS208K=0; PV208K=0; IF SEAT2 IN (11,13) AND REST3=3 THEN DO; IF 2007 LE XMY LE 2013 THEN PV208K=1; ELSE IF 1995 LE XMY LE 2006 AND PRETENLL=1 THEN PV208K=1; END;
NHTSA study showed significant overall (all crash types combined) 12.8-percent fatality reduction for occupant wearing belt with pretensioners and load limiters relative to occupant wearing belt without these devices. However, frontals were the only individual impact type where effect was significant. We will conservatively count the 12.8-percent reduction only in the frontals. /* LIVES SAVED BY PRETENSIONERS & LOAD LIMITERS: BELTED DRIVERS & RF PASSENGERS */ OLDWTFA=WEIGHTFA; IF PS208K GT 0 OR PV208K GT 0 THEN DO; IF CRSH=1 THEN E=.128; ELSE E=0; /* CONSERVATIVELY ASSUME BENEFIT ONLY IN FRONTAL IMPACTS */ P=PS208K+PV208K; S=OLDWTFA*E*P / (1 - E*P); CLS208K=S*PS208K/P; CLV208K=S*PV208K/P; WEIGHTFA=OLDWTFA+CLS208K+CLV208K; END; ELSE DO; CLS208K=0; CLV208K=0; END; CL208K=CLS208K+CLV208K; CLS=CLS+CLS208K; CLV=CLV+CLV208K; CL=CL+CL208K;
Pretensioners and load limiters differ from the other belt technologies (e.g., the next one, 208J) in that when the pretensioners and load limiters are removed, the occupant is still belted, but with a belt that does not have those devices. /* ------------------------------------------------------------------ */ /* 208J 3-POINT BELTS FOR CENTER REAR SEAT OCCUPANTS (ANTON'S LAW) */ /* MEDIAN INSTALLATION YEAR: 2001 PHASE-IN STARTED MY 2006 */ /* ------------------------------------------------------------------ */ /* IDENTIFIES CENTER REAR SEAT OCCUPANTS WEARING 3-POINT BELTS */ PS208J=0; PV208J=0; IF SEAT2=22 AND REST3=3 THEN DO; IF 2006 LE XMY LE 2013 THEN PS208J=1; ELSE IF 1994 LE XMY LE 2005 THEN PV208J=1; END;
The data in NHTSA’s evaluation of 3-point belts in the outboard rear seats indicates fatality reduction of 29 percent in frontals (as defined by the variable CRSH), 42 percent in side impacts, 77 percent in rollovers and 31 percent in rear/other impacts. We will assume the same effectiveness for 3-point belts in the center rear seat. Moreover, when we “remove” the belts from the vehicle, the occupant becomes unrestrained and, in general, 26 percent of unrestrained center rear seat passenger fatalities in frontal
389
crashes were ejected, 33 percent in side impacts, 64 percent in rollovers and 31 percent in rear/other impacts. One of these becomes the new values of EJECT2 as this now-unrestrained occupant fatality case proceeds through the rest of the model. /* LIVES SAVED AND EJECTIONS PREVENTED BY CENTER-REAR-SEAT 3-POINT BELTS */ OLDWTFA=WEIGHTFA; IF PS208J GT 0 OR PV208J GT 0 THEN DO; IF CRSH=1 THEN DO; E=.29; EJECT2=.26; END; ELSE IF CRSH=2 THEN DO; E=.42; EJECT2=.33; END; ELSE IF CRSH=3 THEN DO; E=.77; EJECT2=.64; END; ELSE IF CRSH=4 THEN DO; E=.31; EJECT2=.31; END; P=PS208J+PV208J; S=OLDWTFA*E*P / (1 - E*P); CLS208J=S*PS208J/P; CLV208J=S*PV208J/P; WEIGHTFA=OLDWTFA+CLS208J+CLV208J; END; ELSE DO; CLS208J=0; CLV208J=0; END; CL208J=CLS208J+CLV208J; CLS=CLS+CLS208J; CLV=CLV+CLV208J; CL=CL+CL208J;
By the way, when this model “removes” a 3-point belt system from the vehicle, it removes the entire system, not just the shoulder harness. The occupant from this point onwards is unrestrained, not lap-belted. The lives saved by the 3-point system are the benefits of that system relative to being unre-strained, not the incremental benefit of a 3-point system relative to lap belts only. At most one of the model’s first nine belt technologies (208A, 208B, 208C, 208D, 208E, 208F, 208G, 208H and 208J) can apply to any specific occupant case.624 /* ------------------------------------------------------------------ */ /* 201B INTERIOR IMPACT PROTECTION: HEAD-IMPACT UPGRADE */ /* MEDIAN INSTALLATION YEAR: EARLY2001 PHASE-IN STARTED MY 1999 */ /* ------------------------------------------------------------------ */ /* IDENTIFIES ANY OCCUPANT SITTING AT A DESIGNATED SEATING POSITION IN A VEHICLE MEETING THE HEAD-IMPACT UPGRADE */ PS201B=0; PV201B=0; IF SEAT2 IN (11,12,13,21,22) THEN DO; IF 2003 LE XMY LE 2013 THEN PS201B=1; ELSE IF 1999 LE XMY LE 2002 AND FMVSS201=1 THEN PS201B=1; END;
4.276-percent fatality reduction for any occupant sitting inside the vehicle in any type of crash /* LIVES SAVED BY UPGRADED UPPER-INTERIOR PADDING */ OLDWTFA=WEIGHTFA; IF PS201B GT 0 OR PV201B GT 0 THEN DO; E=.04276; /* 23.73% REDUCTION OF UPPER-INTERIOR AIS 4-6, UPPER-INTERIOR-HEAD IS MOST SEVERE INJURY IN 18.02% OF FATALS */ P=PS201B+PV201B; S=OLDWTFA*E*P / (1 - E*P); CLS201B=S*PS201B/P; CLV201B=S*PV201B/P; WEIGHTFA=OLDWTFA+CLS201B+CLV201B; END; ELSE DO; CLS201B=0; CLV201B=0; END; CL201B=CLS201B+CLV201B; CLS=CLS+CLS201B; CLV=CLV+CLV201B; CL=CL+CL201B;
624 It would also have been theoretically possible to estimate the effectiveness of 3-point belts relative to lap belts only (ra-ther than relative to being unrestrained), and then have the model subdivide the lives saved by 3-point belts into (1) lives that would have been saved even by just a lap belt (and count them under technology 208A) and (2) lives that were saved only because there was also a shoulder harness (and count only these in technology 208F). This approach would probably be confusing, since it would attribute a large number of saves to lap belts who were, in fact, people that used 3-point belts.

390
/* -------------------------------------------------------------------- */ /* 108 TRAILER CONSPICUITY TAPE (LIVES SAVED IN CARS NOT HITTING THEM) */ /* 54.0% OF TRAILERS ON THE ROAD HAD THEM IN 1996 */ /* FMCSA RETROFIT REQUIREMENT ISSUED 3/31/1999, TOOK EFFECT 6/1/2001 */ /* -------------------------------------------------------------------- */ /* IDENTIFIES SIDE/REAR IMPACTS INTO TRAILERS IN THE DARK AND % OF TRAILERS WITH TAPE */ PS108=0; PV108=0;
Identifies cases where the front of a car hit the side or rear of a heavy trailer in the dark. IF CY GE 1991 AND (TAPECASE=1 OR (OVTYP=3 AND ((1991 LE CY LE 1994 AND OVCONFIG=5) OR (CY GE 1995 AND OVCONFIG=6)) AND 2 LE LGT_COND LE 5 AND (OIMPACT2 IN (14,16) AND MAN_COLL IN (1,4,5) AND IMPACT2 IN (11,11.5,12,.5,1)))) THEN DO;
Unlike all the other safety technologies, the tape is not on the case vehicle (the car) but on the other vehicle (the heavy trailer). The MY of the case vehicle is irrelevant. The MY of the trailer is not re-ported on FARS. It is unknown (before June 1, 2001, the effective date of the FMCSA retrofit re-quirement) if this specific trailer was equipped with tape, but we can infer, from the CY of the crash, the probability that it was equipped with tape. PS108 is the percentage of trailers on the road that FMVSS No. 108 requires to be equipped with tape when new (if built after December 1, 1993) plus the percentage required by the FMCSA retrofit rule (after 6/1/2001). PV108 is the percentage of trailers on the road that were built before December 1, 1993 and voluntarily fitted or retrofitted with tape, before June 1, 2001. IF CY=1991 THEN DO; PS108=0; PV108=.09; END; ELSE IF CY=1992 THEN DO; PS108=0; PV108=.18; END; ELSE IF CY=1993 THEN DO; PS108=0; PV108=.27; END; ELSE IF CY=1994 THEN DO; PS108=.09; PV108=.27; END; ELSE IF CY=1995 THEN DO; PS108=.18; PV108=.27; END; ELSE IF CY=1996 THEN DO; PS108=.27; PV108=.27; END; ELSE IF CY=1997 THEN DO; PS108=.36; PV108=.27; END; ELSE IF CY=1998 THEN DO; PS108=.45; PV108=.27; END; ELSE IF CY=1999 THEN DO; PS108=.54; PV108=.27; END; ELSE IF CY=2000 THEN DO; PS108=.63; PV108=.27; END; ELSE IF CY=2001 THEN DO; PS108=.8775; PV108=.1125; END; ELSE IF CY GE 2002 THEN DO; PS108=1; PV108=0; END; END; /* CAR OCCUPANT LIVES SAVED BY CONSPICUITY TAPE ON TRUCK TRAILERS */ OLDWTFA=WEIGHTFA; IF PS108 GT 0 OR PV108 GT 0 THEN DO;
The tape is estimated to reduce fatal impacts into the side/rear of trailers, in the dark, by 29 percent. E=.29; P=PS108+PV108; S=OLDWTFA*E*P / (1 - E*P); CLS108=S*PS108/P; CLV108=S*PV108/P; WEIGHTFA=OLDWTFA+CLS108+CLV108; END; ELSE DO; CLS108=0; CLV108=0; END; CL108=CLS108+CLV108; CLS=CLS+CLS108; CLV=CLV+CLV108; CL=CL+CL108; /* -------------------------------------------------------------------------- */ /* 214B TTI(d) REDUCTIONS W/O AIR BAGS (DYNAMIC TEST UPGRADE FOR FMVSS 214) */ /* 64.1% OF CARS CERTIFIED IN MY 1996 PHASE-IN STARTED MY 1994 */ /* 4 SCENARIOS BASED ON N OF DOORS (2,4) & CERTIFICATION (YES,VOLUNTARY RED) */ /* -------------------------------------------------------------------------- */
The effect of TTI(d) reductions is different in 2-door and 4-door cars. Furthermore, each analysis (2-door and 4-door) has separate estimation for cars certified to meet the upgraded FMVSS No. 214, where we take a single, overall effectiveness value, and pre-standard or non-certified cars from MY
391
1986 onwards, where we take a fraction of the overall effect, slightly higher in each successive MY, as explained in the FMVSS No. 214 chapter in Part 1 of this report. IF 1910 LE XMY LE 1985 THEN GOTO BYP214B; IF SEAT2 NE 11 AND SEAT2 NE 13 THEN GOTO BYP214B; IF 1 LE HARM_EV LE 6 OR CRSH IN (1,3,4) OR CL226 GT 0 THEN GOTO BYP214B; /* ASSUME NO BENEFIT IF CRASH IS BASICALLY FRONTAL, ROLLOVER, REAR+OTHER OR IF ROLLOVER CURTAINS SAVE LIVES */ IF SEAT2=11 AND IMPACT1 IN (8,9,10,61:63) THEN NEARSIDE=1; ELSE IF SEAT2=13 AND IMPACT1 IN (2,3,4,81:83) THEN NEARSIDE=1; ELSE IF SEAT2=11 AND IMPACT2 IN (8,8.5,9,9.5,10,61:63) THEN NEARSIDE=1; ELSE IF SEAT2=13 AND IMPACT2 IN (2,2.5,3,3.5,4,81:83) THEN NEARSIDE=1; ELSE IF SEAT2=13 AND IMPACT1 IN (8,9,10,61:63) THEN NEARSIDE=2; ELSE IF SEAT2=11 AND IMPACT1 IN (2,3,4,81:83) THEN NEARSIDE=2; ELSE IF SEAT2=13 AND IMPACT2 IN (8,8.5,9,9.5,10,61:63) THEN NEARSIDE=2; ELSE IF SEAT2=11 AND IMPACT2 IN (2,2.5,3,3.5,4,81:83) THEN NEARSIDE=2; ELSE GOTO BYP214B; IF NEWVTYP IN (1,2) THEN GOTO TTI2; IF FMVSS214 NE 1 AND 1986 LE XMY LE 1996 THEN GOTO VOL4; /* -------------------------------------------------------------------- */ /* LIVES SAVED BY FMVSS 214 CERTIFICATION, 4-DOOR CARS */ /* 17.3% FATALITY REDUCTION IN NEARSIDE, MULTI-VEHICLE IMPACTS ONLY */ /* -------------------------------------------------------------------- */ /* IDENTIFIES 4-DOOR CARS MEETING FMVSS 214 IN NEARSIDE IMPACTS BY ANOTHER VEHICLE */ IF FMVSS214=1 AND NEARSIDE=1 AND VE_FORMS GE 2 THEN P214=1; ELSE P214=0; /* LIVES SAVED BY FMVSS 214 */ OLDWTFA=WEIGHTFA; E=.173; CLS214B=OLDWTFA*P214*E / (1 - P214*E); CLV214B=0; WEIGHTFA=OLDWTFA+CLS214B; GOTO TALLY214B; /* -------------------------------------------------------------------- */ /* LIVES SAVED BY VOLUNTARY TTI(d) IMPROVEMENTS, 4-DOOR CARS */ /* GRADUAL TTI(d) IMPROVEMENT FROM 1986 TO MY BEFORE CERTIFICATION */ /* WITH PROPORTIONAL FATALITY REDUCTION IN NEARSIDE, MULTI-VEHICLE */ /* -------------------------------------------------------------------- */ /* IDENTIFIES EXTENT OF VOLUNTARY TTI(d) IMPROVEMENT IN 4-DOOR CARS BEFORE FMVSS 214 */ VOL4: IF 1986 LE XMY LE 1990 THEN IMPTTI=XMY-1985; ELSE IF XMY=1991 THEN IMPTTI=7; ELSE IF XMY=1992 THEN IMPTTI=10; ELSE IF 1993 LE XMY LE 1996 THEN IMPTTI=14; /* LIVES SAVED BY VOLUNTARY TTI(d) IMPROVEMENTS */ OLDWTFA=WEIGHTFA; IF IMPTTI GT 0 AND NEARSIDE=1 AND VE_FORMS GE 2 THEN E=1 - EXP(-.00863*IMPTTI); ELSE E=0; CLS214B=0; CLV214B=OLDWTFA*E / (1 - E); WEIGHTFA=OLDWTFA+CLV214B; GOTO TALLY214B; /* -------------------------------------------------------------------- */ /* LIVES SAVED BY FMVSS 214 CERTIFICATION, 2-DOOR CARS */ /* 33.29% FATALITY REDUCTION IN NEARSIDE, MULTI-VEHICLE IMPACTS */ /* 20.03% FATALITY REDUCTION IN OTHER TYPES OF SIDE IMPACTS */ /* -------------------------------------------------------------------- */ /* IDENTIFIES 2-DOOR CARS MEETING FMVSS 214 IN SIDE IMPACTS */ TTI2: IF FMVSS214=1 THEN P214=1; ELSE IF FMVSS214 NE 1 AND 1986 LE XMY LE 1996 THEN GOTO VOL2; ELSE P214=0; /* LIVES SAVED BY FMVSS 214 */ OLDWTFA=WEIGHTFA; IF NEARSIDE=1 AND VE_FORMS GE 2 THEN E=.3329; ELSE E=.2003; CLS214B=OLDWTFA*P214*E / (1 - P214*E); CLV214B=0; WEIGHTFA=OLDWTFA+CLS214B; GOTO TALLY214B;
392
/* -------------------------------------------------------------------- */ /* LIVES SAVED BY VOLUNTARY TTI(d) IMPROVEMENTS, 2-DOOR CARS */ /* GRADUAL TTI(d) IMPROVEMENT FROM 1986 TO MY BEFORE CERTIFICATION */ /* WITH PARTIAL FATALITY REDUCTIONS IN ALL TYPES OF SIDE IMPACTS */ /* -------------------------------------------------------------------- */ /* IDENTIFIES EXTENT OF VOLUNTARY TTI(d) IMPROVEMENT IN 2-DOOR CARS BEFORE FMVSS 214 */ VOL2: IF 1986 LE XMY LE 1991 THEN IMPTTI=2*(XMY-1985); ELSE IF XMY=1992 THEN IMPTTI=15; ELSE IF 1993 LE XMY LE 1996 THEN IMPTTI=19; /* LIVES SAVED BY VOLUNTARY TTI(d) IMPROVEMENTS */ OLDWTFA=WEIGHTFA; IF IMPTTI GT 0 THEN E=1 - (.99073**IMPTTI); ELSE E=0; CLS214B=0; CLV214B=OLDWTFA*E / (1 - E); WEIGHTFA=OLDWTFA+CLV214B; GOTO TALLY214B; BYP214B: CLV214B=0; CLS214B=0; TALLY214B: CL214B=CLS214B+CLV214B; CLS=CLS+CLS214B; CLV=CLV+CLV214B; CL=CL+CL214B; /* ------------------------------------------------------------------ */ /* 208I FRONTAL AIR BAGS FOR DRIVERS AND RF PASSENGERS */ /* ASSUMES 18 PERCENT OF ON-OFF SWITCHES ARE TURNED OFF FOR RF 13+ */ /* MEDIAN INSTALLATION YEAR: 1992 PHASE-IN STARTED MY 1987 */ /* ------------------------------------------------------------------ */
Similar to the analysis of curtain and side air bags, this code will estimate an overall effect for frontal air bags and a separate estimate for various types of frontal air bags: barrier-certified, sled-certified, and advanced, also driver and RF passenger. It will estimate the numbers of children fatally injured by barrier-certified and sled-certified air bags – but also the additional, hypothetical numbers of children that survived with sled-certified or advanced air bags but that would have been fatally injured by barri-er-certified air bags. It will estimate the number of children saved because the manual on-off switch was turned “off” but also the number not saved because it was “on” – and vice-versa for adult passen-gers. It will estimate the number of lives saved by advanced air bags because they made it possible to phase out the manual switches. /* IDENTIFIES CARS WITH AIR BAGS */ PS208I=0; PV208I=0; P_BARRIER=0; P_SLED=0; P_CAC=0; UDAB=0; UPAB=0;
“PASSIVE,” the variable that indicates the types of occupant protection at the outboard front seats, is only defined if FARS has at least a partial VIN to decode. However, even when there is no VIN at all, we can often infer from the model year and the make if the car had driver and/or passenger air bags. All cars from MY 1997 onwards have had dual air bags. Some makes had driver air bags on all of their cars (UDAB = 1) or passenger air bags (UPAB = 1) before 1997. /* CARS WITH UNKNOWN "PASSIVE" (BAD VINs AND/OR NO MAK_MOD) CLASSIFIED BY MAKE AND MODEL YEAR */ IF CY GE 1985 AND XMY GE 1986 AND PASSIVE IN (.,9,1099,9999) AND SEAT2 IN (11,12,13,18) THEN DO; IF SEAT2=11 THEN DO; IF (MAKE=42 AND XMY GE 1986) /* i.e., ALL MERCEDES-BENZ CARS FROM 1986 ONWARDS HAVE DRIVER AIR BAGS */ OR (MAKE IN (13,38,45,47,51,59) AND XMY GE 1990) OR (MAKE IN (6,32,34) AND XMY GE 1991) OR (MAKE=37 AND XMY GE 1992) OR (MAKE IN (19,24,39,49) AND XMY GE 1993) OR (MAKE IN (18,21,54,58) AND XMY GE 1994) OR (MAKE IN (9,10,12,14,20,22,30,35,41,48,52,53) AND XMY GE 1995) OR (MAKE IN (55,63) AND XMY GE 1996) OR PASSIVE=1099 OR XMY GE 1997 THEN UDAB=1; END; ELSE IF SEAT2 IN (12,13,18) THEN DO; IF (MAKE=45 AND XMY GE 1990) OR (MAKE=13 AND XMY GE 1993) OR (MAKE IN (19,32,37,42,51,54,58,59) AND XMY GE 1994)
393
OR (MAKE IN (6,10,12,14,24,30,34,35,39,41,47,48,52,53) AND XMY GE 1995) OR (MAKE IN (9,22,49,55,63) AND XMY GE 1996) OR XMY GE 1997 THEN UPAB=1; END; END;
These are the codes of PASSIVE, based on VIN analysis, that indicate a car is equipped with frontal air bags and the driver or RF seats, respectively. PS208I includes any installation from MY 1987 on-wards, because the phase-in of automatic occupant protection began on September 1, 1986. Sled-certified and advanced air bags are identified by the variables REDES and CAC on LSM2014C. IF CY GE 1984 AND XMY GE 1985 AND (SEAT2=11 AND (PASSIVE IN (1,1003,1004,1006,2,3,1090,1099,1303,1313,1404,1505,1606) OR UDAB=1)) OR (SEAT2 IN (12,13,18) AND (PASSIVE IN (2,3,1313) OR UPAB=1)) THEN DO; IF 1985 LE XMY LE 1986 THEN DO; PV208I=1; P_BARRIER=1; END; ELSE IF XMY GE 1987 THEN DO; PS208I=1; IF XMY LE 1997 THEN P_BARRIER=1; ELSE IF 2000 LE XMY LE 2003 THEN P_SLED=1; ELSE IF XMY GE 2007 THEN P_CAC=1; ELSE IF REDES=0 AND CAC=0 THEN P_BARRIER=1; ELSE IF REDES=1 AND CAC=0 THEN P_SLED=1; ELSE IF REDES=1 AND CAC=1 THEN P_CAC=1; END; END; /* ------------------------------------------------------------------ */ /* SPLITS CASES INTO SCENARIOS DEPENDING ON AIR BAG TYPE, SEAT */ /* POSITION, ON-OFF SWITCH PRESENCE, OCCUPANT AGE, RESTRAINT USE */ /* COMPUTES LIVES SAVED BY AIR BAGS IN EACH SCENARIO */ /* ------------------------------------------------------------------ */
There are eight different effectiveness scenarios:
• Belted drivers, unbelted drivers; • Child passengers, belted adult (age 13+) passengers, and unbelted adult passengers – without
manual on-off switches; • Child passengers, belted adult (age 13+) passengers, and unbelted adult passengers – with
manual on-off switches.
Plus the default scenario, no air bag. Within each scenario, there are several effectiveness estimates. IF PS208I=0 AND PV208I=0 THEN GOTO CNOBAG; /* NO AIR BAG */ ELSE IF CY GE 2005 AND PER_TYP=3 AND AIR_BAG IN (.,0,20,28:32,97:99) THEN GOTO CNOBAG; /* OCCUPANT OF A PARKED CAR: ASSUME NO BENEFIT UNLESS FARS SAYS DEPLOYMENT */ ELSE IF SEAT2=11 AND REST3 GT 0 THEN GOTO CDRVBELT; /* BELTED DRIVER */ ELSE IF SEAT2=11 THEN GOTO CDRVUNR; /* UNRESTRAINED DRIVER */ ELSE IF PASSIVE=3 AND 0 LE AGE LE 12 THEN GOTO CKIDSW; /* CHILD RF WITH SWITCH */ ELSE IF 0 LE AGE LE 12 THEN GOTO CKID; /* CHILD RF NO SWITCH */ ELSE IF SEAT2 IN (12,18) THEN GOTO CNOBAG; /* ADULT IN CENTER FRONT OR NON-DESIGNATED SEAT: AIR BAG HAS NO EFFECT */ ELSE IF PASSIVE=3 AND REST3 GT 0 THEN GOTO CRFBELSW; /* BELTED ADULT RF W SWITCH */ ELSE IF PASSIVE=3 THEN GOTO CRFUNRSW; /* UNBELTED ADULT RF W SWITCH */ ELSE IF REST3 GT 0 THEN GOTO CRFBELT; /* BELTED ADULT RF NO SWITCH */ ELSE GOTO CRFUNR; /* UNBELTED ADULT RF NO SWITCH */
In addition to the basic statistics, WEIGHTFA, CLS208I, CLV208I and CL208I, the model compiles more detailed information on air bags: CNOBAG: /* ALL EFFECTS ARE ZERO HERE, BECAUSE NO FRONTAL AIR BAGS - BUT THESE ARE THE VARIABLES WE WILL TALLY IN EACH SCENARIO */ CLS208I=0; /* NET LIVES SAVED BY FRONTAL AIR BAGS, MY 1987 & LATER VEHICLES (AFTER 208 AUTOMATIC-PROTECTION PHASE-IN STARTED) */ CLV208I=0; /* NET LIVES SAVED BY FRONTAL AIR BAGS, MY 1985 & 1986 (BEFORE 208 PHASE-IN) */

394
CL208I=0; /* NET LIVES SAVED BY ANY FRONTAL AIR BAGS */ C_BARRIER=0; /* NET LIVES SAVED BY BARRIER-CERTIFIED AIR BAGS */ C_SLED=0; /* NET LIVES SAVED BY SLED-CERTIFIED AIR BAGS */ C_CAC=0; /* NET LIVES SAVED BY ADVANCED AIR BAGS. NOTE: CL208I = CLV208I+CLS208I = C_BARRIER+C_SLED+C_CAC */ CABDRV=0; /* DRIVERS SAVED BY FRONTAL AIR BAGS */ CABRF=0; /* RF PASSENGERS 13 AND OLDER SAVED BY FRONTAL AIR BAGS IN VEHICLES W/O ON-OFF SWITCHES */ CABKID_BARRIER=0; /* NET EFFECT OF BARRIER-CERTIFIED BAGS ON RF AGE 0-12 (NEGATIVE NUMBER BECAUSE FATALITY INCREASE), VEH W/O SWITCHES */ CABKID_SLED=0; /* NET EFFECT OF SLED-CERTIFIED BAGS ON RF AGE 0-12 (NEGATIVE NUMBER BECAUSE FATALITY IN-CREASE), VEH W/O SWITCHES */ CSW0=0; /* ACTUAL RF 13 & OLDER SAVED IN VEH WITH ON-OFF SWITCHES, AND THE SWITCHES WERE LEFT ON */ CSW1=0; /* THEORETICAL RF 13 & OLDER SAVED IN VEH WITH ON-OFF SWITCHES, IF THESE SWITCHES HAD ALL BEEN LEFT ON */ CSW2=0; /* LIVES LOST BECAUSE SWITCHES WERE TURNED OFF FOR RF 13+ (NEGATIVE NUMBER BECAUSE FATALITY IN-CREASE). NOTE: CSW0=CSW1+CSW2 */ CSWKID0_BARRIER=0; /* ACTUAL ADD'L CHILD PASSENGER FATALITIES DUE TO BARRIER-CERTIFIED AIR BAGS & SWITCHES LEFT ON */ CSWKID1_BARRIER=0; /* THEORETICAL CHILD PASSENGER FATALITIES DUE TO BARRIER-CERTIFIED AIR BAGS IF SWITCHES HAD NOT EXISTED */ CSWKID2_BARRIER=0; /* LIVES SAVED BECAUSE SWITCHES WERE TURNED OFF FOR CHILD PASSENGERS WITH BARRIER-CERTIFIED AIR BAGS */ CSWKID0_SLED=0; /* ACTUAL ADD'L CHILD PASSENGER FATALITIES DUE TO SLED-CERTIFIED AIR BAGS & SWITCHES LEFT ON */ CSWKID1_SLED=0; /* THEORETICAL CHILD PASSENGER FATALITIES DUE TO SLED-CERTIFIED AIR BAGS IF SWITCHES HAD NOT EXISTED */ CSWKID2_SLED=0; /* LIVES SAVED BECAUSE SWITCHES WERE TURNED OFF FOR CHILD PASSENGERS WITH SLED-CERTIFIED AIR BAGS */ C_KID_SLED=0; /* CHILDREN'S LIVES SAVED BECAUSE THEY WERE EXPOSED TO SLED-CERTIFIED RATHER THAN BARRIER-CERTIFIED AIR BAGS */ C_KID_CAC=0; /* CHILDREN'S LIVES SAVED BECAUSE THEY SAT BEHIND ADVANCED AIR BAGS (NO/LOW-RISK DEPLOYMENT) RATHER THAN BARRIER-CERT */ C_ADULT_CAC=0; /* RF 13+ SAVED BECAUSE ADVANCED AIR BAGS ELIMINATED MANUAL SWITCHES THAT WOULD HAVE BEEN TURNED OFF FOR THESE RF */ GOTO C208H;
Air bag effectiveness: the data from NHTSA’s evaluation indicates that air bags reduce fatalities:
• In all crashes, for all drivers by 12.4 percent, for belted drivers by 10.8 percent, and for unbelt-ed drivers by 14.0 percent.
• In frontal and partially frontal crashes, without a most-harmful-event rollover, fire or immer-sion, for all drivers, by 29.0 percent if the principal impact is 12 o’clock, by 15.2 percent if it is 11 o’clock or 1 o’clock, and by 5.8 percent if it is 10 o’clock or 2 o’clock
• In 12 o’clock crashes, for all adult RF passengers, by 31.9 percent. There are not enough data to get precise individual estimates such as, for belted RF passengers in 11 o’clock or 1 o’clock crashes. Instead, ratios of the preceding estimates are used. For example, the ef-

395
fect of air bags for belted drivers in 12 o’clock crashes is estimated to be (.108/.124) x .290 = .25258. For belted RF passengers it would be (.319/.290) x (.108/.124) x .290 = .27784. CDRVBELT: OLDWTFA=WEIGHTFA; IF 1 LE M_HARM LE 6 OR CRSH IN (3,4) OR (CL226+CL214C+CLS214B)/OLDWTFA GT .05052 THEN E=0; /* ASSUME NO BENEFIT IF THE CRASH IS BASICALLY ROLLOVER/REAR/OTHER OR IF ROLLOVER CURTAINS/SIDE AIR BAGS/SIDE STRUCTURE+PADDING SAVE LIVES. EXCEPTION: FRONTAL AIR BAG CAN HAVE BENEFIT (E.G. IN 2:00 OR 10:00) IF THESE OTHERS HAVE LITTLE EFFECT */ ELSE IF IMPACT2=12 OR (IMPACT2 IN (.,14:18,98,99) AND IMPACT1=12) THEN E=.25258; ELSE IF IMPACT2 IN (.5,1,11,11.5) OR (IMPACT2 IN (.,14:18,98,99) AND IMPACT1 IN (1,11)) THEN E=.13239; ELSE IF IMPACT2 IN (1.5,2,10,10.5) OR (IMPACT2 IN (.,14:18,98,99) AND IMPACT1 IN (2,10)) THEN E=.05052; ELSE E=0; P=PS208I+PV208I; S=OLDWTFA*E*P / (1 - E*P); CLS208I=S*PS208I/P; CLV208I=S*PV208I/P; C_BARRIER=S*P_BARRIER/P; C_SLED=S*P_SLED/P; C_CAC=S*P_CAC/P; WEIGHTFA=OLDWTFA+CLS208I+CLV208I; CL208I=CLS208I+CLV208I; CLS=CLS+CLS208I; CLV=CLV+CLV208I; CL=CL+CL208I; CABDRV=CL208I; CABRF=0; CABKID_BARRIER=0; CABKID_SLED=0; CSW0=0; CSW1=0; CSW2=0; CSWKID0_BARRIER=0; CSWKID1_BARRIER=0; CSWKID2_BARRIER=0; CSWKID0_SLED=0; CSWKID1_SLED=0; CSWKID2_SLED=0; C_KID_SLED=0; C_KID_CAC=0; C_ADULT_CAC=0; GOTO C208H; CDRVUNR: OLDWTFA=WEIGHTFA; IF 1 LE M_HARM LE 6 OR CRSH IN (3,4) OR (CL226+CL214C+CLS214B)/OLDWTFA GT .06548 THEN E=0; /* ASSUME NO BENEFIT IF THE CRASH IS BASICALLY ROLLOVER/REAR/OTHER OR IF ROLLOVER CURTAINS/SIDE AIR BAGS/SIDE STRUCTURE+PADDING SAVE LIVES. EXCEPTION: FRONTAL AIR BAG CAN HAVE BENEFIT (E.G. IN 2:00 OR 10:00) IF THESE OTHERS HAVE LITTLE EFFECT */ ELSE IF IMPACT2=12 OR (IMPACT2 IN (.,14:18,98,99) AND IMPACT1=12) THEN E=.32742; ELSE IF IMPACT2 IN (.5,1,11,11.5) OR (IMPACT2 IN (.,14:18,98,99) AND IMPACT1 IN (1,11)) THEN E=.17161; ELSE IF IMPACT2 IN (1.5,2,10,10.5) OR (IMPACT2 IN (.,14:18,98,99) AND IMPACT1 IN (2,10)) THEN E=.06548; ELSE E=0; P=PS208I+PV208I; S=OLDWTFA*E*P / (1 - E*P); CLS208I=S*PS208I/P; CLV208I=S*PV208I/P; C_BARRIER=S*P_BARRIER/P; C_SLED=S*P_SLED/P; C_CAC=S*P_CAC/P; WEIGHTFA=OLDWTFA+CLS208I+CLV208I; CL208I=CLS208I+CLV208I; CLS=CLS+CLS208I; CLV=CLV+CLV208I; CL=CL+CL208I; CABDRV=CL208I; CABRF=0; CABKID_BARRIER=0; CABKID_SLED=0; CSW0=0; CSW1=0; CSW2=0; CSWKID0_BARRIER=0; CSWKID1_BARRIER=0; CSWKID2_BARRIER=0; CSWKID0_SLED=0; CSWKID1_SLED=0; CSWKID2_SLED=0; C_KID_SLED=0; C_KID_CAC=0; C_ADULT_CAC=0; GOTO C208H; CRFBELT: OLDWTFA=WEIGHTFA; IF 1 LE M_HARM LE 6 OR CRSH IN (3,4) OR (CL226+CL214C+CLS214B)/OLDWTFA GT .05557 THEN E=0; /* ASSUME NO BENEFIT IF THE CRASH IS BASICALLY ROLLOVER/REAR/OTHER OR IF ROLLOVER CURTAINS/SIDE AIR BAGS/SIDE STRUCTURE+PADDING SAVE LIVES. EXCEPTION: FRONTAL AIR BAG CAN HAVE BENEFIT (E.G. IN 2:00 OR 10:00) IF THESE OTHERS HAVE LITTLE EFFECT */ ELSE IF IMPACT2=12 OR (IMPACT2 IN (.,14:18,98,99) AND IMPACT1=12) THEN E=.27784; ELSE IF IMPACT2 IN (.5,1,11,11.5) OR (IMPACT2 IN (.,14:18,98,99) AND IMPACT1 IN (1,11)) THEN E=.14563; ELSE IF IMPACT2 IN (1.5,2,10,10.5) OR (IMPACT2 IN (.,14:18,98,99) AND IMPACT1 IN (2,10)) THEN E=.05557; ELSE E=0; P=PS208I+PV208I; S=OLDWTFA*E*P / (1 - E*P); CLS208I=S*PS208I/P; CLV208I=S*PV208I/P; C_BARRIER=S*P_BARRIER/P; C_SLED=S*P_SLED/P; C_CAC=S*P_CAC/P; WEIGHTFA=OLDWTFA+CLS208I+CLV208I; CL208I=CLS208I+CLV208I; CLS=CLS+CLS208I; CLV=CLV+CLV208I; CL=CL+CL208I; CABDRV=0; CABRF=CL208I; CABKID_BARRIER=0; CABKID_SLED=0; CSW0=0; CSW1=0; CSW2=0;
396
CSWKID0_BARRIER=0; CSWKID1_BARRIER=0; CSWKID2_BARRIER=0; CSWKID0_SLED=0; CSWKID1_SLED=0; CSWKID2_SLED=0; C_KID_SLED=0; C_KID_CAC=0; IF SWITCH_MM=1 THEN DO; /* IF CAC VEHICLES, NOW WITHOUT SWITCH, STILL HAD THE SWITCH, AND IT WERE OFF, FEW-ER LIVES WOULD BE SAVED */ /* USE RATES FOR ON-OFF SWITCHES BY PASSENGER AGE */ IF 13 LE AGE LE 15 THEN U=.22; ELSE IF 16 LE AGE LE 19 THEN U=.17; ELSE IF 20 LE AGE LE 59 THEN U=.15; ELSE IF 60 LE AGE LE 69 THEN U=.19; ELSE IF AGE GE 70 THEN U=.56; C_ADULT_CAC=U*C_CAC; END; ELSE C_ADULT_CAC=0; GOTO C208H; CRFUNR: OLDWTFA=WEIGHTFA; IF 1 LE M_HARM LE 6 OR CRSH IN (3,4) OR (CL226+CL214C+CLS214B)/OLDWTFA GT .07203 THEN E=0; /* ASSUME NO BENEFIT IF THE CRASH IS BASICALLY ROLLOVER/REAR/OTHER OR IF ROLLOVER CURTAINS/SIDE AIR BAGS/SIDE STRUCTURE+PADDING SAVE LIVES. EXCEPTION: FRONTAL AIR BAG CAN HAVE BENEFIT (E.G. IN 2:00 OR 10:00) IF THESE OTHERS HAVE LITTLE EFFECT */ ELSE IF IMPACT2=12 OR (IMPACT2 IN (.,14:18,98,99) AND IMPACT1=12) THEN E=.36016; ELSE IF IMPACT2 IN (.5,1,11,11.5) OR (IMPACT2 IN (.,14:18,98,99) AND IMPACT1 IN (1,11)) THEN E=.18877; ELSE IF IMPACT2 IN (1.5,2,10,10.5) OR (IMPACT2 IN (.,14:18,98,99) AND IMPACT1 IN (2,10)) THEN E=.07203; ELSE E=0; P=PS208I+PV208I; S=OLDWTFA*E*P / (1 - E*P); CLS208I=S*PS208I/P; CLV208I=S*PV208I/P; C_BARRIER=S*P_BARRIER/P; C_SLED=S*P_SLED/P; C_CAC=S*P_CAC/P; WEIGHTFA=OLDWTFA+CLS208I+CLV208I; CL208I=CLS208I+CLV208I; CLS=CLS+CLS208I; CLV=CLV+CLV208I; CL=CL+CL208I; CABDRV=0; CABRF=CL208I; CABKID_BARRIER=0; CABKID_SLED=0; CSW0=0; CSW1=0; CSW2=0; CSWKID0_BARRIER=0; CSWKID1_BARRIER=0; CSWKID2_BARRIER=0; CSWKID0_SLED=0; CSWKID1_SLED=0; CSWKID2_SLED=0; C_KID_SLED=0; C_KID_CAC=0;
Estimation of additional lives saved by advanced air bags because they allowed the phase-out of man-ual switches that might have been incorrectly turned off for adult passengers. IF SWITCH_MM=1 THEN DO; /* IF CAC VEHICLES, NOW WITHOUT SWITCH, STILL HAD THE SWITCH, AND IT WERE OFF, FEW-ER LIVES WOULD BE SAVED */ /* USE RATES FOR ON-OFF SWITCHES BY PASSENGER AGE */ IF 13 LE AGE LE 15 THEN U=.22; ELSE IF 16 LE AGE LE 19 THEN U=.17; ELSE IF 20 LE AGE LE 59 THEN U=.15; ELSE IF 60 LE AGE LE 69 THEN U=.19; ELSE IF AGE GE 70 THEN U=.56; C_ADULT_CAC=U*C_CAC; END; ELSE C_ADULT_CAC=0; GOTO C208H;
Child passengers: as estimated in Part 1 of this report, in 12 o’clock impacts, barrier-certified air bags increased the fatality risk of infants in rear-facing seats by about 450 percent, for unrestrained children < 6 years old by about 100 percent, and for restrained children age 1 to 5 and unrestrained children age 6 to 10 by about 70 percent. In partially frontal crashes (10, 11, 1, or 2 o’clock), the effect of air bags is about 38 percent as large as in 12 o’clock impacts. Sled-certified, redesigned air bags reduced these additional risks by 83 percent. CKID: OLDWTFA=WEIGHTFA; IF KCRSH=1 AND RESTGP=1 THEN E=-4.5; /* FATALITY INCREASE, BARRIER-CERT REL TO NO BAGS, DIRECT FRONTALS, 3 GPS OF YOUNG CHILDREN */ ELSE IF KCRSH=1 AND RESTGP IN (2,3) THEN E=-1; ELSE IF KCRSH=1 AND RESTGP IN (4,5,6) THEN E=-.70; ELSE IF KCRSH IN (2,3) AND RESTGP=1 THEN E=-1.71; /* INCREASE IN OBLIQUE FRONTALS IS 62% LESS THAN IN DIRECT FRONTALS */ ELSE IF KCRSH IN (2,3) AND RESTGP IN (2,3) THEN E=-.38;
397
ELSE IF KCRSH IN (2,3) AND RESTGP IN (4,5,6) THEN E=-.27; ELSE IF KCRSH=11 AND RESTGP=1 THEN E=-.77; /* FATALITY INCREASE WITH SLED-CERTIFIED IS 83% LESS THAN WITH BARRIER-CERTIFIED */ ELSE IF KCRSH=11 AND RESTGP IN (2,3) THEN E=-.17; ELSE IF KCRSH=11 AND RESTGP IN (4,5,6) THEN E=-.12; ELSE IF KCRSH IN (12,13) AND RESTGP=1 THEN E=-.29; /* SLED-CERTIFIED, OBLIQUE FRONTAL */ ELSE IF KCRSH IN (12,13) AND RESTGP IN (2,3) THEN E=-.06; ELSE IF KCRSH IN (12,13) AND RESTGP IN (4,5,6) THEN E=-.05; ELSE E=0; P=PS208I+PV208I; S=OLDWTFA*E*P / (1 - E*P); CLS208I=S*PS208I/P; CLV208I=S*PV208I/P; C_BARRIER=S*P_BARRIER/P; C_SLED=S*P_SLED/P; C_CAC=S*P_CAC/P; WEIGHTFA=OLDWTFA+CLS208I+CLV208I; CL208I=CLS208I+CLV208I; CLS=CLS+CLS208I; CLV=CLV+CLV208I; CL=CL+CL208I; CABDRV=0; CABRF=0; IF KCRSH IN (1,2,3) THEN DO; CABKID_BARRIER=CL208I; CABKID_SLED=0; END; ELSE IF KCRSH IN (11,12,13) THEN DO; CABKID_BARRIER=0; CABKID_SLED=CL208I; END; ELSE DO; CABKID_BARRIER=0; CABKID_SLED=0; END; CSW0=0; CSW1=0; CSW2=0; CSWKID0_BARRIER=0; CSWKID1_BARRIER=0; CSWKID2_BARRIER=0; CSWKID0_SLED=0; CSWKID1_SLED=0; CSWKID2_SLED=0; C_KID_SLED=0; C_KID_CAC=0; C_ADULT_CAC=0; IF KCRSH IN (11,12,13,21,22,23) THEN DO; /* ADD'L FATALITIES IF BAGS HAD BEEN 1st GEN RATHER THAN SLED OR CAC */ IF KCRSH IN (11) AND RESTGP=1 THEN E_HYP=-3.73; ELSE IF KCRSH IN (11) AND RESTGP IN (2,3) THEN E_HYP=-.83; ELSE IF KCRSH IN (11) AND RESTGP IN (4,5,6) THEN E_HYP=-.58; ELSE IF KCRSH IN (12,13) AND RESTGP=1 THEN E_HYP=-1.42; ELSE IF KCRSH IN (12,13) AND RESTGP IN (2,3) THEN E_HYP=-.32; ELSE IF KCRSH IN (12,13) AND RESTGP IN (4,5,6) THEN E_HYP=-.22; ELSE IF KCRSH IN (21) AND RESTGP=1 THEN E_HYP=-4.5; ELSE IF KCRSH IN (21) AND RESTGP IN (2,3) THEN E_HYP=-1; ELSE IF KCRSH IN (21) AND RESTGP IN (4,5,6) THEN E_HYP=-.70; ELSE IF KCRSH IN (21,23) AND RESTGP=1 THEN E_HYP=-1.71; ELSE IF KCRSH IN (21,23) AND RESTGP IN (2,3) THEN E_HYP=-.38; ELSE IF KCRSH IN (21,23) AND RESTGP IN (4,5,6) THEN E_HYP=-.27; ELSE E_HYP=0; IF KCRSH IN (11,12,13) THEN C_KID_SLED=-1*OLDWTFA*E_HYP; ELSE IF KCRSH IN (21,22,23) THEN C_KID_CAC=-1*OLDWTFA*E_HYP; END; GOTO C208H;
Manual on-off switches for passenger air bags: not many cars had the switches, but some cars with small rear seats or no rear seats had them. In each scenario, it is necessary to compute the lives lost, or not saved, because the switch was set “off” for a child or “on” for an adult. The proportion of switches set incorrectly is based on a 2000 NHTSA survey discussed in Part 1 of this report. CRFBELSW: OLDWTFA=WEIGHTFA; IF 1 LE M_HARM LE 6 OR CRSH IN (3,4) OR (CL226+CL214C+CLS214B)/OLDWTFA GT .05557 THEN E=0; /* ASSUME NO BENEFIT IF THE CRASH IS BASICALLY ROLLOVER/REAR/OTHER OR IF ROLLOVER CURTAINS/SIDE AIR BAGS/SIDE STRUCTURE+PADDING SAVE LIVES. EXCEPTION: FRONTAL AIR BAG CAN HAVE BENEFIT (E.G. IN 2:00 OR 10:00) IF THESE OTHERS HAVE LITTLE EFFECT */ ELSE IF IMPACT2=12 OR (IMPACT2 IN (.,14:18,98,99) AND IMPACT1=12) THEN E=.27784; ELSE IF IMPACT2 IN (.5,1,11,11.5) OR (IMPACT2 IN (.,14:18,98,99) AND IMPACT1 IN (1,11)) THEN E=.14563; ELSE IF IMPACT2 IN (1.5,2,10,10.5) OR (IMPACT2 IN (.,14:18,98,99) AND IMPACT1 IN (2,10)) THEN E=.05557; ELSE E=0; /* USE RATES FOR ON-OFF SWITCHES BY PASSENGER AGE */ IF 13 LE AGE LE 15 THEN U=.22; ELSE IF 16 LE AGE LE 19 THEN U=.17; ELSE IF 20 LE AGE LE 59 THEN U=.15; ELSE IF 60 LE AGE LE 69 THEN U=.19; ELSE IF AGE GE 70 THEN U=.56; P=PS208I+PV208I;

398
X=OLDWTFA/(1 - E*P + U*E*P); S=X - OLDWTFA; CLS208I=S*PS208I/P; CLV208I=S*PV208I/P; C_BARRIER=S*P_BARRIER/P; C_SLED=S*P_SLED/P; C_CAC=S*P_CAC/P; WEIGHTFA=OLDWTFA+CLS208I+CLV208I; Y=X*(1-E); CSW1=X-Y; CSW2=Y-OLDWTFA; CL208I=CLS208I+CLV208I; CLS=CLS+CLS208I; CLV=CLV+CLV208I; CL=CL+CL208I; CSW0=CL208I; CABDRV=0; CABRF=0; CABKID_BARRIER=0; CABKID_SLED=0; CSWKID0_BARRIER=0; CSWKID1_BARRIER=0; CSWKID2_BARRIER=0; CSWKID0_SLED=0; CSWKID1_SLED=0; CSWKID2_SLED=0; C_KID_SLED=0; C_KID_CAC=0; C_ADULT_CAC=0; GOTO C208H; CRFUNRSW: OLDWTFA=WEIGHTFA; IF 1 LE M_HARM LE 6 OR CRSH IN (3,4) OR (CL226+CL214C+CLS214B)/OLDWTFA GT .07203 THEN E=0; /* ASSUME NO BENEFIT IF THE CRASH IS BASICALLY ROLLOVER/REAR/OTHER OR IF ROLLOVER CURTAINS/SIDE AIR BAGS/SIDE STRUCTURE+PADDING SAVE LIVES. EXCEPTION: FRONTAL AIR BAG CAN HAVE BENEFIT (E.G. IN 2:00 OR 10:00) IF THESE OTHERS HAVE LITTLE EFFECT */ ELSE IF IMPACT2=12 OR (IMPACT2 IN (.,14:18,98,99) AND IMPACT1=12) THEN E=.36016; ELSE IF IMPACT2 IN (.5,1,11,11.5) OR (IMPACT2 IN (.,14:18,98,99) AND IMPACT1 IN (1,11)) THEN E=.18877; ELSE IF IMPACT2 IN (1.5,2,10,10.5) OR (IMPACT2 IN (.,14:18,98,99) AND IMPACT1 IN (2,10)) THEN E=.07203; ELSE E=0; /* USE RATES FOR ON-OFF SWITCHES BY PASSENGER AGE */ IF 13 LE AGE LE 15 THEN U=.22; ELSE IF 16 LE AGE LE 19 THEN U=.17; ELSE IF 20 LE AGE LE 59 THEN U=.15; ELSE IF 60 LE AGE LE 69 THEN U=.19; ELSE IF AGE GE 70 THEN U=.56; P=PS208I+PV208I; X=OLDWTFA/(1 - E*P + U*E*P); S=X - OLDWTFA; CLS208I=S*PS208I/P; CLV208I=S*PV208I/P; C_BARRIER=S*P_BARRIER/P; C_SLED=S*P_SLED/P; C_CAC=S*P_CAC/P; WEIGHTFA=OLDWTFA+CLS208I+CLV208I; Y=X*(1-E); CSW1=X-Y; CSW2=Y-OLDWTFA; CL208I=CLS208I+CLV208I; CLS=CLS+CLS208I; CLV=CLV+CLV208I; CL=CL+CL208I; CSW0=CL208I; CABDRV=0; CABRF=0; CABKID_BARRIER=0; CABKID_SLED=0; CSWKID0_BARRIER=0; CSWKID1_BARRIER=0; CSWKID2_BARRIER=0; CSWKID0_SLED=0; CSWKID1_SLED=0; CSWKID2_SLED=0; C_KID_SLED=0; C_KID_CAC=0; C_ADULT_CAC=0; GOTO C208H; CKIDSW: OLDWTFA=WEIGHTFA; IF KCRSH=1 AND RESTGP=1 THEN E=-4.5; /* FATALITY INCREASE, BARRIER-CERT REL TO NO BAGS, DIRECT FRONTALS, 3 GPS OF YOUNG CHILDREN */ ELSE IF KCRSH=1 AND RESTGP IN (2,3) THEN E=-1; ELSE IF KCRSH=1 AND RESTGP IN (4,5,6) THEN E=-.70; ELSE IF KCRSH IN (2,3) AND RESTGP=1 THEN E=-1.71; /* INCREASE IN OBLIQUE FRONTALS IS 62% LESS THAN IN DIRECT FRONTALS */ ELSE IF KCRSH IN (2,3) AND RESTGP IN (2,3) THEN E=-.38; ELSE IF KCRSH IN (2,3) AND RESTGP IN (4,5,6) THEN E=-.27; ELSE IF KCRSH=11 AND RESTGP=1 THEN E=-.77; /* FATALITY INCREASE WITH SLED-CERTIFIED IS 83% LESS THAN WITH BARRIER-CERTIFIED */ ELSE IF KCRSH=11 AND RESTGP IN (2,3) THEN E=-.17; ELSE IF KCRSH=11 AND RESTGP IN (4,5,6) THEN E=-.12; ELSE IF KCRSH IN (12,13) AND RESTGP=1 THEN E=-.29; /* SLED-CERTIFIED, OBLIQUE FRONTAL */
399
ELSE IF KCRSH IN (12,13) AND RESTGP IN (2,3) THEN E=-.06; ELSE IF KCRSH IN (12,13) AND RESTGP IN (4,5,6) THEN E=-.05; ELSE E=0; /* USE RATES FOR ON-OFF SWITCHES BY PASSENGER AGE */ IF AGE=0 THEN U=.86; ELSE IF 1 LE AGE LE 6 THEN U=.74; ELSE IF 7 LE AGE LE 8 THEN U=.59; ELSE IF 9 LE AGE LE 10 THEN U=.47; ELSE IF 11 LE AGE LE 12 THEN U=.30; P=PS208I+PV208I; X=OLDWTFA/(1 - E*P + U*E*P); S=X - OLDWTFA; CLS208I=S*PS208I/P; CLV208I=S*PV208I/P; CL208I=CLS208I+CLV208I; CLS=CLS+CLS208I; CLV=CLV+CLV208I; CL=CL+CL208I; C_BARRIER=S*P_BARRIER/P; C_SLED=S*P_SLED/P; C_CAC=S*P_CAC/P; WEIGHTFA=OLDWTFA+CLS208I+CLV208I; Y=X*(1-E); IF KCRSH IN (1,2,3) THEN DO; CSWKID1_BARRIER=X-Y; CSWKID1_SLED=0; CSWKID2_BARRIER=Y-OLDWTFA; CSWKID2_SLED=0; CSWKID0_BARRIER=CL208I; CSWKID0_SLED=0; END; ELSE IF KCRSH IN (11,12,13) THEN DO; CSWKID1_BARRIER=0; CSWKID1_SLED=X-Y; CSWKID2_BARRIER=0; CSWKID2_SLED=Y-OLDWTFA; CSWKID0_BARRIER=0; CSWKID0_SLED=CL208I; END; ELSE DO; CSWKID1_BARRIER=0; CSWKID1_SLED=0; CSWKID2_BARRIER=0; CSWKID2_SLED=0; CSWKID0_BARRIER=0; CSWKID0_SLED=0; END; CSW0=0; CSW1=0; CSW2=0; CABDRV=0; CABRF=0; CABKID_BARRIER=0; CABKID_SLED=0; CSWKID0=0; CSWKID1=0; CSWKID2=0; C_KID_SLED=0; C_KID_CAC=0; C_ADULT_CAC=0; IF KCRSH IN (11,12,13,21,22,23) THEN DO; /* ADD'L FATALITIES IF BAGS HAD BEEN 1st GEN RATHER THAN SLED OR CAC */ IF KCRSH IN (11) AND RESTGP=1 THEN E_HYP=-3.73; ELSE IF KCRSH IN (11) AND RESTGP IN (2,3) THEN E_HYP=-.83; ELSE IF KCRSH IN (11) AND RESTGP IN (4,5,6) THEN E_HYP=-.58; ELSE IF KCRSH IN (12,13) AND RESTGP=1 THEN E_HYP=-1.42; ELSE IF KCRSH IN (12,13) AND RESTGP IN (2,3) THEN E_HYP=-.32; ELSE IF KCRSH IN (12,13) AND RESTGP IN (4,5,6) THEN E_HYP=-.22; ELSE IF KCRSH IN (21) AND RESTGP=1 THEN E_HYP=-4.5; ELSE IF KCRSH IN (21) AND RESTGP IN (2,3) THEN E_HYP=-1; ELSE IF KCRSH IN (21) AND RESTGP IN (4,5,6) THEN E_HYP=-.70; ELSE IF KCRSH IN (21,23) AND RESTGP=1 THEN E_HYP=-1.71; ELSE IF KCRSH IN (21,23) AND RESTGP IN (2,3) THEN E_HYP=-.38; ELSE IF KCRSH IN (21,23) AND RESTGP IN (4,5,6) THEN E_HYP=-.27; ELSE E_HYP=0; IF KCRSH IN (11,12,13) THEN C_KID_SLED=(U-1)*OLDWTFA*E_HYP; ELSE IF KCRSH IN (21,22,23) THEN C_KID_CAC=(U-1)*OLDWTFA*E_HYP; END; /* ------------------------------------------------------------------ */ /* 208H AUTOMATIC 2-POINT BELTS */ /* PEAK INSTALLATION YEAR: 1991 PHASE-IN STARTED MY 1987 */ /* ------------------------------------------------------------------ */ /* IDENTIFIES OCCUPANTS WEARING AUTOMATIC 2-POINT BELTS */ C208H: PS208H=0; PV208H=0;
“REST3 = 7” indicates use of 2-point automatic belts. PS208H includes any installation from MY 1987 onwards, because the phase-in of automatic occupant protection began on September 1, 1986. IF REST3=7 THEN DO; IF XMY LE 1986 THEN PV208H=1; ELSE PS208H=1; END; /* LIVES SAVED AND EJECTIONS PREVENTED BY AUTOMATIC 2-POINT BELTS */ OLDWTFA=WEIGHTFA; IF PS208H GT 0 OR PV208H GT 0 THEN DO;
400
Two-point automatic belts reduce fatalities by an estimated 30 percent in frontals, 18 percent in side impacts, 62 percent in rollovers and 68 percent in rear/other impacts. In general, 21 percent of unre-strained outboard front seat occupant fatalities in frontal crashes were ejected, 23 percent in side im-pacts, 66 percent in rollovers and 35 percent in rear/other impacts. IF CRSH=1 THEN DO; E=.30; EJECT2=.21; END; ELSE IF CRSH=2 THEN DO; E=.18; EJECT2=.23; END; ELSE IF CRSH=3 THEN DO; E=.62; EJECT2=.66; END; ELSE IF CRSH=4 THEN DO; E=.68; EJECT2=.35; END; P=PS208H+PV208H; S=OLDWTFA*E*P / (1 - E*P); CLS208H=S*PS208H/P; CLV208H=S*PV208H/P; WEIGHTFA=OLDWTFA+CLS208H+CLV208H; END; ELSE DO; CLS208H=0; CLV208H=0; END; CL208H=CLS208H+CLV208H; CLS=CLS+CLS208H; CLV=CLV+CLV208H; CL=CL+CL208H; /* ------------------------------------------------------------------ */ /* 208G 3-POINT BELTS FOR OUTBOARD REAR SEAT OCCUPANTS */ /* MEDIAN INSTALLATION YEAR: 1989 FMVSS EFFECTIVE DATE: 12/11/1989 */ /* ------------------------------------------------------------------ */ /* IDENTIFIES REAR SEAT OCCUPANTS WEARING 3-POINT BELTS */ PS208G=0; PV208G=0; IF SEAT2=21 AND REST3=3 THEN DO; IF XMY LE 1989 THEN PV208G=1; ELSE PS208G=1; END; /* LIVES SAVED AND EJECTIONS PREVENTED BY REAR-SEAT 3-POINT BELTS */ OLDWTFA=WEIGHTFA; IF PS208G GT 0 OR PV208G GT 0 THEN DO;
Three-point belts in the outboard rear seats reduce fatalities by 29 percent in frontals, 42 percent in side impacts, 77 percent in rollovers and 31 percent in rear/other impacts. In general, 23 percent of unre-strained outboard rear seat occupant fatalities in frontal crashes were ejected, 28 percent in side im-pacts, 61 percent in rollovers and 27 percent in rear/other impacts. IF CRSH=1 THEN DO; E=.29; EJECT2=.23; END; ELSE IF CRSH=2 THEN DO; E=.42; EJECT2=.28; END; ELSE IF CRSH=3 THEN DO; E=.77; EJECT2=.61; END; ELSE IF CRSH=4 THEN DO; E=.31; EJECT2=.27; END; P=PS208G+PV208G; S=OLDWTFA*E*P / (1 - E*P); CLS208G=S*PS208G/P; CLV208G=S*PV208G/P; WEIGHTFA=OLDWTFA+CLS208G+CLV208G; END; ELSE DO; CLS208G=0; CLV208G=0; END; CL208G=CLS208G+CLV208G; CLS=CLS+CLS208G; CLV=CLV+CLV208G; CL=CL+CL208G; /* ------------------------------------------------------------------ */ /* 213 CHILD SAFETY SEATS */ /* USE RATE WENT OVER 50% IN: 1985 FMVSS EFFECTIVE DATE: 4/1/1971 */ /* ------------------------------------------------------------------ */ /* IDENTIFIES CHILD PASSENGERS IN SAFETY SEATS */ PS213=0; PV213=0; IF REST3=4 THEN DO;
“REST3 = 4” indicates a child passenger in a safety seat (not necessarily correctly used). FMVSS No. 213 regulates the performance of safety seats but does not mandate their use. Therefore, the distinction between PV213 and PS213 will not be based on the effective date of FMVSS No. 213 (April 1, 1971) but on whether the child was covered by a State law for child passenger protection. That depends on the State and the age of the child. Here is a State-by-State listing of when the laws initially took effect and for what age groups and when the laws were subsequently upgraded to include higher age groups:
401
IF STATE=1 THEN DO; IF CY=1982 AND MONTH GE 7 AND AGE LE 3 THEN PS213=1; /* STATE LAWS IN EFFECT UP TO WHAT AGE: ALABAMA */ ELSE IF 1983 LE CY LE 2004 AND AGE LE 3 THEN PS213=1; ELSE IF CY GE 2005 AND AGE LE 5 THEN PS213=1; ELSE PV213=1; END; ELSE IF STATE=2 THEN DO; IF CY=1985 AND MONTH GE 6 AND AGE LE 3 THEN PS213=1; /* ALASKA */ ELSE IF 1986 LE CY LE 2007 AND AGE LE 3 THEN PS213=1; ELSE IF CY GE 2008 AND AGE LE 8 THEN PS213=1; ELSE PV213=1; END; ELSE IF STATE=4 THEN DO; IF CY=1983 AND MONTH GE 8 AND AGE LE 4 THEN PS213=1; /* ARIZONA */ ELSE IF 1984 LE CY LE 2010 AND AGE LE 4 THEN PS213=1; ELSE IF CY GE 2011 AND AGE LE 8 THEN PS213=1; ELSE PV213=1; END; ELSE IF STATE=5 THEN DO; IF CY=1983 AND MONTH GE 8 AND AGE LE 2 THEN PS213=1; /* ARKANSAS */ ELSE IF 1984 LE CY LE 1993 AND AGE LE 2 THEN PS213=1; ELSE IF 1994 LE CY LE 1997 AND AGE LE 3 THEN PS213=1; ELSE IF 1998 LE CY LE 2000 AND AGE LE 4 THEN PS213=1; ELSE IF CY GE 2001 AND AGE LE 5 THEN PS213=1; ELSE PV213=1; END; ELSE IF STATE=6 THEN DO; IF 1983 LE CY LE 2000 AND AGE LE 3 THEN PS213=1; /* CALIFORNIA */ ELSE IF CY GE 2001 AND AGE LE 5 THEN PS213=1; ELSE PV213=1; END; ELSE IF STATE=8 THEN DO; IF 1984 LE CY LE 2003 AND AGE LE 3 THEN PS213=1; /* COLORADO */ ELSE IF CY GE 2004 AND AGE LE 5 THEN PS213=1; ELSE PV213=1; END; ELSE IF STATE=9 THEN DO; IF CY=1982 AND MONTH GE 5 AND AGE=0 THEN PS213=1; /* CONNECTICUT */ ELSE IF 1983 LE CY LE 1993 AND AGE=0 THEN PS213=1; ELSE IF CY=1982 AND MONTH GE 5 AND SEAT2 IN (12,13,18) AND AGE LE 3 THEN PS213=1; ELSE IF 1983 LE CY LE 1993 AND SEAT2 IN (12,13,18) AND AGE LE 3 THEN PS213=1; ELSE IF 1994 LE CY LE 2003 AND AGE LE 3 THEN PS213=1; ELSE IF CY GE 2004 AND AGE LE 6 THEN PS213=1; ELSE PV213=1; END; ELSE IF STATE=10 THEN DO; IF CY=1982 AND MONTH GE 6 AND AGE LE 3 THEN PS213=1; /* DELAWARE */ ELSE IF 1983 LE CY LE 2001 AND AGE LE 3 THEN PS213=1; ELSE IF 2002 LE CY LE 2003 AND AGE LE 5 THEN PS213=1; ELSE IF CY GE 2004 AND AGE LE 6 THEN PS213=1; ELSE PV213=1; END; ELSE IF STATE=11 THEN DO; IF CY=1983 AND MONTH GE 7 AND AGE LE 2 THEN PS213=1; /* DC */ ELSE IF 1984 LE CY LE 1997 AND AGE LE 2 THEN PS213=1; ELSE IF 1998 LE CY LE 2001 AND AGE LE 3 THEN PS213=1; ELSE IF CY GE 2002 AND AGE LE 7 THEN PS213=1; ELSE PV213=1; END; ELSE IF STATE=12 THEN DO; IF CY=1983 AND MONTH GE 7 AND AGE LE 3 THEN PS213=1; /* FLORIDA */ ELSE IF CY GE 1984 AND AGE LE 3 THEN PS213=1; ELSE PV213=1; END; ELSE IF STATE=13 THEN DO; IF CY=1984 AND MONTH GE 7 AND AGE LE 2 THEN PS213=1; /* GEORGIA */ ELSE IF 1985 LE CY LE 2002 AND AGE LE 2 THEN PS213=1; ELSE IF CY=2003 AND AGE LE 4 THEN PS213=1; ELSE IF CY GE 2004 AND AGE LE 5 THEN PS213=1; ELSE PV213=1; END; ELSE IF STATE=15 THEN DO; IF CY=1983 AND MONTH GE 7 AND AGE LE 2 THEN PS213=1; /* HAWAII */ ELSE IF 1984 LE CY LE 2003 AND AGE LE 2 THEN PS213=1; ELSE IF 2004 LE CY LE 2006 AND AGE LE 3 THEN PS213=1; ELSE IF CY GE 2007 AND AGE LE 7 THEN PS213=1; ELSE PV213=1; END; ELSE IF STATE=16 THEN DO; IF 1985 LE CY LE 2003 AND AGE LE 3 THEN PS213=1; /* IDAHO */ ELSE IF CY GE 2004 AND AGE LE 6 THEN PS213=1; ELSE PV213=1; END; ELSE IF STATE=17 THEN DO; IF CY=1983 AND MONTH GE 7 AND AGE LE 3 THEN PS213=1; /* ILLINOIS */ ELSE IF 1984 LE CY LE 2003 AND AGE LE 3 THEN PS213=1; ELSE IF CY GE 2004 AND AGE LE 7 THEN PS213=1; ELSE PV213=1; END; ELSE IF STATE=18 THEN DO; IF 1984 LE CY LE 1997 AND AGE LE 2 THEN PS213=1; /* INDIANA */ ELSE IF 1998 LE CY LE 2003 AND AGE LE 3 THEN PS213=1; ELSE IF CY GE 2004 AND AGE LE 7 THEN PS213=1; ELSE PV213=1; END; ELSE IF STATE=19 THEN DO; IF 1985 LE CY LE 2003 AND AGE LE 2 THEN PS213=1; /* IOWA */ ELSE IF CY GE 2004 AND AGE LE 5 THEN PS213=1; ELSE PV213=1; END; ELSE IF STATE=20 THEN DO; IF 1982 LE CY LE 2004 AND AGE LE 3 THEN PS213=1; /* KANSAS */ ELSE IF CY GE 2005 AND AGE LE 7 THEN PS213=1; ELSE PV213=1; END; ELSE IF STATE=21 THEN DO; IF CY=1982 AND MONTH GE 7 AND AGE LE 2 THEN PS213=1; /* KENTUCKY */ ELSE IF 1983 LE CY LE 2006 AND AGE LE 2 THEN PS213=1; ELSE IF CY GE 2007 AND AGE LE 6 THEN PS213=1; ELSE PV213=1; END; ELSE IF STATE=22 THEN DO; IF CY=1984 AND MONTH GE 9 AND AGE LE 2 THEN PS213=1; /* LOUISIANA */ ELSE IF 1985 LE CY LE 2003 AND AGE LE 2 THEN PS213=1; ELSE IF CY=1984 AND MONTH GE 9 AND SEAT2 IN (12,13,18) AND AGE LE 4 THEN PS213=1; ELSE IF 1985 LE CY LE 2003 AND SEAT2 IN (12,13,18) AND AGE LE 4 THEN PS213=1; ELSE IF CY GE 2004 AND AGE LE 5 THEN PS213=1; ELSE PV213=1; END; ELSE IF STATE=23 THEN DO; IF CY=1983 AND MONTH GE 9 AND AGE LE 3 THEN PS213=1; /* MAINE */ ELSE IF 1984 LE CY LE 2003 AND AGE LE 3 THEN PS213=1; ELSE IF CY GE 2004 AND AGE LE 7 THEN PS213=1; ELSE PV213=1; END; ELSE IF STATE=24 THEN DO; IF 1984 LE CY LE 1992 AND AGE LE 2 THEN PS213=1; /* MARYLAND */ ELSE IF 1993 LE CY LE 2001 AND AGE LE 3 THEN PS213=1; ELSE IF 2002 LE CY LE 2006 AND AGE LE 5 THEN PS213=1; ELSE IF CY GE 2007 AND AGE LE 7 THEN PS213=1; ELSE PV213=1; END;

402
ELSE IF STATE=25 THEN DO; IF 1982 LE CY LE 2006 AND AGE LE 4 THEN PS213=1; /* MASSACHUSETTS */ ELSE IF CY GE 2007 AND AGE LE 7 THEN PS213=1; ELSE PV213=1; END; ELSE IF STATE=26 THEN DO; IF CY=1982 AND MONTH GE 4 AND AGE=0 THEN PS213=1; /* MICHIGAN */ ELSE IF 1983 LE CY LE 1999 AND AGE=0 THEN PS213=1; ELSE IF CY=1982 AND MONTH GE 4 AND SEAT2 IN (12,13,18) AND AGE LE 4 THEN PS213=1; ELSE IF 1983 LE CY LE 1999 AND SEAT2 IN (12,13,18) AND AGE LE 4 THEN PS213=1; ELSE IF 2000 LE CY LE 2006 AND AGE LE 3 THEN PS213=1; ELSE IF CY GE 2007 AND AGE LE 7 THEN PS213=1; ELSE PV213=1; END; ELSE IF STATE=27 THEN DO; IF CY=1983 AND MONTH GE 8 AND AGE LE 3 THEN PS213=1; /* MINNESOTA */ ELSE IF 1984 LE CY LE 2007 AND AGE LE 3 THEN PS213=1; ELSE IF CY GE 2008 AND AGE LE 7 THEN PS213=1; ELSE PV213=1; END; ELSE IF STATE=28 THEN DO; IF CY=1983 AND MONTH GE 7 AND AGE LE 1 THEN PS213=1; /* MISSISSIPPI */ ELSE IF 1984 LE CY LE 1993 AND AGE LE 1 THEN PS213=1; ELSE IF 1994 LE CY LE 2006 AND AGE LE 3 THEN PS213=1; ELSE IF CY GE 2007 AND AGE LE 6 THEN PS213=1; ELSE PV213=1; END; ELSE IF STATE=29 THEN DO; IF 1984 LE CY LE 2004 AND AGE LE 3 THEN PS213=1; /* MISSOURI */ ELSE IF CY GE 2005 AND AGE LE 7 THEN PS213=1; ELSE PV213=1; END; ELSE IF STATE=30 THEN DO; IF 1984 LE CY LE 2003 AND AGE LE 1 THEN PS213=1; /* MONTANA */ ELSE IF CY GE 2004 AND AGE LE 5 THEN PS213=1; ELSE PV213=1; END; ELSE IF STATE=31 THEN DO; IF CY=1983 AND MONTH GE 8 AND AGE LE 3 THEN PS213=1; /* NEBRASKA */ ELSE IF 1984 LE CY LE 2001 AND AGE LE 3 THEN PS213=1; ELSE IF CY GE 2002 AND AGE LE 5 THEN PS213=1; ELSE PV213=1; END; ELSE IF STATE=32 THEN DO; IF CY=1983 AND MONTH GE 7 AND AGE LE 4 THEN PS213=1; /* NEVADA */ ELSE IF 1984 LE CY LE 2003 AND AGE LE 4 THEN PS213=1; ELSE IF 2004 LE CY LE 2008 AND AGE LE 5 THEN PS213=1; ELSE IF CY GE 2009 AND AGE LE 6 THEN PS213=1; ELSE PV213=1; END; ELSE IF STATE=33 THEN DO; IF CY=1983 AND MONTH GE 7 AND AGE LE 3 THEN PS213=1; /* NEW HAMPSHIRE */ ELSE IF 1984 LE CY LE 2003 AND AGE LE 3 THEN PS213=1; ELSE IF CY GE 2004 AND AGE LE 5 THEN PS213=1; ELSE PV213=1; END; ELSE IF STATE=34 THEN DO; IF CY=1983 AND MONTH GE 4 AND AGE=0 THEN PS213=1; /* NEW JERSEY */ ELSE IF 1984 LE CY LE 2001 AND AGE=0 THEN PS213=1; ELSE IF CY=1983 AND MONTH GE 4 AND SEAT2 IN (12,13,18) AND AGE LE 4 THEN PS213=1; ELSE IF 1984 LE CY LE 2001 AND SEAT2 IN (12,13,18) AND AGE LE 4 THEN PS213=1; ELSE IF CY GE 2002 AND AGE LE 7 THEN PS213=1; ELSE PV213=1; END; ELSE IF STATE=35 THEN DO; IF CY=1983 AND MONTH GE 6 AND AGE=0 THEN PS213=1; /* NEW MEXICO */ ELSE IF 1984 LE CY LE 2001 AND AGE=0 THEN PS213=1; ELSE IF CY=1983 AND MONTH GE 6 AND SEAT2 IN (12,13,18) AND AGE LE 4 THEN PS213=1; ELSE IF 1984 LE CY LE 2001 AND SEAT2 IN (12,13,18) AND AGE LE 4 THEN PS213=1; ELSE IF 2002 LE CY LE 2003 AND AGE LE 4 THEN PS213=1; ELSE IF CY GE 2004 AND AGE LE 6 THEN PS213=1; ELSE PV213=1; END; ELSE IF STATE=36 THEN DO; IF CY=1982 AND MONTH GE 4 AND AGE LE 3 THEN PS213=1; /* NEW YORK */ ELSE IF 1983 LE CY LE 2003 AND AGE LE 3 THEN PS213=1; ELSE IF 2004 LE CY LE 2008 AND AGE LE 6 THEN PS213=1; ELSE IF CY GE 2009 AND AGE LE 7 THEN PS213=1; ELSE PV213=1; END; ELSE IF STATE=37 THEN DO; IF CY=1982 AND MONTH GE 7 AND AGE LE 2 THEN PS213=1; /* NORTH CAROLINA */ ELSE IF 1983 LE CY LE 1992 AND AGE LE 2 THEN PS213=1; ELSE IF 1993 LE CY LE 2001 AND AGE LE 3 THEN PS213=1; ELSE IF 2002 LE CY LE 2003 AND AGE LE 4 THEN PS213=1; ELSE IF CY GE 2004 AND AGE LE 7 THEN PS213=1; ELSE PV213=1; END; ELSE IF STATE=38 THEN DO; IF 1984 LE CY LE 1998 AND AGE LE 2 THEN PS213=1; /* NORTH DAKOTA */ ELSE IF 1999 LE CY LE 2003 AND AGE LE 3 THEN PS213=1; ELSE IF CY GE 2004 AND AGE LE 6 THEN PS213=1; ELSE PV213=1; END; ELSE IF STATE=39 THEN DO; IF CY=1983 AND MONTH GE 3 AND AGE LE 3 THEN PS213=1; /* OHIO */ ELSE IF 1984 LE CY LE 2007 AND AGE LE 3 THEN PS213=1; ELSE IF CY GE 2008 AND AGE LE 8 THEN PS213=1; ELSE PV213=1; END; ELSE IF STATE=40 THEN DO; IF CY=1983 AND MONTH GE 11 AND AGE LE 3 THEN PS213=1; /* OKLAHOMA */ ELSE IF 1984 LE CY LE 2003 AND AGE LE 3 THEN PS213=1; ELSE IF CY GE 2004 AND AGE LE 5 THEN PS213=1; ELSE PV213=1; END; ELSE IF STATE=41 THEN DO; IF 1984 LE CY LE 1994 AND AGE=0 THEN PS213=1; /* OREGON */ ELSE IF 1995 LE CY LE 2001 AND AGE LE 3 THEN PS213=1; ELSE IF 2002 LE CY LE 2006 AND AGE LE 5 THEN PS213=1; ELSE IF CY GE 2007 AND AGE LE 7 THEN PS213=1; ELSE PV213=1; END; ELSE IF STATE=42 THEN DO; IF 1984 LE CY LE 1992 AND AGE=0 THEN PS213=1; /* PENNSYLVANIA */ ELSE IF 1984 LE CY LE 1992 AND SEAT2 IN (12,13,18) AND AGE LE 3 THEN PS213=1; ELSE IF 1993 LE CY LE 2003 AND AGE LE 3 THEN PS213=1; ELSE IF CY GE 2004 AND AGE LE 7 THEN PS213=1; ELSE PV213=1; END; ELSE IF STATE=44 THEN DO; IF CY=1980 AND MONTH GE 7 AND AGE LE 3 THEN PS213=1; /* RHODE ISLAND */ ELSE IF 1981 LE CY LE 2001 AND AGE LE 3 THEN PS213=1; ELSE IF 2002 LE CY LE 2008 AND AGE LE 6 THEN PS213=1; ELSE IF CY GE 2009 AND AGE LE 7 THEN PS213=1; ELSE PV213=1; END; ELSE IF STATE=45 THEN DO; IF CY=1983 AND MONTH GE 7 AND AGE=0 THEN PS213=1; /* SOUTH CAROLINA */ ELSE IF 1984 LE CY LE 2003 AND AGE=0 THEN PS213=1;
403
ELSE IF CY=1983 AND MONTH GE 7 AND SEAT2 IN (12,13,18) AND AGE LE 3 THEN PS213=1; ELSE IF 1984 LE CY LE 2003 AND SEAT2 IN (12,13,18) AND AGE LE 3 THEN PS213=1; ELSE IF CY GE 2004 AND AGE LE 5 THEN PS213=1; ELSE PV213=1; END; ELSE IF STATE=46 THEN DO; IF CY=1984 AND MONTH GE 7 AND AGE LE 1 THEN PS213=1; /* SOUTH DAKOTA */ ELSE IF 1985 LE CY LE 1997 AND AGE LE 1 THEN PS213=1; ELSE IF CY GE 1998 AND AGE LE 4 THEN PS213=1; ELSE PV213=1; END; ELSE IF STATE=47 THEN DO; IF 1978 LE CY LE 2003 AND AGE LE 3 THEN PS213=1; /* TENNESSEE */ ELSE IF CY GE 2004 AND AGE LE 8 THEN PS213=1; ELSE PV213=1; END; ELSE IF STATE=48 THEN DO; IF CY=1984 AND MONTH GE 10 AND AGE LE 1 THEN PS213=1; /* TEXAS */ ELSE IF 1985 LE CY LE 2000 AND AGE LE 1 THEN PS213=1; ELSE IF 2001 LE CY LE 2007 AND AGE LE 2 THEN PS213=1; ELSE IF CY GE 2008 AND AGE LE 8 THEN PS213=1; ELSE PV213=1; END; ELSE IF STATE=49 THEN DO; IF CY=1984 AND MONTH GE 7 AND AGE LE 1 THEN PS213=1; /* UTAH */ ELSE IF 1985 LE CY LE 1999 AND AGE LE 1 THEN PS213=1; ELSE IF 2000 LE CY LE 2006 AND AGE LE 4 THEN PS213=1; ELSE IF CY GE 2007 AND AGE LE 7 THEN PS213=1; ELSE PV213=1; END; ELSE IF STATE=50 THEN DO; IF CY=1984 AND MONTH GE 7 AND AGE=0 THEN PS213=1; /* VERMONT */ ELSE IF 1985 LE CY LE 1992 AND AGE=0 THEN PS213=1; ELSE IF CY=1984 AND MONTH GE 7 AND SEAT2 IN (12,13,18) AND AGE LE 4 THEN PS213=1; ELSE IF 1985 LE CY LE 1992 AND SEAT2 IN (12,13,18) AND AGE LE 4 THEN PS213=1; ELSE IF 1993 LE CY LE 2003 AND AGE LE 4 THEN PS213=1; ELSE IF 2004 LE CY LE 2006 AND AGE LE 6 THEN PS213=1; ELSE IF CY GE 2007 AND AGE LE 7 THEN PS213=1; ELSE PV213=1; END; ELSE IF STATE=51 THEN DO; IF 1983 LE CY LE 1992 AND AGE LE 2 THEN PS213=1; /* VIRGINIA */ ELSE IF 1993 LE CY LE 2001 AND AGE LE 3 THEN PS213=1; ELSE IF 2002 LE CY LE 2006 AND AGE LE 5 THEN PS213=1; ELSE IF CY GE 2007 AND AGE LE 7 THEN PS213=1; ELSE PV213=1; END; ELSE IF STATE=53 THEN DO; IF 1984 LE CY LE 1992 AND AGE=0 THEN PS213=1; /* WASHINGTON STATE */ ELSE IF 1993 LE CY LE 1995 AND AGE LE 1 THEN PS213=1; ELSE IF 1996 LE CY LE 2001 AND AGE LE 2 THEN PS213=1; ELSE IF 2002 LE CY LE 2003 AND AGE LE 5 THEN PS213=1; ELSE IF 2004 LE CY LE 2008 AND AGE LE 7 THEN PS213=1; ELSE IF CY GE 2009 AND AGE LE 8 THEN PS213=1; ELSE PV213=1; END; ELSE IF STATE=54 THEN DO; IF CY=1981 AND MONTH GE 7 AND AGE LE 2 THEN PS213=1; /* WEST VIRGINIA */ ELSE IF 1982 LE CY LE 2003 AND AGE LE 2 THEN PS213=1; ELSE IF CY GE 2004 AND AGE LE 7 THEN PS213=1; ELSE PV213=1; END; ELSE IF STATE=55 THEN DO; IF CY=1982 AND MONTH GE 11 AND AGE LE 1 THEN PS213=1; /* WISCONSIN */ ELSE IF 1983 LE CY LE 2004 AND AGE LE 3 THEN PS213=1; ELSE IF CY GE 2005 AND AGE LE 7 THEN PS213=1; ELSE PV213=1; END; ELSE IF STATE=56 THEN DO; IF CY=1985 AND MONTH GE 4 AND AGE LE 2 THEN PS213=1; /* WYOMING */ ELSE IF 1986 LE CY LE 1996 AND AGE LE 2 THEN PS213=1; ELSE IF 1997 LE CY LE 2003 AND AGE LE 4 THEN PS213=1; ELSE IF CY GE 2004 AND AGE LE 8 THEN PS213=1; ELSE PV213=1; END; END; /* LIVES SAVED AND EJECTIONS PREVENTED BY CHILD SAFETY SEATS */ OLDWTFA=WEIGHTFA; IF PS213 GT 0 OR PV213 GT 0 THEN DO;
NHTSA’s evaluation estimates that safety seats reduce fatality risk by 71 percent for infants and by 54 percent for toddlers. Effectiveness is not estimated separately by crash mode. In general, 19 percent of unrestrained child passenger fatalities in frontal crashes were ejected, 26 percent in side impacts, 65 percent in rollovers and 34 percent in rear/other impacts. IF AGE=0 THEN E=.71; ELSE E=.54; IF CRSH=1 THEN EJECT2=.19; ELSE IF CRSH=2 THEN EJECT2=.26; ELSE IF CRSH=3 THEN EJECT2=.65; ELSE IF CRSH=4 THEN EJECT2=.34; P=PS213+PV213; S=OLDWTFA*E*P / (1 - E*P); CLS213=S*PS213/P; CLV213=S*PV213/P; WEIGHTFA=OLDWTFA+CLS213+CLV213; END; ELSE DO; CLS213=0; CLV213=0; END; CL213=CLS213+CLV213; CLS=CLS+CLS213; CLV=CLV+CLV213; CL=CL+CL213;
NCAP-related crashworthiness improvement is the only component of the model that is not associated with a specific FMVSS or even a single, specific technology. Nevertheless, cars became safer, saving
404
lives. Starting in 1979 NCAP tested the injury performance of belted dummies in 35-mph frontal im-pacts, and advised the public about the comparative performance of make-models. Starting about 1982, rapidly at first and more gradually in 1984 to 1987, manufacturers modified or redesigned their cars, resulting in substantial improvements on the NCAP test. Modifications included the belt system, the steering assembly, the instrument panel and the seat structure, taking into account how dummies inter-acted with those systems in 35 mph tests. NHTSA’s evaluation showed a 20-percent reduction of fatal-ity risk, for MY 1983-to-1986 versus MY 1979-to-1982, for belted drivers in head-on collisions with other cars. NHTSA’s evaluation did not consider crashes with other types of vehicles or with fixed ob-jects, and it did not study the fatality risk of passengers; the data was limited almost entirely to cars without air bags. We will assume a 20-percent fatality reduction, for belted drivers only (not passen-gers), when a car frontally impacts another car (but not limited to head-on collisions). Conservatively, we will not assume any benefit for other frontal impacts, such as with an LTV, a heavy truck, or a fixed object; we will limit the benefit to cars without air bags. /* ------------------------------------------------------------------ */ /* NCAP VOLUNTARY FRONTAL CRASHWORTHINESS IMPROVEMENTS */ /* MEDIAN IMPLEMENTATION YEAR: 1984 */ /* ------------------------------------------------------------------ */ /* IDENTIFIES NON-AIR-BAG, 3-POINT-BELT CARS WITH IMPROVED NCAP SCORES */ PSNCAP=0; PVNCAP=0; IF CY GE 1981 AND XMY GE 1982 AND PASSIVE IN (0,505) AND SEAT2=11 THEN DO; IF XMY=1982 THEN PVNCAP=.25; ELSE IF XMY=1983 THEN PVNCAP=.50; ELSE IF XMY=1984 THEN PVNCAP=.67; ELSE IF XMY=1985 THEN PVNCAP=.83; ELSE IF XMY GE 1986 THEN PVNCAP=1; END; /* LIVES SAVED BY NCAP-RELATED IMPROVEMENTS: BELTED DRIVERS IN HEAD-ON CRASHES WITH CARS */ OLDWTFA=WEIGHTFA; IF PSNCAP GT 0 OR PVNCAP GT 0 THEN DO; IF REST3=3 AND (IMPACT2 IN (.5,1,11,11.5,12) OR (CY GE 2010 AND IMPACT2 IN (.,14:18,98,99) AND IMPACT1 IN (1,11,12))) AND OVTYP=1 THEN E=.20; ELSE E=0; P=PSNCAP+PVNCAP; S=OLDWTFA*E*P / (1 - E*P); CLSNCAP=S*PSNCAP/P; CLVNCAP=S*PVNCAP/P; WEIGHTFA=OLDWTFA+CLSNCAP+CLVNCAP; END; ELSE DO; CLSNCAP=0; CLVNCAP=0; END; CLNCAP=CLSNCAP+CLVNCAP; CLS=CLS+CLSNCAP; CLV=CLV+CLVNCAP; CL=CL+CLNCAP; /* ------------------------------------------------------------------ */ /* 208F 3-POINT BELTS FOR FRONT-SEAT OUTBOARD OCCUPANTS */ /* MEDIAN INSTALLATION YEAR: 1974 FMVSS EFFECTIVE DATE: 9/1/1973 */ /* ------------------------------------------------------------------ */ /* IDENTIFIES FRONT SEAT OCCUPANTS WEARING 3-POINT BELTS */ PS208F=0; PV208F=0;
“REST3 = 3” includes use of manual 3-point belts, use of automatic 3-point belts, and use of both belts at seats with separate lap and shoulder belts (i.e., for the separate belts only, FARS must say REST_USE = 3; for the 3-point systems, REST_USE can be 1, 2, 3, 8, 13 or imputed). The FMVSS No. 208 requirement for integral 3-point belts took effect on September 1, 1973 (model year 1974); all lap/shoulder belt use (integral or separate) before MY 1974 will be credited to PV208F. IF SEAT2 IN (11,13) AND REST3=3 THEN DO; IF XMY LE 1973 THEN PV208F=1; ELSE PS208F=1; END; /* LIVES SAVED AND EJECTIONS PREVENTED BY OUTBOARD-FRONT-SEAT 3-POINT BELTS */ OLDWTFA=WEIGHTFA; IF PS208F GT 0 OR PV208F GT 0 THEN DO;
405
With the abundant data for evaluating lap/shoulder belt effectiveness, it is possible to fine-tune the es-timates more than for other belt systems: 60-percent fatality reduction in single-vehicle frontals, 42 percent in multi-vehicle frontals; 21 percent in single-vehicle near-side; 5 percent in multi-vehicle near-side; 46 percent in single-vehicle far-side; 35 percent in multivehicle far-side; 74 percent in rollo-vers; 56 percent in rear/other impacts. The proportion of unrestrained fatalities that were ejectees is also computed separately for each of those crash types. IF CRSH=1 AND VE_FORMS=1 THEN DO; E=.60; EJECT2=.31; END; ELSE IF CRSH=1 THEN DO; E=.42; EJECT2=.12; END; ELSE IF CRSH=2 THEN DO; IF VE_FORMS=1 AND ((SEAT2=11 AND IMPACT2 IN (8,8.5,9,9.5,10,26,61:63)) OR (SEAT2=13 AND IMPACT2 IN (2,2.5,3,3.5,4,26,81:83)) OR (SEAT2=11 AND CY GE 2010 AND IMPACT2 IN (.,14:18,98,99) AND IMPACT1 IN (8,9,10,61:63)) OR (SEAT2=13 AND CY GE 2010 AND IMPACT2 IN (.,14:18,98,99) AND IMPACT1 IN (2,3,4,81:83))) THEN DO; E=.21; EJECT2=.33; END; ELSE IF ((SEAT2=11 AND IMPACT2 IN (8,8.5,9,9.5,10,26,61:63)) OR (SEAT2=13 AND IMPACT2 IN (2,2.5,3,3.5,4,26,81:83)) OR (SEAT2=11 AND CY GE 2010 AND IMPACT2 IN (.,14:18,98,99) AND IMPACT1 IN (8,9,10,61:63)) OR (SEAT2=13 AND CY GE 2010 AND IMPACT2 IN (.,14:18,98,99) AND IMPACT1 IN (2,3,4,81:83))) THEN DO; E=.05; EJECT2=.15; END; ELSE IF VE_FORMS=1 THEN DO; E=.46; EJECT2=.36; END; ELSE DO; E=.35; EJECT2=.20; END; END; ELSE IF CRSH=3 THEN DO; E=.74; EJECT2=.66; END; ELSE IF CRSH=4 THEN DO; E=.56; EJECT2=.35; END; P=PS208F+PV208F; S=OLDWTFA*E*P / (1 - E*P); CLS208F=S*PS208F/P; CLV208F=S*PV208F/P; WEIGHTFA=OLDWTFA+CLS208F+CLV208F; END; ELSE DO; CLS208F=0; CLV208F=0; END; CL208F=CLS208F+CLV208F; CLS=CLS+CLS208F; CLV=CLV+CLV208F; CL=CL+CL208F; /* ------------------------------------------------------------------ */ /* 216 B-PILLARS FOR HARDTOP CARS AND OTHER ROOF STRENGTHENING */ /* MEDIAN INSTALLATION YEAR: 1973 FMVSS EFFECTIVE DATE: 9/1/1973 */ /* ------------------------------------------------------------------ */ /* ROOF STRENGTH IMPROVED GRADUALLY FROM 1970 TO 1977 */ IF XMY LE 1969 THEN DO; PS216=0; PV216=0; END; ELSE IF 1970 LE XMY LE 1973 THEN DO; PS216=0; PV216=.125*(XMY-1969); END; ELSE IF 1974 LE XMY LE 1976 THEN DO; PS216=.125*(XMY-1969); PV216=0; END; ELSE IF XMY GE 1977 THEN DO; PS216=1; PV216=0; END; /* REDUCTION IN NONEJECTION ROLLOVER FATALITY RISK WITH IMPROVED ROOF STRENGTH */ OLDWTFA=WEIGHTFA;
Roof crush resistance can benefit any non-ejected occupant (EJECT2 NE 1) within the vehicle (SEAT2 NE 52) in a rollover crash. NHTSA’s evaluation showed an overall 7.4-percent reduction in non-ejection rollover fatalities during the 1970-to-1977 implementation period associated with FMVSS No. 216. This is one of the FMVSS where it was important to track the changes in EJECT2 in previous steps of the model. But EJECT2 also has to be recomputed at the end of this step EJECT2 = EJECT2/(1+REL_S), because “removing” roof crush strength increases non-ejection fatalities, and thus increases the proportion of fatalities that are not ejected IF (PS216 GT 0 OR PV216 GT 0) AND (CRSH=3 OR M_HARM=1) AND SEAT2 NE 52 AND EJECT2 NE 1 THEN DO; E=.074; P=PS216+PV216; REL_S=(1-EJECT2)*E*P / (1 - E*P); S=OLDWTFA*REL_S; CLS216=S*PS216/P; CLV216=S*PV216/P; WEIGHTFA=OLDWTFA+CLS216+CLV216; EJECT2=EJECT2/(1+ REL_S); END; ELSE DO; CLS216=0; CLV216=0; END;
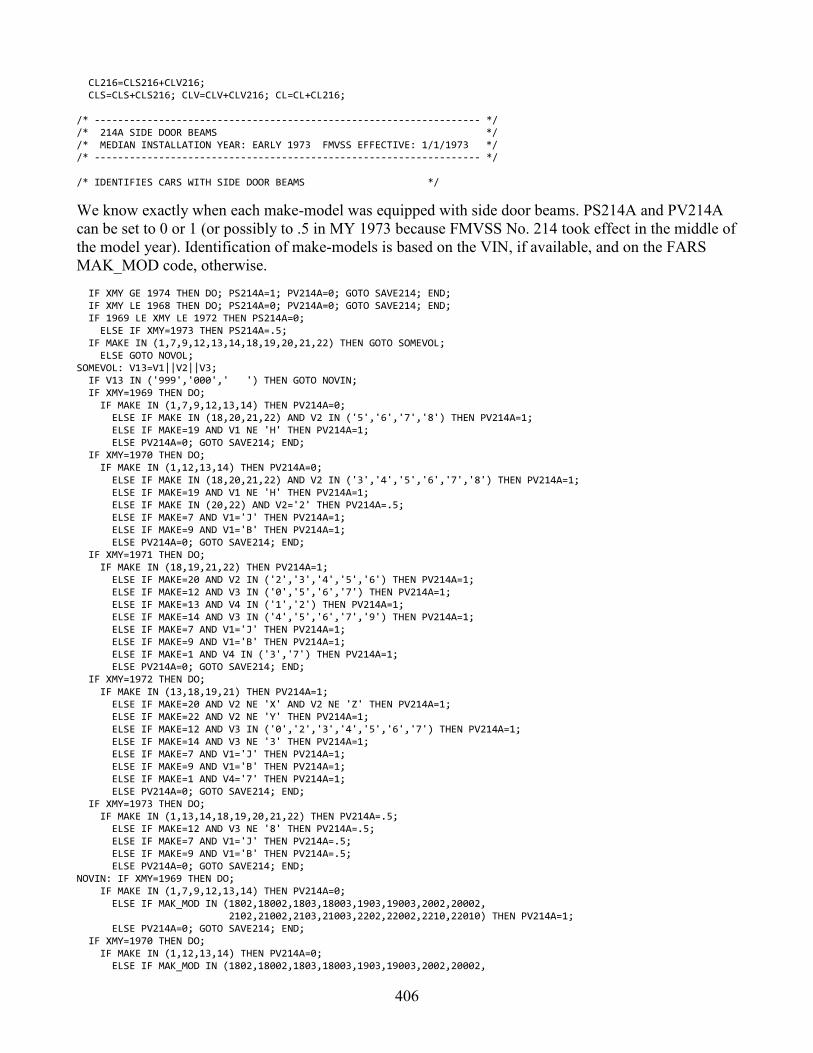
406
CL216=CLS216+CLV216; CLS=CLS+CLS216; CLV=CLV+CLV216; CL=CL+CL216; /* ------------------------------------------------------------------ */ /* 214A SIDE DOOR BEAMS */ /* MEDIAN INSTALLATION YEAR: EARLY 1973 FMVSS EFFECTIVE: 1/1/1973 */ /* ------------------------------------------------------------------ */ /* IDENTIFIES CARS WITH SIDE DOOR BEAMS */
We know exactly when each make-model was equipped with side door beams. PS214A and PV214A can be set to 0 or 1 (or possibly to .5 in MY 1973 because FMVSS No. 214 took effect in the middle of the model year). Identification of make-models is based on the VIN, if available, and on the FARS MAK_MOD code, otherwise. IF XMY GE 1974 THEN DO; PS214A=1; PV214A=0; GOTO SAVE214; END; IF XMY LE 1968 THEN DO; PS214A=0; PV214A=0; GOTO SAVE214; END; IF 1969 LE XMY LE 1972 THEN PS214A=0; ELSE IF XMY=1973 THEN PS214A=.5; IF MAKE IN (1,7,9,12,13,14,18,19,20,21,22) THEN GOTO SOMEVOL; ELSE GOTO NOVOL; SOMEVOL: V13=V1||V2||V3; IF V13 IN ('999','000',' ') THEN GOTO NOVIN; IF XMY=1969 THEN DO; IF MAKE IN (1,7,9,12,13,14) THEN PV214A=0; ELSE IF MAKE IN (18,20,21,22) AND V2 IN ('5','6','7','8') THEN PV214A=1; ELSE IF MAKE=19 AND V1 NE 'H' THEN PV214A=1; ELSE PV214A=0; GOTO SAVE214; END; IF XMY=1970 THEN DO; IF MAKE IN (1,12,13,14) THEN PV214A=0; ELSE IF MAKE IN (18,20,21,22) AND V2 IN ('3','4','5','6','7','8') THEN PV214A=1; ELSE IF MAKE=19 AND V1 NE 'H' THEN PV214A=1; ELSE IF MAKE IN (20,22) AND V2='2' THEN PV214A=.5; ELSE IF MAKE=7 AND V1='J' THEN PV214A=1; ELSE IF MAKE=9 AND V1='B' THEN PV214A=1; ELSE PV214A=0; GOTO SAVE214; END; IF XMY=1971 THEN DO; IF MAKE IN (18,19,21,22) THEN PV214A=1; ELSE IF MAKE=20 AND V2 IN ('2','3','4','5','6') THEN PV214A=1; ELSE IF MAKE=12 AND V3 IN ('0','5','6','7') THEN PV214A=1; ELSE IF MAKE=13 AND V4 IN ('1','2') THEN PV214A=1; ELSE IF MAKE=14 AND V3 IN ('4','5','6','7','9') THEN PV214A=1; ELSE IF MAKE=7 AND V1='J' THEN PV214A=1; ELSE IF MAKE=9 AND V1='B' THEN PV214A=1; ELSE IF MAKE=1 AND V4 IN ('3','7') THEN PV214A=1; ELSE PV214A=0; GOTO SAVE214; END; IF XMY=1972 THEN DO; IF MAKE IN (13,18,19,21) THEN PV214A=1; ELSE IF MAKE=20 AND V2 NE 'X' AND V2 NE 'Z' THEN PV214A=1; ELSE IF MAKE=22 AND V2 NE 'Y' THEN PV214A=1; ELSE IF MAKE=12 AND V3 IN ('0','2','3','4','5','6','7') THEN PV214A=1; ELSE IF MAKE=14 AND V3 NE '3' THEN PV214A=1; ELSE IF MAKE=7 AND V1='J' THEN PV214A=1; ELSE IF MAKE=9 AND V1='B' THEN PV214A=1; ELSE IF MAKE=1 AND V4='7' THEN PV214A=1; ELSE PV214A=0; GOTO SAVE214; END; IF XMY=1973 THEN DO; IF MAKE IN (1,13,14,18,19,20,21,22) THEN PV214A=.5; ELSE IF MAKE=12 AND V3 NE '8' THEN PV214A=.5; ELSE IF MAKE=7 AND V1='J' THEN PV214A=.5; ELSE IF MAKE=9 AND V1='B' THEN PV214A=.5; ELSE PV214A=0; GOTO SAVE214; END; NOVIN: IF XMY=1969 THEN DO; IF MAKE IN (1,7,9,12,13,14) THEN PV214A=0; ELSE IF MAK_MOD IN (1802,18002,1803,18003,1903,19003,2002,20002, 2102,21002,2103,21003,2202,22002,2210,22010) THEN PV214A=1; ELSE PV214A=0; GOTO SAVE214; END; IF XMY=1970 THEN DO; IF MAKE IN (1,12,13,14) THEN PV214A=0; ELSE IF MAK_MOD IN (1802,18002,1803,18003,1903,19003,2002,20002,
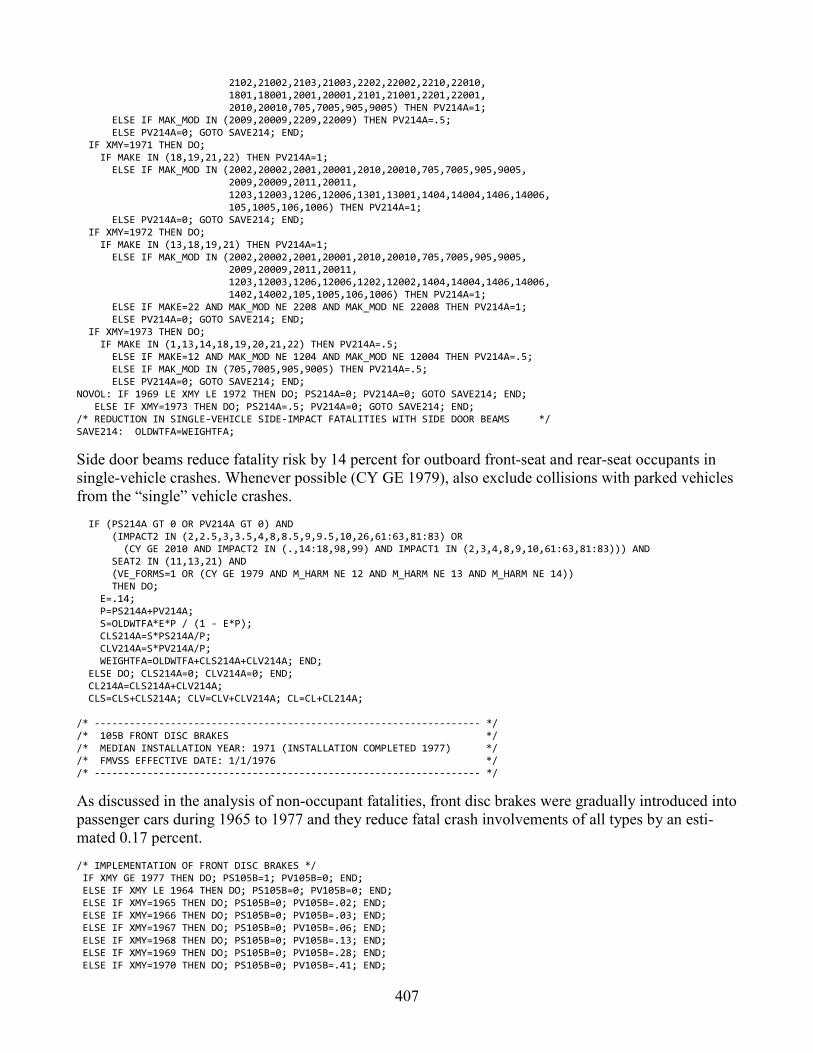
407
2102,21002,2103,21003,2202,22002,2210,22010, 1801,18001,2001,20001,2101,21001,2201,22001, 2010,20010,705,7005,905,9005) THEN PV214A=1; ELSE IF MAK_MOD IN (2009,20009,2209,22009) THEN PV214A=.5; ELSE PV214A=0; GOTO SAVE214; END; IF XMY=1971 THEN DO; IF MAKE IN (18,19,21,22) THEN PV214A=1; ELSE IF MAK_MOD IN (2002,20002,2001,20001,2010,20010,705,7005,905,9005, 2009,20009,2011,20011, 1203,12003,1206,12006,1301,13001,1404,14004,1406,14006, 105,1005,106,1006) THEN PV214A=1; ELSE PV214A=0; GOTO SAVE214; END; IF XMY=1972 THEN DO; IF MAKE IN (13,18,19,21) THEN PV214A=1; ELSE IF MAK_MOD IN (2002,20002,2001,20001,2010,20010,705,7005,905,9005, 2009,20009,2011,20011, 1203,12003,1206,12006,1202,12002,1404,14004,1406,14006, 1402,14002,105,1005,106,1006) THEN PV214A=1; ELSE IF MAKE=22 AND MAK_MOD NE 2208 AND MAK_MOD NE 22008 THEN PV214A=1; ELSE PV214A=0; GOTO SAVE214; END; IF XMY=1973 THEN DO; IF MAKE IN (1,13,14,18,19,20,21,22) THEN PV214A=.5; ELSE IF MAKE=12 AND MAK_MOD NE 1204 AND MAK_MOD NE 12004 THEN PV214A=.5; ELSE IF MAK_MOD IN (705,7005,905,9005) THEN PV214A=.5; ELSE PV214A=0; GOTO SAVE214; END; NOVOL: IF 1969 LE XMY LE 1972 THEN DO; PS214A=0; PV214A=0; GOTO SAVE214; END; ELSE IF XMY=1973 THEN DO; PS214A=.5; PV214A=0; GOTO SAVE214; END; /* REDUCTION IN SINGLE-VEHICLE SIDE-IMPACT FATALITIES WITH SIDE DOOR BEAMS */ SAVE214: OLDWTFA=WEIGHTFA;
Side door beams reduce fatality risk by 14 percent for outboard front-seat and rear-seat occupants in single-vehicle crashes. Whenever possible (CY GE 1979), also exclude collisions with parked vehicles from the “single” vehicle crashes. IF (PS214A GT 0 OR PV214A GT 0) AND (IMPACT2 IN (2,2.5,3,3.5,4,8,8.5,9,9.5,10,26,61:63,81:83) OR (CY GE 2010 AND IMPACT2 IN (.,14:18,98,99) AND IMPACT1 IN (2,3,4,8,9,10,61:63,81:83))) AND SEAT2 IN (11,13,21) AND (VE_FORMS=1 OR (CY GE 1979 AND M_HARM NE 12 AND M_HARM NE 13 AND M_HARM NE 14)) THEN DO; E=.14; P=PS214A+PV214A; S=OLDWTFA*E*P / (1 - E*P); CLS214A=S*PS214A/P; CLV214A=S*PV214A/P; WEIGHTFA=OLDWTFA+CLS214A+CLV214A; END; ELSE DO; CLS214A=0; CLV214A=0; END; CL214A=CLS214A+CLV214A; CLS=CLS+CLS214A; CLV=CLV+CLV214A; CL=CL+CL214A; /* ------------------------------------------------------------------ */ /* 105B FRONT DISC BRAKES */ /* MEDIAN INSTALLATION YEAR: 1971 (INSTALLATION COMPLETED 1977) */ /* FMVSS EFFECTIVE DATE: 1/1/1976 */ /* ------------------------------------------------------------------ */
As discussed in the analysis of non-occupant fatalities, front disc brakes were gradually introduced into passenger cars during 1965 to 1977 and they reduce fatal crash involvements of all types by an esti-mated 0.17 percent. /* IMPLEMENTATION OF FRONT DISC BRAKES */ IF XMY GE 1977 THEN DO; PS105B=1; PV105B=0; END; ELSE IF XMY LE 1964 THEN DO; PS105B=0; PV105B=0; END; ELSE IF XMY=1965 THEN DO; PS105B=0; PV105B=.02; END; ELSE IF XMY=1966 THEN DO; PS105B=0; PV105B=.03; END; ELSE IF XMY=1967 THEN DO; PS105B=0; PV105B=.06; END; ELSE IF XMY=1968 THEN DO; PS105B=0; PV105B=.13; END; ELSE IF XMY=1969 THEN DO; PS105B=0; PV105B=.28; END; ELSE IF XMY=1970 THEN DO; PS105B=0; PV105B=.41; END;
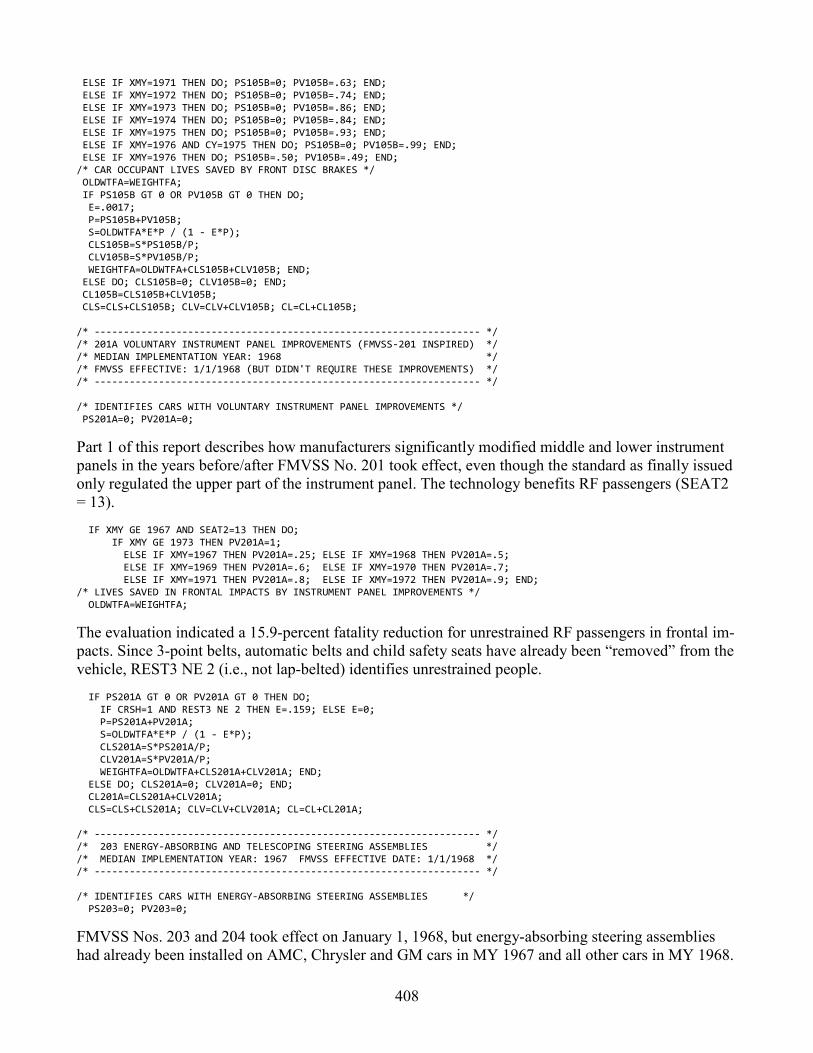
408
ELSE IF XMY=1971 THEN DO; PS105B=0; PV105B=.63; END; ELSE IF XMY=1972 THEN DO; PS105B=0; PV105B=.74; END; ELSE IF XMY=1973 THEN DO; PS105B=0; PV105B=.86; END; ELSE IF XMY=1974 THEN DO; PS105B=0; PV105B=.84; END; ELSE IF XMY=1975 THEN DO; PS105B=0; PV105B=.93; END; ELSE IF XMY=1976 AND CY=1975 THEN DO; PS105B=0; PV105B=.99; END; ELSE IF XMY=1976 THEN DO; PS105B=.50; PV105B=.49; END; /* CAR OCCUPANT LIVES SAVED BY FRONT DISC BRAKES */ OLDWTFA=WEIGHTFA; IF PS105B GT 0 OR PV105B GT 0 THEN DO; E=.0017; P=PS105B+PV105B; S=OLDWTFA*E*P / (1 - E*P); CLS105B=S*PS105B/P; CLV105B=S*PV105B/P; WEIGHTFA=OLDWTFA+CLS105B+CLV105B; END; ELSE DO; CLS105B=0; CLV105B=0; END; CL105B=CLS105B+CLV105B; CLS=CLS+CLS105B; CLV=CLV+CLV105B; CL=CL+CL105B; /* ------------------------------------------------------------------ */ /* 201A VOLUNTARY INSTRUMENT PANEL IMPROVEMENTS (FMVSS-201 INSPIRED) */ /* MEDIAN IMPLEMENTATION YEAR: 1968 */ /* FMVSS EFFECTIVE: 1/1/1968 (BUT DIDN'T REQUIRE THESE IMPROVEMENTS) */ /* ------------------------------------------------------------------ */ /* IDENTIFIES CARS WITH VOLUNTARY INSTRUMENT PANEL IMPROVEMENTS */ PS201A=0; PV201A=0;
Part 1 of this report describes how manufacturers significantly modified middle and lower instrument panels in the years before/after FMVSS No. 201 took effect, even though the standard as finally issued only regulated the upper part of the instrument panel. The technology benefits RF passengers (SEAT2 = 13). IF XMY GE 1967 AND SEAT2=13 THEN DO; IF XMY GE 1973 THEN PV201A=1; ELSE IF XMY=1967 THEN PV201A=.25; ELSE IF XMY=1968 THEN PV201A=.5; ELSE IF XMY=1969 THEN PV201A=.6; ELSE IF XMY=1970 THEN PV201A=.7; ELSE IF XMY=1971 THEN PV201A=.8; ELSE IF XMY=1972 THEN PV201A=.9; END; /* LIVES SAVED IN FRONTAL IMPACTS BY INSTRUMENT PANEL IMPROVEMENTS */ OLDWTFA=WEIGHTFA;
The evaluation indicated a 15.9-percent fatality reduction for unrestrained RF passengers in frontal im-pacts. Since 3-point belts, automatic belts and child safety seats have already been “removed” from the vehicle, REST3 NE 2 (i.e., not lap-belted) identifies unrestrained people. IF PS201A GT 0 OR PV201A GT 0 THEN DO; IF CRSH=1 AND REST3 NE 2 THEN E=.159; ELSE E=0; P=PS201A+PV201A; S=OLDWTFA*E*P / (1 - E*P); CLS201A=S*PS201A/P; CLV201A=S*PV201A/P; WEIGHTFA=OLDWTFA+CLS201A+CLV201A; END; ELSE DO; CLS201A=0; CLV201A=0; END; CL201A=CLS201A+CLV201A; CLS=CLS+CLS201A; CLV=CLV+CLV201A; CL=CL+CL201A; /* ------------------------------------------------------------------ */ /* 203 ENERGY-ABSORBING AND TELESCOPING STEERING ASSEMBLIES */ /* MEDIAN IMPLEMENTATION YEAR: 1967 FMVSS EFFECTIVE DATE: 1/1/1968 */ /* ------------------------------------------------------------------ */ /* IDENTIFIES CARS WITH ENERGY-ABSORBING STEERING ASSEMBLIES */ PS203=0; PV203=0;
FMVSS Nos. 203 and 204 took effect on January 1, 1968, but energy-absorbing steering assemblies had already been installed on AMC, Chrysler and GM cars in MY 1967 and all other cars in MY 1968.
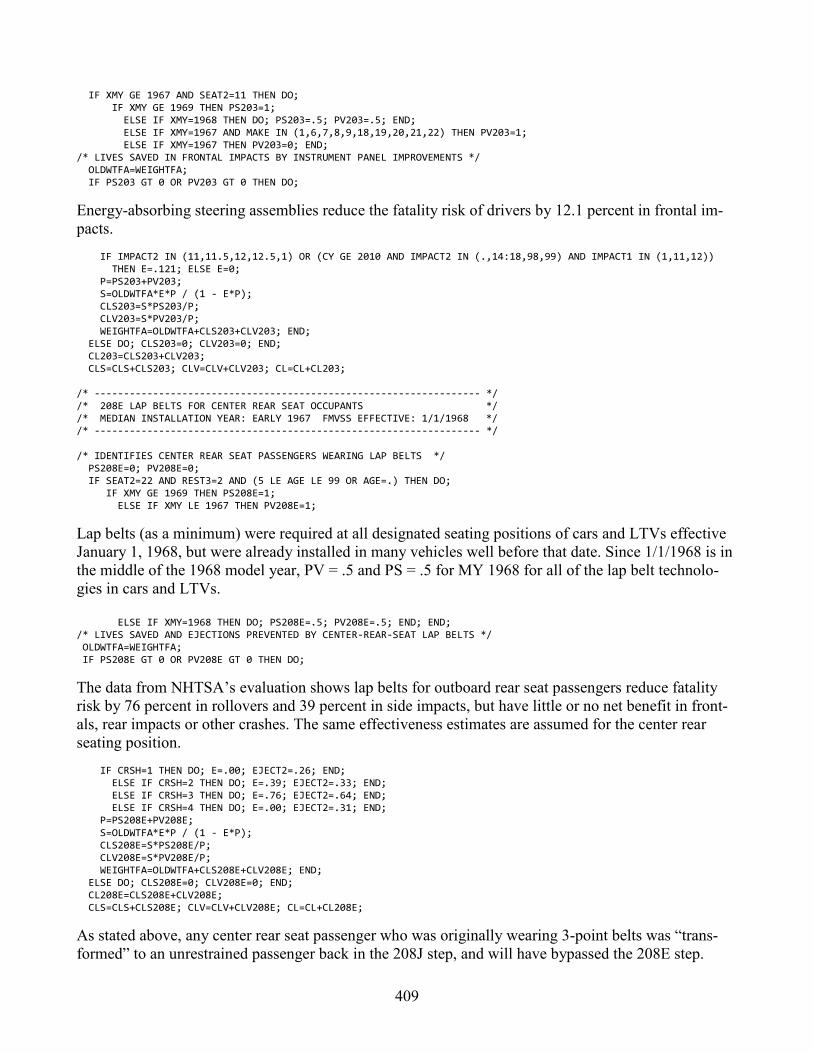
409
IF XMY GE 1967 AND SEAT2=11 THEN DO; IF XMY GE 1969 THEN PS203=1; ELSE IF XMY=1968 THEN DO; PS203=.5; PV203=.5; END; ELSE IF XMY=1967 AND MAKE IN (1,6,7,8,9,18,19,20,21,22) THEN PV203=1; ELSE IF XMY=1967 THEN PV203=0; END; /* LIVES SAVED IN FRONTAL IMPACTS BY INSTRUMENT PANEL IMPROVEMENTS */ OLDWTFA=WEIGHTFA; IF PS203 GT 0 OR PV203 GT 0 THEN DO;
Energy-absorbing steering assemblies reduce the fatality risk of drivers by 12.1 percent in frontal im-pacts. IF IMPACT2 IN (11,11.5,12,12.5,1) OR (CY GE 2010 AND IMPACT2 IN (.,14:18,98,99) AND IMPACT1 IN (1,11,12)) THEN E=.121; ELSE E=0; P=PS203+PV203; S=OLDWTFA*E*P / (1 - E*P); CLS203=S*PS203/P; CLV203=S*PV203/P; WEIGHTFA=OLDWTFA+CLS203+CLV203; END; ELSE DO; CLS203=0; CLV203=0; END; CL203=CLS203+CLV203; CLS=CLS+CLS203; CLV=CLV+CLV203; CL=CL+CL203; /* ------------------------------------------------------------------ */ /* 208E LAP BELTS FOR CENTER REAR SEAT OCCUPANTS */ /* MEDIAN INSTALLATION YEAR: EARLY 1967 FMVSS EFFECTIVE: 1/1/1968 */ /* ------------------------------------------------------------------ */ /* IDENTIFIES CENTER REAR SEAT PASSENGERS WEARING LAP BELTS */ PS208E=0; PV208E=0; IF SEAT2=22 AND REST3=2 AND (5 LE AGE LE 99 OR AGE=.) THEN DO; IF XMY GE 1969 THEN PS208E=1; ELSE IF XMY LE 1967 THEN PV208E=1;
Lap belts (as a minimum) were required at all designated seating positions of cars and LTVs effective January 1, 1968, but were already installed in many vehicles well before that date. Since 1/1/1968 is in the middle of the 1968 model year, PV = .5 and PS = .5 for MY 1968 for all of the lap belt technolo-gies in cars and LTVs. ELSE IF XMY=1968 THEN DO; PS208E=.5; PV208E=.5; END; END; /* LIVES SAVED AND EJECTIONS PREVENTED BY CENTER-REAR-SEAT LAP BELTS */ OLDWTFA=WEIGHTFA; IF PS208E GT 0 OR PV208E GT 0 THEN DO;
The data from NHTSA’s evaluation shows lap belts for outboard rear seat passengers reduce fatality risk by 76 percent in rollovers and 39 percent in side impacts, but have little or no net benefit in front-als, rear impacts or other crashes. The same effectiveness estimates are assumed for the center rear seating position. IF CRSH=1 THEN DO; E=.00; EJECT2=.26; END; ELSE IF CRSH=2 THEN DO; E=.39; EJECT2=.33; END; ELSE IF CRSH=3 THEN DO; E=.76; EJECT2=.64; END; ELSE IF CRSH=4 THEN DO; E=.00; EJECT2=.31; END; P=PS208E+PV208E; S=OLDWTFA*E*P / (1 - E*P); CLS208E=S*PS208E/P; CLV208E=S*PV208E/P; WEIGHTFA=OLDWTFA+CLS208E+CLV208E; END; ELSE DO; CLS208E=0; CLV208E=0; END; CL208E=CLS208E+CLV208E; CLS=CLS+CLS208E; CLV=CLV+CLV208E; CL=CL+CL208E;
As stated above, any center rear seat passenger who was originally wearing 3-point belts was “trans-formed” to an unrestrained passenger back in the 208J step, and will have bypassed the 208E step.

410
/* ------------------------------------------------------------------ */ /* 105A DUAL MASTER CYLINDERS */ /* MEDIAN INSTALLATION YEAR: LATE 1966 FMVSS EFFECTIVE: 1/1/1968 */ /* ------------------------------------------------------------------ */
As discussed in the analysis of non-occupant fatalities, dual master cylinders were gradually intro-duced into passenger cars during 1962 to 1967 and they reduce fatal crash involvements of all types by an estimated 0.7 percent. /* IMPLEMENTATION OF DUAL MASTER CYLINDERS */ IF XMY GE 1969 THEN DO; PS105A=1; PV105A=0; END; ELSE IF XMY LE 1961 THEN DO; PS105A=0; PV105A=0; END; ELSE IF XMY IN (1962,1963) THEN DO; PS105A=0; PV105A=.09; END; ELSE IF XMY IN (1964,1965) THEN DO; PS105A=0; PV105A=.07; END; ELSE IF XMY=1966 THEN DO; PS105A=0; PV105A=.54; END; ELSE IF XMY=1967 THEN DO; PS105A=0; PV105A=1; END; ELSE IF XMY=1968 THEN DO; PS105A=.5; PV105A=.5; END; /* CAR OCCUPANT LIVES SAVED BY DUAL MASTER CYLINDERS */ OLDWTFA=WEIGHTFA; IF PS105A GT 0 OR PV105A GT 0 THEN DO; E=.007; P=PS105A+PV105A; S=OLDWTFA*E*P / (1 - E*P); CLS105A=S*PS105A/P; CLV105A=S*PV105A/P; WEIGHTFA=OLDWTFA+CLS105A+CLV105A; END; ELSE DO; CLS105A=0; CLV105A=0; END; CL105A=CLS105A+CLV105A; CLS=CLS+CLS105A; CLV=CLV+CLV105A; CL=CL+CL105A; /* ------------------------------------------------------------------ */ /* 208D LAP BELTS FOR FRONT-SEAT CENTER OCCUPANTS */ /* MEDIAN INSTALLATION YEAR: 1966 FMVSS EFFECTIVE DATE: 1/1/1968 */ /* ------------------------------------------------------------------ */
A double-pair comparison analysis of lap belt effectiveness for outboard front seat occupants, conduct-ed in support of the 2004 “lives saved” report, found that lap belts reduce fatality risk by 22 percent in frontals, 43 percent in rollovers, and 21 percent in side impacts, rear impacts and other crashes. The same effectiveness is assumed for center front seat passengers. However, the proportion of unre-strained fatalities that were ejected was derived specifically from data on center front seat passengers. /* IDENTIFIES CENTER FRONT SEAT PASSENGERS WEARING LAP BELTS */ PS208D=0; PV208D=0; IF SEAT2=12 AND REST3=2 AND (5 LE AGE LE 99 OR AGE=.) THEN DO; IF XMY GE 1969 THEN PS208D=1; ELSE IF XMY LE 1967 THEN PV208D=1; ELSE IF XMY=1968 THEN DO; PS208D=.5; PV208D=.5; END; END; /* LIVES SAVED AND EJECTIONS PREVENTED BY CENTER-FRONT-SEAT LAP BELTS */ OLDWTFA=WEIGHTFA; IF PS208D GT 0 OR PV208D GT 0 THEN DO; IF CRSH=1 THEN DO; E=.22; EJECT2=.20; END; ELSE IF CRSH=2 THEN DO; E=.21; EJECT2=.22; END; ELSE IF CRSH=3 THEN DO; E=.43; EJECT2=.58; END; ELSE IF CRSH=4 THEN DO; E=.21; EJECT2=.25; END; P=PS208D+PV208D; S=OLDWTFA*E*P / (1 - E*P); CLS208D=S*PS208D/P; CLV208D=S*PV208D/P; WEIGHTFA=OLDWTFA+CLS208D+CLV208D; END; ELSE DO; CLS208D=0; CLV208D=0; END; CL208D=CLS208D+CLV208D; CLS=CLS+CLS208D; CLV=CLV+CLV208D; CL=CL+CL208D;

411
/* ------------------------------------------------------------------ */ /* 212 ADHESIVE WINDSHIELD BONDING */ /* MEDIAN INSTALLATION YEAR: EARLY 1966 FMVSS EFFECTIVE: 1/1/1970 */ /* ------------------------------------------------------------------ */
We know exactly when each domestic make-model, and some imported make-models were equipped with adhesive windshield bonding. PS212 and PV212 can be set to 0 or 1 (or possibly to .5 in MY 1970 because FMVSS No. 212 took effect in the middle of the model year). Identification of these make-models is based on the VIN, if available, and on the FARS MAK_MOD code, otherwise. Note that some domestic models continued with rubber gasket installations after 1970 (meeting FMVSS No. 212, but looser than adhesive bonding); for these models, PS212 = 0 as long as the rubber gaskets con-tinued. For all other make-models, including most Japanese cars, we will conservatively assume that PS212 = 1 only from 1980, even though there is some evidence from NCSS that the rubber gasket installations of the 1970s were about as tight as adhesive bonding in domestic cars. /* IDENTIFIES CARS WITH ADHESIVE WINDSHIELD BONDING */ IF XMY GE 1980 THEN DO; PS212=1; PV212=0; GOTO SAVE212; END; IF XMY LE 1962 THEN DO; PS212=0; PV212=0; GOTO SAVE212; END; IF MAKE IN (41,51) THEN DO; IF XMY GE 1971 THEN DO; PS212=1; PV212=0; END; ELSE IF XMY=1970 THEN DO; PS212=.5; PV212=.5; END; ELSE IF XMY LE 1969 THEN DO; PS212=0; PV212=0; END; GOTO SAVE212; END; IF 1963 LE XMY LE 1969 THEN PS212=0; ELSE IF 1971 LE XMY LE 1979 THEN PV212=0; IF MAKE IN (1,6,7,8,9,12,13,14,18,19,20,21,22,30,32,35,49) THEN GOTO SOMEVOL2; PS212=0; PV212=0; GOTO SAVE212; SOMEVOL2: V13=V1||V2||V3; IF V13 IN ('999','000',' ') THEN GOTO NOVIN2; IF XMY=1963 THEN DO; IF MAKE=18 AND V1 IN ('A','B','C','0','1','3') THEN PV212=.5; ELSE IF MAKE=18 AND V1='7' THEN PV212=1; ELSE IF MAKE=21 AND V3 IN ('0','1') THEN PV212=.5; ELSE PV212=0; GOTO SAVE212; END; IF XMY=1964 THEN DO; IF MAKE=18 AND V1 IN ('A','B','C','0','1','3','7') THEN PV212=1; ELSE IF MAKE=20 AND V2='5' THEN PV212=1; ELSE IF MAKE IN (21,22) AND V2 IN ('0','1','2') THEN PV212=1; ELSE PV212=0; GOTO SAVE212; END; IF XMY=1965 THEN DO; IF MAKE IN (18,19,21,22) THEN PV212=1; ELSE IF MAKE=20 AND V2 IN ('1','9') THEN PV212=0; ELSE IF MAKE=20 THEN PV212=1; ELSE IF MAKE=12 AND V3 IN ('5','6','7') THEN PV212=1; ELSE IF MAKE=14 AND V3 IN ('4','5','6','7') THEN PV212=1; ELSE PV212=0; GOTO SAVE212; END; IF XMY=1966 THEN DO; IF MAKE IN (13,14,18,19,21,22) THEN PV212=1; ELSE IF MAKE=20 AND V2 IN ('1','9') THEN PV212=0; ELSE IF MAKE=20 THEN PV212=1; ELSE IF MAKE=12 AND (V3='8' OR (V3='0' AND V4 IN ('7','8','9'))) THEN PV212=0; ELSE IF MAKE=12 THEN PV212=1; ELSE PV212=0; GOTO SAVE212; END; IF XMY=1967 THEN DO; IF MAKE IN (13,18,19,21,22) THEN PV212=1; ELSE IF MAKE=20 AND V2 IN ('1','9') THEN PV212=0; ELSE IF MAKE=20 THEN PV212=1; ELSE IF MAKE=12 AND V3='0' THEN PV212=0; ELSE IF MAKE=12 THEN PV212=1; ELSE IF MAKE=14 AND V3='9' THEN PV212=0; ELSE IF MAKE=14 THEN PV212=1; ELSE IF MAKE=1 THEN GOTO NOVIN2; ELSE PV212=0; GOTO SAVE212; END; IF XMY=1968 THEN DO; IF MAKE IN (13,18,19,20,21,22) THEN PV212=1; ELSE IF MAKE=12 AND V3='0' THEN PV212=0;

412
ELSE IF MAKE=12 THEN PV212=1; ELSE IF MAKE=14 AND V3='9' THEN PV212=0; ELSE IF MAKE=14 THEN PV212=1; ELSE IF MAKE=1 AND V4='0' THEN PV212=0; ELSE IF MAKE=1 THEN PV212=1; ELSE PV212=0; GOTO SAVE212; END; IF XMY=1969 THEN DO; IF MAKE IN (6,8,12,13,14,18,19,20,21,22) THEN PV212=1; ELSE IF MAKE=7 AND V1='D' THEN PV212=1; ELSE IF MAKE=9 AND V1='P' THEN PV212=1; ELSE IF MAKE=1 AND V4='0' THEN PV212=0; ELSE IF MAKE=1 THEN PV212=1; ELSE PV212=0; GOTO SAVE212; END; IF XMY=1970 THEN DO; IF MAKE IN (1,6,8,13,14,18,19,20,21,22) THEN DO; PV212=.5; PS212=.5; END; ELSE IF MAKE=12 AND V3='9' THEN DO; PV212=0; PS212=0; END; ELSE IF MAKE=12 THEN DO; PV212=.5; PS212=.5; END; ELSE IF MAKE=7 AND V1 IN ('D','J') THEN DO; PV212=.5; PS212=.5; END; ELSE IF MAKE=9 AND V1 IN ('B','P') THEN DO; PV212=.5; PS212=.5; END; ELSE IF MAKE=30 THEN DO; PV212=0; PS212=.5; END; ELSE DO; PV212=0; PS212=0; END; GOTO SAVE212; END; IF XMY IN (1971,1972,1973) THEN DO; IF MAKE IN (1,6,8,13,18,19,20,21,22,30) THEN PS212=1; ELSE IF MAKE=12 AND V3 IN ('1','9') THEN PS212=0; ELSE IF MAKE=12 THEN PS212=1; ELSE IF MAKE=14 AND V3='3' THEN PS212=0; ELSE IF MAKE=14 THEN PS212=1; ELSE IF MAKE=7 AND V1='L' THEN PS212=0; ELSE IF MAKE=7 THEN PS212=1; ELSE IF MAKE=9 AND V1='V' THEN PS212=0; ELSE IF MAKE=9 THEN PS212=1; ELSE PS212=0; GOTO SAVE212; END; IF XMY IN (1974,1975,1976) THEN DO; IF MAKE IN (1,6,8,13,18,19,20,21,22,30) THEN PS212=1; ELSE IF MAKE=12 AND V3 IN ('1','9') THEN PS212=0; ELSE IF MAKE=12 THEN PS212=1; ELSE IF MAKE=14 AND V3 IN ('2','3') THEN PS212=0; ELSE IF MAKE=14 THEN PS212=1; ELSE IF MAKE=7 AND V1='L' THEN PS212=0; ELSE IF MAKE=7 THEN PS212=1; ELSE IF MAKE=9 AND V1='V' THEN PS212=0; ELSE IF MAKE=9 THEN PS212=1; ELSE IF MAKE=35 THEN GOTO NOVIN2; ELSE PS212=0; GOTO SAVE212; END; IF XMY=1977 THEN DO; IF MAKE IN (1,6,7,8,9,13,18,19,20,21,22,30) THEN PS212=1; ELSE IF MAKE=12 AND V3 IN ('1','9') THEN PS212=0; ELSE IF MAKE=12 THEN PS212=1; ELSE IF MAKE=14 AND V3 IN ('2','3') THEN PS212=0; ELSE IF MAKE=14 THEN PS212=1; ELSE IF MAKE=35 THEN GOTO NOVIN2; ELSE PS212=0; GOTO SAVE212; END; IF XMY=1978 THEN DO; IF MAKE IN (1,6,7,8,9,13,18,19,20,21,22,30,32) THEN PS212=1; ELSE IF MAKE=12 AND V3='1' THEN PS212=.5; ELSE IF MAKE=12 THEN PS212=1; ELSE IF MAKE=14 AND V3='2' THEN PS212=.5; ELSE IF MAKE=14 THEN PS212=1; ELSE IF MAKE=49 AND V2='A' THEN PS212=1; ELSE PS212=0; GOTO SAVE212; END; IF XMY=1979 THEN DO; IF MAKE IN (1,6,7,8,9,12,13,14,18,19,20,21,22,30,32) THEN PS212=1; ELSE IF MAKE=49 AND V2='A' AND V4 NE '6' THEN PS212=1; ELSE PS212=0; GOTO SAVE212; END; NOVIN2: IF XMY=1963 THEN DO; IF MAK_MOD IN (1801,18001,2101,21001) THEN PV212=.5; ELSE IF MAK_MOD IN (1805,18005) THEN PV212=1; ELSE PV212=0; GOTO SAVE212; END; IF XMY=1964 THEN DO; IF MAK_MOD IN (1801,18001,1805,18005,2001,20001,2101,21001,2201,22001) THEN PV212=1; ELSE PV212=0; GOTO SAVE212; END; IF XMY=1965 THEN DO;
413
IF MAKE IN (18,19,21,22) THEN PV212=1; ELSE IF MAK_MOD IN (2004,20004,2008,20008) THEN PV212=0; ELSE IF MAKE=20 THEN PV212=1; ELSE IF MAK_MOD IN (1206,12006,1406,14006) THEN PV212=1; ELSE PV212=0; GOTO SAVE212; END; IF XMY=1966 THEN DO; IF MAKE IN (13,14,18,19,21,22) THEN PV212=1; ELSE IF MAK_MOD IN (2004,20004,2008,20008) THEN PV212=0; ELSE IF MAKE=20 THEN PV212=1; ELSE IF MAK_MOD IN (1203,12003,1204,12004) THEN PV212=0; ELSE IF MAKE=12 THEN PV212=1; ELSE PV212=0; GOTO SAVE212; END; IF XMY=1967 THEN DO; IF MAKE IN (13,18,19,21,22) THEN PV212=1; ELSE IF MAK_MOD IN (2004,20004,2008,20008) THEN PV212=0; ELSE IF MAKE=20 THEN PV212=1; ELSE IF MAK_MOD IN (1203,12003,1404,14004) THEN PV212=0; ELSE IF MAKE IN (12,14) THEN PV212=1; ELSE IF MAK_MOD IN (101,1001) THEN PV212=0; ELSE IF MAKE=1 THEN PV212=1; ELSE PV212=0; GOTO SAVE212; END; IF XMY=1968 THEN DO; IF MAKE IN (13,18,19,20,21,22) THEN PV212=1; ELSE IF MAK_MOD IN (1203,12003,1404,14004) THEN PV212=0; ELSE IF MAKE IN (12,14) THEN PV212=1; ELSE IF MAK_MOD IN (101,1001) THEN PV212=0; ELSE IF MAKE=1 THEN PV212=1; ELSE PV212=0; GOTO SAVE212; END; IF XMY=1969 THEN DO; IF MAKE IN (6,8,12,13,14,18,19,20,21,22) THEN PV212=1; ELSE IF MAK_MOD IN (703,7003,704,7004,903,9003,904,9004) THEN PV212=1; ELSE IF MAK_MOD IN (101,1001) THEN PV212=0; ELSE IF MAKE=1 THEN PV212=1; ELSE PV212=0; GOTO SAVE212; END; IF XMY=1970 THEN DO; IF MAKE IN (1,6,8,13,14,18,19,20,21,22) THEN DO; PV212=.5; PS212=.5; END; ELSE IF MAK_MOD IN (1208,12008) THEN DO; PV212=0; PS212=0; END; ELSE IF MAKE=12 THEN DO; PV212=.5; PS212=.5; END; ELSE IF MAK_MOD IN (703,7003,704,7004,705,7005,903,9003,904,9004,905,9005) THEN DO; PV212=.5; PS212=.5; END; ELSE IF MAKE=30 THEN DO; PV212=0; PS212=.5; END; ELSE DO; PV212=0; PS212=0; END; GOTO SAVE212; END; IF XMY IN (1971,1972,1973) THEN DO; IF MAKE IN (1,6,8,13,18,19,20,21,22,30) THEN PS212=1; ELSE IF MAK_MOD IN (1208,12008,1209,12009,1408,14008) THEN PS212=0; ELSE IF MAKE IN (12,14) THEN PS212=1; ELSE IF MAK_MOD IN (701,7001,901,9001) THEN PS212=0; ELSE IF MAKE IN (7,9) THEN PS212=1; ELSE PS212=0; GOTO SAVE212; END; IF XMY IN (1974,1975,1976) THEN DO; IF MAKE IN (1,6,8,13,18,19,20,21,22,30) THEN PS212=1; ELSE IF MAK_MOD IN (1208,12008,1209,12009,1408,14008,1409,14009) THEN PS212=0; ELSE IF MAKE IN (12,14) THEN PS212=1; ELSE IF MAK_MOD IN (701,7001,901,9001) THEN PS212=0; ELSE IF MAKE IN (7,9) THEN PS212=1; ELSE IF MAK_MOD IN (3538,35038,35008) THEN PS212=1; ELSE PS212=0; GOTO SAVE212; END; IF XMY=1977 THEN DO; IF MAKE IN (1,6,7,8,9,13,18,19,20,21,22,30) THEN PS212=1; ELSE IF MAK_MOD IN (1208,12008,1209,12009,1408,14008,1409,14009) THEN PS212=0; ELSE IF MAKE IN (12,14) THEN PS212=1; ELSE IF MAK_MOD IN (3538,35038,35008) THEN PS212=1; ELSE PS212=0; GOTO SAVE212; END; IF XMY=1978 THEN DO; IF MAKE IN (1,6,7,8,9,13,18,19,20,21,22,30,32) THEN PS212=1; ELSE IF MAK_MOD IN (1209,12009,1409,14009) THEN PS212=.5; ELSE IF MAKE IN (12,14) THEN PS212=1; ELSE IF MAK_MOD IN (4933,49033,49003) THEN PS212=1; ELSE PS212=0; GOTO SAVE212; END; IF XMY=1979 THEN DO; IF MAKE IN (1,6,7,8,9,12,13,14,18,19,20,21,22,30,32) THEN PS212=1; ELSE IF MAK_MOD IN (4933,49033,49003) THEN PS212=1;
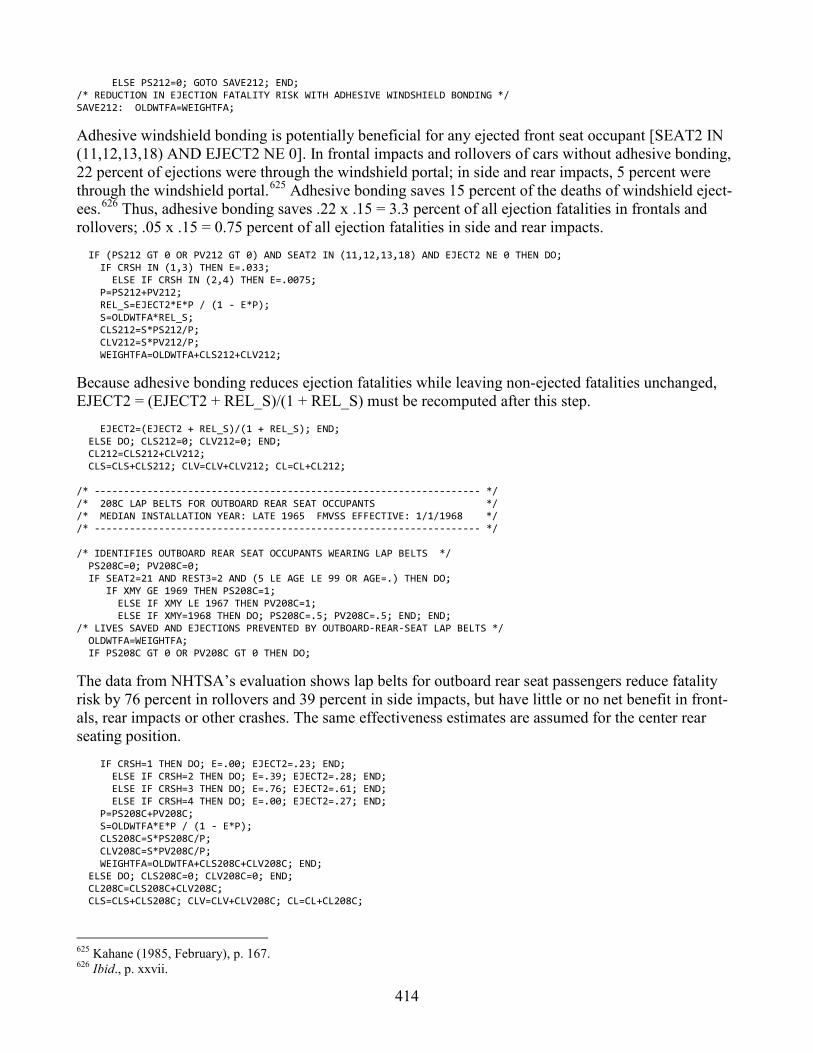
414
ELSE PS212=0; GOTO SAVE212; END; /* REDUCTION IN EJECTION FATALITY RISK WITH ADHESIVE WINDSHIELD BONDING */ SAVE212: OLDWTFA=WEIGHTFA;
Adhesive windshield bonding is potentially beneficial for any ejected front seat occupant [SEAT2 IN (11,12,13,18) AND EJECT2 NE 0]. In frontal impacts and rollovers of cars without adhesive bonding, 22 percent of ejections were through the windshield portal; in side and rear impacts, 5 percent were through the windshield portal.625 Adhesive bonding saves 15 percent of the deaths of windshield eject-ees.626 Thus, adhesive bonding saves .22 x .15 = 3.3 percent of all ejection fatalities in frontals and rollovers; .05 x .15 = 0.75 percent of all ejection fatalities in side and rear impacts. IF (PS212 GT 0 OR PV212 GT 0) AND SEAT2 IN (11,12,13,18) AND EJECT2 NE 0 THEN DO; IF CRSH IN (1,3) THEN E=.033; ELSE IF CRSH IN (2,4) THEN E=.0075; P=PS212+PV212; REL_S=EJECT2*E*P / (1 - E*P); S=OLDWTFA*REL_S; CLS212=S*PS212/P; CLV212=S*PV212/P; WEIGHTFA=OLDWTFA+CLS212+CLV212;
Because adhesive bonding reduces ejection fatalities while leaving non-ejected fatalities unchanged, EJECT2 = (EJECT2 + REL_S)/(1 + REL_S) must be recomputed after this step. EJECT2=(EJECT2 + REL_S)/(1 + REL_S); END; ELSE DO; CLS212=0; CLV212=0; END; CL212=CLS212+CLV212; CLS=CLS+CLS212; CLV=CLV+CLV212; CL=CL+CL212; /* ------------------------------------------------------------------ */ /* 208C LAP BELTS FOR OUTBOARD REAR SEAT OCCUPANTS */ /* MEDIAN INSTALLATION YEAR: LATE 1965 FMVSS EFFECTIVE: 1/1/1968 */ /* ------------------------------------------------------------------ */ /* IDENTIFIES OUTBOARD REAR SEAT OCCUPANTS WEARING LAP BELTS */ PS208C=0; PV208C=0; IF SEAT2=21 AND REST3=2 AND (5 LE AGE LE 99 OR AGE=.) THEN DO; IF XMY GE 1969 THEN PS208C=1; ELSE IF XMY LE 1967 THEN PV208C=1; ELSE IF XMY=1968 THEN DO; PS208C=.5; PV208C=.5; END; END; /* LIVES SAVED AND EJECTIONS PREVENTED BY OUTBOARD-REAR-SEAT LAP BELTS */ OLDWTFA=WEIGHTFA; IF PS208C GT 0 OR PV208C GT 0 THEN DO;
The data from NHTSA’s evaluation shows lap belts for outboard rear seat passengers reduce fatality risk by 76 percent in rollovers and 39 percent in side impacts, but have little or no net benefit in front-als, rear impacts or other crashes. The same effectiveness estimates are assumed for the center rear seating position. IF CRSH=1 THEN DO; E=.00; EJECT2=.23; END; ELSE IF CRSH=2 THEN DO; E=.39; EJECT2=.28; END; ELSE IF CRSH=3 THEN DO; E=.76; EJECT2=.61; END; ELSE IF CRSH=4 THEN DO; E=.00; EJECT2=.27; END; P=PS208C+PV208C; S=OLDWTFA*E*P / (1 - E*P); CLS208C=S*PS208C/P; CLV208C=S*PV208C/P; WEIGHTFA=OLDWTFA+CLS208C+CLV208C; END; ELSE DO; CLS208C=0; CLV208C=0; END; CL208C=CLS208C+CLV208C; CLS=CLS+CLS208C; CLV=CLV+CLV208C; CL=CL+CL208C;
625 Kahane (1985, February), p. 167. 626 Ibid., p. xxvii.

415
/* ------------------------------------------------------------------ */ /* 206 DOOR LOCK IMPROVEMENTS */ /* MEDIAN INSTALLATION YEAR: 1965 FMVSS EFFECTIVE DATE: 1/1/1968 */ /* ------------------------------------------------------------------ */ /* DOOR LOCKS IMPROVED GRADUALLY FROM 1962 TO 1968 */ IF XMY GE 1969 THEN DO; PS206=1; PV206=0; END; ELSE IF XMY=1968 THEN DO; PS206=.5; PV206=.5; END; ELSE IF 1962 LE XMY LE 1967 THEN DO; PS206=0; PV206=(XMY-1961)/7; END; ELSE IF XMY LE 1961 THEN DO; PS206=0; PV206=0; END; /* REDUCTION IN EJECTION ROLLOVER FATALITY RISK WITH IMPROVED DOOR LOCKS */ OLDWTFA=WEIGHTFA;
NHTSA’s evaluation found that improved door locks would save 15.38 percent (400 of 2,600 in the baseline year for that study) of ejection fatalities (excluding occupants riding outside the passenger compartment).627 IF (PS206 GT 0 OR PV206 GT 0) AND (CRSH=3 OR M_HARM=1) AND SEAT2 NE 52 AND EJECT2 NE 0 THEN DO; E=.1538; P=PS206+PV206; REL_S=EJECT2*E*P / (1 - E*P); S=OLDWTFA*REL_S; CLS206=S*PS206/P; CLV206=S*PV206/P; WEIGHTFA=OLDWTFA+CLS206+CLV206; EJECT2=(EJECT2 + REL_S)/(1 + REL_S); END; ELSE DO; CLS206=0; CLV206=0; END; CL206=CLS206+CLV206; CLS=CLS+CLS206; CLV=CLV+CLV206; CL=CL+CL206; /* ------------------------------------------------------------------ */ /* 208B LAP BELT USE BY CHILDREN AGE 1-4 */ /* MEDIAN INSTALLATION YEAR FOR LAP BELTS USED BY CHILDREN: EARLY 65 */ /* FMVSS EFFECTIVE DATE: 1/1/1968 */ /* ------------------------------------------------------------------ */ /* IDENTIFIES CHILD PASSENGERS AGE 1-4 USING LAP BELTS */ PS208B=0; PV208B=0; IF 1 LE AGE LE 4 AND REST3=2 THEN DO; IF XMY GE 1969 THEN PS208B=1; ELSE IF XMY LE 1967 THEN PV208B=1; ELSE IF XMY=1968 THEN DO; PS208B=.5; PV208B=.5; END; END; /* LIVES SAVED AND EJECTIONS PREVENTED BY LAP BELTS (AGE 1-4) */ OLDWTFA=WEIGHTFA; IF PS208B GT 0 OR PV208B GT 0 THEN DO;
NHTSA’s evaluation estimates that lap belts reduce fatality risk by 33 percent for toddlers. Effective-ness is not estimated separately by crash mode.628 In general, 19 percent of unrestrained child passen-ger fatalities in frontal crashes were ejected, 26 percent in side impacts, 65 percent in rollovers and 34 percent in rear/other impacts. E=.33; IF CRSH=1 THEN EJECT2=.19; ELSE IF CRSH=2 THEN EJECT2=.26; ELSE IF CRSH=3 THEN EJECT2=.65; ELSE IF CRSH=4 THEN EJECT2=.34; P=PS208B+PV208B; S=OLDWTFA*E*P / (1 - E*P); CLS208B=S*PS208B/P; CLV208B=S*PV208B/P; WEIGHTFA=OLDWTFA+CLS208B+CLV208B; END; ELSE DO; CLS208B=0; CLV208B=0; END;
627 Kahane (1989, November), pp. 206-209 and 222-225. 628 This evaluation is discussed in the “Child Safety Seats” section of the FMVSS 213 chapter of Part 1, not the FMVSS 208 chapter.

416
CL208B=CLS208B+CLV208B; CLS=CLS+CLS208B; CLV=CLV+CLV208B; CL=CL+CL208B; /* ------------------------------------------------------------------ */ /* 208A LAP BELTS FOR FRONT-SEAT OUTBOARD OCCUPANTS */ /* MEDIAN INSTALLATION YEAR: 1962 FMVSS EFFECTIVE DATE: 1/1/1968 */ /* ------------------------------------------------------------------ */
A double-pair comparison analysis of lap belt effectiveness for outboard front seat occupants, conduct-ed in support of the 2004 “lives saved” report, found that lap belts reduce fatality risk by 22 percent in frontals, 43 percent in rollovers, and 21 percent in side impacts, rear impacts and other crashes. /* IDENTIFIES OUTBOARD-FRONT-SEAT OCCUPANTS WEARING LAP BELTS */ PS208A=0; PV208A=0; IF SEAT2 IN (11,13) AND REST3=2 AND (5 LE AGE LE 99 OR AGE=.) THEN DO; IF XMY GE 1969 THEN PS208A=1; ELSE IF XMY LE 1967 THEN PV208A=1; ELSE IF XMY=1968 THEN DO; PS208A=.5; PV208A=.5; END; END; /* LIVES SAVED AND EJECTIONS PREVENTED BY OUTBOARD-FRONT-SEAT LAP BELTS */ OLDWTFA=WEIGHTFA; IF PS208A GT 0 OR PV208A GT 0 THEN DO; IF CRSH=1 THEN DO; E=.22; EJECT2=.21; END; ELSE IF CRSH=2 THEN DO; E=.21; EJECT2=.23; END; ELSE IF CRSH=3 THEN DO; E=.43; EJECT2=.66; END; ELSE IF CRSH=4 THEN DO; E=.21; EJECT2=.35; END; P=PS208A+PV208A; S=OLDWTFA*E*P / (1 - E*P); CLS208A=S*PS208A/P; CLV208A=S*PV208A/P; WEIGHTFA=OLDWTFA+CLS208A+CLV208A; END; ELSE DO; CLS208A=0; CLV208A=0; END; CL208A=CLS208A+CLV208A; CLS=CLS+CLS208A; CLV=CLV+CLV208A; CL=CL+CL208A; DROP V13; RUN;
That concludes the model for passenger cars. It has estimated, on a case-by-case basis, by how much fatalities would increase if all the safety technologies were “removed” from vehicles. The next step is to tally up the lives saved over all the cases, by calendar year. PROC MEANS SUM NOPRINT DATA=CAR2; BY CY; VAR ORIGWT WEIGHTFA CLV226 CLS226 CL226 CLV126 CLS126 CL126 CLV301 CLS301 CL301 CLV214C CLS214C CL214C C_TORSO C_COMBO C_CURTAIN C_CURT_TORS CLV208K CLS208K CL208K CLV208J CLS208J CL208J CLV201B CLS201B CL201B CLV108 CLS108 CL108 CLV214B CLS214B CL214B CLV208I CLS208I CL208I C_BARRIER C_SLED C_CAC CLV208H CLS208H CL208H CLV208G CLS208G CL208G CLV213 CLS213 CL213 CLVNCAP CLSNCAP CLNCAP CLV208F CLS208F CL208F CLV216 CLS216 CL216 CLV214A CLS214A CL214A CLV105B CLS105B CL105B CLV201A CLS201A CL201A CLV203 CLS203 CL203 CLV208E CLS208E CL208E CLV105A CLS105A CL105A CLV208D CLS208D CL208D CLV212 CLS212 CL212 CLV208C CLS208C CL208C CLV206 CLS206 CL206
417
CLV208B CLS208B CL208B CLV208A CLS208A CL208A CABDRV CABRF CABKID_BARRIER CABKID_SLED CSW0 CSW1 CSW2 CSWKID0_BARRIER CSWKID1_BARRIER CSWKID2_BARRIER CSWKID0_SLED CSWKID1_SLED CSWKID2_SLED C_KID_SLED C_KID_CAC C_ADULT_CAC CLV CLS CL; OUTPUT OUT=CAR3
C_ORIGWT = actual car occupant fatalities. C_WTFA = estimated number of fatalities if all safety technologies had been removed. SUM=C_ORIGWT C_WTFA CLV226 CLS226 CL226 CLV126 CLS126 CL126 CLV301 CLS301 CL301 CLV214C CLS214C CL214C C_TORSO C_COMBO C_CURTAIN C_CURT_TORS CLV208K CLS208K CL208K CLV208J CLS208J CL208J CLV201B CLS201B CL201B CLV108 CLS108 CL108 CLV214B CLS214B CL214B CLV208I CLS208I CL208I C_BARRIER C_SLED C_CAC CLV208H CLS208H CL208H CLV208G CLS208G CL208G CLV213 CLS213 CL213 CLVNCAP CLSNCAP CLNCAP CLV208F CLS208F CL208F CLV216 CLS216 CL216 CLV214A CLS214A CL214A CLV105B CLS105B CL105B CLV201A CLS201A CL201A CLV203 CLS203 CL203 CLV208E CLS208E CL208E CLV105A CLS105A CL105A CLV208D CLS208D CL208D CLV212 CLS212 CL212 CLV208C CLS208C CL208C CLV206 CLS206 CL206 CLV208B CLS208B CL208B CLV208A CLS208A CL208A CABDRV CABRF CABKID_BARRIER CABKID_SLED CSW0 CSW1 CSW2 CSWKID0_BARRIER CSWKID1_BARRIER CSWKID2_BARRIER CSWKID0_SLED CSWKID1_SLED CSWKID2_SLED C_KID_SLED C_KID_CAC C_ADULT_CAC CLV CLS CL; RUN;
Prints the number of lives saved by each technology in each CY, and the sum of lives saved from 1975 to 2012. PROC PRINT DATA=CAR3; FORMAT CLV226 CLS226 CL226 CLV126 CLS126 CL126 CLV301 CLS301 CL301 9.0; ID CY; VAR CLV226 CLS226 CL226 CLV126 CLS126 CL126 CLV301 CLS301 CL301; SUM CLV226 CLS226 CL226 CLV126 CLS126 CL126 CLV301 CLS301 CL301; TITLE1 'CAR OCCUPANT LIVES SAVED BY ROLLOVER CURTAINS, ESC, AND FUEL SYSTEM INTEGRITY - REAR IMPACT UPGRADE, 1975-2012'; TITLE2 ' '; TITLE3 '...226 = ROLLOVER CURTAINS (MEDIAN INSTALLATION YEAR AFTER 2011, FMVSS PHASE-IN TO BEGIN MY 2014)'; TITLE4 '...126 = ELECTRONIC STABILITY CONTROL (MEDIAN INSTALLATION YEAR 2010, FMVSS PHASE-IN BEGAN MY 2009)'; TITLE5 '...301 = FUEL SYSTEM INTEGRITY - REAR IMPACT UPGRADE (MEDIAN INSTALLATION YEAR 2008, FMVSS PHASE-IN BE-GAN MY 2007)'; TITLE6 '...V = VOLUNTARY INSTALLATIONS, BEFORE FMVSS PHASE-IN'; TITLE7 '...S = STANDARD INSTALLATIONS, CARS BUILT ON OR AFTER FMVSS PHASE-IN'; RUN; PROC PRINT DATA=CAR3; FORMAT CLV214C CLS214C CL214C C_TORSO C_COMBO C_CURTAIN C_CURT_TORS 9.0; ID CY; VAR CLV214C CLS214C CL214C C_TORSO C_COMBO C_CURTAIN C_CURT_TORS; SUM CLV214C CLS214C CL214C C_TORSO C_COMBO C_CURTAIN C_CURT_TORS;

418
TITLE1 'CAR OCCUPANT LIVES SAVED BY CURTAIN AND SIDE AIR BAGS IN NEARSIDE IMPACTS, 1975-2012'; TITLE2 ' '; TITLE3 '...214C = ALL TYPES OF CURTAIN AND SIDE AIR BAGS (MEDIAN INSTALLATION YEAR 2007, FMVSS NO. 214 POLE TEST PHASE-IN BEGAN MY 2011)'; TITLE4 '...V = VOLUNTARY INSTALLATIONS, BEFORE FMVSS PHASE-IN'; TITLE5 '...S = STANDARD INSTALLATIONS, CARS BUILT ON OR AFTER FMVSS PHASE-IN'; TITLE6 '...TORSO = TORSO BAG ONLY COMBO = COMBINATION HEAD-TORSO BAG'; TITLE7 '...CURTAIN = CURTAIN ONLY CURT_TORS = CURATAIN PLUS TORSO BAG'; RUN; PROC PRINT DATA=CAR3; FORMAT CLV208K CLS208K CL208K CLV208J CLS208J CL208J CLV201B CLS201B CL201B 9.0; ID CY; VAR CLV208K CLS208K CL208K CLV208J CLS208J CL208J CLV201B CLS201B CL201B; SUM CLV208K CLS208K CL208K CLV208J CLS208J CL208J CLV201B CLS201B CL201B; TITLE1 'CAR OCCUPANT LIVES SAVED BY PRETENSIONERS & LOAD LIMITERS, CENTER-REAR-SEAT 3-POINT BELTS, AND HEAD IM-PACT UPGRADE, 1975-2012'; TITLE2 ' '; TITLE3 '...208K = PRETENSIONERS & LOAD LIMITERS FOR BELTS (ON 50.5% OF MY 2001 CARS, NOT REQUIRED BY ANY FMVSS)'; TITLE4 '...208J = 3-POINT BELTS FOR CENTER REAR SEAT PASSENGERS (ON 59.8% OF MY 2001 CARS, FMVSS PHASE-IN BEGAN MY 2006)'; TITLE5 '...201B = INTERIOR PROTECTION - HEAD IMPACT UPGRADE (ON 64.1% OF MY 2001 CARS, FMVSS PHASE-IN BEGAN MY 1999)'; TITLE6 '...V = VOLUNTARY INSTALLATIONS, BEFORE FMVSS PHASE-IN'; TITLE7 '...S = STANDARD INSTALLATIONS, CARS BUILT ON OR AFTER FMVSS PHASE-IN'; RUN; PROC PRINT DATA=CAR3; FORMAT CLV108 CLS108 CL108 CLV214B CLS214B CL214B 9.0; ID CY; VAR CLV108 CLS108 CL108 CLV214B CLS214B CL214B; SUM CLV108 CLS108 CL108 CLV214B CLS214B CL214B; TITLE1 'CAR OCCUPANT LIVES SAVED BY TRAILER CONSPICUITY TAPE AND TTI(d) REDUCTION BY STRUCTURE/PADDING, 1975-2012'; TITLE2 ' '; TITLE3 '...108 = TRAILER CONSPICUITY TAPE (ON-ROAD FLEET 54% EQUIPPED IN 1996, FMVSS EFFECTIVE DATE 12/1/93, RETROFIT REQUIREMENT 6/1/2001)'; TITLE4 '...214B = TTI(d) REDUCTION BY STRUCTURE & PADDING/DYNAMIC SIDE IMPACT TEST (ON 66.5% OF MY 1996 CARS, FMVSS PHASE-IN BEGAN MY 1994)'; TITLE5 '...V = VOLUNTARY INSTALLATIONS, BEFORE FMVSS EFFECTIVE DATE OR PHASE-IN'; TITLE6 '...S = STANDARD INSTALLATIONS, AFTER FMVSS EFFECTIVE DATE OR PHASE-IN'; RUN; PROC PRINT DATA=CAR3; FORMAT CLV208I CLS208I CL208I C_BARRIER C_SLED C_CAC 9.0; ID CY; VAR CLV208I CLS208I CL208I C_BARRIER C_SLED C_CAC; SUM CLV208I CLS208I CL208I C_BARRIER C_SLED C_CAC; TITLE1 'CAR OCCUPANT LIVES SAVED BY FRONTAL AIR BAGS, 1975-2012'; TITLE2 ' '; TITLE3 '...208I = FRONTAL AIR BAGS (MEDIAN INSTALLATION YEAR 1994, FMVSS PHASE-IN BEGAN MY 1987)'; TITLE4 '...V = VOLUNTARY INSTALLATIONS, BEFORE FMVSS PHASE-IN'; TITLE5 '...S = STANDARD INSTALLATIONS, CARS BUILT ON OR AFTER FMVSS PHASE-IN'; TITLE6 '...BARRIER = FIRST-GENERATION, BARRIER CERTIFIED AIR BAGS'; TITLE7 '...SLED = REDESIGNED (DEPOWERED), SLED-CERTIFIED AIR BAGS'; TITLE8 '...CAC = CERTIFIED-ADVANCED COMPLIANT AIR BAGS (WITH SUPPRESSION OR LOW-RISK DEPLOYMENT FOR SMALL PASSENGERS)'; RUN; PROC PRINT DATA=CAR3; FORMAT CLV208H CLS208H CL208H CLV208G CLS208G CL208G 9.0; ID CY; VAR CLV208H CLS208H CL208H CLV208G CLS208G CL208G; SUM CLV208H CLS208H CL208H CLV208G CLS208G CL208G; TITLE1 'CAR OCCUPANT LIVES SAVED BY AUTOMATIC 2-POINT BELTS AND OUTBOARD-REAR-SEAT 3-POINT BELTS, 1975-2012'; TITLE2 ' '; TITLE3 '...208H = AUTOMATIC 2-POINT BELTS (PEAK INSTALLATION YEAR 1991, FMVSS PHASE-IN BEGAN MY 1987)'; TITLE4 '...208G = 3-POINT BELTS FOR OUTBOARD REAR SEAT OCCUPANTS (MEDIAN INSTALLATION YEAR 1989, FMVSS EFFECTIVE 12/11/89)'; TITLE5 '...V = VOLUNTARY INSTALLATIONS, BEFORE FMVSS EFFECTIVE DATE'; TITLE6 '...S = STANDARD INSTALLATIONS, CARS BUILT ON OR AFTER FMVSS EFFECTIVE DATE'; RUN; PROC PRINT DATA=CAR3; FORMAT CLV213 CLS213 CL213 CLVNCAP CLSNCAP CLNCAP CLV208F CLS208F CL208F 9.0;

419
ID CY; VAR CLV213 CLS213 CL213 CLVNCAP CLNCAP CLV208F CLS208F CL208F; SUM CLV213 CLS213 CL213 CLVNCAP CLNCAP CLV208F CLS208F CL208F; TITLE1 'CAR OCCUPANT LIVES SAVED BY CHILD SAFETY SEATS, VOLUNTARY NCAP IMPROVEMENTS, AND FRONT-SEAT 3-POINT BELTS, 1975-2012'; TITLE2 ' '; TITLE3 '...213 = CHILD SAFETY SEATS (USE EXCEEDED 50% IN 1985, FMVSS EFFECTIVE 4/1/71, STATE LAWS 1978-85)'; TITLE4 '...NCAP = VOLUNTARY NCAP IMPROVEMENTS IN NON-AIR-BAG CARS (MEDIAN IMPLEMENTATION YEAR EARLY 1984)'; TITLE5 '...208F = 3-POINT BELTS FOR FRONT SEAT OCCUPANTS (MEDIAN INSTALLATION YEAR 1974, FMVSS EFFECTIVE 9/1/73)'; TITLE6 '...V = VOLUNTARY INSTALLATIONS, BEFORE FMVSS EFFECTIVE DATE'; TITLE7 '...S = STANDARD INSTALLATIONS, CARS BUILT ON OR AFTER FMVSS EFFECTIVE DATE'; RUN; PROC PRINT DATA=CAR3; FORMAT CLV216 CLS216 CL216 CLV214A CLS214A CL214A CLV105B CLS105B CL105B 9.0; ID CY; VAR CLV216 CLS216 CL216 CLV214A CLS214A CL214A CLV105B CLS105B CL105B; SUM CLV216 CLS216 CL216 CLV214A CLS214A CL214A CLV105B CLS105B CL105B; TITLE1 'CAR OCCUPANT LIVES SAVED BY ROOF CRUSH RESISTANCE, SIDE DOOR BEAMS, AND FRONT DISC BRAKES, 1975-2012'; TITLE2 ' '; TITLE3 '...216 = ROOF CRUSH RESISTANCE, B-PILLARS, ETC. (MEDIAN INSTALLATION YEAR 1973, FMVSS EFFECTIVE 9/1/73)'; TITLE4 '...214A = SIDE DOOR BEAMS (MEDIAN INSTALLATION YEAR EARLY 1973, FMVSS EFFECTIVE 1/1/73)'; TITLE5 '...105B = FRONT DISC BRAKES (MEDIAN INSTALLATION YEAR 1971, FMVSS EFFECTIVE 1/1/76)'; TITLE6 '...V = VOLUNTARY INSTALLATIONS, BEFORE FMVSS EFFECTIVE DATE'; TITLE7 '...S = STANDARD INSTALLATIONS, CARS BUILT ON OR AFTER FMVSS EFFECTIVE DATE'; RUN; PROC PRINT DATA=CAR3; FORMAT CLV201A CL201A CLV203 CLS203 CL203 CLV208E CLS208E CL208E 9.0; ID CY; VAR CLV201A CL201A CLV203 CLS203 CL203 CLV208E CLS208E CL208E; SUM CLV201A CL201A CLV203 CLS203 CL203 CLV208E CLS208E CL208E; TITLE1 'CAR OCCUPANT LIVES SAVED BY SAFER INSTRUMENT PANELS, EA STEERING ASSEMBLIES, AND CENTER-REAR-SEAT LAP BELTS, 1975-2012'; TITLE2 ' '; TITLE3 '...201A = VOLUNTARY INSTRUMENT PANEL IMPROVEMENTS (MEDIAN IMPLEMENTATION YEAR 1968, FMVSS EFFECTIVE 1/1/68)'; TITLE4 '...203 = ENERGY-ABSORBING STEERING ASSEMBLIES (MEDIAN IMPLEMENTATION YEAR 1967, FMVSS EFFECTIVE 1/1/68)'; TITLE5 '...208E = LAP BELTS FOR CENTER REAR SEAT PASSENGERS (MEDIAN INSTALLATION YEAR EARLY 1967, FMVSS EFFEC-TIVE 1/1/68)'; TITLE6 '...V = VOLUNTARY INSTALLATIONS, BEFORE FMVSS EFFECTIVE DATE'; TITLE7 '...S = STANDARD INSTALLATIONS, CARS BUILT ON OR AFTER FMVSS EFFECTIVE DATE'; RUN; PROC PRINT DATA=CAR3; FORMAT CLV105A CLS105A CL105A CLV208D CLS208D CL208D CLV212 CLS212 CL212 9.0; ID CY; VAR CLV105A CLS105A CL105A CLV208D CLS208D CL208D CLV212 CLS212 CL212; SUM CLV105A CLS105A CL105A CLV208D CLS208D CL208D CLV212 CLS212 CL212; TITLE1 'CAR OCCUPANT LIVES SAVED BY DUAL MASTER CYLINDERS, CENTER-FRONT-SEAT LAP BELTS, AND ADHESIVE WINDSHIELD BONDING, 1975-2012'; TITLE2 ' '; TITLE3 '...105A = DUAL MASTER CYLINDERS (MEDIAN INSTALLATION YEAR LATE 1966, FMVSS EFFECTIVE 1/1/68)'; TITLE4 '...208D = LAP BELTS FOR CENTER FRONT SEAT PASSENGERS (MEDIAN INSTALLATION YEAR 1966, FMVSS EFFECTIVE 1/1/68)'; TITLE5 '...212 = ADHESIVE WINDSHIELD BONDING (MEDIAN INSTALLATION YEAR EARLY 1966, FMVSS EFFECTIVE 1/1/70)'; TITLE6 '...V = VOLUNTARY INSTALLATIONS, BEFORE FMVSS EFFECTIVE DATE'; TITLE7 '...S = STANDARD INSTALLATIONS, CARS BUILT ON OR AFTER FMVSS EFFECTIVE DATE'; RUN; PROC PRINT DATA=CAR3; FORMAT CLV208C CLS208C CL208C CLV206 CLS206 CL206 CLV208B CLS208B CL208B 9.0; ID CY; VAR CLV208C CLS208C CL208C CLV206 CLS206 CL206 CLV208B CLS208B CL208B; SUM CLV208C CLS208C CL208C CLV206 CLS206 CL206 CLV208B CLS208B CL208B; TITLE1 'CAR OCCUPANT LIVES SAVED BY OUTBOARD-REAR-SEAT LAP BELTS, IMPROVED DOOR LOCKS, AND LAP BELTS FOR CHIL-DREN AGE 1-4, 1975-2012'; TITLE2 ' '; TITLE3 '...208C = LAP BELTS FOR OUTBOARD REAR SEAT OCCUPANTS (MEDIAN INSTALLATION YEAR LATE 1965, FMVSS EFFEC-TIVE 1/1/68)'; TITLE4 '...206 = IMPROVED DOOR LOCKS (MEDIAN INSTALLATION YEAR 1965, FMVSS EFFECTIVE 1/1/68)'; TITLE5 '...208B = LAP BELT USE BY CHILDREN AGE 1-4 (MEDIAN INSTALLATION YEAR 1964, FMVSS EFFECTIVE 1/1/68)'; TITLE6 '...V = VOLUNTARY INSTALLATIONS, BEFORE FMVSS EFFECTIVE DATE'; TITLE7 '...S = STANDARD INSTALLATIONS, CARS BUILT ON OR AFTER FMVSS EFFECTIVE DATE';
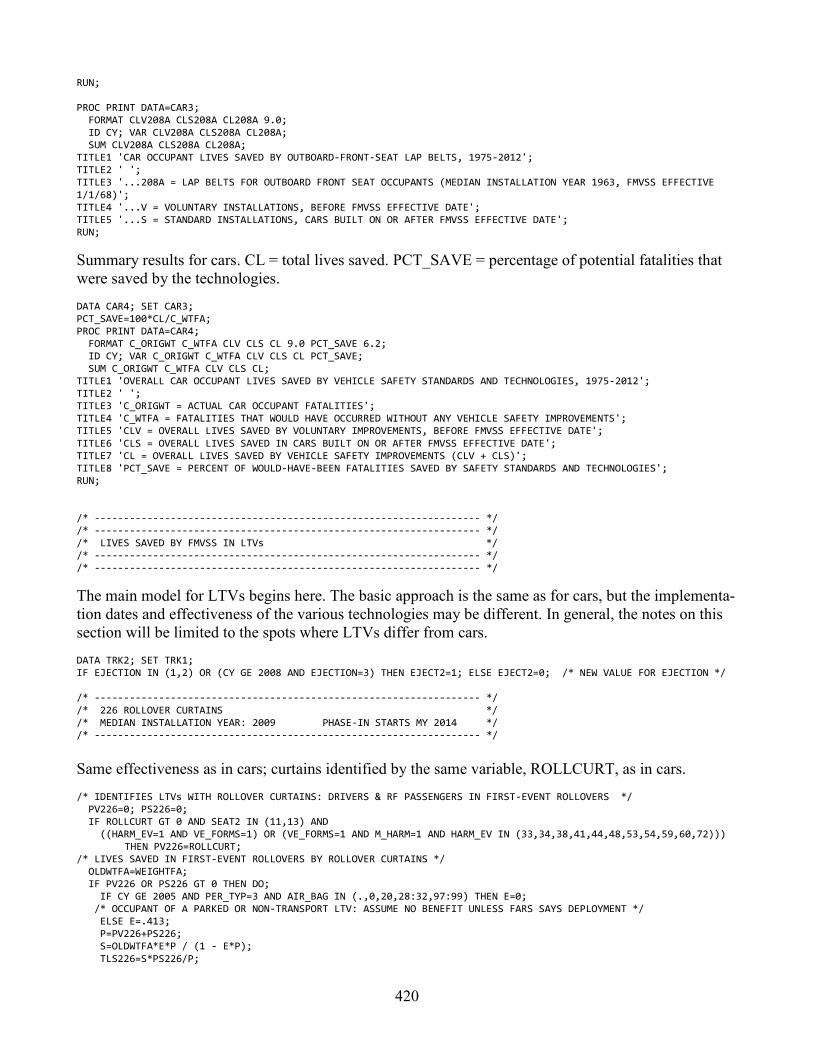
420
RUN; PROC PRINT DATA=CAR3; FORMAT CLV208A CLS208A CL208A 9.0; ID CY; VAR CLV208A CLS208A CL208A; SUM CLV208A CLS208A CL208A; TITLE1 'CAR OCCUPANT LIVES SAVED BY OUTBOARD-FRONT-SEAT LAP BELTS, 1975-2012'; TITLE2 ' '; TITLE3 '...208A = LAP BELTS FOR OUTBOARD FRONT SEAT OCCUPANTS (MEDIAN INSTALLATION YEAR 1963, FMVSS EFFECTIVE 1/1/68)'; TITLE4 '...V = VOLUNTARY INSTALLATIONS, BEFORE FMVSS EFFECTIVE DATE'; TITLE5 '...S = STANDARD INSTALLATIONS, CARS BUILT ON OR AFTER FMVSS EFFECTIVE DATE'; RUN;
Summary results for cars. CL = total lives saved. PCT_SAVE = percentage of potential fatalities that were saved by the technologies. DATA CAR4; SET CAR3; PCT_SAVE=100*CL/C_WTFA; PROC PRINT DATA=CAR4; FORMAT C_ORIGWT C_WTFA CLV CLS CL 9.0 PCT_SAVE 6.2; ID CY; VAR C_ORIGWT C_WTFA CLV CLS CL PCT_SAVE; SUM C_ORIGWT C_WTFA CLV CLS CL; TITLE1 'OVERALL CAR OCCUPANT LIVES SAVED BY VEHICLE SAFETY STANDARDS AND TECHNOLOGIES, 1975-2012'; TITLE2 ' '; TITLE3 'C_ORIGWT = ACTUAL CAR OCCUPANT FATALITIES'; TITLE4 'C_WTFA = FATALITIES THAT WOULD HAVE OCCURRED WITHOUT ANY VEHICLE SAFETY IMPROVEMENTS'; TITLE5 'CLV = OVERALL LIVES SAVED BY VOLUNTARY IMPROVEMENTS, BEFORE FMVSS EFFECTIVE DATE'; TITLE6 'CLS = OVERALL LIVES SAVED IN CARS BUILT ON OR AFTER FMVSS EFFECTIVE DATE'; TITLE7 'CL = OVERALL LIVES SAVED BY VEHICLE SAFETY IMPROVEMENTS (CLV + CLS)'; TITLE8 'PCT_SAVE = PERCENT OF WOULD-HAVE-BEEN FATALITIES SAVED BY SAFETY STANDARDS AND TECHNOLOGIES'; RUN; /* ------------------------------------------------------------------ */ /* ------------------------------------------------------------------ */ /* LIVES SAVED BY FMVSS IN LTVs */ /* ------------------------------------------------------------------ */ /* ------------------------------------------------------------------ */
The main model for LTVs begins here. The basic approach is the same as for cars, but the implementa-tion dates and effectiveness of the various technologies may be different. In general, the notes on this section will be limited to the spots where LTVs differ from cars. DATA TRK2; SET TRK1; IF EJECTION IN (1,2) OR (CY GE 2008 AND EJECTION=3) THEN EJECT2=1; ELSE EJECT2=0; /* NEW VALUE FOR EJECTION */ /* ------------------------------------------------------------------ */ /* 226 ROLLOVER CURTAINS */ /* MEDIAN INSTALLATION YEAR: 2009 PHASE-IN STARTS MY 2014 */ /* ------------------------------------------------------------------ */
Same effectiveness as in cars; curtains identified by the same variable, ROLLCURT, as in cars. /* IDENTIFIES LTVs WITH ROLLOVER CURTAINS: DRIVERS & RF PASSENGERS IN FIRST-EVENT ROLLOVERS */ PV226=0; PS226=0; IF ROLLCURT GT 0 AND SEAT2 IN (11,13) AND ((HARM_EV=1 AND VE_FORMS=1) OR (VE_FORMS=1 AND M_HARM=1 AND HARM_EV IN (33,34,38,41,44,48,53,54,59,60,72))) THEN PV226=ROLLCURT; /* LIVES SAVED IN FIRST-EVENT ROLLOVERS BY ROLLOVER CURTAINS */ OLDWTFA=WEIGHTFA; IF PV226 OR PS226 GT 0 THEN DO; IF CY GE 2005 AND PER_TYP=3 AND AIR_BAG IN (.,0,20,28:32,97:99) THEN E=0; /* OCCUPANT OF A PARKED OR NON-TRANSPORT LTV: ASSUME NO BENEFIT UNLESS FARS SAYS DEPLOYMENT */ ELSE E=.413; P=PV226+PS226; S=OLDWTFA*E*P / (1 - E*P); TLS226=S*PS226/P;
421
TLV226=S*PV226/P; WEIGHTFA=OLDWTFA+TLS226+TLV226; END; ELSE DO; TLV226=0; TLS226=0; END; TL226=TLS226+TLV226; TLS=TLS226; TLV=TLV226; TL=TL226;
TLV226: “T” = LTV, “L” = lives saved, “V” = voluntary, “226” = rollover curtain /* ------------------------------------------------------------------ */ /* 214C CURTAIN & SIDE AIR BAGS (POLE TEST UPGRADE FOR FMVSS 214) */ /* MEDIAN INSTALLATION YEAR: 2008 PHASE-IN STARTED MY 2011 */ /* ------------------------------------------------------------------ */ /* IDENTIFIES LTVs WITH CURATAIN AND/OR SIDE AIR BAGS: DRIVERS & RF PASSENGERS IN NEARSIDE IMPACTS */ P_TORSO=0; P_COMBO=0; P_CURTAIN=0; P_CURT_TORS=0; IF 1910 LE XMY LE 1995 THEN GOTO BYP214C; IF NEW_TORSO=0 AND NEW_COMBO=0 AND NEW_CURTAIN=0 AND CURT_TORS=0 THEN GOTO BYP214C; IF 1 LE HARM_EV LE 6 THEN GOTO BYP214C; IF CY GE 2005 AND PER_TYP=3 AND AIR_BAG IN (.,0,20,28:32,97:99) THEN GOTO BYP214C; /* OCCUPANT OF A PARKED LTV: ASSUME NO BENEFIT UNLESS FARS SAYS DEPLOYMENT */ IF TL226 GT 0 THEN GOTO BYP214C; /* IF WE HAVE TREATED THIS CASE AS A ROLLOVER, ABOVE, WE WILL NOT TREAT IT AS A NEARSIDE IMPACT, TOO */ IF IMPACT1 IN (8,9,10,61:63) AND IMPACT2 IN (2,2.5,3,3,5,4,26,81:83) THEN GOTO BYP214C; IF IMPACT1 IN (2,3,4,81:83) AND IMPACT2 IN (8,8.5,9,9.5,10,26,61:63) THEN GOTO BYP214C; /* WE WILL NOT COUNT A BENEFIT IN VEHICLES HIT ON BOTH SIDES */ IF (NEW_TORSO GT 0 OR NEW_COMBO GT 0 OR NEW_CURTAIN GT 0 OR CURT_TORS GT 0) AND ((SEAT2=11 AND (IMPACT1 IN (8,9,10,61:63) OR IMPACT2 IN (8,8.5,9,9.5,10,61:63))) OR (SEAT2=13 AND (IMPACT1 IN (2,3,4,81:83) OR IMPACT2 IN (2,2.5,3,3.5,4,81:83)))) THEN DO; P_TORSO=NEW_TORSO; P_COMBO=NEW_COMBO; P_CURTAIN=NEW_CURTAIN; P_CURT_TORS=CURT_TORS; END; ELSE GOTO BYP214C; /* LIVES SAVED IN NEARSIDE IMPACTS BY CURTAIN AND/OR SIDE AIR BAGS */ OLDWTFA=WEIGHTFA; T_TORSO=OLDWTFA*.078*P_TORSO / (1 - .078*P_TORSO); /* FATALITY REDUCTION FOR TORSO BAG ONLY: 7.8% */ T_COMBO=OLDWTFA*.248*P_COMBO / (1 - .248*P_COMBO); /* FATALITY REDUCTION FOR COMBO BAG: 24.8% */ T_CURTAIN=OLDWTFA*.164*P_CURTAIN / (1 - .164*P_CURTAIN); /* FATALITY REDUCTION FOR CURTAIN ONLY: 16.4% */ T_CURT_TORS=OLDWTFA*.313*P_CURT_TORS / (1 - .313*P_CURT_TORS); /* FATALITY REDUCTION FOR CURTAIN + TORSO: 31.3% */ IF XMY IN (2011,2012,2013) THEN DO; TLS214C=T_TORSO+T_COMBO+T_CURTAIN+T_CURT_TORS; TLV214C=0; END; ELSE IF 1996 LE XMY LE 2010 THEN DO; TLV214C=T_TORSO+T_COMBO+T_CURTAIN+T_CURT_TORS; TLS214C=0; END; WEIGHTFA=OLDWTFA+TLS214C+TLV214C; GOTO TALLY214C; BYP214C: TLV214C=0; TLS214C=0; T_TORSO=0; T_COMBO=0; T_CURTAIN=0; T_CURT_TORS=0; TALLY214C: TL214C=TLS214C+TLV214C; TLS=TLS+TLS214C; TLV=TLV+TLV214C; TL=TL+TL214C; /* ------------------------------------------------------------------ */ /* 126 ELECTRONIC STABILITY CONTROL */ /* MEDIAN INSTALLATION YEAR: EARLY 2008 PHASE-IN STARTED MY 2009 */ /* ------------------------------------------------------------------ */ /* IDENTIFIES LTVs WITH ESC */ PV126=0; PS126=0; IF ESC GT 0 THEN DO; IF 1998 LE XMY LE 2008 THEN PV126=ESC; ELSE IF 2009 LE XMY LE 2013 THEN PS126=ESC; END; /* LIVES SAVED BY ESC IN CRASHES WHERE ESC IS BENEFICIAL */ OLDWTFA=WEIGHTFA; IF PV126 OR PS126 GT 0 THEN DO; /* IDENTIFY FIRST-EVENT ROLLOVERS, OTHER RUN-OFF-ROAD CRASHES, AND CULPABLE MULTI-VEHICLE INVOLVEMENTS */ DRCF=0; /* IN MULTI-VEHICLE CRASHES, DRCF=0 MEANS NOT CULPABLE, DRCF=1 MEANS CULPABLE */ IF CY LE 2009 AND (DR_CF1 IN (3,6,8,26,27,28,30,31,33,35,36,38,39,44,46,47,48,50,51,57,58,79,87) OR DR_CF2 IN (3,6,8,26,27,28,30,31,33,35,36,38,39,44,46,47,48,50,51,57,58,79,87) OR DR_CF3 IN (3,6,8,26,27,28,30,31,33,35,36,38,39,44,46,47,48,50,51,57,58,79,87) OR DR_CF4 IN (3,6,8,26,27,28,30,31,33,35,36,38,39,44,46,47,48,50,51,57,58,79,87)) THEN DRCF=1; ELSE IF CY GE 2010 AND (DR_SF1 IN (6,8,18,26:30,33:36,38,39,41,47,48,50,51,57,58) OR DR_SF2 IN (6,8,18,26:30,33:36,38,39,41,47,48,50,51,57,58) OR DR_SF3 IN (6,8,18,26:30,33:36,38,39,41,47,48,50,51,57,58) OR DR_SF4 IN (6,8,18,26:30,33:36,38,39,41,47,48,50,51,57,58)) THEN DRCF=1; IF HARM_EV=1 AND VE_FORMS=1 THEN ESC_CRSH=1; /* FIRST-EVENT ROLLOVER */ ELSE IF VE_FORMS=1 AND M_HARM=1 AND HARM_EV IN (33,34,38,41,44,48,53,54,58,59,60,72) THEN ESC_CRSH=1;
422
/* ALSO "1st EVENT ROLLOVER": CURB, DITCH, FENCE, SHRUBBERY, PAVEMENT IRREGULARITY, SNOWBANK, MAILBOX, */ /* FALLING CARGO, GROUND, CARGO SHIFT IS 1st EVENT AND ROLLOVER IS MOST HARMFUL EVENT */ ELSE IF HARM_EV IN (8,9,11,49) THEN ESC_CRSH=0; /* PED/BIKE/ANIMAL (ESC NOT EFFECTIVE) */ ELSE IF VE_FORMS=1 AND HARM_EV IN (14,17,19,20,21,22,23,25,26,27,28,29,30,31,32,35,36,37,39,40,42,43,46,50,52,57,59) THEN ESC_CRSH=2; /* RUN-OFF ROAD CRASH THAT IS NOT A 1st EVENT ROLLOVER */ /* FIXED-OBJECT COLLISIONS: 1st IMPACT WITH PARKED VEH, BOULDER, BUILDING, IMPACT ATTENUATOR, BRIDGE */ /* (ANY PART), BARRIER (ANY TYPE), HIGHWAY SIGN POST, OVERHEAD SIGN, LIGHT SUPPORT, UTILITY POLE, OTHER */ /* POST/POLE, CULVERT, EMBANKMENT (ANY MATERIAL), WALL, FIRE HYDRANT, TREE, OTHER FIXED OBJECT, TRAFFIC */ /* SIGNAL SUPPORT, BRIDGE OVERHEAD STRUCTURE - REGARDLESS OF SUBSEQUENT EVENTS */ ELSE IF VE_FORMS=1 AND HARM_EV IN (24,33,34,38,41,44,48,53,57,58) AND M_HARM IN (24,33,34,38,41,48,52,53,57,14,17,19:23,25:32,35:37,39,40,42,43,46,50) THEN ESC_CRSH=2; /* ALSO FIXED-OBJECT COLLISION: GUARDRAIL FACE, CURB, DITCH, FENCE, SHRUBBERY, PAVEMENT IRREGULARITY, */ /* SNOWBANK, GUARDRAIL END, MAILBOX, CABLE BARRIER IS 1st EVENT AND MOST HARMFUL EVENT IS ONE OF THESE */ /* (EXCEPT PAVEMENT IRREGULARITY) OR ONE OF THE FIXED OBJECTS LISTED ABOVE */ ELSE IF VE_FORMS=1 AND HARM_EV IN (3,24,52,33,34,38,41,53) THEN ESC_CRSH=2; /* RAN-OFF-ROAD, NOT NECESSARILY FIXED OBJECT OR 1st EVENT ROLLOVER: IMMERSION, VARIOUS OFF-ROAD OBJECTS */ ELSE IF CY LE 2009 AND (VEH_MAN IN (4,7) OR TRAV_SP=0) THEN ESC_CRSH=0; /* STOPPED/PARKED (ESC NOT EFFECTIVE) */ ELSE IF CY GE 2010 AND (P_CRASH1 IN (5,7) OR TRAV_SP=0) THEN ESC_CRSH=0; /* STOPPED/PARKED (ESC NOT EFFECTIVE) */ ELSE IF CY GE 2005 AND PER_TYP=3 THEN ESC_CRSH=0; /* OCCS OF PARKED VEHS (ESC NOT EFFECTIVE) */ ELSE IF CY LE 2009 AND (VEH_MAN IN (3,6,8,15) OR 1 LE TRAV_SP LE 10) THEN ESC_CRSH=0; /* BACKING/PARKING/LO-SPEED (ESC NOT EFFECTIVE) */ ELSE IF CY GE 2010 AND (P_CRASH1 IN (4,8,9,13) OR 1 LE TRAV_SP LE 10) THEN ESC_CRSH=0; /* BACKING/PARKING/LO-SPEED (ESC NOT EFFECTIVE) */ ELSE IF IMPACT1 IN (5,6,7) THEN ESC_CRSH=0; /* REAR-END STRUCK (ESC NOT EFFECTIVE) */ ELSE IF DRCF=1 THEN ESC_CRSH=3; /* CULPABLE VEHICLE IN A MULTI-VEHICLE CRASH */
Fatal-crash reduction estimates for LTVs are higher than for cars: (1) first-event rollovers (74.00%); (2) all other single-vehicle crashes without non-occupants involved (45.47%); and (3) culpable in-volvements in multivehicle crashes (16.15%). IF ESC_CRSH=1 THEN E=.7400; /* LTVs: NEW ESTIMATE OF ESC EFFECTIVENESS IN FIRST-EVENT ROLLO-VERS */ ELSE IF ESC_CRSH=2 THEN E=.4547; /* LTVs: NEW ESTIMATE OF ESC EFFECTIVENESS IN OTHER RUN-OFF-ROAD CRASHES */ ELSE IF ESC_CRSH=3 THEN E=.1615; /* LTVs: NEW ESTIMATE OF ESC EFFECTIVENESS IN CULPABLE MULTI-VEHICLE INVOLVEMENTS */ ELSE E=0; P=PV126+PS126; S=OLDWTFA*E*P / (1 - E*P); TLS126=S*PS126/P; TLV126=S*PV126/P; WEIGHTFA=OLDWTFA+TLS126+TLV126; END; ELSE DO; TLV126=0; TLS126=0; END; TL126=TLS126+TLV126; TLS=TLS+TLS126; TLV=TLV+TLV126; TL=TL+TL126; /* ------------------------------------------------------------------ */ /* 301 FUEL SYSTEM INTEGRITY - REAR IMPACT UPGRADE */ /* MEDIAN INSTALLATION YEAR: 2007 PHASE-IN STARTED MY 2007 */ /* ------------------------------------------------------------------ */ /* IDENTIFIES LTVs CERTIFIED TO FMVSS 301 REAR-IMPACT UPGRADE: REAR IMPACTS WITH FIRE */ PV301=0; PS301=0; IF (5 LE IMPACT2 LE 7 OR (CRSH=4 AND IMPACT1 IN (5,6,7))) AND FIRE_EXP=1 AND FMVSS301=1 THEN DO; IF XMY=2006 THEN PV301=1; ELSE IF 2007 LE XMY LE 2013 THEN PS301=1; END; /* LIVES SAVED IN REAR-IMPACT FIRES BY FMVSS 301 REAR-IMPACT UPGRADE */ OLDWTFA=WEIGHTFA; IF PV301 OR PS301 GT 0 THEN DO; E=.3519; P=PV301+PS301; S=OLDWTFA*E*P / (1 - E*P); TLS301=S*PS301/P; TLV301=S*PV301/P; WEIGHTFA=OLDWTFA+TLS301+TLV301; END; ELSE DO; TLV301=0; TLS301=0; END;
423
TL301=TLS301+TLV301; TLS=TLS+TLS301; TLV=TLV+TLV301; TL=TL+TL301; /* ------------------------------------------------------------------ */ /* 208J 3-POINT BELTS FOR CENTER REAR SEAT OCCUPANTS (ANTON'S LAW) */ /* MEDIAN INSTALLATION YEAR: 2003 PHASE-IN STARTED MY 2006 */ /* ------------------------------------------------------------------ */ /* IDENTIFIES CENTER REAR SEAT OCCUPANTS WEARING 3-POINT BELTS */ PS208J=0; PV208J=0; IF SEAT2=22 AND REST3=3 THEN DO; IF 2006 LE XMY LE 2013 THEN PS208J=1; ELSE IF 1994 LE XMY LE 2005 THEN PV208J=1; END; /* LIVES SAVED AND EJECTIONS PREVENTED BY CENTER-REAR-SEAT 3-POINT BELTS */ OLDWTFA=WEIGHTFA; IF PS208J GT 0 OR PV208J GT 0 THEN DO;
In general, belts are more effective in LTVs than in cars; also, a higher percentage of unrestrained fa-talities were ejected. The data in NHTSA’s evaluation of 3-point belts in the outboard rear seats indi-cate fatality reduction of 50 percent in frontals, 84 percent in rollovers and 70 percent in side, rear and other impacts. We will assume the same effectiveness for 3-point belts in the center rear seat. In frontal crashes, 49 percent of unrestrained center rear seat passenger fatalities were ejected, 59 percent in side impacts, 85 percent in rollovers and 58 percent in rear/other impacts. IF CRSH=1 THEN DO; E=.50; EJECT2=.49; END; ELSE IF CRSH=2 THEN DO; E=.70; EJECT2=.59; END; ELSE IF CRSH=3 THEN DO; E=.84; EJECT2=.85; END; ELSE IF CRSH=4 THEN DO; E=.70; EJECT2=.58; END; P=PS208J+PV208J; S=OLDWTFA*E*P / (1 - E*P); TLS208J=S*PS208J/P; TLV208J=S*PV208J/P; WEIGHTFA=OLDWTFA+TLS208J+TLV208J; END; ELSE DO; TLS208J=0; TLV208J=0; END; TL208J=TLS208J+TLV208J; TLS=TLS+TLS208J; TLV=TLV+TLV208J; TL=TL+TL208J; /* ------------------------------------------------------------------ */ /* 208K VOLUNTARY INSTALLATION OF PRETENSIONERS & LOAD LIMITERS */ /* MEDIAN INSTALLATION YEAR: 2002 */ /* ------------------------------------------------------------------ */
NHTSA study showed significant 12.8-percent fatality reduction for occupant wearing belt with pre-tensioners and load limiters relative to occupant wearing belt without these devices: in passenger cars, CUVs, and minivans. No significant effect in pickup trucks, full-size vans, or truck-based SUVs. First step is identifying the make-models of LTVs that are CUVs or minivans. /* IDENTIFIES CUVs AND MINIVANS WITH PRETENSIONERS & LOAD LIMITERS AT THE OUTBOARD FRONT SEATS */ /* NHTSA DOES NOT CLAIM AN EFFECTIVENESS IN PICKUP TRUCKS, TRUCK-BASED SUVs, OR FULL-SIZE VANS */ PS208K=0; PV208K=0; IF SEAT2 IN (11,13) AND REST3=3 AND (XMM2 IN (2001,2352,2353,6052,6054,7021,7027,12017,12022,12014,13014,12025,13016, /* CUVs */ 12342:12347,14342:14347,41342:41347,18024,18356,18357,19020,47038,20023,20024, 23008,22352,22353,24010,24362:24366,30302,30303,30313,32047,32303,32313, 33035,34044,34303,34313,35049,35051,35052,35332,35333,37032,37302,37303,37332,37333, 41053,41054,42323,42333,42336,42337,45313,48044,48045,48303,48313, 49053,49320:49323,49342:49347,51043,51047,51312,51313,52047,52312,52313, 20338,20339,22338,22339,23338,23339,55302:55309,55322,55323,55332,55333, 54040,54302,54303,54323,58039,58040,59332,59333,59342,59343,63241,63243) OR XMM2 IN (6400:6409,7400:7409,7600:7609,9400:9409,30406,12400,12402,12460,12462, /* MINIVANS */ 14402,14450,14452,35450,35452,18450:18459,18650:18659,20440:20459,20640:20659, 21450:21459,22440:22459,22640:22659,24450:24459,30412,30612,37402,38402, 41400:41403,49400:49403,49422,49423,55402,63402) OR (XMM2 IN (37322,37323) AND XMY GE 2003) OR /* STARTED AS TRUCK-BASED SUVs BUT LATER REDESIGNED AS CUVs */ (XMM2 IN (42302,42303) AND XMY GE 2006) OR (XMM2 IN (53338,53339) AND XMY GE 2007) OR

424
(XMM2 IN (63302,63303) AND XMY GE 2005) OR (XMM2 IN (63312,63313) AND XMY GE 2011)) THEN DO; IF 2008 LE XMY LE 2013 THEN PV208K=1; ELSE IF 1995 LE XMY LE 2007 AND PRETENLL=1 THEN PV208K=1; END; /* LIVES SAVED BY PRETENSIONERS & LOAD LIMITERS: BELTED DRIVERS & RF PASSENGERS */ OLDWTFA=WEIGHTFA; IF PS208K GT 0 OR PV208K GT 0 THEN DO; IF CRSH=1 THEN E=.128; ELSE E=0; /* CONSERVATIVELY ASSUME BENEFIT ONLY IN FRONTAL IMPACTS */ P=PS208K+PV208K; S=OLDWTFA*E*P / (1 - E*P); TLS208K=S*PS208K/P; TLV208K=S*PV208K/P; WEIGHTFA=OLDWTFA+TLS208K+TLV208K; END; ELSE DO; TLS208K=0; TLV208K=0; END; TL208K=TLS208K+TLV208K; TLS=TLS+TLS208K; TLV=TLV+TLV208K; TL=TL+TL208K; /* ------------------------------------------------------------------ */ /* 201B INTERIOR IMPACT PROTECTION: HEAD-IMPACT UPGRADE */ /* MEDIAN INSTALLATION YEAR: EARLY 2002 PHASE-IN STARTED MY 1999 */ /* ------------------------------------------------------------------ */ /* IDENTIFIES ANY OCCUPANT SITTING AT A DESIGNATED SEATING POSITION IN A VEHICLE MEETING THE HEAD-IMPACT UPGRADE */ PS201B=0; PV201B=0; IF SEAT2 IN (11,12,13,21,22) THEN DO; IF 2003 LE XMY LE 2013 THEN PS201B=1; ELSE IF 1999 LE XMY LE 2002 AND FMVSS201=1 THEN PS201B=1; END; /* LIVES SAVED BY UPGRADED UPPER-INTERIOR PADDING */ OLDWTFA=WEIGHTFA; IF PS201B GT 0 OR PV201B GT 0 THEN DO; E=.04276; /* 23.73% REDUCTION OF UPPER-INTERIOR AIS 4-6, UPPER-INTERIOR-HEAD IS MOST SEVERE INJURY IN 18.02% OF FATALS */ P=PS201B+PV201B; S=OLDWTFA*E*P / (1 - E*P); TLS201B=S*PS201B/P; TLV201B=S*PV201B/P; WEIGHTFA=OLDWTFA+TLS201B+TLV201B; END; ELSE DO; TLS201B=0; TLV201B=0; END; TL201B=TLS201B+TLV201B; TLS=TLS+TLS201B; TLV=TLV+TLV201B; TL=TL+TL201B; /* -------------------------------------------------------------------- */ /* 108 TRAILER CONSPICUITY TAPE - LIVES SAVED, LTVs NOT HITTING THEM */ /* 54% OF TRAILERS ON THE ROAD HAD THEM IN: 1996 */ /* FMCSA RETROFIT REQUIREMENT ISSUED 3/31/1999, TOOK EFFECT 6/1/2001 */ /* -------------------------------------------------------------------- */ /* IDENTIFIES SIDE/REAR IMPACTS INTO TRAILERS IN THE DARK AND % OF TRAILERS WITH TAPE */ PS108=0; PV108=0; IF CY GE 1991 AND (TAPECASE=1 OR (OVTYP=3 AND ((1991 LE CY LE 1994 AND OVCONFIG=5) OR (CY GE 1995 AND OVCONFIG=6)) AND 2 LE LGT_COND LE 5 AND (OIMPACT2 IN (14,16) AND MAN_COLL IN (1,4,5) AND IMPACT2 IN (11,11.5,12,.5,1)))) THEN DO; IF CY=1991 THEN DO; PS108=0; PV108=.09; END; ELSE IF CY=1992 THEN DO; PS108=0; PV108=.18; END; ELSE IF CY=1993 THEN DO; PS108=0; PV108=.27; END; ELSE IF CY=1994 THEN DO; PS108=.09; PV108=.27; END; ELSE IF CY=1995 THEN DO; PS108=.18; PV108=.27; END; ELSE IF CY=1996 THEN DO; PS108=.27; PV108=.27; END; ELSE IF CY=1997 THEN DO; PS108=.36; PV108=.27; END; ELSE IF CY=1998 THEN DO; PS108=.45; PV108=.27; END; ELSE IF CY=1999 THEN DO; PS108=.54; PV108=.27; END; ELSE IF CY=2000 THEN DO; PS108=.63; PV108=.27; END; ELSE IF CY=2001 THEN DO; PS108=.8775; PV108=.1125; END; ELSE IF CY GE 2002 THEN DO; PS108=1; PV108=0; END; END; /* LTV OCCUPANT LIVES SAVED BY CONSPICUITY TAPE ON TRUCK TRAILERS */ OLDWTFA=WEIGHTFA; IF PS108 GT 0 OR PV108 GT 0 THEN DO; E=.29; P=PS108+PV108;

425
S=OLDWTFA*E*P / (1 - E*P); TLS108=S*PS108/P; TLV108=S*PV108/P; WEIGHTFA=OLDWTFA+TLS108+TLV108; END; ELSE DO; TLS108=0; TLV108=0; END; TL108=TLS108+TLV108; TLS=TLS+TLS108; TLV=TLV+TLV108; TL=TL+TL108; /* ------------------------------------------------------------------ */ /* 208I FRONTAL AIR BAGS FOR DRIVERS AND RF PASSENGERS */ /* ASSUMES 18 PERCENT OF ON-OFF SWITCHES ARE TURNED OFF FOR RF 13+ */ /* MEDIAN INSTALLATION YEAR: 1995 PHASE-IN STARTED MY 1995 */ /* ------------------------------------------------------------------ */ /* IDENTIFIES LTVs WITH AIR BAGS */ PS208I=0; PV208I=0; P_BARRIER=0; P_SLED=0; P_CAC=0; UDAB=0; UPAB=0;
“PASSIVE,” the variable that indicates the types of occupant protection at the outboard front seats, is only defined if FARS has at least a partial VIN to decode. However, even when there is no VIN at all, we can often infer from the body type, the model year and the make if the LTV had driver and/or pas-senger air bags. All SUVs and minivans from MY 1998 onwards have had dual air bags; all compact pickups have had driver air bags from MY 1998 onwards. Some makes had driver air bags (UDAB = 1) or passenger air bags (UPAB = 1) on all LTVs of a certain body type before 1998. Because the FARS body types “large van” and “standard pickup” include vehicles with GVWR over 8,500 pounds, they may be without air bags even after 1998. /* LTVs WITH UNKNOWN "PASSIVE" (BAD VINs AND/OR NO MAK_MOD) CLASSIFIED BY MAKE AND MODEL YEAR */ IF CY GE 1991 AND XMY GE 1992 AND PASSIVE IN (.,9,1099,9999) AND SEAT2 IN (11,12,13,18) THEN DO; IF SEAT2=11 THEN DO; IF (MAKE IN (6,9) AND XMY GE 1992) OR (MAKE IN (7,12,49) AND BODY_TYP=20 AND XMY GE 1992) OR (MAKE=41 AND BODY_TYP=20 AND XMY GE 1993) OR (MAKE IN (14,21,22) AND XMY GE 1994) OR (MAKE=7 AND BODY_TYP=30 AND XMY GE 1994) OR (MAKE=12 AND BODY_TYP IN (15,16) AND XMY GE 1994) OR (MAKE IN (20,23,35) AND BODY_TYP=20 AND XMY GE 1994) OR (MAKE=49 AND BODY_TYP=31 AND XMY GE 1994) OR (MAKE=30 AND XMY GE 1995) OR (MAKE=7 AND BODY_TYP=21 AND XMY GE 1995) OR (MAKE IN (12,20,23) AND BODY_TYP=30 AND XMY GE 1995) OR (MAKE IN (12,23) AND BODY_TYP=14 AND XMY GE 1995) OR (MAKE IN (20,23,49) AND BODY_TYP IN (15,16) AND XMY GE 1995) OR (MAKE=12 AND BODY_TYP=21 AND XMY GE 1995) OR (MAKE IN (2,37,53,54,59,62) AND XMY GE 1996) OR (MAKE IN (20,38,49) AND BODY_TYP=14 AND XMY GE 1996) OR (MAKE IN (35,38,41,49) AND BODY_TYP=30 AND XMY GE 1996) OR (MAKE=38 AND BODY_TYP=20 AND XMY GE 1996) OR (MAKE IN (52,58,63) AND XMY GE 1997) OR (MAKE=35 AND BODY_TYP=14 AND XMY GE 1997) OR (MAKE IN (13,18,19,34,42,48,55) AND XMY GE 1998) OR (MAKE=7 AND BODY_TYP IN (15,16) AND XMY GE 1998) OR (MAKE=41 AND BODY_TYP=14 AND XMY GE 1998) OR (MAKE=12 AND BODY_TYP=31 AND XMY GE 1999) OR (MAKE IN (20,23) AND BODY_TYP=31 AND XMY GE 2001) THEN UDAB=1; END; ELSE IF SEAT2 IN (12,13,18) THEN DO; IF (MAKE IN (6,9) AND XMY GE 1994) OR (MAKE IN (7,49) AND BODY_TYP=20 AND XMY GE 1994) OR (MAKE=12 AND BODY_TYP=14 AND XMY GE 1995) OR (MAKE=49 AND BODY_TYP IN (15,16) AND XMY GE 1995) OR (MAKE IN (14,37,53,54,59,62) AND XMY GE 1996) OR (MAKE IN (23,35,38,41) AND BODY_TYP=20 AND XMY GE 1996) OR (MAKE IN (38,49) AND BODY_TYP=14 AND XMY GE 1996) OR (MAKE IN (2,22,30,52,58) AND XMY GE 1997) OR (MAKE IN (12,20,23) AND BODY_TYP IN (15,16) AND XMY GE 1997) OR (MAKE=12 AND BODY_TYP=21 AND XMY GE 1997)
426
OR (MAKE=20 AND BODY_TYP=20 AND XMY GE 1997) OR (MAKE=35 AND BODY_TYP=14 AND XMY GE 1997) OR (MAKE IN (13,18,19,21,34,42,48,55,63) AND XMY GE 1998) OR (MAKE=7 AND BODY_TYP IN (15,16) AND XMY GE 1998) OR (MAKE=7 AND BODY_TYP=21 AND XMY GE 1998) OR (MAKE=12 AND BODY_TYP=20 AND XMY GE 1998) OR (MAKE IN (20,23,41) AND BODY_TYP=14 AND XMY GE 1998) THEN UPAB=1; END; END;
These are the codes of PASSIVE, based on VIN analysis, that indicate a car is equipped with frontal air bags and the driver or RF seats, respectively – and whether they are barrier-certified, sled-certified, or advanced. PS208I includes any installation from MY 1995 onwards, because the phase-in of auto-matic occupant protection began on September 1, 1994. IF CY GE 1990 AND XMY GE 1991 AND (SEAT2=11 AND (PASSIVE IN (1,2,3,1090) OR UDAB=1)) OR (SEAT2 IN (12,13,18) AND (PASSIVE IN (2,3) OR UPAB=2)) THEN DO; IF 1991 LE XMY LE 1994 THEN DO; PV208I=1; P_BARRIER=1; END; ELSE IF XMY GE 1995 THEN DO; PS208I=1; IF XMY LE 1997 THEN P_BARRIER=1; ELSE IF 2000 LE XMY LE 2002 THEN P_SLED=1; ELSE IF XMY GE 2007 THEN P_CAC=1; ELSE IF REDES=0 AND CAC=0 THEN P_BARRIER=1; ELSE IF REDES=1 AND CAC=0 THEN P_SLED=1; ELSE IF REDES=1 AND CAC=1 THEN P_CAC=1; END; END; /* ------------------------------------------------------------------ */ /* SPLITS CASES INTO SCENARIOS DEPENDING ON AIR BAG TYPE, SEAT */ /* POSITION, ON-OFF SWITCH PRESENCE, OCCUPANT AGE, RESTRAINT USE */ /* COMPUTES LIVES SAVED BY AIR BAGS IN EACH SCENARIO */ /* ------------------------------------------------------------------ */
Same eight scenarios (plus default scenario of no air bag), same effectiveness, and same lives-saved computations as for passenger cars: IF PS208I=0 AND PV208I=0 THEN GOTO TNOBAG; /* NO AIR BAG */ ELSE IF CY GE 2005 AND PER_TYP=3 AND AIR_BAG IN (.,0,20,28:32,97:99) THEN GOTO TNOBAG; /* OCCUPANT OF A PARKED CAR: ASSUME NO BENEFIT UNLESS FARS SAYS DEPLOYMENT */ ELSE IF SEAT2=11 AND REST3 GT 0 THEN GOTO TDRVBELT; /* BELTED DRIVER */ ELSE IF SEAT2=11 THEN GOTO TDRVUNR; /* UNRESTRAINED DRIVER */ ELSE IF PASSIVE=3 AND 0 LE AGE LE 12 THEN GOTO TKIDSW; /* CHILD RF WITH SWITCH */ ELSE IF 0 LE AGE LE 12 THEN GOTO TKID; /* CHILD RF NO SWITCH */ ELSE IF SEAT2 IN (12,18) THEN GOTO TNOBAG; /* ADULT IN CENTER FRONT OR NON-DESIGNATED SEAT: AIR BAG HAS NO EFFECT */ ELSE IF PASSIVE=3 AND REST3 GT 0 THEN GOTO TRFBELSW; /* BELTED ADULT RF W SWITCH */ ELSE IF PASSIVE=3 THEN GOTO TRFUNRSW; /* UNBELTED ADULT RF W SWITCH */ ELSE IF REST3 GT 0 THEN GOTO TRFBELT; /* BELTED ADULT RF NO SWITCH */ ELSE GOTO TRFUNR; /* UNBELTED ADULT RF NO SWITCH */ TNOBAG: /* ALL EFFECTS ARE ZERO HERE, BECAUSE NO FRONTAL AIR BAGS - BUT THESE ARE THE VARIABLES WE WILL TALLY IN EACH SCENARIO */ TLS208I=0; /* NET LIVES SAVED BY FRONTAL AIR BAGS, MY 1987 & LATER VEHICLES (AFTER 208 AUTOMATIC-PROTECTION PHASE-IN STARTED) */ TLV208I=0; /* NET LIVES SAVED BY FRONTAL AIR BAGS, MY 1985 & 1986 (BEFORE 208 PHASE-IN) */ TL208I=0; /* NET LIVES SAVED BY ANY FRONTAL AIR BAGS */ T_BARRIER=0; /* NET LIVES SAVED BY BARRIER-CERTIFIED AIR BAGS */ T_SLED=0; /* NET LIVES SAVED BY SLED-CERTIFIED AIR BAGS */ T_CAC=0; /* NET LIVES SAVED BY ADVANCED AIR BAGS. NOTE: TL208I = TLV208I+TLS208I = T_BARRIER+T_SLED+T_CAC */ TABDRV=0; /* DRIVERS SAVED BY FRONTAL AIR BAGS */ TABRF=0; /* RF PASSENGERS 13 AND OLDER SAVED BY FRONTAL AIR BAGS IN VEHICLES W/O ON-OFF SWITCHES */
427
TABKID_BARRIER=0; /* NET EFFECT OF BARRIER-CERTIFIED BAGS ON RF AGE 0-12 (NEGATIVE NUMBER BECAUSE FATALITY INCREASE), VEH W/O SWITCHES */ TABKID_SLED=0; /* NET EFFECT OF SLED-CERTIFIED BAGS ON RF AGE 0-12 (NEGATIVE NUMBER BECAUSE FATALITY IN-CREASE), VEH W/O SWITCHES */ TSW0=0; /* ACTUAL RF 13 & OLDER SAVED IN VEH WITH ON-OFF SWITCHES, AND THE SWITCHES WERE LEFT ON */ TSW1=0; /* THEORETICAL RF 13 & OLDER SAVED IN VEH WITH ON-OFF SWITCHES, IF THESE SWITCHES HAD ALL BEEN LEFT ON */ TSW2=0; /* LIVES LOST BECAUSE SWITCHES WERE TURNED OFF FOR RF 13+ (NEGATIVE NUMBER BECAUSE FATALITY IN-CREASE). NOTE: TSW0=TSW1+TSW2 */ TSWKID0_BARRIER=0; /* ACTUAL ADD'L CHILD PASSENGER FATALITIES DUE TO BARRIER-CERTIFIED AIR BAGS & SWITCHES LEFT ON */ TSWKID1_BARRIER=0; /* THEORETICAL CHILD PASSENGER FATALITIES DUE TO BARRIER-CERTIFIED AIR BAGS IF SWITCHES HAD NOT EXISTED */ TSWKID2_BARRIER=0; /* LIVES SAVED BECAUSE SWITCHES WERE TURNED OFF FOR CHILD PASSENGERS WITH BARRIER-CERTIFIED AIR BAGS */ TSWKID0_SLED=0; /* ACTUAL ADD'L CHILD PASSENGER FATALITIES DUE TO SLED-CERTIFIED AIR BAGS & SWITCHES LEFT ON */ TSWKID1_SLED=0; /* THEORETICAL CHILD PASSENGER FATALITIES DUE TO SLED-CERTIFIED AIR BAGS IF SWITCHES HAD NOT EXISTED */ TSWKID2_SLED=0; /* LIVES SAVED BECAUSE SWITCHES WERE TURNED OFF FOR CHILD PASSENGERS WITH SLED-CERTIFIED AIR BAGS */ T_KID_SLED=0; /* CHILDREN'S LIVES SAVED BECAUSE THEY WERE EXPOSED TO SLED-CERTIFIED RATHER THAN BARRIER-CERTIFIED AIR BAGS */ T_KID_CAC=0; /* CHILDREN'S LIVES SAVED BECAUSE THEY SAT BEHIND ADVANCED AIR BAGS (NO/LOW-RISK DEPLOYMENT) RATHER THAN BARRIER-CERT */ T_ADULT_CAC=0; /* RF 13+ SAVED BECAUSE ADVANCED AIR BAGS ELIMINATED MANUAL SWITCHES THAT WOULD HAVE BEEN TURNED OFF FOR THESE RF */ GOTO T214A; TDRVBELT: OLDWTFA=WEIGHTFA; IF 1 LE M_HARM LE 6 OR CRSH IN (3,4) OR (TL226+TL214C)/OLDWTFA GT .05052 THEN E=0; /* ASSUME NO BENEFIT IF THE CRASH IS BASICALLY ROLLOVER/REAR/OTHER OR IF ROLLOVER CURTAINS/SIDE AIR BAGS/SIDE STRUCTURE+PADDING SAVE LIVES. EXCEPTION: FRONTAL AIR BAG CAN HAVE BENEFIT (E.G. IN 2:00 OR 10:00) IF THESE OTHERS HAVE LITTLE EFFECT */ ELSE IF IMPACT2=12 OR (IMPACT2 IN (.,14:18,98,99) AND IMPACT1=12) THEN E=.25258; ELSE IF IMPACT2 IN (.5,1,11,11.5) OR (IMPACT2 IN (.,14:18,98,99) AND IMPACT1 IN (1,11)) THEN E=.13239; ELSE IF IMPACT2 IN (1.5,2,10,10.5) OR (IMPACT2 IN (.,14:18,98,99) AND IMPACT1 IN (2,10)) THEN E=.05052; ELSE E=0; P=PS208I+PV208I; S=OLDWTFA*E*P / (1 - E*P); TLS208I=S*PS208I/P; TLV208I=S*PV208I/P; T_BARRIER=S*P_BARRIER/P; T_SLED=S*P_SLED/P; T_CAC=S*P_CAC/P; WEIGHTFA=OLDWTFA+TLS208I+TLV208I; TL208I=TLS208I+TLV208I; TLS=TLS+TLS208I; TLV=TLV+TLV208I; TL=TL+TL208I; TABDRV=TL208I; TABRF=0; TABKID_BARRIER=0; TABKID_SLED=0; TSW0=0; TSW1=0; TSW2=0; TSWKID0_BARRIER=0; TSWKID1_BARRIER=0; TSWKID2_BARRIER=0; TSWKID0_SLED=0; TSWKID1_SLED=0; TSWKID2_SLED=0; T_KID_SLED=0; T_KID_CAC=0; T_ADULT_CAC=0; GOTO T214A; TDRVUNR: OLDWTFA=WEIGHTFA; IF 1 LE M_HARM LE 6 OR CRSH IN (3,4) OR (TL226+TL214C)/OLDWTFA GT .06548 THEN E=0; /* ASSUME NO BENEFIT IF THE CRASH IS BASICALLY ROLLOVER/REAR/OTHER OR IF ROLLOVER CURTAINS/SIDE AIR BAGS/SIDE STRUCTURE+PADDING SAVE LIVES. EXCEPTION: FRONTAL AIR BAG CAN HAVE BENEFIT (E.G. IN 2:00 OR 10:00) IF THESE OTHERS HAVE LITTLE EFFECT */

428
ELSE IF IMPACT2=12 OR (IMPACT2 IN (.,14:18,98,99) AND IMPACT1=12) THEN E=.32742; ELSE IF IMPACT2 IN (.5,1,11,11.5) OR (IMPACT2 IN (.,14:18,98,99) AND IMPACT1 IN (1,11)) THEN E=.17161; ELSE IF IMPACT2 IN (1.5,2,10,10.5) OR (IMPACT2 IN (.,14:18,98,99) AND IMPACT1 IN (2,10)) THEN E=.06548; ELSE E=0; P=PS208I+PV208I; S=OLDWTFA*E*P / (1 - E*P); TLS208I=S*PS208I/P; TLV208I=S*PV208I/P; T_BARRIER=S*P_BARRIER/P; T_SLED=S*P_SLED/P; T_CAC=S*P_CAC/P; WEIGHTFA=OLDWTFA+TLS208I+TLV208I; TL208I=TLS208I+TLV208I; TLS=TLS+TLS208I; TLV=TLV+TLV208I; TL=TL+TL208I; TABDRV=TL208I; TABRF=0; TABKID_BARRIER=0; TABKID_SLED=0; TSW0=0; TSW1=0; TSW2=0; TSWKID0_BARRIER=0; TSWKID1_BARRIER=0; TSWKID2_BARRIER=0; TSWKID0_SLED=0; TSWKID1_SLED=0; TSWKID2_SLED=0; T_KID_SLED=0; T_KID_CAC=0; T_ADULT_CAC=0; GOTO T214A; TRFBELT: OLDWTFA=WEIGHTFA; IF 1 LE M_HARM LE 6 OR CRSH IN (3,4) OR (TL226+TL214C)/OLDWTFA GT .05557 THEN E=0; /* ASSUME NO BENEFIT IF THE CRASH IS BASICALLY ROLLOVER/REAR/OTHER OR IF ROLLOVER CURTAINS/SIDE AIR BAGS/SIDE STRUCTURE+PADDING SAVE LIVES. EXCEPTION: FRONTAL AIR BAG CAN HAVE BENEFIT (E.G. IN 2:00 OR 10:00) IF THESE OTHERS HAVE LITTLE EFFECT */ ELSE IF IMPACT2=12 OR (IMPACT2 IN (.,14:18,98,99) AND IMPACT1=12) THEN E=.27784; ELSE IF IMPACT2 IN (.5,1,11,11.5) OR (IMPACT2 IN (.,14:18,98,99) AND IMPACT1 IN (1,11)) THEN E=.14563; ELSE IF IMPACT2 IN (1.5,2,10,10.5) OR (IMPACT2 IN (.,14:18,98,99) AND IMPACT1 IN (2,10)) THEN E=.05557; ELSE E=0; P=PS208I+PV208I; S=OLDWTFA*E*P / (1 - E*P); TLS208I=S*PS208I/P; TLV208I=S*PV208I/P; T_BARRIER=S*P_BARRIER/P; T_SLED=S*P_SLED/P; T_CAC=S*P_CAC/P; WEIGHTFA=OLDWTFA+TLS208I+TLV208I; TL208I=TLS208I+TLV208I; TLS=TLS+TLS208I; TLV=TLV+TLV208I; TL=TL+TL208I; TABDRV=0; TABRF=TL208I; TABKID_BARRIER=0; TABKID_SLED=0; TSW0=0; TSW1=0; TSW2=0; TSWKID0_BARRIER=0; TSWKID1_BARRIER=0; TSWKID2_BARRIER=0; TSWKID0_SLED=0; TSWKID1_SLED=0; TSWKID2_SLED=0; T_KID_SLED=0; T_KID_CAC=0; IF SWITCH_MM=1 THEN DO; /* IF CAC VEHICLES, NOW WITHOUT SWITCH, STILL HAD THE SWITCH, AND IT WERE OFF, FEW-ER LIVES WOULD BE SAVED */ /* USE RATES FOR ON-OFF SWITCHES BY PASSENGER AGE */ IF 13 LE AGE LE 15 THEN U=.22; ELSE IF 16 LE AGE LE 19 THEN U=.17; ELSE IF 20 LE AGE LE 59 THEN U=.15; ELSE IF 60 LE AGE LE 69 THEN U=.19; ELSE IF AGE GE 70 THEN U=.56; T_ADULT_CAC=U*T_CAC; END; ELSE T_ADULT_CAC=0; GOTO T214A; TRFUNR: OLDWTFA=WEIGHTFA; IF 1 LE M_HARM LE 6 OR CRSH IN (3,4) OR (TL226+TL214C)/OLDWTFA GT .07203 THEN E=0; /* ASSUME NO BENEFIT IF THE CRASH IS BASICALLY ROLLOVER/REAR/OTHER OR IF ROLLOVER CURTAINS/SIDE AIR BAGS/SIDE STRUCTURE+PADDING SAVE LIVES. EXCEPTION: FRONTAL AIR BAG CAN HAVE BENEFIT (E.G. IN 2:00 OR 10:00) IF THESE OTHERS HAVE LITTLE EFFECT */ ELSE IF IMPACT2=12 OR (IMPACT2 IN (.,14:18,98,99) AND IMPACT1=12) THEN E=.36016; ELSE IF IMPACT2 IN (.5,1,11,11.5) OR (IMPACT2 IN (.,14:18,98,99) AND IMPACT1 IN (1,11)) THEN E=.18877; ELSE IF IMPACT2 IN (1.5,2,10,10.5) OR (IMPACT2 IN (.,14:18,98,99) AND IMPACT1 IN (2,10)) THEN E=.07203; ELSE E=0; P=PS208I+PV208I; S=OLDWTFA*E*P / (1 - E*P); TLS208I=S*PS208I/P; TLV208I=S*PV208I/P; T_BARRIER=S*P_BARRIER/P; T_SLED=S*P_SLED/P; T_CAC=S*P_CAC/P; WEIGHTFA=OLDWTFA+TLS208I+TLV208I; TL208I=TLS208I+TLV208I; TLS=TLS+TLS208I; TLV=TLV+TLV208I; TL=TL+TL208I;
429
TABDRV=0; TABRF=TL208I; TABKID_BARRIER=0; TABKID_SLED=0; TSW0=0; TSW1=0; TSW2=0; TSWKID0_BARRIER=0; TSWKID1_BARRIER=0; TSWKID2_BARRIER=0; TSWKID0_SLED=0; TSWKID1_SLED=0; TSWKID2_SLED=0; T_KID_SLED=0; T_KID_CAC=0; IF SWITCH_MM=1 THEN DO; /* IF CAC VEHICLES, NOW WITHOUT SWITCH, STILL HAD THE SWITCH, AND IT WERE OFF, FEW-ER LIVES WOULD BE SAVED */ /* USE RATES FOR ON-OFF SWITCHES BY PASSENGER AGE */ IF 13 LE AGE LE 15 THEN U=.22; ELSE IF 16 LE AGE LE 19 THEN U=.17; ELSE IF 20 LE AGE LE 59 THEN U=.15; ELSE IF 60 LE AGE LE 69 THEN U=.19; ELSE IF AGE GE 70 THEN U=.56; T_ADULT_CAC=U*T_CAC; END; ELSE T_ADULT_CAC=0; GOTO T214A; TKID: OLDWTFA=WEIGHTFA; IF KCRSH=1 AND RESTGP=1 THEN E=-4.5; /* FATALITY INCREASE, BARRIER-CERT REL TO NO BAGS, DIRECT FRONTALS, 3 GPS OF YOUNG CHILDREN */ ELSE IF KCRSH=1 AND RESTGP IN (2,3) THEN E=-1; ELSE IF KCRSH=1 AND RESTGP IN (4,5,6) THEN E=-.70; ELSE IF KCRSH IN (2,3) AND RESTGP=1 THEN E=-1.71; /* INCREASE IN OBLIQUE FRONTALS IS 62% LESS THAN IN DIRECT FRONTALS */ ELSE IF KCRSH IN (2,3) AND RESTGP IN (2,3) THEN E=-.38; ELSE IF KCRSH IN (2,3) AND RESTGP IN (4,5,6) THEN E=-.27; ELSE IF KCRSH=11 AND RESTGP=1 THEN E=-.77; /* FATALITY INCREASE WITH SLED-CERTIFIED IS 83% LESS THAN WITH BARRIER-CERTIFIED */ ELSE IF KCRSH=11 AND RESTGP IN (2,3) THEN E=-.17; ELSE IF KCRSH=11 AND RESTGP IN (4,5,6) THEN E=-.12; ELSE IF KCRSH IN (12,13) AND RESTGP=1 THEN E=-.29; /* SLED-CERTIFIED, OBLIQUE FRONTAL */ ELSE IF KCRSH IN (12,13) AND RESTGP IN (2,3) THEN E=-.06; ELSE IF KCRSH IN (12,13) AND RESTGP IN (4,5,6) THEN E=-.05; ELSE E=0; P=PS208I+PV208I; S=OLDWTFA*E*P / (1 - E*P); TLS208I=S*PS208I/P; TLV208I=S*PV208I/P; T_BARRIER=S*P_BARRIER/P; T_SLED=S*P_SLED/P; T_CAC=S*P_CAC/P; WEIGHTFA=OLDWTFA+TLS208I+TLV208I; TL208I=TLS208I+TLV208I; TLS=TLS+TLS208I; TLV=TLV+TLV208I; TL=TL+TL208I; TABDRV=0; TABRF=0; IF KCRSH IN (1,2,3) THEN DO; TABKID_BARRIER=TL208I; TABKID_SLED=0; END; ELSE IF KCRSH IN (11,12,13) THEN DO; TABKID_BARRIER=0; TABKID_SLED=TL208I; END; ELSE DO; TABKID_BARRIER=0; TABKID_SLED=0; END; TSW0=0; TSW1=0; TSW2=0; TSWKID0_BARRIER=0; TSWKID1_BARRIER=0; TSWKID2_BARRIER=0; TSWKID0_SLED=0; TSWKID1_SLED=0; TSWKID2_SLED=0; T_KID_SLED=0; T_KID_CAC=0; T_ADULT_CAC=0; IF KCRSH IN (11,12,13,21,22,23) THEN DO; /* ADD'L FATALITIES IF BAGS HAD BEEN 1st GEN RATHER THAN SLED OR CAC */ IF KCRSH IN (11) AND RESTGP=1 THEN E_HYP=-3.73; ELSE IF KCRSH IN (11) AND RESTGP IN (2,3) THEN E_HYP=-.83; ELSE IF KCRSH IN (11) AND RESTGP IN (4,5,6) THEN E_HYP=-.58; ELSE IF KCRSH IN (12,13) AND RESTGP=1 THEN E_HYP=-1.42; ELSE IF KCRSH IN (12,13) AND RESTGP IN (2,3) THEN E_HYP=-.32; ELSE IF KCRSH IN (12,13) AND RESTGP IN (4,5,6) THEN E_HYP=-.22; ELSE IF KCRSH IN (21) AND RESTGP=1 THEN E_HYP=-4.5; ELSE IF KCRSH IN (21) AND RESTGP IN (2,3) THEN E_HYP=-1; ELSE IF KCRSH IN (21) AND RESTGP IN (4,5,6) THEN E_HYP=-.70; ELSE IF KCRSH IN (21,23) AND RESTGP=1 THEN E_HYP=-1.71; ELSE IF KCRSH IN (21,23) AND RESTGP IN (2,3) THEN E_HYP=-.38; ELSE IF KCRSH IN (21,23) AND RESTGP IN (4,5,6) THEN E_HYP=-.27; ELSE E_HYP=0; IF KCRSH IN (11,12,13) THEN T_KID_SLED=-1*OLDWTFA*E_HYP; ELSE IF KCRSH IN (21,22,23) THEN T_KID_CAC=-1*OLDWTFA*E_HYP; END; GOTO T214A; TRFBELSW: OLDWTFA=WEIGHTFA; IF 1 LE M_HARM LE 6 OR CRSH IN (3,4) OR (TL226+TL214C)/OLDWTFA GT .05557 THEN E=0;
430
/* ASSUME NO BENEFIT IF THE CRASH IS BASICALLY ROLLOVER/REAR/OTHER OR IF ROLLOVER CURTAINS/SIDE AIR BAGS/SIDE STRUCTURE+PADDING SAVE LIVES. EXCEPTION: FRONTAL AIR BAG CAN HAVE BENEFIT (E.G. IN 2:00 OR 10:00) IF THESE OTHERS HAVE LITTLE EFFECT */ ELSE IF IMPACT2=12 OR (IMPACT2 IN (.,14:18,98,99) AND IMPACT1=12) THEN E=.27784; ELSE IF IMPACT2 IN (.5,1,11,11.5) OR (IMPACT2 IN (.,14:18,98,99) AND IMPACT1 IN (1,11)) THEN E=.14563; ELSE IF IMPACT2 IN (1.5,2,10,10.5) OR (IMPACT2 IN (.,14:18,98,99) AND IMPACT1 IN (2,10)) THEN E=.05557; ELSE E=0; /* USE RATES FOR ON-OFF SWITCHES BY PASSENGER AGE */ IF 13 LE AGE LE 15 THEN U=.22; ELSE IF 16 LE AGE LE 19 THEN U=.17; ELSE IF 20 LE AGE LE 59 THEN U=.15; ELSE IF 60 LE AGE LE 69 THEN U=.19; ELSE IF AGE GE 70 THEN U=.56; P=PS208I+PV208I; X=OLDWTFA/(1 - E*P + U*E*P); S=X - OLDWTFA; TLS208I=S*PS208I/P; TLV208I=S*PV208I/P; T_BARRIER=S*P_BARRIER/P; T_SLED=S*P_SLED/P; T_CAC=S*P_CAC/P; WEIGHTFA=OLDWTFA+TLS208I+TLV208I; Y=X*(1-E); TSW1=X-Y; TSW2=Y-OLDWTFA; TL208I=TLS208I+TLV208I; TLS=TLS+TLS208I; TLV=TLV+TLV208I; TL=TL+TL208I; TSW0=TL208I; TABDRV=0; TABRF=0; TABKID_BARRIER=0; TABKID_SLED=0; TSWKID0_BARRIER=0; TSWKID1_BARRIER=0; TSWKID2_BARRIER=0; TSWKID0_SLED=0; TSWKID1_SLED=0; TSWKID2_SLED=0; T_KID_SLED=0; T_KID_CAC=0; T_ADULT_CAC=0; GOTO T214A; TRFUNRSW: OLDWTFA=WEIGHTFA; IF 1 LE M_HARM LE 6 OR CRSH IN (3,4) OR (TL226+TL214C)/OLDWTFA GT .07203 THEN E=0; /* ASSUME NO BENEFIT IF THE CRASH IS BASICALLY ROLLOVER/REAR/OTHER OR IF ROLLOVER CURTAINS/SIDE AIR BAGS/SIDE STRUCTURE+PADDING SAVE LIVES. EXCEPTION: FRONTAL AIR BAG CAN HAVE BENEFIT (E.G. IN 2:00 OR 10:00) IF THESE OTHERS HAVE LITTLE EFFECT */ ELSE IF IMPACT2=12 OR (IMPACT2 IN (.,14:18,98,99) AND IMPACT1=12) THEN E=.36016; ELSE IF IMPACT2 IN (.5,1,11,11.5) OR (IMPACT2 IN (.,14:18,98,99) AND IMPACT1 IN (1,11)) THEN E=.18877; ELSE IF IMPACT2 IN (1.5,2,10,10.5) OR (IMPACT2 IN (.,14:18,98,99) AND IMPACT1 IN (2,10)) THEN E=.07203; ELSE E=0; /* USE RATES FOR ON-OFF SWITCHES BY PASSENGER AGE */ IF 13 LE AGE LE 15 THEN U=.22; ELSE IF 16 LE AGE LE 19 THEN U=.17; ELSE IF 20 LE AGE LE 59 THEN U=.15; ELSE IF 60 LE AGE LE 69 THEN U=.19; ELSE IF AGE GE 70 THEN U=.56; P=PS208I+PV208I; X=OLDWTFA/(1 - E*P + U*E*P); S=X - OLDWTFA; TLS208I=S*PS208I/P; TLV208I=S*PV208I/P; T_BARRIER=S*P_BARRIER/P; T_SLED=S*P_SLED/P; T_CAC=S*P_CAC/P; WEIGHTFA=OLDWTFA+TLS208I+TLV208I; Y=X*(1-E); TSW1=X-Y; TSW2=Y-OLDWTFA; TL208I=TLS208I+TLV208I; TLS=TLS+TLS208I; TLV=TLV+TLV208I; TL=TL+TL208I; TSW0=TL208I; TABDRV=0; TABRF=0; TABKID_BARRIER=0; TABKID_SLED=0; TSWKID0_BARRIER=0; TSWKID1_BARRIER=0; TSWKID2_BARRIER=0; TSWKID0_SLED=0; TSWKID1_SLED=0; TSWKID2_SLED=0;

431
T_KID_SLED=0; T_KID_CAC=0; T_ADULT_CAC=0; GOTO T214A; TKIDSW: OLDWTFA=WEIGHTFA; IF KCRSH=1 AND RESTGP=1 THEN E=-4.5; /* FATALITY INCREASE, BARRIER-CERT REL TO NO BAGS, DIRECT FRONTALS, 3 GPS OF YOUNG CHILDREN */ ELSE IF KCRSH=1 AND RESTGP IN (2,3) THEN E=-1; ELSE IF KCRSH=1 AND RESTGP IN (4,5,6) THEN E=-.70; ELSE IF KCRSH IN (2,3) AND RESTGP=1 THEN E=-1.71; /* INCREASE IN OBLIQUE FRONTALS IS 62% LESS THAN IN DIRECT FRONTALS */ ELSE IF KCRSH IN (2,3) AND RESTGP IN (2,3) THEN E=-.38; ELSE IF KCRSH IN (2,3) AND RESTGP IN (4,5,6) THEN E=-.27; ELSE IF KCRSH=11 AND RESTGP=1 THEN E=-.77; /* FATALITY INCREASE WITH SLED-CERTIFIED IS 83% LESS THAN WITH BARRIER-CERTIFIED */ ELSE IF KCRSH=11 AND RESTGP IN (2,3) THEN E=-.17; ELSE IF KCRSH=11 AND RESTGP IN (4,5,6) THEN E=-.12; ELSE IF KCRSH IN (12,13) AND RESTGP=1 THEN E=-.29; /* SLED-CERTIFIED, OBLIQUE FRONTAL */ ELSE IF KCRSH IN (12,13) AND RESTGP IN (2,3) THEN E=-.06; ELSE IF KCRSH IN (12,13) AND RESTGP IN (4,5,6) THEN E=-.05; ELSE E=0; /* USE RATES FOR ON-OFF SWITCHES BY PASSENGER AGE */ IF AGE=0 THEN U=.86; ELSE IF 1 LE AGE LE 6 THEN U=.74; ELSE IF 7 LE AGE LE 8 THEN U=.59; ELSE IF 9 LE AGE LE 10 THEN U=.47; ELSE IF 11 LE AGE LE 12 THEN U=.30; P=PS208I+PV208I; X=OLDWTFA/(1 - E*P + U*E*P); S=X - OLDWTFA; TLS208I=S*PS208I/P; TLV208I=S*PV208I/P; TL208I=TLS208I+TLV208I; TLS=TLS+TLS208I; TLV=TLV+TLV208I; TL=TL+TL208I; T_BARRIER=S*P_BARRIER/P; T_SLED=S*P_SLED/P; T_CAC=S*P_CAC/P; WEIGHTFA=OLDWTFA+TLS208I+TLV208I; Y=X*(1-E); IF KCRSH IN (1,2,3) THEN DO; TSWKID1_BARRIER=X-Y; TSWKID1_SLED=0; TSWKID2_BARRIER=Y-OLDWTFA; TSWKID2_SLED=0; TSWKID0_BARRIER=TL208I; TSWKID0_SLED=0; END; ELSE IF KCRSH IN (11,12,13) THEN DO; TSWKID1_BARRIER=0; TSWKID1_SLED=X-Y; TSWKID2_BARRIER=0; TSWKID2_SLED=Y-OLDWTFA; TSWKID0_BARRIER=0; TSWKID0_SLED=TL208I; END; ELSE DO; TSWKID1_BARRIER=0; TSWKID1_SLED=0; TSWKID2_BARRIER=0; TSWKID2_SLED=0; TSWKID0_BARRIER=0; TSWKID0_SLED=0; END; TSW0=0; TSW1=0; TSW2=0; TABDRV=0; TABRF=0; TABKID_BARRIER=0; TABKID_SLED=0; TSWKID0=0; TSWKID1=0; TSWKID2=0; T_KID_SLED=0; T_KID_CAC=0; T_ADULT_CAC=0; IF KCRSH IN (11,12,13,21,22,23) THEN DO; /* ADD'L FATALITIES IF BAGS HAD BEEN 1st GEN RATHER THAN SLED OR CAC */ IF KCRSH IN (11) AND RESTGP=1 THEN E_HYP=-3.73; ELSE IF KCRSH IN (11) AND RESTGP IN (2,3) THEN E_HYP=-.83; ELSE IF KCRSH IN (11) AND RESTGP IN (4,5,6) THEN E_HYP=-.58; ELSE IF KCRSH IN (12,13) AND RESTGP=1 THEN E_HYP=-1.42; ELSE IF KCRSH IN (12,13) AND RESTGP IN (2,3) THEN E_HYP=-.32; ELSE IF KCRSH IN (12,13) AND RESTGP IN (4,5,6) THEN E_HYP=-.22; ELSE IF KCRSH IN (21) AND RESTGP=1 THEN E_HYP=-4.5; ELSE IF KCRSH IN (21) AND RESTGP IN (2,3) THEN E_HYP=-1; ELSE IF KCRSH IN (21) AND RESTGP IN (4,5,6) THEN E_HYP=-.70; ELSE IF KCRSH IN (21,23) AND RESTGP=1 THEN E_HYP=-1.71; ELSE IF KCRSH IN (21,23) AND RESTGP IN (2,3) THEN E_HYP=-.38; ELSE IF KCRSH IN (21,23) AND RESTGP IN (4,5,6) THEN E_HYP=-.27; ELSE E_HYP=0; IF KCRSH IN (11,12,13) THEN T_KID_SLED=(U-1)*OLDWTFA*E_HYP; ELSE IF KCRSH IN (21,22,23) THEN T_KID_CAC=(U-1)*OLDWTFA*E_HYP; END;
432
/* ------------------------------------------------------------------ */ /* 214A SIDE DOOR BEAMS */ /* MEDIAN INSTALLATION YEAR: 1994 FMVSS EFFECTIVE DATE: 9/1/1993 */ /* ------------------------------------------------------------------ */
Side door beams were introduced in a few LTV models in 1991-93. All MY 1994 LTVs were equipped with them. /* IDENTIFIES LTVs WITH SIDE DOOR BEAMS */ T214A: PS214A=0; PV214A=0; IF XMY LE 1990 THEN GOTO SAVE214T; IF XMY GE 1994 THEN DO; PS214A=1; GOTO SAVE214T; END; IF (XMM2 IN (12300:12303,41300,41301,20440,20442,21452,22442,49422,49423) OR CG IN (12303,12304,18405,49402)) AND 1991 LE XMY LE 1993 THEN DO; PV214A=1; GOTO SAVE214T; END; IF (XMM2 IN (12410:12439,12610:12639) OR CG=12404) AND 1992 LE XMY LE 1993 THEN DO; PV214A=1; GOTO SAVE214T; END; IF (XMM2 IN (14450,14452,35450,35452,35240:35249,35300:35303,49313) OR CG IN (12405,35203,35204,35301,49303)) AND XMY=1993 THEN DO; PV214A=1; GOTO SAVE214T; END; IF 1 LE XMM2 LE 65999 OR 1201 LE CG LE 63401 THEN GOTO SAVE214T; IF MAKE IN (12,14,20,21,22,35,41,49) THEN GOTO SOMEVOLT; GOTO SAVE214T; SOMEVOLT: IF MAK_MOD IN (12401,41401,20442,21441,22441,49441) AND 1991 LE XMY LE 1993 THEN DO; PV214A=1; GOTO SAVE214T; END; IF MAK_MOD=12461 AND 1992 LE XMY LE 1993 THEN DO; PV214A=1; GOTO SAVE214T; END; IF MAK_MOD IN (14443,35443,35471,35401,49421) AND XMY=1993 THEN DO; PV214A=1; GOTO SAVE214T; END; /* REDUCTION IN SINGLE-VEHICLE SIDE-IMPACT FATALITIES WITH SIDE DOOR BEAMS */ SAVE214T: OLDWTFA=WEIGHTFA;
NHTSA’s evaluation showed side door beams are effective for outboard occupants in single-vehicle side-impact crashes. Fatality reduction is 26 percent for near-side occupants and 11 percent for far-side occupants. IF (PS214A GT 0 OR PV214A GT 0) AND CRSH=2 AND SEAT2 IN (11,13,21) AND VE_FORMS=1 THEN DO; IF (SEAT_POS IN (11,21) AND (IMPACT2 IN (8,8.5,9,9.5,10,61:63) OR (CY GE 2010 AND IMPACT2 IN (.,14:18,98,99) AND IMPACT1 IN (8,9,10,61:63))) OR (SEAT_POS IN (13,23) AND IMPACT2 IN (2,2.5,3,3.5,4,81:83) OR (CY GE 2010 AND IMPACT2 IN (.,14:18,98,99) AND IMPACT1 IN (2,3,4,81:83)))) THEN E=.25; ELSE E=.11; P=PS214A+PV214A; S=OLDWTFA*E*P / (1 - E*P); TLS214A=S*PS214A/P; TLV214A=S*PV214A/P; WEIGHTFA=OLDWTFA+TLS214A+TLV214A; END; ELSE DO; TLS214A=0; TLV214A=0; END; TL214A=TLS214A+TLV214A; TLS=TLS+TLS214A; TLV=TLV+TLV214A; TL=TL+TL214A; /* ------------------------------------------------------------------ */ /* 208G 3-POINT BELTS FOR OUTBOARD REAR SEAT OCCUPANTS */ /* MEDIAN INSTALLATION YEAR: 1992 FMVSS EFFECTIVE DATE: 9/1/1991 */ /* ------------------------------------------------------------------ */ /* IDENTIFIES OUTBOARD REAR SEAT OCCUPANTS WEARING 3-POINT BELTS */ PS208G=0; PV208G=0; IF SEAT2=21 AND REST3=3 THEN DO; IF XMY LE 1991 THEN PV208G=1; ELSE PS208G=1; END; /* LIVES SAVED AND EJECTIONS PREVENTED BY OUTBOARD-REAR-SEAT 3-POINT BELTS */ OLDWTFA=WEIGHTFA; IF PS208G GT 0 OR PV208G GT 0 THEN DO;
Three-point belts in the outboard rear seats reduce fatality risk by 50 percent in frontals, 84 percent in rollovers and 70 percent in side, rear and other impacts. IF CRSH=1 THEN DO; E=.50; EJECT2=.48; END; ELSE IF CRSH=2 THEN DO; E=.70; EJECT2=.59; END; ELSE IF CRSH=3 THEN DO; E=.84; EJECT2=.85; END;

433
ELSE IF CRSH=4 THEN DO; E=.70; EJECT2=.58; END; P=PS208G+PV208G; S=OLDWTFA*E*P / (1 - E*P); TLS208G=S*PS208G/P; TLV208G=S*PV208G/P; WEIGHTFA=OLDWTFA+TLS208G+TLV208G; END; ELSE DO; TLS208G=0; TLV208G=0; END; TL208G=TLS208G+TLV208G; TLS=TLS+TLS208G; TLV=TLV+TLV208G; TL=TL+TL208G; /* ------------------------------------------------------------------ */ /* 213 CHILD SAFETY SEATS */ /* USE RATE WENT OVER 50% IN: 1985 FMVSS EFFECTIVE DATE: 4/1/1971 */ /* ------------------------------------------------------------------ */ /* IDENTIFIES CHILD PASSENGERS IN SAFETY SEATS */ PS213=0; PV213=0; IF REST3=4 THEN DO; IF STATE=1 THEN DO; IF CY=1982 AND MONTH GE 7 AND AGE LE 3 THEN PS213=1; /* STATE LAWS IN EFFECT UP TO WHAT AGE: ALABAMA */ ELSE IF 1983 LE CY LE 2004 AND AGE LE 3 THEN PS213=1; ELSE IF CY GE 2005 AND AGE LE 5 THEN PS213=1; ELSE PV213=1; END; ELSE IF STATE=2 THEN DO; IF CY=1985 AND MONTH GE 6 AND AGE LE 3 THEN PS213=1; /* ALASKA */ ELSE IF 1986 LE CY LE 2007 AND AGE LE 3 THEN PS213=1; ELSE IF CY GE 2008 AND AGE LE 8 THEN PS213=1; ELSE PV213=1; END; ELSE IF STATE=4 THEN DO; IF CY=1983 AND MONTH GE 8 AND AGE LE 4 THEN PS213=1; /* ARIZONA */ ELSE IF 1984 LE CY LE 2010 AND AGE LE 4 THEN PS213=1; ELSE IF CY GE 2011 AND AGE LE 8 THEN PS213=1; ELSE PV213=1; END; ELSE IF STATE=5 THEN DO; IF CY=1983 AND MONTH GE 8 AND AGE LE 2 THEN PS213=1; /* ARKANSAS */ ELSE IF 1984 LE CY LE 1993 AND AGE LE 2 THEN PS213=1; ELSE IF 1994 LE CY LE 1997 AND AGE LE 3 THEN PS213=1; ELSE IF 1998 LE CY LE 2000 AND AGE LE 4 THEN PS213=1; ELSE IF CY GE 2001 AND AGE LE 5 THEN PS213=1; ELSE PV213=1; END; ELSE IF STATE=6 THEN DO; IF 1983 LE CY LE 2000 AND AGE LE 3 THEN PS213=1; /* CALIFORNIA */ ELSE IF CY GE 2001 AND AGE LE 5 THEN PS213=1; ELSE PV213=1; END; ELSE IF STATE=8 THEN DO; IF 1984 LE CY LE 2003 AND AGE LE 3 THEN PS213=1; /* COLORADO */ ELSE IF CY GE 2004 AND AGE LE 5 THEN PS213=1; ELSE PV213=1; END; ELSE IF STATE=9 THEN DO; IF CY=1982 AND MONTH GE 5 AND AGE=0 THEN PS213=1; /* CONNECTICUT */ ELSE IF 1983 LE CY LE 1993 AND AGE=0 THEN PS213=1; ELSE IF CY=1982 AND MONTH GE 5 AND SEAT2 IN (12,13,18) AND AGE LE 3 THEN PS213=1; ELSE IF 1983 LE CY LE 1993 AND SEAT2 IN (12,13,18) AND AGE LE 3 THEN PS213=1; ELSE IF 1994 LE CY LE 2003 AND AGE LE 3 THEN PS213=1; ELSE IF CY GE 2004 AND AGE LE 6 THEN PS213=1; ELSE PV213=1; END; ELSE IF STATE=10 THEN DO; IF CY=1982 AND MONTH GE 6 AND AGE LE 3 THEN PS213=1; /* DELAWARE */ ELSE IF 1983 LE CY LE 2001 AND AGE LE 3 THEN PS213=1; ELSE IF 2002 LE CY LE 2003 AND AGE LE 5 THEN PS213=1; ELSE IF CY GE 2004 AND AGE LE 6 THEN PS213=1; ELSE PV213=1; END; ELSE IF STATE=11 THEN DO; IF CY=1983 AND MONTH GE 7 AND AGE LE 2 THEN PS213=1; /* DC */ ELSE IF 1984 LE CY LE 1997 AND AGE LE 2 THEN PS213=1; ELSE IF 1998 LE CY LE 2001 AND AGE LE 3 THEN PS213=1; ELSE IF CY GE 2002 AND AGE LE 7 THEN PS213=1; ELSE PV213=1; END; ELSE IF STATE=12 THEN DO; IF CY=1983 AND MONTH GE 7 AND AGE LE 3 THEN PS213=1; /* FLORIDA */ ELSE IF CY GE 1984 AND AGE LE 3 THEN PS213=1; ELSE PV213=1; END; ELSE IF STATE=13 THEN DO; IF CY=1984 AND MONTH GE 7 AND AGE LE 2 THEN PS213=1; /* GEORGIA */ ELSE IF 1985 LE CY LE 2002 AND AGE LE 2 THEN PS213=1; ELSE IF CY=2003 AND AGE LE 4 THEN PS213=1; ELSE IF CY GE 2004 AND AGE LE 5 THEN PS213=1; ELSE PV213=1; END; ELSE IF STATE=15 THEN DO; IF CY=1983 AND MONTH GE 7 AND AGE LE 2 THEN PS213=1; /* HAWAII */ ELSE IF 1984 LE CY LE 2003 AND AGE LE 2 THEN PS213=1; ELSE IF 2004 LE CY LE 2006 AND AGE LE 3 THEN PS213=1; ELSE IF CY GE 2007 AND AGE LE 7 THEN PS213=1; ELSE PV213=1; END; ELSE IF STATE=16 THEN DO; IF 1985 LE CY LE 2003 AND AGE LE 3 THEN PS213=1; /* IDAHO */ ELSE IF CY GE 2004 AND AGE LE 6 THEN PS213=1; ELSE PV213=1; END; ELSE IF STATE=17 THEN DO; IF CY=1983 AND MONTH GE 7 AND AGE LE 3 THEN PS213=1; /* ILLINOIS */ ELSE IF 1984 LE CY LE 2003 AND AGE LE 3 THEN PS213=1; ELSE IF CY GE 2004 AND AGE LE 7 THEN PS213=1; ELSE PV213=1; END; ELSE IF STATE=18 THEN DO; IF 1984 LE CY LE 1997 AND AGE LE 2 THEN PS213=1; /* INDIANA */ ELSE IF 1998 LE CY LE 2003 AND AGE LE 3 THEN PS213=1; ELSE IF CY GE 2004 AND AGE LE 7 THEN PS213=1; ELSE PV213=1; END; ELSE IF STATE=19 THEN DO; IF 1985 LE CY LE 2003 AND AGE LE 2 THEN PS213=1; /* IOWA */ ELSE IF CY GE 2004 AND AGE LE 5 THEN PS213=1; ELSE PV213=1; END; ELSE IF STATE=20 THEN DO; IF 1982 LE CY LE 2004 AND AGE LE 3 THEN PS213=1; /* KANSAS */

434
ELSE IF CY GE 2005 AND AGE LE 7 THEN PS213=1; ELSE PV213=1; END; ELSE IF STATE=21 THEN DO; IF CY=1982 AND MONTH GE 7 AND AGE LE 2 THEN PS213=1; /* KENTUCKY */ ELSE IF 1983 LE CY LE 2006 AND AGE LE 2 THEN PS213=1; ELSE IF CY GE 2007 AND AGE LE 6 THEN PS213=1; ELSE PV213=1; END; ELSE IF STATE=22 THEN DO; IF CY=1984 AND MONTH GE 9 AND AGE LE 2 THEN PS213=1; /* LOUISIANA */ ELSE IF 1985 LE CY LE 2003 AND AGE LE 2 THEN PS213=1; ELSE IF CY=1984 AND MONTH GE 9 AND SEAT2 IN (12,13,18) AND AGE LE 4 THEN PS213=1; ELSE IF 1985 LE CY LE 2003 AND SEAT2 IN (12,13,18) AND AGE LE 4 THEN PS213=1; ELSE IF CY GE 2004 AND AGE LE 5 THEN PS213=1; ELSE PV213=1; END; ELSE IF STATE=23 THEN DO; IF CY=1983 AND MONTH GE 9 AND AGE LE 3 THEN PS213=1; /* MAINE */ ELSE IF 1984 LE CY LE 2003 AND AGE LE 3 THEN PS213=1; ELSE IF CY GE 2004 AND AGE LE 7 THEN PS213=1; ELSE PV213=1; END; ELSE IF STATE=24 THEN DO; IF 1984 LE CY LE 1992 AND AGE LE 2 THEN PS213=1; /* MARYLAND */ ELSE IF 1993 LE CY LE 2001 AND AGE LE 3 THEN PS213=1; ELSE IF 2002 LE CY LE 2006 AND AGE LE 5 THEN PS213=1; ELSE IF CY GE 2007 AND AGE LE 7 THEN PS213=1; ELSE PV213=1; END; ELSE IF STATE=25 THEN DO; IF 1982 LE CY LE 2006 AND AGE LE 4 THEN PS213=1; /* MASSACHUSETTS */ ELSE IF CY GE 2007 AND AGE LE 7 THEN PS213=1; ELSE PV213=1; END; ELSE IF STATE=26 THEN DO; IF CY=1982 AND MONTH GE 4 AND AGE=0 THEN PS213=1; /* MICHIGAN */ ELSE IF 1983 LE CY LE 1999 AND AGE=0 THEN PS213=1; ELSE IF CY=1982 AND MONTH GE 4 AND SEAT2 IN (12,13,18) AND AGE LE 4 THEN PS213=1; ELSE IF 1983 LE CY LE 1999 AND SEAT2 IN (12,13,18) AND AGE LE 4 THEN PS213=1; ELSE IF 2000 LE CY LE 2006 AND AGE LE 3 THEN PS213=1; ELSE IF CY GE 2007 AND AGE LE 7 THEN PS213=1; ELSE PV213=1; END; ELSE IF STATE=27 THEN DO; IF CY=1983 AND MONTH GE 8 AND AGE LE 3 THEN PS213=1; /* MINNESOTA */ ELSE IF 1984 LE CY LE 2007 AND AGE LE 3 THEN PS213=1; ELSE IF CY GE 2008 AND AGE LE 7 THEN PS213=1; ELSE PV213=1; END; ELSE IF STATE=28 THEN DO; IF CY=1983 AND MONTH GE 7 AND AGE LE 1 THEN PS213=1; /* MISSISSIPPI */ ELSE IF 1984 LE CY LE 1993 AND AGE LE 1 THEN PS213=1; ELSE IF 1994 LE CY LE 2006 AND AGE LE 3 THEN PS213=1; ELSE IF CY GE 2007 AND AGE LE 6 THEN PS213=1; ELSE PV213=1; END; ELSE IF STATE=29 THEN DO; IF 1984 LE CY LE 2004 AND AGE LE 3 THEN PS213=1; /* MISSOURI */ ELSE IF CY GE 2005 AND AGE LE 7 THEN PS213=1; ELSE PV213=1; END; ELSE IF STATE=30 THEN DO; IF 1984 LE CY LE 2003 AND AGE LE 1 THEN PS213=1; /* MONTANA */ ELSE IF CY GE 2004 AND AGE LE 5 THEN PS213=1; ELSE PV213=1; END; ELSE IF STATE=31 THEN DO; IF CY=1983 AND MONTH GE 8 AND AGE LE 3 THEN PS213=1; /* NEBRASKA */ ELSE IF 1984 LE CY LE 2001 AND AGE LE 3 THEN PS213=1; ELSE IF CY GE 2002 AND AGE LE 5 THEN PS213=1; ELSE PV213=1; END; ELSE IF STATE=32 THEN DO; IF CY=1983 AND MONTH GE 7 AND AGE LE 4 THEN PS213=1; /* NEVADA */ ELSE IF 1984 LE CY LE 2003 AND AGE LE 4 THEN PS213=1; ELSE IF 2004 LE CY LE 2008 AND AGE LE 5 THEN PS213=1; ELSE IF CY GE 2009 AND AGE LE 6 THEN PS213=1; ELSE PV213=1; END; ELSE IF STATE=33 THEN DO; IF CY=1983 AND MONTH GE 7 AND AGE LE 3 THEN PS213=1; /* NEW HAMPSHIRE */ ELSE IF 1984 LE CY LE 2003 AND AGE LE 3 THEN PS213=1; ELSE IF CY GE 2004 AND AGE LE 5 THEN PS213=1; ELSE PV213=1; END; ELSE IF STATE=34 THEN DO; IF CY=1983 AND MONTH GE 4 AND AGE=0 THEN PS213=1; /* NEW JERSEY */ ELSE IF 1984 LE CY LE 2001 AND AGE=0 THEN PS213=1; ELSE IF CY=1983 AND MONTH GE 4 AND SEAT2 IN (12,13,18) AND AGE LE 4 THEN PS213=1; ELSE IF 1984 LE CY LE 2001 AND SEAT2 IN (12,13,18) AND AGE LE 4 THEN PS213=1; ELSE IF CY GE 2002 AND AGE LE 7 THEN PS213=1; ELSE PV213=1; END; ELSE IF STATE=35 THEN DO; IF CY=1983 AND MONTH GE 6 AND AGE=0 THEN PS213=1; /* NEW MEXICO */ ELSE IF 1984 LE CY LE 2001 AND AGE=0 THEN PS213=1; ELSE IF CY=1983 AND MONTH GE 6 AND SEAT2 IN (12,13,18) AND AGE LE 4 THEN PS213=1; ELSE IF 1984 LE CY LE 2001 AND SEAT2 IN (12,13,18) AND AGE LE 4 THEN PS213=1; ELSE IF 2002 LE CY LE 2003 AND AGE LE 4 THEN PS213=1; ELSE IF CY GE 2004 AND AGE LE 6 THEN PS213=1; ELSE PV213=1; END; ELSE IF STATE=36 THEN DO; IF CY=1982 AND MONTH GE 4 AND AGE LE 3 THEN PS213=1; /* NEW YORK */ ELSE IF 1983 LE CY LE 2003 AND AGE LE 3 THEN PS213=1; ELSE IF 2004 LE CY LE 2008 AND AGE LE 6 THEN PS213=1; ELSE IF CY GE 2009 AND AGE LE 7 THEN PS213=1; ELSE PV213=1; END; ELSE IF STATE=37 THEN DO; IF CY=1982 AND MONTH GE 7 AND AGE LE 2 THEN PS213=1; /* NORTH CAROLINA */ ELSE IF 1983 LE CY LE 1992 AND AGE LE 2 THEN PS213=1; ELSE IF 1993 LE CY LE 2001 AND AGE LE 3 THEN PS213=1; ELSE IF 2002 LE CY LE 2003 AND AGE LE 4 THEN PS213=1; ELSE IF CY GE 2004 AND AGE LE 7 THEN PS213=1; ELSE PV213=1; END; ELSE IF STATE=38 THEN DO; IF 1984 LE CY LE 1998 AND AGE LE 2 THEN PS213=1; /* NORTH DAKOTA */ ELSE IF 1999 LE CY LE 2003 AND AGE LE 3 THEN PS213=1; ELSE IF CY GE 2004 AND AGE LE 6 THEN PS213=1; ELSE PV213=1; END; ELSE IF STATE=39 THEN DO; IF CY=1983 AND MONTH GE 3 AND AGE LE 3 THEN PS213=1; /* OHIO */ ELSE IF 1984 LE CY LE 2007 AND AGE LE 3 THEN PS213=1; ELSE IF CY GE 2008 AND AGE LE 8 THEN PS213=1; ELSE PV213=1; END; ELSE IF STATE=40 THEN DO; IF CY=1983 AND MONTH GE 11 AND AGE LE 3 THEN PS213=1; /* OKLAHOMA */
435
ELSE IF 1984 LE CY LE 2003 AND AGE LE 3 THEN PS213=1; ELSE IF CY GE 2004 AND AGE LE 5 THEN PS213=1; ELSE PV213=1; END; ELSE IF STATE=41 THEN DO; IF 1984 LE CY LE 1994 AND AGE=0 THEN PS213=1; /* OREGON */ ELSE IF 1995 LE CY LE 2001 AND AGE LE 3 THEN PS213=1; ELSE IF 2002 LE CY LE 2006 AND AGE LE 5 THEN PS213=1; ELSE IF CY GE 2007 AND AGE LE 7 THEN PS213=1; ELSE PV213=1; END; ELSE IF STATE=42 THEN DO; IF 1984 LE CY LE 1992 AND AGE=0 THEN PS213=1; /* PENNSYLVANIA */ ELSE IF 1984 LE CY LE 1992 AND SEAT2 IN (12,13,18) AND AGE LE 3 THEN PS213=1; ELSE IF 1993 LE CY LE 2003 AND AGE LE 3 THEN PS213=1; ELSE IF CY GE 2004 AND AGE LE 7 THEN PS213=1; ELSE PV213=1; END; ELSE IF STATE=44 THEN DO; IF CY=1980 AND MONTH GE 7 AND AGE LE 3 THEN PS213=1; /* RHODE ISLAND */ ELSE IF 1981 LE CY LE 2001 AND AGE LE 3 THEN PS213=1; ELSE IF 2002 LE CY LE 2008 AND AGE LE 6 THEN PS213=1; ELSE IF CY GE 2009 AND AGE LE 7 THEN PS213=1; ELSE PV213=1; END; ELSE IF STATE=45 THEN DO; IF CY=1983 AND MONTH GE 7 AND AGE=0 THEN PS213=1; /* SOUTH CAROLINA */ ELSE IF 1984 LE CY LE 2003 AND AGE=0 THEN PS213=1; ELSE IF CY=1983 AND MONTH GE 7 AND SEAT2 IN (12,13,18) AND AGE LE 3 THEN PS213=1; ELSE IF 1984 LE CY LE 2003 AND SEAT2 IN (12,13,18) AND AGE LE 3 THEN PS213=1; ELSE IF CY GE 2004 AND AGE LE 5 THEN PS213=1; ELSE PV213=1; END; ELSE IF STATE=46 THEN DO; IF CY=1984 AND MONTH GE 7 AND AGE LE 1 THEN PS213=1; /* SOUTH DAKOTA */ ELSE IF 1985 LE CY LE 1997 AND AGE LE 1 THEN PS213=1; ELSE IF CY GE 1998 AND AGE LE 4 THEN PS213=1; ELSE PV213=1; END; ELSE IF STATE=47 THEN DO; IF 1978 LE CY LE 2003 AND AGE LE 3 THEN PS213=1; /* TENNESSEE */ ELSE IF CY GE 2004 AND AGE LE 8 THEN PS213=1; ELSE PV213=1; END; ELSE IF STATE=48 THEN DO; IF CY=1984 AND MONTH GE 10 AND AGE LE 1 THEN PS213=1; /* TEXAS */ ELSE IF 1985 LE CY LE 2000 AND AGE LE 1 THEN PS213=1; ELSE IF 2001 LE CY LE 2007 AND AGE LE 2 THEN PS213=1; ELSE IF CY GE 2008 AND AGE LE 8 THEN PS213=1; ELSE PV213=1; END; ELSE IF STATE=49 THEN DO; IF CY=1984 AND MONTH GE 7 AND AGE LE 1 THEN PS213=1; /* UTAH */ ELSE IF 1985 LE CY LE 1999 AND AGE LE 1 THEN PS213=1; ELSE IF 2000 LE CY LE 2006 AND AGE LE 4 THEN PS213=1; ELSE IF CY GE 2007 AND AGE LE 7 THEN PS213=1; ELSE PV213=1; END; ELSE IF STATE=50 THEN DO; IF CY=1984 AND MONTH GE 7 AND AGE=0 THEN PS213=1; /* VERMONT */ ELSE IF 1985 LE CY LE 1992 AND AGE=0 THEN PS213=1; ELSE IF CY=1984 AND MONTH GE 7 AND SEAT2 IN (12,13,18) AND AGE LE 4 THEN PS213=1; ELSE IF 1985 LE CY LE 1992 AND SEAT2 IN (12,13,18) AND AGE LE 4 THEN PS213=1; ELSE IF 1993 LE CY LE 2003 AND AGE LE 4 THEN PS213=1; ELSE IF 2004 LE CY LE 2006 AND AGE LE 6 THEN PS213=1; ELSE IF CY GE 2007 AND AGE LE 7 THEN PS213=1; ELSE PV213=1; END; ELSE IF STATE=51 THEN DO; IF 1983 LE CY LE 1992 AND AGE LE 2 THEN PS213=1; /* VIRGINIA */ ELSE IF 1993 LE CY LE 2001 AND AGE LE 3 THEN PS213=1; ELSE IF 2002 LE CY LE 2006 AND AGE LE 5 THEN PS213=1; ELSE IF CY GE 2007 AND AGE LE 7 THEN PS213=1; ELSE PV213=1; END; ELSE IF STATE=53 THEN DO; IF 1984 LE CY LE 1992 AND AGE=0 THEN PS213=1; /* WASHINGTON STATE */ ELSE IF 1993 LE CY LE 1995 AND AGE LE 1 THEN PS213=1; ELSE IF 1996 LE CY LE 2001 AND AGE LE 2 THEN PS213=1; ELSE IF 2002 LE CY LE 2003 AND AGE LE 5 THEN PS213=1; ELSE IF 2004 LE CY LE 2008 AND AGE LE 7 THEN PS213=1; ELSE IF CY GE 2009 AND AGE LE 8 THEN PS213=1; ELSE PV213=1; END; ELSE IF STATE=54 THEN DO; IF CY=1981 AND MONTH GE 7 AND AGE LE 2 THEN PS213=1; /* WEST VIRGINIA */ ELSE IF 1982 LE CY LE 2003 AND AGE LE 2 THEN PS213=1; ELSE IF CY GE 2004 AND AGE LE 7 THEN PS213=1; ELSE PV213=1; END; ELSE IF STATE=55 THEN DO; IF CY=1982 AND MONTH GE 11 AND AGE LE 1 THEN PS213=1; /* WISCONSIN */ ELSE IF 1983 LE CY LE 2004 AND AGE LE 3 THEN PS213=1; ELSE IF CY GE 2005 AND AGE LE 7 THEN PS213=1; ELSE PV213=1; END; ELSE IF STATE=56 THEN DO; IF CY=1985 AND MONTH GE 4 AND AGE LE 2 THEN PS213=1; /* WYOMING */ ELSE IF 1986 LE CY LE 1996 AND AGE LE 2 THEN PS213=1; ELSE IF 1997 LE CY LE 2003 AND AGE LE 4 THEN PS213=1; ELSE IF CY GE 2004 AND AGE LE 8 THEN PS213=1; ELSE PV213=1; END; END; /* LIVES SAVED AND EJECTIONS PREVENTED BY CHILD SAFETY SEATS */ OLDWTFA=WEIGHTFA; IF PS213 GT 0 OR PV213 GT 0 THEN DO;
NHTSA’s evaluation estimates that safety seats reduce fatality risk by 58 percent for infants and by 59 percent for toddlers. Effectiveness is not estimated separately by crash mode. In general, 34 percent of unrestrained child passenger fatalities in frontal crashes were ejected, 48 percent in side impacts, 79 percent in rollovers and 42 percent in rear/other impacts. IF AGE=0 THEN E=.58; ELSE E=.59; IF CRSH=1 THEN EJECT2=.34; ELSE IF CRSH=2 THEN EJECT2=.48;
436
ELSE IF CRSH=3 THEN EJECT2=.79; ELSE IF CRSH=4 THEN EJECT2=.42; P=PS213+PV213; S=OLDWTFA*E*P / (1 - E*P); TLS213=S*PS213/P; TLV213=S*PV213/P; WEIGHTFA=OLDWTFA+TLS213+TLV213; END; ELSE DO; TLS213=0; TLV213=0; END; TL213=TLS213+TLV213; TLS=TLS+TLS213; TLV=TLV+TLV213; TL=TL+TL213; /* ------------------------------------------------------------------ */ /* 212 ADHESIVE WINDSHIELD BONDING */ /* MEDIAN INSTALLATION YEAR: 1980 FMVSS EFFECTIVE DATE: 9/1/1978 */ /* ------------------------------------------------------------------ */ /* IDENTIFIES LTVs WITH ADHESIVE WINDSHIELD BONDING */
FMVSS No. 212 took effect in LTVs on September 1, 1978. However, many LTVs had rubber gasket installations that complied with the standard. The transition to adhesive bonding began shortly before the standard and continued for several years afterward. IF XMY LE 1977 THEN DO; PS212=0; PV212=0; END; ELSE IF XMY GE 1985 THEN DO; PS212=1; PV212=0; END; ELSE IF XMY=1978 THEN DO; PS212=0; PV212=.2; END; ELSE IF XMY=1979 THEN DO; PS212=.4; PV212=0; END; ELSE IF XMY=1980 THEN DO; PS212=.5; PV212=0; END; ELSE IF XMY=1981 THEN DO; PS212=.6; PV212=0; END; ELSE IF XMY=1982 THEN DO; PS212=.7; PV212=0; END; ELSE IF XMY=1983 THEN DO; PS212=.8; PV212=0; END; ELSE IF XMY=1984 THEN DO; PS212=.9; PV212=0; END; /* REDUCTION IN EJECTION FATALITY RISK WITH ADHESIVE WINDSHIELD BONDING */ OLDWTFA=WEIGHTFA;
NCSS data show that the proportion of ejections that are via the windshield portal is about the same in LTVs with rubber gaskets as in cars with rubber gaskets. We will assume that adhesive bonding has the same percentage effect on ejection fatalities in LTVs as in cars. IF (PS212 GT 0 OR PV212 GT 0) AND SEAT2 IN (11,12,13,18) AND EJECT2 NE 0 THEN DO; IF CRSH IN (1,3) THEN E=.033; ELSE IF CRSH IN (2,4) THEN E=.0075; P=PS212+PV212; REL_S=EJECT2*E*P / (1 - E*P); S=OLDWTFA*REL_S; TLS212=S*PS212/P; TLV212=S*PV212/P; WEIGHTFA=OLDWTFA+TLS212+TLV212; EJECT2=(EJECT2 + REL_S)/(1 + REL_S); END; ELSE DO; TLS212=0; TLV212=0; END; TL212=TLS212+TLV212; TLS=TLS+TLS212; TLV=TLV+TLV212; TL=TL+TL212; /* ------------------------------------------------------------------ */ /* 208F 3-POINT BELTS FOR FRONT-SEAT OUTBOARD OCCUPANTS */ /* MEDIAN INSTALLATION YEAR: 1977 FMVSS EFFECTIVE DATE: 9/1/1976 */ /* ------------------------------------------------------------------ */ /* IDENTIFIES FRONT SEAT OCCUPANTS WEARING 3-POINT BELTS */ PS208F=0; PV208F=0; IF SEAT2 IN (11,13) AND REST3=3 THEN DO; IF XMY LE 1976 THEN PV208F=1; ELSE IF 1977 LE XMY LE 1981 AND NEWVTYP IN (12,13) THEN PV208F=1; ELSE PS208F=1; END; /* LIVES SAVED AND EJECTIONS PREVENTED BY OUTBOARD FRONT SEAT 3-POINT BELTS */ OLDWTFA=WEIGHTFA; IF PS208F GT 0 OR PV208F GT 0 THEN DO;
In LTVs, 3-point belts reduce fatality risk by 64 percent in single-vehicle frontals, 40 percent in multi-vehicle frontals; 47 percent in single-vehicle near-side; 36 percent in multivehicle near-side; 61 percent

437
in single-vehicle far-side; 54 percent in multivehicle far-side; 80 percent in rollovers; and 81 percent in rear/other impacts. IF CRSH=1 AND VE_FORMS=1 THEN DO; E=.64; EJECT2=.42; END; ELSE IF CRSH=1 THEN DO; E=.40; EJECT2=.24; END; ELSE IF CRSH=2 THEN DO; IF VE_FORMS=1 AND ((SEAT2=11 AND IMPACT2 IN (8,8.5,9,9.5,10,26,61:63)) OR (SEAT2=13 AND IMPACT2 IN (2,2.5,3,3.5,4,26,81:83)) OR (SEAT2=11 AND CY GE 2010 AND IMPACT2 IN (.,14:18,98,99) AND IMPACT1 IN (8,9,10,61:63)) OR (SEAT2=13 AND CY GE 2010 AND IMPACT2 IN (.,14:18,98,99) AND IMPACT1 IN (2,3,4,81:83))) THEN DO; E=.47; EJECT2=.44; END; ELSE IF ((SEAT2=11 AND IMPACT2 IN (8,8.5,9,9.5,10,26,61:63)) OR (SEAT2=13 AND IMPACT2 IN (2,2.5,3,3.5,4,26,81:83)) OR (SEAT2=11 AND CY GE 2010 AND IMPACT2 IN (.,14:18,98,99) AND IMPACT1 IN (8,9,10,61:63)) OR (SEAT2=13 AND CY GE 2010 AND IMPACT2 IN (.,14:18,98,99) AND IMPACT1 IN (2,3,4,81:83))) THEN DO; E=.36; EJECT2=.37; END; ELSE IF VE_FORMS=1 THEN DO; E=.61; EJECT2=.49; END; ELSE DO; E=.54; EJECT2=.41; END; END; ELSE IF CRSH=3 THEN DO; E=.80; EJECT2=.77; END; ELSE IF CRSH=4 THEN DO; E=.81; EJECT2=.51; END; P=PS208F+PV208F; S=OLDWTFA*E*P / (1 - E*P); TLS208F=S*PS208F/P; TLV208F=S*PV208F/P; WEIGHTFA=OLDWTFA+TLS208F+TLV208F; END; ELSE DO; TLS208F=0; TLV208F=0; END; TL208F=TLS208F+TLV208F; TLS=TLS+TLS208F; TLV=TLV+TLV208F; TL=TL+TL208F; /* ------------------------------------------------------------------ */ /* 203 ENERGY-ABSORBING AND TELESCOPING STEERING ASSEMBLIES */ /* MEDIAN IMPLEMENTATION YEAR: 1975 FMVSS EFFECTIVE: 9/1/1981 */ /* ------------------------------------------------------------------ */ /* IDENTIFIES LTVs WITH ENERGY-ABSORBING STEERING ASSEMBLIES */ PS203=0; PV203=0; IF XMY GE 1970 AND SEAT2=11 THEN DO;
The introduction date for energy-absorbing steering assemblies in LTVs depends on the manufacturer and the truck type (pickup, SUV or van). IF XMY GE 1982 THEN PS203=1; ELSE IF MAKE=30 THEN PV203=1; ELSE IF MAKE IN (2,20,23) AND XMY GE 1973 THEN PV203=1; ELSE IF MAKE IN (7,9) AND NEWVTYP IN (11,12) AND XMY GE 1977 THEN PV203=1; ELSE IF MAKE IN (7,9) AND XMY GE 1979 THEN PV203=1; ELSE IF MAKE=12 AND NEWVTYP IN (11,12) AND XMY GE 1980 THEN PV203=1; END; /* LIVES SAVED IN FRONTAL IMPACTS BY INSTRUMENT PANEL IMPROVEMENTS */ OLDWTFA=WEIGHTFA; IF PS203 GT 0 OR PV203 GT 0 THEN DO;
NHTSA’s evaluations suggest that energy-absorbing steering assemblies are about equally effective in LTVs and cars. IF IMPACT2 IN (11,11.5,12,12.5,1) OR (CY GE 2010 AND IMPACT2 IN (.,14:18,98,99) AND IMPACT1 IN (1,11,12)) THEN E=.121; ELSE E=0; P=PS203+PV203; S=OLDWTFA*E*P / (1 - E*P); TLS203=S*PS203/P; TLV203=S*PV203/P; WEIGHTFA=OLDWTFA+TLS203+TLV203; END; ELSE DO; TLS203=0; TLV203=0; END; TL203=TLS203+TLV203; TLS=TLS+TLS203; TLV=TLV+TLV203; TL=TL+TL203; /* ------------------------------------------------------------------ */ /* 201A VOLUNTARY INSTRUMENT PANEL IMPROVEMENTS (FMVSS-201 INSPIRED) */ /* MEDIAN IMPLEMENTATION YEAR: 1972 */
438
/* FMVSS EFFECTIVE: 9/1/1981 (BUT DIDN'T REQUIRE THESE IMPROVEMENTS) */ /* ------------------------------------------------------------------ */ /* INSTRUMENT PANELS WERE GRADUALLY IMPROVED FROM 1969 TO 1977 */ PS201A=0; PV201A=0;
NHTSA’s evaluation suggests that LTVs received the same types of instrument panel modifications as cars, and that they were gradually introduced, perhaps over a 1969-77 timeframe. NHTSA has no de-tails about specific make-models. IF XMY GE 1969 AND SEAT2=13 THEN DO; IF XMY GE 1977 THEN PV201A=1; ELSE PV201A=.125*(XMY-1968); END; /* LIVES SAVED IN FRONTAL IMPACTS BY INSTRUMENT PANEL IMPROVEMENTS */ OLDWTFA=WEIGHTFA; IF PS201A GT 0 OR PV201A GT 0 THEN DO;
NHTSA’s evaluation found the instrument panel improvements to be about equally effective in LTVs and cars. IF CRSH=1 AND REST3 NE 2 THEN E=.159; ELSE E=0; P=PS201A+PV201A; S=OLDWTFA*E*P / (1 - E*P); TLS201A=S*PS201A/P; TLV201A=S*PV201A/P; WEIGHTFA=OLDWTFA+TLS201A+TLV201A; END; ELSE DO; TLS201A=0; TLV201A=0; END; TL201A=TLS201A+TLV201A; TLS=TLS+TLS201A; TLV=TLV+TLV201A; TL=TL+TL201A; /* ------------------------------------------------------------------ */ /* 105B FRONT DISC BRAKES */ /* MEDIAN INSTALLATION YEAR: 1971 (INSTALLATION COMPLETED 1977) */ /* FMVSS EFFECTIVE DATE: 9/1/1983 */ /* ------------------------------------------------------------------ */ /* IMPLEMENTATION OF FRONT DISC BRAKES */
We believe the timeframe for introducing front disc brakes was approximately the same for LTVs as cars; we are using the same implementation schedule as for cars. (However, FMVSS No. 105 was not extended to LTVs until September 1, 1983.) IF XMY GE 1984 THEN DO; PS105B=1; PV105B=0; END; ELSE IF XMY LE 1964 THEN DO; PS105B=0; PV105B=0; END; ELSE IF XMY=1965 THEN DO; PS105B=0; PV105B=.02; END; ELSE IF XMY=1966 THEN DO; PS105B=0; PV105B=.03; END; ELSE IF XMY=1967 THEN DO; PS105B=0; PV105B=.06; END; ELSE IF XMY=1968 THEN DO; PS105B=0; PV105B=.13; END; ELSE IF XMY=1969 THEN DO; PS105B=0; PV105B=.28; END; ELSE IF XMY=1970 THEN DO; PS105B=0; PV105B=.41; END; ELSE IF XMY=1971 THEN DO; PS105B=0; PV105B=.63; END; ELSE IF XMY=1972 THEN DO; PS105B=0; PV105B=.74; END; ELSE IF XMY=1973 THEN DO; PS105B=0; PV105B=.86; END; ELSE IF XMY=1974 THEN DO; PS105B=0; PV105B=.84; END; ELSE IF XMY=1975 THEN DO; PS105B=0; PV105B=.93; END; ELSE IF XMY=1976 THEN DO; PS105B=0; PV105B=.99; END; ELSE IF 1977 LE XMY LE 1983 THEN DO; PS105B=0; PV105B=1; END; /* LTV OCCUPANT LIVES SAVED BY FRONT DISC BRAKES */ OLDWTFA=WEIGHTFA; IF PS105B GT 0 OR PV105B GT 0 THEN DO; E=.0017; P=PS105B+PV105B; S=OLDWTFA*E*P / (1 - E*P); TLS105B=S*PS105B/P; TLV105B=S*PV105B/P; WEIGHTFA=OLDWTFA+TLS105B+TLV105B; END; ELSE DO; TLS105B=0; TLV105B=0; END; TL105B=TLS105B+TLV105B;
439
TLS=TLS+TLS105B; TLV=TLV+TLV105B; TL=TL+TL105B; /* ------------------------------------------------------------------ */ /* 208E LAP BELTS FOR CENTER REAR SEAT OCCUPANTS */ /* MEDIAN INSTALLATION YEAR: 1968 FMVSS EFFECTIVE DATE: 7/1/1971 */ /* ------------------------------------------------------------------ */ /* IDENTIFIES CENTER REAR SEAT OCCUPANTS WEARING LAP BELTS */ PS208E=0; PV208E=0; IF SEAT2=22 AND REST3=2 AND (5 LE AGE LE 99 OR AGE=.) THEN DO;
The original FMVSS No. 208 requirement for lap belts at all designated seating positions was extended to LTVs effective July 1, 1971. IF XMY GE 1972 THEN PS208E=1; ELSE IF XMY LE 1970 THEN PV208E=1; ELSE IF XMY=1971 THEN DO; PS208E=.17; PV208E=.83; END; END; /* LIVES SAVED AND EJECTIONS PREVENTED BY CENTER-REAR-SEAT LAP BELTS */ OLDWTFA=WEIGHTFA; IF PS208E GT 0 OR PV208E GT 0 THEN DO;
Lap belts in the outboard rear seats reduce fatality risk by 44 percent in frontals, 80 percent in rollovers and 64 percent in side, rear and other impacts. The same effectiveness is assumed for the center rear seat. IF CRSH=1 THEN DO; E=.44; EJECT2=.49; END; ELSE IF CRSH=2 THEN DO; E=.64; EJECT2=.59; END; ELSE IF CRSH=3 THEN DO; E=.80; EJECT2=.85; END; ELSE IF CRSH=4 THEN DO; E=.64; EJECT2=.58; END; P=PS208E+PV208E; S=OLDWTFA*E*P / (1 - E*P); TLS208E=S*PS208E/P; TLV208E=S*PV208E/P; WEIGHTFA=OLDWTFA+TLS208E+TLV208E; END; ELSE DO; TLS208E=0; TLV208E=0; END; TL208E=TLS208E+TLV208E; TLS=TLS+TLS208E; TLV=TLV+TLV208E; TL=TL+TL208E;
Even though lap belts for center rear seat passengers and the next two technologies, lap belts for center front seat passengers and lap belts for outboard rear seat passengers have approximately the same me-dian installation year in LTVs, 1968, it makes no difference what their sequential order is in the model. Only one of these technologies can apply to any occupant: a properly seated, belted person cannot be in two different seating positions at the same time. /* ------------------------------------------------------------------ */ /* 208D LAP BELTS FOR CENTER FRONT SEAT PASSENGERS */ /* MEDIAN INSTALLATION YEAR: 1968 FMVSS EFFECTIVE DATE: 7/1/1971 */ /* ------------------------------------------------------------------ */ /* IDENTIFIES CENTER FRONT SEAT PASSENGERS WEARING LAP BELTS */ PS208D=0; PV208D=0; IF SEAT2=12 AND REST3=2 AND (5 LE AGE LE 99 OR AGE=.) THEN DO; IF XMY GE 1972 THEN PS208D=1; ELSE IF XMY LE 1970 THEN PV208D=1; ELSE IF XMY=1971 THEN DO; PS208D=.17; PV208D=.83; END; END; /* LIVES SAVED AND EJECTIONS PREVENTED BY CENTER-FRONT-SEAT LAP BELTS */ OLDWTFA=WEIGHTFA; IF PS208D GT 0 OR PV208D GT 0 THEN DO;
A double-pair comparison analysis of lap belt effectiveness for outboard front seat occupants, conduct-ed in support of the 2004 “lives saved” report, found that lap belts reduce fatality risk by 48 percent in LTVs. There were not enough data for separate effectiveness estimates by crash mode. This effective-ness will also be assumed for the center front seat passenger. E=.48;
440
IF CRSH=1 THEN EJECT2=.33; ELSE IF CRSH=2 THEN EJECT2=.38; ELSE IF CRSH=3 THEN EJECT2=.72; ELSE IF CRSH=4 THEN EJECT2=.53; P=PS208D+PV208D; S=OLDWTFA*E*P / (1 - E*P); TLS208D=S*PS208D/P; TLV208D=S*PV208D/P; WEIGHTFA=OLDWTFA+TLS208D+TLV208D; END; ELSE DO; TLS208D=0; TLV208D=0; END; TL208D=TLS208D+TLV208D; TLS=TLS+TLS208D; TLV=TLV+TLV208D; TL=TL+TL208D; /* ------------------------------------------------------------------ */ /* 208C LAP BELTS FOR OUTBOARD REAR SEAT OCCUPANTS */ /* MEDIAN INSTALLATION YEAR: LATE 67 FMVSS EFFECTIVE DATE: 7/1/1971 */ /* ------------------------------------------------------------------ */ /* IDENTIFIES OUTBOARD REAR SEAT OCCUPANTS WEARING LAP BELTS */ PS208C=0; PV208C=0; IF SEAT2=21 AND REST3=2 AND (5 LE AGE LE 99 OR AGE=.) THEN DO; IF XMY GE 1972 THEN PS208C=1; ELSE IF XMY LE 1970 THEN PV208C=1; ELSE IF XMY=1971 THEN DO; PS208C=.17; PV208C=.83; END; END; /* LIVES SAVED AND EJECTIONS PREVENTED BY OUTBOARD-REAR-SEAT LAP BELTS */ OLDWTFA=WEIGHTFA; IF PS208C GT 0 OR PV208C GT 0 THEN DO;
Lap belts in the outboard rear seats reduce fatality risk by 44 percent in frontals, 80 percent in rollovers and 64 percent in side, rear and other impacts. IF CRSH=1 THEN DO; E=.44; EJECT2=.48; END; ELSE IF CRSH=2 THEN DO; E=.64; EJECT2=.59; END; ELSE IF CRSH=3 THEN DO; E=.80; EJECT2=.85; END; ELSE IF CRSH=4 THEN DO; E=.64; EJECT2=.58; END; P=PS208C+PV208C; S=OLDWTFA*E*P / (1 - E*P); TLS208C=S*PS208C/P; TLV208C=S*PV208C/P; WEIGHTFA=OLDWTFA+TLS208C+TLV208C; END; ELSE DO; TLS208C=0; TLV208C=0; END; TL208C=TLS208C+TLV208C; TLS=TLS+TLS208C; TLV=TLV+TLV208C; TL=TL+TL208C; /* ------------------------------------------------------------------ */ /* 206 DOOR LOCK IMPROVEMENTS */ /* MEDIAN INSTALLATION YEAR: 1967 FMVSS EFFECTIVE DATE: 1/1/1972 */ /* ------------------------------------------------------------------ */ /* DOOR LOCKS IMPROVED GRADUALLY FROM 1962 TO 1972 */
FMVSS No. 206 took effect on January 1, 1972 in LTVs (and on January 1, 1968, in cars). Door lock improvements were gradually introduced in cars from MY 1962 until MY 1968, the year the standard took effect. We will assume that LTV door locks received comparable improvements, also starting about 1962 but extending until the 1972 effective date. IF XMY GE 1973 THEN DO; PS206=1; PV206=0; END; ELSE IF XMY=1972 THEN DO; PS206=.5; PV206=.5; END; ELSE IF 1962 LE XMY LE 1971 THEN DO; PS206=0; PV206=(XMY-1961)/11; END; ELSE IF XMY LE 1961 THEN DO; PS206=0; PV206=0; END; /* REDUCTION IN EJECTION ROLLOVER FATALITY RISK WITH IMPROVED DOOR LOCKS */ OLDWTFA=WEIGHTFA; IF (PS206 GT 0 OR PV206 GT 0) AND (CRSH=3 OR M_HARM=1) AND SEAT2 NE 52 AND EJECT2 NE 0 THEN DO;
In passenger cars, the reduction of ejection fatalities in rollovers was 15.38 percent. However, in NCSS, 32.11 percent of ejection fatalities in rollovers in cars were through doors, but only 20.45 per-cent in LTVs. Thus, the effectiveness in LTVs is estimated to be (.2045/.3211) x .1538 = 9.8 percent (excluding occupants riding in the beds of pickups or elsewhere outside the passenger compartment).
441
E=.098; P=PS206+PV206; REL_S=EJECT2*E*P / (1 - E*P); S=OLDWTFA*REL_S; TLS206=S*PS206/P; TLV206=S*PV206/P; WEIGHTFA=OLDWTFA+TLS206+TLV206; EJECT2=(EJECT2 + REL_S)/(1 + REL_S); END; ELSE DO; TLS206=0; TLV206=0; END; TL206=TLS206+TLV206; TLS=TLS+TLS206; TLV=TLV+TLV206; TL=TL+TL206; /* ------------------------------------------------------------------ */ /* 105A DUAL MASTER CYLINDERS */ /* MEDIAN INSTALLATION YEAR: LATE 1966 FMVSS EFFECTIVE: 9/1/1983 */ /* ------------------------------------------------------------------ */ /* IMPLEMENTATION OF DUAL MASTER CYLINDERS */
We believe the timeframe for introducing dual master cylinders was approximately the same for LTVs as cars; we are using the same implementation schedule as for cars. (However, FMVSS No. 105 was not extended to LTVs until September 1, 1983.) IF XMY GE 1984 THEN DO; PS105A=1; PV105A=0; END; ELSE IF XMY LE 1961 THEN DO; PS105A=0; PV105A=0; END; ELSE IF XMY IN (1962,1963) THEN DO; PS105A=0; PV105A=.09; END; ELSE IF XMY IN (1964,1965) THEN DO; PS105A=0; PV105A=.07; END; ELSE IF XMY=1966 THEN DO; PS105A=0; PV105A=.54; END; ELSE IF 1967 LE XMY LE 1983 THEN DO; PS105A=0; PV105A=1; END; /* LTV OCCUPANT LIVES SAVED BY DUAL MASTER CYLINDERS */ OLDWTFA=WEIGHTFA; IF PS105A GT 0 OR PV105A GT 0 THEN DO; E=.007; P=PS105A+PV105A; S=OLDWTFA*E*P / (1 - E*P); TLS105A=S*PS105A/P; TLV105A=S*PV105A/P; WEIGHTFA=OLDWTFA+TLS105A+TLV105A; END; ELSE DO; TLS105A=0; TLV105A=0; END; TL105A=TLS105A+TLV105A; TLS=TLS+TLS105A; TLV=TLV+TLV105A; TL=TL+TL105A; /* ------------------------------------------------------------------ */ /* 208B LAP BELT USE BY CHILDREN AGE 1-4 */ /* MEDIAN INSTALLATION YEAR FOR LAP BELTS USED BY CHILDREN: 1966 */ /* FMVSS EFFECTIVE DATE: 7/1/1971 */ /* ------------------------------------------------------------------ */ /* IDENTIFIES CHILD PASSENGERS AGE 1-4 USING LAP BELTS */ PS208B=0; PV208B=0; IF 1 LE AGE LE 4 AND REST3=2 THEN DO; IF XMY GE 1972 THEN PS208B=1; ELSE IF XMY LE 1970 THEN PV208B=1; ELSE IF XMY=1971 THEN DO; PS208B=.17; PV208B=.83; END; END; /* LIVES SAVED AND EJECTIONS PREVENTED BY LAP BELTS (AGE 1-4) */ OLDWTFA=WEIGHTFA; IF PS208B GT 0 OR PV208B GT 0 THEN DO;
NHTSA’s evaluation estimates that lap belts reduce fatality risk by 48 percent for toddlers in LTVs. Effectiveness is not estimated separately by crash mode.629 E=.48; IF CRSH=1 THEN EJECT2=.34; ELSE IF CRSH=2 THEN EJECT2=.48; ELSE IF CRSH=3 THEN EJECT2=.79; ELSE IF CRSH=4 THEN EJECT2=.42;
629 This evaluation is discussed in the “Child Safety Seats” section of the FMVSS 213 chapter of Part 1, not the FMVSS 208 chapter.

442
P=PS208B+PV208B; S=OLDWTFA*E*P / (1 - E*P); TLS208B=S*PS208B/P; TLV208B=S*PV208B/P; WEIGHTFA=OLDWTFA+TLS208B+TLV208B; END; ELSE DO; TLS208B=0; TLV208B=0; END; TL208B=TLS208B+TLV208B; TLS=TLS+TLS208B; TLV=TLV+TLV208B; TL=TL+TL208B; /* ------------------------------------------------------------------ */ /* 208A LAP BELTS FOR FRONT-SEAT OUTBOARD OCCUPANTS */ /* MEDIAN INSTALLATION YEAR: 1964 FMVSS EFFECTIVE DATE: 7/1/1971 */ /* ------------------------------------------------------------------ */ /* IDENTIFIES OUTBOARD FRONT SEAT OCCUPANTS WEARING LAP BELTS */ PS208A=0; PV208A=0; IF SEAT2 IN (11,13) AND REST3=2 AND (5 LE AGE LE 99 OR AGE=.) THEN DO; IF XMY GE 1972 THEN PS208A=1; ELSE IF XMY LE 1970 THEN PV208A=1; ELSE IF XMY=1971 THEN DO; PS208A=.17; PV208A=.83; END; END; /* LIVES SAVED AND EJECTIONS PREVENTED BY OUTBOARD-FRONT-SEAT LAP BELTS */ OLDWTFA=WEIGHTFA; IF PS208A GT 0 OR PV208A GT 0 THEN DO;
A double-pair comparison analysis of lap belt effectiveness for outboard front seat occupants, conduct-ed in support of the 2004 “lives saved” report, found that lap belts reduce fatality risk by 48 percent in LTVs. There were not enough data for separate effectiveness estimates by crash mode. E=.48; IF CRSH=1 THEN EJECT2=.34; ELSE IF CRSH=2 THEN EJECT2=.42; ELSE IF CRSH=3 THEN EJECT2=.77; ELSE IF CRSH=4 THEN EJECT2=.51; P=PS208A+PV208A; S=OLDWTFA*E*P / (1 - E*P); TLS208A=S*PS208A/P; TLV208A=S*PV208A/P; WEIGHTFA=OLDWTFA+TLS208A+TLV208A; END; ELSE DO; TLS208A=0; TLV208A=0; END; TL208A=TLS208A+TLV208A; TLS=TLS+TLS208A; TLV=TLV+TLV208A; TL=TL+TL208A; RUN;
That concludes the model for LTVs. It has estimated, on a case-by-case basis, by how much fatalities would increase if all the safety technologies were “removed” from vehicles. The next step is to tally up the lives saved over all the cases, by CY. PROC MEANS SUM NOPRINT DATA=TRK2; BY CY; VAR ORIGWT WEIGHTFA TLV226 TLS226 TL226 TLV214C TLS214C TL214C T_TORSO T_COMBO T_CURTAIN T_CURT_TORS TLV126 TLS126 TL126 TLV301 TLS301 TL301 TLV208J TLS208J TL208J TLV208K TLS208K TL208K TLV201B TLS201B TL201B TLV108 TLS108 TL108 TLV208I TLS208I TL208I T_BARRIER T_SLED T_CAC TLV214A TLS214A TL214A TLV208G TLS208G TL208G TLV213 TLS213 TL213 TLV212 TLS212 TL212 TLV208F TLS208F TL208F TLV203 TLS203 TL203 TLV201A TLS201A TL201A TLV105B TLS105B TL105B TLV208E TLS208E TL208E TLV208D TLS208D TL208D TLV208C TLS208C TL208C TLV206 TLS206 TL206 TLV105A TLS105A TL105A

443
TLV208B TLS208B TL208B TLV208A TLS208A TL208A TABDRV TABRF TABKID_BARRIER TABKID_SLED TSW0 TSW1 TSW2 TSWKID0_BARRIER TSWKID1_BARRIER TSWKID2_BARRIER TSWKID0_SLED TSWKID1_SLED TSWKID2_SLED T_KID_SLED T_KID_CAC T_ADULT_CAC TLV TLS TL; OUTPUT OUT=TRK3 SUM=T_ORIGWT T_WTFA TLV226 TLS226 TL226 TLV214C TLS214C TL214C T_TORSO T_COMBO T_CURTAIN T_CURT_TORS TLV126 TLS126 TL126 TLV301 TLS301 TL301 TLV208J TLS208J TL208J TLV208K TLS208K TL208K TLV201B TLS201B TL201B TLV108 TLS108 TL108 TLV208I TLS208I TL208I T_BARRIER T_SLED T_CAC TLV214A TLS214A TL214A TLV208G TLS208G TL208G TLV213 TLS213 TL213 TLV212 TLS212 TL212 TLV208F TLS208F TL208F TLV203 TLS203 TL203 TLV201A TLS201A TL201A TLV105B TLS105B TL105B TLV208E TLS208E TL208E TLV208D TLS208D TL208D TLV208C TLS208C TL208C TLV206 TLS206 TL206 TLV105A TLS105A TL105A TLV208B TLS208B TL208B TLV208A TLS208A TL208A TABDRV TABRF TABKID_BARRIER TABKID_SLED TSW0 TSW1 TSW2 TSWKID0_BARRIER TSWKID1_BARRIER TSWKID2_BARRIER TSWKID0_SLED TSWKID1_SLED TSWKID2_SLED T_KID_SLED T_KID_CAC T_ADULT_CAC TLV TLS TL; RUN;
Prints the number of lives saved by each technology in each CY, and the sum of lives saved from 1975 through 2012. PROC PRINT DATA=TRK3; FORMAT TLV226 TLS226 TL226 TLV214C TLS214C TL214C T_TORSO T_COMBO T_CURTAIN T_CURT_TORS 9.0; ID CY; VAR TLV226 TLS226 TL226 TLV214C TLS214C TL214C T_TORSO T_COMBO T_CURTAIN T_CURT_TORS; SUM TLV226 TLS226 TL226 TLV214C TLS214C TL214C T_TORSO T_COMBO T_CURTAIN T_CURT_TORS; TITLE1 'LTV OCCUPANT LIVES SAVED BY ROLLOVER CURTAINS AND BY CURTAIN AND SIDE AIR BAGS IN NEARSIDE IMPACTS, 1975-2012'; TITLE2 ' '; TITLE3 '...226 = ROLLOVER CURTAINS (ON 54.0% OF MY 2009 LTVs, FMVSS PHASE-IN TO BEGIN MY 2014)'; TITLE4 '...214C = ALL TYPES OF CURTAIN AND SIDE AIR BAGS (ON 69.7% OF MY 2009 LTVs, FMVSS NO. 214 POLE TEST PHASE-IN BEGAN MY 2011)'; TITLE5 '...V = VOLUNTARY INSTALLATIONS, BEFORE FMVSS PHASE-IN'; TITLE6 '...S = STANDARD INSTALLATIONS, CARS BUILT ON OR AFTER FMVSS PHASE-IN'; TITLE7 '...TORSO = TORSO BAG ONLY COMBO = COMBINATION HEAD-TORSO BAG'; TITLE8 '...CURTAIN = CURTAIN ONLY CURT_TORS = CURATAIN PLUS TORSO BAG'; RUN; PROC PRINT DATA=TRK3; FORMAT TLV126 TLS126 TL126 TLV301 TLS301 TL301 TLV208J TLS208J TL208J 9.0; ID CY; VAR TLV126 TLS126 TL126 TLV301 TLS301 TL301 TLV208J TLS208J TL208J; SUM TLV126 TLS126 TL126 TLV301 TLS301 TL301 TLV208J TLS208J TL208J; TITLE1 'LTV OCCUPANT LIVES SAVED BY ESC, FUEL SYSTEM INTEGRITY - REAR IMPACT UPGRADE, AND CENTER-REAR-SEAT 3-POINT BELTS, 1975-2012'; TITLE2 ' '; TITLE4 '...126 = ELECTRONIC STABILITY CONTROL (MEDIAN INSTALLATION YEAR 2008, FMVSS PHASE-IN BEGAN MY 2009)'; TITLE5 '...301 = FUEL SYSTEM INTEGRITY - REAR IMPACT UPGRADE (MEDIAN INSTALLATION YEAR 2007, FMVSS PHASE-IN BE-GAN MY 2007)'; TITLE4 '...208J = 3-POINT BELTS FOR CENTER REAR SEAT PASSENGERS (MEDIAN INSTALLATION YEAR 2004, FMVSS PHASE-IN BEGAN MY 2006)';

444
TITLE6 '...V = VOLUNTARY INSTALLATIONS, BEFORE FMVSS PHASE-IN'; TITLE7 '...S = STANDARD INSTALLATIONS, CARS BUILT ON OR AFTER FMVSS PHASE-IN'; RUN; PROC PRINT DATA=TRK3; FORMAT TLV208K TLS208K TL208K TLV201B TLS201B TL201B TLV108 TLS108 TL108 9.0; ID CY; VAR TLV208K TLS208K TL208K TLV201B TLS201B TL201B TLV108 TLS108 TL108; SUM TLV208K TLS208K TL208K TLV201B TLS201B TL201B TLV108 TLS108 TL108; TITLE1 'LTV OCCUPANT LIVES SAVED BY PRETENSIONERS & LOAD LIMITERS, HEAD IMPACT UPGRADE, AND TRAILER CONSPICUITY TAPE, 1975-2012'; TITLE2 ' '; TITLE3 '...208K = PRETENSIONERS & LOAD LIMITERS FOR BELTS (ON 55.4% OF MY 2002 LTVs, NOT REQUIRED BY ANY FMVSS)'; TITLE4 '...201B = INTERIOR PROTECTION - HEAD IMPACT UPGRADE (ON 75.6% OF MY 2002 LTVs, FMVSS PHASE-IN BEGAN MY 1999)'; TITLE5 '...108 = TRAILER CONSPICUITY TAPE (ON-ROAD FLEET 54% EQUIPPED IN 1996, FMVSS EFFECTIVE DATE 12/1/93, RETROFIT REQUIREMENT 6/1/2001)'; TITLE6 '...V = VOLUNTARY INSTALLATIONS, BEFORE FMVSS PHASE-IN'; TITLE7 '...S = STANDARD INSTALLATIONS, CARS BUILT ON OR AFTER FMVSS PHASE-IN'; RUN; PROC PRINT DATA=TRK3; FORMAT TLV208I TLS208I TL208I T_BARRIER T_SLED T_CAC 9.0; ID CY; VAR TLV208I TLS208I TL208I T_BARRIER T_SLED T_CAC; SUM TLV208I TLS208I TL208I T_BARRIER T_SLED T_CAC; TITLE1 'LTV OCCUPANT LIVES SAVED BY FRONTAL AIR BAGS, 1975-2012'; TITLE2 ' '; TITLE3 '...208I = FRONTAL AIR BAGS (MEDIAN INSTALLATION YEAR 1995, FMVSS PHASE-IN BEGAN MY 1995)'; TITLE4 '...V = VOLUNTARY INSTALLATIONS, BEFORE FMVSS PHASE-IN'; TITLE5 '...S = STANDARD INSTALLATIONS, CARS BUILT ON OR AFTER FMVSS PHASE-IN'; TITLE6 '...BARRIER = FIRST-GENERATION, BARRIER CERTIFIED AIR BAGS'; TITLE7 '...SLED = REDESIGNED (DEPOWERED), SLED-CERTIFIED AIR BAGS'; TITLE8 '...CAC = CERTIFIED-ADVANCED COMPLIANT AIR BAGS (WITH SUPPRESSION OR LOW-RISK DEPLOYMENT FOR SMALL PASSENGERS)'; RUN; PROC PRINT DATA=TRK3; FORMAT TLV214A TLS214A TL214A TLV208G TLS208G TL208G TLV213 TLS213 TL213 9.0; ID CY; VAR TLV214A TLS214A TL214A TLV208G TLS208G TL208G TLV213 TLS213 TL213; SUM TLV214A TLS214A TL214A TLV208G TLS208G TL208G TLV213 TLS213 TL213; TITLE1 'LTV OCCUPANT LIVES SAVED BY SIDE DOOR BEAMS, OUTBOARD-REAR-SEAT 3-POINT BELTS, AND CHILD SAFETY SEATS, 1975-2012'; TITLE2 ' '; TITLE3 '...214A = SIDE DOOR BEAMS (MEDIAN INSTALLATION YEAR 1994, FMVSS EFFECTIVE 9/1/93)'; TITLE4 '...208G = 3-POINT BELTS FOR REAR SEAT OCCUPANTS (MEDIAN INSTALLATION YEAR 1990, FMVSS EFFECTIVE 9/1/91)'; TITLE5 '...213 = CHILD SAFETY SEATS (USE EXCEEDED 50% IN 1985, FMVSS EFFECTIVE 4/1/71, STATE LAWS 1978-85)'; TITLE6 '...V = VOLUNTARY INSTALLATIONS, BEFORE FMVSS EFFECTIVE DATE'; TITLE7 '...S = STANDARD INSTALLATIONS, LTVS BUILT ON OR AFTER FMVSS EFFECTIVE DATE'; RUN; PROC PRINT DATA=TRK3; FORMAT TLV212 TLS212 TL212 TLV208F TLS208F TL208F TLV203 TLS203 TL203 9.0; ID CY; VAR TLV212 TLS212 TL212 TLV208F TLS208F TL208F TLV203 TLS203 TL203; SUM TLV212 TLS212 TL212 TLV208F TLS208F TL208F TLV203 TLS203 TL203; TITLE1 'LTV OCCUPANT LIVES SAVED BY ADHESIVE WINDSHIELD BONDING, FRONT-SEAT 3-POINT BELTS, AND EA STEERING AS-SEMBLIES, 1975-2012'; TITLE2 ' '; TITLE3 '...212 = ADHESIVE WINDSHIELD BONDING (MEDIAN INSTALLATION YEAR 1979, FMVSS EFFECTIVE 9/1/78)'; TITLE4 '...208F = 3-POINT BELTS FOR FRONT SEAT OCCUPANTS (MEDIAN INSTALLATION YEAR 1976, FMVSS EFFECTIVE 1/1/76)'; TITLE5 '...203 = ENERGY-ABSORBING STEERING ASSEMBLIES (MEDIAN IMPLEMENTATION YEAR EARLY 1976, FMVSS EFFECTIVE 9/1/81)'; TITLE6 '...V = VOLUNTARY INSTALLATIONS, BEFORE FMVSS EFFECTIVE DATE'; TITLE7 '...S = STANDARD INSTALLATIONS, LTVS BUILT ON OR AFTER FMVSS EFFECTIVE DATE'; RUN; PROC PRINT DATA=TRK3; FORMAT TLV201A TL201A TLV105B TLS105B TL105B TLV208E TLS208E TL208E 9.0; ID CY; VAR TLV201A TL201A TLV105B TLS105B TL105B TLV208E TLS208E TL208E; SUM TLV201A TL201A TLV105B TLS105B TL105B TLV208E TLS208E TL208E;
445
TITLE1 'LTV OCCUPANT LIVES SAVED BY SAFER INSTRUMENT PANELS, FRONT DISC BRAKES, AND CENTER-REAR-SEAT LAP BELTS, 1975-201A2'; TITLE2 ' '; TITLE3 '...201A = VOLUNTARY INSTRUMENT PANEL IMPROVEMENTS (MEDIAN IMPLEMENTATION YEAR 1972, FMVSS EFFECTIVE 9/1/81)'; TITLE4 '...105B = FRONT DISC BRAKES (MEDIAN INSTALLATION YEAR 1971, FMVSS EFFECTIVE 9/1/83)'; TITLE5 '...208E = LAP BELTS FOR CENTER REAR SEAT PASSENGERS (MEDIAN INSTALLATION YEAR 1968, FMVSS EFFECTIVE 7/1/71)'; TITLE6 '...V = VOLUNTARY INSTALLATIONS, BEFORE FMVSS EFFECTIVE DATE'; TITLE7 '...S = STANDARD INSTALLATIONS, LTVS BUILT ON OR AFTER FMVSS EFFECTIVE DATE'; RUN; PROC PRINT DATA=TRK3; FORMAT TLV208D TLS208D TL208D TLV208C TLS208C TL208C TLV206 TLS206 TL206 9.0; ID CY; VAR TLV208D TLS208D TL208D TLV208C TLS208C TL208C TLV206 TLS206 TL206; SUM TLV208D TLS208D TL208D TLV208C TLS208C TL208C TLV206 TLS206 TL206; TITLE1 'LTV OCCUPANT LIVES SAVED BY CENTER-FRONT-SEAT LAP BELTS, OUTBOARD-REAR-SEAT LAP BELTS, AND IMPROVED DOOR LOCKS, 1975-2012'; TITLE2 ' '; TITLE3 '...208D = LAP BELTS FOR CENTER FRONT SEAT PASSENGERS (MEDIAN INSTALLATION YEAR 1968, FMVSS EFFECTIVE 7/1/71)'; TITLE4 '...208C = LAP BELTS FOR OUTBOARD REAR SEAT PASSENGERS (MEDIAN INSTALLATION YEAR 1968, FMVSS EFFECTIVE 7/1/71)'; TITLE5 '...206 = IMPROVED DOOR LOCKS (MEDIAN INSTALLATION YEAR 1967, FMVSS EFFECTIVE 1/1/72)'; TITLE6 '...V = VOLUNTARY INSTALLATIONS, BEFORE FMVSS EFFECTIVE DATE'; TITLE7 '...S = STANDARD INSTALLATIONS, LTVS BUILT ON OR AFTER FMVSS EFFECTIVE DATE'; RUN; PROC PRINT DATA=TRK3; FORMAT TLV105A TLS105A TL105A TLV208B TLS208B TL208B TLV208A TLS208A TL208A 9.0; ID CY; VAR TLV105A TLS105A TL105A TLV208B TLS208B TL208B TLV208A TLS208A TL208A; SUM TLV105A TLS105A TL105A TLV208B TLS208B TL208B TLV208A TLS208A TL208A; TITLE1 'LTV OCCUPANT LIVES SAVED BY DUAL MASTER CYLINDERS, LAP BELTS FOR CHILDREN AGE 1-4, AND OUTBOARD-FRONT-SEAT LAP BELTS, 1975-2012'; TITLE2 ' '; TITLE3 '...105A = DUAL MASTER CYLINDERS (MEDIAN INSTALLATION YEAR LATE 1966, FMVSS EFFECTIVE 9/1/83)'; TITLE4 '...208B = LAP BELT USE BY CHILDREN AGE 1-4 (MEDIAN INSTALLATION YEAR 1966, FMVSS EFFECTIVE 7/1/71)'; TITLE5 '...208A = LAP BELTS FOR OUTBOARD FRONT SEAT OCCUPANTS (MEDIAN INSTALLATION YEAR 1964, FMVSS EFFECTIVE 7/1/71)'; TITLE6 '...V = VOLUNTARY INSTALLATIONS, BEFORE FMVSS EFFECTIVE DATE'; TITLE7 '...S = STANDARD INSTALLATIONS, LTVS BUILT ON OR AFTER FMVSS EFFECTIVE DATE'; RUN; DATA TRK4; SET TRK3; PCT_SAVE=100*TL/T_WTFA; PROC PRINT DATA=TRK4; FORMAT T_ORIGWT T_WTFA TLV TLS TL 9.0 PCT_SAVE 6.2; ID CY; VAR T_ORIGWT T_WTFA TLV TLS TL PCT_SAVE; SUM T_ORIGWT T_WTFA TLV TLS TL; TITLE1 'OVERALL LTV OCCUPANT LIVES SAVED BY VEHICLE SAFETY STANDARDS AND TECHNOLOGIES, 1975-2012'; TITLE2 ' '; TITLE3 'T_ORIGWT = ACTUAL LTV OCCUPANT FATALITIES'; TITLE4 'T_WTFA = FATALITIES THAT WOULD HAVE OCCURRED WITHOUT ANY VEHICLE SAFETY IMPROVEMENTS'; TITLE5 'TLV = OVERALL LIVES SAVED BY VOLUNTARY IMPROVEMENTS, BEFORE FMVSS EFFECTIVE DATE'; TITLE6 'TLS = OVERALL LIVES SAVED IN LTVs BUILT ON OR AFTER FMVSS EFFECTIVE DATE'; TITLE7 'TL = OVERALL LIVES SAVED BY VEHICLE SAFETY IMPROVEMENTS (TLV + TLS)'; TITLE8 'PCT_SAVE = PERCENT OF WOULD-HAVE-BEEN FATALITIES SAVED BY SAFETY STANDARDS AND TECHNOLOGIES'; RUN; /* ------------------------------------------------------------------ */ /* ------------------------------------------------------------------ */ /* SUMMARY OF LIVES SAVED BY FMVSS FOR CARS, LTVs, PEDS, & MCs */ /* ------------------------------------------------------------------ */ /* ------------------------------------------------------------------ */
Adds up the lives saved among car occupants, LTV occupants, non-occupants and motorcyclists. PCT_SAVE is the percentage of potential car + LTV occupant fatalities saved. DATA CTP3; MERGE CAR3 TRK3 PED3 MC3; BY CY; SAVED=CL+TL+PL+ML;

446
VOL_SAVE=CLV+TLV+PLV+MLV; STD_SAVE=CLS+TLS+PLS+MLS; F_ACTUAL=C_ORIGWT+T_ORIGWT; F_POTNTL=C_WTFA+T_WTFA; PV_SAVE=CL+TL; PCT_SAVE=100*PV_SAVE/F_POTNTL; BELTS=CL208K+CL208J+CL208H+CL208G+CLNCAP+CL208F+CL208E+CL208D+CL208C+CL208B+CL208A; BELTS=BELTS+TL208K+TL208J+TL208G+TL208F+TL208E+TL208D+TL208C+TL208B+TL208A; FRONTAL_BAGS=CL208I+TL208I; SIDE_BAGS=CL226+TL226+CL214C+TL214C; KIDSEATS=CL213+TL213; FMVSS105=ML105B+ML105A+PL105B+PL105A+CL105B+CL105A+TL105B+TL105A; FMVSS108=CL108+TL108; FMVSS126=ML126+CL126+TL126; FMVSS201=CL201B+CL201A+TL201B+TL201A; FMVSS203=CL203+TL203; FMVSS206=CL206+TL206; FMVSS212=CL212+TL212; FMVSS214=CL214C+TL214C+CL214B+CL214A+TL214A; FMVSS216=CL216; FMVSS226=CL226+TL226; FMVSS301=CL301+TL301; STDS11=FMVSS105+FMVSS108+FMVSS126+FMVSS201+FMVSS203+FMVSS206+FMVSS212+FMVSS214+FMVSS216+FMVSS226+FMVSS301; AB_DRV=CABDRV+TABDRV; AB_RF = CABRF+ TABRF; AB_KID_BARRIER=CABKID_BARRIER+TABKID_BARRIER; AB_KID_SLED=CABKID_SLED+TABKID_SLED; SW0=CSW0+TSW0; SW1=CSW1+TSW1; SW2=CSW2+TSW2; SWKID0_BARRIER=CSWKID0_BARRIER+TSWKID0_BARRIER; SWKID1_BARRIER=CSWKID1_BARRIER+TSWKID1_BARRIER; SWKID2_BARRIER=CSWKID2_BARRIER+TSWKID2_BARRIER; SWKID0_SLED=CSWKID0_SLED+TSWKID0_SLED; SWKID1_SLED=CSWKID1_SLED+TSWKID1_SLED; SWKID2_SLED=CSWKID2_SLED+TSWKID2_SLED; KID_SLED=C_KID_SLED+T_KID_SLED; KID_CAC=C_KID_CAC+T_KID_CAC; ADULT_CAC=C_ADULT_CAC+T_ADULT_CAC; RUN; PROC PRINT DATA=CTP3; FORMAT SAVED VOL_SAVE STD_SAVE CL TL PL ML COMMA11.0; ID CY; VAR SAVED VOL_SAVE STD_SAVE CL TL PL ML; SUM SAVED VOL_SAVE STD_SAVE CL TL PL ML; TITLE1 'OVERALL CAR OCCUPANT, LTV OCCUPANT, PEDESTRIAN AND MOTORCYCLIST LIVES SAVED, 1975-2012'; TITLE2 ' '; TITLE3 'SAVED = OVERALL LIVES SAVED BY VEHICLE SAFETY IMPROVEMENTS (VOL_SAVE + STD_SAVE)'; TITLE4 'VOL_SAVE = OVERALL LIVES SAVED BY VOLUNTARY IMPROVEMENTS, BEFORE FMVSS EFFECTIVE DATE'; TITLE5 'STD_SAVE = OVERALL LIVES SAVED BY VEHICLES BUILT ON OR AFTER FMVSS EFFECTIVE DATE'; TITLE6 'CL = CAR OCCUPANT LIVES SAVED'; TITLE7 'TL = LTV OCCUPANT LIVES SAVED'; TITLE8 'PL = PEDESTRIAN/NONOCCUPANT LIVES SAVED BY CAR AND LTV BRAKING IMPROVEMENTS'; TITLE9 'ML = MOTORCYCLIST LIVES SAVED BY CAR AND LTV BRAKING IMPROVEMENTS'; RUN; PROC PRINT DATA=CTP3; FORMAT F_ACTUAL F_POTNTL PV_SAVE COMMA11.0 PCT_SAVE 6.2; ID CY; VAR F_ACTUAL F_POTNTL PV_SAVE PCT_SAVE; SUM F_ACTUAL F_POTNTL PV_SAVE; TITLE1 'OVERALL LIVES SAVED AND NET EFFECTIVENESS OF SAFETY IMPROVEMENTS FOR PASSENGER VEHICLES (CARS + LTVs), 1975-2012'; TITLE2 ' '; TITLE3 'F_ACTUAL = ACTUAL CAR + LTV OCCUPANT FATALITIES'; TITLE4 'F_POTNTL = FATALITIES THAT WOULD HAVE OCCURRED WITHOUT ANY VEHICLE SAFETY IMPROVEMENTS'; TITLE5 'PV_SAVE = CAR + LTV OCCUPANT LIVES SAVED BY VEHICLE SAFETY IMPROVEMENTS'; TITLE6 'PCT_SAVE = PERCENT OF WOULD-HAVE-BEEN FATALITIES SAVED BY SAFETY STANDARDS AND TECHNOLOGIES'; RUN; PROC PRINT DATA=CTP3; FORMAT BELTS FRONTAL_BAGS SIDE_BAGS KIDSEATS COMMA11.0; ID CY; VAR BELTS FRONTAL_BAGS SIDE_BAGS KIDSEATS; SUM BELTS FRONTAL_BAGS SIDE_BAGS KIDSEATS; TITLE1 'LIVES SAVED IN CARS + LTVs BY SEAT BELTS, AIR BAGS AND CHILD SAFETY SEATS, 1975-2012';
447
TITLE2 ' '; TITLE3 'BELTS = LIVES SAVED BY SEAT BELTS (ALL TYPES, ALL SEATING POSITIONS)'; TITLE4 'FRONTAL_BAGS = LIVES SAVED BY FRONTAL AIR BAGS, DRIVERS + RIGHT FRONT PASSENGERS'; TITLE5 'SIDE_BAGS = LIVES SAVED BY CURTAIN AND SIDE AIR BAGS, DRIVERS + RIGHT FRONT PASSENGERS'; TITLE6 'KIDSEATS = LIVES SAVED BY CHILD SAFETY SEATS (ALL TYPES, ALL SEATING POSITIONS, ALL AGES)'; RUN; PROC PRINT DATA=CTP3; FORMAT FMVSS105 FMVSS108 FMVSS126 FMVSS201 FMVSS203 FMVSS206 FMVSS212 FMVSS214 FMVSS216 FMVSS226 FMVSS301 STDS11 9.0; ID CY; VAR FMVSS105 FMVSS108 FMVSS126 FMVSS201 FMVSS203 FMVSS206 FMVSS212 FMVSS214 FMVSS216 FMVSS226 FMVSS301 STDS11; SUM FMVSS105 FMVSS108 FMVSS126 FMVSS201 FMVSS203 FMVSS206 FMVSS212 FMVSS214 FMVSS216 FMVSS226 FMVSS301 STDS11; TITLE1 'LIVES SAVED BY THE OTHER SAFETY STANDARDS, 1975-2012'; TITLE2 ' '; TITLE3 'FMVSS105 = DUAL MASTER CYLINDERS + FRONT DISC BRAKES FMVSS108 = TRAILER CONSPICUITY TAPE (CARS/LTVs NOT HITTING THE TRAILERS)'; TITLE4 'FMVSS126 = ELECTRONIC STABILITY CONTROL FMVSS201 = VOLUNTARY INSTRUMENT PANEL IMPROVE-MENTS & HEAD IMPACT UPGRADE'; TITLE5 'FMVSS203 = ENERGY-ABSORBING STEERING ASSEMBLIES (INCLUDES FMVSS 204)'; TITLE6 'FMVSS206 = IMPROVED DOOR LOCKS FMVSS212 = ADHESIVE WINDSHIELD BONDING'; TITLE7 'FMVSS214 = SIDE DOOR BEAMS IN CARS AND LTVs, TTI(d) BY STRUCTURE/PADDING IN CARS, CURTAIN & SIDE AIR BAGS IN NEARSIDE IMPACTS'; TITLE8 'FMVSS216 = ROOF CRUSH RESISTANCE FOR PASSENGER CARS FMVSS226 = ROLLOVER CURTAINS'; TITLE9 'FMVSS301 = FUEL SYSTEM INTEGRITY - REAR IMPACT UPGRADE'; TITLE10 'STDS11 = LIVES SAVED BY THESE ELEVEN STANDARDS (I.E., EVERTHING EXCEPT BELTS, FRONTAL AIR BAGS, AND SAFETY SEATS)'; RUN;
Six pages of more detailed summary for air bags: (1) driver lives saved; (2) adult passenger lives saved in vehicles without manual on-off switches; (3) estimated net fatality increase for child passengers in vehicles without switches, separately calculated for barrier-certified and sled-certified air bags; (4) ac-tual adult passenger lives saved in vehicles with manual on-off switches, and potential lives saved if the trucks did not have the switches (or if the air bags were always “on” for adults); (5) estimated actu-al net increase in child passenger fatalities in vehicles with switches, potential number of child fatali-ties if these vehicles had air bags and no switches, and lives saved because the switches were turned “off” for child passengers – separately calculated for barrier-certified and sled-certified air bags; (6) three estimates of hypothetical additional fatalities, namely (6a) if children exposed to sled-certified air bags had instead been exposed to barrier-certified air bags; (6b) if children at seats with advanced air bags had instead been exposed to barrier-certified air bags; (6c) if adult passengers in seats with ad-vanced air bags and without manual on-off switches had instead been at seats with manual on-off switches, where a percentage of those switches would have been turned “off.” PROC PRINT DATA=CTP3; FORMAT AB_DRV CABDRV TABDRV COMMA11.0; ID CY; VAR AB_DRV CABDRV TABDRV; SUM AB_DRV CABDRV TABDRV; TITLE1 'LIVES SAVED BY DRIVER AIR BAGS IN ALL CARS AND LTVs, 1975-2012'; TITLE2 ' '; TITLE3 'AB_DRV = LIVES SAVED BY DRIVER AIR BAGS IN CARS + LTVs'; TITLE4 'CABDRV = LIVES SAVED BY DRIVER AIR BAGS IN CARS'; TITLE5 'TABDRV = LIVES SAVED BY DRIVER AIR BAGS IN LTVs'; RUN; PROC PRINT DATA=CTP3; FORMAT AB_RF CABRF TABRF COMMA11.0; ID CY; VAR AB_RF CABRF TABRF; SUM AB_RF CABRF TABRF; TITLE1 'ADULT (AGE 13+) LIVES SAVED BY PASSENGER AIR BAGS IN CARS AND LTVs WITHOUT ON-OFF SWITCHES'; TITLE2 ' '; TITLE3 'AB_RF = ADULT LIVES SAVED BY PASSENGER AIR BAGS IN CARS + LTVs WITHOUT ON-OFF SWITCHES'; TITLE4 'CABRF = ADULT LIVES SAVED BY PASSENGER AIR BAGS IN CARS WITHOUT ON-OFF SWITCHES'; TITLE5 'TABRF = ADULT LIVES SAVED BY PASSENGER AIR BAGS IN LTVs WITHOUT ON-OFF SWITCHES'; RUN; PROC PRINT DATA=CTP3;

448
FORMAT AB_KID_BARRIER CABKID_BARRIER TABKID_BARRIER AB_KID_SLED CABKID_SLED TABKID_SLED COMMA11.0; ID CY; VAR AB_KID_BARRIER CABKID_BARRIER TABKID_BARRIER AB_KID_SLED CABKID_SLED TABKID_SLED; SUM AB_KID_BARRIER CABKID_BARRIER TABKID_BARRIER AB_KID_SLED CABKID_SLED TABKID_SLED; TITLE1 'CHILD (AGE 0-12) FATALITIES DUE TO PRE-ADVANCED AIR BAGS IN CARS AND LTVs WITHOUT ON-OFF SWITCHES'; TITLE2 ' '; TITLE3 'AB_KID_BARRIER = CHILD FATALITIES DUE TO FIRST-GENERATION AIR BAGS IN CARS + LTVs WITHOUT ON-OFF SWITCH-ES'; TITLE4 'CABKID_BARRIER = CHILD FATALITIES DUE TO FIRST-GENERATION AIR BAGS IN CARS WITHOUT ON-OFF SWITCHES'; TITLE5 'TABKID_BARRIER = CHILD FATALITIES DUE TO FIRST-GENERATION AIR BAGS IN LTVs WITHOUT ON-OFF SWITCHES'; TITLE6 'AB_KID_SLED = CHILD FATALITIES DUE TO SLED-CERTIFIED AIR BAGS IN CARS + LTVs WITHOUT ON-OFF SWITCHES'; TITLE7 'CABKID_SLED = CHILD FATALITIES DUE TO SLED-CERTIFIED AIR BAGS IN CARS WITHOUT ON-OFF SWITCHES'; TITLE8 'TABKID_SLED = CHILD FATALITIES DUE TO SLED-CERTIFIED AIR BAGS IN LTVs WITHOUT ON-OFF SWITCHES'; RUN; PROC PRINT DATA=CTP3; FORMAT SW0 SW1 SW2 COMMA11.0; ID CY; VAR SW0 SW1 SW2; SUM SW0 SW1 SW2; TITLE1 'ADULT (AGE 13+) LIVES SAVED BY PASSENGER AIR BAGS IN PICKUP TRUCKS (AND OTHER VEHICLES) WITH ON-OFF SWITCHES'; TITLE2 ' '; TITLE3 'SW0 = ACTUAL ADULT LIVES SAVED BY AIR BAGS & SWITCHES LEFT ON'; TITLE4 'SW1 = THEORETICAL ADDITIONAL LIVES SAVED IF SWITCHES HAD NOT EXISTED'; TITLE5 'SW2 = LIVES LOST BECAUSE SWITCHES WERE TURNED OFF FOR ADULT PASSENGERS'; RUN; PROC PRINT DATA=CTP3; FORMAT SWKID0_BARRIER SWKID1_BARRIER SWKID2_BARRIER SWKID0_SLED SWKID1_SLED SWKID2_SLED COMMA11.0; ID CY; VAR SWKID0_BARRIER SWKID1_BARRIER SWKID2_BARRIER SWKID0_SLED SWKID1_SLED SWKID2_SLED; SUM SWKID0_BARRIER SWKID1_BARRIER SWKID2_BARRIER SWKID0_SLED SWKID1_SLED SWKID2_SLED; TITLE1 'CHILD (AGE 0-12) FATALITIES DUE TO PRE-ADVANCED AIR BAGS IN PICKUP TRUCKS (AND OTHER VEHICLES) WITH ON-OFF SWITCHES'; TITLE2 ' '; TITLE3 'SWKID0_BARRIER = ACTUAL ADDITIONAL CHILD PASSENGER FATALITIES DUE TO FIRST-GENERATION AIR BAGS & SWITCH-ES LEFT ON'; TITLE4 'SWKID1_BARRIER = THEORETICAL ADDITIONAL FATALITIES IF SWITCHES HAD NOT EXISTED (1st GENERATION)'; TITLE5 'SWKID2_BARRIER = LIVES SAVED BECAUSE SWITCHES WERE TURNED OFF FOR CHILD PASSENGERS (1st GENERATION)'; TITLE6 'SWKID0_SLED = ACTUAL ADDITIONAL CHILD PASSENGER FATALITIES DUE TO SLED-CERTIFIED AIR BAGS & SWITCHES LEFT ON'; TITLE7 'SWKID1_SLED = THEORETICAL ADDITIONAL FATALITIES IF SWITCHES HAD NOT EXISTED (SLED-CERTIFIED)'; TITLE8 'SWKID2_SLED = LIVES SAVED BECAUSE SWITCHES WERE TURNED OFF FOR CHILD PASSENGERS (SLED-CERTIFIED)'; RUN; PROC PRINT DATA=CTP3; FORMAT KID_SLED KID_CAC ADULT_CAC COMMA11.0; ID CY; VAR KID_SLED KID_CAC ADULT_CAC; SUM KID_SLED KID_CAC ADULT_CAC; TITLE1 'HYPOTHETICAL ADDITIONAL FATALITIES IF REDESIGNED OR ADVANCED AIR BAGS HAD SITLL BEEN FIRST-GENERATION AIR BAGS'; TITLE2 ' '; TITLE3 'KID_SLED = ADDITIONAL FATALITIES IF CHILDREN EXPOSED TO REDESIGNED AIR BAGS HAD BEEN EXPOSED TO FIRST-GENERATION AIR BAGS'; TITLE4 'KID_CAC = ADDITIONAL FATALITIES IF CHILDREN WITH SUPPRESSED, ADVANCED AIR BAGS HAD BEEN EXPOSED TO FIRST-GENERATION AIR BAGS'; TITLE5 'ADULT_CAC = ADDITIONAL ADULT FATALITIES IF CAC AIR BAGS, NOW WITHOUT SWITCHES, STILL HAD A SWITCH AND IT WAS TURNED OFF'; RUN;
449
APPENDIX B: SUMMARIES OF PUBLISHED EVALUATION REPORTS A systematic program to evaluate the effectiveness of the FMVSS was initiated in 1975, when NHTSA was just beginning to establish its own crash databases. The first "preliminary" evalua-tion of a standard was published in 1979 (side door strength) and the first "final" evaluations in 1981 (energy-absorbing steering assemblies, bumpers). Since 1979, 82 comprehensive evalua-tions of regulations, safety programs, consumer information programs, or safety technologies have been published. Here is a list of the 82 studies including summaries of principal findings [except where findings were superseded in a follow-up evaluation] and, where available, links to the reports for free downloading in PDF format from the Internet: 2014 Evaluation of FMVSS No. 301, “Fuel System Integrity,” as Upgraded in 2005 to 2009 (NHTSA Report No. DOT HS 812 038)
In 2003, NHTSA upgraded FMVSS No. 301 with a 50 mph offset rear-impact test, which phased in during MY 2007 to 2009. Cars and LTVs certifying to the new test requirement have 57 percent lower odds of post-crash fire in rear-impact crashes than vehicles before the upgrade. That results in a 35-percent reduction of fatalities in rear-impact crashes with post-crash fires.
Updated Estimates of Fatality Reduction by ESC (NHTSA Report No. DOT HS 812 020, www-nrd.nhtsa.dot.gov/Pubs/812020.pdf)
ESC uses automatic, computer-controlled braking of individual wheels to enhance drivers’ ability to keep vehicles under control in a wide variety of driving situations. Fatal first-event rollovers are reduced by 60 percent in cars and by 74 percent in LTVs. Other fatal single-vehicle crashes (excluding collisions with pedestrians or bicyclists) are reduced by 31 percent in cars and 45 percent in LTVs. Involvements as the culpable vehicle in fatal multivehicle crashes are reduced by 16 percent in cars and LTVs.
Updated Estimates of Fatality Reduction by Curtain and Side Air Bags in Side Impacts and Preliminary Analyses of Rollover Curtains (NHTSA Report No. DOT HS 811 882, www-nrd.nhtsa.dot.gov/Pubs/811882.pdf)
The four types of curtain and side air bags each significantly reduce fatality risk in near-side impacts of cars and LTVs: curtains plus torso bags by 31 percent, combination head/torso bags by 25 percent, curtains alone by 16 percent, and torso bags alone by 8 percent. Curtains that deploy in rollovers reduce fatality risk in first-event rollovers by 41 percent.
450
2013 Effectiveness of Pretensioners and Load Limiters for Enhancing Fatality Reduction by Seat Belts (NHTSA Report No. DOT HS 811 835, www-nrd.nhtsa.dot.gov/Pubs/811835.pdf)
Pretensioners and load limiters are technologies designed to make seat belts more effective. Belted drivers and RF passengers of cars, CUVs, and minivans have 12.8 percent lower fatali-ty risk when their belt is equipped with a pretensioner and a load limiter than when it is not equipped with either. The current data does not show a significant effect in pickup trucks, SUVs with body-and-frame construction, or full-sized vans.
Evaluation of the Certified-Advanced Air Bags (NHTSA Report No. DOT HS 811 834, www-nrd.nhtsa.dot.gov/Pubs/811834.pdf)
Certified-advanced air bags are designed to not deploy at all for children or deploy only at a low level of force. There is no significant difference between the fatality risk with advanced air bags and with their predecessors, sled-certified air bags, for drivers and passengers of cars and LTVs. NHTSA has not seen any case of an infant or a small child with fatal injuries from advanced air bags.
Injury Vulnerability and Effectiveness of Occupant Protection Technologies for Older Oc-cupants and Women (NHTSA Report No. DOT HS 811 766, www-nrd.nhtsa.dot.gov/Pubs/811766.pdf)
In crashes of cars and LTVs of the past 50 model years, fatality risk increases by an average of 3.11 percent per year that an occupant gets older; risk is, on average, 17.0 percent higher for a female than for a male of the same age (but this has dropped below 10 percent in MY 2000 to 2011). Older occupants are susceptible to thoracic injuries, especially multiple rib fractures. Females are susceptible to neck and abdominal injuries and, at lower severity levels, highly susceptible to arm and leg fractures. All of the major occupant protection technologies in vehicles of recent model years have at least some benefit for adults of all age groups and of either gender; none of them are harmful for a particular age group or gender.
Effectiveness of LED Stop Lamps for Reducing Rear-End Crashes: Analyses of State Crash Data (NHTSA Report No. DOT HS 811 712, www-nrd.nhtsa.dot.gov/Pubs/811712.PDF)
Vehicles equipped with LED stop lamps and CHMSL had a statistically significant 3.6-percent lower rate of involvement in rear-impact crashes than vehicles of the same makes and models with incandescent lamps. However, the analysis does not support a firm conclusion about whether LED stop lamps are more effective than incandescent lamps, because (1) rear impacts increased with LED for over half of the individual makes and models and (2) all of the models that shifted to LED simultaneously changed other aspects of the rear-lighting con-figuration – thus, changes in rear-impact crash rates need not be solely due to LED.
451
2012 Evaluation of the Effectiveness of TPMS in Proper Tire Pressure Maintenance (NHTSA Report No. DOT HS 811 681, www-nrd.nhtsa.dot.gov/Pubs/811681.pdf)
In a CY 2011 survey, MY 2004- 2007 cars and LTVs equipped with TPMS were 56 percent less likely to have one or more severely underinflated tires (25% or more below the vehicle manufacturer’s recommended cold tire pressure) than vehicles of the same MY without TPMS. They were also 31percent less likely to have tires that are overinflated by 25 percent or more above the recommended pressure. During the first 8 years of operation TPMS is es-timated to save 9 gallons of fuel per car and 28 gallons per LTV.
Traffic Safety Facts Research Note: National Child Restraint Use Special Study (NHTSA Report No. DOT HS 811 679, www-nrd.nhtsa.dot.gov/Pubs/811679.pdf)
The five significant mistakes in CRS or booster-seat installation most commonly observed during a 2011 national survey were: (1) Use of the wrong harness slot; (2) The harness retain-er or chest clip incorrectly positioned or not used at all; (3) Loose CRS installation (more than two inches of side-to-side or front-to-back movement); (4) Loose harness strap (more than two inches of slack); and (5) Improper belt placement with booster seats.
Relationships Between Fatality Risk, Mass, and Footprint in Model Year 2000-2007 Pas-senger Cars and LTVs – Final Report (NHTSA Report No. DOT HS 811 665, www-nrd.nhtsa.dot.gov/Pubs/811665.PDF)
The report statistically analyzes the potential effects of mass reduction while holding footprint constant on societal fatality rates per VMT for MY 2000 to 2007 vehicles during CY 2002 to 2008. These rates include occupants of all vehicles in the crash as well as pedestrians. For 100-pound mass reductions, societal risk in cars weighing less than 3,106 pounds increases by a statistically significant 1.56 percent. There are non-significant increases in the heavier cars and the lighter truck-based LTVs and non-significant societal benefits for mass reduction in CUVs, minivans, and the heavier truck-based LTVs. Potential combinations of mass reduc-tions – that maintain footprint and are proportionately somewhat higher for the heavier vehi-cles – may be safety-neutral.
Evaluation of the Enhancing Vehicle-to-Vehicle Crash Compatibility Agreement: Effec-tiveness of the Primary and Secondary Energy-Absorbing Structures on Pickup Trucks and SUVs (NHTSA Report No. DOT HS 811 621, www-nrd.nhtsa.dot.gov/Pubs/811621.PDF)
In crashes between cars and LTVs, there was a statistically significant 8-percent reduction in car-occupant fatalities after the LTVs self-certified to the EVC agreement (voluntary stand-ards for LTVs to reduce height mismatches between LTVs and passenger cars). However, the results for pickup trucks and SUVs, separately, were inconsistent. Furthermore, a supplemen-tary non-parametric analysis does not show fatality reduction for significantly more than 50 percent of the makes and models. Overall, these results provide some evidence that the EVC has reduced fatalities but do not permit an unequivocal conclusion that it has been effective in reducing fatality risk.
452
2011 Evaluation of the 1999-2003 Head Impact Upgrade of FMVSS No. 201 – Upper-Interior Components: Effectiveness of Energy-Absorbing Materials Without Head-Protection Air Bags (NHTSA Report No. DOT HS 811 538, www-nrd.nhtsa.dot.gov/Pubs/811538.PDF)
FMVSS No. 201 was upgraded in MY 1999 to 2003 to reduce occupants’ risk of head injury from contact with a vehicle’s upper interior. Initially, energy-absorbing materials alone were used to meet the standard. These materials reduce AIS 4-to-6 head injuries due to contact with upper-interior components by an estimated 24 percent. That is equivalent to a 4.3-percent re-duction of overall fatality risk.
Relationships Between Fatality Risk, Mass, and Footprint in Model Year 2000-2007 Pas-senger Cars and LTVs – Preliminary Report (Submission to Docket No. NHTSA-2010-0152-0023, www.regulations.gov/#!documentDetail;D=NHTSA-2010-0152-0023)
[Findings have been superseded by the 2012 evaluation - see above.]
A Study of NMVCCS to Identify Critical Precrash Factors in Fatal Crashes (Proceedings of the 22nd Conference on Enhanced Safety of Vehicles, Paper No. 11-0168, www-nrd.nhtsa.dot.gov/pdf/esv/esv22/22ESV-000168.pdf)
In 111 fatal crashes of the NMVCCS, 94 percent of the critical pre-crash factors were driver-related, 3 percent pedestrian/bicyclist-related, 2 percent vehicle-related, and 1 percent envi-ronment-related. Alcohol and/or drugs were the critical factor in 32 percent of the cases, speeding/loss of control in 14 percent, distraction in 8 percent, and drivers’ illness or medical conditions in 7 percent (typically older drivers). Technologies that might conceivably have helped, if the vehicle had been equipped with them, were: ESC (32% of the cases), lane-keeping assistance (32%), drunk-driver detection (27%), crash-imminent braking (23%), and distraction/drowsiness detection (7%).
Crash Prevention Effectiveness of Light-Vehicle Electronic Stability Control: An Update of the 2007 NHTSA Evaluation (NHTSA Report No. DOT HS 811 486, www-nrd.nhtsa.dot.gov/Pubs/811486.pdf)
ESC systems use automatic computer-controlled braking of individual wheels to assist the driver in maintaining control in critical driving situations. Overall, ESC reduces police-reported crash involvements of passenger cars by 5 percent and fatal involvements by 23 per-cent. For LTVs, these reductions are 7 percent and 20 percent. Each reduction is statistically significant except the 5 percent overall effect for cars. [This report also estimates fatality re-duction, but the findings are superseded by the 2014 evaluation – see above.]

453
2010 The Effectiveness of Underride Guards for Heavy Trailers (NHTSA Report No. DOT HS 811 375, www-nrd.nhtsa.dot.gov/Pubs/811375.pdf)
Florida and North Carolina data on crashes where a car or LTV rear-ended a tractor trailer show decreases in fatalities and serious injuries to the car/LTV occupants when the trailer is equipped with underride guards meeting FMVSS Nos. 223 and 224. However, the observed decreases are not statistically significant at the 0.05 level. Passenger-compartment intrusion in the car or LTV is significantly more apt to occur when the corner of the trailer is impacted than when the center of the trailer is impacted.
The Effectiveness of ABS in Heavy Truck Tractors and Trailers (NHTSA Report No. DOT HS 811 339, www-nrd.nhtsa.dot.gov/Pubs/811339.pdf)
ABS on the tractor unit is estimated to reduce involvement in police-reported crashes for air-braked tractor-trailers by a statistically significant 3 percent. There is a non-significant 2-percent reduction in fatal crash involvements. ABS reduces jack-knives, off-road overturns, and at-fault involvements in collisions with other vehicles (except front-to-rear collisions).
Booster Seat Effectiveness Estimates Based on CDS and State Data (NHTSA Report No. DOT HS 811 338, www-nrd.nhtsa.dot.gov/Pubs/811338.pdf)
Among 4-to-8 year olds there is strong evidence of reduced risk of injury when restrained by booster seats rather than just by lap and shoulder belts. The estimated magnitude of this effect is a 14-percent reduction in risk of any type of injury. Among 3- and 4-year-olds there is evi-dence of increased risk of injury when restrained in booster seats rather than with the recom-mended child restraints. The increase depends on the injury severity. The effect may be more pronounced in the 3-year-olds, although sample sizes are too small to draw statistical conclu-sions.
Relationships Between Fatality Risk, Mass, and Footprint in Model Year 1991-1999 and Other Passenger Cars and LTVs (Pages 464-542 of Final Regulatory Impact Analysis: Corpo-rate Average Fuel Economy for MY 2012-MY 2016 Passenger Cars and Light Trucks, www.nhtsa.gov/staticfiles/rulemaking/pdf/cafe/CAFE_2012-2016_FRIA_04012010.pdf)
[Findings have been superseded by the 2012 evaluation - see above.]
454
2009 Fatalities in Frontal Crashes Despite Seat Belts and Air Bags – Review of All CDS Cases – Model and Calendar Years 2000-2007 – 122 Fatalities (NHTSA Report No. DOT HS 811 202, www-nrd.nhtsa.dot.gov/pubs/811102.pdf [sic])
Why are people still dying in frontal crashes despite seat belt use, frontal air bags, and the crashworthy structures of MY 2000 and later vehicles? Aside from a substantial proportion of the crashes that are just exceedingly severe, the main reason people are still dying in these 122 frontal impacts in CDS is that many involve poor structural engagement between the vehicle and its collision partner: corner impacts, oblique crashes, impacts with narrow objects, and underrides. By contrast, few if any of the 122 fatal crashes were full-frontal or offset-frontal impacts with good structural engagement, unless the crashes were of extreme severity or the occupants exceptionally vulnerable.
The Long-Term Effect of ABS in Passenger Cars and LTVs (NHTSA Report No. DOT HS 811 182, www-nrd.nhtsa.dot.gov/Pubs/811182.PDF)
ABS has close to a zero net effect on fatal crash involvements: statistically significant in-creases in run-off-road crashes are more or less offset by significant reductions in collisions with pedestrians and in collisions with other vehicles on wet roads. However, ABS is quite ef-fective in nonfatal crashes, reducing the overall crash-involvement rate by 6 percent in pas-senger cars and by 8 percent in LTVs.
The Effectiveness of Amber Rear Turn Signals for Reducing Rear Impacts (NHTSA Report No. DOT HS 811 115, www-nrd.nhtsa.dot.gov/Pubs/811115.PDF)
FMVSS No. 108 allows rear turn signals to be either red or amber in color. Cars and LTVs with amber turn signals have significantly fewer involvements than corresponding vehicles with red turn signals in two-vehicle crashes where a lead vehicle is rear-struck in the act of turning left, turning right, merging into traffic, changing lanes, or entering/leaving a parking space. The estimated reduction is 5.3 percent.
An In-Service Analysis of Maintenance and Repair Expenses for the Anti-Lock Brake Sys-tem and Underride Guard for Tractors and Trailers (NHTSA Report No. DOT HS 811 109, www-nrd.nhtsa.dot.gov/Pubs/811109.PDF)
The presence of the ABS system does not appear to increase overall maintenance expenses to the brake systems of truck tractors and heavy trailers. Across a vehicle lifetime, the net pre-sent value of the expenses for maintaining and repairing ABS is estimated to range from $56 to $102 for tractors and from $16 to $30 for trailers, in 2007 dollars. These values are relative-ly small compared to the cost of equipping new vehicles with ABS systems. The net present value of the lifetime maintenance and repair expenses to underride guards meeting FMVSS Nos. 223 and 224 is an estimated $15.
455
2008 Statistical Analysis of Alcohol-Related Driving Trends, 1982-2005 (NHTSA Report No. DOT HS 810 942, www-nrd.nhtsa.dot.gov/Pubs/810942.PDF)
The percentage of drivers involved in fatal crashes who had blood alcohol concentrations (BACs) of .08 grams per deciliter or above steadily decreased from 1982 to 1997 and then leveled off. Legislation (.10 BAC, .08 BAC, administrative license revocation, and minimum-legal-drinking-age laws), demographic factors (median age of the population and the propor-tion of female drivers grew from 1982 to 1997), and changes in per-capita alcohol consump-tion largely explain both the initial decrease in BAC ≥ .08 and its leveling off after 1997. The leveling off does not imply that laws are becoming less effective. On the contrary, they have effectively maintained the proportion of drivers in fatal crashes with BAC ≥ .08 at the lowest level since 1982.
2007 Statistical Analysis of the Effectiveness of Electronic Stability Control (ESC) Systems – Fi-nal Report (NHTSA Report No. DOT HS 810 794, www-nrd.nhtsa.dot.gov/Pubs/810794.PDF)
[Findings have been superseded by the 2011 evaluation - see above.]
An Evaluation of Side Impact Protection – FMVSS 214 TTI(d) Improvements and Side Air Bags (NHTSA Report No. DOT HS 810 748, www-nrd.nhtsa.dot.gov/Pubs/810748.PDF)
A dynamic crash test was added to FMVSS No. 214 and phased into new passenger cars dur-ing 1994 to 1997. Manufacturers first upgraded side structures and affixed padding, then equipped many vehicles with side air bags designed to protect the occupant’s torso, the head, or both. The test criterion TTI(d) improved in 2-door cars from an average of 114 in 1981 to 1985 to 44 in cars with side air bags, and from 85 to 48 in 4-door cars. Upgraded structures and padding reduced fatality risk for near-side occupants in multivehicle crashes by an esti-mated 33 percent in 2-door cars and 17 percent in 4-door cars. [This report also evaluates side air bags, but the findings are superseded by the 2014 evaluation – see above.]
2006 HIC Test Results before and after the 1999-2003 Head Impact Upgrade of FMVSS 201 (NHTSA Report No. DOT HS 810 739, www-nrd.nhtsa.dot.gov/Pubs/810739.PDF)
Upgraded requirements in FMVSS No. 201 were phased into new vehicles in 1999 to 2003 to reduce occupants’ risk of head injury from contact with the upper interior, including the pil-lars, roof headers, side rails, and upper roof. Initially, energy-absorbing materials alone were added; later, some vehicles also received head-protection air bags. NHTSA conducted impact tests in pre- and post-standard vehicles, without head-protection air bags, of the same makes and models. The head injury criterion, HIC(d) averaged 909.9 pre-standard and 667.5 post-standard: a statistically significant average improvement of 242.4 units of HIC.
456
An Evaluation of the 1998-1999 Redesign of Frontal Air Bags (NHTSA Report No. DOT HS 810 685, www-nrd.nhtsa.dot.gov/Pubs/810685.PDF)
In 1998 and 1999, air bags were redesigned to make deployments less harmful to child pas-sengers and other out-of-position occupants by removing some of the propellant or gas from their inflators and/or by reducing volume or rearward extent, positioning them further from occupants, tethering, and hybrid inflators. Compared to earlier air bags, these redesigned air bags reduced fatalities to infants and children by 83 percent and to out-of-position drivers by 70 percent in low-to-moderate speed crashes. Yet they entirely preserved the overall life-saving benefits of earlier air bags for belted drivers and for passengers 13 and older.
Child Restraint Use Survey – LATCH Use and Misuse (NHTSA Report No. DOT HS 810 679, www-nrd.nhtsa.dot.gov/Pubs/810679.PDF)
LATCH (Lower Anchors and Tethers for Children) consists of an upper tether that provides an additional point of attachment for greater safety, and lower attachments that simplify in-stallation of child safety seats. NHTSA’s 2005 survey found 55 percent use of the upper tether and 60 percent use of the lower attachments. (People who did not use the lower attachments used the vehicle’s seat belts to install the child safety seat.) Most of the non-users said they had not heard of LATCH, did not realize their vehicle was equipped with it, did not know why it was important, or did not know how to use it.
2005 Trends in the Static Stability Factor of Passenger Cars, Light Trucks, and Vans (NHTSA Report No. DOT HS 809 868, www-nrd.nhtsa.dot.gov/Pubs/809868.PDF)
The static stability factor is a measurement of a vehicle's resistance to rollover. NHTSA has included rollover information as part of its NCAP ratings since model year 2001. Passenger cars have the highest average SSF, and they have remained high. SUVs have substantially improved their SSF values over time, especially after model year 2000, whereas those of pickup trucks have remained consistent over the years. Minivans showed considerable im-provement since they were first introduced. In model year 2003, the sales-weighted average SSF was 1.41 for passenger cars, 1.17 for SUVs, 1.18 for pickup trucks, 1.24 for minivans, and 1.12 for full-size vans.
2004 Cost per Life Saved by the Federal Motor Vehicle Safety Standards (NHTSA Report No. DOT HS 809 835, www-nrd.nhtsa.dot.gov/Pubs/809835.PDF)
NHTSA has evaluated the life-saving benefits as well as the consumer cost for a substantial “core” group of safety technologies for passenger cars and LTVs (pickup trucks, SUVs, and vans). In 2002, these technologies added an estimated $11,353,000,000 (in 2002 dollars) to the consumer cost of new cars and LTVs of that model year, while saving 20,851 lives in the vehicles on the road during that calendar year. That amounts to $544,482 per life saved in 2002. They added $189,842,000,000 to the cost of new cars and LTVs over model years 1968 to 2002, while saving 252,989 lives in model year 1968 and later vehicles during calendar years 1968 to 2002. That amounts to $750,782 per life saved in 1968 to 2002.
457
Cost and Weight Added by the Federal Motor Vehicle Safety Standards for Model Years 1968-2001 in Passenger Cars and Light Trucks (NHTSA Report No. DOT HS 809 834, www-nrd.nhtsa.dot.gov/Pubs/809834.PDF)
NHTSA performs engineering “teardown” analyses to estimate how much a specific FMVSS adds to the weight and the retail price of vehicles. NHTSA has evaluated virtually all the cost-and weight-adding technologies introduced by 2001 in cars and LTVs in response to the FMVSS. NHTSA estimates that the FMVSS added an average of $839 (in 2002 dollars) and 125 pounds to the average passenger car in model year 2001. This was approximately 4 per-cent of the cost and 4 percent of the weight of a new car. An average of $711 (in 2002 dollars) and 86 pounds was added to the average LTV in model year 2001. This was approximately 3 percent of the cost and 2 percent of the weight of a new LTV.
Lives Saved by the Federal Motor Vehicle Safety Standards and Other Vehicle Safety Technologies, 1960-2002 – Passenger Cars and Light Trucks – With a Review of 19 FMVSS and their Effectiveness in Reducing Fatalities, Injuries and Crashes (NHTSA Report No. DOT HS 809 833, www-nrd.nhtsa.dot.gov/Pubs/809833.PDF)
NHTSA has evaluated the effectiveness of virtually all the life-saving technologies introduced in passenger cars, pickup trucks, SUVs, and vans from about 1960 up through the later 1990s. A statistical model estimates the number of lives saved from 1960 to 2002 by the combination of these technologies – including safety equipment meeting specific FMVSS, equipment in-stalled in advance of the FMVSS, and noncompulsory improvements such as the redesign of middle and lower instrument panels. Vehicle safety technologies saved an estimated 328,551 lives from 1960 through 2002. The annual number of lives saved grew steadily from 115 in 1960 to 24,561 in 2002.
Impaired-Driving Program Assessments: A Summary of Recommendations (1991 to 2003) (NHTSA Report No. DOT HS 809 815, www-nrd.nhtsa.dot.gov/Pubs/809815.PDF)
NHTSA’s assessment process allows States to have their impaired-driving programs reviewed by outside teams of nationally recognized experts. NHTSA examined 38 State assessment re-ports. Most of the teams’ 2,982 individual recommendations fit into 10 thematic areas: (1) en-forcement and the arrest, prosecution, and adjudication process; (2) public information and education; (3) DUI data and records; (4) enacting or revising laws; (5) enhanced training for personnel; (6) program evaluation; (7) resources for treatment and rehabilitation; (8) in-ter/intra-governmental coordination; (9) sources of funding; and (10) task forces and/or com-munity involvement.
Preliminary Results Analyzing the Effectiveness of Electronic Stability Control (ESC) Sys-tems (NHTSA Report No. DOT HS 809 790, www-nrd.nhtsa.dot.gov/Pubs/809790.PDF)
[Findings have been superseded by the 2011 evaluation - see above.]
458
Evaluation of Rear-Window Defrosting and Defogging Systems (NHTSA Report No. DOT HS 809 724, www-nrd.nhtsa.dot.gov/Pubs/809724.PDF)
Almost all new cars, minivans and SUVs have rear-window defoggers, even though Federal standards do not require them. Analyses of crashes where drivers were backing up or chang-ing lanes during rain or snow, early morning hours, or in the winter did not show a statistical-ly significant reduction with defoggers. Nevertheless, NHTSA would expect consumers to continue wanting rear-window defoggers for their vehicles because they conveniently clear condensation, frost, ice, and snow from the back window.
Evaluation of FMVSS 214 Side Impact Protection for Light Trucks: Crush Resistance Re-quirements for Side Doors (NHTSA Report No. DOT HS 809 719, www-nrd.nhtsa.dot.gov/Pubs/809719.PDF)
LTVs were required to meet a crush resistance standard for side doors beginning September 1, 1993. Side door beams were installed to reduce the velocity and depth of door intrusion in side impact crashes. The beams are estimated to reduce fatalities by 19 percent in single vehi-cle side impacts. When all LTVs on the road have side door beams, they will save an estimat-ed 151 lives per year. Little or no fatality reduction was found in multivehicle crashes.
2003 Results of the Survey on the Use of Passenger Air Bag On-Off Switches (NHTSA Report No. DOT HS 809 689, www-nrd.nhtsa.dot.gov/Pubs/809689.PDF)
On-off switches allow drivers to temporarily deactivate air bags when children must ride in the front seats of pickup trucks and other vehicles that cannot accommodate rear-facing child safety seats in the rear seats. NHTSA recommends that the passenger air bag be turned off when a child 12 or younger must ride in the front seat, and turned on if all front seat occu-pants are 13 or older. In a 2000 survey, switches were left on for 14 percent of infants and 26 percent of child passengers age 1 to 6, but turned off for 17 percent of the adult passengers.
Vehicle Weight, Fatality Risk and Crash Compatibility of Model Year 1991-99 Passenger Cars and Light Trucks (NHTSA Report No. DOT HS 809 662, www-nrd.nhtsa.dot.gov/Pubs/809662.PDF)
[Findings have been superseded by the 2012 evaluation - see above.]
NCAP Test Improvements with Pretensioners and Load Limiters (NHTSA Report No. DOT HS 809 562, www-nrd.nhtsa.dot.gov/Pubs/809562.PDF)
Seat belt pretensioners pull belts snug as a crash begins. Load limiters allow belts to yield slightly during a crash to reduce the force on the wearer’s chest. In the New Car Assessment Program’s frontal barrier crashes at 35 mph, the combination of pretensioners and load limit-ers reduced average HIC by 232, chest acceleration by 6.6 g’s and chest deflection by 10.6 mm, for driver and RF passenger dummies, relative to cars and LTVs of the same makes and models without these features.
459
2002 Evaluation of Child Safety Seat Registration (NHTSA Report No. DOT HS 809 518, www-nrd.nhtsa.dot.gov/Pubs/809518.PDF)
Since March 1993, manufacturers of child safety seats have been required to provide a post-age-paid registration form with each new child safety seat. Seat registration has increased from 3 percent prior to 1993 to 27 percent in 1996 to 2000. The repair rate for recalled child safety seats increased from 13.8 percent prior to 1993 to 21.5 percent in 1993 to 2000.
Preliminary Report: The Incidence Rate of Odometer Fraud (NHTSA Report No. DOT HS 809 441, www-nrd.nhtsa.dot.gov/Pubs/809441.PDF)
There are an estimated 452,000 cases of odometer rollback per year in the United States. The difference between the inflated prices that consumers paid for rolled-back vehicles and the prices they would have been willing to pay if they had known the true mileage average $2,336 per case of odometer rollback, amounting to $1,056 million per year in the United States.
2001 The Effectiveness of Head Restraints in Light Trucks (NHTSA Report No. DOT HS 809 247, www-nrd.nhtsa.dot.gov/Pubs/809247.PDF)
The purpose of a head restraint is to prevent whiplash injuries in rear-impact crashes. Head restraints reduce overall injury risk in LTVs in rear impacts by a statistically significant 6 per-cent. When all LTVs on the road have head restraints, they will be preventing approximately 15,000 nonfatal injuries per year. (See also the 1982 evaluation of head restraints in passenger cars.)
The Effectiveness of Retroreflective Tape on Heavy Trailers (NHTSA Report No. DOT HS 809 222, www-nrd.nhtsa.dot.gov/Pubs/809222.PDF)
Retroreflective tape enhances the visibility of heavy trailers in the dark. The tape reduces side and rear impacts by other vehicles into trailers by 29 percent in dark conditions (including dark-not-lighted, dark-lighted, dawn and dusk). In dark-not-lighted conditions, the tape reduc-es side and rear impacts by 41 percent. When all heavy trailers have the tape, it will prevent an estimated 191 to 350 fatalities, 3,100 to 5,000 injuries and 7,800 crashes per year.
Evaluation of the American Automobile Labeling Act (NHTSA Report No. DOT HS 809 208, www-nrd.nhtsa.dot.gov/Pubs/809208.PDF)
In a survey of 646 recent or imminent new-vehicle buyers, over 75 percent were unaware of the existence of automobile parts content labels. Among those who had read the labels, many said they used the country-of-assembly information, but none said they used the numerical U.S./Canadian parts content score. Overall U.S./Canadian parts content in new cars and LTVs dropped from an average of 70 percent in model year 1995 to 67.6 percent in 1998. However, it increased from 47 to 59 percent in transplants while dropping from 89 to 84 percent in Big 3 vehicles: trends undoubtedly influenced by the 1995 U.S.-Japan Agreement on Autos and Auto Parts and the North American Free Trade Agreement.
460
2000 Fatality Reduction by Safety Belts for Front-Seat Occupants of Cars and Light Trucks: Updated and Expanded Estimates Based on 1986-99 FARS Data (NHTSA Report No. DOT HS 809 199, www-nrd.nhtsa.dot.gov/Pubs/809199.PDF)
Manual three-point belts reduce fatality risk, relative to the unrestrained front seat occupant, by 45 percent in passenger cars and by 60 percent in pickup trucks, vans, and sport utility ve-hicles. The analyses reconfirm the agency’s earlier (1984 to 1989) estimates of fatality reduc-tion.
1999 Evaluation of FMVSS 214 - Side Impact Protection: Dynamic Performance Requirement; Phase 1: Correlation of TTI(d) With Fatality Risk in Actual Side Impact Collisions of Model Year 1981-1993 Passenger Cars (NHTSA Report No. DOT HS 809 004, www-nrd.nhtsa.dot.gov/Pubs/809004.PDF)
[Findings have been superseded by the 2007 evaluation - see above.]
Effectiveness of Lap/Shoulder Belts in the Back Outboard Seating Positions (NHTSA Re-port No. DOT HS 808 945, www-nrd.nhtsa.dot.gov/Pubs/808945.PDF)
Lap/shoulder belts reduce fatality risk by 44 percent relative to unrestrained rear seat occu-pants of passenger cars, and by 15 percent relative to lap-belted occupants. Lap belts reduce fatality risk by 32 percent relative to unrestrained occupants. Lap/shoulder belts are effective in all crashes, but lap belts only in non-frontal crashes. Lap-belted occupants have substantial-ly higher abdominal-injury risk than unrestrained rear seat occupants in frontal crashes, but lap/shoulder belts reduce abdominal injuries by 52 percent and head injuries by 47 percent relative to lap belts.
1998 Highway Safety Assessment: A Summary of Findings in Ten States (NHTSA Report No. DOT HS 808 796, www-nrd.nhtsa.dot.gov/Pubs/808796.PDF)
Assessment of safety programs in 10 States from 1980 to 1993 showed that Federal grants and technology were used to address safety priorities as intended by Congress. Federal grants, amounting to less than 2 percent of total safety spending by States and communities, have acted as seed money to resolve important highway safety problems. Programs started with Federal funds were often extended or replicated elsewhere with State funds. Occupant protec-tion programs, however, remain heavily dependent on Federal funds.
Auto Theft and Recovery - Effects of the Anti Car Theft Act of 1992 and the Motor Vehicle Theft Law Enforcement Act of 1984 - Report to the Congress (NHTSA Report No. DOT HS 808 761, www-nrd.nhtsa.dot.gov/Pubs/808761.PDF)
Theft rates, which had increased during the 1980s, declined from 714 per million in 1990 to 597 in 1995. Parts marking and factory-installed anti-theft devices have had beneficial and complementary effects on auto thefts and/or recoveries. The Acts have given law enforcement tools to deter thefts, trace stolen vehicles and parts, and apprehend and convict thieves.
461
The Long-Term Effectiveness of Center High Mounted Stop Lamps in Passenger Cars and Light Trucks (NHTSA Report No. DOT HS 808 696, www-nrd.nhtsa.dot.gov/Pubs/808696.PDF)
Throughout 1989 to 1995, cars equipped with center high-mounted stop lamps were 4.3 per-cent less likely to be struck in the rear than cars without the lamps. (In 1987, when the lamps were first introduced, the reduction was 8.5 percent.) The effectiveness of CHMSL in LTVs is about the same as in cars. At the 1989-to-1995 effectiveness level, when all cars and LTVs on the road have the lamps, they would prevent 194,000 to 239,000 crashes, 58,000 to 70,000 nonfatal injuries and $655 million in property damage per year.
1997 Relationship of Vehicle Weight to Fatality and Injury Risk in Model Year 1985-93 Passen-ger Cars and Light Trucks (NHTSA Report No. DOT HS 808 569, www-nrd.nhtsa.dot.gov/Pubs/808570.PDF); Relationships Between Vehicle Size and Fatality Risk in Model Year 1985-93 Passenger Cars and Light Trucks (NHTSA Report No. DOT HS 808 570, www-nrd.nhtsa.dot.gov/Pubs/808569.PDF)
[Findings have been superseded by the 2012 evaluation - see above.]
1996 Fatality Reduction by Air Bags: Analyses of Accident Data through Early 1996 (NHTSA Report No. DOT HS 808 470, www-nrd.nhtsa.dot.gov/Pubs/808470.PDF)
Driver air bags reduce overall fatality risk by an estimated 11 percent in passenger cars and LTVs (essentially unchanged from the 1994 and 1992 NHTSA analyses). Passenger air bags are beneficial for RF passengers 13 or older. Air bags provide a life-saving benefit for belted as well as unbelted drivers. The fatality risk for child passengers up to age 12 in cars with pas-senger air bags is currently higher than in cars without them. Current air bags are significantly less effective for drivers 70 or older than for younger drivers.
1995 Preliminary Evaluation of the Effectiveness of Antilock Brake Systems for Passenger Cars (NHTSA Report No. DOT HS 808 206, www-nrd.nhtsa.dot.gov/Pubs/808206.PDF)
[Findings have been superseded by the 2009 evaluation - see above.]
1994 Fatality Reduction by Automatic Occupant Protection in the United States (Proceedings of the 14th Conference on Enhanced Safety of Vehicles, Paper No. 94-S5-O-08, www-nrd.nhtsa.dot.gov/Pubs/94S5O08.PDF)
The fatality risk of outboard front seat occupants in cars with motorized 2-point belts (without disconnect) is 6 percent lower than in cars with manual belts; the risk in cars with non-motorized 3-point belts is the same as in cars with manual belts. [This report’s findings on air bags have been superseded by the 1996 evaluation - see above.]
462
An Evaluation of the Effects of Glass-Plastic Windshield Glazing in Passenger Cars (NHTSA Report No. DOT HS 808 062, www-nrd.nhtsa.dot.gov/Pubs/808062.PDF)
Following an amendment to the glazing standard (FMVSS No. 205) in 1983, two manufactur-ers equipped some of their cars with glass-plastic windshields. Crash data indicates the injury reduction potential of these windshields is less than predicted. Fleet and warranty data show that durability problems are greater than anticipated. While glass-plastic windshields add $65 to the cost of a new car, their replacement costs are estimated to exceed $1,700.
Correlation of NCAP Performance With Fatality Risk in Actual Head-On Collisions (NHTSA Report No. DOT HS 808 061, www-nrd.nhtsa.dot.gov/Pubs/808061.PDF)
There is a statistically significant correlation between the performance of passenger cars on the NCAP frontal-barrier test and the fatality risk of belted drivers in actual head-on colli-sions. In a head-on collision between a car with "good" NCAP performance and a car of equal mass with "poor" performance, the driver of the "good" car has, on the average, about 15-to-25 percent lower fatality risk. The steady improvement in NCAP scores during 1979 to 1991 was paralleled by a 20-to-25 percent reduction of fatality risk for belted drivers in actual head-on collisions.
1993 Preliminary Evaluation of the Effectiveness of Rear-Wheel Antilock Brake Systems for Light Trucks (Submitted to NHTSA Docket No. 70-27-GR-026, www-nrd.nhtsa.dot.gov/Pubs/7027GR.PDF)
[Findings have been superseded by the 2009 evaluation - see above.]
1992 Evaluation of the Effectiveness of Occupant Protection - Federal Motor Vehicle Safety FMVSS 208 - Interim Report (NHTSA Report No. DOT HS 807 843, www-nrd.nhtsa.dot.gov/Pubs/807843.pdf)
Air bags and automatic belts have significantly reduced the risk of nonfatal injury and occu-pant ejection. [This report’s findings on fatality reduction for air bags have been superseded by the 1996 evaluation; for automatic belts - by the 1994 evaluation.]
An Evaluation of the Uniform Tire Quality Grading Standards and Other Tire Labeling Requirements (NHTSA Report No. DOT HS 807 805, www-nrd.nhtsa.dot.gov/Pubs/807805.PDF)
Consumers and tire dealers were surveyed about their knowledge and use of tire quality grades and other tire information supplied in response to Federal regulations. The ratings for treadwear were viewed as "important" by 29 percent of consumers who had recently pur-chased tires, and the ratings for traction, by 27 percent. The majority of consumers are not aware that these ratings are printed on the tires.
463
1991 Auto Theft and Recovery - Effects of the Motor Vehicle Theft Law Enforcement Act of 1984 - Report to the Congress (NHTSA Report No. DOT HS 807 703, www-nrd.nhtsa.dot.gov/Pubs/807703.pdf)
[Findings have been superseded by the 1998 evaluation - see above.]
Effect of Car Size on Fatality and Injury Risk [Findings have been superseded by the 2012 evaluation - see above.]
1990 Motor Vehicle Fires in Traffic Crashes and the Effects of the Fuel System Integrity Stand-ard (NHTSA Report No. DOT HS 807 675, www-nrd.nhtsa.dot.gov/Pubs/807675.PDF)
Modifications to fuel systems in response to FMVSS No. 301 reduced the frequency of fires in nonfatal crashes of passenger cars by an estimated 14 percent; fatalities in cars and LTVs, however, were not affected. During 1975 to 1988, the number of fire-related fatalities in-creased from 1,300 to 1,800, primarily due to an aging vehicle fleet.
1989 An Evaluation of Door Locks and Roof Crush Resistance of Passenger Cars - Federal Mo-tor Vehicle Safety Standards 206 and 216 (NHTSA Report No. DOT HS 807 489, www-nrd.nhtsa.dot.gov/Pubs/807489.PDF)
Door latch improvements implemented during 1963 to 1968 (preceding or responding to FMVSS No. 206) save an estimated 400 lives per year, reducing the risk of ejection in rollo-ver crashes by 15 percent. The shift from hardtops to pillared cars with stronger roof support, in response to FMVSS No. 216, saves an estimated 110 lives per year.
An Evaluation of Center High Mounted Stop Lamps Based on 1987 Data (NHTSA Report No. DOT HS 807 442, www-nrd.nhtsa.dot.gov/Pubs/807442.PDF)
[Findings have been superseded by the 1998 evaluation - see above.]
1988 An Evaluation of Occupant Protection in Frontal Interior Impact for Unrestrained Front Seat Occupants of Cars and Light Trucks (NHTSA Report No. DOT HS 807 203, www-nrd.nhtsa.dot.gov/Pubs/807203.PDF)
During the 1960s and early 1970s, the manufacturers modified instrument panels of cars and LTVs, installing padding, reducing the rigidity of structures and extending the panel down-ward and toward the passenger. The improvements reduced fatality risk and serious injury risk by nearly 25 percent for unrestrained RF passengers of cars in frontal crashes, saving up to 700 lives per year.
464
1987 An Evaluation of the Bumper Standard - As Modified in 1982 (NHTSA Report No. DOT HS 807 072, www-nrd.nhtsa.dot.gov/Pubs/807072.PDF)
To reduce regulatory burden on manufacturers, damage resistance requirements for bumpers were relaxed in model year 1983: the impact test speed was lowered from 5 to 2.5 mph. The net costs to consumers did not significantly change. A small increase in the repair cost over the lifetime of the car is offset by a reduction in the initial cost of the lighter bumpers. (See al-so the 1981 evaluation of bumpers.)
A Preliminary Evaluation of Seat Back Locks for Two-Door Passenger Cars With Folding Front Seatbacks (NHTSA Report No. DOT HS 807 067, www-nrd.nhtsa.dot.gov/Pubs/807067.PDF)
FMVSS No. 207 requires a locking device for front seats with folding seat backs, designed to limit the forward motion of the seat back in a collision. These locks or other seat components sometimes separate at moderate crash speeds when the seat backs are hit by rear seat occu-pants in frontal impacts. No statistically significant injury or fatality reductions were found for seat back locks in any of the crash data files or in sled tests.
Fatality and Injury Reducing Effectiveness of Lap Belts for Back Seat Occupants (SAE Pa-per 870486)
[Findings have been superseded by the 1999 evaluation - see above.]
The Effectiveness of Center High-Mounted Stop Lamps - A Preliminary Evaluation (NHTSA Report No. DOT HS 807 076, www-nrd.nhtsa.dot.gov/Pubs/HS807076.PDF)
[Findings have been superseded by the 1998 evaluation - see above.]
1986 Fuel Economy and Annual Travel for Passenger Cars and Light Trucks: National On-Road Survey (NHTSA Report No. DOT HS 806 971, www-nrd.nhtsa.dot.gov/Pubs/806971.PDF)
The actual fuel economy of model year 1978-to-1981 vehicles was measured by a national survey in which drivers maintained log books of mileage and fuel purchases. On-road fuel economy of cars increased by 41 percent during model years 1977 to 1981; the fuel economy of LTVs increased by 17 to 26 percent. However, the actual on-road fuel economy is consist-ently 15 to 20 percent below laboratory (EPA) ratings.
An Evaluation of Child Passenger Safety: The Effectiveness and Benefits of Safety Seats (NHTSA Report No. DOT HS 806 890, www-nrd.nhtsa.dot.gov/Pubs/806890.PDF)
A correctly used safety seat reduces fatality risk by an estimated 71 percent and serious injury risk by 67 percent. But misuse can partially or completely nullify this effect. In 1984, when 39 percent of safety seats were correctly used and 61 percent were misused, the average overall fatality reduction for safety seats (correct users plus misusers) was 46 percent. In all, 192 children were saved by safety seats and lap belts in 1984.

465
1985 An Evaluation of Windshield Glazing and Installation Methods for Passenger Cars (NHTSA Report No. DOT HS 806 693, www-nrd.nhtsa.dot.gov/Pubs/806693.PDF)
The high-penetration-resistant windshield doubled the impact velocity needed for the occu-pant's head to penetrate the windshield, reducing serious facial lacerations by 74 percent, pre-venting 39,000 serious lacerations and 8,000 facial fractures per year. Adhesive bonding of the windshield halved the incidence of bond separation and occupant ejection through the windshield portal in crashes, saving 105 lives per year.
1984 Effectiveness - Manual Lap and Lap/Shoulder Belts (Chapter IV-A of "Final Regulatory Im-pact Analysis - Amendment to Federal Motor Vehicle Safety Standard 208 - Passenger Car Front Seat Occupant Protection," NHTSA Report No. DOT HS 806 572)
Manual lap-shoulder belts are estimated to reduce the fatality risk of drivers and RF passen-gers by 40 to 50 percent [reconfirmed and superseded by the 2000 evaluation - see above], and serious injury risk by 45 to 55 percent, relative to an unrestrained occupant. The manual lap belt, alone, is estimated to reduce fatality risk by 30 to 40 percent and serious injury risk by 25 to 35 percent.
1983 An Evaluation of Side Marker Lamps for Cars, Trucks and Buses (NHTSA Report No. DOT HS 806 430, www-nrd.nhtsa.dot.gov/Pubs/806430.PDF)
Side marker lamps were installed in response to FMVSS No. 108 to enable a driver to see an-other vehicle that is approaching at an angle at night. The lamps reduced nonfatal nighttime angle collisions by 16 percent, preventing 106,000 crashes, 93,000 injuries, and $347 million in property damage per year. The lamps have not been effective in reducing fatalities.
A Preliminary Evaluation of Two Braking Improvements for Passenger Cars - Dual Mas-ter Cylinders and Front Disc Brakes (NHTSA Report No. DOT HS 806 359, www-nrd.nhtsa.dot.gov/Pubs/806359.PDF)
Dual master cylinders, by providing a backup braking system in case of certain types of brake failure, prevent 40,000 crashes, 260 fatalities, 24,000 injuries and $132 million in property damage per year. Front disc brakes, which improve vehicle handling under various braking conditions, are estimated to prevent 10,000 crashes, 64 fatalities, 5,700 injuries and $32 mil-lion in property damage per year.
Evaluation of Federal Motor Vehicle Safety Standard 301-75, Fuel System Integrity: Pas-senger Cars (NHTSA Report No. DOT HS 806 335, www-nrd.nhtsa.dot.gov/Pubs/HS806335.pdf)
[Findings have been superseded by the 1990 evaluation - see above.]
466
1982 An Evaluation of Side Structure Improvements in Response to Federal Motor Vehicle Safe-ty Standard 214 (NHTSA Report No. DOT HS 806 314, www-nrd.nhtsa.dot.gov/Pubs/806314.PDF)
Side door beams were installed in passenger cars to reduce the velocity and depth of door in-trusion in side-impact crashes. The beams are especially effective in side impacts with fixed objects, preventing 480 fatalities and 4,500 hospitalizations per year. In vehicle-to-vehicle side impacts, they prevent 4,900 nonfatal hospitalizations per year, but have not reduced fatal-ity risk.
An Evaluation of Head Restraints - Federal Motor Vehicle Safety Standard 202 (NHTSA Report No. DOT HS 806 108, www-nrd.nhtsa.dot.gov/Pubs/806108.PDF)
The purpose of a head restraint is to prevent whiplash injury in rear-impact crashes. There are integral (fixed) and adjustable head restraints; 75 percent of adjustable restraints are left in the "down" position by occupants. In 1982, integral head restraints reduced injury risk in rear im-pacts by 17 percent; adjustable restraints by 10 percent. The 1982 mix of head restraints pre-vented 64,000 whiplash injuries per year. [Subsequently, manufacturers have enlarged adjust-able restraints to provide better protection, even in the "down" position. See also the 2001 evaluation of head restraints in LTVs.]
1981 An Evaluation of the Bumper Standard (NHTSA Report No. DOT HS 805 866, www-nrd.nhtsa.dot.gov/Pubs/HS805866.pdf)
In order to reduce car repair costs for consumers, damage resistance tests were established for bumpers in model year 1973 and upgraded in 1974 and 1979. The bumper standards did not significantly change net costs for consumers: the savings in repair costs over the lifetime of the car are almost equal to the increase in the initial cost of the bumpers. (See also the 1987 evaluation of bumpers.)
An Evaluation of Federal Motor Vehicle Safety Standards for Passenger Car Steering As-semblies: Standard 203 - Impact Protection for the Driver; Standard 204 - Rearward Col-umn Displacement (NHTSA Report No. DOT HS 805 705, www-nrd.nhtsa.dot.gov/Pubs/805705.PDF)
Energy-absorbing, telescoping steering columns reduced the risk of serious injury due to steering-assembly contact by 38 percent. Rearward column displacement was reduced by 81 percent. The standards prevent 1,300 fatalities and 23,000 hospitalizations per year. The per-formance of energy-absorbing steering assemblies is degraded under non-axial impact condi-tions.
1979 An Evaluation of Standard 214 (NHTSA Report No. DOT HS 804 858, www-nrd.nhtsa.dot.gov/Pubs/HS804858.pdf)
[Findings have been superseded by the 1982 evaluation - see above.]
467
APPENDIX C
Year-by-Year Percentages of Cars and LTVs Equipped With Safety Technologies
New Vehicles (by Model Year) and
All Vehicles on the Road (by Calendar Year) In Tables C-1 and C-3, the median installation year for selected technologies (the first model year in which 50 percent or more of new vehicles were equipped with the technology) is shown in bold red type.
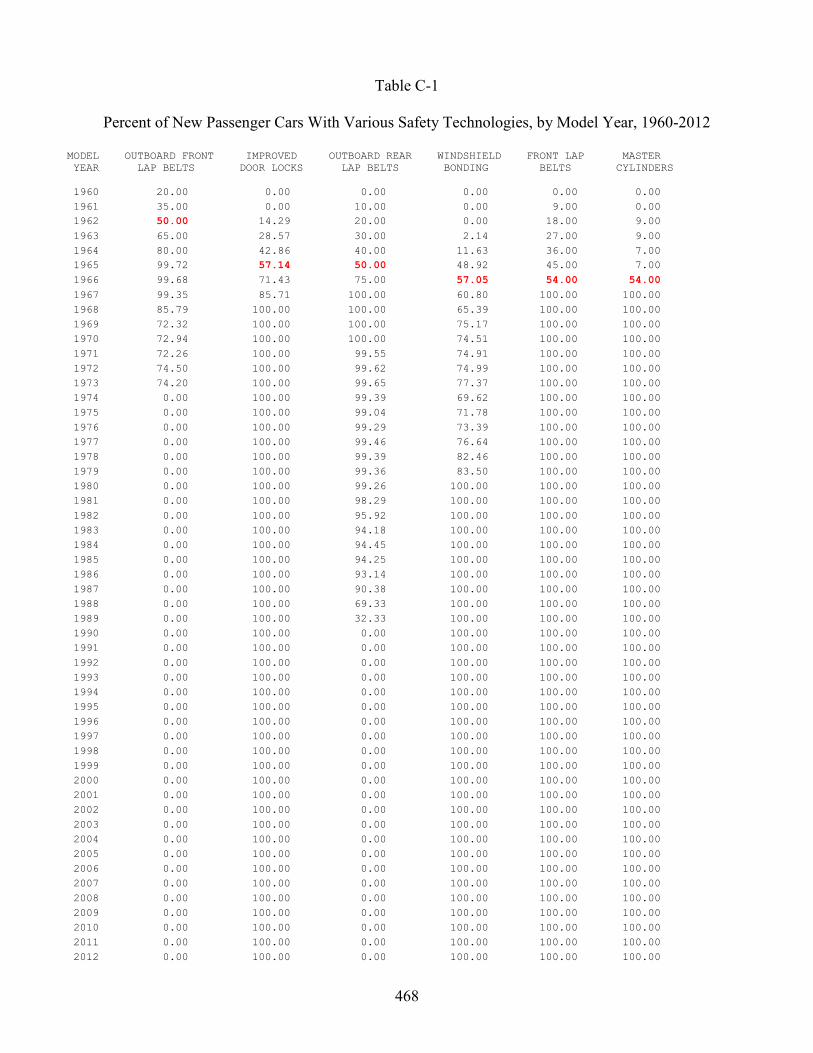
468
Table C-1
Percent of New Passenger Cars With Various Safety Technologies, by Model Year, 1960-2012
MODEL OUTBOARD FRONT IMPROVED OUTBOARD REAR WINDSHIELD FRONT LAP MASTER YEAR LAP BELTS DOOR LOCKS LAP BELTS BONDING BELTS CYLINDERS 1960 20.00 0.00 0.00 0.00 0.00 0.00 1961 35.00 0.00 10.00 0.00 9.00 0.00 1962 50.00 14.29 20.00 0.00 18.00 9.00 1963 65.00 28.57 30.00 2.14 27.00 9.00 1964 80.00 42.86 40.00 11.63 36.00 7.00 1965 99.72 57.14 50.00 48.92 45.00 7.00 1966 99.68 71.43 75.00 57.05 54.00 54.00 1967 99.35 85.71 100.00 60.80 100.00 100.00 1968 85.79 100.00 100.00 65.39 100.00 100.00 1969 72.32 100.00 100.00 75.17 100.00 100.00 1970 72.94 100.00 100.00 74.51 100.00 100.00 1971 72.26 100.00 99.55 74.91 100.00 100.00 1972 74.50 100.00 99.62 74.99 100.00 100.00 1973 74.20 100.00 99.65 77.37 100.00 100.00 1974 0.00 100.00 99.39 69.62 100.00 100.00 1975 0.00 100.00 99.04 71.78 100.00 100.00 1976 0.00 100.00 99.29 73.39 100.00 100.00 1977 0.00 100.00 99.46 76.64 100.00 100.00 1978 0.00 100.00 99.39 82.46 100.00 100.00 1979 0.00 100.00 99.36 83.50 100.00 100.00 1980 0.00 100.00 99.26 100.00 100.00 100.00 1981 0.00 100.00 98.29 100.00 100.00 100.00 1982 0.00 100.00 95.92 100.00 100.00 100.00 1983 0.00 100.00 94.18 100.00 100.00 100.00 1984 0.00 100.00 94.45 100.00 100.00 100.00 1985 0.00 100.00 94.25 100.00 100.00 100.00 1986 0.00 100.00 93.14 100.00 100.00 100.00 1987 0.00 100.00 90.38 100.00 100.00 100.00 1988 0.00 100.00 69.33 100.00 100.00 100.00 1989 0.00 100.00 32.33 100.00 100.00 100.00 1990 0.00 100.00 0.00 100.00 100.00 100.00 1991 0.00 100.00 0.00 100.00 100.00 100.00 1992 0.00 100.00 0.00 100.00 100.00 100.00 1993 0.00 100.00 0.00 100.00 100.00 100.00 1994 0.00 100.00 0.00 100.00 100.00 100.00 1995 0.00 100.00 0.00 100.00 100.00 100.00 1996 0.00 100.00 0.00 100.00 100.00 100.00 1997 0.00 100.00 0.00 100.00 100.00 100.00 1998 0.00 100.00 0.00 100.00 100.00 100.00 1999 0.00 100.00 0.00 100.00 100.00 100.00 2000 0.00 100.00 0.00 100.00 100.00 100.00 2001 0.00 100.00 0.00 100.00 100.00 100.00 2002 0.00 100.00 0.00 100.00 100.00 100.00 2003 0.00 100.00 0.00 100.00 100.00 100.00 2004 0.00 100.00 0.00 100.00 100.00 100.00 2005 0.00 100.00 0.00 100.00 100.00 100.00 2006 0.00 100.00 0.00 100.00 100.00 100.00 2007 0.00 100.00 0.00 100.00 100.00 100.00 2008 0.00 100.00 0.00 100.00 100.00 100.00 2009 0.00 100.00 0.00 100.00 100.00 100.00 2010 0.00 100.00 0.00 100.00 100.00 100.00 2011 0.00 100.00 0.00 100.00 100.00 100.00 2012 0.00 100.00 0.00 100.00 100.00 100.00
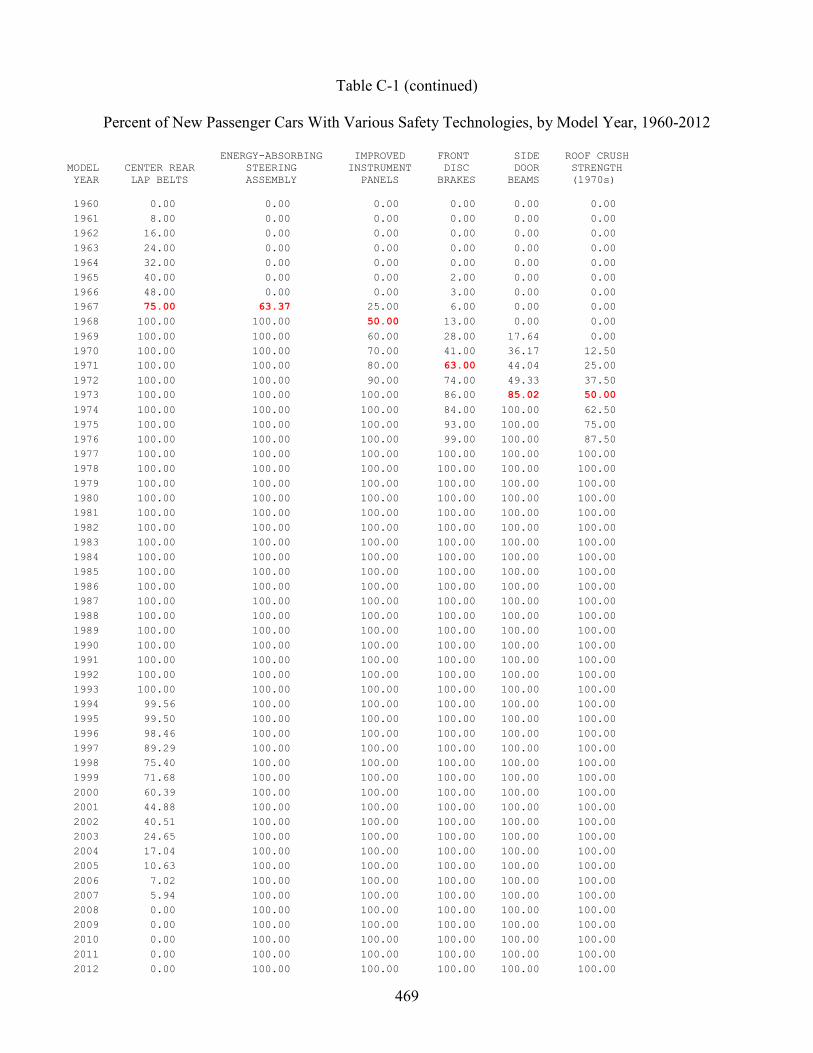
469
Table C-1 (continued)
Percent of New Passenger Cars With Various Safety Technologies, by Model Year, 1960-2012
ENERGY-ABSORBING IMPROVED FRONT SIDE ROOF CRUSH MODEL CENTER REAR STEERING INSTRUMENT DISC DOOR STRENGTH YEAR LAP BELTS ASSEMBLY PANELS BRAKES BEAMS (1970s) 1960 0.00 0.00 0.00 0.00 0.00 0.00 1961 8.00 0.00 0.00 0.00 0.00 0.00 1962 16.00 0.00 0.00 0.00 0.00 0.00 1963 24.00 0.00 0.00 0.00 0.00 0.00 1964 32.00 0.00 0.00 0.00 0.00 0.00 1965 40.00 0.00 0.00 2.00 0.00 0.00 1966 48.00 0.00 0.00 3.00 0.00 0.00 1967 75.00 63.37 25.00 6.00 0.00 0.00 1968 100.00 100.00 50.00 13.00 0.00 0.00 1969 100.00 100.00 60.00 28.00 17.64 0.00 1970 100.00 100.00 70.00 41.00 36.17 12.50 1971 100.00 100.00 80.00 63.00 44.04 25.00 1972 100.00 100.00 90.00 74.00 49.33 37.50 1973 100.00 100.00 100.00 86.00 85.02 50.00 1974 100.00 100.00 100.00 84.00 100.00 62.50 1975 100.00 100.00 100.00 93.00 100.00 75.00 1976 100.00 100.00 100.00 99.00 100.00 87.50 1977 100.00 100.00 100.00 100.00 100.00 100.00 1978 100.00 100.00 100.00 100.00 100.00 100.00 1979 100.00 100.00 100.00 100.00 100.00 100.00 1980 100.00 100.00 100.00 100.00 100.00 100.00 1981 100.00 100.00 100.00 100.00 100.00 100.00 1982 100.00 100.00 100.00 100.00 100.00 100.00 1983 100.00 100.00 100.00 100.00 100.00 100.00 1984 100.00 100.00 100.00 100.00 100.00 100.00 1985 100.00 100.00 100.00 100.00 100.00 100.00 1986 100.00 100.00 100.00 100.00 100.00 100.00 1987 100.00 100.00 100.00 100.00 100.00 100.00 1988 100.00 100.00 100.00 100.00 100.00 100.00 1989 100.00 100.00 100.00 100.00 100.00 100.00 1990 100.00 100.00 100.00 100.00 100.00 100.00 1991 100.00 100.00 100.00 100.00 100.00 100.00 1992 100.00 100.00 100.00 100.00 100.00 100.00 1993 100.00 100.00 100.00 100.00 100.00 100.00 1994 99.56 100.00 100.00 100.00 100.00 100.00 1995 99.50 100.00 100.00 100.00 100.00 100.00 1996 98.46 100.00 100.00 100.00 100.00 100.00 1997 89.29 100.00 100.00 100.00 100.00 100.00 1998 75.40 100.00 100.00 100.00 100.00 100.00 1999 71.68 100.00 100.00 100.00 100.00 100.00 2000 60.39 100.00 100.00 100.00 100.00 100.00 2001 44.88 100.00 100.00 100.00 100.00 100.00 2002 40.51 100.00 100.00 100.00 100.00 100.00 2003 24.65 100.00 100.00 100.00 100.00 100.00 2004 17.04 100.00 100.00 100.00 100.00 100.00 2005 10.63 100.00 100.00 100.00 100.00 100.00 2006 7.02 100.00 100.00 100.00 100.00 100.00 2007 5.94 100.00 100.00 100.00 100.00 100.00 2008 0.00 100.00 100.00 100.00 100.00 100.00 2009 0.00 100.00 100.00 100.00 100.00 100.00 2010 0.00 100.00 100.00 100.00 100.00 100.00 2011 0.00 100.00 100.00 100.00 100.00 100.00 2012 0.00 100.00 100.00 100.00 100.00 100.00
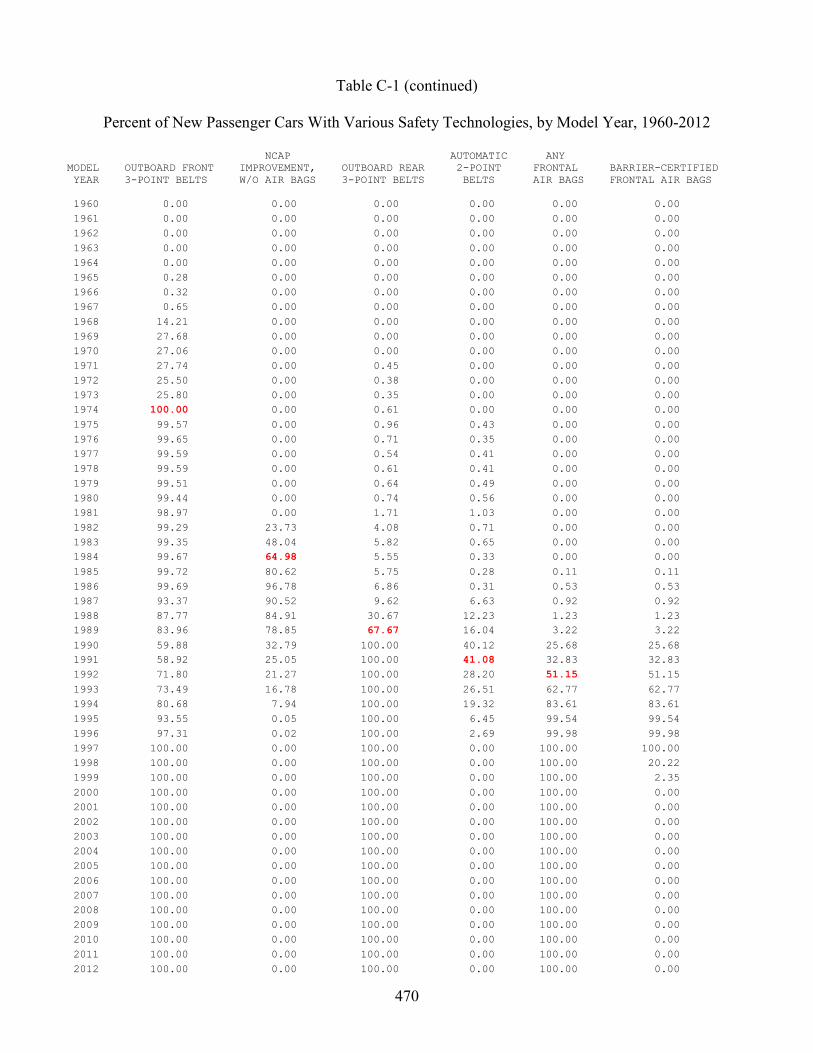
470
Table C-1 (continued)
Percent of New Passenger Cars With Various Safety Technologies, by Model Year, 1960-2012
NCAP AUTOMATIC ANY MODEL OUTBOARD FRONT IMPROVEMENT, OUTBOARD REAR 2-POINT FRONTAL BARRIER-CERTIFIED YEAR 3-POINT BELTS W/O AIR BAGS 3-POINT BELTS BELTS AIR BAGS FRONTAL AIR BAGS 1960 0.00 0.00 0.00 0.00 0.00 0.00 1961 0.00 0.00 0.00 0.00 0.00 0.00 1962 0.00 0.00 0.00 0.00 0.00 0.00 1963 0.00 0.00 0.00 0.00 0.00 0.00 1964 0.00 0.00 0.00 0.00 0.00 0.00 1965 0.28 0.00 0.00 0.00 0.00 0.00 1966 0.32 0.00 0.00 0.00 0.00 0.00 1967 0.65 0.00 0.00 0.00 0.00 0.00 1968 14.21 0.00 0.00 0.00 0.00 0.00 1969 27.68 0.00 0.00 0.00 0.00 0.00 1970 27.06 0.00 0.00 0.00 0.00 0.00 1971 27.74 0.00 0.45 0.00 0.00 0.00 1972 25.50 0.00 0.38 0.00 0.00 0.00 1973 25.80 0.00 0.35 0.00 0.00 0.00 1974 100.00 0.00 0.61 0.00 0.00 0.00 1975 99.57 0.00 0.96 0.43 0.00 0.00 1976 99.65 0.00 0.71 0.35 0.00 0.00 1977 99.59 0.00 0.54 0.41 0.00 0.00 1978 99.59 0.00 0.61 0.41 0.00 0.00 1979 99.51 0.00 0.64 0.49 0.00 0.00 1980 99.44 0.00 0.74 0.56 0.00 0.00 1981 98.97 0.00 1.71 1.03 0.00 0.00 1982 99.29 23.73 4.08 0.71 0.00 0.00 1983 99.35 48.04 5.82 0.65 0.00 0.00 1984 99.67 64.98 5.55 0.33 0.00 0.00 1985 99.72 80.62 5.75 0.28 0.11 0.11 1986 99.69 96.78 6.86 0.31 0.53 0.53 1987 93.37 90.52 9.62 6.63 0.92 0.92 1988 87.77 84.91 30.67 12.23 1.23 1.23 1989 83.96 78.85 67.67 16.04 3.22 3.22 1990 59.88 32.79 100.00 40.12 25.68 25.68 1991 58.92 25.05 100.00 41.08 32.83 32.83 1992 71.80 21.27 100.00 28.20 51.15 51.15 1993 73.49 16.78 100.00 26.51 62.77 62.77 1994 80.68 7.94 100.00 19.32 83.61 83.61 1995 93.55 0.05 100.00 6.45 99.54 99.54 1996 97.31 0.02 100.00 2.69 99.98 99.98 1997 100.00 0.00 100.00 0.00 100.00 100.00 1998 100.00 0.00 100.00 0.00 100.00 20.22 1999 100.00 0.00 100.00 0.00 100.00 2.35 2000 100.00 0.00 100.00 0.00 100.00 0.00 2001 100.00 0.00 100.00 0.00 100.00 0.00 2002 100.00 0.00 100.00 0.00 100.00 0.00 2003 100.00 0.00 100.00 0.00 100.00 0.00 2004 100.00 0.00 100.00 0.00 100.00 0.00 2005 100.00 0.00 100.00 0.00 100.00 0.00 2006 100.00 0.00 100.00 0.00 100.00 0.00 2007 100.00 0.00 100.00 0.00 100.00 0.00 2008 100.00 0.00 100.00 0.00 100.00 0.00 2009 100.00 0.00 100.00 0.00 100.00 0.00 2010 100.00 0.00 100.00 0.00 100.00 0.00 2011 100.00 0.00 100.00 0.00 100.00 0.00 2012 100.00 0.00 100.00 0.00 100.00 0.00
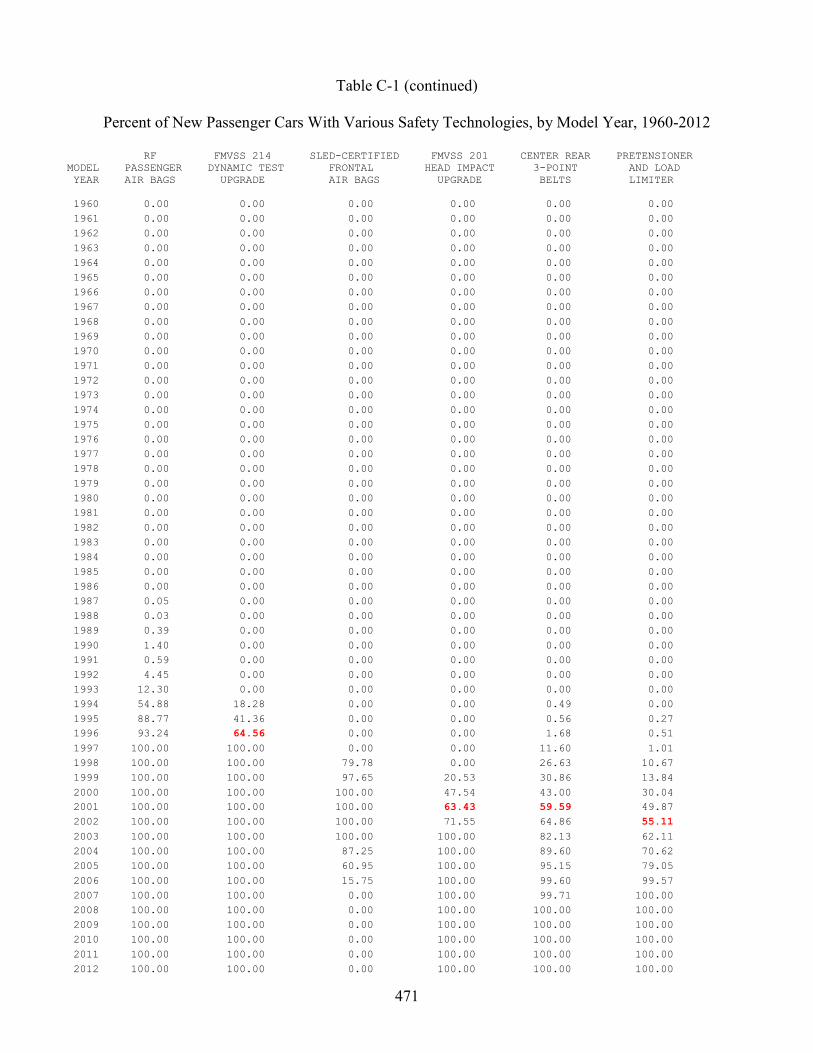
471
Table C-1 (continued)
Percent of New Passenger Cars With Various Safety Technologies, by Model Year, 1960-2012
RF FMVSS 214 SLED-CERTIFIED FMVSS 201 CENTER REAR PRETENSIONER MODEL PASSENGER DYNAMIC TEST FRONTAL HEAD IMPACT 3-POINT AND LOAD YEAR AIR BAGS UPGRADE AIR BAGS UPGRADE BELTS LIMITER 1960 0.00 0.00 0.00 0.00 0.00 0.00 1961 0.00 0.00 0.00 0.00 0.00 0.00 1962 0.00 0.00 0.00 0.00 0.00 0.00 1963 0.00 0.00 0.00 0.00 0.00 0.00 1964 0.00 0.00 0.00 0.00 0.00 0.00 1965 0.00 0.00 0.00 0.00 0.00 0.00 1966 0.00 0.00 0.00 0.00 0.00 0.00 1967 0.00 0.00 0.00 0.00 0.00 0.00 1968 0.00 0.00 0.00 0.00 0.00 0.00 1969 0.00 0.00 0.00 0.00 0.00 0.00 1970 0.00 0.00 0.00 0.00 0.00 0.00 1971 0.00 0.00 0.00 0.00 0.00 0.00 1972 0.00 0.00 0.00 0.00 0.00 0.00 1973 0.00 0.00 0.00 0.00 0.00 0.00 1974 0.00 0.00 0.00 0.00 0.00 0.00 1975 0.00 0.00 0.00 0.00 0.00 0.00 1976 0.00 0.00 0.00 0.00 0.00 0.00 1977 0.00 0.00 0.00 0.00 0.00 0.00 1978 0.00 0.00 0.00 0.00 0.00 0.00 1979 0.00 0.00 0.00 0.00 0.00 0.00 1980 0.00 0.00 0.00 0.00 0.00 0.00 1981 0.00 0.00 0.00 0.00 0.00 0.00 1982 0.00 0.00 0.00 0.00 0.00 0.00 1983 0.00 0.00 0.00 0.00 0.00 0.00 1984 0.00 0.00 0.00 0.00 0.00 0.00 1985 0.00 0.00 0.00 0.00 0.00 0.00 1986 0.00 0.00 0.00 0.00 0.00 0.00 1987 0.05 0.00 0.00 0.00 0.00 0.00 1988 0.03 0.00 0.00 0.00 0.00 0.00 1989 0.39 0.00 0.00 0.00 0.00 0.00 1990 1.40 0.00 0.00 0.00 0.00 0.00 1991 0.59 0.00 0.00 0.00 0.00 0.00 1992 4.45 0.00 0.00 0.00 0.00 0.00 1993 12.30 0.00 0.00 0.00 0.00 0.00 1994 54.88 18.28 0.00 0.00 0.49 0.00 1995 88.77 41.36 0.00 0.00 0.56 0.27 1996 93.24 64.56 0.00 0.00 1.68 0.51 1997 100.00 100.00 0.00 0.00 11.60 1.01 1998 100.00 100.00 79.78 0.00 26.63 10.67 1999 100.00 100.00 97.65 20.53 30.86 13.84 2000 100.00 100.00 100.00 47.54 43.00 30.04 2001 100.00 100.00 100.00 63.43 59.59 49.87 2002 100.00 100.00 100.00 71.55 64.86 55.11 2003 100.00 100.00 100.00 100.00 82.13 62.11 2004 100.00 100.00 87.25 100.00 89.60 70.62 2005 100.00 100.00 60.95 100.00 95.15 79.05 2006 100.00 100.00 15.75 100.00 99.60 99.57 2007 100.00 100.00 0.00 100.00 99.71 100.00 2008 100.00 100.00 0.00 100.00 100.00 100.00 2009 100.00 100.00 0.00 100.00 100.00 100.00 2010 100.00 100.00 0.00 100.00 100.00 100.00 2011 100.00 100.00 0.00 100.00 100.00 100.00 2012 100.00 100.00 0.00 100.00 100.00 100.00
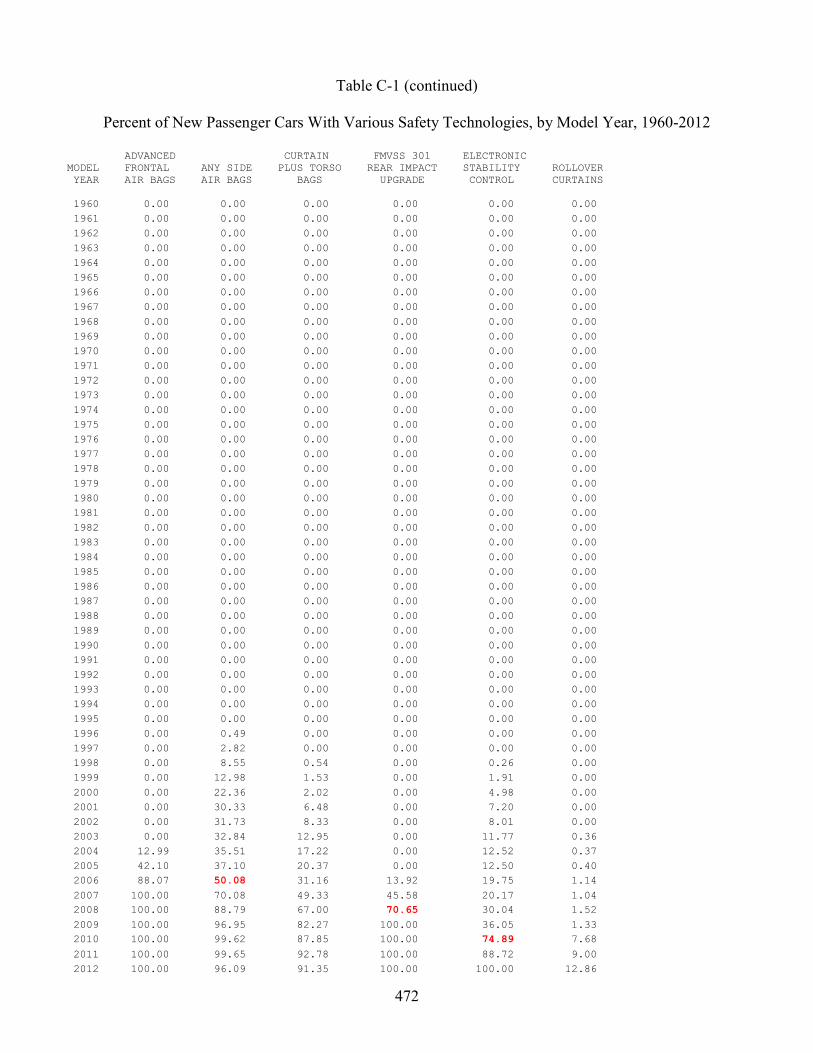
472
Table C-1 (continued)
Percent of New Passenger Cars With Various Safety Technologies, by Model Year, 1960-2012
ADVANCED CURTAIN FMVSS 301 ELECTRONIC MODEL FRONTAL ANY SIDE PLUS TORSO REAR IMPACT STABILITY ROLLOVER YEAR AIR BAGS AIR BAGS BAGS UPGRADE CONTROL CURTAINS 1960 0.00 0.00 0.00 0.00 0.00 0.00 1961 0.00 0.00 0.00 0.00 0.00 0.00 1962 0.00 0.00 0.00 0.00 0.00 0.00 1963 0.00 0.00 0.00 0.00 0.00 0.00 1964 0.00 0.00 0.00 0.00 0.00 0.00 1965 0.00 0.00 0.00 0.00 0.00 0.00 1966 0.00 0.00 0.00 0.00 0.00 0.00 1967 0.00 0.00 0.00 0.00 0.00 0.00 1968 0.00 0.00 0.00 0.00 0.00 0.00 1969 0.00 0.00 0.00 0.00 0.00 0.00 1970 0.00 0.00 0.00 0.00 0.00 0.00 1971 0.00 0.00 0.00 0.00 0.00 0.00 1972 0.00 0.00 0.00 0.00 0.00 0.00 1973 0.00 0.00 0.00 0.00 0.00 0.00 1974 0.00 0.00 0.00 0.00 0.00 0.00 1975 0.00 0.00 0.00 0.00 0.00 0.00 1976 0.00 0.00 0.00 0.00 0.00 0.00 1977 0.00 0.00 0.00 0.00 0.00 0.00 1978 0.00 0.00 0.00 0.00 0.00 0.00 1979 0.00 0.00 0.00 0.00 0.00 0.00 1980 0.00 0.00 0.00 0.00 0.00 0.00 1981 0.00 0.00 0.00 0.00 0.00 0.00 1982 0.00 0.00 0.00 0.00 0.00 0.00 1983 0.00 0.00 0.00 0.00 0.00 0.00 1984 0.00 0.00 0.00 0.00 0.00 0.00 1985 0.00 0.00 0.00 0.00 0.00 0.00 1986 0.00 0.00 0.00 0.00 0.00 0.00 1987 0.00 0.00 0.00 0.00 0.00 0.00 1988 0.00 0.00 0.00 0.00 0.00 0.00 1989 0.00 0.00 0.00 0.00 0.00 0.00 1990 0.00 0.00 0.00 0.00 0.00 0.00 1991 0.00 0.00 0.00 0.00 0.00 0.00 1992 0.00 0.00 0.00 0.00 0.00 0.00 1993 0.00 0.00 0.00 0.00 0.00 0.00 1994 0.00 0.00 0.00 0.00 0.00 0.00 1995 0.00 0.00 0.00 0.00 0.00 0.00 1996 0.00 0.49 0.00 0.00 0.00 0.00 1997 0.00 2.82 0.00 0.00 0.00 0.00 1998 0.00 8.55 0.54 0.00 0.26 0.00 1999 0.00 12.98 1.53 0.00 1.91 0.00 2000 0.00 22.36 2.02 0.00 4.98 0.00 2001 0.00 30.33 6.48 0.00 7.20 0.00 2002 0.00 31.73 8.33 0.00 8.01 0.00 2003 0.00 32.84 12.95 0.00 11.77 0.36 2004 12.99 35.51 17.22 0.00 12.52 0.37 2005 42.10 37.10 20.37 0.00 12.50 0.40 2006 88.07 50.08 31.16 13.92 19.75 1.14 2007 100.00 70.08 49.33 45.58 20.17 1.04 2008 100.00 88.79 67.00 70.65 30.04 1.52 2009 100.00 96.95 82.27 100.00 36.05 1.33 2010 100.00 99.62 87.85 100.00 74.89 7.68 2011 100.00 99.65 92.78 100.00 88.72 9.00 2012 100.00 96.09 91.35 100.00 100.00 12.86
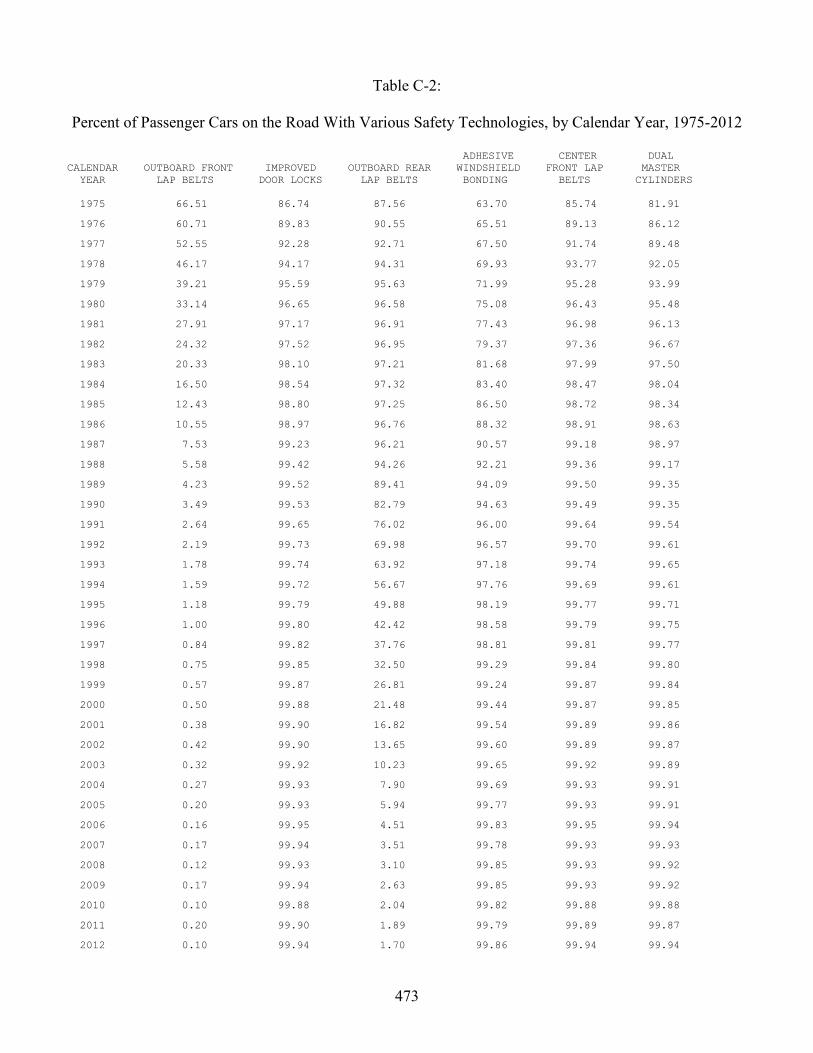
473
Table C-2:
Percent of Passenger Cars on the Road With Various Safety Technologies, by Calendar Year, 1975-2012
ADHESIVE CENTER DUAL CALENDAR OUTBOARD FRONT IMPROVED OUTBOARD REAR WINDSHIELD FRONT LAP MASTER YEAR LAP BELTS DOOR LOCKS LAP BELTS BONDING BELTS CYLINDERS 1975 66.51 86.74 87.56 63.70 85.74 81.91
1976 60.71 89.83 90.55 65.51 89.13 86.12
1977 52.55 92.28 92.71 67.50 91.74 89.48
1978 46.17 94.17 94.31 69.93 93.77 92.05
1979 39.21 95.59 95.63 71.99 95.28 93.99
1980 33.14 96.65 96.58 75.08 96.43 95.48
1981 27.91 97.17 96.91 77.43 96.98 96.13
1982 24.32 97.52 96.95 79.37 97.36 96.67
1983 20.33 98.10 97.21 81.68 97.99 97.50
1984 16.50 98.54 97.32 83.40 98.47 98.04
1985 12.43 98.80 97.25 86.50 98.72 98.34
1986 10.55 98.97 96.76 88.32 98.91 98.63
1987 7.53 99.23 96.21 90.57 99.18 98.97
1988 5.58 99.42 94.26 92.21 99.36 99.17
1989 4.23 99.52 89.41 94.09 99.50 99.35
1990 3.49 99.53 82.79 94.63 99.49 99.35
1991 2.64 99.65 76.02 96.00 99.64 99.54
1992 2.19 99.73 69.98 96.57 99.70 99.61
1993 1.78 99.74 63.92 97.18 99.74 99.65
1994 1.59 99.72 56.67 97.76 99.69 99.61
1995 1.18 99.79 49.88 98.19 99.77 99.71
1996 1.00 99.80 42.42 98.58 99.79 99.75
1997 0.84 99.82 37.76 98.81 99.81 99.77
1998 0.75 99.85 32.50 99.29 99.84 99.80
1999 0.57 99.87 26.81 99.24 99.87 99.84
2000 0.50 99.88 21.48 99.44 99.87 99.85
2001 0.38 99.90 16.82 99.54 99.89 99.86
2002 0.42 99.90 13.65 99.60 99.89 99.87
2003 0.32 99.92 10.23 99.65 99.92 99.89
2004 0.27 99.93 7.90 99.69 99.93 99.91
2005 0.20 99.93 5.94 99.77 99.93 99.91
2006 0.16 99.95 4.51 99.83 99.95 99.94
2007 0.17 99.94 3.51 99.78 99.93 99.93
2008 0.12 99.93 3.10 99.85 99.93 99.92
2009 0.17 99.94 2.63 99.85 99.93 99.92
2010 0.10 99.88 2.04 99.82 99.88 99.88
2011 0.20 99.90 1.89 99.79 99.89 99.87
2012 0.10 99.94 1.70 99.86 99.94 99.94
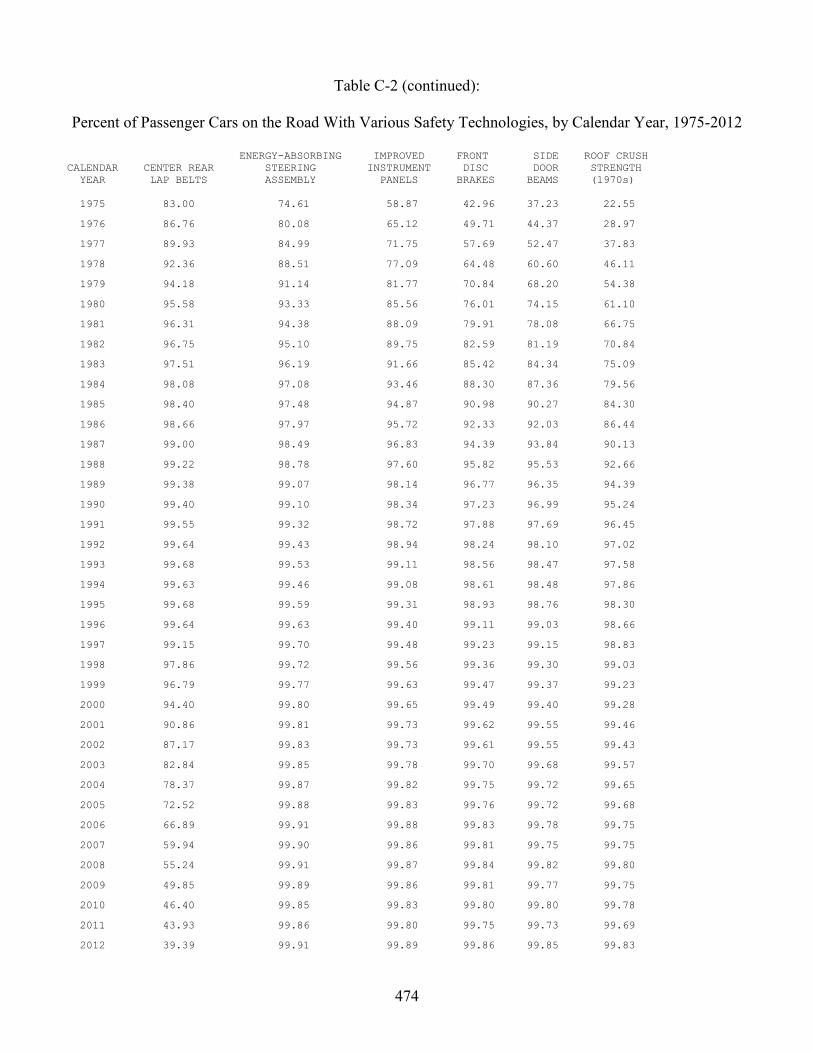
474
Table C-2 (continued):
Percent of Passenger Cars on the Road With Various Safety Technologies, by Calendar Year, 1975-2012
ENERGY-ABSORBING IMPROVED FRONT SIDE ROOF CRUSH CALENDAR CENTER REAR STEERING INSTRUMENT DISC DOOR STRENGTH YEAR LAP BELTS ASSEMBLY PANELS BRAKES BEAMS (1970s) 1975 83.00 74.61 58.87 42.96 37.23 22.55
1976 86.76 80.08 65.12 49.71 44.37 28.97
1977 89.93 84.99 71.75 57.69 52.47 37.83
1978 92.36 88.51 77.09 64.48 60.60 46.11
1979 94.18 91.14 81.77 70.84 68.20 54.38
1980 95.58 93.33 85.56 76.01 74.15 61.10
1981 96.31 94.38 88.09 79.91 78.08 66.75
1982 96.75 95.10 89.75 82.59 81.19 70.84
1983 97.51 96.19 91.66 85.42 84.34 75.09
1984 98.08 97.08 93.46 88.30 87.36 79.56
1985 98.40 97.48 94.87 90.98 90.27 84.30
1986 98.66 97.97 95.72 92.33 92.03 86.44
1987 99.00 98.49 96.83 94.39 93.84 90.13
1988 99.22 98.78 97.60 95.82 95.53 92.66
1989 99.38 99.07 98.14 96.77 96.35 94.39
1990 99.40 99.10 98.34 97.23 96.99 95.24
1991 99.55 99.32 98.72 97.88 97.69 96.45
1992 99.64 99.43 98.94 98.24 98.10 97.02
1993 99.68 99.53 99.11 98.56 98.47 97.58
1994 99.63 99.46 99.08 98.61 98.48 97.86
1995 99.68 99.59 99.31 98.93 98.76 98.30
1996 99.64 99.63 99.40 99.11 99.03 98.66
1997 99.15 99.70 99.48 99.23 99.15 98.83
1998 97.86 99.72 99.56 99.36 99.30 99.03
1999 96.79 99.77 99.63 99.47 99.37 99.23
2000 94.40 99.80 99.65 99.49 99.40 99.28
2001 90.86 99.81 99.73 99.62 99.55 99.46
2002 87.17 99.83 99.73 99.61 99.55 99.43
2003 82.84 99.85 99.78 99.70 99.68 99.57
2004 78.37 99.87 99.82 99.75 99.72 99.65
2005 72.52 99.88 99.83 99.76 99.72 99.68
2006 66.89 99.91 99.88 99.83 99.78 99.75
2007 59.94 99.90 99.86 99.81 99.75 99.75
2008 55.24 99.91 99.87 99.84 99.82 99.80
2009 49.85 99.89 99.86 99.81 99.77 99.75
2010 46.40 99.85 99.83 99.80 99.80 99.78
2011 43.93 99.86 99.80 99.75 99.73 99.69
2012 39.39 99.91 99.89 99.86 99.85 99.83
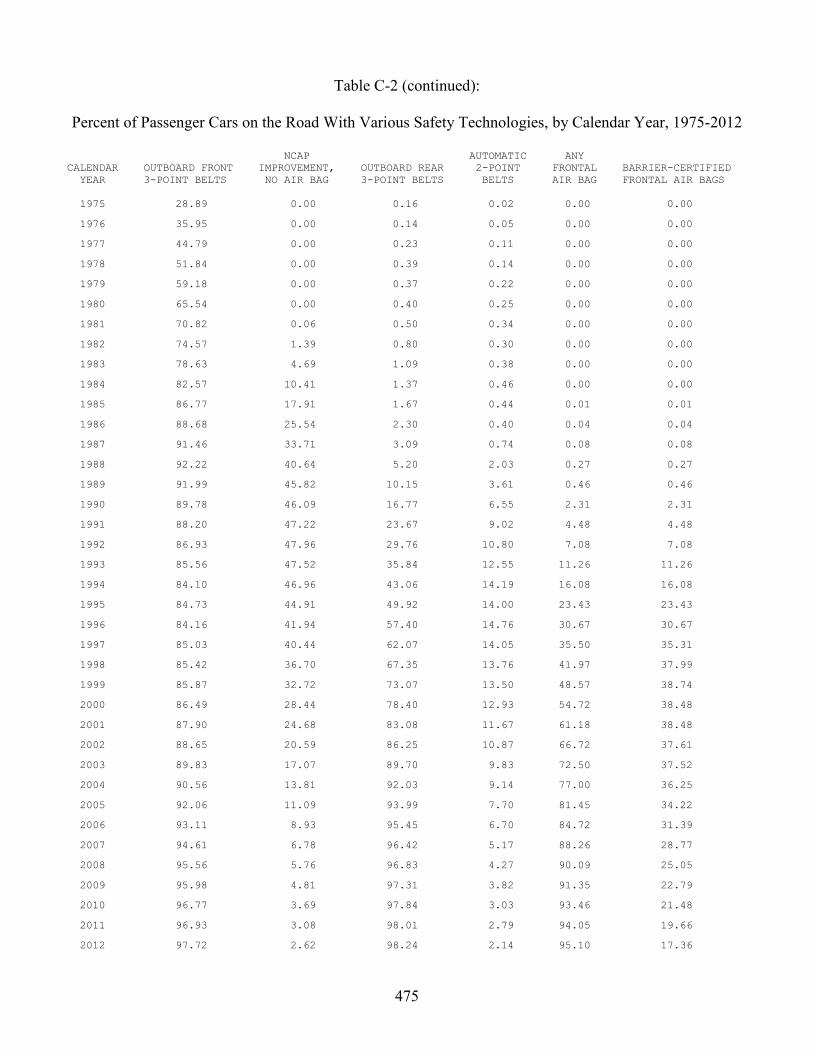
475
Table C-2 (continued):
Percent of Passenger Cars on the Road With Various Safety Technologies, by Calendar Year, 1975-2012
NCAP AUTOMATIC ANY CALENDAR OUTBOARD FRONT IMPROVEMENT, OUTBOARD REAR 2-POINT FRONTAL BARRIER-CERTIFIED YEAR 3-POINT BELTS NO AIR BAG 3-POINT BELTS BELTS AIR BAG FRONTAL AIR BAGS 1975 28.89 0.00 0.16 0.02 0.00 0.00
1976 35.95 0.00 0.14 0.05 0.00 0.00
1977 44.79 0.00 0.23 0.11 0.00 0.00
1978 51.84 0.00 0.39 0.14 0.00 0.00
1979 59.18 0.00 0.37 0.22 0.00 0.00
1980 65.54 0.00 0.40 0.25 0.00 0.00
1981 70.82 0.06 0.50 0.34 0.00 0.00
1982 74.57 1.39 0.80 0.30 0.00 0.00
1983 78.63 4.69 1.09 0.38 0.00 0.00
1984 82.57 10.41 1.37 0.46 0.00 0.00
1985 86.77 17.91 1.67 0.44 0.01 0.01
1986 88.68 25.54 2.30 0.40 0.04 0.04
1987 91.46 33.71 3.09 0.74 0.08 0.08
1988 92.22 40.64 5.20 2.03 0.27 0.27
1989 91.99 45.82 10.15 3.61 0.46 0.46
1990 89.78 46.09 16.77 6.55 2.31 2.31
1991 88.20 47.22 23.67 9.02 4.48 4.48
1992 86.93 47.96 29.76 10.80 7.08 7.08
1993 85.56 47.52 35.84 12.55 11.26 11.26
1994 84.10 46.96 43.06 14.19 16.08 16.08
1995 84.73 44.91 49.92 14.00 23.43 23.43
1996 84.16 41.94 57.40 14.76 30.67 30.67
1997 85.03 40.44 62.07 14.05 35.50 35.31
1998 85.42 36.70 67.35 13.76 41.97 37.99
1999 85.87 32.72 73.07 13.50 48.57 38.74
2000 86.49 28.44 78.40 12.93 54.72 38.48
2001 87.90 24.68 83.08 11.67 61.18 38.48
2002 88.65 20.59 86.25 10.87 66.72 37.61
2003 89.83 17.07 89.70 9.83 72.50 37.52
2004 90.56 13.81 92.03 9.14 77.00 36.25
2005 92.06 11.09 93.99 7.70 81.45 34.22
2006 93.11 8.93 95.45 6.70 84.72 31.39
2007 94.61 6.78 96.42 5.17 88.26 28.77
2008 95.56 5.76 96.83 4.27 90.09 25.05
2009 95.98 4.81 97.31 3.82 91.35 22.79
2010 96.77 3.69 97.84 3.03 93.46 21.48
2011 96.93 3.08 98.01 2.79 94.05 19.66
2012 97.72 2.62 98.24 2.14 95.10 17.36
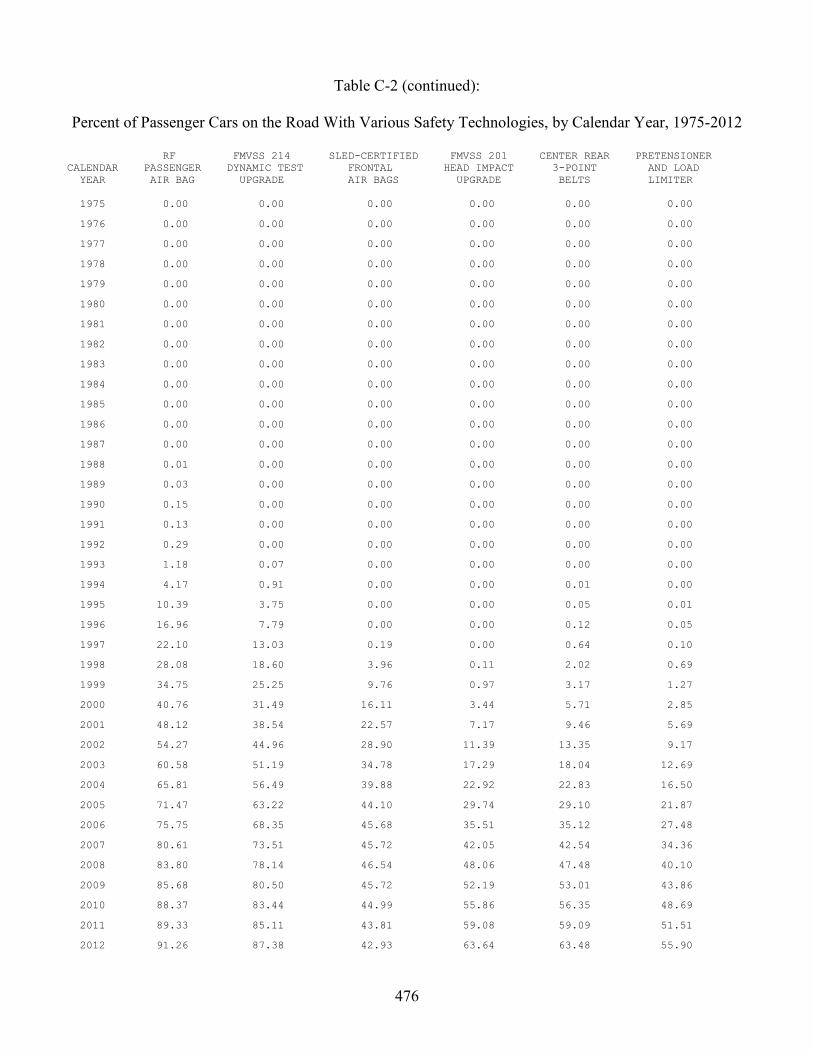
476
Table C-2 (continued):
Percent of Passenger Cars on the Road With Various Safety Technologies, by Calendar Year, 1975-2012
RF FMVSS 214 SLED-CERTIFIED FMVSS 201 CENTER REAR PRETENSIONER CALENDAR PASSENGER DYNAMIC TEST FRONTAL HEAD IMPACT 3-POINT AND LOAD YEAR AIR BAG UPGRADE AIR BAGS UPGRADE BELTS LIMITER 1975 0.00 0.00 0.00 0.00 0.00 0.00
1976 0.00 0.00 0.00 0.00 0.00 0.00
1977 0.00 0.00 0.00 0.00 0.00 0.00
1978 0.00 0.00 0.00 0.00 0.00 0.00
1979 0.00 0.00 0.00 0.00 0.00 0.00
1980 0.00 0.00 0.00 0.00 0.00 0.00
1981 0.00 0.00 0.00 0.00 0.00 0.00
1982 0.00 0.00 0.00 0.00 0.00 0.00
1983 0.00 0.00 0.00 0.00 0.00 0.00
1984 0.00 0.00 0.00 0.00 0.00 0.00
1985 0.00 0.00 0.00 0.00 0.00 0.00
1986 0.00 0.00 0.00 0.00 0.00 0.00
1987 0.00 0.00 0.00 0.00 0.00 0.00
1988 0.01 0.00 0.00 0.00 0.00 0.00
1989 0.03 0.00 0.00 0.00 0.00 0.00
1990 0.15 0.00 0.00 0.00 0.00 0.00
1991 0.13 0.00 0.00 0.00 0.00 0.00
1992 0.29 0.00 0.00 0.00 0.00 0.00
1993 1.18 0.07 0.00 0.00 0.00 0.00
1994 4.17 0.91 0.00 0.00 0.01 0.00
1995 10.39 3.75 0.00 0.00 0.05 0.01
1996 16.96 7.79 0.00 0.00 0.12 0.05
1997 22.10 13.03 0.19 0.00 0.64 0.10
1998 28.08 18.60 3.96 0.11 2.02 0.69
1999 34.75 25.25 9.76 0.97 3.17 1.27
2000 40.76 31.49 16.11 3.44 5.71 2.85
2001 48.12 38.54 22.57 7.17 9.46 5.69
2002 54.27 44.96 28.90 11.39 13.35 9.17
2003 60.58 51.19 34.78 17.29 18.04 12.69
2004 65.81 56.49 39.88 22.92 22.83 16.50
2005 71.47 63.22 44.10 29.74 29.10 21.87
2006 75.75 68.35 45.68 35.51 35.12 27.48
2007 80.61 73.51 45.72 42.05 42.54 34.36
2008 83.80 78.14 46.54 48.06 47.48 40.10
2009 85.68 80.50 45.72 52.19 53.01 43.86
2010 88.37 83.44 44.99 55.86 56.35 48.69
2011 89.33 85.11 43.81 59.08 59.09 51.51
2012 91.26 87.38 42.93 63.64 63.48 55.90
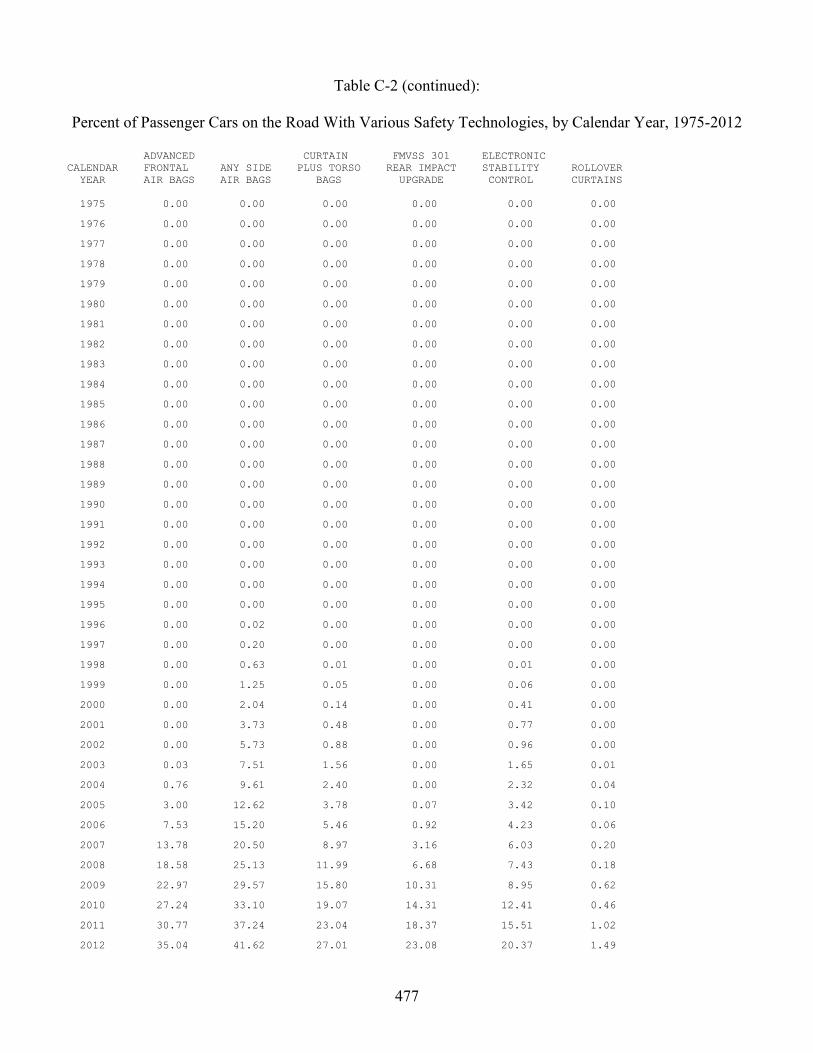
477
Table C-2 (continued):
Percent of Passenger Cars on the Road With Various Safety Technologies, by Calendar Year, 1975-2012
ADVANCED CURTAIN FMVSS 301 ELECTRONIC CALENDAR FRONTAL ANY SIDE PLUS TORSO REAR IMPACT STABILITY ROLLOVER YEAR AIR BAGS AIR BAGS BAGS UPGRADE CONTROL CURTAINS 1975 0.00 0.00 0.00 0.00 0.00 0.00
1976 0.00 0.00 0.00 0.00 0.00 0.00
1977 0.00 0.00 0.00 0.00 0.00 0.00
1978 0.00 0.00 0.00 0.00 0.00 0.00
1979 0.00 0.00 0.00 0.00 0.00 0.00
1980 0.00 0.00 0.00 0.00 0.00 0.00
1981 0.00 0.00 0.00 0.00 0.00 0.00
1982 0.00 0.00 0.00 0.00 0.00 0.00
1983 0.00 0.00 0.00 0.00 0.00 0.00
1984 0.00 0.00 0.00 0.00 0.00 0.00
1985 0.00 0.00 0.00 0.00 0.00 0.00
1986 0.00 0.00 0.00 0.00 0.00 0.00
1987 0.00 0.00 0.00 0.00 0.00 0.00
1988 0.00 0.00 0.00 0.00 0.00 0.00
1989 0.00 0.00 0.00 0.00 0.00 0.00
1990 0.00 0.00 0.00 0.00 0.00 0.00
1991 0.00 0.00 0.00 0.00 0.00 0.00
1992 0.00 0.00 0.00 0.00 0.00 0.00
1993 0.00 0.00 0.00 0.00 0.00 0.00
1994 0.00 0.00 0.00 0.00 0.00 0.00
1995 0.00 0.00 0.00 0.00 0.00 0.00
1996 0.00 0.02 0.00 0.00 0.00 0.00
1997 0.00 0.20 0.00 0.00 0.00 0.00
1998 0.00 0.63 0.01 0.00 0.01 0.00
1999 0.00 1.25 0.05 0.00 0.06 0.00
2000 0.00 2.04 0.14 0.00 0.41 0.00
2001 0.00 3.73 0.48 0.00 0.77 0.00
2002 0.00 5.73 0.88 0.00 0.96 0.00
2003 0.03 7.51 1.56 0.00 1.65 0.01
2004 0.76 9.61 2.40 0.00 2.32 0.04
2005 3.00 12.62 3.78 0.07 3.42 0.10
2006 7.53 15.20 5.46 0.92 4.23 0.06
2007 13.78 20.50 8.97 3.16 6.03 0.20
2008 18.58 25.13 11.99 6.68 7.43 0.18
2009 22.97 29.57 15.80 10.31 8.95 0.62
2010 27.24 33.10 19.07 14.31 12.41 0.46
2011 30.77 37.24 23.04 18.37 15.51 1.02
2012 35.04 41.62 27.01 23.08 20.37 1.49
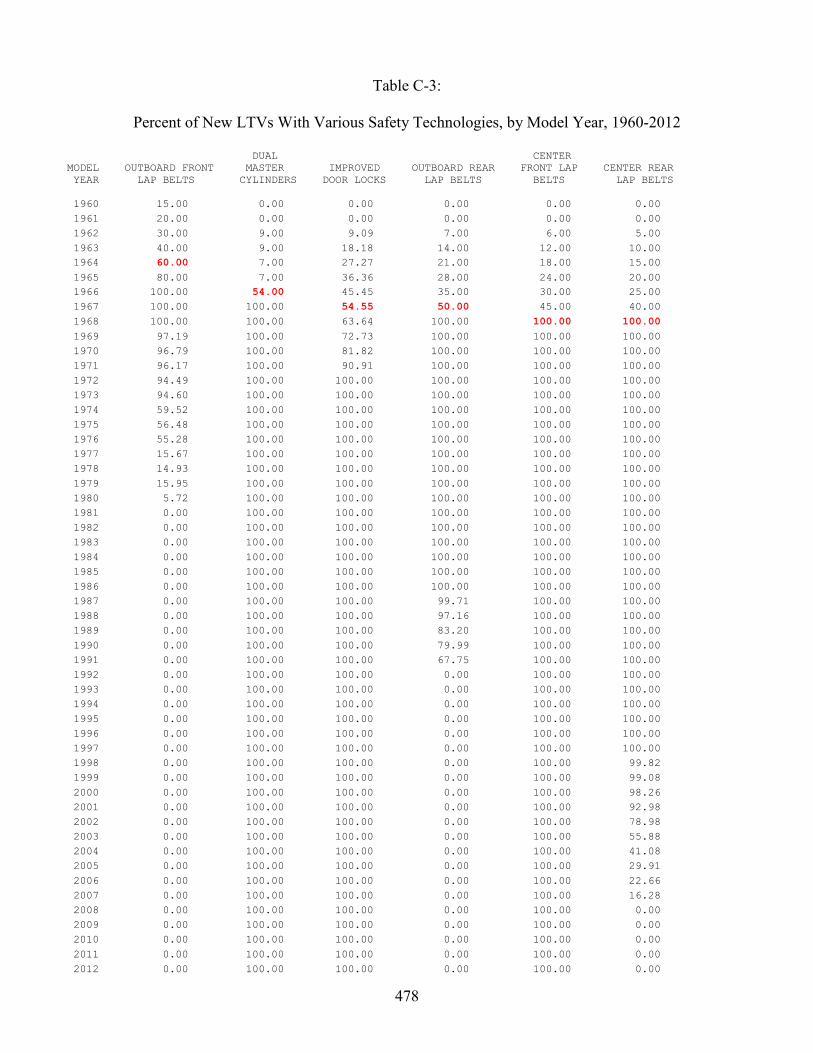
478
Table C-3:
Percent of New LTVs With Various Safety Technologies, by Model Year, 1960-2012
DUAL CENTER MODEL OUTBOARD FRONT MASTER IMPROVED OUTBOARD REAR FRONT LAP CENTER REAR YEAR LAP BELTS CYLINDERS DOOR LOCKS LAP BELTS BELTS LAP BELTS 1960 15.00 0.00 0.00 0.00 0.00 0.00 1961 20.00 0.00 0.00 0.00 0.00 0.00 1962 30.00 9.00 9.09 7.00 6.00 5.00 1963 40.00 9.00 18.18 14.00 12.00 10.00 1964 60.00 7.00 27.27 21.00 18.00 15.00 1965 80.00 7.00 36.36 28.00 24.00 20.00 1966 100.00 54.00 45.45 35.00 30.00 25.00 1967 100.00 100.00 54.55 50.00 45.00 40.00 1968 100.00 100.00 63.64 100.00 100.00 100.00 1969 97.19 100.00 72.73 100.00 100.00 100.00 1970 96.79 100.00 81.82 100.00 100.00 100.00 1971 96.17 100.00 90.91 100.00 100.00 100.00 1972 94.49 100.00 100.00 100.00 100.00 100.00 1973 94.60 100.00 100.00 100.00 100.00 100.00 1974 59.52 100.00 100.00 100.00 100.00 100.00 1975 56.48 100.00 100.00 100.00 100.00 100.00 1976 55.28 100.00 100.00 100.00 100.00 100.00 1977 15.67 100.00 100.00 100.00 100.00 100.00 1978 14.93 100.00 100.00 100.00 100.00 100.00 1979 15.95 100.00 100.00 100.00 100.00 100.00 1980 5.72 100.00 100.00 100.00 100.00 100.00 1981 0.00 100.00 100.00 100.00 100.00 100.00 1982 0.00 100.00 100.00 100.00 100.00 100.00 1983 0.00 100.00 100.00 100.00 100.00 100.00 1984 0.00 100.00 100.00 100.00 100.00 100.00 1985 0.00 100.00 100.00 100.00 100.00 100.00 1986 0.00 100.00 100.00 100.00 100.00 100.00 1987 0.00 100.00 100.00 99.71 100.00 100.00 1988 0.00 100.00 100.00 97.16 100.00 100.00 1989 0.00 100.00 100.00 83.20 100.00 100.00 1990 0.00 100.00 100.00 79.99 100.00 100.00 1991 0.00 100.00 100.00 67.75 100.00 100.00 1992 0.00 100.00 100.00 0.00 100.00 100.00 1993 0.00 100.00 100.00 0.00 100.00 100.00 1994 0.00 100.00 100.00 0.00 100.00 100.00 1995 0.00 100.00 100.00 0.00 100.00 100.00 1996 0.00 100.00 100.00 0.00 100.00 100.00 1997 0.00 100.00 100.00 0.00 100.00 100.00 1998 0.00 100.00 100.00 0.00 100.00 99.82 1999 0.00 100.00 100.00 0.00 100.00 99.08 2000 0.00 100.00 100.00 0.00 100.00 98.26 2001 0.00 100.00 100.00 0.00 100.00 92.98 2002 0.00 100.00 100.00 0.00 100.00 78.98 2003 0.00 100.00 100.00 0.00 100.00 55.88 2004 0.00 100.00 100.00 0.00 100.00 41.08 2005 0.00 100.00 100.00 0.00 100.00 29.91 2006 0.00 100.00 100.00 0.00 100.00 22.66 2007 0.00 100.00 100.00 0.00 100.00 16.28 2008 0.00 100.00 100.00 0.00 100.00 0.00 2009 0.00 100.00 100.00 0.00 100.00 0.00 2010 0.00 100.00 100.00 0.00 100.00 0.00 2011 0.00 100.00 100.00 0.00 100.00 0.00 2012 0.00 100.00 100.00 0.00 100.00 0.00
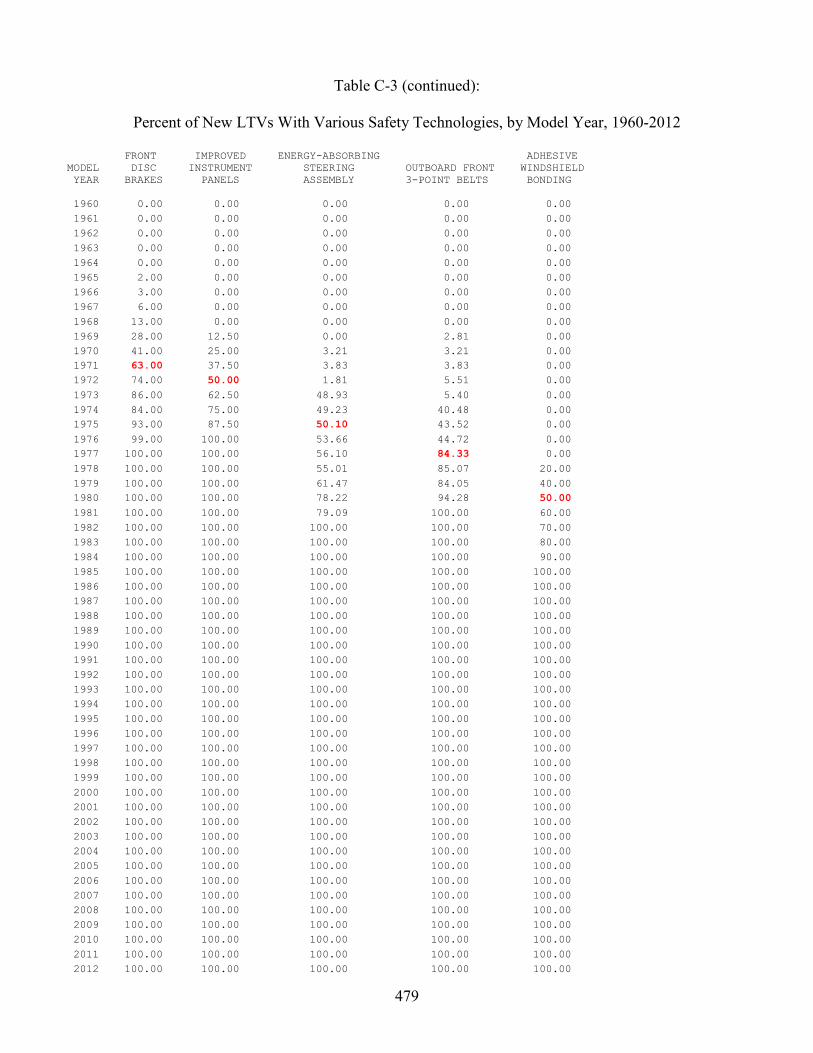
479
Table C-3 (continued):
Percent of New LTVs With Various Safety Technologies, by Model Year, 1960-2012
FRONT IMPROVED ENERGY-ABSORBING ADHESIVE MODEL DISC INSTRUMENT STEERING OUTBOARD FRONT WINDSHIELD YEAR BRAKES PANELS ASSEMBLY 3-POINT BELTS BONDING 1960 0.00 0.00 0.00 0.00 0.00 1961 0.00 0.00 0.00 0.00 0.00 1962 0.00 0.00 0.00 0.00 0.00 1963 0.00 0.00 0.00 0.00 0.00 1964 0.00 0.00 0.00 0.00 0.00 1965 2.00 0.00 0.00 0.00 0.00 1966 3.00 0.00 0.00 0.00 0.00 1967 6.00 0.00 0.00 0.00 0.00 1968 13.00 0.00 0.00 0.00 0.00 1969 28.00 12.50 0.00 2.81 0.00 1970 41.00 25.00 3.21 3.21 0.00 1971 63.00 37.50 3.83 3.83 0.00 1972 74.00 50.00 1.81 5.51 0.00 1973 86.00 62.50 48.93 5.40 0.00 1974 84.00 75.00 49.23 40.48 0.00 1975 93.00 87.50 50.10 43.52 0.00 1976 99.00 100.00 53.66 44.72 0.00 1977 100.00 100.00 56.10 84.33 0.00 1978 100.00 100.00 55.01 85.07 20.00 1979 100.00 100.00 61.47 84.05 40.00 1980 100.00 100.00 78.22 94.28 50.00 1981 100.00 100.00 79.09 100.00 60.00 1982 100.00 100.00 100.00 100.00 70.00 1983 100.00 100.00 100.00 100.00 80.00 1984 100.00 100.00 100.00 100.00 90.00 1985 100.00 100.00 100.00 100.00 100.00 1986 100.00 100.00 100.00 100.00 100.00 1987 100.00 100.00 100.00 100.00 100.00 1988 100.00 100.00 100.00 100.00 100.00 1989 100.00 100.00 100.00 100.00 100.00 1990 100.00 100.00 100.00 100.00 100.00 1991 100.00 100.00 100.00 100.00 100.00 1992 100.00 100.00 100.00 100.00 100.00 1993 100.00 100.00 100.00 100.00 100.00 1994 100.00 100.00 100.00 100.00 100.00 1995 100.00 100.00 100.00 100.00 100.00 1996 100.00 100.00 100.00 100.00 100.00 1997 100.00 100.00 100.00 100.00 100.00 1998 100.00 100.00 100.00 100.00 100.00 1999 100.00 100.00 100.00 100.00 100.00 2000 100.00 100.00 100.00 100.00 100.00 2001 100.00 100.00 100.00 100.00 100.00 2002 100.00 100.00 100.00 100.00 100.00 2003 100.00 100.00 100.00 100.00 100.00 2004 100.00 100.00 100.00 100.00 100.00 2005 100.00 100.00 100.00 100.00 100.00 2006 100.00 100.00 100.00 100.00 100.00 2007 100.00 100.00 100.00 100.00 100.00 2008 100.00 100.00 100.00 100.00 100.00 2009 100.00 100.00 100.00 100.00 100.00 2010 100.00 100.00 100.00 100.00 100.00 2011 100.00 100.00 100.00 100.00 100.00 2012 100.00 100.00 100.00 100.00 100.00
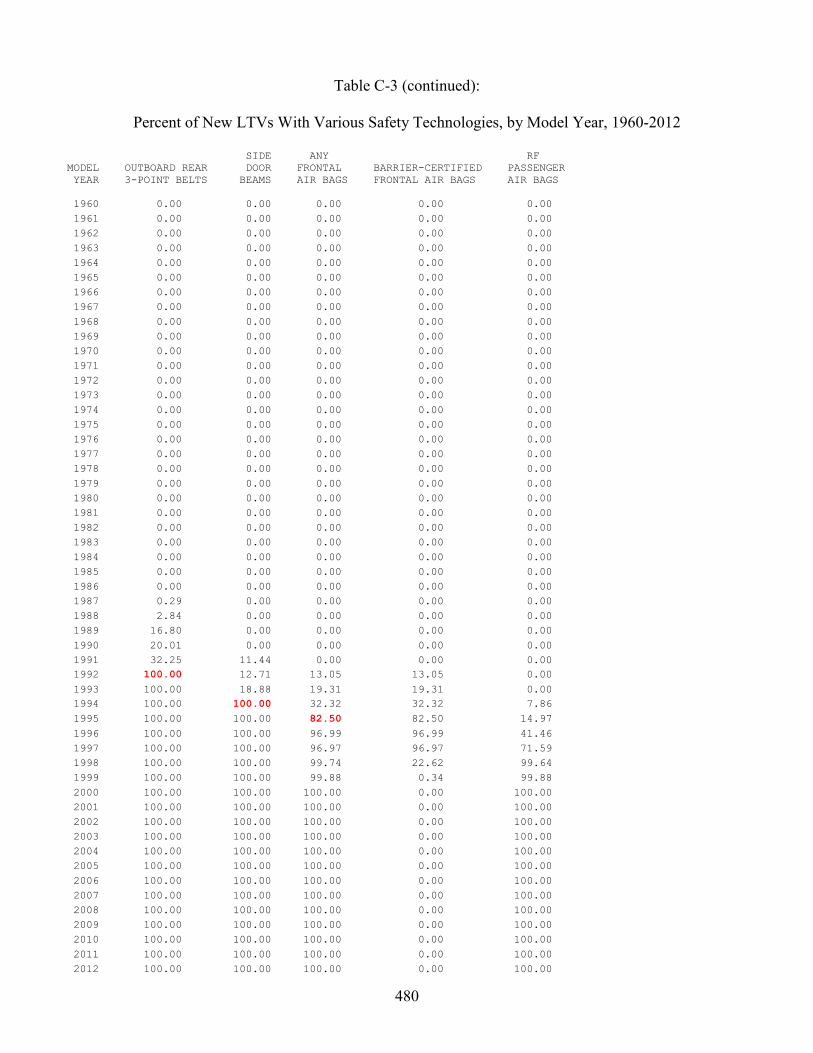
480
Table C-3 (continued):
Percent of New LTVs With Various Safety Technologies, by Model Year, 1960-2012
SIDE ANY RF MODEL OUTBOARD REAR DOOR FRONTAL BARRIER-CERTIFIED PASSENGER YEAR 3-POINT BELTS BEAMS AIR BAGS FRONTAL AIR BAGS AIR BAGS 1960 0.00 0.00 0.00 0.00 0.00 1961 0.00 0.00 0.00 0.00 0.00 1962 0.00 0.00 0.00 0.00 0.00 1963 0.00 0.00 0.00 0.00 0.00 1964 0.00 0.00 0.00 0.00 0.00 1965 0.00 0.00 0.00 0.00 0.00 1966 0.00 0.00 0.00 0.00 0.00 1967 0.00 0.00 0.00 0.00 0.00 1968 0.00 0.00 0.00 0.00 0.00 1969 0.00 0.00 0.00 0.00 0.00 1970 0.00 0.00 0.00 0.00 0.00 1971 0.00 0.00 0.00 0.00 0.00 1972 0.00 0.00 0.00 0.00 0.00 1973 0.00 0.00 0.00 0.00 0.00 1974 0.00 0.00 0.00 0.00 0.00 1975 0.00 0.00 0.00 0.00 0.00 1976 0.00 0.00 0.00 0.00 0.00 1977 0.00 0.00 0.00 0.00 0.00 1978 0.00 0.00 0.00 0.00 0.00 1979 0.00 0.00 0.00 0.00 0.00 1980 0.00 0.00 0.00 0.00 0.00 1981 0.00 0.00 0.00 0.00 0.00 1982 0.00 0.00 0.00 0.00 0.00 1983 0.00 0.00 0.00 0.00 0.00 1984 0.00 0.00 0.00 0.00 0.00 1985 0.00 0.00 0.00 0.00 0.00 1986 0.00 0.00 0.00 0.00 0.00 1987 0.29 0.00 0.00 0.00 0.00 1988 2.84 0.00 0.00 0.00 0.00 1989 16.80 0.00 0.00 0.00 0.00 1990 20.01 0.00 0.00 0.00 0.00 1991 32.25 11.44 0.00 0.00 0.00 1992 100.00 12.71 13.05 13.05 0.00 1993 100.00 18.88 19.31 19.31 0.00 1994 100.00 100.00 32.32 32.32 7.86 1995 100.00 100.00 82.50 82.50 14.97 1996 100.00 100.00 96.99 96.99 41.46 1997 100.00 100.00 96.97 96.97 71.59 1998 100.00 100.00 99.74 22.62 99.64 1999 100.00 100.00 99.88 0.34 99.88 2000 100.00 100.00 100.00 0.00 100.00 2001 100.00 100.00 100.00 0.00 100.00 2002 100.00 100.00 100.00 0.00 100.00 2003 100.00 100.00 100.00 0.00 100.00 2004 100.00 100.00 100.00 0.00 100.00 2005 100.00 100.00 100.00 0.00 100.00 2006 100.00 100.00 100.00 0.00 100.00 2007 100.00 100.00 100.00 0.00 100.00 2008 100.00 100.00 100.00 0.00 100.00 2009 100.00 100.00 100.00 0.00 100.00 2010 100.00 100.00 100.00 0.00 100.00 2011 100.00 100.00 100.00 0.00 100.00 2012 100.00 100.00 100.00 0.00 100.00
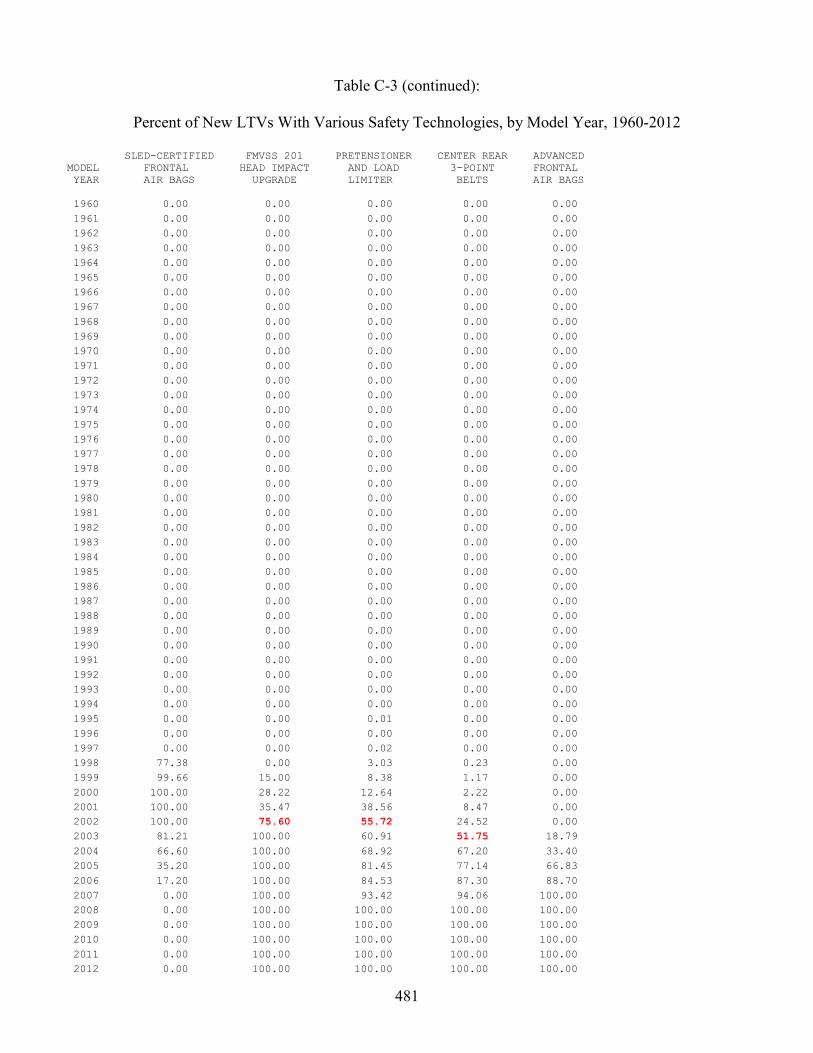
481
Table C-3 (continued):
Percent of New LTVs With Various Safety Technologies, by Model Year, 1960-2012
SLED-CERTIFIED FMVSS 201 PRETENSIONER CENTER REAR ADVANCED MODEL FRONTAL HEAD IMPACT AND LOAD 3-POINT FRONTAL YEAR AIR BAGS UPGRADE LIMITER BELTS AIR BAGS 1960 0.00 0.00 0.00 0.00 0.00 1961 0.00 0.00 0.00 0.00 0.00 1962 0.00 0.00 0.00 0.00 0.00 1963 0.00 0.00 0.00 0.00 0.00 1964 0.00 0.00 0.00 0.00 0.00 1965 0.00 0.00 0.00 0.00 0.00 1966 0.00 0.00 0.00 0.00 0.00 1967 0.00 0.00 0.00 0.00 0.00 1968 0.00 0.00 0.00 0.00 0.00 1969 0.00 0.00 0.00 0.00 0.00 1970 0.00 0.00 0.00 0.00 0.00 1971 0.00 0.00 0.00 0.00 0.00 1972 0.00 0.00 0.00 0.00 0.00 1973 0.00 0.00 0.00 0.00 0.00 1974 0.00 0.00 0.00 0.00 0.00 1975 0.00 0.00 0.00 0.00 0.00 1976 0.00 0.00 0.00 0.00 0.00 1977 0.00 0.00 0.00 0.00 0.00 1978 0.00 0.00 0.00 0.00 0.00 1979 0.00 0.00 0.00 0.00 0.00 1980 0.00 0.00 0.00 0.00 0.00 1981 0.00 0.00 0.00 0.00 0.00 1982 0.00 0.00 0.00 0.00 0.00 1983 0.00 0.00 0.00 0.00 0.00 1984 0.00 0.00 0.00 0.00 0.00 1985 0.00 0.00 0.00 0.00 0.00 1986 0.00 0.00 0.00 0.00 0.00 1987 0.00 0.00 0.00 0.00 0.00 1988 0.00 0.00 0.00 0.00 0.00 1989 0.00 0.00 0.00 0.00 0.00 1990 0.00 0.00 0.00 0.00 0.00 1991 0.00 0.00 0.00 0.00 0.00 1992 0.00 0.00 0.00 0.00 0.00 1993 0.00 0.00 0.00 0.00 0.00 1994 0.00 0.00 0.00 0.00 0.00 1995 0.00 0.00 0.01 0.00 0.00 1996 0.00 0.00 0.00 0.00 0.00 1997 0.00 0.00 0.02 0.00 0.00 1998 77.38 0.00 3.03 0.23 0.00 1999 99.66 15.00 8.38 1.17 0.00 2000 100.00 28.22 12.64 2.22 0.00 2001 100.00 35.47 38.56 8.47 0.00 2002 100.00 75.60 55.72 24.52 0.00 2003 81.21 100.00 60.91 51.75 18.79 2004 66.60 100.00 68.92 67.20 33.40 2005 35.20 100.00 81.45 77.14 66.83 2006 17.20 100.00 84.53 87.30 88.70 2007 0.00 100.00 93.42 94.06 100.00 2008 0.00 100.00 100.00 100.00 100.00 2009 0.00 100.00 100.00 100.00 100.00 2010 0.00 100.00 100.00 100.00 100.00 2011 0.00 100.00 100.00 100.00 100.00 2012 0.00 100.00 100.00 100.00 100.00
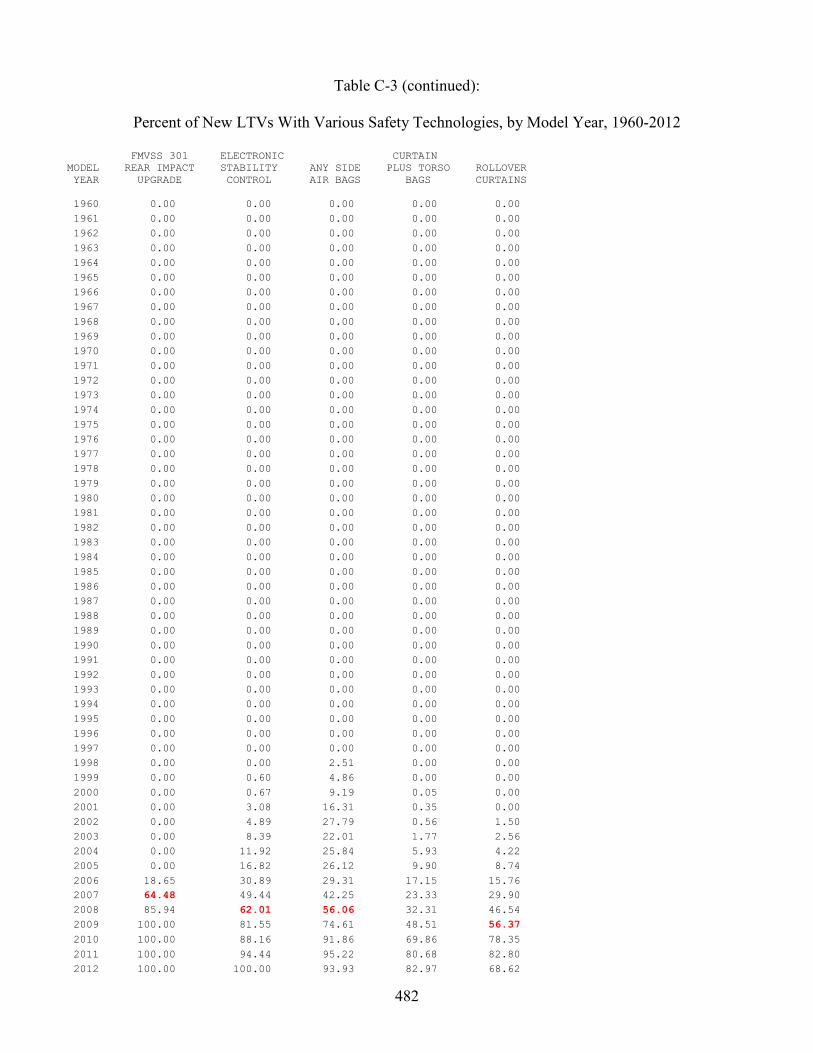
482
Table C-3 (continued):
Percent of New LTVs With Various Safety Technologies, by Model Year, 1960-2012
FMVSS 301 ELECTRONIC CURTAIN MODEL REAR IMPACT STABILITY ANY SIDE PLUS TORSO ROLLOVER YEAR UPGRADE CONTROL AIR BAGS BAGS CURTAINS 1960 0.00 0.00 0.00 0.00 0.00 1961 0.00 0.00 0.00 0.00 0.00 1962 0.00 0.00 0.00 0.00 0.00 1963 0.00 0.00 0.00 0.00 0.00 1964 0.00 0.00 0.00 0.00 0.00 1965 0.00 0.00 0.00 0.00 0.00 1966 0.00 0.00 0.00 0.00 0.00 1967 0.00 0.00 0.00 0.00 0.00 1968 0.00 0.00 0.00 0.00 0.00 1969 0.00 0.00 0.00 0.00 0.00 1970 0.00 0.00 0.00 0.00 0.00 1971 0.00 0.00 0.00 0.00 0.00 1972 0.00 0.00 0.00 0.00 0.00 1973 0.00 0.00 0.00 0.00 0.00 1974 0.00 0.00 0.00 0.00 0.00 1975 0.00 0.00 0.00 0.00 0.00 1976 0.00 0.00 0.00 0.00 0.00 1977 0.00 0.00 0.00 0.00 0.00 1978 0.00 0.00 0.00 0.00 0.00 1979 0.00 0.00 0.00 0.00 0.00 1980 0.00 0.00 0.00 0.00 0.00 1981 0.00 0.00 0.00 0.00 0.00 1982 0.00 0.00 0.00 0.00 0.00 1983 0.00 0.00 0.00 0.00 0.00 1984 0.00 0.00 0.00 0.00 0.00 1985 0.00 0.00 0.00 0.00 0.00 1986 0.00 0.00 0.00 0.00 0.00 1987 0.00 0.00 0.00 0.00 0.00 1988 0.00 0.00 0.00 0.00 0.00 1989 0.00 0.00 0.00 0.00 0.00 1990 0.00 0.00 0.00 0.00 0.00 1991 0.00 0.00 0.00 0.00 0.00 1992 0.00 0.00 0.00 0.00 0.00 1993 0.00 0.00 0.00 0.00 0.00 1994 0.00 0.00 0.00 0.00 0.00 1995 0.00 0.00 0.00 0.00 0.00 1996 0.00 0.00 0.00 0.00 0.00 1997 0.00 0.00 0.00 0.00 0.00 1998 0.00 0.00 2.51 0.00 0.00 1999 0.00 0.60 4.86 0.00 0.00 2000 0.00 0.67 9.19 0.05 0.00 2001 0.00 3.08 16.31 0.35 0.00 2002 0.00 4.89 27.79 0.56 1.50 2003 0.00 8.39 22.01 1.77 2.56 2004 0.00 11.92 25.84 5.93 4.22 2005 0.00 16.82 26.12 9.90 8.74 2006 18.65 30.89 29.31 17.15 15.76 2007 64.48 49.44 42.25 23.33 29.90 2008 85.94 62.01 56.06 32.31 46.54 2009 100.00 81.55 74.61 48.51 56.37 2010 100.00 88.16 91.86 69.86 78.35 2011 100.00 94.44 95.22 80.68 82.80 2012 100.00 100.00 93.93 82.97 68.62
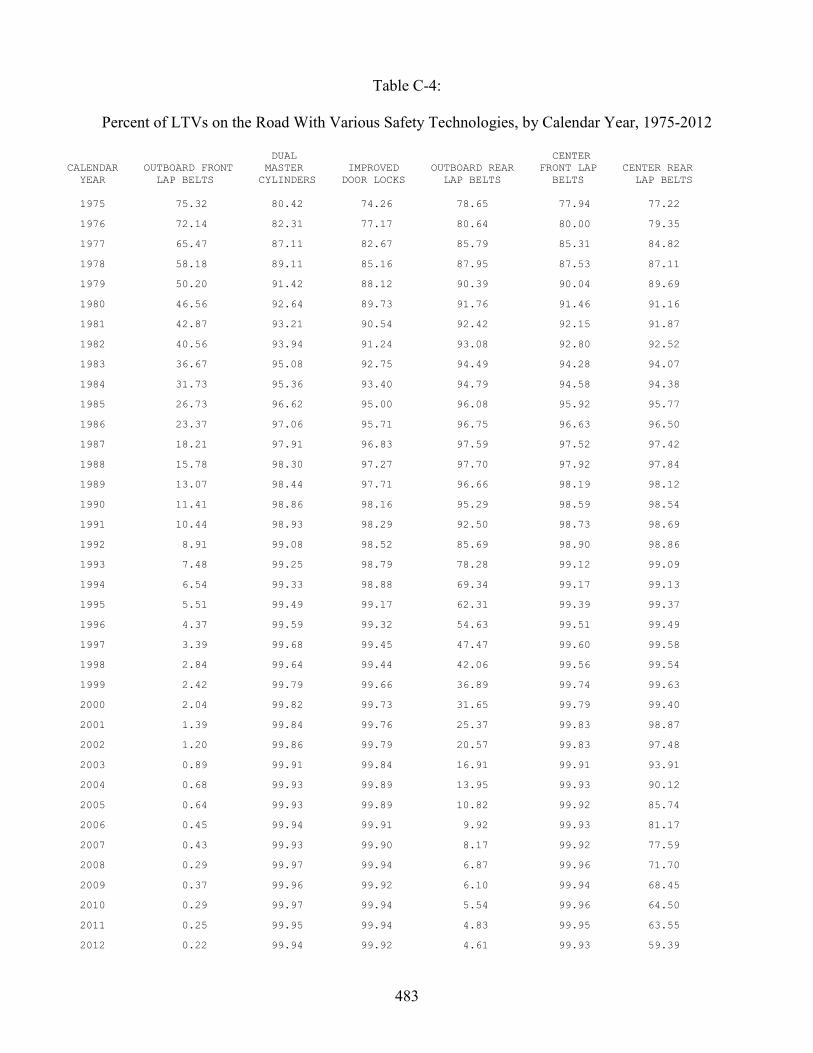
483
Table C-4:
Percent of LTVs on the Road With Various Safety Technologies, by Calendar Year, 1975-2012
DUAL CENTER CALENDAR OUTBOARD FRONT MASTER IMPROVED OUTBOARD REAR FRONT LAP CENTER REAR YEAR LAP BELTS CYLINDERS DOOR LOCKS LAP BELTS BELTS LAP BELTS 1975 75.32 80.42 74.26 78.65 77.94 77.22
1976 72.14 82.31 77.17 80.64 80.00 79.35
1977 65.47 87.11 82.67 85.79 85.31 84.82
1978 58.18 89.11 85.16 87.95 87.53 87.11
1979 50.20 91.42 88.12 90.39 90.04 89.69
1980 46.56 92.64 89.73 91.76 91.46 91.16
1981 42.87 93.21 90.54 92.42 92.15 91.87
1982 40.56 93.94 91.24 93.08 92.80 92.52
1983 36.67 95.08 92.75 94.49 94.28 94.07
1984 31.73 95.36 93.40 94.79 94.58 94.38
1985 26.73 96.62 95.00 96.08 95.92 95.77
1986 23.37 97.06 95.71 96.75 96.63 96.50
1987 18.21 97.91 96.83 97.59 97.52 97.42
1988 15.78 98.30 97.27 97.70 97.92 97.84
1989 13.07 98.44 97.71 96.66 98.19 98.12
1990 11.41 98.86 98.16 95.29 98.59 98.54
1991 10.44 98.93 98.29 92.50 98.73 98.69
1992 8.91 99.08 98.52 85.69 98.90 98.86
1993 7.48 99.25 98.79 78.28 99.12 99.09
1994 6.54 99.33 98.88 69.34 99.17 99.13
1995 5.51 99.49 99.17 62.31 99.39 99.37
1996 4.37 99.59 99.32 54.63 99.51 99.49
1997 3.39 99.68 99.45 47.47 99.60 99.58
1998 2.84 99.64 99.44 42.06 99.56 99.54
1999 2.42 99.79 99.66 36.89 99.74 99.63
2000 2.04 99.82 99.73 31.65 99.79 99.40
2001 1.39 99.84 99.76 25.37 99.83 98.87
2002 1.20 99.86 99.79 20.57 99.83 97.48
2003 0.89 99.91 99.84 16.91 99.91 93.91
2004 0.68 99.93 99.89 13.95 99.93 90.12
2005 0.64 99.93 99.89 10.82 99.92 85.74
2006 0.45 99.94 99.91 9.92 99.93 81.17
2007 0.43 99.93 99.90 8.17 99.92 77.59
2008 0.29 99.97 99.94 6.87 99.96 71.70
2009 0.37 99.96 99.92 6.10 99.94 68.45
2010 0.29 99.97 99.94 5.54 99.96 64.50
2011 0.25 99.95 99.94 4.83 99.95 63.55
2012 0.22 99.94 99.92 4.61 99.93 59.39
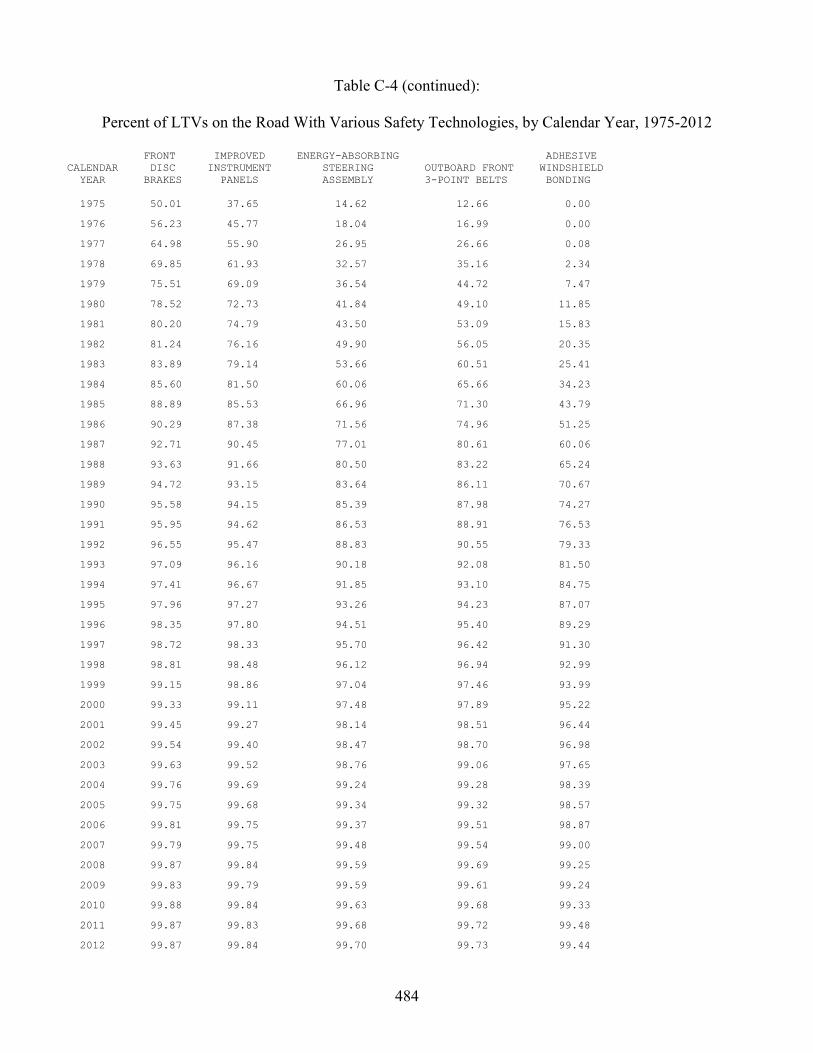
484
Table C-4 (continued):
Percent of LTVs on the Road With Various Safety Technologies, by Calendar Year, 1975-2012
FRONT IMPROVED ENERGY-ABSORBING ADHESIVE CALENDAR DISC INSTRUMENT STEERING OUTBOARD FRONT WINDSHIELD YEAR BRAKES PANELS ASSEMBLY 3-POINT BELTS BONDING 1975 50.01 37.65 14.62 12.66 0.00
1976 56.23 45.77 18.04 16.99 0.00
1977 64.98 55.90 26.95 26.66 0.08
1978 69.85 61.93 32.57 35.16 2.34
1979 75.51 69.09 36.54 44.72 7.47
1980 78.52 72.73 41.84 49.10 11.85
1981 80.20 74.79 43.50 53.09 15.83
1982 81.24 76.16 49.90 56.05 20.35
1983 83.89 79.14 53.66 60.51 25.41
1984 85.60 81.50 60.06 65.66 34.23
1985 88.89 85.53 66.96 71.30 43.79
1986 90.29 87.38 71.56 74.96 51.25
1987 92.71 90.45 77.01 80.61 60.06
1988 93.63 91.66 80.50 83.22 65.24
1989 94.72 93.15 83.64 86.11 70.67
1990 95.58 94.15 85.39 87.98 74.27
1991 95.95 94.62 86.53 88.91 76.53
1992 96.55 95.47 88.83 90.55 79.33
1993 97.09 96.16 90.18 92.08 81.50
1994 97.41 96.67 91.85 93.10 84.75
1995 97.96 97.27 93.26 94.23 87.07
1996 98.35 97.80 94.51 95.40 89.29
1997 98.72 98.33 95.70 96.42 91.30
1998 98.81 98.48 96.12 96.94 92.99
1999 99.15 98.86 97.04 97.46 93.99
2000 99.33 99.11 97.48 97.89 95.22
2001 99.45 99.27 98.14 98.51 96.44
2002 99.54 99.40 98.47 98.70 96.98
2003 99.63 99.52 98.76 99.06 97.65
2004 99.76 99.69 99.24 99.28 98.39
2005 99.75 99.68 99.34 99.32 98.57
2006 99.81 99.75 99.37 99.51 98.87
2007 99.79 99.75 99.48 99.54 99.00
2008 99.87 99.84 99.59 99.69 99.25
2009 99.83 99.79 99.59 99.61 99.24
2010 99.88 99.84 99.63 99.68 99.33
2011 99.87 99.83 99.68 99.72 99.48
2012 99.87 99.84 99.70 99.73 99.44

485
Table C-4 (continued):
Percent of LTVs on the Road With Various Safety Technologies, by Calendar Year, 1975-2012
SIDE ANY RF CALENDAR OUTBOARD REAR DOOR FRONTAL BARRIER-CERTIFIED PASSENGER YEAR 3-POINT BELTS BEAMS AIR BAGS FRONTAL AIR BAGS AIR BAGS 1975 0.00 0.00 0.00 0.00 0.00
1976 0.00 0.00 0.00 0.00 0.00
1977 0.00 0.00 0.00 0.00 0.00
1978 0.00 0.00 0.00 0.00 0.00
1979 0.00 0.00 0.00 0.00 0.00
1980 0.00 0.00 0.00 0.00 0.00
1981 0.00 0.00 0.00 0.00 0.00
1982 0.00 0.00 0.00 0.00 0.00
1983 0.00 0.00 0.00 0.00 0.00
1984 0.00 0.00 0.00 0.00 0.00
1985 0.00 0.00 0.00 0.00 0.00
1986 0.00 0.00 0.00 0.00 0.00
1987 0.02 0.00 0.00 0.00 0.00
1988 0.30 0.00 0.00 0.00 0.00
1989 1.61 0.00 0.00 0.00 0.00
1990 3.36 0.06 0.00 0.00 0.00
1991 6.28 0.71 0.11 0.11 0.00
1992 13.25 1.52 1.47 1.47 0.00
1993 20.87 3.47 2.40 2.40 0.02
1994 29.86 11.53 5.73 5.73 0.91
1995 37.11 20.38 10.81 10.81 1.67
1996 44.90 29.21 20.24 20.24 4.85
1997 52.14 36.80 27.57 27.18 9.86
1998 57.51 43.95 34.93 28.37 18.78
1999 62.86 50.48 43.40 29.07 27.02
2000 68.15 56.89 49.77 26.07 35.84
2001 74.47 63.83 57.46 24.53 43.72
2002 79.27 69.93 64.03 23.96 51.02
2003 83.00 75.29 70.15 23.21 57.86
2004 85.98 78.79 74.13 20.87 63.43
2005 89.10 82.99 78.35 20.29 67.93
2006 90.01 84.82 80.70 17.52 72.03
2007 91.76 87.05 83.91 17.01 75.54
2008 93.09 89.19 86.04 14.76 78.59
2009 93.84 90.19 87.26 13.39 80.48
2010 94.43 91.31 88.52 12.39 82.32
2011 95.13 92.53 89.58 12.38 83.66
2012 95.33 93.14 90.99 10.84 85.56
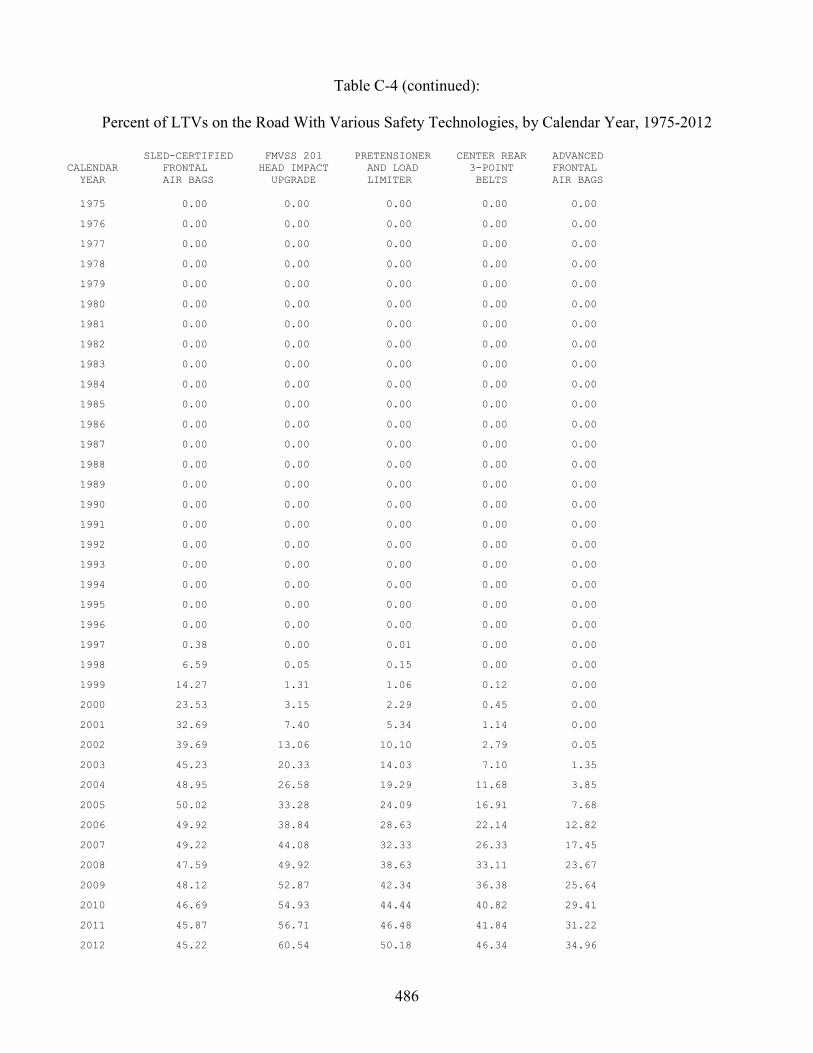
486
Table C-4 (continued):
Percent of LTVs on the Road With Various Safety Technologies, by Calendar Year, 1975-2012
SLED-CERTIFIED FMVSS 201 PRETENSIONER CENTER REAR ADVANCED CALENDAR FRONTAL HEAD IMPACT AND LOAD 3-POINT FRONTAL YEAR AIR BAGS UPGRADE LIMITER BELTS AIR BAGS 1975 0.00 0.00 0.00 0.00 0.00
1976 0.00 0.00 0.00 0.00 0.00
1977 0.00 0.00 0.00 0.00 0.00
1978 0.00 0.00 0.00 0.00 0.00
1979 0.00 0.00 0.00 0.00 0.00
1980 0.00 0.00 0.00 0.00 0.00
1981 0.00 0.00 0.00 0.00 0.00
1982 0.00 0.00 0.00 0.00 0.00
1983 0.00 0.00 0.00 0.00 0.00
1984 0.00 0.00 0.00 0.00 0.00
1985 0.00 0.00 0.00 0.00 0.00
1986 0.00 0.00 0.00 0.00 0.00
1987 0.00 0.00 0.00 0.00 0.00
1988 0.00 0.00 0.00 0.00 0.00
1989 0.00 0.00 0.00 0.00 0.00
1990 0.00 0.00 0.00 0.00 0.00
1991 0.00 0.00 0.00 0.00 0.00
1992 0.00 0.00 0.00 0.00 0.00
1993 0.00 0.00 0.00 0.00 0.00
1994 0.00 0.00 0.00 0.00 0.00
1995 0.00 0.00 0.00 0.00 0.00
1996 0.00 0.00 0.00 0.00 0.00
1997 0.38 0.00 0.01 0.00 0.00
1998 6.59 0.05 0.15 0.00 0.00
1999 14.27 1.31 1.06 0.12 0.00
2000 23.53 3.15 2.29 0.45 0.00
2001 32.69 7.40 5.34 1.14 0.00
2002 39.69 13.06 10.10 2.79 0.05
2003 45.23 20.33 14.03 7.10 1.35
2004 48.95 26.58 19.29 11.68 3.85
2005 50.02 33.28 24.09 16.91 7.68
2006 49.92 38.84 28.63 22.14 12.82
2007 49.22 44.08 32.33 26.33 17.45
2008 47.59 49.92 38.63 33.11 23.67
2009 48.12 52.87 42.34 36.38 25.64
2010 46.69 54.93 44.44 40.82 29.41
2011 45.87 56.71 46.48 41.84 31.22
2012 45.22 60.54 50.18 46.34 34.96
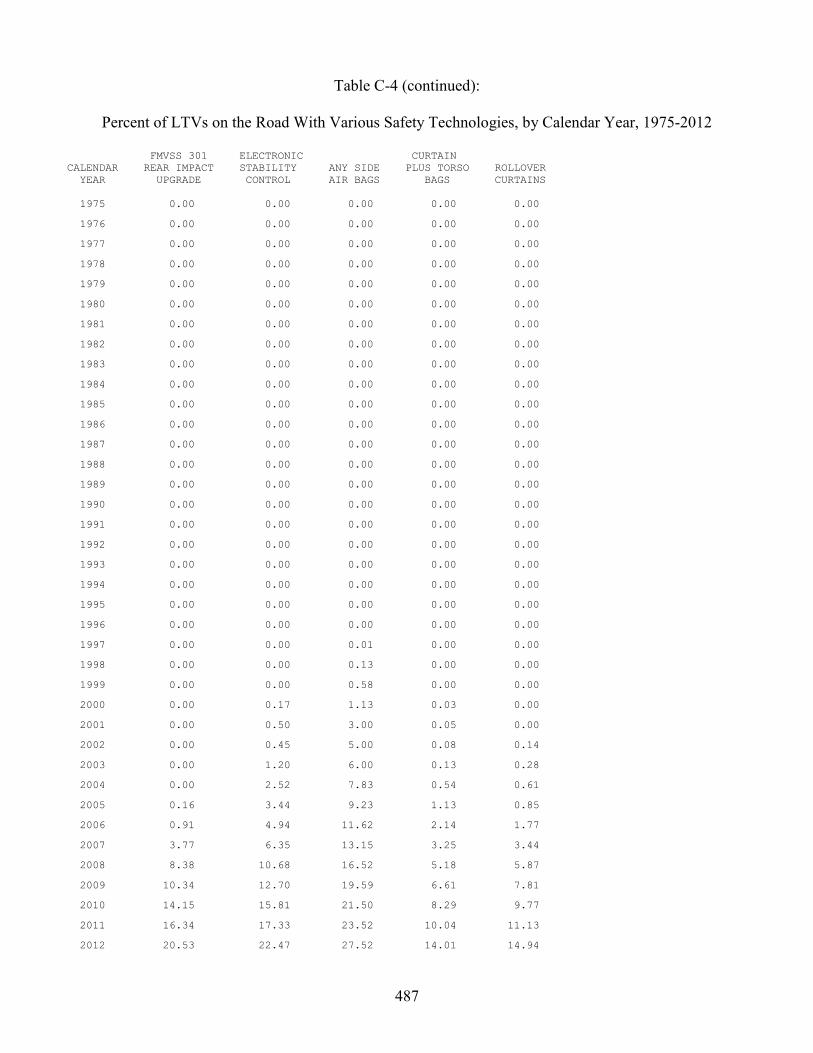
487
Table C-4 (continued):
Percent of LTVs on the Road With Various Safety Technologies, by Calendar Year, 1975-2012
FMVSS 301 ELECTRONIC CURTAIN CALENDAR REAR IMPACT STABILITY ANY SIDE PLUS TORSO ROLLOVER YEAR UPGRADE CONTROL AIR BAGS BAGS CURTAINS 1975 0.00 0.00 0.00 0.00 0.00
1976 0.00 0.00 0.00 0.00 0.00
1977 0.00 0.00 0.00 0.00 0.00
1978 0.00 0.00 0.00 0.00 0.00
1979 0.00 0.00 0.00 0.00 0.00
1980 0.00 0.00 0.00 0.00 0.00
1981 0.00 0.00 0.00 0.00 0.00
1982 0.00 0.00 0.00 0.00 0.00
1983 0.00 0.00 0.00 0.00 0.00
1984 0.00 0.00 0.00 0.00 0.00
1985 0.00 0.00 0.00 0.00 0.00
1986 0.00 0.00 0.00 0.00 0.00
1987 0.00 0.00 0.00 0.00 0.00
1988 0.00 0.00 0.00 0.00 0.00
1989 0.00 0.00 0.00 0.00 0.00
1990 0.00 0.00 0.00 0.00 0.00
1991 0.00 0.00 0.00 0.00 0.00
1992 0.00 0.00 0.00 0.00 0.00
1993 0.00 0.00 0.00 0.00 0.00
1994 0.00 0.00 0.00 0.00 0.00
1995 0.00 0.00 0.00 0.00 0.00
1996 0.00 0.00 0.00 0.00 0.00
1997 0.00 0.00 0.01 0.00 0.00
1998 0.00 0.00 0.13 0.00 0.00
1999 0.00 0.00 0.58 0.00 0.00
2000 0.00 0.17 1.13 0.03 0.00
2001 0.00 0.50 3.00 0.05 0.00
2002 0.00 0.45 5.00 0.08 0.14
2003 0.00 1.20 6.00 0.13 0.28
2004 0.00 2.52 7.83 0.54 0.61
2005 0.16 3.44 9.23 1.13 0.85
2006 0.91 4.94 11.62 2.14 1.77
2007 3.77 6.35 13.15 3.25 3.44
2008 8.38 10.68 16.52 5.18 5.87
2009 10.34 12.70 19.59 6.61 7.81
2010 14.15 15.81 21.50 8.29 9.77
2011 16.34 17.33 23.52 10.04 11.13
2012 20.53 22.47 27.52 14.01 14.94

488
APPENDIX D
Computation of Fatality Risk Indices for Diseases, 1960 to 2010 The objective is to estimate the risk of dying, between the ages of 60 and 70, from any disease, from heart disease, and from cancer in 1960, 1970, 1980, 1990, 2000, and 2010 (indexed to 1960 risk = 100). The indices are graphed in Figure B of the preface to the executive summary of this report. The preface is titled “A Revolution in Safety and Health.” As stated above, all three indi-ces are 100 in 1960.
Table 9 – Cohort Probabilities of Death Within One Year (qx) at Selected Exact Ages, by Sex and Year of Birth in Life Tables for the United States Social Security Area, 1900-2010 lists the exact probabilities of dying within one year, from any cause, by year of birth, gender, and select-ed ages including 60, 65, and 70.630 Thus, for example, the probability of a 60-year-old male in 1960 dying within one year is the table entry for birth year 1900 and age 60. The average of the following six probabilities is computed for birth years 1900, 1910, 1920, 1930, 1940, and 1950: 60-, 65-, and 70-year-old males and 60-, 65-, and 70-year-old females. These averages will be used to estimate the probability of dying between 60 and 70 in 1960, 1970, 1980, 1990, 2000, and 2010, respectively. Indexed to 1960 risk = 100, the index values for dying from any disease are 88.90 in 1970, 76.48 in 1980, 67.91 in 1990, 60.22 in 2000, and 54.80 in 2010.
The indices for heart disease and cancer are approximations, because the sources listed here do not provide death rates for specific ages, except in 2000 and 2010. Leading Causes of Death, 1900-1998, published by the Centers for Disease Control and Prevention and available at www.cdc.gov/nchs/data/dvs/lead1900_98.pdf , lists the death rates for the entire population (all ages), by CY, from all causes, from heart disease, and from cancer. For example, in 1960, the rates per 100,000 were 954.7, 369.0, and 149.2, respectively; while in 1970 they were 945.3, 362.0, and 162.8; and in 1980, 878.3, 336.0, and 183.9. The index for heart disease in 1970 at ages 60 to 70, for example, will be the 1970 index for all causes at ages 60 to 70 (88.90 – see above), adjusted by the change in heart disease (at all ages) from 1960 to 1970 relative to the change in all diseases (at all ages) from 1960 to 1970:
88.90 x (362.0/369.0) / (945.3/954.7) = 88.08
The 1970 index for cancer is similarly defined. The 1980 index for heart disease is computed from the 1970 index for heart disease, the 1970 and 1980 indices for all diseases (60 to 70 years old), and the 1970 and 1980 population death rates for all diseases and for heart disease:
88.08 x (76.48/88.90) x (336.0/362.0) / (878.3/945.3) = 75.70
The 1980 index for cancer is computed similarly. The 1990 indices are computed from the 1980 indices the same way and the 2000 indices from the 1990 indices (but, here, the population death
630 Bell, F. C., & Miller, M. L. (2005, August). Life tables for the United States Social Security Area, 1900-2010. (SSA Pub. No. 11-11536, pp. 158-159). Washington, DC: Social Security Administration. Available at www.ssa.gov/oact/NOTES/pdf_studies/study120.pdf
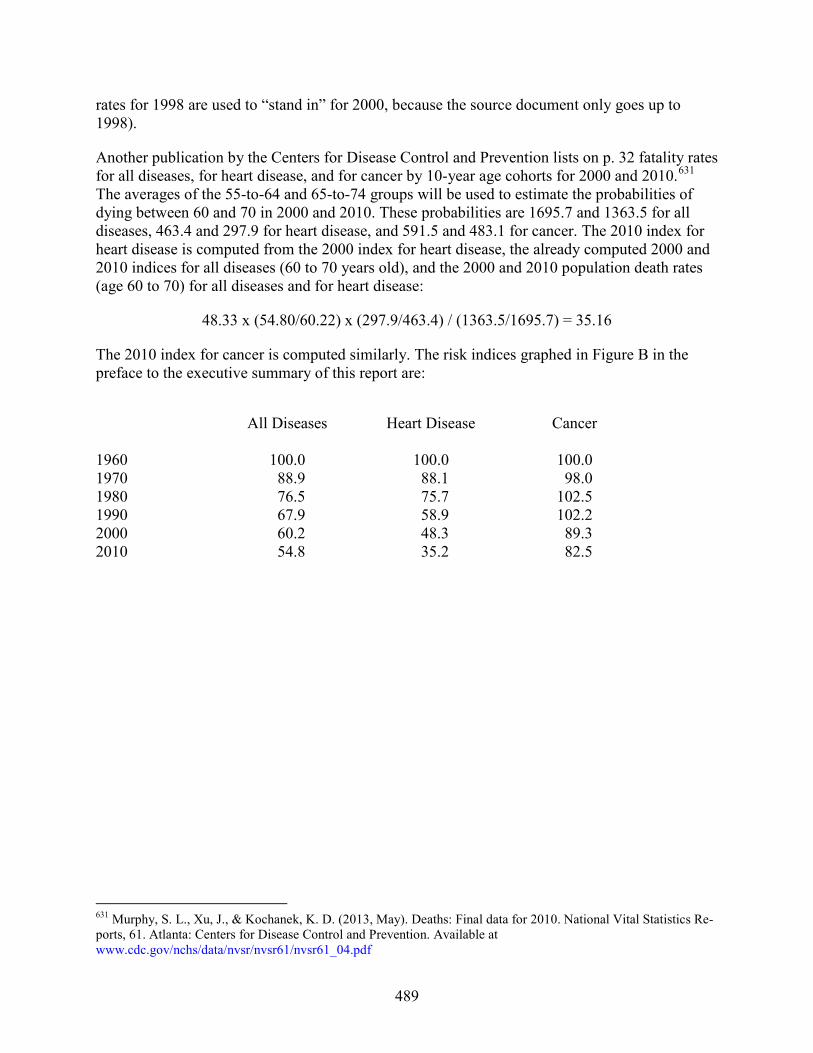
489
rates for 1998 are used to “stand in” for 2000, because the source document only goes up to 1998).
Another publication by the Centers for Disease Control and Prevention lists on p. 32 fatality rates for all diseases, for heart disease, and for cancer by 10-year age cohorts for 2000 and 2010.631 The averages of the 55-to-64 and 65-to-74 groups will be used to estimate the probabilities of dying between 60 and 70 in 2000 and 2010. These probabilities are 1695.7 and 1363.5 for all diseases, 463.4 and 297.9 for heart disease, and 591.5 and 483.1 for cancer. The 2010 index for heart disease is computed from the 2000 index for heart disease, the already computed 2000 and 2010 indices for all diseases (60 to 70 years old), and the 2000 and 2010 population death rates (age 60 to 70) for all diseases and for heart disease:
48.33 x (54.80/60.22) x (297.9/463.4) / (1363.5/1695.7) = 35.16
The 2010 index for cancer is computed similarly. The risk indices graphed in Figure B in the preface to the executive summary of this report are:
All Diseases Heart Disease Cancer 1960 100.0 100.0 100.0 1970 88.9 88.1 98.0 1980 76.5 75.7 102.5 1990 67.9 58.9 102.2 2000 60.2 48.3 89.3 2010 54.8 35.2 82.5
631 Murphy, S. L., Xu, J., & Kochanek, K. D. (2013, May). Deaths: Final data for 2010. National Vital Statistics Re-ports, 61. Atlanta: Centers for Disease Control and Prevention. Available at www.cdc.gov/nchs/data/nvsr/nvsr61/nvsr61_04.pdf
DOT HS 812 069 January 2015
10921-012115-v3