Livelihoods and Access to Market Project - Meghalaya Basin ...
385
Document Date: 11-Jan 2014 Project No. 1715 Report No: 3543-IN Asia and the Pacific Division Programme Management Department Republic of India Meghalaya: Livelihoods and Access to Market Project Final project design report Working papers
-
Upload
khangminh22 -
Category
Documents
-
view
2 -
download
0
Transcript of Livelihoods and Access to Market Project - Meghalaya Basin ...

Document Date: 11-Jan 2014
Project No. 1715
Report No: 3543-IN
Asia and the Pacific Division
Programme Management Department
Republic of India
Meghalaya: Livelihoods and Access to Market Project
Final project design report
Working papers


Republic of India
Meghalaya: Livelihoods and Access to Market Project
Final project design report - Working papers
i
Contents
Currency equivalents iii
Weights and measures ii
Working paper 1: Population, Land and Traditional Institutions 1
Working paper 2: Poverty, Gender and Targeting 31
Working paper 3: Agriculture 61
Working paper 4: Natural Resource Management 95
Working paper 5: Climate Change 125
Working paper 6: Livestock 133
Working paper 7: Enterprise Development 163
Working paper 8: Integrated Production and Marketing 183
Working paper 9: Marketing and Access to Markets 229
Working paper 10: Rural Finance 257
Working paper 11: Knowledge Services 277
Working paper 12: Institutional Capability and Capacity Building 289
Working paper 13: Project Costs and Financing 301
Working paper 14: Financial and Economic Analysis 334

Republic of India
Meghalaya: Livelihoods and Access to Market Project
Final project design report - Working papers
ii
Currency equivalents
Currency Unit =
US$1.0 =
Weights and measures
1 kilogram = 1000 g
1 000 kg = 2.204 lb.
1 kilometre (km) = 0.62 mile
1 metre = 1.09 yards
1 square metre = 10.76 square feet
1 acre = 0.405 hectare
1 hectare = 2.47 acres

Republic of India
Meghalaya: Livelihoods and Access to Market Project
Final project design report - Working papers
1
Working Paper 1: Population, Land and Traditional Institutions1
I. Introduction
1.1 Purpose of the working paper
IBDLP, the flag-ship programme of the Government of Meghalaya, seeks to promote basin-centred people-oriented integrated development to ensure sustainable environment and livelihood security of the people of Meghalaya. The proposed IFAD-funded LAMP will support this development objective by promoting integrated natural resource management focused livelihoods through enterprise development, market access and knowledge services. LAMP will support activities that will address rural poverty to improve family income and the quality of life in rural Meghalaya, amongst others, by understanding the rural poor population, land tenure and the traditional institutions. Thus, the purpose of this Working Paper is to briefly review the current situations of the population, land system and traditional institutions of the programme areas (Meghalaya), and identify issues that the project might be able to address.
1.2 Content of the working paper
The Working Paper has three main sections: Section I – Population; Section II – Land System; and Section III – Traditional Institutions. This is followed by a section on the experiences of IFAD-supported projects working in Meghalaya and lessons learned on issues of land tenure and working with traditional institutions. The idea of this section is to enable LAMP to build on the initiatives done by the IFAD- supported projects that worked well. Maps of the state are in Annex 2.
II. Population
2.1 An overview of the population of Meghalaya2
Meghalaya is the homeland of three major hill tribal communities: the Khasi, Jaintia and the Garo with their numerous divisions into clans. In fact, the term Khasi is often used in the generic sense and includes the Khasi and Jaintia. They are collectively known as the Hynniewtrep people and are mainly found in the four districts of east Meghalaya namely, the East Khasi Hills, West Khasi Hills, Ri– Bhoi and the Jaintia Hills districts. The Jaintias are also called Pnars or Synteng. The Khasis occupying the northern lowlands and the foothills are generally called the Bhoi. Those who live in the southern tracts are termed the War. In the Khasi Hills, the Lyngams inhabit the North-western part of the state. But all of them claim to have descended from the ki hynniewtrep and are known by the generic name of Khasi–Pnars or simply Khasi.
Although there are different legends and beliefs about the origin of the three ethnicities in the region, the Khasis are said to be the earliest immigrants, making their way across present-day Myanmar. The Garos and the Jaintias, on the other hand, are said to have migrated from Tibet-China.
The Garos live in the Western Meghalaya. They prefer to call themselves as A'chiks and the land they occupy as Achik land. In addition to these ancient communities, there are some smaller tribal communities scattered mainly in the southern, eastern and western parts of the state. They are Mikir,
1
The term traditional institution for the purpose of the present study would mean the age-old socio-political institutions prevalent among the Khasis, Jaintias and Garos of Meghalaya for maintaining law and order in the society, settling disputes and administering the villages. The traditional institutions broadly are the Syiemships, Wadadarships, and Lyngdohships among the Khasis, Doloiships among the Jaintias and Nokmaships among the Garos. The village level Dorbar Shnong (village council) among the Khasis would also fall within the ambit of traditional institutions. 2
Extracted from Effectiveness of Land Bank Programme implemented under MLIPH in Meghalaya, Infrastructure Management and Advisory Services Private Limited (INMAAS), Chennai, 2012

Republic of India
Meghalaya: Livelihoods and Access to Market Project
Final project design report - Working papers
2
Lalung, Hmars (Biates), Rabhas, Hajongs, Boro, Kuch and others. There are also non-tribal communities in the state which form nearly 12-13% of the state population. These are people from other parts of the country who had been living in the state for generations. Most of them are Hindus and Muslims. The state also has Nepalese and small Tibetan population.
The account of the social structure of the major communities of the state will not be complete without highlighting the single most important feature of their social structure. All the three major communities of the state – the Khasi, Jaintia and the Garo are matrilineal. They reckon their descent through the female line. Although aunilineal principle of matrilineal descent is followed by all of them, there are local differences in their functional arrangements. The customary systems of inheritance and landownership found among these communities are intimately associated with the institution of matriliny.
Among the Khasi the largest division in society based on the principle of matriliny is in terms of kur which can be seen as a near equivalent of a clan. A kur is an exogamous unit in which every member is a kin of every other person of the same kur. It rests on the belief that they all have descended from a common female ancestry. Accordingly, the clan exogamy is practiced and well-defined relationships exist within which marriage is prohibited. Both matrilocal and neolocal rules of residence are in vogue. While a man married to the youngest daughter normally lives in the house of his wife’s mother, those married to elder sisters move out to establish separate households or they might continue to live with their husband in the house of their mother.
Among the Jaintias a normal residential arrangement till recently has been duolocal under which the husband stays with his own parents but visits his wife at her parent's house. However, this system now is on the wane and matrilocal residence has become common.
The Garos, on the contrary, are divided into five matrilineal clans (chatchi) namely, Areng, Marak, Momin, Sangma and Shira. Every Garo individual is a member of anyone of these five matrilineal descent groups, each of which is ordinarily exogamous. Cross – cousin marriage is widely prevalent. There is however a great deal of variation with regard to the rules of residence after marriage. While marriage with the heiress is uxorilocal and simultaneously avunculocal since after marriage a man moves to his wife‟s residence and lives with both his and her maternal uncle. Marriages with women who are not heiresses are neolocal, as the couple usually establishes a separate household.
However, despite having a matrilineal society, Meghalaya lags behind other NE states in several social indicators. Within this matriliny with the central role of women as the embodiment of the clan, there is the management role of the male relatives, chiefly the uncle. Among these two opposing principles of property, the male principle is in the process of becoming dominant, with the female principle reduced to merely one of inheritance system. Despite heavy work burden, their role in decision making is low. Though both men and women face problems of poverty, women face additional problems in terms of work hours and weak health. Bad health has contributed to hampering agricultural growth amongst working peasant women. Women do not have problems like dowry but their problems are illiteracy, broken marriages, divorce, unwed mothers, early marriages, male drunkenness and unemployment (Livelihoods Improvement Project for the Himalayas, Appraisal Report Volume I, IFAD).
2.2 Population Trends of Meghalaya
According to 2011 census, the population of the state is 2,966,889 with a density of 132 persons per square km. The scheduled tribe populations (mainly belonging to Khasi, Jaintia and Garo tribes) constitute 86.15% of the total population. Meghalaya ranks 23
rd by population among the states in India in
2011. However, with 27.82% decadal growth, it ranks one of the highest in the country, next to only Bihar
(24%). Average exponential population growth rate of Meghalaya were 2.71 (1991-2001) and 2.49 (2001- 2011), which is higher than all India average of 1.97 (1991-2001) and 1.64 (2001-2011), respectively. Rural population in Meghalaya grew by 27.04% in 2011 with Jaintia Hills recording highest growth with 32.96% primarily due to influx of mine workers in coal mining and cement industries in Jaintia Hills. The

Republic of India
Meghalaya: Livelihoods and Access to Market Project
Final project design report - Working papers
3
following table (Table 1) gives the population trends of Meghalaya from 1901 to 2011, showing steady rise in population.
Table 1: Population
Year Meghalaya Total Decadal Variation Density (per sq km) Male Female Meghalaya India Meghalaya India
1901 167,256 173,268 340,524 238,396,327 - - 15 1911 195,706 198,299 394,005 NA 15.71% - 18 1921 211,216 211,187 422,404 251,321,213 7.21% - 19 1931 243,993 236,844 480,837 278,977,238 13.83% 11.00% 21 1941 282,666 273,154 555,820 318,660,580 15.59% 14.22% 25 1951 310,706 294,968 605,674 361,088,090 8.97% 13.31% 27 1961 397,288 372,092 769,380 439,234,771 27.03% 21.64% 34 1971 520,967 490,732 1,011,699 548,159,652 31.50% 24.80% 45 1981 683,710 652,109 1,335,819 683,329,097 32.04% 24.66% 60 1991 907,687 867,091 1,774,778 846,387,888 32.86% 23.86% 79 2001 1,176,087 1,142,735 2,306,069 1,028,830,774 29.94% 21.56% 103 2011 1,491,832 1,475,057 2,966,889 1,210,569,573 27.80% 17.64% 132
(Source: Meghalaya State Development Report 2008-2009; Census of India 2011)
2.3 Human development and key population status
Meghalaya exhibits lower Human Development Index (HDI) as compared to most states in India 3. In
particular, the HDI in rural areas in the state remain dismally low (Table 2). The scenario might not have changed much even in the present situation. While the indices give an overview of some basic dimensions of human development, they must be complemented by looking at the underlying data and other indicators. Other important aspects of human development, particularly in rural context, such as the ability to participate in the decisions that affect one’s life, etc are important factors that ought to be considered.
Table 2: Human Development Index
Year Rural Urban Combined Gender Disparity Index
Value Rank Value Rank Value Rank Value Rank 1981 Meghalaya 0.293 20 0.442 21 0.371 21 0.799 12
All India 0.263 0.442 0.302 0.620 1991 Meghalaya 0.332 24 0.624 10 0.365 24 0.807 7
All India 0.340 0.511 0.381 0.676 2005 Meghalaya 0.547 24 0.757 22 0.585 26
All India 0.509 0.730 0.575 (Source: Meghalaya Human Development Report 2008, Govt of Meghalaya, Shillong)
Extracts from the Census of India 2011: Meghalaya 4
provides interesting facts on status of various population indicators of the state both for the urban and rural population (Table 3). Nearly 80% (79.93%) population of Meghalaya live in rural areas. Nearly 89.37% of illiterates are from rural population. About 98.28% of rural population are cultivators. Almost all agricultural labours (97.19%) are from rural population. Similarly, the rural population form the state’s bulk of marginal workers (91.84%), marginal cultivators (98.45%) and marginal agricultural labours (96.51%). Interestingly, more than half of state’s rural marginal workers (56.13%), marginal cultivators (59.79%) and marginal agricultural labours (57.47%) are women. Furthermore, considering that 87.34% of 0-6 years population of the state are from rural areas, Meghalaya will continue to have bulk of its population coming from rural areas for years to come.
3
Meghalaya Human Development Report 2008. Govt of Meghalaya, Shillong. 4
Census of India 2011: Meghalaya, Govt of India, New Delhi.

Republic of India
Meghalaya: Livelihoods and Access to Market Project
Final project design report - Working papers
4
Table 3: Census data for Meghalaya, 2011
Total State Rural Urban
Total Male Female Number of households 548,059 430,573 - - 117,486 Population 2,966,889 2,371,439 1,194,260 1,177,179 595,450 0-6 Years Population 568,536 496,592 248,751 241,841 77,944 Scheduled Caste 17,355 11,573 6,086 5,487 5,782 Scheduled Tribes 2,555,861 2,136,891 1,070,557 1,066,334 418,970 Literates 1,785,005 1,315,154 675,636 639,518 469,851 Illiterates 1,181,884 1,056,285 518,624 537,661 125,599 Total workers population 1,185,619 973,458 561,812 411,646 212,161 Main workers population 921,575 730,959 455,430 275,529 190,616 Main cultivators 411,270 404,202 239,600 164,602 7,068 Main agricultural labours 114,642 111,422 68,258 43,164 3,220 Main household industry workers 11,969 10,712 5,628 5,084 1,257 Main other workers 383,694 204,623 141,944 62,679 122,852 Marginal workers 264,044 242,499 106,382 136,117 21,545 Marginal cultivators 83,405 82,118 33,016 49,102 1,287 Marginal agricultural labours 83,722 80,801 34,362 46,439 2,921 Marginal household industry workers 8,519 8,042 2,719 5,323 477 Marginal other workers 88,398 71,538 36,285 35,253 16,860 Marginal workers (3-6 months) 209,361 190,995 83,435 107,560 10,101 Marginal cultivators (3-6 months) 65,580 64,462 25,204 39,258 1,118 Marginal agricultural labours (3-6 months) 66,049 63,863 27,360 36,503 2,186 Marginal household industry workers (3-6
months) 6,048 5,688 1,948 3,740 360
Marginal other workers (3-6 months) 71,684 56,982 28,923 28,059 14,702 Marginal workers (0-3 months) 54,683 51,504 22,947 28,557 3,179 Marginal cultivators (0-3 months) 17,825 17,656 7,812 9,844 169 Marginal agricultural labours (0-3 months) 17,673 16,938 7,002 9,936 735 Marginal household industry workers (0-3
months) 2,471 2,354 771 1,583 117
Marginal other workers (0-3 months) 16,714 14,556 7,362 7,194 2,158 Non-Workers population 1,781,270 1,397,981 632,448 765,533 383,289
(Source: Census of India 2011: Meghalaya)
2.4 Rural to urban migration
There is no reliable data available on rural to urban migration in Meghalaya. According to a study done by NEHU, the rural urban migration in Meghalaya is a fairly recent phenomenon and is more externally induced to perform administrative functions and thus not related to structural transformation of the rural economy as such
5 . Although the rural areas of Meghalaya is characterised by a low level of socio-
economic development, it appears that distressed rural urban migration do not take place in Meghalaya due to tribal social structure which is based on ethnic and clan bond, generally viewed as restrictive to large-scale migration. One of the recent examples usually attributed to rural urban migration is the decadal population growth of Tura by 150% from 15,489 in 1971 to 39,440 in 1981.
The NEHU study6
further revealed that the resource context could be a powerful explanation for rural to urban migration in Meghalaya. The fact that primitive economies based on forestry, mining and jhum cultivation are primarily responsible for developing a stream of rural to urban migration is sufficiently indicative of their growing unsustainability of these resource bases. The implications are that unless rural
5
Nengnong, D.D. (1999). Rural Urban Migration in Meghalaya. Unpublished Dissertation submitted in partial fulfillment for the degree of Doctor of Philosophy, Department of Geography, North Eastern Hills University, Shillong. 6
Ibid page 198

Republic of India
Meghalaya: Livelihoods and Access to Market Project
Final project design report - Working papers
5
development is based on restoring these resource bases, the state could experience distressed migration into the urban areas.
Current trend of migration is mainly among the students for higher education and youth for employment. Sizable young women are also migrating to urban areas for seeking domestic employment as revealed by some of the social workers from partner NGOs working with IFAD-supported MLIPH and NERCORMP projects. Overall, urban areas in Meghalaya are still perceived to be ‘pull’ areas for rural students and young people and thankfully the urban Meghalaya continue to be accommodative to the small proportion of rural migrants.
Another type of migration being experienced in Meghalaya is the opportunities offered by coal mining in some pockets of the state, notably in Jaintia Hills. Large numbers of migrant workers are seen in the coal belt of Jaintia Hills. Correspondingly, the decadal growth rate (2001-2011) of Jaintia Hills with 32.96% is the highest among all the districts in Meghalaya. Given the current problems of coal mining, at least in the Jaintia Hills (due to exhaustion of reserves and loss of export markets in Bangladesh), it remains to be seen if this growth continues.
III. Land
3.1 Introduction
Land tenure in Meghalaya is based around a traditional system of communal ownership and traditional
institutions7. Within this system, there are significant variations between the eastern and western parts
of the state, with further variations in tenurial arrangements within the same district and often from village to village. Given that the enterprise and natural resource development for the project rests heavily on primary sector activities, some exploration of the issue of access to land is needed.
The issue of land tenure is also important in view of the emerging trend of privatization of community owned lands, especially in the Garo Hills where A’khing lands are being settled in favor of influential and mostly non-resident elites, who exploit loosely defined clauses in the existing legal statutes to their benefit. This is also true to some extent in the Khasi and Jaintia Hills. Concentration of land in the hands of a smaller number of people could mean that land-based opportunities are denied to many other people. Security of land tenure is an important tool for strengthening traditional social and representative institutions, especially at the village level.
Two factors are common in land tenure systems in parts of the State. One is that, where tenure is insecure, the incentive to invest in livelihood activities is greatly diminished. The second is that, in many areas, there are strong indications that, given appropriate interventions, many of the tenure anomalies can be mitigated.
3.2 The historical context
A brief history of some aspects of land tenure in India is relevant here to place the issues in Meghalaya in perspective. Land tenure systems historically develop along with settled agriculture. As waves of communities moved west from the Indus valley from about 1500 B.C. into the Gangetic plain and cleared land for cultivation, the earliest forms of organization and management of land find reference in various Vedic hymns. Since it was not possible for individuals to clear the thick vegetation that covered the plain, it was community action that contributed to settled agriculture. Title to such lands vested with the clan or community that cleared a particular patch. Thus land was always a community resource in ancient India, held in trust by the village community. With the emergence of states in the central Gangetic valley around
7
“Understanding land ownership and management systems of the Khasi, Jaintia, and Garo Societies of Meghalaya” by Amba Jamir & Dr. Kyrham Nongkynrih. IFAD funded study 2003; “Rural poverty in Meghalaya: its nature, dimensions, and possible options” by N.C. Saxena. IFAD funded study 2002.

Republic of India
Meghalaya: Livelihoods and Access to Market Project
Final project design report - Working papers
6
the 5th century B.C., the sovereign asserted his tutelage over territory, but his suzerainty was expressed in terms of the share of the produce he extracted from the community, not in direct control and management of land.
The concept of private ownership over individual plots did not emerge till the end of the first millennium A.D. This fact is vital to our understanding of surviving models of community control over land resources, as in the present case of Meghalaya. Land was the primary natural resource and traditional village institutions, mostly hereditary and patriarchal, granted access to individual households to cultivate land. However, access did not imply ownership and the primacy of the community over the individual were always maintained. The idea of individual control over land and the notion of private ownership of land were introduced after the arrival of Muslim rulers in India around the 11th century A.D. The early Islamic world’s close mercantile links with Europe, where feudal systems were beginning to emerge, acted as the conduit to bring the idea to the sub-continent.
Even while the sovereign in ancient India saw land as a source of revenue and levied taxes, the village, and not the household, was the unit of assessment and collection. This was set to change by the early 12th century. The needs of expansion over more territories by the early Muslim kingdoms, and the expenditure necessary to maintain a well-equipped standing army, slowly drove up the rates of extraction from land by the rulers. One outcome of this pressure was the emergence of feudal intermediaries, a new institution for rural India, which had hitherto only dealt with the sovereign and his servants. From now onwards, even though the village continued to exercise de facto control over the land, its title had passed de jure through a grant to a close supporter of the ruler, usually in return for a certain number of armed men to fight on his behalf. It was the feudal intermediary thereafter who levied and realized taxes on land.
This process was continued and streamlined during the reign of the Great Mughals through the 13th to 16th centuries. An additional innovation was the physical measurement and valuation of land to determine land rates on a scientific basis. By the time the British East India Company was taking over most of eastern, northern and central India from the mid-18th to early 19th century, traditional institutions at the village level had lost most of their power and collective agency in the management of land. Individual holdings, and not just homesteads as in the past, began to be handed down from one generation to the next by farming households. Tiers of intermediaries appeared at the village level once the British had formalized the so-called zamindari system through the Permanent Settlement in the late
18th century. This formally broke the direct relationship of the sovereign with the tiller. For most of northwestern India (which includes what are now the Punjab, Sind and Baluchistan provinces of Pakistan), the plains of eastern India (including modern Bangladesh) and large parts of southern India, this also marked the formal end of the concept of community ownership and control over land. Some of the implications of this development are being felt even today.
The British were driven primarily by their objective to extract the maximum possible revenue from land. This led to their attention being concentrated on the rich Indo-Gangetic plains, and to a lesser extent on the fertile river valleys of eastern and southern India. It is here that they devised arguably one of the world’s most elaborate land administration systems, which survives more or less intact even today. At the heart of this system lay a detailed field survey of holdings and plot wise assessment of land revenue. It was this atomization of the agriculturist as a taxation point that completely ended any role for the community in land management at a functional level in the major river valleys of the mainland.
Ironically, it was the same preoccupation with revenue realization that led the British to leave large parts of the forested central plateau (including the present states of Madhya Pradesh, Chhattisgarh and Orissa) as well as the entire northeastern region of the country out of the ambit of the feudal organization of lan d relations. Given their forest-based economies, these areas did not merit the trouble of extensive survey and assessment, as the scope for revenue extraction was minimal. Harvesting of natural resources like timber could always proceed without affecting titles to agricultural land. The Census of 1901 for the first time introduced the term “tribes” in the administrative lexicon of the country and eventually it came to describe the inhabitants of all those regions where the British did not extend feudal intermediaries in land.

Republic of India
Meghalaya: Livelihoods and Access to Market Project
Final project design report - Working papers
7
Among the core characteristics of these social groups, which were seen as different from the “castes” that inhabited the main agricultural regions of the country, was the feature of community ownership and management of land. It was thus more by default than design that the entire northeastern region escaped British intervention in land relations.
The foregoing analysis leads us to the conclusion that community control, not individual ownership, was the historical norm in land management in India irrespective of the social structure of rural communities and their livelihood practices. The erosion of this process began in the 11th century, finally culminating in a formal end to this tradition in the late eighteenth century at the hands of the East India Company. Extant examples of community control over land resources, such as those prevailing in the northeast are thus not isolated examples of exotic or quaint social and economic organizations, but represent surviving forms of what was once the prevailing orthodoxy.
3.3 Land relations in Meghalaya: the modern context
Modern India’s early policy makers ensured that there was an explicit recognition of the fact that, while land relations had been severely distorted in the main agricultural regions, a more equitable and desirable situation prevailed in areas such as the northeast (including Meghalaya) and parts of central and eastern India. India’s Constitution, therefore, made special provisions to protect and preserve the special features of community ownership and control that was a key feature of social life in the northeastern region. To a lesser extent, some protection was also extended to tribal land ownership in other parts of the country. However, what is relevant here is that the special provisions in respect of the northeast stemmed from an assumption that these guarantees would insulate the social groups of this region from the deleterious effects of market forces and protect their access to the primary productive resource of their habitat. In practice, things turned out somewhat differently.
Turning to the specific case of Meghalaya, we observe a classic case of “creeping modernization”, where a historically oral and non-written tradition is being slowly eroded by the more formal modern discourse on development with its emphasis on the written code, the printed word and the registered document. Traditionally, the territory of a clan was clearly defined and understood. Disputes over boundaries were resolved sometimes by recourse to violence, but most often through a consultative process of dispute settlement. The village institutions exercised overall control over access to land and ensured some measure of equity. The first brush with modernity happened with the putting into place of the structure of the state government and the Autonomous District Councils (ADCs). While the former had almost no role in micro management of land at the village level, the latter was given a limited role, ironically in the name of protecting the traditional land administration system.
The mandate of the many new authorities that appeared on the scene after 1950 was sometimes overlapping. It was often in conflict with the role of traditional village level institutions. It is also noteworthy that no significant investment has been made to strengthen traditional institutions at the village level since independence either by way of financial resources or capacity building, this effort being concentrated on the new “modern” structures that emerged at the district and state level. The net effect has been an erosion and dilution of the authority of the village level institution.
Seen in this light, the complicated land tenure situation in Meghalaya can be better understood. The prevailing situation is the product of a combination of historical trends and modern interventions. Some may even call it a clash of cultures, where an aggressive modern system overwhelms an older tradition. One must enter a caveat here that it is perhaps impossible in the course of a paper of this nature to summarize the various tenure systems that prevail in the state today. For this aspect a reference should be made to the background study commissioned by IFAD for Meghalaya Livelihoods Improvement Project for the Himalayas (MILPH). However, what has been attempted below is a delineation of the major features of various tenure systems and their consequences.

Republic of India
Meghalaya: Livelihoods and Access to Market Project
Final project design report - Working papers
8
Lack of a formal mechanism for dialogue between the state government and ADCs and village institutions regarding respective rights and duties has led to considerable confusion over roles, mostly to the detriment of the village institutions. Institutional linkages of other kinds, such as those for credit, marketing, technical inputs etc. are weak or completely non-existent in most areas, leaving only the possibility of the most basic form of subsistence cultivation or dependence on the vagaries of the informal credit market. Increased population pressure, privatization, fragmentation of holdings and elite-capture have led to an emerging trend of landlessness among rural households. Lack of standard title documents and land revenue surveys can cause problems and disputes. Land owned by individuals can be used as security for bank loans.
Garo Hills
The lands in Garo Hills consists of revenue areas and non-revenue areas. The revenue areas are the plain areas and the non-revenue areas are the hill areas termed as A’king/A’khing land. The non-revenue areas, which is A’khing land, form over 80% of the land in Garo Hills (as of 2003) which is generally considered as community owned and controlled but facing what can be termed as an epidemic of privatization. Village durbars
8 (Council) under the Nokmas
9 with support from the Chras (the Chras are
the elder male members of the Nokma’s wife’s family; she is called as Nokna and she is the real owner of the land) provide access to cultivable land to households and the land is resumed only if left fallow for three successive years. Long term occupation, plantation of permanent tree crops and requirements of documentary proof of ownership for bank loans, bail bonds etc. has led to former community controlled lands under A’khing Nokmas slipping into private hands. This involves issuing of an individual patta
10 by
the ADC, which can be done after seeking no objection from the clan / community. These patta give legal and permanent ownership rights.
Khasi Hills
In the Khasi and Jaintia Hills traditional institutions control the majority of land, but there is sizeable acreage under private ownership. Here too traditional institutions allocate land units to households for cultivation. However, some of the community lands are controlled by some families and individuals making the land tenure issue fairly complicated. Non-resident, urban-based elites are using grey areas in the current laws to settle land in their favour, a classic case of the written word prevailing over customary law, even if the formal process violates the traditional position. Since no land records are available, providing proof of ownership by individuals is difficult. Some individuals who gain access to community land through the traditional institutions seek a written order from the dorbar, which is then registered under the normal process of registration of documents. This becomes the proof of occupation, if not outright ownership, and accepted by financial institutions as collateral for loans. In some cases we even came across attachment of such property, which was originally community land, by banks owing to default by the borrower. The fact that traditional custom is oral and not recorded gives primacy to the modern written legal statute.
In the Khasi Hills land is classified as community or 'public' land called 'Ri Raid' and private land called 'Ri kynti'. Individuals can be allotted the right to occupy and use Ri Raid lands, and these rights can become heritable and transferable by way of construction of permanent buildings or cultivation of permanent crops, or by conversion to wet paddy land, fish ponds etc. However the individual cannot actually sell this land - but does have the right to reclaim any expenditure on the land when it passes or is transferred
8 Durbar or Dorbar are the village council. Among the Garos, the village councils are made up of elder male members both from the
Nokma’s family and his wife’s family. The elder male members from the wife’s family are known as Chras. 9
Nokma is the head of traditional village institution among the Garos. He is the custodian and guardian of A’khing land, on behalf of
his wife (called as Nokna), 10
Patta is a document which shows the ownership of the property. It comes under the Revenue Department in normal case but in
the case of A’khing land in Garo Hills, the Autonomous District Council is empowered to issue the patta (legal ownership certificate of land title) that are within the purview of the 6
th Schedule of the Constitution.

Republic of India
Meghalaya: Livelihoods and Access to Market Project
Final project design report - Working papers
9
to another person. In any event, ownership rights revert back to the community if the land is not used by its owner.
Jaintia Hills
In Jaintia Hills there are two classes of lands: (i) Hali or irrigated paddy lands and (ii) High lands. These two main categories of land are again sub-divided into different classes. Hali lands consists of (1) Raj lands; (2) Service lands; (3) Village puja lands; and (4) Private lands. Raj lands were the property of the Syiems of Jaintia Hills. They were unoccupied lands and vested with the Jaintia Syiems. After the abolition of Syiemship in Jaintia Hills, these lands were taken over by the British and assessed to land revenue. This type of land can be settled by any individual on lease basis, which is now dispensed by the ADC in consultation with the Dollois. Service lands are the rent free lands given to Dollois, Pators, Basans and other officials of traditional institutions for their services rendered to their administration and community. They were not paid but allowed to hold this piece of land in recognition of their services to community.The village puja lands are the lands held by the Lyngdohs (priests) and the Raid (community council). These lands were set apart for the purpose of worship. These lands are revenue free lands and the Lyngdohs can use any income from these lands for their own upkeep, etc. Private lands are the lands held by the individuals and have the right to transfer, mortgage sale, etc. at their will. The Patta or lease lands were the lands allotted and settled by the British during their regime. These same lands are now being dispensed by the ADC who settles to any individuals in consultation with the Dollois of the areas
11.
IV. Traditional Institutions
4.1 Introduction
Meghalaya is one of the four tribal majority states of North Eastern Region, the others being Arunachal Pradesh, Mizoram and Nagaland. The three major tribal groups of Meghalaya, viz. the Khasis, Jaintias and Garos have traditional self-governing institutions and traditional system of governance. During the British period, some of these institutions were re-modelled but by and large remain as such. After Independence, these traditional institutions came under the purview of Autonomous District Councils (ADC) constituted under the Sixth Schedule of the Constitution of India. Today, all the three tribal communities have their own separate Autonomous District Councils
12.
The traditional institutions in Meghalaya, as in most other tribal communities in NE India, are socio- political, cultural and economic institutions in functions. Such institutions are deeply rooted in the society and are still responsible for the day-to-day administration of the people. They run the administration in a democratic manner and in accordance to the general will of the people based on traditions, customs, culture and usages of the land. The traditional Chiefs, though occupy the highest hierarchy in the ladder of administration, cannot go against the popular will of their people. In many cases, such Chiefs are either selected or elected by the people in order to supervise the administration and not to oppress or suppress them. The people retain the highest authority in matters of decision making although they are assisted and guided by the various traditional councils at different levels of administration. These councils play a very important role in the community administration and decision making process.
11 Traditional Institutions of the people of Meghalaya by Julius L.R. Marak in Heritage of Meghalaya
(megartsculture.gov.in herit frame.htm accessed on 24. .2013) 12
The ADC in Meghalaya, initially one for Khasi-Jaintia Hills and one for Garo Hills, started functioning since 1952. The United
Khasi-Jaintia ADC was bifurcated in 1964 as Khasi Hills ADC (KHADC) and Jaintia Hills ADC (JHADC).

Republic of India
Meghalaya: Livelihoods and Access to Market Project
Final project design report - Working papers
10
4.2 Indigenous tribal institutions during the pre-independence period
Prior to the advent of the British into the Garo Hills areas, all the civil and criminal cases were tried and settled by the tribal chiefs known as A.khing / A.king Nokmas assisted by the village Nokmas and their councils. The A.khing Nokmas were all in all, responsible for all the civil administration, administration of justice and the welfare of his subjects within his A.khing land. They were all independent of each other and subject to none. The proceedings of the cases were not recorded and all decisions and judgments were oral but binding on the offender. The village elders took part in the melaa (bichal or meeting) argued the cases and gave decisions according to the customary laws and practices.
The traditional institutions in the form of Syiemships, Wadadarships, Doloiships, Lyngdohships and Nokmaships were functioning in the form of Panchayati Raj of other states. The Khasi hills comprised of 25 native states commonly known as the “Khasi States” which signed the Instrument of Accession and authorized the constituent Assembly of India to make Rules, keeping in view the terms and conditions laid down in the Instrument of Accession. By the time the British established their power and consolidation in the Khasi and Jaintia Hills, the set up and recognized 20 Dolois in Jaintia Hills, and 16 Syiemships, 3 Lyngdohships, 5 Sirdaships, and 1 Wahadadarship known as “Khasi States” (Hima) and 31 Sirdarships known as “British Villages” in Khasi Hills
13.
The area of Garo Hills was annexed into the British dominion in the last battle of Chisobibra of Rongrenggre village, near the present district of East Garo Hills headquarters Williamnagar on the 12th December, 1872. In this last battle with the British army, Pa Togan Sangma, Garo warrior and the Chief was shot and succumbed to bullet injuries. But, the Garos managed and retained the A. Khing Nokmanship till the present generation.
4.3 Post – independence period
After the attainment of Independence, the Hill districts of Mehgalaya are being administered according to the provision under Para –1(1) of the Sixth Schedule of the Constitution of India; the role of the District Council was to conserve, protect and strengthen the existing tribal indigenous institutions amongst tribal communities. The District Council is empowered to make laws for autonomous districts which have effect only after assent by the Governor.
When the District Councils came into being in the Hill areas of Khasi and Jaintia and the Garo Hills districts, the traditionally elected chiefs or traditional heads such as Syiems, Dollonis, Wadadars and Lyngdohships were appointed by the District Councils and the rights of election of Chiefs by the people were taken away. But, in the case of selection of A.Khing Nokmaship amongst the Garo community, the traditional way of selection continued unaffected. The District Council only recognizes formally the A.Khing Nokma selected by the machong or motherhood.
The President of India may direct that any Act of Parliament shall not apply to an autonomous district. These provisions were inserted in the Schedule by the North-Eastern Areas (Re-organisation) Act, 1971. Further, the Governor of a state could exclude the operation of any Act of Parliament or of the State Legislature in these Autonomous Districts.
4.4 District Councils
The LAMP project will function within the geographical entities of the District Councils in Khasi, Jaintia and Garo Hills. Therefore, it may be pertinent to briefly touch upon the powers of District Councils, as also
13
Synnang, I.R. (2010). Traditional Institutions in Khasi Hills: A Study of Mawphlang Lyngdohship. Unpublished M.Phil. Dissertation, NEHU, Shillong.

Republic of India
Meghalaya: Livelihoods and Access to Market Project
Final project design report - Working papers
11
further clarity on the various roles and functioning of the traditional institutions and governance system of the three major tribes of Meghalaya.
According to para 3 of the Sixth Schedule of the Constitution of India, the District Councils are empowered to make laws with respect to:
(a) The allotment, occupation or use, or the setting apart, of land, other than any land which is a
reserved forest for the purposes of agriculture or grazing or for residential or other non- agricultural purposes or for any other purpose likely to promote the interests of the inhabitants of any village or town. (However, the State government is empowered to acquire any land, whether occupied or unoccupied, for public purposes).
(b) The management of any forest not being a reserved forest; (c) The use of any canal or water-course for agricultural purposes; (d) The regulation of the practice of Jhum or other forms of shifting culstivation; (e) The establishment of village or town committees or councils and their powers; (f) Any other matter relating to village or town administration, including village or town police and
public health and sanitation; (g) The appointment or succession of Chiefs or Headmen; (h) The inheritance of property; (i) Marriage and divorce; (j) Social custom;
The District Councils are also empowered to establish, construct, or manage primary schools,
dispensaries, markets14
, cattle pounds, ferries, fisheries, roads, road transport and waterways in the district. The Council also enjoys the power to levy and collect all or any taxes on professions, trades, employments; animals, vehicles and boats; entry of goods into a market for sale therein, and tolls on passengers and goods carried in ferries; taxes for the maintenance of schools, dispensaries or roads. The traditional institutions at the social or community level, particularly at village context remains strongly embedded among all the three tribal groups in Meghalaya. Modernization, as also market based economy along with pressure for land and other resources, are having their own impacts on the functioning of the traditional institutions. The relationships with ADCs, created to safeguards the interest of the traditional institutions and also to preserve the culture and customs of the communities, and other emerging government institutions are also having its own challenges. A brief treatment of the respective traditional institutions of the Khasis, Jaintias and Garos are outlined below with the idea of appreciating their challenges as also the opportunities of building partnerships for development effectiveness on the basis of their power and functional responsibilities in their respective communities.
Traditional Institutions and Governance in Khasi community
The Khasi polity is based on long-standing traditions, customs and usages. Every Khasi “State” has a definitive entity called Hima or Elaka. The titular heads of such Hima or Elaka are the Syiems, Lyngdohs, Sordars/Sirdars and Wahadadars. Each Hima is a collection of a number of villages or Shnong. At the grassroots level of administration, each village has an office of Village Headman or Rangbah Shnong. On matters of administration, the Syiems are assisted by Myntris and/or Basans. At present there are 16
Syiemships, 3 Lyngdohships, 5 Sirdaships, and 1 Wahadadarship included in the “Schedule – I” and 30 Sirdarships known as included in the “Schedule – II” of the Khasi Hills Autonomous District
(Administration of Elaka) Act, 1991.
14
It may be mentioned that in both Jaintia Hills and Khasi Hills, all markets, whether owned by the District Council, Dolloi/Sirdars/Syiems or other administrative heads or private persons are officially under the control of the Executive Committee of
the District Council. For further details, please refer to Khasi Hills District (Establishment, Management and Control of Markets)
Regulation, 1979 and ACTS, RULES AND REGULATIONS ETC OF JAINTIA HILLS AUTONOMOUS DISTRICT COUNCIL, 1967 TO 2009,Published by JHADC, Jowai (2010). However in practice markets are under the de facto control of the local leaders - the Syiem/Durbar or the Dolio/Elaka.

Republic of India
Meghalaya: Livelihoods and Access to Market Project
Final project design report - Working papers
12
The Syiem presides over the Dorbar Hima or State Assembly. Syiem’s functions, amongst others, include construction and maintenance of roads, bridges, water sources and sanitation; establishment of and maintenance of markets and collection of dues; welfare works and community services; judicial powers to settle petty disputes/cases; to organise cultural festivals.
Each village or Shnong also has a Dorbar/Durbar called Dorbar Shnong, which is headed by a Rangbah Snong (Headman). The headman is elected/selected by majority voice vote of the villagers, so also other member of the Dorbar Shnong to assist the Rangbah Shnong. Dorbar Shnongs are responsible for looking after law and order in their areas, maintenance of common properties, ensuring delivery of services, cleanliness of the shnong, etc.
The Khasis are also strongly interwoven around their respective clan or Kur. Each clan has a Rangbah Kur or clan leader who is responsible for the welfare of all the members of the clan or Kur. In most cases, the internal affairs of the clan are looked after and controlled by the clan head and the clan elders. In fact, Kur is the nucleus around which all institutions – social, cultural and political revolve
15. In that sense,
Rangbah Kur is often considered as the precursor of Rangbah Shnong.
Traditional Institutions and Governance in Jaintia community
In Jaintia hills, the villages are clustered around a particular political entity known as Elaka or province. The chief of the Elaka is known as Doloi. Dolois are elected from the senior members of a particular clan for life, but can be removed by his people for his misrule and corruption. Dolois are assisted by elected/selected elders called Basan and Pator who are heads of a particular area. While a Basan acts as advisor to Doloi, a Pator is an administrator of a particular area. They collectively form the Elaka Dorbar with Doloi as the head of the Elaka Dorbar. Traditionally, an aggregation of Elaka formed the Jaintia Syiemship and the chief of the syiemship was known as Raja (King). The Dolois represented the people of his respective Elaka in the Raja’s Dorbar. While the Doloiship continues, the kingship or Raja is no longer in existence (abolished in 1935 by the British rule).Jaintia Hills was originally knwon in the local parlance as Ka Ri Khad-ar Doloi (Land of the Twelve Tribal Chief or Doloi). Because in those ancient days, Jaintia Hils was ruled by the twelve Dolois who had their own Elaka, boundaries, power to govern and sizable population
16. Currently, there are 18 Elaka and 1 Sirdarship in Jaintia Hills.
At the village level, the Jaintias have similar system as the Khasis with Dorbar Chnong (similar to Dorbar Shnong) at village level and elected/selected headman as head of the Dorbar Chnong. Functionally too, the Dorbar Chnong of the Jaintias are similar to the Dorbar Shnong of the Khasis.
Traditional Institutions in Garo community
In Garo Hills, the institution of Nokmaship and the Village Council were the two traditional administrative institutions and governance. Among the Garos, the A’khing or A’king Nokma as the head of the clan and the custodian of the A’khing land is entrusted with certain political and administrative powers. He occupies a high and respectable place in the Garo Society. He is the pivot of the village organisation through whom the basic network of the entire society is woven. He is responsible for administration of justice, peace and harmony within his jurisdiction.
A Nokma in Garo society is rather a social and economic representative of the village17
without having
much advantage or authority in the true sense of the term, unlike the Chiefs in Khasi community. The
15
Synnang, I.R. (2010). Traditional Institutions in Khasi Hills: A Study of Mawphlang Lyngdohship. Unpublished M.Phil.
Dissertation, NEHU, Shillong. 16
Tiwari, B.K. (2012). Institutional arrangement for preservation and management of community forests of North-East India.
Presidential Address of Section VII: Environmental Sciences of the 99th
Indian Science Congress, Bhubaneswar. 17
Gassah, L.S. (2003) Traditional Self-Governing Institutions Among the Hill Population Groups of Meghalay. www.
dspace.nehu.ac.in/.../Traditional%20self%20governing%20(LS%20Gassah accessed on 12/6/2013
Republic of India
Meghalaya: Livelihoods and Access to Market Project
Final project design report - Working papers
13
A’khing Nokma’s economic status is basically equal to that of others within his area. Though the A’khing land belongs to the wife of Nokma (known as Nokna) and managed by the Nokma, it is actually held in common by all the inhabitants of the village with every member of the village or clan having right to cultivate the village land. As a rule, no portion of the A’khing land can be sold or mortaged by the Nokma (though this aspect is changing in recent years). Such decisions are collectively taken by the clan representatives called Chra and Mahari. The Chra consists of the maternal uncle and brothers of the wife of Nokma, the Mahari consists of the members closely related through common motherhood from both sides. The Nokma, Chra and Maharis form the Village Council to administer the welfare of the people in the village.
It may be mentioned here that although the Nokna (wife of Nokma) in Garo society is the real owner of all the land, she has no role in typical traditional village institution, which is composed of all male members of
the family (male members from both Nokma and Nokna)18
. However, in IFAD-assisted NERCORMP19
and
MLIPH20
projects in Meghalaya, it has been observed that the women are now increasingly consulted by the members of the traditional village institution particularly on issues of social and economic development of village community including on issues of biodiversity conservation. Empowerment of women as members of Self Help Groups (SHGs) or Natural Resource Management Groups (NaRMGs in case of NERCORMP) or Village Employment Council (VEC in case of MLIPH) are contributing to such changing gender relationships in many project village communities.
V. IFAD-supported Projects Experiences in Meghalaya
5.1 Village coverage, development issues and priorities of rural poor people
Meghalaya has the experiences of having two IFAD-supported projects in the state both concurrently running for several years. NERCORMP, a central sector project with North Eastern Council (NEC) as the
Project Lead Agency (PLA), implemented through NERCRMS 21
during 2000-2008 and 2010-2016
covered two erstwhile districts of Meghalaya, viz. West Khasi Hills22
and West Garo Hills23
. The other project, MLIPH, a state sector project with Planning Department as the PLA implemented the project
through MRDS during the period 2005-2013 (loan closed on 30th
June 2013) and covered the remaining
erstwhile five districts of the state (South Garo Hills, East Garo Hills24
, East Khasi Hills, Ri Bhoi and Jaintia Hills
25). NERCORMP promotes NaRMGs and women SHGs and supports various household level
livelihoods, basic village development activities (drinking water and toilets; inter-village roads) and natural resource management (community biodiversity/forest conservation). Similarly, MLIPH promoted largely women SHGs, supported livelihoods including rural finance and social venture capital.
Meghalaya has a total of 5780 villages26
in the entire state. Both the IFAD-assisted NERCORMP and MLIPH projects together have worked or working in about 27% of the villages of the entire state ( MLIPH has worked in 32% of villages in the erstwhile five programme districts of South Garo Hills, East Garo Hills, East Khasi Hills, Ri Bhoi and Jaintia Hills; NERCORMP is working in 22% of villages located within its programme districts covering two erstwhile districts of West Khasi Hills and West Garo Hills). Many
18
This section may be read with WP 2, Gender and Poverty (particularly the section on Gender in Cultural Context and Traditions). 19
North Eastern Region Community Resource Management Project for Upland Areas (NERCORMP) works in erstwhile West Garo
Hills and West Khasi Hills Districts of Meghalaya. 20
Meghalaya Livelihoods Improvement Project for the Himalayas (MLIPH) works in erstwhile five districts of Meghalaya, viz. South
Garo Hills, East Garo Hills, East Khasi Hills, Ri Bhoi and Jaintia Hills districts. 21
North Eastern Region Community Resource Management Society. 22
Now divided into West Khasi Hills with its Hq at Nongstoin and South West Khasi Hills with its Hq at Mawkyrwat. 23
Now divided into West Garo Hills with its Hq at Tura and South West Garo Hills with its Hq at Ampati. 24
Now divided into East Garo Hills with its Hq at Williamnagar and North Garo Hills with Hq at Resubelpara. 25
Now divided into West Jaintia Hills with Hq at Jowai and East Jaintia Hills with Hq at Khliehriat. 26
State of the Environment Report 2005: Meghalaya. Department of Environment & Forests, Govt of Meghalaya, Shillong, 2005
(see page 5).

Republic of India
Meghalaya: Livelihoods and Access to Market Project
Final project design report - Working papers
14
individuals (and also groups) from these villages will now be able to take up enterprises to augment economic benefits. However, the needs of the remaining communities for building the foundations for community empowerment through social mobilisation and capacity building with various other integrated inputs as done in NERCORMP and MLIPH cannot be undermined if the new Megha-LAMP has to achieve its development objectives with scaling up results and impacts.
Indeed the traditional mindset of the rural communities are transforming fast as evidenced from experiences of MLIPH and NERCORMP while analysing few key indicators of changes in attitudes and other parameters of development (Annex I). Based on experiences of MLIPH and NERCORMP, some of the key issues and priorities of rural people of Meghalaya are centred on building and augmenting their social, human, physical, financial and natural assets. The priority issues and opportunities are:
- Strengthening and building the capacity of peoples’ organisations including traditional institutions.
- Augmenting skill deficits to take up diversified livelihoods and entrepreneurships particularly
among literate young people and women.
- Social sector development particularly access to health, education, drinking water, and sanitation.
- Augmenting rural numerical and financial literacy to groups and CBOs including access to
financial services.
- Natural resource management particularly activities to promote community forestry management,
biodiversity conservation, water management, rainwater harvesting, prevention of soil erosion
and enhancing land productivity.
- Resource centres cum one-stop-shops for all agri-horti and other land-base/farm based inputs
and services including livestock and fishery, etc as well as market linkages.
- Access to new farming technologies and rejuvenation of existing horticultural crops.
- Rural infrastructures (inter-village all-weather roads, electricity, storage godowns).
- Market access and market development.
- Enhancing access to social entitlements and convergence with various other government
schemes.
- Women and youth empowerment and awareness education including the traditional village
institutions.
- Learning to build partnerships including with government / non-government agencies and private
sectors.
- Access to quality knowledge and timely information.
5.2 IFAD project experience in enhancing land tenure arrangements
Both NERCORMP and MLIPH addressed issues of land tenure in project villages. MLIPH experimented with creation of community-managed Land Bank to enhance land access and tenurial security for the poorest households, NERCORMP addressed issues of enhancing land tenure security for “landless” households through the NaRMGs with land-owning clans notably in West Khasi Hills district of Meghalaya.
(a) NERCORMP: West Khasi Hills: The typical land tenure problem is more prominent within the Maweit
cluster, where most land is owned by certain clans, while others live as tenants. Traditionally the land tenancies were only for one year where the tenants could grow only annual crops. The project has been able to achieve increase in land lease period rang from a minimum of nine years to 50 years or more, thereby enabling the tenants to grow more permanent crops (like oranges, arecanut, pineapple, etc.). In some cases, land patches have been leased for as long the tenants would like to cultivate with very nominal amount.

Republic of India
Meghalaya: Livelihoods and Access to Market Project
Final project design report - Working papers
15
(b) MLIPH: Land Bank model: The pilot land bank intervention undertaken by MLIPH showed that the model could be up-scaled to the benefits of communities, particularly the landless and the rural poor to improve access to secure land. The studies carried out both by INMAAS
27 and FES showed the
positive results of land bank as a model to address land tenure security for the rural poor. The studies outlined that land bank model could achieve the following
28:
(i) Ensure security of access to productive assets for target households especially landless families on both jhum and non-jhum land;
(ii) Build the capacity of village level institutions in land management, thereby strengthening them in their traditional role of supporting livelihoods through efficient and equitable natural resource management.
(iii) Link target households to credit, marketing, extension, business development, and technical services.
(iv) Check the trends towards privatization of community land.
(v) Provide replicable model for wider application.
Although these arrangements did generate some benefits, they have not been scaled-up or adopted more widely than in the limited number of project villages where the project took the initiative to promote the idea. In order to focus LAMP on a limited number of priority interventions, it is proposed that land banks are not made a compulsory intervention in LAMP, although they will be included as an option in drawing up INRMPs. It may further be mentioned here that LAMP intends to first work with land-owning households on land-based activities and agro-horticultural enterprise promotion. Recent data showed that in Meghalaya, only 4.98% of rural households are landless (not owning any cultivable land but usually have homestead land for housing and small kitchen garden as in West Khasi Hills district). Of the remaining land-owning households, 2.81% households own large land (>3 ha), 11.91% of households own small land (between 1-3 ha) and nearly 80% households own marginal land (<1 ha)
29.
5.3 Working with Traditional Institutions at the Village Level
Traditional institutions at village level such as Dorbar Shnong headed by Rangbah Shnong in Khasi Hills and Nokmas in Garo Hills, particularly in rural context remain powerful institutions. No one or agency can begin to initiate in the villages without taking into confidence the traditional institutions in the village. They are in fact become the first point of contact for entry into the village. Both NERCORMP and MLIPH have always actively engaged with these institutions during project implementation in respective villages. NERCORMP usually had “social agreement” prior to starting the project in the villages. Social agreement entails close interactions and engagement with the village heads/chiefs as heads of traditional institutions together with members of village councils. This ensures social acceptance by all members of the village for the project, after which all members of the village communities freely and actively participate in the project processes. In several instance, in quite several instances, village head or one of the members of the village council also became President of the CBO such as NaRMG in NERCORMP.
The above is a de facto application of the Free Prior and Informed Consent as established in international standards on indigenous and tribal peoples participation in development initiatives happening on their lands and territories. It directly implements IFAD’s key Principles of Engagement with IP/Tribal People, viz. Free Prior Informed Consent, and actually goes beyond the consent, as communities not only provide consent to the project through their traditional governance systems, but they become the co-managers of the project, whereby the project activities and funds at village level are channelled through the village councils. During the contact and interactions with village head and his village council members, the Project staffs explain in details the role, duties and responsibilities of the communities along with benefits if they accept IFAD-supported project in their village. Thus, the communities through their traditional institutions are facilitated to the practical approaches to “free prior
27 INMAAS (2013). Effectiveness of Land Bank Programme implemented under MLIPH in Meghalaya.
28 Draft Report on the Study on Land Bank initiative in Meghalaya Rural Development Society by FES (Foundation for Ecological
Security) for MRDS, Shillong (2013). 29 This section may be read with WP 2 on Gender and Poverty; the data is from WP 2.

Republic of India
Meghalaya: Livelihoods and Access to Market Project
Final project design report - Working papers
16
informed consent” while engaging with tribal communities. Gaining the confidence of the traditional institution goes a long way towards success and impacts of project interventions as experienced both by NERCORMP and MLIPH in Meghalaya and elsewhere among the tribal communities in North-East India.
LAMP will not be working in NERCORMP villages as this project does not end for another three years. Some villages who have participated in MLIPH may be included – the community mobilisation and livelihood work will provide a good launching pad for commercial enterprises. However no more than 30% of the villages in the selected LAMP clusters should be ex-MLIPH villages. This means up to about 400 out of 700 MLIPH villages could be included in LAMP. There are significant differences between LAMP and both MLIPH and NERCORMP. LAMP will not be forming self-help groups, adopting a slightly different approach, Integrated Village Cooperative Societies, for grass-root financial services. MILPH dod not have a natural resource management component (although NERCORMP did). Neither of the projects included interventions for market infrastructure, and only NERCORMP built some village roads. Lastly LAMP will support Enterprise Facilitation Centres and Knowledge Services, a new departure for IFAD, both in this state and in India. Nevertheless there are significant similarities between the three projects and it will be useful for LAMP to lean lessons from MLIPH and NERCORMP – including visits to their field activities.

Republic of India
Meghalaya: Livelihoods and Access to Market Project
Final project design report - Working papers
17
Annex I
Matrix of Khasi, Jaintia and Garo people on their changing attitudes on various rural development indicators (prepared with inputs from IFAD-
supported MLIPH30
and NERCORMP31
based on project experiences in working with rural people in Meghalaya)
Sl No Indicators Khasis Jaintias Garos
1 Typical size of a rural village (No of households)
40-60 HHs 60 – 500 50 - 60
2 Size of a typical household (No of members in a HH)
5-8 5 – 12 5 - 8
30 MLIPH or Meghalaya Livelihoods Improvement Project for the Himalayas (2005-2013) worked in East Khasi Hills and Ri Bhoi Districts with Khasis being the dominant
inhabitants; Jaintia Hills District (now divided into West Jaintia Hills and East Jaintia Hills districts) with Jaintias or Pnars being the dominant inhabitants; South Garo Hills and East Garo Hills (East Garo Hills district now divided into East Garo Hills and North Garo Hills districts) with the Garos as the dominant inhabitants. 31
NERCORMP or North Eastern Region Community Resource Management Project for Upland Areas (2000-2008 and 2010-2016) operates in remaining two districts of Meghalaya, namely, West Khasi Hills (now divided into West Khasi Hills and South West Khasi Hills districts) inhabited by the Khasis; and West Garo Hills (now divided into West Garo Hills and South West Garo Hills districts) inhabited by the Garos as the dominant community.
Republic of India
Meghalaya: Livelihoods and Access to Market Project
Final project design report - Working papers
18
Sl No Indicators Khasis Jaintias Garos
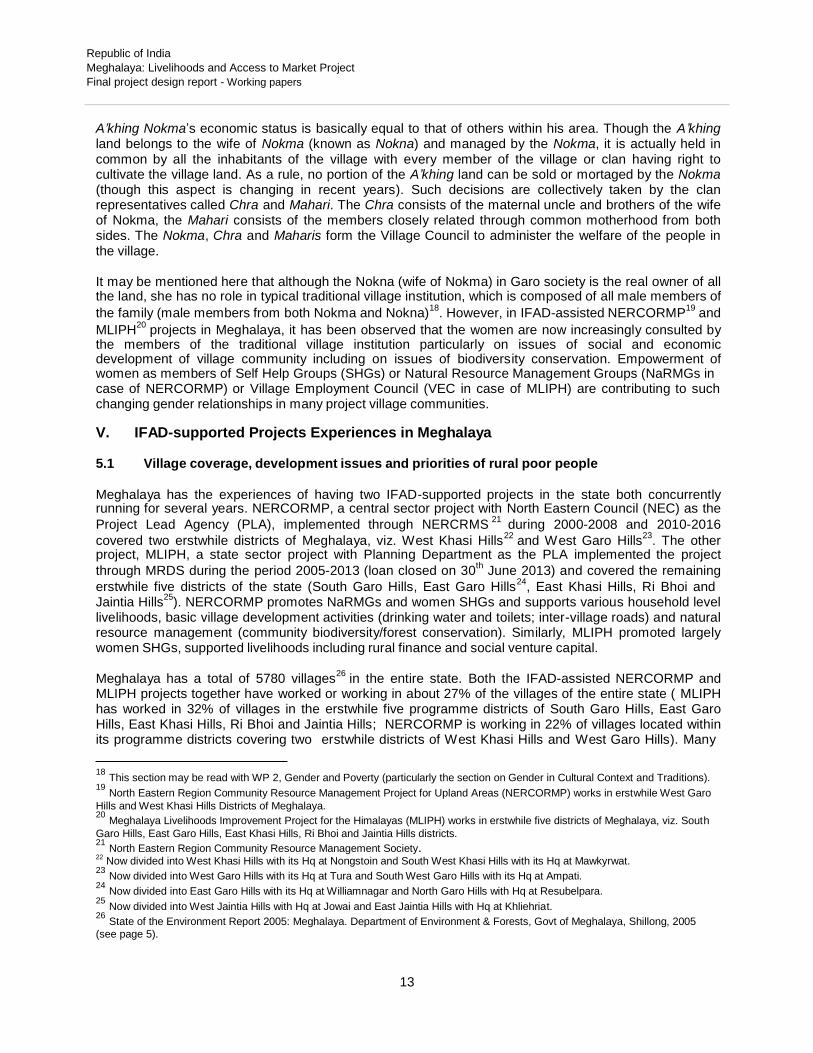
3 Attitudes towards doing business with banks
The community has the courage to do business with banks. In fact from the experience of the Project, they need to be taught on the ‘how’,
rather than ‘why’ they need to do business with banks. Now most of the members of the SHGs primarily those who know how to read and write are approaching the banks for loans etc. for business purposes on their own. Illiterate households remain quite reluctant to approach banks.
Jaintia (Pnar) people in general are willing to do any business with bank, however the attitude of most Bank Branch Managers do not favour banking with rural folk. One of the main reasons is due to remoteness of the villages. People still depend on
Money lenders for expansion of their business. From experience under MLIPH, the SHG members used their Group common fund (seed money/ revolving fund/ project fund) for lending to SHGs members.
People had improved access to KCC (Kishan Credit Card) loan from banks because the project facilitated by way of providing necessary linkages with respective Bank Branch Managers.
Varies from District & Blocks - In South Garo Hills, Business with bank is very poor. Most of the villagers do not have access to loan and are not qualified due to financial and security reason. (Poor investment capacity, lack of collateral security instruments, poor connectivity). Whereas in East Garo Hills as
compared to the earlier times, the people are coming more forward in doing business with the banks as more number of groups as well as individuals are opening the bank accounts. However, they need to improve financial discipline. Wherever the bank is people friendly, the loan repayment is about 60% to 70%.
Republic of India
Meghalaya: Livelihoods and Access to Market Project
Final project design report - Working papers
19
Sl No Indicators Khasis Jaintias Garos
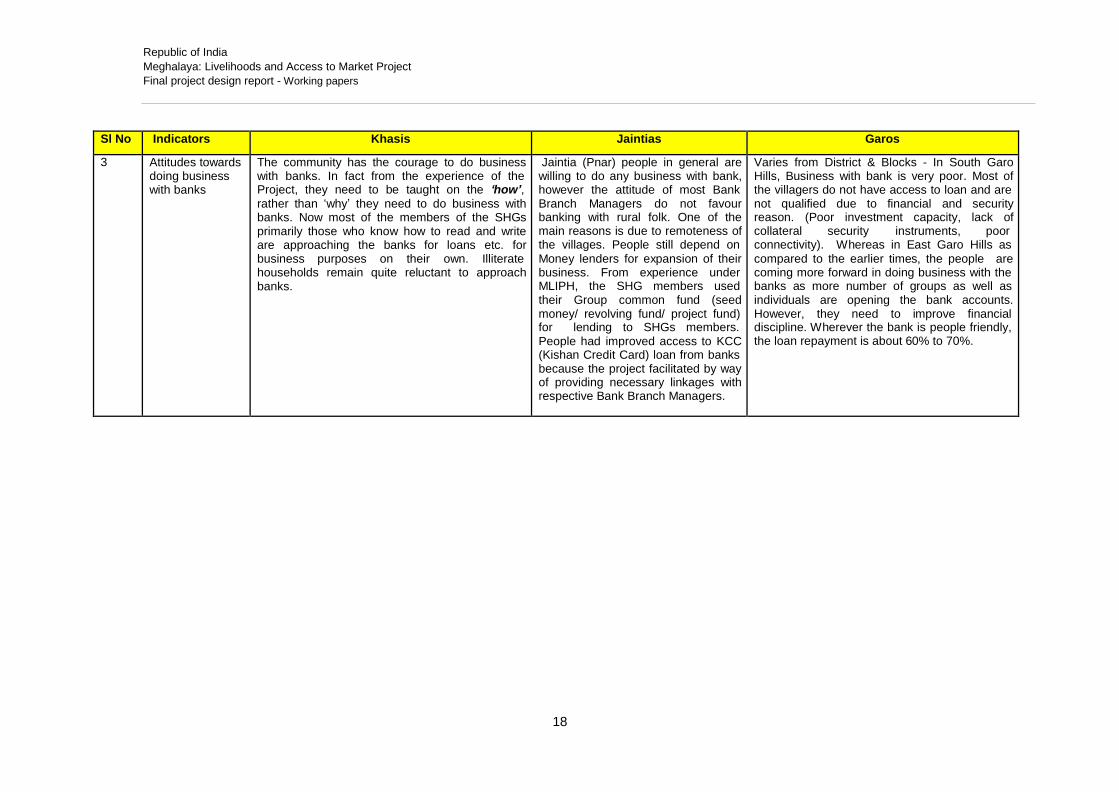
4 Attitudes towards maintenance of community assets (such as road, market place)
Markets are maintained by the Syiems of the particular ‘kingdom or state’ which collects taxes annually from the local vendors.
Legally, ADC has the overriding responsibility for regulations of markets within their jurisdiction.
Periodic cleaning of roads, footpaths and
drains within the immediate village/habitations are carried out under the aegis of the Dorbar
Shnong (Village Council). However, maintenance of community assets such as inter-village roads and market places by labour/financial contribution is generally weak (or depends on the activeness of each village Dorbar). However, from the Project experience, there has been improved trend of collective ownership of common assets. Most of the SHG members are taking ownership of their SHGs and the assets received from
Project, The traditional institutions actively involve the SHGs and VECs and in some cases, the VECs are taking up the leadership roles in managing their community forest and other common assets indicating improved collective responsibility of the communities. The Federations and the SHGs are involve now in planning for their villages up keep and the VECS are looking afresh into the community forest as a sense of responsibility, which are signs of their improved social capitals.
Left to themselves, the people generally have poor attitudes towards maintenance of common assets. People depend much on Govt to maintain the existing infrastructures. Experience showed that a number of Cooperative Markets, Storage
Godowns, SSA Schools are poorly maintained. Attitude for common assets management need to be improved even among SHGs, though the SHGs have started taking care of assets created by them through the
project. The change is gradual but towards positive attitude if adequately capacitated.
In interior areas, villagers undertake maintenance works of village commons such as approach roads, village wells, schools etc on voluntary basis. The issues are identified and decisions taken in Nokma meetings in a participatory manner. Level of cooperation and voluntarism is appreciably high among the
community members in most of the Garo villages.

Republic of India
Meghalaya: Livelihoods and Access to Market Project
Final project design report - Working papers
20
Sl No Indicators Khasis Jaintias Garos
5 Attitude to enterprise and entrepreneurship by individuals
Entrepreneurship is more common among the people in East and West Khasi Hills than the people in Ri Bhoi who generally lack enterprise attitude. Low aspirations to become entrepreneurs still remain important factors especially in the absence of organised markets for their farm products in remote villages. Trading activities
undertaken are seasonal and more for augmenting their income. The positive trend set by migrants from other districts and new generation entrepreneurs are changing the outlook among the communities. There is still lot of scope for improvement. Historically, the Khasi
and War people living closer to boarder areas are observed to be more enterprising and undertook trading with plain people such as Bangladesh borders .since pre- independence period.
Individual Jaintias or Pnar people are in general enterprising, particularly those living in proximity to boarder areas.
The Garo or A’chik people generally lack enterprising skill and have low attitudes towards entrepreneurship. Lack of opportunities and low competitive mindset as also difficult market access along with fluctuating prices for their farm produces are some of the key constraints.

Republic of India
Meghalaya: Livelihoods and Access to Market Project
Final project design report - Working papers
21
Sl No Indicators Khasis Jaintias Garos
6 Attitude to community enterprise and joint activities
Although the people in Khasi Hills live in community, when it comes to economic activities, they would rather prefer individual enterprises. The Project experience has been a mixed one. While they participate in SHGs formation, initiating and sustaining group activities have been rather challenging. Initiatives for facilitating collective
marketing too have been challenging to the project. Time required for building mutual trust among members for undertaking collective ventures has been one important factor. Most group activities initiated for economic enterprises even among women SHGs are yet to experience
sustainable success through collective marketing endeavours. Of course, there are few success models on group activities (preferably small group of 3-5) in piggery, poultry, grocery stores, etc.
The Jaintias are similar to the Khasis when it comes to attitudes towards community enterprise and joint activities. Wherever the initiatives have succeeded, the groups have been rather small, ranging from 3-5 individuals. Lack of exposure and the
need for facilitation by an organized body are some of the key issues.
Attitude towards community enterprise is also weak among the Garos. Only in some of the villages they jointly undertake community enterprises which are either facilitated by NGOs and/or District Industries. However, only about 20% of group activities in project areas have reported encouraging results.
7 Attitude to natural resource conservation and management
A positive community attitude towards natural resource conservation and management among the Khasis is historical. Sacred groves and village common reserves were common. Of late, economic priorities are however overtaking such historical attitudes. Increasing privatization of community forests; haphazard sand, stones and limestone mining; timber felling; charcoal making from trees without replanting are but few indication and reflection of eroding attitudes towards natural resource conservation and management. IFAD-supported projects have initiated community based biodiversity conservation with encouraging results in some villages but the scale of success remains limited in most cases due to limited community forest availability (most forests being private or clan).
Jaintia people historically had similar attitudes to natural resource conservation and management as those of the Khasis. To this date, there are pockets of sacred groves and community reserves. However, economic exploitation of natural resources are rampant in Jaintia Hills as reflected in large scale unorganized coal mining, limestone mining and even timber exploitation impacting local ground and surface water and other environmental degradation.
Community reserve forests are common in Garo Hills but not properly maintained without handholding support from the line department and/or NGOs. Some pockets of Garo Hills too is suffering from rampant unorganized coal mining leading to impacts on other natural resources such as available drinking water and pollution of streams and rivers from the silts flowing from coal mine wastes. NERCORMP has successfully initiated a number of community based biodiversity conservation in West Garo Hills with encouraging community responses.
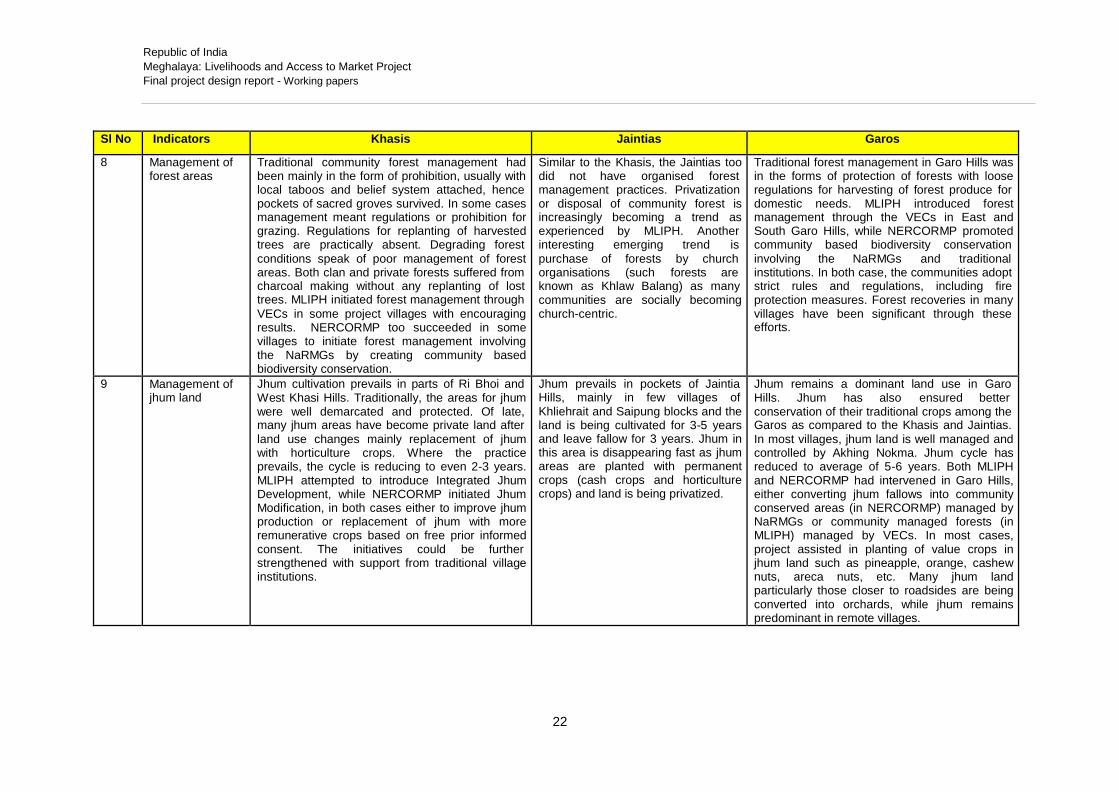
Republic of India
Meghalaya: Livelihoods and Access to Market Project
Final project design report - Working papers
22
Sl No Indicators Khasis Jaintias Garos
8 Management of forest areas
Traditional community forest management had been mainly in the form of prohibition, usually with local taboos and belief system attached, hence pockets of sacred groves survived. In some cases management meant regulations or prohibition for grazing. Regulations for replanting of harvested trees are practically absent. Degrading forest
conditions speak of poor management of forest areas. Both clan and private forests suffered from charcoal making without any replanting of lost trees. MLIPH initiated forest management through
VECs in some project villages with encouraging results. NERCORMP too succeeded in some villages to initiate forest management involving the NaRMGs by creating community based biodiversity conservation.
Similar to the Khasis, the Jaintias too did not have organised forest management practices. Privatization or disposal of community forest is increasingly becoming a trend as experienced by MLIPH. Another interesting emerging trend is
purchase of forests by church organisations (such forests are known as Khlaw Balang) as many communities are socially becoming church-centric.
Traditional forest management in Garo Hills was in the forms of protection of forests with loose regulations for harvesting of forest produce for domestic needs. MLIPH introduced forest management through the VECs in East and South Garo Hills, while NERCORMP promoted community based biodiversity conservation
involving the NaRMGs and traditional institutions. In both case, the communities adopt strict rules and regulations, including fire protection measures. Forest recoveries in many villages have been significant through these efforts.
9 Management of jhum land
Jhum cultivation prevails in parts of Ri Bhoi and West Khasi Hills. Traditionally, the areas for jhum were well demarcated and protected. Of late, many jhum areas have become private land after
land use changes mainly replacement of jhum with horticulture crops. Where the practice prevails, the cycle is reducing to even 2-3 years. MLIPH attempted to introduce Integrated Jhum Development, while NERCORMP initiated Jhum Modification, in both cases either to improve jhum production or replacement of jhum with more remunerative crops based on free prior informed consent. The initiatives could be further strengthened with support from traditional village institutions.
Jhum prevails in pockets of Jaintia Hills, mainly in few villages of
Khliehrait and Saipung blocks and the land is being cultivated for 3-5 years and leave fallow for 3 years. Jhum in this area is disappearing fast as jhum areas are planted with permanent crops (cash crops and horticulture crops) and land is being privatized.
Jhum remains a dominant land use in Garo Hills. Jhum has also ensured better conservation of their traditional crops among the Garos as compared to the Khasis and Jaintias.
In most villages, jhum land is well managed and controlled by Akhing Nokma. Jhum cycle has reduced to average of 5-6 years. Both MLIPH and NERCORMP had intervened in Garo Hills, either converting jhum fallows into community conserved areas (in NERCORMP) managed by NaRMGs or community managed forests (in MLIPH) managed by VECs. In most cases, project assisted in planting of value crops in jhum land such as pineapple, orange, cashew nuts, areca nuts, etc. Many jhum land particularly those closer to roadsides are being converted into orchards, while jhum remains predominant in remote villages.

Republic of India
Meghalaya: Livelihoods and Access to Market Project
Final project design report - Working papers
23
Sl No Indicators Khasis Jaintias Garos
10 Role of women in economic activities
Women play dominant role in economic activities. Women actively participate in all economic activities alongside men in farming activities (rice and vegetable cultivation) and livestock rearing (piggery and poultry); though cattle rearing are seen primarily as the domain of men. Women are also actively engaged in selling of produce,
though heavy head-loads are carried by men (to market for selling).
Jaintia women equally play dominant roles in economic activities as their Khasi counterparts. In fact, in terms of livelihood activities such as Petty trading activities, women are more involved as compared to men. Women are generally more
enterprising than the men. Formation of the women into SHGs and providing them with revolving funds by IFAD-funded projects further
strengthened women’s economic participation.
The Garo women play dominant roles in economic activities like the Khasis and Jaintias. In fact, in jhum cultivation and livestock rearing, the women play critical roles. Almost 80% of jhum related activities are done by the women. Knowledge on jhum crops and post-harvest management including seed storage among Garo women is much superior.
11 Voice of women in household decisions
Women generally play active role in household decisions particularly on matters of household requirements. In typical rural set up, project experience is that when it comes to home gardens and small livestock rearing, women take the lead. However, joint decisions and consultation between wife and husband are becoming more prominent, particularly after the organisation of the women into SHGs and their ability to access financial institutions.
Jaintia women also play similar active roles in household decisions as the Khasi women.
Voices of women in household decisions among
Garo women are almost similar to the Khasis and Jaintias, though men in general are observed to be head of the family in typical rural communities. However, Garo women are also increasingly asserting themselves through project interventions and SHGs formation.

Republic of India
Meghalaya: Livelihoods and Access to Market Project
Final project design report - Working papers
24
Sl No Indicators Khasis Jaintias Garos
12 Voice of women in community decisions
Traditionally, participation of women in local Durbars is a taboo in Khasi community. Village Durbars are places where important community decisions are taken. In recent years, there has been positive trends of participation of women in local governance at least in pockets of project villages where the Project has intervened. Women have become integral part of the VECs (in MLIPH)
and NaRMGs (in NERCORMP) decision making meetings. In villages where the Community leaders are also SHG members, more enlightened and exposed to gender perspectives, women are recognised as important stakeholder in community. They are not only allowed to participate in meetings but endorsed them to holding key office bearer post in the VEC and NaRMGs, and even in Village Durbar in some cases, though still insignificant.
Voice of Jaintia women in community decisions were insignificant, or even absent, as among the Khasis. Before the MLIPH project intervention women could not even participate in local community meeting, Women SHGs members are now becoming
VEC Secretaries and attend durbar shnong or village meetings. Project has examples of instances in which the SHGs have raised their voices against the Durbar Shnong in implementation and mis-management of MGNREGA, Meal Day Meals and PDS System.
Voice of Garo women in community decisions has been insignificant or negligible even though the Nokna (wife of Nokma) is the land owner as per customary practices. Most community decisions are taken by men. After series of training and awareness programme by the NGOs and line department, women’s
participation in community level and their confidence has improved significantly. Now, women are taking part in leadership position in different organization even in the rural areas since the MLIPH and NERCORMP interventions.
13 Interest in crop production and willingness to adopt new ideas / technologies
The farmers are open to adoption of new ideas and technologies in crop production as they realise that the traditional way of cultivation cannot meet their food security. For example project experiences of initiating SRI, multi cropping, improved vegetable cultivation, etc. have been well appreciated and adopted by the farmers. Initial handholding and capacity building would be required though.
Jaintia farmers are also open to new ideas and new technologies in crop production. Even among the traditional turmeric and ginger growing areas, the farmers are willing to adopt new crops and multi- cropping practices. There is the need for strengthening agri-horti extension services.
Remote rural farmers are slow to accepting new ideas and technologies as compared to farmers exposed to roads and market access. Adoption is easier when they see successful demonstrations. Initial hesitations are primarily due to lack of awareness and also if farmers have to invest in cash or kind. Social mobilization, awareness creation and capacity building activities are required for easy and successful adoption of new technologies.

Republic of India
Meghalaya: Livelihoods and Access to Market Project
Final project design report - Working papers
25
Sl No Indicators Khasis Jaintias Garos
14 Interest in horticultural production and willingness to adopt new ideas.
Khasi farmers are traditionally good horticulturists. Mandarin organges in the mid-lower elevation of Cherrapunjee, pineapple and bananas in Ri Bhoi are famous. Similarly, expansion of vegetable cultivation in the Shillong plateau area and parts of West Khasi Hills has been unprecedented. However, access to market and availability of
initial investment support would be the driving force for the farmers to take interest in horticultural production and to adopt new ideas. Both MLIPH and NERCORMP experienced positive interest and willingness among the farmers for horticultural crops, dovetailed with pro-
activeness of the line dept in providing technical guidance and extension services.
Very much, now people have swicht from paddy cultivation to vegetable cultivation as they see more profit[ Like tomatoes, Potato and green leefy vegetables]
Generally, farmers have now seen the potential of their livelihood opprtunities in horticulture production particularly in familiar horti crops wherein they have experienced improved productivity, yield and income by adopting new ideas/improved practices. There is a trend for accepting new technologies/farm tools and equipments at affordable cost.
15 Interest in livestock production and willingness to adopt new ideas
This is an area where the farmers have been very open to adopt new exotic breed which are fast growing in comparison to the local variety; preferred varieties as per project experiences are in piggery and poultry (KUROILER). Goat rearing
is also picking up in villages bordering with Assam.
Livestock rearing is also traditional inherent rural economy among Jaintia people. They are willing to adopt new ideas in livestock production, even as enterprises, with appropriate forward and backward linkages for technical,
finance, market, and capacity building support.
Livelihood rearing along with agricultural activities are typical rural livelihoods system of the Garos. The scale of livestock taken as IGAs through MLIPH and NERCORMP indicate people’s interest in the livestock and willingness to adopt new ideas (such as Bokashi method of
pig rearing).
16 Education level of rural people
40-50% adults/parents in programme villages are illiterate (though many of them can recognise alphabets in local language); among the young population, 70% are those who have studied between Class III-VIII; 20% class IX-X ; and 10% metric and above. But most of those who have studied Class X above do not always reside in the village.
Education level of rural people in Jaintia Hills is more or less similar to those of Khasi Hills.
Adult literacy rate is much lower in Garo Hills in project areas.
16 Migration away from the village
Seasonal migration for seeking wage earning opportunities particularly farm labours, wages, coal mining etc are observed in most villages. But those who migrate for education mostly do not return to their native villages.
Migration to coal mining area is high due to high wages and employment opportunity.
In some village, which are proximity to the mining area, people go out to work in mining area during the season

Republic of India
Meghalaya: Livelihoods and Access to Market Project
Final project design report - Working papers
26
Sl No Indicators Khasis Jaintias Garos
18 Willingness to allow individuals to have access to land for permanent crops.
In Ri Bhoi district, about 60% of the farmers in MLIPH project areas have land of their own for cultivation where they grow permanent crops. There is an increasing trend of privatization of community land in Ri Bhoi. Even in the so called community land holding system like in Jirang, most of the famers who initially took land from the
community, have now become the owners of those lands. In pockets of West Khasi Hills where NERCORMP is working, clan forests dominate and hence there are landless households who can access land annual rent or longer lease for long- gestation crops. In East Khasi Hills and Ri Bhoi districts, MLIPH has experimented with Land
Bank to provide opportunities for access to cultivable land by the poorest households.
In cases where village durbar posses large community land they have no restriction to give land to individual for cultivating permanent crops. However, not all villages have community land. Landless families have to depend on lease from local landlords.
As almost in every village, individual villagers are having a plot of land in which they do the permanent crops plantation to support livelihood. With customary regulation by the Akhing Nokma, generally there are no restrictions for access to land for permanent crops. In MLIPH villages, the VECs take up
such matter and every individual is allowed to cultivate / plant crops according to their capacity and interest on particular crop or crops.
19 Amount of land (average area in ha) under community control
Average range is about 200 ha to more than 1000 ha (few villages over 5000 ha) in both MLIPH and NERCORMP project villages; there are also few villages only with clan forests.
Limited availability of community land in most project villages; there are non-project villages with large community land, mainly sacred groves and protected forests.
The Nokma represents the community and he is the custodian of all land. Most villages have sufficient community land or jhum land, average being 300 – over 5000 ha.
20 Average percentage of land to total
village land under common property or community control
About 20% of land is owned by the community in
Ri Bhoi district; most land in East and West Khasi Hills are private and/or clan land; very few have community land (eg. Sacred grove at Mawphlang). Privatization in Ri Bhoi district more common.
About15% - 20% of land under
Community control in Jaintia Hills; many areas under private mining.
All land under community control, but Nokma is the literal custodian of all the land. Privatization is taking place fairly rapidly.

Republic of India
Meghalaya: Livelihoods and Access to Market Project
Final project design report - Working papers
27
Annex II Map showing boundaries of new districts32
32 Districts were re-organised in 2012, with the former 7 districts becoming 11. Most data is only available for “old” districts.

Republic of India
Meghalaya: Livelihoods and Access to Market Project
Final project design report - Working papers
28
Map showing old districts

Republic of India
Meghalaya: Livelihoods and Access to Market Project
Final project design report - Working papers
29
Map of showing blocks (sub-districts)


Republic of India
Meghalaya: Livelihoods and Access to Market Project
Final project design report - Working papers
31
Working Paper 2: Poverty, Gender and Targeting
1. Introduction
1.1 Overview
The picturesque landscapes, lush forests and rich biodiversity of Meghalaya camouflage pervasive rural poverty and deprivation. A household survey conducted by the State Government in 2002 found that 48.9% of the households in Meghalaya live Below Poverty Line (BPL) as against the all India average of 27.80% in 2004-2005
1. However, unlike other states of India, this deprivation does not affect women disproportionately
largely because approx 85% of the nearly 3 million population of Meghalaya belong to three dominant tribes - Khasis, Jaintias and Garos - who follow matrilineal traditions. Only 13-14% of the state’s population is non- tribal. In terms of Human Development Index (HDI), Meghalaya rates amongst the lowest in the country, placed 26
th out of 35 states and Union territories, but in terms of Gender Development Index (GDI) it is among
the top in India.2
Whereas there are comparatively fewer gender based differences in the state, there is a relatively bigger gap between the urban and rural population with a disproportionately higher level of rural poverty.
Close to 80% of the state’s population lives in the rural areas, relying heavily on agriculture and allied services for its living, largely using traditional practices. For example, in the Garo hills more than 50% of the population continue to depend on subsistence shifting cultivation. According to the Planning Commission there has hardly been any decline in rural poverty in Meghalaya in the last two decades. In fact, recent figures of Planning Commission, Govt of India showed that poverty in Meghalaya has increased from 16.1% in 2004- 2005 to 17.1% in 2009-2010
3. In terms of population, the state has the second highest decadal growth rate in
the country, which further exacerbates the poverty situation.
1.2 Purpose and scope of the Working Paper
The Working Paper attempts to understand the gender and poverty scenario among the rural people in Meghalaya, who form the key target population in LAMP. Appreciating the relatively better social position of women among the three major tribal communities of Meghalaya, the issue is not so much about whether women are poorer than men, but how different dimensions of poverty affect the rural poor both women and men. Income poverty, consumption poverty and human poverty are some of the key areas of concern affecting the rural poor, particularly poorer households and women in disadvantaged situations. IFAD’s experience in the state and elsewhere in India has demonstrated the value of targeting women in poverty reduction programme that translate not only in the well-being of the women but also their family/household and the society at large. The Working Paper broadly encompasses various issues relating to poverty and gender in Meghalaya. The sections are divided into the following thematic areas: (a) economic scenario of the state; (b) extent of poverty and deprivation; (c) factors contributing to poverty and deprivation; (d) gender issues; (e) gender and poverty analysis in relation to key livelihoods interventions; (f) experiences/lessons learned from IFAD-supported projects in the state; (g) targeting groups and targeting strategy; and (h) gender mainstreaming in LAMP.
1 Meghalaya State Development Report 2008-2009. Planning Department, Govt. of Meghalaya, Shillong (2009)
2 Meghalaya Human Development Report 2008.
3 Poverty Estimates for NER for 2004-2005 & 2009-2010 (on Tendulkar Methodology) based on the Press Note of Planning Commission
on Poverty Estimates 2009-2010 (dated 19th
March 2012).

Republic of India
Meghalaya: Livelihoods and Access to Market Project
Final project design report - Working papers
32
2. The Economy of Meghalaya
Meghalaya is a small state accounting for approx. 0.25% of India’s population; its economy is approx 0.2% that of the country’s overall economy. The economy follows a pattern similar to the rest of the country with over half of the total Gross State Domestic Product (GSDP) being contributed by the service sector, almost one third by industry and the rest (around one-sixth) from agriculture and related activities (fishing, forestry). Within the industrial sector, mining and quarrying make a much larger contribution than manufacturing. However, environmental consequences of mining and quarrying in some pockets of the state (notably in Jaintia Hills due to rat-hole coal mining) are increasing areas of concern. Serious lack of safe drinking water and health impacts are reported from many villages of Jaintia Hills consequent to unplanned and unregulated coal mining. The structure of the economy is summarised in Table 1.
Table 1: Contribution to total GSDP
Meghalaya India
2004-05 2011-12 2004-05 2011-12
Agriculture and allied 23.2% 16.1% 19.0% 14.1%
agriculture 16.6% 12.0% 16.0% 12.0%
Industry 26.1% 30.1% 27.9% 27.5%
mining & quarrying 9.3% 6.5% 2.9% 2.1%
manufacturing 2.7% 8.0% 15.3% 15.7%
Services 50.6% 53.8% 53.0% 58.4%
total 100.0% 100.0% 100.0% 100.0% At 2004-5 constant prices. Source: Planning Commission
Over the seven years from 2004-5 to 2011-2 the overall rate of economic growth in Meghalaya was just under 8% per annum, about 0.5% points less than India as a whole. The rate of growth of both the agricultural and service sectors has been below that of India, but industry, especially manufacturing has grown faster, albeit from a very low base. The rate of growth in GSDP per head for Meghalaya has been 1.5% points less than India (5.25% compared to 6.71%), due to the rapid increase in population in the State - a 27.5% increase between 2001 and 2011 compared with 17% for India as a whole. Increasing population means the economic pie has to be shared between more people, so while GSDP per head in Meghalaya was 96% that of India in 2004-5, in 2011-12 it was down to only 87%.
Table 2: Growth of GSDP
Meghalaya (Rs.cr.) India (Rs.cr.) 2004-05 2011-12 Annual
growth 2004-05 2011-12 Annual
growth
Agriculture and allied 1,525 1,802 2.41% 565,426 739,495 3.91%
agriculture 1,088 1,343 3.05% 476,634 630,540 4.08%
Industry 1,715 3,379 10.17% 829,783 1,442,498 8.22%
mining & quarrying 613 725 2.43% 85,028 108,249 3.51%
manufacturing 179 898 25.91% 453,225 823,023 8.90%
Services 3,320 6,034 8.91% 1,576,255 3,061,589 9.95%
Total GDSP Rs.cr. 6,560 11,215 7.96% 2,971,464 5,243,582 8.45%
population ('000) 2,480 2,964 2.58% 1,080,530 1,210,193 1.63%
GSDP/head Rs/year 26,448 37,837 5.25% 27,500 43,328 6.71% At 2004-5 constant prices. Source: Planning Commission

Republic of India
Meghalaya: Livelihoods and Access to Market Project
Final project design report - Working papers
33
Meghalaya India
rural urban Total Rural urban Total
Poverty line (PL) Rs/month1 687 990 673 860
Percent below PL 2004-52 14.0 24.7 16.1 42.0 25.5 37.2
Percent below PL 2009-102 15.3 24.1 17.1 33.8 20.9 29.8
Change 1.3 -0.6 1.0 -8.2 -4.6 -7.4
3. Poverty and Deprivation in Meghalaya
Whereas the proportion of poor people in India has fallen over the last five year, there has been a slight increase in Meghalaya. With the rapid increase in population, this means there has been a significant increase in the absolute number of poor people.
The BPL census, conducted by the Department of Rural Development in 2002, classified 48.7% of rural households as being "Below Poverty Line" (BPL) households. This compares with 52.5% for India as a whole. However the accuracy of such census data is not of the standard of the sample surveys used in the
Planning Commission estimates in Table 34.
Table 3: Population below the poverty line
1 for 2009-10,
2calculated as per the Tendulkar method Source: Planning Commission
A key factor in holding back poverty reduction in Meghalaya has been the high rate of population growth. The increase between 2001 and 2011 (Table 4) has been 10 percentage points higher than India as a whole, with the rate of increase in rural population being more than double (27% compared to 12%).
Table 4: Population growth rate
Meghalaya India
rural urban total rural urban Total
population growth 2001 to 2011 27.0% 31.0% 27.8% 12.2% 31.8% 17.6% Source: Census 2001 and 2011
The high rate of population is linked to other demographic indicators, such as the birth rate and infant mortality rate, both of which are significantly higher than for India as a whole (Table 5).
Table 5: Population growth indicators
2009 2010 2011
Crude birth rate Meghalaya 24.4 24.5 24.1
India 17.2 16.8 16.3
Crude death rate Meghalaya 8.1 7.9 7.8
India 6.2 6.0 6.2
Natural increase (CBR less CDR)
Meghalaya 16.3 16.6 16.3
India 11.0 10.7 10.1
Infant Mortality Rate Meghalaya 59 55 52
India 33 31 32
4
For a critique of the methodology, see
http://www.agrarianstudies.org/UserFiles/File/Usami_Biplab_Ramachandran_Reliability_of_BPL_Census1.pdf

Republic of India
Meghalaya: Livelihoods and Access to Market Project
Final project design report - Working papers
34
District (old) NECCAP index BPL
2002
GSDP per
head1
West Garo Hills 4 - 5 53.7% 17,566
East Garo Hills 2 - 3 55.9% 15,365
South Garo Hills 4 - 5 45.3% 28,749
West Khasi Hills 2 - 3 47.7% 12.592
Ri-Bhoi 4 - 5 49.9% 19,866
East Khasi Hills 0 - 1 46.7% 31,202
Jaintia 3 - 4 39.5% 26,015
Indicators of poverty by district are compared in Table 6. The NECCAP (North East Climate Change Action Plan) index is based on a number of criteria (see section on climate change in the Working Paper on Natural Resource Management). All these indicators agree that poverty levels are lower in East Khasi Hills (where the state's only city is located), and higher in West Garo Hills. However the NECCAP index also shows South Garo Hills and Ri Bhoi as being relatively poor, which is not reflected in their average GDSP, while South Garo Hills has relatively fewer BPL households.
Table 6: Poverty by District
1GSDP for 2007-8 at 1999-2000 prices
Sources: NECCAP, 2012, State Development Report 2008
In a study of issues regarding women's drudgery5, 76% women from the East Khasi Hills and 82% from
Jaintia Hills reported an average monthly family income of Rs. 3001-9000 (different sources of income are given in Table 7). In contrast, no women from East Garo Hills, South Garo Hills and Ri Bhjoi districts reported an average monthly family income over Rs. 1,000 per month. Possible reasons for disparity in incomes across districts include:
The areas of East Khasi Hills and the Jaintia Hills are leading regions in producing cash crops like turmeric, bay leaves, ginger, etc.
East Khasi Hills also boasts of the highest literacy rate among all the districts of Meghalaya, with comparatively small families (Census 2011). In addition, because of easy access to the state capital, Shillong, the people are more exposed and hence more open to new and effective ideas, technologies and techniques brought to them from outside.
Table 7. District-wise main sources of income (percentage of respondents)
Activity East Khasi Jaintia Hills Ri Bhoi South Garo West Garo Total Farms in own land 21.2 69.9 56.0 71.4 53.7 52.0 Aadhi
6 35.0 18.1 10.4 6.0 8.3 15.6 Labour 10.9 19.3 18.0 2.4 6.4 11.1 Fishing 0.4 0.0 0.4 3.2 3.8 1.7 Livestock 12.8 0.4 7.2 10.5 22.4 11.3 Salaried activity 18.9 0.4 6.4 6.5 4.8 7.6 Others 0.7 0.8 1.6 0.0 0.6 0.8 Total 100.0 100.0 100.0 110.0 100.0 100.0 (IFC Survey)
5 Assessing Effectiveness of the Interventions taken to Reduce Women Drudgery under MLIPH, 2013. Study covered 75 villages in five
districts (Jaintia Hills, East Khasi Hills, Ri Bhoi, East Garo Hills and South Garo Hills). 6
Aadhi is farming community land

Republic of India
Meghalaya: Livelihoods and Access to Market Project
Final project design report - Working papers
35
In comparison, many of the people of the South Garo Hills and East Garo Hills are still known to practice subsistence farming, and were comparatively less ready to accept new technologies and ideas. However, things are slowly changing, as the women interviewed reported being engaged, many for the first time in their lives, in small enterprises like running grocery stores, piggeries, etc.
4. Employment
Data for Meghalaya from the 2001 and 2011 censuses shows the total number of people involved in agriculture, both as main and marginal workers has increased by about 54,000 to 693,000 (Table 8). However, as a proportion of total workers, the proportion in agriculture has declined significantly from 66% to 58%. In India as a whole, a slightly smaller proportion of workers are in agriculture (55%), but the proportion has not dropped as dramatically as in Meghalaya (in 2001 the 58% of workers were the sector for India as a whole). In Meghalaya there have been increases for both the number of cultivators (i.e. farmers) and labourers (6% for farmers and 16% for labourers).
Table 8: Employment
2001 census 2011 census Change 2001 to
2011
Main Workers
Persons
% of total
persons
% of total
(a) Cultivators
380,321
39%
411,270
35%
8%
(b) Agricultural labourers
94,938
10%
114,642
10%
21%
(c) Workers in household industries
13,917
1%
11,969
1%
-14%
(d) Other workers
267,835
28%
383,694
32%
43%
Marginal Workers
(a) Cultivators
86,689
9%
83,405
7%
-4%
(b) Agricultural labourers
76,756
8%
83,722
7%
9%
(c) Workers in household industries
7,308
1%
8,519
1%
17%
(d) Other workers
42,382
4%
88,398
7%
109%
Total Workers
970,146
100%
1,185,619
100%
22%
Non-Workers
1,348,676
1,781,270
32%
Main and marginal workers
(a) Cultivators
467,010
48%
494,675
42%
6%
(b) Agricultural labourers
171,694
18%
198,364
17%
16%
All agricultural workers
638,704
66%
693,039
58%
9%
(c) Workers in household industries
21,225
2%
20,488
2%
-3%
(d) Other workers
310,217
32%
472,092
40%
52%
Total Workers
970,146
100%
1,185,619
100%
22%
This is in contrast for all India, where the number of farmers fallen by 7% while the number of labourers has increased by 35%, with the overall numbers employed in the sector increased by 12%, compared with 9% in Meghalaya. The number of farm labourers in India now exceeds the number of farmers, in contrast to Meghalaya where there are almost 2.5 times more farmers than labourers. Farming in Meghalaya remains

Republic of India
Meghalaya: Livelihoods and Access to Market Project
Final project design report - Working papers
36
very much a family business, with relatively few people being employed. Moreover growth in employment in the sector was greater for "main workers" (working for over 6 months per year) than for "marginal workers" (working under 6 months).
5. Factors contributing to Poverty and Deprivation
The Meghalaya Development Report 2008-20097
identified the following broad reasons for the prevalence of poverty in Meghalaya:
(i) The operational land holding in Meghalaya is pre-dominantly small and marginal farmers with an average area of less than 2 ha. Stagnation of agricultural production, soil erosion and lack of new economic opportunities are deterrent factors that cause rural poor farmer in the state to languish in poverty.
(ii) Rural areas in Meghalaya are characterized by limited opportunities, low level of skill development, poor infrastructure, etc. There are also wide rural-urban disparities in terms of level of human development opportunities as viewed from access to amenities and other social services.
(iii) Like most states in NE India, some of the major factors contributing to persistent poverty in Meghalaya appears to be ignorance, inadequate core infrastructure, inadequate market openings, over dependence on agriculture, lack of skills, etc., which makes them apprehensive to face the challenges that emerge in the new economy.
Distance and poor connectivity deprive the communities of access to proper information, services and information.
In the BPL Census 2002 in Meghalaya, 13 indicators were used to measure poverty incidence. Each indicator was measured on a scale of 0-4, which has been defined for each situation for each indicator
8. The indicators
used were (1) Size group of operational holding of land; (2) Type of house; (3) Average availability of normal wear clothing (per person in pieces); (4) Food security; (5) Sanitation; (6) Literacy status of the highest literate adult; (7) Status of the household in labour force; (8) Means of livelihoods; (9) Status of children (5-14) (any child); (10) Type of indebtedness; (11) Reason for migration from household; (12) Preference for assistance; and (13) Ownership of consumer durables. Using these indicators in 2002, 48.9% of the households in the state were assessed as being Below Poverty Line (BPL). Field evidence from IFAD-funded projects suggest the overall poverty scenario may have changed marginally in the past decade but recent figures of Planning Commission, Govt of India showed that poverty in Meghalaya has increased from 16.1% in 2004-2005 to 17.1% in 2009-2010
9.
Figure 1 shows some of the main drivers of poverty in the state, and in particular how environmental factors and the high rate of population growth contribute to the lack of progress in reducing poverty rates. This diagram shows the effects and influences of different factors - starting with high population growth, the high rainfall and hilly environment. These in turn impact on crop production and methods and traditional attitudes, with the combination of population pressure and lack of growth in farm productivity limiting the rate of poverty reduction.
7 Meghalaya State Development Report 2008-2009. Planning Department, Govt of Meghalaya, Shillong (2009)
8 Meghalaya Human Development Report 2008. Govt of Meghalaya, Shillong (2009), page 109 for details.
9 Poverty Estimates for NER for 2004-2005 & 2009-2010 (on Tendulkar Methodology) based on the Press Note of Planning Commission
on Poverty Estimates 2009-2010 (dated 19th
March 2012).

Republic of India
Meghalaya: Livelihoods and Access to Market Project
Final project design report - Working papers
37
Figure 1: Drivers of poverty in Meghalaya
High rate of population growth Hilly topography High and intense rainfall
Low level of
education
Poor communications
Historical isolation
Leached out, infertile soils
Poorly developed
non-farm sector
Few jobs and high
rate of unemployment
Lack of access to markets
Traditional
institutions
Tribal settlement
Relatively recent adoption of settled agriculture
Shifting agriculture
Growing number of farm households
Pressure on land
resources
Social cohesion limits individual aspirations.
Informal land
tenure
Reduced length of
jhum fallow
Little or no use of
FYM to improve
Declining soil
fertility
Little use of cattle for draught power
High labour inputs for land cultivation
Entrepreneurship discouraged and low risk taking ability
Lack of
incentives to
invest in
farming
Low and
declining yields
Lack of labour for other farm operations
Low income per
day worked
Low income
from faming
Overall poverty rate
is not decreasing

Republic of India
Meghalaya: Livelihoods and Access to Market Project
Final project design report - Working papers
38
6. Gender Issues in Meghalaya
Gender disparity, particularly subjugation of women in certain spheres of life, is very common in most patriarchal societies
10. In this context, Meghalaya represents a contrast with its three dominant communities,
viz. Khasis, Jaintias and Garos being matrilineal and matrifocal society where descent and inheritance are traced through the women. The women have the right over their children and over property. Due to this system, women in Meghalaya are considered to be better placed and to have more autonomy than their counterparts in the rest of the country. Women in Meghalaya are free from many of the social restraints of the larger Indian society
11.
6.1 Gender in the Cultural Context and Traditions12
Examining the gender roles in the matrilineal societies in Meghalaya one cannot ignore the complementary nature of the structured roles. The traditional gender roles have been construed in a way that men and women could not function in isolation.
Women in the matrilineal society are considered better placed with more autonomy and status as they have rights over their children and property. However, the rights of, say Khasi women, are balanced off by the traditionally sanctioned roles of men in the society. A Khasi man has two major roles to play, viz., U Kni (maternal uncle) and U Kpa (father) in his family of orientation and procreation respectively. He owes obligations and duties towards his mother and sisters managing the family’s property, also as the priest who presides over the family rituals. As the maternal uncle, he has an important role in the upbringing and welfare of the sister’s children too, besides his socio-economic and socio-religious duties to his lineage members. As a husband and father, he is the provider and protector to his wife and children. The conflicting roles between that of a maternal uncle and husband were minimized in the traditional Pnar (Jaintia) society which practiced the ‘visiting husband system’ in the past. Among the Garo, the prescriptive cross-cousin marriage (Father’s sister’s son) for the heiress, and the management of the corporate property by the Nokma (heiress’s husband) guarded the ambivalent roles. The father is the provider among the Khasi and Garo families with the exception of the Pnar in the past.
In the agrarian society, the clan or lineage serves as an important economic unit. Land as an important asset is within the control of the clan council, headed by the eldest maternal uncle. The inheritress/custodian of the clan-landed-property varies from clan to clan. Among majority of Khasi-Pnar it is the youngest daughter who inherits it, whereas among some sections of the War Khasi it is the eldest daughter and among the Garo, property of the machong passes to any chosen daughter. While the manager is the eldest maternal uncle among the Khasi-Pnar, the Nokma (husband of the inheritress) among the Garos has full control and manages the property inherited by his wife. Neither the inheritress nor the manager has the power and authority over the use and disposal of clan property, because other members of the lineage have a say. The manager can, however, influence any decision as the adviser of the lineage in general. In the past when clan-land was abundant and people depended on it for their livelihood, the role of the maternal uncle in the clan council was significant. The council could distribute or allocate land whether for agricultural purposes, housing or otherwise.
Among the Garos, sons do not inherit property under any circumstances whatsoever. The ancestral property passes from mother to daughter as stated above. The inheritress of the lineage-property by dint of her privileges has more responsibilities and obligation to her family members.The house of the youngest daughter (inherited as the ancestral/parental home) among the Khasi is looked upon by the members of the matri-kin as a refuge in the midst of any contingency and distress. Thus, on her rests the obligation of looking after the parents, house the orphans of her sisters and shelter her divorced/separated brother/ sister.
10
Mishra, S.K. (2010). Analysis of gender disparity in Meghalaya by various types of Composite Indices. ds pac e. nehu. ac. in s pui bits t ream 1 1 1 N-id 4 . pdf accessed on 19.6.2013. 11
Meghalaya Human Development Report 2008. Govt of Meghalaya, Shillong (2009). 12
Extracts from Gender Issues in Meghalaya by Veronica Pala (2013), a study conducted for LAMP.

Republic of India
Meghalaya: Livelihoods and Access to Market Project
Final project design report - Working papers
39
The roles on the youngest daughter and the eldest maternal uncle indicated the complementary nature of the position of men and women in the family and lineage - the basic units of the Khasi social-structure. If the younger brothers have no authority the other elder sisters have no property. In Garo societies the roles of Nokna and Nokma complement each other. The functions of one depend on the reciprocal roles and duties of the other, but as clan members every individual has rights and duties. The cementing bond in the social structure of both Garo and Khasi-Pnar largely depends on the ‘key-roles’ assigned to the ‘key-figures’ in the society. The structural-gender roles at present continue, but need to be redefined and reformulated with the changing times.
Women get the better share as the custodian of the property and the keeper of the home and hearth. However, it is important to note that the relatively high status of women in Meghalaya also entails higher responsibilities. Further, a woman can be stripped of the right of inheritance in the event of her failure to conform to the code of conduct accepted by the society or to fulfil her responsibilities to her natal home. Women have no right to sell the property without the knowledge of the male member - her uncle, her brother or her father. For women coming from poor or landless families these property rights are meaningless. However, their responsibilities are no less than their landed counterparts.
Society’s belief-system, economy, modernization and contact with other cultures is leading to change in the man’s position. For example, the Christian doctrine that a woman should submit to her husband, has fortified the status of man as a husband and father. The concept of the father as the bread earner of the family is relatively new in the state. In the traditional Pnar society, men do not contribute economically to their family of procreation, they earn for the mother’s sister’s family. In the past, a Khasi man who married an heiress lived in the shadow of the maternal uncle and other members of his wife’s family, since he resided uxorilocally. A man who married a non-heiress had a comparatively stable socio-economic position in his family of procreation, residing in a nuclear family. Modernization and urbanization, the emergence of new employment opportunities (eg. in white collared jobs), trade and commerce and a growing cash economy slowly reduce the dependency of the community on agriculture. In the context of Meghalaya this would not only improve the income of families but also change the dynamics of the man-woman relationship as traditionally men cultivated land owned by the wife. In the changing economic scenario whether a man marries an heiress or not his position is reinforced, especially when the family depends on his income for meeting the needs of the family.
6.2 Socio-economic situation of women
Women in Meghalaya are by and large in a much better socio-economic situation than women in the other parts of India. In terms of sex ratio Meghalaya with a sex ratio of 986 is far ahead of the national average of 940 (2011 census), with a marked increase since 2001. Similarly literacy rates among women saw a dramatic
rise in the last decade rising from 50.4% (2001) to 71.8% (2011 census)13
. A comparative study of the GDI and HDI across all states in India shows that gender imbalance was among the lowest in Meghalaya (0.005) as compared to the national average (0.015). A study by the North Western Hill University (NEHU)
14 using a
set of composite indicators related to socio-economic inclusion, shows that overall, in the East Khasi Hills and the West Garo Hills districts the women are in a better position than the men. In the East Garo Hills, with a few exceptions, women are better off in general. In the other areas they are more or less at par with men with some exceptions.
Despite the fact that women are in a better situation in the state some issues need attention. For example, from being the number 1 in the country in terms of HDI-GDI rating in 1996, Meghalaya slipped to 6
th position
in 200615
. In terms of Maternal and Infant Mortality rates the state is lagging behind its neighbours in the North East. Whereas Meghalaya has an IMR of 59, IMR in neighbouring Manipur is only 16
16 and even the national
13
http://www.census2011.co.in/census/state/meghalaya.html 14 S.K. Mishra. Analysis of Gender Disparity in Meghalaya by Various Types of Composite Indices. 2007, NEHU. http://ssrn.com/abstract=994669 15 http://wcd.nic.in/publication/GDIGEReport/Part2.pdf 16
http://mohfw.nic.in/WriteReadData/l892s/972971120FW%20Statistics%202011%20Revised%2031%2010%2011.pdf

Republic of India
Meghalaya: Livelihoods and Access to Market Project
Final project design report - Working papers
40
average which cannot be considered good is still lower than Meghalaya at 50 (2009 data). Similarly the Maternal Mortality Ratio in the state at 238 is higher than the national average of 212. This is resulting largely from poor access to health information and services, malnutrition and general lack of awareness.
The political space continues to elude women. A woman can never be a village head/Nokma because a village Nokma in Garo Hills has certain functions, which cannot be performed by women. Some Dorbars have (token) female representation, but it is considered “taboo” for a woman to aspire to be head of a Dorbar even if she is fully capable. Women have very limited involvement in decision making at the community level. The matrilineal system also tends to lull them into a comfort zone. So, even though their situation is much better than in other states, this may change over a period of time if those bottlenecks are not removed which prevent them from realizing their full potential.
6.3 Women-headed households
The state presents an interesting dichotomy with regards to women headed households. In the past two decades, whereas the proportion of women-headed households has increased in the country, it has shown a notable decline in Meghalaya, reduced to half in most cases (see Table 9 below). This decline varies across the three major tribes, with the lowest proportion of women headed households being in Garo hills and the highest in Jaintia hills. Women are often household heads, either in their own right as the main breadwinner, or because the male breadwinner is working elsewhere or has died, or for some other economic or cultural reason. This decline in women headed households in the state is even more poignant when we see that the state has the highest rate of divorce and separation, almost four and a half times the national average.
Table 9: Proportion of Female headed households in Rural Tribal Households of Meghalaya
Tribe
No. of households surveyed
Percentage of female headed households
1993- 94
2009- 10
1993- 94
2009-10
Garo 347 314 13.12 5.83 Khasi 444 373 28.93 11.88 Jaintia 145 126 42.71 26.65 Meghalaya 936 813 24.49 11.41 All India 9084 9622 8.04 11.57
Note: Only ST households are taken into consideration in case of Meghalaya. The figures for All India pertain to all rural households irrespective of caste/tribe. Source: Gender Issues in Meghalaya by Veronica Pala (2013)
Whereas, in the matrilineal society of Meghalaya women are free from many of social taboos and constraints of the larger Indian society such as dowry, female foeticide, neglect of girl child and other social evils, the state has other problems like poverty, illiteracy, unemployment, high dropout rates, early marriages, broken marriages and divorce. According to the National Family Health Survey-3 conducted in 2005-06, Meghalaya has one of the lowest rates of spousal violence in the country but increasing marital discord and resultant divorce is an issue of concern in the state. Table 10 shows that the divorce/ separation rate is the highest in Meghalaya among all the states in India. More alarming is the rise in 2009-10 to 3.0% as compared to 2.2% during 1993-94 and as compared to the national average of 0.7% in 2009-10. Cases of divorce, legal separation and separation have increased exponentially. Live-in relationships are acknowledged as marriages in the society and there is no registration of marriages in many cases, except those that are conducted through the courts or religious institutions. There is no social stigma attached to a divorce/ separation or remarriage. Women in Meghalaya can separate from their husbands and marry again easily and therefore do not have to suffer violence or suppression. A man could just leave (or abandon) his wife and children if he wants to marry someone else or return to his mother’s sister’s home if finds the present marriage untenable. Since the house and land belong to the woman, she too can tell the man to leave if she does not want the current marriage any more. The increasing marital discord will undoubtedly have an impact on the society, particularly the children. For many women, especially the poor this entails a heavy burden of looking after the children single-handedly.

Republic of India
Meghalaya: Livelihoods and Access to Market Project
Final project design report - Working papers
41
Table 10: Percentage Distribution of Rural Women in India by Marital Status
State 1993-94 2009-10
Currently married
widowed Divorced/ separated
Total Currently married
widowed Divorced/ separated
Total
Andhra Pradesh 87.8 10.8 1.4 100 89.2 9.6 1.2 100 Arunachal Pradesh 90.6 9.3 0.2 100 93.6 4.5 1.8 100 Assam 92.2 7.4 0.4 100 93.2 6.4 0.4 100 Bihar 94.2 5.5 0.3 100 95.4 4.6 0.0 100 Chhattisgarh 91.9 6.9 1.2 100 91.7 7.2 1.2 100 Gujarat 92.9 6.4 0.7 100 92.1 7.3 0.7 100 Haryana 95.4 4.3 0.3 100 94.3 5.6 0.1 100 Himachal Pradesh 92.0 7.4 0.6 100 92.1 7.5 0.4 100 Jammu & Kashmir 93.6 6.1 0.3 100 94.2 5.5 0.3 100 Jharkhand 91.7 7.3 0.9 100 93.4 6.2 0.3 100 Karnataka 86.6 11.5 1.9 100 86.0 12.7 1.3 100 Kerala 89.6 8.6 1.8 100 90.3 7.2 2.5 100 Madhya Pradesh 92.7 6.5 0.8 100 95.9 3.7 0.4 100 Maharashtra 89.7 8.3 2.0 100 91.1 8.0 0.9 100 Manipur 92.6 6.9 0.5 100 92.8 6.6 0.6 100 Meghalaya 85.8 12.0 2.2 100 91.9 5.1 3.0 100 Mizoram 91.9 5.3 2.8 100 92.3 5.2 2.5 100 Nagaland 96.7 3.3 0.0 100 97.4 2.4 0.2 100 Orissa 91.0 8.1 0.9 100 93.0 6.5 0.5 100 Punjab 95.7 4.0 0.3 100 93.6 6.3 0.1 100 Rajasthan 94.5 5.4 0.1 100 95.1 4.6 0.3 100 Sikkim 93.9 5.4 0.7 100 94.5 4.8 0.7 100 Tamil Nadu 87.1 11.3 1.6 100 84.9 13.1 2.0 100 Tripura 90.7 7.5 1.8 100 92.5 6.8 0.7 100 Uttaranchal 92.9 6.4 0.7 100 91.3 7.8 0.9 100 Uttar Pradesh 94.3 5.4 0.3 100 94.9 5.0 0.1 100 West Bengal 89.3 9.4 1.3 100 91.8 7.4 0.8 100 All India 91.4 7.6 0.9 100 92.4 6.9 0.7 100
Note: The figures are calculated for rural women aged 15-59 years who have ever been married. Source: Gender Issues in Meghalaya by Veronica Pala (2013)
6.4 Gender work participation rate
Women’s participation in the workforce in Meghalaya is higher than the national average whereas men’s participation is lower than the national average. About 47% men and 35% women in rural Meghalaya were in the labour force in 2011 (Table 11) as compared to all India figures of 53% and 30% respectively for men and women. Thus relatively more women in rural Meghalaya are workers compared to their counterparts in the rest of the country. Interestingly, female WPR has declined in rural Meghalaya from 39% in 1991 to 35% in 2011.
Table 11: Gender Work Participation Rates in Meghalaya
District Rural Urban Person Male Female Person Male Female
1991 Garo Hills 46.18 51.50 40.67 28.63 40.83 15.03 Khasi Hills 43.15 49.76 36.29 33.06 47.60 17.03 Jaintia Hills 47.66 53.64 41.50 34.62 43.04 25.98 Meghalaya 45.04 51.02 38.85 32.30 46.01 17.22
2011 Garo Hills 40.59 46.47 34.56 30.66 42.61 18.60 Khasi Hills 42.16 48.15 36.10 37.01 49.52 24.50 Jaintia Hills 39.13 45.42 32.89 37.58 43.10 32.46 Meghalaya 41.05 47.04 34.97 35.63 47.68 23.59
Note: The rates have been calculated by taking together main and marginal workers. Source: Census of India, 1991 and 2011

Republic of India
Meghalaya: Livelihoods and Access to Market Project
Final project design report - Working papers
42
It is generally argued that as a country or region develops, more women withdraw from the labour force as their economic status improves. It is only in highly advanced countries that female WPRs are high. Experts argue that in the developed countries, women have higher education and/or skill level and command higher wages in the labour market. Consequently, the female WPR is high. In developing countries, many women enter the workforce as a survival strategy, usually at the lower rungs of the workforce and at lower wages. As the male wage rises, women tend to withdraw from the labour market.
Over the period of 20 years from 1991 to 2011, WPR of rural women remained at 36 percent among the Khasis. It has declined from 41% to 35% for the Garos and from 41% to 33% for the Jaintias. Either the economic condition of rural households has not improved much in Khasi hills or there are other factors like culture that lead to high participation of women in the labour force. It could be that the structure of tribal society in the rural areas of Khasi hills has been relatively unchanged in so far as women’s work participation is concerned. In Garo hills and Jaintia hills, the decline in female WPR may be attributed to the decline of the proportion of cultivators (see Table 12) since in farming households, both men and women work almost equally in the fields. To some extent, the decline is also due to more women in the younger age group attending educational institutions.
In the country women’s participation in the workforce tends to be higher in the rural areas than in urban areas. However, the trend seems to be different in the case of Meghalaya where there has been a rising trend in the past two decades. In 1991, only 15% of Garo women, 17% of Khasi women and 26% of Jaintia women were workers in the urban areas. The rates have increased to 18.6%, 24.5% and 32% for the Garos, Khasis and Jaintias, respectively. At the all India level, only 15% of urban women were workers compared to 30% of rural women in 2011. Although the focus of this paper is rural women, we mention this to emphasise the point that relatively more rural women are workers compared to urban women except in Jaintia hills where the WPRs are very similar.
It may be noted here that higher participation of women in the labour force may be looked at from two aspects and the work participation rate itself will not convey whether women’s welfare is improved or not with high participation. For poor and uneducated women, working or not working is not a choice. They have to work to support their families and their burden is actually more, since generally they have to attend to domestic chores as well. With high level of fertility, this burden is compounded along with the psychological burden of seeing their children work and not attending schools. On the other hand, being a worker increases the independence and decision making power of the women within their respective households. For educated women who can command higher wages in the labour market, higher participation in the labour force definitely increases their welfare and has a direct relation with women’s empowerment
17.
6.5 Gender differentiated work
The women of Meghalaya like their counterparts in other societies whose mainstay is agriculture engage in activities related to agriculture like sowing, weeding, harvesting, threshing, and so on while simultaneously looking after their families (cooking, cleaning, tending to the ill, caring for livestock, etc.). Along with all this, traditionally Meghalayan women also sell their produce in the market place – in this regard, they are unlike women in almost all areas of the Indian subcontinent, where visiting the market and especially selling produce in the market is the preserve of men.
17
Meghalaya Human Development Report 2008, p. 204. Planning Department, Govt of Meghalaya, Shillong (2009)

Republic of India
Meghalaya: Livelihoods and Access to Market Project
Final project design report - Working papers
43
Table 12. Percentage Distribution of Main Workers in Rural Meghalaya
Category Garo hills Khasi Hills Jaintia hills Meghalaya
Male Female Male Female Male Female Male Female
1991 Cultivators 74.89 84.57 47.25 57.00 62.28 65.06 61.01 69.00 Agricultural labourers 9.68 11.41 16.95 16.74 14.11 19.24 13.49 15.08 Livestock, fishery, etc.
0.78
0.35
14.50
14.24
4.12
2.80
7.25
7.00
Mining & quarrying 0.24 0.06 1.10 0.07 1.54 0.37 0.80 0.12 Household industry 0.45 0.47 0.29 0.43 0.13 0.26 0.33 0.42 Manufacturing 0.57 0.13 1.67 0.42 0.96 0.35 1.11 0.30 Construction 1.07 0.30 1.21 0.28 1.40 1.08 1.18 0.42 Trade & commerce 2.76 0.36 2.74 3.87 4.66 4.82 3.03 2.66 Transport, storage& communication
0.31
0.00
1.44
0.12
1.78
0.12
1.02
0.07
Other services 9.25 2.34 12.85 6.56 9.02 5.90 10.79 4.82 Total 100 100 100 100 100 100 100 100
2011
Cultivators 58.99 68.90 49.69 58.54 43.90 41.71 52.61 59.74 Agricultural labourers 10.45 12.44 18.10 16.83 17.67 19.36 14.99 15.67 Household industry 1.58 2.50 1.03 1.45 0.93 1.68 1.24 1.85 Other Workers 28.98 16.16 31.19 23.18 37.50 37.26 31.17 22.75 Total 100 100 100 100 100 100 100 100
Source: Census of India, 1991 and 2011.
In Meghalaya, more men and women are engaged as cultivators and agricultural labours (Table 10). In 1991, 60% of women and 61% of men were cultivators; their percentage reduced in 2011 but there were more women cultivators (59.74%) than men cultivators (52.61%). Between the districts, the Garo Hills accounted for highest women cultivators (68.90%). Gender differences in the classification of rural workers is practically absent in Jaintia hills. But in Garo hills and Khasi hills, the proportion of male cultivators was lower than the proportion of female cultivators by almost 10 percentage points and accordingly the proportion of other workers is lower for females. Another interesting fact is that both men and women take part in trading activities in Meghalaya. This is especially true among the Khasis and Jaintias where the proportion of main workers engaged in trade is the same for males and females in the rural Khasi and Jaintia hills. In the urban areas, the proportion of women traders is even more than the male traders for the two tribes.
6.6 Gender role in decision making and asset management
Women’s participation in decision making and management of the domestic affairs is by and large higher than the national average. According to the NFHS- 3 (2005-06), 80.5 percent of currently married ST women in Meghalaya participate in all four decisions – on their own health care, making large household purchases, making household purchases for daily household needs and visit their own family or relatives- the highest in India. At the all India level, only 37% of currently married women participate in all the four decisions. In Meghalaya, 70% of women are allowed to go by themselves to the market whereas at the all India level, the percentage is only one-third. Extreme cases of domination where the husband does not have any say in household matters are also not uncommon.
In terms of access to resources, rural women of Meghalaya are a little worse off than rural women of India as a whole. Only 32.7% of rural women in Meghalaya had money that they could decide how to use, as compared to 41% at the all India level. About 12% of rural Meghalayan women as against 11% of rural Indian women had a bank or savings account that they themselves used. Only 21% of rural women (36% at the all India level) knew of a micro credit programme but only 1.4% had taken a loan from a micro credit programme in Meghalaya compared to 4.4% of women in the rural areas of the country as a whole.

Republic of India
Meghalaya: Livelihoods and Access to Market Project
Final project design report - Working papers
44
Meghalayan women in general have much better control over income with nearly 86% of working and currently married women in the rural areas reporting that they alone or jointly with their husband decided how their own earnings were used. The proportion was 78% for all (rural) India average. As many as 81% of rural Meghalayan women reported that they alone or ointly with their husband decided how their husband’s earnings were used. Whereas, only 65.8% of rural women in India as a whole had any say regarding how to use their husbands’ earnings. Finally, 2 % of rural Meghalayan women earned more or about the same as their husbands as compared to the all India figure of 19%.
However, the political and administrative domains continue to be dominated by men in the traditional Khasi, Jaintia and Garo societies. Like elsewhere in tribal areas, traditions and customary laws tend to regulate social life in Meghalaya too. Traditionally, Khasi women were restricted from attending Durbar unless specifically called for a purpose. It has been considered inappropriate for women to air their views and voice their opinions in public matters among Khasis and Jaintias. Among the Garos, women are not allowed to hold the position of Nokma; similarly Khasis cannot hold the position of “headman” and among the Jaintias women cannot hold the position of Dolois. Even at the state level, there have been very few women in active politics with only 4 women elected representatives in a house of 60 members in the ninth legislative assembly (2013), the maximum ever. This presents a paradoxical picture because even in states where gender indicators suggest women’s position to be rather low there are a significant number of elected women representatives at all levels, with states like Uttar Pradesh and Bihar having had women Chief Ministers in the recent past. It is possible that being a matrilineal society, women do not feel any further need to assert themselves or position themselves in public domains.
7. Gender and Poverty analysis for proposed key crops and livestock
7.1 Crop choice preferences
The LAMP formulation mission proposed the promotion of certain key crops as part of the integrated
production and marketing support aspect of the project. These include ginger, turmeric, pineapple, orange,
maize and off-season vegetable under crops/horticulture, tejpatta and honey under NTFPs, and piggery and
poultry under livestock interventions. The mission prepared analytical matrices explaining why these crops
should be included and why more traditional crops like potato and paddy should be avoided. It must be
mentioned that most of these crops are already under cultivation in various districts of the state; livestock
activities too are part of traditional activities particularly piggery and backyard poultry.
It was decided to collect preliminary information from gender and poverty perspectives at the farm level.
Taking help from NERCORMP and MRDS/MLIPH, a rapid field exercise was conducted primarily in the
existing IFAD-supported project villages as it was easier to gather the community members there at a short
notice. Both in East and West Khasi Hills18
, potato remained preferred crops among most women and men,
followed by squash. In Jaintia Hills19
, paddy remains preferred crops among land owning households, citing
the need for food security as well as the fact that some of the traditional savouries (putharo, pumalai, pudoh,
etc) are best prepared by local rice varieties. However, in Laskein area of Jaintia Hills20
, turmeric remains
18
Field work at Laitsohpliah village in East Khasi Hills (interview with 13 women SHGs promoted under MRDS/MLIPH and 11 men mostly
VEC members on 2nd
July 2013); and 3 cluster meetings of SHGs and NaRMGs under NERCORMP in West Khasi Hills attended by 65 women and 14 men from 20 villages; the interviews were conducted by the staff of KCRMS-NERCORMP in West Khasi Hills under the leadership of Mr. James Kharkongor, Project Manager. 19
Field work at Umladang village under Thadlaskein Block in West Jaintia Hills District (interviews with 29 women). 20
Field work at Laskein village under Laskein Block in West Jaintia Hills (interview with only women Cluster representatives promoted
under MRDS/MLIPH project on 3rd
July 2013).

Republic of India
Meghalaya: Livelihoods and Access to Market Project
Final project design report - Working papers
45
most preferred crop. The village is famous for Lakadong variety of turmeric. Pineapple is preferred crop in
many pockets of Ri Bhoi District and Garo Hills21
.
The following six indicators or parameters were selected to understand and briefly analyse the gender and
poverty dynamics at farm-level activities both for crops and livestock, mainly those proposed in the LAMP
formulation document. The term ‘value chain’ has been used loosely in this analysis to show inter-related
chain of activities under crop/NTFP/livestock interventions.
Activities Preference anking by ural Women and Men (% of women and men’s preferred ranking of crop and livestock activities)
Reasons for crop preferences (by percentage)
Gender division of labour in crop/NTFP/small livestock production and marketing (what percentage of works relating to production and marketing are done principally by men and women or as shared activity)
Gender performance of task in crop production (what do the men and women principally do in the value chains)
Gender performance of task in smallholder livestock rearing (what do the men and women principally do in the value chain)
Poverty analysis of farm-level activities by different categories of land-owning households (not limited to crops/activities identified by formulation mission but as they exist currently).
Due to paucity of time, the study/analysis was carried out only in West Khasi Hills under NERCORMP project (which may not be covered under LAMP project for now) but nevertheless it presents a representative picture of the entire Khasi Hills at best, if not for Meghalaya as a whole. The study covered 65 women representing 20 villages under three different SHGs clusters and 14 men representing the NaRMGs.
The following tables provide data for percentage of men and women giving their preference for crop and
livestock activities (Table 13) and the reasons for such ranking (Table 14). Both women and men indicated
their first preference for ginger, orange, maize, piggery and poultry. Ginger is preferred because of ready
market (40% respondents), good price with profitability (20%) and easy availability of planting materials
(40%). Maize is preferred both by men and women as it is both a cash crop and used for food and feeds.
Difficulties in market access have been mentioned for pineapple (50%) and off-season vegetables (40%). The
tables are self explanatory but it must be noted that the crop/livestock preference ranking does not
necessarily get corroborated by the reasons for this preference.
Table 13. Activities Preference/Ranking by Rural Women and Men (% of women and men’s preferred ranking)
Preference
Ranking Gender Crops Forest/NTFP Livestock
Ginger Tur- meric
Pine- apple
Orange Maize Off- season veg.
Tej- patta
Ho- ney
Pigs Poultry (back- yard)
Poultry (Broiler)
First Women 20% 50% 70% 50% 100% 50 % Men 80% 50% 30% 50% 100% 50%
Second Women 40% 50% Men 60% 50%
Third Women Men
Fourth Women 60 % 50% 30% Men 40% 50% 70%
21 Discussion with NERCORMP and erstwhile MRDS/MLIPH staff.

Republic of India
Meghalaya: Livelihoods and Access to Market Project
Final project design report - Working papers
46
Table 14. Reasons for crop preference (by percentage) Reasons for crop preference Crops
Ginger Turmeric Pineapple Orange Maize Off- season vegetable
Tezpatta
1. Both cash and food crops 100% 20% 2. Ready market 40% 20% 20% 3. Less labour intensive 20% 4. Good price, high profitability 20% 5. Weather tolerant 50% 6. Agronomic suitability 7. Less input (less seeds,
fertilizers) requirement 20%
8. Existing local knowledge for cultivation
20%
9. Easy availability of seeds/planting materials
40% 20%
10. Difficulty in sourcing planting materials
50%
11. Less storage and transportation damage
20% 50%
12. Useful by-products 13. Difficulty in marketing/market
access 50% 40%
7.2 Gender division of labour
Table 15 provides an idea of percentage of principal works performed by men and women in various crops
and livestock interventions in production and marketing, purely based on their general experiences and
assessment. They also admitted that the percentage of labour contribution by women and men greatly differ
from household to household depending age of the working members and number of productive labour forces
in the individual household. While piggery and poultry (backyard) is largely done by women, when it comes to
commercial poultry farming, men are doing major share of works or labour. Similarly, off-season vegetables
and maize cultivation appear to be the domain of the women, while men contribute about 50% labour in
ginger, Turmeric, pineapple and orange cultivation, again admittedly differ from households to households.
However, both men and women in households significantly share work burden together in all the activities,
ranging from 10-30% as per their assessment.
Table 15. Gender division of labour in crops and livestock Task per- formed
Crops Forest/NTFP Livestock Gin- ger
Tur- meric
Pineapple Orange Maize Off- season vegetable
Tejpatta Honey Piggery Poultry (backyard)
Poultry (Broiler)
Principally women
20
20
50
50
60
80
10
20
70
80
20
Principally men
50
50
50
50
30
10
80
70
20
10
60
Shared
30
30
-
-
10
10
10
10
10
10
20

Republic of India
Meghalaya: Livelihoods and Access to Market Project
Final project design report - Working papers
47
7.3 Gender division of tasks in crop production
Table 16 presents an assessment of gender based performance of principal tasks in crop production, both
annuals and perennial crops. The data is self-explanatory but as is expected, harder labour works (like
clearing of jungle, ploughing, bund preparation, sourcing of seeds from outside the village, transportation of
produce) are all done by men, while women do the remaining farming tasks but not necessarily less
labourious in terms of percentage of time spent or labour time invested for each crop cultivation and
marketing.
Table 16. Gender division of tasks in crop production Value chain activities
Annual crops (Ginger, Turmeric, Maize & Off-season vegetables)
Perennial crops (Pineapple and Orange)
Women principally do Men principally do Women principally do Men principally do Access to seeds
- Sorting household seeds
- Selecting seeds from Local Market with husband
- Visiting neighbouring villages & sometimes Agriculture & Horticulture Departments for procurement of seeds
- Visiting Local Market for purchase of seeds
Proper upkeep of seedlings / planting materials once these are procured
- Visiting neighbouring villages & sometimes Agriculture & Horticulture Departments for procurement of planting materials
- Visiting Local Market for purchase of seeds
Land preparation
Removal of debris from soil / bunds
- Jungle Clearing/burning - Ploughing - Bund preparation
Removal of debris from the planting fields
Jungle Clearing/burning Pit digging
Production and harvesting
- Planting - Weeding - Mulching - Guarding - Harvesting
- Carrying seeds from house to the fiileds
- Carrying from fields to house for storage
- Occasional spray of insecticides
- Planting - Weeding - Mulching - Periodic visit to the field - Harvesting
- Assist in carrying from farm to storage place
- Carrying planting materials to the farm
- Assist in planting and harvesting
- Carry from farm to storage place
Post-harvest
Sorting & Washing
Packaging for transportation Sorting and assist in packing /
packaging
Packing
Marketing Selling
Carrying / transporting to market Negotiating price at farm/village level
Selling
Carrying / transporting to market Negotiating price with buyer at farm/village level
7.4 Gender division of tasks in smallholder livestock rearing
Table 17 provides an idea on gender based performance of tasks in different small livestock value chains.
The general agreement was that men and women in a household share most of the workload, but in some
value chain activities men contribute more than women. The group acknowledged that feeding of animals and
maintenance of their sheds are largely done by women until the animals are mature for market.

Republic of India
Meghalaya: Livelihoods and Access to Market Project
Final project design report - Working papers
48
Table 17. Gender division of tasks in smallholder livestock rearing Value chain activities Piggery Poultry (Backyard) Poultry (Broiler)
Men Women Men Women Men Women Shed construction Sourcing of piglets/chicks Feeding and animal management Maintenance/cleaning of sheds Feed collections Vaccination & other veterinary care Marketing of live pig/poultry Marketing of processed meat
7.5 Poverty analysis of farm-level activities
Table 18 presents information on farm-level activities by three different categories of land-owning households
as identified in the gender and poverty study. It may be noted that crops grown are not restricted to those
identified in the formulation mission. Paddy is primary crop among rich (more than 7.5 ha) and medium
households (1.0-7.5 ha of land). The poorer households having less than 1.0 ha of land prefer maize, potato
and vegetable that they can sell easily in the local markets. Most of the government support and subsidies, if
available, are generally enjoyed by the rich and medium rich households.
Table 18. Poverty analysis of farm-level activities by different categories of land-owning households Activities Household owning land more
than 3 ha or 7.50 acres (Rich HHs)
Household with land between 1-3 ha or 2.50 – 7.50 acres (Middle wealth HHs)
Household with marginal
land owning less than 1 ha or 2.50 acre (Poorer HHs)
Crops grown Paddy, Maize, Potato, Squash, Vegetables
Paddy, Maize, Potato, Squash, Vegetables
Maize, Potato, Vegetable
Access to seeds Own seeds, Govt. department Own seeds, Govt. department Own seeds mostly Production (cultivation)
Hiring labourers, applying Manure , Fertilizer etc
Hiring labourers, Applying Manure, fertilizer
Self labour, applying manure , fertilizer etc
Farm Power Power Tiller Power Tiller Self labour Farm subsidy Seeds, fertilizer etc Seeds, fertilizer etc Seeds, fertilizer etc but very
few get the benefits Extension NA NA NA Post-harvest (Storage)
Storage at home/ or in sheds constructed either at home or near the farm
Storage at home/ or in sheds constructed
Storage in own house
Marketing Self marketing / Agents in village Self marketing / Agents Self marketing Transport Private/Public vehicle, Headload Public vehicle, Headload Public vehicle, Headload
7.6 Gender & poverty analysis of downstream activities
Table 19 identifies a few downstream activities for crops/NTFPs/livestock with respect to gender and poverty
analysis. Although the table presents tasks performed by men and women separately, all the participants
agreed that both men and women are involved in most households in marketing of their
crops/NTFPs/livestock. It was clear during the field study that the cohesive and shared responsibility of men
and women are much more dynamic among rural poor households than generally considered or outlined by
many of the academic researches. Such pictures speak volumes in terms of rural poor peoples’ resilience to
many of the poverty and deprivation challenges that they are constantly confronted with. LAMP must
capitalize or build upon such inherent social assets of the rural poor.

Republic of India
Meghalaya: Livelihoods and Access to Market Project
Final project design report - Working papers
49
Table 19. Gender & Poverty analysis of downstream activities for crops/NTFPs/livestock Downstream activities in value chain
Crops Forest/NTFP Livestock Ginger Turmeric Pineapple Orange Maize Off-
season vegetable
Tejpatta Honey Piggery Poultry (backyard)
Poultry (Broiler)
Selling to market intermediaries (in the village)
Men and women
Men and women
Mostly men
Men Men Men Women
Selling to neighbouring farmers
Women Women Men
Trading to wholesale/retail traders in the market
Men and women
Men Women Men
Trading directly by self in the market
Men and women
Women Men Men Women
8. Experiences of IFAD Project in Gender Mainstreaming and Women’s Issues
Gender mainstreaming is a core element of all IFAD supported projects in the country (or globally). However,
given the unique situation of men and women in Meghalaya, resulting from the matrilineal system being
practiced by key tribal groups in the state, it is pertinent to draw lessons from other projects implemented in
the state itself. The sections below capture lessons from two such projects which have been completed:
NERCORMP and MLIPH.
8.1 Key lessons from MLIPH
The issues faced by the women in the state are compounded due to the hilly terrain, forcing women to make steep ascents and descents ,in places several times a day while engaged in their routine work, the lack of perennial sources of water, plus the remoteness of villages from larger habitations. In summary, problems faced by women in carrying out their daily tasks include:
Access to water, especially during the lean months of December to March
Access to suitable and customised technology for reduction of effort and time and increase of output in farm as well as household activities
Remoteness of location from nearby markets and villages
Lack of transportation
Access to information of new techniques, practices that enhance quality of life
Limited or no infrastructure like roads, health and education services, etc. In many remote villages.
In a study of issues regarding women's drudgery22
, 71% of the interviewed women reported farming as their main occupation, with almost 30% of women engaged in other occupations besides farming. These include handicrafts, weaving, shop keeping, anganwaadi work, etc. Most evidence of entrepreneurship was in the Jaintia Hills District, including tailoring, weaving etc.
The average daily routine of the women interviewed comprised of two main work areas:
Routine housework, including: visiting a water source, cooking, cleaning and caring for the children
Routine outside work like agricultural labour, caring for livestock, and other manual labour
Table 20 shows how drudgery-reducing interventions, have made a significant reduction in the number of hours spent on housework, but there has been little change in time spent on outside work.
22
Assessing Effectiveness of the Interventions taken to Reduce Women Drudgery under MLIPH, 2013. Study covered 75 villages in five
districts (Jaintia Hills, East Khasi Hills, Ri Bhoi, East Garo Hills and South Garo Hills).

Republic of India
Meghalaya: Livelihoods and Access to Market Project
Final project design report - Working papers
50
Table 20: Women's work in MLIPH project villages
Average hours per day Before intervention After intervention
Housework 5.3 3.9
Outside work 5.5 5.4
Total 10.8 9.3 Source: Assessing Effectiveness of the Interventions taken to Reduce
Women Drudgery under MLIPH, 2013
Some of the reasons given by women for the reduction in time spent on housework were:
The construction of roads, washing platforms
Improved access to water
Increased information and awareness about income generating activities
Motivation to engage in activities other than routine housework.
The reasons for the lack of reduction in time spent on outside work (despite introduction of better tools and machinery) could be:
The introduction of many farm and field related income generating activities like horticulture, sericulture, fish-culture, etc.
Introduction of crops like broom stick, ginger, bay leaves, etc.
Year-round cultivation of crops
Keeping livestock for commercial purposes
8.2 Key lessons from NERCORMP23
NERCORMP has had a significant impact on the livelihood of people and made great advances in changing the perception of people towards development and women empowerment. The project management has been able to achieve the project objectives by being very clear about certain activities i.e. training and capacity building, especially in NaRMGs and SHGs; the two organizations that have largely influenced the change in personal growth, earnings, income level, health, education, decision making and economic independence of women, in particular. Gender mainstreaming was brought about by awareness through formation of two main CBOs - NaRMGs and SHGs.
Equal participation of men and women in many areas such as livelihood, decision-making, food intake, etc. that was not present ‘before the pro ect’ was effected during the pro ect implementation. Na MGs allowed both men and women to think and act freely in terms of development of the poorest households and improving village infrastructure. Including men and women in the planning and decision-making phase was the key towards development. SHGs with mostly or all women members, allowed women to earn better with more livelihood options provided by the project. Where women worked the fields in Jhum with just one or two crops, the view that Jhum practice was in fact debilitating to the cropping process was introduced without really looking down on age old traditions. Hence ‘modified Jhum’ and integrated farming, multi-cropping, more options in animal husbandry, horticulture etc. were introduced. This resulted in raising the number of days of sustainable employment and improving income levels for women entrepreneurs. This again resulted in improving the standard of living among women. While women were eating just once or twice during the day and not enough in the pre-project period, they started earning more and spending a little more on their diets. After project intervention, with the help of SHGs, the credit habits of women improved. Women stopped taking loans from the only option “the village moneylender” at a high rate of interest and opted for HG loans. SHGs also improved bank linkage that allowed not women but villagers in general to take loans from additional sources. A case study on Hunger and Poverty in Nonglang Village in West Khasi Hills in 2005 by A.Cordone, IFAD, Rome similarly corroborated the positive impact of SHGs of NERCORMP on
women empowerment including addressing hunger and poverty at household level24
. 24
Cordone, A. (2005). Case Study on Hunger and Poverty in Nonglang Village – State of Meghalaya, India Notwithstanding the aforementioned impact on gender mainstreaming, NERCORMP I also had few

Republic of India
Meghalaya: Livelihoods and Access to Market Project
Final project design report - Working papers
51
weaknesses, both in design and implementation. Some of these, which any future project, should address are:
No baseline survey was conducted before the project start; a baseline survey carried out subsequently had limitations in scope and coverage.
The project continued for about ten years without an effective MIS in place, which was critical to capture project data and results.
Inadequate convergence of government programmes in most villages; women often had to travel long distances to buy crop seeds and feeds for their poultry or animals.
Problem of storage of food, agricultural and horticultural products at village level had been minimally or inadequately addressed; no data on crop loss on storage, etc.
New crops were introduced on the basis of agronomic feasibility but without any potential market survey of demand for the products (like Aloe Vera).
No linkage or contacts were available when farmers were faced with crop hazards and animals/poultry attacked with diseases.
Access to health minimally addressed though priority among many women; health insurance system was conspicuous by its absence.
Non-farm based enterprise development or gainful employment could have been focused in order to attract the participation of youth in the programme, which was not addressed in NERCORMP.
Women and youth counselling and/or help centre could have been an innovation that NERCORMP could have rolled out even on self-sustaining pilot basis.
9. Targeting
With decadal population growth close to 30% over the past two decades (1991-2001: 2001-2011), the state has a burgeoning youth population and would continue to have a large youth population over the next few decades. Any taregtting strategy would, therefore, need to consider their aspirations and needs and the opportunities presented by the demographic dividend in the state. A unique feature of Meghalaya, as with many tribal areas is that there is a very small percent of households which are landless (4.98%), despite the fact that nearly half the state’s population lives below the poverty line. A large ma ority (approx 80%) have a small plot of land, less than a hectare but adequate to feed them. It is pertinent to target these households and increase their income by moving beyond subsistence agriculture, and more importantly the subsistence mindset.
9.1 Target groups
Incidence of poverty and deprivation among the rural tribal communities in all the districts of the state remains high in Meghalaya. This despite externally aided projects being implemented in the state since 2000 (covering 27% of villages) and many other government welfare schemes operating since long. Recent data shows increased rural poverty in the state (from 16.1% in 2004-2005 to 17.1% in 2009-2010). This is perhaps discernible as Meghalaya also had one of the highest (< 27%) decadal growth rates between 2001 and 2011 in India and also in the decade before it. Rural population also grew by 27% in Meghalaya during the same decade. With about 86% of population being tribal and nearly 80% of population living in rural areas, a large majority of the poor in rural Meghalaya can be assumed to be from the tribal communities.
As outlined earlier, the existing state of poverty could be attributed to various factors. Hilly terrains of the state with rather dispersed population pose constraints in rural infrastructure development, thereby limiting

Republic of India
Meghalaya: Livelihoods and Access to Market Project
Final project design report - Working papers
52
adequate access to markets, economic opportunities, resources, assets and social services. Other equally important contributing factors are limited availability of productive land for economic activities coupled with increasing inequality in distribution of land or access to land; general lack of rural income opportunities; shortage of employable labour, shortage of general markets; low level of agricultural productivity; largely subsistence based way of life in rural areas; generally small markets inherent with low and scattered rural population; poor government extension services; poor banking outreach and services; limited access to health, education and sanitation etc. Degrading natural resources particularly forests, low agricultural productivity, persistent shifting cultivation notably in Garo Hills are other contributing factors for poverty in rural Meghalaya.
Considering the characteristics of the rural population, the typology of various target groups in LAMP would be the following, either at household level, or as groups or as individuals.
Tribal Households with Large Land (< 3 ha)
Tribal Households with Small Land (1-3 ha)
Tribal Household with Marginal Land (> 1 ha)
Below Poverty Line Households
Landless
Women Headed Households
Tribal Women
Youth
Table 21. Land ownership and area cultivated
Tribe
Percentage distribution of households by land owned Mean size of land cultivated (hectare)
Landless
Marginal
Land
Small Land
Large Land
Total 1993-94
Garo 3.65 67.35 26.96 2.04 100 0.73 Khasi 8.63 71.11 19.62 0.64 100 0.52 Jaintia 0.47 70.53 28.05 0.94 100 0.66 Meghalaya 5.75 69.59 23.44 1.21 100 0.62
2009-10 Garo 0.00 91.49 5.26 3.25 100 0.41 Khasi 7.31 73.43 16.49 2.77 100 0.80 Jaintia 11.98 70.15 16.26 1.61 100 0.56 Meghalaya 4.98 80.29 11.91 2.81 100 0.57
Notes: (a) Marginal land – less than 1 hectare, Small land – 1 to 3 hectare, Large land – 3 Hectare and above; (b) The average size of
cultivated land is calculated based on those who cultivate land only. (c) Only ST households are taken into consideration.
Source: Gender Issues in Meghalaya by Veronica Pala (2013)
Tribal Households with Large Land (< 3 ha): Approximately 2.81% of rural tribal population are
households owning large land that are more than 3 ha or nearly 7.50 acres (Table 2). Currently, land under many of these households are under-utilized due to low productivity and lack of investment and other technical support. Many of them remain poor. Commercialization of such available land with identified and viable commercial crops would trigger the rural economy with adequate access to market, thus generating opportunities for rural employment. Young people from such households could become commercial farmers thereby encouraging more young people to become productive farmers.
Tribal Households with Small Land (1-3 ha): Nearly 11.91% of rural ST population are under this
category (Table 20). Most of these households remain poor due to unproductive land coupled with lack of input/financial/technical support, as also lack of access to market. Targeting these households with appropriate support would go a long way in improving rural economy in the state.
Republic of India
Meghalaya: Livelihoods and Access to Market Project
Final project design report - Working papers
53
Tribal Household with Marginal Land (> 1 ha): Over 80% rural ST households in Meghalaya are under this category, highest being in Garo Hills with 91.49% of households (Table 20). The bulk of rural poor people would be from this category. Appropriate targeting of these categories of households would significantly contribute to improving the rural poverty scenario of Meghalaya.
Landless: Approximately 4.98% of rural ST households are reported to be landless in Meghalaya,
highest being in Jaintia Hills with 11.98% landless households (Table 20). No one in Garo Hills is a landless though this does not imply better economic conditions. Skill development for non-land-based rural livelihoods would be special focus for these categories of households.
Below Poverty Line Households: In 2002, about 48.9% of the households in the state were Below
Poverty Line (BPL) families. The enumerations were done on 13 scorable indicators. Recent figures of Planning Commission, Govt of India showed that poverty in Meghalaya has increased from 16.1%
in 2004-2005 to 17.1% in 2009-201025
based on the Tendulkar methodology. This means that the condition of many of the BPLs would have remained more or less the same over the past decade. The BPLs would be from among marginal lands holding and landless who together constitute approx 85% of the state’s population.
Women Headed Households: According to sample study done by Pala (2013), about 11.41% ST
households in rural Meghalaya are headed by women, highest being in Jaintia Hills (26.65%) and lowest in Garo Hills (5.83%). Various causes attributed are early death of spouse, desertion by spouse, divorce, long migration of spouse to other place, unwed mother, etc. Many of the rural women-headed households are highly vulnerable and distressed as observed during field visits in Jaintia Hills.
Tribal Women: About 49.72% of total population are women in Meghalaya; spread in equal
proportions in rural and urban areas. Among the STs, over 50.32% are women in Meghalaya, and approx 51.10% are illiterate. In spite being a matrilineal and matri-focal society, the rural women are in many ways disadvantaged in Meghalaya. As the women play crucial role in household well-being and economy, women would be considered as priority target groups, both among illiterate and educated ones. Educated/literate women would be targeted to become entrepreneurs.
Youth: More than 65% of the population of the state26
is below the age of 30. The youth form key resources for development. The rural youth who would be the target groups are often considered as less fortunate cousins of urban youth. However, even in rural areas, there are different categories of youth. The pro ect may not target the “ tudent youth” but there are many other categories of youth that the project may consider targeting. These are: (a) Youth at risk – substance abuse, human trafficking, working in hazardous occupations, bonded labour; (b) Youth in violent conflicts; (c) Youth Drop-outs from formal education mainstreams; (d) Youth affected by HIV/AIDS and TB; (e) Youth in institutional cares, orphanages, correctional homes and prisons; and (f) Differently-abled youth. The project would aim at youth empowerment and development through skill development and capacity building towards making them entrepreneurs for sustainable livelihood and productive living.
9.2 Targeting strategy
Overall targeting strategy would be in line with the project strategy. Saturation approach would be adopted within the village. Inclusive development taking all households in a village would be undertaken. All households would be members of IVCS and/or VECs to access project interventions. Households with land
25 Poverty Estimates for NER for 2004-2005 & 2009-2010 (on Tendulkar Methodology) based on the Press Note of Planning Commission on Poverty
Estimates 2009-2010 (dated 19th March 2012). 26
Draft Meghalaya State Youth Policy 2012, Department of Youth and Sports, Govt of Meghalaya, Shillong,
megsports.gov.in/documents/Draft_State_Youth P olic y 2012. pdf accessed on 21.6.2013

Republic of India
Meghalaya: Livelihoods and Access to Market Project
Final project design report - Working papers
54
would be encouraged to undertake commercial crop production having market access; landless, BPL and others would be supported with income generating activities together with skill development, inputs and knowledge supports. Special focus would be on social and economic empowerment of rural women, linking them with existing community institutions and improving their participation in community decision making processes. Youth development would focus on empowerment, capacity building, skill development and entrepreneurship attainment. In all cases, financial inclusion would be the common strategy for all categories of the target groups. It is understood that Govt of Meghalaya is also working out finer details of mainstreaming financial inclusion in projects to benefit different categories of rural poor in the state. The new project will endeavour to align with such policies and procedures of the government. As the project area is poor and disadvantaged in terms of resources, infrastructure and livelihood opportunities, it fulfils the criteria for IFAD support. The presence of population is almost wholly at a subsistence level which makes it an appropriate target group for project interventions. The project target groups would include tribal communities which form nearly the entire population to be covered by the project, women, particularly those in remote areas, rural youth and BPL households. The project will adopt specific targeting strategies for different groups to ensure that those most vulnerable and marginalised are able to participate in and benefit from the project equitably.
Tribal communities
Meghalaya is a Schedule 6 state, with the large majority of the population of the state consisting of tribal ethnic groups. Therefore almost the entire target population of the project is tribal. However the project recognises that different communities may be at different stages of development. The project will therefore adopt a differential approach in reaching out to the different tribal groups in different geographic locations. The project will also take into consideration the role of the traditional leaders and engage actively with them during project implementation while ensuring that traditional systems and institutions that promote gender discrimination are gradually modified to provide spaces for women’s participation in community decision making. The project will also collect and catalogue traditional knowledge of tribal communities with regards to agricultural practices, medicinal plants, healing etc and promote enterprises in these areas in order to conserve and propagate traditional forms of knowledge and practices.
Women, especially women headed households and women in remote areas
In general women are a priority target group in line with IFAD’s specificity in addressing gender issues. Whereas the situation of women in Meghalaya is better than in many other parts of the country, the project will ensure that gaps that may adversely affect their participation in the project are addressed. For example, recognising that women’s participation in traditional community institutions is limited, the pro ect has opted to work with VECs which ensure equal participation of men and women while also involving representatives of traditional village institutions.
Remoteness affects the lives of both men and women in the state, but women are disproportionately affected due to the fact that their movement is hampered and they are often burdened by the extra work resulting from the difficult terrain and remoteness (e.g. in collecting water). Their access to health services is also severely hampered. The project will work towards providing access to health and education through convergence as part of entry level activities. Additionally the project will organise outreach meetings for EFCs to enable women (and men) in remote areas to gain from the services offered.
Remoteness also contributes to drudgery. It is important to realize that fuel wood collected for household use is not a commodity. Its price to the household women is that of women’s labour time spent in collecting it. If the opportunity cost of labour is very low, because of the lack of income-generating opportunities for women, there would not be a sustainable adoption of labour-saving devices by women. By promoting women’s entry into income-earning jobs, such as in tourism, the opportunity cost of women’s labour would go up, and there would be pressure to save time spent in household duties, such as collecting fuel wood. In fact, as was observed in an IFAD project in Laos, when women’s weaving became the main source of income, then not only did households switch to commercial fuels, but additionally men also began to share, although in a limited way, the domestic work (see Nathan et al, 2011 for details). As drinking water and fuel are two of the

Republic of India
Meghalaya: Livelihoods and Access to Market Project
Final project design report - Working papers
55
most important contributors to drudgery among women, the project will prioritise these in the implementation design. It is envisaged that much of the investment in the Natural Resources and Food Security component will be on improving supplies of domestic water. The project will also take steps to popularize fuel–efficient stoves – a local design has already been well tested, and may also promote biogas (pig manure is now an unutilized resource).
Youth
The youth in Meghalaya are largely educated. Migration is proportionately less common in the state. Communications with youth and the type of services they require may be different from the rest of the communities. Through the EFCs, which are mostly managed by young and aspirating youths, the project will provide a platform to the youth to engage in enterprises and try new ideas. Information will be packaged for the youth in attractive formats and a peer to peer approach will be used to maximise their involvement in the project. .
Below Poverty Line households
Nearly half the population of the state lives below the poverty line, the majority being concentrated in rural areas. BPL families often have limited access to land, and their living conditions are made more difficult by the tough terrain and weather conditions. Most of them depend on daily wage labour. They have insufficient income to sustain family livelihoods and many depend on money lenders for high interest credit. They lack awareness of their entitlements and rights. Even though the project will adopt a saturation approach, specific steps would be undertaken to ensure that the poorest households are included right from the planning stage. The project will, from the very beginning use participatory methods and tools such as PRA exercise, community asset mapping, engaging communities in wealth ranking and identifying the poorest households. Accordingly special efforts will be made to reach out to these households taking into consideration that their confidence building may take time. Door to door visits by the project staff will ensure that all villagers are fully informed about the project activities. During implementation special care would be taken to build capacity of the poorest and more marginalised communities not only in technical areas of enterprise development or livelihoods that may be of interest to them but even softer skills to help them identify and express their priorities, be able to engage with a range of stakeholders etc.
10. Addressing Gender Issues and Gender Mainstreaming in LAMP
10.1 IFAD’s Gender Equality and Women’s Empowerment Policy
Gender mainstreaming in LAMP would be primarily guided by IFAD’s Gender Equality and Women’s Empowerment Policy 2012. Gender issues will be addressed in LAMP in a cross cutting manner across all components and sub-components and also within the project management. It will adopt a KM centric approach so as to bring about a more comprehensive learning and sharing culture within the organisational framework and the project implementation. This strategy will lead to a creation of a more enabling environment for women with gender-focused project implementation.
The Gender Equality and Women’s Empowerment Policy is considered as central to the attainment of the goal of IFAD’s trategic Framework (2011-2015), viz. enabling poor rural women and men to improve their food security and nutrition, raise their incomes and strengthen their resilience. The major shift in this policy was the inclusion of men into the strategy to make it more equitable and inclusive with an emphasis on women in market access and value chains. The Policy
27 has three strategic objectives:
a) Promote economic empowerment to enable rural women and men to have equal opportunity to
participate in, and benefit from, profitable economic activities. b) Enable women and men to have equal voice and influence in rural institutions and organizations.
27
Gender Equality and Women’s Empowerment Policy 2012. IFAD, ome.

Republic of India
Meghalaya: Livelihoods and Access to Market Project
Final project design report - Working papers
56
c) Achieve a more equitable balance in workloads and in the sharing of economic and social benefits between women and men.
To engage in productive activities effectively and efficiently in order to achieve economic empowerment, both women and men require (a) access to and control over assets – inputs, technologies and finance; more secure land tenure rights within both statutory and customary systems; and stronger links to profitable markets; (b) access to financial/economic services – such as extension, training and business development – and the opportunity to participate in decent work; and (c) access to and control over the benefits arising from their endeavours, in particular, income and equitable remuneration for work performed, which in turn will give impetus to maintain their interest and motivation in participating in economic activities
28.
The second strategic objective envisages achieving equal voice and influence in rural institutions and organizations for decision making and representation. For rural development outcomes to be effective and sustainable, rural women need to have greater voice and influence over the decisions that affect their lives. Women and men often have different roles in the economy and in society, and consequently their priorities, needs and interests may differ. Women’s voices need to be heard for policies to be appropriate, and strong women’s representation is necessary to that end. Barriers to women’s participation – both as members and leaders – in rural producer organizations, cooperatives and community organizations, from the local through to the national level, need to be removed. imilarly, women’s groups and rural producer organizations need to be supported to allow networking for experience-sharing and advocacy. Women’s contributions to decision- making at household and community levels need to be valued alongside men’s
29.
The third strategic objective is to achieve balanced workloads and sharing of economic and social benefits. To achieve this the Policy states: “To reduce the drudgery and daily workload of rural living – especially among women with their double role of domestic and productive work –rural populations need improved access to basic infrastructure and services, such as water supply, energy, roads and transport. Domestic and multiple-use water sources -in which IFAD continues to invest directly but also to leverage funding from other sources–and affordable labour-saving technologies can release time from laborious and repetitive tasks such as food preparation, and facilitate greater sharing of roles and responsibilities between women and men. As a result of the time and energy saved, rural people improve their well-being and gain the opportunity to engage in economic activities. It is also important to strive for greater gender equity in the distribution of work among household members and in the share of related economic and social benefits”
30.
10.2 Suggested actions for Gender Mainstreaming
In harmony with the aforementioned strategic ob ectives for mainstreaming gender equality and women’s empowerment, the new Meghalaya LAMP Project would take operational measures to ensure gender- equitable participation in, and benefit from planned activities. By and large the project will adopt an equitable approach towards men and women in planning activities, with certain exceptions. Mainstreaming will be done at two levels:
Systemic mainstreaming of gender
Programmatic mainstreaming of gender
(a) Systemic mainstreaming of Gender
This requires modification or readjustment of existing systems and tools to reflect gender sensitive approaches as well as building it into any new systems/ tools created. This has very little cost implications but most significantly requires commitment at the highest level, the right mindset at the level of implementation and the capacity to facilitate this. This would include the following:
28 Ibid
29 Ibid
30 Ibid.

Republic of India
Meghalaya: Livelihoods and Access to Market Project
Final project design report - Working papers
57
Adopt gender-balanced and gender sensitive HR/recruitment rules and procedures: Existing HR rules to be reviewed by a gender specialist and modified to ensure that requisite provisions are made for equal opportunity employment. Post modification, all concerned staff involved in implementing the rules must be sensitized.
Establish gender-balanced project management teams: to the extent possible the project should
make effort to have gender balance in the teams at all levels.
Ensure that the project adopts at all levels, the principles and practices of a Gender in/and Development (GID/ GAD): Approach that focuses on addressing the inequalities of society. The target groups will thus not only be women, but also include men and youth to build a more enabling society for women’s ability to access assets and resources for economic empowerment and improve their representation and voice in local organisations, enabling them to effectively contribute in decision-making processes and decision-making bodies. This approach often aims at meeting practical needs (immediate needs like water, shelter, food, income, health care within a specific context) as well as promoting strategic interests (refers to relative status of women and men within society and may include gaining of legal rights, closing wage gaps, protection from domestic violence, increased decision-making, control over their assets, etc) of women and men and is in line with the IFAD Gender Equality and Women’s Empowerment Policy (See Table 22).
Table 22. Differences between WID and GAD/GID
Women in Development (WID) Gender and/in Development (GAD/GID)
Focus Women and how they can be integrated into development.
Relationships between women and men (social, economic, political).
The issue or problem
Women (half the productive resources) are excluded from the development process.
Unequal relations of power between men and women that prevent equitable development and women’s full participation.
Goal More efficient and effective development by increasing the participation of women.
Equitable and sustainable development with women and men as decision-makers.
Solution Integrate women into the existing development process.
Empower disadvantaged women to achieve more equal relationships.
The strategies
Increase women’s productivity and their ability to look after the household.
Meet practical needs to improve immediate condition, but address strategic needs to transform relationships.
Types of projects
Women-only projects, and women-focused components of broader projects
Gender-integrated projects.
(Source: Training Package on Gender and Development. Canada Nepal Gender in Organsations Project, www.cngo.org.np/pdf/genderanddevelopment.PDF accessed on 21.6.2013
Establish gender-inclusive M&E system: This would include relevant considerations and actions at
the design, planning and reporting levels. Gender-sensitive M&E tools and systems will
encompass the following31
:
o Gender and Poverty oriented Baseline: The baseline for the project could cover relevant
information that would help the project monitor progress using a gender and poverty lens. Some of the issues that could be monitored include (i) main income sources of men and women; (ii) main expenditure items of men and women; (iii) access and control of resources by men and women; (iv) gender roles in marketing and control of income etc. Socio-
31 More details can be seen from “Gender trengthening Programme for Eastern and outhern African Division: A ource Book”, IFAD,
2002.
Republic of India
Meghalaya: Livelihoods and Access to Market Project
Final project design report - Working papers
58
economic baseline would also be essential to have a ‘without project’ wealth ranking as a basis for assessing the project’s impact on poverty.
o Gender and Poverty Sensitive M&E Plans: Monitoring of project performance with regard to
gender may require separate totals for male and female project participants (beneficiaries/clients) such as (i) Females as a percentage of members of active, project- supported enterprise groups; (ii) Females as a percentage of enterprise group leaders (chairperson, secretary or treasurer) in VECs and IVCS; (iii) Females as percentage of rural input supply agents trained; etc.
o Gender disaggregated Reporting Formats: Reporting formats will need to be designed to
insert separate data for women and men. Staff engaged in reporting would also require to be sensitized/ trained accordingly. LAMP may undertake periodic Gender ‘Audit’, which is a rapid study of project performance with regard to reaching women and men in the project. The value of the gender audit is to check on how well the project is doing on gender targeting. It compares performance between different geographic areas to understand why women’s participation is high in one geographic area and low in others and what can be done to improve it. It also compares performance of different project components and activities in reaching women and men. Some examples of the M&E parameters that could be used to compare are:
Women as a percentage of member of CBOs (IVCS, VECs, etc);
Women as a percentage of members of enterprise groups;
Women as a percentage of leadership of CBOs;
Women as a percentage of leadership of enterprise groups;
Women’s enterprise groups as a percentage of total enterprise groups;
Women as a percentage of beneficiaries of project-related training activities;
Women as a percentage of project staff, by level;
Women as a percentage of NGO service provider staff;
Women as a percentage of market intermediaries receiving training under the project; etc.
o Gender and Poverty Sensitive Monitoring of Project Outcomes: LAMP will develop gender
sensitive SMART performance and outcomes indicators for monitoring eg (i) Income under women’s control increased by 50% by end of 2
nd year in enterprise group formation villages;
(ii) Value of women’s crop sales increased by X% by end of “Y” year in clusters promoting commercial crops; (iii) Area Number of resources under women’s control increased by “X%” by end of “Y” year in project villages. Examples of poverty-sensitive SMART indicators include (i) Percentage of poor household having 12 months food security increased from “X” to “Z” by end of “Y” year in project villages; or (ii) Food insecure poor HHs decreased from “X” to “Z” of total HHs in project villages by end of “Y” year. These would be verified through such “Means of Verifications” as P A, Annual HH interviews, Annual Outcome urveys, etc.
o Gender and Poverty Sensitive AWPBs: LAMP success would depend on allocation of
adequate financial resources for cross-section of activities or components/sub-components capable of benefiting all sections of the target groups. Staff orientation will include a module on gender and poverty sensitive approaches used for planning.
o Gender disaggregated data in knowledge products: Establish protocols whereby all
knowledge and information generated through the project include gender disaggregated data to the extent possible

Republic of India
Meghalaya: Livelihoods and Access to Market Project
Final project design report - Working papers
59
(b) Programmatic mainstreaming of Gender
Based on the learning from other projects in the state (MLIPH, NERCORMP etc) and given the strong position of women in the Meghalayan society, the project will, by and large, adopt an equitable approach in service provision. However, specific activities will be undertaken, where needed, to ensure that the needs of women and the poor are addressed. These would not be stand alone activities but would require additional activities to be built into various project components and will, therefore, have additional cost implications.
Develop and implement a drudgery reduction plan: this would aim to ensure that challenges posed
due to difficult terrain and poor infrastructure which disproportionately affect women are addressed through the project through investment of own resources or through convergence. One of the key challenges that women in the state face is access to water; lessons from other projects show that making water more easily accessible will help to reduce the drudgery in terms of the distance they have to travel to bring water as well as free up their time significantly so that this could be invested in other productive social or economic activities. During the course of the project other activities would be identified through periodic studies to help reduce women’s drudgery in areas such as fuel for cooking, agriculture practices etc. The activities for drudgery reduction would be primarily identified by the VECs and built into the village level NRM Plans. These plans will prioritise the needs of the poorest households too. As envisaged, most of the cost for these activities would be addressed through convergence with relevant government schemes. Where needed the project would cover the gaps in funds.
Outreach activities: Recognising that remoteness may create hurdles in the way of both men and
women in far flung areas from optimally utilising services and assets created through the project, the project will make provisions for outreach services where needed. In planning this, the project will not compromise on its commitment to promoting entrepreneurship and avoiding doorstep deliveries to the extent possible. However, acknowledging the fact that the usual working hours of the EFCs may not be convenient for women involved in agriculture and household activities, and at times the distance may be a major deterrent, the project will organise day long orientation sessions for men and women in the remote areas. During these sessions community members would be familiarised with the work of the EFCs and will be encouraged to access the EFCs for availing other services. Where connectivity exists the project will develop a system of providing need based information through the use of cell phones.
Social development initiatives: As analysed in the paper, there are many social development aspects
in the state that require attention. Primarily among these is the issue of health. Health also provides an entry point for the project to develop a rapport with the communities. The government has a robust health system; since its launch in 2005 the government of Meghalaya has been implementing the National Rural Health Mission (NRHM) in right earnestness. However IMR and MMR continue to be very high in the state. These are related to lack of information/ awareness, difficulties in accessing health facilities, poor quality of services, malnutrition etc. Communities will be provided awareness on proper nutrition and homestead gardens will be promoted among communities to ensure families have access to good nutrition. The project will not directly invest in health services but help communities access health services through convergence with the Health Department. Additionally, the project team will periodically review relevant social indicators for the state to identify other priorities and address these through convergence.
Sensitization and training programmes: In addition to including a module on gender in all key training
programmes of the project, specific trainings will be organised as required to address gender specific issues. These may include:
o Sensitization of VECs and IVCS members to create an enabling environment for engagement of women in decision making processes.
o Staff orientation at all levels on gender and poverty focussed approaches o Orientation of EFC staff to provide customised information/ services to women, if/ when
needed.

Republic of India
Meghalaya: Livelihoods and Access to Market Project
Final project design report - Working papers
60
o Sensitization of partners/NGOs working with LAMP on issues of gender equality and women empowerment
o Capacity building trainings for women to enable them to participate in local decision making processes and promote leadership.
o Awareness programmes on health, especially women’s health issues. o Others
10.3 Developing Gender Strategy in LAMP
The Project should develop a Gender Strategy and Action Plan based on the principles and strategies of IFAD’s Gender Equality and Women Empowerment Policy 2012 to guide planning, implementation, monitoring and evaluation of the project. Gender mainstreaming will be across all project interventions and the organisational structure. As issues of social development intertwine intimately with gender concerns in the state, there will be a full time staff reporting to the Project Director who will be responsible for ensuring that gender and social development issues are mainstreamed in the responses at various levels. The strategy will have gender check list in all components/subcomponents or activities of the project.
10.4 Monitoring progress of the targeting approach
As women and men, particularly in rural context, experience development differently and have different priorities and needs, the need to track these differential outcomes and impacts becomes imperative in LAMP. The project will monitor targeting performance on a regular basis to ensure that the projects benefits are accrued to the intended target groups in line with the requirements of IFAD’s Targeting Policy. In addition, special qualitative studies must be undertaken at regular intervals in order to assess the impact of project interventions in achieving gender equality and women empowerment in addition to RIMS and Annual Outcome Surveys.
10.5 Cost implications
Much of the costs will be covered through convergence and as part of other project components. Specific cost inputs required for gender and poverty mainstreaming will be for the following items (this will be finalised during appraisal): - Full time staff at state and district level for gender and social development. - Outreach programmes in select villages by EFC staff - Periodic studies on women’s drudgery - Training material on proper nutrition and community level awareness programmes on nutrition - At least 3 qualitative studies to assess impact of targetting - Training programmes as listed in 9.2.2.4
10.6 Conclusion
With nearly half the state’s population living below the poverty line, a situation that has not improved over the past two decades, a disproportionately high concentration of the poor in rural areas, a large and burgeoning youth population owing to very high decadal population growth over at least two decades, a stagnant employment market and growing risks to the rich natural resources, the state is in urgent need of newer approaches to address the poverty situation. Ranked very low on the HDI (26th out of 35 states and UTs), a heartening aspect of the state is the very low levels of gender divide. Timely and innovative interventions are required to provide alternative sources of income and livelihood opportunities to both men and women, particularly the youth, in order to help them achieve their aspirations, harness their energies productively and to draw benefits from the demographic dividend for the overall growth and development of the state.

Republic of India
Meghalaya: Livelihoods and Access to Market Project
Final project design report - Working papers
61
Working Paper 3: Agriculture
Purpose of the Working Paper:
To review the status and management of agriculture in Meghalaya, highlighting key issues and challenges in relation to land and crop management;
to provide LAMP with sufficient background information and options to design appropriate and sustainable interventions in the agriculture sector to stimulate local enterprise development; and
to recommend potential crops and agricultural activities for inclusion in the project design.
A. Location, topography, climate and soils
Location: Meghalaya is one of the 8 states of northeast India, and covers an area of 22,429 km 2, with
an altitude of between 150 m and 1,961 m above sea level. It is bordered to the south and west by Bangladesh and to the north and east by Assam.
Topography: the topography of Meghalaya consists of an elevated plateau. In the centre and east of the state, river valleys, often narrow with steep sides, have been cut into this plateau. In the west the topography is more gentle, with rolling hills. The state can be divided into 2 river basins: (i) rivers that flow northwards into the Brahmaputra and (ii) rivers that flow southwards into Bangladesh. The state has 3 major catchments, 8 sub-catchments, 35 watersheds and 179 sub-watersheds.
Climate: the average annual rainfall varies from 4,000 mm to 11,400 mm (at Cherrapunji, the location with the highest rainfall in the world). However, rainfall is seasonal and water shortage is a major problem for both domestic and agricultural users in the months January to March, exacerbated by the fact that there is very little community or household level rainfall harvesting and water storage. The climate is moderated by altitude, with mean monthly temperatures ranging from 43
oC to 4
oC in Jaintia
Hills (Jowai), and from 27oC to 5
oC in East Kashi (Cherrapunji).
The Garo Hills in the western part of the state are almost entirely sub-tropical, and have a smaller seasonal variation, ranging from 35
oC to 8
oC at Tura. The Jaintia and Khasi Hills are a mix of
temperate and sub-tropical, the latter areas occurring in the south adjacent to Bangla Desh, and in those areas adjoining the Indian state of Assam.
Information on climate change is in the Working Paper on Climate Change.
Soils: the soils of the Meghalayan hills are largely derived from gneissic complex parent materials, and often lateritic; they are dark brown to dark reddish-brown in colour, of fine loamy textures, and generally varying in depth from 50 to 200 cm. The soils of the alluvial plains adjacent to the northwest and southern plateau are very deep, dark brown to reddish brown, and sandy loam to silty clay in texture.
The central plateau has red soil and northern border areas have loamy and alluvial soils. The southern parts are mainly characterised by sandy gravels and clay soils. As with many hilly areas, soil characteristics are highly variable within a short distance; ridge soils are often shallow and stony, while some of the red soils on the more gentle slopes can be very deep (>3m). Paddy soil in the valley bottoms are generally deep and medium to fine textured. Further details are to be found in the soil survey report undertaken by the Soil Survey of India in 2008.
Soil Fertility: fertilizer is not much used – generally only for potatoes and tomatoes, in a few valley bottom rice paddy areas, and in very few vegetable plots; where paddy follows a potato crop, rice benefits from fertilizer provided to potato crop. Overall the fertilizer consumption in Meghalaya is way below the national average; mean urea application in Meghalaya is 18kg/ha whereas the national mean is currently around 100kg/ha, and fertilizer consumption in the state had not appreciably

Republic of India
Meghalaya: Livelihoods and Access to Market Project
Final project design report - Working papers
62
increased in the 14 years prior to 2006 (Meghalaya Agriculture Profile 2006, DoA). 80% of the fertilizer is said to be used on potatoes. In the Jaintia Hills, use of bone meal (containing ~9% Calcium, ~4.5% Phosphorus and traces of Potassium, Magnesium and Sodium) is not an uncommon practice.
Part of the reason for the low fertilizer consumption is that due to the climate and low cropping intensity, the soils are naturally high in organic matter and contain moderate Nitrogen levels, even in the cropped lands. Conversely, however, the heavy rainfall results in the soils being leached of bases, especially calcium and magnesium; the soils are thus acid and prone to iron and aluminium toxicity – which leads to interference with uptake of other nutrients, and fixes phosphorus as Fe and Al phosphate. The soils of the higher altitudes in the high rainfall belt tend to be more acidic due to the intense rates of leaching. The use of bone meal in the Jaintia Hills is thus clearly a good practice.
Total nitrogen levels are usually moderate, but available nitrogen levels are sometimes quite low due to slow soil decomposition of organic matter due to the low temperatures. In summary and as a rule of thumb, organic matter levels are good, Nitrogen levels are adequate for the intensity level of most current cropping systems in Meghalaya, phosphorous is deficient due to the acid nature of the soils, and potassium is medium to low due to the leached nature of the soils. As a general rule, without proper treatment and care, both the Meghalayan landscape and soils are not suited to intensive cultivation.
Despite the acidic nature of the soils, very few farmers lime their soils despite repeated advice from the research stations and line agencies, and the fact that there is plenty of limestone in Meghalaya; for example, there is a large mine in South Khasi Hills District operated by a French company, with the limestone being exported to Bangladesh. Some orchards show boron and zinc deficiencies; this also occurs occasionally in the few more intensely cultivated farms where 2-3 vegetable crops are produced in a year, or in the potato-rice paddies. Other reports suggest that all the acid soils of the north eastern region of India are deficient in boron and molybdenum – those of Meghalaya are rated as low in available boron and molybdenum. A study conducted by the Shillong branch of the Indian Council of Agricultural Research (ICAR) reported that about 40% of the soils of the state “contain micronutrients below the critical level”.
Crop Potentials: a brief summary of the crop potentials for the two main agro-climatic zones is provided below.
Agro-Climatic Zone Areas Potential horticultural crops Mild sub-tropical and temperate zone
Ri Bhio, Khasi Hills, Jaintia Hills, and parts of the northern Garo Hills
pineapple, pear, peach, plum, potato, vegetables, passion fruit, strawberry, mandarin orange, black pepper
Mild sub-tropical plain zone
Most of the Garo Hills pineapple, potato, vegetables, cashew nut mandarin orange, black pepper
Source: based on a table in SFAC
B. Land use
The hilly terrain of the state limits the area available for cultivation, and 43% of land is covered by
forest1. Table 1 shows that in 2008-9 13% of land (285,000 ha) was actually cultivated but another
10% is fallow and 25% cultivable land not used for cropping. There is little irrigation: only 2% of the area is cropped more than once. Data on land use for 2011-12 by district is in Appendix 1. This shows that overall land use was similar to that in 2008-09. Amongst the districts, those in the Garo Hills have a higher proportion of forest, while those in Khasi Hills have more uncultivated and uncultivable land. West Garo Hills has a higher proportion of land under crops (almost one third of all land), with relatively low proportions of cropping in West Khasi, Jainita and Ri-Bhoi.
6The Forest Survey of India, 2011, reports a much larger area of forest (68% of land in the state). This includes degraded
forest (15% of land) which may also be jhum fallow and unutilized waste land.

Republic of India
Meghalaya: Livelihoods and Access to Market Project
Final project design report - Working papers
63
Jhum cultivation: the hilly topography means that soils are potentially subject to erosion and prone to acidification and low fertility (due to leaching out of bases and nutrients) by the high and intense rainfall. This has given rise to “jhum” - a system of shifting cultivation, whereby land is cleared of forest, burnt and cultivated for subsistence crops for one or two years and then abandoned as weed growth and declining fertility reduces yields. After being allowed to rest as fallow land, with the secondary forest traditionally re-growing for between 10 and 15 years, the land is cleared and cropped again for another 2 year period of cultivation. However with increasing population, the jhum fallow period is being reduced to as little as 2 or 3 years, and some jhum land has been converted to permanent cropping such as tree crops (eg. areca nut and cashew) and broomgrass.
The area under jhum cultivation is said to be falling. In 1983 the Ministry of Agriculture estimated that a total of 265,000 hectares was cultivated as jhum in Meghalaya – either under current cultivation or
as fallow2. There is no recent data, but land use data includes 155,000 ha of non-current fallow and
391,000 ha of cultivable waste, both of which could be jhum fallow. A study for MLIPH shows the share of jhum in total land use falling from 30% to 15%
3 over the last eight years.
Table 1: Land Use (areas in hectares)
Category
2004-5
2005-6
2006-7
2007-8
2008-9 Forest 941,786 943,746 944,108 946,247 948,133
Not available for cultivation 227,945 226,783 226,939 225,870 225,921
Other uncultivated land 607,717 594,976 594,752 554,410 553,444
Fallow land 230,760 224,726 224,526 217,981 215,453
Net area sown 218,892 236,869 236,775 282,592 284,149
total area 2,227,100 2,227,100 2,227,100 2,227,100 2,227,100
Area sown more than once 46,680 49,215 50,419 52,176 53,245
% of total area
Forest 42% 42% 42% 42% 43%
Not available for cultivation 10% 10% 10% 10% 10%
Other uncultivated land 27% 27% 27% 25% 25%
Fallow land 10% 10% 10% 10% 10%
Net area sown 10% 11% 11% 13% 13%
total area 100% 100% 100% 100% 100%
Area sown more than once 2.1% 2.2% 2.3% 2.3% 2.4% Directorate of Economics and Statistics, Meghalaya
Abandonment of crop land. Reports from Uttarakhand, Bhutan and Nepal speak of substantial areas of hill land being abandoned. This is driven by a combination of poor returns from farming, increasing levels of damage from wild animals, and scarcity of labour stemming from out-migration. There is no evidence that, in general, returns to farming are any better in Meghalaya, but it does seem that there is relatively little wild animal damage (hunting seriously reduced populations many years ago), and considerably less out-migration (e.g. in comparison with Nepal). Data on land use and on recorded crop areas both show a steady increase in areas of cultivation (Tables 1 and 2). Although the area of jhum cultivation is said to be falling, indications are that, in general, these areas are being converted to tree and plantation crops (e.g. areca nut, cashew, pineapple, and orange), rather than being abandoned.
2 Task Force on Shifting Cultivation, MoA, 1983. A total of 53,000 ha was opened for jhum (from fallow) each year, with 52,290
households involved. 3
Demonstration effectiveness and its rate of replication under Meghalaya Livelihood Improvement Project, study by Resources Center for Sustainable Development, 2013. In addition the PCR for NERCORMP-1 reported that 15% of households had ceased cultivating jhum, amounting to a reduction of 24,000 ha across six districts in three states.

Republic of India
Meghalaya: Livelihoods and Access to Market Project
Final project design report - Working papers
64
C. Land tenure
Over half of land is operated by the 80% of farmers with holdings classified as being small and marginal. The overall average size of all holdings of 1.3 hectares. Over half of all farmers (53%) have marginal holdings of under one hectare, and another 27% have small holdings (1 to 4 ha). With a traditional form of land tenure, most farmers do not have formal title to their land, although right to occupation is often registered with traditional authorities.
Land tenure and user-rights in Meghalaya are complex and differ from district to district – see Working Paper on Land and Traditional Institutions.
Table 2: Land Holdings
Category % of total area Average holding ha
Marginal (0.05 to 1.00 ha) 22.7 0.55
Small (1.00 to 2.00 ha) 22.9 1.45
Semi-medium (2.00 to 4.00 ha) 32.7 2.58
Medium (4.00 to 10.00 ha) 12.5 5.41
Large (over 10.00 ha) 1.8 13.12
Total 100.0 1.30
Source: Census 2001
D. Crop area and production
Data in Table 3 below shows that 60% of total crop area is accounted for by field crops (cereals, pulses, oilseeds, fibre crops and a little sugarcane), with the balance divided between tubers, spices, vegetables and plantation crops. Between 2000-01 and 2012-13 the total area of all crops increased by 19%. The total area in Table 2 for 2008-9 was 267,285 ha. This is significantly lower than data for the same year in Table 1 showing a total crop area of 337,394 ha (being the net area sown of 284,149 ha, plus the area sown more than once of 52,245 ha). This difference may partly be accounted for by minor crops excluded from the crop area data. Another possible reason is errors in estimates of land area. With the traditional system of land tenure, very little land has been measured via cadastral surveys, and farmers seem to have little idea regarding units of land area. Crop area data may therefore not be very precise and should be treated with caution.
Much basic land cultivation is still done by hand4. Although many households own cattle, only in Garo
Hills and, to a lesser extent in Ri-Bhoi, are they used for cultivation. In Khasi and Jaintia Hills most land is cultivated by hand. Power tillers have been introduced in all areas, but their use is still limited. Power tillers are expensive (Rs. 145,000 less a Rs. 40,000 subsidy), and not all fields are accessible. In recent years many power tillers have been distributed by government schemes, but some have been immediately sold on to farmers in Bangladesh. High labour requirements for cultivation may discourage sowing of additional crops, such as mustard, after paddy has been harvested. There is potential to introduce “no-till” conservation agriculture technologies. Free grazing of cattle after the paddy harvest and over the winter is another limiting factor – but potential exists here for use of MGNREGA funds to isolate selected areas with bamboo fences, bamboo being widely available throughout the state.
4 Of the respondents for the 2012 final RIMS survey for MLIPH, 81% said they cultivated land by hand, 15% with animals and
4% used power tillers.

Republic of India
Meghalaya: Livelihoods and Access to Market Project
Final project design report - Working papers
65
Crop Area by year (ha) Annual growth in area (ha)
Production m/tons 2012-13 2000-1 2004-5 2008-9 2012-13
Rice 106,600 111,550 108,045 109,042 0.19% 259,195 Other cereal 23,920 20,390 19,975 22,367 -0.56% 44,992 Pulses 3,374 3,426 3,539 8,300 7.79% 10,605 Oilseeds 9,503 9,924 9,994 14,398 3.52% 14,382 Other 5,271 16,258 15,989 19,185 11.37%
Total crops 148,668 161,548 157,542 173,292
1.29% Area in percent
Yield kg/ha 2012-13
Annual growth In yield
Rice 72% 69% 69% 63% 2377 2.94% Other cereal 16% 13% 13% 13% 2012 3.09% Pulses 2% 2% 2% 5% 1278 4.52% Oilseeds 6% 6% 6% 8% 999 3.37% Other 4% 10% 10% 11%
Total crops 100% 100% 100% 100%
Table 3: Total Crop Area
Crop Category
Crop areas – hectares Percentage of total area 2000-1 2004-5 2008-9 2012-13 2000-1 2004-5 2008-9 2012-13
Field crops 148,668 161,548 157,542 173,292 62% 63% 59% 60%
Tubers 27,571 26,236 26,772 28,180 11% 10% 10% 10%
Spices 12,667 12,748 14,001 14,929 5% 5% 5% 5%
Vegetables 10,000 11,947 15,076 15,412 4% 5% 6% 5%
Plantation 18,012 19,196 26,868 26,773 8% 7% 10% 9%
Fruit 23,232 26,231 27,026 28,161 10% 10% 10% 10%
Total 240,150 257,906 267,285 286,747 100% 100% 100% 100% Source: Directorate of Agriculture
1. Field Crops
Table 4 below records the steady increase in area under field crops over the past decade.
Table 4: Field Crops
Source: Directorate of Agriculture
Rice is the predominant food crop in the state, accounting for almost two-thirds of the area of field crops (and 40% of the area of all types of crop). Most rice is grown in wet paddy fields, mostly rainfed, but some fields in valley bottoms are irrigated. Upland rain-fed rice is grown on hillsides and on jhum land.
Except in the Garo Hills and to a lesser extent in Ri-Bhoi, cultivation of all rice areas is generally undertaken by teams of people with hand hoes – this is especially laborious and time consuming work in the valley bottom areas where the more finely textured soils are moist to wet in the May-June cultivation period, or when significant rains arrive early in the season (e.g. in 2013). Power tillers are starting to be used (the cost of cultivation using a machine is one half to one third of that of hired labour), but there seem to be problems in them getting bogged down in flooded fields.
Upland and jhum rice is sown by broadcasting seed. Much of the wetland paddy seed is also broadcast, or seeds are directly sown by dibbling. In some areas seedbeds are prepared, and seedlings either transplanted into the normal way or dibbled into the field due to lack of sufficient water to puddle the land prior to transplanting. In some areas, cattle are used for puddling but not for ploughing.
Rice is grown in three seasons. The main season is winter (sali), during the main monsoon season, with rice being planted in July and harvested in November. This accounts for over half the total area but yield is only 1,304 kg/ha (this includes upland rice). The next most important crop is autumn

Republic of India
Meghalaya: Livelihoods and Access to Market Project
Final project design report - Working papers
66
(ahu), which is grown between March and July during the pre-monsoon rains. A smaller area of spring rice (boro) is grown. This requires irrigation but the average yield is considerably higher: 3,705 kg/ha. At mid-altitude, paddy may be grown in rotation with potato, at higher altitudes, paddy alone is grown.
Table 5: Paddy area, production and yield (2010-11)
Area (ha) Production (tons) Yield (kg/ha)
Autumn (Ahu) 32,596 42,492 1,304
Winter (Sali) 62,892 117,116 1,862
Spring (boro) 12,797 47,413 3,705
Total 108,285 207,021 1,912
With an average milling ratio in the state of 60%, the average yield of milled rice per hectare is 1,147 kg, which is only half the national average of 2,300 kg.
These levels of productivity of rice, whether on the valley bottom wetlands or upland areas, are very low. Upland rice will always have the lower yields, although some of the rice varieties produced in these areas are valuable aromatic varieties. A few lead farmers practice SRI, with significantly higher yields being reported - up to 5 mt/hectare, as against the norm of around 2 mt/hectare – the mean yield of the popular indigenous varieties grown in the valley bottom wetlands is 1.3 mt/ha (Director of Agriculture). However, even some of the farmers employing SRI techniques do not use fertilizer, and rely on limited amounts of farmyard manure for nutrient supply.
Kapasipara, Gasuapara block, South Garo Hills
Paddy: grow a single crop in the monsoon season, cultivating land with power tiller and cattle. No fertiliser is applied and little FYM is available (cattle numbers have fallen sharply). Yield is 0.9 to 1.2 tons per ha, said to be decreasing as rains are unreliable and soil has become less fertile. Used to get between 2.0 and 2.4 tons per ha 10 years ago, and before than even got 3 tons. The crop suffers from disease and pests, but cannot name these. Farmers spray whatever pesticide is available in the market, or apply white pepper.
Cultivating paddy fields by hand in South-West Khasi district. The scale of the task is apparent from the picture to the right.
There is a significant opportunity to improve rice productivity – improved soil nutrient management, replacing broadcasting of seed with improved seedling management, proper crop spacing and

Republic of India
Meghalaya: Livelihoods and Access to Market Project
Final project design report - Working papers
67
general management, and double cropping. For more advanced farmers, SRI is an option. The labour demand and drudgery of paddy cultivation can be reduced by extended use of draught cattle for ploughing, and mechanization in the valley bottom areas. Double cropping can be encouraged by isolating areas from winter grazing with bamboo fences, and use of land can be improved by planting legumes on the paddy bunds – such as soya bean, black gram, green gram, mung bean, bushy type cowpea, horse gram, and rice gram.
Power tiller Transplanting SRI paddy
A State Rice Mission is being planned for implementation from 2014-15 to 2019-20. The aim is to double rice production and so achieve self-sufficiency. Principal activities planned include:
Mapping of rice eco-systems
Increase area of boro paddy
Validate improved varieties
Test and validate packages of practices
Promote mechanisation
Validate harvest and post harvest technologies
Accelerate spread of technologies
Build the capacity of DoA
Half of the planned increase in production will come from the boro crop, with the target of doubling the area while increasing yield by 10%. The plan for the mission has identified areas of potential boro expansion in the north, west and south-west Garo Hills where lowlands have potential for groundwater irrigation from shallow tubewells. There is good potential for LAMP to work closely with the Rice Mission, and obtain support from the mission for the initiatives listed above.
Box 1: Visit to Mawablei Mawjnoin village, West Khasi Hills (NERCORMP-2)
Paddy fields are manually “ploughed” – takes about 50 men + women days for 1 acre; if hired labour is used, wages are around Rs. 300/day. Seed is dibbled, fertiliser is used (DAP+urea), and the yield is about 1000-1500 kg/acre – though it may be more as people are unsure of land areas. Most farmers only grow enough rice for 3- 4 month’s consumption; they receive the rest from the PDS. NERCOMP has built a weir to irrigate some of the paddy, but it is too early to assess the impact.
Squash is the main source of cash income for most farmers. They started growing squash for sale in 1990, and this is mostly sold at the farm gate for around Rs. 8/kg; the price is Rs. 10/kg at the local market at Makassar (10+ km away). As the village is now accessible by road, it is possible to hire a pickup to transport the squash to market for Rs. 0.50/kg; from there, traders take it to Shillong.
Potatoes are also grown and some are sold. Maize is grown around the homestead – this is eaten green as well as stored for grain.
Other cereals are principally maize, with some millet and wheat also grown. The main pulse crops are rabi season peas and gram. The main oilseed is mustard, with soybean and sesame also being

Republic of India
Meghalaya: Livelihoods and Access to Market Project
Final project design report - Working papers
68
grown. There has been some growth in the area of fibre crops – with cotton, jute and also mesta being grown in the Garo Hills.
2. Tuber crops
Potatoes, concentrated in the East Khasi Hills, account for two-thirds of the area of tuber crops. The balance is divided between sweet potatoes and, in the Garo Hills, cassava (Table 5).
Table 5: Tuber Crops
Area: hectares 2000-1 2004-5 2008-9 2012-13 Annual growth in area
Total production tons 2012-13
Potatoes 18,318 17,287 17,690 18,139 -0.08% 172,955 Other tubers 9,253 8,949 9,082 10,041 0.68% 45,112 Total 27,571 26,236 26,772 28,180 0.18% 218,067 Area: percentage Yield 2013-14
kg/ha Annual growth in
yield Potatoes 66% 66% 66% 64% 9535 1.60% Other tubers 34% 34% 34% 36% 4493 0.48% Total 100% 100% 100% 100% 7738 1.26%
Source: Directorate of Agriculture
Potatoes are an important cash crop, but suffer from a number of diseases (principally late blight), with yields also constrained by poor plant nutrition, lack of moisture, poor quality seed, and out-of- date varieties. Yields are less than 10 tons per hectare, less than half the national average of 22 tons/ha in 2010-11 – which itself is only half of that achieved in the USA and UK.
Potatoes are grown in four seasons:
Spring potatoes are planted in paddy fields preceding the rice crop – sowing taking place from mid-January to mid-February, and harvest in May, This crop is less susceptible to blight, but requires irrigation or sufficient residual soil moisture.
Summer potatoes account for the largest proportion of the potatoes grown in the state. The crop is mostly planted on upland (often in raised bun beds). Planting takes place at the end of February and through March, and harvesting takes place from July to the end of October (with farmers delaying lifting until prices rise later in the year). The crop is only susceptible to blight after the monsoon starts in the later part of the growing season.
Autumn potatoes are planted during the rains in August and September and harvested in November and December. The crop is attacked by blight (which requires frequent sprays of fungicide), but fetches high market prices.
Winter potatoes account for the smallest area of the crop, and is grown at lower altitudes in the Garo Hills. Planting is done in October and November and harvest in February and March. This crop is harvested at the same time as the main crop produced in the plains of India, so fetches relatively low prices.
The supply of seed potatoes is totally inadequate. With 2.5 tons required per ha, 18,000 ha requires 45,000 tons of seed. However there are only 50 registered seed growers producing certified seed, each growing only about 0.5 ha producing 4-5 tons (so only a little over 2,000 tons is produced in total). Production of certified seed is constrained by lack of foundation seed – the State Seed Potatoes Farm in Upper Shillong only gets two tons of breeder seed from the Central Potato Research Institute in Shimla, which it multiplies twice to produce around 40 tons of third generation foundation seed – only sufficient for 16 ha of certified seed. Around 25% of seed is imported from other states, and last year the Department of Agriculture bought in 20 tons from Himachal Pradesh. However most growers have to use home saved seed or buy from unregistered growers whose crops are many generations away from the original breeder seed. The Department is now constructing a tissue culture laboratory to increase the supply of first generation seed, but this is only a small facility and is unlikely to begin to meet the need for better seed.
Another constraint on seed potato production are the regulations that control seed potato prices may well be needed. Current market prices of potatoes for human consumption (around Rs30 per kg) are higher than the controlled price for seed (around Rs20 per kg). Clearly this makes the potato seed

Republic of India
Meghalaya: Livelihoods and Access to Market Project
Final project design report - Working papers
69
production system uneconomic and results in registered seed growers diverting some or all of their production away from use as seed.
3. Spices
In terms of area, ginger is the principal spice crop, followed by turmeric. These are both important cash crops that are sold to other parts of India. Ginger is grown all over the state, with the largest area in the East and West Garo Hills, while turmeric is focused in Jaintia Hills. Small areas of other spices are also grown – for example, chilli, tezpatta, garlic, and black pepper.
In the Lasken block of Janitia Hills, 50 villages grow Lakadong turmeric. This is of special quality, with a high curcumin content, and used for pharmaceuticals. Producers receive double the price of ordinary turmeric. Tata (Amalgamated Plantations) buy this turmeric, but there are problems in aggregation (time consuming for Tata), and it now seems that some of the turmeric has a high arsenic content (above the permitted safe level), possibly coming from water polluted by coal mining. Some turmeric is being smuggled into Bangladesh. MLIPH has established a drier, thus producers no longer need to wait for sunny weather.
More details on ginger and turmeric are in the Working Paper on Integrated Production and Marketing.
Table 6: Spice Crops
Area: hectares 2000-1 2004-5 2008-9 2012-13 Annual growth in area
Total production tons 2012-13
Ginger 7,811 9,222 9,283 9,738 1.85% 57,522 Turmeric 1,523 1,682 1,959 2,208 3.14% 12,831 Other spices 1,810
Total spice 11,144 10,904 11,242 11,946 Area: percent Yield kg/ha
2012-13 Annual yield growth
Ginger 70% 85% 83% 82% 5907 1.38% Turmeric 14% 15% 17% 18% 5811 2.79% Other spices 16%
Total spice 100% 100% 100% 100% Source: Directorate of Agriculture
4. Vegetables
Excluding potatoes, the principal vegetables grown are tomatoes (in 2012-13: 12% of the vegetable area, 29,000 tons total production, and with average yield of 15.3 tons/ha) and cabbage (in 2012-13: 11% of the vegetable area, 37,000 tons total production and with average yield of 21.5 tons/ha). Production is generally low and could be much improved by adoption of simple soil and crop management, as highlighted in Box 3.
Box 3: Improving Tomato Production in Meghalaya
Israel-Asia Chamber of Commerce, January 2013
Tomatoes are planted in February, and harvested in June and July before heavy rains, although some continue to August. Farmers use hybrid seeds from Sygenta, Seminus and other seed companies.
Problems:
Pests and diseases – bacterial wilt (Rastonia - a serious disease), and borers.
Need irrigation.
FYM supply limited.
Grown on ground with no support – much fruit spoils and yield is limited.
Packed in 20 kg cartons, 10-25% losses in transit.
11 Horticultural Hubs exist in the state, which provide comprehensive support. Polyhouses have been introduced to extend the tomato season, but the produce has not been of good quality, possibly because of the use of the wrong variety. The Hub staff appear not to be up to date on the latest varieties and technologies in relation to tomato.

Republic of India
Meghalaya: Livelihoods and Access to Market Project
Final project design report - Working papers
70
Research Needs:
Research is required into: varieties, plant spacing, irrigation (main limiting factor), plant supports, and varieties and root stock resistant to bacterial wilt. The potential for extending the season also needs to be studied in relation to the identification of peak price periods in different markets.
Late blight is the most common and serious disease affecting tomatoes in Meghalaya – it can infect and destroy the leaves, stems, fruits, and tubers of potato and tomato plants, and can quickly kill tomatoes and spread for miles. It is a major problem due to perfect humid conditions, a host of plants to be infected, and lack of sound agronomic practices. It is now impossible to grow potatoes and tomatoes without spraying dithane; so virulent has the blight strain become, that farmers make 5 sprays from a ½ kg packet of dithane instead of the recommended 15 sprays. These are dangerous levels, and dithane is highly likely to enter the food chain through the tomato, especially, and potato possibly.
The Dept. of Horticulture recommendation is not to spray tomatoes with dithane within 25 days of harvest, but this advice is very widely ignored – in 2006, in Thadlaskein block, East Jaintia, farmers sprayed dithane 3 days before the harvest; once harvested, the tomatoes were piled up for grading – while grading they also wiped the fruits clean of dithane residue – however a young girl picked up a tomato and ate it – she died within a few days.
Farmers are also unwilling to undertake crop rotations, burning of infected leaves or other recommended practices as both tomatoes and potatoes are profitable; however, one respondent stated that spraying such high amounts of dithane throughout the potato season has, in some cases, made potato cultivation uneconomic. A subsidy on dithane has been provided, but the state government may now have withdrawn this (or is considering withdrawal
5).
The blight spores remain viable in the soil for 3 years, and it is clear that only further fatalities, crop failures, implementation of legislation, or a major disinfection campaign will solve this serious problem. More information on the production and marketing of off-season vegetables is in the Working Paper on Integrated Production and Marketing.
Tomatoes Blight on tomatoes
5. Plantation crops
The principal plantation crop is areca nut (betel nut palm), followed by cashew nut. Areca nut is grown throughout the state, with the largest areas in east Khasi and west Garo. Farmers report (and the mission saw) that palms are dying of some form of rot which seems to start in the centre of the crown. Department of Horticulture staff think areca may be vulnerable to climate change. There is also concern that excessive consumption of areca may lead to human health problems, and a number of states are now not encouraging expansion of the crop.
5 As subsidies for various inputs are provided by a number of central and state sponsored schemes, it is not a simple matter to
withdraw subsidy for a particular input.

Republic of India
Meghalaya: Livelihoods and Access to Market Project
Final project design report - Working papers
71
Table 7: Plantation Crops
Area: hectares 2000-1 2004-5 2008-9 2012-13 Annual growth
in area Total production
tons 2012-13
Areca nut
11,184
11,233
12,632
15,563
2.79%
23,282
Cashew nut
6,320
6,765
7,599
9,170
3.15%
17,194
Other plantation
508
1,198
6,637
2,040
12.28%
9,119
Total plantation
18,012
19,196
26,868
26,773
3.36%
Area: percent Yield kg/ha
2012-13 Annual growth in
yield
Areca nut
62%
59%
47%
58%
1496
0.69%
Cashew nut
35%
35%
28%
34%
1875
1.67%
Other plantation
3%
6%
25%
8%
4470
5.41%
Total plantation
100%
100%
100%
100% Source: Directorate of Agriculture
Cashew is concentrated in west and south Garo. Crop statistics suggest that yields are well above the national average in West Garo, however the mission did not get the impression that this area was better than other districts and, in general, farmers do not seem particularly interested in expanding the crop. Farmers say nut prices are low, the crop is labour-intensive and trees often get blown over in storms. There may be technical developments for cashew production that would improve yield and/or nut quality. At least one farmer is growing improved varieties on grafted rootstock - see below
The Horticulture Department gave Wanen Sangma, of Gimbilgre village, Dadenggre Block, West Garo, grafted trees of recommended varieties like Ullal-4, Priyanka and NRC-2, along with financial and technical assistance. The trees were planted in 2008-09 and started giving nuts in 2011-12, yielding at least 4-5 kgs. per plant. In this year he earned about Rs60,000 from his plantation, and expecting to double production in next season. Inspired by this success, he wants to plant another 2 or 3 ha, and other farmers from the village are encouraged to plant more cashewnut.
There are 20 factories in the state for processing cashew nuts, but most processing takes place in Assam. Tata is thinking of investing in cashew processing, but more likely to do this in Assam as land and labour are not available in Meghalaya. Child labour is used in cashew processing and some raw nuts are exported to Bangladesh.
The area planted with other plantation crops has grown rapidly. This is almost entirely composed of tea (mainly in Ri Bhoi and West Garo) but small areas of rubber and coffee have also been planted. There is said to be much interest in planting rubber in the Garo Hills, with a Catholic NGO having established a processing plant and offering good prices (which may be above true market levels). However there are environmental issues in expanding rubber plantation.
Tea seems to have potential, and there are a few successful commercial gardens producing for the domestic and export markets. However most production is in the hands of small farmers who sell green leaf to factories. There are issues in getting the leaf to the factory in time, and in the quality of the plucked leaf. Further information on tea is in the working paper on Integrate Production and Marketing. A limited amount of coffee has been planted, especially under areca nut. In North Garo Hills it is said to grow well, but there is no market so people are now uprooting the plants. In West Garo Hills people were more positive about the crop, saying that

Republic of India
Meghalaya: Livelihoods and Access to Market Project
Final project design report - Working papers
72
6. Fruits
In terms of area, the main fruit crops are citrus and pineapple. Citrus are mostly mandarin oranges, with the greatest concentration found in East Kashi Hills. Pineapples are focused in Ri Bhoi and West Garo. More details on citrus and pineapple are in the Working Paper on Integrated Production and Marketing. Citrus trees are generally not grafted, and there are disease problems (principally dieback), with production declining in some areas and increasing in others. Fruit tree nurseries are reported to have been a successful intervention in MLIPH.
Table 8: Fruits
Area: hectares
2000-1 2004-5 2008-9 2012-13 Annual growth in area
Total production tons 2012-13
Citrus
8,089
9,808
9,368
9,905
1.70%
44,889
Pineapple
9,235
9,565
10,523
10,693
1.23%
115,570
Banana
5,377
6,276
6,522
6,855
2.04%
84,138
Other
531
582
613
708
2.43%
5,439
Total fruit
23,232
26,231
27,026
28,161
1.62%
250,036
Area: percent Yield kg/ha
2012-13 Annual growth in
yield
Citrus
35%
37%
35%
35%
4,532
1.06%
Pineapple
40%
36%
39%
38%
10,808
1.68%
Banana
23%
24%
24%
24%
12,274
0.24%
Other
2%
2%
2%
3%
7,682
-0.31%
Total fruit
100%
100%
100%
100%
8,879
1.03% Source: Directorate of Agriculture
Bananas are another important fruit crop in eastern, western and southern Garo Hills. With higher yields (state average is 12 t/ha), total banana production exceeds that of citrus. Tissue culture can be used to provide high quality and disease free planting material, will potential yields of 100 tons per ha or more. The Department of Horticulture, with funds from the GoI Horticulture Mission has provided some farmers with tissue culture plants which have grown well (see photo below).
The main other fruit is papaya. Squashes are locally important in some areas (such as West Khasi Hills), and could be improved by better supporting trellises, irrigation, pheromone traps to control fruit fly, better varieties, and bees for pollination. Constructing trellises of stells is excessively expensive, but producers could be encouraged to grow bamboo and to treat bamboo to make it last longer. Bamboo is also useful to make fences to protect winter vegetables from free grazing cattle and to make baskets - the latter could be aided by improved tools
(INBAR may be able to assist here). One local type of squash is called chowchow. It is a perennial
and grows virtually wild. Local market prices can be very low and it is often used to feed pigs (the leaves and tuberous roots can also be used as pig feed). However the price of chowchow in distant markets such as Delhi can be quite high so there is potential to develop improved market linkages .

Republic of India
Meghalaya: Livelihoods and Access to Market Project
Final project design report - Working papers
73
Laitkseh village (upper and lower), Mawthadraishan block, W Khasi Hills.
All 400 housholds in there two villages (upper and lower) grow squash, which is their main source of cash income is squash. Income from squash ranges from Rs15,000 to Rs20,000.
The main problem for squash is the trellis on which they grow. This needs to be replaced every two years. There is a shortage of bamboo as some people lack land to grow their own bamboo so need to buy. Insects
damage the stem (borer), and flower get eaten. Pest control method is not practiced.
In the peak harvest season 14 trucks a day take squash to Guwahati and beyond from this cluster of 3-4 villages. Farmers sell squash for Rs4 to Rs5 per kg – but sometimes price falls to Rs1.50/kg. Squash needs to be transported within 24 hours or will spoil. Bunds etc. in Assam stop transport and cause losses (maybe loose 5% of the total crop per year). Transport may be easier when the railway arrives. Could make squash pickle.
Now also grow pumpkin, bitter gourd, cucumber and beans on the trellis – this is a new idea.
There is a well organised and enthusiastic support system for strawberry cultivation in Meghalaya, a relatively new and profitable crop, but not without its problems. This is covered in some detail in the Working Paper on Integrated Production and Marketing.
There is also potential for fruits such as pear, peach and apricot in the more temperate areas of Meghalaya, and for litchis and mangoes in the more sub-tropical areas. Relatively new fruits such as kiwi, are also worth investigating, initially in terms of markets.
Further details on the general potential of such fruit crops are provided in Table 11, Section H.
E. Jhum Cultivation
1. Jhum cropping systems
The cropping pattern on jhum land is a complex mix of mixed and relay crops, with broadcast upland rice usually accounting for the majority of the planted area. Other crops include maize, tapioca (cassava), colocasia, sesame, beans, several cucurbits, rosell and a range of vegetables including ginger, chilies and turmeric, all mixed in with the upland rice.
Jhum cultivation areas are usually on community land, administered through traditional institutions such as Dollois in the Jaintia Hills, Syiems in the Khasi Hills and the Nokma/A’Khingland in the Garo Hills. Jhum plots are allocated to community members by the traditional village hierarchy (e.g.: A’Khing Nokma, Dollois, Syiems) on a rotating system. In most cases, the “jhumias” have user rights, but not ownership rights over the land, and they face uncertainty in returning to the same plots for operation in subsequent years. The complex land tenure and ownership systems, which vary from one part of Meghalaya to another, together with uncertain access to the same land resources in subsequent jhum operations, are disincentives to carrying out any land improvement activities, such as terracing.
Increasingly, farmers are planting fruit trees, especially citrus and areca, on their jhum plot as a means to establishing ownership; cashew is also important in this regard, and pineapples are increasingly popular. For this, the Nokma/A’Khingland, Syiems or Dollois issue “Certificates of Land Holding”, which are authorized by the Autonomous District Councils (ADCs). This has favoured the more influential people to the exclusion of the poor, and also reduces the land available for jhum cultivation. The majority of jhumias are below the poverty line.

Republic of India
Meghalaya: Livelihoods and Access to Market Project
Final project design report - Working papers
74
Jhum is a system that is much maligned by outsiders, who see it as destructive of forest and wildlife, and a cause of accelerated soil erosion. In other parts of India, the practice is subjected to over- simplified blanket policies without realizing the socio-cultural and livelihood implications for the poorest section of the society. However, in Meghalaya, there is no legislation in regard to jhum, except in the Garo Hills (see section below), and, due to widespread private, clan and community land ownership, the Department of Forests only manages <5% of the land area of the state.
Jhum systems in Meghalaya suffer from reduced fallow cycles and resulting decline in productivity; jhum cultivation is sustainable only if the fallow period is long enough to enable a build-up in soil fertility – around ten years. Whereas in some areas, communities have stopped jhum cultivation, in others, particularly in the Garo Hills, it is still an important part of the traditional farming system. Reductions in the length of the fallow period is said to have arisen due to population increase, increasing aspirations (need for cash), insufficient availability of suitable land for shifting cultivation, and additional pressures from permanent plantations, and non-forest, non-agricultural land use needs of non-jhumias.
In the high rainfall, humid tropical areas where it is practiced, fertility is held in the biomass of the forest. The soils are leached and acidic. The soil fertility and, in the sandier soils, nutrient-holding capacity is therefore very low. Biomass is the main storehouse of nutrients, and thus improved jhum cultivation should, among other aspects, focus on provisions for recycling of leaf and organic matter for sustainability.
Mendal, North Garo Hills:
Jhum yields have drastically fallen (90% less), cultivate for 2 years, then fallow 5 years (before 20 years), 1st year use land for ginger, veg etc, in 2nd year grow rice (there are pest problems with this).
Village Dolagia, South West Garo district: traditionally jhum was practised, but was given up about five years ago as it was not very productive. The jhum land now converted into plantations (cashew, areca),
Village Dombu Afal, East Garo district: all forest and hilly land on which jhum is practised is owned by the
Nokma, Some households do not have any paddy land,
but all have jhum of between
Examples of jhum cultivation
2 to 6 bigha (average 3 bigha). The extent of jhum is determined by the area one can cultivate: there is no restriction on jhum area that one cultivates. The land is cultivated for 2 years and then fallow for about 5 years. There is no regulation—whoever occupies a patch cultivates it. Rice, millets, pumpkin, chilli, ginger, yam, tapioca, maize, banana and melon are jhum crops. Yields in jhum have been going d own, and people would give up jhum if they were helped to develop permanent horticulture; they would need to seek Nokma’s approval; but expect he would agree. Jhum is hard work with low productivity!
Rasnagre village, Bagmara block, South Garo Hills. Jhum crops are grown for one year, followed by 5-6 fallow. Much less area now (one third of that before) as farmers no longer depend on jhum as they have orchards. Jhum land has been converted to orchards. But they carry on doing jhum as it is a tradition. There are more pest problems now, but use no sprays, fertiliser or FYM.
Women are involved in most of the activities related to jhum, and their labour contribution is much higher than that of men. They sow, weed, harvest, post-harvest, store grains and seeds, and also clear jhum-forests for cultivation. They also carry out day-to-day house work, homestead cultivation and livestock rearing. Jhumia-women are overburdened with the work they carry out. Their drudgery

Republic of India
Meghalaya: Livelihoods and Access to Market Project
Final project design report - Working papers
75
could be reduced by adoption of appropriate technologies such as cover crops for weed control and irrigation systems in homestead gardens, and the situation improved significantly by growing perennial cash crops such as pineapple, orange and other fruit crops. Areca nut, cashew, rubber and tea plantations are, in places, other popular substitute crops.
2. Regulations concerning jhum land
The areas under shifting cultivation are regulated within the provisions of the Autonomous District Councils’ Forest Acts and Jhum Control Regulation Act, but these only apply in the Garo Hills. In the past these regulations did not impinge on the practice of shifting cultivation, nor on the harvesting and marketing of small timbers from jhum areas. However legal and administrative regulations on the felling of trees and transport of timber offer no incentive for the farming households to grow timber trees in the jhum fields, as the average jhum cycle is too short to grow trees to the size allowed for cutting.
3. Options for jhum development
Various strategies need to be adopted to develop the jhum areas in a sustainable manner:
a) improve productivity on the permanent paddy and upland farming areas so that farming households are not so dependent on the jhum areas for food security;
b) rationalise and optimise land-use in the jhum areas in order to improve productivity through intercropping of tree and fruit crops, perennials, annuals and legume species;
c) encourage the change from annual to perennial tree and fruit crops on jhum areas – for example, orange, pineapple, other suitable fruit trees, cashew and areca - and facilitate the change from community or clan ownership to private ownership;
d) where farmers want to continue jhum cultivation as they rely on these areas for food security: - ensure that the jhum fallow phase increases from the present situation, in many cases
only 3 to 5 years, thereby allowing system recovery and regeneration, - introduce suitable higher yielding varieties of rice and other crops where acceptable and
appropriate, possibly from other jhum areas, - encourage further diversification through introduction of cash crops as insurance – for
example multipurpose trees, NTFPs, bamboos (for shoots and handicrafts), tejpatta (bay leaf), dalchini (cinnamom), timur (chinese pepper), wild edible fruits, medicinal plants, betel vine and wild black pepper in old fallow areas with standing trees and vegetables, especially legumes
- explore the potential for apiculture in these diverse agroforestry areas; - increase the percentage of crop cover and introduce simple and appropriate soil
conservation measures to decrease the risk of serious erosion – such as contour ridges, small trenches, staggered planting and eyebrow terraces, especially for fruit and tree crops;
- explore the potential for bench terracing through the MGNREGA funds; - discourage the planting of root crops on the steeper areas; - encourage the on-site preparation of compost from plant waste and the diverse mix of
plant materials that exist in the jhum area and surroundings; - encourage the use of bio-pesticides prepared from water – see Appendix 3.
F. Climate Smart Management Options for Improving Productivity
The following options for improving soil fertility in all farming systems in Meghalaya are considered cost effective and climate smart as they reduce the dependence and expenditure on agro-chemicals and their transportation, and make best use of local resources. Experience from Nepal shows that most of these techniques and options require initial extra inputs of labour and minor expenditure and require 2 to 3 years for the majority of farmers to adopt; having observed the increases in crop productivity demonstrated by the lead farmers, the majority realize that the gain is worth the pain.
i) Farmyard manure is an integral part of sound soil fertility management in general, and a major fertilizer for remote areas in particular. A mature cow or buffalo in the mid-hill farming conditions is estimated to produce 1,825 kg fresh dung and 1,460 litres urine in a year (SSMP, Nepal 2010). In

Republic of India
Meghalaya: Livelihoods and Access to Market Project
Final project design report - Working papers
76
areas of Meghalaya, where there are significant numbers of cattle (eg. the Garo districts), manure is poorly often haphazardly managed, with bedding casually laid, FYM stored in the open, and spread when convenient. Where villages have more pigs than cattle, the pig dung is commonly considered as waste rather than a valuable resource. No systematic collection and management of animal waste was observed during the mission – as a result, most of the available N in the FYM and urine is lost through volatilization and leaching.
Improved FYM management techniques need to be adopted – these include: careful collection, layering, and moistening; shading heaps from sunlight to minimize N-volatilization; protecting heaps from rainfall to reduce leaching and surface losses; immediate mixing with soil after taking FYM to the field and the systematic collection and use of cattle urine as a liquid fertilizer and for preparation of urine-based botanical pesticides. In Nepal, the package has been adopted by over 100,000 farmers, all of whom have reduced their reliance on agrochemicals, and a significant proportion of whom no longer use fertilizer or pesticides.
In the Swiss-funded Sustainable Soil Management Programme, the N-content of FYM has been monitored before and after the adaption of SSM techniques on farms over periods of one to three years. Results from 350 farms show that FYM quality has significantly but inconsistently improved; the increases in N contents of improved FYM were substantial and significant in the majority of cases, and the systematic collection of cattle urine has added a significant amount of additional N.
In considerable parts of Meghalaya (especially in parts of the Jaintia and Kashi Hills), very few households own cattle; but most of these households own pigs - pig manure therefore must be carefully managed in these areas, and not just treated as an unusable waste product. Pig manure can be treated as described above and its reputed acidity does not affect the soil or future crops if it is well decomposed; lime or bio-accelerants (eg. EM – effective microorganisms) can also be applied in the composting pit, as can locally available biomass, and bedding materials. MLIPH has a report of a woman pig farmer who is successfully applying pig manure to her vegetable garden.
Cheap and simple re-designs of pig pens and cattle sheds so as to be able to collect and manage the dung and urine is necessary; the fym and compost must also be stored properly in a shed that protects the material from the sun and rain – such a shed can be constructed from bamboo and thatch.
Pig dung is also very useful in manuring fish ponds – work conducted at the fish farm of Punjab Agricultural University, in Ludhiana, concluded that pig dung did not degrade the physico-chemical properties (pH, dissolved oxygen and alkalinity) of water, resulted in higher nutrient (phosphates and nitrates) levels in the water, higher plankton levels, and significantly better growth of carp species.
ii) Bio-pesticides: pest and disease management in the humid Meghalayan environment is a major challenge, and the use of agro-chemicals is haphazard, little understood (“I go to the shop and buy some medicine”), with the result that it poses a threat to human, animal, crop and environmental health, and to the effectiveness of commercially available pesticides.
On-farm preparation of bio-pesticides can be based on either water or cattle urine – although not appropriate to those households in Meghalaya that do not have cattle, preparation in cattle urine, which has a N-content of around 1% (depending on feed regime and season), has the added advantage that it is also a plant tonic. Such preparation of bio-pesticides has proved effective in providing some control against common soft-bodied pests and diseases. Bio-pesticides made from cattle urine first require the collection of cattle urine which requires some small investments in the cattle shed (slope, gutter and collection systems).

Republic of India
Meghalaya: Livelihoods and Access to Market Project
Final project design report - Working papers
77
Covered manure pit and collection of cattle urine in Nepal
Water or the cattle urine are then mixed with locally available plants which have either known pesticidal properties (eg. Neem), or a strong smell or taste (eg. chili, onion, garlic). In Nepal, various locally available plants are used - they act as repellents, anti-feedants, toxicants, and growth inhibitors – for example, Justicia adhatoda (Ashuro), Artemisia vulgaris (Titepati), Eupatoriuma adenophorum (Banmara), Azadirachta indica (Neem), Melia azedarach (Bakaino), Zingiber officinale, Tagetes erecta, Tagetes patula (Sayapatri), Acorus calamus (sweet flag), Mentha, Curcuma domestica (Turmeric), Allium sativum (Garlic), Urtica dicioa (Sisnu). Various parts of these plants (e.g. leaf, tender stem, flower, fruits, or whole plant) are either mixed with water or fermented with cattle urine for 30-60 days. These pesticides are then mixed with water at various proportions (depending upon the crop growth stage) and sprayed at intervals of 7 to 15 days. Other materials commonly available at the village level can also be used, such as ash, kerosene, soap and milk. Further details are provided in Appendix 3.
Results from several studies and farmer led experiments have shown that such homemade urine- and water-based botanical pesticides are effective in managing several insect/pests with no discernible damage to the local agro-ecosystem. There are clear indications from the plant response that these botanical pesticides benefit the soil-plant environment, provide several essential nutrients to the plant thus working as a plant tonic and enhancing improved crop growth and production.
iii) Composting and crop residue management: practices in this category are highly appropriate to Meghalaya as there is an abundance of vegetation, and suited to those farming households that have few or no livestock, especially cattle. Such practices are many and varied, and include on-farm composting of waste or locally collected species, incorporation of chicken and pig manure from small scale backyard units, vermiculture (using the plastic “Silpaulin” bins), green manuring of crop residues, terrace risers and farm vegetation, incorporation of crop residues into the soil, and avoidance of a) biomass burning, and b) uprooting of the legumes. In scattered and often distant farm plots (eg. the jhum areas), on-farm composting reduces the workload associated with transporting farmyard manure from the livestock sheds and pens.
iv) Inclusion of legumes in the cropping system: inclusion of legumes in the cropping system is recommended in a variety of ways; mixed intercropping, relay-, catch-, cover- and break crops, and pulses and beans on the paddy bunds. Additional advantages to the N-fixing properties include the provision of a good forage for livestock, a green manure crop for boosting soil organic matter levels, and additional cash income to the farmer and insurance against main crop failure – off-season legume cover crops can also suppress weeds and break pest cycles, thereby reducing reliance on

Republic of India
Meghalaya: Livelihoods and Access to Market Project
Final project design report - Working papers
78
agro-chemicals. Off-season leguminous cover crops can be encouraged in many of the un-used valley bottom paddy areas by constructing fences from bamboo to isolate areas from browsing livestock.
v) Growing fodder and forage plants: this can be undertaken in a rotation system, as a winter or off-season crop, and either in or around the farm, and is especially appropriate for jhum areas. Fodder and forage crops supply livestock feed, nutrient cycling and building resilience within the local agro-ecosystem, and are well suited to terrace risers, ridges and wasteland surrounding villages. Planting on wastelands, or using such crops as fencing materials (eg. napier grass) nearby the animal sheds and fym/composting units has advantages in relation to reducing times and drudgery, usually of women, for collection of animal feed materials; it also encourages stall feeding (more efficient collection of dung) and improves animal nutrition.
vi) Integrated Plant Nutrient System: IPNS is an approach which integrates all components of soil, plant and nutrient management aimed at higher crop yields and improved and sustainable soil fertility. Evaluation from 54 Farmer Field Schools in Nepal recorded increased crop yields of 26%, and soil analyses showed increases in soil fertility status particularly in OM, N, P and K levels over base levels within a 1 to 3 year time span. Such systems must also include livestock, as cattle, buffalo, pigs, goats and chickens provided much needed nutrition and organic matter through dung and urine.
In Meghalaya, the livestock sector also requires much support to stimulate improvement in management and productivity – see Working Paper on livestock for further details.
G. Potential of Different Crops for Meghalaya
In general, there is much potential for many crops in Meghalaya, which is a veritable agro-forest, especially in regard to productivity increase, as outlined in previous sections, and in terms of optimising land use. Meghalaya has a good cropping climate, warm and wet, which, however, is also favourable to pest and disease outbreaks. The main problems identified are poor crop and soil nutrient management, low productivity, and locally high risks of erosion (see Table 10 overleaf) – none of these problems are insoluble, but key amongst the solutions is an effective transfer of skills and knowledge to the farmers. LAMP must therefore ensure that a sound knowledge management system, an appropriate system of training trainers, and an effective extension service are high on the priority list.
Tables 11 and 12 records the major crops which have potential in Meghalaya, and an indication of the opportunities and interventions that might be considered by LAMP to focus on initially.

Republic of India
Meghalaya: Livelihoods and Access to Market Project
Final project design report - Working papers
79
Table 10 Major Problems Identified and Recommended Project Interventions
Problem Identified Recommended Project Intervention Notes Low productivity Promotion of improved crop management
packages across the board, appropriate improved varieties, and double-cropping in off-seasons – especially for rice, the staple food crop
extension and promotion through on- site coaching, demos, selection of lead farmers/CRPs, extensive use of media (FM radio, digital videos, mobile phone info-boards, posters and pamphlets in local languages etc.)
Poor and/or declining soil fertility
Promotion and demos of sustainable soil management practices, proper use of commercial fertilizers and bio-fertilizers,
appropriate crop rotations, and use of legumes
eg. improved farmyard manure preparation and management, collection and use of cattle urine
(where available), composting, vermiculture, legume inclusion as cover crop, inter-crop, winter crop etc.
Pests and diseases Promotion and demos of bio-pesticide techniques and available commercial bio- pesticides, and training in proper use of agro-chemicals
demos on integrated pest management, bio-pesticide production and use
Need for irrigation Low-cost rainwater harvesting and storage systems, provision of micro-irrigation kits, in- field soil and water conservation techniques (physical and agronomic), improved topsoil organic matter contents
water shortage not seen as a major constraint – relatively easily solved through r/w harvesting demos, establishment of CRP model farms & model villages, extensive farmer to farmer exchange visit programmes
Lack of mechanization and draught animals on paddy lands
Promotion of power tillers and tractors for cultivation of paddies in appropriate valley areas
provision of machinery through incentive loan package to lead farmers and CRPs – demos and hire-out systems
Lack of knowledge and skills Establishment of effective extension service to reach all selected villages
Technical specialists/institutions to prepare appropriate curricula and provide ToT to extension service
agents (eg. NGOs) – which in turn train lead farmers and CRPs to coach cluster farmer groups
Low household income inhibiting self-investment
Improvement in rice productivity to reduce expenditure, and promotion of cash crops for generating income and establishing the base for enterprise development – in home gardens, bari bagan, upland rainfed plots, and jhum areas - and according to appropriate agro-ecological zone
Fruits: pineapple, banana, lemon, orange, guava, papaya, plum, peach and pear
Vegetables: potato, tomato, cabbage, cauliflower, peas, ladies finger, brinjal, carrot, bitter gourd, bottle gourd, beans, radish and cucurbits
Spices: chili, turmeric, ginger according to agro-ecological zone suitability.

Republic of India
Meghalaya: Livelihoods and Access to Market Project
Final project design report - Working papers
80
Table 11 Major Commodities – Opportunities and Interventions (in bold, those crops and sectors on which LAMP will initially focus)
Current situation:
Meghalaya is amongst the leading states in the production of ginger and quality turmeric;
among the fruit crops, pineapples occupies the most land, followed by oranges and banana;
in the vegetable sector, potatoes occupies the most land but there are sizeable areas seasonally under tomatoes and cabbage, with radish, cauliflower and chow- chow also grown - these are off-seasonal crops marketed outside the state;
areca nut and cashew nut are the major plantation crops, followed by rubber and tea;
high value low volume crops such as strawberry and commercial floriculture are seemingly promising sectors.
Commodity Justification for Interventions Potential Interventions by LAMP Notes Rice Increased productivity, food security, import replacement
reduction of hard manual labour General crop & soil fertility management – extension 6
Mechanization, irrigation Double cropping where appropriate – use of MGNREGA funds for fencing
Rice Mission + ICAR + DoA responsible for selection/testing of improved varieties
Maize Increased productivity, food security, improved feed for livestock, raw or processed, sales to feedmills, income potential increased
Expansion for human and animal consumption Improved varieties, soil fertility management
Ginger Increased productivity, local processing enterprises, income generation Seed selection and treatment, growing in raised beds, processing, irrigation
see WP on Integrated Production and Marketing
Turmeric Increased productivity, local processing enterprises, income generation Improved varieties and planting material, intercropping, soil fertility management
see WP on Integrated Production and Marketing
Pineapple Improved plantation management, increased productivity, local processing enterprises, income generation, jhum replacement crop
Varieties and improved planting material Soil fertility management
Popular as new Jhum perennial crop see WP on Integrated Production and Marketing
Potato Appropriate use of agro-chemicals, disease control, increased productivity, processing, income generation
Seed production, market linkage, PPP with seed / processing
Major commercial crop but blight is a serious problem. See WP on Integrated Production and Marketing
Orange Improved orchard management, increased productivity, local processing enterprises, income generation, jhum replacement crop
Grafted trees of improved varieties Use of MGNREGA funds for orchard renovation For all fruit trees - proper spacing, planting, management, use of drip/basin irrigation, eye-brow terraces on sloping land, intercropping in early years
see WP on Integrated Production and Marketing All fruit trees can make productive use of unused community and private lands, as well as jhum areas, and provide improved protection against erosion
Mango Orchard establishment, improved management, increased productivity, local processing enterprises, income generation, jhum replacement crop
Varieties and grafted trees Potential as a Jhum replacement crop
Litchi Orchard establishment, improved management, increased productivity, local processing enterprises, income generation, jhum replacement crop
Varieties and grafted trees Potential as a Jhum replacement crop
Temperate Fruits Orchard establishment, improved management, increased productivity, local processing enterprises, income generation,
Varieties and grafted trees Processing potential
Peaches, pears, plums etc.- proper selection of potential crops vs site essential

Republic of India
Meghalaya: Livelihoods and Access to Market Project
Final project design report - Working papers
81
Commodity Justification for Interventions Potential Interventions by LAMP Notes Honey Pollination, income generation, productive use of jhum areas Processing, packaging, & marketing in support of an
existing IBDLP apiculture programme
Tomato Appropriate use of agro-chemicals, disease control, increased productivity, processing, income generation
Develop options for blight control - no interventions envisaged by LAMP in initial stages
Major commercial crop but blight is a serious problem, serious overuse of pesticides
Other vegetables Increased productivity, more varied diet and improved child nutrition, enhanced hh income thru’ sale of surplus, potential for cooperatives and high value seasonal production
Drip irrigation to stimulate off-season production Vermicompost production and soil fertility management Packaging and marketing
Local shortage, much is exported to B'desh + Assam – good earning potential for those near town or border markets
Pulses & oilseeds General soil fertility management, and disease control through use of legumes as break crop, improved fodder
Inclusion of legumes in crop cycle as general intervention for improvement in soil fertility and fodder quality
Legumes important for cover crops and soil fertility
Banana Easily grown fruit, requires little labour, existing market, potential for processing and income generation
Improved planting material, drip irrigation, soil fertility management
Good local market
Cashew Declining yields, disease control, management overhaul – extension, productive use of jhum areas
Improved varieties and planting material, better tree spacing, eye-brow terraces on sloping land, intercropping in early years
Important crop, much exported to B'desh
Areca Control of bud disease, productive use of jhum areas None envisaged currently Important crop but little potential for future growth Black Pepper None None envisaged currently Potential for future growth Wild Pepper None None envisaged currently Potential for future growth Betal Vine None None envisaged currently Important crop but little potential for future growth Broomgrass None None envisaged currently Important crop but little potential for future growth Floriculture High earner, no Floriculture Association exists to support marketing None envisaged currently, well supported by Dept. of
Horticulture Floriculture in Ri-Bhoi suffering from poor market access currently – need for an Association
Strawberry Potential for LAMP to support mother plant nurseries for runner production – see Appendix 4
Production of planting material, irrigation, marketing
Tea 7 Emerging crop, several tea factories in Meghalaya, ready market for good quality tea
Well supported by Dept. of Horticulture and private sector – good potential for tea gardens in less steep areas of Jhum
See footnote - productive use of, and income from unused private and community lands
7
There are 4 private and 1 government tea processing factories in Ri-Bhoi District, which is the major area for tea plantations in Meghalaya; one of the private factories is reported to export tea to the UK for sale in Harrods. The State
government factory produces organic green tea for export. Nearly all tea is exported from the State.

Republic of India
Meghalaya: Livelihoods and Access to Market Project
Final project design report - Working papers
82
Table 12 Classification of Potential Crops for LAMP Intervention ( in bold, those crops and sectors on which LAMP will initially focus)
Category Crop Notes The following crops are already important and have potential for further development as commercial enterprises on a cluster basis:
Ginger Orange Pineapple
Potato Tomato Banana Turmeric Cabbage and other brassica
The following crops are now grown on a smaller scale or in limited areas, but also have potential for commercial development on a cluster basis
Strawberry
Fish Honey
Mushroom Mango Litchi
Citrus other than oranges Other fruits Rubber Coffee Pepper, chilli
Red cardamom Broilers Goats Floriculture Silk (eri)
plum, pear, pomegranate, passion fruit, kiwi fruit, other berries, and mango and litchi in the Garo Hills and more-sub-tropical parts of Jaintia and Khasi
The following crops are widely grown for sale, but it is not clear if LAMP could make any interventions to significantly improve farmer's income
Cashew Areca nut
Squash, pumpkin etc. Broomgrass Bamboo Tea
The following food crops are important, and need support via NRM-based initiatives
Paddy
Maize Tapioca, sweet potato, yam Pulses and oilseeds Pigs Backyard poultry
Cattle
Pigs also important as a commercial enterprise but may not develop on a cluster basis due to limited feed resources.

Republic of India
Meghalaya: Livelihoods and Access to Market Project
Final project design report - Working papers
83
H. Recommendations
1. Soil Fertility Management
Productivity of all crops, including the staple food rice, are low in Meghelaya, and there is a real need across the board, for all crops, to ensure that more focus is placed on soil fertility management; the following recommendations should become standard practice in extension efforts to improve productivity:-
a) as the soils are generally acid to strongly acid, liming should become standard practice to avoid aluminium and iron toxicity, and phosphorus deficiencies;
b) for the same reason, the use of bone meal should be encouraged; c) management of farmyard manure is very poor, and could be much improved through adoption
of a few simple inexpensive practices – see section G; d) despite the abundant vegetation in most of Meghalaya, little compost is prepared to maintain
chemical and physical soil fertility – compost preparation, in the kitchen gardens, jhum areas and other more permanently crops areas needs to be encourage;
e) preparation of vermicompost, through on-farm use of the plastic Silpaulin vermi-bins, will also assist in maintaining fertility on smaller plots, such as kitchen gardens and areas under strawberry;
f) little fertilizer is used, bar in the tomato and potato crops, and sensible and balanced use of commercial fertilizer and farmyard manure and compost needs to be encouraged;
g) where agricultural enterprise areas are launched, productivity will need to increase, and in these areas, it is important to have the soils tested by the regional research teams of DoA and DoH, so that fertility management is based on more than a hit and miss rule of thumb, and that potential micronutrient toxicities (Al and Fe) and deficiencies (Bo and Mo) are identified.
2. Bio-pesticides
The wide-ranging flora of Meghalaya provide ample opportunity for the on-farm preparation of bio- pesticides – see section G for further information. Many Meghalayan farmers have their own recipes and indigenous technologies for pest and disease control, but these are not documented. It is recommended that:-
a) funds are committed for a 3 to 6 month consultancy team, comprising a senior consultant and two MSc agricultural graduates, to document indigenous practices for controlling pest and diseases through a focused survey of both groups and individual farmers in 100 villages spread over the 11 districts – part of the knowledge management strategy;
b) the preparation of bio-pesticides is encouraged and included in a standard productivity package especially for high value crops and kitchen gardens;
c) where cattle exist, it is recommended that cattle sheds are simply and cheaply redesigned so that cattle urine can be collected and used as a base for bio-pesticide preparation – the mixture then has the added value of a plant tonic (cattle urine contains approximately 1% nitrogen).
3. Rice
Rice is the main staple, but productivity is low in both the valley bottom paddies and the upland and jhum areas. In order to improve food security, and thus reduce the need for short-term migration for off-farm work and providing more time for local enterprise development, extension efforts need to focus on significantly improving rice yields, and reducing the drudgery of hand tillage. It is recommended that:
a) close contact is maintained with the on-going Rice Mission and IRRI, as these are focused on yield improvement through selection of improved varieties and other interventions;
b) soil fertility is improved through the measures listed above; c) beds are prepared for seedling production and later transplanted, and that recommended
spacing is used – broadcasting of seed should be minimized as far as is possible; d) SRI can be used for those farmers who are interested, but this production system will only be
for the more technically advanced and interested farmers;

Republic of India
Meghalaya: Livelihoods and Access to Market Project
Final project design report - Working papers
84
e) efforts should be made to find an entry point in relation to increasing the use of cattle, where feasible, and machinery in tilling the valley-bottom paddies – it is a unique experience in the 21
st century to watch teams of young men turning over the top 4 to 6 inches by hand for
extensive areas of paddy – the entry point at which communities commit themselves to mechanized tillage may correspond with the establishment and success of local cash crop enterprises;
f) awareness raising on alternative cropping systems need to be undertaken by LAMP in order to encourage double and relay cropping – eg. rice can be followed by a pulse or legume crop over the winter (providing bamboo fences are constructed to protect from grazing livestock. Paddy bunds might also be planted with a legume crop, climbing beans can be sued in the maize crop, which will increase the productivity of the paddy areas.
4. Crop interventions for LAMP
There is a wide choice of crops in Meghalaya on which to base local cash crop enterprises, and it is recommended to focus on those crops which have already a proven market, but where potential remains for productivity increases, upscaling and outscaling production, value addition through quality production, and improved market conditions.
Such crops include ginger, turmeric, orange, pineapple, banana, but there is ample scope for both sub-tropical and temperate fruits. Recommendations for each block have been provided in this report, but production clusters and final choice of focal crops need to be identified by experienced workers on the ground in Meghalaya.
Associations of farmers growing the same crop (eg. the Strawberry Association) appears to have several advantages – general support in all aspects, more attractive to investors, collective storage and distribution of inputs and product, more efficient marketing etc.. Floriculture is one of the relatively new industries but appears to suffer from poor marketing, especially in Ri-Bhoi district as there is no association or cooperative.
Livestock interventions are equally important, and the focus of these will also impact on soil fertility management. In parts of Ri-Bhoi and the Garo hills, cattle are quite common thus the base resource for farmyard manure production is available: however, production and storage methods of this valuable local resource are very poor. In other parts of Meghalaya, there are few cattle, but there a few pigs – pig dung can also make a useful contribution to soil fertility management, and extension on improved production and storage techniques is also required
5. Irrigation, Rainwater Harvesting and Water Storage
Winter water shortages are a common complaint, and there is a need for provision of economic storage techniques and simple irrigation schemes to enhance winter production, and water supply at a household level for the months of December, January and February. In the wettest region in the world, this seems an unusual situation, but there are very few places in south Asia that systematically collect and store run-off water during the monsoon, whether from bare slopes, streams and rivers, or village or urban rooftops. It is recommended that:
a) a demonstration village is established in each district, exhibiting the efficient collection and storage of monsoon rain from rooftops for use in the drier seasons; different means of collection (from bamboo gutters to sliced rubber pipes to gutters etc.) and different means of storage (eg. small to medium open and covered ponds, plastic and metal tanks, underground storage tanks etc.) should be displayed to visiting farmer groups;
b) funds should also be made available for the extension services to exhibit through demonstration, different forms of appropriate irrigation system for different crops – eg. lift pumps near rivers or other water source, sprinkler and microjet for orchards, drip for some of the fruit and spice crops and vegetables.
6. Extension Services
There is a clear need in many of the villages visited for greater knowledge and capacity building in many areas of land and animal husbandry and agricultural knowledge and skills. Even only

Republic of India
Meghalaya: Livelihoods and Access to Market Project
Final project design report - Working papers
85
somewhat isolated road-side and road-end villages suffered from lack of service from government institutions responsible for extension, and in some villages, there seemed to be an almost desperate need for assistance. There are many options available for LAMP to provide such a much needed extension service, but this will be decided based on experience for previous IFAD and GoI projects. The scale of such assistance also needs to be defined – is it LAMP’s responsibility to provide basic extension services for all, or how far will it reach? Will it provide assistance only to the selected enterprise clusters?
The options include:
a) training of trainers at one of the several training institutes in Meghalaya – eg. the Rural Resource and Training Centre (RRTC) in Ri-Bhoi;
b) utilize the Cluster Training Centres, 178 of which have been formed in 7 districts by MRDS; c) selecting community resource persons and lead/master farmers (male and female) in each
focal village to be trained at an appropriate institute, and then provide extension services to their own village, backstopped by district, project and private sector staff.
As a more effective government extension system that reaches a significant proportion of villages is not expected in the short or medium term, the target needs to be at least on CRP (community resource person) per village - these CRPs might be skilled local farmers, and need to demonstrate their leadership, good farming practices, enthusiasm for innovation and trying and testing, and should develop their own farm as a model for demonstration.
The training curricula to be received by the trainers-to-be, need to be scrutinized carefully by practical specialists in order to ensure their relevant and practical nature, and the inclusion of latest understanding and practices.
7. MGNREGA Funds
The funds available under this job-card scheme which guarantees 100 days of paid work for each households in India can be usefully used in many construction jobs, whether on private or public land. LAMP needs to raise awareness as to the uses that these funds can be put, in order that agricultural development work can be effectively assisted – for example, these funds might be used to isolate paddy areas with bamboo fences so that winter crops can be produced without risk from free-grazing cattle, planting jhum areas to orchard and plantation crops, and construction of rainwater harvesting and storage schemes.
8. Other Issues
a) It is recommended that improved honey bee promotion is introduced wherever farmers are interested – to stimulate increased income, pollination and biodiversity service enterprises - such as queen rearing, improved hives and bee management. Services of ICIMOD on queen rearing, improved hives and bee management techniques can be accessed.
b) Following discussion with experienced field agronomists and in some cases targeted studies, recommendations can be made on the value of extending alternative cropping systems, including minimum tillage, companion crops, potato followed by winter peas, and other such cropping practices which need to be properly documented in a practical handbook for the local and community resource persons.
c) A wide range of imaginative means of awareness raising and technology transfer needs to be embedded in the extension system – from local language pamphlets, through short street plays and hands-on demo sites, to self-explanatory digital video tutorials.
d) For some crops, it is worth investigating the pros and cons of organic certification – for example, tea is a marginal crop due to high labour costs, and the premium paid for organic tea may be worthwhile.
e) It is recommended that Integrated Natural Resource Management Plans are prepared for the focal villages at the outset – these should be quite detailed with a 5 year implementation period, and cover all aspects of natural resource development – such as changes to the jhum system (see the WP on NRM), water resource utilization, and planned cropping improvements and changes to support local enterprise development.

Republic of India
Meghalaya: Livelihoods and Access to Market Project
Final project design report - Working papers
86
f) The assistance of NESAC in Shillong can be sought for their satellite imagery resources and help in mapping village areas, and identifying the extent of jhum areas and possibly water sources.
g) Orchards are currently poorly managed and there is need for a mobile unit to provide very practical training in both planting and maintenance of orchard and plantation crops, and the potential for intercropping and mixed cropping within orchards.
None of the problems facing the agricultural sector are insoluble, but key amongst the solutions is an effective transfer of skills and knowledge to the farmers. LAMP must therefore ensure that a sound knowledge management system, an appropriate system of training trainers, and an effective extension service are high on the priority list.

Republic of India
Meghalaya: Livelihoods and Access to Market Project
Final project design report - Working papers
87
Appendix 1: Land use data by district
Table 1: Hectares
Land Classifications
Ri-Bhoi East
Khasi Hills
West Khasi
Hills
Jaintia Hills
East Garo Hills
West Garo Hills
South Garo Hills
Meghalaya
1. Forests (classed & unclassed) 86,902 107,080 206,515 154,025 124,525 164,759 102,283 946,089
2. Area not available for cultivation
(i) Area under non-agricultural uses
a. Water logged land - - - - 17 992 - 1,009
b. Social Forestry 2,416 3,028 3,050 2,679 2,372 2,628 3,025 19,198
c. Land under still water 2,024 4,299 5,307 3,751 2,613 6,149 3,169 27,312
d. Other land 9,681 11,911 17,390 11,532 1,622 4,982 1,147 58,265
Total (row a to d) 14,121 19,238 25,747 17,962 6,624 14,751 7,341 105,784
(ii) Barren and unculturable lands 19,358 34,249 48,694 13,820 4,654 7,191 3,778 131,744
Total = column i. & ii. 33,479 53,487 74,441 31,782 11,278 21,942 11,119 237,528
3. Other uncultivated lands
a. Permanent pastures and other grazing - - - - - - - -
b. Land under tree crops etc. 29,706 17,250 43,571 17,480 25,214 24,554 6,440 164,215
c. Cultivable wastelands 56,956 48,028 101,197 114,090 36,917 14,744 18,957 390,889
Total = (a+b+c) 86,662 65,278 144,768 131,570 62,131 39,298 25,397 555,104
4. Fallow lands ,
a. Fallow other than current fallows 8,861 5,924 47,722 17,619 20,238 35,282 19,534 155,180
b. Current fallows 6,173 4,795 18,959 9,750 4,915 10,689 4,812 60,093
Total = (a+b) 15,034 10,719 66,681 27,369 25,153 45,971 24,346 215,273
5. Net area sown 22,279 37,825 30,917 36,082 37,009 95,645 25,420 285,177
6. area sown more than once 2,916 7,809 6,772 339 5,337 25,369 5,498 54,040
7. Total cropped area 25,195 45,634 37,689 36,421 42,346 121,014 30,918 339,217
total reporting area (total of above) 244,356 274,389 523,322 380,828 260,096 367,615 188,565 2,239,171
8. Geographical Area 244,800 274,800 524,700 381,900 260,300 367,700 188,700 2,242,900
Source: Department of Agriculture. Note districts are “old” districts

Republic of India
Meghalaya: Livelihoods and Access to Market Project
Final project design report - Working papers
88
Table 2: Percentage of total area
Land Classifications
Ri-Bhoi East
Khasi Hills
West Khasi
Hills
Jaintia Hills
East Garo Hills
West Garo Hills
South Garo Hills
Meghalaya
3. Forests (classed & unclassed) 35.6% 39.0% 39.5% 40.4% 47.9% 44.8% 54.2% 42.3%
4. Area not available for cultivation
(i) Area under non-agricultural uses
a. Water logged land 0.0% 0.3% 0.0%
b. Social Forestry 1.0% 1.1% 0.6% 0.7% 0.9% 0.7% 1.6% 0.9%
c. Land under still water 0.8% 1.6% 1.0% 1.0% 1.0% 1.7% 1.7% 1.2%
d. Other land 4.0% 4.3% 3.3% 3.0% 0.6% 1.4% 0.6% 2.6%
Total (Column a to d) 5.8% 7.0% 4.9% 4.7% 2.5% 4.0% 3.9% 4.7%
(ii) Barren and unculturable lands 7.9% 12.5% 9.3% 3.6% 1.8% 2.0% 2.0% 5.9%
Total = column i. & ii. 13.7% 19.5% 14.2% 8.3% 4.3% 6.0% 5.9% 10.6%
5. Other uncultivated lands
a. Permanent pastures and other grazing
b. Land under tree crops etc. 12.2% 6.3% 8.3% 4.6% 9.7% 6.7% 3.4% 7.3%
c. Cultivable wastelands 23.3% 17.5% 19.3% 30.0% 14.2% 4.0% 10.1% 17.5%
Total = (a+b+c) 35.5% 23.8% 27.7% 34.5% 23.9% 10.7% 13.5% 24.8%
6. Fallow lands 0.0% 0.0% 0.0% 0.0% 0.0% 0.0% 0.0% 0.0%
a. Fallow other than current fallows 3.6% 2.2% 9.1% 4.6% 7.8% 9.6% 10.4% 6.9%
b. Current fallows 2.5% 1.7% 3.6% 2.6% 1.9% 2.9% 2.6% 2.7%
Total = (a+b) 6.2% 3.9% 12.7% 7.2% 9.7% 12.5% 12.9% 9.6%
7. Net area sown 9.1% 13.8% 5.9% 9.5% 14.2% 26.0% 13.5% 12.7%
8. area sown more than once 1.2% 2.8% 1.3% 0.1% 2.1% 6.9% 2.9% 2.4%
9. Total cropped area 10.3% 16.6% 7.2% 9.6% 16.3% 32.9% 16.4% 15.1%
total reporting area 100.0% 100.0% 100.0% 100.0% 100.0% 100.0% 100.0% 100.0%

Republic of India
Meghalaya: Livelihoods and Access to Market Project
Final project design report - Working papers
89
Appendix 2: Crop Calendars
= planting of seeds and seedlings = harvesting
Food Crops Jan Feb March April May June July Aug Sept Oct Nov Dec Notes Rice – main crop
seedling planting- out
harvest rice is also grown in other seasons at lower elevations
Wheat usually grown as a winter crop Oats, Barley usually grown as a winter crop Maize Pulses/lentils can be grown as a winter or summer crop, depending on variety – highly recommended to include in any crop rotation useful winter crop in the paddy areas Oil Crops Mustard usually grown over the winter Soya usually a summer crop Fruit Crops Orange
seedling plantation fruiting at 4-6 yrs, ~20 yr lifespan –
some varieties harvested in July- August
Assam Lemon seedling plantation fruiting at 4-5 yrs, ~20 yr lifespan Pineapple slip planting sucker + fruiting at 1-1.5 yrs, ~10 yr lifespan Banana
sucker planting
sucker planting fruiting 1-2 yrs mainly in June and July, but depends on variety
Mango
seedling plantation fruiting at 5-7 yrs, ~50 yr lifespan – harvested in June
Litchi May + June seedling plantation fruiting at 3-5 yrs, 30-35 yr lifespan Kiwi budded seedlings fruiting at 4-5 yrs, ~35 yr lifespan Guava seedling plantation fruiting at 4-6 yrs, ~35 yr lifespan
Peach/Apricot seedling plantation
seedling
fruiting at 7 yrs, ~45 yr lifespan
Pear seedling plantation fruiting at 7 yrs, ~45 yr lifespan Plum budded seedlings seedling planting fruiting at 7 yrs, ~45 yr lifespan
Strawberry
see Appendix 4 for further details
planting runners fruiting at max 2 yrs, annual replanting usually practiced

Republic of India
Meghalaya: Livelihoods and Access to Market Project
Final project design report - Working papers
90
Other Cash Crops Jan Feb March April May June July Aug Sept Oct Nov Dec Notes
Vegetables different vegetables can be grown throughout the year (winter, spring, summer) especially at lower altitudes – protection from the monsoon rains and browsing free-range livestock is required (bamboo polyhouses and fences work well), and irrigation (eg. simple drip kits) is required in winter
a very wide variety of vegetables can be produced in Meghalaya
Mushroom
cooler areas
warm areas spawning and harvest temperature and variety dependent
Flowers depends on variety
Tea
planning of seeds plucking usually starts in June; 4 yrs to first harvest, 70 yr lifespan
Potato in the hills plains hills in lower areas 3-4 months to harvest
Tomato
hills and plains
for
winter
crop 80-90 days to harvest – tomatoes will be harvested betwee Sept-Nov, or March to June
Ginger hills and plains 5-6 months to harvest Turmeric hills and plains 5-6 months to harvest Tree Crops Cashew seedling plantation fruiting at 3-5 years, ~ 70 year life span Areca seedling plantation fruiting at 5-6 years, ~ 50 year life span

Republic of India
Meghalaya: Livelihoods and Access to Market Project
Final project design report - Working papers
91
no
of
users
to
pre
pare
Git
imal
Appendix 3: Bio-pesticide Production from Local Resources
Bio-pesticides are not unknown in Meghalaya, and many villages base part of their pest and disease management programmes on use of natural resources –examples include:
a) mix “the hottest chili in the world” (bhot jalukkia – Assamese) in water, and spray any pest/insect
observed in paddy – East Khasi Hill remedy; b) in Ri-Bhoi, the small wetland crabs are killed and the shell cracked – these are put on the end of
a stake and several placed around the paddy land – this is said to be effective against the rice bug which sucks the rice grain at the milky stage – the rice bug sucks on the crab juice instead;
c) Cannabis sativa and Artemisia are used in paddy storage, and placed on top of the stored paddy – the smell of these plants has a deterrent effect on the bugs;
d) Lantana camera is also used to repel the tuber moth from stored potatoes.
There are many local methods for protection of stored crops, and these differ from community to community.
This appendix provides a brief summary of some of the work undertaken in Nepal on bio-pesticides which may be relevant to the Meghalayan situation.
Bio-pesticides are promoted in Nepal through the Swiss Sustainable Soil Management Programme which aims to reduce dependence on expensive agro-chemicals, often unobtainable and of questionable quality, and assist the farmers to rely more on the local resources. A survey of 25 farmers in Myagdi and Baglung Districts (7 female, 18 male) is summarised below.
The farm-made bio-pesticide (GitimaI in Nepali) also acts as a liquid fertilizer, as it is prepared by fermenting
different types of locally available botanical constituents in cattle/buffalo urine. Findings included: a) all farmers were preparing gitimal with botanical constituents available locally near their farm, b) farmers currently use plants which have a pungent smell and/or bitter taste to prepare gitimal, c) different farmers use different plant types and different combinations, and allow the admixture to
ferment for different periods of time, d) some farmers using water and not urine as a solvent, added mustard cake to increase effectiveness
– but gitimal made with urine was considered more effective,
e) the solvent:water ratios used at the time of application were different.
The most common constituents of Gitimal found in the survey are recorded in Figure 1.
Constituents of gitimal
25 23
20
15
10
5
0
19 20 23 22
16 13
10
23
18 18 19
13
1 1 3
Different plants
no of farmers
Figure 1 Plants used in the preparation of Gitimal. (N=23)

Republic of India
Meghalaya: Livelihoods and Access to Market Project
Final project design report - Working papers
92
The following recipe for Gitimal is typical.
Preparation
a) 2/3rds
of a 20 or 50 litre drum is filled with cattle urine (or water);
b) the remaining 1/3 rd
is filled with twigs or leaves or both of the above listed constituents; c) the lid of the drum is then closed securely; d) 25 to 45 days (in summer 25 to 30 days and in winter 40 to 45 days) are allowed for the
fermentation process; e) every week the urine and botanical parts are stirred to encourage fermentation and proper mixing
of the constituents.
Application
The final solution, both a liquid fertilizer and a botanical pesticide, is applied to the in-field crops after mixing with water in the following ratios:
a) for very small plants, the ratio in common usage is 1 gitimal : 8 to 10 water;
b) for larger plants, the ratio is reduced - for a large tree, ratios of 1:2 are used;
c) it is reported that if the solution is used at a ratio of 1:1, plants will be damaged, although such a strong solution kills aphids and the larva of the cabbage butterfly.
Not all farmers adopt bio-pesticides for the following reasons. According to the farmers: i) the major reason behind the low adoption rates was the late or slow response of bio-
pesticides in effecting an insect or disease attack; ii) another reason stated was that preparation of bio-pesticides took a long time – up to 6 weeks; iii) bio-pesticides are generally only preventive, not curative – so in many cases, once a crop has
been attacked or is badly affected, another means of control is required; iv) lack of knowledge regarding bio-pesticide preparation and use.
The farmers however stated there was no problem with availability of appropriate plants for Gitimal preparation. Farmers who make such bio-pesticide preparation and use a regular farm routine, however, do not have the above listed problems, as they spray plants regularly (typically every 2 weeks), with the result that plants are strong, and many diseases and pests are prevented or controlled.
Use of pesticides amongst respondents All respondents were using bio-pesticide or botanical or organic pesticide for the management of insect pest. 5 (20%) were using only bio-pesticides, and the remaining 20 (80%) were using bio- as well as commercial pesticides. None of the respondents were using only commercial pesticides.
The main reasons given for using both types of pesticide was that bio- or botanical pesticides were ineffective for some types of insect attack and disease. Another important reason for using commercial pesticides was lack of knowledge and information about bio-pesticides. 30% of chemical pesticide users had faced problems in the application of such pesticides - most of those facing problems with chemical pesticides, however, were not taking safety measure and had suffered headaches, burning of the eyes and skin, and dizzy feelings.
Of those using bio-pesticides only, 40% answered that the main reason for not using chemical pesticide was its harmful effect , while 40% said that it was necessary to use only bio-pesticides for insect pest management; 20% stated that chemical pesticide were not available.
The following two tables provide further information on the use of bio-pesticides in Nepal that may be suitable and appropriate in Meghalaya and provide inspiration to the farmers.
Recommendation
It is important that the local indigenous knowledge on local methods and materials for controlling pest and disease outbreaks is documented before it is lost. LAMP should provide funds for employing a short-term local consultant to undertake field trips, collect and collate indigenous methods of pest and disease control, and document the findings in a living document than can be updated annually during the life of the project. It may be a good idea to embed this endeavour at one of the local NRMcolleges, universities or training institutes to ensure that such a document has a life beyond the project.

Republic of India
Meghalaya: Livelihoods and Access to Market Project
Final project design report - Working papers
93
Common Water-based Bio-pesticides Used in Nepal
Problem Technique Notes on technique Farmer Quotes Red ants Stinging nettle and water
solution 1) Soak 500 gm stinging nettle in 1 litre of water for 24 hrs. 2) Filter the solution. 3) Before application, mix in a further 1 litre of water.
4) Spray the final solution in red ant affected area or plants. (Other ingredients used include ash, kerosene, century plant, leaf and petiole of the Malabar tree, pepper, mug-wart, and chili, ginger, and garlic.)
“Effective in killing or repelling the red ant”. “For mature plants, the ratio of
solution can be increased; more concentrated solution may also kill red ants”.
Aphids and bugs of beans
Tobacco leaf and water solution
1) Boil 500 gm tobacco leaf in 1 litre of water for 5 minutes and let it cool down.
2) Mix 3 or 4 parts of water with the prepared solution and spray it on insect infested area.
“Effective in controlling aphids
and bugs of bean”.
Larva of cabbage
Butterfly and Aphid
Stinging nettle and water solution.
1) Soak 500 gm stinging nettle in 1 lit of water for 24 hours.
2) Filter the solution. 3) Mix 1 part of water with 1 part of solution, and spray on insect infested plants
“Effective in destroying aphids
and minimize the cabbage butterfly attack.”
Fruit Borer of tomatoes
Stinging nettle and hot chili solution.
1) Soak 2.5kg of stinging nettle and 100 gm of hot chili in 5 litres of water for 24 hrs. 2) Filter the solution and dilute 1:1 with water. 3) Spray the final solution on the insect infested plants.
“Effective in killing or repelling fruit borer in tomatoes”.
Aphids, Red ant, Larva of cabbage butterfly, cut warm
Tobacco and soap solution 1) Add 125 gm of Tobacco leaf to 1 litre of water and boil it for 15 minutes.
2) Filter the solution 3) Add 20 gm of soap and mix it well into the filtered solution. 4) Mix 1 part solution to 4 parts water, and spray in cool conditions every 10 days.
“This is effective in repelling red
ant, cut worm, bean bug and larva of cabbage butterfly, and killing aphids”.
Insect of ladies finger and cucumber
Solution of tobacco and stinging nettle
1) Boil 250 gm of green tobacco leaf and 250 gm of stinging nettle in 1 lit of water for 15 minutes.
2) Cool the solution, filter and spray on insect infested area of ladies finger and cucumber.
“Effective in minimizing general insect attack”.
Aphids and Red ant
Solution of hot chili 1) Grind 500 gm green hot chili and make a paste
2) Mix 1 lit of water in the chili paste and apply the solution to insect infested parts of plants.
“Effective in managing aphids and red ant”.
Soft bodied insects
Solution of Garlic, Onion, Hot chili and kerosene
1) Grind 4 garlic bulbs, 2 onion bulbs, 2 gm of hot chilli and 10 gram of soap. 2) Soak the mixed paste in a half litre of water for 24 hrs. 3) Add 2 spoon of kerosene in the solution. 4) Mix 1 part solution with 3 parts water and spray the insect infested plants.
“It will control the insect with soft bodies”.
Powdery Mildew Curd solution 1) Put curd in a copper pot for 1 week. 2) After 1 week apply it to the PMD infected leaf.
“This will also help to repel the red ant”.
Nematode 1) Planting of marigolds within crop, around crop or as intercrop (Commonly used by polyhouse tomato farmers)
General protection Solution of Urine 1) Prepare a solution of urine and water in the ratio 1:4. 2) Spray the solution on the bug-affected plant, which can repel bug and minimize
the losses.
(Cattle urine probably acts as a fertilizer and boosts general plant health and resistance)

Republic of India
Meghalaya: Livelihoods and Access to Market Project
Final project design report - Working papers
94
Other Local Agronomic Techniques for Pest and Disease Control in Nepal
Problem Local Technique Notes on technique Red ants 1) Plantation of carrot next to the potato field.
2) Water management.
3) Solution of kerosene and water. 4) Solution of kerosene, water and ash.
1) Red ants are attracted towards the carrots, thus limiting the damage to the potato crop; requirement: - single carrot plant for 10 to 20 plants of potato.
2) Keep soil moist. Soil moisture hinders the activities of red ant. 3) Mix 2 spoons of kerosene in 1 litre of water and spray it on insect infested plants – this repels
red ants and other bugs and beetles. 4) Mix 2 spoons of kerosene in 1 litre of water and mix in a handful of ash - spray it on insect
infested plants – this repels the red ants.
Fruit fly 1) Use of pheromone trap. The smell released from the pheromone trap attracts the adult female fruit fly, and they are
trapped - generally use 2 traps for every 10 x 6 m2
area.
Larva of cabbage butterfly
Hand picking of eggs and larva of cabbage butterfly off the plant
Minimizes population, but only worthwhile in high value crops
Cabbage butterfly Intercropping with garlic, onion and tomatoes. The plants help to repel the larvae.
Nematodes 1) Plantation of marigold as trap crop.
2) Green manuring of mustard. 3) Plantation of stinging nettle and basil in a tomato field
1) Plant the marigold around the field or polyhouse of tomatoes
2) Incorporate the mustard into the soil at the flowering stage. 3) An intercropping technique.
Viral disease 1) Good seed selection
2) Solution of urine
3) Solution of Cow milk.
1) For some vegetable crops, seeds are the carrier of plant diseases – purchase seed from a reliable source 2) Mix the urine and water in a ratio of 1:4 to 1:6 and spray viral infested plant parts – can help minimize losses. 3) Mix the cow milk and water in a ratio of 1: 4 to 1:8, and spray viral infested plant parts at 7 to 15 days interval as deemed necessary - can help minimize losses.
Damping off disease 1) Use of Ash powder in nurseries 1) Damping off can be minimized by spreading ash in the nursery beds.
General 1) Early plantation can minimize insect and disease infestation.
2) Crop rotation for nematode management.
2) 3 or 4 yr crop rotation in the rice, maize, wheat crops help to minimize nematode infestation.

Republic of India
Meghalaya: Livelihoods and Access to Market Project
Final project design report - Working papers
95
Working Paper 4: Natural Resource Management
I. Introduction
1.1 Purpose of the Working Paper
IBDLP seeks to promote basin-centred natural resource planning and management to ensure water, food and livelihood security for the people of Meghalaya. LAMP will support this objective by promoting Integrated Natural Resource Management (INRM) along with improving food crop production.
The purpose of this Working Paper is to:
Review the status and management of natural resources in the State, highlighting key issues and challenges in natural resource management, and
Outline activities to be included in the project design for improved management of natural resources and improvement of food security.
1.2 The State of Meghalaya
One of the eight north-eastern States of India, Meghalaya comprises the territory forming the erstwhile United Khasi and Jaintia Hills district and the Garo Hills district of Assam. These were initially designated as Autonomous Districts within the State of Assam in April 1970 and later together became a full-fledged State of the Indian Union in January 1972. The State is bounded by the Brahmaputra valley of Assam in the north and north-west, the hilly Karbi Anglong and Dima Hasao Autonomous Districts of Assam in the east and the Surma-Meghna valley of Bangladesh in the south and south-west. Stretching about 300 km from east to west and 100 km from north to south, Meghalaya has an international boundary of about 450 km with Bangladesh. The long rainy season and high rainfall experienced by the State justifies the name Meghalaya which in Sanskrit means the abode of clouds.
The geographical area of the State is 22,429 sq km and it is divided into 11 administrative districts. Meghalaya is largely rural with 2.37 million people (430,573 households) out of a population of 2.97
million (548,059 households) living in approximately 6,000 villages1. The East Khasi Hills district
where the State capital Shillong is located accounts for 61.55% of the State’s urban population. The population in the remaining 10 districts is 89.32% rural with Jaintia Hills reporting a rural population of almost 93%.
The State is predominantly inhabited by Scheduled Tribes (ST) and accounts for approximately 2.36% of the national ST population against less than 0.25% share in total population. With the exception of the undivided West Garo Hills where the ST population is about 73.69% and East Khasi Hills (80%), the ST population in all other districts is 89% to 98%. The population of Scheduled Castes is a minuscule 0.58%, largely concentrated in West Garo and East Khasi Hills. The Garo tribe inhabiting the western part of the State and Khasi and Jaintia in the eastern part are the principal ST communities in Meghalaya besides a small population of plain tribes, such as Rabhas, Koch, Bodos, etc. Meghalaya has the fourth largest population of people blow the poverty line (BPL) among the
North-eastern States2. The population density of Meghalaya is 132 per km
2 (India 382); it is 109
outside East Khasi Hills district and as low as 73 in the undivided West Khasi district.
Farming comprising of both settled and shifting ( jhum) agriculture, horticulture and plantations, forestry, livestock rearing, collection of forest produce and unskilled work (agriculture, public works, coal mining and brick kilns) are the principal livelihood sources for the rural population. The livelihood composition varies across households depending on ownership of/access to land, connectivity and nearness to markets and skills/exposure to technology.
Meghalaya is endowed with sizeable deposits of a number of valuable minerals. Coal, limestone, uranium, granite, kaolin, clay and glass sand are the principal minerals.
1 Census of India 2011 recorded a population of 2,966,889 people in the State of Meghalaya, of which 2,371,439 were rural.
2 GoI, Planning Commission, Report of the Tendulkar Committee, November 2009.

Republic of India
Meghalaya: Livelihoods and Access to Market Project
Final project design report - Working papers
96
The Khasi Hills and Jaintia Hills which form the central and eastern parts of Meghalaya constitute an imposing plateau with rolling grassland, hills and river valleys. The southern face of the plateau is marked by deep gorges and abrupt slopes, at the foot of which a narrow strip of plain land runs along the international border with Bangladesh.
II. Natural Resources
Natural resources of land, water and forests are principal sources of livelihoods for the rural people in Meghalaya besides providing water, food and climate security to all the people in the State. Indeed, due to its location and terrain Meghalaya affects the ecological security of the neighbouring region, especially the northern plains of Bangladesh into which over half of the State’s rainwater runoff is directly discharged. Agriculture is the main source of livelihoods for over 70% of rural households. Given its climate, the State’s natural resources offer tremendous potential to produce a wide variety of fruits, flowers and medicinal and aromatic plants besides supporting agriculture and livestock rearing to provide food and nutrition security to its population. Improving the management of natural resources offers the greatest opportunity for enhancing the livelihoods of the people, especially the rural people in Meghalaya.
2.1 Physical features
Meghalaya is a remnant of a plateau of the Pre-Cambrian Peninsular shield, lifted to its present height in the course of tectonic events millions of years ago. Known as the Meghalaya Plateau or the Shillong-Mikir massif, it represents the detached north-eastern edge of the Indian Peninsular shield. A part of the shield, known as Malda gap (between Raj Mahal hills in Chhota Nagpur and the Shillong Plateau), lies beneath the alluvium deposited by the Ganga-Brahmaputra system of rivers and forms the alluvial fringes of the State. The elevation of the Meghalaya Plateau varies between 150 meters to 1965 meters above sea level. The western part of the plateau or the Garo Hills has an average elevation of 600 m above sea level. The most important relief feature of this part of the plateau is the Tura range with its highest point at Nokrek, about 1515 m above mean sea level. This part of the plateau slopes down to the Brahmaputra valley in the north and drops down sharply toward Bangladesh in the south and west. The central and the eastern part of the plateau forming the Khasi and the Jaintia Hills is characterised by the presence of many highly eroded rolling and flat surfaces, flat-topped hills and narrow valleys along rivers and smaller drainage channels. The central upland zone to the east of the Garo Hills is the most important relief feature of the plateau and covers more than one-third of its area. The highest point in this part of the plateau and that of the entire State is the Shillong peak at about 1965 m above mean sea level. The plateau with rolling grasslands and hilly outcrops interspersed by narrow river valleys forms the main physical features of Meghalaya.
The State can broadly be divided into three natural formations: the central plateau, the southern fringes and the northern fringes. The central plateau is the main relief and forms the highest region of the State with elevations between 1230-1850 m above mean sea level. It comprises the Khasi and Jaintia highlands and is the origin of all the main rivers in the State. The southern fringes begin as a continuation of the central plateau, with irregular features due to sudden drops and depressions and end into a continuous escarpment with steep slopes approaching the Bangladesh border. The northern parts of the State represent a gradual lowering of the central plateau, maintaining its broad features of narrow valleys and hilly outcrops, till it merges with the Assam border.
The State is part of two major river basins, the Brahmaputra with a catchment of 11,598 km2
(51.71%
of the State’s area) and the Surma-Meghna river system with a catchment of 10,831 km2
(48.29% of the State’s area). The two basins are separated by the Tura range in the Garo Hills and the central highlands across Khasi-Jaintia Hills. The important rivers of the Garo hills are Didram, Krishnai, Dudhnai, Didak, Ghagua and Ringgi flowing south to north and Daru, Dilni, Ganol, Singwil and Golang flowing east to west into the Brahmaputra; and Darang, Bandra, Bugi, Dareng and Simsang flowing north to south into the Meghna. The rivers in the central and eastern parts of the State are Umsiang, Umkhri, Umiew or Barapani, Umta and Umiam flowing south to north and Wahsung, Mynriang, Myntiang and Umlurem west to east into the Brahmaputra; and Umgot, Kynchiang or Jadukata, Umsohringkew and Myntdu flowing north to south into the Surma-Meghna system. The hilly terrain with steep slopes leads to high surface run-off during the monsoon, exacerbated in recent years by changes in land use, loss of vegetation and urbanisation. As the rivers of the State are non-glacial, their discharge falls sharply during the summer. Consequently, the area experiences shortage of

Republic of India
Meghalaya: Livelihoods and Access to Market Project
Final project design report - Working papers
97
drinking water during January-March. With these overall features, there are of course micro-level variations in the terrain that define the physical features of individual human settlements.
2.2 Land use
Approximately 0.219 million hectares (m ha) or 9.83% (all India 47%) out of the 2.2429 m ha geographic area of the State is cultivated and 0.046 m ha or 2.06% of the geographical area is sown more than once. Assuming the fallow land is cultivable (some of the scrub land would also be cultivable under appropriate management systems), less than 49% of the cultivable land, already limited due to the terrain, is presently sown. The effective cropping intensity (ratio of gross cropped area to arable area) is thus less than 59% though the nominal cropping intensity (ratio of gross cropped area to net sown area) is 120% (all India 134%)
3. Since farming is largely rain-fed, land use
would vary somewhat across years.
About 42% of the geographical area in the State is under forests, mostly as private and community forests and scared groves since government forests (including National Parks and Sanctuaries) constitute only about 5% of the forest area. About 10% of the land is not cultivable and another 27% is culturable waste and in miscellaneous use. The availability of cultivable land (area sown and fallows) per rural person varies across districts, with East Khasi Hills having only 0.09 ha, followed by Jaintia Hills and Ri-Bhoi at about 0.15 and 0.16 ha, respectively. South Garo Hills has 0.33 ha cultivable land per rural person and the State as a whole 0.19 ha. Yet the nominal cropping intensity is about the same across districts at about 120% except in Jaintia Hills where it is about 100%.
Apart from low intensity (mono-cropping is practised over most of the cultivated land), land use is significantly affected by the hilly terrain of the State. Over 88% of the area is in moderate, moderately steep or steep slopes (see Annex 2) and cannot be used for growing field crops without appropriate land development measures, such as terracing and establishing hedgerows. The south-eastern part of the State (the southern portions of the Jaintia and Khasi Hills) has steeper slopes overall higher altitudes while the central plateau has gentler slopes. Altitude, similarly, would affect the extent of cultivation as the growing season is severely curtailed in regions with severe winter and prevalence of frost. Finally, aspect affects the crops that can be grown and how critical frost is as it determines the period of exposure to direct sun light. These factors together restrict the area available for normal cultivation, which is largely confined to narrow valleys, homestead lands, plateaus and southern slopes. This perhaps explains the considerable variations in the land use pattern in different parts of the State.
About 17% of the geographical area of the State is classified as wasteland, including 2% area under current or abandoned jhum cultivation. Some of the scrub land, classified as wasteland may be abandoned/discarded jhum land and could be put to productive use with suitable development/ amendments. Rocky and stony land that cannot be used is only about 1% of the geographical area.
2.3 Soils
Being a hilly region, Meghalaya has a wide range of soils in terms of depth, texture, structure, fertility and drainage properties, broadly derived from gneissic complex parent materials. Soils are largely lateritic and deep to moderately deep with the depth of soil varying from 50 to 200 cm in different parts of the State. Broadly, the central part of Garo Hills and central uplands of Khasi and Jaintia Hills have red loamy soils formed as a result of weathering of granite, gneisses, diorites, etc. Red and yellow fine textured soils, ranging from loam to silty loam are found along the southern fringes of the red loamy soils. Lateritic soils are present in the northern part of the State. Alluvial soils are found all along the northern, western and southern fringe of the State, with sandy to clayey-loam texture. Soils are by and large highly leached, rich in organic carbon with high nitrogen supplying potential, but deficient in phosphorus and potassium. Soil reaction varies from acidic (pH 5.0 to 6.0) to strongly acidic (pH 4.5 to 5.0). There is not much difference in fertility classes of the soils across the State.
Soils occurring on higher altitudes under high rainfall belt are strongly acidic due to intense leaching. These tend to be excessively drained and erosion-prone. Soils on very steeply sloping hill escarpment
3
Cropping intensity is usually calculated as the ratio of gross cropped area to net sown area. Much of the farmland in Meghalaya is along valleys with paddy as the main crop. Since terracing is by and large absent as compared to the Central Himalayas, the gentler slopes are by and large not cultivated. It would therefore be useful to look at land besides the valleys that could be cultivated with appropriate land shaping/development interventions.

Republic of India
Meghalaya: Livelihoods and Access to Market Project
Final project design report - Working papers
98
are moderately deep, excessively drained, with coarse-loamy texture, sandy surface with very severe erosion hazard and strong stoniness. Soils on steeply sloping side-slopes of hills are generally moderately deep, excessively drained, with fine-loamy surface. These have severe erosion hazard. Soils on moderately steep side-slopes of hills are deep to moderately deep, excessively drained, with fine loamy surface, moderate erosion hazard and strong stoniness. Soils on moderately sloping side- slopes of hills are deep to moderately deep, excessively drained, with fine loamy surface and moderate erosion hazard. Soils on gently sloping side-slopes of hills are deep to moderately deep, excessively drained, with fine loamy surface and some erosion hazard. Soils on level valley bottoms tend to be deep, very poorly drained, fine in texture with clayey surface and prone to water logging. Soils on gently sloping valleys tend to be deep, well drained, having fine-loamy surface. These are suitable for all kinds of crops with proper management of water. Soils on very gently sloping plains tend to be deep, inadequately drained with loamy surface and mild erosion hazard.
2.4 Water resources
Meghalaya is home to the world’s wettest places—Mawsynram and Cherrapunji in the East Khasi Hills district. Mawsynram, a village west of Cherrapunji has recorded annual rainfall of about 17,800 mm and Cherrapunji has an average annual precipitation of about 11,430 mm during the monsoon season. The State has on an average 160 rainy days in a year, spread over 6 to 8 months from March to October.
The State is criss-crossed by a large number of rivers and rivulets that drain into the Brahmaputra in the east, north and west and the Meghna in the south. Though a census has not been carried out, there are perhaps thousands of springs across the State that serve as drinking water sources in villages during April-November.
The Central Groundwater Board of the Government of India has recently prepared a Groundwater Atlas
4 for the State at 1:250,000 scale. It estimates the annual gross dynamic groundwater recharge
of Meghalaya as 1.234 billion cubic metres (BCM), of which 1.014 BCM could be utilized for irrigation after accounting for water requirements for domestic uses. The report estimates the level of ground water development in the State as 0.15% of available potential. The report also points out that the hydro-geological characteristics of the State are heterogeneous and complex due to lateral variations in geological formations and the rugged terrain. According to the report the unconsolidated alluvial formations and the semi-consolidated sedimentary (Tertiary) formations in the western fringes of Garo hills have the most productive aquifers of the state (see Annex 5).
The gross irrigation from government projects is estimated to be about 25,000 ha or 9.5% of the gross cropped area (GCA) and from private sources approximately 48,900 ha or about 18.5% of the GCA.
5
2.5 Agro-climatic characteristics
The Indian peninsula is divided into 15 Agro-climatic Zones and Meghalaya falls into Zone II, the Eastern Himalayan Region that includes Sikkim, Assam, Meghalaya, Mizoram, Nagaland, Tripura, Arunchal Pradesh, Manipur and the hill districts of West Bengal. The Zone II is further sub-divided into five sub-regions based on rainfall, soils, topography, temperature and cropping systems. Meghalaya falls into Sub-region II of Zone II. The State is further sub-divided into five Agro-climatic Sub-zones to facilitate planned development of the resource base. These are shown in Annex 6. Broadly, these correspond to the warm and humid northern and north-eastern hilly rim, the humid western parts of the central plateau with warm summers and cool winters, the humid eastern parts of the central plateau with severe winters, the warm and wet south facing slopes in the east and the hot and humid south facing slopes in the west.
2.6 Land Tenure System
Meghalaya is covered under the Schedule VI of the Indian Constitution. As such, land tenure is administered according to customary law. The land tenure system in vogue is complex. Though land among the three major tribes, the Khasi, the Garo and the Jaintia belongs to clans, communities and individuals, there are variations across the three. The system is also under stress from attempts at privatisation. Among the Garo tribe all land is originally A‘khing land, held by a clan or ma‘chong
4
Aquifer Systems of Meghalaya, Govt. of India, Ministry of Water Resources, Central Ground Water Board, North Eastern Region, Guwahati, September 2012. 5
http a ricoop.nic.in harif 11 State e halaya.ppt

Republic of India
Meghalaya: Livelihoods and Access to Market Project
Final project design report - Working papers
99
under the custody of the head of the clan called Nokma. All members of the tribe resident in the village can use the land for jhum, which reverts to the community once the jhum cultivation is over (another household can practice jhum on such land in subsequent periods). However, land on which a house has been constructed or which is under permanent cultivation, such as for paddy cultivation, plantations or horticulture remains under the control of the occupant and reverts to A‘khing status if
the occupant abandons it. In recent years individuals have been obtaining title deeds on such land from the District Council so that they can retain ownership even as absentee landlords. In the Jaintia Hills land can be Ri Kynti or private land, Raij land or land under the administration of the Syiem or Doloi which subjected to payment of annual revenue and Zamindars land which is owned by the big landholders or Zamindars who lease out their land on the basis of rent in cash or kind. Among the Khasis the lands are classed as Ri Raid or community land, Ki Ri Kynti or land belonging to individuals and Ki Ri Kur or clan land. Community lands cannot be alienated but Clan land, though traditionally held in trust for the use of a particular clan, has over the years been divided up. The process of privatization has led to creation of absentee landlords who lease out land for cultivation or mining. Due to the matrilineal system a family may have land in several villages and several villages may own land within a single village.
The tenure system for forests includes private forests, sacred groves, community reserve forests, protected and reserve forests under the control of the District Councils and protected forests under the control of the traditional authority, such as Raid or Nokma with jurisdiction across a village cluster.
Less than 5% forests are owned by the Government.
2.7 Resource management practices
A typical village in Meghalaya is situated in a hilly and rolling landscape, with (sometimes steep) hilly outcrops and narrow valleys. Villages are often skirted by a perennial river or a seasonal stream. Most villages have some paddy land in the valley, though only a few households may own paddy land. Though there are variations, a typical village would also have forests. Since government forests and other government land comprise only a small fraction of the State’s eo raphical area, most land is part of one or the other village. It is not unusual therefore to find villages covering 1,000 ha or more of territory with per capita geographical area of a hectare.
Historically, as in most parts of the world, natural resource management systems in Meghalaya and the entire northeast evolved around hunting, gathering of various forest products and jhum cultivation. Extensive resources were thus used for ‘periodic extraction’ cyclically in a sustainable way. Given the hilly terrain with limited flat land available for settled cultivation, low density of population, relative isolation, poor infrastructure, limited market access, a wet and humid climate and weak government extension, the population is yet to make a marked transition to intensive and husbandry oriented resource management system even though settled cultivation, including agriculture and tree crops is now a universal practice.
Broadly the land use systems practiced in the State are: jhum cultivation, bun or modified jhum cultivation, settled cultivation, plantations and orchards, grasslands and forests. Jhum is still practiced in the State, especially in the Garo Hills, Ri-Bhoi and parts of Jaintia Hills, typically in and around forests on steep to moderately steep slopes. Jhum fields are cultivated for two years and with increasing population and colonization of land, the fallow period is now only 4 to 5 years instead of the previous 10 to 20 years. A wide variety of cereal crops, vegetables, spices (ginger and turmeric) pulses and tubers are cultivated in jhum land. Farmers met in the course of field visits said jhum productivity has declined. There is a trend towards converting jhum lands into orchards and plantations, perhaps inspired in part to secure tenure as land under permanent crops becomes private land in all the three tribes.
In the modified jhum or bun system, crops are grown on a series of raised beds called bun, formed along the slope of the hill and in low lands following harvesting of rice. Locally available biomass, including weeds, crop roots, leaves and twigs available from the bun space and areas around it is placed on the raised bed and covered with soil. The biomass is either burnt (it smoulders for several days as it is covered by soil) or allowed to rot before crops are sown. Burning is a more common practice as it also kills soil resident nematodes and insects and reduces weed growth. Since the rainfall is high, the beds on hill slopes are aligned along the slope to allow drainage so that the beds do not get washed away. Potato, vegetables and maize are the crops grown. As in case of jhum, the buns are cultivated for a couple of years and then left fallow or 3 to 5 years. Bun cultivation is more
Republic of India
Meghalaya: Livelihoods and Access to Market Project
Final project design report - Working papers
100
prevalent in the Khasi Hills and to some extent in the Jaintia Hills and generally not prevalent in the Garo Hills. Jhum and bun cultivation on sloping land leads to soil erosion. That said, considering the steep slopes, and high rainfall, there is surprisingly little obvious evidence of erosion in terms of formation of gullies, large scale removal of soil and landslides. However close examination of individual plots provides evidence of soil being washed down the slope.
Settled cultivation is confined to valleys shaped over the years by forming shallow bunds to create terraces and around homesteads. Terracing beyond the valleys is very limited. Rice is the principal crop cultivated over about 0.1 m ha in the valleys. In most cases only a single rice crop is cultivated during the monsoon season and crop land remains fallow during the rest of the year. In some places a second rice crop is cultivated, or potato is cultivated during February to May before the rice crop. Maize (about 10,000 ha) and vegetables are the crops grown around homesteads.
Plantations and orchards essentially represent a shift away from jhum on hill slopes. Khasi mandarin and banana are the most widely grown fruits followed by pineapple. Temperate fruits, such as pears, peaches and plums are grown in the higher reaches and tropical fruits like litchi are now being introduced in the Garo Hills. Cashew was introduced about three decades ago in the Garo Hills region. Areca nut (sometimes with pepper vines and other species) and tea are the main plantation crops. Overall, the area under plantations and fruit crops is small.
Forests and grasslands are the single largest land use in the State. While some of the forests (especially the sacred groves and various reserves, including Government forests) have a degree of regulation, most forests and grasslands are not systematically managed. Open grazing is common, even in crop lands after harvest. This results in compaction of soils in paddy lands, damage to field bunds and erosion of soils from the sloping grasslands.
Due to the high rainfall, the State is endowed with a large number of perennial rivers, streams, lakes, springs and ground water (in some parts). Yet, the abundant water resources are not being fully husbanded and used for productive purposes, such as irrigation and fisheries development. In the absence of systematic rainwater husbandry springs dry up a couple of months after the monsoon rains stop and many villages face shortage of drinking water. In the absence of irrigation there is virtually no cultivation after the rainy season. Villages are often skirted by a perennial river, springs and semi-perennial stream into which the hills and valleys eventually drain. However, river, stream and spring water is by and large not used for irrigation. A notable exception is the innovative bamboo drip irrigation system developed indigenously by betel farmers.
Coal mining and stone and sand quarrying have grown over the past three decades, especially in Garo Hills, Jaintia Hills and West Khasi Hills. Since land is owned privately by individuals, clans or community these mining operations are carried out haphazardly in an unscientific manner and are largely unregulated. The overburden from mines and quarries flows into streams and paddy fields, leading to pollution of water sources and loss of productive land.
2.8 Climate change vulnerabilities6
Ravindranath et al (2010) summarises the specific climate change vulnerabilities of the four main natural resource sectors. These are shown in Annex 7. Other sectors are also vulnerable to the effects of climate change.
For agriculture the main climate variables that are important for determining rice and other crop yields are air temperature and humidity, cloudiness, solar radiation, water availability (including rainfall), and atmospheric CO2 concentration. Increase in temperature adversely affects rice crop physiology and
results in decreasing crop yields and grain quality. Increase in atmospheric concentration of CO2 is
expected to increase plant growth and consequently rice yields. But the effect of increase in CO2
concentration will be nullified by the increase in temperature. Increased temperatures will lead to forced maturity and poor grain harvest index due to limited water supply. The water stress during grain filling period may result in decline of grain yield. Higher temperatures coupled with increased CO2 concentration could result in photosynthetic acclimation because of the imbalance in the
source/sink ratio. Climate change will therefore constrain the overall yield of rice and other crops but, given that yields are now very low, there will still be potential to significantly increase yields through adoption of better methods despite the negative impacts of climate change.
6 A detailed discussion on climate change issues is presented in a separate Working Paper.
Republic of India
Meghalaya: Livelihoods and Access to Market Project
Final project design report - Working papers
101
There are a number of potential actions that LAMP can take in terms of natural resource management and enterprise development that will enhance the ability of rural people to adapt to climate change. These include:
Water conservation, and enhanced water supply for domestic and irrigation use
Water-efficient irrigation methods
Plantation and tree crops (being deeper rooted more able to tolerate variations in water availability than annual crops)
Protected cropping for high value crops - use of plastic tunnels, plastic mulch and net houses to protect crops from extreme weather
Stress tolerant crops and crop varieties - examples such crops are cassava and millet.
Livestock: can adjust feed sources in response to climate changes
2.9 Government and IFAD-supported programmes
The GoI-funded Integrated Watershed Development Programme (IWMP) is being implemented in the State by the Soil and Water Conservation Department. The initiative only began in 2010 after the new guidelines were released by the GoI, with the setting up of a State Watershed Mission in the Department of Soil Conservation. So far 61 small (typically 2,000 ha each) watersheds have been taken up across the State. Other GoI sponsored programmes concerning natural resources are the Accelerated Irrigation Benefit Programme (AIBP), Rastriya Krishi Vikas Yojana (RKVY), the Horticulture Mission for the North-east and Himalayas (HMNEH), the Watershed Development Project in Shifting Cultivation Areas (WDPSCA), the Cherrapunji Ecological Project and the Centrally Sponsored Programme for Soil Conservation in the catchment of the Kopli river. Besides these the Government has also taken up rubber plantations in abandoned jhum areas under MGNREGA. Besides these, there are State Government programmes for the development of jhum areas, control of jhum cultivation and watershed development. The State is also implementing programmes for minor irrigation and soil conservation under the Rural Infrastructure Development Fund administered (RIDF) by the National Bank for Agriculture and Rural Development (NABARD). The overall coverage of these programmes is modest.
Two IFAD-aided projects, namely NERCORMP (I and II) and MLIPH, have been running concurrently in the State. NERCORMP is a central sector project implemented via the North Eastern Council
operating in selected villages in the old (undivided) West Khasi Hills7
and the old (undivided) West
Garo Hills8
districts. MLIPH is a Meghalaya state project with the Planning Department of GoM as the lead agency and operates in selected villages in all the other districts. NERCORMP I was initiated in 2000 and completed in 2008 with an outreach of 6,900 households in 162 villages in West Khasi Hills district and 7,070 households in 192 villages in West Garo Hills district. NERCORMP II was initiated in 2010 is being implemented in 76 villages with 3,619 households in West Khasi Hills and 75 villages with 3,332 households in West Garo Hills. The overall objective of NERCORMP is to improve the livelihoods of vulnerable groups through improved management of their resource base. Key lessons include:
Organising a Natural Resource Management Group (NaRMG) in each village with one man and one woman from each households as members. The NaRMGs were assisted to prepare Community Resource Management Plans (CRMPs) which were implemented by the NaRMG.
NaRMGs and CRMPs are NERCORMP I innovations and inspired the formation of the VECs in Meghalaya for implementing MGNREGA.
CRMP have improved basic infrastructure (water, access roads) in project villages and created participatory (especially with re ard to women’s participation) villa e institutions.
The potential to affect the overall natural resource management has been limited by small budgets, weak convergence with government programmes, and lack of technical expertise to facilitate the preparation of CRMPs along INRM principles.
MLIPH was initiated in 2005 and the loan is to be closed at the end of June 2013. It worked with over
36,000 households in 656 villages, promoting income generating activities in farm and non-farm
7 Now divided into West Khasi Hills and South West Khasi Hills.
8 Now divided into West Garo Hills and South West Garo Hills.

Republic of India
Meghalaya: Livelihoods and Access to Market Project
Final project design report - Working papers
102
sectors. Agriculture, horticulture, livestock rearing and fisheries were the key farm based income generating activities. Key lessons include:
Focus on specific sectors/sub-sectors and selected households resulted in development of enterprises and market opportunities.
Federations of SHGs showed that were able to organise collective marketing and other common service functions.
There was a significant decline in the area of jhum being cultivated.
III. Key Issues & Challenges in Natural Resource Management
Meghalaya is endowed with abundant natural resources of land, water and climate. Managed well, these can not only provide nutrition, livelihood and water security to the people of the State but also benefit the neighbouring regions. These resources are presently being managed sub-optimally due to a variety of reasons rooted inter alia in ecology, the terrain, systems of resource governance and demography. Rural people in Meghalaya are in the midst of a transition in the practices of managing the resources. The traditional system of extraction from a seemingly unlimited resource base is neither sustainable, nor adequate. The alternative where limited, ecologically complex resources have to be intensively used and carefully husbanded is yet to be fully developed and grounded. As a result, the livelihood security is under stress and the long term ecological security itself is threatened. Briefly summarised in the following are the key issues and challenges that need to be addressed to realise the sustainable potential of the resource base to secure food, livelihood and ecological security of the people.
3.1 Key issues
1 Lack of resource development: There have been few attempts in the State to develop the resources to suit the imperative of intensive usage. The traditional jhum based resource use system did not require durable changes/amendments to the resources—land and forests could be used on a ‘as is, where is basis’ so lon as the rotation cycle permitted adequate time for the land and forests to recoup. Intensive resource use systems, such as settled cultivation and horticulture require landscape development to ensure sustained high productivity, conservation/regeneration of the resource base and a degree of control over outcomes. Terracing, irrigation development, drainage management, harnessing rainwater to ensure water availability through the year and stabilisation of the terrain are examples of the kind of development initiatives possible in the rural landscape of the State. Intensive, more productive and sustainable farming/production systems require systematic development of all the available natural resources.
2 Inappropriate resource use systems: Jhum and bun cultivation are no longer sustainable given the pressure of population and short rotation cycles and provide poor returns to labour and land. Further, these offer little scope for productivity enhancement. Though jhum is now limited in extent and is on the decline, in many cases families clear more land than they can manage simply to maintain notional right over community land. The practice of bun cultivation with crop beds are laid out
along (often steep) slopes is still widespread, especially in the Khasi Hills. This practice leads to erosion of soil and loss of soil nutrients. Any farming system that frequently disturbs the soil is unsustainable on steeply sloping land without appropriate landscaping. Overall, land and water resources are poorly husbanded, leading to loss of top soil and soil nutrients due to soil erosion, increasing soil acidity, water shortages in spite of very high and fairly well distributed (compared to the rest of the country) rainfall and progressively declining productively and carrying capacity.
3 Poor use of resource potential: Less than 10% of the geographical area is presently cultivated, with a cropping intensity of about 120% even though most of the cultivated land is in valleys and could support at least two crops. Land left fallow is as much as the land cultivated. Land left as scrub and idle jhum and in other ways wasted (excluding true wastes, such as rocky and stony areas) is about
15% of the geographical area. Thus, land presently sown is about one-third of all the land (excluding forests and other lands not available for cultivation) that could be put to productive use. Even though less than 12% area is flat to gently sloping, another 45% is moderately sloping (slope less than 18%); both these categories of land can support more intensive use with suitable development, such as terracing, as the soils are generally deep. Forests, scrub land and grazing land occupy a large area,

Republic of India
Meghalaya: Livelihoods and Access to Market Project
Final project design report - Working papers
103
owned by individuals, community, clans, village authority or the District Council; these are by and large left as wilderness, without systematic management. Use of water resources is equally poor. Government projects irrigate about 18% of the sown area. Much of the surface water (rivers, streams, springs and ponds/lakes) remains unused. Ground water extraction is minuscule even in the easily accessible alluvial aquifers and valleys. Overall, much potential of land and water resources yet remains idle.
4 Low productivity9: Resource productivity is very low. Yields of agricultural crops as well as
horticulture are well below the national average as well as the potential. Yields of rice, the most important cereal crop in the valleys hover around 1.5 to 2 t/ha against the national average of 3.5 t/ha. Some of the reasons are given below.
Traditional farming practices: Use of traditional seed varieties, absence of seed replacement and seed treatment, traditional methods of cultivation, low use of fertilisers and farm yard manure are some of the reasons for low productivity.
Lack of irrigation: The widespread potential for irrigation from rivers, springs and ground water (in all valleys and the alluvial tracts) is not being fully used. As a result, farming is largely rain dependent and mono-cropped. The valleys could easily support a second crop if irrigation were available.
Soil quality: The soils in the State are acidic to highly acidic and nutrient and micro-nutrient deficient. High rainfall and unmanaged rainwater run-off exacerbates the problem through leaching. Sustained high productivity would need careful management and application of suitable amendments. These are yet too advanced in the prevailing context of traditional agriculture and the lack of know-how among farmers.
Draft power constraint: Farming operations are almost entirely carried out manually, including preparation of paddy fields in case of the Khasi and Jaintia Hills. Tractors cannot be used in most cases due to the hilly terrain and narrow valleys and power tillers are not yet widely used. However, even animal power is not used except in Garo Hills and, to a limited extent, in Ri-Bhoi district. Lack of draft power inhibits proper field preparation and makes double cropping all but impossible.
Open grazing: Cattle and other ruminants are left to graze freely, especially after the paddy crop is harvested. Since fencing of farmland is largely absent, it is not possible to grow a second crop after the main rainy season crop is harvested.
Lack of inputs, know-how and services: Availability of quality seeds and other inputs is limited as there is no local production and local markets have not developed in the absence of demand. Farmers lack knowledge about alternate farming and resource management possibilities due to physical isolation because of poor road network in a hilly terrain, lack of experience in settled agriculture and weak extension.
3.1 Key challenges
1 Land tenure system: As earlier pointed out, land in the State may belong to individuals, a specific clan, the entire village community or the District Council. Certain cultivators (not belonging to the main clan) may not be entitled to get secure tenure unless they buy the land. There are subtle variations across tribes. Certain distortions have also set in due to privatisation and absentee landlordism in recent years. The jhum and bun cultivators and those who have leased in land from clan members/absentee landlords have no incentive to invest in the land as there is no security of tenure. Due to the prevailing system of inheritance, farmers may have land in more than one village. These complexities would need to be negotiated to take up systematic resource development work. It is necessary to follow a watershed perspective for resource development in the ecologically connected hilly terrain
10 in the State for which participation of all farmers and support from the customary village
authority would be necessary.
2 Large expanse of villages: With low population density villages in the State often span large geographical area in a hilly terrain, often encompassing two or three micro-watersheds. Since land
9
A more comprehensive discussion is presented in the Working Paper on Agriculture. 10
The uplands and lowlands, indeed the entire landscape, is hydrolo ically ‘connected’ in an undulatin and hilly terrain.
Therefore, unlike in the plains, isolated actions by individual farmers are ineffective.

Republic of India
Meghalaya: Livelihoods and Access to Market Project
Final project design report - Working papers
104
development work requires earth work and machinery cannot be used in this terrain in most cases, labour availability would be a constraint in carrying out land development. The investments required would be significant and with limited labour availability, scope for leveraging from MGNREGA limited. Also, preparing resource development plans would require time and in-situ technical capability not readily available. Communities would need to persist over a long time to carry out the necessary landscaping work.
3 Complex ecology: High rainfall, steep hills (over 45% of the area has over 18% slope), limited flat land and highly erodible soils make for an ecologically complex landscape. Resource development in such a landscape presents unique challenges as solutions have to be developed in-situ.
4 Unregulated mining: Unregulated and haphazard coal mining in some parts of the State present a serious challenge to natural resource development. The mines are often within existing village boundaries rather than in exclusive mining areas. The overburden gouged out in the course of mining and construction of storage sites leads to heavy silting and pollution of water bodies downstream and often destroys farmland.
5 Lack of relevant experience and tested models: Research in agriculture, soil conservation, watershed development and natural resource mana ement in India has been focused on the ‘hi h potential’ plains (easy to manage and responsive to simple, widely applicable solutions). The rain-fed regions in general and Meghalaya, and the northeast in particular have unique problems that have not received adequate attention. As a result, there are no standard solutions to be replicated widely. A degree of in-situ adaptation is required which calls for local availability of technical expertise.
6 Absence of maps: Cadastral maps have not been drawn for Meghalaya villages except in parts of the Garo Hills along the Assam plains. Absence of maps not only leads to conflicts across villages and between households, it would also make planning difficult. Though satellite maps can now be obtained from the North Eastern Space Applications Center (NESAC), that adds one more layer, the maps would require validation on the ground and mapping of physical features and usage practices.
7 Poor market access: Absence of established markets locally, combined with poor road connectivity limits access to various inputs needed for a modern, diversified and market-oriented farming system.
8 Poor infrastructure: As many interior villages lack roads (especially all weather roads) transportation of materials for construction of irrigation structures and water harvesting will pose problems.
IV. Potential Interventions
4.1 Land and water resource development
A key component of the INRMP will be a land and water resource development plan that spells out both the treatment as well as likely use of each kind of resource. The treatment and resource use plan essentially emanates from the agro-ecological characteristics of different parcels of land in the landscape. Potential activities to be taken up under land and water resource development are listed below.
Ensuring security of water supplies
This is the major priority in many villages. In the dry season women often have to go considerable distances to fetch drinking water. Without irrigation, many villages can only grow a single crop of paddy, and the yield of valuable cash crops, such as pineapple, is reduced. Possible interventions for water supply include:
a) Small scale irrigation: There is widespread potential for small scale, localised irrigation in the State. Irrigation could be provided by pumping water from rivers and streams that lie above the cultivated valleys and newly formed terraces on gently sloping parts of the village, from groundwater in the small alluvial tracts around the Assam border and to tap seepage/ground water in the valleys and along the seepage line by digging open wells. Diversion based irrigation by constructing a diversion weir across small perennial streams and
stretchingburied PVC pipes11
to the fields is another possibility. Diversion of water from perennial springs can similarly be carried out by constructing a small stilling basin and

Republic of India
Meghalaya: Livelihoods and Access to Market Project
Final project design report - Working papers
105
stretching PVC pipes from it to the fields. In case of streams where the dry season flows fall too low to allow flood irrigation (by pumping or diversion), water can be impounded by constructing gated weirs that are closed once the monsoon flows recede; using drip, especially for vegetables and horticulture is another option in water scarce situations. Irrigation works could be financed through convergence with a combination of government programmes, such as the Accelerated Irrigation Benefit Programme (AIBP), the National Food Security Mission, the State Rice Mission, and MGNREGS.
b) Spring rejuvenation: Springs are a major source of water in Meghalaya villages and indeed in all hilly and mountainous regions, especially for drinking and livestock. Springs discharge rainwater stored in an aquifer located somewhere upstream of the spring. The level and duration of spring flow depends on the extent of rainwater recharge and the hydrogeological properties (transmissivity and storativity) of the aquifer. The extent of replenishment/recharge into the aquifer depends on the quantum, intensity and duration of rainfall as well as ground conditions in the recharge area that facilitate or inhibit recharge/runoff.
Springs in the State come alive with the onset of rains. However, many dry up a few weeks or months after the monsoon rains end. Water flow in a spring gradually declines after the monsoon ends and may stop altogether during December to March, causing drinking water shortages. Spring rejuvenation may be taken up systematically as part of natural resource development activities in the project to secure drinking water availability and facilitate small scale irri ation. This would require treatment of the rechar e area or ‘sprin shed’ of a sprin by constructing staggered contour trenches, digging staggered pits, other techniques of impounding rainwater (e.g. ponds and water harvesting structures) and changing the vegetative cover through plantations. Some of the activities listed earlier (e.g. terracing, jhum development) would also aid spring recharge. The attempt essentially is to increase rainwater percolation and reduce runoff.
It is important to note that, contrary to common perception, the recharge area of a spring may not be the land directly above it and may lie some distance away, even in an attached but different micro-watershed. Simple ridge-to-valley strategies of treatment often followed in watershed development may not succeed. Once a spring site has been identified hydrogeological studies of the aquifer associated with the spring would need to be carried out to delineate the recharge area. The recharge techniques can be determined on the basis of the ground conditions, such as slope, soil depth and the nature and extent of vegetation.
The project may draw upon the experience of the spring recharge programme taken up by the
Government of Sikkim12
using resources from MGNREGS and the technical support of
ACWADAM13
, a Pune based resource NGO specialising in geohydrological action research
and trainin , and the People’s Science Institute (PSI)14
, a Dehradun based resource NGO specialising in promoting applications of science and technology in villages.
c) Rainwater harvesting/storage structures with earthen or cement-concrete embankments could be constructed at suitable sites to support small scale irrigation (and spring recharge). It must be noted, however, that the most suitable sites for such structures are in narrow valleys where construction may not be feasible as valuable paddy land may get submerged.
Training of shallow perennial streams by building a series of cascading gated weirs is another possibility for impounding water for irrigation, while roof-top water harvesting can be supported in areas where other options for domestic water do not exist.
d) Potable water supply: a village water supply system may involve a concrete tank to collect spring water, with a pipeline down to a village where there are one or more public taps / washing areas. This may be linked to spring rejuvenation and catchment conservation work. Many villages already have such systems but they may require extension (to cover more
11
Buried PVC pipes should be used for transporting water except in a rocky terrain. PVC pipes would cost significantly less than cement channels, are light weight and easy to transport (an important consideration given the terrain and poor road network) and do not require skilled masons to install. 12
www.sikkimsprings.org 13
www.acwadam.org 14
www.peoplesscienceinstitute.org

Republic of India
Meghalaya: Livelihoods and Access to Market Project
Final project design report - Working papers
106
households) or improvement (such as tapping another spring. In some locations, tubewells with hand pumps, or open wells can be used for water supply. Apart from MGNREGS, these works can be supported by other government schemes for village water supply.
Soil and water conservation
The INRMP for each village will identify and map out areas of village land that have different land uses. The plan may propose some changes in land use, such as tree planting on wasteland and conversion of jhum land to plantation crops. The plan may also identify areas where soil and water conservation works could be carried out. Such works may include:
a) Stabilisation of steep slopes About 45% of the State’s eo raphical area is on moderately steep (between 9-18%) to steep (>36%) slopes. Typically, the steeper slopes are located at higher altitudes in any given landscape and receive higher rainfall. These areas are most suited to permanent tree cover to ensure stability of the slopes and to prevent heavy soil erosion in view of high rainfall. Therefore, where tree cover is thin or non-existent, tree planting with protection measures through social fencing could be initiated. Simultaneously, soil and water conservation measures would be taken up, such as drainage treatment and contour trenching, along with vegetative measures such as strip planting of vetiver grass. In some cases the slopes might be part of the jhum fields, in which case horticulture and plantation crops would be an option. This activity can be taken up under MGNREGS.
b) Jjhum stabilisation and management: Jhum lands could be converted into permanent cultivation areas as one of the land and water resource development activity. The specific treatment or route to such conversion would depend on the slope of the land. Jhum lands with low to moderate slopes could be terraced for tree horticulture of species suited to the agro- climatic conditions, intercropped with vegetables and tubers. Pineapple with hedge rows or contour trenches is another option. Higher slopes could be used for raising plantation crops, with intercropping of spices. This activity can be taken up under MGNREGS.
c) Terracing: Flat lands suitable for field crops are presently limited to narrow valleys as terracing is very limited, mainly for shaping valley lands for paddy cultivation. However, large tracts of the State are in low to moderate slopes <18%. Generally, these slopes have deep soils and are suitable for terracing. Once terracing is done the fields can be used for cultivation of field crops, vegetables, spice crops, tubers and horticulture. Depending on the location, it may be possible to irrigate the terraces by lifting or diverting water from nearby streams and take two crops. Wider terraces could be developed on lower slopes and on higher slopes thin terraces could be formed to take up tree horticulture or pineapple. Estimates of the cost of terracing are presented in Annex 8.
The Indian Council of Agriculture Research (ICAR) has taken up terracing around their research center near Bara Pani and also in a watershed project in the Tyrsod valley. The State Soil Conservation Department has also promoted terracing on a small scale in the Khasi
Hills area15
. Terracing should be done with appropriate techniques to conserve top soil, e.g. scraping the top soil to one side before earth cutting, beginning terraces from lower ends of the slope so that top soil from upper reaches can be deposited lower down and green manuring by sowing and ploughing-in legumes, etc. This activity can be taken up under MGNREGS.
d) Drainage management in the valleys: The valley lands are presently used primarily for cultivation of rice, the principal food crop. In most cases only a single rice crop is cultivated even though the deep soils in the valley can support two, and where frost is not severe, three crops with proper soil fertility management through crop rotation, soil amendments and use of composts and farm yard manure. The valleys in most cases receive large and unregulated runoff from higher catchments. This adversely affects water management in rice paddy, leaches away soil nutrients and renders the valleys water logged even after the rice crop is harvested. Construction/improvement of drainage in the valleys for safe disposal of excess rainwater runoff would enable farmers to take up at least one more crop after rice is harvested and also enable them to adopt SRI to substantially increase rice yields. This can be taken up under MGNREGS.
6
Interview with Divisional Soil & Water Conservation Officer, East Khasi Hills. He said farmers resist terracing for fear of losing top soil.

Republic of India
Meghalaya: Livelihoods and Access to Market Project
Final project design report - Working papers
107
e) Developing village common lands: Many villages have village lands that are kept as commons and not available for jhum or any other form of cultivation. These are often barren and may be part of the 7% eo raphical area classified as ‘uncultivated land other than fallow land’. These may be taken up for forestry, forage tree plantation and grassland development with suitable soil and water conservation measures, such as staggered contour trenches, contour bunds, staggered pits, etc. This activity can be supported under MGNREGS. Common lands could also be developed as an enterprise, with the village forming a producer company that develops the land for a plantation crops, possibility in a joint venture with the private sector. Another option is to lease these lands to a private sector company. Such enterprises are discussed in the Working Paper on Integrated Production and Marketing.
4.2 Productivity enhancement and crop diversification16
Enhancing productivity of land and water resources and diversifying land use are an integral part of improving the management of natural resources and a necessary condition for the acceptance and success of alternative (more sustainable) resource management practices by the people. Besides issues of land tenure, low productivity is often a cause of low investment, poor husbandry and extension of cultivation to unsuitable areas. The INRMP would include productivity enhancement and crop and land use diversification plans would be an integral part of the INRMP. The following activities can be included:
a) Increasing crop yields: There is huge potential to enhance yields as the present levels are quite low. Apart from the interventions described above (irrigation, soil conservation, terracing – which can increase both yields and crop area), there is potential to apply improved crop husbandry methods and to use improved inputs.
Paddy yields can be enhanced considerably by introducing better nursery techniques (raised beds, application of farmyard manure, lower plant density); seed treatment (brine treatment to select well formed seeds, seed treatment against fungal attack, pre-sowing germination and soaking in organic nutrient concentrates); use of HYV seeds suitable for local agro-ecological conditions and periodic seed replacement; timely sowing; transplanting of younger seedlings and fewer seedlings per hill; line sowing; regular weeding; lower seed rate; better water management; and SRI. SRI (Systems of Rice Intensification) has the potential to significantly increase yields with low levels of external inputs
17.
Support for paddy production can be channelled to LAMP villages by convergence with the National Food Security Mission and with the forthcoming Meghalaya State Rice Mission.
The yield of maize, the second most significant cereal crop can similarly be enhanced by introducing HYV (preferably composite rather than hybrids) seeds, better sowing techniques (use of selected and germinated seeds, one seed at a place (presently 2 to 4 are sown for fear of poor germination), proper spacing, use of farm yard manure and earthing-up.
b) Diversification: The area coverage and output of all other crops is very small compared to rice. Maize could be taken up on a larger area, especially outside valleys and winter (in lower altitudes) and spring crops could be cultivated. There is huge scope for introduction of oilseeds, pulses and millets as these are virtually absent at present. Certain crops, such as sesame and soybeans could be cultivated on paddy bunds. Mung beans or green gram (Vigna radiate) and chickpea
could be grown in paddy fallows. Tuber crops, such as sweet potato, elephant foot yam, colocasia (taro) and cassava can be taken up on a larger scale, including as inter-crops in plantations. Some of these tubers (and maize) are already used as feed crops for pigs.
c) Soil fertility management: as present there is surprisingly little use of compost and farmyard manure. Some villages have few cattle (and numbers appear to be declining in Khasi areas) and with little stall feeding, the supply of farm yard manure can be limited, with what little is available only being used for homestead gardens (and even not used at all). Surprisingly, no use seems to be made of pig manure, with farmers saying they did not know it could be applied to crops. Apart from encouraging greater use of what manure is available, and improving the quality of manure
16 A detailed treatment of this topic is presented in the Working Paper on Agriculture.
17 http://sri.ciifad.cornell.edu

Republic of India
Meghalaya: Livelihoods and Access to Market Project
Final project design report - Working papers
108
through better composting (see working paper on agriculture), the use of green manure (such as sowing dhaincha (Sesbaia bispinosa) before paddy) could be introduced. Soil tests may indicate the need for chemical amendments, such as use of lime in acidic soils and micronutrients. Crop rotation, especially cultivation of pulses could be promoted.
d) Homestead development: Homesteads and bari-bagans could be better utilised to grow vegetables, fruit trees, drumstick, etc. by provisioning low cost micro-drip system. These comprise of elevated water drums with a network of drip irrigation pipes. The homesteads could thus serve as nutrition gardens besides being sources of cash income.
e) Draft power, inputs and services: Most land cultivation is still done manually except in parts of the Garo Hills. As a result, the quality of field preparation, timely sowing, intensification of farming (multiple cropping) and profitability all get compromised. Power tillers are being introduced, but they are not always being used effectively. Similarly, the virtual absence of places to buy farming inputs (seeds, other planting materials fertilisers and pesticides) at the village level is a major constraint on modern farming. Input supply systems, including machinery rental services, need to be developed. These could include support to individuals establishing such services as a business enterprise, and village or cluster owned Farmer Service Centres. At the cluster level, IVCS may take on this activity.
f) Livestock development: most support for livestock in LAMP will be via the Livelihood Support component - either via EFCs (Enterprise Development) or village clusters (Integrated Production and Marketing). However in other villages some initiatives to support livestock development via improved health care services (with VF or Lead Farmers being trained to provide vaccination, deworming and other preventive and basic health care services). Information on improved feeding could also be disseminated - via printed materials and videos. More details are in the Working Papers on Livestock and Knowledge Services.
V. Implementing Natural Resource Management Interventions
The principal challenge before rural people of Meghalaya that this project seeks to address is to make an orderly transition from an extensive-extractive system of resource use to one of intensive, husbandry focused resource management regime. The former is no longer sustainable and cannot meet the rising needs and aspirations of a growing population. A revitalised and more productive resource management system would also help strengthen the traditional, decentralised, community based systems of resource governance now under stress from attempts to privatise resources.
Given the ecological context of the State, a two-pronged strategy combining resource conservation and regeneration with intensive and sustainable resource use for higher production and productivity would be appropriate. Both would introduce physical changes into the landscape and foster new resource use practices; the nature of these would depend on the location, slope, soils, hydrology, etc. Typically, conservation would be the focus on steeper slopes, conservation practices would be systematically combined with production systems in moderate slopes (e.g. contour trenches in pineapple farms) and sustainable intensive use should be the objective on gentle slopes and level ground (e.g. terracing, irrigation). Both these strands can be combined by introducing Integrated Natural Resource ana ement (INR ) to harmonize interactions amon people and nature’s elements so that labour and resource productivity is enhanced and resource regeneration and conservation processes are set in motion, simultaneously.
4.1 Integrated natural resource management
INRM would foster inclusive, village level mechanisms for resource development planning, implementation of such plans and taking responsibility for resource governance. Resource development and productivity are the inter-connected elements of INRM. These require suitable physical changes in the landscape to serve the objectives of resource stability and enhanced production, introduction of new management and production systems, building local capacity to adopt such systems and establishing linkages to serve the new systems. Broadly the following streams of actions are needed to introduce INRM:
Mobilising and organising village people so that all parts of the ecologically connected village landscape can be comprehensively developed for maximum effect, plans can be made with

Republic of India
Meghalaya: Livelihoods and Access to Market Project
Final project design report - Working papers
109
people’s participation, the plannin process is GNREGS compliant and people themselves take the responsibility for implementation of the plans.
Preparing Integrated Natural Resource Management Plans (INRMP) through participation of the community, expert technical inputs and taking into account present ownership and usage practices and availability of resources from government programmes such as MGNREGS, RKVY, etc. through convergence.
Land and water resource development to implement the INRMP and stabilise fragile areas, facilitate intensive production systems on ecologically stable and less vulnerable areas, reduce soil erosion/degradation and ensure year round water availability for drinking, livestock rearing and farming. This would encompass drainage treatment and tree planting on fragile slopes, jhum, abandoned jhum and bun rehabilitation, rejuvenation of springs, terracing, drainage management in valleys, rainwater harvesting in small earthen dams where there are no perennial streams and springs and developing irrigation potential of streams, rivers, ground water and springs.
Productivity enhancement and crop (and land use) diversification to enhance food security and incomes by providing better know-how to adopt better farming technique, better seeds and services, bio-mass recycling, introducing crops most suited to different parts of a village landscape and training Village Facilitators and Lead Farmers to be community resource persons (CRPs) to provide technical support to village communities in an on-going manner.
Climate Change Adaptation will be an important consideration in drawing up INRMPs. LAMP will support the introduction of climate-smart approaches and technologies such as soil and water conservation, stress-tolerant crops and crop varieties, and cultivation methods.
4.2 Community mobilization and organisation
The landscape of a typical Meghalaya village comprises one or more micro-watersheds that generally drain into a narrow valley. The landscape might include parts that are steep to very steep, areas that are situated on gentle to moderate slopes and narrow flat valleys skirted by a river or seasonal stream originating from one or more springs. Some slopes may have permanent tree cover of varying canopy and tree species, others used for jhum/bun and yet others for orchards and/or and seasonal crops. The valleys are used for cultivation of paddy and potatoes. All the components of the landscape are hydrologically connected, e.g. loss of tree cover and jhum/bun cultivation upstream would lead to soil erosion, silting of streams, flooding of valley lands and drying up of springs, etc. It is important therefore that resource development/management systems encompass the entire landscape, requiring agreement with the traditional village authority as well as participation of all who live in the village. Participation of all is also important so that planning and implementation is compliant with the requirements of Government programmes, especially MGNREGS which is a major and opportune source of funds. Finally, participation of all is important so that the mechanism created to implement plans during and beyond the tenure of this project and for enforcing systems of resource governance has the support of all.
Village Employment Council: The community will be organised by the Village Employment Council (VEC), which already exists in all villages for the purpose of implementing MGNREGA. VEC have bank accounts and experience in handling funds, and are to be preferred over setting up an additional village institution, such as the Natural Resource Management Groups (NaRM-G) established by
NERCORMP18
. Like NaRMP-G, VEC include male and female representatives from all households. To ensure clarity of the participation of the VEC in implementation of LAMP, the project will sign a Social Agreement with the VEC (to be signed by at least 80% of households in the village) setting out the role of the VEC in LAMP and the support to be provided by the project. This Social Agreement will be based on those already in use for the implementation of MGNREGS
With assistance and advice from project staff, the VEC will select suitable a local person to be the Village Facilitator (VF). The facilitator will be paid by the VEC a monthly honorarium to compensate for the time and effort to be put in. The VF will have the following roles:
18
The capacity of VECs wll be strengthened, but should a few VECs still lack the required capacity, the project will have the flexibility to implement the component via other village level organisations, such as groups similar to the Natural Resource Management Groups of NERCORMP.

Republic of India
Meghalaya: Livelihoods and Access to Market Project
Final project design report - Working papers
110
Data collection on present status of use of natural resources in the village
Assessing demand and supply of resources
Difficulties in marching demand with supply
Organising meetings to draw up an INRMP
Assist VEC in identifying people for training courses, and coordinating their attendance.
Follow-up after training and communicating with DPMU regarding further information needs and skill gaps
Convening of periodic meetings of VEC
Preparing the agenda for discussion in VEC and recording a gist of discussions of the VEC
Keeping an account of the funds received and spent – in the format made available by the project
Follow-up with government departments for convergence funds or projects for implementing the plan
Providing a report on progress of the plan (monthly or quarterly)
The VF is expected to work a maximum of about 10 days in a month on the NRM plan and implementation aspects, generally performing the roles listed above.
For the first two years of implementation in each village, LAMP will provide additional support via a contracted local Facilitating NGO (FNGO) or an equivalent agency, which will provide two Field Organisers (FO) for each cluster of about 25 villages for a period of two years. These agencies need to have good local knowledge and to employ local staff. To support these agencies, the project would hire two or three larger technical service providers (which could be Resource NGOs), which could be from outside of the state (but preferably not from outside of the region).
Capacity building will be proved to build and enhance the capacity of service providers, VEC and village households. This will be flexible, but for the purposes of costing the project the following capacity building has been assumed:
The SPMU will organise training for FOs at suitable state-level training institute
Either the DPMU or FNGO will provide each VF with 6 days training at a training centre. In addition VFs will receive on-the-job training from the FO.
To strengthen the capacity of VECs, four committee members of each VEC will receive three days training organised by either the DPMU or FNGO.
All this training will be followed up by DPMU staff to ensure that FOs, VFs and VECs have appropriate levels of capacity from the required tasks. The effectiveness of some training courses may also be evaluated via Knowledge Attitude Practice surveys conducted by the LAMP M&E unit.
4.3 Integrated Natural Resource Management Planning
A village Integrated Natural Resource Management Plan (INRMP) will be prepared by the executive committee of the VEC using a participatory process involving all the households in the village. The VECs will be supported in this task by the VF and by facilitation from the FOs, with technical back-up from the District PMU. Planning will be done using participatory rural appraisal tools developed for the project. It would begin with marking the physical features of the village on a satellite map obtained from NESAC
19, demarcating different patches of the landscape that have similar physical, ecological
and present usage features. Hand held GPS equipment would be used to correlate ground observations to map coordinates. Slope, soils (including indicative depth), aspect (south facing or north facing), present usage, nature of vegetation, drainage pattern and present ownership would be used to differentiate patches from each other. Site visits and use of satellite maps (showing slope, drainage and land use/vegetation cover) would be used to demarcate the patches. Through site visits, the presence of water sources (springs, ponds and streams/ rivers) would be demarcated. Site visits would also identify problems and suggest potential treatments. Site visits would also help delineate area of present and future land use.
19It may also be possible to use images from Google Earth. An illustration of the use of Google Earth to make an initial outline of the village area is shown in “Report on GIS Model of Swer Village, WEBCONS Consulting, MBDA. The use of Google Earth and Google SketchUp to make simple maps is explained in “Technical Handbook for Rural Infrastructure”, NERCORMP, 2012. Further details are in the Working Paper on Knowledge Services.

Republic of India
Meghalaya: Livelihoods and Access to Market Project
Final project design report - Working papers
111
The maps and embedded plans of the INRMP would then be presented before the entire VEC assembly and finalised. The VEC would also prioritize the plans for implementation of a range of NRM and food crop related interventions, and also identify potential sources of funds. The VEC executive and FNGO would present the plans to the DPMU for approval and obtaining agreement for convergence from the relevant Block/District authorities.
A typical INRMP would be written in the vernacular will contain a patch-wise diagnostic of problems, list all the land and water resource development plans, future usage and productivity enhancement plans, designs of the proposed physical works and their cost estimates, productivity enhancement activities and their cost estimates, convergence plans and other sources of funds and implementation schedules. Besides maps that include features of the village and patch-wise problems identification and proposed activities, the INRMP will have a brief description of the village and interpretation of the maps and proposed activities, drawings and layouts where relevant, tables showing the volume and costs of works/activities, sources of funds and schedule.
MBDA, with support from MRDS, has started on a programme to carry out Integrated Village Development Plans (IVDP) in all 6000 villages of the state. Fieldwork has been completed for the first 110, and another 1,100 are planned by March 2014, with the final plans being completed in 2016. The work was started with 66 trained staff, but with two volunteers being selected and trained in each village, who then draw up (via a participatory process) plans in other villages, it is planned to have 220 people working on this by June 2013. A standard data collection format has been produced for these IVDPs, which will gather much useful information on the population, social and economic infrastructure, local institutions, agriculture, individual entrepreneurs, production and input costs, marketing, income and expenditure, priority needs (and associated cost implications). The idea is to produce a comprehensive computerised baseline for all villages.
These IVDP will complement INRMP, which will collect more detailed and complementary information on the bio-physical environment.
4.4 Implementation of Natural Resource Management Interventions
Implementation of the INRMP will be the responsibility of the VEC with the support of the VF and, for the first two years, the FOs of the FNGO, and with back up from the DPMU. The project will provide each village with Rs50,000 per year (paid as Rs12,500 per quarter) for two years to cover the payment of an honorarium to the VF and for other operational expenses. The staff at the DPMU will include an Agricultural Engineer who will oversee land and water development works. The VECs will have two bank accounts; one for receiving Operating Funds (OF) for covering cost of engagement of the VF and other operating costs and the other for a Village Development Fund (VDF) for implementing land and water resource development activities.
The project will allocate Rs400,000 per village20
split into two annual amounts of Rs200,000. This will pay for activities identified and prioritized as a part of the INRMP. In the first year the cost of activities shall be 100% covered by project funds plus a 20% contribution by the village in terms of labour or other inputs (including future O&M costs). Provision of a second instalment is subject to: (i) satisfactory utilization of the funds first tranche, verified through a social audit and a financial audit from external auditors; and (ii) to mobilize an equal amount (Rs200,000) through convergence. It should not be difficult for a VEC to mobilise such convergence.
Convergence: The VEC has primary responsibility to implementation of the MGNREGS employment creation programme, which guarantees each BPL household 100 days work per year. This scheme is implemented more efficiently in Meghalaya than in many other states and in villages visited by the formulation the vast majority of households were “job card” holders, indicatin their eli ibility for the scheme, and worked for the full 100 days. The type of work eligible for MGNEGS support is predominantly NRM related, and the table below calculates that a typical village should be able to generate support for work valued at Rs506,880 per year. Even if only half of this is actually achieved, it still exceeds Rs200,000.
20 This amount may be adjusted according to the number of households in the village. With an average village comprising of 75
households, Rs400,000 amounts to Rs5,300 per household

Republic of India
Meghalaya: Livelihoods and Access to Market Project
Final project design report - Working papers
112
Calculation of the value of NRM convergence
Per village
Number of households participating 60 80% of 75 households
Number of days worked per year 80 80% of 100 days allocated
Wage paid Rs/day Rs128 Standard for the state
Total including 10% for materials Rs141
Total per village per year Rs675840
Percentage of work NRM related 75%
Total NRM works per village Rs506880
Actual achievement Rs253440 Assume 50% achieved
The total value of all convergence for this component is calculated at Rs253,440 per village each year for three years. This is likely to be exceeded as no estimate has been made for the value of convergence with other programmes – such as village water supply and sanitation, irrigation, watershed development and forestry. Nor are contributions from programmes developing food crops included – such as the National Food Security Mission, RKVY and the State Rice Mission.
Support for food crop production LAMP may provide resources to complement those from convergence programmes. To support increased production of food crops, there is provision in LAMP costs for the following training:
Two lead farmers from each village for seven days
One power tiller operator from each village for 14 days.
This support may be changed during implementation to meet actual needs. Although most cultivation in the Khasi and Jaintia Hills is still done by hand, power tillers are being introduced in all districts with support from various government programmes. However people reported some problems with their operation – in particularly becoming bogged down in flooded fields. Training of operators and introduction of cage wheels would make the use of these machines more efficient. There may also be potential in introduce "no-till" or "minimum tillage" methods (conservation agriculture).
The component will also be supported by technical service providers for food crops and livestock. BAIF, the major non-government livestock service provider in India, has already been contracted by MBDA to support livestock development. In LAMP it is planned that BAIF will support livestock development across all components - for this component support will include training of VF and Lead Farmers to be village animals health assistants to provide basic animal health services. The service provider for food crops will have a more limited role, and focus on a pilot scheme for improved paddy (such as SRI) in a few village clusters that could then be scaled up across the project area
21.
Convergence: Much support for food crop production will come via convergence with other programmes. LAMP village level organisation and facilitation will be valuable for these programmes in providin “last mile delivery” to the tar et households. Two programmes that may, in particular, provide support are:
The National Food Security Mission aims to increase food grain (mainly rice) production by 15% per annum for 3 years, making a total increase of 45%. The programme provides improved seed, plant protection chemicals, lime, and machinery (power tillers and pumps. It also builds check dams to irrigate boro (dry season paddy).
The State Rice Mission proposals (drawn up with assistance from former IRRI staff) are in the process of being submitted to GoM. The mission is planned to operate from 2014-15 to 2019-20,
21 Potential service providers who have experience of SRI include: the Peoples' Science Institute (http://peoplesscienceinstitute.org) and the Covenant Centre for Development ( http://www.ccdgroup.org/).

Republic of India
Meghalaya: Livelihoods and Access to Market Project
Final project design report - Working papers
113
with a total cost of Rs465.58 crore. The aim is to double rice production and so achieve self-sufficiency. A summary of proposed activity and cost is in the table below.
Social development fund
LAMP will have resources to fund need-based social interventions in areas such as health and education. This would aim to bridge gaps in service provision, and act as an entry point for livelihood interventions, as well as leveraging resources from other agencies. A total fund of Rs50 million amounts to only about Rs37,000 per village, however the fund would not be allocated equally to all villages but managed by the PMU and used only in villages where there is a real need that cannot be met by other government programmes and resources.
Cost breakdown of proposed State Rice Mission
Components Investment over 5 years
Rs. crores
Mini Mission – 1 Mapping of rice eco-systems 10.20
Mini Mission – 2 Increase area of boro 109.60
Mini Mission – 3 Validate improved varieties 91.85 Mini Mission - 4 Test and validate packages of practices 51.00
Mini Mission - 5 Promote mechanisation 10.20
Mini Mission - 6 Validate harvest post harvest technologies 25.50 Mini Mission - 7 Accelerate spread of technologies 76.50
Mini Mission - 8 Build capacity of DoA 51.00
Mini Mission - 9 Integrated plan for the mission 20.40
Mini Mission - 10 Monitoring and evaluation 10.20
Total cost 456.45
Administrative Cost (2%) 9.13
Grand Total 465.58
4.5 Monitoring
Monitoring of implementation and outcomes of the Natural Resources and Food Security component will be integrated into the overall project M&E system. Key indicators for this component include:
Key performance indicators Goal level 75% of households report increased food security Objective level 1,200 villages implementing natural resource management plans
20,000 households report reduced time to collect domestic water*. Outcome level 10,000 farmers report increased area of irrigated crops*
50,000 farmers report increased cereal production* Reduced number of farmers cultivating jhum.
Output level 1,350 INMPs prepared and approved Water-related interventions in 1000 villages Land use management plans implemented in 500 villages, and area covered. 50,000 farmers involved in food crop interventions.
In addition, other indicators may be measured in thematic and annual outcome surveys, and in project impact evaluation surveys. These include:
Actual increase in area irrigated, crop areas and crop yields as a result of specific irrigation interventions.
Changes in input use, cultivation practices and crop yields related to specific crop technology interventions
Changes in source of water and time taken to collect water as a result of interventions in water supply
Changes in land use and the resulting outcomes

Republic of India
Meghalaya: Livelihoods and Access to Market Project
Final project design report - Working papers
114
Annex 1: Land Use Data
Table 1: District-Wise Land Use Statistics 2004-05 Area in Hectares (% of Total)
Forests Not available for cultivation
Other uncultivated land excluding fallow lands
Fallow land
Net area sown
Areas sown more than once
Gross cropped area
East Khasi Hills
104,468 (38.38)
50,621 (18.60)
74,528 (27.38)
11,245 (4.13)
31,338 (11.51)
7,741 (2.84)
39,079 (14.36)
Ri-Bhoi 86,750 (35.60
34,370 (14.10
87,226 (35.79
16,135 (6.62
192,19 (7.89
2,465 (1.01
21,684 (8.90
West Khasi
Hills 207,960 (40.22)
70,437 (13.62)
152,097 (29.41)
65,974 (12.76)
20,632 (3.99)
5,948 (1.15)
26,580 (5.14)
Jaintia Hills 154,150 (40.45)
30,957 (8.12)
137,103 (35.98)
28,740 (7.54)
30,150 (7.91)
357 (0.09)
30,507 (8.00)
East Garo
Hills 122,562
(47.27) 10,370
(4.00) 68,085
(26.26) 27,235
(10.50) 31,048
(11.97) 5,315
(2.05) 36,363
(14.02) West Garo Hills
164,001 (44.37)
21,728 (5.88)
58,983 (15.96)
55,413 (14.99)
69,475 (18.80)
20,275 (5.49)
89,570 (24.28)
South Garo
Hills 101,895 (55.35)
9,462 (5.14)
29,695 (16.13)
26,018 (14.13)
17,030 (9.25)
3,862 (2.10)
20,892 (11.35)
Meghalaya 941,786 (42.29)
227,925 (10.23)
607,717 (27.29)
230,760 (10.36)
218,892 (9.83)
45,963 (2.06)
264,675 (11.89)
Source: Statistical Abstract Meghalaya 2006
Table 2: Area under different slopes Slope Category
Slope Area Places Degrees % km
2 %
Level to Gentle
<5
<9
2,630
11.73
Damra, Dainadubi, Mandipather, Resubelpara, Tikrikila, Phulbari, Garobadha, Mancacher, Mahendraganj, Dalu and south western part of South Garo Hills district
Moderate
5 to 10
9 to 18
9,975
44.47
Northern part of Ri-Bhoi district, north and eastern part
of Jaintia Hills district, central highland zone of East Khasi Hills district and Jaintia Hills district, Rangmil, Rangjeng, Darugiri Anogiri, Rangram, Tura, Adugiri Nengkhra, Nangalbibra, Siju, Baghmara and Chokpot
Moderately Steep
10 to 20
18 to 36
9,614
42.86 Umsning till Sonapahar, Mawsynrut, Nongstoin and Wahlyngdoh
Steep
>20
>36
210
0.94 Cherrapunjee, Mawsynram and Katdum
Source: Environmental Accounting of Natural Resources of Meghalaya: Phase I, Land and Forest Resources, Central
Statistical Organisation, Ministry of Statistics & Programme Implementation Government of India, New Delhi, 2008.

Republic of India
Meghalaya: Livelihoods and Access to Market Project
Final project design report - Working papers
115
Table 3: Wastelands in Meghalaya, 2005-06 Area in sq. km
Districts Dense scrub
Open scrub
Current jhum
Abandoned jhum
Degraded scrub forest
Rocky/stony waste
Total wasteland
East Garo Hills
9.56 223.81 39.9 77.23 13.9 0.02 364.42
East Khasi Hills
6.58 199.61 - - 2.69 179.23 388.11
Jaintia Hills - 898.37 10.52 0.09 27.86 31.48 968.32 Ri Bhoi 139.68 273.99 9.67 - 6.27 - 429.61 South Garo Hills
36.06 8.46 76.35 52.06 14.09 0.08 187.1
West Garo Hills
11.66 372.22 123.38 13.52 2.3 - 523.08
West Khasi Hills
250.89 663.64 32.05 14.22 - 44.32 1005.12
Total 454.43 2640.1 291.87 157.12 67.11 255.13 3865.76 % of Geographical Area
2.03
11.77
1.30
0.70
0.30
1.14
17.24 Source: Department of Land Resources, GoI

Republic of India
Meghalaya: Livelihoods and Access to Market Project
Final project design report - Working papers
116
Source: Aquifer Systems of Meghalaya, Govt. of India, Ministry of Water Resources, Central Ground Water Board, North Eastern Region, Guwahati,
September 2012

Republic of India
Meghalaya: Livelihoods and Access to Market Project
Final project design report - Working papers
117
Table 4: Exploitable Groundwater Resources in Meghalaya
Substrate E. Khasi W. Khasi S-W Khasi E. Jaintia W. Jaintia Ri-Bhoi E. Garo N. Garo W. Garo S-W Garo S. Garo Total
Alluvium
Area, sq km - 5 - 29 0 20 0 539 494 71 0 1,158 Exploitable area, sq km - 6 - 11 0 20 22 490 530 56 0 1,135 % of Geographical Area - 0.15 - 0.54 0.00 0.82 1.52 42.24 19.06 6.25 0.00 5.06
Basalt
Area, sq km 133 - 15 - - - - - - - - 148 Exploitable area, sq km 74 - 3 - - - - - - - - 77 % of Geographical Area 2.69 - 0.22 0.00 0.00 0.00 0.00 0.00 0.00 0.00 0.00 0.34
Sandstone
Area, sq km 134 - 60 352 0 0 0 0 343 681 220 1,788 Exploitable area, sq km 80 - 18 0 0 0 0 0 398 426 37 959 % of Geographical Area 2.91 - 1.34 0.00 0.00 0.00 0.00 0.00 14.31 47.54 1.96 4.28
Shale
Area, sq km 275 110 311 1,389 220 - 76 - 578 47 1,290 4,296 Exploitable area, sq km 62 16 20 354 60 - 17 - 17 36 582 % of Geographical Area 2.26 0.41 1.49 17.35 3.37 0.00 1.18 0.00 0.61 0.00 1.91 2.59
Limestone
Area, sq km 4 - - 21 13 - - - - - 0 37 Exploitable area, sq km 3 - - 1 2 - - - - - 0 6 % of Geographical Area 0.11 - - 0.05 0.11 - - - - - 0.00 0.03
Granite
Area, sq km 607 544 421 - 105 550 54 48 - - 2,328 Exploitable area, sq km 111 46 111 - 39 129 12 10 - - 458 % of Geographical Area 4.04 1.18 8.28 0.00 2.19 5.27 0.83 0.86 0.00 0.00 0.00 2.04
Qurtzite
Area, sq km 1,126 - - - 536 127 0 0 0 0 0 1,790 Exploitable area, sq km 227 - - - 107 0 0 0 0 0 0 334 % of Geographical Area 8.26 - - - 6.01 0.00 0.00 0.00 0.00 0.00 0.00 1.49
Gnesis
Area, sq km 331 3,175 534 250 905 1,686 1,313 573 1,366 97 377 10,608 Exploitable area, sq km 30 422 51 105 450 279 393 191 411 24 - 2,356 % of Geographical Area 1.09 10.80 3.80 5.15 25.30 11.40 27.23 16.47 14.78 2.68 - 10.50
Intrusive
Area, sq km 139 72 - - - 65 - - - - - 275 Exploitable area, sq km 58 22 - - - 26 - - - - - 106 % of Geographical Area 2.11 0.56 0.00 0.00 0.00 1.06 - - - - - 0.47
Geographical area of district, sq km 2,748 3,906 1,341 2,040 1,779 2,448 1,443 1,160 2,781 896 1,887 22,429 Source: Aquifer Systems of Meghalaya, Govt. of India, Ministry of Water Resources, Central Ground Water Board, North Eastern Region, Guwahati, September 2012

Republic of India
Meghalaya: Livelihoods and Access to Market Project
Final project design report - Working papers
118
Table 5: Agro-climatic Sub-zones of Meghalaya Sub-Region Agro-climatic features Soils Dominant
geographic units. Location
I: Hills & Northern Slopes
Humid and warm with an average rainfall 1,270 to 2,032 mm
Light to medium texture, depth varying between deep to very deep
Hills and rolling and undulating pediment
Lower plateau in the northern and western parts of Garo Hills, northern parts of Khasi
Hills and north-eastern parts of Jaintia Hills
II: Central Hyperthermic
Plateau
Humid and hypothermic moderately cold in winter and warm in summer, rainfall 2,800 to 4,000 mm
Light to medium texture depth varying from deep to very deep
Upper and middle plateau
Central plateau of the
Garo Hills and central parts of the West Khasi Hills district
III: Central Thermic Plateau
Humid and moderately warm summer and severe winter, rainfall 2,800 to 6,000 mm
Light to medium texture, depth varying from deep to very deep
Upper and middle plateau
Central plateau of Khasi and Jaintia Hills
IV: Southern Slopes & Valleys of the East
Humid and warm, rainfall 4,000 to 10,000 mm
Light to medium texture, depth varying from deep to very deep
Severely dissected and undulating low hills gentle to steep slope and rolling pediment
Eastern and northern parts of Jaintia Hils, southern parts of East Khasi Hills and southern fringes of West Khasi Hills
V: Southern Slopes & Valleys in the West
Humid and hot, rainfall varying from 2,800 to 4,000 mm
Light to heavy texture, depth varying from moderately deep to very deep
Rolling and undulating pediment and valley land having depressions
Southern slopes of West Garo Hills districts and southern fringes of West Khasi Hills district
Source: Based on the Report of the Working Group of Zonal Planning Team, Eastern Himalayan Region (Zone- II), Planning Commission, GoI

Republic of India
Meghalaya: Livelihoods and Access to Market Project
Final project design report - Working papers
119
Annex 2: Climate change vulnerabilities
Sector Climate change vulnerabilities Agriculture High intensity rainfall events affecting grain harvest and production,
Higher temperatures affecting crop physiology and grain quality
Water stress and drought-like conditions during grain filling period (reduces yield)
Higher temperatures causes forced maturity of crops and poorer harvest
Higher temperatures cause increased insect and pest incidences on agricultural and horticulture crops
Overall decreased rice yields due to a combination of temperature, rainfall and CO2 patterns
Market access for crop sales reduced during monsoon seasons (flash floods, landslides etc.) Forests Forest fire incidence increased
Invasive species increased
Increased forest pathogens and pests
Loss of biodiversity and species richness
Reduced natural regeneration of native species and change in species succession
Changes in forest net primary productivity and soil carbon (due to higher rainfall and temperature) Soil and water resources
Inadequate ground water storage capacity and lower recharge of natural sources
Flood damage to irrigation structures, fisheries structures and other infrastructure
Reduced availability of water for livestock
Soil erosion and nutrient loss
Landslide hazards and loss of lives and property from flash floods Livelihoods and poverty
Subsistence agriculture less sustainable and less reliable as a livelihoods option
Few options available (especially for the poorest and most vulnerable households) to diversify their livelihoods as a coping strategy
Market-based agriculture (cash crops) is increasingly risk-prone and market access is disrupted
Disruption to provision of state government services (due to climate damage and prolonged inundation)
Infrastructure damage (houses, irrigation structures, public building, culverts etc.) due to extreme rainfall events and flash floods
Increased incidence of human disease Source: NECCAP, 2012

Republic of India
Meghalaya: Livelihoods and Access to Market Project
Final project design report - Working papers
120
Annex 3 Table 7: Estimates of terracing cost per hectare
Earth work in cu m and Costs in INR
Slope Terrace Width 3 m Terrace Width 2 m Terrace Width 1 m
Degrees % Earth work Cost MGNREGS days Earth work Cost MGNREGS days Earth work Cost MGNREGS days
2 3.49 130.95 9,821 66 87.30 6,548 44 43.65 3,274 22 4 6.99 262.23 19,667 133 174.82 13,111 89 87.41 6,556 44 6 10.51 394.14 29,561 200 262.76 19,707 133 131.38 9,854 67 8 14.05 527.03 39,527 267 351.35 26,351 178 175.68 13,176 89 10 17.63 661.23 49,592 335 440.82 33,061 223 220.41 16,531 112
Note: Earthwork rate (cost of cutting and filling) has been assumed to be INR 75 per cu m and MGNREGS wage rate INR 148/day.
Earth work per hectare = 12.5 x %slope x width of terrace in m.

Republic of India
Meghalaya: Livelihoods and Access to Market Project
Final project design report - Working papers
121
Annex 4
Essential elements of an INRM plan22
The INRM plan is the core of a Village Development Plan since land and water (especially rainwater) are the anchors of livelihoods in project villages. The key principles to be followed are:
1. The plans should reflect the informed choices and aspirations of all the people in the village; 2. It should lead to year-round availability of water in the village for domestic usage and livestock
rearing, enhanced livelihoods and well-being of all the people in the village and reduced livelihood vulnerabilities;
3. It should enhance the current productivity of land, water (including rainwater) and available human resources in the village; and
4. It should set in motion processes that would keep enhancing the carrying capacity of the land resources of the village over time.
The INRM plan will be used to prepare annual action plans and budgets for the natural resource management component. The plan may be revised over time as new opportunities, knowledge and experience emerge. The step-by-step methodology for preparing the INRM plan is described below.
I. Collecting relevant maps and census data: The NGO will collect the 0.5 m resolution NESAC satellite maps for the project village from the DPMU concerning slope, land use, soils and drainage. The NGO will make enlarged copies of the maps for use in the planning process
23. The NGO will also
collect from the DPMU a map of the block showing important physical features, such as rivers, forests, various settlements and road links and census data (2011 census) for the village for reference and cross-checking data generated in the course of the planning exercise.
II. Community mobilisation: This is a step-by-step process of bringing village people, especially women, on board, sharing the project concept with them and exposing them to alternative resource management practices. The VEC will be reconstituted to ensure that all adults are included and the executive committee created to take the planning and implementation process forward.
III. Mapping broad features of the village: The objective of this step is to generate data about the socio-economic and physical features of the village and to set in motion a participatory process of
planning that will continue for a few days24. The NGO staff, executive committee members and CRPs will facilitate this exercise with technical assistance from the DPMU. The following steps may be followed:
III.1. Location map of the Village: Using the official block map as a guide, the facilitators help the assemblage to plot on a map
25 the location of the village with respect to the block town
and other key features, such as roads, market towns, post office, bank, neighbouring villages, neighbouring, schools, church, public health facilities, streams/rivers, forests, etc. Approximate distances should be recorded. This is a standalone map of the village, marking its general location in the area with respect to other settlements and service establishments.
III.2. Physical and social map of the Village: Using an enlarged copy of the NESAC drainage map, key features of the village, such as houses with numbers assigned to each and other buildings, pathways, drinking water sources, springs, wells, streams and hills/ hillocks and various land uses, such as agriculture, grazing area, forest, etc. are marked. This defines the broad features of the Village. Actual land-use should be cross-checked with the NESAC map but the land use observed on the ground must be recorded.
III.3. Resource mapping and demarcation of patches: On another enlarged drainage map, the ownership (with house numbers used in the previous map for private land), including homestead or bari-bagan land is marked. The land should also be demarcated into different patches, using local nomenclature if any. The patches should be differentiated based on a combination of slope (level to gentle with slope <9%, moderately sloping with slope 9% to
18%, moderately steep with slope 18% to 36% and steep with slope >36%), soil depth and
22 This is a broad outline to serve as a guide for developing a Detailed Operating Manual for preparing INRM plan.
23 This could be done by projecting a soft copy of the map on a white chart paper and manually tracing the map.
24 Considering the large expanse of the village, absence of cadastral maps and a rugged terrain, the exercise is likely to stretch over 10 to 15 days (depending on the size of the village) and should be done in stages. 25 The map could be made on the ground using ash or lime and later transcribed on a chart.
Republic of India
Meghalaya: Livelihoods and Access to Market Project
Final project design report - Working papers
122
aspect26
. Other features, such as extent of soil erosion, problem soils, distance from water sources, etc. should also be recorded on the map. Each patch should be identified with either a local name or a unique number.
III.4. Basic household and village data: Household data should include demographic details, ownership of land and other assets, income and sources, extent of food security, membership of SHG/other institutions, MGNRGA job card, Kisan Credit Card/bank account, etc. Village level data should record consolidated demographic data, basic infrastructure, land area and land use, irrigation coverage, location of key service facilities, such as markets, government offices, bank branch, etc.
IV. Patch-wise planning: Once different patches have been identified and marked on a map, the planning exercise begins through site visits or transect walks. The NGO, executive committee members and owners of private land in respective patches of land (both women and men from each household owning land in the patch) participate in this exercise to consider various possibilities to enhance present productivity of the patch, reduce risk and promote management systems that are regenerative. At the end of this exercise a treatment, future usage and productivity enhancement plan will emerge for each patch and will be recorded for each patch, owner-wise. The following steps are involved.
IV.1. Physical characteristics: The drainage pattern on each patch is marked with arrows. Other physical characteristics, such as location on a slope, soil depth, soil texture, presence of problematic soils, location in the watershed, presence or absence of trees, presence of wells, location of patch with respect to nearby water sources, aspect, etc. are recorded for each patch. These would aid the identification of problems and generation of solutions by way of treatment and alternate use.
IV.2. Present status and use: The present land use and status, such as forests, their composition and status, crops cultivated, frequency of cultivation, crop yields, quality of terracing if any, presence or absence of bunds and quality of bunds if any, extent of erosion, use of organic manures and chemical fertilisers, etc. are recorded for each patch.
IV.3. Problem identification: Through discussions, site observation and analysis of characteristics and usage practices the problems that hinder productivity, such as water retention in soils, vulnerability to drought, lack of irrigation, soil fertility are recorded for each patch. Problems emanating from the patch that affect the wider landscape should also be identified and documented.
IV.4. Option generation: Through discussions with owners and with technical inputs from the NGO facilitators and DPMU various technically feasible options for treatment and post- treatment usage are generated based on INRM principles. The available options should also take into account present and potential linkages with other resources outside the patch, such as possibility of irrigation from wells, ponds and streams far away from the patch and by diverting rainwater run-off from land beyond the patch, seepage from neighbouring patches, etc. Similarly, the potential (positive and negative) effects of such options on other resources (neighbouring patches, groundwater, etc.) should also be taken into account. Homestead land should also be covered in this exercise.
IV.5. Proposed treatment and usage plan: The available options are evaluated in terms of economic viability, willingness of the owner and optimality of effect on the landscape from an INRM perspective. This is the most critical step and must not be hurried through. Individual owners may not be convinced of the likely benefits and may find the apparent adverse effects too high
27. They may not fully appreciate the potential benefits of landscape-
level treatments, such as seepage from upstream, etc. The chosen treatment as well as future land use plan is worked out for each patch, including the homestead land. This will be an input to the Land and Water Resource Development Plan, the MGNREGS Plan as well as the Productivity Enhancement Plan.
26
For example, one patch might be moderately sloping with deep soils and facing north, while another might be moderately sloping with deep soils facing south, and so on. 27
Farmers often get discouraged by the immediate adverse effects of landscape amendments such as terracing, land leveling, etc. Similarly, land use changes that appear to affect subsistence security, such as shift from field crops to vegetables or tree crops, or a shift from cereals to pulses and oilseeds are not readily accepted. These are normal anxieties and the facilitators must not rush solutions through, nor give up at the first sign of hesitation.

Republic of India
Meghalaya: Livelihoods and Access to Market Project
Final project design report - Working papers
123
IV.6. Land and water resource development plan: The proposed treatment plan is the land and water resource development plan. It spells out proposed interventions for landscape development, rainwater management and future land use changes.
IV.7. Productivity enhancement and crop diversification plan: The productivity enhancement and crop diversification plan will emerge in the course of deciding the land treatment plan which is linked to land use plan. Possibilities of developing irrigation from lowland wells and nearby springs and streams, if any, will also be part of this plan.
IV.8. Cost estimation: The cost of treatment for each patch, owner-wise, is worked out based on the prevailing Schedule of Rates. Cost of productivity enhancement activities is worked out separately, based on proposed activities.
IV.9. Labour and material requirements: Since the treatment would be financed mainly through convergence with MGNREGS, the labour and material requirement for each patch would be worked out.
IV.10. Financing plan: Proposed sources of funds for carrying out the treatment will be identified for each patch. Similarly, budget for proposed productivity enhancement activities will be prepared and sources of funds for the same would be identified. These would include finances to be mobilised through convergence.
IV.11. Phasing of activities: Eventual phasing would depend on budget availability. At this stage an implementation sequence and time-line should be prepared.
IV.12. Annual plans: Annual plans for each sub-component and MGNREGS will be prepared every year by the executive committee with the facilitation of NGO based on budget availability, the labour budget for MGNREGS and willingness of beneficiaries to take up proposed activities.
V. Consolidation of plans: The plans are consolidated by combining the proposals for all the patches. These would be recorded on maps as well as in tables. The following items would be included in the consolidated plan:
V.1. Overall treatment plan: Patch and owner-wise consolidation of proposed treatment.
V.2. Productivity enhancement and crop diversification plan: Patch and owner-wise consolidation of proposed activities.
V.3. Overall budget: Patch and owner-wise consolidation of required investment.
V.4. Financing plan: Patch and owner-wise consolidation of proposed sources of funds.
V.5. Land use plan: Patch and owner-wise consolidation of proposed land use.
V.6. Implementation schedule: The timeline for implementation in terms of sequences of activities and duration should be presented.
V.7. Annual plans: Annual plans will be prepared on the basis of the perspective plan, the budget provided by DPMU and the resources available through convergence.
VI. Documentation: The proposed consolidated plan is captured in the form of a bound report in the
vernacular28
. The plan should be presented as a document from the VEC and not from the NGO. The plan document should have the following information:
The Planning Process (brief description of process followed, dates of events, participants by category)
Brief description of the village (based on data collected from the village) o Physical Location (map and description; location of block, markets, etc.) and
administrative identity (block, thana, district)
o People (summary demographic data defining different social groups and their
respective population; vulnerable households, such as differently-abled, women headed households; education; gender composition; general health scenario; land ownership)
28
The INRM plan is a village plan, to be implemented by the VEC and its implementation may extend (through convergence) beyond the project period. Therefore members of the executive committee of the VEC and other literate people in the village should be able to ead and interpret it.

Republic of India
Meghalaya: Livelihoods and Access to Market Project
Final project design report - Working papers
124
o Basic Services (drinking water, Balwadi and ICDS center, School, PHC/ health services, ASHA, PDS shop, post office, bank)
o Infrastructure (roads, electricity, community halls) o Institutions (traditional institutions, SHGs, cooperatives, Church, others) o Broad Features of the Village Economy (predominant economic activities) o Resources (map and description: land—total area, different categories with area and
characteristics; water sources—quantum and distribution of rain, ponds, springs with duration of flow, streams, wells and groundwater; forests—government forests, community forests, private forests, present usage; grazing area)
o Livelihoods (primary, secondary and tertiary sources of livelihoods—settled agriculture, jhum, NTFP, livestock, local wage labour, migration, other)
o Markets—traditional weekly markets, nearest settled market, market for farming inputs
o Financial services o Description of Agriculture and other production systems o Level of food security o On-going government programmes o Key problems pertaining to livelihoods, food security, resource management systems
Vision and goals: With respect to the problems described above, a brief description of the changes the community want to bring about and specific outcomes it seeks by implementing this plan
Proposed Land & Water Resource Development plans o Present status and use (map and description in tables: Patch-wise map of how
resources are used, with listing of owners) o Problem identification (problems described patch-wise, listing owners, in a tabular
format) o Proposed treatment plan (map and description in tables: Patch-wise map of proposed
landscape amendments/treatment, with listing of beneficiaries) o Activity-wise summary and phasing of treatment (e.g. (i) contour trenches,
(ii) terracing, (iii) forestry/tree planting, (iv) jhum treatment/ stabilization, (v) drainage management, etc.); total budget for each activity; sources of funds; phasing
o The proposed activities would be summarized for the entire village, patch-wise, including households-wise summary of activities for the entire village; investments; phasing
Proposed productivity enhancement and crop diversification plans (plans pertaining to crops and land use would get refined as landscape treatment gets underway): o Plans for developing irrigation from wells and streams (map showing irrigated area
and tables showing beneficiaries, area, budget, etc. o Plans to enhance productivity of present crops (paddy, maize, potatoes and spices)
would include description of specific strategies year-wise, such as exposure visits, demonstrations, training, input supply, etc. The plans would identify likely participants, acreage, budget and expected outcomes.
o Plans showing changes in land use towards pulses, oil seeds, vegetables, winter crops and tree crops (household-wise plans) would describe proposed changes and strategies.
Consolidated activity plan: For the entire village, a consolidated plan, including all the sub-components (Land and Water Resource Development, Productivity Enhancement, etc.) will be made, including map and tables.
Drawings of proposed treatment activities: Drawings of all proposed activities would be prepared to show the design features. Since the activities are repetitive, such as terracing, contour trenches, rainwater storage structures, wells, plantations, etc. the drawings will be illustrative to aid in estimate preparation and construction.
Detailed estimates: For each of the activity or item of treatment detailed estimates would be prepared.

Republic of India
Meghalaya: Livelihoods and Access to Market Project
Final project design report - Working papers
125
Working Paper 5: Climate Change1
1. Introduction
Climate-change modelling studies for India show that the sub-continent is likely to experience a
warming of over 3-5oC and significant changes in rainfall, (increases and decreases), increased flood
and drought frequency and intensity. Ravindranath et al (2010) made a district-wise assessment of all districts in NER (north-eastern region) including those in Meghalaya based on their projected increases in temperature (2021-50) and projected change in their total rainfall (2021-50). The results of this as they apply to Meghalaya are shown in Tables 1 and 2. Note that all districts in Meghalaya are projected by the models used to have both rainfall and temperature increases. This was not necessarily the scenario indicated during discussions with farmers and rural communities who indicated that they were experiencing reduced rainfall.
Table 1: Forecast of change in temperature
Districts (old) Increase in temperature (
oC)
West Garo Hills, East Garo Hills, South Garo Hills 1.8 to 1.9
Ri-Bhoi, Jaintia Hills, West Khasi Hills 1.7 to 1.8
East Khasi Hills 1.6 to 1.7 Source: NECCAP, 2012
Meghalaya’s climate change scenario can be broadly characterised by higher rainfall (with subsequent impacts); more irregularity and uncertainty in rainfall distribution and higher frequency of drought-like periods. Also important is the greater likelihood of extreme rainfall events. With temperature there is an overall increase – probably more marked at higher altitudes. Under these circumstances, climate change modelling is likely to be complex and very location-specific.
Table 2: Forecast of change in rainfall
Districts (old) Increase in annual rainfall
Jaintia Hills 15 - 20%
Ri-Bhoi, East Khasi Hills 10 - 15%
West Khasi Hills 5 - 10%
West Garo Hills, East Garo Hills, South Garo Hills 0 - 5% Source: NECCAP, 2012
2. Change in rainfall
Apart from the change in total rainfall projected in Table 2, a number of other factors relating to rainfall are also critical. These include the variability in the summer monsoon (total quantity of rainfall, frequency of ‘gaps’ during the monsoon, start date and end date), winter rainfall, and frequency and intensity of extreme rainfall incidents. Regional and state level data for Meghalaya as analysed by Ravindranath et al (2010) indicate an overall increase in extreme hydrological events (large-scale droughts and floods) in the North East Region (with Meghalaya being no exception). The east of Meghalaya is projected as being particularly vulnerable to increases in the number of extreme rainfall events.
Analysis of precipitation trends over the past 100 years shows an overall increase in rainfall for parts of Garo Hills and West Khasi Hills districts. However, people report that, although the quantity and
1
Information on climate change has been extracted from the North East Climate Change Adaptation Programme (NECCAP) – Detailed Planning of Adaptation Measures, Programme Design Document, Meghalaya (GIZ), GFA Consulting Group, November 2012

Republic of India
Meghalaya: Livelihoods and Access to Market Project
Final project design report - Working papers
126
intensity of rainfall has increased, the duration of the rainy season has declined. Heavy north- westerly monsoon rainfall occurs in few intense spells which result into heavy run-off, flash floods and soil erosion. Reduction in the duration of the rains has also resulted into low retention and availability of groundwater.
Rainfall variability expressed as percentage deviation from the long term mean shows greater variability in South Garo Hills District and the southern part of West Khasi Hills District. These districts can expect to experience greater variability in the monsoon pattern – although all districts in the state show this trend to some extent.
Most parts of Meghalaya have an annual probability of moderate and severe drought between 5- 10%. During the bad drought years of 2005 and 2006, rainfall was 30-40% below normal rainfall. Inter-annual variability of monsoons as a result of climate change is likely to be the cause of this. In the media, much has been written about changes in rainfall and the consequent effects in Cherrapunji which, whilst normally being considered as having the highest rainfall on earth, has also experienced winter season droughts.
3. Change in temperature
The projected trend (Ravindranath et al 2010) is for steadily increasing temperatures in NER. This is manifest in observed increases in maximum temperature in post-monsoon and monsoon months since 1970. An increase in the maximum temperature of around 0.4°C is notable over all parts of NER during the post-monsoon of the past decade. This warming trend is observed across all seasons. Spatially there are differences across the state with a projected increase in the minimum temperature of ≥2°C per 100 yr. in Garo Hills and West Khasi Hills and a maximum temperature increase of 0° to 1°C per 100 years in Garo Hills and West Khasi Hills where as it has increased by more than 1
oC
compared with the rest of Meghalaya. These changes in temperature regimen have implications for agriculture, forest and human health. These is enough literature available on ill effects of global warming some of the most prominent consequences may be incidence of vector borne diseases, fall in productivity of staple crops, changes in species and loss of known and useful bio-diversity.
4. Climate vulnerability
Climate risks and hazards include: (i) the direct effects of extreme climate events such as floods, droughts, landslides etc. which have a dramatic and immediate impact on vulnerable households; and (ii) more gradual climate shifts such as increasing mean annual temperatures, decreasing rainfall or seasonal shifts in weather patterns. In both these situations people and ecosystems always have some capacity to cope and adapt. However the adaptation capacity of people varies significantly depending on factors such as livelihoods practices – especially on the level of dependency on natural resources and on livelihoods diversity; poverty levels; other available resources; services and support from outside; geographical location etc. as well as on the frequency, speed and intensity of the climate changes and climate events themselves.
Meghalaya is particularly vulnerable to climate change as a result of the fragile eco-systems, the physiological diversity of the state, its geographical location on the periphery of the Eastern Himalayas and its economic under development. The river systems of the state are both a great resource and also a source of climate change vulnerability.
A survey of stakeholder perceptions done by the Ministry of Environment and Forests, GoM, shows the major environmental concerns in the Khasi Hills are water scarcity, depletion of biodiversity and soil erosion, whereas the main environmental concerns in the Garo Hills where water scarcity, deforestation, jhum cultivation, loss of bio-diversity, floods, sustainability of agriculture. All these concerns are directly or indirectly related to climate change.
Floods: analysis over the period 1901-2007 shows a 5-10% probability of floods of moderate or severe intensity. More intense floods are expected in the western part of East Garo Hills and West

Republic of India
Meghalaya: Livelihoods and Access to Market Project
Final project design report - Working papers
127
Garo Hills. Extreme precipitation events (heavy rain storm, cloud burst) cause widespread landslides and soil erosion and later sedimentation. Extremely heavy cloudbursts of unprecedented intensity in the western Meghalaya Hills in 2004 produced devastating flash floods causing hundreds of deaths. Floods in the northern part of West Garo Hills adjoining Assam regularly cause tremendous loss to crops, infrastructure, economy, livelihoods and lives of the people. 815,000 ha in Meghalaya is affected by flood hazard. This may increase in the next few decades in terms of intensity, frequency, erosion potential, environmental damage, social disruption and economic costs.
The southern slopes of the Meghalaya Hills receive very high rainfall during the monsoon months. In addition, the shallow soils of these areas produce high surface runoff. As a result, considerable quantities of water pour down the steep slopes of the Meghalaya Hills into the Meghna flood plains of Bangladesh, and cause significant losses in this densely populated country.
Associated with floods and heavy rain events are landslides, hailstorms and thunderstorms. At other times of year the frequency of fog, snow storms and cold waves also appears to be changing – although with no clear empirical data being available.
Drought: Ravindranath et al (2010) indicates that, for most parts of Meghalaya, the probability of drought is relatively high. In practice, the state experiences a drought-like situation every year during winter, and failure of monsoon will further aggravate this situation. Rainfed agriculture is particularly affected thus exposing a large number of people to climate change.
Higher incidence of drought means higher exposure to vulnerability to climate change especially for poor people who have less adaptive capacity. Identified vulnerable districts of West Garo Hills, East Garo Hills, South Garo Hills and West Khasi Hills are expected to receive more monsoon precipitation, with an increase in intensity of rainfall events, but with a reduction in the number of these rain events. Thus, in the short term, water yield may increase but the water scarcity may also increase due to increased rainfall intensity and increased runoff leading to less in-situ storage in watershed.
A combination of drought and higher temperatures will lead to increased moisture stress during the critical crop growing stages and so reduced yields.
5. Natural resources sector vulnerabilities
Ravindranath et al (2010) summarises the specific climate change vulnerabilities of the four main natural resource sectors. These are shown in Table 3. Other sectors are also vulnerable to the effects of climate change. For Meghalaya, agriculture will be the main sector where climate change makes itself felt, though both increased temperatures and, especially, water-related stresses caused by more intense rainfall in a shorter rainy season. The natural resource sectors of forest and soil and water resources are likely to be impacted to a greater extent by human and economic activity than by climate change. This is not to say climate change will not have an impact, but it will be significantly less than changes brought about by population increase and economic growth.
For agriculture the main climate variables that are important for determining rice and other crop yields are air temperature and humidity, cloudiness, solar radiation, water availability (including rainfall), and atmospheric CO2 concentration. Increase in temperature adversely affects rice crop physiology and
results in decreasing crop yields and grain quality. Increase in atmospheric concentration of CO2 is
expected to increase plant growth and consequently rice yields. But the effect of increase in CO2
concentration will be nullified by the increase in temperature. Increased temperatures will lead to forced maturity and poor grain harvest index due to limited water supply. The water stress during grain filling period may result in decline of grain yield. Higher temperatures coupled with increased CO2 concentration could result in photosynthetic acclimation because of the imbalance in the
source/sink ratio.
These climate related factors suggest that overall rice yield could be expected to decrease in Meghalaya with climate change. However given the low level of development of this crop in terms of use of inputs (organic and inorganic), inadequate cultivation and non-adoption of improved methods,

Republic of India
Meghalaya: Livelihoods and Access to Market Project
Final project design report - Working papers
128
it is more likely that, in future, with adoption of improved methods, yields will increase. The same is broadly true of other crops - apart from some temperature-critical crops, such as temperate fruits, where increasing temperatures may reduce the area where they can be grown. Although agriculture is more vulnerable to climate change than the other NR sectors, it is also subject to human and economic influences which can generate larger and more rapid changes.
Table 3: Climate change vulnerabilities
Sector Climate change vulnerabilities Agriculture High intensity rainfall events affecting grain harvest and production,
Higher temperatures affecting crop physiology and grain quality
Water stress and drought-like conditions during grain filling period (reduces yield)
Higher temperatures causes forced maturity of crops and poorer harvest
Higher temperatures cause increased insect and pest incidences on agricultural and horticulture crops
Overall decreased rice yields due to a combination of temperature, rainfall and CO2 patterns
Market access for crop sales reduced during monsoon seasons (flash floods, landslides etc.) Forests Forest fire incidence increased
Invasive species increased
Increased forest pathogens and pests
Loss of biodiversity and species richness
Reduced natural regeneration of native species and change in species succession
Changes in forest net primary productivity and soil carbon (due to higher rainfall and temperature) Soil and water resources
Inadequate ground water storage capacity and lower recharge of natural sources
Flood damage to irrigation structures, fisheries structures and other infrastructure
Reduced availability of water for livestock
Soil erosion and nutrient loss
Landslide hazards and loss of lives and property from flash floods Livelihoods and poverty
Subsistence agriculture less sustainable and less reliable as a livelihoods option
Few options available (especially for the poorest and most vulnerable households) to diversify their livelihoods as a coping strategy
Market-based agriculture (cash crops) is increasingly risk-prone and market access is disrupted
Disruption to provision of state government services (due to climate damage and prolonged inundation)
Infrastructure damage (houses, irrigation structures, public building, culverts etc.) due to extreme rainfall events and flash floods
Increased incidence of human disease Source: NECCAP, 2012
The production and productive capacity of agriculture depends on environmental and resource factors. The ability of agriculture systems to cope with the variability of climatic changes determines its vulnerability. Ravindranath et al (2010) outlined the following indicators of vulnerability of agriculture (Table 4). However, as shown in the table, the application of these indicators may be of limited application in Meghalaya. Nevertheless, using these indicators an overall index of the vulnerability of each district has been calculated in Table 5. These indexes apply to both the baseline and A1B climate change scenarios.

Republic of India
Meghalaya: Livelihoods and Access to Market Project
Final project design report - Working papers
129
Table 4: Indicators for vulnerability of agriculture
Symbol Indicator and unit
Rationale (with comments in italics)
A7 Area under irrigated crops (ha) Irrigation can reduce vulnerability to drought, but irrigation systems themselves can be vulnerable to water shortages.
A8 Area under HYV Higher yields of HYV can increase farm incomes. The higher the farm income, the less vulnerable the farmer. This ignores the fact that some local varieties are relatively drought tolerant, and use less
inputs (so loss is lower in the event of failure), but stress-tolerant HYVs are now being developed.
A9 Amount of fertilisers used (tons)
Higher inputs mean higher yields, higher income and hence less vulnerability. Although more investment in inputs increases the risk of
more substantial loss. Farmers in high risk environments usually use less inputs.
A10 Amount of manure used (tons)
Higher inputs mean higher yields, higher income and hence less vulnerability. Manure also helps retain moisture, which may help reduce vulnerability to drought.
A11 Net annual ground- water availability (b.m3) Groundwater provides irrigation, which in turn reduces vulnerability.
Again prolonged drought may exhaust groundwater reserves.
A12 Groundwater recharge (b.m
3)
More groundwater recharge reduces vulnerability
A13 Mean yield of rain- fed crops (kg/ha)
Higher crop yields indicates that rainfall is sufficient. However Meghalaya vrop yields are low despite high rainfall - other factors are important such as soil acidity (linked to high rainfall) and backward farming practices.
Source: NECCAP (North East Climate Change Action Plan), 2012
Table 5: Index of agricultural vulnerability
District (old) Index West Garo Hills 2 - 3
East Garo Hills 4 - 5
South Garo Hills 4 - 5
West Khasi Hills 3 - 4
Ri-Bhoi 1 - 2
East Khasi Hills 0 - 1
Jaintia 4 - 5 Source: NECCAP, 2012
Vulnerability of water resources in each district is shown in Table 6. Table 6: Vulnerability of water resources
District (old) Ranking Overall water
vulnerability* Water
availability Evapo-
transpiration demand
Monsoon drought weeks
Flood magnitude
1 Jaintia 7 1 1 3 Low
2 East Khasi Hills 6 2 2 2 Low
3 West Khasi Hills 5 3 3 4 High
4 South Garo Hills 4 6 4 1 High
5 Ri-Bhoi 3 5 6 5 Very high
6 East Garo Hills 2 4 7 6 Very high
7 West Garo Hills 1 7 5 7 Very high
* for both baseline and climate change scenarios Source: NECCAP, 2012

Republic of India
Meghalaya: Livelihoods and Access to Market Project
Final project design report - Working papers
130
6. Livelihoods vulnerability
The poverty index (Table 7) is calculated from 5 variables. There is a strong link between poverty and the ability to adapt to climate change, so this poverty index is an important element for indicating overall vulnerability. Except for East Khasi Hills, all districts in Meghalaya have high to moderate poverty levels (Table 8).
Table 7: Components of poverty index
Indicator and unit
Rationale
Urban-rural population ratio
Access to healthcare, employment and education are better in urban areas. Rural populations are more vulnerable.
Per capita income The higher the income the lower the vulnerability
Number of livestock per household
Livestock are an asset that provides a buffer if crops fail. The number of animals can be a proxy indicator of rural income.
Gini coefficient of income
Higher Gini coefficient (income inequality) the higher the vulnerability.
Literacy rate Literacy represents an ability to gain employment in more remunerative jobs, and also access to services such as education and healthcare.
Source: NECCAP, 2012
Table 8: Index of poverty District (old) Index West Garo Hills 4 - 5
East Garo Hills 2 - 3
South Garo Hills 4 - 5
West Khasi Hills 2 - 3
Ri-Bhoi 4 - 5
East Khasi Hills 0 - 1
Jaintia 3 - 4 Source: NECCAP, 2012
7. Overall Vulnerability
The overall vulnerability index uses all criteria of forests, agriculture, soils and water and livelihoods to make an assessment of the vulnerability to climate change of different districts in Meghalaya. In Meghalaya, 5 districts are moderately to highly vulnerable (West Khasi Hills, South Garo Hills, Ri-Bhoi East Garo Hills and West Garo Hills). However these levels of vulnerability to climate change need to be taken in the context of opportunities to increase the productivity of the current agricultural sector which, by Indian standards, is at a very low level of development. Although climate change vulnerability may not support development, its impacts are limited relative to the opportunities for productivity enhancement through adoption of improved techniques.
Table 9: Index of overall vulnerability
District (old) current Future West Garo Hills 4 - 5 4 - 5
East Garo Hills 4 - 5 4 - 5
South Garo Hills 4 - 5 3 - 4
West Khasi Hills 3 - 4 3 - 4
Ri-Bhoi 4 - 5 4 - 5
East Khasi Hills 2 - 3 1 - 2
Jaintia 2 - 3 1 - 2 Source: NECCAP, 2012

Republic of India
Meghalaya: Livelihoods and Access to Market Project
Final project design report - Working papers
131
8. Interventions to adapt to climate change
There are a number of potential actions that LAMP can take in terms of natural resource management and enterprise development that will enhance the ability of rural people to adapt to climate change. These include:
Water conservation, and enhanced water supply for domestic and irrigation use. This is the
focus of interventions in the Natural Resource and Food Security component. Not only will water supply and irrigation systems be constructed or improved, but catchment conservation works will help improve water infiltration.
Better crop planning – to get more crop per unit of water; such as sequential planting of alternate crops to mitigate risks of late arrival of monsoons.
Most water-efficient irrigation methods – such as drip irrigation. The SRI method of growing rice also requires less water. This is also proposed in the Natural Resource and Food Security component.
Plantation and tree crops (being deeper rooted more able to tolerate variations in water availability than annual crops). However account also needs to be taken of the suitability of different tree crops in terms of tolerance of climate change. Rising temperatures limit the potential for temperate fruits, and areca nut, although very widely grown, is said to be adversely affected. Meghalaya has considerable potential for plantation and tree crops, and some of these will be supported in the Integrated Production and Marketing component – taking account of which species and varieties are best adapted to increasing temperatures.
Protected cropping for high value crops - use of plastic tunnels, plastic mulch and net houses to protect crops from extreme weather. Protected cropping may also be supported in the Integrated Production and Marketing component.
Stress tolerant crops and crop varieties - examples such crops are cassava and millet. Stress tolerant varieties of paddy are being developed – that can tolerate submergence and drought. LAMP will support such food crops via the Natural Resource and Food Security component.
Livestock: can adjust feed sources in response to climate changes. Livestock are an important component of the rural household economy and will be supported by LAMP.The Knowledge Services component of the project can make a useful contribution to climate change adaptation by:
Disseminating information on weather early warning systems and agro-meteorological data
Providing information on innovations and initiatives aimed at climate change adaptation that are being tested or used by communities in Meghalaya, and from elsewhere in India and other countries.
Identify institutions with which the project could collaborate (for south-south cooperation, knowledge management, technical backstopping etc.) for climate change adaptation.


Republic of India
Meghalaya: Livelihoods and Access to Market Project
Final project design report - Working papers
133
Working Paper 6: Livestock
A. Introduction The livestock sector in Meghalaya has a number of features that set it aside from other parts of India – although not so much from the other states of the north-east. These include:
Popularity of consumption of all types of meat, including beef and pork
Low level of milk consumption
Only limited use of animals for draught power
Minimal amount of crop production for animal feed: either as green fodder or for use in manufactured compound feeds for poultry, pigs and dairy animals.
The following opportunities exist in the livestock sector in Meghalaya:
(a) Almost all inhabitants are non-vegetarian and pork is popular. Traditionally, a large
proportion of households keep pigs. However these pigs have low level of productivity, with each sow only producing about 8-10 weaned piglets per year, which take one year to grow to about 30kg. Therefore, most urban pork demand is met from imports. With an improved management system, one could easily increase output by three to four times: each sow weaning 16-18 piglets per year, and each growing to 90kg at one year of age.
(b) There is growing demand for chicken meat and eggs in the urban centres as well as in rural
areas. Although most poultry meat is supplied by local producers of broilers (using feed bought in from other states) and backyard flocks, a very large number of eggs are imported, which could be produced locally. Projects such as MLIPH have also demonstrated that there is a good market for "improved backyard" poultry, which sells at a premium price over broilers.
(c) Although milk consumption is very low, there is increasing demand for milk and milk
products in urban centres, and most milk products are imported from other states. Local cattle produce little milk, and there are not very many improved crossbreds. Jhum lands could be utilized for fodder with contour hedgerows and cover crops under orchard trees.
Lessons from other projects and programmes
Anecdotal evidence from a number of projects supported by IFAD and other agencies (including MLIPH in Meghalaya) indicates that pro-poor growth is often largely linked to livestock enterprises. Households with little or no access to land are able to establish livestock enterprises (poultry, goats, cattle and buffalo) that can generate a significant income. Livestock are also an important source of employment for the rural people
1.
Examples of livestock enterprises supported by MLIPH include:
An SHG at Mawkhap village, Ri Bhoi district are rearing broilers. They started with 50 in
2009, and now rear batches of 400 birds.
In Pammanik village Ms Nihi took an Rs2000 loan from her SHG to buy one pig. This enterprise has now expended, and poultry has been added, earning a total of Rs20,000 per year.
At Jatah Lakadong village in East Khasi Hills district an SHG invested in the purchase of 20 piglets, all of which died. However it persevered with this enterprise, and now has a pig breeding unit with 10 sows and one boar, and sells 70 to 80 piglets pr year. Total income is around Rs190,000, which feed (the major cost) comes to Rs72,000. Each of the 10 SHG members gets a net income of about Rs10,000 per year.
Mrs Irinda Lyndoh is producing Kuroiler chickens. Starting with a loan of Rs5000, she purchased 100 3-4 week old birds and reared them for 3 months before selling them when
1
Source: Potential for Livelihood Improvement through Livestock Development in Jharkhand, ILRI 2011
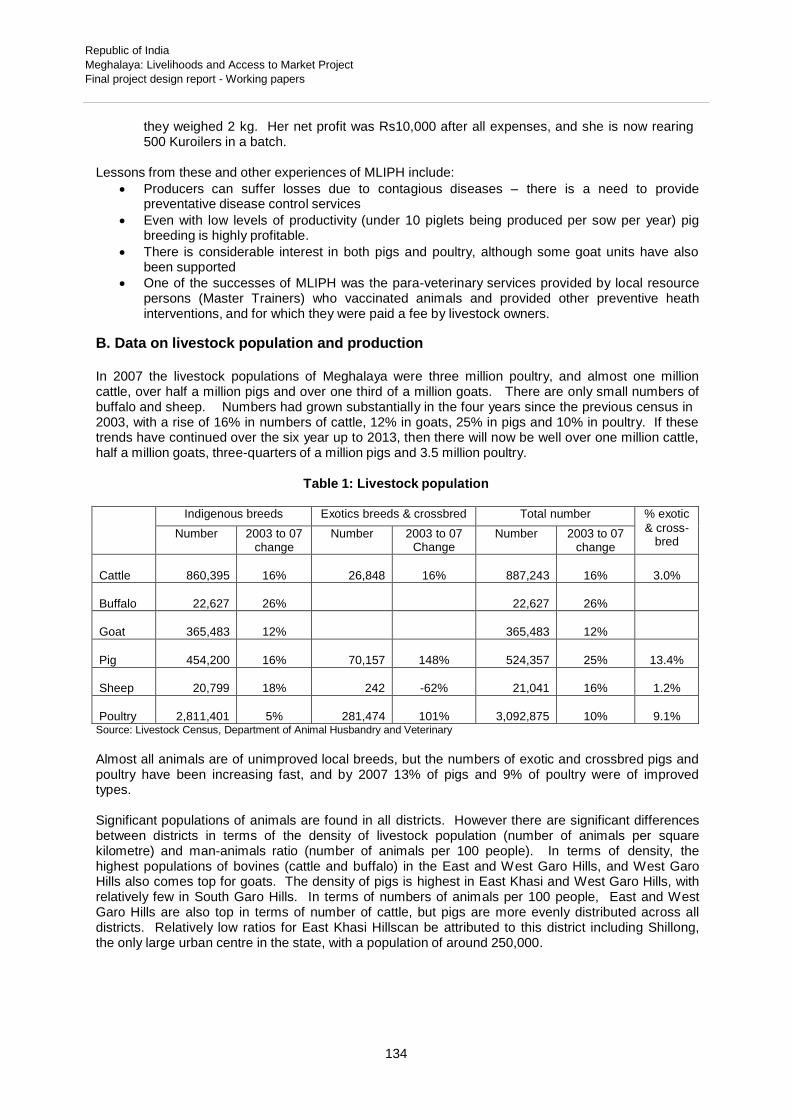
Republic of India
Meghalaya: Livelihoods and Access to Market Project
Final project design report - Working papers
134
they weighed 2 kg. Her net profit was Rs10,000 after all expenses, and she is now rearing 500 Kuroilers in a batch.
Lessons from these and other experiences of MLIPH include:
Producers can suffer losses due to contagious diseases – there is a need to provide preventative disease control services
Even with low levels of productivity (under 10 piglets being produced per sow per year) pig breeding is highly profitable.
There is considerable interest in both pigs and poultry, although some goat units have also been supported
One of the successes of MLIPH was the para-veterinary services provided by local resource persons (Master Trainers) who vaccinated animals and provided other preventive heath interventions, and for which they were paid a fee by livestock owners.
B. Data on livestock population and production
In 2007 the livestock populations of Meghalaya were three million poultry, and almost one million cattle, over half a million pigs and over one third of a million goats. There are only small numbers of buffalo and sheep. Numbers had grown substantially in the four years since the previous census in 2003, with a rise of 16% in numbers of cattle, 12% in goats, 25% in pigs and 10% in poultry. If these trends have continued over the six year up to 2013, then there will now be well over one million cattle, half a million goats, three-quarters of a million pigs and 3.5 million poultry.
Table 1: Livestock population
Indigenous breeds Exotics breeds & crossbred Total number % exotic
& cross- bred
Number 2003 to 07 change
Number 2003 to 07 Change
Number 2003 to 07 change
Cattle
860,395
16%
26,848
16%
887,243
16%
3.0%
Buffalo
22,627
26%
22,627
26%
Goat
365,483
12%
365,483
12%
Pig
454,200
16%
70,157
148%
524,357
25%
13.4%
Sheep
20,799
18%
242
-62%
21,041
16%
1.2%
Poultry
2,811,401
5%
281,474
101%
3,092,875
10%
9.1%
Source: Livestock Census, Department of Animal Husbandry and Veterinary
Almost all animals are of unimproved local breeds, but the numbers of exotic and crossbred pigs and poultry have been increasing fast, and by 2007 13% of pigs and 9% of poultry were of improved types.
Significant populations of animals are found in all districts. However there are significant differences between districts in terms of the density of livestock population (number of animals per square kilometre) and man-animals ratio (number of animals per 100 people). In terms of density, the highest populations of bovines (cattle and buffalo) in the East and West Garo Hills, and West Garo Hills also comes top for goats. The density of pigs is highest in East Khasi and West Garo Hills, with relatively few in South Garo Hills. In terms of numbers of animals per 100 people, East and West Garo Hills are also top in terms of number of cattle, but pigs are more evenly distributed across all districts. Relatively low ratios for East Khasi Hillscan be attributed to this district including Shillong, the only large urban centre in the state, with a population of around 250,000.

Republic of India
Meghalaya: Livelihoods and Access to Market Project
Final project design report - Working papers
135
Table 2: Livestock Population by District, 2007
Livestock
East KH
Ri Bhoi
West KH
Jaintia
East GH
West GH
South GH
total
Bovines
73,687
86,410
118,496
149,721
159,449
274,476
47,631
909,870
Goats
56,632
13,835
61,786
27,005
43,652
138,468
24,105
365,483
Pig
119,357
42,470
85,710
70,208
55,537
128,346
22,729
524,357
Poultry
629,036
344,451
498,237
374,839
599,743
629,036
171,316
3,092,875
Area/population
Area km2
2,748
2,448
5,247
3,819
2,603
3,677
1,887
22,429
Population
741,594
232,523
347,013
353,539
285,833
578,584
128,306
2,667,393
Animals/km2
Bovines
26.8
35.3
22.6
39.2
61.3
74.6
25.2
40.6
Goats
20.6
5.7
11.8
7.1
16.8
37.7
12.8
16.3
Pig
43.4
17.3
16.3
18.4
21.3
34.9
12.0
23.4
Poultry
228.9
140.7
95.0
98.2
230.4
171.1
90.8
137.9 Animals per 100 people
Bovines
9.94
37.16
34.15
42.35
55.78
47.44
37.12
34.11
Goats
7.64
5.95
17.81
7.64
15.27
23.93
18.79
13.70
Pig
16.09
18.26
24.70
19.86
19.43
22.18
17.71
19.66
Poultry
84.82
148.14
143.58
106.02
209.82
108.72
133.52
115.95 Source: Livestock Census, Department of Animal Husbandry and Veterinary
The state is a major consumer of meat, and half of the total supply comes from beef.
Table 3: Meat Supply
2011-12, tons
total supply produced Imported % imported
Beef 22,920 50% 13,988 8,932 39%
Pork 10,099 31% 8,704 1,395 14%
Mutton 1,085 4% 1,062 23 2%
Chicken 4,137 15% 4,087 50 1%
Total 38,241 100% 27,841 10,400 27% Source: Livestock survey 2012, Department of Animal Husbandry and Veterinary
C. Review of constraints and opportunities for development
1. Cattle
Current situation
In contrast to most other states in India, milk is not widely consumed in Meghalaya.Only in a few pockets, such as close to the Shillong city, are animals kept specifically for dairy farming (usually by people of Nepali origin). Although the state has a long history of breeding improved dairy animals (Friesian-Holstein cattle have been bred at government farms for 100 years), only 3% of animals are of exotic breeds or crossbred with those breeds. Cattle are predominant grazed with relatively little stall-feeding apart from for the limited number of cross-bred animals. This will limit the amount of manure that can be collected to that produced when they are housed or kept in an enclosure at night. A survey by

Republic of India
Meghalaya: Livelihoods and Access to Market Project
Final project design report - Working papers
136
DAH&V recorded an average of only 3.31 kg being collected per animal per day (this may also include pigs and goats).
Table 4: Feeding systems for cattle
local cross bred
Summer Grazed 72% 26%
stall fed 18% 52%
Both 10% 22%
Monsoon Grazed 83% 23%
stall fed 8% 48%
Both 9% 29%
Winter Grazed 75% 30%
stall fed 10% 46%
Both 15% 24%
The DAH&V also recorded milk yields of only 0.75 kg/head/day for local cows, 8.96 kg for crossbred cows and 1.84 kg for buffalo. Milk marketing: there are two central (publically owned) dairies in the state at Shillong and Tura, which are supplied by three chilling units. These dairies collect and pasteurize milk prior to sale. A number of small shops were observed selling locally produced fresh milk in Shillong.
This was confirmed by in villages visited by the formulation mission, which found that cows were milked only in some villages in the Garo Hills (and sometimes not by all households in these villages). Milk yields from these local animals are between 1 and 2 litres per day. Although milk was sometimes sold, people do not seem to view milk production as an important source of income.
Moreover there is only limited use of animals for draught power: Only in Garo Hills and, to a lesser extent, in Ri-Bhoi district, are they used for cultivation, with most land being cultivated manually. In some villages cattle are driven over paddy fields to puddle the land after manual cultivation.
Cattle manure does not seem to be a particularly important by-product from keeping cattle. The formulation mission found that, although cattle manure was usually applied to vegetable gardens, only in a few villages was it used for paddy fields, and it was never applied to upland crops.
People report that the main reason to keep cattle is to sell them for meat. A mature animal can fetch Rs10,000 and is a valuable store of wealth. However in a number of villages visited by the design missions, it was reported that cattle numbers were falling, and in some places only a few people still kept cattle. Reasons were said to be shortage of labour to take cattle to graze (with children now at school), scarcity of grazing (with rising human population) and, in villages close to Bangladesh, cross- border cattle theft. At only one out of 12 villages visited by the design missions did people say that the cattle population was increasing. This is in contrast to the data on animal population, which shows a significant increase.
Relative to pigs and poultry (and possibly also goats), cattle seem to be less affected by diseases, and mortality rates are low. However foot and mouth disease is widespread. Veterinary services do not reach most villages, and some animals do die, but there to not seem to the outbreaks of fatal infectious diseases that kill many pigs and chickens.

Republic of India
Meghalaya: Livelihoods and Access to Market Project
Final project design report - Working papers
137
Opportunities to develop cattle production
There is considerable potential to increase cattle production. It is apparent from travelling through the state, even in the dry season, that much grazing goes unused. There are some villages near Shillong where people of Nepali origin produce milk for sale in the city (especially to people from other parts of India). The design mission also learned of EFC enquiries regarding milk production from parts of the Garo Hills, and there is also a dairy cluster in Umsning block of Ri Bhoi district. However, in most of the state, the lack of any tradition of milk production, and with only limited use of manure, it is difficult to justify much investment in cattle production. As a means of meat production (when not combined with milk or draught power, or as a vital contributor to soil fertility), cattle are not as efficient as goats (or sheep) in converting green vegetation into meat.
Power tillers (and possibly zero-tillage technologies) offer a better alternative to manual cultivation than attempting to introduce the use of draught animals. What would be worthwhile for LAMP to do is to improve the collection and utilisation of farm-yard manure, and to increase provision of health-care services at the village level. Dairy clusters may be developed in a few locations. In particular EFC’s may get proposals for dairy production units – which in the right location could be a good investment and should be supported. There might also be potential to cross-breed local cows with dairy breeds in order to sell cross-bred heifers to milk producers outside of the state.
2. Pigs
Current situation
Although pork is widely consumed in Meghalaya, and the vast majority of village households keep pigs, pig production is poorly developed. Pigs are kept in small units of only a few animals each (typically only one or two animals), using traditional methods. Feeding is based on waste food from the household and crop by-products (especially rice bran), together with some wild forage collected from the forest. Given that most households do not grow enough grain to meet their requirement for direct consumption, the supply of crop by-products is limited and there is little, if any, surplus grain to feed to animals. Local breeds of pig are adapted to surviving on an inadequate diet, and consequently have a slow rate of growth, low feed conversion efficiency, and low fertility. The restricted supply of feed food supply also limits the number of pigs that can be kept in a single village.
Prompted by concerns about hygiene (and also to prevent damage to gardens and crops), there has been a move away from allowing pigs to roam free and scavenge food for themselves. This is especially in the Khasi and Jaintia Hills, and some free-roaming pigs are still seen in the Garo Hills. This move to keeping pigs housed, has meant that forage that they used to find for themselves now has to be gathered from crop land, around the village or from the forest. This may be increasing the workload on women.
Another issue is the lack of healthcare. Periodic outbreaks of Classic Swine Fever (CSF) kill many pigs, and the Department of Animal Husbandry and Veterinary (DAH&V) report that they are only able to obtain about 20% of the amount of vaccine needed to cover the pig population (but an ILRI paper shows that only 0.5% of the vaccine requirements are met for the northeastern states as a whole).
Although the pig population is fairly evenly distributed across the state, pig production is less developed in Garo Hills. Here pigs tend to be tethered rather than housed in sties, and a considerable number still roam free. Some roaming pigs were also seen in Jaintia Hills. While the pigs seen in the Khasi and Jaintia hills appeared to have a proportion of improved breed in their make-up, most of those in in Garo Hills were smaller and appeared to be of a smaller multi-coloured local breed. While pig keepers here also had some larger black pigs, these tended to be for fattening (maybe they came from other districts), with the local pigs being preferred for breeding.
Local pigs from all parts of the state are preferred by consumers to the pigs of modern breeds that are imported from other states to meet the demand for pig meat. However it seems difficult for local producers to obtain premium prices in Shillong, the main urban market where these two types of pig are sold. This is because local price controls set a ceiling for pigmeat of Rs250 per kg. Although, like in Assam, there are reports that black coloured pigs are preferred, other people say that white

Republic of India
Meghalaya: Livelihoods and Access to Market Project
Final project design report - Working papers
138
pigs are also acceptable, and the local breed in Garo Hills is multi-coloured – so it seems there is a preference for local breeds, regardless of skin colour.
Opportunities for development
There is considerable potential to increase pig production. Much of the pork supply for urban areas comes from live pigs imported from other states - from as far away as Punjab. However it appears to be more economic to transport live pigs into the state than to bring in pig feeds. This is in contrast to poultry, where it is economic to import feed and produce broilers in the state. This is because pigs do not convert feed into meat as efficiently as chicken (and this gap will be larger given the relatively high quality genetic material in commercial broilers, compared with the local types of pig). In addition live chickens are more bulky to transport than live pigs - less weight can be loaded onto a truck.
Despite these serious constraints, there are great opportunities to develop pig production in the state. Not only do almost all rural households keep pigs, but they are often the major source of cash income. A mature pig – over one year old – will sell for around Rs10,000, and most households will produce one or two pigs per year – which are sold rather than slaughtered for home consumption. People are willing to invest in pig production: many already spend significant money on purchasing weaned piglets and a proportion of the feed they use. In some villages maize is specifically grown to feed pigs and poultry. Data from EFCs shows that pigs are the enterprise that attract to most enquiries. To increase production and improve the returns to pig keepers two major interventions are needed:
Improve the supply and quality of feed used by pigs
Reduce risk by improving preventative health care.
If these are both done, then it will also be worthwhile to improve the genetic quality of pig breeding stock, which would enable them to more efficiently convert good quality feed into meat. It could also be worthwhile to improve pig housing, as well as introducing the idea of utilising pig manure.
Pig feeding: the following initiatives could improve pig feeding:
Information for pig producers on the nutritive value of different feeds that are available in villages, and suggestions on the optimal combination of these materials
Support for the cultivation of crops that can produce more feed at the village level, including geed forages, root crops, cereals, vegetables and pulses. The small IFPRI initiative in Nagaland has shown how this can be done, with the introduction of food-feed crops on small areas of land. In particular root crops (sweet potatoes, cassava and taro) could produce significant amounts of feed from small areas of land. It may also be possible to obtain feeds from leguminous shrubs in hedgerows planted on contours on jhum/sloping agricultural lands, and on groundcover plants planted under trees in orchards
2.
Introduction of ready-made feeds that can be used to supplement locally produced feed materials. Although it seems to be more economic to bring live pigs into the state than to import pig feed, it could well be economic for feed concentrates and supplements to be bought in (or manufactured in the state from raw materials that are bought in). These would be used in small quantities to provide essential nutrients (such as protein, amino acids, minerals and vitamins) that are not available in local feeds, and which prevent pigs for efficiently utilising their current feed resource.
Pig health: The risk of pig mortality could be reduced by the following actions:
Improve the availability of vaccine against CSF. This is an important national policy issue, and ILRI report that they have had a positive response from GoI on this issue. GoM is taking up this issue and is proposing to start vaccine production in the state.
Training and supporting community level livestock workers to provide vaccinations and other animal health support, especially deworming (for other animals as well as pigs) and castration. These workers could combine this role with other service provision, such as
2
Potential groundcover crops are: Stylosanthes guianensis, Centrosema pubescens, Macroptilium atropurpureum, Desmodium intortum, Arachis pintoi, Aeschynomene americana. Hedgerow species include: Manihot esculenta, Flemingia congesta, perennial Cajanas cajan, Medicago aborea (tree lucerne), Morus alba and Leucaena diversifolia. Soybean and pigeon pea could also be grown on the bunds of rice fields.

Republic of India
Meghalaya: Livelihoods and Access to Market Project
Final project design report - Working papers
139
selling other farm inputs, so they are able to generate sufficient income to support this activity.
Investigation, verification and dissemination of information on traditional and indigenous health remedies for pigs and other animals.
Pig breeding and productivity: Improving the genetic quality of pigs in the state may be worthwhile for those producers with access to better feed resources and health care. Improved breeds of pig are more efficient at converting feed into meat. To improve the genetic quality of pigs, a supply of pure- bred and cross-bred pigs is needed. The DAH&V has 13 pig breeding farms with 283 breeding animals, producing almost 2000 pigs for sale each year, but reports that the genetic quality of its breeding stock has deteriorated in recent years. At the end of 2014 it was reported that DAH&V is making arrangements to import breeding pigs from Canada, which should help improve the quality of stock at DAH&V pig farms. It should also be possible for an individual or group of progressive farmers to bring in stock from other states, and to then produce breeding stock for sale in the state. There is said to be good demand for such pigs, which cannot now be met from government farms.
In the Khasi and Jaintia Hills there may be a local preference for black coloured pigs, and these may sell at a premium over white or part-white animals. The Large Black seems to be a preferred pig for cross-breeding, but DAH&V pig breeding farms are using Hampshire and have recently acquired Duroc. Neither of these breeds are pure black, but have the advantage over Large Black of being more modern breeds, and so more efficient feed converters – although local tastes may prefer the greater fat content of Large Black carcasses.
There will also be opportunities to improve productivity through better housing and other aspects of pig husbandry. One NGO (the Bethany Society), is promoting the Bokashi approach to pig production. This system involves a specially mixed deep litter with absorbs the smell produced by pigs enabling them to be kept in peri-urban areas where there is a plentiful supply of waste food.
3. Goats
Although the goat sub-sector is not much talked about in Meghalaya, there are over one third of million goats in the state, and a large number of rural households keep goats. This can be a low risk enterprise with a short gestation period. At Mawthadthied village, Khatarshnong block, East Khasi Hills district the design mission found that most households had stopped keeping goats as they were each being paid Rs14,000 by the Soil and Water Conservation Department to agree not to keep goats for five years as re-afforestation of catchment was in progress. Nevertheless in almost all areas grazing and forage is readily available, and more goats could be kept without any adverse environmental impact. Goat meat sells at a premium price over beef and pork. Goat development, aimed at meat production for sale inside the state and beyond, could be based on the successful cluster approach used by BAIF (with support from IFAD and ILRI) in Rajasthan and Jharkhand.
4. Poultry
Current situation
Backyard poultry are an important household enterprise. Typically almost all families in a village will keep 10 to 15 chickens (sometimes more). These are of a local type, and feed picked up by scavenging is supplemented by rice and maize. Despite this, the birds do not seem particularly productive with birds taking about six months to reach a saleable size, and only around two birds being sold or eaten per year per hen (although some eggs are also consumed). Predators, especially birds, are often the major cause of loss of chicks in backyard systems, but seem less of a problem in Meghalaya. In the villages visited by the mission, no poultry was vaccinated, and people report major epidemics periodically cause mass deaths.
Local birds sell at premium prices, ranging from Rs500 to Rs 300 each – around two times the price of broilers. A household selling 10 to 20 birds per year, will earn around Rs5000 per year – making it a significant source of cash.

Republic of India
Meghalaya: Livelihoods and Access to Market Project
Final project design report - Working papers
140
In addition broilers are also produced, using chicks and feed bought in Assam. The government also operates a number of hatcheries producing chicks. Live chickens are bulky to transport so, in contrast to pigs, it is more economic to transport feed into Meghalaya than to import live birds.
Potential for poultry development
There is good scope for small/medium scale intensive broiler and layer units. Kuroilers, a dual purpose type of bird suitable for small back-yard flocks also seem to be popular and sell at premium prices. The BAIF report also mentions Vanraja and Giriraj as improved backyard breeds. Key interventions for poultry will be: (i) vaccination against contagious diseases, especially Newcastle disease; (ii) input supply - especially feed and chicks; (iii) and improved (but low cost) housing. It may also be worthwhile to see if the semi-scavenging backyard poultry model from Bangladesh could be adapted for Meghalaya. This involves mini-hatcheries
3 producing chicks at the village level,
supplied with hatching eggs by small parent farm units. An improved backyard bird, Fayoumi crossed with Rhode Island Red is more productive that local birds, but can be sold at a premium price.
D. The Livestock Mission of the Integrated Basin Development and Livelihood Programme
BAIF has been contracted by MBDA to provide programme and policy advisory services to MBDA & the Animal Husbandry & Veterinary Department (AH&VD) for implementation of the State Livestock Mission and other related activities. The main objectives are (briefly) as follows:
To prepare & finalise the mission document for livestock activities under IBDLP.
To assess the market within the context of the value chain for livestock and related products.
To foster market access and promote market development for identified lines
To undertake product development for identified lines
To support market access initiatives under the Livestock Mission
To assist in capacity building, and development of skills for livestock rearing & product development
To form producer groups
To collate existing schemes of Government of India/Central agencies supporting livestock development and marketing and suggest potential to leverage assistance under these schemes
To prepare concept papers and DPRs for projects under the Mission
To build up extension network under the aegis of the livestock mission
Any activity related/ incidental to the above as may be agreed to mutually
The scope of work includes both forward as well as backward linkages for productivity enhancem ent and income generation. The project will be implemented in two phases. First phase will involve preparation and finalization of the mission document and second phase will involve implementing pilot programme followed by handholding support and identifying agencies for implementation of field programmes.
The initial report (draft mission document) from BAIF includes a number of recommendations concerning AH&VD policies and support for animal breeding and extension/health services. It also identifies a number of government schemes that could provide financial support for livestock development (see Annex 4). There are recommendations for a livestock gender strategy and for better forward linkages (marketing) with producer groups and investment in hygienic slaughterhouses and cold stores. To improve extension services BAIF propose to develop pig, goat and cattle development centres, some of which could be implemented as part of LAMP. The pig development centres are based on BAIF’s successful goat development model, which involve community level workers providing basic health care and other support, along with breed improvement. The cattle development centres are based on BAIF’s successful model of provision of AI services via local technicians.
3 Videos on this technology are available: http://www.youtube.com/watch?v=GlqCZXQrzX0,
http://www.youtube.com/watch?v=f5BlBu04-nc http://www.youtube.com/watch?v=IAeyifqiGXU

Republic of India
Meghalaya: Livelihoods and Access to Market Project
Final project design report - Working papers
141
E. Support for livestock development to be funded by LAMP
(a) Overall support for livestock production
LAMP would carry out the following livestock related activities:
a) Implement Livestock Development Centres in around 120 locations within the 54 village clusters to be supported for Natural Resources and Food Security (NR&FS), together with the supportive animal breeding and feeding initiatives. These Livestock Development Centres (LDC) would be a sub-component of component 2: Livelihood Support, and would take place alongside another sub-component, Integrated Production and Marketing (IPM), aimed at developing value chains for cash crops and other products. This IPM sub-component would also take place in the same 54 NR&FS village clusters, although neither LDC nor IPM would cover all the villages involved in NR&FS. Households participating in LDC would also benefit from the development of IVCS, roads and markets – all supported by LAMP.
b) Support EFC clients who wish to invest in livestock enterprises in any part of the state. Livestock production (especially pigs) is the most widely requested enterprise at EFCs. Livestock production units supported by EFCs will be commercial enterprises, and require support for disease control and improved production methods (including housing, feeding, breeding). As EFC enquiries come from all parts of each block so producers will be scattered rather than being in a cluster, which will require a different approach to support compared to the clustered producers in an LDC. This support would include hand-on training at an actual pig unit. Training needs to be backed up with other media - videos showing practical demonstrations, technical manuals and booklets and posters. In addition Pig Producer Associations may be established at the block or district level. These associations would act as information exchanges – particularly regarding the sale of improved breeding stock and weaned piglets. Enterprises supported through EFCs could also include backward and forward linkage enterprises – feed and other input supply, livestock and meat marketing etc.
c) Knowledge Services will support livestock production through: (i) Enterprise knowledge: production and dissemination of manuals, videos and other
technical materials to support livestock production. Other useful information includes lists of input suppliers and other service providers. Where producers have problems, assistance could be given via mobile phone based information systems to be supported via the Knowledge Services component. In addition value chain studies could be commissioned for livestock sub-sectors, including animal feed supply to see if production of manufactured feeds, including a supplementary protein concentrate
4, could be viable in
the state5.
(ii) Natural resource knowledge: collection of information on indigenous and traditional methods used in animal production, including plants used as feed and to treat livestock ailments. Efforts to conserve biodiversity should include recording of the characteristics of local breeds of animal and their conservation – either through farmer groups who wish to continue to use traditional breeds, or even on government farms.
(iii) Technology testing and action research sub-component could fund the following investigations:
Feed crops for pigs. Some may already be well known and just need to be popularised as a source of feed for pigs (e.g. sweet potatoes). Others may need to be tested and tried out - both from the point of view of their cultivation and acceptability as a feed for pigs.
The productivity of current back-yard poultry production with the objective of identifying constraints and suggesting possible solutions. This could include action research to see if the semi-scavenging backyard poultry model with mini-hatcheries from Bangladesh could be adapted for the colder climate of Meghalaya.
If the economics producing supplementary protein concentrate feeds seem viable, arrangements could made for its production and testing on a pilot scale. .
4
The idea behind a supplementary protein concentrate is to provide a high-value and low volume feed that supplements the starch-rich foods available in villages and so provides pigs with a balanced diet. 5
There are no private feedmills in the state. DAH&V has a feedmill, but it is not operational due to problems in getting raw materials.

Republic of India
Meghalaya: Livelihoods and Access to Market Project
Final project design report - Working papers
142
Possible Livestock Mission initiatives that will not be supported by LAMP:
Implementation of Livestock Development Centres in locations outside of the 54 NR&FS clusters. These clusters, which will cover about 24% of all villages in the state, will primarily be selected on their potential for the development of commercial and marketable crops. As livestock production has potential across the state this will not preclude LAMP LDCs being established at these locations. However other locations may be particularly advantageous for livestock, including proximity to urban markets or as an established dairy centre. Non- LAMP LDCs could therefore be established, and would probably be more likely to include dairy LDCs than will the LAMP clusters.
Support for DAH&V activities including government farms, staff capacity building and disease control (including possible production of CSF vaccine in the state).
Investment in slaughterhouses, coldstores etc, apart from private investments supported via EFCs.
(b) Livestock Development Centres
Support would focus on pigs and, to a lesser extent, on goats. Given the very limited potential for dairy production in the state, the cattle development centres do not seem to have much potential (apart from at one or two locations near Shillong or Tura – where, in any case, AH&VD are already providing AI services).
Pig Development Centres.
Pig Development Centres, on the model of BAIF’s successful goat clusters in other states, would focus their efforts on existing pig producers and the existing pig population – with interventions in health, feeding, housing and breeding. These interventions have been tested and found to be successful in other states in the north-east, including in a small project in Nagaland implemented by ILRI with funds from IFAD.
Each centre would be supported by a technician (a Community Livestock Facilitator - CLF), with a number of Village Livestock Resource Persons (VLRP) – also called “field guides” or “paravets”. A CLF would have a senior secondary pass out with a certificate course in CLF training, and will monitor the work of six or more village-level resource persons. The CLF will conduct monthly review meetings with these workers, and visit the operational area to meet pig farmers. They will be trained in social mobilization, project management and implementation, documentation, pig management practices (feeding, health care and breeding). If needed the CLF will be equipped with a motorcycle.
An average village in Meghalaya is only 75 households, and villages can be scattered over a large area, so a typical centre would consist of 360 pig producers – this being 6 villages each with 60 pig producers supported by a VLRP in each village. The VLRP would have a high school pass, and would be the backbone of the programme, working at the grassroots level to be a bridge between pig farmers and the CLF. The budget for each centre for a three year period covers:
Community Livestock Facilitator – salary, allowance and transport of Rs20,000/month, initial and refresher training, equipment
Village Livestock Resource Persons (x 6), allowance (Rs2,500 per month), initial and refresher training, equipment
Pig producers – training (for 360), exposure visits (for 18)
Feed development (feed supplements, plants for feed production)
Critical health inputs (vaccine, deworming etc.)
Depending on the availability of project funds, 100 such centres could be supported. Pig breed improvement has been budgeted separately, with 600 boars (male breeding pigs) plus feed for one year and health inputs. This amounts to one boar per village, but the requirement for improved breeds may be more concentrated in some centres than other. In any case, breed improvement may only be warranted after feeding has improved and disease controlled. In addition block level units to produce improved breeding stock may be supported via EFCs. Further details on pig breeding are in Annex 2.

Republic of India
Meghalaya: Livelihoods and Access to Market Project
Final project design report - Working papers
143
Goat Development Centres
It is also proposed to support 20 further centres for goat improvement. These are basically similar to pig clusters, but include 36 improved bucks. It is not so certain that there are locations where there would be as many as 360 goat keepers within an area of six villages, and it is possible that it may be better to develop combined goat and pig centres.
IFAD is currently funding a goat development project in Rajasthan and Jharkhand. This is a grant to ILRI " Small ruminant value chains as platforms for reducing poverty and increasing food security in dryland areas of India and Mozambique (imGoats, in short). In India the project is being implemented by BAIF and partner NGOs. Further information is available at www imgoats.org. This project is already producing useful lessons for goat-based livelihoods and is being scaled up by other IFAD- supported projects. Key activities include:
1. Capacity Building
Training of supervisors – the Community Livestock Faciliators (CLF) and other trainers of Bakri Mitra (village level livestock resource persons)
Selection and training of Bakri Mitra in goat feeding, health, vaccination, deworming and castration. Bakri Mitra are local women who act as aminators, field guides and paravets.
Training of goat keepers by Bakri Mitra and CLF
Organization of goat keepers’ groups and their capacity building
2. Breed Improvement
Introduction of superior bucks for breeding
Support for feeding bucks
Buck rotation and castration of kids
Weight recording of kids at birth, 6, 8 and 12 months
Goat Rallies/Shows
Regular culling of inferior and nondescript animals
Restriction on herd size, depending on local carrying capacity
3. Health Care
Vaccination, deworming and castration by Bakri Mitra
Linkage with veterinary dispensary of Animal Husbandry Department
4. Fodder Resource Development
Development of community lands into silvi-pastures
Plantation of fodder trees by Goat Keepers on their own land
Processing crops residues and tree pods into feed
Promotion of stall feeding
5. Market Linkage
Awareness about market price of meat and proportionate value of goats
Weighing of goats before selling
Periodic meetings between goat keepers, traders and local butchers
Direct supply of goats to butchers and large traders
Rearing of goats for special festivals such as Bakri Id, Dashehara Pooja, etc.
The programme is intended to help existing goat keeping families and not to distribute goats to new families. A goat programme should not bring large number of female goats in from outside, as this is likely to cause pressure on range resources and biodiversity. The project should provide critical technical and managerial services through trained local women, who will continue to provide critical services beyond the project period.

Republic of India
Meghalaya: Livelihoods and Access to Market Project
Final project design report - Working papers
144
Each buck will be maintained by one of the goat keepers. The feeding support can be reduced in the second or third year depending on the willingness of the buck keepers to maintain them on their own. Bucks should be rotated among different groups to avoid in-breeding. Goat keepers should assess the fodder availability in their villages and, depending on the fodder sources, a restriction on the herd size of individual members should be decided. This is essential to prevent denudation of biodiversity and forests.
There is good scope for promoting community pastures by actively involving the VEC. This being a labour intensive activity, finance can be mobilised under the MGNREGA scheme. Apart from introducing fodder shrubs and grasses on common lands, seeds of fodder trees suitable to local conditions can be distributed to individual families to grow on in their backyards and fields. Collection of pods of leguminous trees and treating crop residues can also be promoted for feeding the goats. Selected goat keepers can be sent for exposure visit to progressive goat rearing areas and where silvipasture development has been carried out with good success.
Support for other livestock
As already mentioned people wanting to establish small or medium scale commercial poultry units for egg or meat production would be supported by EFCs. The action research sub-component of the Knowledge Services component could commission a project to develop an improved system of back- yard production, possibly based on the Bangladesh system of mini-hatcheries and village level breeding units. In addition the VLRP at CDCs could also provide vaccination and advisory services to backyard poultry keepers.
The potential for dairy development is limited to a few locations in the state. People wanting to develop dairy units will be supported via EFCs, but should there be potential to develop the sub- sector in a group of villages within a NR&FS cluster, then a Cattle Development Centre could be set up (in place of one of the planned pig or poultry centres). This would follow the established BAIF model of a trained technician providing artificial insemination and para-vet services on a fee earning basis. This technician would also advise producers on improved feeding and cattle management practices and could generate additional income through selling feed and feed supplements and from operating a milk collection centre.
(c) Feed development
Improving feed supply will focus on developing village level resources - such as the pig feed gardens that were promoted by ILRI in Nagaland. These were based mainly on root crops (yam, cassava, sweet potatoes) along with green leaf plants. These will be developed via participatory feed resource assessments (based on ILRI’s FEAST model) which will identify periods of feed shortage and identify potential resources, meetings to explain the feed garden approach (with videos and possibly exposure visits), identification of interested farmers, planning and layout of gardens, and distribution of planting material (if this is not already available).
In addition LAMP should investigate the technical feasibility, economic benefits and financial viability of manufacturing a feed supplement for pigs. This would aim to complement village feed resources and by-products – and thus might have a high level of protein, vitamins, minerals and amino acids to complement the energy coming from village feeds. There may also be potential to manufacture complete pig, poultry and dairy feeds in the state. These are now imported (pig and dairy feeds in only limited quantities) from Assam. To make feeds in Meghalaya would still mean that most materials would need
A small grinding and mixing unit

Republic of India
Meghalaya: Livelihoods and Access to Market Project
Final project design report - Working papers
145
to be imported, there could be a cost advantage in using local rice bran and possibly soyabeans, and local production of maize could be encouraged.
If investigations show that local feed production could be beneficial for farmers and financially viable, a pilot scheme could be implemented. A feed supplement could be produced to the required specification by a manufacturer in Assam (or at the existing but unused DAH&V facility) and then tested to see if farmers find it useful and would be prepared to buy it at a price which makes investment in a production facility viable (although it could also continue to be produced in Assam). Manufacture of complete feeds could also be piloted at the DAH&V feed mill (if this is in working order), or a small feed milling unit may be obtained to set up a pilot unit. Such small mills with a capacity of 0.5 to 1.0 tons per hour, are not expensive, the equipment for grinding and mixing costing in the region of Rs100,000 to Rs200,000.
(d) Marketing
Livestock production will primarily be for local markets – which are growing with the continued rise in the population of the state. While access to specific milk markets will be a prerequisite for any investment in Cattle Development Centres, there is good demand for meat in all parts of the state. As the implementation of Pig and Goat Development Centres expand the numbers of animals produced, there will be a need for input supply and livestock marketing to reach out to a larger area. In this situation aggregation will reduce transport and transaction costs. This aggregation can be done by for formation of Pig Producer Groups or Associations, or by the involvement of other community organisations such as IVCS. Market linkage enterprises can also be supported such as input suppliers, goat, pig and piglet traders, animal slaughtering, meat shops and meat processing. Such enterprises can all be supported via EFCs.
(e) Coverage of LDC
With a total of 120 centres, each supporting 360 livestock producers, a total of 43,200 households in 720 villages would be involved. These livestock centres would be located in the same villages as will be covered by the larger LAMP NRM clusters. In total the 54 NRM clusters will cover 1,350 villages with 101,225 households, so livestock activities will take place in 53% of the villages and involve 43% of total households. This compares with 20,250 households involved in integrated production and marketing (IPM) for value chain development in 540 villages – also in the same 54 NRM clusters.
On an average two LDC (or sometimes three) would be located in each Natural Resource and Food Security (NR&FS) cluster of about 25 villages selected for with an average of three clusters per block. The approach to implementation will need to b adapted to the realities that become apparent once field activities start. NR&FS clusters may cover a larger or smaller number of villages. Similarly LDCs may be larger than the six villages with 360 participating households projected in this paper. It is also possible that there may be an imperative to locate a few LDC outside of NR&FS clusters, but still within the 18 selected priority blocks.
(f) Implementation and management
Implementation of LDCs would be via BAIF as a contracted service provider. BAIF would first undertake field investigations and meetings with local people to select suitable locations for these centres and identify the type of livestock to be developed.
Work in each cluster would start with visits to the selected villages to list all the households in the village together with household composition, main occupation, area of land farmed (if this is not possible to record due to lack of any measurement, then the use of paddy land, upland, tree crops and jhum should be recorded), and numbers of each type of livestock. This information may already be available from an Integrated Natural Resource Management Plan and need not be duplicated. At a village (VEC) meeting the opportunities offered by LAMP for livestock development would be explained (with help from the Village Facilitators), which could be supported by a video showing how similar livestock development initiatives have worked. The fact that LAMP is not a subsidy-led project will need to be emphasised, and aims to increase the productivity of the existing livestock

Republic of India
Meghalaya: Livelihoods and Access to Market Project
Final project design report - Working papers
146
population. Participation by existing livestock owning households will not need a big investment, but rather the application of a number of simple techniques.
Households interested in participating in livestock development will then be identified (including pig breeding households) and a Village Livestock Resource Person selected. Implementation with then proceed with training of VLRP (and also Community Livestock Facilitators supporting each LDC). Based on the model of the goat programme in Rajasthan, each VLRP would have a programme of regular visits to all livestock households in the village passing on technical information on improved production methods and providing preventative health care. Livestock keepers would also be provided with practical training on production methods and some would go on exposure villages to locations where improved production methods are being practiced. There would also be support for feed production in the village (see section (c) above).
To support the establishment of the LDCs, BAIF would employ a Livestock Development Officer in each of 11 districts, who would be located in the LAMP district project management office. This Officer would also support livestock enterprises belonging to EFC clients.
BAIF has built its reputation on the success of its cattle breeding centres, which has now extended to goat development clusters, natural resource management and tree crops. BAIF has not yet done much work with pigs, which will be a focal animal in Meghalaya. To provide this expertise, BAIF will link up with ILRI’s Assam office, which has implemented a number of pig development projects in the north-east, and has an excellent understanding of the key issues and opportunities for specific interventions. In addition some NGOs in Meghalaya and other north-eastern states have been working on pig development. This will be combined with BAIF’s expertise in large-scale delivery of livestock development, and backed up by partnership with DAH&V. To help develop an approach for pig development that works, only a small number of Pig Development Centres will be established in the first two years of the project. Faster progress may be made with goats and cattle development centres.
(g) Sustainability
Livestock services in these centres should be sustainable. VLRP would charge for their services and could also provide other services, such as supply of inputs. From a legal standpoint, there is no problem in Meghalaya with having VLRPs deliver minor veterinary services. The central legislation on the subject of veterinary practice and the setting of state veterinary councils does not bar such arrangements. However the State may need to issue a Government Order listing the type of services that can be performed by VLRPs.

Republic of India
Meghalaya: Livelihoods and Access to Market Project
Final project design report - Working papers
147
Annex 1:Department of Animal Husbandry and Veterinary Livestock Support Facilities
2011-12
Hospitals 4
Dispensary 92
Aid centres 51
Mobile dispensary 15
Vigilance unit 3
AI centres 2
Locations with AI facilities 64
inseminations done 27,620
calves produced 16,960
Cattle breeding farms 4
Animals 321
Buffalo farm 1
Animals 52
Poultry farm 12
Pig farms 13
breeding animals 283
pigs sold 1961
Goat & sheep farms 2
Fodder farms 4
Fodder seed farm 1
Number'000
2011-12 As % of livestock population
Vaccinations
Poultry 1945.7 63%
Bovine 348.5 38%
Pigs 49.9 10%
Treatments 4171.9
Castration 20.3

Republic of India
Meghalaya: Livelihoods and Access to Market Project
Final project design report - Working papers
148
Annex 2: Strategies for Pig Breeding
Despite the consumer preference for meat from local breeds of pig, there seems the be a strong demand from producers for pigs of improved breeds, with animals being produced by the farms operated by DAH&V in great demand. However the main constraints on pig production are lack of feed and inadequate preventive health care. If these can be addressed, it will be worthwhile to improve pig breeds.
Improvements in the genetic quality of pigs could involve: (i) using improved boars to cross-breed with local sows; and/or (ii) use of both improved sow and improved boars. The improved breeding pigs may be either exotic breeds such as the Hampshire, Large Black, Duroc and Tamworth, or crossbreds of exotic breeds with improved local breeds. The breeding strategy to be adopted may vary between different farmers and in different locations of the state. Cross-breeding local sows with improved boars, and then using their offspring for breeding would gradually change the type of pigs in the state. Although this might well improve them in the pig population in terms of genetic potential for growth and production, there may be reasons to maintain local breeds – which may have a better ability to utilise local feed resources and to resist diseases.
A breeding programme could aim maintain local breeds as the female line, only using improved boars for the final meat production generation of pigs. This would mean that pigs being fattened for slaughter could grow faster and convert feed more efficiently (providing more feed is available), while their mothers (sows of local breeds) would remain well adapted to local conditions. However information from Assam suggests that exotic breeds are more valued for their prolificacy (giving birth to a larger number of piglets) with less emphasis on growth rate of offspring (as this is constrained by limited feed resources). This suggests that many pig producers will want to breed from sows of exotic breeds (or sows that are crossbreds of exotic and local breeds).
One breeding strategy would be to distribute improved boars, which will have quick impact on growth rates via crossbred fattening pigs, but it will take longer to upgrade the genetic quality of breeding females via crossbreeding. An alternative breeding strategy would be use exotic breeds (or improved crossbreds) to produce animals for fattening at the village level. In practice a combination of these two approaches are likely to be adopted.
Calculations in Table 1 show the numbers of pigs produced by a typical village which is part of a Pig Development Centre under different stages of development of pig production. This village would have 75 households, of which 60 keep pigs. Of these 60, 58 households buy piglets for fattening and sale, and two households keep breeding sows (and a boar) to produce piglets for the other 58 households to rear. It is estimated that two farmers with pig breeding units, each with around four breeding sows, would at current levels of pig breeding performance, raise sufficient piglets for each of the other 58 households to rear one pig per year each (including an allowance for mortality) – see column 1 of Table 1.
If improvements in feeding and health care encourage pig rearing households to increase their production from 1.0 to 1.5 pigs per year (column 2 of Table 1) , this will require the two pig breeding households to increase their number of breeding sows from 4.0 to 5.5 (i.e. one with 5 and the other with 6). The introduction of boars of improved breeds for crossbreeding with local sows would produce crossbred sows, which, with further improvements in feeding and healthcare would be more prolific than local sows, so the same number of sows could produce sufficient piglets for each household to rear two piglets per year (column 3 in Table 2). The final stage of development would be the use of improved exotic breeds for both the male and female lines (column 4 in Table 1). In this situation, with further improvements in productivity, the two pig breeding households with 15 sows between them, could rear enough piglets for each of the 58 pig rearing households to rear four pigs per year each.

Republic of India
Meghalaya: Livelihoods and Access to Market Project
Final project design report - Working papers
149
Table 1: Projection of village level production
Local breed Crossbreed Improved
Breeds Current improved
Column number 1 2 3 4
Requirement of piglets per village
Number of pig rearers (fattening) 58 58 58 58
Pigs reared per rearer per year 1 1.5 2 4
Total number of pigs produced per year 58 87 116 232
Mortality in fattening period 15% 10% 5% 5%
Number of piglets needed per village 67 96 122 244
Production of piglets
Number of pig breeders 2 2 2 2
Number of sows per breeder 4 5.5 5.5 7.5
Farrowing interval, months 8 8 7 6
Litters per sow per year 1.50 1.50 1.71 2.00
Piglets born per litter 7 7 8 9
Mortality 20% 15% 15% 10%
Piglets reared per litter 5.60 5.95 6.80 8.10
Piglets reared per sow per year 8.40 8.93 11.66 16.20
Piglets reared per breeder per year 33.60 49.09 64.11 121.50
Sow breeding period (years) 3 3 4 4
Sow mortality per year 10% 5% 3% 3%
Number of sows lost 0.40 0.28 0.17 0.23
Replacement sows 1.73 2.11 1.54 2.10
Retained from own production 1.73 2.11
Purchased from external breeder 1.54 2.10
Net piglets sold per breeder per year 31.87 46.98 64.11 121.50
Net piglets sold per village per year 63.73 93.96 128.23 243.00
Numbers of villages involved
Number of Pig Development Centres 100 100 100 100
Number of villages 600 600 600 600
Number of blocks 18 18 18 18
Villages per block 33 33 33 33
Requirement for improved breeding stock
Requirement for breeding boars per block
Initial 67 67
replacement each year 19 19
Requirement for breeding sows per block
Initial 500
Replacement 140
It is recommended that a pig breeding strategy for LAMP should support: (i) crossbreeding in the short-to medium term; (ii) the introduction of more productive exotic breeds in the longer term; and (iii) conservation of local breeds of pig. This would involve:

Republic of India
Meghalaya: Livelihoods and Access to Market Project
Final project design report - Working papers
150
Support distribution of improved boars to villages participating in Pig Development Centres once village level breeders have been identified and their capacity built and they have adopted the improved methods of health control, breeding and housing that are required if improved boars are to survive and breed. If one boar is provided per village, 600 boars would be needed. Providing the breeding stock of government farmers is of good genetic
quality, these farms could easily provide the boars required6. It this is not possible, it should
be possible to procure boars from breeders in other states.
Breeding units should be established at block level to be owned and operated by progressive farmers. Such units, each with about 10 sows and one boar (although they may expand to more breeding sows over time) would be supported by EFCs and the District Livestock Officer (provided by BAIF) and through convergence with DAH&V. A 10 sow unit would produce 77 young female breeding pigs (known as “gilts”) per year. This number would be sufficient to provide replacement breeding sows for 33 villages (2 breeders, with 15 sows per village), enabling local/crossbred sows to be gradually replaced over a four year period. With a total of 100 Pig Development Centres, each covering six villages, there would be a total of 33 villages per block, so two breeding units of 10 sows each could supply improved females to all of these villages in just over two years. This is shown in Figure 1.
Conservation of indigenous pig breeds by supporting farmers who want to maintain these breeds, and possible establishment of conservation herds in DAH&V farms.
Figure 1: Strategies for pig breeding
The block level breeding units will sell their male pigs for meat, and will need to be financially viable in terms of purely meat production in case demand for breeding stock does not absorb the numbers of breeding females that they will produce.
6 It is reported that here are 283 breeding pigs at the 17 DAH&V farms. The vast majority of these will be female (sows).
Under good management it would only need 75 sows to produce 600 boars in one year (amounting to one per village in the Pig Development Centre scheme. At the moment it seems that DAH&V farms sell all their pigs as weaned piglets at a little less than the market price. This means most of these animals are fattened and sold for meat. It is suggested that the farms rear boars to around 10-12 months of age (when they are ready to be used for breeding), and that they are then sold at a price above the market level for pigs for slaughter.

Republic of India
Meghalaya: Livelihoods and Access to Market Project
Final project design report - Working papers
151
Annex 3:Cost projections for LAMP
Pig production centre Items
number
unit cost Rs
Expenditure Rs.'000 Total Rs thousand
Year 1 Year 2 Year 3
Training of Community Livestock Facilitator 1 10000 10 10
Refresher training for CLF 1 8000 8 8 16
Training of Village Livestock Resource Person 6 8000 48 48
Refresher training of VLRP 6 5000 30 30
Training of pig keepers 360 200 72 72
Exposure visits (persons) 18 5000 90 90
Pig development kit for VLRP 10 1000 10 10
Veterinary kit for CLF 1 10000 10 10
Feed development 6 2000 12 12 12 36
Critical inputs for health care 6 3000 18 18 18 54
Honorarium for VLRP 6 30000 180 180 180 540
Salary of CLF 1 240000 240 240 240 720
TOTAL 690 488 458 1636
Pig breed improvement
number unit cost Total Rs'000
Improved boars including transport 600 30000 18000
Feed for boars (Rs50 per day for one year) 600 18250 10950
Veterinary etc 600 1000 600
Misc 600 750 450
Total 30000
Cost per boar 50

Republic of India
Meghalaya: Livelihoods and Access to Market Project
Final project design report - Working papers
152
Goat development centre Items
number
unit cost Rs
Expenditure Rs.'000 Total Rs thousand
Year 1 Year 2 Year 3
Training of Community Livestock Facilitator 1 10000 10 10
Refresher training for CLF 1 8000 8 8 16
Training of Village Livestock Resource Person 6 8000 48 48
Refresher training of VLRP 6 5000 30 30
Training of goat keepers 360 200 72 72
Exposure visits (persons) 18 5000 90 90
Goat development kit for VLRP 10 1000 10 10
Castrators and Balances 1 10000 10 10
Fodder and feed development 6 2000 12 12 12 36
Critical inputs for health care 6 3000 18 18 18 54
Bucks and transport 36 6000 216 216
Feeding of bucks 36 2400 86 86 86 259
Honorarium for VLRP 6 30000 180 180 180 540
Salary of CLF 1 240000 240 240 240 720
TOTAL 992 574 544 2111
Total cost
Unit Number Rs'000 unit cost total cost
Pig centres cluster 100 1,636 163,600
Pig breed improvement boar 600 50 30,000
Goat centres cluster 20 2,111 42,224
Livestock programme managers person- year
55
360
19,800
Travel and miscellaneous 2,640
RNGO overheads and management 10% of total costs 25,562
Sub-total for RNGO implementation 283,826
Financial support for livestock production 70,000
Total
353,828
Financial support for livestock production would provide producers with a range of investment incentives such as grants and quasi-equity. A policy for providing such support would be drawn up as part of project start-up activities.

Republic of India
Meghalaya: Livelihoods and Access to Market Project
Final project design report - Working papers
153
Annex 4: Convergence of Government Schemes
The BAIF draft Livestock Mission document indentified a number of government schemes for livestock development within the state that can be converged with the ongoing IBDLP programme. These include:
i) National Mission for Protein Supplements (NMPS)
Pig Development The scheme aims at promoting cross-bred piglets by setting up one nucleus breeding farm and 10 satellite breeding farms that will be ensure availability of cross-bred piglets to farmers in the state. A nucleus farm will produce around 5000 piglets in a year. Suitable provisions have been kept for technological interventions like use of artificial insemination. Rs. 3.3 crore has been earmarked for various activities under this scheme and this fund will be given as 100 percent subsidy.
Goat Development Funds have been earmarked under NMPS for schemes on goat development. The activities promoted under this scheme are intensive goat production systems and supporting conventional goat production with capacity building in the community. Goat farmers rearing more than 10 goats may be provided all the financial support required for increasing herd size by 100 goats which will comprise of 95 goats and 5 bucks. All supported including medicines and insurance will be provided. Rs 39 crore has been earmarked for this component. Preference will be given to SC/ST and BPL families.
In order to increase the productivity, clusters will be identified and local youth will be trained as extension workers to provide support services in those clusters. Rs 21 crore have been kept for this component. This includes remuneration of goat extension worker for 18 months.
Besides this scheme, there are a number of schemes offered by NABARD for entrepreneurship development.
ii) Centre Sponsored Schemes implemented through NABARD
Scheme on Pig Development This scheme has been designed with an objective to encourage commercial rearing of pig by adopted scientific methods and creation of infrastructure. It also includes creation of supply chain for meat industry and value addition for additional income. A capital subsidy of 33 percent will be offered to beneficiaries in Meghalaya. Provisions have been kept for Pig breeding, pig rearing, retail outlets with chilling, facility for live market, insurance of animals and support for government farms. A provision of Rs 12 crore has been kept for this central sponsored scheme in budget for 2013-14.
Scheme on Poultry Development Poultry venture capital fund is one of the capital subsidy being offered through central sponsored scheme that is been implemented by NABARD. The fund allocated for this financial year is 30 crore. Various components that may be supported through this scheme includes setting up of breeding farms for low input technology birds like quails, central grower units with upto 16000 layer chicks per batch, hybrid layer units with up to 5000 layers, hybrid broiler units with upto 5000 units, feed mix unit, disease investigation lab, transport vehicles (open cage as well as refrigerated), opening of retails outlets (dressing units/marketing units), mobile marketing units, cold storage for poultry products, eggs/broilers cart, large processing units (2000-4000 birds per hr), feather processing units and technology up-gradation. One–third of capital will be supported by government through this scheme. For loans below one lakh, banks may not insist upon the margin money and beyond that margin money will be minimum 10 percent. Like all central sponsored schemes, 8% of funds are targeted to ST and 30% of funds are targeted to women. Scheme for Small Ruminants Funds have been allocated for small ruminants under Integrated development of small ruminants and rabbits scheme. Rs 15 crore has been kept under this scheme for this financial year and proposals will be considered on first come first service basis. Key components of this scheme are: cluster based integrated development approach, strengthening of entire backend and forward linkage support required for improvement of small ruminants and developing the skill pool of NGOs for taking up development projects in PPP (public private partnership mode). 33 percent capital subsidy will be offered to entrepreneurs taking up

Republic of India
Meghalaya: Livelihoods and Access to Market Project
Final project design report - Working papers
154
rearing/breeding activities while support for other interventions will be offered as grants which include human resource development. For institutional restructuring, state has to nominate a state implementing agency which can be MBDA in case of Meghalaya. Emphasis will be given on promoting artificial insemination, establishment of semen bank and other innovative projects to promote production. Government has already identified certain districts where this program will be implemented. Ri-bhoi district of Meghalaya has been selected for implementing this scheme.
Scheme for Dairy Rs 50 lakh has been reserved under Dairy entrepreneur development schem e for Meghalaya. 75 percent of total outlay will be for establishment of dairy unit, rearing of heifer calves and other forward linkage facilitation like processing and transportation facilities, establishment of cold chains and retail outlets. Remaining 25 percent will be used for activities other than establishment of dairy units. In this scheme also 33% capital subsidy will be offered by government. Margin money of 10% of the capital cost will be contributed by entrepreneur while rest can be financed. Priority will be given to projects being implemented in cluster mode.
Strengthening Infrastructure for Quality & Clean Milk Production is another central scheme in which Rs 30 crore have been kept for present financial year. The main objective of the schem e is creation of necessary infrastructure for production of quality milk at the farmer’s level up to the points of consumption, improvement of milking procedure at the farmer’s level, training and strengthening of infrastructure to create mass awareness about importance of clean milk production. Under this scheme, 75% grant will be provided as for all components by Government of India to profit making unions and 100% grant-in-aid for all milk unions.
Schemes for fodder and feed development Centrally sponsored fodder and feed development scheme has kept 90 crores with the objective of promoting fodder and feed development all across the country. In includes establishment of fodder block making unit, silage units, grassland development, fodder seed production and distribution, strengthening of feed testing labs, introduction of chaff cutters, demonstration and production of Azolla and establishment of concentrated feed making units. Highest priority has been given to fodder seed production and distribution. There is 50 percent to 100% subsidy provided by center for various components. Full subsidy is provided for grasslands development and establishing silage making units.
Scheme for modernization of slaughterhouses Central scheme on modernization of slaughter houses in rural areas (having population lesser than 50000) will continue this year also. It will focus on establishment of three types of slaughter houses:
Model 1: For rural areas and having capacity of around 50 small ruminants per day
Model 2: For semi urban areas and capacity for slaughter of 50 small ruminants and 25 cattle per day.
Model 3: Large slaughterhouse with multiple lines for slaughter of different types of species.
A 50 percent subsidy will be offered for modernization of these slaughter houses. Appropriate provisions have been kept for expenditure on cold chains and certifications. For urban areas with huge meat requirement scheme for modernization of abattoirs offered under ministry of food processing industries may be considered.
There are a number of other schemes offered by the Ministry of Food Processing Industries like mega food parks may be considered. It is more suitable in context of Meghalaya as a cluster development approach has been considered for implementation of scheme. Rashtriya Krishi Vikas Yojana (RKVY) There are a number of activities for livestock development projects that may be taken up under this scheme. In different states BAIF is implementing various projects on heifer rearing, adult cattle feed and fodder development, organizing productivity cattle camps, azolla production and demonstration, grassland development and goat development. These projects may be considered for convergence with the proposed activities under livestock mission.
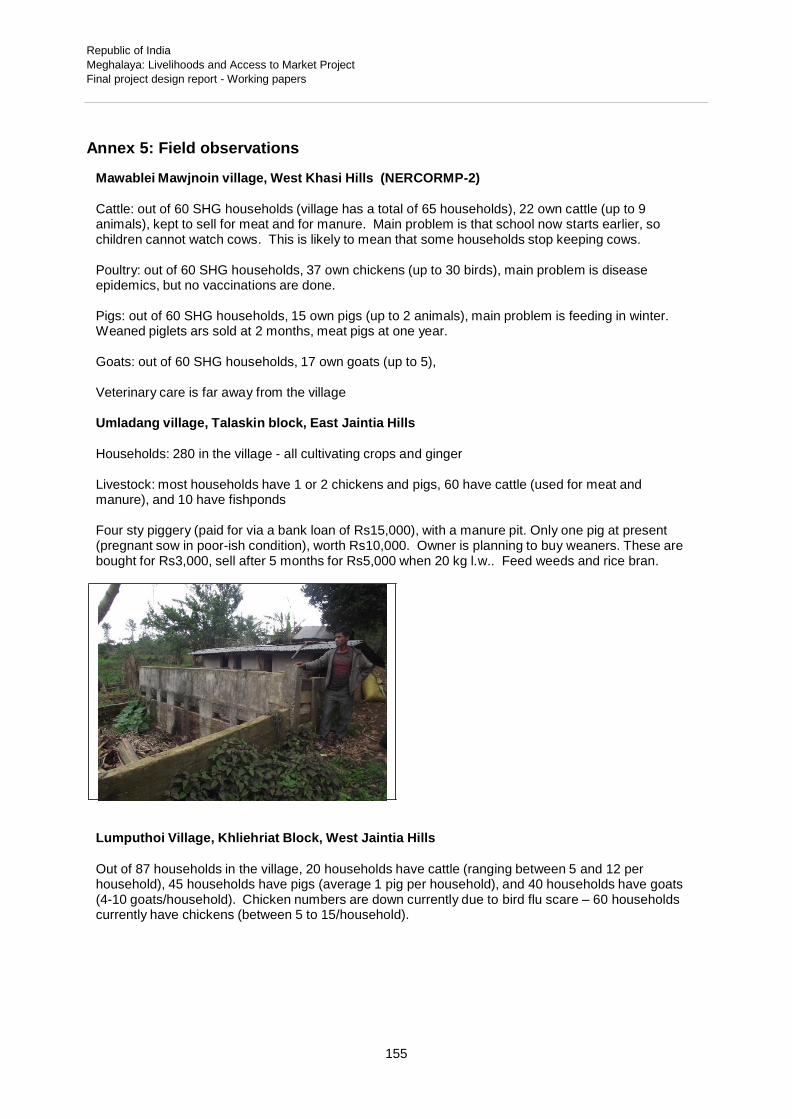
Republic of India
Meghalaya: Livelihoods and Access to Market Project
Final project design report - Working papers
155
Annex 5: Field observations
Mawablei Mawjnoin village, West Khasi Hills (NERCORMP-2)
Cattle: out of 60 SHG households (village has a total of 65 households), 22 own cattle (up to 9 animals), kept to sell for meat and for manure. Main problem is that school now starts earlier, so children cannot watch cows. This is likely to mean that some households stop keeping cows.
Poultry: out of 60 SHG households, 37 own chickens (up to 30 birds), main problem is disease epidemics, but no vaccinations are done.
Pigs: out of 60 SHG households, 15 own pigs (up to 2 animals), main problem is feeding in winter. Weaned piglets ars sold at 2 months, meat pigs at one year.
Goats: out of 60 SHG households, 17 own goats (up to 5),
Veterinary care is far away from the village
Umladang village, Talaskin block, East Jaintia Hills
Households: 280 in the village - all cultivating crops and ginger
Livestock: most households have 1 or 2 chickens and pigs, 60 have cattle (used for meat and manure), and 10 have fishponds
Four sty piggery (paid for via a bank loan of Rs15,000), with a manure pit. Only one pig at present (pregnant sow in poor-ish condition), worth Rs10,000. Owner is planning to buy weaners. These are bought for Rs3,000, sell after 5 months for Rs5,000 when 20 kg l.w.. Feed weeds and rice bran.
Lumputhoi Village, Khliehriat Block, West Jaintia Hills
Out of 87 households in the village, 20 households have cattle (ranging between 5 and 12 per household), 45 households have pigs (average 1 pig per household), and 40 households have goats (4-10 goats/household). Chicken numbers are down currently due to bird flu scare – 60 households currently have chickens (between 5 to 15/household).
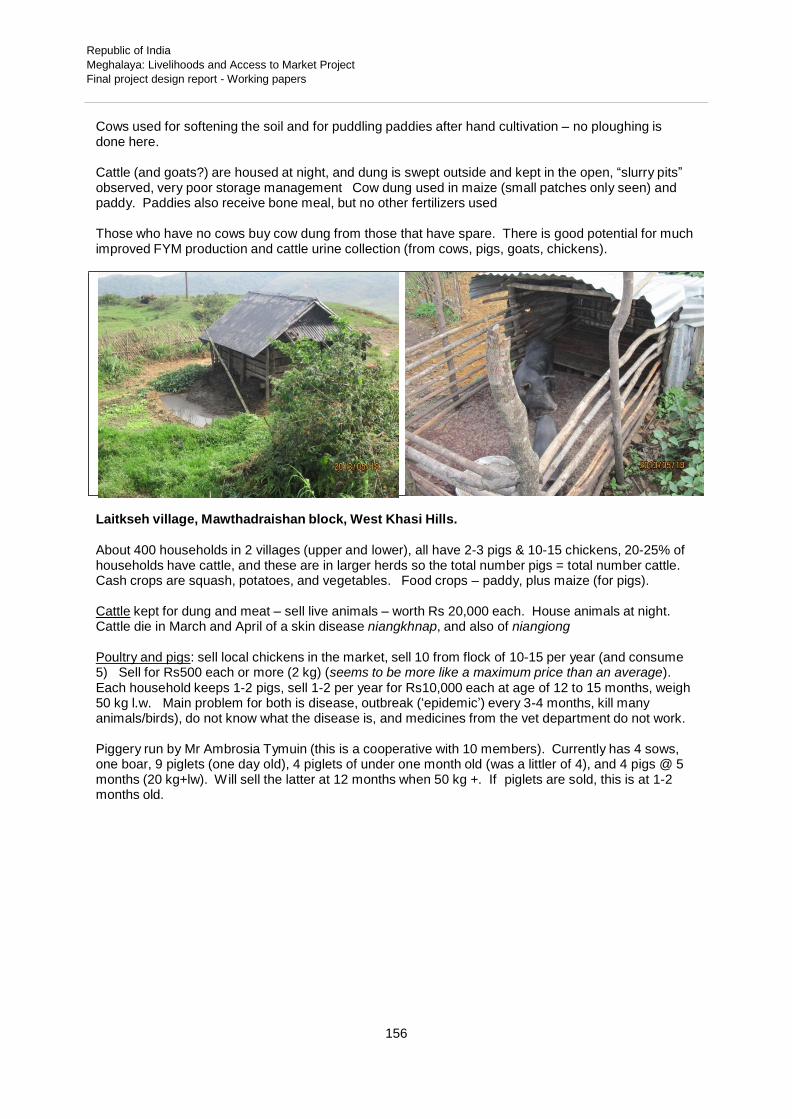
Republic of India
Meghalaya: Livelihoods and Access to Market Project
Final project design report - Working papers
156
Cows used for softening the soil and for puddling paddies after hand cultivation – no ploughing is done here.
Cattle (and goats?) are housed at night, and dung is swept outside and kept in the open, “slurry pits” observed, very poor storage management Cow dung used in maize (small patches only seen) and paddy. Paddies also receive bone meal, but no other fertilizers used
Those who have no cows buy cow dung from those that have spare. There is good potential for much improved FYM production and cattle urine collection (from cows, pigs, goats, chickens).
Laitkseh village, Mawthadraishan block, West Khasi Hills.
About 400 households in 2 villages (upper and lower), all have 2-3 pigs & 10-15 chickens, 20-25% of households have cattle, and these are in larger herds so the total number pigs = total number cattle. Cash crops are squash, potatoes, and vegetables. Food crops – paddy, plus maize (for pigs).
Cattle kept for dung and meat – sell live animals – worth Rs 20,000 each. House animals at night. Cattle die in March and April of a skin disease niangkhnap, and also of niangiong
Poultry and pigs: sell local chickens in the market, sell 10 from flock of 10-15 per year (and consume 5) Sell for Rs500 each or more (2 kg) (seems to be more like a maximum price than an average). Each household keeps 1-2 pigs, sell 1-2 per year for Rs10,000 each at age of 12 to 15 months, weigh 50 kg l.w. Main problem for both is disease, outbreak (‘epidemic’) every 3-4 months, kill many animals/birds), do not know what the disease is, and medicines from the vet department do not work.
Piggery run by Mr Ambrosia Tymuin (this is a cooperative with 10 members). Currently has 4 sows, one boar, 9 piglets (one day old), 4 piglets of under one month old (was a littler of 4), and 4 pigs @ 5 months (20 kg+lw). Will sell the latter at 12 months when 50 kg +. If piglets are sold, this is at 1-2 months old.

Republic of India
Meghalaya: Livelihoods and Access to Market Project
Final project design report - Working papers
157
Maize 60-70% of household grow this, mostly on homestead land, used as feed for poultry and pigs. On average each household gets one bag of 100 kg. Problem: needs a lot of expensive fertiliser,
DAP cost Rs35/40/kg, need 1-1.5 kg for 14.5 m2, which produces 5 kg maize (1 kg amounts to 690
kg/ha and 5 kg yield is 3.5 tons/ha – both of which seem very high). Problem of rats and insects (stem borer?).
Village Maothang, Mawkyrwat block, South West Khasi Hills district
Out of 240 households, some 2-3 households have cattle. Earlier everyone had about five cattle, but now there is no labour as kids go to school! All households have pigs (at least 2) and chicken (average 20). Pig waste is used as manure
Ranikhet seems to occur with some regularity about every 3 years.
Piggeries could be expanded but shortage of water
Mawryngkang village, Umling block, Ri Bhoi district
All household have pigs (1-2) & poultry (10-20). One household has 3 cows, tied up in the jungle to graze. No goats . Shortage of labour so others not keep cows – no space, children at school. Before 24 cows in village – 10 years ago all household had cattle.
Before pigs were free roaming – now kept in a sty to keep the village clean, and to avoid crop damage. No pig disease problem. Problem for pigs is lack of feed. Grow tapioca to eat and sell, but do not feed to pigs. Use rice husk, vegetables, yam leaf and stalk, banana. Buy in most of the feed: wheat bran @ Rs20/15 kg. Dry pig manure in winter before use in vegetable gardens, but this meant they loose nutrients.
Poultry wiped out by disease every 3 years, feed on paddy and rice bran. If someone has 20 chickens, they eat 15 and sell 5. Price is Rs400-500 for a cock, while a hen sells for Rs250-300.
No fertiliser, compost or FYM on crops, yields going down. Say village has good soil compared with other parts of the state in district (W Kashi).
Mendal, North Garo Hills District
Livestock – cattle (70% of households, average of 4 head (up to 20), pigs (100% of household, 2 each (ranges from 1 to 6), goats (6-7% of household, do not grow well, trespass), poultry (100% of household, average of 15 birds).
Cattle kept for ploughing, emergency savings and meat. Trend in numbers is down – grazing becoming difficult as the population is increasing and field plots are occupied for longer. Main
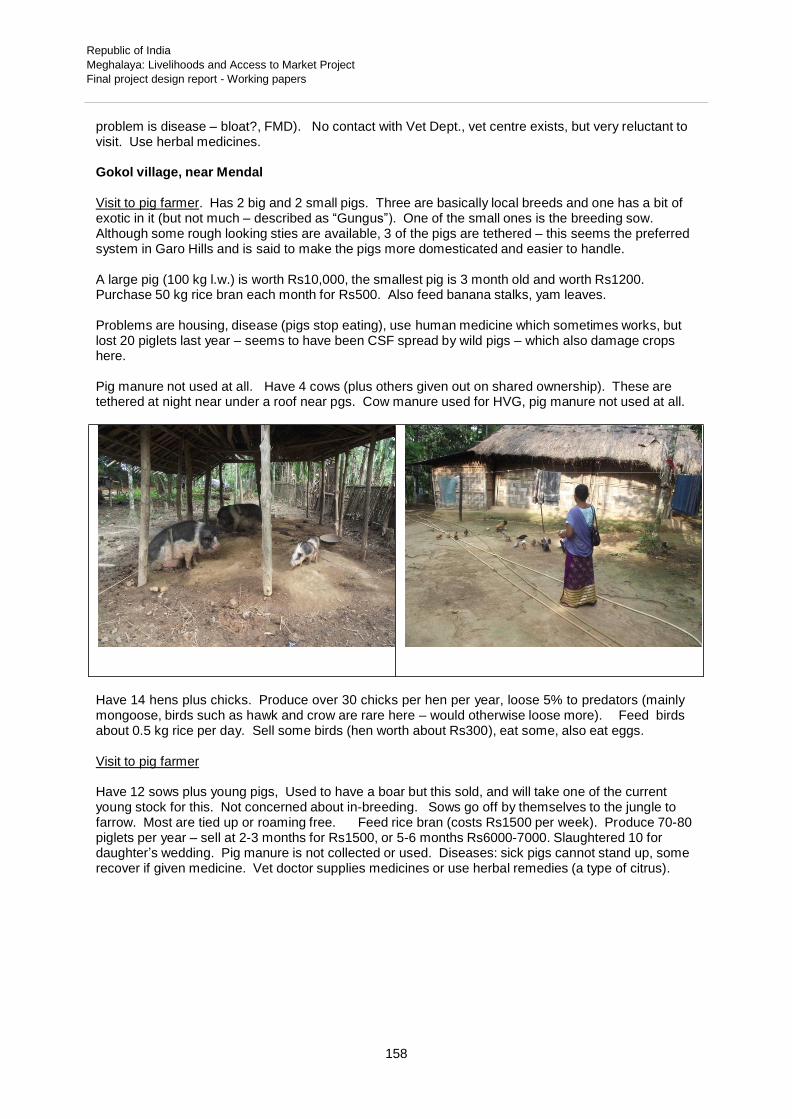
Republic of India
Meghalaya: Livelihoods and Access to Market Project
Final project design report - Working papers
158
problem is disease – bloat?, FMD). No contact with Vet Dept., vet centre exists, but very reluctant to visit. Use herbal medicines.
Gokol village, near Mendal
Visit to pig farmer. Has 2 big and 2 small pigs. Three are basically local breeds and one has a bit of exotic in it (but not much – described as “Gungus”). One of the small ones is the breeding sow. Although some rough looking sties are available, 3 of the pigs are tethered – this seems the preferred system in Garo Hills and is said to make the pigs more domesticated and easier to handle.
A large pig (100 kg l.w.) is worth Rs10,000, the smallest pig is 3 month old and worth Rs1200. Purchase 50 kg rice bran each month for Rs500. Also feed banana stalks, yam leaves.
Problems are housing, disease (pigs stop eating), use human medicine which sometimes works, but lost 20 piglets last year – seems to have been CSF spread by wild pigs – which also damage crops here.
Pig manure not used at all. Have 4 cows (plus others given out on shared ownership). These are tethered at night near under a roof near pgs. Cow manure used for HVG, pig manure not used at all.
Have 14 hens plus chicks. Produce over 30 chicks per hen per year, loose 5% to predators (mainly mongoose, birds such as hawk and crow are rare here – would otherwise loose more). Feed birds about 0.5 kg rice per day. Sell some birds (hen worth about Rs300), eat some, also eat eggs.
Visit to pig farmer
Have 12 sows plus young pigs, Used to have a boar but this sold, and will take one of the current young stock for this. Not concerned about in-breeding. Sows go off by themselves to the jungle to farrow. Most are tied up or roaming free. Feed rice bran (costs Rs1500 per week). Produce 70-80 piglets per year – sell at 2-3 months for Rs1500, or 5-6 months Rs6000-7000. Slaughtered 10 for daughter’s wedding. Pig manure is not collected or used. Diseases: sick pigs cannot stand up, some recover if given medicine. Vet doctor supplies medicines or use herbal remedies (a type of citrus).

Republic of India
Meghalaya: Livelihoods and Access to Market Project
Final project design report - Working papers
159
Has cows – no cattle sheds (tied to trees), get 1 litre milk per day – but do not sell any milk. They are not used for ploughing as she has no crop land – this has been occupied by elephants for 10 years.
Panda village, Bagpara Block, South Garo Hills District
Cluster Training Centre set up by MLIPH is still in use after the end of MLIPH. There is also a net/poly house nursery run by an MLIPH Federation, and an MLIPH SHG jointly owned piggery. This uses rice bran as feed, which comes from B’desh and costs Rs10/kg. Now have 7 sows, 2 boars (one quite old), and have produced 150 piglets in 2 years (=approx 10 per sow per year, not very good), sell these for Rs2000 at 3 months old. There is high demand for these piglets, but there is not much evidence of improved management practice with sows roaming freely around in the locality of the unit.
“improved” pigs at SHG piggery
Rasnagre village, Bagmara block, South Garo Hills district
Livestock all households have 1-2 cows, most have a pig (up to 3), 50% have goats (5-6, up to 15), all had poultry but all the birds died, said to be of bird flu (but this disease is also said to have been around a long time, so seems more likely to be ranikhet – although birds are said to die faster now).
Cows - main problem theft via border streams, although this is less since the fence as built. Cows are milked for milk for tea, and used for ploughing, (but have they now have a power tiller given to them by DoA, which they use for the first ploughing.
Pigs: main problem is diseases - epidemics
Use of FYM – cattle manure used for vegetables, pig manure not used as have no idea that they can do this. Cattle are kept locked up in sheds at night.

Republic of India
Meghalaya: Livelihoods and Access to Market Project
Final project design report - Working papers
160
Goats: problem is disease – epidemics – but some household escape loss.
Kapasipara, Gasuapara block, South Garo Hills district
Half of the households have 1-2 pigs. Feed on rice bran, yam leaves, jackfruit, manure not used. Main problem is disease – many die (get sick and usually die overnight, an epidemic within a household).
Only a few household now have cows, all used to have cattle, but most stopped as cows were stolen. Now they have no cows steal, Bangladeshis steal their motorcycles instead. Cows were milked (get 1 lt/day), and some households now buy milk, while others take black tea. FYM used for vegetables.
Poultry – all household have, 10-15 birds, main problem disease –
epidemic, Goats – 20% of household, skin disease – die of this.
Vet sub-centre is located next to the village but the doctor and medicines are not available.
Village Dolagia, Ampati (?) block, South West Garo district
All households have cattle (usually 1 to 2; a few 5 to 10); all milk cows (max yield 2 litre/day; sell and consume); all have 1-2 pigs; and all have 10-15 chickens.
Village Dombu Afal, Rangjeng block, East Garo district
Out of 54 households, 30 households have cattle; some milk, others do not (leave the milk for the calf); about 10 households have 2-3 pigs; and all have 10-15 chickens. The cattle population has been rising

Republic of India
Meghalaya: Livelihoods and Access to Market Project
Final project design report - Working papers
161
Annex 6: Insights from Assam and Nagaland
ILRI has carried out studies of the pig sub-sectors in Assam and Nagaland, which provide some useful insights which may be applicable in Meghalaya.
In these states most pigs are kept in small herds of 1 to 3 animals, being purchased as weaned piglets and fed for between 1 and 4 years before sale. Only a few wealthy households will kill and consume their own pigs. Relatively few producers keep breeding sows and production of piglets is a specialised business, although also carried out be small-scale producers with between one and five sows. There is a general shortage of piglets, but many households say they lack the knowledge to breed pigs themselves. In Assam around 60-80% of piglets are sold to households for fattening via intermediary traders. In Nagaland the proportion is lower, only 10% to 20%, with the rest being sold directly by breeders to fattening households - although this trade may take place in public markets.
Pig production in Assam is relatively well developed, and is now dominated by crossbred pigs - although some of these crosses appear to be a non-descript mix of various local and exotic breeds. A higher proportion of pigs in Nagaland are of local breeds, although crossbreds are becoming popular. There has been a general move (for hygiene reasons) from allowing pigs to roam and scavenge for feed to keeping them in pens with concrete or raised wood floors (or tethered).
Lack of feed and poor quality of feed are major limitations on production. Feeds are based on crop by-products and home-produced crops: rice polishing, broken rice, root crops (cassava, taro, sweet potato), vegetables, crushed maize, and gathered forages. Some purchased oilcake and wheat bran are also used (and fishmeal is also reported in Assam). Communities making country liquor will feed the residue (juguuli) to pigs. In peri-urban areas, waste food is available. These diets lack the required balance of nutrients (in particular are often deficient on protein). Even in Assam there is only minimal use of manufactured compound feeds.
Another major problem is disease control . Classical Swine Fever (CSF) kills many pigs in the north- east, with annual losses amounting to almost Rs2,000 million per year in Assam alone. CSF can be controlled by vaccination. The 3.82 million pigs in the northeast require 7.64 million doses , but only 0.04 million (0.5% of the requirement) doses are supplied by government laboratories. There is an urgent need to expand production at these laboratories, as well as getting the private sector to start making the vaccine. ILRI reports that GoI has agreed to expend production , as well as to invest in supporting vaccine distribution services, diagnostic laboratories disease surveillance.
Other pig health problems are internal worms, piglet diarrhoea, pneumonia, FMD, haemorrhagic septicaemia (HS) and mange. However FMD and HS are not very common, and most producers seem to get by with minimal services and inputs to maintain pig health. In Nagaland few producers using de-worming medicines, but worm infestations have been reduced with the move away from scavenging to penned systems. Producers have a low level of awareness regarding pig health issues, although some producers in parts of Assam make use of deworming drugs. A significant number of producers report hernias and deformities, which could be due to in-breeding.
ILRI suggest interventions centre around improving feeding, including assessment of the available feed resources, and cropping -based interventions to make more feed available. Producers need more awareness and knowledge regarding feeding, breeding and health control. A more systematic approach to genetic improvement and crossbreeding would produce pigs that are able to make more efficient use of the available feed resources. However there is a strong preference for black coloured pigs and the most popular exotic breed is the Large Black, a breed which is no longer used in modern pig production systems, and which has had relatively little genetic improvement over the last 50 years. Lastly a cadre of veterinary assistants is needed to provide vaccination and other health care services.ILRI also point out the human health implications of inadequate hygiene and health controls in the slaughtering of pigs and handling of pork. A

Republic of India
Meghalaya: Livelihoods and Access to Market Project
Final project design report - Working papers
162
particular area of risk is the spread of tapeworms from pigs to humans.
In Mon district, a remote area of Nagaland, ILRI is implementing a project to improve pig production. This is part of a larger programme entitled ‘Livelihood improvement and empowerment of rural poor through sustainable farming systems in North-east India’ - which is supported through the National Agricultural Innovation Project (NAIP) of the World Bank and Government of India led by the Indian Council of Agricultural Research (ICAR). The pig project in Mon district has additional support from IFAD and also involves the ICAR-Nagaland Centre, the School of Agricultural Science and Rural Development (SASARD), Nagaland University and the International Water Management Institute (IWMI).
In the two project villages ILRI had adopted a people-centric approach, and interventions include training and other capacity building for members of women's self-help group. The "Pass on Gift" scheme enables poor households to obtain better quality breeding animals. Each SHG is asked to identify "first line" six pig producers to receive better quality piglets supplied by ILRI, along with two or three "down-line" beneficiaries for each first line producer, who then receive piglets as a gift at the end of the first production cycle from the first line beneficiaries.
The project is making a number of technical interventions to improve pig production, including crossbreeding with Large Black and Hampshire, improved feeding using local by-products and specially cultivated crops, improved hygienic pig housing, veterinary care from village Livestock Service Providers, and business development services (access to government services and input supplies). Benefits for 91 households are summarised in the table below:
Before After
Households with breeding pigs 2 91
Households with crossbred pigs 4 91
Growth rate (kg per year) 30 70
Number of piglets per farrowing 4 to 8 8 to 11
Cost of rearing a sow up to first farrowing Rs 1,000 3,800
Income per sow per farrowing Rs 4,000 15,391
Profit per sow per farrowing Rs 3,000 11,591
Increase in income 286%

Republic of India
Meghalaya: Livelihoods and Access to Market Project
Final project design report - Working papers
163
Working Paper 7: Enterprise Development
A. Strategy for enterprise development Enterprise Promotion & Facilitation is a people-centred approach to community and economic development. The model seeks to support the passion and ideas of local entrepreneurs and to facilitate the transformation of those ideas into viable businesses that contribute to community economic vitality.
Meghalaya has redefined entrepreneurship by choosing to view every individuals of the state who produces anything for the market as an entrepreneur. Entrepreneurship Promotion is one of the four key pillars of the Integrated Basin Development and Livelihood Promotion Programme (IBDLP) along with Knowledge Management, Natural Resource Management and Good Governance. Enterprise Promotion is sought to be done through the setting up of Entrepreneurship Facilitation Centre’s (EFC), with enterprises being built in the nine sectors under which missions have been launched- aquaculture, apiculture, sericulture and weaving, horticulture, forestry and plantation crops, livestock, tourism, water, and renewable energy; along with the agricultural and service sectors.
The EFC model is based on the following basic premise that it is possible to promote Entrepreneurship by creating a conducive eco system for Entrepreneurship to bud, blossom and thrive and the government will strive to create such an eco system. An additional strength of the model is its focus on entrepreneurs. The EFC model identifies the needs of individual entrepreneurs and matching them with the resources they need to be successful.
EFCs are being set up in all the 39 block HQ of the state to act as the front end of the IBDLP at the grass roots. EFCs will act as one-stop shops to provide an entrepreneur-sensitive public interface to provide structured communication and guidance on Entrepreneurship and the IBDLP. EFCs will link entrepreneurs to agencies involved in enterprise building including banks and provide hand-holding support.
The EFC approach has the considerable merit of potential entrepreneurs being self-selecting. Instead of trying to encourage people from pre-selected project villages to come forward (which usually means setting up some form of community groups and going through an awareness raising process), interested people from any location in the state can travel to their local EFC and make an application. This means the expense of a village mobilisation effort is avoided, and in taking the trouble to visit the EFC, potential entrepreneurs are demonstrating that they are really interested.
Information on the background to the Enterprise Facilitation Approach at the international level, and examples of enterprise development initiatives in India are in Annex A.
B. Current status of Enterprise Facilitation Centres MBDA is establishing and Enterprise Facilitation Centre (EFC) in each of the 39 blocks (sub-districts) in the state. As of June 2013 a total of 22 were operational, and it is expected that all 39 will be operational by the end of July 2013. These centres are usually staffed by two Enterprise Resource Persons (ERP), but some also have more qualified Field Business Advisors who can help in getting bank loans. There are also two vans equipped to provide information for enterprise development. Details of current EFC processes are in Annex B.
The first EFCs opened in January 2013, and by May 2013 a total of 21,349 people have made enquiries about starting an enterprise, of whom 6,595 have completed an enterprise questionnaire (EQ) on their enterprise plans and 5,704 have had one-to-one interviews with EFC staff (Table 1).

Republic of India
Meghalaya: Livelihoods and Access to Market Project
Final project design report - Working papers
164
Table 1: Enquiries handled by EFCs (up to May 2013)
District
EFC Centre
Name of ERPs No. of People who
visited the centre No. of People (1- on-1 interaction)
No. of people who have taken the EQ
No. of people who have submitted the
EQ
Data entered in the SMS
Module
South West Garo Hills
Zikzak Eli 2200 330 800 250 Betasing Raisa 1400 430 320 270 85
West Garo Hills
Rongram Tracy 443 421 421 350 250 Selsella Tangchi 2856 335 1070 335 200
Gambegre Dalu
Tikrikilla Dadenggiri
South Garo
Hills
Baghmara Werish 2080 784 550 531 808 Gasuapara Right Lucent 3401 514 514 404 400
Chokpot Marbin 896 273 175 165 152 Rongara Sunshine 983 327 327 100 200
East Khasi Hills
Pynursla Andrea 200 80 200 70 80 Laitkroh Suklang 70 42 64 26 39 Mylliem
Mawkynrew Mawphlang
Mawryngkneng Mawsynram
Shella Bholaganj
East Garo Hills
Dambo Rongjeng Songsak Samanda Romeo 2196 598 1720 598 481
North Garo Hills
Resubelpara Celine 3848 1200 3848 3287 700 Kharkutta
East Jaintia Hills
Khliehriat Saipung
West Jaintia
Hills
Amlarem Justina 76 30 60 30 30 Laskein Ban 130 91 43 30 48
Thadlaskein Wallam 88 49 68 49 49
West Khasi
Hills
Mawthadraishan Mairang Evarista 482 200 200 100 150
Nongstoin Mawshynrut
South West Khasi Hills
Ranikor Mawkyrwat
Ri-Bhoi
Umling Umsning
Jirang Total 21349 5704 10380 6595 3672
By November 2013, 16528 registrations had been made in 31 EFCs across the state for a variety of services in different sectors of activity. About 52% of registrants were women.

Republic of India
Meghalaya: Livelihoods and Access to Market Project
Final project design report - Working papers
165
Table 2: Registrations with EFCs (October 2013)
Name of District No of people registered
East Garo Hills 698
East Jaintia Hills 208
East Khasi Hills 726
North Garo Hills 1488
Ri-Bhoi 408
South Garo Hills 3511
South West Garo Hills 1308
South West Khasi Hills 1399
West Garo Hills 1166
West Jaintia Hills 3201
West Khasi Hills 2415
Total 16528
Table 3: Sector disaggregation of registrations (October 2013)
Sector No of registrations
Agriculture 72
Apiculture 182
Aquaculture 1867
Forestry 2799
Horticulture 2502
Livestock 6023
Non-Farm 2131
Renewable Energy 29
Sericulture and Weaving 430
Soil and Water
Conservation
18
Tourism 38
EFC applications by sector are shown in Table 3. By a considerable margin, the sector of greatest interest to EFC applicants is livestock (with pigs being the leading sub-sector), followed by forestry (which includes rubber plantations), horticulture and non-farm (such as grocery shops).
Specific assistance (services) requested in applications are shown in Table 4, Each applicant can request up to three different services. The most widely requested service is assistance with inputs, accounting for over half of all service requests for forestry (especially planting materials and tools), and a major share of requests for agriculture, apiculture, aquaculture, horticulture, livestock, textiles (sericulture and weaving). Infrastructure development is widely requested in the non-farm sector (such as building grocery shops), livestock (animal sheds), and aquaculture (fish ponds). Capacity building (various types of training) was requested by significant numbers of applicants in most sectors

Republic of India
Meghalaya: Livelihoods and Access to Market Project
Final project design report - Working papers
166
apart from the non-farm sector and aquaculture. Financial inclusion (mostly assistance with loan applications) is the most widely requested form of assistance for the non-farm sector
The challenge for IBDLP and its EFC approach is that, having generated considerable interest and a large number of enquiries from potential entrepreneurs, is now to actually deliver the support required to develop enterprises. To do this IBDLP, with the participation from line departments, has been holding a "dialogue with partners" (the partners being the potential entrepreneurs) to get feedback from people who have visited EFCs. This dialogue found that people accept that EFCs do not give subsidies, and are interested in bank loans. Examples of feedback:
A farmer took his piglets to the block veterinary office to get vaccination, but found no staff there
Handicraft people want to know from where to get machine to accurately split bamboo for weaving.
Musical instrument maker – machine for finishing string instruments and drums to make them look smarter, and how to sell beyond the village cluster.
To help develop enterprise services and build the capacity of EFC staff, MBDA has recently contracted The Livelihood School (TLS) to support eight EFCs in the Garo and Khasi Hills for an 18 month period. TLS is an affiliate of the BASIX Social Enterprise Group. TLS is expected to build capacity of EFC personnel, identify and assess the prospects of two main livelihood activities in each block, conduct intensive training courses, spot potential entrepreneurs, and introduce a new partner management information system software to deal with the registrations in EFCs. TLS has provided a Project Manager and three Field Executives, while BMDA will attach some of their interns to the team. Training of EFC staff aims to identify some ERP and FBA who can act as master trainers to build the capacity of staff at further EFCs. TLS has also identified experts to develop toolkits for packages of practices and problem solving. TLS will also assist EFCs to set key milestones and monitor the progress of enterprises. TLS will help ERPs to map livelihoods, identify sub-sectors with potential for enterprise development, and build linkages to support entrepreneurs in these sectors. TLS has carried out value chain studies for backyard poultry, orange, cashew, banana, piggery, milch cattle and arecanut, and reports are in preparation.. The livelihood maps generated through these studies will be correlated with the demand arising from EFCs.

Republic of India
Meghalaya: Livelihoods and Access to Market Project
Final project design report - Working papers
167
Table 4: Assistance Requested for Enterprise Development (May 2013)
Type of assistance Agric Apiculture Aquaculture Forestry Horticulture Livestock Non-farm Energy Textiles SWC Tourism Total
Area expansion 3 0 10 64 28 2 12 0 0 0 0 119
Capacity building 18 73 415 663 427 811 179 7 161 5 22 2781
Extension services 0 0 0 2 3 258 0 0 4 0 0 267
Financial inclusion 9 23 298 472 318 701 588 3 68 4 12 2496
Infrastructure 5 13 618 84 129 1619 479 2 71 13 16 3049
Inputs 26 96 913 1479 923 2727 167 12 186 3 1 6533
Market access 2 8 32 85 124 146 13 0 10 0 5 425
Technology upgrade 0 8 53 45 61 33 13 0 9 0 0 222
Value addition 0 10 0 3 29 3 1 0 0 0 0 46
Total 63 231 2339 2897 2042 6300 1452 24 509 25 56 15938
Percentage of total
Area expansion 4.8% 0.0% 0.4% 2.2% 1.4% 0.0% 0.8% 0.0% 0.0% 0.0% 0.0% 0.7%
Capacity building 28.6% 31.6% 17.7% 22.9% 20.9% 12.9% 12.3% 29.2% 31.6% 20.0% 39.3% 17.4%
Extension services 0.0% 0.0% 0.0% 0.1% 0.1% 4.1% 0.0% 0.0% 0.8% 0.0% 0.0% 1.7%
Financial inclusion 14.3% 10.0% 12.7% 16.3% 15.6% 11.1% 40.5% 12.5% 13.4% 16.0% 21.4% 15.7%
Infrastructure 7.9% 5.6% 26.4% 2.9% 6.3% 25.7% 33.0% 8.3% 13.9% 52.0% 28.6% 19.1%
Inputs 41.3% 41.6% 39.0% 51.1% 45.2% 43.3% 11.5% 50.0% 36.5% 12.0% 1.8% 41.0%
Market access 3.2% 3.5% 1.4% 2.9% 6.1% 2.3% 0.9% 0.0% 2.0% 0.0% 8.9% 2.7%
Technology upgrade 0.0% 3.5% 2.3% 1.6% 3.0% 0.5% 0.9% 0.0% 1.8% 0.0% 0.0% 1.4%
Value addition 0.0% 4.3% 0.0% 0.1% 1.4% 0.0% 0.1% 0.0% 0.0% 0.0% 0.0% 0.3%
total 100.0% 100.0% 100.0% 100.0% 100.0% 100.0% 100.0% 100.0% 100.0% 100.0% 100.0% 100.0%
Republic of India
Meghalaya: Livelihoods and Access to Market Project
Final project design report - Working papers
168
Operation of the EFCs during the last year has generated the following lessons:
There is great interest in enterprise development - EFCs have been able to attract a large number of enquiries
Many potential entrepreneurs say that they would be happy to take bank loans, and do not expect to rely on subsidies to finance their investment
Data from EFCs show that there is great interest in livestock enterprises, especially pig production.
Generating enquiries is much easier than providing the support that entrepreneurs require.
C. LAMP support for EFCs
Approach
LAMP will take responsibility in providing support for EFCs, with EFC staff becoming LAMP project staff. There will be potential for LAMP to further develop the operational modalities for EFCs, based on experience gained to date, including lessons from the support provided by TLS.
There is a need to formulate a mechanism for taking enquiries received through to implementation of enterprises. The roles, qualifications and training for ERP and FBA need to be planned, and a structure set up with certain numbers of each type of staff.
In order to strengthen linkages with line agencies, awareness and information workshops will be arranged with line agency staff in each district and block. EFCs will link with the Knowledge Services component to provide improved information to potential entrepreneurs to help them select viable enterprises and to support implementation through technical guidelines and other materials. EFCs would also have a database of the support available for different enterprises (including grants and subsidies) and links to banks.
EFCs will use a two pronged strategy to generate applications for enterprise development. First, a publicity and awareness campaign will be conducted with distribution of promotional material, putting up posters in important market places, and through radio advertisements. Second, the EFC team will visit villages to appraise the traditional leaders and the community about the enterprise developm ent activities of the project. Interested entrepreneurs will then visit the EFC where their capacity will be assessed along with the viability of their proposed activities. Approved applications will get access to bank, convergence and project funding, along with training and technical support via the network already being established by IBDLP.
Data from EFCs shows that pig production is the enterprise that has generated the greatest interest, so it may well be worthwhile developing a package of information on different types of pig enterprise, including improved practices (see Working Paper on Livestock), investment requirements, and expected returns. BAIF, a national NGO active in the livestock space, has been contracted by MBDA to manage the livestock mission in the state. Cluster development for livestock in the blocks selected for LAMP is likely to be facilitated by BAIF. The technical services and local resource persons trained by BAIF will be available for EFC registrants, and these will be backed up by a dstrict livestock manager to be provided by BAIF. The EFCs will be able to link up aspiring entrepreneurs in pig, goat and poultry clusters with the livestock mission, BAIF and the LAMP clusters. A system of technical support for pig producers could provide technical and management training, linkages with the Department of Animal Husbandry and Veterinary, and with the LAMP livestock services partner (BAIF); as well as supporting local level service providers such as paravets and feed suppliers. Block or district Pig Producer Associations could be formed, that could be forums for information exchange, collective purchase of inputs, and marketing - especially of weaned piglets.
Staffing
Based on its experience to date, MBDA is revising the staffing of EFCs. Initially each EFC was staffed by two ERPs supported by an office assistant Some ERPs had received additional training and were appointed Field Business Advisors (FBA). These FBA responsible for facilitating enterprise

Republic of India
Meghalaya: Livelihoods and Access to Market Project
Final project design report - Working papers
169
bank loans, and were initially based in district Basin Development Units, However as the bank branches that they need to deal with are located at the block level, it seemed more appropriate to attach an FBA to each block EFC. Although the FBA may be slightly senior to ERP, their job is not to manage the EFC. To provide a clear chain of command, MBDA has decided to appoint a manager for each EFC (at the grade of Assistant Manager), in place of one of the ERPs – so each EFC will be staffed by a team of four – Manager, FBA, ERP and office assistant.
Equipment
It is assumed that all EFCs will be fully equipped with computers, audio-visual equipment and furniture (see Annex B) by BMDA before LAMP starts. There is provision in the LAMP budget to re- equip EFCs in project year 4.
Capacity building and support
LAMP will provide training for ERPs and Field Business Advisors (FBA). This will include courses in communication skills, operating processes, convergence and bank loan applications. FBAs may be sent for training in business planning. FBAs should be able to prepare business plans, using templates for commonly undertaken activities in the block, provide costs and pricing analysis that is understood by the entrepreneurs and prepare proposals for bank loans. The training courses should focus on these aspects. Training course design will also utilise the work now being done by TLS, who could be contracted to provide further training.
LAMP budget includes initial training for FBA for four batches (of about 20 people), four batches of refresher training for FBA, six batches of initial training for ERP, and four batches of refresher training for ERP. Some of this training could include exposure visits.
Entrepreneurs would also be trained - in business management, marketing and accounting, and in technical subjects such as pig production. LAMP budgets provide for training of 720 batches (about 15,000 training places), with another 2,300 batches to be trained through convergence with other programmes. Some of this training could include exposure visits.
LAMP also has provision to fund support from technical partners for EFCs. This would be on the pattern of that now being provided by TLS for eight EFCs, although the tasks and scope of work would be adjusted based on lessons from the TLS support and the emerging needs of EFCs. TLS has so far trained some of the ERPs, carried out livelihood mapping of select blocks and analysed expectations of registrants. They may be asked to expand the handholding support to all EFCs in the state. LAMP budgets include fees for three such support agencies, each providing three staff for a period of four years. This budget could be re-arranged to have a larger or smaller number of agencies and for a longer or shorter period. Apart from TLS, agencies that potentially could provide support to EFCs include MART, Access Development Services and Vrutti.
Outcome - numbers of enterprises to be supported
EFCs are expected to identify potential entrepreneurs and support them to set-up micro/small enterprises consistent with their competence and skill sets. Further EFCs will help family based businesses to expand and optimise their activities by providing the linkages required. For those operating on a smaller scale – engaged in income generating activities that are supplemental – the EFC will provide access to technical and market linkages. For other registrants, the facilitation from EFC will be in the form of referral to a suitable scheme for the support needed. Enabling those with enterprise or income generation ideas to prepare business plans, link with bank credit and training in suitable skills are the main tasks of EFC with a focus on spawning of enterprises and household business/income activities on a larger scale.
An estimate of the number of enterprises that will be supported via EFCs is in the table below. It is assumed that, on average, each EFC gets 100 enquiries per month (1200 per year), of which 15 (180 per year or 15% of enquiries) result in actual businesses being supported. These have been divided

Republic of India
Meghalaya: Livelihoods and Access to Market Project
Final project design report - Working papers
170
into 60 enterprises per year that receive support through a combination of bank loans and grants, and 120 per year who are supported by grants with no bank loans.
Table 5: Average number of enquiries and resulting businesses per EFC
Bank loan & grant Grant only Total per year
per month per year per month per year
Number of EFC enquiries 60 720 40 480 1200
Conversion rate to bank/convergence applications 25% 50%
Number of applications 15 180 20 240 420
Percentage of applications approved 40% 60%
Number of loans and convergence grants approved 6 72 12 144 216
Percentage of loanees investing in business 80% 80%
Number of businesses supported 5 60 10 120 180
for 39 EFC 195 2340 390 4680 7020
Based on these projections, the total number of businesses supported via EFCs over an eight year period will be 47,385, of which 15,795 will be financed by bank loans and grants and 31,590 by only grants. Enterprises will also get access to advice and technical support. Effectively 15,795 enterprises of different types are likely to emerge through the EFCs (see Table 6).
Table 6: Total numbers of enterprises supported via EFCs
Build-up
Bank loan & grant
Grant / technical assistance only
Total
year 1 25% 585 1170 1755
year 2 50% 1170 2340 3510
year 3 100% 2340 4680 7020
year 4 100% 2340 4680 7020
year 5 100% 2340 4680 7020
year 6 100% 2340 4680 7020
year 7 100% 2340 4680 7020
year 8 100% 2340 4680 7020
Total for 8 years 15795 31590 47385
Of the enterprises (15,795), 25% are likely to be small household-level income generating activities, 50% are likely to be farm enterprises that sell the bulk of their production to the market and the chosen activity a major household activity, with only 25% (3,950) of the enterprises will be genuine small businesses involving commercial production or marketing on a significant scale
Financing for enterprises
Projections of the financial support required by enterprises are based on three models: (i) a small enterprise (such as processing, marketing or larger scale production) with a total investment of Rs145,000; (ii) a farm-based enterprise with a total investment of Rs68,000; and (iii) a small income generating activity with an investment of Rs55,000. These amounts include bank loans. If bank loans are excluded, the average total investment is Rs45,000, Rs28,000 and Rs25,000 for the three types of enterprises, divided between a grant from LAMP (using GoM funds), convergence programme grants and owners' equity. Although the investment for grant-only support seems quite low, a large proportion of people enquiring at EFCs are seeking assistance with technology or with finding supplies of inputs, rather than with investment.

Republic of India
Meghalaya: Livelihoods and Access to Market Project
Final project design report - Working papers
171
Table 7: Funding of enterprises (Rs) including bank loans
Type of enterprise
% of total
bank loan
converg
LAMP grant
equity
total
Small enterprises
25%
100000
15000
15000
15000
145000
Farm enterprises
50% 1. 40000 2. 10000 3. 10000 4. 8000 5. 68000
Income generating activity
25%
30000
10000
10000
5000
55000
Average all enterprises
52500
11250
11250
9000
84000
Apart from the work of FBAs in facilitating bank loan applications, bank linkage workshops would be held to inform local bank staff about EFCs and the opportunities to provide loans to entrepreneurs being supported via LAMP. Product development to design credit products for different types of activities and enterprises will be necessary; this will be supported under the rural finance component. EFCs will be able to provide basic information on the credit needs for this purpose.
Resources have been provided to support EFCs for the full eight years of the project. However it is likely that the role of EFCs will evolve considerably during this period and they may become more a business support network than shops for enterprise start-ups. However it may not be reasonable to expect them to generate significant amounts of income and be self-supporting - at least with the proposed level of staff. This issue needs to be addressed during project implementation, with sufficient flexibility in the design to allow the EFC model to evolve in response to changing needs.

Republic of India
Meghalaya: Livelihoods and Access to Market Project
Final project design report - Working papers
172
Annex A: Background to the enterprise facilitation approach
1. International experience
"Enterprise Facilitation", as a bottom-up approach to stimulating rural people to pursue entrepreneurship is the brainchild of Ernesto Sirolli. It was first developed and tested in Western Australia, and has attracted much attention across rural America in the past five years. It has now also been tried in UK and in Africa (Democratic Republic of Congo). Sirolli’s view is that a successful business requires competency in three areas: technical ability to produce a product or service, ability to market the product or service, and ability to manage the finances of the venture, and that few individual entrepreneurs have competency across all three areas. Consequently, teams of competence have to be built around the entrepreneur to achieve success.
In practice, Enterprise Facilitation comprises two elements. The first is an enterprise facilitator who serves as the initial point of contact for business owners and aspiring entrepreneurs, and who provides confidential, free services within his or her local community. The second element is a community board, composed of anywhere between 20 to 50 local residents, which supports the facilitator by providing introductions to community leaders and potential clients.
The enterprise facilitator is not an expert but someone who is a good listener, supportive, well- networked, and able to evaluate the skills and needs of entrepreneurs. The community board includes local business and civic leaders, economic development practitioners, and private sector professionals, and is responsible for hiring and supporting the facilitator. Board members are trained by the Sirolli Institute. More details are at http://sirolli.com
Ernesto Sirolli gave an inspiring TED talk in Christchurch, New Zealand on 1 Sep 2012. His key ideas: entrepreneurs never come to community meetings - work 1:1 you don't need infrastructure - sit in a café or bar and talk to people - word will get round shut up and listen - don't offer advice, offer people with passion the information they need offer confidentiality Peter Drucker: planning is the kiss of death for entrepreneurship nobody started a company alone. The person has not been born who could do all 3 critical jobs:
make it sell it look after the money
This approach has some of the same elements of the enterprise facilitation approach of IBDLP - the Enterprise Facilitator and the teams of competence. However the Community Board is not part of the IBDLP approach - and it could well be unreasonable to expect to find suitable people to be members of such boards in the rural blocks of Meghalaya.
2. Enterprise Facilitation in India
(a) Small Producers Advisory Resource Centres
Access Development Services, one of technical partners of IBDLP, is promoting Small Producers Advisory Resource Centres (SPARC) in a number of its programme areas. Each SPARC has a team of 3 or 4 staff and covers a cluster of villages. This approach is similar to the EFCs of IBDLP in Meghalaya. Since it was initiated in 2007, the innovative concept of SPARC has attracted the interest of diverse stakeholders within the sector, allowing ACCESS to significantly increase its livelihoods portfolio.
SPARC is the core of ACCESS livelihoods interventions. It is an ACCESS innovation to bring prudential norms, discipline and sustainability of resources invested in livelihoods interventions. SPARC is conceptualised as an embedded service within a cluster to support the primary producers with need-based services that they desire and integrate them into value chains. Typically a SPARC is manned by a Professional Team headed by a Team Leader, one subject matter specialist, one social

Republic of India
Meghalaya: Livelihoods and Access to Market Project
Final project design report - Working papers
173
processes expert and one value chain expert. One SPARC can service about 500 primary producers in the non-farm sector and about 1000 primary producers in the farm sector.
Among the several tasks that SPARC is expected to perform, the following are key responsibilities:
Undertake cluster diagnostics of the area to identify the issues, gaps and potential and prepare a five year perspective plan for the cluster
Undertake a stakeholder analysis
Facilitate formation of Producer Business Groups and provide business services to them as well as monitor their functioning
Enable aggregation to become more efficient
Explore possibilities of value addition (through processing / design / efficient production / change in package of practices / product development)
Analyse and understand the value chain relating to the product / commodity by identifying key actors in the value chain and establishing strategic links with them
Set up systems for information flows
Explore financial and strategic business leverage
While SPARC may be set up through a grant support in the beginning, by the end of year four, it is expected that SPARCs are either not required by the local cluster / community or are able to self sustain entirely on the basis of fees from services.
(b) micro Enterprises Facilitation Centres (mEFCs)
Micro enterprises contribute towards eradication of poverty and development of economy of an area. The dream of most of the poorest families is to own a micro Enterprise. Similarly, the development of economy of an area requires growth of micro enterprises. Micro enterprises provide both backward and forward linkage to different sectors of economy. In this context, promotion of micro Enterprises is critical to overall development of an area. However, it is not so easy to promote micro Enterprises. Promotion of micro Enterprises requires facilitation support and Business Development Services (BDS).
Historically, development process in India has either focused on industrialization or on rural development. Government has played a key role in promoting large, medium and small enterprises (not so much on micro Enterprises). Rural development efforts have focused on reduction of vulnerability and extreme poverty (not focused on micro Enterprises). Government can play a key role in supporting growth of micro Enterprises. Increase in access to BDS services can potentially contribute towards promotion of micro Enterprises in India. This could be provided through a cadre of BDS providers. BDS providers could be individuals having experience of managing a micro Enterprise or having interest to support micro Enterprises. Typically, micro Enterprises relate to resources, skills and market opportunities in a village or cluster of villages. Hence it is desirable that BDS providers operate at village/cluster level.
Currently, most of the BDS providers provide business services to micro Enterprises in an informal manner. Most of them are also managing their own micro/small enterprise. Often such services are associated with exploitative practices like buying produces from micro Enterprises at a lower price. There is need to facilitate promotion of a cadre of quality BDS providers at an area level, preferably at block level. BDS providers would also require back up support to enhance their quality of services. This includes enhancing skill in providing BDS and sharing experience between the BDS providers. This could be facilitated through local Civil Society Organizations (CSOs) having experience of promoting/managing micro Enterprises. Facilitating promotion of a cadre of BDS providers could further be institutionalized by promoting micro Enterprise Facilitation Centre (mEFC) at block level.
The Micro Enterprise Facilitation Centre (mEFC) can be visualized as a long term sustainable institution dedicated to promotion of micro Enterprises in a block. MEFC can facilitate provision of BDS for micro Enterprises through a cadre of BDS providers affiliated to it. Services of MEFC would include running certificate course on BDS for micro Enterprises (BDS4ME), promoting quality standards relating to BDS for micro Enterprises and facilitating sharing of experience/networking

Republic of India
Meghalaya: Livelihoods and Access to Market Project
Final project design report - Working papers
174
amongst BDS providers. MEFC could be managed by local CSO having experience in promoting and/or managing micro Enterprises.
Promotion of micro Enterprises seems to be the missing link in India’s development process. Government can play a key role in promoting micro Enterprises. Micro Small and Medium Enterprises (MSME) Act already indicates Government of India’s commitment to promote and support micro Enterprises. Government could promote a network of mEFCs at block level. Overall, this would contribute to agenda of “Inclusive Growth” in India.
mEFCs are being supported by Vrutti. Vrutti was established in 2004 by Catalyst Management Services, a consulting firm working in social development. It was established to address the need for social, technical and managerial resources in the livelihoods sector. Vrutti is a partner in the IFAD- supported Tejaswini (Women's Empowerment) project in Madhya Pradesh. More information is at www.vrutti.com.

Republic of India
Meghalaya: Livelihoods and Access to Market Project
Final project design report - Working papers
175
Annex B: Current EFC processes extracted from draft guidelines for EFCs prepared by MBDA. Enterprise Resource Person (ERP)
The ERP has a pivotal role in the functioning of the EFC and his/ her ingenuity, sensitivity and effectiveness will determine the success or failure of the EFC. As the primary “face” of enterprise facilitation at the community level, the ERP serves as the initial point of contact for Partners and aspiring entrepreneurs.
Two ERPs (designated as ERP1 and ERP2), one FBA (Field Business Associate) and one support staff designated as Enterprise Support Person (ESP) will manage each EFC as a norm. However, this format may be modified a little to suit the local needs and the workload at a specific EFC. Interns recruited by MBDA will be trained by Meghalaya Institute of Entrepreneurship (MIE) at Shillong and Tura. Some of the interns could also be sent for training/ exposure with Infrastructure Development Finance Company (IDFC) at Delhi and Uttarakhand. At the end of the training, the suitability of the interns to work as ERPs will be assessed and those found suitable for the job will be designated as ERP and posted at the blocks.
The skill set expected of an ERP is:
Excellent communication skills in the local language
Passion to work and ability to strive for the success of the entrepreneurs
Sensitivity and empathy towards the entrepreneurs
Creativity and commitment to the job
Basic understanding of the IBDLP
Functions, Expectations & Responsibilities of the ERP: i. To communicate with the entrepreneurs in their language and at their level. ii. A good listener, providing a sounding board for entrepreneurs to describe their dreams and
ideas so that the potential for actually creating a viable enterprise can be discovered. iii. A key tenet of enterprise facilitation is that belief that as an enterprise facilitator an ERP must
be passive. They should not seek to “convert” others to entrepreneurship. Instead, they need to guide and counsel partners who are motivated to share all the enterprise related information.
iv. To clarify the doubts raised by the entrepreneurs to the extent possible and wherever not possible to seek clarification from officials at the block (extension officers) and the nodal officers of the mission implementing departments who will be notified in every district.
v. To visit villages as required to remain in contact with entrepreneurs and propagate the IBDLP programme by organizing awareness programmes
vi. To liaise and form alliances with BDO, block level officials and staff, bankers at the block level and other stakeholders on the supply side.
vii. To keep in touch (as regularly as possible) with the registered entrepreneurs over telephone and hand hold them.
viii. To enter the data of the entrepreneurs in the Entrepreneur MIS (EMIS) portal on a daily basis and to upload the data.
ix. To send reports to the BDU on a weekly basis. x. To visit the BDU on a “need based” or as desired by the Deputy Commissioner (DC). xi. To facilitate/ support the entrepreneurs in identifying the sector and sub sector in which
enterprises could be set up and to identify the probable interventions for each entrepreneurs to enable his/ her success.
xii. The Attendance sheet of the ERP should be countersigned by the BDO. xiii. The skills, personality and commitment of the ERP’s are keys to success.
As the project moves forward, the central role played by ERPs will continue to be the key to success.

Republic of India
Meghalaya: Livelihoods and Access to Market Project
Final project design report - Working papers
176
Field Business Advisors (FBA)
Financial inclusion and access to credit is essential for setting up of enterprises and for running them with reasonable degree of success. The entrepreneurs are however not equipped to formulate bankable projects and present them to the bank. There is a strong need for creating a cadre which will act as a bridge between the banks and potential entrepreneurs and hence the FBA’s.
The FBA’s will be selected either directly from amongst the Interns or from amongst experienced ERP’s. The FBA’s should have the following skill set:
i. Basic understanding of business and enterprise building ii. Ability to make Feasibility studies for tiny (Investment below Rs.50,000) and micro enterprises iii. Understanding of the market dynamics and value chain possibilities in their respective areas iv. Sensitivity and empathy in dealing with entrepreneurs v. Perseverance in dealing with the banks
vi. Understanding of the investment opportunities available under the various schemes of the government and the banks and lending institution
One FBA will be appointed per block to start off with and the numbers could be increased depending on the number of potential entrepreneurs emerging in the block. After the ERP finalizes the desired services for a entrepreneurs, all those entrepreneurs who require Financial inclusion services will be connected to the FBA, who will now be responsible to link the entrepreneurs with the bank and to set up the enterprise.
The FBA will be thoroughly trained in all aspects of Enterprise Building; the training module will be designed in accordance with the requirements of the banks. The FBA will handhold the entrepreneurs in choosing the right project size after conducting feasibility study and will suggest the best available investment mode taking into consideration all the existing schemes of the government and the banks. A first batch of thirty FBAs have been trained in partnership with banks. These trained FBAs have already been deployed in the operating EFCs and in BDU to perform functions as outlined above.
Basic Infrastructural Framework of an EFC
i. Two rooms - one for showing of films continuously (Room 1- AV room) and the other for interaction/ inter personal communication with the entrepreneurs (Room 2- Interaction Room).
ii. Two computers- One POP computer with Internet connectivity, which already exists in the blocks and one laptop which will be used by the Enterprise Resource Person
iii. LCD Projector and Screen- Required for showing films on Entrepreneurship, IBDLP, value chains and other themes.
iv. Tables (4 nos) and Chairs (30 nos) in both the rooms together. v. A Printer. vi. An internet connection from SWAN/V-sat link, in the absence of which a mobile datacard. vii. Power back up facility in locations with poor power supply. viii. Register for recording entry into EFC and other office stationery for the ERP’s. ix. Register for recording appointment for interaction with ERP. x. Arrangement for offering Tea/ Coffee/ Kwai to the entrepreneurs after watching the films
Design & look of an EFC
The EFC should have a very welcoming look and the inner walls may be painted in some bright colours; posters featuring the success stories of the state in different livelihood and entrepreneurial activities and value chain flow charts for the different products of the state will adorn the walls of the two rooms of the centre. These posters may be changed periodically, as directed by DBDU.
The name board of the EFC with the logo of IBDLP should be in English and the prevailing local language (Khasi/Garo/Jaintia) and should be fixed in some Prominent & Visible location.
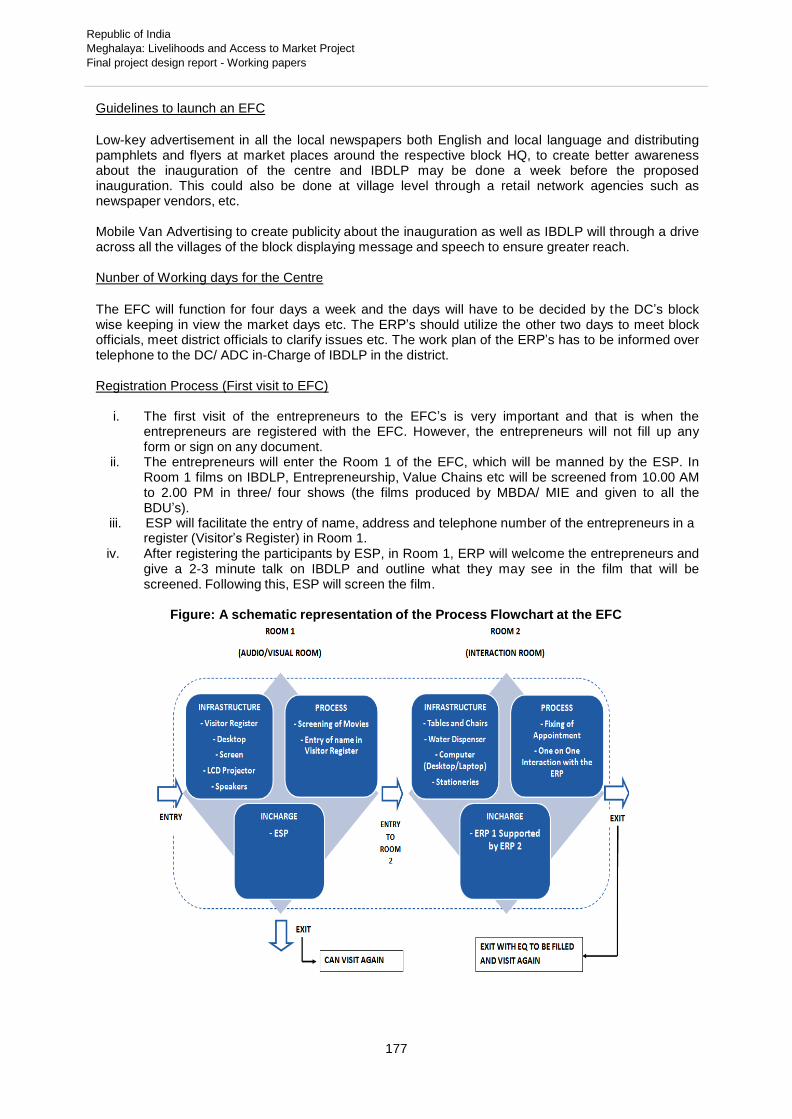
Republic of India
Meghalaya: Livelihoods and Access to Market Project
Final project design report - Working papers
177
Guidelines to launch an EFC
Low-key advertisement in all the local newspapers both English and local language and distributing pamphlets and flyers at market places around the respective block HQ, to create better awareness about the inauguration of the centre and IBDLP may be done a week before the proposed inauguration. This could also be done at village level through a retail network agencies such as newspaper vendors, etc.
Mobile Van Advertising to create publicity about the inauguration as well as IBDLP will through a drive across all the villages of the block displaying message and speech to ensure greater reach.
Nunber of Working days for the Centre
The EFC will function for four days a week and the days will have to be decided by the DC’s block wise keeping in view the market days etc. The ERP’s should utilize the other two days to meet block officials, meet district officials to clarify issues etc. The work plan of the ERP’s has to be informed over telephone to the DC/ ADC in-Charge of IBDLP in the district.
Registration Process (First visit to EFC)
i. The first visit of the entrepreneurs to the EFC’s is very important and that is when the entrepreneurs are registered with the EFC. However, the entrepreneurs will not fill up any form or sign on any document.
ii. The entrepreneurs will enter the Room 1 of the EFC, which will be manned by the ESP. In Room 1 films on IBDLP, Entrepreneurship, Value Chains etc will be screened from 10.00 AM to 2.00 PM in three/ four shows (the films produced by MBDA/ MIE and given to all the BDU’s).
iii. ESP will facilitate the entry of name, address and telephone number of the entrepreneurs in a register (Visitor’s Register) in Room 1.
iv. After registering the participants by ESP, in Room 1, ERP will welcome the entrepreneurs and give a 2-3 minute talk on IBDLP and outline what they may see in the film that will be screened. Following this, ESP will screen the film.
Figure: A schematic representation of the Process Flowchart at the EFC

Republic of India
Meghalaya: Livelihoods and Access to Market Project
Final project design report - Working papers
178
v. Each film will end with a verbal message from ERP inviting them to proceed for a personal interaction with ERP’s in Room 2 (Interaction Room). At this stage the entrepreneurs have two choices- he/she could choose to exit the centre after collecting some printout materials or to proceed for one to one interaction with the ERP’s. Before leaving Room 1, ERP will make an announcement that the interested entrepreneurs may talk to ESP to fix up time for face to face interaction with ERP. If it is not possible to interact with all entrepreneurs who visit the centre on a particular day, an appointment could be given to the entrepreneurs for a day of his convenience (a First In First Out FIFO) policy could be adopted in fixing the appointments to the extent possible). The ESP is responsible for managing the appointments register and will allocate time slots as per above guideline.
vi. In the meanwhile, they can be offered tea/ Kwai etc., and can go through the posters and the value chain flow chart diagrams put up on the walls of the centre.
vii. The ERP should interact with the partner on his basic details and make a note of the information on the “Basic BIO-DATA” form and conclude the interaction by handing over the General Entrepreneurship Questionnaire (GEQ).
viii. Some idea about the sector/ sub sector in which the entrepreneurs seeks to build an enterprise will have be arrived at through the discussion.
ix. The discussion should focus on the following themes- current livelihoods of the entrepreneurs, importance and possibility of taking up multiple livelihoods, interventions required in the current livelihoods, interventions required to start new livelihoods, interaction with bank and other departments, market linages required, etc.
x. Both ERP 1 and ERP2 will focus on interpersonal communication, while the ESP could handle appointments register along with film screening and hospitality.
xi. The entrepreneurs may be given the newsletter and other material on IBDLP but the General Entrepreneurship Questionnaire should not be given without interaction.
xii. The entrepreneurs would be requested to fill up the General Enterprise Questionnaire (GEQ) and return to the centre after a week for further interaction.
Second and Subsequent Visits of the entrepreneurs to the EFC
The entrepreneurs will return to the EFC with the filled in GEQ approximately after a week after the first interaction. The ERP should have a second round of personal interaction with the entrepreneurs on the basis of the responses in the GEQ. The discussion should focus on achieving clarity/ finality on the sector/ sub sector, which is best suited for setting up of enterprise by the entrepreneurs. If the entrepreneurs at this stage feel that the sector/ sub sector chosen during the first visit is not right for him in light of the examination of the issues done as per the GEQ, he can choose a new sector/ sub sector and again take another GEQ and repeat the exercise.
However, if the entrepreneurs with support from the ERP, are able to arrive at some clarity on the sector/ sub sector in which to set up enterprise, he should be given the Sectoral Enterprise Questionnaire (SEQ), which will take the entrepreneurs through the various details of setting up Enterprise in a particular sector.
The entrepreneurs will return to the EFC with the filled SEQ after a week and will have another round of interaction with the ERP. After this discussion, the ERP will be able to finalize the sector and sub sector in which to build enterprise and the list of desired interventions for the entrepreneurs. For each entrepreneur, not more than 2 sectors, and each sector not more than two sub-sectors should be chosen, both in the order of priority as ‘1’ and ‘2’. For each chosen sub-sector not more than three interventions should be recorded, again in the order of priority.
Maintaining Entrepreneur MIS
The common question asked after the entrepreneurs submit the details above at the EFCs is “What next?”. The information obtained through the above process is indeed the most important input for all further interventions in the enterprise creation process. Therefore, completeness and correctness of the information from the entrepreneurs is of paramount importance in effective and efficient delivery of service.

Republic of India
Meghalaya: Livelihoods and Access to Market Project
Final project design report - Working papers
179
The key information about each entrepreneur who comes to the EFC will be recorded in an MIS through the Basin Entrepreneur Portal. As of now, the system is designed for data entry by the ERP and the ERP should enter the data of the entrepreneurs who visited the EFC on a particular day by the evening of the same day using the SMS module. The system is designed to capture the following data:
i. Some basic personal information. ii. Information on current livelihood profile. iii. Information on the sectors and sub-sectors the entrepreneurs are interested to pursue and
the interventions needed.
The comments of the ERP on responses in the EQ, on the leadership and other attributes of the entrepreneurs are written down in the hard copies maintained at the EFC and such additional information may be referred to later as needed.
Data thus entered and transmitted by ERPs using the SMS module are stored in a central server by MBDA and the data is processed on a continuous basis at MBDA to determine the next level of interaction required and the timing of such intervention.
The database is used to generate query based reports on the services desired by and required for the various entrepreneurs in each sector/sub sector district wise, block wise and village wise. A list of desired services along with agency responsible for delivering or facilitating the delivery of the service and the time frame for delivery of services will be generated for every entrepreneur, may be as a Group Contact Programme.
The reports will reflect the needs at the grass root level and the District Basin Development Units (BDU’s), Mission implementing departments and the MBDA should address through interventions/projects/ programmes to respond to the felt needs of entrepreneurs.
Desired Services with Delivery
The MIS will provide a list of services desired on the basis of data entered into the system for every entrepreneur along with the types of the agencies responsible for service delivery and the tentative time frame for service delivery. An indicative list of services and the agency responsible for service delivery is given below:

Republic of India
Meghalaya: Livelihoods and Access to Market Project
Final project design report - Working papers
180
Figure 3: A schematic representation of the Service Delivery Flowchart at the EFC:

Republic of India
Meghalaya: Livelihoods and Access to Market Project
Final project design report - Working papers
181
DIALOGUE WITH PARTNERS (DP)
The IBDLP Programme is people-centric and brings about a complete paradigm shift in the development strategy as it veers away from the traditional ‘Beneficiary’ approach and promotes alliances with ‘Entrepreneurs’ and ‘Development Partners’ in taking the State to the higher trajectory of growth, prosperity and well being. This essentially means the following:
Need assessment of the current income generating activities of the farmers and the identification of the missing links in the value chain.
Designing of customized solutions on the basis of the need assessment to fill the gaps in the value chain development process.
Focus on capacity building and skill up gradation through trainings and exposure visits and creation of extension service networks at the community level.
Engagement with banks and financial institutions for mobilizing investments for the different interventions and putting in place a system which ensures timely availability of credit to every entrepreneur who has a viable business plan.
The DP is the final step in the need assessment process and will enable senior functionaries of the line departments and MBDA to understand the interventions required by the partners. It will be a capacity building exercise for the partners on IBDLP and on the potential enterprise opportunities in the different sectors (Aquaculture, Apiculture, Horticulture, Sericulture, Forestry, Tourism, Livestock, Agriculture, rural energy, services and water).
The DP will be a sector specific interaction with the partners registered at the EFC in groups of 50 each. The team conducting the process will ideally comprise of one officer from MBDA/ MRDS, one line department officer and two interns/ program staff of MBDA. In addition to the team conducting the program, the extension officer for the sector from the block will also be present during the process.
The Dialogue with Partners is structured to achieve the following : i. Explaining to people about the basin program and the whole idea of enterprise- costing, business
cycles, market orientation (we should only produce what we can sell), reducing input costs,

Republic of India
Meghalaya: Livelihoods and Access to Market Project
Final project design report - Working papers
182
aggregation of produce for marketing etc. To many farmers in Meghalaya these ideas are almost alien. Through the DP program, MBDA plans to introduce these ideas to the farmers/ entrepreneurs.
ii. A presentation on the sector- importance/ introduction to the sector, the traditional and the modern package of practices, the common problems being faced by farmers, forward and backward linkages, cluster formation for aggregation and linkages, market issues and a business model for the sector in terms of cost benefit analysis.
iii. Feedback from each partner on his current activity status and validation of the desired interventions.
iv. Identification of partners who are ready for bank linkage, for skill up gradation, for training on extension services and for exposure visits.
v. Identification of partners who with a little help/ assistance/ facilitation from the government can become successful.
vi. Identification of clusters for taking up activities. The partners have to strongly introduce to the idea of aggregation and clustering. We ask people to form product clusters and spell out tentative clusters in which they will work (if possible). The detailed mapping of the cluster including the number of members, the volume of current produce, the linkages to the cluster etc., can be worked out later by the ERP’s through visits to the clusters. Cluster could be a village or a group of villages or a group of farmers from one or multiple villages who are doing a common activity. Clusters should ideally be contiguous and should have some competitive advantage in that product. For instance, if a village is practicing weaving for many years, all the weavers in the village could from a sericulture cluster.
vii. Collecting feedback from partners on the EFC and its functioning. viii. Drawing up an action plan for the short term.
The engagement with partners through the Dialogue with Partners has already commenced and the linkages as outlined are being worked out for each interested entrepreneur.

Republic of India
Meghalaya: Livelihoods and Access to Market Project
Final project design report - Working papers
183
Working Paper 8: Integrated Production and Marketing
A. Introduction 1. Outline of working paper
The opportunity for the state to generate significant income from agriculture lies primarily with the horticultural sector. The state has a comparative advantage in terms of climate and availability of land for a number of horticultural products, especially tree crops and spices. This working paper briefly outlines opportunities for commercial horticulture in Meghalaya and the lessons learned so far from other initiatives in this area. The paper goes on to describe the constraints (both production and marketing) faced by producers of some existing commercial products, and identifies opportunities for their future development. These products are two major fruits (pineapple and oranges), the two main spices (ginger and turmeric), off-season vegetables, potatoes, an NTFP (bay-leaf), and four emerging crops (tea, flowers, strawberries and biofuel).
2. Marketable surpluses in Meghalaya
At the state level Meghalaya has a deficient in all types of food: grain, meat (beef and pork), milk and eggs. Although it is almost self-sufficient on poultry meat, this is based on the import of poultry feeds. However, with the cool climate of state gives it an advantage for temperate crops such as off-season vegetables and strawberries. Relative to many other state, the population density is low, but the hilly topography mans that only a small proportion of land is suitable for crop production – but with considerable scope for trees and plantation crops. As a result, significant volumes of a number of commercial and horticultural crops are sold outside the state, such as ginger, turmeric, tezpatta, oranges, and pineapple, but much fruit and vegetables are also imported.
At the farm level, many farmers do not produce enough food grains to supply their own households all year round. If they could produce more, there would seem to be a ready market within the state for food grains, meat, milk and a number of horticultural crops. However, apart from a transport advantage for markets within the state, hill farmers may have higher production costs compared with farmers on the plains, making their products more expensive than those bought up from the plains. It therefore makes sense for commercial production (i.e. production for sale) to focus on those commodities where Meghalaya has a comparative advantage – such as off season vegetables, fruits and certain spices and plantation crops. It may well be advantageous for farmers to devote their efforts to producing such crops and use the income to purchase food – as already done by many farmers. Table 1 shows the estimated marketable surplus of some of the main cash crops produced in Meghalaya.
Potential for horticulture on Meghalaya lies in:
Two distinct agro climatic zones which allow production of a wide range of vegetables, including off season vegetables.
Production belts close to major markets in Assam and West Bengal, as well as to transportation routes and distribution hubs.
More than half of the horticulture produce is contributed by vegetables, but the productivity of vegetable crops is half of the national average productivity, and below the average for the NER.
A substantial quantity of vegetables finds its way to Bangladesh through unofficial channels.
Over a period of time, due to the climate and its strategic location, Meghalaya has emerged as an off season vegetable production hub, not only for NER, but also for Bangladesh and Kolkata.
It seems that climatic changes have started making a detrimental impact on seasonality and productivity, which can lead to loss of the competitive advantage in off season vegetables.
Lack of post-harvest infrastructure, specifically modern vegetable packing houses, is an impediment in competing in the changing market scenario.

Republic of India
Meghalaya: Livelihoods and Access to Market Project
Final project design report - Working papers
184
Table 1: Marketable Surpluses
Crops Total Production
(tons) Estimated Marketable
Surplus (tons)
Ginger 45,590 43,310
Turmeric 6,997 6,300
Tezpatta 4,300 3,600
Potato 201,059 140,740
Pineapple 80,116 56,080
Oranges 35,205 28,160
Aerecanut 11,567 4,630
Betelvine 27,390 8,320
Broomstick 18,000 13,400
Black pepper 400 380
Dry Chillies 1,051 790
Raw cashew nut 7,500 7,500
Tea 600 600
3. Lessons from the development of commercial crops and market linkages
Lessons from MLIPH
• SHGs and SHG federations have demonstrated the potential for collective marketing. However federations in their present form (societies registered under the Societies Registration Act), member SHGs cannot have ownership rights over the federation and participate in its governance. A Society will find it difficult to incentivise members for their patronage, distribute profits and mobilise additional equity. Restructuring of these institutions is needed with change of form from Societies to Cooperatives.
• Commodities with potential for collective marketing include: bay leaf, arecanut, turmeric, ginger, cashew and honey. Other activities with potential for collective action include: input purchase, veterinary health care, transport of outputs, stocking of veterinary medicine and delivery of technology services.
• Collective enterprises have found it difficult to access bank finance, while LIFCOM, as an alternative source needs to be reengineered.
• The strategy of carrying out demonstrations of enterprises and improved technologies does not seem to have worked particularly well. The idea was that farmers would replicate these demonstrations and so scale-up the enterprises. Demonstrations provide the same sort of support as that in other schemes and farmers expect to get this support for their investments. An approach that aims to enlist these other schemes through convergence would seem to be the way forward.
Lessons from NERCORMP The brand name NEAT (North Eastern Agro-business Trade) has established for products made by SHGs and NaRMGs. Sales have been promoted by setting up retail sales outlets, organising "NEAT fests" and linking producers to wholesale buyers (channel sales). However retail sales have been modest, as these products that primarily have urban markets outside of the project area. With this experience, it seems better to link with an existing brand which can reach a larger and broader market and so is able to absorb significant volumes.
Lessons from other initiatives in Meghalaya
The success of development of the strawberry cluster has been based on allowing (and supporting) lead farmers to establish a producer organisation and it carefully researching market requirements.

Republic of India
Meghalaya: Livelihoods and Access to Market Project
Final project design report - Working papers
185
Floriculture has been developed via a public-private partnership with a private company providing the technology, support and marketing. However it has been difficult to develop a reliable and consistent marketing arrangement.
4. Some cross-cutting issues
The state generally suffers from low quality planting material. Seed replacement rates are very low and planting material for horticultural crops has been similarly poor. The state needs to encourage seed and planting material production in the private sector to ensure that market demand for good quality material is well met. Rather than subsidies being paid to reduce the cost of planting material, incentives should be used to encourage the private sector to make investments in seed and planting material nurseries. The state should look after quality assurance and the certification of quality material produced by the private sector.
Small marketable surpluses do not have great bargaining power in the market. Aggregation should be encouraged through farmer organisations as was done by a few federations under the MLIPH project. Wherever feasible, the farmer organisations should be supported for sorting, grading and primary processing for realizing better prices. Such an initiative will benefit a large number of farmers that are members of the farmer organisations.
Adequate study and research has perhaps not gone in to packaging of farm produce for transport over poor quality roads. A study of appropriate technology for better quality packaging that sustains product quality during transport is necessary. The results of such a study will directly reflect in higher value realization.
Another issue is shortage of labour – cited as a major problem by farmers all over India. It is difficult to use machines for farming in hill areas. This is one reason why much hill land has gone out of crop production, but this may be less critical for plantation and tree crops. Where possible LAMP will support the use introduction of appropriate machinery, both to reduce production costs and the make the work of farming less labourious and so a more attractive occupation for women and young people.
Data on production and productivity are unreliable and often do not reflect the field realities. In some crops, official statistics report higher yields and production levels than seem apparent on the ground, and so may not offer a sufficient basis for planning farm and market interventions. Studies to establish realistic yield and production levels are necessary.
5. Sources of information
This working paper has been based on information from the following studies:
Value Chain Development Efforts for Ginger and Turmeric, STADD Development Consulting Ltd. for ICIMOD, MRDS/MLIPH 2008
Value Chain Analysis of Selected Crops in North Eastern States, SFAC, 2012
State Horticultural Plan RKVY Draft Proposals for Spices and Oranges, ATI for MBDA, 2013
In addition the LAMP formulation mission collected its own data from field interviews and discussions with farmers, traders and with MBDA and other GoM staff.
B. Pineapple
Pineapple is the main fruit grown in Meghalaya, with over 100,000 tons being grown on about 10,000 ha. However the crop seems fairly static, with the recorded area only increasing by 1,000 ha over the last 10 years. Amongst the states of India, Meghalaya ranks six in pineapple production, but only accounts for 7.7% of total supply, and so any increase in production will not have a significant impact on the overall market.
Production practices: pineapples are cultivated on slopes of hills. Varieties grown include Queen, Ceylon and Kew. Plants are not particularly densely planted with about 37,500-50,000 plants per ha

Republic of India
Meghalaya: Livelihoods and Access to Market Project
Final project design report - Working papers
186
(up to 63,000 are planted in south India), and one farmer said that he used a 2' x 4' plant spacing, amounting to only 14,000 plants per ha. For new plantations, the farmers get the planting material (either a sucker or crown for Rs2-3 per piece). Planting is carried out in the month of May-June. The farmers generally do not use any inputs (manure, chemical fertilisers, insecticides, pesticides and weedicides). No irrigation is applied and the crop is dependent on the monsoon for its water requirement. Weeding is mainly done manually by the farm household, but labour is employed for harvesting and other intercultural operations. Total labour of 400-500 person-days are required with only 100-150 hired.
The pre-harvest fruit loss due to fruit drop, insect pest attack and diseases generally ranges from 3-5 percent at the field level.
The peak season for pineapple harvesting in Meghalaya is from May to July. The average yield in the SFAC study is said to be 12 to 15 tons per acre or 25-30 tons/ha (DoA crop statistics show average yields are much lower – only 11 tons per ha, while NHB gives an average of only 8.87 tons/ha, compared with 15.95 tons/ha for India as a whole). These yields are well below potential. The average yield in Nagaland is over 28 tons per ha, and NABARD's model bankable project is based on between 40 and 60 tons per ha.
Post harvest: some farmers manually grade fruits based on size (small: up to 1 kg, medium: 1.5-2.5 kg, large: 3-4 kg). Uniform and bigger sized fruits get a better price in the market, however other farmers say that they sell baskets of mixed size fruits.
The fruits are packed in bamboo baskets which accommodate 40-50 big fruits or 60-70 small fruits. The cost of the bamboo basket is Rs 60 per basket and the life is one year. The produce is sold on the basis of kuri (1 kuri = 20 pineapple pieces) or big bhar (1 big bhar =64 pieces) in the local market. Thus, one bamboo baskets accommodates 2 kuri (40 pineapple pieces).
Mawryngkang village, Umling block, Ri Bhoi district
Pineapples are sold in the local market for Rs600-700 per kuri of 20 fruits (1.5-2 kg). Big fruits can fetch up to Rs1000/kuri but usually mixed sizes are sold. Harvest is from July to Dec/Jan. No disease problem, but earth road connecting village can be muddy and only passable by small pick-ups. Bigger trucks would reduce transport cost to local market (now Rs20/kuri). Basket is returned to grower.
Variety grown is ‘Ceylon’, suckers obtained in village (farmers exchange suckers). Plant spacing is 2’ by 4’. Takes 2 years from sucker to fruit, 5 years if grow from top. Plants fruit indefinitely, with good plants producing 2-
3 fruits per year. No fertiliser or FYM applied, and yield has not changed over time.
Farmers usually carry the produce as head loads to the nearest transport point and from there it is transported by jeep/maxi to the local market. The transportation cost for carrying the produce to local market is Rs20-25 per bamboo basket which translates into Rs0.50-0.60 per fruit. The transportation loss while taking the produce from field to local market is approximately 0.25 percent.
The produce moves through the following marketing channels:
In the local market, the farmer sells the produce to the middlemen/aggregator, who then transports to the main market by means of mini trucks or buses.
Some farmers may take their pineapples directly to main markets and sell to either consumers or to wholesalers, who then send the fruit to markets outside the state.
Many farmers sell to aggregators at the farm gate, who then send the pineapples to main markets within or outside of the state.
Transport cost by mini truck is Rs 40-50 per bamboo basket (Rs 1.00-1.20 per fruit) and Rs 30-35 per bamboo basket (Rs 0.75-0.875 per fruit) by bus. The transport cost also varies with distance. During the transportation from the local market to main market such as Barabazaar in Shillong, the loss is about 3 percent, while at the wholesaler’s and retailers’ level the post-harvest and handling losses are 2 percent each.
There are a limited number of processing factories in the state that can handle pineapples (mainly for juice) and others over the border in Assam (where canning also takes place). The price paid for fruit

Republic of India
Meghalaya: Livelihoods and Access to Market Project
Final project design report - Working papers
187
for processing is significantly less than the fresh price (Rs5.00 to Rs7.50 per piece), so this is primarily a market for sub-standard fruit.
Price build-up in the pineapple marketing chain
Price markup
Rs/fruit Cumulative price
Rs/fruit % of consumer
price
Farmer’s sale price
15.00
15.00
41.7%
Loading/unloading
0.20
15.20
0.6%
Transport to local market
0.50
15.70
1.4%
Wastage – 0.25% to local market
0.04
15.74
0.1%
Aggregator charges – 20%
3.14
18.88
8.8%
Transport to main market
1.00
19.88
2.8%
Wastage – 3% to main market
0.59
20.47
1.6%
Wholesale margin – 25%
5.11
25.59
14.2%
Wastage – 2% wholesale level
0.51
26.10
1.4%
Retail margin
9.13
35.24
25.4%
Wastage – 2% retails level
0.70
35.94
1.9%
Strategy for LAMP
Potential interventions:
Improve producer prices to provide an incentive to invest in improved production. The following actions could improve producer prices:
o Aggregation at the village level through producer organisations and sales direct to wholesalers in main markets.
o Improve fruit quality by growing larger fruit o Time crop harvests to coincide with peak prices in urban markets o Grade fruit according to size and package to improve producer prices. o Utilise sub-standard fruit for processing
Increase yield by better production practices including: o Use of comost, manure and mineral fertiliser o Drip irrigation o Propagation via tissue culture to improve quality of planting material
The following actions are recommended for implementation under the Integrated Production and Marketing Component of LAMP.
a) Carry out a detailed value chain study in order to:
Identify specific practices and technologies to increase yields under the production conditions in the state, and to quantify the benefits for farmers from improved production methods
Identify marketing in opportunities and quantify the resulting returns to producers. This could include production of premium quality fruit for specific buyers, direct supply to wholesale markets in major consumption areas, and supply of sub-standard fruit to processing plants.

Republic of India
Meghalaya: Livelihoods and Access to Market Project
Final project design report - Working papers
188
b) Interventions would be implemented in identified pineapple production clusters via trained lead farmers who would establish model farms to demonstrate improved methods and organise aggregation and grading of produce.
c) Lead farmers and other local leaders would be taken to visit buyers in major markets and to progressive producers.
d) Pineapple producer organisations may, where needed, emerge and take responsibility for production support and marketing.
To implement these interventions, a specialised service provider would be contracted with experience in value chain development in this sector.
C. Citrus
Citrus orange is another important fruit crop in Meghalaya. Total production of all varieties of citrus is reported around 38,817 tons according to data from DoH, Government of Meghalaya. The main districts for orange production are the East and West Khasi Hills, the Jaintia Hills, and western Garo.
Table 9: Orange Production In Meghalaya
District Area (Ha.) Production (MT) Ribhoi District 342 1,748 East Khasi Hills 4,261 19,751 West Khasi Hills 1,165 4,933 Jaintia Hills 1,075 5,248 East Garo Hills 770 2,744 West Garo Hills 1,805 3,822 South Garo Hills 467 571 Total 9,885 38,817
Source: Horticulture Directorate, State Government, Meghalaya
The main type of citrus grown is the Khasi mandarin, which accounts for over 80% of the area planted to citrus, with Assam lemons coming next at 10%. The Khasi mandarin is well-known for its quality, colour development, unique sugar acid blend and shelf life. It also comes later in the season than some other suppliers. However it was notable that most of the citrus on sale in Shillong in March was imported from Nagpur (Maharashtra), and appeared to be of better quality than the local fruit.
The major production clusters of Khasi mandarin in Meghalaya are East Khasi Hills, West Khasi Hills and Jaintia Hills. Most of the orchards are very old (up to 80-150 years), and show considerable evidence of dieback. Many farmers are moving away from citrus production and are tuning to other tree crops such as areca nut and rubber. However a visit to the Leskha area – divided between Khleliehriat and Amlarem blocks of East and West Jaintia Hills districts, found there had been considerable recent planting.
Production Practices: due to close plant-to-plant spacing, plantations are congested. The number of trees per acre varies from 200 to 300 (500-750 per ha). For new plantations, the planting material costs Rs10-25 per plant. The planting of new orchards is carried in June-July. Most of the farmers do not use chemical fertiliser. Use of FYM, insecticides and pesticides is negligible.
Approximately 10-15 percent of the fruit is lost in the field due to insect/pests (trunk borer, leaf miner, mealy bug white flies, fruit flies and sucking moth), diseases (citrus canker, gummosis, root rot and powdery mildew) and fruit drop. Many trees suffer from die-back and completely dead trees are often seen. Only in the last 2-3 years have a few farmers started using insecticides /pesticides. Weeding is mainly done manually, with a few using weedicides (glysophate). Most orchards are not irrigated and depend on monsoon rains. On an average 250-300 labour-days per acre are needed for the various cultivation operations. The cost is around Rs 200 per day for men and Rs 100 per day for women.
Harvesting and yield: The plants start bearing fruit in November–December and the fruiting period
continues up to February. Based on reported typical numbers of trees per ha (400 to 600), fruits per

Republic of India
Meghalaya: Livelihoods and Access to Market Project
Final project design report - Working papers
189
tree (180 to 300), and fruits per kg (10 to 12), average yield is 6 to 18 tons per per ha. This may be an overstatement, as it higher than DoH statistics of 4.54 tons/ha, while NHB has 4.09 tons/ha – and 8.82 tons/ha for India as a whole. However, given the low standard of orchard management, yields must be far below potential. NABARD's model for mandarin oranges has a wider tree spacing of 6 m x 6 m giving 227 trees per ha. From the 8th year, average production is about 700-800 fruits per tree, which, at 10 fruit per kg, amounts to 17 tons per ha.
Post-harvest Practices: grading of fruit based on size (large: 100-150 gms, medium: 80-100 gms, small: 40-50 gms) is carried out by farmers. Farmers also sell fruit on the tree, with traders being responsible for picking and marketing.
Marketing & Logistics: The fruit is generally packed in bamboo baskets (small basket accommodates 55-60 kg and big basket accommodates 80-85 kg). The farmers carry the bamboo baskets on head loads to the nearest transportation point and from there it is transported by jeep/maxi which cost the farmers Rs 20-25 per bamboo basket – or around Rs 0.35 to 0.40 per kg.
Farmers sell the produce to the aggregator who carries it to the main market by mini trucks or buses. The cost for mini truck transport is Rs 40-50 per basket and by bus is Rs 30-35 per basket. However, this cost varies as per the distance from the main market. During transport from farm gate to local market, the post-harvest losses are around 0.5 percent, while from local market to main market, the losses are up to 2 percent. At the wholesale and retail levels, the losses are one percent each.
Price build-up in the orange marketing chain
Price markup
Rs/kg Cumulative price
Rs/kg % of consumer
price
Farmer’s sale price
32.00
32.00
56.8%
Transport to local market
0.70
32.70
1.2%
Wastage – 0.5% to local market
0.16
32.86
0.3%
Aggregator charges – 10%
3.29
36.15
5.8%
Transport to main market
1.50
37.65
2.7%
Wastage – 2% to main market
0.75
38.40
1.3%
Wholesale margin – 15%
5.76
44.16
10.2%
Wastage – 1% wholesale
0.44
44.60
0.8%
Retail margin
11.15
55.76
19.8%
Wastage – 1% retail
0.56
56.31
0.9%
The produce is sold on the basis of bhar (1 small bhar is 32 pieces and 1 big bhar is 64 pieces). The price of product varies with the size of fruit (small, medium and large). In October 2013, a big bhar from the Leskha area of Jaintia Hills was being sold in Jowai (the district town) for Rs 550 (large fruits) or Rs 450 (medium fruits). This amounts to about Rs73 per kg, of which Rs1/kg was absorbed by the cost of transport from the production area. As for pineapple, fruit sold for processing (into ju ice) is worth much less than for the fresh market - a price of Rs30 per 10 fruits (about 1 kg) being reported.

Republic of India
Meghalaya: Livelihoods and Access to Market Project
Final project design report - Working papers
190
Two examples of orange production
At Lumputhoi Village, Khliehriat Block, West Jaintia Hills, oranges are the main cash crop. The crop is sold on the trees to traders, who pick and transport fruit to the Bangladesh border for on-selling. The price received by farmers is only Rs 5,000 per 100 trees, which seems derisory, even though the yield is only about 180-200 fruits per tree,
At Nongkwai, Steshon Mawiong is an orange enthusiast who has pioneered the innovative method of air layering to propagate trees. One of the best orange trees is producing about 240-300 fruits and in total he has about 500 trees are of bearing age which are providing him with an income of Rs. 400-450 per ‘bhar’ (64 number of oranges = 1 bhar
1). In a single market day, he is able to send about 60-70 bhar to the nearest market located at Mawpran.
The only drawback is the lack of a motorable road, as the load has to be carried in bamboo baskets 2500 steps up the steep hill (report from BMDA).
A significant volume of oranges are sold to Bangladesh, but these mostly flow through informal channels due to tariff and non-tariff barriers. Oranges from Meghalaya are also sold in other northeastern states. However the major market appears to be within the state itself. In terms of India as a whole, the state is not a major producer of citrus, contributing only 0.4% of national production of 9.6 million tons (2009-10), so any increase in production in the state will not have a significant impact on the market.
Rongram Horticulture Hub in West Garo Hills was set up in December 2009. Deals with flowers, oranges, and
vegetables (winter season open field), supporting around 30 farmers for flowers, and 20 farmers for strawberry.
Seedling oranges sold for Rs7/each (Rs10 is the cost, less Rs3 subsidy). Have just started grafting, and these seedlings will cost Rs16 each. Areca nut is dying due to climate change, and could be replaced by oranges, although they need an orange variety for the lower, hotter, areas. Seedling trees start to yield after 9 years, with an economic yield after 15 years, while grafted trees yield after 4 years, with an economic yield from 5-6 years. Grafted trees also produce better quality fruit being clones of the mother tree. The hub sells 30,000 seedlings per year (including some given free under government schemes), Encouraging farmer-owned nurseries (2-3 have been setup), but private nurseries would have to sell back to the government to if their customers are to benefit from subsidy
schemes. Cannot meet demand for orange trees. Mainly grow Khasi mandarin orange mainly, also Mosabi sweet & processing orange.
There is no citrus greening, and the main problem is dieback, also some thrips (but no need to spray). There is a scheme to rejuvenate orchards, and CCRI Nagpur provides demonstrations on how to do this, and also provides mother planting material for grafted trees
Potential interventions
Replant orchards with grafted trees of improved varieties (early/late season to suit market demand). There could be opportunities for off-season production in areas that do not now grow oranges.
If disease is a problem, then ensure new stock is disease free.
Renovate existing orchards through pruning and fertilisation
More widely spaced trees and drip irrigation would improve fruit size and quality
Establish fruit tree nurseries to produce improved (grafted) planting material
Develop a premium market for high quality fruit.
Although some orchards appear to be very neglected, with dead and dying trees, and farmers are reported to be switching to other crops, in some pockets new trees are being planted, with farmers eager to plant more trees. At least some producers are getting prices in the order of Rs70 per kg, which should provide a good incentive to invest in improved production methods.
1 If there are 12 fruits per kg, Rs400 per bhar amounts to Rs75 per kg, which seems a very good price indeed.

Republic of India
Meghalaya: Livelihoods and Access to Market Project
Final project design report - Working papers
191
Strategy for LAMP
The following actions are recommended for implementation under the Integrated Production and Marketing Component of LAMP.
a) Carry out a detailed value chain study in order to:
Identify opportunities to increase yields under the production conditions in the state, and to quantify the benefits for farmers from improved production methods
Identify marketing in opportunities and quantify the resulting returns to producers. This could include production of premium quality fruit for specific buyers, direct supply to wholesale markets in major consumption areas, and supply of sub-standard fruit to processing plants. One such marketing intervention could be a packhouse to grade and pack fruit for export to Bangladesh.
b) Interventions would be implemented in identified orange production clusters via trained lead farmers who would establish model farms to demonstrate improved methods and organise aggregation and grading of produce.
c) Production of improved planting material in the form of grafted trees of improved varieties is likely to be a key intervention. Where possible this will be done via private nurseries - which may themselves become nodes for dissemination of improved production practices and market information.
d) Lead farmers and other local leaders would be taken to visit buyers in major markets and to progressive producers in Meghalaya and in other states.
e) Orange producer organisations may, where needed, emerge and take responsibility for production support and marketing.
To implement these interventions, a specialised service provider would be contracted with experience in value chain development in this sector. It may also be useful to link to a technical agency such as the Central Citrus Research Institute in Maharashtra.
D. Ginger
Ginger is an important cash crop in Meghalaya, with around 57,000 tons being produced on over 9,000 ha. Ginger is shipped out to other states and Meghalaya produced 8% of the national supply. India is the largest producer and exporter of ginger in the world and accounts between 20-30% of world ginger production.
Ginger is grown all over the state, with the largest area in the East and West Garo Hills. Ri Bhoi district is also an important producer. Farmers are prepared to make considerable efforts with this crop, despite low yields and poor returns. However, declining productivity and increased competition are exerting pressure on farmers and, unless favourable returns are assured, there will be a pressure to shift to other crops.
Production practices
In Ri-bhoi district ginger is sown in March. On jhum land the crop is sown as a rainfed crop and
without any land preparation. On permanently cultivated land a few farmers sow ginger on raised bed – this has been shown to yield good results. By default, the crop is organic as farmers generally do not use any external inputs such as fertilisers and pesticides.
DoH report that ginger needs raised beds (for drainage). Farmers should select good quality seed, and treat seed with Bordeaux Mixture. This is not done, but farmers do seem to have adopted the recommendation of rotating with other crops and not growing continuously on the same land.
After harvesting the rhizomes are thoroughly washed in water twice or thrice and sun dried for a day. For preparing dry ginger, the produce is soaked in water overnight. Currently streams and canals are used to wash ginger, a practice that needs to improve. The rhizomes are then rubbed well to clean

Republic of India
Meghalaya: Livelihoods and Access to Market Project
Final project design report - Working papers
192
them. After cleaning, the rhizomes are removed from water and the outer skin is removed with pointed bamboo sticks. Considering the limited number of sunny days experienced in Meghalaya, mechanised driers could help improve quality.
Only clean and new gunny bags should be used for packing dried ginger and use of polythene laminated gunny bags for packing dried ginger would be useful. Care needs to be taken to keep the bags dry. No insecticide should be directly used on dried ginger, and insects, rodents and other animals should be kept away from stored ginger. Stored ginger should be periodically exposed to the sun, but prolonged storage will result in loss of aroma, flavour and pungency.
In Ri-Bhoi district ginger is mostly harvested in two seasons:
(a) Mother Ginger Harvesting Season: The mother ginger is the rhizome extracted by farmers once it has seeded the next crop and sold to meet their cash needs. Mother ginger is harvested in the month of July-August and fetches a high price as no other fresh ginger is available at this time. The yield is however small, about 500 kg per acre. Although scientists do not recommend harvesting of mother ginger as open cuts are left that are prone to disease and pest attack, farmers want to harvest because of the high prices offered by the market, and their need for cash, specifically for children’s education, at this time of the year.
(b) Main Crop Harvesting Season: Main crop harvesting season starts from November and continues till the month of March. Yield is about 1,200 kg per acre in this season out of which about 400 kg is saved for purposes of seed leaving a marketable surplus of 800 kg per acre with the farmer.
In other districts, only one harvest is usually taken
Umladang village, Talaskin block. The mission visited this village growing ginger in East Jaintia district. In this
village all households grow ginger, which was the man source of cash income, with sales per household in the range of Rs20,000 to Rs30,000 per year, of which half was accounted for by production costs. There has been a general growth in the area cultivated - although this fluctuates according to prices, but yields are decreasing. No fertiliser or FYM are used. Ginger is grown on upland (2 years ginger, 2 years upland paddy or vegetable).
Main problems: pest attacks – have got advice on this (dip into cow urine before planting and apply chemicals - but afraid to use chemicals, and cow urine does not work). Roots rot, yellowing leaf, reflecting a possible soil fertility or health problem.
Marketing: Ginger roots are either sold in the village (to traders) and at the market 20 km away. Difference in price is the cost of transport to the market (Rs60/100 kg). Prices for fresh roots: Rs80 per kg for best, Rs3.50 lowest, average Rs10/kg. Fluctuates sharply
On this basis an acre of land yields roughly 1.7 tons of ginger per year (4.2 tons/ha – or 5.19 tons if ginger saved as seed is not deducted), which is low considering the double cropping opportunity available to Meghalaya farmers. This compares with 5.9 tons/ha recorded in DoA statistics, 5.79 tons/ha by NHB for the state, and 9 tons/ha in the SFAC value chain analysis. The national average yield in 2010-11 was 4.7 tons per ha. However the recent ATI value chain study for spices and oranges, estimates typical yield of only 2.5 to 3.0 tons per ha. As farmers have little idea of the area that they actually grow, it is not easy to estimate yield. However all these yields are only a fraction of the potential of 20 to 30 tons per ha.
In Ri-bhoi district the major varieties grown are Nadia, Mauran, and Varada. About 25-30% of total ginger grown in the state is Nadia.
Variety Type Fibre content % of area in Ri-Bhoi Potential yield
Nadia Non-fibrous < 5% 60% 20 to 22 ton/ha
Mauran Fibrous 6.25% 15-20% 30 ton/ha
Vareda Fibrous 6.0% 20-25% 20-22 ton/ha
Source: ICAR Research Centre, Umaling

Republic of India
Meghalaya: Livelihoods and Access to Market Project
Final project design report - Working papers
193
The yields in the table, based on research trials, show that farmers only get about one fifth to one quarter of the potential yield. Such a yield gap supports the argument that much needs to be done to focus on production to lift yields. Presently ginger is rotated with food crops but scientific efforts need to be pursued to identify rotation crops that will not only enhance economic income of farmers but also the physical condition of the soil. This is needed since the yield of ginger is continually decreasing in Meghalaya.
Marketing
Farmers in Jaintia reported an average price of Rs10/kg, while the ATI Spice and Orange Value Chain study gives a price of Rs25 per kg in Rhi Bhoi. Prices are reported to fluctuate sharply.
There seems to be little aggregation at the village level. Individual farmers carry ginger gunny bags (weighing from 60-80 kg) to the nearest market, generally at a distance of about 6-7 km from the village. In some of the villages, a few traders have set up shops to collect ginger closer to the point of production and supply it to an Agent located in a nearby market. In some villages, government schemes have established collection centres. Once the Agent receives the produce; he discounts 3 kg weight as wastage (on account of loading, unloading and transportation) and price is paid for 60 kg of produce. If a bag weighs more than 63 kg, farmer is still only paid for 60 kg. This is the standard and accepted practice in all major ginger markets.
In contrast, the ginger value chain is highly organized beyond the village market. The wholesale traders (mainly based in Shillong, but often from outside of the state) usually have local agents who procure and assist in despatch of material (aggregating, weighing, packing, and loading trucks). They have storage space and inform the wholesale trader when a truck can be sent to collect ginger. The truck driver, who works on the instruction of the wholesale dealer, carries sufficient cash for the local agent to covers cost of ginger and logistical costs. Based on instructions received from the wholesale trader; the Agent loads the specified quantity of ginger for onward despatch to larger markets, mostly outside of the state.
The Agent is paid a commission of Rs. 0.40-0.50 per kg. In the event that the procurement price of ginger falls, resulting in a higher margin being left in the hands of the Village Agent, the Wholesale Dealer will share some of the gains with the agent up to an amount of Rs. 1.00-1.50 per kg. This ensures a steady supply and loyalty in the system that may otherwise tempt alternative arrangements and disrupt the overall market functioning.
The value chain for fresh ginger in Ri-bhoi district is: Main crop Mother ginger crop
Production Farmer Rs10-15/kg Rs 25/kg
Aggregation Local agent in village
Rs 10.60-15.60/kg Rs25.60/kg
Wholesale Wholesale trader based in Shillong
Rs 18/kg Rs 29/kg
Wholesale Mandi trader
Kolkata, Siliguri, Kanpur etc.
Rs 21/kg Rs 35/kg
Retail Retail traders Rs 30/kg Rs 42/kg

Republic of India
Meghalaya: Livelihoods and Access to Market Project
Final project design report - Working papers
194
The wholesale trader is in touch with Mandi based traders in larger markets such as Kanpur, Kolkata, Hyderabad and New Delhi. Road is the preferred mode of transportation, despite the long distances that need to be covered to reach markets. The average cost of transport from Ri-Bhoi to markets is about Rs. 4 per kg. Poor handling of the produce during transport leads to waste and deterioration in quality. As Meghalaya has a border with Bangladesh, a significant quantity of ginger also moves to Bangladesh but most of it is not recorded.
Ginger pricing is normally stable, with farm gate prices in the range of Rs. 8/kg to Rs. 10/kg during November- February (main crop harvesting season) and up to Rs.25/kg during July-August (mother ginger harvesting season). In the November to February season it sells between Rs.45/- and Rs.60/- in retail markets of the eastern region.
The market price of ginger is also affected by the transport cost and APMC fees that range from 6%- 8% (6% in Kolkata Mandi, 7.5% at Delhi and 8% at Nagpur).
The quality of fresh ginger is assessed on the basis of several factors, which include fibre, moisture, volatile oil and oleoresin content. The relative importance of these various attributes is dependent upon the intended end-use of the product. The ATI study records the following prices paid by wholesalers in Kolkata:
Grade A (large size roots) - Rs30/kg Grade B (medium size) - Rs20/kg Grade C (small size) - Rs15/kg
Ginger from the north-east, mainly produced in Arunachal Pradesh, Mizoram and Assam moves through Assam. Delhi is the major assembling point from where it moves to western and south Indian states. Ginger from Shillong comes to Azadpur Mandi in Delhi only when there is shortage of produce from other suppliers. Traders say that the quality is perceived to be inferior (on account of poor appearance and higher moisture). The cost of transport from Assam to Delhi was reported to be around Rs 4/kg by road, with a transit a loss of about 3-4 kg per gunny bag of 60 kgs. Train transport cost was reported to be higher due to multiple points of loading and unloading. The traders have acknowledged that washed and graded ginger would fetch higher values.
The retail trading pattern of fresh ginger in metro markets is as below:
Market Monthly trade volume
(tons)
Delhi 6,000 to 8,000
Kolkata 3,500 to 4,000
Mumbai 2,700 to 2,800
Chennai 2,200 to 2,000
Fresh ginger could fetch improved value if the process of waxing is introduced that helps improve shelf life and appearance of the produce that would appeal to organised markets. However it needs to be borne in mind that currently the trader’s word is final. This is a normal practice that can be reversed by collective efforts of bargaining if from the farmer’s end, quality and market related demands are got in line, and are backed with efforts directed at transparency. The retail ginger price in Delhi markets during peak season is on an average around Rs60/kg, and can go as high as Rs100/kg, or even beyond, during off season (April – August).

Republic of India
Meghalaya: Livelihoods and Access to Market Project
Final project design report - Working papers
195
Seasonality of ginger supply Source of supply J F M A M J J A S O N D
Karnataka Assam Meghalaya Nepal China
Value Addition Options
Mother ginger fetches a good price of Rs25/kg or more in July and August. Given the high price, little value addition should be attempted. However the second crop that is harvested between November and February sells at substantially lower prices, roughly Rs10 to Rs15/kg (going down to Rs3.50/kg on occasions) and could lend itself to value addition. In the regular season it has to compete with ginger from other regions where its location and resultant transport cost works to its disadvantage.
Very little processing takes place in the state to add value to the crop. The problem is that buyers will always suspect that dried and ground spices have been adulterated, and to sell such processed spices at premium prices requires a strong brand in which consumers have confidence.
Dried Ginger: This is used for domestic culinary purposes in the powdered form called Saunth. In western countries it also finds extensive use as flavouring for processed foods especially for needs of bakery and desserts. Dried ginger is extensively used as a condiment and for food flavouring and is also used for beverage flavouring including tea, ginger ale and ginger beer. It is also said to possess certain medicinal properties that can address illnesses related to digestion, skin, respiratory, relieving pain and reducing inflammation, diarrhoea and stomach cramping, nausea, arthritis, rheumatism and muscle spasms; circulation of blood, removing toxins, and cleansing of bowels and kidneys.
Saunth has a large well established market with 5 kgs of fresh ginger yielding 1 kg of saunth that can fetch a price ranging from Rs.60/- to Rs.120/- per kg. It has a large market with a constant demand, being mainly used for preparation of different spice mixes, ayurvedic preparations, cough syrup, churan4, and as a nutritive mixture recommended for post natal health needs of women.
Ginger Oleoresin: this extract is also used as flavouring for processed foods, in certain beverages and, to a limited extent, in pharma preparations
Ginger Oil: distilled from dried spice, is used in flavouring beverages and also in confectionery and perfumery, largely in Western Europe and North America.
Preserved Ginger: This is used both for domestic culinary needs and manufacture of processed foods such as jams, marmalades, cakes and confectionery.
Other value added products that are popular are ginger ale, lemon ginger syrup, candies, and pickles; all of which can be produced by manufacturers having squash and jam manufacturing facilities. However the volume of such products is low with little impact in market terms.
Key Constraints
There is little awareness regarding improved practices and inputs for cultivation.
Quality of seeds need to be improved and credit made available for procurement of seeds and other inputs.
Mono-cropping and poor drainage encourage diseases
Significant produce is lost due to damage and wastage in handling and storage.
There are no storage facilities in the growing area, which prevents aggregation and collective marketing
Farmers have little bargaining power since the market beyond the Village Agent is highly organised. Considering the volatile nature of pricing and the high perishability of non-fibrous

Republic of India
Meghalaya: Livelihoods and Access to Market Project
Final project design report - Working papers
196
ginger, even trader’s positions are limited to the fibrous variety and that too for a maximum of 2-3 months
If a project organises farmers, there is a risk that, if local traders are then bypassed, they may form a cartel to weaken the efforts of the community acting on a collective basis
Meghalaya is disadvantaged as far as distance to national market is concerned
Very little interest from the private sector and for the establishment of value addition facilities
Key Opportunities
There is a sizeable area devoted to ginger and the community is aware of traditional growing practices
There is ample opportunity available to increase yield and also control damage and wastage. Both can lead to substantial gains for the farmer
In addition to improved crop management, intercropping can increase the economic returns to farmer and also help improve soil health
Soil and water conservation measures can improve the quality of land used for ginger production
The ability of the region to have dual harvest works is an advantage
Although the producers are not yet organised, once this takes place it will increase returns from selling a larger lot size and alignment to market needs. Such opportunities will also yield results in terms of optimised availability of inputs
Initiatives directed at waxing, sorting, grading, drying and packing can help improve returns, especially when addressing needs of larger organised buyers
Dry ginger is easier to transport, transport cost will be a lower proportion of its value, and there is less risk of quality deteriorating while in transit
The non-fibrous variety, if it has a higher oil content, can offer value addition opportunities for juices and oleo-resins
Strategy for ginger development in LAMP
IFC are currently carrying out a value chain study in the spices sector with the objective of enlisting one or more private sector spice companies to establish facilities in the state. This investment may be supported by IFC, and could involve processing and/or purchase of spice crops (which could be sent out of the state for further processing and marketing). These companies may organise and support farmers to produce the spices they require. LAMP can provide complementary support to organise production clusters and increase the volume and efficiency of production.
Apart from this, there is potential to improve producer prices and so provide incentives to invest in better production methods. Better prices could come from:
Improving the quality of the fresh ginger crop – whole roots fetch higher prices
Storage for off season sales
Aggregation of production and bulk transport to more distant markets
Sales of ginger in the organic and medicinal markets
Implementation of these measures could include the following actions under the Integrated Production and Marketing Component of LAMP:
a) Identification and training of lead farmers who would establish model farms to demonstrate
improved methods and organise aggregation and grading of produce. b) Provision (or production) of improved planting material and other inputs. c) Lead farmers and other local leaders would be taken to visit buyers in major markets and to
progressive producers in Meghalaya and in other states. d) Producer organisations may, where needed, emerge and take responsibility for production
support and marketing. e) Producer organisations can also be encouraged to set up common leaning, drying and
packing facilities around which aggregation and marketing can take place.
This support may be implemented via a private sector spice company and/or by an agency with expertise in the development of rural value chains. The ATI study suggests that the spice sector

Republic of India
Meghalaya: Livelihoods and Access to Market Project
Final project design report - Working papers
197
interventions be implemented by Agribusiness Service Centres. Such centres have been promoted by a GoI programme, Agri-Clinics and Agri-Business Centres (ACABC), but these centres need to be established by local entrepreneurs as new businesses, which themselves will also need support - in the ACABC programme nodal agencies are appointed to do this job.
The ATI study also suggests spices could be marketed as being organically produced. ATI has experience in this area, with its Devbhumi Natural Products Producers Company Ltd selling a range of organic spices and honey produced in Uttarakhand. However the report does not make any projections of the likely volumes that could be sold as organic products, and suggests that a market survey would be needed. There will also be a need to establish an organic produce certification system, and the ATI report suggests that the Uttarakhand State Organic Certification Agency could provide assistance. It could be an good idea to follow-up on the option of organic production, but it is likely that the size of this market would only provide an outlet for a small proportion of the state production.
E. Turmeric
Turmeric is a spice as a condiment, dye, drug and cosmetic, as well as in religious ceremonies. It is the dried rhizome of a herbaceous perennial tropical plant. The primary rhizomes are round and called bulbs, while the thin long secondary rhizomes are called fingers. India is the largest producer and exporter of turmeric in the world, although 95% of production is consumed domestically.
Meghalaya is a relatively small producer, with 80% of Indian turmeric coming from Andhra Pradesh and Tamil Nadu. Turmeric from the north east region accounts for hardly 5% of national production, and is mostly sold locally or in West Bengal.
Production, 2005
World
652,500 tons
India
522,000 tons
80% of World
Meghalaya
8,196 tons*
1.6% of India
* production estimated at 12,831 tons in 2012-13
Seasonality of turmeric supply Source of supply J F M A M J J A S O N D
Tamil Nadu
Andhra Pradesh
Maharashtra
Karnataka
Meghalaya
Turmeric is grown in all districts, although in Khasi hills relatively little is grown, primarily for local consumption. Rather more is produced in Garo Hills, but the main area is Jaintia hills which produces over half of the state's total output of around 12,000 tons. Turmeric is a major cash crop in the Jaintia Hills, and growers consider turmeric to be a “fixed deposit” that can be cashed in as needed. For this reason it is often left in the field if cash needs are not felt, and is harvested only when cash is needed.
Turmeric is sown in the month of March and is harvested during December-February. Generally farmers do not use fertilisers and pesticides, and the major inputs are labour and seed rhizomes, but most of the seed used is saved from the previous crop. While this saves on cost, it may be another reason for low productivity. Crop statistics show that the average yield for the state in 2011-12 was 5,111 kg per ha, the same as the national average yield of 5.1 tons/ha in 2010-11. However it has been suggested that actual yields may be considerable lower, and the ATI study assumed 3,750 kg per ha.

Republic of India
Meghalaya: Livelihoods and Access to Market Project
Final project design report - Working papers
198
After harvesting, boiling and drying (5-6 kg of fresh produce giving about 1 kg of dried produce). Grinding is carried out on a contract basis at mills located close to the growing area. The mills normally charge Rs. 3-5 per kg, and many also acts as traders for a small margin. There are about 40 mills in Meghalaya, and two in Jaintia Hills, all of which are privately owned. The average output per mill is about 200 kg per day. During milling, there is an approximately 10 percent reduction in volume due to poor handling and wastage.
After milling, powder is sold either in local wholesale markets or is packaged and sold in the retail market. Marketing of turmeric takes place in Hat Bazaars. Shillong is the biggest turmeric market in the state.
Turmeric Value Chain Lakadong Non-Lakadong
Production Farmer Cultivation, harvesting, boiling, drying
Rs30-35/kg fresh
Rs180-200/kg dry
Rs10/kg fresh
Rs45-50/kg dried
Aggregation Village Agent collection from farm-gate
Rs195-205/kg Rs55-60/kg
Processing Spice
manufacturers grind, package
Milling unit Grind on fee
basis
Rs205-210/kg Rs60-70/kg
Wholesale Wholesale Spice Market
Rs240/kg Rs75-85/kg
Retail Retails Spice Market
Rs260-300/kg Rs100/kg
Usually Village Collection Agents (mostly women) travel to villages and make an offer to buy at the farm gate itself. The growers in Lashkein block in Jaintia Hills have been seen to negotiate with buyers from Shangpung and Raliang markets through mobile phones and, at times, have got higher prices from th Agents. The Village Collection Agents in turn sell it to traders. However the village collection agents and market traders in the two locations could be part of an integrated system and the entire exercise could be a “doctored” effort. Certain spice manufacturers also travel to villages to directly procure raw material for their needs.
There are 4-5 spice manufacturers in the region, who should not be confused with milling units, since these spice manufacturers produce different kinds of end-use spices and sell them as packaged and branded products. Hunbait is one of the leading turmeric powder manufacturers of Jaintia district (although still a very small scale operation, selling about 7 tons of turmeric per year). These spice manufacturers sell their produce in local markets, and other locations such as Shillong and Guwahati. Apart from milling units and such spice manufacturing units, no other value addition facilities exist in the region such as polishing, oleoresin manufacture, etc.
Republic of India
Meghalaya: Livelihoods and Access to Market Project
Final project design report - Working papers
199
Jaintia Hills district grows mostly three varieties of turmeric: Lakadong, Lashein, and Ladaw. The Lakadong turmeric has curcumin content in range of 6.0 to7.5 percent, which is very high, whereas the non-Lakadong varieties have curcumin content in the range of 2 to 3 percent.
Lakadong is a unique variety that grows only in Jaintia Hills district and cannot be cultivated anywhere else. Even within the district; it only grows in localized pockets - the reasons for this localization are not known.
Turmeric is mostly sold in powdered form, and oils and oleoresins of turmeric are also used by cosmetic, pharmaceutical, and the dye/food colour industry. The market seems to be quite stable with powdered turmeric price in markets being around Rs120-Rs150/kg. In its raw whole form it sells for Rs30/kg for Lakadong and Rs10/kg for other varieties. As indicated, compared to ginger that has many players and an organised supply chain, turmeric has few players with a casual supply chain system.
A point that needs to be borne in mind is the fact that whereas turmeric would better retain its properties in its whole form, in Meghalaya it is converted slices (60%) and powder (40%). This not only weakens its active ingredient, but also increases chances of adulteration and /or contamination, compromising the value a buyer may be willing to pay. This practice needs to be understood and may be the reason for larger commodity markets not registering sales of Meghalaya turmeric.
The quality of cured turmeric is assessed on the basis of several factors, which include the pigment (curcumin) content, and the general appearance, size and shape of the rhizome. The relative importance of these various quality attributes is dependent upon the intended end-use. The chief factors of good quality in finger turmeric are a high content of pigment, giving a deep, yellow colour, and low ‘bitter-principle’ content. When used as a spice or condiment, the aroma and flavour imparted by the volatile oil are important. The aroma should have a musky, pepper-like character and the flavour should be slightly aromatic and somewhat bitter. When the turmeric is intended for use as a colouring agent, either in the powdered form or as an oleoresin extract, the general appearance and physical form of the whole rhizome is less important. In this case, very high curcumin content is essential and low volatile oil content is desirable. Bulbs, splits and old rhizomes are often suitable for this purpose.
The processing of turmeric consists of four stages:
Curing: Fingers are separated from mother rhizomes that are usually kept as seed material. Curing involves boiling of fresh rhizomes in water and drying in the sun. The traditional method of curing is to first clean rhizomes by boiling in copper or galvanized iron or earthen vessels with water just enough to soak them. Boiling is stopped when froth emerges and white fumes appear jigging out a typical odour and the boiling process lasts for 45-60 minutes when the rhizomes are soft. The stage at which boiling is stopped influences colour and aroma of the final product. Over-cooking spoils the colour of the final product while undercooking renders the dried product brittle.
The improved scientific method of curing turmeric is by cleaning fingers/bulbs in perforated troughs. The perforated trough containing raw turmeric is then immersed in a pan of water which can hold 3-4 troughs at the same time. They are boiled till the fingers/ bulbs become soft and cooked turmeric is taken out of the pan by lifting the trough and draining the water into the pan itself. The same hot water in the pan can be used to boil the next set of raw turmeric. Cooking of turmeric is to be done within 2- 3 days of harvest.
The rhizomes may also be placed in baskets with perforated bottom and sides and dipped in covered tanks when the quantity is large or may be put directly into the vessels when the quantity is small. Mother rhizomes and fingers are generally cured separately.
Drying: Cooked fingers are dried in the sun by spreading in 5-7 cm thick layers on bamboo mats or a drying floor. A thinner layer is not desirable as the colour of the dried product may be adversely affected. During night time, the material should be heaped or covered. It may take 10-15 days for the rhizomes to become completely dry. Artificial drying using cross flow hot air at a maximum

Republic of India
Meghalaya: Livelihoods and Access to Market Project
Final project design report - Working papers
200
temperature of 60° C is also found to give a satisfactory product. The yield of dry turmeric varies from 20 to 30%, depending upon the variety and the location where the crop is grown. If the turmeric is to be pulverised, then before drying the turmeric is sliced to that it is easier to handle in the mills.
Spice Processing Cooperative in Jaintia Hills
The Laskein Turmeric and Ginger Processing Cooperative Society has been formed by the turmeric
producing farmers in about 100 SHGs. This 5-year-old Society has been procuring Lakhadong turmeric
from its members, milling the same and selling the powder. In the last three years procurement has bee 3
tons, 2 tons and 5.5 tons of dry turmeric (including from some non-members). The members sell the
turmeric to the Society at a fixed price and the profits of the Society are shared at the end of the year on the
basis of patronage (quantity of turmeric sold to Society by individual members).
On account of the high curcumin content of the Lakhadong variety grown in this area, a plant for extraction
of curcumin is set up which is poised to commence production. The plant and machinery for oil extraction
(costing Rs 6.4 million) has been provided as a grant from the Department of Bio-technology of Government
of India . A private export firm dealing in curcumin from Kochi, Kerala is to provide the expertise to run the
plant and manage the business in the initial period. The Cooperative Society is approaching banks for
working capital as the plant has a capacity to handle 600 tonnes of turmeric per annum. While plans for
procuring this comparatively large volume of turmeric are in place, working capital availability and additional
storage space will be critical. Members have contributed about Rs 1.6 million as equity in cash and kind to
the Society, and MLIPH has provided a grant of Rs 0.35 million. A turmeric development programme is also
on the cards including acreage expansion and productivity/quality improvement. The business plan shows
that the Society will be profitable and emerge as a reliable buyer of member’s produce.
Apart from working capital, the Society will require a business manager and technical personnel to ensure
smooth handling of production and commercial operations. LAMP should be in a position to identify such
producers’ collectives and handhold them during their initial period. These entities with processing and
marketing options are capable of offering superior access to markets for their members.
Polishing: Dried turmeric has a poor appearance and rough dull colour outside the surface with scales and root bits. The appearance is improved by smoothening and polishing the outer surface by manual or mechanical rubbing. Manual polishing consists of rubbing the dried turmeric fingers on a hard surface or trampling them under feet wrapped with gunny bags. The improved method is by using a hand operated barrel or drum mounted on a central axis, the sides of which are made of expanded metal mesh. When the drum is filled with turmeric is rotated, polishing is effected by abrasion of the surface against the mesh as well as by mutual rubbing against each other is as they roll inside the drum. The turmeric is also polished in power operated drums. The yield of polished turmeric from the raw material varies from 12 to 25 %.
Colouring: The colour of turmeric is an indicator of its quality. In order to impart an attractive yellow colour, turmeric suspension in water is added to the polishing drum in the last 10 minutes. When the rhizomes are uniformly coated with suspension, they may be dried in the sun. After polishing, it should be kept in clean sacks and stored on wooden pallets. Stores should be clean, free from pests since pesticides should not be applied to dried/polished turmeric.
Value Addition Options
Value added products from turmeric include dried rhizomes, turmeric powder, oleoresin and oils as discussed below.
Dried Rhizome is extracted from soil in the form of fingers, bulbs and splits. Fingers are secondary branches from the mother rhizome and are about 2 to 8 cm long and 1 to 2 cm wide, and are easier to grind than the more fibrous bulbs and splits and, therefore, command a higher price.
Turmeric Powder: Ground turmeric is mostly used in the retail market, and by food processors. Since curcuminoids, the colour constituents of turmeric, deteriorate with light and, to a lesser extent, under

Republic of India
Meghalaya: Livelihoods and Access to Market Project
Final project design report - Working papers
201
heat and oxidative conditions, it is important that ground turmeric is packed in a UV protective packaging and appropriately stored. Turmeric powder is a major ingredient in curry powders and pastes. In the food industry, it is mostly used to colour and flavour mustard.
Oleoresins are obtained by solvent extraction of powdered or dried rhizome. This process yields about 12 per cent of an orange/red viscous liquid which, depending on the solvent used and on the turmeric type and cultivar, contains various proportions of the colouring matter, i.e. the curcuminoids, the volatile oils which impart the flavour to the product, and non-volatile fatty and resinous materials. The compounds of interest in turmeric oleoresin are curcuminoids (40 to 55 per cent), and volatile oils (15 to 20 per cent). Curcuminoids consist mostly of curcumin, can be further purified to a crystalline material, and are used preferably in products where the turmeric flavour is undesirable. The advantage of spray-dried turmeric oleoresin over ground turmeric powder is that it is devoid of starch, the predominant component in dried rhizome, and also proteins and other fibres.
Essential Oil is of little interest in the western food industry and it has no commercial value as opposed and volatile oil contents, and is darker and is not desired by US importers. The Bengal type is used in dyes in India.
Key Constraints
Little attention paid to disease and pest management, which has a direct bearing on low yields
Compared to ginger, the supply-chain beyond the village level is not organised
Most is sold in sliced and powder form that is amenable to adulteration. Some buyers will prefer whole turmeric to ensure quality
Arbitrary grading and quality assessment are used and a distinct approach is not adopted for the Lakadong variety, which gets mixed with other varieties
The Lakadong variety has a limited growing area
As in the case of ginger, market cartels could be a threat if current trader’s interests are hurt
There is need to address issues of soil health and resources
Derivative varieties such as ICAR Megha I and II have reasonably high curcumin content, and can be grown in regions other than Jaintia Hills. This could eat into the premium price for Lakadong
Transport costs are substantial, particularly for the lower priced non-Lakadong varieties and for national markets
Processing turmeric for local consumption
At Mendal, in Noth Garo Hills district, MRDS supported a small turmeric processing unit for 7 SHG. This processed 2,400 kg last year (the first year of operation). 40 kg fresh turmeric is converted into 5-6 kg powder. The unit sells powder for Rs450/kg , and buy raw turmeric for Rs7.50/ kg, making a net profit of Rs5 per kg after labour costs etc. It is investing the profit in expansion and maintenance of the unit. Next year they want to package and brand the product, and to process 4,000 kg – the volume is limited by working capital.
This area is not a major turmeric growing area, and there is no other buyer for turmeric in this area – people had stopped growing turmeric for sale. This meant local people were buying powder from outside, creating an opportunity for local production and processing.
Farmers in this area say turmeric requires less labour than ginger, with fresh ginger sold for Rs50/kg (goes straight to Benares), but some people say turmeric is a better crop as it is cheap to grow and can be cultivated on any sort of land.
Key Opportunities
Lakadong is a unique turmeric variety that can be cultivated only in Jaintia Hills. If this is well marketed, it can fetch high returns for farmers. A secure chain of custody needs to be developed for Lakadong to achieve such value. If this can be achieved, institutional buyers would be keen to buy turmeric.
Geographical Indication (GI) for Lakadong turmeric is a possibility, which should be explored to help improve returns to farmers and protect producers from possible imitations.

Republic of India
Meghalaya: Livelihoods and Access to Market Project
Final project design report - Working papers
202
Collective organization for production and marketing could improve the economics for inputs and marketing.
Improved inter-cropping could produce higher returns to farmers
Improved varieties could counter pest resistance and give higher returns
There is a retail market for turmeric in the NE region and this can be tapped by providing a quality product.
The high curcumin content of Lakadong is an opportunity for high-end utilisation in the pharma industry that has discovered its ability to reduce cholesterol, improving cardio- vascular health, glucose control, and contributing to cancer fighting.
Improved storage facilities could free fields occupied by un-harvested turmeric for other crops.
Commodity finance could prevent farmers selling in distress
Strategy for turmeric development in LAMP
The proposed strategy for turmeric is the same as that for ginger - see above. In fact, given the greater interest in processing of turmeric, there may be a better chance of a partnership with a private sector spice company.
F. Off season vegetables
Agro-climatic conditions in the region allow cultivation of vegetables round the year. During the summer season, when no temperate vegetables are grown in the neighbouring states of Assam, Nagaland, Tripura, Mizoram and Manipur, the produce from Meghalaya is sent to these markets as off season vegetables and fetch good prices. Vegetables also reach markets in Bangladesh, mainly through unofficial channels.
The East Khasi hills are the main area for off-season vegetable production in Meghalaya. The major vegetables cultivated in this region are potato (although this has been classified separately as a tuber crop), cabbage, cauliflower, radish, carrot, peas, French beans, tomato, squash, lettuce and mustard (leaf). Capsicum, broccoli, coriander, beet root, pumpkin, cucumber, turnip, knol khol, brinjal, okra, onion (green) bitter gourd, bottle gourd and ridge gourd are also grown, with protected cultivation of capsicum, tomato, broccoli, pea, cucumber and mustard leaves.
Excluding potatoes, the principal vegetables grown are tomatoes (in 2012-13: 12% of the vegetable area, 29,000 tons total production, and with average yield of 15.3 tons/ha) and cabbage (in 2012-13: 11% of the vegetable area, 37,000 tons total production and with average yield of 21.5 tons/ha).
Figure 1 shows how prices for radish and cabbage in the Guwahati (Assam) wholesale market can increase by between three and five times between June and September – the off-season for production in the plains. Prices for potatoes also increase, although not as much, as production from the plains is kept in cold stores to meet off-season demand.
In East Kashi vegetables are mostly grown on small raised beds with all cultivation being done manually. Most farmers growing vegetables for sale use hybrid seeds (apart from peas, beans and root crops), chemical fertilisers and pesticides. As described in the Working Paper on Agriculture, farmers use excessive amounts of fungicide to try and control blight in tomatoes and potatoes. This adds significant costs and may raise food safety issues.
Yields are well below optimal levels, which mean that the labour cost per unit output will be high compared with other parts of the India. Post-harvest operations are limited. A few farmers wash potatoes and radish, and some also sort potatoes, cabbage, cauliflower and tomatoes. Farmers generally harvest vegetables in the evening and take the produce to market the next morning.

Republic of India
Meghalaya: Livelihoods and Access to Market Project
Final project design report - Working papers
203
Rs p
er
quin
tal (1
00 k
g)
Figure 1: Seasonal vegetable prices in Guwahati wholesale market (2010)
3000
2500
2000
1500
1000
Potato
Cabbag
e
Radish
500
0
Jan Feb Mar Apr May Jun Jul Aug Sep Oct Nov Dec
After harvest, vegetables are packed in gunny/jute bags (potato/radish) or bamboo baskets (cabbage, cauliflower, tomato, French beans etc.). There are no separate storage facilities for vegetables at the field level. The cost of packaging is:
Gunny bag - Rs 20-30 per bag, Jute bag - Rs 10-20 per bag Bamboo basket - Rs 40-60 per basket.
The movement of produce to urban markets is through bus/mini trucks/jeeps. Vegetables are carried as head loads for around 1 to 5 kilometres to reach rural markets or to a point from where motor transport is available to reach Shillong markets. Farmers travel up to 50-60 kms to Shillong to sell their produce, and distance to market/transport cost is a major problem. The typical cost of transport is:
Small truck Rs 0.50 to Rs 1.00 per kg. Bus: Rs 1.00 to Rs 1.20 per kg.
The following marketing channels are used:
1. Farmers to consumers: farmers sell their produce direct to consumers in local rural hat bazaars or in the nearest urban market.
2. Farmers to village level aggregators to consumers. Village level aggregators may be agents of wholesale traders, big farmers or farmer groups. Many farmers sell vegetables at the farm gate to village level aggregators. This saves the time, energy and cost in transporting produce to the urban markets.
3. Farmers to wholesalers to retailers to consumers. Farmers in production clusters visit the nearest hat bazaar and sell their produce to the wholesaler offering the best price. Wholesalers in turn sell to retailers. Being in a production cluster is important to produce a sufficient volume to attract a number of wholesalers to the hat bazaar and so create competition amongst them to buy produce from farmers.
4. Farmers to agents of traders (from Assam, Tripura, Mizoram, Manipur and Nagaland) to wholesalers to retailers to consumers. Agents of traders from nearby states procure vegetables at the village level.

Republic of India
Meghalaya: Livelihoods and Access to Market Project
Final project design report - Working papers
204
Average post-harvest loss up to the farm gate is estimated around 5%. Farmers say there are higher post-harvest losses for tomatoes, beans, leafy vegetables, brinjal, carrot and gourds. Post-harvest loss of fresh vegetables at the wholesale level is estimated to range from 3% for peas to 15% for tomatoes, with an overall average loss of 8%. Losses at the retail level is estimated to be 4% in the region, as volumes handled by retailers are small for day to day consumer demand. The majority of this wastage is due to sorting and daily surplus of supply over demand, which needs to be discarded at the end of day.
Farmers face the following problems in selling fresh vegetables:
Cost of transport (along with time and trouble) to urban markets
Limited potential sales volume at the local retail level apart from in Shillong
Dependence on wholesalers in rural markets – reported to adopt unfair trade practices such as raising issues on quality
Poor facilities in rural markets, along with poor road communications between farm and market.
A few wholesalers purchase vegetable produce against the money advanced to the farmers – so the farmer may have to accept a lower price and/or supply more volume to cover the interest on this debt.
Farm gate prices offered by aggregators can be substantially lower than that in the market.
Sales of off-season vegetables to Assam (and via Assam to other markets) can be disrupted by periodic bouts of civil unrest in Assam.
Strategy for off-season vegetable development in LAMP
There is potential to capitalise on Meghalaya's cool climate to grow off-season vegetables. However excessive use of chemicals for tomatoes, one of the two main vegetable crops (and also for potatoes), reduces profitability and may affect the health of farmers and consumers (and risks restrictions being imposed on the sale of such vegetables). A strategy for off-season vegetables needs to develop a feasible, safe and economically viable method of controlling blight. Alternatively support would be limited to vegetables that do not require large applications of pesticides.
The LAMP approach would therefore be to support the testing of improved methods of blight control. This could be carried out by either a research agency (GoM or GoI) or by an NGO or private sector agency with appropriate experience. The ToR for this work will be in the PIM. At the same time LAMP may appoint an agency to support production and marketing interventions for vegetables which are not being produced using potentially dangerous amounts of pesticides. The tasks of this agency would be to:
a) Carry out a detailed value chain study in order to:
Identify marketing in opportunities and quantify the resulting returns to producers. This could include production of premium quality vegetables for specific buyers (such as the emerging supermarket chains), and direct supply to wholesale markets in major consumption areas.
Identify opportunities to improve production methods to meet these market opportunities (in terms of type of vegetable, quality and seasonality of supply), and to increase yields without adopting unsafe methods.
b) Interventions would be implemented in identified vegetable production clusters via trained lead farmers who would establish model farms to demonstrate improved methods and organise aggregation and grading of produce.
c) Organise supply of inputs - including seed, equipment and safe pest control methods. d) Lead farmers and other local leaders would be taken to visit buyers in major markets and to
progressive producers in Meghalaya and in other states. e) Vegetable producer organisations may, where needed, emerge and take responsibility for
production support and marketing.

Republic of India
Meghalaya: Livelihoods and Access to Market Project
Final project design report - Working papers
205
G. Strawberry
Strawberries are an example of a successful value chain development in Meghalaya, and point the way for the development of other rural products.
Brief History Strawberries were not known in Meghalaya before Mr Lyngkhoi imported some planting material (50 plants) from Maharashtra in 1998, and planted them in Sohliya village in Ri Bhoi. The Ri Bhoi Strawberry Association was established in mid-2000.
After encouraging results, there were 1,000 plants by 2002. In 2003, planting material for a further 1,500 plants were imported from Argentina - “Sweet Charlene”, which grew very well.
Strawberries growing in Sohliya village Packing strawberries for sale
There was a large demand, and in 2003/04, the government was persuaded, with much difficulty, to fund further project support totaling Rs 2 crore in the period 2004/05; a DoH station in Ri Bhoi was commandeered to become the centre for strawberry support.
Within a year, Rs 9 lakhs had been earned through the sale of strawberries, and a successful strawberry festival was held in Shillong on 14-02-2005 – 2 tons of strawberries and 500 litres of strawberry wine were sold in 6 hours. The festival has been held every year since then bar 2013. In 2013, the festival was not organized as there was a new District Horticultural Officer, the Association was very busy trying to supply the high local demand, there was not enough fruit in February (1 to 1.5 tons are required for the festival) , and then after big hail storm in March, no further harvest occurred in March.
DoH report that growers can earn from Rs40,000 to over Rs100,000 per season with between 0.25 to 3 acres of strawberries. Shri O. Lyngkhoi, General Secretary of the Ri Bhoi Strawberry Growers Association, who is also the headman of Sohliya village, cites the example of families in his village who were earlier earning an average weekly income of Rs.400 to Rs.500 by toiling as agricultural labourers and who now, by virtue of strawberries, are able to earn an average of Rs. 7000 to 9000 per week.
Current Situation
Meghalaya is now the biggest producer of strawberries in the NE states
Growers The Association now has 564 registered members in 12 villages of Ri Bhoi District, and there are over 400 unregistered growers in other districts – East and West Kashi, Jaintia Hills and East Garo. The Strawberry Association has no problem if growers from other districts wish to join the association.

Republic of India
Meghalaya: Livelihoods and Access to Market Project
Final project design report - Working papers
206
In 2012/2013, however, there were only a total of 148 growers as it was not possible to obtain sufficient planting stock for all interested members. In Sohliya village itself (“the Strawberry Village”), there are a total of 68 hhs, of which 60 hhs grow strawberries when planting material is available – see below, “main strawberry problems”.
Villages without reasonable access are not suitable for strawberry production as the fruit and runners are perishable and transport needs to be rapid.
Nutrition – according to Mr O. Lyngkhoi (a farmer in Sohliya):
as he has no cattle of his own, he buys in organic manure (Rs 8,000 per truck of fym) from the nearby dairy unit;
he provides commercially available liquid organic fertilizer through drip irrigation kit;
he adds lime before ploughing (by hand), and replants every year; although is possible to obtain 2 crops out of the same planting material, but yields and fruit size decrease in year 2.
Equipment:
all equipment is now from India eg. drip irrigation kits, packaging, mulching plastic etc. – earlier, equipment had been imported from many different countries;
the drip kits from India cost Rs 12,000 a roll, each roll 400m long; about 6 rolls are required per acre, and with care, the drip pipes last for about 10 years;
as all the strawberries produced in Meghalaya are under drip irrigation, this has encouraged the growers to terrace their land as the drip lines have to be level.
Crop Calendar and Production Aspects:
not much success has been achieved with producing strawberries under plastic as there is not enough sun for ripening or sweetening the fruit – all current plantations are in the open;
strawberry runners are planted in October, and harvested in the December to May period; where possible the first harvest is made in time for the Christmas market when prices are highest, but this is often hampered as planting materials are received too late for prompt October planting;
the imported US varieties need 45 days to fruiting, those from Maharashtra, which are somewhat more easy to obtain, 90 days;
disease is not seen as much of a problem, but some growers use pesticides to flowering stage – thus these strawberries, although marketed as organic, are not truly organic, and there has been no certification carried out;
hail storms damage the fruit in one out of two years - protective netting may be option, but this has to be tried;
tea is also a popular crop in the strawberry growing areas of Ri-Bhoi as it fits well with the strawberry season – farm labour is finished with the strawberries in May, and tea is then plucked (top 3 leaf system) for the next 5 months – some 30 hhs in Sohliya village grow tea and strawberries;
however, Mr Lyngkhoi states that is only profitable if it is plucked by the farming family as labour is increasingly expensive – nearby Sohliya village, there are 2 factories, which pay Rs 15/kg for the green tea leaf;
tea plantations can also provide excellent ground cover on steep slopes and thus is a real option for sloping jhum areas.
Runner Production:
the Association is currently waiting for 2,000 mother plants from Maharashtra – the cost of one mother plant = Rs 39;
one mother plant produces 8 runners, and each runner is sold for Rs 8 = “very profitable” – the runners are sold in bunches of 50;
runners from Maharashtra are not as good quality as those from the US/Turkey but it is very hard to obtain runners from abroad;
there is also a high mortality in runners produced from Maharasthran mother plants – “60% die”;
supply of planting stock and runners is THE major problem, and is a major drawback for strawberry production in Meghalaya – if good quality planting was easily obtainable, then

Republic of India
Meghalaya: Livelihoods and Access to Market Project
Final project design report - Working papers
207
“everybody would grow them” – but then supply and demand would seriously impact the price;
when the runners are received by the Strawberry Association, they are distributed to Sohliya farmers first then to other members, but there is never enough to satisfy the demand even in Ri-Bhoi;
in 2013, some planting material was received from California and Turkey; each runner cost Rs 17;
Mr Lyngkhoi will use all 4 tunnels on his farm for runner production when the planting material arrives from Maharashtra – it is expected soon.
Markets:
The Strawberry Association tried to ship to Delhi some years ago but it failed due to shipment problems, off-loading, spoilt and rejected fruit – the Association is happy now to leave the marketing to middle men;
the growers sell to middle men who supply the markets in Guwahati, Shillong, Nagaland, and Siliguri - these traders also supply markets (shipping by air) in Calcutta, Delhi, Chennai, Bangladesh, Bhutan and Nepal when the price is good – but the local market in NE India is big enough;
the Strawberry godown in Sohliya was provided by DoH, as well as one pre-cooler and two cold storage units – not in use in May 2013 as harvesting season is largely over;
the highest prices are received in December when Rs 400/punnet (about 250 gm) is obtained - this declines as the season progresses because of availability (supply and demand), size of fruit, sweetness, general appearance, etc. Currently the late May the producer price is Rs 150/punnet, but middle men charge Rs 200 in Shillong and Guwahati;
if the price is too high, there are fears that sales will suffer and strawberries will be seen as a rich-man’s fruit; the Association is happier to see lower prices in late winter, early spring;
strawberries are considered to be the most profitable crop per unit area but not all farmers have succeeded in making a good living from strawberries, and it has a limited season;
loans have been taken from the State Bank of India by members of the Associaiton, and so impressed have they been with the rate of recovery, that they have provided further support to the Association and the growers – for example, SBI have provided funds for a cold store, and partial funding for a school in Sohliya village.
Mr O. L yng kho i’s farm (b lack sh irt in p h o to ):
1 acre under strawberry, drip irrigation, plastic mulch,
“organic” strawberries says the packaging box, but sprays against pests up to
flowering stage
about 10 acres of tea,
3 fish ponds – “for fun”,
various fruit trees, but oranges he recently planted have all died,
stopped growing rice and broom grass,
4 polytunnels, all free handouts – one with capsicum, the other 3 empty, awaiting mother, plants for runner production – previous attempts did not go well,
used to grow roses in the very large DoH polyhouse, provided for floriculture, but all roses died of disease and he gave up – too hot-humid for roses?
3 beehives – 2 occupied;
Mr Lyngkhoi is now a key member of the Association, a grower, an exporter, a
resource person and affiliated to various development institutions and universities.
Fruit Processing:
fruit processors need a license, which inhibits some growers embarking on an enterprise;
there is an informal market for strawberry wine; as there is no license however, this remains a somewhat secretive, village based industry;
jams, jellies, juices are already made – these are a good outlet for damaged, small, un-ripe fruit especially toward the end of the harvesting season (April-May);

Republic of India
Meghalaya: Livelihoods and Access to Market Project
Final project design report - Working papers
208
other options for the future include dairy products (ice cream, and yoghurt, dependent on milk availability), other soft drinks, liqueurs, chocolate, and cosmetic products;
Mr O. Lyngkhoi contracts a local factory to produce jams and juices – he provides fruit, sugar, jam jars, bottles etc and just pays for labour.
The Main Strawberry Problems
It is an expensive crop to produce, and farmers need “100%” support – the plastic mulch, the drip kits, other equipment, and fertilizer are all provided by DoH via the Strawberry Association.
However the main problem by a long way is that planting material (mother plants and runners) is in short supply all over the world, including India. In past years, planting material has been imported by the Association from Turkey, Thailand, the US and other countries. Currently, the best planting material for Meghalaya are short day varieties from Florida, as day neutral and June picking varieties are not suitable in Meghalaya where a variety which fruits from December for 3 to 4 months is required. The variety that is currently imported from Florida is “Festival” which is well suited to Meghalayan growing conditions, and has good taste, colour, shelf life, etc.. “Fortune” is another well suited variety but in limited supply. Work continues in Florida on an even better variety. The Association and the Department of Horticulture has built up contacts with planting material producers all over the world, and spends much time in trying to obtain quality planting material.
Current Focus The current focus is on the establishment of a nursery for propagation of G3 planting material to replace some of that imported every year, mostly from Florida. A 2 ha site has been purchased by the Association in Mawthadraishan Block in West Khasi Hills for propagation; and a cluster of villages will be formed for out-grower producers of strawberry runners. This is said to be an ideal site lying at a more favourable higher elevation than the fruit growing areas, which can be sited at lower altitudes. Runners costing Rs5 to Rs10 each would be profitable for propagators to produce and attractive for fruit growers to buy.
Mr Lyngkhoi will continue to try to produce runners in the four polytunnels on his farm, but other nursery sites are to be established at higher elevations in Ri Bhoi District; IFAD support through LAMP will be welcome in the push to provide sufficient planting material for this growing industry. Small nursery establishments will provide good livelihoods for farmers within the cluster.
The DoH horticultural hub in Umsning block has also imported mother plants and attempted to propagate them in their greenhouses – however, this too failed, and all the plants died, possibly because of high temperatures and humidity. In the off-season, from June to October, the Horti-hub grows soya beans in the strawberry beds at the support station; the old strawberry plants are removed and soya bean seeds are planted through the existing hole in the plastic – this would be to be a good practice, a sound utilization of land, and if successful and without drawbacks, should be extended to the strawberry growers.
Modified atmosphere packaging (a special plastic membrane developed in USA) is being tested. The cost will be about Rs11 per kg of strawberries (this could fall to Rs5 if the volume grows). This is less than 10% of the local whole price of fruit of Rs140/kg. It is hoped the packaging will double the shelf life for fruit and vegetables, adding one week or more to the time that strawberries can be in the marketing chain.
Strategy for strawberry development in LAMP
The strawberry sub-sector has come a long way in the last 10 years, and any support from LAMP should build on the work that has already been done. In particular the Strawberry Growers Association should be point of entry for any interventions, acting as the executing agency for LAMP. Specific areas where LAMP could support producers are:

Republic of India
Meghalaya: Livelihoods and Access to Market Project
Final project design report - Working papers
209
Technical support
It is recommended that an international strawberry specialist is provided to the Association through LAMP for 3 months to look at the mother plant/runner propagation and production problem, world- wide sources of planting material, the whole strawberry cycle, local and overseas markets, and processing potential; much has already been invested in this enterprise, and there is a good future if the local planting material problem can be solved. This will also lead to a good opportunity for a number of farmers in several districts in the production of runners.
The ToR for the strawberry specialist, who must have current and active knowledge of the world-wide strawberry business, is summarized below:
a) identify the best varieties for different areas of Meghalaya, b) identify the best sources of planting materials and mother plants (including the possible use of
tissue culture), c) identify the optimal elevations, locations, crop management technologies for mother plant and
runner production, d) draw up a business plan for a strawberry propagation business – which could involve a PPP
with a commercial horticultural business to produce mother plants and outgrowers multiplying runners for sale to fruit growers.
e) develop an appropriate course curriculum for extension agents/trainers in relation to runner and strawberry production
f) undertake at least one ToT, and 3 on-farm training of farmers, g) review the current strawberry production systems in Ri-Bhoi, and provide appropriate advice
on cultural aspects; h) provide advice and recommendations on marketing systems, crop storage, packaging, and
transportation
Although an expert could be recruited from Maharashtra, the major strawberry production area in India, it is suggested that an international specialist be hired as growing conditions in Meghalaya are significantly different and varieties and production methods from other countries may be useful in this state.
Production of planting material
Once a strategy for production of planting material has been drawn up, LAMP could support the development of specialized cluster for runner production. This would involve selection and training of lead farmers, dissemination of the required technologies, provision of equipment, land preparation, and supply mother planting materials, together with technical back-up and support. A considerable proportion of these costs should be covered by convergence with other programmes.
Marketing support
The Strawberry Growers Association may benefit from support to expand markets. This includes improvements to preservation of strawberries in the market chain via modified atmosphere packaging and possibly a cold chain, as well as development of new market outlets including direct sales to supermarkets and other retail outlets.
H. Tea
Tea production is expanding in the state, principally in the West Garo Hills and Ri Bhoi districts. There are a few gardens where estate production is integrated with a tea factory, but most production takes place on small farms which sell green leaf to independent factories (mostly private, but some government and cooperative factories exist). This "bought leaf" model utilises family labour and, at least partly, avoids the problems of needing to find a large labour force for picking. In national terms the state is a very small producer, with only 600 tons per year out of a national output of over one million tons. However the tea is of good quality and one garden is exporting high quality tea to the UK for sale in the famous Harrods department store.

Republic of India
Meghalaya: Livelihoods and Access to Market Project
Final project design report - Working papers
210
Tea growing on small farms in West Garo Hills Government tea nursery in West Garo Hills
Durama Tea Factory
This cooperative factory was established in 2010, funded by grants of Rs17.59 million RSVY (now the Backward Regions Grant Fund), Rs200,000 from NERCORMP and Rs2.14 million from the community. In total 600 farmers now supply leaf, of which 318 are members of the West Garo Tea Farmers Federation. The factory pays farmers Rs15/kg for green leaf, and sells processed and packed tea for Rs200/kg (retail price is Rs65/250 gm = Rs325/kg). The total turnover last year was Rs5.8 million for 52,315 kg tea sold, and they have 11 staff and 14 labourers with an eight month operating season. There is a plan to apply for organic certification, which could open up export possibilities.
Durma Tea Factory Green leaf intake
Factory management want to expand both the number of farmers supplying tea and the intake per farmer, but say the factory lacks capacity. To do this they want three more withering troughs (in addition to the existing four troughs) which will cost Rs1.2 million, and they hope to get Horticultural Mission support for this. The maximum daily intake is now 3000 kg of green leaf (100 kg leaf = 20 kg tea), so 52.5 tons of tea requires 261.5 tons of leaf, which could be processed in only 87 days, yet the picking season runs for eight months.
Based on this information the factory does not seem to be operating very efficiently. Although it covered almost all its establishment cost via capital grants, and only takes a bank loan for working capital, it is only breaking even on its operating costs. It may be worth considering a seasonal pricing pattern for green leaf to encourage farmers to spread supply over a longer period so that total output can be increased without increasing factory capacity. This would make better use of staff as well as the capital investment.

Republic of India
Meghalaya: Livelihoods and Access to Market Project
Final project design report - Working papers
211
The price for green leaf of Rs15 per kg is the same as that paid by other factories, so there does not seem to be any advantage in cooperative marketing. However the leaf price has risen significantly since the cooperative started, so it may well have contributed to better prices for farmers.
Withering troughs
Processing line
Firewood for the boiler – said to be from jhum land
Packaging line
There are a number government schemes to encourage expansion of tea. Government nurseries produce tea saplings at a total cost of about Rs5 each, but which they sell for Rs1 each. The government has also paid subsidies to growers to provide them with an income before plants start to produce.
Strategy for tea development in LAMP
Specialist expertise is needed to draw up plans for tea development. Support for tea producer organisations could include advice on purchase of green leaf, pricing, processing and marketing. LAMP could also assist in studies for new tea investments. Recently IFAD headquarters held discussions with Unilever which identified tea in Meghalaya as a potential crop where Unilever could link up with small scale producers from IFAD projects.
I. Floriculture
The state has made significant progress in developing the floriculture sector. It has benefited from the rapid increase in demand for flowers - in 2001 daily sales of roses in Guwahati were only 1,000 stems, now 50,000 to 60,000 are sold each day with more demanded at peak times.
Around 10 horticulture hubs (operated by DoH) are producing flowers and also supporting farmers in the area - including buying back flowers for onward sale. For example the Rongram Horticulture Hub in the Garo Hills was set up in December 2009. It is supporting around 30 farmers for floriculture.

Republic of India
Meghalaya: Livelihoods and Access to Market Project
Final project design report - Working papers
212
Name Area Annual income Metrida Sangma 100m
2 Rs65,000 Illa Momin 100m
2 Rs40,000 Changme Momin 100m
2 Rs45,000 Campbel Sangma 100m
2 Rs60,000
Flowers include gerberer, chrysanthemum, orchid, carnation, fern, lilium, anthurium. Most flowers produced by growers supported by the Horti Hub (HH) are sold direct by farmers to Tura (the district headquarters), but if not, they sell them to the HH. The HH then sell in Guwahati (sent via the night bus). Wholesalers who buy these flowers may then send them on to Delhi by air.
Examples of Anthurium production in West Garo Hills
Name Area Annual income Lydia Momin 100m
2 Rs70,000 Bonani Sangma 525m
2 Rs245,000 Merry Sangma 100m
2 Rs45,000 Dipsera Marak 100m
2 Rs80,000
Orchids at horticultural hub near Jowai, Jaintia Hills Anthurium at Rongram horticultural hub, West Garo Hills
In another initiative, farmers supported by DoH via the Horticultural Mission for the North East and Himalayan States (HMNEHS) are being supported via a public-private partnership. The private company, West Bengal Floritech (WBF) provides technical support, inputs and marketing services. WBF are also working in Nagaland and Sikkim. They are based in Siliguri in West Bengal, where they have their own farm. WBF an MoU with Dept of Horticulture, which fixes the rates for construction of floriculture units and supply of planting material etc. WBF are paid for establishing a unit, including polyhouse construction, drip irrigation system, preparation of soil, and supply of planting material. WBF then invest their own money in training, technical support and marketing.
Cluster of floriculture units at Bynther, West Khasi Hills Cluster of floriculture units at Bynther, West Khasi Hills

Republic of India
Meghalaya: Livelihoods and Access to Market Project
Final project design report - Working papers
213
Floriculture unit at Bynther, West Khasi Hills Carnations in floriculture unit at Bynther, West Khasi Hills
WBF sell flowers supplied by contracted farmers in Nagaland and other parts of eastern India – only special orchids need to go to Delhi. Seldom use cold rooms, and try to ship out flowers as quickly as possible, using the night bus to Guwahati.
WBF are just starting in the Garo hills, but have 250 + units elsewhere in the state, with size ranging
from 96 to 1000 m2. WBF could expand the sector further, but this depends on availability of land
with the farmer and on the budget of the DoH – where there is a success story there is a lot of demand for more units. Units get a 50% subsidy (in practice this amounts to more like 100%), and there are problems (due to the high rate of subsidy) with farmers not being serious, often only trying hard in the first year when all inputs are provided. After this the volumes of production can be reduced, however the majority of farmers continue. At times of peak demand (in the wedding season) growers tend to by-pass WBF and sell flowers directly to local buyers. At times of low demand they sell through WBF, but then complain about the low prices that they receive. Nevertheless a number of success stories have been recorded for floriculture units.
Gerberer plants come from Pune (a Dutch jv there has a tissue culture unit). Vegetables can also be grown and WBF tried growing capsicum in Kashi Hills, but there was not much interest from farmers. In Nagaland WBF are supporting vegetable clusters, but overall management of flower crops in polyhouses is easier than vegetables. Thinking of using a soil-less medium for growing vegetables.
Strategy for floriculture development in LAMP
There are two ways of looking at this sector. One is that it has demonstrated considerable potential and has an established private-public partnership that can be built upon and expanded. The other is that it is a "done deal", which DoH is able to implement without further external assistance. Flower producers in Meghalaya also have to compete with larger and more advanced units in Assam and in other NE states. The suggested strategy for LAMP is therefore to:
Encourage interested farmers in LAMP IPM clusters (and people using EFCs) to invest in floriculture via the HMNEHS programme - with little or no further support needed from LAMP.
Provide direct support for horticulture ventures that are not covered through the HMNEHS
programme. In particular the state may have a climatic advantage for some flowers and ornamental plants. For example there may be potential to produce hybrid orchids using some of the wild species that are unique to the state.
J. Bay Leaf
Bay leaf, locally known as tejpatta, is a non-timber forest product (NTFP). Bay trees occur in forests in the southern part of the state, but when land is cleared for jhum and other farming activities, trees are usually left and so become part of the farm landscape and so could be described as semi- cultivated. The state is one of the major producers of tejpatta in India, and the SFAC study estimated annual production to be 4,300 tons, with most coming from the Khasi Hills.
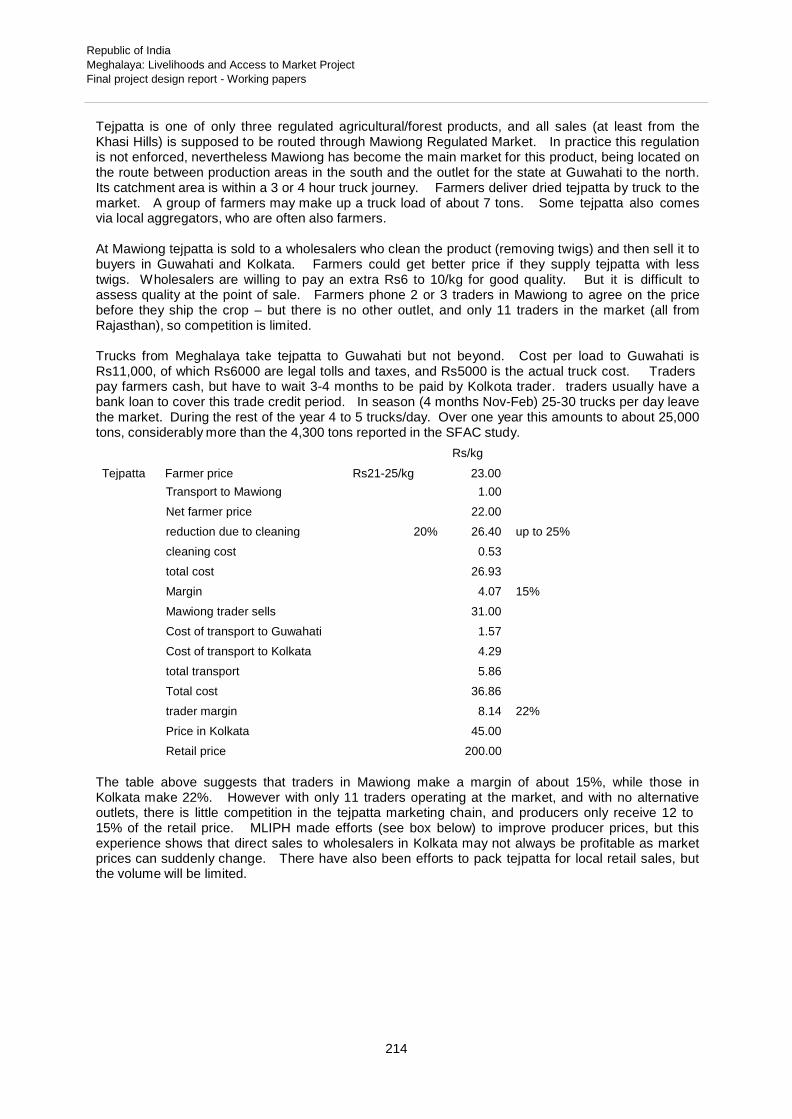
Republic of India
Meghalaya: Livelihoods and Access to Market Project
Final project design report - Working papers
214
Tejpatta is one of only three regulated agricultural/forest products, and all sales (at least from the Khasi Hills) is supposed to be routed through Mawiong Regulated Market. In practice this regulation is not enforced, nevertheless Mawiong has become the main market for this product, being located on the route between production areas in the south and the outlet for the state at Guwahati to the north. Its catchment area is within a 3 or 4 hour truck journey. Farmers deliver dried tejpatta by truck to the market. A group of farmers may make up a truck load of about 7 tons. Some tejpatta also comes via local aggregators, who are often also farmers.
At Mawiong tejpatta is sold to a wholesalers who clean the product (removing twigs) and then sell it to buyers in Guwahati and Kolkata. Farmers could get better price if they supply tejpatta with less twigs. Wholesalers are willing to pay an extra Rs6 to 10/kg for good quality. But it is difficult to assess quality at the point of sale. Farmers phone 2 or 3 traders in Mawiong to agree on the price before they ship the crop – but there is no other outlet, and only 11 traders in the market (all from Rajasthan), so competition is limited.
Trucks from Meghalaya take tejpatta to Guwahati but not beyond. Cost per load to Guwahati is Rs11,000, of which Rs6000 are legal tolls and taxes, and Rs5000 is the actual truck cost. Traders pay farmers cash, but have to wait 3-4 months to be paid by Kolkota trader. traders usually have a bank loan to cover this trade credit period. In season (4 months Nov-Feb) 25-30 trucks per day leave the market. During the rest of the year 4 to 5 trucks/day. Over one year this amounts to about 25,000 tons, considerably more than the 4,300 tons reported in the SFAC study.
Rs/kg
Tejpatta Farmer price Rs21-25/kg 23.00
Transport to Mawiong 1.00
Net farmer price 22.00
reduction due to cleaning 20% 26.40 up to 25%
cleaning cost 0.53
total cost 26.93
Margin 4.07 15%
Mawiong trader sells 31.00
Cost of transport to Guwahati 1.57
Cost of transport to Kolkata 4.29
total transport 5.86
Total cost 36.86
trader margin 8.14 22%
Price in Kolkata 45.00
Retail price 200.00
The table above suggests that traders in Mawiong make a margin of about 15%, while those in Kolkata make 22%. However with only 11 traders operating at the market, and with no alternative outlets, there is little competition in the tejpatta marketing chain, and producers only receive 12 to 15% of the retail price. MLIPH made efforts (see box below) to improve producer prices, but this experience shows that direct sales to wholesalers in Kolkata may not always be profitable as market prices can suddenly change. There have also been efforts to pack tejpatta for local retail sales, but the volume will be limited.

Republic of India
Meghalaya: Livelihoods and Access to Market Project
Final project design report - Working papers
215
Trucks loading tejapatta at Wawiong market Cleaning tejpatta at Mawiong
MLIPH support for tejpatta marketing To increase producer prices, MILPH supported the trial marketing of tejapatta by the federation of six SHGs in the Nongsohphan- Nongtyngur cluster of East Khasi Hills district. In March 2011 a consignment of seven tons of cleaned and sorted leaf was sold direct to a wholesalers in Kolkata, for a price of Rs178,000. A federation leader said “The small efforts to sort out the leaf paid off, our farmers got 38% more profit and that meant that the village benefited from this project directly and indirectly”. However as prices of unsorted leaf suddenly increased, the venture ended up paying farmers slightly less relative to local sales.
Learning from this deal, another SHG federation from Pyndemdkhar village sold bay leaf to retailers in Sohra and Shillong. “Packs of 50 and 100 gms are available at selected retail outlets including Raps Groceries, WISE and NERAMAC – the same leaf made it to the trade fairs held in Shillong”, said Teilinson Lawlur, the Chairperson of the Federation.
Strategy for bay leaf development in LAMP
Bay leaf is not a priority product for LAMP interventions. It is usually a secondary product for producers so increasing prices will not have a huge impact on overall household income. However there may be opportunities for including bay leaf in interventions for other spices.
K. Potatoes
In terms of tonnage produced and sold, potatoes are the major commercial crop in the state. Over 140,000 tons per year enter the marketing chain (see Table 2 above) to supply the local market and other northeastern states, and for exports to Bangladesh via informal channels. In terms of total national production Meghalaya is not a major producer, growing less than 0.5% of the 44 million tons produced in India. Meghalaya has an advantage in being able to grow off-season potatoes which can be sold at premium prices. However yields are less than 10 tons per hectare, less than half the national average of 22 tons/ha in 2010-11 – which itself is only half of that achieved in the USA and UK. Yields are constrained by diseases (principally late blight), poor plant nutrition, lack of moisture (very little of the crop is irrigated) and out-of-date varieties. As described in the Working Paper on Agriculture, the supply of seed potatoes is totally inadequate, leading to the spread of disease and lack of replacement of old varieties (some popular varieties, such as Great Scot, have been grown in the state for over 100 years).
Possible interventions for LAMP include:
Improvements to the marketing of fresh potatoes through aggregation and direct sales to major consumption centres, such as Guwahati in Assam.
Potato storage: although there is little to be gained by storing off-season production, there could be some advantages in short-term storage of some of the summer crop (harvested from July to October) as prices increase later in the year. Conventional cold stores require a major investment and are vulnerable to unreliable electricity supplies, however other storage technologies exist that have lower cost and use less energy.

Republic of India
Meghalaya: Livelihoods and Access to Market Project
Final project design report - Working papers
216
Contract production for potato processors has already become well established in other part of India and might have potential in Meghalaya. Although Meghalaya should continue to capitalize on its advantage as an off-season producer in markets for fresh potatoes, there could be potential to also produce potatoes for processing – as processors want to extend their season of supply and are reported to be willing to pay up to Rs30 per kg, a price that makes off-season production attractive.
Improving the supply of seed potatoes could both increase yields and provide an opportunity for farmers to become specialized seed producers, with a market for seed potatoes in other northeastern states. The feasibility of such a venture is discussed below.
Seed potato production
To provide seed growers with sufficient foundation seed will require a major investment in tissue culture and grow-out facilities (aeroponic and net houses) together with the ability to manage a large scale facility on a commercial basis. This could be done through PPP with a private sector partner on the pattern of that of Mahindra in Palampur, Himachal Pradesh. This company supplies seed to farmers in Uttar Pradesh, Madhya Pradesh, Gujarat, and West Bengal, as well as exports to Bangladesh. Mahindra has a partnership with HZPC, a major Dutch potato breeder and seed potato supplier.
To be viable it will need to be shown that seed potato production is commercially profitable in Meghalaya. Although the Mahindra venture carries out tissue culture and associated grow-out activities in the cool environment of the hills of Himachal Pradesh, actual multiplication of seed potatoes can take place on the plains in the winter season. Such production can be mechanized and, with irrigation and optimal fertilization, production costs of seed potatoes in the plains can be lower than on small farms in the hills. Even if basic land cultivation could be mechanized, it would be difficult to use machines to harvest the summer crop from wet soil in the monsoon season. One alternative could be to produce seed potatoes as a spring crop on paddy land (maybe with irrigation) and harvest them in May before the monsoon starts.
Another issue would be the need to reform regulations controlling seed potato prices. Current market prices of potatoes for human consumption (around Rs30 per kg) are higher than the controlled price for seed (around Rs20 per kg). Clearly this makes a potato seed production system uneconomic and would encourage seed growers diverting some or all of their production away from use as seed.
A strategy for LAMP in the potato sector could include the following:
Studies of the existing potato marketing system to identify opportunities for interventions in the marketing of off-season potatoes.
Establishment of potato grower organizations – primarily for collective marketing but these groups could also procure inputs, especially seed potatoes, including seed from outside the state.
Studies on current production practices and identification of opportunities for the adoption of improved technologies – including a comparison of the economics of potato production in Meghalaya with the economic in other states.
Identification of a potential PPP for seed potato production. This could also encompass contract production for processing – there are some major potato processors (Frito Lay, McCain) who are also involved in seed potatoes. Siddhivinayak Agric Processing Pvt Ltd of Pune is a smaller company that works with small farmers in eastern UP, providing seed and arranging marketing contracts with second tier processors.
L. Bio-fuel2
Meghalaya is well-suited to production of a number of tree crops - which could include plantations for bio-fuel production - with oil-producing nuts/seeds being used to produce bio-diesel. The best known bio-fuel shrub in India is jatropha, and this is widely grown in the state, but as a hedge and not for its oil-seed. The draw-back of jatropha is that it is a single use plant - the leaves being inedible to livestock (which makes it a good hedge). Another possible tree crop is Pongamia pinnata, a medium-size tree is indigenous to the Indian subcontinent and south-east Asia, and has been successfully introduced to humid tropical regions of the world. It is a fast-growing leguminous tree
2
Extracted from "Integrated Village Development Plan, Mawlyngbna, East Khasi Hills", by Narender Singh Rathore,
Consultant

Republic of India
Meghalaya: Livelihoods and Access to Market Project
Final project design report - Working papers
217
with the potential for high oil seed production and the added benefit of the ability to grow on marginal land. These properties support the suitability of this plant for large-scale vegetable oil production required by a sustainable biodiesel industry.
Uses: Historically, this plant has been used in India as a source of traditional medicines, animal fodder, green manure, timber, fish poison and fuel. With a calorific value of 4600 kcal per kg, pongamia is commonly used as fuelwood. The wood is used for cabinet making, cart wheels, posts, agricultural implements, tool handles etc.
A thick yellow-orange to brown oil is extracted from seeds. Yields of 30-40% of volume are possible using a mechanical expeller. The oil has a bitter taste and a disagreeable aroma, thus it is not considered edible. In India, the oil is used as a fuel for cooking and lamps. The oil is also used as a lubricant, water-paint binder, pesticide, and in soap making and tanning industries. The oil is known to have value in folk medicine for the treatment of rheumatism, as well as human and animal skin diseases. It is effective in enhancing the pigmentation of skin affected by leucoderma or scabies.
Pollination is insect-mediated, most often by bees, of which P. pinnata is recognized as an important source of nectar. There is a long tradition of P. pinnata being used as a medicinal plant, particularly with the Ayurvedha and Siddha medicine systems of India. Extracts of P. pinnata have also been shown to have applications in agriculture and environmental management, with insecticidal and nematicidal activity. Opinions vary on the usefulness of this species as a fodder. The leaves contain 43% dry matter, 18% crude protein, 62% neutral detergent fiber, 40% acid detergent fiber, and in vitro dry matter digestibility of 50%.
Deoiled cake, which is the leftover component of P. pinnata seeds following solvent extraction and as a byproduct containing up to 30% protein has the potential to provide a sustainable animal and poultry feed supplement. While the deoiled cake may be a source of protein, it contains a number of toxic and unpalatable components, including the furanoflavones karanjin and pongamol, and other polyphenolic compounds in the residual oil. To overcome this undesirable characteristic, the toxic components may be reduced by soaking the cake in water, autoclaving, alkali treatment and/or ether extraction. P. pinnata oil cake also contains protease inhibitors, the activity of which can be eliminated by firstly autoclaving the cake with lime, refluxing with 2% HCl and then neutralizing with NaOH.
Incorporation of leaves and the presscake into soils improves fertility. Dried leaves are used as an insect repellent in stored grains. The presscake, when applied to the soil, has pesticidal value, particularly against nematodes. String and rope can be made from the bark fiber.
Ecology and silviculture: P. pinnata is a plant well-suited to “marginal lands”. Native to humid and subtropical environments, pongam thrives in areas having an annual rainfall ranging from 500 to 2500
mm. in its natural habitat, the maximum temperature ranges from 27 to 38oC and the minimum 1
to16oC. Mature trees can withstand waterlogging and slight frost. This species grows to elevations of
1200 m, but in the Himalayan foothills is not found above 600 m. Pongamia can grow on most soil types ranging from stony to sandy to clayey. Pongamia trees are noninvasive and highly resistant to heat (more than 110 degrees Fahrenheit), drought and saline soils. It’s also tolerant to cold temperatures. The tree fixes nitrogen in the soil thereby rehabilitating distressed, marginal land. Highest growth rates are observed on well drained soils with assured moisture. Natural reproduction is profuse by seed and common by root suckers.

Republic of India
Meghalaya: Livelihoods and Access to Market Project
Final project design report - Working papers
218
Limitations: P pinnata attracts many pests and diseases. Some of the important pests are Parnara mathias, Gracillaria sp., Indarbela quadrinotata, Myllocerus curvicornis, and Acrocercops sp. Attacks by these insects cause whitish streaks and the formation of galls on affected leaves. The lateral spread of roots of this species, about 9 m in 18 years, is greater than most other tree species. Moreover, it produces root suckers profusely. Because of these characteristics, Pongamia Pinnata is unsuitable for agro-forestry and has the potential to become a weed if not managed carefully.
Strategy for bio-fuel development in LAMP
IFAD currently has an international grant project, Development of Alternative Biofuel Crops, which is being implemented by the World Agroforestry Centre (ICRAF) through its office in Delhi. This provides an opportunity to obtain some expert advice on the potential for bio-fuel in Meghalaya, although the grant is likely to be completed before LAMP gets into its full implementation phase.
A pongamia plantation is currently being planned for Mawlyngbna village in East Khasi district, where
140 ha of what is now wasteland will be planted. The scheme, which is calculated to require an investment of Rs6.5 million, may get support from the National Oilseeds and Vegetable Oil Development Board, but will also require significant support from bank loans and/or GoM finance. Financial projections show the plantation being profitable from year 6, and having an IRR of 30.1%. Another larger scheme in Jaintia Hills is said to be even more advanced.
Given that these will be the first large-scale plantation of pongamia in the state, it is recommended that LAMP wait until this one of these projects show indications of feasibility - in terms of trees growing well and beginning to bear seeds - before committing resources to supporting more ventures of this type. In the meantime ICRAF could be approached for its advice.
M. Selection of priority commercial products, blocks and village clusters
To select village clusters for development of commercial products via the Integrated Production and Marketing (IPM) sub-component, the following steps are recommended:
1. Selection of a number of commodities (sub-sectors) with potential for commercial production in the state. The formulation mission has drawn up a draft list (Annex 1) which prioritises 10 crops plus 4 livestock/other sub-sectors. This needs further review and some other sub- sectors may replace some of those that are now in the list. The aim behind having a limited number of sub-sectors is to, at least at the initial stage, focus the efforts of the project on a limited number of priority areas.
2. The main commercial sub-sectors in each block then need to be identified. The mission, with expert local assistance, has done this (Annex 2).
3. The 18 blocks with the greatest potential for commercial sub-sector development should then be chosen. The mission has not done this, but it would be useful if MBDA could do this prior to the Appraisal Mission.
4. Within each of the selected 18 blocks, three village clusters, with around 75 villages per block in total, should then be selected for LAMP participation. Both NRM and IPM interventions would take place in these villages.
Selection of priority sub-sectors, blocks and clusters would aim to selected sub-sectors and locations with potential for commercial production on some significant scale. Selection should take account of existing skills, availability of land, water and other natural resources, and access to inputs, support services, finance and markets. In selection of sub-sectors it is also important to consider if LAMP will be in a position to make interventions in production and/or marketing that will significantly increase returns to producers. There will be some crops that are now commercially important, but for which there are no tried and tested interventions that will reliably increase producer returns by a really significant amount. For this reason it could be worthwhile to select some crops that are not now widely grown but have good potential. In some cases, further investigations are needed to identify useful interventions – which may even require some field testing on farms in Meghalaya.

Republic of India
Meghalaya: Livelihoods and Access to Market Project
Final project design report - Working papers
219
Account should be taken of environmental impacts – some sub-sectors may be rejected on grounds of the risk of negative environmental impacts. Finally, in selecting blocks and clusters, some weight could be given to the existence of viable cooperatives and producer organisations, or of other organisations (SHG clusters and federations) that could become IVCS.
Sub-sectors and blocks (and, if possible, clusters) should be provisionally selected by BMDA prior to the appraisal mission. Some villages who have participated in MLIPH could be included – the community mobilisation and livelihood work will provide a good launching pad for commercial enterprises. It was agreed that no more than 30% of the villages in the selected LAMP clusters should be ex-MLIPH villages. This means up to about 400 out of 700 MLIPH villages could be included in LAMP. It was also agreed that NERCORMP villages should not be selected for LAMP as NERCORMP will continue to be implemented in these villages for the next 3 years.

Republic of India
Meghalaya: Livelihoods and Access to Market Project
Final project design report - Working papers
220
Annex 1: Selection of priority sub-sectors for initial LAMP activities Commercial crops (for IPM sub-component)
Sub-sector Value chain information Reason to include Reason not to include Conclusion
1 Ginger MLIPH study 2006,
IFC study July 2013 ATI study June 2013
Major cash crop, potential to increase yields Farmers unwilling to use any inputs in production Include
2 Tumeric MLIPH study 2006, ATI study June 2013
IFC study July 2013
Major cash crop, potential to improve marketing, interest in processing
Production may be over-stated, valuable lakadong turmeric effected by arsenic contamination from coal mining
Include
3 Pineapple Brief SFAC study 2012 Major cash crop, could increase yields Difficult t use drip irrigation on steep slopes. Include, but study would be useful
4 Orange Brief SFAC study 2012 ATI study June 2013
Important cash crop, could increase yield Sale of fruit on the tree reduces incentives to maximise yield.
Include, but study would be useful
5 Honey Proven results from better production and marketing Small scale of production, few producers Include – a “safe bet”
6
7
Strawberries
Litchi (&mango?)
Major State success story. Established Producer Association Seems to grow well, opportunity in S/W Garo
Sector may not need further external support
Not yet a commercial crop
Include – support propagation & expand to other areas, Include, but study would be useful.
8 Pepper, chilli IFC study July 2013 Reported to have potential Not yet grown on a significant scale. Include, subject to results of IFC study
9 Cashew Major cash crop in some areas, Seems to grow easily Not much scope to improve yield. Include? – but a study would be useful.
10 Temperate fruits Opportunity for higher altitudes. Local varieties might be processed
Not yet a commercial crop. May need new varieties for the fresh fruit market. Climate change may reduce area for cultivation.
Include? – select right varieties for location
11 Banana Widely grow, large volume produced, may be a climatic advantage,
Only a commercial crop in a few areas. Uncertain of commercial potential.
Exclude: need a value chain study first to identify commercial potential
12 Tea Expanding area in Garo Hills/Ri-Bhio Difficult to get farmers to improve leaf quality and to organise a smooth supply of leaf to the factory.
Exclude – but a study would be useful.
13 Off-season vegetables
Brief SFAC study 2012 Widely grown, climatic advantage Major disease problem and over-use of pesticide in tomatoes and potatoes
Include, but initially exclude tomatoes and potatoes
14 Floriculture Over 250 commercial units established and supported by private sector partner. Good PPP opportunity.
Established initiative with GoI support available, so no need for LAMP
Exclude – unless specific opportunity for orchids identified.
15 Squash, pumpkin etc.
Important cash crop in some places No obvious interventions to increase yield or price Exclude – but a study would be useful.
16 Areca nut Major cash crop. Said to be declining due to climate change. Human health concerns. No obvious interventions to increase yield.
Exclude

Republic of India
Meghalaya: Livelihoods and Access to Market Project
Final project design report - Working papers
221
Sub-sector Value chain information Reason to include Reason not to include Conclusion
17 Bamboo Widely grown, suitable climate No obvious interventions to increase yield or price Exclude – but a study would be useful.
18 Coffee Some producers are interested, scope to improve price if locally processed.
Not much grown, market has disappeared in some locations, sold as dried cherry = low price
Exclude – but a study would be useful.
19 Bio-fuel Pongamia
ICRAF interested in supporting MBDA for this value chain
New crop, not sure how well it will grow or if it will produce an economic yield of oil seeds.
Exclude until a more detailed study done and test planting made.
20 Potatoes Major cash crop. Potential to increase yields and maybe marketing
Major disease problem and over-use of pesticide. Exclude: first need to find a way to control blight .
21 Rubber High level of interest Environmental impacts Exclude
22 Broomgrass Widely grown, major cash crop Environmental impacts. Little scope to increase yield/price
Exclude
Non-Timber Wood Forest Products (for IPM component)
Sub-sector Reason to include Reason not to include Conclusion 1 Tejpatta State is a major producer. A secondary product, limited potential for improvement Exclude 2 Broomgrass Major product Mostly cultivated, environmental issues if cultivated Exclude 3 Wild Pepper Very high value Include but need a study 4 Stone flower
(lichen) High value Limited availability, needs care if pine tree not to be
damaged Include but need a study
Food crops (for INRM component)
Sub-sector Reason to include Reason not to include Conclusion 1 Paddy Most widely grow crop in the state Huge labour inputs in land cultivation Include: need to address soil
fertility issues 2 Maize Second most important cereal Very primitive cultivation methods. Include 3 Cassava.
Sweet potato Drought/climate change tolerant Feed for pigs
Mostly limited to Garo Hills Sweet potato declining
Include
4 Pulses, oilseeds
Potential additional crop after paddy Low yields and low profit Include as part of the paddy intervention

Republic of India
Meghalaya: Livelihoods and Access to Market Project
Final project design report - Working papers
222
Livestock (for EFC, IPM and INRM components)
Sub-sector Reason to include Reason not to include Conclusion 1 Pigs Most rural hh have pigs, are an important source of
cash. Farmers could grow some feed Opportunity to tap unused manure Most popular proposed enterprise for EFC clients
Lack of maize/soya as a basis for manufactured feed More economic to import pigs into the state than to bring in feeds or feed raw materials Lack of feed limits scale of production to locally available by- products. Shortage of vaccine to control endemic CSF.
Include with a focus on EFC clients and as part of NRM. May be less potential to develop production clusters due to limited feed resources.
2 Poultry (backyard)
Most households have 10-20 backyard chickens. Local birds sell at a good price.
Risky - disease outbreaks kill many birds. No obvious interventions other than disease control
Include – include a study into potential interventions
3 Cattle More numerous than pigs Opportunity to improve utilisation of manure
Rarely used for milk, and only in Garo for draught power – so limited benefit from improving cattle productivity. Many households do not own cattle, and numbers low & falling in some places, while rising in others.
Exclude, apart from interventions to include collection and use of manure.
4 Goats Widespread in the state Plentiful feed resources Good demand for meat
Does not seem to be a big priority for people. Not as numerous or widespread as pigs
Exclude – at least to start with
5 Poultry (broiler)
Economic to import feed for broilers Demand in urban areas
Local market limited in size Access to day-old-chicks could be an issue
Include: but more likely for EFC clients than in IPM clusters
6 Fish farming State has placed emphasis on its aquaculture mission. Plentiful water resources.
LAMP may not be able to add much to a very active fisheries mission .
Exclude
7 Silk (eri) Utilise locally available wild caster t feed the worms. Pupae are eaten as a nutritious food, and the silk is used by local hand-loom weavers.
Although high quality, eri silk is not particularly valuable and its economics depend on utilisation of pupae as food.
Include – but unlikely to be on a large scale.

Republic of India
Meghalaya: Livelihoods and Access to Market Project
Final project design report - Working papers
223
Annex 2
Cash Crop Options by Block and District
Crops in bold are priority crops for the initial implement of implementation of LAMP, but initially
only two crops will be selected in 18 blocks. Village clusters need to be selected.
District Block Cluster Commodity Notes
We
st
Ja
inti
a
Hills
Laskein Ginger
Mixed temperate and sub-
tropical
Turmeric lakadong var. – high
circumin
Orange
Vegetables
Floriculture
Sericulture
Thadlaskein Ginger
Mostly temperate Turmeric
Orange
Temperate
fruits
pear, plum, peach
Vegetables
Strawberries
Tomatoes
Floriculture gerbera, orchids, leather
leaf
(bouquet filler)
Amlaren Pineapple
Sub-tropical, southern slopes
facing B’desh
Oranges
Beetle vine
Black pepper
Areca
District Block Cluster Commodity Notes
Ea
st
Ja
inti
a H
ills
Khliehriat Orange varieties
Sub-tropical Ginger
Black Pepper
Beetle Vine
Areca
Sajpung Turmeric Major turmeric area
(inc. lakadong var??)
Mixed temperate and sub-
tropical
Ginger
Orange
Areca

Republic of India
Meghalaya: Livelihoods and Access to Market Project
Final project design report - Working papers
224
(mix
ed t
emp
erat
e an
d s
ub
-tro
pic
al –
9 b
lock
s)
District Block Cluster Commodity Notes
R
i B
ho
i
(all
su
b-t
rop
ica
l)
Umling Ginger
Sub-tropical Pineapple
Orange
Tea an important crop in Ri-Bhoi
Banana
Black Pepper
Beetle Vine
Areca
Umsning Ginger
Sub-tropical Pineapple
Orange
Banana
Black Pepper
Beetle Vine
Areca
Strawberry Nursery pilot nurseries for runner production
in
Ribhoi and East Kashi only Floriculture rose, orchids, gerbera
already established
Jirang Ginger
Sub-tropical Pineapple
Orange
Tea
Banana
Black Pepper
Beetle Vine
Areca
District Block Cluster Commodity Notes
Ea
st
Kh
as
i H
ills
Mawryngkneng Ginger
Plateau area,
temperate to
sub- tropical
Tumeric
Orange
Temperate Fruits
Vegetable cold crops
Tomatoes
Mawkynrew,
Pynursla,
Mawsymram, Shella
Bholagang
Orange
Mostly s-facing
slopes above
Bangladesh –
sub-tropical:
Mawsymram
has
recorded heaviest
rainfall in Megalaya
in recent years
Pineapple
Banana
Black Pepper
Beetle Vine
Tea limited no. of tea gardens
Areca
Mawphlang, Mylliem,
Khatarshnong Laitkroh
Temperate fruits
Temperate areas,
quite cold, even frost in
Vegetables cold crops only
Potatoes

Republic of India
Meghalaya: Livelihoods and Access to Market Project
Final project design report - Working papers
225
(all
sub
-tro
pic
al)
some areas Floriculture orchids, carnations, gerbera
and
rose – already established
District Block Cluster Commodity Notes
W
es
t K
ha
si
Hills
Mairang Ginger
Mostly temperate but
sub-tropical areas near the border with
Assam
Temperate Fruits pear, peach, plum
Vegetables cold crops
Tomatoes
Potatoes 2 crops a year in some places
Mawthadraishan Temperate Fruits plum, peach, pear
Temperate only,
famous for local pigs and poultry
Vegetables cold crops only
Potatoes
Strawberry
nursery
2 ha plot already purchased
for
runner production
Nongstoin Ginger
Temperate and semi
sub-tropical in areas bordering Assam (coal and seliminite mines in this block)
Orange
Temperate Fruits
Vegetables cold crops
Floriculture orchids and carnations
Mawshynrut Orange
Sub-tropical area,
borders Assam and e
& S Garo hills (coal mine area)
Pineapple
Ginger main cash crop here
Banana
Areca
District Block Cluster Commodity Notes
S
ou
th W
es
t K
ha
si
Hil
ls
(all
su
b-t
rop
ica
l)
Mankyrwat Temperate Fruits
90% temperate + few
south facing areas
overlooking B’desh
only small areas of
orange in
south of block Vegetables cold type in 90%
Potato main crop of block
Black Pepper small areas only
Wild Pepper small areas only
Beetle Vine small areas only
Areca small areas only
Ranikor Orange
100% sub-tropical,
borders B’desh and S.
Garo Hills
Black Pepper
Wild Pepper
Beetle Vine
Areca
District Block Cluster Commodity Notes
N
ort
h G
aro
Hil
ls Rasubelpara Ginger
Turmeric
Honey
Banana
Areca
Kharkutta Ginger
Turmeric
Honey
Banana
Areca

Republic of India
Meghalaya: Livelihoods and Access to Market Project
Final project design report - Working papers
226
District Block Cluster Commodity Notes
Ea
st
Ga
ro H
ills
(all
su
b-t
rop
ica
l)
Samanda Orange
Ginger
Turmeric
Banana
Areca
Songsak Orange
Pineapple
Turmeric
Ginger
Banana
Strawberry
Rongjang Orange
Turmeric
Ginger
Banana
Areca
District Block Cluster Commodity Notes
We
st
Ga
ro H
ills
(all
su
b-t
rop
ica
l)
Tikrikila Pineapple
Ginger
Turmeric
Cashew
Areca
Dadenggiri Pineapple
Ginger
Turmeric
Cashew
Areca
Salsella Pineapple
Ginger
Turmeric
Cashew
Areca
Rongram Orange
Ginger
Turmeric
Cashew
Floriculture Gerberas, antheneums
Strawberry said to be good quality
Gambegre Orange
Ginger
Turmeric
Cashew
Areca
Dalu Orange
Ginger
Turmeric
Cashew
Areca

Republic of India
Meghalaya: Livelihoods and Access to Market Project
Final project design report - Working papers
227
(all
sub
-tro
pic
al)
District Block Cluster Commodity Notes
S
ou
th G
aro
Hil
ls
(all
su
b-t
rop
ica
l)
Chokpot Pineapple
Orange
Bananas good local market
Cashew
Areca
Gasuapara Pineapple
Orange
Bananas good local market
Cashew
Areca
Baghmara Pineapple
Orange
Bananas good local market
Cashew
Areca
District Block Cluster Commodity Notes
S
ou
th W
es
t G
aro
Hil
ls
Betasing Pineapple important in Jhum
Turmeric
Mango, Litchi
Banana good local market
Cashew important crop, exported to B’desh
Areca important crop
Vegetables local shortage, much is exported to B’desh
+
Assam
Zikzak Pineapple increasing area, esp. in Jhum lands
Ginger
Turmeric
Vegetables local shortage, much is exported to B’desh
+
Assam Cashew important crop, exports to B’desh
Banana good local market
Floriculture especially good for orchids

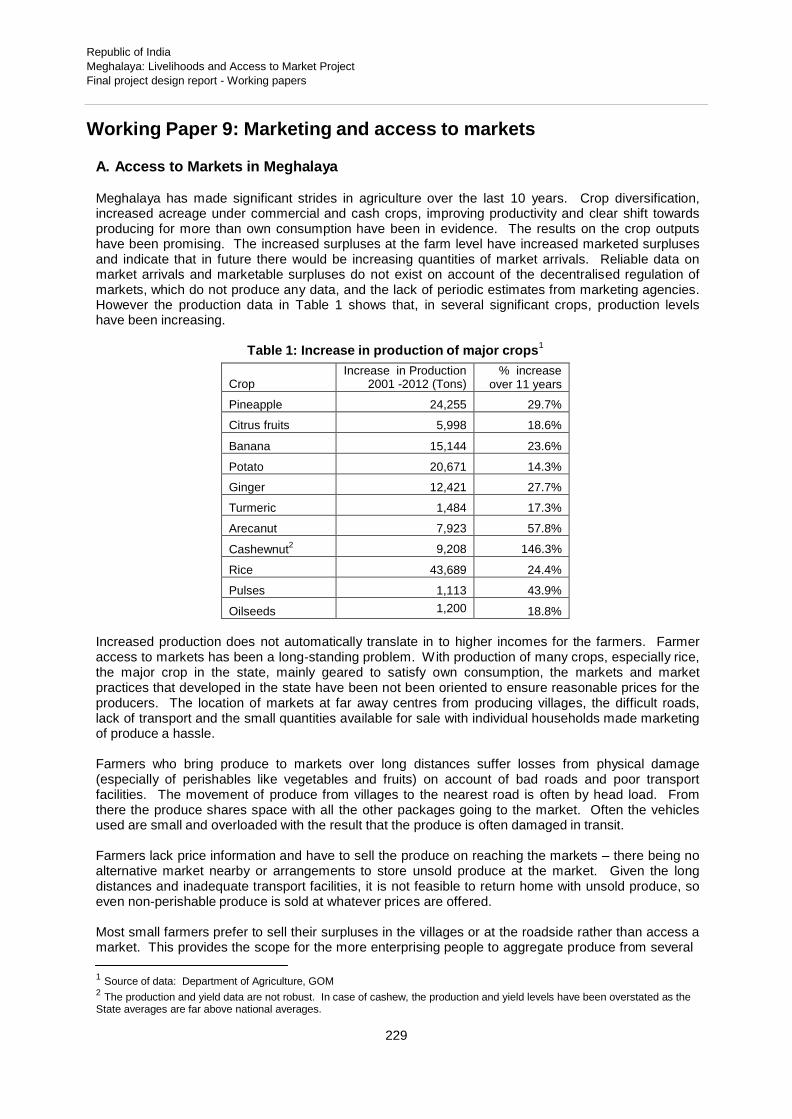
Republic of India
Meghalaya: Livelihoods and Access to Market Project
Final project design report - Working papers
229
Working Paper 9: Marketing and access to markets
A. Access to Markets in Meghalaya
Meghalaya has made significant strides in agriculture over the last 10 years. Crop diversification, increased acreage under commercial and cash crops, improving productivity and clear shift towards producing for more than own consumption have been in evidence. The results on the crop outputs have been promising. The increased surpluses at the farm level have increased marketed surpluses and indicate that in future there would be increasing quantities of market arrivals. Reliable data on market arrivals and marketable surpluses do not exist on account of the decentralised regulation of markets, which do not produce any data, and the lack of periodic estimates from marketing agencies. However the production data in Table 1 shows that, in several significant crops, production levels have been increasing.
Table 1: Increase in production of major crops1
Crop
Increase in Production 2001 -2012 (Tons)
% increase over 11 years
Pineapple 24,255 29.7%
Citrus fruits 5,998 18.6%
Banana 15,144 23.6%
Potato 20,671 14.3%
Ginger 12,421 27.7%
Turmeric 1,484 17.3%
Arecanut 7,923 57.8%
Cashewnut2 9,208 146.3%
Rice 43,689 24.4%
Pulses 1,113 43.9%
Oilseeds 1,200 18.8%
Increased production does not automatically translate in to higher incomes for the farmers. Farmer access to markets has been a long-standing problem. With production of many crops, especially rice, the major crop in the state, mainly geared to satisfy own consumption, the markets and market practices that developed in the state have been not been oriented to ensure reasonable prices for the producers. The location of markets at far away centres from producing villages, the difficult roads, lack of transport and the small quantities available for sale with individual households made marketing of produce a hassle.
Farmers who bring produce to markets over long distances suffer losses from physical damage (especially of perishables like vegetables and fruits) on account of bad roads and poor transport facilities. The movement of produce from villages to the nearest road is often by head load. From there the produce shares space with all the other packages going to the market. Often the vehicles used are small and overloaded with the result that the produce is often damaged in transit.
Farmers lack price information and have to sell the produce on reaching the markets – there being no alternative market nearby or arrangements to store unsold produce at the market. Given the long distances and inadequate transport facilities, it is not feasible to return home with unsold produce, so even non-perishable produce is sold at whatever prices are offered.
Most small farmers prefer to sell their surpluses in the villages or at the roadside rather than access a market. This provides the scope for the more enterprising people to aggregate produce from several
1
Source of data: Department of Agriculture, GOM 2
The production and yield data are not robust. In case of cashew, the production and yield levels have been overstated as the State averages are far above national averages.

Republic of India
Meghalaya: Livelihoods and Access to Market Project
Final project design report - Working papers
230
farmers, and sell this on to traders/wholesalers in the markets. The lack of marketing skills and information relating to prices result in low price realisation for the producers and benefit intermediaries.
Turmeric producers in the Umsalait clusters reported that the middleman has set the
prices and assessed the quality and grade of the Turmeric grown in the whole cluster
. The producers realized an average price of Rs.15 to Rs. 17 per kg for fresh turmeric.
The farmers who are members of the Laskein Turmeric Processing Cooperative
Society were able to get a price of Rs 30 per kg for their fresh turmeric.
Producers face access barriers when they try to deal through the markets. The barriers are not merely infrastructural as indicated in the preceding paragraphs, but also procedural and informational. Associations or cartels exist in wholesaling and transport; growers or petty traders are not part of these associations but have to use the services for sale of their produce. The private traders have a large share of commodities trade in the state. Marketing of surplus agricultural produce, minor forest produce, supply of essential foodstuffs, agricultural inputs etc. are mostly handled by the private traders. The traders are well organized with market information and links to logistic services and external markets. Their superior information access and linkages enable them to dictate their terms in the local markets when they procure from producers and petty farmer-traders.
B. Status of Markets
The markets in the state are widely (and randomly) distributed and no centralised data is available on the market structures, volumes and efficacy. The official data from the government available through
the Meghalaya State Agricultural Marketing Board lists 62 markets3. A survey carried out by IDFC
foundation last year (2012) listed 169 markets in the state. The variations were significant in the case of Garo Hills districts.
Table 2: Agricultural markets in Meghalaya
Name of district Number of markets listed by IDFC
foundation survey
Number of markets as per state government
East Khasi Hills 33
11 West Khasi Hills 15
South West Khasi Hills 3
Ri-Bhoi 16 8
West Jaintia Hills 11
9 East Jaintia Hills 4
West Garo Hills 29 12
East Garo Hills 14 9
South Garo Hills 23
5 North Garo Hills 13
South West Garo Hills 8
Total 169 62
Of these markets, three are main urban markets (Idewuh in Khasi Hills, Jowai in Jaintia hills, and Tura in Garo Hills) and two are regulated markets (Mawiong in Khasi hills, Garobadha in Garo hills). The urban markets are large and reported to have significant volumes. Of the two regulated markets, only Mawiong is operating as a regulated market. This market handles significant volumes of broom grass and bayleaf, and a smaller volume of potatoes.
3 The MSAMB indicates that there two Regulated Market Yards and 119 sub-market yards are in the State. But a location wise
list of names of markets provides only 62 markets, including the two regulated markets.

Republic of India
Meghalaya: Livelihoods and Access to Market Project
Final project design report - Working papers
231
Most markets do not function daily, with a main market day once in a week - although a small daily consumer market can operate on other days. The markets in the district headquarters and large towns work daily. Given the quantities, the one day operation of the market seems appropriate though in some locations the volumes and crowding seen on the weekly market days point to the need for having more market days in a week.
C. Market regulation and management
The State Agricultural Produce Marketing Act was enacted in the year 1980 and the State Agricultural Marketing Board was set up in 1983, to develop marketing infrastructural facilities and to provide marketing support to the farmers in the State. The formal regulation of markets is under the following Acts and subordinate legislation of the State of Meghalaya:
1.The Meghalaya Agricultural Produce Market Act 1980; 2. The Meghalaya Agricultural Produce market (General) Rules, 1982; and 3. The by-laws of the Meghalaya State Agricultural Marketing Board, 1983
Despite the legislation the State Government control over markets is superficial. The Meghalaya State Agricultural Market Board has set up only two markets, which only deal in a limited range of products. While the state regulation lists 50 commodities for trade in regulated markets
4, only four
have been notified for actual trade in the two regulated markets. The first market is located at Mawlong near Shillong for Zone I (Khasi Hills and Ri-Bhoi District) where broomstick, tezpatta (bay leaf), potato and torchwood are the notified items. This market has developed infrastructure such as auction platforms, wholesale shops, warehouses and a cold store. The second market is located at Garobadha in East Garo Hills District for Zone II (Garo Hills), where only livestock marketing has been regulated (but this market is not active as a regulated market). Jaintia Hills is Zone III, but does not have any regulated market.
Since marketing and trading was a traditional practice, with the exception of the two regulated markets, the market related aspects are placed under the control of the Autonomous District Councils, and tribal/village chiefs (Syiems, Nokmas and Dalois) in the different districts. The Autonomous District Councils have issued regulations in the districts on management of markets, collection of market fees and sharing of revenues
5. The markets are controlled by either Autonomous District
Councils or the tribal chief / traditional village Chief. The marketing systems differ from district to district, and are based on the traditional practices. While most markets are owned by the ADC or the Tribal chief and durbar there are also privately owned markets which share revenue with the Tribal Chief of the village concerned or the ADC. The village chief or the tribal chief also shares revenue with the ADC.
The Autonomous District Councils (ADC) typically garner 60% of revenues generated by the markets under their control. Each market is managed by a market committee, which auctions the right to collect market fees, parking and other charges. The successful contractor collects fees from market participants – usually Rs 10 per stall per market day (but ten times this amount was collected in some markets visited by the IFAD design mission). Any rentals for shops and storage spaces are collected directly by the committee. While the ADC fixes the base price for auctions, the auctioned amount in some markets visited was short of the potential revenue, and very much more may be collected by contractors as fees.
While markets function in the different places and are managed by local village committees, the facilities and practices leave scope for considerable improvement. During the mission visits, the few markets visited were crowded, poorly maintained and lacked basic facilities. Facilities for weighing, quality assessment, loading and unloading, packing, storage, drinking water, toilets, canteens and parking of vehicles were very limited. The layout of stalls and shops is usually haphazard. The approach pathways between the stalls were full of weeds and muddy in some stretches. The management and users did not seem to take garbage disposal seriously.
4
See annex 1 for a list of notified commodities. 5
E.g. Khasi Hills District (Establishment, Management and Control of market) Regulation 1979; ii) The Administration of Langrin Syiemship Rules, 2010, District Council Affairs.

Republic of India
Meghalaya: Livelihoods and Access to Market Project
Final project design report - Working papers
232
The market committees had representation from the local village and looked after award of the lease for market fee collection rights, collection of rent from the shops and storage spaces if any, maintaining accounts and rendering accounts to the ADC. The practices in the market were opaque. No information on prices prevailing in the market was displayed. Neither weighing equipment not a place for same were available and a trading area was not designated for those who bring bulk produce to sell to traders in the market. Market fees were levied on goods brought in which taxed producers rather than the traders in the market. The market fees did not make a distinction between those who are permanent traders that deal in large quantities and producer-sellers that sell small quantities on the margins of the market.
Table 3: Marketing arrangements in different regions
Types of markets Directly Controlled by Market fee collection
6 Remarks
Khasi Hills District Council Markets ADC Auctioned Revenue fully accrues to
ADC Elaka Markets Owned by Syiem and the durbar; at times village councils also own village markets
Syiem; where market is owned by the Village council these jointly managed by Syiem and Village council with revenue sharing
Auctioned Under the Syiemship Rules, GOM
Private (Raid) markets Independent Raid Management Recognised by the Executive Committee of ADC
Garo Hills Village markets ADC – Revenue Sharing with
Nokma and the village durbar Auctioned Fee collection rights
leased out for five years after auction
Jaintia Hills District markets ADC owned– controlled by ADC Auctioned Revenue fully accrues to
ADC Private markets under ADC control Auctioned Sharing of revenue
between private owner and ADC
Elaka markets – Under Daloi of the village concerned
Auctioned Revenue fully retained by Daloi and the durbar
Information of buyers, sellers, goods transacted, volumes, value was not collected. The shops were not insured against fire and natural calamities. One of the markets visited by the mission (in Iaw Physun) had experienced destruction of a number of shops by fire, yet insurance cover had not been arranged by the market committee after the incident.
Attempts have been made to improve market infrastructure. Under a NABARD funded scheme for improving the village Hat Bazaars, selected village markets were taken up for building market stalls, common auction platform, drinking water facility, etc. One of the markets visited in Law Physun had been taken up under the NABARD scheme and the difference in infrastructure was visible. However there has been little development of supporting infrastructure - such as internal market pathways and drainage, water supply and rubbish disposal.
A visit to a market in West Garo Hills district is described in Annex C
6Toll gates are independent of markets and the Syiem collects tolls, usually on forest produce and at times also on the cattle.

Republic of India
Meghalaya: Livelihoods and Access to Market Project
Final project design report - Working papers
233
Figure 1 – Market stalls under NABARD Scheme in Iaw Physun
Figure 2: Market stalls built by individuals and the market committee at Iaw Physun
Republic of India
Meghalaya: Livelihoods and Access to Market Project
Final project design report - Working papers
234
The MLIPH and NERCORMP projects, funded by IFAD had built small trading sheds in a few village markets. These were were also built at other locations - usually to function as village collection centres or roadside retail sales points. However, these interventions by NABARD and IFAD projects did not deal with the market practices and benefits to the users. The problems of producer-sellers continue to persist resulting in low price realizations and problems of trader-buyers increasing their costs of operation
D. Market development and improving access to markets
(a) Development of public markets
The constraints in marketing of produce, especially for farmers need to be dealt with so that farm based livelihoods become viable. Improving production and productivity will improve overall revenues from farm. But profitability is a function of prices realized and whether the prices adequately cover costs. Unless well functioning markets are there, which the producers can access, farm livelihoods will be at risk.
In Meghalaya the reform of markets both in terms of governance and practices is likely to be complex as traditional institutions exercise control over markets. Introducing new practices to rationalise market conduct and optimise costs and revenues is likely to face resistance from those who currently manage and control the markets. While wholesalers and traders might welcome infrastructure improvements, they are likely to oppose rationalisation of fees and introduction of transparency in market conduct. Since the state is not in a position to enforce a unified set of rules over all the markets, better markets cannot be secured through law. The option available is to exhibit good working models of well-managed, reformed markets in each district and influence the users to exert pressure on market committees and traditional institutions for reform.
Market development will consist of hard and soft interventions. The hard interventions will generally relate to better designed stalls, intervening spaces, auction platform, weighing arrangement, loading and unloading places, storage, water and sanitation facilities, parking facilities and price information display. Soft interventions will relate to introduction of changes in management of the market, determining market fees, ensuring equitability of revenue collection between traders and producer sellers, maintenance and upkeep of the market and dispute resolution mechanism. The knowledge and skill levels of market committees should be built up to look in to aspects such as garbage disposal, avoiding health hazards, insurance of the market stalls and imaginative use of the market space. Market committees should be trained to ensure that producer-sellers are fairly treated by the established traders and wholesalers in the market.
Market infrastructure needs to meet the actual needs of market users. This is primarily for a place to set up a stall (preferably sheltered from the rain and sun) and some provision of roads and walk-ways for people to circulate in the market. There often no need for more advanced facilities, such as auction rings, weighbridges, warehouses and cold stores. However it is often useful to provide supporting facilities such as water supply, toilets, and rubbish bins. Larger markets may also need an office for the market management.
If warehouses and cold stores are provided in rural markets, they are often not used, and represent a considerable waste of resources as well as occupying valuable land. The regulated market at Mawong near Shillong has a cold store that was designed to store potatoes but, as the crop in Meghalaya is harvested later that the crop in the plains, it can be sold at a premium price and there is no point in storage. As a result space in the cold store is hired out as a non-refrigerated warehouse to store packaged foods bought up from the plains for local consumers - and is of no benefit for marketing of local production.
Although large warehouses are generally not of use in markets, some secure storage could be useful in rural markets for farmers and small traders to store unsold products until the next market day. With the low population density, these goods may have been transported a significant distance to the market and it would be costly to take them home and then return them on the next market day.

Republic of India
Meghalaya: Livelihoods and Access to Market Project
Final project design report - Working papers
235
While new markets built and operated on sound lines might seem to be a good way forward to set up the models for others to emulate, practical problems on the ground will make it difficult for such green field markets being set up. Land for markets is not easily available and the village councils do not easily accommodate requests for land, especially if the new markets come up in the vicinity of existing markets. Even if such markets are built, the village council may prevent the users from using the infrastructure. There have been instances of new infrastructure remaining unutilised as the Tribal/Village chief did not approve of the shift to such markets
7. Hence the way forward is to
collaborate with willing village councils to improve and reform existing markets and develop them in to good models for other markets to follow.
The markets should be networked to pool information regarding market arrivals, price levels and trends in trade. This information should be made available to all the markets in the network. The market managements should be made responsible for providing access to this information to all potential users so that there is improved transparency; facilitating the producers to make informed choices on marketing their produce. A mobile phone based MIS could also be designed which will facilitate gathering of information at the end of the market day regarding commodities traded, volumes and prices. A back end server in the State Marketing Board can collate information and generate state-wide data. This will fill a critical gap in the information availability in government departments and provide a reliable basis for planning.
On the producer farmer side, interventions are necessary to improve their access to markets. Some of the important aspects are:
i. Attention to cleaning, sorting, grading and packing of produce so that incremental value is realized
ii. Encouraging producer to pool and aggregate their produce so that their power to negotiate is strengthened – this can be through farmer organisations of any type – SHG federations, crop cluster groups, IVCS proposed under the project etc.
iii. Accessing market and price information on a regular basis from the MIS to be established by networking the markets
iv. Direct marketing to processing units and bulk consumers.
On these aspects, the farmers will require capacity building and farmer organisations will need to be established and strengthened. These tasks will be part of the work of the Integrated Production and Marketing sub-component and is described in Working Paper 8. Creation of sound markets is just one part of the solutions to better price realisation in the hands of producers. They should be trained to take full advantage of the markets and deal with them from a position of strength, which will come from aggregation and joint action.
Market related infrastructure such as godowns, warehouses and cold stores are also needed for a number of crops and commodities in the state. These are typically large investments and should taken up by private sector entities. Such infrastructure will improve direct procurement of produce from farmers from large commercial entities. For market related infrastructure, an investment subsidy scheme is operated by the Government of India through NABARD. From small rural godowns to end- to-end cold chains can be set up under this scheme. Investments in Meghalaya in market related infrastructure can avail subsidies of up to 33.3%. Details of the scheme are provided in Annex 4.
(b) Communications infrastructure
Alongside the development of public markets, there is a need to improve communications infrastructure to: (i) ensure markets are well connected to the road network in order to move goods in and out of markets; and (ii) provide access from clusters where cash crops are produced to markets. The Basic Road Statistics of India 2012, published by the Ministry of Road Transport and Highways, GoI,shows that in 2011 there are a total of 11,984 km of roads in th state, of which 7,072 km were surfaced. These roads are mostly major highways and other roads of PWD, there is only a relatively small length of rural and project roads (See Table 4).
7 Reportedly the Mawiong regulated market does very restricted commodity trading on account of this. In another instance in
Jowai district, the village council decided to refuse to provide land to GOM for building a new farmers market.
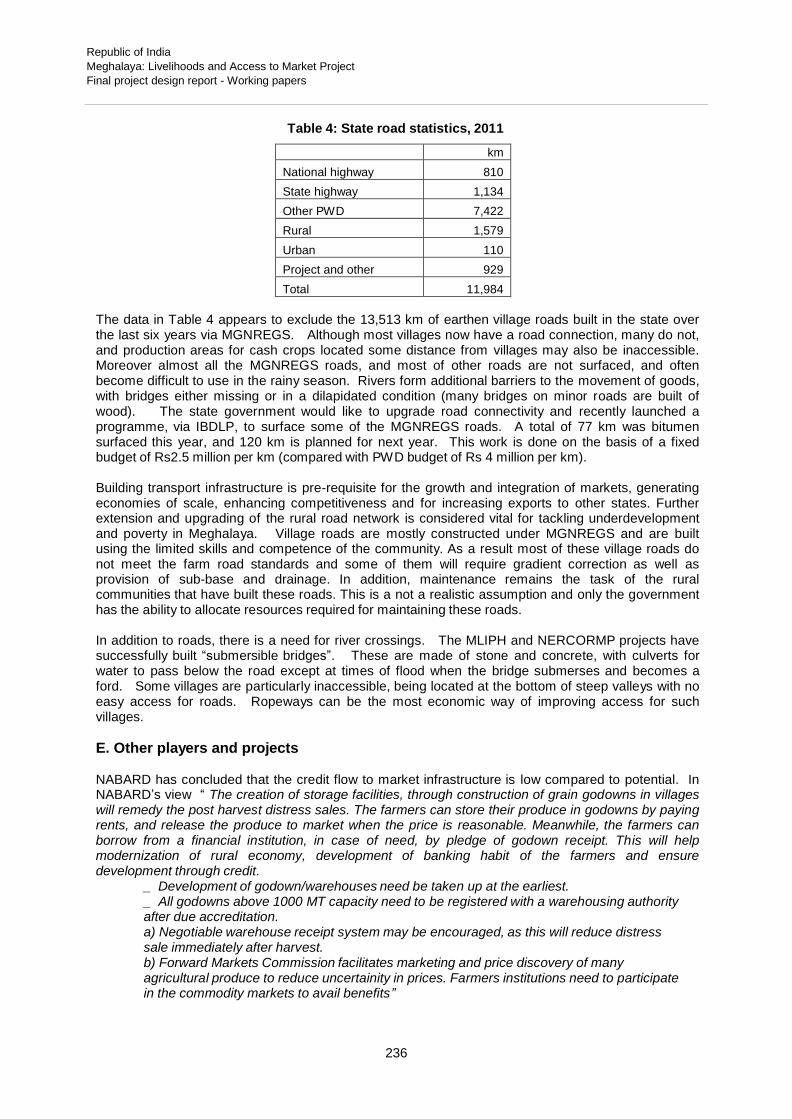
Republic of India
Meghalaya: Livelihoods and Access to Market Project
Final project design report - Working papers
236
Table 4: State road statistics, 2011
km
National highway 810
State highway 1,134
Other PWD 7,422
Rural 1,579
Urban 110
Project and other 929
Total 11,984
The data in Table 4 appears to exclude the 13,513 km of earthen village roads built in the state over the last six years via MGNREGS. Although most villages now have a road connection, many do not, and production areas for cash crops located some distance from villages may also be inaccessible. Moreover almost all the MGNREGS roads, and most of other roads are not surfaced, and often become difficult to use in the rainy season. Rivers form additional barriers to the movement of goods, with bridges either missing or in a dilapidated condition (many bridges on minor roads are built of wood). The state government would like to upgrade road connectivity and recently launched a programme, via IBDLP, to surface some of the MGNREGS roads. A total of 77 km was bitumen surfaced this year, and 120 km is planned for next year. This work is done on the basis of a fixed budget of Rs2.5 million per km (compared with PWD budget of Rs 4 million per km).
Building transport infrastructure is pre-requisite for the growth and integration of markets, generating economies of scale, enhancing competitiveness and for increasing exports to other states. Further extension and upgrading of the rural road network is considered vital for tackling underdevelopment and poverty in Meghalaya. Village roads are mostly constructed under MGNREGS and are built using the limited skills and competence of the community. As a result most of these village roads do not meet the farm road standards and some of them will require gradient correction as well as provision of sub-base and drainage. In addition, maintenance remains the task of the rural communities that have built these roads. This is a not a realistic assumption and only the government has the ability to allocate resources required for maintaining these roads.
In addition to roads, there is a need for river crossings. The MLIPH and NERCORMP projects have successfully built “submersible bridges”. These are made of stone and concrete, with culverts for water to pass below the road except at times of flood when the bridge submerses and becomes a ford. Some villages are particularly inaccessible, being located at the bottom of steep valleys with no easy access for roads. Ropeways can be the most economic way of improving access for such villages.
E. Other players and projects
NABARD has concluded that the credit flow to market infrastructure is low compared to potential. In NABARD’s view “ The creation of storage facilities, through construction of grain godowns in villages will remedy the post harvest distress sales. The farmers can store their produce in godowns by paying rents, and release the produce to market when the price is reasonable. Meanwhile, the farmers can borrow from a financial institution, in case of need, by pledge of godown receipt. This will help modernization of rural economy, development of banking habit of the farmers and ensure development through credit.
_ Development of godown/warehouses need be taken up at the earliest. _ All godowns above 1000 MT capacity need to be registered with a warehousing authority after due accreditation. a) Negotiable warehouse receipt system may be encouraged, as this will reduce distress sale immediately after harvest. b) Forward Markets Commission facilitates marketing and price discovery of many agricultural produce to reduce uncertainity in prices. Farmers institutions need to participate in the commodity markets to avail benefits”

Republic of India
Meghalaya: Livelihoods and Access to Market Project
Final project design report - Working papers
237
NABARD has estimated that the credit potential for supporting creation of storage and market yard investments is of the order of INR 54.9 million in 2013-14. The total credit potential estimated for this subsector for the four period 2013 to 2017 is INR 645 million.
IDFC foundation has been partnering the government in the market infrastructure related aspects. The foundation has carried out a survey and identified some of the problems in the sector. The proposal of the foundation is to develop “Integrated Rural Market Hubs to contribute to accelerated economic growth on a sustainable basis through enhanced incomes and access to better infrastructure (feeder roads, market centres and storage, community management of infrastructure, increase share of value added of small and medium producers and processors” The foundation may select up to six markets to develop on the foregoing lines. These markets are likely to be relatively large markets and their development will complement the work of LAMP, which will focus on small hat bazaars.
A major upgrade of the national highway between Guwahati and Shillong is in progress, funded by GoI. An ADB funded project, the Northeastern States Roads Investment Programme, is constructing roads connecting district towns. Both these projects will complement the village roads to be developed by LAMP.
The Border Area Development Department (BADD) of GoM develops infrastructure is a 10 km strip of land along the border with Bangladesh in the south of the state. Villages in this area are often at the bottom of narrow, steep-sided valleys and are often difficult to reach by roads which run on the plateau above the valleys. Ropeways can be used to transport goods to and from these villages. More than 60 ropeways built by BADD are active. BADD has found that it is best to set up a cooperative to manage a ropeway are charge for its use. A ropeway of 1 km can replace a two hour climb for people carrying goods, cutting transport costs from the upper road head by around 80%.
F. Lessons from market development
Over the last 25 years a number of IFAD-supported projects in Bangladesh have invested in the infrastructure of rural markets. Recent projects have also made interventions in market management and governance. Lessons from developing rural markets in Bangladesh include:
i. It is essential to consult market users at the planning stage regarding the proposed location,
facilities and layout of the market. ii. Markets built at entirely new locations often fail to attract buyers and sellers, and fall into
disuse. It is almost always better to develop an existing market, even if its location is rather cramped.
iii. Market facilities should be tailored to suit the trade at different locations - for example, at one place where the business was dominated by the assembly of bananas for urban markets, the main facility needed was hard-standing for trucks to park and load.
iv. Shops are primarily private facilities, and can be developed alongside public markets through private investment without requiring support from project funds.
v. Market toilets are often not properly maintained and can quickly become unusable. If at all possible toilets should be leased to an operator who then charges for their use and maintains them in working order.
vi. Markets are an important catalyst for local development and market development has benefits that goes beyond the direct business transacted in the market.
vii. Developing the infrastructure of existing markets has attracted more buyers to the market, resulting in increased completion between buyers and improved prices for farmers.
G. LAMP support for market development
(a) Improving market management
As explained earlier, the approach to improving market access for farmers and efficiency of markets ideally should comprise soft and hard interventions. While improved infrastructure in the form better market stalls, storage, auction/trading platforms, weighing equipment, etc., is necessary to improve

Republic of India
Meghalaya: Livelihoods and Access to Market Project
Final project design report - Working papers
238
efficiency of the market, convincing the village and district councils to improve management of the market and introduce better practices relating to conduct of trade is a more important intervention. Given the complexities of negotiating with traditional institutions on reforming market practices, initially a limited number of willing market committees should be approached with a package of finance for physical improvements and changes in market management and governance. The changes in governance and management should relate to aspects such as:
composition of market committee to include representative farmers that bring produce and traders besides persons from the villages covered,
a longer term of office for market committees (currently it is one year at a time),
fixing market fees on traders who buy rather than on famers that bring produce to sell,
focus on cleanliness and hygienic conditions,
fixing base auction prices that fairly reflect the revenue potential, encouraging risk mitigation against natural calamities / fire,
allocation of market space among traders, retailers and casual participants in fair manner.
Market committees require their capacity to be built up through exposure to better markets and training on market management and development. There is a need to seed the idea of market development and, especially, the combination of hard and soft side developments, with market committee members and other local decision makers. This will aim to bring about changes in the structure of market committees (to include representatives of market users). Other desirable changes in market management include rationalisation of market fees, transparent practices in allotment of market stalls, weighing of produce, settlement of transactions and dissemination of prevailing prices. LAMP will adopt a cautious approach, with a significant period of consultations with market users and decision makers, including visits to well developed and managed markets in India and neighbouring countries.
LAMP project budgets include expenditure on the following:
Studies to identify markets for development (if needed these studies could also cover roads
and other communications infrastructure).
Negotiation with communities and traditional leaders regarding improvements in market management
Exposure visits to see public markets in other states and abroad (such as Bangladesh).
Training in market management and maintenance
(b) Improving physical market infrastructure
To select markets for development, a screening process would be followed.
(i) Criteria that must be met
Cooperative local leadership and agreement to: (i) establish a fund for market investment and maintenance into which an agreed share of market revenue will be paid; (ii) establishment of a market users’ committee with defined roles and responsibilities; (iii) guaranteed access for primary producers and temporary traders; (iv) establishment of set rates of market toll, and display of these toll rates on a public notice board.
Development is technically feasible – sufficient land is available in a viable location alongside or within an existing market.
(ii) If a market meets both the above criteria, preference will be given to:
Markets where local institutions and traders are prepared to contribute additional investment in developing market facilities
Markets that have an important role in marketing key rural products
Eventually market development and reform should cover most of the markets in the state. In the initial two years, in selected blocks about 10 markets can be developed into models for other markets to follow. As stated earlier, selection of the markets for developing as models would be based on willingness of the market committees to improve governance and management and the village

Republic of India
Meghalaya: Livelihoods and Access to Market Project
Final project design report - Working papers
239
authorities to provide support including making land available where necessary. LAMP has resources for development of a total of about 55 markets.
The scope and specification of market development would be tailored to the need of each market. For the purpose of project costing a typical development plan has been drawn up. This comprises of the following:
Six open sheds for to provide stalls for sale of products on market days. Each shed would be 16’x18’
One storehouse, 16’x18’ to provide
One latrine block with male and female sections
Concrete pathways around the trading sheds.
The total cost of these facilities for one market is estimated at INR 2.64 million. Details are in Annex 5 along with drawings of the proposed facilities.
(c) Communications infrastructure
Project budgets include funds for 250 km of roads, 20 submersible bridges and 10 ropeways. Details of costing and specification are in Annex 6.
Criteria for selection of locations for the development of roads, bridges and ropeways for development include:
Improve the connectivity of public markets being developed by the project. Some markets require a short length of road to connect them to the main road network – one reason this has not been done is that a number of road schemes will not construct lengths of less than 1 km.
Connect project villages which are producing for the market with the road network and with public markets.
Improve access to areas used for cash crop production, reducing the cost of getting these products to the market.
In addition, account will be taken of the number of households to be served by the proposed infrastructure.
It is envisaged that most road construction would involve improving an existing road or farm track – in particular upgrading the earth roads constructed by MGNREGS. However in some locations it may be necessary to construct a new road. Upgrading of roads will often be more than adding a hard surface to an existing road. Earthwork excavations may be needed to ease steep gradients and sharp corners. Drainage is a critical factor in preventing landslips on hill roads, and many roads require both lateral and cross drainage – arguably this should be a greater priority than surfacing. In some locations, where traffic is light, LAMP may construct earth rather than surfaced roads.
A Village Road Construction Guideline will be prepared, approved and implemented with appropriate design features, eco-friendly construction methods and maintenance guidelines with roles and responsibility of each of the stakeholders comprising the government, traditional institutions and the communities.
Ropeways would be powered by a small diesel or electric motor and would have small godowns at the top and bottom to store goods being transported.
(d) Maintenance and sustainability
The basic infrastructure of public markets is not costly to maintain, however very little (if any) of the fees that are now collected from market users are used for this purpose. Agreements made by LAMP with existing market authorities for the development of their markets will include the requirement to reserve a certain amount of income for maintenance and further improvements, along with the drawing up of an agreed maintenance plan. To ensure that toilet blocks are kept clean and useable, blocks would be leased out to a person who would levy a small user charge and take responsibility for cleaning and maintenance.

Republic of India
Meghalaya: Livelihoods and Access to Market Project
Final project design report - Working papers
240
Although PWD has resources to maintain its highways and other roads, these do not cover village roads such as those built using MGNREGS resources. While MGNREGS works can repair damaged sections of earth roads there is currently no provision for maintenance of bitumen surfaces of village roads. To ensure that the rural roads developed by LAMP provide sustainable communications, the following provisions would be made:
Ensure roads are well constructed, with proper provision for drainage – lack of drainage is a major cause of failure of roads in hill regions.
Consider limiting the width of village roads (but not market connecting roads) to prevent their use by heavy trucks that exceed the carrying capacity of the road
When constructing surfaced roads, pilot concrete rather than bitumen surfaces. Minor rural roads built using RCC have been successful in a number of states in India. Concrete roads should be more durable, and given the availability of stone, do not seem to be significantly more expensive than bitumen roads (see Annex 6).
Finally the Government should create a fund for village road maintenance.
(e) Implementation of infrastructure development
Construction of markets: this would be managed via the Market Management Committee, which would be strengthened through training and support from project staff. Standard designs would be adapted to the needs of individual locations. Construction work would be tendered by the market committee, under the supervision of district PMU staff, and bids would need to be approved by the PMU.
Construction of roads and bridges: construction of MGNREGS funded earth roads has been undertaken by VECs, and a similar approach could be used for any earth roads to be built by LAMP. Upgrading of MGNREGS roads with bitumen surfaces is now being done via the Deputy Commissioner in each district, with a district level convergence committee (including PWD) to ensure these works do not overlap with other schemes. Approved road projects are then implemented by Block Development Officers and their Assistant Engineers. The BDO either engages a contractor, passes the work to the VEC, or uses directly hired labour with government or hired machinery. The Meghalaya Infrastructure Development and Finance Corporation is being established within the MBDA and will support construction work carried out by LAMP. In addition LAMP budgets include provision to hire engineers (either a consulting firm or individuals) or other expertise to assist with design, tendering and construction supervision, as well as training and monitoring in support of works undertaken at the community level.
Construction of ropeways is a highly specialised task and BADD uses an expert from Uttarakhand who is based in Delhi. LAMP would take advantage of BADD experience to engage similar expertise for its ropeways.
H. Risks and mitigation
The traditional institutions and ADCs might resist any GOM initiated intervention. The ground level progress in farming and greater marketable surpluses produced will exert pressure on the traditional institutions. The farmers’ organisations should be ‘educated’ on market access and market related reforms so that they can influence the village councils and ADCs. Already there are examples of aggregated produce marketing initiatives influencing village councils.
Vested interests such as middlemen, traders and commission agents might derail changes in market practice, by offering short term inducements to farmers. The soft interventions should also focus on these intermediaries in the market. Their participation and cooperation should be secured by providing them space in management of the markets.
Producer-sellers might find markets difficult to negotiate and might suffer losses on account of volatilities. As a result the component might underperform. Since the market interventions are both from supply and demand sides, preparing farmers to deal with markets and open up their

Republic of India
Meghalaya: Livelihoods and Access to Market Project
Final project design report - Working papers
241
choices in accessing markets will be a key soft interventions. The farmers’ organisation should also be strengthened and their capacity to negotiate with markets should be enhanced.
I. Conclusion
Meghalaya is in cusp of breaking out into a market economy. The crop diversification and production for markets demand a better-designed market structure. The existing regulations and governance structures leave limited scope for reforms and drastic improvements that are needed to make markets work for the poor and vulnerable small scale producers. While constraints and challenges are many, designing viable examples will pave the way for many markets to find their way to better working.
While ensuring fair share for the producer is challenge across the country, the special difficulties of people that are not market-savvy has to be appreciated and remedies built in to design. A combination of training, capacity building, exposure to better practices at the mark et governance levels and awareness building coupled with aggregation of farmers around their produce is likely to produce good results. The soft interventions to reform practices, processes and market conduct should be supported with infrastructure investments that improve market conditions, hygiene, transparency, information dissemination and better access.
Given the existing state of many of the rural markets, the improvements will be visible within a short period of time, once the local authorities are convinced of the need to transform the markets. The results will be judged by the improvement in realisation of value by producers and the ease of access to all users.

Republic of India
Meghalaya: Livelihoods and Access to Market Project
Final project design report - Working papers
242
Annex 1: List of notified items in the schedule to the APMC Act.

Republic of India
Meghalaya: Livelihoods and Access to Market Project
Final project design report - Working papers
243
Annex 2: Crop-wise important markets8
Crop Market 2. Citrus Saura, Dawki,(JH)
Pynursla (EKH)
1. Pineapple Phulbari (WGH) *Chibinang(WGH) Dawki (JH) Pynursla (EKH) *Nongpo, *Byrnihat (RB) Rongram (WGH) Siju(SGH) Songsak (EGH) Rongjeng (EGH)
3. Banana Karkuta (NGH) Nongpo (RB) Durang Re (assam)
4.Potato Umphyrnai ( EKH) Barabazaar (Shillong) Laitlyngkot
Ginger Bhoyrymbong (RB) Umsning (RB) Mawhati (RB) Chipinang, Rongram(WGH) Williamnagar (EGH)
Turmeric Shangpung (West Jaintia) Mokaiaw (Jaintia) Iooksi (East Jaintia) Selsela (WGH)
Pepper Chibinang WGH Garobada Shella Bolaganj Saura
Bayleaf Pynursla (EKH)** Mawsynram(EKH) Siju (SGH) Mawiong (EKH)*
Chillies Nongpo (RB) Umsning (RB) Rongram (WGH) Dadengre (WGH)
Arecanut Barabazaar (Shillong) Pynursla (EKH) Tura Rongram (WGH)
Cashewnut Phulbari Mostly sold to Assam processing units
Betel leaves Pynursla (EKH) Shella
Plum Barabazaar, (shilling) Umphyrnai (EKH)
Peach Barabazaar (Shillong) Pear Bara bazaar (Shillong) Cauliflower Bara bazaar (Shillong) Cabbage Bara bazaar (Shillong) Tomato Bara bazaar (Shillong) Broomgrass Mawiong, (Shillong)
8 Based on discussions with MSAMB, Departments of agriculture and horticulture and SFAC.

Republic of India
Meghalaya: Livelihoods and Access to Market Project
Final project design report - Working papers
244
Annex 3: Visit to Rongram Hat Bazaar
This market is in West Garo Hills District. About 500 traders are in the market on its weekly trading day. These are mostly retail traders and mostly from outside the state. These pay fees of Rs50-100+ per day, local traders (mostly women) pay Rs10/day (but sell small amounts). Fruit, vegetables, meat, fish, second hand cloths, groceries and sundries are sold. A row of wholesale shops buy areca nut and ginger purchased from farmers – on which toll of Rs10 per bag is levied. In the areca season (3 months) 1000 bags/day are sold, in ginger season (2 months peak) 400-500 bags per day are sold. Ginger is declining.
Vegetable seller (from Assam), daily sales of Rs2000-2500 – pay market fee of Rs100
Dried fish seller: daily sales of Rs3000-4000 (up to Rs5,000-10,000) - pay fee of Rs100
Vegetable seller (local woman): daily sales of Rs1500-2000 - fee of Rs10
General view of part of the market Meat section
Vegetable seller from Assam who was interviewed Dried fish seller from who was interview
Upper floor of market shed and a NERCORMP collection shed not used. There is also a market store which did not appear to be used.
There seems to be some room for expansion. Toll collection is leased out.
A woman paid Rs150 for a plant of a local variety of mango (could have been grafted)
Problems: market committee not working properly, market not cleaned, toilets dirty, too congested, need better arrangement of space. Seems to be no system of allocation of pitches, although traders say they take the same place each week.

Republic of India
Meghalaya: Livelihoods and Access to Market Project
Final project design report - Working papers
245
Local woman vegetable seller being interviewed
Areca nut arriving from farms for sale to traders in the shops to the left.
Rubbish, unusable toilet
Upper floor of market shed not used as access is via stairs
Shed built by NERCORMP not used by traders
Possible space for expansion
Republic of India
Meghalaya: Livelihoods and Access to Market Project
Final project design report - Working papers
246
Annex 4: Reform Linked Investment Scheme
To encourage rapid development of infrastructure projects in agriculture and allied sectors including dairy, meat, fisheries and minor forest produce. Investment subsidy: 25% of the capital cost up to Rs.50 lakh in each project providing ‘Direct’ service delivery to producers/ farming community in post harvest management/ marketing of their produce. However, the entrepreneurs may also have an opportunity to use the infrastructure for their own purpose during the lean period. In case of NE States, hilly and tribal areas, and in the States of Uttarakhand, Himachal Pradesh, Jammu & Kashmir and to SC/ST entrepreneurs and their cooperatives in vestment subsidy shall be 33.33% of the capital cost up to Rs.60 lakh. No upper ceiling on subsidy in respect of infrastructure projects of State Agencies.
Conditions:
* Applicable only in such States/Union Territories, which undertake reforms in APMC Act to allow ‘Direct Marketing’ and ‘Contract Farming’ and to permit agricultural produce markets in private and cooperative sectors.
Promoter’s contribution in project cost to be decided by financing Bank with minimum bank loan of 50% in general cases and 46.67% in hilly areas and North eastern states. State Agencies may take up infrastructure projects from their own funds dovetailing the subsidy under the scheme, with bank loan or without borrowing from the financial institution.
Illustrative List of Infrastructure Projects
*Market user common facilities like market yards, platforms for loading, assembling and auctioning of the produce, weighing and mechanical handling equipment, etc.
*Functional Infrastructure for assembling, grading, standardization and quality certification, labelling, packaging, value addition facilities (without changing the product form)
*Infrastructure for Marketing from producers to consumers/processing units/bulk buyers etc.
*Infrastructure for E-trading, market extension and market oriented production planning.
*Mobile infrastructure for post harvest operations viz. grading, packaging, quality testing etc., (excluding transport equipment)
*Reefer vans, or any other refrigerated vans used for transporting agricultural produce, which are essential for maintaining cold supply chains.

Republic of India
Meghalaya: Livelihoods and Access to Market Project
Final project design report - Working papers
247
Annex 5: Specifications and Costing of Market Development
Development of infrastructure would be tailored to meet the needs of individual markets. A typical market might require the following:
Open sheds for traders to set up stalls – six each 12’ x 18’
Store room with individual lockers – one 12’ x 18’
Toilet block
Concrete pathway between sheds
The cost of constructing these facilities is estimated to be:
Item number Unit cost Total cost
Shops 6 Rs. 223,259 Rs. 1,339,553
Storage 1 Rs. 338,911 Rs. 338,911
Latrine 1 Rs. 611,705 Rs. 611,703
Pavement 1 Rs. 133,583 Rs. 133,583
Sub-total Rs. 2,423,751 Admin 8.75% Rs. 212,078
Total Rs. 2,635,829
Other infrastructure that might be needed could include:
Vehicle parking and loading space
Water supply
Drains
Solid waste disposal
Slaughtering slab
Auction platform
Weighting equipment
However LAMP would not fund infrastructure that is more appropriate for large terminal markets such as cold stores, abattoirs and large godowns
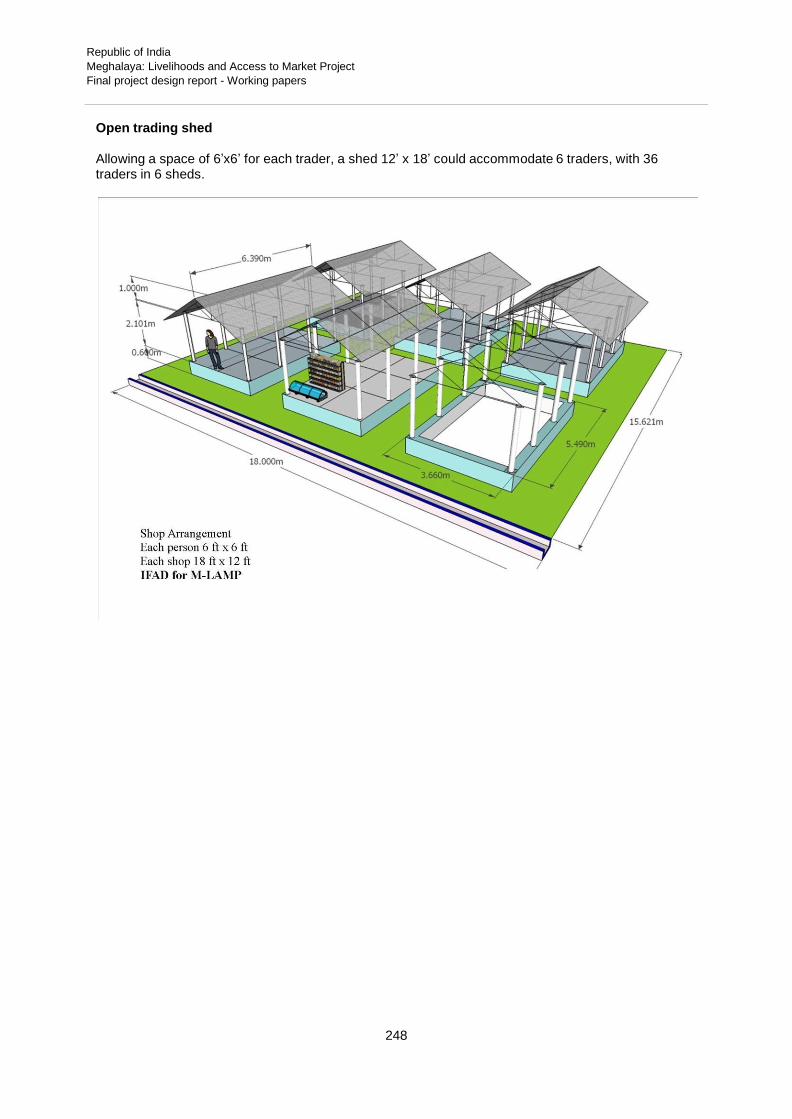
Republic of India
Meghalaya: Livelihoods and Access to Market Project
Final project design report - Working papers
248
Open trading shed
Allowing a space of 6’x6’ for each trader, a shed 12’ x 18’ could accommodate 6 traders, with 36 traders in 6 sheds.

Republic of India
Meghalaya: Livelihoods and Access to Market Project
Final project design report - Working papers
249
Specification of open trading shed
SL MPWD Items L B D Qty Unit Rate/Unit Amount Remarks 1 1.1.e Earthw ork in excavation in foundation trenches, including dressing
of sides and ramming of the bottom including stacking of
serviceable stones, disposal and removal of excavated earth within
a lead of 50 m and lift of 1.50 m complete as directed (e) Hard
shale or Medium shale
18+18+11+11= 58 1 1 58 cft 1 feet deep 1.642 m3 Rs. 379.00 Rs. 622.32 2 2.3 Providing and laying cement concrete in proportion 1:2:4
corresponding to M150 (1-cement, 2-sand, 4-stone aggregates of
20 mm and down graded) including necessary curing complete,
excluding shuttering, in foundation and below plinth and in sepic
tank, inspection pits etc.complete.
58
0.75
3
130.5
cft 3 ft high; 2 ft
above gl 3.695 m3 Rs. 7,239.00 Rs. 26,748.11 3 1.7 Sand filling in plinth in layers not exceeding 15 cm including
breaking of clods, consolidated b ramming and watering complete
as directed (Maximum depth 45 cm).
16 12 2.75 528 cft Below sub-base 14.951 m3 Rs. 2,244.00 Rs. 33,550.04 4 2.1 Providing and laying cement concrete in proportion 1:4:8 (1-
cement, 4-sand, 8 stone aggregates of 63 mm and down graded)
including necessary curing complete excluding shuttering.
16 12 0.25 48 cft Sub-base 1.359 m3 Rs. 6,329.00 Rs. 8,601.11 5 4.31 Providing glazed ceramic floor tiles (Somany/Johnson) of
approved shade 7.3 mm thick in flooring, treads of steps, landings,
laid on a bed of 12 mm thick cement mortar 1:3 (1-cement: 3-
coarse sand) finished with flush pointing as directed. (b) For
medium traffic areas.
18 12 216 sft Flooring 20.07 m2 Rs. 1,622.00 Rs. 32,553.54 6 6.6 Providing stel work in built up tubular trusses including cutting,
hoisting, fixing in position, including welding, etc., and applying a
coat of approved steel primer complete as directed.
int dia
kg/m
m
kg
Truss 65 dia 5.84 14.6 85.498 Truss 65 dia 5.84 20.8 121.47 25 dia 2.99 12 35.88 Purlin 65 dia 5.84 40.2 234.77 477.62 kg Rs. 116.52 Rs. 55,652.00 Truss 7 6.3 Providing steel w orks in tees, flats, angles and channels
including cutting, drilling holes, hoisting and fixing in position
complete.
int dia kg/m m kg Pillar 150 dia 4.5 56 252 252 kg Rs. 116.52 Rs. 29,363.04 Pillar 8 5.9 Providing corrugated galvanised iron sheet roofing fixed with
galvanised iron J & L hooks, bolts and nuts, 8 mm diameter with
bitumen and GI limpet washers filled with white lead complete
excluding the cost of purlins, rafters and trusses. (b) 0.63 mm
thick.
2.85 2 6.69 38.112 m2 Rs. 949.00 Rs. 36,168.74 Roofing Rs. 223,258.91 Rupees Tw o Lakh Tw entyThree Thousand Tw o Hundred FiftyEight And NinetyOne Paisa

Republic of India
Meghalaya: Livelihoods and Access to Market Project
Final project design report - Working papers
250
Storeroom for traders to leave un-sold produce between market days

Republic of India
Meghalaya: Livelihoods and Access to Market Project
Final project design report - Working papers
251
Sl MPWD Item L B D Qty Unit Rate/Unit Amount Remarks 1 1.1.e Earthwork in excavation in
foundation trenches, including
dressing of sides and ramming of
the bottom including stacking of
serviceable stones, disposal and
removal of excavated earth within a
lead of 50 m and lift of 1.50 m
complete as directed (e) Hard shale
or Medium shale
18+18+11+11= 58 1 1 58 cft 1 feet deep
1.642 m3 Rs. 379.00 Rs. 622.32 2 2.3 Providing and laying cement
concrete in proportion 1:2:4
corresponding to M150 (1-cement, 2-
sand, 4-stone aggregates of 20 mm
and down graded) including
necessary curing complete,
excluding shuttering, in foundation
and below plinth and in sepic tank,
inspection pits etc.complete.
58 0.75 3 130.5 cft 3 ft high; 2 ft above gl
3.695 m3 Rs. 7,239.00 Rs. 26,748.11 3 1.7 Sand filling in plinth in layers not
exceeding 15 cm including breaking
of clods, consolidated b ramming
and watering complete as directed
(Maximum depth 45 cm).
16 12 2.75 528 cft Below sub-base
14.951 m3 Rs. 2,244.00 Rs. 33,550.04
4 2.1 Providing and laying cement
concrete in proportion 1:4:8 (1-
cement, 4-sand, 8 stone aggregates
of 63 mm and down graded)
including necessary curing complete
excluding shuttering.
16 12 0.25 48 cft Sub-base
1.359 m3 Rs. 6,329.00 Rs. 8,601.11 5 4.31 Providing glazed ceramic floor tiles
(Somany/Johnson) of approved
shade 7.3 mm thick in flooring,
treads of steps, landings, laid on a
bed of 12 mm thick cement mortar
1:3 (1-cement: 3-coarse sand)
finished with flush pointing as
directed. (b) For medium traffic
areas.
18 12 216 sft Flooring
20.07 m2 Rs. 1,622.00 Rs. 32,553.54 6 6.6 Providing stel work in built up
tubular trusses including cutting,
hoisting, fixing in position, including
welding, etc., and applying a coat of
approved steel primer complete as
directed.
int dia
kg/m
m
kg
Truss 65 dia 5.84 14.64 85.4976 Truss
65 dia 5.84 20.8 121.472 25 dia 2.99 12 35.88 Purlin 65 dia 5.84 40.2 234.768 477.6176 kg Rs. 116.52 Rs. 55,652.00 Truss
7 6.3 Providing steel works in tees, flats,
angles and channels including
cutting, drilling holes, hoisting and
fixing in position complete.
int dia
kg/m
m
kg
150 di 4.5 56 252 Pillar
252 kg Rs. 116.52 Rs. 29,363.04 8 5.9 Providing corrugated galvanised
iron sheet roofing fixed with
galvanised iron J & L hooks, bolts
and nuts, 8 mm diameter with
bitumen and GI limpet washers filled
with white lead complete excluding
the cost of purlins, rafters and
trusses. (b) 0.63 mm thick.
2.85 2 6.686 38.11248 m2 Rs. 949.00 Rs. 36,168.74 Roofing
Specification of store room

Republic of India
Meghalaya: Livelihoods and Access to Market Project
Final project design report - Working papers
252
Sl MPWD Item L B D Qty Unit Rate/Unit Amount Remarks 9 7.1 Providing dressed and rebated
wood works in frames of doors
and other similar works, framed and
fitted in position with nails, spikes,
nuts, bolts etc. as required and
directed complete. (a) White
pinewood.
Frame of doors
White Pinewood 36 16 0.003 1.44 m3 Rs. 20,613.00 Rs. 29,682.72
10 7.15 Providing and fixing 38 mm thick
battened ad braced shutters for
doors and windows including iron
hinges, tower bolts, screws etc.
complete with (a) White pinewood
Doors
36 0.55 2 39.6 m2 Rs. 1,157.00 Rs. 45,817.20 11 7.5 Providing wood work in floor joists
etc. and the like fixed with nails,
spikes etc. complete (a) White Pine Partitions
10 1.2 2 24 m2 36 0.6 0.6 12.96 m2 1 5.5 2 11 m2 47.96 m2 1 inch thick 1.199 m3 Rs. 27,057.00 Rs. 32,441.34
12 7.25 Providing and fixing fly-proof wire
netting fixed on to wooden frames
with wooden beading 60 mm x 20
mm complete with necessary nails
etc (Frames to be paid separately)
(a) White proof beading.
36 0.6 0.6 12.96 m2 Rs. 595.00 Rs. 7,711.20 Rs. 338,911.37 Rupees Three Lakh ThirtyEight Thousand Nine Hundred Eleven And ThirtySeven Paisa

Republic of India
Meghalaya: Livelihoods and Access to Market Project
Final project design report - Working papers
253
Toilet block
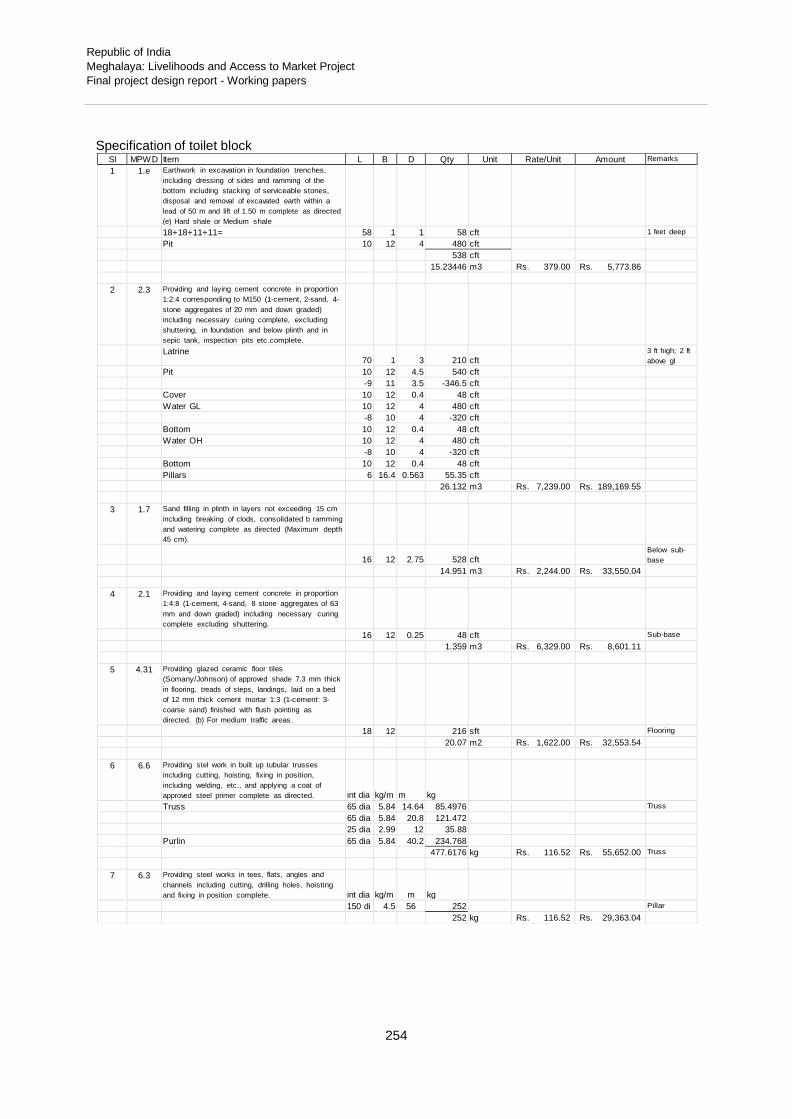
Republic of India
Meghalaya: Livelihoods and Access to Market Project
Final project design report - Working papers
254
Sl MPWD Item L B D Qty Unit Rate/Unit Amount Remarks 1 1.e Earthwork in excavation in foundation trenches,
including dressing of sides and ramming of the
bottom including stacking of serviceable stones,
disposal and removal of excavated earth within a
lead of 50 m and lift of 1.50 m complete as directed
(e) Hard shale or Medium shale
18+18+11+11= 58 1 1 58 cft 1 feet deep Pit 10 12 4 480 cft 538 cft 15.23446 m3 Rs. 379.00 Rs. 5,773.86
2 2.3 Providing and laying cement concrete in proportion
1:2:4 corresponding to M150 (1-cement, 2-sand, 4-
stone aggregates of 20 mm and down graded)
including necessary curing complete, excluding
shuttering, in foundation and below plinth and in
sepic tank, inspection pits etc.complete.
Latrine 70
1
3
210
cft 3 ft high; 2 ft
above gl Pit 10 12 4.5 540 cft -9 11 3.5 -346.5 cft Cover 10 12 0.4 48 cft Water GL 10 12 4 480 cft -8 10 4 -320 cft Bottom 10 12 0.4 48 cft Water OH 10 12 4 480 cft -8 10 4 -320 cft Bottom 10 12 0.4 48 cft Pillars 6 16.4 0.563 55.35 cft 26.132 m3 Rs. 7,239.00 Rs. 189,169.55
3 1.7 Sand filling in plinth in layers not exceeding 15 cm
including breaking of clods, consolidated b ramming
and watering complete as directed (Maximum depth
45 cm).
16
12
2.75
528
cft Below sub-
base 14.951 m3 Rs. 2,244.00 Rs. 33,550.04
4 2.1 Providing and laying cement concrete in proportion
1:4:8 (1-cement, 4-sand, 8 stone aggregates of 63
mm and down graded) including necessary curing
complete excluding shuttering.
16 12 0.25 48 cft Sub-base 1.359 m3 Rs. 6,329.00 Rs. 8,601.11
5 4.31 Providing glazed ceramic floor tiles
(Somany/Johnson) of approved shade 7.3 mm thick
in flooring, treads of steps, landings, laid on a bed
of 12 mm thick cement mortar 1:3 (1-cement: 3-
coarse sand) finished with flush pointing as
directed. (b) For medium traffic areas.
18 12 216 sft Flooring
20.07 m2 Rs. 1,622.00 Rs. 32,553.54
6 6.6 Providing stel work in built up tubular trusses
including cutting, hoisting, fixing in position,
including welding, etc., and applying a coat of
approved steel primer complete as directed.
int dia
kg/m
m
kg
Truss 65 dia 5.84 14.64 85.4976 Truss
65 dia 5.84 20.8 121.472 25 dia 2.99 12 35.88 Purlin 65 dia 5.84 40.2 234.768 477.6176 kg Rs. 116.52 Rs. 55,652.00 Truss
7 6.3 Providing steel works in tees, flats, angles and
channels including cutting, drilling holes, hoisting
and fixing in position complete.
int dia
kg/m
m
kg
150 di 4.5 56 252 Pillar
252 kg Rs. 116.52 Rs. 29,363.04
Specification of toilet block

Republic of India
Meghalaya: Livelihoods and Access to Market Project
Final project design report - Working papers
255
Sl MPWD Item L B D Qty Unit Rate/Unit Amount Remarks
8 5.9 Providing corrugated galvanised iron sheet roofing
fixed with galvanised iron J & L hooks, bolts and
nuts, 8 mm diameter with bitumen and GI limpet
washers filled with white lead complete excluding
the cost of purlins, rafters and trusses. (b) 0.63 mm
thick.
2.85
2
6.686
38.11248
m2
Rs. 949.00
Rs. 36,168.74
Roofing - 0.63
mm
9 7.1 Providing dressed and rebated wood works in
frames of doors and other similar works, framed and
fitted in position with nails, spikes, nuts, bolts etc.
as required and directed complete. (a) White
pinewood.
2
17
0.006
0.19125
m3
Rs. 20,613.00
Rs. 3,942.24
White Pinewood 7
16.5
0.006
0.649688
m3
Rs. 20,613.00
Rs. 13,392.01
Frame of
Doors
10 7.15 Providing and fixing 38 mm thick battened ad
braced shutters for doors and windows including
iron hinges, tower bolts, screws etc. complete with
(a) White pinewood
Doors
2 3 2 12 m2 Rs. 1,157.00 Rs. 13,884.00 7 0.75 2 10.5 m2 Rs. 1,157.00 Rs. 12,148.50
11 3.1 Providing 100 mm thick hollow cement concrete
block wall with cement mortar in proportion 1:1:8 (1
cement, 1-hydraulic lime and 8-sand) complete
(standard size of hollow cement concrete 400 mm x
100 mm thick x 200 mm high) laid in cement mortar
in proportion 1:6 (1-cement, 6 -sand) and curing 3
(three) times a day for 10 days.
Walls
17.07 2.1 1 35.84448 m2 0 m2 0 m2 35.84448 m2 bricks 35.84448 Rs. 610.00 Rs. 21,865.13
12 6.2 (a) Providing tor steel reinforcement in RCC work
including cutting, bending, cranking and tying in
position with binding wire, 20 gauge, as shown in
drawings, complete up to floor two level.
Reinforcemen
t
12 dia 8 6 5 240 m @0.89 Kg/m 213.6 Kg 8 dia 20 3 4 240 m @0.39 Kg/m 93.6 Kg 30 3 3 270 m @0.39 Kg/m 105.3 Kg 412.5 kg Rs. 99.80 Rs. 41,167.50 6.1 Providing mild steel reinforcement in RCC work
including cutting, bending, cranking and tying in
position with binding wire, 20 gauge, as shown in
drawings, complete up to floor two level.
Mild Steel
6 dia 33 6 1.1 217.8 m @0.22 Kg/m 84.942 Kg Rs. 79.98 Rs. 6,793.66
13 11.1 Providing and fixing in position European patterned
water closet including traps, seats and lids, lead
alkathene pipes etc. conforming to relevant IS
Specification and of approved make, in cement
concrete 1:3:6 (1-cement, 3-coarse sand: 6-stone
aggregate) complete with all necessary fittings
including cutting and making good the walls and
floors wherever required and as directed by the
Engineer-in-charge. (a) P-type (White)
7
each
Rs. 3,146.00
Rs. 22,022.00
Commodes
14 11.6 Providing and fixing vitreous china clay urinal pan
(standing etc. complete with all necessary fittings
including cutting and making good the walls and
floors wherever required and as directed by the
Engineer-in-charged. (a) 465 mm x 355 mm x 265
mm
4
each
Rs. 1,331.00
Rs. 5,324.00
Urinal basins
15 11.5 Providing and fixing in position wash hand basin
etc. complete with all necessary fittings including
cutting and making good the walls and floors
wherever required and as directed by the Engineer-
in-charged (a) 300 mm x 400 mm (a) White
5
each
Rs. 2,233.00
Rs. 11,165.00
Wash basins
16 4.39 Providing and fixing cement bonded particle board
10 mm thick on partition walls frame with seasoned
local wood frame with seasoned local wood/pine
wood including 1st class local/pine wood beading
(50 mm x 12 mm) complete as directed frame to be
paid separately.
7
2.1
1.5
22.05
m2
Rs. 1,096.00
Rs. 24,166.80
10 mm
partition wall
17 Pump LS Rs. 25,000.00 18 Pipes LS Rs. 10,000.00 19 Finishes LS Rs. 10,000.00
Rs. 611,702.72 Rupees Six Lakh Eleven Thousand Seven Hundred Two And SeventyTwo Paisa

Republic of India
Meghalaya: Livelihoods and Access to Market Project
Final project design report - Working papers
256
Annex 6: Specifications and Costing of Road and Bridge Development
The cost on one kilometre of bitumen and concrete surfaced roads are compared in Table 1. This cost includes earthworks to cut a new roadway in a hill location – but in many cases this will not be needed if an existing road or track is being upgraded. The total cost of a concrete road is Rs3.96 million, which is higher than that the Rs3.19 million cost of a bitumen surfaced road, but the bitumen road will need more maintenance. If the cost of a replacement prime coat and bitumen surfacing is included every five years, with this cost stream discounted over a 20 year period at 10%, then the net present value (NPV) of the bitumen road is Rs 4.1 million, higher than NPV of the concrete road of Rs3.6 million. Project budgets are based on an average cost roads of Rs3,500,000 per km, allowing for a combination of bitumen and concrete roads to be constructed. If needed, some earth roads could also be built, allowing the budget to be stretched to a greater length of road.
Table 1: Cost per kilometre of bitumen and concrete surfaced roads
unit
quantity
Rs per kilometre
bitumen Concrete
Earth work to cut roadway cu.m. 3000 573,000 573,000
Lateral drain excavation cu.m. 300 57,300 57,300
Lateral drain concrete cu.m. 82.5 358,215 358,215
Sub-base, 150 mm cu.m. 450 1,147,500
Prime coat sq.m 3000 212,400
Bitumen surfacing, 20mm sq.m 3000 846,000
Concrete slab, 2.5 m x 150 mm cu.m. 375 2,974,125
Total 3,194,415 3,962,640
NPV over 20 years @ 10% 4,102,754 3,602,400
The cost of a typical submersible bridge is shown in Table 2, and a ropeway in Table 3.
Table 2: Cost of a submersible bridge
Quantity Cost Rs
Causeway 12 m 611,792
Wing Wall 4 nos 284,732
Culvert, 2 m 2 nos 717,406
Total 1,613,930
Table 3: Cost of a ropeway
quantity Cost Rs Ropeway, 1 km, including engine/motor
1
2,000,000
Godowns, 8 x 4 m 2 1,200,000
Total 3,200.000

Republic of India
Meghalaya: Livelihoods and Access to Market Project
Final project design report - Working papers
257
Working paper 10: Rural Finance
1. Introduction
Financial inclusion is a tall task in the state with its difficult topography and sparsely distributed population. Until recently subsistence level livelihoods did not make many demands on financial services. The banking sector has not been prioritizing access to finance in the state on account of the poor commercial prospects. The state has a population of 2.96 million in 0.53 million households. There are 0.21 million farm land holdings of which more 0.17 million were very small at less than 2 ha. The State has a population density of 132 persons per square kilometer, which is among the one of the lower
population densities in the country (the Indian average is about 365/km2). Two districts, viz., West Khasi
Hills and South Garo Hills have population densities of only 73 and 77 persons respectively per km2.
At the end of December 2012, 29 commercial banks, one regional rural bank and the State Cooperative Bank were functional. Two Urban Cooperative Banks and the North Eastern Development Financial Institution were part of the financial system in Meghalaya. Of the 180 Primary Agricultural Cooperative Societies that existed about five years back, 95 are reported to be functional. Apart from this six Micro Finance Institutions had been extending credit services. More than 13,000 Self Help Groups (SHGs) have been formed in the State and, of these, 9,200 groups have been linked with banks. About 2,400 SHG have been affiliated to 144 Cluster Level Federations (CLF) formed under the Meghalaya Livelihood Improvement Project for the Himalayas, funded by IFAD.
2. Banking coverage and service availability
In terms of population served per branch, Meghalaya had a better coverage compared to the national average. The population per bank office in Meghalaya is lower at 12,650 against the national average of 14,950. But this apparently better availability of branch network belies the fact of poor actual coverage of financial services on account of the distances between villages and bank branches. The 305 branches of
banks in the state are distributed across a vast geography at the rate of only 13.6 branches per 1000 km2
(compared with the country distribution of branches across India of 30 branches per 1000km2). About
50% of respondents in a survey on Access to Finance reported that they have travel more than 5 KM to get to a bank branch.
Table 1: Distance to the nearest bank branch1
The number of deposit accounts per 100 adults is 41 and the number of loan accounts is 8.3. The national average is much higher, at 59.3 deposit accounts and 13.3 credit accounts per 100 adults. The per capita deposit in the State is about Rs 13,000, which is less than the national average of Rs 16,700. The average credit outstanding per capita is low at Rs 5,200 when compared with the national average of Rs 10,470. Moreover bank branches do not cover the State evenly. East Khasi Hills and Jayantia Hills have more than a proportionate number of branches when compared with their population, while there
1 Excerpted from ‘Designing an access to finance programme in Meghalaya – Demand side survey Report’ October 2012 –
International Finance Corporation

Republic of India
Meghalaya: Livelihoods and Access to Market Project
Final project design report - Working papers
258
are fewer in West Khasi Hills, East and West Garo Hills and South Garo Hills. People from villages that were farther away from the branch locations are least likely to approach the bank branch for services.
Table 2: Bank network and business in Meghalaya2
March 2013 Commercial bank branches 256
Cooperative bank branches 46
Commercial banks Deposits Rs billion 139.72
Commercial banks Loans Rs billion 32.74
Agricultural loan accounts 54437
Agricultural Loans amount Rs billion 2.67
Proportion of agricultural loans to total loans 8.15 %
The credit-deposit ratio in the state is 37% for all the banks put together and it has been marginally declining over the last few years. The credit to state domestic product ratio was 41%, which is much less than the national credit to GDP ratio of 62%. Agricultural credit to agricultural domestic product is very low at 3.5%, compared to the national average of 47.7%. From all points of view the State suffers from limited access to financial services and the shortfalls are severe in the rural areas.
Overall the performance of the banks in the State had been less than optimal. During the year 2012-13 banks had provided loans to the tune of Rs 17.12 billion of which the priority sector loans were to the extent of Rs12.33 billion. Housing loans were the single largest segment at almost Rs 4 billion. Services sector also got support to the extent of Rs 5.89 billion. The overall achievement against the priority sector targets during 2012-13 was only 49% indicating that needy sections of people and deserving sectors in the economy did not get adequate credit support.
3. Farm credit
Of the total agricultural credit, SBI had a lion’s share followed by the Meghalaya Rural Bank and Meghalaya Cooperative Apex Bank. Overdues in agriculture loans were stated to be 49% for all banks but the Non Performing Assets were only 5% of the total assets. In all, more than 13,000 defaulted loans are filed for recovery proceedings before the Government of Meghalaya for a pending sum of Rs. 0.42 billion.
The State has more than 390,000 farm holdings, but the number of loans given for agriculture during 2012-13 was only 67,600, of which crop loans were 54,800. The total number of outstanding agricultural loans was 97,973 at the end of March 2013, involving an amount of Rs 4.49 billion. Credit access from formal institutions was available to only 25% of farm holdings. About 75% farm holdings remained outside credit coverage. Credit support for farm based livelihoods is negligible as can be seen from the fact that agricultural credit was only 3.5% of the agricultural GDP in the state in 2011
3. The average agricultural
loan outstanding in Meghalaya at Rs. 9,230/ha was much lower than the national average of Rs 68,000/ha. Kisan Credit Cards provide lower limits to farmers in the state at Rs 28,000 per KCC
compared to the national average of Rs 78,000 per KCC4.
Bankers, during meetings with mission, held that the demand for credit is low and culturally people were unwilling to take loans. In particular farm households were fearful of incurring debts with banks as they feared adverse consequences in case of default. With few enterprises and the subsistence nature of economic activities rural people were unlikely to resort to loans from banks. The slew of different types of funds available within the village, and the number of schemes of government through which subsidies were made available, also dampened the demand for credit and basically the people were not inclined to travel long distances to approach bank branches for their services.
2
Source: State Level Bankers committee data; State Focus Paper 2013-14-National Bank for Agriculture and Rural Development, Shillong. 3
The national average was 47.7% 4
The data pertains to 2011. The number of Kisan Credit Cards active in the state was 59300 with a credit limit of Rs1.82 billion. The average limit sanctioned in 2013 was Rs 30600; but national average data for 2013 is not available for comparison.

Republic of India
Meghalaya: Livelihoods and Access to Market Project
Final project design report - Working papers
259
While these were the explanations offered by banks for low credit coverage, visits to the field and discussions with other stakeholders brought out that unwillingness of banks to lend was also cause for low take-up of loans. The robust demand for loans is seen from the number of people who had requested assistance for these while registering their names with the Enterprise Facilitation Centres. Visits to some of the cluster level federations and also to one Primary Agricultural Credit Society brought out that there was a demand for loans especially for expanding the cultivation of cash crops and also personal loans of several types. While the demand might be muted compared to other states, the fact that supply had been severely limited indicates that, in the short term, a significant amount of loans would be needed to fulfill the basic requirements.
Table 3: Agricultural credit demand and supply scenario
Aspect Unit Credit demand estimate
Comments
Acreage under cultivation (NSA) 284,000 ha 55% land (NSA) demanding credit 156,200 ha 37.5% rural households access
financial services in Meghalaya. National average 55% (Census 2011).
Number of farm households 390,000 Number of rural households are 422197 (census 2011)
Number currently availing credit 97,970 only 25% households had credit access
Loans required at current national average
Rs 68,100/ha Rs 10.63 billion Agriculture loans outstanding Meghalaya Rs 4.49 billion (March 2013)
Loans required to reach 75% of the national agricultural credit to agricultural GDP ratio in 2011
State GDP from agriculture Rs 36.130 billion (2012-13).
Rs 13.0 billion 75% of national average agricultural credit to agri GDP is 36%
Improvements in the technology of cultivation, use of better inputs and inducing enterprise activity in rural Meghalaya would require fairly strong credit support by willing institutions that operate on the ground. A rough estimate has been made to understand the nature of demand and the current supply response. As can be seen from the table above, the demand even at conservative levels far exceeds the current supply. To reach a credit support level that is 75% of the all-India average, credit should expand three times. Even with the financial inclusion plans being implemented, banks may not expand their credit portfolios. The recent experience in implementing financial inclusion in Meghalaya and elsewhere, very clearly shows that banks prioritize savings and not credit. Hence other institutional alternatives have to be found to ensure that the livelihood and enterprise finance requirements are better met. It is in this context that the proposal made by Government of Meghalaya for setting up of integrated village cooperatives needs to be examined.
Table 4: Credit demand in the context of the project
Credit demand for Amount Assumptions Enterprises to be set up Rs 1.5 billion 50% of enterprises set up (30000 envisaged) will
require bank loan. Average loan demand Rs0.1 million per enterprise
Product cluster livelihoods Rs 1.0 billion 25000 households in 1350 villages. Average loan per household Rs 40000
Other farm based livelihoods Rs 1.5 billion 50000 remaining households (outside clusters) with average loan of Rs 30000.
Aggregation and marketing Rs 2 billion 100 aggregation centres transacting an average of Rs 20 million
Total credit demand Rs 6 billion
For LAMP activities to be successful, minimum credit support of the order of Rs 6 billion over the project period may be needed (Table 4). The total current outstanding loan volume for agriculture from banks is

Republic of India
Meghalaya: Livelihoods and Access to Market Project
Final project design report - Working papers
260
about Rs 4.5 billion, covering about 97,000 households. Net of overlaps, about 60,000 new households might require credit under the project to the extent of Rs 5 billion.
4. Status of community based financial services in the state
4.1 Self Help Groups
The SHG bank linkage programme in the state has credit-linked about 4750 groups with outstanding loans of Rs 0.26 billion; and 8,500 SHGs have saved Rs 0.11 billion with banks. The average loan per member is about Rs 5,500. There is a likely overlap of farm households that borrowed from banks and SHG members that borrowed from banks through their groups. 144 Cluster Level Federations had been set up covering about 2,400 SHGs formed under the MLIPH project. Some of these federations have been operational in providing services relating to input supply and marketing of aggregated produce. 85% of CLFs had their own cluster training centres (CTC) and 90% had developed a roadmap for their future. Some have prepared their business plan and a strategy for their sustainability. Some federations have also been active in financial intermediation. All the CLFs were reported to be collecting charges from the affiliated SHGs to meet the administrative costs and further charge fees and commission for other services. The governance of these CLFs emphasize the potential for developing viable local community based entities. LIFCOM, a State promoted financial institution, has not been too active, providing 261 enterprise loans to the tune of Rs 7.2 million. LIFCOM’s future plans include retail lending to groups and individuals, with equity from the state government and bulk loans from banks.
Table 5: Position of Cluster Level Federations – March 20135
DISTRICT TOTAL NO.
OF CLF NO. OF
CTC HAVING
VISION/ROAD MAP HAVING
SUSTAINABILITY PLAN HAVING
BUSINESS PLAN
JAINTIA HILL 28 28 28 28 5
EAST KHASI HILLS 30 14 30 2 18
RI BHOI 24 24 10 10 2
EAST GARO HILLS 35 29 35 35 35
SOUTH GARO HILLS 27 27 27 27 0
TOTAL
144 122 130 102 60
% 85% 90% 71% 42%
4.2 Primary Financial cooperatives in the state
Table 6: Status of primary financial cooperatives6
Position as on 31 March 2013 Number of PACS registered 179 Number of members 88908 Equity capital Rs million 84.61 Government share of capital Rs million 68.83 Number of PACS reporting profits 68 Average number of members per PACS 496 Average Member equity per PACS Rs 88150 Average equity contribution per member Rs 175 PACS that availed loans from MCAB 135 PACS that have potential revival and restructuring
7 95
5 Information provided by MRDS, Shillong. (implementing agency for MLIPH)
6 Data source: Department of Cooperatives and MCAB
7 As indicated by MCAB

Republic of India
Meghalaya: Livelihoods and Access to Market Project
Final project design report - Working papers
261
The PACS and the Meghalaya Cooperative Apex Bank had been taken up for restructuring and reform
under the Cooperative Reform Project8
of the Government of India. The State government had carried out legislative and operational changes in the financial cooperatives. About Rs 0.11 billion was received as assistance towards recouping the assessed losses of PACS (at the cut off date of June 2004). The PACS were adversely affected when the cadre of secretaries of PACS was dismantled as part of the reforms. In absence of a central source of salaries, the PACS did not pay the secretaries in many locations and hence the PACS become dormant. The State and the Apex Cooperative Bank have taken up the Integrated Cooperative Development Programme (ICDP) with support from the National Cooperative Development Corporation. PACS that have potential are provided funds for their business plans. The funds required for business plans are provided to the extent of 90%, with 30% as a corpus grant by the government and 60% as a loan from MCAB. The balance of 10% has to be brought in by the PACS. The most critical problems noticed were that: (i) the PACS were unable to meet the salary expenditure of the Secretary, (ii) very few members were active, (iii) extent of loan funding from MACB was low, (iv) repayment rates of loans by members to PACS were not satisfactory, (v) member contribution to equity capital of PACS was meager, (vi) the business volume was very low, and (vii) the leadership in most PACS was weak. PACS have large areas of operation with some PACS covering 75 villages. Most PACS typically covers about 20 villages. The image of PACS in the minds of people was not positive. Any restructuring and reform of the PACS will have to take in to account to these problems and find effective solutions.
The Registrar of Cooperatives had finalized a strategy for promoting and establishing a few pilot IVCS and had prepared the model bye-laws for the purpose. The model bye-laws have been examined and changes required to make them fully suitable to the requirements of the proposed IVCS have been suggested. The revised model bye-laws are enclosed as annex 3.
5. Interventions by IFC
IFC has prepared a proposal for a project that aims at increasing access to financial services in the state. The proposal seeks to incentivize banks to expand branchless banking models through staff serviced mobile van kiosks and technology enabled business correspondent agent network. The overall project outlay proposed is about Rs 0.25 billion. While the banks in the state might be able to increase their network presence through branches and agents, with the priorities established by banks as described in earlier paragraphs, credit access for rural households is likely to prove elusive. On account of the likely engagement of the IFC with formal financial sector, LAMP does not propose to engage with commercial banks through the project, except to coordinate activities and influence credit flow to enterprises and higher level activities in value chains. Some expenditure in dissemination of information and creating awareness might be necessary and also some training courses for bankers on specific aspects of project promoted enterprises. These costs are expected to be negligible and during appraisal these can be quantified once the nature of IFCs project interventions become clear. LAMP will coordinate with IFC and ensure the two projects work to mutual advantage for improving the efficacy of rural finance interventions.
6. Proposed rural finance intervention under LAMP
6.1 Integrated Village Cooperative Societies
The Meghalaya Basin Development Authority, under its Integrated Basin Development and Livelihoods Programme has envisaged the setting up of home-grown institutions in the villages to deliver access to financial services in the different parts of the State. The Government has reached this conclusion after considering the reality of the formal banking network being unable to provide access to finance in the different villages and the distant parts of the state on account of difficult topography and sparse population with limited transport and communication infrastructure. Government had prepared a basic concept paper on the setting up Integrated Village Cooperative Societies on which substantive
8
This is also referred to as the Vaidyanathan Committee package, named after the expert groups that prepared the reform package.

Republic of India
Meghalaya: Livelihoods and Access to Market Project
Final project design report - Working papers
262
discussions have been held with the government officials as also the Meghalaya Cooperative Apex Bank. The natural bonding that exist between the village communities as also the existing groups and community organizations of different types (both traditional and project specific creations) would be utilized in setting up the IVCS. The Integrated Village Cooperative Societies would be comprehensive in their character. The roles that they are expected to play are
(a) provide access to financial services especially savings and credit to its members,
(b) Sell inputs and other essential requirements that have to be sourced from outside the village to its members,
(c) Engage in aggregation of crops/products of members with a view to market the same advantageously to improve price realization (and if necessary to engage in processing activities as well),
(d) Act as a service provider for different entities that would like to reach the village households through the medium of the IVCS for variety of objectives such as marketing of products - both financial and non- financial,
(e) Act as a service provider for NGOs, government and other entities that might choose to operate through the IVCS for delivery of their technical and non-technical services.
(f) Help the village community and households to receive, handle and account for moneys received under different programmes – such as for NRLM, watershed, forestry, MGNREGS, etc.
6.2. Establishment of IVCS
The IVCS establishment would be carried out through a dedicated service provider9
with adequate knowledge of formation of grassroots financial institutions especially in the cooperative sector and handholding these institutions during their initial phase. The setting up of IVCS would be preceded by pilot testing 3 different models of mobilization of people viz,. (a) mobilization of people into SHGs and aggregating these groups into societies with provision for individuals joining directly as members if they choose not to be part of SHGs, (b) to mobilize individuals and households in villages and aggregate their needs at the village level and aggregating 5 or more villages into an IVCS at the apex for the constituent villages, (c) to set up the IVCS as a cooperative society of individual households comprising the population of 5 villages directly with adequate representation for members from each village in the governance of the IVCS. (The difference between (b) and (c) would be that at each constituent village level a committee of village members would review financial and operational performance of IVCS in that particular village , make recommendations on loan proposals and monitor defaults – the accounts and finances will be aggregated at the IVCS for the constituent villages.)
9
See annex 1 for criteria for selection of service providers

Republic of India
Meghalaya: Livelihoods and Access to Market Project
Final project design report - Working papers
263
Chart 1: IVCS Different mobilization models
IVCS
Model (a) IVCS
Model (b)
SHGs SHGs Members Village 1
Members Village 2
Members
village 3
IVCS
Model (c)
Individual members in the select villages
Each village will have a representation in the board of the IVCS). Based on the findings and learning in these 3 different models, appropriate decisions as to which model is most suitable and if there are differing needs for different districts would be taken on the approaches to be followed. The facilitating service provider will be required to prepare (a) process manual for setting up and incubating the IVCS in the initial period, (b) training manual for training those staff who would be facilitating and handholding the IVCS, (c) a training manual for staff of IVCS in relation to their roles, responsibilities and tasks, (d) an operational manual for the IVCS in relation to their governance, management, day to day operations relating to financial services to members as also the administration of the society. The accounting systems and processes would be the same as that of the Common Accounting System introduced for PACS during the implementation of the reform process.
6.3. Location
The location of IVCS should be done on the basis of business potential. The business potential for IVCS might be low if located in individual villages. Of the 5800 plus villages in the state only 39 have a population of 2000 people or more (Table 7). In all these villages, banks have either opened a branch or appointed an agent to cater to the needs of financial inclusion under guidance from RBI. The IVCS might avoid these 39 villages in the initial period.

Republic of India
Meghalaya: Livelihoods and Access to Market Project
Final project design report - Working papers
264
Table 7: Population-wise distribution of villages
Population No villages
Less than 200 2762
200 to 1000 2827
1000 to 2000 154
Above 2000 39
For assessing suitability of location, a cluster of 5 to 6 villages with potential may be considered after examining aspects such as having a feasible number of members (say 400 to 500), level of economic activity (cash crops, existence of local market), potential for mobilizing savings and providing loans, potential for promoting enterprise activities. The villages with a population of 1000 to 2000 will be a first choice for locating the IVCS. The clusters of villages with population between 200 and 1000 will be the next choice for putting together the required membership for IVCS. A total of 300 IVCS across the state seems a reasonable goal.
The locations where there are cluster federations (promoted by MRDS under MLIPH) could be considered as good locations for IVCS. These federations (subject to feasibility) may be converted to function as IVCS. This conversion could be achieved within a relatively shorter period of time than setting up new IVCS in other locations. The converted IVCS can then serve as models for other locations where new institutions have to be set up. Further the locations where the previous Primary Agricultural Credit Societies were functional in the past may also be considered as possible locations. Of the 180 or so PACS which have reportedly become defunct, around 60 are being revived by the Government of Meghalaya in collaboration with the MCAB. These societies can be developed on the IVCS format. Beyond this, other locations can be based on the selection criteria. Preference should be given to conversion of existing institutions into IVCS as that might be the faster means of achieving the goal of providing financial service access to the rural people.
The cluster level offices provided for cluster Area Employment Councils (that were to deal with MGNREGS, but have largely been superceded by VEC)) are presently not fully used. The premises are well designed for handling a number of footfalls that is required for a financial institution and have electricity supply. A part of these premises where available can be provided to the IVCS for its operations. Existing own premises of PACS may also be considered for housing the IVCS.
Many PACS presently have 20 to 40 villages in their area of operation. It is operationally not feasible to cover such a large number of villages. Due to lack of familiarity, the members (the distance between villages rules out bonding between members) might not trust their cooperative society, especially for savings. Where the PACS have to be transformed in to IVCS, the core set of five or six contiguous villages should be identified. The RCS should be requested to remove the remaining villages from the area of operation of the resultant IVCS, giving scope for formation of new IVCS in feasible set of villages that become available on account of RCS’ action. Some PACS that are dormant and do not have potential for revival in their present form, may have to be liquidated. A study should be carried out - of existing PACS with a view to identify the potential ones that can be reformed in to IVCS and those without potential that might have to be liquidated.
6.4. IVCS membership
The IVCS would have adequate flexibility to take individuals as well as groups (formal or informal) as its members. It would also have the flexibility to admit nominal members for short periods of time (usually a year) in order to ensure that coverage of people in the local area for access to services is complete and comprehensive. Financial service availability from the IVCS would be conditional on membership and non-members would not be provided saving and credit services. Other non-financial services may be offered to non-members at a price which might be higher than those charged to the members of the cooperative. While services will be offered within the villages that are covered by the IVCS as per its initial design, it can admit members from other nearby villages not covered by any IVCS. The services for such members will be available only in the IVCS premises and not at these members’ own villages.

Republic of India
Meghalaya: Livelihoods and Access to Market Project
Final project design report - Working papers
265
6.5 Members’ responsibilities and rights
Members should contribute to the equity capital of IVCS from the initial stages. A review of the progress of PACS shows that member contribution to equity is at a low level. With very low level of equity
investment, members will not feel their ownership. A forty year old PACS10
that was visited, had member equity of about Rs 64,000 with an average member contribution of Rs 250, which is very low. IVCS should target healthy mobilization of equity from members, with the support of matching corpus fund contributions. The equity held by individual member should be a key consideration in provision of credit facilities and also output marketing. A clear relationship between equity and patronage should be established
11. If members are required to hold equity at a percentage of their credit requirements or input
purchase or output sales, the overall equity of the PACS will increase steadily with increasing business each year. Retirement of equity at the end of the year should be discouraged. Payment of dividends and patronage payments will keep capital intact with the PACS. The members should participate in the conduct of affairs of their IVCS through attendance in General Meetings, contesting for elections to office, voting in elections to the board of IVCS, patronizing the IVCS for all financial and non-financial services requirements, proper use of IVCS products and services and on-time repayment of loans.
6.6. Staffing
Paid staff for each of the societies is an essential precondition. In order that the societies’ day-to-day operations and accounting are carried out diligently, paid staff should be engaged. These staff would require to be well trained prior to taking up their responsibility. This training would be carried out by the facilitating service providers based on the operations manual and a planned training course. With an increase in business and the range of services offered, there might be need for additional staff. The boards of IVCS would be trained in taking decisions on staff hiring based on business viability principles.
Remuneration to staff, apart from a regular salary, should have an element of incentive for business development. A small share of profits available for distribution may be reserved for the staff, so that profitable working is encouraged. The board members should also be paid an honorarium, recognizing the value of time they spend on the affairs of IVCS.
6.7 Government support
As an incentive, the government may consider contributing to a corpus fund (that would count towards capital funds) an amount that would be a multiple of the equity contribution brought in by members. While a ceiling per IVCS would be desirable the amount should be proportional to new equity mobilized from members each year. The corpus fund should not be made available upfront, but should be provided only after equity mobilization of a significant level has been made and matching with the same. This is to ensure that IVCS start up as a member driven entity and not formed just for the purpose of government funding. The equity brought in by the members will remain with the IVCS and its retirement will be subject to stringent conditions.
In the initial period the payments to staff may not be fully covered by the revenue earned by the IVCS. Any gap in revenue to meet the annual cost of running the society should be provided as viability gap funding by the government for the first 3 to 5 years (the number of years of support to be decided based on discussions with the government and the MCAB).
In addition a risk fund may be set up at the level of the IVCS where contribution to the extent of 1% of the incremental loans outstanding at the end of the year may be provided for the first 3 years. As an added incentive if the IVCS manages to recover loans on time (say 99% + of all loans given in the first 3 years), an amount equivalent to 5% of the outstanding loans at the end of three years may be provided as additional risk fund contribution. This will incentivize the management and board to ensure default free functioning in the first three years, and this will then become a habit. Further the risk fund will provide the ability to the IVCS to deal with any unanticipated defaults that might occur in later years.
10 Nongbah Primary Agricultural Cooperative Society, Jaintia Hills.
11 Most Primary cooperative societies in other states have a share linkage of 5 to 10% depending on the category of farmer and the size of loan.

Republic of India
Meghalaya: Livelihoods and Access to Market Project
Final project design report - Working papers
266
6.8. Institutional collaboration
Apart from engaging a competent service provider to facilitate the setting up and incubation of IVCS, an institutional partner is needed, who would be able to take care of their financial and liquidity needs. The Meghalaya Cooperative Apex Bank (MCAB) has shown willingness to collaborate in the process and act as the higher level financing institution for IVCS. Under the Meghalaya State Cooperative Societies Act, the cooperative institutions formed in the state should affiliate themselves with the MCAB. Thus the legal framework for providing financial support in the form of loans and also guidance on operational and technical issues is already in place. In fact the entire support mechanism relating to providing viability gap funding, corpus and risk funds may be entrusted with the MCAB by the GOM. The ongoing monitoring of the performance of the IVCS as also supervisory guidance on their performance should be entrusted to the apex bank along with the PMU.
6.9. Role of Government and legal requirements
Government, at the programme level, should review the performance of the apex bank as also the IVCS that are under incubation but should desist from interference in governance, management and day-to- day operations of IVCS in order to ensure these remain people’s institutions with appropriate financial discipline under the apex financial institution.
The formation and registration of primary cooperative societies and their registrations fall within the purview of the State Government under the state cooperative law. Financial support, guidance and affiliation based supervision on these institutions fall within the purview of the apex cooperative bank in the state. Under the RBI regulations, the Apex cooperative bank in the state can service the primary financial cooperatives, support and guide them to offer financial services to their members. No new legal dispensations for creation of IVCS or conversion of the existing institutions are necessary. Therefore from a legal and central bank’s regulation point of view, there are no impediments for creating the IVCS structure as a possible solution for financial inclusion needs in the State of Meghalaya.
The Registrar of Cooperative Societies (RCS), having powers to register/liquidate cooperative societies and approve of the bylaws, is a key stakeholder in the IVCS. Issues relating to scaling down the number of villages under PACS, merger of PACS and CLFs, registering of CLFs as IVCS, changes to bylaws to deal with issues relating to group membership, equity mobilization, fair representation to women and savers on PACS boards, etc., should be discussed and courses of action agreed upon with the RCS. The Bylaws will need careful drafting. The existing model bylaws need scrutiny and revision to suit the requirements of IVCS.
6.10. Governance
The cooperative law entails the adoption of a set of bylaws by the members, which serves practically as the manual on governance. The bylaws provide for election of office bearers, their terms and their roles and functions. At the initial stage the bylaws should be formed as model bylaws for adoption by the members of individual IVCS with or without modifications consistent with the cooperative law in the State. There are a few aspects that deserve attention in framing these bylaws. The first is that of providing representation on the society’s boards to the different villages and different interest groups such as women, the landless and pure savers. The second is that of defining the relationship between members and the society in terms of continued patronage, adherence to the financial discipline and the need to collaborate with the society in matters beyond mere financial services. Thirdly the bylaws should also allow for reasonable tenure for office bearers while at the same time ensuring rotation.
Concepts such as an elected board having a term of three years and partial rotation to the extent of one- third of members being replaced each year; and the chairman or president of the society having a maximum term of 3 years would be very useful. To ensure that a fair representation for depositors exists, there should be adequate numbers of board seats for those who do not borrow. The bylaws should also provide for patronage based rewards to members and should not prioritise returns on equity. Each village in the area of operation of the IVCS can be identified as a constituency from which a board member will be elected – to ensure that each village is represented in IVCS governance. The seats for pure savers and women could be additionally provided apart from the village representatives. The members on the managing committee should be compensated for their time either with a sitting fee or a share of net profits. Typically 0.5% or less of the net profits of the IVCS can be shared between the managing

Republic of India
Meghalaya: Livelihoods and Access to Market Project
Final project design report - Working papers
267
committee members as a honorarium for their services. This would provide the right incentives for more members aspiring to lead the IVCS and thus ensure greater participation.
6.11. Risks and mitigation
a) The past lackluster performance of cooperatives in Meghalaya has resulted in a poor image for cooperative institutions in the State. The poor image might have a negative influence in the minds of people and inhibit their enrolling as members of IVCS. The campaign for starting new IVCS should target appropriate messages at the potential members. The key differences in the IVCS approach that would avoid the pitfalls of the erstwhile PACS should be highlighted. As regards the performance of primary cooperatives in other states, where the support and leadership have been mature, the cooperative institutions have done very well. In states such as West Bengal, Uttar Pradesh, Chattisgarh, Karnataka and Kerala majority of PACS have been making profits. Where leadership is well informed and trained, the cooperatives tend to perform well. A concerted initiative that focuses on the future of IVCS coupled with a set of appropriate incentives and disincentives should be in a position to ensure viable working of a preponderant majority of the institutions. In Meghalaya both the government and the apex cooperative bank have congruent objectives in the future of primary cooperatives, which will lead to concerted action. The capacity building programmes should target identified leaders and raise their capabilities. Incentives to staff will also play a critical role in ensuring that operational efficiencies are at optimal levels.
b) Lack of ownership and lack of trust among members have led to problems in community owned institutions. When people from different villages are brought together in one institution, the lack of homogeneity might lead to loose bonds and might encourage group-based clichés forming within. The formation process of the IVCS will test out different models to identify those which produce good bonds between members from different villages. The experience of Cluster Level Federations in the recently concluded MLIPH project clearly shows that community based institutions covering households in five or six villages can work effectively. Representation of different interest groups (including that of every village) in the board of management of IVCS should be provided for in the bylaws to ensure that all interest groups have a voice in governance.
c) Financial resources required for scaling up business might not be forthcoming and as a result viability of the IVCS might be compromised. To mitigate the funding risk, it is proposed to bring the Apex Cooperative Bank on board, right from the inception of the IVCS initiative. Apart from capacity building and supervision of IVCS, the Apex Bank will also provide necessary funding. Discussions with MCAB indicate that they are keenly interested in the creation of IVCS as it will contribute to the business of the bank and enable it achieve its objective of leading a sound financial cooperative movement in the state. MCAB in turn will be able to access refinance loans from NABARD in case of need.
d) Competition from banks and other mainstream institutions might erode the business prospects and wean away members from IVCS. While competition for customers and business in rural Meghalaya is a possible scenario, it is not probable. Despite five years of attention to financial inclusion, much progress has not been achieved. There is a large latent demand for services in rural Meghalaya, mainly on account of the fact that there is little institutional presence. The Branchless Banking initiatives of banks prioritize savings and not credit on account of their heightened risk perception. Local institutions, with a feel of the ground situation and strong ownership in the local community are likely to serve the distant village clusters better as they are much better able to understand the risks of doing business.
e) The reported default levels among banks are high and point to high default probability in IVCS. The IVCS might suffer from credit indiscipline of members and may stagnate even in the initial years. The performance of the Microfinance Institutions in the state proves that the credit culture in the state is not negative. MFIs such as Bandhan, Ujjivan and RGVN have provided loans to the extent of Rs 0.5 billion and recovered the installments on time to the extent of more than 99%. Product suitability and close customer contact are the key elements of their good credit performance. IVCS should learn from such successful experiences within the state and offer suitable products and services; and ensure close and frequent contact with customers.
f) The IVCS might be brought in to being as a top-down government initiative with adverse consequences. This possibility has been discussed in detail with the Government of Meghalaya. It has been agreed that IVCS will come in to existence only when a sufficient number of households express

Republic of India
Meghalaya: Livelihoods and Access to Market Project
Final project design report - Working papers
268
willingness to become members, after understanding their rights and responsibilities. In the mobilization meetings, the local people will be made aware of the requirements and benefits of becoming members and the establishment of the IVCS in their cluster of villages.
g) NRLM is being rolled out in a phased manner in the state. As per the design of NRLM poor households (which form 50%), will be serviced by SHGs and their federations. This might result in erosion of membership base for the IVCS, reduce their business potential and introduce conflicts among members on account of subsidies that might be made available to select members by NRLM. The issue of overlap of NRLM and LAMP has been discussed with the state government and it had been agreed to avoid duplication of efforts. Generally the following will be the approach to avoid overlap:
At the initial phase of NRLM, LAMP and NRLM will agree to work in different blocks. However block selection by LAMP will depend on potential for the value chain based clusters and enterprise creation.
Later, as NRLM covers more of the state, NRLM will agree that LAMP-supported IVCS will implement NRLM in LAMP "Special Dispensation Blocks". The State Government will convey to GOI MORD that it will implement NRLM with the LAMP processes and institutions as these are more in tune with overall development approach of the state.
6.12. Viability – some assumptions
The scenario over the first three years will be that the IVCS will make marginal losses. By the fourth year it will be able to breakeven. In locations where the loan business is brisk and savings by members is high, the breakeven will be achieved earlier. The assumptions on the size of loan and extent of savings are very conservative. It is possible to achieve a loan size that is 50 to 100% more than the assumed average and thus generate higher revenue. The equity level will also increase as there will be a minimum ratio of shareholding required compared with the credit facility demanded by members. Further the IVCS will also offer input supply and output marketing services and the income from this will add to surpluses. However the need to recruit more staff will arise, which should be carefully considered by the IVCS boards. These numbers are tentative and reflect the opinions of practitioners met during the mission.
Table 8: IVCS – some assumptions
Number of villages covered 5 to 6
Number of households in 5 to 6 villages 400 to 700
% of village households enrolling 75 %
Average number of households per IVCS 400
Borrowing members % 50%
Average amount of loan in the first cycle Rs 12500
Loan outstanding by third year Rs 2.5 million
Loan disbursements by third year Rs 3 million
Initial Equity from members @ Rs 500 Rs 0.25 million
Corpus fund from GOM Rs 0.25 million
Savings of members Rs 0.25 million
Borrowing from bank Rs 2.0 million
Margin from loan business 3%
Amount of surplus from margin Rs 0.11 million
Salary of staff Rs 0.06 million
Other operating costs Rs 0.03 million
Net surplus Rs 0.02 million
The risk fund contributions will take care of initial problems of delayed repayment and delinquencies. Viability gap funding may not become necessary if the IVCS are able to generate 3% margin on their loans and 10% revenue on equity/corpus funds. The efforts initially should be market both savings and

Republic of India
Meghalaya: Livelihoods and Access to Market Project
Final project design report - Working papers
269
credit products to a large number of members and try to achieve a level of 75% of members ava iling these services. The larger the proportion of members that patronize the IVCS, sooner will be the achievement of sustainability.
6.13. Support from LAMP for rural finance
LAMP, through IFAD’s share of the project funds proposes to support technical assistance for establishment and stabilization of IVCS, capacity building of personnel and institutions during the entire initial period including the MCAB and staff of RCS. The cost of providing financial support to IVCS for corpus, viability gap and risk funds will be borne out of the share of GOM in project funds. The tentative numbers relating to support to rural finance are as follow.
The costs of setting up or transforming institutions in to IVCS are likely to be about Rs 38 million. The cost of providing corpus funds and risk funds to the IVCS is estimated at about Rs 120 million. The total estimated costs are about Rs 165 million.
Table 9: Estimated Cost of interventions in Rural Finance
Intervention Cost Rs million IFAD funds Producing toolkits, process and operational manuals, design of training courses
5.00
Training of 30 to 40 Local Facilitators from MCAB and Coop Department
0.50
Training of staff of IVCS (400 Secretaries) 3.00 Training of Boards (2000 members) 3.75 Service providers costs for three years 25.00 GOM funds Corpus funds to match equity contribution of members
75.00
Viability gap funding 7.50 Risk fund contribution 45.00 Total 164.75
The IVCS at a steady state will cover between 120000 to 150000 members; say about 450000 to 560000 people
12. At the minimum level of expected coverage the project cost per household for providing
sustained financial services access is about Rs 1830.
7. Process of formation of new IVCS
7.1 Initial steps
a) Identify village clusters with potential for forming IVCS – based on population, economic activities, access to markets and availability of formal financial services from other institutions
b) Identify staff from MBMA, MCAB and Department of Cooperatives to act as facilitators and mobilisers of IVCS. If necessary, hire some more staff from the field to support the team of facilitators. Train the facilitators on mobilization of people and formation of IVCS.
c) Convene village wise meetings to explain the concept, advantages, rights and duties of becoming members
d) The members should discuss whether all or any of the following activities are of interest to them as part of IVCS’ role: Savings services, loans, agency for insurance and pensions, supply of inputs for local economic activities, aggregation of produce of members for marketing
e) Ascertain willingness to become members, contribute to equity and avail services from the IVCS
12
Up to two adults per household can become members of the IVCS. The average population per household is about 5. It is assumed that out of every three households there might be 4 members in the IVCS. This works out to 90000 households enrolling 120000 members at the minimum level and 112500 households enrolling 150000 members at the higher level.

Republic of India
Meghalaya: Livelihoods and Access to Market Project
Final project design report - Working papers
270
f) Once willingness of a large proportion of households (about 60% of the eventual membership) is clear, convene a meeting providing a map of the IVCS and the detailed plan for its formation
g) In particular stress the fact that other villages will be part of the IVCS; the IVCS will work more like a federation, each village will have its management, supervisory and monitoring role, that representatives of each village will be part of the board of the IVCS which will formally deal with government, banks, employ the paid staff and draw up periodic accounts.
h) Get the bye-laws adopted in a common meeting of willing households in each village. i) If possible get the bye-laws approved in a meeting of maximum number of households in all
villages – if this is not feasible, then representatives from each village should meet to adopt the bye-laws for the IVCS
j) Once the byelaw adoption is complete, move for registration of the Society before the RCS k) Collection of equity should begin, after byelaw adoption/registration.
7.2 Key messages to be given to the members
a) The IVCS is their own and not a government institution. b) Their equity investment and their patronage is what will make it strong c) Govt corpus investment is a one time support and it will match the members equity investment d) At village level the local committees should ensure that maximum households are enrolled as
members. e) The members should jointly decide on what business that IVCS should take up. The board of
IVCS should decide on new lines of activity, expansion, new products, etc., keeping in mind local needs and potential. Any schemes brought in by any project or scheme should be examined to see if the same fits in with local requirements.
f) The households should be encouraged to save their surplus with the IVCS g) Their loan requirements will be met by IVCS – beginning with small loans initially and increasingly
larger loans every year, as the Society becomes strong. h) The local committee should ensure that borrowing members use the loans properly and repay the
same on time. i) The local committee representatives should cooperate with other representatives of other villages
on the board of IVCS. All of them should ensure that the IVCS works well for the benefit of all households in the different villages.
j) Members should bring to the notice of local committee any issues in product features, problems faced and new requirements.
7.3 Governance of IVCS
Base level: Members – either individuals or SHGs
First tier organization : Village level group – Village local committee
Second Tier organization: Cluster level IVCS – Board of management of IVCS
Third tier: Meghalaya Cooperative Apex Bank – commercial banks, RRB, LIFCOM
Structure: a local committee in the village will deal withy matters relating to Members and/or SHGs within in a village. This committee, under the guidance of the village members, will be responsible for new member acquisition, equity mobilization, mobilizing savings, recommending loans for members, monitoring loan usage, monitoring loan repayments, enforcing repayments in case of recalcitrant borrowers, represent the village in the IVCS through the designated/elected representatives, liaise with the board of the IVCS to secure the interests of the village and ensure that the IVCS is run on professional, profitable lines.

Republic of India
Meghalaya: Livelihoods and Access to Market Project
Final project design report - Working papers
271
Members from the village 1 Members from the village 2
Local Committee Local committee
IVCS
(Board)
MCAB Other
Banks
Chart 2: IVCS structure at the village level
7.4 Formation of IVCS
The IVCS can be formed in any of the three following ways:
a. A new institutions formed from scratch, in locations where no suitable existing community institutions (such as CLFs or PACS) exist
b. Conversion of existing PACS, subject to their suitability (as found in a rating/grading exercise), conforming to the size, coverage and viability parameters for IVCS
c. Conversion of existing CLFs, subject to their suitability (as found in a rating/grading exercise), conforming to the size, coverage and viability parameters for IVCS
The IVCS that will come in to existence (both new and converted forms) will have flexibility to have individuals and groups as members. The byelaws will be modified in tune with the requirements. The following will chiefly be the key new aspects in the byelaws.
A minimum number of shares at an adequate level will be required.
The board will have reserved seats for women and pure savers (as seen from previous years’ record).
When a member brings in equity to fulfill loan to equity linking requirements, the same should not be repaid immediately after the repayment of the loan as it will make the net worth of society fluctuate too often. The loan linkage requirement can be met by a combination of equity and savings in a predecided proportion by the general body of the society.
Corpus fund, risk fund and viability gap funding by government, if any, will not be available for distribution among the members. Corpus fund cannot be used for writing off irrecoverable loans.

Republic of India
Meghalaya: Livelihoods and Access to Market Project
Final project design report - Working papers
272
Dividend on shares will be minimal and not normally exceed the interest paid on deposits. Surplus profits of the IVCS should be shared with members in proportion to the weighted average savings or loans with the IVCS as patronage dividend or bonus. This will improve patronage.
Members, to qualify for board seats should not be defaulters, should be availing services from the IVCS and actively participate in its activities. A minimum shareholding and patronage level may be stipulated for those aspiring for board positions.
7.5 Start-up activities
a) A core team from among LAMP, MCAB and RCS office will get training with a customized and intensive course. This will provide grounding in the policy, strategy and implementation aspects of the IVCS initiative.
b) MCAB will make available a team of officers who will be able to monitor the progress of formation and stabilization of the IVCS
c) A technical service provider will in consultation with the local institutions prepare a process manual for formation of IVCS, a check list of step-by-step activities, a tool for quality measurement at different stages of formation and training design for different functionaries – IVCS secretary/manager, IVCS board members, Core team, supervisory staff of RCS and MCAB, monitoring officials in LAMP.
7.6 Preparatory activities
The ongoing efforts to form new IVCS undertaken by the RCS will be kept in abeyance till the methodology and processes are finalized and personnel in formation of IVCS are trained. Funding from the GOM for the IVCS already formed will not be released till they achieve the bench marks in the criteria to be finalized. Other preparatory activities will include:
Identification of suitable PACS through rating/grading
Identification of CLFs through rating/grading (IIBM is already assigned this task by the MBDA)
Identification of cluster locations
Preparation of an approach for merging PACS and CLFs overlapping in same cluster
7.7 Anticipated issues and ways of dealing with the same
a) In case of large PACs, some of the existing societies may have to be dropped from the area of operation. In such a case the existing members from the dropped villages might have a problem of continued services. The bye-laws of the IVCS should provide for such members to continue at their option. Other members that do not want to continue should be paid their net dues (value of shares held in the PACS – loans outstanding against their name). Such members can be persuaded to join any other IVCS that might be formed covering their village. Soon after the IVCS comes in to existence, elections should be held for the governance board.
b) In case of merger of two PACS or a PACS with a CLF accounting for assets and liabilities and responsibility for the credit obligations will pose problems and should be resolved. Based on the net position of assets and liabilities the credit obligations to the creditors should be discharged. In case the assets are inadequate to meet liabilities, the creditors may have to come to a settlement to the extent of available assets. The procedure followed in liquidation of societies should be followed. The members of these entities should enroll as new members of the IVCS that is formed. Taking over the balance sheets of the existing institutions may not be the ideal way as it will create a rift among members coming from different institutions. To avoid problems in governance, elections should be held immediately after the IVCS comes in to existence.
c) In case of conversion of CLF/PACS in to an IVCS, if the balance sheet of the entity is clean and having a positive net-worth, the same may be retained in the IVCS too. The members will be new shares in the IVCS in lieu of old shares in the erstwhile entity. However fresh elections to the boards of the IVCS should be held soon after formation.

Republic of India
Meghalaya: Livelihoods and Access to Market Project
Final project design report - Working papers
273
8. Next Steps
Based on an analysis of the different villages in the state that have an economic and banking potential but currently deprived of services by other institutions, the scope for setting up IVCS has to be determined. Three models of viability for the IVCS should be prepared based on (a) low potential, (b) high potential and (c) average potential. Location based decisions on which of the three models should be adopted should be taken. A service provider should be identified with required competence in setting up and guiding financial institutions preferably with experience in cooperatives.
The financial support structure comprising of corpus fund contributions, viability gap funding and risk fund contributions should be designed and the budget quantified/ agreed upon.
Studies of issues that might arise in merger of a PACS with CLF and reducing the area of operation of PACS where they have too many villages are necessary. The former study is best carried out by the MCAB and the other study by the Registrar of Cooperatives.
Rating and grading of the CLFs (formed under the MLIPH project) are in progress through IIBM, Guwahati. The PACS (95 are reported to be functional by the MCAB) have also be rated and graded. It would be preferable to entrust the work to the same service provider (IIBM, Guwahati) in order to ensure uniform application of rating methodology and coherence of findings across CLFs and PACS. The service provider’s involvement is critical from the pilot phase so that in scaling up the direct learning can be put to use.

Republic of India
Meghalaya: Livelihoods and Access to Market Project
Final project design report - Working papers
274
Annex 1: Establishment of IVCS - Criteria for selection of service providers
The GOM proposes to set up IVCS in potential locations of the village to carry out financial and other services for improving access of rural households to finance and markets. The IVCS will be cooperative in character and expected to function under rigorous financial and operational disciplines. For setting up of the IVCS, a service provider to coordinate and guide the start-up activities will be required.
The tasks expected of the service provider are
I. Prepare a phased approach for setting up of IVCS in different villages/clusters based on objective selection criteria in consultation with the Project
II. Prepare a checklist of activities for formation and launch of individual IVCS III. Prepare a process manual detailing the sequence of activities leading to launch of the IVCS,
with estimated time schedule IV. Prepare a checklist of activities to be carried out by individual facilitators in setting up IVCS,
and handholding them in the initial years V. Design a training course, training material for skill development of facilitators to set-up IVCS
and handhold them in the initial years – and conduct the training courses for the identified facilitators
VI. Prepare an operations and accounting manual for use by the IVCS staff in their day to day work for dealing with member enrolment, equity mobilization, opening and maintaining deposit and loan accounts, putting through different types of transaction, accounting, capture of MIS data and preparation and filing of reports, monitoring of performance of customer accounts, loan management, loan default management, preparation of annual account statements and supporting the board of management in its meetings.
VII. Design a training course, training material for skill development of staff of IVCS based on the operations and accounting manual – and conduct training courses for the staff of IVCS in collaboration with the MACB and Registrar of Cooperative Societies
VIII. Prepare a check list on governance practices and board tasks for use by the board of management of IVCS
IX. Design and conduct training courses for members on the board of management of IVCS based on the checklist
X. Design and conduct training courses for the Board and staff of IVCS on business planning and profitability
XI. Design a training course in collaboration with Registrar of cooperatives for Coop Dept staff - on supervision over IVCS and MIS based surveillance
Service provider competencies and experience
Experience of preparing process and operations manuals for start up retail financial institutions
Experience in training of financial institutions staff in business planning, implementation over a period of time with responsibility for results in the trainee institutions
Experience of preparing toolkits and check lists based training courses and conducting the courses
Handling projects/programmes as a service provider for capacity building and institution building of retail financial institutions (preferably in the cooperative sector)
Strong study, research, knowledge management record in microfinance, rural finance and financial inclusion
Past experience of partnering with government systems
Staffing and role Requirements
Should be in a position to provide exclusive specialists with domain competence in cooperative banking, institution building and training

Republic of India
Meghalaya: Livelihoods and Access to Market Project
Final project design report - Working papers
275
Maintain an office at appropriate levels in the state consistent with the locations in which the IVCS will be formed
Deal with technical and coordination issues in a time-bound manner
Liaise with Project management, MCAB and Registrar of Coops to ensure smooth implementation
Carry out periodic reviews on progress of work, progress of institutions and provide timely reports every quarter in an agreed format
Support the project management in annual grading of the institutions that are set up to identify areas for strengthening
Deliverables
Start-up of …##…IVCS in identified the locations as per the approach indicated by the project
Fulfillment of capacity and institution building requirements to the satisfaction of the project
Ensuring that at least 90% of IVCS staff trained achieve high levels of competence to manage their Societies independently
Ensure that 90% of boards reach a satisfactory level of governance at the end of three year handholding period
Ensure that 60 % of IVCS achieve breakeven (100% + OSS) in the fourth year and a further 30% institutions achieve potential viability (increasing trend in OSS, reaching a level of 85% of more at end of third year).
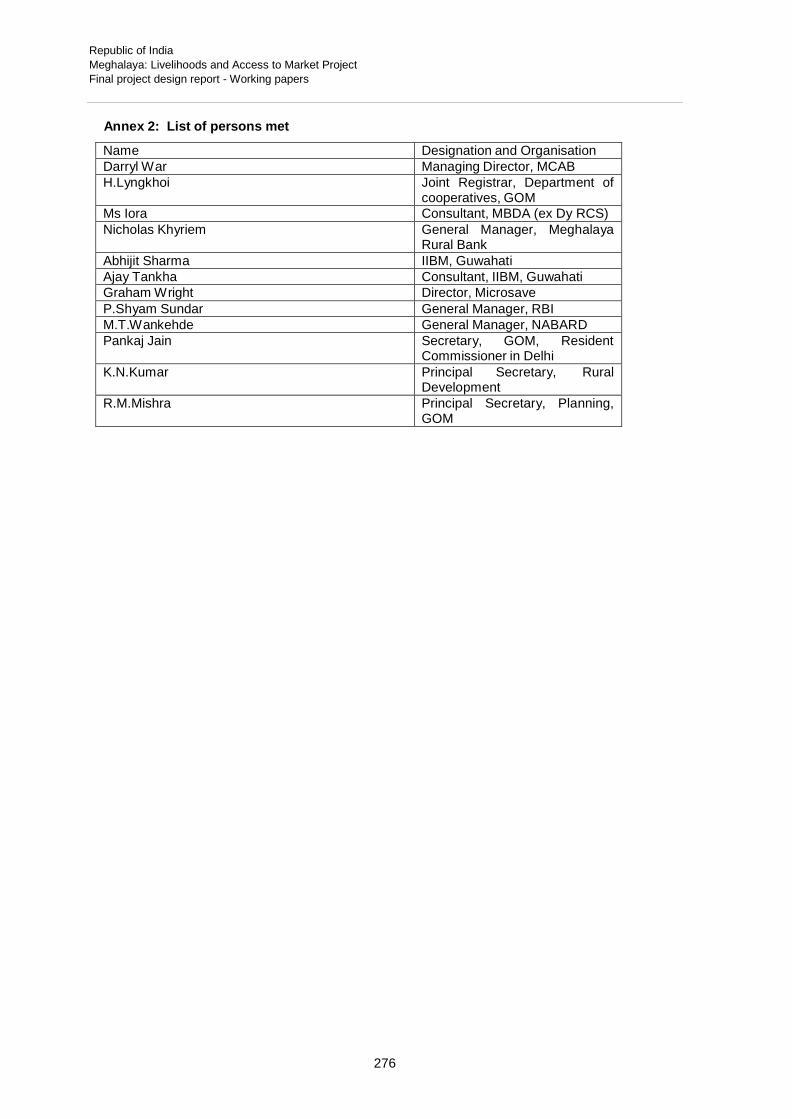
Republic of India
Meghalaya: Livelihoods and Access to Market Project
Final project design report - Working papers
276
Annex 2: List of persons met
Name Designation and Organisation Darryl War Managing Director, MCAB H.Lyngkhoi Joint Registrar, Department of
cooperatives, GOM Ms Iora Consultant, MBDA (ex Dy RCS) Nicholas Khyriem General Manager, Meghalaya
Rural Bank Abhijit Sharma IIBM, Guwahati Ajay Tankha Consultant, IIBM, Guwahati Graham Wright Director, Microsave P.Shyam Sundar General Manager, RBI M.T.Wankehde General Manager, NABARD Pankaj Jain Secretary, GOM, Resident
Commissioner in Delhi K.N.Kumar Principal Secretary, Rural
Development R.M.Mishra Principal Secretary, Planning,
GOM

Republic of India
Meghalaya: Livelihoods and Access to Market Project
Final project design report - Working papers
277
Working Paper 11: Knowledge Services Objectives One of the key objectives of the IBDLP is to document existing traditional knowledge and juxtapose it with the modern knowledge and technology in different sectors. This will generate actionable knowledge which can be used to strengthen livelihood/ enterprise decisions of individuals and communities.
LAMP will support this objective via creation of a Knowledge Hub. The Hub will support the planning and implementation of enterprises, improved livelihoods, and natural resource management.
B. Current IBDLP Knowledge Activities MBDA is already undertaking a number of activities to generate, manage and disseminate knowledge, including:
Websites for MBDA and its associated agencies: http://mbda.nic.in/ The Meghalaya Entrepreneur Portal: a technology and MIS platform for capturing and
managing the entire data relating to entrepreneurs of the state: http://mbdaonline.com/mbda An SMS module which enables real time transfer of partner information to the central server
and keeps the partner (entrepreneur) informed and connected to the ERP (Enterprise Resource Person) has been developed and is being used at the EFCs (Enterprise Facilitation Centres).
The study of the Markets of Meghalaya has been done by IDFC foundation. The preliminary report was presented to the MBDA team and is now being finalized by IDFC. As we move along, the market information will be integrated into the Meghalaya Enterprise Portal.
Study on financial inclusion, including a detailed demand survey, has been carried out by IFC
GIS mapping of villages from comprehensive NRM point of view has been started. A GIS team has completed the work on building knowledge layers for one village. The project will now be scaled up. The GIS lab of the IT department is being strengthened to provide all support for execution of the project.
Publications of reports and pamphlets targeted at different audiences: such as the "Report to Citizens" of 2012.
Videos to introduce potential entrepreneurs to the IBDLP. MBDA has appointed a number of technical partners to support implementation of the IBDLP. These include three agencies with special capacities for data handling and knowledge management:
Arete Consultants Limited is working on development of MBDA website, Meghalaya Entrepreneur Development Portal.
Mutual PR (MPR) is working on the publications of MBDA and is moving toward development of a development communication road map.
WEBCON was providing PMU support to MIE for Enterprise Management and Knowledge Management and is also developing the GIS based village maps.
At district level, collectors (supported by MBDA district Basin Development Units) are:
Compiling a list of traditional knowledge practices, successful entrepreneurs, innovative models of community governance and NRM for documentation by the MBDA media team. This list has to be compiled in consultation with line departments, MRDS and other NGOs in the district.
Compiling a list of agencies (SHGs, Cooperatives, NGOs)/ individuals within the district where partners could be sent for training and exposure visits sectorally. This list of agencies outside the state and is being compiled at the state HQ. This list should be ready by end of March so that partners could be sent for training and capacity building from April onwards.
Making a shelf/ library of projects for investments under gap funding. The projects should be taken up in convergence with at least two other line departments and the upper limit for gap

Republic of India
Meghalaya: Livelihoods and Access to Market Project
Final project design report - Working papers
278
funding is 50% of the project cost. The guidelines in this regard are being finalized and will be communicated by 20th March after approval of the Executive Committee of MBDA.
MBDA and MRDS have started to carry out Integrated Village Development Plans in all 6,000 villages in the state. This involves participatory data gathering, and aims to gather comprehensive information on the population, social organisations, infrastructure, resources, livelihoods and needs. This also aims to create database with baseline information for all villages, which will be periodically updated. It is expected that work in 110 villages will be completed by July 2013, and another 1,100 by March 2014, with 6,000 villages being completed in 2016.
The Bio Resources Development Centre is now part of MBDA. Apart from promoting conservation and sustainable use of bio-resources, including the preservation of rare species of orchid, the Centre is generating useful knowledge on bio-inoculants (fungus and bacteria extracted from plants), such as phosphate solubilising bacteria (which can fertilise crops). Other inoculants can help control pests and diseases. The Centre is working on this with other agencies in India.
C. Approach to provision of knowledge services
Lessons learned on knowledge management (KM) from other IFAD-supported projects in India:
Knowledge management strategies and plans are best formulated at the start of project implementation and not during project design. This enables project management and the staff responsible for implementing KM to be fully involved, helps KM to provide useful support for project implementation, and for project staff to have ownership of the strategy and plans.
Lack of KM capacities and very limited resources for implementation of KM (including M&E and progress reporting) in most projects have meant that projects have not been able to adequately distil the lessons learned during implementation and to disseminate these to interested stakeholders.
If KM is approached on a systematic basis, it can generate significant benefits. One project where KM was given more attention was the Uttarakhand Livelihood Improvement Project for the Himalayas (ULIPH), which generated a significant volume (well over 60 or 70) of various types of printed material (training manuals, booklets, reports, studies, newsletters, posters, games, calendars and diaries), along with about 30 videos, and an active website. In addition to these physical products, the project developed systems for internal information sharing such as e-documents and regular review meetings. In 2011 the project started holding Gyan Sabha, an interactive knowledge sharing event at village/cluster level, organised by village or project field staff at successful demonstration fields of progressive farmers with the objective of sharing best practices, disseminating information, and facilitating replication. In 2011 210 Gyan Sabhas were organized covering 2,808 participants. Results of an evaluation of ULIPH KM
Outcomes and Lessons from ULIPH An assessment of Knowledge Management materials (Review of Existing Knowledge Sharing Materials, Anmol Jain, 2012) found that these materials had effectively supplemented the extension efforts of the project staff in promoting alternate livelihoods, reducing drudgery, and bringing about changes in practices at household and community levels. Findings of the study include:
(a) Community members and ULIPH field staff reported that the materials were of good quality. “It is easy to
understand through the pictures and in future and more publications like this must be brought out in the future,” remarked Geeta Verma, an SHG member from Almora district.
(b) Respondents said that they been able to get much information related to cultivation techniques. Members from Uttarkashi district said: “The literature shared by ULIPH made us aware about the techniques of organic farming and vegetable cultivation and subsequently many people in our village benefitted from this knowledge,” “The booklets by Ajeevika greatly helped us to learn and adopt vermicomposting techniques”.
(c) The women respondents in particular told that they really likely watching video documentaries as they not only got useful information but at the same time documentaries were also a source of entertainment “Apart from imparting useful information to us, documentaries are also a source of fund and entertainment especially if several women are watching a documentary together,” remarked Beena Devi, an SHG member
from Bageshwar district.

Republic of India
Meghalaya: Livelihoods and Access to Market Project
Final project design report - Working papers
279
(d) Gyan Sabhas have proved to be a highly successful knowledge sharing mechanism. According to PradeepYadav, “through the Gyan Sabhas the farmers are able to see for themselves the impacts of the various package of practices resulting in high adoption rates.”
(e) The success stories documented and circulated by ULIPH have motivated farmers, especially women, to take up improved livelihood practices. “By reading the success stories we felt motivated that if another woman can do it then why can’t we do it,” (Sanju Bora, an SHG member from Bageshwar district).
(f) Significant changes in the community attitudes and practices relating to personal hygiene and food habits have been observed which have helped in reducing the incidence of diseases among the households from project villages. According to Heera Singh Jadoda, CRP from Chamoli district “Waterborne diseases have been reduced by at least 20-30% ever since households have started boiling water,”
(g) Although the SHG and Federation members were primary target groups of the knowledge sharing materials, information has also trickled down to family members: “I am making vermicompost for the past several years based upon the knowledge I acquired from the books that ULIPH gave to my mother who is a SHG member,” (Pushkar Singh Dakuni from Bageshwar district).
Lessons learned from this experience include:
Printed and video media are an effective means of disseminating information and other messages to the rural population.
The need to print a large number of booklets and other materials have been printed to ensure they reach the intended numbers of households.
Videos were well liked but had quite limited circulation, partly due to lack of video players and electric power cuts (although in one place they were reaching a larger audience via a local cable TV network).
Materials need to be produced at the appropriate stage of the project cycle, and more technical information would have been useful.
Objectives: the Knowledge Services component of LAMP will support MBDA knowledge-related activities across the entire IBDLP and will not just be restricted to the LAMP project area and activities. The IBDLP proposes to develop a Knowledge Hub. This hub will include on-line information services, but will go further, with IBDLP acting as a knowledge broker to provide information for enterprise development and natural resource management to stakeholders in the public sector and beyond. The diagram below shows the elements of the knowledge hub.
An example of a knowledge hub is that of the Asia Pacific Water Forum: http://www.apwf- knowledgehubs.net/about.html.

Republic of India
Meghalaya: Livelihoods and Access to Market Project
Final project design report - Working papers
280
LAMP knowledge services will aim to gather, manage and disseminate information on:
a) Bio-environmental information on the bio-environment of the state: agro-eco-zones, soils, climate and water resources. Some of this data could come from remote sensing - the North East Space Applications Centre has already developed systems to utilise satellite imagery to identify potential locations for specific crop-based enterprises, and for development of water resources. Other data would come from existing mapping of vegetation, soils and climate.
b) Natural resource management and enterprise development. This will include examples of
effective or useful interventions from within the State and from other locations in India and beyond, along with information on markets, technologies and inputs. LAMP will also collect and store traditional knowledge and indigenous knowledge on natural resources, such as the collection and use of plants for medicinal and other uses.
c) Project/programme management information relates to the implementation of the basin
programme. LAMP will have a comprehensive M&E system with a dedicated M&E unit to collect, analyse and interpret information on the progress of project implementation and link this outcomes and impacts. This provides the basis for assessment of project performance and lesson learning.
Improving the access to information will be an important element of the IBDLP/MBDA knowledge hub. The aim will be to make information accessible and useful to a range of different users. At the planning and management levels, online access (which already exists) will enable different stakeholders to access data. However information should be useful for a much larger number of rural households - entrepreneurs, farmers and other people. To be accessible and to reach users who may not be specifically looking for information, knowledge should be supplied in different formats and at different locations. For example, inform potential entrepreneurs about IBDLP and support for enterprise, a video has been produced to show to people making enquiries at EFCs. This includes some success stories of individual enterprises.
To help people make the correct decisions about selection of enterprises, booklets (or other media) could be produced listing (and explaining) factors that contribute to the success or failure of enterprises in a particular sub-sector. Once an enterprise has been selected, the challenge for each EFC is to help these individual enterprises scattered over their entire block. Linking with line agencies and/or with IBDLP technical partners (such as BAIF for livestock) will not necessarily provide the assistance needed as they will also find it difficult to support scattered businesses. Use of centralised training, provision of information via media (booklets, manuals, videos etc.) and telephone/internet based help services can all enable information reach enterprises in remote locations.
Dissemination of information: LAMP can support the production of information in user-orientated and user-accessible formats - such as training materials, technical manuals, booklets and leaflets, posters and videos (where needed in local languages). Events such as seminars, field-days and fairs can also be a means of disseminating information. Videos can be particularly useful as a means of disseminating ideas and skills for farmer to farmer. For a good example of such as approach, see www.digitalgreen.org.
D. Proposed LAMP Support for Knowledge Services
1. Information on natural resource management and governance
At the moment there are no large scale maps that can be used to support INRMP at project villages. LAMP will create base maps for each village using satellite data available from the North East Space Applications Centre (this is to a resolution of 0.5 m and dates from 2010). Using GPS equipment to define the extremities of the land occupied by a village, satellite data will be used to create maps each village (with layers for base & drainage, slope, land use and elevation. The base/drainage map would be printed out on a large sheet and used as a map for participatory planning in the village. This will result in a much better land use plan as the alternative is to use participatory maps sketched by villagers, which usually do not give an even approximately estimate the areas involved in different types of land use.
To demonstrate the feasibility of using remote sensing, NESAC used satellite information to create a

Republic of India
Meghalaya: Livelihoods and Access to Market Project
Final project design report - Working papers
281
seven layer map for one village (see Annex 1). To do this work for the 1,350 villages to be covered by LAMP NRM, a full-time GIS unit will be established in MBDA. This unit will print out large size maps for use in village participative planning, add data and other information to base maps and produce other mapping information for project implementation teams.
Apart from the creation of village maps, data from satellite imagery can be used to identify potential locations for specific crop-based enterprises, and for development of water resources. Other data would come from existing mapping of vegetation, soils and climate. The information could be stored in a GIS, along with data related to livelihoods - such as land use, crop areas, irrigated land and numbers of livestock. It would also be useful to combine this with information on communications - at the moment the state does not seem to have a master list and map showing all roads - each agency responsible for road development has its own data.
LAMP will also collect and collate information on interventions in natural resource management will support LAMP IWRM activities. These will include examples of effective or useful interventions from within the State and from other locations in India and beyond. This will also include governance aspects of NRM, such as rules and regulations for resource management. Linked to this are issues concerning land tenure, transfer of land to other uses, and access to land for poor people. Apart from searching secondary sources, collection of this information may involve commissioning some studies to into specific NRM themes.
LAMP will also collect and store traditional knowledge and indigenous knowledge on natural resources, such as the collection and use of plants for medicinal and other uses, and traditional management of land and water resources. Three Indigenous Knowledge Specialists will be employed to gather his information (one covering each of the major language groups). These specialists will visit the field and interview communities regarding their traditional knowledge on subjects such as the use and availability of wild plants, and to gather information on traditional land tenure practices.
2. Information on enterprise development
Information on enterprise development will support the entrepreneur partners of EFCs as well as farmers participating in the Integrated Production and Marketing clusters. In addition this information will support enterprise development activities undertaken by IBDLP in other villages. Specific activities related to information on enterprise development include:
a) Support for EFC clients: to provide technical and management support to enterprises
supported through EFCs is a challenge as these will not necessarily be clustered together. Apart from provision of training courses, and the supply of printed and video guidelines and manuals, it could be worth investigating if a telephone or SMS help line would by feasible and useful.
b) Information repository (on-line as far as possible) for data on markets, technologies, technical
manuals, management guidelines, and information on suppliers of input and services. Sources of financing (both loans and grants) are one of these services. Some of this information may come from secondary sources and, in some cases (such as for market prices), this could involve links to other data sources. Information would be up-dated at least annually. LAMP would also commission technical manuals and enterprise guidelines to assist entrepreneurs in the selection, establishment and management of a range of enterprises.
c) Value chain studies: this information would be bought together and analysed as value chain
studies for specific sub-sectors. LAMP would commission external agencies to carry out 10 comprehensive value chain studies in sectors with economic potential. These would be in addition to the cluster-specific value chain studies carried out as part of the implementation of the Integrated Production and Marketing sub-component, and would also take account of studies already commissioned by IBDLP. Possible sub-sectors for these studies include: potatoes, tomatoes, other off-season vegetables, pineapple, oranges, tea and coffee, and pigs.
Republic of India
Meghalaya: Livelihoods and Access to Market Project
Final project design report - Working papers
282
d) Meghalaya Trade Promotion Organisation (MTPO) would receive some financial support from LAMP. This agency is part of MBDA and is responsible for promotion of Meghalaya products in other parts of India. Part of this money would be used to draw up a business development plan for MTPO, on which further support from LAMP would be based.
3. Technology testing and action research
The formulation mission identified a number of opportunities to test technologies and conduct action research. Unlike most other parts of India the state does not have a long history of settled farming, and techniques used be farmers, even on wet paddy land, are often related to those used on slash- and burn jhum cultivation. Traditional varieties are grown, from seed saved on the farm, there is little use of inputs such as fertilisers or even farm-yard manure, and most land is cultivated by hand. Technology testing and action research is needed where there is no intervention or new technology that will be obviously adopted by farmers – i.e. there is no evidence that these interventions are already being adopted by some farmers in the state. Based on the observations and interviews of the formulation mission, technology testing and action research may be carried out covering the following topics:
Soil fertility management with improved methods for collection and use of farmyard manure
Conservation Agriculture (minimal tillage cultivation)
Improved cultivation of potatoes and tomatoes, including control of blight
Improved cultivation of banana including new varieties and use of tissue culture
Improved cultivation of pineapple, including use of drip irrigation
Improved ginger cultivation, including pre-planting treatment of seed roots.
Potential for bio-energy crops as an additional cash crop for farmers
Pig production, including on-farm feed production and improved breeds
Improvements to backyard poultry systems, including possible introduction of improved genetic stock that can be produced at the village level.
This list will be further refined as more meetings are held with technical agencies. This work would be contracted out as individual sub-projects to public sector research agencies (state and ICAR) and NGOs or private sector agencies with the required technical expertise. In general research would take place under real-life conditions on the fields of cooperating farmers.
4. Monitoring and evaluation
Monitoring and Evaluation is a tool is to collect reliable data and information for measuring performance and progress towards achievement of results; and to provide information about success and failures, so that corrective measures can be taken for successful implementation of project activities. M&E would be also used as a learning tool to provide information for critical reflection on project strategies and operations to support decision-making.
M&E would be guided by an M&E framework as set out in the Project Implementation Manual. An M&E unit would be established in the PMU to support programme monitoring by the field implementation units. In addition the M&E unit will implement a programme of outcome and impact monitoring, as well as producing consolidated reports on project progress and results.
(a) Outline of a project M&E framework
The M&E framework is a system to collect, analyse and report on data at three different levels of project implementation: (i) outputs; (ii) outcomes; and (iii) impact.
Output monitoring will measure the progress of activities and achievement of outputs against annual targets in the annual workplan (AWP) for each project component. Information on the progress of the annual workplan will be measures against indicators in the plan, such as number of INRMP prepared, numbers of people trained, and number of markets developed. This can be linked to the financial expenditure on the concerned activities, and data may be stored and reported via a computerised MIS. Data would be collected by field implementation agencies such as EFCs, District PMUs, Field NGOs, service providers, and other implementation units, including information from the registers and accounts kept by community organisations supported by LAMP. Wherever necessary, data will be

Republic of India
Meghalaya: Livelihoods and Access to Market Project
Final project design report - Working papers
283
collected disaggregated by gender, particularly those related to training and access to services.
Outcome monitoring measures the immediate changes coming about as a result of project interventions. In LAMP this would include:
Reports from EFCs on numbers of bank loans and other financing facilitated for their partners,
and on numbers of enterprises established or expanded.
Reports from district PMU offices on indicators of improved NRM (e.g. area of watershed conserved, area under irrigation, number of farmers adopting improved methods, increase in cereal crop production,
Reports from district PMU on the outcomes of value chain development in IPM clusters (numbers of farmers reporting increased sales and size of sales, adopting improved technology).
Reports from district PMUs on villages involved in livestock improvement showing adoption of improved methods and increased in livestock numbers and sales.
Reports from the Market Committees or key informants of improved hat bazaars of increases in numbers of traders and volume of trade.
As it may not be easy for implementation staff to collect such information, the M&E unit could conduct Annual Outcome Surveys (AOS), interviewing a sample of 200 to 400 farmers/households to gather data on indicators such as those listed above. An AOS may also be carried out on a thematic basis in order to focus on a specific area of project intervention, such as enterprises created as a result of EFC facilitation.
Related to outcome monitoring is process monitoring, which involves monitoring the processes leading to outputs and outcomes. Specific areas where progress monitoring will be useful in LAMP include: service provision by EFCs, the provision of technical services, and the functioning of community organisations. Information on these may be gathered via Participatory M&E (see section below on knowledge management and learning), as well as from the records of community organisations and service providers. In addition, the Project can undertake specific studies related to food security, women’s empowerment, market access and outreach of producer groups, value chain development, and functionality of infrastructure and benefit assessment of project services for disadvantaged groups such women and poor households.
Information on the effectiveness of training will be assessed via KAP (Knowledge, Attitude and Practice) surveys carried out each year.
Impact evaluation is the process which will assess the contribution of LAMP in achieving the overall goal of the project. It will consist of baseline, mid-term and end-of-project surveys. This survey will be coordinated by the M&E unit and contracted to an external agency with specific expertise in such assessments. Information to be collected will include the impact level indicators of IFAD’s Results and Impact Monitoring System (RIMS). These include mandatory ‘anchor indicators’ relating to household assets, food security and child malnutrition (anthropometric data of children under five years of age). ToR for this survey will be in the draft PIM.
(b) Management Information System
Information on progress of project implementation (activities and outputs) and on some outcome indicators (such as numbers of households served by improved water supplies) will be recorded on a computerised Management Information System (MIS). This system may be linked to (or part of) the EFC Enterprise Development Portal – this already exists and is being further developed with support from TLS. A separate system for micro-finance data would handle data from IVCS (this could be hosted by the Meghalaya Apex Cooperative Bank).
(c) RIMS indicators
The Results and Impact Monitoring System of IFAD generates annual report tables on a number of first and second level results indicators that correspond to the output and outcome indicators. IFAD has produced a standard list of these indicators, but only some of these will apply to an individual project.

Republic of India
Meghalaya: Livelihoods and Access to Market Project
Final project design report - Working papers
284
Stakeholder Level Frequency Staff Block Monthly District Monthly State Quarterly Villagers Cluster Half-yearly District Annual
Prior to mid-term review, the project will report on only the first level results, but after the mid-term report it reports on second level indicators. These second level indicators are used as
evidence to support ratings of the effectiveness and likely sustainability of each component. The third level RIMS results are the anchor indicators used for impact assessment (see impact assessment paragraph above).
(d) Special studies
The LAMP M&E unit may also carry out, or commission, a number of special studies. These could investigate topics such as: (i) agribusiness and marketing; (ii) production and productivity (cropping system studies in agriculture and horticulture crops); and (iii) environment and NRM (impact of soil and water conservation measures, flow monitoring and flood discharge in micro-watersheds). Cost effectiveness studies will be also undertaken to assess delivery systems and implementation methodology/approaches adopted by LAMP and other agencies implementing similar activities.
5. Knowledge management and lesson learning
Knowledge management involves the use of information from the experience of project implement- ation (including data from the M&E system) to learn lessons that will improve implementation processes and increase impact. As a tool for internal learning by project stakeholders (staff of the various implementing agencies, and participating farmers and villagers) it involves a series of meetings at different levels as follows:
At these meetings, progress of project activities will be reviewed and reasons for success and failure identified. Participatory tools such as “most significant change”, “story telling” and “participatory monitoring and evaluation” (PME) may be used at these meetings. PME forums can be set up in villages, with simple activity sequencing charts and other tools to help communities monitor their progress, evaluate performance, and identify implementation issues. These forums will be also used for social audits of activities and associated expenditure involving community members, contractors and service providers.
LAMP will document the results of these knowledge sharing for wider dissemination. LAMP will also implement a video system to disseminate information from farmer to farmer and village to village. It is proposed that LAMP participate in the Digital Green programme (see box below).
Another approach in sharing knowledge are "Learning Routes". These are information exchanges between rural people from different countries - and usually different regions. They started as a link between small farmers in Bolivia’s altiplano and in Tanzania. Learning routes have been creating knowledge-sharing opportunities for both smallholder farmers and big international organizations – like IFAD – since 2006.
A Learning Route is a continuous process of in-the-field training that seeks to broaden and diversify the markets of rural technical services, placing special value on the best experiences and knowledge of institutions, associations, communities and rural families. Each Route is organized thematically around experiences, case studies and best practices on innovative rural and local development. The end goal is for the local participants to become the trainers. Through workshops, interviews, conversations and other learning activities, the Route generates a space for individual and collective learning for visitors and hosts. For the final product, Learning Route participants come up with a concrete innovation plan.

Republic of India
Meghalaya: Livelihoods and Access to Market Project
Final project design report - Working papers
285
Digital Green
Digital Green builds and deploys information and communication technology to amplify the effectiveness of development efforts around the world to affect sustained, social change. The Digital Green system combines technology and social organization to improve the cost-effectiveness and broaden the community participation of existing agricultural extension systems. The unique components of the Digital Green system include: (i) a participatory process for local video production, (ii) a human-mediated instruction model for video dissemination and training, (iii) a hardware and software technology platform for exchanging data in areas with limited Internet and electrical grid connectivity, and (iv) an iterative model to progressively better address the needs and interests of the community with analytical tools and interactive phone-based feedback channels.
Digital Green has 70 staff in India with offices in Bangalore, Bhubaneswar, Bhopal, Hyderabad, Patna, Delhi. It is working in seven states with seven executive partners who implement the programme at the field level. These include 5 NGOs (including BAIF and Access Development Services) and two state rural development societies.
Impact & outcome evidence: JPAL starting an RCT (also looking at adoption of SRI and SWI). An evaluation was carried out in 2009 by ITAD.
For LAMP, it is proposed that 10 units be established to implement Digital Green. These units would include some DPMU, service providers for livestock and foodcrops, and some IPM service providers. They would use the approach in around a total of 500 villages
Equipment:
At a unit level: camera, mike, tripod (USD400), also need to use a computer with Windows Movie Maker,
At the village cluster level (6-8 groups each of 15 farmers) need pico projector (USD200). This rotates between groups, with a new video shown each 2 weeks, facilitated by a field worker.
Training:
Video production for each unit: 4-5 people (existing project staff) trained in each district for 3 days.
Contents are topic identification, story boarding, shooting (need a team of 2), and editing. Follow-up every 2-4 months for a year or so, and also train other staff on the overall approach. Aim to produce 4 to 6 videos over 2-3 months. Another 2 days training is needed for analysis of results in terms of adoption and feedback.
Training of village facilitators for 2 days. Training costs:
facilitation: 2 days, 20 people – Rs6000 per person.
5 day course for video and analysis, 5 persons Rs30,000 per person.
www.digital-green.org
6. Dissemination and communications
All components of the project have a role in dissemination of information and knowledge, both internally within the project (particularly to entrepreneurs, farmers and other villagers), and externally to citizens of the state, Government of India, IFAD, other development agencies, and wider civil society. The Knowledge Services component will support this via:
Provision of village information kits – this is a set of project and development related information that will be useful at the village level, together with storage shelves, display cabinet, notice boards etc. This would be kept in a publically accessible building in the village, such as a community hall or school. A notice board would provide details of the LAMP development plan for the village, and show the progress of the plan to date (the board would be designed in such a way that it can be regularly up-dated).
Production and printing of posters and leaflets.
Translation, into the three main local languages, of technical manuals and guidelines, along with their printing
Editing and design of project publications aimed at an external audience
Printing of communication materials
Creation of a LAMP website (or a LAMP section of the BMDA website) with information on the project and the results obtained. Information about LAMP would also be posted on other websites such as http://asia.ifad.org/
Publicity and communication videos
An annual high level knowledge sharing event aimed at sharing results and influencing policy

Republic of India
Meghalaya: Livelihoods and Access to Market Project
Final project design report - Working papers
286
E. Implementation of Knowledge Services
The Knowledge Services Unit would be located in the PMU and would be managed on a day-to-day basis by the Head of Knowledge Services - who in turn would be answerable to the Assistant Project Director (and through him/her) to the Project Director. The Head of Knowledge Services would be supported by a Project Assistant.
The Knowledge Services Unit will consist of four sections, which will be staffed as follows:
a) Natural Resources and Governance Section
Natural Resource Knowledge Manager - 1
Indigenous Knowledge Specialists - 3
GIS operator – 1 (for village natural resource mapping and planning)
b) Enterprise Development Section
Enterprise Knowledge Manager – 1
Enterprises Telephone Help Line Operators – 3
c) Monitoring and evaluation Section
Planning and M&E Manager - 1
Data Analyst – 1
MIS system operator - 1
Project Assistants - 2
Driver - 1
Enumerators - 7 (based in field offices)
d) Knowledge Management and Communications Section
Knowledge Management and Communications Manager - 1
Technology testing and action research would not have any staff in the Knowledge Services Unit, but be managed by a group of PMU technical staff, under the overall guidance of the LAMP Research Committee. This Committee would consist of staff members from LAMP together with experts from local research stations and line agencies.

Republic of India
Meghalaya: Livelihoods and Access to Market Project
Final project design report - Working papers
287
Annex 1: Example of a Village Base Map Derived from Remote Sensing
Village boundaries will defined through discussion with local people. Hand held GPS equipment would be used to correlate ground observations to map coordinates. Village boundaries may also be obtained from Google maps, Wikimapia, and mapper.acme.com. WEBCONS has been working on this for BMDA and has drawn up a GIS map of Swer village. This also involved the use of Google Earth for basic mapping
1, demarcating different patches of the landscape that have similar physical,
ecological and present usage features.
1It may also be possible to use images from Google Earth. An illustration of the use of Google Earth to make an initial outline of
the village area is shown in “Report on GIS Model of Swer Village, WEBCONS Consulting, MBDA. The use of Google Earth and Google SketchUp to make simple maps is explained in “Technical Handbook for Rural Infrastructure”, NERCORMP, 2012. Further details are in the Working Paper on Knowledge Services.


Republic of India
Meghalaya: Livelihoods and Access to Market Project
Final project design report - Working papers
289
Working Paper 12: Institutional Capability and Capacity Building
A. Introduction This first part of this working paper provides background information on the capability of a range of technical partner agencies who may be contracted to support LAMP activities. Some of these agencies are already partners of MBDA in the IBDLP, while others are typical of agencies that could be selected in the future. Almost all of these agencies have been working with IFAD projects in India. BMDA is a new organisation and is at the stage of building its management and institutional capacity. in this respect it is typical of implementing agencies for IFAD projects in India, which are usually government societies that have been specifically established to implement the IFAD project. The process of project implementation includes capacity building for their staff and the creation of institutional processes such as human resources policies and financial guidelines.
The second part of this working paper summarises capacity building proposals for the various components of LAMP and sets out an overall strategy for capacity building. A list of training centres in Meghalaya and nearby states is in Annex A.
B. Institutional Capability Name of Agency: Small Farmer Agribusiness Consortium Status: current IBDLP partner agency Type of agency: GoI society, formed 1994 Core competence: promoting agri-business projects through its Project Development Facility and Venture Capital Assistance schemes, establishing forward and backward linkages with farmers. SFAC also implements GoI schemes, including the Horticultural Mission for the North East and Himalayan States. Work in IBDLP: procurement and contracting of specialised technical agencies. Proposed work in LAMP: procurement of ,technical agencies - SFAC has a well establishment and efficient procurement process.
website: http://www.sfacindia.com
Name of Agency: Infrastructure Development Finance Corporation (IDFC) Foundation Status: current IBDLP partner agency Type of agency: Section 25 (not-for-profit) company, formed 2011, subsidiary of IDFC (non-bank financial company, leading financier of infrastructure development Core competence: knowledge sharing, policy research and advocacy, capacity building and programme support services to both government and non government organizations. Work in IBDLP: strategic partner for all components, and is also focusing on green/rural energy and rural markets. A useful initial study of rural markets has been completed and further work on markets is progressing Proposed work in LAMP: support for market infrastructure development website: http://www.idfc.com/foundation/our_firm/overview.htm
Name of Agency: BAIF Development Research Foundation Status: current IBDLP partner agency Type of agency: not-for-profit trust, formed 1967 Core competence: premier non-government livestock development agency in India working in 15 states, often in partnership with state governments to set up and operate cattle breeding services. Also active in other livestock initiatives (such as goats) and in crops and horticulture (such as cashew nuts). 4,500 staff, and has reached 5.6 million households. Work in IBDLP: livestock partner - carrying out a study and drawing up a proposal Proposed work in LAMP: technical partner for livestock development website: www.baif.org.in Name of Agency: NABCONS Status: current IBDLP partner agency Type of agency: subsidiary of NABARD (National Bank for Agriculture and Rural Development), formed over 20 years ago

Republic of India
Meghalaya: Livelihoods and Access to Market Project
Final project design report - Working papers
290
Core competence: consulting company - feasibility studies, investment studies etc, other consultancy work and capacity building. Work in IBDLP: water sector: to include policy/planning level support (finalise documents for the State Water Mission, a Water Master Plan, basin plans, selection of sites for small multi-purpose reservoirs, prepare project proposals, conduct surveys, assist with the State Water Code), as well as supporting the bidding process and providing general support Proposed work in LAMP: technical partner to support water conservation works, including standard designs, preparation of guidelines, staff training.
website: http://nabcons.com
Name of Agency: Appropriate Technology India (ATI) Status: current IBDLP partner agency contracted via SFAC Type of agency: NGO founded in 1993, offshoot of AT International of USA, Core competence: expanding local capacity in Uttarakhand to harvest, process and market NTFP - tasar silk, honey, bamboo and rajma. Also supports dairy farming and spices. Devbhumi Natural Products Producers Company Limited (DNPCL) founded in 2007, provides product development and production services to link the rural sector with mainstream markets. See www.devbhumi.com Work in IBDLP: value chain development of spices, silk and oranges. A brief value chain study has been completed for ginger, turmeric and oranges. Proposed work in LAMP: possible support for IPM value chains. website: http://www.atindia.org/
Name of Agency: Arete Consultants Limited Status: current IBDLP partner agency contracted via SFAC Type of agency: company, founded in 2004 Core competence: business consultants and IT services, offices in six countries. Work in IBDLP: development of MBDA website and Meghalaya Entrepreneur Development Portal. Proposed work in LAMP: MIS and website development and support
website: http://www.aretecon.com
Name of Agency: The Livelihood School Status: current IBDLP partner agency contracted via SFAC Type of agency: not-for-profit company, part of the BASIX Social Enterprise Group Core competence: livelihood training materials and training of practitioners, livelihood research Work in IBDLP: support of EFC and training of EFC staff. Proposed work in LAMP: support of EFC and training of EFC staff. website: http://www.thelivelihoodschool.in/
Name of Agency: Mutual Public Relations (MPR) Status: current IBDLP partner agency contracted via SFAC Type of agency: company, founded in 1995, offices in 5 countries, part of Whiteoaks Internation Network, based in UK and operating worldwide Core competence: public relations Work in IBDLP: production of MBDA publications, videos and other communications support Proposed work in LAMP: possible support for project external communications website: www.mutualpr.com
Name of Agency: Access Development Services Status: current IBDLP partner agency contracted via SFAC Type of agency: not-for-profit Section 25 company, founded in 2006 Core competence: support for microfinance and rural livelihoods, working in 12 states, 100 staff. Experience in value chain development, enterprise development and establishing producer companies. Work in IBDLP: thematic Farmers Producer Organizations Possible work in LAMP: support for sub-sectors in Integrated Production and Marketing, support for EFCs
website: http://www.accessdev.org

Republic of India
Meghalaya: Livelihoods and Access to Market Project
Final project design report - Working papers
291
Name of Agency: MART Status: potential partner agency Type of agency: consulting company, founded in 1993 Core competence: rural marketing, value chain development, micro-enterprises, Possible work in LAMP: support for sub-sectors in Integrated Production and Marketing, support for EFCs website: www.martrural.com
Name of Agency: Vrutti Status: potential partner agency Type of agency: consulting company, subsidiary of Catalyst Management Services Core competence: micro-enterprises, producer organisations, value chains Possible work in LAMP: support for EFCs and sub-sectors in Integrated Production and Marketing website: http://vrutti.org
Name of Agency: Covenant Centre for Development Status: potential partner agency Type of agency: NGO, based in Tamil Nadu, working on 4 states Core competence: cooperatives and producer organisations, value chains, farmer field schools for paddy. Possible work in LAMP: support for food crops, support for sub-sectors in Integrated Production and Marketing website: www.ccdgroup.org
Name of Agency: MicroSave Status: potential partner agency Type of agency: consulting company, based in India/UK/Kenya, 100 staff working in 25 countries. Core competence: institutional strengthening and capacity building, organisation strategy, product development, and delivery chain innovation. Particular expertise in financial service cooperatives in India. Possible work in LAMP: staff capacity building and support for IVCS. website: www.microsave.net
Name of Agency: Sambodhi Research and Communications Ltd. Status: potential partner agency Type of agency: consulting company, based in Delhi Core competence: monitoring and evaluation. Possible work in LAMP: support for the M&E unit. website: www.sambodhi.co.in
Name of Agency: Catalyst Management Services. Status: potential partner agency Type of agency: consulting company, based in Bangalore Core competence: livelihoods development, impact evaluation Possible work in LAMP: support for the M&E unit. website: http://cms.org.in
Name of Agency: DigitalGreen. Status: potential partner agency Type of agency: non-profit organisation, based in India/USA Core competence: participatory videos for farmer-to-farmer extension and communications, 70 staff working in five states. Supported by BMGF and other foundations. Possible work in LAMP: support Knowledge Services website: http://www.digitalgreen.org

Republic of India
Meghalaya: Livelihoods and Access to Market Project
Final project design report - Working papers
292
Name of Agency: ITC Agribusiness Division. Status: potential public-private partnership Type of agency: company - part of ITC (major diversified corporation with turnover of USD 7 billion). Core competence: contract farming, processing, export of a range of agricultural commodities Possible work in LAMP: contract farming of spices, spice processing and marketing website: http://www.itcabd.com
Name of Agency: Tata Global Beverages Status: potential public-private partnership Type of agency: company - part of India's largest corporation with turnover of USD 83 billion. Core competence: contract farming, processing, export of a range of tea and coffee. Now expanding into spices (cardamom is to be produced on contract by farmers in Tamil Nadu, and TGB is already purchasing turmeric is Meghalaya. Possible work in LAMP: contract farming of spices, spice processing and marketing. Might also be interested in tea and coffee.
website: http://www.tataglobalbeverages.com/
Name of Agency: Rural Resource and Training Centre Status: provider of training services in Meghalaya Type of agency: NGO, once a unit Bosco Reach Out, which pioneered SHGs in the state. Core competence: training in rural development and agriculture, vocational training. Has its own 175 ha farm to provide practical training, and a 200 place residential training centre. Has provided training for ULIPH, MBDA and many other government and non-government programmes in the state. More information on RRTC is in Annex B. Possible work in LAMP: provider of training services, Resource NGO
website: http://rrtcumran.org/index.htm
C. Capacity building and support
1. Lessons from IFAD projects
Lessons regarding training and capacity building from the experience from IFAD projects in India and elsewhere in Asia
1 include:
Results of mass training programmes, covering many thousands of rural people, has been generally disappointing. Reach ambitious numerical targets requires a huge effort and becomes the focus of project management, and quality is sacrificed.
Post training follow-up is a key factor in adoption of technologies and skills learned in training courses.
Top quality training is well worth the extra cost - this may involve hands-on practical learning, good trainers (including farmers who have done what they are now teaching), and training from top institutions.
Capacity building and skill development can take place through a number of routes, and does not always need to involve formal training courses. Farmers can adopt messages from group meetings, take advice from input suppliers, and learn through mass media, as well as day-to- day contact with project staff. Above all farmers learn from seeing what other farmers are doing.
2. Approach to capacity building
An important conclusion to be drawn from these lessons is the need for flexibility in project design. Too often project management think that by following a detailed cost table line-by-line, they will achieve the objectives of the project. Training courses are provided because they are in the cost table, not because they are really needed. The approach for LAMP will be to provide lump sums for broad capacity building activities in each component, suggest possible training topics and methods,
1
in particular see Bangladesh: Evaluation of Training Provided by Projects, E Mallorie and N Sarder, IFAD Case Study, 2011

Republic of India
Meghalaya: Livelihoods and Access to Market Project
Final project design report - Working papers
293
but let project management draw up detailed plans of what they actually want to do each year as part of the AWPB process.
To calculate the quantum of resources likely to be needed for capacity building, and to illustrate the type of training that might be done, detailed cost tables have been drawn up for this stage of project design. However they will be omitted from the final design document. Avoiding this detailed specification of training in the project cost tables will also avoid problems, that have occurred in some projects, of unit rates, for things such as training allowances, being fixed at the wrong level, or indeed, the whole cost of a course being inadequate to provide the training needed.
The table below is based on these detailed cost tables, and includes additional information on how training will be organised and what outcomes are expected. In addition, capacity will be built for farmers and rural producers in the following ways:
Day-to-day contact with project staff - including local NRM facilitators (FNGO), and technical service providers for food crops, livestock and commercial products
Day-to-day contact and mentoring from village facilitators and lead farmers
Contact with VECs, IVCS and producer groups
Reading technical manuals, leaflets and other printed material
Viewing of videos produced for farmer-to-farmer knowledge sharing
Participation in knowledge sharing and review meetings at the village and district levels (participatory M&E)
Utilisation of telephone help-line and mobile-phone based information systems
Additional capacity building will be provided for project staff via:
Contact with other staff, especially PMU technical advisors and specialised agencies (such as the RNGOs (or similar agencies) employed to support FNGO/cluster agencies for NRM).
Contact with other agencies, especially GoM line departments
Contact with agencies in other states and countries - this may be partly facilitated by IFAD, and include contact with IFAD supported grant projects.
Technical manuals and other materials
Telephone help-line for EFC staff.
The overall capacity building effort for LAMP will be coordinated by a Training Specialist in the State PMU. This person will be responsible for the following tasks:
Assess training needs (in conjunction with other staff) and technical advisors, draw up an outline plan for training to be carried during LAM.
Identify suitable training providers and specify the contents of the required training courses.
Develop and maintain a library of training materials and follow-up support materials. Include non-convention learning routes in the menu for capacity building. Draw up annual training plans showing who is to be trained, the type of training to be
delivered, training methods, its duration and location, and cost. Establish and maintain (possibly via the MIS) records of training delivery, including
setting up recording systems at the district and block levels. Monitor the quality, effectiveness and outcomes of training courses (this may include
participating in Knowledge Attitude Practice Surveys) and learn lessons for the future. Ensure that training providers and individuals facilitating training are competent to
transfer knowledge and skills – and where needed organize Training of Trainer courses. Periodic analysis of gaps in skills and identify those which have a training solution
Maintain contact with other agencies involved in training to ensure that LAMP has access to the best available training resources and most appropriate training methods.
It should be remembered that there are other capacity development initiatives in the state. In particular GoM will soon start to implement the Supporting Human Capital Development in Meghalaya - a project for vocational training (along with secondary education) to be supported by ADB.

Republic of India
Meghalaya: Livelihoods and Access to Market Project
Final project design report - Working papers
294
Training included in detailed cost tables
Training topic People to be trained Training or
visit Batches planned
Organised by Objective
Natural Resources and Food Security
INRM planning & implementation DPMU & FNGO staff Training 7 DPMU Build staff skills and common approach for INRM
INRM planning & implementation Village facilitators Training 70 FNGO/DPMU Build skills for INRM - participatory planning, facilitation and LAMP processes
INRM planning & implementation Village leaders training/visit 280 FNGO/DPMU Awareness re INRM
Food crop production Lead farmers training/visit 140 DPMU Food crop production
Power tiller operation PT operators Training 70 DPMU Food crop production - operation and maintenance of machinery
Improved livestock technologies DPMU staff, VF training/visit 34 Livestock TSP* Livestock production - focus on pigs and poultry
Improved crop (paddy etc.) technologies DPMU staff, VF training/visit 10 Food crops TSP* Food crop production - focus on rice
Integrated Production & Marketing
commercial production and marketing Lead farmers Training 54 IPM TSP* Build skills and knowledge of markets
commercial production and marketing Farmers Training 1,620 IPM TSP* Build skills for better production methods
commercial production and marketing Farmers Visit 1,620 IPM TSP* See production pockets and visit markets
Enterprise Facilitation Centres
Bank loan application and business plans Field Business Advisor Training 4 EFC TSP* Expertise in business planning and knowledge of bank lending procedures
Refresher training for FBA Field Business Advisor training/visit 4 PMU Follow-up, problem solving, additional knowledge
Enterprise development Enterprise Res. Person Training 8 EFC TSP* Knowledge of how EFCs should operate, how to deal with enquiries
Refresher training for ERP Enterprise Res. Person training/visit 6 PMU Follow-up, problem solving, additional knowledge
Enterprise training (LAMP) Entrepreneurs Training 720 PMU/EFC TSP*/other Business management, accounting, marketing, production
Enterprise training (convergence) Entrepreneurs training/visit 2300 Line departments Production methods and technologies
Rural Finance
MACB & Coop. Department facilitators Bank and GoM staff Training 3 Coop Support Agency Approach to building IVCS
IVCS operation IVCS managers Training 24 MACB IVCS processes and practices
IVCS governance and management IVCS directors Training 80 MACB Duties of IVCS boards
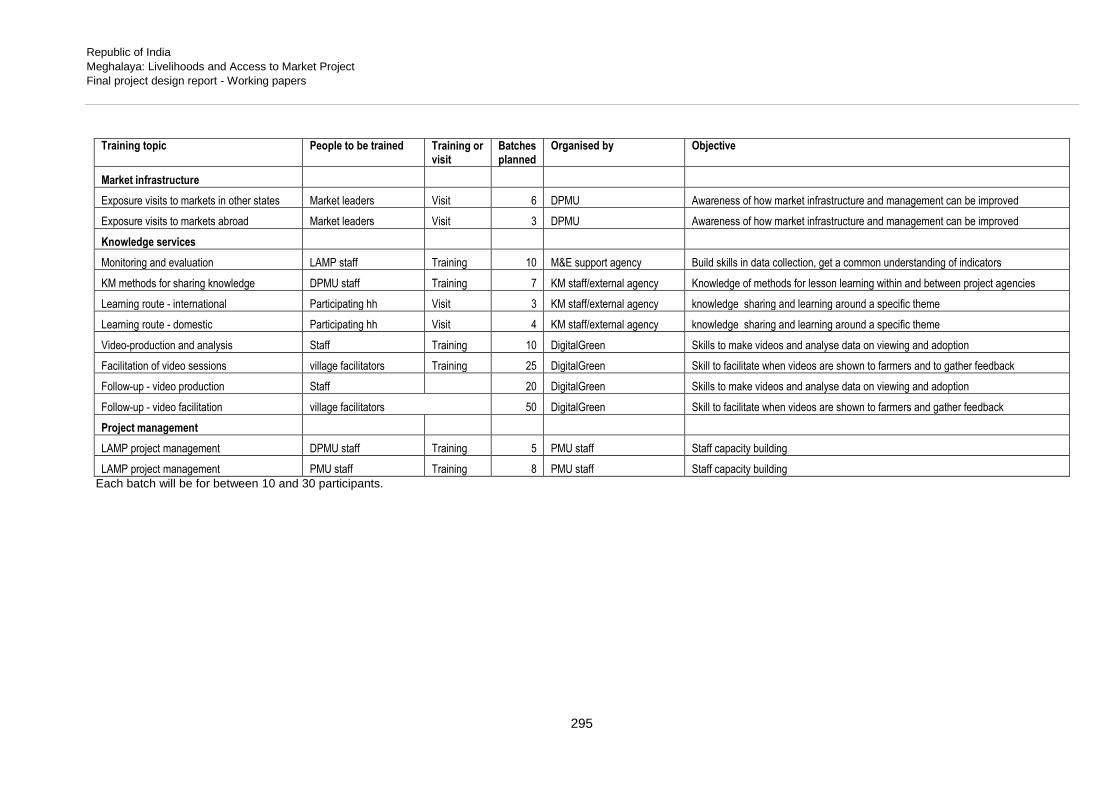
Republic of India
Meghalaya: Livelihoods and Access to Market Project
Final project design report - Working papers
295
Training topic People to be trained Training or
visit Batches planned
Organised by Objective
Market infrastructure
Exposure visits to markets in other states Market leaders Visit 6 DPMU Awareness of how market infrastructure and management can be improved
Exposure visits to markets abroad Market leaders Visit 3 DPMU Awareness of how market infrastructure and management can be improved
Knowledge services
Monitoring and evaluation LAMP staff Training 10 M&E support agency Build skills in data collection, get a common understanding of indicators
KM methods for sharing knowledge DPMU staff Training 7 KM staff/external agency Knowledge of methods for lesson learning within and between project agencies
Learning route - international Participating hh Visit 3 KM staff/external agency knowledge sharing and learning around a specific theme
Learning route - domestic Participating hh Visit 4 KM staff/external agency knowledge sharing and learning around a specific theme
Video-production and analysis Staff Training 10 DigitalGreen Skills to make videos and analyse data on viewing and adoption
Facilitation of video sessions village facilitators Training 25 DigitalGreen Skill to facilitate when videos are shown to farmers and to gather feedback
Follow-up - video production Staff 20 DigitalGreen Skills to make videos and analyse data on viewing and adoption
Follow-up - video facilitation village facilitators 50 DigitalGreen Skill to facilitate when videos are shown to farmers and gather feedback
Project management
LAMP project management DPMU staff Training 5 PMU staff Staff capacity building
LAMP project management PMU staff Training 8 PMU staff Staff capacity building Each batch will be for between 10 and 30 participants.

Republic of India
Meghalaya: Livelihoods and Access to Market Project
Final project design report - Working papers
296
Annex A: Training Institutes for Meghalaya
Sector Institute/Agencies Contact/Resource Person Agriculture Institute of Rural Development
Nongsder, PO- Umiam Khwan Meghalaya-793103
Director
Phone- 0364-2570348
Rural Resource Training Centre
Umran, Nayabunglow, Meghalaya
Director,
Phone- 03638-262314 [email protected] [email protected]
Kisan Mobile Advisory Services
(KMAS) Shri Shaheen Sangma
09436744079 Shri Bhupen Hajong 9863120278
Apiculture Rural Resource Training Centre Umran, Nayabunglow,
Meghalaya
Director, Phone- 03638-262314 [email protected] [email protected]
Aquaculture Rural Resource Training Centre Umran, Nayabunglow,
Meghalaya
Director, Phone- 03638-262314 [email protected] [email protected]
Kisan Mobile Advisory Services (KMAS)
Shri Abanti Hajong Md Zilkat Hussain 09615894468 9615177797
Horticulture Rural Resource Training Centre Umran, Nayabunglow,
Meghalaya
Director, Phone- 03638-262314
9856003212 [email protected] [email protected] Training Cordinator 9856286420
Kisan Mobile Advisory Services (KMAS)
Shri Shaheen Sangma 9436744079
Livestock Institute of Rural Development Nongsder, PO- Umiam Khwan
Meghalaya-793103
Director Phone- 0364-2570348
Rural Resource Training Centre
Umran, Nayabunglow, Meghalaya
Director,
Phone- 03638-262314 [email protected] [email protected]
VFA Training Institute, Upper Shillong East Khasi Hills, Meghalaya
Principal 0364-2560985
Vocational Training Institute, Kyrdemkulai , Ri-Bhoi, Meghalaya
VFA Training Institute, Nonstoin,West Khasi Hills
VFA Training Institute, Jowai, Jaintia Hills
VFA Training Institute, Tura, West Garo Hills
Neramac
NEC Secretariat, Nongrim Hills Shillong-
Shri K C S Kurup
+ 9706098141
Sericulture & Weaving Weaving Training Centre Nongpoh, Ri-Bhoi
Weaving Training Centre Jowai, Jaintia Hills
Weaving Training Center Nongstoin, West Khasi Hills
Weaving Training Centre Sella, East Khasi Hills
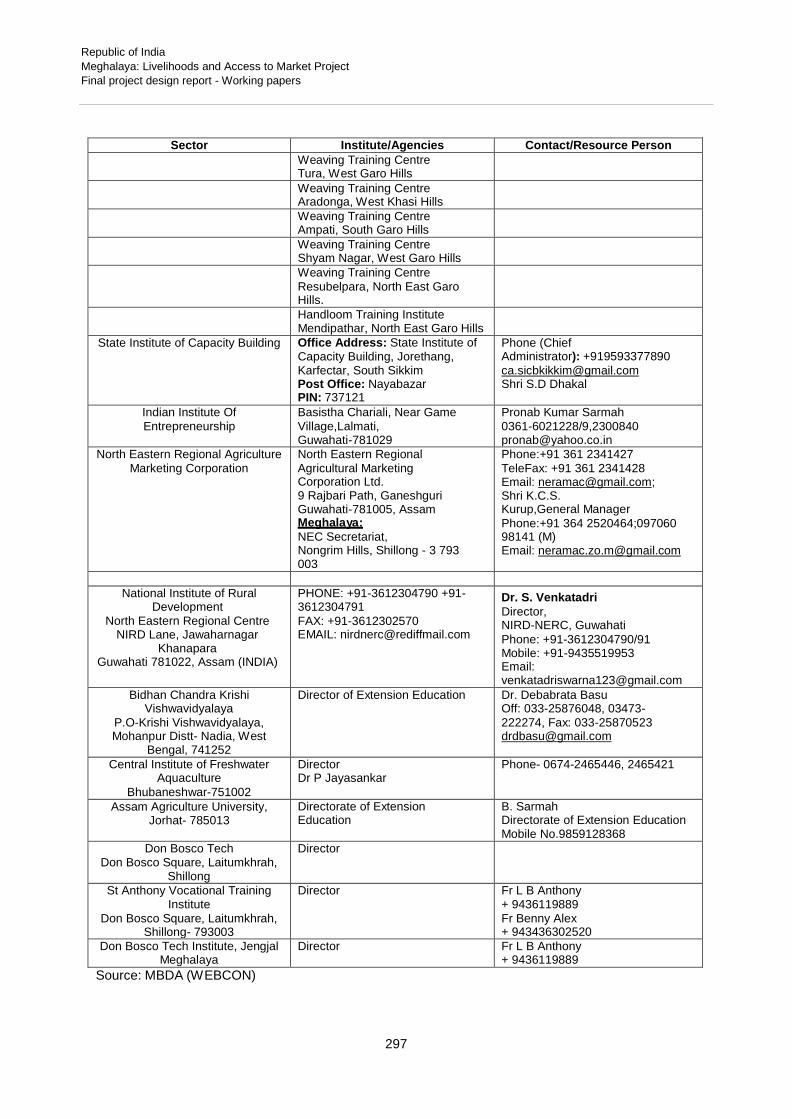
Republic of India
Meghalaya: Livelihoods and Access to Market Project
Final project design report - Working papers
297
Sector Institute/Agencies Contact/Resource Person
Weaving Training Centre Tura, West Garo Hills
Weaving Training Centre Aradonga, West Khasi Hills
Weaving Training Centre Ampati, South Garo Hills
Weaving Training Centre Shyam Nagar, West Garo Hills
Weaving Training Centre
Resubelpara, North East Garo Hills.
Handloom Training Institute Mendipathar, North East Garo Hills
State Institute of Capacity Building Office Address: State Institute of Capacity Building, Jorethang, Karfectar, South Sikkim Post Office: Nayabazar PIN: 737121
Phone (Chief Administrator): +919593377890
[email protected] Shri S.D Dhakal
Indian Institute Of
Entrepreneurship Basistha Chariali, Near Game
Village,Lalmati, Guwahati-781029
Pronab Kumar Sarmah
0361-6021228/9,2300840 [email protected]
North Eastern Regional Agriculture
Marketing Corporation North Eastern Regional
Agricultural Marketing Corporation Ltd. 9 Rajbari Path, Ganeshguri Guwahati-781005, Assam Meghalaya:
NEC Secretariat, Nongrim Hills, Shillong - 3 793 003
Phone:+91 361 2341427
TeleFax: +91 361 2341428 Email: [email protected]; Shri K.C.S. Kurup,General Manager
Phone:+91 364 2520464;097060 98141 (M) Email: [email protected]
National Institute of Rural
Development
North Eastern Regional Centre NIRD Lane, Jawaharnagar
Khanapara Guwahati 781022, Assam (INDIA)
PHONE: +91-3612304790 +91- 3612304791
FAX: +91-3612302570 EMAIL: [email protected]
Dr. S. Venkatadri
Director, NIRD-NERC, Guwahati
Phone: +91-3612304790/91 Mobile: +91-9435519953 Email: [email protected]
Bidhan Chandra Krishi Vishwavidyalaya
P.O-Krishi Vishwavidyalaya, Mohanpur Distt- Nadia, West
Bengal, 741252
Director of Extension Education Dr. Debabrata Basu Off: 033-25876048, 03473-
222274, Fax: 033-25870523 [email protected]
Central Institute of Freshwater Aquaculture
Bhubaneshwar-751002
Director Dr P Jayasankar
Phone- 0674-2465446, 2465421
Assam Agriculture University, Jorhat- 785013
Directorate of Extension Education
B. Sarmah Directorate of Extension Education Mobile No.9859128368
Don Bosco Tech Don Bosco Square, Laitumkhrah,
Shillong
Director
St Anthony Vocational Training Institute
Don Bosco Square, Laitumkhrah, Shillong- 793003
Director Fr L B Anthony + 9436119889
Fr Benny Alex + 943436302520
Don Bosco Tech Institute, Jengjal Meghalaya
Director Fr L B Anthony + 9436119889
Source: MBDA (WEBCON)

Republic of India
Meghalaya: Livelihoods and Access to Market Project
Final project design report - Working papers
298
Annex B: Note on visit to Rural Resource and Training Centre
30-05-13
Met with: Father James Mani, Director and other staff Tel.
094361 62873, 085750 20662 [email protected], [email protected] St Joseph’s Agricultural Training Centre, Umran, Nayabungalow, Ri-Bhoi
Father James, originally from Kerala, came to Ri-Bhoi as a young boy with priests and completed his schooling in Meghalaya. He took over a year ago from previous Director, Fr Cyril. Does not have an NRM background, but seems to be an effective, inspiring, and energetic manager – which is probably more important.
RRTC is situated on the Guwahati-Shillong National Highway at an altitude of 2,450 feet, and comprises 400 acres of rolling hills, forests, lakes and farmland. The Centre is bordered and watered by 3 rivers. RRTC began as St. Joseph's Agricultural Training Centre in the 1970's. It became RRTC in the year 2000.
RRTC visualizes “a society which is self-reliant in food and income requirements from land resources and livestock, through eco-friendly and mutually collaborative entrepreneurship”, a mission (to achieve a self-sufficient and self-sustaining society through generating awareness, capacity building, skills development and dissemination of appropriate technology).
Personal Impressions: Committed, charismatic man, committed staff. Simple but well equipped and spacious residential training centre, and provides accommodation and food within the overall cost of the courses.
Appears well organized with enthusiastic staff - the farm sounds to be an impressive and extensive spread, with many good demonstrations of good management and sound practice – livestock, crops, and other on-farm livelihood options.
Fr James is clearly a well-respected man, quite strict, but motivational – meeting with village heads had just finished when we arrived, were offered lunch there, followed by meeting with Fr James, who was keen to be involved and provide services.
The Centre likes to innovate and try things out – have recently developed mud-block bee hives which has been very successful – better temperature stability and higher productivity.
Training Provided: RRTC has 81 staff, of whom 15 are teachers; also bring in trainers from outside to fill in where the RRTC staff are not so strong. External trainers are government officers, individuals who have a particular skill/s and work for other organisations, and visitors to Meghalaya etc. Many of the staff work on the farm.
Consultancy and training partners include: AFPRO Guwahati, ASK New Delhi, SSU Bosco Reach Out, Bikas Northeast Guwahati, ICAR Barapani, North Eastern Hill University Shillong, and the State Bank of India.
Training provided is very much practical – much of it on their 400 acre farm, where there are established demos – see below.
Much of their training concerns farming and natural resource management – see Table - but they also conduct training on hair-dressing, carpentry, masonry, house-keeping, cooking etc.. They would be happy to have someone/a project review their curricula, but RRTC staff might need training by an external consultant if there were any particularly new topics to cover.

Republic of India
Meghalaya: Livelihoods and Access to Market Project
Final project design report - Working papers
299
Farmers and young people sometimes pay for themselves, but most are paid for by a sponsoring organisation or project.
Students/trainees who cannot afford the fees quite often work for 2 months at the farm or in the college to pay for their tuition fees - which are very reasonable, see Table.
RRTC trains both farmers directly, and those who will coach farmers (ToT).
They undertake training on-site at RRTC, as well as in the field – quite happy, it seems, to send staff to SW Garo to train trainers or farmers, and will provide on-site back-up in the field every 3 months, depending on contract. Each year around 4,000 farmers visit the RRTC farm on exposure and training programmes.
RRTC has good facilities for learning and hands-on experience, conference halls, a dining room, and rooms and dormitories, and camp sites for tourists, scouting and guiding, adventure and hiking.
Extension Programmes:
RRTC implements programmes and projects in rural areas of Meghalaya such as the National Agricultural Innovation Project in South Garo Hills (NAIP), and Sustainable Livelihood through Poultry and Pig Farming in Ri Bhoi. They also undertake collaborative ventures with others – such as supply of quality planting materials in collaboration with NEHU, and providing assistance on contract with other NGOs and organizations – eg. need assessments, strategic planning, project evaluation and capacity building.
The Demonstration Farm: RRTC runs a self-sustaining farm with various demonstration units, as follows:-
family units with homestead farming agriculture, horticulture, herbal and indigenous medicinal
plant nurseries apiary and honey production floriculture demo areas vegetable production plots water and soil conservation demo sites fishery demo ponds spices cultivation experimentation plots horticultural farm agro-forestry plantation poultry, piggery and dairy units mushroom production centre
Financial Support The course fees and farm sales do not cover the costs, but they manage somehow. They try to be self-sufficient, and receive nothing from Don Bosco in Rome, but survive from year to year from projects (2-3 running currently), and other commitments. Past projects have been funded by Caritas Denmark, ICAR, government departments and Ministries, NABARD and other banks, the State Spice Board etc.etc.
In 2012, they received Rs 5 lakhs from the District Commissioner as a contribution, which helped pay off a debt, as did the sale from some land – they had borrowed from Rs 10 lakh from DB in Rome some years back. The fees will have to go up again soon, but not by much as they are 100% committed to helping the rural poor.
Conclusion
For basic training of lead/master farmers (those who will pass on skills to the farmers), RRTC would be a good service provider. An added advantage is that they will undertake training on-farm in any part of the State – with extra cost provision for travel and DSA.
Proposal:
basic courses for the lead/master farmers (to be identified by the project) could initially be provided at the Centre (eg. training in basic crop production, poultry, pigs, cattle) – fully residential, plus established farm and demos;

Republic of India
Meghalaya: Livelihoods and Access to Market Project
Final project design report - Working papers
300
these basic courses need to be tailored to fulfill the needs of the project – eg. would combine appropriate crop, soil and livestock management, + soil fertility + NRM and soil conservation aspects + jhum options + basic entrepreneurship/ago business + participatory and practical training techniques;
curriculum development required;
RRTC would be contracted to provide support in the field every 3 months for a year, ensuring that each lead/master farmer had established a sound demo farm, and was effectively coaching other farmers in the village, and then in the clusters;
for those interested master farmers, identified as potentially useful to the project, specialist training could follow in year 2 - in, for example, animal health, rice, strawberries, floriculture, mushrooms, and bee-keeping.
Relevant RRTC Training Programmes Offered in 2013
Course Duration - days Training Fee (Rs)
Integrated Farming 6 2,760 Horticulture Management 4 1,560 Nursery Management 5 2,160 Kitchen Gardening 4 1,560 Organic Farming 5 2,160 Types of Composting 5 2,160 Vermicomposting 4 1,560 Irrigation System & Nursery Management 5 2,760 Pig Farming 5 2,160 Dairy Farming 4 1,560 Goat Farming 4 2,160 Duck Farming 5 2,160 Animal Health Care 6 2,760 Fish Farming 4 1,560 Fish Breeding 4 1,560 Bee Keeping 5 2,160 Mushroom Cultivation 4 1,560 Floriculture 5 2,160 Food Processing 6 3,160 Ginger & Turmeric Processing 4 1,560 Preparation of Sweets 4 3,160 Community Leadership 2 2,000 Capacity Building 6 2,960
Important Notes:
a) many of the above programmes are held regularly and annually, while some others are conducted on demand;
b) prices are likely to rise in the near future – allow another 10% for budgeting purposes; c) prices include accommodation and fooding; d) groups of up to 30 trainees are accommodated; e) also need to budget for transport of trainees from/to block/district headquarters, and a small sum for
DSA; f) other courses held in the past include Appropriate Technology (8 days), Fishery Management (5 days), Plant
Propagation (5 days), and Land and Water Management (5 days) g) longer courses in Rural Entrepreneurship Development Programme (20 days), Livestock Management
(15 days) and Animal Health Care (15 days) are also offered, and will be of interest to LAMP.

Republic of India
Meghalaya: Livelihoods and Access to Market Project
Final project design report - Working papers
301
0.0 0.0 8.0 8.0 8.0 8.0 8.0 8.0 8.0 8.0 0.0 0.0 4.0 12.3 21.3 31.0 41.5 52.8 65.0 78.2
Working Paper 13: Project Costs and Financing
I. INTRODUCTION
1. This Working Paper on “Project Costs and Financing” describes the estimated project costs, based on the information collected during the course of the mission’s fieldwork and data provided by the concerned line agencies in Shillong, Meghalaya, India. The FAO/World Bank COSTAB software version 32 was used to calculate the costs, financing schedules, and disbursement, procurement and expenditure accounts. All entries are made starting from fiscal year 2014/15 for an eight year project. Input costs are in domestic currency units, i.e. INR, Indian Rupees.
II. MAIN ASSUMPTIONS
A. Physical and Price Contingencies
2. As all project interventions are on a project mode, no specific physical contingencies have been applied. Price contingencies at 5% have been applied on all items except for enterprises financing, risk fund, corpus fund, village development fund, social development fund etc. As the current domestic inflation rate is 5%, price contingencies assumed at constant rate of 5%. For staff salaries and allowances, 8% price contingencies have been assumed. Foreign inflation rate has been assumed at 2%.
B. Exchange Rates
3. The initial exchange rate for the analysis has been set at Indian Rupees (INR) 62
1 to one
USD, the rate prevailing at the time of data collection (November 2013). Exchange rates during implementation phase and the foreign exchange rates forecasts for the Project costs estimates, and conversions from current INR values into USD are calculated using current exchange rate (INR/USD). Both foreign and local inflation rates are compounded at mid-year. See Table 1 below
Table 1: Inflation Rates (Yearly Values within each Project Year)
Inflation (in %'s) /a
All
Annual rates
Up to
Up to Project
Negotiation Start 14/15 15/16 16/17 17/18 18/19 19/20 20/21 21/22
Local 1.3 1.3 5.0 5.0 5.0 5.0 5.0 5.0 5.0 5.0
Foreign 0.0 0.0 2.0 2.0 2.0 2.0 2.0 2.0 2.0 2.0
Compounded rates
Local 1.3 1.3 3.8 9.0 14.4 20.1 26.1 32.5 39.1 46.0
Foreign 0.0 0.0 1.0 3.0 5.1 7.2 9.3 11.5 13.7 16.0
Salaries & allowances
Annual rates
Local
Compounded rates
Local
Exchange rates (Local/Foreign) /b
All
Rates actually used 62.0 62.0 62.0 62.0 62.0 62.0 62.0 62.0 62.0 62.0
Constant purchasing parity rates 62.0 62.8 64.5 66.4 68.4 70.4 72.4 74.6 76.8 79.0
% deviation 0.0 -1.2 -3.9 -6.6 -9.3 -11.9 -14.4 -16.9 -19.2 -21.5
Salaries & allowances
Rates actually used 62.0 62.0 62.0 62.0 62.0 62.0 62.0 62.0 62.0 62.0
Constant purchasing parity rates 62.0 62.0 64.5 69.6 75.2 81.2 87.7 94.7 102.3 110.5
% deviation 0.0 0.0 -3.8 -11.0 -17.6 -23.7 -29.3 -34.6 -39.4 -43.9
\a Yearly values are within Each Project Year \b Yearly values are at Project Year Midpoints
1
Current exchange rates are volatile due to various factors. It is likely that this situation may continue for some more time, probably till the time of India’s General Election, which is due in April 2014.

Republic of India
Meghalaya: Livelihoods and Access to Market Project
Final project design report - Working papers
302
B. Taxes and Duties
4. Taxes and duties have been estimated using the prevailing prices in June 2013. All items which contain implicit duties and taxes, have accordingly accounted for, while nationally purchased items are subject to national and local taxes of different types. Consulting services, surveys and studies are contracted or sourced out and contracted entities are responsible of their national tax liabilities, and a flat rate of 10% has been assumed. A tax rate of 10% has been assumed for goods and equipment, 5% for all office operations costs, service providers’ contracts at 15%, and civil works at 15%, training and workshops at 5%.
5. Starting from the baseline-cost, annual amounts are calculated for contingencies, which may occur during the project implementation. Such contingencies include both physical events, specific to each type of activity, and price contingencies deriving from both domestic inflation. No physical contingencies added to any category of cost items. The resulting price contingencies calculated have been added to all expenditure categories, except grant and loan financing to enterprises and convergence funding.
D. Project Life and Components
6. The project life is 8 years, starting from fiscal 2014/15 and it is expected to be completed by fiscal 2021/2022. Cost estimates for the project period have accordingly been calculated. The cost estimates presented in COSTAB Tables comprise all taxes and duties including taxes that will be drawn from the counterpart funds. The following components and sub-components constitute the COSTAB Structure, which corresponds to specific project development objectives.
Table 2: Project Components and Subcomponents with reference to Detailed Cost Tables
Components Sub-components Costab Table No
A. Natural Resources & Food Security 1.1 Integrated NRM 1.1
B. Livelihoods Support: 2.1 Integrate Village Cooperatives 2.1 2.2 Enterprises Development 2.2 2.3 Integrated Production & Marketing 2.3
2.4 Access to Markets 2.4 C. Knowledge Management: 3.1 Knowledge Services 3.1 D. Project Management: 4.1 District Project Management Units 4.1
4.2 Project Management Unit, Shillong 4.2
Detailed Cost Tables are presented in Appendix-2
E. Procurement, Disbursement and Expenditure Accounts
7. Following accounts under procurement, disbursement and expenditure categories have been set up and used in estimating the project costs in compliance with IFAD information Circular # IC/FOD/02/2013 of 29 August 2013.

Republic of India
Meghalaya: Livelihoods and Access to Market Project
Final project design report - Working papers
303
Table 3: COSTAB Accounts
Procurement Accounts Disbursement Accounts a/ Expenditure Accounts Works_PA Works_DA Works_EA Convergence_PA Convergence_DA Convergence_EA Vehicles_PA Vehicles_DA Vehicles_EA Equipment and materials_PA Equipment and materials_DA Equipment and materials_EA Training_PA Training_DA Training_EA Consultancy_PA Consultancy_DA Consultancy_EA Goods, services and inputs_PA Goods, services and inputs_DA Goods, services and inputs_EA Credit / Guarantee funds_PA Credit / Guarantee funds_DA Credit / Guarantee funds_EA Grants and subsidies_PA Grants and subsidies_DA Grants and subsidies_EA Salaries and allowances_PA Salaries and allowances_DA Salaries and allowances_EA Operating costs_PA Operating costs_DA Operating costs_EA Works include rural roads, culverts and bridges, ropeways, markets and buildings; Convergence work include works relating to NRM; Consultancy includes studies and all technical assistance;
Credit and guarantee funds include institutional credit, corpus fund, risk fund, viability gap fund for IVCS and loans, grants etc. for EFC, livestock and IPM enterprises Grants and subsidies include VDF for NRM, support to VEC, and social development fund
Salaries and allowances for all incremental staff under the Project Management
F. Unit Costs
8. Unit costs, together with physical units, have been identified for most items and these are inputted using domestic currency units, namely Indian Rupees, INR. In certain instances a lump sum allocations have been computed so as to give flexibility in procurement or for the implementation of the activity/task. All NRM interventions are lumped together and are shown under village development fund and social development fund. Office equipment such as laptops, printers, desk-tops and furniture and materials are categorized under Goods and equipment category. Institutional credit, financing support for enterprises by the project, beneficiaries and convergence are shown under the category, “Grants/credit for subproject”. Government support for IVCS in the form of risk fund, viability gap fund and corpus etc are categorized under credit and guarantee fund”. All works relating to convergence are shown under the “Convergence” category.
9. It is noted that “all unit costs are indicative and are used for the purposes of estimating the overall project costs. These are, therefore, subject to changes and revision during project implementation and also at the time of preparing Annual Work Plans and Budgets”.
G. Financiers
10. The project will be financed by the following financiers: IFAD, Government of Meghalaya, Banks, participating beneficiaries and convergence. The convergence funds will be pooled from all on-going, government-sponsored schemes and programmes such as MGNEGS, RKVY, the State Rice Mission, National Horticulture Mission, National Food Security Mission etc
III. PROJECT COSTS
A. Total Project Costs
11. Total Project Costs is estimated at USD 169.9 million. This is inclusive of all contingencies of USD 14.9 million, beneficiary contribution of USD 12.6 million equivalent primarily in the form of labour and materials, institutional credit USD 29.3 million, convergence USD 28.2 million, and USD 49.6 million as counterpart funding from the government. See Table 4 below.

Republic of India
Meghalaya: Livelihoods and Access to Market Project
Final project design report - Working papers
304
Table 4: Project Cost Summary
Amount in million 1/
Total Project Costs including contingencies and taxes
INR
10,534.1 USD
169.9
-IFAD Loan amount 3103.9 50.0
-GoM contribution including taxes 3079.2 49.6
-Beneficiaries contribution 786.3 12.6
-Banks 1817.8 29.3
-Convergence 1746.9 28.2
12. The Aggregate Project Cost Summary is presented in Appendix-1 and the Detailed cost
Tables are presented in Appendix-2.
B. Project Costs by Project Component
13. Project costs are organized into four major components: (i) Natural Resources and Food Security (22% of total base costs); (ii) Livelihoods Support (69% of total baseline costs); (iii) Knowledge Services (4% of baseline costs); and (iv) Project Management (5% of estimated baseline costs). Project baseline costs together with contingencies are summarised in Table 5 below.
Table 5: Project Costs by Project Components
India
Meghalaya: LAMP Appraisal Mission % Total
Components Project Cost Summary (INR '000) (US$ '000) Base
Total Total Costs
A. Natural Resources & Food Security
1. Integrated NRM 2,144,981 34,596 22
Subtotal Natural Resources & Food Security 2,144,981 34,596 22
B. Livelihood support
1. Integrated village cooperatives 823,029 13,275 9
2. Enterprises development 3,116,793 50,271 32
3. Integrated production & marketing 1,035,903 16,708 11
4. Livestock Development 357,102 5,760 4
5. Access to markets 1,302,567 21,009 14
Subtotal Livelihood support 6,635,394 107,022 69
C. Knowledge Services
1. Knowledge services 338,092 5,453 4
Subtotal Knowledge Services 338,092 5,453 4
D. Project Management
1. Project Management Unit, Shillong 131,176 2,116 1
2. District Project Management Units 362,483 5,847 4
Subtotal Project Management 493,659 7,962 5
Total BASELINE COSTS 9,612,126 155,034 100
Physical Contingencies - - -
Price Contingencies 921,969 14,870 10
Total PROJECT COSTS 10,534,095 169,905 110
C. Project Costs by Expenditure Accounts
14. Total investment costs are estimated at USD 146.69 million and these accounts for about 86.3% of the total project costs and the balance, USD 23.21 million are recurrent costs. Credit and Guarantee funds account for about 35.9%, followed by works 13.5%, civil works (and other works under convergence 9.7%), Grant and subsidies at 12.4%, training 5%, Goods, services and inputs account for 5% and other investment expenditures are very minor cumulatively accounting for about 1.7% of the total project costs. The recurrent costs are incremental salary and allowances accounting for 11.8% and office operating costs account for 1.9%.

Republic of India
Meghalaya: Livelihoods and Access to Market Project
Final project design report - Working papers
305
D. Project Costs by Disbursement Accounts
15. Disbursement accounts, derived from the expenditure accounts described above, provide the basis for determining the financing plan for the Project. Disbursement accounts and the IFAD financing rules are presented in Appendix 1. In estimating the semester disbursement, a ratio of 4:6 has been assumed between first and second semester for each fiscal year. The disbursement accounts have been organised into following categories as presented in Table 6 below.
Table 6: Project Disbursement Categories
Disbursement / Expenditure category
Total Project Expenditure
Amount
(000 USD)
IFAD Financing
rule
(%) a/
IFAD Financing (000 USD)
Works 22,944 55% 12,619
Convergence 16,555 0% 0 Vehicles 486 75% 364
Equipment and materials 2,407 75% 1,142
Training 8,545 90% 7,686
Consultancy 3,846 85% 3,269
Goods, services and inputs 9,859 85% 8,380
Credit / Guarantee funds 60,867 0% 0 Grants and subsidies 21,185 50% 7,706
Salaries and allowances 19,972 40% 7,989
Operating costs 3,239 50% 908
Total 169,905 50,063
a/ percentage to eligible expenditures only; Refer Table below Section E
E. Project Costs by Procurement Accounts
16. Procurement accounts are identical to those of expenditure accounts except that all accounts are treated under one group whereas the expenditure accounts are grouped into two: namely investment and recurrent costs accounts by default. All three costab accounts are maintained in identical format in order to get results without any errors.
IV. PROJECT FINANCING
17. The proposed financiers for the Project are IFAD, the Government of Meghalaya. Banks, beneficiaries and the funds from convergence programme. IFAD will finance about USD 50 million about 30% of total project costs, the government counterpart funding will be about USD 49.7 million including taxes, financing institutions will provide about USD 29.3 million, the beneficiaries USD 12.6 million, mostly in the form of labour, and the funds from convergence programmes will be about USD 28.2 million. The financing plan is summarised in Table 7 below.
Table 7: Project Financing by Financier and Disbursement Account
India
Meghalaya: LAMP Appraisal Missio (US$ '000)
Dis burs e m e nt Accounts by Financie rs
Govt
IFAD
Bank s
Conve rge nce
Be ne ficiarie s
Total Dutie s &
Am ount % Am ount % Am ount % Am ount % Am ount % Am ount % Taxe s 1. Works 10,325 45.0 12,619 55.0 - - - - - - 22,944 13.5 3,442 2. Works/Convergence - - - - - - 16,555 100.0 - - 16,555 9.7 - 3. Vehicle 121 25.0 364 75.0 - - - - - - 486 0.3 121 4. Equipment & materials 1,264 52.5 1,142 47.5 - - - - - - 2,407 1.4 241 5. Training 859 10.1 7,686 89.9 - - - - - - 8,545 5.0 427 6. Consultancy 577 15.0 3,269 85.0 - - - - - - 3,846 2.3 577 7. Goods, services and inputs 1,479 15.0 8,380 85.0 - - - - - - 9,859 5.8 1,479 8. Credit, Guarantee f unds 9,699 15.9 - - 29,319 48.2 11,593 19.0 10,256 16.8 60,867 35.8 - 9. Grant & subsidies 11,625 54.9 7,706 36.4 - - - - 1,855 8.8 21,185 12.5 - 10. Salaries & allow ances 11,983 60.0 7,989 40.0 - - - - - - 19,972 11.8 531 11. Operating costs 1,732 53.5 908 28.0 - - 27 0.8 572 17.7 3,239 1.9 69
Total PROJECT COSTS 49,665 29.2 50,063 29.5 29,319 17.3 28,175 16.6 12,682 7.5 169,905 100.0 6,887

Republic of India
Meghalaya: Livelihoods and Access to Market Project
Final project design report - Working papers
306
18. Convergence: Based on data from the State Plans and other information including institutional credit, the following sources of funds may be available in the form of convergence investments: MGNREGS, State Rice Mission, RKVY, National Food Security Mission and HMNEHS. No account has been taken of possible convergence from ADB funded programmes in the state for road development and skill development, the IFC financial inclusion project and the GIZ project for climate change adaptation. Nevertheless convergence and bank loans are expected to contribute over one third of the overall project resources, with the ratio of IFAD to other funding (GoM, banks and convergence) is 1:2.6.
A. Disbursement Procedures
19. Disbursement for each payment for eligible expenditure costing in excess of USD 50 000 require detailed documentation. Disbursements for each payment for eligible expenditure costing less than USD 50 000 equivalent will be made against statements of expenditure (SOEs). All services contracts exceeding USD 50,000 require prior review. The PMU will retain the relevant documents and make them available for inspection and review by IFAD supervision missions and the auditors. Requests for replenishment will be made by PMU through the Ministry of Finance (MoF) for processing. The PMU will compile and consolidate, on a timely basis, eligible project expenditures for all project activities and consolidate and process, on a timely basis, withdrawal applications for all eligible project expenditures and submit those withdrawal applications to IFAD through MoF for reimbursement. Withdrawals from the Loan account will be made in amounts no less than 20-30% of the authorised allocation or its equivalent, or such other amount as IFAD may designate from time to time.
B. Procurement Procedures2
20. The following procurement arrangements are expected: (i) local shopping, (ii) local competitive bidding, (iii) direct contracting, and (iv) procurement by community participation. Procurement financed by IFAD will be made in accordance with IFAD procurement regulations.
Table 8: Project Cost by Procurement Methods
Procurement Arrangements
(US$ '000)
A. Works
B. Works/Convergence
C. Vehicles
D. Equipment & materials
E. Training
F. Consultancy
G. Goods, services & inputs
H. Grant & subsidies
I. Credit, Guarantee funds
J. Salaries and allowances
K. Operating costs
Total
Procurement Method
Community
Local Participation
Competitive Local Direct in
Bidding Shopping Contracting Procurement Other N.B.F. Total 22,944 - - - - - 22,944
(12,619) (12,619)
- - - - - 16,555 16,555
486 - - - - - 486
(364) (364)
- 1,523 - - - 884 2,407
(1,142) (1,142)
- 8,545 - - - - 8,545
(7,686) (7,686)
- 3,846 - - - - 3,846
(3,269) (3,269)
- 9,859 - - - - 9,859
(8,380) (8,380)
- - - 16,702 565 3,919 21,185
(7,480) (226) (7,706)
- - - - 38,878 21,990 60,867
- - 19,972 - - - 19,972
(7,989) (7,989)
- 1,815 - 574 - 850 3,239
(908) (908) 23,430 25,588 19,972 17,276 39,442 44,197 169,905
(12,983) (21,385) (7,989) (7,480) (226) - (50,063)
ective amounts financed by IFAD
Note: Figures in parenthesis are the resp
2
Refer also Appendix 8, Procurement Procedures of Main Report

Republic of India
Meghalaya: Livelihoods and Access to Market Project
Final project design report - Working papers
307
21. Any procurement decision for award of contract for procurement of goods and works costing USD 100,000 equivalent or more and for consultancy services costing USD 50,000 equivalent or more will require prior review by IFAD. Whenever possible, items will be bulked into sizeable bid packages to make procurement more cost-effective
22. The PMU or the Lead Programme Agency may procure the vehicles, motorcycles, and computers and also TA and Service Providers Services. The procurement of all other goods, civil works and services financed by the IFAD financing will be the responsibility of the respective implementing agencies. Materials, labour and inputs will be procured through respective community organisation using the procurement by community participation. Inputs used by project groups for production purposes will be purchased by the group using grant funds from the project.
C. Designated Account, Accounts and Audit
23. Designated Account: There is no Designated Account for LAMP. The MoF, GoI is responsible for foreign exchange risks and repayment of the principal and interest on the loan to IFAD.
24. Accounts: The project will set up its accounting and internal control systems. The PMU and district PMUs will maintain appropriate financial records and accounts in accordance with acceptable system and consistence with IFAD guidelines. The project accounts will reflect all financial transactions during the project period, both of the IFAD loan and government financing by project component and separately by standard expenditure categories. The LAMP project accounts will be maintained separately from any routine budget account or other externally funded project account. The PMU will consolidate the project accounts and submit annual financial statements of project expenditures for each fiscal year to IFAD no later than four months after the close of each fiscal year.
25. Audit: The PMU will appoint an independent external auditor (an audit firm) acceptable to IFAD to audit the LAMP project accounts, including the IFAD and government contribution to the project in accordance with International Standards on Auditing. The audited accounts and financial statements, in a format agreed with IFAD at Loan Negotiations and including separate opinions on the SOEs, project accounts, all other accounts relating to the project will be submitted to IFAD no later than six months after the close of each government fiscal year, until closing of the loan, i.e. 30
th
September each year. The Audit Report will be in a Long Form Audit and will contain a separate management letter, which will include a report on the efficiency of the flow of funds procedures and internal controls. The reply by the PMU to the management letter will be submitted to IFAD within one month of the receipt of the audited accounts.
D. Flow of Funds
26. On request from the PMU, GoM and in accordance with the approved project AWPBs, MoF will advance the IFAD loan funds quarterly in advance from the Designated Account to the following INR project accounts held in a commercial bank approved by IFAD: the Project Account operated by the PMU, Shillong under the authorisation of the GoM. Funds from the project accounts finance the activities included in approved AWPB, executed under contracts between implementing agency district PMUs and all other eligible parties and other agencies. The respective executing agencies and the district PMUs will open their Project Accounts. Each assisted Village Employment Council, Producer Groups will have their own bank accounts and so also the respective IVCS, where required. The funds flow from the PMU to the respective accounts directly as follows: to the district PMUs to meet their operating costs, and to the service providers and other implementing agencies to meet their operating expenditure. All financial assistance to the VECs and producer groups or cluster groups or IVCS will flow directly to their accounts held by them.

Republic of India
Meghalaya: Livelihoods and Access to Market Project
Final project design report - Working papers
308
E. Indicative Schedule 2 for IFAD Financing Agreement
Disbursement / Expenditure category
Total Eligible Expenditure
Amount (000 USD)
IFAD Financing rule (% of total eligible
expenditures)
Total Financing Amount by IFAD
(000 USD)
Works a/ 19,089 55% 10,499
Vehicles b/ 404 75% 303
Equipment and materials c/ 1,267 75% 950
Training 7,105 90% 6,395
Consultancy d/ 3,200 85% 2,720
Goods, services and inputs e/ 8,202 85% 6,972
Grants and subsidies f/ 15,411 50% 6,411
Salaries and allowances g/ 16,617 40% 6,647
Operating costs h/ 1,510 50% 755
Unallocated i/ 11,589 7,116
Total 84,396 50,063
a/ Civil works such as roads, buildings, markets, bridges and culverts, ropeways etc except civil works carried out under NRM; Civil works under NRM, 100% funded by convergence, or via Grants and Subsidies to VEC; b/ Only vehicles required for PMU and district offices and knowledge services component; c/ Office equipment, materials other than for IVCS units;
d/ Consulting services including audits, surveys etc e/ Also includes service providers contracts; f/ village development funds, social development funds, support to Village Employment Committees for
operating costs. g/ Staff salaries and allowances to all incremental staff at PMU and district offices, knowledge services, EFC units and except IVCSs; h/ Incremental office operating costs excluding office rents;
i/ estimated using price contingencies factor of 16.8% over base costs (except for Grants and subsidies).

Republic of India
Meghalaya: Livelihoods and Access to Market Project
Final project design report - Working papers
309
APPENDIX 1: SUMMARY PROJECT COSTS
1. Summary of Project Cost Estimates
India
Meghalaya: LAMP Appraisal Mission % Total
Components Project Cost Summary (INR '000) (US$ '000) Base
Total Total Costs
A. Natural Resources & Food Security
1. Integrated NRM 2,144,981 34,596 22
Subtotal Natural Resources & Food Security 2,144,981 34,596 22
B. Livelihood support
1. Integrated village cooperatives 823,029 13,275 9
2. Enterprises development 3,116,793 50,271 32
3. Integrated production & marketing 1,035,903 16,708 11
4. Livestock Development 357,102 5,760 4
5. Access to markets 1,302,567 21,009 14
Subtotal Livelihood support 6,635,394 107,022 69
C. Knowledge Services
1. Knowledge services 338,092 5,453 4
Subtotal Knowledge Services 338,092 5,453 4
D. Project Management
1. Project Management Unit, Shillong 131,176 2,116 1
2. District Project Management Units 362,483 5,847 4
Subtotal Project Management 493,659 7,962 5
Total BASELINE COSTS 9,612,126 155,034 100
Physical Contingencies - - -
Price Contingencies 921,969 14,870 10
Total PROJECT COSTS 10,534,095 169,905 110

Republic of India
Meghalaya: Livelihoods and Access to Market Project
Final project design report - Working papers
310
2. Procurement Arrangements by Procurement Methods
Procurement Arrangements
(US$ '000)
A. Works
B. Works/Convergence
C. Vehicles
D. Equipment & materials
E. Training
F. Consultancy
G. Goods, services & inputs
H. Grant & subsidies
I. Credit, Guarantee funds
J. Salaries and allowances
K. Operating costs
Total
Procurement Method
Community
Local Participation
Competitive Local Direct in
Bidding Shopping Contracting Procurement Other N.B.F. Total
22,944 - - - - - 22,944
(12,619) (12,619)
- - - - - 16,555 16,555
486 - - - - - 486
(364) (364)
- 1,523 - - - 884 2,407
(1,142) (1,142)
- 8,545 - - - - 8,545
(7,686) (7,686)
- 3,846 - - - - 3,846
(3,269) (3,269)
- 9,859 - - - - 9,859
(8,380) (8,380)
- - - 16,702 565 3,919 21,185
(7,480) (226) (7,706)
- - - - 38,878 21,990 60,867
- - 19,972 - - - 19,972
(7,989) (7,989)
- 1,815 - 574 - 850 3,239
(908) (908) 23,430 25,588 19,972 17,276 39,442 44,197 169,905
(12,983) (21,385) (7,989) (7,480) (226) - (50,063)
ective amounts financed by IFAD Note: Figures in parenthesis are the resp

Republic of India
Meghalaya: Livelihoods and Access to Market Project
Final project design report - Working papers
311
3. Procurement Accounts by Year
India
Meghalaya: LAMP Appraisal Mission (US$ '000)
Procurement Accounts by Financiers
Government IFAD Banks Convergence Beneficiaries Total Duties &
Amount % Amount % Amount % Amount % Amount % Amount % Taxes
1. Works 10,325 45.0 12,619 55.0 - - - - - - 22,944 13.5 3,442 2. Works/Convergence - - - - - - 16,555 100.0 - - 16,555 9.7 - 3. Vehicles 121 25.0 364 75.0 - - - - - - 486 0.3 121 4. Equipment & materials 1,264 52.5 1,142 47.5 - - - - - - 2,407 1.4 241 5. Training 859 10.1 7,686 89.9 - - - - - - 8,545 5.0 427 6. Consultancy 577 15.0 3,269 85.0 - - - - - - 3,846 2.3 577 7. Goods, services & inputs 1,479 15.0 8,380 85.0 - - - - - - 9,859 5.8 1,479 8. Grant & subsidies 11,625 54.9 7,706 36.4 - - - - 1,855 8.8 21,185 12.5 - 9. Credit, Guarantee funds 9,699 15.9 - - 29,319 48.2 11,593 19.0 10,256 16.8 60,867 35.8 - 10. Salaries and allowances 11,983 60.0 7,989 40.0 - - - - - - 19,972 11.8 531 11. Operating costs 1,732 53.5 908 28.0 - - 27 0.8 572 17.7 3,239 1.9 69
Total PROJECT COSTS 49,665 29.2 50,063 29.5 29,319 17.3 28,175 16.6 12,682 7.5 169,905 100.0 6,887

Republic of India
Meghalaya: Livelihoods and Access to Market Project
Final project design report - Working papers
312
11. Operating costs 1,732 53.5 908 28.0 - - 27 0.8 572 17.7 3,239 1.9 69 Total PROJECT COSTS 49,665 29.2 50,063 29.5 29,319 17.3 28,175 16.6 12,682 7.5 169,905 100.0 6,887
4. Disbursement Accounts by Financiers
India
Meghalaya: LAMP Appraisal Mission (US$ '000)
Disbursement Accounts by Financiers
Govt IFAD Banks Convergence Beneficiaries Total Duties &
Amount % Amount % Amount % Amount % Amount % Amount % Taxes
1. Works 10,325 45.0 12,619 55.0 - - - - - - 22,944 13.5 3,442 2. Works/Convergence - - - - - - 16,555 100.0 - - 16,555 9.7 - 3. Vehicle 121 25.0 364 75.0 - - - - - - 486 0.3 121 4. Equipment & materials 1,264 52.5 1,142 47.5 - - - - - - 2,407 1.4 241 5. Training 859 10.1 7,686 89.9 - - - - - - 8,545 5.0 427 6. Consultancy 577 15.0 3,269 85.0 - - - - - - 3,846 2.3 577 7. Goods, services and inputs 1,479 15.0 8,380 85.0 - - - - - - 9,859 5.8 1,479 8. Credit, Guarantee funds 9,699 15.9 - - 29,319 48.2 11,593 19.0 10,256 16.8 60,867 35.8 - 9. Grant & subsidies 11,625 54.9 7,706 36.4 - - - - 1,855 8.8 21,185 12.5 -
10. Salaries & allowances 11,983 60.0 7,989 40.0 - - - - - - 19,972 11.8 531

Republic of India
Meghalaya: Livelihoods and Access to Market Project
Final project design report - Working papers
313
5. Project Components by Financiers
India
Meghalaya: LAMP Appraisal Mission
Components by Financiers
G
A. Natural Resources & Food Security
1. Integrated NRM
B. Livelihood support
1. Integrated village cooperatives
2. Enterprises development
3. Integrated production & marketing
4. Livestock Development
5. Access to markets
Subtotal Livelihood support
C. Knowledge Services
1. Knowledge services
D. Project Management
1. Project Management Unit, Shillong
2. District Project Management Units
Subtotal Project Management
Total PROJECT COSTS
(US$ '000)
overnment IFAD Banks Convergence Beneficiaries Total Duties &
Amount % Amount % Amount % Amount % Amount % Amount % Taxes
7,679 22.1 8,759 25.2 - - 16,555 47.7 1,742 5.0 34,736 20.4 177
3,063 22.7 774 5.7 9,677 71.6 - - - - 13,514 8.0 199
14,433 26.8 7,688 14.3 15,158 28.1 8,980 16.7 7,643 14.2 53,902 31.7 598
4,455 25.7 3,756 21.6 3,919 22.6 2,613 15.1 2,613 15.1 17,355 10.2 427
1,255 18.9 4,720 71.0 565 8.5 - - 113 1.7 6,653 3.9 803
10,739 40.8 15,002 57.0 - - 27 0.1 572 2.2 26,340 15.5 3,848 33,945 28.8 31,940 27.1 29,319 24.9 11,620 9.9 10,941 9.3 117,764 69.3 5,875
1,804 27.5 4,762 72.5 - - - - - - 6,566 3.9 627
1,518 53.9 1,301 46.1 - - - - - - 2,818 1.7 74
4,719 58.8 3,301 41.2 - - - - - - 8,020 4.7 133 6,237 57.5 4,602 42.5 - - - - - - 10,839 6.4 207
49,665 29.2 50,063 29.5 29,319 17.3 28,175 16.6 12,682 7.5 169,905 100.0 6,887

Republic of India
Meghalaya: Livelihoods and Access to Market Project
Final project design report - Working papers
314
6. Project Expenditure Accounts by Financiers
India
Meghalaya: LAMP Appraisal Mission
Expenditure Accounts by Financiers
I. Investment Costs
A. Works
B. Other works under convergence /a
C. Vehicles
D. Equipment & materials
E. Training
F. Consultancy
G. Goods, services & inputs
H. Credit, Guarantee funds
I. Grant & subsidies
Total Investment Costs
II. Recurrent Costs
A. Salaries and allowances
B. Operating costs Total
Recurrent Costs Total
PROJECT COSTS
G
(US$ '000)
overnment IFAD Banks Convergence Beneficiaries Total Duties &
Amount % Amount % Amount % Amount % Amount % Amount % Taxes
10,325 45.0 12,619 55.0 - - - - - - 22,944 13.5 3,442
- - - - - - 16,555 100.0 - - 16,555 9.7 -
121 25.0 364 75.0 - - - - - - 486 0.3 121
1,264 52.5 1,142 47.5 - - - - - - 2,407 1.4 241
859 10.1 7,686 89.9 - - - - - - 8,545 5.0 427
577 15.0 3,269 85.0 - - - - - - 3,846 2.3 577
1,479 15.0 8,380 85.0 - - - - - - 9,859 5.8 1,479
9,699 15.9 - - 29,319 48.1 11,593 19.0 10,369 17.0 60,980 35.9 -
11,625 55.2 7,706 36.6 - - - - 1,742 8.3 21,073 12.4 - 35,949 24.5 41,166 28.1 29,319 20.0 28,148 19.2 12,110 8.3 146,694 86.3 6,287
11,983 60.0 7,989 40.0 - - - - - - 19,972 11.8 531
1,732 53.5 908 28.0 - - 27 0.8 572 17.7 3,239 1.9 69 13,716 59.1 8,896 38.3 - - 27 0.1 572 2.5 23,211 13.7 600 49,665 29.2 50,063 29.5 29,319 17.3 28,175 16.6 12,682 7.5 169,905 100.0 6,887
\a Convergence such as MGNREGA

Republic of India
Meghalaya: Livelihoods and Access to Market Project
Final project design report - Working papers
315
7. Procurement Accounts by Financiers
India
Meghalaya: LAMP Appraisal Mission (US$ '000)
Procurement Accounts by Financiers
Government IFAD Banks Convergence Beneficiaries Total Duties &
Amount % Amount % Amount % Amount % Amount % Amount % Taxes
1. Works 10,325 45.0 12,619 55.0 - - - - - - 22,944 13.5 3,442 2. Works/Convergence - - - - - - 16,555 100.0 - - 16,555 9.7 - 3. Vehicles 121 25.0 364 75.0 - - - - - - 486 0.3 121 4. Equipment & materials 1,264 52.5 1,142 47.5 - - - - - - 2,407 1.4 241 5. Training 859 10.1 7,686 89.9 - - - - - - 8,545 5.0 427 6. Consultancy 577 15.0 3,269 85.0 - - - - - - 3,846 2.3 577 7. Goods, services & inputs 1,479 15.0 8,380 85.0 - - - - - - 9,859 5.8 1,479 8. Grant & subsidies 11,625 54.9 7,706 36.4 - - - - 1,855 8.8 21,185 12.5 - 9. Credit, Guarantee funds 9,699 15.9 - - 29,319 48.2 11,593 19.0 10,256 16.8 60,867 35.8 - 10. Salaries and allowances 11,983 60.0 7,989 40.0 - - - - - - 19,972 11.8 531 11. Operating costs 1,732 53.5 908 28.0 - - 27 0.8 572 17.7 3,239 1.9 69
Total PROJECT COSTS 49,665 29.2 50,063 29.5 29,319 17.3 28,175 16.6 12,682 7.5 169,905 100.0 6,887

Republic of India
Meghalaya: Livelihoods and Access to Market Project
Final project design report - Working papers
316
8. Disbursement by Semesters and Government Cash Flow (INR 000)
India
Meghalaya: LAMP
Disbursements by
1
2
3
4
5
6
7
8
9
10
11
12
13
14
15
16
Total
(INR '000)
Financing Available Costs to be
IFAD Banks Convergence Beneficiaries Financed
Amount Amount Amount Amount Total Project Costs
Government Cumulative
Cash Flow Cash Flow
55,003 13,923 8,249 7,020 84,195 125,631 -41,437 -41,437
82,505 20,885 12,373 10,530 126,292 188,447 -62,155 -103,592
204,194 63,669 37,346 45,060 350,269 538,868 -188,599 -292,191
136,129 42,446 24,897 30,040 233,512 359,245 -125,733 -417,923
285,281 241,638 175,534 77,007 779,460 1,064,342 -284,882 -702,805
190,187 161,092 117,023 51,338 519,640 709,561 -189,921 -892,727
332,451 244,338 279,977 89,806 946,572 1,277,496 -330,924 -1,223,651
221,634 162,892 186,652 59,871 631,048 851,664 -220,616 -1,444,267
315,919 244,338 280,068 80,699 921,024 1,238,118 -317,094 -1,761,361
210,612 162,892 186,712 53,799 614,016 825,412 -211,396 -1,972,757
320,794 102,738 163,125 68,323 654,981 962,765 -307,784 -2,280,541
213,863 68,492 108,750 45,549 436,654 641,843 -205,189 -2,485,730
238,206 86,538 49,792 49,458 423,994 656,337 -232,343 -2,718,073
158,804 57,692 33,195 32,972 282,663 437,558 -154,895 -2,872,968
82,981 86,538 49,912 50,904 270,335 394,085 -123,750 -2,996,718
55,321 57,692 33,275 33,936 180,223 262,723 -82,500 -3,079,217
3,103,883 1,817,803 1,746,880 786,312 7,454,878 10,534,095 -3,079,217 -3,079,217

Republic of India
Meghalaya: Livelihoods and Access to Market Project
Final project design report - Working papers
317
Disbursement by Semesters and Government Cash Flow (000 USD)
India
Meghalaya: LAMP
Disbursements by
1
2
3
4
5
6
7
8
9
10
11
12
13
14
15
16
Total
(US$ '000)
Financing Available
IFAD Banks Convergence Beneficiaries
Amount Amount Amount Amount Total
Costs to
be
Financed Government Project Cumulative
Costs Cash Flow Cash Flow
887 225 133 113 1,358 2,026 -668 -668
1,331 337 200 170 2,037 3,039 -1,003 -1,671
3,293 1,027 602 727 5,649 8,691 -3,042 -4,713
2,196 685 402 485 3,766 5,794 -2,028 -6,741
4,601 3,897 2,831 1,242 12,572 17,167 -4,595 -11,336
3,068 2,598 1,887 828 8,381 11,445 -3,063 -14,399
5,362 3,941 4,516 1,448 15,267 20,605 -5,337 -19,736
3,575 2,627 3,011 966 10,178 13,737 -3,558 -23,295
5,095 3,941 4,517 1,302 14,855 19,970 -5,114 -28,409
3,397 2,627 3,011 868 9,903 13,313 -3,410 -31,819
5,174 1,657 2,631 1,102 10,564 15,528 -4,964 -36,783
3,449 1,105 1,754 735 7,043 10,352 -3,310 -40,092
3,842 1,396 803 798 6,839 10,586 -3,747 -43,840
2,561 931 535 532 4,559 7,057 -2,498 -46,338
1,338 1,396 805 821 4,360 6,356 -1,996 -48,334
892 931 537 547 2,907 4,237 -1,331 -49,665
50,063 29,319 28,175 12,682 120,240 169,905 -49,665 -49,665

Republic of India
Meghalaya: Livelihoods and Access to Market Project
Final project design report - Working papers
318
9. Project Cost Summary
India
Meghalaya: LAMP Appraisal Mission
Project Cost Summary
(US$ '000)
A. Natural Resources & Food Security
1. Integrated NRM
Subtotal Natural Resources & Food Security
B. Livelihood support
1. Integrated village cooperatives
2. Enterprises development
3. Integrated production & marketing
4. Livestock Development
5. Access to markets
Subtotal Livelihood support
C. Knowledge Services
1. Knowledge services
Subtotal Knowledge Services
D. Project Management
1. Project Management Unit, Shillong
2. District Project Management Units
Subtotal Project Management
Total PROJECT COSTS
Cost
Including % of IFAD %
Contingencies Total Financing Financing
34,736 20.4 8,759 25.2 34,736 20.4 8,759 25.2
13,514 8.0 774 5.7
53,902 31.7 7,688 14.3
17,355 10.2 3,756 21.6
6,653 3.9 4,720 71.0
26,340 15.5 15,002 57.0 117,764 69.3 31,940 27.1
6,566 3.9 4,762 72.5 6,566 3.9 4,762 72.5
2,818 1.7 1,301 46.1
8,020 4.7 3,301 41.2 10,839 6.4 4,602 42.5
169,905 100.0 50,063 29.5

Republic of India
Meghalaya: Livelihoods and Access to Market Project
Final project design report - Working papers
319
10. Expenditure Accounts Project Cost Summary
India
Meghalaya: LAMP Appraisal Mission
Expenditure Accounts Project Cost Summary
(INR '000)
(US$ '000)
% Total
Base
Total Total Costs
I. Investment Costs A. Works 1,103,321 17,796 11 B. Other works under convergence /a 1,026,432 16,555 11 C. Vehicles 25,566 412 - D. Equipment & materials 126,039 2,033 1 E. Training 435,851 7,030 5 F. Consultancy 238,461 3,846 2 G. Goods, services & inputs 521,849 8,417 5 H. Credit, Guarantee funds 3,780,776 60,980 39 I. Grant & subsidies 1,306,500 21,073 14
Total Investment Costs 8,564,795 138,142 89 II. Recurrent Costs
A. Salaries and allowances 889,437 14,346 9 B. Operating costs 157,894 2,547 2
Total Recurrent Costs 1,047,331 16,892 11 Total BASELINE COSTS 9,612,126 155,034 100
Physical Contingencies - - - Price Contingencies 921,969 14,870 10
Total PROJECT COSTS 10,534,095 169,905 110
\a Convergence such as MGNREGA

Republic of India
Meghalaya: Livelihoods and Access to Market Project
Final project design report - Working papers
320
11. Expenditure Accounts by Components- total costs including contingencies
India
Meghalaya: LAMP Appraisal Mission
Expenditure Accounts by Components
(US$ '000)
I. Investment Costs
A. Works
B. Other works under convergence /a
C. Vehicles
D. Equipment & materials
E. Training
F. Consultancy
G. Goods, services & inputs
H. Credit, Guarantee funds
I. Grant & subsidies
Total Investment Costs
II. Recurrent Costs
A. Salaries and allowances
B. Operating costs
Total Recurrent Costs
Total BASELINE COSTS
Physical Contingencies
Price Contingencies
Subtotal Price Contingencies
Total PROJECT COSTS
Taxes
- Base Costs
Natural
Resources & Livelihood support Project Management
Food Integrated Knowledge Project District
Security Integrated production Services Management Project
Integrated village Enterprises & Livestock Access to Knowledge Unit, Management
NRM cooperatives development marketing Development markets services Shillong Units Total
- - - - - 17,796 - - - 17,796
16,555 - - - - - - - - 16,555
- - - - - - 47 114 251 412
- 735 191 - - - 862 125 120 2,033
400 218 2,535 1,879 - 148 1,756 74 20 7,030
- - - - - 2,631 1,167 48 - 3,846
940 588 564 1,764 4,268 - 292 - - 8,417
- 11,734 39,424 9,145 677 - - - - 60,980
16,702 - - 3,919 452 - - - - 21,073 34,596 13,275 42,714 16,708 5,397 20,574 4,124 362 392 138,142
- - 6,854 - 319 - 1,238 1,471 4,464 14,346
- - 703 - 43 435 92 283 991 2,547 - - 7,557 - 362 435 1,329 1,754 5,455 16,892
34,596 13,275 50,271 16,708 5,760 21,009 5,453 2,116 5,847 155,034
- - - - - - - - - -
140 240 3,631 647 893 5,331 1,113 703 2,174 14,870
34,736 13,514 53,902 17,355 6,653 26,340 6,566 2,818 8,020 169,905
177 199 598 427 803 3,848 627 74 133 6,887 \a Convergence such as MGNREGA

Republic of India
Meghalaya: Livelihoods and Access to Market Project
Final project design report - Working papers
321
12. Project components by year-Base cost and contingencies
India
Meghalaya: LAMP Appraisal Mission
Project Components by Year -- Base Costs
A. Natural Resources & Food Security
1. Integrated NRM
Subtotal Natural Resources & Food Security
B. Livelihood support
1. Integrated village cooperatives
2. Enterprises development
3. Integrated production & marketing
4. Livestock Development
5. Access to markets
Subtotal Livelihood support
C. Knowledge Services
1. Knowledge services
Subtotal Knowledge Services
D. Project Management
1. Project Management Unit, Shillong
2. District Project Management Units
Subtotal Project Management
Total BASELINE COSTS
Physical Contingencies
Price Contingencies
Subtotal Price Contingencies
Total PROJECT COSTS
Taxes
Base Cost (US$ '000)
14/15 15/16 16/17 17/18 18/19 19/20 20/21 21/22 Total
575 3,552 6,116 10,338 8,523 5,405 87 - 34,596 575 3,552 6,116 10,338 8,523 5,405 87 - 34,596
225 914 4,332 4,326 3,473 2 2 - 13,275
2,572 4,184 7,175 7,539 7,197 7,204 7,202 7,199 50,271
- 2,601 4,251 4,045 4,045 1,765 - - 16,708
160 720 1,329 1,801 964 463 161 161 5,760
68 292 2,169 2,491 4,685 6,086 5,059 159 21,009 3,024 8,712 19,255 20,202 20,365 15,520 12,424 7,520 107,022
671 812 865 818 629 530 683 445 5,453 671 812 865 818 629 530 683 445 5,453
242 286 263 259 324 264 258 220 2,116
437 589 806 831 828 887 838 631 5,847 679 875 1,069 1,089 1,152 1,150 1,096 851 7,962
4,949 13,951 27,306 32,447 30,669 22,606 14,290 8,816 155,034
- - - - - - - - -
117 534 1,306 1,894 2,614 3,275 3,353 1,778 14,870
5,066 14,486 28,611 34,341 33,283 25,881 17,643 10,594 169,905
274 482 943 1,107 1,300 1,440 1,182 158 6,887
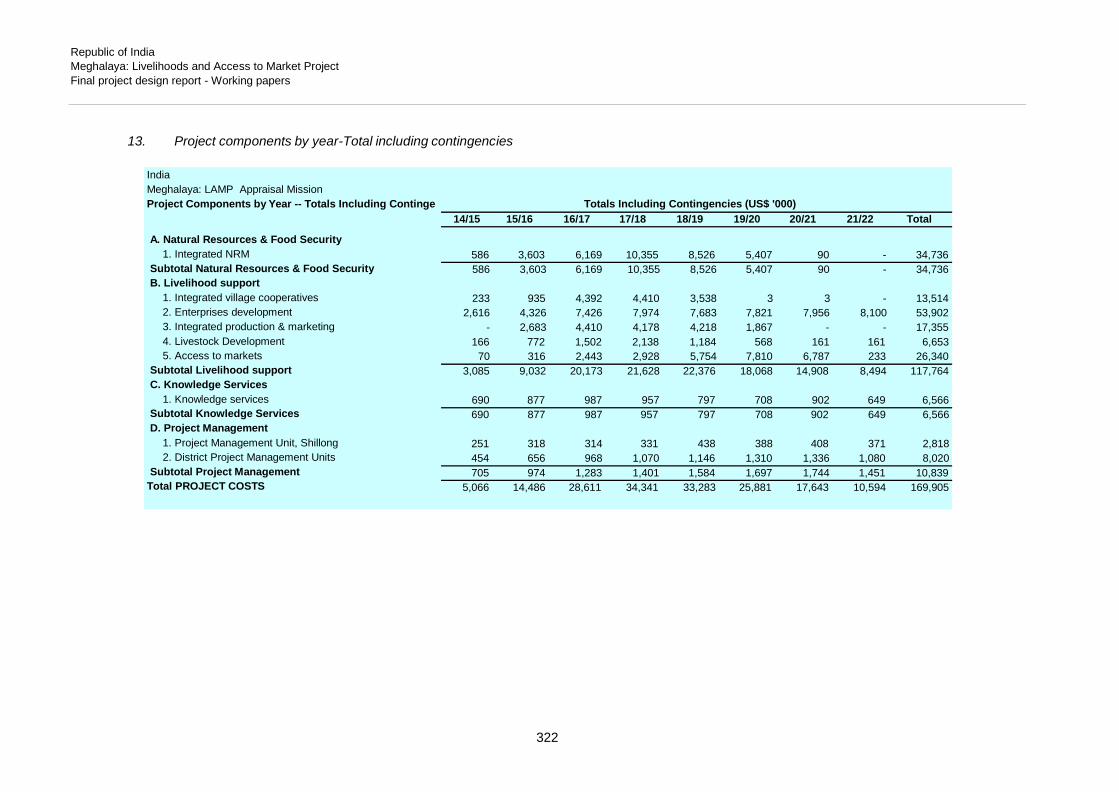
Republic of India
Meghalaya: Livelihoods and Access to Market Project
Final project design report - Working papers
322
13. Project components by year-Total including contingencies
India
Meghalaya: LAMP Appraisal Mission
Project Components by Year -- Totals Including Continge
A. Natural Resources & Food Security
1. Integrated NRM
Subtotal Natural Resources & Food Security
B. Livelihood support
1. Integrated village cooperatives
2. Enterprises development
3. Integrated production & marketing
4. Livestock Development
5. Access to markets
Subtotal Livelihood support
C. Knowledge Services
1. Knowledge services
Subtotal Knowledge Services
D. Project Management
1. Project Management Unit, Shillong
2. District Project Management Units
Subtotal Project Management
Total PROJECT COSTS
Totals Including Contingencies (US$ '000)
14/15 15/16 16/17 17/18 18/19 19/20 20/21 21/22 Total
586 3,603 6,169 10,355 8,526 5,407 90 - 34,736 586 3,603 6,169 10,355 8,526 5,407 90 - 34,736
233 935 4,392 4,410 3,538 3 3 - 13,514
2,616 4,326 7,426 7,974 7,683 7,821 7,956 8,100 53,902
- 2,683 4,410 4,178 4,218 1,867 - - 17,355
166 772 1,502 2,138 1,184 568 161 161 6,653
70 316 2,443 2,928 5,754 7,810 6,787 233 26,340 3,085 9,032 20,173 21,628 22,376 18,068 14,908 8,494 117,764
690 877 987 957 797 708 902 649 6,566 690 877 987 957 797 708 902 649 6,566
251 318 314 331 438 388 408 371 2,818
454 656 968 1,070 1,146 1,310 1,336 1,080 8,020 705 974 1,283 1,401 1,584 1,697 1,744 1,451 10,839
5,066 14,486 28,611 34,341 33,283 25,881 17,643 10,594 169,905

Republic of India
Meghalaya: Livelihoods and Access to Market Project
Final project design report - Working papers
323
14. Expenditure Accounts by year-Total including contingencies
India
Meghalaya: LAMP Appraisal Mission
Expenditure Accounts by Years -- Base Costs
I. Investment Costs
A. Works
B. Other works under convergence /a
C. Vehicles
D. Equipment & materials
E. Training
F. Consultancy
G. Goods, services & inputs
H. Credit, Guarantee funds
I. Grant & subsidies
Total Investment Costs
II. Recurrent Costs
A. Salaries and allowances
B. Operating costs
Total Recurrent Costs
Total BASELINE COSTS
Physical Contingencies
Price Contingencies
Total PROJECT COSTS
Taxes
Base Cost (US$ '000)
14/15 15/16 16/17 17/18 18/19 19/20 20/21 21/22 Total
36 204 1,837 2,164 4,042 5,226 4,287 - 17,796
- - 2,759 5,518 5,518 2,759 - - 16,555
166 46 - 11 57 86 46 - 412
197 269 472 580 337 67 56 56 2,033
406 1,371 1,456 988 926 704 652 526 7,030
198 183 376 546 695 870 863 115 3,846
700 1,476 2,111 2,362 1,206 510 31 21 8,417
1,460 4,888 12,050 12,220 11,534 6,953 5,937 5,937 60,980
272 3,565 4,000 5,815 4,073 3,140 145 65 21,073 3,435 12,001 25,062 30,204 28,387 20,316 12,017 6,720 138,142
1,312 1,717 1,958 1,954 1,954 1,925 1,862 1,662 14,346
202 233 285 290 328 365 411 434 2,547 1,514 1,950 2,244 2,244 2,282 2,290 2,273 2,096 16,892 4,949 13,951 27,306 32,447 30,669 22,606 14,290 8,816 155,034
- - - - - - - - -
117 534 1,306 1,894 2,614 3,275 3,353 1,778 14,870 5,066 14,486 28,611 34,341 33,283 25,881 17,643 10,594 169,905
274 482 943 1,107 1,300 1,440 1,182 158 6,887

Republic of India
Meghalaya: Livelihoods and Access to Market Project
Final project design report - Working papers
324
APPENDIX 2: Detailed Cost Tables
Table 1.1 Integrated Natural Resources Management
India
Meghalaya: LAMP Appraisal Mission
Table 1.1. Integrated Natural Resources
Detailed Costs
I. Investment Costs
A. Technical service provider
1. Technical service provider-Food
B. Resource NGO
Resource NGO
C. Cluster level Facilitating Agency
Facilitating agency at cluster
Training staff of facilitating agency
Subtotal Cluster level Facilitating A
D. Village Institutions
1. Training /b
Training village facilitators-6days
Training village Leaders- 4 per vil
Lead farmer training-7 days, 2 pe
Training power tiller operators/ 14
Subtotal Training
2. VEC operating costs including pa
3. Village development fund
VDF First instalment
VDF Second installment
VDF Beneficiary contribution
Subtotal Village development fun
4. Social Development fund /c
5. Convergence from MGNREGS &
Subtotal Village Institutions
Total
Management
crops
/a
gency
lage, 3 days
r village
days, 1 per village
yment to PF
d
others
as drudgery reduction, he
Quantities Unit Cost
Unit 14/15 15/16 16/17 17/18 18/19 19/20 20/21 21/22 Total (INR)
Totals Including Contingencies (INR '000)
14/15 15/16 16/17 17/18 18/19 19/20 20/21 21/22 Total
LS
agency-year 3 3 3 - - - - - 9 500,000
cluster_year 27 54 27 - - - - - 108 375,500
batch 2 4 1 - - - - - 7 250,000
batch 40 30 - - - - - - 70 36,000
batch 40 80 80 40 - - - - 240 18,000
batch 20 40 40 40 - - - - 140 70,000
batch 10 30 30 - - - - - 70 112,000
village_year 337 1,350 1,350 1,350 1,350 1,013 - - 6,750 50,000
LS - 450 450 450 - - - - 1,350 200,000
LS - - - 450 450 450 - - 1,350 200,000
LS - 450 450 900 450 450 - - 2,700 40,000
village - 0.2 0.2 0.2 0.2 0.1 0.1 - 1 50,000,000
LS - - 675 1,350 1,350 675 - - 4,050 253,440
alth etc
1,807 3,156 3,313 2,092 996 536 563 - 12,464
1,576 1,655 1,738 - - - - - 4,969
10,653 22,372 11,745 - - - - - 44,771
525 1,103 290 - - - - - 1,918 11,179 23,475 12,035 - - - - - 46,689
1,513 1,192 - - - - - - 2,705
757 1,589 1,668 876 - - - - 4,889
1,471 3,089 3,244 3,406 - - - - 11,210
1,177 3,707 3,893 - - - - - 8,777 4,918 9,577 8,805 4,282 - - - - 27,581
16,850 67,500 67,500 67,500 67,500 50,650 - - 337,500
- 90,000 90,000 90,000 - - - - 270,000
- - - 90,000 90,000 90,000 - - 270,000
- 18,000 18,000 36,000 18,000 18,000 - - 108,000 - 108,000 108,000 216,000 108,000 108,000 - - 648,000
- 10,000 10,000 10,000 10,000 5,000 5,000 - 50,000
- - 171,072 342,144 342,144 171,072 - - 1,026,432 21,768 195,077 365,377 639,926 527,644 334,722 5,000 - 2,089,513 36,330 223,363 382,463 642,018 528,640 335,258 5,563 - 2,153,635
\a 25 villages per cluster
\b A batch of 20 to 30 persons
\c For social development activities such

Republic of India
Meghalaya: Livelihoods and Access to Market Project
Final project design report - Working papers
325
Table 2.1 Rural Finance (Integrated Village Cooperative Societies)
India
Meghalaya: LAMP Appraisal Mission
Table 2.1. Integrated Village Cooperative
Detailed Costs
I. Investment Costs
A. State level costs
Tool kits, operations manual, trainin
Training MCAB & Department Facil
Training IVCS staff (300 secretaries
Training IVCS Board members /a
Subtotal State level costs
B. Cooperative development support
C. IVCS development
Corpus fund for IVCS
Risk fund for IVCS
Viability gap fund
Office equipment & furniture
Borrowing from banks
Subtotal IVCS development
Total
Societies
g course design
itators
)
agency
VCS
Quantities Unit Cost
Unit 14/15 15/16 16/17 17/18 18/19 19/20 20/21 21/22 Total (INR)
Totals Including Contingencies (INR '000)
14/15 15/16 16/17 17/18 18/19 19/20 20/21 21/22 Total
lS 1 1 - - - - - - 2 2,500,000
batch 2 - - 1 - - - - 3 250,000
batch 5 10 5 1 1 1 1 - 24 150,000
batch 20 20 20 20 - - - - 80 50,000
year 1 1 1 1 - - - - 4 9,000,000
IVCS - 100 100 100 - - - - 300 250,000
IVCS - 100 100 100 - - - - 300 150,000
IVCS - 100 100 100 - - - - 300 25,000
IVCS - - 100 100 100 - - - 300 150,000
IVCS - - 100 100 100 - - - 300 2,000,000
2,627 2,758 - - - - - - 5,385
525 - - 304 - - - - 829
788 1,655 869 182 192 201 211 - 4,098
1,051 1,103 1,158 1,216 - - - - 4,529 4,991 5,517 2,027 1,703 192 201 211 - 14,842
9,457 9,930 10,426 10,948 - - - - 40,761
- 25,000 25,000 25,000 - - - - 75,000
- 15,000 15,000 15,000 - - - - 45,000
- 2,500 2,500 2,500 - - - - 7,500
- - 17,377 18,246 19,159 - - - 54,782
- - 200,000 200,000 200,000 - - - 600,000 - 42,500 259,877 260,746 219,159 - - - 782,282
14,448 57,947 272,331 273,397 219,350 201 211 - 837,885
\a Training 5 board members from each I

Republic of India
Meghalaya: Livelihoods and Access to Market Project
Final project design report - Working papers
326
Table 2.2 Enterprise Development
India
Meghalaya: LAMP Appraisal Mission
Table 2.2. Enterprises Development
De taile d Cos ts Quantitie s Unit Cos t Totals Including Continge ncie s (INR '000)
Unit 14/15 15/16 16/17 17/18 18/19 19/20 20/21 21/22 Total (INR) 14/15 15/16 16/17 17/18 18/19 19/20 20/21 21/22 Total
I. Inve s tm e nt Cos ts
A. Ente rpris e s Facilitation Ce ntre s
Equipment Sets - - - 39 - - - - 39 300,000 - - - 14,232 - - - - 14,232 Training of FBA batch 1 1 - 1 - - 1 - 4 300,000 315 331 - 365 - - 422 - 1,434 Ref resher training to FBAs batch - - 1 - 1 1 1 - 4 150,000 - - 174 - 192 201 211 - 778 Training of ERPs batch 2 2 - 1 - 1 - 2 8 150,000 315 331 - 182 - 201 - 444 1,473 Ref resher training to ERPs batch - - 1 1 1 1 1 1 6 50,000 - - 58 61 64 67 70 74 394 Entreprenuer training batch 20 100 100 100 100 100 100 100 720 50,000 1,051 5,517 5,792 6,082 6,386 6,705 7,041 7,393 45,967 Entreprenuer training-convergence batch - 100 200 400 400 400 400 400 2,300 50,000 - 5,517 11,585 24,328 25,545 26,822 28,163 29,571 151,531 Bank-linkage w orkshop batch - 2 - 2 - 2 - - 6 150,000 - 331 - 365 - 402 - - 1,098
Subtotal Ente rpris e s Facilitation Ce ntre s
1,681 12,026 17,609 45,616 32,186 34,399 35,908 37,482 216,907 B. Financing e nte rpris e s
Bank loans to entreprenuers /a enterprise 585 1,170 2,340 2,340 2,340 2,340 2,340 2,340 15,795 52,500 34,808 69,615 139,230 139,230 139,230 139,230 139,230 139,230 939,803 Convergence support /b enterprises 1,755 3,510 7,020 7,020 7,020 7,020 7,020 7,020 47,385 11,250 20,621 41,243 82,485 82,485 82,485 82,485 82,485 82,485 556,774 Entreprenuers contribution enterprise 1,755 3,510 7,020 7,020 7,020 7,020 7,020 7,020 47,385 9,000 17,550 35,100 70,200 70,200 70,200 70,200 70,200 70,200 473,850 LAMP Matching Grant enterprise 1,755 3,510 7,020 7,020 7,020 7,020 7,020 7,020 47,385 9,500 17,550 35,100 70,200 70,200 70,200 70,200 70,200 70,200 473,850
Subtotal Financing e nte rpris e s
90,529 181,058 362,115 362,115 362,115 362,115 362,115 362,115 2,444,276 C. Enterprises support agency agency_year 3 3 3 3 - - - - 12 2,880,000 9,079 9,533 10,009 10,510 - - - - 39,131
Total Inve s tm e nt Cos ts
101,289 202,616 389,733 418,240 394,301 396,514 398,023 399,597 2,700,314 II. Re curre nt Cos ts
A. Staff cos ts /c lump sum
55,243 59,662 64,435 69,590 75,157 81,170 87,663 94,676 587,596 B. Ope rating cos ts
1. Ope rating cos ts Of f ice rent month 468 468 468 468 468 468 468 468 3,744 5,000 2,459 2,582 2,711 2,846 2,989 3,138 3,295 3,460 23,480
Consumables month 468 468 468 468 468 468 468 468 3,744 1,500 738 775 813 854 897 941 989 1,038 7,044 Utilities month 468 468 468 468 468 468 468 468 3,744 1,000 492 516 542 569 598 628 659 692 4,696 Motor cycle use charges pers_month 468 468 468 468 468 468 468 468 3,744 1,500 738 775 813 854 897 941 989 1,038 7,044 Travel allow ances pers_month 468 468 468 468 468 468 468 468 3,744 1,500 738 775 813 854 897 941 989 1,038 7,044 Others month 468 468 468 468 468 468 468 468 3,744 1,000 492 516 542 569 598 628 659 692 4,696
Subtotal Ope rating cos ts
5,655 5,938 6,235 6,547 6,874 7,218 7,579 7,958 54,003 Total Re curre nt Cos ts 60,898 65,600 70,670 76,137 82,031 88,387 95,242 102,634 641,600
Total 162,187 268,217 460,404 494,377 476,333 484,902 493,265 502,230 3,341,914
\a Institutional credit
\b Financial assistance f rom ongoing government-schemes and programmes
\c f or each EFC includes a manager, FBA, ERP and of f ice assistant

Republic of India
Meghalaya: Livelihoods and Access to Market Project
Final project design report - Working papers
327
Table 2.3 Integrated Production and Marketing
India
Meghalaya: LAMP Appraisal Mission
Table 2.3. Integrated Production and Mar
Detailed Costs
I. Investment Costs
A. Key Interventions /a
1. Value-chain studies, cluster spec
2. IPM Resource agencies
3. Support for implementation
LAMP support
Bank loan and convergence
Convergence
Beneficiary contribution
Subtotal Support for implementa
4. Farmers training
Lead farmer training /b
Training costs at 20 person/batc
Exposure visits - 20 per batch
Subtotal Farmers training
5. Trial marketing
Total
keting
ific
tion
h /c
area
Quantities Unit Cost
Unit 14/15 15/16 16/17 17/18 18/19 19/20 20/21 21/22 Total (INR)
Totals Including Contingencies (INR '000)
14/15 15/16 16/17 17/18 18/19 19/20 20/21 21/22 Total
cluster - 30 24 - - - - - 54 225,000
agency_year - 5 10 10 10 5 - - 40 2,701,000
cluster - 7 13 14 14 6 - - 54 4,500,000
LS - 7 13 14 14 6 - - 54 4,500,000
cluster - 7 13 14 14 6 - - 54 3,000,000
LS - 7 13 14 14 6 - - 54 3,000,000
batch - 30 24 - - - - - 54 56,000
batch - 210 390 420 420 180 - - 1,620 30,000
batch - 900 720 - - - - - 1,620 30,000
LS - 7 13 14 14 6 - - 54 50,000
- 7,447 6,256 - - - - - 13,703
- 14,900 31,291 32,855 34,498 18,112 - - 131,656
- 31,500 58,500 63,000 63,000 27,000 - - 243,000
- 31,500 58,500 63,000 63,000 27,000 - - 243,000
- 21,000 39,000 42,000 42,000 18,000 - - 162,000
- 21,000 39,000 42,000 42,000 18,000 - - 162,000 - 105,000 195,000 210,000 210,000 90,000 - - 810,000
- 1,854 1,557 - - - - - 3,411
- 6,951 13,554 15,327 16,093 7,242 - - 59,167
- 29,790 25,023 - - - - - 54,813 - 38,594 40,135 15,327 16,093 7,242 - - 117,391
- 386 753 851 894 402 - - 3,287 - 166,328 273,434 259,034 261,485 115,756 - - 1,076,038
\a There will be 54 clusters in the project
\b 20 lead farmers per cluster for 7 days
\c for a batch of 20 farmers

Republic of India
Meghalaya: Livelihoods and Access to Market Project
Final project design report - Working papers
328
Livestock Programme Manager from RNGO staff-year 5 11 11 11 11 6 - - 55 360,000 1,872 4,448 4,804 5,188 5,603 3,301 - - 25,215 Staff travel and other costs staff-year 5 11 11 11 11 6 - - 55 48,000 252 583 612 642 674 386 - - 3,149
Total Recurrent Costs
2,124 5,030 5,415 5,830 6,277 3,687 - - 28,365 Total
10,289 47,881 93,103 132,579 73,425 35,195 10,000 10,000 412,472
\a Each cluster with 360 households from 6 villages
Table 2.4 Livestock Development
India
Meghalaya: LAMP Appraisal Mission
Table 2.4. Livestock Development
Detailed Costs Quantities Unit Cost Totals Including Contingencies (INR '000)
Unit 14/15 15/16 16/17 17/18 18/19 19/20 20/21 21/22 Total (INR) 14/15 15/16 16/17 17/18 18/19 19/20 20/21 21/22 Total
I. Investment Costs
A. Pig Clusters
Year 1 services /a Cluster 10 20 40 30 - - - - 100 690,000 7,250 15,226 31,974 25,180 - - - - 79,630 Year 2 services Cluster - 10 20 40 30 - - - 100 488,000 - 5,384 11,307 23,744 18,699 - - - 59,134 Year 3 services Cluster - - 10 20 40 30 - - 100 458,000 - - 5,306 11,142 23,399 18,427 - - 58,274
Subtotal Pig Clusters
7,250 20,610 48,587 60,067 42,098 18,427 - - 197,039 B. Goat clusters
Year 1 services cluster - 2 5 13 - - - - 20 992,000 - 2,189 5,746 15,687 - - - - 23,622 Year 2 services cluster - 2 5 13 - - - - 20 574,000 - 1,267 3,325 9,077 - - - - 13,668 Year 3 services cluster - - 2 5 13 - - - 20 544,000 - - 1,260 3,309 9,033 - - - 13,602
Subtotal Goat clusters
- 3,456 10,331 28,072 9,033 - - - 50,892 C. Pig breeding Boars, feeding Boars - 100 200 300 - - - - 600 50,000 - 5,517 11,585 18,246 - - - - 35,348 D. RNGO Management & overheads year 914 3,268 7,184 10,364 6,017 3,082 - - 30,829 E. Financial support for livestock development GOM Grants to livestock producers year - 1 1 1 1 1 1 1 7 4,000,000 - 4,000 4,000 4,000 4,000 4,000 4,000 4,000 28,000
Bank loans to livestock producers year - 1 1 1 1 1 1 1 7 5,000,000 - 5,000 5,000 5,000 5,000 5,000 5,000 5,000 35,000 Beneficiaries contribution year - 1 1 1 1 1 1 1 7 1,000,000 - 1,000 1,000 1,000 1,000 1,000 1,000 1,000 7,000
Subtotal Financial support for livestock developmen t
- 10,000 10,000 10,000 10,000 10,000 10,000 10,000 70,000 Total Investment Costs 8,165 42,850 87,687 126,749 67,147 31,509 10,000 10,000 384,107
II. Recurrent Costs
A. Operating costs

Republic of India
Meghalaya: Livelihoods and Access to Market Project
Final project design report - Working papers
329
Table 2.5 Access to Markets (Marketing Infrastructure)
India
Meghalaya: LAMP Appraisal Mission
Table 2.5. Access to Markets
De taile d Cos ts Quantitie s Unit Cos t Totals Including Continge ncie s (INR '000)
Unit 14/15 15/16 16/17 17/18 18/19 19/20 20/21 21/22 Total (INR) 14/15 15/16 16/17 17/18 18/19 19/20 20/21 21/22 Total
I. Inve s tm e nt Cos ts
A. M ark e ts and rural roads -Proje ct le ve l
Identif ication of markets and road stretches district 11 - - - - - - - 11 200,000 2,312 - - - - - - - 2,312 Negotiation w ith the community district 11 11 11 - - - - - 33 50,000 578 607 637 - - - - - 1,822 Exposure visits to other states person 20 50 50 - - - - - 120 20,000 420 1,103 1,158 - - - - - 2,682 Exposure visists to markets-abroad person 10 20 20 - - - - - 50 100,000 1,051 2,207 2,317 - - - - - 5,574 Improvement of agricultural markets market - 5 5 10 20 15 - - 55 2,640,000 - 13,792 14,481 30,410 63,862 50,291 - - 172,836 Improvement of rural roads /a km - - 25 25 50 75 75 - 250 3,500,000 - - 101,368 106,436 223,516 352,038 369,640 - 1,152,999 Construction of low -cost bridges each - - 5 5 5 5 - - 20 1,614,000 - - 14,481 15,205 15,965 16,764 - - 62,415 Construction of ropew ay each - - - 3 4 3 - - 10 3,200,000 - - - 9,123 12,772 10,058 - - 31,954 Engagement of consulting engineers /b LS - 1,875 16,875 19,875 37,125 48,000 39,375 - 163,125
Total Inve s tm e nt Cos ts
II. Re curre nt Cos ts
A. M ainte nance cos ts 4,361 19,583 151,318 181,050 353,241 477,151 409,015 - 1,595,719
Maintenance of Markets /c market - - 5 10 20 40 55 - 130 25,000 - - 145 304 639 1,341 1,936 - 4,365 Road maintenance /d km_year - - - - 50 100 175 250 575 35,000 - - - - 2,235 4,694 8,625 12,937 28,491 Maintenance of bridges each - - - - 5 10 15 20 50 25,000 - - - - 160 335 528 739 1,762 Maintenance of Ropew ays unit-year - - - 3 7 10 10 10 40 50,000 - - - 182 447 671 704 739 2,743
Total Re curre nt Cos ts - - 145 487 3,480 7,041 11,793 14,416 37,362 Total 4,361 19,583 151,463 181,537 356,721 484,192 420,808 14,416 1,633,081
\a Black-topped or RCC road
\b Assumed at 15% of engineering unit cost estimates
\c At 1% of investment cost
\d Estimated at 1% of investment costs;

Republic of India
Meghalaya: Livelihoods and Access to Market Project
Final project design report - Working papers
330
Vehicles unit 1 - - 1 - - - - 2 700,000 736 - - 851 - - - - 1,587 Equipment & f urniture set 1 - - - - - - - 1 100,000 105 - - - - - - - 105 Know ledge management strategy sum 1 - - - - - - - 1 1,000,000 1,051 - - - - - - - 1,051
Subtotal Know le dge s e rvice s m anage m e nt 1,891 - - 851 - - - - 2,743
B. Inform ation for NRM & gove rnance GIS unit equipment LS 1 - - - 1 - - - 2 300,000 315 - - - 383 - - - 698
village maps f rom remote-sensing village 500 500 500 - - - - - 1,500 10,000 5,254 5,517 5,792 - - - - - 16,563 GPS equipment LS 1 - - - - - - - 1 100,000 105 - - - - - - - 105 Gathering indigenous know ledge LS - 1 1 1 - - - - 3 12,000 - 12 12 12 - - - - 36 Collation of bio-envvironmetal data year 1 1 1 1 1 1 1 1 8 100,000 100 100 100 100 100 100 100 100 800 Collation of NRM good practices year 1 1 1 1 1 1 1 1 8 100,000 100 100 100 100 100 100 100 100 800
Subtotal Inform ation for NRM & gove rnance 5,874 5,729 6,004 212 583 200 200 200 19,002
C. Inform ation for Ente rpris e s de ve lopm e nt 1. Data colle ction
Value-chain & market studies study 3 3 2 2 - - - - 10 1,000,000 3,152 3,310 2,317 2,433 - - - - 11,212 Collection of enterprises & market data year 1 1 1 1 1 1 1 1 8 150,000 150 150 150 150 150 150 150 150 1,200
Subtotal Data colle ction 3,302 3,460 2,467 2,583 150 150 150 150 12,412
2. Preparation of manuals & guidelines number 2 4 2 2 1 1 - - 12 500,000 1,000 2,000 1,000 1,000 500 500 - - 6,000 3. Te le phone s upport unit
Needs assessment, design support year 1 1 0.5 - - - - - 2.5 1,000,000 1,051 1,103 579 - - - - - 2,733 Computer equipment set - 1 - - - - 1 - 2 200,000 - 221 - - - - 282 - 502 Operating costs year - 1 1 1 1 1 1 1 7 - - - - - - - - -
Subtotal Te le phone s upport unit 1,051 1,324 579 - - - 282 - 3,236
4. Support to Meghalaya Trade Promotion Organisation LS 1 1 1 1 1 1 1 1 8 800,000 800 800 800 800 800 800 800 800 6,400 Subtotal Inform ation for Ente rpris e s de ve lopm e n
6,153 7,584 4,846 4,383 1,450 1,450 1,232 950 28,048 D. Te chnology te s ting & action re s e arch
Crop sector year 0.5 1 1 1 1 1 1 0.5 7 1,250,000 657 1,379 1,448 1,521 1,597 1,676 1,760 924 10,962 Livestock sector year 0.5 1 1 1 1 1 1 0.5 7 1,000,000 525 1,103 1,158 1,216 1,277 1,341 1,408 739 8,769 Non-f arm sector year 0.5 1 1 1 1 1 1 0.5 7 200,000 105 221 232 243 255 268 282 148 1,754 Environment & energy sectors year 0.5 1 1 1 1 1 1 0.5 7 300,000 158 331 348 365 383 402 422 222 2,631 Research management & review year 0.5 1 1 1 1 1 1 0.5 7 300,000 158 331 348 365 383 402 422 222 2,631
Subtotal Te chnology te s ting & action re s e arch 1,602 3,365 3,533 3,710 3,896 4,090 4,295 2,255 26,747
E. M onitoring and e valuation Computer & other equipment set 1 0.5 - 0.5 0.5 0.5 - - 3 300,000 315 165 - 182 192 201 - - 1,056
Vehicle Number 1 - - - - - - - 1 700,000 736 - - - - - - - 736 Motor cycles number 5 - - - - 5 - - 10 75,000 394 - - - - 503 - - 897 Other equipment, crop cutting etc set 0.5 0.5 - - - - - - 1 100,000 53 55 - - - - - - 108 Staf f capacity building batch 2 2 2 1 1 1 1 - 10 40,000 84 88 93 49 51 54 56 - 475 Baseline survey LS 1 - - - - - - - 1 7,500,000 7,500 - - - - - - - 7,500 Case studies, other studies LS - 3 2 2 2 2 2 3 16 500,000 - 1,500 1,000 1,000 1,000 1,000 1,000 1,500 8,000 Impact Assessment Survey LS - - - 1 - - 1 - 2 7,500,000 - - - 7,500 - - 7,500 - 15,000 M&E Support agency year 1 1 0.5 0.5 0.5 0.5 0.5 0.5 5 600,000 630 662 348 365 383 402 422 444 3,656 Short-term specialist pers_month 6 12 6 6 6 6 12 12 66 200,000 1,200 2,400 1,200 1,200 1,200 1,200 2,400 2,400 13,200
Subtotal M onitoring and e valuation 10,912 4,871 2,640 10,296 2,826 3,360 11,379 4,344 50,627
Table-3.1a Knowledge Services India
Meghalaya: LAMP Appraisal Mission
Table 3.1. Know ledge Services
De taile d Cos ts Quantitie s Unit Cos t Totals Including Continge ncie s (INR '000)
Unit 14/15 15/16 16/17 17/18 18/19 19/20 20/21 21/22 Total (INR) 14/15 15/16 16/17 17/18 18/19 19/20 20/21 21/22 Total
I. Inve s tm e nt Cos ts /a
A. Know le dge s e rvice s m anage m e nt

Republic of India
Meghalaya: Livelihoods and Access to Market Project
Final project design report - Working papers
331
Table 3.1b: Knowledge Services India
Meghalaya: LAMP Appraisal Mission
Table 3.1. Know ledge Services
De taile d Cos ts Quantitie s Unit Cos t Totals Including Continge ncie s (INR '000)
Unit 14/15 15/16 16/17 17/18 18/19 19/20 20/21 21/22 Total (INR) 14/15 15/16 16/17 17/18 18/19 19/20 20/21 21/22 Total
I. Inve s tm e nt Cos ts
F. Know le dge m anage m e nt & le s s ons le arning
1. Staff le ve l
Monthly meetings at Block level meetings 108 216 216 216 216 216 216 216 1,620 5,000 567 1,192 1,251 1,314 1,379 1,448 1,521 1,597 10,269 Monthly meetings at district level meeting 66 132 132 132 132 132 132 132 990 8,000 555 1,165 1,223 1,285 1,349 1,416 1,487 1,561 10,041 Quarterly meetings at state level meetings 2 4 4 4 4 4 4 4 30 20,000 42 88 93 97 102 107 113 118 761 Training in KM methods f or sharing batch 1 3 2 1 - - - - 7 30,000 32 99 70 36 - - - - 237 Overseas training & study tours person - 4 4 4 4 4 4 - 24 440,000 - 1,942 2,039 2,141 2,248 2,360 2,478 - 13,208
Subtotal Staff le ve l 1,406 4,486 4,676 4,873 5,078 5,332 5,599 3,276 34,726 2. Participant le ve l Focus group & participatory M&E meetings 11 66 66 66 66 66 66 66 473 5,000 58 364 382 401 421 443 465 488 3,022
Cluster level meetings, half -yearly meetings - 54 108 108 108 108 108 108 702 7,000 - 417 876 920 966 1,014 1,065 1,118 6,374 Annual district meetings f or villages meeting - 11 11 11 11 11 11 11 77 12,000 - 146 153 161 169 177 186 195 1,186 Documentation of lessons year - 1 1 1 1 1 1 1 7 100,000 - 110 116 122 128 134 141 148 898 Learning routes-international batch of 10 - - 1 - 1 - 1 - 3 4,400,000 - - 5,097 - 5,620 - 6,196 - 16,913 Learning routes-national batch of 10 - 1 - 1 - 1 - 1 4 550,000 - 607 - 669 - 738 - 813 2,827 Videos equipment set 10 - - - - - - - 10 137,500 1,445 - - - - - - - 1,445 Intial training unit 10 - - - - - - - 10 433,333 4,553 - - - - - - - 4,553 Follow up training LS - - 0.3 0.3 0.3 0.1 - - 1 10,000,000 - - 3,475 3,649 3,832 1,341 - - 12,298 Backstopping & support LS - - 0.3 0.3 0.3 0.1 - - 1 1,520,000 - - 528 555 582 204 - - 1,869
Subtotal Participant le ve l 6,056 1,644 10,628 6,476 11,717 4,050 8,052 2,762 51,385 Subtotal Know le dge m anage m e nt & le s s ons le ar 7,462 6,130 15,304 11,349 16,796 9,382 13,651 6,038 86,112 G. Dis s e m ination and com m unications Village inf ormation kit village 20 500 500 330 - - - - 1,350 10,000 210 5,517 5,792 4,014 - - - - 15,533
Posters and leaf lets year - 1 1 1 1 1 1 1 7 500,000 - 552 579 608 639 671 704 739 4,492 Translation of technical materials year 0.5 1 1 1 0.5 0.5 0.5 - 5 500,000 263 552 579 608 319 335 352 - 3,008 Printing of technical materials year - 1 1 1 1 1 1 1 7 1,200,000 - 1,324 1,390 1,460 1,533 1,609 1,690 1,774 10,780 Annual know ledge-sharing event event - 1 1 1 1 1 1 1 7 500,000 - 552 579 608 639 671 704 739 4,492 Attending national events persons - 5 5 5 5 5 5 5 35 30,000 - 165 174 182 192 201 211 222 1,347 Editing & design of publications year - 1 1 1 1 1 1 1 7 1,000,000 - 1,000 1,000 1,000 1,000 1,000 1,000 1,000 7,000 LAMP w ebsite design & operation year 1 1 1 1 1 1 1 1 8 800,000 800 800 800 800 800 800 800 800 6,400 Printing of communication materials year - 1 1 1 1 1 1 1 7 600,000 - 662 695 730 766 805 845 887 5,390 Communication videos year - 1 1 1 0.5 0.5 0.5 0.5 5 1,000,000 - 1,103 1,158 1,216 639 671 704 739 6,231 KM & Communication Support Agency year 1 1 1 1 0.5 0.5 0.5 0.5 6 2,000,000 2,102 2,207 2,317 2,433 1,277 1,341 1,408 1,479 14,563
Subtotal Dis s e m ination and com m unications 3,374 14,433 15,065 13,660 7,803 8,103 8,418 8,380 79,236 Total Inve s tm e nt Cos ts 37,270 42,112 47,393 44,462 33,353 26,586 39,174 22,166 292,515 II. Re curre nt Cos ts A. Staff cos t/a lump sum 5,001 11,477 12,941 13,976 15,094 16,302 15,705 16,961 107,457
B. Office , ve hicle and othe r ope rating cos ts lump sum 492 812 853 895 940 987 1,036 1,088 7,103 Total Re curre nt Cos ts 5,493 12,289 13,794 14,871 16,034 17,289 16,741 18,049 114,561
Total 42,763 54,401 61,186 59,333 49,388 43,875 55,915 40,216 407,076
/a Staf f to be f unded by LAMP are listed in the Appendix 6 of the main LAMP design report

Republic of India
Meghalaya: Livelihoods and Access to Market Project
Final project design report - Working papers
332
Vehicles /a units 7 4 - - - 7 4 - 22 700,000 5,149 3,089 - - - 6,571 3,943 - 18,752 Laptops units 56 32 - 56 32 - - - 176 25,000 1,471 883 - 1,703 1,022 - - - 5,079 Printers units 14 8 - 14 8 - - - 44 6,000 88 53 - 102 61 - - - 305 Desks & chairs set 56 32 - - - - - - 88 10,000 588 353 - - - - - - 942 Cupborads unit 21 12 - - - - - - 33 6,000 132 79 - - - - - - 212 Visitors chairs units 42 24 - - - - - - 66 1,500 66 40 - - - - - - 106 Photocopiers units 7 4 - - 7 4 - - 22 50,000 368 221 - - 447 268 - - 1,304 Pow erback ups units 7 4 - - 7 4 - - 22 15,000 110 66 - - 134 80 - - 391 Other f urniture & equipment sets 7 4 - - - - - - 11 5,000 37 22 - - - - - - 59
Subtotal Equipm e nt and ve hicle s 8,010 4,806 - 1,805 1,664 6,920 3,943 - 27,149 B. staf f capacity building batch 1 1 1 1 1 - - - 5 250,000 263 276 290 304 319 - - - 1,452
Total Inve s tm e nt Cos ts
II. Re curre nt Cos ts 8,273 5,082 290 2,109 1,984 6,920 3,943 - 28,600
A. Staff s alary & allow ance s /b Subtotal Staff s alary & allow ance s 15,004 29,686 49,966 53,963 58,280 62,942 66,988 54,466 391,295 B. Office ope rating cos ts Subtotal Office ope rating cos ts 4,855 5,931 9,787 10,276 10,790 11,330 11,896 12,491 77,356
Total Re curre nt Cos ts 19,859 35,618 59,753 64,239 69,070 74,272 78,884 66,957 468,651 Total 28,132 40,700 60,042 66,349 71,054 81,192 82,827 66,957 497,251
\a Replacement in year 5 \bStaf f to be f unded are listed in Appendix 5 of the Main Report
Table.4.1 District Project Management Units
India
Meghalaya: LAMP Appraisal Mission
Table 4.1. District Project Management Units
De taile d Cos ts Quantitie s Unit Cos t Totals Including Continge ncie s (INR '000)
Unit 14/15 15/16 16/17 17/18 18/19 19/20 20/21 21/22 Total (INR) 14/15 15/16 16/17 17/18 18/19 19/20 20/21 21/22 Total
I. Inve s tm e nt Cos ts
A. Equipm e nt and ve hicle s

Republic of India
Meghalaya: Livelihoods and Access to Market Project
Final project design report - Working papers
333
Table 4.2: State Project Management Unit Shillong India
Meghalaya: LAMP Appraisal Mission
Table 4.2. Project Management Unit, Shillong
De taile d Cos ts Quantitie s Unit Cos t Totals Including Continge ncie s (INR '000)
Unit 14/15 15/16 16/17 17/18 18/19 19/20 20/21 21/22 Total (INR) 14/15 15/16 16/17 17/18 18/19 19/20 20/21 21/22 Total I. Inve s tm e nt Cos ts
A. Ve hicle s and Equipm e nt
4 w heel drive vehicles units 5 - - - 5 - - - 10 700,000 3,678 - - - 4,470 - - - 8,148
Laptops units 7 - - - 7 - - - 14 25,000 184 - - - 224 - - - 407
Desktop computers units 4 - - - 4 - - - 8 20,000 84 - - - 102 - - - 186
Printers units 7 - - - 7 - - - 14 6,000 44 - - - 54 - - - 98
Desks & chairs sets 11 - - - - - - - 11 10,000 116 - - - - - - - 116
Cupboards units 8 - - - - - - - 8 6,000 50 - - - - - - - 50
Visitor chairs units 20 - - - - - - - 20 1,500 32 - - - - - - - 32
Photocopiers units 2 - - - 2 - - - 4 50,000 105 - - - 128 - - - 233
Pow erbacks units 2 - - - 2 - - - 4 50,000 105 - - - 128 - - - 233
Other f urnitures & equipment LS 1 - - - - - - - 1 50,000 53 - - - - - - - 53
Other costs LS 1 - - - - - - - 1 50,000 53 - - - - - - - 53
Subtotal Ve hicle s and Equipm e nt 4,503 - - - 5,105 - - -
9,608
B. Staf f training batch 2 2 1 1 1 1 - - 8 40,000 84 88 46 49 51 54 - -
372 C. Audit & accounting
Internal auditing /a year - 1 1 1 1 1 1 1 7 600,000 - 662 695 730 766 805 845 887 5,390
Annual auditing year 1 1 1 1 1 1 1 1 8 300,000 300 300 300 300 300 300 300 300 2,400
Accounting sof tw are /b LS 1 1 - - - - - - 2 300,000 300 300 - - - - - - 600
Subtotal Audit & accounting 600 1,262 995 1,030 1,066 1,105 1,145 1,187
8,390 D. Ente rpris e s de ve lopm e nt portal
Computer equipment set - 1 - - - 1 - - 2 300,000 - 331 - - - 402 - - 733
Technical support year 1 1 0.5 0.5 0.5 0.5 0.5 0.5 5 1,000,000 1,051 1,103 579 608 639 671 704 739 6,094
Other costs year 1 1 1 1 1 1 1 1 8 100,000 105 110 116 122 128 134 141 148 1,003
Subtotal Ente rpris e s de ve lopm e nt portal 1,156 1,545 695 730 766 1,207 845 887
7,831
Total Inve s tm e nt Cos ts 6,343 2,895 1,737 1,808 6,989 2,365 1,990 2,074
26,201 II. Re curre nt Cos ts
A. Salary & allow ance
1. PM Te am /c
Subtotal PM Te am
7,504
14,328
15,146
16,004
17,285
18,667
20,161
17,603
126,697 B. Ope rating cos ts
Subtotal Ope rating cos ts
1,723
2,471
2,595
2,725
2,861
3,004
3,154
3,312
21,846 Total Re curre nt Cos ts 9,227 16,799 17,741 18,729 20,146 21,671 23,315 20,915 148,543
Total 15,569 19,694 19,478 20,537 27,134 24,037 25,305 22,989 174,743
\a Outsourced \b Cost including installation, training and operation \c Staf f to be f unded are listed in Appendix 5 of the main repo

Republic of India
Meghalaya: Livelihoods and Access to Market Project
Final project design report - Working papers
334
Working Paper 14: Financial and Economic Analysis
I. FINANCIAL ANALYSIS A. Objectives and Scope
1. The objectives of the financial analysis are to: (i) evaluate the viability of the improved agricultural production technologies and marketing to be demonstrated, extended and adapted and various livelihood options as needed by target group households; (ii) analyse the impact of these improvements on the poverty of adopting households, specifically on their income levels; (iii) assess the incremental production that results from programme interventions; and (iv) provide a basis for the economic analysis of the project. The financial analysis of the LAMP is based on prices and costs collected by the mission during its field work in May/June and validated in December 2013.
2. The methodology used involved (i) developing appropriate crop and activity models that are being focused under the LAMP, (ii) thereafter developing farm models based on average size of operational landholding per household and activity models or household models based on the type of activity proposed, (iii) developing subproject models such as NRM households, IPM households and EFC households which are the aggregate of respective category of farms or activity operated by the LAMP households over the programme implementation period, and (iv) the project model, which comprised the aggregate of all subproject models
3. For the purposes of evaluation of the average returns per Labour Day, a financial rural daily
wage rate of INR 2501
was assumed for both men and women for various farm operations like planting, weeding, harvesting etc. (although there are variations between male and female wage rates). Female labours receive about 60% of what male labour received. Input and output prices of farm production, NTFP, livestock were obtained from Department of Horticulture, Shillong, from MRDS and NERCORMP. Commodity prices were obtained from the regulated markets operating in Meghalaya through websites: megamb.nic.in.
4. Carrying out the economic and financial analysis has been extremely complex given varying agro-ecological regions and hilly terrains, soil types, complex cropping patterns, even more complex land distribution patterns including the practice of jhuming (slash and burn) and socio-economic settings and highly varying prices of agricultural inputs and farm outputs at farm-gate etc. In developing models, therefore several adjustments have been made in order to ensure that a reasonable outcome of estimates of benefits is justifiably obtained.
B. Present Situation
5. Conventional technologies (cultivation, primary processing, etc.) are available for most crops, although farmers have limited access to the emerging and new technologies. The project area has access to roads and agricultural markets but, in spite of these facilities, prices of agricultural inputs and output vary significantly. There are a good number of local service providers working in the project area but, with varied interests, targets and coverage, and they may offer scope for enhanced engagement under the project.
6. Average size of landholding in Meghalaya is 1.3 ha but the average operational area per household is only 0.7 ha. Landholdings are generally scattered in several tiny parcels. Nearly 80% of households own property rights over their land. According to RIMS Survey for the IFAD-supported
1
For all farm-related operations within jhum area, labour is shared and no payments made. But the farmer has to pay for labour if he was cultivating any commercial crops.

Republic of India
Meghalaya: Livelihoods and Access to Market Project
Final project design report - Working papers
335
MLIPH project, about 26% of households are headed by women and about 25% of households are landless
2.
7. The main crop is paddy, with other cereal crops, pulses and oilseeds, vegetables and spices also being grown, mainly under rainfed conditions. Generally the crop mix is as follows: food crops 60%, tubers and fruit crop 10% each, spices 5%, vegetables 5%, and plantations on the remaining 9% of land. On an average, a household cultivates about 54% of landholding (0.7 ha) during main season. Only about 24% households have access to some kind of irrigation sources. For all farm operations, animal drawn or manual ploughs and implements are widely used. Demonstrations have shown that use of small, hand-held power tillers has significantly reduced the cost of productions.
8. Much of the basic land cultivation is still done by hand. Although many households own cattle, only in Garo Hills and, to a lesser extent in Ri-Bhoi, they use them for cultivation. In Khasi and Jaintia Hills most land is cultivated by hand. High labour requirements for cultivation discourage sowing or planting of additional crops after paddy harvest. There is potential to introduce “no-till” conservation agriculture technologies. Free grazing of cattle after the paddy harvest and over the winter is another limiting factor. Only 2.4% of net sown area is planted more than once.
9. A household may have some 0.06 ha under plantation and orchards. Reviving and improving existing orchards such as peach, plum, lemon appears to be more profitable and generate immediate incomes to households than planting new orchards. Average size of arable land per village is 52 ha with 75 households and all of whom own some piece and a parcel of land for cultivation. Only about 78% of households cultivate their land.
3
10. The households carry forward sufficient seed to next season's crops but these seeds are often of poor quality. Availability of quality seed and seedlings remains an issue. Nearly 80% households produce for own consumption and the rest produce both for own consumption and markets. Households survive by augmenting their farm incomes from livestock, non-farm activities, wage employment and other sources.
11. About 74% of households own livestock4, in particular pigs. Livestock productivity is usually
low due to lack of vet services and drugs. The households manage their livestock along traditional lines. They have limited or no access to vaccination or parasite control. The households meet their fodder and fuel wood requirements from nearby forests. To improve the genetic quality of pigs, a supply of pure-bred and cross-bred pigs is needed. The DAH&V has 13 pig breeding farms with 283 breeding animals, producing almost 2,000 pigs for sale each year.
12. Although the goat sub-sector5
is not much talked about in Meghalaya, there are over one third of million goats in the state, and a large number of rural households keep goats. This can be a low risk enterprise with a short gestation period.
13. Spices of commercial importance that are cultivated in the project area are turmeric, ginger, chilli etc. and including NTFP Tejpatta (Indian Bay-leaf, Cinnamomum tamala)
C. Assumptions
14. Key assumptions are:
With training, technology support and better input services, the farmers are capable of undertaking improved farming practices and thereby enhancing production at farm level.
2 Source IFAD/MLIPH Annual Outcome Survey; “Ownership pattern over productive land is similar in both programme and
control villages. However, when it comes to access and ownership over the cultivable lands, 75% of HHs from project villages reported to own some productive land as compared to 55% HHs in control villages. This may be attributed to the initiatives taken by MLIPH to ensure access to cultivating land for the landless households under the Land Bank Programme. 3
IFAD/MLIPH Annual Outcome Survey 2013. 4
In 2007 the livestock populations of Meghalaya were three million poultry, and almost one million cattle, over half a million pigs and over one third of a million goats. There are only small numbers of buffalo and sheep. Numbers had grown substantially in the four years since the previous census in 2003, with a rise of 16% in numbers of cattle, 12% in goats, 25% in pigs and 10% in poultry. If these trends have continued over the six year up to 2013, then there will now be well over one million cattle, half a million goats, three-quarters of a million pigs and 3.5 million poultry. 5
IFAD is currently funding a goat development project in Rajasthan. This is a grant to ILRI " Small ruminant value chains as platforms for reducing poverty and increasing food security in dryland areas of India and Mozambique (imGoats, in short). In India the project is being implemented by BAIF (through RRIDMA in Rajasthan). Further information is available at www imgoats.org. This project is already producing useful lessons for goat-based livelihoods

Republic of India
Meghalaya: Livelihoods and Access to Market Project
Final project design report - Working papers
336
There are skills and practices for rainfed agriculture, cultivation of off-season vegetables, spices and flowers, etc and livestock products such pig, poultry, goats which can be expanded with improved farm management practices.
Although, there are three district agro-climatic zones (tropical, sub-tropical and temperate), crop and activity models that are common to these zones have been prepared and used in the analysis.
Soil health is invariably poor and as a result overall production potential is far lower than other places in India. Therefore application of FYM, composts, other organic manure and mineral fertilisers is necessary to improve the soil health and their fertility and sustaining productions.
Farm gate prices are nearly 15% lower than those of the nearby market prices. In case of off- season vegetables, the farm gate prices amount to no more than 60%
6.
On an average, cost of transportation from farm gate to the nearest market is estimated at INR 0.1/kg/km during normal season and it is higher during rainy season, say INR 0.125/kg/km
Average distance between farm-gate and a wholesale market is 10 km. There are a number of private jeeps and vans plying, carrying both passengers and commodities. But these vehicular operations have random schedules. This affects input and output prices.
Under the project some 101,250 households from NRM interventions such as soil and water conservation, small-scale irrigation, micro-watershed treatment, spring protection and
development, access to clean drinking water, drudgery reduction interventions7. All these
interventions are carried out in 1,350 targeted villages using inclusive approach. Out of 101,250 NRM households, some 20,250 households from 54 village clusters benefit from
the cultivation of high value crops, spices, honey production etc under the Integrated Production and Marketing sub-component and, in addition, some 32,400 households benefit from livestock
interventions such as pig-keeping and goat-keeping at household levels8.
Under enterprises development some 47,400 units operated and owned by individuals and groups, will benefit from support via EFCs. Of these 11,364 units will be located within the NRM areas.
Improvement of some 55 existing rural agricultural markets and improvement of rural roads network benefit all target villages and clusters and these will cover 41,250 households and of
whom 9,890 households will be within NRM villages9.
Productivity increases under NRM development and IPM interventions are assumed at conservative levels ranging between 15% and 35% over the existing levels. These increases are achieved due to in situ soil and moisture conservation practices and improved agronomic practices.
In all 300 integrated villages cooperative societies are proposed and these will cover some 120,000 households including 60,000 from NRM villages.
The traditional pigs have low level of productivity with each sow only producing about 8-10 weaned piglets per year, which take one year to grow to about 30kg. Therefore, most urban pork demand is met from imports. With an improved management system, the productivity could be enhanced:
each sow weaning 16-18 piglets per year, and each growing to 90kg at six months of age10
.
There is scope for small and medium scale intensive broiler and layer units. Kuroilers, a dual purpose type of bird suitable for small back-yard flocks also popular. Key interventions for poultry will be: (i) vaccination against contagious diseases, especially Newcastle disease; (ii) input supply - especially feed and chicks; (iii) and improved (but low cost) housing.
There is growing demand for chicken meat and eggs. Although most poultry meat is supplied by local producers of broilers (using feed bought in from other states) and backyard flocks, a very large number of eggs are imported, which could be produced locally. Projects such as MLIPH
6
Mission assessment during market surveys 7
Refer WP on Natural Resources Management for details. 8
Details are provided in WP on Livestock Management 9
Refer to WP on Rural Markets and Roads. 10
Refer to WP on Livestock Development.

Republic of India
Meghalaya: Livelihoods and Access to Market Project
Final project design report - Working papers
337
have demonstrated that there is a good market for "improved backyard" poultry, which sells at a premium price over broilers
No significant changes or shifts in cropping patters are assumed but the key assumptions have been adoption of appropriate agronomic practices including inter-cropping, crop rotation, conservation farming etc and these reflect in cultivation of off-season vegetables, spices, plantation crops
D. Agro-climatic zones and Production Models
15. The Project Area falls under three distinct agro-climatic sub-zones: tropical zone, sub-tropical zone and temperate zone based on crops and altitude association. Their characteristics are summarised in Table 1 below.
Agro-climatic
Zone
Table 1: Agro-climatic sub-zones of the Project Area
Characteristic Features Districts
Tropical zone Elevation between 100 & 300 m MSL. Area suitable for banana, areca, pineapple, ornage, cashewnut, turmeric, lemon, guava, papaya etc
East Garo, RiBhoi
Sub-tropical Elevation between 300 & 1100 m MSL. Area suitable for floriculture, ginger, pineapple, ornage, turmeric, lemon, guava, grape fruits
East Garo, Jaintia
Temperate Elevation between 1100 & 2000 m MSL. Area suitable for floriculture, spices, chesnut, peach, plum, pear, apricot etc.
West Khasi, East Khasi, West Jaintia
Source: According to National Zoning of Agro-climatic region, Meghalaya fall under Zone –II; it is further sub-divided in to 5 sub-zones. The Report of the Working Group of Zonal Planning Team, Eastern Himalayan Region (Zone-II), Planning Commission, GoI
E. Characteristic Features of Households
16. Table 3 below gives brief characteristic features of the participating households of the project area.
Table 2: Description of Participating households
Household - Area Model Number of participating households
Project Household Description b/
NRM households 101,250 Rural households are poor cultivating 0.7 ha of land
IPM households 20,250
Livestock households 32,250
EFC households 47,385
IVCS households 120,000
Markets & roads households 41,250
out of average size of 1.3 ha; more than 74% households own cattle but they mostly cultivate land by hand; 80% household produce for own consumption and income from agriculture is low and the target group augments this from livestock, non- farm activities; although they have access to market, transport cost is high; crop are generally rainfed.
F. Crop and activity Models
17. Following crop and activity models have been developed and used for the analysis. Table 3 below gives brief features of these models:

Republic of India
Meghalaya: Livelihoods and Access to Market Project
Final project design report - Working papers
338
Table-3: Crop and Activity Models for LAMP
Crop or Activity model Model Area (ha) or unit
NRM Crops and activity models 1 ha
Paddy, Maize, Sweet potato, pulses, oilseeds under
rainfed conditions
Piggery & backyard poultry 1 unit
IPM crops & activity models 1 ha
Ginger, turmeric, pine apple, oranges, chilli, cashewnut, vegetables, Honey production, tejpatta trading
EFC models
Reference Table in Appendix
Appendix-1
Appendix-2 & 3
Small enterprises such as processing, marketing or large-scale production
1 unit Appendix-4
Farm-based enterprise; similar to IPM crop model 1 unit IGA unit such as piggery, backyard poultry, duck- farming, goat-keeping etc,
1 unit
G. Farm / Household Models
18. Using indicative crop, activity and plantation models, several Farm and Household Models were prepared using FARMOD software. These models were designed to pattern the landholdings and livelihood options and resource availability of the target group in the project area. The models broadly illustrate the LAMP’s expected impact on the incomes, and labour use of households adopting and/or adapting both on-farm and non-farm technology options. These models are indicative and assumed for assessing the Project Performance Indicators. These are briefly described below.
NRM household model: the model has been assumed based on an area of 0.7 ha per household primarily with rainfed paddy (0.04 ha) maize (0.07 ha) peas (0.05 ha) mustard (0.05 ha) sweet potato (0.1 ha), vegetables (0.1 ha) etc with an annual cropping intensity of 100%. No major shift in cropping patterns is envisaged in the short run. These details are summarised in Appendix 5.
IPM household models: It has been assumed that IPM households participating in LAMP will have three different modes of models (i) NRM model as described above, (ii) IPM crop model and (iii) IPM activity model. The IPM crop model has ginger (0.2 ha), turmeric (0.2 ha), pineapple (0.1 ha), citrus, oranges (0.1 ha), off-season vegetables (0.05 ha), chilli (0.05 ha) all with limited irrigation facilities. Under IPM activity model honey production and Tejpatta trading have been assumed. More non-farm activities can be included on the basis of detailed feasibility studies and market-demand. These IPM households are a sub-set of NRM households. Details are in Appendices 7 to 10.
Livestock households: In addition to cultivating a meagre landholding of 0.70 ha, some 30 to 32% of NRM households also tend livestock - predominantly of pigs and poultry, but also cattle and goats. Each model household pig unit rears three pigs, has one pigsty, and facilities for vet services. Each goat unit include 8 does, one buck, a goat-shed and other facilities. Details are in Appendices 10A to 10D.
EFC11
household models: The EFC households have three categories of activities: (i) small enterprises such as processing, marketing or large-scale production; (ii) farm-based enterprises similar to that of IPM farm model, or (iii) IGA There could be other such enterprises as rice milling, processing of cashew, banana, areca plate-making unit, floriculture, mushroom production and marketing, setting up of grocery shops etc. The EFC households are outside the NRM households. Average investment for small enterprises has been assumed at INR 150,000 per unit with INR 100,000 for raw materials, INR 30,000 for
11
According to the data compiled by the existing EFCs, some 6,000 households have been short-listed for availing the EFC facilities and these cover paddy cultivation (0.4%), apiculture (1.5%), fisheries (14.7%), rubber planting (18.1%), areca plantation (12.8%), piggery (39.5%), non-silk enterprises (3.2%), water related development (0.2%), hotels and restaurants (0.4%) etc.

Republic of India
Meghalaya: Livelihoods and Access to Market Project
Final project design report - Working papers
339
Table 4: Summary Results of Unit Farm and Activity model (Financial) Model Gross Income Input
Cost (INR) (INR)
Labour FIRR NPV
(INR) (%) (INR)
other operating costs and INR 25,000 for labour. For the farm-based enterprises, a sum of INR 33,800 for inputs and INR 39,000 for labour has been assumed. The IGA unit will have varying unit costs. Details are in Appendices 11 to 15
19. Details of the financial analysis of models presented in Appendices 5 to 18 are summarized in
Table 4 below:
NRM household 50,707 7,306 27,325 93 29,044 IPM farm household 159,200 41,708 40,425 74 294,388 IPM activity household 50,480 39,840 2500 7 26,148 Piggery household 25,000 1250 18,000 25 26,340 Goatery household 110,000 42,825 84 357,881 EFC small enterprise 202,300 155,000 35 192,544 EFC farm-based enterprise 103,430 30,370 13,935 37 141,609 EFC IGA household 34,125 9,399 12,675 29 48,416
20. The household models described above assume a given and unchanging level of technology: the proposed activities are entirely demand-driven, iterative and market-dictated, incorporating lessons learned from past experience and technologies preferred by the target groups over time. Second, the farmers at cluster levels, facilitated by the service providers undertake a problem analysis and decide on the options within available resources. Third, the inputs to be used depend on the problem analysis undertaken by the beneficiary group and the needs at each specific location and emphasis is on using locally available bio-inputs such as FYM, vermin-compost, bio-pesticides etc. Fourth, the target groups identify priority opportunities themselves and as facilitated by the service providers or the EFCs.
G. Subproject Models
21. Four subproject models were developed: (i) NRM households subproject for Natural Resources and food Security; (ii) IPM households subproject for integrated production and marketing; (iii) livestock subproject and (iv) EFC enterprises household subproject. In addition a road and markets subproject was also developed to assess the benefits of improvements of local markets and rural roads. These subproject models are briefly described below.
22. NRM subproject: About 101,250 households participate in phased manner over a five year period. Benefits accrue to the households on the year following the completion of the NRM interventions. There are no increases in cropping intensity but productivity increases are achieved due to the use of quality seeds, adoption of proper management practices etc. Average land holding has been assumed at 0.7 ha per household. Model results are summarised in Appendix 16 & 17
23. IPM subproject: In all some 20,250 households, out of 101,250 NRM households participate under IPM interventions. These households may have larger landholdings than the average landholding size of 0.7 ha. In addition to farming, these households undertake non-farm enterprises such as honey production, or trading. Details are in Appendix 18 & 19.
24. Livestock subproject: This subproject includes 32,400 units of pigs and goats and equal number of households participates in the project. These households are all NRM households and they undertake these activities in addition to farming. The piggery units are provided in 100 village clusters and that of goats in 20 clusters. Each cluster will have some 360 households. See Appendix 18A and 19A.
25. EFC subprojects: In all 47,400 households are covered over the project implementation. Of total
47,400 households, some 11400 households are from NRM villages. Of total EFC households, 35% households go for small enterprises such as processing, marketing, or large-scale production; 50% households opt for farm-based enterprises and the remaining 15% households take up IGA activities. See Appendix 20 & 21

Republic of India
Meghalaya: Livelihoods and Access to Market Project
Final project design report - Working papers
340
26. Benefits from Markets and rural roads: Improvement of rural roads result in reduction of transport costs to the rural households. It is assumed that annual benefits is about INR 1,500/km/year: assuming that 75 households each transport a ton of agricultural and other commodities per year in a road stretch of 10 km and reduction in transport cost at INR 0.2.km/kg/household.
27. It is assumed that 10 to 15 villages benefit from improvement of one market and thus 750 households are benefitted and of which some 60% household access market facilities and 30% households (50% of access households) realise enhanced price for their product. This is estimated at about 500 kg/year and INR 500/year/household. See Appendix 22.
28. Results of analysis of these major four subprojects in terms of incomes, production costs, labour input, etc are summarised in Table 5 below.
Table 5: Summary Results of Subprojects (Financial) Models: Amount in million INR 1/
NRM IPM Livestock EFC
WOP WP WOP WP WOP WP WOP WP Gross income 4304.9 5134.0 858.2 1969.6 460.8 1692.0 1110.7 8048.8 Inputs 1002.8 1123.6 537.1 803.7 140.6 353.3 681.0 5366.4 Labour 2577.0 2768.6 208.0 415.1 540.0 648.0 64.0 421.3 Net Income 725.1 1241.8 113.1 750.8 -219.8 690.7 365.7 2261.1 1/ at full development stage and assuming labour requirements met fully by households themselves
H. Incremental Production and Incremental Input Requirements
29. The households participating in the LAMP and adopting project recommendations in a sustained manner contribute to increased agricultural production, both farm and non-farm and livestock products. Table 6 below summarises incremental production, input requirements, and labour. Details are in Appendix 26.

Republic of India
Meghalaya: Livelihoods and Access to Market Project
Final project design report - Working papers
341
Table 6: Crop, Fodder and Livestock Production a/
PRODUCTION AND INPUTS Future Percentage
(In Units) Present Without Future With Change
Unit %
Main Production
Paddy, main season ton 91,125 91,125 101,250 11
Byproduct ton 101,756 101,756 116,134 14
Maize, shelled ton 10,631 10,631 17,719 67
Beans ton 7,088 7,088 9,113 29
Mustard ton 7,088 7,088 8,100 14
Sweet Potato ton 43,031 43,031 50,625 18
Vegetables ton 66,552 66,552 83,190 25
Ginger ton 11,604 11,604 14,505 25
Turmeric ton 11,604 11,604 14,505 25
Chilli ton 338 338 435 29
Arecanut ton - - 5,331 -
Pine Apple ton - - 13,151 -
Citrus ton - - 16,682 -
Livestock products
Poultry birds bird - - 17,783 -
Eggs each - - 3,556,500 -
Piglets, cross-bred No - - 402,678 -
Goat No - - 181,873 -
Sale of honey litre - - 1,547,200 -
Bee wax kg - - 216,608 -
Bee Colonies colony - - 541,520 -
Fertilisers and manure
DAP ton 217.6 217.6 430.3 98 Organic Manure ton 22,184.0 22,184.0 82,609.0 272 PP chemicals lit 36.7 36.7 54.9 50 NPK Fertilisers ton 554.6 554.6 1,109.2 100 Urea ton 735.9 735.9 1,766.2 140 MOP ton - - 1,374.6 -
Labour (000 persondays) pers_da 13,558 13,558 17,004 19
a/ Details are summarised in Appendix 26
30. Household level food production and labour requirement at full development stage of LAMP is presented in Table 7 below.
Table 7: Household food production & Incomes at full development stage
Households
Food production: Kg / hh a/ Labour inputs/hh b/ WOP WP WOP WP
All households 1,070 1,260 143 170 a/ Food production excludes tuber, fruits, vegetables, spices. b/ includes labour-days for all interventions under the project.
II. ECONOMIC ANALYSIS
A. Objectives and Methodology
329. The objective of the economic analysis is to evaluate the expected contribution of the LAMP to the economic development of the project area districts. The purpose of such analysis is to determine whether the economic benefits sufficiently justify the use of the scarce resources that the project needs.
330. The mission has assessed that the expected benefits from project investments will be inextricably linked, as the ability of farm households to realise the potential increases in incomes will depend on all options of diversifications. It is considered that in these project area villages, the additional
Republic of India
Meghalaya: Livelihoods and Access to Market Project
Final project design report - Working papers
342
infrastructure investments are necessary for on-farm development to enable target households to participate in the project, and to purchase inputs and sell outputs. Thus for example, for some households, the time saved by women in easier access to safe drinking water free up their time, and or reduces the numbers of days lost due to ill-health; for others, year-round access to markets will be critical to the sale of their farm produce. For others still, the benefits of in situ soil and water conservation enable them to cultivate their all land in the rain season. Thus, benefits accruing as a result of “productive good" infrastructure investments and other incomes from enterprises are all accounted for and included in the increases in farm household incomes.
331. The analysis includes all incremental costs and incremental benefits that are quantifiable and associated with the project's investments in development. Target group households adopting and participating in LAMP interventions contribute to increased production, besides ensuring their increases in incomes.
B. Assumptions
332. The following assumptions underlie this economic analysis of the project.
A twenty five-year analysis period has been assumed, which included an 8 year project
investment period.
Agricultural goods move freely within the project area in response to market signals.
All agricultural inputs and outputs that are traded are valued at their border prices as of June 2013. These have been adjusted to allow for transport and marketing costs between the state border and target districts, to give an economic export parity value at the farm gate.
Economic investment costs are net of taxes and price contingencies, credit, office rent etc. All costs directly associated with the incremental production are included in full, including incremental farm inputs and family labour.
A standard conversion factor (SCF) of 0.85 is applied to both traded and non-traded items for adjusting financial prices but with the following variations: food crops at 85%, fruits and vegetables and spice crops at 75%, labour 75%, livestock products, seeds and seedling and all planting materials and enterprises at 100%.
The average financial rural wage rate is taken to be the best estimate of the economic
value of labour12
. The financial price of labour (INR 250) reflects seasonal variation in employment opportunities in the State. The financial wage rate is thus taken to reflect the value of the marginal product of agricultural male and female labour without the project;
The analysis includes only on-farm benefits and including attributable benefits from soil and water conservation under NRM;
All costs and benefits are relating to investments made on targeted project area households and the resultants benefits;
Time required for the full development has been assumed over 10 years including farming system development, dissemination of information and technology transfer, and establishment of improved farming practices including changes at grassroots levels, improved access to markets, road improvement etc;
The analysis employs an Opportunity Cost of Capital (OCC) at 12%.
12 From the year 2011-12 data, four trends stand out: first, poverty is falling sharply, second, rural wages are rising sharply, third
farmers are shifting from cereals to superior foods and fourth, the MGNREGA has not been the key driver of higher wages in rural area, Source, Rising Rural Wages, Times of India, July 7, 2013 issue.

Republic of India
Meghalaya: Livelihoods and Access to Market Project
Final project design report - Working papers
343
C. Costs - Benefits Streams and Analysis
333. Investment and Recurrent Costs: The incremental cost streams include all incremental on- farm investment and operating costs (total incremental production costs calculated using FARMOD) including the economic value of all the necessary incremental labour; and the project investment costs (calculated using COSTAB) and excluding the cost of the input packages, taxes and duties, grant, risk fund, office rentals, price contingencies, etc. See Appendix 23.
334. The project economic costs were calculated from the financial project costs excluding price contingencies, subsidies for production inputs, development credit, taxes and duties. Recurrent costs for continued extension/training support, operations and maintenance and periodic replacement of vehicles have been included. Economic prices for inputs and output models were estimated by applying the conversion factors on the financial prices.
335. Production Benefits: The farm productions are direct output from the respective models, which were based on the respective production models. It is assumed that about 101,250 households in receipt of NRM and improved agriculture and farming practices achieve productivity increases ranging from 15 to 25% due to enhanced soil-moisture, better seeds and training and soil and water conservation practices. Under integrated production and marketing some 20,250 households are benefitted by a wide range of support from the project such as irrigation infrastructure, vegetable production, spices cultivation livestock interventions and also other non-farm activities and under livestock some 32,400 households. Under enterprises development some 47,400 households benefit mostly in the form of enhanced price margins that accrue to the beneficiaries. Benefits estimated from the improvement of rural roads and markets are very conservative. All these Project benefits are quantified in monetary terms and summarised in Appendix 24.
336. Project Performance Indicators: Cost-benefit analysis method was used for the economic analysis of the project and using three indicators to assess the overall performance of the project. These are (i) economic internal rate of return (IRR), (ii) net present value (NPV), and (iii) benefit cost ratio (BCR). These were estimated using a 25 year incremental cash flows of benefit and cost streams.
337. According to the details presented in Appendix-27, overall Project IRR is 26%13
. The estimated NPV for a 12% discount rate is INR 6,752 million and the BCR of 1.33. A positive NPV under the current Opportunity Cost of Capital (OCC) of 12% and even at a 20% discounted rate indicates that the project investments are robust.
40. Sensitivity analysis: Sensitivity analysis of the project performance indicators has been carried out in order to test the robustness of project investments and benefits streams. The impact of increases in costs and decline in benefits assessed at varying stages indicates that the project is more sensitive to decline in benefits than increases to costs. See Table 8 below and details in Appendix 28.
Table 8: Sensitivity Analysis of NPV a/ Scenario NPV of Present Net Streams of Benefits and Costs in
INR million Cost Increases by Benefits down by
20% 25% 20% 25% Benefit streams & cost streams discounted at 12%
2,705 1,693 1,354 5
a/ The NPV is a very concise performance indicator of an investment project: it represents the present amount of the net benefits (i.e. incremental benefits less incremental costs) flow generated by the investment expressed in INR (a single value with the same unit of measurement used in the accounting tables). The Net Present Value is the sum of a 25 year discounted net cash flows.
41. If all benefits are delayed by two years (in effect, if the project’s production activities take longer to become established) then the IRR declines to 18% with a NPV of 3,493 million and BCR of
1.17. Table 9 below shows the sensitivity of IRR to costs and benefits changes.
13 Overall FIRR of the project is 34%.
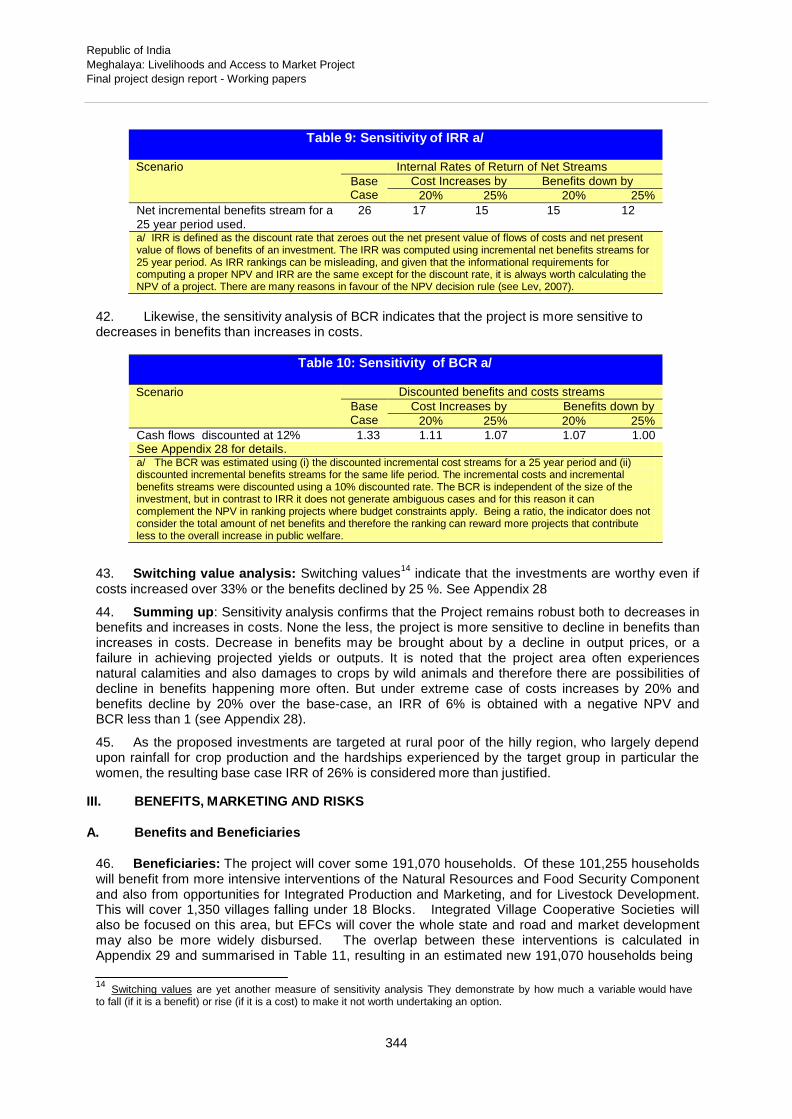
Republic of India
Meghalaya: Livelihoods and Access to Market Project
Final project design report - Working papers
344
Table 9: Sensitivity of IRR a/
Scenario Internal Rates of Return of Net Streams Base Case
Cost Increases by Benefits down by 20% 25% 20% 25%
Net incremental benefits stream for a
25 year period used. 26 17 15 15 12
a/ IRR is defined as the discount rate that zeroes out the net present value of flows of costs and net present value of flows of benefits of an investment. The IRR was computed using incremental net benefits streams for 25 year period. As IRR rankings can be misleading, and given that the informational requirements for computing a proper NPV and IRR are the same except for the discount rate, it is always worth calculating the NPV of a project. There are many reasons in favour of the NPV decision rule (see Lev, 2007).
42. Likewise, the sensitivity analysis of BCR indicates that the project is more sensitive to decreases in benefits than increases in costs.
Table 10: Sensitivity of BCR a/
Scenario Discounted benefits and costs streams Base Case
Cost Increases by Benefits down by 20% 25% 20% 25%
Cash flows discounted at 12% 1.33 1.11 1.07 1.07 1.00 See Appendix 28 for details. a/ The BCR was estimated using (i) the discounted incremental cost streams for a 25 year period and (ii) discounted incremental benefits streams for the same life period. The incremental costs and incremental benefits streams were discounted using a 10% discounted rate. The BCR is independent of the size of the investment, but in contrast to IRR it does not generate ambiguous cases and for this reason it can complement the NPV in ranking projects where budget constraints apply. Being a ratio, the indicator does not consider the total amount of net benefits and therefore the ranking can reward more projects that contribute less to the overall increase in public welfare.
43. Switching value analysis: Switching values
14 indicate that the investments are worthy even if
costs increased over 33% or the benefits declined by 25 %. See Appendix 28
44. Summing up: Sensitivity analysis confirms that the Project remains robust both to decreases in benefits and increases in costs. None the less, the project is more sensitive to decline in benefits than increases in costs. Decrease in benefits may be brought about by a decline in output prices, or a failure in achieving projected yields or outputs. It is noted that the project area often experiences natural calamities and also damages to crops by wild animals and therefore there are possibilities of decline in benefits happening more often. But under extreme case of costs increases by 20% and benefits decline by 20% over the base-case, an IRR of 6% is obtained with a negative NPV and BCR less than 1 (see Appendix 28).
45. As the proposed investments are targeted at rural poor of the hilly region, who largely depend upon rainfall for crop production and the hardships experienced by the target group in particular the women, the resulting base case IRR of 26% is considered more than justified.
III. BENEFITS, MARKETING AND RISKS
A. Benefits and Beneficiaries
46. Beneficiaries: The project will cover some 191,070 households. Of these 101,255 households will benefit from more intensive interventions of the Natural Resources and Food Security Component and also from opportunities for Integrated Production and Marketing, and for Livestock Development. This will cover 1,350 villages falling under 18 Blocks. Integrated Village Cooperative Societies will also be focused on this area, but EFCs will cover the whole state and road and market development may also be more widely disbursed. The overlap between these interventions is calculated in Appendix 29 and summarised in Table 11, resulting in an estimated new 191,070 households being
14
Switching values are yet another measure of sensitivity analysis They demonstrate by how much a variable would have to fall (if it is a benefit) or rise (if it is a cost) to make it not worth undertaking an option.

Republic of India
Meghalaya: Livelihoods and Access to Market Project
Final project design report - Working papers
345
reached by one or more LAMP intervention. With an average household size of 5.6 persons, there will be just over one million people in the 191,070 households.
Table 11: Cumulative number of participating households
Interventions
Year 1
Year 2
Year 3
Year 4
Year 5
Year 6
Year 7
Year 8
NRM* households
0
20,000
40,000
60,000
80,000
101,255
101,255
101,255
IPM total households 0 4,000 8,000 12,000 1,600 20,250 20,250 20,250
IPM (overlap with NRM) 0 -4,000 -8,000 -12,000 -1,600 -20,250 -20,250 -20,250
Livestock total households 0 3,600 11,520 27,720 32,400 32,400 32,400 32,400
Livestock (overlap with NRM) 0 -3,600 -11,520 -27,720 -32,400 -32,400 -32,400 -32,400
EFC households – total 0 1,755 5,265 12,285 19,305 26,325 33,345 47,385
EFC overlap with other sub-components 0 -421 -1,264 -2,948 -4,633 -6,318 -8,003 -11,364
IVCS households – total 0 20,000 40,000 60,000 80,000 100,000 120,000 120,000
IVCS overlap with other sub-components 0 -15,200 -30,400 -45,600 -60,800 -76,000 -91,242 -91,242
Market households – total 0 0 0 4,125 8,250 16,500 28,875 41,250
Market households overlap with other 0 0 0 -1,609 -3,218 -6,435 -11,261 -16,222
Total (net)
0
26,136
53,604
86,257
118,909
155,333
172,976
191,070 * households participating in Component 1 – Natural Resources and Food Security
47. Beneficiary participation has been phased in such a manner to permit flexibility in project interventions and also to prepare the vulnerable groups to gain confidence and adequate capacity. Accordingly, the project interventions would commence in each district or cluster simultaneously except the NRM subproject, which is phased on the basis of the villages’ implementation capacity.
48. Benefits: The immediate benefits from the project are increased productivity through the introduction of in-situ water conservation practices, improved farming practices including shift in cropping patterns in response to market demands, cultivation of spices and plantation crops. This response is expressed as increased household incomes, and improved food security. As shown in the project logframe, some 50,000 will households adopt new livelihood opportunities linked to market and equal number of households has increased cereal production. All 1,350 villages access services for enterprise development and implement INRM plans. About 10,000 households will have an increased area of irrigated crops and 20,000 households have reduced time to collect domestic water. About 1,350 lead farmers will be trained and 55 rural agricultural markets are improved. In addition some 250 km of roads improved and upgraded. About 54 village clusters will be producing commodities for market. Some 120,000 members have access to financial services from the project- supported ICVS with 90,000 savers and 60,000 borrowers.
49. In qualitative terms, minimised soil erosion in the cropped area, reduced runoff and increased infiltration, and enhancement of organic contents of the soil are some of the benefits of the NRM interventions, which have not been quantified. In all 500 villages take actions to manage areas for watershed and forest conservation.
50. Other benefits: Additional benefits will come from the LAMP’s capacity building interventions. First, at the end of the project, all participating villages will have the benefit and advantages of the services of their VECs, which are capacitated and provided with funding for various social and economic developments. Secondly, 300 IVCSs set up and capacitated to cater to the credit requirement of the project villages for their economic activities covering some 80,000 members. Thirdly, women from the poor and very poor groups will be participating in and managing their social and economic development and will have better access to markets and inputs and marketing their products. Lastly, the improvement of some 55 rural markets and upgrading of 250 km of rural road will provide better access to markets and marketing and thus facilitating better prices to the farmers through well-established procedures for market operations, 30% increases in sales and about 20% increases in number of farmers selling their produce in market.

Republic of India
Meghalaya: Livelihoods and Access to Market Project
Final project design report - Working papers
346
B. Markets and Marketing
51. There three types of markets in the state: village markets or farmers markets, aggregation or assembly markets, and terminal markets. The Meghalaya APMC has two markets in the project area: one at Mowiang in East Khasi Hills and other at Garobadha in West Garo Hills. In addition, there are 36 markets at block level and 63 daily markets at village level. All local markets are under the control and management of the respective local Councils, which have varying rules and regulations for market fees, levies etc. Traditionally, all small holders sell their marketable produce to the local traders
52. The cost of marketing the farm produce, such as vegetables and other horticultural produce, is very high because of (i) difficult terrain conditions; (ii) distance to wholesale markets is far, on an average of 37 km from farm-gate and 10 km to the rural market and (iii) transporting of limited quantities. The average cost of transport ranges between INR 0.1/kg/km and INR 0.125 kg/km. It is higher during the rainy season. Thus the marketing costs vary between 15% and 46%. While transport cost ranges between 2% and 10% depending up on the type of commodity and produce, it averages at 8% at village level, 13% at Block level and another 4% at district level totalling about 25%. In addition to increasing marketing and transport costs, post-harvest losses are also high and these account for about 20%: ranging from 5% at farm level to 10% at retail. Difference between farm- gate price and consumer price is about 210%
53. Major production benefits are quantified in Appendix 26. About 80% of food produced is consumed at farm. In addition, the project produce 82,646 ton of vegetables excluding 50,000 ton of tuber, of which 70% are marketable, 32,624 ton of spices, 13,065 ton of pineapple, 16,944 ton of citrus fruits for marketing. These products will be marketed through the proposed value-chain arrangements. The proposed 54 clusters will facilitate these arrangements and supported by the respective EFC. With project interventions, farm level production costs reduce by 15%, about 75% of market establish a procedure for maintenance by using the revenue collected, sales in 75% of markets increase by 30% and 20% increase in number of people selling in markets, some 30% reduction in transport cost of crops and inputs on improved roads.
C. Environment and Adaptations to Climate Change Risks
54. Environment-related aspects of the project are its integrated natural resources management including watershed development to agricultural development, a focus on community-based village development and the encouragement of alternative income generating opportunities for the poor. All these aspects yield substantial environmental benefits that have not been quantified in the economic analysis, for the following reasons: (i) farmers may not perceive degradation of their lands as a result of declining soil fertility and soil erosion and thus underestimate the potential benefits of soil and water conservation measures over the longer terms; and (ii) communities, lacking assured property rights over forests that they access to, for fuel and fodder, may not regulate their harvests to ensure sustainable use of the forests, ie open access may result in overexploitation. No interventions result in any adverse impact on environment: for example market constructions involve only improvement of existing rural markets. Similarly all roads are nothing but improvement and upgrading of existing road alignments and gradients and no vegetation is cleared for alignment or existing settlements disturbed.
55. There are a number of potential actions that LAMP can take in terms of natural resource management and enterprise development that will enhance the ability of rural people to adapt to climate change. These include:
Water conservation, and enhanced water supply for domestic and irrigation use. This is the focus of interventions in the NR and Food Security component.
More water-efficient irrigation methods – such as drip irrigation. .
Plantation and tree crops (being deeper rooted more able to tolerate variations in water availability than annual crops). However account also needs to be taken of the suitability of different tree crops in terms of tolerance of climate change. Rising temperatures limit the potential for temperate fruits, and areca nut, although very widely grown, is said to be adversely affected.
Protected cropping for high value crops - use of plastic tunnels, plastic mulch and net houses to protect crops from extreme weather
Stress tolerant crops and crop varieties - examples such crops are cassava and millet. Stress tolerant varieties of paddy are being developed – that can tolerate submergence and drought.
Livestock: can adjust feed sources in response to climate changes
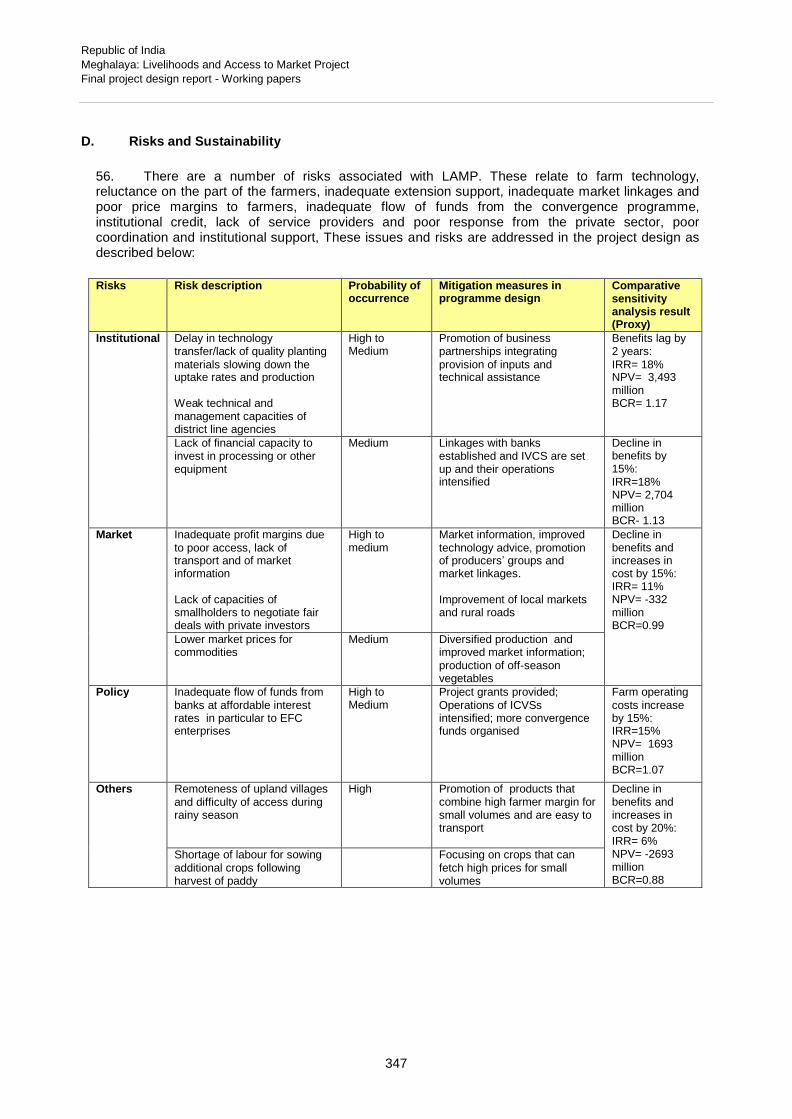
Republic of India
Meghalaya: Livelihoods and Access to Market Project
Final project design report - Working papers
347
D. Risks and Sustainability
56. There are a number of risks associated with LAMP. These relate to farm technology, reluctance on the part of the farmers, inadequate extension support, inadequate market linkages and poor price margins to farmers, inadequate flow of funds from the convergence programme, institutional credit, lack of service providers and poor response from the private sector, poor coordination and institutional support, These issues and risks are addressed in the project design as described below:
Risks Risk description Probability of
occurrence Mitigation measures in programme design
Comparative sensitivity analysis result (Proxy)
Institutional Delay in technology transfer/lack of quality planting materials slowing down the uptake rates and production
Weak technical and management capacities of district line agencies
High to Medium
Promotion of business partnerships integrating provision of inputs and technical assistance
Benefits lag by 2 years: IRR= 18% NPV= 3,493 million BCR= 1.17
Lack of financial capacity to invest in processing or other equipment
Medium Linkages with banks established and IVCS are set up and their operations intensified
Decline in benefits by 15%: IRR=18% NPV= 2,704 million BCR- 1.13
Market Inadequate profit margins due to poor access, lack of transport and of market information
Lack of capacities of smallholders to negotiate fair deals with private investors
High to medium
Market information, improved technology advice, promotion of producers’ groups and market linkages.
Improvement of local markets and rural roads
Decline in benefits and increases in cost by 15%: IRR= 11% NPV= -332 million BCR=0.99
Lower market prices for commodities
Medium Diversified production and improved market information; production of off-season vegetables
Policy Inadequate flow of funds from banks at affordable interest rates in particular to EFC enterprises
High to Medium
Project grants provided; Operations of ICVSs intensified; more convergence funds organised
Farm operating costs increase by 15%: IRR=15% NPV= 1693 million BCR=1.07
Others Remoteness of upland villages and difficulty of access during rainy season
High Promotion of products that combine high farmer margin for small volumes and are easy to transport
Decline in benefits and increases in cost by 20%: IRR= 6% NPV= -2693 million BCR=0.88
Shortage of labour for sowing additional crops following harvest of paddy
Focusing on crops that can fetch high prices for small volumes

Republic of India
Meghalaya: Livelihoods and Access to Market Project
Final project design report - Working papers
348
Appendix 1: Production Costs, Labour and Yields of Food Crops (INR/ha)
Crop
Inputs (INR) Without project
Labour (INR)
Yield (kg/ha)
Inputs (INR) With Project
Labour (INR)
Yield (kg/ha)
Paddy, rainfed
6447
43500
2300
7300
44250
2500 Maize 8945 27000 1500 11470 33750 2300 Sweet potato 5250 29000 4300 7656 35000 5000 Peas 4095 35500 1400 7670 35500 1800 Beans 4246 37500 1200 4995 38750 1500 Soybean 8621 33750 1100 8871 36250 1500 Mustard 4990 37750 1400 4335 37750 1600 Vegetables, seasonal 6400 108000 12000 11630 125500 15000 Tomatoes 18115 43000 10000 18531 51750 12000 Potato 40500 75500 10000 44090 90000 12000 Considerable variations in prices exist between districts
Appendix 2: Production Costs, Labour and Yields of IPM Crops (INR/ha)
Crop
Inputs (INR) Without project
Labour (INR)
Yield (kg/ha)
Inputs (INR) With Project
Labour (INR)
Yield (kg/ha)
Ginger
81830
92000
6000
80090
93250
7500 Turmeric 79090 93250 6000 80090 93250 7500 Chilli 4745 37250 700 5685 36250 900 Black pepper 26590 74500 1000 Vegetables, off season Pine Apple (see App 3) Oranges (see App 3) Cashew (see App 3) Considerable variations in prices exist between districts.
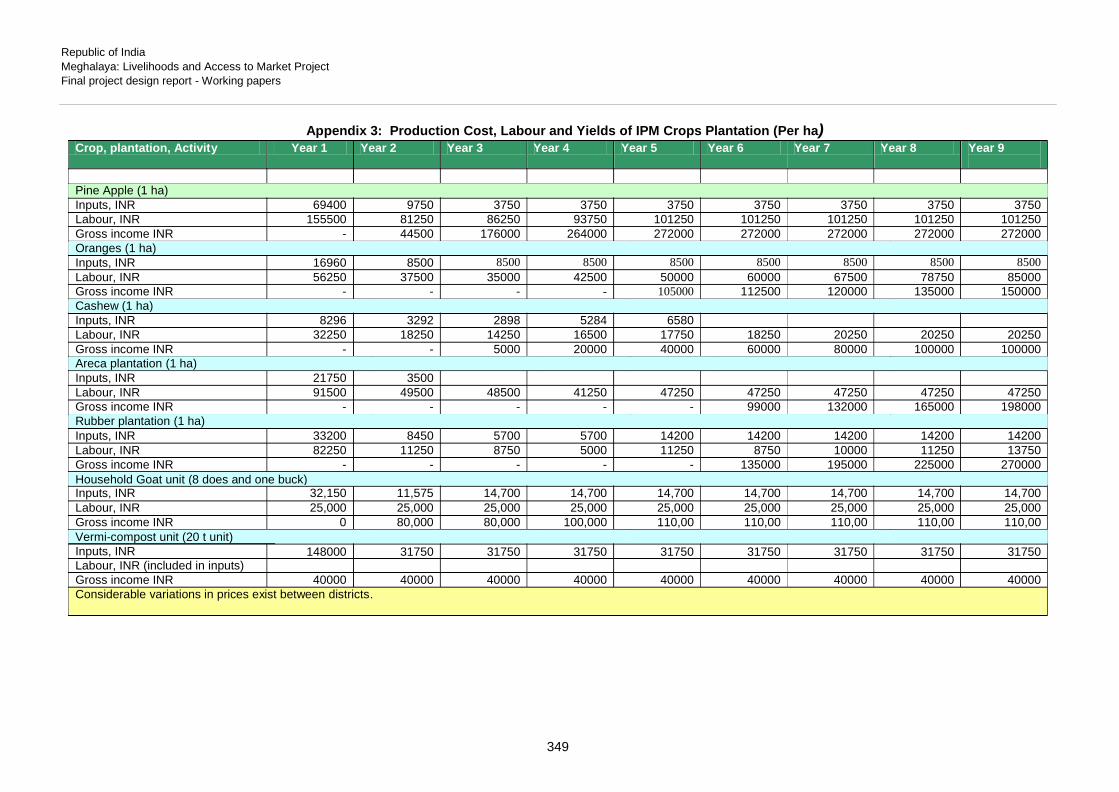
Republic of India
Meghalaya: Livelihoods and Access to Market Project
Final project design report - Working papers
349
Appendix 3: Production Cost, Labour and Yields of IPM Crops Plantation (Per ha) Crop, plantation, Activity Year 1 Year 2 Year 3 Year 4 Year 5 Year 6 Year 7 Year 8 Year 9
Pine Apple (1 ha) Inputs, INR 69400 9750 3750 3750 3750 3750 3750 3750 3750 Labour, INR 155500 81250 86250 93750 101250 101250 101250 101250 101250 Gross income INR - 44500 176000 264000 272000 272000 272000 272000 272000 Oranges (1 ha) Inputs, INR 16960 8500 8500 8500 8500 8500 8500 8500 8500 Labour, INR 56250 37500 35000 42500 50000 60000 67500 78750 85000 Gross income INR - - - - 105000 112500 120000 135000 150000 Cashew (1 ha) Inputs, INR 8296 3292 2898 5284 6580 Labour, INR 32250 18250 14250 16500 17750 18250 20250 20250 20250 Gross income INR - - 5000 20000 40000 60000 80000 100000 100000 Areca plantation (1 ha) Inputs, INR 21750 3500 Labour, INR 91500 49500 48500 41250 47250 47250 47250 47250 47250 Gross income INR - - - - - 99000 132000 165000 198000 Rubber plantation (1 ha) Inputs, INR 33200 8450 5700 5700 14200 14200 14200 14200 14200 Labour, INR 82250 11250 8750 5000 11250 8750 10000 11250 13750 Gross income INR - - - - - 135000 195000 225000 270000 Household Goat unit (8 does and one buck) Inputs, INR 32,150 11,575 14,700 14,700 14,700 14,700 14,700 14,700 14,700 Labour, INR 25,000 25,000 25,000 25,000 25,000 25,000 25,000 25,000 25,000 Gross income INR 0 80,000 80,000 100,000 110,00 110,00 110,00 110,00 110,00 Vermi-compost unit (20 t unit) Inputs, INR 148000 31750 31750 31750 31750 31750 31750 31750 31750 Labour, INR (included in inputs) Gross income INR 40000 40000 40000 40000 40000 40000 40000 40000 40000 Considerable variations in prices exist between districts.

Republic of India
Meghalaya: Livelihoods and Access to Market Project
Final project design report - Working papers
350
Appendix 4: Production Costs, Labour and Yields of Enterprises
Activity Year 1 Year 2 Year 3 Year 4 Year 5 Year 6 Year 7 Year 8 Year 9
Piggery (3 piglets unit)
Inputs, INR 10250 1250 1250 1250 1250 7250 1250 1250 1250
Labour, INR 21500 18000 18000 18000 18000 18000 18000 18000 18000
Gross income INR - 25000 25000 25000 25000 25000 25000 25000 25000
Broiler 200 birds unit
Inputs, INR 41320 20863 20863 20863 20863 20863 20863 20863 20863
Labour, INR 18750 18750 18750 18750 18750 18750 18750 18750 18750
Gross income INR 50000 50000 50000 50000 50000 50000 50000 50000 50000
Backyard poultry unit (10 birds)
Inputs, INR 11650 8900 8900 8900 8900 8900 8900 8900 8900
Labour, INR 7500 7500 7500 7500 7500 7500 7500 7500 7500
Gross income INR 10500 10500 10500 10500 10500 10500 10500 10500 10500
Bee-keeping: (14 boxes unit)
Inputs, INR 53350 46050 46050 53550 46050 46050 46050 46050 46050
Labour, INR (included in inputs)
Gross income INR - 45600 56100 56100 56100 56100 56100 56100 56100
Tejpatta trading (1 ton/hh)
Inputs, INR 15000 15000 15000 15000 15000 15000 15000 15000 15000
Labour, INR 12500 12500 12500 12500 12500 12500 12500 12500 12500
Gross income INR 28000 28000 28000 28000 28000 28000 28000 28000 28000
Areca plate-making unit
Inputs, INR 152300
Labour, INR 30000 176940 228420 254910 254910 254910 254910 254910 254910
Gross income INR - 239040 318720 358500 358500 358500 358500 358500 358500
Rice milling unit ( 600t/year unit)
Inputs, INR 608000
Labour, INR 252000 336000 420000 420000 420000 420000 420000 420000
Gross income INR - 720000 960000 960000 960000 960000 960000 960000 960000
Grocery unit
Inputs, INR 42000 18000 18000 18000 18000 18000 18000 18000 18000
Labour, INR - 75000 75000 75000 75000 75000 75000 75000 75000
Gross income INR - 130000 130000 130000 130000 130000 130000 130000 130000
Prices vary significantly between districts

Republic of India
Meghalaya: Livelihoods and Access to Market Project
Final project design report - Working papers
351
Appendix 5: NRM Household Model (0.7 ha/household) financial
India Meghalaya
LAMP Appraisal Report
NRM farm households Household
FINANCIAL BUDGET (AGGREGATED)
(In INR)
Main Production
Food Crops
Production Cost
Investment
Purchased Inputs
Seeds & Planting materials
Agri tools & materials
Fertilisers
Sub-Total Purchased Inputs
Hired Labor
Labour
Sub-total Investment Costs
Operating
Purchased Inputs
Seeds & Planting materials
Fertilisers
Sub-Total Purchased Inputs
Hired Labor
Labour
Sub-total Operating Costs
Sub-Total Production Cost
OUTFLOWS
Farm Family Benefits After Financing
Future Future Percentage
WOP With Project Present Without With Change 25 1 2 3 4 to 24 25 1 25 25 %
42,518 45,453 47,804 49,255 50,707 50,707 42,518 42,518 50,707 19
550 550 550 550 550 550 550 550 550 -
- 167 - - - - - - - -
295 631 631 631 631 631 295 295 631 114 845 1,347 1,181 1,181 1,181 1,181 845 845 1,181 40
5,400 6,275 6,125 6,125 6,125 6,125 5,400 5,400 6,125 13 6,245 7,622 7,306 7,306 7,306 7,306 6,245 6,245 7,306 17
780 620 620 620 620 620 780 780 620 -21
2,878 3,201 3,201 3,201 3,201 3,201 2,878 2,878 3,201 11 3,658 3,821 3,821 3,821 3,821 3,821 3,658 3,658 3,821 4
25,453 27,325 27,325 27,325 27,325 27,325 25,453 25,453 27,325 7 29,111 31,146 31,146 31,146 31,146 31,146 29,111 29,111 31,146 7 35,356 38,768 38,452 38,452 38,452 38,452 35,356 35,356 38,452 9 35,356 38,768 38,452 38,452 38,452 38,452 35,356 35,356 38,452 9 42,518 3,589 9,352 10,804 12,255 50,707 7,162 42,518 50,707 19
IRR = 93.2%, NPV = 29,044.71

Republic of India
Meghalaya: Livelihoods and Access to Market Project
Final project design report - Working papers
352
Appendix 6: NRM Household Model (0.7 ha/household) Economic
India Meghalaya
LAMP Appraisal Report
NRM farm households Household
ECONOMIC BUDGET (AGGREGATED)
(In INR)
Main Production
Food Crops
Production Cost
Investment
Purchased Inputs
Seeds & Planting materials
Agri tools & materials
Fertilisers
Sub-Total Purchased Inputs
Labor
Labour
Sub-total Investment Costs
Operating
Purchased Inputs
Seeds & Planting materials
Fertilisers
Sub-Total Purchased Inputs
Labor
Labour
Sub-total Operating Costs
Sub-Total Production Cost
OUTFLOWS
Cash Flow
Without Future Future Percentage
Project With Project Present Without With Change 1 to 25 1 2 3 4 to 25 1 25 4 %
36,016 38,657 40,586 41,705 42,823 36,016 36,016 42,823 19
550 550 550 550 550 550 550 550 -
- 167 - - - - - - -
371 966 966 966 966 371 371 966 161 921 1,683 1,516 1,516 1,516 921 921 1,516 65
4,050 4,706 4,594 4,594 4,594 4,050 4,050 4,594 13 4,971 6,389 6,110 6,110 6,110 4,971 4,971 6,110 23
780 620 620 620 620 780 780 620 -21
5,301 5,823 5,823 5,823 5,823 5,301 5,301 5,823 10 6,081 6,443 6,443 6,443 6,443 6,081 6,081 6,443 6
19,089 20,494 20,494 20,494 20,494 19,089 19,089 20,494 7 25,171 26,937 26,937 26,937 26,937 25,171 25,171 26,937 7 30,141 33,326 33,047 33,047 33,047 30,141 30,141 33,047 10 30,141 33,326 33,047 33,047 33,047 30,141 30,141 33,047 10 5,875 5,331 7,539 8,658 9,776 5,875 5,875 9,776 66
IRR = 360.8%, NPV = 24,053.53

Republic of India
Meghalaya: Livelihoods and Access to Market Project
Final project design report - Working papers
353
Appendix 7: IPM household Farm Model (0.7 ha per household)
India Meghalaya
LAMP Appraisal Report
IPM FARM households household
FINANCIAL BUDGET (AGGREGATED)
(In INR)
Main Production
Food Crops
Spices
Plantation crops
Sub-total Main Production
Production Cost
Investment
Purchased Inputs
Seeds & Planting materials
Agri tools & materials
Fertilisers
Sub-Total Purchased Inputs
Labor
Labour
Sub-total Investment Costs
Operating
Labour
Sub-Total Production Cost
OUTFLOWS
Cash Flow Before Financing
Farm Family Benefits After Financing
Future Future Percentage
WOP Present Without With Change 25 1 2 3 4 8 9 10 11 to 24 25 1 25 25 %
15,000 15,000 16,250 17,500 18,750 18,750 18,750 18,750 18,750 18,750 15,000 15,000 18,750 25
73,750 73,875 74,000 80,000 86,125 92,250 92,250 92,250 92,250 92,250 73,750 73,750 92,250 25
- - 4,400 8,800 17,600 40,700 42,200 42,200 42,200 42,200 - - 42,200 - 88,750 88,875 94,650 106,300 122,475 151,700 153,200 153,200 153,200 153,200 88,750 88,750 153,200 73
30,275 36,942 30,875 30,275 30,275 30,275 30,275 30,275 30,275 30,275 30,275 30,275 30,275 -
1,236 2,152 - - - - - - - - 1,236 1,236 - -
1,230 3,508 3,508 3,508 3,508 3,508 3,508 3,508 3,508 3,508 1,230 1,230 3,508 185 32,741 42,602 34,383 33,783 33,783 33,783 33,783 33,783 33,783 33,783 32,741 32,741 33,783 3
22,763 23,700 8,050 8,050 8,050 8,050 8,050 8,050 7,925 7,925 22,763 22,763 7,925 -65 55,504 66,302 42,433 41,833 41,833 41,833 41,833 41,833 41,708 41,708 55,504 55,504 41,708 -25
21,550 42,975 33,675 33,925 34,675 38,675 39,800 40,425 40,425 40,425 21,550 21,550 40,425 88 77,054 109,277 76,108 75,758 76,508 80,508 81,633 82,258 82,133 82,133 77,054 77,054 82,133 7 77,054 109,277 76,108 75,758 76,508 80,508 81,633 82,258 82,133 82,133 77,054 77,054 82,133 7 11,696 -20,402 18,542 30,542 45,967 71,192 71,567 70,942 71,067 71,067 11,696 11,696 71,067 508 88,750 -19,456 18,892 29,792 44,467 70,067 70,942 71,067 71,067 153,200 11,696 88,750 153,200 73
IRR = 74.1%, NPV = 294,388.82

Republic of India
Meghalaya: Livelihoods and Access to Market Project
Final project design report - Working papers
354
Appendix 8: IPM Household Farm Model (0.7 ha/household) Economic
India Meghalaya
LAMP Appraisal Report
IPM FARM households household
ECONOMIC BUDGET (AGGREGATED)
(In INR)
Main Production
Food Crops
Spices
Plantation crops
Sub-total Main Production
Production Cost
Investment
Purchased Inputs
Seeds & Planting materials
Agri tools & materials
Fertilisers
Sub-Total Purchased Inputs
Labor
Labour
Sub-total Investment Costs
Operating
Labour
Sub-Total Production Cost
OUTFLOWS
Cash Flow
Without Future Future Percentage
Project Present Without With Change 1 to 25 1 2 3 4 5 8 9 10 11 to 25 1 25 11 %
11,250 11,250 12,188 13,125 14,063 14,063 14,063 14,063 14,063 14,063 11,250 11,250 14,063 25
73,400 73,500 73,600 79,600 85,700 91,800 91,800 91,800 91,800 91,800 73,400 73,400 91,800 25
- - 3,300 6,600 13,200 27,675 30,525 31,650 31,650 31,650 - - 31,650 - 84,650 84,750 89,088 99,325 112,963 133,538 136,388 137,513 137,513 137,513 84,650 84,650 137,513 62
30,275 36,942 30,875 30,275 30,275 30,275 30,275 30,275 30,275 30,275 30,275 30,275 30,275 -
1,236 2,152 - - - - - - - - 1,236 1,236 - -
1,705 4,734 4,734 4,734 4,734 4,734 4,734 4,734 4,734 4,734 1,705 1,705 4,734 178 33,216 43,827 35,609 35,009 35,009 35,009 35,009 35,009 35,009 35,009 33,216 33,216 35,009 5
17,072 17,775 6,038 6,038 6,038 6,038 6,038 6,038 6,038 5,944 17,072 17,072 5,944 -65 50,288 61,602 41,646 41,046 41,046 41,046 41,046 41,046 41,046 40,953 50,288 50,288 40,953 -19
16,163 32,231 25,256 25,444 26,006 27,131 29,006 29,850 30,319 30,319 16,163 16,163 30,319 88 66,451 93,834 66,903 66,490 67,053 68,178 70,053 70,896 71,365 71,271 66,451 66,451 71,271 7 66,451 93,834 66,903 66,490 67,053 68,178 70,053 70,896 71,365 71,271 66,451 66,451 71,271 7 18,199 -9,084 22,185 32,835 45,910 65,360 66,335 66,616 66,147 66,241 18,199 18,199 66,241 264
IRR = 69.4%, NPV = 237,014.18
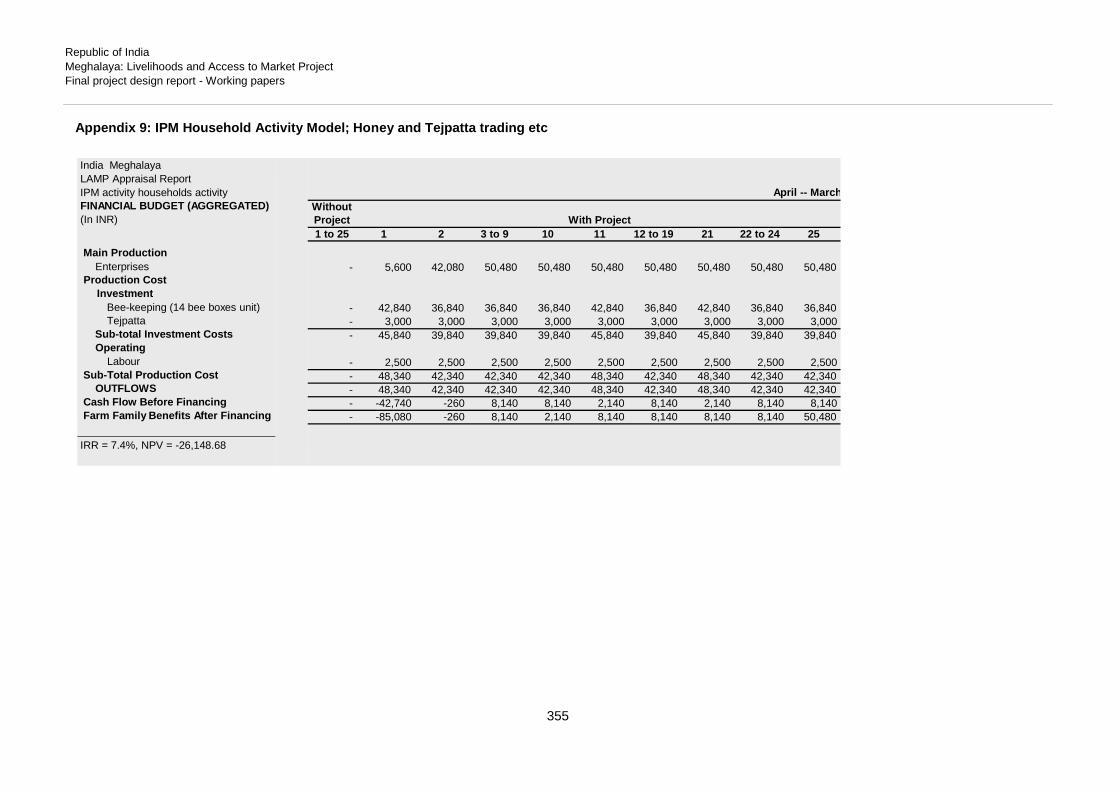
Republic of India
Meghalaya: Livelihoods and Access to Market Project
Final project design report - Working papers
355
Appendix 9: IPM Household Activity Model; Honey and Tejpatta trading etc
India Meghalaya
LAMP Appraisal Report
IPM activity households activity
FINANCIAL BUDGET (AGGREGATED)
(In INR)
Main Production
Enterprises
Production Cost
Investment
Bee-keeping (14 bee boxes unit)
Tejpatta
Sub-total Investment Costs
Operating
Labour
Sub-Total Production Cost
OUTFLOWS
Cash Flow Before Financing
Farm Family Benefits After Financing
April -- March Without
Project With Project 1 to 25 1 2 3 to 9 10 11 12 to 19 21 22 to 24 25
- 5,600 42,080 50,480 50,480 50,480 50,480 50,480 50,480 50,480
- 42,840 36,840 36,840 36,840 42,840 36,840 42,840 36,840 36,840
- 3,000 3,000 3,000 3,000 3,000 3,000 3,000 3,000 3,000 - 45,840 39,840 39,840 39,840 45,840 39,840 45,840 39,840 39,840
- 2,500 2,500 2,500 2,500 2,500 2,500 2,500 2,500 2,500 - 48,340 42,340 42,340 42,340 48,340 42,340 48,340 42,340 42,340 - 48,340 42,340 42,340 42,340 48,340 42,340 48,340 42,340 42,340 - -42,740 -260 8,140 8,140 2,140 8,140 2,140 8,140 8,140 - -85,080 -260 8,140 2,140 8,140 8,140 8,140 8,140 50,480
IRR = 7.4%, NPV = -26,148.68

Republic of India
Meghalaya: Livelihoods and Access to Market Project
Final project design report - Working papers
356
Appendix 10: IPM Household Activity Model; Honey and Tejpatta trading etc Economic
India Meghalaya
LAMP Appraisal Report
IPM activity households activity
ECONOMIC BUDGET (AGGREGATED)
(In INR)
Main Production
Enterprises
Production Cost
Investment
Bee-keeping (14 bee boxes unit)
Tejpatta
Sub-total Investment Costs
Operating
Labour
Sub-Total Production Cost
OUTFLOWS
Cash Flow
April -- Marc Without
Project With Project 1 to 25 1 2 3 to 10 11 12 to 20 21 22 to 25
- 5,600 42,080 50,480 50,480 50,480 50,480 50,480
- 28,840 22,840 22,840 28,840 22,840 28,840 22,840
- 3,000 3,000 3,000 3,000 3,000 3,000 3,000 - 31,840 25,840 25,840 31,840 25,840 31,840 25,840
- 1,875 1,875 1,875 1,875 1,875 1,875 1,875 - 33,715 27,715 27,715 33,715 27,715 33,715 27,715 - 33,715 27,715 27,715 33,715 27,715 33,715 27,715 - -28,115 14,365 22,765 16,765 22,765 16,765 22,765
IRR = 68.7%, NPV = 124,143.85

Republic of India
Meghalaya: Livelihoods and Access to Market Project
Final project design report - Working papers
357
Appendix 10A: NRM Piggery Household Activity Model; Financial
India Meghalaya
LAMP Appraisal Report
NRM Piggery households Activity
FINANCIAL BUDGET (AGGREGATED)
(In INR)
Main Production
Livestock & fisheries
Production Cost
Investment
Piggery (3 piglets unit)
Operating
Labour
Sub-Total Production Cost
OUTFLOWS
Cash Flow Before Financing
Net Financing
Cash Flow After Financing
Change in Net Worth
Contribution from own savings
Residual value of
Transfer to Next Period
Sub-Total Change in Net Worth
Farm Family Benefits After Financing
April -- March
Future Percentage
With Project Present Without Future With Change WOP 1 2 to 4 5 10 11 12 to 14 17 to 19 20 21 22 to 25 1 25 25 %
4,608,000 - 9,000,000 9,000,000 9,000,000 9,000,000 9,000,000 9,000,000 9,000,000 9,000,000 9,000,000 4,608,000 4,608,000 9,000,000 95
- 3,690,000 450,000 450,000 450,000 2,610,000 450,000 450,000 450,000 2,610,000 450,000 1,404,000 - 450,000 -68
5,400,000 7,740,000 6,480,000 6,480,000 6,480,000 6,480,000 6,480,000 6,480,000 6,480,000 6,480,000 6,480,000 5,400,000 5,400,000 6,480,000 20 5,400,000 11,430,000 6,930,000 6,930,000 6,930,000 9,090,000 6,930,000 6,930,000 6,930,000 9,090,000 6,930,000 6,804,000 5,400,000 6,930,000 28 5,400,000 11,430,000 6,930,000 6,930,000 6,930,000 9,090,000 6,930,000 6,930,000 6,930,000 9,090,000 6,930,000 6,804,000 5,400,000 6,930,000 28 -792,000 -11,430,000 2,070,000 2,070,000 2,070,000 -90,000 2,070,000 2,070,000 2,070,000 -90,000 2,070,000 -2,196,000 -792,000 2,070,000 361
- 4,500,000 - -2,160,000 -2,160,000 2,160,000 - - -2,160,000 2,160,000 - - - - - -792,000 -6,930,000 2,070,000 -90,000 -90,000 2,070,000 2,070,000 2,070,000 -90,000 2,070,000 2,070,000 -2,196,000 -792,000 2,070,000 361
- 6,030,000 - - - - - - - - - - - - -
5,400,000 - - - - - - - - - - - 5,400,000 6,930,000 28 5,400,000 -6,030,000 - - - - - - - - - - 5,400,000 6,930,000 28 4,608,000 -12,960,000 2,070,000 -90,000 -90,000 2,070,000 2,070,000 2,070,000 -90,000 2,070,000 2,070,000 -2,196,000 4,608,000 9,000,000 95
IRR = 25.4%, NPV = 9,482,115.45

Republic of India
Meghalaya: Livelihoods and Access to Market Project
Final project design report - Working papers
358
Appendix 10B: NRM Piggery Household Activity Model; Economic
India Meghalaya
LAMP Appraisal Report
NRM Piggery households Activity
ECONOMIC BUDGET (AGGREGATED)
(In INR)
Main Production
Livestock & fisheries
Production Cost
Investment
Piggery (3 piglets unit)
Operating
Labour
Sub-Total Production Cost
OUTFLOWS
Cash Flow
April -- March
Future Percentage
With Project Present Without Future With Change WOP 1 2 to 5 6 7 to 10 11 12 to 15 16 22 to 25 1 22 22 %
4,608,000 - 9,000,000 9,000,000 9,000,000 9,000,000 9,000,000 9,000,000 9,000,000 4,608,000 4,608,000 9,000,000 95
- 3,690,000 450,000 2,610,000 450,000 2,610,000 450,000 2,610,000 450,000 1,404,000 - 450,000 -68
4,050,000 5,805,000 4,860,000 4,860,000 4,860,000 4,860,000 4,860,000 4,860,000 4,860,000 4,050,000 4,050,000 4,860,000 20 4,050,000 9,495,000 5,310,000 7,470,000 5,310,000 7,470,000 5,310,000 7,470,000 5,310,000 5,454,000 4,050,000 5,310,000 31 4,050,000 9,495,000 5,310,000 7,470,000 5,310,000 7,470,000 5,310,000 7,470,000 5,310,000 5,454,000 4,050,000 5,310,000 31
558,000 -9,495,000 3,690,000 1,530,000 3,690,000 1,530,000 3,690,000 1,530,000 3,690,000 -846,000 558,000 3,690,000 561 IRR = 35.3%, NPV = 13,252,321.59

Republic of India
Meghalaya: Livelihoods and Access to Market Project
Final project design report - Working papers
359
Appendix 10C: NRM Goat Household Activity Model; Financial
India Meghalaya
LAMP Appraisal Report
NRM Goat households Activity
FINANCIAL BUDGET (AGGREGATED)
(In INR)
Main Production
Livestock & fisheries
Production Cost
Goatery (8 does and 1 buck unit)
OUTFLOWS
Cash Flow Before Financing
Cash Flow After Financing
Farm Family Benefits After Financing
April -- March
With Project Future With
1 2 3 4 5 to 6 7 8 to 12 14 to 18 19 20 to 25 20
- 28,800,000 28,800,000 36,000,000 39,600,000 39,600,000 39,600,000 39,600,000 39,600,000 39,600,000 39,600,000
20,574,000 13,167,000 14,292,000 15,417,000 15,417,000 21,537,000 15,417,000 15,417,000 21,537,000 15,417,000 15,417,000 20,574,000 13,167,000 14,292,000 15,417,000 15,417,000 21,537,000 15,417,000 15,417,000 21,537,000 15,417,000 15,417,000
-20,574,000 15,633,000 14,508,000 20,583,000 24,183,000 18,063,000 24,183,000 24,183,000 18,063,000 24,183,000 24,183,000 -20,574,000 15,633,000 14,508,000 20,583,000 24,183,000 18,063,000 24,183,000 24,183,000 18,063,000 24,183,000 24,183,000 -20,574,000 15,633,000 14,508,000 20,583,000 24,183,000 18,063,000 24,183,000 24,183,000 18,063,000 24,183,000 24,183,000
IRR = 83.9%, NPV = 128,837,182.66

Republic of India
Meghalaya: Livelihoods and Access to Market Project
Final project design report - Working papers
360
Appendix 10D: NRM Goat Household Activity Model; Economic
India Meghalaya
LAMP Appraisal Report
NRM Goat households Activity
ECONOMIC BUDGET (AGGREGATED)
(In INR)
Main Production
Livestock & fisheries
Production Cost
Goatery (8 does and 1 buck unit)
OUTFLOWS
Cash Flow
April -- March
With Project Future With
1 2 3 4 5 to 6 7 8 to 12 13 14 to 18 19 20 to 25 20
- 28,800,000 28,800,000 36,000,000 39,600,000 39,600,000 39,600,000 39,600,000 39,600,000 39,600,000 39,600,000 39,600,000
20,574,000 13,167,000 14,292,000 15,417,000 15,417,000 21,537,000 15,417,000 21,537,000 15,417,000 21,537,000 15,417,000 15,417,000 20,574,000 13,167,000 14,292,000 15,417,000 15,417,000 21,537,000 15,417,000 21,537,000 15,417,000 21,537,000 15,417,000 15,417,000
-20,574,000 15,633,000 14,508,000 20,583,000 24,183,000 18,063,000 24,183,000 18,063,000 24,183,000 18,063,000 24,183,000 24,183,000 IRR = 83.9%, NPV = 128,837,182.66

Republic of India
Meghalaya: Livelihoods and Access to Market Project
Final project design report - Working papers
361
EFC Enterprises - 127,500 87,750 103,313 129,250 127,500 87,750 103,313 129,250 129,250 OUTFLOWS - 127,500 87,750 103,313 129,250 127,500 87,750 103,313 129,250 129,250
ash Flow - -127,500 55,050 75,188 73,050 -127,500 55,050 75,188 73,050 73,050
Appendix 11: EFC Small enterprises Household Activity Model, Financial & Economic
India Meghalaya
LAMP Preparation Report
EFC Small enterprises households Activit
FINANCIAL BUDGET (AGGREGATED)
(In INR)
Main Production
Enterprises
Production Cost
EFC Enterprises
OUTFLOWS
Cash Flow Before Financing
y
April -- March
Without Future
Project With Project Increments With 1 to 25 1 2 3 4 to 25 1 2 3 4 to 25 4
- - 142,800 178,500 202,300 - 142,800 178,500 202,300 202,300
- 150,000 105,000 123,750 155,000 150,000 105,000 123,750 155,000 155,000 - 150,000 105,000 123,750 155,000 150,000 105,000 123,750 155,000 155,000 - -150,000 37,800 54,750 47,300 -150,000 37,800 54,750 47,300 47,300
IRR = 30.9%, NPV = 192,549.19
India Meghalaya
LAMP Preparation Report
EFC Small enterprises hous April -- March
ECONOMIC BUDGET (AGG Without Future
(In INR) Project With Project Increments With
1 to 25 1 2 3 4 to 25 1 2 3 4 to 25 4
Main Production
Enterprises - - 142,800 178,500 202,300 - 142,800 178,500 202,300 202,300
Production Cost
C
IRR = 52.8%, NPV = 381,050.75

Republic of India
Meghalaya: Livelihoods and Access to Market Project
Final project design report - Working papers
362
Appendix 12: EFC farm-based enterprise household model (0.7 ha) Financial
India Meghalaya
LAMP Appraisal Report
EFC farm-based households Area
FINANCIAL BUDGET (AGGREGATED)
(In INR)
Main Production
Plantation crops
Enterprises
Sub-total Main Production
Production Cost
Investment
Seeds & Planting materials
Agri tools & materials
Fertilisers
EFC Enterprises
Sub-total Investment Costs
Operating
Labour
Sub-Total Production Cost
OUTFLOWS
Cash Flow Before Financing
Farm Family Benefits After Financing
April -- March
Future Future Percentage
With Project Present Without With Change WOP 1 2 3 4 5 6 7 8 9 10 11 to 25 1 25 25 %
- - - - - 10,500 11,250 21,900 26,700 31,500 34,800 39,750 - - 39,750 -
44,576 44,576 50,944 63,680 63,680 63,680 63,680 63,680 63,680 63,680 63,680 63,680 44,576 44,576 63,680 43 44,576 44,576 50,944 63,680 63,680 74,180 74,930 85,580 90,380 95,180 98,480 103,430 44,576 44,576 103,430 132
- 2,177 - - - - - - - - - - - - - -
- 495 - - - - - - - - - - - - - -
- 1,200 1,200 1,200 1,200 1,200 1,200 1,200 1,200 1,200 1,200 850 - - 850 -
28,044 29,520 29,520 29,520 29,520 29,520 29,520 29,520 29,520 29,520 29,520 29,520 28,044 28,044 29,520 5 28,044 33,392 30,720 30,720 30,720 30,720 30,720 30,720 30,720 30,720 30,720 30,370 28,044 28,044 30,370 8
- 14,775 8,700 8,350 7,625 8,375 9,125 10,725 11,475 12,600 13,225 13,975 - - 13,975 -
28,044 48,167 39,420 39,070 38,345 39,095 39,845 41,445 42,195 43,320 43,945 44,345 28,044 28,044 44,345 58 28,044 48,167 39,420 39,070 38,345 39,095 39,845 41,445 42,195 43,320 43,945 44,345 28,044 28,044 44,345 58 16,532 -3,591 11,524 24,610 25,335 35,085 35,085 44,135 48,185 51,860 54,535 59,085 16,532 16,532 59,085 257 44,576 -14,967 11,874 25,335 24,585 34,335 33,485 43,385 47,060 51,235 54,135 59,085 16,532 44,576 103,430 132
IRR = 37.4%, NPV = 141,609.49

Republic of India
Meghalaya: Livelihoods and Access to Market Project
Final project design report - Working papers
363
Appendix 13: EFC farm-based enterprise household model (0.7 ha) Economic
India Meghalaya
LAMP Appraisal Report
EFC farm-based households Area
ECONOMIC BUDGET (AGGREGATED)
(In INR)
Main Production
Plantation crops
Enterprises
Sub-total Main Production
Production Cost
Investment
Seeds & Planting materials
Agri tools & materials
Fertilisers
EFC Enterprises
Sub-total Investment Costs
Operating
Labour
Sub-Total Production Cost
OUTFLOWS
Cash Flow
April -- March
Without Future Future Percentage
Project With Project Present Without With Change 1 to 25 1 2 3 4 5 6 7 8 9 10 11 to 25 1 25 11 %
- - - - - 7,875 8,438 17,415 21,345 25,275 28,080 32,288 - - 32,288 -
44,576 44,576 50,944 63,680 63,680 63,680 63,680 63,680 63,680 63,680 63,680 63,680 44,576 44,576 63,680 43 44,576 44,576 50,944 63,680 63,680 71,555 72,118 81,095 85,025 88,955 91,760 95,968 44,576 44,576 95,968 115
- 2,177 - - - - - - - - - - - - - -
- 495 - - - - - - - - - - - - - -
- 1,200 1,200 1,200 1,200 1,200 1,200 1,200 1,200 1,200 1,200 850 - - 850 -
24,244 25,520 25,520 25,520 25,520 25,520 25,520 25,520 25,520 25,520 25,520 25,520 24,244 24,244 25,520 5 24,244 29,392 26,720 26,720 26,720 26,720 26,720 26,720 26,720 26,720 26,720 26,370 24,244 24,244 26,370 9
- 11,081 6,525 6,263 5,719 6,281 6,844 8,044 8,606 9,450 9,919 10,481 - - 10,481 -
24,244 40,473 33,245 32,983 32,439 33,001 33,564 34,764 35,326 36,170 36,639 36,851 24,244 24,244 36,851 52 24,244 40,473 33,245 32,983 32,439 33,001 33,564 34,764 35,326 36,170 36,639 36,851 24,244 24,244 36,851 52 20,332 4,103 17,699 30,698 31,241 38,554 38,554 46,331 49,699 52,785 55,121 59,116 20,332 20,332 59,116 191
IRR = 56.4%, NPV = 148,869.31

Republic of India
Meghalaya: Livelihoods and Access to Market Project
Final project design report - Working papers
364
Appendix 14: EFC Household IGA model Economic
India Meghalaya
LAMP Appraisal Report
EFC IGA households Activity
ECONOMIC BUDGET (AGGREGATED)
(In INR)
Main Production
Livestock & fisheries
Production Cost
Investment
Piggery (3 piglets unit)
Backyard Poultry (10 layers unit)
Goatery (8 does and 1 buck unit)
Sub-total Investment Costs
Operating
Purchased Inputs
Poultry Broiler unit (200 chicks u
Labor
Labour
Sub-total Operating Costs
Sub-Total Production Cost
OUTFLOWS
Cash Flow
nit)
April -- March
Future Future Percentage
With Project Present Without With Change WOP 1 2 3 4 5 6 7 8 to 10 11 14 to 15 20 22 to 25 1 22 22 %
7,680 2,625 29,625 29,625 32,625 34,125 34,125 34,125 34,125 34,125 34,125 34,125 34,125 7,680 7,680 34,125 344
- 6,150 750 750 750 750 4,350 750 750 4,350 750 750 750 2,340 - 750 -68
- 2,600 2,225 2,225 2,225 2,225 2,225 2,225 2,225 2,225 2,225 2,225 2,225 - - 2,225 -
- 8,573 5,486 5,955 6,424 6,424 6,424 8,974 6,424 6,424 6,424 6,424 6,424 - - 6,424 - - 17,323 8,461 8,930 9,399 9,399 12,999 11,949 9,399 12,999 9,399 9,399 9,399 2,340 - 9,399 302
- 313 - - - - - - - - - - - - - - -
6,750 11,081 9,506 9,506 9,506 9,506 9,506 9,506 9,506 9,506 9,506 9,506 9,506 6,750 6,750 9,506 41 6,750 11,394 9,506 9,506 9,506 9,506 9,506 9,506 9,506 9,506 9,506 9,506 9,506 6,750 6,750 9,506 41 6,750 28,716 17,968 18,436 18,905 18,905 22,505 21,455 18,905 22,505 18,905 18,905 18,905 9,090 6,750 18,905 180 6,750 28,716 17,968 18,436 18,905 18,905 22,505 21,455 18,905 22,505 18,905 18,905 18,905 9,090 6,750 18,905 180
930 -26,091 11,658 11,189 13,720 15,220 11,620 12,670 15,220 11,620 15,220 15,220 15,220 -1,410 930 15,220 1,537 IRR = 47.8%, NPV = 67,263.36

Republic of India
Meghalaya: Livelihoods and Access to Market Project
Final project design report - Working papers
365
Appendix 15: EFC Household IGA model, Financial
India Meghalaya
LAMP Appraisal Report
EFC IGA households Activity
FINANCIAL BUDGET (AGGREGATED)
(In INR)
Main Production
Livestock & fisheries
Production Cost
Investment
Piggery (3 piglets unit)
Backyard Poultry (10 layers unit)
Goatery (8 does and 1 buck unit)
Sub-total Investment Costs
Operating
Labor
Labour
Sub-total Operating Costs
Sub-Total Production Cost
OUTFLOWS
Cash Flow Before Financing
Farm Family Benefits After Financing
April -- March
Future Future Percentage
Present Without With Change WOP 1 2 3 4 5 6 7 8 to 10 15 20 21 22 to 24 25 1 25 25 %
7,680 2,625 29,625 29,625 32,625 34,125 34,125 34,125 34,125 34,125 34,125 34,125 34,125 34,125 7,680 7,680 34,125 344
- 6,150 750 750 750 750 4,350 750 750 750 750 4,350 750 750 2,340 - 750 -68
- 2,600 2,225 2,225 2,225 2,225 2,225 2,225 2,225 2,225 2,225 2,225 2,225 2,225 - - 2,225 -
- 8,573 5,486 5,955 6,424 6,424 6,424 8,974 6,424 6,424 6,424 6,424 6,424 6,424 - - 6,424 - - 17,323 8,461 8,930 9,399 9,399 12,999 11,949 9,399 9,399 9,399 12,999 9,399 9,399 2,340 - 9,399 302
9,000 14,775 12,675 12,675 12,675 12,675 12,675 12,675 12,675 12,675 12,675 12,675 12,675 12,675 9,000 9,000 12,675 41 9,000 15,088 12,675 12,675 12,675 12,675 12,675 12,675 12,675 12,675 12,675 12,675 12,675 12,675 9,000 9,000 12,675 41 9,000 32,410 21,136 21,605 22,074 22,074 25,674 24,624 22,074 22,074 22,074 25,674 22,074 22,074 11,340 9,000 22,074 145 9,000 32,410 21,136 21,605 22,074 22,074 25,674 24,624 22,074 22,074 22,074 25,674 22,074 22,074 11,340 9,000 22,074 145
-1,320 -29,785 8,489 8,020 10,551 12,051 8,451 9,501 12,051 12,051 12,051 8,451 12,051 12,051 -3,660 -1,320 12,051 1,013 7,680 -41,921 8,020 7,551 10,551 8,451 9,501 12,051 12,051 8,451 8,451 12,051 12,051 34,125 -3,660 7,680 34,125 344
IRR = 28.8%, NPV = 48,411.70

Republic of India
Meghalaya: Livelihoods and Access to Market Project
Final project design report - Working papers
366
Appendix 16: NRM SUBPROJECT (101,250 households) Economic
India Meghalaya
LAMP Appraisal Report
NRM Farm households Subproject
ECONOMIC BUDGET (AGGREGATED)
(In INR '000)
Main Production
Food Crops
Production Cost
Investment
Purchased Inputs
Seeds & Planting materials
Agri tools & materials
Fertilisers
Sub-Total Purchased Inputs
Labor
Labour
Sub-total Investment Costs
Operating
Purchased Inputs
Seeds & Planting materials
Fertilisers
Sub-Total Purchased Inputs
Labor
Labour
Sub-total Operating Costs
Sub-Total Production Cost
OUTFLOWS
Cash Flow
April -- March
Without Future Percentage
Project With Project Present Without Future With Change 1 to 25 1 to 2 3 4 5 6 7 8 9 10 to 25 1 25 10 %
3,646,595 3,646,595 3,699,429 3,790,836 3,904,616 4,040,768 4,180,222 4,265,950 4,312,093 4,335,864 3,646,595 3,646,595 4,335,864 19
55,688 55,688 55,688 55,688 55,688 55,688 55,688 55,688 55,688 55,688 55,688 55,688 55,688 -
- - 3,330 3,330 3,330 3,330 3,538 - - - - - - -
37,523 37,523 49,441 61,358 73,276 85,194 97,856 97,856 97,856 97,856 37,523 37,523 97,856 161 93,211 93,211 108,458 120,376 132,294 144,211 157,082 153,544 153,544 153,544 93,211 93,211 153,544 65
410,063 410,063 423,188 434,063 444,938 455,813 467,508 465,117 465,117 465,117 410,063 410,063 465,117 13 503,273 503,273 531,646 554,438 577,231 600,024 624,590 618,661 618,661 618,661 503,273 503,273 618,661 23
78,975 78,975 75,775 72,575 69,375 66,175 62,775 62,775 62,775 62,775 78,975 78,975 62,775 -21
536,752 536,752 547,189 557,626 568,063 578,500 589,590 589,590 589,590 589,590 536,752 536,752 589,590 10 615,727 615,727 622,964 630,201 637,438 644,675 652,365 652,365 652,365 652,365 615,727 615,727 652,365 6
1,932,799 1,932,799 1,960,887 1,988,974 2,017,062 2,045,149 2,074,992 2,074,992 2,074,992 2,074,992 1,932,799 1,932,799 2,074,992 7 2,548,526 2,548,526 2,583,851 2,619,175 2,654,500 2,689,825 2,727,357 2,727,357 2,727,357 2,727,357 2,548,526 2,548,526 2,727,357 7 3,051,799 3,051,799 3,115,497 3,173,614 3,231,731 3,289,848 3,351,946 3,346,018 3,346,018 3,346,018 3,051,799 3,051,799 3,346,018 10 3,051,799 3,051,799 3,115,497 3,173,614 3,231,731 3,289,848 3,351,946 3,346,018 3,346,018 3,346,018 3,051,799 3,051,799 3,346,018 10
594,795 594,795 583,933 617,222 672,885 750,920 828,275 919,932 966,076 989,847 594,795 594,795 989,847 66 IRR = 360.8%, NPV = 1,494,258.48
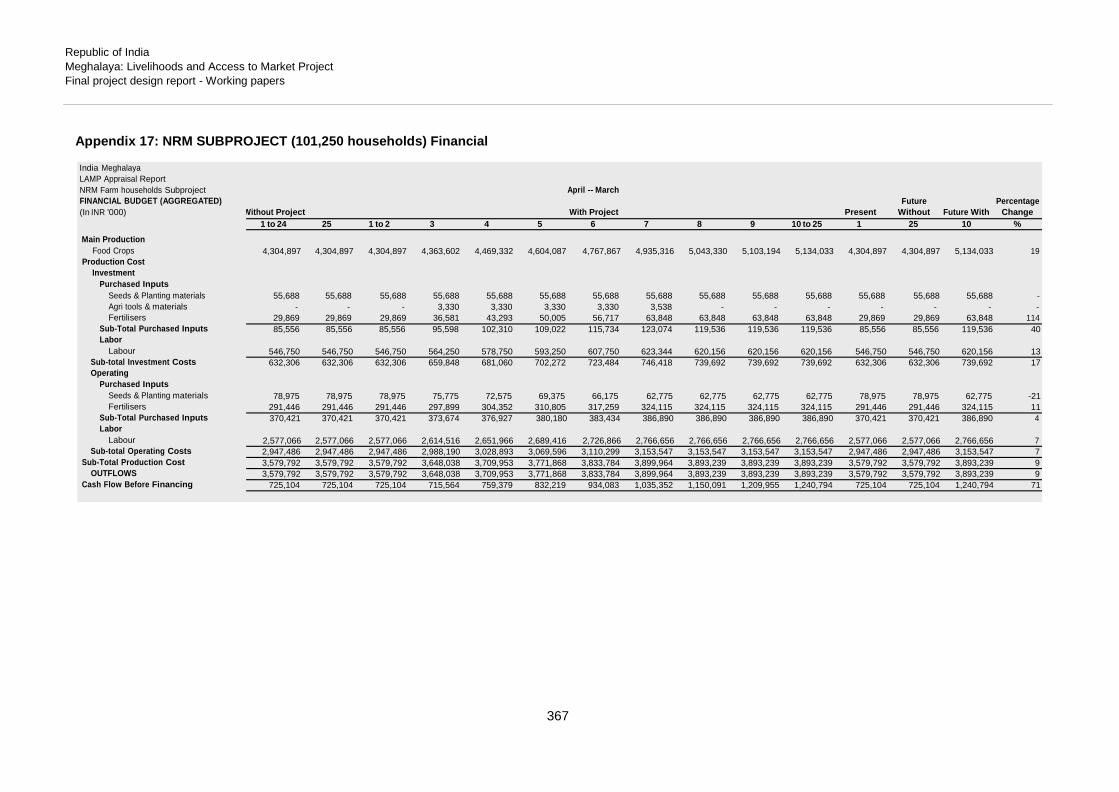
Republic of India
Meghalaya: Livelihoods and Access to Market Project
Final project design report - Working papers
367
Appendix 17: NRM SUBPROJECT (101,250 households) Financial
India Meghalaya
LAMP Appraisal Report
NRM Farm households Subproject
FINANCIAL BUDGET (AGGREGATED)
(In INR '000)
Main Production
Food Crops
Production Cost
Investment
Purchased Inputs
Seeds & Planting materials
Agri tools & materials
Fertilisers
Sub-Total Purchased Inputs
Labor
Labour
Sub-total Investment Costs
Operating
Purchased Inputs
Seeds & Planting materials
Fertilisers
Sub-Total Purchased Inputs
Labor
Labour
Sub-total Operating Costs
Sub-Total Production Cost
OUTFLOWS
Cash Flow Before Financing
April -- March
Future Percentage
Without Project With Project Present Without Future With Change 1 to 24 25 1 to 2 3 4 5 6 7 8 9 10 to 25 1 25 10 %
4,304,897 4,304,897 4,304,897 4,363,602 4,469,332 4,604,087 4,767,867 4,935,316 5,043,330 5,103,194 5,134,033 4,304,897 4,304,897 5,134,033 19
55,688 55,688 55,688 55,688 55,688 55,688 55,688 55,688 55,688 55,688 55,688 55,688 55,688 55,688 -
- - - 3,330 3,330 3,330 3,330 3,538 - - - - - - -
29,869 29,869 29,869 36,581 43,293 50,005 56,717 63,848 63,848 63,848 63,848 29,869 29,869 63,848 114 85,556 85,556 85,556 95,598 102,310 109,022 115,734 123,074 119,536 119,536 119,536 85,556 85,556 119,536 40
546,750 546,750 546,750 564,250 578,750 593,250 607,750 623,344 620,156 620,156 620,156 546,750 546,750 620,156 13 632,306 632,306 632,306 659,848 681,060 702,272 723,484 746,418 739,692 739,692 739,692 632,306 632,306 739,692 17
78,975 78,975 78,975 75,775 72,575 69,375 66,175 62,775 62,775 62,775 62,775 78,975 78,975 62,775 -21
291,446 291,446 291,446 297,899 304,352 310,805 317,259 324,115 324,115 324,115 324,115 291,446 291,446 324,115 11 370,421 370,421 370,421 373,674 376,927 380,180 383,434 386,890 386,890 386,890 386,890 370,421 370,421 386,890 4
2,577,066 2,577,066 2,577,066 2,614,516 2,651,966 2,689,416 2,726,866 2,766,656 2,766,656 2,766,656 2,766,656 2,577,066 2,577,066 2,766,656 7 2,947,486 2,947,486 2,947,486 2,988,190 3,028,893 3,069,596 3,110,299 3,153,547 3,153,547 3,153,547 3,153,547 2,947,486 2,947,486 3,153,547 7 3,579,792 3,579,792 3,579,792 3,648,038 3,709,953 3,771,868 3,833,784 3,899,964 3,893,239 3,893,239 3,893,239 3,579,792 3,579,792 3,893,239 9 3,579,792 3,579,792 3,579,792 3,648,038 3,709,953 3,771,868 3,833,784 3,899,964 3,893,239 3,893,239 3,893,239 3,579,792 3,579,792 3,893,239 9
725,104 725,104 725,104 715,564 759,379 832,219 934,083 1,035,352 1,150,091 1,209,955 1,240,794 725,104 725,104 1,240,794 71

Republic of India
Meghalaya: Livelihoods and Access to Market Project
Final project design report - Working papers
368
Appendix 18: IPM SUBPROJECT (20,500 households) Economic
India Meghalaya
LAMP Appraisal Report
NRM IPM households Subproject Model
ECONOMIC BUDGET (AGGREGATED)
(In INR '000) /a
Main Production
Food Crops
Spices
Plantation crops
Enterprises
Sub-total Main Production
Production Cost
Investment
Purchased Inputs
Seeds & Planting materials
Agri tools & materials
Fertilisers
Bee-keeping (14 bee boxes unit)
Tejpatta
Sub-Total Purchased Inputs
Labor
Labour
Sub-total Investment Costs
Operating
Labour
Sub-Total Production Cost
OUTFLOWS
Cash Flow
Without Future Percentage
Project With Project Present Without Future With Change 1 to 25 1 to 2 3 4 5 6 7 8 9 10 11 15 18 to 22 25 1 25 25 %
108,788 108,788 108,788 109,969 113,344 119,081 126,000 131,691 135,019 135,984 135,984 135,984 135,984 135,984 108,788 108,788 135,984 25
709,778 709,778 709,904 710,264 718,310 740,540 777,975 822,844 859,768 881,423 887,706 887,706 887,706 887,706 709,778 709,778 887,706 25
- - - 4,158 16,038 40,392 90,707 154,390 214,327 263,265 286,571 306,056 306,056 306,056 - - 306,056 -
- - 7,056 66,125 176,184 301,882 420,747 479,490 488,142 488,142 488,142 488,142 488,142 488,142 - - 488,142 - 818,566 818,566 825,748 890,516 1,023,876 1,201,895 1,415,429 1,588,414 1,697,255 1,768,814 1,798,403 1,817,887 1,817,887 1,817,887 818,566 818,566 1,817,887 122
292,759 292,759 301,160 309,116 310,964 311,072 301,138 293,377 292,759 292,759 292,759 292,759 292,759 292,759 292,759 292,759 292,759 -
11,952 11,952 13,106 12,537 9,810 6,695 2,216 - - - - - - - 11,952 11,952 - -
16,492 16,492 20,307 27,394 35,025 42,657 45,776 45,776 45,776 45,776 45,776 45,776 45,776 45,776 16,492 16,492 45,776 178
- - 36,338 96,264 154,901 212,458 227,043 220,863 220,863 220,863 220,863 235,983 220,863 235,983 - - 235,983 -
- - 3,780 10,800 18,360 25,920 29,010 29,010 29,010 29,010 29,010 29,010 29,010 29,010 - - 29,010 - 321,203 321,203 374,691 456,111 529,060 598,801 605,183 589,026 588,408 588,408 588,408 603,528 588,408 603,528 321,203 321,203 603,528 88
165,085 165,085 165,971 152,827 127,133 99,327 70,472 58,383 58,383 58,383 58,383 57,809 57,476 57,476 165,085 165,085 57,476 -65 486,288 486,288 540,662 608,938 656,193 698,128 675,655 647,409 646,791 646,791 646,791 661,337 645,884 661,004 486,288 486,288 661,004 36
156,291 156,291 178,901 212,100 241,233 270,022 274,133 272,180 278,887 286,183 293,029 310,831 311,314 311,314 156,291 156,291 311,314 99 642,579 642,579 719,563 821,038 897,426 968,150 949,789 919,589 925,678 932,974 939,819 972,168 957,198 972,318 642,579 642,579 972,318 51 642,579 642,579 719,563 821,038 897,426 968,150 949,789 919,589 925,678 932,974 939,819 972,168 957,198 972,318 642,579 642,579 972,318 51 175,986 175,986 106,185 69,477 126,450 233,745 465,640 668,825 771,577 835,840 858,584 845,720 860,690 845,570 175,986 175,986 845,570 380
IRR = 69.1%, NPV = 2,129,039.12
\a Both farm & activity households

Republic of India
Meghalaya: Livelihoods and Access to Market Project
Final project design report - Working papers
369
Appendix 19: IPM SUBPROJECT (20,500 households) Financial
India Meghalaya
LAMP Appraisal Report
NRM IPM households Subproject Model
FINANCIAL BUDGET (AGGREGATED)
(In INR '000) /a
Main Production
Food Crops
Spices
Plantation crops
Enterprises
Sub-total Main Production
Production Cost
Investment
Purchased Inputs
Seeds & Planting materials
Agri tools & materials
Fertilisers
Bee-keeping (14 bee boxes unit)
Tejpatta
Sub-Total Purchased Inputs
Labor
Labour
Sub-total Investment Costs
Operating
Labour
Sub-Total Production Cost
OUTFLOWS
Cash Flow Before Financing
\a Both farm & activity households
Future Percentage
With Project Present Without Future With Change WOP 1 to 2 3 4 5 6 7 8 9 10 15 20 25 1 25 25 %
145,050 145,050 145,050 146,625 151,125 158,775 168,000 175,588 180,025 181,313 181,313 181,313 181,313 145,050 145,050 181,313 25
713,163 713,163 713,320 713,770 721,938 744,325 781,939 826,955 864,005 885,749 892,058 892,058 892,058 713,163 713,163 892,058 25
- - - 5,544 21,384 53,856 120,942 205,853 285,769 351,020 408,074 408,074 408,074 - - 408,074 -
- - 7,056 66,125 176,184 301,882 420,747 479,490 488,142 488,142 488,142 488,142 488,142 - - 488,142 - 858,213 858,213 865,426 932,064 1,070,631 1,258,838 1,491,628 1,687,885 1,817,941 1,906,223 1,969,586 1,969,586 1,969,586 858,213 858,213 1,969,586 129
292,759 292,759 301,160 309,116 310,964 311,072 301,138 293,377 292,759 292,759 292,759 292,759 292,759 292,759 292,759 292,759 -
11,952 11,952 13,106 12,537 9,810 6,695 2,216 - - - - - - 11,952 11,952 - -
11,897 11,897 14,767 20,097 25,838 31,578 33,925 33,925 33,925 33,925 33,925 33,925 33,925 11,897 11,897 33,925 185
- - 53,978 146,664 240,581 333,418 362,423 356,243 356,243 356,243 371,363 356,243 371,363 - - 371,363 -
- - 3,780 10,800 18,360 25,920 29,010 29,010 29,010 29,010 29,010 29,010 29,010 - - 29,010 - 316,608 316,608 386,791 499,214 605,552 708,683 728,712 712,555 711,937 711,937 727,057 711,937 727,057 316,608 316,608 727,057 130
220,113 220,113 221,295 203,769 169,511 132,435 93,963 77,844 77,844 77,844 77,079 76,635 76,635 220,113 220,113 76,635 -65 536,721 536,721 608,085 702,984 775,063 841,118 822,675 790,398 789,780 789,780 804,135 788,572 803,692 536,721 536,721 803,692 50
208,389 208,389 238,534 282,801 321,645 360,030 365,511 362,907 371,850 381,577 414,441 415,085 415,085 208,389 208,389 415,085 99 745,110 745,110 846,619 985,784 1,096,708 1,201,148 1,188,186 1,153,306 1,161,630 1,171,358 1,218,576 1,203,656 1,218,776 745,110 745,110 1,218,776 64 745,110 745,110 846,619 985,784 1,096,708 1,201,148 1,188,186 1,153,306 1,161,630 1,171,358 1,218,576 1,203,656 1,218,776 745,110 745,110 1,218,776 64 113,103 113,103 18,807 -53,720 -26,077 57,690 303,442 534,580 656,311 734,865 751,009 765,929 750,809 113,103 113,103 750,809 564

Republic of India
Meghalaya: Livelihoods and Access to Market Project
Final project design report - Working papers
370
Appendix 19A: NRM Livestock SUBPROJECT (32,400 households), Economic
India Meghalaya
LAMP Appraisal Report
NRM Livestock households Subproject M
ECONOMIC BUDGET (AGGREGATED)
(In INR '000) /a
Main Production
Livestock & fisheries
Production Cost
Investment
Piggery (3 piglets unit)
Goatery (8 does and 1 buck unit)
Sub-total Investment Costs
Operating
Labour
Sub-Total Production Cost
OUTFLOWS
Cash Flow
odel
Future Percentage
WOP With Project Present Without Future With Change 1 2 3 4 5 6 7 8 9 10 15 20 25 1 22 25 %
460,800 414,720 412,560 465,840 831,600 1,490,400 1,533,600 1,645,200 1,692,000 1,692,000 1,692,000 1,692,000 1,692,000 1,692,000 460,800 460,800 1,692,000 267
- 163,260 78,300 161,100 142,200 45,000 66,600 88,200 131,400 109,800 45,000 45,000 45,000 45,000 140,400 - 45,000 -68
- - 41,148 129,204 361,881 273,465 293,715 308,340 320,580 338,940 387,900 338,940 320,580 308,340 - - 308,340 - - 163,260 119,448 290,304 504,081 318,465 360,315 396,540 451,980 448,740 432,900 383,940 365,580 353,340 140,400 - 353,340 152
405,000 422,550 448,200 499,500 514,350 486,000 486,000 486,000 486,000 486,000 486,000 486,000 486,000 486,000 405,000 405,000 486,000 20 405,000 585,810 567,648 789,804 1,018,431 804,465 846,315 882,540 937,980 934,740 918,900 869,940 851,580 839,340 545,400 405,000 839,340 107 405,000 585,810 567,648 789,804 1,018,431 804,465 846,315 882,540 937,980 934,740 918,900 869,940 851,580 839,340 545,400 405,000 839,340 107
55,800 -171,090 -155,088 -323,964 -186,831 685,935 687,285 762,660 754,020 757,260 773,100 822,060 840,420 852,660 -84,600 55,800 852,660 1,428
IRR = 46.3%, NPV = 2,861,232.57
\a Each unit includes 360 households
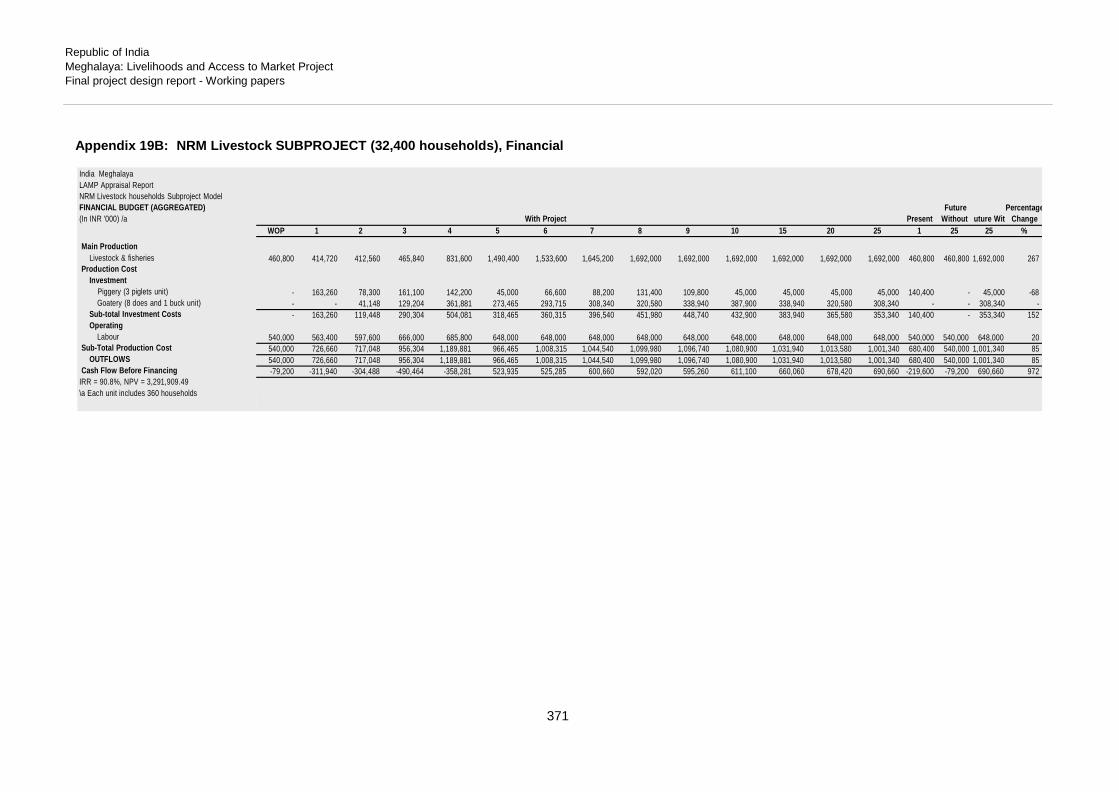
Republic of India
Meghalaya: Livelihoods and Access to Market Project
Final project design report - Working papers
371
Appendix 19B: NRM Livestock SUBPROJECT (32,400 households), Financial
India Meghalaya
LAMP Appraisal Report
NRM Livestock households Subproject Model
FINANCIAL BUDGET (AGGREGATED)
(In INR '000) /a
Main Production
Livestock & fisheries
Production Cost
Investment
Piggery (3 piglets unit)
Goatery (8 does and 1 buck unit)
Sub-total Investment Costs
Operating
Labour
Sub-Total Production Cost
OUTFLOWS
Cash Flow Before Financing
IRR = 90.8%, NPV = 3,291,909.49
\a Each unit includes 360 households
Future Percentage
With Project Present Without uture Wit Change WOP 1 2 3 4 5 6 7 8 9 10 15 20 25 1 25 25 %
460,800 414,720 412,560 465,840 831,600 1,490,400 1,533,600 1,645,200 1,692,000 1,692,000 1,692,000 1,692,000 1,692,000 1,692,000 460,800 460,800 1,692,000 267
- 163,260 78,300 161,100 142,200 45,000 66,600 88,200 131,400 109,800 45,000 45,000 45,000 45,000 140,400 - 45,000 -68
- - 41,148 129,204 361,881 273,465 293,715 308,340 320,580 338,940 387,900 338,940 320,580 308,340 - - 308,340 - - 163,260 119,448 290,304 504,081 318,465 360,315 396,540 451,980 448,740 432,900 383,940 365,580 353,340 140,400 - 353,340 152
540,000 563,400 597,600 666,000 685,800 648,000 648,000 648,000 648,000 648,000 648,000 648,000 648,000 648,000 540,000 540,000 648,000 20 540,000 726,660 717,048 956,304 1,189,881 966,465 1,008,315 1,044,540 1,099,980 1,096,740 1,080,900 1,031,940 1,013,580 1,001,340 680,400 540,000 1,001,340 85 540,000 726,660 717,048 956,304 1,189,881 966,465 1,008,315 1,044,540 1,099,980 1,096,740 1,080,900 1,031,940 1,013,580 1,001,340 680,400 540,000 1,001,340 85 -79,200 -311,940 -304,488 -490,464 -358,281 523,935 525,285 600,660 592,020 595,260 611,100 660,060 678,420 690,660 -219,600 -79,200 690,660 972

Republic of India
Meghalaya: Livelihoods and Access to Market Project
Final project design report - Working papers
372
Appendix 20: EFC SUBPROJECT (47,400 households) ECONOMIC
India Meghalaya
LAMP Appraisal Report
EFC households subproject
ECONOMIC BUDGET (AGGREGATED)
(In INR '000)
Main Production
Plantation crops
Livestock & fisheries
Enterprises
Sub-total Main Production
Production Cost
Investment
Seeds & Planting materials
Agri tools & materials
Fertilisers
Piggery (3 piglets unit)
Backyard Poultry (10 layers unit)
Goatery (8 does and 1 buck unit)
EFC Enterprises
Sub-total Investment Costs
Operating
Purchased Inputs
Poultry Broiler unit (200 chicks un
Labor
Labour
Sub-total Operating Costs
Sub-Total Production Cost
OUTFLOWS
Cash Flow
it)
April -- March
Future Percentage
WOP With Project Present Without Future With Change 1 2 3 4 5 6 7 8 9 10 15 20 24 to 25 WOP 22 24 %
- - - - - - - 9,332 28,654 68,613 124,525 576,865 764,988 764,988 - - 764,988 -
54,628 54,628 54,628 52,828 58,846 72,649 97,133 123,215 150,898 179,115 209,131 242,731 242,731 242,731 54,628 54,628 242,731 344
1,056,139 1,056,139 1,056,139 1,056,139 1,182,066 1,478,745 1,965,791 2,517,279 3,088,497 3,659,715 4,230,933 4,864,320 4,864,320 4,864,320 1,056,139 1,056,139 4,864,320 361 1,110,767 1,110,767 1,110,767 1,108,967 1,240,913 1,551,394 2,062,924 2,649,826 3,268,049 3,907,443 4,564,589 5,683,916 5,872,039 5,872,039 1,110,767 1,110,767 5,872,039 429
- - - 2,580 5,157 7,737 7,737 7,737 7,737 7,737 5,157 - - - - - - -
- - - 586 1,172 1,758 1,758 1,758 1,758 1,758 1,172 - - - - - - -
- - - 1,422 4,265 8,530 12,794 17,059 21,324 25,589 28,432 25,944 20,139 20,139 - - 20,139 -
- 16,644 - 2,189 4,640 7,362 17,317 8,963 11,045 13,123 13,015 11,736 11,736 11,736 16,644 - 11,736 -29
- - - 926 2,641 5,148 7,522 9,896 12,271 14,645 16,093 15,826 15,826 15,826 - - 15,826 -
- - - 3,052 8,048 15,168 21,522 28,209 35,063 42,825 47,532 49,321 48,413 48,413 - - 48,413 -
574,413 574,413 574,413 700,275 914,843 1,233,467 1,556,254 1,920,523 2,310,698 2,700,873 2,965,185 3,175,630 3,175,630 3,175,630 574,413 574,413 3,175,630 453 574,413 591,058 574,413 711,030 940,765 1,279,169 1,624,904 1,994,145 2,399,895 2,806,549 3,076,587 3,278,457 3,271,744 3,271,744 591,058 574,413 3,271,744 470
- - - 111 222 333 333 333 333 333 222 - - - - - - -
48,013 48,013 48,013 62,686 86,057 117,837 142,701 167,277 192,542 220,561 236,661 286,342 315,950 315,950 48,013 48,013 315,950 558 48,013 48,013 48,013 62,797 86,279 118,170 143,035 167,611 192,875 220,894 236,883 286,342 315,950 315,950 48,013 48,013 315,950 558
622,426 639,070 622,426 773,827 1,027,045 1,397,339 1,767,939 2,161,756 2,592,770 3,027,443 3,313,470 3,564,799 3,587,695 3,587,695 639,070 622,426 3,587,695 476 622,426 639,070 622,426 773,827 1,027,045 1,397,339 1,767,939 2,161,756 2,592,770 3,027,443 3,313,470 3,564,799 3,587,695 3,587,695 639,070 622,426 3,587,695 476 488,341 471,697 488,341 335,140 213,868 154,055 294,986 488,070 675,279 880,000 1,251,119 2,119,117 2,284,345 2,284,345 471,697 488,341 2,284,345 368
IRR = 37.6%, NPV = 3,412,487.15

Republic of India
Meghalaya: Livelihoods and Access to Market Project
Final project design report - Working papers
373
Appendix 21: EFC SUBPROJECT (47,400 households) Financial
India Meghalaya
LAMP Appraisal Report
EFC households subproject
FINANCIAL BUDGET (AGGREGATED)
(In INR '000)
Main Production
Plantation crops
Livestock & fisheries
Enterprises
Sub-total Main Production
Production Cost
Investment
Seeds & Planting materials
Agri tools & materials
Fertilisers
Piggery (3 piglets unit)
Backyard Poultry (10 layers unit)
Goatery (8 does and 1 buck unit)
EFC Enterprises
Sub-total Investment Costs
Operating
Purchased Inputs
Poultry Broiler unit (200 chicks un
Labor
Labour
Sub-total Operating Costs
Sub-Total Production Cost
OUTFLOWS
Cash Flow Before Financing
Farm Family Benefits After Financing
it)
Future Percentage
WOP With Project Present Without Future With Change 1 2 3 4 5 6 7 8 9 10 15 20 25 1 25 25 %
- - - - - - - 12,443 38,206 89,920 160,820 717,549 941,797 941,797 - - 941,797 -
54,628 54,628 54,628 52,828 58,846 72,649 97,133 123,215 150,898 179,115 209,131 242,731 242,731 242,731 54,628 54,628 242,731 344
1,056,139 1,056,139 1,056,139 1,056,139 1,182,066 1,478,745 1,965,791 2,517,279 3,088,497 3,659,715 4,230,933 4,864,320 4,864,320 4,864,320 1,056,139 1,056,139 4,864,320 361 1,110,767 1,110,767 1,110,767 1,108,967 1,240,913 1,551,394 2,062,924 2,652,937 3,277,601 3,928,750 4,600,884 5,824,600 6,048,848 6,048,848 1,110,767 1,110,767 6,048,848 445
- - - 2,580 5,157 7,737 7,737 7,737 7,737 7,737 5,157 - - - - - - -
- - - 586 1,172 1,758 1,758 1,758 1,758 1,758 1,172 - - - - - - -
- - - 1,422 4,265 8,530 12,794 17,059 21,324 25,589 28,432 25,944 20,139 20,139 - - 20,139 -
- 16,644 - 2,189 4,640 7,362 17,317 8,963 11,045 13,123 13,015 11,736 11,736 11,736 16,644 - 11,736 -29
- - - 926 2,641 5,148 7,522 9,896 12,271 14,645 16,093 15,826 15,826 15,826 - - 15,826 -
- - - 3,052 8,048 15,168 21,522 28,209 35,063 42,825 47,532 49,321 48,413 48,413 - - 48,413 -
664,446 664,446 664,446 790,546 1,005,587 1,324,922 1,648,420 2,013,399 2,404,285 2,795,171 3,059,957 3,270,402 3,270,402 3,270,402 664,446 664,446 3,270,402 392 664,446 681,091 664,446 801,300 1,031,510 1,370,624 1,717,070 2,087,021 2,493,482 2,900,847 3,171,359 3,373,229 3,366,516 3,366,516 681,091 664,446 3,366,516 407
- - - 111 222 333 333 333 333 333 222 - - - - - - -
64,017 64,017 64,017 83,581 114,743 157,116 190,268 223,037 256,723 294,081 315,548 381,790 421,267 421,267 64,017 64,017 421,267 558 64,017 64,017 64,017 83,693 114,965 157,449 190,602 223,370 257,056 294,415 315,770 381,790 421,267 421,267 64,017 64,017 421,267 558
728,463 745,108 728,463 884,993 1,146,475 1,528,073 1,907,671 2,310,391 2,750,538 3,195,262 3,487,129 3,755,018 3,787,783 3,787,783 745,108 728,463 3,787,783 420 728,463 745,108 728,463 884,993 1,146,475 1,528,073 1,907,671 2,310,391 2,750,538 3,195,262 3,487,129 3,755,018 3,787,783 3,787,783 745,108 728,463 3,787,783 420 382,304 365,659 382,304 223,975 94,438 23,321 155,253 342,545 527,063 733,488 1,113,756 2,069,582 2,261,065 2,261,065 365,659 382,304 2,261,065 491
1,110,767 365,659 382,304 270,532 187,737 152,467 305,255 481,027 660,968 863,720 1,194,592 2,058,047 2,262,717 2,263,624 365,659 1,110,767 2,263,624 104 IRR = 47.4%, NPV = 3,782,660.97

Republic of India
Meghalaya: Livelihoods and Access to Market Project
Final project design report - Working papers
374
Appendix 22: Market and Roads Benefits
India Meghalaya
LAMP Appraisal Report
Road & Market benefits Subproject
ECONOMIC BUDGET (AGGREGATED)
(In INR '000) /a
Main Production
Markets & Road benefits
Production Cost
Investment
Rural road
Operating
Rural Market
Sub-Total Production Cost
OUTFLOWS
Cash Flow
April -- March
Without Future
Project With Project With 1 to 25 1 to 3 4 5 6 7 8 9 to 25
- - 1,337 2,712 5,423 10,847 14,971 15,083 15,083
- - - 5,625 11,250 22,500 39,375 56,250 56,250
- - 1,700 3,400 6,800 13,600 18,700 18,700 18,700 - - 1,700 9,025 18,050 36,100 58,075 74,950 74,950 - - 1,700 9,025 18,050 36,100 58,075 74,950 74,950 - - -363 -6,313 -12,627 -25,253 -43,104 -59,867 -59,867
in the form of reduction in transport cost
r;
IRR = None, NPV = -211,189.64
\a Benefits estimated at INR 1500/km/ton
Assuming 7.5 hh transport 1 t/year/yea
LAMP Appraisal Report
Road & Market benefits Subproject
FINANCIAL BUDGET (AGGREGATED)
(In INR '000) /a
Main Production
Markets & Road benefits
Production Cost
Investment
Rural road
Operating
Rural Market
Sub-Total Production Cost
OUTFLOWS
Cash Flow Before Financing
Farm Family Benefits After Financing
April -- March
Without Future
Project With Project With 1 to 25 4 5 6 7 8 9 to 25
- 1,337 2,712 5,423 10,847 14,971 15,083 15,083
- - 5,625 11,250 22,500 39,375 56,250 56,250
- 1,700 3,400 6,800 13,600 18,700 18,700 18,700 - 1,700 9,025 18,050 36,100 58,075 74,950 74,950 - 1,700 9,025 18,050 36,100 58,075 74,950 74,950 - -363 -6,313 -12,627 -25,253 -43,104 -59,867 -59,867 - -2,063 -9,713 -19,427 -30,353 -43,104 -59,867 -59,867

Republic of India
Meghalaya: Livelihoods and Access to Market Project
Final project design report - Working papers
375
Appendix 23: Project Investment Costs (Economic)
India
Meghalaya: LAMP Appraisal Mission
Expenditure Accounts by Years -- Base Costs
I. Investment Costs
A. Works
B. Other works under convergence /a
C. Vehicles
D. Equipment & materials
E. Training
F. Consultancy
G. Goods, services & inputs
H. Credit, Guarantee funds
I. Grant & subsidies
Total Investment Costs
II. Recurrent Costs
A. Salaries and allowances
B. Operating costs
Total Recurrent Costs
Total BASELINE COSTS
Physical Contingencies
Price Contingencies
Total PROJECT COSTS
Taxes
Base Cost (INR '000)
14/15 15/16 16/17 17/18 18/19 19/20 20/21 21/22 Total
2,228 12,656 113,906 134,156 250,594 324,000 265,781 - 1,103,321
- - 171,072 342,144 342,144 171,072 - - 1,026,432
10,302 2,835 - 709 3,544 5,341 2,835 - 25,566
12,183 16,662 29,261 35,978 20,908 4,161 3,443 3,443 126,039
25,202 85,026 90,289 61,236 57,389 43,665 40,433 32,612 435,851
12,250 11,337 23,337 33,837 43,075 53,950 53,525 7,150 238,461
43,404 91,485 130,873 146,456 74,756 31,634 1,924 1,316 521,849
90,529 303,058 747,115 757,615 715,115 431,115 368,115 368,115 3,780,776
16,850 221,000 248,000 360,500 252,500 194,650 9,000 4,000 1,306,500 212,949 744,059 1,553,853 1,872,631 1,760,024 1,259,588 745,056 416,635 8,564,795
81,369 106,482 121,422 121,152 121,152 119,352 115,440 103,068 889,437
12,504 14,440 17,677 17,956 20,310 22,623 25,496 26,888 157,894 93,873 120,922 139,099 139,108 141,462 141,975 140,936 129,956 1,047,331
306,822 864,981 1,692,953 2,011,739 1,901,486 1,401,563 885,991 546,591 9,612,126
- - - - - - - - -
7,256 33,132 80,951 117,422 162,044 203,045 207,903 110,217 921,969 314,078 898,113 1,773,903 2,129,161 2,063,530 1,604,608 1,093,894 656,808 10,534,095
16,979 29,908 58,472 68,655 80,583 89,270 73,308 9,803 426,977 Computation of economic costs
Less Taxes 16,979 29,908 58,472 68,655 80,583 89,270 73,308 9,803 426,977
Less price contingencies 7,256 33,132 80,951 117,422 162,044 203,045 207,903 110,217 921,969
Less credit and Guarantee funds 90,529 303,058 747,115 757,615 715,115 431,115 368,115 368,115 3,780,776
Less Grants and subsidies 16,850 221,000 248,000 360,500 252,500 194,650 9,000 4,000 1,306,500
Add village development fund - 108,000 108,000 216,000 108,000 108,000 - - 648,000
Add Social development fund - 10,000 10,000 10,000 10,000 5,000 5,000 - 50,000
Total adjustments 131,614 469,097 1,016,537 1,078,191 1,092,242 805,080 653,326 492,134 5,738,222 Net Economic costs 182,464 429,016 757,366 1,050,969 971,288 799,528 440,568 164,673 4,795,873

Republic of India
Meghalaya: Livelihoods and Access to Market Project
Final project design report - Working papers
376
Appendix 24: Project Incremental Benefits Stream & Incremental Costs Stream
India Meghalaya
LAMP Appraisal Report
Project Summary
ECONOMIC BUDGET (AGGREGATED)
(In INR Million)
Main Production
Food Crops
Spices
Plantation crops
Livestock & fisheries
Enterprises
Markets & Road benefits
Sub-total Main Production
Production Cost
Investment
Purchased Inputs
Seeds & Planting materials
Agri tools & materials
Fertilisers
Piggery (3 piglets unit)
Backyard Poultry (10 layers unit)
Goatery (8 does and 1 buck unit)
Bee-keeping (14 bee boxes unit)
Rural road
Tejpatta
EFC Enterprises
Sub-Total Purchased Inputs
Labor
Labour
Sub-total Investment Costs
Operating
Purchased Inputs
Seeds & Planting materials
Fertilisers
Poultry Broiler unit (200 chicks u
Rural Market
Sub-Total Purchased Inputs
Labor
Labour
Sub-total Operating Costs
Sub-Total Production Cost
Other Costs
Project Investment costs
OUTFLOWS
Cash Flow
nit)
Future Future Percentage
Present Without With Change 1 2 3 4 5 6 7 8 9 10 15 20 25 WOP 22 25 %
- - 53 145 263 404 551 642 692 716 716 716 716 3,755 3,755 4,472 19
- - 0 0 9 31 68 113 150 172 178 178 178 710 710 888 25
- - - 4 16 40 100 183 283 388 883 1,071 1,071 - - 1,071 -
-46 -48 3 375 1,048 1,115 1,253 1,327 1,356 1,386 1,419 1,419 1,419 515 515 1,935 275
- - 7 192 599 1,212 1,882 2,512 3,092 3,663 4,296 4,296 4,296 1,056 1,056 5,352 407
- - - 1 3 5 11 15 15 15 15 15 15 - - 15 - -46 -48 63 718 1,936 2,808 3,865 4,793 5,587 6,340 7,508 7,696 7,696 6,037 6,037 13,733 127
- - 11 22 26 26 16 8 8 5 - - - 348 348 348 -
- - 5 5 3 -0 -4 -10 -10 -11 -12 -12 -12 12 12 - -
- - 17 39 63 87 107 111 115 118 116 110 110 54 54 164 203
23 78 163 147 52 -73 97 142 123 58 57 57 57 157 - 57 -64
- - 1 3 5 8 10 12 15 16 16 16 16 - - 16 -
- 41 132 370 289 315 337 356 382 435 388 369 357 - - 357 -
- - 36 96 155 212 227 221 221 221 236 221 236 - - 236 -
- - - - 6 11 23 39 56 56 56 56 56 - - 56 -
- - 4 11 18 26 29 29 29 29 29 29 29 - - 29 -
- - 126 340 659 982 1,346 1,736 2,126 2,391 2,601 2,601 2,601 574 574 3,176 453 23 119 496 1,033 1,276 1,594 2,187 2,645 3,065 3,319 3,487 3,447 3,450 1,146 989 4,438 349
- - 14 12 -3 -20 -37 -52 -52 -52 -52 -53 -53 575 575 523 -9
23 119 510 1,044 1,273 1,574 2,149 2,593 3,013 3,267 3,435 3,394 3,397 1,721 1,564 4,961 217
- - -3 -6 -10 -13 -16 -16 -16 -16 -16 -16 -16 79 79 63 -21
- - 10 21 31 42 53 53 53 53 53 53 53 537 537 590 10
- - 0 0 0 0 0 0 0 0 - - - - - - -
- - - 2 3 7 14 19 19 19 19 19 19 - - 19 - - - 7 16 25 36 51 56 56 56 55 55 55 616 616 671 9
18 43 160 259 320 402 460 484 518 542 616 646 646 2,542 2,542 3,188 25 18 43 167 276 345 438 511 539 574 597 671 701 701 3,158 3,158 3,859 22 40 163 677 1,320 1,618 2,011 2,660 3,133 3,587 3,865 4,106 4,096 4,099 4,879 4,722 8,820 87
182 429 757 1,051 971 800 441 165 - - - - - - - - - 223 592 1,434 2,371 2,589 2,811 3,101 3,297 3,587 3,865 4,106 4,096 4,099 4,879 4,722 8,820 87
-269 -640 -1,371 -1,653 -653 -3 764 1,495 2,000 2,475 3,402 3,601 3,598 1,158 1,315 4,913 274 IRR = 25.7%, NPV = 6,751.92

Republic of India
Meghalaya: Livelihoods and Access to Market Project
Final project design report - Working papers
377
Appendix 25: Project Incremental Labour RequirementROJECT INCREMENTAL LABOUR REQUIREMENT
India Meghalaya
LAMP Appraisal Report
Project Summary
LABOR BUDGET
(In Units)
Labor Requirements
Site clearance
Land Preparation
Planting
Manuring
Pitting
Fencing
Weeding
spraying
Fire line cutting
Interculture
Removal of basal Leaves
Transportation
Harvesting
Shed construction
Managing cost
Watch and ward
Sub-Total Labor Requirements
Unit
Future Percentage
Increments Present Without Future With Change 3 4 5 6 7 8 9 10 15 20 to 25 1 25 20 %
Pers_day
pers_day
pers_day
pers_day
pers_day
pers_day
pers_day
pers_day
pers_day
pers_day
pers_day
pers_day
pers_day
pers_day
pers_day
pers_day
23,970 10,545 -44,634 -117,031 -207,246 -249,706 -250,221 -259,701 -280,430 -280,430 1,111,215 1,111,215 830,785 -25
12,225 -15,553 -82,476 -162,433 -250,523 -289,378 -289,893 -295,818 -309,440 -309,440 3,400,290 3,400,290 3,090,850 -9
30,356 66,419 97,075 118,988 121,854 118,949 126,804 126,683 111,758 111,758 2,789,751 2,789,751 2,901,509 4
31,274 71,908 117,362 162,817 202,059 213,787 225,515 233,333 233,333 233,333 179,520 179,520 412,853 130
17,246 44,252 77,198 102,678 121,488 135,704 149,920 151,931 133,452 133,452 - - 133,452 -
36,584 64,433 80,938 89,351 66,157 39,142 42,696 40,088 11,441 9,666 360,803 360,803 370,469 3
5,915 12,100 18,330 24,560 30,768 30,768 30,768 30,768 30,768 30,768 285,463 285,463 316,230 11
50,034 109,054 171,844 234,635 291,283 299,457 306,920 310,948 300,286 298,864 143,798 143,798 442,662 208
12,188 35,747 66,634 97,521 121,703 141,250 160,797 173,827 173,827 173,827 - - 173,827 -
37,743 96,394 166,825 237,257 293,502 323,356 353,210 373,109 373,109 373,109 945,950 945,950 1,319,059 39
6,300 18,000 30,600 43,200 48,350 48,350 48,350 48,350 48,350 48,350 - - 48,350 -
42,315 86,160 132,390 181,140 237,108 252,672 276,192 307,307 560,495 658,432 1,528,933 1,528,933 2,187,364 43
85,315 173,420 266,250 364,120 476,860 507,988 548,362 597,619 850,830 914,799 1,957,368 1,957,368 2,872,167 47
255,418 230,453 83,524 84,804 86,084 87,365 88,645 86,508 80,536 80,536 - - 80,536 -
12,600 36,000 61,200 86,400 96,700 96,700 96,700 96,700 96,700 96,700 - - 96,700 -
267,884 406,644 447,347 488,051 520,559 547,403 574,246 592,136 592,136 592,136 3,922,248 3,922,248 4,514,384 15 927,364 1,445,975 1,690,408 2,036,057 2,256,706 2,303,806 2,489,010 2,613,786 3,007,148 3,165,858 16,625,338 16,625,338 19,791,196 19

Republic of India
Meghalaya: Livelihoods and Access to Market Project
Final project design report - Working papers
378
Appendix 26: Project Production – Without Project and With Project
India Meghalaya
LAMP Appraisal Report
Project Summary
PRODUCTION AND INPUTS (Detailed)
(In Units)
Main Production
Paddy, main season
Byproduct
Maize, shelled
Beans
Mustard
Sweet Potato
Vegetables
Ginger
Turmeric
Chilli
Arecanut
Pine Apple
Citrus
Poultry birds
Eggs
Piglets, cross-bred
Piglet
Goat
Sale of honey
Bee wax
Bee Colonies
Investment
Purchased Inputs
DAP
Organic Manure
PP chemicals
NPK Fertilisers
Urea
MOP
Unit
Future Percentage
Increments Present Without Future With Change 3 4 5 6 7 8 9 10 16 20 25 1 22 25 %
ton 2,000 4,000 6,000 8,000 10,125 10,125 10,125 10,125 10,125 10,125 10,125 91,125 91,125 101,250 11
ton 2,840 5,680 8,520 11,360 14,378 14,378 14,378 14,378 14,378 14,378 14,378 101,756 101,756 116,134 14
ton 350 1,050 2,100 3,500 4,922 5,994 6,716 7,088 7,088 7,088 7,088 10,631 10,631 17,719 67
ton 200 600 1,000 1,400 1,813 2,025 2,025 2,025 2,025 2,025 2,025 7,088 7,088 9,113 29
ton 100 300 500 700 906 1,013 1,013 1,013 1,013 1,013 1,013 7,088 7,088 8,100 14
ton 500 2,000 3,500 5,000 6,531 7,594 7,594 7,594 7,594 7,594 7,594 43,031 43,031 50,625 18
ton - 1,063 3,243 6,549 9,918 13,284 15,524 16,638 16,638 16,638 16,638 66,552 66,552 83,190 25
ton - - 126 486 1,098 1,836 2,443 2,798 2,901 2,901 2,901 11,604 11,604 14,505 25
ton - - 126 486 1,098 1,836 2,443 2,798 2,901 2,901 2,901 11,604 11,604 14,505 25
ton 3 12 24 40 58 73 85 94 97 97 97 338 338 435 29
ton - - - - - - 107 355 4,211 5,331 5,331 - - 5,331 -
ton - 277 1,069 2,693 5,386 8,355 10,893 12,556 13,151 13,151 13,151 - - 13,151 -
ton - - - - 856 2,565 4,870 7,388 16,267 16,682 16,682 - - 16,682 -
bird 890 2,668 5,335 8,003 10,670 13,338 16,005 17,783 17,783 17,783 17,783 - - 17,783 -
each 178,000 533,500 1,067,000 1,600,500 2,134,000 2,667,500 3,201,000 3,556,500 3,556,500 3,556,500 3,556,500 - - 3,556,500
- No 108,000 254,136 366,402 372,804 379,206 385,608 392,010 398,412 402,678 402,678 402,678 - - 402,678 -
animal -203,309 -293,122 -298,243 -303,365 -308,486 -313,608 -318,730 -322,142 -322,142 -322,142 -322,142 322,142 322,142 - -
No 11,520 41,174 120,641 132,055 157,469 170,244 173,765 177,286 181,873 181,873 181,873 - - 181,873 -
litre - 201,600 576,000 979,200 1,382,400 1,547,200 1,547,200 1,547,200 1,547,200 1,547,200 1,547,200 - -1,547,200 -
kg - 28,224 80,640 137,088 193,536 216,608 216,608 216,608 216,608 216,608 216,608 - - 216,608 -
colony - - 70,560 201,600 342,720 483,840 541,520 541,520 541,520 541,520 541,520 - - 541,520 -
Kg 27,720 79,200 134,640 190,080 212,740 212,740 212,740 212,740 212,740 212,740 212,740 217,575 217,575 430,315 98
ton 5,953 16,488 29,762 43,036 53,318 60,426 67,534 72,272 66,941 60,426 60,426 22,184 22,184 82,610 272
lit 2,082 6,083 11,194 16,306 20,076 22,919 25,762 27,657 23,393 18,180 18,180 36,689 36,689 54,869 50
Kg 106,300 218,000 330,600 443,200 554,600 554,600 554,600 554,600 554,600 554,600 554,600 554,600 554,600 1,109,200 100
Kg 181,895 399,700 623,490 847,280 1,030,278 1,030,278 1,030,278 1,030,278 1,030,278 1,030,278 1,030,278 735,913 735,913 1,766,190 140
Kg 260,790 539,400 820,980 1,102,560 1,374,555 1,374,555 1,374,555 1,374,555 1,374,555 1,374,555 1,374,555 - - 1,374,555 -

Republic of India
Meghalaya: Livelihoods and Access to Market Project
Final project design report - Working papers
379
NPV of benefit streams discounted at 12% 23,728 NPV of costs stream discounted at 12% 20,236 NPV of project discounted at 12% 3,493 BCR- discounted benefits & costs at 12% 1.17 IRR 18%
Appendix 27: Economic Analysis of the Project
ECONOMIC ANALYSIS
Country: India
Project: Meghalaya Livelihoods and Access to Markets Project
(Million INR)
Discount rate:DR
Project Year
0.12 12%
Details 1 2 3 4 5 6 7 8 9 10 11 12 13 14 15 16 17 18 19 20 25
Incremental Benefits 1/
All benefits -46.1 -48.2 63.3 718.5 1,936.3 2,807.9 3,864.8 4,792.7 5,587.1 6,339.6 6,914.4 7,164.4 7,315.3 7,420.8 7,508.0 7,582.1 7,630.3 7,664.6 7,686.2 7,696.1 7,696.1
Total benefits -46.08 -48.24 63.3 718.5 1936.3 2807.9 3864.8 4792.7 5587.1 6339.6 6914.4 7164.4 7315.3 7420.8 7508.0 7582.1 7630.3 7664.6 7686.2 7696.1 7696.1
Incremental Costs
Investment costs 2/ 182.5 429.0 757.4 1,051.0 971.3 799.5 440.6 164.7
Production costs 3/ 40.4 162.6 676.9 1,320.0 1,618.2 2,011.5 2,660.3 3,132.6 3,587.0 3,864.5 3,691.0 3,996.0 4,118.9 4,135.7 4,106.1 4,027.5 4,123.4 4,166.1 4,147.7 4,095.6 4,098.5
Total costs 222.9 591.7 1434.3 2371.0 2589.5 2811.0 3100.9 3297.3 3587.0 3864.5 3691.0 3996.0 4118.9 4135.7 4106.1 4027.5 4123.4 4166.1 4147.7 4095.6 4098.5
Net benefits -269.0 -639.9 -1371.0 -1652.5 -653.2 -3.1 763.9 1495.4 2000.1 2475.1 3223.4 3168.3 3196.4 3285.1 3402.0 3554.6 3506.9 3498.4 3538.5 3600.5 3597.6
1/ & 3 Source: Farmod programme 2/ from Costab programme
Basecase results: Benefits lagged by 2 year
NPV of benefit streams discounted at 12% 26,987 NPV of costs stream discounted at 12% 20,236 NPV of project discounted at 12% 6,752 BCR- discounted benefits & costs at 12% 1.33 IRR 26%

Republic of India
Meghalaya: Livelihoods and Access to Market Project
Final project design report - Working papers
380
Appendix 28: Sensitivity Analysis of the
Results of Sensitivity Analysis:
Costs increased by Benefits down by Both cost increase & benefits down
Project Performance indicators 10% 15% 20% 25% 10% 15% 20% 25% 10% 15% 20% 25%
NPV of at discount rate of 12% 4,728 3,717 2,705 1,693 4,053 2,704 1,354 5 2,030 -332 -2,693 -5,054 BCR at discount rate of 12% 1.21 1.16 1.11 1.07 1.20 1.13 1.07 1.00 1.09 0.99 0.89 0.80
IRR 21% 19% 17% 15% 21% 18% 15% 12% 16% 11% 6% #NUM!
Switching Value Analysis:
Switching Value: Appraisal Switching value % change
Total Benefits at 12% DR 26,987 20,236 -25
Total Costs at 12% DR 20,236 26,987 33

Republic of India
Meghalaya: Livelihoods and Access to Market Project
Final project design report - Working papers
381
Appendix 29: Calculation of number of participating households
Calculation of total number of LAMP participating HH EFC NRM IPM livestock ICVS markets Total rural hh
Number of households involved in activity 47,385 101,255 20,250 32,400 120,000 41,250 422,197
As percentage of total rural households 11.2% 24.0% 4.8% 7.7% 28.4% 9.8% 100.0%
Calculation of total households involved NRM Non NRM total EFC ICVS markets total
in multiple activities EFC 11,364 36,021 47,385 22,263
NRM 37,241
IPM 20,250
Livestock 32,400
IVCS 81,004 38,996 120,000 10,238 25,948
markets 9,893 31,357 41,250 3,519 2,810 25,028
total 101,255 36,021 28,758 25,028 191,062
% of all h'holds 24.0% 8.5% 6.8% 5.9% 45.3%
101,225 households will be in NRM clusters: 75 villages x 18 blocks x 75 households per village = 101,225 All 20,250 IPM and 32,400 livestock households will be in NRM clusters. In NRM blocks 11,364 hh will be supported by EFCs - this is 11% of total NRM hh, the same percentage as the percentage of EFC hh for all of the state. Assuming that there is no overlap between the EFC, IPM and livestock hh in NRM clusters, this leaves 37,241 hh only involved in NRM activities.
Most IVCS will be established in NRM clusters, and 80% of NRM cluster hh will be IVCS members = 81,004. Markets will each benefit 750 hh (9.8% of all rural households) and will be spread over the state without any focus on NRM clusters. Households in NRM clusters participating in IVCS and markets will include IPM, livestock, EFC and NRM -only households. There will be 36,021 EFC, 38,996 IVCS and 31,357 market hh outside of
NRM blocks. Of the 36,021 EFC housholds, 10,238 (28.4%) will be IVCS members and 3,519 (9.8%) will participate in markets. Deducting 81,004 NRM and 10,238 EFC housholds belonging to IVCS, leaves 28,012 other IVCS members. Of these 9.8% (2,810) will also participate in markets. Deducting 9,893 NRM, 3,519 market and 2,810 IVCS households from the market household total of 41,250 leaves 25,028 only involved in market activities. Adding up the totals for NRM, EFC, IVCS and market hh gives a total of 191,062 hh involved in the project, 45% of all rural hh in the state