lit-shea-advanced language and literature-2e-sample chapter ...
Upload
khangminh22Category
view
1download
0
liT? o6WORLD BANK TECHNICAL PAPER NUMBER 176
World and Regional Supply and DemandBalances for Nitrogen, Phosphate,and Potash, 1990/91-1996/97
The World Bank/FAO/UNIDO/IndustryFertilizer Working Group
DUN iUDEVELIEVEN
l~~~~~~~~~~~~~ AX
SE!8 T fi WMENT
P4s_ - O ND TENURE LMNG STA
~~~~~~~~~~~~~~~~~~~~~~~~~~~~i_5\;l7-srEtL'E;
Pub
lic D
iscl
osur
e A
utho
rized
Pub
lic D
iscl
osur
e A
utho
rized
Pub
lic D
iscl
osur
e A
utho
rized
Pub
lic D
iscl
osur
e A
utho
rized
Pub
lic D
iscl
osur
e A
utho
rized
Pub
lic D
iscl
osur
e A
utho
rized
Pub
lic D
iscl
osur
e A
utho
rized
Pub
lic D
iscl
osur
e A
utho
rized
RECENT WORLD BANK TECHNICAI PAPERS
No. 113 Vergara and Babelon, The Petrochemical Industry in Developing Asia: A Review of the CurrentSituation and Prospects for Development in the 1990s
No. 114 McGuire and Popkins, Helping Women Improve Nutrition in the Developing World: Beating the ZeroSum Game
No. 115 Le Moigne, Plusquellec, and Barghouti, Dam Safety and the Environment
No. 116 Nelson, Dryland Management: The "Desertification" Problem
No. 117 Barghouti, Timmer, and Siegel, Rural Diversification: Lessons from East Asia
No. 118 Pritchard, Lending by the World Bankfor Agricultural Research: A Review of the Years 1981through 1987
No. 119 Asia Region Technical Department, Flood Control in Bangladesh: A Plan for Action
No. 120 Plusquellec, The Gezira Irrigation Scheme in Sudan: Objectives, Design, and Performance
No. 121 Listorti, Environmental Health Components for Water Supply, Sanitation, and Urban Projects
No. 122 Dessing, Support for Microenterprises: Lessons for Sub-Saharan Africa
No. 123 Barghouti and Le Moigne, Irrigation in Sub-Saharan Africa: The Development of Publicand Private Systems
No. 124 Zymelman, Science, Education, and Development in Sub-Saharan Africa
No. 125 van de Walle and Foster, Fertility Decline in Africa: Assessment and Prospects
No. 126 Davis, MacKnight, IMO Staff, and Others, Environmental Considerations for Port and HarborDevelopments
No. 127 Doolette and Magrath, editors, Watershed Development in Asia: Strategies and Technologies
No.128 Gastellu-Etchegorry, editor, Sa Yellite Remote Sensing for Agricultural Projects
No. 129 Berkoff, Irrigation Management in the Indo-Gangetic Plain
No.130 Agnes Kiss, editor, Living with Wildlife: Wildlife Resource Management with Local Participationin Africa
No. 131 Nair, The Prospects for Agrofores try in the Tropics
No.132 Murphy, Casley, and Curry, Farmers' Estimations as a Source of Production Data: MethodologicalGuidelines for Cereals in Africa
No. 133 Agriculture and Rural Development Department, ACIAR, AIDAB, and ISNAR, AgriculturalBiotechnology: The Next "Green Revolution"?
No. 134 de Haan and Bekure, Animal Health in Sub-Saharan Africa: Initial Experiences with AlternativeApproaches
No. 135 Walshe, Grindle, Nell, and Bachmann, Dairy Development in Sub-Saharan Africa: A Study of Issuesand Options
No.136 Green, editor, Coconut Production: Present Status and Priorities for Research
No. 137 Constant and Sheldrick, An Outlookfor Fertilizer Demand, Supply, and Trade, 1988/89-1993/94
No. 138 Steel and Webster, Small Enterpn'ses under Adjustment in Ghana
No. 139 Environment Department, Environmental Assessment Sourcebook, vol. I: Policies, Procedures,and Cross-Sectoral Issues
No. 140 Environment Department, Environmental Assessment Sourcebook, vol. 11: Sectoral Guidelines
No. 141 Riverson, Gaviria, and Thriscutl., Rural Roads in Sub-Saharan Africa: Lessons from World Bank Experience
No. 142 Kiss and Meerman, Integrated Pest Management and African Agriculture
No. 143 Grut, Gray, and Egli, Forest Pricing and Concession Policies: Managing the High Forest of Westand Central Africa
No. 144 The World Bank/FAO/UNIDO/Industry Fertilizer Working Group, World and Regional Supplyand Demand Balances for Nitrog?n, Phosphate, and Potash, 1989/90-1995/96
(List continues on the inside back cover)
WORLD BANK TECHNICAL PAPER NUMBER 176
World and Regional Supply and DemandBalances for Nitrogen, Phosphate,
and Potash, 1990/91-1996/97
The World Bank/FAO/UNIDO/IndustryFertilizer Working Group
The World BankWashington, D.C.
Copyright e 1992The International Bank for Reconstructionand Development/THE WORLD BANK1818 H Street, N.W.Washington, D.C. 20433, U.S.A.
All rights reservedManufactured in the United States of AmericaFirst printing July 1992
Technical Papers are published to communicate the results of the Bank's work to the developmentcommunity with the least possible delay. The typescript of this paper therefore has not been prepared inaccordance with the procedures appropriate to formal printed texts, and the World Bank accepts noresponsibility for errors.
The findings, interpretations, and conclusions expressed in this paper are entirely those of the author(s)and should not be attributed in any manner to the World Bank, to its affiliated organizations, or tomembers of its Board of Executive Directors or the countries they represent. The World Bank does notguarantee the accuracy of the data included in this publication and accepts no responsibility whatsoeverfor any consequence of their use. Any maps that accompany the text have been prepared solely for theconvenience of readers; the designatlons and presentation of material in them do not imply the expressionof any opinion whatsoever on the part of the World Bank, its affiliates, or its Board or member countriesconcerning the legal status of any country, territory, city, or area or of the authorities thereof orconcerning the delimitation of its boumdaries or its national affiliation.
The material in this publication is copyrighted. Requests for permission to reproduce portions of it shouldbe sent to the Office of the Publisher at the address shown in the copyright notice above. The World Bankencourages dissemination of its work and will normally give permission promptly and, when thereproduction is for noncommercial purposes, without asking a fee. Permission to copy portions forclassroom use is granted through the Copyright Clearance Center, 27 Congress Street, Salem,Massachusetts 01970, U.S.A.
The complete backlist of publications from the World Bank is shown in the annual Index of Publications,which contains an alphabetical title list (with full ordering information) and indexes of subjects, authors,and countries and regions. The latest edition is available free of charge from the Distribution Unit, Officeof the Publisher, Department F, The 'World Bank, 1818 H Street, N.W., Washington, D.C. 20433, U.S.A., orfrom Publications, The World Bank, 66, avenue d'Iena, 75116 Paris, France.
ISSN: 1014-9848
- iii -
CONTENTS
INTRODUCTION .................................................... v
Historical Background .................................................... viMembership of the Fertilizer Working Group .................................................... viiRegional Country Classification .................................................... viiiIntroduction to the Tables ..................................................... xGeneral Notes on Terminology ..................................................... xNotes on Nitrogen .................................................... xiNotes on Phosphate .................................................... xiNotes on Potash .................................................... xii
NITROGEN SUPPLY AND DEMAND BALANCES ....................................................1I
Country Ammonia Capacity ..................................................... 2Country Ammonia Supply Capability ..................................................... 5Regional Ammonia Capacity .................................................... 8Regional Ammonia Supply Capability ..................................................... 9Regional Non-Ammonia Nitrogen Supply Capability .................................................... 10Regional Nitrogen Fertilizer Demand ..................................................... 11Regional Industrial and Feed Nitrogen Demand .................................................... 12World and Regional Nitrogen Supply and Demand Balances .................................................... 13
PHOSPHATE SUPPLY AND DEMAND BALANCES ................................................... 17
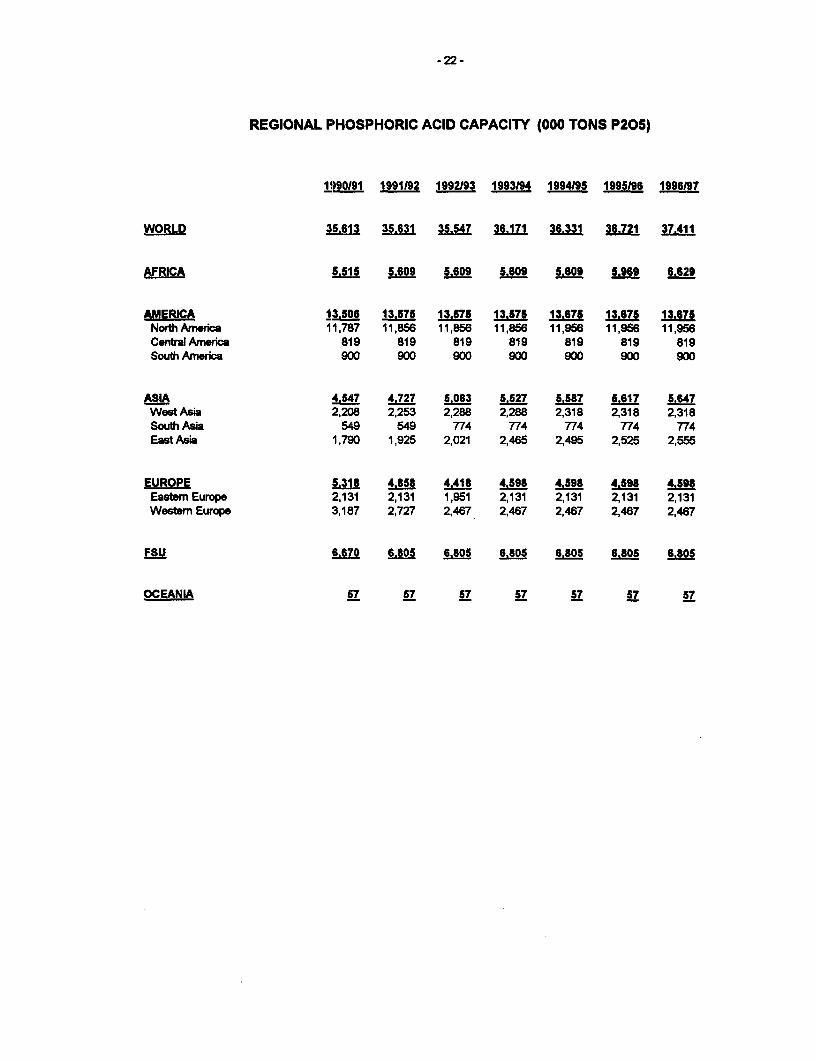
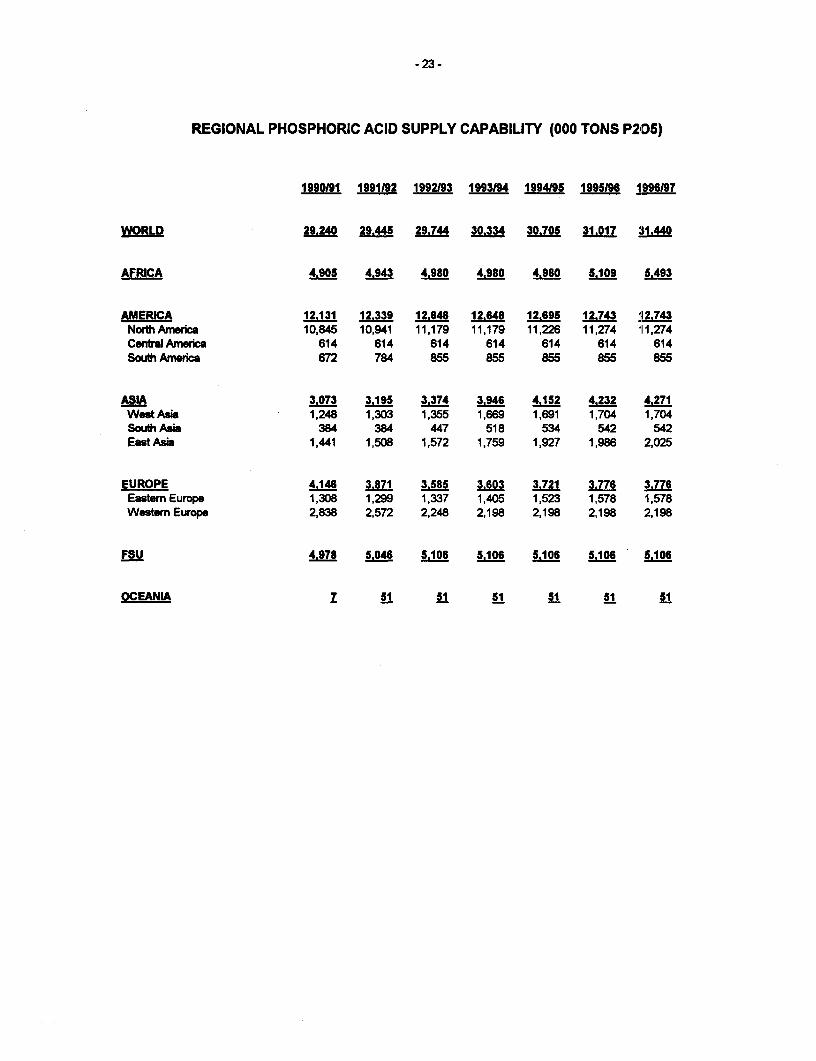
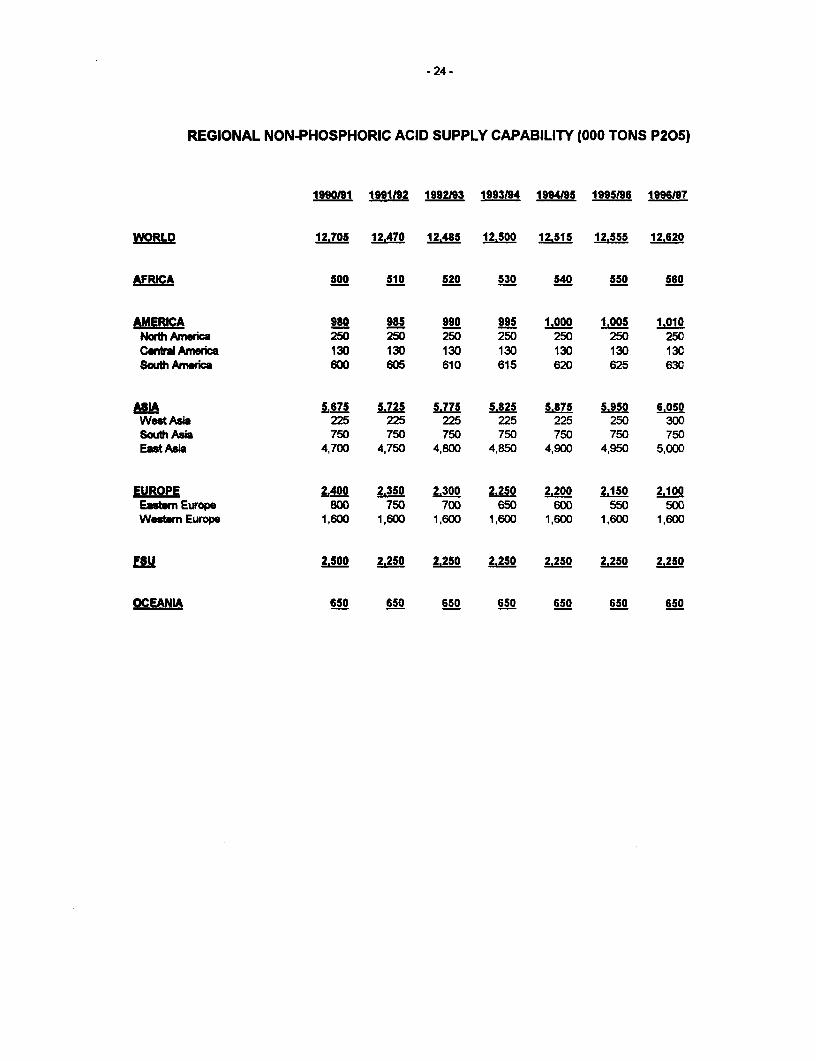
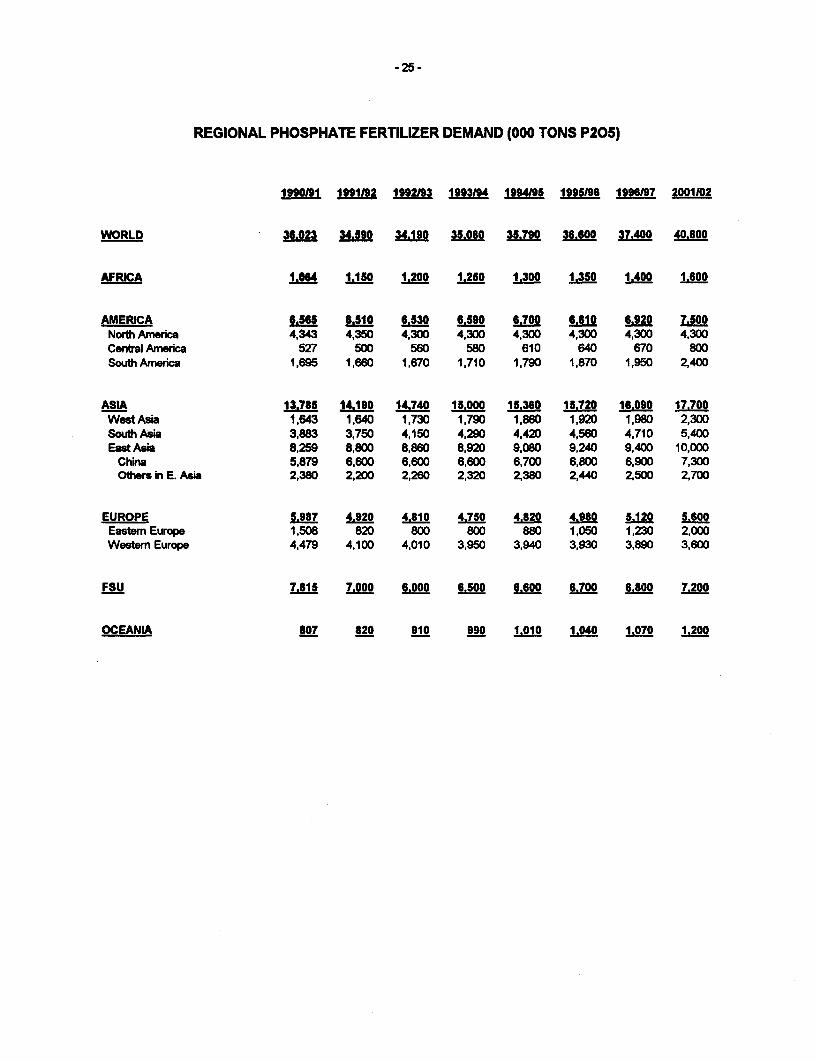
Country Phosphoric Acid Capacity ................................................... 18Country Phosphoric Acid Supply Capability ................................................... 20Regional Phosphoric Acid Capacity ................................................... 22Regional Phosphoric Acid Supply Capability ................................................... 23Regional Non-Phosphoric Acid Supply Capability ................................................... 24Regional Phosphate Fertilizer Demand ................................................... 25Regional Non-Fertilizer Phosphoric Acid Demand ................................................... 26World and Regional Phosphate Supply and Demand Balances ................................................. 27
POTASH SUPPLY AND DEMAND BALANCES .................................................... 31
Country Potash Mine Capacity .................................................... 32Country Potash Mine Supply Capability .................................................... 33Regional Potash Fertilizer Demand .................................................... 34Regional Technical Grade Potash Production .................................................... 35World and Regional Potash Supply and Demand Balances .................................................... 36

I
I
INTRODUCTION
The World Bank/FAO/UNIDO/lndustry Fertilizer Working Group (the "Group") includes a numberof specialists who are experienced in the analysis of trends in the production and consumption of thethree main fertilizer nutrients (nitrogen, phosphate and potash) and fertilizer raw materials. Othermembers of the Group represent major industrial associations of the nitrogen, phosphate, potash andsulfur industries. Technical, production, marketing and agricultural interests are also represented withinthe Group.
Usually, the Group meets twice a year. However, special meetings may be convened, if andwhen major changes in the intemational fertilizer supply and demand pattern call for an interim update ofthe most recent forecast balances. The first (i.e. preparatory) meeting is held in early spring followingthe availability of the official FAO fertilizer production, consumption and trade figures for the previousyear.
The capacity and supply capability of the main fertilizer raw materials and intermediates arecalculated on a country by country basis and take into account the phasing-in of new plants, anticipatedplant utilization rates and idle capacity. Because some of these raw materials are also used for purposesother than fertilizers, their industrial consumption is subtracted from the supply capability to arrive atavailability for fertilizer use; further, allowances are made for processing and distribution losses. Theresultant figure is the potential fertilizer supply capability at the farm level.
Demand projections are the consensus of the Group and take into account a variety ofmethodologies, including trend analyses, market surveys, agricultural programs and, for some largecountries, econometric modeling. Other economic factors that are taken into account by the Groupinclude the impact of oil and agricultural prices on fertilizer demand and the possible constraints arisingfrom environmental legislation. Policy issues and agricultural programs in the major fertilizer consumingcountries are also taken into consideration. Of particular importance to both fertilizer demand and tradeare current political and economic changes that are taking place, especially in Eastern Europe and theformer Soviet Union (FSU).
Before the preparatory meeting, the Group makes contact with fertilizer experts in major fertilizerconsuming and producing countries and asks them for their most recent views on the fertilizer situation intheir country or region. Their valued comments form an important and integral part of the discussions atthe preparatory meeting.
Through their work in the agricultural and industrial sectors of many developing countries andareas that may not always be fully accessible to other groups, the participating international agencies areoften able to bring unique experience and knowledge to the Group.
The Working Group operates in an informal manner and members are encouraged to discussavailable data freely before a consensus is taken. Generally, anyone representing a major fertilizerinterest is welcome to join the Working Group, provided he or she is willing and able to make a positivecontribution to the work. A wide geographical membership is encouraged. Representatives from thePeople's Republic of China, the former Soviet Union (FSU) and Eastem European countries haveattended the meeting from time to time and arrangements are underway to secure representation fromthese areas on a regular and permanent basis.
It is understood that the forecasts of the Working Group do not necessarily reflect the detailedviews of all members of the Group or their associations. A particular strength of the Working Group isthat it is prepared to take all views into account, but has no obligations other than that an objectiveconsensus be reached after all relevant issues have been discussed.
-vi -
The World Bank acts as the custodian of the fertilizer data base that has been developed andmaintained by the Group. With the help of other members of the Group, the Bank regularly prepares theupdated regional and global supply/demand balances, typically for 5-year periods.
The second (i.e. main) meeting of the Working Group takes place about 1-2 months after thepreparatory meeting and comprises a much larger gathering. The meeting is hosted and chaired in tumby the World Bank, FAO and UNIDO. The fertilizer supply and demand balances are discussed andupdated if required in the light ol further information then available before publication. Followingnumerous requests from the intemational community for ensuring that the new projections prepared bythe Group are timely made available for world-wide distribution in order to obtain the maximum benefit ofmost recent information, the World Bank has undertaken to publish, on behalf of the Fertilizer WorkingGroup, the annual fertilizer supply and demand balances as soon as they have been finalized after therelevant main annual meetings.
Subsequently, an analysis of the conclusions of the Group is usually published by FAO as part ofits annual "Fertilizer Review and Outlook" that is available in several languages and receives world-widecirculation.
Historical Backaround
In 1974, the world experienced its worst fertilizer crisis ever with prices rising several-fold tounprecedented levels. Many farmeirs in developing countries could no longer afford to buy or justify theuse of fertilizers. Undoubtedly, one of the factors aggravating the problem was the lack of reliableinformation on supply and demand forecasts for fertilizer materials. Projections from the internationalagencies and fertilizer industry associations varied widely and a common view was that the worid washeading for a catastrophic shortage of fertilizers. Consequently during 1974, many countries, bothdeveloping and developed, bought considerably more than their actual requirements for fertilizers andfertilizer raw materials and thus induced significant changes in intemational trade patterns.
At the World Food Conference held in Rome in November 1974 to discuss the food and fertilizercrisis, it was recognized that there was an urgent need for authoritative and reliable information on thesupply and demand of fertilizers which could be disseminated widely throughout the world. Such dataprovide a valuable input for planning and decision making, assist developing countries in assessing thetrue state of the market and help planners of new capacity to make better decisions so as to minimizesurges in supply and demand.
One of the recommendations of the World Food Conference was that the intemational agenciesconcerned, as a matter of urgency, should establish and maintain an authoritative analysis of themedium and long term fertilizer supply and demand situation and provide information that would assist inavoiding major imbalances between supply and demand.
Since the beginning of 1975, the World Bank, FAO and UNIDO, in association with otherintemational fertilizer agencies and representatives from the international fertilizer industry, have beenresponsible for maintaining a fertilizer data base and providing five year forecasts of world and regionalsupply and demand balances through the World Bank/FAO/UNIDO/lndustry Fertilizer Working Group.
-vii -
Membership of the Fertilizer Workina Group
Preparatorv Meeting
Representation at the preparatory meeting is relatively small and currently comprises fertilizerexperts from the following organizations:
- Intemational Fertilizer Industry Association (IFA)- Intemational Fertilizer Development Center (IFDC)- National Fertilizer & Environmental Research Center (TVA)- European Fertilizer Manufacturers Association (EFMA)
(represented by NITREX)- United Nations Industrial Development Organization (UNIDO)- Food and Agriculture Organization of the UN (FAO)- The World Bank (IBRD)- Canpotex Limited- Kali und Salz AG
All of these organizations maintain their own comprehensive data bases on fertilizers from whichinformation is available to the Group.
Main Meeting
Many fertilizer organizations attend the main meetings regularly or on an occasional basis, eitherto participate in the discussions or to present papers of topical interest to the Group. Theseorganizations include the following:
International Organizations:
- Food and Agricultural Organization of the UN (FAO)- United Nations Industrial Development Organization (UNIDO)- The World Bank (IBRD)- intemational Fertilizer Development Center (IFDC)- Intemational Food Policy Research Institute (IFPRI)- Fertilizer Industry Advisory Committee (FIAC)- Intemational Potash Institute (IPI)- The Sulphur Institute (TSI)- The World Phosphate Institute (IMPHOS)- Potash and Phosphate Institute (PPI)
Regional and National Organizations
- Fertilizer Advisory, Development and Information Network for Asia and the Pacific (FADINAP)- Arab Federation of Chemical Fertilizer Producers (AFCFP)- Association for the Use of Fertilizers, Brazil (ANDA)- European Fertilizer Manufacturers Association (EFMA)- Fertilizer Association of India (FAI)- Japan Urea & Ammonium Sulphate Industry Association (JUASIA)- The Fertilizer Institute of the USA (TFI)- The American Phosphate Foundation (APF)
Trade Associations
- Canpotex Limited- European Fertilizer Exporters (NIT1REX)- Prism Sulphur Corporation (as successor of Canada Sulphur Exporers, CANSULEX)
Govemment Agencies
- US Bureau of Mines (USBM)- US Department of Agriculture (USDA)- National Fertilizer & Environmental Research Center, USA- State Institute of Nitrogen Industry, FSU (GIAP)- Ministry of Chemical Industry, China
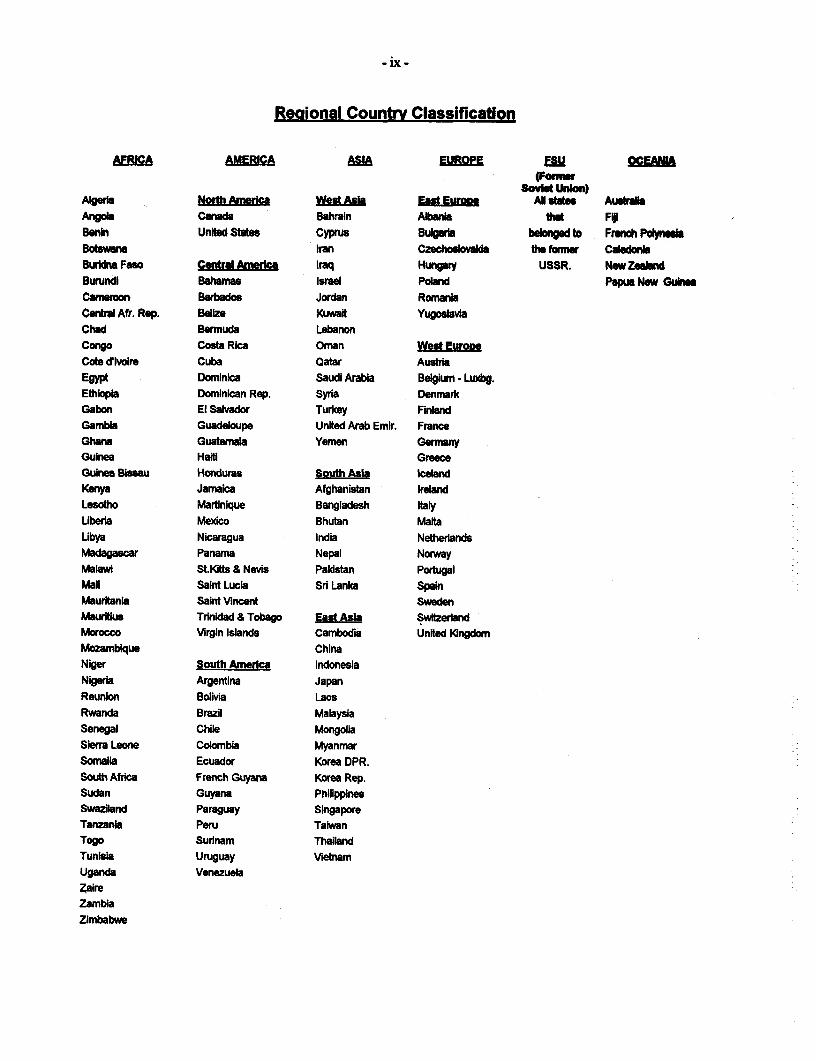
Reaional Country Classification
Until 1991, the Fertilizer Working Group followed the FAO economic classification. In 1991,following political and economic changes in many centrally planned economies, FAO revised its fertilizercountry classification. Consequently, the Fertilizer Working Group also decided to revise itsclassification and move to a geographical classification. This new dassification is compatible with theFAO geographic classification and with geographic classifications maintained by other fertilizer agencies.
-Lx-
Regional Country Classification
AFRICA AMERICA AMA EUROPE FSU OEAMA(Fonnw
Sovie UnbnAlgerba No An Wes Asi East Europe All sds AustraliAngok Canada Bahraln Albania #t FBenin Unibd States Cyprus Buirib beWgd to Frch PlyeaBotwana Iran Czechoeload the forme CabedonlaButlkna Faso AmeCica Iraq Hungay USSR. New ZeandBurundi Bahamas Israel Poband Papua New GuineaCameoon Barbados Jordan RomaniaCentral Afr. Rep. Belize Kuwait YugosaviChad Bermuda LebanonCongo Costa Rica Oman West EuropeCote dcire Cuba Qatar AustriaEgypt Dominica Saudi Arabia Belgium - Luxbg.Ethiopia Dominican Rep. Syria DenmarkGabon El Salvador Turkey FinbndGambia Guadeloupe United Arab Emir. FranceGhana Guatemala Yemen GermanyGuinea Ham GreeceGuiea Bbaau Honduras South Asiia IcelandKenya Jamaica Afghanistan IrelndLesotho Martinique Bangladesh ItalyUberia Mexico Bhutan MaltaUbya Nicaragua India NetherlandsMadagasr Panama Nepal NorwayMa.hwi StJGlts & Nevis Paldstan PortugalMaN Saint Lucia Sri Lanka SpainMauritania Saint Vmncent SwedenMaurkius Trinidad & Tobago East Asia SwitzerlandMorocco Virgin Islands Cambodia United KingdomMozambique ChinaNiger South Anerica IndonesiaNieria Argentina JapanReunion Bolivia LaosRwanda Brazil MalaysiaSenegal Chile MongoliaSierra Leone Colombia MyanmarSomalia Ecuador Korea DPR.South Africa French Guyana Korea Rep.Sudan Guyana PhilippinesSwaziland Paraguay SingaporeTanzania Peru TaiwanTogo Surinam ThailandTunisia Uruguay VietnamUganda VenezuelaZaireZambiaZimbabwe
Introduction to the Tables
The World Bank/FAO/UNIDO/lndustry Fertilizer Working Group has updated its forecasts ofworld and regional fertilizer nutrient supply and demand balances. The supply potential calculated in thetables is the supply that would be available from xsting capacities without any marketconstraints. Recent developments in Eastem Europe and the former Soviet Union have been takeninto account and due consideration was also given to current and anticipated constraints in fertilizerrelated sectors, such as agriculture, energy and infrastructure. Fetrllzer demand Is the projectedeffve market requirement and is not necessarily Identfcal with projected agronomic feitilizerneeds.
General Notes on Terminologv
Capacity:Refers to nominal or name-plate capacity of ammonia plants, phosphoric plants or potash mines.Effective capacity is nominal capacity less an allowance for capacity that has not been fullyrealized during the phasing-in of new plants. Idle plants that have the potential for resumingoperation are included in nominal capacity. Effective capacity and supply capability does notinclude idle capacity. Shorter periods of non-operation are accounted for in the utilization rates.
Supply Capability:Is the total production supply capability for either ammonia, phosphoric acid or potash. It isestimated by applying forecasts of specific country operating rates to effective capacity.Projected operating rates ireflect past performance and take into account anticipated futuretechnical improvements or otherwise. No market constraints to production are assumed inprojecting operating rates.
Fertilizer Supply Potential:Is derived from supply capability. First, non-fertilizer use is subtracted, followed by processinglosses, where appropriate. Fertilizers available from other sources are added to yield fertilizersupply potential. Allowance is made for distribution losses and stock changes.
Balances (-Deficits):A nutrient balance or deficit is obtained by subtracting fertilizer consumption from fertilizer supplypotential. It shows the difference between fertilizer supply potential and demand, assuming nomarket constraints to production. Care is needed in comparing balances from different sourcesin absolute terms as they may vary significantly depending on assumptions made for capacities,utilization rates, losses etc. Also, projected balances may often not be realized in practice,particularly in those cases where a negative balance is indicated and demand has to adjust tomeet available supply. In a surplus situation, supply will be adjusted downwards by operating atrates below the supply potential.
The main function of the balances is to help estimating future trends in the supply and demandrelationship based on a consistent set of assumptions compared with existing and past situations.These trends provide usefuil information on the market place and the need for new productioncapacity.
Time Reference:Data refer to the fertilizer year July 1 - June 30. For countries that report their fertilizer statisticson a calendar year basis, data are shown under the fertilizer year, the first part of whichcorresponds to the calendar year, i.e. 1988 calendar year data are shown under fertilizer year1988/89.
-xi-
Units:All figures are given in metric tons of plant nutrients: N, P205 and K20. The terms "P205 " and"K20 are conventionally used to express the fertilizer nutrients "phosphate" and *potash". Theyrepresent the oxides of the elements P and K.
To convert oxides to elements:multiply P205 value by 0.4364;multiply K20 value by 0.8302.
To convert elements to oxides:multiply P value by 2.2914;multiply K value by 1.2046.
Owing to rounding, individual figures may not add up to the totals.
Notes on Nitroaen
New ammonia capacities are phased-in as 80%-90%-1 00% of nominal capacity for the first threefull years of operation. Expansions are phased-in over a two year period.
Non-fertilizer use of ammonia includes industrial uses and ammonia for production of animalfeed. As nitrogen recovered as ammonium sulfate has already been included in the fertilizerconsumption forecast, it is not listed under non-fertilizer ammonia.
The processing loss of ammonia in the production of nitrogenous fertilizers is assumed to be3.5% on average.
Sources for non-ammonia nitrogen are coke oven gases, cyanamid and mineral nitrates.
The nitrogen fertilizer supply potential is assumed to be 95.5% of the total fertilizer nitrogensupply capability. This percentage is based on the average historical difference between total nitrogenfertilizer consumption and production for the last five years as recorded in the respective FAO FertilizerYearbooks and takes account of transport and distribution losses and stock changes. It also accounts forthe fact that in some cases (for example China) consumption is recorded as apparent consumption (i.e.net imports plus production) rather than actual.
Notes on PhosDhate
New phosphoric acid capacities are phased-in as 80%-90%-100% of nominal capacity for thefirst three full years of operation. Expansions are phased-in over a two year period.
Non-fertilizer phosphoric acid consumption includes wet process phosphoric acid for industrialuse in detergents, phosphate chemicals etc. and for animal feedstuff.
The processing and conversion loss of phosphoric acid in the manufacture of phosphatefertilizers is assumed to be 4.0% on average.
Other P205 production includes all other phosphates not derived directly from phosphoric acidsuch as single superphosphate, basic slag, thermal phosphates, nitrophosphates, ground phosphate rockused for direct application as fertilizer, but excludes phosphoric acid feed and the secondary rock in triplesuperphosphates. Production is based on existing capacity and projected changes in capacity.
- xii -
Phosphate fertilizer supply potential is assumed to be 97.0% of total fertilizer phosphate supplycapabiliTy. It Is based on the average historical difference between total phosphate fertilizer consumptionand production for the last five years as recorded in the respective FAO Fertilizer Yearbooks. Thisstatistical adjustment accounts for transport and distribution losses, and stock changes. It also accountsfor the fact that In some cases (for example China) consumption is recorded as apparent consumption(i.e. net imports plus production) rather than actual.
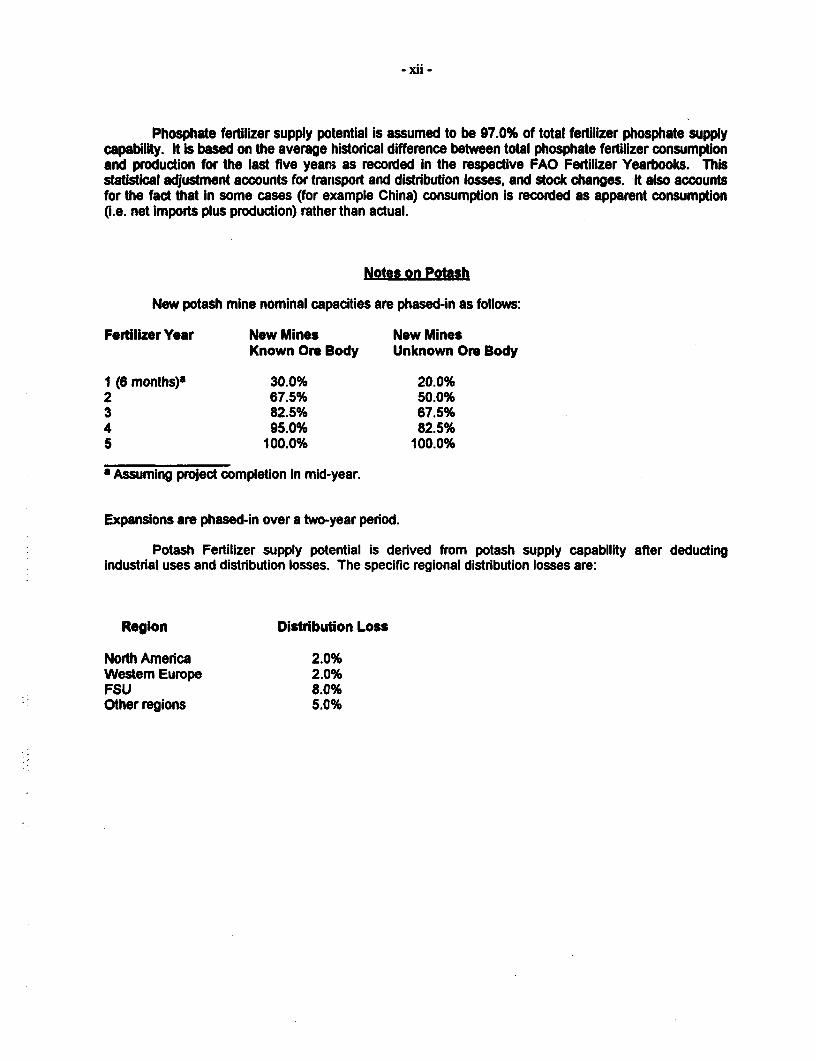
Notes on Potash
New potash mine nominal capacities are phased-in as follows:
Fertilizer Year New Mines New MinesKnown Ore Body Unknown Ore Body
1 (6 months)' 30.0% 20.0%2 67.5% 50.0%3 82.5% 67.5%4 95.0% 82.5%5 100.0% 100.0%
-Assuming project completion in mid-year.
Expansions are phased-in over a two-year period.
Potash Fertilizer supply potential is derived from potash supply capability after deductingindustrial uses and distribution losses. The specific regional distribution losses are:
Region Distribution Loss
North America 2.0%Westem Europe 2.0%FSU 8.0%Other regions 5.0%
-xiii -
This Technical Paper reflects the most recent fertilizer supply and demand projections preparedby the Wortd Bank/FAO/UNIDOflndustry Fertilizer Working Group at its 1992 annual meeting, held inBangkok, Thailand, from June 1-3, 1992.
The Group welcomes suggestions and comments on the improvement of its fertilizer supply anddemand balances. Any communication relating to the Group's activities and its supply and demandforecasts should be addressed to The World Bank, Asia Technical Department, for the attention of Mr.Kurt M. Constant, 1818 H Street, N.W., Washington, D.C. 20433, USA, telephone (202) 458-2708,telefax (202) 477-0685.
The contents of this paper should, however, not be attributed to the World Bank, to its affiliatedorganizations, or to any Individual acting on their behalf.

NITROGEN SUPPLY AND DEMAND BALANCES
1990191 - 1996197
-2 -
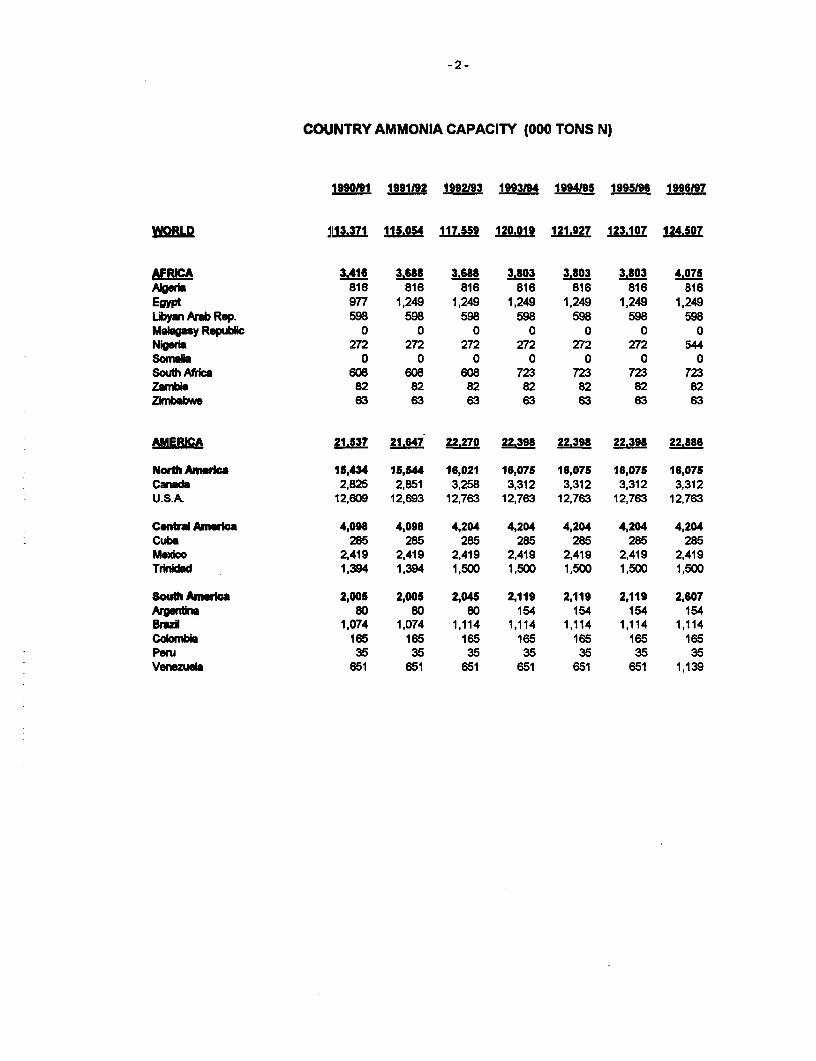
COUNTRY AMMONIA CAPACITY (000 TONS N)
1990191 1991/92 1992/93 1993194 1994195 1995/96 1996197
WORLD 1113.371 115.OS4 117.SS9 120.019 121.927 123.107 124.S07
AFRCA 3.416 3.688 3.688 3.803 3.803 3.803 4.075Algria 816 816 816 816 816 816 816Egypt 977 1,249 1,249 1,249 1,249 1,249 1,249Libyan Arab Rep. 598 598 598 598 598 598 598Maldgay Republic 0 0 0 0 0 0 0Nigeria 272 272 272 272 272 272 544Somalia 0 0 0 0 0 0 0South ica 608 608 608 723 723 723 723Zanbia 82 82 82 82 82 82 82Zimbabwe 63 63 63 63 63 63 63
AMERICA 21.537 21.647 22,270 22.398 22.398 22.398 22.886
Nouth America 15,434 15,544 16,021 16,075 18,075 16,075 16,075Canada 2,825 2,851 3,258 3,312 3,312 3,312 3,312U.S.A. 12,609 12,693 12,763 12,763 12,763 12,763 12,763
Centa AnmeIca 4,098 4,098 4,204 4,204 4,204 4,204 4,204Cuba 285 285 285 285 285 285 285Mexdoo 2,419 2,419 2,419 2,419 2,419 2,419 2,419Trinidad 1,394 1,394 1,500 1,500 1,500 1,500 1,500
South Ameica 2,005 2,005 2,045 2,119 2,119 2,119 2,607Argenina 80 80 80 154 154 154 154Bra 1,074 1,074 1,114 1,114 1,114 1,114 1,114Colombia 165 165 165 165 165 165 165Peru 35 35 35 35 35 35 35Veneelab 651 651 651 651 651 651 1,139
-3-
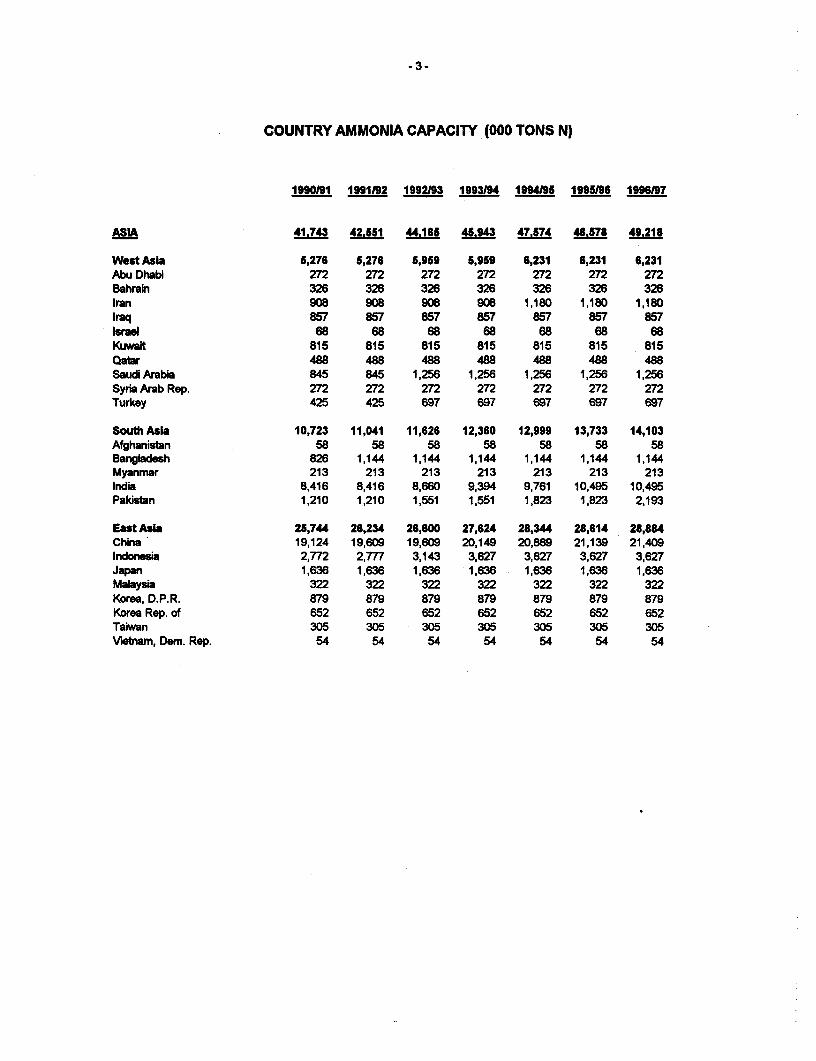
COUNTRY AMMONIA CAPACITY (000 TONS N)
1990/I 1991192 1992193 1993194 1994195 1995/96 1996197
ASIA 41.743 42.5S1 44.185 4.94 47.574 48.578 49.218
West Asia 5,276 5,276 5,959 5,959 6,231 6,231 6,231Abu Dhabi 272 272 272 272 272 272 272Bahrain 326 326 326 326 326 326 326Iran 908 908 908 908 1,180 1,180 1,180Iraq 857 857 857 857 857 857 857lual 68 68 68 68 68 68 68Kuwait 815 815 815 815 815 815 815Qatar 488 488 488 488 488 488 488Saudi Arabia 845 845 1,256 1,256 1,256 1,256 1,256Syria Arab Rep. 272 272 272 272 272 272 272Turkey 425 425 697 697 697 697 697
South Asia 10,723 11,041 11,626 12,360 12,999 13,733 14,103Afghanistan 58 58 58 58 58 58 58Bangadesh 826 1,144 1,144 1,144 1,144 1,144 1,144Myanmar 213 213 213 213 213 213 213India 8,416 8,416 8,660 9,394 9,761 10,495 10,495Pakistan 1,210 1,210 1,551 1,551 1,823 1,823 2,193
East Asia 25,744 26,234 26,600 27,624 28,344 28,614 28,884China 19,124 19,609 19,609 20,149 20,869 21,139 21,409Indonesia 2,772 2,777 3,143 3,627 3,627 3,627 3,627Japan 1,636 1,636 1,636 1,636 1,636 1,636 1,636Malaysia 322 322 322 322 322 322 322Korea, D.P.R. 879 879 879 879 879 879 879Korea Rep. of 652 652 652 652 652 652 652Taiwan 305 305 305 305 305 305 305Vietnam, Dem. Rep. 54 54 54 54 54 54 54
-4-
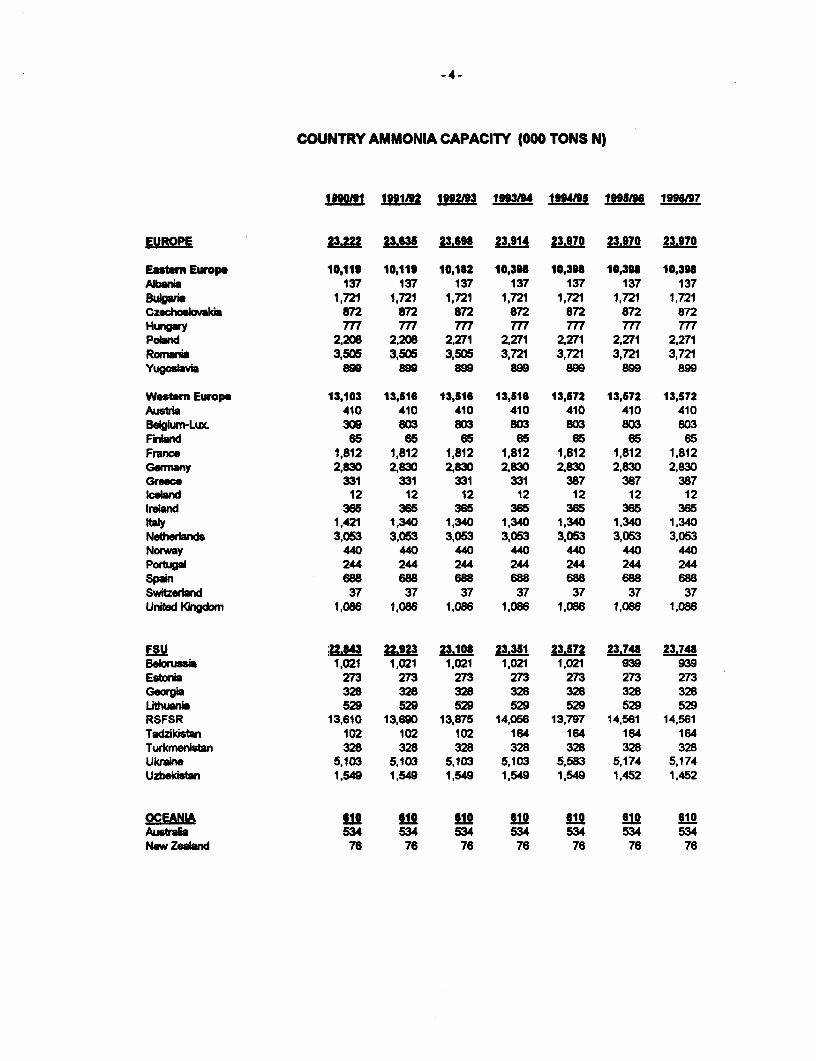
COUNTRY AMMONIA CAPACITY (000 TONS N)
19Wft1 19i1192 "2193 1993 99495 1995196 1996197
EUROPE 2.2 ,23.B35 p.B98 23.914 23.370 23.970 23.970
Eastem Europe 10,119 10,119 10,182 10,39 10,398 10,398 10,398Abania 137 137 137 137 137 137 137Bugaia 1,721 1,721 1,721 1,721 1,721 1,721 1,721Czechosakima 872 872 872 872 872 872 872Hungay 777 777 777 777 777 777 777PoIand 2,206 2,208 2,271 2,271 2,271 2,271 2,271Romsani 3,505 3,505 3,505 3,721 3,721 3,721 3,721Yugosavia 899 899 899 899 899 899 899
Western Europe 113,103 13,516 13,516 13,516 13,572 13,572 13,572A.stra 410 410 410 410 410 410 410Beiunm-Lux 309 803 803 803 803 803 803Fkiand 65 65 85 65 65 65 65France 1,812 1,812 1,812 1,812 1,812 1,812 1,812
wermany 2,830 2,830 2,830 2,830 2,830 2,830 2,830Greec 331 331 331 331 387 387 387kceand 12 12 12 12 12 12 12Ireand 365 365 365 365 365 365 365Ihay 1,421 1,340 1,340 1,340 1,340 1,340 1,340Ne#miands 3,053 3,053 3,053 3,053 3,053 3,053 3,053Norway 440 440 440 440 440 440 440Portual 244 244 244 244 244 244 244Spain 688 688 688 688 688 688 688Swizerlnd 37 37 37 37 37 37 37Unied Kndom 1,086 1,086 1,086 1,086 1,086 1,086 1,086
FSU 2M 22.923 23.108 23i351 23.572 23.748 23X748Beloruesa 1,021 1,021 1,021 1,021 1,021 939 939Estnia 273 273 273 273 273 273 273Georgia 328 328 328 328 328 328 328Lthuania 529 529 529 529 529 529 529RSFSR 13,610 13,690 13,875 14,056 13,797 14,561 14,561Tadfikb*an 102 102 102 164 164 164 164Turkmeni*an 328 328 328 328 328 328 328Ukraine 5,103 5,103 5,103 5,103 5,583 5,174 5,174Uzbekistan 1,549 1,549 1,549 1,549 1,549 1,452 1,452
OCEANI 610 610 10 610 610 610 610Ausbal 534 534 534 534 534 534 534NeWZealand 76 76 76 76 76 76 76
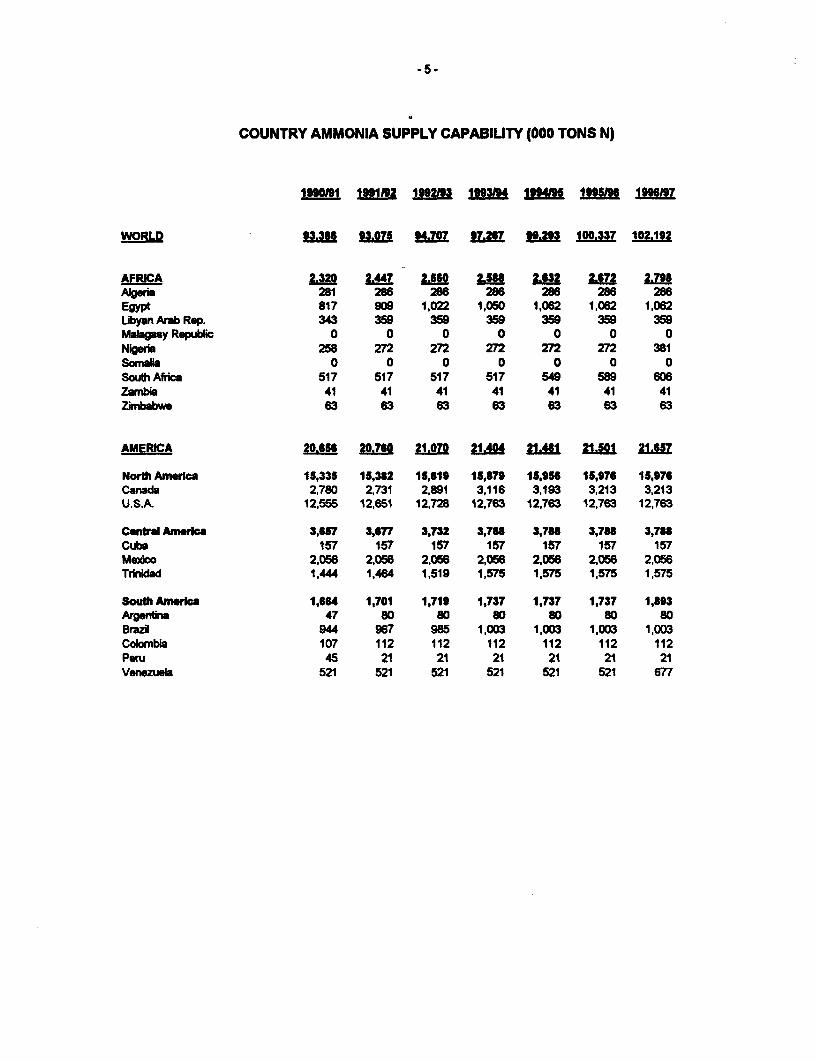
COUNTRY AMMONIA SUPPLY CAPABIUTY (000 TONS N)
rN0I9 1fl9 J92j jflH 1f41999/ 51W 1N 1996197
WORLD 933*f H! 34.707 97.217 MM 100.337 102.192
AFRICA 2.2 " 2.560 2!l 23j Z!7 2.798AIeria 281 286 286 288 286 286 288Egypt 817 90 1,022 1,050 1,062 1,082 1,082Ubyan Arab Rep. 343 359 359 359 359 359 359MaI.gasy Republ 0 0 0 0 0 0 0Nigera 258 272 272 272 272 272 361Somlia 0 0 0 0 0 0 0South A*ica 517 517 517 517 549 589 606Zawnbi 41 41 41 41 41 41 41Zimbabwe 63 63 63 63 63 63 63
AMERICA 20.656 2 21.070 21.404 21.481 21.501 21.SS7
North Amerka 15,335 15,382 15,619 15,679 15,956 15,976 15,976Caanada 2.780 2,731 2,891 3,116 3,193 3,213 3,213U.S.A. 12,555 12,651 12,728 12,763 12,763 12,763 12,763
Central America 3,67 3,677 3,732 3,768 3,78 3,78 3,788Cube 157 157 157 157 157 157 157WAxco 2,056 2,056 2,056 2,056 2,056 2,056 2,056Trindad 1,444 1,484 1,519 1,575 1,575 1,575 1,575
South Amwrica 1,6'4 1,701 1,719 1,737 1,737 1,737 1,893Argentina 47 80 80 80 80 80 80Brazl 944 967 985 1,003 1,003 1,003 1,003Colonbia 107 112 112 112 112 112 112Peru 45 21 21 21 21 21 21Venezuela 521 521 521 521 521 521 677
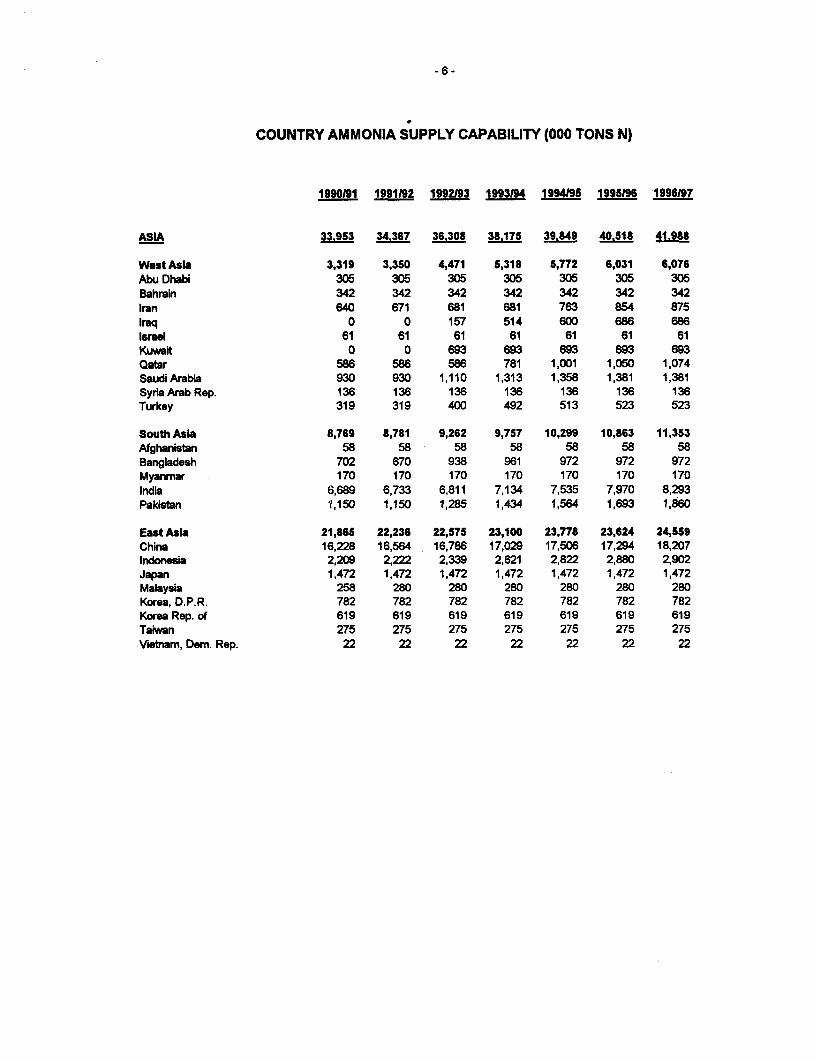
-6-
COUNTRY AMMONIA SUPPLY CAPABILITY (000 TONS N)
1990191 1991192 1992193 1993194 1994195 1995196 1996197
ASIA 33.953 34.367 36.308 38.175 39.849 40.518 41.988
West Asia 3,319 3,350 4,471 5,318 5,772 6,031 6,076Abu Dhabi 305 305 305 305 306 305 305Bahrain 342 342 342 342 342 342 342Iran 640 671 681 681 763 854 875Iraq 0 0 157 514 600 686 686Israel 61 61 61 61 61 61 61Kuwait 0 0 693 693 693 693 693Qatar 586 586 586 781 1,001 1,050 1,074Saudi Arabia 930 930 1,110 1,313 1,358 1,381 1,381SyriaArabRep. 136 136 136 136 136 136 136Turkey 319 319 400 492 513 523 523
South Asia 1,769 8,781 9,262 9,757 10,299 10,863 11,353Afghanistan 58 58 58 58 58 58 58Bangladesh 702 670 938 961 972 972 972Myanmar 170 170 170 170 170 170 170India 6,689 6,733 6,811 7,134 7,535 7,970 8,293Pakistan 1,150 1,150 1,285 1,434 1,564 1,693 1,860
East Asia 21,865 22,236 22,575 23,100 23,778 23,624 24,559China 163,228 16,564 16,786 17,029 17,506 17,294 18,207Indonesia 2,209 2,222 2,339 2,621 2,822 2,880 2,902Japan 1,472 1,472 1,472 1,472 1,472 1,472 1,472Malaysia 258 280 280 280 280 280 280Korea, D.P.R. 782 782 782 782 782 782 782Korea Rep. of 619 619 619 619 619 619 619Taiwan 275 275 275 275 275 275 275Vetnam, Dem. Rep. 22 22 22 22 22 22 22
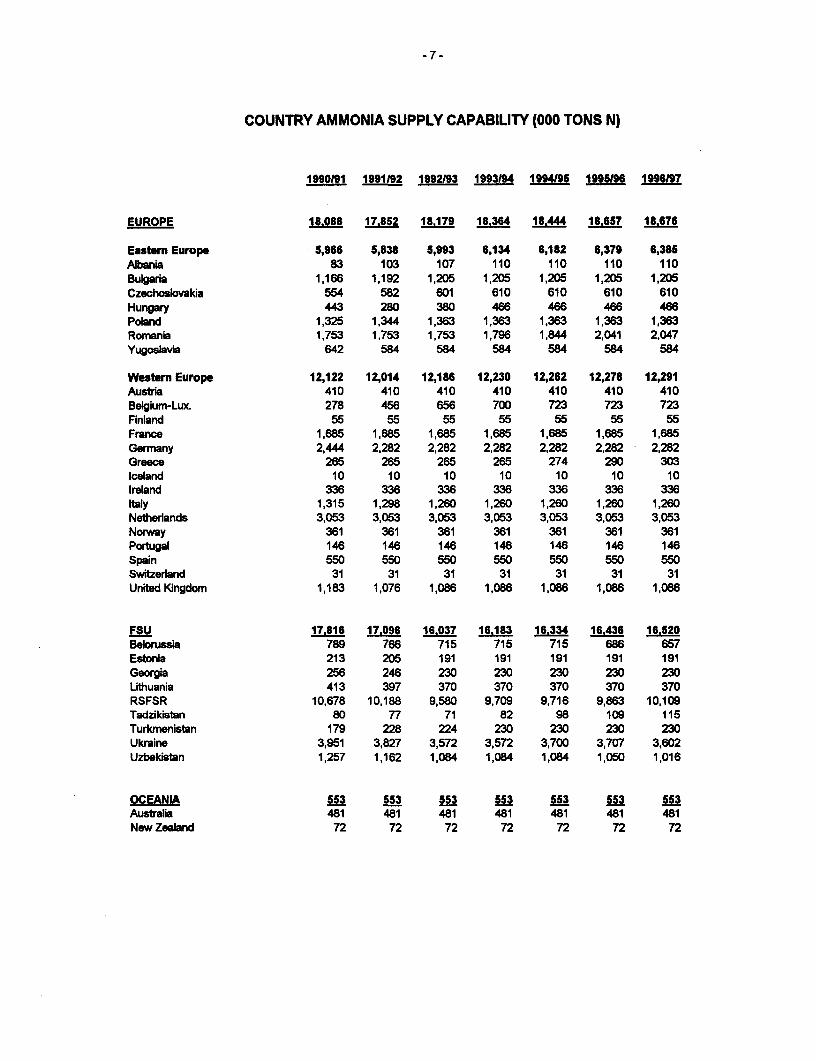
-7 -
COUNTRY AMMONIA SUPPLY CAPABILITY (000 TONS N)
1990191 1991192 1992/93 1993194 1994195 1995196 1996197
EUROPE 18.088 17.852 18.179 18.364 18.444 18.6S7 18.678
Eastern Europe 5,966 5,838 5,993 6,134 6,182 6,379 6,385Albania 83 103 107 110 110 110 110Bulgaria 1,166 1,192 1,205 1,205 1,205 1,205 1,205Czechoslovakia 554 582 601 610 610 610 610Hungary 443 280 380 466 466 466 466Poland 1,325 1,344 1,363 1,363 1,363 1,363 1,363Romania 1,753 1,753 1,753 1,796 1,844 2,041 2,047Yugoslavia 642 584 584 584 584 584 584
Western Europe 12,122 12,014 12,186 12,230 12,262 12,278 12,291Austria 410 410 410 410 410 410 410Belgium-Lux. 278 456 656 700 723 723 723Finland 55 55 55 55 55 55 55France 1,685 1,685 1,685 1,685 1,685 1,685 1,685Germany 2,444 2,282 2,282 2,282 2,282 2,282 2,282Greece 265 265 265 265 274 290 303Iceland 10 10 10 10 10 10 10Ireland 336 336 336 336 336 336 336Italy 1,315 1,298 1,260 1,260 1,260 1,260 1,260Netherlands 3,053 3,053 3,053 3,053 3,053 3,053 3,053Norway 361 361 361 361 361 361 361Portgal 146 146 146 146 146 146 146Spain 550 550 550 550 550 550 550Switzerland 31 31 31 31 31 31 31United Kingdom 1,183 1,076 1,086 1,086 1,086 1,086 1,086
FSU 17.816 17.096 16.037 16.183 16.334 16.436 16.520Beorussia 789 766 715 715 715 686 657Estonia 213 205 191 191 191 191 191Georgia 256 246 230 230 230 230 230Lithuania 413 397 370 370 370 370 370RSFSR 10,678 10,188 9,580 9,709 9,716 9,863 10,109Tadzikistan 80 77 71 82 98 109 115Turkmenistan 179 228 224 230 230 230 230Ukraine 3,951 3,827 3,572 3,572 3,700 3,707 3,602Uzbekistan 1,257 1,162 1,084 1,084 1,084 1,050 1,016
OCEANIA 553 553 553 553 553 553 553Australia 481 481 481 481 481 481New Zealand 72 72 72 72 72 72 72
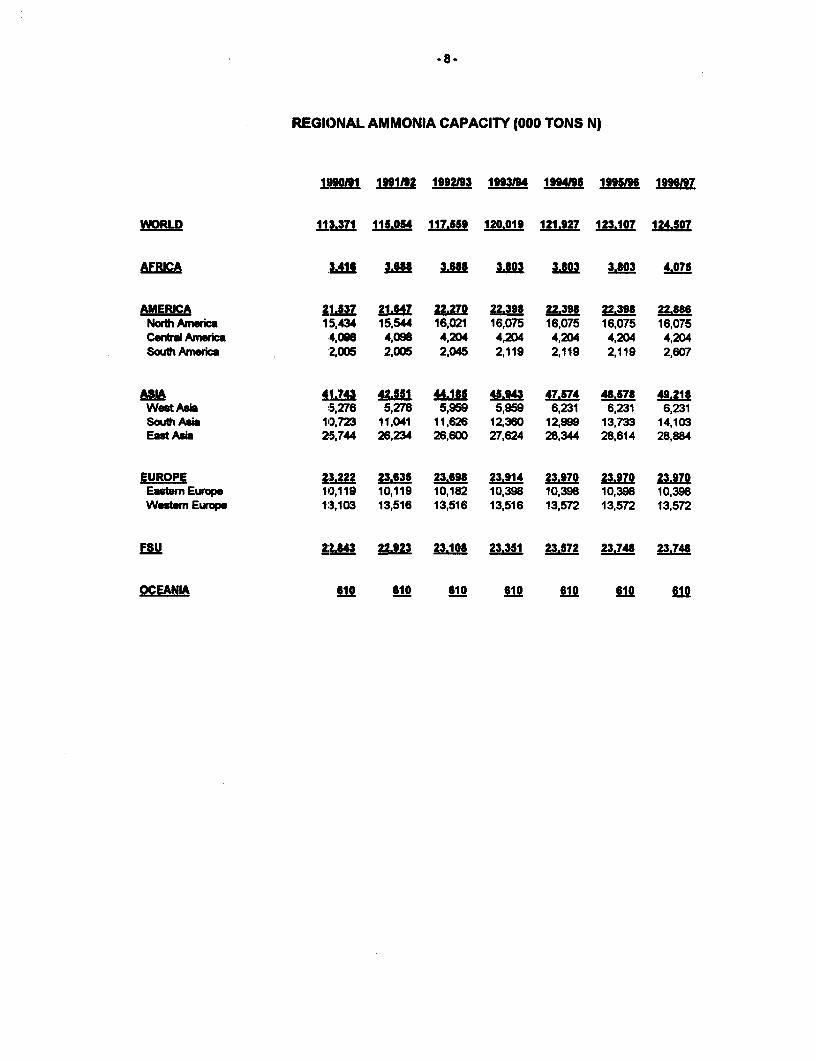
-8-
REGIONAL AMMONIA CAPACITY (000 TONS N)
1PW1 1"11111A 1992if9 1993194 1994195 1995M 1996197
WORLD 11X,371 1154 1l7J55 120.019 121.927 123.107 124.507
AFRICA SM 3.4168 3! 3l.803 L3 3.803 4.075
AMERICA 21537 21.647 22.270 22.398 22.398 22.398 22.886North Amrwica 15,434 15,544 16,021 16,075 16,075 16,075 16,075Ceinba Aneica 4,0GB 4,098 4,2D4 4,204 4,204 4,204 4,204SouthAmerica 2,005 2,005 2.045 2,119 2,119 2,119 2,607
ASIA 41. 43 45 4.185 4S.943 47.574 4f578 49.218West Asia 5,276 5,276 5,959 5,959 6,231 6,231 6,231South ASi 10,723 11,041 11,626 12,380 12,999 13,733 14,103East Asb 25,744 26,234 26,600 27,624 28,344 28,614 28,884
EUROPE 23.22 23.698 23.914 23.970 23.970 23,970Eastem Europe 10,119 10,119 10,182 10,398 10,398 10,398 10,398Wetern Europe 1:3,103 13,516 13,516 13,516 13,572 13,572 13,572
FSU Zj43 22.923 23.108 23.351 23.572 23.748 23.748
OCEANIA 610 610 3 610 610 610 610 610
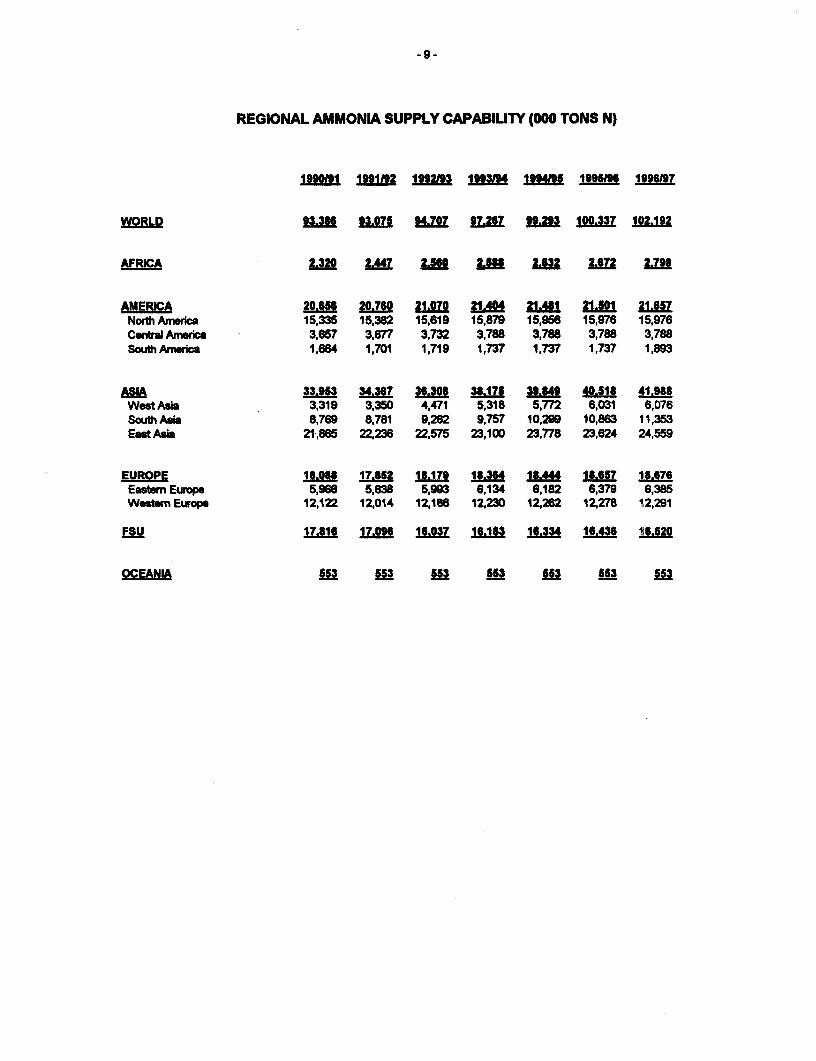
-9-
REGIONAL AMMONIA SUPPLY CAPABIUTY (000 TONS N)
199U01 1M M1 18293 1394mL 194J95 1995ri 1996197
WORLD 93,386 9u0J7S 94.707 ffMZ 99.29 100.337 102.192
AFRICA 2.320 2.447 26 2LS lm 2.79J
AMERICA 20.B5f 20.760 t.m 21A4Dl Ij241 21.51 21t657North America 15,335 15,382 15,619 15,879 15,958 15,976 15,976Centr Anerwc 3,657 3,677 3,732 3,788 3,788 3,788 3,788SouthAmerica 1,664 1,701 1,719 1,737 1,737 1,737 1,893
ASIA 33.953 S4. a"3 3J.17S a" 40.518 41.90JWest Asa 3,319 3,350 4,471 5,318 5,772 6,031 6,076South Asia 8,769 8,781 9,282 9,757 10,299 10,863 11,353East Asia 21,865 22,236 22,575 23,100 23,778 23,624 24,559
EUROPE 1i0AI 17.J52 10:179 1JI34 J.A444 15.657 18.676Eastwn Europe 5,968 5,838 5,993 6,134 6,182 6,379 6,385Wesaten Europe 12,122 12,014 12,186 12,230 12,262 12,278 12,291
FSU 17.816 17.086 16.037 InIII 16.334 16.436 16.520
OCEANIA 553 S53 553 553 53 553 553
-10-
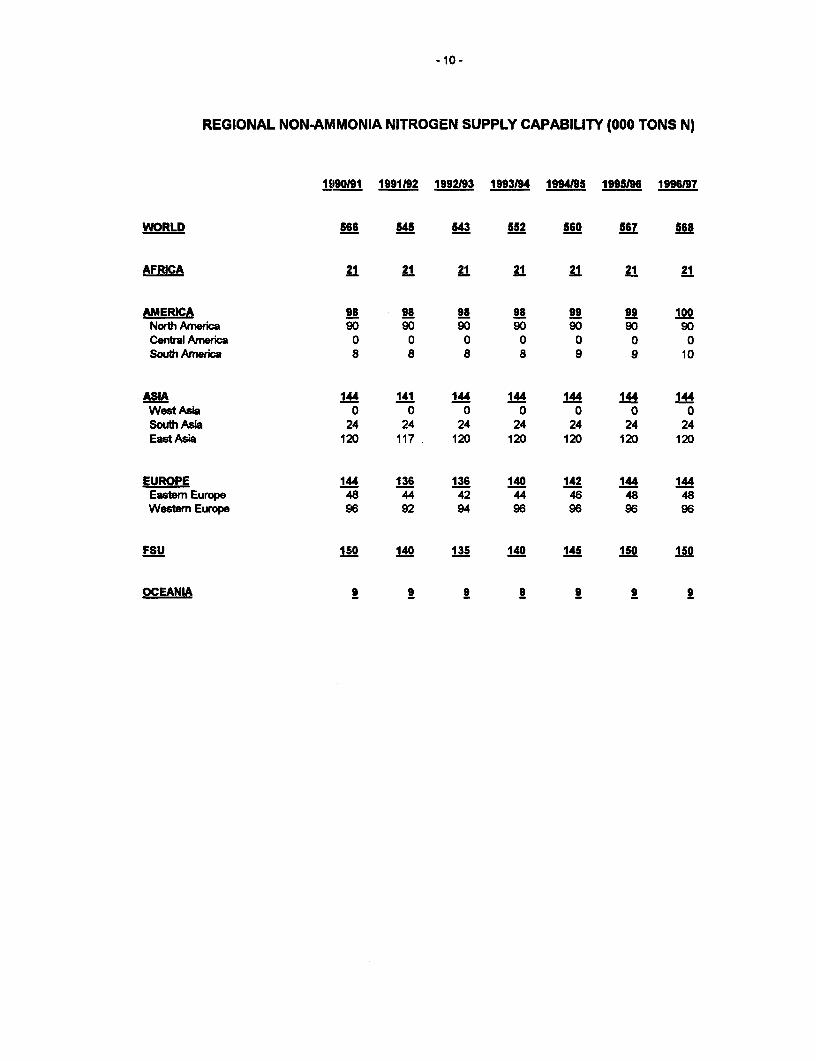
REGIONAL NON-AMMONIA NITROGEN SUPPLY CAPABILITY (000 TONS N)
1990191 1991192 1992193 1993194 1994195 1995196 1996197
WORLD Se6 545 543 552 560 567 568
AFRICA 21 21 21 21 21 21 21
AMERICA 98 98 98 98 99 99 100NorthAmOwica 90 90 90 90 90 90 90Central America 0 0 0 0 0 0 0South America 8 8 8 8 9 9 10
ASIA 144 141 144 14 144 144 144West Asia 0 0 0 0 0 0 0South Asia 24 24 24 24 24 24 24EastAsia 120 117 120 120 120 120 120
EUROPE 144 136 136 140 142 144 144Easten Europe 48 44 42 44 46 48 48Westemn Europe 96 92 94 96 96 96 96
FSU 150 140 135 140 145 150 150
OCEANIA 9 9 9 9 9
- 1 1 -
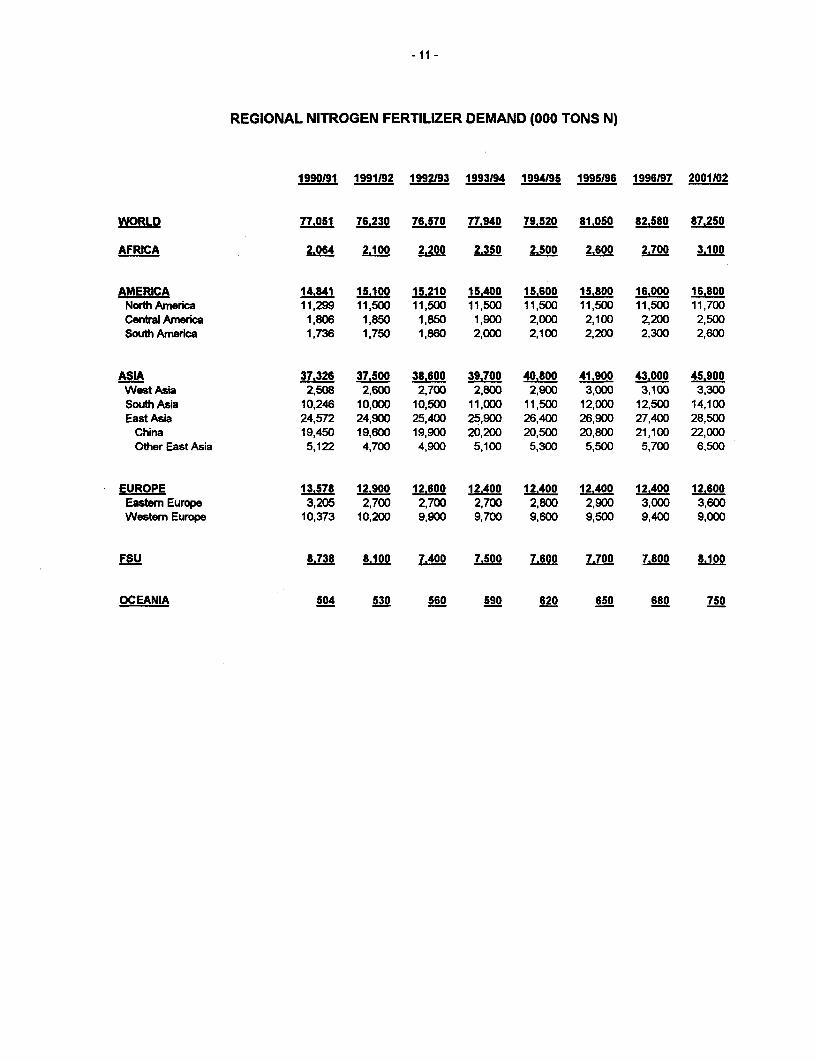
REGIONAL NITROGEN FERTILIZER DEMAND (000 TONS N)
1990191 1991192 1992193 1993194 1994195 1995196 1996197 2001102
WORLD 77.051 76.230 76.570 77.940 ZL7S MM0S 82.580 87.250
AFRICA 2.064 2.100 2.200 2.350 2.500 2,600 2.700 3.100
AMERICA 14.841 1S.100 1 15.400 1.0 15.800 16.000 16.800North America 11,299 11,500 11,500 11,500 11,500 11,500 11,500 11,700Central America 1,806 1,850 1,850 1,900 2,000 2,100 2,200 2,500South America 1,736 1,750 1,860 2,000 2,100 2,200 2,300 2,600
ASIA 37.326 37.500 38.600 39.700 40.800 41.900 43,000 45,900West Asia 2,508 2,600 2,700 2,800 2,900 3,000 3,100 3,300SouthAsia 10,246 10,000 10,500 11,000 11,500 12,000 12,500 14,100East Asia 24,572 24,900 25,400 25,900 26,400 26,900 27,400 28,500
China 19,450 19,600 19,900 20,200 20,500 20,800 21,100 22,000Other East Asia 5,122 4,700 4,900 5,100 5,300 5,500 5,700 6,500
EUROPE 13.578 12.900 12.600 12.400 12.400 12.400 12.400 12.600Eastern Europe 3,205 2,700 2,700 2,700 2,800 2,900 3,000 3,600Western Europe 10,373 10,200 9,900 9,700 9,600 9,500 9,400 9,000
FSU 8.738 8.100 7.400 7.500 7.600 7,700 L800 8.100
OCEANIA 504 530 560 590 620 650 680 750
-12-
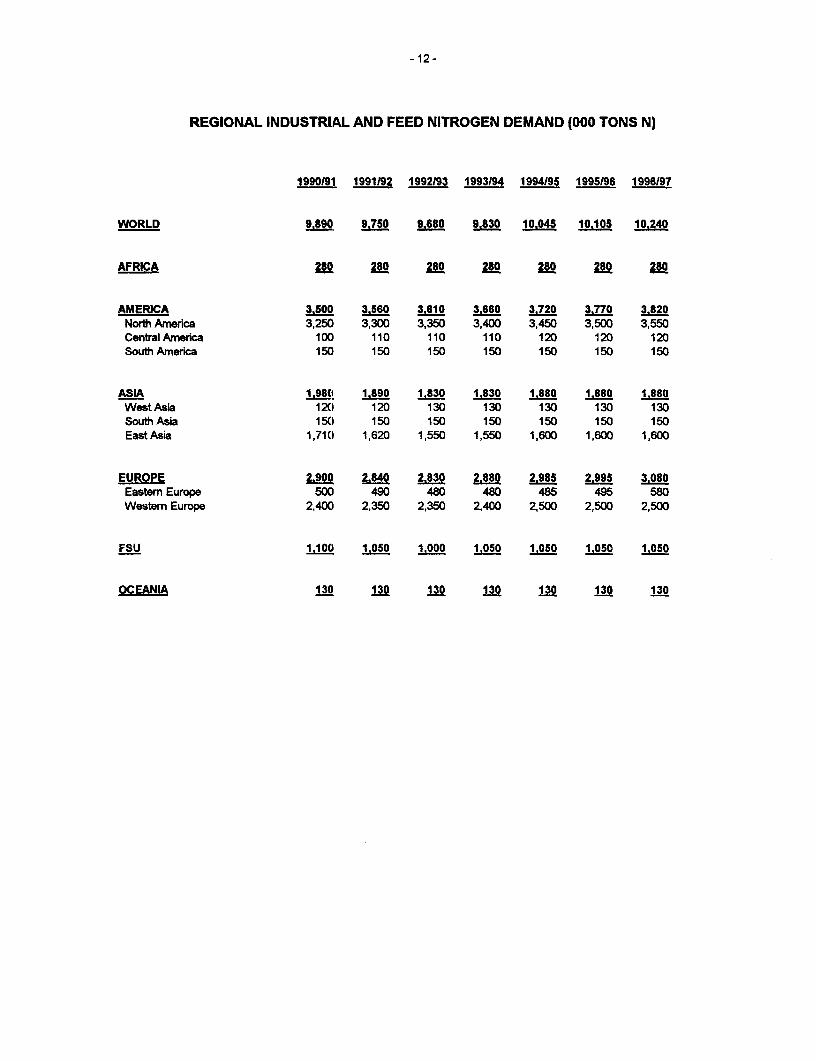
REGIONAL INDUSTRIAL AND FEED NITROGEN DEMAND (000 TONS N)
1990191 1991192 1992193 1993194 1994195 1995196 1996197
WORLD 9.890 9.750 9.680 9.830 1 04 10.10 10.240
AFRICA 280 280 280 280 280 280 280
AMERICA 3.50t 3.560 3.610 3.660 3.720 3.770 3.820North America 3,25C0 3,300 3,350 3,400 3,450 3,500 3,550Central America 10C 110 110 110 120 120 120South America 15c0 150 150 150 150 150 150
ASIA I 98q 1.890I 1.830 1.880 1.880 1.880West Asia 120 120 130 130 130 130 130South Asia 150 150 150 150 150 150 150EastAsia 1,710 1,620 1,550 1,550 1,600 1,600 1,600
EUROPE 2.90Q 2840 2 830 2.880 2.985 2.995 3.080Eastern Europe 500 490 480 480 485 495 580Western Europe 2,400 2,350 2,350 2,400 2,500 2,500 2,500
FSU I'M 1.050 1.000 1 0S0 1 0S0 1.050 1.050
OCEANIA 130 130 130 130 130 130 130
-13-
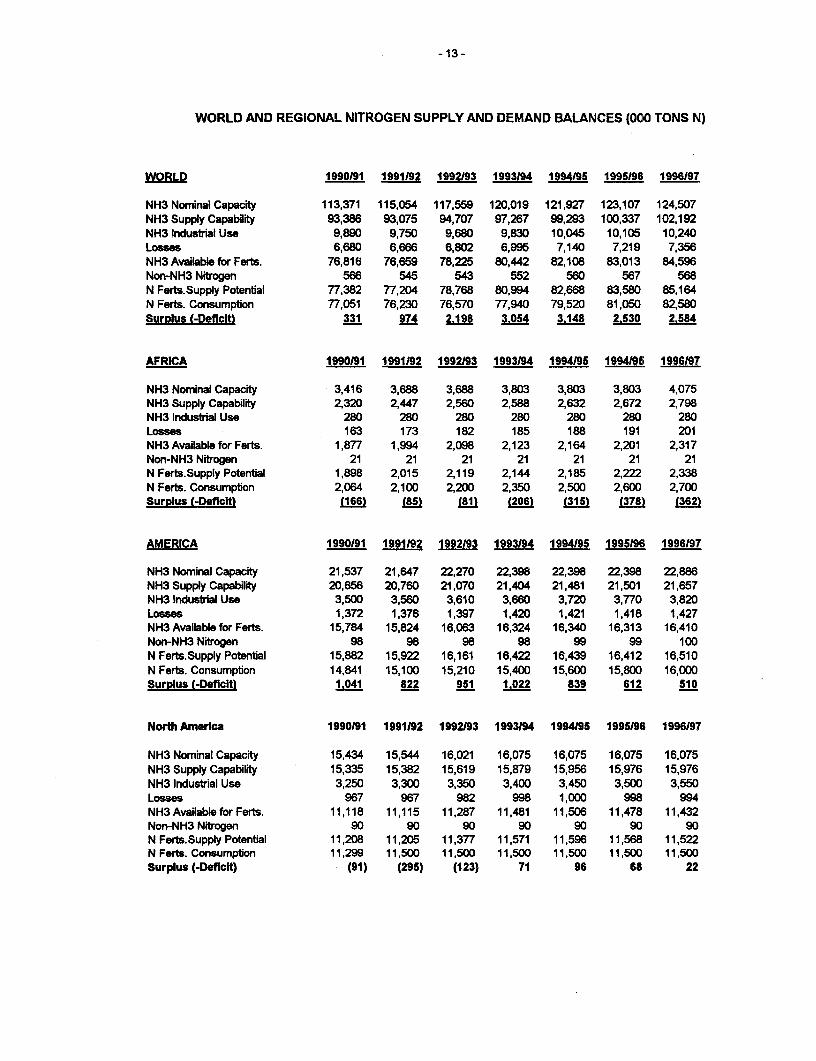
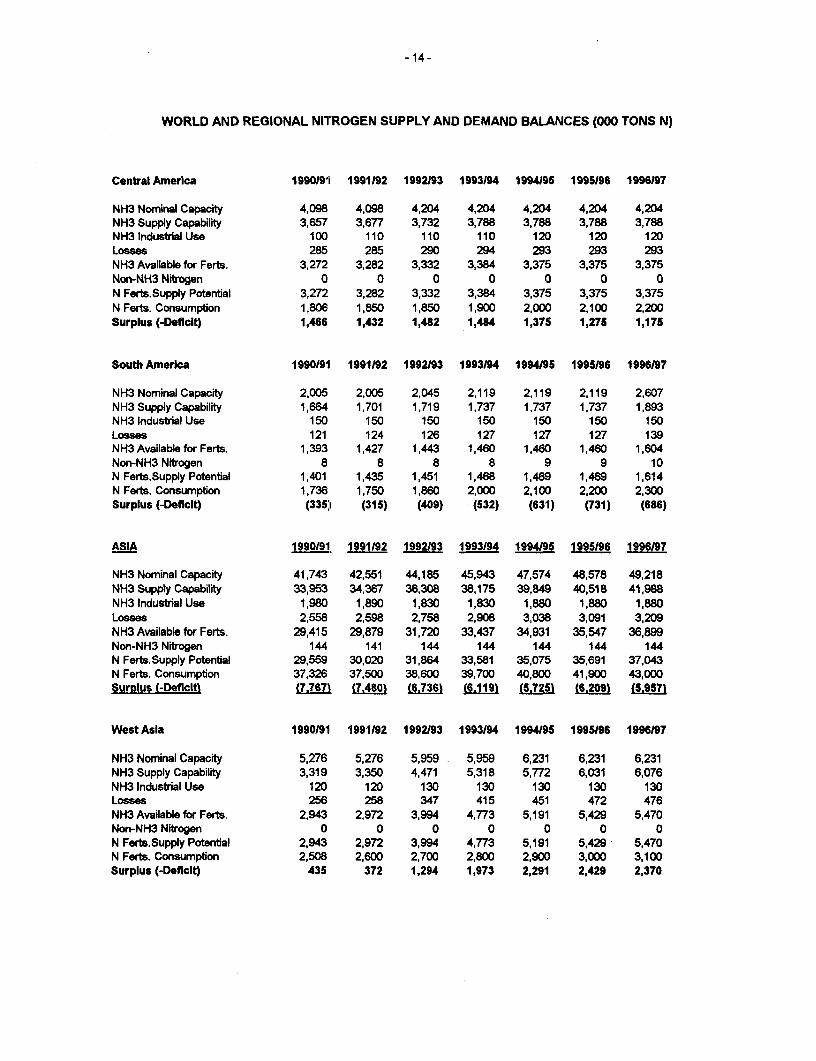
WORLD AND REGIONAL NITROGEN SUPPLY AND DEMAND BALANCES (000 TONS N)
WORLD 1990191 1991192 1992193 1993194 1994195 199S/96 1996197
NH3 Nominal Capacity 113,371 115,054 117,559 120,019 121,927 123,107 124,507NH3 Supply Capability 93,386 93,075 94,707 97,267 99,293 100,337 102,192NH3 Industrial Use 9,890 9,750 9,680 9,830 10,045 10,105 10,240Losses 6,680 6,666 6,802 6,995 7,140 7,219 7,356NH3 Available for Ferts. 76,816 76,659 78,225 80,442 82,108 83,013 84,596Non-NH3 Nitrogen 566 545 543 552 560 567 568N Ferts.Supply Potential 77,382 77,204 78,768 80,994 82,668 83,580 85,164N Ferts. Consumption 77,051 76,230 76,570 77,940 79,520 81,050 82,580SurDlus (-DeficIt) 331 974 2.198 3.054 3.148 2.530 2.584
AFRICA 1990191 1991192 1992193 1993/94 1994195 1994195 1996197
NH3 Nominal Capacity 3,416 3,688 3,688 3,803 3,803 3,803 4,075NH3 Supply Capability 2,320 2,447 2,560 2,588 2,632 2,672 2,798NH3 Industrial Use 280 280 280 280 280 280 280Losses 163 173 182 185 188 191 201NH3 Available for Ferts. 1,877 1,994 2,098 2,123 2,164 2,201 2,317Non-NH3 Nitrogen 21 21 21 21 21 21 21N Ferts.Supply Potential 1,898 2,015 2,119 2,144 2,185 2,222 2,338N Ferts. Consumption 2,064 2,100 2,200 2,350 2,500 2,600 2,700Surpdus (-Deficit) (166) (85) (81) (206) (315) (378) (362)
AMERICA 1990191 1991192 1992193 1993194 1994195 1995196 1996197
NH3 Nominal Capacity 21,537 21,647 22,270 22,398 22,398 22,398 22,886NH3 Supply Capability 20,656 20,760 21,070 21,404 21,481 21,501 21,657NH3 Indusrial Use 3,500 3,560 3,610 3,660 3,720 3,770 3,820Losses 1,372 1,376 1,397 1,420 1,421 1,418 1,427NH3 Available for Ferts. 15,784 15,824 16,063 16,324 16,340 16,313 16,410Non-NH3 Nitrogen 98 98 98 98 99 99 100N Ferts.Supply Potential 15,882 15,922 16,161 16,422 16,439 16,412 16,510N Ferts. Consumption 14,841 15,100 15,210 15,400 15,600 15,800 16,000Surplus (-DefIcIt) 1.041 822 951 1 022 839 612 510
North America 1990/91 1991192 1992193 1993194 1994195 1995196 1996197
NH3 Nominal Capacity 15,434 15,544 16,021 16,075 16,075 16,075 16,075NH3 Supply Capability 15,335 15,382 15,619 15,879 15,956 15,976 15,976NH3 Industrial Use 3,250 3,300 3,350 3,400 3,450 3,500 3,550Losses 967 967 982 998 1,000 998 994NH3AvailableforFerts. 11,118 11,115 11,287 11,481 11,506 11,478 11,432Non-NH3 Nitrogen 90 90 90 90 90 90 90N Ferts.Supply Potental 11,208 11,205 11,377 11,571 11,596 11,568 11,522N Ferts. Consumption 11,299 11,500 11,500 11,500 11,500 11,500 11,500Surplus (-Deficit) (91) (295) (123) 71 96 68 22
-14-
WORLD AND REGIONAL NITROGEN SUPPLY AND DEMAND BALANCES (000 TONS N)
Central America 1990191 1991192 1992193 1993194 1994195 1995196 1996197
NH3 Nominal Capacity 4,098 4,098 4,204 4,204 4,204 4,204 4,204NH3 Supply Capability 3,657 3,677 3,732 3,788 3,788 3,788 3,788NH3 Industrial Use 100 110 110 110 120 120 120Losses 285 285 290 294 293 293 293NH3 Available for Ferts. 3,272 3,282 3,332 3,384 3,375 3,375 3,375Non-NH3 Nitrogen 0 0 0 0 0 0 0N Ferts.Supply Potential 3,272 3,282 3,332 3,384 3,375 3,375 3,375N Ferts. Consumption 1.806 1,850 1,850 1,900 2,000 2,100 2,200Surplus (-Deflcit) 1,466 1,432 1,482 1,484 1,375 1,275 1,175
South America 19901911 1991/92 1992193 1993/94 1994195 199596 1996/97
NH3 Nominal Capacity 2,005 2,005 2,045 2,119 2,119 2,119 2,607NH3 Supply Capability 1,664 1,701 1,719 1,737 1,737 1,737 1,893NH3 Industrial Use 150 150 150 150 150 150 150Losses 121 124 126 127 127 127 139NH3 Available for Ferts. 1,393 1,427 1,443 1,460 1,460 1,460 1,604Non-NH3 Nitrogen 8 8 8 8 9 9 10N Ferts.Supply Potential 1,401 1,435 1,451 1,468 1,469 1,469 1,614N Ferts. Consumption 1,736 1,750 1,860 2,000 2,100 2,200 2,300Surplus (-Deficit) (335)p (315) (409) (532) (631) (731) (686)
ASIA 1990191 1991/92 1992/93 1993/94 1994/95 1995/96 1996/97
NH3 Nominal Capacity 41,743 42,551 44,185 45,943 47,574 48,578 49,218NH3 Supply Capability 33,953 34,367 36,308 38,175 39,849 40,518 41,988NH3 Industrial Use 1,980 1,890 1,830 1,830 1,880 1,880 1,880Losses 2,558 2,598 2,758 2,908 3,038 3,091 3,209NH3 Available for Ferts. 29,415 29,879 31,720 33,437 34,931 35,547 36,899Non-NH3 Nitrogen 144 141 144 144 144 144 144N Ferts.Supply Potential 29,559 30,020 31,864 33,581 35,075 35,691 37,043N Ferts. Consumption 37,326 37,500 38,600 39,700 40,800 41,900 43,000Surplus (-Deficitl (7.7671 (7.4801 (6.7361 (6.1191 (5.7251 (6.2091 (5.9571
West Asia 1990/91 1991/92 1992/93 1993/94 1994195 1995/96 1996/97
NH3 Nominal Capacity 5,276 5,276 5,959 5,959 6,231 6,231 6,231NH3 Supply Capability 3,319 3,350 4,471 5,318 5,772 6,031 6,076NH3 lndustrial Use 120 120 130 130 130 130 130Losses 256 258 347 415 451 472 476NH3 Available for Ferts. 2,943 2,972 3,994 4,773 5,191 5,429 5,470Non-NH3 Nitrogen 0 0 0 0 0 0 0N Ferts.Supply Potential 2,943 2,972 3,994 4,773 5,191 5,429 5,470N Ferts. Consumption 2,508 2,600 2,700 2,800 2,900 3,000 3,100Surplus (-Deficit) 435 372 1,294 1,973 2,291 2,429 2,370
- 15-
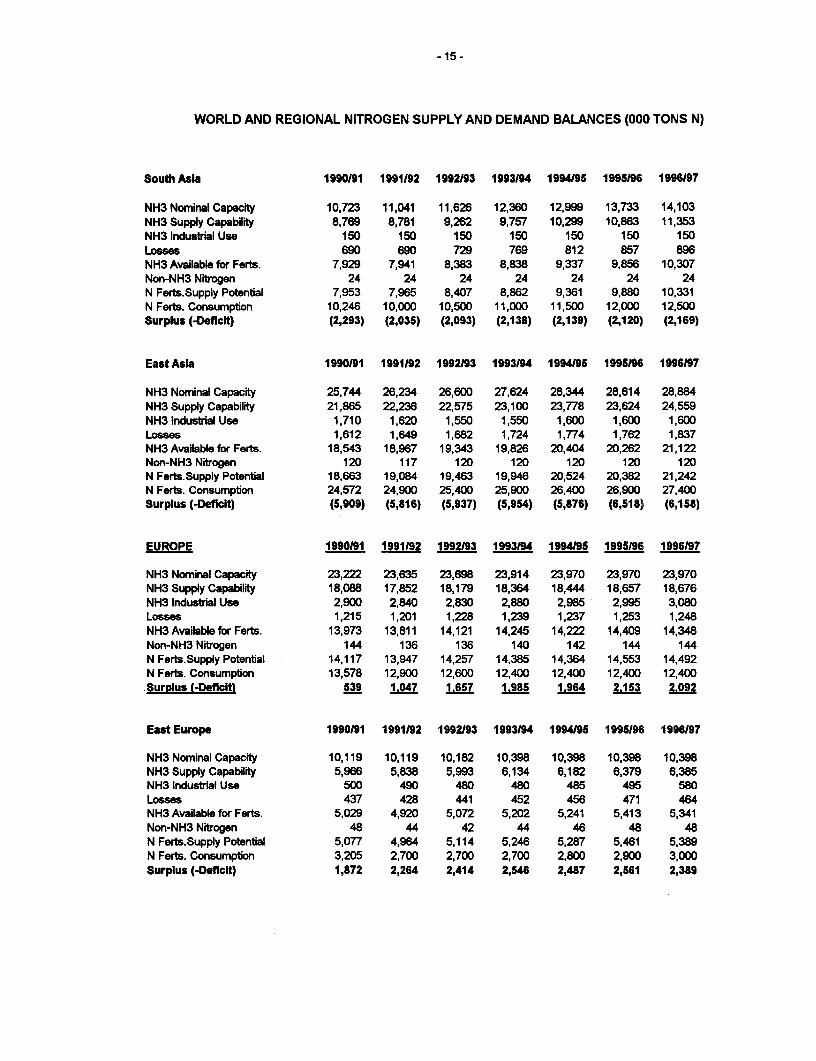
WORLD AND REGIONAL NITROGEN SUPPLY AND DEMAND BALANCES (000 TONS N)
South Asia 1990191 1991192 1992/93 1993/94 1994195 1995196 1996/97
NH3 Nominal Capacity 10,723 11,041 11,626 12,360 12,999 13,733 14,103NH3 Supply Capability 8,769 8,781 9,262 9,757 10,299 10,863 11,353NH3 Industrial Use 150 150 150 150 150 150 150Losses 690 690 729 769 812 857 896NH3 Available fbr Ferts. 7,929 7,941 8,383 8,838 9,337 9,856 10,307Non-NH3 Nitrogen 24 24 24 24 24 24 24N Ferts.Supply Potential 7,953 7,965 8,407 8,862 9,361 9,880 10,331N Fwrts. Consumption 10,246 10,000 10,500 11,000 11,500 12,000 12,500Surplus (-Deficit) (2,293) (2,035) (2,093) (2,138) (2,139) (2,120) (2,169)
East Asia 1990191 1991192 1992)93 1993/94 1994195 199596 1996197
NH3 Nominal Capacity 25,744 26,234 26,600 27,624 28,344 28,614 28,884NH3 Supply Capability 21,865 22,236 22,575 23,100 23,778 23,624 24,559NH3 industrial Use 1,710 1,620 1,550 1,550 1,600 1,600 1,600Losses 1,612 1,649 1,682 1,724 1,774 1,762 1,837NH3Availablefor Ferts. 18,543 18,967 19,343 19,826 20,404 20,262 21,122Non-NH3 Nitrogen 120 117 120 120 120 120 120N Ferts.Supply Potential 18,663 19,084 19,463 19,946 20,524 20,382 21,242N Ferts. Consumption 24,572 24,900 25,400 25,900 26,400 26,900 27,400Surplus (-Deficit) (5,909) (5,816) (5,937) (5,954) (5,876) (6,518) (6,158)
EUROPE 1990191 1991/92 1992/93 1993194 1994195 1995/96 1996/97
NH3 Nominal Capacity 23,222 23,635 23,698 23,914 23,970 23,970 23,970NH3 Supply Capability 18,088 17,852 18,179 18,364 18,444 18,657 18,676NH3 Industrial Use 2,900 2,840 2,830 2,880 2,985 2,995 3,080Losses 1,215 1,201 1,228 1,239 1,237 1,253 1,248NH3 Availablefor Ferts. 13,973 13,811 14,121 14,245 14,222 14,409 14,348Non-NH3 Nitrogen 144 136 136 140 142 144 144N Ferts.Supply Potental 14,117 13,947 14,257 14,385 14,364 14,553 14,492N Ferts. Consumption 13,578 12,900 12,600 12,400 12,400 12,400 12,400Surdlus (-Deficit) 539 1.047 1.657 1.985 1.964 2153 2.092
East Europe 1990191 1991192 1992/93 1993/94 1994/95 199596 1996/97
NH3 Nominal Capacity 10,119 10,119 10,182 10,398 10,398 10,398 10,398NH3 Supply Capability 5,966 5,838 5,993 6,134 6,182 6,379 6,385NH3 Industrial Use 500 490 480 480 485 495 580Losses 437 428 441 452 456 471 464NH3 Available for Forts. 5,029 4,920 5,072 5,202 5,241 5,413 5,341Non-NH3 Nitrogen 48 44 42 44 46 48 48N Ferts.Supply Potential 5,077 4,964 5,114 5,246 5,287 5,461 5,389N Ferts. Consumption 3,205 2,700 2,700 2,700 2,800 2,900 3,000Surplus (-Deficit) 1,872 2,264 2,414 2,546 2,487 2,561 2,389
- 16-
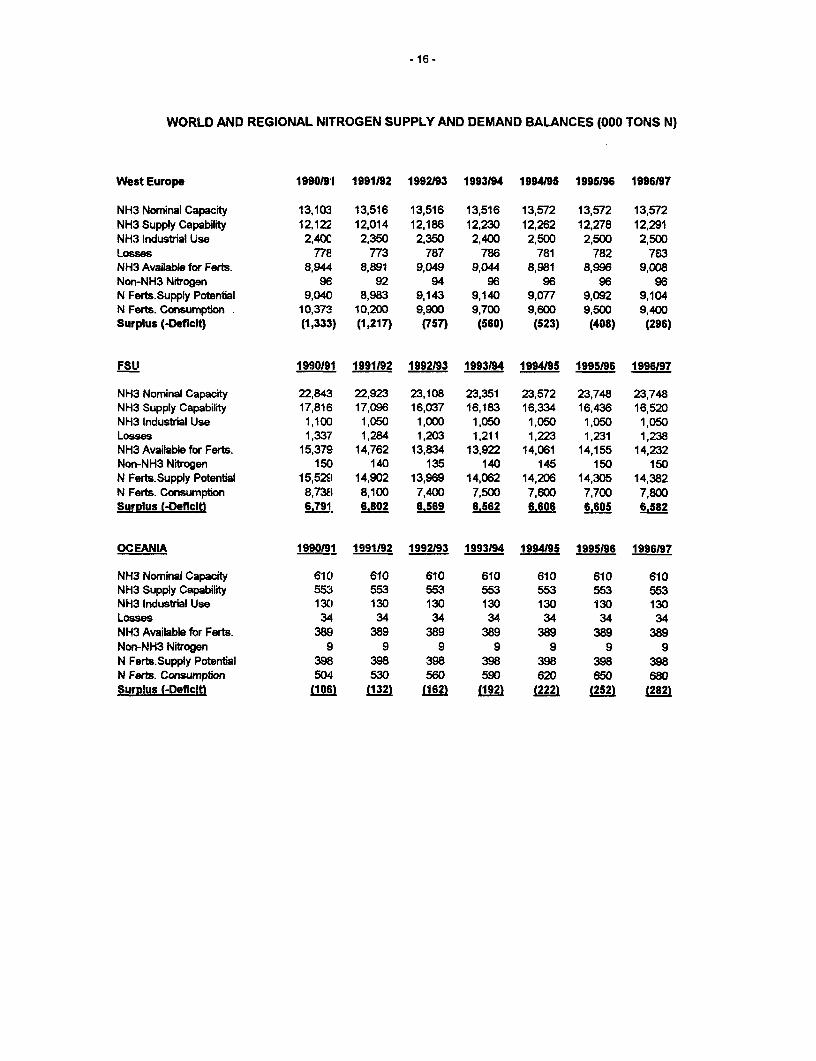
WORLD AND REGIONAL NIlrROGEN SUPPLY AND DEMAND BALANCES (000 TONS N)
West Europe 1990191 1991192 1992/93 1993194 1994/95 1995/96 1996197
NH3 Nominal Capacity 13,103 13,516 13,516 13,516 13,572 13,572 13,572NH3 Supply Capability 12,122 12,014 12,186 12,230 12,262 12,278 12,291NH3 Industrial Use 2,400 2,350 2,350 2,400 2,500 2,500 2,500Losses 778 773 787 786 781 782 783NH3 Available for Ferts. 8,944 8,891 9,049 9,044 8,981 8,996 9,008Non-NH3 Nitrogen 96; 92 94 96 96 96 96N Ferts.Supply Potental 9,040 8,983 9,143 9,140 9,077 9,092 9,104N Ferts. Consumption 10,373 10,200 9,900 9,700 9,600 9,500 9,400Surplus (4DefIcit) (1,333) (1,217) (757) (560) (523) (408) (296)
FSU 1990191 1991/92 1992193 1993194 1994195 1995196 1996197
NH3 Nominal Capacity 22,843 22,923 23,108 23,351 23,572 23,748 23,748NH3 Supply Capability 17,816 17,096 16,037 16,183 16,334 16,436 16,520NH3 Industrial Use 1,10CI 1,050 1,000 1,050 1,050 1,050 1,050Losses 1,337' 1,284 1,203 1,211 1,223 1,231 1,238NH3 Available for Ferts. 15,379 14,762 13,834 13,922 14,061 14,155 14,232Non-NH3 Nitrogen 150 140 135 140 145 150 150N Ferts.Supply Potential 15,529 14,902 13,969 14,062 14,206 14,305 14,382N Ferts. Consumption 8,738 8,100 7,400 7,500 7,600 7,700 7,800Surolus (-DeficIt! 6.791 6.802 6.569 6.562 6.606 6.605 6.582
OCEANIA 1990191 1991192 1992/93 1993194 1994195 1995196 1996197
NH3 Nominal Capacity 610 610 610 610 610 610 610NH3 Supply Capability 553 553 553 553 553 553 553NH3 Industrial Use 130 130 130 130 130 130 130Losses 34 34 34 34 34 34 34NH3 Available for Ferts. 389 389 389 389 389 389 389Non-NH3 Nitrogen 9 9 9 9 9 9 9N Ferts.Supply Potential 398 398 398 398 398 398 398N Forts. Consumption 504 530 560 590 620 650 680SurDlus (-Deficit) J106 (132) 11621 122 (222) 252) (282)
PHOSPHATE SUPPLY AND DEMAND BALANCES
1990191 - 1996197
- 18 -
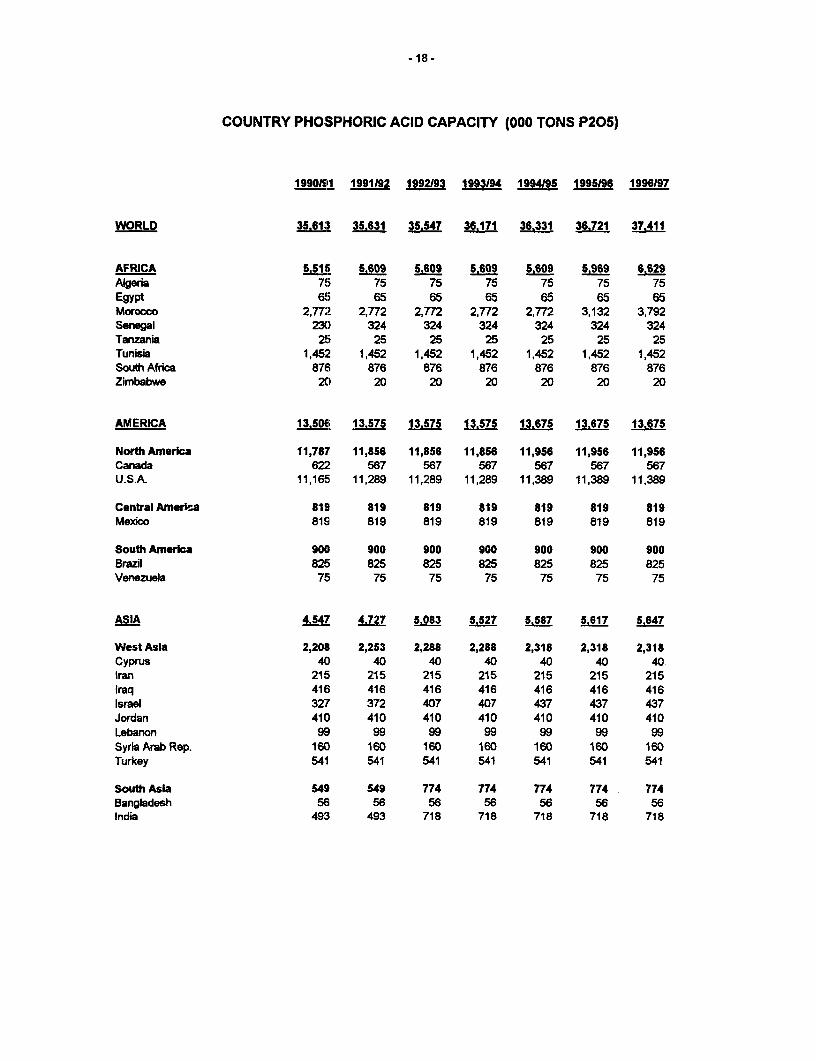
COUNTRY PHOSPHORIC ACID CAPACITY (000 TONS P205)
1990/11 1991192 1992193 1993/94 1994195 1995/96 1996/97
WORLD 35.B13 35.631 35.547 36.171 36.331 36.721 37.411
AFRICA 5.515 5,609 5.609 5,609 5.609 5.969 6.629Algeria 75 75 75 75 75 75 75Egypt 65 65 65 65 65 65 65Morocco 2,772 2,772 2,772 2,772 2,772 3,132 3,792Senegal 230 324 324 324 324 324 324Tanzania 25 25 25 25 25 25 25Tunisia 1,452 1,452 1,452 1,452 1,452 1,452 1,452South Africa 876 876 876 876 876 876 876Zimbabwe 20 20 20 20 20 20 20
AMERICA 13s.5o 13.S7S 13.57S I135 13.675 13.675 13.675
North America 11,787' 11,856 11,856 11,856 11,956 11,956 11,956Canada 622 567 567 567 567 567 567U.S.A. 11,165, 11,289 11,289 11,289 11,389 11,389 11,389
Central Ameria 819 819 819 819 819 819 819Mexico 819 819 819 819 819 819 819
South America 900 900 900 900 900 900 900Brazil 825 825 825 825 825 825 825Venezuela 75 75 75 75 75 75 75
ASIA 4lS47 4.727 5.083 5527 5.587 5.617 5.647
West AsIa 2,208 2,253 2,288 2,288 2,318 2,318 2,318Cyprus 40 40 40 40 40 40 40Iran 215 215 215 215 215 215 215Iraq 416 416 416 416 416 416 416Israel 327 372 407 407 437 437 437Jordan 410 410 410 410 410 410 410Lebanon 99 99 99 99 99 99 99Syria Arab Rep. 160 160 160 160 160 160 160Turkey 541 541 541 541 541 541 541
South Asia 549 549 774 774 774 774 774Bangladesh 56 56 56 56 56 56 56India 493 493 718 718 718 718 718
- 19 -
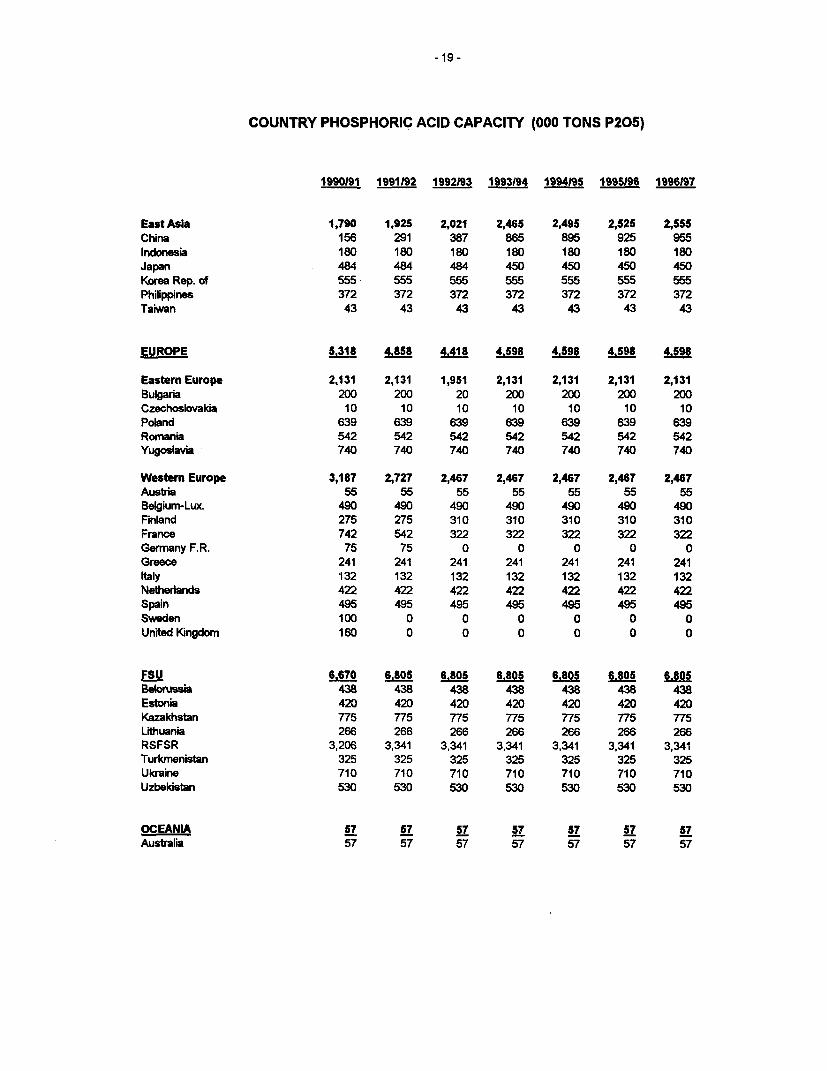
COUNTRY PHOSPHORIC ACID CAPACITY (000 TONS P205)
1990191 1991192 1992193 1993194 1994195 1995196 1996197
East Asia 1,790 1,925 2,021 2,465 2,495 2,525 2,555China 156 291 387 865 895 925 955Indonesia 180 180 180 180 180 180 180Japan 484 484 484 450 450 450 450Korea Rep. of 555 555 555 555 555 555 555Philippines 372 372 372 372 372 372 372Taiwan 43 43 43 43 43 43 43
EUROPE 5.318 4,858 4,418 4.598 4.598 4.598 4.598
Eastern Europe 2,131 2,131 1,951 2,131 2,131 2,131 2,131Bulgaria 200 200 20 200 200 200 200Czechoslovakia 10 10 10 10 10 10 10Poland 639 639 639 639 639 639 639Romania 542 542 542 542 542 542 542Yugoslavia 740 740 740 740 740 740 740
Western Europe 3,187 2,727 2,467 2,467 2,467 2,467 2,467Austria 55 55 55 55 55 55 55Belgium-Lux. 490 490 490 490 490 490 490Finland 275 275 310 310 310 310 310France 742 542 322 322 322 322 322Germany F.R. 75 75 0 0 0 0 0Greece 241 241 241 241 241 241 241Italy 132 132 132 132 132 132 132Netherlands 422 422 422 422 422 422 422Spain 495 495 495 495 495 495 495Sweden 100 0 0 0 0 0 0United Kingdom 160 0 0 0 0 0 0
FSU 6.670 6.805 6.805 6.805 6.805 6.805 6.805Belorussia 438 438 438 438 438 438 438Estonia 420 420 420 420 420 420 420Kazakhstan 775 775 775 775 775 775 775Lithuania 266 266 266 266 266 266 266RSFSR 3,206 3,341 3,341 3,341 3,341 3,341 3,341Turkmenistan 325 325 325 325 325 325 325Ukraine 710 710 710 710 710 710 710Uzbekistan 530 530 530 530 530 530 530
OCEANIA 57 57 57 57 57 57 57
Australia 57 57 57 57 57 57 57
-20-
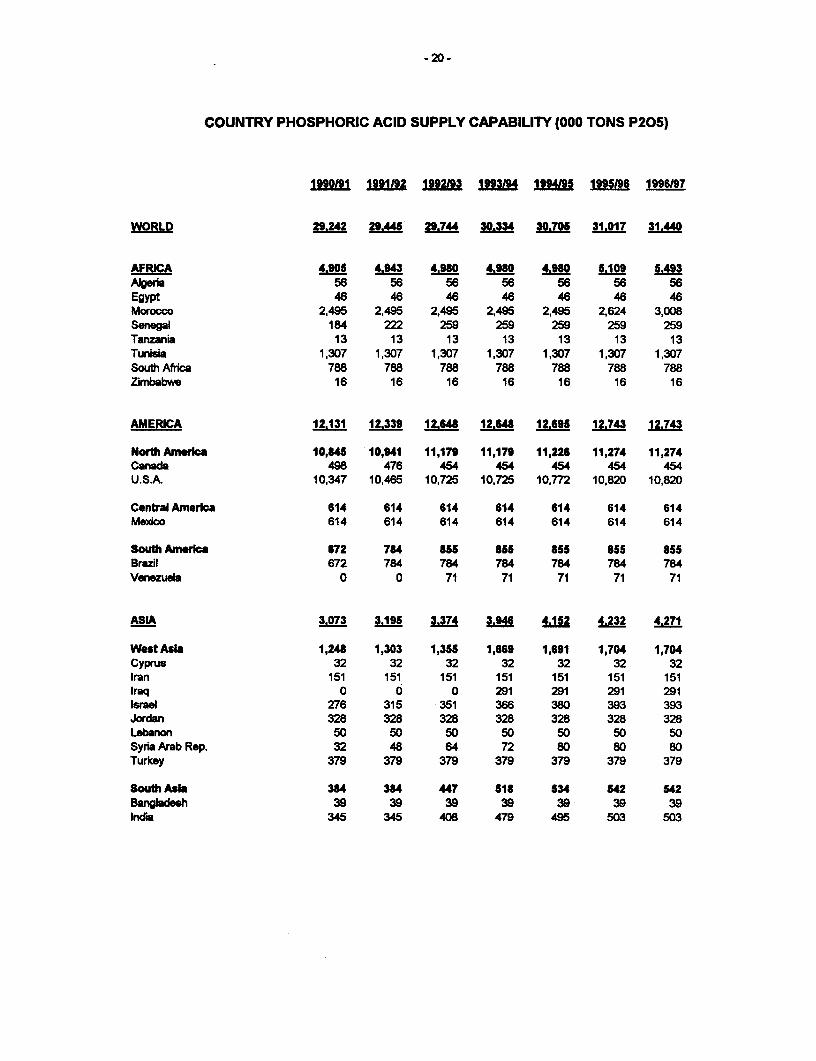
COUNTRY PHOSPHORIC ACID SUPPLY CAPABILITY (000 TONS P205)
1990191 1991192 1992193 1993194 1994195 1995196 1996197
WORLD 29.M4 29.4S 29.74 303J34 30.705 31.017 31.440
AFRICA 4_30 4.943 4.9 4.980 4.980 5.109 5.493Aberia 56 56 56 56 56 56 56Egypt 46 46 46 46 46 46 46Morocco 2,495 2,495 2,495 2,495 2,495 2,624 3,008Senegal 184 222 259 259 259 259 259Tanzania 13 13 13 13 13 13 13Tunisia 1,307 1,307 1,307 1,307 1,307 1,307 1,307South Africa 788 788 788 788 788 788 788Zimbabwe 16 16 16 16 16 16 16
AMERICA 1213 12.339 1248 12.648 12.69 12.743 12.743
North America 10,I15 10,941 11,179 11,179 11,226 11,274 11,274Canada 498 476 454 454 454 454 454U.S.A. 10,347 10,465 10,725 10,725 10,772 10,820 10,820
Central America 614 614 614 614 614 614 614MeWAco S14 614 614 614 614 614 614
South America 172 784 855 855 8S5 855 855Brazil 672 784 784 784 784 784 784Venezula 0 0 71 71 71 71 71
ASIA 3073 3.195 3.374 3.946 4.152 4.232 4.271
W"t Asia 1,248 1,303 1,355 1,669 1,691 1,704 1,704Cyprus 32 32 32 32 32 32 32Iran 151 151 151 151 151 151 151Iraq 0 0 0 291 291 291 291Israel :276 315 351 366 380 393 393Jordan :328 328 328 328 328 328 328Lebanon 50 50 50 50 50 50 50Syria Arab Rep. 32 48 64 72 80 80 80Turkey 379 379 379 379 379 379 379
South Asia 384 384 447 518 534 542 542Bangldesh 39 39 39 39 39 39 39India 345 345 408 479 495 503 503
- 21 -
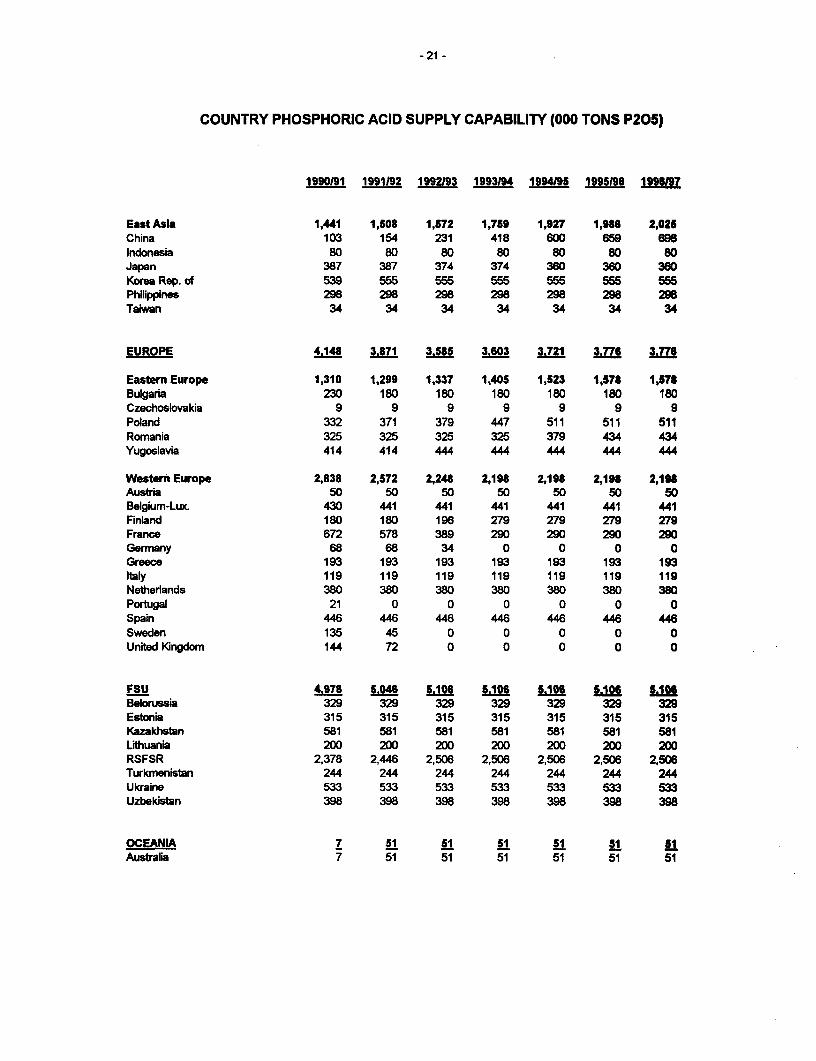
COUNTRY PHOSPHORIC ACID SUPPLY CAPABILITY (000 TONS P205)
1990191 1991192 1992193 1993194 1994)95 1995196 1996197
East Asia 1,441 1,508 1,572 1,759 1,927 1,986 2,025China 103 154 231 418 600 859 698Indonesia 80 80 80 80 80 80 80Japan 387 387 374 374 360 360 360Korea Rep. of 539 5S5 555 555 556 555 555Philippines 298 298 298 298 298 298 298Taiwan 34 34 34 34 34 34 34
EUROPE 4148 3.871 3.585 3.603 3.721 3.776 3.776
Eastern Europe 1,310 1,299 1,337 1,405 1,523 1,578 1,578Bulgaria 230 180 180 180 180 180 180Czechosovakia 9 9 9 9 9 9 9Poland 332 371 379 447 511 511 511Romania 325 325 325 325 379 434 434Yugoslavia 414 414 444 444 444 444 444
Western Europe 2,838 2,572 2,248 2,198 2,198 2,198 2,198Austria 50 50 50 50 50 50 50Belgium-Lux. 430 441 441 441 441 441 441Finland 180 180 196 279 279 279 279France 672 578 389 290 290 290 290Germany 68 68 34 0 0 0 0Greece 193 193 193 193 193 193 193Italy 119 119 119 119 119 119 119Netherlands 380 380 380 380 380 380 380Portugal 21 0 0 0 0 0 0Spain 446 446 446 446 446 446 446Sweden 135 45 0 0 0 0 0United Kingdom 144 72 0 0 0 0 0
FSU 4.978 S.046 5.106 5.106 5.106 5.106 LIIIBelorussia 329 329 329 329 329 329 329Estonia 315 315 315 315 315 315 315Kazakhstan 581 581 581 581 581 581 581Lithuania 200 200 200 200 200 200 200RSFSR 2,378 2,446 2,506 2,506 2,506 2,506 2,506Turkmenistan 244 244 244 244 244 244 244Ukraine 533 533 533 533 533 533 533Uzbekistan 398 398 398 398 398 398 398
OCEANIA 7 51 51 51 51 51 S1Australia 7 51 51 51 51 51 51
-22-
REGIONAL FPHOSPHORIC ACID CAPACITY (000 TONS P205)
1990191 1991192 1992193 1993194 1994195 1995196 1996197
WORLD 35S613 353 35.547 36.171 3 36.721 37.411
AFRICA 5.515 5.609 5.609 5.609 5.609 5.969 6.629
AMERICA 13.506 13.S7S 13.575 13.S75 13.675 1.7 13.875Nort America 11,787 11,856 11,856 11,856 11,956 11,956 11,956CentralAnierica 819 819 819 819 819 819 819South America 900 900 900 900 900 900 900
ASIA 4.547 4.727 5.083 5.527 5.587 5.617 5.647West Asia 2,208 2,253 2,288 2,288 2,318 2,318 2,318South Asia 549 549 774 774 774 774 774East Asia 1,790 1,925 2,021 2,465 2,495 2,525 2,555
EUROPE 5.318 4.858 4.418 4.598 4.598 4.598 4.598Eastern Europe 2,131 2,131 1,951 2,131 2,131 2,131 2,131Western Europe 3,187 2,727 2,467 2,467 2,467 2,467 2,467
FSU 6.670 6.805 6.805 6.805 6.805 6.805 6.805
OCEANIA 57 57 57 57 57 57 57
-23-
REGIONAL PHOSPHORIC ACID SUPPLY CAPABILITY (000 TONS P205)
1990/91 1991192 1992/93 1993194 1994/95 199596 1996/97
WORLD 29.240 29.445 29.744 30.3 30.705 31.017 31.440
AFRICA 4.905 4.943 4.980 4.980 4.980 5.109 5.493
AMERICA 12.131 12.339 12.648 12.648 12.69 12.743 12.743NothAnerica 10,845 10,941 11,179 11,179 11,226 11,274 11,274Csnbral Anerica 614 614 614 614 614 614 614South America 672 784 855 855 855 855 855
ASIA 3.073 3.195 3.374 3.946 4.152 4.232 4.271West Asia 1,248 1,303 1,355 1,669 1,691 1,704 1,704South Asia 384 384 447 518 534 542 542East Asia 1,441 1,508 1,572 1,759 1,927 1,986 2,025
EUROPE 4.148 3.871 3.585 3.603 3.721 3.776 3.776Eastem Europe 1,308 1,299 1,337 1,405 1,523 1,578 1,578Western Europe 2,838 2,572 2,248 2,198 2,198 2,198 2,198
FSU 4.978 5.046 5.106 5.106 S.106 5.106 5.106
OCEANIA 7 51 51 51 51 51 51
-24-
REGIONAL NON-PHOSPHORIC ACID SUPPLY CAPABILITY (000 TONS P205)
1990191 1991192 1992/93 1993194 1994/95 1995196 1996197
WORLD 12.705 12.470 12.485 12.500 12.515 12.555 12.620
AFRICA 500 510 520 530 540 550 560
AMiEICA 980 985 990 995 1.000 1.005 1.010North America 250 250 250 250 250 250 250CQnw" AAmeica 130 130 130 130 130 130 130South America 600 605 610 615 620 625 630
amL 5675 5:725 5 77 S.825 5.875 5.950 6.050Wet Asia 225 225 225 225 225 250 300Southt Asia 750 750 750 750 750 750 750East Asia 4,700 4,750 4,800 4,850 4,900 4,950 5,000
EUROPE 1400 2.350 2.300 2.250 2.200 2.150 2100Easten Europe 800 750 700 650 600 550 500Western Europe 1,600 1,600 1,600 1,600 1,600 1,600 1,600
f8U _500 2250 2.250 2.250 2.250 2.250 2 250
OCEANIA 650 650 650 650 650 650 650
-25-
REGIONAL PHOSPHATE FERTILIZER DEMAND (000 TONS P205)
1990191 1991192 1992193 1993194 1994195 1995196 1996197 2001102
WORLD 36.023 34.590 34.190 3S.080 35.790 36.600 37.400 40.800
AFRICA 1.064 1.150 1.200 1.250 1.300 1.350 1.400 1.600
AMERICA 6.565 6.510 6.530 6.590 6.700 6.,10 6.920 7.500North America 4,343 4,350 4,300 4,300 4,300 4,300 4,300 4,300Cenrbal America 527 500 560 580 610 640 670 800SouthAmerica 1,695 1,660 1,670 1,710 1,790 1,870 1,950 2,400
ASIA 13.785 14.190 14.740 15.000 1S.360 15.720 16.090 17.700WestAsia 1,643 1,640 1,730 1,790 1,860 1,920 1,980 2,300South Asia 3,883 3,750 4,150 4,290 4,420 4,560 4,710 5,400East Asia 8,259 8,800 8860 8,920 9,080 9,240 9,400 10,000
China 5,879 6,600 6,600 6,600 6,700 6,800 6,900 7,300Others in E. Asa 2,380 2,200 2,260 2,320 2,380 2,440 2,500 2,700
EUROPE 5.987 4.920 4.810 4.750 4.820 4.980 5.120 5.600Eastern Europe 1,508 820 800 800 880 1,050 1,230 2,000Western Europe 4,479 4,100 4,010 3,950 3,940 3,930 3,890 3,600
FSU 7.81S 7.000 6.000 6.500 6.600 6.700 6.800 7.200
OCEANIA 607 820 910 990 1.010 1.040 1.070 1.200
-26-
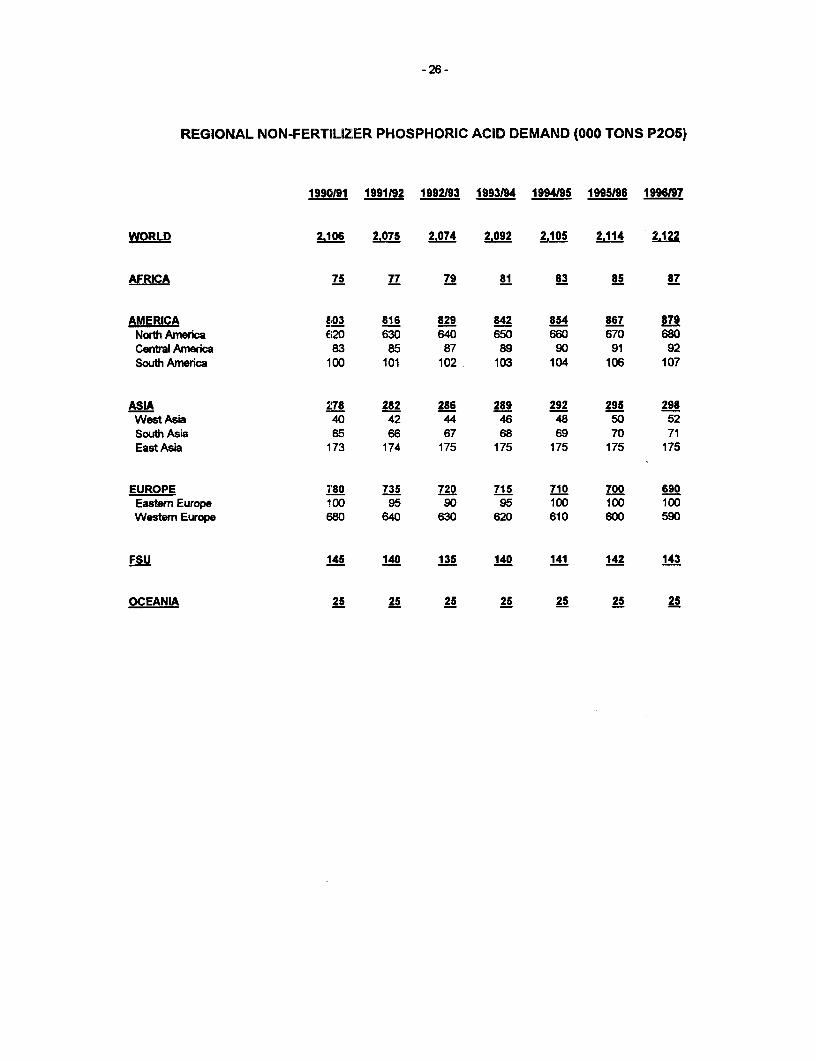
REGIONAL NON-FERTILIZER PHOSPHORIC ACID DEMAND (000 TONS P205)
1990191 1991192 1992193 1993194 1994195 1995196 1996197
WORLD 2.106 2.075 2.074 2.092 2.105 2.114 2.122
AFRICA 75 77 79 81 83 85 87
AMERICA X03 816 829 842 854 867 879North America 620 630 640 650 660 670 680Central America 83 85 87 89 90 91 92South America 100 101 102 103 104 106 107
ASIA 278 282 286 289 292 295 298West Asia 40 42 44 46 48 50 52South Asia 65 66 67 68 69 70 71East Asia 173 174 175 175 175 175 175
EUROPE 7'80 735 720 715 710 700 690Eastern Europe 100 95 90 95 1W0 100 100Western Europe 680 640 630 620 610 600 590
FSU 1145 140 135 140 141 142 143
OCEANIA 25 25 25 25 25 25 25
-27-
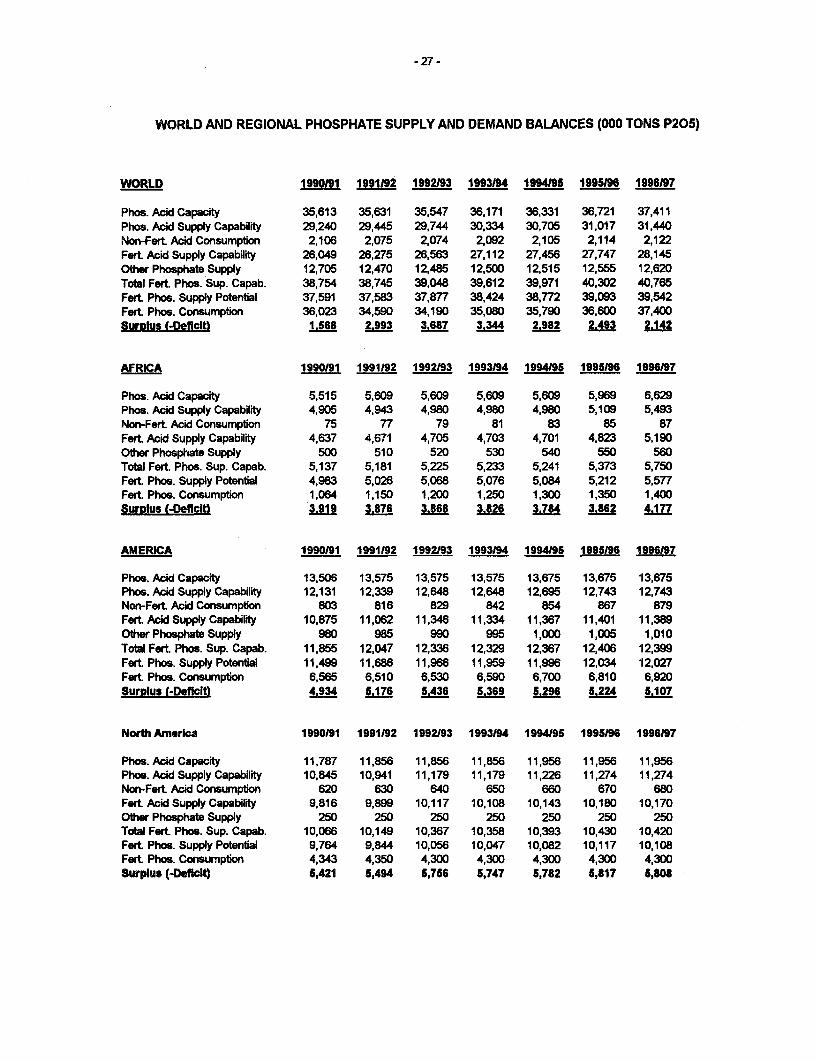
WORLD AND REGIONAL PHOSPHATE SUPPLY AND DEMAND BALANCES (000 TONS P205)
WORLD 1990191 1991192 1992/93 1993/94 1994195 1995196 1996197
Phos. Acid Capacity 35,613 35,631 35,547 36,171 36,331 36,721 37,411Phos. Acid Supply Capability 29,240 29,445 29,744 30,334 30,705 31,017 31,440Non-Fort. Acid Consumption 2,106 2,075 2,074 2,092 2,105 2,114 2,122Fert Acid Supply Capability 26,049 26,275 26,563 27,112 27,456 27,747 28,145Other Phosphate Supply 12,705 12,470 12,485 12,500 12,515 12,555 12,620Total Fort Phos. Sup. Capab. 38,754 38,745 39,048 39,612 39,971 40,302 40,765Fort Phos. Supply Potential 37,591 37,583 37,877 38,424 38,772 39,093 39,542Fort Phos. Consumption 36,023 34,590 34,190 35,080 35,790 36,600 37,400SurDlus f-Deficit) 1,SB8 2.993 3.687 3.344 2.982 2.493 2.142
AFRICA 1990191 1991192 1992193 1993194 1994195 1995196 1996/97
Phos. Acid Capacity 5,515 5,609 5,609 5,609 5,609 5,969 6,629Phos. Acid Supply Capability 4,905 4,943 4,980 4,980 4,980 5,109 5,493Non-Fort Acid Consumption 75 77 79 81 83 85 87Fert Acid Supply Capability 4,637 4,671 4,705 4,703 4,701 4,823 5,190Other Phosphate Supply 500 510 520 530 540 550 560Total Fort Phos. Sup. Capab. 5,137 5,181 5,225 5,233 5,241 5,373 5,750Fort Phos. Supply Potential 4,983 5,026 5,068 5,076 5,084 5,212 5,577Fort Phos. Consumption 1,064 1,150 1,200 1,250 1,300 1,350 1,400Surplus (-Deficit) 3.919 3.876 3.868 3.826 378 3.862 4.177
AMERICA 1990/91 1991192 1992/93 1993194 1994/95 1995/96 1996197
Phos. Acid Capacity 13,506 13,575 13,575 13,575 13,675 13,675 13,675Phos. Acid Supply Capability 12,131 12,339 12,648 12,648 12,695 12,743 112,743Non-Fort Acid Consumption 803 816 829 842 854 867 879Fort Acid Supply Capability 10,875 11,062 11,346 11,334 11,367 11,401 111,389Other Phosphate Supply 980 985 990 995 1,000 1,005 1,010Total Fert Phos. Sup. Capab. 11,855 12,047 12,336 12,329 12,367 12,406 12,399Fert Phos. Supply Potential 11,499 11,686 11,966 11,959 11,996 12,034 112,027Fort Phos. Corsumption 6,565 6,510 6,530 6,590 6,700 6,810 6,920Surplus (Defticit) 4.934 5.176 5.436 5.369 5.296 5.224 5.107
North America 1990/91 1991/92 1992/93 1993194 1994195 1995/96 1996197
Phos. Acid Capacity 11,787 11,856 11,856 11,856 11,956 11,956 11,956Phos. Acid Supply Capability 10,845 10,941 11,179 11,179 11,226 11,274 11,274Non-Fort Acid Consumption 620 630 640 650 660 670 680Fert Acid Supply Capability 9,816 9,899 10,117 10,108 10,143 10,180 10,170Oter Phosphate Supply 250 250 250 250 250 250 250Total Fort Phos. Sup. Capab. 10,066 10,149 10,367 10,358 10,393 10,430 10,420Fort Phos. Supply Potential 9,764 9,844 10,056 10,047 10,082 10,117 10,108Fort Phos. Consumption 4,343 4,350 4,300 4,300 4,300 4,300 4,300Surplus (4DefcIt) 5,421 5,494 5,756 5,747 5,782 5,817 5,808
-28-
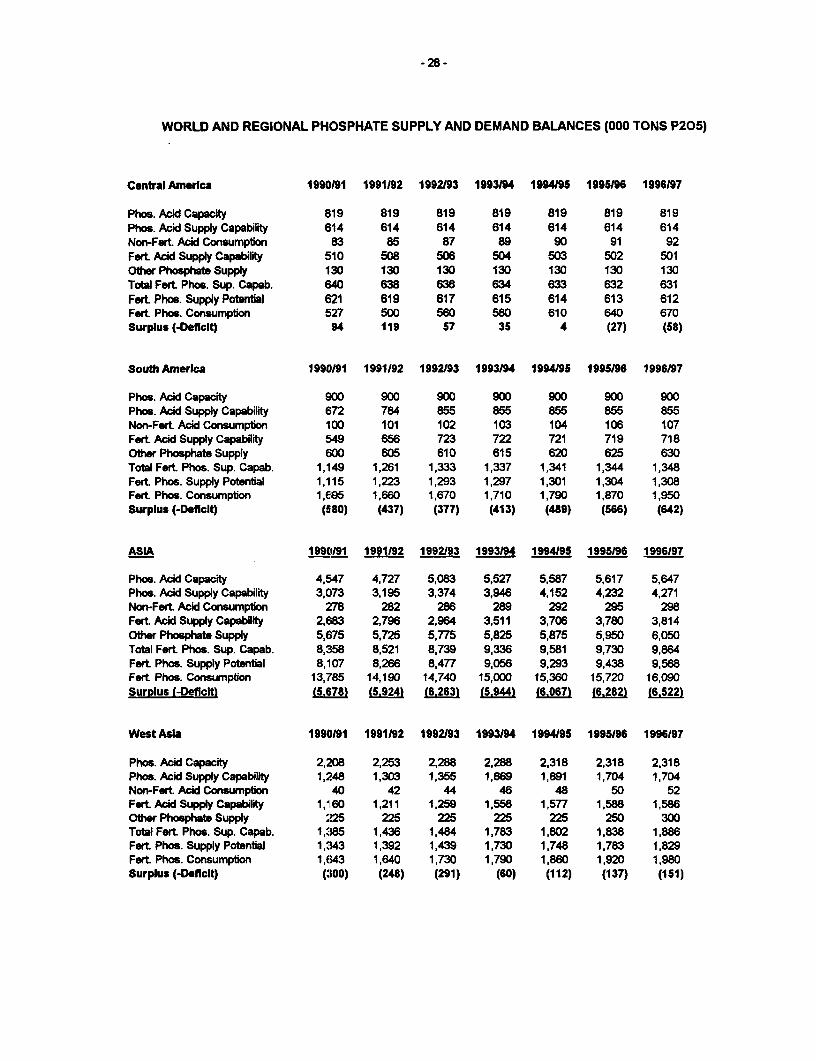
WORLD AND REGIONAL PHOSPHATE SUPPLY AND DEMAND BALANCES (000 TONS P205)
Central America 1990191 1991192 1992193 1993194 1994J95 1995196 1996197
Phos. Acid Capacity 819 819 819 819 819 819 819Phos. AcidSupplyCapability 614 614 614 614 614 614 614Non-Fart Acid Consumption 83 85 87 89 90 91 92Fort Acid Supply Capability 510 508 506 504 503 502 501Other Phosphat Supply 130 130 130 130 130 130 130Total Fort Phos. Sup. Capab. 640 638 636 634 633 632 631Fort Phos. Supply Potential 621 619 617 615 614 613 612Fort Phos. Consumption 527 500 560 580 610 640 670Surplus (4-eficit) 94 119 57 35 4 (27) (58)
South America 1990191 1991/92 1992193 1993/94 1994195 1995/96 1996197
Phos. Acid Capacity 900 900 900 900 900 900 900Phos. Acid Supply Capability 672 784 855 855 855 855 855Non-Fort Acid Consumption 100 101 102 103 104 106 107Fort Acid Supply Capability 549 656 723 722 721 719 718Otr Phosphate Supply 600 605 610 615 620 625 630Total Fert Phos. Sup. Capab. 1,149 1,261 1,333 1,337 1,341 1,344 1,348Fort Phos. Supply Potential 1,115 1,223 1,293 1,297 1,301 1,304 1,308Fert Phos. Consumption 1,695 1,660 1,670 1,710 1,790 1,870 1,950Surplus (-Deficit) (580) (437) (377) (413) (489) (566) (642)
ASIA 1990/91 1991192 1992/93 1993194 1994/95 1995/96 1996/97
Phos. Acid Capacity 4,547 4,727 5,083 5,527 5,587 5,617 5,647Phos. Acid Supply Capability 3,073 3,195 3,374 3,946 4,152 4,232 4,271Non-Fort Acid Consumption 278 282 286 289 292 295 298Fort Acid Supply Capability 2,683 2,796 2,964 3,511 3,706 3,780 3,814Oter Phosphate Supply 5,675 5,725 5,775 5,825 5,875 5,950 6,050Total Fort Phos. Sup. Capab. 8,358 8,521 8,739 9,336 9,581 9,730 9,864Fert Phos. Supply Potential 8,107 8,266 8,477 9,056 9,293 9,438 9,568Fert Phos. Consumption 13,785 14,190 14,740 15,000 15,360 15,720 16,090Surplus (-DeficIt) (,678) (5.924) (6.263) (5.944) (6.0671 (6.282) (6.522)
West Asia 1990191 1991192 1992193 1993194 1994195 1995196 1996/97
Phos. Acid Capacity 2,!208 2,253 2,288 2,288 2,318 2,318 2,318Phos. Acid Supply Capability 1,,248 1,303 1,355 1,669 1,691 1,704 1,704Non-Fort Acid Consumption 40 42 44 46 48 50 52Fort Acid Supply Capability 1,1160 1,211 1,259 1,558 1,577 1,588 1,586Ohr Phosphate Supply :225 225 225 225 225 250 300Total Fart Phos. Sup. Capab. 1,385 1,436 1,484 1,783 1,802 1,838 1,886Fort Phos. Supply Potential 1,343 1,392 1,439 1,730 1,748 1,783 1,829Fort Phos. Consumption 1,643 1,640 1,730 1,790 1,860 1,920 1,980Surplus (-DeficIt) (:100) (248) (291) (60) (112) (137) (151)
-29 -
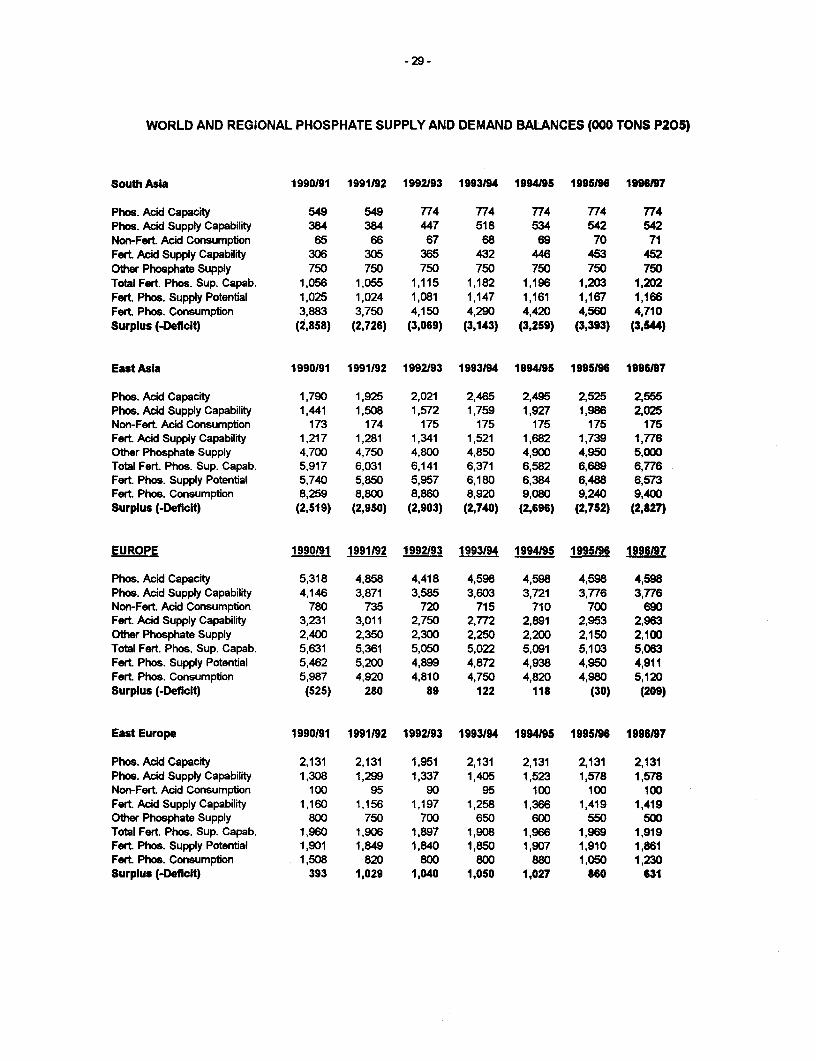
WORLD AND REGIONAL PHOSPHATE SUPPLY AND DEMAND BALANCES (000 TONS P205)
South Asia 1990191 1991192 1992/93 1993/94 1994195 1995)96 1996197
Phos. Acid Capacity 549 549 774 774 774 774 774Phos. Acid Supply Capability 384 384 447 518 534 542 542Non-Fort. Acid Consumption 65 66 67 68 69 70 71Fert Acid Supply Capability 306 305 365 432 446 453 452Oter Phosphate Supply 750 750 750 750 750 750 750Total Fert Phos. Sup. Capab. 1,056 1,055 1,115 1,182 1,196 1,203 1,202Fert Phos. Supply Potential 1,025 1,024 1,081 1,147 1,161 1,167 1,166Fort Phos. Consumption 3,883 3,750 4,150 4,290 4,420 4,560 4,710Surplus (-Deficit) (2,858) (2,726) (3,069) (3,143) (3,259) (3,393) (3,544)
East Asia 1990191 1991192 1992193 1993194 1994195 1995196 1996)97
Phos. Acid Capacity 1,790 1,925 2,021 2,465 2,495 2,525 2,555Phos. Acid Supply Capability 1,441 1,508 1,572 1,759 1,927 1,986 2,025Non-Fert Acid Consumption 173 174 175 175 175 175 175Fort. Acid Supply Capability 1,217 1,281 1,341 1,521 1,682 1,739 1,776Other Phosphate Supply 4,700 4,750 4,800 4,850 4,900 4,950 5,000Total Fert. Phos. Sup. Capab. 5,917 6,031 6,141 6,371 6,582 6,689 6,776Fert Phos. Supply Potential 5,740 5,850 5,957 6,180 6,384 6,488 6,573Fert. Phos. Consumption 8,259 8,800 8,860 8,920 9,080 9,240 9,400Surplus (-Deficit) (2,519) (2,950) (2,903) (2,740) (2,696) (2,752) (2,827)
EUROPE 1990191 1991/92 1992/93 1993/94 1994/95 1995)96 1996/97
Phos. Acid Capacity 5,318 4,858 4,418 4,598 4,598 4,598 4,598Phos. Acid Supply Capability 4,146 3,871 3,585 3,603 3,721 3,776 3,776Non-Fert. Acid Consumption 780 735 720 715 710 700 690Fort. Acid Supply Capability 3,231 3,011 2,750 2,772 2,891 2,953 2,963Other Phosphate Supply 2,400 2,350 2,300 2,250 2,200 2,150 2,100Total Fert. Phos. Sup. Capab. 5,631 5,361 5,050 5,022 5,091 5,103 5,063Fort. Phos. Supply Potential 5,462 5,200 4,899 4,872 4,938 4,950 4,911Fort. Phos. Consumpton 5,987 4,920 4,810 4,750 4,820 4,980 5,120Surplus (-Deficit) (525) 280 89 122 118 (30) (209)
East Europe 1990)91 1991192 1992193 1993)94 1994195 1995)96 1996)97
Phos. Acid Capacity 2,131 2,131 1,951 2,131 2,131 2,131 2,131Phos. Acid Supply Capability 1,308 1,299 1,337 1,405 1,523 1,578 1,578Non-Fert Acid Consumption 100 95 90 95 100 100 100Fert. Acid Supply Capability 1,160 1,156 1,197 1,258 1,366 1,419 1,419Other Phosphate Supply 800 750 700 650 600 550 500Total Fert. Phos. Sup. Capab. 1,960 1,906 1,897 1,908 1,966 1,969 1,919Fort Phos. Supply Potental 1,901 1,849 1,840 1,850 1,907 1,910 1,861Fort Phos. Consumption 1,508 820 800 800 880 1,050 1,230Surplus (-DeficIt) 393 1,029 1,040 1,050 1,027 860 631
-30-
WORLD AND REGIONAL PHOSPHATE SUPPLY AND DEMAND BALANCES (000 TONS P205)
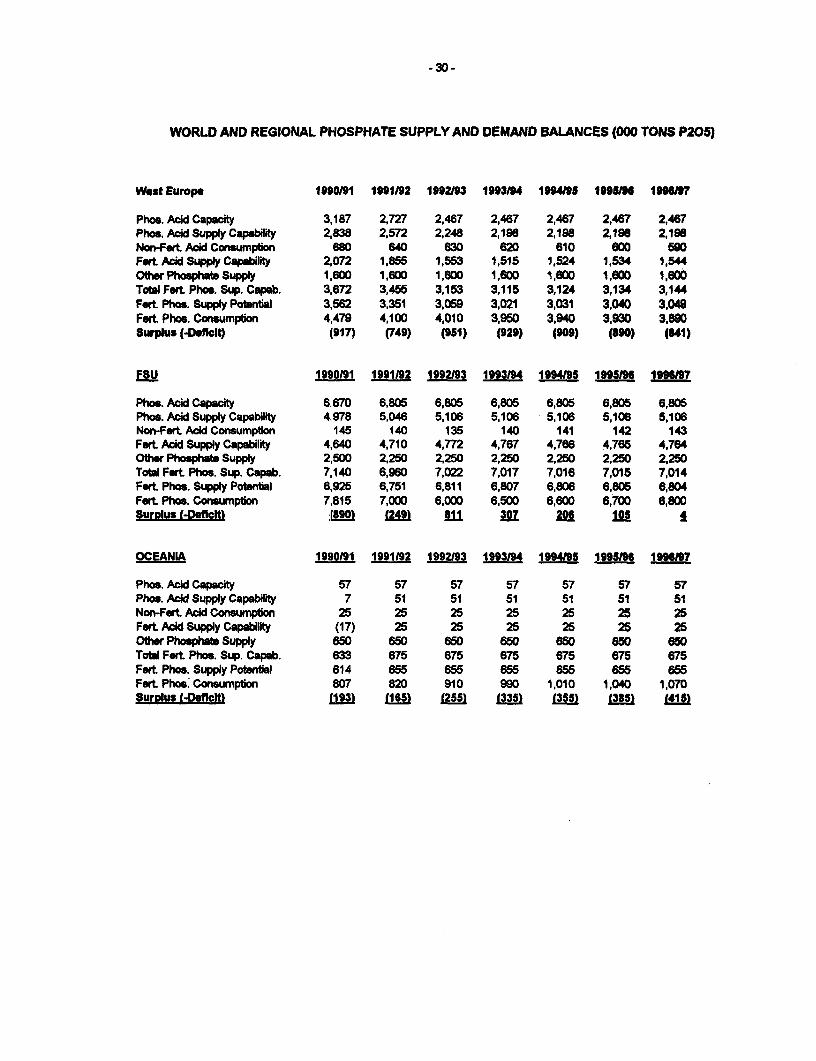
West Europe 1990/91 1991192 1992193 1993/94 1994195 1998 1906/N7
Phos. Acid Capacity 3,187 2,727 2,467 2,467 2,487 2,467 2,467Phos. Acid Supply Capability 2,838 2,572 2,248 2,198 2,198 2,198 2,198Non-Fort Acid Conumptin 880 640 830 620 610 600 590Fort Acid Supply Capabilty 2,072 1,855 1,553 1,515 1,524 1,534 1,544Oter PhosphaW Supply 1,600 1,600 1,800 1,600 1,600 1,600 1,600Tol Fot Phos. Sup. Capab. 3,672 3,455 3,153 3,115 3,124 3,134 3,144Fort Phos. Supply Pontil 3,562 3,351 3,059 3,021 3,031 3,040 3,049Fort Phos. Consumpton 4,479 4,100 4,010 3,950 3,940 3,930 3,890Surplus (4-Dfict) (917) (749) (9S1) (929) (909) (890) (341)
FSU 1990191 1991192 1992193 1993194 1994U95 1995/91 11thIB
Phos. Acid Capacity 6,670 6,805 6,805 6,805 6,805 6,805 6,805Phos. Acid Supply Capability 4,978 5,046 5,106 5,106 5,106 5,106 5,106Non-Fort Acid Consumption 145 140 135 140 141 142 143Fort Acid Supply Capability 4,640 4,710 4,772 4,767 4,766 4,765 4,764Oter Phosphate Supply 2,500 2,250 2,250 2,250 2,250 2,250 2,250Totidal Fort Phos. Sup. Capab. 7,140 6,960 7,022 7,017 7,016 7,015 7,014ForL Phos. Supply Potential 6,925 6,751 6,811 6,807 6,806 6,805 6,804Fort Phos. Consumption 7,815 7,000 6,000 6,500 6,600 6,700 6,800Surplus -Defit) MM9o l249) 811 307 206 10S 8
OCEANIA 190191 1991192 1992193 1993194 1994195 1995196 1991197
Phos. Acid Capacity 57 57 57 57 57 57 57Phos. Acid Supply Capability 7 51 51 51 51 51 51Non-Fert Acid Consumtion 25 25 25 25 25 25 25Fort Acid Supply Capability (17) 25 25 25 25 25 25Othr Phosphat Supply 650 650 650 650 850 650 850Totl Fort Phos. Sup. Capab. 633 675 675 675 675 675 875Fot Phos. Supply PotntaJ 614 855 655 655 655 655 655Fort Phos. Consumption 807 820 910 990 1,010 1,040 1,070SurDlus (-De4icIt) l193) 1165) (255) (3351 (355 1385) 41
POTASH SUPPLY AND DEMAND BALANCES
1990/91 - 1996197
- 32 -
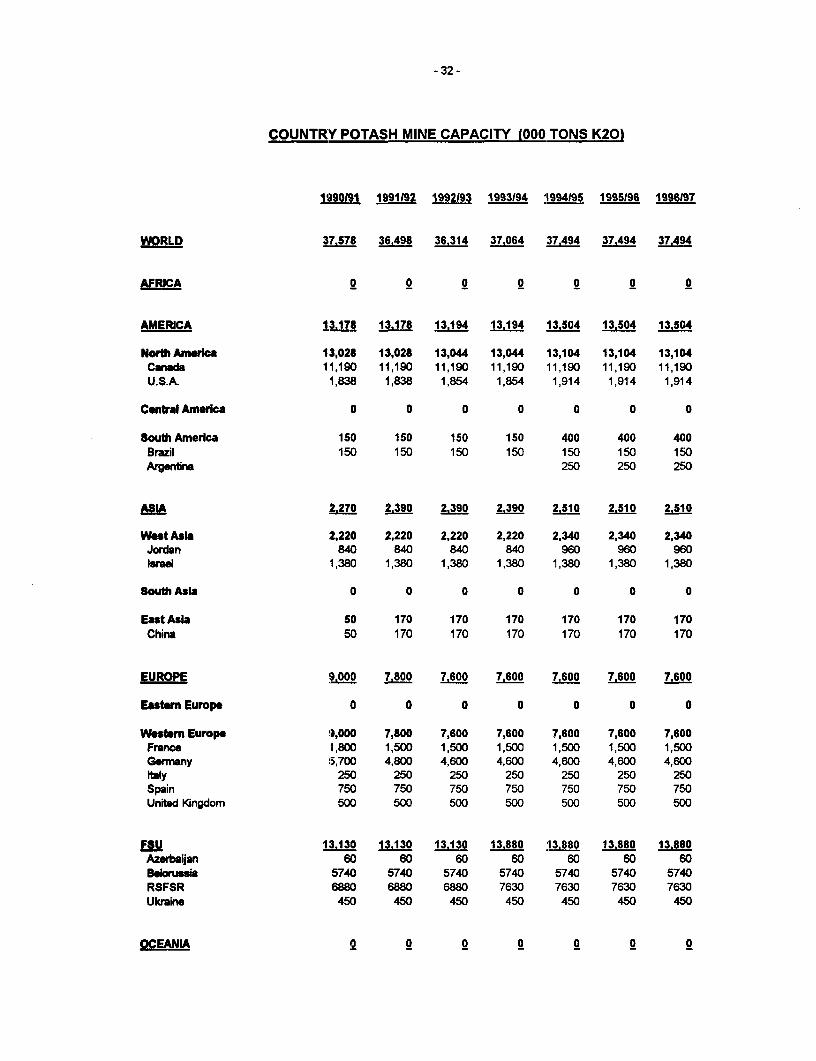
COUNTRY POTASH MINE CAPACITY (000 TONS K20)
1990191 1991192 1992193 1993194 1994195 1995196 1996197
WORLD 37.578 36.498 36.314 370 37,494 37.494 37,494
AFRICA Q O Q 2 0 o 2
AMERICA 13.3.17 8 78 13.194 13.194 13.04 13.504 13,504
North Ameulca 13,028 13,028 13,044 13,044 13,104 13,104 13,104Canada 11,190 11,190 11,190 11,190 11,190 11,190 11,190U.S.A. 1,838 1,838 1,854 1,854 1,914 1,914 1,914
Central America 0 0 0 0 0 0 0
South America 150 150 150 150 400 400 400Brazil 150 150 150 150 150 150 150Argentina 250 250 250
Am ;2.270 2.0 L 3390 2,390 2.510 2.S10 2.510
West Asia 2,220 2,220 2,220 2,220 2,340 2,340 2,340Jordan 840 840 840 840 960 960 960lsrae 1,380 1,380 1,380 1,380 1,380 1,380 1,380
SouthAsla 0 0 0 0 0 0 0
EnstAsia 50 170 170 170 170 170 170China 50 170 170 170 170 170 170
EUROPE 9.000 7.800 7.600 7,600 7,600 7,600
Easten Europe 0 0 0 0 0 0 0
Western Europe 9,000 7,800 7,600 7,600 7,600 7,600 7,600France 1,800 1,500 1,500 1,500 1,500 1,500 1,500Germany !5,700 4,800 4,600 4,600 4,600 4,600 4,600Ibly 250 250 250 250 250 250 250Spain 750 750 750 750 750 750 750United Kingdom 500 500 500 500 500 500 500
fam. 13.130 13.130 13.130 13.880 13,880 13.880 13.880Azerbeian 60 60 60 60 60 60 60Beorussi 5740 5740 5740 5740 5740 5740 5740RSFSR 6880 6880 6880 7630 7630 7630 7630Ukraine 450 450 450 450 450 450 450
OCEANIA 0 0 Q 2 o Q Q
-33-
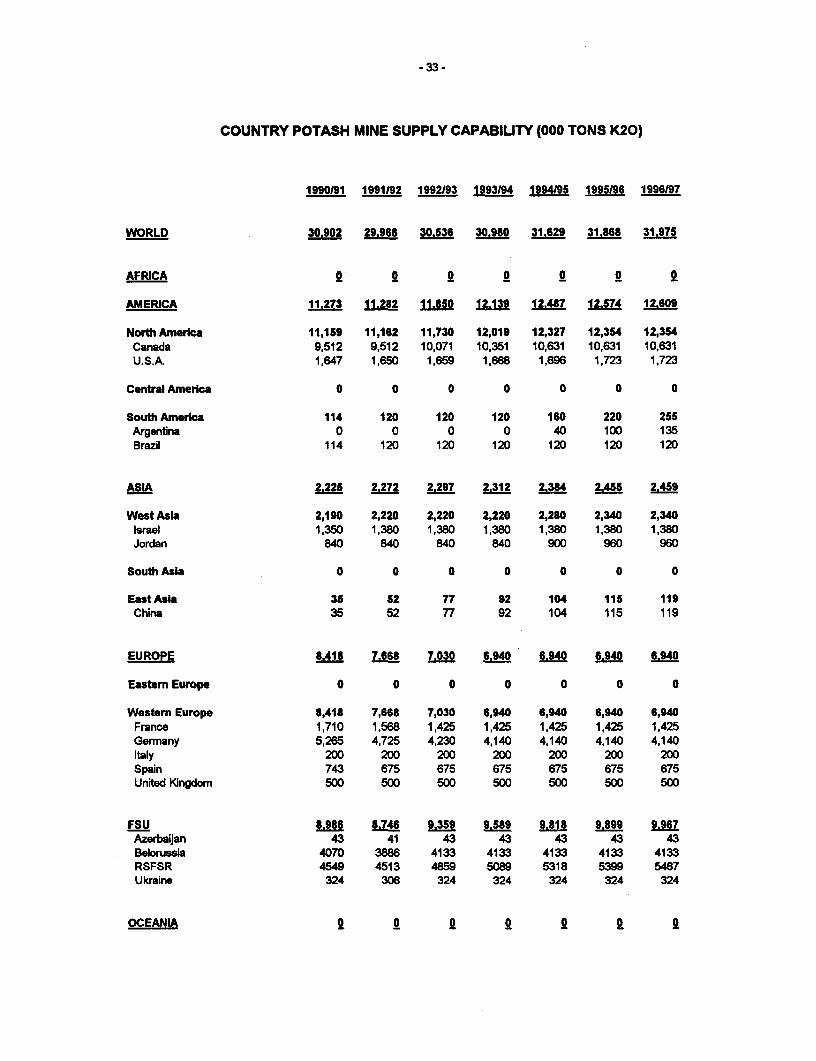
COUNTRY POTASH MINE SUPPLY CAPABILITY (000 TONS K20)
1990191 1991192 1992193 1993/94 1994195 1995196 1996197
WORLD 30.902 29.968 30.536 30.980 31.629 31.868 31.97S
AFRICA Q Q Q Q Q Q Q
AMERICA 11,273 11.282 11.850 12.139 12.487 12.574 12.609
North America 11,159 11,162 11,730 12,019 12,327 12,354 12,354Canada 9,512 9,512 10,071 10,351 10,631 10,631 10,631U.S.A. 1,647 1,650 1,659 1,668 1,696 1,723 1,723
CentralAmerica 0 0 0 0 0 0 0
South America 114 120 120 120 160 220 255Argentina 0 0 0 0 40 100 135Brazil 114 120 120 120 120 120 120
ASIA 2.225 2.272 2.297 2.312 2.384 2.455 2.459
West Asia 2,190 2,220 2,220 2,220 2,280 2,340 2,340Israel 1,350 1,380 1,380 1,380 1,380 1,380 1,380Jordan 840 840 840 840 900 960 960
South Asia 0 0 0 0 0 0 0
East Asia 35 52 77 92 104 11S 119China 35 52 77 92 104 115 119
EUROPE 8.418 7.668 7.030 6.940 6.940 6.940 6.940
Eastern Europe 0 0 0 0 0 0 0
Western Europe 8,418 7,668 7,030 6,940 6,940 6,940 6,940Francoe 1,710 1,568 1,425 1,425 1,425 1,425 1,425Germany 5,265 4,725 4,230 4,140 4,140 4,140 4,140Italy 200 200 200 200 200 200 200Spain 743 675 675 675 675 675 675United Kingdom 500 500 500 500 500 500 500
FSU 8.986 8.746 9.359 9.589 9.818 9.899 9.967Azerbaijan 43 41 43 43 43 43 43Bekrussia 4070 3886 4133 4133 4133 4133 4133RSFSR 4549 4513 4859 5089 5318 5399 5487Ukraine 324 306 324 324 324 324 324
OCEANIA Q 0 Q Q Q Q Q
-34 -
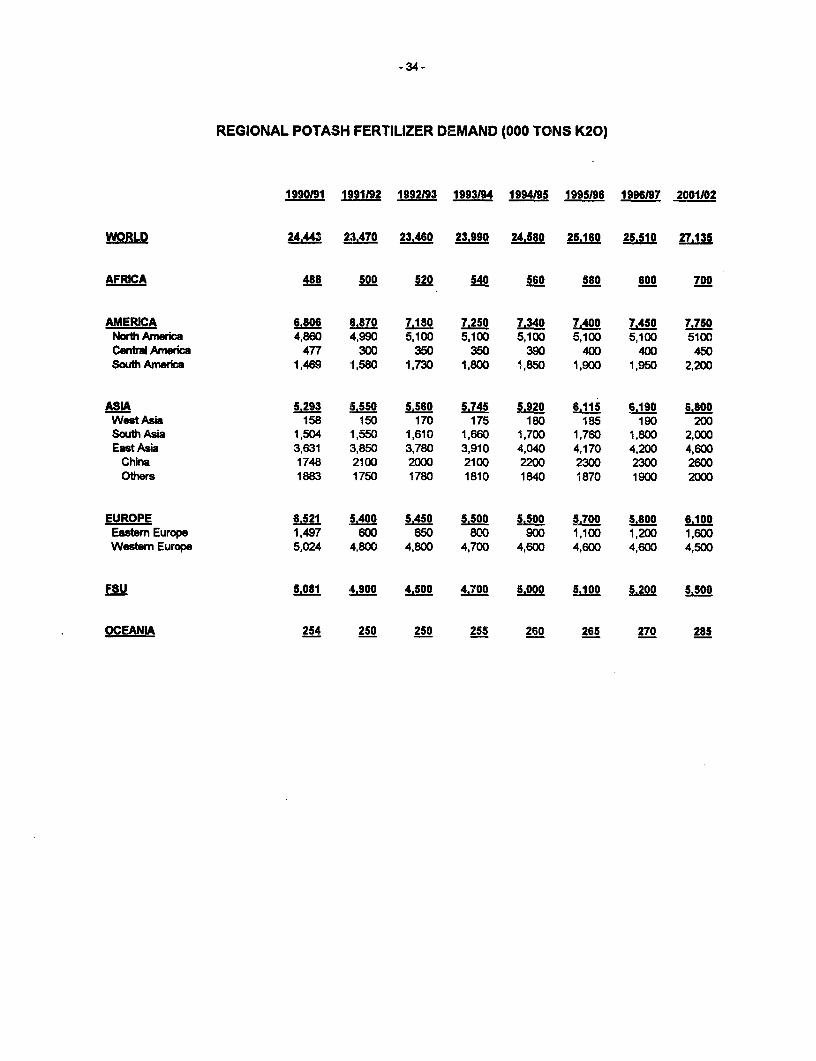
REGIONAL POTASH FERTILIZER DEMAND (000 TONS K20)
1990/91 1991192 1992193 1993194 1994/95 1995196 1996197 2001102
WORLD 24.443 23.470 23.460 23.990 24.580 2S.160 25.510 27.13S
AFRICA 488 500 520 540 560 580 600 700
AMERICA 6.806 S.870 7.180 7.250 7.340 7.400 7.450 7.750North America 4,860 4,990 5,100 5,100 5,100 5,100 5,100 5100Central America 477 300 350 350 390 400 400 450South America 1,469 1,580 1,730 1,800 1,850 1,900 1,950 2,200
ASIA 5 293 5.S50 5.560 5.745 5.920 6.115 6 190 6WestAsia 158 150 170 175 180 185 190 200South Asia 1,504 1,550 1,610 1,660 1,700 1,760 1,800 2,000East Asia 3,631 3,850 3,780 3,910 4,040 4,170 4,200 4,600
China 1748 2100 2000 2100 2200 2300 2300 2600Others 1883 1750 1780 1810 1840 1870 1900 2000
EUROPE 68521 5.400 5.450 5.500 5.500 5.700 5.800 6.100Eastern Europe 1,497 600 650 800 900 1,100 1,200 1,600Western Europe 5,024 4,800 4,800 4,700 4,600 4,600 4,600 4,500
FSU 5.081 4 900 4.500 4.700 5.000 5.100 5.200 5.500
OCEANIA 254 250 250 255 260 265 270 285
-35-
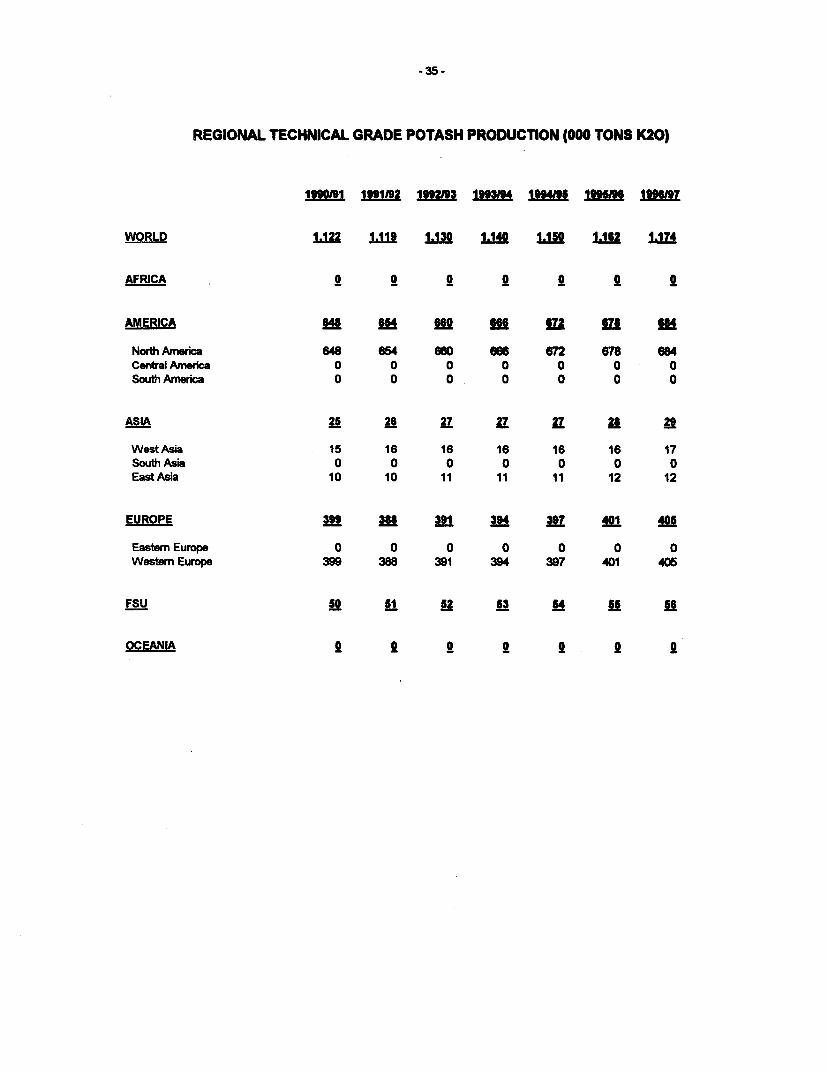
REGIONAL TECHNICAL GRADE POTASH PRODUCTION (000 TONS K20)
110Mm 199U92 JIM= "3 119 MM MM
WORLD 1.1 22 1.119 1.1SQ 11f 1.15 1.1t 1.4
AFRICA Q ii it i
AMERICA us Sf4 NO 666 li E l
North America 648 654 60 666 672 678 664Central America 0 0 0 0 0 a South America 0 0 0 0 0 0 0
ASIA 25 26 7 2 2 28 29
West Asia 15 16 16 16 16 16 17South Asia 0 0 0 0 0 0 0EastAsia 10 10 11 11 11 12 12
EUROPE 3 36i 391 3f4 it! 0l 400
Easter Europe 0 0 0 0 0 0 0Western Europe 399 388 391 394 397 401 405
FSU 5 51 2 53
OCEANIA i i f 2 f 2
-38-
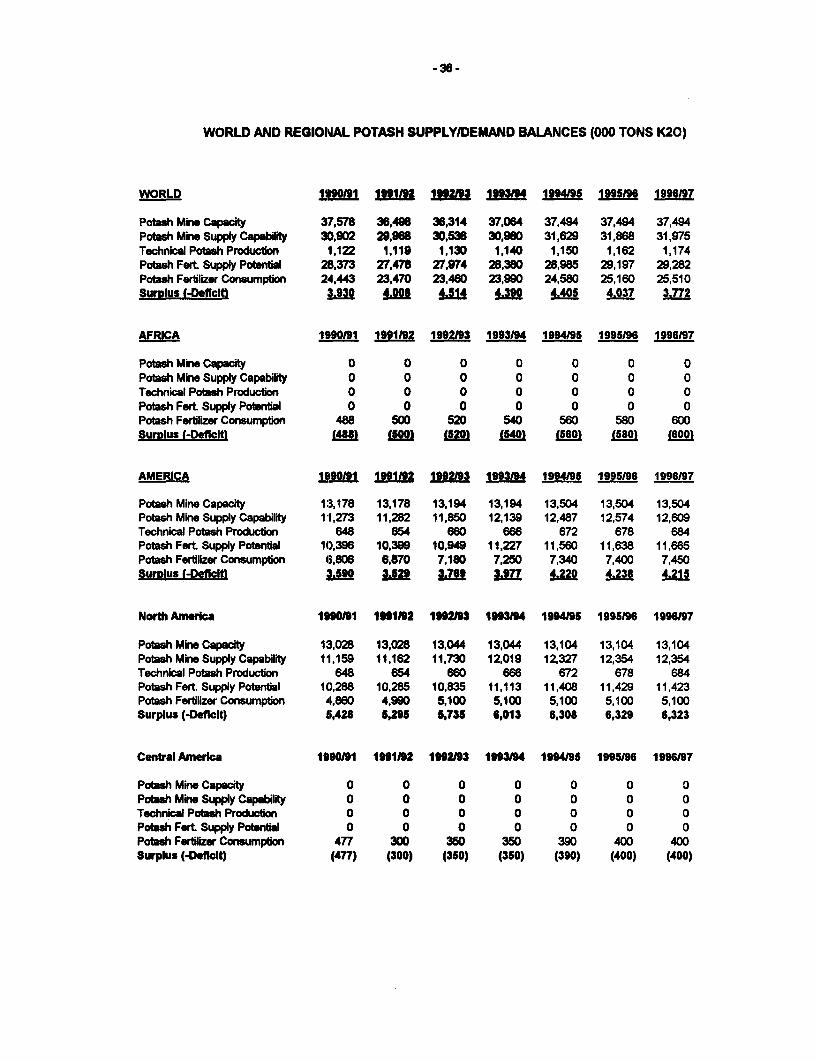
WORLD AND REGIONAL POTASH SUPPLY/DEMAND BALANCES (000 TONS K20)
WORLD 1lMU9 1991t92 119i293 ,13f4 194U95 1995196 1996197
Potash Mine Capacity 37.578 36,4S8 36,314 37,064 37,494 37.494 37,494Potash Mine Supply Capability 30,902 29,968 30,536 30,980 31,629 31,868 31,975Technical Potash Production 1.122 1,119 1,130 1,140 1,150 1,162 1,174Potash Frt. Supply Potenti 28,373 27,478 27,974 28,380 28,985 29,197 29,282Potash Fertilize Consumpton 24,443 23,470 23,480 23,990 24,580 25,160 25,510Surplus f-DefcMi 3.930 4.00 4.14 4.3M0 4u405 4.037 3.772
AFRICA 1990t91 1"1192 192193 1993/94 1994195 1995196 1996197
Potash Mi Capacity 0 0 0 0 0 0 0Potash Mine Supply Capability 0 0 0 0 0 0 0Technical Potash Production 0 0 0 0 0 0 0Potash Fet SupplyPoetian 0 0 0 0 0 0 0Potash Feorlizer Consumption 488 500 520 540 560 580 600SurDlus (-DefctM 14ff88) !5) (fl3 S40j (560) (580) &600)
AMERICA jP90191 91192 1J99293 1993194 1994195 199596 1996197
Potash Mine Capacdy 1:3,178 13,178 13,194 13,194 13,504 13,504 13,504Potash Mine Supply Capability 11,273 11,282 11,850 12,139 12,487 12,574 12,609Technical Potash Production 648 654 660 666 672 678 684Potash Fert Supply Potental 10,396 10,399 10,949 11,227 11,580 11,638 11,665Potash Fertilizer Consumption 18,806 6,870 7,180 7,250 7,340 7,400 7,450SurpIus (-Defigcit Lj90 3A29 9 1977 4.220 4.238 4.215
North America 1990/91 1991192 1992193 1993/94 1994195 1995196 1996197
Potash Mine Capacity 13,028 13,028 13,044 13,044 13,104 13,104 13,104Potash Mine Supply Capability 111,159 11,162 11,730 12,019 12,327 12,354 12,354Technical Potash Production 648 654 680 666 672 678 684Potash Fort Supply Potential 10,288 10,285 10,835 11,113 11,408 11,429 11,423Potash Fertilizer Consumption 4,860 4,960 5,100 5,100 5,100 5,100 5,100Surplus (4-eficit) 5,428 5,295 5,735 6,013 6,308 6,329 6,323
Central America 1990)91 1991/92 1992/93 1993194 1994195 1995196 1996197
Potsh MineCapacity 0 0 0 0 0 0 0Potash Mie Supply Capability 0 0 0 0 0 0 0Technical Potash Production 0 0 0 0 0 0 0Potash Fsrt Supply Potential 0 0 0 0 0 0 0Potash Fertilizer Consumption 477 300 350 350 390 400 400Surplus (DeficIt) (477) (300) (350) (350) (390) (400) (400)
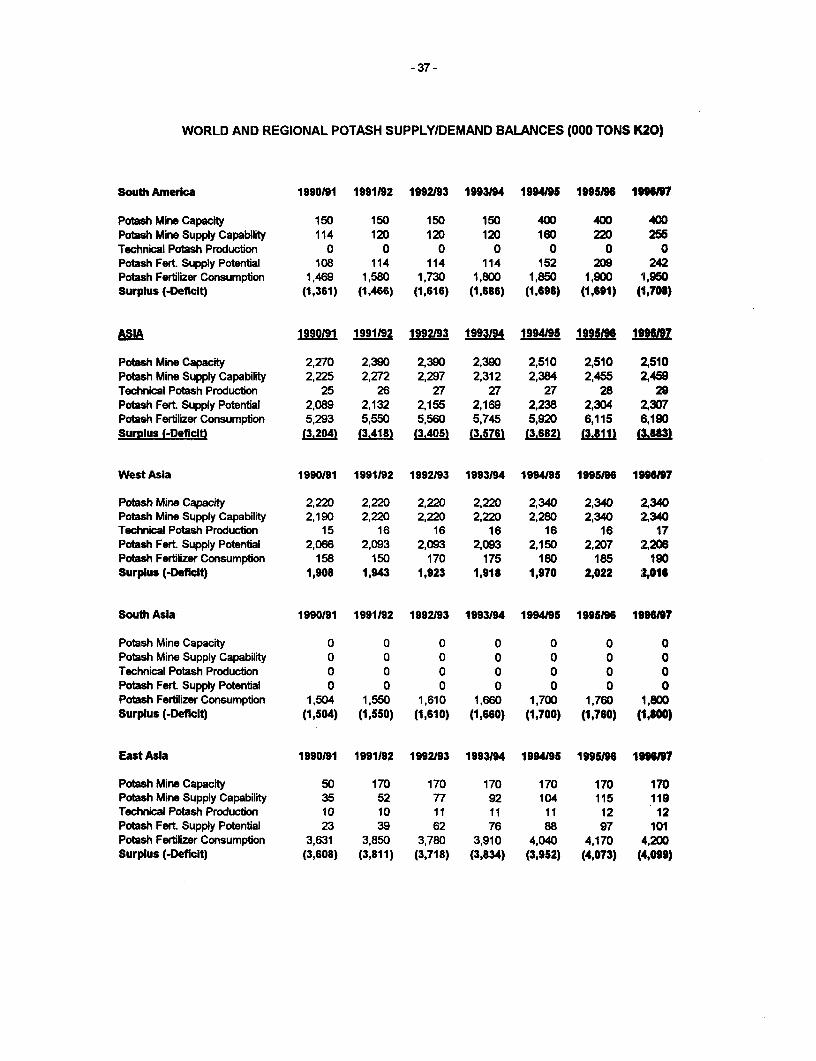
- 37 -
WORLD AND REGIONAL POTASH SUPPLYIDEMAND BALANCES (000 TONS K20)
South AmeriCa 1990191 1991192 1992193 1993194 1994U95 1995196 1996197
Potash Mine Capacity 150 150 150 150 400 400 400PotashMineSupplyCapability 114 120 120 120 160 220 255Technical Potash ProductOn 0 0 0 0 0 0 0Potash Fert. Supply Potential 108 114 114 114 152 209 242Potash Fertilizer Consumption 1,469 1,580 1,730 1,800 1,850 1,900 1,950Surplus (-DeficIt) (1,361) (1,466) (1,616) (1,686) (1,698) (1,691) (1,708)
ASIA 1990191 1991192 1992193 1993194 1994195 1995196 1901l97
Potash Mine Capacity 2,270 2,390 2,390 2,390 2,510 2,510 2,510PotaSh Mine Supply Capability 2,225 2,272 2,297 2,312 2,384 2,455 2,459Technical Potash Production 25 26 27 27 27 28 29Potash Fert Supply Potential 2,089 2,132 2,155 2,169 2,238 2304 2,307Potash Fertilizer Consumpt;on 5,293 5,550 5,560 5,745 5,920 6,115 6,190Surplus (-Deficit) (3,204) (3.418) (3,405) (3.5761 (3.6821 (3.811) (3.883)
West Asia 1990191 1991192 1992193 1993194 1994195 1995/96 1996197
Potash Mine Capacity 2,220 2,220 2,220 2,220 2,340 2,340 2,340Potash Mine Supply Capability 2,190 2,220 2,220 2,220 2,280 2,340 2,340Technical Potash Production 15 16 16 16 16 16 17Potash Fert. Supply Potential 2,066 2,093 2,093 2,093 2,150 2,207 2206Potash Fertilizer Consumption 158 150 170 175 180 185 190Surplus (4)efiIt) 1,908 1,943 1,923 1,918 1,970 2,022 2,016
South Asia 1990191 1991192 1992193 1993194 1994195 1995196 1996197
Potash Mine Capacity 0 0 0 0 0 0 0Potash Mine Supply Capability 0 0 0 0 0 0 0Technical Potash Production 0 0 0 0 0 0 0Potash Fert Supply Potential 0 0 0 0 0 0 0Potash Fertilizer Consumption 1,504 1,550 1,610 1,660 1,700 1,760 1,800Surplus (-Deficit) (1,504) (1,550) (1,610) (1,660) (1,700) (1,760) (1,800)
East Asia 1990191 1991192 1992193 1993/94 1994195 1995/96 1996197
Potash Mine Capacity 50 170 170 170 170 170 170Potash Mine Supply Capability 35 52 77 92 104 115 119Technical Potash Production 10 10 11 11 11 12 12Potash Fort Supply Potential 23 39 62 76 88 97 101Potash Fertilizer Consumption 3,631 3,850 3,780 3,910 4,040 4,170 4,200Surplus (-Deficit) (3,608) (3,811) (3,718) (3,834) (3,952) (4,073) (4,099)
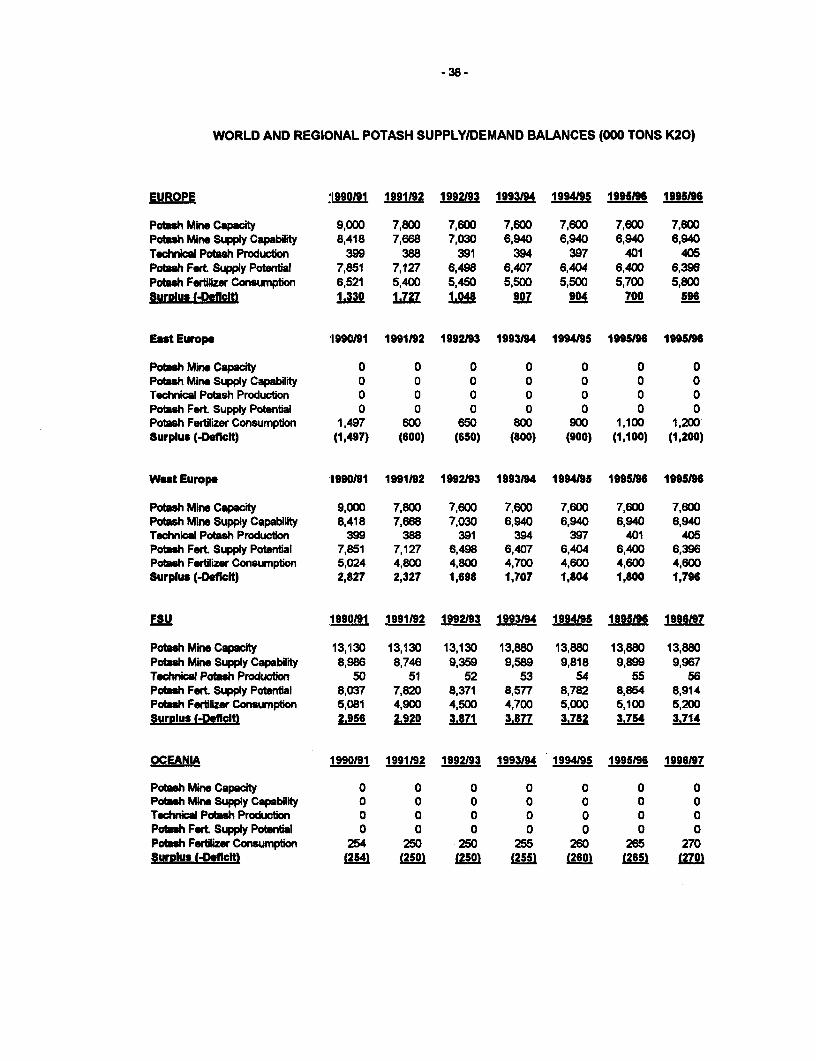
-38 -
WORLD AND REGIONAL POTASH SUPPLY/DEMAND BALANCES (000 TONS K20)
EUROPE 1990191 1991/92 1992193 1993194 1994195 1995196 1995196
Potash Mine Capacity 9,000 7,800 7,600 7,600 7,800 7,600 7,600Potah Mine Supply Capability 8,418 7,668 7,030 6,940 6,940 6,940 6,940Technical Potash Production 399 388 391 394 397 401 405Potash Fort Supply Potential 7,851 7,127 6,498 6,407 6,404 6,400 6,396Potsh Fertlizer Consumption 6,521 5,400 5,450 5,500 5,500 5,700 5,800Surplus tIDencf- 1.330 1.727 1.4 907 904 700 596
East Europe 1990/91 1991192 1992193 1993194 1994/95 1995196 1995/96
Potash MineCapwcity 0 0 0 0 0 0 0Potash Mine SupplyCapability 0 0 0 0 0 0 0Technical Potash Production 0 0 0 0 0 0 0Potash Fert Supply Potential 0 0 0 0 0 0 0Potash Fertilizer Consumption 1,497 600 650 800 900 1,100 1,200Surplus (-DefticIt) (1,497) (600) (650) (800) (900) (1,100) (1,200)
West Europe 1990191 1991192 1992193 1993194 1994/95 1995/96 1995196
Potish Mine Capacity 9,000 7,800 7,600 7,600 7,600 7,600 7,600Potash Mine Supply Capability 8,418 7,668 7,030 6,940 6,940 6,940 6,940Technical Potash Production 399 388 391 394 397 401 405Potash Fort Supply Potential 7,851 7,127 6,498 6,407 6,404 6,400 6,396Potash Fertilizer Consumption 5,024 4,800 4,800 4,700 4,600 4,600 4,600Surplus (4DefIlt) 2,827 2,327 1,698 1,707 1,804 1,800 1,796
FSU t1990191 1991192 1992193 1993194 1994195 1995/96 1996197
Potwah Mine Capacity 13,130 13,130 13,130 13,880 13,880 13,880 13,880Potah Mine Supply Capability 8,986 8,746 9,359 9,589 9,818 9,899 9,967Tdclc Potash Prodwcon 50 51 52 53 54 55 56Potash Fort Supply Pobntial 8,037 7,820 8,371 8,577 8,782 8,854 8,914Poth Fertilizer Consumption 5,081 4,900 4,5W 4,700 5,000 5,100 5,200Surplus (De4icIt) 2.956 2.920 3.871 3.877 3.782 3.754 3.714
OCEANIA 1990191 1991/92 1992193 1993/94 1994195 1995196 1996/97
Potsh Mine Capacity 0 0 0 0 0 0 0Potsh Mine Supply Capability 0 0 0 0 0 0 0Tschni alPotash Production 0 0 0 0 0 0 0Poth Fort Supply Potentisl 0 0 0 0 0 0 0Potsh Ferlize Consumption 254 250 250 255 260 265 270Surplus (DeftICIt) (254) (250) (250) (255) (260) (265B) (27
Distributors of World Bank PublicationsARGENTINA EL SALVADOR JAPAN SOUTH AFRICA, BOTSWANACaurl Hirsch, SRL Fusades Eastern Book Service For singl thAwGaleria Gume Alrn Dr. Manuel Enuique Araujo 83530 Hongo 3-Chome, Bunkyo-ku 113 Oxford Universty PrmFlorda 165, 4th Floor-Oft 453/465 Edificio SISA. la. Pio Tokyo Southern Africa1333 Buenos Abu San Salvador 011 P.O. Box 1141
KENYA Cape Town 8000AUSTRALIA, PAPUA NEW GUINEA, FINLAND Africa Book Srvice EA) Ltd.FIJI, SOLOMON ISLANDS, Akatminen Kaauppa Quaan House. Mfnpno Sbeet Foer suhcrrpvn der:VANUATU, AND WEST1RN SAMOA P.O. Box 128 P.O. Box 45245 International Subscrip on SevieD.A. Boobs & ounals S-00101 Hell"Id 10 Naibi P.O. Box 41095648 WFJtehone Road CraiallMBtcam33U2 FRANCE KOREA, REPUBLIC OF Johannesurg 2024Vketwia World Bank Publications Pan Korea Book Corporaon
66,avenuedl&na P.O. Box 101, Kwangwhamun SPAINAUSTRIA 73116 Paris Seoul Mund9Pa Lbre S.A.Gerold and Co. Castello 37Graben31 3 GERMANY MALAYSIA 28001 MadridA-I011 Wien UNO.Verlag University of Malaya Cooperdve
Poppebdorfer Alee 55 Bookshop, Limited LWbrwa Intma7donal AEDOSBANGLADESH D-300 Bonn 1 P.O. Box 1127, jalan Pantad Buu Conel de Cent,391Micro Industriu Developmet 59700 Kuala Lumpur O8O9 Baelona
Aiasince Society ODAS) GUATEMALAHouseeu Road 16 lIbrerixs Piedra Santa MEXICO SRI LANKA AND THE MALDIVESDhanmondi R/Area Sa. CaIle 745 INFITEC Lake House BookhopDhaka 1209 Zona1 Apartado Posl 22460 P.O. Box 244
Guatemal Clty 14060 IalpnMexidco D.F. 100, Sir Chitampalam ABush Jkes Gardiner Mawatha156, Nur Ahmed Sauk HONG KONG, MACAO NErHERLANDS Colombo 2Chittagong;4000 Aaia 2000 Ltd. De Lndeboom/lnOr-Publkatiea
46.48 Wyndham Strt P.O. Box 2M SWEDEN76, KD.. Avenue Winning Centre 7480 AE Haekebr For singl it wKuina 9100 2nd Floor Fritees FackbokMortet
Cental Hong Kong NEWZEALAND Regeorigstabn12,Box16356BELGIUM EBSCO NZ Ltd. S-1O3 27 StockholmJean De LAnnoy INDIA Private Mail Bag 99914Av. du Roi 202 Allied Publishers Private Ltd. New Market Forsuhscrop, oers:1060 Brussel 751 Mount Road Auckland Wennergren-WilliamAB
Madrs - 600 002 Box 30004CANADA NIGERIA 504 25 SteckholmLa Diffueur BSch v7w University Prea LinitedCP. 85 1501B rue Arnp&re 15 ).N. Heredia Marg Three Crowns Building jaicho SWTTZERLANDBoucdrvie. Quebec Ballard Esbtte Private Mail Beg 5095 For sihrle hucJ4BSEo Bombay-400 O8 Ibadan Libraiui Payot
1, rue de BeurgCHINA 13/14 Asaf All Road NORWAY CH 1002 LausasutChina Fincl & Economic New Delh -110 002 Narven Information Center
Publhing Houe Beok Deartment For sus cr dam:8, Da Fo Si DongJib 17 Chitbrmnjn Avenue P.O. Box 6125 Ettebstad Librarie PayotBeifing Calcutta - 700 072 N-0602 Oslo 6 Service des Abonntens
Case poebi 3312COLOMBIA Jayadeva Hostel Building PAKISTAN CH 1002 LausanneInjoenlace Ltda. 5th Main Road Gandhnkagar Miria Book AgencyApartdoAereo3470 Bangalore -560009 65, Shalwah-e.Quaid-e-Azam TANZANIABogota D.E. P.O. Box No. 729 Oxford Univemty Prm
3-5-1129 Kachiguda Cros Road LAhore S400C P.O. Box 5299COTE D'IVOIRE Hydesbad - 500 027 Maktaba RPodCentre d'Edition at de Diffuion PERU Dar et Salam
Africaines (CEDA) Prarhana Flatse 2nd Floor Editorial DeNarol SA04 B.P. 541 Ner Thakore Baug, Navrangpurn Apartedo 3824 THAILANDAbidjan 04 Plateu Ahmledabd -380009 Lima I Centnl DepyrtmentStore
306 SUiom RoadCYPRUS PatialaHouse PHIUPPINES BangkokCyprus College Bookds 16-A Ashok Msrg intematlonel Book Center6, Diegene Street. Engomi Lucknow - 226 001 FIh Floor, Filipines Lf Building TRINIDAD & TOBAGO, ANTIGUAP.O. Box 2006 Ayala Avenue, Makati BARBUDA, BARBADOS,Nicoesa Cental Bazaar Road Metro Manila DOMINICA. GRENADA, GUYANA.
60 Bajaj Nagar JAMAICA, MONTSERRAT, ST.DENMARK Nagpur 440O1 POLAND KIlTS & NEVIS, ST. LUCI4ASamfundaUtteratur ORPAN ST. VINCENT & GRENADINESRosenoa AIM 11 INDONESIA Palac Kulitury i Nauld Systenatice Studim UnitDK-1970 FrederikebergC Pt Indira Limited 00-901 Warwa 99 Watta Street
JL Sam Ratublngi 37 CurepeDOMINICAN REPUBUC P.O. Box 181 PORTUGAL Trinidad, West IndieaEditom Taeir, C. por A. Jalarta Pusat Livraia PortugalResturaci6n Isabe a Ca6llka 309 Rua Do Carmno 70.74 UNITED KINGDOMAparledo de Correor2l9O Z.1 ISRAEL 12C0 Libon Micrinfo Ltd.Santo Domingo Yomrot Uterture Ltd. P.O. Box 3
P.O. Box 5605 SAUDI ARABIA. QATAR Alton, Hampshire GUC3 2PGEGYPT, ARAB REPUBUC OF Tel Aviv 61560 Jarir BokStokS EnglandAl Ahram Isl P.O. Box 3196Al Galme Street Rlydy 11471 VENEZUELACairo ITALY Lbrelua del ELts
Licoe Commisronaia Snonl SPA SINGAPORE, TAIWAN, Aptdo. 60.337TheMiddleEsatObserve Via Duca Di Calabria4 1/1 MYANMAR,BRUNEI CarcLs 1060-A41, Shrif Street Casella Poatale 552 Information PubUctionsCairo 50125 Firenae Private, Ltd.
02-06 lt PL. Pei-Pu IndustrlBldg.
24NewindustrlalRoadSingapore 1953


I
RECENT WORLD BANK TECHNICAL PAPERS (continued)
No. 145 Ivanek, Nulty, and Holcer, Manufacturing Telecommunications Equipment in Newly IndustrializingCountries: The Effect of Technological Progress
No. 146 Dejene and Olivares, Integrating Environmental Issues into a Strategyfor Sustainable AgriculturalDevelopment: The Case of Mozambique
No. 147 The World Bank/UNDP/CEC/FAO, Fisheries and Aquaculture Research Capabilities and Neea'sin Asia: Studies of India, Thailand, Malaysia, Indonesia, the Philippines, and the ASEAN Region
No. 148 The World Bank/UNDP/CEC/FAO, Fisheries and Aquaculture Research Capabilities and Needsin Latin America: Studies of Uruguay, Argentina, Chile, Ecuador, and Peru
No. 149 The World Bank/UNDP/CEC/FAO, Fisheries and Aquaculture Research Capabilities and Needsin Africa: Studies of Kenya, Malawi, Mozambique, Zimbabwe, Mauritania, Morocco, and Senegal
No. 150 The World Bank/UNDP/CEC/FAO, International Cooperation in Fisheries Research
No. 151 The World Bank/UNDP/CEC/FAO, Tropical Aquaculture Development: Research Needs
No. 152 The World Bank/UNDP/CEC/FAO, Small-Scale Fisheries: Research Needs
No. 153 The World Bank/UNDP/CEC/FAO, Small Pelagic Fish Utilization: Research Needs
No. 154 Environment Department, Environmental Assessment Sourcebook, vol. III: Guidelinesfor Environmental Assessment of Energy and Industry Projects
No. 155 Belot and Weigel, Programs in Industrial Countries to Promote Foreign Direct Investment in DevelopingCountries
No. 156 De Geyndt, Managing Health Expenditures under National Health Insurance: The Case of Korea
No. 157 Critchley, Reij, and Seznec, Water Harvesting for Plant Production, vol. II: Case Studiesand Conclusions for Sub-Saharan Africa
No. 158 Hay and Paul, Regulation and Taxation of Commercial Banks during the International Debt Crisis
No. 159 Liese, Sachdeva, and Cochrane, Organizing and Managing Tropical Disease Control Programs:Lessons of Success
No. 160 Boner and Krueger, The Basics of Antitrust Policy: A Review of Ten Nations and the EuropeanCommunities
No. 161 Riverson and Carapetis, Intermediate Means of Transport in Sub-Saharan Africa: Its Potentialfor Improving Rural Travel and Transport
No. 162 Replogle, Non-Motorized Vehicles in Asian Cities
No. 163 Shilling, editor, Beyond Syndicated Loans: Sources of Credit for Developing Countries
No. 164 Schwartz and Kampen, Agricultural Extension in East Africa
No. 165 Kellaghan and Greaney, Using Examinations to Improve Education: A Study in Fourteen AfricanCountries
No. 166 Ahmad and Kutcher, Irrigation Planning with Environmental Considerations: A Case Studyof Pakistan's Indus Basin
No. 167 Liese, Sachdeva, and Cochrane, Organizing and Managing Tropical Disease Control Programs:Case Studies
No. 168 Industry and Energy Department, An Introduction and Update on the Technology, Performance, Costsand Economics
No. 169 Westoff, Age at Marriage, Age at First Birth, and Fertility in Africa
No. 170 Sung and Troia, Developments in Debt Conversion Programs and Conversion Activities
No. 171 Brown and Nooter, Successful Small-Scale Irrigation in the Sahel
No. 172 Thomas and Shaw, Issues in the Development of Multigrade Schools
No. 173 Byrnes, Water Users Associations in World Bank-Assisted Irrigation Projects in Pakistan
No. 174 Constant and Sheldrick, World Nitrogen Survey
No. 175 Le Moigne and others, editors, Country Experiences with Water Resources Management: Economic,Institutional, Technological and Environmental Issues
The World Bank o,
Headquarters European Office Tokyo Office | tt 411818 H Street, N.W. 66, avenue d'Ina Kokusai BuildingWashington, D.C. 20433, U.S.A. 75116 laris, France 1-1 Manmouchi 3-chome
Chiyoda-ku, Tokyo 100, JapanTelephone: (202) 477-1234 Telephone: (1) 40.69.30.00Facsimile: (202) 477-6391 Facsimile: (1) 40.69.30.66 Telephone: (3) 3214-5001 ',ITelex: wui64145WORLDBANK Telex: 640651 Facsimile: (3)3214-3657 O O
RCA 248423 WORLDBK Telex: 26838Cable Address: INTBAFRAD
WASHNIGTONDC
0
0C d
Cover design by Walton Rosenquist ISBN 0-8213-2163-3
Copyright © 2022 FDOKUMEN