
Listed property trusts and downside systematic risk sensitivity
26
Deakin Research Online This is the authors’ final peer reviewed (post print) version of the item published as: Lee, Chyi Lin, Robinson, Jon and Reed, Richard 2008, Listed property trusts and downside systematic risk sensitivity, Journal of property investment and finance, vol. 26, no. 4, pp. 304-328. Available from Deakin Research Online: http://hdl.handle.net/10536/DRO/DU:30021983 Reproduced with the kind permission of the copyright owner. Copyright : 2008, Emerald Group Publishing Limited
Transcript of Listed property trusts and downside systematic risk sensitivity

Deakin Research Online
This is the authors’ final peer reviewed (post print) version of the
item published as:
Lee, Chyi Lin, Robinson, Jon and Reed, Richard 2008, Listed property trusts and downside systematic risk sensitivity, Journal of property
investment and finance, vol. 26, no. 4, pp. 304-328.
Available from Deakin Research Online:
http://hdl.handle.net/10536/DRO/DU:30021983
Reproduced with the kind permission of the copyright owner.
Copyright : 2008, Emerald Group Publishing Limited

Listed property trusts and downside systematic risk sensitivity
The Authors
Chyi Lin Lee, Faculty of Architecture, Building and Planning, The University of Melbourne, Melbourne, Australia
Jon Robinson, Faculty of Architecture, Building and Planning, The University of Melbourne, Melbourne, Australia
Richard Reed, Faculty of Architecture, Building and Planning, The University of Melbourne, Melbourne, Australia
Abstract
Purpose – This paper aims to identify and examine the determinants of downside systematic risk in Australian listed property trusts (LPTs). Design/methodology/approach – Capital asset pricing model (CAPM) and lower partial moment-CAPM (LPM-CAPM) are employed to compute both systematic risk and downside systematic risk. The methodology of Patel and Olsen and Chaudhry et al. is adopted to examine the determinants of systematic risk and downside systematic risk. Findings – The results confirm that systematic risk and downside systematic risk can be individually identified. There is little evidence to support the existence of linkages between systematic risk in Australian LPTs and financial/management structure determinants. On the other hand, downside systematic risk is directly related to the leverage/management structure of a LPT. The results are also robust after controlling for the LPTs' investment characteristics and varying target rates of return. Practical implications – Investors and real estate analysts should conscious with the higher returns from high leverage and internally managed LPTs. Although there is no evidence that these higher returns are related to higher systematic risk, there could be the compensation for higher downside systematic risk. Originality/value – This study provides invaluable insights into the management of real estate risk in Australian LPTs with implications for REITs in other countries. Unlike previous studies of systematic risk in REITs or LPTs, this is the first study to assess downside systematic risk and explore the determinants of downside systematic risk in LPTs.
1. Introduction
Listed property trusts (LPTs) are some of the most successful indirect property investments in Australia. As at 31 December 2006, the total market capitalisation of Australian LPTs was approximately AUD$135 billion, representing over 12 per cent of the global listed real estate market (ASX, 2006a, b). Following the increasing acceptance of LPTs or REITs as an investment vehicle in other countries such as UK, factors affecting the level of risk, particularly systematic risk, in LPTs have received considerable research attention.
Previous real estate studies have generally accepted that the characteristics of LPTs have direct implications for the level of systematic risk. Such studies have employed the capital asset pricing model (CAPM) to quantify the systematic risk of a LPT (or REIT). However, using CAPM has several drawbacks, such as the assumptions that return distributions are normally distributed and utility functions are irrelevant for investors. More importantly, these assumptions have been rejected by extensive studies. Therefore, it is not surprising that there is little empirical evidence supporting CAPM in finance and real estate literature (Chen et al., 1998; Conover et al., 2000; Fama and French, 1992, 2004; Malkiel and Xu, 1997).
In order to address these limitations, alternative measures for capturing the market-related risk of a LPT must be employed. A viable alternative is to use downside systematic risk since it has been shown that downside systematic risk is a more intuitively appealing risk measure compared to conventional risk measures (Bawa and Linderberg, 1977; Hogan and Warren, 1974). Reasons for acceptance of downside systematic risk as an efficient measure of risk are that it:
does not require an assumption about the return distribution of an asset; is more consistent with the investor's expected utility function; and is a risk measure that only focuses on the downside and combines information
provided by variance and skewness into one measure (Estrada, 2002; Nawrocki, 1999).
Recent studies have also highlighted the ability of downside systematic risk to explain return variations and offer some empirical support for downside systematic risk (Ang et al., 2006; Post and Vilet, 2004).
The questions surrounding downside systematic risk in LPTs (or REITs) have been the subject of relatively little research. Therefore, the aim of this paper is to address this gap in the literature by examining downside systematic risk in Australian LPTs. This study also examines variations in the sensitivities of systematic risk and downside systematic risk in relation to LPT's financial conditions as well as its management structure.
The reminder of the paper is structured as follows. Section 2 reviews the connection between financial determinants, management structure and systematic risk. The importance of downside systematic risk is also reviewed in Section 2. The data and methodology are described in Section 3. Section 4 discusses the results. Section 5 presents the conclusions.
2. Literature review

This section contains two parts, with the first part focusing on a review of the determinants of systematic risk in real estate literature. The second part reviews the importance and advantages of lower partial moment-CAPM (LPM-CAPM) in estimating market-related risk.
2.1 Systematic risk and its determinants
Previous studies examining systematic risk have highlighted the relationship between the systematic risk of a LPT with its financial conditions and management structure. The study of Patel and Olsen (1984) was the first landmark study in a real estate context. Importantly, they argued that short-term financial leverage, business risk and the advisor's fee of a LPT are directly related to the level of systematic risk. More recently, Delcoure and Dickens (2004) extended the earlier study of Patel and Olsen (1984) by employing a larger sample size of US REITs where the results confirmed that business risk is significantly and negatively related to the REIT systematic risk. In addition, they also identified an inverse relationship between REIT systematic risk and short term and variable-rate financing. However, a positive and statistically significant relationship was observed between long-term debt and REIT systematic risk for REITs.
Allen et al. (2000) have identified a positive and significant relationship between total financial leverage and systematic risk. The study further confirmed the findings of Patel and Olsen (1984) in which the asset variable (i.e. the proportion of the REIT invested in equity real estate) is insignificant in explaining beta. They also demonstrated that specialisation (i.e. the total of the squared proportions of the REIT's portfolio invested in each property type) is an insignificant factor in explaining systematic risk.
Conover et al. (1998) have found some indirect evidence for the role of size in understanding systematic risk since they found that the return and risk differences between large and small foreign real estate firms were statistically significant. Similarly, Gyuorko and Nelling (1996) examined the systematic risk of REITs from 1988 to 1992 and identified a positive and statistically significant relationship between size and systematic risk. With reference to Australian LPTs, Tan (2004) provided indirect evidence to demonstrate that large size LPTs have a higher beta. On the other hand, a study by Litt et al. (1999) employed a different study period (1993-1997) for the US REIT market and produced contrasting results. Ambrose and Linneman (2001) and Byrne and Lee (2003) revealed similar results in which no significant size effect was evident for betas of US REITs and UK property funds. More recently, Ambrose et al. (2005) re-examined and documented a significant inverse relationship between beta and size and concluded that it can be attributed to the economies of scale in REITs.
Several studies have also examined the influence of the management structure of the LPT on its systematic risk. Capozza and Seguin (2000) demonstrated that externally managed REITs have higher systematic risk than self-managed REITs. Moreover, Allen et al. (2000) studied the impacts of management strategy on risk and offered evidence that self-managed REITs exhibit less systematic risk. However, Ambrose and Linneman (2001) found that internally managed REITs had a higher beta in recent years.

In Australia, Tan (2004) examined the effect of management structure on the performance of Australian LPTs where the results indicated that LPTs employing an internal management structure outperform externally managed LPTs. The results have also offered indirect evidence about the effect of management structure on systematic risk in which externally managed LPTs show higher systematic risk. This is consistent with the findings from Newell and Tan (2005) for an earlier study period.
Overall, these studies have confirmed that firm characteristics have some links with the traditional systematic risk of a LPT. However, traditional systematic risk and CAPM might provide misleading results in line with some theoretical flaws in CAPM.
2.2 Systematic risk and downside systematic risk
Sharpe (1964) developed CAPM based on the mean-variance model. This model suggests that beta can be used to measure the systematic risk of an asset and an asset is riskier if the asset exhibits a higher beta. However, a higher beta can also be contributed by the upside performance of an asset. This is not intuitively appealing and most investors would probably not accept this method in measuring the systematic risk for an asset (Estrada, 2006).
Previous research by Bawa (1975) and Fishburn (1977) have also highlighted the limitations in CAPM which assumes that investors' utility functions are irrelevant in asset pricing and all asset return distributions are normally distributed. In a real estate context, the normal distribution assumption in real estate returns has been rejected by previous studies (Graff et al., 1997; Myer and Webb, 1993, 1994; Peng, 2005). Therefore, CAPM may provide misleading results when it is analysed under a non-normality distribution.
In order to overcome these limitations, Bawa and Linderberg (1977) and Hogan and Warren (1974) developed a LPM-CAPM, which is a model that does not rely on these assumptions. Both studies have concluded that the LPM-CAPM model is preferred to CAPM at least on theoretical grounds. Harlow and Rao (1989) later improved the LPM-CAPM model and developed a more general model, which has come to be known as the Generalised Mean-Lower Partial Moment CAPM. This is a LPM-CAPM model for any arbitrary benchmark return. More importantly, their empirical results supported the use of the Generalised LPM-CAPM model although no similar evidence was found for traditional CAPM. Another important finding from the study was that target return should be equal to the mean of the assets' returns rather than the risk-free rate.
It must be noted that an earlier research study by Jahankhani (1976) found that there was relatively little improvement for LPM-CAPM model over the traditional CAPM model. At the same time, Nantell and Price (1979) found that variance and semi-variance produce similar equilibrium rates of return under the assumption of a bi-variate normal distribution of returns for an asset and also for the market. In contrast, Nantell et al. (1982) demonstrated that skewness in the distribution of market returns has a profound impact on CAPM in which divergence results are obtained from both LPM-CAPM and CAPM models if skewness exists in the asset return distribution. Furthermore Price et al. (1982) showed that systematic risk in a downside risk framework is different from systematic risk in a mean-
variance framework if the return distributions are in lognormal form. Clearly this supported the use of the LPM-CAPM model.
Moreover, Estrada (2000, 2002, 2004) has reported considerably different results generated by both models and argued for the superiority of using the LPM-CAPM model in emerging markets by providing evidence that supported the use of downside beta over traditional beta. Post and Vilet (2004) also provided evidence that LPM-CAPM outperformed the traditional CAPM when examining a cross-section of US stock returns. This was also confirmed by Ang et al. (2006) for US stock, where Fraser et al. (2004) also provided indirect empirical evidence from the UK stock market to support the use of LPM-CAPM. Note that these results offered evidence in favour of the CAPM in a bear market when there is a higher likelihood of negative returns and downside risk, whereas no similar result is found in a bull market. However, there has been relatively little research into the superiority of LPM-CAPM in real estate. One exception is Cheng (2005), who demonstrated the superiority of downside systematic risk over traditional systematic risk in explaining US direct property return variations.
The primary conclusion that can be drawn from this literature is that downside systematic risk appears to be a more intuitively appealing approach than systematic risk, as well as being distinguishable from traditional systematic risk. Whilst previous studies have highlighted the link between systematic risk, financial determinants and management structures, there has been relatively little focus placed on the relationship between downside systematic risk and these variables.
3. Data and methodology
3.1 Data
The dataset used for this analysis included all LPTs listed on the Australian Stock Exchange (ASX) from 1993 to 2005. This study was sub-divided into six equal time periods in order to address issues surrounding the time-variation in beta. To reliably examine a LPT's economic and financial situation, three-year intervals were employed where it was argued that annual accounting information cannot accurately reflect the real situation of a company (Alexander et al., 2003). The methodology was also adopted by Chaudhry et al. (2004) and Patel and Olsen (1984). Another reason for using a three-year interval was to include as many LPTs as possible in the study; 106 LPTs were identified by using the Global Industry Classification Standard (GICS) and ASX Sub-Code over the entire study period[1]. However, there were only 73 LPTs with adequate information over the six different study periods due to the relatively short lifespan of LPTs[2].
Period 1 includes the average annual accounting information from 1993 to 1995, where there were 25 LPTs that had sufficient accounting data for all the variables. Note that a LPT was removed from the sample if it did not have complete accounting information for the period. Period 2 spans from 1995 to 1997, period 3 is from 1997 to 1999, period 4 is 1999-2001, period 5 is 2001-2003 and period 6 is 2003-2005.

Monthly returns for LPTs were obtained from Bloomberg for the corresponding period. Annual data for total asset (TA), long term debt (LTD), short-term debt (STD), earnings before interest and tax (EBIT), the number of common shares outstanding, market capitalisation and total number of traded shares were collected from Bloomberg and DatAnalysis. Any missing data were sourced manually from Shares Magazine, which is a monthly magazine published by ASX. The ASX All Ordinaries Price Index was used as a benchmark, while the one-month interbank rate was employed as the risk-free rate. Both of these data sets were extracted from Datastream. Management structures, type of property and geographic characteristics for all LPTs were collected from property investment research (PIR) reports and LPT company annual reports.
3.2 Methodology
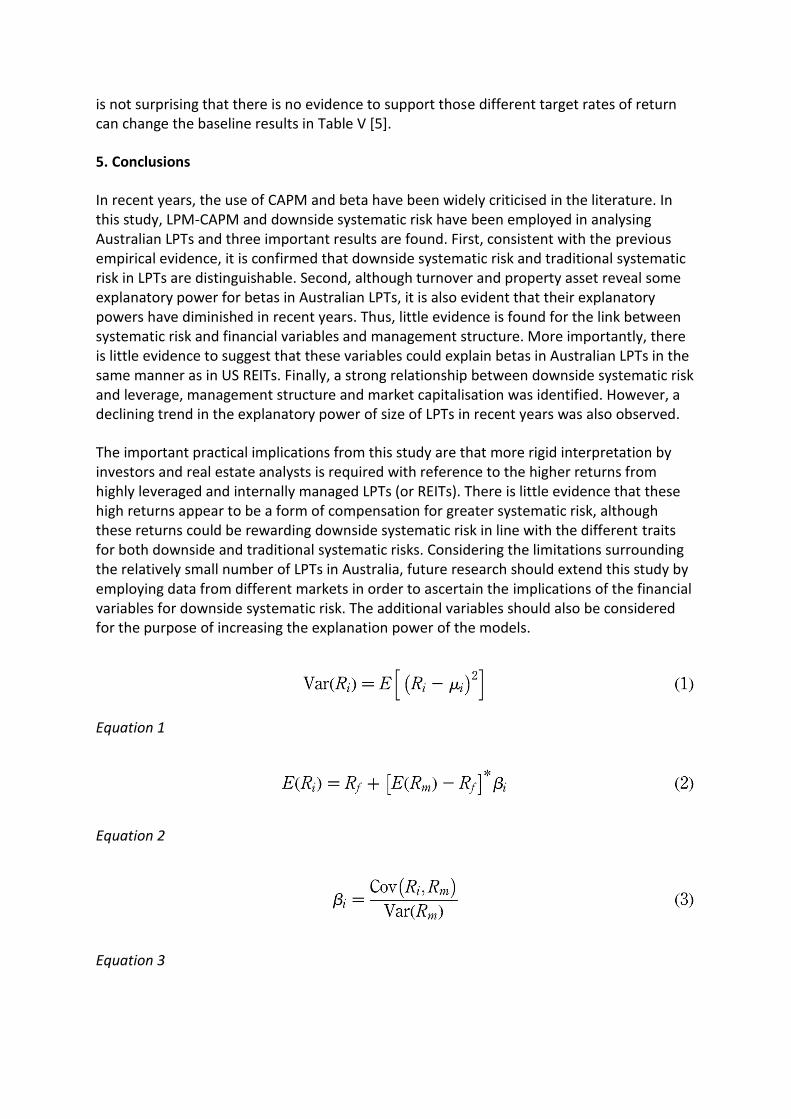
In the mean-variance framework, CAPM employs variance as a risk measure and it can be computed as follows: Equation 1 where R i represents return of asset i and μ i is the mean of the returns.
The expected required return in the mean-variance framework can be displayed as follows: Equation 2 where R f is the risk-free rate of return, β i represents beta of asset i in which it also can be expressed as: Equation 3 where Cov(R i ,R m ) is the covariance between asset i and market, Var(R m ) is the variance of the market returns.
In the downside risk framework, Bawa and Linderberg (1977), Harlow and Rao (1989) and Hogan and Warren (1974) proposed using downside risk as the risk measure. Downside risk/LPM is given as follows: Equation 4 The co-lower partial moment (CLPM) is defined as: Equation 5 where μ m is the benchmark for market, α is the degree of the LPM and R m is the market return. For consistency, the α is equal to 2 in this study. It should be noted it is also known as semi-variance.
The expected required return on asset i based on LPM-CAPM is: Equation 6 where R f is the risk-free rate of return and CLPM(R m ,R i )/LPM(R m ) can be simplified to the downside beta of asset i(β i
D ).
Recently, Estrada (2002) formally defined downside beta as follows: Equation 7 where μ i is the benchmark for asset i.
In this study, the beta and downside beta for asset i were computed in the first stage of the analysis by using equations (3) and (7) respectively in which the target rate for equation (7) is set equal to the mean of the benchmark. Thereafter, the computed beta and downside beta were regressed with the average accounting-based variables over the three-year interval and management structure by using equations (8) and (9): Equation 8 Equation 9 where STLeverage presents the short-term leverage of asset i, LTLeverage is the long-term leverage of asset i, BusRisk is business risk of asset i, PAsset is property asset investment of asset i, Turnover is turnover of asset i, MarketCap is market capitalisation of asset i, Management is a dummy variable with a value of 0 for an externally managed LPT and 1 for an internally managed LPT.

The definitions of the above variables that are suggested by the literature are as follows:
Leverage. In this study, the ratio of short-term debt to total assets and the ratio of long-term debt to total assets are used to measure the leverage level of a LPT. The greater the level of leverage, the more likely that the LPT has higher uncertainty in respect of the market-related risk. Hence, it is hypothesised that systematic risk and downside systematic risk are positively related to leverage ratios (short-term and long-term).
Business risk. It is measured by the ratio of total annual earnings (before interest and taxes) to average total assets. Business risk measures the variability of the LPT's income. A greater variability could lower the dividend payouts and contribute to higher market-related risk. Therefore, a direct association is expected between business risk and systematic risk and downside systematic risk respectively.
Property asset. Property asset is measured by the ratio of total property investment to total assets. Property investment is viewed as a steady and long-term investment in which real property assets are also expected to provide a stable income. As such, it is hypothesised that property asset is negatively related to systematic risk and downside systematic risk.
Turnover. It is measured by the natural logarithm of the ratio of average trading volume to common shares outstanding. A higher turnover ratio of a LPT indicates higher liquidity of the LPT. Hence, an inverse relationship between Turnover and systematic risk is hypothesised.
Market capitalisation (size). The market capitalisation is determined by multiplying the total shares outstanding by the current LPT's price. A negative relationship is expected between market capitalisation and systematic risk and downside systematic risk respectively. In line with the argument of economies of scale, a large size LPT is expected to have the ability to lower its market related risk.
Management structure. In Australia, an internal management structure permits a LPT to engage in property development and/or fund management activities. Inevitably, greater involvement in property development activities could increase the variability in returns of a LPT. Hence, it is expected that internally managed LPTs are exposed to higher systematic risk in both frameworks.
Table I contains descriptive statistics of the LPT market. Since the 1990s, the market has experienced a dramatic growth in which the number of LPTs has increased dramatically from 38 in period 1 to 60 in period 3. Thereafter the market has undergone a consolidation phase via merger and acquisition activities. It is evident that the number of LPTs has decreased to 37 in period 6, whilst the average market capitalisation of LPTs has increased dramatically from $334 million in period 1 to $1,340 million in period 6. This growth has attracted the attention of investors as there has been a gradual increase in turnover until period 6. The increased turnover is expected to reduce market risk as LPTs have become more liquid.
Another interesting point that can be seen in Table I is that the LPT market has also undergone some structural changes in which the debt level has increased over the last decade, particularly long-term debt. The long-term debt has increased substantially from an average of 7 per cent in period 1 to 28 per cent in period 6. Additionally, there is a trend
showing a steady increase in the number of LPTs employing an internal management structure via a stapled security arrangement. Consequently the property asset proportion of LPTs has decreased in periods 5 and 6. These changes have further increased the sensitivity of LPTs to the market's risk. The structural change in recent years is also evident in business risk. The business risk of LPTs was stable in first three periods and peaked in period 4, thereafter it decreased in periods 5 and 6[3].
4. Results and discussion
4.1 Comparison between beta and downside beta
The average standard deviation, downside deviation, beta and downside beta are presented in Table II. Panel A in Table II reveals that standard deviation exhibits higher risk than downside deviation. The results are also consistent with the previous studies on downside risk framework such as Peng (2005) and Sing and Ong (2000).
Notably, the results from Panel B in Table II indicate the dynamics of beta in Australian LPTs in which it varies from 0.292 in period 1 to 0.432 in period 6. The results confirm the findings from previous studies on time variation in beta. Khoo et al. (1993) and Liang et al. (1995) highlighted a decline in market beta in US REITs from the 1970s until the end of the 1980s. Matysiak and Brown (1997) have found that the equity betas of 18 UK property companies vary over time, where Newell and Tan (2005) also found similar results from Australian LPTs. Similar results are also found in Panel B Table II for downside beta. These results indicate that downside beta as well as beta varies from time to time.
Interestingly, downside beta reveals that Period 4 has the highest systematic risk, while beta shows it has the lowest beta. This provides some indirect evidence to support the dissimilarity between beta and downside beta. Another interesting observation from Table II is that downside betas are substantially higher than betas. On average over the sample period downside betas are at least 25 per cent higher than betas. In other words, beta underestimates downside systematic risk. It should be noted that most LPTs have beta and downside beta that are lower than 1. Hence, Australian LPTs are considered to be low risk. These results confirm the findings of Price et al. (1982) in which beta for the low risk sample actually underestimates downside systematic risk. The results are also consistent with the results identified by Estrada (2002) for emerging stock markets.
To reinforce the findings about the significant differences between beta and downside beta, t-statistics and sign-tests are conducted. For the t-statistic, it is hypothesised that the mean difference between beta and downside beta is equal to zero(X¯=0), while the alternative hypothesis is X¯≠0. T-statistics can be displayed as follows: Equation 10 Equation 11 where X¯ is the mean of X i , and S is the standard deviation of X i .
A non-parametric test (sign test) is also conducted. The null hypothesis is the number of positive differences and negative differences are equal; whereas its alternative hypothesis is the numbers of positive (negative) differences are not equal. The sign test can be computed as following: Equation 12 where K is number of negative/positive differences, and n is
number of observations. The results from t-statistics and sign-tests for the differences between beta and downside beta are exhibited in Table III.
Table III provides strong evidence to reject the null hypothesis of similarity of both beta and downside beta. T-statistics reveal that the difference between downside beta and beta is statistically significant at least at the 5 per cent level in all periods except periods 1 and 6. In other words, the null hypothesis in which there is zero difference between beta and downside beta is rejected for periods 2, 3, 4 and 5.
Z-statistics also confirm previous findings and offer evidence that downside beta is consistently higher than beta in all periods in which the null hypothesis for all periods can be rejected at the 1 per cent significance level. All of these results are consistent with the findings from Price et al. (1982) for US stocks.
Another important observation from periods 1 and 6 is that the null hypothesis cannot be rejected by the t-statistic, although these are rejected by Z-statistic with a 1 per cent significance level. Smaller sample size could be an explanation, although it cannot be the only reason in accounting for this scenario. Another possible explanation is the non-normality in return distributions where 88 per cent, 36 per cent and 24 per cent of the number of LPTs from the sample in period 1 can be rejected by Jarque-Bera, Lillifors and Shapiro-Wilk normality tests respectively. Similar strong normality rejection evidence is found for period 6. The t-statistic is a parametric test that requires a normality assumption. On the other hand, the sign-test is a non-parametric test which is liberated from this assumption. Hence, it is not surprising that the Z-statistics in Table III reject the null hypothesis for all periods being statistically significant at 1 per cent while there is no similar evidence for the t-statistics.
In summary, beta and downside beta vary from time to time and both are distinguishable from each other. The important finding here is that the financial determinants for beta could be distinguished from downside beta. In this case, it is crucial to examine the determinants of downside beta.
4.2 Determinants of systematic risk
Table IV presents the regression results from equation (8) between beta and the financial determinants and LPT structures over the six different periods. Surprisingly, in periods 1, 4 and 6, none of the variables are significant in explaining beta. Notably, the coefficient on turnover is significant and positive in periods 2 and 3, suggesting that the higher turnover of a LPT, the riskier is the LPT in terms of systematic risk. This is inconsistent with the previous findings in US REITs as discussed earlier.
The coefficient for market capitalisation is only negative and statistically significant in period 5, suggesting that the larger size of a LPT greatly reduces the chance of higher market risk. In contrast, no similar significant result was found for market capitalisation in other periods. This was supported by previous studies including Litt et al. (1999) and Ambrose and Linneman (2001) for US REITs and Byrne and Lee (2003) for UK property funds, which show little impact from size on systematic risk. However, it is inconsistent with the findings from

Gyuorko and Nelling (1996), as well as the indirect evidence from Tan (2004) for Australian LPTs.
The results also exhibit that property assets are only negatively and statistically significantly related to beta at the 5 per cent level in periods 2 and 3. However, no similar significant evidence is found for other periods, where the insignificance of the property asset result is consistent with the previous studies in US REITs. This can be attributed to the little variation in property asset proportions for LPTs since most of the Australian LPTs maintain a high proportion of property assets. In this case, it is not surprising that this variable does not provide good explanation for beta.
The empirical results also reveal that short-term debt is positively correlated with beta in all periods except period 6 but was only significant in period 3. Similarly, long-term debt has a statistically insignificant relationship with beta. These findings are in contrast to the results from US REITs in which there is little evidence to support the explanatory power of leverage in Australian LPTs' betas. A plausible explanation could be the relatively low leverage level for Australian LPTs. As observed by Newell and Tan (2005), in comparison to US REITs, the leverage levels for Australian's LPTs generally are considered low even though there has been an increase in leverage levels for Australian LPTs in recent years.
The results also indicate that business risk is positively linked to beta, suggesting that the LPTs with high business risk would have higher market risk. However, this variable is insignificant over all time periods. The insignificance of this variable contradicts the findings of previous studies into US REITs. The lack of significance for this variable can probably be attributed to the relatively little variation in the sample for this variable, where the median for business risk over all periods remains constant at around 7 per cent.
The management coefficient confirms that internally managed LPTs have higher beta. This is consistent with the findings from recent studies such as Ambrose and Linneman (2001). However, the evidence to support this factor is generally insignificant as it is only significant in period 5. Overall, this provides indirect evidence to support the findings of Capozza and Seguin (2000) who demonstrated that the differences in management structure can be solely attributed to the financial risk (i.e. leverage). Since no significant influence of financial risk on Australian LPTs' betas is identified; it is not surprising that this factor is insignificant in explaining betas.
Overall, turnover and property asset have significant explanatory power in regard to beta. However, these explanatory powers have diminished in recent years. More importantly, the financial variables and management structure variables adopted for explaining beta in US REITs are not suitable for Australian LPTs.
4.3 Determinants of downside systematic risk
Table V displays the regression results between downside beta and the financial and LPT management structure variables from equation (9). Unlike the results for conventional beta, short-term leverage reveals a strong positive relationship with downside beta and that downside beta is more sensitive to leverage. More importantly, these significant results are

consistent with the hypothesis that higher leverage leads to greater market risk. Another interesting point is that downside beta is more sensitive to short-term leverage than long-term leverage.
In general, market capitalisation shows a negative relationship with downside beta. It is a significant variable at least at the 5 per cent level in periods 1 and 4. This suggests that large LPTs can reduce downside systematic risk and this can be attributed to economies of scale. However, the coefficients in periods 2 and 3 are positive and statistically significant at 5 per cent in period 3. This is consistent with the indirect evidence from Newell and Tan (2005) for Australian LPTs in which their sub-period analysis shows that the larger LPTs have a higher level of market risk in this period.
It is clear that internally managed LPTs exhibit higher downside beta than externally managed LPTs except for periods 1 and 6. However, unlike the case for beta, management structure is significant in explaining downside beta in periods 2, 3 and 5. Coincidently, the results show that downside beta is more sensitive to leverage in comparison with beta. As a consequence, it is reasonable to expect that management structure has a stronger influence on downside beta if the findings from Capozza and Seguin (2000) can be generalised into a downside risk framework.
An inverse relationship is evident between property asset and downside beta over all time periods, suggesting a higher property asset level in a LPT has a lower downside beta. However, the property asset variable is only significant in explaining downside beta in Period 6. This can be largely attributed to the relatively small differences in property asset holdings between LPTs.
Interestingly, no evidence is available to show business risk and turnover variables are significant over any individual time period. These results contradict the findings for beta in which turnover has significant explanatory power in beta. On the other hand, this supports the alternative hypothesis of this study in which beta and downside beta have different relationships with financial conditions and management structure.
In summary, this analysis has demonstrated that leverage has significant explanatory power for downside beta. The importance of the market capitalisation and management structure variables in explaining downside beta was also highlighted. However, the size effect has diminished in recent years. More importantly, the explanatory variables for beta are different from downside beta. These results also provide further support for downside systematic risk being distinguishable from systematic risk.
4.4 Property type and geographic specialisation
There are several concerns about property type and geographic specialisation that should be addressed. LPTs have different investment characteristics where they invest in different property types and in varying locations. The evidence from Ambrose and Linneman (2001), Byrne and Lee (2003) and Delcoure and Dickens (2004) suggested that beta does vary to a noticeable extent when controlling for these characteristics. However, Gyuorko and Nelling

(1996) and Allen et al. (2000) showed that diversification across property types and geographic location does not have a significant impact on diversification of systematic risk.
To reinforce the previous findings, the investment characteristics of LPTs should be controlled. In this study, controlling for the type of property and location by employing dummy variables was found to be a worthless exercise in line with the issue of undue multicollinearity and small sample size especially in period 1. Pearson correlation displays that office and retail sectors are strongly correlated being statistically significant at least at 5 per cent from period 1 to period 5. Similar multicollinearity issues are also found in the variance-inflation factor (VIF). Moreover, strong correlations between New South Wales and Victoria are evident[4]. Therefore, the Herfindahl-property type (or geographic) index is employed in this study in order to capture the differences in the LPTs' holdings and to overcome these issues. The Herfindahl-property type (or geographic) index is: Equation 13 Equation 14 where N is the number of property type (or geographic) segments and w i is the weight of the LPT's investment in segment i (Gyuorko and Nelling, 1996).
The Herfindahl-property type index is based on the five market segments, namely, office, industrial, retail, leisure and others. If a LPT only specialises in the office market, the weight for office would be equal to one and zero for other segments; the Herfindahl-property type index is also equal to one. A naïve property type diversification strategy will result in a Herfindahl-property type index of 0.2(1/n). Hence, D i
prop value for a LPT will vary from 0.2 to 1 and is subject to the level of differences in the property types.
The Herfindahl-geographic index is also constructed for geographic specialisation based on four segments, namely, New South Wales, Victoria, Queensland and others. Similar to the Herfindahl-property type index, greater geographic diversification for a LPT is reflected in a smaller Herfindahl-geographic index. On the other hand, if the LPT is heavily concentrated in one particular segment; the Herfindahl-property type index is equal to one.
The Herfindahl-property type and Herfindahl-geographic indices for each LPT are regressed with beta in equations (15) and (16) respectively: Equation 15 Equation 16 Next, the Herfindahl-property type and Herfindahl-geographic indices for each LPT are further regressed with downside beta in equations (17) and (18) respectively: Equation 17 Equation 18 where STLeverage represents the short-term leverage of asset i, LTLeverage is the long-term leverage of asset i, BusRisk is business risk of asset i, PAsset is property asset investment of asset i, Turnover is turnover of asset i, MarketCap is market capitalisation of asset i, Management is a dummy variable with a value of 0 for an externally managed LPT and 1 for an internally managed LPT, D i
prop is Herfindahl-property type index and D i geo is
Herfindahl-geographic index.
In general, the regression results from equation (15) are reported in Table VI and the results are similar to the baseline results that are found in Table IV. Clearly, there is no significant variation observed in comparison with Table IV in which the evidence to support property asset and turnover is only significant in the early study period. Little evidence is available to support other variables having a strong explanatory power for systematic risk. Importantly, these findings corroborate the findings from Table IV. The lack of variation between these

results and the previous results is not surprising given the relatively low impact of the degree of specialisation in property type on systematic risk.
The results are further examined using the Herfindahl-geographic index. Table VII reports the regression results between beta and the determinants including the Herfindahl-geographic index from equation (16).
The results confirm that LPTs concentrated in a particular location generally exhibit lower systematic risk. However, a marginal effect of the degree of geographic specialisation on systematic risk is found in which it is only significant at 5 per cent in Period 2. Therefore, little alteration is evident by comparing Tables IV and VII. The baseline results are considered to be quite consistent even after considering the degree of geographic concentration.
Similarly, the previous results for downside systematic risk are reinforced by further regressing with the degree of property-type specialisation using equation (17). The results are reported in Table VIII.
Consistently, no substantial difference is found in Table VIII for downside systematic risk in comparison with Table V. The significance of leverage is consistent with the results from Table V even after controlling for the degree of concentration in property type. Additionally, the significant explanatory power of market capitalisation and management structure is also evident. The insignificance of the other variables is also evident.
Table IX presents the regression results between downside systematic risk and its determinants and the degree of geographic specialisation from equation (18). An insignificant coefficient on the Herfindahl-geographic index suggests no significant effect from the degree of concentration in location on downside systematic risk. The result indicates that neither LPTs heavily concentrated in a particular location nor LPTs diversified by location are able to considerably lower the downside systematic risk. Most of variables present results that corroborate the results from Table V once controlled for the geographic specialisation of LPTs.
4.5 The impact of different target rates of return on downside beta
The baselines are further examined for the impact of a different target rate on downside beta. The risk-free rate and zero rate of return are commonly used cut-off points in downside risk analysis. Hence, the downside beta is first measured using the risk-free rate (β
rf −) and second, measured using a zero rate of return(β 0 −). The correlations resulting from
different downside beta measures are shown in Table X.
Table X illustrates that the previous results do not change as a result of estimating asymmetries in betas. More specifically, the results are robust to using different target rates of return. Obviously, β −, β rf
− and β 0 − are all strongly correlated with each other over all time periods with correlation greater than 0.75. These downside beta measures exhibit even stronger correlation results in periods 1, 4, 5 and 6. Given these strong correlations, it
is not surprising that there is no evidence to support those different target rates of return can change the baseline results in Table V [5].
5. Conclusions
In recent years, the use of CAPM and beta have been widely criticised in the literature. In this study, LPM-CAPM and downside systematic risk have been employed in analysing Australian LPTs and three important results are found. First, consistent with the previous empirical evidence, it is confirmed that downside systematic risk and traditional systematic risk in LPTs are distinguishable. Second, although turnover and property asset reveal some explanatory power for betas in Australian LPTs, it is also evident that their explanatory powers have diminished in recent years. Thus, little evidence is found for the link between systematic risk and financial variables and management structure. More importantly, there is little evidence to suggest that these variables could explain betas in Australian LPTs in the same manner as in US REITs. Finally, a strong relationship between downside systematic risk and leverage, management structure and market capitalisation was identified. However, a declining trend in the explanatory power of size of LPTs in recent years was also observed.
The important practical implications from this study are that more rigid interpretation by investors and real estate analysts is required with reference to the higher returns from highly leveraged and internally managed LPTs (or REITs). There is little evidence that these high returns appear to be a form of compensation for greater systematic risk, although these returns could be rewarding downside systematic risk in line with the different traits for both downside and traditional systematic risks. Considering the limitations surrounding the relatively small number of LPTs in Australia, future research should extend this study by employing data from different markets in order to ascertain the implications of the financial variables for downside systematic risk. The additional variables should also be considered for the purpose of increasing the explanation power of the models.
Equation 1
Equation 2
Equation 3

Equation 4
Equation 5
Equation 6
Equation 7
Equation 8
Equation 9
Equation 10

Equation 11
Equation 12
Equation 13
Equation 14
Equation 15
Equation 16

Equation 17
Equation 18
Table ISummary statistics
Table IIRiskiness and beta and downside beta in Australian LPTs
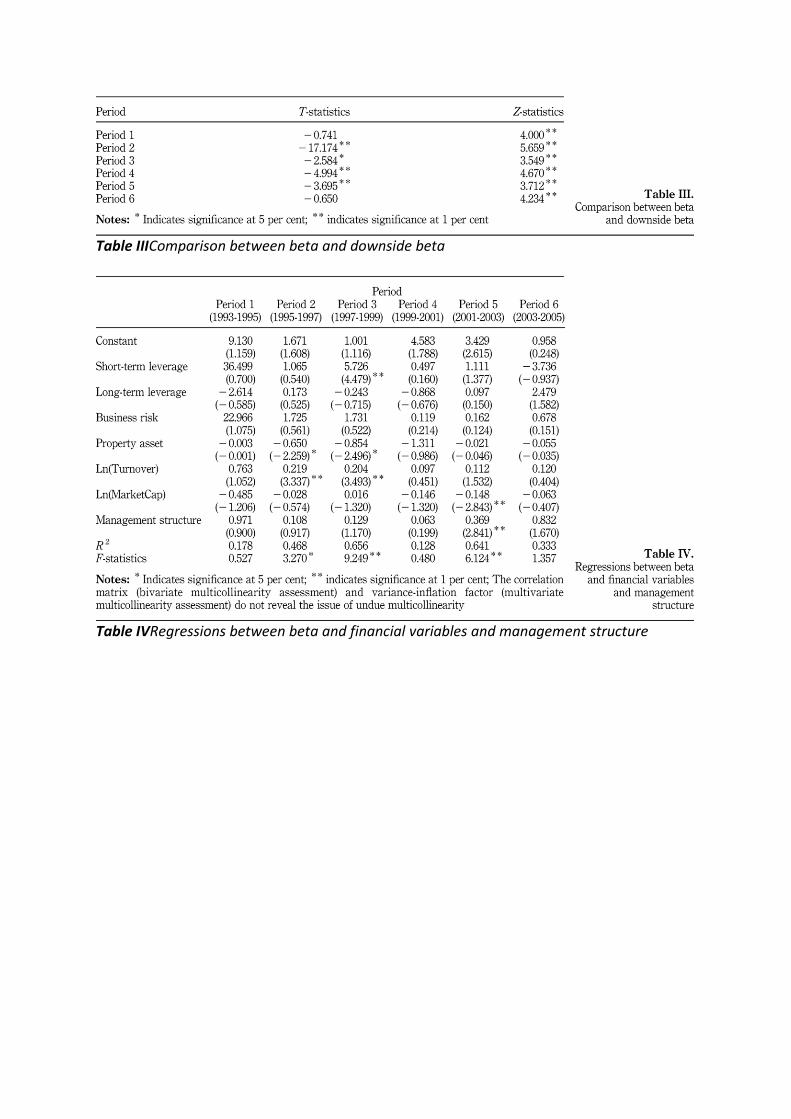
Table IIIComparison between beta and downside beta
Table IVRegressions between beta and financial variables and management structure

Table VRegressions between downside beta and financial variables and management structure
Table VIRegressions between beta and financial variables and management structure by controlling property type specialisation

Table VIIRegressions between beta and financial variables and management structure by controlling geographic specialisation
Table VIIIRegressions between downside beta and financial variables and management structure by controlling property type specialisation

Table IXRegressions between downside beta and financial variables and management structure by controlling geographic specialisation
Table XCorrelations between different downside beta measures
References
Alexander, D., Britton, A., Jorissen, A. (2003), International Financial Reporting and Analysis, Thomson Learning, London, .

Allen, M.T., Madura, J., Springer, T.M. (2000), "REIT characteristics and the sensitivity of REIT returns", Journal of Real Estate Finance and Economics, Vol. 21 No.2, pp.141-52.
Ambrose, B.W., Linneman, P.D. (2001), "REIT organizational structure and operating characteristics", Journal of Real Estate Research, Vol. 21 No.3, pp.141-61.
Ambrose, B.W., Highfield, M.J., Linneman, P.D. (2005), "Real estate and economies of scale: the case of REITs", Real Estate Economics, Vol. 33 No.2, pp.323-50.
Ang, A., Chen, J., Xing, Y. (2006), "Downside risk", Review of Financial Studies, Vol. 19 No.4, pp.1191-239.
Australian Stock Exchange (ASX) (2006a), “Listed property trusts fact sheet: March 2006”, available at: www.asx.com.au/markets/pdf/LPT%20Retail%20Sheet.pdf (accessed 11 March 2007), .
Australian Stock Exchange (ASX) (2006b), “Listed managed investments December 31, 2006”, available at: www.asx.com.au/investor/pdf/lmi_performance_dec06.pdf (accessed 11 March 2007), .
Bawa, V.S. (1975), "Optimal rules for ordering uncertain prospects", Journal of Financial Economics, Vol. 2 No.1, pp.95-121.
Bawa, V.S., Linderberg, E.B. (1977), "Capital market equilibrium in a mean-lower partial moment framework", Journal of Financial Economics, Vol. 5 No.2, pp.189-200.
Byrne, P., Lee, S. (2003), "An exploration of the relationship between size, diversification and risk in UK real estate portfolios: 1989-1999", Journal of Property Research, Vol. 20 No.2, pp.191-206.
Capozza, D.R., Seguin, P.J. (2000), "Debt, agency, and management contracts in REITs: the external advisor puzzle", Journal of Real Estate Finance and Economics, Vol. 20 No.2, pp.91-116.
Chaudhry, M.K., Maheshwari, S., Webb, J.R. (2004), "REITs and idiosyncratic risk", Journal of Real Estate Research, Vol. 26 No.2, pp.207-22.
Chen, S.-J., Hsieh, C., Chiou, S.-N. (1998), "Macroeconomic variables, firm-specific variables and returns to REIT", Journal of Real Estate Research, Vol. 16 No.3, pp.269-77.
Cheng, P. (2005), "Asymmetric risk measures and real estate returns", Journal of Real Estate Finance and Economics, Vol. 30 No.1, pp.89-102.
Conover, C.M., Friday, H.S., Howton, S. (1998), "The relationship between size and return for foreign real estate investments", Journal of Real Estate Portfolio Management, Vol. 4 No.2, pp.107-12.

Conover, C.M., Friday, H.S., Howton, S.W. (2000), "An analysis of the cross section of returns for EREITs using a varying-risk beta model", Real Estate Economics, Vol. 28 No.1, pp.141-63.
Delcoure, N., Dickens, R. (2004), "REIT and REOC systematic risk sensitivity", Journal of Real Estate Research, Vol. 26 No.3, pp.237-54.
Estrada, J. (2000), "The cost of equity in emerging markets: a downside risk approach", Emerging Markets Quarterly, Vol. 4 No.1, pp.19-30.
Estrada, J. (2002), "Systematic risk in emerging markets: the D-CAPM", Emerging Markets Review, Vol. 3 No.4, pp.365-79.
Estrada, J. (2004), "The cost of equity of internet stocks: a downside risk approach", The European Journal of Finance, Vol. 10 No.4, pp.239-54.
Estrada, J. (2006), "Downside risk in practice", Journal of Applied Corporate Finance, Vol. 18 No.1, pp.117-25.
Fama, E.F., French, K.R. (1992), "The cross-section of expected stock returns", Journal of Finance, Vol. 47 No.2, pp.427-65.
Fama, E.F., French, K.R. (2004), "The capital asset pricing model: theory and evidence", Journal of Economic Perspectives, Vol. 18 No.3, pp.25-46.
Fishburn, P.C. (1977), "Mean-risk analysis with risk associated with below-target returns", American Economic Review, Vol. 67 No.2, pp.116-26.
Fraser, P., Hamelink, F., Hoesli, M., Macgregor, B. (2004), "Time-varying betas and the cross-sectional return-risk relation: evidence from the UK", The European Journal of Finance, Vol. 10 No.4, pp.255-76.
Graff, R.A., Harrington, A., Young, M.S. (1997), "The shape of Australian real estate return distributions and comparisons to the United States", Journal of Real Estate Research, Vol. 14 No.3, pp.291-308.
Gyuorko, J., Nelling, E. (1996), "Systematic risk and diversification in the equity REIT market", Real Estate Economics, Vol. 24 No.4, pp.493-515.
Harlow, W.V., Rao, R.K.S. (1989), "Asset pricing in a generalized mean-lower partial moment framework: theory and evidence", Journal of Financial and Quantitative Analysis, Vol. 24 No.3, pp.285-311.
Hogan, W.W., Warren, J.M. (1974), "Toward the development of an equilibrium capital-market model based on semivariance", Journal of Financial and Quantitative Analysis, Vol. 9 No.1, pp.1-11.
Jahankhani, A. (1976), "E-V and E-S capital asset pricing models: some empirical tests", Journal of Financial and Quantitative Analysis, Vol. 11 No.4, pp.513-28.

Khoo, T., Hatrzell, D., Hoesli, M. (1993), "An investigation of the changes in real estate investment trust betas", Journal of the American Real Estate & Urban Economics Association, Vol. 21 No.2, pp.107-30.
Liang, Y., Mclntosh, W., Webb, J.R. (1995), "Intertemporal changes in the riskiness of REITs", Journal of Real Estate Research, Vol. 10 No.4, pp.427-33.
Litt, J., Mei, J., Webber, P. (1999), "A risk adjustment model for REIT evaluation", Real Estate Finance, Vol. 16 No.1, pp.9-19.
Malkiel, B.G., Xu, Y. (1997), "Risk and return revisited", Journal of Portfolio Management, Vol. 23 No.3, pp.9-14.
Matysiak, G.A., Brown, G.R. (1997), "A time-varying analysis of abnormal performance of UK property companies", Applied Financial Economics, Vol. 7 No.4, pp.367-77.
Myer, F.C.N., Webb, J.R. (1993), "Return properties of equity REITs, common stocks, and commercial real estate: a comparison", Journal of Real Estate Research, Vol. 8 No.1, pp.87-106.
Myer, F.C.N., Webb, J.R. (1994), "Retail stocks, retail REITs, and retail real estate", Journal of Real Estate Research, Vol. 9 No.1, pp.65-78.
Nantell, T.J., Price, B. (1979), "An analytical comparison of variance and semivariance capital market theories", Journal of Financial and Quantitative Analysis, Vol. 14 No.2, pp.221-42.
Nantell, T.J., Price, K., Price, B. (1982), "Mean-lower partial moment asset pricing model: empirical evidence", Journal of Financial and Quantitative Analysis, Vol. 17 No.5, pp.763-82.
Nawrocki, D.N. (1999), "A brief history of downside risk measures", Journal of Investing, Vol. 8 No.3, pp.9-24.
Newell, G., Tan, Y.K. (2005), “The changing risk profile of listed property trusts”, paper presented at the Pacific Rim Real Estate Society Conference 2005, Melbourne, 23 January, .
Patel, R.C., Olsen, R.A. (1984), "Financial determinants of systematic risk in real estate investment trusts", Journal of Business Research, Vol. 12 No.4, pp.481-91.
Peng, V. (2005), "Risk measurements and listed property trusts investment strategies: focusing on the downside", Pacific Rim Property Research Journal, Vol. 11 No.2, pp.178-99.
Post, T., Vilet, P.V. (2004), Conditional Downside Risk and the CAPM, Working Report, Erasmus Research Institute of Management (ERIM), Erasmus Universiteit Rotterdam, Rotterdam, .
Price, K., Price, B., Nantell, T.J. (1982), "Variance and lower partial moment measures of systematic risk: some analytical and empirical results", Journal of Finance, Vol. 37 No.3, pp.843-55.

Sharpe, W. (1964), "Capital asset prices: a theory of market equilibrium under conditions of risk", Journal of Finance, Vol. 19 No.3, pp.425-42.
Sing, T.F., Ong, S.E. (2000), "Asset allocation in a downside risk framework", Journal of Real Estate Portfolio Management, Vol. 6 No.3, pp.213-23.
Tan, Y.K. (2004), “The effect on management structure on the performance of listed property trusts”, paper presented at the European Real Estate Society Conference 2004, Milan, 2-5 June, .
Corresponding author
Chyi Lin Lee can be contacted at: [email protected]