List of Abbreviation - Kota - uok.ac
335
Fabrication of the Nanomolecular Devices of ZnO for Solar Hydrogen Production A THESIS Doctor of Philosophy Degree In Chemistry (Faculty of Science) to the University of Kota, Kota RAJESH KUMAR MEENA Dr. Neelu Chouhan Department of Pure & Applied Chemistry University of Kota, Kota (Rajasthan) 2018
-
Upload
khangminh22 -
Category
Documents
-
view
3 -
download
0
Transcript of List of Abbreviation - Kota - uok.ac

FabricationoftheNanomolecularDevicesofZnOforSolarHydrogen
Production
A THESIS
Doctor of Philosophy Degree
In Chemistry (Faculty of Science)
to the
University of Kota, Kota
RAJESH KUMAR MEENA
Dr. Neelu Chouhan
DepartmentofPure&AppliedChemistryUniversityofKota,Kota
(Rajasthan) 2018

UniversityofKota,KotaM. B. S. Road, Near Kabir Circle,
Swami Vivekanand Nagar, Kota (Rajasthan)-324005
Certificate It is to certify that, The thesis entitled “Fabrication of the Nanomolecular Devices of ZnO for Solar Hydrogen Production” submitted by Rajesh Kumar Meena (Enrolment No RS/ 1766/13) is an original piece of research work carried out by the candidate under my supervision.
He has completed the following requirement as per Ph.D regulation of the University.
a) Course work as per the University rules.
b) Residential requirement of the university (200 days).
c) Regularly submitted annual progress reports.
d) Presented his work in the departmental committee.
e) Published/accepted minimum of one research paper in a referred research
journal.
I recommend the submission of thesis.
Date: Dr. Neelu Chouhan,
Dr. Neelu Chouhan Associate Professor Department of Pure and Applied Chemistry, University of Kota, Kota- (Raj.)-324005 Tel: 91-0744-2411742; Fax No. - 91-0744-2411742 Email: [email protected] & [email protected]
ABSTRACT Energy played a crucial role in the development of human race’s life style. Currently,
the energy is generated through consumption of fossil fuel, which are depleting day
by day. Furthermore, these fuels contain carbonaceous materials, which upon
oxidation causes pollution that disturb the ecological equilibrium of the mother
earth that resulted in various natural disasters. Therefore, it is a high time to work on
to find the better substitution of the conventional energy sources. And hydrogen can
be a best solution to this problem as it can play a role of fuel as well as energy
carrier. But currently, the hydrogen is produced by using steam reforming of
hydrocarbon that themselves produces the huge pollution. Therefore, it is necessary
to degrade pollution by forming hydrogen using clean/green methods. Artificial
photosynthesis can be better choice to produce green hydrogen by splitting of water
by using sunlight and photocatalyst in water. Hence in this research work, we had
synthesised and characterised (using advance analytical techniques such as, UV-
Visible spectrophotometer, FTIR spectrophotometer, XRD, FESEM, HRTEM, EDS,
PL, Cyclic voltmeter, etc.) total four composite systems using different types of silver
nanoparticles, ZnO nanorods and 1.5%loading of Pt i.e. Pt/Ag(Ajwain seeds)@ZnO,
Pt/Ag(Fenugreek)@ZnO, Pt/Ag(Tea leaves) @ZnO and Pt/Ag(shikakai pods) @ZnO.
Beside above four systems, we had also synthesized one more system i.e. 1.5%Pt/
CdS@ZnO. All of these five systems were used to generate hydrogen gas by splitting
of water. And the systems Ag@ZnO was also successfully used to degrade pollutant
PAP(p-aminophenol) into PNP(p-nitrophenol). Therefore, we established that the
Ag@ZnO systems are quite benign materials for significant high water splitting for
hydrogen production in comparison to chemically synthesized CdS@ZnO as well as
they show good catalytic properties for pollutant degradation.
Key Words: Hydrogen generation, Pollutant degradation, Water splitting, UV-
Visible spectrophotometer, FTIR spectrophotometer, XRD, FESEM, HRTEM, EDS,
PL.

Candidate’s Declaration
I hereby certify that the work, which is being presented in the
thesis, entitled “Fabrication of the Nanomolecular Devices of ZnO for
Solar Hydrogen Production” in partial fulfillment of the requirement for
the award of the Degree of Doctor of Philosophy, carried under the
supervision of Dr. Neelu Chouhan, Department of Pure & Applied
Chemistry, University of Kota, Kota, Rajasthan and submitted to the
Research Section, University of Kota, Kota. The work was approved by
Senior Research Committee of the University. I have presented my ideas
in my own words and adequately cited and referred from the original
sources. The work presented in this thesis as not been submitted
elsewhere for the award of any other degree of diploma from any
Institutions. I also declare that I have adhered to all principles of academic
honesty and integrity and have not misrepresented or fabricated or falsified any
idea/data/fact/source in my submission.
Date:
Place : Kota Rajesh Kumar Meena

“Guru is someone
who stands with us patiently,
who insists us for the essence of life, and
who tells us about the fundamentals of the moral and professional education”
I begin with a humble expression of my deep respect to holy and reverent
“Lord Ganesh Ji” with my obeisance to him whose protective hands over my bowed head
always proved a sustaining and enlivening blessings to me.
Research is the one of the most significant academic work, in which a he/she has
faces many challenges during the entire research time. I also came across with these
challenges but I am lucky enough to found a great number of generous and inspiring people
with their unconditional support, relentless patience and guidance, to help me out in every
difficult situation. They deserved to be mention here. I would like to express my deepest
thankfulness to all these people to the height and breadth of my soul.
I wish to express my profound sense of gratitude to my supervisor Dr. Neelu
Chouhan, Department of Pure & Applied Chemistry, University of Kota, Kota, who has
supported me throughout my research work and during the thesis writing with her all cool
and knowledge whilst allowing me the room to work in my own way. I attribute this research
and thesis to my supervisor’s encouragement and effort, without her guidance it would not be
possible to complete. One simply could wish for such a friendlier supervisor for them. I am
extremely fortunate to have been trained and initiated into this scientific world under her
valuable guidance. With deep regards, overwhelming sense of pride and genuine obligation, I
seize this jubilant opportunity to express my sincere, heartfelt and reverential gratitude to my
esteemed supervisor Dr. Neelu Chouhan, for her valuable, highly knowledgeable and
illuminating ideas, suggestions, critical evaluation and expert advice on the designing and

execution of this research work in the best possible way. She educated me on different aspects
of the subject and told about the importance of work discipline as well as she encouraged me
to reach much above than my natural abilities.
I am also grateful to Prof. Ashu Rani, Dean PG of the University along with all
faculty member of the Department including Dr. Bhawani Singh, Dr. Sushil Sharma, Dr.
Shweta Vyas and Mr. Ankit Sharma, for their valuable support and inspirations during this
research. I express my heart-felt gratitude to all faculty members of the University, who have
been very kind enough to extend their help at various phases of this research.
My special words of thanks should also go to Prof. Suresh Chand Ameta, Professor and
Director, Department of Chemistry, Pacific University, Udaipur for his guidance and support
throughout the research work.
It is an honour for me to convey my special regards to Prof. Pahup Singh, Prof. I.K.Sharma,
Mr.Hanuman Singh Shakawat, Dr.Rakshit Ameta, Dr.Pragati Fageria, Dr.Amit Kotiya,
Dr.Amanpal, Mr.Mohtashim Reza, Dr.Akhtar Khan, Dr.Dinesh Chand Sharma, Dr.Usha
Pillai, Dr.Vijay Devra, Dr.Bharti Sharma, Dr.Shweta Saxena, Dr. Pallavi Sharma, Dr.Shweta
Nagar, Dr. Neeru Choudhary, Dr.Ruchi Sahu, Dr.Deepak Sharma and Dr.Ashish Sharma for
their genuine interest, continuous encouragement and optimistic support. I would also expree my
heartfelt thanks to my seniors Dr.Renu Hada, Dr.Sakshi Kabra, Dr.Khushboo Shirivastava,
Dr.Stuti Katara, Dr.Niharika shringi, and Dr.Priynka rajoriya for their guidance and moral
support.
In my daily work I have been blessed with a friendly and cheerful group of my labmates
researchers, these are Kavita Nagar, Niranjan Kumar Mandawat, Neeta Gurbani, Khaksaha
Ansari, Tripti Bermen, Naval Kishore Sahu, Pragya Khandal, Sangeeta Yadav, Hariom Gour,
Deepak Karsoliya, Kiran, Nidhi Gautam, Jaswant, Deepa, Kuldeep, Hanny, Megha Gang,
Kanchan, Dr. Aruna, Dr. Ankita Jain, Dr. Shikha Jain, Dr. Priya Vijayvergiya, Dr.Dhanraj,
Dr.Shivraj, Niharika Nagar, Gajala Tazwar, who always helped me out in my difficult time.
I wish to convey my humble feelings of respect to my parents Sh. Shriniwas Meena
and Smt. Kamala Devi for their affection, care, inspiration, and constant encouragement, for
pursuing higher studies. They are always with me and their teachings have always been a
source of inspiration to me in the journey of my life which has no destination. In fact, I am

short of words for their contribution in shaping my life, as they are the real architects of my
life.
My Sisters Rajkiran and Hemlata, my Brother- in- laws Mr. Kamlesh Meena and
Mr. Mukesh Kumar Meena along with my loving niece Chanchal and Guddu deserve to be
remembered for their encouragement during the research at the University. I would also like
to share this pleasure with my Brother Deependra Kumar Meena, who stood by me in the
hard time and he has always been a constant source of inspiration in all spheres of life.
My heartiest thank to my all friends including Pragati Fageria, Swati Soni, Maya,
Mardula, Suman, Dr.Rajneesh, Saroj Meena, Rinky, Shimla, Dr.Nisha Bhaskar,
Dr.Rajendra, Jaypraksh Jeliya, Anil Kundara, Rohit Upadhyay, Sandeep, Vijay, Rohit
Meena, Anil Nanglot, Sapana, Rahul Garg, Dr.Pankaj, Ashok Kumar, Lokesh, Dr.Deepak,
Sachin, Rajendra Sharma, Pradeep and Vijya for their constant encouragement.
I take this opportunity to express my heartiest thanks to Asha Nagar, Aradhana,
Roopa, Abhina, Pinki Nagar, Shubham, Vaishali Jain, Harshita, Sonia, Harshit Vijay,
Mukesh Nagar, Lokesh, Om Prakash, Bajrang, Ghanshyam, Akanksha Tripathi,
Chanchal Nagar, Yash Sharma, Suresh Bishnoi and all my M.Sc students for their co-
operation and moral support when my morale ebbed.
Last but not least, I would like to thank all those who have helped me directly or
indirectly for the success of this work.
(Rajesh Kumar Meena)

List of Abbreviation
AU Arbitrary Unit
BE Binding Energy
BET Brunauer-Emmett-Teller
CPS Cycles per Second
CTAB Cetyltrimethylammonium Bromide
CTR Charge transfer resistance
CV Cyclic voltammetry
DLE Deep Level Emissions
DR Diffusion Resistance
DRS Diffuse Reflectance Measurement
DSC Differential Scanning Calorimetry
DTA Differential Thermal Analysis
EM Electron Microscopy
EDS Energy Dispersive Spectroscopy
EIS Electrochemical impedance spectroscopy
EDX Energy Dispersive X-ray
eV Electron Volt
FTIR Fourier Transform Infrared Spectroscopy
FWHM Full Width Half Maxima
H Hour
HRSEM High Resolution Scanning Electron Microscopy
HRTEM High Resolution Transmission Electron Microscopy
M Molar
Min Minute
mL Milliliter
mM Millimolar
Mn million
μM Micromolar
NIR Near-infrared Radiation
nm Nanometer
NP Nanoparticle

List of Abbreviation
NR Nanorod
PED Potential Energy Distribution
PL Photoluminescence
PXRD Powder X-ray Diffraction
QSE Quantum size Effect
Sec Second
SAED Selected Area Electron Diffraction
SEM Scanning Electron Microscopy
SPB Surface Plasmon Band
SPR Surface Plasmon Resonance
STEM Scanning Transmission Electron Microscopy
TEM Transmission Electron Microscopy
UV Ultra Violet
WBG Wide Band Gap
XAS X-ray absorption spectroscopy
XPS X-ray Photoelectron Spectroscopy
XRD X-ray Diffraction

Table of contents Candidate’s Certificate Abstract Declaration Acknowledgement List of Abbreviation CHAPTER-I 1-88 Introduction 1.1 Introduction of research work 1.2 Hydrogen as an energy carrier and fuel 1.3 Current energy status 1.4 Hydrogen energy and related concerns 1.5 Hydrogen evolution from renewable 1.6 Selection criteria of photocatalytic material 1.7 Hydrogen production by water splitting 1.8 Electrochemistry of Water Splitting 1.9 Types of Photocatalytic Reactions 1.10.Photocatalyst Materials 1.11.Oxide Photocatalysts: Challenges and Perspectives 1.12.Zinc Oxide 1.13.Application of nano zinc oxide in water splitting 1.14.Scope of the Work 1.15.References
CHAPTER-II 89-106 Instrumentation 2.1. Instrumental techniques 2.1.1. Electron Microscopy (EM) 2.1.1.1. Transmission Electron Microscopy (TEM) 2.1.1.2. Scanning Electron Microscopy (SEM) 2.1.2. Fourier Transform Infrared Spectrophotometer (FTIR) 2.1.3. Ultraviolet -Visible Spectrophotometer (Uv-Visible) 2.1.4. X-ray absorption spectroscopy (XAS) 2.1.5. X-RAY Diffraction (XRD) 2.1.6. Cyclic Voltammetry (CV) 2.1.7. Spectrofluorimeter 2.1.8. Ultrasonic Processor 2.1.9. Centrifuge 2.1.10. pH-Meter 2.1.11 Water splitting Instrumentation 2.2. References

CHAPTER-III 107-209 Synthesis and Characterization: Co catalyst (Pt)/ Sensitizer (Ag or CdS) loaded- ZnO NRs 3.1 Synthesis of ZnO NRs by Hydrothermal Method and their Characterization 108-120
3.1.1 INTRODUCTION 3.1.2 EXPERIMENTAL PROCEDURES 3.1.3 RESULTS AND DISCUSSION 3.1.4 CONCLUSION 3.1.5 REFERENCES 3.2 Synthesis and Characterization of biogenic Ag NPs prepared by using: 121-177 (I) Ajwain (Trachyspermum Ammi) seeds extract 122-143 3.2 (I) 1 INTRODUCTION 3.2 (I) 2 EXPERIMENTAL DETAILS 3.2 (I) 3 RESULTS AND DISCUSSION 3.2 (I) 4 CONCLUSION 3.2 (I) 5 REFERENCES (II) Fenugreek (Trigonella Foenum Graecum) seeds extract 144-153 3.2 (II) 1 INTRODUCTION 3.2 (II) 2 EXPERIMENTAL METHODS 3.2 (II) 3 RESULTS AND DISCUSSION 3.2 (II) 4 CONCLUSION 3.2 (II) 5 REFERENCES (III) Tea (Camellia Sinensis) leaves extract 154-165
3.2 (III) 1 INTRODUCTION 3.2 (III) 2 EXPERIMETAL METHODS 3.2 (III) 3 RESULTS AND DISCUSSION 3.2 (III) 4 CONCLUSION 3.2 (III) 5 REFERENCES (IV) Shikakai (Acacia Concinna) pods extract 166-177
3.2 (IV) 1 INTRODUCTION 3.2 (IV) 2 EXPERIMENTAL METHODS 3.2 (IV) 3 RESULTS AND DISCUSSION 3.2 (IV) 4 CONCLUSION 3.2 (IV) 5 REFERENCES
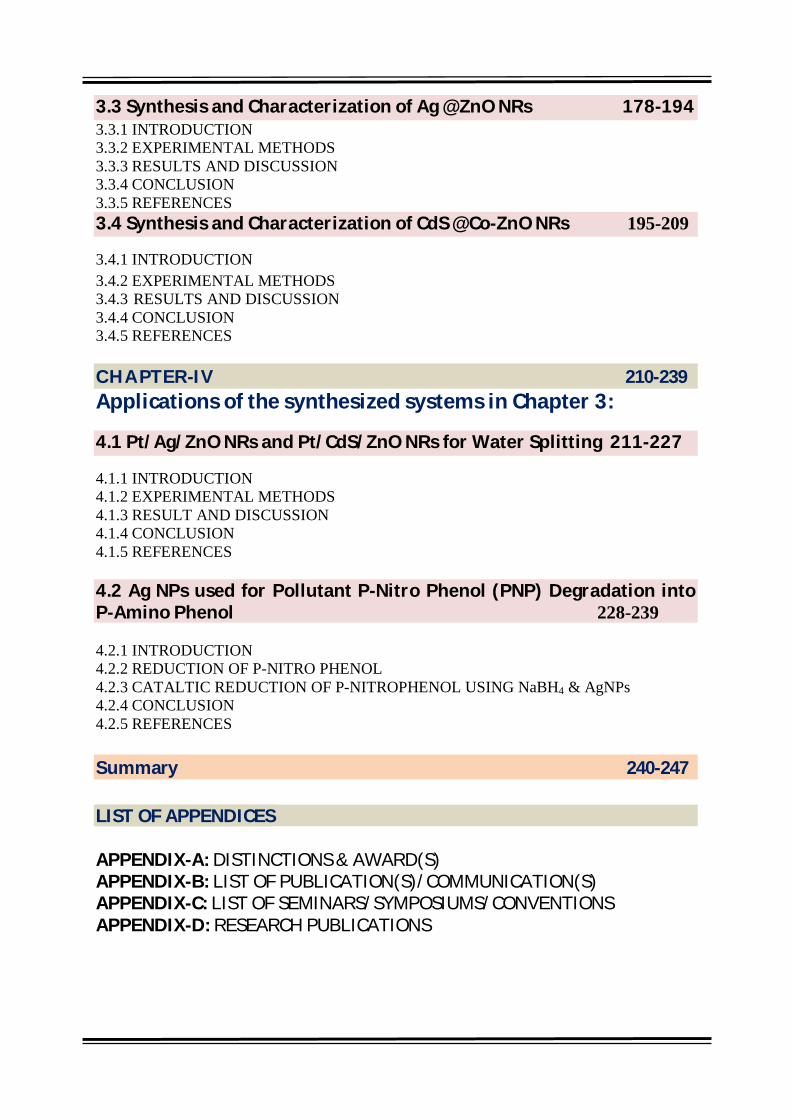
3.3 Synthesis and Characterization of Ag @ZnO NRs 178-194 3.3.1 INTRODUCTION 3.3.2 EXPERIMENTAL METHODS 3.3.3 RESULTS AND DISCUSSION 3.3.4 CONCLUSION 3.3.5 REFERENCES 3.4 Synthesis and Characterization of CdS @Co-ZnO NRs 195-209
3.4.1 INTRODUCTION 3.4.2 EXPERIMENTAL METHODS 3.4.3 RESULTS AND DISCUSSION 3.4.4 CONCLUSION 3.4.5 REFERENCES CHAPTER-IV 210-239 Applications of the synthesized systems in Chapter 3:
4.1 Pt/Ag/ZnO NRs and Pt/CdS/ZnO NRs for Water Splitting 211-227
4.1.1 INTRODUCTION 4.1.2 EXPERIMENTAL METHODS 4.1.3 RESULT AND DISCUSSION 4.1.4 CONCLUSION 4.1.5 REFERENCES 4.2 Ag NPs used for Pollutant P-Nitro Phenol (PNP) Degradation into P-Amino Phenol 228-239 4.2.1 INTRODUCTION 4.2.2 REDUCTION OF P-NITRO PHENOL 4.2.3 CATALTIC REDUCTION OF P-NITROPHENOL USING NaBH4 & AgNPs 4.2.4 CONCLUSION 4.2.5 REFERENCES Summary 240-247 LIST OF APPENDICES APPENDIX-A: DISTINCTIONS & AWARD(S) APPENDIX-B: LIST OF PUBLICATION(S)/COMMUNICATION(S) APPENDIX-C: LIST OF SEMINARS/SYMPOSIUMS/CONVENTIONS APPENDIX-D: RESEARCH PUBLICATIONS

Chapter 1
1
Chapter 1
Introduction

Chapter 1
2
ABSTRACT This chapter give a general introduction of the current status of the fuel and the impact of its
application on environment. There are a good number of renewable fuels that can replace the
conventional fuels i.e. tidal, solar, geothermal, water, wind and radiation energy, etc. Out of
these renewable energies, hydrogen is a good substitute of conventional fuels. Steam
reforming of hydrocarbons is the most popular way used to produce hydrogen at
industrial level along with other methods such as electrolysis and thermolysis of
water. Production of the hydrogen by splitting of water using sunlight and photocatalyst is a
one of the greener way to generate hydrogen. Here, a comprehensive literature survey was
made to identify the low cost, environmentally benign, stable in (light and water) and
abundant material (photocatalyst) to be used for water splitting. The literature survey of the
conductive oxides, sulphides and nitrides oxysulphides, and oxynitrides was carried out to
provide the background of the materials used for water splitting. Pure, doped or composite-
ZnO based materials, was reviewed under this chapter is used for setting the parameters of
the fabrication of nanomolecular devices to produce hydrogen through photocatalytic water
splitting. This will guides us in identification of the key parameters for the synthesis of
nanomolecular devices. This is highly needed to understand the significance of ZnO
nanomolecular devices. The theoretical background of the fabrication of the nanomolecular
devices and water splitting phenomenon was also discussed in brief.
Key Words: Nanomolecular devices, water splitting, renewable energies, hydrogen
production, oxides, sulphides, nitrides, oxysulphides, and oxynitrides etc.

Chapter 1
3
1.1 Introduction of research work Day by day growing demands of energy going hand in hand with its potential bad impact on
environment. The world’s increasing population and the continuous industrial expansion are
two major driving factors behind the increasing energy conflicts. Moreover, limited
availability of the conventional fuels, along with inflaming fuel prices, attracted the concern
of layman towards the energy supply, energy security and climate changes. [1] This burning
issue comply the world community to think about the better substitute of the conventional
fossil fuel in the form of the alternative fuels. Major alternative/substantial fuel resources are
hydrogen, wind, geothermal, solar, tidal, nuclear, hydrothermal, water flow, hydroelectric,
photovoltaic, and many more. If we are not ready to adopt this transformation than the life on
the planet became miserable in term of quality of life and health. [2] A number of recent
studies show the direct use of hydrogen as a fuel, is a much cleaner and far less expensive
fuel alternative. [3] Almost no pollution is produced by hydrogen engines because burning of
the hydrogen gives water as its main product. Hydrogen is the lightest and most abundant
(98% of the Universe mass) element of the Universe. Although hydrogen does not found
naturally but it compound with the elements such as: metals, oxygen, carbon etc. [4]
In addition, hydrogen can carry energy and possess high energy efficiency (75%), and also
useful as “chemical feedstock” in different industries. Furthermore, it can be envisioned that
hydrogen could be a future energy source for homes, businesses, industries and for
transportation. [3] Hydrogen can also contribute as an energy carrier or as an energy vector.
[2]
1.2 Hydrogen as an energy carrier and fuel
Nowadays, hydrogen is being produced in large quantities for industrial and commercial
purposes. Most of hydrogen production requires fossil fuels as feed stocks. It uses steam to
reform natural gas by utilizing electricity for electrolysis, which can be produced from natural
gas, coal, petroleum feed stocks or nuclear energy [2-3]. Large scale production of hydrogen
from renewable resource, is a great challenge. The hydrogen produced from the alternative
renewable feed stocks, is considered as a secondary energy carrier. Table 1 summarizes the
several approaches used to produce hydrogen with their advantages and disadvantages. Few
Chapter 1
4
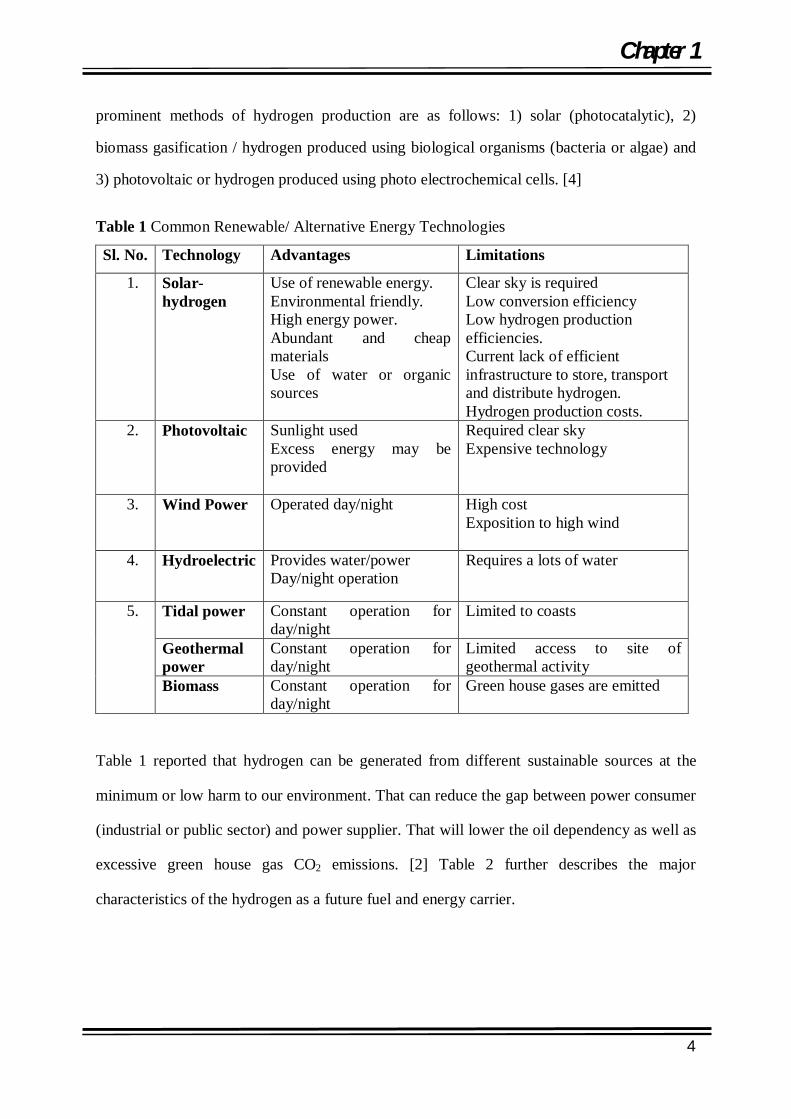
prominent methods of hydrogen production are as follows: 1) solar (photocatalytic), 2)
biomass gasification / hydrogen produced using biological organisms (bacteria or algae) and
3) photovoltaic or hydrogen produced using photo electrochemical cells. [4]
Table 1 Common Renewable/ Alternative Energy Technologies
Sl. No. Technology Advantages Limitations
1. Solar-hydrogen
Use of renewable energy. Environmental friendly. High energy power. Abundant and cheap materials Use of water or organic sources
Clear sky is required Low conversion efficiency Low hydrogen production efficiencies. Current lack of efficient infrastructure to store, transport and distribute hydrogen. Hydrogen production costs.
2. Photovoltaic
Sunlight used Excess energy may be provided
Required clear sky Expensive technology
3. Wind Power Operated day/night High cost Exposition to high wind
4. Hydroelectric
Provides water/power Day/night operation
Requires a lots of water
5. Tidal power Constant operation for day/night
Limited to coasts
Geothermal power
Constant operation for day/night
Limited access to site of geothermal activity
Biomass Constant operation for day/night
Green house gases are emitted
Table 1 reported that hydrogen can be generated from different sustainable sources at the
minimum or low harm to our environment. That can reduce the gap between power consumer
(industrial or public sector) and power supplier. That will lower the oil dependency as well as
excessive green house gas CO2 emissions. [2] Table 2 further describes the major
characteristics of the hydrogen as a future fuel and energy carrier.

Chapter 1
5
Table 2 Properties of hydrogen fuel in comparaison to other popular fuels i.e. CH4, gasoline
& diesel.
Properties / Fuel H2 CH4(CNG) Gasoline Diesel Molecular weight 2
(No-carbon) 16 (75% carbon)
100-105 (C4-C12, 88%)
200-300 (C9-C25, 87%)
Density (g/l) 0.0899(g) 70.990 (l)
1.8160 (g) 422.36 (l)
- -
Auto ignition Temperature (oC) 385 540-630 260-460 180-320 Air/ fuel ratio 34.3 17.2 14.6 14.5 Ignition energy(mJ) 0.002 0.28 0.24 - Diffusion coefficient cm3/sec) 0.61 1.90 21.34 - Energy Density KJ/Kg 142.00 45.30 48.6 33.8 Combustion temperature (oC) 2318 (O2) 1914 (O2) 2307 2327 Combustion range in air (%) 4-75 5.3-15 1.4-7.6 0.6-5.5 Explosive range in air (%) 13-79 19 - - Octane rating 130 87-93 91-99 - Fuel efficiency in combustion internal engine (%)
60 - 22 45
Heterogeneous photocatalysis can be used as an ideal technology to produce hydrogen and to
remove a wide range of organic pollutants, [5] simultaneously. Heterogeneous photocatalysis
has also been used for water/air purification, [6-8] due to its low cost, environmental-friendly
and potentially efficient properties. [9]
1.3 Current energy status Energy is a lever to trigger the speed of the development in all segments of life (economical,
social and political) for the safer, affordable, cleaner and more habitable environmental
conditions, for better standard of living. Secured, uninterrupted, affordable and adequate
amount of the energy supply, are also required to sustain the global economic growth and
stability. Worldwide our current energy storage contains 1047.7 billion barrels of oil, 5501.5
trillion SCF(standard cubic foot) of natural gas and 984 billion tons of coal as conventional
energy sources that might be sufficient to satisfy our energy needs for 40.2, 53.8 and 205
years, respectively. Moreover, these energy sources are not proportionately distributed
throughout the world. For example, USA contains about 25% of world coal reserves while
Middle East countries accounts for about 60% of oil reserves. This resulted in energy
insecurity among the countries, which did not have inadequate energy assets/ supply that
consequent the most probable grounds for the political disturbances. According to the

Chapter 1
6
estimated record nearly one-quarter of world's population (1. 6 billion) yet to have electricity
today. However, the continuous increase in energy requirement has been putting a lot of
pressure on the conventional energy sources. But the limited availability of the fossil fuels
and corresponding environmental threats, compel us to explore more alternative resources for
uninterrupted supply of the energy. All conventional sources of energy are carbon rich and so
their combustion leads to CO2 emission (main green house gas) that adds on extra burden on
it’s naturally occurrence amount. CO2 is a green house gas absorbs the infrared part of the
sun's radiation and re-radiates it to earth's surface that leads to trap the heat and keep the earth
30 degrees warmer than it would be otherwise - without greenhouse gases, earth would be too
cold to live. But the additional CO2 leads to the extra raise in temperature. [10] As a
consequences earth's average temperature increases, which will result in unpredictable
changes in weather patterns in the form of floods, droughts and submerging of low-lying
areas due to melting of ice at poles. The concentration level of CO2 in atmosphere is around
390 ppm (in Jan 2011) and scientists suggest that this value might be drop to 350 ppm
otherwise it might be directed to irreversible catastrophic effects. The amount of carbon
dioxide emission was 27 Giga tons in 2005 and expected to boost up to 42 Giga tons in 2030
and 62 Giga tons in 2050. Country wise contribution in CO2 emission is shown in Figure 1.1.
(A) (US Environmental Protection Agency, 2013) Most of these emissions are coming from
power sectors, industries and transportation sectors.
(A) (B)
Figure 1.1 (A) Country wise per capita CO2 emission in percentage. (B) World energy consumption history (1990-2011) and futuristic energy projections (2011-2035).
Our energy consumption history (1990-2011) Figure 1.1(A) and futuristic energy projections
(2011-2035), are shown in Figure 1.1(B) which will be increases by the rate of 1.4 percent
per year till 2035. This energy consumption profile reflected with the world average capacity
of energy utilization rates have continued to rise with time, from about 65 percent in 1990 to
about 80 percent today, with some more increases will anticipated in the future. That imposed

Chapter 1
7
the severe challenges in front of us as the threat of disruptive climate challenges and huge
capital investments in energy segment. Both become the problematic issues for developed
and developing countries. According to a report, there is irrational ratio of the population and
energy consumption rate found among the developed (20% and 60%) and developing
countries (80% and 40%). [11] To meet these demands without further damaging the
environment is a greatest challenge of the time. There are two main approaches to achieve the
longing energy scenario: the first scenario involved the replacement of the long-term
development process with the advanced energy-productive technologies and/or
implementation of the hybrid processes instead of the conventional fuels to reduce the fuel
consumption by reducing the climate change effect via the new advanced technologies used
for gas conversion So, more fixations of the gases to value-added products will achieved. The
second scenario includes the development of the alternative energy resources. The renewable
resources, i.e. biomass, hydropower, wind, solar, geothermal and biofuels, are economically,
socially and environmentally, sustainable. But no single approach is able to achieve this
hercules goal. Therefore, a number of energy scenarios are given by different agencies i.e.
energy information administration (EIA), World Energy Council (WEC) international energy
agency (IEA), and many more, using different proportion of both approaches. Most
comprehensive and authentic analysis on world energy scenario, based on world’s facts and
perceptions, was given by the International Energy Agency (IEA), which has constituted by a
committee of 5000 experts from 39 countries on Energy Research and Technology to develop
a strategy for the world energy scenario for 2050. In their report, they concluded the world
energy consumption will be double by 2050 and carbon emission rate will increase by 2.5
factors. Their recommended focused on alternative resources of energy. To shape the world
energy future, IEA projected a strategically energy scenario planning for 2050, which is
represented by the Figure 1.2. [12] This includes step by step process to achieve the desired
scenario. Process initiated by identifying the scope of the scenario then defining the main
driving forces behind it. For developing the scenario model a system dynamics of the future
energy market will be analyzed by identification of the interrelationship among the driving
forces. Continuation of the status quo is not sustainable due to the raising the demand of the
energy, particularly from fossil fuel and unacceptable level of the CO2 emission. Therefore,
by employing the existing technologies or the technologies under the development, a path
towards the clean, clever and competitive energy, would be established by utilizing the
sustainable energy solutions. Afterwards the possible future energy scenario (few models
suggested by IEA, are the baseline for the accelerated technologies and blue map) models

Chapter 1
8
would be developed. Where, they assume the future energy demand and level of the CO2
emissions in the light of above defined driving forces. And accordingly they would set the
periodical goals to meet the most probabilistic energy assess and reduced CO2 emission level
for 2050 by utilizing the decision support software. Finally, the strategies will develop to
accomplish the final goal. No single strategy is enough to reach the desired level of energy
production, consumption and CO2 reduction. Therefore, a fusion of the below mentioned
strategies, might be used for achieving the desired goal:
(a) Research development, demonstration and deployment on new technology.
(b) Investment strategies
(c) CO2 emission reduction
(d) International collaborations
(e) Governmental involvement
Beside this, by employing the technology already exist or under development, world could
bring onto a much more sustainable energy path.
Figure 1.2 Stepwise energy scenario planning. [12]

Chapter 1
9
1.4 Hydrogen energy and related concerns Hydrogen is a pollution free promising substituent to the conventional source of energy with
the properties like easy storage and high-energy efficiency. It is a most promising fuel,
contains few drawbacks like handling of hydrogen in the form of compressed gas or liquid
needs energy that adds extra costs [13] along with the limited number of infrastructure as
fuelling station. The hydrogen production is currently depends on fossil fuel and several
researches has been conducted to produce hydrogen from renewable resources through
different methods.
1.5 Hydrogen evolution from renewable The steam methane reforming is largely used to produce the hydrogen gas from the natural
gas at high temperatures (up to 900°C) and pressures (1.5-3MPa). [14, 15] Furthermore, the
coal gasification is also used to generate hydrogen at high temperatures and pressures
(5MPa). [14] Biological methods like pyrolysis and gasification by using biomass materials
are also used to produce hydrogen along with the by-products like CO, CO2 and methane.
Hydropower, wind power, and sunlight, etc, are also used as a renewable energy sources for
the hydrogen production. out of which solar energy has been considered as a more promising
source because of its good availability everywhere in abundance. The combination of solar
energy and water resources in presence of the photocatalyst, can also provides a suitable
method for hydrogen generation, known as solar water splitting, [16-18] which can be done
mostly in three ways (1) thermo-chemical water splitting (highly expensive).[19] (2) photo-
biological water splitting (bio-photolysis and organic bio-photolysis); and (3) photo-catalytic
water splitting, which includes advantages of (a) low cost [20] (b) high solar-to-H2 efficiency;
(c) ability to separate H2 and O2 gas streams; and (d) flexible reactor size for small scale
usage. [21] The Department of Energy (DOE), US had been ascertained a final goal of 26%
efficiency of the solar to hydrogen energy conversion ratio, which needs a aggressive
research to improve the current energy status. [22] 1.6 Selection criteria of photocatalytic material The development of photocatalytic materials that can utilize maximum solar energy inputs to
convert into either electric or chemical energy is one of the holy grails of future advancement
in material research and technology that can direct the way in obtaining clean energy. At the
molecular level, several physicochemical functions need to be integrated into one stable
chemical system that can set the criteria, which must be satisfied simultaneously:

Chapter 1
10
1. Band gap of the semiconducting material should lies between 1.6 eV (1.23 eV+ over
potential) to 2.5 eV (larger than 2.43eV). Then, the material can harvest the visible part of the
sunlight (which 52% of the total sunlight) and enhance the efficiency of the water splitting.
2. Band edge positions means that band edges of (VB and CB) must straddle between the
redox potentials of the water i.e. (0.00 eV and 1.23 eV), respectively. Semiconductor
materials must satisfy the minimum band gap requirement (~1.23 eV). But the materials of
low band gap are visible light active but susceptible to photocorrosion and stable materials
with a wider band gap absorb light only in the ultraviolet (UV) region (i.e. 5% of the whole
sunlight spectrum). It has been found that the valence band (VB) holes are the powerful
oxidant (+1.0 to +3.5V vs. NHE depending on the semiconductor and pH), while the
conduction band (CB) electrons are good reductants (+0.5 to -1.5 V vs. NHE). Therefore,
holes oxidise, water in to oxygen and electron reduce water into hydrogen.
3. Charge transfer is necessary at the photocatalytic surface and it must be fast enough to
prevent photocorrosion and shifting of the band edges, which result in the loss of photon
energy that can provide the efficient oxidation and reduction sites on the surface of the
material.
4. Stability of the material in aqueous acidic/basic medium is essential (at least for 20 years).
The hydrophilic and hydrophobic surface of the photocatalysts under light radiation is one of
the important issues to maximize the photocatalytic efficency.
5. Aid of a cocatalyst for hydrogen generation is necessary, but some of the cocatalyst are
highly active and induce a reverse reaction. That promotes the generation of water from
molecular oxygen and hydrogen, which must be reduced. For example, Pt@TiO2-anatase
produce both reactions at surface, but addition of an iodine layer on the Pt surface prevents
this backward reaction. [23]
6. Abundant availability can reduce the cost of the material and assure sustainability.
7. A complementary metal-oxide semiconductor (CMOS) compability and bio-compatibility
of the photocatalytic material should be considered as a one parameter for their selection.
8. Nontoxic and easy to handle materials with good compatibility with sensitizers are
important.

Chapter 1
11
1.7 Hydrogen production by water splitting The two half reactions of water splitting have been studied widely to examine the structural
property relationships of the photocatalysts. Reactions use sacrificial reagents to improve the
hydrogen and oxygen yield by promoting hydrogen and oxygen evolution reaction. The ratio
of hydrogen and oxygen evolution during the water splitting is 2:1. Number of research and
review articles have been published to explore the mechanism of photocatalytic water
splitting. [24-26] Photon absortion is the initiation reaction, which generates numerous
electron-hole pairs. Afterwards the charge carrier moves onto the photocatalyst surface to
create the surface active sites. Finally, the photo-generated electrons used to reduce the water
to prepare hydrogen and the holes to oxidize water molecules to give oxygen gas. The
overall photocatalytic water splitting first reported by Fujishima and Honda by a titanium
dioxide (TiO2) electrode. [27] Numerous research studies of water splitting have been
conducted on semiconductor materials, especially via heterogeneous catalysis.
Semiconductors have non-overlapping valence bands and conduction bands. When sufficient
light energy is applied, electrons will be jumped into the conduction band, by leaving holes in
the valence band and enrich the population of the electrons in the conduction band. These
electron-hole pairs play key roles in performing the redox reactions of water splitting.
Electrons are responsible for reducing water/protons in to hydrogen molecules, and hydroxyl
ions/ radicals that to be oxidized by the holes. To initiate the redox reactions, the upper most
level of the valence band should be more positive than water oxidation level (EO2/H2O, 1.23 V
with respect to the Normal Hydrogen Electrode; NHE), while the lower most level of the
conduction band that should be more negative than the hydrogen evolution potential (EH2/H2O,
0 V Vs. NHE).
Oxidation Reaction 퐻 푂 + 2ℎ → 2퐻 + 푂 Eo Oxidation = -1.23V ........ (1)
Reduction Reaction
2퐻 + 2푒 → 퐻 Eo Reduction = 0.00V ........ (2)
Overall Reaction
퐻 푂 → 퐻 + 2푂 E = -1.23V ........ (3)

Chapter 1
12
1.8 Electrochemistry of Water Splitting
1.8.1 Thermodynamic and Electrochemical aspects of water splitting
Solar water splitting is an energetically uphill chemical reaction that requires 1.23 V for the
complete decomposition of pure water into hydrogen and oxygen. Usually, due to very low
ionization (Kw= 1.0×10⁻¹⁴) power, water splitting becomes thermodynamically (Gibbs free
energy Go= 237kJ/mol, 2.46 eV per molecule) unfavourable at standard temperature and
pressure. Where, G calculated at 25oC using the thermodynamic parameters (H, T, and
S) that required
G = H - TS = 285.83 kJ – 48.7 kJ = 237.13kJ ......... (4)
In the case of water electrolysis, Gibbs free energy represents the minimum work function i.e.
necessary for the reaction to proceed and the reaction enthalpy is the amount of energy (both
work and heat) that has to be provided so the reaction can proceed at the same temperature of
the reactant. It also requires energy to overcome the changes in entropy of the reaction. Here,
G the electrical energy demand of the water splitting decreases with the temperature. Thus
the useful electrical work requirement reduces on increasing the reaction temperature T. Heat
demand (TS) gradually increases with temperature. Therefore, the total energy demand H
does not increase significantly with temperature.
Therefore, the process cannot proceed below 286 kJ/mol if no external heat energy is added.
At this condition an electrolyzer operating at 1.48 V, would be 100% efficient. The positive
value for G (a measure of the thermodynamic driving force that makes a reaction occur)
indicates that a reaction cannot proceed spontaneously without any large external inputs. The
standard cell potential Eo of any reaction, related to the Gibbs free energy (Go= - nFEo), is
represented by the following equation:
Eo = - (Go/nF) ............ (5)
Where, n is the number of electrons transferred in the reaction and F is a proportionality
constant in the Faraday units (96, 485 C/mol). Using above equation, the standard potential of
the water electrolysis can be calculated as -1.229 V at 25o C. This cell potential belongs to the
difference in potentials of the two half cell reactions occurring at the cathode (reduction;

Chapter 1
13
hydrogen evolution reaction [HER] and anode (oxidation; oxygen evolution reaction [OER]).
The Nernst equations for the half cell reactions of water splitting are mentioned below at pH
0 and 7.
Therefore, the minimum band gap for a suitable water splitting photocatalyst should be 1.23
eV. Accordingly, TiO2, ZrO2, KTaO3, SrTiO3, and BiVO4 are good candidates for
photocatalytic water splitting. [28-30] Except some typical exceptions i.e. SiC, InP, and CdS,
etc, the most of the photocatalyst used for water splitting are oxide semiconductor that can be
operated under ultraviolet (UV) light, which accounts for only ca. 4% of the total solar
energy. [31-33] To have a visible light response (45% of the sunlight), the band gap of the
semi conductors should be less than 3.00 eV, for this either new compound may be searched
or doping of the elements such as N, B, S, C, P, etc should be done to the oxide
semiconductors. Traditional water-splitting photocatalysts are based on transition metal
oxides which form stable compounds due to the high electronegativity of oxygen atoms. [34]
According to the d orbital structure of the transition metal oxides are classified into two
catagories: (i) d0 - and (ii) d10- materials. Early the transition metals like Ti, V, Nb, and W
have empty d-orbitals, thus having a low valence band energy. As a result, these materials
have large band gaps, which make them less efficient for photocatalytic process. Strategies
like doping are used to increase the light absorption efficiency of the main semiconductor.
Zhao et al. successfully designed defect-enriched mesoporous black TiO2 species via the
high-temperature hydrogenation process that exhibited the excellent photocatalytic hydrogen
evolution activity. [35] On the other hand, the late transition metals such as Mn, Fe, Co, and
Ni, have fully occupied d-orbitals and their oxides had the small band gaps and the strong d-d
electron transitions capability that play significant role in deciding band positions of these
oxides. Fe2O3 is a typical example of this group due to its abundant avability and inexpensive
nature, and it has been accounted as an attractive candidate for photocatalytic activities. [36-
37] Having little polaron conductivity is the disadvantage of late transition metal oxides. [38]
Wei et al have been reported that combining cations with s2 material and d0 typed materials
with oxide, can also lowered the band gap. The coupling between s-band of s2 cation and p-
band of oxygen can increase the valence band level while the coupling between d-band of d0
cations and p-band of oxygen can also lower the conduction band level. [39] A ternary
oxides; BiVO4 is a typical example of this type. Its photocatalytic properties have been

Chapter 1
14
intensively studied over the years. [40-43] Further doping of BiVO4 with the cations such as
Ag+, V5+, and W6+ can also increases its electronic conductivity and causes better catalytic
performance. [44-46] The ternary oxides including CuWO4, ZnFe2O4, CaFe2O4, CuBi2O4,
and CuNb3O8, etc are the good examples of the band gap tuning. [47-51] Besides metal
doping techniques; nitrogen substitution to semiconductor can also decrease the band gap due
to its higher-lying 2p orbital levels. [52-53] Like nitrogen, sulfur and selenium also possess
higher-lying p-bands than those of oxygen; they can also be induced smaller band gap in
materials than their parent oxides. [54-56] Moreover, modification of the catalysts with
silicon, group III-V semiconductors, and carbon-based materials have been reported and
proved to be efficient methods for developing photoactive materials. [57-59] Few of the
prominent photocatlytic systems for water splitting with their hydrogen generation efficiency,
are presented in Table 3. Where, the amount of active photocatalyst material, the type of the
light source, turnover frequency and catalytic stability are different. After the electron-hole
pairs are generated, these charge carriers need to move to the surface of the catalysts and
catalyze water splitting at the interfaces between the electrode and electrolyte. The major
challenge in this step is the recombination of electrons and holes. [35, 37] Before the
photogenerated electron-hole pairs catalyze the redox reaction, they recombine in a short
period of time. In general, the development of the fewer defects and addition of the cocatalsyt
of small sized noble metals are believed to be able to inhibit the recombination of the
electrons and holes. Nano sized materials can provide the short diffusion distances for the
migration of the electrons and holes to the surface active sites that suppressed the probability
of the carriers recombination. Lastly, these migrated electrons and holes will interact with
surface active sites to perform the series of redox reactions to manufacture the hydrogen and
oxygen, respectively. Sometimes, the bottom of the conduction bands of transition metal
oxides are not sufficiently negative to start the hydrogen evolution reaction, so co-catalysts
such as precious noble metals or their oxides to provide the assistance for water reduction
[35]. However, the top level of valence bands of metal oxides is usually positive enough to
oxidize water to oxygen without the aid of co-catalysts. Prominent ways to increase the
efficiency of the photoctalyst are: band gap engineering, sensitization (dye / quantum dot),
nanostructring, inorganic doing (metals/nonmetals), loading of noble metal (co-calayst), etc,
as mentioned in Figure. 1.3. Moreover, water splitting into hydrogen and oxygen is an energy

Chapter 1
15
demanding reaction, which is thermodynamically unfavourable and the backward reaction is
more likely to occur. Therefore, the separation and removal of produced oxygen and
hydrogen play a major role in this reaction.
Figure 1.3 Modes of the modification of photocatalysts for water splitting.

Chapter 1
16
Table 3 Recent visible light active photocatalysts for water splitting with their hydrogen
generation efficiency.
Photocatalysts Band Gap (eV)
Illumination Hydrogen production
Ref.
Pt, Cr, Ta Dopped TiO2 N/A Visible light (>420) 11.7µmol. h-1.g-1 [60]
Cu-Ga-In-S/TiO2 N/A 300 W Xe arc lamp (385-740nm)
50.6 µmol. h-1.g-
1 [61]
1 wt%Pt/C-HS-TiO2
2.94 Visible light
5713.6 µmol. h-
1.g-1
[62]
Platinized Sub-10nm rutile TiO2 (1 wt%Pt)
2.7– 2.9
Xe lamp (PLS-SXE,300 – 2500 nm) with (UV-REF: 320-400 nm, ca. 83 Mw.cm-2; UV-Cut 400-780 nm, ca.80 Mw.cm-2)
932 µmol. h-1.g-1
Visible light 1954 µmol. h-
1.g-1
Stimulated solar light
[63]
Rh-and La- codoped Sr TiO3
N/A 300W Xe lamp fitted with a cutoff filter (λ>420nm)
84 µmol. h-1.g-1 [64]
Cu1.94 S-Znx Cd1-xS (0≤X≤1)
2.57-2.9
visible-light irradiation (λ> 420 nm)
7735 µmol. h-
1.g-1 [65]
MoS2/Co2O3/ poly(heptazine imide)
N/A Visible light irradiation 0.67 µmol. h-1.g-
1 [66]
Bi4NbO8Cl 2.4 Visible light 6.25 µmol. h-1.g-
1 [67]
CdS nanorods/ ZnS nanoparticale
N/A Visible light irradiation(>420)
239,000 µmol. h-1.g-1
[68]
Ni/CdS/g-C3N4 N/A 300 W Xe lamp(≥420 nm 1258.7 µmol. h-
1.g-1 [69]
CdS/WS/graphene N/A Visible light irradiation (>420nm)
1842 µmol. h-
1.g-1 [70]
V-dopped TiO2/RGO N/A Visible light irradiation 160 µmol. h-1.g-1 [71]
Pt/g-C3N4 Conjugated polumers
2.56 Visible light irradiation (>420nm)
1.2 µmol. h-1.g-1 [72]
Au-TiO2 Nanohybrids N/A Vis- NIR irradiation (>420nm)
647,000 µmol. h-1.g-1
[73]
SrTiO2:La,Rh/Au/BiVO4:Mo N/A 300W Xe lamp fitted with a cutoff filter(λ>420nm)
90 µmol. h-1.g-1 [74]
CoOX -B/TiO2-TaON N/A 150 W Xe Lampe arc (>420 nm)
40 µmol. h-1.g-1 [75]
MoS2/CuS2 N/A 300W Xe lamp fitted with a cutoff filter(λ>420nm)
202 µmol. h-1.g-1 [76]
Copper-Organic Framework; H2PtC16
2.1 UV-Visible irradiation 30 µmol. h-1.g-1 [77]
Chapter 1
17
1.9 Types of Photocatalytic Reactions
1.9.1 Photochemical Reactions
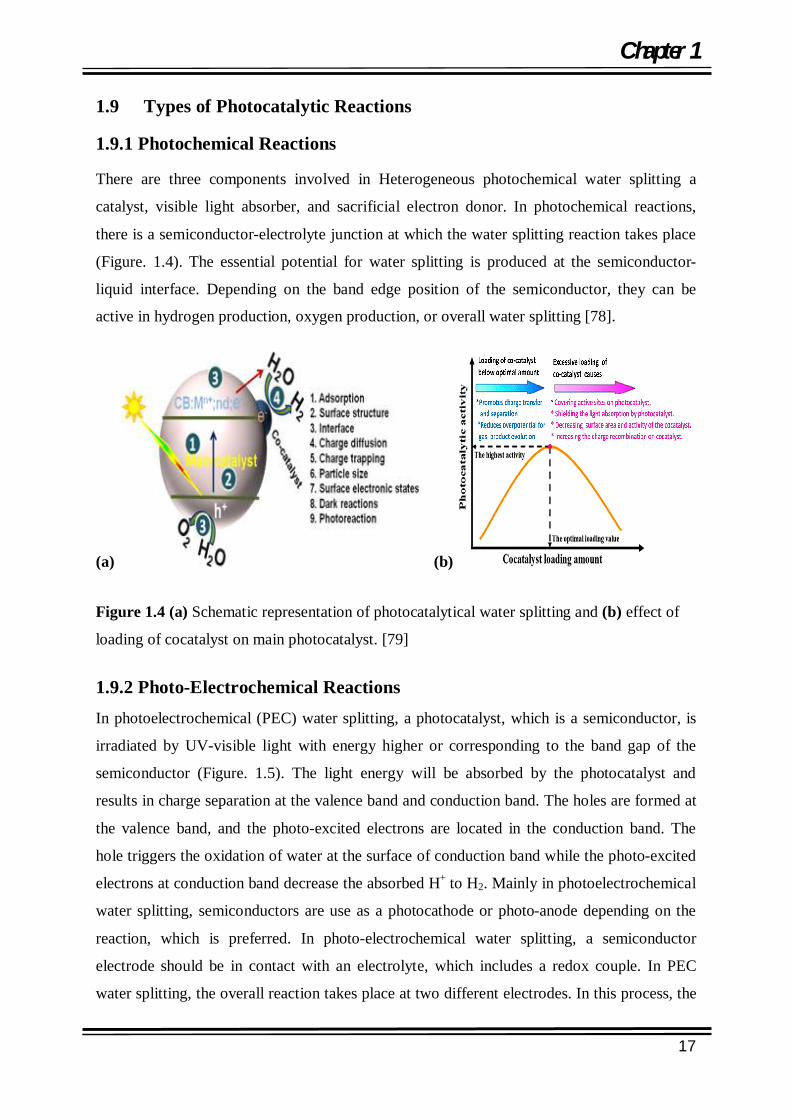
There are three components involved in Heterogeneous photochemical water splitting a
catalyst, visible light absorber, and sacrificial electron donor. In photochemical reactions,
there is a semiconductor-electrolyte junction at which the water splitting reaction takes place
(Figure. 1.4). The essential potential for water splitting is produced at the semiconductor-
liquid interface. Depending on the band edge position of the semiconductor, they can be
active in hydrogen production, oxygen production, or overall water splitting [78].
(a) (b)
Figure 1.4 (a) Schematic representation of photocatalytical water splitting and (b) effect of
loading of cocatalyst on main photocatalyst. [79]
1.9.2 Photo-Electrochemical Reactions
In photoelectrochemical (PEC) water splitting, a photocatalyst, which is a semiconductor, is
irradiated by UV-visible light with energy higher or corresponding to the band gap of the
semiconductor (Figure. 1.5). The light energy will be absorbed by the photocatalyst and
results in charge separation at the valence band and conduction band. The holes are formed at
the valence band, and the photo-excited electrons are located in the conduction band. The
hole triggers the oxidation of water at the surface of conduction band while the photo-excited
electrons at conduction band decrease the absorbed H+ to H2. Mainly in photoelectrochemical
water splitting, semiconductors are use as a photocathode or photo-anode depending on the
reaction, which is preferred. In photo-electrochemical water splitting, a semiconductor
electrode should be in contact with an electrolyte, which includes a redox couple. In PEC
water splitting, the overall reaction takes place at two different electrodes. In this process, the
Chapter 1
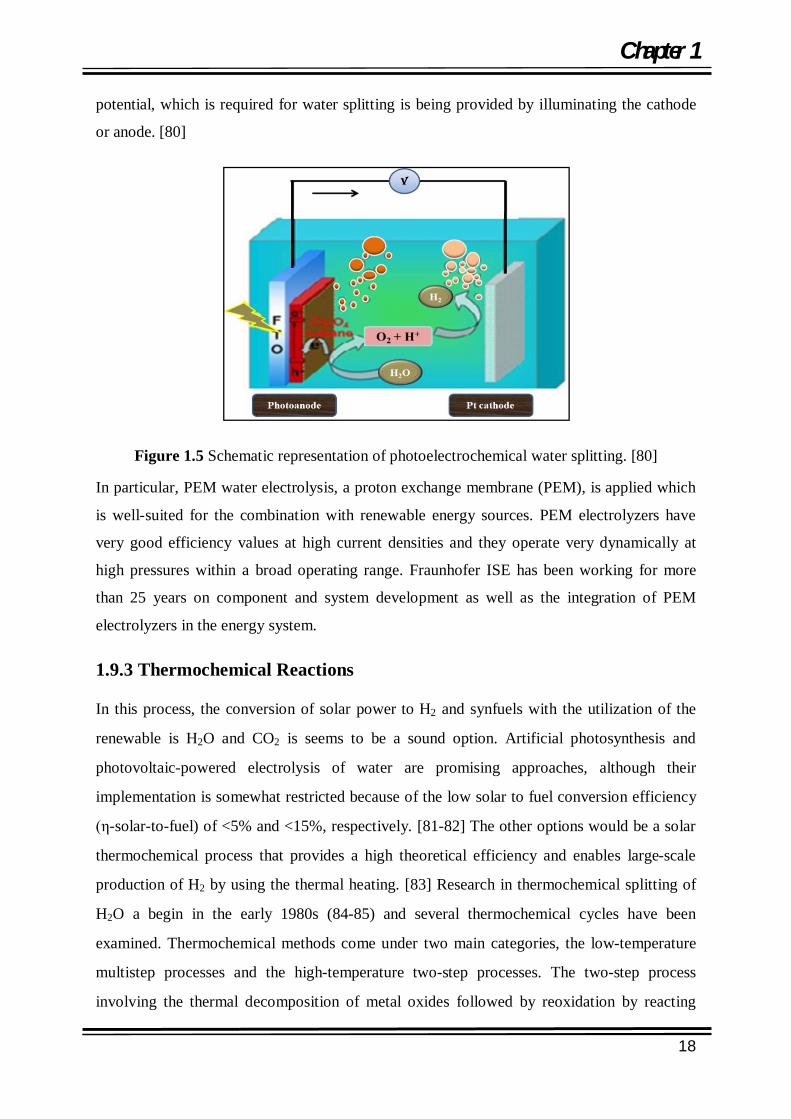
18
potential, which is required for water splitting is being provided by illuminating the cathode
or anode. [80]
Figure 1.5 Schematic representation of photoelectrochemical water splitting. [80]
In particular, PEM water electrolysis, a proton exchange membrane (PEM), is applied which
is well-suited for the combination with renewable energy sources. PEM electrolyzers have
very good efficiency values at high current densities and they operate very dynamically at
high pressures within a broad operating range. Fraunhofer ISE has been working for more
than 25 years on component and system development as well as the integration of PEM
electrolyzers in the energy system. 1.9.3 Thermochemical Reactions
In this process, the conversion of solar power to H2 and synfuels with the utilization of the
renewable is H2O and CO2 is seems to be a sound option. Artificial photosynthesis and
photovoltaic-powered electrolysis of water are promising approaches, although their
implementation is somewhat restricted because of the low solar to fuel conversion efficiency
(η-solar-to-fuel) of <5% and <15%, respectively. [81-82] The other options would be a solar
thermochemical process that provides a high theoretical efficiency and enables large-scale
production of H2 by using the thermal heating. [83] Research in thermochemical splitting of
H2O a begin in the early 1980s (84-85) and several thermochemical cycles have been
examined. Thermochemical methods come under two main categories, the low-temperature
multistep processes and the high-temperature two-step processes. The two-step process
involving the thermal decomposition of metal oxides followed by reoxidation by reacting

Chapter 1
19
with H2O to yield H2 is an attractive and viable process that can be rendered to become an
isothermal process. Thermochemical splitting of H2O at low temperatures (<1,000°C) is
accomplished by a minimum of three steps as dictated by thermodynamic energy constraints.
[86] Below mentioned examples the highlights of recent investigations of H2O splitting by
the low-temperature multistep process as well as the high temperature two-step process.
1.9.3.1 Low-temperature multistep cycles Low-temperature cycles are advantageous due to low radioactive losses and availability of
more heat resources, including nuclear waste heat sources. There has been a good deal of
research in the past decades in this area and the performances of a few cycles such as the S-I
and S-Br cycles as well as Fe-Cl, Hg-Br, and Cu-Cl cycles are noteworthy. [87]
1.9.3.2 Two-step thermochemical processes The two-step metal oxide process carried out with the aid of solar concentrators and
eliminates the necessity of separating of H2 and O2. The metal oxide (MOoxd) reduced to the
metal or to a lower valent metal oxide (MOred) with the release of O2(g) during the
endothermic step (Tred), and in the next step it gets reoxidized (Toxd) on reaction with H2O,
releasing a stoichiometric amount of H2(g).
Thermochemical water splitting uses high temperatures by using energy from concentrated
solar power or from the waste heat of nuclear power reactions and chemical reactions to
produce hydrogen and oxygen from water. This is a long-term technological pathway, with
potentially low or no greenhouse gas emissions. Thermochemical water splitting processes
use high-temperature heat (500°-2,000°C) to drive a series of chemical reactions that produce
hydrogen. The chemicals used in the process are reused within each cycle, creating a closed
loop that consumes only water and produces hydrogen and oxygen. The necessary high
temperatures can be generated in the following ways, Two examples of thermochemical
water splitting cycles, the "direct" two-step cerium oxide thermal cycle and the "hybrid"
copper chloride cycle, are illustrated in Figure 1.6 Typically direct cycles are less complex
with fewer steps, but they require higher operating temperatures compared with the more
complicated hybrid cycles.
Chapter 1
20
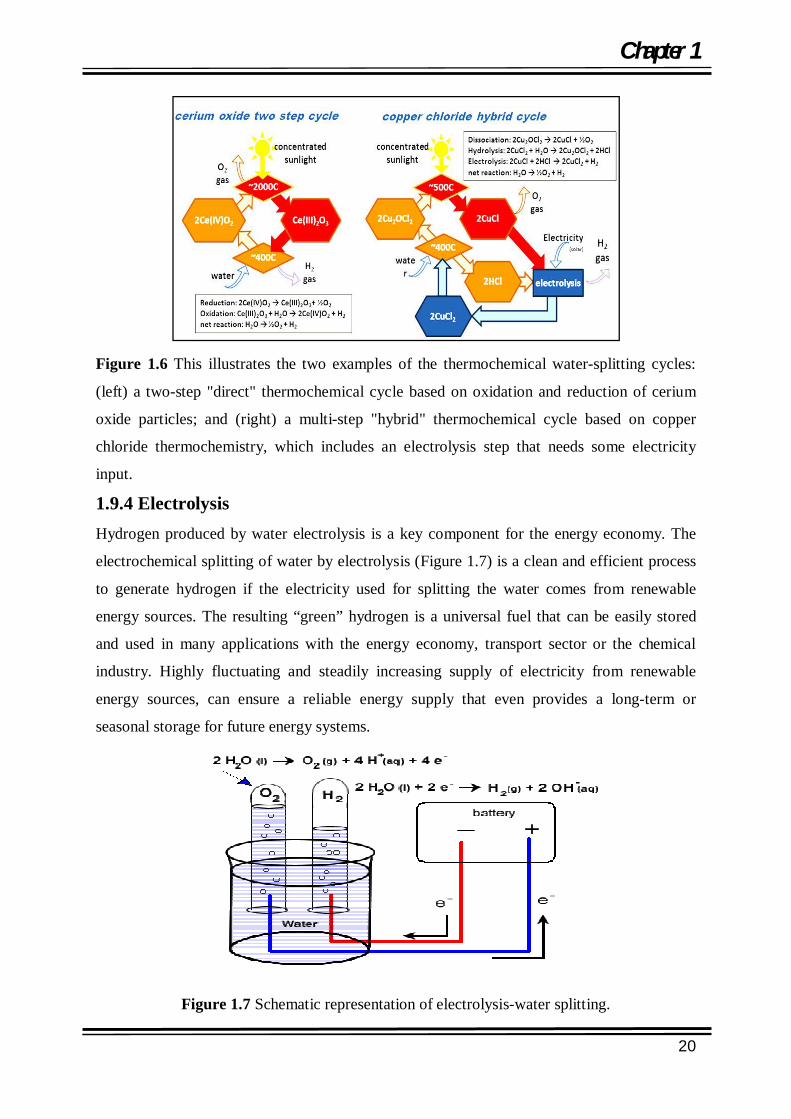
Figure 1.6 This illustrates the two examples of the thermochemical water-splitting cycles:
(left) a two-step "direct" thermochemical cycle based on oxidation and reduction of cerium
oxide particles; and (right) a multi-step "hybrid" thermochemical cycle based on copper
chloride thermochemistry, which includes an electrolysis step that needs some electricity
input.
1.9.4 Electrolysis Hydrogen produced by water electrolysis is a key component for the energy economy. The
electrochemical splitting of water by electrolysis (Figure 1.7) is a clean and efficient process
to generate hydrogen if the electricity used for splitting the water comes from renewable
energy sources. The resulting “green” hydrogen is a universal fuel that can be easily stored
and used in many applications with the energy economy, transport sector or the chemical
industry. Highly fluctuating and steadily increasing supply of electricity from renewable
energy sources, can ensure a reliable energy supply that even provides a long-term or
seasonal storage for future energy systems.
Figure 1.7 Schematic representation of electrolysis-water splitting.
Chapter 1
21
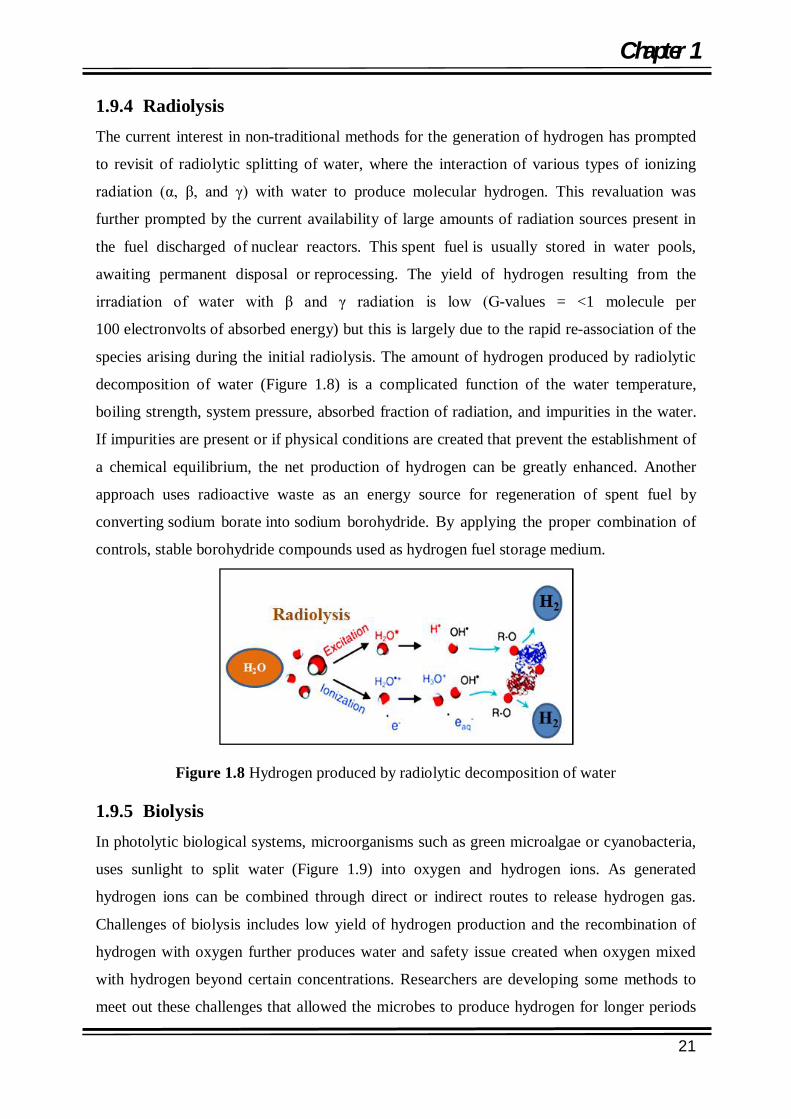
1.9.4 Radiolysis The current interest in non-traditional methods for the generation of hydrogen has prompted
to revisit of radiolytic splitting of water, where the interaction of various types of ionizing
radiation (α, β, and γ) with water to produce molecular hydrogen. This revaluation was
further prompted by the current availability of large amounts of radiation sources present in
the fuel discharged of nuclear reactors. This spent fuel is usually stored in water pools,
awaiting permanent disposal or reprocessing. The yield of hydrogen resulting from the
irradiation of water with β and γ radiation is low (G-values = <1 molecule per
100 electronvolts of absorbed energy) but this is largely due to the rapid re-association of the
species arising during the initial radiolysis. The amount of hydrogen produced by radiolytic
decomposition of water (Figure 1.8) is a complicated function of the water temperature,
boiling strength, system pressure, absorbed fraction of radiation, and impurities in the water.
If impurities are present or if physical conditions are created that prevent the establishment of
a chemical equilibrium, the net production of hydrogen can be greatly enhanced. Another
approach uses radioactive waste as an energy source for regeneration of spent fuel by
converting sodium borate into sodium borohydride. By applying the proper combination of
controls, stable borohydride compounds used as hydrogen fuel storage medium.
Figure 1.8 Hydrogen produced by radiolytic decomposition of water
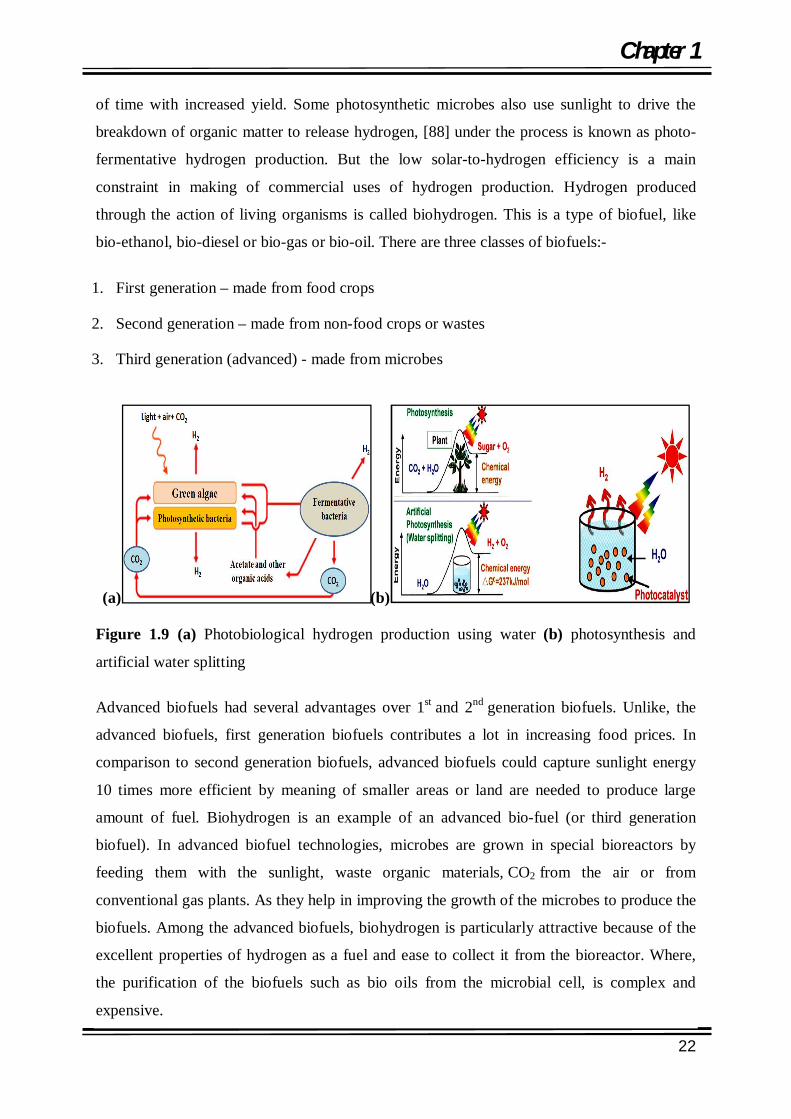
1.9.5 Biolysis In photolytic biological systems, microorganisms such as green microalgae or cyanobacteria,
uses sunlight to split water (Figure 1.9) into oxygen and hydrogen ions. As generated
hydrogen ions can be combined through direct or indirect routes to release hydrogen gas.
Challenges of biolysis includes low yield of hydrogen production and the recombination of
hydrogen with oxygen further produces water and safety issue created when oxygen mixed
with hydrogen beyond certain concentrations. Researchers are developing some methods to
meet out these challenges that allowed the microbes to produce hydrogen for longer periods
Chapter 1
22
of time with increased yield. Some photosynthetic microbes also use sunlight to drive the
breakdown of organic matter to release hydrogen, [88] under the process is known as photo-
fermentative hydrogen production. But the low solar-to-hydrogen efficiency is a main
constraint in making of commercial uses of hydrogen production. Hydrogen produced
through the action of living organisms is called biohydrogen. This is a type of biofuel, like
bio-ethanol, bio-diesel or bio-gas or bio-oil. There are three classes of biofuels:-
1. First generation – made from food crops
2. Second generation – made from non-food crops or wastes
3. Third generation (advanced) - made from microbes
(a) (b) Figure 1.9 (a) Photobiological hydrogen production using water (b) photosynthesis and
artificial water splitting
Advanced biofuels had several advantages over 1st and 2nd generation biofuels. Unlike, the
advanced biofuels, first generation biofuels contributes a lot in increasing food prices. In
comparison to second generation biofuels, advanced biofuels could capture sunlight energy
10 times more efficient by meaning of smaller areas or land are needed to produce large
amount of fuel. Biohydrogen is an example of an advanced bio-fuel (or third generation
biofuel). In advanced biofuel technologies, microbes are grown in special bioreactors by
feeding them with the sunlight, waste organic materials, CO2 from the air or from
conventional gas plants. As they help in improving the growth of the microbes to produce the
biofuels. Among the advanced biofuels, biohydrogen is particularly attractive because of the
excellent properties of hydrogen as a fuel and ease to collect it from the bioreactor. Where,
the purification of the biofuels such as bio oils from the microbial cell, is complex and
expensive.

Chapter 1
23
1.10 Photocatalyst Materials
1.10.1 Design and Description
As earlier mentioned, a suitable photocatalyst for complete water splitting should have a ideal
band gap of 1.23 eV with no photocorrosion. In terms of water splitting, high crystallinity and
small particle size are desired to minimize the recombination of photo-carriers i.e. electrons
and holes. Metal oxides, sulfides, nitrides, and phosphates with d0 and d10 metal cations have
been used as water splitting catalysts. Group I, and Group II metals along with some
lanthanides form perovskite materials can also be employed to catalyze photoelectron
chemical (PEC) water splitting. The band diagram of the different semiconductors with
respect to their redox potentials with respect to the water splitting requirement are
summarized in the Figure 1.10. Advancement in photocatalysts by doping with some metal
cations such as Ag2+, Ni2+, Cr3+, and V5+, are made to improve the solar energy conversion
efficiency that can help to increase the visible light response. To prohibit the backward
reaction of water splitting and to increase the hydrogen production yield, the suitable co-
catalysts i.e. RuO2, NiO, Au and Pt, can be added. In this section, we will focus on
heterogeneous photocatalysts including metal oxides, metal sulfides, and metal nitrides.
Figure 1.10 (A) Schematic of water splitting using semiconductor photocatalyst. (B) Band
structure illustration of various semiconductors with respect to the redox potentials of water
splitting. [89]

Chapter 1
24
1.11 Oxide Photocatalysts: Challenges and Perspectives
Although, the oxide photocatalysts are a very common and famous class of photocatalyst,
used for water splitting for a long time, due to their wide band gap (BG) they have some
limitations, on which we need to focus our efforts. First, the study of oxide photocatalyst
requires more devoted and goal-oriented efforts in the direction of overall efficient water
splitting, as this field is quite complicated and the reported studies are quite scattered. A more
systematic practical approach aligned with a theoretical scheme is needed to move toward
this direction and to rationalize the major experimental observations. Second, new oxide
photocatalyst materials with better performance at lower cost are required. In the long run,
the cost of the material will be a driving factor even if the photocatalysis achieves high
efficiency and stability under sunlight irradiation. Therefore, low cost material with stability
and efficiency are in demand. Oxide materials, which have an apt BG with good light
harvesting capacities, are still at the top of the “WANTED” list in the field of the functional
materials. Third, new modified reactor designs are urgently needed in place of conventionally
designs (typically slurry reactors and immobilized film reactors). [90]
1.11.1Prominent oxide photocatalysts
1.11.1.1Metal Oxides
A large number of representative metal oxides (such as ZnO, TiO2, Fe2O3, WO3, Cu2O,
Al2O3, Ga2O3, Ta2O5, CoO and ZrO2, etc) have been widely studied for water splitting due to
their high stability in aqueous solution and their low cost. However, most metal oxides
suffers from the large band gaps that limits their ability to absorb visible light. Under the
typical class of metal oxide, the valence band have O2p and metal s character and conduction
band has metallic nd or np characters. Therefore, they might have relatively large band gap
suchn as: ZrO2(5.0 eV) SnO2(3.68 eV), Nb2O5(3.5 to 4.8 eV), Cu2O (2.2eV), In2O3 (3.75 eV),
TiO2 (3.2 eV) [91] ZnO (3.2 eV) [92], Ga2O3 (4.5 eV) [93], Al2O3 (8.8 eV) [94] etc.

Chapter 1
25
(a) (b)
Figure 1.11 Typical valence and conduction band offsets of (a) Cu2O, ZnO, In2O3 and SnO2
[95] and (b) The band diagram of different popular semiconductors.
Table 4 Properties of the metal oxides with their band gap, donor concentration, valance
bond voltage, conduction band voltage and EB.
Typical photocatalyst are discussed as follows:
1.11.1.1.1 TiO2
TiO2 (with band gap 3.2 eV) is the first ever photocatlyst that used for water splitting. [96]
Titanium dioxide is a low-cost and nontoxic optoelectronic material that used to produce
environmental friendly solar-hydrogen to support the future hydrogen economy. It found in
three forms i.e rutile, anatase and brookite along with the two high pressure forms
a monoclinic bad deleyite like form and an orthorhombic α-PbO2-like form, in nature. Their
strengths and weakness vary with the method of preparation. For example, the maximum
value obtained for the photo-voltage of a photoelectrochemical cell using a TiO2 photoanode
is ∼0.9 V. Hence, for TiO2 (rutile, bandgap ≈ 3.0 eV) the conduction band edge potential is
insufficiently negative to generate hydrogen at a useful rate. Consequently, it requires a bias

Chapter 1
26
in order to decompose water by use of an externally applied bias voltage. Despite intensive
research onto TiO2, from both experimental and theoretical aspects, the understanding of the
fundamentals of TiO2 chemistry is still limited. Most of the microscopic mechanisms of the
properties mentioned above have not been clarified but it was cleared that the surface
chemistry of the TiO2 has been expected to play an eminent role in solar hydrogen generation
processes. In addition, a strong photocatalytic activity and photo induced hydrophilic
conversion phenomena have also been observed on TiO2 surfaces. Satoshi and Hiroshi in
2016, reported a visible-light-sensitive two-step overall water-splitting process for Pt/Cr, Ta
doped -rutile (O2) and -anatase (H2) TiO2 system, as shown in (Figure. 1.12 a), Li etal
illustrated a Z scheme between the wide bandgap TiO2 and narrow bandgap Ag2S i.e. Ag2S-
Ag-TiO2 (Figure 1.12 b), for photocatalytic hydrogen production under full-spectrum light
illumination. The 30-mg Ag2S-(Ag)-TiO2 hybrid structures exhibit H2 production rates at
1.3x10⁻⁷ and 1.9x10⁻⁸ mol/h under λ < 400 nm and λ > 400 nm, respectively. Pu etal
compared the pure TiO2, with Au NP and Au NR decorated- TiO2 nanowires where the
decorated electrodes exhibited significantly enhanced photoactivity in both the UV and
visible regions. For Au NR-decorated TiO2 electrodes, the photoactivity enhancement was,
observed in the visible region only with the largest photocurrent generation achieved at 710
nm. Significantly, TiO2 nanowires loaded with a mixture of Au NPs and NRs showed
enhanced photoactivity in the entire UV-Visible region (Figure 1.12c).
(a (b (c
Figure 1.12 Visible-light-sensitive two-step overall water-splitting using TiO2 based systems
(a) Pt/Cr, Ta doped-rutile (O2) and-anatase (H2) TiO2 system [97] (b) Ag2S-Ag-TiO2 [98] and
(c) Au NP and Au NR decorated- TiO2 nanowire [99].
Chapter 1
27
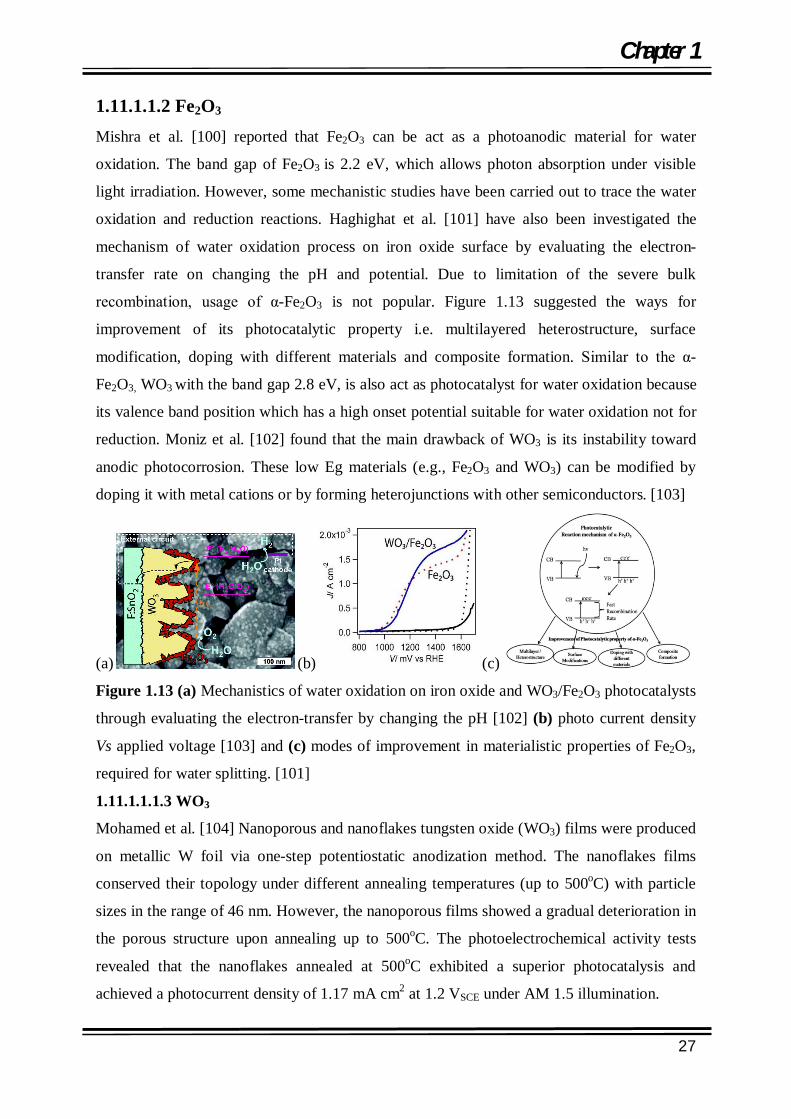
1.11.1.1.2 Fe2O3 Mishra et al. [100] reported that Fe2O3 can be act as a photoanodic material for water
oxidation. The band gap of Fe2O3 is 2.2 eV, which allows photon absorption under visible
light irradiation. However, some mechanistic studies have been carried out to trace the water
oxidation and reduction reactions. Haghighat et al. [101] have also been investigated the
mechanism of water oxidation process on iron oxide surface by evaluating the electron-
transfer rate on changing the pH and potential. Due to limitation of the severe bulk
recombination, usage of α-Fe2O3 is not popular. Figure 1.13 suggested the ways for
improvement of its photocatalytic property i.e. multilayered heterostructure, surface
modification, doping with different materials and composite formation. Similar to the α-
Fe2O3, WO3 with the band gap 2.8 eV, is also act as photocatalyst for water oxidation because
its valence band position which has a high onset potential suitable for water oxidation not for
reduction. Moniz et al. [102] found that the main drawback of WO3 is its instability toward
anodic photocorrosion. These low Eg materials (e.g., Fe2O3 and WO3) can be modified by
doping it with metal cations or by forming heterojunctions with other semiconductors. [103]
(a) (b) (c)
Figure 1.13 (a) Mechanistics of water oxidation on iron oxide and WO3/Fe2O3 photocatalysts
through evaluating the electron-transfer by changing the pH [102] (b) photo current density
Vs applied voltage [103] and (c) modes of improvement in materialistic properties of Fe2O3,
required for water splitting. [101]
1.11.1.1.1.3 WO3
Mohamed et al. [104] Nanoporous and nanoflakes tungsten oxide (WO3) films were produced
on metallic W foil via one-step potentiostatic anodization method. The nanoflakes films
conserved their topology under different annealing temperatures (up to 500oC) with particle
sizes in the range of 46 nm. However, the nanoporous films showed a gradual deterioration in
the porous structure upon annealing up to 500oC. The photoelectrochemical activity tests
revealed that the nanoflakes annealed at 500oC exhibited a superior photocatalysis and
achieved a photocurrent density of 1.17 mA cm2 at 1.2 VSCE under AM 1.5 illumination.

Chapter 1
28
1.11.1.1.4 CoO Liao et al. [105] had testimony the CoO nanocrystals as HER photocatalyst for water splitting
under visible light exposure. However, short lifetime and rapid deactivation of CoO
nanoparticles that can limits their usage in water splitting. Morphology of nanomaterials can
influence on the band-edge positions [106] and developing the CoO nanoparticles with
different 1D morphology such as nanotubes or nanowires, can provide the more efficient
photocatalystic material Zhan et al. [107] developed CoO nanowires on the carbon fiber
papers with hydrogen generation rate of 81.3 mol g_1 h_1, which indicated higher chemical
stability in comparison with CoO nanoparticles.
Figure 1.14 Water splitting into hydrogen and oxygen using CoO with its UV spectra, Mott
schottky plot, SEM image and XPS spectra. [105]
1.11.1.1. 5 Tantalum oxide (Ta2O5) Tantalum oxide (Ta2O5) has been an attractive semiconductor for photocatalytic water
splitting [108-111] due to their wide band gap (about 4 eV), it is required to narrow the band
gap that can be done by the doping of foreign ions. Lu et al. [108] described the Ta2O5
nanowires as an active photocatalysts, which generated hydrogen with the rate of 214 mmol

Chapter 1
29
g-1 h-1 under Xe lamp irradiation without any cocatalyst. They concluded that the Ta2O5
nanowire with low dimensional structures provides a higher surface area with favorable
carrier transport to harvest light for H2 production. Tao et al.[109] explained the fabrication
of the well dispersed mesoporous Ta2O5 submicrospheres at R = 5 °C/min that showed a
considerablely enhanced photocatalytic activity not only for hydrogen evolution but also for
photodegradation of organic pollutants such as methylene blue and rhodamine B. The results
here suggest that the meticulous control over the structural characteristics is an effective
alternative to obtain highly efficient photocatalytic materials. Mao et al. [110] developed a
H2O2-mediated hydrothermal method for the fabrication of the hydrophilic Ta2O5/graphene
composite. The composite shows a superior H2 productivity, up to 30 mmol g−1 h−1 for water
splitting, corresponding to an apparent quantum efficiency of 33.8% at 254 nm. This superior
performance is due to the hydrophilic nature of the composite with the ultrafine
Ta2O5 nanoparticles (about 4.0 ± 1.5 nm), which are covalently bonded with the conductive
graphene. The hydrophilic property of the composite is attributed to the use of H2O2 in the
hydrothermal process. The ultrafine size of the Ta2O5 particles which are covalently bonded
with the graphene sheets is attributed to the use of sonication in the synthesis process.
Furthermore, the hydrophilic Ta2O5/Gr composite is durable, which is beneficial to long term
photocatalysis. Zhu et al. [111] reported the gray Ta2O5 nanowires, which were modified by
aluminum doping to improve electron density and photo electrochemical water splitting
properties of the material. Where, the single-crystalline uniform Ta2O5 nanowires are prepared
by a novel synthetic route. The formation of the nanowires, oriented in particular direction, result
in the reduction of surface energy. These nanowires had been successfully applied to the
photocatalytic H2 evolution, pollutant degradation and dye-sensitized solar cells (DSSCs). The
Ta2O5-based DSSCs revealed a significant photovoltaic response. As synthesised Ta2O5
nanowires possess high H2 evolution efficiency with nearly 27-fold higher than the commercial
powders, under the Xe lamp irradiation. A better performance for the photocatalytic degradation
of the contaminant is also observed. Such improvements are ascribed to better charge transport
ability for the single-crystalline wire and a higher potential energy of the conduction band.
Chapter 1
30
(1) (II)
(III) (IV)
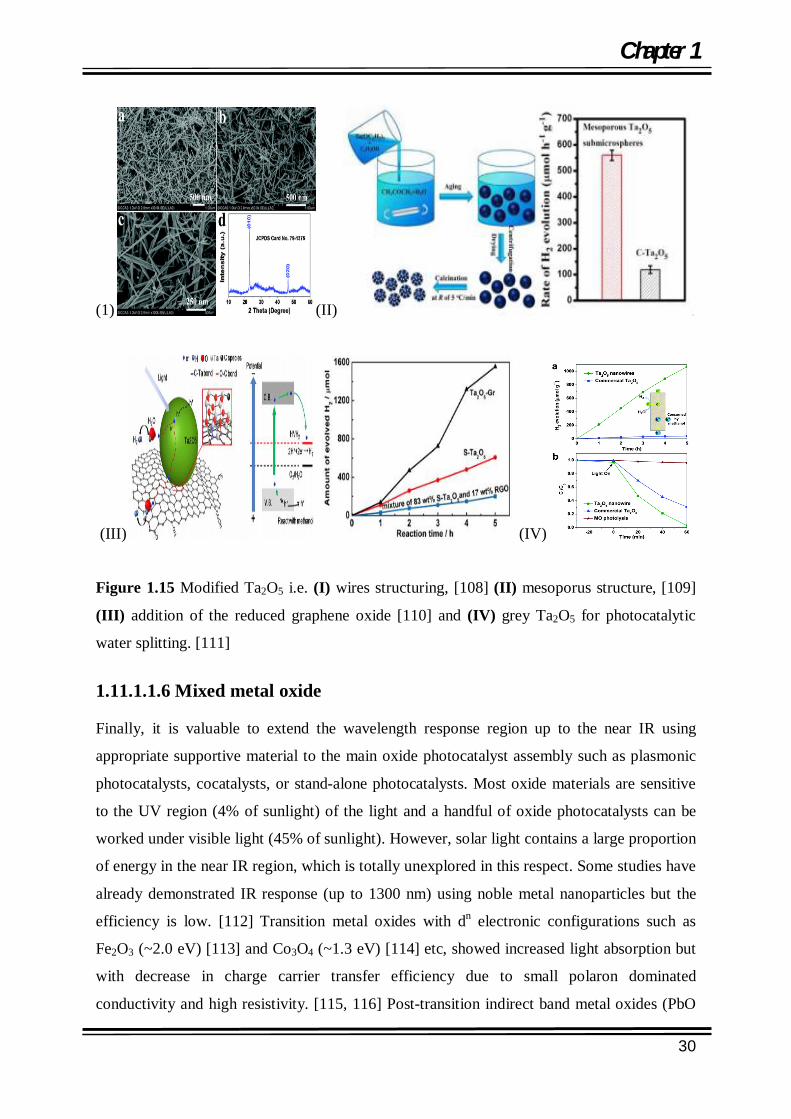
Figure 1.15 Modified Ta2O5 i.e. (I) wires structuring, [108] (II) mesoporus structure, [109]
(III) addition of the reduced graphene oxide [110] and (IV) grey Ta2O5 for photocatalytic
water splitting. [111]
1.11.1.1.6 Mixed metal oxide Finally, it is valuable to extend the wavelength response region up to the near IR using
appropriate supportive material to the main oxide photocatalyst assembly such as plasmonic
photocatalysts, cocatalysts, or stand-alone photocatalysts. Most oxide materials are sensitive
to the UV region (4% of sunlight) of the light and a handful of oxide photocatalysts can be
worked under visible light (45% of sunlight). However, solar light contains a large proportion
of energy in the near IR region, which is totally unexplored in this respect. Some studies have
already demonstrated IR response (up to 1300 nm) using noble metal nanoparticles but the
efficiency is low. [112] Transition metal oxides with dn electronic configurations such as
Fe2O3 (~2.0 eV) [113] and Co3O4 (~1.3 eV) [114] etc, showed increased light absorption but
with decrease in charge carrier transfer efficiency due to small polaron dominated
conductivity and high resistivity. [115, 116] Post-transition indirect band metal oxides (PbO

Chapter 1
31
(2.1 eV) [115], SnO (2.4 eV) [116, 117] and Bi2O3 (2.5 eV) [118]) have occupied ns-orbital
that leads to better photogeneration of charge carriers but their efficiency of carrier extraction
process is less because their optical absorption band edges vary with the square root of the
photon energy. Therefore, ternary metal oxide compounds or nanosturctures of the metal
oxides have been employed to overcome these limitations using the photocatlyst like as:
wormhole like mesoporous Bi20TiO32 [119] (with pore size 6.1nm and Eg = 2.5eV),
NiO/NaTaO3:La (with maximum apparent quantum yield 56% at 270 nm for water splitting)
[120] SnNb2O6 [121] A2-xLa2Ti3-xNbxO10 (A = K, Rb, Cs; x = 0, 0.5, 1.0), [122] NiO(0.15 wt
%)/Sr2Ta2O7 photocatalyst was 12% at 270 nm) [123] and BiVO4 [124] BiVO4 has been
investigated with owning a low band gap (2.4-2.5 eV) and reasonable good aligned band edge
positions suitable for the water redox potentials. [125-126]
SrTiO3 (STO) has also been widely used for hydrogen production as a solid-state
photocatalyst with a band gap of 3.2 eV, which has been explored for the overall water
splitting under UV light irradiation. Since STO, is active towards water splitting only in the
UV region with the solar to hydrogen conversion (STH). Doping can enhance the quantum
efficiency of SrTiO3 in the visible light region [127-128].
(a) (b) (c)
Figure 1.16 Mixed oxides (a) cocatalyst IrO2 loaded Rh: Sb doped SrTiO3 [128] (b) Rh:Sb
doped SrTiO3 [129] and (c) NiO/NaTaO3:La, used for water splitting. [130]
Rh and Sb doped SrTiO3 photocatalysts were prepared by hydrothermal synthesis. Figures
1.16 represents of effect of doping to STO. Rh doping to STO causes optical absorption
centered at 580 and 420 nm, attributed to Rh4+ and Rh3+ species. Addition of Sb to Rh-doped
SrTiO3, result in the oxidation state of Rh shifts to be 3+ and the absorption at 580 nm
disappears. These doped and nondoped photocatalysts exhibit transient infrared absorption
between 3000-1000 cm–1 due to excited electrons, when pumped by 355 or 532 nm light
pulses. The absorbance decay was observed in a vacuum as a function of the microsecond

Chapter 1
32
time delays to deduce the relative rate of electron-hole recombination. Doping of aliovalent
metal cations to SrTiO3 lowers the valence cation to introduce oxygen vacancies and decrease
Ti3+ concentration, which is effective to enhance photocatalytic activity [129] have recently
reported the photocatalytic behavior of the SrTiO3 for the overall water splitting reaction their
can significantly be improved to 30% at 360 nm by flux-mediated Al doping. In another
study, Rh-doped SrTiO3 is with a donor level in the band gap region of SrTiO3: Rh that can
averts the charge recombination and facilitates the hydrogen production (2223 mol h-1 g-1)
with respect to pure STO. Kato et al. in 2003, [130] investigated the highly efficient
lanthanum-doped NaTaO3 with high crystallinity and surface nanostructuring for overall
water splitting into H2 and O2 under UV light irradiation.
1.11.1.1.7 Graphene Oxide
Graphene based nanocomposites or super carbons can also be proved as a good alternative
material can be used for water splitting by using renewable energy that is solar energy. They
can be fabricated using graphite as an initial material, as shown in Figure 1.17 a. They can
also absorb over a wide range of wavelengths that is from IR through visible to UV region
and can act as electron acceptors and transporters. Graphene is a large aromatic
macromolecule with a flat monolayer of sp2 bonded carbon atoms tightly packed into a 2D
honeycomb lattice, which has no BG and has a unique band structure, in which the lowest
unoccupied molecular orbital (HOMO) level (π) meet up at the dirac point, as shown in
Figures 1.17 a and 1.17 b. This allows graphene to display quite high conductivity and
electron mobility. Furthermore, the doping of the heteroatom or electrostatic field tuning
makes graphene as n-or p-type semiconductor with a small BG that accompanied by detuning
off the Fermi level from the Dirac point near to LUMO and HOMO [131]. Moreover, it has
high thermal conductivity (~5000 Wm/K) [132], excellent mobility of the charge carriers
(200,000 cm2V-1S-1) [133] (Castro neto et al. 2009) a large specific surface area.
(a) (b)
Figure 1.17 (a) the making of graphene based compounds from graphite. (b) Electronic
structure of graphene. [131]

Chapter 1
33
Specific surface area (2630 m2/g) [134] easily functionalized in compared with carbon
nanotubes, biodegradability [135], nontoxicity and good mechanical stability, [136]
transparency, [137] large work function (4.42 eV) [138], which enables it to accept
photogenerated electrons from CB of most of semiconductors and LUMO of dyes that results
in suppression in charge recombination and enhance H2 generation capacity. Accepted
electrons can migrate across its 2D plane to a reactive site for hydrogen generation.
Therefore, the roles of graphene as an electron acceptor and transporter need to be
extensively investigated to enhance PEC/photocatalytic hydrogen generation. Moreover, the
lateral size, layer thickness, homogeneity, and purity of the graphene are the qualities, which
directed the material for high end uses in electronics and other devices. Furthermore, it might
be suitable as a good electrode material for electronic devices due to its high thermal and
chemical stability, low resistivity (10-30 per square), light weight, flexibility and
transparency (˃90% at 550 nm). [139] it has the potential to replace indium tin oxide (ITO)
as an electrode material as it is thermally and chemically stable, highly conductive, flexible,
and transparent. [140] Graphene based composite systems are classified into three categories:
binary (one compound with graphene based composite), ternary (two compounds with
graphene based composite) and dye sensitized (dye with graphene based composite). There
typical examples are mentioned in Figures 1.18. TiO2/graphene photocatalyst was first ever
reported system for photocatalytic H2 generation, as demonstrated in Figure 1.18 a and 1.18 b
other binary systems are: graphenes with TiO2 [141-142] ZnO, [137] ZnS 6H-SiC [143],
BiOCl [144], 23.4% Znx Cd1-x S, [145], CdSe [146] and CdTe [147].

Chapter 1
34
Figure 1.18 Schematic illustration of photocatalytic H2 production by using graphene based
materials with (a) Zn0.8Cd0.2S NPs, [145] (b) CdS-Pt, [148] (c) Fe2O3@BiV1-xMoxO4 [149]
and (d) dye (Eosin Y)-doped reduced graphene oxide under UV light irradiation [150].
In ternary graphene system, graphene acts as an electron mediator for water splitting in an
ingenious Z-scheme that accelerates that transfer of electron from two different kind of
semiconductor to the active sites of the graphene through the 2D plane. In a typical
photoreduced graphene oxide (PRGO) is used as a mediator among Z-scheme
semiconductors BiVO4 and Ru-SrTiO3:Rh. Under visible light illumination, photogenerated
electrons of the CB of BiVO4 transfer to Ru-SrTiO3:Rh via graphene as an electron
conductor. The electrons in Ru/SrTiO3:Rh reduce water to H2 on the Ru cocatalyst, while the
holes in BiVO4 oxidize water to O2, accomplishing a complete water splitting. Similarly
Fe2O3@BiV1-x MOxO4 works effectively for hydrogen generation by water splitting as
shown in Figure 1.18c [149] In graphene based dye sensitized nano-coposite system, the dye
(Eosin Y [EY], Rose Bengal [RB], Fluorescein and Rhodamine B, etc) molecules act as a
photosensitizer and are first adsorbed on the surface of RGO sheet with dispersed Pt
cocatalyst, which has excellent electron accepting and electron transporting properties; RGO
can facilitate the electron transfer from excited dye (Eosin Y)-doped reduced graphene oxide
molecule to the Pt cocatalyst, which promotes photocatalytic activity for hydrogen evolution
(Figure 1.18 d). [150]
Chapter 1
35
1.11.1.1.8 Oxynitride
Oxynitrides can be made by replacing few of the oxygen content by nitrogen at lattice sites,
which intend to narrow the BG of the oxides, by pushing the VB towards the BG. Such a
modification does not produce native point defects. This would otherwise be introduced in
the case of N doping. Stoichiometric incorporation of the nitrogen also avoids the localized
states induced by N doping and reduces the possible electron hole recombination. The solid
solution of GaN and ZnO has been considered as a promising photocatalyst for the overall
water splitting. [151] Although, the pristine GaN and ZnO are the poor visible light absorbers
due to their wide band gaps but their solid solution (Ga1-xZnx)(N1-xOx) formed their will have
new electronic states that considerably reduce the band gap. [152] Siritanaratkul et al in 2011
[153] studied the perovskite type crystal structured oxynitride compounds such as CaNbO2N,
SrNbO2, BaNbO2N, and LaNbON2, etc. Maeda et al in 2011 [154] reported SrNbO2N (Eg =
1.8 eV) for photocatalytic hydrogen evolution under visible light from methanol solution. The
photoelectrode of SrNbO2N on a transparent conducting surface shows water oxidation
reaction without external bias. Higashi et al in 2009 [155] developed Tantalum based
compounds such as CaTaO2N and BaTaO2N that to be utilized in Z-scheme photocatalysis.
CaTaO2N and BaTaO2N loaded with Pt cocatalyst and coupled with Pt/WO3, were used for
Z-scheme water splitting. Maeda and Domen in 2014, [156] investigated a solid solution of
BaTaO2N and BaZrO3 for hydrogen and oxygen evolution, which showed improved
performance compared with individual photocatalysts under visible light irradiation. Paven-
Thivet et al in 2009 [157] developed a perovskite type compound LaTiOxNy which shows
high photocurrent density under visible light. Apart from the double perovskites that belongs
to the general formula AA’BB’O6. There are a several other compounds that show crystal
structures close to the perovskite type structure. Theoretically, double perovskites offer a
wider scope to design photocatalysts by selecting suitable cations and AA’ and BB’ sites in
the lattice. Work on design and advancement of double perovskites is in progress.
1.11.1.1.9 Oxy Sulfides
Usually, oxides are active in UV light but its bandgap engineering can be done by in
cooperating sulphur and metal ions. Hence, most of the oxysulfides are visible light active.
For a typical example, Ishikawa et al [158] developed the oxysulfides with a similar

Chapter 1
36
composition of sulfur and oxygen for photocatalysts. The mixed oxysulfide perovskite
Sm2Ti2S2O5 (Eg = 2.0 eV) is known for water oxidation and reduction reaction for oxygen
and hydrogen evolution, respectively, in the presence of sacrificial agent under low photon
energy wavelength of 650 nm. The band structure of the phase reveals the presence of the
sulfur that by narrowing the BG makes enable the compound for visible light absorption.
1.11.1.1.10 Metal Sulfides Metal sulfide photocatalysts (MSP i.e. CdS and ZnS, etc), [159] with narrower band gap (in
comparasion to metal oxide semiconductors) is considered as the most promising class of
visible-light-driven photocatalyst for water splitting. [160] However, MSP are highly
sensitive to photocorrossion due to rapid recombination of the photocarriers i.e. electrons and
holes. Therefore, pristine MSP semiconductors usually show low hydrogen production rates
[161-162] with less stability. To avoid this problem, MSPs can be coupled with other noble
metals as a co-catalyst or form a heterojunction structure with other semiconductors. [163] In
such case, the photogenerated electrons on the conduction band of semiconductor can be
transferred to the conduction band of the MSP’s that transferred to the electronic levels of the
noble metals or to be delocalized through LSPR/ SPR. The whole assembly can be used for
the photoreduction of water. Huang et al. [164] had synthesised the noble metal free hollow
bimetallic sulfide materials (MxCo3–xS4, M = Zn, Ni, and Cu) with a narrow band gap (Figure
1.19a). The bimetallic metal sulfides exhibit a hydrogen production rate comparable to Pt or
Eosin Y dye sensitized TiO2 coupled with C3N4 semiconductors. The H2 evolution rates for
CdS/Pt/Ga2O3 and CdS/Pt/In2O3 are found as high as 995.8 and 1032.2 μmol h−1,
respectively, under visible light (λ>420 nm) with high apparent quantum efficiencies of 43.6
and 45.3 % obtained at 460 nm, respectively, as shown in Figure 1.19b. These are much
higher than those on Pt/CdS (108.09 μmol h−1), Pt/Ga2O3 (0.12 μmol h−1), and Pt/In2O3 (0.05
μmol h−1). Nickel sulfide, in particular has proven to be enormously useful in raising the
activity of semiconductors, when they use a co-catalyst along with TiO2, CdS, and g-C3N4.
[165] Unlike CdS, wide band gap ZnS (3.6 eV), responds weakly to visible light. [166, 167]
Efforts have been made to improve the photoactivity of ZnS for hydrogen evolution.

Chapter 1
37
(a (b (c
Figure 1.19 Metal sulphides used for water splitting i.e. (a) MxCo3–xS4, M = Zn, Ni, and
Cu) 164 (b) CdS/Pt/Ga2O3 and CdS/Pt/In2O3 core-shell nanorods (c) WS2-Au-CIS [173]
Li et al. [168] have reported highly active solid solution system i.e. Zn1-xCdxS for visible-
light irradiated hydrogen gas production from breaking of water. The band gaps of the solid
solution photocatalysts can be narrowed by varying the Zn/Cd molar ratios with respect to the
bare ZnS of large band gap that can favour the absorption of light photons. Although, the
metal oxides with large band gaps are highly stable and can produced stable the composite
material. [169] Some significant solid solutions of metal oxides (TaON, TiO2 and ZnO) and
CdS are studied by various groups. [170, 171] Nanocarbon with different morphology can
combined with CdS to promote their catalytic behaviour towards water splitting by
suppressing the charge recombination. Due to good compatibility of the carbon
nanostructures and CdS and the high conductivity of carbon can improve the degree of the
charge separation. Consequently, the catalytic behavior of the above nanocomposites will be
improved. Different strategies for production of the carbon-based CdS nanocomposites that
may include simple mixing of carbon-based nanomaterials with CdS or in-situ growing of the
CdS at the graphene oxide surface by using oxygen moieties as the templates. [172] WS2-Au-
CuInS2 has also been reported for photocatalytical H2 production by insertion of gold
nanoparticles between of WS2 nanotubes and CuInS2 (CIS) nanoparticles, as demonstrated in
Figure 1.19c. [173] Addition of Au nanoparticles with WS2 and CuInS2 can lead to
significant enhancement of light absorption, resulted in highest H2 evolution efficiency for
WS2-Au-CIS due to the more rapid photogenerated carrier separation from the type II band
structures and the localized surface plasmonic resonance (LSPR) associated with the Au
nanoparticles.
Chapter 1
38
1.11.1.1.11 Nitrides
To efficiently harvest solar light, nitrides and oxynitrides can be applied as photocatalysts for
water splitting .The 2p orbitals corresponding to nitrogen in nitrides have higher energy than
analogous orbitals of oxygen in metal oxides. Consequently, in nitrides lower energy is
needed to excite electrons to the conduction band. Tantalum nitride (Ta3N5) also has been
identified as an active photocatalyst for water splitting. In 2013, Zhen et al. reported a
template-free synthesis of Ta3N5 nanorod, which was modified with Co(OH)x to be used as
anode for photo electrochemical cell to split water. [174] Somewhere else, reported the Mg2+
and Zr4+ -modified Ta3N5 by partial substitution, which leads to the apparent decrease in
onset potential for PEC water oxidation. [175] Such modification could be applied to other
semiconductors in order to enhance photocatalytic activity. Oxynitrides and graphitic carbon
nitrides (g-C3N4) combination with the narrow band gap of 2.7 eV have been utilized as
photocatalysts to produce hydrogen due to their conduction band position shallower than
hydrogen evolution potential and a valence band potential higher than the oxygen evolution
potential. Hence, g-C3N4 could produce hydrogen from water under visible light (<540 nm)
exposure in the presence of a sacrificial agent (oxidizing agent) without the assistance of any
noble metal. However, pristine g-C3N4 shows a low affinity towards photocatalytic reactions.
Wang et al. [176] have first time reported a graphitic semiconductor that was synthesized
from cyanamide, which exhibited absorption in the visible light region and continued
hydrogen production for 75 h. Band gap engineering for the g-C3N4 made to enhance the
photocatalytic properties by in-cooperation of the non-metal (i.e., S, F, B, P) [177] and metal
doping (i.e., Pt, Pd, Fe, Zn, Cu). [178] Furthermore, the degree of charge separation in g-
C3N4 can be enhanced by application of the conductive graphene, carbon nanotubes, and
reduced graphene oxide.
1.11.1.1. 12 Plasmonic material induced metal oxide photocatalysts
Ebbesen et al [179] introduced a new class of optoelectronic materials in the form of
plasmonic photocatalytic materials that stimulated research in photocatalysis due to their
good light harvesting qualities along with their BG breaking effect and sensitizer effect
(Figure 1.20). To improve photocatalytic efficiency (due to the recombination of photo
electrons and photoholes) and visible light response in photocatalytic water splitting process
with nice stability, plasmonic photocatalytic materials are introduced. Because most
commonly available and stable oxides have a wide BG, which allow them to absorb UV light,

Chapter 1
39
and short BG materials did not sustain photoactivity for a long time. [180] SPR materials
have two major parts: (1) nanoparticles of novel metals with localized surface plasmonic
resonance (LSPR); and (2) Schottky junction at the junction of noble metal and
semiconductor/polar material (support/carrier). In noble metal carried on semiconductor/polar
material, LSPR adds on the assistance of the enhanced local heating effect, LSPR- powered
e/h generation, enhanced UV-Vis absorption, reduced e/h diffusion length, enhanced local
electric effect and molecular polarisation effect, quantum tunnelling effect, high catalytic
effect, to the main photocatalytic unit. Hence, NPs of noble metals act as the thermal redox
reaction-active centres on catalyst that can trap, scatter, and concentrate light and enhance the
number of active sites, rate of electron-hole formation by providing a fast lane for charge
transfer on the semiconductor surface. Few of the prominent members of this class are
Au@ZnFe2O4, [181] Ag/TiO2−xNx, [182] Au /CuWO4 [183], Au/ZnO [184], Au/TiO2 [185],
Au@ carbon quantum dots [186] etc, as shown in Figure 1.21a, 1.21b, 1.21c and 1.21d.
Figure 1.20 Schematic presentation of the localized surface plasmonic resonating electron of
a noble metal. [181]
(a) (b) (c) (d)
Figure 1.21 Representative examples of the surface activation by noble metal on catalytic
surface by plasmonic photocatalysis in (a) Au@ZnFe2O4. A hot electron is transferred from
CB of Au to the ZnFe2O4 and the same electron jumps into the CB of ZnO. [181] (b) Surface
modification of Ag/TiO2−xNx.[182] (c) Au/ZnO, heterojunction between Au nanoparticles
and ZnO semiconductors [184] and (d) Au/TiO2, where pathway I shows the extraction of
photo-generated electron from TiO2 conduction band to Au NPs and pathway II shows the
coupling of extraction of TiO2 and surface plasmon of Au. [187]

Chapter 1
40
Among various strategies to overcome fast charge recombination that result in low
photocatalytic efficiency, [188, 189] plasmonic photocatalysis is the most promising
approach to promote charge separation and visible light absorption [190,191]. Noble metal
nanoparticles of Au [192-195], Ag [196] and Pd [197] have been applied to improve visible
and near infrared (NIR) absorption and generate surface plasmon resonance (SPR) hot
electrons.[191] The plasmonic properties of the metallic nanoparticles (normally Au Ag, Pd,
Pt, Cu, etc) are very attracting due to their ability to promote catalytic reactions. Suitable
photocatalyst combines an ability to dissociate water molecules with a band gap that absorbs light
in the visible range and also enhance their stability in water and sunlight.
1.11.1.1.13 Z-Scheme Photocatalysts
Z-scheme photocatalysts has subsequently turned to achieving more efficient utilization of
the visible light by widening the band of photo phonon-absorption and increasing the
quantum efficiency of the photocatalyst. This can happen by combining the two wide band
oxide photocatalysts (oxygen evolution reactant (OER) and hydrogen evolution reactant
(HER)) in the redox pair of an electrolyte, one whose VB maxima exists below the oxidation
potential of water is suitable for O2 production and another with CBs that exist in the upper
side of the reduction side of the water, is suitable for H2 production, under the redox
electrolyte system and light irradiation. This scheme is known as “Z-scheme or Tandem
photocatalysis” that used for achieving the overall water splitting, which can show the
similarity with the photosynthesis process occurs in the plants. To imitate the natural
photosynthesis process of the green plants, where, the photosystems I and II harvest 700 and
680 nm photons, respectively, to oxidize water into O2 and reduce water to generate glucose
under sunlight, the artificial photosynthesis of the water was performed using photocatlyst in
electrolyte medium. Similarly, the Z-scheme includes two step-photoexcitation using two
different semiconductor powders electrodes (one having a VB position suitable for oxidation
of water and other do reduction of water in a reversible donor/acceptor pair (so-called shuttle
redox mediator) electrolyte as shown by Equations 6 to 9 and Figures 1.22a and 1.22b. The
H2 evolution process is the forward reaction (acceptor converted into donor) occurred due to
the reduction of protons by CB electrons coupled with the backward reaction where,
oxidation of water observed by the VB holes and oxidation of the donor to acceptor.

Chapter 1
41
2퐻 → 2푒 + 퐻 (Photoreduction of H+ to H2) ......... (6)
퐷 + 푛ℎ → 퐴 (Photoreduction of D to A) ......... (7) 퐴 + 푛푒 → 퐷 (photoreduction of A to D) ......... (8) 2퐻푂 + 4ℎ → 푂 + 4퐻 (photooxidation of OH- to O2) ......... (9) Few important Z scheme systems are discussed as follows:
Figure 1.22 Z-scheme systems for photoelectrochemically water splitting by (a) two-photon
process with a visible light response for Pt-WO3 and Pt-SrTiO3 (Cr-Ta doped) in mediator
IO3−/I− . [199] (b) Combination of MO-1 and MO-2 for overall water splitting.
Kransnovskii and Brin [198] in 1962 reported the first case of Z-scheme water splitting by
using the semiconductor such as TiO2 and WO3 in the presence of Fe+3/Fe2+ as an electron
acceptor. Simlarly, the system consisting Pt/SrTiO3:Cr/Ta, Pt/WO3 and IO3-/I- redox couple
shows that the QY is 0.1% at 420.7 nm. [199] Tabata et al. in 2010 [200] used the system
Pt/ZrO2/TaON and Ir/Rutile-TiO2/Ta3N5 in the mediator IO3−/I− for overall water splitting. In
the process of the development of the better Z-scheme water splitting systems by studying
various systems it was found that photocatalyst works efficiently in the presence of a shuttle
redox mediator by creating active sites to promote surface chemical reactions and suppressing
backward reactions involving redox mediators (Kudo and Miseki in 2009). [201] Where the
redox cycle of the mediator challenges the reduction or oxidation process of water at the
hydrogen and oxygen evolution sites. Sasaki et al in 2009 [202] includes Ru/SrTiO3 and
BiVO4 as hydrogen and oxygen evolution catalyst (at pH = 3.5 maintained using H2SO4),
respectively with 1.7% apparent efficiency and without an electron mediator. The results
indicates that an inter-particle electron transfer occured between the two catalyst (Figure 1.23
a).
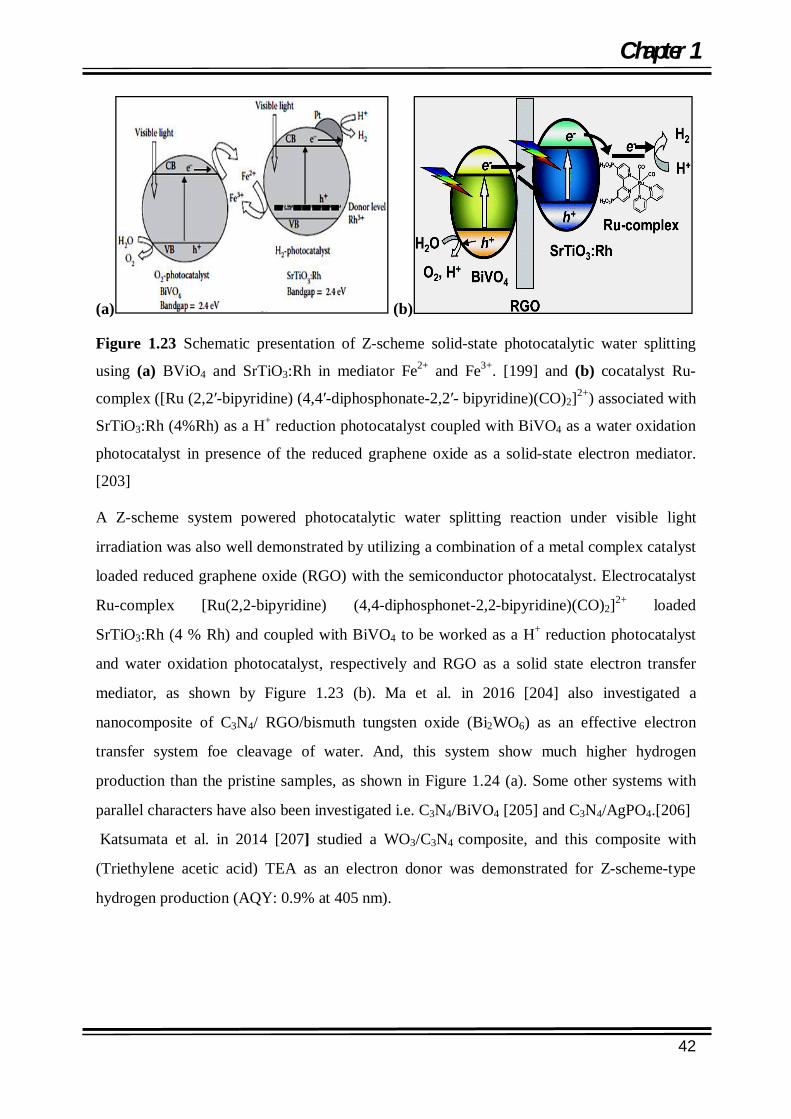
Chapter 1
42
(a) (b)
Figure 1.23 Schematic presentation of Z-scheme solid-state photocatalytic water splitting
using (a) BViO4 and SrTiO3:Rh in mediator Fe2+ and Fe3+. [199] and (b) cocatalyst Ru-
complex ([Ru (2,2′-bipyridine) (4,4′-diphosphonate-2,2′- bipyridine)(CO)2]2+) associated with
SrTiO3:Rh (4%Rh) as a H+ reduction photocatalyst coupled with BiVO4 as a water oxidation
photocatalyst in presence of the reduced graphene oxide as a solid-state electron mediator.
[203]
A Z-scheme system powered photocatalytic water splitting reaction under visible light
irradiation was also well demonstrated by utilizing a combination of a metal complex catalyst
loaded reduced graphene oxide (RGO) with the semiconductor photocatalyst. Electrocatalyst
Ru-complex [Ru(2,2-bipyridine) (4,4-diphosphonet-2,2-bipyridine)(CO)2]2+ loaded
SrTiO3:Rh (4 % Rh) and coupled with BiVO4 to be worked as a H+ reduction photocatalyst
and water oxidation photocatalyst, respectively and RGO as a solid state electron transfer
mediator, as shown by Figure 1.23 (b). Ma et al. in 2016 [204] also investigated a
nanocomposite of C3N4/ RGO/bismuth tungsten oxide (Bi2WO6) as an effective electron
transfer system foe cleavage of water. And, this system show much higher hydrogen
production than the pristine samples, as shown in Figure 1.24 (a). Some other systems with
parallel characters have also been investigated i.e. C3N4/BiVO4 [205] and C3N4/AgPO4.[206]
Katsumata et al. in 2014 [207] studied a WO3/C3N4 composite, and this composite with
(Triethylene acetic acid) TEA as an electron donor was demonstrated for Z-scheme-type
hydrogen production (AQY: 0.9% at 405 nm).

Chapter 1
43
(a) (b) (c)
Figure 1.24 (a) RGO mediated C3N4-BiWO4 hybrid Z-scheme-type photocatalyst [204] (b)
Ag-embedded solid solution ZnRh2O4/Ag/Ag1-x SbO3-y [208] and (c) Z-scheme-type organic-
inorganic composite system for photocatalytic hydrogen production. Dye-sensitized
nanosheets with WO3 hybrid system. [211]
Kobayashi et al in 2014 [208] observed {ZnRh2O4/Ag/Ag1-x SbO3-y} system, where Ag acted
as a solid state electron mediator for the electrons transfer from the CB of Ag1-x SbO3-y to the
VB of ZnRh2O4. The system simultaneously produced H2 and O2 from pure water at a molar
ratio of ~2:1 under irradiation with visible light at 500 nm (Figure 1.24b) Gratzel [209]
discussed the Z-scheme-type electron transfer for a complete water-splitting system, using a
dye-sensitized photocatalyst. This system used a mesoporous WO3 film as a OER catalyst for
oxygen production, and a dye-sensitized mesoporous TiO2 film as a catalyst for hydrogen
generation.
Abe et al. in 2009 and 2013 [210, 211] studied the powder-type photocatalytic Z-scheme
reaction with a coumarin-based dye-sensitized Z-scheme water-splitting system and iridium
oxide (IrO2)-Pt/ WO3 and Pt/H4Nb6O17 as photocatalysts in I-/I3- the mediator. It showed the
complete water splitting under visible light irradiation with (Apparent quantum yield) AQY
0.05% at 480 nm (Figure 1.24c).
1.11.1.1.14 Doped metal oxide
When the BG energy of the metal oxide becomes smaller, the CB edge shifts towards positive
side [212]. Thus, the CB edge of metal oxides having a small BG energy tends to locate quite
close to the redox potential of H+/H2 redox couple (0 eV vs NHE). In some cases, it shifts to
more positive potential than the redox potential of H+/H2 and loses their ability to reduce H+
into H2. A large amount work has been done to develop visible light responsive metal oxide
photocatalysts such as the chemical doping of TiO2 with transition metal ions or non metals
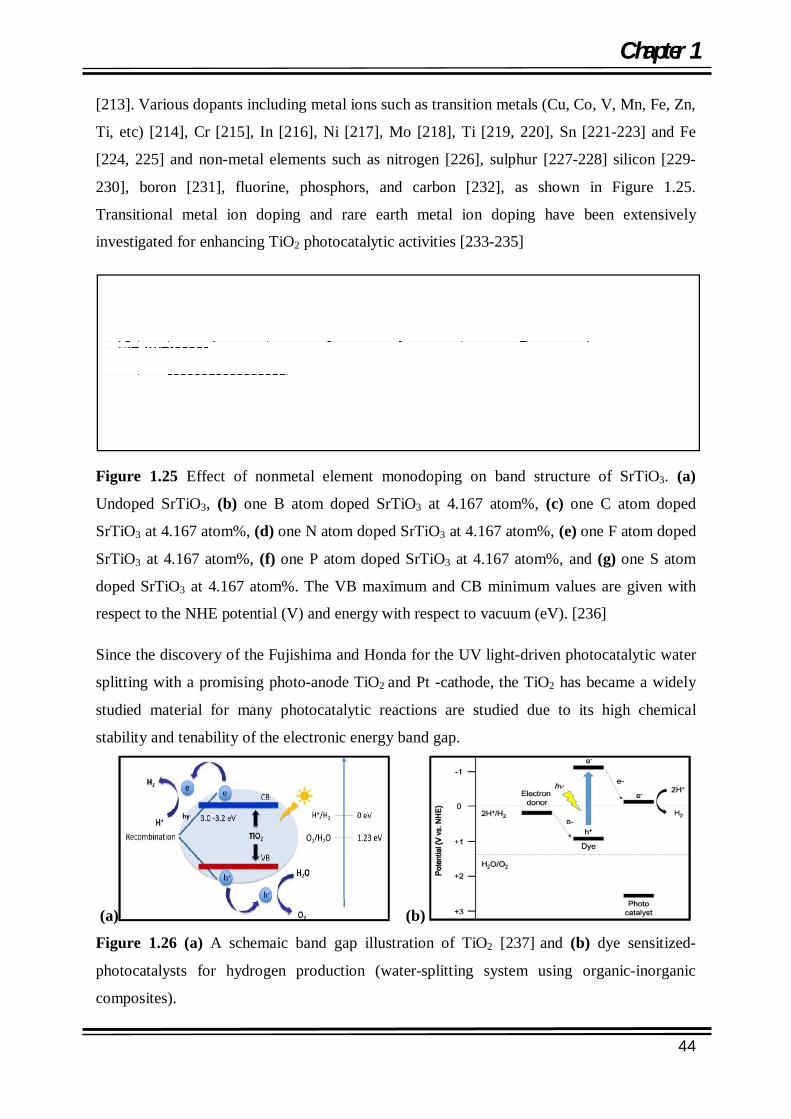
Chapter 1
44
[213]. Various dopants including metal ions such as transition metals (Cu, Co, V, Mn, Fe, Zn,
Ti, etc) [214], Cr [215], In [216], Ni [217], Mo [218], Ti [219, 220], Sn [221-223] and Fe
[224, 225] and non-metal elements such as nitrogen [226], sulphur [227-228] silicon [229-
230], boron [231], fluorine, phosphors, and carbon [232], as shown in Figure 1.25.
Transitional metal ion doping and rare earth metal ion doping have been extensively
investigated for enhancing TiO2 photocatalytic activities [233-235]
Figure 1.25 Effect of nonmetal element monodoping on band structure of SrTiO3. (a)
Undoped SrTiO3, (b) one B atom doped SrTiO3 at 4.167 atom%, (c) one C atom doped
SrTiO3 at 4.167 atom%, (d) one N atom doped SrTiO3 at 4.167 atom%, (e) one F atom doped
SrTiO3 at 4.167 atom%, (f) one P atom doped SrTiO3 at 4.167 atom%, and (g) one S atom
doped SrTiO3 at 4.167 atom%. The VB maximum and CB minimum values are given with
respect to the NHE potential (V) and energy with respect to vacuum (eV). [236]
Since the discovery of the Fujishima and Honda for the UV light-driven photocatalytic water
splitting with a promising photo-anode TiO2 and Pt -cathode, the TiO2 has became a widely
studied material for many photocatalytic reactions are studied due to its high chemical
stability and tenability of the electronic energy band gap.
(a) (b)
Figure 1.26 (a) A schemaic band gap illustration of TiO2 [237] and (b) dye sensitized-
photocatalysts for hydrogen production (water-splitting system using organic-inorganic
composites).

Chapter 1
45
The another method to extend the photocatalytic activity of TiO2 to visible light region is by
making solid state solution with metal oxide of small band gap or doping with non metals.
The nice photocatalytic hydrogen evolution of Pt-N-TiO2 over the pure TiO2 and N-TiO2, was
investigated in an aqueous media in the presence of 20% ethanol as an electron donor under
UV-light irradiation (Figure 1.26 a). Performance photocatalyst Pt-N-TiO2 nanotubes was
highly is the synergetic with the three time treated TiO2 Degussa P-25, namely Pt-N-TiO2
provides an increase in total production of hydrogen compared to the material TiO2 Degussa
P-25 and N-TiO2. [237]
1.11.1.1.14 .1 Doping and defects in ZnO In the recent years, much attention has been focused on wide band gap semiconductors
materials because of their excellent potential for blue light emitting devices, short-wavelength
laser diodes and detectors in UV-blue spectral region. Wide band gap semiconductor ZnO is
gaining much importance for the possible application due to the capability of ultraviolet
lasing at room temperature and possibilities to engineer the band gap. In order to attain the
potential offered by ZnO, both high-quality n-and p-type ZnO are essential. But it is very
difficult to obtain the bipolar carrier doping (both n and p types) in wide-band-gap
semiconductors such as GaN and II-VI compound semiconductors including ZnS, ZnSe, and
ZnTe. Unipolar doping has not been a surprising issue in wide-band-gap semiconductors:
ZnO, GaN, ZnS, and ZnSe are easily doped to n-type, while p-type doping is difficult. All
undoped ZnO to date has been found to be n-type, with donor concentrations typically around
1017 cm-3 for high-quality material. The situation is opposite for ZnTe where p-type doping
is easily obtained, while n-type doping is difficult. The main characterization techniques used
to find the shallow electrical defects in semiconductor materials are photoluminescence and
temperature dependent Hall Effect measurements.
1.11.1.1.14 .1.1 N-type doping ZnO has wurtzite structure, excess zinc is always found in ZnO. Due to this zinc excess, ZnO
is a non-stoichiometric compound and n-type semiconductor. Undoped ZnO shows intrinsic
n-type conductivity with high electron densities of about 1021 cm+3 value. Zinc interstitials
Zni and the oxygen vacancy V are known as the dominant native donor in unintentionally
ZnO film. But still it is debatable issue. Photoluminescence and temperature dependent Hall
studies of electron irradiated ZnO have shown that zinc is the most likely candidate for purely

Chapter 1
46
lattice-related dominant shallow donor, with an activation energy about 30-50 meV. It has
been argued that the n-type conductivity of unintentionally doped ZnO film is only due to
hydrogen (H), which is treated as a shallow donor with activation energy of 31 meV instead
of Zni. This assumption is valid because hydrogen (H) is always present in all growth
methods and can easily diffuse into ZnO in large amounts due to it large mobility. Hydrogen
has been considered as a shallow donor candidate, much research has been done on hydrogen
(H) in ZnO. During seeded chemical vapor transport (SCVT) growth of ZnO, it has been
shown that hydrogen with activation energy 39 meV acts as main donor. This donor
disappears through on annealing process [238, 239]. N-type doping of ZnO is relatively easy
as compared to p-type doping. Group III elements Al, Ga and In as substitutional elements
for Zn and group-VII elements Cl and I as substitutional elements for O can be used as n-type
dopants. Doping with Al, Ga, and In has been attempted by many groups, resulting in high-
quality, highly conductive n- type ZnO films. Al-doped ZnO films were grown by MOCVD.
The films obtained through this method is high by conductive with minimum resistivity as
compared to Ga- doped ZnO films by Chemical-vapor deposition [239-240].
1.11.1.1.14 .1.2 P-type doping
It is very difficult to obtain p-type doping in a wide band gap semiconductors. Acceptors in
ZnO can also take place from both lattice defects and impurity atoms. The oxygen interstitial
Oi and zinc vacancy Vzn are both known to be acceptors in ZnO. P-Type doping in ZnO may
be possible by substituting either group-I elements (Li, Na, and K) for Zn sites acting as
shallow acceptors and group-V elements (N, P, and As) are found to act as deep acceptors on
O sites. It was shown that group-I elements could be better p-type dopants than group-V
elements in terms of shallowness of acceptor levels. However, group-I elements tend to
occupy the interstitial sites, due to their small atomic radii, rather than substitutional sites,
and therefore, they can act as donors instead of acceptors. Moreover, significantly larger bond
length for Na and K than ideal Zn-O bond length (1.93 Å) induces lattice strain, increasingly
forming native defects such as vacancies which compensate the shallow dopants. Group V
elements except N, both P and as, have a larger bonds lengths. That’s why they are likely to
form antisites to avoid the lattice strain. Unfortunately, for p-conduction these elements have
a tendency towards antisite formation, i.e. they can substitute not only oxygen but also zinc
atoms, in which case they act as donors. Nitrogen (N) appears to be good candidate for a
shallow p-type dopant in ZnO with smallest ionization energy, although N is not soluble in
ZnO, and doping can be achieved by ion implantation [239-241].

Chapter 1
47
1.11.1.1.15 Dye-sensitized photocatalysts Dye-sensitized photocatalytic water-splitting systems (dye-inorganic semiconductor) may be
an alternative for hydrogen production under visible light irradiation. By using the visible-
light absorption of dye molecules, photo-excited electrons can be efficiently transferred to
inorganic semiconductors, and hydrogen can be produced by these electrons. Since the dye
molecules are used to absorb the visible light, the inorganic semiconductors only need to be
UV-responsive materials (>3.0 eV). As it is possible to separate charges from the dye to the
inorganic semiconductor over a long distance, charge separation is easier than that in a
inorganic- inorganic photocatalyst. In addition, since the photon energies absorbed can be
changed by modification of the dye molecule, various inorganic semiconductors can be used
in dye-sensitized photocatalytic water-splitting systems. Figure 1.26b shows two types of
organic-inorganic composite photocatalysts. The mechanism of dye-sensitized photocatalysts
is generally similar to that of dye-sensitized solar cells. The dye reaches the excited state by
photoexcitation. The injected electrons travel to the surface of the inorganic semiconductor
(or move to the co-catalyst) and react with protons to produce hydrogen (Figure. 1.26b).
After that, electrons are injected from the excited state of oxidation potential of the dye to the
CB of an inorganic semiconductor with a lifetime of several hundred femtoseconds [242-
245].
1.12 Zinc Oxide The native properties of wide-band-gap semiconductor (WBGS Eg=3.37eV) ZnO such as
large exciton binding energy (~60 MeV) over TiO2 (~6MeV) and GaN (~21 MeV), bio and
complementary metal oxide semiconductor (MOS) compatibility, abundant availability, deep
penetration power, efficient excitonic emission at room temperature [246] and short diffusion
length for incident photon than TiO2, made ZnO superior to others oxides of the same class.
Furthermore, the 10 to 100 times greater carrier mobility of ZnO than the same of TiO2. [247]
It has the one of its kind optical and electrical properties, which can be used in number of
applications. These characteristics empowered this compound as an extremely attractive
material that to be used in versatile applications in optoelectronics, solar cell [248], SAW
(surface acoustic wave) devices [249], gas sensors [250], UV photo detectors, laser diodes
[251-252] and information storage device, heating mirrors, transparent electrodes [253] and
so on.

Chapter 1
48
(a) (b)
Figure 1.27 (a) Unit cell with ionic positions of ‘Zn’ & ‘O’ atoms and (b) Wurzite crystal
structure with tetrahedral symmetry.
After the discovery of ZnO in 1930s, it come into limelight in mid 1950’s but in 1970,
researchers start losing interest in the material due to its limitation of p-type doping.
Subsequently, advancement in the form of nanostructuring of the ZnO using different growth
methods (such as magnetron sputtering, reactive evaporation, chemical vapor deposition,
pulsed laser deposition [254], spray pyrolysis [255-257], aqueous chemical method [258],
chemical bath deposition method [259], and electro deposition method [260]) in the mid of
1990s, reawakened the ZnO oriented research. Therefore, a new spring season of the ZnO
research begins with the production of high quality p-type conducting ZnO nanomolecular
devices for large number applications. Generally, zinc oxide crystallizes in two major forms,
hexagonal wurtzite and cubic zinc blende with different parameters. The tetrahedral
symmetry plays a vital role in deciding polarity along hexagonal axis, which gives rise to the
piezoelectric property. The structure of ZnO, can be described as a number of alternating
planes composed of tetrahedraly coordinated O2- and Zn2+ ions, stacked alternately along the
c-axis and are shown in Figures 1.27a and 1.27b. The fundamental properties of ZnO are
mentioned in Table 5. The most important band structure property of ZnO is that it possesses
a direct band gap character. The lowest conduction band is s-type and the highest valence
band is p- type with direct inter band transition occursed at the Brilliouin zone center, with
k=0. The valence band is split by crystal field and spin orbit interaction into three states
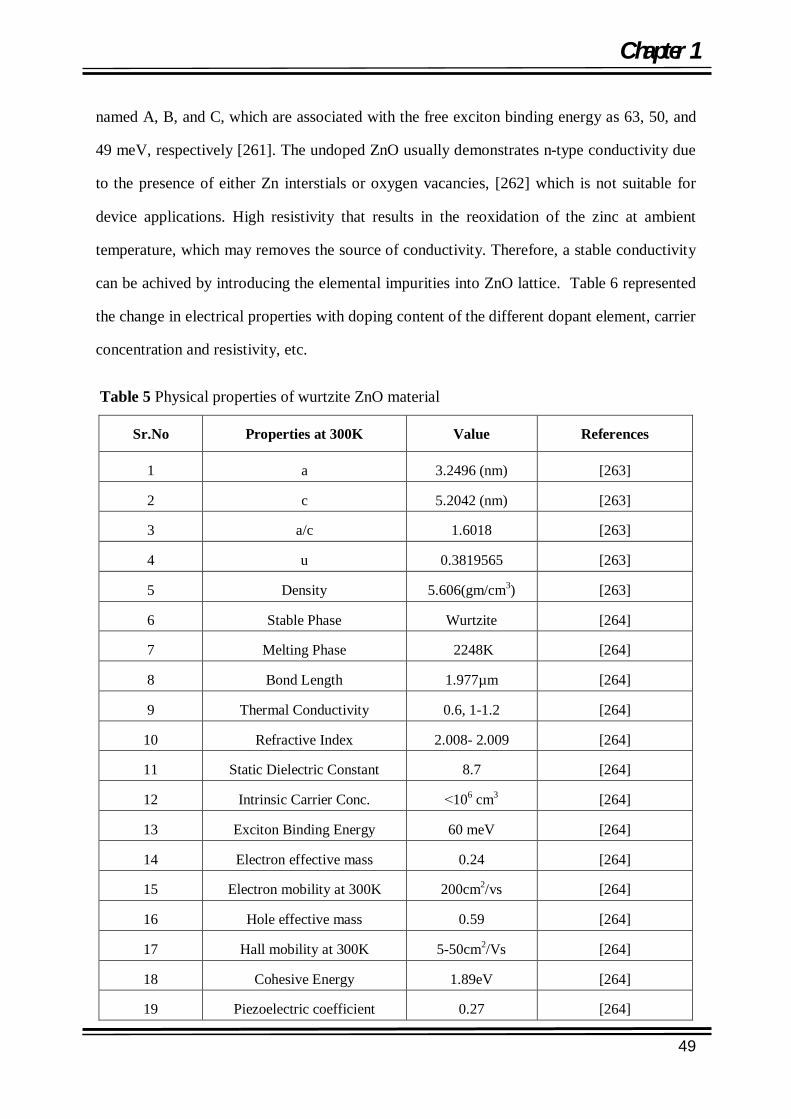
Chapter 1
49
named A, B, and C, which are associated with the free exciton binding energy as 63, 50, and
49 meV, respectively [261]. The undoped ZnO usually demonstrates n-type conductivity due
to the presence of either Zn interstials or oxygen vacancies, [262] which is not suitable for
device applications. High resistivity that results in the reoxidation of the zinc at ambient
temperature, which may removes the source of conductivity. Therefore, a stable conductivity
can be achived by introducing the elemental impurities into ZnO lattice. Table 6 represented
the change in electrical properties with doping content of the different dopant element, carrier
concentration and resistivity, etc.
Table 5 Physical properties of wurtzite ZnO material
Sr.No Properties at 300K Value References
1 a 3.2496 (nm) [263]
2 c 5.2042 (nm) [263]
3 a/c 1.6018 [263]
4 u 0.3819565 [263]
5 Density 5.606(gm/cm3) [263]
6 Stable Phase Wurtzite [264]
7 Melting Phase 2248K [264]
8 Bond Length 1.977µm [264]
9 Thermal Conductivity 0.6, 1-1.2 [264]
10 Refractive Index 2.008- 2.009 [264]
11 Static Dielectric Constant 8.7 [264]
12 Intrinsic Carrier Conc. ˂106 cm3 [264]
13 Exciton Binding Energy 60 meV [264]
14 Electron effective mass 0.24 [264]
15 Electron mobility at 300K 200cm2/vs [264]
16 Hole effective mass 0.59 [264]
17 Hall mobility at 300K 5-50cm2/Vs [264]
18 Cohesive Energy 1.89eV [264]
19 Piezoelectric coefficient 0.27 [264]

Chapter 1
50
Table 6 Effect of different dopants on electrical properties of ZnO nanomaterial
Doping Element
Doping Content (%)
Resistivity (10-4 cm)
Carrier Concentration (1020cm-3)
Al 1.6-3.2 1.3 15 Ga 1.7-6.1 1.2 14.5 B 4.6 2 5.4 Y 2.2 7.9 5.8 In 1.2 8.1 3.9 Sc 2.5 3.1 6.7 Si 8 4.8 8.8 Ge 1.6 7.4 8.8 Ti 2.0 5.6 6.2 Zr 5.4 5.2 5.5 Hf 4.1 5.5 3.5 F 0.5 4 5
Doping of III groups impurities (substitutes for zinc atoms) like B [265], Al [266], Ga [267],
In [268], Zr or VII group impurities (substitutes for oxygen atoms) like F, Cl, and I [269] to
the ZnO lattice, play an important role in enhancing the quality of the ZnO. The doping leads
to increase the carrier concentration and increase the concentration of the conducting electron
that leads to reduce the resistivity. However, the excess of doping may generate the scattering
centre by use of ionized impurity in ZnO lattice and leads to decrease the electron mobility.
As a result the amount of doping must be controlled. In the last two decades, transparent
conducting ZnO nanomaterial with resistivity’s of the order of 10-4Ω cm, were prepared by
impurity doping. The minimum resistivities and maximum carrier concentrations obtained for
the ZnO nanomaterial prepared with the optimal doping contents for various doping elements
were summarized in Table 6. [269] Actually, doping with group III elements have been
attempted by many researchers. But it is very difficult to obtain p-type doping for wide band
gap ZnO. It plays significant resistance for p-type doping. It appears that the most promising
dopants for p-type materials are the group I elements like Li [270, 271], Na, K [272] and for
Zinc sites they acting as shallow acceptors and group V elements like N [273, 274], P [275]
and As sites which acted as deep acceptors for oxygen sites. Literature review [276, 277]
shows that group I elements show better p-type dopants than group V elements. In case of
group I elements, they occupy Zinc interstials, due to their small atomic radius, rather than
substitution sites. They acted as donors instead of acceptors. ZnO is a piezoelectric material
which as a key characteristic for the on water splitting or hydrogen production. ZnO also is a
biocompatible, and it can be used in biomedical applications with or without further

Chapter 1
51
modifications. Finally, ZnO is an environmentally benign and chemically stable material so it
is favorable to practical applications.
1.12.1 Synthesis of ZnO
The variety of one- (1D), two- (2D), and three-dimensional (3D) nanometric structures of the
zinc oxide can be produced by using different synthesis techniques that to be used for the
applications in many fields of nanotechnology. One-dimensional structures are being made
up by the large number of groups including nanorods, [278-280] needles, [281] -helixes, -
springs and –rings, [282] ribbons, [283] –tubes, [284-286] –belts, [287] –wires, [288-290]
etc. 2D Zinc oxide can be obtained in the shape such as nanotriangles, nanoplate/nanosheet
and nanopellets [291, 292] Prominent examples of the 3D structures of the zinc oxide include
flower, dandelion, snowflakes, coniferous urchin-like, etc. [293-296] Above structures are
results of the synthesis method opted for the fabrication of the nanomaterial and reaction
conditions. Following are the most frequently used chemical methods for the nano zincoxide
synthesis.
1.12.1.1 Sol gel method The sol-gel method of the ZnO synthesis is subject to interest of researchers because of its
simplicity, low cost, reliability, repeatability and relatively mild conditions of synthesis.
Therefore, this method often used to modify the zinc oxide surface with selected organic
compounds, as shown in Figure 1.28 a.
1.12.1.2 Precipitation method
Controlled precipitation is a widely practiced method for obtaining zinc oxide as the product
with the reproducible properties. The method involves fast and spontaneous reduction of a
solution of zinc salt using a reducing agent (chemical/ green from part of the plant, fungi,
bacteria, etc) to limit the growth of particles with specified dimensions, followed by the
precipitation of a ZnO precursor from the solution. Afterwards this precursor undergoes the
thermal treatment, followed by milling to remove impurities. The limitation of this process is
difficulty in breaking down the agglomerates, because the calcined powders have a high level
of agglomeration of particles. The process of precipitation can be controlled by parameters
such as pH, temperature and time of precipitation. Typical process of the controlled
precipitation of the zinc oxide was carried out by Wang et al. [297] where, the nanometric

Chapter 1
52
zinc oxide was obtained by precipitation from aqueous solutions of NH4HCO3 and
ZnSO4·7H2O by the way of the following reactions (10) and (11).
10NH HCO + 5ZnSO · 7H O → 5(NH ) SO + Zn (CO ) (OH) + 8CO + 2H O...(10)
Zn (CO ) (OH) 5ZnO + 2CO + 3H O ..... (11)
1.12.1.3 Solvothermal / Hydrothermal method
The hydrothermal method is better than other chemical methods as it does not required the
organic solvents or additional processing of the product (grinding and calcination) or high
temperature (need temperature 100-300 °C), which makes it a simple and environmentally
friendly technique. The reduction of precursor takes place in an autoclave, under the gradual
heating of the substances at the temperature of 100-300 °C for several days, followed by
cooling. That leads to the formation of the nuclei and its growth with diverse shapes by
growth along different dimensions. The properties of the resulting crystals depending on the
composition of the starting mixture, the process temperature and pressure. The high degree of
crystallinity of the product, and the high purity of the material obtained, as shown in
Figure1.28 b.
1.12.1.4 Polyol method
This method is used for the production of well-controlled nanoparticles with higher
crystallinity using polyethylene glycol as the polyol. In this process, Polyvinylpyrrolide
(PVP) is also used as a stabilizer and shape-controlling reagent in the polyol synthesis
methods. The precursor is thoroughly mixed with liquid polyol and heated to the boiling
point of polyol. The used polyol acts as solvent, reducing agent, and stabilizer, thereby
controlling the growth of particles and also preventing the aggregation of the particles. In this
method, precursor compounds such as hydroxides, oxides, nitrates, sulfates, and acetates are
either dissolved or suspended in a polyol, and the reaction mixture is then heated to reflux. As
the temperature is increased, the reduction potential of the ethylene glycol increases, which
leads to nucleation. During the reaction, the soluble metal precursor in polyol forms an
intermediate compound and reduced to the metal nuclei, which will result in metal
nanoparticles. The particle size can be controlled by adding foreign nuclei for heterogeneous
nucleation and increasing temperature for thermal degradation of the polyol, as shown in
Figure1.28 c.

Chapter 1
53
1.12.1.5 Emulsion method
Microemulsions are thermodynamically stable, clear and isotropic mixtures of water, oil,
and surfactant. Quite often cosurfactant is also added in to the mixtures. The
aqueous phase may contain salt(s) and/or other ingredients, and the "oil" may actually be a
complex mixture of different hydrocarbons and olefins. In contrast to ordinary emulsions,
microemulsions form upon simple mixing of the components and do not require the
high shear conditions generally used in the formation of ordinary emulsions. The three basic
types of microemulsions are: direct (oil dispersed in water, o/w), reversed (water dispersed in
oil, w/o) and bicontinuous. In ternary systems, such as microemulsions, where two
immiscible phases (water and ‘oil’) are present with a surfactant,
the surfactant molecules may form a monolayer at the interface between the oil and water,
with the hydrophobic tails of the surfactant molecules dissolved in the oil phase and the
hydrophilic head groups in the aqueous phase, as shown in Figure1.28 d.
1.12.1.6 Green Synthesis method
The nature is a huge active bio-laboratory that comprising of bio-organisms like plants, algae,
fungi, yeast, etc. which are composed of the large number of phytochemicals. These naturally
occurring biomolecules have been identified as an active species for the formation of the
nanoparticles with in diverse shapes and sizes. The biogenic production is a better option due
to its ease of fabrication via green route with non-toxic and non-poisonous ingredients,
biocompatibility, mild reaction conditions, low cost, simplicity and eco-friendly nature of the
reaction, are the benefits associated with the biogenic synthesis. Therefore, this can be used
as an economic and valuable alternative for the large scale production of the metal
nanoparticles. The use of the bio waste materials are not only reduces the cost of synthesis
but also minimizes the need of using hazardous chemicals by practicing the greener, safe and
environmentally benign protocols for nanopartical fabrication. It also focuses on the
computational aspects of binding of biomolecules to nanoparticles and some other
applications of the biosynthesized nanoparticles in biomedical, catalysis and biosensors
fields. Large number of the biological materials/tools are adopted in this method , such as
fungi [298-300], bacteria [301-303], Bengal gram bean [304], yeasts [305], capsicum annuum
[306], quercetin [307], biomass of oat (Avena sativa) and wheat (Triticum aestivum) [308],
honey [309], plants' extract, etc. A wide range of metal NPs such as Au [310-314], Ag [315-
316], TiO2 [317], In2O3 [318], ZnO [319], CuO [320], etc, have been synthesized using

Chapter 1
54
herbal/ plant extracts. Several plants have been explored for the synthesis of metal NPs
including medicinal plants. [319] Use of plant extract and microbial cells in the synthesis of
metal NPs, was triggered by existence of the several organic group/compounds such as
carbonyl groups, terpenoids, phenolics, flavonones, amines, amides, proteins, pigments
alkaloids and other reducing agents of the plant extract, as shown in Figure 1.28e.
(a) (b) (c)
(d) (e) Figure 1.28 Schematic of the methods used for synthesis of ZnO (a) sol-gel method [321] (b)
hydrothermal method [322] (c) polyol method [323] (d) emulsion method [324] and (e) green
method with the formation of possible different morphologies.
1.12.2 Morphology of ZnO nanostructures
ZnO nanostructures have been attracting a great attention for their potential applications in
various fields. A diversity of the ZnO nanostructures has been reported. Traditional
morphologies, such as nanowires, [325-330] nanorods, [331-335] tetra pod nanorods, [336-
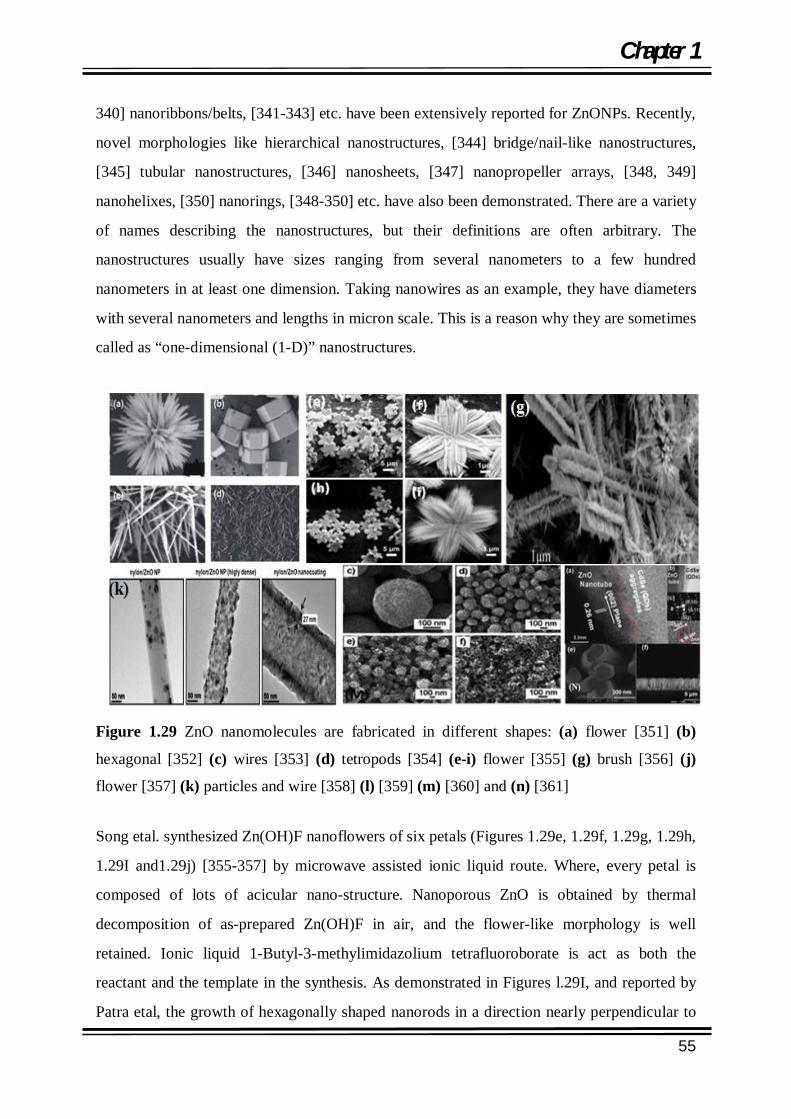
Chapter 1
55
340] nanoribbons/belts, [341-343] etc. have been extensively reported for ZnONPs. Recently,
novel morphologies like hierarchical nanostructures, [344] bridge/nail-like nanostructures,
[345] tubular nanostructures, [346] nanosheets, [347] nanopropeller arrays, [348, 349]
nanohelixes, [350] nanorings, [348-350] etc. have also been demonstrated. There are a variety
of names describing the nanostructures, but their definitions are often arbitrary. The
nanostructures usually have sizes ranging from several nanometers to a few hundred
nanometers in at least one dimension. Taking nanowires as an example, they have diameters
with several nanometers and lengths in micron scale. This is a reason why they are sometimes
called as “one-dimensional (1-D)” nanostructures.
Figure 1.29 ZnO nanomolecules are fabricated in different shapes: (a) flower [351] (b)
hexagonal [352] (c) wires [353] (d) tetropods [354] (e-i) flower [355] (g) brush [356] (j)
flower [357] (k) particles and wire [358] (l) [359] (m) [360] and (n) [361]
Song etal. synthesized Zn(OH)F nanoflowers of six petals (Figures 1.29e, 1.29f, 1.29g, 1.29h,
1.29I and1.29j) [355-357] by microwave assisted ionic liquid route. Where, every petal is
composed of lots of acicular nano-structure. Nanoporous ZnO is obtained by thermal
decomposition of as-prepared Zn(OH)F in air, and the flower-like morphology is well
retained. Ionic liquid 1-Butyl-3-methylimidazolium tetrafluoroborate is act as both the
reactant and the template in the synthesis. As demonstrated in Figures l.29I, and reported by
Patra etal, the growth of hexagonally shaped nanorods in a direction nearly perpendicular to

Chapter 1
56
the substrate surface with a tip size of ∼50 nm and aspect ratio around 10. Formation of the
Co (+2 and +3 oxidation states) doped hexagonal ZnO along the preferred c-axis. The doping
of Co (+2 and +3 oxidation states) ions in ZnO nanorods was confirmed by presence of the
absorption bands at 658, 617 and 566 nm in the UV-Vis spectra.
Figure 1.29m shows a schematic illustrating the hierarchical structure of the uniform
submicrometer ZnO aggregates with almost perfect spherical shape and smooth surface can
be seen in Figure 1.29m(c). Three other samples were prepared at slightly higher
temperatures, and their SEM images (Figure 1.29m) reveal deteriorating aggregation and
increasing surface roughness of the aggregates. All of the ZnO samples exhibit the hexagonal
Wurtzite structure with lattice constants a=0.32 nm and c=0.52 nm. In Figure 1.29 n Chouhan
etal. used the surfactant (CTAB)-controlled low cost fabrication of the ZnO NRs via reverse-
micelles synthesis (Figure 1.29 n). Current work is focused on the performance of the
nanomolecular photoelectrode of ZnO NRs by gradual surface modification for hydrogen
production efficiency.
1.13 Application of nano zinc oxide in water splitting
Although, the oxide photocatlysts were used to split water for solar hydrogen production. But
the most of powdered photocatalyst systems have wide band structures. Therefore they used
to show low efficiency for water splitting. As a photoelectrode material ZnO has a limitation
of a large band gap that prevents visible light absorption and show chemical in stability under
both anodic and cathodic bias. Kyoung Shin Choi’s group recently fabricated the cobalt
oxide-phosphate cocatalyst that can be photo deposited on to the ZnO nanorod arrays [362]
for improving the photocurrent onset potential by 0.23 V. Photodeposition was advantageous
over electrodeposition, as it deposits the co-catalyst at locations with high photohole
concentrations. Sun et al. also demonstrated the improved cathode photocurrents from the n-
type ZnO nanowire arrays on p-Si wafers. The increased photocurrent was attributed to
enhanced photocurrent carriers’ separation at the n-ZnO/p-Si interface and reduction in light
scattering from the nanorods surface. [363] Previously, Jin Zhang’s group had demonstrated
that non-sensitized nanoparticulate ZnO photoanodes supported photocurrents up to 175 mA
cm2 at 1.6 V (NHE) applied potential at pH = 7.4 and AM 1.5 illumination. [364]
A layered structure of In2O3(ZnO)m (m=3/9), crystallizes in a layered structure containing
sheets of the octahedral InO6 units alternating with the sheets of tetrahedral and trigonal-
Chapter 1
57
pyramidal ZnO4 units.[365] The band gaps for the material is 2.6 and 2.7 eV for m=3 and 9,
respectively. Under visible light irradiation, both materials evolve small quantities of H2/O2
from aqueous solutions of methanol / AgNO3 as electrolytes. [366]
Heterostructure (ZnO)1/(CdS)0.2 demonstrates the highest H2 evolution rate of 1805 mmol h-1
g-1 among diffrent ZnO/CdS heterostructures, (Figure 1.30a) which has 14- and 40- times
higher value than that of the pure CdS and ZnO photocatalysts, prepared by parallel synthesis
routes. H2 evolution from ZnO/CdS heterostructures gradually decreases with the increasing
CdS molar ratios though their absorption edges are further extended. This is the possibly due
to the decrease in oxidation reaction sites on the ZnO surface by post-deposited CdS. The
optimal loading content of Pt was found to be 1 wt%, which gives the highest H2 evolution
(3870 mmol h-1 g-1) rate and is twice that of the (ZnO)1/(CdS)0.2 alone. [367] It is known that
Pt particles loaded on photocatalysts can trap excited electrons and act as H2 evolution sites.
(Figure 1.30 b)
Co-catalyst Rh2-xCrxO3 loaded (Zn1+xGe)(N2Ox) was studied by Lee etal., which is a solid
solution between ZnO and ZnGeN2 and prepared by the reaction between GeO2 and ZnO
under a NH3 flow (20 mL min-1) at 1123 K. Samples nitrided for 5-15 h under these
conditions exhibit a single phase of wurtzitic (Zn1+xGe)(N2Ox), and are responsive to visible
light with a band gap of ca. 2.7-2.8 eV. Modification of the optimized (Zn1.44Ge)(N2.08O0.38)
sample by loading with Rh2-xCrxO3 (3.0 wt % Rh, 0.2 wt % Cr) results in an effective
photocatalyst for overall water decomposition with a quantum efficiency of ca. 0.20% at 420
nm. The material demonstrated the photocatalytic activity for overall water splitting under
both ultraviolet (UV) and visible irradiation after surface modification with co-catalyst RuO2.
5 wt% RuO2 afforded the stoichiometric decomposition of the water in to the H2 and O2 with
activities of 54.3µmol h-1 for H2 and 27.5µmol h-1 for O2 (Figure1.30 d). However, when the
solid solution was loaded with a cocatalyst Rh2-xCrxO3 the mixed oxide consisting of 3.0 wt %
Rh and 0.2 wt % Cr, the optimum activity of (Zn1.44Ge)(N2.08O0.38) that increased to
414.5µmol h-1 for H2 evolution and 202.3µmol h-1 for O2 evolution. [368]
CdTe quantum dots sensitized nanowire of ZnO in a stable photocatalytic device dipped in a
nonsacrificial electrolyte. The significant photocurrent and efficiency achieved here confirms
that this structure can facilitate the stability and provide the true efficiency for the overall

Chapter 1
58
water-splitting reaction in terms of the maximum photoconversion efficiency of 1.83 %
which is more than 200 % higher than that of pristine ZnO nanowires. [369]
Figure 1.30 (a) & (b) H2 evolution of the ZnO)1/(CdS)0.2 heterostructure with different
content of loaded Pt. Measurement conditions: 0.2 g sample, 300 mL aqueous solution
containing 0.1MNa2S and 0.1MNa2SO3,and light source: 300 W Xe lamp [367] (c) Schematic
of band structures in the Z-scheme mechanism in ZnO/CdS heterostructures. H2 evolution of
ZnO, (ZnO)x/(CdS)y heterostructures and CdS, where x and y denote, the molar ratios of Zn
and Cd precursors; (d) time courses of gas evolution for optimum (Zn1+xGe)(N2Ox) loaded
with (A) 5 wt % RuO2 and (B) Rh2-xCrxO3 (3.0 wt % Rh, 0.2 wt % Cr) under UV-visible light
(λ> 300 nm). Circles denote H2 evolution, squares denote O2 evolution, and triangles denote
N2 production and [368] (e) & (f) quantum dots of CdTe- doped ZnO for hydrogen
generation using water splitting. [369]
Meda etal. have recently been reported an active RuO2/GaN:ZnO system for overall water
splitting. The material Ga0.38N0.33Zn0.13O0.16 (Eg=2.38 eV) is a solid solution of GaN (Eg=3.4
eV)) and (ZnO Eg=3.2 eV) that crystallised in a Wurtzite structure type. And its band gap
depends upon the composition of the solid solution and it appeared to be due to a raised
valence band edge that resulted from p-d electron repulsion of Zn (3d) and N (2p) electrons.
The photocatalyst show the highest activity among the ZnO solid solutions that can use
visible light up to about 450nm. After modification with RuO2, Ga0.38N0.33Zn0.13O0.16 splits
water stoichiometrically into H2 and O2 at very reasonably good rates under UV and visible
light quantum yield (QE) 0.14% for 300-480 nm) light exposure. The good quantum yields of

Chapter 1
59
these photocatalyst systems are exhibited for water splitting under visible light irradiation.
[370-371] Cocatalyst RuO2 can be replaced with other (Rh, Ir, and Pt) materials, [372] out of
which a mixed Cr/Rh oxide is the most effective (QE=2.5%) coactalyst. [373-374]
As produced hydrogen can be used as an fuel for motor vehicles, lawn movers, cooking gas
for burners, hydrogen-warmed house, fuel cell and hydrogenation reaction or generating H2
atmosphere for chemical reactions and industrial uses for chemical synthesis, and so on. Few
of the applications are illustrated by the Figures 1.31 a, 1.31 b, 1.31 c and 1.31 d. [375]
(a (b (c (d
Figure 1.31 Application of hydrogen fuel as (a) fuel for car (b) fuel for hydrogen- burnner,
road cleaner and loan mover (c) house warming (500 W commercial PEM - fuel cell by
BFH-TI and CEKA AG typical applications) and (d) fuel cells. [375]
1.14 Scope of the Work
Day by day increasing price of conventional fuel, accompanied with the scarcity of the fuel
compound the situation moving towards the energy crisis. To release the as created- energy
pressure, green and abundant fuel is required and hydrogen might be the good fuel substitute.
If the hydrogen (fuel with maximum efficiency~75%) generated by breaking of water using
sunlight and photocatalyst, then it can assure to maintain the good health of our earth by
reduce of CO2 content. Moreover, the CO2 content & low degradation of the chemical
pollutant by using the same catalyst, adds on the metal nanoparticulated catalyst and their
derivates have been attracted a great deal of attention and gained numerous achievements in
the past years. This study has shown that at a definite point of their growth the particles
become catalytic active and the grown up particles are showing the more catalytic properties
than bulk metal. In order to fulfilling the growing demands of the versatile field, the reliable
synthesis are required that can generate well-defined nanoparticles (with respect to shape and
size) with a high degree of monodispersity. The synthesis of Ag and ZnO nanoparticles is
carried out with specific attention to their future use in hydrogen generation from water

Chapter 1
60
splitting and degradation of organic pollutants. This aim is being achieved through the green
route of synthesis of Ag nanoparticles using green reductants (plant extraction i.e. TA, Tea,
Fenugreek and Acacia) under the controlled synthesis conditions with respect to the time,
temperature, pH as well as concentration, etc. The aqueous reduction method is currently
selected for the synthesis of Ag nanoparticles because of its robust, cost effective, and
efficient yield. This enables to achieve the properties such as the size, shape, solubility and
surface functionality of the carefully tuned resulting nanoparticles. The diameter of the
relatively monodisperse Ag nanoparticles is controlled under the range of approximately 12-
40 nm by varying the nature concentration of reducing agent and time. Smaller nanoparticles
obtained for higher concentration of plant extract content, because in this case more small
nuclei can apparently become stabilized. This means that this method allows the formation of
Ag nanoparticles of variable size that are stable under ambient conditions that is something
typically and not achieved by simple chemical approaches. Such materials are being explored
for many different applications, especially in catalysis. The current research work represents
the development of innovative methodology of synthesis of the stable metal (Ag) and ZnO
nano composites in application of the water splitting for hydrogen production reactions as
well as organic pollutant (p-nitrophenol) degradation. Hydrogen production through water
splitting is of great importance both from the chemical point of view and its commitment of
the green fuel generation. The amounts of hydrogen production vary with the type of the
reducing agent used in synthesis, the concentration nanoparticle, and the size/shape of
nanocatalyst, etc. is investigated. Excelling catalytic activities of Ag and Ag-ZnO
nanoparticle-based catalytic systems and nanocomposite (Pt/CdS/Co-ZnO) system over the
bulk ZnO materials show a light on hydrogen production. Thus precise understanding of the
mechanism of the green synthesis and their uses in the field of aforesaid applications is
possible. The cost of synthesis and case of synthesis can make the use of the catalysts at
industrial scale generation of hydrogen and degradation of pollutant.
Chapter 1
61
1.15 REFERENCES
[1] B Johnston, MC Mayo, A. Khare “Hydrogen: the energy source for the 21st century” Technovation (2005), 25 (6): 569-585. [2] Michael Ball, Werner Weindorf, Ulrich Bünger, Chapter 10 in “The Hydrogen Economy: Opportunities and. Challenges”by Michael Ball and Martin Wietschel, published by Cambridge. University Press, 24 September (2009), ISBN 978-0521882163. [3] G.P. Dunn, A.T. Bruce, H. Ikeda, L.J. Old, D. Schreiber, “Cancer immunoediting: From immuno-surveillance to tumor escape” Nature Immunology (2002), 3991-998. [4] M. Momirlan, T. N. Veziroglu, “The properties of hydrogen as fuel tomorrow in sustainable energy system for a cleaner planet” International Journal of Hydrogen Energy (2005), 30: 795-802. [5] A. Patsoura, D. I. Kondarides, X. E. Verykios, “Photocat- alytic degradation of organic pollutants with simultaneous production of hydrogen” Catalysis Today (2007), vol. 124, no. 3-494-102. [6] A. Ortiz-Gomez, B. Serrano-Rosales, M. Salaices, H. de Lasa, “Photocatalytic Oxidation of Phenol: Reaction Network, Kinetic Modeling, and Parameter Estimation” Industrial & Engineering Chemistry Research (2007), 46 (23): 7394-7409. [7] H. I brahim, H. de Lasa, “Photo-catalytic conversion of air borne pollutants: Effect of catalyst type and catalyst loading in a novel photo-CREC-air unit” Applied Catalysis B: Environmental (2002), 38 (3): 201-213. [8] B. Serrano, H. de Lasa, “Photocatalytic Degradation of Water Organic Pollutants. Kinetic Modeling and Energy Efficiency” Industrial & Engineering Chemistry Research (1997), 36 (11): 4705-4711. [9] Escobedo Salas, Salvador, Benito Serrano Rosales, Hugo de Lasa “Quantum Yield with Platinum Modified TiO2 Photocatalyst for Hydrogen Production” Applied Catalysis B: Environmental 140-141 (August) (2013), 523-536. [10] B. Van Ruijven, J. F. Lamarque, D. P. van Vuuren, “Emission scenarios for a global hydrogen economy and the consequences for global air pollution” Glob. Environ.Chang. (2011), 21: 983-94. [11] H. Nezhad, “World Energy Scenarios to 2050: Issues and Options. Minnesota” MN: State University of Minneapolis (2009). [12] H. Nezhad, "Software Tools for Managing Project Risk: Management Concepts. Vienna, VA” Management Concepts (2007), 1037-55. [13] A. Midilli, M. Ay, I. Dincer, M.A. Rosen, “On hydrogen and hydrogen energy strategies I: Current status and needs” Renew. Sustain. Energy Rev. (2005), 9: 255-271.

Chapter 1
62
[14] G.L. Chiarello, M.H. Aguirre, E. Selli, “Hydrogen production by photocatalytic steam reforming of methanol on noble metal-modified TiO2” J. Catal. (2010), 273: 182-190. [15] K. Hou, R. Hughes, “The kinetics of methane steam reforming over a Ni/-Al2O catalyst” Chem. Eng. J. (2001), 82: 311-328. [16] Q. Xie, Y. Wang, B. Pan, H. Wang, W. Su, X. Wang, “A novel photocatalyst LaOF: Facile fabrication and photocatalytic hydrogen production” Catal. Commun. (2012), 27: 21-25. [17] J. Luo, J.H. Im, M.T. Mayer, M. Schreier, M.K. Nazeeruddin, N.G. Park, S.D. Tilley, H.J. Fan, M. Gratzel, “Water photolysis at 12.3% efficiency via perovskite photovoltaics and Earth-abundant catalysts” Science (2014), 345: 1593-1596. [18] N.L. Wu, M.S. Lee, “Enhanced TiO2 photocatalysis by Cu in hydrogen production from aqueous methanol solution” Int. J. Hydrog. Energy (2004), 29: 1601-1605. [19] A. Steinfeld, “Solar hydrogen production via a two-step water-splitting thermochemical cycle based on Zn/ZnO redox reactions” Int. J. Hydrog. Energy (2002), 27: 611-619. [20] N.S. Lewis, D.G. Nocera, “Powering the planet: Chemical challenges in solar energy utilization” Proc. Natl. Acad. Sci. USA (2006), 103: 15729-15735. [21] A. Kudo, “Photocatalysis and solar hydrogen production” Pure Appl. Chem. (2007), 79: 1917-1927. [22] Department of Energy. “Fuel Cell Technologies Office Multi-Year Research, Development, and Demonstration Plan” Available online: http://energy.gov/eere/fuelcells/downloads/fuel-cell-technologies-office-multi-yearresearch.
[23] Li W. X., “Photocatalysis of oxide semiconductors” J. Aust. Ceram Soc. (2013), 49: 41-6. [24] A. Kudo, Y. Miseki, “Heterogeneous photocatalyst materials for water splitting” Chem. Soc. Rev. (2009), 38: 253-278. [25] A.L. Linsebigler, J.T. Yates, Jr. G. Lu, “Photocatalysis on TiO2 Surfaces: Principles, Mechanisms, and Selected Results” Chem. Rev. (1995), 95: 735-758. [26] Z. Zou, J. Ye, K. Sayama, H. Arakawa, “Direct splitting of water under visible light irradiation with an oxide semiconductor photocatalyst” Nature (2001), 414: 625-627. [27] A. Fujishima, K. Honda, “Electrochemical photolysis of water at a semiconductor electrode” Nature (1972), 238: 37-38. [28] M. Halmann, M. Grätzel, “Energy Resources through Photochemistry and Catalysis” Academic Press: New York, NY, USA (1983). [29] N. Serpone, E. Pelizzetti, “Photocatalysis: Fundamentals and Applications” Wiley: New York, NY, USA (1989).

Chapter 1
63
[30] Y.V. Pleskov, Y.Y. Gurevich, “Semiconductor Photoelectrochemistry; Consultants Bureau” New York, NY, USA (1986). [31] A. Kudo, Y. Miseki, “Heterogeneous photocatalyst materials for water splitting” Chem. Soc. Rev. (2009), 38: 253-278. [32] A.L. Linsebigler, J.T. Yates, G. Lu, “Photocatalysis on TiO2 Surfaces: Principles, Mechanisms, and Selected Results” Chem. Rev. (1995), 95: 735-758. [33] Z. Zou, J. Ye, K. Sayama, H. Arakawa, “Direct splitting of water under visible light irradiation with an oxide semiconductor photocatalyst” Nature (2001), 414: 625-627. [34] K. Sivula, R. van de Krol, “Semiconducting materials for photoelectrochemical energy conversion” Nat. Rev. Mater. (2016), 70: 15010:1-15010:7.
[35] W. Zhou, W. Li, J.Q. Wang, Y. Qu, Y. Yang, Y. Xie, K. Zhang, L. Wang, H. Fu, D. Zhao, “Ordered Mesoporous Black TiO2 as Highly Efficient Hydrogen Evolution Photocatalyst” J. Am. Chem. Soc. (2014), 136: 9280-9283.
[36] A. Kay, I. Cesar, M. Gratzel, “New Benchmark for Water Photooxidation by Nanostructured Fe2O3 Films” J. Am. Chem. Soc. (2006), 128: 15714-15721. [37] J.Y. Kim, G. Magesh, D.H. Youn, J.W. Jang, J. Kubota, K. Domen, J.S. Lee, “Single-crystalline, wormlike hematite photoanodes for efficient solar water splitting” Sci. Rep.(2013), 3: 2681 1-2681:8. [38] V.E. Henrich, P.A. Cox, “The Surface Science of Metal Oxides” Cambridge University Press: Cambridge, UK (1996). [39] A. Walsh, Y. Yan, M.N. Huda, M.M. Al-Jassim, S.H. Wei, “Band Edge Electronic Structure of BiVO4: Elucidating the Role of the Bi s and V d Orbitals” Chem. Mater. (2009), 21: 547-551. [40] J.K. Cooper, S. Gul, F.M. Toma, L. Chen, P.A. Glans, J. Guo, J.W. Ager, J. Yano, I.D. Sharp, “Electronic Structure of Monoclinic BiVO4” Chem. Mater. (2014), 26: 5365-5373. [41] W. Lu, D. Yuan, J. Sculley, D. Zhao, R. Krishna, H.C. Zhou, “Sulfonate-grafted porous polymer networks for preferential CO2 adsorption at low pressure” J. Am. Chem. Soc. (2011), 133: 18126-18129. [42] A. Kudo, K. Ueda, H. Kato, I. Mikami, “Photocatalytic O2 evolution under visible light irradiation on BiVO4 in aqueous AgNO3 solution” Catal. Lett. (1998), 53: 229-230. [43] K. Sayama, A. Nomura, T. Arai, T. Sugita, R. Abe, M. Yanagida, T. Oi, Y. Iwasaki, Y. Abe, H. Sugihara, “Photoelectrochemical decomposition of water into H2 and O2 on porous BiVO4 thin-film electrodes under visible light and significant effect of Ag ion treatment” J. Phys. Chem. B (2006), 110: 11352-11360.

Chapter 1
64
[44] Y. Liang, T. Tsubota, L.P.A. Mooij, R. van de Krol, “Highly Improved Quantum Efficiencies for Thin Film BiVO4 Photoanodes” J. Phys. Chem. C (2011), 115: 17594-17598. [45] H. Ye, J. Lee, J.S. Jang, A.J. Bard, “Rapid Screening of BiVO4-Based Photocatalysts by Scanning Electrochemical Microscopy (SECM) and Studies of Their Photoelectrochemical Properties” J. Phys. Chem. C (2010), 114: 13322-13328.
[46] D.K. Zhong, S. Choi, D.R. Gamelin, “Near-Complete Suppression of Surface Recombination in Solar Photoelectrolysis by “Co-Pi” Catalyst-Modified W:BiVO4” J. Am. Chem. Soc.(2011), 133: 18370-18377. [47] J.E. Yourey, B.M. Bartlett, “Electrochemical deposition and photoelectrochemistry of CuWO4, a promising photoanode for water oxidation” J. Mater. Chem. (2011), 21: 7651-7660. [48] K.J. McDonald, K.S. Choi, “Synthesis and Photoelectrochemical Properties of Fe2O3/ZnFe2O4 Composite Photoanodes for Use in Solar Water Oxidation” Chem. Mater. (2011), 23: 4863-4869.
[49] S. Ida, K. Yamada, T. Matsunaga, H. Hagiwara, Y. Matsumoto, T. Ishihara, “Preparation of p-Type CaFe2O4 Photocathodes for Producing Hydrogen from Water” J. Am. Chem. Soc. (2010), 132: 17343-17345. [50] R. Patil, S. Kelkar, R. Naphade, S. Ogale, “Low temperature grown CuBi2O4 with flower morphology and its composite with CuO nanosheets for photoelectrochemical water splitting” J. Mater. Chem. A (2014), 2: 3661-3668. [51] U.A. Joshi, P.A. Maggard, “CuNb3O8 A p-Type Semiconducting Metal Oxide Photoelectrode” J. Phys. Chem. Lett. (2012), 3: 1577-1581. [52] P. Zhang, J. Zhang, J. Gong, “Tantalum-based semiconductors for solar water splitting” Chem. Soc. Rev. (2014), 43: 4395-4422. [53] M. Higashi, K. Domen, R. Abe, “Highly Stable Water Splitting on Oxynitride TaON Photoanode System under Visible Light Irradiation” J. Am. Chem. Soc. (2012), 134: 6968-6971. [54] J. Zhao, T. Minegishi, L. Zhang, M. Zhong, M. Gunawan, M. Nakabayashi, G. Ma, T. Hisatomi, M. Katayama, S. Ikeda, “Enhancement of Solar Hydrogen Evolution from Water by Surface Modification with CdS and TiO2 on Porous CuInS2 Photocathodes Prepared by an Electrodeposition-Sulfurization Method” Angew. Chem. Int. Ed. (2014), 53: 11808-11812. [55] L. Zhang, T. Minegishi, M. Nakabayashi, Y. Suzuki, K. Seki, N. Shibata, J. Kubota, K. Domen, “Durable hydrogen evolution from water driven by sunlight using (Ag, Cu)GaSe2 photocathodes modified with CdS and CuGa3Se5” Chem. Sci. (2015), 6: 894-901.

Chapter 1
65
[56] M. Moriya, T. Minegishi, H. Kumagai, M. Katayama, J. Kubota, K. Domen, “Stable Hydrogen Evolution from CdS-Modified CuGaSe2 Photoelectrode under Visible-Light Irradiation” J. Am. Chem. Soc. (2013), 135: 3733-3735. [57] B. Seger, A.B. Laursen, P.C.K. Vesborg, T. Pedersen, O. Hansen, S. Dahl, I. Chorkendorff, “Hydrogen Production Using a Molybdenum Sulfide Catalyst on a Titanium-Protected n+p-Silicon Photocathode” Angew. Chem. Int. Ed. (2012), 51: 9128-9131. [58] C. Liu, J. Sun, J. Tang, P. Yang, “Zn-Doped p-Type Gallium Phosphide Nanowire Photocathodes from a Surfactant-Free Solution Synthesis” Nano Lett. (2012), 12: 5407-5411. [59] J. Zhang, M. Zhang, R.Q. Sun, X. Wang, “A Facile Band Alignment of Polymeric Carbon Nitride Semiconductors to Construct Isotype Heterojunction” Angew. Chem. (2012), 124: 10292-10296. [60] S. Tanigawa, H. Irie, “Visible-light-sensitive two-step overall water-splitting based on band structure control of titanium dioxide” Appl. Catal. B Environ. (2016), 180: 1-5. [61] T.A. Kandiel, K. Takanabe, “Solvent-induced deposition of Cu-Ga-In-S nanocrystals onto a titanium dioxide surface for visible-light-driven photocatalytic hydrogen production” Appl. Catal. B Environ. (2016), 184: 264-269.
[62] Z. Zhu, J.Y. Chen, K.Y. Su, R.J. Wu, “Efficient hydrogen production by water-splitting over Pt-deposited C-HS-TiO2 hollow spheres under visible light” J. Taiwan Inst. Chem. Eng. (2016), 60: 222-228. [63] L. Li, J. Yan, T. Wang, Z.J. Zhao, J. Zhang, J. Gong, N. Guan, “Sub-10 nm rutile titanium dioxide nanoparticles for efficient visible-light-driven photocatalytic hydrogen production” Nat. Commun. (2015), 6: 5881. [64] Q. Wang, T. Hisatomi, S.S.K. Ma, Y. Li, K. Domen, “Core/shell structured La- and Rh-Codoped SrTiO3 as a hydrogen evolution photocatalyst in Z-scheme overall water splitting under visible light irradiation” Chem. Mater. (2014), 26: 4144-4150. [65] Y. Chen, S. Zhao, X. Wang, Q. Peng, R. Lin, Y. Wang, R. Shen, X. Cao, L. Zhang, G. Zhou, “Synergetic Integration of Cu1.94S-ZnxCd1-xS Heteronanorods for Enhanced Visible-light-driven Photocatalytic Hydrogen Production” J. Am. Chem. Soc. (2016), 138: 4286-4289. [66] D. Dontsova, C. Fettkenhauer, V. Papaefthimiou, J. Schmidt, M. Antonietti, “1,2,4-Triazole-Based Approach to Noble-Metal-Free Visible-Light Driven Water Splitting over Carbon Nitrides” Chem. Mater. (2015), 28: 772-778.
[67] H. Fujito, H. Kunioku, D. Kato, H. Suzuki, M. Higashi, H. Kageyama, R. Abe, “Layered Perovskite Oxychloride Bi4NbO8Cl: A Stable Visible Light Responsive Photocatalyst for Water Splitting” J. Am. Chem. Soc. (2016), 138: 2082-2085.

Chapter 1
66
[68] D. Jiang, Z. Sun, H. Jia, D. Lu, P. Du, “A cocatalyst-free CdS nanorod/ZnS nanoparticle composite for high-performance visible-light-driven hydrogen production from water” J. Mater. Chem. A Mater. Energy Sustain. (2016), 4: 675-683. [69] X. Yue, S. Yi, R. Wang, Z. Zhang, S. Qiu, “Cadmium Sulfide and Nickel Synergetic Co-catalysts Supported on Graphitic Carbon Nitride for Visible-Light-Driven Photocatalytic Hydrogen Evolution” Sci. Rep. (2016), 6: 22268:1-22268:9. [70] Q. Xiang, F. Cheng, D. Lang, “Hierarchical Layered WS2/Graphene-Modified CdS Nanorods for Efficient Photocatalytic Hydrogen Evolution” Chem Sus Chem (2016), 9: 996-1002. [71] A.K. Agegnehu, C.J. Pan, M.C. Tsai, J. Rick, W.N. Su, J.F. Lee, B. J. Hwang, “Visible light responsive noble metal-free nanocomposite of V-doped TiO2 nanorod with highly reduced graphene oxide for enhanced solar H2 production” Int. J. Hydrog. Energy (2016), 41: 6752-6762. [72] G. Zhang, Z.A. Lan, L. Lin, S. Lin, X. Wang, “Overall water splitting by Pt/g-C3N4 photocatalysts without using sacrificial agents” Chem. Sci. (2016), 7: 3062-3066.
[73] J. Zhang, X. Jin, P.I. Morales-Guzman, X. Yu, H. Liu, H. Zhang, L. Razzari, J.P. Claverie, “Engineering the Absorption and Field Enhancement Properties of Au-TiO2 Nanohybrids via Whispering Gallery Mode Resonances for Photocatalytic Water Splitting” ACS Nano (2016), 10: 4496-4503. [74] Q. Wang, T. Hisatomi, Q. Jia, H. Tokudome, M. Zhong, C. Wang, Z. Pan, T. Takata, M. Nakabayashi, N. Shibata, “Scalable water splitting on particulate photocatalyst sheets with a solar-to-hydrogen energy conversion efficiency exceeding” 1. Nat. Mater. (2016), 15: 611-615. [75] S.S. Gujral, A.N. Simonov, M. Higashi, X.Y. Fang, R. Abe, L. Spiccia, “Highly Dispersed Cobalt Oxide on TaON as Efficient Photoanodes for Long-Term Solar Water Splitting” ACS Catal. (2016), 6: 3404-3417. [76] Y.J. Yuan, D.Q. Chen, Y.W. Huang, Z.T. Yu, J.S. Zhong, T.T. Chen, W.G. Tu, Z.J. Guan, D.P. Cao, “MoS2 Nanosheet-Modified CuInS2 Photocatalyst for Visible-Light-Driven Hydrogen Production fromWater”. Chem Sus Chem (2016), 9: 1003-1009. [77] Z.L. Wu, C.H. Wang, B. Zhao, J. Dong, F. Lu, W.H. Wang, W.C. Wang, G.J. Wu, J.Z. Cui, P. A Cheng, “Semi-Conductive Copper-Organic Framework with Two Types of Photocatalytic Activity” Angew. Chem.-Int. Ed. (2016), 55: 4938-4942 [78] N.S. Lewis, “Light work with water” Nature (2001), 414: 589-590. [79] N Chouhan, RS Liu, J. Zhang, “Photochemical Water Splitting: Materials and Applications” CRC Press; (2017), Jan 27. [80] S. Ikeda, T. Itani, K. Nango, M. Matsumura, “Overall water splitting on tungsten-based photocatalysts with defect pyrochlore structure” Catal. Lett. (2004), 98: 229-233.

Chapter 1
67
[81] GP Smestad, A Steinfeld, “Photochemical and thermochemical production of solar fuels from H2O and CO2 using metal oxide catalysts” Ind Eng Chem Res (2012), 51: 11828-11840. [82] CNR Rao, SR Lingampalli, S Dey, A Roy, “Solar photochemical and thermochemical splitting of water” Philos Trans A Math Phys Eng Sci (2016), 374: 20150088. [83] CNR Rao, S Dey, “Generation of H2 and CO by solar thermochemical splitting of H2O and CO2 by employing metal oxides” J Solid State Chem (2016), 242: 107-115. [84] GE Eghi, “A decade of research on thermochemical hydrogen at the Joint Research Centre, Ispra” Int J Hydrogen Energy (1986), 11: 761-771. [85] S Yalccin, “A review of nuclear hydrogen production” Int J Hydrogen Energy (1989), 14: 551-561. [86] B Meredig, C Wolverton, “First-principles thermodynamic framework for the evaluation of thermochemical H2O- or CO2-splitting materials” Phys Rev B (2009), 80: 245119. [87] T Kodama, N Gokon “Thermochemical cycles for high-temperature solar hydrogen production” Chem Rev (2007), 107: 4048-4077. [88] https://www.energy.gov/eere/fuelcells/hydrogen-production-photobiological. [89] W.J. Ong, L.L. Tan, Y.H. Ng, S.T. Yong, S.P. Chai, “Graphitic Carbon Nitride (g-C3N4) Based Photocatalysts for Artificial Photosynthesis and Environmental Remediation” Chem. Rev. (2016), 116: 7159-7329. [90] W. Wunderlich, H. Ohta, K. Koumoto. “Enhanced effective mass in doped SrTiO3 and related perovskites” Physica B (2009), 404: 2202-212. [91] A. Walsh, Y. Yan, M.N. Huda, M.M. Al-Jassim, S. H. Wei, “Band Edge Electronic Structure of BiVO4: Elucidating the Role of the Bi s and V d Orbitals” Chem. Mater. (2009), 21: 547-551. [92] O. Madelung, “Semiconductors: Data Handbook; Springer Berlin Heidelberg: Berlin/Heidelberg” Germany (2004). [93] G. Schmitz, P. Gassmann, R. Franchy, “A combined scanning tunneling microscopy and electron energy loss spectroscopy study on the formation of thin, well-ordered Ga2O3 films on CoGa” (001). J. Appl. Phys. (1998), 83: 2533-2538. [94] T.V. Perevalov, A.V. Shaposhnikov, V.A. Gritsenko, H. Wong, J.H. Han, C.W. Kim, “Electronic structure of Al2O3 Ab initio simulations and comparison with experiment” JETP Lett. (2007), 85: 165-168.
[95] B. Kramm, A. Laufer, D. Reppin, A. Kronenberger, P. Hering, A. Polity, B. K. Meyer, “The band alignment of Cu2O/ZnO and Cu2O/GaN heterostructures” Appl. Phys. Lett. (2012), 100: 094102.

Chapter 1
68
[96] Akira Fujishima, Kenichi Honda, "Electrochemical Photolysis of Water at a Semiconductor Electrode" Nature. (1972), 238 (5358): 37-8. [97] Satoshi Tanigawa Hiroshi Irie, “Visible-light-sensitive two-step overall water-splitting based on band structure control of titanium dioxide” Applied Catalysis B: Environmental (2016), 1801-5. [98] Yanrui Li, Leilei Li, Yunqi Gong, Song Bai, Huanxin Ju, Chengming Wang, Qian Xu, Junfa Zhu, Jun Jiang, Yujie Xiong, “Towards full-spectrum photocatalysis: achieving Z scheme between Ag2S and TiO2 by engineering energy band alignment with interfacial Ag” Nano Research.(2015), 12274: 1-9. [99] Ying-Chih Pu, Gongming Wang, Kao-Der Chang, Yichuan Ling, Yin-Kai Lin, Bob C. Fitzmorris, Chia-Ming Liu, Xihong Lu, Yexiang Tong, Jin Z. Zhang, Yung-Jung Hsu, and Yat Li. “Au Nanostructure-Decorated TiO2 Nanowires Exhibiting Photoactivity Across Entire UV-visible Region for Photoelectrochemical Water Splitting” Nano Lett. (2013), 13: 3817-3823 [100] M. Mishra, D.M. Chun, “Fe2O3 as a photocatalytic material: A review” Appl. Catal. A Gen. (2015), 498: 126-141. [101] S. Haghighat, J.M. Dawlaty, “Continuous representation of the proton and electron kinetic parameters in the pH-potential space for water oxidation on hematite” J. Phys. Chem. C (2015), 119: 6619-6625. [102] S. Moniz, S.A. Shevlin, D. Martin, Z. Guo, J. Tang, “Visible-Light Driven Heterojunction Photocatalysts for Water Splitting, A Critical Review” Energy Environ. Sci. (2015), 8: 731-759. [103] V.J. Babu, S. Vempati, T. Uyar, S. Ramakrishna, “Review of one-dimensional and two-dimensional nanostructured materials for hydrogen generation” Phys. Chem. Chem. Phys. (2015), 17: 2960-2986. [104] M. Aya, Mohamed Seham A. Shaban Hussien A. El Sayed Nageh K. Allam “Morphology-photoactivity relationship: WO3 nanostructured films for solar hydrogen production” International Journal of Hydrogen Energy (2016), Volume 41 Issue 2866-872. [105] L. Liao, Q. Zhang, Z. Su, Z. Zhao, Y. Wang, Y. Li, X. Lu, D. Wei, G. Feng, Q. Yu, “Efficient solar water-splitting using a nanocrystalline CoO photocatalyst” Nat. Nanotechnol. (2014), 9: 69-73. [106] J. Jasieniak, M. Califano, S.E. Watkins, “Size-Dependent Valence and Conduction Band-Edge Energies of Semiconductor Nanocrystals” ACS Nano (2011), 5: 5888-5902. [107] X. Zhan, Z. Wang, F. Wang, Z. Cheng, K. Xu, Q. Wang, M. Safdar, J. He, “Efficient CoO nanowire array photocatalysts for H2 generation” Appl. Phys. Lett. (2014), 105: 153903:1-153903:5. [108] X. Lü, S. Ding, T. Lin, X. Mou, Z. Hong, F. Huang, “Ta2O5 nanowires: A novel synthetic method and their solar energy utilization” Dalton Trans. (2012), 41: 622-627.

Chapter 1
69
[109] C. Tao, L. Xu, J. Guan, “Well-dispersed mesoporous Ta2O5 submicrospheres: Enhanced photocatalytic activity by tuning heating rate at calcinations” Chem. Eng. J. (2013), 229: 371-377. [110] L. Mao, S. Zhu, J. Ma, D. Shi, Y. Chen, Z. Chen, C. Yin, Y. Li, D. Zhang, “Superior H2 production by hydrophilic ultrafine Ta2O5 engineered covalently on graphene” Nanotechnology (2014), 25: 215401:1-215401:9.
[111] G. Zhu, T. Lin, H. Cui, W. Zhao, H. Zhang, F. Huang, “Gray Ta2O5 Nanowires with Greatly Enhanced Photocatalytic Performance” ACS Appl. Mater. Interfaces (2016), 8: 122-127. [112] J. M. Herrmann, “Heterogeneous photocatalysis: State of the art and present applications” Top. Catal. (2005), 34: 49-65. [113] U. Schwertmann, R. Cornell, “The Iron Oxides. Structure, Properties, Reactions Occurrences and Uses” VCH:Weinheim, Germany (1996). [114] K.J. Kim, Y.R. Park, “Optical investigation of charge-transfer transitions in spinel Co3O4” Solid State Commun. (2003), 127: 25-28. [115] A. Walsh, G.W. Watson, “The origin of the stereochemically active Pb(II) lone pair: DFT calculations on PbO and PbS” J. Solid State Chem.(2005), 178: 1422-1428. [116] A. Walsh, G.W. Watson, “Electronic structures of rocksalt, litharge, and herzenbergite SnO by density functional theory” Phys. Rev. B (2004), 70: 235114:1-235114:7.
[117] J. Geurts, S. Rau, W. Richter, F.J. Schmitte, “SnO films and their oxidation to SnO2: Raman scattering, IR reflectivity and X-ray diffraction studies” Thin Solid Films (1984), 121: 217-225. [118] V. Dolocan, “Some electrical properties of Bi2O3 thin films” Phys. Status Solidi (1978), 45: K155-K157. [119] L. Kong, H. Chen, W. Hua, S. Zhang, J. Chen, “Mesoporous bismuth titanate with visible-light photocatalytic activity” Chem. Commun. (2008), 40: 4977-4979. [120] H. Kato, K. Asakura, A. Kudo, “Highly efficient water splitting into H2 and O2 over lanthanum-doped NaTaO3 photocatalysts with high crystallinity and surface nanostructure” J. Am. Chem. Soc. (2003), 125: 3082-3089. [121] Y. Hosogi, Y. Shimodaira, H. Kato, H. Kobayashi, A. Kudo, “Role of Sn2+ in the Band Structure of SnM2O6 and Sn2M2O7 (M = Nb and Ta) and Their Photocatalytic Properties” Chem. Mater. (2008), 20: 1299-1307. [122] T. Takata, Y. Furumi, K. Shinohara, A. Tanaka, M. Hara, J. N. Kondo, K. Domen, “Photocatalytic Decomposition of Water on Spontaneously Hydrated Layered Perovskites” Chem. Mater., (1997), 9 (5): 1063-64.
Chapter 1
70
[123] A. Kudo, H. Kato, S. Nakagawa, “Water Splitting into H2 and O2 on New Sr2M2O7 (M = Nb and Ta) Photocatalysts with Layered Perovskite Structures: Factors Affecting the Photocatalytic Activity” J. Phys. Chem. B (2000), 104: 571. [124] K. Sayama, A. Nomura, T. Arai, T. Sugita, R Abe, M. Yanagida, T. Oi, Y. Iwasaki, Y. Abe, H. Sugihara, “Photoelectrochemical decomposition of water into H2 and O2 on porous BiVO4 thin-film electrodes under visible light and significant effect of Ag ion treatment” J. Phys. Chem. B (2006), 110: 11352-11360. [125] H. Kisch, “Visible Light Induced Photoelectrochemical Properties of n-BiVO4 and n-BiVO4/p-Co3O4” J. Phys. Chem. C (2008), 112: 548-554. [126] K. Sayama, A. Nomura, Z. Zou, R. Abe, Y. Abe, H. Arakawa, “Photoelectrochemical decomposition of water on nanocrystalline BiVO4 film electrodes under visible light” Chem. Commun.(2003), 23: 2908-2909. [127] R. Asai, H. Nemoto, Q. Jia, K. Saito, A. Iwase, A. Kudo, “A visible light responsive rhodium and antimony-codoped SrTiO3 powdered photocatalyst loaded with an IrO2 cocatalyst for solar water splitting” Chem. Commun. (2014), 50: 2543-2546. [128] K. Furuhashi, Q. Jia, A. Kudo, H. Onishi, “Time-Resolved Infrared Absorption Study of SrTiO3 Photocatalysts Codoped with Rhodium and Antimony” J. Phys. Chem. C (2013), 117: 19101-19106. [129] H.W. Kang, S.N. Lim, D. Song, S. Bin Park, “Organic-inorganic composite of g-C3N4-SrTiO3:Rh photocatalyst for improved H2 evolution under visible light irradiation” Int. J. Hydrog. Energy (2012), 37: 11602-11610. [130] Hideki Kato, Kiyotaka Asakura, Akihiko Kudo, “Highly Efficient Water Splitting into H2 and O2 over Lanthanum-Doped NaTaO3 Photocatalysts with High Crystallinity and Surface Nanostructure” J. Am. Chem. Soc., (2003,) 125 (10): 3082-3089. [131] K. S. Novoselov, A. K. Geim, S. V. Morozov, “Electric field effect in atomically thin carbon films” Science (2004), 306: 666-669. [132] S. Stankovich, D. A. Dikin, G. H. B. Dommett, “Graphene based composite materials” Nature (2006), 442: 282-286. [133] A. H. Castro Neto, F. Guinea, N. M. R. Peres, K. S. Novoselov, A. K. Geim, “The electronic properties of graphene” Rev. Mod. Phys., (2009) Vol. 81, No. 1, January-March. [134] G. P. Kotchey, B. L. Allen, H. Vedala, “The enzymatic oxidation of graphene oxide” ACS Nano (2011), 5: 2098-108. [135] A. Bianco, “Graphene: Safe or toxic? The two faces of the medal” Angew. Chem. Int. Engl. (2013), 52: 4986-97. [136] R. R. Nair, P. Blake., A. N. Grigorenko, “Fine structure constant defines visual transparency of graphene” Science (2008), 320: 1308.

Chapter 1
71
[137] T. F. Yeh, S. J. Chen, C. S. Yeh, H. Teng, “Tuning the electronic structure of graphite oxide through ammonia treatment for photocatalytic generation of H2 and O2 from water splitting” J. Phys. Chem. C (2013), 117: 6516-24. [138] X. Huang, Z. Zeng, Z. Fan, J. Liu, H. Zhang, “Graphene-based electrodes” Adv. Mater.(2012), 24: 5979-6004. [139] S. Bae, H. Kim, Y. Lee, “Roll-to-roll production of 30-inch graphene films for transparent electrodes” Nat. Nanotechnol. (2010), 5: 574-78. [140] V. C. Tung, J. H. Huang, I. Tevis, “Surfactant-free water-processable photoconductive all-carbon composite” J. Am. Chem. Soc.(2011), 133: 4940-47. [141] N. J. Bell, Y. H. Ng, A. Du, H. Coster, S. C. Smith, R. Amal, “Understanding the enhancement in photoelectrochemical properties of photocatalytically prepared TiO2reduced graphene oxide composite” J. Phys. Chem. C (2011), 115: 6004-6009. [142] A. T. Garcia-Esparza, D. Cha, Y. Ou, J. Kubota, K. Domen, K. Takanabe, “Tungsten carbide nanoparticles as efficient cocatalysts for photocatalytic overall water splitting” Chem. Sus. Chem.(2013), 6 (1): 168-181. [143] T. Jayasekera, K. W. Kim, M. B. Nardelli, “Electronic and structural properties of turbostratic epitaxial graphene on the 6H-SiC (000-1) surface” Mater. Sci. Forum (2012), 717-720 595-600. [144] L Tian, J. Liu, C. Gong, L. Ye, L. Zan, “Fabrication of reduced graphene oxide-BiOCl hybrid material via a novel benzyl alcohol route and its enhanced photocatalytic activity” J. Nanopart. Res. (2013), 15: 1917. [145] J. Zhang, J. Yu, M. Jaroniec, J. R. Gong, “Noble metal-free reduced graphene oxide-Zn x Cd1- x S nanocomposite with enhanced solar photocatalytic H2-production performance” Nano Lett. (2012b), 12: 4584-89. [146] X. Geng, L. Niu, Z. Xing, “Aqueous-processable noncovalent chemically converted graphene-quantum dot composites for flexible and transparent optoelectronic films” Adv. Mater.(2010), 22: 638-42. [147] Z. Lu, C. X. Guo, H. B. Yang, “One-step aqueous synthesis of graphene -CdTe quantum dot-composed nanosheet and its enhanced photoresponses” J Colloid and Iter. Science (2011), 353 (2): 588-592. [148] Peng Gao, Jincheng Liu, Siewsiang Lee, Tong Zhang, Darren Delai Sun, “High quality graphene oxide-CdS-Pt nanocomposites for efficient photocatalytic hydrogen evolution” J. Mater. Chem., (2012), 22: 2292-2298 (Highest hydrogen evolution rate of 123 mL h−1 g−1) [149] Y. Hou, F. Zuo, A. Dagg, P. Feng. “Visible light-driven α-Fe2O3 nanorod/graphene/ BiV1 core/shell heterojunction array for efficient photoelectrochemical water splitting” Nano Lett. (2012b), 12 (12): 6464-73.

Chapter 1
72
[150] N. J. Bell, J. Phys. Chem., C (2011) 115: 6004-09.
[151] K. Maeda, T. Takata, M. Hara, N. Saito, Y. Inoue, H. Kobayashi, K. Domen, “GaN:ZnO solid solution as a photocatalyst for visible-light-driven overall water splitting” J. Am. Chem. Soc.(2005), 127: 8286-8287. [152] K. Maeda, K. Teramura, K. Domen, “Effect of post-calcination on photocatalytic activity of (Ga1-xZnx)(N1-xOx) solid solution for overall water splitting under visible light” J. Catal. (2008), 254: 198-204. [153] B. Siritanaratkul, K. Maeda, T. Hisatomi, K. Domen. “Synthesis and photocatalytic activity of perovskite niobium oxynitrides with wide visible-light absorption bands” Chem. Sus. Chem. (2011), 4: 74-8. [154] K. Maeda, M. Higashi, B. Siritanaratkul, R. Abe, K. Domen. “SrNbO2N as a water splitting photoanode with a wide visible-light absorption band” J. Am. Chem. Soc. (2011), 133: 12334-37. [155] M. Higashi, R. Abe, T. Takata, K. Domen, “Photocatalytic overall water splitting under visible light using A TaO 2N (A) Ca, Sr, Ba) and WO3 in a IO3−/I −shuttle redox mediated system” Chem. Mater. (2009), 21: 1543-49.
[156] K. Maeda, K. Domen, “Preparation of BaZrO3-BaTaO2N solid solutions and the photocatalytic activities for water reduction and oxidation under visible light” J. Catal. (2014), 310: 67-74. [157] C. L. Paven-Thivet, A. Ishikawa, A. Ziani, “Photoelectrochemical properties of crystalline perovskite lanthanum titanium oxynitride films under visible light” J. Phys.Chem. C (2009), 113: 6156-62. [158] A. Ishikawa, T. Takata, J. N. Kondo, M. Hara, H. Kobayashi, K. Domen, “Oxysulfide Sm2Ti2S2O5 as a stable photocatalyst for water oxidation and reduction under visible light irradiation (λ ≤ 650 nm)” J. Am. Chem. Soc. (2002), 124: 13547-53. [159] A.A. Ismail, D.W. Bahnemann, “Photochemical splitting of water for hydrogen production by photocatalysis: A review” Sol. Energy Mater. Sol. Cells (2014), 128: 85-101.
[160] H. Ahmad, S.K. Kamarudin, L.J. Minggu, M. Kassim, “Hydrogen from photo-catalytic water splitting process: A review. Renew” Sustain. Energy Rev. (2015), 43: 599-610. [161] I. Majeed, M.A.A. Nadeem, M. Al-Oufi, M.A.A. Nadeem, G.I.N. Waterhouse, A. Badshah, J.B. Metson, H. Idriss, “On the role of metal particle size and surface coverage for photo-catalytic hydrogen production: A case study of the Au/CdS system” Appl. Catal. B Environ. (2016), 182: 266-276. [162] M. Reza Gholipour, C.T. Dinh, F. Béland, T.O. Do, “Nanocomposite heterojunctions as sunlight-driven photocatalysts for hydrogen production from water splitting” Nanoscale (2015), 7: 8187-8208.
Chapter 1
73
[163] J. Cao, J.Z. Sun, J. Hong, H.Y. Li, H.Z. Chen, M. Wang, “Carbon Nanotube/CdS Core-Shell Nanowires Prepared by a Simple Room-Temperature Chemical Reduction Method” Adv. Mater. (2004), 16: 84-87. [164] Z.F. Huang, J. Song, K. Li, M. Tahir, Y.T. Wang, L. Pan, L. Wang, X. Zhang, J.J. Zou, “Hollow Cobalt-Based Bimetallic Sulfide Polyhedra for Efficient All-pH-Value Electrochemical and Photocatalytic Hydrogen Evolution” J. Am. Chem. Soc. (2016), 138: 1359-1365. [165] J. Ran, J. Zhang, J. Yu, M. Jaroniec, S.Z. Qiao, “Earth-abundant cocatalysts for semiconductor-based photocatalytic water splitting” Chem. Soc. Rev. (2014), 43: 7787-7812. [166] P. Reiss, M. Protière, L. Li, “Core/shell semiconductor nanocrystals” Small (2009), 5: 154-168. [167] J. Zhang, J. Yu, M. Jaroniec, J.R. Gong, “Noble Metal-Free Reduced Graphene Oxide-ZnxCd1–xS Nanocomposite with Enhanced Solar Photocatalytic H2-Production Performance” Nano Lett. (2012), 12: 4584-4589. [168] Li, Q.; Meng, H.; Zhou, P.; Zheng, Y.; Wang, J.; Yu, J.; Gong, J. “Zn1–xCdxS solid solutions with controlled bandgap and enhanced visible-light photocatalytic H2-production activity” ACS Catal. (2013), 3: 882-889. [169] Y.X. Pan, H.Q. Zhuang, J.D. Hong, Z. Fang, H. Liu, B. Liu, Y.Z. Huang, R. Xu, “Cadmium Sulfide Quantum Dots Supported on Gallium and Indium Oxide for Visible-Light-Driven Hydrogen Evolution fromWater” Chem Sus Chem (2014), 7: 2537-2544. [170] X. Wang, G. Liu, G.Q. Lu, H.M. Cheng, “Stable photocatalytic hydrogen evolution from water over ZnO-CdS core-shell nanorods” Int. J. Hydrog. Energy (2010), 35: 8199-8205. [171] J. Hou, Z. Wang, W. Kan, S. Jiao, H. Zhu, R.V. Kumar, “Efficient visible-light-driven photocatalytic hydrogen production using CdS@TaON core-shell composites coupled with graphene oxide nanosheets” J. Mater. Chem. (2012), 22: 7291-7299. [172] S. Bai, X. Shen, “Graphene-inorganic nanocomposites” RSC Adv. (2012), 2: 64-98.
[173] Z. Cheng, Z. Wang, T.A. Shifa, F. Wang, X. Zhan, K. Xu, Q. Liu, J. He, “Au plasmonics in a WS2-Au-CuInS2 photocatalyst for significantly enhanced hydrogen generation” Appl. Phys. Lett. (2015), 107: 223902:1-223902:5. [174] C. Zhen, L. Wang, G. Liu, G.Q.M. Lu, H.M. Cheng, “Template-free synthesis of Ta3N5 nanorod arrays for efficient photoelectrochemical water splitting” Chem. Commun. (2013), 49: 3019-3021.
[175] J. Seo, T. Takata, M. Nakabayashi, T. Hisatomi, N. Shibata, T. Minegishi, K. Domen, “Mg-Zr Cosubstituted Ta3N5 Photoanode for Lower-Onset-Potential Solar-Driven Photoelectrochemical Water Splitting” J. Am. Chem. Soc. (2015), 137: 12780-12783.

Chapter 1
74
[176] X. Wang, K. Maeda, A. Thomas, K. Takanabe, G. Xin, J.M. Carlsson, K. Domen, M. Antonietti, “A metal-free polymeric photocatalyst for hydrogen production from water under visible light” Nat. Mater. (2009), 8: 76-80. [177] G. Zhang, M. Zhang, X. Ye, X. Qiu, S. Lin, X. Wang, “Iodine modified carbon nitride semiconductors as visible light photocatalysts for hydrogen evolution” Adv. Mater. (2014), 26: 805-809. [178] Z. Ding, X. Chen, M. Antonietti, X. Wang, “Synthesis of transition metal-modified carbon nitride polymers for selective hydrocarbon oxidation” Chem Sus Chem (2011), 4: 274-281. [179] W. L. Barnes, A. Dereux, T. W. Ebbesen, “Surface plasmon subwavelength optics” Nature (2003), 424: 824-830. [180] K. Hashimoto, H. Irie, A. Fujishima, “TiO2 photocatalysis: A historical overview and future prospects” Jpn. J. Appl. Phys. (2005), 44: 8269. [181] A. Sheikh, A. Yengantiwar, M. Deo, S. Kelkar, S. C. Ogale, “Near-field plasmonic functionalization of light harvesting oxide–oxide heterojunctions for efficient solar photoelectrochemical water splitting: The AuNP/ZnFe2O4/ZnO system” Small (2013), 9 (12): 2091-96. [182] J Virkutyte, RS. Varma, “Fabrication and visible light photocatalytic activity of a novel Ag/TiO2−xNx nanocatalyst” New Journal of Chemistry (2010), 34 (6): 1094-1096.
[183] M Valenti, D Dolat, G Biskos, A Schmidt-Ott, WA. Smith, “Enhancement of the photoelectrochemical performance of CuWO4 thin films for solar water splitting by plasmonic nanoparticle functionalization” The Journal of Physical Chemistry C. (2015), 119 (4): 2096-2104. [184] HM Chen, CK Chen, CJ Chen, LC Cheng, PC Wu, BH Cheng, YZ Ho, ML Tseng, YY Hsu, TS Chan, JF. Lee, “Plasmon inducing effects for enhanced photoelectrochemical water splitting: X-ray absorption approach to electronic structures” ACS nano. (2012), 6 (8): 7362-7372. [185] M Haro, R Abargues, I Herraiz-Cardona, J Martínez-Pastor, S. Giménez, “Plasmonic versus catalytic effect of gold nanoparticles on mesoporous TiO2 electrodes for water splitting” Electrochimica Acta. (2014), 144: 64-70. [186] Akansha Mehta, Pooja D., Anupma Thakur, Soumen Basu, “Enhanced photocatalytic water splitting by gold carbon dot core shell nanocatalyst under visible/sunlight” New J. Chem., (2017), 41: 4573-4581. [187] C.G. Silva, J.L. Faria, “Photocatalytic oxidation of benzene derivatives in aqueous suspensions: Synergic effect induced by the introduction of carbon nanotubes in a TiO2 matrix” Appl. Catal. B Environ. (2010), 101: 81-89.

Chapter 1
75
[188] Z. Lou, B. Huang, Z. Wang, X. Ma, R. Zhang, X. Zhang, X. Qin, Y. Dai, M.H. Whangbo, “Ag6Si2O7: A Silicate Photocatalyst for the Visible Region” Chem. Mater. (2014), 26: 3873-3875. [189] H. Cheng, K. Fuku, Y. Kuwahara, K. Mori, H. Yamashita, “Harnessing single-active plasmonic nanostructures for enhanced photocatalysis under visible light” J. Mater. Chem. A (2015), 3: 5244-5258. [190] Z. Bian, T. Tachikawa, P. Zhang, M. Fujitsuka, T. Majima, “Au/TiO2 Superstructure-Based Plasmonic Photocatalysts Exhibiting Efficient Charge Separation and Unprecedented Activity” J. Am. Chem. Soc. (2013), 136: 458-465. [191] C. Clavero, “Plasmon-induced hot-electron generation at nanoparticle/metal-oxide interfaces for photovoltaic and photocatalytic devices” Nat. Photonics (2014), 8: 95-103.
[192] S. Mubeen, J. Lee, D. Liu, G.D. Stucky, M. Moskovits, “Panchromatic Photoproduction of H2 with Surface Plasmons” Nano Lett. (2015), 15: 2132-2136. [193] Moskovits, M. “The case for plasmon-derived hot carrier devices” Nat. Nanotechnol. (2015), 10: 6-8. [194] C. Liu, J. Tang, H.M. Chen, B. Liu, P. Yang, “A Fully Integrated Nanosystem of Semiconductor Nanowires for Direct SolarWater Splitting” Nano Lett. (2013), 13: 2989-2992. [195] S. Mubeen, J. Lee, N. Singh, S. Krämer, G.D. Stucky, M. Moskovits, “An autonomous photosynthetic device in which all charge carriers derive from surface plasmons” Nat. Nanotechnol. (2013), 8: 247-251. [196] G. Li, C. Cherqui, N.W. Bigelow, G. Duscher, P.J. Straney, J.E. Millstone, D.J. Masiello, J.P. Camden, “Spatially Mapping Energy Transfer from Single Plasmonic Particles to Semiconductor Substrates via STEM/EELS” Nano Lett. (2015), 15: 3465-3471. [197] R. Long, Z. Rao, K. Mao, Y. Li, C. Zhang, Q. Liu, C. Wang, Z.Y. Li, X. Wu, Y. Xiong, “Efficient Coupling of Solar Energy to Catalytic Hydrogenation by Using Well-Designed Palladium Nanostructures” Angew. Chem. (2015), 127: 2455-2460. [198] A. A. Krasnovskii, G. P. Brin, “Inorganic models of hills reaction” Dokl. Akad. Nauk. SSSR (1962), 147: 656-65. [199] K. Sayama, K. Masuka, R. Abe, Y. Abe, H. Arakawa, “Stiochiometric water splitting into H2 and O2 using a mixture of two different photocatalysts and an IO3−/I– shuttle redox mediator under visible light irradiation” Chem. Commun. (2001), 2416-17. [200] M. Tabata, K. Maeda, M. Higashi, “Modified Ta3N5 powder as a photocatalyst for O2 evolution in a two-step water splitting system with an iodate/iodide shuttle redox mediator under visible light” Langmuir (2010), 26 (12): 9161-65. [201] A. Kudo, Y. Miseki. “Heterogeneous photocatalyst materials for water splitting” Chem. Soc. Rev. (2009), 38: 253-78.

Chapter 1
76
[202] Y. Sasaki, H. Nemoto, K. Saito, A. Kudo. “Solar water splitting using powdered photocatalysts driven by Z-schematic interparticle electron transfer without an electron mediator” J. Phys. Chem. C (2009), 113: 17536-42. [203] H. Kato, M. Hori, R. Konta, Y. Shimodaira, A. Kudo. “Construction of Z-scheme type heterogeneous photocatalysis systems for water splitting into H2 and O2under visible light irradiation” Chem. Lett. (2004), 33: 1348-49. [204] D Ma, J Wu, M Gao, “Fabrication of Z-scheme g-C3N4/RGO/Bi2WO6 photocatalyst with enhanced visible-light photocatalytic activity” Chem Engineer J. (2016), 290: 136-146. [205] N Tian, H Huang, Y He, “Mediator-free direct Z-scheme photocatalytic system: BiVO4/g-C3N4 organic-norganic hybrid photocatalyst with highly efficient visible-light-induced photocatalytic activity” Dalton Trans. (2015), 44: 4297-4307. [206] H Katsumata, T Sakai, T Suzuki, “Highly efficient photocatalytic activity of g-C3N4/Ag3PO4 hybrid photocatalysts through Z-scheme photocatalytic mechanism under visible light” Ind Eng Chem Res. (2014), 53: 8018-8025. [207] H Katsumata, Y Tachi, T Suzuki, “Z-scheme photocatalytic hydrogen production over WO3/g-C3N4 composite photocatalyst” RSC Adv. (2014), 4: 21405-21409. [208] R. Kobayashi, S. Tanigawa, T. Takashima, B. Ohtani, H. Irie. “Silver-inserted heterojunction photocatalysts for Z-scheme overall pure-water splitting under visible-light irradiation” J. Phys. Chem. C (2014), 118 (39): 22450-456. [209] M. Gratzel “Photoelectrochemical cells” Nature. (2001), 414: 338-344. [210] R Abe, K Shinmei, K Hara, “Robust dyesensitized overall water splitting system with two-step photoexcitation of coumarin dyes and metal oxide semiconductors” Chem Commun. (2009), 3577-3579. [211] R Abe, K Shinmei, N Koumura, “Visiblelight-induced water splitting based on two-step photoexcitation between dye-sensitized layered niobate and tungsten oxide photocatalysts in the presence of a triiodide/iodide shuttle redox mediator” J Am Chem Soc. (2013), 135: 16872-16884. [212] D. E. Scaife, “Oxide semiconductors in photoelectrochemical conversion of solar energy” Sol. Energy (1980), 25: 41-54. [213] M. R. Hoffmann, S. T. Martin, W. Y. Choi, D. W. Bahnemann. “Environmental applications of semiconductor photocatalysis” Chem. Rev. (1995), 95: 69-96. [214] A. Hameed, M. A. Gondal, Z. H. Yamani. “Effect of transition metal doping on photocatalytic activity of WO3 for water splitting under laser illumination: Role of 3D-orbitals” Catalysis Commun. (2004), 5(11): 715-19.

Chapter 1
77
[215] S. Shen, C. X. Kronawitter, J. Jiang, P. Guo, L. Guo, S. S. Mao. “A ZnO/ZnO:Cr isostructural nanojunction electrode for photoelectrochemical water splitting” Nano Energy (2013), 2: 958-65. [216] R. Sasikala, A. R. Shirole, V. Sudarsan, “Enhanced photocatalytic activity of indium and nitrogen co-doped TiO2-Pd nanocomposites for hydrogen generation” Appl.Catal. A Gen. (2010), 377(1-2): 47-54. [217] X. Hou, S. Jiang, Y. Li, J. Xiao, Y. Li. “Ni-doped InN/GaZnON composite, catalyst for overall water splitting under visible light irradiation” Int. J. Hydrogen Energy 40 (45): 15448-53. [218] S. K. Pilli, T. E. Furtak, L. D. Brown, T. G. Deutsch, J. A. Turner, A. M. Herring. “Cobalt-phosphate (Co-Pi) catalyst modified Mo-doped BiVO4 photoelectrodes for solar water oxidation” Energy Environ. Sci. (2011), 4: 5028-34. [219] Y. S. Hu, A. K. Shwarsctein, G. D. Stucky, E. W. McFarland. “Improved photoelectrochemical performance of Ti-doped α-Fe2O3 thin films by surface modification with fluoride” Chem. Commun. (2009), (19): 2652-54. [220] G. M. Wang, H. Y. Wang, Y. C. Ling, “Hydrogen-treated TiO2 nanowire arrays for photoelectrochemical water splitting” Nano Lett. (2011a), 11: 3026-33. [221] Y. C. Ling, G. M. Wang, D. A. Wheeler, J. Z. Zhang, Y. Li. “Sn-doped hematite nanostructures for photoelectrochemical water splitting” Nano Lett. (2011), 11: 2119-25. [222] J. Frydrych, L. Machala, J. Tucek, “Facile fabrication of tin-doped hematite photoelectrodes: Effect of doping on magnetic properties and performance for light-induced water splitting” J. Mater. Chem. (2012), 22: 23232-39. [223] J. Xu, C. Hu, Y. Xi, B. Wan, C. Zhang, Y. Zhang. “Synthesis and visible light photocatalytic activity of β-AgVO3 nanowires” Solid State Sci. (2012a), 14: 535-39. [224] A. P. Singh, S. Kumari, R. Shrivastav, S. Dass, V. R. Satsangi. “Iron doped nanostructured TiO2 for photoelectrochemical generation of hydrogen. Int. J. Hydrogen Energy (2008), 33: 5363-68. [225] Dholam, R. N. Patel, M. Adami, A. Miotello. “Hydrogen production by photocatalytic water-splitting using Cr- or Fe-doped TiO2 composite thin films photocatalyst” Int.J. Hydrogen Energy (2009), 34: 5337-46. [226] S. Hoang, S. W. Guo, N. T. Hahn, A. J. Bard, C. B. Mullins., “Visible light driven photoelectrochemical water oxidation on nitrogen-modified TiO2 nanowires” Nano Lett.(2012b), 12: 26-32. [227] E. M. Rockafellow, L. K. Stewart, W. S. Jenks. “Is sulfur-doped TiO2 an effective visible light photocatalyst for remediation” Appl. Catal. B Environ. (2009), 91: 554-62.

Chapter 1
78
[228] Q. J. Xiang, J. G. Yu, M. Jaroniec. “Nitrogen and sulfur co-doped TiO2 nanosheets with exposed {001} facets: Synthesis, characterization and visible-light photocatalytic activity” Phys. Chem. Chem. Phys. (2011b), 13: 4853-61. [229] A. Kay, I. Cesar, M. Gratzel. “New benchmark for water photooxidation by nanostructured α-Fe2O3 films” J. Am. Chem. Soc. (2006), 128: 15714-21. [230] K. Sivula, F. Le Formal, M. Gratzel. “Solar water splitting: Progress using hematite (α Fe2O3) photoelectrodes” Chem. Sus. Chem. (2011), 4: 432-49. [231] N. Lu, X. Quan, J. Y. Li, S. Chen, H. T. Yu, G. H. Chen. “Fabrication of boron-doped TiO2 nanotube array electrode and investigation of its photoelectrochemical capability” J. Phys. Chem. C (2007), 111: 11836-42. [232] Y. Park, W. Kim, H. Park, T. Tachikawa, T. Majima, W. Choi. “Carbon-doped TiO2 photocatalyst synthesized without using an external carbon precursor and the visible light activity” Appl. Catal. B Environ. (2009), 91: 355-61. [233] W. Y. Choi, A. Termin, M. R. Hoffmann. “The role of metal ion dopants in quantum- sized TiO2: Correlation between photoreactivity and charge carrier recombination dynamics” J Phys Chem (1994), 84: 13669-79. [234] M. I. Litter, “Heterogeneous photocatalysis transition metal ions in photocatalytic systems” Appl. Catal. B Environ. (1999), 23: 89-114. [235] K. Wilke, H. D. Breuer. “The influence of transition metal doping on the physical and photocatalytic properties of titania” J. Photochem. Photobiol. A Chem. (1999), 121 (1): 49-53. [236] C. Zhang, Y. Z. Jia, Y. Jing, Y. Yao, J. Ma, J. Sun. “Effect of non-metal elements (B, C, N, F, P, S) mono-doping as anions on electronic structure of SrTiO3” Comput. Mater. Sci. (2013a), 79: 69-74. [237] Septia Nurkhalisa, Hanifatun Maghfiroh, Eko Budi Wibowo, Emas Agus Prastyo Wibowo; “A Concept: Improved Hydrogen Production using Pt-N-TiO2 under Visible Light via Photocatalysis Process” Chemistry Research Journal (2017), 2 (2): 90-95. [238] S. Tuzemen, Emre Gur, “Principal issues in producing new ultraviolet light emitters based on transparent semiconductor zinc oxide” Optical Materials (2007), 30: 292-310.
[239] N. Izyumskaya, V. Avrutin, Ü. Özgür, Y. I. Alivov, H. Morkoç “Preparation and properties of ZnO and devices” Phys. stat. sol. (2007), 244: 51439-1450. [240] Ü. Özgür, Ya. I. Alivov, C. Liu, A. Teke, M. A. Reshchikov, S. Dogan, V. Avrutin,S.J. Cho, H. Morkoçd, “A comprehensive review of ZnO materials and devices” Journal of applied physics (2005), 98: 041301-041404. [241] D. C. Look, “Recent advances in ZnO materials and devices” Mat. Sci. Eng. B. (2001), 80: 383-387.

Chapter 1
79
[242] H Furube, R Katoh, H Hara, “Ultrafast stepwise electron injection from photoexcited Ru-complex into nanocrystalline ZnO film via intermediates at the surface” J Phys Chem B.(2003), 107: 4162-4166. [243] R Huber, S Spörlein, JE Moser, “The role of surface states in the ultrafast photoinduced electron transfer from sensitizing dye molecules to semiconductor colloids” J Phys Chem B. (2000), 104: 8995-9003. [244] J Kallioinen, G Benkö, V Sundström. “Electron transfer from the singlet and triplet excited states of Ru(dcbpy)2 (NCS)2 into nanocrystalline TiO2 thin films” J Phys Chem B.(2002), 106: 4396-4404. [245] G Benkö, J Kallioinen, JEI Korppi-Tommola. Photoinduced ultrafast dye-to-semiconductor electron injection from nonthermalized and thermalized donor states. J Am Chem Soc. (2002), 124: 489-493 [246] Z. L. Wang, “Zinc oxide nanostructures: growth, properties and applications” J. Phys. Condense matter (2004), 303: R829 [247] E. Hendry, M. Koeberg, B. O Regan, M. Bonn, “Local field effects on electron transport in nanostructured TiO2 revealed by terahertz spectroscopy” Nano Lett., (2006), 6: 755 [248] H. H. Afifty, S. H. EL Hefnawi, A.Y. Eliwa, M. M. Abdel-Naby, N.M. Ahmed, Egypt. J. Solids (2005), Vol. (28) No. (2). [249] G. Epurescu, N. D. Scarisoreanu, D.G. Matei, G. Dinescu, C. Ghica, L. C. Nistor, M. Dinescu, “ Functional ZnO thin films obtained by radiofrequency beam assisted pulsed laser deposition” Romanian reports in Physics (2008),Vol. (60) No. (3): 807-814. [250] A. Maldonado, S. T. Guerra, J. M. Cázares, M. de. La L. Olvera, “Physical and Sensing Properties of ZnO:F:Al Thin Films Deposited by Sol-Gel” Thin Solid Films (2010), 518: 1815-1820. [251] S. Y. Lee, E. S.S him, H. S. Kang, S. S. Pang, J. S. Kang, “Fabrication of ZnO thin film diode using laser annealing” Thin Solid Films (2005), 473: 31. [252] M. H. Huang, S. Mao, H. Feick, H. Yan, Y. Wu, H. Kind, E. Weber, R. Russo, P. Yang, “Room-Temperature Ul- traviolet Nanowire Nanolasers” Science (2001), 292: 1897. [253] H. Liu, V. Avrutin, N. Izyumskaya, Ü.Özgür, H. Morkoç, “Transparent conducting oxides for electrode applications in light emitting and absorbing devices" Superlattices and Microstructures (2010), 48: 458-484. [254] S. Singh, D. Nakamura, K. Sakai, T. Okada, M. S. Ramachandra Rao, “Investigation of lowtemperature excitonic and defect emission from Ni-doped ZnO nanoneedles and V-doped ZnO nanostructured film" New J. of Phys. (2010), 12: 023007.

Chapter 1
80
[255] M. Caglar, S. Ilican, Y. Caglar, F. Yakuphanoglu, “The effects of Al doping on the optical constants of ZnO thin films prepared by spray pyrolysis method” J. Mater Sci: Mater Electron (2008), 19: 704-708. [256] R. Ferro, J .A. Rodriguez, P. Bertrand, “Mixed (ZnO)X(CdO)1−X policrystalline oxide films deposited by spray pyrolysis from metal nitrate solutions” J. of materials science letters (2002), 21: 1939-1941. [257] P. M. Ratheesh Kumar, K. P. Vijayakumar, C. Sudha Kartha, “On the origin of blue-green luminescence in spray pyrolysed ZnO thin films” J. Mater Sci (2007), 42: 2598-2602. [258] R. C. Pawar, J. S. Shaikh, N. L. Tarwal, M. M. Karanjkar , P. S. Patil, “Surfactant mediated growth of ZnO nanostructures and their dye sensitized solar cell properties” J. Mater Sci: Mater Electron (2012), 2: 349-355.
[259] A. D. A. Buba, J. S .A. Adelabu, “Optical and Electrical Properties of Chemically Deposited ZnO Thin Films” The Pacific Journal of Science and Technology (2010), 2: 429-434. [260] D. Ramırez , D. Silva , H. Gomez , G. Riveros , R.E. Marotti , E.A. Dalchiele, “Electrodeposition of ZnO thin films with molecular oxygen and hydrogen peroxide as oxygen precursors” Solar Energy Materials & Solar Cells (2007), 91: 1458-1461. [261] T.S. Kim, C. J. Youn, “Splitting of the valence band for polycristalline ZnO” J. of the Korean Physical Society (2001), Vol. 38 No.1: 42-46. [262] S. J. Henley, M.N.R. Ashfold, D. Cherns, “The growth of transparent conducting ZnO films by pulsed laser ablation” Surface and Coatings Technology (2004), volumes 177-178, pages 271-276. [263] Ü. Özgür, Ya. I. Alivov, C. Liu, A. Teke, M. A. Reshchikov, S. Doğan, V.Avrutin, S. J. Cho, H. Morkoç “A comprehensive review of ZnO materials and devices” J. of Applied Physics (2005), 98: 041301. [264] C. Kilngshirn, “ZnO: From basics towards applications” Phys. Stat. Sol. (b) (2007), No. 9: 3027-3073. [265] M. L. Addonizio, C. Diletto, “Doping influence on intrinsic stress and carrier mobility of LP-MOCVD-deposited ZnO: B thin films” Solar Ener. Materi. & Solar Cells (2008), 92: 1488-1494. [266] A. Aiaddine, I. Rachidi, F. Bahsoun, Y. Mohanna, O. Bazzi, F. El Hai Hassan, J. of Applied Sciences (2009), 9 (8): 1588-1592. [267] T. Minami, T. Miyata, Y. Honma, T. Ito, “Effect of spatial relationship between arc plasma and substrate on the properties of transparent conducting Ga-doped ZnO thin films prepared by vacuum arc plasma evaporation” Thin Solid Films (2009), 517: 6824-6828. [268] S. Ilicana, Y. Caglar, M. Caglar, F. “Low-dimensional Systems and Nanostructures” Yakuphanoglu Physica E35 (2006), 131-138.

Chapter 1
81
[269] T. Minami, “New n-Type Transparent Conducting Oxides” MRS Bulletin (2000), 25: 38-44. [270] E. M. El-Maghraby, “Temperature dependence of growth orientation and surface morphology of Li-doped ZnO thin films on SiO2/Si substrates” Cryst. Res. Technol. (2008), 43, No. 9: 970-974. [271] B. Xiao, Z. Ye, Y. Zhang, Y. Zeng, L. Zhu, B. Zhao, “Fabrication of p-type Li-doped ZnO films by pulsed laser deposition” Applied Surface Science (2006), 253: 895-897. [272] W. Jun, Y. Yintang, “Deposition of K-doped p type ZnO thin films on (0001) Al2O3 substrates” Materials Letters (2008), 62: 1899-1901. [273] X. D. Zhang, C. L. Liu, Z. Wang, Y. Y. Lu, L. J. Yin, “Photoluminescence and electrical properties of N-implanted ZnO films” Nuclear Instruments and Methods in Physics Research B (2007), 254: 83-86. [274] Y. Zhang, J. Lu, L. Chen, Z. Ye, “Properties of N-doped ZnO thin films in annealing process” Solid State Communications (2007), 143: 562-565. [275] D. S. Kim, llert, A. Lotnyka, R. Scholza, E. Pippel, S. Senza, H. Kalt, U. G. Oselea, M. Zachariasa, “Growth and optical properties of phosphorus-doped ZnO nanowires” Solid State Communications (2007), 143: 570-573. [276] A.N. Banerjee, K. K. Chattopadhyay, “Recent Developments in the Emerging Field of Crystalline 'p-Type' Transparent Conducting Oxide Thin Films” Progress in Crystal Growth and Characterization of Materials (2005), 50: 52-105. [277] Y. Yan, S. B. Zhang, “Control of doping by impurity chemical potentials: predictions for p-type Zno” Physical Review Letters (2001), Volume 86 Number 25 5723-5726. [278] D. Banerjee, J.Y. Lao, D.Z. Wang, J.Y. Huang, Z.F. Ren, D. Steeves, B. Kimball, M. Sennett, “Large-quantity free-standing ZnO nanowires” Appl. Phys. Lett. (2003), 83: 2061-2063. [279] Y.B. Hahn, “Zinc oxide nanostructures and their applications” Korean J. Chem. Eng. (2011), 28: 1797-1813. [280] T. Frade, Melo, M.E. Jorge, A. Gomes, “One-dimensional ZnO nanostructured films: Effect of oxide nanoparticles” Mater. Lett. (2012), 82: 13-15. [281] R. Wahab, S.G. Ansari, Y.S. Kim, H.K. Seo, H.S. Shin, “Room temperature synthesis of needle-shaped ZnO nanorods via sonochemical method” Appl. Surf. Sci. (2007), 253: 7622-7626. [282] X. Kong, Y. Ding, R. Yang, Z.L. Wang, “Single-crystal nanorings formed by epitaxial self-coiling of polar-nanobelts” Science (2004), 303: 1348-1351. [283] Z.W. Pan, Z.R. Dai, Z.L. Wang, “Nanobelts of semiconducting oxides” Science (2001), 291: 1947-1949.

Chapter 1
82
[284] J.J. Wu, S.C. Liu, C.T. Wu, K.H. Chen, L.C. Chenm, “Heterostructures of ZnO-Zn coaxial nanocables and ZnO nanotubes” Appl. Phys. Lett. (2002), 81: 1312-1314. [285] W.J Chen, W.L. Liu, S.H. Hsieh, T.K. Tsai, “Preparation of nanosized ZnO using α brass” Appl. Surf. Sci. (2007), 253: 6749-6753. [286] J. Liu, X. Huang, J. Duan, H. Ai, P. Tu, “A low-temperature synthesis of multiwhisker-based zinc oxide micron crystals” Mater. Lett. (2005), 59: 3710-3714. [287] Y. Huang, J. He, Y. Zhang, Y. Dai, Y. Gu, S. Wang, C. Zhou, “Morphology, structures and properties of ZnO nanobelts fabricated by Zn-powder evaporation without catalyst at lower temperature” J. Mater. Sci. (2006), 41: 3057-3062. [288] B. Nikoobakht, X. Wang, A. Herzing, J. Shi, “Scable synthesis and device integration of self-registered one-dimensional zinc oxide nanostructures and related materials” Chem. Soc. Rev. (2013), 42: 342-365. [289] L.C. Tien, S.J. Pearton, D.P. Norton, F. Ren, “Synthesis and microstructure of vertically aligned ZnO nanowires grown by high-pressure-assisted pulsed-laser deposition” J. Mater. Sci. (2008), 43: 6925-6932. [290] J. Cui, Zinc oxide naniwires. and combs (Xu, T.; Ji, P.; He, M.; Li,) J. “Growth and structure of pure ZnO micro/nanocombs” J. Nanomater. Mater. Charact. (2012), 64: 43-52. [291] W.S. Chiua, P.S. Khiew, M. Clokea, D. Isaa, T.K. Tana, R.S. Abd-Shukorb, M.A. Abd-Hamid, N.M. Huangc, H.N. Limd, “Photocatalytic study of two-dimensional ZnO nanopellets in the decomposition of methylene blue” Chem. Eng. J. (2010), 158: 345-352. [292] M. Jose-Yacaman, C. Gutierrez-Wing, M. Miki, D.Q. Yang, K.N. Piyakis, E. Sacher, “Surface diffusion and coalescence of mobile metal nanoparticles” J. Phys. Chem. B (2005), 109: 9703-9711. [293] V. Polshettiwar, B. Baruwati, R.S. Varma, “Self-asssembly of metal oxides into three-dimensional nanostructures: Synthesis and application in catalysis” ACS Nano (2009), 3: 728-736. [294] Q. Xie, Z. Dai, J. Liang, L. Xu, W. Yu, Y. Qian, “Synthesis of ZnO three-dimensional architectures and their optical properties” Solid State Commun. (2005), 136: 304-307. [295] J. Liu, X. Huang, Y. Li, K.M. Sulieman, F. Sun, X. He, “Selective growth and properties of zinc oxide nanostructures” Scr. Mater. (2006), 55: 795-798. [296] M. Bitenc,; Z.C. Orel, “Synthesis and characterization of crystalline hexagonal bipods of zinc oxide” Mater. Res. Bull. (2009), 44: 381-387. [297] Y. Wang, C. Zhang, S. Bi, G. Luo, “Preparation of ZnO nanoparticles using the direct precipitation method in a membrane dispersion micro-structured reactor” Powder Technol. (2010), 202: 130-136.
Chapter 1
83
[298] N. Duran, P.D. Marcato, O.L. Alves, G.I.H. De Souza, E. Esposito, “Mechanistic aspects of biosynthesis of silver nanoparticles by several Fusarium oxysporum strains” J. Nanobiotechnol. (2005) 3: 1. [299] D.S. Balaji, S. Basavaraja, R. Deshpande, D.B. Mahesh, B.K. Prabhakar, A. Venkataraman, “Extracellular biosynthesis of functionalized silver nanoparticles by strains of Cladosporium cladosporioides fungus” Colloids Surf. B (2009), 68: 88-92. [300] A. Ahmad, P. Mukherjee, D. Mandal, S. Senapati, M.I. Khan, R. Kumar, M. Sastry, “Enzyme mediated extracellular synthesis of CdS nanoparticles by the fungus, Fusarium oxysporum” J. Am. Chem. Soc. (2002), 124: 12108. [301] A. Ahmad, S. Senapati, M.I. Khan, R. Kumar, M. Sastry, “A novel extracellular synthesis of monodisperse gold nanoparticles using marine alga, Sragassium, wightii, greville” Langmuir (2003), 19: 3550. [302] A. Ahmad, S. Senapati, M.I. Khan, R. Ramani, V. Srinivas, M. Sastry, “Intracellular synthesis of gold nanoparticles by a novel alkalo tolerant actinomycete, Rhodococcus species” Nanotechnology (2003), 14: 824. [303] H. Lee, A.M. Purdon, V. Chu, R.M. Westervelt, “Controlled assembly of magnetic nanoparticles from magnetotactic bacteria using micro electromagnets arrays” Nano Lett. (2004), 4: 995-998. [304] V. Armendariz, J.L. Gardea-Torresdey, M. Jose-Yacaman, J. Gonzalez, I. Herrera, J.G. Parsons, “Gold nanoparticles formation by oat and wheat biomasses” Proceedings– Waste Research Technology Conference at the Kansas City, Mariott-Country Club Plaza July 30-Aug 1, (2002). [305] M. Kowshik, S. Ashtaputre, S. Kharrazi, W. Vogel, J. Urban, S.K. Kulkarni, K.M. Paknikar, “Extracellular synthesis of silver nanoparticles by a silver-tolerant yeast strain MKY3” Nanotechnology (2003), 14 (1): 95. [306] K. Ghule, A.V. Ghule, J.Y. Liu, Y.C.J. Ling, “Microscale size triangular gold prisms synthesized using Bengal Gram beans (Cicer arietinum L.) extract and HAuCl4·3H2O: A green biogenic approach” Nanosci. Nanotechnol. (2006), 6: 3746-3751. [307] S. Li, Y. Shen, A. Xie, X.Yu, L. Qiu, L. Zhang, Q. Zhang, “Green synthesis of silver nanoparticles using. Capsicum annum L. extract” Green Chem. (2007), 9: 852-858. [308] J.L. Gardea-Torresdey, J.G. Parsons, E. Gomez, J. Peralta-Videa, H.E. Troiani, P. Santiago, M. Yacaman, “Formation and growth of Au nanoparticles inside live alfalfa plants” J. Nano Lett. (2002), 2: 397-401. [309] I.B. Obot, S.A. Umoren, A.S.J. Johnson, Mater. Environ. Sci. (2013), 4 (6): 1013-1019. [310] E.M. Egorova, A.A. Revina, Physicochem. “Synthesis of metallic nanoparticles in reverse micelles in the presence of quercetin” Eng. Asp. (2000), 168: 87-96.

Chapter 1
84
[311] Huang, Q. Li, D. Sun, Y. Lu, X. Yang, H. Wang, Y. Wang, W. Shao, N. He, J. Hong, C. Chen, “Biosynthesis of Silver and Gold Nanoparticles by Novel Sundried Cinnamomum camphora Leaf” Nanotechnology (2007), 8: 105104. [312] B. Ankamwar, C. Damle, A. Ahmad, M. Sastry, “Biosynthesis of gold and silver nanoparticles using Emblica officinalis fruit extract, their phase transfer and transmetallation in an organic solution,” J. Nanosci. Nanotechnol. (2005), 51665-1671. [313] S.P. Chandran, M. Chaudhary, R. Pasricha, A. Ahmad, M. Sastry, “Synthesis of gold nanotriangles and silver nanoparticles using Aloe vera plant extract” Biotechnol. Prog. (2006), 22: 577-583. [314] S.S. Shankar, A. Rai, A. Ahmad, M. Sastry, “Rapid synthesis of Au, Ag, and bimetallic Au core Ag shell nanoparticles using Neem (Azadirachta indica) leaf broth” J. Colloid Interf. Sci. (2004), 275: 496-502. [315] R.P. Singh, S. Magesh, C. Rakkiyappan, “ Formation of fenugreek (Trigonella foenum-graecum) extract mediated Ag nanoparticles: mechanism and applications” Int. J. Bioeng. Sci. Technol. (2011), 02 (03): 75-80. [316] K. Govindaraju, S. Tamilselvan, V. Kiruthiga, G. Singaravelu, “Biogenic silver nanoparticles by Solanum torvum and their promising antimicrobial activity” J. Biopestic. (2010), (1): 3394-399. [317] M. Sundarajan, S. Gowri, “Green synthesis of titanium dioxide nanoparticles by Nyctanthes arbour-tristis leaves extract“ Chalcogenide Lett. (2011), 8 (8): 447-451. [318] S. Maensiri, P. Laokul, J. Klinkaewnarong, S. Phokha, V. Promarak, S. Seraphin, J. Optoelectron. “Indium oxide (In2O3) nanoparticles using Aloe vera plant extract: synthesis and optical properties optoelectron” Adv. Mater. (2008), 10 (3): 161-165. [319] H.M. Gong, L. Zhou, X.R.Su, S. Xiao, S.D. Liu, Q.Q.Wang, “Illuminating dark plasmons of silver nanoantenna rings to enhance exciton–plasmon interactions” Adv.Funct. Mater. (2009), 19: 298-303. [320] N.P.S. Acharyulu, R.S. Dubey, V. Swaminadham, P. Kollu, S.V.N. Pammi, “Green synthesis of Cuo nanoparticles using Phyllanthus amarus leaf extract and their antibacterial activity against multidrug resistance bacteria” Int. J. Eng. Res. Technol. (2014), 3 (4): 639-641. [321] L. Znaidi, “Sol-gel-deposited ZnO thin films: A review. Mater” Sci. Eng. (2010), 174: 18-30. [322] Ruri Agung Wahyuono, Christa Schmidt, Andrea Dellith, Jan Dellith, Martin Schulz, Martin Seyring, Markus Rettenmayr, Jonathan Plentz, Benjamin Dietzek “ZnO nanoflowers-based photoanodes: Aqueous chemical synthesis, microstructure and optical properties” Open Chem., (2016), 14: 158-169.

Chapter 1
85
[323] Nabraj Bhattarai, Subarna Khanal, J. Jesus Velazquez-Salazar, Miguel Jose-Yacaman chapter 3 “Advanced Electron Microscopy in the Study of Multimetallic Nanoparticles” Springer International Publishing Switzerland (2015), 59-91. [324] Maria Luisa Bondì, Roberto Di Gesù, “Emanuela Fabiola Craparo Chapter twelve Lipid Nanoparticles for Drug Targeting to the Brain” Methods in Enzymology (2012), 508: 229-251. [325] Q. Wan, Q. H. Li, Y. J. Chen, T. H. Wang, X. L. He, J. P. Li, C. L. Lin, “Fabrication and ethanol sensing characteristics of ZnO nanowire gas sensors” Appl. Phys. Lett. (2004) 84: 3654-3656. [326] S. Y. Li, P. Lin, C. Y. Lee, T. Y. Tseng, “Field emission and photofiuorescent characteristics of zinc oxide nanostructure synthesized by a metal catalyzed vapor-liquid-solid process” J. Appl. Phys. (2004), 95: 3711-3716. [327] M. H. Huang, Y. Wu, H. Feick, N. Tran, E. Weber, P. Yang, “Catalytic growth of zinc oxide nanowires by vapor transport” Adv. Mater. (2001), 13: 113-116. [328] B. D. Yao, Y. F. Chan, N. Wang, “Formation of ZnO nanostructures by a simple way of thermal evaporation” Appl. Phys. Lett. (2002), 81: 757-759. [329] L. E. Greene, M. Law, J. Goldberger, F. Kim, J. C. Johnson, Y. Zhang, R. J. Saykally, P. Yang, “Low-Temperature Wafer-Scale Production of ZnO Nanowire Arrays” Augew. Chem. Int. Ed. (2003), 42: 3031-3034. [330] C. Liu, J. A. Zapien, Y. Yao, X. Meng, C. S. Lee, S. Fan, Y. Lifshitz, S. T. Lee, “High-density, ordered ultraviolet light-emitting ZnO nanowire arrays” Adv. Mater. (2003), 15: 838-841. [331] B. Liu, H. C. Zeng, “Hydrothermal synthesis of ZnO nanorods in the diameter regime of 50 nm” J. Am. Chem. Soc. (2003), 125: 4430-4431. [332] M. Guo, P. Diao, S. Cai, “Hydrothermal Growth of Well-Aligned ZnO Nanorod Arrays: Dependence of Morphology and Alignment Ordering upon Preparing Conditions” J. Solid State Chemistry (2005), 178: 1864-1873. [333] W. I. Park, Y. H. Jun, S. W. Jung, G. C. Yi, “Excitonic emissions observed in ZnO single crystal nanorods” Appl. Phys. Lett. (2003), 82: 964-966. [334] A. B. Hartanto, X. Ning, Y. Nakata, T. Okada, “Growth mechanism of ZnO nanorods from nanoparticles formed in a laser ablation plume” Appl. Phys. A (2003), 78: 299-301. [335] W. D. Yu, X. M. Li, X. D. Gao, “Using an elastomeric phase mask for sub-100nm photolithography in the optical near field” Appl. Phys. Lett. (2004), 84: 2658-2660. [336] Y. Dai, Y. Zhang, Q. K. Li, and C. W. Nan, “Synthesis and optical properties of tetrapod-like zinc oxide nanorods” Chem. Phys. Lett. (2002), 358: 83-86. [337] Y. Dai, Y. Zhang, Z. L. Wang, “The octa-twin tetraleg ZnO nanostructures” Solid State Commun. (2003), 126: 629-633.

Chapter 1
86
[338] V. A. L. Roy, A. B. Djurišić, W. K. Chan, J. Gao, H. F. Lui, C. Surya, “Luminescent and structural properties of ZnO nanorods prepared under different conditions.” Appl. Phys. Lett. (2003), 83: 141-143. [339] J. M. Szarko, J. K. Song, C. W. Blackledge, I. Swart, S. R. Leone, S. Li, Y. Zhao, “ Optical injection probing of single ZnO tetrapod lasers” Chem. Phys. Lett. (2005), 404: 171-176. [340] H. Yan, R. He, J. Pham, P. Yang, “Morphogenesis of One-Dimensional ZnO Nano- and Microcrystals” Adv. Mater. (2003), 15: 402-405. [341] Z. W. Pan, Z. R. Dai, Z. L. Wang, "Nanobelts of semiconducting oxides" Science (2001), 291: 1947-1949. [342] H. Yan, J. Johnson, M. Law, R. He, K. Knutsen, J. R. McKinney, J. Pham, R. Saykally, P. Yang, “ZnO. Nanoribbon Microcavity Lasers” Adv. Mater. (2003), 15: 1907-1911. [343] Y. B. Li, Y. Bando, T. Sato, K. Kurashima, “ZnO nanobelts grown on Si substrate” Appl. Phys. Lett. (2002), 81: 144-146. [344] J. Y. Lao, J. G. Wen, Z. F. Ren, “Hierarchical ZnO Nanostructures” Nano Lett. (2002), 2: 1287-1291. [345] J. Y. Lao, J. Y. Huang, D. Z. Wang, Z. F. Ren, “ZnO nanobridges and nanonails” Nano Lett. (2003), 3: 235-238. [346] Y. J. Xing, Z. H. Xi, X. D. Zhang, J. H. Song, R. M. Wang, J. Xu, Z. Q. Xue, D. P. Yu, “Nanotubular structures of Zinc Oxide” Solid State Commun. (2004), 129: 671-675. [347] J.H. Park, H.J. Choi, Y.J. Choi, S.H. Sohn, J.G. Park, “Ultrawide ZnO nanosheets” J. Mater. Chem. (2004), 1435-36. [348] Z. L. Wang, X. Y. Kong, Y. Ding, P. Gao, W. L. Hughes, R. Yang, Y. Zhang, “Semiconducting and piezoelectric oxide nanostructures induced by polar surfaces” Adv. Funct. Mater. (2004), 14943-956. [349] P. X. Gao, Z. L. Wang, “Quantifying oxygen diffusion in ZnO nanobelt” Appl. Phys. Lett. (2004), 84: 2883-2885. [350] X. Y. Kong, Z. L. Wang, "Spontaneous polarization-induced nanohelixes, nanosprings, and nanorings of piezoelectric nanobelts” Nano Lett. (2003), 31625-1631. [351] V. Polshettiwar, B. Baruwati, R.S. Varma, “Self-asssembly of metal oxides into three-dimensional nanostructures: Synthesis and application in catalysis” ACS Nano (2009), 3: 728-736. [352] W.J. Chen, W.L. Liu, S.H. Hsieh, T.K. Tsai, “Preparation of nanosized ZnO using α brass” Appl. Surf. Sci. (2007), 253: 6749-6753.

Chapter 1
87
[353] J. Cui, “Zinc oxide nanowires” Mater Charact. (2012), 64: 43-52. [354] M. Bitenc, Z.C. Orel, “Synthesis and characterization of crystalline hexagonal bipods of zinc oxide” Mater. Res. Bull. (2009), 44: 381-38. [355] JK Song, MB Zheng, ZJ Yang, HQ Chen, HY Wang, JS Liu, GB Ji, HQ Zhang, JM. Cao “Synthesis of Novel Flower-Like Zn(OH)F via a Microwave-Assisted Ionic Liquid Route and Transformation into Nanoporous ZnO by Heat Treatment” Nanoscale Res Lett (2009), 4 (12): 1512. [356] Zhang Yuan, Xu Jiaqiang, Xiang Qun, Li Hui, Pan Qingyi, Xu Pengcheng, “Brush-Like Hierarchical ZnO Nanostructures: Synthesis, Photoluminescence and Gas Sensor Properties” J. Phys. Chem. C (2009), 113: 3430-3435. [357] Salavati-Niasari Masoud, Mi Noshin, Davar Fatemeh, “ZnO nanotriangles: Synthesis, characterization and optical properties” Journal of Alloys and Compounds (2009), 476: 908-912. [358] F. Kayaci, C. Ozgit-Akgun, N. Biyikli, T. Uyar "Surface-Decorated ZnO Nanoparticles and ZnO Nanocoating on Electrospun Polymeric Nanofibers by Atomic Layer Deposition for Flexible Photocatalytic Nanofibrous Membranes" RSC Advances (2013), 3 (19): 6817-6820. [359] M.K. Patra, K. Manzoor, M. Manoth, S.R. Vadera, N. Kumar “Studies on structural and magnetic properties of Co-doped pyramidal ZnO nanorods synthesized by solution growth technique” J. Phys. Chem. Solids (2009), 70: 659-664. [360] D. Jezequel, J. Guenot, N. Jouini, F. Fievet, “Submicrometer zinc oxide particles: Elaboration in polyol medium and morphological characteristics” J. Mater. Res., (1995), 10 77. [361] N. Chouhan, L. Yeh, S. F. Hu, R. S. Liu, W. S. Chang, K. H. Chen. “CdSe(QDs)@ ZnO Nanotubes as an Effective Photoanode” Chem. Comm, (2011), 47: 3493-3495. [362] E. M. P. Steinmiller, K. S. Choi, “Photochemical deposition of cobalt-based oxygen evolving catalyst on a semiconductor photoanode for solar oxygen production” Proc. Natl. Acad. Sci. U. S. A., (2009), 106: 20633-20636. [363] K. Sun, K. Madsen, P. Andersen, W. N. Bao, Z. L. Sun, D. L. Wang, “Metal on metal oxide nanowire Co-catalyzed Si photocathode for solar water splitting” Nanotechnology (2012), 23: 194013. [364] A. Wolcott, W. A. Smith, T. R. Kuykendall, Y. P. Zhao, J. Z. Zhang, “Photoelectrochemical study of nanostructured ZnO thin films for hydrogen generation from water splitting” Adv. Funct. Mater. (2009), 19: 1849-1856. [365] N. Kimizuka, M. Isobe, Nakamura, “Syntheses and singlecrystal data of homologous compounds, In2O3 (ZnO)m (m = 3, 4, and 5), InGaO3 (ZnO)3 , and Ga2 O3 (ZnO)m (m = 7, 8, 9, and 16) in the In2O3 -ZnGa2 O4-ZnO system” M. J. Solid State Chem.(1995), 116 (1): 170-178.

Chapter 1
88
[366] A. Kudo, Mikami, “New In2O3 (ZnO)m pholocatalysts with laminai structure for visible light-induced H2 or O2 evolution from aqueous solutions containing sacrificial reagents” I. Chem. Lett. (1998), 10: 1027-1028. [367] Xuewen Wang, Gang Liu, Zhi-Gang Chen, Feng Li, Lianzhou Wang, Gao Qing Lu and Hui-Ming Cheng, “Enhanced photocatalytic hydrogen evolution by prolonging the lifetime of carriers in ZnO/CdS heterostructures” Chem. Commun., (2009), 3452-3454. [368] Yungi Lee, Kentaro Teramura, Michikazu Hara and Kazunari Domen. “Modification of (Zn1+xGe)(N2Ox) Solid Solution as a Visible Light Driven Photocatalyst for Overall Water Splitting” Chem. Mater. (2007), 19: 2120-2127. [369] HM Chen, CK Chen, YC Chang, CW Tsai, RS Liu, SF Hu, WS Chang, KH Chen, “Quantum dot monolayer sensitized ZnO nanowire‐array photoelectrodes: true efficiency for water splitting” Angewandte Chemie. (2010), Aug 9 122(34): 6102-5. [370] K. Maeda, K. Teramura, T. Takata, M. Hara, N. Saito, K. Toda, Y. Inoue, H. Kobayashi, Domen, “GaN:ZnO Solid Solution as a Photocatalyst for Visible-Light-Driven Overall Water Splitting” J. Am. Chem. Soc. (2005), 127 (23): 8286-8287. [371] K. Maeda, K. Teramura, T. Takata, M. Hara, N. Saito, K. Toda, Y. Inoue, H. Kobayashi, Domen, “GaN:ZnO solid solution as a photocatalyst for visible-light-driven overall water splitting” K. J. Phys. Chem. B (2005), 109 (43): 20504-20510. [372] K. Maeda, K. Teramura, D. L. Lu, T. Takata, N. Saito, Y. Inoue, Domen, “Noble-metal/Cr2O3 core/shell nanoparticles as a cocatalyst for photocatalytic overall water splitting” K. Angew. Chem., Int. Ed. (2006), 45 (46): 7806-7809. [373] K. Maeda, K. Teramura, D. L. Lu, T. Takata, N. Saito, Y. Inoue, Domen, “Characterization of Rh-Cr mixed-oxide nanoparticles dispersed on (Ga1-xZnx)(N1-xOx) as a cocatalyst for visible-light-driven overall water splitting” K. J. Phys. Chem. B (2006), 110 (28): 13753-13758. [374] K. Maeda, K. Teramura, D. L. Lu, T. Takata, N. Saito, Y. Inoue, Domen, “Photocatalyst releasing hydrogen from water” K. Nature (2006), 440 (7082): 295-295. [375] K. Yvon Lawn Mower, “Hydrogen-powered lawn mower: 14 years of operation” Int. J. Hydrogen. Energy (2006), 31.

Chapter 2
89
Chapter 2
Instrumentation
Chapter 2
90
ABSTRACT The present chapter deals with the some of the important experimental techniques that used to
conduct experiments for characterisation of the samples. In this chapter, we deals with the details
(that includes the basic theories along with their principle and application part) of the various
characterization techniques, which were used to characterized the as-synthesized nanocatalyst or
molecular device.
Key Words: XRD, FESEM, HRTEM, EDS, FTIR, UV-Visible, PL, Cyclic Voltammetry and
Water Splitting.

Chapter 2
91
2.1 Instrumental techniques
This part discussed the basic theories and application of the advanced analytical analysis tools to
characterise the samples that used in this study. The instrumental details of the analytical tools
such as :x-ray diffraction (XRD), UV-VIS spectrophotometer, ATR (Attenuated total reflection)
and Fourier Transmission Infrared (FTIR) spectroscopy, Field emission scanning electron
microscopy (FE-SEM), transmission electron microscopy (TEM), Cyclic Voltammetry (CV), X-
ray Absorption spectroscopy (XAS) and X-ray photoelectron spectroscopy (XPS) etc, were
adopted to study the optical properties, crystallinity, functional groups, shape, size, sample purity
and binding energy in the presence of nanocatalysts, chemical environment at bulk and surface.
2.1.1 Electron Microscopy (EM)
Electron microscopy is extremely versatile technique for providing morphological information
over a wide range of resolution from 10 μm to 2Å. Particularly in the range where the specimen is
so small (<1μm) that optical microscopes are not able to image it anymore. Electron microscopes
operate in either transmission (TEM) or scanning (SEM) mode.
2.1.1.1 Transmission Electron Microscopy (TEM)
Transmission Electron Microscopy (TEM) is one of the most important tools used in
nanotechnology for imaging nanomaterial with sub-nanometer resolution (High resolution TEM).
In this technique, a thin specimen is imaged by an electron beam, which is irradiated through the
sample at uniform current density. The typical acceleration voltage in an operational TEM is 80-
200 KV. The electrons are emitted from a thermionic (tungsten or lanthanum hexaboride filament)
or field emission (tungsten filament) electron guns. The set of the condenser lenses and
illumination slit can control the area of specimen to be illuminated, as shown in Figure 2.1.
The function of the objective lens is the diffraction image formation by the sample. Electron
diffraction images are used to identify the surface morphology of the material. To investigate the
particle size distribution and crystalline nature of the metal nanoparticles. For this particular study
the diffraction image mode is used to monitor the samples,. The electron intensity distribution of
the specimen will be investigated with the help of the magnified three or four stage lens system
and fluorescent screen. [1] The images of the samples are captured on a photographic plate or
CCD camera. A full detailed description about the TEM can be found elsewhere [2] The analysing

Chapter 2
92
capacity of TEM has been significantly enhanced by introduction of the several advanced
techniques into the main instrument.
Figure 2.1 Setkch diagram of a Transmission Electron Microscope that to be used in the imaging
and diffraction modes. [3]
TEM column alignment, applied voltage, angle/plane of incident light, magnification unit and
several other factors are used to control / acquire good quality high resolution-TEM (HRTEM)
images of the samples. TEM column alignment is needed to be carried out instrument alignment
using electron gun and condenser lens alignment unit, plus astigmatic correction unit for
condenser lenses and objective lens. Optimum focus is a crucial requirement of the HRTEM
atomic image of a crystalline sample. TEM instrument of the Model- JEOL-2010F TEM, located

Chapter 2
93
at Material Research Center (MRC) MNIT, Jaipur (Raj.), was used for the study. It has a
operating voltage range from 20 to 200kV. TEM samples were prepared by taking small quantities
of nanoparticles in alcohol was separated by centrifugation and gone through ultra sonication and
the well dispersed suspensions were made. 3-4 Drops of the well dispersed solid samples in
alcohol on a 300-mesh, were mounted on carbon-coated Cu grid (EM sciences) and after careful
evaporation of the liquid in air, Cu grid with sample will be placed at sample holder for collecting
the information regarding particle size, shape and determination of the size distribution of the as-
synthesised nanoparticles. Electron diffraction patterns and EDX profile obtained from a field
emission TEM were used to study the composition and morphology of the studied nanoparticles.
2.1.1.2 Scanning Electron Microscopy (SEM)
The Scanning electron microscope (SEM) is a representative electron microscope that is capable
for producing high resolution images of a sample surface. This method was developed to
overcome the limitations of optical microscopy to provide increased magnification and resolution.
This is far superior to the optical systems. SEM is powerful tool for examining and interpreting
microstructure of materials, and is widely used in the field of material science. The SEM
technique is based on the interaction of an incident electron beam with the specimen. [4] SEM
images have a characteristic three-dimensional appearance and are useful for judging the surface
structure of the sample. By correlating the sample scan position with the resulting signal, a black
and white image can be formed that is absolutely similar to what would be seen through an optical
microscope. A schematic diagram of an SEM apparatus is given below in Figure 2.2.

Chapter 2
94
Figure 2.2 Schematic diagram of Scanning Electron Microscope [5]
SEM analysis technique is a very unique and versatile tool over the other complementary imaging
modes. That can be use two different modes of analuses i.e.
(1) Specimen current imaging mode, in which the sample was illuminated by the electron beam to
produce an image and controlled by the intensity of the electrical current.. It can often be used to
show subsurface defects.
2) Backscatter imaging mode, which used high-energy electrons that emerged from the nearly 180
degrees from the irradiation beam direction. The backscatter electron yields is function of the
average atomic number of each point on the sample, and thus can able to give us the information
about the composition.

Chapter 2
95
The detailed description of the technique and it practical application can be found elsewhere. [6]
For this study FESEM analyses were done by using the instrument of make FEI Nova NanoLab
situated at Material Research Center (MRC) MNIT, Jaipur (Raj.). This microscope is equipped
with a field emission gun, operating at an accelerating voltage 0.2 to 30kV, with a claimed
resolution images of 2 nm.
2.1.2 Fourier Transform Infrared (FTIR) Spectrophotometer
Fourier transform infrared (FTIR) Spectrophotoscopy is a energy dispersive technique that used
for the many applications, where identification of bonding and group is required with higher
sensitivity. [7] This technique is based on the vibrations of the atoms present with in a molecule
where the IR spectrum obtained by passing IR radiation through a sample and used to detect the
fraction of the incident radiation absorbed by the sample. The absorption spectrum corresponds to
the frequency of a vibration and intensity of a sample molecule. [8] Moreover, chemical bonds
and the motion of the molecules present in different environments, which will absorb the different
intensities at varying frequencies. Thus, the frequencies of infrared radiation absorbed (peaks or
signals) can be directly correlated to the bonds within the analysed compound. Because each inter-
atomic bond might vibrate with different type of motions (stretching or bending). Therefore, an
individual bond may absorb at more than one IR frequency. Usually, the stretching absorptions
can produce the stronger peaks than bending. However, the Finger print region of absorptions can
be useful in identification of the similar types of bonds. One of the finest advantages of FTIR technology is that it can accept a wide range of sample such
as gases, liquid, pastes, powders, films, fibers and surfaces can be examined through a sensible
sampling technique. Attenuated total reflectance (ATR) spectrophotometer is also used for
analysing the samples. Attenuated total Reflectance FTIR (ATR-FTIR) is a modified version of
FTIR, where. The IR radiation falls onto the studing crystal. And attenuated IR radiations
reflected from the surface of the materials, are used to identify the sample. This technique is
especially useful for obtaining IR spectra of the difficult samples (such as thick or highly
absorbing solid and liquid materials, including films, coatings, powders, threads, adhesive,
polymers and aqueous samples) that cannot be examined by the normal transmission method..
ATR required a little amount of the sample with simple sample preparation method. The sampled

Chapter 2
96
surface pressed into intimate optical contact with the lid of the crystal such as ZnSe, diamond or
Ge.
In this work, FTIR spectrometer of Bruker -Tensor model, situated at Department of Pure &
Applied Chemistry of University of Kota, Kota (Raj.) was used for the study. The sample for
FTIR was prepared by mixing of the sample with dried KBr (1: 20) weight ratio and the spectrum
was recorded in the range of 400-4000cm-1 with a resolution of 4cm-1.
Figure 2.3 Schematic diagram of Fourier transform infrared (FTIR) spectrometer.
2.1.3 Ultraviolet -Visible Spectrophotometer
Ultraviolet-visible (UV-Vis) spectroscopy offers a relatively straight forward and effective way
for quantitatively characterization of the wide range of the organic and inorganic compounds by
determining the electronic transition and the band gap of a material. Furthermore, the instrument
operates on the principle of absorption of photons that promotes the molecule to be in an excited
state and it is an ideal technique for. UV-Vis analysis can be performed for the metal
nanoparticles that dispersed in a solvent or embedded in to the insulator matrix. In such cases,
absorption of incident radiation takes place on to the sample surface and due to surface plasmon
resonance (SPR) of the metal nanoparticles the light waves trapped on the surface of the
semiconductor because of their interaction with the free electrons of the noble metal/

Chapter 2
97
nanoparticles with light. [9] Which is not found in the spectrum of their bulk counter parts. [10]
The UV-Vis spectrum shows a characteristic absorption band at a specific wavelength depending
upon the nature of nanoparticles, matrix, shape of the particles and their distribution. [11, 12, 13]
Figure 2.4 Schematic diagram of Ultraviolet-Visible Spectrophotometer
Furthermore, size-depending optical properties can be evaluated by the UV-visible spectrum,
particularly at the atomic scales. Broadening or shifts of the peak along the absorption wavelength
was found on varying different factors. [14, 15]
In this work UV-vis absorption spectra was recorded on a double beam spectrophotometer
(LABINDIA Uv-Visible 3000+), situated at Department of Pure & Applied Chemistry, University
of Kota, Kota (Raj.). The sample was dissolved in methanol, and placed in a quart’s cuvette with
path length was set to 1.0 cm for taking observation on the structure.
2.1.4 X-ray absorption spectroscopy (XAS)
X-ray absorption spectroscopy (XAS) is a technique is used when XRD fails to detect the atomic
environment of the element f. When the x-rays fall upon the sample the oscillating electric field of

Chapter 2
98
the electromagnetic radiation interacts with the electrons bounded with the atom. Afterwards
either the radiation will be scattered or absorbed to excite the other electrons. A narrow
monochromatic x-ray beam of intensity I0 passing through a sample of thickness x, and afterwards
the reduced intensity I detected at the receiving end as follows:
ln (I0 /I) = μ x ....... (1)
Where, μ is the linear absorption coefficient, which depends on the types of atoms and the density
ρ of the material.
Figure 2.5 Schematic diagram of X-ray absorption spectroscopy (XAS)
At certain absorption energies, where the intensity increases drastically and gives rise to an
absorption edge. Each of theedge corresponds to the energy of the incident photons that sufficient
to cause excitation of a core electron of the absorbing atom to a continuum state, i.e. to produce a
photoelectron. Thus, the energies of the absorbed radiation at these edges correspond to the
binding energies of electrons in the K, L, M, etc- shells of the absorbing elements. Therefore, the
absorption edges are indicated by the increasing energy, K, LI, LII, LIII, MI,…. that corresponds to
the excitation of an electron from the 1s (2S½), 2s (
2S½), 2p (
2P½), 2p (
2P3/2), 3s (
2S½), … to the
other orbital (states), respectively. A XAS spectra is generally divided into four parts:

Chapter 2
99
1) Pre-edge (E < E0).
2) X-ray absorption near edge structure (XANES), where the energy of the incident x-ray beam is
E = E0 ± 10 eV.
3) Near edge x-ray absorption fine structure (NEXAFS), in the region between 10 eV up to 50 eV
above the edge.
4) Extended x-ray absorption fine structure (EXAFS), which starts approximately from 50 eV and
continues up to 1000 eV above the edge.
The minor features in the pre-edge region occured due to the electron transitions from the core
level to the higher unfilled or half-filled orbital (e.g. : s → p, or p → d). XANES region belongs to
the transitions of core electrons to non-bound levels. Due to the high probability of such
transition, a sudden raise in absorption intensity is observed. In NEXAFS, the ejected
photoelectrons possess a low kinetic energy (E-E0 is small) and experience strong multiple
scattering among electrons of even higher coordinating shells. In EXAFS region, the
photoelectrons with high kinetic energy (E-E0 is large), are enriched with the single scattering of
the electrons by the nearest neighbouring atoms.
2.1.5 X-Ray Diffraction
X-ray diffraction is a versatile, non-destructive method of analyses of the crystallinity, phase
identification and quantitative determination of various crystalline forms, present in powder and
solid samples. Diffraction occurs when the X ray waves interacted with a regular structure of
crystal where the atomic distances are same as the wavelength of x-rays. For example, light can be
diffracted by a grating having scribed lines spaced on the order of a few thousand angstroms
(about the wavelength of light). It happens because of the X-rays have the wavelengths of order of
a few angstroms, the same as typical inter-atomic distances in crystalline solids. That means X-
rays can be diffracted from minerals which, by definition, are crystalline and have regularly
repeating atomic structures. When certain geometric requirements are met, X-rays scattered from
a crystalline solid can constructively interfere, producing a diffracted beam. In 1912, W. L. Bragg
recognized a predictable relationship among several factors.

Chapter 2
100
1. The distance between similar atomic planes in a mineral (the inter atomic spacing) which we
call the d-spacing and measure in angstroms.
2. The angle of diffraction which we call the theta angle and measure in degrees. For practical
reasons the diffractometer measures an angle twice that of the theta angle. Not surprisingly, we
call the measured angle '2-theta'.
3. The wavelength of the incident X-radiation, symbolized by the Greek letter lambda and, in our
case, equal to 1.54 angstroms.
nλ=2d Sin θ ........ (2)
Where, λ- Wavelength of X-ray, d- Inter planer spacing, θ- diffraction angle and n- 0,1,2,3….
(a) (b) (c)
Figure 2.6: (a) Schematic diagram of Bragg’s diffraction and (b) schematic diagram of
PANalytical diffractometer (Model: DY-1656) (c) Wiliamson curve for particle size
determination
Here, XRD was done by the X-ray diffraction of the as milled powder samples were performed
using the diffractometer. X-Ray diffraction patterns were recorded from 20° to 90° with a
PANalytical system diffractometer (Model: DY-1656) using Cu Kα (λ=1.542Ao) with an
accelerating voltage of 40 KV. Data were collected with a counting rate of 1°/min. The Kα
doublets were well resolved. From XRD, the crystallite size can be found out by using the
Scherrer’s formula,
P = 0.9 λ/ β Cos θ .......... (3)

Chapter 2
101
Where P-crystallite size, λ-wavelength (CuK~1.54A0), β -full maxima half width, θ- diffraction
angle, by applying Scherer’s formula, the crystallite size of the nanostructure sample found out to
be approximately similar to the value measured by particle size analyzer. Moreover,
G.K.Williamson and his student, W.H.Hall [16] gives a formula (Equation no. 4) for particle size
determination that based on the principle of the approximate formulae for size broadening, β, and
strain broadening, βe, vary quite differently with respect to Bragg angle, θ:
............. (4)
Williamson-Hall plot includes the all peak information beside the Scherrer formula, used the
single maxima for particle size determination. Therefore, this method is more accurate than other
methods.
2.1.6 Cyclic Voltammetry (CV)
Cyclic Voltammetry (CV) is an electrochemical technique which measures the current- voltage
curve in an electrochemical cell under conditions where voltage is applied in excess of that can be
predicted by the Nernst equation. The equipment required to perform cyclic voltammetry consists
of a conventional three-electrode potentiostat connected to three electrodes (working, reference
and auxiliary) immersed in a test solution. The potentiostat applies and maintains the potential
between the working and reference electrode while at the same time measuring the current at the
working electrode. Charge flows between the working electrode and the auxiliary electrode. CV is
performed by cycling the potential of a working electrode, and measuring the resulting current. A
cyclic voltammogram is obtained by applying a linear potential sweep (that is, a potential that
increases or decreases linearly with time) to the working electrode. As the potential is swept back
and forth past the formal potential, E° of an analyte a current flow through the electrode that either
oxidizes or reduces the analyte. The magnitude of this current is proportional to the concentration
of the analyte in solution, which allows cyclic voltammetry to be used in an analytical
determination of concentration. A recording device (such as a computer or plotter) is used to
record the resulting cyclic voltammogram as a graph of current versus potential. CV methods have
found to be extensive applicable for the evaluation of thermodynamic and kinetic parameters such
)()( SinL
kCosBr

Chapter 2
102
as number of electrons change (n), heterogeneous rate constant (ko), entropy (S), Gibb's free
energy (G) and diffusion coefficient (Do) etc, for a number of redox reactions and associated
chemical reactions. These methods are especially useful in both oxidation and reduction process
and to study the multiple electron transfer in an electrochemical reaction.
Figure 2.7 Schematic diagram of Electrochemical cell
We had use potentiostat of autolab metrohm model no. AUT50244, placed at the Pure & Applied
Chemistry, University of Kota, Kota (Raj.), for cyclic voltametric study of the as synthesised
system with respect to the time and concentration.
2.1.7 Spectrofluorimeter
Figure 2.8 depict the basic flow diagram of the spectrofluorimeter used for the measuring of the
fluorescence that includes two wavelength selectors, one for selecting an excitation wavelength
from the source and one for selecting the emission wavelength from the samples with the help of
the absorption or interference filters. We had used the low-pressure Hg vapour lamp to provides
the emission energy in the ultraviolet and visible region (254, 312, 365, 405, 436, 546, 577, 691,
and 773 nm with the help of the monochromator and high-pressure Xe arc lamp as an excitation
source, that gives us a continuous emission spectrum.

Chapter 2
103
Figure 2.8 schematic diagrams for measuring fluorescence showing the placement of the
wavelength selectors for excitation and emission. When a filter is used the instrument is called a
fluorimeter, and when a monochromator is used the instrument is called a spectrofluorimeter.
Jablonski diagram is shown in inset is the working principle of the spectrofluorimeter.
Photoluminescence spectroscopy is widely used to identify the optical and electronic properties of
semiconductors and molecules. The photoluminescence is relaxation processes and divided into
two categories: fluorescence and phosphorescence. When an analyte absorbsan ultraviolet or
visible photon, one of its valence electrons jump from the ground state to an excited state by
conservation of the electron’s spin. Emission of a photon occur when electron moves from
the singlet excited state to the singlet ground state or between any two energy levels with the same
spin is known as fluorescence. It has an average lifetime of excited state of an electron is 10–5 -
10–8 s. Fluorescence, occurs in absence of the source of excitation. Emission from a triplet excited
state to the singlet ground state or between any two energy levels that differ in their respective
spin states–is called phosphorescence. Because the average lifetime for phosphorescence ranges
from 10–4 -104 s, phosphorescence may continue for some time after removing the excitation
source. These techniques can be combined with microscopy, to trace the intensity or the lifetime
of the photoluminescence across a sample i.e. either a solid or liquid sample.

Chapter 2
104
(a) (b)
Figure 2.9 (A) Electron configurations for (a) a singlet ground state; (b) a singlet excited state;
and (c) a triplet excited state. (B) Absorbance spectrum and fluorescence emission spectrum
In this work PL spectrum was recorded on spectrofluorimeter processor Shimadzu model (RF-
5301 (PC) S CE (LVD) situated at Department of Pure & Applied Chemistry, University of Kota,
Kota (Raj.).
2.1.8 Ultrasonic Processor Ultrasonic processor of make cole-parmer and model EI-250UP of 250 watts (average) and 20+/-3
KHz frequency and with microprocessor based timer 0 to 20 minutes was used to prepare the
sample for analysis. The instrument is located at Pure & Applied Chemistry, University of Kota,
Kota (Raj.)
2.1.9 Centrifuge Centrifuge (REMI model 8X15) is located at of Pure & Applied Chemistry, University of Kota,
Kota (Raj.) with the swings of out four heads was used to separate nano particles from aqueous
dispersion from colloidal solution and as separated silver nanoparticles are stabilized for the more
than two months.
2.1.10 pH-Meter Systronics digital pH meter of model MAC (MSW-552) was used for the pH determination for the
synthesized nanoparticles and the reaction mixtures during the various steps of the synthesis
process. The pH of the reduced solution of the nanoparticles was found to be basic in nature.

Chapter 2
105
2.1.11 Water splitting Instrumentation The catalyst (0.3 g) was suspended in 120 mL of 20% aqueous CH3OH electrolyte in a double
walled Pyrex glass reaction cell (volume ~220 mL, with water jacket) that was sealed with a
rubber septum. To expel the air content from the solution, the sample was purged with Ar for 1 h
prior to start the photochemical reaction. Ar gas flow continuously in inner jacket, to maintain 1
atm. pressure of the solution. Temperature of the outer jacket was set at 25oC. The suspension was
irradiated with a 300 W Xe lamp (>420 nm, light intensity 1x10²² photons per hour Xe lamp-
HX1, Model PE300UV). All the experiments are carried out under ambient conditions.
Photocatalytic responses were hourly monitored in terms of the amount of the hydrogen generated
at 1-4 h time intervals, using gas chromatograph (Shimazdu, Japan, thermal conductivity detector
and molecular sieve with 5 A columns) throughout the course of the reaction.
Figure 2.10 Schematic diagram of Water Splitting Instrument
2.2 References
[1] L. Reimer, “Transmission electron microscopy: physics of image formation and microanalysis” Springer-Verlag, Berlin: New York (1989).
[2] D. B. Williams, C. B. Carter, “Transmission electron microscopy: A textbook for material science” Plenum Press, New York (1996).
[3] http://commons.wikipedia.org/wiki/File:TEM-ray-Diag.basic.en.png, visited June (2010).

Chapter 2
106
[4] P. J. Grundy, G. A. Jones, “Electron microscopy in the study of materials” Edward Arnold, London (1976).
[5] J. Goldstein, “Scanning electron microscopy and X-ray microanalysis: A text book for biologist, material scientist, geologist” Plenum Press, New York (1992).
[6] http://www.purdue.edu/REM/rs/sem.htm, visited June (2010).
[7] F. A. Settle, “Handbook of instrumental techniques for analytical chemistry” Prentice Hall, Upper saddle River, N. J., (1997).
[8] B. Stuart, D. J. Ando, “Modern infrared spectroscopy” Wiley, Chichester, New York (1996).
[9] W. L. Brans, A. Dereux, T. W. Ebbesen, “Surface plasmon sub wavelength optics” Nature (2003) 424 824.
[10] J. J. Mock, D. R. Smith, S. Schultz, “Local refractive index dependence of plasmon resonance spectra from individual nanoparticles” Nano Lett. (2003) 3 485.
[11] F. Strelow, A. Fojtik, A. Henglein, “Chemisorption of phosphine on colloidal silver in aqueous solution” J. Phys. Chem. (1994) 98 3032.
[12] A. C. Templeton, J. J. Pietron, R. W. Murray, P. Mulvaney, “Solvent refractive index and core charge influences on the surface plasmon absorbance of alkanethiolate monolayer-protected gold clusters” J. Phys. Chem. B (2000) 104 564.
[13] (a) C. Bullen, P. Mulvaney, “The effects of chemisorption on the luminescence of CdSe quantum dots” Langmuir (2006) 22 3007. (b) A. Henglein, “Chemisorption effects on colloidal lead nanoparticles” J. Phys. Chem. B (1999) 103 9302.
[14] U. Kreibig, M. Vollmer, “Optical properties of metal clusters” Springer, Berlin: New York, (1995).
[15] A. D. Mcfarl, R. P. Van Duyne, “Single silver nanoparticles as real-time optical sensors with zeptomole sensitivity” Nano Lett. (2003) 3 1057.
[16] G.K. Williamson, W.H. Hall, “X-ray line broadening from filed Al and W” Acta Metall. (1953) 1, 22-31.

Chapter 3
`107
Chapter 3 Synthesis and Characterization: Co catalyst (Pt)/ Sensitizer (Ag or CdS) loaded- ZnO NRs 3.1 Synthesis of ZnO NRs by Hydrothermal Method and their Characterization
3.2 Synthesis and Characterization of biogenic Ag NPs prepared by using:
(I) Ajwain (Trachyspermum Ammi) seeds extract
(II) Fenugreek (Trigonella Foenum Graecum) seeds extract
(III) Tea (Camellia Sinensis) leaves extract
(IV) Shikakai (Acacia Concinna) pods extract
3.3 Synthesis and Characterization of Ag @ZnO NRs
3.4 Synthesis and Characterization of CdS @Co-ZnO NRs

Chapter 3
`108
Chapter 3.1 Synthesis of ZnO NRs by Hydrothermal Method and their Characterization
ABSTRACT Single crystal ZnO nanorods arrays were synthesized at low temperature in an aqueous solution
containing zinc nitrate and hexamethylenetetramine by simple hydrothermal method. In this
chapter ZnO, nanorods were synthesized using zinc acetate dihydrate as starting material for ZnO
seed formation. Afterwards, the ZnO nanorods were hydrothermally synthesised using
hexamethylenetetramine and zinc nitrate in a seeds (ZnO) grown at 90°C for 10h. The crystal
structure, orientation and surface morphology were investigated by X-ray diffractometer and
electron microscopy, respectively. Optical properties were studied using UV-visible spectroscopy.
As prepared ZnO nanorods were employed as wide band gap semiconductor to split water for
hydrogen generation when it decorated with Ag nanoparticles.
Key Words: ZnO nanorods, HMT, optical properties, hydrothermal method, hydrogen
generation.

Chapter 3
`109
3.1.1 INTRODUCTION
Wide band gap II-VI semiconductor, zinc oxide (ZnO) has many applications such as transducers,
gas sensors, and dye-sensitized solar cells, water splitting and other optoelectronic activities, etc.
[1] Specially, ZnO have attracted considerable attention because they can be tailored in different
morphologies to possess high electrical conductivity and high visible transmittance. ZnO is a self-
excitation semiconductor, one of the most important promising materials which have been applied
tomany fields such as transparent conductive contacts, solar cells, laser diodes, ultraviolet lasers,
thin film transistors, optoelectronicand piezoelectric applications and surface acoustic wave
devices. [2-5] ZnO films with well aligned sheets, rods, or wires may exhibit better performance
due to high surface to volume ratio that can promote fast and effective path for electron
transportation. Therefore, it is essential to control the morphology of zinc oxide. 1D- ZnO
nanostructures such as nano tubes, nano wires, nanorods, nano belts, nano cables, and nano
ribbons had stimulated considerable interest of researchers due to their applications in numeous
fields. Several methods for the synthesis of nano structured ZnO have been explored, but some of
them are highly power demanding (by means of temperature or pressure) or they used
sophisticated fabrication techniques such as laser ablation, chemical vapour pressure deposition
(CVD) method,etc, that can scaling up thecomplicacy of the method. One of the most promising
andcost effective method to synthesize nanorods is the hydrothermal method, which
comparatively needs low-temperature and lesscomplexity. Additionally, the above method has a
high degree of versatility to modify several parameters, such as temperature, pH and concentration
of reactants, which in turn could modify the morphology, size and shape of the nanozincoxide.
3.1.2 EXPERIMENTAL PROCEDURES
3.1.2.1 Preparation of ZnO seed powder
ZnO nanorods were grown via a two-step process. In the first step, a ZnO seeds was prepared by
zinc acetate. In the second step, ZnO nano rods were grown by hydrothermal technique. In this
process firstly 2 gm of zinc acetate powder exposed to the 350°C temperature in muffule furnace
(350oC is the decomposition temperature of the zinc acetate) for 30 min to form ZnO seeds, by
using below mentioned reactions:

Chapter 3
`110
푍푛(퐶퐻 퐶푂푂) . 2퐻 푂 ⎯ 푍푛(퐶퐻 퐶푂푂) + 2퐻 푂 (1)
4푍푛(퐶퐻 퐶푂푂) + 2퐻 푂 ⎯ 푍푛 푂(퐶퐻 퐶푂푂) + 2퐶퐻 퐶푂푂퐻 (2)
푍푛 푂(퐶퐻 퐶푂푂) + 3퐻 푂 ⎯ 4푍푛푂 + 6퐶퐻 퐶푂푂퐻 (3)
푍푛 푂(퐶퐻 퐶푂푂) ⎯ 4푍푛푂 + 3퐶퐻 퐶푂퐶퐻 + 3퐶푂 (4)
Figure 3.1 depicted the preparation procedure of ZnO seed powder.
Figure 3.1 Preparation of ZnO seed powder 3.1.2.2 Preparation of ZnO nanorods Hydrothermal method was carried out by suspending the ZnO seed powder. ZnO nanorods were
grown using hydrothermal method by immersing a dilute seed solution in a glass beaker which
contain 0.06 M zinc nitrate and 0.06 M hexamethylenetetramine (HMT) solution on 1:1 molar
concentration, which is an optimized ratio to grow ZnO nano rods, as reported in our prior work.
[6] The solution was heated in a hot air oven and maintained at 90°C for 24 hours.Zinc nitrate
hexahydrate salt provides Zn2+ ions required for building up ZnO nanowires. Water molecules in
the solution provide O2− ions. The hexamethylenetetramine (HMT) actas a weak base during the
ZnO nanowire growth by releasing NH3 in to the solution, which would slowly hydrolyze in the
water solution and gradually produce OH−. [7] Which is very important for the synthesis process
because if the HMT hydrolyzes fast to produces a lot of OH− in a shortperiod of time, the Zn2+
ions in solution would precipitate out very quickly due to thehigh pH, which would have little
contribution to the ZnO nanorods oriented growth, and eventually results in fast consumption of
the nutrient and prohibits further growth of ZnO nanorods. The growth process of ZnO nanorods
can be controlled through slow release of OH- ion in a chemical reaction. That can be controlled
by adjusting the reaction parameters, such as precursor concentration, growth temperatureand
growth time, in order to push the reaction equilibrium forward or backward. Ingeneral, precursor
concentration control the nanowire size and density. The growth time and temperature control the

Chapter 3
`111
ZnO nanorods morphology and aspect ratio. The synthesis of ZnO follows following reaction
steps 5-12.
푍푛(푁푂 ) ↔ 푍푛 +푁푂 (5)
(퐶퐻 ) 푁 + 6퐻2푂 ↔ 4푁퐻3 + 6퐻퐶퐻푂 (6)
푁퐻 +퐻 푂 ↔ 푁퐻 .퐻 푂 (7)
푁퐻 .퐻 푂 ↔ 푁퐻 + 푂퐻 (8)
2퐻 푂 → 푂퐻 + 퐻 푂 K¼ = 10−14 (9)
푍푛 + 4푁퐻 ↔ [푍푛(푁퐻 ) ] K = 10−9.58 K = 10-9.58 (10)
푍푛 + 2푂퐻 ↔ 푍푛(푂퐻) K = 3x10⁻¹⁷ (11)
푍푛(푂퐻) ↔ 푍푛푂 +퐻 푂 (12)
At the end of the growth period, as prepared solid is rinsed immediately with deionized water to
remove the residuals from the surface and dried in air at room temperature. Afterwards the
powder was further annealed in a muffle furnace at different temperatures, i.e. 300°C, 500°C and
700°C for 1 hour. The flow diagram shown in Figure 3.2 depicts the detailed preparation
procedure of ZnO nanorods.
Figure 3.2 Flow chart for the preparation of ZnO nanorods

Chapter 3
`112
3.1.2.2.1 A proposed growth mechanism for ZnO nanorods
ZnO is a polar crystal charge species whose positive polar plane is rich in Zn and the negative
polar plane is rich in O. [8] Several growth mechanisms have been proposed for aqueous chemical
solution deposition. The most important growth path for a single crystal is the so called Ostwald
ripening process. [9] This is a spontaneous process that occurs because larger crystals are more
energetically favored than smaller crystals. In this case, kinetically favored tiny crystallites
nucleate first in supersaturated medium are followed by the growth of larger particles, which is
thermodynamically favoured due to the energy difference between large and smaller particles of
high solubility based on the Gibbs-Thomson law. [10] The aqueous zinc nitrate and HMT can
produce the following chemical reactions. (equation 13-17) The concentration of HMT plays a
vital role in formation of the ZnO nanostructure. Since the concentration of the OH- is strongly
related to the reaction that produces nanostructures. Initially, due to decomposition of zinc nitrate
hexahydrate and HMT at modrate temperature (90oC), OH- was introduced in Zn2+ aqueous
solution and their concentration increased:
(13)
(14)
(15)
(16)
(17) As precipitated colloidal Zn(OH)4 clusters in solution were act partly as nuclei for the growth of
ZnO nanorods. During the hydrothermal growth process, the Zn(OH)4 dissolves with increasing
temperature. When the concentrations of Zn2+ and OH- reached at the critical value of the
supersaturation, nucleation of the ZnO into the fine ZnO rods started in the aqueous complex
solution. [11] That will reduce the interfacial free energy of the nanorods because the molecules
situated at the surface are energetically less stable than the ones who is well ordered and packed in
the interior. Since the (101) face has higher symmetry (C6v) than the other faces growing along the
c-axis (101) direction), it is the typical growth plane. The nucleation determines the surface-to-
volume ratio of the ZnO nanorod. Then the dehydration reaction takes place by incorporation of
growth units into crystal lattice of the nanorods. It is concluded that the growth mechanism is

Chapter 3
`113
determined by the thermodynamic factor and concentration of OH- as the kinetic factor in aqueous
solution growth.
3.1.3 RESULTS AND DISCUSSION
3.1.3.1 Electron microscopic measurements ZnO nanorods were synthesized by simple hydrothermal method at low growth temperature i.e.
90°C. The diffraction studies disclosed that the ZnO crystallized in the wurtzite phase with c-axis
orientation. The wurtzite phase has been identified using x-ray diffraction method and confirmed
by SAED pattern associated with HRTEM images. The surface morphology of the as- prepared
ZnO nanorod has been studied by using SEM, TEM and HRTEM. Synthesized ZnO NRs can be
used for further characterization after annealing at different temperatures i.e. 300oC, 500°C and
700oC. Morphological changes occured due to the annealing are represented by FESEM as shown
in Figure 3.3a shows the FESEM image of the 300oC annealed-dense ZnO-NRs. The Figures 3.3b
and 3.3c exhibits the increasing size of ZnO NRs annealed at 500oC and 700oC with increasing
annealing temperature. The diameter and length of the ZnO NRs in the range 100-300 nm. The
FESEM images of the ZnO NRs show the increase in annealing temperature (300oC, 500oC and
700oC) increases the size (300, 600 and 900 nm) as well as lengths of the nano rods. FESEM
images of ZnO NRs also proved that higher temperatures of post-annealing give better crystal
quality, but at very high-temperature and longer period of heating surface diffusion of Zn or ZnO
can take place. [12] Figure 3.4a shows the high magnification TEM images of the ZnO NRs.
Length and diameter of the ZnO NRs in the range of 50-300 nm. The TEM supported EDXS
analysis of the samples depicted in Figure 3.4b that had proved the synthesis of the pure ZnO NRs
with elements Zn and O.
Figure 3.3 FESEM image of ZnO nanorods samples annealed at three different temperature (a)
300oC (b) 500oC and (c) 700oC. All have scale of 1m length.

Chapter 3
`114
TEM images of the as-grown samples also confirm the high crystallinity of the ZnO NRs. The
lengths and diameters of the NRs obtained from the TEM images are in close agreement with the
FESEM images. Figure 3.4c shows the HRTEM lattice image taken for the single NRs with the
lattice spacing is 0.36 Å which corresponds to the (101) plane. Figure 3.4d represents the
SAEDpatternof the after annealed ZnO nanorods that confirm the formation of the one-
dimensional single crystal with high crystallinity that grown with hexagonal shape.
Figure 3.4 (a) TEM images of the hydrothermally prepared ZnO NRs (b) EDXS pattern image of
the ZnO NRs.(c) HRTEM image of ZnO NRs (d) The SAED pattern of the corresponds to the
ZnO NRs with high crystalline hexagonal wurtzite phase.

Chapter 3
`115
Figure 3.5 FESEM imageand its supported EDXS elemental mapping of the ZnO NRs and
elemental mapping which depicts the distribution of constituents O(Kα1), Zn(Lα1), and C (Kα1).
Carbons from the tape used to spread the sample for analysis.
For the determination of the spatial distribution of Zn and O element in ZnO NRs, EDS mapping
was employed to map the oxygen and zinc in the ZnO NRs without carbon content. Carbon
showing in Figure 3.5, is comes from the carbon tape and which is correlates with the result
obtained from FESEM, TEM and HRTEM and tell us that the oxygen is almost homogeneously
spread element across the sample surface. This means the oxygen is included into Zn matrix of the
NRs as well as into underlying 2D bottom layer between the rods.
3.1.3.2 X-ray diffraction studies The crystal structure and growth orientation of the ZnO NRs were investigated by X-ray
diffraction (XRD) patterns. X-ray diffraction spectra of the ZnO NR sannealed at different
temperature are represented by the Figure 3.6. All the diffraction spectra indicates that the all
samples are polycrystalline in nature with a hexagonal wurtzite structure, and the peaks with
(100), (002), (102), (110), (103), (200), (112) and (201) reflections, in 2 = 20-70o range that
belong to the ZnO NRs. [13] As shown in Figure 3.6a, ZnO NRs have (101) reflection as the
preferred orientation in case of all samples annealed at 300oC, 500oC and 700oC temperatures.
This (101) preferred orientation result of the minimal surface energy in the hexagonal
arrangement of the ZnO crystallites that corresponds to the densest packed plane. No bogus
diffraction peaks corresponds to the high purity of the synthesized ZnO NRs. The intensity of the
peaks increases with annealed temperature, indicating decreasing the size of ZnO NRs which in
are in good harmony with the FESEM results and reported literature. [14-17]

Chapter 3
`116
(a) (b) (c)
Figure 3.6 (a) XRD patterns of ZnO NRs anealed at different temperature i.e 300oC, 500oC and
700oC (b) UV-vis absorption spectra and (c) Kubelka Munk plot for the band gaps determination
of ZnO nanorod.
3.1.3.3 UV-Visible studies
UV-Visible spectroscopic study of the as-synthesized ZnO nanorods was performed at room
temperature using UV Visble spectroscopy. Deionised Millipore water (DIW) was used as the solvent
throughout the experiment. The UV-visible spectrum shows a strong first excitonic absorption peak
at 368 nm for ZnO nanorods as a result of near band gap excitonic emission. [18,19] When the
optical transition energy moves from the top of the valence band to the bottom of the conduction
bottom and the absorption maximum shifts to the shorter wavelength region. The stronger exciton
effect is a character of quantum confinement in nanosemiconductors, in which the electrons, holes
and excitons have limited space to move and their motion is possible for definite values of
energies. In case of 1D nano structures, quantum confintment in two directions are achieved and
electrons and excitoons can move in single direction (growth direction). Thus, their energy
spectrum is quantized. The band gap of as synthesized ZnO nanorods is calculated using Kubelka
Munk plot, i.e. plotted between photon energy and (aEp)1/n using equation (18) as shown in Figure
6(c).
a = (2.303*A)T where Ep=hυ...... (18)
Where A is absorbance, T =2 (for direct band gap material), T=1/2 (for indirect band gap
material). [20] The band gap calculated from Tauc plot is found to be 3.00 eV, which is lower
than the bulk ZnO (3.2 eV).

Chapter 3
`117
3.1.3.4 PL studies The photoluminescence studies had represented the presence of defects levels leading to
luminescence phenomena. Figures 3.7a and 3.7b, represents PL emission spectrum of the samples
recorded at an excitation wavelength 250 nm. This results shows one emission peaks in green
region (at 501 nm) broad peak is generated by radial recombination of the photoexcited holes with
respect to the oxygen vacancies. [21]
Figure 3.7 PL (a) excitation peak at 250 nm and (b) emission spectra at 501 nm at ex= 250 nm of
as-synthesized ZnO nanorods.
It is commonly known that the room-temperature PL spectra for ZnO usually show three major
emission peaks at: 380 nm (UV peak), 500-520 nm (a green peak) and 600 nm (a red or orange).
[22] The UV peak is recognized to band-edge emission, while the two broad visible bands are
generally recognized todeep level defects in ZnO crystal, such as vacancies and interstitials of
zinc and oxygen atoms. In this synthesis process green emission peaks are observed for our
samples, which confirm the origins of the defect in ZnO nanorods samples. After annealing in
hydrogen (in argon) at 700 °C for 30 min, the defect PL peak around at 501 nm observed due to
the oxygen vacancies and zinc position at the interstitials. [23] The large surface area of the ZnO
nanorods with small diameters generated along with the depletion layers near the nanorod’s
surface, plays an important role in the PL process. Close to the surface region, when electrons are
excited to the conduction band, they are easily trapped by high-density surface states and are
relaxed via a nonradiative process, so that the photon emissions can occur only in the central
region of the ZnO nanorods (deep from the surface). When ZnO nanorods are annealed, more
oxygen vacancies and zinc interstitials are created, which increases the emission centers of green
peak around at 520 nm. At the same time, the free carrier density is also increased in ZnO and
therefore it reduces the width of depletion region and increases the volume of bulk region, where
radiative recombination occurs. [24] Consequently, the intensity of the green PL peak increases
significantly. This implies that when ZnO nanorods are annealed at high temperature, new defects

Chapter 3
`118
of oxygen interstitials are created. The effect of increasing number of oxygen interstitial defects
with increasing temperature of ZnO nanorods, shifted PL the emission peak toward the higher
wavelength side.
3.1.4 CONCLUSION The study accounts for the synthesis of highly crystalline, pure and hexagonal shaped ZnO
nanorods by a simple hydrothermal technique. The samples annealed at three different
temperatures 300oC, 500oC and 700°C. From the results of SEM, it was clearly observed that
good quality ZnO nanorods are grown at the annealing temperature of 300oC, 500oC and 700°C.
The UV-vis spectrum of the as synthesized ZnO nanorods indicates the blue shift in the spectra
and exhibits a band gap of 3.1eV. PL spectrum of as synthesized ZnO nanorods indicates high
emission peak in the green region with oxygen vacancy defects. Synthesized ZnO nanorods can
withstand at very high temperature retaining the hexagonal symmetry. Therefore, can be used in
various devices such as gas sensors, which is operated at very high temperature and specially for
water splitting after decorated with cocatalyst.
3.1.5 REFERENCES
[1] D. Sharma, J.R., B.S. Kaith, M. Kaur, S. Sharma “Synthesis of ZnO nanoparticles and study of their antibacterial and antifungal properties” Thin Solid Films (2010), 519: 1224-1229. [2] V.S. Khomchenkoa, T.G. Kryshtabb, A.K. Savina, “Fabrication and properties of ZnO:Cu and ZnO:Ag thin films” Superlattices Microstruct .(2007), (42): 94. [3] D.P. Norton, Y.W. Heo, M.P. Ivill, K. Ip, S.J. Pearton, M.F. Chisholm, T. Steiner, “ZnO Growth, Doping & Processing” Mater. Today (2004), 7: 34-40. [4] S.H. Jeong, J.W. Lee, S.B. Lee, J.H. Boo, “The insert of zinc oxide thin film in indium tin oxide anode for organic electroluminescence devices” Surf. Coat. Technol. (2003), 174: 187-192. [5] J.F. Chang, H.H. Kuo, I.C. Leu, M.H. Hon, “The effects of thickness and operation temperature on ZnO: Al thin film CO gas sensor” Sens. Actuators B (2002), 84: 258-264.
[6] J. Deenathayalan, M. Saroja, M.Venkatachalam, P.Gowthaman, T.S.Senthil, “Effect of growth layer solution concentration on the structural and optical properties of hydrothermally grown zinc oxide nano rods” Chalcogenide letters (2011), 8: 549-554. [7] Zhong Lin Wang, “Nanogenerators for Self-powered Devices and Systems” Georgia Tech., U.S.A., (2011), June.

Chapter 3
`119
[8] H. Zhang, D. Yang, Y.J. Yi, X.Y. Ma, J. Xu, D.L. Que, J. “Low Temperature Synthesis of Flowerlike ZnO Nanostructures by Cetyltrimethylammonium Bromide-Assisted Hydrothermal Process” Phys. Chem. B (2004), 108: 3955-3958. [9] O. Krichershy, J. Stavan, “Solvable dynamical model for a quantum measurement process. Hiromichi Nakazato and Saverio Pascazio” Phys. Rev. Lett. (1993), 70: 1473-1479. [10] J.W. Mullin, Crystallization, third ed., Butterworth/Heinemann, Oxford (1997), 1436. [11] L.G. Sillen, A.E. Martell, “Stability constants of metal-ion complexes” The Chemical Society, Burlington House, London IInd Edition (1964), 754. [12] Akbar Zendehnam, Marzieh Shirazi, Samira Doulatshah, and Mahdieh Sadat “Effect of temperature and period of post-annealing on the optical properties of zno thin films” Armenian Journal of Physics, (2010) vol 3, 4, 305-311. [13] Wei Huiying, Wu Youshi, Lun Ning, Hu Chunxia, “Hydrothermal synthesis and characterization of ZnO nanorods” Materials Science and Engineering A (2005), 393: 80-82. [14] Y. Caglar, Silicon, M. Calagr, F.Yakuphanoglu, “Effects of in Al and Sn dopants on the structural and optical properties of ZnO thin films” Spec. Act. Part A (2007), 67: 1113-1119. [15] A. Bougrine, A. El Hichou, M. Addou, J. Ebothe, A. Kachouane, M. Troyon,“ Microstructure and cathodoluminescence study of sprayed Al and Sn doped ZnS thin films” Mater Chem. Phys. (2003), 80: 438-445. [16] E. Luna-Arredondo, A. Maldonado, R. Asomoza, D. Acosta, M. Melendez-Lira, M. Dela, L. Olvera, “Indium-doped ZnO thin films deposited by the sol-gel technique” Thin Solid Films (2005), 490: 132-136. [17] X. Zi-qiang, D. Hong, L. Yan, C. Hang, “Al-doping effects on structure, electrical and optical properties of c-axis-orientated ZnO: Al thin films” Mater.Sci. Semiconductor. Process. (2006), 9132-135. [18] Zhuo Wang, Xue-feng Qian, Jie Yin, Zi -Kang Zhu, “Large scale fabrication of Tower- like, Flower-like and Tube- like ZnO arrays by a simple chemical solution route” Langmuir (2004), 20: 3441-3448. [19] Jian-Bai Xia, KW Cheah, “Quantum confinement effect in thin quantum wires ”Phys. Rev. B (1997), 55: 15688-15694. [20] H Kumar, R Rani., “Structural and optical characterization of ZnO nanoparticles synthesized by microemulsion route” International Letters of Chemistry, Physics and Astronomy (2013), 14: 26-32. [21] C Lin, Y Li “Synthesis of ZnO nanowires by thermal decomposition of zinc acetate dihydrate” Materials Chemistry and Physics (2009), 113: 334-337.

Chapter 3
`120
[22] S. A. Studenikin, N. Golego, M. Cocivera, “Fabrication of green and orange photoluminescent, undoped ZnO films using spray pyrolysis” J. Appl. Phys. (1998), 84: 2287-2294. [23] K. Vanheusden, W. L. Waren, C. H. Seager, D. R. Tallant, J. A. Voigt, “Mechanisms behind green photoluminescence in ZnO phosphor powders” J. Appl. Phys. (1996), 79: 7983-7990. [24] X. L. Wu, G. G. Siu, C. L. Fu, H. C. “Photoluminescence and cathodo luminescence (CL) spectra of stoichiometric” Ong, Appl. Phys. Lett., (2001), 78: 2285.
Chapter 3
`121
Chapter 3.2
Synthesis and Characterization of biogenic Ag NPs prepared by using: (I) Ajwain (Trachyspermum Ammi) seeds extract (II) Fenugreek (Trigonella Foenum Graecum)
seeds extract (III) Tea (Camellia Sinensis) leaves extract (IV) Shikakai (Acacia Concinna) pods extract
Chapter 3
`122
3.2 Synthesis and Characterization of biogenic Ag NPs prepared by using: (1)Ajwain (Trachyspermum Ammi) seeds extract
ABSTRACT
Plasmonic silver nanoparticles (AgNPs, size=3-50 nm) were synthesized by biogenic reduction of
aqueous AgNO3 using Trachyspermum ammi (TA, Ajwain) seeds extract. Effect of aging and
increasing concentration ofTA, was observed on particle concentration/size and their
corresponding catalytic activity. Surface plasmonic resonance band centered around 420 nm
wavelength, recognized as first exitonic peak of UV–vis absorption spectra of Ag NPs, was used
to estimate the particle size (10-30 nm) of Ag NPs. However, some cubic-structures along with
the rod like patterns were grown along the 111plane. ATR and IR results suggested the presence
of the reducing agent/phytochemicals (nicotinic acid, thymol, sugars, proteins, saponin, etc)
incorporated NPs. Impedance study revealed that the rate of charge transfer in TA-Ag NPs
aggregates is inversely proportional to the concentration of TA that confirms the stability of the
AgNPs in water. These biogenic AgNPs are also characterized using by XRD, FESEM and
HRTEM transmission electron microscopy (TEM) and their corresponding energy dispersive X-
ray analysis (EDX), electrochemical impedance spectroscopy (EIS), cyclic voltammetry (CV)
studies, etc. On the basis of the above observations and optoelectronic characteristics, the most
probable mechanism of biogenesis of the stable Ag NPs, is suggested.
Key Words: SilverNanoparticles, plasmonics nano particles, Trachyspermum ammi (TA,
Ajwain), Green Synthesis, FESEM, HRTEM, XRD, FTIR, Cyclic Voltammetry (CV) etc.

Chapter 3
`123
3.2 (I) 1 INTRODUCTION
Recently, metal nanoparticles (MNPs) have drawn enormous attention of researchers over their
bulk equivalents due to their multipurpose applicability in diverse areas. [1-4] These are magnetic,
electronic, catalytic, electrochemical, optoelectronics, antimicrobial, corrosion, inhibition and
optical performances, and many more. Because of their unmatched fabulous qualities, they can
affect human life in various avatars such as biosensors, nano-molecular optoelectronic devices,
bio-mimetic materials, catalyst, biomedicine, industrial and environmental fields. There are two
well-known approaches for fabrication of MNPs. First is bottom to top or small to big -approach,
where the MNPs gain the final shape by addition of small building blocks and prepared by using
supercritical liquid medium, templates, spinning, plasma or fire sparing, pyrolysis, sol-gel process,
biological method, chemical vapour deposition, atomic condensation, etc. The second approach is
top to bottom approach, which involves mechanical milling, electrochemical explosion, laser
ablation, chemical etching, etc. Where, bigger particle cut down into small particles of different
shapes. Morphology (dominated by the shape and size) of the MNPs is very important factor in
deciding their optical, electronic, magnetic, and catalytic properties that can be engineered by
controlling the dimensions of MNPs. The conventional methods popular for the synthesizing
MNPs are namely: physical and chemical processs but their biogenic production is a better choice
due to the use of non-toxic and non-poisonous ingredients, biocompatibility, mild reaction
conditions, low cost, simplicity and eco-friendly nature of the reaction. The alleviate fabrication
of MNPs via green route includes the above benefits of the biogenic synthesis that can make the
MNPs production as an economic and valuable alternative for the large scale production.
Biological tools or materials adopted in biogenic synthesis are fungi, [5-7] bacteria, [8-10] Bengal
gram bean, [11] yeasts, [12] Capsicum annuum, [13] quercetin, [14] biomass of oat (Avena sativa)
and wheat (Triticum aestivum), [15] honey,[16] part of plants' extract, etc. A wide range of metal
NPs such as Au, [17-21] Ag, [22-23] TiO2, [24] In2O3, [25] ZnO, [26] znd CuO, [27] etc, have
been synthesized using herbal/ plant’parts extract in different shape and size. [26] Use of plant
extract and microbial cells in the synthesis of metal NPs, was triggered by presence of the several
organic group/compounds such as carbonyl groups, terpenoids, phenolics, flavonones, amines,
amides, proteins, pigments alkaloids and other reducing agents present in the plant extract. In this
research work, an aqueous seed extract of Trachyspermum ammi (TA; Ajwain) has been used to

Chapter 3
`124
grow the metal (silver) nanoparticles. This plant is the native of Egypt and cultivated in Iran, Iraq,
Afghanistan, Pakistan and India. TA has a great medicinal and nutrition values because its seed
extract consists of carbohydrates (-CHO, -OH), glucosides (6- O-β-glucopyranosyl oxythymol),
oleoresin, saponin, phenols, volatiles (thymol, γ-terpinmene, para-cymene, α- and β-pinene,
dipentene), proteins, fat, fibres, and minerals (P, Fe, Ca, etc). Furthermore, prominent principle
oils such as, carvone (46%), dillapiole (9%) and limonene (38%) along with reducing agents
(nicotinic acid), are also present in TA. Therefore, due to the presence of these biochemical
ingredients, TA can be served as the reducing and capping agent without addition of any external
stabilizing agent, during the synthesis process of NPs. Silver has long been famous for its good
inhibitory effect towards many bacterial strains/microorganisms and catalytic activity. Therefore,
commonly used in medical and industrial products that directly come in to the contact with the
human body, such as shampoos, soaps, detergent, shoes, cosmetic products, and toothpaste,
including the photocatalytic and pharmaceutical applications. Moreover, superiority of the
nanosilver particles over other candidates of the same class is already established in terms of the
small losses in optical frequency during the surface-plasmon propagation, high conductivity and
stability at ambient conditions, less costlier price than other noble metals such as gold and
platinum, high primitive character, and wide range of visible light absorption, etc. Which, prompt
us to select silver as a plasmonic material for this study. MNPs of the noble metals (size <10nm)
with localised spin plasmonic resonance (LSPR) are known as plasmonic material. Free electrons
integrated with the photon energy produces a LSPR [28-32] on exposing nano-particles of noble
metals to sunlight. Therefore, NPs of the noble metals will be act as the active centres on catalyst
for the thermal redox reaction that can trap, scatter, and concentrate light [33-35], due to the fast
charge transfert hat result in enhanced activities. Pure Ag NPs, as well as some chemically
modified Ag NPs has also been in trend that to be used in various applications such as: cleaning
water, catalyst, sensor, optoelectronic properties, eradication of organic pollutants, etc.
Consequently, as-synthesized Ag NPs were rigorously investigated using advance techniques i.e.
XRD (X-ray diffraction), UV-vis spectrophotometry, FTIR and ATR spectroscopy, scanning
electron microscopy (SEM) and their corresponding energy dispersive X-ray analysis (EDX),
transmission electron microscopy (TEM), high resolution transmission electron microscopy

Chapter 3
`125
(HRTEM), photoluminescence emission (PLE), cyclic voltammetry and electrochemical
impedance spectroscopy (EIS), etc.
3.2(I) 2 EXPERIMENTAL DETAILS 3.2 (I) 2.1 TA seed Extract Preparation
Established procedure was adopted for preparing the aqueous extract of Trachyspermum ammi
(TA; Ajwain) seeds [24] that include the washing of dry seeds of TA thoroughly with DIW to
make them free form dust particles and surface contamination. Afterwads the seeds dried for 24 h
in moisture free atmosphere and 2 g of dried seeds were soaked in 50 mL of pure DIW for 24 h.
The extract was filtered using Whatmann filter paper No. 42. All other reagents employed in this
study were of analytical grade and used as supplied without undertaking any further treatment.
DIW water was used throughout the study.
3.2 (I) 2.2 AgNPs Synthesis
Silver nitrate (Merck, Germany) is used for generating silver metal ion in given solution. A fresh
solution of aqueous 0.001 M AgNO3 was prepared in deionised water (DIW, purified by Millipore
assembly). Silver nanoparticles were synthesized using the procedure describe somewhere else.
[25] 2.5 mL of the aqueous TA seeds' extract was added drop wise into the 25.0 mL of aqueous
0.001 M AgNO3 that kept in a 50 mL boiling tube, at room temperature. Afterwards, the mixture
was shifted in a desiccator at room temperature for aging (7 h, 24 h, 48 h, 7 days, 14 days, 21
days, etc) that leads to a biogenic chemical reduction of Ag+ ions into Ag NPs. When transparent
solution of AgNO3 starting turning pink with time, is indication of the presence of Ag
nanoparticles. Aging added fastness to the colour. Silver nanoparticles in aqueous phase are
extremely stable without any precipitation and their stability for long period may be due to the
antimicrobial properties of this plant. Highly dispersed colloidal Ag NPs were found soluble in
water and stable at ambient condition for more than 6 months. After certain aging time, the
suspension was centrifuged at 20,000 rpm for 20 min, which resulted in suspended solid settled at
bottom of the centrifuge tube it was washed by hot DIW thrice prior to be used for further analysis
(XRD, TEM, and FESEM with EDX, HRTEM, UV-vis, FTIR, PLE, and cyclic voltammetric
study) and catalytic activity analysis.

Chapter 3
`126
3.2 (I) 2.3 Characterization and product analysis
3.2 (I) 2.3.1 Optical measurement
The Ag NPs were analyzed by X-ray diffraction (XRD) using a Bruker D2 Phase diffractometer
that was operated in transmission mode with CuKα radiation (λ = 1.5418 Å). The data were
collected over the 2θ range from 20° to 90° at the interval of 0.02° with a counting time of 30 s
per step. UV-visible absorption spectra were measured in the range of 200-800 nm by periodic
sampling of 1 mL aliquot, in spectrophotometer (LAB India, UV 3000+). The particle size of the
Ag NPs was also monitored by considering the position of the first excitonic peak of the spectra.
The FTIR spectra of the as-synthesized nanoparticles (in form of KBr pellet), were recorded in
transmission mode at the frequency range between 4000 and 400 cm-1 with the resolution of 4 cm-
1, by using FTIR spectrophotometer (Tensor-27 Bruker, Germany with software OPUS version
5.1) for solid and ATR spectrophotometer (T-alpha, Bruker) for liquid samples. PL spectra were
observed using a spectrofluorimeter (Shimazdu Model RF-5301; along with software PC-IV)
equipped with a 150 W Xe lamp and a Hamamatsu R928 photo-multiplier tube at room
temperature. The excitation and emission spectra were recorded at fixed slit width i.e. 5 nm.
Morphology and elemental composition of the sample was checked using scanning electron
microscopy (FESEM, JEOL JSM-6700F) and their corresponding energy dispersive X-ray
spectrum (EDXS, OXFORD), respectively. EDXS measurement was carried out with the same
instrument by focusing a particular area of the samples. TEM and HRTEM micrographs were
recorded using an electron microscope (CM12, PHILIPS). The images were analyzed on the basis
of the shape, size and crystallinity of Ag NPs at accelerating voltage of 200 kV. Samples were
prepared by placing 3-4 drops of the well dispersed Ag NPs in ethyl alcohol solution on to a 300-
mesh, carbon coated Cu grid (EM Sciences) and afterwards allowing the liquid to evaporate in air.
For Ag NPs, the particle size distribution measure by randomly selected 30 particles.
3.2 (I) 2.3.2 Electrochemical measurements
Electrochemical experiments were performed in a conventional three-electrode glass cell of
capacity 100 mL, using a potentiostat/ galvanostat (Auto Lab-PGSTAT 204 Metrohm, equipped
with the software NOVA 3.1). Three types of electrode i.e. Pt-tipped carbon electrode, Pt-wire
and a saturated Ag-AgCl electrode of were used as a working, counter and reference electrodes,
correspondingly. In these experiments, all the potentials were reported against the Ag/AgCl
reference electrode in naturally aerated and unstirred solutions at 303 K. Impedance
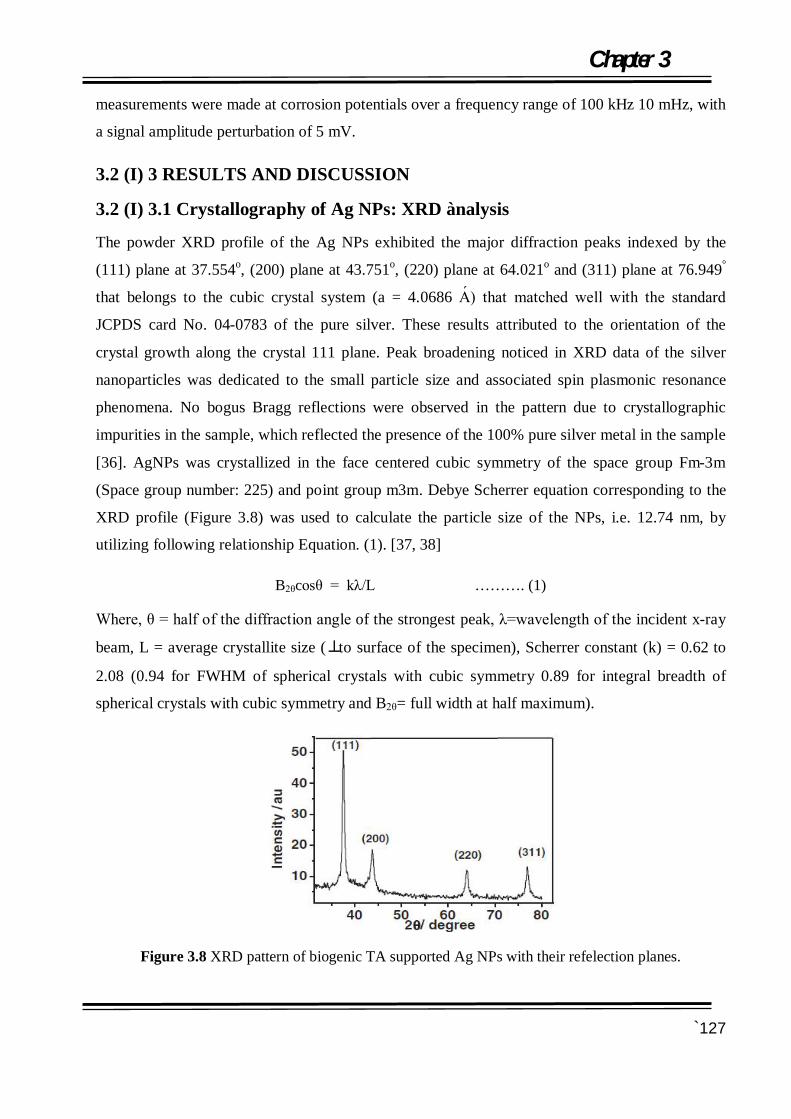
Chapter 3
`127
measurements were made at corrosion potentials over a frequency range of 100 kHz 10 mHz, with
a signal amplitude perturbation of 5 mV.
3.2 (I) 3 RESULTS AND DISCUSSION
3.2 (I) 3.1 Crystallography of Ag NPs: XRD ànalysis
The powder XRD profile of the Ag NPs exhibited the major diffraction peaks indexed by the
(111) plane at 37.554o, (200) plane at 43.751o, (220) plane at 64.021o and (311) plane at 76.949°
that belongs to the cubic crystal system (a = 4.0686 Ǻ) that matched well with the standard
JCPDS card No. 04-0783 of the pure silver. These results attributed to the orientation of the
crystal growth along the crystal 111 plane. Peak broadening noticed in XRD data of the silver
nanoparticles was dedicated to the small particle size and associated spin plasmonic resonance
phenomena. No bogus Bragg reflections were observed in the pattern due to crystallographic
impurities in the sample, which reflected the presence of the 100% pure silver metal in the sample
[36]. AgNPs was crystallized in the face centered cubic symmetry of the space group Fm-3m
(Space group number: 225) and point group m3m. Debye Scherrer equation corresponding to the
XRD profile (Figure 3.8) was used to calculate the particle size of the NPs, i.e. 12.74 nm, by
utilizing following relationship Equation. (1). [37, 38]
B2θcosθ = kλ/L ………. (1)
Where, θ = half of the diffraction angle of the strongest peak, λ=wavelength of the incident x-ray
beam, L = average crystallite size (⊥ to surface of the specimen), Scherrer constant (k) = 0.62 to
2.08 (0.94 for FWHM of spherical crystals with cubic symmetry 0.89 for integral breadth of
spherical crystals with cubic symmetry and B2θ= full width at half maximum).
Figure 3.8 XRD pattern of biogenic TA supported Ag NPs with their refelection planes.

Chapter 3
`128
3.2 (I) 3.2Electron Microscopic study
FESEM and TEM images along with the corresponding EDX profile exhibited by Figures 3.9a,
3.9b and 3.9c, which reveals the information about their surface morphology, particle shape/size
and elemental composition of the synthesized Ag NPs. Flocculated surface visualised by the
FESEM and TEM images, indicates uniformly dispersed colloidal silver NPs in sample as
visualised by Figure 3.9a. On minute observation of the TEM micrographs, it was found that the
Ag NPs crystallized in two shapes i.e. features in the form of the dark cubes of size 5-20 nm (inset
of Figure 3.9a). Where, Figure 3.9b shows the particle size distribution in the despersion.
(d) (e)
Figure 3.9 (a) FESEM images of silver nanoparticles, (b) TEM image and particle size
distribution of Ag NPs and (c) corresponding EDX profile. Inset images (in a and c) are the
magnified TEM images of the square and elongated Ag NPs. (d) HRTEM image of a 12.78 nm
spherical and rod like structure that featuring d-spacing for the 111 plane and (e) cross-grating
patterns (SAED pattern) consistent with the cubic structure for biogenic Ag NPs.

Chapter 3
`129
These features are result of the interaction between some of the interesting biochemicals present
in aqueous TA extract and Ag+ / Ag NPs. Figure 3.9c corresponds to the EDXS profile of the Ag
NPs, collected at 3.2 KeV and used to exhibit the chemical composition of the silver NPs i.e.
100% pure Ag without any foreign contaminants and corresponds to the FESEM image. Few
transparent features of gray elongated cylinderical particles of size 0.480×2 μm are demonstrated
by inset of Figure 3.9c but the number of dark cubic structures are dominated over the rod shape
structures. Figures 3.9d and 3.9e, represents the HRTEM images and corresponding SAED pattern
of the as synthesized AgNPs. Figure 3.9d exhibits a high resolution TEM image featuring lattice
fringes associated with a d-spacing of 0.2286 nm, consistent with the growth plane 111. The
SAED pattern in Figure 3.9e exhibits polycrystalline diffraction rings consistent with 111, 200,
220, 311 and 222 cubic reflections.
One of the chief bio-constituent of TA is the surfactant; saponin (present as 38% limonene with
cmc = 0.5-0.8 g/L), [39] which can induces micellization process and captivate silver ions through
hydrophobic force, resulting into reduction in entropy. When the concentration of the surfactant is
higher than it’s CMC, the entropy penalty for Ag ions assembly formation is lesser than the
entropy penalty for caging of Ag ions by surfactant into water. That causes the electrostatic
interaction between surfactant and Ag ions that leads to elongated structures. Hydrophobic group
of the surfactant sequestrated into the centre, which solubilised in bulk Ag ions by the virtue of
head's group interaction with solvent and hydrophilic part extended away from the centre.
Moreover, position strongly affects the micellisation process by reducing its surface and
interfacial tension. [40] The carboxylic group belongs to saponin (responsible for stabilizing the
silver nanoparticles) fasten to the hydrophobic a glycone part of the molecule, which dissociates
slowly. It leads to grow molecular self assembling of surfactant around Ag NPs in a one
dimensional way and induce the formation of the elongated filamentous nanoclusters. The extract
also contains the carboxylic/phenolic group attached to the different moieties i.e. nicotinic acid,
thymol, sugars, proteins, etc that also highly influence the surface activity, foam ability, and
emulsifying ability of the surfactant. These carboxylic/phenolic groups dissociate into aqueous
phase and form free carboxyl/phenoxide anions, which increases the solubility of molecule in
water and promote the formation of cubical Ag NPs (Figure 3.10).

Chapter 3
`130
Figure 3.10 Schematic presentation of physical growth mechanism of Ag NPs from two routes
that responsible for synthesis of spherical and cylindrical shaped silver nano particles.
3.2 (I) 3.3 Optical characterization Presence of the Ag NPs, grown at different concentrations of TA and growth time, was
successfully examined using UV-vis absorption spectrum (Figures 3.11a and 3.11b). UV spectra
shown in Figure 3.11c, revealed the production of AgNPs in TA extract (Red line), where TA
extract in absence of AgNO3 didn't exhibit any peak in region 350-550 nm (Black line). Silver
NPs exhibited an intense, small and broad absorption at 440 nm due to the surface plasmon
resonance (it describes the collective excitation of the conduction electrons of metal in presence of
light) excitation. [41] All absorption spectra possess two prominent peaks with maximas; first at
200 nm and second around 420-450 nm. Strong peak around 200 nm, usually caused by the
general transition of electrons between the valence and conduction bands of Ag NPs. Second,
broad but short peak found within the range of excitonic transitions between 415 nm and 460 nm,
depending on TA extract concentration, structural, and aging conditions. [42-44] Figure 4a
confirmed the formation of the Ag NPs at different concentrations (0.5, 1.0, 1.5, 2.0 and 2.5%
(w/v)) of TA at fixed AgNO3 concentration i.e. 0.001M AgNO3 and 1 h aging. The increase in the
intensity of the first excitonic peak at 446, 445, 446, 452, and 452 nm along with the broadness of
the peak on raising the TA concentration, was observed. Furthermore, 2.0 and 2.5% TA
concentrated samples has shown the same pattern and peak maxima (452 nm) (Figure 3.11a).
Therefore, 2.0% TA samples were taken for optimisation through aging. The effect of aging on
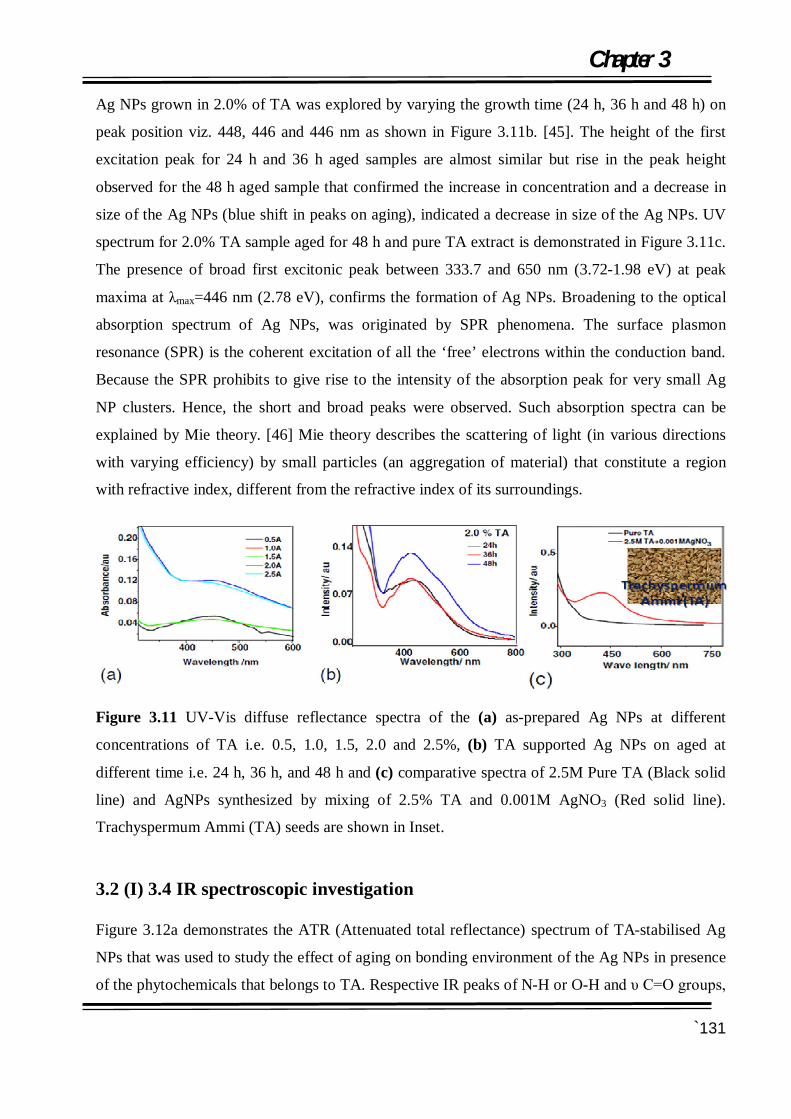
Chapter 3
`131
Ag NPs grown in 2.0% of TA was explored by varying the growth time (24 h, 36 h and 48 h) on
peak position viz. 448, 446 and 446 nm as shown in Figure 3.11b. [45]. The height of the first
excitation peak for 24 h and 36 h aged samples are almost similar but rise in the peak height
observed for the 48 h aged sample that confirmed the increase in concentration and a decrease in
size of the Ag NPs (blue shift in peaks on aging), indicated a decrease in size of the Ag NPs. UV
spectrum for 2.0% TA sample aged for 48 h and pure TA extract is demonstrated in Figure 3.11c.
The presence of broad first excitonic peak between 333.7 and 650 nm (3.72-1.98 eV) at peak
maxima at λmax=446 nm (2.78 eV), confirms the formation of Ag NPs. Broadening to the optical
absorption spectrum of Ag NPs, was originated by SPR phenomena. The surface plasmon
resonance (SPR) is the coherent excitation of all the ‘free’ electrons within the conduction band.
Because the SPR prohibits to give rise to the intensity of the absorption peak for very small Ag
NP clusters. Hence, the short and broad peaks were observed. Such absorption spectra can be
explained by Mie theory. [46] Mie theory describes the scattering of light (in various directions
with varying efficiency) by small particles (an aggregation of material) that constitute a region
with refractive index, different from the refractive index of its surroundings.
Figure 3.11 UV-Vis diffuse reflectance spectra of the (a) as-prepared Ag NPs at different
concentrations of TA i.e. 0.5, 1.0, 1.5, 2.0 and 2.5%, (b) TA supported Ag NPs on aged at
different time i.e. 24 h, 36 h, and 48 h and (c) comparative spectra of 2.5M Pure TA (Black solid
line) and AgNPs synthesized by mixing of 2.5% TA and 0.001M AgNO3 (Red solid line).
Trachyspermum Ammi (TA) seeds are shown in Inset.
3.2 (I) 3.4 IR spectroscopic investigation Figure 3.12a demonstrates the ATR (Attenuated total reflectance) spectrum of TA-stabilised Ag
NPs that was used to study the effect of aging on bonding environment of the Ag NPs in presence
of the phytochemicals that belongs to TA. Respective IR peaks of N-H or O-H and υ C=O groups,

Chapter 3
`132
were observed at different aging period i.e. 24 h (3315.74 & 1637.36 cm−1), 36 h (3314.32 &
1635.59 cm−1) and 48 h (3313.64 & 1635.69 cm−1). Gradual shifting of peaks towards low wave
number was observed for the TA and AgNO3 mixture with aging that signifies the increase in
bulkiness (heavier the molecule, lesser the frequency or wave number) of the molecular self
assembly of TA due to the formation of the cluster of Ag NPs.
(a)
(b)
Figure 3.12 (a) ATR spectra of 2.5% TA supported Ag NPs with aging of 24 h, 36 h and 48 h and
(b) FTIR spectrum of the 2.5% pure TA (Red solid line) extract and Ag NPs stabilised in 2.5%
TA (Black solid line).
It was also justified from the FTIR study, which was carried out (Figure 3.12b) in the range of the
wave number 4000-500 cm−1. This technique is also used to recognize the most probable

Chapter 3
`133
interactions between the Ag ions and phytochemicals present in TA with time and the role of the
chemical constituents of the TA in stabilization of Ag NPs. Pure 2.5% TA gave peaks at the wave
number of 3918.14, 3876.04, 3832.59, 3770.15, 3308.45, 2926.98, 2368.65, 2331.20, 2237.03,
2132.62, 1652.2, 1453.87, 1245.57, 1085.17, 806, 693.40 and 604.85 cm−1. Where, 2.5% TA
stabilised AgNPs exhibits prominent peaks at the wave number 3926.55 (w), 3760.21 (w),
3723.95 (s), 3664.86 (s), 3497.01 (w), 3428.69 (w), 3060.18 (b), 2876.84 (w), 2762.44 (vw),
2350.23 (vw), 1695.78 (s), 1539.02 (w), 1366.14 (vw,b), 1236.47 (w), 1115.45 (s), 1047.55 (w),
972.57 (s), 861.14 (s), 713.30 (b,s), 676.98 (b,s) and 587.36 (vs) cm-1. These peaks are
representative of the respective functional groups belongs to the most probable biomolecular
species, shown in Table 1. Similar to the ATR results, the shifting of the IR peaks towards the
lower frequencies was observed due to the formation of the TA stabilised-Ag NPs. Characteristic
intermolecular hydrogen bonding of the pure TA, is attributed to the broad band at 3308.45 cm-1.
Where, the sharp and well defined peaks at 3723.95 s and 3664.86 s in TA stabilised Ag NPs, are
attributed to the intra-molecular hydrogen bond. [47] IR peak at 3428.69 cm−1 belongs to the OH
stretching of alcohols and phenolic groups in TA stabilised Ag NPs. The frequencies between
3000-2800 cm−1 dedicated to the stretching modes of CH2 group. The absorption band at 3060.18,
2876.84 and 1366.14 (vw,b) cm−1 might be linked with the asymmetric and symmetric
stretching/wagging vibrations of CH2 group, respectively. Distinguish peak at 3060.18 cm−1,
attributed to the poly substituted benzenes and aromatic CH2 stretching vibrations. [48, 49] Sharp
IR peaks at 1695.78 cm−1 suggested the presence of amide group [50], due to the carbonyl
stretching of the proteins that strongly adsorbs the MNPs.
TA supported Ag NPs exhibits the strong bands at 972.57 and 861.14 cm−1 that identified as
twisting and rocking modes of CH2 bending. The secondary structures of the proteins were not
affected during the reaction with Ag+ ions or after binding with Ag nanoparticles. [51] Thus, the
IR spectroscopic studies confirmed the presence of the amino acid that develop the strong binding,
reducing and stabilizing ability with metal through carbonyl group. Thus, it is concluded that a
layer of the bio-organics have formed on AgNPs to secure the nanoparticles. This layer acts as a
capping agent to prevent agglomeration and provides the extra stability in aqueous medium. [52]
The IR spectra also possess the peaks at 1321 and 1580 cm−1, attributed to ν-C-N and δ-NH2,
respectively. [53] The position and relative intensity of these bands changes with respect to the
pure amine (2083, 1514 cm−1) groups. [54, 55] The variation in the -NH2 and -NH infrared bands

Chapter 3
`134
suggests the links between the two or more nanoparticles. The typical bands at 1120 and 1480
cm−1 are representative of the ν-C-OC and δs-CH2/ δa-CH3 vibrations, respectively. [56]
Table 1 Representative bonding of functional groups and corresponding bio-molecules belonging
to FTIR peaks positions (in wave number).
Wave number (cm-1) Functional groups Bio-molecules
587.35 CCC out of plane bending P-O bending PO43-
676.98 C-S str. O-Ag-O str. Thiol, sulfide 713.30 b N-H bonded, secondary amide carvone 861.14 C-O str. epoxide 972.57 C-H out of the plane bend Trans RHC=CHR’, fat oil 1047.55 Alkane, C-O str. P-O str. Lipids, saponin 1115.45 C-O, C-N, C-C str. Lipid, amino acid sugars 1236.47 C=S str., (RO)2C=S, thioketone 1366.13 S=O str., ν-C–N, (RO)2SO2, sulfuric ester,
nicotinic acid 1539.02 C=N(plus C=C), δ-NH2 str. Aromatic
ring str. Aromatic ring, pyrimidines, thymol
1695.78 Primary Amide , carboxylate C-O stretch, conjugated ketones H O-H bending HO-H
Proteins, thymol, nicotinic acid p-cymene
2350.23 NH2+, NH+ str. Nicotinic acid
2762.44 C-H str. , –C(=O)H, aldehyde Carbohydrates, 2876.84 -CH2- stretch (s), C-H str. methine Aliphatic methylene group,
limonene 3060.18 Alkane, aromatic C-H strech Lipids, saponin poly sterene 3428.69 Asym.N-H str., carboxylate C-O sym.
and asym. str. Bonded /non bonded OH group
Alcohols and phenols, thymol, nicotinic acid
3497.01 Intra- or inter-molecular Bonded OH saponin 3664.86 free OH , primary NH amines
asymmetric, Amino acids
3723.95 free OH saponin 3760.21 free OH saponin 3926.55 C-H stretch of aromatic combination All aromatic rings
The aromatic C-H out-of-plane deformations signals were observed in the range 720-1000 cm−1.
The out-of-plane and in-plane deformation of the phenyl ring are observed below 1000 cm−1 and
these modes are not pure but contain a significant contribution from other modes and are
substituent sensitive also, the spectral positions of the weaker γ-CH near 900 cm−1 correlates well

Chapter 3
`135
with the electron donating or electron attracting properties of the substituent. The CH in-plane
deformations (δ-CH) were obtained at 972.57 s and 1047.55 cm−1 in the IR spectrum. Aromatic
nitro compounds shows a C-N stretching vibration near 870 cm−1and the ν- CN band is available
at 861.14 cm−1 in the IR spectrum. The vibration modes of the various functional groups are
variant with respect to the formation of the complex and to the adsorption at the nanoparticle’s
surface. It is suggested that the alkyl chains adopted the stretched conformation irrespective of the
complex formation. Stretching also confirms the inter band and intra band transitions between
electronic states of silver. IR study prove the presence of two kinds of chemicals in TA extract:
one the reducing agent (nicotinic acid, polyphenols) that convert Ag+ ions into Ag nanoparticles
and second the capping agents/surfactant (carvone, thymols, sugars, proteins, lipids, saponin, etc),
which can act as an scaffold for controlling size and shape of these nanoparticles, as it was
mentioned in SEM/TEM/HRTEM study segment of this chapter.
3.2 (I) 3.5 Visible Photoluminescence
Figure 3.13 illustrated the excitation and emission spectra of biogenic silver nanoparticles that
synthesized at 24 h aging time of AgNPs in 2.0% TA. Excitation spectra of the as-prepared
AgNPs was obtained at λ=289 nm under the emission radiation of 565 nm and sharp PL emission
spectrum of green light at λem=563 nm was found under the excitation of λex= 285 nm. Excitation
of electrons from the occupied d-bands into the states above the Fermi level and successive
relaxation of electrons from an occupied sp-band to the holes takes place by the electron-phonon
scattering process directed an energy loss, which is responsible for the visible light luminescence
of the Ag nanoparticles. [57]
Figure 3.13 Photoluminescence (PL) excitation spectra (blue) of the as prepared Ag NPs under
emission wavelength 565 nm and PLE spectrum (red) at λem = 563 nm under the excitation
radiation of λex = 285 nm.

Chapter 3
`136
The optical properties of the silver nanoparticles depend on both; inter band and intra band
transitions between electronic states. FESEM and TEM results indicate that the smaller non-
metallic clusters coexist with large metallic nanoparticles. Here, only small metallic particles
(cubic crystals) contribute to luminescence phenomine because large metal particle didn't exhibit
luminescence due to rapid radiation loss process that makes it hard to compete with effective
radioactive process. [58]
3.2 (I) 3.6 Cyclic potentiometeric study Cyclic voltammetric study has proved to be a successful tool for monitoring the progress of the
reaction and reduction mechanism of the Ag+ ions, using the partial cathodic and anodic reactions
proceeding at electrodes. Graphical representation of the cathodic and anodic peak currents vs
applied potential (V), was observed for the reaction mixture of the pure 2.0% TA extract and 2.0%
TA extract with AgNO3 solution, at 2, 3, 4 and 5 h aging time with the scan rate of 0.1 V s−1
(Figure 3.14). It was observed that the anodic peak current decreases on increasing the time of
reaction kinetics from 1 h to 5 h. Decrease in anodic peak current with time indicates that an
electron transferred from the solution to electrode, which converts Ag+ ions in the colloidal
solution to Ag as a result of reduction reaction. However, reverse occured in oxidation process,
where electrons release during the reaction Ag → Ag+ + e− and that is responsible for the
backward reaction. [59] But none of the above investigated reversible couples show the reverse-
to-forward peak currents ratio, i.e. ipr/ipf = 1. Hence, all the studied cases irreversible with respect
to the peak current ratio. The pure TA extract solution exhibited the anodic peak at -0.4 V (at
current = 13.0 μA) and cathodic peak at -0.5 V (at current = -7.4 μA). TA-incorporated AgNO3
solution, aged at the different time intervals (1 h, 2 h, 3 h, 4 h and 5 h) exhibited two respective
irreversible oxidative peak potentials around -0.5 V and between 0.40 and 0.60 V, are followed by
the one reductive wave peak at -0.5 V. The corresponding values of currents for the I- and II -
peaks are presented in Table 2. In Figures 3.14a and 3.14b (inset), the first oxidative peak
potentials lay around -0.4 to -0.5 V that corresponds to the azo group and aromatic rings. The
second peak exsisit between 0.40 and 0.60 V are responsible for the reduction of Ag+ ion to Ag.
[60] Azo group promotes thereduction of Ag+ to Ag metal NPs. Aging encouraged the depression
in current height of I oxidative peak that represents the azo group and aromatic rings were
destroyed gradually with time. Simultaneously, increase in the current height of II oxidative peak
with aging time, is belongs to the formation of AgNPs formation by the reduction of Ag+/Ag
(EAg+/Ag). Figure 3.14b exhibited the linear raise in current peak height with aging time. Red shift

Chapter 3
`137
in peak was observed due to increase in AgNPs concentration, which results in increase in current
(Table 2).
Table 2 Current and voltage values of pure 2.0% TA extract and Ag NPs prepared at 1-5 h aging.
Aging of Ag NPs/h
I Peak applied potential/V; Current/A
II Peak applied potential; Current/A
Pure TA -0.490: 1.36 × 10⁻⁵ 0.43/0.58: no peak 1 -0.610:2.00 × 10⁻⁷ 0.481: 1.360 × 10⁻⁷ 2 -0.182: 1.890 × 10⁻⁷ 0.430:5.081 × 10⁻⁷ 3 -0.173: 1.456 × 10⁻⁷ 0.439: 8.900 × 10⁻⁷ 4 -0.133: - 2.010 × 10⁻⁷ 0.501: 1160 × 10-7 5 -0.083: - 1.93 × 10⁻⁷ 0.598: 20.70 × 10⁻⁷
Figure 3.14 Cyclic voltagrams for pure TA and the colloidal AgNPs the formed in 2.0% TA seed
extract at different time interval; 1 h, 2 h, 3 h, 4 h and 5 h (a) CV plot with aging and (b) working
electrode current vs aging time plot along with the Inset represents the close up of II peak
(belongs to AgNPs) around applied potential between 0.40 and 0.60 V. (c) Electrochemical
impedance spectroscopy (EIS) plot of pure TA, 2.0% and 2.5% TA seed extract in 0.001 M
AgNO3 solution.
3.2 (I) 3.7 Electrochemical impedance spectroscopy (EIS)
Impedance experiments were carried out to get into the kinetic of the electrochemical processes
occurring at electrode/electrolyte interface in the absence/ presence of Ag NPs. In these
experiments, all the measurements have been reported with respect to the reference Ag/AgCl
electrode. The local impedance diagrams (Figure 3.14c), were recorded in terms of the real
impedance Vs imaginary impedance as a function of frequency over a range from10 kHz to 500
mHz. Complex impedance diagram were recorded in Nyquist modulus format, for Pure TA and
Chapter 3
`138
24 h aged Ag NPs that was suspended in 2.0% and 2.5% aqueous TA solution, as shown by
Figure 3.14c.
Pristine TA sample comprise of two depressed capacitive semicircle, spread over from the high to
low frequency regions. This typical behaviour of the solid metal electrodes corresponds to the non
ideal frequency dispersion that related to the surface the inhomogeneities. Rapid linear increase in
the real impedance was observed with increase in concentration of TA (2-2.5%) in TA supported-
Ag NPs, due to the increase in particle size and decrease in ionic conductivity. This is a clear cut
indication of the corrosion inhibition process/proceeds during the production of AgNPs.
Moreover, Warburg impedance dropped out at higher frequency because the time scale is so short
that diffusion can't manifest itself. At low frequency, the reactants have to diffuse farther that
increases the Warburg-impedance.
3.2 (I) 4 CONCLUSION
A nanometal has a remarkable impact on the present century due to its ability to show different
physical, electrical, magnetic and optical properties because of their great surface to volume ratio
(aspect ratio). Different physical and chemical methods are in fashion to synthesis MNPs. But the
biogenesis is the most benign way to synthesis MNPs over the presently used chemical and
physical methods. In this study, nanoparticles of silver metal have been successfully fabricated by
using aqueous extract of the TA and AgNO3 at varying the concentration of TA and aging time.
During the biosynthesis of the Ag nanoparticles, self-assembling of the chemical components (i.e.
nicotinic acid and steroidal saponins) of the TA extract's rap around the of Ag+ ion that leads to
the reduction of Ag+ ion in to Ag NPs in dilteral shapes. TA seeds extract contains nicotinic acid,
which attributed to the reduction. Other phythogen altogether leads to the nucleation of the Ag
nanoparticles in two shapes (cubes of 5-20 nm and elongated particles of 0.52 × 2 μm). XRD
studies confirmed the purity of these nanosized NPs that crystallized in a cubic and rod shape
crystals with growth orientation of the Ag NPs along the 111 plane. Prominent, intense and broad
excitonic UV-vis. spectrum peak of the Ag NPs was found at 420-440 nm, attributed to the
associated surface plasmonic phenomena. IR spectroscopic studies confirmed that carbonyl group
of amino acid residues have strong binding ability with metal suggesting the formation of the
layer covering metal nanoparticles and acting as capping agent to prevent agglomeration and
providing stability to the medium. Excitation of electrons from occupied d bands into states above
the Fermi level is responsible to the green light luminescence of Ag nanoparticles at 563 nm.

Chapter 3
`139
Cyclic-voltammetric studies confirms the one electron reduction process of the AgNPs. Silver
nanoparticles are successfully synthesised using biosynthesis method that can be further used in
water splitting for hydrogen generation and for reduction of organic pollutant PNP to PAP.
3.2 (I) 5 REFERENCES [1] M. Catauro, M.G. Raucci, F. Gaaetano, A. De Marotta, “Antibacterial and bioactive silver containing Na2O·CaO·2SiO2 glass prepared by sol gel method” J. Mater. Sci. Mater. Med. (2004), 15: 831-840. [2] J.H. Crabtree, R.J. Burchette, I.T. Siddiqi Ra, B. Huen, L.L. Hadnott, A. Fishman, “The efficacy of silver-ion implanted catheters in reducing peritoneal dialysis-related infections” Perit. Dial. Int. (2003), 23: 368-374. [3] A. Krolikowska, A. Kudelski, A. Michota, Bukowska, “SERS Studies on the Structure of Thioglycolic Acid Monolayers on Silver and Gold” J. Surf. Sci. (2003), 532: 227-232. [4] G. Zhao, S.J. Stevens, “Multiple parameters for the comprehensive evaluation of the susceptibility of Escherichia coli to the silver ion” Biometals (1998), 11: 27-32. [5] N. Duran, P.D. Marcato, O.L. Alves, G.I.H. De Souza, E. Esposito, “Mechanistic aspects of biosynthesis of silver nanoparticles by several Fusarium oxysporum strains” J. Nanobiotechnol. (2005), (3): 1. [6] D.S. Balaji, S. Basavaraja, R. Deshpande, D.B. Mahesh, B.K. Prabhakar, A., “Extracellular biosynthesis of functionalized silver nanoparticles by strains of Cladosporium cladosporioides fungus” Colloids Surf. B (2009), 68: 88-92. [7] A. Ahmad, P. Mukherjee, D. Mandal, S. Senapati, M.I. Khan, R. Kumar, M. Sastry, “ Biotemplated Inorganic Nanostructures: Supramolecular Directed Nanosystems of Semiconductor(s)/Metal(s) Mediated by Nucleic Acids and Their Properties” J. Am. Chem. Soc. (2002), 124: 12108. [8] A. Ahmad, S. Senapati, M.I. Khan, R. Kumar, M. Sastry, “Biotemplated Inorganic Nanostructures: Supramolecular Directed Nanosystems of Semiconductor(s)/Metal(s) Mediated by Nucleic Acids and Their Properties” Langmuir (2003), 19: 3550. [9] A. Ahmad, S. Senapati, M.I. Khan, R. Ramani, V. Srinivas, M. Sastry, “Intracellular synthesis of gold nanoparticles by a novel alkalotolerant actinomycete, Rhodococcus species” Nanotechnology (2003), 14: 824. [10] H. Lee, A.M. Purdon, V. Chu, R.M. Westervelt, “Controlled assembly of magnetic nanoparticles from magnetotactic bacteria using microelectromagnets arrays” Nano Lett. (2004), 4: 995-998.

Chapter 3
`140
[11] V. Armendariz, J.L. Gardea-Torresdey, M. Jose-Yacaman, J. Gonzalez, I. Herrera, J.G. Parsons, Proceedings Waste Research Technology Conference at the Kansas City, Mariott-Country Club Plaza (2002), July 30 Aug 1. [12] M. Kowshik, S. Ashtaputre, S. Kharrazi, W. Vogel, J. Urban, S.K. Kulkarni, K.M. Paknikar, “Extracellular synthesis of silver nanoparticles by a silver-tolerant yeast strain” Nanotechnology (2003), 14 (1): 95. [13] K. Ghule, A.V. Ghule, J.Y. Liu, Y.C.J. Ling, “Microscale size triangular gold prisms synthesized using Bengal Gram beans extract and HAuCl4· 3H2O: A green biogenic approach” Nanosci. Nanotechnol. (2006), 6: 3746-3751. [14] S. Li, Y. Shen, A. Xie, X. Yu, L. Qiu, L. Zhang, Q. Zhang, “Green synthesis of silver nanoparticles using Capsicum annum L. extract” Green Chem. (2007), 9: 852-858. [15] J.L. Gardea-Torresdey, J.G. Parsons, E. Gomez, J. Peralta-Videa, H.E. Troiani, P. Santiago, M. Yacaman, “ Formation and growth of Au nanoparticles inside live alfalfa plants” J. Nano Lett. (2002), 2: 397-401. [16] I.B. Obot, S.A. Umoren, A.S.J. Johnson, “Sunlight- mediated synthesis of silver nanoparticles using honey and its promising anticorrosion potentials for mild steel in acidic environments” Mater. Environ. Sci. (2013), 4 (6): 1013-1019. [17] E.M. Egorova, A.A. Revina, “Synthesis of metallic nanoparticles in reverse micelles in the presence of quercetin” Physicochem. Eng. Asp. (2000), 168: 87-96. [18] J. Huang, Q. Li, D. Sun, Y. Lu, X. Yang, H. Wang, Y. Wang, W. Shao, N. He, J. Hong, C. Chen,“Biosynthesis of Silver and Gold Nanoparticles by Novel Sundried Cinnamomum camphora Leaf” Nanotechnology (2007), 8: 105104. [19] B. Ankamwar, C. Damle, A. Ahmad, M. Sastry, “Biosynthesis of gold and silver nanoparticles using Emblica Officinalis fruit extract, their phase transfer and transmetallation in an organic solution” J. Nanosci. Nanotechnol. (2005), 5: 1 665-671. [20] S.P. Chandran, M. Chaudhary, R. Pasricha, A. Ahmad, M. Sastry, “Synthesis of gold nanotriangles and silver nanoparticles using Aloe vera plant extract” Biotechnol. Prog. (2006), 22: 577-583. [21] S.S. Shankar, A. Rai, A. Ahmad, M. Sastry, “Rapid synthesis of Au, Ag and bimetallic Au core-Ag shell nanoparticles using Neem (Azadirachta indica) leaf broth” J. Colloid Interf. Sci. (2004), 275: 496-502. [22] R.P. Singh, S. Magesh, C. Rakkiyappan, “Ginger (Zingiber officinale) root extract: a source of silver nanoparticles and their application” Int. J. Bioeng. Sci. Technol. (2011), 02 (03): 75-80. [23] K Govindaraju, S Tamilselvan, V Kiruthiga, G Singaravelu, “Antimicrobial activity of silver nanoparticles. Biogenic silver nanoparticles by Solanum torvum and their promising antimicrobial activity” J. Biopestic. (2010) 3 (1): 394-399.
Chapter 3
`141
[24] M. Sundarajan, S. Gowri, “Green synthesis of titanium dioxide nanoparticles by Nyctanthes arbour-tristis leaves extract” Chalcogenide Lett. (2011), 8 (8): 447-451.
[25] S. Maensiri, P. Laokul, J. Klinkaewnarong, S. Phokha, V. Promarak, S. Seraphin, “Indium oxide (In2O3) nanoparticles using Aloe vera plant extract: Synthesis and optical properties” J. Optoelectron. Adv. Mater. (2008), 10 (3): 161-165.
[26] H.M. Gong, L. Zhou, X.R. Su, S. Xiao, S.D. Liu, Q.Q.Wang, “Illuminating dark plasmons of silver nanoantenna rings to enhance exciton-plasmon interactions” Adv. Funct. Mater. (2009), 19: 298-303.
[27] N.P.S. Acharyulu, R.S. Dubey, V. Swaminadham, P. Kollu, S.V.N. Pammi, “Green synthesis of CuO nanoparticles using Phyllanthus Amarus leaf extract and their antibacterial activity against multidrug resistance bacteria” Int. J. Eng. Res. Technol. (2014), 3 (4): 639-641.
[28] S. Ankanna, P. TNVKV, E.K. Elumalai, N. Savithramma, “Production of biogenic silver nanoparticles using Boswellia ovalifoliolata stem bark” Dig. J. Nanomater. Biostruct. (2010), 5 (2): 369-372.
[29] R.H. Ritchie, “Plasma losses by fast electrons in thin films” Phys. Rev. (1957), 106: 874.
[30] W.L. Barnes, A. Dereux, T.W. Ebbesen, “Surface plasmon subwavelength optics” Nature (2003), 424: 824-830.
[31] S.A. Maier, H.A. Atwater, “Plasmonics: localization and guiding of electromagnetic energy in metal/dielectric structures” J. Appl. Phys. (2005), 98: 011101.
[32] S.A. Maier, “Plasmonics Fundamentals and Applications, first ed” Springer, New York, (2007), 21-34 and 65-88.
[33] S. Lal, S. Link, N. Halas, “Nano-optics from sensing to waveguiding” Nat. Photonics (2007), 1: 641-648.
[34] X.C. Wang, J.C. Yu, H.Y. Yip, L. Wu, P.K. Wong, S.Y. Lai, “A mesoporous Pt=TiO2 nanoarchitecture with catalytic and photocatalytic functions” Chem. Eur. J. (2006), 11: 2997-3004.
[35] X.B. Cao, L. Gu, L.J. Zhuge, W.J. Gao, W.C.Wang, S.F.Wu, “Template-free preparation of hollow. Sb2S3 microspheres as supports for Ag nanoparticles and photocatalytic properties of the constructed metal– semiconductor nanostructures” Adv. Funct. Mater. (2006), 16: 896-902.
[36] K. Satyavani, T. Ramanathan, S. Gurudeeban, “Green synthesis of silver nanoparticles by using stem derived callus extract of bitter apple Citrullus colocynthis” Dig. J. Nanomater. Biostruct. (2011), 61019-1024.
[37] P. Scherrer, “Bestimmung der Grösse und der inneren Struktur von Kolloidteilchen mittels Röntgenstrahlen” Nachr. Ges. Wiss. Göttingen (1918), 26: 98-100.

Chapter 3
`142
[38] J.I. Langford and A.J.C. Wilson, “Scherrer after Sixty Years: A Survey and Some New Results in the Determination of Crystallite Size” J. Appl. Cryst. (1978), 11: 102-113.
[39] R. Varshney, S. Bhadauria, M.S. Gaur, “Biogenic synthesis of silver nanocubes and nanorods using sundried Stevia rebaudiana leaves” Adv. Mat. Lett. (2010), 1 (3): 232-237.
[40] K. Jeet, N. Devi, T. Narendra, T. Sunil, S. Lalit, T. Raneev, “Trachyspermum ammi (Ajwain) Comprehensive Review” Int. Res. J. Pharm. (2012), 3 (5): 133-138.
[41] M. Kjellin, I. Johansson, “Surfactants from Renewable Resources” John Wiley & Sons, (2010).
[42] X. Gao, G. Gu, Z. Hu, Y. Guo, X. Fu, J. Song, “A simple method for preparation of silver dendrites colloids Surf” A Physicochem. Eng. Asp. (2005), 254: 57-61.
[43] A. van Dijken, E.A. Meulenkamp, D. Vanmaeklenbergh, A. Meijerink, “The luminescence of nanocrystalline ZnO particles: the mechanism of the ultraviolet and visible emission” J. Lumin. (2000), 87-89 454-456.
[44] Y.J. Xing, Z.H. Xi, Z.Q. Xue, X.D. Zhang, J.H. Song, R.M. Wang, J. Xu, Y. Song, S.L. Zhang, D.P. Yu, “Optical properties of the ZnO nanotubes synthesized via vapor phase growth” Appl. Phys. Lett. (2003), 83: 1689-1691.
[45] W. Haiss, N.T.K. Thanh, J. Aveyard, D.G. Fernig, "Determination of. Size and Concentration of Gold Nanoparticles from UV-Vis Spectra" Anal. Chem. (2007), 79: 4215-221.
[46] D.C. Oh, T. Suzuki, J.J. Kim, H. Makino, T. Hanada, M.W. Cho, T. Yao, “Electron-Trap Centers in ZnO Layers Grown by Molecular-Beam Epitaxy” Appl. Phys. Lett. (2005), 86: 032909.
[47] Wriedt, T. Mie Theory 1908-2008, ed. by W. Hergert, T. Wriedt, Universität Bremen. Bremen (2008), 17-21. [48] K. Jilie, Y.U. Shaoning, “Fourier Transform. Infrared Spectroscopic Analysis of Protein. Secondary Structures” Acta Biochim. Biophys. Sin. (2007), 39: 549-559. [49] N.P.G. Roeges, “A Guide to the Complete Interpretation of Infrared Spectra of Organic Structures” Wiley, New York, (1994). [50] G. Varsanyi, “Assignments of Vibrational Spectra of Seven Hundred Benzene Derivatives” vol. 1, Halsted Press (1974).
[51] I.D.G. Macdonald, W.E. Smith, “Orientation of Cytochrome c Adsorbed on a Citrate-Reduced Silver Colloid Surface” Langmuir (1996), 12: 706-713.

Chapter 3
`143
[52] A.M. Fayaz, K. Balaji, M. Girilal, R. Yadav, P.T. Kalaichelvan, R. Venketesan, “Biogenic synthesis of silver nanoparticles and their synergistic effect with antibiotics: a study against gram-positive and gram-negative bacteria” Nanomedicine: NBM (2010), 6: 103-109.
[53] R. Sathyavathi, M.B. Krishna, S.V. Rao, R. Saritha, D.N. Rao, “Biosynthesis of silver nanoparticles using Coriandrum Sativum leaf extract and their application in nonlinear optics” Adv. Sci. Lett. (2010), 3: 138-143.
[54] A. Manna, T. Imae, M. Iida, N. Hisamatsu, “Formation of Silver Nanoparticles from a N-Hexadecylethylenediamine Silver Nitrate Complex” Langmuir (2001), 17 (19): 6000-6004.
[55] M.H. Moore, R.L. Hudson, “Infrared study of ion-irradiated N2-dominated ices relevant to Triton and Pluto: Formation of HCN and HNC” Icarus (2003)161: 486-500.
[56] W. Zheng, D. Jewitt, Y. Osamura, R.I. Kaiser, “Formation of Nitrogen and Hydrogen-bearing Molecules in Solid Ammonia and Implications for Solar System and Interstellar Ices” Astrophys. J. (2008), 674 (2): 1242.
[57] B.M.V. Romão, C. Pardini, R.C.L. Dutra, F. Burel, “Caracterização por FT-IR de. Agentes de Cura Utilizados em Resinas Epoxídicas-II-Polimercaptana, Poliaminoamida e Amina Modificada” Polímeros Ciência Tecnologia (2003), 13: 173-180.
[58] J.P. Wilcoxon, J.E. Martin, F. Paraspour, D.F.J. Kelley, "Photoluminescence from nanosize gold clusters" Chem. Phys. (1998), 108: 9137-9143.
[59] H. Peng, S.X. Hai, G.H. Cheng, “Pternopetalum Franch. represents one of the largest genera of Apiaceae in Asia” Acta Phys. -Chim. Sin. (2004), 20 (10): 1200-1203.
[60] A. Frattini, N. Pellegri, D. Nicastro, O.D. Sanctis, “Effect ofamine groups in the synthesis of Ag nanoparticles using aminosilanes” Mater. Chem. Phys. (2005), 94 (1): 148-152.

Chapter 3
`144
Chapter 3.2
Synthesis and Characterization of biogenic Ag NPs prepared by using: (2) Fenugreek (Trigonella Foenum Graecum)
ABSTRACT In this chapter, we had reported the biosynthesis of 13.42 nm sized silver nanoparticles (AgNPs)
using Fenugreek (Methi) seed extract at room temperature. Synthesis of plasmonic AgNPs is
carried out by reducing the AgNO3 with the aqueous Fenugreek seed extract. Formation of AgNPs
is confirmed by the appearance of a red color due to the prominent localised surface plasmon
resonance band in the UV-Visible spectrum around 425 nm. As synthesized AgNPs were
characterized by using advance analyses techniques such as: Fourier-transform infrared
spectroscopy (FTIR), powder X-ray diffraction (PXRD) studies, scanning electron microscopy
(SEM) and transmission electron microscopy (TEM) supported EDX and ATR, etc. And observed
optical properties leads to a good optoelectronic material.
Key Words: Aqueous Fenugreek seed extract, Ag-nanoparticles, LSPR, biogenic synthesis, etc.

Chapter 3
`145
3.2 (II) 1 INTRODUCTION Currently, the noble metals such as Ag, Au, Pd and Pt nanoparticles have been extensively studied
due to their unique properties like as a optical, mechanical, electronic, biochemical, polarizability,
metallic, [1-3] dielectric [4,5] semiconductor [6,7] magnetic [8,9] antimicrobial as well as
antibacterial activities, photocatalytic, surface-enhanced Raman scattering (SERS) and DNA
sequencing, etc, which are extensively different from their bulk counterparts. But the hussle free
production of the nontoxic metal nanoparticles became a great challenge. Production of the
metallic nanoparticles became important due to their uses in many applications such as a
photonics, catalysis and electronics, etc. A number of processes have been involved in order to
prepare metallic NPs, like as a UV light irradiation, [10,11] microwave irradiation process,
[12,13] chemical reduction method, [14-16] photo chemical process, [17,18] electron/light
irradiation, [19,20] and sonoelectrochemical method, [21] etc. Microemulsions methods were
used for the synthesis of MNPs arrays with chemicals as a precursor along with the large amounts
of surfactants as a stabilizing agent. However, the intensive use of solvents and synthetic chemical
reactants are harmful for our biological environment as they consumed more energy. Moreover,
these methods are not cost effective and they also used the toxic and hazardous chemicals, which
may pretend to potential ecological risks in long way. In looking to the high demand of the metal
NPs in different facets of life, we need to modify the way to prepare them. For these reasons, it is
very attractive to plan the green path for production of nanomaterial research by using natural
reactants and of course by without/less consuming the poisonous chemicals.
A bio-mimetic fabrication of the metal nanoparticles involves the bio reduction process by using
enzymes, fungus, extracts of different parts of plants such as a stem, root, leaf, seed and fruit, and
microorganisms, are recommended as the green alternative to the chemical and physical methods.
Silver nanoparticles are produced by different parts of the herbal plants like bark of the neem
leaves [22], Juice of Citrus lemon [23] and plant’s leaves. Among the noble metal nanoparticles
like Ag, Au, Pt, Pd, silver nanoparticles found more beneficial on the grounds of their studies as
catalysts, photosensitive components, and localised surface plasmon resonance possessing
material, etc.
This chapter, includes the synthesis of the stable AgNPs by using aqueous Fenugreek plant seeds’
extract and characterized them using advance analyses techniques. The silver nanoparticles were
synthesized by the reduction of silver nitrate solution with fenugreek seed’s extract. Fenugreek
seeds are golden-yellow in colour; small in size/structure [24] and possess the phytochemicals
Chapter 3
`146
such as, alkaloids, steroids, carbohydrates, terpenoids, flavonoids, saponins, anthocyanin, tannins
and quinones etc. [25] Which can works as reducing agents as well as a stabilizing/capping agents
for the synthesis of the AgNPs. [26] As-synthesized AgNPs were characterized by using different
analytical techniques such as: X-ray differaction (XRD), FESEM, transmission electron
microscopy (TEM), UV-Vis-spectroscopic, ATR, FTIR, etc.
3.2(II) 2 EXPERIMENTAL METHODS
3.2(II) 2.1 Preparation of the Feenugreek Extract
The fenugreek plant seeds were collected from medicinal garden of Agriculture University
campus, Kota, India. The collected seeds were carefully washed by deionised water (DIW) then
dried and crushed. Subsequently, 2g fresh Fenugreek seeds were soaked in 50 mL of DIW at room
temperature for 24 h, followed by filtration and the extract was kept at 4oC in refrigeration until it
further utilized for the investigations. The extract can be used within 7 days of its preparation.
3.2 (II) 2.2 Synthesis of silver nanoparticle
AgNO3 (99.98%; Merck (Germany)) was purchased and deionised distilled water was used for
solution preparation. The chemicals used in the study are of analytical grade and used without any
further purification. The aqueous 2.0 mL fenugreek seeds extract was dropwise mixed with 25 ml
of freshly prepared 10-3 M AgNO3 solution at room temperature. The colour change in AgNO3
solution with aging was observed that is from transparent to dark reddish-brown. On
centrifugation the AgNPs powder was obtained, which is well dispersed in DIW to clear the
uncoordinated biological material in solution. The purified AgNPs was then dried in oven at 90oC
temperature for 24 h.
3.2 (II) 2.3 Characterization of synthesized AgNPs
The synthesized AgNPs were optically observed by UV-Vis spectroscopy over a range between
the wavelength 200 to 800 nm. The morphology and composition of the synthesized AgNPs was
observed by SEM investigations and their corresponding EDX. FTIR was performed to trace out
the possible phytochemicals present in Ag NPs that responsible for capping and reduction in
synthesis of AgNPs by fenugreek seed extract. The XRD result was analysed to check the
crystalline nature, purity of the samples, average particle size, and plane of the growth of the
AgNPs.

Chapter 3
`147
3.2 (II) 3 RESULTS AND DISCUSSION
3.2 (II) 3.1 Optical Analysis
Figure 3.15a, 3.15b and 3.15c, confirmed the formation of AgNPs by change in colour with the
AgNO3 solution from transparent to dark reddish-brown with time.
Figure 3.15 (a) Soaked FG seed extract, (b) pure AgNO3 solution and (c) synthesized solution of AgNPs and (d) UV-Vis. spectrum of as synthesized AgNPs with aging time 6h,12h,18h and 24h.
3.2 (II) 3.1.1 UV-Visible Analysis
One of the most widely used tool for analysing the particle concentration and size of silver
nanoparticles is UV-Visible spectroscopy. Figure 3.15d, graphically represents the UV-Vis
absorption spectrum of the as synthesized reddish-brown AgNPs solution, which consist of a one
peakat 236 nm (n*) and another broad peak from 429 to 411 nm peaks to show blue shift with
aging with first excitation due to surface plasmon absorption band (*) with the maximum
absorbance that signify the existence of the AgNPs with SPR. The effect of aging on UV-Vis
spectrum of as synthesized AgNPs with aging time 6h,12h,18h and 24h, demonstrated by Figure
3.15d. First peak of all samples are retained at same position but the first excitation peaks show
the blue shift with aging. Therefore, it is important to notice the effect of synthesis time on
particle size and concentration that can play an important role in formation of the Ag
nanoparticles. The influence of aging of the AgNPs, was evaluated with reaction mixture (inset of
Figure 3.15d). Six hour aged sample show small but broad SPR band the indicates, the formation
of low concentration of nanoparticles with small size. These results confirmed the formation of
silver nanoparticles with increasing concentration and increasing particle size with time. In the
present analysis 24 h synthesised samples are taken for study.

Chapter 3
`148
3.2 (II) 3.1.2 FTIR/ ATR Analysis
ATR measurement used to recognize the probable phytochemicals present in the plant extract,
which are accountable for reducing and capping agent for AgNPs, as shown by the Figure 3.16a.
The apparent infrared band was observed at 3330 cm-1, 1635 cm-1 and 580/557 cm-1. The strong
and broad band at 3330 cm-1, attributed to the O-H (intermolecular/intramolecular) group and N-H
band. The intense band at 1635 cm-1 belongs to the C=O stretching of amino functional group
present in the representative protein, used as capping agent for AgNPs, which causes high stability
to AgNPs. The small and broad peaks at 580 cm-1and 557cm-1, are responsible for bonding Ag
metal with phytochemicals. Figure 3.16b shown FTIR spectrum of the sample Feenugreek
supported AgNPs.
(a)
(b)
Figure 3.16 (a) ATR spectra and (b) FTIR spectra of the AgNPs prepared by Fenugreek plant
extract in 24h.
3330
.58
2126
.65
1635
.95
580.47
557.36
100015002000250030003500Wavenumber cm-1
0.0
0.1
0.2
0.3
0.4
Abso
rban
ce U
nits
3726
.21
3471
.78
3307
.14
2881
.43
2825
.73
1756
.01
1647
.69 1572
.95
1491
.94
1389
.77
1148
.79
1023
.10
809.
43
664.
39
597.
6357
5.32
100015002000250030003500Wavenumber cm-1
8688
9092
9496
9810
0
Tran
smitt
ance
[%]

Chapter 3
`149
The FTIR absorption bands of Fenugreek supported AgNPs are found at 3726.21, 3471.78 (O-H
stretching), 3307.14 (C-H stretching), 2881.43 (C-H stretching), 2825.73, 1756.01 (C-H
stretching), 1647.69 (C=O stretching) due to protien, 1572.96 (Aromatic skeletal stretching),
1491.94 (CH2 deformation stretching), 1389.77 (Aliphatic C-H stretching group in methyl and
phenol O-H), 1143.79 (C-O-C stretching, C=O stretching), 1023.10 (C-O,C=O, C-H stretching),
809.43,654.39, 597.63 and 575.32 cm−1. The characteristic absorptions peaks at 1143.79 and
1023.10cm−1, were exhibited the presence of polysaccharides and coumarin. The peak ranging
from 800 cm−1 to 500 cm−1was mainly attributed to the vibration and bending vibration of
hydroxyl groups of alcohols and benzene rings and their respective intratcions with Ag NPs [27] a
strong IR band at 809.43 cm−1 (with pure Fenugreek it is at 793cm-1), is formed due to the
inorganic part of fenugreek that mainly consists of phosphate compounds. It could be concluded
that of phosphate compounds. The Fenugreek seed contains proteins, fat, fiber, and ash, which is
in complete harmony with AACC, 1980. [28]
3.2 (II) 3.2 X-ray diffraction analysis
XRD patterns for the as- synthesized AgNPs were exhibited by the Figure 3.17 in the form of the
most distinguished diffraction peaks of silver metal at 2θ = 38.45o, 45.04o and 53.90o, which
indicated the presence of the fcc (face centered cubic) crystalline phase of the AgNPs that
resembles to the standard JCPDS File No. 00-004-0783 of the metallic silver. No bogus peaks
found shows phase purity of the AgNPs. The crystalline particle size of the AgNPs was calculated
by using Scherrer equation by using full width half maxima (FWHM) of the strongest diffraction
peaks.According to the Scherrer equation, the synthesized sample of AgNPs possesses13.42 nm
size. [29,30] The hump in diffractogram is associated with the glass substrate because the sample
was dried on glass substrate before running it for XRD analysis. The results express that the Ag
ions reduced to Ag0 by fenugreek plant seed extract under suitable reaction conditions.

Chapter 3
`150
Figure 3.17 XRD diffraction pattern of the Fenugreek supported AgNPs aged at 24h.
3.2 (II) 3.3 TEM, SEM and EDX studies of AgNPs
The size, morphology and structure of the nano particle were also confirmed by the TEM and
FESEM images (Figures 3.18a and 3.18b). Morphology of the synthesized samples of the
Fenugreek supported AgNPs was studied using different electron microscopic techniques such as
SEM, TEM and HRTEM. Particle size (~13 nm) with cubic shape of the as-synthesized AgNPs
was traced by using TEM as demonstrated by Figure 3.18a. As grown particle morphology in bilk
is shown by the Figure 3.18b.
The elemental chemical composition of the AgNPs was analysed by the SEM supported EDX
spectroscopy i.e. Ag ~ 99.36% and C ~ 0.64% (Figure 3.18c). Over all EDX profile exhibits
there are no bogus peaks of impurity except carbon, which might becomes from the carbon tape
that used to hold the sample during the SEM analysis. So, we can say this method produced the
highly purity organic molecules freeAg NPs.
Figure 3.18 (a) TEM image and particle size distribution of AgNPs (b) FESEM images of silver
nanoparticles, (c) corresponding AgNP’s EDX profile.

Chapter 3
`151
3.2 (II) 4 CONCLUSION
In this chapter, we produced aprooimately 14.00 nm sized AgNPs by using biogenic reducing
method, where the aqueous extract of Fenugreek was acted as a green reducing agent without
hazarding environment. AgNPs crystallised in cubic crystalline phase. During the biosynthesis of
the Ag nanoparticles, self-assembling biochemical of the fenugreek seed extract's covered the Ag+
ion and leads to the reduction of Ag+ ion to Ag NPs. As synthesized AgNPs were characterized
by Fourier-transform infrared spectroscopy (FTIR), powder X-ray diffraction (PXRD) studies,
scanning electron microscopy (SEM) and transmission electron microscopy (TEM) supported
EDX and ATR, etc.
3.2 (II) 5 REFERENCES
[1] CJ Murphy, TK Sau, AM Gole, CJ Orendorff, J Gao, L Gou, SE Hunyadi, Li T, “Anisotropic metal nanoparticles: synthesis, assembly, and optical applications” J Phys Chem B (2006), 109: 13857-13870. [2] DM Ledwith, D Aherne, JM Kelly, “Approaches to the Synthesis and Characterization of Spherical and Anisotropic Silver Nanomaterials” Wiley-VCH Verlag (2009), 1: 99-148. [3] CH Yu, K Tam, ESC Tsang: In Handbook of Metal Physics, Vol. 5, Chapter 5 “Chemical Methods for Preparation of Nanoparticles in Solution” Elsevier (2009), 113-141. [4] JK Nelson, “Overview of nanodielectrics: insulating materials of the future. In Proceedings of Electrical Insulation Conference and Electrical Manufacturing Expo” October 2007. Nashville: EEIC (2007), 229. [5] MR Baklanov, “In Nanodevices and Nanomaterials for Ecological Security: Chapter 1 Nanoporous Dielectric Materials for Advanced Micro- and Nanoelectronics” Springer (2012), 3-18. [6] JZ Zhang, Z Wang, J Liu, S Chen, G Liu, “In Self-Assembled Nanostructures: Chapter 8 Optical, Electronic, and Dynamic Properties of Semiconductor Nanomaterials” Kluwer Academic Publishers (2004), 201-255. [7] C Weber, M Richter, S Ritter, A Knorr, “In Semiconductor Nanostructures: Chapter 9 Theory of the Optical Response of Single and Coupled Semiconductor Quantum Dots” Springer (2008), 189-210. [8] A Lu, EL Salabas, F Schüth, “Magnetic nanoparticles: synthesis, protection, functionalization, and application” Angew Chem Int Ed (2007), 461222-1244. [9] YA Koksharov, “In Magnetic Nanoparticles: Magnetism of nanoparticles: effects of size, shape and interactions” Wiley-VCH Verlag (2009), 117-196.

Chapter 3
`152
[10] AT Le, LT Tam, PD Tam, “Synthesis of oleic acid-stabilized silver nanoparticles and analysis of their antibacterial activity” Materials Science and Engineering: C (2010), 30(6): 910-916. [11] H Huang, Y Yang. “Preparation of silver nanoparticles in inorganic clay suspensions” Composites Science and Technology (2008), 68(14): 2948-2953. [12] H Yin, T Yamamoto, Y Wada, S Yanagida, “Large-scale and size-controlled synthesis of silver nanoparticles under microwave irradiation” Materials Chemistry and Physics (2004), 83(1): 66-70. [13] MN Nadagouda, TF Speth, RS Varma, “Microwave-Assisted Green Synthesis of Silver Nanostructures” Accounts of Chemical Research (2011) 44 (7): 469-478. [14] L Suber, I Sondi, E Matijevic, DV Goia, “Preparation and the mechanisms of formation of silver particles of different morphologies in homogeneous solutions” Journal of Colloid and Interface Sicence (2005), 288(2): 489-495. [15] K Song, S Lee, T Park, B Lee, “Preparation of colloidal silver nanoparticles by chemical reduction method” Korean Journal of Chemical Engineering (2009), 26 (1): 153-155. [16] O Golubeva, O Shamova, D Orlov, T Pazina, A Boldina, V Kokryakov, “Study of antimicrobial and hemolytic activities of silver nanoparticles prepared by chemical reduction” Glass Physics and Chemistry (2010), 36 (5): 628-634. [17] M Harada, C Kawasaki, K Saijo, M Demizu, Y Kimura, “Photochemical synthesis of silver particles using water-in-ionic liquid microemulsions in high-pressure CO2” Journal of Colloid and Interface Science (2010), 343 (2): 537-545. [18] M Harada, Y Kimura, K Saijo, T Ogawa, S Isoda, “Photochemical synthesis of silver particles in Tween 20/water/ionic liquid microemulsions” Journal of Colloid and Interface Science (2009), 339 (2): 373-381. [19] K Li, FS Zhang, “A novel approach for preparing silver nanoparticles under electron beam irradiation” Journal of Nanoparticle Research (2009), 12 (4): 1423-1428. [20] KA Bogle, “Silver nanoparticles: synthesis and size control by electron irradiation” Nanotechnology (2006), 17 (13): 3204. [21] J Zhu, S Liu, O Palchik, Y Koltypin, A Gedanken, “Shape-Controlled Synthesis of Silver Nanoparticles by Pulse Sonoelectrochemical Methods” Langmuir (2000), 16 (16): 6396-6399. [22] Aparajita Verma, Mohan Singh Mehata, “Controllable synthesis of silver nanoparticles using Neem leaves and their antimicrobial activity” Journal of Radiation Research and Applied Sciences (2016), Volume 9, Issue 1, January 109-115. [23] P Vankar, D Shukla, "Biosynthesis of silver nanoparticles using lemon leaves extract and its application for antimicrobial finish on fabric" Applied Nanoscience (2012), 1-6.

Chapter 3
`153
[24] E Altuntas, E Ozgoz, “Taser of Some physical properties of fenugreek (Trigonellafoenum-graceum L.) seeds” J Food Eng (2005), 71: 37-43. [25] AR Sumayya, Srinivasan Sivagami, Amatullah Nabeelah, “Screening and biochemical quantification of phytochemicals in fenugreek (Trigonella foenum-graecum)” RJPBCS (2012), 3(1): 165-169 [26] R Jani, SA Udipi, PS Ghugre, “Mineral content of complementary foods” Indian J Pediatr (2009), 7637-44. [27] Doha Samargandi J. Chem. Pharm. Res., (2014), 6(9): 19-24. [28] GMS El-Bahy, “FTIR and Raman spectroscopic study of Fenugreek (Trigonella foenum
graecum L.) seeds” Journal of Applied Spectroscopy (2005), 72 (1): 111-116.
[29] P Scherrer “Bestimmung der Grösse und der inneren Struktur von Kolloidteilchen mittels
Röntgenstrahlen” Nachr. Ges.Wiss. Göttingen (1918), 26: 98-100.
[30] JI Langford, AJC Wilson, “Scherrer after Sixty Years: A Survey and Some New Results in
the Determination of Crystallite Size” J. Appl. Cryst. (1978), 11: 102-113.
Chapter 3
`154
Chapter 3.2
Synthesis and Characterization of biogenic Ag NPs prepared by using:
(III) Tea (Camellia Sinensis) leaves extract
ABSTRACT Biosynthesis of silver nanoparticles is comparative simple, cheap and environmentally benign
alternative to the physical and chemical procedures. Green synthesis of silver nanoparticles from
biogenic tools is more compatible, economic viability, effective, easy to scale up and less time
consuming process. Tea leaves extract act as a capping agent and reducing agent in the
nanoparticles synthesis. This green method is a single step process and good for rapid production
of nanoparticles that could be used in many optoelectronics/sensing devices, biomedical and
chemical transformation applications. The silver ions reduced to nano silver and show
characteristic UV-Vis absorbtion peak at 420 nm. As-prepared AgNPs were characterized by
powder X-ray diffraction (PXRD), UV-Visible spectroscopy and Scanning electron microscopy
(SEM), Fourier transformer Infrared spectroscopy (FTIR). X-ray diffraction pattern confirmed the
formation of face centered cubic crystals of size range of 5-20 nm with prominent SPR peak at
412 nm in UV -Vis spectra.
Key Words: Silver nanoparticles, Tea leaves, ecofriendly synthesis, surface plasmon resonance
etc.

Chapter 3
`155
3.2 (III) 1 INTRODUCTION Currently, the nanotechnology became a vital tool in current research as well as in other fields.
Nanomaterials have been getting considerable attention due to their distinctive physical and
chemical properties over their larger-size equivalents. [1-3] Nanostructured silver particles
(AgNPs), have been utilised in different fields for example chemical, biological, physical, and
medical. [4-6] Recently, the silver nanoparticles have been established to exhibit fascinating
antibacterial activities, coating stainless steel metals, sun creams and burn treatments. [7] All
noble metal nanoparticles have been produced by chemical reduction method by using different
reducing reagents (NaBH4, ascorbate or citrate), [8] reduction via reverse micelles way, [9]
radiation cum chemical reduction [10] and thermal decomposition. [11] Many of these methods
are expensive, consuming a lot of energy, outcome in low yields, the chemicals, which used in
fabrications are toxic and harmful, which affects the human health and environment. [12] Now a
day, silver nanoparticles have been prepared by the biological methods by using enzymes, [13]
microorganisms, [14] and fungus. [15] The main drawbacks of these methodologies are they
need special culture preparation and nonuniform partical size along with their tough separation
procedures. [16,17] Silver nanoparticles have also been made-up by using plant extracts as
reducing, stablising and capping agents. The major benefits of using plant extracts is it simple
reaction route, environmentally benign, cost effective, ease to scale-up, and non-toxic nature.
[18-22] A vast range of metal NPs such as Au, [23-27] Ag, [28,29] TiO2, [30] In2O3, [31] ZnO,
[32] CuO, [33] etc, have been synthesized using herbal plant extracts. Utilization of plant extract
and microbial cells in the synthesis of metal NPs was triggered by the occurrence of the various
organic group/compounds such as carbonyl groups, terpenoids, phenolics, flavanones, amines,
amides, proteins, pigments alkaloids and other phytochemicals of the plant extract. Tea leaves
has a great medicinal and nutrition values because its seed extract consists of the most important
compounds in fresh tea leaves responsible for producing Tea with desirable appearance, aroma,
flavor, and taste are: polyphenols (flavonoid group, flavanols (catechin (C), epicatechin (EC),
epicatechin gallate (ECG), gallocatechin (GC), epigallocatechin (EGC), and epigallocatechin
gallate (EGCG) 40%), amino acids (L-Theanine , 6%), enzymes (Polyphenol oxidase and
peroxidase ), pigments ( chlorophylls and carotenoids), carbohydrates (11% ), methylxanthines,
minerals (25 menerals including fluorine, manganese, arsenic, nickel, selenium, iodine,
aluminum, and potassium) and many volatile flavor and aromatic compounds ( linalool and
linalool oxide are responsible for sweetness; geraniol and phenylacetaldehyde are responsible

Chapter 3
`156
for floral aromas; nerolidol, benzaldehyde, methyl salicylate, and phenyl ethanol are responsible
for fruity flavors; and trans-2-hexenal, n-hexanal, cis-3-hexenol, and p-ionone are responsible
for a Tea’s fresh flavour. [34,35] These components undergo changes during tea processing to
produce different effect on the body and mind of the drinker. Hence, due to the existence of
these biochemical ingredients, tea leaves can be served as the reducing and capping agent
without addition of any external stabilizing agent, during the synthesis process of NPs. Silver
has long been well-known for its good inhibitory effect towards many bacterial
strains/microorganisms and catalytic activity. Therefore, it commonly used in the medical and
industrial products such as shampoos, soaps, detergents, shoes, cosmetic products, and
toothpaste etc. These are also stuitable for the photocatalytic and pharmaceutical applications.
Here, in this work, a facile and rapid green chemical method was explored for the fabrication of
the silver nanoparticles using tea leaves essence. To the best of our knowledge, there is no such
report is available, in which the aqueous tea leaves essence is used for the production of AgNPs.
As prepared nanoparticles were characterized using XRD, UV-Visible absorption spectroscopy,
FESEM, transmission electron microscopy (TEM), EDX and FTIR, etc. Therefore, this study is
dedicated to the production of the Ag NPs by biogenic reduction method using aqueous tea
leaves extract at ambient conditions.
3.2 (III) 2 EXPERIMETAL
3.2 (III) 2.1 Preparation of the Tea leaves extract Fresh leaves of Tea plant are carefully washed with water and dried in air for 2h. 20 g of plant
leaves are crushed in 50 mL water and filtered first through sterile muslin cloth and then through
with Whatman filter paper. This Tea leaves extract is later on used in silver NPs synthesis.
3.2 (III) 2.2 Synthesis of AgNPs All the chemicals used during this experiment are of analytical reagent grade and used without
further purification. Deionised Millipore water (DIW) was used as the solvent throughout the
experiment. 2 mL of Tea leaf extract is added to 25 mL of an aqueous solution of 10-3 M AgNO3
and kept at room temperature. The solution color changed from pale yellow to dirty greenish red,
suggested the formation of Ag NPs. (Figure 3.19) the pure AgNO3 solution and leaf extract have
not shown any visible color changes during the incubation period under similar conditions. The
formation of AgNPs was monitored and confirmed by UV-visible spectroscopy. As- produced
AgNPs were centrifuged at 28,000 rpm speed for 20 min and purified using methanol/ hot water.

Chapter 3
`157
The repeated purification is done by giving several washes to the sample by methanol and hot
water to remove the plant residues. AgNPs are finally dried at 70oC in muffle furnace for 2h to
evaporate methanol/water solvent form solution.
Figure 3.19 Step-wise representation of the synthesis of AgNPs by Tea Leaves’ Extract
3.2 (III) 2.3 Characterization of AgNPs The as-synthesized nanoparticles are characterized by using UV-visible, FTIR, XRD, SEM, TEM,
EDX and SAED methods.The powder X-ray diffraction pattern of the biologically synthesized Ag
NPs is recorded using XRD Bench-top Powder Diffractometer (Proto Manufacturing Limited).
The XRD data is analyzed to find out the crystal structure and average crystal domain size of
synthesized Ag NPs. The reduction of silver ions (Ag+) to Ag NPs (Ag0) in the reaction mixture is
confirmed by a visual color change from pale radish pink to greenish red. The formation of
AgNPs is confirmed by UV-visible spectroscopy. The UV spectrum was taken for the reaction
mixture after diluting a small aqueous aliquot in solvent. The UV-visible spectral analysis is
performed using Shimadzu-1800 UV-Vis spectrometer. The DIW was used as a control. FTIR
studies conducted on the as synthesized samples using Jasco FTIR 4100 (Japan) spectrometer.
The spectral analysis is performed in the wave number range of 500-4000 cm-1. SEM is analysed
on a ZEISS EVO40EP (Germany) microscope and the micrograph images of synthesized AgNPs
are recorded. TEM is performed on JEOL/JEM 2100 microscope with an accelerating voltage of
200 kV with a resolution of 0.23 nm.

Chapter 3
`158
3.2(III) 3 RESULTS AND DISCUSSION
3.2 (III) 3.1 XRD study
The structural identity and phase purity of the as synthesized AgNPs were studied by PXRD
analysis. XRD pattern of AgNPs is shown in Figure 3.20a. This showed three intense peaks in the
range of 2θ from 30o to 70o. The peaks at 37.56, 43.54 and 64.06 are indexed to lattice planes of
(111), (200) and (220), of AgNP’s respectively. These planes represent the cubic crystal system of
the Ag NPs that matched well with the standard JCPDS card No. 04-0783 of pure silver. The
XRD study confirms that the resultant particles are (FCC) pure silver nanoparticles as no other
peaks revealed in XRD pattern. [36] These results also revealed that the crystal growth along the
(111) plane was recorded as the highest intensity peak. The experimentally obtained X-ray
reflections are consistent with the standard diffraction pattern of the silver (standard JCPDS File
No. 00-004-0783 of silver) metal. [37] The ratio between the intensities of the (200) and (111)
diffraction peaks and (220) and (111) peaks is also slightly higher than the conventional value
(0.48 versus 0.31) and (0.34 versus 0.22). [38] Peak broadening observed in the XRD data was
due to the small particle size and associated spin plasmonic resonance phenomena. Absence of
any extra peak in the PXRD analysis of synthesized AgNPs, confirms that the as-prepared NPs are
pure and there is no traces of precursor salt. The particle size D (11 to 18 nm) is calculated based
on the regular broadening of XRD peaks as a function of decreasing crystallite size. [39]
3.2 (III) 3.2 UV-visible spectroscopy
UV-visible spectroscopy is used as a tool to investigate the formation of AgNPs. The UV-visible
spectral measurements of reaction mixture at regular intervals during incubation period showed a
gradual increase in absorbance with shifting of peak position. The absorbance reached a
maximum and almost stabilized after 12 hours of incubation indicating the complete reduction of
silver ions to AgNPs. A broad and strong peak in UV spectrum at 420 nm clearly confirmed the
formation of AgNPs (Figure 3.20b). This peak may be attributed to the surface plasmon resonance
of the AgNPs. [33] Saha et al., reported absorption band for the synthesized silver particles at 420
nm due to the pressure of the colloidal silver. [40]

Chapter 3
`159
(a) (b)
Figure 3.20 Tea leaves extract supported AgNPs X-ray diffraction pattern and UV Vis spectrum
taken at a different time intervals (4, 8 and 12h)
A broadening of peak in the range from 380-440 nm is also observed indicating that the nano
particles are polydispersed [41] and it was further established by SEM analysis. UV-visible study
also verifies the completion of AgNPs formation in nearly 12 hours. Maximum concentration of
the silver nanoparticles was obtained after 12 h. The spectra show peaks at 420 nm (4h), 418nm
(8h), and 412nm (12h). With the increasing reaction time UV-vis spectra show sharp narrow peak
shift at lower wavelength of 420 nm. The SPR band also shows blue shift because the peaks are
shifted from 420 nm to 412 nm after 12 h, suggesting that the particle shape strongly influences
the SPR band.
The phytochemical and spectral studies reported in previous literatures have established the
presence of alkaloids, glucosides, carbohydrates, flavonoids, proteins, steroids, gums and
mucilages in the plant extracts. These are responsible for the reduction from Ag+ to AgNPs. In the
present research work, FTIR study of biosynthesized AgNPs is carried out to establish the identity
of biomolecules attached to AgNPs surface and their possible involvement in reduction from Ag+
to Ag0. FTIR spectrum of biosynthesized AgNPs showed prominent peaks at 3388, 2886, 2066,
1646. 1394, 1239, 1064, 986, 758, 679 and 628 cm-1 (Figure 3.21d). The major and broad peak
around 3388 cm-1 represent the -OH stretching vibrations corresponding to glycosides. The peaks
at 2886 and 2820 cm-1 are probably due to -C-H stretching and asymmetric bending vibrations of -
CH3 group respectively. The existence of amide group (-NH-CO-) of protein and the aromatic ring
structures is revealed by the peaks around 1646 and 1500 cm-1, which represents amide I and
amide II of proteins and arises due to carbonyl stretch and –N-H stretch vibrations in the amide
linkages shown in Figure 3.21d. Carbonyl group of amino acid residues and peptides of proteins

Chapter 3
`160
has the stronger ability to bind metal, so proteins could be the most possible organic moiety for
stabilizing the AgNPs in the medium. [42] The -C=O stretching vibration of -COOH group is
exposed by peak around 1763 cm-1. The signals located at 1394 and 1064 cm-1 indicate the in
plane bending vibrations of -OH and C-O-C groups correspondingly. The aliphatic -C-H bending
vibration has appeared as a signal at 758 cm-1. The FTIR spectral analysis clearly suggests the
presence of biomolecules with functional groups such as -OH, -C=O, -NH-CO-, -COOH, C-O-C,
etc, as attachments to AgNPs surface and these biomolecules are possibly involved in reduction of
Ag+ to Ag0 and shape deciding factor.
3.2 (III) 3.3 Electron Microscopy
The surface morphology of as synthesized AgNPs is studied using SEM and TEM techniques.
Figure 3.21a shows SEM image of AgNPs. The SEM image reveals that the size of synthesized
AgNPs is in the range of 5-10 nm. The nanoparticles tend to agglomerate to form still bigger
structures. TEM study indicates that most of the nanoparticles are spherical and oval shape as
visible in Figure 3.21b is due to the fact that when a particle is formed, in its initial state, it tries to
acquire a shape that corresponds to minimum potential energy. The spherical and oval shapes
correspond to the state of minimum potential energy. Other factors that a vital play role in
determining the shape of silver nanoparticles i.e. concentration of AgNPs and rate of reaction
leads to symmetrical particles and low concentration of silver nitrate solution and slower rate of
reaction [43] and higher concentration of silver nitrate [44] leads to anisotropic silver
nanoparticles. The size distribution histogram of AgNPs shown in Figure 3.21c suggest that most
particles have a size distribution around 7-8 nm.

Chapter 3
`161
Figure 3.21 Tea supported-AgNPs representing their (A) SEM, (B) TEM image of respectively
(C) size distribution histogram obtained from TEM studies and (D) FTIR spectrum of AgNPs
synthesized from Tea Leaves.
3.2 (III) 3.4 Surface Morphology analysis of AgNPs
Figure 3.22 (a) HRTEM image of a 12 nm spherical like structure that featuring d-spacing for the
111 plane and (b) cross-grating patterns (SAED pattern) consistent with the cubic structure (c)
EDX spectrum of biogenic Ag NPs.
Figure 3.22a represents the HRTEM images and corresponding SAED pattern of the as
synthesized AgNPs. Figure 3.22a. exhibits a high resolution TEM image featuring lattice fringes
associated with a d-spacing of 0.2286 nm, consistent with the growth planes (111). The SAED
pattern in Figure 3.22b exhibits polycrystalline diffraction rings consistent of (111), (200), (220),
Chapter 3
`162
(311) and (222) cubic reflections. The EDS spectra recorded from the silver nanoparticles are
shown inset Figure 3.22c, which revealed the information about the particle size and elemental
composition of the synthesized Ag NPs. The EDS profile shows a strong silver signal along with
weak oxygen and carbon peaks, which may have originated due to the carbon being present in the
sample holder. Thus, stable AgNPs in solution up to 4 weeks after synthesis [45,46]. This is
another advantage of nanoparticles synthesized using plant extracts over those synthesized using
chemical methods.
3.2 (III) 4 CONCLUSION
In this chapter, we report a green approach for the synthesis of Ag nanoparticles using the fresh
tea leaves extract. This is a simple, green, cheap and efficient method to synthesize silver
nanoparticles at room temperature without using any harmful reducing agents such as sodium
borohydrite, EDTA, hydrazine and any capping or dispersing agent. It was found that the green
synthesized silver nanoparticles were composed of spherical particles which have high
crystallinity. The particles sizes were controlled in the range from 5 to 10 nm.
3.2 (III) 5 REFERENCES
[1] AM Fayaz, “Biogenic Synthesis of Silver Nanoparticles and Their Synergistic Effect with Antibiotics: A Study against Gram-Positive and Gram-Negative Bacteria” Nanomedicine: Nanotechnology, Biology and Medicine (2010), 6: 103-109.
[2] M Vijayakumar, “Biosynthesis, Characterisation and Anti-Bacterial Effect of Plant-Mediated Silver Nanoparticles Using Artemisia nilagirica” Industrial Crops and Products (2013), 41: 235-240.
[3] E Alzahrani, K Welham, “Optimization Preparation of the Biosynthesis of Silver Nanoparticles Using Watermelon and Study of Its Antibacterial Activity” International Journal of Basic and Applied Sciences (2014), 3: 392-400.
[4] JY Song, BS Kim, “Rapid Biological Synthesis of Silver Nanoparticles Using Plant Leaf Extracts” Bioprocess and Biosystems Engineering (2009), 32: 79-84.
[5] M Rai, A Yadav, A Gade, “Silver Nanoparticles as a New Generation of Antimicrobials” Biotechnology Advances (2009), 27: 76-83.
[6] A Kumar, “Silver-Nanoparticle-Embedded Antimicrobial Paints Based on Vegetable Oil” Nature Materials (2008), 7: 236-241.
[7] F Furno, “Silver Nanoparticles and Polymeric Medical Devices: A New Approach to Prevention of Infection” Journal of Antimicrobial Chemotherapy (2004), 54: 1019-1024.
[8] LM Liz-Marzán, I Lado-Tourino, “Reduction and Stabilization of Silver Nanoparticles in Ethanol byNonionic Surfactants” Langmuir (1996), 12: 3585-3589.
Chapter 3
`163
[9] Y Sun, P Atorngitjawat, MJ Meziani, “Preparation of Silver Nanoparticles via Rapid Expansion of Water in Carbon Dioxide Microemulsion into Reductant Solution” Langmuir (1996), 17: 5707-5710.
[10] A. Henglein, “Physicochemical Properties of Small Metal Particles in Solution: “Microelectrode” Reactions, Chemisorption, Composite Metal Particles, and the Atom-to-Metal Transition” The Journal of Physical Chemistry (1993), 97: 5457-5471.
[11] K Esumi, “Preparation and Characterization of Bimetallic Palladium-Copper Colloids by Thermal Decomposition of Their Acetate Compounds in Organic Solvents” Chemistry of Materials (1990), 2: 564-567.
[12] S Ponarulselvam, C Panneerselvam, K Murugan, N Aarthi, K Kalimuthu, S Thangamani, “Synthesis of Silver Nanoparticles Using Leaves of Catharanthusroseus Linn. G. Don and Their Antiplasmodial Activities” Asian Pacific Journal of Tropical Biomedicine (2012), 2: 574-580.
[13] I Willner, R Baron, B Willner, “Growing Metal Nanoparticles by Enzymes” Advanced Materials, (2006), 18: 1109-1120.
[14] Y Konishi, K Ohno, N Saitoh, T Nomura, S Nagamine, H Hishida, “Bioreductive Deposition of Platinum Nanoparticles on the Bacterium Shewanella algae” Journal of Biotechnology (2007), 128: 648-653.
[15] XR Zhang, XX He, KM Wang, XH Yang, “Different Active Biomolecules Involved in Biosynthesis of Gold Nanoparticles by Three Fungus Species” Journal of Biomedical Nanotechnology (2011), 7: 245-254.
[16] D Jain, HK Daima, S Kachhwala, SL Kothari, “Synthesis of Plant-Mediated Silver Nanoparticles Using Papaya Fruit Extract and Evaluation of Their Anti Microbial Activities” Digest Journal of Nanomaterials and Biostructures (2009), 4: 557-563.
[17] A Saxena, R Tripathi, R Singh, “Biological Synthesis of Silver Nanoparticles by Using Onion (Allium cepa) Extract and Their Antibacterial Activity” Digest Journal of Nanomaterials and Biostructures (2010), 5: 427-432.
[18] ARJ Azar, S Mohebbi, “One-Pot Greener Synthesis of Silver Nanoparticles Using Tangerine Peel Extract: Large-Scale Production” Micro & Nano Letters (2013), 8: 813-815.
[19] MC Moulton, LK Braydich-Stolle, MN Nadagouda, S Kunzelman, SM Hussain, RS Varma, “Synthesis, Characterization and Biocompatibility of “Green” Synthesized Silver Nanoparticles Using Tea Polyphenols” Nanoscale (2010), 2: 763-770.
[20] M Dubey, S Bhadauria, B Kushwah, “Green Synthesis of Nanosilver Particles from Extract of Eucalyptus hybrid (Safeda) Leaf” Digest Journal of Nanomaterials and Biostructures (2009), 4: 537-543.
[21] V Parashar, R Parashar, B Sharma, Pandey, AC Parthenium “Leaf Extract Mediated Synthesis of Silver Nanoparticles: A Novel Approach towards Weed Utilization” Digest Journal of Nanomaterials and Biostructures (2009), 4: 45-50.

Chapter 3
`164
[22] SS Shankar, A Rai, A Ahmad, M. Sastry, “Rapid Synthesis of Au, Ag, and Bimetallic Au Core-Ag Shell Nanoparticles Using Neem (Azadirachtaindica) Leaf Broth” Journal of Colloid and Interface Science (2004), 275: 496-502.
[23] SS Shankar, A Rai, A Ahmad, M Sastry, “Rapid synthesis of Au, Ag, and bimetallic Au core-Ag shell nanoparticles using Neem (Azadirachta indica) leaf broth” J. Colloid Interf. Sci. (2004), 275: 496-502.
[24] J Huang, Q Li, D Sun, Y Lu, X Yang, H Wang, Y Wang, W Shao, N He, J Hong, “Biosynthesis of Silver and Gold Nanoparticles by Novel Sundried Cinnamomum camphora Leaf” C. Chen, Nanotechnology (2007), 8: 105104.
[25] B Ankamwar, C Damle, A Ahmad, M Sastry, “Biosynthesis of gold and silver nanoparticles using Emblica officinalis fruit extract, their phase transfer and transmetallation in an organic solution” J. Nanosci. Nanotechnol. (2005), 5: 1665-1671
[26] SP Chandran, M Chaudhary, R Pasricha, A Ahmad, M Sastry, “Synthesis of gold nanotriangles and silver nanoparticles using Aloe vera plant extract” Biotechnol. Prog. (2006), 22: 577-583.
[27] EM Egorova, AA Revina, “Synthesis of metallic nanoparticles in reverse micelles in the presence of quercetin” Physicochem. Eng. Asp. (2000), 16887-96.
[28] K Govindaraju, S Tamilselvan, V Kiruthiga, G Singaravelu, “Biogenic silver nanoparticles by Solanum torvum and their promising antimicrobial activity” J. Biopestic. 3 (1): 394-399.
[29] RP Singh, S Magesh, C Rakkiyappan, “Formation of fenugreek (Trigonella foenum- graecum) extract mediated Ag nanoparticles: mechanism and applications” Int. J. Bioeng. Sci. Technol. (2011), 02 (03): 75-80.
[30] M Sundarajan, S Gowri, “Green synthesis of titanium dioxide nanoparticles by Nyctanthes arbour-tristis leaves extract” Chalcogenide Lett. (2011), 8 (8): 447-451.
[31] S Maensiri, P Laokul, J Klinkaewnarong, S Phokha, V Promarak, S Seraphin, “Indium oxide (In2O3) nanoparticles using Aloe vera plant extract: Synthesis and optical properties” J. Optoelectron. Adv. Mater. (2008), 10 (3): 161-165.
[32] HM Gong, L Zhou, XR Su, S Xiao, SD. Liu, QQ Wang, “Illuminating dark plasmons of silver nanoantenna rings to enhance exciton-plasmon interactions” Adv. Funct.Mater. (2009), 19: 298-303.
[33] M A Noginov, G Zhu, M Bahoura, J Adegoke, C Small, BA Ritzo, VP Drachev, VM Shalaev, “The effect of gain and absorption on surface plasmons in metal nanoparticles” Appl. Phys. B.(2007), 86: 455-60. [34] Harbowy, E Matthew, A. Balentine Douglas “Tea Chemistry” Critical Reviews in Plant Sciences (1997), 16 (5): 415-480 [35] Ercisli, Sezai, Emine Orhan, Ozlem Ozdemir, Memnune Sengul, Neva Gungor. “Seasonal Variation of Total Phenolic, Antioxidant Activity, Plant Nutritional Elements, and Fatty Acids in Tea Leaves Grown in Turkey” Pharmaceutical Biology (2008), 46: 683-687.
Chapter 3
`165
[36] AS Lanje, SJ Sharma, RB Pode, “Synthesis of Silver Nanoparticles: A Safer Alternative to Conventional Antimicrobial and Antibacterial Agents” Journal of Chemical and Pharmaceutical Research (2010), 2: 478-483.
[37] R Das, SS Nath, D Chakdar, G Gope, R Bhattacharjee, “Preparation of Silver Nanoparticles and Their Characterization” Journal of Nanotechnology Online (2009), 51-6.
[38] YG Sun, YN Xia, “Shape-Controlled Synthesis of Gold and Silver Nanoparticles” Science (2002), 298: 2176-2179.
[39] R Georgekutty, MK Seery, SC Pillai, “A highly efficient Ag-ZnO photocatalyst: synthesis, properties, and mechanism” The Journal of Physical Chemistry C (2008), 112 (35): 13563-13570.
[40] S Saha, MM Malik, MS Qureshi, “Characterisation and synthesis of silver nano particle using leaf extract of epipremnumaureum” International Journal of Nanomaterials and Biostructures (2012), 2: 1-4. [41] R Geethalakshmi, D V L Sarada, “Synthesis of plant-mediated silver nanoparticles using Trianthemadecandra extract and evaluation of their anti microbial activities” International Journal of Engineering Science and Technology (2010), 2: 970-75. [42] K. Das Sujoy, Dickinson Calum, Lfir Fathima, F. Brougham Dermot, Marsili Enrico, “Synthesis, characterization and catalytic activity of gold nanoparticles biosynthesized with Rhizopus oryzae protein extract” Green Chem.(2012), 14: 1322-1334. [43] SP Chandran, M Chaudhary, R Pasricha, “snthesis of gold nanotriangles and silver nanoparticles using aloe vera plant extract” Biotechnology progress (2006), vol. 22, No 2 577-583. [44] I Pastoriza-Santos, LM Liz-Marzan, “Formation and characterization of silver nanoparticles in DMF with shape control” (2005). [45] SS Shankar, A Rai, A Ahmad, M Sastry, “Rapid synthesis of Au, Ag, and bimetallic Au core Ag shell nanoparticles using Neem (Azadirachta indica) leaf broth” J Colloid Interface Sci (2004), 275: 496-502.
[46] JY Song, BS Kim “Rapid biological synthesis of silver nanoparticles using plant leaf extract” Bioprocess Biosyst Eng (2009), 3279-84.

Chapter 3
`166
Chapter 3.2
Synthesis and Characterization of biogenic Ag NPs prepared by using: (IV) Shikakai (Acacia Concinna) pods extract
ABSTRACT
Green Synthesis method was employed to synthesis the silver nanoparticles (AgNPs) by aging the
mixture of the aqueous extract of the Acacia concinna (Shikakai fruit) and AgNO3 solution at
different time interval. Synthesized spherical shaped silver nanoparticles were characterized for
their structural, optical and morphological properties. The Fourier transformer infrared (FTIR)
spectroscopy reveals the presence of polyphenolic compounds in Acacia Concinna pods extract,
which can acts as a reducing agent for the conversion of silver nitrate to silver nanoparticles. The
x-ray diffraction (XRD) pattern examine the absence of the impurities that ascertains the higher
order purity of the biosynthesized silver nanoparticles. The experimental UV results absorption
peak at 419 nm corresponds to surface plasmon resonance property of the silver nanoparticles.
The green synthesized silver nanoparticles with average size ranging below 60 nm imaged using
(HRTEM) High Resolution Transmission Electron Microscopy. As synthesized AgNPs could be
applicable in different types of field such as biomedical, spintronics, optical, home products, etc.
Key Words: Silver Nitrate, Acacia Concinna pods, Nanotechnology, Silver Nanoparticles.

Chapter 3
`167
3.2 (IV) 1 INTRODUCTION
The unique features of nanoparticles may lead to play an important role in biomedicine, energy,
optics and other health care applications. [1] Among the various nanoparticles, AgNPs are widely
investigated ought to be their broad range of applications as antibacterial agent, catalyst and
biosensor. Several researches have made attempts for synthesis of AgNPs using chemical
reduction, [2] electrochemical reduction and photochemical reduction. [3] To overcome the
difficulties of the convential methods of AgNPs synthesis requires more chemicals, large
quantities of energy and results in formation of hazardous by products. [4] Some prominent
chemical and physical methods have been employed to prepare silver nanoparticles of different
sizes and shapes, are: UV irradiation, [5,6] microware irradiation, [7,8] chemical reduction, [9-11]
photochemical method, [12,13] electron irradiation, [14,15] and sonoelectrochemical method. [16]
However, most of the reported methods involve more than one step, high energy requirement, low
material conversions, difficulty in purification, and hazardous nature of the chemicals. The
chemical synthesis of nanoparticles may lead to the presence of some toxic chemical species
adsorbed on the surface that may have adverse effects to its application. The synthesis of
nanoparticles by green method can potentially eliminate this problem. Therefore, there is an
urgent need to develop a green process of nanoparticle synthesis.
Green synthesis methods employing either biological microorganism such as bacteria, either
intracellularly and extracellularly, fungus and algae or plant extracts have emerged as a simple
and alternative to chemical synthesis. The interest in this field has shifted towards green approach.
Recently, plant extract assisted syntheses of nanoparticle have attracted interest in the area of
nanoscience and technology due to its eco-friendly nature. These approaches focused on the
utilization of the environment friendly, cost effective and biocompatible reducing agents for the
synthesis of the AgNP’s so the green synthesis of the AgNP’s has attracted much attention in
recent years than the conventional methods of synthesis. [17] The use of plant and their extacts for
the synthesis of AgNP’s can be advantageous over other biological synthesis process.
Nanoparticles produced by the plant extracts are more stable and rate of synthesis is faster than in
the case of microorganisms. Some of the plant materials such as leaves, stem, seeds, fruits, latex
and barks are involved in metal reduction process so the use of plant extract reduces the cost as
well as we do not require any special culture preparation and isolation techniques. [18] The
another advantages of using plants and their extracts for the synthesis of metal nanoparticle is that
they are easily available, safe to handle and possess a broad variability of metabolites that may aid
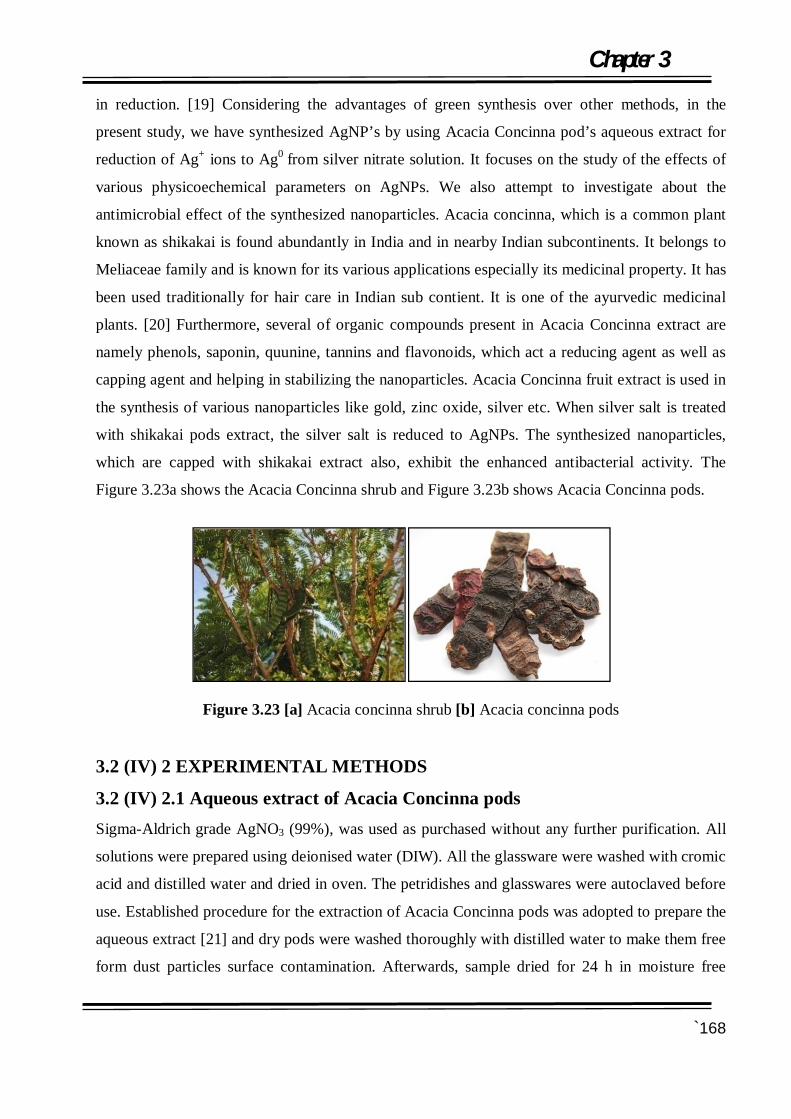
Chapter 3
`168
in reduction. [19] Considering the advantages of green synthesis over other methods, in the
present study, we have synthesized AgNP’s by using Acacia Concinna pod’s aqueous extract for
reduction of Ag+ ions to Ag0 from silver nitrate solution. It focuses on the study of the effects of
various physicoechemical parameters on AgNPs. We also attempt to investigate about the
antimicrobial effect of the synthesized nanoparticles. Acacia concinna, which is a common plant
known as shikakai is found abundantly in India and in nearby Indian subcontinents. It belongs to
Meliaceae family and is known for its various applications especially its medicinal property. It has
been used traditionally for hair care in Indian sub contient. It is one of the ayurvedic medicinal
plants. [20] Furthermore, several of organic compounds present in Acacia Concinna extract are
namely phenols, saponin, quunine, tannins and flavonoids, which act a reducing agent as well as
capping agent and helping in stabilizing the nanoparticles. Acacia Concinna fruit extract is used in
the synthesis of various nanoparticles like gold, zinc oxide, silver etc. When silver salt is treated
with shikakai pods extract, the silver salt is reduced to AgNPs. The synthesized nanoparticles,
which are capped with shikakai extract also, exhibit the enhanced antibacterial activity. The
Figure 3.23a shows the Acacia Concinna shrub and Figure 3.23b shows Acacia Concinna pods.
Figure 3.23 [a] Acacia concinna shrub [b] Acacia concinna pods 3.2 (IV) 2 EXPERIMENTAL METHODS
3.2 (IV) 2.1 Aqueous extract of Acacia Concinna pods Sigma-Aldrich grade AgNO3 (99%), was used as purchased without any further purification. All
solutions were prepared using deionised water (DIW). All the glassware were washed with cromic
acid and distilled water and dried in oven. The petridishes and glasswares were autoclaved before
use. Established procedure for the extraction of Acacia Concinna pods was adopted to prepare the
aqueous extract [21] and dry pods were washed thoroughly with distilled water to make them free
form dust particles surface contamination. Afterwards, sample dried for 24 h in moisture free

Chapter 3
`169
atmosphere and 2 gm of this sample was dried and soaked in 50 mL of pure DIW for 24 h. The
extract was filtered using Whatmann filter paper No. 42.
3.2 (IV) 2.2 Synthesis of silver nanoparticle Silver nanoparticles were synthesized using the procedure describe somewhere else. [22] 2.5 mL
of the aqueous Acacia Concinna fruit extract was added drop wise into the 25.0 mL of aqueous
0.001 M AgNO3 kept in a boiling tube at room temperature. Subsequently, the mixture was
shifted in a desiccator at room temperature for aging (8 h, 16 h and 24 h etc) that leads to a
biogenic chemical reduction of Ag+ ions into Ag NPs. Transparent solution of AgNO3 turns
reddish brown with time, which indicates the presence of Ag nanoparticles. Aging added
sharpness to the colour shfted toward low wavelength. The effects of physicoehemical parameter
were examined by varying the reaction time. Silver nanoparticles in aqueous phase are extremely
stable without any precipitation and their stability for long period may be due to antimicrobial
properties of this plant. Highly dispersed colloidal Ag NPs were found soluble in water and stable
at ambient condition for more than 6 months. After certain aging time, the suspension was
centrifuged at 20,000 rpm for 20 min, which resulted in suspended solid. It was washed by
distilled water then to be used for further analysis (XRD, HRTEM, UV-vis, FTIR, and PL study)
and catalytic activity analysis of Ag NPs.
3.2 (IV) 3 RESULTS AND DISCUSSION
3.2 (IV) 3.1 UV-Vis absorbtion spectrum Effect of reaction time on the formation of AgNPs was noted by the naked eyes. The change in the
colour of solution indicates the formation of Ag nanoparticles. This is the strong indication of the
formation of silver nanoparticles the change due to the strong absorption of visible light due to the
excitation of the surface plasmonic effect of the AgNPs. [23-26] The inset image of the Figure
3.24, the vials with of differently aged samples (8h, 16h and 24h) are a signal of the growth of
silver nanoparticles. The nanoparticle formed after 8h is the beginning of the reaction.The
reduction of silver salt to silver ions is happened due to the presence of reducing agents like
terpenoids and flavanones etc. AgNPs show yellowish brown colour in aqueous solution due to
the excitation of surface plasmon vibrations. It is noticed that the complete colour change
appeared after about 24h and thereafter no further change in colour of the reaction mixture
occured. This indicates that silver salt present in the reaction mixture has been reduced
completely. Then the formation of the silver nanoparticles was examined, and confirmed by the

Chapter 3
`170
respective absorption spectra. The absorption spectrum originated due to the strong surface
plasmon resonance (SPR). The observed absorption band is size dependent, since SPR band
depends on the refractive index of the solution. Figure 3.24 shows the UV-Vis absorption spectra
of AgNPs obtained in the range of 250-700 nm at different reaction time.
Figure 3.24 UV-visible-NIR spectra of the Ag NPs synthesized from predicted optimum
conditions upon dilution of 3.5 times. Inset shows the coloration due to formation of AgNPs with
aging.
Silver nanoparticles had free hot electrons, which give surface Plasmon resonance (SPR)
absorption band, due to the combination of vibration of electrons of silver nanoparticles with the
light wave. In Figure 3.24, we showed the 8 h aged samples with the pronounced SPR peak at 436
nm. That confrms that the prepared AgNPs are smaller in size and uniform in size distribution. It
is also observed that there is anincrease in height of the peak with aging that represents the
enhancement in the concentration of AgNPs with time. All the spectra displayed in Figure 3.24,
showed the polyphenolic peak around 278 nm. We also display the UV- Vis is spectra of the
AgNO3 and solution; it has a peak around 217 nm, as expected for Ag+ ions. Changes in colour
was observed initially after 3 min of adding the salt solution to the acacia concinna fruit extract.
After 24 h, the colour of the solution becomes nearly constant, indicating that no silver salt was
left for further reaction. The results are complete correlated with the passage of time, the intensity
of the SPR band increased without any shift in peak wavelength. According to the absorption
spectra of the spherical AgNPs, as the anisotropy increases the number of peaks increases. In the
present study, SPR band suggested that the synthesized nanoparticles are hexagonal top shaped,
which is further confirmed by TEM study.

Chapter 3
`171
3.2 (IV) 3.2 XRD Analyses
Figure 3.25 showed the XRD profile for Ag nanoparticles synthesized by the pure Acacia
Concinna fruit extract. Three main characteristic diffraction peaks of Ag NPs, were observed at 2θ
= 38.4o, 44.5o and 64.8o, which corresponds to the major peak (111) along with the very weaks
reflections along (200) and (220) crystallographic planes of face-centered cubic (fcc) Ag crystals,
(JCPDS 00-004-0783), respectively with the lattice parameter of a = 4.077 Å. No other peaks
from different phase were observed showing that the presence of the single phase Ag
nanoparticles without forgien element/compound. Because no biomass residue or other
crystallographic impurities are observed in the XRD profile. These observations reflected the
single phase Ag nanoparticles formation without any adultration. In general, Scherrer equation
was used to determine the average crystalline size. [27] The (111) plane was chosen to calculate
crystalline particle size, which is measured to be 34.2 nm. [28] This result was also matches well
with the TEM study.
Figure 3.25 XRD patterns for Ag nanoparticles developed in Acacia Concinna pod’s extract. 3.2 (IV) 3.3 Transmission electron microscopy (TEM) Transmission electron microscopy (TEM) has been employed to characterize the size, shape and
morphology of the synthesized silver nanoparticles. The TEM and HRTEM images of the silver
nanoparticles are shown in Figure 3.26A and 3.26B, respectively. From the image, it is evident
that the hexagonal top likes morphology for the silver nanoparticles. The average particles size
measured from the TEM image is 40.06 nm, which is in good agreement with the particle size
calculated from XRD analysis. TEM corresponding to the SAED pattern is showing the hint of
hexagonal structuring of the AgNPs Figure 3.26 C.

Chapter 3
`172
Figure 3.26 (A) TEM and (B) HRTEM image of the biogenic Acacia Concinna supported Ag
NPs, featuring with the d-spacing along the 111 plan and (C) SAED pattern consistent with the
hexagonal top shaped structure. (D) ATR spectra of 2 % Acacia concinna supported Ag NPs of 24
h.
3.2 (IV) 3.4 ATR measurement
ATR analyses were carried out to identify the possible biomolecules responsible for capping and
reducing agent for the Ag nanoparticles synthesized by Acacia Concinna fruit extract. Two
obvious infrared bands are observed at 3321cm-1 and 1635 cm-1(Figure 3.26 D) that represents the
presence of the intermolecular hydrogen bonding (N-H and O-H stretching mode in linkage of the
protein) and the C=O /C=C stretching mode in amine aqueous group, in pure Acacia Concinna
pods. [29,30] Which indicated the presence of the proteins as capping agent for the silver
nanoparticles, which increases the stability of the nanoparticles. [31] The secondary structures of
the proteins were not affected during the reduction of Ag+ ions or after binding with Ag
nanoparticles. [32] These spectroscopic studies confirmed the presence of the amino acid that
develops the strong binding, reducing and stabilizing ability with the metal through carbonyl
group.
These IR spectroscopic studies confirmed the presence of the amino acid that develop the strong
binding, reducing and stabilizing ability with metal through carbonyl group. Thus, it is concluded

Chapter 3
`173
that a layer of the bio-organics was formed around AgNPs to secure the nanoparticles. This layer
acts as a capping agent to prevent agglomeration and provides the extra stability in aqueous
medium. [33] IR study prove the presence of two kinds of chemicals in Acacia Concinna extract:
one, the reducing agents (polyphenols, Acaciac acid (trihydroxymonocarboxylic acid)) that
convert Ag+ ions into Ag nanoparticles and second, the capping agents/surfactant (tannins,
flavonoids, oil and fats, qunine, saponin, etc), which can act as an scaffold for controlling size and
shape of these nanoparticles. 3.2 (iv) 3.5 PL spectrum
Figures 3.27A and 3.27B, represents PL spectrum of the sample recorded at an excitation
wavelength λex=283 nm. Its shows the emission peaks at λem=564 nm (green region) at ecitation
wavelength λex=283 nm. The broad peak in green region is generated by radial recombination of
the photoexcited holes with the electrons in oxygen vacancies. Excitation of the electrons from the
occupied d-bands into the states above the Fermi level and successive relaxation of the electrons
from an occupied sp-band to the holes takes place by the electron-phonon scattering process
directed an energy loss, which is responsible for the visible light luminescence of the Ag
nanoparticles. [34] For Ag NPs broad peak in green emission region indicates that Ag NPs have
good crystal structure with very few oxygen vacancies. The optical properties of the silver
nanoparticles depend on both; interband and intraband transitions between electronic states.
FESEM and TEM results indicate that the smaller non-metallic clusters coexist with large metallic
nanoparticles. Here, only small metallic particles (cubic crystals) responsible for the
photoluminescence because it is hard for large metal particle to compete with effective radioactive
process with rapid radiation loss process. Therefore, they didn't exhibit photoluminescence. [35]
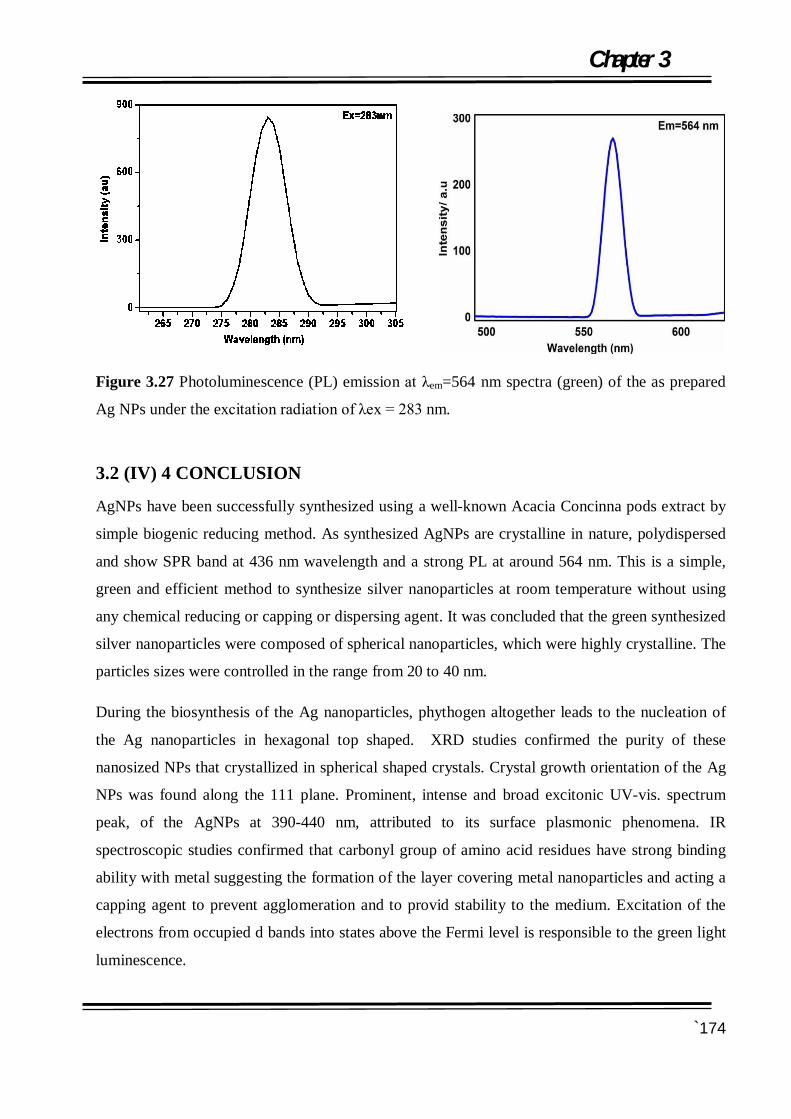
Chapter 3
`174
Figure 3.27 Photoluminescence (PL) emission at λem=564 nm spectra (green) of the as prepared
Ag NPs under the excitation radiation of λex = 283 nm.
3.2 (IV) 4 CONCLUSION
AgNPs have been successfully synthesized using a well-known Acacia Concinna pods extract by
simple biogenic reducing method. As synthesized AgNPs are crystalline in nature, polydispersed
and show SPR band at 436 nm wavelength and a strong PL at around 564 nm. This is a simple,
green and efficient method to synthesize silver nanoparticles at room temperature without using
any chemical reducing or capping or dispersing agent. It was concluded that the green synthesized
silver nanoparticles were composed of spherical nanoparticles, which were highly crystalline. The
particles sizes were controlled in the range from 20 to 40 nm.
During the biosynthesis of the Ag nanoparticles, phythogen altogether leads to the nucleation of
the Ag nanoparticles in hexagonal top shaped. XRD studies confirmed the purity of these
nanosized NPs that crystallized in spherical shaped crystals. Crystal growth orientation of the Ag
NPs was found along the 111 plane. Prominent, intense and broad excitonic UV-vis. spectrum
peak, of the AgNPs at 390-440 nm, attributed to its surface plasmonic phenomena. IR
spectroscopic studies confirmed that carbonyl group of amino acid residues have strong binding
ability with metal suggesting the formation of the layer covering metal nanoparticles and acting a
capping agent to prevent agglomeration and to provid stability to the medium. Excitation of the
electrons from occupied d bands into states above the Fermi level is responsible to the green light
luminescence.

Chapter 3
`175
3.2 (IV) 5 REFERENCES [1] A Fayaz, M Balaji, M Girilal, R Yadav, P Thangavelu, KR Venketesan, “Biogenic synthesis of silver nanoparticles and their synergistic effect with antibiotics: a study against gram-positive and gram-negative bacteria” Nanomed Nanotechnol. Biol. Med (2010), 6: 103-109. [2] K Balantrapu, D Goia, “Silver nanoparticles for printable electronics and biological applications” J Mater Res. (2009), 24 (9): 2828-2836. [3] RK Bera, AK Das, CR Raj, “Enzyme-Cofactor-Assisted Photochemical Synthesis of Ag Nanostructures and Shape Dependent Optical. Sensing of Hg (II) Ions” Chem. Mater (2010), 4505-4511. [4] AM Awwad, NM Salem, “Green synthesis of silver nano- particles by mulberry leaves extract” Nanosci Nanotechno (2011), 2125-128. [5] AT Le, LT Tam, PD Tam, “Synthesis of oleic acid-stabilized silver nanoparticles and analysis
of their antibacterial activity” Materials Science and Engineering: C. (2010), 30 (6): 910-916. [6] H Huang, Y Yang, “Preparation of silver nanoparticles in inorganic clay suspensions” Composites Science and Technology (2008), 68 (14): 2948-2953. [7] H Yin, T Yamamoto, Y Wada, S Yanagida, “Large-scale and size-controlled synthesis of silver nanoparticles under microwave irradiation” Materials Chemistry and Physics (2004), 83 (1): 66-70. [8] MN Nadagouda, TF Speth, RS Varma, “Microwave-Assisted Green Synthesis of Silver Nanostructures” Accounts of Chemical Research (2011), 44 (7): 469-478. [9] L Suber, I Sondi, E Matijevic, DV Goia, “Preparation and the mechanisms of formation of silver particles of different morphologies in homogeneous solutions” Journal of Colloid and Interface Science (2005), 288 (2): 489-495. [10] K Song, S Lee, T Park, B Lee, “Preparation of colloidal silver nanoparticles by chemical reduction method” Korean Journal of Chemical Engineering. (2009), 26 (1): 153-155. [11] O Golubeva, O Shamova, D Orlov, T Pazina, A Boldina, V Kokryakov, “Study of antimicrobial and hemolytic activities of silver nanoparticles prepared by chemical reduction” Glass Physics and Chemistry. (2010), 36 (5): 628-634. [12] M Harada, C Kawasaki, K Saijo, M Demizu, Y Kimura, “Photochemical synthesis of silver particles using water-in-ionic liquid microemulsions in high-pressure CO2” Journal of Colloid and Interface Science (2010), 343 (2): 537-545. [13] M Harada, Y Kimura, K Saijo, T Ogawa, S Isoda, “Photochemical synthesis of silver particles in Tween 20/water/ionic liquid microemulsions” Journal of Colloid and Interface Science (2009), 339 (2): 373-381. [14] K Li, FS Zhang, “A novel approach for preparing silver nanoparticles under electron beam irradiation” Journal of Nanoparticle Research (2010), 12(4): 1423-1428.
Chapter 3
`176
[15] KA Bogle, “Silver nanoparticles synthesis and size control by electron irradiation” Nanotechnology. (2006), 17(13): 3204. [16] J Zhu, S Liu, O Palchik, Y Koltypin, A Gedanken, “Shape-Controlled Synthesis of Silver Nanoparticles by Pulse Sonoelectrochemical Methods” Langmuir. (2000), 16 (16): 6396-6399. [17] M Gnanadesigan, M Anand, S Ravikumar, M Maruthupandy, M Syed Ali, V Vijayakumar, AK Kumaraguru; “Antibacterial potential of biosynthesised silver nanoparticles using Avicennia marina mangrove plant” Appl. Nanosci. (2012), 2: 143-147. [18] KC Bhainsa, SD Souza, “Extracellular biosynthesis of silver nanoparticles using the fungus Aspergillus fumigates” Colloids Surf Biointerfaces (2006), 47(2): 160-164. [19] N Krumov, I.N Perner, S Oder, V Gotcheva, A Angelov, C Posten, “Production of Inorganic Nanoparticles by Microorganisms” Chem. Eng. Technol (2009), 32(7): 1026-1035. [20] Y Tezuka, K.Honda, A.H.Banskota, M.M.Thet, S.Kadota, “Kinmoonosides A-C, three new cytotoxic saponins from the fruits of Acacia concinna, a medicinal plant collected in Myanmar” J. Nat. Prod (2000), 63: 1658-1664. [21] S Ankanna, P. TNVKV, E.K. Elumalai, N. Savithramma, “Production of biogenic silver nanoparticles using Boswelliaovalifoliolata stem bark” Dig. J. Nanomater. Biostruct. (2010), 5 (2): 369-372. [22] J Virkutyte, R.S. Varma, “Fabrication and visible-light photocatalytic activity of novel Ag/TiO2ÀxNx photocatalyst” New J. Chem. (2010), 34: 1094-1096. [23] MJ Kwon, J Lee, AW Wark, HJ Lee, “Nanoparticles-enhanced surface plasmon resonance detection of proteins at attomolar concentrations: comparing different nanoparticle shape and size” Anol chem. (2012), 84: 1702-1707. [24] PC Ray, “Size and shape dependent second order nonlinear optical properties of nanomaterials and their application in biological and chemical sensing” Chem Rev (2010), 110: 5332-5365. [25] V Amendola, OM Bakr, F stellacci, “A study of the surface plasmon resonance of silver nanoparticles by the discrete dipole approximation method: effect of shape, size, structure and assembly” Plasmonics (2010), 5: 85-97. [26] GV Hartland: “Optical studies of dynamic in noble metal nanostructures”Chem Rev (2011), 111: 3858-3887. [27] P. Scherrer, “Bestimmung der Grösse und der inneren Struktur von Kolloidteilchen mittels Röntgenstrahlen” Nachr. Ges. Wiss. Göttingen (1918), 26: 98-100. [28] J. I. Langford, A.J.C. Wilson, “Scherrer after Sixty Years: A Survey and Some New Results in the Determination of Crystallite Size” J. Appl. Cryst. (1978) 11 102-113.

Chapter 3
`177
[29] T. Wriedt, Mie Theory 1908-2008, ed. by Hergert, W.; Wriedt, “Present developments and interdisciplinary aspects of light scattering, eds” T. Universität Bremen. Bremen (2008), 17-21. [30] H Jiale, L Qingbiao, S. Daohua, “Biosynthesis of silver and gold nanoparticles b novel sundried Cinnamomum camphora leaf” Nanotechnology. (2007), 18 (10): 105-104. [31] G. Varsanyi, “Assignments of Vibrational Spectra of Seven Hundred Benzene Derivatives” Halsted Press (1974), vol. 1. [32] I.D.G. Macdonald, W.E. Smith, “Orientation of Cytochrome c Adsorbed on a Citrate-Reduced Silver Colloid Surface” Langmuir (1996), 12: 706-713. [33] A.M. Fayaz, K. Balaji, M. Girilal, R. Yadav, P.T. Kalaichelvan, R. Venketesan, “NanomedicineNanotechnology” Biology and Medicine (2010), NBM 6: 103-109. [34] B.M.V. Romão, C. Pardini, R.C.L. Dutra, F. Burel, “Caracterização por FT-IR de. Agentes de Cura Utilizados em Resinas Epoxídicas-II-Polimercaptana, Poliaminoamida- Amina Modificada” Polímeros Ciência Tecnologia (2003), 13: 173-180. [35] J.P. Wilcoxon, J.E. Martin, F. Paraspour, D.F.J. Kelley, "Photoluminescence from nanosize gold clusters" Chem. Phys. (1998), 108: 9137-9143.
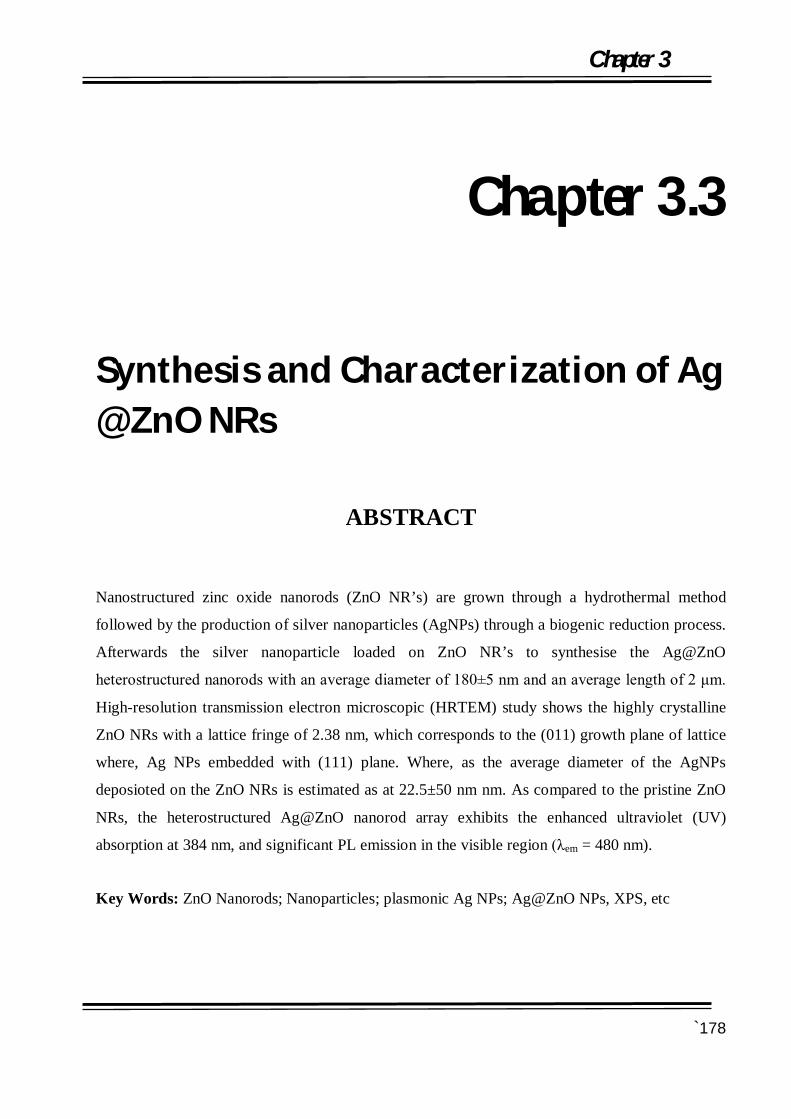
Chapter 3
`178
Chapter 3.3
Synthesis and Characterization of Ag @ZnO NRs
ABSTRACT
Nanostructured zinc oxide nanorods (ZnO NR’s) are grown through a hydrothermal method
followed by the production of silver nanoparticles (AgNPs) through a biogenic reduction process.
Afterwards the silver nanoparticle loaded on ZnO NR’s to synthesise the Ag@ZnO
heterostructured nanorods with an average diameter of 180±5 nm and an average length of 2 μm.
High-resolution transmission electron microscopic (HRTEM) study shows the highly crystalline
ZnO NRs with a lattice fringe of 2.38 nm, which corresponds to the (011) growth plane of lattice
where, Ag NPs embedded with (111) plane. Where, as the average diameter of the AgNPs
deposioted on the ZnO NRs is estimated as at 22.5±50 nm nm. As compared to the pristine ZnO
NRs, the heterostructured Ag@ZnO nanorod array exhibits the enhanced ultraviolet (UV)
absorption at 384 nm, and significant PL emission in the visible region (λem = 480 nm).
Key Words: ZnO Nanorods; Nanoparticles; plasmonic Ag NPs; Ag@ZnO NPs, XPS, etc

Chapter 3
`179
3.3.1 INTRODUCTION In modern era, nanotechnology is a boon for the researchers. Nanoparticles having a size of 1-100
nm along one dimension are used significantly concern with catalysis chemistry, industrial
chemistry, medical chemistry, atomic physics, and moreover it touched the almost all known
fields. Nanoparticles are immensely used in all parts of life due to their small size (surface to
volume ratio), preferred orientation, optical, chemical, magenetic, physical properties. Broad
domain of nanotechnology, includes oxide nanoparticles that can exhibits unique chemical
properties owing to their limited size and high density of interfaces or edge at surface sites. [1, 2]
ZnO-based semiconductors are always matter of interest for scienctific community. ZnO is a
group II–VI semiconductor, which not only has excellent thermal and chemical stability, with
high carriers mobility, but also has relatively large excitonic binding energy (60 meV) and it is a
direct wide band gap (3.37eV) at room temperature. In addition to above, ZnO also possesses
strong piezoelectric properties due to the inherent crystal structure. [3] These characteristics made
ZnO semiconductor suitable for applications in electronic, optoelectronic, electrochemical, and
electromechanical devices such as light-emitting diodes, [4] photodetectors, [5] photodiodes, [6]
gas sensors, [7] solar cells, [8] piezoelectric transducers, [9] and so on. Modification of ZnO
properties by incorporation of the metal /elements (dopant) is important to improve the feasibility
of these devices in multiple applications. Due to the high aspect ratio (~ equal to 3 to 5) of 1D-
ZnO nanostructures, these are considered as the best system to understand the transport
mechanism in 1D materials with excellent performance. Like nanowires, ZnO nanorods can also
exhibits properties i.e. tuneable optical band gap and morphology, composition and size, high
carrier mobility and direct conduction pathway for the flow of excitons. [10] It can also be serve
as an better interface between electrodes and fecilitate electrical path for the flow of charge
carriers in sensors. [11] ZnO nanorods can be easily grown on number of substrates including,
metal, conductive glass, polymers, etc and exhibit low density defects. These are also applicable
for the electronic and optoelectronic devices, transparent electrodes, short wavelength lasers, and
catalyst (for solar cells, photo-catalytic dye degradation, water splitting etc). [12-22] So Ag metal
ion deposition on ZnO NRs can offers good electrical, optical, magnetic and piezoelectric
properties, which is vital for their practical applications. In Ag@ZnO NRs, silver (Ag) act as a
cocaltalyst to enhance its optical properties of ZnO. Ag ions can act as acceptors in ZnO NRs,
existing on substitutional Zn sites or in the interstitial form. In Ag doped -ZnO NRs, the location

Chapter 3
`180
of the acceptor level remains contentious. [23] In general, the physical properties of Ag-ZnO NRs
are closely related to the deposition parameters and temperature of annealing. Due to these
reasons, the hydrothermal method has been widely used to adjust the structural, electrical and
optical properties of Ag@ZnO NRs. Ag-coated ZnO nanorods have been used in many
applications, such as efficient and cost effective transparent conducting oxide electrodes. In order
to test its utility as transparent conducting oxide electrode and antireflection coating, parameters
like conductivity and refractive index of the film needs to be investigated in future as reported in
literature. [24-26] In these studies, Ag doped ZnO thin films reported to increase in the resistivity
in addition to enhancement in the UV emission, and reduction of the optical band gap. [27-29] All
Ag-decorated ZnO NRs arrays were used for the electrical or optoelectrical properties. Although,
the pure ZnO nanostructures show weak optical features because of point defects such as oxygen
vacancy or interstitial Zn. Metal decorated ZnO can be engineered the optical and magnetic
properties of the pure ZnO. Therefore, various metals are used to in-cooperate with ZnO to make
the n-type and p-type optoelectronic devices. Silver has been reported as the best candidate
because of its high solubility, larger ionic size, and minimum orbital energy. [30] Theoretically,
among the all reported elements of group I B, copper (0.7 eV) and Au (0.5 eV), had higher
ionization energy than Ag (0.4 eV) that will caused silver to be the best candidate for making p-
doping in ZnO. [31,32] Recently, experimental and theoretical approaches revealed that when the
Ag doped (substitution) into the ZnO lattice, [33] Ag 4d and O 2p orbitals were overlapped to
form an impurity band, which can shift the Fermi level toward the valence band maxima and
induced p-type character in ZnO. These p-type properties not only depend on Ag content, but also
on experimental conditions such as electrochemical growth and post-annealing conditions, etc.
[34,35] Electrical properties of the AgNPs-doped ZnO governed by the place Ag in ZnO lattice
(substitution and interstitial), where the substitutional sites were more energetically favourable
than interstitial sites. Few of the studies reported the effects of silver doping on the photocatalytic
activity and antibacterial properties of ZnO. [36-38] The dilute magnetism was also observed for
the AgNPs- doped ZnO semiconductor. However, the origin of ferromagnetic properties is still
under investigation. But few studies said that the ferromagnetic behaviour of the compound are
result of the formation of impurity band, which interacts with the d orbital of nonmagnetic
element. Therefore, it can also be used in spintronic applications. [39-41] Here, we synthesised

Chapter 3
`181
the nanostructures of ZnO NRs by a simple and low-cost hydrothermal method and AgNPs by
biogenic reduction of silver salt. Afterwards the AgNPs decorated on the surface of the ZnO by
chrmical bath deposition technique. The aim of this work was to produce p-type semiconductor
that can be used in different type of optical applications specially for water splitting and pollutant
degeradation.
3.3.2 EXPERIMENTAL During the fabrication of the heterostructured device, we first, grow ZnO nanorod array using the
modified low-temperatured hydrothermal method, as it discussed in section 3.1. [42,43] Synthesis
of AgNPs was done by biogenic plant extract reduction of silver salts as it discussed in the section
3.2.To modify the ZnO NRs surface with AgNPs, the mixture of both was stirred at room
temperature. And as shown in Scheme 1, the synthesized Ag@ZnO NR were exposed under a UV
light (hv) that leads to form electron-hole pairs because when sunlight exposed to ZnO the
electron jump from VB (photoholes formed) to CB (photoelectrons formed) of ZnO. In presence
of CH3OH, the holes (h+) are consumed to produce ethoxy radicals CH3O*.
Scheme 1 Flow chart for the preparation of Ag@ZnO nanorods

Chapter 3
`182
3.3.3 RESULTS AND DISCUSSION 3.3.3.1 Structural Characterization
The surface morphology and chemical composition of the Ag@ZnO nanorods have been studied
by FESEM, HRTEM and SAED analysis. Figure 3.28A shows the FESEM micrograph of the Ag
loaded on to the ZnO nanorod substrate. The average diameter of ZnO hexagonal nanorods is
estimated as 180±5 nm with their average length of 2 μm. The shape and size of the typical as-
grown Ag at the surface of ZnO nanorod are revealed in the TEM micrograph (Figure 3.28B),
which is consistent with the result of the FESEM micrograph. The HRTEM micrograph
demonstrated by the Figure 3.28C further indicates that the Ag@ZnO nanorods are highly
crystalline with a lattice fringe of 2.38 nm, which corresponds to the (011) growth planes of the
ZnO crystal lattice. The heterostructures of Ag@ZnO nanorods are clearly shown in TEM (Figure
3.28E). The surface of nanostructured Ag@ZnO NRs are not smooth as it was decorated with Ag
NPs. The chemical composition of Ag@ZnO heterostructured nanorods were also determined
using EDX neasurement. Figure 3.28f indicate the three elements presence in nanocomposite i.e.
Zn, O, and Ag with their % composition (Zn: O : Ag :: 56.86 : 32.53 :10.61 %). It indicates that
the large amount of spherical Ag NPs loaded on the ZnO NRs surface. Furthermore, Ag@ZnO
NRs were studied by HRTEM that confirms the loading of the average diameter of spherical Ag
nanoparticles is estimated at 22.5±5 nm as shown in Figure 3.28C and a small-inset image shows
a HRTEM micrograph of Ag@ZnO NRs. In addition, the inter planar and distance between two
fringes is measured as 0.95 nm, as it illustrated by the Figure 3.28C, which corresponds to the d-
spacing of the [111] crystal plane of Ag NPs. The interface between ZnO NR and Ag NP is
highlighted by the white rectangle, shown in figure 3.28E.

Chapter 3
`183
Figure 3.28 (A) FESEM micrograph of aligned Ag@ZnO nanorod, (B) TEM micrograph of
Ag@ZnO nanorod, (C) HRTEM micrograph of the Ag@ZnO nanorod and (D) SAED Pattern of
Ag@ZnO nanorods, (E) TEM micrograph of the single Ag@ZnO nanorod that loaded with nano
Ag, (F) EDX micrograph of Ag-ZnO nanorods.
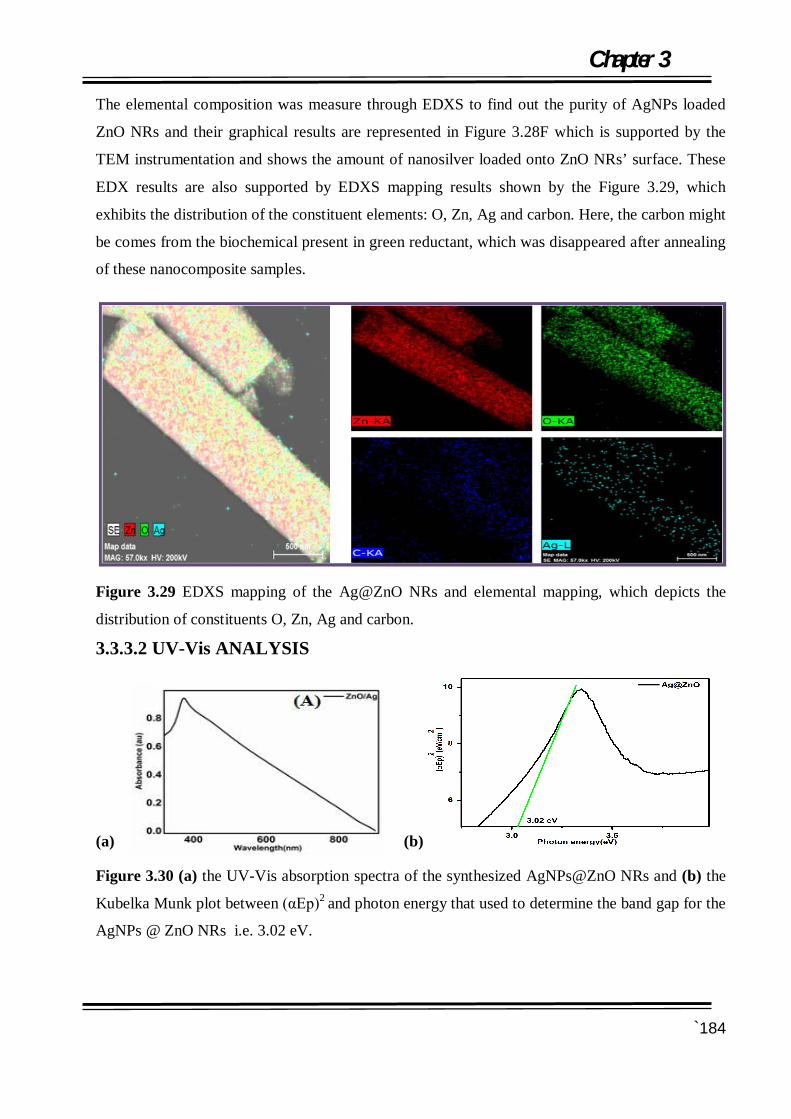
Chapter 3
`184
The elemental composition was measure through EDXS to find out the purity of AgNPs loaded
ZnO NRs and their graphical results are represented in Figure 3.28F which is supported by the
TEM instrumentation and shows the amount of nanosilver loaded onto ZnO NRs’ surface. These
EDX results are also supported by EDXS mapping results shown by the Figure 3.29, which
exhibits the distribution of the constituent elements: O, Zn, Ag and carbon. Here, the carbon might
be comes from the biochemical present in green reductant, which was disappeared after annealing
of these nanocomposite samples.
Figure 3.29 EDXS mapping of the Ag@ZnO NRs and elemental mapping, which depicts the
distribution of constituents O, Zn, Ag and carbon.
3.3.3.2 UV-Vis ANALYSIS
(a) (b)
Figure 3.30 (a) the UV-Vis absorption spectra of the synthesized AgNPs@ZnO NRs and (b) the
Kubelka Munk plot between (αEp)2 and photon energy that used to determine the band gap for the
AgNPs @ ZnO NRs i.e. 3.02 eV.

Chapter 3
`185
The UV-visible absorption spectra of the ZnO@Ag NRs samples as shown in Figures 3.30(a) and
3.30(b), was taken in the range of 200-900 nm. Figure 3.30(a) exhibited a strong excitonic peak of
Ag NPs decorated ZnO NRs absorption that was existed at 384 nm that is higher than that of the
pure ZnO nano rods 368 nm [Chapter 3.1] The peak obtained at 384 nm is assigned to absorption
of ZnO NRs and careful investigation shows the presence of Ag NPs peak at 420 nm. The
difference in the absorption peak positions of the pure ZnO NRs and Ag NPs/ ZnO NRs, was
observed due to the binding of the SPR Ag NPs to the zinc oxide surface. This enriched the
absorption peak. Figure 3.30(b) represents the Kubelka Munk plot between (αEp)2 and photon
energy that used to determine the band gap for the AgNPs @ ZnO NRs i.e. 3.02 eV.
3.3.3.3 XRD STUDY
The XRD patterns of the Ag@ZnO nanorods are displayed in Figure 3.31. The diffraction peaks
of the ZnO NRs array match as well the typical hexagonal wurzite structure of the ZnO
(corresponds to the standard JCPDS card no. 36-1451). The extra peaks located at 2θ = 38.12°,
44.28°, 64.25°, and 77.47°, are attributed to the respective crystalline planes (111), (200), (220),
and (311) belongs to the Ag NPs i.e. consistent with the standard Ag JCPDS card no. 04-0783. In
addition, there is no remarkable shift and intensity change to all diffraction peaks. The ZnO and
Ag NPs particle size can be estimated by Scherrer’s equation [28]
Figure 3.31 XRD profile of the Ag@ZnO nanorods

Chapter 3
`186
The average particle size of the Ag NPs deposited on ZnO nanorods is around 22.9 nm which is
consistent with the result of TEM and 300 nm diameter of ZnO nanorods was estimated along
with their the average length of 2 μm.
3.3.3.4 XPS STUDY
The XPS spectra of as-grown Ag-ZnO NRs was taken for the Zn, Ag, C and O elementsusing the
XPS spectrophotometer (Omicron EA 125 spectrometer). High-resolution XPS spectrum of the
as-grown Ag@ZnO nanorods is illustrated by the Figures 3.32a, 3.32b, 3.32c and 3.32d. The
chemical state of the Ag was characterized by examining Ag-3d levels demonstrated in Figure
3.32a. The Ag peaks (3d3/2) located at 367.95 and Ag (3d5/2) at 373.51 eV, due to the splitting of
the energy about ~6eV that represent the metallic state of silver present in the synthesized
samples. [44, 45] Khosravi et. al. [46], have revealed the presence of two different components,
which could be attributed to the either metallic Ag or Ag2O and to an Ag-Zn-O ternary compound.
As the binding energy of the Ag-3d for the doped sample compared to the binding energy of the
bulk silver sample (367.95 eV for Ag (3d5/2) and 373.51 eV for Ag (3d3/2) [47] was significantly
shifted towards lower binding energy. That result of the interaction between silver and ZnO
nanoparticles, which could regulate the position of the Fermi level of silver by the formation of a
new Fermi level for metallic silver. Free electrons above the new Fermi level might be tunnelled
to the empty conduction band of ZnO. [48] As per present XPS patterns, Ag-3d binding energy
was shifted to lower binding energy that can be explained by two processes: In first process, the
binding energy of the unit valance silver is much lower than the zero valance silver [49] and the
second one is due to the formation of an oxide layer on the surface of silver particles but there is
no oxide layer confirmed by the XRD analysis. Due to the high electronegativity of Ag than Zn,
electron transfer was assumed to be occured from Zn to the Ag particles, suggested that the
chemical bond between ZnO and Ag, which is compensate the defects at ZnO crystal lattice.

Chapter 3
`187
(a) (b)
(c) (d) Figure 3.32 XPS spectra of the AgNPs @ZnO sample. (a) XPS spectra of Zn 2p (b) Ag 3d (c) O
1s. and (d) C element high-resolution spectra.
When Ag NPs are loaded onto ZnO NRs surface, the positions of the symmetrical peaks of Zn are
located at 1022.01 and 1045.40 eV, as demonstrated by the Figure 3.32b. Where, the peaks
positions for the sample of pure zinc oxide ascribed to Zn(2p1/2) and Zn(2p3/2), are located at
1021.67 and 1044.81 eV and corresponding to Zn(2p1/2) and Zn(2p3/2). [50] The splitting energy
of Zn-2p states is about 23 eV, which can be induced from the powerful spin-orbit coupling. Red
shift in Zn spectra was observed on silver doping from the binding energy of the standard ZnO
(1022.1 eV for Zn(2p1/2) and 1045.1 eV for Zn(2p3/2), which can be attributed to the charge
transfer from Zn2+ to O2−due to the presence of the vacancies. [51] These peaks positions confirms
the wurtzite structure and Zn2+ mode of the Zn atom on the samples. [52] Therefore, due to the
charge transfer in the binding energy of XPS spectrum, it can be deduced that the Zn-2p peak shift
indicates that oxygen deficiency is the dominant factor versus Zn deficiency in the doped samples
in contrast to the pure one. [51]
Chapter 3
`188
Figure 3.32c shows the internal levels of the oxygen in both of the nanoparticles. Itis clearly seen
that the O-1s curve was asymmetric that can be fitted with two Gaussian peaks (530.87 (I) and
533.33 (II) symmetrically to represent the two different types of oxygen groups in the samples.
The peak (I) was located in the lower binding energy in comparison with the peak (II), which was
dedicated to O2-ions of Zn-O bonding at crystal lattice due to lattice oygen species. [53] The peak
(II) was related to the oxygen vacency due to structural defects. [54] These groups could play a
major role in the photocatalytic activity.
It could increase the photocatalytic activity [55] by suppressing the recombination of electron-
hole pairs. Silver doping of ZnO led to a shift in the O-1s spectrum toward lower binding energy.
The atomic ratio of oxygen vacancy (II) to total oxygen was calculated for pure ZnO, which was
equal to 51% and increased by 16% using Ag doping. So, the photocatalytic activity should be
increased by silver addition process. Also, decreasing the binding energy of the Zn-2p and O-1s
levels with silver doping could be due to the reduction of oxygen vacancy. Decrease in the ratio of
Zn/O in the present XPS results for the doped samples compared to the pure sample confirmed the
reduced the density of oxygen defects.Figure 3.32d, exhibited the three type of carbon situated at
285.23 (C-C and C-H) 287.53 (O-C-O) and 290.67(O-C=O) eV in XPS profile of the
AgNPs@ZnO NRs.The presences of carbon in XPS profile of the compound may be result of the
phytochemicals present on the Ag NPs surface and removed on annealing.
3.3.3.5 PL STUDY
Figure 3.33 represents PL spectrum of the sample recorded at the excitation wavelength 281 nm
and display deep level emissions (DLE) at about 480 nm in the visible region. This visible
emission of ZnO has been frequently ascribed to several intrinsic and extrinsic defects or
blue/green radiation is due to the oxygen vacancy with a hole in the valence band. [56-58]

Chapter 3
`189
(a) (b)
Figure 3.33 (a) Excitation spectra of the Ag@ZnO at λem= 480 nm. (b) Photoluminescent
emission spectra of Ag@ZnO heterostructured nanorodrecorded at λex= 281nm.
3.3.4 CONCLUSION Ag@ZnO heterostructure nanorods with excellent optical properties are successfully prepared
through a simple chemical deposition method. The heterostructures of Ag@ZnO was examined by
various analytical techniques such as XRD, UV-Vis, SEM, TEM, HRTEM, EDXS, XPS, PL, etc.
It is found that the addition of Ag NPs to ZnO surface, results in the formation of zero valent
metallic Ag deposited on the surface of ZnO nanorods and the optical properties of Ag@ZnO
nanorods is dependent on their structure, especially the heterostructure and oxygen vacancy. The
presence of the Ag nanoparticles and oxygen vacancy on the surface of ZnO nanorods promotes
the separation of photogenerated electron-hole pairs and thus enhances the optical and
photocatalytic activity.
3.3.5 REFERENCES [1] T.C. Prathna, L.M., N. Chandrasekaran, Ashok M. Raichur and Amitava Mukherjee, “Biomimetic synthesis of Nanoparticles: Science, Technology & Applicability” School of Bio Sciences & Technology, VIT University, Department of Materials Engg., Indian Institute of Science, India. (2010), 1-17. [2] Deepali Sharma , J.R., B.S. Kaith , Mohinder Kaur, Sapna Sharma “Synthesis of ZnO nanoparticles and study of their antibacterial and antifungal properties” Thin Solid Films (2010), 5191224-1229. [3] U. Ozgur, Ya. I. Alivov, C. Liu, A. Teke, M. A. Reshchikov, S. Doan, V. Avrutin, S.-J.Cho, H. Morkoc, “A comprehensive review of ZnO materials and devices” J. Appl. Phys. (2005), 98: 041301.

Chapter 3
`190
[4] N. Saio, H. Hanela, T. Sekiguchi, N. Ohashi, I. Sakaguch, K. Koumoto, “Low-Temperature Fabrication of Light-Emitting Zinc Oxide Micropatterns Using Self-Assembled Monolayers” Adv. Mater. (2002), 14: 418-421. [5] S. Liag, H. Sheng, Y. Liu, Z. Hio, Y. lu, H. Shen, “ZnO Schottky ultraviolet photodetectors” J. Cryst. Growth (2001), 225: 110-113. [6] J. Y. Lee, Y. S. Choi, J. H. Kim, M. O. Park, S. Im, “Optimizing n-ZnO/p-Si heterojunctions for photodiode applications” Thin solid films (2002), 403: 553-557. [7] N. Golego, S. A. Studenik, M. Cocivera, “Sensor Photoresponse of Thin-Film Oxides of Zinc and Titanium to Oxygen Gas” J. Electrochem. Soc. (2000), 147: 1592-1594. [8] R.J. Hong, K. Helming, X. Jiang, B. Szyszka, “Texture analysis of. Al-doped ZnO thin films prepared by in-line reactive MF magnetron sputtering” Appl. Surf. Sci. (2004), 226 378. [9] T. Shiosaki and A. Kawabata,"Low-Frequency Piezoelectric-Transducer Applications of ZnO Film" Appl. Phys. Lett. (1974), 25: 10-11. [10] WI Park, J S Kim, GC Yi, MH Bae, HJ Lee, “Fabrication and electrical characteristics of high-performance ZnO nanorod field-effect transistors” Appl. Phys. Lett. (2004), 85: 5052-5054. [11] M Jiao, NV Chien, NV Duy, ND Hoa, NV Hieu, K Hjort, H Nguyen, “On-chip hydrothermal growth of ZnO nanorods at low temperature for highly selective NO2 gas sensor” Mater. Lett. (2016), 169: 231-235. [12] Q Zhang, CS Dandeneau, X Zhou, G Cao, “ZnO Nanostructures for Dye-Sensitized Solar Cells” Adv. Mater. (2009), 21: 4087-4108. [13] Y Hames, Z Alpaslan, A Koasemen, S E San, Y Yerli “Electrochemically grown ZnO nanorods for hybrid solar cell applications” Sol. Energy (2010), 84: 426-431. [14] ML Zhang, F Jin, ML Zheng, J Liu, Z S Zhao, XM Duan, “High efficiency solar cell based on ZnO nanowire array prepared by different growth methods” RSC Adv. (2014), 4: 10462-10466. [15] A Djurisic, A Ng, X Chen “ZnO nanostructures for optoelectronics: material properties and device applications” Prog.Quantum Electron. (2010), 34: 191-259. [16] S Chu, G Wang, W Zhou, Y Lin, L Chernyak, J Zhao, J Kong, L Li, J Ren, J Liu “Electrically pumped waveguide lasing from ZnO nanowires” Nat. Nanotechnol. (2011), 6: 506-510. [17] F T Liu, S F Gao, S K Pei, SC Tseng, C Hsin, J Liu “ZnO nanorod gas sensor for NO2 detection” Journal of the Taiwan Institute of Chemical Engineers (2009), 405528-532.

Chapter 3
`191
[18] M Thambidurai, N Muthukumarasamy, D Velauthapillai, C Lee “Synthesis of garland like ZnO nanorods and their application in dye sensitized solar cells” Mater. Lett. (2013), 92: 104-107. [19] L Schlur, A Carton, P Leveque, D Guillon, G Pourroy, “Optimization of a new ZnO nanorods hydrothermal synthesis method for solid state dye sensitized solar cells applications" J. Phys. Chem.C (2013), 117: 2993. [20] R Zou, G He, K Xu, Q Liu, Z Zhangand, J Hu “ZnO nanorods on reduced graphene sheets with excellent field emission gas sensor and photocatalytic properties” J. Mater. Chem. A (2013), 1: 8445-8452. [21] M Raja, N Muthukumarasamy, D Velauthapillai, R Balasundaraprabhu, S Agilan, T S Senthil “ Influence of pH on ZnO nanocrystalline thin films prepared by sol-gel dip coating method” Sol. Energy (2014), 106: 129-135. [22] J J. Hassan, MA Mahdi, CW Chin, HA Hassan, Z Hassan, “A high-sensitivity room-temperature hydrogen gas sensor based on oblique and vertical ZnO nanorod arrays” Sensors and Actuators B: Chemical (2013), 176: 360-367. [23] Y. Zhang, “Effects of Ag Doping on the Photoluminescence of ZnO Films Grown on Si Substrates” J. Phys. Chem. B (2005), 109: 19200-19203. [24]J. Fan, “The roles played by Ag and Al dopants in controlling the electrical properties of ZnO varistors” J. Appl. Phys. (1995)77 4795-4800. [25] L. Xu, G. Zheng, L. Zhao, and S. Pei, “Two different mechanisms on UV emission. enhancement in Ag-doped ZnO thin films” Journal of Luminescence (2015), 158: 396-400. [26] A.N. Gruzintsev, V.T. Volkov, and E.E. Yakimov, “Photoelectric properties of ZnO films doped with Cu and Ag acceptor impurities” Semiconductors (2003), 37: 259-262. [27] J. Xu, Z.Y. Zhang, Y. Zhang, B.X. Lin, and Z.X. Fu, “Effect of Ag Doping on Optical and Electrical Properties of ZnO Thin Films” Chin. Phys. Lett. (2005), 22: 2031-2034. [28] H.S. Kang, B.D. Ahn, J.H. Kim, G.H. Kim, S.H. Lim, H.W. Chang, and S.Y. Lee, “Structural, electrical, and optical properties of p-type ZnO thin films with Ag dopant” Appl. Phys. Lett. (2006), 88: 202108. [29] M. Liu, S.W. Qu,W.W. Yu, S.Y. Bao, C.Y. Ma, Q.Y. Zhang, J. He, J.C. Jiang, E.I. Meletis, and C.L. Chen, “Photoluminescence and extinction enhancement from ZnO films embedded with Ag nanoparticles” Appl. Phys. Lett. (2010), 97231906. [30] H. Xue, X.L. Xu, Y. Chen, G.H. Zhang, and S.Y. Ma,“Influence of Ag-doping on the optical properties of ZnO films” Applied Surface Science (2008), 255: 1806-1810. [31] K. Liu, B. Yang, H. Yan, Z. Fu, M. Wen, Y. Chen, and J. Zuo,“Strong room-temperature ultraviolet emission from nanocrystalline ZnO and ZnO: Ag films grown by ultrasonic spray pyrolysis” Applied Surface Science (2008), 255: 2052-2056.

Chapter 3
`192
[32] M. Ahmad, J. Zhao, J. Iqbal, W. Miao, L. Xie, R. Mo, J. Zhu, “Conductivity enhancement by slight indium doping in ZnO nanowires for optoelectronic applications” Journal of Physics D: Applied Physics (2009), 42 (16): 165406. [33] Y. Yan, M. Al Jassim, S.H. Wei, “Doping of ZnO by group-IB elements” Applied physics letters (2006), 89 (18): 181912-181912. [34] Y. Ma, G. T. Du, S. R. Yang, Z. T. Li, B. J. Zhao, X. T. Yang, T. P. Yang, Y. T. Zhang, D. L. Liu, “Control of conductivity type in undoped ZnO thin films grown by metalorganic vapor phase epitaxy” Journal of Applied Physics (2004), 95: (11) 6268-6273. [35] M. Thomas, W. Sun, J. Cui, “Mechanism of Ag doping in ZnO nanowires by electrodeposition: experimental and theoretical insights” The Journal of Physical Chemistry C 116 (10) (2012), 6383-6391. [36] O. Lupan, L. Chow, L. K. Ono, B. R. Cuenya, G. Chai, H. Khallaf, S. Park, A. Schulte, “Synthesis and characterization of Ag or Sb doped ZnO nanorodsby a facile hydrothermal route” The Journal of Physical Chemistry C (2010), 114 (29): 12401-12408. [37] C. Karunakaran, V. Rajeswari, P. Gomathisankar, “Optical, electrical, photocatalytic, and bactericidal properties of microwave synthesized nanocrystalline Ag-ZnO and ZnO” Solid State Sciences (2011), 13 (5): 923-928. [38] P. Amornpitoksuk, S. Suwanboon, S. Sangkanu, A. Sukhoom, N. Muensit, J. Baltrusaitis, “Synthesis, characterization, photocatalytic and antibacterial activities of Ag-doped ZnO powders modified with a d-block copolymer” Powder Technology (2012), 219: 158-164. [39] T. Chen, Y. Zheng, J.M. Lin, G. Chen, “Study on the photocatalytic degradation of methyl orange in water using Ag/ZnO as catalyst by liquid chromatography electrospray ionization ion-trap mass spectrometry” Journal of the American Society for Mass Spectrometry (2008), 19 (7): 997-1003. [40] R. Kumar, D. Rana, A. Umar, P. Sharma, S. Chauhan, M. S. Chauhan, “Ag-doped ZnO nanoellipsoids: Potential scaffold for photocatalytic and sensing applications” Talanta (2015), 137204-213. [41] M. He, Y. Tian, D. Springer, I. Putra, G. Xing, E. Chia, S. Cheong, T. Wu, “Polaronic transport and magnetism in Ag-doped ZnO” Applied Physics Letters (2011), 99 (22): 222511/1-222511/3. [42] SK. Tzeng, MH. Hon, IC. Leu, “Improving the performance of a zinc oxide nanowire ultraviolet photodetector by adding silver nanoparticles” J Electrochem Soc. (2012), 159 H440-H443. [43] D. Lin, H. Wu, R. Zhang, W. Pan, “Enhanced photocatalysis of electrospun Ag-ZnO heterostructured nanofibers” Chem Mater. (2009), 21: 3479-3484.

Chapter 3
`193
[44] Y. Ao, J. Xu, D. Fu, C. Yuan, “Preparation of Ag-doped mesoporous titania and its enhanced photocatalytic activity under Uv light irradiation” Journal of Physics and Chemistry of Solids (2008), 69 (11): 2660-2664. [45] M. Wu, B. Yang, Y. Lv, Z. Fu, J. Xu, T. Guo, Y. Zhao, “Efficient one-pot synthesis of Ag nanoparticles loaded on n-doped multiphase TiO2 hollow nanorod arrays with enhanced photocatalytic activity” Applied Surface Science (2010), 256 (23): 7125-7130. [46] S. Khosravi-Gandomani, R. Yousefi, F. Jamali-Sheini, N. M. Huang, “Optical and electrical properties of p-type Ag-doped ZnO nanostructures” Ceramics International (2014), 40 (6): 7957-7963. [47] Y. Zheng, C. Chen, Y. Zhan, X. Lin, Q. Zheng, K. Wei, J. Zhu, “Photocatalytic activity of Ag/ZnO heterostructure nanocatalyst:correlation between structure and property” The Journal of Physical Chemistry C (2008), 112 (29): 10773-10777. [48] Y. Zheng, L. Zheng, Y. Zhan, X. Lin, Q. Zheng, K. Wei, “Ag/ZnO heterostructure nanocrystals: synthesis, characterization, and photocatalysis” Inorganic chemistry (2007), 46 (17): 6980-6986. [49] M. Habibi, R. Sheibani, “Preparation and characterization of nanocomposite znoag thin film containing nano-sized Ag particles: influence” Journal of Sol-Gel Science and Technology (2010), 54 (2): 195-202. [50] Y. Jin, Q. Cui, K. Wang, J. Hao, Q. Wang, J. Zhang, “Investigation of photoluminescence in undoped and Ag-doped ZnO flower like nanocrystals” Journal of Applied Physics (2011), 109 (5). [51] R. K. Sahu, K. Ganguly, T. Mishra, M. Mishra, R. Ningthoujam, S. Roy, L. Pathak, “Stabilization of intrinsic defects at hightemperatures in ZnO nanoparticles by Ag modification” Journal of colloid and interface science (2012), 366 (1): 8-15. [52] A. Meng, S. Sun, Z. Li, J. Han, “Synthesis, characterization, and dispersion behavior of ZnO/Ag nanocomposites” Advanced Powder Technology (2013), 24 (1): 224-228. [53] J. H. Zheng, J. L. Song, X. J. Li, Q. Jiang, J. S. Lian, “Experimental and first-principle investigation of Cu-doped ZnO ferromagnetic powders” Crystal Research and Technology (2011), 46 (11): 1143-1148. [54] R. Al-Gaashani, S. Radiman, A. Daud, N. Tabet, Y. Al-Douri, “XPS and optical studies of different morphologies of ZnO nanostructures prepared by microwave methods” CeramicsInternational (2013), 39 (3): 2283-2292. [55] M. N. Chong, B. Jin, C. W. Chow, C. Saint, “Recent developments in photocatalytic watertreatment technology: a review” Water research (2010), 44 (10): 2997-3027. [56] C. Karunakaran, J. Jayabharathi, K. Jayamoorthy, P. Vinayagamoorthy, “Inhibition of fluorescence enhancement of benzimidazolederivative on doping ZnO with Cu and Ag” Journal of Photochemistry and Photobiology A: Chemistry (2012), 247: 16-23.

Chapter 3
`194
[57] H. Kumar and R. Rani “Structural and Optical Characterization of ZnO Nanoparticles Synthesized by Microemulsion Route” International Letters of Chemistry, Physics and Astronomy (2013), 1426-36. [58] C. Lin and Y. Li, “Synthesis of ZnO nanowires by thermal decomposition of zinc acetate dihydrate” Materials Chemistry and Physics (2009), 113: 334-337.

Chapter 3
`195
Chapter 3.4
Synthesis and Characterization of CdS @Co-ZnO NRs
ABSTRACT CdS@Co-ZnO Nanorods with different end shapes, were synthesised using hydrothermal method
by varying the concentration of the aqueous CTAB (17.5, 20, 25, 30, 35 and 40%). The growth
mechanism of the preparation is proposed for the Co-ZnO Nanorods (~400 nm broad and 2 mm
long). CdS nanocrystals were loaded on to the surface of the Co-ZnO to increase the activity of
the ZnO in visible range. Successive surface modification of the one dimensional ZnO
nanostructures, reduces the band gaps, after each modification as follows 3.18 eV (ZnO NRs),
3.00 eV (Co-ZnO NRs), 2.48 eV (CdS/ZnO NRs) and 2.25 eV (CdS/Co-ZnO NRs). These
heterostructures exhibits the excellent stability, capability to utilize the wide portion of visible
light, and suppress the recombination of the photocarriers i.e. light generated photo-electrons and
photo holes. As synthesised nanostructures are examined using advance the techniques such as
XRD, SEM, EDX, TEM, HRTEM, SAED, UVVis spectroscopy, XAS , etc. It was established
that the nanodevice nanocomposite is useful for the optoelectronic devices.
Key words: one dimensional structured Co-ZnO, CdS nano crystal, CdS/Co-ZnO NRs, hydrothermal method, XAS.

Chapter 3
`196
3.4.1 INTRODUCTION Oxide photocatalysts (ZnO, TiO2, Ga2O3, Nb2O3, In2O3 Fe2O3, SnO2, WO3, NiO, etc.) are
comparatively found stable and cost effective photocatalyst. Out of the commercially available
wide range of oxide semiconductors, ZnO [1,2] has been selected for the study because of its
superb and unique inherent qualities such as low cost, wide availability, viability to change in
morphology, large excitonic binding energy (60 me V), deep photon penetration, short diffusion
length, low reflectivity, high carrier mobility, good bio-compatibility, etc. Usually, the
nanostructures of ZnO possess a large degree of charge character transfer over their bulk counter
part that is due to their large surface area to volume ratio, short lateral diffusion length and low
reflectivity. [3] Furthermore, doping of transition metals to the semiconductors, used to improve
the optical output of these photocatalytic materials. Hence, cobalt doping was employed to modify
the surface quality of ZnO. Therefore, it was decided to synthesize nanostructures of ZnO and Co
doped ZnO systems for utilizing them for hydrogen generation through water splitting.
Consequently, the hydrothermal method [2] was adopted to develop one dimensional (1D)
nanorods (NRs) of Co-ZnO by controlling the surfactant (CTAB; cetyltrimethylammonium
bromide) concentration in water. Unluckily, neither the ZnO NRs nor Co-ZnO NRs, can exploit
sunlight fully due to their wide band gap (WBG) i.e. Eg = 3.2 eV. More often the hetero-
assemblies (by incorporation of visible light harvesting moiety to oxides) are made by introducing
better light harvesting material (chalcogenide quantum dots/dyes) to nanooxide systems that to
enhance their light harvesting capacity. These heterostructure exhibit excellent stability, capability
to utilize the wide portion of visible light, and to suppress the recombination of the light generated
photo-electrons and photo holes. For this reason, a chalcogenide CdS (Eg = 2.4 eV) was
introduced as a sensitizer to ZnO or Co-ZnO NRs. Additionally,1.5% Pt was loaded as co-catalyst
to generate reduction site to consume the photoelectrons at the surface of CdS/Co-ZnO NRs. Then
this nanomolecular machines i.e. 1.5% Pt/CdS/Co-ZnO NRs, were utilized for photocatalytic
water cleavage, in aqueous electrolyte (0.35 M Na2S +0.25 M K2SO3, pH =13.3) under visible
light irradiation. [4]

Chapter 3
`197
3.4.2 EXPERIMENTAL 3.4.2.1 Synthesis of ZnO and Co-ZnO NRs Typical synthesis of ZnO or Co-ZnO nanostructures includes two major steps: (i) seed formation
and (ii) growth of NRs. First step involves precipitation of Co-doped ZnO NRs were fabricated
using pinkish white precipitate of Co-doped ZnO powder obtained by oxidizing 40mL aqueous
solution of 0.009 mol (2.67g) of Zn(NO3)2.6H2O and 0.0009 mol (0.262g) of Co(NO3)3.2H2O, till
the pH of the solution become 7. Subsequently, as-obtained slurry of Co-ZnO (2.2g) was
transferred into a Teflon-lined stainless-steel autoclave of 100 cm3, containing 35 ml of aqueous
1% CTAB by varying surfactant (CTAB) concentration (17.5, 20, 25, 30, 35 and 40%) in reverse
micelle hydrothermal method. Then the autoclave was sealed properly and heated at 200°C for
10h in an oven. [5] Here, CTAB-micelles served as the templates in nano crystals growth. Dry
1.4g green solid product was collected by centrifugation of the resulted autoclave solution and
their washing several times with distilled water and alcohol. Finally, the sample dried at 80°C for
5h in oven under vacuum. For the synthesis of ZnO NRs, the same synthesis process was adopted
without taking cobalt salt. 3.4.2.2 Loading of CdS on to the surface of ZnO and Co-ZnO NRs Direct sulfurization method was employed to add CdS sensitizer to ZnO and Co-ZnO NRs,
Mixture of 0.2g Co-ZnO NRs and 4.0 mM (0.733g) CdCl2.5H2O in 30 mL were treated with 0.2M
Na2S (2.6g in 100 mL DIW, 90%, extra pure reagent), and nanoadded until the pH of solution
reached up to 7. Respective pinkish white and yellowish green powder of CdS/ZnO NRs and
CdS/Co-ZnO NRs were obtained, which was washed thoroughly with hot water and dried in the
oven at 60oC for 24h. [6]
3.4.2.3 Co-catalyst addition to CdS-loaded ZnO and CdS/Co-ZnO NRs surface CdS-loaded ZnO and Co-ZnO NRs were decorated with co-catalyst (1.5% Pt) to facilitate the
reduction sites on the photocatalytic surface. Impregnation method was adopted to load 1.5%Pt on
CdS/ Co-ZnO and CdS-loaded ZnO surface by continuously stirring of the solution (0.2g CdS/
Co-ZnO and 0.00769g H2PtCl6 in 2mL deionised H2O) in porcelain dish with glass rod, at 60oC
temperature. [7] Finally, the sample dried at 60°C for 12h in oven and employed in photocatalytic
reaction as nanomolecular photoelectrode.

Chapter 3
`198
3.4.3 RESULTS AND DISCUSSION 3.4.3.1 Study of surface morphology
As fabricated nanomolecular device (1.5% Pt/CdS/Co-ZnO NRs) was rigorously characterized at
every step of fabrication process, using variety of analytic tools. Morphological images of ZnO
NRs, was recorded using a field emission-scanning electron microscope (FESEM; Hitachi S-
4000) after every step of advancement. High resolution transmission electron microscope
(HRTEM; JEM-2100F, at 200 kV) and corresponding energy-dispersive X-ray (EDX)
spectroscopy were used to know the lattice fringes and growth directions by knowing the distance
between lattice fringes with and chemical camposition. Selected area electron diffraction (SAED)
pattern gives the information about crystallinity product of the hydrothermal process at varying
concentration of aqueous CTAB and seeds were examined by using FESEM (Figures. 3.34a,
3.34b, 3.34c, 3.34d and 3.34e). All concentrations of CTAB (17.5, 20, 25, 30, 35 and 40%) were
kept greater than its critical micelle concentration (CMC; 0.95 mM) to promote one dimensional
(1D) augmentation of Co-ZnO seeds. [8] According to the principle of dynamic salvation, there is
a selective adsorption (electrostatic) of the cationic surfactant on the hexagonal facets i.e. (100)
and (111) planes, which was also evident from HRTEM images of the Co-ZnO seeds. [9]
Dissimilar rate of attachment/detachment of the surfactant on above planes, effectively reduce the
energy and growth rate along these planes that allows NRs to grow along (011) plane. [10,11]
Bulky cationic surfactant, CTAB plays two major roles in production of one dimensional Co-ZnO
structures: (i) as a micellizer, it induces 1D molecular aggregation of micelles in aqueous medium
and (ii) as a stabilizer; it stabilizes the micelle-captivated Co-ZnO nanoclusters by preventing their
uncontrollable growth. Results of both of these actions collectively promote cylindrical
aggregation (wormlike micelle) of ZnO or Co-ZnO seeds (scaffold by CTAB) in opposite
directions with time that creates a junction in the middle of the rods (revealed from FESEM
images). [12,13]

Chapter 3
`199
Figure 3.34 FESEM optical images of Co-ZnO at the different stages of the advancement along
with their corresponding closeup SEM images of (011) plane of Co-ZnO with morphological
sketches, which was fabricated using hydrothermal method on varing surfactant CTAB
concentration from (a) 17.5%, (b) 20%, (c) 25%, (d) 30%, (e) 35%, and (f) 40%. Where, 4.5 cm
equal to the 6 μm length of the NRs.
The growth process of NRs will continuous till the critical mass of the nanorods of ZnO or Co-
ZnO was attained. Afterwards, NRs split into two parts, as illustrated in Figure 3.35e. Final size of
the NRs strictly depends on the size of the reaction volume i.e. driven by the radius of the cavity
in water droplets with surfactant Rw, which is expressed by the following Equation (1). [14]
Rw = 3 Vaq [H2O]/σ[s] .................... (1) Where, σ[s] =polar group area of surfactants' head and Vaq[H2O] =volume of water. It means the
size of the nanorod can be regulated by changing the volume of water and the polar head area of
micelles (controlled by CTAB concentration). Increase in volume of water droplet directed to
increase the volume of the surfactant in surfactant-incorporated water droplets. Increase in CTAB
concentration tends to increase in head area of polar group. Both of these effects, contribute
equally in keeping the size of the Co-ZnO NRs (~400 nm broad and 2 mm long) same even at
higher CTAB concentration reactions. FESEM images (Figures 3.34a, 3.34b, 3.34c, 3.34d, and
3.34e) of the Co-ZnO nano architects fabricated at different concentrations of the CTAB and the
supporting literature [15], give some significant hints about their physical growth mechanism.

Chapter 3
`200
Gradual morphological transformations were observed in finishing-end shape of the Co-ZnO NRs
by varying CTAB amount/ concentrations.
(e)
Figure 3.35 HRTEM micrographs of Co-ZnO NRs including the (a) SAED pattern, (b) lattice
fringes, (c) EDX analysis. This shows well ordered crystalline planes along with hexagonal
packing of atoms and a lattice spacing of 2.42 nm, corresponding to the growth 011-plane of Co
doped-ZnO lattice and (d) HRTEM image of CdS nanoparticles loaded Co-doped ZnO that
revealed the presence of the heterojunction between CdS and Co-doped ZnO. (e) Schematic
gradual physical growth mechanism for hexagonal faceted Co-ZnO nanorods.
At 17.5, 20, 25, 30, 35 and 40% CTAB concentration, corresponding shuttle-end, flat end,
cocoon-end (without hole), cocoon-end (with hole), cocoon-end (with big hole) and cocoon-end
(with hole) hexagonal rods were obtained, respectively. Due to the apt salt/surfactant ratio (Co-
Chapter 3
`201
ZnO/CTAB =1:0.20) in 20% CTAB [16], the flat-end Co-ZnO NRs were produced. Beyond 20%
CTAB concentration, the enhancement in CTAB concentration, promotes the formation of the
excess of bromide ions by cleavage of CTAB. These bromide ions induced the chemical inching
in nanooxides, which was initiated from the centre of the (011) plane of the hexagonal Co-ZnO
NRs and created a hole at centre. The size of this hole increases with CTAB concentration from
50 nm (30% CTAB) to 76 nm (35% CTAB) to 98nm (40% CTAB). Further, whatever may be the
concentration of CTAB was used for synthesis; almost same sized (400 nm wide and 2 mm long)
hexagonal-nanorods were obtained. SAED pattern (Figure 3.35a) of flat-end Co-ZnO NRs was
obtained corresponding to the HRTEM image, which evident the hexagonal orientation of the
Lau's spot around central spot, proves the presence of the crystalline single hexagonal phase of the
Co-ZnO NRs, which consistent with the X-ray powder diffraction (XRD) results. Lattice fringes,
depicted in the HRTEM image (Figure 3.35b), are separated by 2.42 nm distance, illustrate the
high crystalline nature of NRs that grow along the (011) plane. EDX profile of the Co-ZnO NRs,
possess the Co and Zn peaks that confirms the Co-doping onto ZnO lattice (Figure 3.35c). Figure
3.35d exhibits the HRTEM image of the CdS loaded Co doped ZnO that revealed the presence of
the hetero junction between CdS and Co-doped ZnO. 3.4.3.2 XRD analysis
X-ray diffraction patterns of the synthesized samples were recorded on Philips X'Pert MPD-3
diffractometer (mono-chromatizedradiation of Cu Kα (l =0.15418 nm), with the scan rate
=0.0502θs-1, at applied voltage 45 kV and current 40 mA). XRD patterns, as shown in Figures
3.36a, 3.36b and 3.36c, verify crystallization of ZnO and Co-ZnO NRs in a single wurtzite phase.
Positions of the diffraction peaks of the ZnO and Co-ZnO NRs, are in good agreement with the
standard JCPDS (Joint Committee on Powder Diffraction Standards) card No. 36-1451, which
accounts for the hexagonal crystal growth in both samples along the 011 plane.
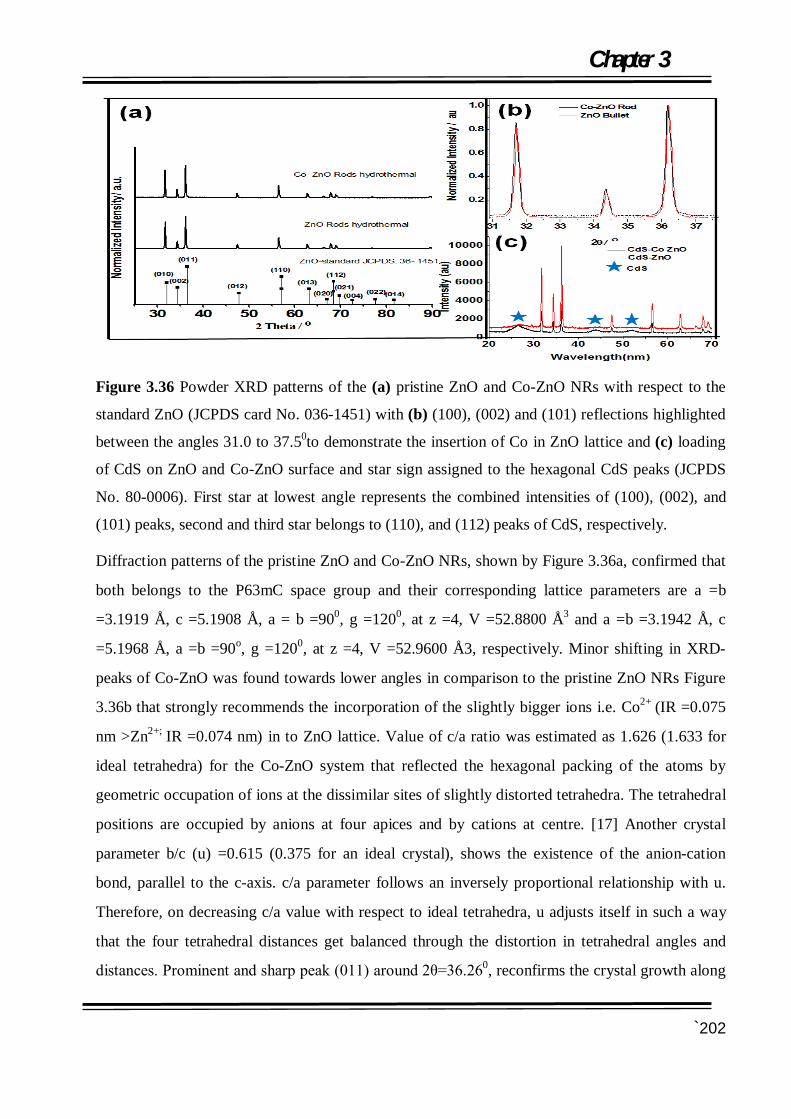
Chapter 3
`202
Figure 3.36 Powder XRD patterns of the (a) pristine ZnO and Co-ZnO NRs with respect to the
standard ZnO (JCPDS card No. 036-1451) with (b) (100), (002) and (101) reflections highlighted
between the angles 31.0 to 37.50to demonstrate the insertion of Co in ZnO lattice and (c) loading
of CdS on ZnO and Co-ZnO surface and star sign assigned to the hexagonal CdS peaks (JCPDS
No. 80-0006). First star at lowest angle represents the combined intensities of (100), (002), and
(101) peaks, second and third star belongs to (110), and (112) peaks of CdS, respectively.
Diffraction patterns of the pristine ZnO and Co-ZnO NRs, shown by Figure 3.36a, confirmed that
both belongs to the P63mC space group and their corresponding lattice parameters are a =b
=3.1919 Å, c =5.1908 Å, a = b =900, g =1200, at z =4, V =52.8800 Å3 and a =b =3.1942 Å, c
=5.1968 Å, a =b =90o, g =1200, at z =4, V =52.9600 Å3, respectively. Minor shifting in XRD-
peaks of Co-ZnO was found towards lower angles in comparison to the pristine ZnO NRs Figure
3.36b that strongly recommends the incorporation of the slightly bigger ions i.e. Co2+ (IR =0.075
nm >Zn2+; IR =0.074 nm) in to ZnO lattice. Value of c/a ratio was estimated as 1.626 (1.633 for
ideal tetrahedra) for the Co-ZnO system that reflected the hexagonal packing of the atoms by
geometric occupation of ions at the dissimilar sites of slightly distorted tetrahedra. The tetrahedral
positions are occupied by anions at four apices and by cations at centre. [17] Another crystal
parameter b/c (u) =0.615 (0.375 for an ideal crystal), shows the existence of the anion-cation
bond, parallel to the c-axis. c/a parameter follows an inversely proportional relationship with u.
Therefore, on decreasing c/a value with respect to ideal tetrahedra, u adjusts itself in such a way
that the four tetrahedral distances get balanced through the distortion in tetrahedral angles and
distances. Prominent and sharp peak (011) around 2θ=36.260, reconfirms the crystal growth along

Chapter 3
`203
(011) plane. Crystalline domain of the flat end Co-ZnO NRs, was calculated using Debye-Sherrer
equation i.e. 385 nm, which is quite near to the average size (~400 nm) of the NRs that measured
by FESEM images Figure 3.36c expressed the significantly broad XRD peaks of CdS
accompanied with regular wurtzite Co-ZnO peaks, in CdS/ZnO NR's sample. In the same sample
presence of the first broad peak centred at 2θ=270 is an aggregation of (100), (002), and (101)
peaks of CdS, (110) peak at 2θ=440, and (112) peak at 2θ=52.50, are also in good agreement with
the standard CdS (JCPDS card No. 80-0006). It proves the successful loading of the hexagonal
CdS nanoparticles onto the ZnO NR's and Co-ZnO NR's surface as shown in Figure 3.36c XRD
patterns of the all studied samples are shown in Figure 3.36a - 3.36c and following Equation (2)
[18], is used to measure the crystallinity of the samples.
Crt(%) = {(I011 – Iam)/I011} ×100 ......................(2)
Where, Crt = the relative crystallinity (in percentage) I011=the highest intensity of the (011)
diffraction angle of the crystal lattice (arbitrary unit; au) and Iam= is the scattering strength
diffracted by the non-crystalline environment (if 2θ is close to angle 210, the unit is similar to
I011). The observed crystallinity (ZnO NRs (95.00%), Co-ZnO NRs (94.00%), CdS-ZnO
(90.00%) and CdS/Co-ZnO (78.95%) of the all studied samples is decreases with gradual
modification in the basic ZnO NRs sample.
3.4.3.3 UV-Vis DRS study Diffuse reflectance UV-visible absorption spectrum was recorded for the dry and pressed disk
samples of powdered ZnO NRs to confirm the doping of Co and deposition of CdS on ZnO NRs,
by using UV-visible spectrophotometer (UV-1700, Shimazdu, Japan with UV Probe device).
Moisture free BaSO4 was used as a reflectance standard in a UV-Vis diffuse reflectance
experiment. Instrumental error was noticed around the wavelength 350 nm due to the shifting of
the light source from UV to Visible region, which was found responsible for the noise.
Characteristic diffuse reflectance spectra (Figures 3.37a and 3.37b) of the samples illustrate the
red shifts in their edges with broadening in the main peak (300-525 nm) on successive
advancement (addition of Co or CdS) in the ZnO NRs for making of the hetero-assembly CdS/Co-
ZnO NRs.
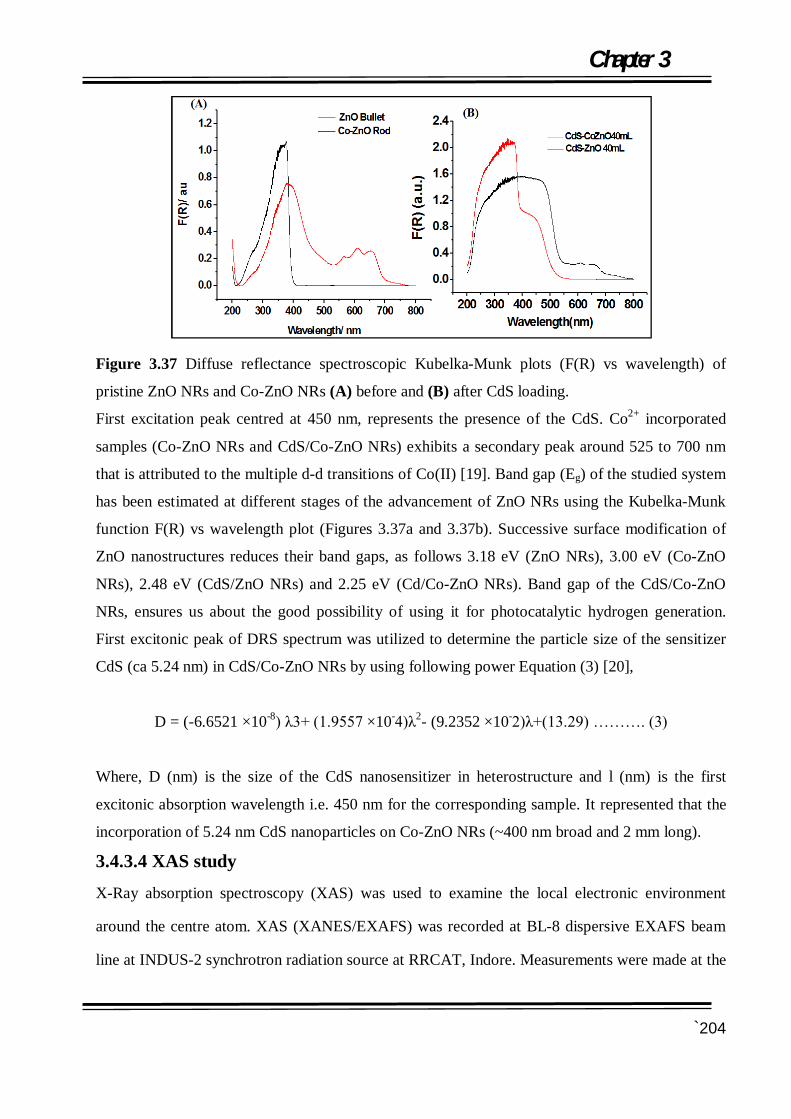
Chapter 3
`204
Figure 3.37 Diffuse reflectance spectroscopic Kubelka-Munk plots (F(R) vs wavelength) of
pristine ZnO NRs and Co-ZnO NRs (A) before and (B) after CdS loading.
First excitation peak centred at 450 nm, represents the presence of the CdS. Co2+ incorporated
samples (Co-ZnO NRs and CdS/Co-ZnO NRs) exhibits a secondary peak around 525 to 700 nm
that is attributed to the multiple d-d transitions of Co(II) [19]. Band gap (Eg) of the studied system
has been estimated at different stages of the advancement of ZnO NRs using the Kubelka-Munk
function F(R) vs wavelength plot (Figures 3.37a and 3.37b). Successive surface modification of
ZnO nanostructures reduces their band gaps, as follows 3.18 eV (ZnO NRs), 3.00 eV (Co-ZnO
NRs), 2.48 eV (CdS/ZnO NRs) and 2.25 eV (Cd/Co-ZnO NRs). Band gap of the CdS/Co-ZnO
NRs, ensures us about the good possibility of using it for photocatalytic hydrogen generation.
First excitonic peak of DRS spectrum was utilized to determine the particle size of the sensitizer
CdS (ca 5.24 nm) in CdS/Co-ZnO NRs by using following power Equation (3) [20],
D = (-6.6521 ×10⁻⁸) λ3+ (1.9557 ×10⁻⁴)λ2- (9.2352 ×10⁻²)λ+(13.29) ………. (3)
Where, D (nm) is the size of the CdS nanosensitizer in heterostructure and l (nm) is the first
excitonic absorption wavelength i.e. 450 nm for the corresponding sample. It represented that the
incorporation of 5.24 nm CdS nanoparticles on Co-ZnO NRs (~400 nm broad and 2 mm long).
3.4.3.4 XAS study
X-Ray absorption spectroscopy (XAS) was used to examine the local electronic environment
around the centre atom. XAS (XANES/EXAFS) was recorded at BL-8 dispersive EXAFS beam
line at INDUS-2 synchrotron radiation source at RRCAT, Indore. Measurements were made at the

Chapter 3
`205
Zn K-edge (9659 eV) in fluorescence mode at room temperature with a seven element HP Ge
detector and double crystal Si (111) monochromator. Measurements were performed along the c
axis perpendicular to electric field vector and along the c axis in the plane of the electric field
vector. The raw X-ray absorption data were analysed using a standard procedure (software
program ATHENA) that includes the subtraction of the pre- and post-edge background, edge
calibration with a reference Zn foil, and normalization of edge jump. The Fourier transform of the
normalized k3-weighted EXAFS spectra was taken using the program ARTEMIS for k from 2 to
11.5 Å-1 and Hanning window function followed by nonlinear least-squares fit between 1.0 and
3.6 Å. Theoretical phase and amplitude functions were calculated using the FEFF (V.8.4) code.
This technique identifies the lattice disorders and short range local atomic arrangement around the
central atoms, which XRD can't observe. [21]
XAS profiles of the ZnO, Co-ZnO and CdS/Co-ZnO NRs, were recorded at Zn K edge. Typical
normalized XAS plot between X-ray absorption cross-section and photonic energy (PE) are
displayed in Figure 3.38a-c. XAS profile was divided into four prominent zones with respect to
the photonic energy of incoming photons i.e. pre-edge, edge, near-edge (XANES; X-rays
absorption near edge spectroscopy) and fine structures (EXAFS; extended X-rays absorption fine
structures and NEXAFS; near edge X-ray absorption fine structure) regions. Absence of pre-edge
features (ls → 3d; dipole forbidden transition, PE < 9659 eV) in all samples is credited to the fully
occupied 3 d10 configuration of Zn2+ ions [22] and negligible p-band defects. Edge features (ls →
4p) of Co-ZnO shifted towards the higher PE =9660.23 eV with respect to the pure ZnO and
CdS/Co-ZnO NRs (PE < 9659 eV) are attributed to the replacement of the high polarity Zn-O
bonds by the low polarity Co-O and Co-Zn bonds in Co-ZnO. Eventually, the presence of the
highly polar bonds of CdS/Co-ZnO NRs i.e. Cd-O, Cd-S and Zn-S, nullified the shifting in edge.
It also confirms the existence of the highly oxidized Zn atoms (>2+ oxidation state) in Co-ZnO
NRs, attributed to the adsorption process [23]. Almost same edge position of the pristine ZnO and
CdS/Co-ZnO NRs, signify the retention of similar oxidation state of Zn (2+) in both. Intense,
symmetrical and superimposed white line (WL) peak features of ZnO and Co-ZnO NRs, centred

Chapter 3
`206
at 9668.50 eV (10.01 eV/step), are originated due to ls-4p hybridization, reflected the similar
electronic surroundings in both the species. Short heighted WL peak of CdS/Co-ZnO NRs,
predicts the low degree of anisotropy, and highly disordered arrangement of elements around Zn
atom. Electronic transition 1s → 4d in Zn is attributed to the EXAFS features at P E ~ 9668.50
+50 eV. Shoulder peak was observed at 9678.52 eV, followed by the symmetrical third and fourth
peaks at PE 9695.96 and 9714.00 eV, respectively for both sample. These fine features reflected
that the anions envelop the central Zn atoms in a regular tetrahedral fashion in above two samples.
Figure 3.38 Normalized synchrotron-radiation based absorption cross section as a function of
photonic energy with the geometry of the c-axis aligned parallel to the electric field vector of the x
rays at the Zn K-edge (E = 9659 eV) spectra of (a) pristine ZnO NRs, (b) Co-ZnO NRs and (c)
CdS/Co-ZnO NRs, recorded in a florescent mode.
Absence of the 9695.96 eV peak in Co-ZnO, reveals the existence of the cobalt (II) oxide with
few Co atoms that substitute zinc in the ZnO system [24]. It stimulates the distorted tetrahedral
surrounding around Zn and deviation in the lattice parameters. NEXAFS features for ZnO and
CdS/Co-ZnO NRs, coincide within 1 eV PE range, suggesting that both have similar regular
tetrahedral environment of anions for Zn atoms. The results also suggested about the distorted
tetrahedral arrangement in the Co-ZnO system, where the metallic species Co (II) and Zn are at
the centre of the tetrahedra and anions (O2-) are situated at the four apexes of the tetrahedra.

Chapter 3
`207
NEXAFS features of the all examined systems were refined by keeping typical k3- weight Age in
the range of 3.5-12 Å-1 and using software FEFF (V-7) (Figures 3.39a and 3.39b). [25] Respective
refined parameters (least squares refined R-factor, mean first-shell metal- oxygen bond length,
coordination number, and Debye-Waller factor) are extracted for ZnO (3.8wt%, 1.99(8) Å, 5.10
and 0.96 ×10⁻² Å2), Co-ZnO (4.10wt%, 2.01(4) Å, 5.40 and 0.82 ×10⁻² Å2) and CdS- Co-ZnO
(4.20wt%, 1.95(7) Å, 5.80 and 0.86 10-2 Å2).
Figure 3.39 It shows the (a) Fourier-transformed magnitudes of the extended XAFS (EXAFS)
oscillations in the Zn K-edge XAS spectra as a function of the phase-uncorrected interatomic
distance R (nm), and fitting for the pure wurtzite phase of CdS/Co-ZnO NRs. The solid blue lines
represent experimental data and red lines the calculated values are fits to the parameter. (b) The
k3-weighted EXAFS Å-1) corrected for phase shifts.
3.4.4 CONCLUSION Current work is focused on the surfactant (CTAB)-controlled low cost fabrication of the ZnO NRs
via reverse-micelles synthesis. This study gives us and focused on the performance of the
nanomolecular photoelectrode of ZnO NRs by gradual surface modification for hydrogen
production efficiency. A good correlation between atomic arrangement around Zn atom and light
harvesting capacity of the modified ZnO NRs has been established. Defects developed on Co-ZnO

Chapter 3
`208
NR's surface, may act as recombination centres for the photocarriers. These defects were
suppressed by the decoration of flat-end Co-ZnO NRs with visible light sensitizer CdS.
Heterocouple Cds/Co-ZnO NRs, show a good compatibility of nanoparticles of CdS with Co-ZnO
NRs.
3.4.5 REFERENCES [1] N Chouhan, L Yeh, SF Hu, RS Liu, WS Chang, KH Chen, “CdSe(QDs)@ ZnO nanotubes as an effective photoanode” Chem Commun (2011), 47: 3493-5. [2] XH Wang, YC Zhang, WL He, MK Zhu, B Wang, H Yan, “Hydrothermal synthesis of zinc oxide powders with controllable morphology” Ceram Int (2004), 30: 93-7
[3] A Wolcott, WA Smith, TR Kuykendall, YP Zhao, JZ Zhang, “Photoelectrochemical generation of hydrogen from water splitting based on dense and aligned TiO2 nanorod arrays” Small (2008), 5 (1): 104-11. [4] JF Reber, K Meier, “Photochemical hydrogen production with platinized suspensions of cadmium sulfide and cadmium zinc sulfide modified by silver sulphide” J Phys Chem (1986), 90 (5): 824-34. [5] D Chu, YP Zeng, DL Jiang, “Hydrothermal synthesis and optical properties of Pb2+doped ZnO nanorods” Mater Lett (2006), 60: 2783-5. [6] G Larramona, C Chone, A Jacob, D Sakakura, B Delatouche, D Pere, “Nanostructured photovoltaic cell of the type titanium dioxide, cadmium sulfide thin coating, and copper thiocyanate showing high quantum efficiency” Chem Mater (2006), 18 (6): 1688-96. [7] X Wang, G Liu, GQ Lu, HM Cheng, “Stable photocatalytic hydrogen evolution from water over ZnO-CdS coreeshell nanorods” Int J Hydrogen Energy (2010), 35: 8199-205. [8] HC Gao, RX Zhu, XY Yang, SZ Mao, S Zhao, JY Yu, “Properties of polyethylene glycol (23) lauryl ether with cetyltrimethylammonium bromide in mixed aqueous solutions studied by self-diffusion coefficient NMR” Colloid Interface Sci (2004), 273(2): 626-31. [9] YD Yin, AP Alivisatos, “Colloidal nanocrystal synthesis and the organic inorganic interface” Nature (2005), 437: 664-70. [10] E Faeibold, B Michels, G Waton, “Micellar growth study by micocalorimetry in CTAB solutions” J Phys Chem (1996), 100: 20063-7. [11] PJ Missel, NA Mazer, MC Carey, GB Benedek, “Influence of alkali-metal counterion identity on the sphere-to-rod transition in alkyl sulfate micelles” J Phys Chem (1989), 93: 8354-66. [12] H Rehage, H Hoffmann, “Rheological properties of viscoelastic surfactant systems” J Phys Chem (1988), 92: 4712-9.
Chapter 3
`209
[13] G Porte, J Appell, J Poggi, “Experimental investigations on the flexibility of elongated cetylpyridinium bromide micelles” J Phys Chem (1980), 84(23): 3105-10. [14] J Appell, G Porte, A Khatory, A Kern, SJ Candau, “Static and dynamic properties of a network of wormlike surfactant micelles (Cetylpyridinium chlorate in sodium chlorate brine)” J Phys II (1992), 2(5): 1045-52. [15] M Pileni, “Reverse micelles as microreactors” J Phys Chem (1993), 97(27): 6961-74. [16] WJ Kim, SM Yang, “Preparation of mesoporous materials from the flow-induced microstructure in aqueous surfactant solutions” Chem Mater (2000), 12: 3227-35. [17] H Karzel, W Potzal, M Kofferlein, W Schiessl, M Steiner, U Hiller, “Lattice dynamics and hyperfine Interactions in ZnO and ZnSe at high external pressures” Phys Rev, B Condens Matter (1996), 53: 11425-39. [18] N Chouhan, CC Lin, S-F Hu, R-S Liu, “Earth-free GaZnON phosphor prepared by combustion for white light-emitting diodes” J Mater Chem C (2015), 3: 1473-9. [19] (a) X Qiu, M Miyauchi, H Yu, H Irie, K Hashimoto, “Visiblelight- driven Cu(II)-(Sr1-
yNay)(Ti1-xMox)O3 photocatalysts based on conduction band control and surface ion modification” J Am ChemSoc (2010), 132: 15259-67. (b) H Yu, H Irie, K Hashimoto. “Conduction band energy level control of titanium dioxide: toward an efficient visible lightsensitive photocatalyst” J Am Chem Soc (2010), 132: 6898-9. (c) H Irie, K Kamiya, T Shibanuma, S Miura, DA Tryk, T Yokoyama. “Visible light-sensitive Cu(II)-grafted TiO2 photocatalysts: activities and x-ray absorption Fine structure analyses” J Chem Phys C (2009), 113: 10761-6. [20] WW Yu, L Qu, W Guo, X Peng, “Experimental determination of the extinction coefficient of CdTe, CdSe, and CdS nanocrystals” Chem Mater (2003), 15: 2854-60. [21] JJ Rehr, RC Albers, “Theoretical approaches to x-ray absorption fine structure” Rev Mod Phys (2000), 72(3): 621-54. [22] WJ Kim, SM Yang, “Preparation of mesoporous materials from the flow-induced microstructure in aqueous surfactant solutions” Chem Mater (2000), 12: 3227-35. [23] T Yamamoto, “Assignment of pre-edge peaks in k-edge x-ray absorption spectra of 3d transition metal compounds: electric dipole or quadurpole?” X-Ray Spectrom (2008), 37: 572-84. [24] S Krishnamurthy, C Guinness, LS Dorneles, M Venkatesan, JMD Coey, JG Lunney, “Soft x-ray spectroscopic investigation of ferromagnetic co-doped ZnO” J Appl Phys (2006), 99 08M111, 3 pages. [25] EA Stern. Theory of EXAFS. In: DC Koningsberger, R Prins, “X-ray absorption: principles, applications, techniques of EXAFS, SEXAFS and XANES” New YorkWiley-Interscience (1988), Ch. 8.618-708.

Chapter 4
`210
Chapter 4 Applications of the synthesized systems in Chapter 3: 4.1 Pt/Ag/ZnO NRs and Pt/CdS/ZnO NRs for Water Splitting
4.2 Ag NPs used for Pollutant P-Nitro Phenol (PNP) Degradation into P-Amino Phenol

Chapter 4
`211
Chapter 4 4.1 Pt/Ag/ZnO NRs and Pt/CdS/ZnO NRs for Water Splitting
ABSTRACT We had utilised the all as-synthesized systems in Chapter 3 for photocatalytic water splitting and
hydrogen generation. These systems are Pt/Ag NPs @ ZnO NRs with four different AgNPs and
Pt/CdS@ZnO NRs as molecular devices. Electron sacrificial electrolyte CH3OH (pH=7.0) and
Na2S+K2SO3 solution (pH =13.5), were used for above mentioned systems under the irradiation
of AM1.5 G light for four or seven hours, respectively. The Pt/Ag NPs @ ZnO NRs systems
show amount of hydrogen release as: Pt/Ag(TA)@ZnO (204.60 mol h-1 g-1), Pt/Ag(AC)@ZnO
(78.1580 mol h-1 g-1), Pt/Ag(Tea)@ZnO (33.9639 mol h-1 g-1) and Pt/Ag(FG)@ZnO (27.7400
mol h-1 g-1). A nice correlation was established between the first excitation UV-Vis peak of Ag
NPs, particle shape and size of AgNPs (all samples had the same ZnO NRs) with the hydrogen
production efficiency of the molecular device. In another case of Pt/CdS/Co-ZnO NRs, the
defects developed on Co-ZnO NR's surface, may act as recombination centres for the
photocarriers. And after the decoration of the Co-ZnO NR's with the visible light sensitizer CdS,
the concentration of the defects on the flat-end Co-ZnO NRs was suppressed. In a heterocouple
CdS/Co-ZnO NRs, a good compatibility of nanoparticles of CdS with Co-ZnO NRs, is found.
Gradual increase in the photocatalytic hydrogen evolution activity of the devices was monitored
with surface modification, such as 1.5% Pt/ZnO (10.20 mmol/hg, AQY =0.30%), 1.5% Pt/Co-
ZnO (22.56 mmol/hg, AQY =0.66%), 1.5% Pt/CdS/ZnO (50.57 mmol/hg, AQY =1.49%) and
1.5% Pt/CdS/Co-ZnO NRs (67.20 mmol/hg, AQY = 1.98%).
Key words: Pt/CdS@Co-ZnO, Pt/Ag NPs @ ZnO NRs Electron sacrificial electrolyte CH3OH
(pH=7.0), Na2S+K2SO3 solution (pH =13.5), photocatalytic water splitting, hydrogen generation.
Chapter 4
`212
4.1.1 INTRODUCTION Hydrogen is the most compatible and clean fuel on the planet in terms of energy economy and
ecological health of the planet. [1-3] Unfortunately, the large amount of the H2 is produced by
the carbon containing conventional fuel resources that release the enormous amount of CO2 in
atmosphere. Beside this, nature has provided us a carbon - free abundant source of hydrogen in
form of water at almost free of cost. Cleavage of water in presence of the photocatalyst (a
semiconductor of appropriate band gap) and sunlight can produce the hydrogen in an eco-
friendly manner. Although, the sunlight and water comes free of cost to us but the fabrication
cost, stability and efficiency of the photocatalysts are the main thrust areas for the large scale
hydrogen production. At some extent oxide photocatalysts (ZnO, TiO2, Ga2O3, Nb2O3, In2O3
Fe2O3, SnO2, WO3, NiO, etc) were found fit in above criteria. Out of the commercially available
wide range of oxide semiconductors, ZnO [4,5] has been selected for the study because of its
superb and unique inherent qualities such as low cost, wide availability, viability to change in
morphology, large excitonic binding energy (60 Me V), deep photon penetration, short diffusion
length, low reflectivity, high carrier mobility, good bio-compatibility, etc. Usually, the
nanostructures of ZnO have a large degree of charge transfer over their bulk counter part that is
due to their large surface area to volume ratio, short lateral diffusion length and low
reflectivity.[6] Few of the notable ZnO systems that accounts for photocatalytic water splitting
are : N-doped ZnO nanowires (η=4%),[7] CdTe sensitized ZnO nanorods (η=1.98%),[8] CdSe
sensitized ZnO nanotubes, [4] GaN-ZnO (η=5.2%), [9] ZnS-ZnO core-shell (STH =0.38%), [10]
TiO2 shell ZnO core NPs (η=0.17%),[11] ZnO/ZnO/Cr,[12] Si/ZnO core shell nanowires
(η=0.035%), [13] ZnO and Fe2O3 modified TiO2 fibers (0.12 ml/min mg), [14] etc. Furthermore,
the doping of transition metals to the semiconductors, used to improve the optical output of these
photocatalytic materials. The effect of the different transition metals (Fe, Co, Ni, Cu, Zn, In, etc)
on the photocatalytic activity of oxide semiconductor was studied for splitting of water into
hydrogen and oxygen under UV irradiation. [15,16] In nonoxide semiconductor category,
nanocomposite Ni-doped InN/GaZnON and Ni-doped CdS nanoparticles are a good example of
the semiconductor that release 2.23 mmol h-1g-1 and 25.848 mmol/(h g) of H2, respectively,
under visible light irradiation. [17,18] Hence, cobalt doping was employed to modify the surface
quality of ZnO. Therefore, it was decided to synthesize nanostructures of ZnO and Co-doped
Chapter 4
`213
ZnO systems for water splitting and hydrogen generation. Consequently, the hydrothermal
method, [5] was adopted to develop one dimensional (1D) nanorods (NRs) of Co-ZnO by
controlling the surfactant (CTAB; cetyltrimethylammonium bromide) concentration in water.
Unluckily, neither the ZnO NRs nor Co-ZnO NRs, can able to exploit the sunlight fully due to
their wide band gap (WBG) i.e. Eg = 3.2 eV. More often the hetero-assemblies (by
incorporation of the visible light harvesting moiety to oxides) are made by introducing better
light harvesting material (chalcogenide quantum dots/dyes) to nanooxide systems that to enhance
their light harvesting capacity. A small amount of the state of art hetero-assemblies are
mentioned here i.e. H4Nb6O17/CdS, Pt/TiO2/Zn-porphyrin, ZnO/Erythrosine,
Pt/SrTiO3:Rh/BiVO4, Fe2O3/WO3, ZnO/CdSe, TiO2/CdS, etc, which was also used for water
splitting. [19-28] These heterostructures exhibit excellent stability, capability to utilize the wide
portion of the visible light, and suppress the recombination of the light generated photo-electrons
and photo holes. For this reason, we had synthesised the following systems: (i)
AgNPs@ZnONRs and (ii) chalcogenide CdS (Eg=2.4 eV) sensitized ZnO or Co-ZnO NRs, for
hydrogen generation using photocatalytic water splitting. Additionally, 1.5% Pt was loaded as
co-catalyst to generate reduction sites for consuming the photoelectrons at the surface of
Ag@ZnO and CdS/Co-ZnO NRs. Then this nanomolecular machines i.e. 1.5% Pt/Ag@ZnO NRs
(four systems with different Ag produced AgNPs) and 1.5% Pt/CdS/Co-ZnO NRs, were utilized
for photocatalytic water cleavage, in aqueous electrolyte (0.35 M Na2S +0.25 M K2SO3 at pH
=13.3 for CdS sensitizer or 20% CH3OH for Ag with LSPR) under 300W Xe light source
irradiation. [29]
4.1.2 EXPERIMENTAL 4.1.2.1 Synthesis of Photocatalyst for water splitting Here, we synthesised and characterised the five different systems i.e. (i) Ag(TA)@ZnO (ii)
Ag(Fenugreek)@ZnO (iii) Ag(Tea)@ZnO (iv) Ag(Acacia Concinna/Shikakai)@ZnO and (v)
CdS@Co-ZnO, those methods are discussed in detail in Chapter 3. In which, we had first
prepared Ag nanoparticles with four different routes along with ZnO, Co-doped ZnO, CdS@ Co
doped ZnO. Afterwards, Ag@ZnO and CdS@ZnO, will be made by (loading of Ag NPs on ZnO
NRs and CdS NPs on ZnO/Co-ZnO NRs) impregnation method.

Chapter 4
`214
4.1.2.2 Photocatalytic hydrogen production The catalyst (0.3 g) was suspended in 120 mL of aqueous electrolyte (0.35 M Na2S +0.25 M
K2SO3 at pH =13.3 for CdS sensitizer or 20% CH3OH for Ag with LSPR) in a double walled-
Pyrex glass reaction cell (volume ~120 mL, with water jacket) that was sealed with a rubber
septum. To expel the air content from the solution, the sample was purged with Ar for 1 h prior
to start the photochemical reaction. Ar gas flows continuously in inner jacket, to maintain 1 atm
pressure of the solution. Temperature of the outer jacket was set at 250C. The suspension was
irradiated with a 300 W Xe lamp (>420 nm, light intensity 1 ×10²² photons per hour Xe lamp-
HX1, Model PE300UV, ISS, USA). All the experiments are carried out under ambient
conditions. Photocatalytic responses were hourly monitored in terms of the amount of hydrogen
generated at 1-7h time intervals, using gas chromatograph (Shimazdu, Japan, thermal
conductivity detector and molecular sieve with 5 A columns) throughout the course of the
reaction. Photocatalytic cleavage of water was carried out in presence of the hole-scavenger
electrolyte (0.35 M Na2S + 0.25 M K2SO3 at pH =13.3 for CdS sensitizer or 20% CH3OH for Ag
with LSPR in pH=7.0 solution), under the irradiation of 1 Sun (100 mW/cm2, AM1.5 G) visible
light, as demonstrated in the Figure 1.
Figure 1 Instrumental set up for hydrogen generation through water splitting.
Ideal gas equation is used to calculate the number of moles of the hydrogen released since the
hydrogen gas has very small density, it is usually not practical to collect the gas and find its

Chapter 4
`215
mass. For gases that are not particularly soluble in water, it is possible to collect the evolved gas
by displacement of the water from a container. The setup for the collection of a gas over water
involves a gas collection container that filled with water and inverted over a reservoir of the
water. The gas evolved from the reaction is collected by attaching one end of a hose to the
reaction container and inserting the other up into the inverted gas collection graduated bottle. As
the gas is created, it will displace water from the bottle. The volume of gas can be determined by
the amount of water that was displaced by the gas. The volume of gas collected and the gas laws
(equation 1) can be used to calculate the number of moles of gas collected.
PV= nRT ……….… (1)
Where: P = Pressure of the gas, V = Volume of water displaced, n = number of moles of gas, R =
the ideal gas constant and T = the temperature of the gas.
4.1.3 RESULT AND DISCUSSION
Rough and hexagonal crystalline surface of the Ag@ZnO and CdS/Co-ZnO, was loaded with co-
catalyst (Pt) to facilitate the active sites for the oxidation (photo hole rich) and reduction
(photoelectron rich) of water. These active sites suppress the recombination of the photoelectric
current carriers i.e. photoelectrons and photo holes. Hole-scavenger electrolyte was used to avoid
the photooxidation of CdS or Ag nanoparticles present in the nanomolecular device by the
irreversible consumption of photogenerated holes that prohibited the oxidation of water. [30] We
had examined below mentioned total four systems i.e. (i) Ag (Trachyspermum Ammi)@ZnO (ii)
Ag (Trigonella foenum graecum/Fenugreek)@ZnO (iii) Ag (Tea)@ZnO (iv) Ag (Acacia
Concinna/Shikakai)@ZnO and (v) CdS@Co-ZnO and discussed in detail.
4.1.3.1 Ag(TA)@ ZnO NRs
Nanocomposite Ag(TA)@ ZnO NRs (0.30g) was homogeneously dispersed in 20% methanol
(hole scavenger electrolyte) and exposed to the 300W Xe lamp for photocatalytic water splitting
that leads to generate the hydrogen gas, which was half hourly checked in terms of the amount of

Chapter 4
`216
the hydrogen released continuously for 4 hours. Pristine ZnO NRs were modified in terms of
four following stages i.e. ZnO NRs, Pt/ ZnO NRs, Ag(TA)@ZnO NRs and Pt/Ag(TA)@ZnO
NRs. Their corresponding release of hydrogen was monitored as: 5.0000, 13.5037, 102.3000 and
204.6000 mol h-1g-1 and shown by the Figure 2.
(a) Figure 2 Ag(TA)@ ZnO NRs (a) HRTEM image with lattice fringes, (b) TEM image along
with particle size distribution (c) EDX profile along with long particle at inset. (d) Comparative
water splitting efficiency of the ZnO NRs, Pt/ ZnO NRs, Ag(TA)@ZnO NRs and
Pt/Ag(TA)@ZnO NRs.
4.1.3.2 Ag(Fenugreek)@ ZnO NRs
Nanocomposite Ag(Fenugreek)@ ZnO NRs (0.30g) was well dispersed in 20% methanol (hole
scavenger electrolyte) was mixed and exposed to the 300W Xe lamp for photocatalytic water
splitting that leads to generate the hydrogen gas, which was half hourly checked in terms of the
amount of the hydrogen released continuously for 4 hours. Pristine ZnO NRs were modified in
terms of the following four stages i.e. ZnO NRs, Pt/ ZnO NRs, Ag(FG)@ZnO NRs and
Pt/Ag(FG)@ZnO NRs. Their corresponding release of hydrogen was monitored as: 5.0000,
13.5037, 20.4670, and 27.7400 mol h-1g-1 and shown by the Figure 3.

Chapter 4
`217
Figure 3 Comparative water splitting efficiency of the ZnO NRs, Pt/ ZnO NRs, Ag(TA)@ZnO
NRs and Pt/Ag(TA)@ZnO NRs.
4.1.3.3 Ag(Tea)@ZnO Nanocomposite Ag(Tea)@ ZnO NRs (0.30g) was equally dispersed in 20% methanol (hole
scavenger electrolyte) by stirring the solution and exposed to the 300W Xe lamp for
photocatalytic water splitting that leads to generate the hydrogen gas, which was half hourly
observed in terms of the amount of the hydrogen released continuously for 4 hours. Pristine ZnO
NRs were modified in terms of following four stages i.e. ZnO NRs, Pt/ ZnO NRs, Ag(FG)@ZnO
NRs and Pt/Ag(FG)@ZnO NRs. Their corresponding release of hydrogen was monitored as 5,
13.5037, 20.467 and 33.9639 mol h-1g-1 and shown by the Figure 4. The silver ions reduced to
nano silver and show characteristic UV-Vis absorbtion peak at and 412nm 420 nm. size
distribution around 7-8 nm, (Figures 4a, 4b and 4c).
Figure 4 (a) Particle size distribution along with HRTEM and TEM images and (b) comparative
water splitting efficiency of the ZnO NRs, Pt/ZnO NRs, Ag(Tea)@ZnO NRs and
Pt/Ag(Tea)@ZnONRs.

Chapter 4
`218
4.1.3.4 Ag(Acacia Concinna)@ZnO Nanocomposite Ag(Acacia Concinna)@ ZnO NRs (0.30g) was equally dispersed in 20%
methanol (hole scavenger electrolyte) and irradiated with the 300W Xe lamp for photocatalytic
water splitting that leads to generate the hydrogen gas, which was half hourly monitored in terms
of the amount of the hydrogen released continuously for 4 hours. Pristine ZnO NRs were
modified in terms of the following four stages i.e. ZnO NRs, Pt/ ZnO NRs, Ag(FG)@ZnO NRs
and Pt/Ag(FG)@ZnO NRs. Their corresponding release of hydrogen for above systems was
monitored as: 5.000, 13.5037, 61.3800 and 78.1580 mol h-1g-1 and shown by the Figure 5.
Figure 5 .TEM, HRTEM images and SAED pattern of the Acacia Concinna supported Ag NPs
comparative water splitting efficiency of the ZnO NRs, Pt/ZnO NRs, Ag(TA)@ZnO NRs and
Pt/Ag(TA)@ZnO NRs.
4.1.3.5 Water splitting mechanism for the all molecular photocatalytic devices i.e. Ag@ ZnO systems When the sunlight falls on the surface of the molecular photocatalytic devices i.e. Pt loaded
Ag@ ZnO then the electron (energised from sunlight) jumped from the valance band to
conduction band. This process leads to enrich the conduction band with electrons and left
valance band with high concentration of holes. Electrons of the conduction band (ZnO) flow
towards the surface of the AgNPs presented at the surface of ZnO and ultimately come to the Pt
surface and holes stay at valance band. The separation of the carriers leads to reduce and oxidise
the water as hydrogen and oxygen-gases production, respectively via water splitting process.
Here, cocatalyst (Ag) supported ZnO works as anode and Pt (co- cocatalyst) act as a cathode.

Chapter 4
`219
(a)
ZnO Pt/ZnO Ag@ZnO Pt/Ag@ZnO
0
50
100
150
200H
2 pro
duct
ion
mol
h-1 g
-1
Photocatalyst
Ag(TA)@ZnO Ag(FG)@ZnO Ag(Tea)@ZnO Ag(AC)@ZnO
(b)
Figure 6 Photocatalytic hydrogen production via water splitting of Ag @ZnO NRs using
different type of Ag NPs where, silver nanoparticles stands for (i) Ag NPs (Trachyspermum
Ammi)@ZnO NRs (ii) Ag NPs (Trigonella foenum graecum/ Fenugreek)@ZnO NRs (iii)
Ag(Tea) NPs @ZnO NRs (iv) Ag(Acacia Concinna/Shikakai)@ZnO NRs. (b) Electron transfer
mechanism for Ag NPs @ZnO NRs systems that applied for water splitting.
As per electron transfer mechanism predicted in Figure 6b, it is demonstrated that the holes
induced the oxidation of methanol (sacrificial electrolyte) at nanorods of ZnO and Ag surface,
where Pt surface induced the reduction of water to generate hydrogen.[2, 4] The system wise
results are shown in Table 1. In looking the results that shown in Table 1 and Figure 6a, it can be
predicted that the Pt/Ag(TA)@ZnO show the highest efficiency in terms of hydrogen production
(204.60/ mol h-1 g-1). Afterwards, the efficiency order follows the following order:
Pt/Ag(AC)@ZnO (78.1580 mol h-1 g-1), Pt/Ag(Tea)@ZnO (33.9639 mol h-1 g-1) and
Pt/Ag(FG)@ZnO (27.7400 mol h-1 g-1). Position of first excitation peak with the particle shape
and size are important to correlate the efficiency of the molecular device. Therefore, we can
conclude as the higher the position of first excitation peak on wavelength and lower the particle
size can result in the high efficiency of hydrogen generation.

Chapter 4
`220
The tentative chemical reactions responsible for hydrogen evolution by photocatalytic cleavage
of the water, are given by the Equations (2-5), under the 300 W Xe light exposure:
Pt/Ag@ZnO + hv(radiation) → e- (Pt/Ag@ZnO) + h+(ZnO@Ag/Pt) (2)
Cathode (Pt/Ag@ZnO) 2H2O + 2e- → 2OH- + H2 (3) Anode (ZnO@Ag/Pt) CH3OH + 2OH- + H2O + 6h+→ CO2 + 2H2O + 4H+ (4)
6 OH- + CH3OH + 6H+ → HCHO + HCOOH + H+ (5)
Table 1 A correlation between the various parameters of molecular device and their
corresponding hydrogen generation.
S. L. Type of silver
nanoparticles
Particle size Shape of
the particle
Position of 1st
excitonic peak
Hydrogen
generated with Pt/
AgNPs@ ZnONRs
/ mol h-1 g-1
1. Ag(Ajwain) 12.478 Cubic + Rods 446 nm 204.6000
2. Ag(Fenugreek) 13.420 Spherical 425 nm 27.7400
3. Ag(Tea) 7.0 - 8.000 Spherical 420 nm 33.9639
4. Ag(Shikakai) 23.420 Hexagonal top
shaped structure
436 nm 78.1580
All of above systems show good hydrogen generation quality of course without any noticeable
degradation in the photocatalytic devices.
4.1.3.6 Pt/CdS@Co-ZnO
Nanocomposite heteromolecular devices of Pt/CdS@Co-ZnO at their different stages of
advancement, 1.5% Pt/ZnO, 1.5% Pt/Co-ZnO, 1.5% Pt/CdS/ZnO and 1.5% Pt/CdS/Co-ZnO, was
documented exhibits the corresponding amount of H2 evolved, such as 10.20, 22.56, 50.57 and
67.20 mmol/H2 g-1h-1, respectively (Figures 7a and 7b). All of above systems show good
hydrogen generation quality of course without any noticeable degradation in the photocatalytic
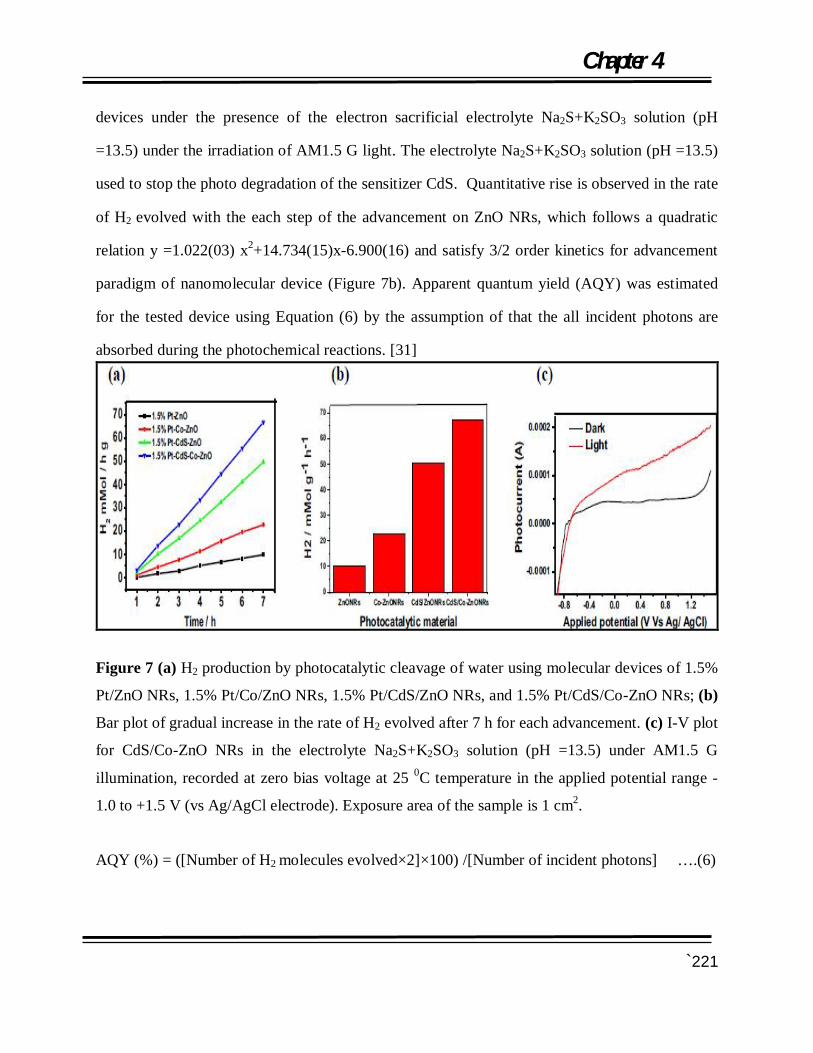
Chapter 4
`221
devices under the presence of the electron sacrificial electrolyte Na2S+K2SO3 solution (pH
=13.5) under the irradiation of AM1.5 G light. The electrolyte Na2S+K2SO3 solution (pH =13.5)
used to stop the photo degradation of the sensitizer CdS. Quantitative rise is observed in the rate
of H2 evolved with the each step of the advancement on ZnO NRs, which follows a quadratic
relation y =1.022(03) x2+14.734(15)x-6.900(16) and satisfy 3/2 order kinetics for advancement
paradigm of nanomolecular device (Figure 7b). Apparent quantum yield (AQY) was estimated
for the tested device using Equation (6) by the assumption of that the all incident photons are
absorbed during the photochemical reactions. [31]
Figure 7 (a) H2 production by photocatalytic cleavage of water using molecular devices of 1.5%
Pt/ZnO NRs, 1.5% Pt/Co/ZnO NRs, 1.5% Pt/CdS/ZnO NRs, and 1.5% Pt/CdS/Co-ZnO NRs; (b)
Bar plot of gradual increase in the rate of H2 evolved after 7 h for each advancement. (c) I-V plot
for CdS/Co-ZnO NRs in the electrolyte Na2S+K2SO3 solution (pH =13.5) under AM1.5 G
illumination, recorded at zero bias voltage at 25 0C temperature in the applied potential range -
1.0 to +1.5 V (vs Ag/AgCl electrode). Exposure area of the sample is 1 cm2.
AQY (%) = ([Number of H2 molecules evolved×2]×100) /[Number of incident photons] ….(6)

Chapter 4
`222
Where, the number of incident photons was 4.48 × 1024 photon h-1, measured using a Si
photodiode, at 420 nm wavelength. Corresponding water splitting ability of the device was
estimated in terms of AQY at 420 nm. These were found to be 0.30, 0.66, 1.49 and 1.98%,
respectively for above mentioned systems (1.5% Pt-ZnO, 1.5% Pt/Co-ZnO, 1.5% Pt/CdS/ZnO
and 1.5% Pt/CdS-Co-ZnO). Reproducibility of these systems against their photocatalytic water
splitting ability was checked thrice by using the same photocatalytic material, (suspended
particles in aqueous electrolyte) after their five times washing with the pure de-ionized water and
drying at 100 0C for 1 h. Electrochemical analyzer [Auto lab potentiostat model PGSTAT30] in
the midst of software GPES (general purpose electrochemical study) manager, was used to
monitor the photovoltaic responses of the test samples. Power density of the light source was
controlled at 100 mWcm-2 (AM1.5 G), using thermopile (Gentec (ε) Solo-2, Model-UP12E105-
H5 ISS, USA) at the beginning and checked at end of the each PEC run. Pyrex glass
photoelectrochemical (PEC) cell with water jacket was well equipped with a small quartz
window and conventional three electrode-system, comprising of a saturated calomel electrode
(SCE) as reference electrode, a Pt flag as counter electrode and uniform film of the sample
loaded on fluorine doped tin oxide (FTO) substrate (using doctor blade method) as the working
electrode (WE). A wide potential window with a width of 1.5 V (-0.9 to +0.6 V) recorded during
photovoltaic study of 1.5% Pt/CdS/Co-ZnO NRs device, was attributed to a good electron
exchange quality of the system (Fig. 7c). [32] Significantly, no saturation in photocurrent was
observed at applied positive potentials, which indicates efficient charge separation upon light
illumination that is responsible for higher hydrogen evolution amount. [33] On the basis of this
study and other supportive analytical evidences, [7,34] the most plausible overall photocatalytic
water splitting mechanism for the nano device (1.5% Pt/CdS/Co/ZnO NRs) in presence of hole
sacrificial electrolyte under visible light exposure, is suggested and illustrated by Figures 8.
Accordingly, during the electron transfer, when the surface of the device was illuminated with
light, an electron was excited from VB to CB, which generates a pair of photohole and
photoelectron in corresponding VB and CB of Co-ZnO. Nascent photoelectrons of the CB (Co-
ZnO) are transported to the CB of quantum confined nano-sized sensitizer (CdS). This electron
arrived at the junction of Pt/electrolyte interface by passing through the electron-pool of the
metallic Pt.

Chapter 4
`223
Figure 8 Electron transfers mechanism for the photocatalytic water splitting using the nanomolecular device i.e. 1.5% Pt-CdS/Co-ZnO NRs.
At the interface of material surface with Pt and water, the photoelectrons interact with H+ ions
[35] of the solution and liberated the nascent H that combined with another nascent H atom to
generate H2 gas. Holes accumulated at VB of Co-ZnO and CdS responsible for the degradation
of the scavenger electrolyte by photocatalytic cleavage of the water, are given by the Equations
(7-9) on photo exposure:
CdS/Co-ZnO +hv → e- (CdS/Co – ZnO) + h+(CdS/Co –ZnO) ...........(7)
Cathode: 2H2O +2e- → 2OH- + H2 ...........(8) Anode: SO3
2-+S2-+ 2OH- +1.5H2O + 6h+→1.5S2O32-+SO4
2- + 4H+ ...........(9) Overall Redox Reaction: S2- + SO3
2-+ 5H2O → 5H2+2SO42- ......... (10)
4.1.4 CONCLUSION In short, this study gives us an inside view of the photocatalytic water splitting of two type of
systems: (A) Ag @ZnO NRs using different type of Ag NPs [where, silver nanoparticles (i)Ag
NPs (Trachyspermum Ammi) @ZnO NRs (ii)Ag NPs(Trigonella foenum graecum/
Chapter 4
`224
Fenugreek)@ZnO NRs (iii) Ag NPs (Tea) @ZnO NRs (iv) Ag NPs (Acacia
Concinna/Shikakai)@ZnO NRs] and (B) CdS@Co-ZnO. System A i.e. AgNPs@ ZnO NRs
dispersed in 20% CH3OH (electron sacrificial electrolyte) under the 300W Xe light source for 4h
to perform the reduction of water and generation of the hydrogen gas. The results exhibited that
the AgNPs@ ZnO NRs after Pt loading i.e. Pt/Ag(TA)@ZnO, showed the highest efficiency in
terms of hydrogen production (204.60/ mol h-1 g-1), that followed by the Pt/Ag(AC)@ZnO
(78.1580 mol h-1 g-1), Pt/Ag(Tea)@ZnO (33.9639 mol h-1 g-1) and Pt/Ag(FG)@ZnO (27.7400
mol h-1 g-1). Ag NPs with the different particle shape and size, play an important role in
correlating the hydrogen generation efficiency of the molecular device, where the ZnO NRs are
taken in the same proportion in all cases. Therefore, we can conclude as the higher the position
of first excitation peak on wavelength axis and lower particle size can result in the high
efficiency of hydrogen generation In case of system B, a good correlation between atomic
arrangement around Zn atom and light harvesting capacity of the modified ZnO NRs has been
established, in terms of the water splitting. Defects developed on Co-ZnO NR's surface, may act
as recombination centres for the photocarriers. The concentration of the defects on the flat-end
Co-ZnO NRs was suppressed by its decoration with the visible light sensitizer CdS.
Heterocouple CdS/Co-ZnO NRs, show a good compatibility of nanoparticles of CdS with Co-
ZnO NRs. Whole molecular assembly was utilised as a photoelectrode after Pt-loading for
hydrogen generation via water splitting in the electron sacrificial electrolyte i.e. Na2S+K2SO3
solution (pH =13.5) under the 300 W Xe light exposure. (hydrogen evolved amount, apparent
quantum yield) Gradual increase in the photocatalytic activity of the devices was recorded with
surface modification, such as 1.5% Pt/ZnO (10.20 mmol/hg, AQY =0.30%), 1.5% Pt/Co-ZnO
(22.56 mmol/hg, AQY =0.66%), 1.5% Pt/CdS/ZnO (50.57 mmol/hg, AQY =1.49%) and 1.5%
Pt/CdS/Co-ZnO NRs (67.20 mmol/hg, AQY = 1.98%), which can execute a excellent job of
water splitting better than pristine samples. Time dependent hydrothermal synthesis
CdS/Co/ZnO NRs is in progress to explore the relationship between their photocatalytic
hydrogen generation efficiency and atomic arrangement. Therefore, it can be established the SPR
effect of Ag NPs and sensitizer CdS increase the efficiency of the ZnO NRs of the hydrogen
generation via water splitting.

Chapter 4
`225
4.1.5 REFERENCES [1] M Balat, “Potential importance of hydrogen as a future solution to environmental and transportation problems” Int J Hydrogen Energy (2008), 33: 4013-29. [2] N Chouhan, RS Liu, “Electrochemical technologies for energy storage and conversion” In: Liu RS, Zhang L, Sun X, Liu H, Zhang J, editors, “Electrochemical technologies for energy storage and conversion” 1. Weinheim, Germany: Wiley-VCH (2012), Chap. 1: 23-33. [3] JM Ogden, “Prospectus of building a hydrogen energy Infrastructure” Annu Rev Energy Environ (1999), 24: 227-79. [4] N Chouhan, L Yeh, SF Hu, RS Liu, WS Chang, KH Chen, “CdSe(QDs)@ ZnO nanotubes as an effective photoanode” Chem Commun (2011), 47: 3493-5. [5] XH Wang, YC Zhang, WL He, MK Zhu, B Wang, H Yan, “Hydrothermal synthesis of zinc oxide powders with controllable morphology” Ceram Int (2004), 30: 93-7. [6] A Wolcott, WA Smith, TR Kuykendall, YP Zhao, JZ Zhang, “Photoelectrochemical generation of hydrogen from water splitting based on dense and aligned TiO2 nanorod arrays” Small (2008), 5 (1): 104-11. [7] X Yang, A Wolcott, G Wang, A Sobo, RC Fitzmorris, F Qian, “Nitrogen-doped ZnO nanowire arrays for photoelectrochemical water splitting” Nano Lett (2009), 9 (6): 2331-6. [8] HM Chen, CK Chen, YC Chang, CW Tsai, RS Liu, SF Hu, “Quantum dot monolayer sensitized ZnO nanowirearray photoelectrodes: true efficiency for water splitting” Angew Chem (2010), 122(34): 6102-5. [9] K Maeda, K Teramura, D Lu, T Takata, N Saito, Y Inoue, “Photocatalyst releasing hydrogen from water” Nature (2006), 440 295. [10] A Kushwaha, M Aslam, “ZnS shielded ZnO nanowire photoanodes for efficient water splitting” Electrochim Acta (2014), 130: 222-31. [11] M Liu, CY Nam, CT Black, J Kamcev, L Zhang, “Enhancing water splitting activity and chemical stability of zinc oxide nanowire photoanodes with ultrathin titania shells” J Phys Chem C (2013), 117: 13396-402. [12] S Shen, CX Kronawitter, J Jiang, P Guo, L Guo, SS, “A ZnO/ZnO: Cr isostructural nanojunction electrode for Photoelectrochemical water splitting” Nano Energy (2013), 2: 958-65.

Chapter 4
`226
[13] J Ji, W Zhang, H Zhang, Y Qiu, Y Wang, Y Luo, “High density Si/ZnO core/shell nanowire arrays for photoelectrochemical water splitting” J Mater Sci Mater Electron (2013), 24 (9): 3474-80. [14] NAM Barakat, A Taha, M Motlak, MM Nassar, MS Mahmoud, SS Al-Deyab, “ZnO &Fe2O3-incoportaed TiO2 nanofibers as super effective photocatalyst for water splitting under visible light radiation” Appl Catal A General (2014), 481: 19-26. [15] A Hameed, MA Gondal, ZH Yamani, “Effect of transition metal doping on photocatalytic activity of WO3 for water splitting under laser illumination: role of 3d-orbitals” Catal Commun (2004), 5 (11): 715-9. [16] R Sasikala, AR Shirole, V Sudarsan, Jagannath, C Sudakar, R Naik, “Enhanced photocatalytic activity of indium and nitrogen co-doped TiO2-Pd nanocomposites for hydrogen generation” Appl Catal A General (2010), 377(1-2): 47-54. [17] X Hou, S Jiang, Y Li, J Xiao, Y Li, “Ni-doped InN/GaZnON composite, catalyst for overall water splitting under visible light irradiation” Int J Hydrogen Energy (2015), 40 (45): 15448-53. [18] H Wang, W Chen, J Zhang, C Huang, L Mao, “Nickel nanoparticles modified CdSe A potential photocatalyst for hydrogen production through water splitting under visible light irradiation” Int J Hydrogen Energy (2015), 40 (1): 340-5. [19] K Hashimoto, T Kawai, T Sakata, “Hydrogen production with visible light by using dye sensitized TiO2 powder” Nouv J Chim (1983), 7: 249-53. [20] S Tawkaew, Y Fujishiro, S Yin, T Sato, “Synthesis of cadmium sulfide pillared layered compounds and photocatalytic reduction of nitrate under visible light irradiation” Colloids Surf A (2001), 179: 139-44. [21] EA Malinka, GL Kamalov, SV Vodzinskii, VI Melnik, ZI Zhilina, “Hydrogen production from water by visible light using zinc porphyrin-sensitized platinized titanium dioxide” J PhotochemPhotobiol A (1995), 90: 153-8. [22] T Shimidzu, T Iyoda, Y Koide. “An advance visible light induced water reduction with dye sensitised semiconductor powder catalyst” J Am ChemSoc (1985), 107: 35-41. [23] H Kato, M Hori, R Konta, Y Shimodaira, A Kudo, “Construction of Z scheme type heterogeneous photocatalysis systems for water splitting into H2 and O2 under visible light irradiation” Chem Lett (2004), 33 (10): 1348-9. [24] X Wang, G Liu, GQ Lu, HM Cheng, “Stable photocatalytic hydrogen evolution from water over ZnO-CdScoreeshell nanorods” Int J Hydrogen Energy (2010), 35 8:199-205.

Chapter 4
`227
[25] D Chu, YP Zeng, DL Jiang, “Hydrothermal synthesis and optical properties of Pb2+doped ZnO nanorods” Mater Lett (2006,) 60: 2783-5. [26] BC Cheng, YH Xiao, GS Wu, LD Zhang. “Controlled growth and properties of one-dimensional ZnO nanostructures with Ce as activator/dopant” Adv Funct Mater (2004), 14 (9): 913 9. [27] SM Zhou, XH Zhang, XM Meng, SSK Wu, T Lee. “Enhancement of UV luminescence in sol-gel prepared ZnO thin films by incorporation of Mg” Phys Status Solidi A (2005), 202(3): 405-10. [28] CX Xu, XW Sun, ZL Dong, MB Yu, YZ Xiong, JS Chen, “Magnetic nanobelts of iron-doped zinc oxide” Appl Phys Lett (2005), 86: 173110. 3 pages. [29] JF Reber, K Meier, “Photochemical hydrogen production with platinized suspensions of cadmium sulfide and cadmium zinc sulfide modified by silver sulphide” J Phys Chem (1986), 90 (5): 824-34. [30] J Neamtu, G Georgescu, T Malaeru, NG Gheorghe, RM Costescu, I Jitaru, “Atomic structure and magnetic properties of cobalt doped ZnO thin films prepared by the sol-gel method”, Dig J NanomaterBiostr (2010) 5:873-85. [31] AL Ankudinov, B Ravel, JJ Rehr, SD Conradson, “Real-space multiple-scattering calculation and interpretation of x-rayabsorption near-edge structure” Phys. Rev B (1998), 58: 7565-76. [32] M Sathish, B Viswanathan, RP Viswanath, “Alternate synthetic strategy for the preparation of CdS nanoparticles and its exploitation for water splitting” Int J Hydrogen Energy (2006), 31: 891-8. [33] R Konta, T Ishii, H Kato, A Kudo, “Photocatalytic activities of Noble metal ion doped SrTiO3 under visible light irradiation” J Phys Chem B (2004), 108 (26): 8992-5. [34] WC Poh, KP Loh, WD Zhang, S Tripathy, JS Ye, FS Sheu, “Biosensing properties of diamond and carbon nanotubes” Langmuir (2004), 20: 5484-92. [35] G Lindbergh, D Simonsson, “Inhibition of cathode reactions in sodium hydroxide solution containing chromate” J ElectrochemSoc (1991), 36: 1985-94.

Chapter 4
`228
Chapter 4 4.2 Ag NPs used for Pollutant P-Nitro
Phenol (PNP) Degradation into P-Amino
Phenol
ABSTRACT Plasmonic silver nanoparticles (AgNPs, size=3-50 nm) were synthesized by biogenic reduction
of aqueous AgNO3 using aqueous Trachyspermum ammi (TA, Ajwain) seeds extract. Increase in
concentration of TA, accelerated the reduction rate of Ag+ and affected the AgNPs particle size.
Pronounce effect of the AgNP's aging (24, 48 and 72 h) was exhibited by the systems on Ag
particle concentration/size and their corresponding catalytic activity. As-synthesized 24, 48 and
72 h aged-Ag NPs, were tested for their catalytic reduction activity towards the conversion of p-
nitro phenol to p-aminophenol in excess of NaBH4. 48h-aged Ag NPs show highest catalytic
activity for conversion of p-nitrophenol to p-aminophenol in excess of NaBH4 in terms of rate (r
=0.34539 min−1) with the complete reduction time of 12 min.
Key Words: Ag Nanoparticles, green synthesis (Trachyspermum Ammi), p-nitrophenol, p-
aminophenol, NaBH4, etc.

Chapter 4
`229
4.2.1 INTRODUCTION
The silver nanoparticles exhibits quite good antibactericidal, antiviral, anti-inflammatory,
antiangiogenic, anti tumor, anti-oxidative properties against the bacterial strains/ microorganisms
along with the biological and chemical sensing, imaging, drug carrier, diagnosis of the
cancer/HIV/AIDS and catalytic activity. Therefore, it commonly used in medical and industrial
products that can directly get in touch with the human body, such as shampoos, soaps, detergent,
shoes, cosmetic products, and toothpaste, besides photocatalytic and pharmaceutical
applications. Moreover, superiority of the nanosilver particles over other candidates of the same
class is already established in terms of the small losses in optical frequency during the surface-
plasmon propagation, high conductivity, thermal and chemical stability at ambient conditions,
lesser costlier price than other noble metals such as gold and platinum, high primitive character,
and wide range of visible light absorption, etc. Which, prompt us to select silver as a plasmonic
material for this study. Tiny nano-particles of the noble metals under light exposure can possess
the localised spin plasmonics resonance (LSPR) character, are known as plasmonics material.
Free electrons integrated with the photon energy produces a LSPR [1-5] on exposing nano-
particles of noble metals to sunlight. Therefore, NPs of the noble metals will be work as the
energetic centres on catalyst for the thermal redox reaction that can entrap, scatter, and ponder
the light [6-8], due to the fast charge transfer and bring about enhanced activities. Pure Ag NPs,
as well as some chemically modified Ag NPs has also been in trend that to be used in various
applications such as: cleaning water, catalyst, sensor, optoelectronic properties, eradication of
organic pollutants (dye phenol,etc), etc. Out of which the removal of organic pollutants
(nitrophenol) from waste water is quite fascinating as the 4-nitrophenol (PNP) is a low water-
soluble and highly stable chemical that used to be found in waste water, produced by explosive-
and dye-industries. Environmental Protection Agency of United States rated nitrophenols as the
highly polluted chemical among the top 114 organic pollutants. It adversely affects the human
and animal organs like liver, kidney, blood and central nervous system, skin, etc.[9] Moreover,
the degradation of PNP to non dangerous product is difficult due to its high stability. Therefore,
the study for catalytic reduction of hazardous PNP to benign 4-aminophenol (PAP) becomes a
remarkable echnique in terms of nitrophenol-pollution mitigation process. [10] PAP is a very
fascinating chemical as it can be used in production of analgesic and antipyretic drugs,

Chapter 4
`230
photographic developer, corrosion inhibitor, anti-corrosion lubricant, and many more
applications. It can be produced by reduction of PNP to PAP using reducing agents at room
temperature. Aforementioned reaction is a thermodynamically feasible process as it involves E0
for PNP/PAP = −0.76 V and H3BO3/BH4− = −1.33 V versus NHE. But this reaction is kinetically
restricted by nature and never produce PAP as end product but generate an intermediate i.e. p-
nitrophenolate ion in absence of the catalyst. Metal, were often used to catalyse the above
reaction Here, the metal NPs or modified metal NPs can serve as catalysts to transfer electrons
from metal ions to the PNP and smoothen the way to be converted into the PAP by reducing
activation energy requirements. Few outstanding examples of the metal NPs used for catalytic
reduction of PNP into PAP in presence of excess of NaBH4 are Ag NPs-decorated polyaniline
nanofibers (AgNPs/PANINFs) nanocomposites, [11] SiO2-coated graphene oxide nanosheets,
decorated with Ag nanoparticles, [12] Pd/CuO NPs, [13] Ag NPs synthesized by using of
Theobroma cacao L. seed extract, etc. Where, PNP absorbed on the catalytic surface of metal
NPs and reduce PNP in presence of NaBH4, result in the production of PAP. Hence, this study is
devoted to the fabrication of the Ag NPs by biogenic reduction method using aqueous TA seed
extract at ambient conditions. Finally, the biogenic Ag NPs produced by varying concentration
and aging time and used to reduce p-nitrophenol to p-aminophenol in excess of NaBH4. The
reaction mechanism for this reaction is also suggested on the basis of the characterisation. Effect
of aging/particle size on catalytic activity and rate of reaction will also be discussed.
4.2.2 Reduction of p-nitro phenol
The light yellow colour of 0.05 mM p-nitrophenol turns to yellow green upon incorporation of
the alkaline 15 mM sodium borohydride solution. But under such conditions PNP didn't convert
into PAP, until the addition of AgNPs. The peak intensity was quantitatively observed by using
UV-Vis spectrophotometer (Model 3000+ of Lab India) with a time gap of 3m in a scanning
range of 200-800 nm at room temperature of 25 °C with scan speed of 250nm per minute. The
reduction of p-nitrophenol with NaBH4 was monitored using UV-Vis absorption spectroscopy by
use of 1 mL of 15 mM NaBH4 (aqueous solution) mixed with 1.7 mL of 0.2 mM 4-nitrophenol
(aqueous) and 0.1 mL of 100 mgL-1 of AgNPs, poured in to a 5 mL quartz cell for optical
observations.
Chapter 4
`231
4.2.3 Catalytic reduction of p-nitrophenol using NaBH4 and AgNPs
Currently, the AgNPs has been extensively observed in the field of chemical catalysis. In
eradication of nitrophenol pollution AgNPs are proved to be a remarkable material. In order to
evaluate the catalytic activity of the AgNPs (synthesized by using Trachyspermum ammi
(Ajwain) seed extract; aged at 24 h, 48 h and 72 h) for the reduction of PNP (0.05mM) to PAP in
aqueous sodiumborohydride (15mM). The reaction was monitored at room temperature in
absence and presence of AgNPs. The reaction progress was spectrophotometrically examined by
recording the absorption spectra at various time interval. The main absorption peaks of PNP
were found at 258 and 316.5 nm due to π→ π* and n→ π* transition, respectively. The treatment
of this solution with freshly prepared aqueous solution of NaBH4 result in disappearance of π→
π* nm peak and red shift of the first excitation peak of PNP from 316.5 nm to 401.5 nm, due to
the formation of 4-nitrophenolate ion in the solution, which was demonstrated by optical spectra
in Figure 1a and its schematic presentation is demonstrated by Scheme 1.
The peak position at 401.5 nm in absence of AgNPs remains unaltered even after the month long
aging because of a huge kinetic barrier exist due to large potential difference between the donor
and acceptors that decreases the feasibility of this reaction for the reduction process. [14]
Interestingly, on addition of a freshly prepared biogenic AgNPs (0.1 mL, 100 mgL−1) to the
mixture of PNP and sodiumborohydride solution, the intensity of the 4-nitrophenolate peak at
401.5 nm, start decreasing development of new peak at 300nm nm wavelength was confirmed
the catalytic reduction of PNP to PAP and its mechanism is shown by the Scheme 1. [15] The
whole reduction process of the PNP in 24, 48 and 72 h aged samples of AgNPs, was completed
in 10, 12 and 18 min, respectively. As it revealed by the naked eyes the disappearance of the
yellow colour of the PNP (Figures 1b, 1c and 1d) into colorless solution. Simultaneously, the
peak position of the 24 h, 48 h and 72 h aged samples in absence of AgNPs, were observed at
401, 400 and 402 nm, respectively (Figure 1e). This confirms the particle size reduces from 24 h
aging to 48 h aging but its increases after 72 h aging.
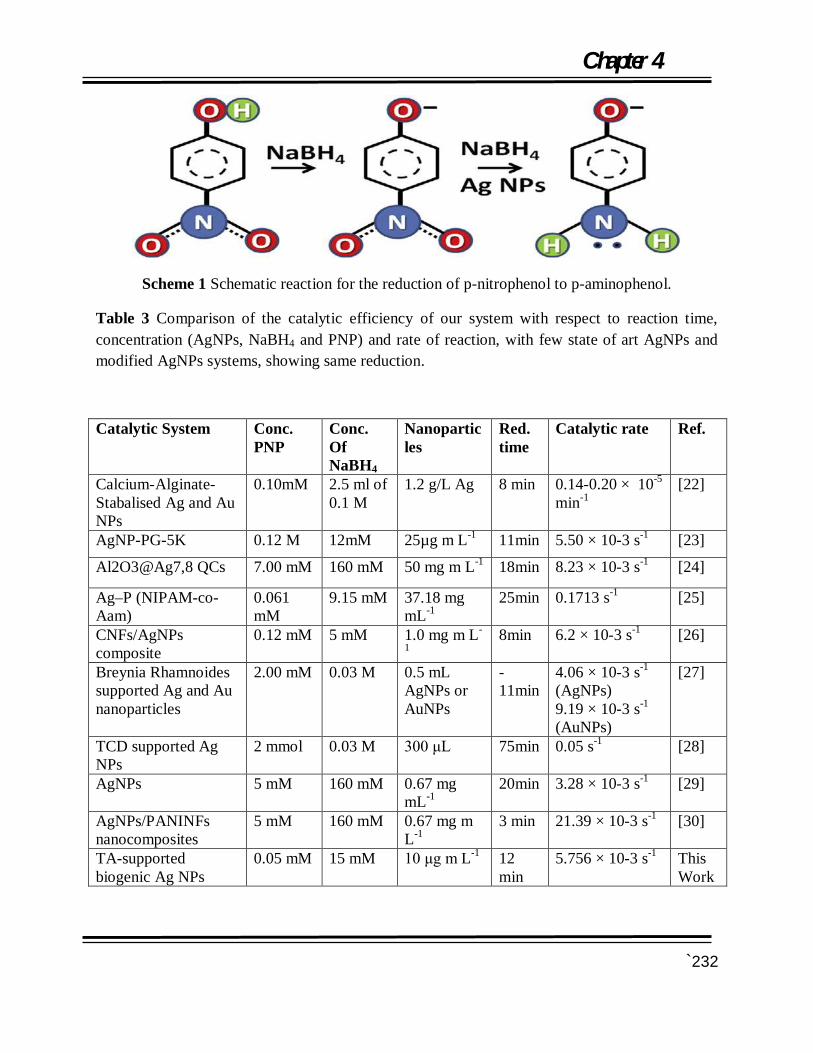
Chapter 4
`232
Scheme 1 Schematic reaction for the reduction of p-nitrophenol to p-aminophenol.
Table 3 Comparison of the catalytic efficiency of our system with respect to reaction time, concentration (AgNPs, NaBH4 and PNP) and rate of reaction, with few state of art AgNPs and modified AgNPs systems, showing same reduction.
Catalytic System Conc. PNP
Conc. Of NaBH4
Nanoparticles
Red. time
Catalytic rate Ref.
Calcium-Alginate-Stabalised Ag and Au NPs
0.10mM 2.5 ml of 0.1 M
1.2 g/L Ag 8 min 0.14-0.20 × 10⁻⁵ min-1
[22]
AgNP-PG-5K 0.12 M 12mM 25µg m L-1 11min 5.50 × 10⁻³ s-1 [23]
Al2O3@Ag7,8 QCs 7.00 mM 160 mM 50 mg m L-1 18min 8.23 × 10⁻³ s-1 [24]
Ag–P (NIPAM-co-Aam)
0.061 mM
9.15 mM 37.18 mg mL-1
25min 0.1713 s-1 [25]
CNFs/AgNPs composite
0.12 mM 5 mM 1.0 mg m L-
1 8min 6.2 × 10⁻³ s-1 [26]
Breynia Rhamnoides supported Ag and Au nanoparticles
2.00 mM 0.03 M 0.5 mL AgNPs or AuNPs
- 11min
4.06 × 10⁻³ s-1 (AgNPs) 9.19 × 10⁻³ s-1 (AuNPs)
[27]
TCD supported Ag NPs
2 mmol 0.03 M 300 μL 75min 0.05 s-1 [28]
AgNPs 5 mM 160 mM 0.67 mg mL-1
20min 3.28 × 10⁻³ s-1 [29]
AgNPs/PANINFs nanocomposites
5 mM 160 mM 0.67 mg m L-1
3 min 21.39 × 10⁻³ s-1 [30]
TA-supported biogenic Ag NPs
0.05 mM 15 mM 10 μg m L-1 12 min
5.756 × 10⁻³ s-1 This Work

Chapter 4
`233
Figure 1 (a) Red shift observed in UV–visible spectrum of 4-nitrophenol (Black) when it reduced to 4-nitrophenolate ions (401.5 nm) (Red) with NaBH4; catalytic reduction of 4- nitrophenol in NaBH4 solution to 4-aminophenol (300 nm peak), was observed on the addition of AgNPs at the time interval (b) 24 h (c) 28 h and (d) 72 h. (e) peak position of the aged samples in absence of AgNPs and (f) Rate constant vs aging time plot. Where, the concentration of various reactants are taken as [0.05 mM PNP]; [0.1 mL of 100 mgL−1 AgNPs] and [15 mM NaBH4].

Chapter 4
`234
Figure 2 Plot of (i) At/A0 vs time and (ii) ln (At/A0) vs time for the reduction of p-nitrophenol at (a) 24 h, (b) 48 h and (c) 72 h aging. Where, [0.05mMPNP]; [0.1 mL of 100mgL−1 AgNPs] and [15 mM NaBH4].
Catalytic action of AgNPs is shown for the above reduction process, lower down the activation
energy that leads to the formation of PAP by following a pseudo-first-order rate kinetics with
respect to PNP. Effect of aging ((a) 24 h, (b) 48 h and (c) 72 h) revealed on AgNPs catalytic
activity (as At/A0 vs time and (ii) ln (At/A0) vs time plots) against the reduction process of PNP

Chapter 4
`235
in terms of the rate of reaction. The apparent catalytic rate constant (k24=0.25709min−1,
k48=0.34539min−1 and k72=0.0866min−1) was calculated for the reduction process at 24 h, 48 h
and 72 h, using the slope of the plot between logarithm of the observed optimum absorbance and
time, which are represented by Figures 2a, 2b and 2c, respectively.
Scheme 2 Reduction mechanism of p-nitro phenol to p-aminophenol in presence of the aqueous NaBH4 and Ag NPs.
Scheme 3 Conversion of 4-nitrophenol to 4 aminophenol in the presence of Ag nanoparticles, proposed by Anand etal.
Chapter 4
`236
The catalytic action of Ag nanoparticles is corresponds to its’ size, shape and well dispersion. A
probable mechanism for the catalytic conversion of 4-nitrophenol to 4-aminophenol is shown in
scheme 3, was proposed by K. Anand et al., [16] with slight modification. During the catalytic
action, of the PNP molecule are initially chemisorbed at the (100) surface of the AgNPs through
two oxygen atoms of the nitro group of p-nitro phenolate ion. That may create a pentagonal Ag-
O-N-O-Ag cyclic intermediate that may react with BH4− ion and decomposed into PAP, as
illustrated by Scheme 2. Binding of organic molecules to metal surfaces and their reduction
process has been extensively model by Newns [17] and later on expanded by Hammer and
Nørskov. [18-22] After executing our experiment we compare the efficiency of our results with
respect to reaction time (12 min), concentration and rate of reaction (5.756 × 10⁻³ s-1), with some
of the recent state of art AgNPs and modified AgNPs systems such as; Calcium-Alginate-
stabilised Ag and Au NPs, Ag/NP-PG-5K (PG: polyguanidino oxanorbornenes (PG), 5 K and 25
kDa), Al2O3@Ag, QCs, Ag-P (NIPAM-co-Aam; NIPAM: Nisopropylacrylamide), CNFs (carbon
nano fibres)/AgNPs composite, Breynia Rhamnoides supported Ag and Au Nanoparticles, TCD
(TCD: trisodium citrate dihydrate (HOC(COONa) (CH2COONa)2·2H2O)) supported Ag NPs,
chemically reduced Ag NPs, AgNPs/PANINFs nanocomposites (PANINFs: polyaniline nano
fibres), etc., as shown as Table 3 [23-29]. And it was found that our system is performing better
than above mentioned systems. Reason behind the superiority can be given on the basis of
Garcia-Vidal and Pendry's model, the smaller metallic particles and higher content of NPs gave
higher enhancement in efficiency [30]. Moreover, TA supported-AgNPs shown the high catalytic
activity that will be sustain till the three successive cycles of reduction reactions and would
greatly promoted for their industrial applications.

Chapter 4
`237
4.2.4 CONCLUSION
As synthesized AgNPs, were used successfully to completely catalyse the reduction of notorious
pollutant PNP to PAP in presence of excess NaBH4, which was kinetically toughest reaction in
absence of catalyst. The study of effect of AgNPs particle size on PNP reduction catalytical
activity was observed. The results showed that the 48 h-aged AgNPs prepared in 2.0% TA
extract, exhibited the optimum catalytic efficiency in comparision to the many state of art
catalytic systems.
4.2.5 REFERENCES
[1] S. Ankanna, P. TNVKV, E.K. Elumalai, N. Savithramma, “Production of biogenic silver nanoparticles using Boswellia ovalifoliolata stem bark” Dig. J. Nanomater. Biostruct. (2010), 5 (2) 369-372.
[2] R.H. Ritchie, “Plasma Losses by Fast Electrons in Thin Films” Phys. Rev. (1957) 106: 874.
[3] W.L. Barnes, A. Dereux, T.W. Ebbesen, “Surface Plasmon Sub wavelength Optics” Nature (2003), 424: 824-830.
[4] S.A. Maier, H.A. Atwater, “Plasmonics: localization and guiding of electromagnetic energy in metal/dielectric structures” J. Appl. Phys. (2005), 98: 011101.
[5] S.A. Maier, “Plasmonics Fundamentals and Applications” first ed. Springer, New York, (2007), 21-34 and 65-88.
[6] S. Lal, S. Link, N. Halas, Nat. Photonics (2007), 1: 641-648.
[7] X.C. Wang, J.C. Yu, H.Y. Yip, L. Wu, P.K. Wong, S.Y. Lai, “A mesoporous Pt=TiO2 nanoarchitecture with catalytic and photocatalytic functions” Chem. Eur. J. (2006), 11: 2997–3004.
[8] X.B.Cao, L. Gu, L.J.Zhuge, W.J.Gao, W.C. Wang, S.F.Wu, “Template-free preparation of hollow Sb2S3 microspheres as supports for Ag nanoparticles and photocatalytic properties of the constructed metal- semiconductor nanostructures” Adv.Funct.Mater. (2006), 16: 896-902.
[9] J. Virkutyte, R.S. Varma, “Fabrication and visible-light photocatalytic activity of novel Ag/TiO2ÀxNx photocatalyst” New J. Chem. (2010), 34: 1094-1096.
[10] T. Vincent, E. Guibal, “Influence of experimental parameters on nitrophenol degradation” Langmuir (2003), 19: 8475-8483.
[11] G. Chang, Y. Luo,W. Lu, X. Qin, A.M. Asiri, A.O. Al-Youbi, X. Sun, “Ag. Nanoparticles Decorated Polyaniline Nanofibers: Synthesis, Characterization, and. Applications Toward

Chapter 4
`238
Catalytic Reduction of 4-Nitrophenol and Electrochemical. Detection of H2O2 and Glucose” Catal. Sci. Technol. (2012), 2: 800-806.
[12] W. Lu, Y. Luo, G. Chang, X. Sun, “Synthesis of functional SiO2-coated graphene oxide nanosheets decorated with Ag nanoparticles for H2O2 and glucose detection” Biosens. Bioelectron. (2011), 26: 4791-4797.
[13] M. Nasrollahzadeh, S.M. Sajadi, A. Rostami-Vartooni, M. Bagherzadeh, “Green synthesis of Pd/CuO nanoparticles by Theobroma cacao L. seeds extract and their catalytic performance for the reduction of 4-nitrophenol and phosphine-free” J. Colloid Interface Sci. (2015), 448: 106-113.
[14] N. Pradhan, A. Pal, T. Pal, “Silver nanoparticle catalyzed reduction of aromatic nitro compounds” Colloids Surf. A Physicochem. Eng. Asp. (2002), 196: 247-257.
[15] Z.D. Pozun, S.E. Rodenbusch, E. Keller, K. Tran, W. Tang, K.J. Stevenson, G.J. Henkelman, “Systematic Investigation of p-Nitrophenol Reduction by Bimetallic Dendrimer Encapsulated Nanoparticles” Phys. Chem. C (2013), 117: 7598-7604.
[16] K. Anand, R.M. Gengan, A. Phulukdaree, A. Chuturgoon, “Agroforestry waste Moringa oleifera petals mediated green synthesis of gold nanoparticles and their anti-cancer and catalytic activity” Journal of Industrial and Engineering Chemistry, (2015), 21: 1105-1111.
[17] D.M. Newns, “Self-Consistent Model of Hydrogen Chemisorption” Phys. Rev. (1969), 178: 1123-1135.
[18] B. Hammer, J.K. Nørskov, “Self-Consistent Model of Hydrogen Chemisorption” Nature (1995), 376: 238-240.
[19] B. Hammer, Y. Morikawa, J.K. Nørskov, “CO Chemisorption at Metal Surfaces and Overlayers” Phys. Rev. Lett. (1996), 76 2141-2144.
[20] B. Hammer, J.K. Nørskov, “Electronic factors determining the reactivity of metal surfaces” Surf. Sci. (1995), 343: 211-220.
[21] B. Hammer, J.K. Nørskov, “Erratum to Electronic factors determining the reactivity of metal surfaces” Surf. Sci. (1996), 359: 306.
[22] B. Hammer, “Special sites at noble and late transition metal catalysts” Top. Catal. (2006), 37: 3-16.
[23] S. Saha, A. Pal, S. Kundu, S. Basu, T. Pal, “ Photochemical Green Synthesis of Calcium-Alginate-Stabilized Ag and Au Nanoparticles and Their Catalytic Application to 4-Nitrophenol Reduction “ Langmuir (2010), 26 (4): 2885-2893.
[24] B. Baruah, G.J. Gabriel, M.J. Akbashev, M.E. Booher, “Facile synthesis of silver nanoparticles stabilized by cationic polynorbornenes and their catalytic activity in 4-nitrophenol reduction” Langmuir (2013), 29 (13): 4225-4234.

Chapter 4
`239
[25] A. Leelavathi, B.T.U. Rao, T. Pradeep, “Supported quantum clusters of silver as enhanced catalysts for reduction” Nanoscale Res. Lett. (2011), 6: 123.
[26] R. Begum, Z.H. Farooqi, E. Ahmed, K. Naseem, S. Ashraf, A. Sharif, R. Rehan, “Catalytic reduction of 4‐nitrophenol using silver nanoparticles engineered poly(N‐isopropylacrylamide‐co‐acrylamide) hybrid microgels” Appl. Organomet. Chem. (2016) 1-8.
[27] P. Zhang, C. Shao, Z. Zhang, M. Zhang, J. Mu, Z. Guo, Y. Liu, “In situ assembly of well-dispersed Ag nanoparticles (AgNPs) on electrospun carbon nanofibers (CNFs) for catalytic reduction of 4-nitrophenol” Nanoscale (2011), 3: 3357-3363.
[28] A. Gangula, R.K. Podila, M. Ramakrishna, L. Karanam, C. Janardhana, A.M. Rao, “Catalytic reduction of 4-nitrophenol using biogenic gold and silver nanoparticles derived from Breynia rhamnoides” Langmuir (2011), 27 (24): 15268-15274.
[29] F.A. Al-Marhaby, R. Seoudi, “Preparation and characterization of silver. nanoparticles and their use in catalytic reduction of 4-nitrophenol” World J. Nanosci. Eng. (2016), 6: 29-37.
[30] H. Hu, Z. Wang, L. Pan, S. Zhao, S.J. Zhu, “Ag-coated Fe3O4@SiO2 three-ply composite microspheres: synthesis, characterization, and application in detecting melamine with their surface-enhanced Raman scattering” Phys. Chem. C (2010), 114:7738-7742.

Summary
`240
Fabrication of the Nanomolecular Devices of ZnO for Solar Hydrogen
Production
Summary
Submitted by
Rajesh Kumar Meena
Under the supervision of
Dr. Neelu Chouhan Head and Associate Professor
Department of Pure & Applied Chemistry University of Kota, Kota (Rajasthan)
Submitted to
University of Kota, Kota MBS Road, Vivekananda Nagar, Kota (Rajasthan)-324005
www.uok.ac.in
2018

Summary
`241
Energy is the basic need of the mankind. Current resources of energy are not sufficient to
satisfy the energy requirement of human rescores. Moreover, perpetual energy resource-war
among countries, disturbed ecological balance of the earth, soaring prices. Global warming
due to vichele and industrial air pollution that responsible for the associated climate changes,
inextricable link between nuclear weapons and nuclear power, consumer awareness, abundant
and cheap renewable energy resources, are the major driving forces behind the shifting of
energy trend from conventional to renewable fuels. Free and abundant availability of
sustainable energy resources like, water and solar energy, adds volume to the field of
sustainable energy sources. Nature split water via photosynthesis process in plants, to
produce oxygen and glucose. That inspired us to impersonate the same phenomena in
producing hydrogen by substituting plant’s chlorophyll with apt catalyst in photocatalytic
water splitting and photoelectron catalytic water splitting. Similarly artificial water splitting
can generate oxygen and hydrogen using appropriate and sun light. Hydrogen, produced via
photocatalytic water splitting, is a clean fuel (without greenhouse gases production), because
on oxidation of hydrogen water is produced which is not harmful for nature and human being
energy security (can be produced from abundant sources), economic growth, high efficiency
(75% fuel efficiency), portability (Car tanks, micro fuel), can do wonders in energy world.
Photo water splitting (PWS) or photoelectron chemical water splitting (PECWS) is the most
promising technology to produce H2 energy directly from renewable source water and solar
light at photocatalytic surface. The splitting of water into molecular hydrogen and oxygen by
light irradiation is one of the most fascinating ways for the photochemical conversion and
storage of energy. Therefore, we prepare less toxic metal nanoparticles using different
chemical and green synthesis methods, which is a great challenge of recent time. We focus to
maximize the usage of environmental friendly materials for generating metal nanoparticles.
The synthesized materials was rigorously analysed through advance analytical techniques
such as, UV-Visible spectrophotometer, FTIR spectrophotometer, XRD, FESEM, HRTEM,
EDS, PL, Cyclic voltmeter, etc. As synthesized nanomaterials used for solar H2 production
by water splitting and pollutant degradation. This study became contemporary in context of
present energy scenario.
The present thesis describes the synthesis of metal nanoparticles like as a metal oxide, metal
Summary
`242
sulphide, noble metals and their composite etc. As synthesized metal oxide molecular devices
was used for hydrogen production through water splitting and strengthening our
technological capabilities in designing the photocatalyst for efficient water splitting with a
promise of giving competitive solutions for the production of clean fuel (i.e.H2) at large scale.
It will resolve the present current energy crisis without damaging our precious environment
anymore. The entire research work is divided into six chapters.
The first chapter deals with introduction of this research work, objective, scope and
application of the research work. This chapter deals with review on the potential thrust for the
material scientists to develop an ultimate material with appropriate band edge positions and
adequate stability for the photocatalytic water cleavage processes.1 This is expected to offer
new horizons in the development of visible-light-driven photocatalysis, for achieving overall
water splitting.2 A number of metal oxides containing d0-transition metal cations (e.g., Ti4+,
Zr4+, Nb5+, Ta5+, and W6+) or d10-typical metal cations (e.g., Zn2+, Ga3+, In3+, Ge4+, Sn4+, and
Sb5+) with metal titanates, oxynitrides, oxysulphides, etc, 3-12 have been reported as active
photocatalysts for overall water splitting. Unfortunately, beside the wide domain of
photocatlysts most of them fail on the criteria of stability, cost, and efficiency under visible
light (altogether). Methods to overcome this limitation by controlling the energy structure
using nano solid solutions (ZnO-ZnS) between semiconductor photocatalysts of wide and
narrow band gaps or to develop the one dimensional nanomaterials of apt band gap oxide-
semiconductors and their sensitization with short band gap visible light driven catalyst.13
Synthetic techniques like epitaxial growth,14 sol-gel15 reduction by natural products16,
hydrothermal,17,18 will definitely do great help in this felid by enhancing their structural
qualities. In this regard, we propose a below mentioned strategy, which involves to build up
the infrastructure for study and literature survey along with the fabrication of the apt
semiconductor (doped with elements C, N, S, P, B, F or transition metal ions)19-24 and used
these assemblies as a photoanode and loaded them with sensitizer (quantum dots)25-29 and
utilised noble metal30 as a counter electrode i.e. photocathode. Semiconductor quantum dots,
such as CdS, CdSe, CdTe, and InP, etc,31-35 found compatible to be assembled on metal oxide
semiconductor nanostructures as sensitizers of photoelectrodes.36-40 This combination would
be tested as a functionalized molecular device for the cleavage of water.
Summary
`243
This chapter also sheds light on the development of silver nanoparticles with different sizes
and shapes, using methods such as UV irradiation,41,42 microware irradiation,43,44 chemical
reduction,45-47 photochemical method,48,49 electron irradiation,50,51 and sonoelectrochemical
method, etc.52 However, most of the reported methods involve more than one step, high
energy requirement, low material conversions, difficulty in purification, and hazardous
chemicals. The chemical synthesis of nanoparticles may lead to the presence of some toxic
chemical species adsorbed on the surface that may have adverse effects in its application. The
synthesis of nanoparticles by green method can potentially eliminate this problem. Therefore,
there is an urgent need to develop a green process of nanoparticle synthesis. Green synthesis
methods employed either biological microorganisms or plant extracts and emerged as a
simple and alternative to chemical synthesis. Green synthesis provides advancements over
chemical methods as it is environment friendly, cost effective, and easily scaled up for large
scale synthesis. Generally, the green synthesis method involves three main steps, (1) solvent
medium selection, (2) environmental benign reducing agent selection, and (3) non-toxic
substances for nanoparticles stability selection. The synthesis of nanoparticles by using plant
extracts can be advantageous over other biological processes because it eliminates the
elaborate process of maintaining cell cultures and can be suitably scaled up for large scale
production under non-aseptic environments.
The second chapter describes with the fundamental experimental part along with chemicals
basic information. This chapter divided into two sections. The first (A) section of this
chapter deals with the description of various characterization techniques which are most
important to characterize the synthesized nanocatalyst. This section also describes the basic
theories and principles associated with the main analytical methods, i.e. electron microscopy
UV-Visible spectrophotometer, FTIR spectrophotometer, XRD, FESEM, HRTEM, EDS, PL,
Cyclic voltmeter, electronic balance, pH meter, used throughout the study. UV-Visible
spectrophotometer and FTIR spectrophotometer were frequently employed to analyze the
progress of reaction and identification of the synthesis nanoparticle. The second (B) section is
deals with the details of the reagents, chemicals and their solutions with other specifications
employed in kinetic study of various suitable reactions.

Summary
`244
The third chapter deals with the synthesis part of ZnO nanorods and green synthesis of Ag
nanoparticles, which divided into two sections. In the first (A) section, we discuss about
synthesis process and optical properties of ZnO nanorods by hydrothermal method using in a
reagent solution of zinc acetate, zinc nitrate and HMT in a hydrothermal reactor. This was
sealed in an autoclave and heated to 90oC to grow nanorods. Their physical growth
mechanism on FTO substrate by an aqueous solution growth method was traced in the light
of PL, FESEM and HRTEM studies. The nanorod of the ZnO has been analyzed by using X-
ray diffraction analysis and UV visible DRS measurement. Similarly in the Second (B)
chapter divided into four sections basis on preparation method of silver nanoparticles from
silver metal ion using different plant extract using as a reducing agent. The first section (a) of
this chapter deals with the description of synthesized spherical and rod shaped silver
nanoparticles by green synthesis method (with use of Ajwain seed extract in aqueous
medium) and characterize it with physicochemical techniques. Section b, c and d, used to
synthesize the spherical silver nanoparticles, using Fenugreek, Tea leaves and Acacia
concinna fruit extract. The progress of the reaction was is investigated by X-ray diffraction,
transmission electron microscopy, UV-Visible spectrophotometer, FTIR spectrophotometer.
And now Section (C) we synthesized silver decorated nanorods of ZnO i.e. Ag/ZnO
hetrostructures and study the optical properties. Effect of variation of morphology, size and
shape, temperature, was also studied. On the basis of results, the nanorods growth mechanism
was proposed. And now Section (D) Synthesis part of metal (Co) doped ZnO nanorods,
which is further divided into three sections. The synthesis and mechanism of visible light
harvesting section (A) Co-doped ZnO nanorods, (B) CdS/Co-doped ZnO nanorods and (C)
Pt/CdS/Co-doped ZnO nanorods molecular devices. All prepared by hydrothermal method
using cationic surfactant cetyltrimethylammonium bromide (CTAB). Their physical growth
mechanism was traced in the light of FESEM and HRTEM studies.
The fourth chapter deals with the synthesis part of biosynthesized Ag@ZnO NRs (i)
Ag(Ajwain)@ZnO (ii) Ag(Fenugreek)@ZnO (iii) Ag(Tea)@ZnO (iv) Ag(Acacia
Concinna/Shikakai)@ZnO and metal (Co) doped ZnO nanorods, which is further divided into
three sections. The synthesis and mechanism of visible light harvesting section (A) Co-doped
ZnO nanorods, (B) CdS/Co-doped ZnO nanorods and (C) Pt/CdS/Co-doped ZnO nanorods
molecular devices. All prepared by hydrothermal method using cationic surfactant

Summary
`245
cetyltrimethylammonium bromide (CTAB). Their physical growth mechanism was traced in
the light of FESEM and HRTEM studies. A strong correlation between their electronic
structural arrangement and photocatalytic activity was established. Broad and uniform UV-
vis. diffuse reflectance spectral peaks were found between 525 and 700 nm, which were
attributed to the d-d transition of Co2+ ion. Successful loading of the nano-sized sensitizer
CdS onto the Co-ZnO NRs' surface, contributes to the band gap reduction in CdS/Co-ZnO
NRs (Eg = 2.25 eV) sample. X-ray absorption spectroscopy confirms the presence of the
lower degree structural disorders in CdS/Co-ZnO NRs with respect to the pristine ZnO and
Co-ZnO NRs. It was found that the gradual modification in pristine ZnO NRs enhances the
photocatalytic activity. Finally, the hetero-assembly, 1.5% Pt/CdS/Co-ZnO NRs, exhibited
excellent photocatalytic responses in terms of quantum efficiency (1.98%) and hydrogen
generation capacity (67.20 mmol/H2 g) under 1 Sun (1.5AM G) light exposure.
In the second part of this chapter deals with the green synthesis of silver nanoparticles are
used for pollutant degradation like as 4-nitrophenol to 4-aminophenol reduction. Finally, the
products were used to degrade the 4-nitrophenol.
REFERENCES 1. Doorslaer X V, Dewulf J, Langenhove H V, Demeestere K, Sci. Total. Environ. 2014;
500-501: 250. 2. Bouki C, Venieri D, Diamadopoulos E. Ecotoxicol. Environ. Saf. 2013; 91:1. 3. Kümmerer K. Chemosphere, 2009; 75: 417. 4. Adriaenssens N, Coenen S, Versporten A, Muller A, Minalu G, Faes C, Vankerckhoven
V, Aerts M, Hens N, Molenberghs G, Goossens H. J. Antimicrob. Chemother. 2011; 66:47.
5. Grave K, Greko C, Kvaale M K, Torren-Edo J, Mackay D, Muller A, Moulin G. J. Antimicrob. Chemother. 2012; 67:3001.
6. Watkinson A J, Murby E J, Costanzo S D. Water Res. 2007; 41: 4164. 7. Kummerer K.; Al-Ahmad A.; Mersch-Sundermann V. Chemosphere, 2000; 40: 701. 8. Gudaganatti M S, Hanagadakar M S, Kulkarni R M, Malladi R S, Nagarale R K. Prog.
React. Kinet. Mech. 2012; 37: 366. 9. Patgar M B, Nandibewoor S T, Chimatadar S A. Cogent Chemistry, 2015; 1: 1. 10. Zhang H, Huang C H. Environ. Sci. Technol. 2005; 39: 4474. 11. Zhang H, Chen W-R, Huang C-H, Environ. Sci. Technol. 2008; 42: 5548. 12. Wang P, Yi-Liang H, Ching-Hua C H. Water Res. 2010; 44: 5989. 13. Dodd M C, Shah A D, Gunten U V, Huang C-H. Environ. Sci. Technol. 2005; 39:7065. 14. De Witte B, Dewulf J, Demeestere, Langenhove H. J. Hazard. Mater .2009; 161:701. 15. Nanda N, Mayanna S M, Gowda N M M. Int. J. Chem. Kinet. 1999; 3:153.
Summary
`246
16. Nanda N, Kumar P, Malini. Int. J. Pharm. Sci. Rev. Res. 2013; 23:388. 17. Adegoke O A, Balogun B B. Int. J. Pharm. Sci. Rev. Res. 2010; 4:1. 18. Ebraheem S A M, Elbashir A A. American Academic & Scholarly Research Journal.
2012; 4:89. 19. Pavagada R J, Kanakapura B, Nagaraju R, Okram Z D, Kanakapura B V. J. Appl.
Spectrosc. 2011;78:383. 20. Diab N, Abu-Shqair I, Al-Subu M, Salim R. International Journal of Chemistry, 2013;
34:1388. 21. Khan A A P, Asiri A M, Azum N, Rub M A, Khan A, Al-Youbi O A. Ind. Eng. Chem.
Res. 2012; 51: 4819. 22. Shrivastavaa A, Singh A K, Sachdev N, Shrivastava D R, Katre Y, Singh S P, Singh M,
Mejuto J C. J. Mol. Catal. A: Chem. 2012; 1. 23. Khan A A P, Khan A, Asiri A M, Khan S A. J. Mol. Liq. 2016; 218: 604. 24. Padavathil H T, Mavalangi S, Nandibewoor S T. American International Journal of
Research in Science, Technology, Engineering & Mathematics, 2013; 3:63. 25. Yang B, Kookana R S, Williams M, Kumar A. J. Hazard. Mater.2016; 320. 26. Zhou Z, Jiang J-Q. Chemosphere, 2015; S119:95. 27. Kulkarni R M, Hanagadakar M S, Malladi R S, Biswal H S, Cuerda-Correa E M.
Desalination and Water Treatment. 2015; 57:1. 28. Naik P N, Chimatadar S A, Nandibewoor ST. Ind. Eng. Chem. Res. 2009; 48:2548. 29. Badi S S, Tuwar S M. Res. Chem. Intermed. 2015; 41:7827. 30. Law M., Greene,L.E., Johnson,J.C., Saykally R and Yang P. Nat. Mater., 2005; 4:
455. 31. Nozik A.J. and Miller J., Chemical Reviews, 2010; 110: 11 32. Si H.Y., Sun,Z.H., Zhang H.L., Eng. Aspects, 2008. 33. Gao X.F., Li,H.B., Sun,W.T., Chen Q., Tang F.Q., Peng,L.M., J. Phys. Chem. C,
2009; 113:18. 34. Hao Ming Chen, Chih Kai Chen, Chih-Jung Chen, Liang-Chien Cheng, Pin ChiehWu,
Bo Han Cheng,You Zhe Ho, Ming Lun Tseng,Ying-Ya Hsu, Ting-Shan Chan, Jyh-Fu Lee, Ru-Shi Liu, and Din Ping Tsa, ACS Nano, 2012; 6 :8.
35. H.M. Chen, C.K. Chen, Y.C. Chang, C.W. Tsai, R.S. Liu, S.F. Hu, W.S. Chang, and K. H. Chen, Angew. Chem. Int. Ed. 2010; 49.
36. J. Hensel , G. M. Wang , Y. Li , J. Z. Zhang , J. Phys. Chem. C, 2010; 114:1. 37. Jingfei Luan * and Jianhui Chen Materials, 2012; 5. 38. Gongming Wang, Yichuan Ling and Yat Li* Nanoscale, 2012; 4. 39. Hao Ming Chen,† Chih Kai Chen,† Chun Che Lin,† Ru-Shi Liu,*,† Heesun Yang,‡
Wen-Sheng Chang,§ Kuei-Hsien Chen,|| Ting-Shan Chan,# Jyh-Fu Lee,# and Din Ping Tsai J. Phys. Chem. C, 2011; 115.
40. Le A-T, Tam LT, Tam PD, et al. Materials Science and Engineering: C. 2010; 30:6. 41. Huang H, Yang Y. Composites Science and Technology. 2008; 68:14. 42. Yin H, Yamamoto T, Wada Y, Yanagida S. Materials Chemistry and Physics. 2004;
83:1.

Summary
`247
43. Nadagouda MN, Speth TF, Varma RS. Accounts of Chemical Research. 2011; 44:7. 44. Suber L, Sondi I, Matijevic E, Goia DV. Journal of Colloid and Interface Science.
2005; 288:2. 45. Song K, Lee S, Park T, Lee B. Korean Journal of Chemical Engineering. 2009; 26:1. 46. Golubeva O, Shamova O, Orlov D, Pazina T, Boldina A, Kokryakov V. Glass Physics
and Chemistry. 2010; 36:5. 47. Harada M, Kawasaki C, Saijo K, Demizu M, Kimura Y. Journal of Colloid and
Interface Science. 2010; 343:2. 48. Harada M, Kimura Y, Saijo K, Ogawa T, Isoda S. Journal of Colloid and Interface
Science. 2009; 339:2. 49. Li K, Zhang F-S. Journal of Nanoparticle Research. 2010; 12:4. 50. Bogle KA, et al. Nanotechnology. 2006; 17:13. 51. Zhu J, Liu S, Palchik O, Koltypin Y, Gedanken A. Langmuir. 2000; 16:16.

Distinctions and Awards
APPENDIX-A
Distinctions anD awarDs
1. International Best Research Scholar Award 2018 for contributed to a great extent in the field of Nanotechnology, by International Science Community Association (ISCA) Venu: Rashtriya Sanskrit Vidyapeetha, Tirupati, Andhra Pradesh, India on Monday, 8th May 2018.
2. International Young Scientist Award 2018 in 4th International Young Scientist Congress (IYSC-2018) organized by International Science Community Association (ISCA) in collaboration with Rashtriya Sanskrit Vidyapeeth, Tirupati, Andhra Pradesh, India on 8th & 9th May 2018.
3. Campus Ambassador of University of Kota in “APOGEE” The Annual Technical Festival of Bits Pilani Organized by Birla Institute of Technology & Science, Pilani on March 2015, 2017 and Feb 2018.
4. Best Poster Presentation Award during International Conference on Recent Trends in Chemical Sciences (ICRCS-2017) Organized by Department of Chemistry, Govt. Engineering College Bikaner, Rajasthan, India Jan 12-13, 2017.
5. Best Appreciation Award during National Symposium Global Environmental Challenges: Present Scenario (GECPS-2017) Organized by Department of Botany, University of Rajasthan, Jaipur, India 21st Jan 2017.
6. Dr. S. K. Banerji Award in UGC-Sponsored National Conference on Modern Trends in Chemical Sciences Organized by Department of Chemistry, Faculty of Science, Mohan Lal Sukhadia University, Udaipur, Rajasthan 30th - 31st January 2016.
7. Young Scientist Award 2016 in 92nd Annual Indian Chemical Society (ICS) organized by Department of Chemistry, Institute of Science, GITAM University, Visakhapatnam, Andhra Pradesh during 27-29 Dec. 2016.

List of Publications
APPENDIX B
LIST OF PUBLICATION(S)/COMMUNICATION(S)
(1) Rajesh Kumar Meena & Neelu Chouhan, “Rapid Biosynthesis of Silver Nanoparticles using Fenugreek Seeds” Proceeding of 3rd International Conference on “Advance Trends in Engineering, Technology and Research” (ICATETR-2014) held at Balkrishna Institute of Technology, IPR-15, Kota on 22-24 Dec.2014 pp 376-378.
(2) Neelu Chouhan* & Rajesh Kumar Meena, “Biosynthesis of Silver Nanoparticles Using Trachyspermum Ammi and Evaluation of Their Antibacterial Activities” J. Pharm. Biochemical Sciences, 2015, 6(2): (B) 1077-1086 publisher STRP, (IF=2.958) e-ISSN: 2320-1924.
(3) Rajesh Kumar Meena and Neelu Chouhan, “Biosynthesis of Silver Nanoparticles
from Plant (Fenugreek Seeds) Reducing Method and their Optical Properties” Research Journal of Recent Sciences, Vol. 4(IVC-2015), 1-5 (2015) ISSN 2277-2502.
(4) Rajesh Kumar Meena and Neelu Chouhan “ZnO Nanoparticles Synthesized by a
Novel Approach at Room Temperature and Antibacterial activity” American International Journal of Research in Formal, Applied & Natural Sciences, 11(1), June-August 2105, pp. 68-72.
(5) Neelu Chouhan, Rakshit Ameta, Rajesh Kumar Meena, Niranjan Mandawat, and
Rahul Ghildiyal, “Visible light harvesting Pt/CdS/Co-doped ZnO nanorods molecular device for hydrogen generation” International Journal of Hydrogen Energy, 41(4) 2016, 2298-2306 (Elsewhere publications) (IF= 3.659) (doi:10.1016/j.ijhydene.2015.11.019)
(6) Rajesh Kumar Meena & Neelu Chouhan, “Synthesis and characterization of Flower-
shaped Ag@ZnO nanocomposite and Antibacterial Activities” Proceeding of National Conference on “Green Chemistry and Sustainable Technologies for Society 2016” (NCGCSTS-2016) held at Government Women Engineering College, Ajmer on – 11-12, Jan.2016 pp-16-18.

List of Publications
(7) Rajesh Kumar Meena & Neelu Chouhan, “Biosynthesis of silver nanoparticles (Tea Leaves) reducing method and there optical properties, Research Journal of Recent Sciences, Vol. 5(11), 39-43, November 2016.
(8) Rajesh Kumar Meena & Neelu Chouhan, “ZnO Nanoparticles synthesized by
precipitation method and Optical properties” ISST Journal of Applied Chemistry, Vol. 7(2), (July - December 2016), p.p. 7-10.
(9) Neelu Chouhan, Rakshit Ameta, Rajesh Kumar Meena, “Biogenic Silver Nanoparticle from Trachyspermum Ammi (Ajwain) Seeds Extract used in Catalytic Reduction of p-Nitrophenol to p-Aminophenol in excess of NaBH4” Journal of Molecular Liquids, 230 (2017) 74-84.
(10) Rajesh Kumar Meena, Niranjan Kumar Mandawat, Neeta Gurbani and Neelu Chouhan, “Synthesis of ZnO Nanoparticles for Organic Pollutant Degradation” International Journal of Advance Research in science and Engineering, Vol. No 6(01), January 2017 P.P 802-808.
(11) Rajesh Kumar Meena, Kahkashan Ansari, Nawal Kishor and Neelu Chouhan “Green synthesis of silver nanoparticles using acacia concinna plant extract and their antibacterial activity” Research Journal of Recent Sciences, (2018) Vol. 7(3), 1-6.
Publications Book Chapter:
1. Co-Author of SOLAR ENERGY CONVERSION AND STORAGE Photochemical Modes: Some Photochemical Modes, Chapter 8 Hydrogen: An Alternative fuel Neelu Chouhan, Rajesh Kumar Meena and R. S. Liu, Apple Academics Press CRC Press, a Taylor & Francis Group, Florida- USA. 2015 (978-48-224630-8)

List of Seminar /Symposium/ Conferences
APPENDIX C
LIST OF SEMINAR/SYMPOSIUMS/ CONFERENCES
1. Indo-Swedish Symposium on Strategic Knowledge on Climate Change (Designing
Climate-Smart Water adaptation Strategies for Sustainable Development) Organized by Department of Pure and Applied Chemistry, University of Kota, Kota (India) October 09, 2012.
2. International Workshop on Chemistry for a Sustainable Future jointly Organized
by Department of Chemistry , University of Rajasthan, jaipur & Malaviya National Institute of Technology, jaipur in Collaboration With Green Chemistry Network Centre, Department of Chemistry, University of Delhi (India) December 10-12, 2012.
3. Indian chemical society Convention (49th Annual Convention of Chemists 2012) Organized by Department of Applied Science, National Institute of Technical Teacher’s Training and Research, Bhopal, Madhya Pradesh (India) December 12–15, 2012.
4. 19th ISCB International Conference (ISCBC-2013) titled “Recent Advances and Current Trends in Chemical and Biological Science” jointly Organized by Indian Society of Chemistry & Biologists, Lucknow (UP) India and Deptt. Of Chemistry, Mohanlal Sukhadia University, Udaipur (Rajasthan) India March 2-5, 2013.
5. Board of Research in Nuclear Sciences (BRNS) Sixth School on Analytical
Chemistry (SAC-6) Organised By Association of Environmental Analytical Chemistry of India (AEACI), C/O Analytical Chemistry Division, Bhabha Atomic Research Centre, Trombay, Mumbai, India During May 13-20, 2013.
6. International Conference on Interdisciplnary Areas With Chemical Sciences
(ICIACS2013) Organized by Panjab University, Chandigarh In Association With Institute of Nano Science and Technology (INST), Mohali, (India) 30th Oct- 1st Nov 2013.
7. DAE-BRNS Conference on organic devices the future ahead (ODeFA) 2014 organized by Technical Physics Division Bhabha Atomic Research Center, Mumbai on 3rd to 6th March 2014.
List of Seminar /Symposium/ Conferences
8. “IVCr workshop on X-ray diffraction systems and related applications” Containing XRD basics, experimental techniques & data analysis using Highscore Plus software Organized by University of Delhi, India on 25-26th Sep 2014.
9. National Conference on Material Science (NCMS-2014) Organized by Department of Physics, Mewar University Gangrar, Chittorgarh-312901 (Rajasthan) India on Oct. 17-18, 2014.
10. National Seminar on “Recent Advancements in Protection of Environment and its Management Issues” (NSRAPEM-2015) Organized by Maharishi Arvind College of Engineering & Technology, Ranpur, Kota on 27-28 February 2015.
11. 2nd International Virtual Congress (IVC-2015) Organized by International Science Congress Association, and presented a scientific paper “Biosynthesis of Silver Nanoparticles from Plant (Fenugreek Seeds) Reducing Method and their Optical Properties” ISBN 978-93-83520-98-1.
12. 52nd Annual Convention of Chemists 2015 And International Conference on Recent Advances in Chemical Sciences Organized by JECRC University, Jaipur, Rajasthan December 28–30, 2015.
13. National Conference on “Green Chemistry and Sustainable Technologies for Society2016” Organized by Government Women Engineering College, Ajmer, January 11-12, 2016.
14. UGC-Sponsored National Conference on Modern Trends in Chemical Sciences Organized by Department of Chemistry, Faculty of Science, Mohan Lal Sukhadia University, Udaipur, Rajasthan 30th – 31st January 2016.
15. International Conference on Frontiers at the Chemistry Allied Sciences Interface
(FCASI-2016) Organized by Department of Chemistry, University of Rajasthan, Jaipur 25-26 April, 2016.
16. 3rd International Virtual Congress (IVC-2016) Organized by International Science Congress Association, and presented a scientific paper “Biosynthesis of Silver Nanoparticles (Tea Leaves’) Reducing Method and their Optical Properties” ISBN 978-93-83520-98-1.
17. INUP “Familiarization Workshop on “Nanofabrication Technologies” Organized by Electronics & Communication Engineering Department, Malaviya National Institute of Technology, Jaipur, Rajasthan 26-27 August 2016.
18. National Conference on Frontiers in Chemical Sciences (NCFCS-2016) in association of Indian Chemical Society, Kolkata Organized by Department of PG Studies & Department of Chemistry, Pacific University, Udaipur (Raj.) 4th October 2016.

List of Seminar /Symposium/ Conferences
19. National Conference and workshop on Green Chemistry teaching and technology (NCWGC- 2016) Organized by Department of Chemistry, Faculty of Science, Mohan Lal Sukhadia University, Udaipur, Rajasthan 20 Oct. 2016.
20. 2nd International Conference on Soft Material (ICSM-2016) Organized by Department of Physics Malaviya National Institute of Technology (MNIT), Jaipur, Dec 12-16, 2016.
21. 92nd Annual Indian Chemical Society organized by Department of Chemistry, Institute of Science, GITAM University, Visakhapatnam, Andhra Pradesh during 27-29 2016.
22. International Conference on Recent Trends in Chemical Sciences (ICRCS-2017) Organized by Department of Chemistry, Govt. Engineering College Bikaner, Rajasthan, India Jan 12-13, 2017.
23. National Symposium Global Environmental Challenges: Present Scenario (GECPS-2017) Organized by Department of Botany, University of Rajasthan, Jaipur, India 21st Jan 2017
24. “Synthesis of ZnO Nanoparticles for Organic Pollutant degradation” Rajesh Kumar
Meena1, Niranjan Kumar Mandawat2, Neeta Gurbani3, Neelu Chouhan4* International Conference on Innovative Research in Science, Technology and Management (ICIRSTM-17) Modi Institute of Management & Technology, Dadabari, Kota, Rajasthan 22-23 Jan 2017. Conference proceeding in Page 802-808, ISSN (o) 2319-8354
25. Presented of Research Work in “Nano India 2017” Conference Organized by Indian Institute Of Technology Delhi, New Delhi during 15-16 March 2017.
26. UGC-Sponsored One Week Short-term Course on Separation Techniques and
Instrumental Method of Analysis from January 30, 2017 to February 4, 2017 at University of Kota, Kota, Rajasthan.
27. Anveshan Students’ Research Convention (West Zone) organized by association of Indian Universities and hosted by Nims University Rajasthan on 7th-8th March 2017.
28. National Symposium on Nano Science & Technology (NSNST-2017) from 2nd - 4th
july 2017 conducted by the Centre for Nano Science and Engineering, Indian Institute of Science, Bangalore.
29. CRSI-ACS Symposium in Chemistry July 30, 2017 Organized by CSIR-Indian Institute of Chemical Technology, Tarnaka, Hyderabad, India.
30. International Conference on Frontiers at the Chemistry – Allied Science Interface (FCASI-2017) Organized by Centre of Advanced Study, Department of Chemistry University of Rajasthan, Jaipur (INDIA) Supported by UGC, New Delhi; DST, Govt.

List of Seminar /Symposium/ Conferences
of India, New Delhi CRSI-Rajasthan Chapter; ISCB-Jaipur Chapter; RSC-North India Section.
31. 4th International Virtual Congress (IVC-2017) Organized by International Science Congress Association, and presented a scientific paper “Green Synthesis of Silver Nanoparticles using Acacia Concinna extract and their Antibacterial activity” ISBN 978-93-83520-98-1.
32. International Conference of Advancing Green Chemistry: Building a Sustainable Tomorrow 3-4 Oct 2017 Organized by Green Chemistry Network Centre, Department of Chemistry, University of Delhi, Delhi. “Green Synthesis of Metal nanoparticles using Plant extract” by Reducing method and Optical Properties Presented by Rajesh Kumar Meena and Neelu Chouhan*
33. International Conference on Nano and Functional Materials- Interface between Science & Engineering (NFM-2017) jointly Organized by Department of Chemistry, BITS Pilani, Pilani campus and Materials Research Society of India (MRSI) Rajasthan Chapter, held between 16-18 November 2017.
34. 7th International Science Congress (ISC-2017) 8th & 9th December 2017 jointly
organized by International Science Community Association & College of Science and Technology, Rinchending, Phuentsholing, Chukkha, Bhutan, “Synthesis of flower-like ZnO nanostructures and Optical properties by Hydrothermal process” Rajesh Kumar Meena and Neelu Chouhan*
35. 54th Annual Convention of Chemists 2017 Organized by Uka Tarsadia University, Bardoli, Surat, Gujarat December 23-25, 2017 (AEC (AP)-06 Green Synthesis of silver nanoparticles by using Black pepper extract for catalytic reduction of organic pollutant Rajesh Kumar Meena and Neelu Chouhan*
36. 54th Annual Convention of Chemists 2017 Organized by Uka Tarsadia University,
Bardoli, Surat, Gujarat December 23-25, 2017 (IAC (AP)-03 “Synthesis of flower shape ZnO nanostructure and optical properties for dyes degradation” Rajesh Kumar Meena and Neelu Chouhan*
37. 4th International Young Scientist Congress (IYSC-2018) organized by International Science Community Association (ISCA) in collaboration with Rashtriya Sanskrit Vidyapeeth, Tirupati, Andhra Pradesh, India on 8th & 9th May 2018.

Research Publications
APPENDIX D
ReseaRch Publication (s)

� � � � � � � � � � � � � � � � � � � � � � � � � � � � � � � � � � � � � � � � � � � � � � � � � � � � � � � � � � � � � � ! � � � � � � � � � � � � � �� � � � � " � � � � ! � � � � � � � � � � � � � # � � � � � � � � � � � � $� � � � � % � � � � � � � � � � � � � � � � � � � � � � � � � � � � � � � � � � � � � � � " & ' ' ( ) ' ' � � * + � � � � � � � � � " � � � � ! � � � � � � , - *. / 0 � � � ! � � � � � � � � � � � � � 1 � 2 3 � � � � � � � � � % � 1 � � � � � � � � � � � � � � � � � � � � � � � � � � � � � � � � � � � � � � � � � � � � � � � � � � � � � � � � � � � � � � � � � � $ � # � � � � � + � � � � � � � � � � � � � � � � � � � � � � � � � � � � � � � � � � �� � � � � � � � � � � � � � � � � � � � � � � � � � � � � � � % � # � � � � � � � �� ! � � � � � � � � � $ � � 4 & 5 � � � � � � � � � � � � � � � � � � � � � � �� � � � � � ! � � � � � � � � � � � � � � � � � � � � � � � � %6 7 8 9 : � ; � < = � � � � � � � � � � * � � � � � � � � * 1 � � � � $ � *� � � � � � � � � � � � * = � � � � � � � � � � � � � � � %> ? > @ A B C D E F A G C @> H � � : ; I � � J : H � H ; K L M 7 � J N 7 H � � O� � � � � � � � � � � � � � � � � � � � � � � � � � � � � � � � � � � � � � � � � �� � � � � � � � � � � � � � � � � � � � � � � � � � ! � � � � " � ! � � � � � � � � � � � � � � � � � � � � � % � � � � � � � � � � � � � � � � � � � � � � ! � � � � � � � � � � � � # � ! � � � � � � � � � � � � � � � � � � � � � � � � � � � � *� � � � � � � � � ! � � � � � � � � � � � � � � � � � � � � � � � ! � � $� � � � � � � � � � � � � � � � � � � � � % � � � � � � � � � � � � � * = � � � � � # � � � � � � � � � � � � � � � � � � � � � � � � � � � � � � � � � � � � � � � � � � � � � � � � � � � � � � � � � � � � � � � � � P & Q % 2 �� � � � � � � * � � � � � � � � � � � � � � � � � � ! � � � � � � �! � ! � � � � � � � � � � � � � � � � � � � � � � � � � � � � � � � � � � P ) * R Q %S � � � � � � � � * � � � � � � � � � � � � � � � � � � � ! � � � � � � � � � � � � � � � � # � � � � � � � � � � � � � � � � � � � � � �� ! � � � � = � � � � � � � � � � � � � � � � � � � � * � � � � + � � � � � � � � � � �� � + � � � � ! � � � � � � � � � � � � � � � � � � � � � � � � � � � �� � � � � � � � � $ � � � * � � � � � � � � # � � � � � * � " � � * � � * � � � � � � � % � � � � � � � � � � � � � * � � � � � � � � ! � ! �� � � � � � � � � � � � � � � � � � � ! � � � � � � � � � � � ! � � � � � � � �� � � � � � � � � � � % � � � � � � � � � � � � � � � � � � ! � � � � � � � � � � � � � ! � * � � � � � � � � � � � � � � � � � � � � � � � � � � � � � � � � � � � � � � � � � % T � � � � � � � � � = � � � � P 4 Q � � � � � � � � � � � � � � � � � � � � � � � � # � � � � � � � � � � � " � � � � � � � � � � � � � � � � � � � � � � � � � � � � � � � � � � � � � � � � � � � � � � � � + � � � � � � � � � � � � � % / � � � � � � � � � � � � � � � � � � � � � � � � � � � � � *" � � � * � � � � � � � � � * � � � � � � % * � � ! � � � � � � � " � � � � �! � � � � � � � � � � � � P U Q % . � � � � � � � % * P V Q * W � � � � � � � - � � � �P X Q � � � � � � � � � � � � � � � � � � � � � ! � � � � � � � � � � � � � � � � � �! � � � � � ! � � � � � � � � � � � Y � � � � � � � � � � � � � � � � � � �� � � � � � � ! � � � � � � � � � � � � � � � � � � � � � � � � � � # � � � * � � � � � � �� � � � � � � � % � % � " � � + � � * � � � � � � * � � � � � � � � � � �� � � � � � � � � � � % � � � � � � � � � � � � � � � � � � � � $ � � � � � � � � � � � � � � � � � � � � � � � � � � � � � � � � � � � � � % Z � � � � �� � � � � � � � � � � � � � � � � ! � � � � ! � � � � � * 1 � � � � $ � � �
� � � � � � � � � � � � � � � � * � � � � � � � � � � � � � � � � � � � � � � � � � � � � $ � � � � � � � � � � � ! � � � � � � � � � � �� � � � � � � � � � � � � � � � � � � � � � � � � � � � %> > ? K L M 7 � J N 7 H � � O [ 7 � � J O � <\ ] 7 N J � � O � < � � � � � � � � � + � � � � � � � � � � � � � � � � � � � 3 � � �� � � � � � � � � + � � � � � � � � � � � � � � � � � � � � � � � � � % � � � � � � � � � �� � � � � � � � � � � � � * � � � ^ _ � � � � � � � � � � � * ` a a b c d e- � � $ * � � � , � � � � � � � � � � = f � � � ( � � � � � � � � + � � �� � � � � � � % � � � � � � � � � � + � � � � � � � � � � � � � � � � �- � � � � � � � + � � � %\ ] � � � � � 7 � J g � � J : H < - � � � � � � � � � � � � � � � � � � � � � � � � � � �� � � � � � � + � � � $ � � � � � � � � � � � � � � � � � �� � � � � � � � � � 1 , = , - * h , ^ i h = - ( V X ' ' 1 % � � � � � � � �� ! � � � � � � � � � � � � # � � � � � � # � � � � � � � � � � � � � � � � � � � � � � � � � � � � � ^ _ � � � � � � � � � � � � + � � � � � � � � � � & '� � � � � � � � � � � � � � � � j � � � � " � � � � � % � � � � � � � � � � � �� ! � � � � � � � � � $ � � � � � � + � # � � � � � � � � � . / ( � � � ! � � � � � � � * � � � � � � � � � � . / ( / � � � � � � � � � � � i � Z 2 � f 2 �. / ( / � � ! � R ' ' ' Y � � � � � � � ! � + � ) U ' 0 k ' ' � � % 2 �� � � � � � � � � � � � � � � � � � � � � � � � � � � � � � � � � � � � � � �� � � � � � � � � � � � � % 1 � � � � � � � � � � � � � 2 � � � � ( � � � � � � � � � � � � Z � � $ � ( � � � � - � � � + � � � � � � � � � � ! � � � � � � � � � � � � � � � � � � � � � � � � 1 � � � � $ # � � � � � � �� � � � � � � 4 ' ' ' � � 4 ' ' � � l m % f � � � � � � � � � � � � � � � + � � � �� � � � � � W Z � � � � � + � � � � � ! n � � � � � 1 � 2 3 � � � � � � � � � � � � � � � � � %o � 7 M � � � � J : H : p [ � J 7 ; q 7 H I r � 7 7 s t 7 7 ; � <� � � � � � � � $ � � � � � � + � # � � � � � � � � � � � � �� � + � � � � � � � � � � � � % � � � � � � $ � � � � � � # � � � � � � � �+ � � � � � � � ! � ! � � � � � � � � � # � � � � � U � � � � � � � � $ � � � � � � � � � � � � � � � � � � � � + � � � � � � � , � � � � � � � � � $ � � � U� � � � � � � � � � � � � � � � � u � � � � � � � � � � � � � � % � � � � � � � � v w x y z { | } ~ { y � � | ~ { ~ � | } { � z � } c b � � � x � � ~ � y � � | ~ { x b � } ~ x � � z | � � �+ � � � � � � � � � � � � � � � � 4 � T � � � + � � � + � � � � � + $ � �� � � � � � � � � � � � % � # � � � � � � � � � � � � � � � � � � � � � � � � �� � � � � � � � � � � � � � � � � � � � %� J : � 8 H � ] 7 � J � : p t J O � 7 � � � H : M � � � J � O 7 � <� � � � � � � � * � � � � � $ � # � � � � � � 1 = , * + � � � � � � � � �� � � � � � � � � � � � � � � � � � � � � � + � * � � � � � � � � � � 4 � & � � � � � � � � � � � � P k Q % � � � � � � # � � � + � � � � � # � � � � � � �� � � � � � � � � � � ) 4 � � 4 k � � � � � � ! � � � � � � � � � � � � � � � � �� � � � � � � � � � � � 1 � � % & � � � � & ! + � � � � � � � � � � � � � � � � � � � � � � � � � � � � � � � " � � � � � % � � � j � � � � � � � � � � � �' % ' ' & - � � � ^ _ + � � � � � � � � � � � � � � � �� � � � � � � � � � � ! � ! � � � � � � � � � � � � � � � � � � � � � � � � � � � � %� � � � + � � � � � � � � � � � � & ' * ' ' ' � � � � � � & U � � � % � � � � � � � � � � � � � � � � � � � � � � � � � � � � � � � � � � � � � � � � � � �
3 � n W � � � � - � � m � � � � T � � � � � m� m f � � � � � � � � � � � � � � � � � � � T � � � � � * . � � � � � � � � � W � � � * W � � � * 3 � n � � � � * 2 � � � � %� � � � � � � � � � � � � � � � ¡ � � ¢ � £ ¤ � � ¥ � � � � � � � ¦ � � � � � � � � � � § � � � � � � % � � �
¨ © ª
« ¬ ® ¯ ° ± ² ³ ¬ ´ ³ ± µ ° µ ¶ µ · ¸ ¹ º · » ² ³ ¸ ¸ ¼ ½ ¾ ´ ¿ À Á  à ¾ Ä ´ ´ À Å ´ ³ ± µ ° µ ¶ µ ° ¸ ³ ¬ Æ ¯ · ¬ ¾ Ä ¬ ³ Ç ¶ ¯ ® ¸ µ ¬ ¾ Ä ¬ È ¬ ± µ ² ¬ ³ ¾ É ´ ³ Ê ° ¬ Ë Ì Ì Ì Í Î Ï ° µ Ï ¸ µ ¬ Í » ¸ п ¯ ¸ » · · Ê ° ³ ¼ ¸ ¹ Ñ Ò Ó ´ ³ µ · ¯ ³ ¬ µ ° ¸ ³ ¬ À ¸ ³ ¹ · ¯ · ³ » · ¸ ³ Ô Æ Ê Õ ¬ ³ » · º ¯ · ³ Ê ± ° ³ Ö ³ ¼ ° ³ · · ¯ ° ³ ¼ ¾ º · » ² ³ ¸ ¸ ¼ ½ ¬ ³ Ê Ä · ± · ¬ ¯ » ² × ´ À Æ º Ö º Ä Á Ø Ù Â Ú Û Ü Ü Á Ø Ú Ý Þ ¾ ß · » Ø Ù Â Úà á â ã ä å æ ç è á é è æ ê å ê ë ê ì í î ï ì ð ç è í â í ñ ò ó é ô õ ö ÷ ø ó ù é é õ ú é è æ ê å ê ë ê å í è á â û ä ì á ó ù á è ü ë ä ã í ê á ó ù á ý á æ ê ç á è ó þ é è ÿ å á � � � � � � � å ê � í ê á � ð í �� � � � � � � � � � � � � � � � � � � � � � � � � � � � � � � � � � � � � � � � � � � � � � � � � � ! � � � � " � � � � � � ! # $ % & ' ( ) ) # $ ' * + � , $ % & '

- . / 0 1 - . 2 1 0 3 0 . / 0 4 / 5 1 0 0 / 6 7 0 2 / 8 0 9 2 : 1 0 ; 0 / / 0 1 2 0 3 . 1 . / 6 8 9 8 << 1 0 0 0 9 / 6 / 6 0 2 < 1 8 7 / 5 0 7 0 / . = 9 . 9 8 3 . 1 / 6 > = 0 2 ? @ 5 0 A B C D 22 8 = : / 6 8 9 E 0 3 / . / 1 8 8 7 / 0 7 3 0 1 . / : 1 0 < 8 1 F G 5 8 : 1 2 ?
H H H I J K L M N O L P Q R S T L U M L L T V QW 6 B ? X . ? Y 2 5 8 - 2 / 5 0 > 8 = = 8 6 4 . = 2 8 = : / 6 8 9 2 8 < / 5 0 0 Z / 1 . > / Y . 9 4 / 5 07 6 Z / : 1 0 2 8 < 0 Z / 1 . > / . 9 4 A B C [ \ 2 8 = : / 6 8 9 Y > 8 = 8 : 1 > 5 . 9 B 0 < 1 8 7B 8 = 4 0 9 ] 0 = = 8 - / 8 1 0 4 4 6 2 5 ] 0 = = 8 - 8 > > : 1 2 ; ] . 4 4 6 9 B / 5 0 A B C [ \2 8 = : / 6 8 9 6 9 / 8 / 5 0 0 Z / 1 . > / Y - 5 6 > 5 6 9 4 6 > . / 0 2 / 5 0 3 1 0 2 0 9 > 0 8 < A B9 . 9 8 3 . 1 / 6 > = 0 2 ? ^ 6 > 1 8 2 > 8 3 6 > 2 / : 4 6 0 2 6 = = : 2 / 1 . / 0 4 / 5 0 < 8 1 7 . / 6 8 98 < > : ; 6 > . = A B C D 2 8 < 2 6 _ 0 X ` ` a F ` ` 9 7 . 2 2 5 8 - 9 ; ] W b c b ^6 7 . B 6 9 B d W 6 B ? X ; e f g T h M i K j 0 Z 5 6 ; 6 / 2 / 5 0 4 6 2 / 6 9 > / 6 k 0. ; 2 8 1 3 / 6 8 9 3 0 . E 6 9 l m a k 6 2 6 ; = 0 2 3 0 > / 1 8 2 > 8 3 ] < 8 1 A B9 . 9 8 3 . 1 / 6 > = 0 2 ; 0 > 8 7 0 k 6 2 6 ; = 0 . 1 8 : 9 4 G ` ` 9 7 8 < / 5 0 8 3 / 6 > . =1 . 9 B 0 4 : 0 / 8 2 : 1 < . > 0 3 = . 2 7 8 9 1 0 2 8 9 . 9 > 0 n o a X ` p ? @ 5 6 2. ; 2 8 1 3 / 6 8 9 6 4 0 9 / 6 < 6 0 2 / 5 0 < 8 1 7 . / 6 8 9 8 < A B 9 . 9 8 3 . 1 / 6 > = 0 2 6 9 .> 8 = = 8 6 4 . = 2 8 = : / 6 8 9 ? q . / . 1 0 k 0 . = 0 4 . 9 . 3 3 0 . 1 . 9 > 0 8 < 2 : 1 < . > 03 = . 2 7 8 9 1 0 2 8 9 . 9 > 0 3 0 . E d c D r e . / / 5 0 G X o 9 7 Y / 5 0 - . k 0 = 0 9 B / 5> 8 1 1 0 2 3 8 9 4 2 / 8 2 6 = k 0 1 9 . 9 8 3 . 1 / 6 > = 0 2 < 8 1 7 . / 6 8 9 ?
W 6 B : 1 0 F ? l m m 6 2 6 ; = 0 2 3 0 > / 1 : 7 8 < 2 6 = k 0 1 9 . 9 8 3 . 1 / 6 > = 0 2 d F G 5 e ?g s H J t Q P N u L T L V v w T N x K i y P Q V z P i O T U N K L P v O K i { T V i K R M U O T V Q |@ 8 6 4 0 9 / 6 < ] / 5 0 3 1 8 ; . ; = 0 ; 6 8 7 8 = 0 > : = 0 2 1 0 2 3 8 9 2 6 ; = 0 < 8 1 / 5 01 0 4 : > / 6 8 9 8 < / 5 0 A B } 6 8 9 2 . 9 4 0 Z a > . 3 3 6 9 B 8 < / 5 0 ; 6 8 a 1 0 4 : > 0 42 6 = k 0 1 9 . 9 8 3 . 1 / 6 > = 0 2 2 ] 9 / 5 0 2 6 _ 0 4 : 2 6 9 B < 0 9 : B 1 0 0 E 2 0 0 4 0 Z / 1 . > / ?W @ ~ r 2 / : 4 6 0 2 - 0 1 0 > . 1 1 6 0 4 8 : / . 9 4 / 5 0 1 0 3 1 0 2 0 9 / . / 6 k 02 3 0 > / 1 : 7 8 < / 5 0 9 . 9 8 3 . 1 / 6 > = 0 2 8 ; / . 6 9 0 4 6 9 / 5 0 3 1 0 2 0 9 / 2 / : 4 ] 6 23 1 0 2 0 9 / 0 4 6 9 g T h M i K � ? A 7 8 9 B 2 / / 5 0 7 Y / 5 0 . ; 2 8 1 3 / 6 8 9 3 0 . E . /2 8 7 0 / 5 6 9 B = 6 E 0 F � ` ` Y X � � F Y X � o o Y X X G � > 7 � � > . 9 ; 0 . 2 2 6 B 9 0 4. 2 . ; 2 8 1 3 / 6 8 9 3 0 . E 2 ?
@ 5 0 ; 1 8 . 4 3 0 . E 8 ; / . 6 9 0 4 . / / 5 0 F � ` ` > 7 � � 2 : B B 0 2 / 2 / 5 03 1 0 2 0 9 > 0 8 < 8 1 B . 9 6 > . > 6 4 B 1 8 : 3 2 - 5 6 > 5 7 . 6 9 / . 6 9 / 5 0 5 6 B 5 0 1< : 9 B 6 > 6 4 . = 0 < < 6 > . > ] 8 < 2 6 = k 0 1 9 . 9 8 3 . 1 / 6 > = 0 2 . 2 . = 1 0 . 4 ]7 0 9 / 6 8 9 0 4 . ; 8 k 0 : 9 4 0 1 1 0 < 0 1 0 9 > 0 / 5 . / < 0 9 : B 1 0 0 E 3 = . 9 / 5 . 2< : 9 B 6 > 6 4 . = 8 1 B . 9 6 > . > 6 4 2 = 6 E 0 < 0 1 : = 6 > . > 6 4 Y > 8 : 7 . 1 6 > . > 6 4 . 9 43 1 8 / 8 > . / 0 > 5 : 6 > . > 6 4 Y 0 / > ? D 0 . E . / X � o o > 7 � � . 2 2 6 B 9 0 4 / 8 / 5 0. 7 6 4 0 2 . 9 4 . 7 6 9 0 2 ? @ 5 0 9 . 1 1 8 - 3 0 . E 2 . / X � � F . 9 4 X G o X> 7 � � Y > = 0 . 1 = ] 0 k 6 4 0 9 > 0 / 5 0 . / / 0 9 4 . 9 > 0 8 < 2 / 1 0 / > 5 0 2 8 < � � � a �. 9 4 � a � ; 8 9 4 2 6 9 . 1 8 7 . / 6 > 1 6 9 B 2 / 5 . / . 1 0 < 8 : 9 4 6 9 > 8 : 7 . 1 6 >. > 6 4 Y < 0 1 : = 6 > . > 6 4 ? A 9 8 / 5 0 1 3 0 . E . / / 5 0 X X G � > 7 � � . / / 1 6 ; : / 0 2/ 5 0 . 9 / 6 < : 9 B . = . > / 6 k 6 / ] < : 1 / 5 0 1 2 : 6 / . ; = 0 / 8 / 5 0 3 1 0 2 0 9 > 0 8 <> 8 7 3 8 : 9 4 2 < 1 8 7 < 0 9 : B 1 0 0 E 2 0 0 4 0 Z / 1 . > / / 5 . / 5 . k 0 0 / 5 0 1 . 9 40 2 / 0 1 < 8 1 7 6 9 B � � [ 2 0 / : 3 2 n X X a X � p ? c 8 W @ ~ r 1 0 2 : = / 2 > 8 9 < 6 1 7/ 5 0 3 1 0 2 0 9 > 0 8 < / 5 0 3 5 ] / 8 > 5 0 7 6 > . = 2 2 : > 5 . 2 3 8 = ] 3 5 0 9 8 = 2 d a [ �B 1 8 : 3 e Y > . 1 ; 8 9 6 > . > 6 4 2 3 1 0 2 0 9 / 6 9 / 5 0 W c b > . 3 2 / 5 0 2 6 = k 0 19 . 9 8 3 . 1 / 6 > = 0 2 2 : 1 < . > 0 Y / 5 0 1 0 ; ] 1 0 2 / 1 6 > / 6 9 B / 5 0 . B B 1 0 B . / 6 8 9 8 <2 6 = k 0 1 9 . 9 8 3 . 1 / 6 > = 0 2 . 9 4 2 / . ; 6 = 6 _ 0 / 5 0 7 ?H � I � V Q U N M L T V Q LA = / 5 8 : B 5 / 5 0 1 0 4 : > / 6 8 9 3 1 8 > 0 2 2 4 : 1 6 9 B / 5 0 < 8 1 7 . / 6 8 9 8 << 0 9 : B 1 0 0 E 2 0 0 4 2 0 Z / 1 . > / 7 0 4 6 . / 0 4 A B 9 . 9 8 3 . 1 / 6 > = 0 2 / . E 0 25 8 : 1 2 / 8 4 . ] 2 Y ; : / A B 9 . 9 8 3 . 1 / 6 > = 0 2 / 5 : 2 3 1 8 4 : > 0 4 - 0 1 0 8 <. = 7 8 2 / : 9 6 < 8 1 7 2 6 _ 0 Y - 5 6 > 5 6 2 . 7 8 2 / - . 9 / 0 4 1 0 � : 6 1 0 7 0 9 / < 8 1/ 5 0 6 1 : / 6 = 6 _ . / 6 8 9 ? ^ 0 > 5 . 9 6 2 7 8 < < 8 1 7 . / 6 8 9 8 < / 5 0 < 0 9 : B 1 0 0 E2 0 0 4 2 0 Z / 1 . > / 7 0 4 6 . / 0 4 A B 9 . 9 8 3 . 1 / 6 > = 0 2 5 . 2 ; 0 0 9 4 0 1 6 k 0 4< 1 8 7 / 5 0 0 Z 3 0 1 6 7 0 9 / . = 8 ; 2 0 1 k . / 6 8 9 2 ? @ 8 / 5 0 ; 0 2 / 8 < 8 : 1E 9 8 - = 0 4 B 0 / 5 6 2 6 2 / 5 0 ; 0 2 / 6 9 < 8 1 7 . / 6 8 9 8 < / 5 0 8 ; 2 0 1 k . / 6 8 9 2 8 </ 5 0 : 9 6 � : 0 2 / 1 : > / : 1 0 2 8 < < 0 9 : B 1 0 0 E 2 0 0 4 2 0 Z / 1 . > / 7 0 4 6 . / 0 4 A B9 . 9 8 3 . 1 / 6 > = 0 2 ? @ 5 6 2 8 3 0 9 2 . - . ] / 8 : 9 4 0 1 2 / . 9 4 / 5 0 2 ] 9 / 5 0 2 6 27 0 > 5 . 9 6 2 7 8 < A B 9 . 9 8 3 . 1 / 6 > = 0 2 < 8 1 7 0 4 < 1 8 7 8 / 5 0 1 3 = . 9 /2 0 0 4 2 0 Z / 1 . > / 2 ?
d . e d ; e� � � � � � � � � � � � � � � � � � � � � � � � � � � � � � � � � � � � � � � � � � � � � � ¡ ¢ � � �� £ � � � � � � � � � � � � � � � � � � � � � � � � � � � � ¤ � � � � � � � � � � � � � � � � � � �� � � � ¢ � ¥ ¢ ¦ § ¨ � © � � � ª « � ¬ � ® ¯ ° ± ² ³ ´ µ ¶ · ¸ ¹ º » ¼ ½ ¾ ¿ À Á Â Ã Ä Ä ½ Å Á Æ À ½ ½ Ç » Á ¼ ¼ à À ¿ ½ È » É Ê Ë ½ ÀÅ Ì Å Ã ¼ Ì À ¿ É ¾ Ê ½ »ÍÎÏÐ ÑÏÒ
ÍÓÎÒ ÑÎÔ ÍÍÕÎ ÑÒÓ ÏÔÔÒ ÑÓÍ ÏÔÏÖ ÑÎÍ ÒÎÖÐ ÑÕÒ ÒÐÓÎ ÑÐ× ÒÖÎÏ Ñ×Ö ÒÓ×Ò Ñ×Ó ÒÍÔ× ÑÎÎ ÒÒÓÔ ÑÎ× ÒÕÏÍ ÑÒÕ ÔÕ× ÑÓÍ ÐÐÓ ÑÍ× Ö×Î ÑÐÍ ÖÎÖ ÑÍÏØ Ù Ù ÙØ Ú Ù ÙÛ Ù Ù ÙÛ Ú Ù ÙÜ Ù Ù ÙÜ Ú Ù Ù Ý Þ ß à á â ã ä à å æ ã Øçèççéêéëéì
éèéçíêêîïðñòóôõõðñö÷øùú
û ü ý þ ý ý ÿ ü ý � ý ý � ü ýý � ýý � ûý � � � � � � � ý � ü � � � �� �� ��
� � � � � � � � � � � � �� � � !
" # #
$ % & ' ( ) * + , % - , * . ) . / . 0 1 2 3 0 4 + , 1 & 1 5 6 7 - 8 9 : ; < 7 = - - 9 > - , * . ) . / . ) 1 , % & ? ( 0 % 7 = % , @ / ( ' 1 . % 7 = % A % * . + % , 7 B - , C ) % D E E E F G H ) . H 1 . % F 4 1 I8 ( 1 4 0 0 C ) , 5 1 2 J K L - , . 0 ( , % . ) 1 , % & 9 1 , 2 0 ( 0 , 4 0 1 , M ? C N % , 4 0 3 ( 0 , C * ) , O , 5 ) , 0 0 ( ) , 5 7 3 0 4 + , 1 & 1 5 6 % , C = 0 * 0 % ( 4 + P - 9 ? 3 O 3 = : Q R ; S T U U : Q S V W 7 X 0 4 Q R ; SY Z [ \ ] ^ _ ` a Z b a _ c ^ c d c e f g h e i ` a f [ f j k l b m n o p q l r b b n s b a _ c ^ c d c ^ f a Z [ t ] e Z l r Z a u d ] \ f c Z l r Z v Z _ c ` Z a l w b a x ^ Z y z z z { | } ^ c } f c Z { i f ~m ] f i e e x ^ a j f g � � � b a c e ] a Z c ^ f a Z [ n f a g e ] e a i e f a � � � � � � � � � � � � � � � � � � � � � � � � � � � � � � � � � � � � � � � � � � � � � � � � � � � � � � � � � � � � � � � � � � � � ¡ � ¢ � � � � � �

£ ¤ ¥ ¤ ¦ ¤ § ¨ ¤ ©ª « ¬ ® ¯ ° ± ² ³ ´ µ ¶ µ · ± ¸ ¹ º » ¼ µ ½ ¸ ¸ ¾ µ » µ · ³ º ¿ À µ ² Á  ± · à º ° ¼ ¸  ² ³ º Ä ¬ µ · Å µ ² ¯ µ · ¸ Á  º ¬ ° ³ ¾ µ ² µ ·µ · Æ ¿ ¬ ± Ç µ Å ³ ¾ µ ² º È É Ê Ë ¾ ¸ µ Ì µ ² · ¸ µ Í ´ µ Á ¸ Æ Á ± ¹ Ç ¸ ²· µ · Ë Ê µ ² Î ± Ì ¹ ¸ Á à · Î Â ¸ Á ± Á Ï Ë ² µ · Î ± ´ µ Ì Î ¸ ² ± µ ¹ µ Ì Î ± Ç ± Πõ Ð µ ± · Á Î Á ¸ ¹ ¸ Ì Î ¸ Æ Â ³ ¾ µ · Ê µ Î Â Ë Ð ¸ · Á º Ñ Ò Ó Ô Õ Ö × Ø ÙÚ Û Ü Ó Ý Þ ß Ù à Ê Ê á Í á â º ã ä á ã å « æ ç è ± Æ Æ ± · º ¿ ¯ ¸ ² ± Ì Å ¸ µ · Æ ® ¯ é  ± Î ¸ ¹ ¸ à ºÈ ê · µ ¹ à Á ± Á Ë Ï Î Â ¸ É · Î ¸ ² Í µ · Æ ë ì Î ² µ Ì ¸ ¹ ¹ ³ ¹ µ ² í Ë ² ¾ µ Î ± Ë ·Ë Ï Ä ¹ µ Î ± · ³ ¾ ¼ µ · Ë Ê µ ² Î ± Ì ¹ ¸ Á ´ Ã í ³ Á µ ² ± ³ ¾ Ë ì à Á Ê Ë ² ³ ¾ Á Ê ç Ã Ì Ë Ê ¸ ² Á ± Ì ³ ¾ î Á ± · Ð ¬ ³ ² Ï µ Ì ¸ è ¸ Á Ê Ë · Á ¸¿ ¸ Î Â Ë Æ Ë ¹ Ë Ð Ã º Ñ Ú Û Ü Ó Ø ï Þ ð Ü Ó ñ Ó ò ó º ô Ë ¹ á õ º ¼ Ë á ö ºÊ Ê â ö ÷ ã Í â ö ÷ ø º ã ä ä ù ú « ° » ¼ µ ² µ à µ · µ µ · Æ ¼ ¬ µ Å Î Â ± Ç ¸ ¹ º È » ± Ë ¹ Ë Ð ± Ì µ ¹¬ à · Î Â ¸ Á ± Á Ë Ï ¿ ¸ Î µ ¹ ¼ µ · Ë Ê µ ² Î ± Ì ¹ ¸ Á ´ à ¿ ± Ì ² Ë ´ ¸ Á º Ñû ü ý Û Ü Þ ï Ý ß Ü þ Ó ñ ñ Ó ß ü Ý Û Ü ü ÿ Ü Ø ï � Ô Û Þ ï � Þ ß ï Ü Þ ï º ô Ë ¹ á � ù º ¼ Ë á Í ã º Ê Ê á Í á â º ã ä á ä � « ¬ Ä ®  µ · Æ ² µ · º ¿ ®  µ ³ Æ Â µ ² à º è Ä µ Á ² ± Ì Â µ º ê ê  ¾ µ Æ µ · Æ ¿ ¬ µ Á Î ² à º È ¬ à · Î Â ¸ Á ± Á Ë Ï ¯ Ë ¹ Æ ¼ µ · Ëæ ² ± µ · Ð ¹ ¸ Á µ · Æ ¬ ± ¹ Ç ¸ ² ¼ µ · Ë Ê µ ² Î ± Ì ¹ ¸ Á î Á ± · Ð ê ¹ Ë ¸ ô ¸ ² µÄ ¹ µ · Î ë ì Î ² µ Ì Î º Ñ � ß Ó � Ø ï Þ ð Ü Ó ñ Ó ò ó � � Ó ò � ï Ý Ý à ô Ë ¹ ã ã º¼ Ë ã º Ê Ê � õ õ Í � ÷ â º ã ä ä ù � « ¿ ¬ µ Á Î ² à º ê ê  ¾ µ Æ º ° ¿ É Á ¹ µ ¾ µ · Æ è ° ³ ¾ µ ² ºÈ » ± Ë Í Á à · Î Â ¸ Á ± Á Ë Ï ¿ ¸ Î µ ¹ ¼ µ · Ë Ê µ ² Î ± Ì ¹ ¸ Á î Á ± · Ð í ³ · Ð ±µ · Æ ê Ì Î ± Í · Ë ¾ Ã Ì ¸ Î ¸ Á º Ñ þ � � � ï Ü Ø � Þ ß ï Ü Þ ï º ô Ë ¹ ÷ � º ¼ Ë ã º Ê Ê á ù ã Í á õ ä º ã ä ä â « ¿ î Ì Â ± Æ µ º æ µ ¾ µ ¾ Ë Î Ë µ · Æ ê æ µ · ± Ð ³ Ì Â ± ºÈ è ¸ µ Ì Î ± Ë · Ë Ï ¬ ± ¹ Ç ¸ ² É Ë · Á µ · Æ ¬ Ë ¾ ¸ ê ¾ ± · Ë µ Ì ± Æ Á º Ñ ÒÓ Ô û Ü Ø ß � Û Þ Ø ï � ß Û ñ Û Ü ü û Ü Ø ß Ü Ø ß Ô � Ü ò Û ñ û ò ï Ü Ø Ý à ô Ë ¹ â á º¼ Ë á á º Ê Ê ù ø � Í õ ä ö º ã ä ä â � « è ° ³ ¾ µ ² µ · Æ À ¿ · Á Î ¸ Æ Î º È ¬ ± ¹ Ç ¸ ² É Ë · è ¸ ¹ ¸ µ Á ¸Ï ² Ë ¾ ê · Î ± ¾ ± Ì ² Ë ´ ± µ ¹ Ä Ë ¹ à µ ¾ ± Æ ¸ � ¬ ± ¹ Ç ¸ ² ® Ë ¾ Ê Ë Á ± Î ¸ Á º Ñ� ß Ó � Û Ø ï � ß Û ñ Ý à ô Ë ¹ ã ù º ¼ Ë á ö º Ê Ê ã ä ÷ á Í ã ä ÷ ÷ º ã ä ä � � « ¶ ¸ Ç µ Á ¸ · µ æ º ¯ µ à µ Î Â ² ± è µ · Æ æ µ ¾ ± ¹ µ ² µ Á ± ° ºí ¸ · ³ Ð ² ¸ ¸ Å ¾ ¸ Æ ± µ Î ¸ Æ ´ ± Ë Á à · Î Â ¸ Á ± Á Ë Ï Á ± ¹ Ç ¸ ²· µ · Ë Ê µ ² Î ± Ì ¹ ¸ Á µ · Æ Î Â ¸ ± ² Ì Â µ ² µ Ì Î ¸ ² ± ½ µ Î ± Ë · Ï Ë ²´ ± Ë ¾ ¸ Æ ± Ì µ ¹ µ Ê Ê ¹ ± Ì µ Î ± Ë · Á º � ß Ó � ï ü º â ä º ã º á ø ã Í á ø õ ºã ä á ä � « î ° ² ¸ ± ´ ± Ð º ¿ ô Ë ¹ ¹ ¾ ¸ ² º � × � ß Ü ò ï � � ï � ß ï Ý ß Ü � Û Ø ï � ß Û ñ� Þ ß ï Ü Þ ï à ã � � á ø ø � � � ä ª � « ê · ³ Ê µ ¾ è º ° µ ¹ à µ · ± ° º ê · � µ · ¿ º µ · Æ ¼ µ · Æ µ · » ºÀ ± Ð Â ¹ à ® Ã Î Ë Î Ë ì ± Ì � Ä ê Í á � º ¹ ¸ Á Á ® Ã Î Ë Î Ë ì ± Ì � ê � ö ø �µ · Æ µ · Î ± ¾ ± Ì ² Ë ´ ± µ ¹ µ Ì Î ± Ç ± Î Ã Ë Ï µ Ð ² ¸ ¸ · Á à · Î Â ¸ Á ± ½ ¸ ÆÁ ± ¹ Ç ¸ ² · µ · Ë Ê µ ² Î ± Ì ¹ ¸ ³ Á ± · Ð � ß � Û Ü ß Û Þ Ó � ü Û Ø Û É · Î � Ë Ïê Æ Ç µ · Ì ¸ Á è ¸ Á º ã ä á â º á º á ø â Í á ø ÷ ª ª « ô » µ · Á µ ¹ º ¶ è µ ³ Î µ ² µ à º ê »  µ ² Æ ¸ º ° ê  ± ² ¸ º ê ¬ µ · à µ ¹ º ê ê  ¾ µ Æ º ï Ø Û ñ Ù º È í ³ · Ð ³ Á Í ¿ ¸ Æ ± µ Î ¸ Æ» ± Ë Á à · Î Â ¸ Á ± Á Ë Ï ¬ ± ¹ Í ± Ì µ µ · Æ æ ± Î µ · ± µ Ä µ ² Î ± Ì ¹ ¸ Á º ÑÒ Ó � � Ü Û ñ Ó Ô � Û Ø ï � ß Û ñ Ý þ ð ï � ß Ý Ø � ó º ô Ë ¹ á � º ¼ Ë ã ù º Ê Ê ã � ÷ â Í ã � ÷ ø º ã ä ä � ª å « � À ³ µ · Ð º � ç ± º ¶ ¬ ³ · º ç ³ º ¬ ³ º � µ · Ð º ï ØÛ ñ Ù º È » ± Ë Á à · Î Â ¸ Á ± Á Ë Ï ¬ ± ¹ Ç ¸ ² µ · Æ ¯ Ë ¹ Æ ¼ µ · Ë Ê µ ² Î ± Ì ¹ ¸ Á´ à ¼ Ë Ç ¸ ¹ ¬ ³ · Æ ² ± ¸ Æ ® ± · · µ ¾ Ë ¾ ³ ¾ ® µ ¾ Ê Â Ë ² µ ç ¸ µ Ï º ÑÚ Û Ü Ó Ø ï Þ ð Ü Ó ñ � Ó ò ó º ô Ë ¹ á ÷ º ¼ Ë á ä º ã ä ä õ ª ú « è ¬ µ · Ð Â ± µ · Æ Ä ô ¸ ² ¾ µ º È » ± Ë ¾ ± ¾ ¸ Î ± Ì ¬ à · Î Â ¸ Á ± Á µ · Æ®  µ ² µ Ì Î ¸ ² ± Á µ Î ± Ë · Ë Ï Ä ² Ë Î ¸ ± · ® µ Ê Ê ¸ Æ ¬ ± ¹ Ç ¸ ²¼ µ · Ë Ê µ ² Î ± Ì ¹ ¸ Á º Ñ � ß Ó � ï Ý Ó � � Þ ï � ï Þ ð Ü Ó ñ Ó ò ó º ô Ë ¹ á ä ä º¼ Ë á º Ê Ê � ä á Í � ä ö º ã ä ä ø
� ¦ « � ¤ ¤ � � ! " � ! # § $ µ Ï Î ¸ ² Ë ´ Î µ ± · ± · Ð µ Ä Â ¶Æ ¸ Ð ² ¸ ¸ ± · % ² Ð µ · ± Ì Ì Ë · Æ ³ Ì Î Ë ² Á Ï ² Ë ¾ Î Â ¸ ¿ ç ¬ ³ Å Â µ Æ ± µ î · ± Ç ¸ ² Á ± Î Ã î Æ µ ± Ê ³ ² º ³ · Æ ¸ ² Î Ë Ë Å² ¸ Á ¸ µ ² Ì Â Ë · Ç µ ² ± Ë ³ Á Î Ë Ê ± Ì Á ¬  ¸  µ Á ´ ¸ ¸ ·Î ¸ µ Ì Â ± · Ð Ê Â Ã Á ± Ì µ ¹ Ì Â ¸ ¾ ± Á Î ² à µ Î Î Â ¸î · ± Ç ¸ ² Á ± Î Ã Ë Ï ° Ë Î µ º ° Ë Î µ À ¸ ² ¾ µ ± ·² ¸ Á ¸ µ ² Ì Â ± · Î ¸ ² ¸ Á Î Á µ ² ¸ ± · Ï ± ¸ ¹ Æ Ë Ï Ë ² Ð µ · ± ÌÌ Ë · Æ ³ Ì Î Ë ² Á º Å ± · ¸ Î ± Ì Á Î ³ Æ ± ¸ Á Ë Ï Ê Â ¸ · Ë ¹ Á º· µ · Ë ¾ µ Î ¸ ² ± µ ¹ µ · Æ ² ¸ ¹ µ Î ¸ Æ Ï ± ¸ ¹ Æ Á ¬  ¸  ¸ µ Æ Á µ ² ¸ Á ¸ µ ² Ì Â Ð ² Ë ³ Ê º&  ± Ì Â Ì µ ² ² ± ¸ Æ Ë ³ Î Ì Ë ¾ Ê ³ Î µ Î ± Ë · µ ¹ µ · Æ ¸ ì Ê ¸ ² ± ¾ ¸ · Î µ ¹ Á Î ³ Æ ± ¸ Á Ë ·Ì µ Î µ ¹ à Á ± Á ´ à · µ · Ë ¾ µ Î ¸ ² ± µ ¹ Á À ¸ ² ² ¸ Á ¸ µ ² Ì Â Ë · · µ · Ë Á Ì µ ¹ ¸¾ µ Î ¸ ² ± µ ¹ Á µ ¹ Á Ë ± · Ì ¹ ³ Æ ¸ Á Î Â ¸ Ë ² ¸ Î ± Ì µ ¹ µ · Æ ¸ ì Ê ¸ ² ± ¾ ¸ · Î µ ¹ Á Î ³ Æ ± ¸ ÁË · ' ³ µ · Î ³ ¾ Æ Ë Î Á µ · Æ Î Â ¸ ± ² Á ± ½ ¸ Í Æ ¸ Ê ¸ · Æ ¸ · Î Ê ² Ë Ê ¸ ² Î ± ¸ Á Î Ë ´ ¸³ Á ¸ Æ ± · Ê Â Ë Î Ë Ì µ Î µ ¹ à Π± Ì & µ Î ¸ ² Á Ê ¹ ± Î Î ± · Ð Ï Ë ² Â Ã Æ ² Ë Ð ¸ · Ê ² Ë Æ ³ Ì Î ± Ë ·µ Á & ¸ ¹ ¹ µ Á Á ¸ ¾ ± Ì Ë · Æ ³ Ì Î Ë ² Æ ¸ Ç ± Ì ¸ Á µ · Æ Á ¸ · Á Ë ² Á Ä ² Ë Ï ® Â Ë ³  µ ·Â µ Á Ë Ç ¸ ² ã ä ² ¸ Á ¸ µ ² Ì Â Ê ³ ´ ¹ ± Ì µ Î ± Ë · Á ± · ± · Î ¸ ² · µ Î ± Ë · µ ¹ � Ë ³ ² · µ ¹ Á Ë Ï& ¸ ¹ ¹ ² ¸ Ê ³ Î ¸ ¬  ¸  µ Á Æ ¸ ¹ ± Ç ¸ ² ¸ Æ ± · Ç ± Î ¸ Æ Á ¸ Ç ¸ ² µ ¹ Î µ ¹ Å Á µ ÎÁ Ì ± ¸ · Î ± Ï ± Ì Ì Ë · Ï ¸ ² ¸ · Ì ¸ Á ¬  ¸ ² ¸ Ð ³ ¹ µ ² ¹ à ² ¸ Ç ± ¸ & Á ¾ µ · ³ Á Ì ² ± Ê Î Á Ï Ë ²¾ µ · à ± · Î ¸ ² · µ Î ± Ë · µ ¹ � Ë ³ ² · µ ¹ Á º ± · Ì ¹ ³ Æ ± · Ð Î Â Ë Á ¸ Ê ³ ´ ¹ ± Á  ¸ Æ ´ à Π ¸ê ¾ ¸ ² ± Ì µ · ®  ¸ ¾ ± Ì µ ¹ ¬ Ë Ì ± ¸ Î Ã º è Ë Ã µ ¹ ¬ Ë Ì ± ¸ Î Ã Ë Ï ®  ¸ ¾ ± Á Î ² à µ · Æë ¹ Á ¸ Ç ± ¸ ² £ # ( ¤ © ! ) � * # ¦ + ¤ ¤ § # Æ ± Æ Â ± Á » ¬ Ì � ã ä ä ø �µ · Æ ¿ ¬ Ì � ã ä á á � ± · É · Ë ² Ð µ · ± Ì ®  ¸ ¾ ± Á Î ² ÃÏ ² Ë ¾ ¶ ¸ Ê µ ² Î ¾ ¸ · Î Ë Ï ®  ¸ ¾ ± Á Î ² à º è µ � µ Á Î Â µ ·î · ± Ç ¸ ² Á ± Î Ã º � µ ± Ê ³ ² º É · Æ ± µ À ¸ ± Á Ì ³ ² ² ¸ · Î ¹ ÃÊ ³ ² Á ³ ± · Ð Ä Â ¶ ³ · Æ ¸ ² Î Â ¸ Ð ³ ± Æ µ · Ì ¸ Ë Ïê Á Á Ë Ì ± µ Î ¸ Ä ² Ë Ï ¶ ² ¼ ¸ ¸ ¹ ³ ® Â Ë ³  µ · µ Î Î Â ¸¶ ¸ Ê µ ² Î ¾ ¸ · Î Ë Ï Ä ³ ² ¸ µ · Æ ê Ê Ê ¹ ± ¸ Æ ®  ¸ ¾ ± Á Î ² à ºî · ± Ç ¸ ² Á ± Î Ã Ë Ï ° Ë Î µ º ° Ë Î µ É · Æ ± µ À ± Á ² ¸ Á ¸ µ ² Ì Â ± · Î ¸ ² ¸ Á Î Á ± · Ì ¹ ³ Æ ¸¼ µ · Ë Á Ì ± ¸ · Ì ¸ º � ³ µ · Î ³ ¾ Æ Ë Î Á º ¼ µ · Ë Ê µ ² Î ± Ì ¹ ¸ Á Á à · Î Â ¸ Á ± ½ ¸ Æ µ · ÆÎ Â ¸ ± ² µ Ê Ê ¹ ± Ì µ Î ± Ë · Á ± · Ä Â Ë Î Ë Ì µ Î µ ¹ à Π± Ì é µ Î ¸ ² ¬ Ê ¹ ± Î Î ± · Ð Ï Ë ²À Ã Æ ² Ë Ð ¸ · Ä ² Ë Æ ³ Ì Î ± Ë · µ Á & ¸ ¹ ¹ µ Á Á ¸ ¾ ± Ì Ë · Æ ³ Ì Î Ë ² Æ ¸ Ç ± Ì ¸ Á ºÁ ¸ · Á Ë ² Á µ · Æ ´ ± Ë ¾ ¸ Æ ± Ì µ ¹ µ ² ¸ µ
, - .
/ 0 1 2 3 4 5 6 7 0 8 7 5 9 4 9 : 9 ; < = > ; ? 6 7 < 1 < @ A B 8 C D E F G B H 8 8 D I 8 7 5 9 4 9 : 9 4 < 7 0 1 J 3 ; 0 B H 0 7 K : 3 2 < 9 0 B H 0 L 0 5 9 6 0 7 B M 8 7 N 4 0 O P P P Q R S 4 9 S < 9 0 Q ? < TC 3 < ? ; ; N 4 7 @ < = U V W 8 7 9 ; 3 7 0 9 4 < 7 0 1 D < 7 = ; 3 ; 7 ? ; < 7 X J N Y 0 7 ? ; > 3 ; 7 N 5 4 7 Z 7 @ 4 7 ; ; 3 4 7 @ B > ; ? 6 7 < 1 < @ A 0 7 N H ; 5 ; 0 3 ? 6 [ 8 D J > Z > H E \ ] F ^ _ ` ` E \ ^ a b B c ; ? \ ] F ^d e f g h i j k l e m l j n i n o n p q r s p t k l q f q u v w m x y z { | w } m m y ~ m l j n i n o n i q l e f � h p e w } e l � o h g q n e w } e � e j n k e l w � m l � i e � � � � � � � i n � q n e � t q �� � � � � � � � � � � � � � � � � � � � � � � � � � � � � � � � � � � � � � � � � � � � � � � � � � � � � � � ¡ � � � � � � � � � � ¢ � � � £ � � � � � ¤ � � � ¥ � � � � � £ ¦ � � � � ¡ � ¥ § ¨ © ª « ¬ § ¨ « ® ¯ ¢ ° � � ¨ © ª «


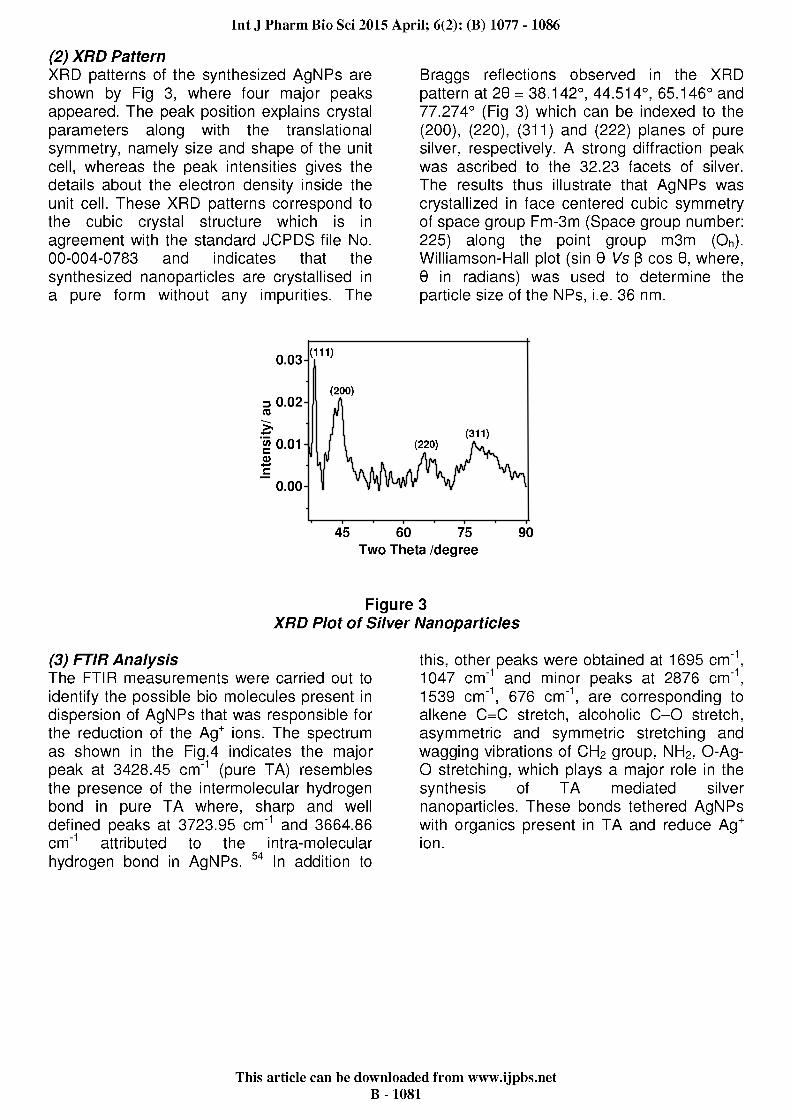


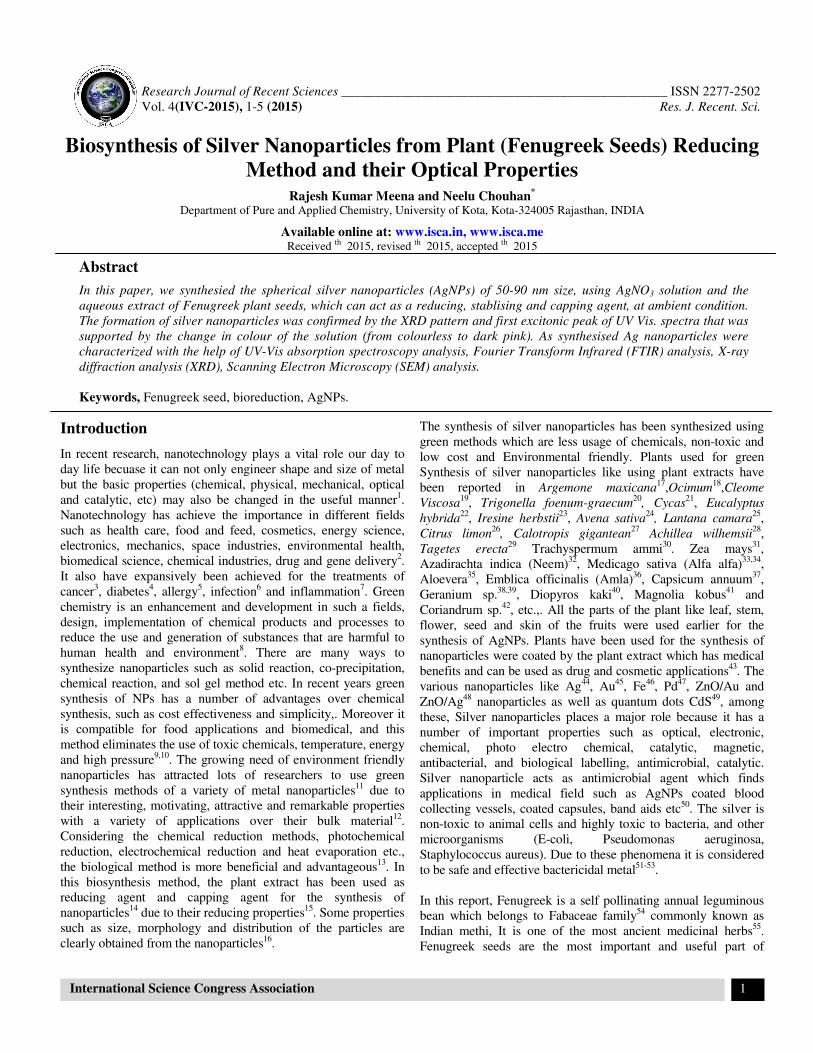
Research Journal of Recent Sciences _________________________________________________ ISSN 2277-2502
Vol. 4(IVC-2015), 1-5 (2015) Res. J. Recent. Sci.
International Science Congress Association 1
Biosynthesis of Silver Nanoparticles from Plant (Fenugreek Seeds) Reducing
Method and their Optical Properties Rajesh Kumar Meena and Neelu Chouhan
*
Department of Pure and Applied Chemistry, University of Kota, Kota-324005 Rajasthan, INDIA
Available online at: www.isca.in, www.isca.me Received th 2015, revised th 2015, accepted th 2015
Abstract
In this paper, we synthesied the spherical silver nanoparticles (AgNPs) of 50-90 nm size, using AgNO3 solution and the
aqueous extract of Fenugreek plant seeds, which can act as a reducing, stablising and capping agent, at ambient condition.
The formation of silver nanoparticles was confirmed by the XRD pattern and first excitonic peak of UV Vis. spectra that was
supported by the change in colour of the solution (from colourless to dark pink). As synthesised Ag nanoparticles were
characterized with the help of UV-Vis absorption spectroscopy analysis, Fourier Transform Infrared (FTIR) analysis, X-ray
diffraction analysis (XRD), Scanning Electron Microscopy (SEM) analysis.
Keywords, Fenugreek seed, bioreduction, AgNPs.
Introduction
In recent research, nanotechnology plays a vital role our day to
day life becuase it can not only engineer shape and size of metal
but the basic properties (chemical, physical, mechanical, optical
and catalytic, etc) may also be changed in the useful manner1.
Nanotechnology has achieve the importance in different fields
such as health care, food and feed, cosmetics, energy science,
electronics, mechanics, space industries, environmental health,
biomedical science, chemical industries, drug and gene delivery2.
It also have expansively been achieved for the treatments of
cancer3, diabetes
4, allergy
5, infection
6 and inflammation
7. Green
chemistry is an enhancement and development in such a fields,
design, implementation of chemical products and processes to
reduce the use and generation of substances that are harmful to
human health and environment8. There are many ways to
synthesize nanoparticles such as solid reaction, co-precipitation,
chemical reaction, and sol gel method etc. In recent years green
synthesis of NPs has a number of advantages over chemical
synthesis, such as cost effectiveness and simplicity,. Moreover it
is compatible for food applications and biomedical, and this
method eliminates the use of toxic chemicals, temperature, energy
and high pressure9,10
. The growing need of environment friendly
nanoparticles has attracted lots of researchers to use green
synthesis methods of a variety of metal nanoparticles11
due to
their interesting, motivating, attractive and remarkable properties
with a variety of applications over their bulk material12
.
Considering the chemical reduction methods, photochemical
reduction, electrochemical reduction and heat evaporation etc.,
the biological method is more beneficial and advantageous13
. In
this biosynthesis method, the plant extract has been used as
reducing agent and capping agent for the synthesis of
nanoparticles14
due to their reducing properties15
. Some properties
such as size, morphology and distribution of the particles are
clearly obtained from the nanoparticles16
.
The synthesis of silver nanoparticles has been synthesized using
green methods which are less usage of chemicals, non-toxic and
low cost and Environmental friendly. Plants used for green
Synthesis of silver nanoparticles like using plant extracts have
been reported in Argemone maxicana17
,Ocimum18
,Cleome
Viscosa19
, Trigonella foenum-graecum20
, Cycas21
, Eucalyptus
hybrida22
, Iresine herbstii23
, Avena sativa24
, Lantana camara25
,
Citrus limon26
, Calotropis gigantean27
Achillea wilhemsii28
,
Tagetes erecta29
Trachyspermum ammi30
. Zea mays31
,
Azadirachta indica (Neem)32
, Medicago sativa (Alfa alfa)33,34
,
Aloevera35
, Emblica officinalis (Amla)36
, Capsicum annuum37
,
Geranium sp.38,39
, Diopyros kaki40
, Magnolia kobus41
and
Coriandrum sp.42
, etc.,. All the parts of the plant like leaf, stem,
flower, seed and skin of the fruits were used earlier for the
synthesis of AgNPs. Plants have been used for the synthesis of
nanoparticles were coated by the plant extract which has medical
benefits and can be used as drug and cosmetic applications43
. The
various nanoparticles like Ag44
, Au45
, Fe46
, Pd47
, ZnO/Au and
ZnO/Ag48
nanoparticles as well as quantum dots CdS49
, among
these, Silver nanoparticles places a major role because it has a
number of important properties such as optical, electronic,
chemical, photo electro chemical, catalytic, magnetic,
antibacterial, and biological labelling, antimicrobial, catalytic.
Silver nanoparticle acts as antimicrobial agent which finds
applications in medical field such as AgNPs coated blood
collecting vessels, coated capsules, band aids etc50
. The silver is
non-toxic to animal cells and highly toxic to bacteria, and other
microorganisms (E-coli, Pseudomonas aeruginosa,
Staphylococcus aureus). Due to these phenomena it is considered
to be safe and effective bactericidal metal51-53
.
In this report, Fenugreek is a self pollinating annual leguminous
bean which belongs to Fabaceae family54
commonly known as
Indian methi, It is one of the most ancient medicinal herbs55
.
Fenugreek seeds are the most important and useful part of
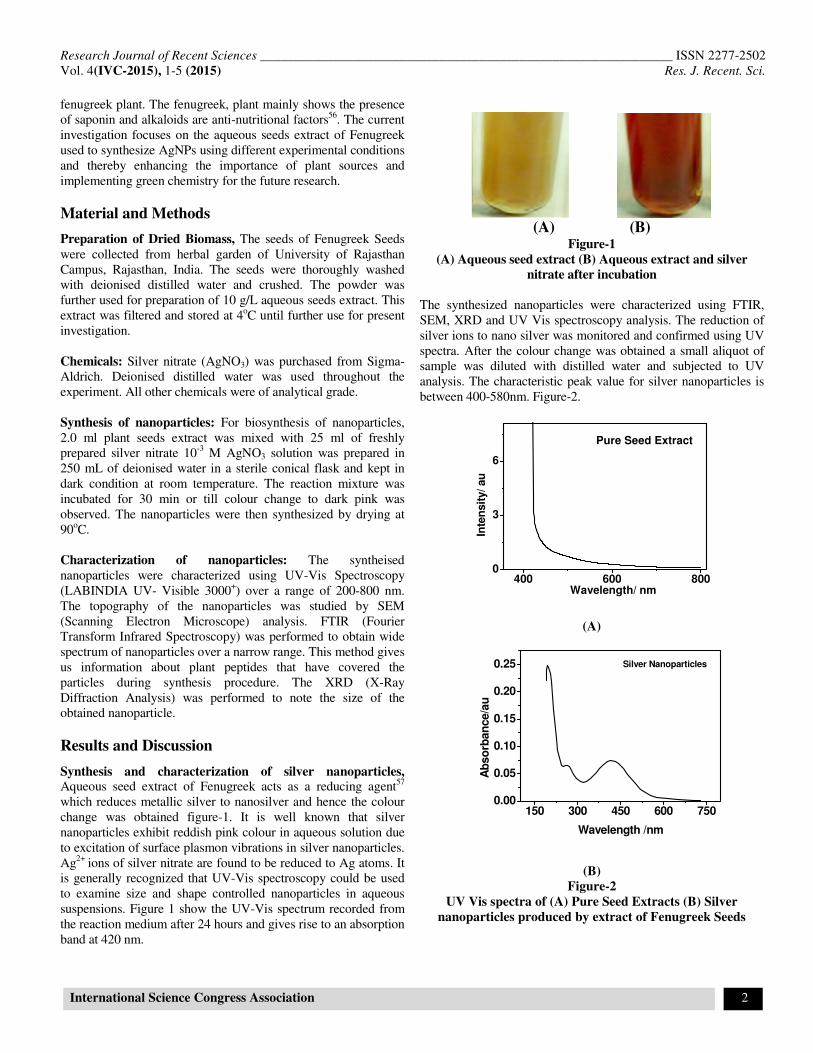
Research Journal of Recent Sciences ______________________________________________________________ ISSN 2277-2502
Vol. 4(IVC-2015), 1-5 (2015) Res. J. Recent. Sci.
International Science Congress Association 2
fenugreek plant. The fenugreek, plant mainly shows the presence
of saponin and alkaloids are anti-nutritional factors56
. The current
investigation focuses on the aqueous seeds extract of Fenugreek
used to synthesize AgNPs using different experimental conditions
and thereby enhancing the importance of plant sources and
implementing green chemistry for the future research.
Material and Methods
Preparation of Dried Biomass, The seeds of Fenugreek Seeds
were collected from herbal garden of University of Rajasthan
Campus, Rajasthan, India. The seeds were thoroughly washed
with deionised distilled water and crushed. The powder was
further used for preparation of 10 g/L aqueous seeds extract. This
extract was filtered and stored at 4oC until further use for present
investigation.
Chemicals: Silver nitrate (AgNO3) was purchased from Sigma-
Aldrich. Deionised distilled water was used throughout the
experiment. All other chemicals were of analytical grade.
Synthesis of nanoparticles: For biosynthesis of nanoparticles,
2.0 ml plant seeds extract was mixed with 25 ml of freshly
prepared silver nitrate 10-3
M AgNO3 solution was prepared in
250 mL of deionised water in a sterile conical flask and kept in
dark condition at room temperature. The reaction mixture was
incubated for 30 min or till colour change to dark pink was
observed. The nanoparticles were then synthesized by drying at
90oC.
Characterization of nanoparticles: The syntheised
nanoparticles were characterized using UV-Vis Spectroscopy
(LABINDIA UV- Visible 3000+) over a range of 200-800 nm.
The topography of the nanoparticles was studied by SEM
(Scanning Electron Microscope) analysis. FTIR (Fourier
Transform Infrared Spectroscopy) was performed to obtain wide
spectrum of nanoparticles over a narrow range. This method gives
us information about plant peptides that have covered the
particles during synthesis procedure. The XRD (X-Ray
Diffraction Analysis) was performed to note the size of the
obtained nanoparticle.
Results and Discussion
Synthesis and characterization of silver nanoparticles, Aqueous seed extract of Fenugreek acts as a reducing agent
57
which reduces metallic silver to nanosilver and hence the colour
change was obtained figure-1. It is well known that silver
nanoparticles exhibit reddish pink colour in aqueous solution due
to excitation of surface plasmon vibrations in silver nanoparticles.
Ag2+
ions of silver nitrate are found to be reduced to Ag atoms. It
is generally recognized that UV-Vis spectroscopy could be used
to examine size and shape controlled nanoparticles in aqueous
suspensions. Figure 1 show the UV-Vis spectrum recorded from
the reaction medium after 24 hours and gives rise to an absorption
band at 420 nm.
(A) (B)
Figure-1
(A) Aqueous seed extract (B) Aqueous extract and silver
nitrate after incubation
The synthesized nanoparticles were characterized using FTIR,
SEM, XRD and UV Vis spectroscopy analysis. The reduction of
silver ions to nano silver was monitored and confirmed using UV
spectra. After the colour change was obtained a small aliquot of
sample was diluted with distilled water and subjected to UV
analysis. The characteristic peak value for silver nanoparticles is
between 400-580nm. Figure-2.
(A)
(B)
Figure-2
UV Vis spectra of (A) Pure Seed Extracts (B) Silver
nanoparticles produced by extract of Fenugreek Seeds
150 300 450 600 7500.00
0.05
0.10
0.15
0.20
0.25
Ab
so
rban
ce/a
u
Wavelength /nm
Silver Nanoparticles
400 600 8000
3
6
Inte
nsit
y/ au
Wavelength/ nm
Pure Seed Extract

Research Journal of Recent Sciences ______________________________________________________________ ISSN 2277-2502
Vol. 4(IVC-2015), 1-5 (2015) Res. J. Recent. Sci.
International Science Congress Association 3
The spectrum of the sample was obtained for wavelength range
in-between 400nm to 580nm. The λ max of the nanoparticles
was observed at 470nm. This is because of a phenomenon called
Surface Plasmon Resonance (SPR) exhibited by silver
nanoparticles. The silver nanoparticles oscillate when exposed
to electromagnetic radiation and this oscillation gives a typical
peak value58
. The SEM (FESEM, JEOL JSM-6700F) image of
the nanoparticles represents the topography of the particles is
shown in image figure-3.
Figure-3
SEM image of silver nanoparticles produced by Fenugreek
seeds extract
The SEM image suggests the presence of roughly spherical
silver nanoparticles. The incidence of Xrays on the powdered
nanoparticles gives a particular pattern which helps to
characterize the nanoparticles as shown in the XRD graph
figure-4.
40 5 0 60 70
2 T h et a (d e g ree)
(22 0)
(2 00)
( 111 )
Inte
nsit
y (
co
un
ts)
2 T h et a (d e g ree)
Ag Na n o p art ic les
Figure-4
XRD pattern of the silver nanoparticles produced by extract
of Fenugreek seeds
XRD (manual mode) was used to characterize the AgNp. The
2d angle is converted to the diameter using the Scherrer formula
(Dp = Kλ /β1/2 cosθ). The size of silver nanoparticles
synthesised by green synthesis was estimated to be around 20-
50 nm. FTIR (Bruker -Tensor Model) analysis also gives a set
of peak values unique for the sample along with information of
the plant peptides that are present in the sample as the plant
extract acts as a reducing agent figure-5. FTIR analysis is used
to confirm the presence of plant peptides visible due to the
bending produced by amide bonds59
.
37
26
.21
34
71
.78
33
07
.14
28
81
.43
28
25
.73
17
56
.01
16
47
.69
15
72
.95
14
91
.94
13
89
.77
11
48
.79
10
23
.10
80
9.4
3 66
4.3
9 59
7.6
35
75
.32
100015002000250030003500
Wavenumber cm-1
86
88
90
92
94
96
98
10
0
Tra
ns
mit
tan
ce
[%
]
Figure-5
FTIR spectra of nanoparticles synthesized by extract of
Fenugreek seeds
Biological synthesis of silver nanoparticles is an alternative to
chemical synthesis and it used the reducing properties of
biological products for synthesis of silver nitrate to nanosilver.
Biological synthesis of nanoparticles has been previously
reported using plant seed extracts. The phytochemical in the
seed reduce the silver salts and not only produce silver
nanoparticles but also stabilize it by capping the nanoparticles
with the plant peptides. The antimicrobial activity of the
nanoparticles is thus enhanced due to the presence of plant
proteins and phytochemical.
Conclusion
In this present study the synthesis of silver nanoparticles was
synthesized by biological method using Fenugreek seed extract
which acts as a reducing agent to reduce silver metal to nanosize
particles. The synthesized silver nanoparticles were subjected to
analysis such as SEM, UV Vis Spectroscopy, XRD, and FTIR
in order to characterize them. To the best of our knowledge this
is the best information of the observations of the unique
structures of fenugreek seeds extract mediated Ag nanoparticles.
This opens a way to understand the synthesis mechanism of Ag
nanoparticles formed from other plant seeds extracts.
Reference
1. Alqudami A and Annapoorni S., Fluorescence from
metallic silver and iron nanoparticles prepared by
exploding wire technique, Plasmonics., 2(1) 5-13 (2007)
2. Korbekandi H and Iravani S., Silver Nanoparticles,
Nanotechnology and Nanomaterials, 3, 5-16 (2012)
3. Brigger I, Dubernet C, Couvreur P., Nanoparticles in
cancer therapy and diagnosis, Adv Drug Deliv Rev., 64,
24–36 (2012)

Research Journal of Recent Sciences ______________________________________________________________ ISSN 2277-2502
Vol. 4(IVC-2015), 1-5 (2015) Res. J. Recent. Sci.
International Science Congress Association 4
4. Basarkar A, Singh J. Poly (lactide-co-glycolide)-
polymethacrylate nanoparticles for intramuscular
delivery of plasmid encoding interleukin-10 to prevent
autoimmune diabetes in mice, Pharm Res., 26, 72–81
(2009)
5. Roy K, Mao HQ, Huang SK and Leong KW, Oral gene
delivery with chitosan-DNA nanoparticles generates
immunologic protection in a murine model of peanut
allergy, Nat. Med., 5, 387–391 (1999)
6. Furno F, Morley KS, Wong B, Sharp BL, Arnold PL,
Howdle SM et al. Silver nanoparticles and polymeric
medical devices, a new approach to prevention of
infection, J Antimicrob Chemother., 54, 1019–1024
(2004)
7. Wilson DS, Dalmasso G, WangL, Sitaraman SV, Merlin
D and Murthy N., Orally delivered thioketal
nanoparticles loaded with TNF-α–siRNA target
inflammation and inhibit gene expression in the
intestines, Nat. Mater., 9, 923–928 (2010)
8. Mano Priya M, Karunai Selvia B, John Paul JA. Green
Synthesis of Silver Nanoparticles from the Leaf Extracts
of Euphorbia Hirta and Nerium Indicum, Digest.J.
Nanomat. Biostruct., 6(2), 869–877 (2011)
9. Chandrakant K, Tagad, Sreekantha Reddy Dugasanic,
Rohini Aiyer, Sungha Parkc, Atul Kulkarni and Sushma
Sabharwal., Green synthesis of silver nanoparticles and
their application for the development of optical fiber
based hydrogen peroxide sensor, Sensors and Actuators
B., 183, 144–149 (2013)
10. Yamini Sudha Lakshmi G, Fouzia Banu, Ezhilarasan,
Arumugam, Sahadevan., Green Synthesis of Silver
Nanoparticles from Cleome Viscosa, Synthesis and
Antimicrobial Activity., 5 (2011)
11. Christopher L, Kitchens Douglas E, Hirt Scott M, Husson
Alexey A and Vertegel., Synthesis, Stabilization, and
Characterization of Metal Nanoparticles, The Graduate
School of Clemson University, (2010)
12. Hasna Abdul Salam, Rajiv P, Kamaraj M, Jagadeeswaran
P, Sangeetha Gunalan and Rajeshwari Sivaraj., Plants,
Green Route for Nanoparticle Synthesis, Inter.Res.J.Bio.
Sci., 1(5), 85-90 (2012)
13. Geoprincy G, Vidhyasrr BN, Poonguzhali U, Nagendra
Gandhi N, Renganathan S., A review on green synthesis
of silver nano particles, Asian.J.Pharma.Clini.res.,
6(1),8–12 (2013)
14. Akl M Awwad1, Nidà M., Green Synthesis of Silver
Nanoparticles by Mulberry Leaves Extract, Nanoscience
and Nanotechnology., 2(4), 125-128 (2012)
15. Umesh B. Jagtap, Vishwas A. Bapat., Green synthesis of
silver nanoparticles using Artocarpus heterophyllus Lam.
Seed extract and its antibacterial activity, Industrial
Crops and Products., 46, 132– 137 (2013)
16. Nethra Devi C, Sivakumar P and Renganathan S., Green
synthesis of silver nanoparticles using Datura metel
flower extract and evaluation of their antimicrobial
activity, Inter.J. Nanomat.Biostruct., 2(2), 16–21 (2012)
17. Singh D. Jain, M.K. Upadhyay, N. Khandelwal and H.N.
Verma., Green Synthesis Of Silver Nanoparticles Using
Argemone Mexicana Leaf Extract And Evaluation Of
Their Antimicrobial Activities., Digest Journal of
Nanomaterials and Biostructures, 5(2), 483-489 (2010)
18. Mallikarjun K, Narsimha G, Dillip GR, Praveen B,
Shreedhar B, Lakshmi S, Reddy VS and Raju DP., Green
synthesis of silver nanoparticles using Ocimum leaf
extract and their characterization. Digest J Nanomat
Biostruct., 6(1), 181-186 (2011)
19. Yamini Sudha Lakshmi.G Singapore., Green Synthesis of
Silver Nanoparticles from Cleome Viscosa, Synthesis and
Antimicrobial Activity, International Conference on
Bioscience, Biochemistry and Bioinformatics IPCBEE., 5
(2011)
20. R.P. Singh, S. Magesh, C., Rakkiyappan formation of
fenugreek (Trigonella foenum-graecum) extract mediated
Ag Nanoparticles, mechanism and applications,
International Journal of Bio-Engineering Sciences &
Technology-IJBEST., 2(3), 283-294 (2011)
21. Anal K. Jha K. Prasad., Green Synthesis of Silver
Nanoparticles Using Cycas Leaf, International Journal of
Green Nanotechnology, Physics and Chemistry., 1, 110–
117 (2010)
22. Manish dubey, Seema bhadauria, B.S. Kushwah., Green
synthesis of nanosilver particles from extract of
Eucalyptus hybrida (safeda) leaf, Digest Journal of
Nanomaterials and Biostructures., 4(3), 537–543 (2009)
23. Dipankar C, Murugan S., The green synthesis,
characterization and evaluation of the biological activities
of silver nanoparticles synthesized from Iresine herbstii
leaf aqueous extracts, Colloids., 98,112-119 (2012)
24. V. Armendariz, I. Herrera, J.R. Peralta-Videa et al., Size
controlled gold nanoparticle formation by Avena sativa
biomass, use of plants in nanobiotechnology, Journal of
Nanoparticle Research., 6(4), 377–382 (2004)
25. Thirumurugan A et al., Biological synthesis of silver
nanoparticles by Lantana camara leaf extracts,
International Journal of Nanomaterials and
Biostructures., 2(4) 65-69 (2012)
26. Prathna TC and Chandrasekaran N and Raichur, Ashok
M and Mukherjee, Amitava., Biomimetic synthesis of
silver nanoparticles by Citrus limon (lemon) aqueous
extract and theoretical prediction of particle size, In,

Research Journal of Recent Sciences ______________________________________________________________ ISSN 2277-2502
Vol. 4(IVC-2015), 1-5 (2015) Res. J. Recent. Sci.
International Science Congress Association 5
Colloids and Surfaces B, Biointerfaces., 82(1), 152-159
(2011)
27. J. Sivakumar, C.Premkumar, P. Santhanam and N.
Saraswathi., Biosynthesis of Silver Nanoparticles Using
Calotropis gigantean Leaf, African Journal of Basic &
Applied Sciences., 3(6), 265-270 (2011)
28. Javad karimi andeani, Hojjatollah kazemi, Sasan
mohsenzadeh, Afsanehs afavi., Biosynthesis of gold
nanoparticles using dried flowers extract of achillea
wilhelmsii plant, Digest Journal of Nanomaterials and
Biostructures., 6(3) 1011-1017 (2011)
29. krishnamurthy NB, Nagaraj , Barasa malakar, liny P, and
Dinesh R., Green synthesis of gold nanoparticles using
tagetes erecta l.(mari gold) flower extract & evaluation of
their antimicrobial activities, International Journal of
Pharma and BioSciences., 3(1), 212-221 (2012)
30. Chouhan Neelu and Meena Rajesh Kumar., Biosynthesis
of silver nanoparticles using Trachyspermum ammi and
evaluation of their antibacterial activities, Int J Pharm
Bio Sci., 6(2),1077–1086 (2015)
31. Choi S.M., Seo M.H., Kim H.J. and Kim W.B., Synthesis
and characterization of graphene-supported metal
nanoparticles by impregnation method with heat
treatment in H2 atmosphere, Synthetic Metals., 161,
2405– 2411 (2011)
32. Shankar S., Rai S., Ahmad A. and Sastry M., Rapid
synthesis of Au, Ag, and bimetallic Au core-Ag shell
nanoparticles using Neem (Azadirachta indica) leaf broth,
J.Colloid Interface Sci., 275, 496–502 (2004)
33. Gardea-Torresdey J. L., Gomez E., Peralta-Videa J.,
Parsons J.G., Troiani H.E. and Santiago P., Formation
and growth of Au nanoparticles inside live alfalfa plants,
Nano Lett., 2, 397–401 (2002)
34. Gardea-Torresdey J.L., Gomez E., Peralta-Videa J.,
Parsons J.G., Troiani H.E. and Santiago P., Alfalfa
sprouts, a natural source for the synthesis of silver
nanoparticles, Langmuir., 19, 1357–1361 (2003)
35. Chandran S.P., Chaudhary M., Pasricha R., Ahmad A.
and Sastry M., Synthesis of gold nanotriangles and silver
nanoparticles using Aloe vera plant extract, Biotechnol.
Prog., 22, 577–583 (2006)
36. Amkamwar B., Damle C., Ahmad A., Sastry M.,
Biosynthesis of gold and Ag nanoparticles using Emblica
officinalis fruits extract, their phase transfer and
transmetallation in an organic solution, J Nanosci.
Nanotechnol., 5, 1665-1671 (2005)
37. Li S., Shen Y., Xie A., Yu X., Qiu L., Zhang L. and
Zhang Q., Synthesis of silver nanoparticles using.
Capsicum annum L. Extract, Green Chemistry., 9, 852–
858 (2007)
38. Shankar S. S., Ahmad A. and Sastry M., Geranium Leaf
Assisted Biosynthesis of Silver Nanoparticles,
Biotechnol. Progress., 19, 1627–1631 (2003)
39. Vijayakumara M., Priya K., Nancy F.T., Noorlidah A.
and Ahmed A.B.A., Biosynthesis, characterisation and
antibacterial effect of plant-mediated silver nanoparticles
using Artemisia nilagirica, Industrial Crops and
Products., 41, 235–240 (2013)
40. Gan P. P., Ng S. H., Huang Y., Fong S. and Li Y., Green
synthesis of gold nanoparticles using palm oil mill
effluent (POME), A low-cost and eco-friendly viable
approach, Bioresource Technology., 113, 132–135 (2012)
41. Song J.Y., Hyeon-Kyeong H.K. and Kim B.S., Biological
synthesis of gold nanoparticles using Magnolia kobus
and Dipyros kaki leaf extracts, Process Biochem., 44,
1133-1138 (2009)
42. Narayanan K.B. and Sakthivel N., Coriander leaf
mediated biosynthesis of gold nanoparticles, Materials
Letters., 62, 4588–4590 (2008)
43. Mallikarjunaa K, Narasimhab G, Dillipa GR, Praveenb B,
Shreedharc B and Sree Lakshmic C et al., Green
Synthesis of Silver Nanoparticles Using Ocimum Leaf
Extract and Their Characterization,
Digest.J.Nanomat.Biostruct., 6(1), 181–186 (2011)
44. Song JY and Kim BS., Rapid biological synthesis of
silver nanoparticles using plant leaf extracts, Bioprocess
Biosyst Eng., 32, 79-84 (2009)
45. Huang J, Li Q, Sun D, Lu Y, Su Y, Yang X, Wang H,
Wang Y, Shao W, He N, Hong J, Chen C., Biosynthesis
of silver and gold nanoparticles by using novel sun-dried
Cinnamomum camphora leaves, Nanotechnol., 18, 105-
104 (2007)
46. Pattanayak M and Nayak PL., Green Synthesis and
Characterization of Zero Valent Iron Nanoparticles from
the Leaf Extract of Azadirachta indica (Neem), World
Journal of Nano Science & Technology., 2(1), 06-09
(2013)
47. Nadagouda M.N. Varma R.S., Green synthesis of silver
and palladium nanoparticles at room temperature using
coffee and tea extract, Green Chem., 10, 859–862 (2008)
48. Fageria P., Gangopadhyay S. and Pande S., Synthesis of
ZnO/Au and ZnO/Ag nanoparticles and their
photocatalytic application using UV and visible light.
RSC Adv., 4, 24962–24972 (2014)
49. Ahmad, P. Mukherjee, D. Mandal, S. Senapati, M.I.
Khan, R. Kumar and M. Sastry., Enzyme Mediated
Extracellular Synthesis of CdS Nanoparticles by the
Fungus, Fusariuoxysporum, J.Am. Chem. Soc.,
124,12108–12109 (2002)
50. Geoprincy G, Saravanan P, NagendraGandhi N and
Renganathan S., A novel approach for studying the

Research Journal of Recent Sciences ______________________________________________________________ ISSN 2277-2502
Vol. 4(IVC-2015), 1-5 (2015) Res. J. Recent. Sci.
International Science Congress Association 6
combined antimicrobial effects of silver nano particles
and antibiotics through agar over layer method and disk
diffusion method, Digest.J.Nanomat.Biostruct, 6(4),
1557-1565 (2011)
51. Kalimuthu K, Babu RS, Venkataraman D, Bilal M and
Gurunathan S., Biosynthesis of silver nanocrystals by
Bacillus licheniformis, Colloids Surf B., 65(1), 150-153
(2008)
52. Wijnhoven SWP, Peijnenburg WJGM, Herberts CA,
Hagens WI, Oomen AG and Heugens EHW et al., Nano–
silver, a review of available data and knowledge gaps in
human and environmental risk assessment, Nano
toxicology., 3, 109-138 (2009)
53. Klueh U, Wagner V, Kelly S, Johnson A and Bryers JD.,
Efficacy of silver-coated fabric to prevent bacterial
colonization and subsequent device-based biofilm
formation, J. Biomed. Mater. Res., 53(6), 621–631 (2000)
54. Balch PA Prescription for dietary wellness (2nd
edn).
Penguin group, New York 15-17 (2003)
55. Thomas JE, Bandara M, Lee EL, Driedger D and
Acharya S., Biochemical monitoring in fenugreek to
develop functional food and medicinal plant variants, N
Biotechnol., 28, 110-117 (2011)
56. Jani R, Udipi SA. and Ghugre PS Mineral content of
complementary foods, Indian J Pediatr 76, 37-44 (2009)
57. Thombre RS, Mehta S, Mohite J and Jaisinghani P.,
Synthesis of silver nanoparticles and its cytotoxic effect
on THP-1 cancer cell line. International Journal of
Pharma and Biosciences. 4(1),184-192 (2013)
58. Smitha SL, Nissamudeen KM, Philip D and
Gopchandran KG., Studies on surface Plasmon resonance
and photoluminescence silver nanoparticles,
Spectrochim. Acta A., 71(1), 186–190 (2008)
59. Jing A, Wang D, Luo Q and Yuan X., Antimicrobial
active silver nanoparticles and Silver/polystyrene core-
shell nanoparticles prepared in room-temperature ionic
liquid, Materials Science and Engineering C,
29(6),1984–1989 (2009)

ISSN (Print): 2328-3777, ISSN (Online): 2328-3785, ISSN (CD-ROM): 2328-3793
American International Journal of Research in Formal, Applied & Natural Sciences
AIJRFANS 15-349; © 2015, AIJRFANS All Rights Reserved Page 68
AIJRFANS is a refereed, indexed, peer-reviewed, multidisciplinary and open access journal published by International Association of Scientific Innovation and Research (IASIR), USA
(An Association Unifying the Sciences, Engineering, and Applied Research)
Available online at http://www.iasir.net
ZnO Nanoparticles Synthesized by a Novel Approach at Room
Temperature and Antibacterial activity Rajesh Kumar Meena1 and Neelu Chouhan*2 1,2Department of Pure & Applied Chemistry,
University of Kota, Kota-324005 Rajasthan, India
I. Introduction
ZnO Semiconductors with magnitude in the nanometer region are important because their electrical, optical and
chemical properties can be tuned by varying the size of particles. Optical properties are of great importance for
relevance in optoelectronics, photovoltaics and biological sensing. Various chemical synthetic methods have
been developed to prepare such nanoparticles. Zinc Oxide (ZnO) is a exclusive material with a direct band gap
(3.37eV) and large exciton binding energy of 60me1-2. It has been normally used in near-UV emission, gas
sensors, transparent conductor and piezoelectric application3 - 7. Most of the ZnO crystals have been synthesized
by conventional high temperature solid state method which is energy consuming and difficult to manage the
particle properties as well as similar methods that are used for the fabrication of ZNPs include the sol–gel
method, facile hydrothermal method, solution method, electric current heating method; solvothermal method,
self-propagating high-temperature synthesis method, spontaneous nucleation method, spray pyrolysis, gas-phase
reaction method, laser ablation method and thermal evaporation8–21. Hydrothermal technique is a promising
substitute synthetic method because of the low process temperature and very easy to control the particle size.
The hydrothermal process have several advantage over other growth processes such as use of simple equipment,
catalyst-free growth, low cost, large area uniform fabrication, environmental friendliness and less hazardous.
The low down reaction temperatures create this method an gorgeous one for microelectronics and plastic
electronics22. This method has also been successfully employed to prepare nanoscale ZnO and other luminescent
materials. The particle properties such as morphology and size can be controlled via the hydrothermal process
by adjusting the reaction temperature, time and concentration of precursors. In this consider, several reports are
obtainable that are neither feasible nor cost effective. The hydrothermal preparation of ZnO/Au and ZnO/Ag
nanoparticles at 800C for 5 hours23 and flower-like ZnO nanorods is masintained at more than 120°C, for several
hours, at basic medium24 chrysanthemum-like ZnO nanorods are formed in the presence of sodium dodecyl
sulfate at 120°C for 24 hours25 and 10 hours,26,27 and the preparation of flower-like ZnO microstructures was
conducted via sonochemical treatment for 1 hour.28
The present study focuses on the hydrothermal synthesis of ZnO nanopowders. The hydrothermal synthesis of
ZnO powders has four advantages (1) powders with nanometer-size can be obtained by this method (2) the
reaction is carried out under moderate situations (3) powders with different morphologies by adjusting the
reaction situation and (4) the as-prepared powders have different properties from that of the bulk. In this present
work, we have reported the synthesis of ZnO nanoparticles using hydrothermal method and characterized its
structural, morphological properties. Additionally we have performed the electrochemical activity of the
synthesized ZnO.
Abstract: Applications of metal oxide nanoparticles in research and health-related applications, metal
oxide nanoparticles are increasingly being developed through cheaper and more user-friendly approaches.
We have formulated a simple route to synthesize zinc oxide nanoparticles (ZNPs) by a hydrothermal method
at near-room temperatures. The results are analyzed by X-ray diffraction, transmission electron
microscopy, FTIR and ultraviolet-visible absorption spectroscopy. Highly significant antimicrobial activity
against medically important Gram-positive (S.aureus) and Gram-negative (Escherichia coli) bacteria by
these ZNPs. we can postulate that our fabricated ZNPs may be useful as antimicrobial agents in antiseptic
creams and lotions for the treatment of skin diseases.
Index Terms: Nanoparticles, hydrothermal method, antimicrobial activity etc.

Neelu et al., American International Journal of Research in Formal, Applied & Natural Sciences, 11(1), June-August 2105, pp. 68-72
AIJRFANS 15-349; © 2015, AIJRFANS All Rights Reserved Page 69
II. Materials and Experimental Methods:
Materials:
Zinc acetate dihydrate Zn(CH3COO)2·2H2O) and sodium hydroxide pellets (NaOH) were purchased from
Sigma- Aldrich and were all used without further purification and Double distilled water was used as the
solvent.
Synthesis of Zinc Oxide Nanoparticles: 5g of Zn(CH3COO)2·2H2O) and 10ml (5M) of NaOH were dissolved
into 100 mL of distilled water. After the mixture are magnetically stirred for 4h at room temperature and then
slowly being cooled to room temperature, obtained powders were collected by centrifugation and washed with
distilled water and absolute ethanol. The powders were finally dried at 60 °C for 12 h.
Optical Properties: Ultraviolet-visible spectroscopy (UV-Vis) refers to absorption spectroscopy in the UV-
Visible spectral region. That means it uses beam in the visible and adjacent (near-UV and near-infrared (NIR))
ranges. The absorption in the visible range openly affects the perceived colour of the chemicals involved. In this
region of the electromagnetic spectrum generate by the electronic transitions. In this time uv-vis absorption
spectra was takened using a (LABINDIA Uv- Visible 3000+) spectrophotometer where the cuvette path length
was set to 1.0 cm. The particles were dissolved in methanol, and solution was placed in a quarts cuvettes.
pH Analysis
The pH was determined by using Digital pH meter Systronics. The pH of the reduced solution with Nanoparticle
synthesized was found to be basic. After reduction the pH of sample was found to increase and move towards
the basic range.
Structure and morphology:
Powder X-Ray Diffraction: XRD patterns of the powdered samples were obtained on a Phillips X’Pert
materials research diffractometer using secondary monochromated Cu Kα radiation (λ = 1.54060 A°) at 40
Kv/50mA. Samples were supported on a glass slide. Measurements were taken using a glancing angle of
incidence detector at an angle of 2 for 2θ values over 10–80 in steps of 0.05 with a scan speed of 0.012.
TEM analysis: The TEM measurement was done with JEOL model 1200Ex instrument operated at an
accelerating voltage of 80kV. Samples were prepared by placing 3-4 drops of the well dispersed Zn
nanoparticles samples on a 300-mesh, carbon coated Cu grid (EM sciences) and allowing the liquid to evaporate
in air. For Zn nanoparticles the particle size distribution was based on 30 randomly selected particles. The TEM
image was taken with very high resolution and MATLAB analysis gives the pixel depth of the image equal to
24bits and the image format as JPEG. The TEM Images have been taken from National Chemical Laboratory,
Pune, India.
Fourier Transform Infrared (FTIR) Spectroscopy: FTIR analysis range 4000 to 400 cm-1 using Bruker -
Tensor Spectrum in the diffuse reflectance mode at a resolution of 4cm−1 in KBr pellets. The powder sample
was placed on a sample holder and the spectrum was recorded.
III. Results and discussions
Synthesis of silver nano particles:
Structural Characterization: XRD patterns of the ZnO nanoparticles prepared by hydrothermal method is shown in Figure 1, which indicates
the ZnO has hexagonal wurtzite phase structure The peak and relative intensities obtained for the ZnO
competition with the reported JCPDS data29 and no other attribute peaks were observed other than ZnO. The x-
ray diffraction information were recorded by using Cu Kα radiation (1.5406 Ao). The intensity data were
collected over a 2θ range of 20-80o. In addition, the peaks (100), (002), and (101) clearly indicate formation of
pure wurtzite structure of ZnO.30
Therefore, the XRD pattern showed that samples were formed in single phase.
The high intensity of (100) peak at 31° suggested the growth of ZNPs along the easy direction of
crystallization.31
No other peaks related to impurities were detected in the XRD spectra, confirming the pure
form of the synthesized ZNPs. The expected grain size of the ZnO nanoparticles was estimated with the help out
of Scherrer equation using the diffraction intensity of (101) peak. x-ray diffraction studies confirmed that the
synthesized materials were ZnO nanoparticles with wurtzite phase and all the diffraction peaks agreed. The
mean grain size (D) of the particles was resolute from the XRD line broadening measurement via Scherrer
equation.
D=0.89λ / (βCosθ)
Where λ is the wavelength (Cu Kα), β is the full width at the half- maximum (FWHM) of the ZnO (101) line
and θ is the diffraction angle. A specific line broadening of the diffraction peaks is suggested that the
synthesized materials are in nanometer series and the average grain size of ZnO is determined using Scherrer
equation32 and it was found to be around 50 nm.

Neelu et al., American International Journal of Research in Formal, Applied & Natural Sciences, 11(1), June-August 2105, pp. 68-72
AIJRFANS 15-349; © 2015, AIJRFANS All Rights Reserved Page 70
Figure 1. XRD pattern of ZnO nanoparticles
FT-IR spectrum of ZnO nanoparticles (Figure 2) showed significant absorption peaks at 3372 and 1577, 573
cm-1. The absorption band at 573 cm-1 was assigned to Zn-O stretching vibration. The weak band near 1577 cm-
1 is assigned to H-O-H bending vibration mode were presented due to the adsorption of moisture, when FTIR
sample disks were prepared in an open air atmosphere. These observations provided the evidence for the
presence of hydration in the structure and intense broad band near 3372 cm-1 represents the hydrogen bonded O-
H stretching vibration.
Figure 2. FT-IR spectrum of ZnO nanoparticles
Figure 3 shows the TEM image and equivalent selected-area electron diffraction (SAED) pattern of the ZnO
nanoparticles synthesized at room temperature for 4h from 5M NaOH. TEM image confirms the formation of
ZnO nanoparticles and it has an average size about 50 nm.
Figure 3 TEM Images of ZnO Nanoparticles
Size evolution of semiconducting nano particles become very essential to explore the properties of the materials.
UV-Visible absorption spectroscopy is widely used technique to examine the optical properties of nano sized
particles. The prepared zinc oxide white Crystalline powder was not soluble in water and almost in all organic
solvents. ZnO nano particles UV-Visible spectra recorded by dispersed in methanol solution and sonicated for 5
to 10 min. Fig. 4 shows the absorption spectroscopy of the ZnO nanoparticles in the uv-spectral region. ZnO
D:\FTIR DATA\RAJESH KUMAR MEENA\ZacCitNaoHWithoutH.0 ZacCitNaoHWithoutH D:\FTIR DATA\RAJESH KUMAR MEENA\ 12/02/2015
3913
.50
3372
.20
2889
.12
2825
.62
2353
.06
2144
.88
1770
.17
1577
.41
1405
.46
1247
.05
1087
.03
914.
69
650.
51
573.
00
100015002000250030003500
Wavenumber cm-1
020
4060
8010
0
Tra
nsm
ittan
ce [%
]
Page 1/1
(a)

Neelu et al., American International Journal of Research in Formal, Applied & Natural Sciences, 11(1), June-August 2105, pp. 68-72
AIJRFANS 15-349; © 2015, AIJRFANS All Rights Reserved Page 71
exhibits a sharp band at 354 nm, which corresponds to the formation of ZnO nanoparticles. From the absorption
spectrum of ZnO nanoparticles an approximate optical band gap can be derived using the following equation:
αEp¼ K(Ep-Eg)1/2
1 2 3 40
20
40
(E
p)2
(eV
/cm
2)
Photon energy(eV)
ZnO Nanoparticle
Fig.4. UV-Visible spectra of ZnO nanoparticles synthesized at room temperature
where, α stands for the absorption coefficient, K is a constant, Ep is the discrete photo energy, and Eg is the
band gap energy. A classical Tauc approach is further employed to estimate the Eg value of ZnO
nanoparticles.33-35A plot of (αEp)2 vs. Ep is shown within the inset of Fig. 4. The extrapolated straight line of
this plot meets the Ep axis. Which represents the absorption edge energy corresponds to the band gap (Eg) of the
material. The band gap value of ZnO from the experimental data was calculated to be 3.12eV, which is in good
agreement with the value reported in the literature.36
IV. Antibacterial Activity The antibacterial property of the ZnO was evaluated against Gram-ve Escherichia coli and Gram +ve bacteria S.
aureus using agar well diffusion method. In agar well diffusion method the ZnO nanoparticles showed
significant antibacterial activity on bacterial strains Gram-ve and Gram +ve bacteria and Table 1 represents the
comparative activities in terms of inhibition zone i.e 16 and 14, respectively. Study demonstrated that the ZnNPs
show best antagonistic activity of Zinc nanoparticles against Escherichia coli.
Table: 1 Antagonistic activity of silver nanoparticles against bacteria
V. Conclusion ZnO powder was successfully synthesized by novel approach at room temperature. The crystallite size
calculated from the XRD is 50 nm is in good agreement with TEM results. FT-IR results confirm that the
presence of Zn-O at 573cm-1 as well as UV-visible Spectroscopy. the absorption spectrum was 354 nm show the
blue shift compared to bulk ZnO. The antibacterial activity of ZnO Nanoparticles was confirmed by Zone of
inhibition. As the diameter of the zone of inhibition is high, we can conclude that ZnO is also a very effective
antibacterial agent. ZnO Nanoparticles are effective against both the bacteria which gives a conclusion that it is
effective against gram +ve and gram –ve bacteria. Therefore we can conclude that ZnO Nanoparticles is a very
effective antibacterial agent.
Acknowledgments The authors are sincerely thankful to the Department of Science and Technology and their sub wing Science and Engineering Research Board of the, India (SB/S1/PC- 31/2012) for their financial support. NCL, Pune and IIT Rorkee, India, are also thanked by the authors for
providing XRD and TEM facilities, respectively as well as the authors are thankful to the Institute of Modi College, Biotechnology
Department, Kota, Rajasthan for giving permission to carry out the antibacterial activities.
References
[1] Qiuxiang Z, Ke Y, Wei B, Qingyan W, Feng X, Ziqiang Z, Ning D, Yan S, “Synthesis, optical and field emission properties of
three different ZnO nanostructures”, Materials Letters; 2007, 61, 3890.
Organism Zone of inhibition (mm)
Escherichia coli 16
Staphylococcus aureus 14
400 600 800
0.6
1.2
1.8
Ab
so
rb
an
ce
/au
Wavelength/nm
ZnO Nanoparticle
354 nm

Neelu et al., American International Journal of Research in Formal, Applied & Natural Sciences, 11(1), June-August 2105, pp. 68-72
AIJRFANS 15-349; © 2015, AIJRFANS All Rights Reserved Page 72
[2] Gyu-Chul Y, Chunrui W. and Won Il P. “ZnO nanorods: synthesis, characterization and applications” Semicond. Sci. Technol;
2005, 20, S22. [3] Morkoc H, Strite S, Gao G B, Lin M E, and Sverdlov B, and M. Burns, “Large-band-gap SIC, Ill-V nitride, and II-VI ZnSe-based
semiconductor device technologies”, J.Appl. Phys; 1994 ,76, 1363.
[4] Yuzhen L, Lin G, Huibin X, Lu D, Chunlei Y, Jiannong W, Weikun G, and Shihe Y, Ziyu W, “Low temperature synthesis and optical properties of small-diameter ZnO nanorods”, J. Appl. Phys; 2006, 99, 114302.
[5] Hachigo A, Nakahata H, Higaki K, Fujii S and Shikata S-I, “Heteroepitaxial growth of ZnO films on diamond (111) plane by
magnetron sputtering”, Appl. Phys. Lett; 1994,65, 2556. [6] Spanhel L and Anderson M A, “Semiconductor Clusters in the Sol-Gel Process: Quantized Aggregation, Gelation, and Crystal
Growth in Concentrated ZnO Colloids”, J.Am. Chem. Soc; 1991, 113, 2826.
[7] Bagnall D M, Chen Y F, Shen M Y, Zhu Z, Goto T and Yao T, “Room temperature excitonic stimulated emission from zinc oxide epilayers grown by plasma-assisted MBE”, J.Cryst. Growth; 1998, 184/185, 605.
[8] Zhao H, Su X, Xiao F, Wang J, Jian J. Synthesis and gas sensor properties of flower-like 3D ZnO microstructures. Materials
Science and Engineering: B. 2011;176(7):611–615. [9] Bahnemann DW, Kormann C, Hoffmann MR. Preparation and characterization of quantum size zinc oxide: a detailed
spectroscopic study. J Phys Chem. 1987;91(14):3789–3798.
[10] Spanhel L, Anderson MA. Semiconductor clusters in the sol-gel process: quantized aggregation, gelation, and crystal growth in concentrated zinc oxide colloids. J Am Chem Soc. 1991;113(8):2826–2833.
[11] Tokumoto MS, Pulcinelli SH, Santilli CV, Briois V. Catalysis and temperature dependence on the formation of ZnO
nanoparticles and zinc acetate derivatives prepared by the sol-gel route. J Phys Chem B. 2003;107(2):568–574. [12] Meulenkamp EA. Synthesis and growth of ZnO nanoparticles. J Phys Chem B. 1998;102(29):5566–5572.
[13] Sivakumar R, Tsunoda T, Kuroki Y, Okamoto T, Takata M. ZnO nanowire growth by electric current heating method: a study on
the effect of substrate temperature. Mater Chem Phys. 2012;134(1):345–349. [14] Bilecka I, Elser P, Niederberger M. Kinetic and thermodynamic aspects in the microwave-assisted synthesis of ZnO
nanoparticles in benzyl alcohol. ACS Nano. 2009;3(2):467–477.
[15] Chen Y, Yu R, Shi Q, Qin J, Zheng F. Hydrothermal synthesis of hexagonal ZnO clusters. Mater Lett. 2007;61(22):4438–4441. [16] Hwang CC, Lin CS, Wang GP, Peng CH, Chung SL. A self-propagating high-temperature synthesis method for synthesis of zinc
oxide powder. J Alloys Compd. 2009;467(1–2):514–523. [17] Yu Q, Fu W, Yu C, et al. Fabrication and optical properties of large-scale ZnO nanotube bundles via a simple solution route. J
Phys Chem C. 2007;111(47):17521–17526.
[18] Zhao W, Song X, Yin Z, Fan C, Chen G, Sun S. Self-assembly of ZnO nanosheets into nanoflowers at room temperature. Mater Res Bull. 2008;43(11):3171–3176.
[19] Haile SM, Johnson DW Jr, Wiseman GH, Bowen HK. Aqueous precipitation of spherical zinc oxide powders for varistor
applications. J Am Ceram Soc. 1989;72(10):2004–2008. [20] Zhang S, Yao S, Li J, Zhao L, Wang J, Boughton RI. Growth habit control of ZnO single crystals in molten hydrous alkali
solutions. J Cryst Growth. 2011;336(1):56–59.
[21] Umar A, Kim SH, Suh EK, Hahn YB. Ultraviolet-emitting javelin-like ZnO nanorods by thermal evaporation: growth mechanism, structural and optical properties. Chem Phys Lett. 2007;440(1–3):110–115.
[22] Lee. C.Y, Tseng T. Y, Li. S. y, Lin.P. Effect of phosphorus dopant on photoluminescence and field-emission characteristics of
Mg0.1Zn0.9O nanowires”, J. Appl. Phys; 2006, 99, 024303.
[23] Fageria P., Gangopadhyay S. and Pande S. Synthesis of ZnO/Au and ZnO/Ag nanoparticles and their photocatalytic application
using UV and visible light. RSC Adv., 4, 24962–24972 (2014).
[24] Zhang H, Yang D, Ji Y, Ma X, Xu J, Que D. Low temperature synthesis of flowerlike ZnO nanostructures by cetyltrimethylammonium bromide-assisted hydrothermal process. J Phys Chem B. 2004;108(13): 3955–3958.
[25] Yin H, Xu Z, Wang Q, Bai J, Bao H. Study of assembling ZnO nanorods into chrysanthemum-like crystals. Mater Chem Phys.
2005;91(1): 130–133. [26] Ni Y, Wu G, Zhang X, et al. Hydrothermal preparation, characterization and property research of flowerlike ZnO nanocrystals
built up by nanoflakes. Mater Res Bull. 2008;43(11):2919–2928.
[27] Li F, Hu L, Li Z, Huang X. Influence of temperature on the morphology and luminescence of ZnO micro and nanostructures prepared by CTAB-assisted hydrothermal method. J Alloys Compd. 2008;465(1–2): L14–L19.
[28] Li H, Ni Y, Hong J. Ultrasound-assisted preparation, characterization and properties of flower-like ZnO microstructures. Scr
Mater. 2009;60(7):524–527. [29] JCPDS Card No. 36-1451
[30] Rekha K, Nirmala M, Nair MG, Anukaliani A. Structural, optical, photocatalytic and antibacterial activity of zinc oxide and
manganese doped zinc oxide nanoparticles. Physica B Condens Matter. 2010;405(15):3180–3185. [31] Lin HF, Liao SC, Hung SW. The dc thermal plasma synthesis of ZnO nanoparticles for visible-light photocatalyst. J Photochem
Photobiol A Chem. 2005;174(1):82–87.
[32] Klug H P and Alexander L E. X-ray diffraction Procedures for polycrystalline and Amorphous Materials, 1st edn, chapter 9, Wiley, New York; 1st edition, 1954.
[33] Wong E. M and. Searson. P. C. ZnO quantum particle thin films fabricated by electrophoretic deposition. Appl. Phys. Lett.;
1999;74(20): 2939-2941. [34] Brus. L, Electronic wave functions in semiconductor clusters: experiment and theory. J. Phys. Chem. 1986;90(12): 2555-2560.
[35] Ghobadi. N, Band gap determination using absorption spectrum fitting procedure Int.Nano Lett. 2013;1186/2228-5326-3-2.
[36] Chandrappa K. G. and Venkatesha T. V. Electrochemical generation of cubic shaped nano Zn2SnO4 photocatalysts. Nano-Micro Lett. 2010; 4(14): 19-22.

ww.sciencedirect.com
i n t e rn a t i o n a l j o u rn a l o f h y d r o g e n en e r g y x x x ( 2 0 1 5 ) 1e9
Available online at w
ScienceDirect
journal homepage: www.elsevier .com/locate/he
Visible light harvesting Pt/CdS/Co-doped ZnOnanorods molecular device for hydrogengeneration
Neelu Chouhan a,*, Rakshit Ameta b, Rajesh Kumar Meena a,1,Niranjan Mandawat a,1, Rahul Ghildiyal c
a Department of Pure and Applied Chemistry, University of Kota, MBS Road, Near Kabir Circle, Kota 324005,
Rajasthan, Indiab Department of Chemistry, PAHER University, Udaipur 313003, Rajasthan, Indiac Display Materials Laboratory, Applied Physics Department, Faculty of Technology and Engineering, M. S.
University of Baroda, Baroda 390002, Gujarat, India
a r t i c l e i n f o
Article history:
Received 11 September 2015
Received in revised form
31 October 2015
Accepted 2 November 2015
Available online xxx
Keywords:
CTAB
Micelles
Co-doped ZnO nanorods
Structural disorders
Photocatalytic water splitting
* Corresponding author. Tel.: þ91 744 2471E-mail address: [email protected]
1 Tel.: þ91 744 2471722; fax: þ91 744 24717http://dx.doi.org/10.1016/j.ijhydene.2015.11.00360-3199/Copyright © 2015, Hydrogen Ener
Please cite this article in press as: Chouhahydrogen generation, International Journal
a b s t r a c t
Co-doped ZnO nanorods (CoeZnO NRs) were synthesized by hydrothermal method using
cationic surfactant cetyltrimethylammonium bromide (CTAB). Their physical growth
mechanism was traced in the light of FESEM and HRTEM studies. A strong correlation
between their electronic structural arrangement and photocatalytic activity was estab-
lished. Broad and uniform peaks were found between 525 and 700 nm in UVeVis. diffuse
reflectance spectra, which were attributed to the ded transition of Co2þ ion. Successful
loading of the nano-sized sensitizer CdS onto the CoeZnO NRs' surface, contributes to the
band gap reduction in CdS/CoeZnO NRs (Eg ¼ 2.25 eV) sample. X-ray absorption spec-
troscopy confirms the presence of the lower degree structural disorders in CdS/CoeZnO
NRs with respect to the pristine ZnO and CoeZnO NRs. Gradual modification in pristine
ZnO NRs enhances the photocatalytic activity. Hetero-assembly of 1.5% Pt/CdS/CoeZnO
NRs, exhibited excellent photocatalytic responses in terms of quantum efficiency (1.98%)
and hydrogen generation capacity (67.20 mmol/H2 g) under 1 Sun (1.5AM G) light exposure.
Copyright © 2015, Hydrogen Energy Publications, LLC. Published by Elsevier Ltd. All rights
reserved.
Introduction
Hydrogen is the most compatible and clean fuel on the planet
in terms of energy economy and ecological health of the
planet [1e3]. Unfortunately, the large amount of the H2 is
produced by the carbon containing resources that release
722; fax: þ91 744 2471742(N. Chouhan).42.19gy Publications, LLC. Publ
n N, et al., Visible light hof Hydrogen Energy (2015
enormous amount of CO2 in atmosphere. Beside this, nature
has provided us a carbon-free abundant source of hydrogen in
form of water almost free of cost. Cleavage of water in pres-
ence of the photocatalyst (a semiconductor of appropriate
band gap) and sunlight, can produce hydrogen in an eco-
friendly manner. Although, sunlight and water, comes free
of cost to us but the cost, stability and efficiency of the
.
ished by Elsevier Ltd. All rights reserved.
arvesting Pt/CdS/Co-doped ZnO nanorods molecular device for), http://dx.doi.org/10.1016/j.ijhydene.2015.11.019

i n t e r n a t i o n a l j o u r n a l o f h y d r o g e n en e r g y x x x ( 2 0 1 5 ) 1e92
photocatalysts are the main thrust areas for the large scale
hydrogen production. At some extent oxide photocatalysts
(ZnO, TiO2, Ga2O3, Nb2O3, In2O3 Fe2O3, SnO2, WO3, NiO, etc.)
were found fit in above criteria. Out of the commercially
available wide range of oxide semiconductors, ZnO [4,5] has
been selected for the study because of its superb and unique
inherent qualities such as low cost, wide availability, viability
to change in morphology, large excitonic binding energy
(60meV), deep photon penetration, short diffusion length, low
reflectivity, high carrier mobility, good bio-compatibility, etc.
Usually, the nanostructures of ZnO have a large degree of
charge transfer over their bulk counterparts that is due to
their large surface area to volume ratio, short lateral diffusion
length and low reflectivity [6]. Few of the notable ZnO systems
that accounts for photocatalytic water splitting are N-doped
ZnO nanowires (h ¼ 4%) [7], CdTe sensitized ZnO nanorods
(1.98%) [8], CdSe sensitized ZnO nanotubes [4], GaN-ZnO (5.2%)
[9], ZnSeZnO coreeshell (STH ¼ 0.38%) [10], TiO2 shell ZnO
core NPs (h ¼ 0.17%) [11], ZnO/ZnO:Cr [12], Si/ZnO core shell
nanowires (0.035%) [13], ZnO and Fe2O3 modified TiO2 fibres
(0.12 ml/min mg) [14], etc. Furthermore, doping of transition
metals to the semiconductors, used to improve the optical
output of these photocatalytic materials. The effect of
different transition metals (Fe, Co, Ni, Cu, Zn, In, etc) on the
photocatalytic activity of oxide semiconductorwas studied for
splitting of water into hydrogen and oxygen under UV irradi-
ation [15,16]. In nonoxide semiconductors category, nano-
composite Ni-doped InN/GaZnON and Ni-doped CdS
nanoparticles are a good example of semiconductor that
release 2.23 mmol h�1 and 25.848 mmol/(h g) of H2, respec-
tively, under visible light irradiation [17,18].
Hence, cobalt doping was employed to modify the surface
quality of ZnO. Therefore, it was decided to synthesize
nanostructures of ZnO and Co doped ZnO systems for water
splitting and hydrogen generation. Consequently, the hydro-
thermal method [5] was adopted to develop one dimensional
(1D) nanorods (NRs) of CoeZnO by controlling the surfactant
(CTAB; cetyltrimethylammonium bromide) concentration in
water. Unluckily, neither the ZnO NRs nor CoeZnO NRs, can
exploit sunlight fully due to their wide band gap (WBG) i.e.
Eg ¼ 3.2 eV. More often the hetero-assemblies (by incorpora-
tion of visible light harvesting moiety to oxides) are made by
introducing better light harvesting material (chalcogenide
quantum dots/dyes) to nanooxide systems that to enhance
their light harvesting capacity. A small amount of the state of
art hetero-assemblies are mentioned here as H4Nb6O17/CdS,
Pt/TiO2/Zn-porphyrin, ZnO/Erythrosine, Pt/SrTiO3:Rh/BiVO4,
Fe2O3/WO3, ZnO/CdSe, TiO2/CdS, etc, which was also used for
water splitting [19e28]. These heterostructures exhibit excel-
lent stability, capability to utilise the wide portion of visible
light, and suppress the recombination of the light generated
photo-electrons and photoholes. For this reason, a chalco-
genide CdS (Eg ¼ 2.4 eV) was introduced as a sensitizer to ZnO
or CoeZnONRs. Additionally,1.5% Ptwas loaded as co-catalyst
to generate reduction site to consume the photoelectrons at
the surface of CdS/CoeZnO NRs. Then this nanomolecular
machines i.e. 1.5% Pt/CdS/CoeZnO NRs, were utilised for
photocatalytic water cleavage, in aqueous electrolyte (0.35 M
Na2S þ 0.25 M K2SO3, pH ¼ 13.3) under visible light irradiation
[29].
Please cite this article in press as: Chouhan N, et al., Visible light hhydrogen generation, International Journal of Hydrogen Energy (2015
Experimental
Synthesis of ZnO and CoeZnO NRs
Typical synthesis of ZnO or CoeZnO nanostructures includes
twomajor steps: (i) seed formation and (ii) growth of NRs. First
step involves precipitation of CoeZnO seeds by oxidation of
aqueous nitrates for zinc and cobalt in 10:1 ratio, using liquid
ammonia. Afterwards, CoeZnO seeds (2 g; green powder) were
utilised to harvest NRs, by varying surfactant (CTAB) con-
centration (17.5, 20, 25, 30, 35 and 40%) in reverse micelle hy-
drothermal method at 200 �C for 10 h, reported earlier [25].
Here, CTAB-micelles served as the templates in nanocrystals
growth. For the synthesis of ZnO NRs, the same synthesis
process was adopted without taking cobalt salt.
Loading of CdS on to the surface of ZnO and CoeZnO NRs
Direct sulfurization method was employed to add CdS sensi-
tizer to ZnO and CoeZnO NRs, described somewhere else [30].
Respective pinkish white and yellowish green powder of CdS/
ZnO NRs and CdS/CoeZnO NRs were obtained, which was
washed thoroughly with hot water and dried in the oven at
60 �C for 24 h.
Co-catalyst addition to CdS/CoeZnO NRs surface
CdS-loaded ZnO and CoeZnO NRs, were decorated with co-
catalyst (1.5% Pt) to facilitate the reduction sites on the pho-
tocatalytic surface, by impregnation method [24]. Finally, the
sample was dried at 60 �C for 12 h in oven and used as such for
photocatalytic cleavage of water.
Results and discussion
Study of surface morphology
As fabricated nanomolecular device (1.5% Pt/CdS/CoeZnO
NRs) was rigorously characterised at every step of fabrication
process, using variety of analytic tools. Morphological images
of ZnO NRs, was recorded using a field emission-scanning
electron microscope (FESEM; Hitachi S-4000) after every step
of advancement. High resolution transmission electron mi-
croscope (HRTEM; JEM-2100F, at 200 kV) and corresponding
energy-dispersive X-ray (EDX) spectroscopy, were used to
know the lattice fringes and growth directions from selected
area electron diffraction (SAED) pattern and elemental ratio.
Products of hydrothermal process at varying concentration of
aqueous CTAB and seeds, were examined by using FESEM
(Fig. S1). All concentrations of CTAB (17.5, 20, 25, 30, 35 and
40%) was kept greater than its critical micelle concentration
(CMC; 0.95 mM) to promote one dimensional (1D) augmenta-
tion of CoeZnO seeds [31]. According to the principle of dy-
namic solvation, there is a selective adsorption (electrostatic)
of the cationic surfactant on the hexagonal facets i.e. (100) and
(111) planes, which was also evident from HRTEM images of
CoeZnO seeds [32]. Dissimilar rate of attachment/detachment
of surfactant on above planes, effectively reduce the energy
arvesting Pt/CdS/Co-doped ZnO nanorods molecular device for), http://dx.doi.org/10.1016/j.ijhydene.2015.11.019

i n t e rn a t i o n a l j o u rn a l o f h y d r o g e n en e r g y x x x ( 2 0 1 5 ) 1e9 3
and growth rate along these planes that allows NRs to grow
along (011) plane [33,34]. Sterically bulky cationic surfactant,
CTAB plays two major roles in production of one dimensional
CoeZnO structures: (i) As micellizer, it induces 1D molecular
aggregation of micelles in aqueous medium and (ii) As stabi-
lizer, it stabilises themicelle-captivated CoeZnOnanoclusters
by preventing their uncontrollable growth. Results of both of
these actions collectively promote cylindrical aggregation
(wormlikemicelle) of ZnO or CoeZnO seeds (scaffold by CTAB)
in opposite directions with time that creates a junction in the
middle of the rods (revealed from FESEM images) [35,36]. The
growth process of NRs will continuous till the critical mass of
the nanorods of ZnO or CoeZnO, was attained. Afterwards,
NRs split into two parts, as illustrated in Fig. 1. Final size of the
NRs strictly depend on the size of the reaction volume i.e.
driven by the radius of the cavity in water droplets with sur-
factant Rw, which is expressed by the following Equation (1)
[37].
Radius of the cavity in water droplets with surfactant
Rw ¼ 3 Vaq½H2O�=s½s� (1)
where, s[s] ¼ polar group area of surfactants' head and
Vaq[H2O] ¼ volume of water. It means the size of the nanorod
can be regulated by changing the volume of water and the
polar head area of micelles (controlled by CTAB concentra-
tion). Increase in volume of water droplet directed to increase
the volume of the surfactant in surfactant-incorporated water
droplets. Increase in CTAB concentration tends to increase in
head area of polar group. Both of these effects, contribute
equally in keeping the size of the CoeZnONRs (~400 nm broad
and 2 mm long) same even at higher CTAB concentration
reactions.
FESEM images (Fig. S1a and b) of the CoeZnO nano-
architects fabricated at different concentrations of the CTAB
and the supporting literature [38], give some significant hints
about their physical growth mechanism. Gradual morpho-
logical transformations were observed in finishing-end shape
of the CoeZnO NRs with augmentation in CTAB amount/
concentrations. At 17.5, 20, 25, 30, 35 and 40% CTAB concen-
tration, corresponding shuttle-end, flat end, cocoon-end
Fig. 1 e A schematic gradual physical growth mecha
Please cite this article in press as: Chouhan N, et al., Visible light hhydrogen generation, International Journal of Hydrogen Energy (2015
(without hole), cocoon-end (with hole), cocoon-end (with big
hole) and cocoon-end (with hole) hexagonal rods were ob-
tained, respectively. Due to the apt salt/surfactant ratio
(CoeZnO/CTAB ¼ 1:0.20) in 20% CTAB [39], the flat-end
CoeZnO NRs were produced. Beyond 20% CTAB concentra-
tion, the enhancement in CTAB concentration, promotes the
formation of excess of bromide ions by cleavage of CTAB.
These bromide ions induced chemical inching in nanooxides,
which was initiated from the centre of the (011) plane of the
hexagonal CoeZnO NRs and created a hole at centre. The size
of this hole increases with CTAB concentration from 50 nm
(30%CTAB) to 76 nm (35%CTAB) to 98 nm (40%CTAB). Further,
whatever may be the concentration of CTAB was used for
synthesis, almost same sized (400 nm wide and 2 mm long)
hexagonal-nanorods were obtained.
SAED pattern (Fig. 2a) of flat-end CoeZnO NRs was ob-
tained corresponding to the HRTEM image, which evident the
hexagonal orientation of the Lau's spot around central spot,
proves the presence of the crystalline single hexagonal phase
of the CoeZnO NRs, consistent with X-ray powder diffraction
(XRD) results. Lattice fringes, depicted in the HRTEM image
(Fig. 2b), are separated by 2.42 nm distance, illustrate the high
crystalline nature of NRs that grow along the (011) plane. EDX
profile of the CoeZnO NRs, possess the Co and Zn peaks that
confirms the Co-doping onto ZnO lattice (Fig. 2c). Fig. 2d ex-
hibits the HRTEM image of CdS loaded Co doped ZnO that
revealed the presence of the heterojunction between CdS and
Co-doped ZnO.
XRD analysis
X-ray diffraction patterns of the synthesised samples were
recorded on Philips X'Pert MPD-3 diffractometer (mono-
chromatized radiation of Cu Ka (l ¼ 0.15418 nm), scan
rate¼ 0.05� 2q s�1, at applied voltage 45 kV and current 40mA).
XRD patterns, shown in Fig. 3aec, verify crystallisation of ZnO
and CoeZnO NRs in a single wurtzite phase. Positions of
diffraction peaks of the ZnO and CoeZnO NRs, are in good
agreement with the standard JCPDS (Joint Committee on
Powder Diffraction Standards) card No. 36e1451, which
nism for hexagonal faceted CoeZnO nanorods.
arvesting Pt/CdS/Co-doped ZnO nanorods molecular device for), http://dx.doi.org/10.1016/j.ijhydene.2015.11.019

Fig. 2 e HRTEM micrographs of CoeZnO NRs including the (a) SAED pattern, (b) lattice fringes, (c) EDX analysis. This shows
well ordered crystalline planes along with hexagonal packing of atoms and a lattice spacing of 2.42 nm, corresponding to
the growth 011-plane of Co doped-ZnO lattice and (d) HRTEM image of CdS nanoparticles loaded Co-doped ZnO that revealed
the presence of the heterojunction between CdS and Co-doped ZnO.
Fig. 3 e Powder XRD patterns of the (a) pristine ZnO and CoeZnO NRs with respect to standard ZnO (JCPDS card No. 036-1451)
with (b) (100), (002) and (101) reflections highlighted between the angles 31.0e37.5� to demonstrate the insertion of Co in
ZnO lattice and (c) loading of CdS on ZnO and CoeZnO surface and star sign assigned to the hexagonal CdS peaks (JCPDS No.
80-0006). First star at lowest angle represents the combined intensities of (100), (002), and (101) peaks, second and third star
belongs to (110), and (112) peaks of CdS, respectively.
i n t e r n a t i o n a l j o u r n a l o f h y d r o g e n en e r g y x x x ( 2 0 1 5 ) 1e94
accounts for the hexagonal crystal growth in both samples
along the 011 plane. Diffraction patterns of the pristine ZnO
and CoeZnO NRs, shown by Fig. 3a, confirm that both belongs
to the P63mC space group and their corresponding lattice pa-
rameters are a¼ b¼ 3.1919Å, c¼ 5.1908Å, a¼ b¼ 90�, g¼ 120�,at z ¼ 4, V ¼ 52.8800 Å3 and a ¼ b ¼ 3.1942 Å, c ¼ 5.1968 Å,
a ¼ b ¼ 90�, g ¼ 120�, at z ¼ 4, V ¼ 52.9600 Å3, respectively.
Minor shifting in XRD-peaks of CoeZnO was found towards
lower angles in comparison to the pristine ZnO NRs (Fig. 3b)
that strongly recommends the incorporation of the slightly
bigger ions i.e. Co2þ (IR ¼ 0.075 nm > Zn2þ; IR ¼ 0.074 nm) into
ZnO lattice. Value of c/a ratio was estimated as 1.626 (1.633 for
ideal tetrahedra) for the CoeZnO system that reflected the
hexagonal packing of the atoms by geometric occupation of
ions at dissimilar sites of slightly distorted tetrahedra. The
tetrahedral positions are occupied by anions at four apices
and by cations at centre [40].
Please cite this article in press as: Chouhan N, et al., Visible light hhydrogen generation, International Journal of Hydrogen Energy (2015
Another crystal parameter b/c (u) ¼ 0.615 (0.375 for an ideal
crystal), shows the existence of the anionecation bond, par-
allel to the c-axis. c/a parameter follows an inversely pro-
portional relationship with u. Therefore, on decreasing c/a
valuewith respect to ideal tetrahedra, u adjusts itself in such a
way that the four tetrahedral distances get balanced through
the distortion in tetrahedral angles and distances. Prominent
and sharp peak (011) around 2q¼ 36.26�, reconfirms the crystal
growth along (011) plane. Crystalline domain of the flat end
CoeZnO NRs, was calculated using Debye-Sherrer equation
i.e. 385 nm,which is quite near to the average size (~400 nm) of
the NRs thatmeasured by FESEM images. Fig. 3c expressed the
significantly broad XRD peaks of CdS accompanied with reg-
ular wurtzite CoeZnO peaks, in CdS/CoeZnO NR's sample. In
the same sample presence of the first broad peak centred at
2q¼ 27� is an aggregation of (100), (002), and (101) peaks of CdS,
(110) peak at 2q ¼ 44�, and (112) peak at 2q ¼ 52.5�, are also in
arvesting Pt/CdS/Co-doped ZnO nanorods molecular device for), http://dx.doi.org/10.1016/j.ijhydene.2015.11.019

i n t e rn a t i o n a l j o u rn a l o f h y d r o g e n en e r g y x x x ( 2 0 1 5 ) 1e9 5
good agreement with the standard CdS (JCPDS card No. 80-
0006). It proves the successful loading of the hexagonal CdS
nanoparticles onto the ZnO NR's and CoeZnO NR's surface as
shown in Fig. 3c. XRD patterns of the all studied samples are
shown in Fig. 3aec and following Equation (2) [41], is used to
measure the crystallinity of the samples.
Crtð%Þ ¼ fðI011 � IamÞ=I011g � 100 (2)
where, Crt ¼ the relative crystallinity (in percentage); I011 ¼ the
highest intensity of the (011) diffraction angle of the crystal
lattice (arbitrary unit; au); and Iam ¼ the scattering strength
diffracted by the non-crystalline environment (if 2q is close to
angle 21�, the unit is similar to I011). The observed crystallinity
(ZnO NRs (95.00%), CoeZnO NRs (94.00%), CdS/ZnO (90.00%)
and CdS/CoeZnO (78.95%)) of the all studied samples is de-
creases with gradual modification in the basic ZnO NRs
sample.
UVeVis DRS study
Diffuse reflectance UVevisible absorption spectrum was
recorded for the dry and pressed disk samples of powdered
ZnO NRs to confirm the doping of Co and deposition of CdS on
ZnO NRs, by using UVevisible spectrophotometer (UV-1700,
Shimazdu, Japan with UV Probe device). Moisture free BaSO4
was used as a reflectance standard in a UVeVis diffuse
reflectance experiment. Instrumental error was noticed
around the wavelength 350 nm due to the shifting of the light
source from UV to Visible region, which was found respon-
sible for the noise. Characteristic diffuse reflectance spectra
(Fig. 4a and b) of the samples illustrate the red shifts in their
edges with broadening in the main peak (300e525 nm) on
successive advancement (addition of Co or CdS) in the ZnO
NRs for making of the hetero-assembly CdS/CoeZnO NRs.
First excitation peak centred at 450 nm, represents the pres-
ence of the CdS. Co2þ-incorporated samples (CoeZnONRs and
CdS/CoeZnO NRs) exhibits a secondary peak around
525e700 nm that is attributed to the multiple ded transitions
of Co(II) [42]. Band gap (Eg) of the studied system has been
estimated at different stages of the advancement of ZnO NRs
using the KubelkaeMunk function F(R) vs wavelength plot
(Fig. 4a and b). Successive surface modification of ZnO nano-
structures reduces their band gaps, as follows 3.18 eV (ZnO
Fig. 4 e Diffuse reflectance spectroscopic Kubelka-Munk plots (F
before and (b) after CdS loading.
Please cite this article in press as: Chouhan N, et al., Visible light hhydrogen generation, International Journal of Hydrogen Energy (2015
NRs), 3.00 eV (CoeZnO NRs), 2.48 eV (CdS/ZnO NRs) and
2.25 eV (CdS/CoeZnO NRs). Band gap of the CdS/CoeZnO NRs,
ensures us about the good possibility of using it for photo-
catalytic hydrogen generation.
First excitonic peak of DRS spectrum was utilized to
determine the particle size of the sensitizer CdS (ca 5.24 nm) in
CdS/CoeZnO NRs by using following power Equation (3) [43],
D ¼ ��6:6521� 10�8�l3 þ �
1:9557� 10�4�l2 � �
9:2352� 10�2�l
þ ð13:29Þ(3)
where, D (nm) is the size of the CdS nanosensitizer in heter-
ostructure, and l (nm) is the first excitonic absorption wave-
length i.e. 450 nm for the corresponding sample. It
represented that the incorporation of 5.24 nm CdS nano-
particles on CoeZnO NRs (~400 nm broad and 2 mm long).
XAS study
X-Ray absorption spectroscopy (XAS), was used to examine
the local electronic environment around the centre atom. XAS
(XANES/EXAFS) was recorded at BL-8 dispersive EXAFS
beamline at INDUS-2 synchrotron radiation source at RRCAT,
Indore. Measurements were made at the Zn K-edge (9659 eV)
in fluorescence mode at room temperature with a seven-
element HPGe detector and double crystal Si (111) mono-
chromator. Measurements were performed along the c axis
perpendicular to electric field vector and along the c axis in the
plane of the electric field vector. The raw X-ray absorption
data were analysed using a standard procedure (software
program ATHENA) that includes the subtraction of the pre-
and post-edge background, edge calibration with a reference
Zn foil, and normalization of edge jump. The Fourier trans-
form of the normalized k3-weighted EXAFS spectra was taken
using the program ARTEMIS for k from 2 to 11.5 �1 and
Hanning window function followed by a nonlinear least-
squares fit between 1.0 and 3.6 Å. Theoretical phase and
amplitude functions were calculated using the FEFF (V. 8.4)
code.
This technique identifies the lattice disorders and short-
range local atomic arrangement around the central atoms,
which XRD can't observe [44]. XAS profiles of the ZnO, CoeZnO
(R) vs wavelength) of pristine ZnO NRs and CoeZnO NRs (a)
arvesting Pt/CdS/Co-doped ZnO nanorods molecular device for), http://dx.doi.org/10.1016/j.ijhydene.2015.11.019

i n t e r n a t i o n a l j o u r n a l o f h y d r o g e n en e r g y x x x ( 2 0 1 5 ) 1e96
and CdS/CoeZnO NRs, were recorded at Zn K edge. Typical
normalized XAS plot between X-ray absorption cross-section
and photonic energy (PE) are displayed in Fig. 5aec. XAS pro-
file was divided into four prominent zones with respect to the
photonic energy of incoming photons i.e. pre-edge, edge,
near-edge (XANES; X-rays absorption near edge spectroscopy)
and fine structures (EXAFS; extended X-rays absorption fine
structures and NEXAFS; near edge X-ray absorption fine
structure) regions. Absence of pre-edge features (ls / 3d;
dipole forbidden transition, PE < 9659 eV) in all samples are
credited to the fully occupied 3 d10 configuration of Zn2þ ions
[39] and negligible p-band defects. Edge features (ls / 4p) of
CoeZnO shifted towards the higher PE ¼ 9660.23 eV with
respect to the pure ZnO and CdS/CoeZnO NRs (PE ¼ 9659 eV)
are attributed to the replacement of the high polarity ZneO
bonds by the low polarity CoeO and CoeZn bonds in CoeZnO.
Eventually, the presence of the highly polar bonds of CdS/
CoeZnO NRs i.e. CdeO, CdeS and ZneS, nullified the shifting
in edge. It also confirms the existence of the highly oxidised
Zn atoms (>2 þ oxidation state) in CoeZnO NRs, attributed to
the adsorption process [45]. Almost same edge position of the
pristine ZnO and CdS/CoeZnO NRs, signify the retention of
similar oxidation state of Zn (2þ) in both. Intense, symmetri-
cal and superimposed white line (WL) peak features of ZnO
and CoeZnO NRs, centred at 9668.50 eV (10.01 eV/step), are
originated due to ls-4p hybridization, reflected the similar
electronic surroundings in both the species. Short heighted
WL peak of CdS/CoeZnO NRs, predicts the low degree of
anisotropy, and highly disordered arrangement of elements
around Zn atom [6]. Electronic transition 1s / 4d in Zn is
attributed to the EXAFS features at P E ~ 9668.50 þ 50 eV.
Shoulder peak was observed at 9678.52 eV, followed by the
symmetrical third and fourth peaks at PE 9695.96 and
9714.00 eV, respectively for both sample. These fine features
reflected that the anions envelop the central Zn atoms in a
regular tetrahedral fashion in above two samples. Absence of
the 9695.96 eV peak in CoeZnO, reveals the existence of the
cobalt (II) oxide with few Co atoms that substitute zinc in the
ZnO system [46]. It stimulates the distorted tetrahedral sur-
rounding around Zn and deviation in the lattice parameters
9660 9680 9700 9720
0.0
0.4
0.8
1.2
1.6
No
rm
alised
A
bso
rp
tio
n / a.u
.
Photonic Energy /eV
ZnO
Co-ZnO
CdS-Co-ZnO
Fig. 5 e Normalized synchrotron-radiation based
absorption cross section as a function of photonic energy
with the geometry of the c-axis aligned parallel to the
electric field vector of the x rays at the Zn K-edge
(E ¼ 9659 eV) spectra of (a) pristine ZnO NRs, (b) CoeZnO
NRs and (c) CdS/CoeZnO NRs, recorded in a florescent
mode.
Please cite this article in press as: Chouhan N, et al., Visible light hhydrogen generation, International Journal of Hydrogen Energy (2015
[45]. NEXAFS features for ZnO and CdS/CoeZnO NRs, coincide
within 1 eV PE range, suggesting that both have similar regular
tetrahedral environment of anions for Zn atoms. The results
also suggested about the distorted tetrahedral arrangement in
the CoeZnO system, where the metallic species Co (II) and Zn
are at the centre of the tetrahedra and anions (O2�) are situ-
ated at the four apexes of the tetrahedra. NEXAFS features of
the all examined systems were refined by keeping typical k3-
weightage in the range of 3.5e12 �A�1 and using software FEFF
(V-7) (Fig. S2a and b) [47]. Respective refined parameters (least-
squares refined R-factor, mean first-shell metaleoxygen bond
length, coordination number, and Debye-Waller factor) are
extracted for ZnO (3.8wt%, 1.99(8)�A, 5.10 and 0.96 � 10�2 �A2),
CoeZnO (4.10wt%, 2.01(4)�A, 5.40 and 0.82 � 10�2 �A2) and CdS/
CoeZnO (4.20wt%, 1.95(7)�A, 5.80 and 0.86 � 10�2 �A2).
Photocatalytic hydrogen production
The catalyst (0.3 g) was suspended in 140 mL of aqueous
electrolyte of 0.35MNa2S and 0.25MK2SO3 in a doublewalled-
Pyrex glass reaction cell (volume ~220 mL, with water jacket)
that was sealed with a rubber septum. To expel the air-
content from the solution, the sample was purged with Ar
for 1 h prior to start the photochemical reaction. Ar gas flows
continuously in inner jacket, tomaintain 1 atm pressure of the
solution. Temperature of the outer jacket was set at 25 �C. Thesuspension was irradiated with a 300 W Xe lamp (>420 nm,
light intensity 1 � 1022 photons per hour Xe lamp-HX1, Model
PE300UV, Perkin Elmer). All the experiments are carried out
under ambient conditions. Photocatalytic responses were
hourly monitored in terms of the amount of hydrogen
generated at 1e7 h time intervals, using gas chromatograph
(Shimazdu, Japan, thermal conductivity detector and molec-
ular sieve with 5 A columns) throughout the course of the
reaction. Photocatalytic cleavage of water was carried out
in presence of the hole-scavenger electrolyte
(0.25 M K2SO3 þ 0.35 M Na2S) solution of 13 pH, under the
irradiation of 1 Sun (100 mW/cm2, AM1.5 G) visible light.
Rough and hexagonal crystalline surface of the CdS/CoeZnO,
loaded with co-catalyst (Pt) to facilitate the active sites for the
oxidation (photohole rich) and reduction (photoelectron rich)
of water. These active sites suppress the recombination of the
photoelectric current carriers i.e. photoelectrons and photo-
holes. Hole-scavenger electrolyte was used to avoid the
photooxidation of CdS nanoparticles present in the nano-
molecular device by irreversible consumption of photo-
generated holes that prohibited the oxidation of water [48].
Corresponding amount of H2 evolved without any noticeable
degradation of the photocatalytic devices, such as 1.5% Pt/
ZnO, 1.5% Pt/CoeZnO, 1.5% Pt/CdS/ZnO and 1.5% Pt/CdS/
CoeZnO, was recorded as 10.2, 22.56, 50.57 and 67.20 mmol/
H2 g, respectively (Fig. 6a). Quantitative rise in the rate of H2
evolved, was noticed after each step of the advancement on
ZnO NRs, which follows a quadratic relation y ¼ 1.022(03)
x2 þ 14.734(15) x � 6.900(16) and satisfy 3/2 order kinetics for
advancement paradigm of nanomolecular device (Fig. 6b).
Apparent quantum yield (AQY) was estimated for the tested
device using Equation (4) with the assumption that all of the
incident photons are absorbed during the photochemical re-
actions [49].
arvesting Pt/CdS/Co-doped ZnO nanorods molecular device for), http://dx.doi.org/10.1016/j.ijhydene.2015.11.019

(a) (b) (c)
1 2 3 4 5 6 7
0
10
20
30
40
50
60
70
H2 m
Mo
l / h
g
Time / h
1.5% Pt-ZnO
1.5% Pt-Co-ZnO
1.5% Pt-CdS-ZnO
1.5% Pt-CdS-Co-ZnO
ZnONRs Co-ZnONRs CdS/ZnONRs CdS/Co-ZnONRs
0
10
20
30
40
50
60
70
H2 / m
Mo
l g
-1 h
-1
Photocatalytic material
-0.8 -0.4 0.0 0.4 0.8 1.2
-0.0001
0.0000
0.0001
0.0002
Ph
oto
cu
rre
nt (A
)
Applied potential (V Vs Ag/ AgCl)
Dark
Light
Fig. 6 e (a) Comparative rate of H2 evolution by photocatalytic cleavage of water using molecular devices of 1.5% Pt/ZnO NRs,
1.5% Pt/CoeZnO NRs, 1.5% Pt/CdS/ZnO NRs, and 1.5% Pt/CdS/CoeZnO NRs; (b) Bar plot of gradual increase in the rate of H2
evolved after 7 h for each advancement. (c) IeV plot for CdS/CoeZnO NRs in electrolyte solution (pH ¼ 13.5) under AM1.5 G
illumination, recorded at zero bias voltage at 25 �C temperature in the applied potential range ¡1.0 to þ1.5 V (vs Ag/AgCl
electrode). Exposure area of the sample ~1 cm2.
Fig. 7 e Electron transfer mechanism for the photocatalytic
water splitting using the nanomolecular device i.e. 1.5% Pt/
CdS/CoeZnO NRs.
i n t e rn a t i o n a l j o u rn a l o f h y d r o g e n en e r g y x x x ( 2 0 1 5 ) 1e9 7
AQY ð%Þ ¼ ��Number of H2 molecules evolved� 2
�� 100�
�½Number of incident photons� (4)
where, the number of incident photons was 4.48 � 1024
photon h�1, measured using a Si photodiode, at 420 nm
wavelength. Correspondingwater splitting ability of thedevice
was estimated in terms of AQY at 420 nm. Thesewere found to
be 0.30, 0.66, 1.49 and 1.98%, respectively for abovementioned
systems (1.5% Pt/ZnO, 1.5% Pt/CoeZnO, 1.5% Pt/CdS/ZnO and
1.5% Pt/CdS/CoeZnO). Reproducibility of these systems
against their photocatalyticwater splitting abilitywas checked
thrice by using the same photocatalytic material (suspended
particles in aqueous electrolyte) after their five times washing
with the pure de-ionized water and drying at 100 �C for 1 h.
Electrochemical analyzer (Auto lab potentiostat model
PGSTAT30) in the midst of software GPES (general purpose
electrochemical study) manager, was used to monitor the
photovoltaic responses of the test samples. Power density of
the light source was controlled at 100 mWcm�2 (AM1.5 G),
using thermopile (Gentec (ε) Solo-2, Model-UP12E105-H5) at
the beginning and checked at end of the each PEC run. Pyrex
glass photoelectrochemical (PEC) cell with water jacket was
well equipped with a small quartz window and conventional
three electrode-system, comprising of a saturated calomel
electrode (SCE) as reference electrode, a Pt flag as counter
electrode and uniform film of the sample loaded on fluorine-
doped tin oxide (FTO) substrate (using doctor blade method)
as theworking electrode (WE). Awide potential windowwith a
width of 1.5 V (�0.9 to þ 0.6 V) recorded during photovoltaic
study of 1.5% Pt/CdS/CoeZnO NRs device, was attributed to
good electron exchange quality of the system (Fig. 6c) [50].
Significantly, no saturation in photocurrent was observed at
applied positive potentials, which indicates efficient charge
separation upon light illumination that is responsible for
higher hydrogen evolution amount [51].
On the basis of this study and other supportive analytical
evidences [7,52], the most plausible overall photocatalytic
water splitting mechanism for the nanodevice (1.5% Pt/CdS/
CoeZnO NRs) in presence of hole sacrificial electrolyte under
visible light exposure, is suggested and illustrated by Fig. 7.
Please cite this article in press as: Chouhan N, et al., Visible light hhydrogen generation, International Journal of Hydrogen Energy (2015
During electron transfer, when the surface of the device was
illuminated with light, an electron was excited from VB to CB,
which generates a pair of photohole and photoelectron in
corresponding VB and CB of CoeZnO. Nascent photoelectrons
of CB (CoeZnO) are transported to the CB of quantum confined
nano-sized sensitizer (CdS). This electron arrived at the
junction of Pt/electrolyte interface by passing through the
electron-pool of the metallic Pt. At the interface, photoelec-
trons interacts with Hþ ions [53] of the solution and liberates
nascent H that combined with another nascent H atom to
generate H2 gas. Hole accumulated at VB of CoeZnO and CdS,
were consumed by hole-scavenger electrolyte. Major chemical
reactions [54], responsible for hydrogen evolution by photo-
catalytic cleavage of the water, are given by the Equations
(5e8).
On photo� exposure : CdS=Co� ZnOþ hv/e�ðCdS=Co� ZnOÞþ hþðCdS=Co� ZnOÞ
(5)
Cathode : 2HOþ 2e�/2OH� þH2 (6)
Anode : SO2�3 þ S2� þ 2OH� þ 1:5H2Oþ 6hþ/1:5S2O
2�3 þ SO2�
4
þ 4Hþ
(7)
arvesting Pt/CdS/Co-doped ZnO nanorods molecular device for), http://dx.doi.org/10.1016/j.ijhydene.2015.11.019
i n t e r n a t i o n a l j o u r n a l o f h y d r o g e n en e r g y x x x ( 2 0 1 5 ) 1e98
Overall Redox Reaction : S2� þ SO2�3 þ 5H2O!hn5H2 þ 2SO2�
4 (8)
Conclusion
In short, this study gives us an inside view of the surfactant
(CTAB)-controlled low cost fabrication of the ZnO NRs via
reverse-micelles synthesis. Current work is focused on the
performance of the nanomolecular photoelectrode of ZnO
NRs by gradual surface modification for hydrogen production
efficiency. A good correlation between atomic arrangement
around Zn atom and light harvesting capacity of the modified
ZnO NRs has been established. Defects developed on CoeZnO
NR's surface, may act as recombination centres for the pho-
tocarriers. These defectswere suppressed by the decoration of
flat-end CoeZnO NRs with visible light sensitizer CdS. Heter-
ocouple CdS/CoeZnO NRs, show a good compatibility of
nanoparticles of CdS with CoeZnO NRs. Whole molecular
assembly was utilised as a photoelectrode after Pt-loading for
hydrogen generation via water splitting. Gradual increase in
the photocatalytic activity of the device was recorded with
modification, such as 1.5% Pt/ZnO (10.20 mmol/hg,
AQY¼ 0.30%), 1.5% Pt/CoeZnO (22.56 mmol/hg, AQY¼ 0.66%),
1.5% Pt/CdS/ZnO (50.57 mmol/hg, AQY ¼ 1.49%) and 1.5% Pt/
CdS/CoeZnO NRs (67.20 mmol/hg, AQY ¼ 1.98%), which can
execute a job of water splitting better than pristine samples.
Time dependent hydrothermal synthesis CdS/CoeZnO NRs is
in progress to explore the relationship between their photo-
catalytic hydrogen generation efficiency and atomic
arrangement.
Acknowledgement
One of the authors (NC) gratefully acknowledge the financial
support of the Science and Engineering Research Board (SERB)
of Department of Science and Technology (DST SR/S1/PC-31/
2012), India, for this work. Authors thank Dr. Gupta, of
INDUS-2 BeamLine-8 of Raja Ramannna Institute of Advanced
Technology, Indore, India, for his assistance in XAS mea-
surements and Prof R. S.Liu, NTU, Taipei, Taiwan for his
valuable discussion and assistance in FESEM and HRTEM
studies.
Appendix A. Supplementary data
Supplementary data related to this article can be found at
http://dx.doi.org/10.1016/j.ijhydene.2015.11.019.
r e f e r e n c e s
[1] Balat M. Potential importance of hydrogen as a futuresolution to environmental and transportation problems. Int JHydrogen Energy 2008;33:4013e29.
Please cite this article in press as: Chouhan N, et al., Visible light hhydrogen generation, International Journal of Hydrogen Energy (2015
[2] Chouhan N, Liu RS. Electrochemical technologies for energystorage and conversion. In: Liu RS, Zhang L, Sun X, Liu H,Zhang J, editors. Electrochemical technologies for energystorage and conversion, 1. Weinheim, Germany: Wiley-VCH;2012. p. 23e33. Chap. 1.
[3] Ogden JM. Prospectus of building a hydrogen energyInfrastructure. Annu Rev Energy Environ 1999;24:227e79.
[4] Chouhan N, Yeh L, Hu SF, Liu RS, Chang WS, Chen KH.CdSe(QDs)@ ZnO nanotubes as an effective photoanode.Chem Commun 2011;47:3493e5.
[5] Wang XH, Zhang YC, He WL, Zhu MK, Wang B, Yan H.Hydrothermal synthesis of zinc oxide powders withcontrollable morphology. Ceram Int 2004;30:93e7.
[6] Wolcott A, Smith WA, Kuykendall TR, Zhao YP, Zhang JZ.Photoelectrochemical generation of hydrogen from watersplitting based on dense and aligned TiO2 nanorod arrays.Small 2008;5(1):104e11.
[7] Yang X, Wolcott A, Wang G, Sobo A, Fitzmorris RC, Qian F,et al. Nitrogen-doped ZnO nanowire arrays forphotoelectrochemical water splitting. Nano Lett2009;9(6):2331e6.
[8] Chen HM, Chen CK, Chang Y-C, Tsai C-W, Liu R-S, Hu S-F,et al. Quantum dot monolayer sensitized ZnO nanowire-array photoelectrodes: true efficiency for water splitting.Angew Chem 2010;122(34):6102e5.
[9] Maeda K, Teramura K, Lu D, Takata T, Saito N, Inoue Y, et al.Photocatalyst releasing hydrogen from water. Nature2006;440:295.
[10] Kushwaha A, Aslam M. ZnS shielded ZnO nanowirephotoanodes for efficient water splitting. Electrochim Acta2014;130:222e31.
[11] Liu M, Nam C-Y, Black CT, Kamcev J, Zhang L. Enhancingwater splitting activity and chemical stability of zinc oxidenanowire photoanodes with ultrathin titania shells. J PhysChem C 2013;117:13396e402.
[12] Shen S, Kronawitter CX, Jiang J, Guo P, Guo L, Mao SS. A ZnO/ZnO: Cr isostructural nanojunction electrode forphotoelectrochemical water splitting. Nano Energy2013;2:958e65.
[13] Ji J, Zhang W, Zhang H, Qiu Y, Wang Y, Luo Y, et al. Highdensity Si/ZnO core/shell nanowire arrays forphotoelectrochemical water splitting. J Mater Sci MaterElectron 2013;24(9):3474e80.
[14] Barakat NAM, Taha A, Motlak M, Nassar MM, Mahmoud MS,Al-Deyab SS, et al. ZnO & Fe2O3-incoportaed TiO2
nanofibers as super effective photocatalyst for watersplitting under visible light radiation. Appl Catal A General2014;481:19e26.
[15] Hameed A, Gondal MA, Yamani ZH. Effect of transition metaldoping on photocatalytic activity of WO3 for water splittingunder laser illumination: role of 3d-orbitals. Catal Commun2004;5(11):715e9.
[16] Sasikala R, Shirole AR, Sudarsan V, Jagannath, Sudakar C,Naik R, et al. Enhanced photocatalytic activity of indium andnitrogen co-doped TiO2ePd nanocomposites for hydrogengeneration. Appl Catal A General 2010;377(1e2):47e54.
[17] Hou X, Jiang S, Li Y, Xiao J, Li Y. Ni-doped InN/GaZnONcomposite, catalyst for overall water splitting under visiblelight irradiation. Int J Hydrogen Energy2015;40(45):15448e53.
[18] Wang H, Chen W, Zhang J, Huang C, Mao L. Nickelnanoparticles modified CdSeA potential photocatalyst forhydrogen production through water splitting under visiblelight irradiation. Int J Hydrogen Energy 2015;40(1):340e5.
[19] Hashimoto K, Kawai T, Sakata T. Hydrogen production withvisible light by using dye sensitized TiO2 powder. Nouv JChim 1983;7:249e53.
arvesting Pt/CdS/Co-doped ZnO nanorods molecular device for), http://dx.doi.org/10.1016/j.ijhydene.2015.11.019

i n t e rn a t i o n a l j o u rn a l o f h y d r o g e n en e r g y x x x ( 2 0 1 5 ) 1e9 9
[20] Tawkaew S, Fujishiro Y, Yin S, Sato T. Synthesis of cadmiumsulfide pillared layered compounds and photocatalyticreduction of nitrate under visible light irradiation. ColloidsSurf A 2001;179:139e44.
[21] Malinka EA, Kamalov GL, Vodzinskii SV, Melnik VI,Zhilina ZI. Hydrogen production from water by visible lightusing zinc porphyrin-sensitized platinized titanium dioxide.J Photochem Photobiol A 1995;90:153e8.
[22] Shimidzu T, Iyoda T, Koide Y. An advance visible lightinduced water reduction with dye sensitised semiconductorpowder catalyst. J Am Chem Soc 1985;107:35e41.
[23] Kato H, Hori M, Konta R, Shimodaira Y, Kudo A. Constructionof Z scheme type heterogeneous photocatalysis systems forwater splitting into H2 and O2 under visible light irradiation.Chem Lett 2004;33(10):1348e9.
[24] Wang X, Liu G, Lu GQ, Cheng HM. Stable photocatalytichydrogen evolution from water over ZnOeCdS coreeshellnanorods. Int J Hydrogen Energy 2010;35:8199e205.
[25] Chu D, Zeng YP, Jiang DL. Hydrothermal synthesis andoptical properties of Pb2þ doped ZnO nanorods. Mater Lett2006;60:2783e5.
[26] Cheng BC, Xiao YH, Wu GS, Zhang LD. Controlled growth andproperties of one-dimensional ZnO nanostructures with Ceas activator/dopant. Adv Funct Mater 2004;14(9):913e9.
[27] Zhou SM, Zhang XH, Meng XM, Wu SSK, Lee T.Enhancement of UV luminescence in sol-gel prepared ZnOthin films by incorporation of Mg. Phys Status Solidi A2005;202(3):405e10.
[28] Xu CX, Sun XW, Dong ZL, Yu MB, Xiong YZ, Chen JS.Magnetic nanobelts of iron-doped zinc oxide. Appl Phys Lett2005;86:173110. 3 pages.
[29] Reber JF, Meier K. Photochemical hydrogen production withplatinized suspensions of cadmium sulfide and cadmiumzinc sulfide modified by silver sulphide. J Phys Chem1986;90(5):824e34.
[30] Larramona G, Chone C, Jacob A, Sakakura D, Delatouche B,P�er�e D, et al. Nanostructured photovoltaic cell of the typetitanium dioxide, cadmium sulfide thin coating, and copperthiocyanate showing high quantum efficiency. Chem Mater2006;18(6):1688e96.
[31] Gao HC, Zhu RX, Yang XY, Mao SZ, Zhao S, Yu JY, et al.Properties of polyethylene glycol (23) lauryl ether withcetyltrimethylammonium bromide in mixed aqueoussolutions studied by self-diffusion coefficient NMR. ColloidInterface Sci 2004;273(2):626e31.
[32] Yin YD, Alivisatos AP. Colloidal nanocrystal synthesis andthe organic�inorganic interface. Nature 2005;437:664e70.
[33] Faeibold E, Michels B, Waton G. Micellar growth study bymicocalorimetry in CTAB solutions. J Phys Chem1996;100:20063e7.
[34] Missel PJ, Mazer NA, Carey MC, Benedek GB. Influence ofalkali-metal counterion identity on the sphere-to-rodtransition in alkyl sulfate micelles. J Phys Chem1989;93:8354e66.
[35] Rehage H, Hoffmann H. Rheological properties of viscoelasticsurfactant systems. J Phys Chem 1988;92:4712e9.
[36] Porte G, Appell J, Poggi J. Experimental investigations on theflexibility of elongated cetylpyridinium bromide micelles. JPhys Chem 1980;84(23):3105e10.
[37] Appell J, Porte G, Khatory A, Kern A, Candau SJ. Static anddynamic properties of a network of wormlike surfactantmicelles (Cetylpyridinium chlorate in sodium chlorate brine).J Phys II 1992;2(5):1045e52.
Please cite this article in press as: Chouhan N, et al., Visible light hhydrogen generation, International Journal of Hydrogen Energy (2015
[38] Pileni M. Reverse micelles as microreactors. J Phys Chem1993;97(27):6961e74.
[39] KimWJ, Yang SM. Preparation of mesoporous materials fromthe flow-induced microstructure in aqueous surfactantsolutions. Chem Mater 2000;12:3227e35.
[40] Karzel H, Potzal W, Kofferlein M, Schiessl W, Steiner M,Hiller U, et al. Lattice dynamics and hyperfine Interactions inZnO and ZnSe at high external pressures. Phys Rev, BCondens Matter 1996;53:11425e39.
[41] Chouhan N, Lin CC, Hu S-F, Liu R-S. Earth-free GaZnONphosphor prepared by combustion for white light-emittingdiodes. J Mater Chem C 2015;3:1473e9.
[42] (a)Qiu X, Miyauchi M, Yu H, Irie H, Hashimoto K. Visible-light-driven Cu(II)�(Sr1�yNay)(Ti1�xMox)O3 photocatalystsbased on conduction band control and surface ionmodification. J Am Chem Soc 2010;132:15259e67.(b)Yu H, Irie H, Hashimoto K. Conduction band energy levelcontrol of titanium dioxide: toward an efficient visible-light-sensitive photocatalyst. J Am Chem Soc 2010;132:6898e9.(c)Irie H, Kamiya K, Shibanuma T, Miura S, Tryk DA,Yokoyama T, et al. Visible light-sensitive Cu(II)-grafted TiO2
photocatalysts: activities and x-ray absorption Fine structureanalyses. J Chem Phys C 2009;113:10761e6.
[43] Yu WW, Qu L, Guo W, Peng X. Experimental determination ofthe extinction coefficient of CdTe, CdSe, and CdSnanocrystals. Chem Mater 2003;15:2854e60.
[44] Rehr JJ, Albers RC. Theoretical approaches to x-rayabsorption fine structure. Rev Mod Phys 2000;72(3):621e54.
[45] Yamamoto T. Assignment of pre-edge peaks in k-edge x-rayabsorption spectra of 3d transition metal compounds:electric dipole or quadurpole? X-Ray Spectrom2008;37:572e84.
[46] Krishnamurthy S, McGuinness C, Dorneles LS,Venkatesan M, Coey JMD, Lunney JG, et al. Soft x-rayspectroscopic investigation of ferromagnetic co-doped ZnO. JAppl Phys 2006;99:08M111. 3-pages.
[47] Stern EA. Theory of EXAFS. In: Koningsberger DC, Prins R,editors. X-ray absorption: principles, applications,techniques of EXAFS, SEXAFS and XANES. New York: Wiley-Interscience; 1988. p. 618e708. Ch. 8.
[48] Neamtu J, Georgescu G, Malaeru T, Gheorghe NG,Costescu RM, Jitaru I, et al. Atomic structure and magneticproperties of cobalt doped ZnO thin films prepared by thesol-gel method. Dig J Nanomater Biostr 2010;5:873e85.
[49] Ankudinov AL, Ravel B, Rehr JJ, Conradson SD. Real-spacemultiple-scattering calculation and interpretation of x-ray-absorption near-edge structure. Phys. Rev B 1998;58:7565e76.
[50] Sathish M, Viswanathan B, Viswanath RP. Alternatesynthetic strategy for the preparation of CdS nanoparticlesand its exploitation for water splitting. Int J Hydrogen Energy2006;31:891e8.
[51] Konta R, Ishii T, Kato H, Kudo A. Photocatalytic activities ofNoble metal ion doped SrTiO3 under visible light irradiation. JPhys Chem B 2004;108(26):8992e5.
[52] Poh WC, Loh KP, Zhang WD, Tripathy S, Ye JS, Sheu FS.Biosensing properties of diamond and carbon nanotubes.Langmuir 2004;20:5484e92.
[53] Lindbergh G, Simonsson D. Inhibition of cathode reactions insodium hydroxide solution containing chromate. JElectrochem Soc 1991;36:1985e94.
[54] Reber JF, Meier K. Photochemical production of hydrogenwith zinc sulfide suspensions. J Phys Chem1984;88(24):5903e13.
arvesting Pt/CdS/Co-doped ZnO nanorods molecular device for), http://dx.doi.org/10.1016/j.ijhydene.2015.11.019


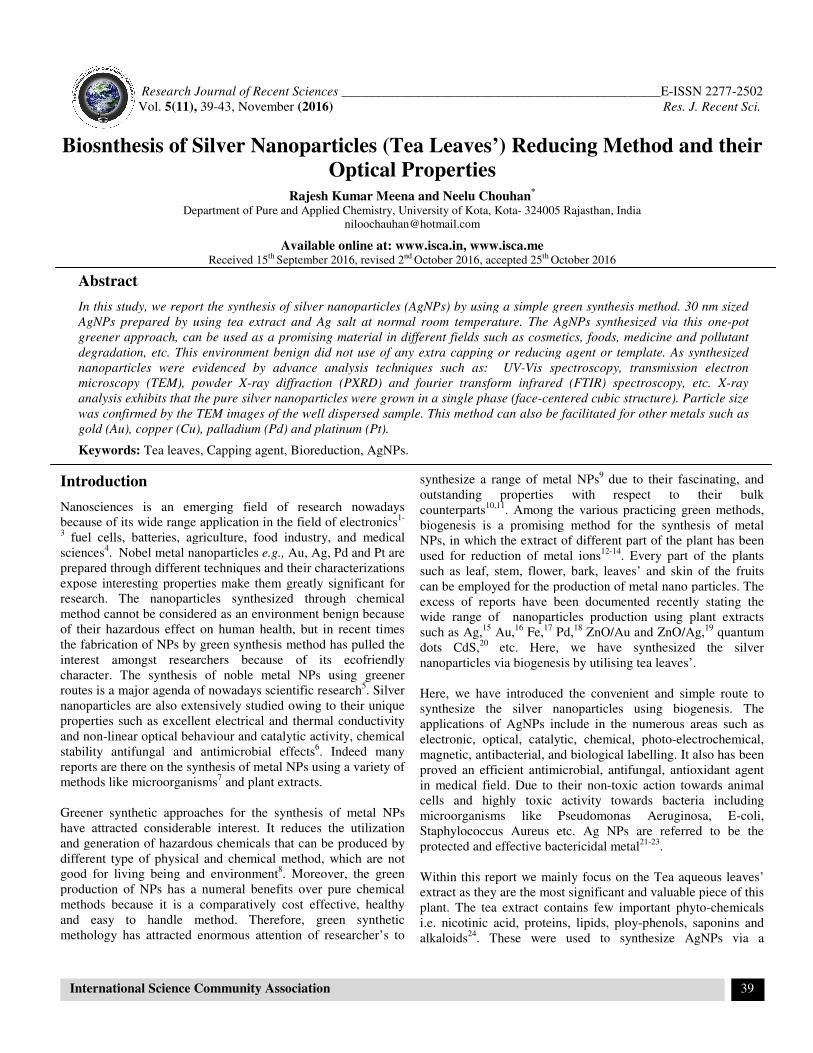
Research Journal of Recent Sciences
Vol. 5(11), 39-43, November (201
International Science Community Association
Biosnthesis of Silver Nanoparticles (Tea Leaves’) Reducing
Rajesh Kumar Meena and Neelu ChouhanDepartment of Pure and Applied Chemistry, University of
Available online at: Received 15th September
Abstract
In this study, we report the synthesis of silver nanoparticles (AgNPs) by using a
AgNPs prepared by using tea extract and Ag salt at normal room temperature. The
greener approach, can be used as a promising
degradation, etc. This environment benign did not
nanoparticles were evidenced by advance analysis techniques such as: UV
microscopy (TEM), powder X-ray diffraction (PXRD) and fourier transform infrared (FTIR) spectroscopy, etc. X
analysis exhibits that the pure silver nanopa
was confirmed by the TEM images of the well dispersed sample.
gold (Au), copper (Cu), palladium (Pd) and platin
Keywords: Tea leaves, Capping agent, Bioreduction, AgNPs.
Introduction
Nanosciences is an emerging field of research nowadays because of its wide range application in the field of electronics3 fuel cells, batteries, agriculture, food industry, and medical sciences4. Nobel metal nanoparticles e.g., Au, Ag, Pd and Ptprepared through different techniques and their characterizations expose interesting properties make them greatly significant for research. The nanoparticles synthesized through chemical method cannot be considered as an environment benign because of their hazardous effect on human health, but in recent times the fabrication of NPs by green synthesis method has pulled the interest amongst researchers because of its ecofriendly character. The synthesis of noble metal NPs using greener routes is a major agenda of nowadays scientific researchnanoparticles are also extensively studied owing to their unique properties such as excellent electrical and thermal conductivity and non-linear optical behaviour and catalytic activity, chemical stability antifungal and antimicrobial effectsreports are there on the synthesis of metal NPs using a variety of methods like microorganisms7 and plant extracts. Greener synthetic approaches for the synthesis of metal NPs have attracted considerable interest. It reduces the utilization and generation of hazardous chemicals that can be produced by different type of physical and chemical method, which are not good for living being and environment8. Moreover, the green production of NPs has a numeral benefits over pure chemical methods because it is a comparatively cost effective, healthy and easy to handle method. Therefore, green synthetimethology has attracted enormous attention of researcher’s to
Sciences ___________________________________________
(2016)
International Science Community Association
Biosnthesis of Silver Nanoparticles (Tea Leaves’) Reducing Method and their
Optical Properties Rajesh Kumar Meena and Neelu Chouhan
*
Department of Pure and Applied Chemistry, University of Kota, Kota- 324005 Rajasthan, [email protected]
Available online at: www.isca.in, www.isca.me September 2016, revised 2nd October 2016, accepted 25th October 2016
In this study, we report the synthesis of silver nanoparticles (AgNPs) by using a simple green synthesis method. 30 nm sized
AgNPs prepared by using tea extract and Ag salt at normal room temperature. The AgNPs synthesized via this
can be used as a promising material in different fields such as cosmetics, foods, medicine and pollutant
This environment benign did not use of any extra capping or reducing agent or template.
ere evidenced by advance analysis techniques such as: UV-Vis spectroscopy, transmission electron
ray diffraction (PXRD) and fourier transform infrared (FTIR) spectroscopy, etc. X
analysis exhibits that the pure silver nanoparticles were grown in a single phase (face-centered cubic structure). Particle size
was confirmed by the TEM images of the well dispersed sample. This method can also be facilitated for other metals such as
gold (Au), copper (Cu), palladium (Pd) and platinum (Pt).
ioreduction, AgNPs.
Nanosciences is an emerging field of research nowadays because of its wide range application in the field of electronics1-
batteries, agriculture, food industry, and medical Au, Ag, Pd and Pt are
prepared through different techniques and their characterizations expose interesting properties make them greatly significant for
. The nanoparticles synthesized through chemical method cannot be considered as an environment benign because of their hazardous effect on human health, but in recent times the fabrication of NPs by green synthesis method has pulled the
searchers because of its ecofriendly The synthesis of noble metal NPs using greener
routes is a major agenda of nowadays scientific research5. Silver nanoparticles are also extensively studied owing to their unique
lectrical and thermal conductivity linear optical behaviour and catalytic activity, chemical
stability antifungal and antimicrobial effects6. Indeed many reports are there on the synthesis of metal NPs using a variety of
and plant extracts.
Greener synthetic approaches for the synthesis of metal NPs reduces the utilization
and generation of hazardous chemicals that can be produced by method, which are not . Moreover, the green
production of NPs has a numeral benefits over pure chemical methods because it is a comparatively cost effective, healthy and easy to handle method. Therefore, green synthetic methology has attracted enormous attention of researcher’s to
synthesize a range of metal NPs9 outstanding properties with respect to their bulk counterparts10,11. Among the various biogenesis is a promising method for the synthesis of metal NPs, in which the extract of different part of the plant has been used for reduction of metal ions12
such as leaf, stem, flower, bark, leaves’ and skin of the fruits can be employed for the production of metal nano particles. The excess of reports have been documented recently stating the wide range of nanoparticles production using plant extracts such as Ag,15 Au,16 Fe,17 Pd,18 ZnO/Au and ZnO/Ag,dots CdS,20 etc. Here, we have synthesized the silver nanoparticles via biogenesis by utilising tea leaves’. Here, we have introduced the convenient and simple route to synthesize the silver nanoparticles using biogenesis. The applications of AgNPs include in the numerous areas such as electronic, optical, catalytic, chemical, photomagnetic, antibacterial, and biological labelling. It also has been proved an efficient antimicrobial, antifungal, antioxidant agent in medical field. Due to their non-cells and highly toxic activity towards bacteria including microorganisms like Pseudomonas Aeruginosa, EStaphylococcus Aureus etc. Ag NPs are referred to be the protected and effective bactericidal metal Within this report we mainly focus on the Tea aqueous leaves’ extract as they are the most significant and valuable piece of this plant. The tea extract contains few important phytoi.e. nicotinic acid, proteins, lipids, ployalkaloids24. These were used to synthesize AgNPs via a
___________E-ISSN 2277-2502
Res. J. Recent Sci.
39
Method and their
324005 Rajasthan, India
2016
simple green synthesis method. 30 nm sized
AgNPs synthesized via this one-pot
material in different fields such as cosmetics, foods, medicine and pollutant
capping or reducing agent or template. As synthesized
Vis spectroscopy, transmission electron
ray diffraction (PXRD) and fourier transform infrared (FTIR) spectroscopy, etc. X-ray
centered cubic structure). Particle size
This method can also be facilitated for other metals such as
due to their fascinating, and outstanding properties with respect to their bulk
. Among the various practicing green methods, promising method for the synthesis of metal
NPs, in which the extract of different part of the plant has been 12-14. Every part of the plants
such as leaf, stem, flower, bark, leaves’ and skin of the fruits or the production of metal nano particles. The
excess of reports have been documented recently stating the wide range of nanoparticles production using plant extracts
ZnO/Au and ZnO/Ag,19 quantum ave synthesized the silver
nanoparticles via biogenesis by utilising tea leaves’.
Here, we have introduced the convenient and simple route to synthesize the silver nanoparticles using biogenesis. The
include in the numerous areas such as electronic, optical, catalytic, chemical, photo-electrochemical, magnetic, antibacterial, and biological labelling. It also has been proved an efficient antimicrobial, antifungal, antioxidant agent
-toxic action towards animal cells and highly toxic activity towards bacteria including microorganisms like Pseudomonas Aeruginosa, E-coli, Staphylococcus Aureus etc. Ag NPs are referred to be the protected and effective bactericidal metal21-23.
Within this report we mainly focus on the Tea aqueous leaves’ are the most significant and valuable piece of this
tea extract contains few important phyto-chemicals nicotinic acid, proteins, lipids, ploy-phenols, saponins and
. These were used to synthesize AgNPs via a

Research Journal of Recent Sciences ____________________________________
Vol. 5(11), 39-43, November (2016)
International Science Community Association
convenient and highly reproducible method. The most important benefit of this process is, necessity of any external reducing agent can also be eliminated, synthesis can occur at room temperature and aqueous medium synthesis. Materials and Methods
Required materials: Clean tea leaves were collected from tea garden of Agriculture University Kota. Silver nitrate (AgNOwas purchased from Merck, Germany. All of the chemicals used in the study are of analytical grade and used without any purification. Deionised water was used throughout in the experiment to prepare all the solutions. Preparation of Dried Biomass: 2gm of collected and transferred to a beaker containing 25 ml of deionised water. The combination was thoroughly agitated for the complete night via a magnetic stirrer. The extract was then filtered to achieve the deep pink coloured solution. Thewas centrifuged and filtered one more time to remove impurities. This extract was further filtered and stored at 4until the use for current study. Synthesis of nanoparticles: For green synthesis of silver nanoparticles, 2.0ml aqueous tea leaves’ extract was taken for the reaction. Freshly prepared 25 mL of 10solution was mixed drop by drop into the plant extract. The reaction mixture filtered was incubated in dark and at ambient temperature till the colour of the solution tcolourless to light green. Afterwards the AgNPs were dried at 90oC. Characterization of nanoparticles:
nanoparticles were carefully characterized by means of advance analytical techniques. The absorption spectra were recordusing UV-Vis spectroscopy (Schimadzu UV- over a range of wavelength i.e. 200-800 nm, where water is used as a reference. The surface morphology of the AgNPsexamined using a JEOL-2010F TEM operating with electron beam of energy of 200 kV. FTIR (UV 3000+
was examined to achieve broad spectrum of nanoparticles over a narrow series. This process gives us information regarding phytochemicals that have enclosed the particles through synthesis method. The XRD investigations were performed using Rigaku (Ultima IV) diffractometer with Cuat 25oC to determine the phase purity and the crystal structure of the NPs. Results and Discussion
Synthesis and characterization of silver nanoparticles:
Aqueous tea leaves’ extract act as a reducing agent as well as capping agent during the silver nanoparticle production. Which reduces silver ions to nano silver hence, the colourchange from light pink to green, as shown in appearance of the aqueous silver nanoparticles was light green
______________________________________________________
International Science Community Association
and highly reproducible method. The most important necessity of any external capping and
reducing agent can also be eliminated, synthesis can occur at m temperature and aqueous medium synthesis.
Clean tea leaves were collected from tea University Kota. Silver nitrate (AgNO3)
was purchased from Merck, Germany. All of the chemicals used in the study are of analytical grade and used without any
water was used throughout in the
2gm of tea leaves were collected and transferred to a beaker containing 25 ml of deionised water. The combination was thoroughly agitated for the complete night via a magnetic stirrer. The extract was then filtered to achieve the deep pink coloured solution. The liquor was centrifuged and filtered one more time to remove impurities. This extract was further filtered and stored at 4oC
For green synthesis of silver s’ extract was taken for
the reaction. Freshly prepared 25 mL of 10-3 M silver nitrate solution was mixed drop by drop into the plant extract. The reaction mixture filtered was incubated in dark and at ambient temperature till the colour of the solution transformed from colourless to light green. Afterwards the AgNPs were dried at
The synthesised nanoparticles were carefully characterized by means of advance analytical techniques. The absorption spectra were recorded
1600 model 2010) 800 nm, where water is used
as a reference. The surface morphology of the AgNPs was 2010F TEM operating with electron
+ Lab India, 2011)
was examined to achieve broad spectrum of nanoparticles over a narrow series. This process gives us information regarding
that have enclosed the particles through synthesis method. The XRD investigations were performed
) diffractometer with Cu-Kα radiation to determine the phase purity and the crystal structure of
Synthesis and characterization of silver nanoparticles: Aqueous tea leaves’ extract act as a reducing agent as well as capping agent during the silver nanoparticle production. Which reduces silver ions to nano silver hence, the colour will be change from light pink to green, as shown in Figure-1. The appearance of the aqueous silver nanoparticles was light green
in colour due to excitation of surface plasmon vibration in silver nanoparticles.25 UV-Vis spectroscopy could be used to examsize and shape controlled by nanoparticles in aqueous suspensions. The peak attributed to the surface plasmon resonance is observed at 460 nm. The broad UVspectrum of the sample was obtained betweenrange in 200nm-800nm. Figurescorresponding UV-Vis spectrum recorded for pure Tea extract and mixture of Tea with AgNO3 after 24 hours aging that gives rise to the two absorption bands: first around 280 nmtransition) and second the characteristic firsbetween 340-580nm (d-d transition) with a well defined peak at 460 nm, as shown in figure FigureUV peak the nanoparticles was experimentally obtained due to the surface plasmon resonance (SPR) exhibited by nanoparticles. Which will caused when AgNP solution exposed to electromagnetic radiation and resulted oscillation gives a typical peak value.26
Figure-
(a) Aqueous Tea leaves’ extract (b)
incubation
Figure-
Uv-Vis spectra of pure Tea leaves extract
_____________E-ISSN 2277-2502
Res. J. Recent Sci.
40
in colour due to excitation of surface plasmon vibration in silver Vis spectroscopy could be used to examine
size and shape controlled by nanoparticles in aqueous The peak attributed to the surface plasmon
The broad UV-Vis- absorption spectrum of the sample was obtained between the wavelength
Figures-2 and 3, shows the Vis spectrum recorded for pure Tea extract
after 24 hours aging that gives rise to the two absorption bands: first around 280 nm (π-π*
characteristic first excitonic UV peak d transition) with a well defined peak at
ure-2 and 3. The first excitonic UV peak the nanoparticles was experimentally obtained due to the surface plasmon resonance (SPR) exhibited by silver
when AgNP solution exposed electromagnetic radiation and resulted oscillation gives a
-1
(a) Aqueous Tea leaves’ extract (b) AgNPs after24h
incubation
-2
Vis spectra of pure Tea leaves extract

Research Journal of Recent Sciences ____________________________________________________________E-ISSN 2277-2502
Vol. 5(11), 39-43, November (2016) Res. J. Recent Sci.
International Science Community Association 41
Figure-3
Silver nanoparticles produced by extract of Tea leaves
TEM image of the NPs corresponds to the topography of the AgNPs (Figure-4), which exhibits the particle size in between 20-50 nm and recommended the presence of approximately spherical silver nanoparticles in the solution. The Transmission Electron Micrograph image indicates the dispersity and morphology of the silver nanoparticles. These particles are rounded in shape and distributed in smaller and bigger size zones. These silver nanoparticles may be due to the capping of phytochemicals such as polyphenols or due to the formation of the cluster.
Figure-4
TEM images of AgNPs produced by Tea leaves’ extract
The XRD patterns of the powdered silver nanoparticles taken using CuKα radiation (λ= 1.5418 Å) gives major peaks at 38.09°, 44.12° and 64.37° that can be indexed to the (111), (200) and (220) planes of a cubic crystal system (a=4.0686Ǻ) and corresponding well with the standard JCPDS file No.04-0783 of pure silver metal. Broadness in patterns reflected the small particle size of the AgNPs and spin plasmonic resonance phenomena (Figure-5).
Figure-5
XRD plot of synthesized AgNPs via extract of tea leaves’
The Debye-Scherrer formula (Dp = Kλ /β1/2 cosθ with K=0-89, λ=wavelength of the radiation, β=full width at half maximum, θ = incident angle of radiation beam, Dp=particle size) was also used for calculation of the particle size i.e. ~ 20-50 nm. FTIR investigation also gives a series of peaks for the AgNPs sample belong to the sequence of the phytochemicals present in the sample that acts as a reducing agent (Figure-6). FTIR investigations on the biosynthesized AgNPs was passed out in the range of 4000-500 cm-1 wave number to make out the most likely interactions between the Ag ions and phytochemicals present in tea leaves’ extract that used to stabilize the AgNPs. Figure-6 definite the existence of plant peptides visible due to the bending formed by amide bonds. AgNPs exhibits prominent peaks at 3379.76, 1696.45 and 1648.73 cm-1, representing the contribution of N-H stretching vibrations, N-H bending vibrations and C=O stretching vibrations that refers to the Tea-AgNPs aggregates. The C-N and C-O-C stretching vibration suggested the existence of a lot of phytochemicals on the surface of the NPs.
Green production method of AgNPs is an additional way to chemical and physical synthesis methods and it is used to reduce metal ion of silver to nano silver. Green Synthesis of the silver nanoparticles has been earlier reported using plant’s leaves’ extracts as well as different kind of plant body parts. The phytochemicals present in the leaves’ extract, which are responsible for reducing the silver salts and producing stable silver nanoparticles without using any capping agent27. Furthermore, the antimicrobial, antifungal and antioxidant activities of the nanoparticles are also improved by the existence of the phytochemicals.

Research Journal of Recent Sciences ____________________________________________________________E-ISSN 2277-2502
Vol. 5(11), 39-43, November (2016) Res. J. Recent Sci.
International Science Community Association 42
Figure-6
FTIR spectra of AgNPs synthesized by plant tea leaves’ extract
Conclusion
In this current study we have planned and an ecofriendly synthesis of AgNPs using tea leaves’ extracts via biological method, in which tea leaves’ extract act as a reducing agent. In green synthesis method, tea leaves’ extract are responsible for reduction of silver metal to nano size. The synthesized silver nanoparticles were subjected to advance analysis technique such as a TEM, XRD, Uv-Vis spectroscopy and FTIR in order to characterize them. The formation of nanoparticles as well as size was also confirmed by UV-Vis spectroscopy; while crystalline properties of the nanoparticles and average particle size is investigated by XRD analysis and the TEM image show visibly the formation of nanoparticles. To the best of our information this is the unique information of the explanation that lead the path to produce the tea mediated AgNPs. These research works are further extended to investigate the synthesis and optical properties of AgNPs formed by the other plant leaves’ extracts. Acknowledgment
The authors are sincerely thankful to the Department of Science and Technology and their sub wing Science and Engineering Research Board of the, India (SB/S1/PC-31/2012) for their financial support. The instrumental supports for TEM measurements from MRC, MNIT Jaipur, are acknowledged. RKM also thanks Pragati Fageria from Department of Chemistry, University of Rajasthan, Jaipur for assistance with powder XRD measurements.
References
1. Alqudami A. and Annapoorni S. (2007). Fluorescence from metallic silver and iron nanoparticles prepared by exploding wire technique. Plasmonics., 2(1), 5-13.
2. Korbekandi H. and Iravani S. (2012). Silver Nanoparticles. Nanotechnology and Nanomaterials., 3, 5-16.
3. Brigger I., Dubernet C. and Couvreur P. (2002). Nanoparticles in cancer therapy and diagnosis. Adv Drug
Deliv Rev., 64, 24-36.
4. Basarkar A. and Singh J. Poly. (2009). Poly (lactide-co-glycolide)-polymethacrylate nanoparticles for intramuscular delivery of plasmid encoding interleukin-10 to prevent autoimmune diabetes in mice. Pharm Res., 26, 72-81.
5. Roy K., Mao H.Q., Huang S.K. and Leong K.W. (1991). Oral gene delivery with chitosan-DNA nanoparticles generates immunologic protection in a murine model of peanut allergy. Nat. Med., 5, 387-391.
6. Wilson D.S., Dalmasso G., Wang L., Sitaraman S.V., Merlin D. and Murthy N. (2010). Orally delivered thioketal nanoparticles loaded with TNF-α–siRNA target inflammation and inhibit gene expression in the intestines. Nat. Mater., 9, 923-928.
7. Mano Priya M., Karunai Selvia B. and John Paul J.A. (2011). Green Synthesis of Silver Nanoparticles from the Leaf Extracts of Euphorbia Hirta and Nerium Indicum. Digest .J. Nanomat. Biostruct., 6(2), 869-877.
3379.7
6 2880.8
12827.2
6
2357.7
9
1696.4
51648.7
3
1497.2
3
1394.6
0
1239.9
1
1122.2
81064.8
7
991.3
9
100015002000250030003500
Wavenumber cm-1
-20
-020
40
60
80
100
Tra
nsm
itta
nce [%
]
Research Journal of Recent Sciences ____________________________________________________________E-ISSN 2277-2502
Vol. 5(11), 39-43, November (2016) Res. J. Recent Sci.
International Science Community Association 43
8. Li S., Shen Y., Xie A., Yu X., Qui L., Zhang L. and Zhang Q. (2007). Green synthesis of silver nanoparticles using Capsicum annuum L. extract. Green Chem., 9, 852.
9. Christopher L., Kitchens, Douglas E., Hirt, Scott M., Husson, Alexey A. and Vertegel (2010). Synthesis, Stabilization, and Characterization of Metal Nanoparticles. The Graduate School of Clemson University.
10. Salam H.A., Rajiv P., Kamaraj M., Jagadeeswaran P., Gunalan S. and Sivaraj R. (2012). Plants: Green Route for Nanoparticle Synthesis. Inter.Res.J.Bio. Sci., 1(5), 85-90.
11. Geoprincy G., Vidhyasrr B.N., Poonguzhali U., Gandhi N. and Renganathan S. (2013). A review on green synthesis of silver nano particles. Asian.J.Pharma.Clini.res, 6(1), 8-12.
12. Akl M. Awwad and Nida M. (2012). Green Synthesis of Silver Nanoparticles by Mulberry Leaves Extract. Nanoscience and Nanotechnology, 2(4), 125-128.
13. Umesh B.J. and Vishwas A.B. (2013). Green synthesis of silver nanoparticles using Artocarpus heterophyllus Lam. Leaves’ extract and its antibacterial activity. Industrial
Crops and Products, 46, 132-137.
14. Nethra Devi C., Sivakumar P. and Renganathan S. (2012). Green synthesis of silver nanoparticles using Datura metel flower extract and evaluation of their antimicrobial activity. Inter.J. Nanomat.Biostruct, 2(2), 16-21.
15. Song J.Y. and Kim B.S. (2009). Rapid biological synthesis of silver nanoparticles using plant leaf extracts. Bioprocess
Biosyst Eng., 32, 79-84.
16. Huang J., Li Q., Sun D., Lu Y., Su Y., Yang X., Wang H., Wang Y., Shao W., He N., Hong J. and Chen C. (2007). Biosynthesis of silver and gold nanoparticles by using novel sun-dried Cinnamomum camphora leaves. Nanotechnol., 18, 105-104.
17. Pattanayak M. and Nayak P.L. (2013). Green Synthesis and Characterization of Zero Valent Iron Nanoparticles from the Leaf Extract of Azadirachta indica (Neem). World
Journal of Nano Science & Technology, 2(1), 6-9.
18. Nadagouda M.N. and Varma R.S. (2008). Green synthesis of silver and palladium nanoparticles at room temperature using coffee and tea extract. Green Chem., 10, 859-862.
19. Fageria P., Gangopadhyay S. and Pande S. (2014). Synthesis of ZnO/Au and ZnO/Ag nanoparticles and their photocatalytic application using UV and visible light. RSC
Adv., 4, 24962-24972.
20. Ahmad A., Mukherjee P., Mandal D., Senapati S., Khan M.I., Kumar R. and Sastry M. (2002). Enzyme Mediated Extracellular Synthesis of CdS Nanoparticles by the Fungus, Fusariuoxysporum. J.Am. Chem. Soc., 124, 12108-12109.
21. Kalimuthu K., Babu RS., Venkataraman D., Bilal M. and Gurunathan S. (2008). Biosynthesis of silver nanocrystals by Bacillus licheniformis. Colloids Surf B., 65(1), 150-153.
22. Wijnhoven S.W.P., Peijnenburg W.J.G.M., Herberts C.A., Hagens W.I., Oomen A.G. and Heugens E.H.W et al. (2009). Nano-silver: a review of available data and knowledge gaps in human and environmental risk assessment. Nano Toxicology, 3, 109-138.
23. Klueh U., Wagner V., Kelly S., Johnson A. and Bryers JD. (2000). Efficacy of silver-coated fabric to prevent bacterial colonization and subsequent device-based biofilm formation. J. Biomed. Mater. Res., 53(6), 621-631.
24. Jani R., Udipi S.A. and Ghugre P.S. (2009). Mineral content of complementary foods. Indian J Pediatr, 76, 37-44.
25. Mulvaney P. (1996). Surface plasmon spectroscopy of nanosized metal particles. Langmuir, 12, 788-800.
26. Abu Bakar N.H.H, Ismail J. and Abu Bakar M. (2007). Synthesis and Characterization of Silver Nanoparticles in Natural Rubber. Mater. Chem. Phys., 104, 276-283.
27. Meena R.K. and Chouhan N. (2015). Biosynthesis of Silver Nanoparticles from Plant (Fenugreek Leaves’) Reducing Method and their Optical Properties. Research Journal of
Recent Sciences, 4(IVC-2015), 1-5.
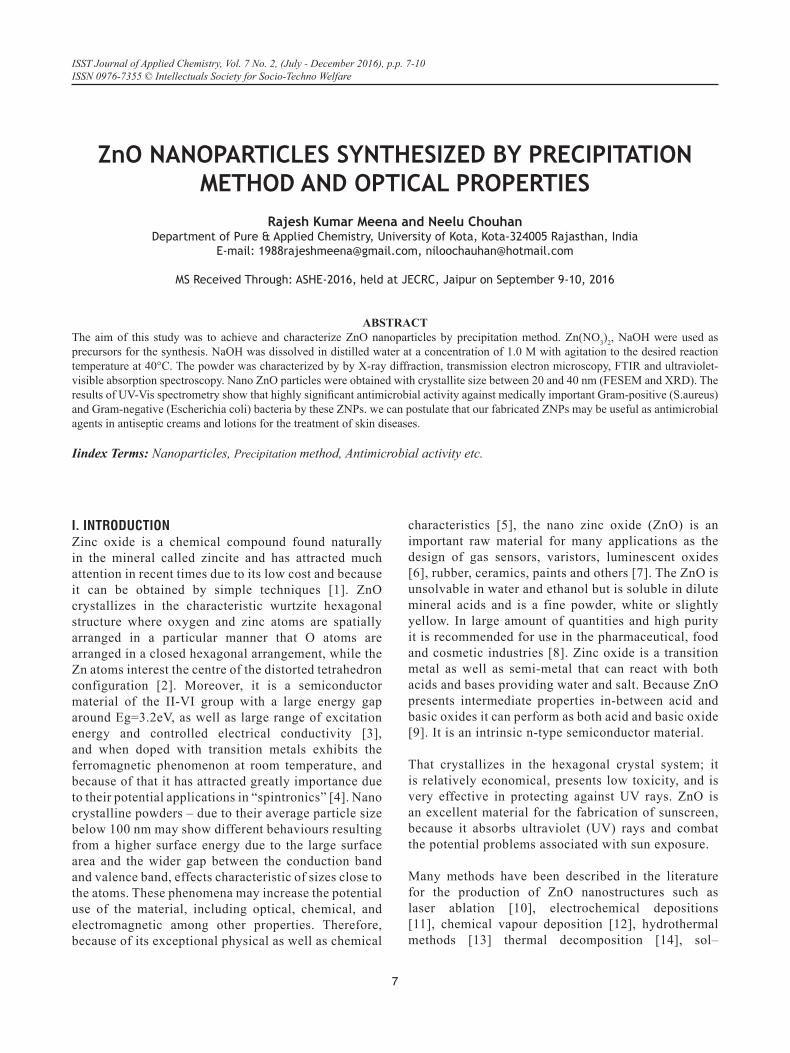
7
I. INTRODUCTIONZinc oxide is a chemical compound found naturally in the mineral called zincite and has attracted much attention in recent times due to its low cost and because it can be obtained by simple techniques [1]. ZnO crystallizes in the characteristic wurtzite hexagonal structure where oxygen and zinc atoms are spatially arranged in a particular manner that O atoms are arranged in a closed hexagonal arrangement, while the Zn atoms interest the centre of the distorted tetrahedron configuration [2]. Moreover, it is a semiconductor material of the II-VI group with a large energy gap around Eg=3.2eV, as well as large range of excitation energy and controlled electrical conductivity [3], and when doped with transition metals exhibits the ferromagnetic phenomenon at room temperature, and because of that it has attracted greatly importance due to their potential applications in “spintronics” [4]. Nano crystalline powders – due to their average particle size below 100 nm may show different behaviours resulting from a higher surface energy due to the large surface area and the wider gap between the conduction band and valence band, effects characteristic of sizes close to the atoms. These phenomena may increase the potential use of the material, including optical, chemical, and electromagnetic among other properties. Therefore, because of its exceptional physical as well as chemical
characteristics [5], the nano zinc oxide (ZnO) is an important raw material for many applications as the design of gas sensors, varistors, luminescent oxides [6], rubber, ceramics, paints and others [7]. The ZnO is unsolvable in water and ethanol but is soluble in dilute mineral acids and is a fine powder, white or slightly yellow. In large amount of quantities and high purity it is recommended for use in the pharmaceutical, food and cosmetic industries [8]. Zinc oxide is a transition metal as well as semi-metal that can react with both acids and bases providing water and salt. Because ZnO presents intermediate properties in-between acid and basic oxides it can perform as both acid and basic oxide [9]. It is an intrinsic n-type semiconductor material.
That crystallizes in the hexagonal crystal system; it is relatively economical, presents low toxicity, and is very effective in protecting against UV rays. ZnO is an excellent material for the fabrication of sunscreen, because it absorbs ultraviolet (UV) rays and combat the potential problems associated with sun exposure.
Many methods have been described in the literature for the production of ZnO nanostructures such as laser ablation [10], electrochemical depositions [11], chemical vapour deposition [12], hydrothermal methods [13] thermal decomposition [14], sol–
ZnO NANOPARTICLES SYNTHESIZED BY PRECIPITATION METHOD AND OPTICAL PROPERTIES
Rajesh Kumar Meena and Neelu ChouhanDepartment of Pure & Applied Chemistry, University of Kota, Kota-324005 Rajasthan, India
E-mail: [email protected], [email protected]
MS Received Through: ASHE-2016, held at JECRC, Jaipur on September 9-10, 2016
ABSTRACTThe aim of this study was to achieve and characterize ZnO nanoparticles by precipitation method. Zn(NO3)2, NaOH were used as precursors for the synthesis. NaOH was dissolved in distilled water at a concentration of 1.0 M with agitation to the desired reaction temperature at 40°C. The powder was characterized by by X-ray diffraction, transmission electron microscopy, FTIR and ultraviolet-visible absorption spectroscopy. Nano ZnO particles were obtained with crystallite size between 20 and 40 nm (FESEM and XRD). The results of UV-Vis spectrometry show that highly significant antimicrobial activity against medically important Gram-positive (S.aureus) and Gram-negative (Escherichia coli) bacteria by these ZNPs. we can postulate that our fabricated ZNPs may be useful as antimicrobial agents in antiseptic creams and lotions for the treatment of skin diseases.
Iindex Terms: Nanoparticles, Precipitation method, Antimicrobial activity etc.
ISST Journal of Applied Chemistry, Vol. 7 No. 2, (July - December 2016), p.p. 7-10ISSN 0976-7355 © Intellectuals Society for Socio-Techno Welfare
8
gel method [15], and combustion method [16,17]. Recently, ZnO nanoparticles were prepared by ultrasound [18], two-step mechanochemical-thermal synthesis [19], co-precipitation [20], anodization[21], microwave-assisted combustion method [22], and electrophoretic deposition [23]. Rodrigues-Paez et al. synthesized zinc oxide nanoparticles with different morphologies by controlling different parameters of the precipitation process such as solution concentration, pH, and washing medium etc.[24] In the present study, ZnO nanostructures were synthesized using a simple precipitation method. Zinc nitrate and sodium hydroxide were used as precursors to formulate ZnO nanostructures. The prepared samples were characterized by the purity of the sample was tested by X-ray diffraction (XRD) and scanning electron microscopy (SEM), The band gap energies of the samples were calculated from diffuse reflectance spectroscopy. The morphology, crystallite size, and optical properties of ZnO nanostructures were investigated, and an attempt was made to correlate the optical properties of ZnO with morphology and crystallite size.
II. EXPERIMENTAL PROCEDUREA. MaterialsZinc nitrate Zn(NO3)2 and sodium hydroxide were used in the experiments. All the chemicals used were of Sigma- Aldrich and were all used without further purification and Double distilled water was used as the solvent.
B. Synthesis of ZnO NanoparticlesTo the aqueous solution of zinc nitrate Zn(NO3)2, sodium hydroxide solution was added slowly dropwise in a molar ratio of 1:2 under vigorous stirring, and the stirring was continued for 12h.The resulting solution was heated under constant stirring at the 40°C reaction temperature. The precipitate obtained was filtered and washed thoroughly with deionised water. The precipitate was dried in an oven at 100°C and ground to fine powder using agate mortar. The powder obtained from the above method was calcined at 300°C for 2h.
III. RESULTS AND DISCUSSIONFigure 1 shows XRD patterns of the ZnO nanoparticles prepared by precipitation method is shown in Figure 1, which indicates the ZnO has hexagonal wurtzite phase structure The peak and relative intensities obtained for the ZnO competition with the reported JCPDS data.25 The x-ray diffraction information were recorded by using Cu Kα radiation (1.5406 Ao). The intensity data were collected over a 2θ range of 20-80o.
Figure 1. XRD pattern of ZnO nanoparticles
In addition, the peaks (100), (002), and (101) obviously indicate formation of pure wurtzite structure of ZnO.26 Therefore; the XRD pattern showed that samples were formed in single phase. The high intensity of (100) peak at 31° suggested the growth of ZNPs along the easy direction of crystallization.27 No other peaks related to impurities were detected in the XRD spectra, confirming the pure form of the synthesized ZNPs. x-ray diffraction studies confirmed that the synthesized materials were ZnO nanoparticles with wurtzite phase and all the diffraction peaks agreed. The mean grain size (D) of the particles was resolute from the XRD measurement via Scherrer equation. D=0.89λ / (βCosθ)
Where λ is the wavelength (Cu Kα), β is the full width at the half- maximum (FWHM) of the ZnO (101) line and θ is the diffraction angle. A definite line broadening of the diffraction peaks is recommended that the synthesized materials are in nanometer series and the average grain size of ZnO is determined using Scherrer equation and it was found to be around 50 nm.
Figure 2. High resolution SEM image of the (101) plane of the wurtzite structure for the condition Zn(NO3)2, at 40oC
room temperature
Rajesh Kumar Meena and Neelu Chouhan

9
ZnO Nanoparticles Synthesized by precipitation Method and Optical Properties
Figure 2 shows a high resolution SEM image – and detail at higher magnification – using zinc nitrate as a precursor with synthesis temperature of 90°C. The image shows the basal plane (101) of the wurtzite structure, which has a higher growth rate. SEM image showed relatively more uniform polyhedral nanoparticle formed with diameter range 10-50nm.
Figure 3. UV-Visible spectra of ZnO nanoparticles synthesized at 40oC room temperature
Finally, Figure 3 shows the UV-Vis spectrum for the synthesis condition using zinc nitrate as precursor, synthesis at room temperature. It is possible to see a strong absorbance at near uv regions 300~400nm, showing that the synthesis resulted in photosensitive samples in the UV region.
IV. ANTIBACTERIAL ACTIVITYThe antibacterial property of the ZnO nanoparticles was evaluated against Gram-ve Escherichia coli and Gram +ve bacteria S. aureus using disk diffusion method. In disk diffusion method the ZnO nanoparticles showed significant antibacterial activity on bacterial strains Gram-ve and Gram +ve bacteria and below this Table 1 represents the comparative activities in terms of inhibition zone i.e 18 and 15, respectively. These Studies verified that the ZnO NPs show best antagonistic activity against Escherichia coli.
Table: 1 Antagonistic activity of silver nanopar ticles against bacteria
Organism Zone of inhibition (mm)
Escherichia coli Staphylococcus aureus
1815
V. CONCLUSIONZnO nanoparticles with wurtzite structure were obtained from a precipitation method quickly and easily, using zinc nitrate. The results of the crystallite size calculations by the FWHM method from the XRD spectra showed that for the (101) plane the crystallite size is a function of the of precursor and the synthesis temperature. The smallest crystallite size is depends on using a precursor in the highest synthesis temperature, 40°C. Images of high resolution SEM show that zinc oxide nanoparticles were obtained with sizes close to 50 nm (300 Å) for the basal plane (101).
VI. REFERENCES[1] Koudelka, L.; Horak, J.; Jariabka, P. Morphology
of polycrystalline ZnO and its physical properties. Journal Materials Science, v.29, n.6, p.1497-1500, (2004).
[2] Martins, J.B.L.; Sambrano, J.R.; Vasconcellos, L.A.S.; Longo, E.; Taft, C.A. Análise teórica da interação de CO, CO2 e NH3 com ZnO. Química Nova, v.27, n.1, p.10-16, (2004).
[3] Look, D.C.; Reynolds, D.C.; Jones, R.L.; Litton, C.W.; Cantwell, G.; Eason, D.B. Characterization of homoepitaxial p-type ZnO grown by molecular beam epitaxy. Applied Physics Letters, v.81, n.10, p.1830-1832, (2002).
[4] Prellier, W.; Fouchet, A.; Mercey, B. Oxide-diluted magnetic semiconductors: A review of the experimental status. Journal of Physics Condensed Matter, v.15, R1583, (2003).
[5] Kwon, Y.J.; Kim, H.K.; Lim, C.S.; Shim, K.B. Characterization of ZnO nanopowders synthesized by the polymerized complex method via an organochemical route. Journal of Ceramic Processing Research, v.3, n.3, p.146-149, (2002).
[6] Ravi, V.; Pasricha, R.; Dhage, S.R. Synthesis of fine particles of ZnO at 100°C. Materials Letters, v.59, p.779-781, (2004).
[7] Perez-lopes, O.W.; Faria, A.C.; Marcilio, N.R.; Bueno, J.M.C. The catalytic behaviour of zinc oxide prepared from various precursors and by different methods. Materials Reserch Bulletin, (2005).
[8] Ramalho, M.A.F. Avaliação da proporção de ácido cítrico/metal no tamanho da partícula de ZnO preparados pelo método de Pechini. In: Congresso Brasileiro de Ciência e Engenharia de Materiais, (2004).
[9] Horak, J.; Kouldelka, L. J Mater Sci., v.29, p.1497, (1994).
[10] carisoreanu, N, Metai, DG, Dinescu, G, Epurescu, G, Ghica, C, Nistor, LC, Dinescu, M: Properties of ZnO thin films prepared by radio-frequency plasma beam

10
assisted laser ablation. Appl. Surf. Sci. 247, 518–525 (2005)
[11] Chang, S, Yoon, SO, Park, HJ, Sakai, A: Luminescence properties of Zn nanowires prepared by electrochemical etching. Mater. Lett. 53, 432–436 (2002)
[12] Wu, JJ, Liu, SC: Low-temperature growth of well-aligned ZnO nanorods by chemical vapor deposition. Adv. Mater. 14, 215–218 (2002)
[13] Ni, YH, Wei, XW, Hong, JM, Ye, Y: Hydrothermal synthesis and optical properties of ZnO nanorods. Mater. Sci. Eng., B, Solid State Mater. Adv. Technol 121, 42–47 (2005)
[14] Wang, RC, Tsai, CC: Efficient synthesis of ZnO nanoparticles, nanowalls, and nanowires by thermal decomposition of zinc acetate at a low temperature. Appl. Phys. A. 94, 241–245 (2009)
[15] Ristiac, M, Musiac, S, Ivanda, M, Popoviac, S: Sol–gel synthesis and characterization of nanocrystalline ZnO powders. J. Alloys Compd. 397, L1–L4 (2005)
[16] Badhuri, S, Badhuri, SB: Enhanced low temperature toughness of Al2O3-ZrO2 nano/nano composites. Nanostrct. Mater. 8, 755–763 (1997)
[17] Lamas, DG, Lascalea, GE, Walsoc, NE: Synthesis and characterization of nanocrystalline powders for partially stabilized zirconia ceramics. J. Eur. Ceram. Soc. 18, 1217–1221 (1998)
[18] Khorsand, Z, Abid, A, Majid, WH, Wang, HZ, Yousefi, R, Golsheikh, M, Ren, ZF: Sonochemical synthesis of hierarchical ZnO nanostructures. Ultrasonic Sonochemistry 20, 395–400 (2013)
[19] Rajesh, D, Vara Lakshmi, B, Sunandana, CS: Two-step synthesis and characterization of ZnO nanoparticles. Physica B-Cond. Mater. 407, 4537–4539 (2012)
[20] Singh, O, Kohli, N, Singh, RC: Precursor controlled morphology of zinc oxide and its sensing behavior. Sens. Actuators B. 178, 149–154 (2013)
[21] Shetty, A, Nanda, K: Synthesis of zinc oxide porous structures by anodisation with water as an electrolyte. Appl. Phys. A. 109, 151–157 (2012)
[22] Kooti, M, Nagdhi Sedish, A: Microwave-assisted combustion synthesis of ZnO nanoparticles. J. Chem (2013).
[23] Vazquez, A, Lopez, IA, Gomez, I: Growth mechanism of one-dimensional zinc sulfide nanostructures through electrophoretic deposition. J. Mater. Sci 48, 2701–2704 (2013)
[24]. Rodrigues-Paez, J, Caballero, AC, Villegas, M, Moure, C, Duran, P, Fernandz, JF: Controlled precipitation methods: formation mechanism of ZnO nanoparticles. J. Eur. Ceram. Soc. 21, 925–930 (2001)
[25] JCPDS Card No. 36-1451 [26] Rekha K, Nirmala M, Nair MG, Anukaliani A.
Structural, optical, photocatalytic and antibacterial activity of zinc oxide and manganese doped zinc oxide nanoparticles. Physica B Condens Matter;405(15):3180–3185 (2005)
[27] Lin HF, Liao SC, Hung SW. The dc thermal plasma synthesis of ZnO nanoparticles for visible-light photocatalyst. J Photochem Photobiol A Chem.;174(1):82–87 (2005).
Rajesh Kumar Meena and Neelu Chouhan

Journal of Molecular Liquids 230 (2017) 74–84
Contents lists available at ScienceDirect
Journal of Molecular Liquids
j ourna l homepage: www.e lsev ie r .com/ locate /mol l iq
Biogenic silver nanoparticles from Trachyspermum ammi (Ajwain) seedsextract for catalytic reduction of p-nitrophenol to p-aminophenol inexcess of NaBH4
Neelu Chouhan a,⁎, Rakshit Ameta b, Rajesh Kumar Meena a
a Department of Pure and Applied Chemistry, University of Kota, Kota 324005, Indiab Department of Chemistry, PAHER University, Udaipur 313003, India
⁎ Corresponding author.E-mail addresses: [email protected], neeluc
(N. Chouhan).
http://dx.doi.org/10.1016/j.molliq.2017.01.0030167-7322/© 2017 Elsevier B.V. All rights reserved.
a b s t r a c t
a r t i c l e i n f oArticle history:Received 2 September 2016Received in revised form 16 December 2016Accepted 2 January 2017Available online 04 January 2017
Plasmonic silver nanoparticles (AgNPs, size = 3–50 nm) were synthesized by biogenic reduction of aqueousAgNO3 using Trachyspermum ammi (TA, Ajwain) seeds extract. Increase in concentration of TA, accelerated thereduction rate of Ag+ and affected the AgNPs particle size. Pronounce effect of the AgNP's aging (24, 48 and72 h) on particle concentration/size and their corresponding catalytic activity,was exhibited by the systems. Sur-face plasmonic resonance band centered between 420 and 430 nmwavelength, recognized as first exitonic peakof UV–vis absorption spectra of Ag NPs, was used to estimate the particle size (10–30 nm) of Ag NPs, which wasconsistent with the particle size observed with the FESEM (5–20 nm) and XRD observations (12.74 nm). XRDanalysis also indicated that the silver nanoparticles were crystallized in the cubic crystal pattern. However,some cubic/rod like patterns grown along the 111 plane, was also observed by FESEM and HRTEM. ATR (Atten-uated total reflectance) profile of aging of TA supported Ag NPs, exhibited the decrease in intensity of 3394, 1716and 1618 cm−1 peakswith respect to the pristine TA extract sample. That reflects the increase in particle concen-tration with time (24–48 h). These peaks correspond to the O\\H group, carbonyl group and C _C stretchingalong with C\\O\\C and C\\N stretching in TA-AgNPs aggregates. ATR and IR results suggested the presence ofthe reducing agent/phytochemicals (nicotinic acid, thymol, sugars, proteins, saponin, etc) incorporated NPs. Im-pedance study revealed that the rate of charge transfer in TA-Ag NPs aggregates is inversely proportional to theconcentration of TA that confirms the stability of the Ag NPs in water. These biogenic Ag NPs are also character-ized using transmission electron microscopy (TEM) and their corresponding energy dispersive X-ray analysis(EDX), electrochemical impedance spectroscopy (EIS), cyclic voltammetry (CV) studies, etc. On the basis of theabove observations and optoelectronic characteristics, the most probable mechanism of biogenesis of the stableAgNPs, is suggested. As-synthesized 24, 48 and 72h agedAgNPs,were tested for their catalytic reduction activitytowards the conversion of p-nitro phenol to p-aminophenol in excess of NaBH4. 48 h-aged Ag NPs show highestcatalytic activity for conversion of p-nitrophenol to p-aminophenol in excess of NaBH4 in terms of rate (r =0.34539 min−1) with complete reduction time 12 min.
© 2017 Elsevier B.V. All rights reserved.
Keywords:Silver nanoparticlesTrachyspermum ammip-Nitrophenolp-AminophenolNaBH4
Catalytic reduction
1. Introduction
Recently, metal nanoparticles have attracted immense attention ofresearchers over their bulk counterparts due to their versatile applica-bility in different areas [1–4]. These are magnetic, electronic, electro-chemical, antimicrobial, corrosion, inhibition and opticalperformances. Because of their unmatched superb qualities, they can af-fect human life in various avatars such as biosensors, nano-molecularoptoelectronic devices, bio-mimetic materials, catalysts in biomedicine,
industrial and environmental fields. There are two most well-liked ap-proaches for fabrication of nanoparticles. First is bottom to top orsmall to big approach, where the NPs gain the final shape by additionof small building blocks and prepared using supercritical liquid medi-um, templates, spinning, plasma or fire sparing, pyrolysis, sol-gel pro-cess, biological method, chemical vapour deposition, atomiccondensation, etc. The second approach is top to bottom approach,which involves mechanical milling, electrochemical explosion, laser ab-lation, chemical etching, etc. Where, bigger particle cut down into smallparticles of different shapes. Morphology (shape and size) of the nano-particles' is very important for deciding their optical, electronic, mag-netic, and catalytic properties. These novel properties can beengineered by controlling thedimensions ofmetal nanoparticles. Beside

40 50 60 70 80
10
20
30
40
50
(311)(220)
(200)
(111)
Inte
nsi
ty /
au
2 / degree
Fig. 1. XRD pattern of biogenic TA supported Ag NPs with reference to the standard JCPDSfile No. 04-0783 of pure Ag.
75N. Chouhan et al. / Journal of Molecular Liquids 230 (2017) 74–84
the conventional practices of synthesizing metallic nanoparticles i.e.physical and chemical methods, the biogenic production is a better op-tion due to its ease of fabrication via green route with non-toxic andnon-poisonous ingredients, biocompatibility, mild reaction conditions,low cost, simplicity and eco-friendly nature of reaction, are the benefitsof the biogenic synthesis. Therefore, this can beused as an economic andvaluable alternative for the large scale production of metal nanoparti-cles. Biological materials/tools adopted in this method are fungi [5–7],bacteria [8–10], Bengal gram bean [11], yeasts [12], Capsicum annuum[13], quercetin [14], biomass of oat (Avena sativa) and wheat (Triticumaestivum) [15], honey [16], plants' extract, etc.
A wide range of metal NPs such as Au [17–21], Ag [22–23], TiO2 [24],In2O3 [25], ZnO [26], CuO [27], etc, have been synthesized using herbal/plant extracts. Several plants have been explored for the synthesis ofmetal NPs including medicinal plants [26]. Use of plant extract and mi-crobial cells in the synthesis of metal NPs, was triggered by existence ofthe several organic group/compounds such as carbonyl groups, terpe-noids, phenolics, flavonones, amines, amides, proteins, pigments alka-loids and other reducing agents of the plant extract. In this researchwork, an aqueous seed extract of Trachyspermum ammi (TA; Ajwain)has been used to grow the metal (silver) nanoparticles. This plant isthe native of Egypt and cultivated in Iran, Iraq, Afghanistan, Pakistanand India. TA has a great medicinal and nutrition values because itsseed extract consists of carbohydrates (\\CHO,\\OH), glucosides (6-O-β-glucopyranosyl oxythymol), oleoresin, saponin, phenols, volatiles(thymol, γ-terpinmene, para-cymene, α- and β-pinene, dipentene),proteins, fat, fibres, and minerals (P, Fe, Ca, etc). Furthermore, promi-nent principle oils such as, carvone (46%), dillapiole (9%) and limonene(38%) alongwith reducing agents (nicotinic acid), are also present in TA.Therefore, due to the presence of these biochemical ingredients, TA canbe served as the reducing and capping agentwithout addition of any ex-ternal stabilizing agent, during the synthesis process of NPs.
Silver has long been famous for its good inhibitory effect towardsmany bacterial strains/microorganisms and catalytic activity. Therefore,commonly used inmedical and industrial products that directly come into the contact with the human body, such as shampoos, soaps, deter-gent, shoes, cosmetic products, and toothpaste, besides photocatalyticand pharmaceutical applications. Moreover, superiority of thenanosilver particles over other candidates of the same class is alreadyestablished in terms of the small losses in optical frequency during thesurface-plasmon propagation, high conductivity and stability at ambi-ent conditions, less costlier price than other noble metals such as goldand platinum, high primitive character, and wide range of visible lightabsorption, etc. Which, prompt us to select silver as a plasmonic mate-rial for this study. Tiny nano-particles of the noble metals with localisedspin plasmonic resonance (LSPR) are known as plasmonicmaterial. Freeelectrons integrated with the photon energy produces a LSPR [28–32]on exposing nano-particles of noble metals to sunlight. Therefore, NPsof the noble metals will be act as the active centres on catalyst for thethermal redox reaction that can trap, scatter, and concentrate light[33–35], due to the fast charge transfer and result in enhanced activities.
Pure Ag NPs, as well as some chemically modified Ag NPs has alsobeen in trend that to be used in various applications such as: cleaningwater, catalyst, sensor, optoelectronic properties, eradication of organicpollutants, etc. Out of which removal of organic pollutants(nitrophenols) from waste water is very important. 4-Nitrophenol(PNP) is a highly stable and low water-soluble chemical that used tobe found in waste water that produced by explosive- and dye-indus-tries. Environmental Protection Agency of United States ratednitrophenols highly polluted chemical among the top 114 organic pol-lutants. It adversely affects the human and animal organs like liver, kid-ney, blood and central nervous system, skin, etc [36]. Moreover, thedegradation of PNP to nondangerous product is difficult due to its highstability. Therefore, the study for catalytic reduction of hazardous PNPto benign 4-aminophenol (PAP) becomes a remarkable step in termsof nitrophenol-pollution mitigation [37]. PAP is very fascinating
chemical as it can be used in production of analgesic and antipyreticdrugs, photographic developer, corrosion inhibitor, anti-corrosion lubri-cant, and many more applications. It can be produced by reduction ofPNP to PAP in sodium borohydride at room temperature. Aforemen-tioned reaction is a thermodynamically feasible process as it involvesE0 for PNP/PAP = −0.76 V and H3BO3/BH4
− = −1.33 V versus NHE.But this reaction is kinetically restricted by nature and never producePAP as end product but generate an intermediate i.e. p-nitrophenolateion in absence of the catalyst. Metal NPs or modified metal NPs, wereused to catalyse the above reaction. Few prominent e example, AgNPs-decorated Polyaniline nanofibers (AgNPs/PANINFs) nanocompos-ites [38], SiO2-coated graphene oxide nanosheets, decorated with Agnanoparticles [39], Pd/CuO NPs [40], synthesized by using of Theobromacacao L. seed extract, etc, were used for catalytic reduction of PNP intoPAP in presence of excess of NaBH4. Themetal NPs can serve as catalyststo transfer electrons from ion to the PNP. Both absorbed on the catalystsurface and result in the production of PAP.
Hence, this study is devoted to the fabrication of the Ag NPs by bio-genic reduction method using aqueous TA seed extract at ambient con-dition. Consequently, as-synthesized Ag NPs were rigorouslyinvestigated using advance techniques i.e. XRD (X-ray diffraction),UV–vis spectrophotometry, FTIR and ATR spectroscopy, scanning elec-tron microscopy (SEM) and their corresponding energy dispersive X-ray analysis (EDX), transmission electronmicroscopy (TEM), high reso-lution transmission electron microscopy (HRTEM), photoluminescenceemission (PLE), cyclic voltammetry and electrochemical impedancespectroscopy (EIS), etc. Finally, the biogenic Ag NPswere used to reducep-nitrophenol to p-aminophenol in excess of NaBH4 and reactionmech-anism for this reaction is also suggested. Effect of aging/particle size oncatalytic activity and rate of reaction will also be discussed.
2. Results and discussion
2.1. Crystallography of Ag NPs
The powder XRD patterns of the Ag NPs exhibited the major diffrac-tion peaks at 37.554°, 43.751° 64.021° and 76.949° (Fig. 1).
One sharp and strong peak at 37.554°, followed by the other smallpeaks can be index by (111), (200), (220) and (311) planes of a cubiccrystal system (a = 4.0686 Ǻ) that matched well with the standardJCPDS card No. 04-0783 of pure silver. These results attributed to theorientation of the crystal growth along the 111 plane. Peak broadeningnoticed in XRD data of the silver nanoparticles was dedicated to thesmall particle size and spin plasmonic resonance phenomena. Nobogus Bragg reflections were observed in the pattern due to crystallo-graphic impurities in the sample, which reflected the presence of the100% pure silver metal in the sample [41]. Ag NPs was crystallized inface centered cubic symmetry of the space group Fm-3m (Space groupnumber: 225) and point group m3m. Debye Scherrer equation

76 N. Chouhan et al. / Journal of Molecular Liquids 230 (2017) 74–84
corresponding to the XRD profile (Fig. 1) was used to calculate the par-ticle size of theNPs, i.e. 12.74 nm, by utilizing following relationship (Eq.(1)).
BrCosθ ¼ kλL
ð1Þ
where, θ=half of the diffraction angle, λ=wavelength of the incidentX-ray beam, L = average crystallite size (⊥ to surface of specimen), k(constant) = 0.94 [k ∈ (0.89, 1.39)] and Br = full width at halfmaximum.
FESEM and TEM images along with the corresponding EDX profileexhibited by Fig. 2a, b and c,which reveal the information about the sur-face morphology, particle shape/size and elemental composition of thesynthesized Ag NPs. Flocculated surface visualised by the FESEM andTEM images, indicates a uniformly dispersed colloidal silver NPs in sam-ple. Fig. 2c corresponds to the EDXS profile of the Ag NPs, collected at3.2 KeV and used to exhibit the chemical composition of the silver NPsi.e. 100% pure Ag without any foreign contaminants. On minute obser-vation of the TEMmicrographs, it was found that the AgNPs crystallizedin two shapes i.e. features in the form of the dark cubes of size 5–20 nm(inset of Fig. 2a) and transparent gray elongated cylinderical particles ofsize 0.480 × 2 μm (inset of Fig. 2c). Where, the dark cubic structuresdominated over the rod shape structures. These features are result ofthe interaction between some of the interesting biochemicals presentin aqueous TA extract and AgNO3. One of the chief bio-constituent ofTA is the surfactant; saponin (present as 38% limonene with cmc =0.5–0.8 g/L) [42], which induces micellization process and captivate sil-ver ions through hydrophobic force, resulting into reduction in entropy.When the concentration of surfactant is higher than CMC, entropy pen-alty for Ag ions assembly formation is lesser than the entropy penaltyfor caging of Ag ions by surfactant into water. That causes the electro-static interaction between surfactant andAg ions that leads to elongatedstructures. Hydrophobic group of the surfactant sequestrated into thecentre, which solubilised in bulk Ag ions by the virtue of head's groupinteraction with solvent and hydrophilic part extended away from thecentre. Moreover, position strongly affects the micellisation process byreducing its surface and interfacial tension [43]. The carboxylic groupbelongs to saponin (responsible for stabilizing the silver nanoparticles)fasten to the hydrophobic aglycone part of themolecule, which dissoci-ates slowly. It leads to grow molecular self assembling of surfactantaround Ag NPs in a one dimensional way and induce the formation ofthe elongated filamentous nanoclusters.
The extract also contains the carboxylic/phenolic group attached tothe different moieties i.e. nicotinic acid, thymol, sugars, proteins, etc.that also highly influence the surface activity, foam ability, and emulsi-fying ability of the surfactant. These carboxylic/phenolic groups dissoci-ate into aqueous phase and form free carboxyl/phenoxide anions, which
Fig. 2. (a) FESEM images of silver nanoparticles, (b) TEM image and particle size distribution ofimages of square and elongated Ag NPs.
increase the solubility of molecule in water and promote the formationof cubical Ag NPs.
Fig. 3a and b, represents theHRTEM images and corresponding SAEDpattern of the as synthesized AgNPs. Fig. 3a exhibits a high resolutionTEM image featuring lattice fringes associated with a d-spacing of0.2286 nm, consistent with the growth planes 111. The SAED patternin Fig. 3b exhibits polycrystalline diffraction rings consistent with 111,200, 220, 311 and 222 cubic reflections.
2.2. Optical characterization
Presence of the Ag NPs, grown at different concentrations of TA andgrowth time, was successfully examined using UV-vis absorption spec-trum (Fig. 3a and b). UV spectra shown in Fig. 3c, revealed the produc-tion of AgNPs in TA extract (Red line), where TA extract in absence ofAgNO3 didn't exhibit any peak in region 350–550 nm (Black line). SilverNPs exhibited an intense, small and broad absorption peak due to thesurface plasmon (it describes the collective excitation of the conductionelectrons in a metal) excitation [44].
All of the absorption spectra possess two prominent peak maximas;first at 200 nm and second around 420–450 nm. Strong peak around200 nm, usually caused by the general transition of electrons betweenthe valence and conduction bands of Ag NPs. Second, broad but shortpeak found within the range of excitonic transitions between 415 and460 nm, depending on TA extract concentration, structural, and agingconditions [45–47]. Fig. 4a confirmed the formation of the Ag NPs at dif-ferent concentrations (0.5, 1.0, 1.5, 2.0 and 2.5% (w/v)) of TA at fixedAgNO3 concentration i.e. 0.001 M AgNO3 and 1 h aging. The increasein intensity of the first excitonic peak at 446, 445, 446, 452, and452 nm along with the broadness of the peak on raising the TA concen-tration, was observed. Furthermore, 2.0 and 2.5% TA concentrated sam-ples has shown the same pattern and peak maxima (452 nm) (Fig. 4a).Therefore, 2.0% TA samples were taken for optimisation through aging.The effect of aging on Ag NPs grown in 2.0% of TAwas explored by vary-ing the growth time (24 h, 36 h and 48 h); on peak position viz. 448, 446and 446 nm as shown in Fig. 4b [48]. The height of the first excitationpeak for 24 h and 36 h aged samples are similar but rise in the peakheight with 48 h aged sample confirmed the increase in concentrationof Ag NPs. Blue shift in peaks on aging, indicated a decrease in size ofthe Ag NPs. UV spectrum for 2.0% TA sample aged at 48 h and pure TAextract is demonstrated in Fig. 4c. The presence of broad first excitonicpeak between 333.7 and 650 nm (3.72–1.98 eV) at peak maxima atλmax=446 nm(2.78 eV), confirms the formation of AgNPs. Broadeningto the optical absorption spectrum of Ag NPs, was originated by SPR ab-sorption. The surface plasmon resonance (SPR) is the coherent excita-tion of all the ‘free’ electrons within the conduction band. Because theSPR prohibits to give rise to the intensity of the absorption peak forvery small Ag NP clusters. Hence, the short and broad peaks were
AgNPs and (c) corresponding EDX profile. Inset images (in a and c) are themagnified TEM

Fig. 3.HRTEM image of a 12.78 nm spherical and rod like structure that featuring d-spacing for the 111 plane and cross-grating patterns (SAED pattern) consistentwith the cubic structurefor biogenic Ag NPs.
77N. Chouhan et al. / Journal of Molecular Liquids 230 (2017) 74–84
observed. Such absorption spectra can be explained by Mie theory [49].Mie theory describes the scattering of light (in various directions withvarying efficiency) by small particles (an aggregation of material) thatconstitutes a region with refractive index, different from the refractiveindex of its surroundings.
2.3. IR spectroscopic investigation
Fig. 5 demonstrates the ATR (Attenuated total reflectance) spectrumof TA-stabilised Ag NPs that was used to study the effect of aging onbonding environment of the Ag NPs in presence of the phytochemicalsthat belongs to TA. Respective IR peaks of N\\H or O\\H and υ C _Ogroups, were observed at different aging period i.e. 24 h (3315.74 &1637.36 cm−1), 36 h (3314.32 & 1635.59 cm−1) and 48 h (3313.64 &1635.69 cm−1). Gradual shifting of peaks towards low wave numberwas observed for the TA and AgNO3mixturewith aging, signifies the in-crease in bulkiness (heavier the molecule, lesser the frequency or wavenumber) of the molecular self assembly of TA due to the formation ofthe cluster of Ag NPs. It was also justified by the FTIR study, whichwas carried out (Fig. 6) on the biosynthesized Ag NPs and pure TA inthe range of the wave number 4000–500 cm−1. This technique is alsoused to recognize the most probable interactions between the Ag ionsand phytochemicals present in TA with time and the role of the chemi-cal constituents of TA in stabilization of AgNPs. Pure 2.5% TA gave peaksat the wave number of 3918.14, 3876.04, 3832.59, 3770.15, 3308.45,2926.98, 2368.65, 2331.20, 2237.03, 2132.62, 1652.2, 1453.87,1245.57, 1085.17, 806, 693.40 and 604.85 cm−1.
2.5% TA stabilisedAgNPs exhibits prominent peaks at thewave num-ber 3926.55 (w), 3760.21 (w), 3723.95 (s), 3664.86 (s), 3497.01 (w),3428.69 (w), 3060.18 (b), 2876.84 (w), 2762.44 (vw), 2350.23 (vw),
4000.00
0.07
0.14
Inte
nsi
ty/ a
u
Wa
400 500 600
0.04
0.08
0.12
0.16
0.20
Ab
sorb
ance
/au
Wavelength /nm
0.5 A 1.0 A 1.5 A 2.0 A 2.5 A
(a) (b)
Fig. 4.UV–vis diffuse reflectance spectra of the (a) as-prepared Ag NPs at different concentratio24h, 36 h, and 48h and (c) comparative spectra of 2.5MPure TA (Black solid line) andAgNPs sythe references to colour in this figure legend, the reader is referred to the web version of this a
1695.78 (s), 1539.02 (w), 1366.14 (vw,b), 1236.47 (w), 1115.45 (s),1047.55 (w), 972.57 (s), 861.14 (s), 713.30 (b,s), 676.98 (b,s) and587.36 (vs) cm−1. The respective functional groups of these peaksalong their most probable biomolecular species are shown in Table 1.Similar to the ATR results, the shifting of the IR peaks towards thelower frequencies was observed due to the formation of the TAstabilised-Ag NPs. Characteristic broad band at 3308.45 cm−1, repre-sents the presence of the intermolecular hydrogen bonding in pureTA. Where, the sharp and well defined peaks at 3723.95 s and3664.86 s in TA stabilised Ag NPs, are attributed to the intra-molecularhydrogen bond [50]. Absorption peak at 3428.69 cm−1 belongs to theOH stretching of alcohols and phenolic groups in TA stabilised Ag NPs.The frequencies due to stretching modes of CH2 group are generallyfound in the region of 3000–2800 cm−1. The IR bands at 3060.18,2876.84 and 1366.14 (vw,b) cm−1 may be associate with the asymmet-ric and symmetric stretching/wagging vibrations of CH2 group,respectively.
Distinctive peak at 3060.18 cm−1, was attributed to thepolysubstituted benzenes and aromatic CH2 stretching vibrations [51,52]. Sharp absorption band at 1695.78 cm−1 suggested the presenceof amide group [53], due to the carbonyl stretch of the proteins thatstrongly adsorbed the metal nanoparticles. TA supported Ag NPs ex-hibits the strong bands at 972.57 and 861.14 cm−1, identified as twist-ing and rocking modes of CH2 bending. The secondary structures ofproteins were not affected during the reaction with Ag+ ions or afterbinding with Ag nanoparticles [54]. These IR spectroscopic studies con-firmed the presence of the amino acid that develop the strong binding,reducing and stabilizing ability with metal through carbonyl group.Thus, it is concluded that a layer of the bio-organics have formed onAgNPs to secure the nanoparticles. This layer acts as a capping agent
300 450 600 750
0.0
0.5
Inte
nsi
ty/ a
u
Wave length/ nm
Pure TA 2.5M TA+0.001MAgNO3
600 800velength/ nm
24h 36h 48h
2.0 % TA
(c)
ns of TA i.e. 0.5, 1.0, 1.5, 2.0 and 2.5%, (b) TA supported Ag NPs on aged at different time i.e.nthesized bymixing of 2.5MTAand 0.001MAgNO3 (Red solid line). (For interpretation ofrticle.)

Fig. 5. ATR spectra of 2.5% TA supported Ag NPs with aging of 24 h, 36 h and 48 h.
78 N. Chouhan et al. / Journal of Molecular Liquids 230 (2017) 74–84
to prevent agglomeration and provides the extra stability in aqueousmedium [55]. The spectra also show peaks at 1321 and 1580 cm−1, at-tributed to ν-C\\N and δ-NH2, respectively [56]. The position and rela-tive intensity of these bands change with respect to the pure amine(2083, 1514 cm−1) [57,58]. The variation in the\\NH2 and\\NH infra-red bands suggests the links between the nanoparticles. The bands at1120 and 1480 cm−1 are typical of the ν-C\\OC, δs-CH2 and δa-CH3 vi-brations, respectively [59]. The aromatic C\\H out-of-plane deforma-tions were observed in the range 720–1000 cm−1. The out-of-planeand in-plane deformation of the phenyl ring are observed below1000 cm−1 and these modes are not pure but contain a significant
Fig. 6. FTIR spectrum of the 2.5% pure TA (Red solid line) extract and Ag NPs stabilised in 2.5% Treader is referred to the web version of this article.)
contribution from other modes and are substituent sensitive also, thespectral positions of the weaker γ-CH near 900 cm−1 correlates wellwith electron donating or electron attracting properties of the substitu-ent. TheCH in-plane deformations (δ-CH)were obtained at 972.57 s and1047.55 cm−1 in the IR spectrum. Aromatic nitro compounds show aC\\N stretching vibration near 870 cm−1. In the present study, the ν-CN is available at 861.14 cm−1 in the IR spectrum. The vibrationmodes of the various functional groups are variant with respect to theformation of the complex and to the adsorption at the nanoparticles sur-face. It is suggested that the alkyl chains adopted the stretched confor-mation irrespective of the complex formation. Stretching also confirms
A (Black solid line). (For interpretation of the references to colour in this figure legend, the

Table 1Representative functional groups and their corresponding biomolecules with respect tothe FTIR peak positions (in wave number) for the 2.5% TA stabilised AgNPs.
Wavenumber(cm−1) Functional groups
Associatedbiomolecules
587.35 CCC out of plane bending P\\O bending PO43−
676.98 C\\S str. O\\Ag\\O str. Thiol, sulfide713.30 N\\H bonded, secondary amide Carvone861.14 C\\O str. Epoxide972.57 C\\H out of the plane bend Trans RHC_CHR′, fat
oil1047.55 Alkane, C\\O str. P\\O str. Lipids, saponin1115.45 C\\O, C\\N, C\\C str. Lipid, amino acid
sugars1236.47 C_S str. (RO)2C_S,
thioketone1366.13 S_O str., ν-C\\N (RO)2SO2, sulfuric
ester, nicotinic acid1539.02 C_N (plus C _C), δ-NH2 str. Aromatic
ring str.Aromatic ring,pyrimidines, thymol
1695.78 Primary amide, carboxylate C\\O stretch,conjugated ketones H O\\H bendingHO\\H
Proteins, thymol,nicotinic acid,p-cymene
2350.23 NH2+, NH+ str. Nicotinic acid
2762.44 C\\H str.,\\C(_O)H, aldehyde Carbohydrates2876.84 \\CH2− stretch (s), C\\H str. methine Aliphatic methylene
group, limonene3060.18 Alkane, aromatic C\\H stretch Lipids, saponin,
polystyrene3428.69 Asym. N\\H str., carboxylate C\\O sym.
and asym. str. Bonded/non-bonded OHgroup
Alcohols and phenols,thymol, nicotinic acid
3497.01 Intra- or inter-molecular bonded OH Saponin3664.86 Free OH, primary NH amines asymmetric Amino acids3723.95 Free OH Saponin3760.21 Free OH Saponin3926.55 C\\H stretch of aromatic combination All aromatic rings
79N. Chouhan et al. / Journal of Molecular Liquids 230 (2017) 74–84
the interband and intraband transitions between electronic states of sil-ver. IR study prove the presence of two kinds of chemicals in TA extract:one the reducing agent (nicotinic acid, polyphenols) that convert Ag+
ions into Ag nanoparticles and second the capping agents/surfactant(carvone, thymols, sugars, proteins, lipids, saponin, etc), which can actas an scaffold for controlling size and shape of these nanoparticles, asit was mentioned in SEM/TEM/HRTEM study segment of this paper.
2.4. Visible photoluminescence
Fig. 7 illustrated the excitation and emission spectra of biogenic sil-ver nanoparticles that synthesized at 48 h aging AgNPs in 2.0% TA. Exci-tation spectra of the as-prepared Ag NPs was obtained at λex = 289 nm
555 570
Em=563 nm
2850
150
300
450
600
750Ex=283 nm
u.a
/yti
sn
etnI
Fig. 7. Photoluminescence (PL) excitation spectra (blue) of the as prepared Ag NPs underemission wavelength 565 nm and PLE spectrum (red) at λem = 563 nm under theexcitation radiation of λex = 285 nm. (For interpretation of the references to colour inthis figure legend, the reader is referred to the web version of this article.)
under the emission radiation of 565 nmand sharp PL emission spectrumof green light at λem= 563 nmwas found under the excitation of λex=285 nm. Excitation of electrons from the occupied d-bands into thestates above the Fermi level and successive relaxation of electronsfrom an occupied sp-band to the holes takes place by the electron-pho-non scattering process directed an energy loss, which is responsible forthe visible light luminescence of the Ag nanoparticles [60]. The opticalproperties of the silver nanoparticles depend on both; interband andintraband transitions between electronic states. FESEM and TEM resultsindicate that the smaller non-metallic clusters coexist with large metal-lic nanoparticles. Here, only smallmetallic particles (cubic crystals) con-tribute to luminescence because large metal particle didn't exhibitluminescence due to rapid radiation less process that is hard to competewith effective radioactive process [61].
2.5. Cyclic potentiometeric study
Cyclic voltammetric study has proved to be a successful tool formonitoring the progress of the reaction and reduction mechanism ofthe Ag+ ions, using the partial cathodic and anodic reactions proceedingat electrodes. Graphical representation of the cathodic and anodic peakcurrents vs applied potential (V), was observed for the reactionmixtureof pure 2.0% TA extract and 2.0% TA extract with AgNO3 solution, at 2, 3,4 and 5 h aging and scan rate of 0.1 V s−1 (Fig. 8).
It was observed that the anodic peak current decreases on increasingthe time of reaction kinetics from 1 h to 5 h. Decrease in anodic peakcurrent with time indicates that an electron transferred from the solu-tion to electrode, which converts Ag+ ions in the colloidal solution toAg as a result of reduction reaction. However, reverse occurs in oxida-tion process, where electrons release during the reactionAg → Ag+ + e− and that is responsible for the backward reaction[62]. But none of the above investigated reversible couples show the re-verse-to-forward peak currents ratio, ipr/ipf = 1. Hence, all these casesare irreversible with respect to the peak current. The pure TA extract so-lution exhibited the anodic peak at −0.4 V (at current = 13.0 μA) andcathodic peak at −0.5 V (at current = −7.4 μA). TA-incorporatedAgNO3 solution, aged at the different time intervals (1 h, 2 h, 3 h, 4 hand 5 h) exhibited two respective irreversible oxidative peak potentialsaround −0.5 V and between 0.40 and 0.60 V, are followed by the onereductive wave peak at −0.5 V. The corresponding values of currentsof I and II peaks are presented in Table 2. In Fig. 8 (a and b (inset)),the first oxidative peak potentials around −0.4 to −0.5 V correspondto the azo group and aromatic rings. The second peak around between0.40 and 0.60 V are responsible for the reduction of Ag+ ion to Ag[63]. Azo group promotes the reduction of Ag+ to Ag metal. Aging en-couraged the depression in current height of I oxidative peak that repre-sents the azo group and aromatic rings were destroyed gradually.Simultaneously, increase in the current height of II oxidative peakwith aging time, is belongs to the formation of AgNPs formation by re-duction of Ag+/Ag (EAg+/Ag). Fig. 8b exhibited the linear raise in currentpeak height with aging time. Red shift observed in peak was observeddue to increase in concentration of AgNPs, result in increase in current(Table 2).
2.5.1. Electrochemical impedance spectroscopy (EIS)Impedance experimentswere carried out to get insight of the kinetic
of the electrochemical processes occurring at electrode/electrolyte in-terface in the absence and presence of Ag NPs. In these experiments,all the measurements have been reported with respect to the referenceAg/AgCl electrode. The local impedance diagrams (Fig. 9)were recordedin terms of the real impedance vs imaginary impedance as a function offrequency over a frequency range of 10 kHz to around 500 mHz. Com-plex impedance diagram were recorded in Nyquist modulus format,for Pure TA and 24 h aged Ag NPs that was suspended in 2.0% and2.5% aqueous TA solution, as shown by Fig. 9.

(a)
-1.5 -1.0 -0.5 0.0 0.5 1.0 1.5
-8.0µ
-4.0µ
0.0
4.0µ
8.0µ
12.0µA/
tnerr
uC
Applied Potential / V
Pure TA1h2h3h4h5h
(b)
1 2 3 4 5
0
5
10
15
20
0.00 0.25 0.50 0.75
0.0
1.0µ
2.0µ
3.0µ
Cu
rre
nt
/ A
Applied Potential / V
Pure TA1h2h3h4h5h
01x/t
nerruc
EW
-7 A
Aging time / h
Fig. 8. Cyclic voltagrams for pure TA and the colloidal Ag NPs the formed in 2.0% TA seed extract at different time interval; 1 h, 2 h, 3 h, 4 h and 5 h (a) bird eye view and (b) workingelectrode current vs aging time plot along with the Inset represents the close up of II peak (belongs to AgNPs) around applied potential between 0.40 and 0.60 V.
900.0k
1.2M
/ o
hm
Pure TA 2.0% TA 2.5% TA
80 N. Chouhan et al. / Journal of Molecular Liquids 230 (2017) 74–84
Pristine TA sample comprise of two depressed capacitive semicircle,spread over from the high to low frequency regions. This typical behav-iour of the solidmetal electrodes corresponds to thenon ideal frequencydispersion that related to the surface the inhomogeneities. Rapid linearincrease in real impedancewas observedwith increase in concentrationof TA (2–2.5%) in TA supported-Ag NPs, due to the increase in particlesize and decrease in ionic conductivity. This is a clear indication of inhi-bition in the corrosion process that might be aspected during the pro-duction of AgNPs. Moreover, Warburg impedance dropped out athigher frequency because the time scale is so short that diffusion can'tmanifest itself. At low frequency, the reactants have to diffuse fartherthat increases the Warburg-impedance.
2.6. Catalytic reduction of p-nitrophenol using NaBH4 and AgNPs
In recent years one of the most important applications of the AgNPshas been observed in catalysis of chemical reactions. Even in eradicationof nitrophenol pollution it proved remarkable. In order to evaluate thecatalytic activity of the AgNPs (synthesized by using Trachyspermumammi (Ajwain) seed extract; aged at 24 h, 48 h and 72 h) for the reduc-tion of PNP (0.05mM) to PAP in aqueous sodiumborohydride (15mM).The reaction was monitored at room temperature in absence and pres-ence of AgNPs. The reaction progresswas spectrophotometrically exam-ined by recording the absorption spectra at various time interval. Themain absorption peaks of PNP were found at 258 and 316.5 nm due toπ→π* andn→π* transition, respectively. The treatment of this solutionwith freshly prepared aqueous solution of NaBH4 result in disappear-ance of 258 nm peak and shift of the first excitation peak of PNP from316.5 nm to 401.5 nm, due to the formation of 4-nitrophenolate ion inthe solution, which was demonstrated by optical spectra in Fig. 10aand its schematic presentation is demonstrated by Scheme 1.
The peak position at 401.5 nm in absence of AgNPs, remains unal-tered even after the month long aging because of a huge kinetic barrier
Table 2Current and voltage values of pure 2.0% TA extract and Ag NPs prepared at 1–5 h aging.
Aging of AgNPs/h
I peak applied potential/V;current/A
II peak applied potential/V;current/A
Pure TA −0.490; 1.36 × 10⁻⁵ 0.43/0.58; no peak1 −0.610; 2.00 × 10⁻⁷ 0.481; 1.360 × 10⁻⁷
2 −0.182; 1.890 × 10⁻⁷ 0.430; 5.081 × 10⁻⁷
3 −0.173; 1.456 × 10⁻⁷ 0.439; 8.900 × 10⁻⁷
4 −0.133; −2.010 × 10⁻⁷ 0.501; 11.60 × 10⁻⁷
5 −0.083; −1.943 × 10⁻⁷ 0.598; 20.70 × 10⁻⁷
development due to large potential difference between the donor andacceptors that decreases the feasibility of this reaction for the reductionprocess [64]. Interestingly, on addition of a freshly prepared biogenicAgNPs (0.1 mL, 100 mgL−1) to the mixture of PNP and sodium borohy-dride solution, the intensity of the 4-nitrophenolate peak at 401.5 nm,start decreasing. The whole reduction process of the PNP in 24, 48 and72 h aged samples of AgNPs, was completed in 10, 12 and 18 min,which was revealed by naked eyes through the disappearance of theyellow colour of the PNP (Fig. 10b,c and d). Simultaneously, the appear-ance of a new peak at 300 nmwavelength, was confirmed the catalyticreduction of PNP to PAP and its mechanism is shown by the Scheme 1[65]. Peak position of the 24 h-, 48 h- and 72 h-aged samples in absenceof AgNPs, were observed at 401, 400 and 402 nm, respectively (Fig.10e). This confirms the particle size reduces from 24 h aging to 48 haging and afterwards its increases at 72 h aging.
Catalytic action of AgNPs in above reduction process, lower downthe activation energy that leads to the formation of PAP by following apseudo-first-order rate kinetics with respect to PAP. Effect of aging re-vealed on AgNPs's catalytic activity for the PNP reduction process interms of rate of reaction (Fig. 10f). The apparent catalytic rate constant(k24= 0.25709min−1, k48= 0.34539min−1 and k72= 0.0866min−1)was calculated for the reduction process at 24, 48 and 72 h, using theslope of the plot between logarithm of the observed optimum absor-bance and time, which are represented by Fig. 11a, b and c, respectively.
During the catalytic action, AgNPs are initially chemisorbed at the(100) surface of the PNP molecule through two oxygen atoms of the
0.0 500.0k 1.0M 1.5M 2.0M 2.5M
0.0
300.0k
600.0k
Z"
Z'/ ohm
Fig. 9. Electrochemical impedance spectroscopy (EIS) plot of pure TA, 2.0% and 2.5% TAseed extract in 0.001 M AgNO3 solution.

300 400 5000.0
0.5
1.0
1.5
2.0
).u.a(
ecna
bros
bA
Wavelength/nm
Nitrophenol Nitrophenol+ NaBH
4
(b)
(d)
300 350 400 450 500
0.7
1.4
2.1
2.8
3.5
4.2
ua/ytis
netnI
Wavelength / nm
24 h(r =0.2570 min-1)
48 h(r =0.3454 min-1)
72 h(r =0.0866 min-1)
(f)
200 300 400 500 6000
1
2
3
4
)ua(ecnabrosb
A
Wavelength (nm)
Blank 2 Mit. 4 Mit. 6 Mit. 8 Mit. 10 Mit.
200 300 400 500 6000
1
2
3
4
)u
a(e
cn
abr
os
bA
Wavelength (nm)
Blank 2 Mit. 4 Mit. 6 Mit. 8 Mit. 10 Mit. 12 Mit.
200 300 400 500 6000
1
2
3
4
)u
a(e
cn
abr
os
bA
Wavelength (nm)
Blank 2 Mit. 4 Mit. 6 Mit. 8 Mit. 10 Mit. 12 Mit. 14 Mit. 16 Mit. 18 Mit.
20 30 40 50 60 70 800.05
0.10
0.15
0.20
0.25
0.30
0.35
(72h)
(48h)
(24h)
nim/t
natsn
oC
etaR
-1
Aging time /h
(a)
(c)
(e)
Fig. 10. (a) Red shift observed in UV–visible spectrum of 4-nitrophenol (Black) when it reduced to 4-nitrophenolate ions (401.5 nm) (Red) with NaBH4; catalytic reduction of 4-nitrophenol in NaBH4 solution to 4-aminophenol (300 nm peak),was observed on the addition of AgNPs at the time interval (b) 24 h (c) 28 h and (d) 72 h. (e) peak position of theaged samples in absence of AgNPs and (f) Rate constant vs aging time plot. Where, the concentration of various reactants are taken as [0.05 mM PNP]; [0.1 mL of 100 mgL−1 AgNPs]and [15 mM NaBH4]. (For interpretation of the references to colour in this figure legend, the reader is referred to the web version of this article.)
81N. Chouhan et al. / Journal of Molecular Liquids 230 (2017) 74–84
nitro group of p-nitro phenolate ion. That may create a pentagonalAg\\O\\N\\O\\Ag cyclic intermediate that may react with BH4
− ionanddecomposed into PAP, as illustrated by Scheme2. Binding of organicmolecules to metal surfaces and their reduction process has been
Scheme 1. Schematic reaction for the reduction of p-nitrophenol to p-aminophenol.
extensively modeled by Newns [66] and later expanded upon by Ham-mer and Nørskov [67–71].
After executing our experimentwe compare the efficiency of our re-sults with respect to reaction time (12 min), cost and rate of reaction(5.756 × 10⁻³ s−1), with some of the recent state of art AgNPs andmodified AgNPs systems such as; Calcium-Alginate-Stabilised Ag andAu NPs, AgNP-PG-5K (PG: polyguanidino oxanorbornenes (PG), 5 Kand 25 kDa), Al2O3@Ag7,8 QCs, Ag–P (NIPAM-co-Aam; NIPAM: N-isopropylacrylamide), CNFs (carbon nano fibres)/AgNPs composite,Breynia Rhamnoides supported Ag and Au Nanoparticles, TCD (TCD:trisodium citrate dihydrate (HOC(COONa) (CH2COONa)2·2H2O)) sup-ported Ag NPs, chemically reduced Ag NPs, AgNPs/PANINFs nanocom-posites (PANINFs: polyaniline nano fibres), etc (Table 3) [38,72–78].

Fig. 11. Plot of (i) At/A0 vs time and (ii) ln (At/A0) vs time for the reduction of p-nitrophenol at (a) 24 h, (b) 48 h and (c) 72 h aging.Where, [0.05 mMPNP]; [0.1mL of 100mgL−1 AgNPs]and [15 mM NaBH4].
82 N. Chouhan et al. / Journal of Molecular Liquids 230 (2017) 74–84
And it was found that our system is better than above mentioned sys-tems. Reason behind the superiority can be given on the basis ofGarcia–Vidal and Pendry's model, the smaller metallic particles andhigher content of NPs gave higher enhancement in efficiency [79].Moreover, TA supported-AgNPs with high catalytic activity could beeasily recovered by sedimentation upon three successive cycles of re-duction reactions, and would greatly promote their industrialapplication.
Scheme 2. Reduction mechanism of p-nitro phenol to p-aminophenol in presence of theaqueous NaBH4 and Ag NPs.
3. Conclusion
Nanotechnology has a remarkable impact on the present centurydue to its ability to convert materials into their nanosized counterparts.At nano-level, drastic changes in the chemical, physical, electrical andoptical properties of the metals, is observed because of their great sur-face to volume ratio, prominent randommotion, negligible gravitationalforces and dominating electromagnetic forces. Biogenesis is the mostbenign way to synthesis the nanoparticles of metals rather than thepresently chemical and physical methods in practice. In this study,nanoparticles of silver metal have been successfully fabricated byusing aqueous extract of the TA and AgNO3 at varying the concentrationof TA and aging time. During the biosynthesis of the Ag nanoparticles,self-assembling of the chemical components (i.e. nicotinic acid and ste-roidal saponins) of the TA extract's around the of Ag+ ion that leads thereduction of Ag+ ion in Ag NPs. TA seeds extract contains nicotinic acid,which attributed to the reduction. These phythogen altogether leads tothe nucleation of Ag nanoparticles in two shapes (cubes of 5–20 nmandelongated particles of 0.52 × 2 μm). XRD studies confirmed the purity of

Table 3Comparison of the catalytic efficiency of our system with respect to reaction time, cost and rate of reaction, with few state of art AgNPs and modified AgNPs systems.
Catalytic system Conc. PNP (M) Conc. of NaHB4 Nano particles Reduction time Catalytic rate Reference
Calcium-Alginate-Stabilised Ag and Au NPs 0.10 mM 2.5 mL of0.1 M
1, 2 g/L Ag 8 min 0.14–0.20 × 10⁻⁵ min−1 [71]
AgNP-PG-5K 0.12 mM 12 mM 25 μg 11 min 5.50 × 10⁻³ s−1 [72]Al2O3@Ag7,8 QCs 7.00 mM 160 mM 50 mg 18 min 8.23 × 10⁻³ s−1 [73]Ag–P (NIPAM-co-Aam) 0.061 mM 9.15 mM 37.18 mg ml−1 25 min 0.1713 [74]CNFs/AgNPs composite 0.12 mM 5 mM 1.0 mg 8 min 6.2 × 10⁻³ s−1 [75]Breynia Rhamnoides supported Ag and Au nanoparticles 2.00 mM 0.03 M 0.5 mL AgNPs or AuNPs – 4.06 × 10⁻³ s−1 (AgNPs)
9.19 × 10⁻³ s−1 (AuNPs)[76]
11 minTCD supported Ag NPs 2 mmol 0.03 M 300 μL 75 min 0.05 s−1 [77]Ag NPs 5 mM 160 mM 0.675 mg mL−1 20 min 3.28 × 10⁻³ s−1 [78]AgNPs/PANINFs nanocomposites 5 mM 160 mM 0.675 mg m L−1 3 min 21.39 × 10⁻³ s−1 [78]TA-supported biogenic Ag NPs 0.05 mM 15 mM 10 μg 12 min 5.756 × 10⁻³ s−1 This work
PG: polyguanidino oxanorbornenes (PG), 5 K and 25 kDa; NIPAM: N-isopropylacrylamide; TCD: trisodium citrate dihydrate (HOC(COONa)(CH2COONa)2·2H2O).
83N. Chouhan et al. / Journal of Molecular Liquids 230 (2017) 74–84
these nanosized NPs that crystallized in a cubic and rod shaped crystals.Crystal growth orientation of the Ag NPswas found along the 111 plane.Prominent, intense and broad excitonic UV–vis. spectrumpeak of theAgNPs at 420–440 nm, attributed to its surface plasmonic phenomena. IRspectroscopic studies confirmed that carbonyl group of amino acid res-idues have strongbinding abilitywithmetal suggesting the formation oflayer covering metal nanoparticles and acting as capping agent to pre-vent agglomeration and providing stability to the medium. Excitationof electrons from occupied d bands into states above the Fermi level isresponsible to the green light luminescence of Ag nanoparticles at563 nm. Cyclic-voltammetric studies confirm theone electron reductionprocess of the AgNPs. As synthesized AgNPs, were used successfully tocompletely catalyse the reduction of notorious pollutant PNP to PAP inpresence of NaBH4, which was kinetically hard reaction in absence ofcatalyst. The study of effect of AgNPs particle size on PNP reductioncatalytical activity was observed. That results the 48 h-aged AgNPs pre-pared in 2.0% TA extract, show the optimum catalytic efficiency in termof high reaction with respect to many state of art catalytic systems.
4. Experimental
4.1. Aqueous extract of TA seeds
Analytical grade AgNO3 (99%, Merck), was used as purchased with-out any further purification. All solutionswere preparedusingdeionisedMillipore water (DMW). Established procedure for the extraction ofTrachyspermum ammi (Ajwain) seeds was adopted to prepare the aque-ous extract [28] and dry seeds were washed thoroughly with distilledwater to make them free form dust particles and surface contaminationand dried for 24 h in moisture free atmosphere. Afterwards 2 g driedseeds were soaked in 50 mL of pure DMW for 24 h. The extract was fil-tered using Whatmann filter paper No. 42.
4.2. Synthesis of silver nanoparticle
Silver nanoparticles were synthesized using the procedure describesomewhere else [36]. 2.5 mL of the aqueous TA seeds' extract wasadded drop wise into the 25.0 mL of aqueous 0.001 M AgNO3, kept ina 50 mL boiling tube, at room temperature. Afterwards, the mixturewas shifted in a desiccator at room temperature for aging (7 h, 24 h,48 h, 7 days, 14 days, 21 days, etc) that leads to a biogenic chemical re-duction of Ag+ ions into Ag NPs. Transparent solution of AgNO3 turnspink with time, which indicates the presence of Ag nanoparticles.Aging added sharpness to the colour. Silver nanoparticles in aqueousphase are extremely stable without any precipitation and their stabilityfor long period may be due to antimicrobial properties of this plant.Highly dispersed colloidal Ag NPs were found soluble in water and sta-ble at ambient condition for more than 6 months. After certain agingtime, the suspension was centrifuged at 20,000 rpm for 20 min, whichresulted in suspended solid. It was washed by hot DMW thrice prior
to be used for further analysis (XRD, TEM, FESEM with EDX, UV–vis,FTIR, PLE, and cyclic voltammetric study) and catalytic activity analysis.
5. Characterization
5.1. Optical measurement
The Ag NPs were analyzed by X-ray diffraction (XRD) using a BrukerD2 Phase diffractometer that was operated in transmission mode withCuKα radiation (λ = 1.5418 Å). The data were collected over the 2θrange from 20° to 90° at the interval of 0.02° with a counting time of30 s per step. UV–visible absorption spectra were measured in therange of 200–800 nm by periodic sampling of 1 mL aliquot, in spectro-photometer (LAB India, UV 3000+). The particle size of the Ag NPswas also monitored by considering the position of the first excitonicpeak of the spectra. The FTIR spectra of the synthesized nanoparticles(in form of KBr pellet), were recorded in transmission mode at the fre-quency range between 4000 and 400 cm−1 with the resolution of4 cm−1, by using FTIR spectrophotometer (Tensor-27 Bruker, Germanywith software OPUS version 5.1) for solid and ATR spectrophotometer(T-alpha, Bruker) for liquid sample. PL spectra were observed using aspectrofluorimeter (Shimazdu Model RF-5301; along with softwarePC-IV) equipped with a 150 W Xe lamp and a Hamamatsu R928photo-multiplier tube at room temperature. The excitation and emis-sion spectra were recorded at fixed slit width i.e. 5 nm. Morphologyand elemental composition of the sample was checked using scanningelectron microscopy (FESEM, JEOL JSM-6700F) and their correspondingenergy dispersive X-ray spectrum (EDXS, OXFORD), respectively. EDXSmeasurement was carried out with the same instrument by focusing aparticular area of the samples. TEM and HRTEMmicrographs were re-corded using an electron microscope (CM12, PHILIPS). The imageswere analyzed on the basis of the shape, size and crystallinity of AgNPs at accelerating voltage of 200 kV. Sampleswere prepared by placing3–4 drops of the well dispersed Ag NPs in ethyl alcohol samples on a300-mesh, carbon coated Cu grid (EM Sciences) and afterwardsallowing the liquid to evaporate in air. For Ag NPs, the particle size dis-tribution was based on 30 randomly selected particles.
5.2. Electrochemical measurements
Electrochemical experiments were conducted in a conventionalthree-electrode glass cell of capacity 100 mL, using a potentiostat/galvanostat (Auto Lab-PGSTAT 204 Metrohm, equipped with the soft-ware NOVA 3.1). Pt-tipped carbon electrode, Pt-wire and a saturatedAg-AgCl electrode, were used as a working, counter and reference elec-trodes, respectively. In these experiments, all the potentials were re-ported against the Ag/AgCl reference electrode in naturally aeratedand unstirred solutions at 303 K. Impedance measurements weremade at corrosion potentials over a frequency range of 100 kHz–10 mHz, with a signal amplitude perturbation of 5 mV.

84 N. Chouhan et al. / Journal of Molecular Liquids 230 (2017) 74–84
5.3. Reduction of p-nitro phenol
The light yellow colour of 0.05 mM p-nitrophenol turns to yellow-green upon incorporation of the alkaline 15 mM sodium borohydridesolution. But under such conditions PNP didn't convert into PAP, untilthe addition of AgNPs. The peak intensity was quantitatively observedby using UV–Vis spectrophotometer (Model 3000+ of Lab India) witha time gap of 3min. in a scanning range of 200–800 nmat room temper-ature of 25 °Cwith scan speed of 250nmperminute. The reduction of p-nitrophenol with NaBH4 was monitored using UV–vis absorption spec-troscopy in 1 mL of 15 mM NaBH4 (aqueous solution) was mixed with1.7 mL of 0.2 mM 4-nitrophenol (aqueous solution) and 0.1 mL of100 mgL−1 of AgNPs than the mixture was poured in a 5 mL quartzcell for optical observations.
Acknowledgements
The authors thank to the Science and Engineering Research Board ofthe Department of Science and Technology, India (SB/S1/PC-31/2012)for their financial support.We gratefully acknowledge theMIMT, Jaipur,IIT Rorkee and CAIF, Department of Pure and Applied Chemistry, Uni-versity of Kota, for providing help in characterization of samples.
References
[1] M. Catauro, M.G. Raucci, F. Gaaetano, A. De Marotta, J. Mater. Sci. Mater. Med. 15(2004) 831–840.
[2] J.H. Crabtree, R.J. Burchette, I.T. Siddiqi Ra, B. Huen, L.L. Hadnott, A. Fishman, Perit.Dial. Int. 23 (2003) 368–374.
[3] A. Krolikowska, A. Kudelski, A. Michota, Bukowska, J. Surf. Sci. 532 (2003) 227–232.[4] G. Zhao, S.J. Stevens, Biometals 11 (1998) 27–32.[5] N. Duran, P.D. Marcato, O.L. Alves, G.I.H. De Souza, E. Esposito, J. Nanobiotechnol. 3
(2005) 1.[6] D.S. Balaji, S. Basavaraja, R. Deshpande, D.B. Mahesh, B.K. Prabhakar, A.
Venkataraman, Colloids Surf. B 68 (2009) 88–92.[7] A. Ahmad, P. Mukherjee, D. Mandal, S. Senapati, M.I. Khan, R. Kumar, M. Sastry, J.
Am. Chem. Soc. 124 (2002) 12108.[8] A. Ahmad, S. Senapati, M.I. Khan, R. Kumar, M. Sastry, Langmuir 19 (2003) 3550.[9] A. Ahmad, S. Senapati, M.I. Khan, R. Ramani, V. Srinivas, M. Sastry, Nanotechnology
14 (2003) 824.[10] H. Lee, A.M. Purdon, V. Chu, R.M. Westervelt, Nano Lett. 4 (2004) 995–998.[11] V. Armendariz, J.L. Gardea-Torresdey, M. Jose-Yacaman, J. Gonzalez, I. Herrera, J.G.
Parsons, Proceedings – Waste Research Technology Conference at the Kansas City,Mariott-Country Club Plaza July 30–Aug 1, 2002.
[12] M. Kowshik, S. Ashtaputre, S. Kharrazi, W. Vogel, J. Urban, S.K. Kulkarni, K.M.Paknikar, Nanotechnology 14 (1) (2003) 95.
[13] K. Ghule, A.V. Ghule, J.Y. Liu, Y.C.J. Ling, Nanosci. Nanotechnol. 6 (2006) 3746–3751.[14] S. Li, Y. Shen, A. Xie, X. Yu, L. Qiu, L. Zhang, Q. Zhang, Green Chem. 9 (2007) 852–858.[15] J.L. Gardea-Torresdey, J.G. Parsons, E. Gomez, J. Peralta-Videa, H.E. Troiani, P.
Santiago, M. Yacaman, J. Nano Lett. 2 (2002) 397–401.[16] I.B. Obot, S.A. Umoren, A.S.J. Johnson, Mater. Environ. Sci. 4 (6) (2013) 1013–1019.[17] E.M. Egorova, A.A. Revina, Physicochem. Eng. Asp. 168 (2000) 87–96.[18] J. Huang, Q. Li, D. Sun, Y. Lu, X. Yang, H. Wang, Y. Wang, W. Shao, N. He, J. Hong, C.
Chen, Nanotechnology 8 (2007) 105104.[19] B. Ankamwar, C. Damle, A. Ahmad, M. Sastry, J. Nanosci. Nanotechnol. 5 (2005)
1665–1671.[20] S.P. Chandran, M. Chaudhary, R. Pasricha, A. Ahmad, M. Sastry, Biotechnol. Prog. 22
(2006) 577–583.[21] S.S. Shankar, A. Rai, A. Ahmad, M. Sastry, J. Colloid Interf. Sci. 275 (2004) 496–502.[22] R.P. Singh, S. Magesh, C. Rakkiyappan, Int. J. Bioeng. Sci. Technol. 02 (03) (2011)
75–80.[23] K. Govindaraju, S. Tamilselvan, V. Kiruthiga, G. Singaravelu, J. Biopestic. 3 (1) (2010)
394–399.[24] M. Sundarajan, S. Gowri, Chalcogenide Lett. 8 (8) (2011) 447–451.[25] S. Maensiri, P. Laokul, J. Klinkaewnarong, S. Phokha, V. Promarak, S. Seraphin, J.
Optoelectron. Adv. Mater. 10 (3) (2008) 161–165.[26] H.M. Gong, L. Zhou, X.R. Su, S. Xiao, S.D. Liu, Q.Q.Wang, Adv. Funct. Mater. 19 (2009)
298–303.[27] N.P.S. Acharyulu, R.S. Dubey, V. Swaminadham, P. Kollu, S.V.N. Pammi, Int. J. Eng.
Res. Technol. 3 (4) (2014) 639–641.[28] S. Ankanna, P. TNVKV, E.K. Elumalai, N. Savithramma, Dig. J. Nanomater. Biostruct. 5
(2) (2010) 369–372.
[29] R.H. Ritchie, Phys. Rev. 106 (1957) 874.[30] W.L. Barnes, A. Dereux, T.W. Ebbesen, Nature 424 (2003) 824–830.[31] S.A. Maier, H.A. Atwater, J. Appl. Phys. 98 (2005) 011101.[32] S.A. Maier, Plasmonics Fundamentals and Applications, first ed. Springer, New York,
2007 pp 21–34 and 65–88.[33] S. Lal, S. Link, N. Halas, Nat. Photonics 1 (2007) 641–648.[34] X.C. Wang, J.C. Yu, H.Y. Yip, L. Wu, P.K. Wong, S.Y. Lai, Chem. Eur. J. 11 (2006)
2997–3004.[35] X.B. Cao, L. Gu, L.J. Zhuge,W.J. Gao,W.C.Wang, S.F.Wu, Adv. Funct. Mater. 16 (2006)
896–902.[36] J. Virkutyte, R.S. Varma, New J. Chem. 34 (2010) 1094–1096.[37] T. Vincent, E. Guibal, Langmuir 19 (2003) 8475–8483.[38] G. Chang, Y. Luo, W. Lu, X. Qin, A.M. Asiri, A.O. Al-Youbi, X. Sun, Catal. Sci. Technol. 2
(2012) 800–806.[39] W. Lu, Y. Luo, G. Chang, X. Sun, Biosens. Bioelectron. 26 (2011) 4791–4797.[40] M. Nasrollahzadeh, S.M. Sajadi, A. Rostami-Vartooni, M. Bagherzadeh, J. Colloid In-
terface Sci. 448 (2015) 106–113.[41] K. Satyavani, T. Ramanathan, S. Gurudeeban, Dig. J. Nanomater. Biostruct. 6 (2011)
1019–1024.[42] R. Varshney, S. Bhadauria, M.S. Gaur, Adv. Mat. Lett. 1 (3) (2010) 232–237.[43] K. Jeet, N. Devi, T. Narendra, T. Sunil, S. Lalit, T. Raneev, Int. Res. J. Pharm. 3 (5)
(2012) 133–138.[44] M. Kjellin, I. Johansson, Surfactants from Renewable Resources, John Wiley & Sons,
2010.[45] X. Gao, G. Gu, Z. Hu, Y. Guo, X. Fu, J. Song, Colloids Surf. A Physicochem. Eng. Asp. 254
(2005) 57–61.[46] A. van Dijken, E.A. Meulenkamp, D. Vanmaeklenbergh, A. Meijerink, J. Lumin. 87–89
(2000) 454–456.[47] Y.J. Xing, Z.H. Xi, Z.Q. Xue, X.D. Zhang, J.H. Song, R.M. Wang, J. Xu, Y. Song, S.L. Zhang,
D.P. Yu, Appl. Phys. Lett. 83 (2003) 1689–1691.[48] W. Haiss, N.T.K. Thanh, J. Aveyard, D.G. Fernig, Anal. Chem. 79 (2007) 4215–4221.[49] D.C. Oh, T. Suzuki, J.J. Kim, H. Makino, T. Hanada, M.W. Cho, T. Yao, Appl. Phys. Lett.
86 (2005) 032909.[50] Wriedt, T. Mie Theory 1908–2008, ed. by Hergert, W.; Wriedt, T. Universität Bre-
men. Bremen, 2008, pp. 17–21.[51] K. Jilie, Y.U. Shaoning, Acta Biochim. Biophys. Sin. 39 (2007) 549–559.[52] N.P.G. Roeges, A Guide to the Complete Interpretation of Infrared Spectra of Organic
Structures, Wiley, New York, 1994.[53] G. Varsanyi, Assignments of Vibrational Spectra of Seven Hundred Benzene Deriva-
tives, vol. 1, Halsted Press, 1974.[54] I.D.G. Macdonald, W.E. Smith, Langmuir 12 (1996) 706–713.[55] A.M. Fayaz, K. Balaji, M. Girilal, R. Yadav, P.T. Kalaichelvan, R. Venketesan,
Nanomedicine: NBM 6 (2010) 103–109.[56] R. Sathyavathi, M.B. Krishna, S.V. Rao, R. Saritha, D.N. Rao, Adv. Sci. Lett. 3 (2010)
138–143.[57] A. Manna, T. Imae, M. Iida, N. Hisamatsu, Langmuir 17 (19) (2001) 6000–6004.[58] M.H. Moore, R.L. Hudson, Icarus 161 (2003) 486–500.[59] W. Zheng, D. Jewitt, Y. Osamura, R.I. Kaiser, Astrophys. J. 674 (2) (2008) 1242.[60] B.M.V. Romão, C. Pardini, R.C.L. Dutra, F. Burel, Polímeros Ciência Tecnologia 13
(2003) 173–180.[61] J.P. Wilcoxon, J.E. Martin, F. Paraspour, D.F.J. Kelley, Chem. Phys. 108 (1998)
9137–9143.[62] H. Peng, S.X. Hai, G.H. Cheng, Acta Phys. -Chim. Sin. 20 (10) (2004) 1200–1203.[63] A. Frattini, N. Pellegri, D. Nicastro, O.D. Sanctis, Mater. Chem. Phys. 94 (1) (2005)
148–152.[64] N. Pradhan, A. Pal, T. Pal, Colloids Surf. A Physicochem. Eng. Asp. 196 (2002)
247–257.[65] Z.D. Pozun, S.E. Rodenbusch, E. Keller, K. Tran, W. Tang, K.J. Stevenson, G.J.
Henkelman, Phys. Chem. C 117 (2013) 7598–7604.[66] D.M. Newns, Phys. Rev. 178 (1969) 1123–1135.[67] B. Hammer, J.K. Nørskov, Nature 376 (1995) 238–240.[68] B. Hammer, Y. Morikawa, J.K. Nørskov, Phys. Rev. Lett. 76 (1996) 2141–2144.[69] B. Hammer, J.K. Nørskov, Surf. Sci. 343 (1995) 211–220.[70] B. Hammer, J.K. Nørskov, Surf. Sci. 359 (1996) 306.[71] B. Hammer, Top. Catal. 37 (2006) 3–16.[72] S. Saha, A. Pal, S. Kundu, S. Basu, T. Pal, Langmuir 26 (4) (2010) 2885–2893.[73] B. Baruah, G.J. Gabriel, M.J. Akbashev, M.E. Booher, Langmuir 29 (13) (2013)
4225–4234.[74] A. Leelavathi, B.T.U. Rao, T. Pradeep, Nanoscale Res. Lett. 6 (2011) 123.[75] R. Begum, Z.H. Farooqi, E. Ahmed, K. Naseem, S. Ashraf, A. Sharif, R. Rehan, Appl.
Organomet. Chem. (2016) 1–8.[76] P. Zhang, C. Shao, Z. Zhang, M. Zhang, J. Mu, Z. Guo, Y. Liu, Nanoscale 3 (2011)
3357–3363.[77] A. Gangula, R.K. Podila, M. Ramakrishna, L. Karanam, C. Janardhana, A.M. Rao, Lang-
muir 27 (24) (2011) 15268–15274.[78] F.A. Al-Marhaby, R. Seoudi, World J. Nanosci. Eng. 6 (2016) 29–37.[79] H. Hu, Z. Wang, L. Pan, S. Zhao, S.J. Zhu, Phys. Chem. C 114 (2010) 7738–7742.
802 | P a g e
SYNTHESIS OF ZnO NANOPARTICLES FOR
ORGANIC POLLUTANT DEGRADATION
Rajesh Kumar Meena
1*, Niranjan Kumar Mandawat
2,
Neeta Gurbani3, Neelu Chouhan
4*
1,2,3,4
Department of Pure & Applied Chemistry, University of Kota, Kota, Rajasthan, (India)
ABSTRACT
In this research work, we have synthesized an effective water filtration system based on the photocatalytic
performance of semiconducting dense nanoparticles under natural sunlight. The present study, focus on the
photocatalytic activity of nanostructures semiconductor like zinc oxide (ZnO) was prepared by sol-gel methods
on the degradation of organic dye such as methylene blue that was investigated. Synthesized ZnO nanoparticles
are characterized and study of morphology structure and stability of the synthesized ZnO nanoparticles were
studied using scanning electron microscope (FESEM), UV-spectro photometer and Fourier Transform Infrared
(FTIR) spectroscopy. The results depicted that the synthesized nanoparticles are moderately stable, roughly
spherical with maximum particles in size range within 40-50 nm in diameter.
Key Words: Organic pollutant FTIR, XRD, FESEM etc.
I INTRODUCTION
Environmental contaminants similar to dyes, pesticides and heavy metals in water require remediation and
probable removal to make the water it for human consumption. A lot of research is established to purify water
from its contaminants, a most important portion of which are organic in nature. Further, the photocatalytic
degradation of organic pollutants from water using semiconducting materials has attracted a lot of attention.
Such semiconductors are increasingly used for oxidation or degradation of organic dyes and other contaminants
particularly in industrial wastewater. The basic mechanism for this remediation is primarily based on the oxygen
defects on the surface of the semiconducting materials which when activated by photon irradiation are used to
destroy the organic contaminants. The various advantages that the process has are (a) the photocatalytic reaction
is not specific to compounds and, therefore, is capable of destroying a spectrum of organic chemicals like
hydrocarbon fuels, halogenated solvents, surfactants, pesticides and many hazardous organic chemicals,[1,2]
(b)
this process is very effective mostly owing to the process of its removal, oven achieving a complete degradation,
(c) the process is very resistant to toxicity etc., (d) the process can be applied equally well to liquid (e.g.
wastewater and contaminated groundwater) and gaseous streams (e.g. VOC emission), and finally (e) there is a
potential to utilize solar energy as reported in this particular work.[3–5]
Most photo degradation is still
accomplished by exposure to UV radiation although UV sources consume considerable amount of energy.

803 | P a g e
In the past two decades, zinc oxide has paying much attention with respect to the degradation of different
pollutants due to its high stability, photosensitivity and wide band gap. Most researchers have earlier used ZnO
in a nano-powder form dispersed in industrial water for the photo-degradation of organic pollutants. Further, it
has been reported that ZnO has a higher photocatalytic efficiency compared to TiO2 in the degradation of
several organic contaminants in both acidic and basic media, which has attracted researchers to explore the
properties of zinc oxide in many photocatalytic reactions.[6-8]
Zinc oxide is consideration to be as a low cost
alternative photocatalyst to TiO2 for degradation of organics in aqueous solutions. The dispersion and surface
area of zinc oxide, which depend on the synthesis method, are significant factors for determining its
photocatalytic activity for pollutant degradation. Zinc oxide NPs can be synthesis by various type of methods,
such as, alkali precipitation, hydrothermal synthesis, thermal decomposition, spray pyrolysis and microwave
irradiation, organo-zinc hydrolysis, plasma heat-decomposing, etc. Composites of zinc oxide and silica
nanoparticle could be created through coprecipitation route; in this case, the zinc oxide could be covered on the
silica nanoparticle surface[9].Photocatalyst is besides called photochemical catalyst and the function is parallel
to the chlorophyll in the photosynthesis. In a photocatalytic scheme, photo-induced molecular transformation or
reaction takes place at the surface of catalyst. A basic photocatalytic reaction on the generation of electron–hole
pair and its destination is as follows: when a photocatalyst is illuminated by the light stronger than its band gap
energy, electron–hole pairs diffuse out to the surface of photocatalyst and participates in the chemical reaction
with electron donor and acceptor. Those free electrons and holes transform the neighboring oxygen or water
molecules into OH free radicals with super strong oxidization. It can oxygenolyse various kinds of organic
compounds and some parts of minerals. It may also deoxidize harmful substances like formaldehyde, benzene
and ammonia into CO2 and water free of toxic, harm, and odor. Therefore, photocatalyst may kill viruses,
germs, pollen, epiphytes and the like and may decompose formaldehyde, benzenes, ammonia, and other harmful
gases, and it will not bring secondary environmental pollution [10]. The degradation of the pollutants catalyzed
by ZnO has been studied broadly. ZnO is known of the important photocatalysts because of its unique
advantages, high photocatalytic activity, such as its low price and nontoxicity etc.[11, 12]
II MATERIALS AND METHODS
2.1 Materials
Zinc nitrate and citric acid were purchased from Sigma- Aldrich and were all used without further purification
and Double distilled water was used as the solvent during this process.
2.2 Synthesis of Zinc Oxide Nanoparticles
ZnO NPs were prepared by the sol-gel method. Firstly from Sigma- Aldrich of zinc nitrate and citric acid were
selected as original materials without any purification. 0.5837 g citric acid and 0.826 g zinc nitrate were
dissolved into DIW water. In which citric acid acted as both stabilizer and mineralizer. After stirring for 1h, the
mixture solution aged in the next 14 h at near room temperature. Then the mixture solution was evaporated and
concentrated until changing to wet-gel at 90℃ water-bath. Then the wet-gel was put into drying oven at 120℃

804 | P a g e
for 6h, and then the formed mixture was calcined at 500℃ for 3h, and the ZnO nanospheres material was
achieved for further characterization.
2.3 Optical Properties
UV-Visible spectroscopy (UV-Vis) refers to absorption spectroscopy in the UV-Visible spectral region. That
means it uses beam in the visible and adjacent (near-UV and near-infrared (NIR)) ranges. . In this time uv-vis
absorption spectra was takened using a (LABINDIA Uv- Visible 3000+) spectrophotometer where the cuvette
path length was set to 1.0 cm. The particles were dissolved in DIW water, and solution was placed in a quarts
cuvettes. The absorption in the visible range openly affects the perceived colour of the chemicals involved. In
this region of the electromagnetic spectrum generate by the electronic transitions.
2.4. Powder X-Ray Diffraction
XRD patterns of the powdered samples were obtained on a Phillips X’Pert materials research diffractometer
using secondary monochromated Cu Kα radiation (λ = 1.54060 A°) at 40 Kv/50mA. Samples were supported on
a glass slide. Measurements were taken using a glancing angle of incidence detector at an angle of 2 for 2θ
values over 10–70 in steps of 0.05 with a scan speed of 0.012.
2.5. FESEM analysis
The FESEM image was taken with very high resolution and MATLAB analysis gives the pixel depth of the
image equal to 24bits and the image format as JPEG. The FESEM Images have been taken from MNIT Jaipur,
Rajasthan, India.
2.6. Fourier Transform Infrared (FTIR) Spectroscopy
FTIR analysis range 4000 to 400 cm-1 using Bruker -Tensor Spectrum in the diffuse reflectance mode at a
resolution of 4cm−1 in KBr pellets. The powder sample was placed on a sample holder and the spectrum was
recorded.
III RESULTS AND DISCUSSION
3.1 UV-Visible Analysis
UV-Visible absorption spectroscopy is widely used technique to examine the optical properties of nano sized
particles. The prepared zinc oxide white crystalline powder was not soluble in water and almost in all organic
solvents. ZnO nano particles UV-Visible spectra recorded by dispersed in methanol solution and sonicated for 5
to 10 min. Fig. 4 shows the absorption spectroscopy of the ZnO nanoparticles in the UV-spectral region. ZnO
exhibits a sharp band at 354 nm, which corresponds to the formation of ZnO nanoparticles.

805 | P a g e
Fig.1. UV-Vis. spectra of ZnO NPs synthesized by sol-gel method
3.2 XRD Analysis
The crystal structures of the synthesized samples were determined by powder X-ray diffraction (XRD) using a
copper Kα radiation source at 40 kV and 200 mA in steps of 0.02. Data were recorded ranging from 10° to 70°.
Fig. 2 showed the XRD patterns of as-synthesized samples obtained by sol-gel method whose reflection peaks
can be readily indexed with the wurtzite ZnO (JCPDS No. 79-2205). Prepared ZnO nanospheres were obtained
by the sol-gel method, the crystal structure of ZnO was shown in Fig. 3, which belonged to the wurtzite
structure. It can be seen that lattice parameters were a=0.3249 nm and c=0.5206 nm.
Fig.2. XRD spectra of ZnO synthesized by: sol-gel method Fig.3. Crystal structure of ZnO

806 | P a g e
3.3 Morphology Analysis:
SEM images of the products were shown in Fig. 4. ZnO NPs was prepared by sol-gel method calcined at 500℃
for 3 hours and pH was 8. SEM image showed relatively more uniform ZnO NPs prepared by sol-gel method
look like nanospheres, with diameter range 10-50nm.
Fig.4. SEM image of ZnO NPs produced by the Sol-gel method
3.4 FTIR Analysis
FT-IR spectrum of ZnO nanoparticles (Fig. 5) showed significant absorption peaks at 573 and 1577, 3372cm
-1.
The absorption band at 573 cm-1 due to Zn-O stretching vibration mode. The weak band near 1577 cm- 1
is
assigned to H-O-H bending vibration mode were presented due to the adsorption of moisture, when FTIR
sample disks were ready in an open air atmosphere. These explanations provided the evidence for the presence
of hydration in the structure and intense broad band near 3372 cm-1 represents the hydrogen bonded O-H
stretching vibration mode.
Fig.5 FTIR spectra of synthesized ZnO NPs

807 | P a g e
3.6 Photocatalytic activity of ZnO NPs
Photocatalytic activity of ZnONPs was investigated by measuring the photocatalytic degradation of methylene
blue in water under the illumination of UV light. The ZnO nanoparticles of 50 nm in common particle size were
chosen for the evaluation of photocatalytic activity. As shown in Fig. 6, it was found that the ZnO nanoparticles
were effective on the degradation of the methylene blue. Higher photocatalytic activity of the ZnO nanoparticles
is considered due to the higher surface area of the ZnO nanoparticles. At higher surface area, larger contact area
between photocatalyst and target material can be obtained. It also meant that higher degree of UV light
absorption could occur at the smaller particle size in the test solution.
Fig.6. Effect of catalyst loading on the photodegradation of methylene blue using ZnO
nanoparticles.
lV. CONCLUSION In this present study, ZnO NPs have been successfully synthesized using Zinc nitrate and citric acid solution as
precursors via sol-gel approach. By carefully controlling the process window, various morphologies of ZnO
particles such as disk like and spherical NPs could be produced. The crystallite size calculated from the XRD is
50 nm. FT-IR results confirm that the presence of Zn-O at 573cm-1 as well as UV-visible Spectroscopy the
absorption spectrum was 374 nm absorbed. The photo degradation of methylene blue using ZnO spherical
nanoparticles process was investigated. In which catalysts may further enhance the photocatalytic activity due to
its high surface to volume ration which will facilitate the better adsorption of dyes.
V. ACKNOWLEDGMENT The authors are sincerely thankful to the Department of Science and Technology and their sub wing Science and
Engineering Research Board of the, India (SB/S1/PC- 31/2012) for their financial support.NCL, Pune and IIT
Rorkee, India, are also thanked by the authors for providing XRD and FESEM facilities, respectively.

808 | P a g e
REFERENCES
[1] R. Venkatadri and R. W. Peters, Chemical oxidation technologies: ultraviolet light/hydrogen peroxide,
Fenton’s reagent, and titanium dioxide-assisted photocatalysis, Hazard. Waste Hazard. Mater., 10(2), 1993,
107–149.
[2] M. R. Hoffmann, S. T. Martin, W. Choi and D. W. Bahnemann, Environmental applications of
semiconductor photocatalysis, Chem. Rev., 95(1), 1995, 69– 96.
[3] A. L. Pruden and D. F. Ollis, Photoassisted heterogeneous catalysis: the degradation of trichloroethylene in
water, J. Catal., 82(2), 1983, 404–417.
[4] C. Kormann, D. W. Bahnemann and M. R. Hoffmann, Photolysis of chloroform and other organic molecules
in aqueous titanium dioxide suspensions, Environ. Sci. Technol., 25(3), 1991, 494–500.
[5] J. C. Crittenden, J. Liu, D. W. Hand and D. L. Perram, Photocatalytic oxidation of chlorinated hydrocarbons
in water, Water Research, 31(3), 1997, 429–438.
[6] M. Muruganandham and J. J. Wu, Synthesis, characterization and catalytic activity of easily recyclable zinc
oxide nanobundles, Appl. Catal., B, 80(1), 2008, 32–41.
[7] J. C. Lee, S. Park, H.-J. Park, J.-H. Lee, H.-S. Kim and Y.-J. Chung, Photocatalytic degradation of TOC
from aqueous phenol solution using solution combusted ZnO nanopowders, J. Electroceram., 22(1–3), 2009,
110–113.
[8] A. A. Khassin, T. M. Yurieva, V. V. Kaichev, V. I. Bukhtiyarov, A. A. Budneva, E. A. Paukshtis and V. N.
Parmon, Metal– support interactions in cobalt-aluminum co-precipitated catalysts: XPS and CO adsorption
studies, J. Mol. Catal. A: Chem., 175(1), 2001, 189–204.
[9] Wenzhong Sh., Zhijie L ., Hui W., Yihong L., Qingjie G., Yuanli Z., Photocatalytic degradation for
methylene blue using zinc oxide prepared by codeposition and sol–gel methods. Journal of Hazardous
Materials. 152: 2008, 172–175.
[10] Comparelli R., Fanizza E., Curri M L., Cozzi P D., Mascolo G., Agostiano A., Photodegradation of
methylene blue using Ta-doped ZnO nanoparticle. Appl. Catal. B: Environ. 60: 2005, 1–11.
[11] Akyol A., Yatmaz H C., Bayramoglu M., Photocatalytic degradation of reactive brilliant blue X-BR in
aqueous solution using quantum-sized ZnO. Appl. Catal. B: Environ. 54: 2004, 19–24.
[12] Liu H Q., Yang J X., Liang J H., Huang Y X., Tangz C Y., Photo-degradation of methylene blue using Ta-
doped ZnO nanoparticle. J. Am. Chem. Soc. 91: 2008, 1287–1291.

Research Journal of Recent Sciences
Vol. 7(3), 1-6, March (2018)
International Science Community Association
Short Communication
Green synthesis of silver nanoparticles using acacia concinna plant extract
and their antibacterial activityRajesh Kumar Meena
Department of Pure, Applied and Chemistry, University of Kota, Kota, Rajasthan, India
Available online at: Received 25th May
Abstract
Rapid synthesis of AgNPs by plant of Acacia concinna
eco-friendly approach. This research work are
extract of acacia concinna plant and aqueous silver nitrate solution, for the preparation of the AgNPs. This plant extract ac
as both reducing and capping agent. The essential in
present in the fruit extract that used for the formation of AgNPs.
it showed the formation of Ag NPs using UV
nm. The sizes of nanoparticles were calculated by transmission electron microscopy (TEM) and X
addition, by using Agar-Well Diffusion Method, the antimicrobial ac
Escherichia coli. For the conversion of Ag
chemical synthesis method without the contribution of any hazardous to envi
Keywords: Eco friendly, TEM, UV-visible, XRD,
Introduction
Recently, synthesis of noble metal NPs such as Au, Ag, Pd and Pt and their study are given much importanceas well as chemical properties are look like different from the bulk materials which fascinate the current research fieldmetal nanoparticles are of much significanceoptical, electronic and magnetic as well as catalMainly PXRD technique is used to study the phase and purity of nanomaterials. In this research work, we discussed about the easy, low cost and room temperature synthesis of metal AgNPs. The as prepared AgNPs are of 2-20 nm size and their resresults are exhibited by TEM analysis. To prepare nanoparticles on solid support materials, including diverse lithographic techniques, vacuum depositionl, diffusion, electrophoretic chemical and electrochemical deposition of the metal NPs etc.a range of synthetic techniques has been adopted. For consistent morphology and size of NPs, there are a variety of techniques like vacuum deposition of metal, diffusion, lithography etc and but they all are not cost-effective. The appropriate, simplest andeconomical approaches to synthesize nanomaterials are using the green and environmentally benign method. Currently, the green synthetic method has gained fabulous persuade in large-scale biosynthesis process than physical and chemical process due to environmental concerns. The green synthesis of NPs is a clean, nontoxic, nonhazardous, costeffective and environmentally friendly approach. The biological synthesis process includes use of the plant (or) and microbes
Sciences ___________________________________________
International Science Community Association
of silver nanoparticles using acacia concinna plant extract
and their antibacterial activity Rajesh Kumar Meena, Kahkashan Ansari, Nawal Kishor and Neelu Chouhan
Department of Pure, Applied and Chemistry, University of Kota, Kota, Rajasthan, [email protected]
Available online at: www.isca.in, www.isca.me May 2017, revised 9th January 2018, accepted 20th January 2018
Rapid synthesis of AgNPs by plant of Acacia concinna fruit extract. Synthesis of Ag Nps has been planned as a valuable and
This research work are cost effective as well as eco-friendly i.e reduction method using the fruit
extract of acacia concinna plant and aqueous silver nitrate solution, for the preparation of the AgNPs. This plant extract ac
as both reducing and capping agent. The essential ingredients liable variables are triterpenes, flavonoids and eugenol, are
present in the fruit extract that used for the formation of AgNPs. After the reduction process silver (Ag
it showed the formation of Ag NPs using UV-visible spectrophotometry, which exhibits the absorption peak around at 430
nm. The sizes of nanoparticles were calculated by transmission electron microscopy (TEM) and X
Well Diffusion Method, the antimicrobial activity of synthesized AgNPs was investigated by against
Escherichia coli. For the conversion of Ag+ to AgNPs at room temperature, this method could be proved a better substitute to
chemical synthesis method without the contribution of any hazardous to environment.
visible, XRD, diffusion method etc.
Recently, synthesis of noble metal NPs such as Au, Ag, Pd and Pt and their study are given much importance1-3. Their physical as well as chemical properties are look like different from the bulk materials which fascinate the current research field4. Noble metal nanoparticles are of much significance owing to their optical, electronic and magnetic as well as catalytic behavior. Mainly PXRD technique is used to study the phase and purity of nanomaterials. In this research work, we discussed about the easy, low cost and room temperature synthesis of metal AgNPs.
20 nm size and their respective results are exhibited by TEM analysis. To prepare nanoparticles on solid support materials, including diverse lithographic techniques, vacuum depositionl, diffusion, electrophoretic chemical and electrochemical deposition of the metal NPs etc.5-8
range of synthetic techniques has been adopted. For consistent morphology and size of NPs, there are a variety of techniques like vacuum deposition of metal, diffusion, lithography etc and
effective. The appropriate, simplest and economical approaches to synthesize nanomaterials are using the green and environmentally benign method.
Currently, the green synthetic method has gained fabulous scale biosynthesis process than physical and
ronmental concerns. The green synthesis of NPs is a clean, nontoxic, nonhazardous, cost-effective and environmentally friendly approach. The biological synthesis process includes use of the plant (or) and microbes
(fungi, bacteria, algae) for the synthesismicrobial culture protection the use of plant extract is more significant than using microbes, timeeffective. In this research work, we have confirmed the synthesis of AgNPs via green synthesis method usingConcinna plant extract. We have also investigated using UVVis spectroscopy, ATR, biological activity against(Escherichia coli (E. coli) bacteria,results were correlated with TEM results. Materials and methods
Silver nitrates (99.99%) were purchased from sigma Aldrich and Acacia concinna plant fruit extract as a green reducing agent and all valuable glassware’s were cleaned with distilled water during the experiment. Aqueous extract of Acacia concinna fruit:
plant fruit were collected from University of Rajasthan, Jaipur, Rajasthan, and cleaned with distilled water and dry at normal room temperature and grind to make it powder. 2 gm of concinna fruit powder was dissolved with 50 mL of distwater and kept for 12 h, afterwards the extracts were filtered by whatman paper and stored at 4o
synthesis process. Synthesis of silver nanoparticle:
concinna plant fruit extract and freshly 10 mM ssolution prepared in a separate beaker. Secondly, silver nitrate
_____________ISSN 2277-2502
Res. J. Recent Sci.
1
of silver nanoparticles using acacia concinna plant extract
Chouhan*
Department of Pure, Applied and Chemistry, University of Kota, Kota, Rajasthan, India
fruit extract. Synthesis of Ag Nps has been planned as a valuable and
friendly i.e reduction method using the fruit
extract of acacia concinna plant and aqueous silver nitrate solution, for the preparation of the AgNPs. This plant extract act
gredients liable variables are triterpenes, flavonoids and eugenol, are
After the reduction process silver (Ag+) ions was monitored,
spectrophotometry, which exhibits the absorption peak around at 430
nm. The sizes of nanoparticles were calculated by transmission electron microscopy (TEM) and X-ray diffraction (XRD). In
tivity of synthesized AgNPs was investigated by against
to AgNPs at room temperature, this method could be proved a better substitute to
(fungi, bacteria, algae) for the synthesis. Due to adverse microbial culture protection the use of plant extract is more significant than using microbes, time-consuming and cost-
In this research work, we have confirmed the synthesis of AgNPs via green synthesis method using Acacia
plant extract. We have also investigated using UV-Vis spectroscopy, ATR, biological activity against Gram (-) ve (Escherichia coli (E. coli) bacteria, PXRD data. The PXRD results were correlated with TEM results.
Silver nitrates (99.99%) were purchased from sigma Aldrich plant fruit extract as a green reducing
agent and all valuable glassware’s were cleaned with distilled
Aqueous extract of Acacia concinna fruit: Acacia concinna were collected from University of Rajasthan, Jaipur,
Rajasthan, and cleaned with distilled water and dry at normal room temperature and grind to make it powder. 2 gm of Acacia
fruit powder was dissolved with 50 mL of distilled water and kept for 12 h, afterwards the extracts were filtered by
oC for further nanoparticles
Synthesis of silver nanoparticle: Firstly 10 ml of Acacia
plant fruit extract and freshly 10 mM silver nitrate solution prepared in a separate beaker. Secondly, silver nitrate

Research Journal of Recent Sciences ______________________________________________________________ ISSN 2277-2502
Vol. 7(3), 1-6, March (2018) Res. J. Recent Sci.
International Science Community Association 2
solution was stirred for half an hour and afterwards the plant fruit extract was drops wise added to aqueous AgNO3. The titration was carried out for reducing of Ag+ ions to Ag nanoparticles. The obtain solution is dissolved for on 15 minutes and then incubated at near room temperature for 24 h. The change in color was observed in the solution that confirms the formation of the NPs in the solution.
Figure 1: Acacia concinna fruit.
Separation of AgNPs: The synthesized Ag NPs was separated by centrifugation technique at 4000 rpm for 30 min. For further settlement of particles the supernatant material was transferred to a beaker and frequent centrifugation process was carried out to clean AgNPs. The obtained synthesized pellet was dry in an oven and stored for further characterizations. Characterization: The absorption spectra of samples were observed at 200-800 nm wavelengths using by UV-visible spectrophotometer (LAB India, UV 3000+). Using FTIR spectrum, the synthesized NPs were analyzed for the existence of biomolecules (Thermo Scientific Nicolet 380 FTIR Spectrometer). In transmission mode at the frequency range between 4000 and 400 cm-1 with the resolution of 4 cm-1, the IR spectra of the synthesized nanoparticles were recorded by using ATR spectrophotometer (T-alpha, Bruker) for liquid sample. The nature of Ag nanoparticles is crystalline as evaluated by X-ray diffraction method. The synthesized Ag nanoparticles study on size, shape and the size distribution of nanoparticles of colloidal solution were analyzed by transmission electron microscopy (JEOL JEM2100 TEM). Estimation of antibacterial activity: The antibacterial activities of synthesized Ag NPs, from the relevant plant extracts were successfully against Gram (-) ve (Escherichia coli (E. coli) bacteria for investigation. The microorganisms use in the study are purchase from the market. Disc diffusion method9 was featured for trying of plant extract and their synthesized respective Ag NPs solution. The discs were soaking with
distilled water, plant extract, pure AgNO3 solution and solution containing AgNPs of each type individually. Then the discs were air dry at room temperature. The plates containing nutrient agar media were ready by swabbing them with the microbial cultures. The discs were located in the subsequent manner, disc soaked with distilled water as negative control, disc soaked with plant extract, disc soaked with 1 mM silver nitrate solution and disc soaked with solution of synthesized AgNPs. The dishes were incubated at 37°C for 24 to 48 h. Then, the maximum zone of inhibition was experimental and calculated for analysis beside of microorganism. Results and discussion
Effect of reaction time on the formation of AgNPs, by visual observation was noted, when Acacia concinna fruit extract is added to aqueous silver salt (AgNO3), colour will be changed from pale yellow to yellowish brown and lastly show the brown colour, as shown in Figure-2. By the reduction of silver salt, the optically observed and vary in colour of the solution indicates the creation of metal silver nanoparticles.
Figure-2: Shows the coloration due to formation of Ag NPs.
Figure-3: UV-visible spectra of the synthesized Ag NPs from predicted optimum conditions upon dilution of 3.5 times. Inset Figure shows the coloration due to formation of Ag NPs. Synthesized AgNPs show the yellowish brown colour from pale yellow solution due to the excitation of (SPR) surface plasmon resonance. The change in color was appeared initially after 3
Research Journal of Recent Sciences ______________________________________________________________ ISSN 2277-2502
Vol. 7(3), 1-6, March (2018) Res. J. Recent Sci.
International Science Community Association 3
min. of adding the salt solution to the acacia concinna fruit broth. After 24 h, the colour of the solution becomes stable, which indicates that no silver salt was missing in solution for further reaction. In the present study, the synthesized nanoparticles are spherical in shape as suggested by SPR band, which is further confirmed by TEM study. Then the synthesized silver nanoparticles was examined and showed a broad adsorption peak around at 430 nm, which is liable for the Ag10 and confirmed by respective absorption spectra. The synthesized AgNPs are uniform size distribution and absorption maximum is practically observed at around 430 nm. Due to the strong surface plasmon resonance (SPR) the UV absorption spectrum appeared, i.e., Silver nanoparticles responsible for surface Plasmon resonance (SPR) absorption band, due to the combined vibration of electrons of synthesized AgNPs in resonance with light wave. The resulted absorption spectra are size dependent and SPR band depends on the refractive index of the solution. Figure-3 spectra of the absorption due to the synthesis of AgNPs which is appeared from the reaction of acacia concinna fruit extract with AgNO3 solution recorded in between the range of 200-800 nm.
Figure-4: Shows XRD patterns for Ag nanoparticles. Figure-4 Acacia concinna fruit extract broth containing AgNPs were centrifuged at 20,000 rpm for 20 min and to get rid of any unwanted impurities, the sterile distilled water was used for during this process. The purified pellet was then dried at 60oC at 12h and the sample was characterized by the X-ray diffraction (XRD) using a Bruker D2 Phase diffractometer that was operated in transmission mode with CuKα radiation (λ = 1.5418 Å). At the interval of 0.02° with a counting time of 30 s per step, the data were collected over the 2θ range from 20° to 90°. Figure-4 shows XRD results for synthesized Ag nanoparticles by pure acacia concinna fruit extract. Three major distinguishing diffraction peaks for AgNPs were experimental at 2θ = 38.4, 44.5, 64.8 which correspond to the (111), (200) and (220) crystallographic planes of face-centered cubic Ag crystals,
respectively (JCPDS 00-004-0783) with a lattice parameter of a = 4.077 Å. In general, the crystallite size of Ag NPs is related to width of XRD peaks and Debye-Scherrer equation used for determines average crystallite size. To calculate crystalline size the (111) plane was chosen. The average particle size of synthesized AgNPs is found to be 3.42 nm from Debye-Scherrer equation. This result was consistent with the TEM study.
Figure-5: TEM images of synthesized AgNPs.
In Figure-5 TEM image of the Ag NPs corresponds to the topography, which particle size exhibits in between 2-20 nm and suggested the presence of approximately spherical size of silver nanoparticles. The image indicates the dispersity and morphology of the Ag NPs. These particles are distributed in smaller and bigger size zones and rounded in shape and size. These synthesized Ag NPs may be due to the capping agent as well as phytochemicals such as polyphenols or due to the formation of the cluster. The present biomolecules are liable for capping agent as well as proficient stabilization of the AgNPs by ATR investigation. The IR spectrum of synthesized AgNPs shows the intense powerful bands around at 3315.79 and 1637.36 cm-1 are identified for O-H stretching, H-bond and C=C stretch respectively. The IR spectrum of plant extract has exposed in Figure-6. The IR bands located at 3315.79 cm-1 and 1634.37 cm-1, clearly show significant variance among the spectral positions of IR bands due to the reduction process. The analysis of IR band peaks confirmed the absorbed alkaloids, phenols as well as terpenoids on the surface of AgNPs11. The IR results also provided and show an idea with reference to biomolecules approach at different functionalities. The probable mechanism designed for the reduction of Ag+ to AgNPs be able of explained as: The present phenolic OH groups are in hydrolysable, and tannins can form transitional complexes with suitable Ag+ ions, which for that reason go through oxidation to quinone forms. This results in the successive form of Ag+ to Ag nanoparticles12.

Research Journal of Recent Sciences ______________________________________________________________ ISSN 2277-2502
Vol. 7(3), 1-6, March (2018) Res. J. Recent Sci.
International Science Community Association 4
Figure-6: ATR spectrum of biosynthesized AgNPs.
Antibacterial activities: In the present research study of the antibacterial activity of the AgNPs which is analysed against E.Coli bacterial colony presented from sample is exposed in following information (Figure-7). Different quantities of synthesized AgNPs (2, 4, 8 and 10mg) are further to the agar dishes containing bacterial colony. The dishes are visible for each dilution and bacterial colony is observed results after incubating the agar plates overnight at 37oC. Zone of approval is experiential maximum at 10 mg of AgNPs. The antibacterial activity results show due to modify in the bacteria cell membrane permeability as well as degradation of enzymes in bacteria by synthesized AgNPs. The result zone of inhibition increased as well as increases the concentration of AgNPs.
Figure-7: The inhibition zones of Ag NPs against E.coli on
nutrient agar. Where, the samples A, B, C and D are the as
synthesized AgNPs in 2, 4, 8 and 10mg, respectively.
Conclusion
In this report, we have synthesized AgNPs using Acacia Concinna plant extract via a biological method. Here the plant extract useful for reducing agent as well as stabilizing. Which are responsible for silver metal to nano-size (2-20 nm) and to stabilize the NPs. The as-synthesized AgNPs were examined using TEM, XRD, UV-Vis, and FTIR. The formation of nanoparticles, as well as size, was investigated by using UV-Vis spectroscopy. The crystal structure of the nanoparticle as well as average particle size of the NPs were investigated by PXRD analysis and further the shape and size were demonstrated by TEM analysis. This research work can be further extended to explore the synthesis and optical properties of AgNPs using other plant extracts which can be of medicinal use. Acknowledgment
The all authors are honestly appreciative to the DST, Delhi and their associate wing Science and Engineering Research Board of India (SB/S1/PC-31/2012) for their economic support. Authors also acknowledged technical supports of MRC, MNIT Jaipur for XRD and TEM measurements and Dr. Amit Kotia, Department of Botany of Rajasthan University, Jaipur for the biological activity measurement of our samples. References
1. Nath S.S., Chakdar D., Gope G. and Avasthi D.K. (2008). #Characterizations of CdS and ZnS Quantum Dots Prepared by Chemical Method on SBR Latex.# Journal of
Nanotechnology Online, 4, 1-6.
2. Cao G. (2004). #Nanostructures and Nanomaterials: Synthesis, Properties and Applications.# Imperial College Press, London.

Research Journal of Recent Sciences ______________________________________________________________ ISSN 2277-2502
Vol. 7(3), 1-6, March (2018) Res. J. Recent Sci.
International Science Community Association 5
3. Ahmadipour M., Venkateswara Rao K. and Rajendar V. (2012). #Formation of Nanoscale Mg(x) Fe (1-x) O (x = 0.1, 0.2, 0.4) Structure by Solution Combustion: Effect of Fuel to Oxidizer Ratio.# Journal of Nanomaterials.
4. Wang X., Zhuang J., Peng Q. and Li Y. (2004). #A General Strategy for Nanocrytsal Synthesis.# Nature, 437, 121-124.
5. Xu B. and Kevan L. (1991). #Formation of silver ionic clusters and silver metal particles in zeolite rho studied by electron spin resonance and far-infrared spectroscopies.# The Journal of Physical Chemistry, 95(3), 1147-1151.
6. Foss C.A., Tierney M.J. and Martin C.R. (1992). #Template Synthesis of Infrared-Transparent Metal Microcylinders: Comparison of Optical Properties with the Predictions of Effective Medium Theory.# Journal of Physical Chemistry
B, 96(22), 9001-9007.
7. Foss C.A., Hornyak G.L., Stockert J.A. and Martin C.R. (1994). #Template-Synthesized Nanoscopic Gold Particles: Optical Spectra and the Effects of Particle Size and Shape.# Journal of Physical Chemistry B, 98(11), 2963-2971.
8. Bo X. and Kevan L. (1992). #Formation of Alkali Metal Partides in Alkali Metal Cation Exchanged X Zeollte
Exposed to Atka Metat Vapor: Control of Metat Particle Identity.# Journal of Physical Chemistry B, 96, 2642-2645.
9. Bao Q., Zhang D. and Qi P. (2011). #Synthesis and characterization of silver nanoparticle and graphene oxide nanosheet composites as a bactericidal agent for water disinfection.# J Colloid Interface Sci., 360(2), 463-470.
10. Muthukrishnan S., Bhakya S., Kumar T.S. and Rao M.V. (2015). #Biosynthesis, characterization and antibacterial effect of plant-mediated silver nanoparticles using Ceropegia thwaitesii-An endemic species.# Ind Crops
Prod., 63, 119-124.
11. Nithya Deva Krupa A. and Raghavan V. (2014). #Biosynthesis of Silver Nanoparticles Using Aegle
marmelos (Bael) Fruit Extract and Its Application to Prevent Adhesion of Bacteria: A Strategy to Control Microfouling.# Bioinorg Chem Appl, 8.
12. Fayaz A.M., Balaji K., Girilal M., Yadav R., Kalaichelvan P.T. and Venketesan R. (2010). #Biogenic synthesis of silver nanoparticles and their synergistic effect with antibiotics: a study against gram-positive and gram-negative bacteria.# Nanomedicine: Nanotechnology,
Biology and Medicine, 6(1), 103-109.