
Life Sciences - Department of Basic Education
184
Life Sciences STUDY GUIDE GRADE 12
-
Upload
khangminh22 -
Category
Documents
-
view
0 -
download
0
Transcript of Life Sciences - Department of Basic Education

Life SciencesStudy Guide
Grade
12


© Department of Basic Education 2014
Life SciencesStudy Guide
Grade
12

this content may not be sold or used for commercial purposes.
Curriculum and Assessment Policy Statement (CAPS) Mind the Gap Grade 12 Study Guide Life SciencesiSBN 978-1-4315-1947-7
This publication has a Creative Commons Attribution NonCommercial Sharealike license. You can use, modify, upload, download, and share content, but you must acknowledge the Department of Basic Education, the authors and contributors. If you make any changes to the content you must send the changes to the Department of Basic Education. This content may not be sold or used for commercial purposes. For more information about the terms of the license please see:http://creativecommons.org/licenses/by-nc-sa/3.0/.
Copyright © Department of Basic Education 2014222 Struben Street, Pretoria, South AfricaContact person: Dr Patricia WatsonEmail: [email protected]: (012) 357 4502http://www.education.gov.zaCall Centre: 0800202933
The first edition published in 2012 Revised National Curriculum Statement (RNCS) Mind the Gap Grade 12 Study Guide Life Sciences: ISBN 978-0-621-40906-2Second edition published in 2014 Curriculum and Assessment Policy Statement (CAPS) Mind the Gap Grade 12 Study Guide Life Sciences : iSBN 978-1-4315-1947-7
Mind the Gap teamSeries managing editor: Dr Patricia WatsonProduction co-ordinators for CAPS edition: Lisa Treffry-Goatley and Radha PillayAuthors: Alfie Bouwer, Sivalingam Chetty, Marlena Ford, Jean Goliath, Gayle Lombard, Nontobeko Mjali, Gonasagaren Pillay, Ronel Pretorius, Susan Wieseexpert readers: Esther Makhanywa, Kanthan Naidoo, Christina Nono editors: Julia Grey, Herbert OplandProofreader: Jenny de Wet designers: Alicia Arntzen, Philisiwe Nkosi, Michele Dean, Nomalizo NgwenyaStudy skills: Margarita Karnasopoulosillustrators: Michele Dean, Kenneth Kunene, Vusi Malindi, Bié VenterCover illustration: Alastair FindlayOnsite writers’workshop support: Wayne Cussons
© Department of Basic Education 2014

Ministerial forewordThe Department of Basic Education has pleasure in releasing the second edition of Mind the Gap study guides for Grade 12 learners. These study guides continue the innovative and committed attempt by the Department of Basic Education to improve the academic performance of Grade 12 candidates in the National Senior Certificate (NSC) examination.
The study guides have been written by subject expert teams comprised of teachers, examiners, moderators, subject advisors and subject co-ordinators. Research started in 2012 shows that the Mind the Gap series has, without doubt, had a positive impact in improving grades. It is my fervent wish that the Mind the Gap study guides take us all closer towards ensuring that no learner is left behind, especially as we move forward in our celebration of 20 years of democracy.
The second edition of Mind the Gap is aligned to the 2014 Curriculum and Assessment Policy Statement (CAPS). This means that the writers have considered the National Policy pertaining to the programme, promotion requirements and protocol for assessment of the National Curriculum Statement for Grade 12 in 2014.
The Mind the Gap CAPS study guides take their brief in part from the 2013 National Diagnostic report on learner performance and draws on the 2014 Grade 12 Examination Guidelines. Each of the Mind the Gap study guides provides explanations of key terminology, simple explanations and examples of the types of questions that learners can expect to be asked in an exam. M a r k i n g m e m o r a n d a are included to assist learners in building their understanding. Learners are also referred to specific questions in past national exam papers and examination memos that are available on the Department’s website – www.education.gov.za.
The CAPS edition include Accounting, Economics, Geography, Life Sciences, Mathematics, Mathematical Literacy and Physical Sciences. The series is produced in both English and Afrikaans. There are also nine English First Additional Language study guides. They include EFAL Paper 1 (Language); EFAL Paper 3 (Writing); and a study guide for each of the Grade 12 prescribed literature set works.
The study guides have been designed to assist those learners who have been underperforming due to a lack of exposure to the content requirements of the curriculum and aims to mind-the-gap between failing and passing, by bridging the gap in learners’ understanding of commonly tested concepts so candidates can pass.
All that is now required is for our Grade 12 learners to put in the hours preparing for the examinations. Learners make us proud – study hard. We wish each and every one of you good luck for your Grade 12 examinations.
_________________________________
Matsie Angelina Motshekga, MPMinister of Basic EducationMay 2014
Matsie Angelina Motshekga, MPMinister of Basic education
© Department of Basic Education 2014

© Department of Basic Education 2014

© Department of Basic Education 2014
© Department of Basic Education 2014
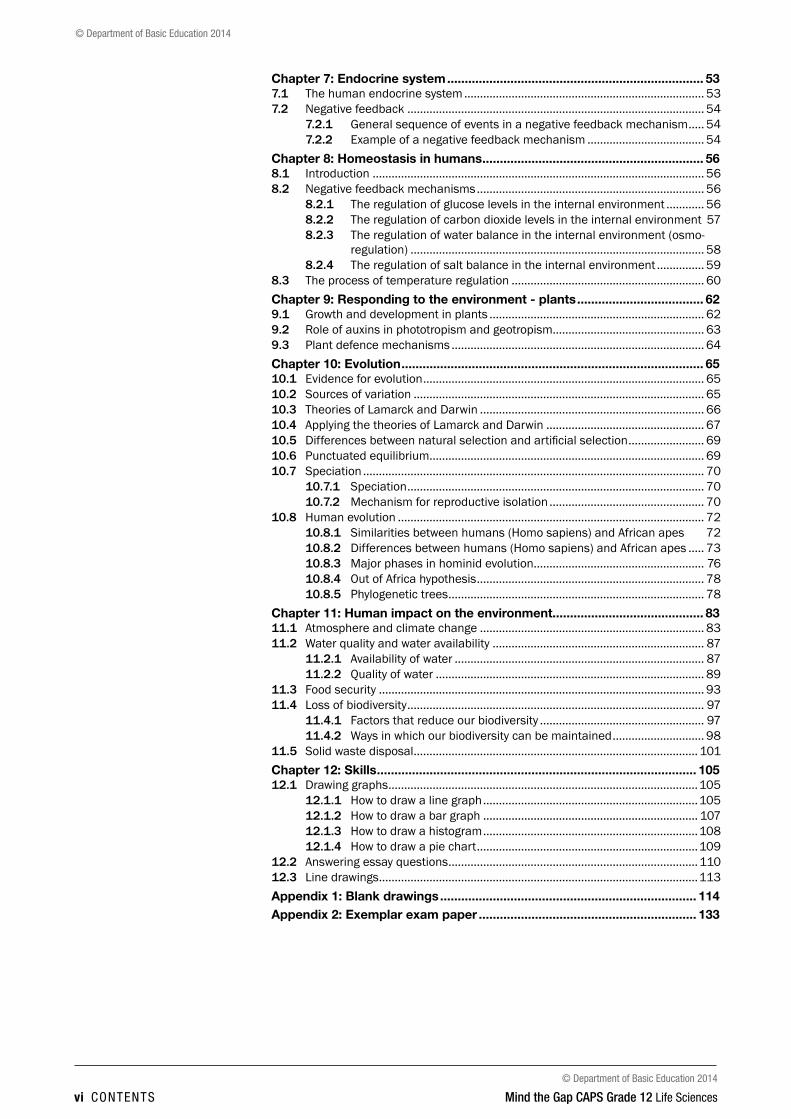
Mind the Gap CAPS Grade 12 Life Sciences contEntS v
Table of contentsdear Grade 12 learner ... ................................................................................................... viiHow to use this study guide ............................................................................................. viiitop 10 study tips ................................................................................................................. ixStudy skills to boost your learning ......................................................................................xOn the day of the exam … ................................................................................................ xiiiQuestion words to help you answer questions ...............................................................xivLearner’s checklist ..............................................................................................................xvChapter 1: Nucleic acids ................................................................................... 11.1 The structure of DNA and RNA ..............................................................................11.2 Differences between DNA and RNA ......................................................................21.3 DNA replication and its significance .....................................................................31.4 DNA profiling ...........................................................................................................31.5 Protein synthesis ....................................................................................................5Chapter 2: Meiosis............................................................................................. 92.1 What is meiosis? ....................................................................................................92.2 The process of meiosis in animal cells .................................................................9
2.2.1 First meiotic division ............................................................................. 102.2.2 Second meiotic division ........................................................................ 11
2.3 The significance of meiosis................................................................................. 122.4 Abnormal meiosis ................................................................................................ 122.5 Differences between meiosis I and meiosis II ................................................... 13Chapter 3: Reproduction in vertebrates ........................................................ 17Chapter 4: Reproduction ................................................................................ 194.1 Male reproductive system ................................................................................... 194.2 Female reproductive system............................................................................... 214.3 Puberty ................................................................................................................. 214.4 Menstrual cycle ................................................................................................... 224.5 Hormonal control of the menstrual cycle........................................................... 234.6 Development of the foetus ................................................................................. 25Chapter 5: Genetics ........................................................................................ 275.1 Key concepts ....................................................................................................... 275.2 Genetic crosses ................................................................................................... 29
5.2.1 Complete dominance ............................................................................ 305.2.2 Incomplete dominance ......................................................................... 315.2.3 Co-dominance ....................................................................................... 315.2.4 Inheritance of sex.................................................................................. 325.2.5 Inheritance of sex-linked characteristics ............................................. 325.2.6 Dihybrid cross ........................................................................................ 35
5.3 Mutations ............................................................................................................. 375.4 Pedigree diagrams .............................................................................................. 385.5 Genetic engineering ............................................................................................ 405.6 Genetic counselling ............................................................................................. 40Chapter 6: Responding to the environment – humans ................................ 416.1 The brain .............................................................................................................. 41
6.1.1 Structure and functions of the brain ................................................... 416.2 Neurons ................................................................................................................ 426.3 Reflex arc ............................................................................................................. 446.4 The human eye .................................................................................................... 46
6.4.1 Accommodation .................................................................................... 476.4.2 Pupillary mechanism ........................................................................... 476.4.3 Visual defects ........................................................................................ 48
6.5 The human ear .................................................................................................... 496.5.1 Structure of the ear ............................................................................... 496.5.2 Hearing .................................................................................................. 506.5.3 Balance .................................................................................................. 516.5.4 Hearing defects ..................................................................................... 51
© Department of Basic Education 2014
© Department of Basic Education 2014
vi contEntS Mind the Gap CAPS Grade 12 Life Sciences
Chapter 7: Endocrine system ......................................................................... 537.1 The human endocrine system ............................................................................ 537.2 Negative feedback .............................................................................................. 54
7.2.1 General sequence of events in a negative feedback mechanism ..... 547.2.2 Example of a negative feedback mechanism ..................................... 54
Chapter 8: Homeostasis in humans ............................................................... 568.1 Introduction ......................................................................................................... 568.2 Negative feedback mechanisms ........................................................................ 56
8.2.1 The regulation of glucose levels in the internal environment ............ 568.2.2 The regulation of carbon dioxide levels in the internal environment 578.2.3 The regulation of water balance in the internal environment (osmo-
regulation) ............................................................................................. 588.2.4 The regulation of salt balance in the internal environment ............... 59
8.3 The process of temperature regulation ............................................................. 60Chapter 9: Responding to the environment - plants .................................... 629.1 Growth and development in plants .................................................................... 629.2 Role of auxins in phototropism and geotropism................................................ 639.3 Plant defence mechanisms ................................................................................ 64Chapter 10: Evolution ...................................................................................... 6510.1 Evidence for evolution ......................................................................................... 6510.2 Sources of variation ............................................................................................ 6510.3 Theories of Lamarck and Darwin ....................................................................... 6610.4 Applying the theories of Lamarck and Darwin .................................................. 6710.5 Differences between natural selection and artificial selection ........................ 6910.6 Punctuated equilibrium ....................................................................................... 6910.7 Speciation ............................................................................................................ 70
10.7.1 Speciation .............................................................................................. 7010.7.2 Mechanism for reproductive isolation ................................................. 70
10.8 Human evolution ................................................................................................. 7210.8.1 Similarities between humans (Homo sapiens) and African apes 7210.8.2 Differences between humans (Homo sapiens) and African apes ..... 7310.8.3 Major phases in hominid evolution ...................................................... 7610.8.4 Out of Africa hypothesis ........................................................................ 7810.8.5 Phylogenetic trees ................................................................................. 78
Chapter 11: Human impact on the environment........................................... 8311.1 Atmosphere and climate change ....................................................................... 8311.2 Water quality and water availability ................................................................... 87
11.2.1 Availability of water ............................................................................... 8711.2.2 Quality of water ..................................................................................... 89
11.3 Food security ....................................................................................................... 9311.4 Loss of biodiversity .............................................................................................. 97
11.4.1 Factors that reduce our biodiversity .................................................... 9711.4.2 Ways in which our biodiversity can be maintained ............................. 98
11.5 Solid waste disposal .......................................................................................... 101Chapter 12: Skills ........................................................................................... 10512.1 Drawing graphs ..................................................................................................105
12.1.1 How to draw a line graph ....................................................................10512.1.2 How to draw a bar graph .................................................................... 10712.1.3 How to draw a histogram ....................................................................10812.1.4 How to draw a pie chart ......................................................................109
12.2 Answering essay questions ...............................................................................11012.3 Line drawings .....................................................................................................113Appendix 1: Blank drawings ......................................................................... 114Appendix 2: Exemplar exam paper .............................................................. 133

© Department of Basic Education 2014
Mind the Gap CAPS Grade 12 Life Sciences introDuction vii
© Department of Basic Education 2014
Dear Grade 12 learnerThis Mind the Gap study guide helps you to prepare for the end-of-year CAPS Life Sciences Grade 12 exam.
The study guide does NOT cover the entire CAPS curriculum, but it does focus on core content of each knowledge area and points out where you can earn easy marks.
You must work your way through this study guide to improve your understanding, identify your areas of weakness and correct your own mistakes.
To ensure a good pass, you should also cover the remaining sections of the curriculum using other textbooks and your class notes.
Overview of the exam for CAPS Life Sciences Grade 12The following topics make up each of the TWO Life Sciences exam papers that you write at the end of the year:
PAPeR 1 WeiGHtiNG PAPeR 2 WeiGHtiNG
topic % MARKS topic % MARKS
term 1 MeiosisReproduction in VertebratesHuman Reproductionterm 2Responding to the Environment (Humans)term 3Human Endocrine SystemHomeostasis in HumansResponding to the Environment (Plants)term 4Human Impact (Grade 11)
74
21
27
1077
17
116
31
40
151111
25
term 1DNA: Code of LifeMeiosisterm 2Genetics and Inheritanceterms 3/4Evolution
197
30
44
2712
45
66
100 150 100 150
Both Paper 1 and Paper 2 will include the following types of questions:
Section type of question Marks
A Short answer, objective questions such as multiple-choice questions, terminology, columns/statement and items
50
B A variety of question types.There will be two questions of 40 marks each. Both of these questions will be divided into two to four subsections.
2 × 40
C Essay 20
We are confident that this Mind the Gap study guide can help you to
prepare well so that you pass the end-of-year
exams.

© Department of Basic Education 2014
viii introDuction Mind the Gap CAPS Grade 12 Life Sciences
© Department of Basic Education 2014
Use this study guide as a workbook. Make notes, draw pictures and highlight important
concepts.
Look out for these icons in the
study guide.
How to use this study guideThis study guide covers selected parts of the different topics of the CAPS Grade 12 Life Sciences curriculum in the order they are usually taught during the year. The selected parts of each topic are presented in the following way:• An explanation of terms and concepts;• Worked examples to explain and demonstrate;• Activities with questions for you to answer; and• Answers for you to use to check your own work.
PAY SPECIAL ATTENTION
ACTIVITIES boy and girl-left and right of page
Step by step comment
EG - worked examples
HINT!
e.g.
NB NB
hint
activity
activity
comment
exams
Pay special attention
PAY SPECIAL ATTENTION
ACTIVITIES boy and girl-left and right of page
Step by step comment
EG - worked examples
HINT!
e.g.
NB NB
hint
activity
activity
comment
exams
Hints to help you remember a concept or guide you in solving problems
PAY SPECIAL ATTENTION
ACTIVITIES boy and girl-left and right of page
Step by step comment
EG - worked examples
HINT!
e.g.
NB NB
hint
activity
activity
comment
exams
Worked examples
Step-by-step instructions
PAY SPECIAL ATTENTION
ACTIVITIES boy and girl-left and right of page
Step by step comment
EG - worked examples
HINT!
e.g.
NB NB
hint
activity
activity
comment
exams Refers you to exam questions
Activities with questions for you to answer
• A checklist from the exam guidelines for Life Sciences has been provided on page xvii for you to keep track of your progress. Once you have mastered the core concepts and have confidence in your answers to the questions provided, tick the last column of the checklist.
• The activities are based on exam-type questions. Cover the answers provided and do each activity on your own. Then check your answers. Reward yourself for the things you get right. If you get any incorrect answers, make sure you understand where you went wrong before moving on to the next section.
• In Chapter 12, you will find a section on graphing skills which you must master when preparing for both Paper 1 and Paper 2. This chapter also provides guidelines on how to answer essay-type questions in the exam.
• You will be asked to draw a labelled diagram in the exam. On page 115 to 132 are a set of blank diagrams that you can use to practise your drawing and labelling skills. Filling in these blank diagrams is a good way to test yourself and work out what you know well and what you still need more practice in.
• exemplar exam papers are included in the study guide for you to do. Check your answers by looking back at your notes and the exam memoranda. Past exam papers go a long way in preparing you for what to expect and help reduce exam anxiety. Go to www.education.gov.za to download past exam papers.
© Department of Basic Education 2014
Mind the Gap CAPS Grade 12 Life Sciences introDuction ix
© Department of Basic Education 2014
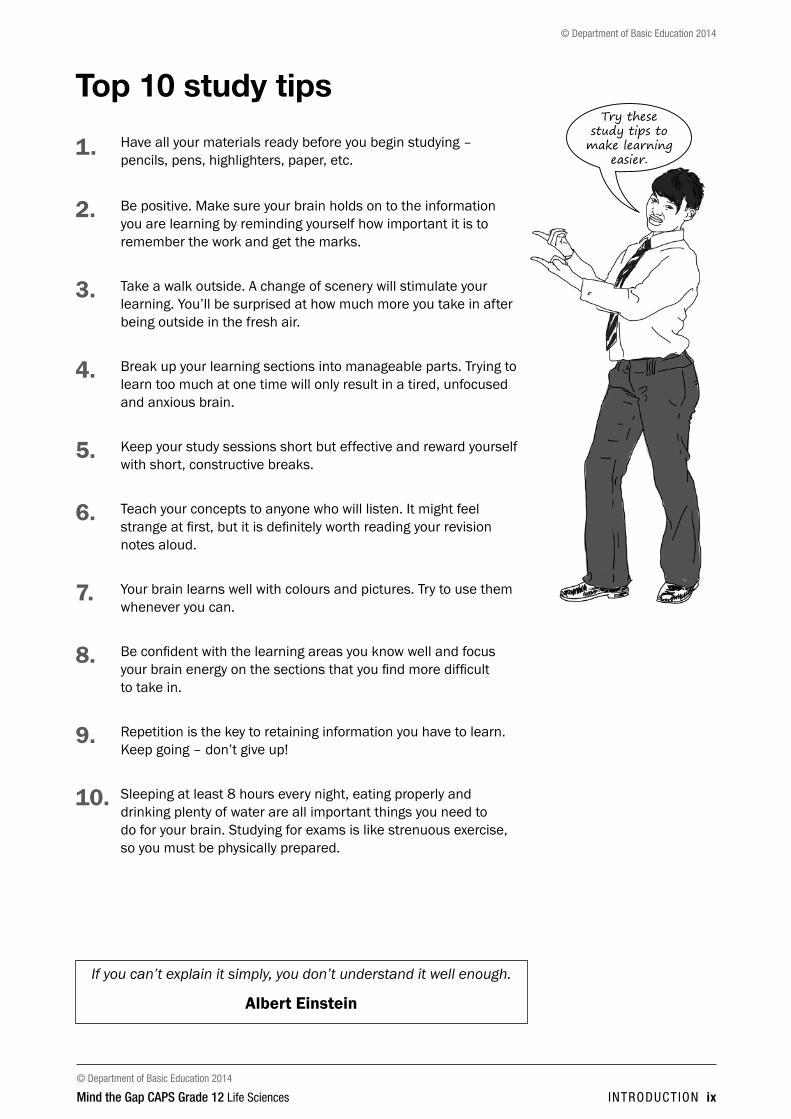
Top 10 study tips
1. Have all your materials ready before you begin studying – pencils, pens, highlighters, paper, etc.
2. Be positive. Make sure your brain holds on to the information you are learning by reminding yourself how important it is to remember the work and get the marks.
3. Take a walk outside. A change of scenery will stimulate your learning. You’ll be surprised at how much more you take in after being outside in the fresh air.
4. Break up your learning sections into manageable parts. Trying to learn too much at one time will only result in a tired, unfocused and anxious brain.
5. Keep your study sessions short but effective and reward yourself with short, constructive breaks.
6. Teach your concepts to anyone who will listen. It might feel strange at first, but it is definitely worth reading your revision notes aloud.
7. Your brain learns well with colours and pictures. Try to use them whenever you can.
8. Be confident with the learning areas you know well and focus your brain energy on the sections that you find more difficult to take in.
9. Repetition is the key to retaining information you have to learn. Keep going – don’t give up!
10. Sleeping at least 8 hours every night, eating properly and drinking plenty of water are all important things you need to do for your brain. Studying for exams is like strenuous exercise, so you must be physically prepared.
If you can’t explain it simply, you don’t understand it well enough.
albert einstein
Try these study tips to
make learning easier.
© Department of Basic Education 2014
x introDuction Mind the Gap CAPS Grade 12 Life Sciences
© Department of Basic Education 2014
These techniques will
help you to study smarter!
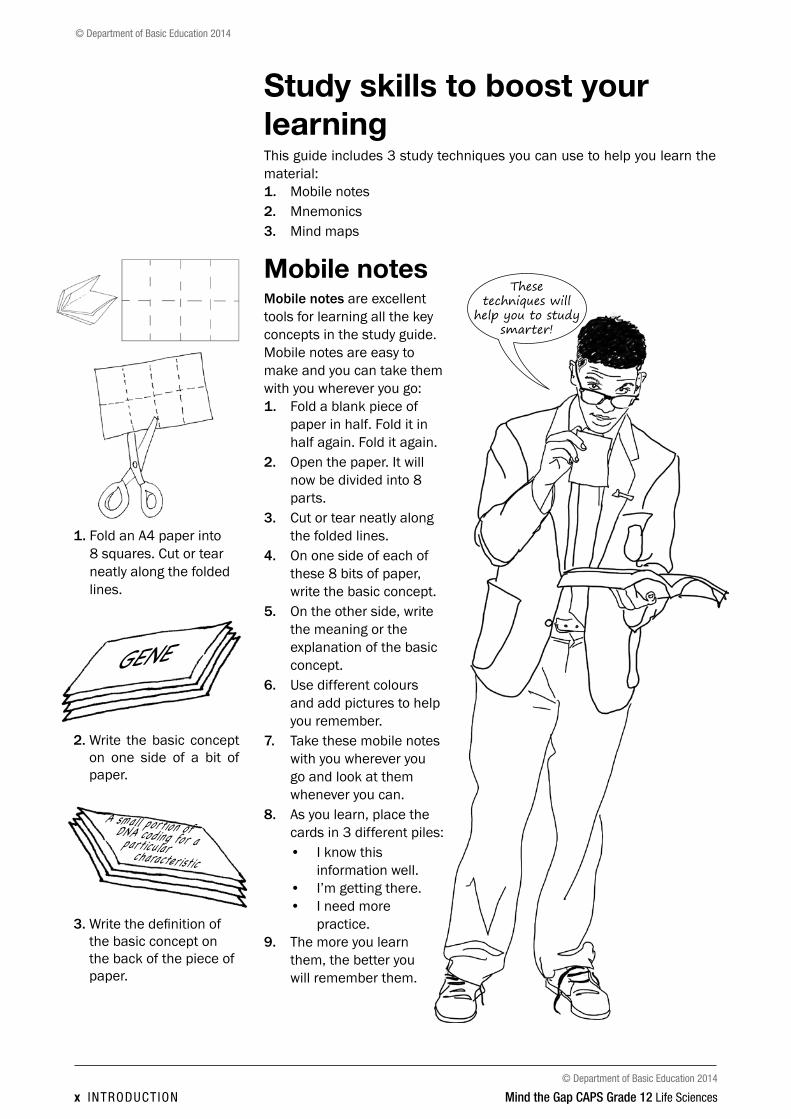
Study skills to boost your learningThis guide includes 3 study techniques you can use to help you learn the material:1. Mobile notes2. Mnemonics3. Mind maps
Mobile notesMobile notes are excellent tools for learning all the key concepts in the study guide. Mobile notes are easy to make and you can take them with you wherever you go:1. Fold a blank piece of
paper in half. Fold it in half again. Fold it again.
2. Open the paper. It will now be divided into 8 parts.
3. Cut or tear neatly along the folded lines.
4. On one side of each of these 8 bits of paper, write the basic concept.
5. On the other side, write the meaning or the explanation of the basic concept.
6. Use different colours and add pictures to help you remember.
7. Take these mobile notes with you wherever you go and look at them whenever you can.
8. As you learn, place the cards in 3 different piles: • I know this
information well.• I’m getting there.• I need more
practice.9. The more you learn
them, the better you will remember them.
1. Fold an A4 paper into 8 squares. Cut or tear neatly along the folded lines.
2. Write the basic concept on one side of a bit of paper.
3. Write the definition of the basic concept on the back of the piece of paper.
Gene
A small portion of DnA coding for a particular characteristic

© Department of Basic Education 2014
Mind the Gap CAPS Grade 12 Life Sciences introDuction xi
© Department of Basic Education 2014
Mnemonics
A mnemonic code is a useful technique for learning information that is difficult to remember.
Below are two examples of mnemonics.
Here is a made-up word to help you remember the structure of a sperm cell – each letter of the word stands for a part of the cell:
M – Mitochondria
A – Acrosome
N – Nucleus
T – Tail
Here is a sentence to help you remember the 4 nitrogenous bases in DNA – each word in the sentence begins with the same letter as one of the nitrogenous bases:
All Teachers Get Chocolate
Adenine Thymine Guanine Cytosine
Mnemonics code information and make it easier to remember.
The more creative you are and the more you link your ‘codes’ to familiar things, the more helpful your mnemonics will be.
This guide provides ideas for using mnemonics. Be sure to make up your own.
Education helps one cease being intimidated by strange situations.
Maya angelou
There is another example of a mnemonic on page 12.
© Department of Basic Education 2014
xii introDuction Mind the Gap CAPS Grade 12 Life Sciences
© Department of Basic Education 2014
Mind mapping
your notes makes them more interesting
and easier to remember.
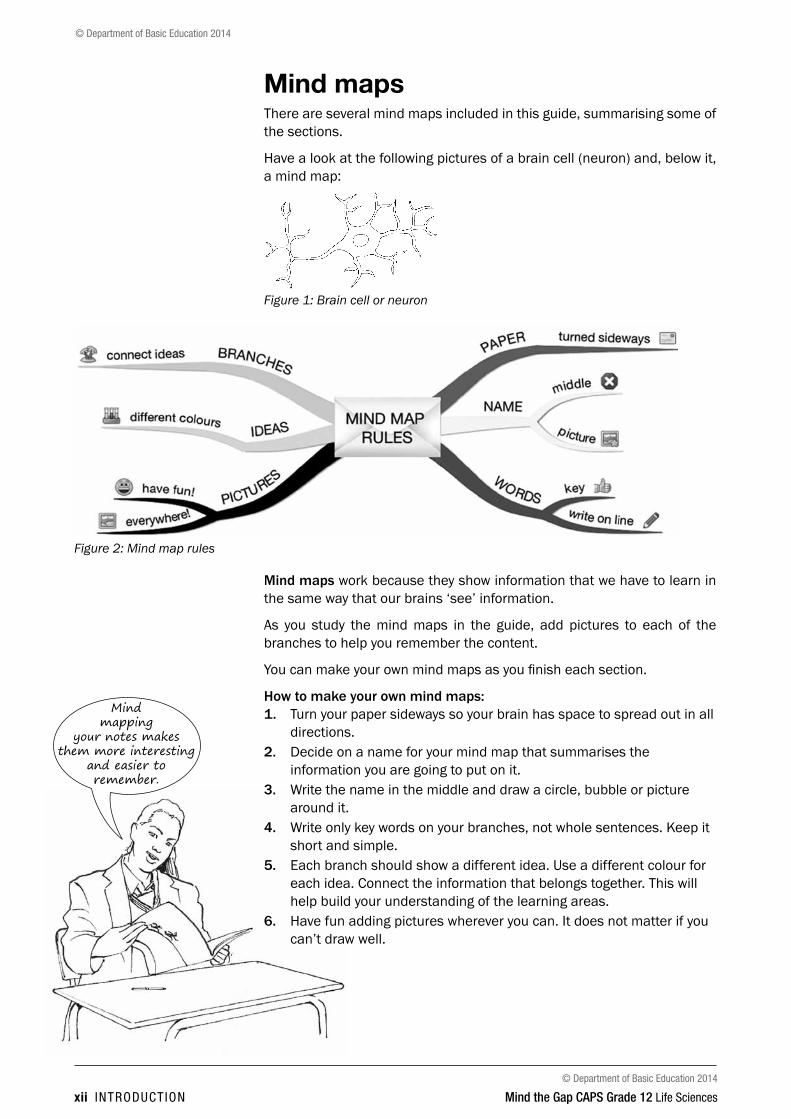
Mind mapsThere are several mind maps included in this guide, summarising some of the sections.
Have a look at the following pictures of a brain cell (neuron) and, below it, a mind map:
Figure 1: Brain cell or neuron
Figure 2: Mind map rules
Mind maps work because they show information that we have to learn in the same way that our brains ‘see’ information.
As you study the mind maps in the guide, add pictures to each of the branches to help you remember the content.
You can make your own mind maps as you finish each section.
How to make your own mind maps:1. Turn your paper sideways so your brain has space to spread out in all
directions.2. Decide on a name for your mind map that summarises the
information you are going to put on it.3. Write the name in the middle and draw a circle, bubble or picture
around it.4. Write only key words on your branches, not whole sentences. Keep it
short and simple.5. Each branch should show a different idea. Use a different colour for
each idea. Connect the information that belongs together. This will help build your understanding of the learning areas.
6. Have fun adding pictures wherever you can. It does not matter if you can’t draw well.
© Department of Basic Education 2014
Mind the Gap CAPS Grade 12 Life Sciences introDuction xiii
© Department of Basic Education 2014
GOOD LUCK!
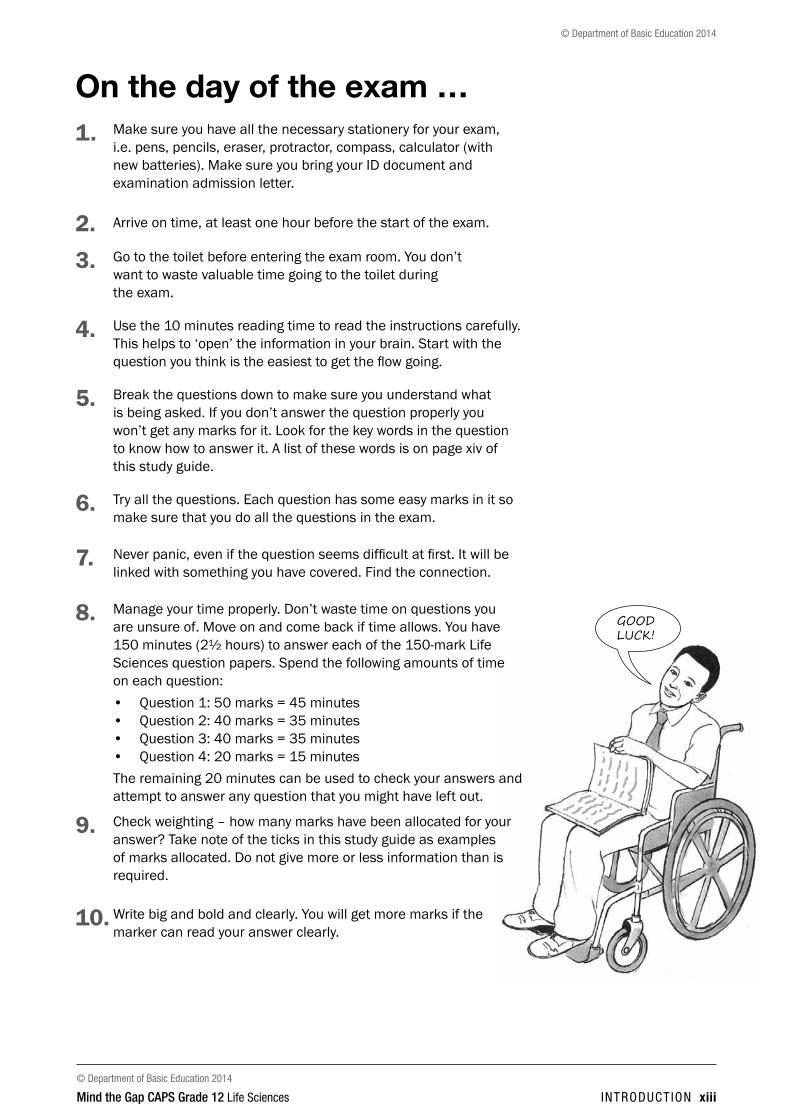
On the day of the exam …1. Make sure you have all the necessary stationery for your exam,
i.e. pens, pencils, eraser, protractor, compass, calculator (with new batteries). Make sure you bring your ID document and examination admission letter.
2. Arrive on time, at least one hour before the start of the exam.
3. Go to the toilet before entering the exam room. You don’t want to waste valuable time going to the toilet during the exam.
4. Use the 10 minutes reading time to read the instructions carefully. This helps to ‘open’ the information in your brain. Start with the question you think is the easiest to get the flow going.
5. Break the questions down to make sure you understand what is being asked. If you don’t answer the question properly you won’t get any marks for it. Look for the key words in the question to know how to answer it. A list of these words is on page xiv of this study guide.
6. Try all the questions. Each question has some easy marks in it so make sure that you do all the questions in the exam.
7. Never panic, even if the question seems difficult at first. It will be linked with something you have covered. Find the connection.
8. Manage your time properly. Don’t waste time on questions you are unsure of. Move on and come back if time allows. You have 150 minutes (2½ hours) to answer each of the 150-mark Life Sciences question papers. Spend the following amounts of time on each question: • Question 1: 50 marks = 45 minutes• Question 2: 40 marks = 35 minutes• Question 3: 40 marks = 35 minutes• Question 4: 20 marks = 15 minutes
The remaining 20 minutes can be used to check your answers and attempt to answer any question that you might have left out.
9. Check weighting – how many marks have been allocated for your answer? Take note of the ticks in this study guide as examples of marks allocated. Do not give more or less information than is required.
10. Write big and bold and clearly. You will get more marks if the marker can read your answer clearly.

© Department of Basic Education 2014
xiv introDuction Mind the Gap CAPS Grade 12 Life Sciences
© Department of Basic Education 2014
Question words to help you answer questionsIt is important to look for the question words (the words that tell you what to do) to correctly understand what the examiner is asking. Use the words in the table below as a guide when answering questions.
Question word What is required of youAnalyse Separate, examine and interpretCalculate This means a numerical answer is required – in general,
you should show your working, especially where two or more steps are involved
Classify Group things based on common characteristicsCompare Point out or show both similarities and differences between
things, concepts or phenomenaDefine Give a clear meaningdescribe State in words (using diagrams where appropriate) the main
points of a structure/process/phenomenon/investigationdetermine To calculate something, or to discover the answer by
examining evidencedifferentiate Use differences to qualify categoriesdiscuss Consider all information and reach a conclusionexplain Make clear; interpret and spell outidentify Name the essential characteristicsLabel Identify on a diagram or drawingList Write a list of items, with no additional detailMention Refer to relevant pointsName Give the name (proper noun) of somethingState Write down information without discussionSuggest Offer an explanation or a solutiontabulate Draw a table and indicate the answers as direct pairs
PAY SPECIAL ATTENTION
ACTIVITIES boy and girl-left and right of page
Step by step comment
EG - worked examples
HINT!
e.g.
NB NB
hint
activity
activity
comment
exams
Examples of question words
Questions1. Figure 6.12 shows a longitudinal section through the human eye.
Study the diagram and answer the questions that follow.a) Label parts 2, 3, 4 and 5 respectively. (4)b) Name and describe the process that causes part 1 to dilate
(become wider). (5)2. Figure 6.13 is a longitudinal section through the human eye. The
structures which enable the eye to focus on objects are missing in this diagram. Study the diagram and answer the questions that follow.
Draw a longitudinal section through the missing parts of Figure 6.13 to indicate the appearance of these structures when you are...a) reading a book. (6)b) looking at an object more than 6 metres away. (6)
[21]
In every exam question, put a CIRCLE
around the question word and underline any other important
key words. These words tell you exactly what is
being asked.

© Department of Basic Education 2014
Mind the Gap CAPS Grade 12 Life Sciences introDuction xv
© Department of Basic Education 2014
Learner’s checklistUse this checklist to monitor your progress when preparing for the examination. the ticks (3) tell you which aspects of the curriculum are covered in this study guide. the stars (*) tell you to go to textbooks and class notes.
tOPiC ASPeCt
Cove
red
in
stud
y gu
ide
i do
not
unde
rsta
nd
i un
ders
tand
DNA: The code of life Discovery of DNA structure *Nucleic acids terminology 3
Structure of DNA and RNA 3
Differences between DNA and RNA 3
DNA replication and the importance thereof 3
DNA profiling 3
Protein synthesis 3
Meiosis The process of meiosis using diagrams 3
Significance of meiosis 3
Abnormal meiosis 3
Differences between meiosis I and meiosis II 3
Reproduction in vertebrates
Diversity in reproductive strategies 3
Human reproduction Male reproductive system 3
Female reproductive system 3
Puberty 3
Menstrual cycle 3
Development of the foetus 3
Gestation 3
Role of placenta 3
Genetics and inheritance
Genetic terminology 3
Complete dominance 3
Incomplete dominance 3
Co-dominance 3
Inheritance of sex 3
Sex-linked characteristics 3
Dihybrid crossing 3
Mutations 3
Pedigree diagrams 3
Genetic engineering 3
Genetic counselling 3
Paternity testing and DNA fingerprinting 3
Responding to the environment: Humans
The brain 3
Neurons, reflex actions and reflex arcs 3
Peripheral nervous system *Autonomic nervous system *Brain disorders and injuries *Effects of drugs on the central nervous system *Structure and functions of parts of the eye 3

© Department of Basic Education 2014
xvi introDuction Mind the Gap CAPS Grade 12 Life Sciences
© Department of Basic Education 2014
Responding to the environment: Humans
Accommodation 3
Pupillary mechanism 3
Visual defects 3
Structure and functions of parts of the ear 3
Hearing 3
Balance 3
Hearing defects 3
Human endocrine system
Glands and the hormones they secrete 3
Negative feedback – glucose 3
Negative feedback – thyroxin 3
Homeostasis in humans Negative feedback – glucose 3
Negative feedback – carbon dioxide 3
Negative feedback – water 3
Negative feedback – salts 3
The role of the skin on hot and cold days 3
Responding to the environment: Plants
Functions of auxins, gibberillins and abscisic acid 3
Role of auxins in phototropism and geotropism 3
Plant defence mechanisms is included 3
Evolution Evidence for evolution 3
Sources of variation 3
Lamarck and Darwin’s theories 3
Natural and artificial selection 3
Punctuated equilibrium 3
Speciation 3
Mechanisms for reproductive isolation 3
Evolution in present times 3
Human evolution: similarities to African apes 3
Human evolution: differences from African apes 3
Major phases in hominid evolution 3
Out of Africa hypothesis 3
Phylogenetic trees 3
Human impact on the environment
Atmosphere and climate change 3
Water availability 3
Water quality 3
Food security 3
Loss of biodiversity 3
Waste disposal 3
Skills Draw a line graph 3
Draw a bar graph 3
Draw a histogram 3
Draw a pie chart 3
Answering essay questions 3
Chapter 1Paper 2
© Department of Basic Education 2014
Mind the Gap CAPS Grade 12 Life Sciences chaptEr 1 nucLEic aciDS (papEr 2 ) 1
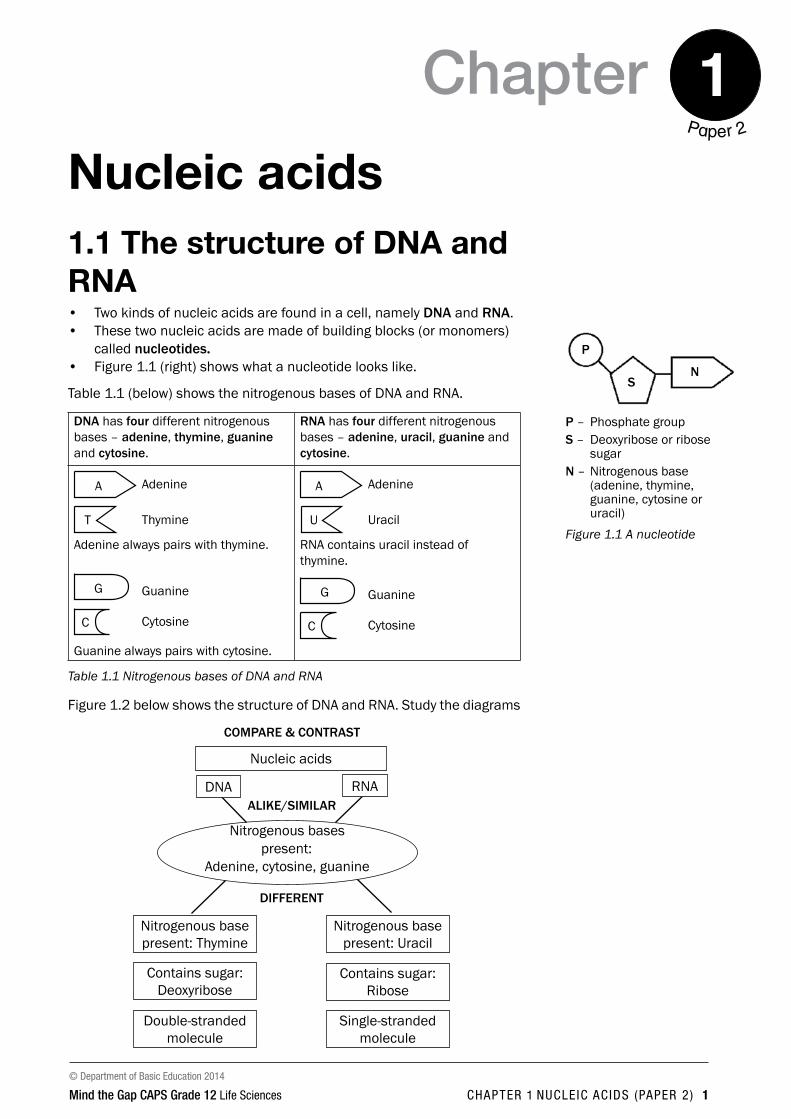
Nucleic acids1.1 The structure of DNA and RNA• Two kinds of nucleic acids are found in a cell, namely dNA and RNA.• These two nucleic acids are made of building blocks (or monomers)
called nucleotides.• Figure 1.1 (right) shows what a nucleotide looks like.
Table 1.1 (below) shows the nitrogenous bases of DNA and RNA.
dNA has four different nitrogenous bases – adenine, thymine, guanine and cytosine.
RNA has four different nitrogenous bases – adenine, uracil, guanine and cytosine.
Thymine
AdenineA
T
Adenine always pairs with thymine.
C Cytosine
GuanineG
Guanine always pairs with cytosine.
Uracil
AdenineA
U
RNA contains uracil instead of thymine.
C Cytosine
GuanineG
Table 1.1 Nitrogenous bases of DNA and RNA
Figure 1.2 below shows the structure of DNA and RNA. Study the diagrams
COMPARe & CONtRASt
Nucleic acids
ALiKe/SiMiLAR
Nitrogenous bases present:
Adenine, cytosine, guanine
Contains sugar: Ribose
Single-stranded molecule
diFFeReNt
DNA RNA
Contains sugar: Deoxyribose
Double-stranded molecule
Nitrogenous base present: Uracil
Nitrogenous base present: Thymine
P – Phosphate group S – Deoxyribose or ribose
sugarN – Nitrogenous base
(adenine, thymine, guanine, cytosine or uracil)
Figure 1.1 A nucleotide
P
SN

© Department of Basic Education 2014
2 chaptEr 1 nucLEic aciDS (papEr 2 ) Mind the Gap CAPS Grade 12 Life Sciences
Chapter1
in Figure 1.2, and then read the information in the boxes below the diagrams to find out how to tell a DNA molecule from an RNA molecule.
1.2 Differences between DNA and RNATable 1.2 below summarises the differences between DNA and RNA molecules.
dNA RNA
1. Double-stranded molecule 1. Single-stranded molecule
2. Contains deoxyribose (sugar) 2. Contains ribose (sugar)
3. Contains the nitrogenous base, thymine
3. Contains the nitrogenous base, uracil
Table 1.2 The differences between DNA and RNA
dNA (deoxyribonucleic acid) RNA (ribonucleic acid)
Nitrogenous base
Phosphate group
Ribose
A
G
T
C
A
G
A
G
U
Phosphate group
Deoxyribose
Nitrogenous base
Weak hydrogen bonds
How to recognise a dNA molecule• Double-stranded molecule • Contains the nitrogenous base
thymine (T) instead of uracil (U)• A always joins with T• G always joins with C
How to recognise an RNA molecule• Single-stranded molecule• Contains the nitrogenous base
uracil (U) instead of thymine (T)
Figure 1.2 The structure of DNA and RNA

© Department of Basic Education 2014
Mind the Gap CAPS Grade 12 Life Sciences chaptEr 1 nucLEic aciDS (papEr 2 ) 3
Chapter 1
1 The double helix unwinds.
2 Weak hydrogen bonds between nitrogenous bases break and two DNA strands unzip (separate).
3 Each original DNA strand serves as a template on which its complement is built.
4 Free nucleotides build a DNA strand onto each of the original two DNA strands by attaching to their complementary nitrogenous bases (A to T and C to G).
5 This results in two identical dNA molecules. Each molecule consists of one original strand and one new strand.
1. Unwinds
2. Unzips
Template
4. Complementary strand forms
5. Two identical DNA molecules
CGA–TAT
G-C
G–CT – AG – CG–
T–G–
T – AA – T
C–GT–AA–TA–TT–AA–T
T-AC–GG-C
T-AC–GG-C
C–GT – AA – TA – TT – AA–T
A – T
–C–A–C
–A3. Template
Figure 1.3 DNA replication
1.3 DNA replicationdNA replication takes place at interphase before mitosis or meiosis begins. DNA replication is the process during which a DNA molecule makes an exact copy (replica) of itself. This is shown in Figure 1.3 below.
Significance of DNA replicationdNA replication is important because it:• Doubles the genetic material so it can be shared between the
resulting daughter cells during cell division.• Results in the formation of identical daughter cells during mitosis.
1.4 DNA profilingEvery person except identical twins has her/his own unique DNA profile. It can be described as an arrangement of black bars representing DNA fragments of the person.
It is used to:• Identify criminals• Identify dead bodies• Identify relatives• Identify paternity
© Department of Basic Education 2014
4 chaptEr 1 nucLEic aciDS (papEr 2 ) Mind the Gap CAPS Grade 12 Life Sciences
Chapter1
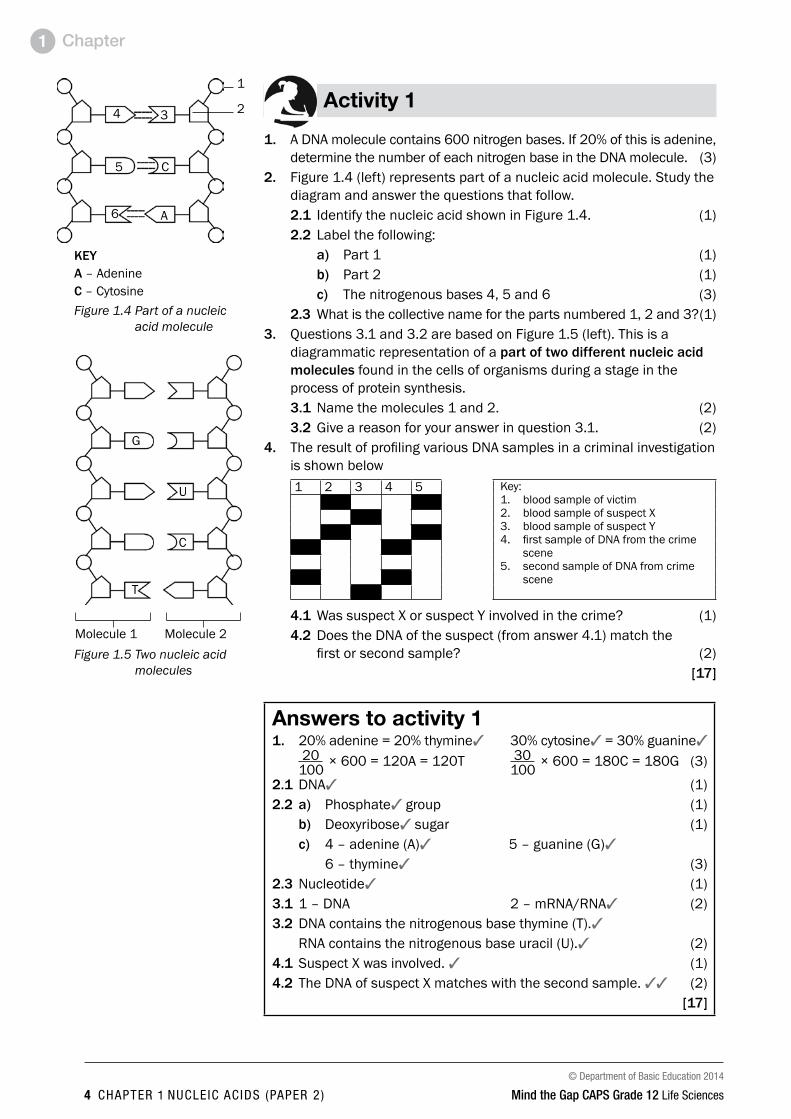
Activity 1
1. A DNA molecule contains 600 nitrogen bases. If 20% of this is adenine, determine the number of each nitrogen base in the DNA molecule. (3)
2. Figure 1.4 (left) represents part of a nucleic acid molecule. Study the diagram and answer the questions that follow.2.1 Identify the nucleic acid shown in Figure 1.4. (1)2.2 Label the following:
a) Part 1 (1)b) Part 2 (1)c) The nitrogenous bases 4, 5 and 6 (3)
2.3 What is the collective name for the parts numbered 1, 2 and 3? (1)3. Questions 3.1 and 3.2 are based on Figure 1.5 (left). This is a
diagrammatic representation of a part of two different nucleic acid molecules found in the cells of organisms during a stage in the process of protein synthesis.3.1 Name the molecules 1 and 2. (2)3.2 Give a reason for your answer in question 3.1. (2)
4. The result of profiling various DNA samples in a criminal investigation is shown below1 2 3 4 5 Key:
1. blood sample of victim2. blood sample of suspect X3. blood sample of suspect Y4. first sample of DNA from the crime
scene 5. second sample of DNA from crime
scene
4.1 Was suspect X or suspect Y involved in the crime? (1)4.2 Does the DNA of the suspect (from answer 4.1) match the
first or second sample? (2)[17]
Answers to activity 11. 20% adenine = 20% thymine3 30% cytosine3 = 30% guanine3
20 100 × 600 = 120A = 120T 30
100 × 600 = 180C = 180G (3)
2.1 DNA3 (1)2.2 a) Phosphate3 group (1)
b) Deoxyribose3 sugar (1)c) 4 – adenine (A)3 5 – guanine (G)3 6 – thymine3 (3)
2.3 Nucleotide3 (1)3.1 1 – DNA 2 – mRNA/RNA3 (2)3.2 DNA contains the nitrogenous base thymine (T).3 RNA contains the nitrogenous base uracil (U).3 (2)4.1 Suspect X was involved. 3 (1)4.2 The DNA of suspect X matches with the second sample. 33 (2) [17]
1
2
Figure 1.4 Part of a nucleic acid molecule
KeyA – AdenineC – Cytosine
4
6
3
C
A
5
A
Figure 1.5 Two nucleic acid molecules
G
T
Molecule 1
U
C
Molecule 2

© Department of Basic Education 2014
Mind the Gap CAPS Grade 12 Life Sciences chaptEr 1 nucLEic aciDS (papEr 2 ) 5
Chapter 1
1.5 Protein synthesisProtein synthesis is the process by which proteins are made in each cell of an organism to form enzymes, hormones and new structures for cells.
in the nucleus
U C A G G C A C A
Codon(triplet)
6. Protein
5. tRNA
Anticodon
3. mRNA
A. t
RAN
SCR
iPti
ON
Ribosome
B. t
RAN
SLAt
iON
in the cytoplasm
1. DNA
U C A G G C A C A
Codon
A G U
4.
2.
Figure 1.6 The process of protein synthesis
There are two main processes involved in protein synthesis, namely transcription and translation. They are labelled as A and B in Figure 1.6 above.
Note that the numbers on the diagram correspond with the description below.
A transcription (takes place in the nucleus)
1. DNA unwinds and splits.
2. One DNA strand acts as a template for forming mRNA.
3. Free nucleotides arrange to form mRNA according to the DNA template. This process is called transcription.
4. The mRNA leaves the nucleus through the nuclear pores. Stage B now takes place when mRNA in the cytoplasm attaches to the ribosome.
Remember this order: Order ExampleDNA AGTmRNA (codon) UCAtRNA AGU
PAY SPECIAL ATTENTION
ACTIVITIES boy and girl-left and right of page
Step by step comment
EG - worked examples
HINT!
e.g.
NB NB
hint
activity
activity
comment
exams
mRNA (messenger RNA) –
carries the message.
© Department of Basic Education 2014
6 chaptEr 1 nucLEic aciDS (papEr 2 ) Mind the Gap CAPS Grade 12 Life Sciences
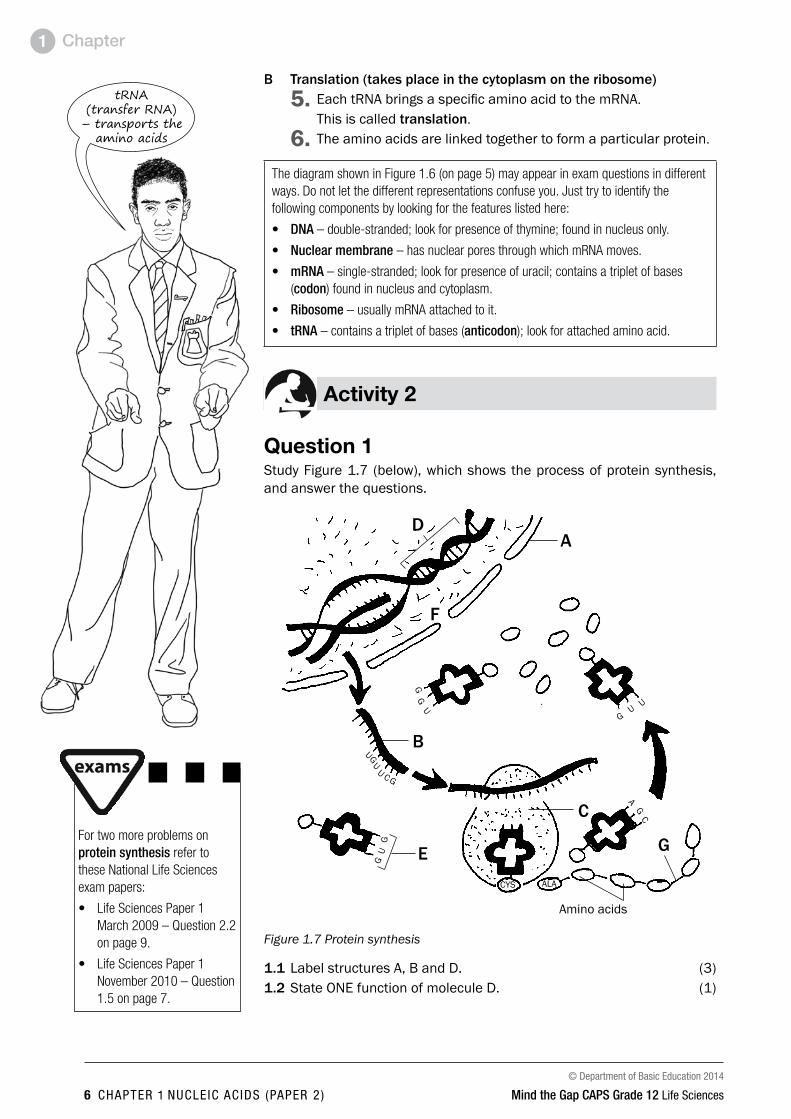
Chapter1
B translation (takes place in the cytoplasm on the ribosome)5. Each tRNA brings a specific amino acid to the mRNA. This is called translation. 6. The amino acids are linked together to form a particular protein.
The diagram shown in Figure 1.6 (on page 5) may appear in exam questions in different ways. Do not let the different representations confuse you. Just try to identify the following components by looking for the features listed here:
• DNA – double-stranded; look for presence of thymine; found in nucleus only.
• Nuclear membrane – has nuclear pores through which mRNA moves.
• mRNA – single-stranded; look for presence of uracil; contains a triplet of bases (codon) found in nucleus and cytoplasm.
• Ribosome – usually mRNA attached to it.
• tRNA – contains a triplet of bases (anticodon); look for attached amino acid.
Activity 2
Question 1Study Figure 1.7 (below), which shows the process of protein synthesis, and answer the questions.
Figure 1.7 Protein synthesis
1.1 Label structures A, B and D. (3)1.2 State ONE function of molecule D. (1)
F
Amino acids
A
B
e
C
GCUU
GU
GU
U
GG
U
AG
C
GU
G
CYS ALA
d
G For two more problems on protein synthesis refer to these National Life Sciences exam papers:
• Life Sciences Paper 1 March 2009 – Question 2.2 on page 9.
• Life Sciences Paper 1 November 2010 – Question 1.5 on page 7.
tRNA (transfer RNA)
– transports the amino acids

© Department of Basic Education 2014
Mind the Gap CAPS Grade 12 Life Sciences chaptEr 1 nucLEic aciDS (papEr 2 ) 7
Chapter 1
1.3 Which stage of protein synthesis takes place at F? (1)1.4 Identify organelle C. (1)1.5 Name and describe the stage of protein synthesis that takes
place at organelle C. (7)1.6 Write down the codon of anticodon E from top to bottom. (1)1.7 Name the type of bond (labelled G) between the amino acids. (1)
[15]
Answers to question 11.1 A – Nuclear membrane3
B – mRNA3
D – DNA3 (3)1.2 Carrying hereditary characteristics from parents to their offspring 3 OR Controls the synthesis (manufacturing) of proteins3 (1)1.3 Transcription3 (1)1.4 Ribosome3 (1)1.5 Translation3
• The mRNA strand from the nucleus becomes attached3 to a ribosome with its codons exposed
• each tRNA molecule carrying a specific amino acid3 • according to its anticodon3• matches up with/complements the codon of the mRNA3• so that the amino acids are placed in the correct sequence3• adjacent amino acids are linked3• to form a protein3 (7)
1.6 CAC3 (the anticodon is GUG, so the complementary codon is CAC) (1)
1.7 Peptide Bond (1)[15]
Question 2Table 1.3 below shows the DNA base triplets that code for different amino acids.
Amino acid Base triplet in dNA template
Leu (leucine) GAA
His (histidine) GTA
Lys (lysine) TTT
Pro (proline) GGG
Ala (alanine) CGA
Trp (tryptophan) ACC
Phe (phenylalanine) AAA
Gly (glycine) CCT
Table 1.3 Different amino acids and their DNA base triplets
You don’t have to know the
names of the amino acids related to the
base triplets.

© Department of Basic Education 2014
8 chaptEr 1 nucLEic aciDS (papEr 2 ) Mind the Gap CAPS Grade 12 Life Sciences
Chapter1
The following is a part of a sequence of amino acids that forms a particular protein molecule:
Ala His trp Leu Lys
2.1 Name the process by which mRNA is formed from a DNA template. (1)
2.2 How many mRNA codons would be involved in forming the portion of protein shown above? (1)
2.3 Write down the sequence of the first three mRNA codons (from left to right) for this portion of the protein. (3)
[5]
Answers to question 22.1 Transcription3 (1)2.2 53 (1)2.3 GCU3– CAU3– UGG3 (3)
[5]
Keep going!
Remember this order:Order ExampleDNA CGAmRNA (codon) GCUtRNA CGA
PAY SPECIAL ATTENTION
ACTIVITIES boy and girl-left and right of page
Step by step comment
EG - worked examples
HINT!
e.g.
NB NB
hint
activity
activity
comment
exams

© Department of Basic Education 2014
Mind the Gap CAPS Grade 12 Life Sciences chaptEr 2 mEioSiS (papEr 1 anD 2) 9
Chapter 2Paper 1 and 2
Meiosis
Chromosome
Chromatid
Centromere
Homologous chromosomes – one from the mother and one from the fatherFigure 2.1 Homologous chromosomes
2.1 What is meiosis?Meiosis is a type of cell division whereby a diploid cell (somatic cell) undergoes two cell divisions, and divides to form four dissimilar haploid cells (sex cells). Diploid cells have two sets of chromosomes, where each chromosome has a homologous partner. Haploid cells only have one set of chromosomes. Chromosomes in haploid cells have no homologous partners.
Before meiosis begins (during interphase), DNA replication takes place. The result is two sets of chromosomes consisting of two identical chromatids joined together with a centromere. This is shown in Figure 2.1 (right).
2.2 The process of meiosis in animal cells
Meiosis is the type of cell division used to produce gametes or sex cells (sperm and egg cells). A cell undergoing meiosis will divide twice – the first division is meiosis i and the second is meiosis ii.
In the first meiotic division, the number of cells is doubled, but the number of chromosomes is not. This results in half as many chromosomes per cell.
In the second meiotic division, the number of chromosomes does not get reduced.
The diagram alongside shows how meiosis starts with a diploid cell and divides twice (meiosis I and II), resulting in four haploid cells.
Now turn the page to find out what happens during each stage of meiosis I and II.
Meiosis
Meiosis I
DNA replication and recombination
Meiosis II

© Department of Basic Education 2014
10 chaptEr 2 mEioSiS (papEr 1 anD 2) Mind the Gap CAPS Grade 12 Life Sciences
Chapter2
2.2.1 First meiotic division
Spindle fibres
Homologous chromosomes
Figure 2.2 Prophase 1
Prophase 1• Chromosomes shorten and become visible as two
chromatids joined by a centromere.• Homologous pairs of chromosomes are now visible.• The nuclear membrane and nucleolus disappear.• The spindle starts to form.• Chromatids from each homologous pair touch.
The point where they touch is called a chiasma.• DNA is crossed over (swopped) at the chiasma.• The spindle continues to form.
Figure 2.3 Metaphase 1
Metaphase 1• The spindle extends across the whole cell.• The homologous chromosomes line up along the
equator of the spindle in their homologous pairs.• One chromosome of each pair lies on either side of the
equator.• The centromere of each chromosome attaches to the
spindle fibres.
Figure 2.4 Anaphase 1
Anaphase 1• The spindle fibres shorten and pull each chromosome
of each chromosome pair to opposite poles of the cell.
Constriction
Figure 2.5 Telophase 1
Telophase 1• The chromosomes reach the poles of the cell.• Each pole has half the number of chromosomes
present in the original cell.• The cell membrane constricts and divides the
cytoplasm in half to form two cells.

© Department of Basic Education 2014
Mind the Gap CAPS Grade 12 Life Sciences chaptEr 2 mEioSiS (papEr 1 anD 2) 11
Chapter 2
2.2.2 Second meiotic division
Figure 2.6 Prophase 2
Prophase 2• Each cell formed during meiosis I now divides again.• A spindle forms in each of the new cells.
Figure 2.7 Metaphase 2
Metaphase 2• Individual chromosomes line up at the equator of
each cell, with the centromeres attached to the spindle fibres.
Figure 2.8 Anaphase 2
Anaphase 2• The spindle fibres start to contract.• The centromeres split and daughter chromosomes/
chromatids are pulled to the opposite poles of each cell.
nucleus
Figure 2.9 Telophase 2
Telophase 2• The daughter chromosomes/chromatids reach the
poles and a new nucleus forms.• The cell membrane of each cell constricts and the
cytoplasm divides into two cells.• Four haploid daughter cells are formed.• Each daughter cell has half the number of
chromosomes of the original cell.• The daughter cells are genetically different from each
other.

© Department of Basic Education 2014
12 chaptEr 2 mEioSiS (papEr 1 anD 2) Mind the Gap CAPS Grade 12 Life Sciences
Chapter2
An easy way to remember the events of meiosis is to use the word mnemonic IPMAT.
Letter Phase event
i interphase i for in between: The part of the life cycle of the cell that is in between cell divisions.
P Prophase P for preparation: The chromosomes prepare for meiosis by untangling and becoming clearly visible. Crossing over also takes place.
M Metaphase M for middle: The chromosomes move to the ‘middle’ (equator).
A Anaphase A for apart: The chromosomes/chromatids move apart/move to the poles.
t telophase t for terminal: The final phase of meiosis I/meiosis II.
2.3 The significance of meiosisThere are two reasons why meiosis is important.1. It reduces the number of chromosomes by half, in other words from
diploid to haploid. This ensures that sex cells have half the number of chromosomes of other somatic cells so that when fertilisation occurs the zygote formed has the correct number of chromosomes. It balances the doubling effect of fertilisation.
2. Crossing over introduces genetic variation. Genetic variation results in offspring that are better adapted to a particular environment and
ensures that they will have a better chance of survival.
2.4 Abnormal meiosis• Sometimes mistakes occur during the
process of meiosis.• This can happen in Anaphase 1 where
the homologous chromosomes may not separate. Also called non-disjunction.
• It can also happen in Anaphase 2 when there is non-disjunction of the sister chromatids.
• If there is non-disjunction of chromosome pair 21 in humans it leads to the formation of an abnormal gamete with an extra copy of chromosome 21.
• If there is fusion between a normal gamete and an abnormal gamete (with extra copy of chromosome 21) it leads to Down Syndrome.
Figure 2.10 Non-disjunction meiosis I and meiosis II XX : 2 chromosomes X : 1 chromosome O : no chromosomes
a) Non-disjunction in meiosis I
b) Non-disjunction in meiosis II
non-disjunction
non-disjunction
XX XX O O XX O X X
© Department of Basic Education 2014
Mind the Gap CAPS Grade 12 Life Sciences chaptEr 2 mEioSiS (papEr 1 anD 2) 13
Chapter 2
PAY SPECIAL ATTENTION
ACTIVITIES boy and girl-left and right of page
Step by step comment
EG - worked examples
HINT!
e.g.
NB NB
hint
activity
activity
comment
exams
Worked example
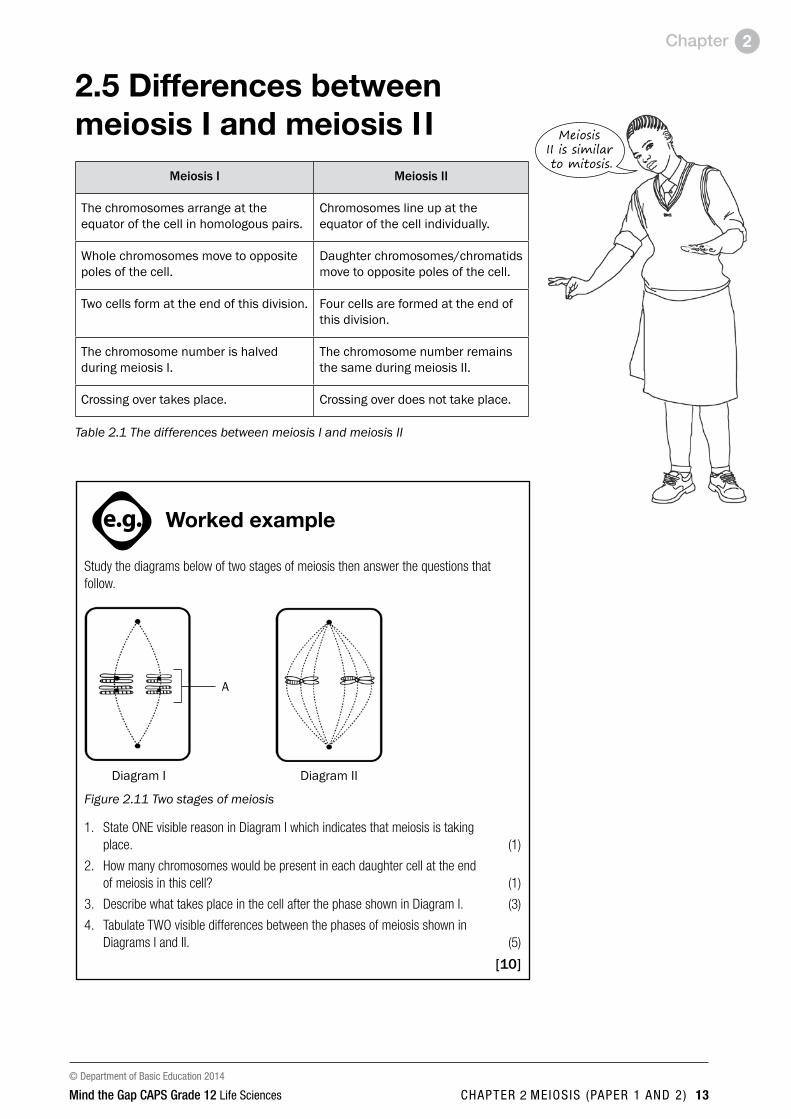
Study the diagrams below of two stages of meiosis then answer the questions that follow.
Diagram I Diagram II
Figure 2.11 Two stages of meiosis
1. State ONE visible reason in Diagram I which indicates that meiosis is taking place. (1)
2. How many chromosomes would be present in each daughter cell at the end of meiosis in this cell? (1)
3. Describe what takes place in the cell after the phase shown in Diagram I. (3)
4. Tabulate TWO visible differences between the phases of meiosis shown in Diagrams I and II. (5)
[10]
A
2.5 Differences between meiosis I and meiosis I I
Meiosis i Meiosis ii
The chromosomes arrange at the equator of the cell in homologous pairs.
Chromosomes line up at the equator of the cell individually.
Whole chromosomes move to opposite poles of the cell.
Daughter chromosomes/chromatids move to opposite poles of the cell.
Two cells form at the end of this division. Four cells are formed at the end of this division.
The chromosome number is halved during meiosis I.
The chromosome number remains the same during meiosis II.
Crossing over takes place. Crossing over does not take place.
Table 2.1 The differences between meiosis I and meiosis II
Meiosis II is similar to mitosis.

© Department of Basic Education 2014
14 chaptEr 2 mEioSiS (papEr 1 anD 2) Mind the Gap CAPS Grade 12 Life Sciences
Chapter2
Answers to worked example1. The chromosomes are lined up at the equator of the cell in their
homologous pairs.3 OR The chromosomes show evidence of crossing over.3 (1)2. Two 3 chromosomes. (1)3. The next phase is Anaphase 1. The spindle fibres contract.3
(shorten) and pull each chromosome3 of each chromosome pair to opposite poles3 of the cell. (3)
4.
diagram i (metaphase 1) diagram ii (metaphase 2)
1. Chromosomes are lined up at the equator in homologous pairs.3
1. Chromosomes are lined up at the equator individually.3
2. Four chromosomes are present.3
2. Two chromosomes are present.3
(5)[10]
Activity 1
Question 1Give the correct word or term for each of the statements or definitions provided below.
1.1 The structure that joins the two halves of a double-stranded chromosome (1)
1.2 A pair of chromosomes, one inherited from each parent, that have the same genes at the same locus (1)
1.3 A single-stranded chromosome formed during Anaphase 2 (1)
1.4 The point of contact between two chromosomes of a homologous pair during crossing over (1)
1.5 One half of a double-stranded chromosome (1)
1.6 The phase in meiosis where crossing over occurs (1)
[6]
Answers to question 11.1 Centromere3 (1)1.2 Homologous chromosomes3 (1)1.3 Daughter chromosome/chromatid3 (1)1.4 Chiasma3/chiasmata3 (1)1.5 Chromatid3 (1)1.6 Prophase 13 (1)
[6]
3
© Department of Basic Education 2014
Mind the Gap CAPS Grade 12 Life Sciences chaptEr 2 mEioSiS (papEr 1 anD 2) 15
Chapter 2
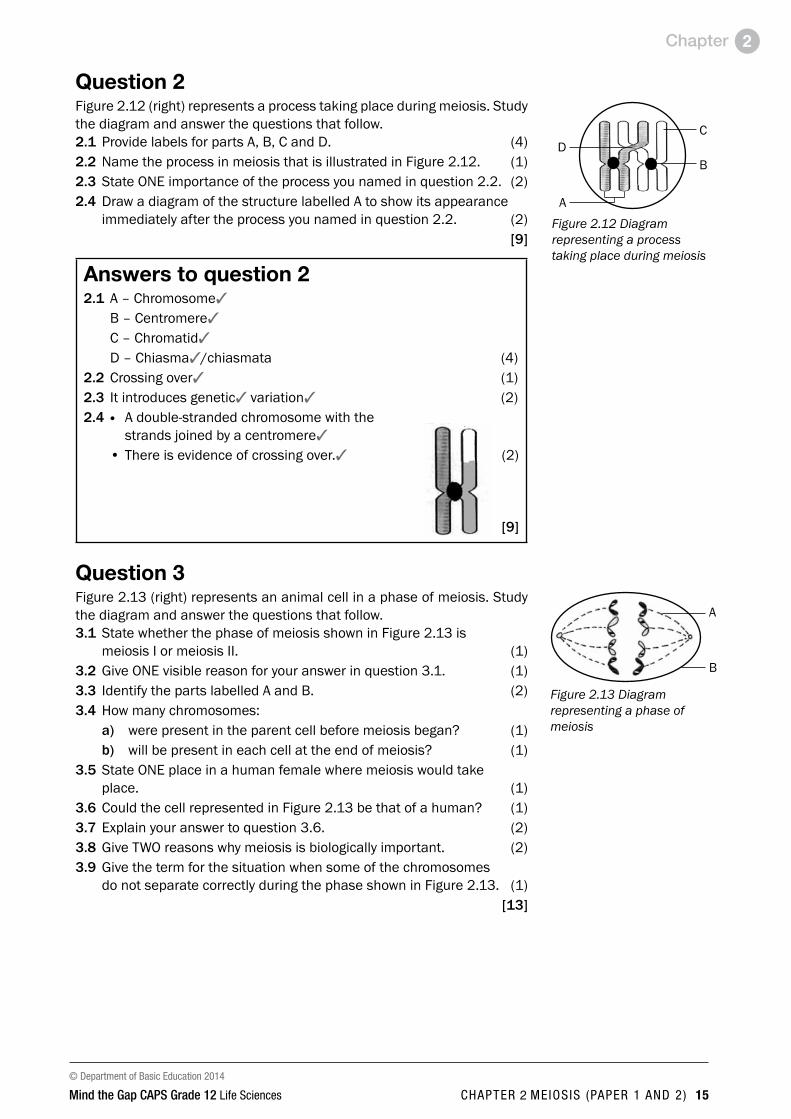
Question 2Figure 2.12 (right) represents a process taking place during meiosis. Study the diagram and answer the questions that follow.2.1 Provide labels for parts A, B, C and D. (4)2.2 Name the process in meiosis that is illustrated in Figure 2.12. (1)2.3 State ONE importance of the process you named in question 2.2. (2)2.4 Draw a diagram of the structure labelled A to show its appearance
immediately after the process you named in question 2.2. (2)[9]
Answers to question 22.1 A – Chromosome3
B – Centromere3
C – Chromatid3
D – Chiasma3/chiasmata (4)2.2 Crossing over3 (1)2.3 It introduces genetic3 variation3 (2)2.4 l A double-stranded chromosome with the
strands joined by a centromere3
• There is evidence of crossing over.3 (2)
[9]
Question 3Figure 2.13 (right) represents an animal cell in a phase of meiosis. Study the diagram and answer the questions that follow.3.1 State whether the phase of meiosis shown in Figure 2.13 is
meiosis I or meiosis II. (1)3.2 Give ONE visible reason for your answer in question 3.1. (1)3.3 Identify the parts labelled A and B. (2)3.4 How many chromosomes:
a) were present in the parent cell before meiosis began? (1)b) will be present in each cell at the end of meiosis? (1)
3.5 State ONE place in a human female where meiosis would take place. (1)
3.6 Could the cell represented in Figure 2.13 be that of a human? (1)3.7 Explain your answer to question 3.6. (2)3.8 Give TWO reasons why meiosis is biologically important. (2)3.9 Give the term for the situation when some of the chromosomes
do not separate correctly during the phase shown in Figure 2.13. (1) [13]
C
BD
AFigure 2.12 Diagram representing a process taking place during meiosis
A
B
Figure 2.13 Diagram representing a phase of meiosis
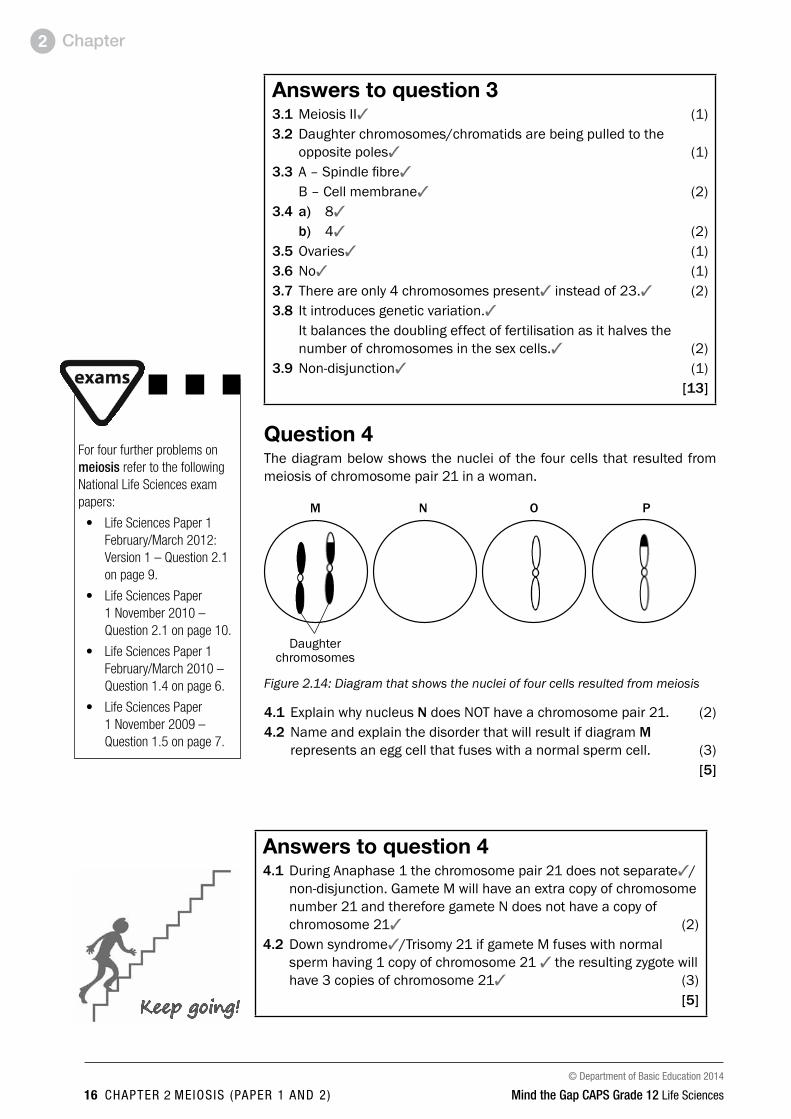
© Department of Basic Education 2014
16 chaptEr 2 mEioSiS (papEr 1 anD 2) Mind the Gap CAPS Grade 12 Life Sciences
Chapter2
Answers to question 33.1 Meiosis II3 (1)3.2 Daughter chromosomes/chromatids are being pulled to the
opposite poles3 (1)3.3 A – Spindle fibre3
B – Cell membrane3 (2)3.4 a) 83
b) 43 (2)3.5 Ovaries3 (1)3.6 No3 (1)3.7 There are only 4 chromosomes present3 instead of 23.3 (2)3.8 It introduces genetic variation.3 It balances the doubling effect of fertilisation as it halves the
number of chromosomes in the sex cells.3 (2)3.9 Non-disjunction3 (1) [13]
Question 4The diagram below shows the nuclei of the four cells that resulted from meiosis of chromosome pair 21 in a woman.
Daughter chromosomes
M N O P
Figure 2.14: Diagram that shows the nuclei of four cells resulted from meiosis
4.1 Explain why nucleus N does NOT have a chromosome pair 21. (2)4.2 Name and explain the disorder that will result if diagram M
represents an egg cell that fuses with a normal sperm cell. (3) [5]
Answers to question 44.1 During Anaphase 1 the chromosome pair 21 does not separate3/
non-disjunction. Gamete M will have an extra copy of chromosome number 21 and therefore gamete N does not have a copy of chromosome 213 (2)
4.2 Down syndrome3/Trisomy 21 if gamete M fuses with normal sperm having 1 copy of chromosome 21 3 the resulting zygote will have 3 copies of chromosome 213 (3)
[5]Keep going!
For four further problems on meiosis refer to the following National Life Sciences exam papers:
• Life Sciences Paper 1 February/March 2012: Version 1 – Question 2.1 on page 9.
• Life Sciences Paper 1 November 2010 – Question 2.1 on page 10.
• Life Sciences Paper 1 February/March 2010 – Question 1.4 on page 6.
• Life Sciences Paper 1 November 2009 – Question 1.5 on page 7.
© Department of Basic Education 2014
Mind the Gap CAPS Grade 12 Life Sciences chaptEr 3 rEproDuction in vErtEBratES (papEr 1 ) 17
Paper 1
Chapter 3Paper 1
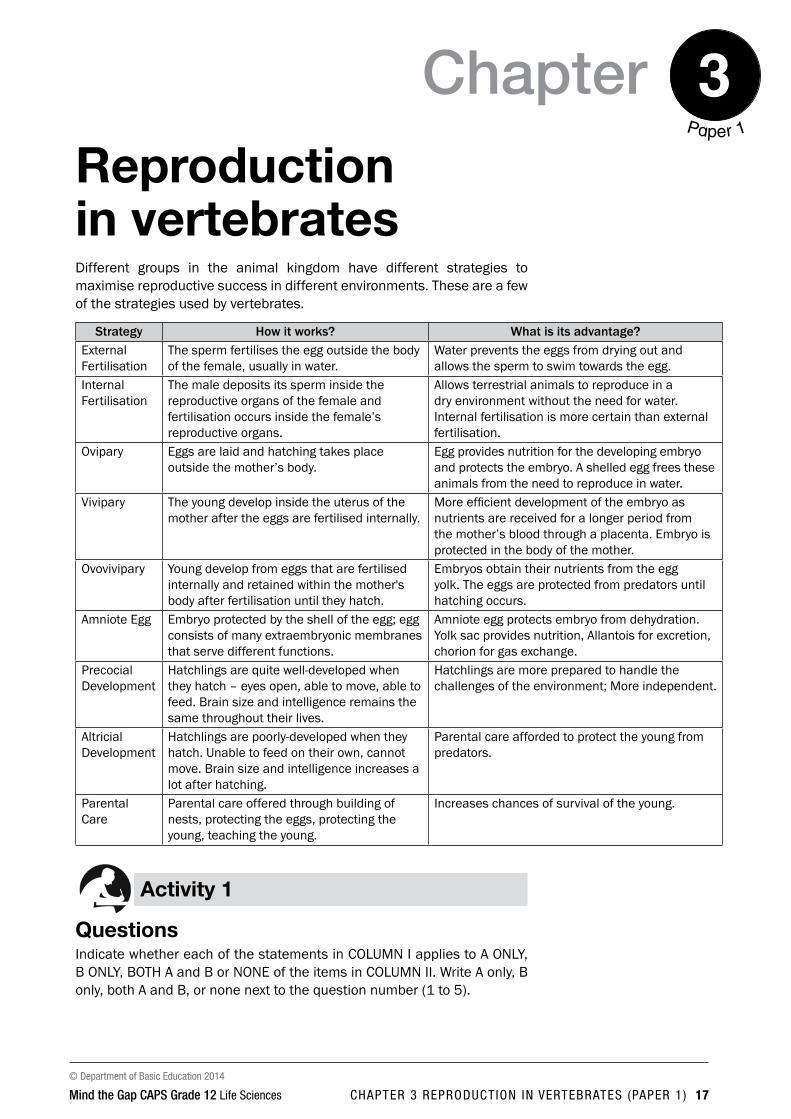
Reproduction in vertebratesDifferent groups in the animal kingdom have different strategies to maximise reproductive success in different environments. These are a few of the strategies used by vertebrates.
Strategy How it works? What is its advantage?External Fertilisation
The sperm fertilises the egg outside the body of the female, usually in water.
Water prevents the eggs from drying out and allows the sperm to swim towards the egg.
Internal Fertilisation
The male deposits its sperm inside the reproductive organs of the female and fertilisation occurs inside the female’s reproductive organs.
Allows terrestrial animals to reproduce in a dry environment without the need for water. Internal fertilisation is more certain than external fertilisation.
Ovipary Eggs are laid and hatching takes place outside the mother’s body.
Egg provides nutrition for the developing embryo and protects the embryo. A shelled egg frees these animals from the need to reproduce in water.
Vivipary The young develop inside the uterus of the mother after the eggs are fertilised internally.
More efficient development of the embryo as nutrients are received for a longer period from the mother’s blood through a placenta. Embryo is protected in the body of the mother.
Ovovivipary Young develop from eggs that are fertilised internally and retained within the mother's body after fertilisation until they hatch.
Embryos obtain their nutrients from the egg yolk. The eggs are protected from predators until hatching occurs.
Amniote Egg Embryo protected by the shell of the egg; egg consists of many extraembryonic membranes that serve different functions.
Amniote egg protects embryo from dehydration. Yolk sac provides nutrition, Allantois for excretion, chorion for gas exchange.
Precocial Development
Hatchlings are quite well-developed when they hatch – eyes open, able to move, able to feed. Brain size and intelligence remains the same throughout their lives.
Hatchlings are more prepared to handle the challenges of the environment; More independent.
Altricial Development
Hatchlings are poorly-developed when they hatch. Unable to feed on their own, cannot move. Brain size and intelligence increases a lot after hatching.
Parental care afforded to protect the young from predators.
Parental Care
Parental care offered through building of nests, protecting the eggs, protecting the young, teaching the young.
Increases chances of survival of the young.
Activity 1
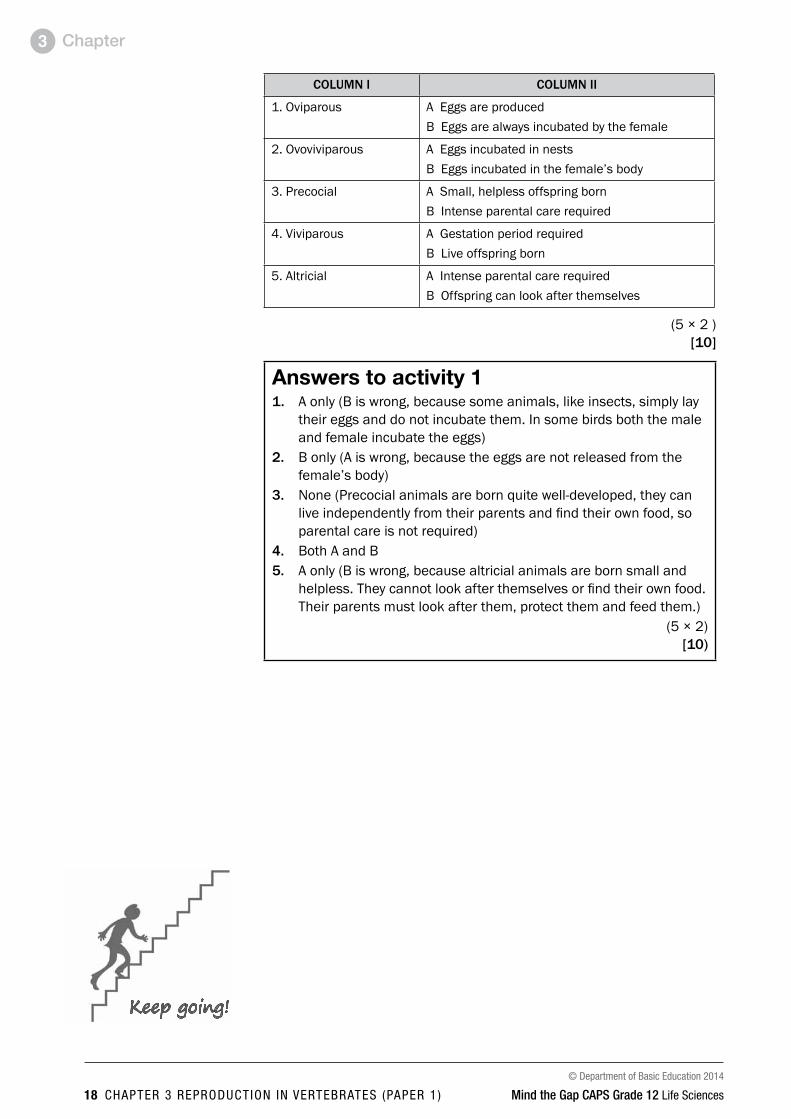
QuestionsIndicate whether each of the statements in COLUMN I applies to A ONLY, B ONLY, BOTH A and B or NONE of the items in COLUMN II. Write A only, B only, both A and B, or none next to the question number (1 to 5).
© Department of Basic Education 2014
18 chaptEr 3 rEproDuction in vErtEBratES (papEr 1 ) Mind the Gap CAPS Grade 12 Life Sciences
Chapter3
COLuMN i COLuMN ii
1. Oviparous A Eggs are producedB Eggs are always incubated by the female
2. Ovoviviparous A Eggs incubated in nestsB Eggs incubated in the female’s body
3. Precocial A Small, helpless offspring bornB Intense parental care required
4. Viviparous A Gestation period requiredB Live offspring born
5. Altricial A Intense parental care requiredB Offspring can look after themselves
(5 × 2 )[10]
Answers to activity 11. A only (B is wrong, because some animals, like insects, simply lay
their eggs and do not incubate them. In some birds both the male and female incubate the eggs)
2. B only (A is wrong, because the eggs are not released from the female’s body)
3. None (Precocial animals are born quite well-developed, they can live independently from their parents and find their own food, so parental care is not required)
4. Both A and B5. A only (B is wrong, because altricial animals are born small and
helpless. They cannot look after themselves or find their own food. Their parents must look after them, protect them and feed them.)
(5 × 2) [10)
Keep going!
© Department of Basic Education 2014
Mind the Gap CAPS Grade 12 Life Sciences chaptEr 4 rEproDuction (papEr 1 ) 19
Paper 1
Chapter 4Paper 1
Reproduction
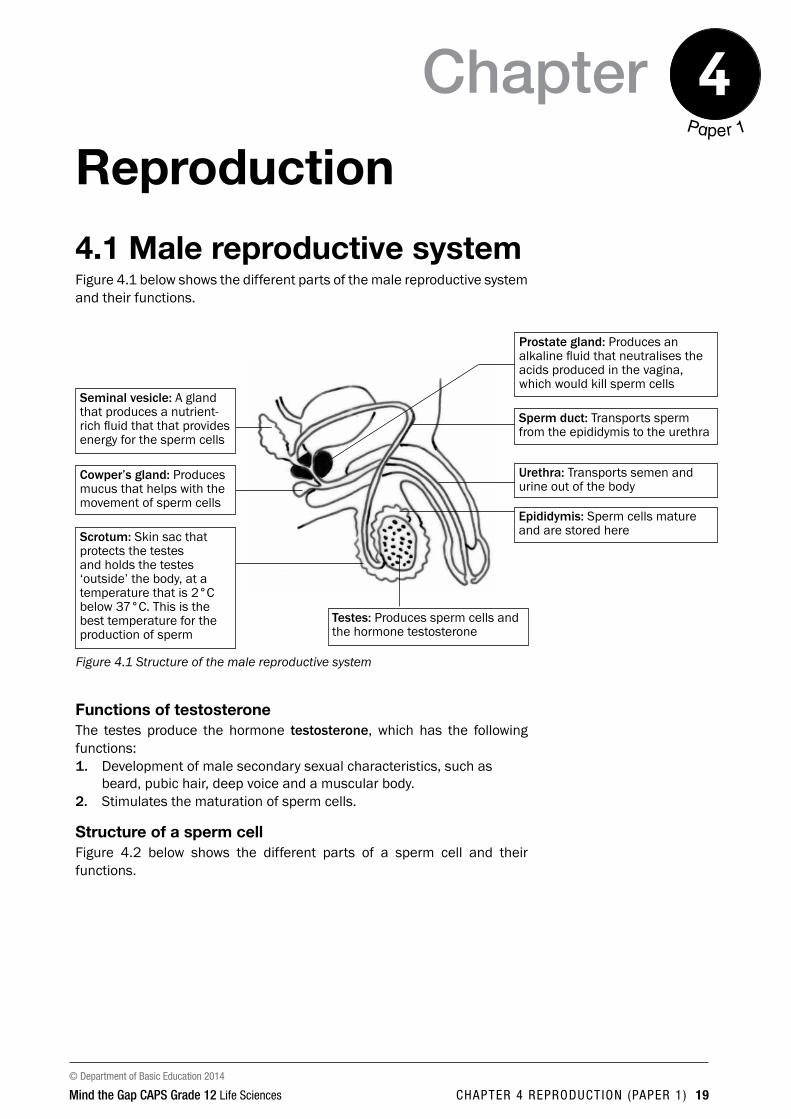
4.1 Male reproductive systemFigure 4.1 below shows the different parts of the male reproductive system and their functions.
testes: Produces sperm cells and the hormone testosterone
Figure 4.1 Structure of the male reproductive system
Seminal vesicle: A gland that produces a nutrient-rich fluid that that provides energy for the sperm cells
Cowper’s gland: Produces mucus that helps with the movement of sperm cells
Scrotum: Skin sac that protects the testes and holds the testes ‘outside’ the body, at a temperature that is 2°C below 37°C. This is the best temperature for the production of sperm
Prostate gland: Produces an alkaline fluid that neutralises the acids produced in the vagina, which would kill sperm cells
epididymis: Sperm cells mature and are stored here
urethra: Transports semen and urine out of the body
Sperm duct: Transports sperm from the epididymis to the urethra
Functions of testosteroneThe testes produce the hormone testosterone, which has the following functions: 1. Development of male secondary sexual characteristics, such as
beard, pubic hair, deep voice and a muscular body.2. Stimulates the maturation of sperm cells.
Structure of a sperm cellFigure 4.2 below shows the different parts of a sperm cell and their functions.
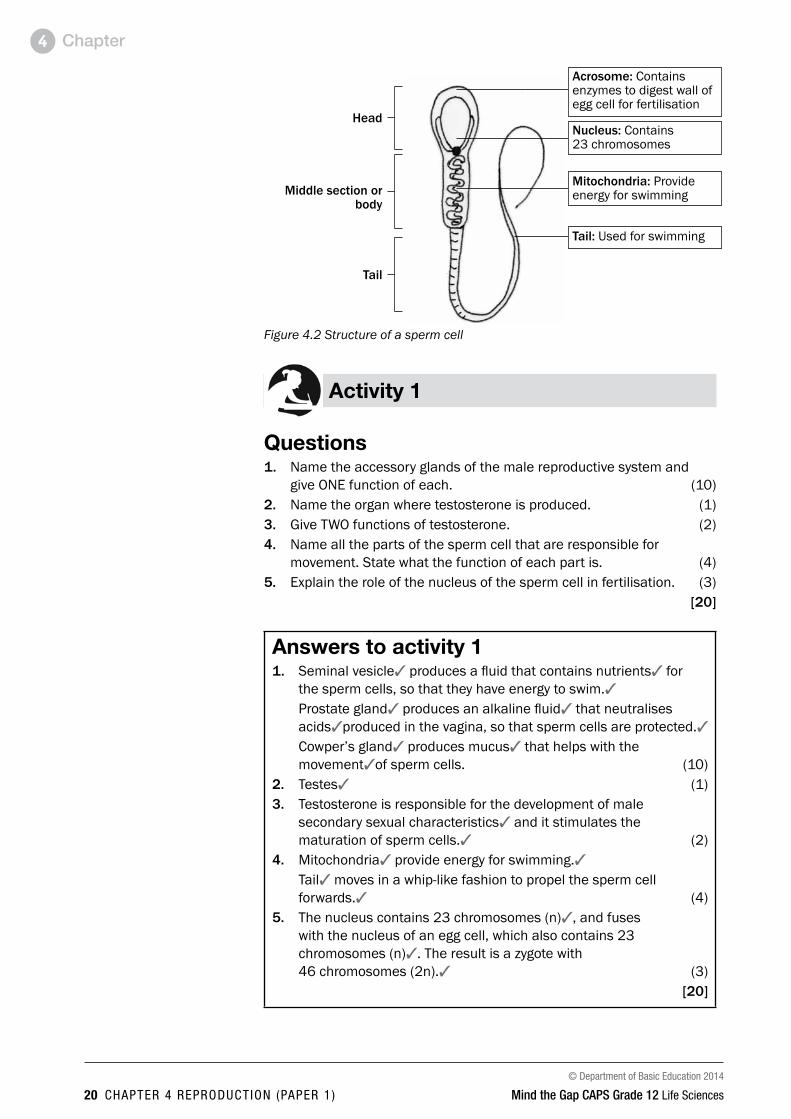
© Department of Basic Education 2014
20 chaptEr 4 rEproDuction (papEr 1 ) Mind the Gap CAPS Grade 12 Life Sciences
Chapter4
Head
Middle section or body
tail
Acrosome: Contains enzymes to digest wall of egg cell for fertilisation
Nucleus: Contains 23 chromosomes
Mitochondria: Provide energy for swimming
tail: Used for swimming
Figure 4.2 Structure of a sperm cell
Activity 1
Questions1. Name the accessory glands of the male reproductive system and
give ONE function of each. (10)2. Name the organ where testosterone is produced. (1)3. Give TWO functions of testosterone. (2)4. Name all the parts of the sperm cell that are responsible for
movement. State what the function of each part is. (4)5. Explain the role of the nucleus of the sperm cell in fertilisation. (3)
[20]
Answers to activity 11. Seminal vesicle3 produces a fluid that contains nutrients3 for
the sperm cells, so that they have energy to swim.3 Prostate gland3 produces an alkaline fluid3 that neutralises
acids3produced in the vagina, so that sperm cells are protected.3 Cowper’s gland3 produces mucus3 that helps with the
movement3of sperm cells. (10)2. Testes3 (1)3. Testosterone is responsible for the development of male
secondary sexual characteristics3 and it stimulates the maturation of sperm cells.3 (2)
4. Mitochondria3 provide energy for swimming.3 Tail3 moves in a whip-like fashion to propel the sperm cell
forwards.3 (4) 5. The nucleus contains 23 chromosomes (n)3, and fuses
with the nucleus of an egg cell, which also contains 23 chromosomes (n)3. The result is a zygote with 46 chromosomes (2n).3 (3)
[20]
© Department of Basic Education 2014
Mind the Gap CAPS Grade 12 Life Sciences chaptEr 4 rEproDuction (papEr 1 ) 21
Chapter 4
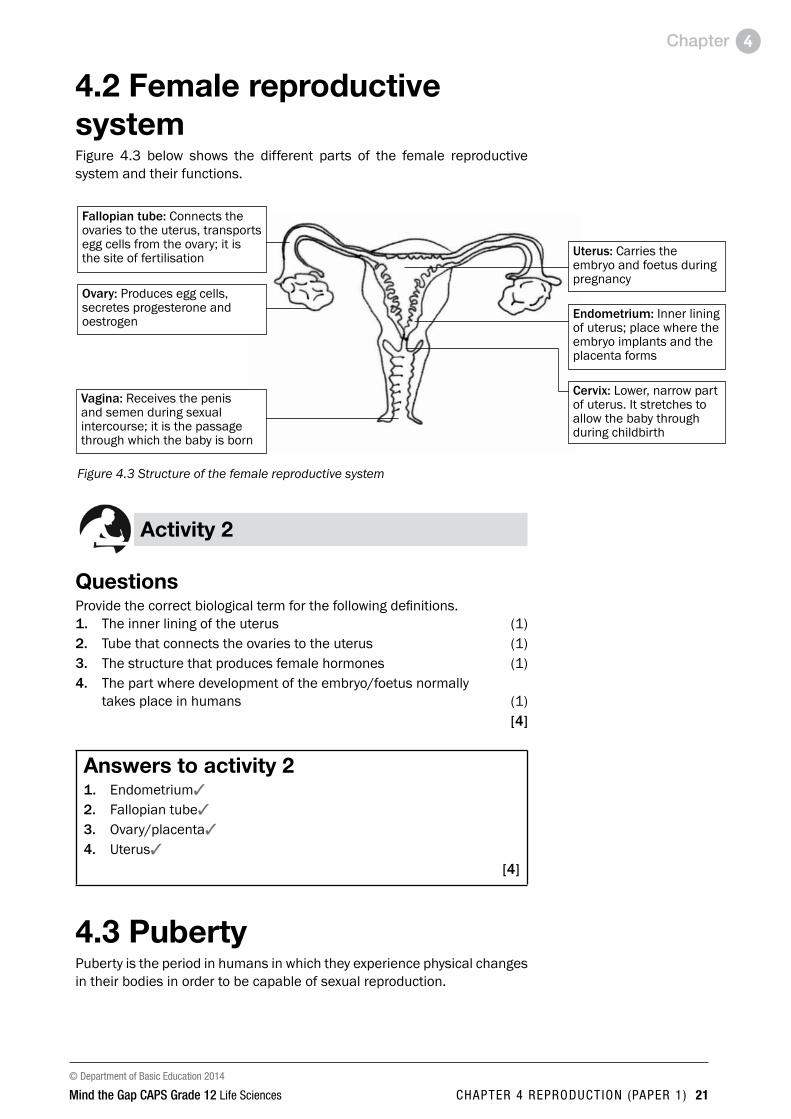
4.2 Female reproductive systemFigure 4.3 below shows the different parts of the female reproductive system and their functions.
Figure 4.3 Structure of the female reproductive system
Fallopian tube: Connects the ovaries to the uterus, transports egg cells from the ovary; it is the site of fertilisation
Ovary: Produces egg cells, secretes progesterone and oestrogen
Vagina: Receives the penis and semen during sexual intercourse; it is the passage through which the baby is born
uterus: Carries the embryo and foetus during pregnancy
endometrium: Inner lining of uterus; place where the embryo implants and the placenta forms
Cervix: Lower, narrow part of uterus. It stretches to allow the baby through during childbirth
Activity 2
QuestionsProvide the correct biological term for the following definitions.1. The inner lining of the uterus (1)2. Tube that connects the ovaries to the uterus (1)3. The structure that produces female hormones (1)4. The part where development of the embryo/foetus normally
takes place in humans (1)[4]
Answers to activity 21. Endometrium3
2. Fallopian tube3
3. Ovary/placenta3
4. Uterus3
[4]
4.3 PubertyPuberty is the period in humans in which they experience physical changes in their bodies in order to be capable of sexual reproduction.

© Department of Basic Education 2014
22 chaptEr 4 rEproDuction (papEr 1 ) Mind the Gap CAPS Grade 12 Life Sciences
Chapter4
Puberty in males Puberty in females
Stimulated by testosterone Stimulated by oestrogen
Growth of male sex organs Growth of female sex organs
Start of the production of sperm cells Start of the menstrual cycle and production of ova
Growth of pubic hair, facial hair and body hair Growth of pubic hair
Development of muscles and deepening of voice Growth and development of breasts and widening of hips
4.4 Menstrual cycleThe series of diagrams in Figure 4.4 below shows the events occurring in the ovary (ovarian cycle) and uterus (uterine cycle) during the menstrual cycle. The days are not exact, but are averages.
Figure 4.4 The menstrual cycle
day 8–13 Ovaries: Mature Graafian follicle develops:• The Graafian follicle moves to
edge of the ovary• It secretes oestrogenuterus: Oestrogen stimulates the endometrium to become thicker and develop more blood vessels and glands
day 23–28Ovaries:If fertilisation does not take place: • The corpus luteum shrinks and stops secreting
progesteroneIf fertilisation takes place:• The corpus luteum remains active in the ovary
and continues to secrete progesterone• No more follicles develop in the ovaries• No menstruation takes place
day 1–7Ovaries: New follicles develop and secrete oestrogenuterus: Lining breaks down and is released (menstruation)
day 14 Ovaries: Graafian follicle bursts to release an egg cell. The process is called ovulation
day 15–22 Ovaries: The Graafian follicle becomes a corpus luteum that secretes progesteroneuterus: Progesterone stimulates the endometrium to become even thicker and to develop more blood vessels and glands, ready to receive the embryo if an egg cell is fertilised
Start here!

© Department of Basic Education 2014
Mind the Gap CAPS Grade 12 Life Sciences chaptEr 4 rEproDuction (papEr 1 ) 23
Chapter 4
4.5 Hormonal control of the menstrual cycleThe graph in Figure 4.5 below shows changes in the ovary, uterus and in the level of hormones during a 28-day menstrual cycle.
APituitary/hypophysis hormone levels
B Growth of follicle
C Ovarian hormone levels
d thickness of uterine lining/endometrium
0 7 14 21 28days
FSH LH
OestrogenProgesterone
Figure 4.5 Hormonal regulation of the female reproductive cycle
The hormonal changes that take place at A, B, C and D in the graph in Figure 4.5 above are explained in Table 4.1 below.
A B C dday 0–11
Pituitary gland produces FSH which stimulates development of the follicle.
Follicle is developing to become a Graafian follicle containing an egg cell.
Oestrogen levels increase as the hormone is produced by the follicle.
Thickness of endometrium increases from day 7 (after menstruation has ended) as a result of oestrogen.
day 11–17
FSH and LH (produced by the pituitary gland) levels are highest around day 14.
Follicle development is completed as a result of the influence of FSH by day 14.Ovulation is stimulated by high levels of FSH and LH on day 14.LH then stimulates the development of the corpus luteum.
Oestrogen levels reach a maximum towards day 14 until ovulation takes place, but then start to decrease because the Graafian follicle stops functioning.
Endometrium thickens further.
day 17–28
LH levels decrease and then remain constant to maintain the corpus luteum.
Corpus luteum produces progesterone.Corpus luteum gradually disintegrates since fertilisation does not take place.
Oestrogen levels increase again and then decrease towards the end of the cycle.Progesterone levels increase towards day 21.Progesterone levels decrease when corpus luteum disintegrates and stops functioning.
Progesterone prepares endometrium fully for pregnancy.Decreased progesterone levels from around day 21 cause endometrium to shed after day 28 by menstruation since no fertilisation took place.
Table 4.1 Hormonal changes during the menstrual cycle

© Department of Basic Education 2014
24 chaptEr 4 rEproDuction (papEr 1 ) Mind the Gap CAPS Grade 12 Life Sciences
Chapter4
Activity 3
Study Figure 4.6 below and answer the questions that follow.
Hormonal regulation of the menstrual cycle
Growth of follicle
Ovarian hormone levels
0 7 14 21 28days
AB
Figure 4.6 Hormonal changes during the menstrual cycle
1. Name the hormones A and B. (2)2. Give reasons for your answers in question 1. (2)3. What event occurs on day 14? (1)4. Name the other two hormones involved in this cycle. (2)5. Did fertilisation occur during the cycle shown in Figure 4.6? (1)6. Explain your answer in question 5. (2)
[10]
Answers to activity 31. A – Oestrogen3 B – Progesterone3 (2)2. A: The Graafian follicle secretes oestrogen3/Oestrogen reaches
its maximum level before ovulation.3 B: The corpus luteum produces progesterone3/Progesterone
reaches its maximum level after ovulation.3 (2)3. Ovulation3 (1)4. LH3 and FSH3 (2)5. No3 (1)6. Progesterone levels decrease3 towards the end of the cycle.
The corpus luteum decreases3 in size. (2) [10]
Here is a hint to help you to remember the names of the two hormones:
• O stands for Oestrogen and when it is high, Ovulation occurs.
• P stands for Progesterone and when it remains high, there is a Pregnancy.
PAY SPECIAL ATTENTION
ACTIVITIES boy and girl-left and right of page
Step by step comment
EG - worked examples
HINT!
e.g.
NB NB
hint
activity
activity
comment
exams
Make sure you know how to interpret the graph in Figure 4.6 before you try to answer the questions:
• All the information refers to the ovary.
• The information is presented in graph form. The days of the menstrual cycle are indicated on the X-axis.
• The graph should be read from left to right in the same way that you read a sentence.
• The graph illustrates the concentrations of two hormones, namely oestrogen and progesterone.
PAY SPECIAL ATTENTION
ACTIVITIES boy and girl-left and right of page
Step by step comment
EG - worked examples
HINT!
e.g.
NB NB
hint
activity
activity
comment
exams

© Department of Basic Education 2014
Mind the Gap CAPS Grade 12 Life Sciences chaptEr 4 rEproDuction (papEr 1 ) 25
Chapter 4
4.6 Development of the foetusFigure 4.7 below shows the stages in the development of the foetus.
Fertilisation
Egg cell Ovulation
Ovary
Placenta
Fallopian tube
Embryo
Sperm cell
FoetusChorion
Umbilical cord
Amnion
Amniotic fluid
Figure 4.7 Stages in the development of the foetus
Explanation of Figure 4.71. In the ovary a mature Graafian follicle bursts (usually on day 14 of
the menstrual cycle) and releases an egg cell. This process is called ovulation.
2. Fertilisation takes place high up in the fallopian tube. The egg cell (containing 23 chromosomes) and sperm cell (containing 23 chromosomes) fuse to form a zygote (containing 46 chromosomes).
3. The zygote divides by mitosis to form a morula, then a blastocyst, and finally an embryo as it moves down the Fallopian tube.
4. It takes about 5 to 7 days for the embryo to reach the uterus.5. In the uterus the embryo settles on the endometrium and sinks
into it, embedding itself in the endometrium. This process is called implantation.
6. After implantation, the embryo produces many finger-like structures called villi from the outer membrane of the embryo, which is known as the chorion.
7. The villi grow into the tissue of the uterus to form a placenta.8. The placenta is attached to the embryo by the umbilical cord. It
has 2 umbilical arteries (which carry deoxygenated blood from the embryo towards the placenta) and 1 umbilical vein (which carries oxygenated blood from the placenta to the embryo).
9. The embryo is enclosed in a fluid-filled sac called the amnion. The fluid is called the amniotic fluid.
10. After about 8 weeks, the embryo develops structures such as limbs and all the organs of the body. Now it is called a foetus.
11. Gestation is the period between fertilisation and the birth of the baby. It usually lasts for a period of 9 months (39–40 weeks).
12. The stages involved in the natural birth process are:• Dilation of the cervix (labour)• Expulsion of the foetus.• Delivery of the afterbirth (placenta) and extra-embryonic
membranes.
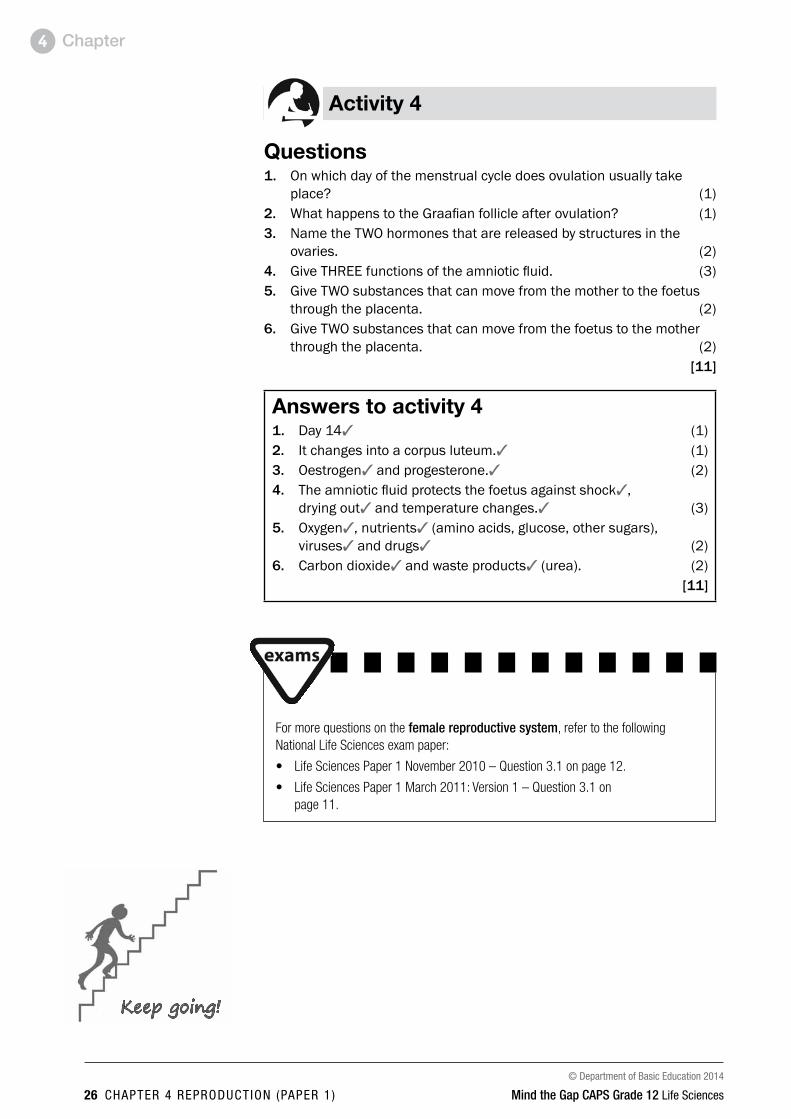
© Department of Basic Education 2014
26 chaptEr 4 rEproDuction (papEr 1 ) Mind the Gap CAPS Grade 12 Life Sciences
Chapter4
Activity 4
Questions1. On which day of the menstrual cycle does ovulation usually take
place? (1)2. What happens to the Graafian follicle after ovulation? (1)3. Name the TWO hormones that are released by structures in the
ovaries. (2)4. Give THREE functions of the amniotic fluid. (3)5. Give TWO substances that can move from the mother to the foetus
through the placenta. (2)6. Give TWO substances that can move from the foetus to the mother
through the placenta. (2)[11]
Answers to activity 41. Day 143 (1)2. It changes into a corpus luteum.3 (1)3. Oestrogen3 and progesterone.3 (2) 4. The amniotic fluid protects the foetus against shock3,
drying out3 and temperature changes.3 (3)5. Oxygen3, nutrients3 (amino acids, glucose, other sugars),
viruses3 and drugs3 (2)6. Carbon dioxide3 and waste products3 (urea). (2)
[11]
Keep going!
For more questions on the female reproductive system, refer to the following National Life Sciences exam paper:
• Life Sciences Paper 1 November 2010 – Question 3.1 on page 12.
• Life Sciences Paper 1 March 2011: Version 1 – Question 3.1 on page 11.

© Department of Basic Education 2014
Mind the Gap CAPS Grade 12 Life Sciences chaptEr 5 gEnEticS (papEr 2 ) 27
Paper 2
Chapter 5Paper 2
Genetics5.1 Key conceptsMake mobile notes (see instructions on page x) to learn these key concepts.
term explanation diagram/Additional notes
Gene A small portion of DNA coding for a particular characteristic.
Cell Chromosome dNA
NucleusGene
Alleles Different forms of a gene which occur at the same locus (position) on homologous chromosomes.
dominant allele (t) – tall plantRecessive allele (t) – short plant
• Homozygous dominant (both alleles are dominant)
• Genotype TT• Phenotype – tall
• Homozygous recessive (both alleles are recessive)
• Genotype tt• Phenotype – short
• Heterozygous (one dominant and one recessive allele)
• Genotype Tt• Phenotype – tall
t
t
t
t
t t
AllelesGenotype Genetic composition (make-up) of an organism.
Phenotype The physical appearance of an organism determined by the genotype, e.g. tall, short.
dominant allele
An allele that is expressed (shown) in the phenotype when found in the heterozygous (Tt) and homozygous (TT) condition.
Recessive allele
An allele that is masked (not shown) in the phenotype when found in the heterozygous (Tt) condition. It is only expressed in the homozygous (tt) condition.
Heterozygous Two different alleles for a particular characteristic, e.g. Tt.
Homozygous Two identical alleles for a particular characteristic, e.g. TT or tt.

© Department of Basic Education 2014
28 chaptEr 5 gEnEticS (papEr 2 ) Mind the Gap CAPS Grade 12 Life Sciences
Chapter5
term explanation diagram/Additional notes
Monohybrid cross
Only one characteristic or trait is being shown in the genetic cross.
Example: Flower colour only, e.g. yellow flower or white flower OR shape of seeds only, e.g. round seeds or wrinkled seeds.
Complete dominance
A genetic cross where the dominant allele masks (blocks) the expression of a recessive allele in the heterozygous condition.
In this type of cross the allele for tall (T) is dominant over the allele for short (t). The offspring will therefore be tall because the dominant allele (T) masks the expression of the recessive allele (t).
Tall (TT) × short (tt)
Tall (Tt)
incomplete dominance
A genetic cross between two phenotypically different parents produces offspring different from both parents but with an intermediate phenotype.
Example: If a red-flowered plant is crossed with a white-flowered plant and there is incomplete dominance – the offspring will have pink flowers (intermediate colour).
Red flower – White flower
Pink flowers
Co-dominance A genetic cross in which both alleles are expressed equally in the phenotype.
Example: If a red-flowered plant is crossed with a white-flowered plant and there is co-dominance the offspring has flowers with red and white patches.
Red flower × White flower
Flowers with red and white patches
Multiple alleles More than two alternative forms of a gene at the same locus.
Example: Blood groups are controlled by three alleles, namely IA, IB and i.
Sex-linked characteristics
Characteristics or traits that are carried on the sex chromosomes.
Examples: Haemophilia and colour-blindnessThe alleles for haemophilia (or colour-blindness) are indicated as superscripts on the sex chromosomes, e.g. XHXH (normal female), XHXh (normal female), XhXh (female with haemophilia), XHY (normal male), XhY (male with haemophilia).
Karyotype The number, shape and arrangement of all the chromosomes in the nucleus of a somatic cell. Chromosomes
Cloning Process by which genetically identical organisms are formed using biotechnology.
Example: Dolly the sheep was cloned using a diploid cell from one parent; therefore it had the identical genetic material of that parent.
Genetic modification
The manipulation of the genetic material of an organism to get desired changes.
Example: The insertion of human insulin gene in plasmid of bacteria so that the bacteria produce human insulin.
Human genome
The mapping of the exact position of all the genes in all the chromosomes of a human.
Example: Gene number 3 on chromosome number 4 is responsible for a particular characteristic.
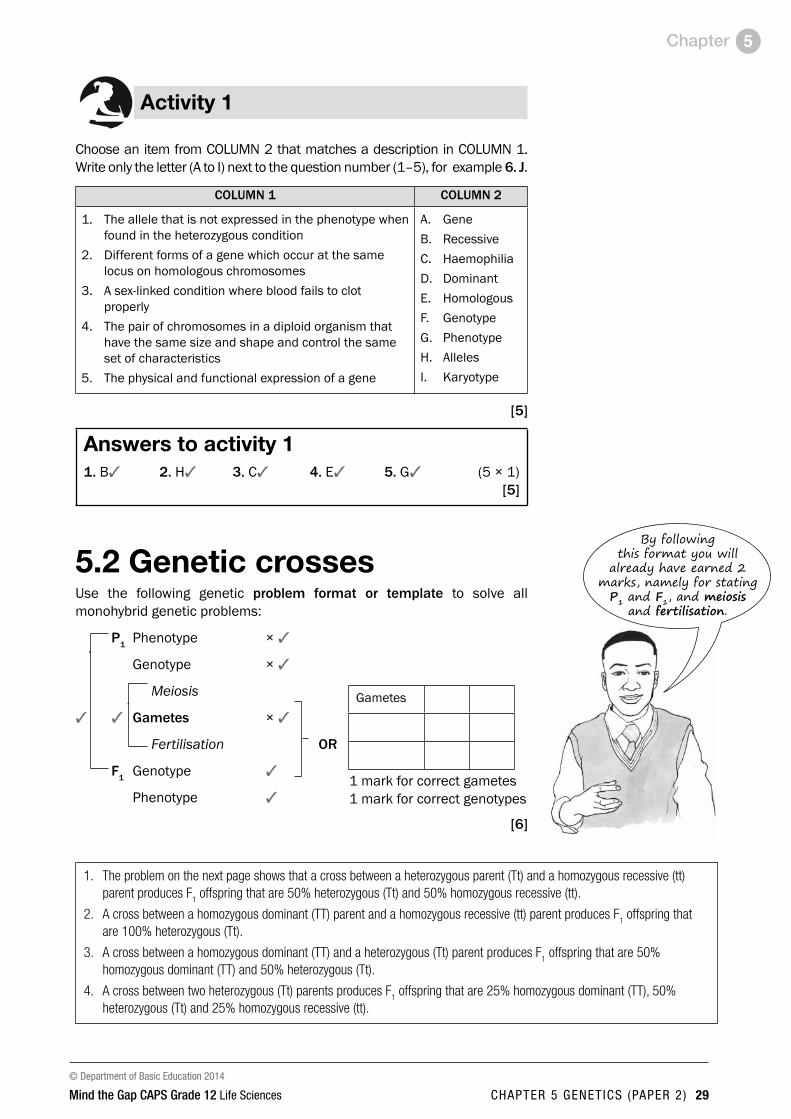
© Department of Basic Education 2014
Mind the Gap CAPS Grade 12 Life Sciences chaptEr 5 gEnEticS (papEr 2 ) 29
Chapter 5
Activity 1
Choose an item from COLUMN 2 that matches a description in COLUMN 1. Write only the letter (A to I) next to the question number (1–5), for example 6. J.
COLuMN 1 COLuMN 2
1. The allele that is not expressed in the phenotype when found in the heterozygous condition
2. Different forms of a gene which occur at the same locus on homologous chromosomes
3. A sex-linked condition where blood fails to clot properly
4. The pair of chromosomes in a diploid organism that have the same size and shape and control the same set of characteristics
5. The physical and functional expression of a gene
A. GeneB. RecessiveC. HaemophiliaD. Dominant E. HomologousF. GenotypeG. PhenotypeH. AllelesI. Karyotype
[5]
Answers to activity 11. B3 2. H3 3. C3 4. E3 5. G3 (5 × 1)
[5]
5.2 Genetic crossesUse the following genetic problem format or template to solve all monohybrid genetic problems:
P1 Phenotype × 3
Genotype × 3
Meiosis
3 3 Gametes × 3
Fertilisation OR
F1 Genotype 3
Phenotype 3
[6]
Gametes
1 mark for correct gametes1 mark for correct genotypes
1. The problem on the next page shows that a cross between a heterozygous parent (Tt) and a homozygous recessive (tt) parent produces F
1 offspring that are 50% heterozygous (Tt) and 50% homozygous recessive (tt).
2. A cross between a homozygous dominant (TT) parent and a homozygous recessive (tt) parent produces F1 offspring that
are 100% heterozygous (Tt).
3. A cross between a homozygous dominant (TT) and a heterozygous (Tt) parent produces F1 offspring that are 50%
homozygous dominant (TT) and 50% heterozygous (Tt).
4. A cross between two heterozygous (Tt) parents produces F1 offspring that are 25% homozygous dominant (TT), 50%
heterozygous (Tt) and 25% homozygous recessive (tt).
By following this format you will
already have earned 2 marks, namely for stating
P1 and F1, and meiosis and fertilisation.

© Department of Basic Education 2014
30 chaptEr 5 gEnEticS (papEr 2 ) Mind the Gap CAPS Grade 12 Life Sciences
Chapter5
5.2.1 Complete dominanceThis refers to a genetic cross where the dominant allele masks (blocks) the expression of a recessive allele in the heterozygous condition.
The following problem represents a genetic cross which shows complete dominance:
PAY SPECIAL ATTENTION
ACTIVITIES boy and girl-left and right of page
Step by step comment
EG - worked examples
HINT!
e.g.
NB NB
hint
activity
activity
comment
exams
Genetic problem 1
In humans the ability to roll the tongue is due to a dominant allele. A man who is heterozygous for tongue-rolling and a woman who cannot roll her tongue have children. Use the symbols T and t for the alleles of the tongue-rolling characteristic and represent a genetic cross to determine the possible genotypes and phenotypes of the children. (6)
Read the problem carefully and note the following steps:• Identify the phenotypes of the man and the woman
(parents/P1), i.e. the man is a tongue-roller and the woman is a non-tongue-roller. ..............................Step 1
• Identify the genotypes of the two parents, i.e. the man is heterozygous (Tt) and the woman can only be a non-tongue-roller if she is homozygous recessive for this characteristic, i.e. she must have the genotype (tt) ...................................................... Step 2
• The next step is to show how the alleles are separated through the process of meiosis into separate gametes, i.e. in the man the gametes (sperm) will contain either the ‘T’ allele or the ‘t’ allele. In the woman the egg can only contain the ‘t’ allele .................Step 3
• The next step shows that fertilisation takes place. Indicate all possible combinations of how sperm cells fuse with a possible egg cell to show the possible genotypes of the F1 generation that could arise ....................................................................................Step 4
• Interpret the phenotypes of all the possible genotypes from the cross .............................................................................................Step 5
Solution to genetic problem 1 P1 Phenotype Tongue-roller × Non-tongue-roller3 ......Step 1
Genotype Tt × tt3 ...................Step 2
Meiosis
3 3 Gametes T and t × t 3 ..................Step 3
Fertilisation .................Step 4
F1 Genotype Tt tt 3 .................Step 4
Phenotype Tongue-roller Non-tongue-roller3 ....... Step 5
(Max 6 marks)

© Department of Basic Education 2014
Mind the Gap CAPS Grade 12 Life Sciences chaptEr 5 gEnEticS (papEr 2 ) 31
Chapter 5
5.2.2 Incomplete dominanceThis refers to a genetic cross between two phenotypically different parents producing an offspring different from both parents but with an intermediate phenotype. The following problem represents a genetic cross that shows incomplete dominance.
PAY SPECIAL ATTENTION
ACTIVITIES boy and girl-left and right of page
Step by step comment
EG - worked examples
HINT!
e.g.
NB NB
hint
activity
activity
comment
exams
Genetic problem 2
A homozygous snapdragon plant with red flowers (R) was cross-pollinated with a homozygous snapdragon plant with white (W) flowers. All the plants that grew from the cross had pink flowers. Represent a genetic cross to show the possible genotypes and phenotypes of the F
1 generation of plants.
Solution to genetic problem 2 P1 Phenotype Red × White3 ........................Step 1
Genotype RR × WW3 ..........................Step 2
Meiosis
3 3 Gametes R × W3 ..............................Step 3
Fertilisation ....................................Step 4
F1 Genotype RW3 .....................................Step 4
Phenotype Pink3 ....................................Step 5
5.2.3 Co-dominanceThis refers to a genetic cross in which both alleles are equally expressed in the phenotype.
The following problem represents a genetic cross which shows co- dominance.
PAY SPECIAL ATTENTION
ACTIVITIES boy and girl-left and right of page
Step by step comment
EG - worked examples
HINT!
e.g.
NB NB
hint
activity
activity
comment
exams
Genetic problem 3
A plant with white flowers was cross-pollinated with a plant with red flowers. All the plants that grew from the cross had flowers with equal distribution of red and white colour. Represent a genetic cross to show the possible genotypes and phenotypes of the F
1 generation of plants.
Solution to genetic problem 3 P1 Phenotype Red × White3 .....................Step 1
Genotype RR × WW3 ........................Step 2
Meiosis
3 3 Gametes R × W3 ...........................Step 3
Fertilisation ...................................Step 4
F1 Genotype RW3 ...................................Step 4
Phenotype Flower with equal distribution of red and white colour3 .......Step 5
The solution for incomplete dominance
and co-dominance is exactly the same except for the interpretation of the phenotype of the F1
generation (step 5).

© Department of Basic Education 2014
32 chaptEr 5 gEnEticS (papEr 2 ) Mind the Gap CAPS Grade 12 Life Sciences
Chapter5
5.2.4 Inheritance of sexThe following problem represents a genetic cross which shows inheritance of sex.
PAY SPECIAL ATTENTION
ACTIVITIES boy and girl-left and right of page
Step by step comment
EG - worked examples
HINT!
e.g.
NB NB
hint
activity
activity
comment
exams
Genetic problem 4
A couple has three sons and the woman is pregnant again. Show diagrammatically by means of a genetic cross what the percentage chance is of the couple having a baby girl.
Solution to genetic problem 4 P1 Phenotype Male × Female3 ......................Step 1
Genotype XY × XX3 ..........................Step 2
Meiosis
3 3 Gametes X and Y × X3 ...........................Step 3
Fertilisation .............................Step 4
F1 Genotype XX, XY3 ..........................Step 4
Phenotype Female, Male3 ........................Step 5
50% chance3
5.2.5 Inheritance of sex-linked characteristicsSex-linked characteristics are characteristics (traits) that are carried on the sex chromosomes.
The following problem represents a genetic cross which shows the inheritance of sex-linked characteristics.
PAY SPECIAL ATTENTION
ACTIVITIES boy and girl-left and right of page
Step by step comment
EG - worked examples
HINT!
e.g.
NB NB
hint
activity
activity
comment
exams
Genetic problem 5
Haemophilia is a sex-linked hereditary disease that occurs as a result of a recessive allele on the X-chromosome (Xh). A normal father and heterozygous normal mother have children. Represent a genetic cross to determine the possible genotypes and phenotypes of their children.
The alleles for haemophilia are indicated as superscripts on the sex chromosomes, e.g. XHXH (normal female), XHXh (carrier/heterozygous normal female), XhXh (female with haemophilia), XHY (normal male), XhY (male with haemophilia).

© Department of Basic Education 2014
Mind the Gap CAPS Grade 12 Life Sciences chaptEr 5 gEnEticS (papEr 2 ) 33
Chapter 5
Solution to genetic problem 5 P1 Phenotype normal father x heterozygous/carrier ......... Step 1 normal mother3
Genotype XHY x XHXh 3 ........... Step 2
Meiosis
3 3 Gametes XH and Y x XH and Xh3 ........... Step 3
Fertilisation ........... Step 4
F1 Genotype XH XH, XH Xh, XH Y, Xh Y3 ...... Step 4
Phenotype 2 normal 1 normal 1 son with daughters son haemophilia3 Step 5
Activity 2
Question 1Try solving this problem on your own before you look at the solution.
Fur colour in mice is controlled by a gene with two alleles. A homozygous mouse with black fur was crossed with a homozygous mouse with brown fur. All offspring had black fur. Using the symbols B and b to represent the two alleles for fur colour, show diagrammatically a genetic cross between a mouse that is heterozygous for fur colour and a mouse with brown fur. Show the possible genotypes and phenotypes of the offspring. (6)
Question 2In rabbits the dominant allele (B) produces black fur and the recessive allele (b) produces white fur. Use a genetic cross to show the possible phenotypes and genotypes of the F1 generation for fur colour if two heterozygous rabbits are crossed. (6)
For two further problems on genetic crosses, refer to the following National Life Sciences exam papers:
• Life Sciences Paper 1 November 2010 – Question 2.2 on page 11.
• Life Sciences Paper 1 November 2011 Version 1 – Question 2.1 on page 8.
The cross between a mouse with
black fur and a mouse with brown fur resulted in offspring having black fur. This shows
that the allele for black fur (B) is dominant over the allele
for brown fur (b).

© Department of Basic Education 2014
34 chaptEr 5 gEnEticS (papEr 2 ) Mind the Gap CAPS Grade 12 Life Sciences
Chapter5
Answers to activity 2
Question 1 P1 Phenotype Black × Brown3
Genotype Bb × bb3
Meiosis
3 3 Gametes B and b × b3
Fertilisation
F1 Genotype Bb and bb3
Phenotype Black and brown3(Max 6)
Question 2 P1 Phenotype Black × Black 3
Genotype Bb × Bb3
3 Meiosis
3 Gametes B, b × B, b3
Fertilisation
F1 Genotype BB ; Bb ; Bb ; bb3
Phenotype Black ; White3 any (6)

© Department of Basic Education 2014
Mind the Gap CAPS Grade 12 Life Sciences chaptEr 5 gEnEticS (papEr 2 ) 35
Chapter 5
5.2.6 Dihybrid cross • A dihybrid cross involves the inheritance of two characteristics.
Mendel explained the results obtained from dihybrid crosses according to his Law of Independent Assortment.
• According to the Law of Independent Assortment, alleles of a gene for one characteristic segregate independently of the alleles of a gene for another characteristic. The alleles for the two genes will therefore come together randomly during gamete formation.
• This means that the two characteristics are transmitted to the offspring independently of one another.
• The above law only applies if the genes for the two characteristics are not on the same chromosome.
Steps you should follow in working out a dihybrid cross:
PAY SPECIAL ATTENTION
ACTIVITIES boy and girl-left and right of page
Step by step comment
EG - worked examples
HINT!
e.g.
NB NB
hint
activity
activity
comment
exams
Example
In pea plants, the allele for tallness (T) is dominant and the allele for shortness (t) is recessive. The allele for purple flowers is dominant (P) and the allele for white flowers is recessive (p). Two plants, heterozygous for both tallness and purple flowers, were crossed.
SteP What to do generally What to do in this problem
Step 1 Identify the phenotypes of the two plants for each of the two characteristics.
According to the statement of the problem, both parents are tall and have purple flowers.
Step 2 Choose letters to represent the alleles for the gene responsible for each characteristic.
Use the letters, e.g. t for tall, t for short, P for purple, and p for white as provided in the question.
Step 3 Write the genotypes of each parent. According to the statement of the problem, both parents are heterozygous for each characteristic. Their genotype will therefore be ttPp.
Step 4 • Determine the possible gametes that each parent can produce.
• Remember that each parent will have two alleles for each gene.
• The gametes of each parent will have only one allele for each gene because of segregation during meiosis.
• Remember that because of the principle of independent assortment an allele for one gene could appear in the same gamete with any of the alleles for the other gene.
• Each parent has the genotype TtPp.• If we represent the alleles for each gene in
the following format, then we can see how these alleles could come together randomly (principle of independent assortment) to form the four types of gametes: TP; Tp; tP and tp as shown below.
Alleles T t
P tP tP
p tp tp
Step 5 Enter the possible gametes at the top and side of a Punnett square.
Please refer to the solution that follows.
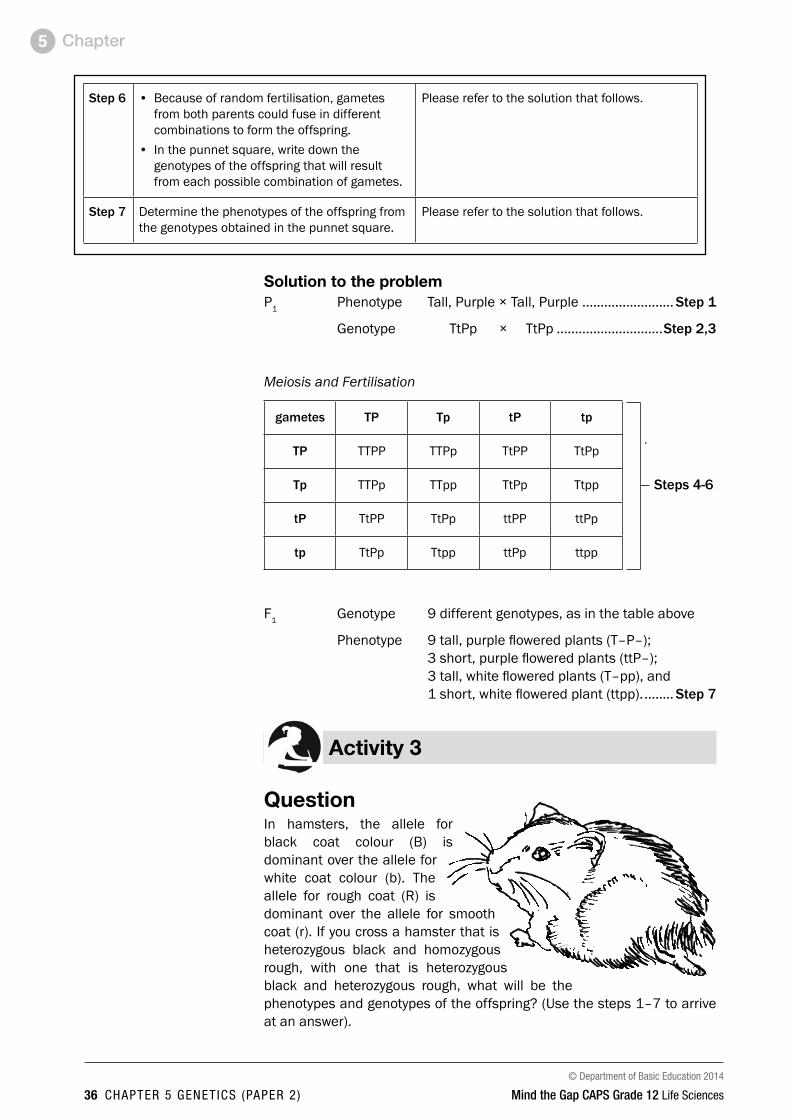
© Department of Basic Education 2014
36 chaptEr 5 gEnEticS (papEr 2 ) Mind the Gap CAPS Grade 12 Life Sciences
Chapter5
Solution to the problemP1 Phenotype Tall, Purple × Tall, Purple ......................... Step 1
Genotype TtPp × TtPp .............................Step 2,3
Meiosis and Fertilisation
gametes tP tp tP tp
tP TTPP TTPp TtPP TtPp
tp TTPp TTpp TtPp Ttpp
tP TtPP TtPp ttPP ttPp
tp TtPp Ttpp ttPp ttpp
F1 Genotype 9 different genotypes, as in the table above
Phenotype 9 tall, purple flowered plants (T–P–); 3 short, purple flowered plants (ttP–); 3 tall, white flowered plants (T–pp), and 1 short, white flowered plant (ttpp). ........ Step 7
Activity 3
Question In hamsters, the allele for black coat colour (B) is dominant over the allele for white coat colour (b). The allele for rough coat (R) is dominant over the allele for smooth coat (r). If you cross a hamster that is heterozygous black and homozygous rough, with one that is heterozygous black and heterozygous rough, what will be the phenotypes and genotypes of the offspring? (Use the steps 1–7 to arrive at an answer).
Step 6 • Because of random fertilisation, gametes from both parents could fuse in different combinations to form the offspring.
• In the punnet square, write down the genotypes of the offspring that will result from each possible combination of gametes.
Please refer to the solution that follows.
Step 7 Determine the phenotypes of the offspring from the genotypes obtained in the punnet square.
Please refer to the solution that follows.
Steps 4-6

© Department of Basic Education 2014
Mind the Gap CAPS Grade 12 Life Sciences chaptEr 5 gEnEticS (papEr 2 ) 37
Chapter 5
Answer to activity 3P1 Phenotype Black, Rough coat × Black, Rough coat ...Step 1
Genotype BbRR × BbRr ................. Step 2,3
Meiosis and Fertilisation
gametes BR BR bR bR
BR BBRR BBRR BbRR BbRR
Br BBRr BBRr BbRr BbRr
bR BbRR BbRR bbRR bbRR
br BbRr BbRr bbRr bbRr
F1 Genotype 6 different genotypes, as in the table above
Phenotype 12 with a black, rough coat and 4 with a white, rough coat ............................Step 7
5.3 MutationsA mutation is any sudden unexpected change in the genetic structure of a cell. Mutations occur suddenly and randomly and may be caused by many environmental agents such as X-rays and certain chemicals.
Mutations may be harmful or harmless to the organism in which they occur. Harmful mutations cause changes in DNA that can cause errors in protein sequencing, that can result in partially or completely non-functional proteins. Harmless mutations have no effect on the structure or functioning of the organism. useful mutations can be advantageous to the organism and they are passed on from parent to offspring.
Gene mutations are mutations that affect a single or a few base pairs in just a single gene, while Chromosomal aberrations refer to changes in the normal structure or number of chromosomes.
Mutations result in new genotypes as we move from one generation to the next. This leads to variation within a species.
Gene mutations can cause genetic disorders:• Haemophilia: Absence of the protein needed for the formation of
blood clots due to a mutant gene.• Colour blindness: Absence of the proteins that make up either the
red or green cones/photoreceptors in the eye.• Albinism: Absence of the protein that forms the pigment melanin.
Chromosomal aberrations e.g. Down syndrome is where there is an extra chromosome (47 instead of 46) in the zygote.
Steps 4-6

© Department of Basic Education 2014
38 chaptEr 5 gEnEticS (papEr 2 ) Mind the Gap CAPS Grade 12 Life Sciences
Chapter5
5.4 Pedigree diagramsA pedigree diagram is used to study the inheritance of characteristics in a family over a number of generations. A pedigree diagram is also called a family tree.
Remember the following steps when interpreting pedigree diagrams:Step 1 Study any key and opening statement/s and look for dominant and recessive characteristics
and phenotypes.
Step 2 Write in the phenotypes of all the individuals as given in the problem.
Step 3 Fill in the genotype of all the individuals with the recessive condition – it must have two recessive alleles (two lower case letters, e.g. ff).
Step 4 For every individual in the diagram that has the recessive condition, it means that each allele was obtained from each of the parents. Work backwards and fill in one recessive allele for each parent.
Step 5 If the parents showed the dominant characteristic, fill in the second letter which represents the dominant allele (a capital letter, e.g. F).
Step 6 Any other individual showing the dominant characteristic will most likely be homozygous dominant (FF) or heterozygous dominant (Ff).
Joshua Ronel
Sarah Peter Veronica
Marlena Frank Jack John Gayle
Male with blue eyes
Male with brown eyes
Female with blue eyes
Female with brown eyes
Figure 5.1 Pedigree diagram showing inheritance of eye colour
Activity 4
The pedigree diagram in Figure 5.1 shows inheritance of eye colour in humans over three generations of a family. Brown eye colour (B) is dominant over blue eye colour (b). Study the diagram and then answer the questions that follow.

© Department of Basic Education 2014
Mind the Gap CAPS Grade 12 Life Sciences chaptEr 5 gEnEticS (papEr 2 ) 39
Chapter 5
Note the following in the pedigree diagram on page 38: • Squares represent males and circles represent females.• The horizontal line between a square (Joshua) and a circle (Ronel)
shows that they have mated.• The vertical line flowing from the horizontal line represents the
offspring (Sarah and Peter) of the two parents (Joshua and Ronel).• Brown eye colour (B) is dominant over blue eye colour (b) –
stated in problem. ....................................................................... Step 1• Joshua, Jack and John are males with blue eyes. • Veronica and Marlena are females with blue eyes.• Peter and Frank are males with brown eyes.• Ronel, Sarah and Gayle are females with brown eyes.• Joshua, Veronica, Marlena, Jack and John will have the genotype
‘bb’. The recessive characteristic only shows up in the homozygous condition.................................... ................................................... Step 3
• Example: The genotype of Peter is ‘Bb’ – working backwards from the offspring Marlena or Jack or John who are homozygous recessive. This means that one of the recessive alleles of Marlena, Jack and John, i.e. ‘b’, must have come from parent Peter and the other one from parent Veronica ..................................................... Steps 4 and 5
• Ronel could be homozygous dominant (BB) or heterozygous dominant (Bb) ............................................................................. Step 6
Questions1. How many members of the family have blue eyes? (1)2. Is Veronica homozygous or heterozygous for eye colour? (1)3. Write down the genotype of:
a) Joshua (2)b) Ronel (2)c) Frank (2)
4. If Frank marries a woman with the same genetic composition as Sarah, what is the percentage probability of them having a child with brown eyes? (1)
[9]
Answers to activity 41. 53 (1)2. Homozygous3 (1)3. a) bb33 (2)
b) BB/Bb33 (2)c) Bb33 (2)
4. 75%3 (1) [9]
Step 2
For two more problems on
pedigree diagrams refer to these National Life Sciences exam papers:
• Life Sciences Paper 1 March 2010 – Question 1.5 on page 7.
• Life Sciences Paper 1 March 2012 Version 1 – Question 2.4 on page 11.
Working out the following
questions will be easy if you have followed the steps explained
on page 38.
© Department of Basic Education 2014
40 chaptEr 5 gEnEticS (papEr 2 ) Mind the Gap CAPS Grade 12 Life Sciences
Chapter5
5.5 Genetic engineeringGenetic engineering is the process whereby the genes on the DNA are changed, transferred or manipulated to produce a different organism.
Activity 5
QuestionState FOUR disadvantages and FOUR advantages of genetic engineering. [8]
Answer to activity 5Four disadvantages of genetic engineering:• Expensive3/research money could be used for other needs• Interfering with nature3/immoral• Potential health impacts3• Unsure of long-term effects3 (4)Four advantages of genetic engineering:• Production of medication/resources cheaply3• Control pests with specific genes inserted into a crop3• Using specific genes to increase crop yields3/food security• Selecting genes to increase shelf-life of plant products3 (4)
[8]
5.6 Genetic counsellingCouples with a risk of a genetic disease can undergo genetic counselling to enable them to make informed decisions on whether they want to have children or not.
Activity 6
QuestionA young couple wants to have a child, but they are aware of a serious genetic disorder in one of their families that could be carried through to their offspring. State THREE benefits of genetic counselling in this case. [3]
Answer to activity 6Three benefits of genetic counselling:• To be given advice on the risk of transferring the defective gene3/
to find the probability of passing on the defective gene to the offspring
• To be given an explanation of the procedure involved in DNA testing3
• To be given an explanation of the results of DNA testing3 [3]Keep going!

© Department of Basic Education 2014
Mind the Gap CAPS Grade 12 Life Sciences chaptEr 6 rESponDing to thE EnvironmEnt – humanS (papEr 1) 41
Chapter 6Paper 1
Responding to the environment – humansThe human nervous systemThe nervous system is responsible for processing and transmitting information throughout the body:• It tells the body how to react to stimuli (changes in the environment
to which the body responds). For example, it regulates body temperature on a hot or cold day. It is also responsible for the reflex action, for example, when you step on a pin or touch a hot surface.
• The nervous system also coordinates the various activities of the body, such as walking, hearing, seeing, and so on.
The central nervous system consists of the brain and the spinal cord.
6.1 The brain6.1.1 Structure and functions
of the brainFigure 6.1 below shows the different parts of the brain and their functions.
Figure 6.1 The structure and functions of the brain
Pituitary gland
B. Cerebellum • Coordinates all
voluntary movements • Controls muscle
tension to maintain balance
A. Cerebrum • Controls voluntary
actions • Receives and interprets
sensations from sense organs
• Higher thought processes
C. Medulla oblongata • Transmits nerve impulses
between the spinal cord and the brain
• Controls involuntary actions such as heartbeat and breathing
d. HypothalamusControl centre for hunger, thirst, sleep, body temperature and emotions
e. Corpus callosum Connects the left and right hemispheres of the brain – allowing communication between both hemispheres

© Department of Basic Education 2014
42 chaptEr 6 rESponDing to thE EnvironmEnt – humanS (papEr 1) Mind the Gap CAPS Grade 12 Life Sciences
Chapter6
Activity 1
QuestionsWrite down the name of the part which:1. Controls heartbeat (1)2. Contains the centres that control balance, muscle tone and
equilibrium (1)3. Has centres that interpret what you see (1)4. Coordinates voluntary muscle movements (1)5. Controls body temperature (1)
[5]
Answers to activity 11. Medulla oblongata3 (1)2. Cerebellum3 (1)3. Cerebrum3 (1)4. Cerebellum3 (1)5. Hypothalamus3 (1)
[5]
6.2 NeuronsNeurons are specialised cells which connect the brain and spinal cord to all other parts of the body.
Myelin sheath
Cell body Dendrite: Transmits impulses towards the cell body of the neuron
Nucleus
Axon: Transmits impulses away from the cell body of the neuron
Figure 6.2 A neuron
About mind maps:
Look at the information about mind maps on page xii. Information represented in a mind map resembles the way information is stored in our brains. A mind map is an excellent technique for studying.
PAY SPECIAL ATTENTION
ACTIVITIES boy and girl-left and right of page
Step by step comment
EG - worked examples
HINT!
e.g.
NB NB
hint
activity
activity
comment
exams

© Department of Basic Education 2014
Mind the Gap CAPS Grade 12 Life Sciences chaptEr 6 rESponDing to thE EnvironmEnt – humanS (papEr 1) 43
Chapter 6
There are three types of neurons, namely sensory (afferent) neurons, motor (efferent) neurons and interneurons (or connectors). Table 6.1 below shows the structure and function of these neurons.
type of neuron Function Structure
Sensory (afferent) neuron
Senses the stimulus
Transmits impulses from the sense organs or receptors to the spinal cord and brain.
Cell body
Direction of impulses
Figure 6.3 Sensory neuron
Motor (efferent) neuron
Response to the stimulus
Transmits impulses from the brain and spinal cord to the effectors (muscles and glands). The effectors bring about the response.
Cell body
Direction of impulses
Figure 6.4 Motor neuron
Interneuron (connector)Found in the brain and spinal cord
Links the sensory neuron to the motor neuron.
Cell body
Figure 6.5 Interneuron
Table 6.1 Sensory, motor and interneurons
A synapse is the functional connection between the axon of one neuron, and the dendrites of another neuron.
You must know the structure and function of the different
neurons in order to understand the reflex action, which will be
discussed next.

© Department of Basic Education 2014
44 chaptEr 6 rESponDing to thE EnvironmEnt – humanS (papEr 1) Mind the Gap CAPS Grade 12 Life Sciences
Chapter6
6.3 Reflex arcA reflex action is a quick, automatic action that involves the spinal cord and does not involve the brain. It is an important function to protect the body from harm. Examples are blinking the eye, coughing, sneezing, dilation and constriction of the pupil of the eye, and quickly withdrawing your hand when it touches a hot surface.
The reflex arc is the path along which an impulse is transmitted to bring about a response to a stimulus during a reflex action.
Figure 6.6 below shows what happens when you hold your finger close to a flame. The grey arrows represent the reflex arc.
The path of a reflex arc:
Receptor (A) → Sensory neuron (B) → Interneuron (C) → Motor neuron (D) → Effector (E)
Figure6.6Thereflexactionofwithdrawingafingerwhenplacedinaflame
A Receptor: A structure which receives a stimulus and converts it into an impulse (the heat sensor of the finger feels burn)
C interneuron: Carries the impulse from sensory neuron to the motor neuron in the spinal cord
Grey matterWhite matter
e effector: A structure which produces the reaction (the muscles in the finger contract and the finger is pulled away)
B Sensory neuron: Carries the impulse from the receptor to the spinal cord
d Motor neuron: Carries the impulse from the spinal cord to the effectors

© Department of Basic Education 2014
Mind the Gap CAPS Grade 12 Life Sciences chaptEr 6 rESponDing to thE EnvironmEnt – humanS (papEr 1) 45
Chapter 6
Activity 2
QuestionsUse the diagram of the reflex arc in Figure 6.6 on page 44 to answer the following questions.1. Part B indicates the …
A dendrite of the motor neuron.B axon of the motor neuron.C dendrite of the sensory neuron.d axon of the sensory neuron. (2)
2. The correct sequence in which impulses move from the receptor to the effector in the reflex arc in Figure 6.6 is ...A A → B → C → D→ EB C → A → B → E→ DC C → B → E → D→ Ad A → D → E → B→ C (2)
3. Give the correct term for the following definitions:a) A structure which receives a stimulus and converts it into
a impulseb) A structure which responds to a stimulus, e.g. a muscle
or glandc) A neuron that carries impulses from the central nervous system
to the effectorsd) A neuron that carries impulses from the receptors to the central
nervous systeme) A neuron that carries impulses from a sensory neuron to a
motor neuron in the spinal cordf) A very quick, automatic action that involves the spinal cord
and not the braing) The pathway along which an impulse is transmitted to
bring about a response to a stimulus during a reflex action 7 × 1 = (7)
[11]
Answers to activity 2 1. C33 (2)2. A33 (2)3. a) Receptor3
b) Effector3c) Motor/efferent neuron3
d) Sensory/afferent neuron3
e) Interneuron3/ connectorf) Reflex action3
g) Reflex arc3 7 × 1 = (7)[11]

© Department of Basic Education 2014
46 chaptEr 6 rESponDing to thE EnvironmEnt – humanS (papEr 1) Mind the Gap CAPS Grade 12 Life Sciences
Chapter6
6.4 The human eye Figure 6.7 below shows the different parts of the eye and their functions.
Retina: Contains the light-sensitive receptor cells, i.e. the rods and cones
Sclera: The tough white outer coat, which protects the eye against damage
Blind spot: This area has no rods and cones; therefore there is no vision at this point
Vitreous humour: A jelly-like substance which gives shape to the eye
Lens: Changes shape for near and distant (far) vision
iris: The coloured part of the eye
Aqueous humour: Watery fluid that supports the cornea and the front chamber of the eye
Pupil: A circular opening in the iris which allows light into the eye
Suspensory ligament: Holds the lens in position
Cornea: Responsible for the refraction (bending) of light rays from the object, to create the image on the retina
Choroid: A dark-coloured layer which: • Reduces
reflection • Is rich in blood
vessels which supply the cells of the eye with nutrients and oxygen
yellow spot: Has the greatest number of cones; this area offers the clearest image
Optic nerve: Carries nerve impulses from the retina to the brain
Figure 6.7 The structure of the eye

© Department of Basic Education 2014
Mind the Gap CAPS Grade 12 Life Sciences chaptEr 6 rESponDing to thE EnvironmEnt – humanS (papEr 1) 47
Chapter 6
6.4.1 AccommodationAccommodation is the adjustment of the shape of the lens to see objects clearly whether they are far away or close by. This is shown in Table 6.2 and Figures 6.8 and 6.9 below.
distant vision (objects further than 6 m) Near vision (objects closer than 6 m)
1. Ciliary muscles relax 1. Ciliary muscles contract
2. Suspensory ligaments tighten (become taut) 2. Suspensory ligaments slacken
3. Tension on lens increases 3. Tension on lens decreases
4. Lens is less convex (flatter) 4. Lens becomes more convex (more rounded)
5. Light rays are refracted (bent) less 5. Light rays are refracted (bent) more
6. Light rays are focused onto the retina 6. Light rays are focused onto the retina
Ciliary muscles relax
Suspensory ligaments become tautLens becomes less convex
Figure 6.8 Distant vision
Ciliary muscles contract
Suspensory ligaments slackenLens becomes more convex
Figure 6.9 Near vision
Table 6.2 Accommodation of the eye for distant and near vision
6.4.2 Pupillary mechanism The pupillary mechanism (or pupil reflex) regulates the amount of light entering the eye by adjusting the size of the pupil. This is shown in Table 6.3 and Figures 6.10 and 6.11 below.
Light is bright Light is dim
1. Radial muscles of the iris relax 1. Radial muscles of the iris contract
2. Circular muscles of the iris contract 2. Circular muscles of the iris relax
3. Pupil constricts (gets smaller) 3. Pupil widens (gets bigger)
4. Less light enters the eye 4. More light enters the eye
ScleraRadial muscles of iris relax
Circular muscles of iris contract
Pupil constricts (becomes
smaller)
Figure 6.10 The pupil in bright light
ScleraRadial muscles of iris contractCircular muscles of iris relax
Pupil widens
Figure 6.11 The pupil in dim light
Table 6.3 Pupillary mechanism

© Department of Basic Education 2014
48 chaptEr 6 rESponDing to thE EnvironmEnt – humanS (papEr 1) Mind the Gap CAPS Grade 12 Life Sciences
Chapter6
6.4.3 Visual defects
Visual defect Nature of the defect Corrective measures
Short-sightednessNear objects can be seen clearly (myopia)
• Inability of lens to become more flat/eyeball is longer than normal
• Lens bends the light rays too much
• As a result it falls in front of the retina
• causing the image to be blurred• Cannot see distant objects
clearly
Wearing glasses with converging (biconcave) lensFigure 6.12 A
Long-sightednessObjects far away can be seen clearly (hyperopia)
• Inability of lens to become more convex/eyeball is shorter than normal
• Lens does not bend light rays enough
• As a result it falls behind the retina
• causing the image to be blurred • Cannot see near objects clearly
Wearing glasses with converging (biconvex) lensFigure 6.12 B
Astigmatism • The curvature of the lens or cornea is uneven resulting in distorted images
Glasses with lenses shaped to correct the distortion
Cataracts • Lens becomes cloudy and opaque
Surgery to replace the lens with a synthetic lens
Activity 3
Questions1. Figure 6.13 shows a longitudinal section through the human eye.
Study the diagram and answer the questions that follow.a) Label parts 2, 3, 4 and 5 respectively. (4)b) Name and describe the process that causes part 1 to dilate
(become wider). (5)2. Figure 6.14 is a longitudinal section through the human eye. The
structures which enable the eye to focus on objects are missing in this diagram. Study the diagram and answer the questions that follow.
Draw a longitudinal section through the missing parts of Figure 6.14 to indicate the appearance of these structures when you are ...a) reading a book. (6)b) looking at an object more than 6 metres away. (6)
[21]
Figure 6.13 Longitudinal section through the human eye
Figure 6.14 Longitudinal section through a human eye
2
1 3
45
Figure 6.12 A
Short sightedness
Long sightedness
Figure 6.12 Bconvex lens
concave lens

© Department of Basic Education 2014
Mind the Gap CAPS Grade 12 Life Sciences chaptEr 6 rESponDing to thE EnvironmEnt – humanS (papEr 1) 49
Chapter 6
Answers to activity 31. a) 2 – Cornea3
3 – Lens3
4 – Suspensory ligaments3
5 – Ciliary muscles3/ body (4)b) Pupillary mechanism3/ pupil reflex The radial muscles3of the iris contract3and the circular
muscles3 relax.3 The pupil dilates and more light enters the eye.3 (5)
2. a) b)
Ciliary muscle3 contracts3
Lens3more convex3
Suspensory ligaments 3 slacken3
Ciliary muscle3 relaxes3
Lens3less convex/flatter3
Suspensory ligaments3 tighten/become taut3
(6) (6) [21]
6.5 The human ear6.5.1 Structure of the earThe human ear consists of three main parts:• The outer ear• The middle ear• The inner ear
Outer Middle inner
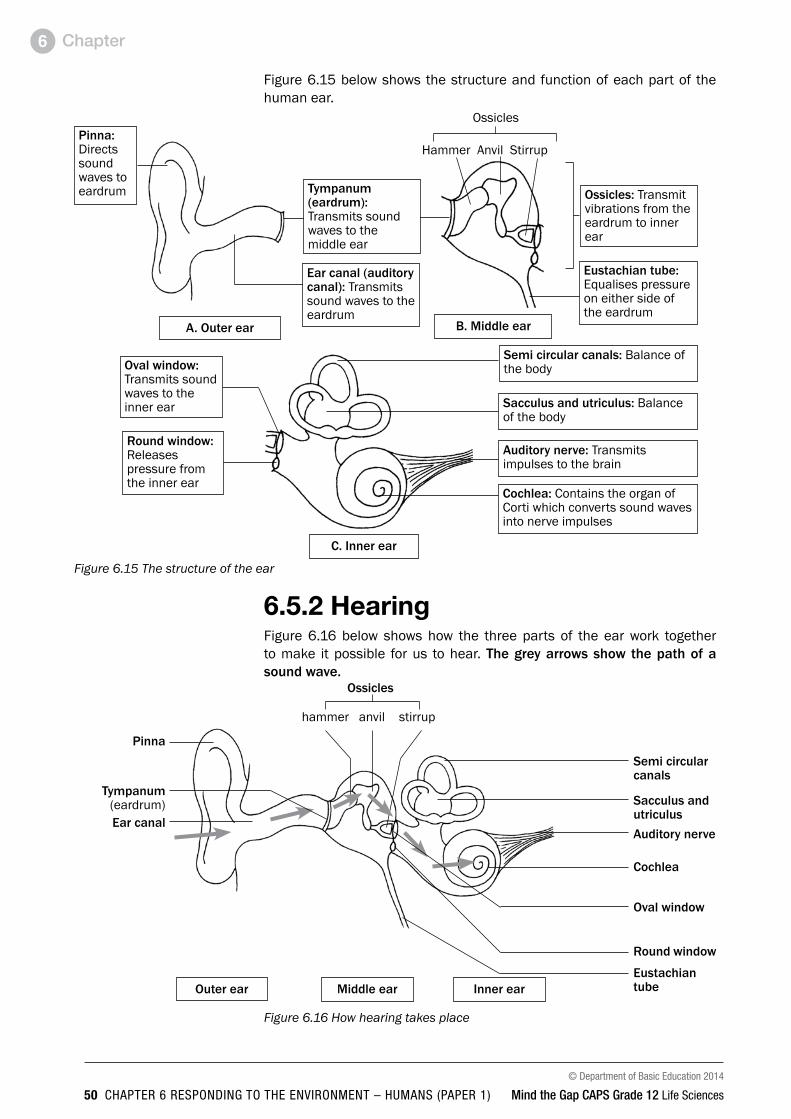
© Department of Basic Education 2014
50 chaptEr 6 rESponDing to thE EnvironmEnt – humanS (papEr 1) Mind the Gap CAPS Grade 12 Life Sciences
Chapter6
Pinna: Directs sound waves to eardrum
Hammer Anvil Stirrup
Ossicles
Ossicles: Transmit vibrations from the eardrum to inner ear
eustachian tube: Equalises pressure on either side of the eardrum
Oval window: Transmits sound waves to the inner ear
Round window: Releases pressure from the inner ear
Semi circular canals: Balance of the body
Sacculus and utriculus: Balance of the body
Auditory nerve: Transmits impulses to the brain
Cochlea: Contains the organ of Corti which converts sound waves into nerve impulses
A. Outer ear
C. inner ear
B. Middle ear
ear canal (auditory canal): Transmits sound waves to the eardrum
tympanum (eardrum): Transmits sound waves to the middle ear
Figure 6.15 The structure of the ear
Figure 6.15 below shows the structure and function of each part of the human ear.
6.5.2 Hearing Figure 6.16 below shows how the three parts of the ear work together to make it possible for us to hear. the grey arrows show the path of a sound wave.
Ossicles
hammer anvil stirrup
Pinna
tympanum (eardrum)ear canal
Semi circular canals
Sacculus and utriculusAuditory nerve
Cochlea
Oval window
Round window
eustachian tube Outer ear Middle ear inner ear
Figure 6.16 How hearing takes place
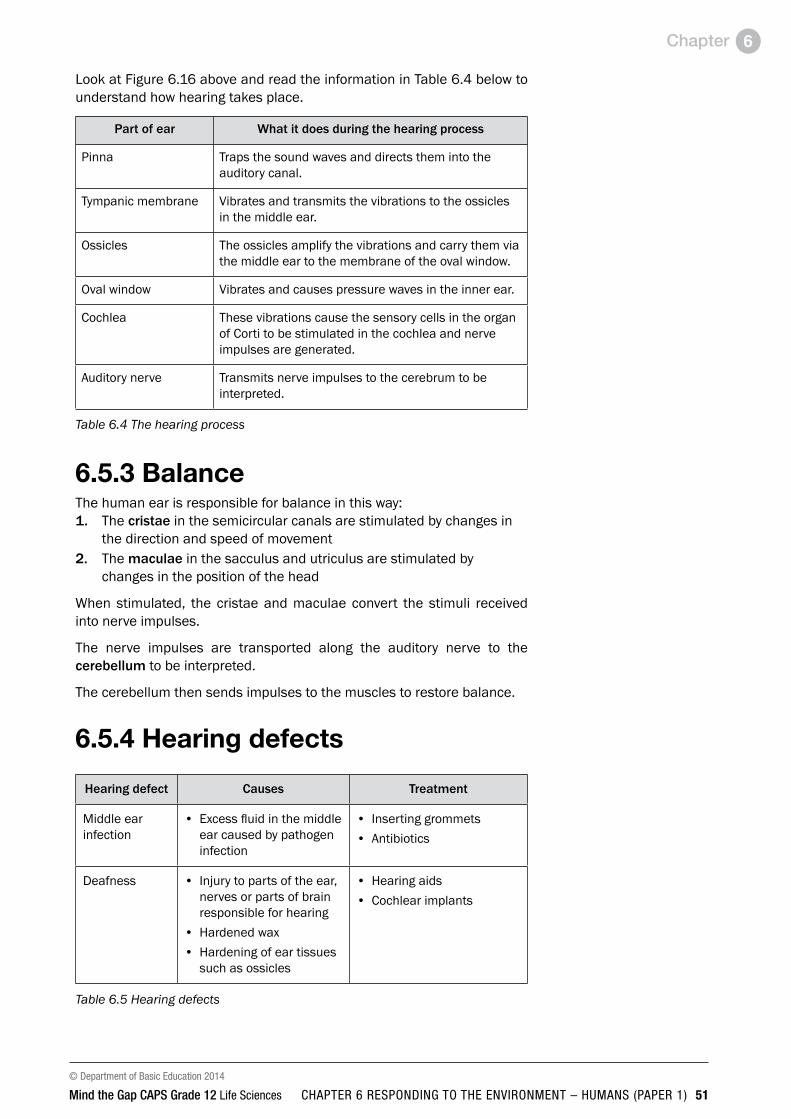
© Department of Basic Education 2014
Mind the Gap CAPS Grade 12 Life Sciences chaptEr 6 rESponDing to thE EnvironmEnt – humanS (papEr 1) 51
Chapter 6
Look at Figure 6.16 above and read the information in Table 6.4 below to understand how hearing takes place.
Part of ear What it does during the hearing process
Pinna Traps the sound waves and directs them into the auditory canal.
Tympanic membrane Vibrates and transmits the vibrations to the ossicles in the middle ear.
Ossicles The ossicles amplify the vibrations and carry them via the middle ear to the membrane of the oval window.
Oval window Vibrates and causes pressure waves in the inner ear.
Cochlea These vibrations cause the sensory cells in the organ of Corti to be stimulated in the cochlea and nerve impulses are generated.
Auditory nerve Transmits nerve impulses to the cerebrum to be interpreted.
Table 6.4 The hearing process
6.5.3 BalanceThe human ear is responsible for balance in this way:1. The cristae in the semicircular canals are stimulated by changes in
the direction and speed of movement2. The maculae in the sacculus and utriculus are stimulated by
changes in the position of the head
When stimulated, the cristae and maculae convert the stimuli received into nerve impulses.
The nerve impulses are transported along the auditory nerve to the cerebellum to be interpreted.
The cerebellum then sends impulses to the muscles to restore balance.
6.5.4 Hearing defects
Hearing defect Causes treatment
Middle ear infection
• Excess fluid in the middle ear caused by pathogen infection
• Inserting grommets• Antibiotics
Deafness • Injury to parts of the ear, nerves or parts of brain responsible for hearing
• Hardened wax• Hardening of ear tissues
such as ossicles
• Hearing aids• Cochlear implants
Table 6.5 Hearing defects

© Department of Basic Education 2014
52 chaptEr 6 rESponDing to thE EnvironmEnt – humanS (papEr 1) Mind the Gap CAPS Grade 12 Life Sciences
Chapter6
Activity 4
Questions Study Figure 6.17 below and answer the questions that follow.
C E
A B G F
D
Figure 6.17 Parts of the ear
1. Identify the parts labelled B, C and F. (3)2. Give the function of the pinna. (2)3. Write the letter of the part which:
a) contains receptors for balance. (1)b) equalises the pressure on either side of part B. (1)c) transmits impulses to the brain. (1)
4. Describe how hearing occurs. (8) [16]
Answers to activity 41. B –Tympanic membrane3 C – Malleus/hammer/an ossicle3
F – Cochlea3 (3)2. It directs sound waves3 into the auditory canal3. (2) 3. a) D3
b) G3 c) E3 (3)
4. l Sound waves are directed into the auditory canal3 by the pinna3.• The sound waves make the tympanic membrane vibrate3 and
the vibrations are passed on to the ossicles3 in the middle ear.
• The ossicles make the oval window vibrate3 and this causes pressure waves to be set up in the inner ear.
• These vibrations also cause the organ of Corti3 to be stimulated and it generates impulses which are sent to the cerebrum3 along the auditory nerve3.
• The cerebrum interprets the impulses as sound3. (8)[16]Keep going!
For more questions on the human nervous system, refer to the following National Life Sciences exam papers:
• Life Sciences Paper 2 March 2012: Version 1 – Question 2.1 on page 9 and Question 2.2 on page 10.
• Life Sciences Paper 2 November 2011: Version 1 – Question 1.4 on page 9; Question 2.1 on page 11 and Question 2.2 on page 12.

© Department of Basic Education 2014
Mind the Gap CAPS Grade 12 Life Sciences chaptEr 7 EnDocrinE SyStEm (papEr 1 ) 53
Chapter 7
Endocrine system
Figure 7.1 The human endocrine system
Ovary (only females):Reproductive hormones: Oestrogen and progesterone• Oestrogen – stimulates puberty in females,
promotes thickening of the endometrium• Progesterone – promotes thickening of the
endometrium, maintains pregnancy
testes (only males):Reproductive hormone: Testosterone• Stimulates the maturation of
sperm cells• Stimulates puberty in males
Pituitary gland (hypophysis): GH (growth hormone)• Controls growth TSH (thyroid stimulating hormone)• Stimulates thyroid gland to
secrete thyroxinReproductive hormones:FSH, LH and prolactin• FSH – stimulates the
development of the follicle in the ovaries
• LH – stimulates ovulation, and stimulates development of the corpus luteum
• Prolactin – stimulates the mammary glands to secrete milk
Pancreas: islets of Langerhans Glucagon• Stimulates conversion of
glycogen to glucose (increases blood glucose levels)
Insulin• Stimulates conversion of glucose
to glycogen (reduces the blood glucose levels)
7.1 The human endocrine systemThe endocrine system is responsible for chemical coordination and regulates activities that take place inside the body. The endocrine system consists of glands that produce different hormones, which are the body’s chemical messengers. Figure 7.1 below shows the glands of the endocrine system, the hormones they produce and the function of these hormones in the body.
Adrenal gland: Adrenalin Increases:• heartbeat• blood pressure• conversion from
glycogen to glucose• blood supply to the
cardiac and skeletal muscles
• skeletal muscle tone• rate and depth of
breathing• diameter of pupilsDecreases:• blood flow to the
digestive system and skin
Aldosterone• Target organ: Kidney• Regulates salt
concentration in the blood
Hypothalamus:ADH (antidiuretic hormone)• Target organ: Kidney• Controls the
concentration of water in the blood
thyroid gland: Thyroxin• Controls basic metabolic
rate
The names of the hormones are printed in bold italics.
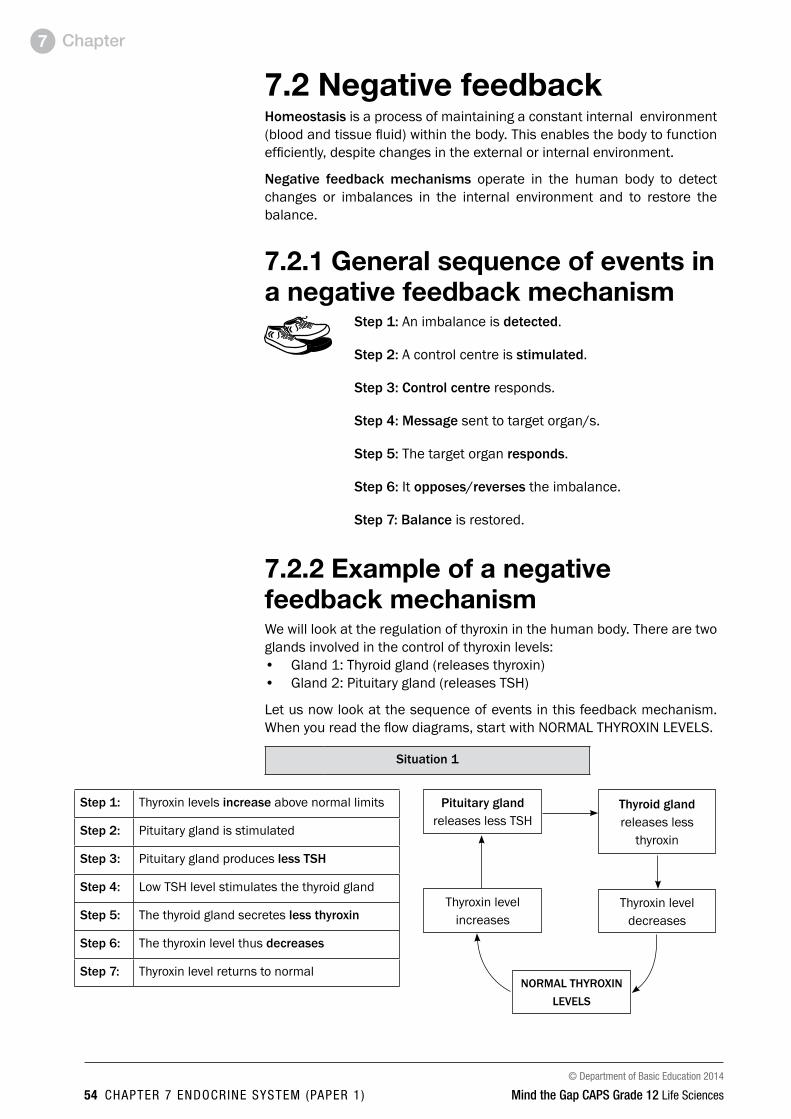
© Department of Basic Education 2014
54 chaptEr 7 EnDocrinE SyStEm (papEr 1 ) Mind the Gap CAPS Grade 12 Life Sciences
Chapter7
7.2 Negative feedbackHomeostasis is a process of maintaining a constant internal environment (blood and tissue fluid) within the body. This enables the body to function efficiently, despite changes in the external or internal environment.
Negative feedback mechanisms operate in the human body to detect changes or imbalances in the internal environment and to restore the balance.
7.2.1 General sequence of events in a negative feedback mechanism
Step 1: An imbalance is detected.
Step 2: A control centre is stimulated.
Step 3: Control centre responds.
Step 4: Message sent to target organ/s.
Step 5: The target organ responds.
Step 6: It opposes/reverses the imbalance.
Step 7: Balance is restored.
7.2.2 Example of a negative feedback mechanism We will look at the regulation of thyroxin in the human body. There are two glands involved in the control of thyroxin levels:• Gland 1: Thyroid gland (releases thyroxin) • Gland 2: Pituitary gland (releases TSH)
Let us now look at the sequence of events in this feedback mechanism. When you read the flow diagrams, start with NORMAL THYROXIN LEVELS.
Situation 1
Step 1: Thyroxin levels increase above normal limits
Step 2: Pituitary gland is stimulated
Step 3: Pituitary gland produces less tSH
Step 4: Low TSH level stimulates the thyroid gland
Step 5: The thyroid gland secretes less thyroxin
Step 6: The thyroxin level thus decreases
Step 7: Thyroxin level returns to normal
Pituitary gland releases less TSH
thyroid gland releases less
thyroxin
Thyroxin level increases
Thyroxin level decreases
NORMAL tHyROXiN LeVeLS

© Department of Basic Education 2014
Mind the Gap CAPS Grade 12 Life Sciences chaptEr 7 EnDocrinE SyStEm (papEr 1 ) 55
Chapter 7
Situation 2
Step 1: Thyroxin levels decrease below normal limits
Step 2: Pituitary gland is stimulated
Step 3: Pituitary gland produces more TSH
Step 4: High TSH level stimulates the thyroid gland
Step 5: The thyroid gland secretes more thyroxin
Step 6: The thyroxin level thus increases
Step 7: Thyroxin level returns to normal
Activity 1
QuestionThe flow chart in Figure 7.2 below shows the control of glucose levels. Provide labels for 1 to 6. [6]
Pancreas: Releases 1 ............ Liver and muscles: Glucose converted to 2 ...................
Glucose level increases Glucose level 3 ......................
Glucose level 4 .................. Glucose level increases
5 ......................... releases glucagon
Liver and muscles: Glycogen converted to 6 ...............
NORMAL GLuCOSe LeVeL
Figure 7.2 The negative feedback system to control glucose levels in the body
Answers to activity 11. Insulin3 2. Glycogen 3 3. Decreases3 4. Decreases3
5. Pancreas 3 6. Glucose3 [6]
thyroid gland releases more
thyroxin
Thyroxin level increases
NORMAL tHyROXiN LeVeLS
Pituitary gland releases more TSH
Thyroxin level decreases
Keep going!

© Department of Basic Education 2014
56 chaptEr 8 homEoStaSiS in humanS (papEr 1 ) Mind the Gap CAPS Grade 12 Life Sciences
Chapter8
Homeostasis in humans8.1 IntroductionHomeostasis is the process of maintaining a constant internal environment within the body. The internal environment refers to the blood and tissue fluid that surrounds the cells of the body. Homeostasis enables the body to function efficiently, despite changes that might occur in the external or internal environment.
Changes in temperature, glucose levels, carbon dioxide levels, water levels and salt levels of the internal environment affects the homeostatic balance of the body. Negative feedback mechanisms operate in the human body to detect changes or imbalances in the internal environment and to restore the balance.
8.2 Negative feedback mechanismsGeneral sequence of events in a negative feedback mechanism :
Step 1: An imbalance is detected.
Step 2: A control centre is stimulated.
Step 3: Control centre responds.
Step 4: Message sent to target organs/s.
Step 5: The target organ responds.
Step 6: It opposes/reverses the imbalance.
Step 7: Balance is restored.
8.2.1 The regulation of glucose levels in the internal environment
When the glucose level in the blood increases above normal levels:
Step 1 Glucose levels in the blood increase above normal levels
Step 2 The pancreas is stimulated
Step 3 to secrete insulin into the blood
Step 4 insulin travels in the blood to the liver
Step 5 where it stimulates the conversion of excess glucose to glycogen which is then stored
Step 6 The glucose level in the blood now decreases
Step 7 and returns to normal

© Department of Basic Education 2014
Mind the Gap CAPS Grade 12 Life Sciences chaptEr 8 homEoStaSiS in humanS (papEr 1 ) 57
Chapter 8
Homeostasis in humans
When the glucose level in the blood decreases below normal levels:
Step 1 Glucose levels in the blood decrease below normal levels
Step 2 The pancreas is stimulated
Step 3 to secrete glucagon into the blood
Step 4 Glucagon travels in the blood to the liver
Step 5 where it stimulates the conversion of stored glycogen to glucose
Step 6 The glucose level in the blood now increases
Step 7 and returns to normal
Pancreas secretes insulin
Glucose level increases
Glucose is converted to glycogen
Glucose level decreases
Glucose level decreases
Glucose level increases
Pancreas secretes glucagon
Glycogen is converted to glucose
Normal glucose levels in blood
Figure 8.1 Negative feedback mechanism to regulate the glucose levels
8.2.2 The regulation of carbon dioxide levels in the internal environment
When the CO2 level in the blood increases above normal levels:
Step 1 CO2 levels in the blood increase above normal levels
Step 2 Receptor cells in the carotid artery in the neck are stimulated
Step 3 To send impulses to the medulla oblongata in the brain
Step 4 Medulla oblongata stimulates breathing muscles (intercostal muscles and diaphragm) and heart
Step 5 Breathing muscles contract more actively – increases the rate and depth of breathing. The heart beats faster.
Step 6 More CO2 is taken to and exhaled from the lungs
Step 7 The CO2 level in the blood returns to normal
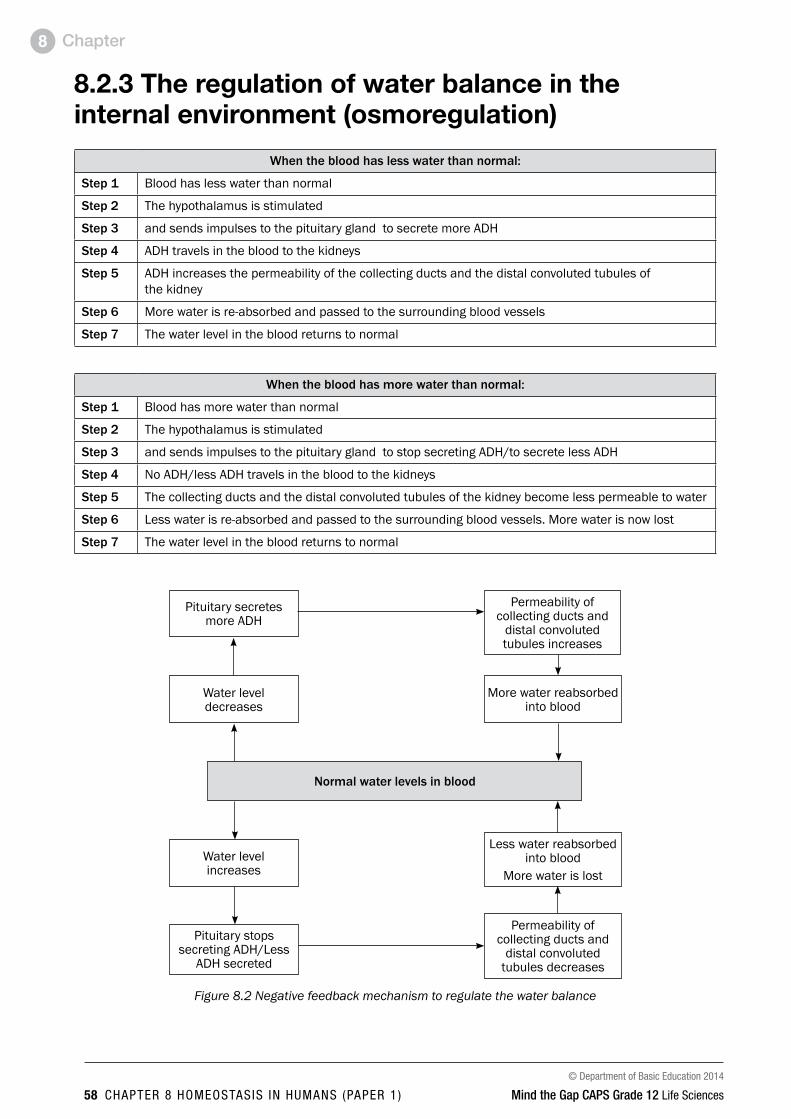
© Department of Basic Education 2014
58 chaptEr 8 homEoStaSiS in humanS (papEr 1 ) Mind the Gap CAPS Grade 12 Life Sciences
Chapter8
8.2.3 The regulation of water balance in the internal environment (osmoregulation)
When the blood has less water than normal:
Step 1 Blood has less water than normal
Step 2 The hypothalamus is stimulated
Step 3 and sends impulses to the pituitary gland to secrete more ADH
Step 4 ADH travels in the blood to the kidneys
Step 5 ADH increases the permeability of the collecting ducts and the distal convoluted tubules of the kidney
Step 6 More water is re-absorbed and passed to the surrounding blood vessels
Step 7 The water level in the blood returns to normal
When the blood has more water than normal:
Step 1 Blood has more water than normal
Step 2 The hypothalamus is stimulated
Step 3 and sends impulses to the pituitary gland to stop secreting ADH/to secrete less ADH
Step 4 No ADH/less ADH travels in the blood to the kidneys
Step 5 The collecting ducts and the distal convoluted tubules of the kidney become less permeable to water
Step 6 Less water is re-absorbed and passed to the surrounding blood vessels. More water is now lost
Step 7 The water level in the blood returns to normal
Pituitary secretes more ADH
Water level decreases
Water level increases
More water reabsorbed into blood
Pituitary stops secreting ADH/Less
ADH secreted
Normal water levels in blood
Permeability of collecting ducts and
distal convoluted tubules increases
Permeability of collecting ducts and
distal convoluted tubules decreases
Less water reabsorbed into blood
More water is lost
Figure 8.2 Negative feedback mechanism to regulate the water balance
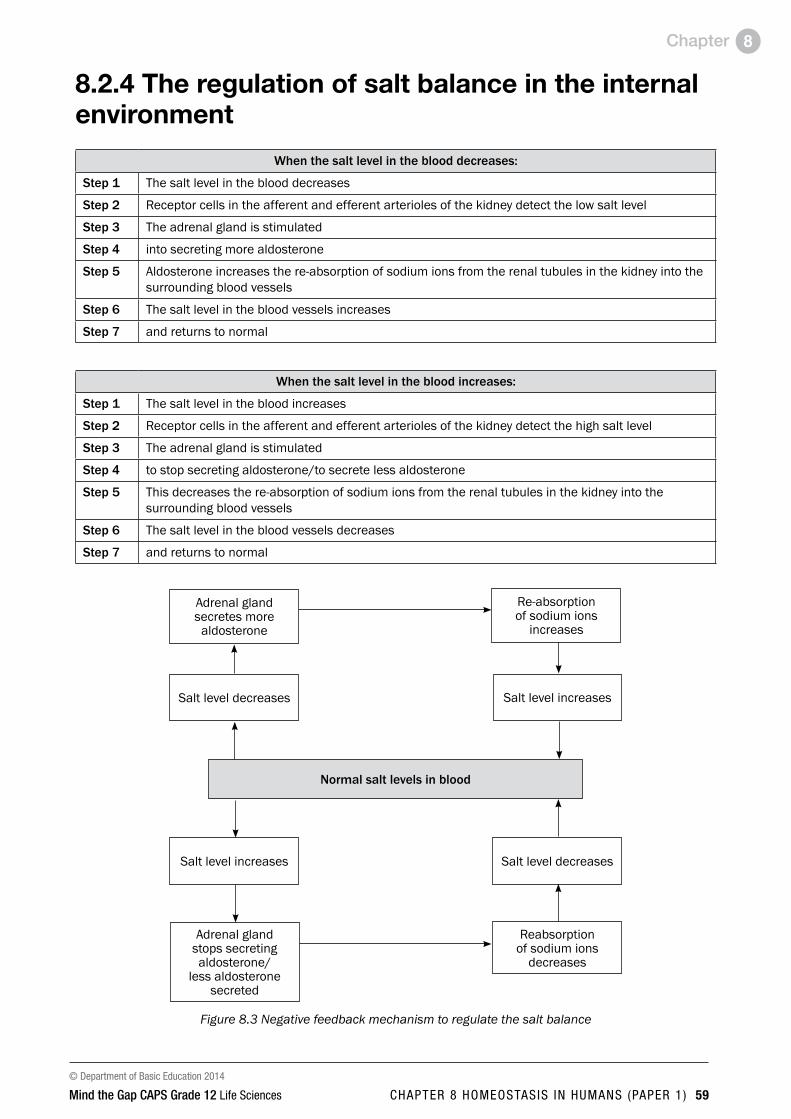
© Department of Basic Education 2014
Mind the Gap CAPS Grade 12 Life Sciences chaptEr 8 homEoStaSiS in humanS (papEr 1 ) 59
Chapter 8
8.2.4 The regulation of salt balance in the internal environment
When the salt level in the blood decreases:
Step 1 The salt level in the blood decreases
Step 2 Receptor cells in the afferent and efferent arterioles of the kidney detect the low salt level
Step 3 The adrenal gland is stimulated
Step 4 into secreting more aldosterone
Step 5 Aldosterone increases the re-absorption of sodium ions from the renal tubules in the kidney into the surrounding blood vessels
Step 6 The salt level in the blood vessels increases
Step 7 and returns to normal
When the salt level in the blood increases:
Step 1 The salt level in the blood increases
Step 2 Receptor cells in the afferent and efferent arterioles of the kidney detect the high salt level
Step 3 The adrenal gland is stimulated
Step 4 to stop secreting aldosterone/to secrete less aldosterone
Step 5 This decreases the re-absorption of sodium ions from the renal tubules in the kidney into the surrounding blood vessels
Step 6 The salt level in the blood vessels decreases
Step 7 and returns to normal
Salt level decreases
Salt level increases
Salt level increases
Salt level decreases
Adrenal gland stops secreting aldosterone/
less aldosterone secreted
Normal salt levels in blood
Re-absorption of sodium ions
increases
Reabsorption of sodium ions
decreases
Adrenal gland secretes more
aldosterone
Figure 8.3 Negative feedback mechanism to regulate the salt balance

© Department of Basic Education 2014
60 chaptEr 8 homEoStaSiS in humanS (papEr 1 ) Mind the Gap CAPS Grade 12 Life Sciences
Chapter8
8.3 The process of temperature regulationtemperature regulation is the control of body temperature to keep it as close to 370C as possible to enable the body to function normally.
Body temperature is regulated by the hypothalamus in the brain and the blood vessels and sweat glands in the skin.
Figure 8.4 below shows how the body temperature is regulated by the hypothalamus and the skin.
ON A HOt dAy the hypothalamus is stimulated and sends impulses to the blood vessels
ON A COLd dAy the hypothalamus is stimulated and sends impulses to the blood vessels
Sweat gland becomes less active.
Less sweat is released. There is less evaporation of sweat and less cooling of the skin.
Blood vessels constrict (become narrower). This is called vasoconstriction.• Less blood
flows to the skin.
• Less heat is lost from the skin.
• Less blood is sent to the sweat glands.
Blood vessels dilate (become wider). This is called vasodilation.• More blood
flows to the skin.
• More heat is lost from the skin.
• More blood is sent to the sweat glands.
More sweat is released. Evaporation of the sweat cools the skin.
Sweat gland becomes more active.
Figure 8.4 The homeostatic mechanism to regulate body temperature
Activity 1
Questions1. Name the heat regulation centre in the brain. (1)2. What happens to the blood vessels of the skin on a cold day? (1)3. Describe how the state of the blood vessels mentioned in
question 2 decreases heat loss. (4)4. What happens to blood vessels of the skin on a hot day? (1)5. Describe how the state of the blood vessels mentioned in
question 4 increases heat loss. (4) [11]
© Department of Basic Education 2014
Mind the Gap CAPS Grade 12 Life Sciences chaptEr 8 homEoStaSiS in humanS (papEr 1 ) 61
Chapter 8
Answers to activity 11. Hypothalamus3 (1)2. Blood vessels constrict3/vasoconstriction (1)3. l Less blood flows to the surface of the skin.3
• Less heat is lost from the surface of the skin.3• Less blood flows to the sweat glands.3 • Sweat glands release less sweat.3• Less evaporation of sweat.3• Less cooling of the skin on a cold day.3 (any 4)(4)
4. Blood vessels dilate3/vasodilation (1)5. l More blood flows to the surface of the skin.3
• More heat is lost from the surface of the skin.3• More blood flows to the sweat glands.3 • Sweat glands release more sweat.3• Evaporation of sweat3 • cools the skin on a hot day.3 (any 4)(4)
[11]
Keep going!

© Department of Basic Education 2014
62 chaptEr 9 rESponDing to thE EnvironmEnt – pLantS (papEr 1) Mind the Gap CAPS Grade 12 Life Sciences
Chapter9
Responding to the environment – plants
9.1 Growth and development in plantsGrowth and development in plants are controlled by hormones. Auxin is an example of a hormone.
tropism is the growth or turning movement of a plant or part of a plant in response to an environmental stimulus.• Phototropism is the growth of a plant in the direction of a light
source.• Geotropism is the growth of a plant in response to gravity.
The growth movement of phototropism and geotropism is due to chemical messengers (hormones) called auxins in a plant.
Activity 1
QuestionsComplete the table:
term description
a) Chemical messenger in the plantb) Growth of a plant stem towards lightGeotropism c)
Tropism d)
[4]
Answers to activity 1a) Plant hormone3
b) Phototropism3
c) Growth of a plant root in response to gravity3
d) Growth movement of a part of a plant in response to an environmental stimulus3 [4]
Root
StemPhototropism: Growth of a plant stem towards light
Geotropism: Growth of a plant root downwards into the soil in response to gravity
Figure 9.1 A germinating seedling
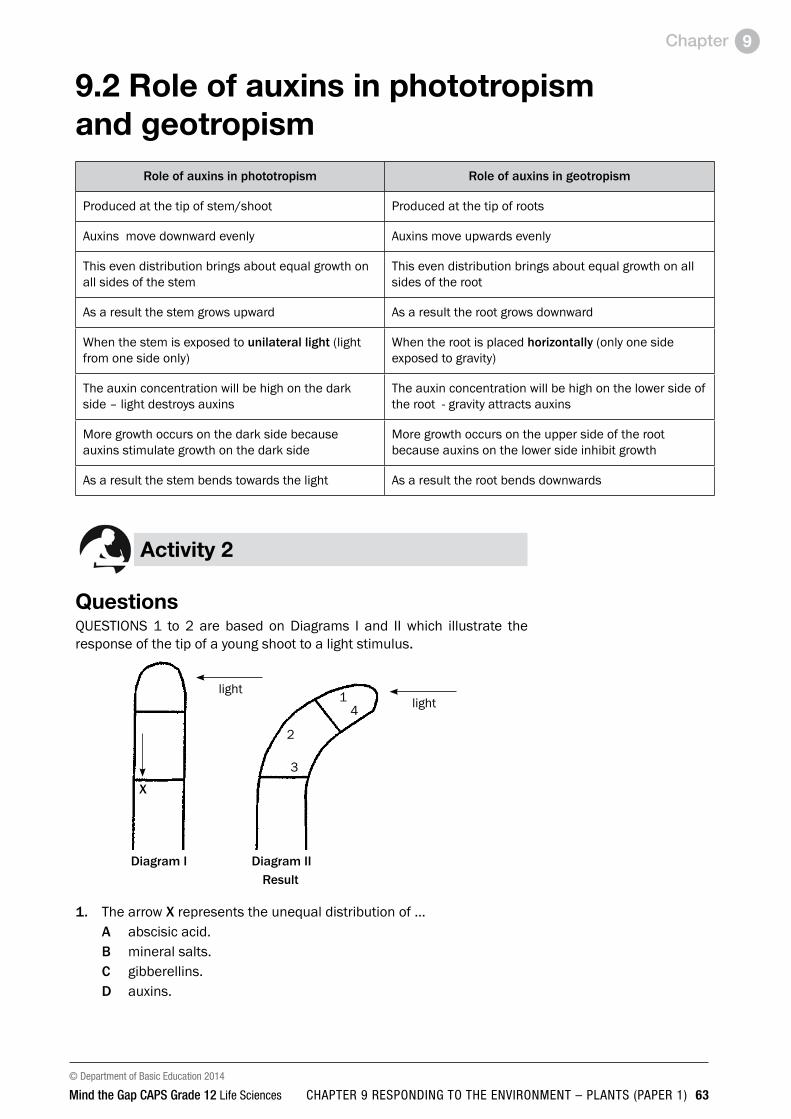
© Department of Basic Education 2014
Mind the Gap CAPS Grade 12 Life Sciences chaptEr 9 rESponDing to thE EnvironmEnt – pLantS (papEr 1) 63
Chapter 9
9.2 Role of auxins in phototropism and geotropism
Role of auxins in phototropism Role of auxins in geotropism
Produced at the tip of stem/shoot Produced at the tip of roots
Auxins move downward evenly Auxins move upwards evenly
This even distribution brings about equal growth on all sides of the stem
This even distribution brings about equal growth on all sides of the root
As a result the stem grows upward As a result the root grows downward
When the stem is exposed to unilateral light (light from one side only)
When the root is placed horizontally (only one side exposed to gravity)
The auxin concentration will be high on the dark side – light destroys auxins
The auxin concentration will be high on the lower side of the root - gravity attracts auxins
More growth occurs on the dark side because auxins stimulate growth on the dark side
More growth occurs on the upper side of the root because auxins on the lower side inhibit growth
As a result the stem bends towards the light As a result the root bends downwards
Activity 2
QuestionsQUESTIONS 1 to 2 are based on Diagrams I and II which illustrate the response of the tip of a young shoot to a light stimulus.
lightlight
diagram i diagram iiResult
X
2
3
14
1. The arrow X represents the unequal distribution of …A abscisic acid.B mineral salts.C gibberellins.d auxins.

© Department of Basic Education 2014
64 chaptEr 9 rESponDing to thE EnvironmEnt – pLantS (papEr 1) Mind the Gap CAPS Grade 12 Life Sciences
Chapter9
2. The curving of the shoot in Diagram II is due to more rapid cell growth in region(s) …A 1.B 2.C 1 and 4.d 3 and 4.
3. The diagram above represents …A. geotropism.B. apical dominance.C. phototropism.d. gravity. 3 × 2
[6]
Answers to activity 21. D33
2. B33
3. C33 3 × 2[6]
9.3 Plant defence mechanismsPlants are eaten by herbivores and attacked by pathogenic organisms such as viruses, bacteria and fungi, causing them to become diseased. Plants protect themselves from these threats using chemicals and thorns.
Activity 3
1. Describe TWO methods used by plants as defence mechanisms (4)
Answers to activity 31. Plants have thorns3 on their stems and leaves. They are
unable to escape from herbivores, and the thorns are used to protect themselves. 3
The chemical secretion of plants is poisinous to some organisms. 3
Sticky secretions given of by plants make it difficult for insects and animals to eat the plant 3
[4]
Keep going!
© Department of Basic Education 2014
Mind the Gap CAPS Grade 12 Life Sciences chaptEr 10 EvoLution (papEr 2 ) 65
Chapter 10
EvolutionA theory is an explanation of something that has been observed in nature which can be supported by facts, generalisations, tested hypotheses, models and laws.
A hypothesis is a possible solution to a problem.
10.1 Evidence for evolution• Fossil evidence: The evidence that shows characteristics that make
us similar to, or different from African apes comes largely from a study of fossils (thousands of fossil fragments).
• Genetic evidence: Scientists state that organisms are closely related and are likely to have a common ancestor if they have:
– Identical DNA structure – Similar sequence of genes – Similar portions of DNA with no functions and – Similar mutations (mitochondrial DNA)
Species that are closely related have a greater similarity to each other than distant species.
• Cultural evidence: Cultural evidence from studies of tools and weapons, as well as language is also used to show similarities and differences between humans and African apes.
10.2 Sources of variationThe genotypes and therefore phenotypes (appearance) of individuals of the same species are different from each other because:• Crossing over in Prophase I of meiosis involves an exchange of
genetic material, leading to new combinations of maternal and paternal genetic material in each new cell resulting from meiosis.
• Random arrangement of maternal and paternal chromosomes at the equator during metaphase allows different combinations of chromosomes/chromatids to go into each new cell resulting from meiosis, making them different.
• Random fertilisation between different egg cells and different sperm cells formed by meiosis result in offspring that are different from each other.
• Random mating between organisms within a species leads to a different set of offspring from each mating pair.
• A mutation changes the structure of a gene or chromosome and therefore the organism’s genotype. Since the genotype influences the phenotype, it creates organisms with new, different characteristics from one generation to the next.

© Department of Basic Education 2014
66 chaptEr 10 EvoLution (papEr 2 ) Mind the Gap CAPS Grade 12 Life Sciences
Chapter10
10.3 Theories of Lamarck and DarwinJean-Baptiste Lamarck explained evolution using the following two ‘laws’:1. the inheritance of acquired characteristics: Characteristics developed during the life of an individual (acquired
characteristics) can be passed on to their offspring.2. the law of use and disuse: As an organism uses a structure or organ more regularly, it becomes
better developed or enlarged. If an organism does not use a structure or organ frequently, it becomes less developed or reduced in size and may disappear altogether.
Charles darwin explained evolution in terms of natural selection which states that:• There is a great deal of variation among members of the same
species.• Organisms with favourable characteristics, which enable them to
cope with challenges in the environment, survive.• Organisms which do not have favourable characteristics that allow
them to cope with challenges in the environment, die.
punctuated equilibrium
periods of gradual change
periods of rapid change

© Department of Basic Education 2014
Mind the Gap CAPS Grade 12 Life Sciences chaptEr 10 EvoLution (papEr 2 ) 67
Chapter 10
10.4 Applying the ideas of Lamarck and DarwinFigure 10.1 below shows a series of changes involving cacti plants over a period of time. Some notes are included on the events at A, B and C.
There are many cacti plants. There is variation among the plants. Some have long roots and some have short roots.A
Only cacti plants with the longer roots are present. The ones with shorter roots are absent (have died).B
Only the plants with longer roots were able to reproduce to form offspring with longer roots. C
time
Figure 10.1 Changes in cacti plants over time
We can use Figure 10.1 to describe how Darwin would have explained how modern cacti plants may have developed longer roots as compared to their ancestors with shorter roots.
The second column in Table 10.1 below gives Darwin’s explanation of how modern cacti plants may have developed longer roots. The first column contains questions that guide the explanation from one point to the next. You will be able to use the same questions to guide you when answering questions on Darwin’s theory using any other example, for example the development of longer necks in modern giraffes.
Guiding questions darwin’s explanation
Describe the variation in the population.
What was the challenge?
What was the result of the challenge?
What is this called?
What happened to the favourable characteristic?
What was the result of this?
As a result of genetic variation3in the cacti population, some cacti plants had longer roots than others.3
As a result of drought 3, competition for water occurred.
Plants with shorter roots died3 and those with longer roots survived.3
This is called natural selection.3
The allele for longer roots was passed on to subsequent generations.3
Eventually all the plants had longer roots.3
Table 10.1 Darwin’s explanation for changes in cacti plants over time
Roots Offspring

© Department of Basic Education 2014
68 chaptEr 10 EvoLution (papEr 2 ) Mind the Gap CAPS Grade 12 Life Sciences
Chapter10
The second column in Table 10.2 below states how Lamarck would have explained how modern cacti plants may have developed longer roots when compared to their ancestors with shorter roots. The first column contains guiding questions that will help you answer other questions on Lamarck’s theory using any other example, for example the development of longer necks in modern giraffes.
Guiding questions Lamarck’s explanation
What was the original characteristic at the start?
What did the organism do?
Why did the organism do this?
What was the result?
What happened to this new characteristic?
What was the result of this?
All cacti had short roots3 originally.
Cacti frequently stretched3 their roots.
They did this to reach deeper for water in the soil.3
As a result, the roots became longer.3
The characteristic of long roots acquired in this way was then passed on to the next generation.3
Eventually all the plants had longer roots.3
Table 10.2 Lamarck’s explanation for changes in cacti plants over time
Activity 1
Questions 1. Write an account showing how Lamarck would have explained the
development of longer necks in modern giraffes. (5)2. Write an account showing how Darwin would have explained the
development of longer necks in modern giraffes. (7)3. Explain why Lamarck’s theory was rejected. (2)
[14]
Answers to activity 1 1. l All giraffes had short necks3 originally.
• These giraffes frequently stretched3their necks.• They did this to reach the leaves that were available only
higher up on the trees.3 • As a result, their necks became longer.3 • The characteristic of long necks acquired in this way was then
passed on to the next generation.3• Eventually all the giraffes had longer necks.3 (5)
Use the guiding questions in Tables 10.1 and 10.2.
PAY SPECIAL ATTENTION
ACTIVITIES boy and girl-left and right of page
Step by step comment
EG - worked examples
HINT!
e.g.
NB NB
hint
activity
activity
comment
exams

© Department of Basic Education 2014
Mind the Gap CAPS Grade 12 Life Sciences chaptEr 10 EvoLution (papEr 2 ) 69
Chapter 10
Answers to activity 1 (continued)2. l As a result of genetic variation3 in the giraffe population some giraffe had longer necks than others.3
• As a result of leaves being available only higher up on trees,3 giraffes competed for these leaves.
• Giraffes with shorter necks died.3 • Giraffes with longer necks survived.3 • This is natural selection.3• The allele 3 for longer necks was passed on to subsequent
generations.3 • Eventually all the giraffes had longer necks.3 (7)
3. There is no evidence3 to show that acquired characteristics are inherited3/There is no evidence that structures used more frequently become more developed or vice versa (2)
[14]
10.5 Differences between natural selection and artificial selectionFor a long time, humans have been doing breeding experiments to develop organisms with a selected set of desirable characteristics, for example increased quality and quantity of milk produced by cows, or drought resistance and increased sugar content in sugar cane.This is achieved by artificial selection, which is a similar process to natural selection. However, artificial selection differs from natural selection in the following ways:
Natural selection Artificial selection
The environment or nature is the selective force.
Humans represent the selective force.
Selection is in response to suitability to the environment.
Selection is in response to satisfying human needs.
Occurs within a species. May involve one or more species (as in cross breeding).
Table10.3Thedifferencesbetweennaturalselectionandartificialselection
10.6 Punctuated EquilibriumBased on the explanations of Lamarckism and Darwinism, it is thought that evolution takes place through an accumulation of small or gradual changes that occur over a long period of time. This is supported by the many transitional fossils in the fossil record which show the progressive change over time.
For more questions on Lamarck and Darwin, refer to the following National Life Sciences exam papers:• Life Sciences Paper 2
November 2008 – Question 2.3 on page 12.
• Life Sciences Paper 2 November 2009 – Question 2.2 on page 9.
• Life Sciences Paper 2 March 2010 – Question 2.1 and 2.2 on page 9.
• Life Sciences Paper 1 November 2010 – Question 3.1 and 3.2 on page 11.
• Life Sciences Paper 1 November 2011: Version 1 – Question 3.3 on page 10.
• Life Sciences Paper 1 March 2012: Version 1 – Question 4.2 on page 14.

© Department of Basic Education 2014
70 chaptEr 10 EvoLution (papEr 2 ) Mind the Gap CAPS Grade 12 Life Sciences
Chapter10
Punctuated equilibrium is a hypothesis that explains the speed at which evolution takes place through natural selection:• According to punctuated equilibrium, evolution is not always gradual
as proposed by Lamarckism and Darwinism.• Evolution involves long periods of time where species do not change
or change very little (known as equilibrium).• This alternates with (is punctuated by) short periods of time where
rapid changes occur.• As a result, new species are formed in a short period of time, relative
to the long periods of no/little change.• This is supported by the absence of transitional fossils (usually
termed ‘missing links’) indicating the period of rapid change.
10.7 SpeciationAs a result of natural selection taking place over a period of time, the characteristics of organisms may change to such an extent that they cannot reproduce with the original members of that species to produce fertile offspring. We say that they have become a new species. This is called speciation.
We can describe the process of speciation as follows:
10.7.1 SpeciationA population of a particular species may become split by a geographical barrier, e.g. a river. As a result, the two parts of the population cannot interbreed. There is no gene flow between the two populations.Natural selection occurs independently in each population. This is due to different environmental conditions. As a result, the two populations become genotypically and phenotypically different over a period of time.Even if the two populations mixed at a later time, they will not be able to interbreed again. We say that one or both parts of the population have become a new species = speciation.
10.7.2 Mechanism for reproductive isolationGeographic isolation causes speciation. Reproductive isolation isolates the gene pool of a species. Examples of reproductive isolation:• Breeding at different times of the year.• Species-specific courtship behaviour.• Adaptation to different pollinators in plants.• Infertile offspring.
Figure 10.2 Phylogenetic trees that show a) gradualism and b) punctutated equilibrium
a) Gradualism
b) Punctuated equilibriumTime
For more questions on speciation, refer to these National Life Sciences exam papers:• Life Sciences Paper 2
November 2008 – Question 3.3 on page 13.
• Life Sciences Paper 2 November 2009 – Question 2.1 on page 9.
• Life Sciences Paper 2 March 2010 – Question 3.2 on page 13.
• Life Sciences Paper 2 March 2011 – Question 3.1 on page 9.
• Life Sciences Paper 1 November 2011: Version 1 – Question 3.4 on page 10.
• Life Sciences Paper 1 March 2012: Version 1 – Question 3.4 on page 12.

© Department of Basic Education 2014
Mind the Gap CAPS Grade 12 Life Sciences chaptEr 10 EvoLution (papEr 2 ) 71
Chapter 10
Activity 2
1. Use the information in Figure 10.3 below to explain how a new species of rabbit has arisen because of a geographical barrier. [9]
River
Gene flow
Population A Population B
LandslideRiver River
No gene flow occurs
Species X Species Y
Diagram 1 Diagram 2 Diagram 3Figure 10.3 Speciation in a rabbit population
2. The diagram below represents the changes in a population of bacteria over time as a result of exposure to an antibiotic over time.
Original population Final population Key
Low High
Antibiotic resistance level
Diagram A Diagram B
Figure 10.4. Development of antibiotic resistance in a bacteria population
Explain, in terms of natural selection, the shift in the resistance level of the bacteria illustrated above. [8]
Answer to activity 21. l A population of rabbits become split3 by a geographical
barrier/river.3• As a result, the two parts of the population cannot interbreed.3• There is no gene flow3 between the two populations.• Natural selection occurs independently3 in each population due
to different environmental conditions3 on either side of the river.• As a result, the two populations become genotypically and
phenotypically different3over a period of time.• Even if the geographical barrier is removed (ie the river returns to
its normal course at some later time), the rabbits will not be able to interbreed again.3
• We say that one or both parts of the rabbit population have become a new species3. [9]
2. there is a large degree of variation in the bacteria population3
• When the antibiotic was first used, it killed off a large number of bacteria3
• But some bacteria were resistant to the antibiotic3 and survived3• Those that survived were able to reproduce3• Increasing the population of resistant bacteria3• Continued use of the antibiotic had little effect on the resistant
bacteria3• Hence the resistant bacteria increased3• And non-resistant bacteria decreased3 [8]

© Department of Basic Education 2014
72 chaptEr 10 EvoLution (papEr 2 ) Mind the Gap CAPS Grade 12 Life Sciences
Chapter10
10.8 Human evolutionSo far in this chapter you have seen that:• As a result of natural selection, the characteristics of organisms can
change over time due to changing environmental conditions• New species can arise when a group of organisms change so much
that they can no longer reproduce with the original species (this is called speciation).
Natural selection and speciation can also be used to explain how humans have evolved.
Scientists identify trends in human evolution by comparing humans to other primates in terms of similarities and differences. The differences point to the existence of different species, while the similarities point to a possible common ancestor.
10.8.1 Similarities between humans (Homo sapiens) and African apesFigure 10.5 below shows characteristics of humans that are similar to that of African apes.
Figure 10.5 Characteristics humans and African apes have in common
Now try this:1. Cover the labels on Figure 10.5 and try to list the common features
of humans and African apes by looking at the parts that the arrows are pointing to.
2. Write down the EIGHT similarities without looking at the diagram.
Large brain
Eyes in front
Freely rotating arms
Long upper arms
Rotation around elbow joints
Bare fingertips or nails instead of claws
Opposable thumb
Upright posture

© Department of Basic Education 2014
Mind the Gap CAPS Grade 12 Life Sciences chaptEr 10 EvoLution (papEr 2 ) 73
Chapter 10
10.8.2 Differences between humans (Homo sapiens) and African apesTable 10.4 below is a comparison between the anatomical characteristics of Humans (Homo sapiens) and African apes according to the features listed in the first column.
FeAtuRe Humans (Homo sapiens) African ApesCranium Large cranium/brain Small cranium/brainBrow Ridges Brow ridges are not well developed Brow ridges well developedSpine More curved spine (S-shaped spine) Less curved spine (C-shaped spine)Pelvic girdle Short, wide pelvis Long, narrow pelvisCanines Small canines Large caninesPalate shape Small and semi-circular Long and rectangularJaws • Small jaws
• Less protruding jaws/less-prognathous• Large jaws• More protruding jaws/more prognathous
Cranial ridges No cranial ridge Cranial ridge across the top of the craniumForamen Magnum Foramen magnum in a forward position Foramen magnum in a backward position
Table 10.4: The anatomical differences between humans and African apes.
Now try this:1. Study the differences listed in Table 10.4 above by referring to the
features shown in Figure 10.6 below.
Cranial ridgeBrow ridges – size
Canines – size
Jaws – protrusion
Cranium – size
Foramen magnum – position
Figure 10.6 Labelled diagram of an African ape skull
Figure 10.7 Difference in shape of spine
2. Now write down the differences using the above diagrams but without referring to Table 10.4.
These are easy marks. Learn these
features well.

© Department of Basic Education 2014
74 chaptEr 10 EvoLution (papEr 2 ) Mind the Gap CAPS Grade 12 Life Sciences
Chapter10
Activity 3
Question 1 Study the two skulls shown in Figure 10.8 below and answer the questions that follow.
Skull A Skull B
Figure 10.8 Skull diagrams of two organisms
1.1 Which skull (A or B) is that of a non-human primate? (1)1.2 List FIVE OBSERVABLE reasons (based only on features that are
visible in the diagram) for your answer in question 1.1. (5)[6]
Answers to question 1 1.1 Skull B3 (1)1.2 Pronounced brow ridge3
Protruding jaw/prognathous3
Large canine3
Small cranium3Cranial ridge across the top of the cranium3 (5)
[6]
Question 2 The diagrams in Figure 10.9 below represent the skulls of three organisms: Taung child (Australopithecus africanus), a modern human (Homo sapiens) and a gorilla (Gorilla gorilla). The arrow indicates the position of the foramen magnum (the opening that allows the spinal cord to connect with the brain). Study the diagrams and answer the questions that follow:
Skull A Skull B Skull C
Figure 10.9 Skull diagrams showing the position of the foramen magnum

© Department of Basic Education 2014
Mind the Gap CAPS Grade 12 Life Sciences chaptEr 10 EvoLution (papEr 2 ) 75
Chapter 10
2.1 Identify the organisms that are represented by each of skulls A, B and C. (3)
2.2 Assuming that the diagrams were drawn to scale, list THREE observable differences between the skulls of organisms A and B. (6)
2.3 By looking at the position of the foramen magnum (indicated by the arrows), state which TWO organisms are best adapted for walking on two legs rather than four legs. (2)
2.4 Explain, using observable features, why the organism to which skull C belongs can be regarded as a transitional species (a species that is in the process of changing). (3)
[14]
Answers to question 2 2.1 A – Homo sapiens/human3
B – Gorilla gorilla/gorilla3
C – Australopithecus africanus (Taung child)3 (3)2.2
Skull A Skull B
Brow ridge reduced/absent3 Pronounced brow ridge3
Non-prognathous/non-protruding jaw3
Prognathous/protruding jaw3
Poorly developed canines3 Large canines3
No cranial ridges3 Cranial ridges present3
Large cranium3 Small cranium3
(any 3 × 2) (6)
2.3 Homo sapiens/human3 AND Australopithecus africanus (Taung child)3 (2)
2.4 It has features of the skull that are intermediate3 between that of skulls A and B, e.g. jaw protrudes more than in skull A but less than in skull B3, face not flat in skull of B but flat in skull A. (3)
[14]
For more questions on human evolution, refer to the following National Life Sciences exam papers:
• Life Sciences Paper 2 November 2008 – Question 3.1 on page 13.
• Life Sciences Paper 2 March 2009 – Question 1.5 on page 8.
• Life Sciences Paper 2 March 2010 – Question 4.2 on page 16.
• Life Sciences Paper 1 November 2010 – Question 3.3 on page 12.
• Life Sciences Paper 2 March 2011 – Question 3.2 on page 10.
• Life Sciences Paper 1 November 2011: Version 1 – Question 3.1 and 3.2 on pages 9 and 10.

© Department of Basic Education 2014
76 chaptEr 10 EvoLution (papEr 2 ) Mind the Gap CAPS Grade 12 Life Sciences
Chapter10
10.8.3 Major phases in hominid evolutionThe table below shows the characteristics of different organisms (as obtained from a study of their fossils) that are thought to be in the same line that led to the evolution of modern humans. The fossils are dealt with in the order in which they appeared on Earth (as calculated by the age of the fossil using dating techniques).
Organism When organism existed
Fossil site discovered by
Characteristics
Ardipithecus ramidus
5 – 4 mya North-East Ethiopia
Tim White Brain size: 300–350 mlForward position of foramen magnumVery prognathous (more protruding jaws)Heavy brow ridgesPelvis structure: bipedal and tree climbing
Australopithecus afarensis
4 – 2,7 mya Ethiopia, Kenya, Tanzania
Donald Johanson
Brain size: 375–550 mlForward position of foramen magnumVery prognathousHeavy brow ridgesCanines large and pointedLong armsNo cranial ridge
Australopithecus africanus
3 – 2 mya Taung; Sterkfontein
Raymond Dart
Brain size: 428–625 mlForward position of foramen magnum PrognathousBrow ridges Teeth large, canines not long Long armsNo cranial ridge
Australopithecus sediba
1,9 – 1,8 mya Malapa Cave – in the cradle of humankind
Lee Burger Brain size: 420 mlLess prognathousBrow ridgesLarge teeth, canines not longLong armsNo cranial ridge
Homo habilis 2,2 – 1,6 mya Tanzania Louis and Mary Leakey
Brain size: 650 mlLess prognathousLess pronounced brow ridgesHuman-like teeth – smaller canines Long arms
Homo erectus 2 – 0,4 mya Java in Indonesia and then Swartkrans
Eugene Dubois
Brain size: 900 mlPrognathousCranial ridgesShort caninesLonger legs and shorter arms
Homo sapiens 200 000 years ago – present
Makapansgat in Limpopo; Border Cave in KZN; Blombos Cave in the Western Cape
Tim White Brain size: 1200–1800 mlNo brow ridgesSmall teethShort arms

© Department of Basic Education 2014
Mind the Gap CAPS Grade 12 Life Sciences chaptEr 10 EvoLution (papEr 2 ) 77
Chapter 10
Activity 4
1. What general observation can you make about the characteristics as one moves from the earlier to the later organisms listed in the table? (2)
2. Use information in the table to describe the specific evolutionary trend (how each of the features changed over time) relating to each of the following characteristics:2.1 Brain size2.2 Position of foramen magnum2.3 Prognathous jaws2.4 Dentition2.5 Development of brow ridges 5 × 2 (10)
3. State the significance of the changes that occurred as they apply to each of the following characteristics:3.1 Brain size3.2 Position of foramen magnum3.3 Prognathous jaws3.4 Dentition3.5 Development of brow ridges 5 × 2 (10)
4. Explain how the information in the table provides evidence for the ‘Out of Africa’ hypothesis. (2)
[24]
Answers to activity 4 1. There is a gradual change in the characteristics3 over a period
of time. 3 (2)2. 2.1 Brain size: Increase3 in brain size3
2.2 Position of foramen magnum: Movement to a more3 forward position3
2.3 Prognathous jaws: Change from more prognathous3 to less prognathous3
2.4 Dentition: Decrease in the size3 of the teeth3OR decrease3 in the size3 of the canines
2.5 Development of brow ridges: Brow ridges become less3 developed3 5 × 2 (10)
3. 3.1 Brain size: Increased brain size allows for processing information more quickly 3and for processing a larger amount of information. 3
3.2 Position of foramen magnum: More forward position of the foramen magnum3 indicates bipedalism. 3 A decrease in the length of the arms indicates a decreased dependency on its use in locomotion and therefore shows a more advanced stage of bipedalism. This is usually accompanied by an increase in the length of the legs.
3.3 Prognathous jaws: A less prognathous jaw indicates a smaller jaw. 3 A small jaw is sufficient since there was a change from eating raw food to eating cooked food. 3
3.4 Dentition: The change from large to smaller teeth3was due to the change in diet from raw food to cooked food3

© Department of Basic Education 2014
78 chaptEr 10 EvoLution (papEr 2 ) Mind the Gap CAPS Grade 12 Life Sciences
Chapter10
Answers to activity 4 (continued)3.5 Development of brow ridges: Brow ridges became less
developed since the action of the smaller jaws3did not create forces great enough for the skull to have increased strength from the brow ridges3 5 × 2 (10)
4. The information in the table shows that fossils of the different organisms that are considered to have existed in the same line as humans3 were all found in Africa. 3 (2)
[24]
10.8.4 Out of Africa hypothesisThe ‘Out of Africa’ hypothesis states that modern humans originated in Africa and then migrated out of Africa to the other continents.
The following lines of evidence have been used to support this hypothesis:• The oldest fossils of australopithecines/Homo habilis/bipedal
organisms have been found in Africa. • The oldest fossils of Homo erectus have been found in Africa.• Analysis of mutations in mitochondrial DNA shows that the oldest
female ancestors of humans are from Africa.
10.8.5 Phylogenetic treesA phylogenetic tree (or evolutionary tree) represents the possible evolutionary relationships among a set of organisms or groups of organisms. The tips of the tree represent descendants (often species) and the points where the tree branches represent the common ancestors of those descendants.
Hints on interpreting phylogenetic trees
Reading a phylogenetic tree is similar to understanding a family tree. The root of the tree represents the ancestor and the tips of the branches represent the descendants of that ancestor. As you move from the root of the tree to
its tips, you are moving forward in time.
Past
Recent
Ancestor
descendants 1 2 3 4
When speciation occurs, it is represented as branching on the tree. A single ancestral lineage gives rise to two or more daughter lineages.
Speciation eventAncestral lineage
PAY SPECIAL ATTENTION
ACTIVITIES boy and girl-left and right of page
Step by step comment
EG - worked examples
HINT!
e.g.
NB NB
hint
activity
activity
comment
exams

© Department of Basic Education 2014
Mind the Gap CAPS Grade 12 Life Sciences chaptEr 10 EvoLution (papEr 2 ) 79
Chapter 10
PAY SPECIAL ATTENTION
ACTIVITIES boy and girl-left and right of page
Step by step comment
EG - worked examples
HINT!
e.g.
NB NB
hint
activity
activity
comment
exams
Worked example
Look at the phylogenetic tree in Figure 10.10 and read the following information:• Start in the past (4,5 mya) and
read towards the present. This means that the oldest common ancestor of all the hominids on this tree is A. ramidus.
• Each branch on the tree represents a point where the common ancestor split into one, two or more groups. In this case, the new species that evolves is shown as a side branch while the original species continues its evolutionary line up the trunk of the tree. For example, A. aethiopicus forms a side branch with A. africanus evolving from the common ancestor that existed at point X (this took place about 3 mya).
• Progression up the ‘trunk of the tree’ represents a movement in time from the past to the present. This shows the relationships between the hominids through time. Hominids that share a recent common ancestor are the most closely related to each other. For example, P. robustus shares a most recent common ancestor with P. boisei, namely A. africanus.
H. sapiens
H. heidelbergensis
H. ergasterP. robustus P. boisei
H. habilis
A. afarensis
A. africanusA. aethiopicus
H. rudolfensis
H. neanderthalensis
H. erectus(China)
H. erectus (S.E. Asia)
A. ramidus
Figure 10.10 A phylogenetic tree
Each lineage has a part of its history that is unique and parts that are shared with other lineages.
unique history of CShared history of B and C
unique history of B
A B C
Similarly, each lineage has ancestors that are unique to that lineage and common ancestors that are shared with other lineages.
Shared ancestor of B and CCommon ancestor of A, B and C
unique ancestor of C
A B C

© Department of Basic Education 2014
80 chaptEr 10 EvoLution (papEr 2 ) Mind the Gap CAPS Grade 12 Life Sciences
Chapter10
QuestionsLet us look at the type of questions that can be asked about this phylogenetic tree:1. Give the common ancestor of H. neanderthalensis and H. sapiens. (1)2. How long ago did H. rudolfensis split from its common ancestor? (2)3. Name the direct ancestor of H. ergaster. (1)4. How long has it taken H. heidelbergensis to evolve from A. afarensis? (3)5. Give the common ancestor of all the hominids. (1) [8]
Answers1. H. heidelbergensis3 (1)2. 2,43 million years ago3/mya (2)3. H. habilis3 (1)4. 3,8 million years ago – 0,7 million years ago3 = 3,13million
years3 (3)5. A. ramidus3 (1) [8]
Activity 5
Study the phylogenetic tree in Figure 10.11 below and answer the questions based on it.
Figure 10.11 Phylogenetic tree
0
10
20
30
40
50
Lem
urs
Tars
iers
New
Wor
ld m
onke
ys
Old
Wor
ld m
onke
ys
Gib
bons
Oran
g-ut
ans
Gor
illas
Chim
ps
Hum
ans
Mill
ion
year
s ag
o
Ancestral primate
Present

© Department of Basic Education 2014
Mind the Gap CAPS Grade 12 Life Sciences chaptEr 10 EvoLution (papEr 2 ) 81
Chapter 10
Questions1. How long ago did the ancestral primate live on earth? (2)2. Name the organism that shares the most distant common
ancestor with humans. (1)3. Name the organism that is most closely related to humans. (1)4. How many years ago did the New World monkeys split from the
common ancestor that gave rise to the Old World monkeys? (2)5. For how long did the common ancestor that evolved into the
gibbons exist? Show your working. (3)6. Humans and gorillas share many common characteristics with
primates. List THREE of these common characteristics. (3)[12]
Answers to activity 51. 503 million years ago3/mya (2) 2. Lemurs3 (1)3. Chimpanzee3 (1)4. 333 million years ago3/mya (2)5. 22 million years – 15 million years3 = 73million years3 (3)6. l Large brain3
• Eyes in front3• Freely rotating arms3• Long upper arms3• Rotation around elbow joints3• Bare fingertips or nails instead of claws3• Opposable thumb3• Upright posture3 (any 3) (3)
[12]
Activity 6
Question 1Give the correct biological term for each of the following descriptions. Write only the term next to the question number (1.1 to 1.17).1.1 The development of new species from existing species.1.2 A study of the distribution of organisms in different parts of the
world.1.3 Similar structures in different organisms indicating common
ancestry.1.4 Having a pointed face because of projecting jaws and nose.1.5 A group of similar organisms that can breed to produce fertile
offspring.1.6 A group of organisms of the same species that occupy a particular
habitat.1.7 Only organisms with favourable characteristics survive.
For more questions on phylogenetic trees, refer to these National Life Sciences examination papers:
• Life Sciences Paper 2 November 2009 – Question 1.5 on page 7.
• Life Sciences Paper 2 March 2009 – Question 3.4 on page 11.
• Life Sciences Paper 2 March 2010 – Question 1.4 on page 6.
• Life Sciences Paper 2 March 2011 – Question 1.4 on page 5.
• Life Sciences Paper 1 March 2012: Version 1 – Question 1.4 on page 8.
Try to give your own answers to
the terminology questions in activity 5 before you look at
the answers on the next page! If you do not know an answer, try to find it in your textbook
or class notes.

© Department of Basic Education 2014
82 chaptEr 10 EvoLution (papEr 2 ) Mind the Gap CAPS Grade 12 Life Sciences
Chapter10
1.8 Using parents with particular desirable characteristics to obtain a combination of these desirable characteristics in the offspring
1.9 An opening in the skull through which the spinal cord passes1.10 Locomotion involving the use of a pair of hind limbs only1.11 Mechanisms that prevent different species from reproducing with
each other1.12 The study of fossils which provides evidence for evolution1.13 Sudden change to the genetic composition of an organism1.14 Branched diagram showing evolutionary relationships among
organisms1.15 Remains of organisms that have existed in the past1.16 Genus to which Little Foot, Mrs Ples, Karabo and the Taung Child
belong1.17 Genotypic and phenotypic differences among organisms of the
same species[17]
Answers to activity 61.1 Speciation3
1.2 Biogeography3
1.3 Homologous3
1.4 Prognathous3
1.5 Species3
1.6 Population3
1.7 Natural selection3
1.8 Artificial selection3
1.9 Foramen magnum3
1.10 Bipedal31.11 Reproductive isolation3
1.12 Paleontology3
1.13 Mutation3
1.14 Phylogenetic tree3
1.15 Fossils3
1.16 Australopithecus3
1.17 Variation3
[17]
Keep going!

© Department of Basic Education 2014
Mind the Gap CAPS Grade 12 Life Sciences chaptEr 11 human impact on thE EnvironmEnt (papEr 1 ) 83
Chapter 11
Human impact on the environmentOrganisms interact with other organisms and with the environment. When we, as humans, interact with the environment to satisfy our needs, we may have many negative impacts on the environment through our activities. We may pollute the land, the water and the atmosphere. We also make demands on the earth to ensure our food security. In doing all of this we may impact negatively on the biodiversity of our planet.
11.1 The atmosphere and climate changeIntroductionClimate refers to the long-term weather conditions of an area. The atmosphere is made up of nitrogen, oxygen and other gases, which include the greenhouse gases such as carbon dioxide and methane. Greenhouse gases absorb infrared (long wave radiation) long wave radiation emitted from the Earth and prevent it from escaping back into the atmosphere. This is known as the ‘greenhouse effect’.
The greenhouse effect is important in keeping the Earth warm so that it can sustain life. However, an increase in the concentration of greenhouse gases leads to the ‘enhanced greenhouse effect’. As a result, there may be a significant rise in the average temperature of the surface of the Earth over a period of time. This is known as ‘global warming’.
Increased concentration of carbon dioxide in the atmosphere is due mainly to:• Burning of fossil fuels (for electricity, to power vehicles and for
industrial processes): Combustion of carbon-rich fuels such as coal or plants (wood) releases carbon that was stored in them, as carbon dioxide.
• deforestation: Cutting down trees and removing vegetation from the land decreases the amount of carbon dioxide taken up by plants during photosynthesis. This increases the amount of carbon dioxide available in the atmosphere.
Use mobile notes to
help you learn the answers to the key concepts you don't
know.
© Department of Basic Education 2014
84 chaptEr 11 human impact on thE EnvironmEnt (papEr 1 ) Mind the Gap CAPS Grade 12 Life Sciences
Chapter11
Increased concentration of the methane in the atmosphere is due mainly to:• The increased number of landfills: decaying organic matter in
waterlogged soils such as landfills releases methane.• the increased number of livestock: ruminants such as cows release
methane gas through their digestive tracts.• Mining of coal.
Increased temperatures may lead to:• More evaporation of water which can lead to increased precipitation
which eventually increases the potential for flooding.• Rising sea levels caused by melting ice in the glaciers which can
eventually increase the potential for flooding.• Increased wildfires that increase the chances of soil erosion and
eventually desertification.• Increased loss of biodiversity, as species are unable to cope with
rapidly rising temperatures, eventually leading to desertification.• Increased droughts in some areas leading to desertification and food
insecurity.
Carbon footprintThis is a measure of the total amount of carbon dioxide emissions of an individual, a defined population or a company per year.
Strategies to reduce the carbon footprint include the following:• Reuse and recycle: less fossil fuels burnt in the production of some
of the material.• drive less: by using public transport, walking, bicycles.• Reduce the need for heating: insulating walls and building energy
efficient homes.• Carbon offsetting: by using alternative energy (solar and wind) and
reforestation to act as a carbon reservoir. • technological developments: decrease the amount of energy
needed for production/decreasing the dependency on carbon emitting fuels.
Destruction of the ozone layerOzone is a greenhouse gas that is found at low concentrations 15 – 50 km above the Earth’s surface. It absorbs the ultraviolet rays from the sun. The ultraviolet rays damage the DNA and cause skin cancer. Measurements in certain areas have shown a significant decrease in the amount of ozone layer. The damage to the ozone layer is caused mainly by chemicals called CFCs (chlorofluorocarbons), released by refrigerators, aerosol sprays and fast-food packaging.
If the measures to reduce the destruction of ozone layer fail:• There will be a significant increase in the number of skin cancer
cases.• Ultraviolet rays reaching the Earth’s surface may cause permanent
damage to our eyes.

© Department of Basic Education 2014
Mind the Gap CAPS Grade 12 Life Sciences chaptEr 11 human impact on thE EnvironmEnt (papEr 1 ) 85
Chapter 11
Activity 1
Questions1. Figure 11.1 below shows the averages of carbon dioxide
concentration in the atmosphere since January 2009, as measured at the Mauna Loa Observatory in Hawaii.
2009 2010 2011 2012 2013
Figure 11.1: Average carbon dioxide concentration in the atmosphere since January 2009, at Mauna in Hawaii
Carb
on d
ioxi
de (C
O 2) co
ncen
tratio
n in
par
ts p
er m
illio
n (p
pm)
400
395
390
385
380
Time (Years)
1.1 Describe how deforestation could lead to an increase in the carbon dioxide concentration in the atmosphere. (2)
1.2 Mention ONE human activity that might have led to the increase in carbon dioxide concentration as seen in the graph. (1)
1.3 What was the carbon dioxide concentration in the atmosphere in July 2012? (2)
1.4 What is the dependent variable in this investigation? (1)1.5 Explain how the excess carbon dioxide in the atmosphere
could lead to climate change. (4)1.6 Mention ONE way in which humans can reduce the amount of
carbon dioxide released into the atmosphere. (1) [11]
Answers to activity 11. 1.1 Cutting down of trees decreases the amount of carbon
dioxide3 taken up by the plants during photosynthesis3 (2)1.2 Burning of fossil fuels3 (1)1.3 393,53 ppm3 (2)1.4 Carbon dioxide concentration in ppm3 (1)

© Department of Basic Education 2014
86 chaptEr 11 human impact on thE EnvironmEnt (papEr 1 ) Mind the Gap CAPS Grade 12 Life Sciences
Chapter11
Answers to activity 1 (continued)1.5 l Carbon dioxide is a greenhouse gas3
• which absorbs long wave radiation emitted from the Earth3
• and prevents it from escaping back into the atmosphere3.
• An increase in the concentration of carbon dioxide leads to an increase in the greenhouse effect3,
• which may result in global warming3. (any 4)1.6 l Drive less3/use public transport, walking, bicycle more
• Reduce the need for heating by insulating walls3 • Building energy efficient homes3• Use alternative energy sources3 (solar and wind) • Reforestation3to act as carbon reservoir• Reuse and recycle3 (any 1)
[11]
Activity 2
Questions1. An investigation to measure the ozone concentration and the
chlorine levels has been done in Antarctica since 1950 and the results are shown in the graph below:
1950 1960 1970 1980 1990
Chlo
rine
leve
ls (p
ppv)
4,0
3,5
3,0
2,5
2,0
1,5
1,0
0,5
0
Time (Years)
400
350
300
250
200
150
100
50
0
ozone
chlorine
Ozone concentration (arbitrary units)
1.1 Give a caption for the graph. (2)1.2 What is the relationship between the levels of chlorine and
the concentration of ozone? (2)1.3 Name the dependent variable(s) in the investigation. (2)1.4 In which 10-year period was the ozone depletion the
greatest? (1)
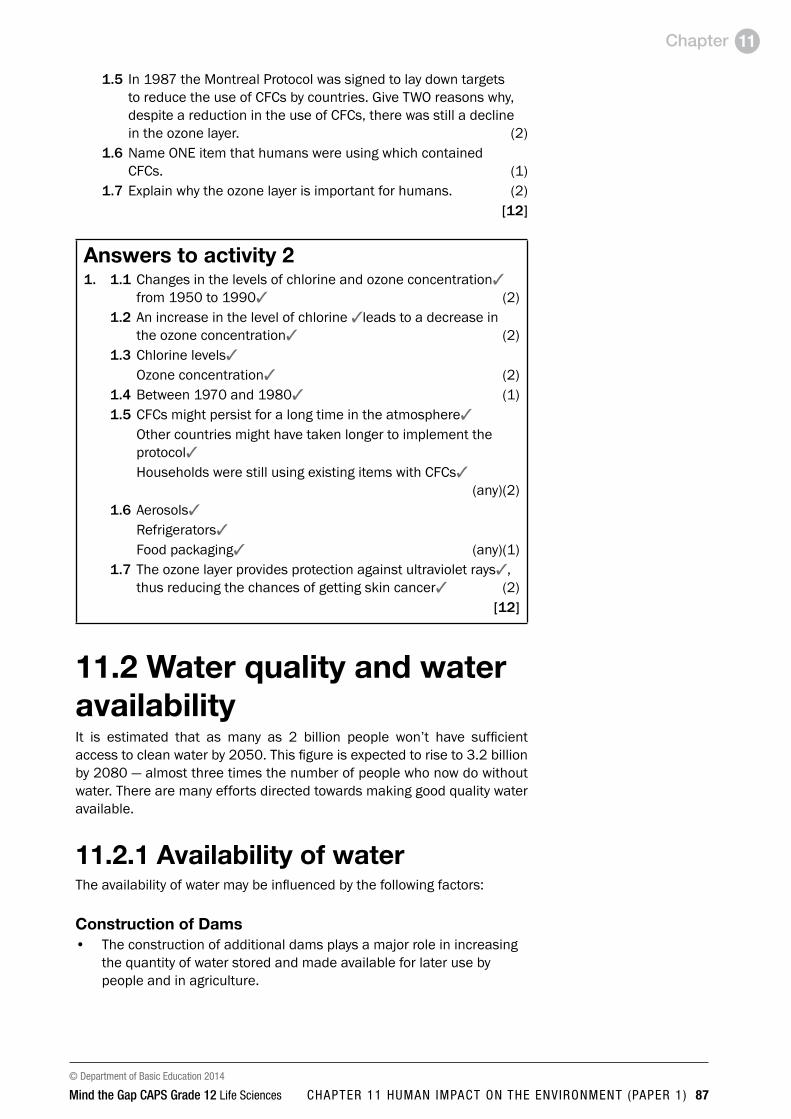
© Department of Basic Education 2014
Mind the Gap CAPS Grade 12 Life Sciences chaptEr 11 human impact on thE EnvironmEnt (papEr 1 ) 87
Chapter 11
1.5 In 1987 the Montreal Protocol was signed to lay down targets to reduce the use of CFCs by countries. Give TWO reasons why, despite a reduction in the use of CFCs, there was still a decline in the ozone layer. (2)
1.6 Name ONE item that humans were using which contained CFCs. (1)
1.7 Explain why the ozone layer is important for humans. (2)[12]
Answers to activity 21. 1.1 Changes in the levels of chlorine and ozone concentration3
from 1950 to 19903 (2)1.2 An increase in the level of chlorine 3leads to a decrease in
the ozone concentration3 (2)1.3 Chlorine levels3
Ozone concentration3 (2) 1.4 Between 1970 and 19803 (1)1.5 CFCs might persist for a long time in the atmosphere3
Other countries might have taken longer to implement the protocol3
Households were still using existing items with CFCs3 (any)(2)
1.6 Aerosols3
Refrigerators3
Food packaging3 (any)(1)1.7 The ozone layer provides protection against ultraviolet rays3,
thus reducing the chances of getting skin cancer3 (2)[12]
11.2 Water quality and water availabilityIt is estimated that as many as 2 billion people won’t have sufficient access to clean water by 2050. This figure is expected to rise to 3.2 billion by 2080 — almost three times the number of people who now do without water. There are many efforts directed towards making good quality water available.
11.2.1 Availability of waterThe availability of water may be influenced by the following factors:
Construction of Dams• The construction of additional dams plays a major role in increasing
the quantity of water stored and made available for later use by people and in agriculture.

© Department of Basic Education 2014
88 chaptEr 11 human impact on thE EnvironmEnt (papEr 1 ) Mind the Gap CAPS Grade 12 Life Sciences
Chapter11
Destruction of wetlands• Wetlands should not be destroyed because they influence both the
availability and quality of water.
Water wastage• A large amount of water used for irrigation is lost due to poor farming
practices. Open drain irrigation leads to loss of water by evaporation. The use of water for irrigation further up a river decreases the availability of water for other users lower down the river.
• Availability is also affected by wastage of water through leaking taps and toilets and faulty pipelines.
• Wastage of water can be reduced by reducing the pressure in the pipes, by educating people to use water wisely and by maintaining all plumbing in good condition.
Cost of water• The cost of water is influenced by costs involved in increasing the
availability and quality of water. • The cost per kilolitre (kl) of water increases with the increased use of
water. This is meant to discourage over-use of water, thus allowing for its sustained use.
• A certain amount of water is available free to all citizens to ensure that water is available to the poorest.
Poor farming practices• Contamination of water sources by fertilizers and pesticides has
decreased the amount of clean water available, thus increasing the costs involved in purification.
• Over-grazing leads to soil erosion. On land that is eroded, water runs off rapidly rather than soaking into the ground, and is thus wasted.
Droughts and floods• During periods of drought, water availability decreases. Water used
from dams during the drought periods cannot be easily replaced. • Natural vegetation can hold back water from floods. If the natural
vegetation is removed, flood waters are lost.
Boreholes and their effect on aquifers• Boreholes have been used to increase water availability in areas that
do not have direct access to other sources of water.• Constant use of boreholes eventually leads to the drying up of
aquifers (the source of borehole water) thus decreasing water availability in the future.
Water recycling• The availability of water can be increased if existing water is used
for more than one purpose. For example, some water used in the household can be used for the garden. Sewage water can be treated and used again.

© Department of Basic Education 2014
Mind the Gap CAPS Grade 12 Life Sciences chaptEr 11 human impact on thE EnvironmEnt (papEr 1 ) 89
Chapter 11
Exotic plantations and the depletion of the water table• Some exotic plants use a large quantity of water from the ground.
As a result, this decreases the level of the water table, making less water available to other vegetation in the area.
11.2.2 Quality of waterThe quality of water may be influenced by the following factors:
Eutrophication and algal bloom• Water used for agriculture may contain pesticides, herbicides and
fertilizers which pollute the water in rivers, dams and lakes, causing eutrophication. The added nutrients lead to an increase in algal growth (algal bloom). These algae over-use and thus deplete the oxygen in the water, thus reducing the potential for life in such water.
Thermal pollution• Thermal pollution refers to the heating of water caused by the use of
water for cooling in power-stations and industries.• The quality of water is affected because heated water has a lower
oxygen content, making it difficult to support life.
Pollution of water through domestic, agricultural and industrial use• After water is used for domestic purposes it may contain detergents
(such as from washing) and pathogenic bacteria (such as in sewage). This polluted water has to be treated before it can be used again.
• After water is used for industrial purposes it may contain many heavy metals, oil, heat and fertilizers. This adversely affects the quality of the water and all life that depends on it.
• Fertilisers and pesticides may run off into rivers, ponds and dams and pollute the water.
Mining• Water returned to the environment from mines is generally acidic
and toxic. This water is hot and thus also contributes to thermal pollution.
Alien Plants• Alien invasive water plants block the waterways, reducing light to
other aquatic plants. These plants eventually die and decompose. Bacteria that decompose these plants eventually deplete the oxygen supply in the water.
Water purification• The quality of water is improved through purification methods.
Undrinkable water can be made drinkable.

© Department of Basic Education 2014
90 chaptEr 11 human impact on thE EnvironmEnt (papEr 1 ) Mind the Gap CAPS Grade 12 Life Sciences
Chapter11
Activity 3
Questions1. A group of learners conducted an investigation to determine
the average amount of water used by a household for different purposes. They collected data on water-use from 5 families in their neighbourhood. The results are shown below.
Purpose for which water is used Average amount of water used (%)
Toilet flushing 30
Baths and showers 25
Gardening 15
Washing clothes and dishes 20
Cooking and drinking water 10
1.1 Identify the:a) Dependent variable (1)b) Independent variable (1)
1.2 State TWO ways in which the reliability of the results can be improved. (2)
1.3 Draw a pie-chart to represent the data in the table. Show all calculations. (7)
1.4 Describe ONE advantage of making the results of the survey available to the various households that participated. (2)
[13]
Answers to activity 31.1 a) Average amount of water used3 (1)
b) Purpose for which water is used3 (1)1.2 l Repeat the investigation3
• Select the households randomly3• Increase the number of households involved in the
investigation3 (any 2)

© Department of Basic Education 2014
Mind the Gap CAPS Grade 12 Life Sciences chaptEr 11 human impact on thE EnvironmEnt (papEr 1 ) 91
Chapter 11
Answers to activity 3 (continued)1.3 Calculations for proportions of slices in the pie-chart
Purpose for which water was used
Working Proportion (degrees)
Toilet flushing 30 100 × 360 108
Baths and showers 25 100 × 360 90
Gardening 15 100 × 360 54
Washing clothes and dishes 20 100 × 360 72
Cooking and drinking water 10 100 × 360 36
Toilet flushing 30%
Bath and showers 25%
Gardening 15%
Washing clothes and dishes 20%
Cooking and drinking water
10%
Average amount of water used by a household for different purposes
(7)
1.4 Owners can identify the areas of greatest water use3 to allow them to then develop strategies to reduce water use in that area3 (2)
[13]
Activity 4
Questions1. Describe how alien plants may reduce both the availability and
quality of water. (4)2. Describe how poor farming practices may reduce both the availability
and quality of water. (4)[8]
© Department of Basic Education 2014
92 chaptEr 11 human impact on thE EnvironmEnt (papEr 1 ) Mind the Gap CAPS Grade 12 Life Sciences
Chapter11
Answers to activity 41. l Alien invasive plants may use water excessively3 and thus
reduce the amount of water available for the natural vegetation3 of an area (2)• Alien invasive water plants block the waterways, reducing
light to other aquatic plants3. These plants eventually die and decompose3. Bacteria that decompose these plants eventually deplete the oxygen supply in the water3. (any) (2)
2. l Over-grazing leads to soil erosion3. On land that is eroded, water runs off rapidly rather than soaking into the ground3, and is thus wasted. (2)• The use of fertilizers and pesticides may pollute nearby
dams, ponds and rivers3 thus reducing the quality of water available3 (2)
[8]
Activity 5
Questions1. Read the article below entitled ‘Durban to Recycle Sewage water into
Drinking Water’.
Durban to Recycle Sewage water into Drinking Water
Durban plans to become the first SA city to purify and recycle sewage water into drinking-quality tap water. The city is also carrying out a feasibility study on purifying seawater.
Water is going astray in Durban because of leaks and theft. The city recently spent millions of rand replacing large sections of old, leaky pipes and reduced pressure levels in several areas to curb leaking. Although a large new dam, Spring Grove, was being built near Mooi River, this would not relieve the water supply risk to an acceptable level in the short term.
Windhoek had been partially reliant on recycled sewage-to-tap water since 1968. ‘Crucial to this public acceptance is Windhoek’s 42-year record of no waterborne disease outbreaks and no negative health effects attributable to drinking reclaimed water.’
According to eThekwini’s water department, there would be at least three safety barriers to ensure the quality of treated effluent. The semi-treated clear water would be pumped at high pressure through ultra-filtration membranes that removed suspended and dissolved solids, and bacteria. This water would then be filtered through tiny pores. The final stage involved ultra-violet light disinfection.
As a further safeguard, all purified effluents from the two new Durban plants would be stored for at least 12 hours after treatment so that final samples could be taken for testing before the water was released into tap supplies.
The Mercury – 15 March 2012

© Department of Basic Education 2014
Mind the Gap CAPS Grade 12 Life Sciences chaptEr 11 human impact on thE EnvironmEnt (papEr 1 ) 93
Chapter 11
1.1 List FIVE different strategies referred to in the article intended to increase the availability of clean drinking water. (5)
1.2 Describe THREE arguments used in the article to convince the reader about the safety of recycled sewage water. (6)
1.3 List THREE processes that will be used to ensure that the recycled sewage water will be fit for human consumption. (3)
[14]
Answers to activity 51.1 l Recycling sewage water3
• Purifying sea water3• Replacing old, leaky pipes3• Reducing water pressure3• Building new dams3 (5)
1.2 l No outbreak of water-borne diseases3 in Windhoek for 42 years3
• 3 safety barriers3 to ensure the quality3 of treated effluent• Stored for at least 12 hours3 allowing sufficient time for
repeated testing3 (6)1.3 l Pumped at high pressure through ultra-filtration membranes3
to remove suspended and dissolved solids and bacteria• Filtration through tiny pores3 • Ultra-violet disinfection3 (3)
[14]
11.3 Food securityFood security refers to the access, by all people at all times, to adequate, safe and nutritious food for a healthy and productive life. Food security may be influenced by the following factors:
Exponential growth of the human population• The world’s population is growing at an exponential rate (very rapidly)
and as a result some countries cannot produce enough food to feed their growing population. Food production needs to increase as rapidly as the world population; otherwise many countries will experience food insecurity.
Droughts and floods• Climate change has led to more frequent and severe droughts and
floods. Droughts result in crop losses and livestock death which reduce the food available in an area. Floods cause extensive damage in a short period of time and decrease the amount of farmland available to grow crops. People also usually lose their homes, possessions and economic security during floods, further impacting on food security.

© Department of Basic Education 2014
94 chaptEr 11 human impact on thE EnvironmEnt (papEr 1 ) Mind the Gap CAPS Grade 12 Life Sciences
Chapter11
Poor farming practices – monoculture, pest control, loss of topsoil and the need for fertilizers• Monoculture is the growing of one type of crop over large areas
of land year after year. Monoculture depletes nutrients and water supplies and therefore impacts negatively on the quality of the topsoil.
• Pest control involves the use of pesticides (chemicals) to kill pests that compete with humans for food. Pesticides may kill or get into the tissues of healthy plants. This may reduce crop production and, since pesticides are expensive, increase the cost of food and thus reduce access to poor consumers. Many farmers now use biological control, which uses a natural predator/parasite to get rid of the pest instead of using expensive pesticides.
• topsoil is the top 1.5 metres of soil that contain the nutrients that plants require for growth. The tilling of the soil between plantings and heavy rainfall cause much of the topsoil to be lost, leading to the loss of valuable nutrients over time, reducing crop yields.
• the use of fertilizers, both inorganic (chemical) and organic (compost and manure) can increase the nutrients in the soil and keep soil fertile. This replaces nutrients in the soil that are lost when crop plants absorb them. Fertilizers can be expensive, contributing to the high cost of food, thus reducing access to poor consumers.
Alien plants and reduction of agricultural land• Alien plants deplete the topsoil of water and nutrients. These alien
plants out-compete indigenous plants because they have no natural predators, grow rapidly and invade land that could be used to grow crops.
The loss of wild varieties and the impact on gene pools• Crop plants have replaced wild varieties. The preservation of wild
varieties is important because, if changing environmental conditions destroy the present crop plants, then wild varieties could be used as alternative sources of food. If wild varieties are wiped out, it will reduce the genetic diversity and thus the gene pool.
Genetically engineered food• Genetically engineered food is produced from genetically modified
organisms (GMOs). Genetic engineering involves the inserting of a gene (with a desired characteristic) from one organism into another organism to increase the yield. For example, a gene for drought resistance could be inserted into a crop plant that grows in areas where water is scarce.
Food wastage• Wastage could occur during the storage, production and processing
of food. Wastage includes food thrown away and food not eaten. Wastage increases the prices of food to consumers and could reduce food security in a country.

© Department of Basic Education 2014
Mind the Gap CAPS Grade 12 Life Sciences chaptEr 11 human impact on thE EnvironmEnt (papEr 1 ) 95
Chapter 11
Activity 6
Questions1. Study the table below and answer the questions that follow.
Country/Region total (kg)
developed/developing
Regions
Food loss and waste per person per year
At the production and retail stages(kg)
By consumers
(kg)
Europe 280 Developed 190 90
North America and Oceania
295 Developed 185 110
Industrialized Asia 240 Developed 160 80
Sub-Saharan Africa 160 Developing 155 5
North Africa, West and Central Asia
215 Developing 180 35
South and Southeast Asia
125 Developing 110 15
Latin America 225 Developing 200 25
Adapted from CUP Biology: Jones and Jones, 2010
1.1 For Sub-Saharan Africa, calculate the food wastage by consumers as a percentage of the total food waste. (3)
1.2 Suggest a reason for this low percentage calculated in QUESTION 1.1 above. (2)
1.3 Explain the differences in the pattern of food wastage in developed and developing regions. (4)
1.4 State TWO possible ways of preventing the high levels of food waste that are found in the developed countries. (2)
[11]
2. The following questions relate to the factors that threaten food security in a country.2.1 Give ONE reason why there has been an increase in the
demand for food over the years. (1)2.2 State one way in which the use of each of the following helps
to increase food productivity:a) Pesticides (1)b) Fertilizers (1)
2.3 Describe how the use of pesticides could destroy food chains. (2)
2.4 Explain why GMOs may be considered a threat to food security. (3)
[8]

© Department of Basic Education 2014
96 chaptEr 11 human impact on thE EnvironmEnt (papEr 1 ) Mind the Gap CAPS Grade 12 Life Sciences
Chapter11
Answers to activity 61. 1.1 Food Wastage in Sub-Saharan Africa
5/1603 × 1003 = 3.1%3 (3)1.2 Access to food is scarce and the food that is available is
either provided by international aid agencies or subsistence farming3. Very little food is bought and even less is bought from supermarkets.3 There is no food left over to waste.3 (any 2)
1.3 In developed regions: buy food from markets, shops and supermarkets, often in excess of their requirements and will throw unused food away.3 The markets, shops and supermarkets will also throw away unsold food.3
In developing regions: people will depend more on small, local sources of food,3 have less food security and will not have food in excess of their needs.3 (4)
1.4 Possible ways to reduce food waste include:• Prevention – prevent consumers from throwing away food
or stop them from producing/buying more food than they need3
• Plan what you need before you shop and reduce impulse and spontaneous buying3
• Understand how to store and preserve food3• Ensure that unused food is used in some way – e.g. give
to the poor, animal feed, compost heaps.3 • Education3 (any 2)
[11]
2. 2.1 There has been a rapid increase in the human population3 (1)2.2 a) Pesticides kill the pests which destroy the crops3 (1)
b) Fertilizers increase nutrient content in the soil3 (1)2.3 Secondary consumers e.g. birds can eat the pests with the
poison3, which can kill the birds3 thereby decreasing the population size of birds3
OR The pest can become extinct3, and the population size of
the secondary consumer feeding on the pest will also decrease3 (any 1 × 2) (2)
2.4 l Loss of flora and fauna biodiversity by inbreeding of GMOs3
• Entire species could be wiped out3 if exposed to diseases3 (no variation in the population)/GMOs will have no resistance to the diseases (3)
[8]

© Department of Basic Education 2014
Mind the Gap CAPS Grade 12 Life Sciences chaptEr 11 human impact on thE EnvironmEnt (papEr 1 ) 97
Chapter 11
11.4 Loss of biodiversityBiodiversity refers to the variety of plant and animal species on Earth. Biodiversity ensures that we have food, fresh water, medicines and fuel that we obtain from our environment. It also ensures that the climate is regulated, floods are controlled (wetlands), diseases are kept in check (predators eat the sick animals) and water is purified (filtering by wetlands). Biodiversity ensures that seeds are dispersed, nutrients are cycled (e.g. nitrogen and phosphorus) and oxygen and soil continue to form. It also helps improve our quality of life by providing us with forms of recreation and ecotourism. As biodiversity declines, these things do not occur as they should and the survival of humans becomes threatened.
11.4.1 Factors that reduce our biodiversityHabitat destruction through:
Farming methodsMonoculture: Monoculture is the growing of one type of crop over large areas of land year after year. Monoculture replaces indigenous plants and reduces biodiversity. Insects that specialise in feeding on one type of crop spread rapidly because there are no natural enemies or barriers to stop them. This means the farmer needs to use more pesticides to kill them. Intensive use of agrochemicals such as fertilisers and pesticides often end up in rivers, streams and groundwater, poisoning species in the area and causing eutrophication. This results in a large loss of biodiversity.
Overgrazing: It occurs when livestock such as sheep or cattle are kept in an area for too long; the vegetation is grazed to a point where it will not grow back. It causes soil erosion by removing the plants that bind the soil together with their roots. Topsoil is lost during rainstorms. This can lead to the extensive destruction of land through desertification which results in loss of biodiversity. Sometimes overgrazed land becomes subject to alien plant invaders which destroy habitats by taking over the land.
Golf EstatesDevelopments such as golf estates are a form of monoculture that requires large amounts of water, pesticides and fertilisers which may runoff and poison aquatic ecosystems. Housing associated with golf developments replaces large areas of natural vegetation.
MiningMining alters the environment and can negatively affect the biodiversity in an area. Pollutants in the form of dust and smoke may be released into the air while vegetation is removed and replaced with rock and waste dumps. Underground water may be poisoned because of sulphates and heavy metals released into them.
UrbanisationThe growth of large cities (urbanisation) also negatively impacts on biodiversity. Surfaces are covered with concrete, and natural habitats are

© Department of Basic Education 2014
98 chaptEr 11 human impact on thE EnvironmEnt (papEr 1 ) Mind the Gap CAPS Grade 12 Life Sciences
Chapter11
destroyed to build houses and businesses. Habitat fragmentation causes the loss of biodiversity, as natural plants are replaced by exotic trees and plants.
DeforestationDeforestation is the permanent destruction of indigenous forest and woodland areas. Deforestation is caused by human activities such as agriculture, logging, and using trees as firewood. Deforestation leads to the destruction of the habitats of other organisms, like frogs and insects, and this leads to the loss of biodiversity.
Loss of wetlands and grasslandsGrasslands and wetlands have unique plant and wildlife and provide many ecological services to humans. Destruction of these habitats will lead to the loss of species.
PoachingPoaching refers to the illegal hunting of animals, either for food or because certain body parts can be sold for money. ‘Poaching’ may also be applied to plants that are removed and sold for profit e.g. medicinal plants. Some wild animals are hunted for food (‘bush meat’) and are on the verge of extinction. Elephants are poached for their tusks to make carvings and jewellery and rhinos are hunted for their horns which are used in the Far East for medicinal reasons.
Alien plant invasionsThese plants are species that have been introduced into an area and which compete with the natural plants in the area. They can outcompete indigenous plants, thus reducing the biodiversity.
11.4.2 Ways in which our biodiversity can be maintainedControl of alien plant invasionsAlien invasive species may be controlled by mechanical, chemical and biological methods. Mechanical methods involve chopping down plants or physically removing them by hand and is very time consuming. Chemical control involves spraying herbicides onto the plants; this can pollute the environment and is expensive. Biological methods involve introducing a natural enemy from the alien plant’s environment and allowing it to reproduce and feed on the invasive plant.
Sustainable use of the environmentSustainable use of the environment means using resources without harming the ability of future generations to use that resource. Substances from indigenous plants such as the African potato, Hoodia, rooibos and Devil’s claw all have economic and medicinal value. These indigenous plants can be used sustainably by encouraging traditional healers to grow their own plants and through improving education of the women who generally gather the plants in the wild. Encouraging traditional healers to

© Department of Basic Education 2014
Mind the Gap CAPS Grade 12 Life Sciences chaptEr 11 human impact on thE EnvironmEnt (papEr 1 ) 99
Chapter 11
be part of formal medical programmes would encourage training to be on-going and help establish sustainable use of medicinal plants. Legislation should be passed to limit the numbers of plants that can be harvested at one time and seeds of medicinal plants could be collected and distributed to increase plant numbers.
Activity 7
Questions1. Study the following table showing a summary of the rhino poaching
incidents in South Africa from 2006 – 2010.
Province
2006
2007
2008
2009
2010
tota
l
Kruger National Park (part of Limpopo)
17 10 36 50 109 222
Gauteng 0 0 0 7 15 22
Limpopo 0 0 23 16 37 76
Mpumalanga 2 3 2 6 12 25
North West 0 0 7 10 44 61
Eastern Cape 0 0 1 3 2 6
Free State 0 0 0 2 3 5
KwaZulu-Natal 5 0 14 28 23 70
Northern Cape 0 0 0 0 2 2
total illegally hunted 24 13 83 122 247 489
1.1 How many rhinos were illegally hunted in 2009? (1)1.2 Suggest THREE ways in which the poaching of rhinos can be
stopped. (3)1.3 Describe the general trend observed in the table. (2)1.4 By what percentage did the poaching of rhino incidents
increase in North West from 2008 to 2010? Show all working. (3)1.5 Use the data in the table and draw a bar graph to show the
number of rhinos poached each year from 2006 to 2010 in South Africa. (7)
[16]
2. Read the following passage on Rooibos (Aspalanthus linearis) and answer the questions that follow.
The Rooibos plant is used to make herbal tea. South Africa is the only commercial grower of Rooibos plants in the world. Rooibos tea is a caffeine-free beverage with health and medicinal benefits. Some of the benefits of drinking Rooibos tea are: it has a calming effect, it helps with digestion problems and it helps with infant colic.

© Department of Basic Education 2014
100 chaptEr 11 human impact on thE EnvironmEnt (papEr 1 ) Mind the Gap CAPS Grade 12 Life Sciences
Chapter11
2.1 Describe TWO ways in which over-exploitation of plants, such as Rooibos, impacts on other life forms and the environment. (2)
2.2 Describe THREE strategies that could be used to prevent the over-exploitation of plants such as Rooibos. (3)
[5]
Answers to activity 71. 1.1 122 3 (1)
1.2 l Rhino horns must be sawn off 3• Implant a ‘Pro Tag Device’ to monitor movement of the
rhino 3• Institute heavy penalties like imprisonment instead of
fines 3 (3)1.3 Rhino poaching 3 has increased 3 from 2008 to 2010 (2)
1.4 447 3 × 100
1 3 = 628,53% 3 (3)
1.5
Num
ber o
f Rhi
no p
oach
ing
inci
dent
s
Rhino poaching incidents in South Africa from 2006 - 2010
2006 2007 2008 2009 2010
300
250
200
150
100
50
0
Time (Years)
(7)
[16]
2.2.1 l Plants can become extinct 3/leads to loss of biodiversity
• Food chains/webs can be destroyed 3• Could lead to degradation of the environment 3• Erosion of ground surface if too many plants are
removed 3• Increase run-off of water 3• Alien plant invasion 3in the habitats from which the
plants are removed• Upset the balance of oxygen and carbon dioxide 3/global
warming if too many plants are removed (any 2)
© Department of Basic Education 2014
Mind the Gap CAPS Grade 12 Life Sciences chaptEr 11 human impact on thE EnvironmEnt (papEr 1 ) 101
Chapter 11
Answers to activity 7 (continued)2.2 l Sustainable harvesting 3
• Impose quotas 3/limit numbers• Limit area 3where plants are harvested• Limit size of plants harvested 3• Limit time/seasons of collection 3• Research done to look at reproductive cycle 3/alternative
source of active ingredient/cloning• Legislation to control harvesting 3• Permits to control harvesting 3• Monitoring of harvest 3• Penalties 3for breaking legislation• Education 3/campaign on the impact and consequences
of over-exploitation• Establish nurseries 3/seed banks – to replace plants
harvested• Establish more nature reserves 3 to conserve indigenous
plants (any 3)(5)
11.5 Solid-waste disposalSolid waste is any solid material that is of no use to humans and which needs to be disposed of in a safe and environmentally friendly way.
Managing dumpsites for rehabilitation and prevention of soil and water pollution The simplest and most cost effective way of disposing of solid waste is to bury it in landfill sites. A landfill site is a hole where solid waste is dumped and then covered by soil. However, this way of disposing of solid waste contributes to soil and groundwater pollution because rain seeps through the waste to produce a toxic substance called leachate. To prevent the toxic leachate from reaching the groundwater, a plastic liner is placed under the dumpsite area.
Rehabilitation of landfill sites occurs before they are closed down. This involves the covering of the old landfill site with clay soil, which is impermeable to water, and then it is covered with topsoil. Grass or other vegetation is then planted on the old landfill site. The growth of the plants stabilises the area and the old landfill site may be used as a recreational area such as a park or a golf course.
The need for recyclingVarious methods may be used to manage solid waste, they include the reduction of waste, re-using waste and recycling of waste. • Re-using waste products includes re-using plastic shopping bags,
re-using glass and plastic containers – this helps to reduce the waste produced.
• Recycling is a process whereby used materials/waste products are recycled to make new products, for example plastic, glass, tin and
© Department of Basic Education 2014
102 chaptEr 11 human impact on thE EnvironmEnt (papEr 1 ) Mind the Gap CAPS Grade 12 Life Sciences
Chapter11
paper. The advantage of recycling is that it provides employment, reduces the use of raw materials and energy, and reduces air, ground and water pollution.
Using methane from dumpsites for domestic use: heating and lighting Methane is a gas produced as a result of the decomposition of organic waste. The methane gas can be used as a fuel. Methane can be collected from landfill sites and used to generate electricity for domestic use – heat for cooking and electricity for lighting.
Safe disposal of nuclear wasteSouth Africa also uses radioactive material such as uranium to power its nuclear power station at Koeberg in the Western Cape. Unfortunately, a by-product of using uranium is nuclear waste that is still radioactive and therefore dangerous to living organisms. The nuclear waste is stored in thick steel drums and buried in trenches at special protected sites.
Activity 8
Questions1. State FOUR strategies you would use to manage solid waste if you
were appointed as the head of the waste disposal division of your town. (4)
2. The following table shows the total amount of solid waste and the amount of recyclable material dumped in a South African city landfill site over a number of years.
yeAR tOtAL AMOuNt OF SOLid WASte
(MiLLiONS OF tONS)
AMOuNt OF ReCyCLABLe MAteRiAL iN SOLid WASte
(MiLLiONS OF tONS)
2003 1,49 0,78
2004 1,59 0,82
2005 1,80 1,20
2006 1,93 1,30
2.1 Describe the general trend in the total amount of waste produced and the amount of recyclable materials dumped from 2003 to 2006. (2)
2.2 Explain TWO advantages of recycling. (4)
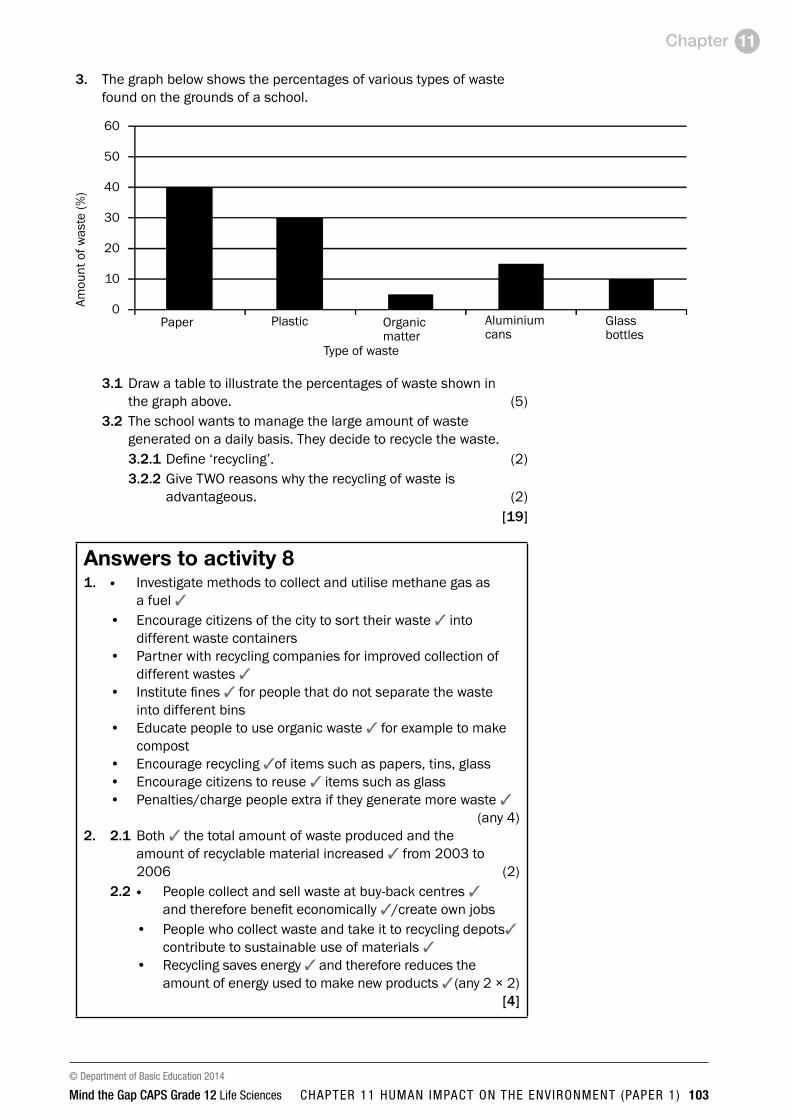
© Department of Basic Education 2014
Mind the Gap CAPS Grade 12 Life Sciences chaptEr 11 human impact on thE EnvironmEnt (papEr 1 ) 103
Chapter 11
3. The graph below shows the percentages of various types of waste found on the grounds of a school.
Amou
nt o
f was
te (%
)
Paper Plastic Organic matter
60
50
40
30
20
10
0
Type of waste
Aluminium cans
Glass bottles
3.1 Draw a table to illustrate the percentages of waste shown in the graph above. (5)
3.2 The school wants to manage the large amount of waste generated on a daily basis. They decide to recycle the waste.3.2.1 Define ‘recycling’. (2)3.2.2 Give TWO reasons why the recycling of waste is
advantageous. (2)[19]
Answers to activity 81. l Investigate methods to collect and utilise methane gas as
a fuel 3• Encourage citizens of the city to sort their waste 3 into
different waste containers • Partner with recycling companies for improved collection of
different wastes 3 • Institute fines 3 for people that do not separate the waste
into different bins• Educate people to use organic waste 3 for example to make
compost • Encourage recycling 3of items such as papers, tins, glass• Encourage citizens to reuse 3 items such as glass • Penalties/charge people extra if they generate more waste 3
(any 4) 2. 2.1 Both 3 the total amount of waste produced and the
amount of recyclable material increased 3 from 2003 to 2006 (2)2.2 l People collect and sell waste at buy-back centres 3
and therefore benefit economically 3/create own jobs• People who collect waste and take it to recycling depots3
contribute to sustainable use of materials 3• Recycling saves energy 3 and therefore reduces the
amount of energy used to make new products 3 (any 2 × 2)[4]
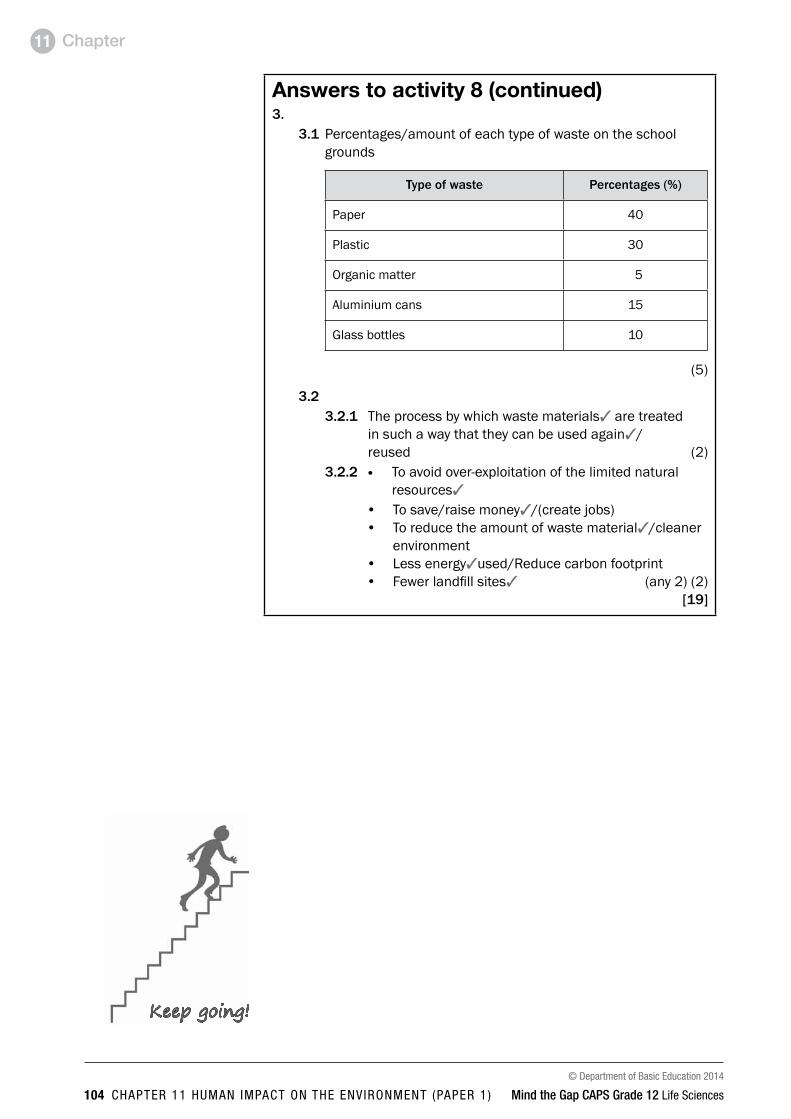
© Department of Basic Education 2014
104 chaptEr 11 human impact on thE EnvironmEnt (papEr 1 ) Mind the Gap CAPS Grade 12 Life Sciences
Chapter11
Answers to activity 8 (continued)3.
3.1 Percentages/amount of each type of waste on the school grounds
type of waste Percentages (%)
Paper 40
Plastic 30
Organic matter 5
Aluminium cans 15
Glass bottles 10
(5)
3.23.2.1 The process by which waste materials3 are treated
in such a way that they can be used again3/ reused (2)
3.2.2 l To avoid over-exploitation of the limited natural resources3
• To save/raise money3/(create jobs)• To reduce the amount of waste material3/cleaner
environment• Less energy3used/Reduce carbon footprint• Fewer landfill sites3 (any 2) (2)
[19]
Keep going!

© Department of Basic Education 2014
Mind the Gap CAPS Grade 12 Life Sciences chaptEr 12 Sk iLLS (papEr 1 anD 2) 105
Chapter 12
Skills12.1 Drawing graphs Graphs and charts condense large amounts of information in a format that is easier to understand, showing important points clearly and effectively.1. Line graphs show the relationship between two types of information
where the independent variable is continuous. Line graphs are useful in showing trends over time and are often used for biological data.
2. Bar graphs show different categories of data and are used when the independent variable is not a set of continuous numbers or continuous groups (discontinuous data). They are best used to compare values across categories.
3. Histograms have connected bars displaying continuous data. They are used when the values of the independent variables are continuous but fit into categories or groups that follow on after each other.
4. Pie charts are circular charts used to compare parts of the whole. They are divided into sectors that are equal in size to the quantity represented. They are used for discontinuous data.
12.1.1 How to draw a line graph
Step 1Identify the dependent and the independent variables from the
information you are given (usually in table format).• dependent: This is the variable or factor that is being
measured, i.e. the temperature in degrees Celsius in this example.
• independent: This is the variable that the investigator can change. The dependent variable changes as the independent variable changes, i.e. the time in hours in this example.
time (hours) temperature (°C)
0 16
5 24
9 28
13 26
17 21
20 19
24 17
Table 12.1 Air temperature recorded over a 24 hour period
You need to know how to draw these four different
graph types.
The independent variable is usually given in the first column of the
table.

© Department of Basic Education 2014
106 chaptEr 12 Sk iLLS (papEr 1 anD 2) Mind the Gap CAPS Grade 12 Life Sciences
Chapter12
Step 2Draw a set of axes and label the X and Y axes. The dependent variable goes on
the Y-axis and the independent variable on the X-axis. Include the unit in each label, e.g. temperature in °C and time in hours. Do NOt forget to label the axes.
Step 3Choose a scale for the X and the Y axes. Make sure that the scale includes the
highest numbers in the table for each of the variables. Do not use the values for the Y-axis directly from the table unless they have regular intervals.
time (hours)
tem
pera
ture
(°C)
0 2 4 6 8 10 12 14 16 18 20 22 24
3025201510
50
Figure 12.2 Draw the axes and choose a scale
Step 4Place a dot at the point where the two values for each result intersect (meet).
In the example, the point where 5 hours and 24°C intersect on the graph is indicated by the second dot on the graph. Plot all the points using the information in the table.
Step 5Join the dots using a ruler until all the dots have been joined in sequence.
time (hours)
tem
pera
ture
(°C)
0 2 4 6 8 10 12 14 16 18 20 22 24
3025201510
50
Figure 12.3 Plot the points on the graph and join them
Step 6Give the graph a heading or caption. The heading or caption should include
both variables. In this case both air temperature and the time period of 24 hours must be mentioned in the heading.
time (hours)
tem
pera
ture
(°C)
0 2 4 6 8 10 12 14 16 18 20 22 24
3025201510
50
Figure 12.4 Final line graph with heading
0 5 9 13 17 20 24{ }X – wrong
The independent
variable must be plotted on the
X-axis
If the graph has two lines on it, then you
should draw a key to show what the different lines represent. For example if there was another
line on this graph for rainfall, then your key might look like this:
Keytemperaturerainfall
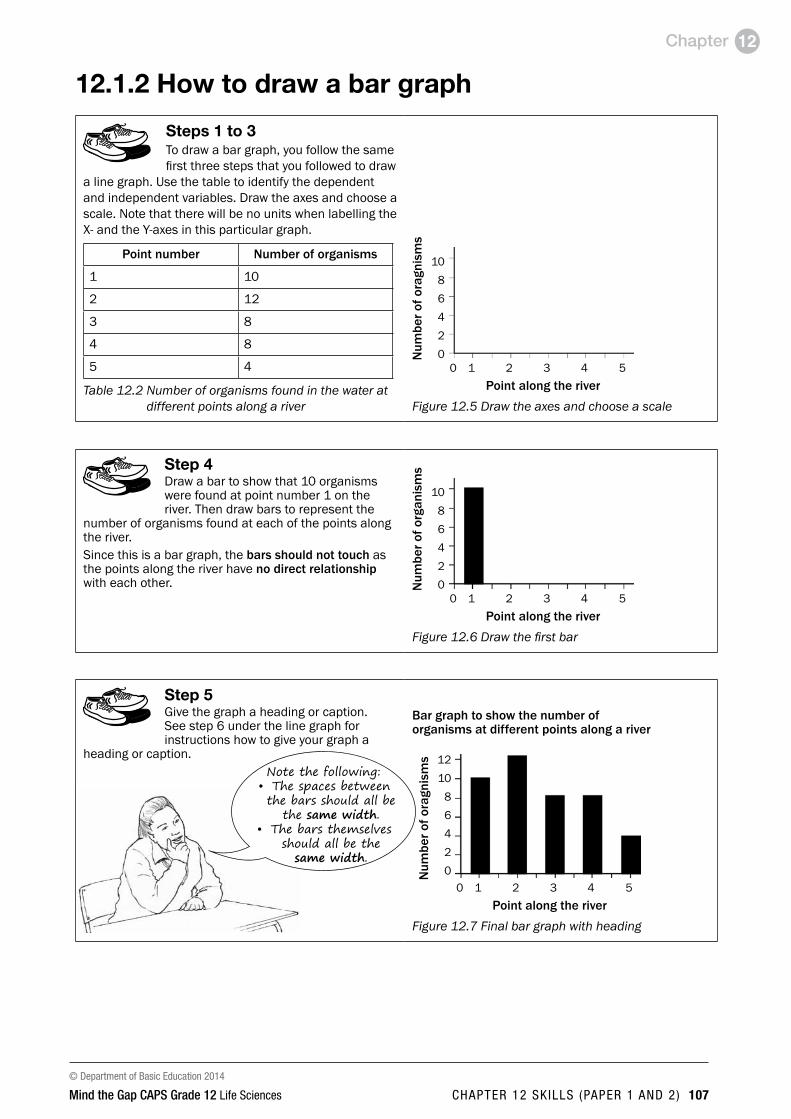
© Department of Basic Education 2014
Mind the Gap CAPS Grade 12 Life Sciences chaptEr 12 Sk iLLS (papEr 1 anD 2) 107
Chapter 12
12.1.2 How to draw a bar graph
Steps 1 to 3To draw a bar graph, you follow the same first three steps that you followed to draw
a line graph. Use the table to identify the dependent and independent variables. Draw the axes and choose a scale. Note that there will be no units when labelling the X- and the Y-axes in this particular graph.
Point number Number of organisms
1 10
2 12
3 8
4 8
5 4
Table 12.2 Number of organisms found in the water at different points along a river
Point along the river
Num
ber o
f ora
gnis
ms
0 1 2 3 4 5
1086420
Figure 12.5 Draw the axes and choose a scale
Step 4Draw a bar to show that 10 organisms were found at point number 1 on the river. Then draw bars to represent the
number of organisms found at each of the points along the river.Since this is a bar graph, the bars should not touch as the points along the river have no direct relationship with each other.
Point along the river
Num
ber o
f org
anis
ms
0 1 2 3 4 5
1086420
Figure12.6Drawthefirstbar
Step 5Give the graph a heading or caption. See step 6 under the line graph for instructions how to give your graph a
heading or caption.
Bar graph to show the number of organisms at different points along a river
Point along the river
Num
ber o
f ora
gnis
ms
0 1 2 3 4 5
1210
86420
Figure 12.7 Final bar graph with heading
Note the following:• The spaces between
the bars should all be the same width.
• The bars themselves should all be the
same width.
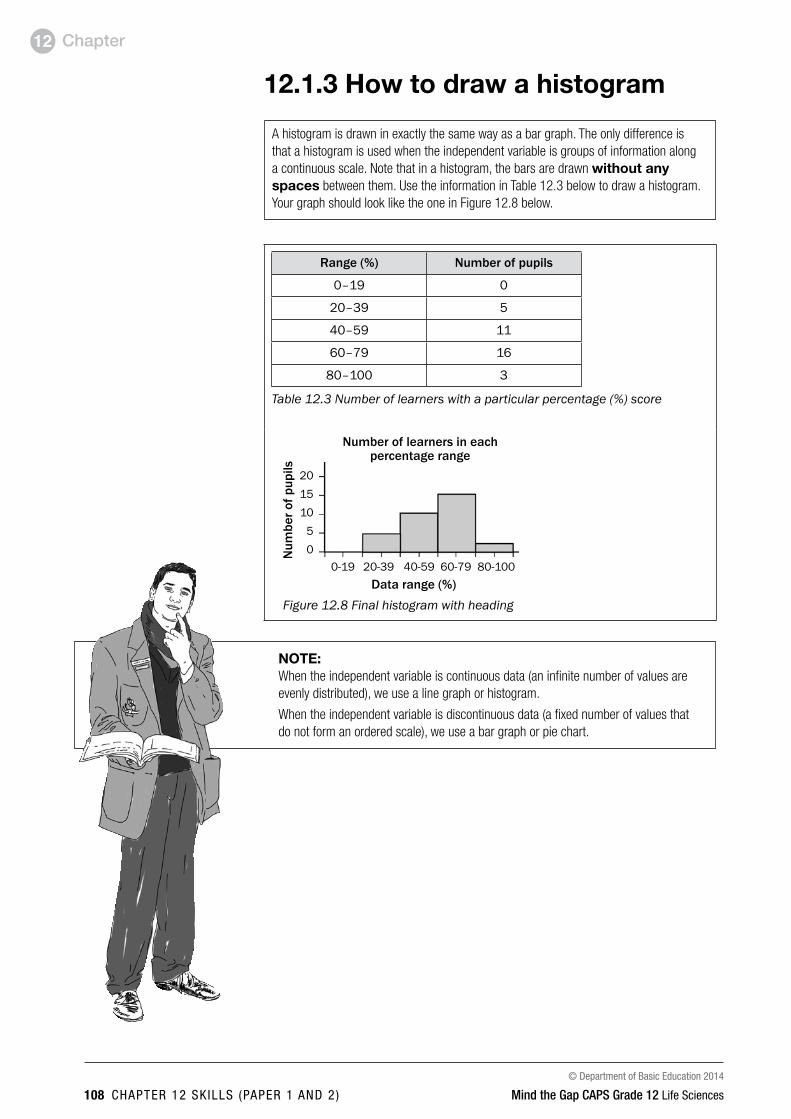
© Department of Basic Education 2014
108 chaptEr 12 Sk iLLS (papEr 1 anD 2) Mind the Gap CAPS Grade 12 Life Sciences
Chapter12
12.1.3 How to draw a histogram
A histogram is drawn in exactly the same way as a bar graph. The only difference is that a histogram is used when the independent variable is groups of information along a continuous scale. Note that in a histogram, the bars are drawn without any spaces between them. Use the information in Table 12.3 below to draw a histogram. Your graph should look like the one in Figure 12.8 below.
Range (%) Number of pupils
0–19 0
20–39 5
40–59 11
60–79 16
80–100 3
Table 12.3 Number of learners with a particular percentage (%) score
data range (%)
Num
ber o
f pup
ils
0-19 20-39 40-59 60-79 80-100
201510
50
Number of learners in each percentage range
Figure 12.8 Final histogram with heading
NOTE: When the independent variable is continuous data (an infinite number of values are evenly distributed), we use a line graph or histogram.
When the independent variable is discontinuous data (a fixed number of values that do not form an ordered scale), we use a bar graph or pie chart.
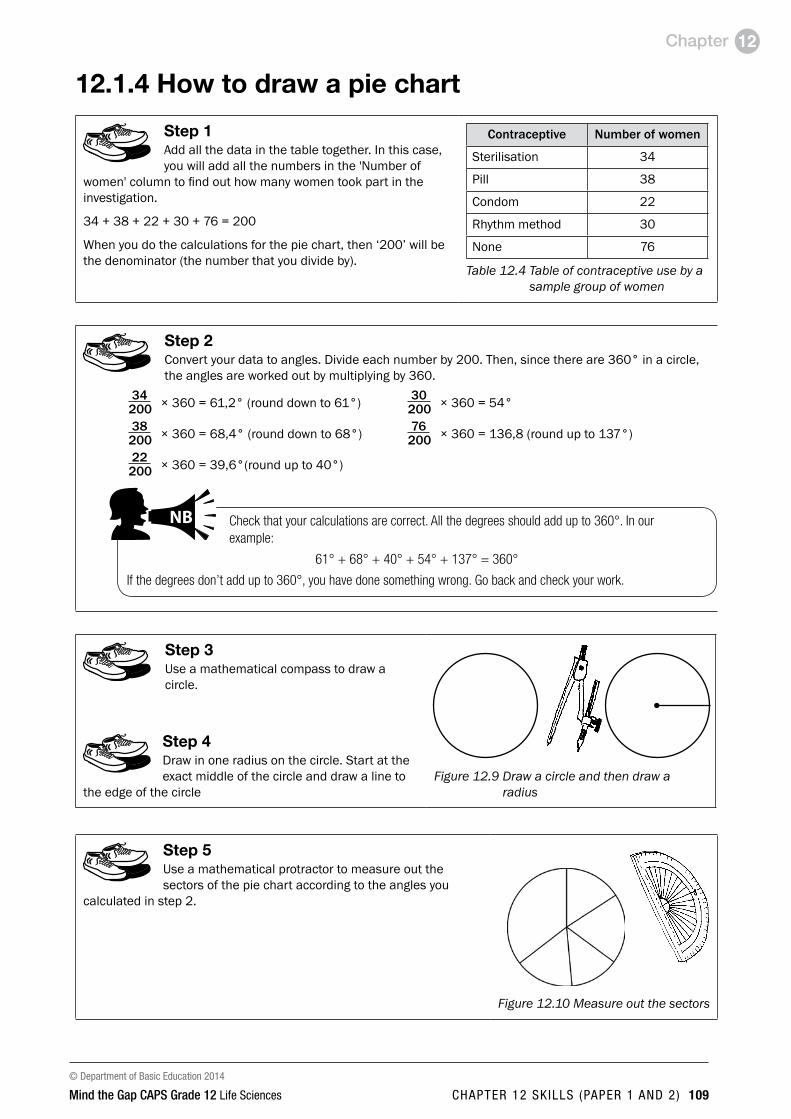
© Department of Basic Education 2014
Mind the Gap CAPS Grade 12 Life Sciences chaptEr 12 Sk iLLS (papEr 1 anD 2) 109
Chapter 12
12.1.4 How to draw a pie chart
Step 1Add all the data in the table together. In this case, you will add all the numbers in the 'Number of
women' column to find out how many women took part in the investigation.
34 + 38 + 22 + 30 + 76 = 200
When you do the calculations for the pie chart, then ‘200’ will be the denominator (the number that you divide by).
Contraceptive Number of women
Sterilisation 34
Pill 38
Condom 22
Rhythm method 30
None 76
Table 12.4 Table of contraceptive use by a sample group of women
Step 2Convert your data to angles. Divide each number by 200. Then, since there are 360° in a circle, the angles are worked out by multiplying by 360.
34 200 × 360 = 61,2° (round down to 61°) 30
200 × 360 = 54°
38 200 × 360 = 68,4° (round down to 68°) 76
200 × 360 = 136,8 (round up to 137°)
22 200 × 360 = 39,6°(round up to 40°)
Check that your calculations are correct. All the degrees should add up to 360°. In our example:
61° + 68° + 40° + 54° + 137° = 360°
If the degrees don’t add up to 360°, you have done something wrong. Go back and check your work.
PAY SPECIAL ATTENTION
ACTIVITIES boy and girl-left and right of page
Step by step comment
EG - worked examples
HINT!
e.g.
NB NB
hint
activity
activity
comment
exams
Step 3Use a mathematical compass to draw a circle.
Step 4Draw in one radius on the circle. Start at the exact middle of the circle and draw a line to
the edge of the circleFigure 12.9 Draw a circle and then draw a
radius
Step 5Use a mathematical protractor to measure out the sectors of the pie chart according to the angles you
calculated in step 2.
Figure 12.10 Measure out the sectors
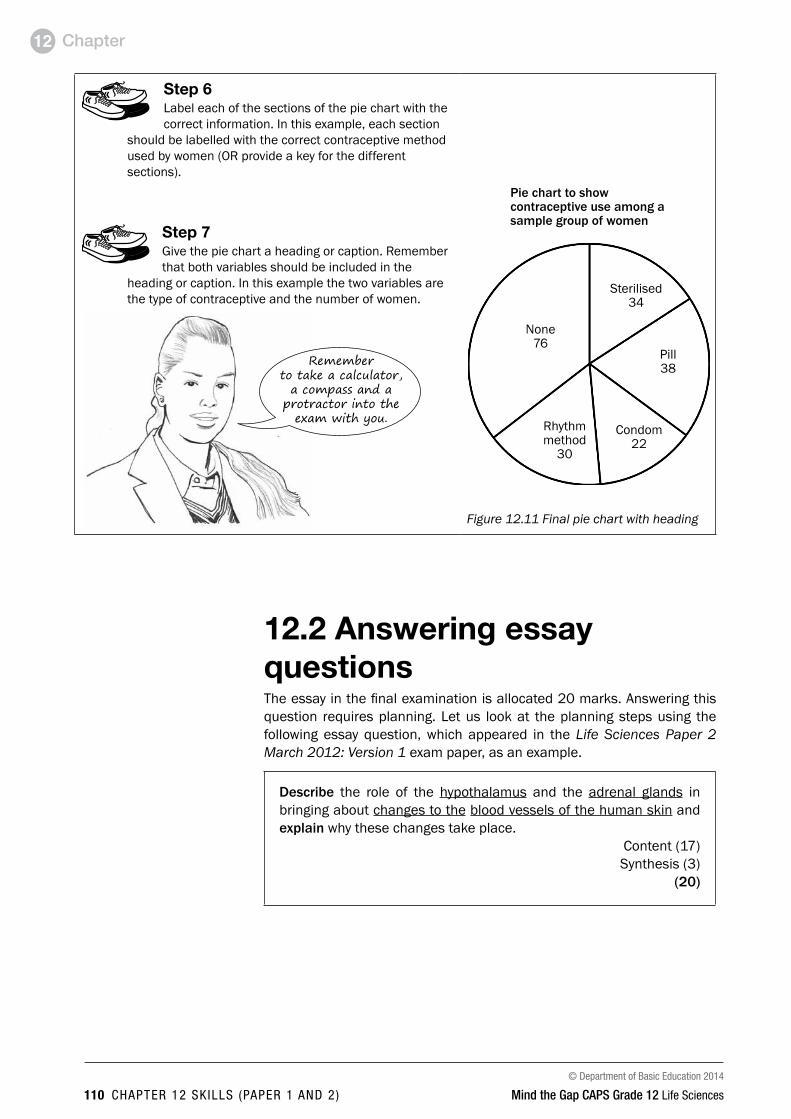
© Department of Basic Education 2014
110 chaptEr 12 Sk iLLS (papEr 1 anD 2) Mind the Gap CAPS Grade 12 Life Sciences
Chapter12
Step 6Label each of the sections of the pie chart with the correct information. In this example, each section
should be labelled with the correct contraceptive method used by women (OR provide a key for the different sections).
Step 7Give the pie chart a heading or caption. Remember that both variables should be included in the
heading or caption. In this example the two variables are the type of contraceptive and the number of women.
Pie chart to show contraceptive use among a sample group of women
None 76
Sterilised 34
Pill 38
Condom 22
Rhythm method
30
Figure 12.11 Final pie chart with heading
12.2 Answering essay questionsThe essay in the final examination is allocated 20 marks. Answering this question requires planning. Let us look at the planning steps using the following essay question, which appeared in the Life Sciences Paper 2 March 2012: Version 1 exam paper, as an example.
describe the role of the hypothalamus and the adrenal glands in bringing about changes to the blood vessels of the human skin and explain why these changes take place.
Content (17)Synthesis (3)
(20)
Remember to take a calculator,
a compass and a protractor into the
exam with you.

© Department of Basic Education 2014
Mind the Gap CAPS Grade 12 Life Sciences chaptEr 12 Sk iLLS (papEr 1 anD 2) 111
Chapter 12
Step 1Read the essay question thoroughly to determine the topics
that are being covered. Underline the key words in the essay question that provide clues to the different topics:
Nervous system – since the hypothalamus (a part of the brain) is involvedEndocrine system – since adrenal glands are involvedTemperature regulation – since this involves blood vessels of the skin
Step 2interpret and analyse the essay question. Identify the aspects or
processes that are required from each of the topics identified. You may need to read the question more than once to enable you to do this.
Hypothalamus – What effect does it have on the blood vessels of the skin? Adrenal glands – What effect do they have on the blood vessels of the skin?
If you cover the above in your essay you will only be answering the ‘describe’ part required by the essay question.
Note that the essay also requires an ‘explanation’ of why these changes take place. For the explanation, you need to elaborate on the functions of the hypothalamus and the adrenal gland that involve the blood vessels of the skin as follows:
Hypothalamus – controls body temperature by stimulating a change in the diameter of the blood vessels of the skin.
Adrenal glands secrete adrenalin into the bloodstream, which decreases the diameter of the blood vessels of the skin so that more blood (with oxygen and glucose) can be directed to other parts of the body to prepare for an emergency.
Step 3Write the first draft of your essay in a logical and organised
manner, linking each aspect that is discussed. This will help you obtain a high mark from the 3 marks allocated for the synthesis of your essay.
Your plan or draft of the essay may take the form of a flow diagram. But note that you final answer to the essay CANNOt be in the form of a flow diagram.
Make sure you are answering the question. Keep referring back to the question to
guide you.
A mind map is a useful way to brainstorm your
ideas. It is then easy to structure your essay in a clear and organised
manner.

© Department of Basic Education 2014
112 chaptEr 12 Sk iLLS (papEr 1 anD 2) Mind the Gap CAPS Grade 12 Life Sciences
Chapter12
Increases diameter: more blood sent to surface
of skin to increase heat loss on a hot day.
More blood to sweat glands increases loss of sweat and therefore increases heat loss.
Hypothalamus – regulates body temperature
Sends impulses via neurons
Adrenal glands – secrete adrenalin
Adrenalin – prepares body for an emergency.Travels in bloodstream.Blood
vessels of skin
Decreases diameter: less blood sent to skin so that more blood (with
glucose and oxygen) can be directed to parts of the body that prepare for an
emergency.Decreases diameter:
less blood sent to surface of skin so less heat is lost
on a cold day.Less blood to sweat glands decreases loss of sweat and therefore reduces heat loss.
Step 4Write out the final version of your essay. Put a line across the
plan of your essay so that the marker assesses your final answer and not your plan or draft.
Step 5Now read the question again one more time to check if your
answer corresponds to the question.
Proofread your essay carefully.
This is your opportunity to pick out any spelling errors or incomplete words, sentences or
ideas.

© Department of Basic Education 2014
Mind the Gap CAPS Grade 12 Life Sciences chaptEr 12 Sk iLLS (papEr 1 anD 2) 113
Chapter 12
12.3 Line drawingsIn the exam, you may be asked to draw a labelled diagram. Keep these tips in mind if you are asked to draw a labelled diagram:• Draw in pencil and use neat, strong lines.• Do not use shading in your diagram.• Your diagram must not be too small. It must be clear and correctly
proportioned.• The label lines must point directly to the structure that is being
labelled.• The label lines should not have arrow points.• If possible, label lines should all end at the same point so that the
labels are neatly aligned.• Label lines should never cross. If two label lines cross, neither label
will be marked.• Print the labels neatly in pen.• Finally, give your diagram a descriptive heading that states exactly
what it illustrates.
To enable you to practise your drawing and labelling skills, we have included the diagrams from this guide on the following pages.
You are there, well done!
Good luck with the exam!

© Department of Basic Education 2014
114 appEnDix 1 Mind the Gap CAPS Grade 12 Life Sciences
Appendix 1
Appendix 1: Blank drawingsIn this section you will find a number of key diagrams from this study guide. These blank diagrams can help you prepare for the exam in two ways:1. You can use them to practise your drawing and labelling skills. You may be asked
to draw a diagram in the exam, so make sure you follow the guidelines set out on page 113 when you redraw and label a diagram.
2. These diagrams are a valuable study aid. They summarise key information and important processes in Life Sciences. If you can label all these diagrams correctly on your own, without looking at them in the text, you'll be well prepared for the exam.
The following diagrams are included:
topic 1: dNA: the code of lifeNucleotideDNARNAReplication of DNAProtein synthesis
topic 2: MeiosisHomologous chromosomesStages in meiosis IStages in meiosis II
topic 3: ReproductionMale reproductive systemSperm cellFemale reproductive systemHormonal control of the menstrual cycleFertilisation and gestation
topic 4: Responding to the environment: humansBrainNeuronReflex arcEyeAccommodationPupillary mechanismEar
topic 5: Human endocrine systemName, position and functions of glands
topic 6: Homeostasis in humansSkin regulating temperature on a hot and cold day
topic 7: evolutionCharacteristics we share with the African apesCharacteristics that make us different from the African apes
Before you start writing on the diagrams, photocopy
these pages so that you can use them to practise, practise,
practise!

© Department of Basic Education 2014
Mind the Gap CAPS Grade 12 Life Sciences appEnDix 1 115
Appendix 1
Topic 1: DNA: The code of life1. Nucleotide
2. dNA
3. RNA

© Department of Basic Education 2014
116 appEnDix 1 Mind the Gap CAPS Grade 12 Life Sciences
Appendix 1
4. Replication of dNA
CGA–TAT
G-C
G–CT – AG – CG–
T–G–
T – AA – T
C–GT–AA–TA–TT–AT–A
T-AC–GG-C
T-AC–GG-C
C–GT – AA – TA – TT – AT–A
A – T
–C–A–C
–A

© Department of Basic Education 2014
Mind the Gap CAPS Grade 12 Life Sciences appEnDix 1 117
Appendix 1
5. Protein synthesis
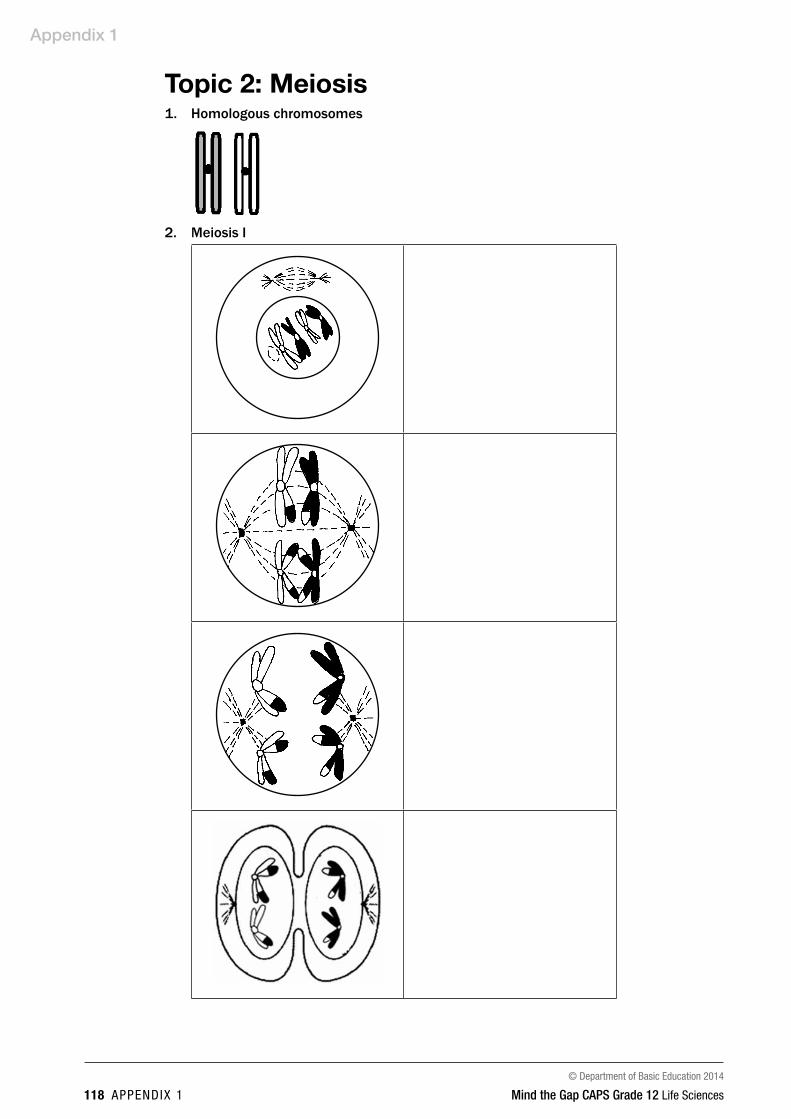
© Department of Basic Education 2014
118 appEnDix 1 Mind the Gap CAPS Grade 12 Life Sciences
Appendix 1
Topic 2: Meiosis1. Homologous chromosomes
2. Meiosis i

© Department of Basic Education 2014
Mind the Gap CAPS Grade 12 Life Sciences appEnDix 1 119
Appendix 1
3. Meiosis ii
nucleus

© Department of Basic Education 2014
120 appEnDix 1 Mind the Gap CAPS Grade 12 Life Sciences
Appendix 1
Topic 3: Human reproduction1. Male reproductive system
2. Sperm cell

© Department of Basic Education 2014
Mind the Gap CAPS Grade 12 Life Sciences appEnDix 1 121
Appendix 1
3.
Fem
ale
repr
oduc
tive
syst
em

© Department of Basic Education 2014
122 appEnDix 1 Mind the Gap CAPS Grade 12 Life Sciences
Appendix 1
4.
Hor
mon
al c
ontr
ol o
f the
men
stru
al c
ycle
A B C d
0
7
14
21
28d
ays
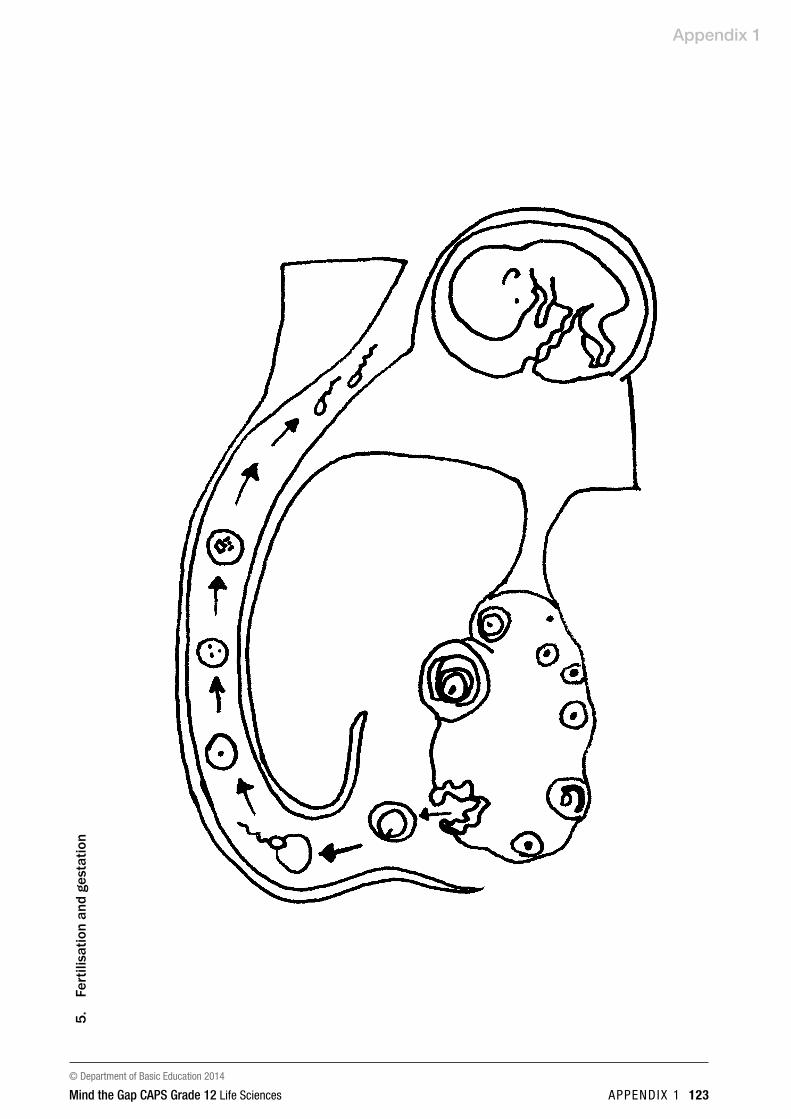
© Department of Basic Education 2014
Mind the Gap CAPS Grade 12 Life Sciences appEnDix 1 123
Appendix 1
5.
Fert
ilisa
tion
and
gest
atio
n

© Department of Basic Education 2014
124 appEnDix 1 Mind the Gap CAPS Grade 12 Life Sciences
Appendix 1
Topic 4: Responding to the environment – humans1. Brain

© Department of Basic Education 2014
Mind the Gap CAPS Grade 12 Life Sciences appEnDix 1 125
Appendix 1
2. Neuron

© Department of Basic Education 2014
126 appEnDix 1 Mind the Gap CAPS Grade 12 Life Sciences
Appendix 1
3.
Refl
ex a
rc
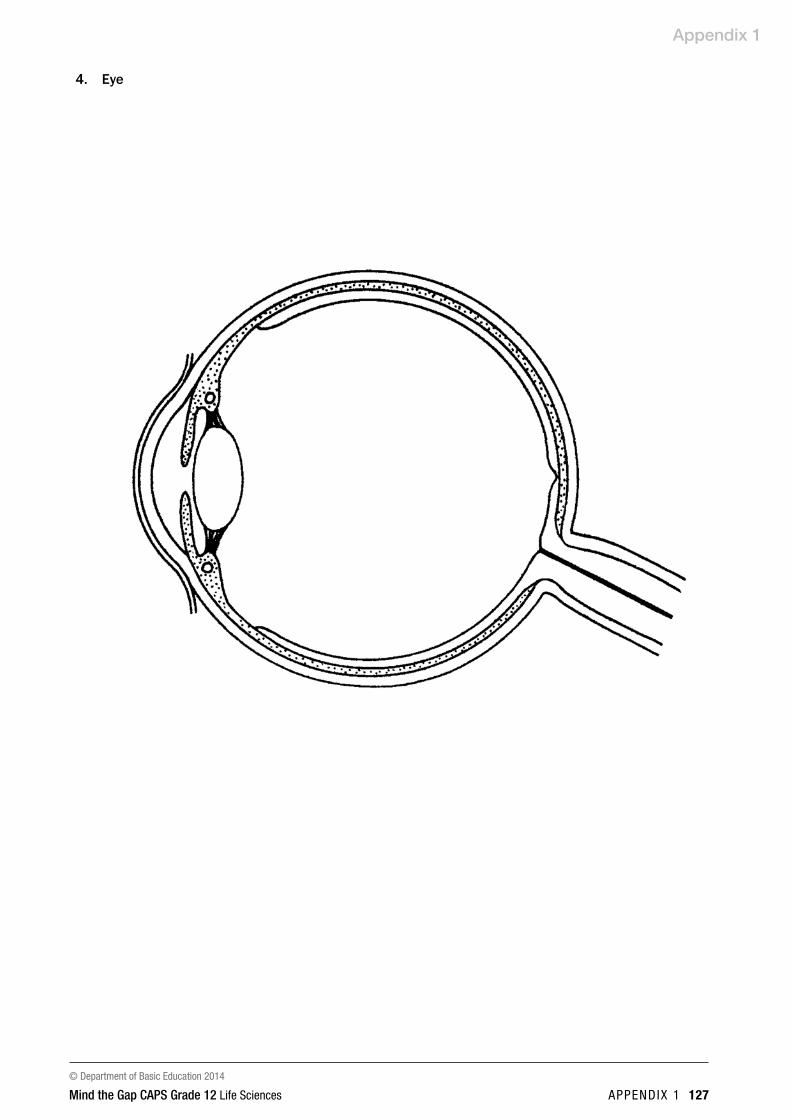
© Department of Basic Education 2014
Mind the Gap CAPS Grade 12 Life Sciences appEnDix 1 127
Appendix 1
4. eye

© Department of Basic Education 2014
128 appEnDix 1 Mind the Gap CAPS Grade 12 Life Sciences
Appendix 1
5. Accommodation
6. Pupillary mechanism
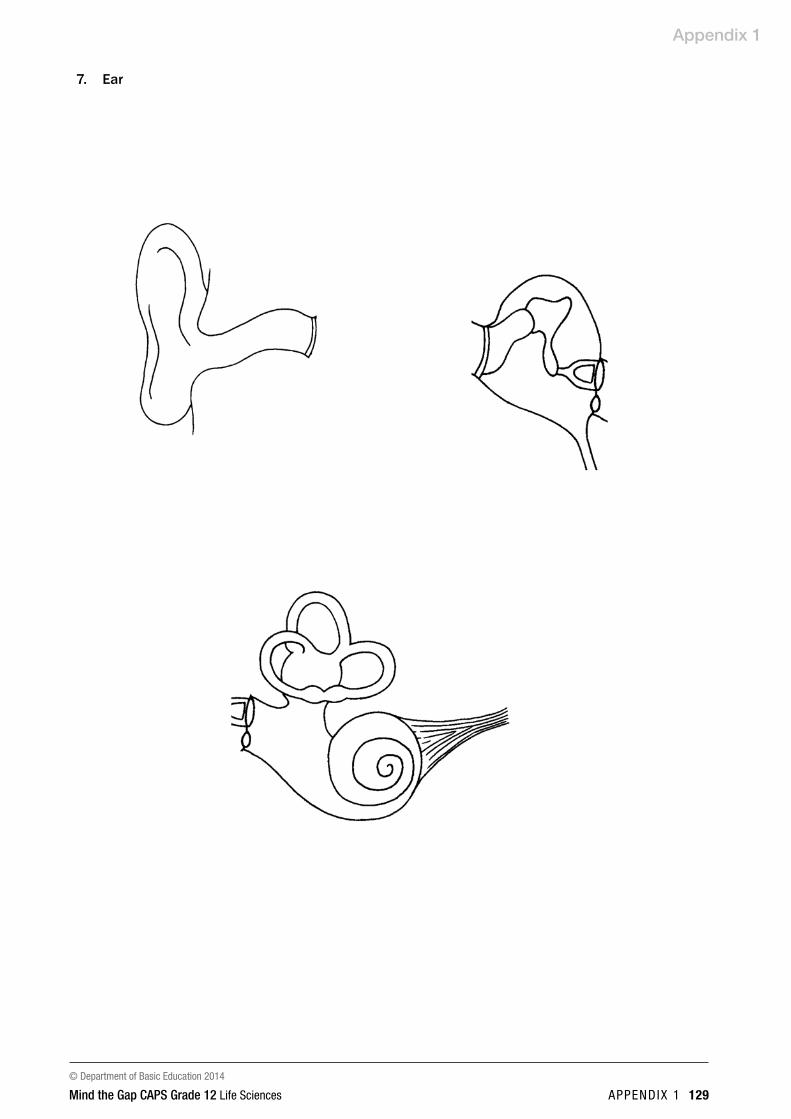
© Department of Basic Education 2014
Mind the Gap CAPS Grade 12 Life Sciences appEnDix 1 129
Appendix 1
7. ear
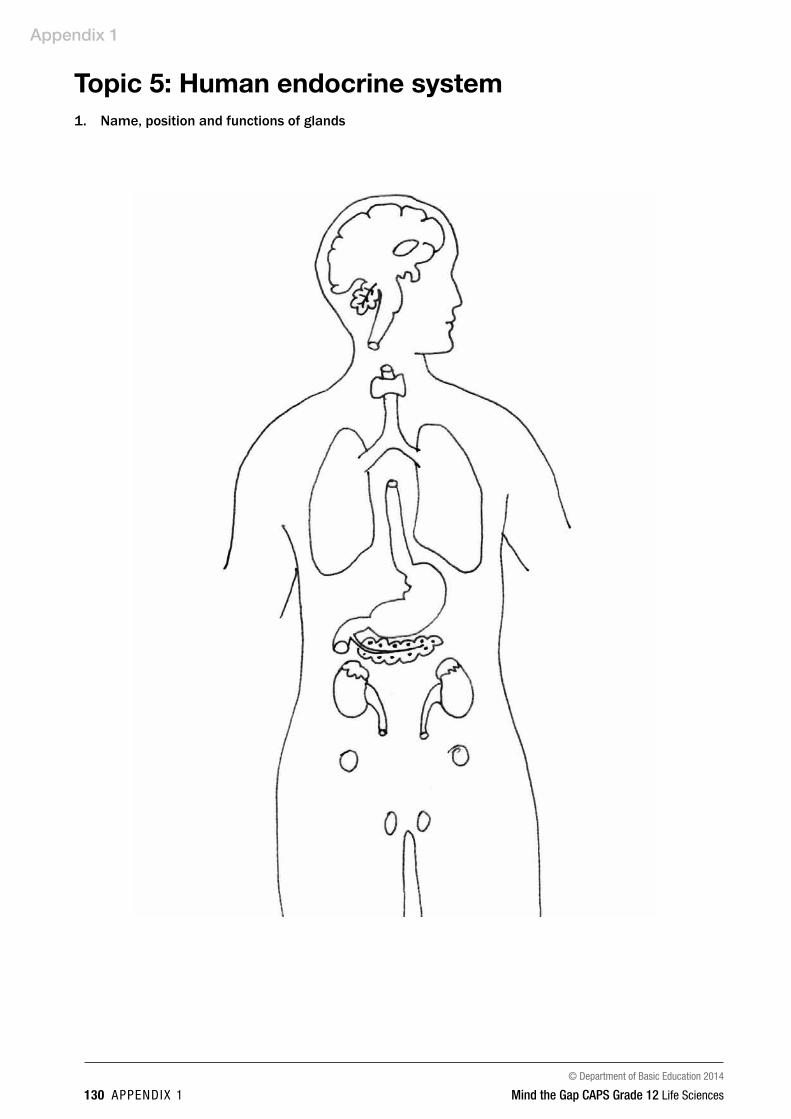
© Department of Basic Education 2014
130 appEnDix 1 Mind the Gap CAPS Grade 12 Life Sciences
Appendix 1
Topic 5: Human endocrine system1. Name, position and functions of glands

© Department of Basic Education 2014
Mind the Gap CAPS Grade 12 Life Sciences appEnDix 1 131
Appendix 1
Top
ic 6
: Ho
meo
stas
is in
hum
ans
1.
Skin
regu
latin
g te
mpe
ratu
re o
n a
hot a
nd c
old
day
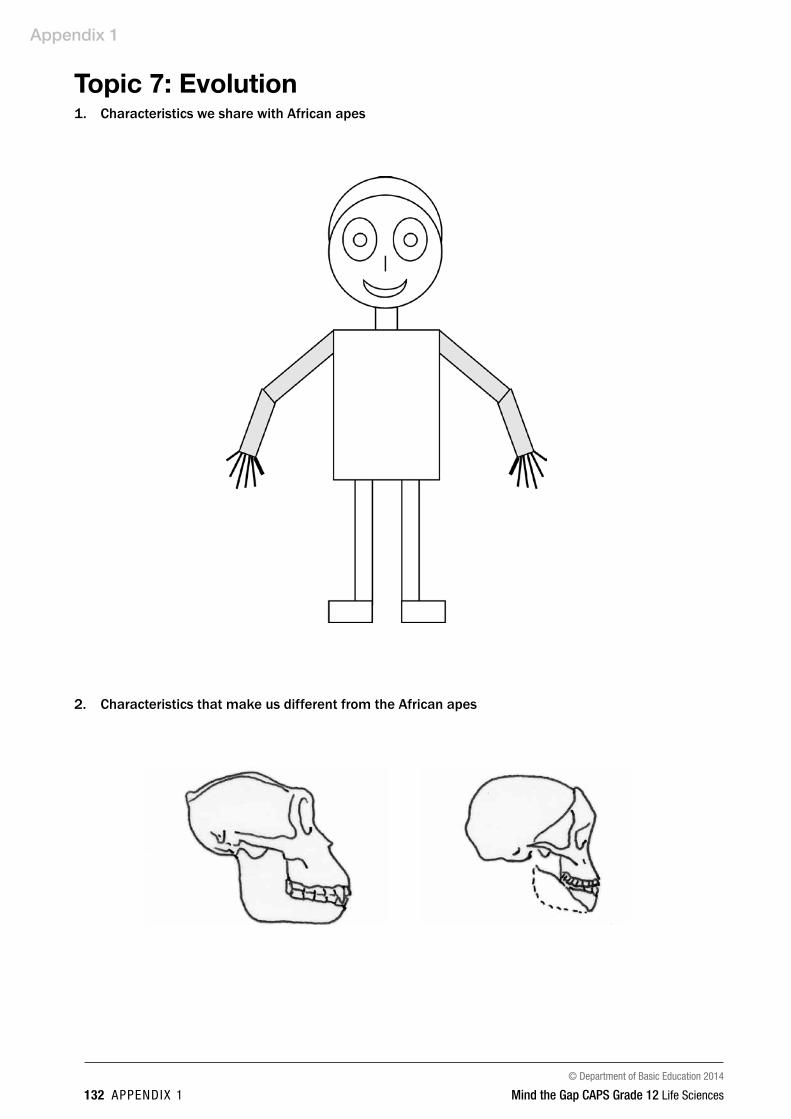
© Department of Basic Education 2014
132 appEnDix 1 Mind the Gap CAPS Grade 12 Life Sciences
Appendix 1
Topic 7: Evolution1. Characteristics we share with African apes
2. Characteristics that make us different from the African apes
© Department of Basic Education 2014
Mind the Gap CAPS Grade 12 Life Sciences appEnDix 2 133
Appendix 2
Appendix 2: Exemplar exam paper
The 2014 Life Sciences exams have a new format in line with CAPS. The Department of Basic Education has offered an example of Life Sciences Paper 1 and Paper 2 with marking memoranda.
Use these exam papers and memoranda to help you prepare for your exams:1. Answer the questions in Life Sciences Paper 1. Make sure you take
a break before doing the same with Paper 2. Treat them as “real” exams by preparing yourself as if these were real exams, so have the paper, pens, pencils, eraser and other materials that you need. time yourself so you complete each paper within the 2 ½ hours that is allocated to them. This exercise is meant to test your own knowledge – so don’t cheat yourself by looking up the answers in the memo before you’ve finished each exam.
2. Use the memoranda to check whether or not your answers are correct. Note where you have got answers wrong – these are the sections of the curriculum that you need to do more work on. Go back to your textbooks and to the relevant sections of this study guide, and spend time learning the sections for which you got the lowest marks.

Appendix 2
134 appEnDix 2 Mind the Gap Life Sciences capS
Life
Sci
ence
s/P
12
DBE
/201
4N
SC –
Gra
de 1
2 Ex
empl
ar
Cop
yrig
ht re
serv
edPl
ease
turn
ove
r
INST
RU
CTI
ON
S A
ND
INFO
RM
ATI
ON
Rea
d th
e fo
llow
ing
inst
ruct
ions
car
eful
lybe
fore
ans
wer
ing
the
ques
tions
.
1. 2. 3. 4. 5. 6. 7. 8. 9. 10.
11.
Ans
wer
ALL
the
ques
tions
.
Writ
e AL
L th
e an
swer
s in
the
AN
SWER
BO
OK
.
Sta
rtth
e an
swer
s to
EA
CH
que
stio
n at
the
top
of a
NEW
pag
e.
Num
ber t
he a
nsw
ers
corre
ctly
acc
ordi
ng to
the
num
berin
g sy
stem
used
in th
is
ques
tion
pape
r.
Pre
sent
you
r ans
wer
s ac
cord
ing
to th
e in
stru
ctio
ns o
f eac
h qu
estio
n.
Do
ALL
dra
win
gs in
pen
cil a
nd la
bel t
hem
in b
lue
or b
lack
ink.
Dra
w d
iagr
ams
orflo
w c
harts
onl
y w
hen
aske
dto
do
so.
The
diag
ram
s in
this
que
stio
n pa
per a
reN
OT
nece
ssar
ily d
raw
n to
sca
le.
Do
NO
Tus
e gr
aph
pape
r.
You
mus
t us
e a
non-
prog
ram
mab
le c
alcu
lato
r, pr
otra
ctor
and
aco
mpa
ss,
whe
re n
eces
sary
.
Writ
e ne
atly
and
legi
bly.

Appendix 2
Mind the Gap appEnDix 2 135Life Sciences capS
Life
Sci
ence
s/P
13
DBE
/201
4N
SC –
Gra
de 1
2 Ex
empl
ar
Cop
yrig
ht re
serv
edPl
ease
turn
ove
r
SEC
TIO
N A
QU
ESTI
ON
1
1.1
Var
ious
opt
ions
are
pro
vide
d as
pos
sibl
e an
swer
s to
the
follo
win
g qu
estio
ns.
Cho
ose
the
corre
ct a
nsw
er a
nd w
rite
only
the
let
ter
(Ato
D)
next
to
the
ques
tion
num
ber
(1.1
.1
to1.
1.9)
in
th
e A
NSW
ER
BO
OK
, fo
r ex
ampl
e1.
1.10
D.
QU
ESTI
ON
S 1.
1.1
AN
D1.
1.2
REF
ER
TOTH
E D
IAG
RA
M
BEL
OW
SH
OW
ING
TH
E ST
RU
CTU
RE
OF
THE
HU
MA
N E
AR
.
1.1.
1W
hich
par
t sen
ds v
ibra
tions
to th
e os
sicl
es?
A B C D
3 1 4 5
A B C D
4 3 2 1
1.1.
2W
hich
par
t mai
ntai
ns e
qual
pre
ssur
e on
eith
er s
ide
of th
e ty
mpa
nic
mem
bran
e?
1
2
3 4
5
Life
Sci
ence
s/P
14
DBE
/201
4N
SC –
Gra
de 1
2 Ex
empl
ar
Cop
yrig
ht re
serv
edPl
ease
turn
ove
r
1.1.
3B
elow
is a
set
of e
vent
s fo
llow
ing
ferti
lisat
ion
in h
uman
s.
1.Th
e em
bryo
is e
mbe
dded
in th
e ut
erin
e w
all i
n hu
man
s.2.
A z
ygot
e is
form
ed in
the
Fallo
pian
tube
.3.
Cel
l div
isio
n oc
curs
to fo
rm a
bal
l of s
ever
al h
undr
ed c
ells
.4.
The
blas
tocy
st re
mai
ns fr
ee fo
r sev
eral
day
s in
the
uter
us.
Whi
ch O
NE
of
the
follo
win
g re
pres
ents
the
corre
ct o
rder
in w
hich
th
e ab
ove
even
tsoc
cur?
A B C D
2, 3
, 4, 1
2, 1
, 3, 4
3, 2
, 4, 1
1, 3
, 2, 4
1.1.
4Th
efo
llow
ing
are
effe
cts
of th
e se
cret
ion
of d
iffer
ent h
orm
ones
:
1.A
n in
crea
se in
the
bloo
d gl
ucos
e le
vel
2.A
n in
crea
se in
the
hear
t rat
e3.
An
incr
ease
in th
e am
ount
of d
iges
tive
enzy
mes
4.A
n in
crea
se in
blo
od fl
ow to
the
skel
etal
mus
cles
Whi
ch O
NE
of
the
follo
win
g co
mbi
natio
ns o
f th
e ab
ove
effe
cts
isdu
e to
adr
enal
in?
A B C D
1, 3
and
42,
3 a
nd 4
1, 2
and
41,
2, 3
and
4
1.1.
5Th
e co
ntro
l ce
ntre
in
the
body
tha
t w
ill b
e ac
tivat
ed w
hen
anat
hlet
e is
deh
ydra
ted
isth
e …
A B C D
cere
bellu
m.
cere
brum
.co
rpus
cal
losu
m.
pitu
itary
gla
nd.
1.1.
6Th
e fo
llow
ing
bloo
d ve
ssel
s ca
rry b
lood
to o
r fro
m th
e pl
acen
ta in
hu
man
s:
1.M
othe
r's a
rtery
2.M
othe
r's v
ein
3.U
mbi
lical
arte
ry4.
Um
bilic
al v
ein
Whi
ch b
lood
ves
sels
con
tain
blo
od w
ith a
larg
er a
mou
nt o
f oxy
gen
and
nutri
ents
?
A B C D
1 an
d 3
as c
ompa
red
to 2
and
41
and
4as
com
pare
d to
2 a
nd 3
2 an
d 3
as c
ompa
red
to 1
and
42
and
4as
com
pare
d to
1 a
nd 3

Appendix 2
136 appEnDix 2 Mind the Gap Life Sciences capS
Life
Sci
ence
s/P
15
DBE
/201
4N
SC –
Gra
de 1
2 Ex
empl
ar
Cop
yrig
ht re
serv
edPl
ease
turn
ove
r
1.1.
7W
hich
ON
E o
f th
e fo
llow
ing
is a
n ad
vant
age
of t
he t
este
s be
ing
held
in th
e sc
rotu
m, o
utsi
de th
e bo
dy c
avity
?
A B C D
Mor
e sp
erm
can
be
stor
ed in
the
scro
tum
.S
perm
for
mat
ion
is m
ore
effic
ient
at
tem
pera
ture
s be
low
the
no
rmal
bod
y te
mpe
ratu
re.
The
test
es a
re b
ette
r pro
tect
ed in
the
scro
tum
than
in th
e bo
dy
cavi
ty.
Ther
e is
mor
e tim
e fo
r pr
osta
te s
ecre
tions
to b
e ad
ded
to t
he
sper
m.
1.1.
8M
eios
is in
a d
iplo
id c
ell r
esul
ts in
…
A B C D
four
iden
tical
gam
etes
.fo
ur h
aplo
id g
amet
es.
two
diffe
rent
dip
loid
gam
etes
.fo
ur g
amet
es h
avin
g th
e sa
me
chro
mos
ome
num
ber
as t
he
pare
nt c
ell.
1.1.
9Th
e lis
t be
low
giv
es s
ome
of t
he s
tage
s in
volv
ed in
gam
ete
and
zygo
te fo
rmat
ion.
1.P
roph
ase
I2.
Pro
phas
e II
3.M
etap
hase
I4.
Ferti
lisat
ion
Whi
ch O
NE
of
the
follo
win
g co
mbi
natio
ns o
f th
e ab
ove
stag
es
cont
ribut
es to
gen
etic
var
iatio
n?
A B C D
1, 2
and
31,
3 a
nd 4
2 an
d 3
3 an
d 4
(9x
2)
(18)
Life
Sci
ence
s/P
16
DBE
/201
4N
SC –
Gra
de 1
2 Ex
empl
ar
Cop
yrig
ht re
serv
edPl
ease
turn
ove
r
1.2
Giv
e th
e co
rrect
bio
logi
cal t
erm
for
eac
h of
the
fol
low
ing
desc
riptio
ns. W
rite
only
the
ter
m n
ext
to t
he q
uest
ion
num
ber
(1.2
.1 t
o 1.
2.9)
in t
he A
NSW
ER
BO
OK
.
1.2.
1
1.2.
2
1.2.
3
1.2.
4
1.2.
5
1.2.
6
1.2.
7
1.2.
8
1.2.
9
The
perio
d of
dev
elop
men
t of
an
embr
yo i
n th
e ut
erus
bet
wee
n fe
rtilis
atio
n an
d bi
rth
Dis
ease
cha
ract
eris
ed b
y a
lack
of i
nsul
in p
rodu
ctio
n
Tube
that
con
nect
s th
e ph
aryn
xan
d th
e m
iddl
e ea
r
A p
roce
ss b
y w
hich
nut
rient
s be
com
e hi
ghly
con
cent
rate
d in
a
body
of
wat
er,
lead
ing
to in
crea
sed
grow
th o
f or
gani
sms
such
as
alga
e
A s
tage
in
the
deve
lopm
ent
of h
uman
s in
whi
ch t
he e
mbr
yo
cons
ists
of a
laye
r of c
ells
sur
roun
ding
a c
avity
The
stru
ctur
e at
the
tip
of
a sp
erm
cel
l co
ntai
ning
enz
ymes
and
w
hich
mak
es c
onta
ct w
ith th
e eg
g ce
ll du
ring
ferti
lisat
ion
The
glan
d in
th
e m
ale
repr
oduc
tive
syst
em
of
hum
ans
that
pr
oduc
es a
n al
kalin
e flu
id to
cou
nter
act t
he a
cid
envi
ronm
ent o
f the
va
gina
The
duct
lead
ing
from
the
test
is to
the
uret
hra
in h
uman
mal
es
The
proc
ess
by w
hich
the
ovum
isfo
rmed
thro
ugh
mei
osis
in t
he
ovar
y (9
x 1
)(9
)

Appendix 2
Mind the Gap appEnDix 2 137Life Sciences capS
Life
Sci
ence
s/P
17
DBE
/201
4N
SC –
Gra
de 1
2 Ex
empl
ar
Cop
yrig
ht re
serv
edPl
ease
turn
ove
r
1.3
Indi
cate
whe
ther
eac
h of
the
sta
tem
ents
in
CO
LUM
N I
app
lies
to A
onl
y,B
only
,bo
th A
and
Bor
non
eof
the
item
s in
CO
LUM
N I
I. W
rite
A o
nly,
B o
nly,
both
A a
nd B
,orn
one
next
to th
equ
estio
n nu
mbe
r(1.
3.1
to 1
.3.6
) in
the
AN
SWER
BO
OK.
CO
LUM
N I
CO
LUM
N II
1.3.
1Ty
pe o
f dev
elop
men
t res
ultin
g in
of
fspr
ing
that
are
capa
ble
of
mov
ing
arou
nd s
oon
afte
r hat
chin
g
A BP
reco
cial
Altr
icia
l
1.3.
2C
onve
rts g
luco
se to
gly
coge
nA B
Glu
cago
nA
dren
alin
1.3.
3Fa
ctor
s af
fect
ing
wat
er a
vaila
bilit
yA B
Des
truct
ion
of w
etla
nds
Poo
r far
min
g pr
actic
es1.
3.4
Pro
vide
s gr
eate
r cha
nces
for t
he
fusi
on o
f spe
rm a
nd e
gg
A BE
xter
nal f
ertil
isat
ion
Inte
rnal
ferti
lisat
ion
1.3.
5C
hara
cter
istic
of v
ivip
ary
A BP
lace
nta
is fo
rmed
Live
offs
prin
g is
bor
n1.
3.6
Exa
mpl
es o
f gre
enho
use
gase
sA B
Car
bon
diox
ide
Met
hane
(6x
2)(1
2)
Life
Sci
ence
s/P
18
DBE
/201
4N
SC –
Gra
de 1
2 Ex
empl
ar
Cop
yrig
ht re
serv
edPl
ease
turn
ove
r
1.4
The
diag
ram
bel
ow r
epre
sent
s a
porti
on o
f th
e ce
ntra
l ne
rvou
s sy
stem
of
hum
ans.
Writ
e do
wn
the
LETT
ERO
NLY
of t
he p
art w
hich
:
1.4.
1
1.4.
2
1.4.
3
1.4.
4
1.4.
5
Reg
ulat
es h
eartb
eat a
nd b
reat
hing
rate
Coo
rdin
ates
mov
emen
t whi
le w
alki
ng
Inte
rpre
ts w
hat y
ou s
ee
Has
its
hem
isph
eres
con
nect
ed b
y th
e co
rpus
cal
losu
m
Con
trols
bal
ance
and
equ
ilibriu
m
(1)
(1)
(1)
(1)
(1)
(5)
Port
ion
of th
e ce
ntra
l ner
vous
sys
tem
of a
hum
an
A
C
B

Appendix 2
138 appEnDix 2 Mind the Gap Life Sciences capS
Life
Sci
ence
s/P
19
DBE
/201
4N
SC –
Gra
de 1
2 Ex
empl
ar
Cop
yrig
ht re
serv
edPl
ease
turn
ove
r
1.5.
1
1.5.
2
1.5.
3
1.5.
4
Sta
te t
he c
hrom
osom
e nu
mbe
r of
the
cel
ls r
epre
sent
ed b
y A
,B
and
C.
Nam
e th
e st
ruct
ure
at S
tage
3.
Bet
wee
n w
hich
two
cons
ecut
ive
stag
es d
oes
mei
osis
occ
ur in
the
life
cycl
e?
Bet
wee
n w
hich
tw
o co
nsec
utiv
e st
ages
doe
s m
itosi
s oc
cur
inth
e lif
e cy
cle?
TOTA
L SE
CTI
ON
A:
(3)
(1)
(1)
(1)
(6)
50
1.5
The
diag
ram
bel
ow s
how
s th
e va
rious
sta
ges
in th
e lif
ecy
cle
of a
hum
an.
MA
LEFE
MA
LE
A B
C D
Sta
ge 1
Bod
y C
ells
Sta
ge 2
Gam
etes
Sta
ge 3
Sta
ge 4
Bod
y C
ells
Life
Sci
ence
s/P
110
DBE
/201
4N
SC –
Gra
de 1
2 Ex
empl
ar
Cop
yrig
ht re
serv
edPl
ease
turn
ove
r
SEC
TIO
N B
QU
ESTI
ON
2
2.1
Stu
dy th
e di
agra
m b
elow
,whi
ch s
how
sa
refle
x ar
c.
2.1.
1G
ive
labe
ls fo
r eac
h of
the
follo
win
g:
(a)
(b)
Reg
ion
D
Neu
ron
E
(1)
(1)
2.1.
2W
rite
dow
n th
e LE
TTER
of t
he p
art w
hich
:
(a)
(b)
Tran
smits
impu
lses
to th
e ce
ntra
l ner
vous
sys
tem
Con
tain
s ce
rebr
ospi
nal f
luid
(1)
(1)
2.1.
3
2.1.
4
2.1.
5
Exp
lain
the
effe
ct o
n th
e re
flex
actio
n if
part
Bw
as d
amag
ed.
The
nerv
e pa
thw
ay in
the
abo
ve r
espo
nse
is a
bout
1,5
met
res
in
leng
th. A
ner
ve im
puls
e tra
vels
at 7
5 m
s-1
.
Use
this
info
rmat
ion
to c
alcu
late
the
time
take
n fo
r thi
s re
flex
actio
n to
occ
ur. S
how
all
wor
king
.
Exp
lain
the
sign
ifica
nce
of a
refle
x ac
tion.
(2)
(3)
(2)
(11)
A
BC
D
E

Appendix 2
Mind the Gap appEnDix 2 139Life Sciences capS
Life
Sci
ence
s/P
111
DBE
/201
4N
SC –
Gra
de 1
2 Ex
empl
ar
Cop
yrig
ht re
serv
edPl
ease
turn
ove
r
2.2
A l
earn
erca
rried
out
an
inve
stig
atio
n to
mea
sure
the
rea
ctio
n tim
e of
tw
o pe
ople
(A a
nd B
). E
ach
pers
on h
ad to
ring
abe
llw
hen
a lig
ht fl
ashe
d on
. The
tim
e ta
ken
for
each
per
son
to r
eact
was
rec
orde
d an
d pl
otte
d on
the
bar
gr
aph
belo
w. T
he te
st w
as c
arrie
d ou
t 10
times
.
2.2.
1
2.2.
2
2.2.
3
2.2.
4
2.2.
5
Wha
t was
the
slow
est r
eact
ion
time?
Des
crib
e ho
w th
e re
actio
n tim
e of
Per
son
Bch
ange
d ov
er th
e 10
at
tem
pts.
Sug
gest
a
poss
ible
reas
on
for
the
trend
de
scrib
ed
in
QU
ES
TIO
N2.
2.2.
Wha
t was
the
stim
ulus
in th
is in
vest
igat
ion?
How
wou
ld t
he r
eact
ion
time
of P
erso
nA
have
diff
ered
if h
e/sh
eha
d be
en u
nder
the
influ
ence
of d
rugs
dur
ing
the
expe
rimen
t?
(1)
(3)
(2)
(1)
(1)
(8)
0
0.050.
1
0.150.
2
0.250.
3
0.350.
4
0.45
12
34
56
78
910
Reaction Time (seconds)
Atte
mpt
Num
ber
Rea
ctio
n Ti
me
of P
erso
n A
and
Pers
on B
KEY:
Pers
on A
Pers
on B
Life
Sci
ence
s/P
112
DBE
/201
4N
SC –
Gra
de 1
2 Ex
empl
ar
Cop
yrig
ht re
serv
edPl
ease
turn
ove
r
2.3
The
diag
ram
sho
ws
two
eyes
(Xan
dY)
focu
sed
on o
bjec
ts(re
pres
ente
d by
ar
row
s)at
diff
eren
t dis
tanc
es fr
om th
e ey
e.O
bjec
ts A
and
Cw
ere
2 m
etre
s aw
ay fr
omth
e ey
e. O
bjec
ts B
and
Dw
ere
7 m
etre
s aw
ay fr
om th
e ey
e.
2.3.
1W
rite
dow
nth
e LE
TTER
ON
LY o
f the
obj
ectt
hat:
(a)
(b)
Eye
Xis
focu
sed
on
Eye
Yis
focu
sed
on
(2)
(2)
2.3.
2N
ame
and
desc
ribe
the
proc
ess
that
allo
ws
eye
Yto
form
a c
lear
im
age
on th
e re
tina.
(5)
(9)
2 m
aw
ay fr
om
eye
7 m
aw
ay fr
om
eye
AB
CD
X Y

Appendix 2
140 appEnDix 2 Mind the Gap Life Sciences capS
Life
Sci
ence
s/P
113
DBE
/201
4N
SC –
Gra
de 1
2 Ex
empl
ar
Cop
yrig
ht re
serv
edPl
ease
turn
ove
r
2.4
A G
rade
12
lear
ner p
erfo
rmed
an
inve
stig
atio
n to
det
erm
ine
the
effe
ct o
f lig
ht
on th
e gr
owth
of p
lant
sho
ots.
The
lear
ner d
ivid
ed th
e pl
ants
that
wer
e us
ed
into
thre
e gr
oups
as
follo
ws:
Gro
up A
–Th
e tip
of t
he s
hoot
was
inta
ct.
Gro
up B
–Th
e tip
of t
he s
hoot
was
rem
oved
.G
roup
C–
The
tip o
f th
e sh
oot
was
cov
ered
by
a ca
p th
at d
oes
not
allo
w
light
to p
ass
thro
ugh.
The
diag
ram
belo
w s
how
s ea
ch s
hoot
at
the
star
t of
the
inve
stig
atio
n an
d ne
xt to
eac
h,th
e sa
me
shoo
t at t
he e
nd o
f the
inve
stig
atio
n.
The
arro
ws
indi
cate
the
dire
ctio
n of
ligh
t in
each
inve
stig
atio
n.
2.4.
1
2.4.
2
2.4.
3
2.4.
4
2.4.
5
Nam
eth
e de
pend
ent v
aria
ble
in th
is in
vest
igat
ion.
Sta
te T
WO
fact
ors
that
mus
t be
kept
con
stan
t in
this
inve
stig
atio
n.
The
influ
ence
of w
hich
pla
nt h
orm
one
isbe
ing
inve
stig
ated
?
Exp
lain
th
e re
sults
ob
serv
ed
in
inve
stig
atio
ns
Aan
dC
, as
illu
stra
ted
inth
e di
agra
m a
bove
.
Sta
te T
WO
way
sin
whi
ch th
e le
arne
r co
uld
impr
ove
the
relia
bilit
y of
this
inve
stig
atio
n.
(1)
(2)
(1)
(6)
(2)
(12)
[40]
Star
t
End
ASt
art
E
ndB
Star
t
End
C
Life
Sci
ence
s/P
114
DBE
/201
4N
SC –
Gra
de 1
2 Ex
empl
ar
Cop
yrig
ht re
serv
edPl
ease
turn
ove
r
QU
ESTI
ON
3
3.1
The
diag
ram
be
low
re
pres
ents
th
e in
tera
ctio
n be
twee
n tw
o im
porta
nt
endo
crin
e gl
ands
. The
gla
nd la
belle
d A
is fo
und
at th
e ba
se o
f the
bra
in,w
hile
th
e gl
and
labe
lled
Cis
pre
sent
tow
ards
the
front
of t
he n
eck.
3.1.
1
3.1.
2
3.1.
3
3.1.
4
Giv
ea
labe
l for
gla
nd A
.
Nam
e ho
rmon
e B
.
Sta
te T
WO
func
tions
of h
orm
one
D.
Des
crib
e th
e ne
gativ
e fe
edba
ck m
echa
nism
that
ope
rate
s w
hen
the
leve
l of h
orm
one
Dis
hig
her t
han
norm
al in
the
bloo
d.
(1)
(1)
(2)
(5)
(9)
B
C
D
A
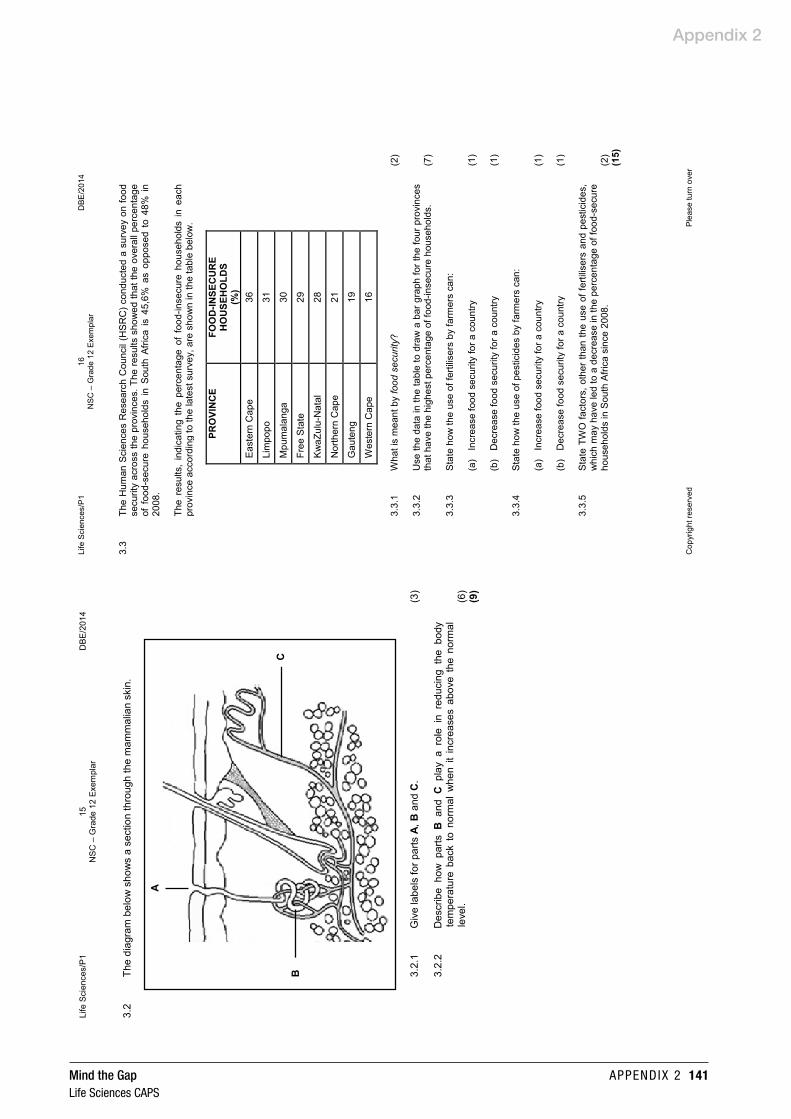
Appendix 2
Mind the Gap appEnDix 2 141Life Sciences capS
Life
Sci
ence
s/P
115
DBE
/201
4N
SC –
Gra
de 1
2 Ex
empl
ar
Cop
yrig
ht re
serv
edPl
ease
turn
ove
r
3.2
The
diag
ram
bel
ow s
how
s a
sect
ion
thro
ugh
the
mam
mal
ian
skin
.
3.2.
1
3.2.
2
Giv
ela
bels
for p
arts
A,B
and
C.
Des
crib
eho
w p
arts
Ban
dC
play
aro
le i
n re
duci
ng t
he b
ody
tem
pera
ture
bac
k to
nor
mal
whe
n it
incr
ease
s ab
ove
the
norm
al
leve
l.
(3)
(6)
(9)
A
BC
Life
Sci
ence
s/P
116
DBE
/201
4N
SC –
Gra
de 1
2 Ex
empl
ar
Cop
yrig
ht re
serv
edPl
ease
turn
ove
r
3.3
The
Hum
an S
cien
ces
Res
earc
h C
ounc
il (H
SR
C)c
ondu
cted
a s
urve
y on
food
se
curit
yac
ross
the
prov
ince
s. T
he re
sults
sho
wed
that
the
over
all p
erce
ntag
e of
foo
d-se
cure
hou
seho
lds
in S
outh
Afri
ca is
45,
6%as
opp
osed
to
48%
in
2008
.
The
resu
lts,
indi
catin
gth
e pe
rcen
tage
of
food
-inse
cure
hou
seho
lds
in e
ach
prov
ince
acc
ordi
ng to
the
late
st s
urve
y,ar
e sh
own
in th
e ta
ble
belo
w.
PRO
VIN
CE
FOO
D-IN
SEC
UR
E H
OU
SEH
OLD
S(%
)E
aste
rn C
ape
36
Lim
popo
31
Mpu
mal
anga
30
Free
Sta
te29
Kw
aZul
u-N
atal
28
Nor
ther
n C
ape
21
Gau
teng
19
Wes
tern
Cap
e16
3.3.
1
3.3.
2
3.3.
3
Wha
t is
mea
nt b
y fo
od s
ecur
ity?
Use
the
data
in th
e ta
ble
to d
raw
a b
ar g
raph
for t
he fo
ur p
rovi
nces
th
at h
ave
the
high
est p
erce
ntag
e of
food
-inse
cure
hou
seho
lds.
Sta
teho
w th
e us
e of
ferti
liser
s by
farm
ers
can:
(2)
(7)
(a)
(b)
Incr
ease
food
sec
urity
for a
coun
try
Dec
reas
e fo
od s
ecur
ity fo
r aco
untry
(1)
(1)
3.3.
4S
tate
how
the
use
of p
estic
ides
by
farm
ers
can:
(a)
(b)
Incr
ease
food
sec
urity
for a
cou
ntry
Dec
reas
e fo
od s
ecur
ity fo
r a c
ount
ry
(1)
(1)
3.3.
5S
tate
TWO
fact
ors,
othe
r th
an th
e us
e of
ferti
liser
s an
d pe
stic
ides
, w
hich
may
hav
e le
d to
a d
ecre
ase
in th
e pe
rcen
tage
off
ood-
secu
re
hous
ehol
ds in
Sou
th A
frica
sinc
e 20
08.
(2)
(15)

Appendix 2
142 appEnDix 2 Mind the Gap Life Sciences capS
Life
Sci
ence
s/P
117
DBE
/201
4N
SC –
Gra
de 1
2 Ex
empl
ar
Cop
yrig
ht re
serv
ed
3.4
The
carb
on
diox
ide
conc
entra
tion
in
the
atm
osph
ere
was
re
cord
edat
400
parts
per
milli
on(p
pm)
in M
ay20
13 c
ompa
red
to 3
16pa
rts p
er m
illion
(ppm
)in
195
8. T
his
chan
ge is
due
to a
n in
crea
se in
the
use
offo
ssil
fuel
sas
w
ell a
s an
incr
ease
inde
fore
stat
ion.
3.4.
1
3.4.
2
3.4.
3
3.4.
4
Des
crib
e ho
w d
efor
esta
tion
cont
ribut
es to
the
high
car
bon
diox
ide
conc
entra
tion
in th
e at
mos
pher
e.
Sta
te O
NE
oth
er im
pact
of d
efor
esta
tion
on th
e en
viro
nmen
t.
Exp
lain
why
we
shou
ld b
e co
ncer
ned
abou
t th
e ris
ing
carb
on
diox
ide
leve
ls.
Sug
gest
ON
E w
ay i
n w
hich
the
gov
ernm
ent
can
redu
ce c
arbo
n em
issi
ons
caus
ed b
y th
e ge
nera
tion
of e
lect
ricity
.
(2)
(1)
(3)
(1)
(7)
[40]
TOTA
L SE
CTI
ON
B:
80
SEC
TIO
N C
QU
ESTI
ON
4
Nam
e th
e ho
rmon
es p
rodu
ced
by th
e te
stes
and
ova
ries
and
desc
ribe
the
role
of e
ach
horm
one
in h
uman
repr
oduc
tion.
C
onte
nt:
Syn
thes
is:
(17)
(3)
(20)
NO
TE:
NO
mar
ks w
ill be
aw
arde
d fo
r ans
wer
s in
the
form
of f
low
cha
rts o
r dia
gram
s.
TOTA
L SE
CTI
ON
C:
GR
AN
D T
OTA
L:20 15
0

Appendix 2
Mind the Gap appEnDix 2 143Life Sciences capS
Life
Sci
ence
s/P
12
D
BE/
2014
NSC
–G
rade
12
Exem
plar
–M
emor
andu
m
Cop
yrig
ht re
serv
ed
Pl
ease
turn
ove
r
PRIN
CIP
LES
REL
ATED
TO
MA
RK
ING
LIF
E SC
IEN
CES
1.If
mor
e in
form
atio
n th
an m
arks
allo
cate
d is
giv
enS
top
mar
king
whe
n m
axim
um m
arks
is re
ache
d an
d pu
t a w
avy
line
and
'max
'in
the
right
-han
d m
argi
n.
2.If,
for e
xam
ple,
thre
e re
ason
s ar
e re
quire
d an
d fiv
e ar
e gi
ven
Mar
k th
e fir
st th
ree
irres
pect
ive
of w
heth
er a
ll or
som
e ar
e co
rrect
/inco
rrect
.
3.If
who
le p
roce
ss is
giv
en w
hen
only
apa
rt o
f it i
s re
quire
dR
ead
all a
nd c
redi
t the
rele
vant
par
t.
4.If
com
paris
ons
are
aske
d fo
r but
desc
riptio
ns a
re g
iven
Acc
ept i
f the
diff
eren
ces/
sim
ilarit
ies
are
clea
r.
5.If
tabu
latio
n is
requ
ired
but p
arag
raph
s ar
e gi
ven
Can
dida
tes
will
lose
mar
ks fo
r not
tabu
latin
g.
6.If
diag
ram
s ar
e gi
ven
with
ann
otat
ions
whe
n de
scrip
tions
are
requ
ired
Can
dida
tes
will
lose
mar
ks.
7.If
flow
cha
rts
are
give
n in
stea
d of
des
crip
tions
Can
dida
tes
will
lose
mar
ks.
8.If
sequ
ence
is m
uddl
ed a
nd li
nks
do n
ot m
ake
sens
eW
here
seq
uenc
e an
d lin
ks a
re c
orre
ct,
cred
it. W
here
seq
uenc
e an
d lin
ks a
rein
corre
ct, d
o no
t cre
dit.
If se
quen
ce a
nd li
nks
beco
me
corre
ct a
gain
, res
ume
cred
it.
9.N
on-r
ecog
nise
dab
brev
iatio
nsA
ccep
t if
first
def
ined
in
answ
er.
If no
t de
fined
, do
not
cre
dit
the
unre
cogn
ised
ab
brev
iatio
n bu
t cre
dit t
he re
st o
f the
ans
wer
if c
orre
ct.
10.
Wro
ng n
umbe
ring
If an
swer
fits
into
the
corre
ct s
eque
nce
of q
uest
ions
but
the
wro
ng n
umbe
r is
give
n,
it is
acc
epta
ble.
11.
If la
ngua
ge u
sed
chan
ges
the
inte
nded
mea
ning
Do
not a
ccep
t.
12.
Spel
ling
erro
rsIf
reco
gnis
able
,acc
ept t
he a
nsw
er,p
rovi
ded
it do
es n
ot m
ean
som
ethi
ng e
lse
in L
ife
Sci
ence
s or
if it
is o
ut o
f con
text
.
13.
If co
mm
on n
ames
are
giv
en in
term
inol
ogy
Acc
ept,
prov
ided
it w
as a
ccep
ted
at th
e na
tiona
lmem
o di
scus
sion
mee
ting.
14.
If on
ly th
e le
tter i
s as
ked
for b
uton
ly th
e na
me
is g
iven
(and
vic
e ve
rsa)
Do
not c
redi
t.

Appendix 2
144 appEnDix 2 Mind the Gap Life Sciences capS
Life
Sci
ence
s/P
13
D
BE/
2014
NSC
–G
rade
12
Exem
plar
–M
emor
andu
m
Cop
yrig
ht re
serv
ed
Pl
ease
turn
ove
r
15.
If un
its a
re n
ot g
iven
in m
easu
rem
ents
Can
dida
tes
will
lose
mar
ks. M
emor
andu
m w
ill a
lloca
te m
arks
for u
nits
sep
arat
ely.
16.
Be
sens
itive
to th
e se
nse
of a
n an
swer
, whi
ch m
ay b
e st
ated
in a
diff
eren
t way
.
17.
Cap
tion
All
illust
ratio
ns (d
iagr
ams,
gra
phs,
tabl
es, e
tc.)
mus
t hav
e a
capt
ion.
18.
Cod
e-sw
itchi
ng o
f offi
cial
lang
uage
s (te
rms
and
conc
epts
) A
sin
gle
wor
d or
two
that
app
ear(s
)in
any
offi
cial
lang
uage
oth
er th
an th
e le
arne
rs'
asse
ssm
ent
lang
uage
use
d to
the
gre
ates
t ex
tent
in
his/
her
answ
ers
shou
ld b
e cr
edite
dif
it is
cor
rect
.A
mar
ker
that
is p
rofic
ient
in t
he r
elev
ant
offic
ial l
angu
age
shou
ld b
e co
nsul
ted.
Thi
s is
app
licab
le to
all
offic
ial l
angu
ages
.
19.
Cha
nges
to th
e m
emor
andu
mN
o ch
ange
s m
ust
be m
ade
to t
he m
emor
anda
with
out
cons
ultin
g th
e pr
ovin
cial
in
tern
al m
oder
ator
who
in tu
rn w
ill co
nsul
t with
the
natio
nal i
nter
nal m
oder
ator
(and
th
e U
mal
usim
oder
ator
s w
here
nec
essa
ry).
20.
Offi
cial
mem
oran
daO
nly
mem
oran
da b
earin
g th
e si
gnat
ures
of t
he n
atio
nal i
nter
nal m
oder
ator
and
the
Um
alus
i mod
erat
ors
and
dist
ribut
ed b
y th
e N
atio
nal D
epar
tmen
t of B
asic
Edu
catio
n vi
a th
e pr
ovin
ces
mus
t be
used
.
Life
Sci
ence
s/P
14
D
BE/
2014
NSC
–G
rade
12
Exem
plar
–M
emor
andu
m
Cop
yrig
ht re
serv
ed
Pl
ease
turn
ove
r
SEC
TIO
N A
QU
ESTI
ON
1
1.1
1.1.
11.
1.2
1.1.
31.
1.4
1.1.
51.
1.6
1.1.
71.
1.8
1.1.
9
D
A
A
C
D
B
B
B
B
(9x
2)
(18)
1.2
1.2.
1G
esta
tion
1.2.
2D
iabe
tes
mel
litus
1.2.
3E
usta
chia
ntu
be1.
2.4
Eut
roph
icat
ion
1.2.
5B
last
ocys
t1.
2.6
Acr
osom
e1.
2.7
Pro
stat
e1.
2.8
Spe
rm d
uct
/vas
def
eren
s
1.
2.9
Oog
enes
is
(9
x 1)
(9)
1.3
1.3.
11.
3.2
1.3.
31.
3.4
1.3.
51.
3.6
A o
nly
Non
e
Bot
h A
and
B
Bon
ly
Bot
h A
and
B
Bot
h A
and
B
(6
x 2)
(12)
1.4
1.4.
11.
4.2
1.4.
31.
4.4
1.4.
5
C
B
A
A
B
(1)
(1)
(1)
(1)
(1)
(5)
1.5
1.5.
1
1.5.
2
1.5.
3
1.5.
4
A–
46
B–
23
C–
46
Zygo
te
Sta
ges
1 an
d 2
Sta
ges
3 an
d 4
(3)
(1)
(1)
(1)
(6)
TOTA
L SE
CTI
ON
A:
50

Appendix 2
Mind the Gap appEnDix 2 145Life Sciences capS
Life
Sci
ence
s/P
15
D
BE/
2014
NSC
–G
rade
12
Exem
plar
–M
emor
andu
m
Cop
yrig
ht re
serv
ed
Pl
ease
turn
ove
r
SEC
TIO
N B
QU
ESTI
ON
2
2.1
2.1.
1(a
) G
rey
mat
ter
(b)
Inte
rneu
ron
/con
nect
or n
euro
n(1
)(1
)
2.1.
2(a
) A
(b)
C
(1)
(1)
2.1.
3
2.1.
4
2.1.
5
Sen
satio
n w
ould
be
felt
but t
here
wou
ld b
e no
resp
onse
1,5
m ÷
75
m.s
-1
= 0,
02
s
Hel
ps to
pro
tect
the
body
by re
actin
g qu
ickl
y
(2)
(3)
(2)
(11)
2.2
2.2.
10,
42 s
econ
ds
(1)
2.2.
2
2.2.
3
2.2.
4
2.2.
5
−It
decr
ease
dfir
st
−th
en le
velle
d of
f−
and
final
lyin
crea
sed
agai
n.
Pra
ctic
e m
akes
reac
tion
time
fast
er
but l
ater
,tire
dnes
s sl
ows
dow
n th
e re
actio
n tim
e.
Li
ght
Rea
ctio
n tim
e w
ould
pro
babl
y in
crea
se
(3)
(2)
(1)
(1)
(8)
2.3
2.3.
1(a
) B
(b)
C
(2)
(2)
2.3.
2A
ccom
mod
atio
n(1
)−
Cilia
ry m
uscl
es c
ontra
ct
−S
uspe
nsor
y lig
amen
ts s
lack
en
−Te
nsio
n on
lens
dec
reas
es
−Le
ns b
ecom
es m
ore
conv
ex
−R
efra
ctiv
e po
wer
of l
ens
incr
ease
s−
A c
lear
imag
e no
w fo
rms
on th
e re
tina
(any
4)
(5)
(9)
Life
Sci
ence
s/P
16
D
BE/
2014
NSC
–G
rade
12
Exem
plar
–M
emor
andu
m
Cop
yrig
ht re
serv
ed
Pl
ease
turn
ove
r
2.4
2.4.
1G
row
th o
f pla
nt s
hoot
s(1
)
2.4.
2−
Sam
e en
viro
nmen
t in
whi
ch th
e sh
oots
are
pla
ced
−S
ame
type
of s
hoot
used
(Mar
k fir
st T
WO
only
)(2
)
2.4.
3
2.4.
4
2.4.
5
Aux
ins
In in
vest
igat
ion
A:
−Li
ght f
rom
the
right
−ca
used
aux
ins
to m
ove
to s
hade
d si
de o
f the
sho
ot
−le
adin
g to
incr
ease
d ce
ll el
onga
tion
and
divi
sion
−Th
ere
was
ther
efor
e gr
eate
rgro
wth
on th
e sh
aded
sid
e−
thus
ben
ding
the
shoo
t in
the
dire
ctio
n of
the
sour
ce o
f lig
ht
(an
y4)
In in
vest
igat
ion
C:
−Li
ght h
as n
o in
fluen
ce o
n th
e di
strib
utio
n of
aux
ins
−th
eref
ore
the
shoo
t gre
wup
right
(2)
−R
epea
t the
inve
stig
atio
n−
Use
mor
e th
an o
ne p
lant
for e
ach
treat
men
t(M
ark
first
TW
O o
nly)
(1)
(6)
(2)
(12)
[40]
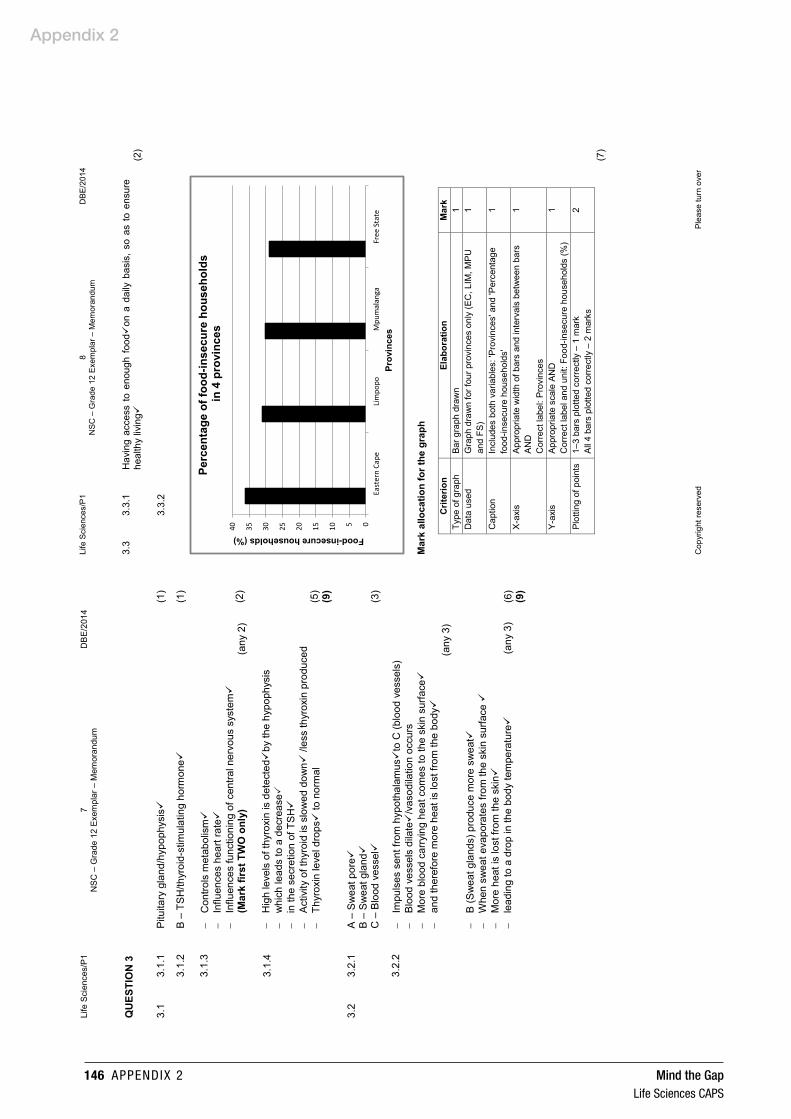
Appendix 2
146 appEnDix 2 Mind the Gap Life Sciences capS
Life
Sci
ence
s/P
17
D
BE/
2014
NSC
–G
rade
12
Exem
plar
–M
emor
andu
m
Cop
yrig
ht re
serv
ed
Pl
ease
turn
ove
r
3.1
3.1.
1P
ituita
ry g
land
/hyp
ophy
sis
(1)
3.1.
2B
–TS
H/th
yroi
d-st
imul
atin
g ho
rmon
e(1
)
3.1.
3
3.1.
4
−C
ontro
lsm
etab
olis
m
−In
fluen
ces
hear
t rat
e−
Influ
ence
s fu
nctio
ning
of c
entra
l ner
vous
sys
tem
(Mar
k fir
st T
WO
only
)
(any
2)
−H
igh
leve
lsof
thyr
oxin
is d
etec
ted
by th
e hy
poph
ysis
−w
hich
lead
s to
a d
ecre
ase
−in
the
secr
etio
n of
TSH
−A
ctiv
ity o
f thy
roid
is s
low
ed d
own
/less
thyr
oxin
pro
duce
d−
Thyr
oxin
leve
l dro
ps
to n
orm
al
(2)
(5)
(9)
3.2
3.2.
1A
–S
wea
t por
eB
–S
wea
t gla
nd
C–
Blo
od v
esse
l(3
)
3.2.
2−
Impu
lses
sen
t fro
m h
ypot
hala
mus
to C
(blo
od v
esse
ls)
−B
lood
ves
sels
dila
te
/vas
odila
tion
occu
rs−
Mor
e bl
ood
carry
ing
heat
com
es to
the
skin
sur
face
−an
dth
eref
ore
mor
e he
at is
lost
from
the
body
(any
3)
−B
(Sw
eat g
land
s)pr
oduc
e m
ore
swea
t−
Whe
nsw
eat e
vapo
rate
s fro
m th
e sk
in s
urfa
ce
−M
ore
heat
islo
stfro
m th
e sk
in
−le
adin
g to
a d
rop
in th
ebo
dy te
mpe
ratu
re
(any
3)
(6)
(9)
QU
ESTI
ON
3
Life
Sci
ence
s/P
18
D
BE/
2014
NSC
–G
rade
12
Exem
plar
–M
emor
andu
m
Cop
yrig
ht re
serv
ed
Pl
ease
turn
ove
r
Mar
k al
loca
tion
fort
he g
raph
Crit
erio
nEl
abor
atio
nM
ark
Type
of g
raph
Barg
raph
dra
wn
1D
ata
used
Gra
ph d
raw
n fo
r fou
r pro
vinc
es o
nly
(EC
, LIM
, MPU
an
d FS
)1
Cap
tion
Incl
udes
bot
h va
riabl
es: '
Prov
ince
s'an
d'P
erce
ntag
e fo
od-in
secu
re h
ouse
hold
s'1
X-a
xis
Appr
opria
te w
idth
of b
ars
and
inte
rval
s be
twee
n ba
rs
AND
Cor
rect
labe
l: Pr
ovin
ces
1
Y-ax
isAp
prop
riate
sca
le A
ND
Cor
rect
labe
l and
uni
t: Fo
od-in
secu
re h
ouse
hold
s (%
)1
Plot
ting
of p
oint
s1–
3 ba
rs p
lotte
d co
rrec
tly –
1 m
ark
All 4
bar
s pl
otte
d co
rrect
ly –
2 m
arks
2
(7)
0510152025303540
East
ern
Cape
Lim
popo
Mpu
mal
anga
Free
Sta
te
Food-insecure households (%)
Prov
ince
s
Perc
enta
ge o
f foo
d-in
secu
re h
ouse
hold
sin
4 p
rovi
nces
3.3
3.3.
1H
avin
g ac
cess
to
enou
gh f
ood
on a
dai
ly b
asis
, so
as
to e
nsur
e he
alth
y liv
ing
(2)
3.3.
2

Appendix 2
Mind the Gap appEnDix 2 147Life Sciences capS
Life
Sci
ence
s/P
19
D
BE/
2014
NSC
–G
rade
12
Exem
plar
–M
emor
andu
m
Cop
yrig
ht re
serv
ed
Pl
ease
turn
ove
r
3.3.
3
3.3.
4
3.3.
5
(a)F
ertil
iser
s pr
ovid
e nu
trien
ts th
at in
crea
se c
rop
grow
th
(b)F
ertil
iser
s ar
e ex
pens
ive
–ca
uses
foo
d pr
ices
to
incr
ease
/ov
er-u
se o
f fe
rtilis
ers
can
caus
e ox
ygen
dep
rivat
ion
in s
oil
whi
ch w
ill ev
entu
ally
redu
ce c
rop
prod
uctio
n
(a)P
estic
ides
ens
ure
that
pes
ts d
o no
t cau
se la
rge-
scal
e da
mag
e to
cro
ps
(b)P
estic
ides
cou
ld k
ill pe
sts
as w
ell
as t
heir
pred
ator
s –
henc
e m
ore
pest
icid
es w
ould
hav
e to
be
used
, ra
isin
g th
e co
st o
f fo
od
−M
assi
ve u
nem
ploy
men
t in
the
coun
try
−In
crea
se in
the
size
of t
he h
uman
pop
ulat
ion
−Fa
rms
dest
roye
d fo
r dev
elop
men
t−
Dec
reas
e in
sub
sist
ence
farm
ing
−P
rolo
nged
unf
avou
rabl
e en
viro
nmen
tal c
ondi
tions
(M
ark
first
TW
O o
nly)
(any
2 x
1)
(1)
(1)
(1)
(1)
(2)
(15)
3.4
3.4.
1
3.4.
2
3.4.
3
3.4.
4
−Th
ere
will
be le
ss tr
ees
−so
les
s ca
rbon
dio
xide
will
be u
sed
from
the
atm
osph
ere
for
phot
osyn
thes
is
−C
an l
ead
to t
he l
oss
of b
iodi
vers
ity
/hab
itat
dest
ruct
ion/
soil
eros
ion
(Mar
k fir
st O
NE
only
)
−In
crea
sed
carb
on
diox
ide
leve
ls
lead
to
th
e en
hanc
ed
gree
nhou
se e
ffect
−w
hich
cau
ses
an in
crea
se in
the
glob
al te
mpe
ratu
res
−Th
is c
ould
lead
to
rise
in s
ea le
vels
bec
ause
of
mel
ting
ice
/flo
ods/
chan
ge in
clim
ate
−w
hich
can
lead
to th
e ex
tinct
ion
of s
ome
orga
nism
s.
(a
ny 3
)
Use
alte
rnat
e so
urce
s of
ene
rgy
(Mar
k fir
st O
NE
only
)
TOTA
L SE
CTI
ON
B:
(2)
(1)
(3)
(1)
(7)
[40]
80
Life
Sci
ence
s/P
110
D
BE/
2014
NSC
–G
rade
12
Exem
plar
–M
emor
andu
m
Cop
yrig
ht re
serv
ed
Pl
ease
turn
ove
r
SEC
TIO
N C
QU
ESTI
ON
4
Test
oste
rone
Pro
duce
d by
sem
inife
rous
tubu
les
in th
e te
stes
Dur
ing
pube
rty te
stos
tero
ne s
timul
ates
:
-Th
e de
epen
ing
of th
e vo
ice
as v
ocal
cor
ds e
long
ate
in th
e la
rynx
-Th
e de
velo
pmen
t of m
uscl
es
-Th
e gr
owth
of f
acia
l, pu
bic
and
body
hai
r-
Dev
elop
men
t of t
he p
enis
and
test
es
-Th
e pr
oduc
tion
of s
perm
in th
e te
stes
m
ax
Oes
trog
en
Pro
duce
d by
the
Gra
afia
n fo
llicle
sin
the
ovar
ies
-C
ause
s th
e lin
ing
of th
e ut
erus
/end
omet
rium
-
to b
ecom
e th
icke
r/mor
e va
scul
ar
-in
pre
para
tion
for
a po
ssib
le im
plan
tatio
n of
the
em
bryo
and
dev
elop
men
t of
the
fo
etus
Dur
ing
pube
rty o
estro
gen
stim
ulat
es:
-Th
e w
iden
ing
of th
e pe
lvis
/hip
s-
The
grow
th a
nd d
evel
opm
ent o
f the
bre
asts
-Th
e gr
owth
of t
he fe
mal
e se
x or
gans
-Th
e st
art o
f the
men
stru
al c
ycle
,ovu
latio
n an
d m
enst
ruat
ion
max
Prog
este
rone
Pro
duce
d by
the
corp
us lu
teum
an
d pl
acen
ta
-P
roge
ster
one
caus
es fu
rther
thic
keni
ng o
f the
end
omet
rium
-so
that
it is
read
y fo
r im
plan
tatio
n of
the
embr
yo s
houl
d fe
rtilis
atio
n oc
cur
-H
igh
leve
ls o
f pro
gest
eron
e-
inhi
bits
the
secr
etio
n of
FS
H
-by
the
pitu
itary
gla
nd
-w
hich
in tu
rn p
reve
nts
the
furth
er d
evel
opm
ent o
f any
new
ovu
m in
the
ovar
ym
ax
Con
tent
S
ynth
esis
(5)
(7)
(5)
(17)
(3)
(20)

Appendix 2
148 appEnDix 2 Mind the Gap Life Sciences capS
Life
Sci
ence
s/P
111
D
BE/
2014
NSC
–G
rade
12
Exem
plar
–M
emor
andu
m
Cop
yrig
ht re
serv
ed
ASS
ESSI
NG
TH
E PR
ESEN
TATI
ON
OF
THE
ESSA
Y
Crit
erio
nEl
abor
atio
nM
ark
Rel
evan
ceN
o ot
her h
orm
ones
exc
ept t
esto
ster
one,
oe
stro
gen
and
prog
este
rone
are
men
tione
d.1
Logi
cal s
eque
nce
Each
hor
mon
e na
med
is li
nked
to it
s co
rrec
t rol
e.1
Com
preh
ensi
veAl
l TH
REE
cor
rect
hor
mon
es m
entio
ned
with
at
leas
t TH
REE
role
s de
scrib
ed fo
r eac
h ho
rmon
e.1
TOTA
L SE
CTI
ON
C:
20
GR
AN
D T
OTA
L:15
0
Appendix 2
Mind the Gap appEnDix 2 149Life Sciences capS
Life
Sci
ence
s/P
22
DBE
/201
4N
SC –
Gra
de 1
2 Ex
empl
ar
Cop
yrig
ht re
serv
edPl
ease
turn
ove
r
INST
RU
CTI
ON
S A
ND
INFO
RM
ATI
ON
Rea
d th
e fo
llow
ing
inst
ruct
ions
car
eful
lybe
fore
ans
wer
ing
the
ques
tions
.
1. 2. 3. 4. 5. 6. 7. 8. 9. 10.
11.
Ans
wer
ALL
the
ques
tions
.
Writ
e AL
L th
e an
swer
s in
the
AN
SWER
BO
OK
.
Sta
rtth
e an
swer
s to
EA
CH
que
stio
n at
the
top
of a
NEW
pag
e.
Num
ber t
he a
nsw
ers
corre
ctly
acc
ordi
ng to
the
num
berin
g sy
stem
used
in th
is
ques
tion
pape
r.
Pre
sent
you
r ans
wer
s ac
cord
ing
to th
e in
stru
ctio
ns o
f eac
h qu
estio
n.
Do
ALL
dra
win
gs in
pen
cil a
nd la
bel t
hem
in b
lue
or b
lack
ink.
Dra
w d
iagr
ams
orflo
w c
harts
onl
y w
hen
aske
dto
do
so.
The
diag
ram
s in
this
que
stio
n pa
per a
reN
OT
nece
ssar
ily d
raw
n to
sca
le.
Do
NO
Tus
e gr
aph
pape
r.
You
mus
t us
e a
non-
prog
ram
mab
le c
alcu
lato
r, pr
otra
ctor
and
aco
mpa
ss,
whe
re n
eces
sary
.
Writ
e ne
atly
and
legi
bly.

Appendix 2
150 appEnDix 2 Mind the Gap Life Sciences capS
Life
Sci
ence
s/P
23
DBE
/201
4N
SC –
Gra
de 1
2 Ex
empl
ar
Cop
yrig
ht re
serv
edPl
ease
turn
ove
r
SEC
TIO
N A
QU
ESTI
ON
1
1.1
Var
ious
opt
ions
are
pro
vide
d as
pos
sibl
e an
swer
s to
the
follo
win
g qu
estio
ns.
Cho
ose
the
corre
ct a
nsw
eran
d w
rite
only
the
let
ter
(Ato
D)
next
to
the
ques
tion
num
ber
(1.1
.1 t
o1.
1.10
) in
the
AN
SWER
BO
OK,
for
exa
mpl
e1.
1.11
D.
1.1.
1W
hich
O
NE
of
th
e fo
llow
ing
serv
es
as
evid
ence
of
cu
ltura
l ev
olut
ion
in e
arly
Hom
osp
ecie
s?
A B C D
Dra
win
gs a
nd c
arvi
ngs
on ro
cks
Ani
mal
rem
ains
clo
se to
a H
omo
skel
eton
Mal
e an
d fe
mal
e sk
elet
ons
in th
e sa
me
area
Mor
e th
an o
ne H
omo
skel
eton
in a
n ar
ea
1.1.
2A
fat
her
has
bloo
d ty
pe A
. H
e ha
s 4
child
ren
with
the
follo
win
g bl
ood
type
s:
Chi
ld1
–A
Chi
ld2
–O
Chi
ld3
–A
BC
hild
4–
B
Wha
t is
the
bloo
d ty
pe o
f the
mot
her o
f the
abo
ve c
hild
ren?
A B C D
A B O AB
1.1.
3N
ew a
llele
s ar
ise
in a
sex
ually
repr
oduc
ing
popu
latio
n th
roug
h ...
A B C D
mut
atio
ns in
DN
A s
eque
nces
prio
r to
mei
osis
.ra
ndom
ferti
lisat
ion
of g
amet
es d
urin
g re
prod
uctio
n.ra
ndom
as
sortm
ent
of
hom
olog
ous
chro
mos
omes
du
ring
mei
osis
.ex
chan
ge
of
chro
mat
id
segm
ents
be
twee
n ho
mol
ogou
s ch
rom
osom
es d
urin
g m
eios
is.
1.1.
4A
tall
pea
plan
t was
cro
ssed
rep
eate
dly
with
a s
hort
pea
plan
t. In
ea
ch o
f th
ese
cros
ses,
the
y pr
oduc
ed o
nly
tall
offs
prin
g. I
t is
re
ason
able
to c
oncl
ude
that
the
…
A B C D
tall
pea
plan
t inv
olve
d in
the
cros
s is
hom
ozyg
ous.
tall
pea
plan
t inv
olve
d in
the
cros
s is
het
eroz
ygou
s.of
fspr
ing
are
all h
eter
ozyg
ous
for h
eigh
t.sh
ort p
ea p
lant
invo
lved
in th
e cr
oss
is h
eter
ozyg
ous.
Life
Sci
ence
s/P
24
DBE
/201
4N
SC –
Gra
de 1
2 Ex
empl
ar
Cop
yrig
ht re
serv
edPl
ease
turn
ove
r
OR
GA
NIS
MSE
CTI
ON
OF
mtD
NA
SEQ
UEN
CE
Mod
ern
hum
anA
AT-T
CC
-CC
G-A
CT-
GC
A-A
TT-C
AC
-CTT
Chi
mpa
nzee
XXX-
XX
X-TX
A-T
TX-X
XX-X
AC
-TG
A-A
AA
Hom
inid
spe
cies
1G
GX-
CTT
-TTA
-TTC
-XTC
-TC
C-G
TA-T
AG
Hom
inid
spe
cies
2G
GX-
XGX-
XXA
-TTC
-XTC
-CC
C-T
GT-
AA
G
Hom
inid
spe
cies
3XT
A-X
XX-
XXA
-TTX
-ATC
-CXC
-TG
T-TC
C
From
the
data
in th
e ta
ble
abov
e it
is p
ossi
ble
to c
oncl
ude
that
…
A B C D
chim
panz
ees
are
mor
e cl
osel
y re
late
d to
hom
inid
spe
cies
3
than
they
are
to m
oder
n hu
man
s.ho
min
idsp
ecie
s 1
is
prob
ably
th
e m
ost
rece
nt
com
mon
an
cest
or o
f chi
mpa
nzee
s an
d m
oder
n hu
man
s.m
oder
n hu
man
s ar
e m
ore
clos
ely
rela
ted
to h
omin
id s
peci
es 2
th
an to
hom
inid
spe
cies
3.
mod
ern
hum
ans
are
mor
e cl
osel
y re
late
d to
hom
inid
spe
cies
3
than
to h
omin
id s
peci
es 2
.
A B C D
this
porti
on o
f nuc
leic
aci
d w
ill c
ode
for
a ch
ain
of e
ight
am
ino
acid
s.th
e se
quen
ce g
iven
will
be
com
plem
enta
ry t
o th
e se
quen
ce
C
T C
G T
G C
T T
.th
e nu
clei
c ac
id s
how
n co
ntai
ns th
e su
gar r
ibos
e.th
e nu
clei
c ac
id s
how
n is
DN
A.
1.1.
5Th
e ta
ble
belo
w
show
s a
sect
ion
of
the
mito
chon
dria
l D
NA
(mtD
NA
) se
quen
ce fo
r a
mod
ern
hum
an, a
chi
mpa
nzee
and
thre
e ho
min
id s
peci
es. T
he le
tter
'X'i
n th
e ch
impa
nzee
and
the
hom
inid
se
quen
ces
mea
ns th
at th
e D
NA
bas
e w
as th
e sa
me
as th
at fo
und
in th
e m
oder
n hu
man
seq
uenc
e.
1.1.
6Th
e fo
llow
ing
data
rep
rese
nts
a sm
all
sect
ion
of a
seq
uenc
e of
nu
clei
c ac
id b
ases
take
n fro
m a
n an
imal
cel
l:
A G
C U
C G
U U
From
this
dat
a it
is re
ason
able
to c
oncl
ude
that
…

Appendix 2
Mind the Gap appEnDix 2 151Life Sciences capS
Life
Sci
ence
s/P
25
DBE
/201
4N
SC –
Gra
de 1
2 Ex
empl
ar
Cop
yrig
ht re
serv
edPl
ease
turn
ove
r
1.1.
7Th
e lis
t be
low
pr
ovid
es
info
rmat
ion
rela
ting
to
the
repl
icat
ion
of D
NA
:
1.C
ompl
emen
tary
nuc
leot
ides
bin
d to
eac
h of
the
two
stra
nds.
2.S
ugar
pho
spha
te b
onds
form
bet
wee
n th
e nu
cleo
tides
.3.
The
new
ly fo
rmed
DN
A m
olec
ules
are
iden
tical
to e
ach
othe
r.4.
Afte
r unw
indi
ng, t
he D
NA
mol
ecul
e fo
rms
two
sing
le s
trand
s.
The
corre
ct o
rder
of t
hese
eve
nts
as th
ey o
ccur
in D
NA
rep
licat
ion
is … A B C D
1, 2
, 3 a
nd 4
.1,
2, 3
and
2.
4, 2
, 1 a
nd 3
.4,
1, 2
and
3.
1.1.
8W
hich
ON
E o
f the
follo
win
g ac
coun
ts fo
r ga
met
es h
avin
g a
sing
le
alle
le o
nly
for a
par
ticul
ar c
hara
cter
istic
, ins
tead
of t
wo?
A B C D
The
chro
mos
ome
num
ber i
s ha
lved
dur
ing
Mei
osis
IIM
ende
l's p
rinci
ple
of s
egre
gatio
nM
ende
l's p
rinci
ple
of in
depe
nden
t ass
ortm
ent
The
'law
'of d
omin
ance
1.1.
9In
mul
tiple
alle
les
…
A B C D
mor
e th
an o
ne g
ene
cont
rols
a tr
ait o
r cha
ract
eris
tic.
ther
e ar
e m
ore
than
two
diffe
rent
alle
les
for t
he s
ame
gene
.th
e di
ffere
nt a
llele
s fo
r th
e sa
me
char
acte
ristic
are
atd
iffer
ent
posi
tions
.th
ere
are
only
two
alle
les
for a
par
ticul
ar g
ene.
1.1.
10In
a s
ituat
ion
whe
re a
cha
ract
eris
tic is
exp
ress
ed m
ore
frequ
ently
in
mal
es th
an in
fem
ales
in h
uman
s, w
e ca
n co
nclu
de th
at …
A B C D
one
alle
le is
dom
inan
t ove
r the
oth
er.
the
alle
les
for
the
char
acte
ristic
ar
e lo
cate
d on
th
e
X ch
rom
osom
es.
the
alle
les
for t
he c
hara
cter
istic
are
loca
ted
on th
e au
toso
mes
.th
e al
lele
s fo
r th
e ch
arac
teris
tic
are
loca
ted
on
the
Y
chro
mos
omes
.
(10
x 2
)(2
0)
Life
Sci
ence
s/P
26
DBE
/201
4N
SC –
Gra
de 1
2 Ex
empl
ar
Cop
yrig
ht re
serv
edPl
ease
turn
ove
r
1.2
Giv
e th
e co
rrect
bio
logi
cal t
erm
for
eac
h of
the
fol
low
ing
desc
riptio
ns. W
rite
only
the
ter
m n
ext
to t
he q
uest
ion
num
ber
(1.2
.1 t
o 1.
2.6)
in t
he A
NSW
ER
BO
OK
.
1.2.
1
1.2.
2
1.2.
3
1.2.
4
1.2.
5
1.2.
6
An
alle
le t
hat
does
not
influ
ence
the
phe
noty
pe w
hen
foun
d in
the
he
tero
zygo
us c
ondi
tion
The
posi
tion
of a
gen
e on
a c
hrom
osom
e
The
phys
ical
and
func
tiona
l exp
ress
ion
of a
gen
e
Chr
omos
omes
that
are
not
resp
onsi
ble
for s
ex d
eter
min
atio
n
The
proc
ess
of fi
ndin
g a
desi
rabl
e ge
ne, i
sola
ting
it an
d th
en m
ovin
g it
into
the
cells
of a
noth
er o
rgan
ism
The
two
parts
of a
chr
omos
ome
held
toge
ther
by
a ce
ntro
mer
e (6 x
1)
(6)
1.3
Indi
cate
whe
ther
eac
h of
the
sta
tem
ents
in
CO
LUM
N I
app
lies
to A
onl
y,B
only
,bo
th A
and
Bor
non
eof
the
item
s in
CO
LUM
N I
I. W
rite
A o
nly,
B o
nly,
both
A a
nd B
,orn
one
next
to th
equ
estio
n nu
mbe
r(1.
3.1
to 1
.3.8
) in
the
AN
SWER
BO
OK.
CO
LUM
N I
CO
LUM
N II
1.3.
1D
isco
vere
d th
e do
uble
hel
ical
stru
ctur
e of
DN
AA B
Fran
cis
Cric
kJa
mes
Wat
son
1.3.
2D
escr
ibes
evo
lutio
n as
con
sist
ing
of
long
pha
ses
of li
ttle
chan
ge a
ltern
atin
g w
ith s
hort
phas
es o
f rap
id c
hang
e
A Bpu
nctu
ated
equ
ilibriu
mD
arw
inis
m
1.3.
3V
aria
tion
with
in a
pop
ulat
ion
in w
hich
th
ere
is a
rang
e of
inte
rmed
iate
ph
enot
ypes
A Bdi
scon
tinuo
us v
aria
tion
cont
inuo
us v
aria
tion
1.3.
4E
vide
nce
for e
volu
tion
A Bm
itoch
ondr
ial D
NA
clad
ogra
m1.
3.5
Chr
omos
ome
cond
ition
of a
cel
l tha
t ha
s a
sing
le s
et o
f chr
omos
omes
A Bdi
ploi
dha
ploi
d1.
3.6
Two
alle
les
of a
gen
e th
at a
re e
qual
ly
dom
inan
tA B
codo
min
ance
com
plet
e do
min
ance
1.3.
7Th
e fu
ll co
mpl
emen
t of g
enes
pre
sent
in
an
orga
nism
A Bka
ryot
ype
phen
otyp
e1.
3.8
Bon
ds th
at h
old
amin
o ac
ids
toge
ther
in
a p
rote
in m
olec
ule
A Bhy
drog
en b
onds
pept
ide
bond
s(8
x 2)
(16)
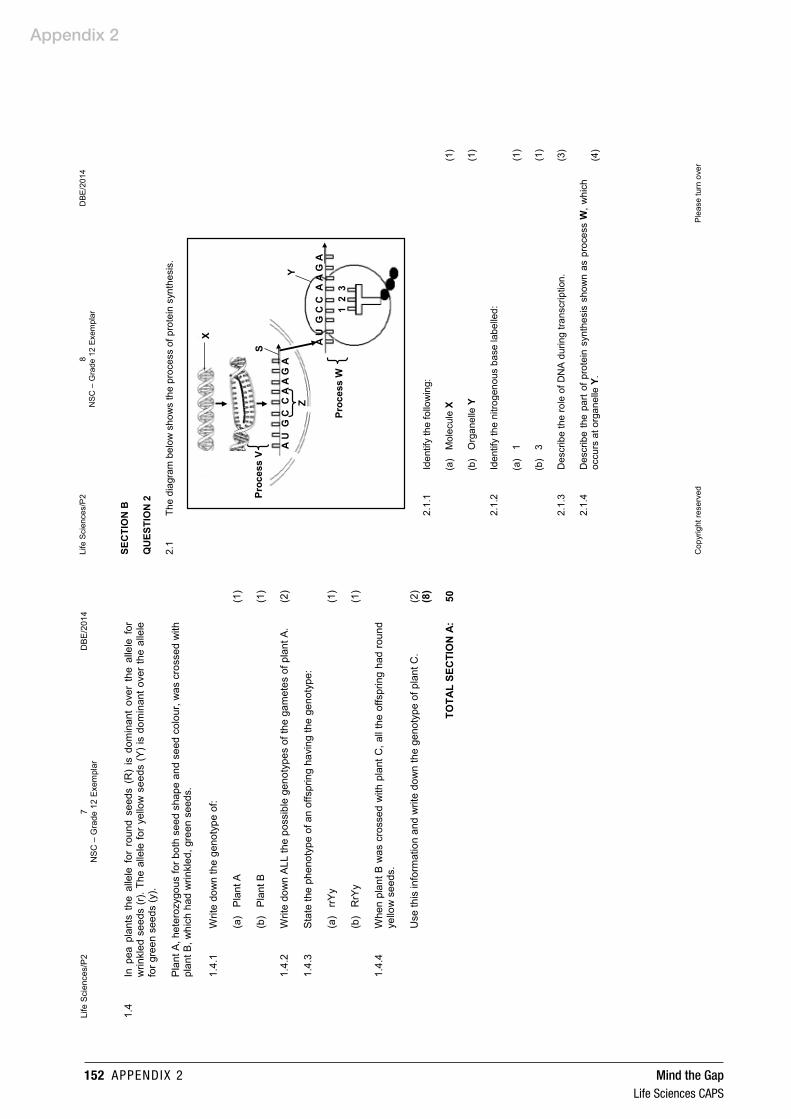
Appendix 2
152 appEnDix 2 Mind the Gap Life Sciences capS
Life
Sci
ence
s/P
27
DBE
/201
4N
SC –
Gra
de 1
2 Ex
empl
ar
Cop
yrig
ht re
serv
edPl
ease
turn
ove
r
1.4
In p
ea p
lant
s th
e al
lele
for
rou
nd s
eeds
(R
) is
dom
inan
t ov
er t
he a
llele
for
w
rinkl
ed s
eeds
(r).
The
alle
le fo
r ye
llow
see
ds (
Y) is
dom
inan
t ove
r th
e al
lele
fo
r gre
en s
eeds
(y).
Pla
nt A
, het
eroz
ygou
s fo
r bot
h se
ed s
hape
and
see
d co
lour
, was
cro
ssed
with
pl
ant B
,whi
ch h
ad w
rinkl
ed, g
reen
see
ds.
1.4.
1
1.4.
2
1.4.
3
1.4.
4
Writ
e do
wn
the
geno
type
of:
(a)
Pla
nt A
(b)
Pla
nt B
Writ
e do
wn
ALL
the
poss
ible
gen
otyp
es o
f the
gam
etes
of p
lant
A.
Sta
te th
e ph
enot
ype
of a
n of
fspr
ing
havi
ng th
e ge
noty
pe:
(a)
rrY
y
(b)
RrY
y
Whe
n pl
ant B
was
cro
ssed
with
pla
nt C
, all
the
offs
prin
g ha
d ro
und
yello
w s
eeds
.
Use
this
info
rmat
ion
and
writ
e do
wn
the
geno
type
of p
lant
C.
(1)
(1)
(2)
(1)
(1)
(2)
(8)
TOTA
L SE
CTI
ON
A:
50
Life
Sci
ence
s/P
28
DBE
/201
4N
SC –
Gra
de 1
2 Ex
empl
ar
Cop
yrig
ht re
serv
edPl
ease
turn
ove
r
SEC
TIO
N B
QU
ESTI
ON
2
2.1
The
diag
ram
bel
ow s
how
s th
e pr
oces
s of
pro
tein
syn
thes
is.
2.1.
1Id
entif
y th
e fo
llow
ing:
(a)
(b)
Mol
ecul
e X
Org
anel
le Y
(1)
(1)
2.1.
2Id
entif
y th
e ni
troge
nous
bas
e la
belle
d:
(a)
(b)
1 3
(1)
(1)
2.1.
3
2.1.
4
Des
crib
e th
e ro
le o
f DN
A d
urin
g tra
nscr
iptio
n.
Des
crib
e th
e pa
rt of
pro
tein
syn
thes
is s
how
n as
pro
cess
W,w
hich
oc
curs
at o
rgan
elle
Y.
(3)
(4)
X
A U
G C
C A
A G
AY
Z
Proc
ess
V
Proc
ess
W1
2 3
S A U
G C
CA
A G
A

Appendix 2
Mind the Gap appEnDix 2 153Life Sciences capS
Life
Sci
ence
s/P
29
DBE
/201
4N
SC –
Gra
de 1
2 Ex
empl
ar
Cop
yrig
ht re
serv
edPl
ease
turn
ove
r
2.1.
5Th
e ta
ble
belo
w s
how
s th
e am
ino
acid
s th
at c
orre
spon
d w
ith
diffe
rent
DN
A c
odes
.
Writ
e do
wn
the
corre
ct s
eque
nce
of a
min
o ac
ids
code
d fo
r by
st
ruct
ure
Sin
the
diag
ram
on th
e pr
evio
us p
age.
(3)
(14)
2.2
The
phyl
ogen
etic
tree
bel
ow s
how
s on
e in
terp
reta
tion
of th
e or
igin
of h
uman
s.
The
dotte
d lin
es i
ndic
ate
the
poss
ible
evo
lutio
nary
rel
atio
nshi
ps,
and
the
verti
cal b
ars
show
the
perio
d du
ring
whi
ch th
e or
gani
sms
are
belie
ved
to h
ave
exis
ted
on e
arth
.
2.2.
1
2.2.
2
Use
th
e di
agra
m
to
iden
tify
ON
E
orga
nism
th
at
may
ha
ve
com
pete
d w
ith H
omo
heid
elbe
rgen
sis
for r
esou
rces
.
Iden
tify
the
com
mon
anc
esto
r th
at g
ave
rise
to b
oth
Par
anth
ropu
san
dH
omo.
(1)
(1)
AM
INO
AC
IDD
NA
CO
DE
Arg
inin
eTC
TM
ethi
onin
eTA
CG
lyci
neG
GT H
omo
sapi
ens
Hom
one
ande
rthal
ensi
s
Hom
o ha
bilis
Par
anth
ropu
sbo
isei
Hom
o he
idel
berg
ensi
s
Par
anth
ropu
sro
bust
usH
omo
erga
ster
Hom
o er
ectu
s
Par
anth
ropu
sae
thio
picu
s
Aus
tralo
pith
ecus
afric
anus A
ustra
lopi
thec
usaf
aren
sis
Aus
tralo
pith
ecus
anam
ensi
s
Pres
ent
1 M
YA
2 M
YA
3 M
YA
4 M
YA
5 M
YA
KEY
:
MYA
= M
illio
n Ye
ars
Ago
Life
Sci
ence
s/P
210
DBE
/201
4N
SC –
Gra
de 1
2 Ex
empl
ar
Cop
yrig
ht re
serv
edPl
ease
turn
ove
r
2.2.
3(a
)
(b)
For w
hat p
erio
d of
tim
e di
d A
.afri
canu
sex
ist o
n E
arth
? Sh
ow
allw
orki
ng.
Nam
e O
NE
pie
ce o
f ev
iden
ce t
hat
coul
d be
use
d to
pro
ve
that
A.
afric
anus
exis
ted
durin
g th
e tim
e pe
riod
calc
ulat
ed in
Q
UE
STI
ON
2.2
.3(a
).
(3)
(1)
2.2.
4(a
)
(b)
Whi
ch o
rgan
ism
, H.e
rgas
ter
or H
.nea
nder
thal
ensi
s, is
mor
e cl
osel
y re
late
d to
mod
ern-
day
hum
ans?
Exp
lain
you
r ans
wer
toQ
UE
STIO
N 2
.2.4
(a) u
sing
info
rmat
ion
inth
e di
agra
m.
(1)
(2)
(9)
2.3
The
diag
ram
bel
ow s
how
s th
e re
sult
of a
bnor
mal
mei
osis
, sta
rting
with
a c
ell
show
ing
chro
mos
ome
pair
21.
2.3.
1
2.3.
2
2.3.
3
2.3.
4
Exp
lain
the
num
ber
of c
hrom
osom
es p
rese
nt i
n sp
erm
Ran
d sp
erm
T.
How
man
y co
pies
of c
hrom
osom
e 21
wou
ld y
ou e
xpec
t in
a no
rmal
ga
met
e?
Wha
t ge
netic
dis
orde
r w
ill r
esul
t if
sper
m U
ferti
lises
a n
orm
al
ovum
?
Des
crib
e TW
O
way
s in
w
hich
m
eios
is
cont
ribut
es
to
gene
tic
varia
tion.
(3)
(1)
(1)
(7)
(12)
Spe
rm R
Spe
rm S
Spe
rm T
Spe
rm U

Appendix 2
154 appEnDix 2 Mind the Gap Life Sciences capS
Life
Sci
ence
s/P
211
DBE
/201
4N
SC –
Gra
de 1
2 Ex
empl
ar
Cop
yrig
ht re
serv
edPl
ease
turn
ove
r
2.4
Stu
dy th
e di
agra
ms
belo
w s
how
ing
stru
ctur
es o
fdiff
eren
t org
anis
ms.
2.4.
1
2.4.
2
Whi
ch d
iagr
am r
epre
sent
s a
stru
ctur
e th
at i
s an
alog
ous
to t
he
stru
ctur
e in
Dia
gram
4?
Writ
e do
wn
the
num
bers
of a
ny T
WO
dia
gram
s th
at r
epre
sent
ho
mol
ogou
s st
ruct
ures
.
(1)
(2)
2.4.
3W
hat i
nfor
mat
ion
do a
nalo
gous
and
hom
olog
ous
stru
ctur
es p
rovi
de
abou
t evo
lutio
n?(2
)(5
)[4
0]
Hum
an li
mb
But
terfl
y w
ing
Bat
win
g
Dia
gram
2D
iagr
am 3
Dia
gram
4
Wha
le li
mb
Dia
gram
1
Life
Sci
ence
s/P
212
DBE
/201
4N
SC –
Gra
de 1
2 Ex
empl
ar
Cop
yrig
ht re
serv
edPl
ease
turn
ove
r
QU
ESTI
ON
3
3.1
Sci
entis
ts in
vest
igat
ed th
e re
sist
ance
of m
osqu
itos
to D
DT.
The
follo
win
g st
eps
wer
e fo
llow
ed:
•Th
ey c
aptu
red
a sa
mpl
e of
mos
quito
s fro
m th
e en
viro
nmen
t.•
The
mos
quito
s w
ere
then
exp
osed
to a
sta
ndar
d do
se o
f DD
T (4
% D
DT
for1
hour
) in
the
labo
rato
ry.
•Th
e nu
mbe
r of m
osqu
itos
that
die
d w
as c
ount
ed.
•Th
ose
that
sur
vive
d w
ere
left
to re
prod
uce.
•
A s
ampl
e w
as ta
ken
from
this
pop
ulat
ion
ever
y tw
o m
onth
s an
d th
e sa
me
proc
edur
e w
as fo
llow
ed fo
r a p
erio
d of
16
mon
ths.
The
resu
lts a
re s
how
n in
the
tabl
e be
low
.
TIM
E (IN
MO
NTH
S)M
OR
TALI
TY O
F M
OSQ
UIT
OES
(%
)0
952
874
806
698
6010
5412
3514
2716
22
3.1.
1
3.1.
2
3.1.
3
3.1.
4
3.1.
5
3.1.
6
Iden
tify
the:
(a)
Inde
pend
ent v
aria
ble
(b)
Dep
ende
nt v
aria
ble
Form
ulat
e a
hypo
thes
is fo
r thi
s in
vest
igat
ion.
Dra
w
a lin
e gr
aph
to
show
ho
w
the
mor
talit
y of
mos
quito
es
chan
ged
over
the
perio
d of
the
inve
stig
atio
n du
e to
the
appl
icat
ion
of D
DT.
Sta
teTW
O f
acto
rs,
othe
r th
an t
hose
men
tione
d, t
hat
shou
ld b
e co
ntro
lled
in th
is in
vest
igat
ion.
Sta
te T
WO
way
s in
whi
ch th
e sc
ient
ists
cou
ld im
prov
e th
e re
liabi
lity
of th
eir r
esul
ts.
Exp
lain
, in
term
s of
nat
ural
sel
ectio
n, h
ow m
osqu
itoes
may
dev
elop
re
sist
ance
to D
DT.
(1)
(1)
(3)
(6)
(2)
(2)
(8)
(23)

Appendix 2
Mind the Gap appEnDix 2 155Life Sciences capS
Life
Sci
ence
s/P
213
DBE
/201
4N
SC –
Gra
de 1
2 Ex
empl
ar
Cop
yrig
ht re
serv
edPl
ease
turn
ove
r
3.2
Stu
dy t
he t
able
bel
ow,
whi
ch in
dica
tes
som
e of
the
hom
inid
fos
sils
fou
nd in
di
ffere
nt p
arts
of t
he w
orld
.
SPEC
IES
AR
EAW
HER
EIT
WAS
FO
UN
DPE
RIO
D O
F EX
ISTE
NC
E
Aus
tralo
pith
ecus
afa
rens
isE
aste
rn A
frica
3,4–
2,8
mya
Aus
tralo
pith
ecus
afri
canu
sS
outh
ern
Afric
a2,
1–2,
8 m
yaA
ustra
lopi
thec
us s
edib
aS
outh
ern
Afric
a2,
0–1,
9 m
yaH
omo
habi
lisS
ub-S
ahar
an (A
frica
)2,
3–1,
4 m
yaH
omo
erec
tus
Afric
a, E
urop
e, A
sia
1,5–
0,2
mya
Hom
o he
idel
berg
ensi
sE
urop
e, C
hina
0,6–
0,35
mya
Hom
o ne
ande
rthal
ensi
sE
urop
e, W
este
rn A
sia
0,
35–0
,03
mya
Hom
o sa
pien
sW
orld
wid
e
0
,2 m
ya–p
rese
nt[A
dapt
ed fr
om T
he E
volu
tiona
ry R
oad,
Jam
ie S
hree
ve, N
atio
nal G
eogr
aphi
c, J
uly
2010
]
3.2.
1
3.2.
2
Exp
lain
why
the
info
rmat
ion
in th
e ta
ble
supp
orts
the
'Out
of A
frica
' hy
poth
esis
.
Des
crib
e ho
w th
e an
alys
is o
f mito
chon
dria
l DN
A is
use
d to
sup
port
the
'Out
of A
frica
' hyp
othe
sis.
(2)
(3)
(5)
3.3
The
pedi
gree
dia
gram
bel
ow s
how
s th
e in
herit
ance
of D
alto
nism
in
a fa
mily
. D
alto
nism
(re
d-gr
een
colo
ur-b
lindn
ess)
is
se
x-lin
ked.
Th
e al
lele
for
Dal
toni
sm i
s re
cess
ive
to t
he a
llele
for
nor
mal
colo
ur v
isio
n.
3.3.
1U
se t
he s
ymbo
ls X
D,
Xdan
d Y
to s
tate
the
gen
otyp
e of
the
fo
llow
ing:
(a)
(b)
Indi
vidu
al 2
Indi
vidu
al 3
(2)
(2)
3.3.
2
3.3.
3
How
man
y fa
mily
mem
bers
not
affe
cted
by
Dal
toni
sm a
re d
efin
itely
ca
rrier
s?
Use
a ge
netic
cro
ss t
o de
term
ine
the
poss
ible
gen
otyp
es a
nd
phen
otyp
es o
f th
e of
fspr
ing
that
may
be
form
ed b
y in
divi
dual
s 5
and
6.
(2)
(6)
(12)
TOTA
L SE
CTI
ON
B:
[40]
80
KEY
:
Nor
mal
mal
e
C
olou
r-blin
d m
ale
N
orm
al fe
mal
e
C
olou
r-blin
d fe
mal
e
12
34
56
Life
Sci
ence
s/P
214
DBE
/201
4N
SC –
Gra
de 1
2 Ex
empl
ar
Cop
yrig
ht re
serv
ed
SEC
TIO
N C
QU
ESTI
ON
4
It is
thou
ght t
hat m
oder
n hu
man
s ev
olve
d gr
adua
lly fr
om a
pe-li
ke b
eing
s ov
er m
illion
s of
yea
rs th
roug
h sp
ecia
tion.
Des
crib
e ho
w a
sin
gle
spec
ies
can
form
new
spe
cies
,and
exp
lain
how
the
diffe
renc
es
in t
he s
kulls
and
oth
er p
arts
of
the
skel
eton
of
prim
itive
ape
-like
bei
ngs
and
mod
ern
hum
ans
supp
ort t
he id
ea th
at th
e ge
nera
l tre
nd in
hum
an e
volu
tion
has
been
tow
ards
bi
peda
lism
and
a c
hang
e in
die
t fro
m ra
w fo
od to
coo
ked
food
.
C
onte
nt:
Syn
thes
is:
(17)
(3)
(20)
NO
TE:
NO
mar
ks w
ill be
aw
arde
d fo
r ans
wer
s in
the
form
of f
low
cha
rts o
r dia
gram
s.
TOTA
L SE
CTI
ON
C:
GR
AN
D T
OTA
L:20 15
0

Appendix 2
156 appEnDix 2 Mind the Gap Life Sciences capS
Life
Sci
ence
s/P
2 2
D
BE/
2014
NSC
– G
rade
12
Exem
plar
– M
emor
andu
m
Cop
yrig
ht re
serv
ed
Pl
ease
turn
ove
r
PRIN
CIP
LES
REL
ATED
TO
MA
RK
ING
LIF
E SC
IEN
CES
1.
If
mor
e in
form
atio
n th
an m
arks
allo
cate
d is
giv
en
Sto
p m
arki
ng w
hen
max
imum
mar
ks is
reac
hed
and
put a
wav
y lin
e an
d 'm
ax' i
n th
e rig
ht-h
and
mar
gin.
2.
If,
for e
xam
ple,
thre
e re
ason
s ar
e re
quire
d an
d fiv
e ar
e gi
ven
Mar
k th
e fir
st th
ree
irres
pect
ive
of w
heth
er a
ll or
som
e ar
e co
rrect
/inco
rrect
. 3.
If
who
le p
roce
ss is
giv
en w
hen
only
a p
art o
f it i
s re
quire
d R
ead
all a
nd c
redi
t the
rele
vant
par
t. 4.
If
com
paris
ons
are
aske
d fo
r but
des
crip
tions
are
giv
en
Acc
ept i
f the
diff
eren
ces/
sim
ilarit
ies
are
clea
r. 5.
If
tabu
latio
n is
requ
ired
but p
arag
raph
s ar
e gi
ven
Can
dida
tes
will
lose
mar
ks fo
r not
tabu
latin
g.
6.
If di
agra
ms
are
give
n w
ith a
nnot
atio
ns w
hen
desc
riptio
ns a
re re
quire
d C
andi
date
s w
ill lo
se m
arks
. 7.
If
flow
cha
rts
are
give
n in
stea
d of
des
crip
tions
C
andi
date
s w
ill lo
se m
arks
. 8.
If
sequ
ence
is m
uddl
ed a
nd li
nks
do n
ot m
ake
sens
e W
here
seq
uenc
e an
d lin
ks a
re c
orre
ct,
cred
it. W
here
seq
uenc
e an
d lin
ks a
re
inco
rrect
, do
not c
redi
t. If
sequ
ence
and
link
s be
com
e co
rrect
aga
in, r
esum
e cr
edit.
9.
N
on-r
ecog
nise
d ab
brev
iatio
ns
Acc
ept
if fir
st d
efin
ed i
n an
swer
. If
not
defin
ed,
do n
ot c
redi
t th
e un
reco
gnis
ed
abbr
evia
tion
but c
redi
t the
rest
of t
he a
nsw
er if
cor
rect
.
10
. W
rong
num
berin
g If
answ
er fi
ts in
to th
e co
rrect
seq
uenc
e of
que
stio
ns b
ut th
e w
rong
num
ber i
s gi
ven,
it
is a
ccep
tabl
e.
11
. If
lang
uage
use
d ch
ange
s th
e in
tend
ed m
eani
ng
D
o no
t acc
ept.
12.
Spel
ling
erro
rs
If re
cogn
isab
le, a
ccep
t the
ans
wer
, pro
vide
d it
does
not
mea
n so
met
hing
els
e in
Life
S
cien
ces
or if
it is
out
of c
onte
xt.
13.
If co
mm
on n
ames
are
giv
en in
term
inol
ogy
Acc
ept,
prov
ided
it w
as a
ccep
ted
at th
e na
tiona
l mem
o di
scus
sion
mee
ting.
14
. If
only
the
lette
r is
aske
d fo
r but
onl
y th
e na
me
is g
iven
(and
vic
e ve
rsa)
D
o no
t cre
dit.

Appendix 2
Mind the Gap appEnDix 2 157Life Sciences capS
Life
Sci
ence
s/P
2 3
D
BE/
2014
NSC
– G
rade
12
Exem
plar
– M
emor
andu
m
Cop
yrig
ht re
serv
ed
Pl
ease
turn
ove
r
15.
If un
its a
re n
ot g
iven
in m
easu
rem
ents
Can
dida
tes
will
lose
mar
ks. M
emor
andu
m w
ill a
lloca
te m
arks
for u
nits
sep
arat
ely.
16
. B
e se
nsiti
ve to
the
sens
e of
an
answ
er, w
hich
may
be
stat
ed in
a d
iffer
ent w
ay.
17.
Cap
tion
A
ll illu
stra
tions
(dia
gram
s, g
raph
s, ta
bles
, etc
.) m
ust h
ave
a ca
ptio
n.
18.
Cod
e-sw
itchi
ng o
f offi
cial
lang
uage
s (te
rms
and
conc
epts
) A
sin
gle
wor
d or
two
that
app
ear(s
) in
any
offi
cial
lang
uage
oth
er th
an th
e le
arne
rs'
asse
ssm
ent
lang
uage
use
d to
the
gre
ates
t ex
tent
in
his/
her
answ
ers
shou
ld b
e cr
edite
d if
it is
cor
rect
. A
mar
ker
that
is p
rofic
ient
in t
he r
elev
ant
offic
ial l
angu
age
shou
ld b
e co
nsul
ted.
Thi
s is
app
licab
le to
all
offic
ial l
angu
ages
. 19
. C
hang
es to
the
mem
oran
dum
N
o ch
ange
s m
ust
be m
ade
to t
he m
emor
anda
with
out
cons
ultin
g th
e pr
ovin
cial
in
tern
al m
oder
ator
who
in tu
rn w
ill co
nsul
t with
the
natio
nal i
nter
nal m
oder
ator
(an
d th
e U
mal
usi m
oder
ator
s w
here
nec
essa
ry).
20.
Offi
cial
mem
oran
da
Onl
y m
emor
anda
bea
ring
the
sign
atur
es o
f the
nat
iona
l int
erna
l mod
erat
or a
nd th
e U
mal
usi m
oder
ator
s an
d di
strib
uted
by
the
Nat
iona
l Dep
artm
ent o
f Bas
ic E
duca
tion
via
the
prov
ince
s m
ust b
e us
ed.
Life
Sci
ence
s/P
2 4
D
BE/
2014
NSC
– G
rade
12
Exem
plar
– M
emor
andu
m
Cop
yrig
ht re
serv
ed
Pl
ease
turn
ove
r
SEC
TIO
N A
Q
UES
TIO
N 1
1.
1 1.
1.1
1.1.
2 1.
1.3
1.1.
4 1.
1.5
1.1.
6 1.
1.7
1.1.
8 1.
1.9
1.1.
10
A
B
A
A
D
C
D
B
B
B
(
10 x
2)
(2
0)
1.2
1.2.
1 R
eces
sive
1.2.
2 Lo
cus
1.2.
3 P
heno
type
1.2.
4 A
utos
omes
1.2.
5 1.
2.6
Gen
etic
eng
inee
ring
/DN
A m
anip
ulat
ion/
B
iote
chno
logy
/DN
A re
com
bina
tion
Chr
omat
ids
(6
x 1
)
(6
) 1.
3 1.
3.1
1.3.
2 1.
3.3
1.3.
4 1.
3.5
1.3.
6 1.
3.7
1.3.
8
Bot
h A
and
B
A
onl
y
B
onl
y
A
onl
y
B
onl
y
A o
nly
N
one
B
onl
y
(8 x
2)
(1
6)
1.4
1.4.
1 1.
4.2
1.4.
3 1.
4.4
(a)
RrY
y
(b)
rryy
R
Y, R
y, rY
, ry
(a
) W
rinkl
ed, y
ello
w
see
ds
(b)
Rou
nd, y
ello
w
see
ds
R
RY
Y
(1
) (1
) (2
) (1
) (1
) (2
) (8
) [5
0]

Appendix 2
158 appEnDix 2 Mind the Gap Life Sciences capS
Life
Sci
ence
s/P
2 5
D
BE/
2014
NSC
– G
rade
12
Exem
plar
– M
emor
andu
m
Cop
yrig
ht re
serv
ed
Pl
ease
turn
ove
r
QU
ESTI
ON
2
2.1
2.1.
1 (a
) D
NA
(b)
Rib
osom
e
(1
) (1
)
2.1.
2 (a
) G
(b
) U
(1)
(1)
2.
1.3
2.1.
4 2.
1.5
− D
NA
cod
es fo
r a p
artic
ular
pro
tein
but
can
not l
eave
nuc
leus
−
One
stra
nd o
f DN
A is
use
d as
a te
mpl
ate
−
to fo
rm m
RN
A
− A
ccor
ding
to th
e co
dons
on
mR
NA
−
tRN
A m
olec
ules
with
mat
chin
g an
ticod
ons
−
brin
g th
e re
quire
d am
ino
acid
s to
the
ribos
ome
−
This
is c
alle
d tra
nsla
tion
−
The
amin
o ac
ids
beco
me
atta
ched
by
pept
ide
bond
s
− to
form
the
requ
ired
prot
ein
(any
4)
Met
hion
ine,
G
lyci
ne,
Arg
inin
e (i
n th
e co
rrect
ord
er)
(3
) (4
) (3
) (1
4)
2.2
2.2.
1 2.
2.2
H. e
rect
us
A
. afa
rens
is
(1
) (1
)
2.
2.3
2.2.
4
(a)
3 m
ya –
2,4
mya
= 0
,6
my
O
R
3 m
ya –
2,3
mya
= 0
,7
my
(b
) F
ossi
ls
(a
) H
. nea
nder
thal
ensi
s
(b)
H. n
eand
erth
alen
sis
and
H. s
apie
ns s
hare
a c
omm
on
an
cest
or
O
R
Bot
h ev
olve
d fr
om H
hei
delb
erge
nsis
(3
) (1
) (1
) (2
) (2
) (9
)
Life
Sci
ence
s/P
2 6
D
BE/
2014
NSC
– G
rade
12
Exem
plar
– M
emor
andu
m
Cop
yrig
ht re
serv
ed
Pl
ease
turn
ove
r
2.3
2.3.
1
− Th
e ho
mol
ogou
s ch
rom
osom
e pa
ir
−
does
not
sep
arat
e/n
on-d
isju
nctio
n
− du
ring
anap
hase
1
(3
) 2.
4 2.
4.1
Dia
gram
1
(1)
2.
4.2
Dia
gram
s 2
& 3
/ 2 &
4/ 3
& 4
(2)
2.
4.3
Ana
logo
us s
truct
ures
sho
w th
at tw
o or
gani
sms
evol
ved
inde
pend
ently
of e
ach
othe
r
Hom
olog
ous
stru
ctur
es s
how
that
two
orga
nism
s ha
ve a
com
mon
an
cest
or
.
(2
) (5
) [4
0]
2.
3.2
1
(1
)
2.
3.3
Dow
n sy
ndro
me
(1)
2.
3.4
− D
urin
g cr
ossi
ng o
ver
−
in P
roph
ase
1
− se
gmen
ts o
f chr
omat
ids
of h
omol
ogou
s ch
rom
osom
es
−
are
exch
ange
d
− le
adin
g to
eac
h ga
met
e ha
ving
a m
ix o
f ge
netic
mat
eria
l fro
m
both
par
ents
(
any
4)
− D
urin
g M
etap
hase
I/II
−
each
pai
r of h
omol
ogou
s ch
rom
osom
es
/eac
h ch
rom
osom
e −
may
line
up
in d
iffer
ent w
ays
on
the
equa
tor o
f the
spi
ndle
−
allo
win
g th
e ga
met
es to
hav
e di
ffere
nt c
ombi
natio
ns o
f mat
erna
l an
d pa
tern
al c
hrom
osom
es
(
any
3)
(7
) (1
2)

Appendix 2
Mind the Gap appEnDix 2 159Life Sciences capS
Life
Sci
ence
s/P
2 7
D
BE/
2014
NSC
– G
rade
12
Exem
plar
– M
emor
andu
m
Cop
yrig
ht re
serv
ed
Pl
ease
turn
ove
r
3.1
3.1.
1 (a
) T
ime
(b
) M
orta
lity
of m
osqu
itoes
(1
) (1
)
3.1.
2 3.
1.3
Mos
quito
Mor
talit
y du
e to
DD
T/R
esis
tanc
e of
mos
quito
s to
DD
T w
ill d
ecre
ase
ove
r tim
e
O
R
Mos
quito
Mor
talit
y du
e to
DD
T/R
esis
tanc
e of
mos
quito
s to
DD
T w
ill in
crea
se
ove
r tim
e
O
R
Mos
quito
Mor
talit
y du
e to
DD
T/R
esis
tanc
e of
mos
quito
s to
DD
T w
ill re
mai
n th
e sa
me
ove
r tim
e
(3
)
NO
TE:
If th
e w
rong
type
of g
raph
is d
raw
n:
- M
arks
will
be
lost
for '
corre
ct ty
pe o
f gra
ph'
If ax
es a
re tr
ansp
osed
: -
Mar
ks w
ill b
e lo
st fo
r lab
ellin
g of
X-a
xis
and
Y-ax
is
QU
ESTI
ON
3
Tim
e (m
onth
s)
Life
Sci
ence
s/P
2 8
D
BE/
2014
NSC
– G
rade
12
Exem
plar
– M
emor
andu
m
Cop
yrig
ht re
serv
ed
Pl
ease
turn
ove
r
Mar
k al
loca
tion
for t
he g
raph
Crit
erio
n El
abor
atio
n M
ark
Type
of g
raph
Li
ne g
raph
dra
wn
1 C
aptio
n In
clud
es b
oth
varia
bles
: 'Pe
rcen
tage
mor
talit
y of
mos
quito
es'
and
'Tim
e'
1
X-a
xis
Appr
opria
te s
cale
AN
D
Cor
rect
labe
l and
uni
ts fo
r X-a
xis:
Tim
e (m
onth
s)
1
Y-ax
is
Appr
opria
te s
cale
AN
D
Cor
rect
labe
l and
uni
ts fo
r Y-a
xis:
Mor
talit
y of
mos
quito
es (%
) 1
Plot
ting
of
poin
ts
1–8
poin
ts p
lotte
d co
rrect
ly –
1 m
ark
All 9
poi
nts
plot
ted
corre
ctly
– 2
mar
ks
2
(6
)
3.1.
4 3.
1.5
3.1.
6
− S
ame
spec
ies
of m
osqu
ito
−
Iden
tical
la
bora
tory
co
nditi
ons
for
the
full
perio
d of
th
e in
vest
igat
ion
−
The
sam
e sc
ient
ist
mus
t be
use
d fo
r th
e fu
ll pe
riod
of t
he
inve
stig
atio
n
−
Mos
quito
s sh
ould
no
t be
hu
rt fo
r th
e fu
ll pe
riod
of
the
inve
stig
atio
n
(M
ark
first
TW
O o
nly)
(any
2)
− U
se a
larg
er s
ampl
e of
mos
quito
es
−
Rep
eat t
he in
vest
igat
ion
−
Take
man
y sa
mpl
es e
ach
time
and
calc
ulat
e th
e av
erag
e m
orta
lity
(M
ark
first
TW
O o
nly)
(any
2)
− M
ore
mos
quito
es a
re p
rodu
ced
than
can
sur
vive
.
− Th
ere
is g
enet
ic v
aria
tion
am
ongs
t the
mos
quito
es.
− S
ome
mos
quito
es m
ay b
e na
tura
lly re
sist
ant t
o D
DT.
−
Whe
n D
DT
is a
pplie
d
− th
ose
that
are
resi
stan
t sur
vive
−
and
they
then
repr
oduc
e,
−
pass
ing
the
alle
le fo
r res
ista
nce
to th
e of
fspr
ing.
−
Thos
e th
at a
re n
ot re
sist
ant,
die
−
and
thei
r alle
les
are
lost
from
the
popu
latio
n.
−
The
num
ber
of D
DT-
resi
stan
t m
osqu
itoes
the
refo
re i
ncre
ases
ov
er th
e ge
nera
tions
.
(an
y 8)
(2
) (2
) (8
) (2
3)
3.2
3.2.
1 Th
e ol
dest
foss
ils o
f hum
an a
nces
tors
wer
e on
ly fo
und
in A
frica
(2)
3.
2.2
− M
itoch
ondr
ial D
NA
is p
asse
d do
wn
from
mot
her t
o ch
ild
−
mut
atio
ns
on
the
mito
chon
dria
l DN
A
− w
ere
trace
d to
an
ance
stra
l fem
ale
that
exi
sted
in A
frica
(3
) (5
)

Appendix 2
160 appEnDix 2 Mind the Gap Life Sciences capS
Life
Sci
ence
s/P
2 9
D
BE/
2014
NSC
– G
rade
12
Exem
plar
– M
emor
andu
m
Cop
yrig
ht re
serv
ed
Pl
ease
turn
ove
r
3.3.
3
P1
phen
otyp
e
Nor
mal
fem
ale
x
Nor
mal
mal
e
geno
type
XDXd
x
XD
Y
Mei
osis
G1
XD ,
Xd
x
XD ,
Y
Fe
rtilis
atio
n
XDXD
, XD
Xd ,
XD
Y,
Xd Y
F 1
gen
otyp
e
p
heno
type
2
norm
al fe
mal
es
1 no
rmal
m
ale
1 co
lour
-bl
ind
mal
e
P
aren
ts a
nd o
ffspr
ing
/P1
& F 1
M
eios
is a
nd fe
rtilis
atio
n
(an
y 6)
OR
P1/
pare
nt p
heno
type
G
rey
bodi
ed x
gre
y bo
died
gen
otyp
e
G
g
x
Gg
M
eios
is
Fe
rtilis
atio
n
F 1
g
enot
ype
phe
noty
pe
2 no
rmal
fem
ales
1
norm
al
mal
e 1
colo
ur-
blin
d m
ale
Par
ents
and
offs
prin
g/P
1 &
F 1
Mei
osis
and
ferti
lisat
ion
(
any
6)
TO
TAL
SEC
TIO
N B
:
(6)
(12)
[4
0]
80
3.3
3.3.
1
(a)
Xd Xd
(b
) X
DY
(2
) (2
)
3.
3.2
3
(2
)
ga
met
es
XD
Xd XD
XD
XD
XDXd
Y
XDY
Xd Y
1
mar
k fo
r cor
rect
gam
etes
1
mar
k fo
r cor
rect
gen
otyp
es
Life
Sci
ence
s/P
2 10
DB
E/20
14
N
SC –
Gra
de 1
2 Ex
empl
ar –
Mem
oran
dum
Cop
yrig
ht re
serv
ed
Pl
ease
turn
ove
r
SEC
TIO
N C
Q
UES
TIO
N 4
The
deve
lopm
ent o
f a n
ew s
peci
es
• If
a po
pula
tion
split
s in
to tw
o po
pula
tions
. •
Ther
e is
now
no
gene
flow
bet
wee
n th
e tw
o po
pula
tions
.
• S
ince
eac
h po
pula
tion
may
be
expo
sed
to d
iffer
ent e
nviro
nmen
tal c
ondi
tions
, •
Nat
ural
sel
ectio
n oc
curs
inde
pend
ently
in e
ach
of th
e tw
o po
pula
tions
•
such
tha
t th
e in
divi
dual
s of
the
tw
o po
pula
tions
bec
ome
very
diff
eren
t fro
m e
ach
othe
r
• ge
noty
pica
lly a
nd p
heno
typi
cally
. •
Eve
n if
the
two
popu
latio
ns w
ere
to m
ix a
gain
, •
they
will
not
be
able
to
repr
oduc
e w
ith e
ach
othe
r,
thus
bec
omin
g di
ffere
nt
spec
ies
(a
ny 5
) Th
e de
velo
pmen
t of b
iped
alis
m
• Th
e ba
ckw
ard
posi
tion
of th
e fo
ram
en m
agnu
m o
n th
e sk
ull
, •
the
narro
w p
elvi
s
• an
d th
e le
ss-c
urve
d sp
ine
•
indi
cate
s th
at th
e ap
e-lik
e be
ings
wer
e qu
adrip
edal
(an
y 3)
•
The
forw
ard
posi
tion
of th
e fo
ram
en m
agnu
m o
n th
e sk
ull
, •
the
wid
er p
elvi
s
• an
d th
e cu
rved
spi
ne
•
indi
cate
s th
at m
oder
n hu
man
s ar
e bi
peda
l
(a
ny 3
) C
hang
e in
the
diet
from
raw
food
to c
ooke
d fo
od
• Th
e la
rge
teet
h, e
spec
ially
the
cani
nes
•
as w
ell a
s th
e la
rge
and
long
jaw
s
• w
hich
mak
es th
e sk
ull p
rogn
atho
us
•
as w
ell a
s cr
ania
l/bro
w ri
dges
ass
ocia
ted
with
larg
e m
uscl
es th
at o
pera
te th
e ja
ws
•
indi
cate
tha
t th
e ap
e-lik
e be
ings
ate
raw
foo
d th
at r
equi
red
a gr
eat
amou
nt o
f pr
oces
sing
/tear
ing,
biti
ng a
nd c
hew
ing.
(
any
3)
• Th
e sm
alle
r tee
th, i
nclu
ding
the
cani
nes
•
as w
ell a
s th
e sm
alle
r jaw
siz
e
• w
hich
mak
es th
e sk
ull l
ess
prog
nath
ous
•
as w
ell
as t
he a
bsen
ce o
f cr
ania
l/bro
w r
idge
s du
e to
the
pre
senc
e of
sm
alle
r m
uscl
es fo
r che
win
g
• in
dica
te th
at m
oder
n hu
man
s re
ly o
n a
diet
of c
ooke
d fo
od th
at d
oes
not r
equi
re th
e sa
me
amou
nt o
f pro
cess
ing
/tear
ing,
biti
ng a
nd c
hew
ing.
(an
y 3)
Con
tent
: S
ynth
esis
:
(5
) (6
) (6
) (1
7)
(3)
(20)

Appendix 2
Mind the Gap appEnDix 2 161Life Sciences capS
Life
Sci
ence
s/P
1 11
DB
E/20
14
N
SC –
Gra
de 1
2 Ex
empl
ar –
Mem
oran
dum
Cop
yrig
ht re
serv
ed
ASS
ESSI
NG
TH
E PR
ESEN
TATI
ON
OF
THE
ESSA
Y
Rel
evan
ce
Logi
cal s
eque
nce
Com
preh
ensi
on
Onl
y in
form
atio
n re
gard
ing
deve
lopm
ent o
f a
new
spe
cies
, the
de
velo
pmen
t of
bipe
dalis
m a
nd c
hang
e in
di
et is
giv
en (n
o irr
elev
ant
info
rmat
ion)
.
Gen
eral
ly, t
he
deve
lopm
ent o
f a n
ew
spec
ies,
the
deve
lopm
ent
of b
iped
alis
m a
nd c
hang
e in
die
t are
exp
lain
ed
logi
cally
.
All
thre
e as
pect
s of
the
ques
tion
are
desc
ribed
co
rrect
ly.
TO
TAL
SEC
TIO
N C
: 20
G
RA
ND
TO
TAL:
15
0


The Mind the Gap study guide series assists you to make the leap by studying hard to achieve success in the Grade 12 exam.
This publication is not for sale.© Copyright Department of Basic Education www.education.gov.za Call Centre 0800 202 933