licili 11 IN .1 1 - Budget Archive
269
GRACE — FILE ARCOD! licil i 1 1 IN .1 1 c 1310oo05 53996 J AUSTRALIA '- PAYMENTS TO OR FOR THE STATES AND LOCAL GOVERNMENT AUTHORITIES 1974-75 PRESENTED BY THE HONOURABLE FRANK CREAN, M.P., TREASURER OF AUSTRALIA FOR THE INFORMATION OF HONOURABLE MEMBERS ON THE OCCASION OF THE BUDGET 1974.75 1974-75 BUDGET PAPER No. 7
-
Upload
khangminh22 -
Category
Documents
-
view
4 -
download
0
Transcript of licili 11 IN .1 1 - Budget Archive
GRACE —FILE ARCOD!
licili 11 IN .1 1 c 1310oo05 53996 J AUSTRALIA '-
PAYMENTS TO OR FOR THE STATES
AND LOCAL GOVERNMENT AUTHORITIES
1974-75
PRESENTED BY THE HONOURABLE FRANK CREAN, M.P.,
TREASURER OF AUSTRALIA FOR THE INFORMATION OF
HONOURABLE MEMBERS ON THE OCCASION OF THE BUDGET 1974.75
1974-75 BUDGET PAPER No. 7
1974-75 BUDGET PAPERS
No. 1 Budget Speech and Statements ($1.50) No. 2 Appropriation Bill (No. 1)1974-75 ($1.90) No. 3 Appropriation Bill (No. 2)1974-75 (40c) No. 4 Estimates of Receipts and Summary of
Estimated Expenditure 1974-75 ($2.90) No. 5 Civil Works Program 1974-75 ($1.60) No. 6 Government Securities on Issue at 30 June
1974 (80c) No. 7 Payments to or for the States and Local
Government Authorities 1974-75 ($2.40) No. 8 Urban and Regional Development 1974-75
(60c) No. 9 Australia's External Aid 1974-75 (25c) No. 10 National Income and Expenditure 1973-74
(40c) No. 11 National Accounting Estimates of Receipts
and Expenditure of Australian Government Authorities (20c)
No. 12 Income Tax Statistics (15c)
1974-75 BUDGET PAPER No. 7
PAYMENTS TO OR FOR THE STATES
AND LOCAL GOVERNMENT AUTHORITIES
1974-75
PRESENTED BY THE HONOURABLE FRANK CREAN, M.P.,
TREASURER OF AUSTRALIA FOR THE INFORMATION OF
HONOURABLE MEMBERS ON THE OCCASION OF THE BUDGET 1974-75
AUSTRALIAN GOVERNMENT PUBLISHING SERVICE CANBERRA 1974

Printed by Authority by the Government Printer of Australia
TABLE OF CONTENTS PAGE
Chapter I. Introduction .. .. .. .. .. .. 1 Chapter II. General Revenue Assistance
The Financial Assistance Grants .. .. .. .. 7 The Special Grants .. .. .. :. .. 19 Other General Revenue Assistance .. .. .. 22
Chapter III. General Purpose Capital Funds— State Government Loan Council Programs .. .. .. 26 Borrowing Programs for State Authorities .. .. .. 32
Chapter IV. Specific Purpose Payments— Assistance Related to State Debts .. .. .. .. 35 Defence .. .. .. .. .. .. 38 Education .. .. .. .. .. .. 39 Health.. .. .. .. .. .. .. 59 Social Security and Welfare .. .. .. .. 68 Aboriginal Advancement.. .. .. .. .. 73 Housing .. .. .. .. .. .. 75 Culture and Recreation . . .. .. .. .. 77 Urban and Regional Development n.e.c. and the Environment 79 Assistance for Local Government .. .. .. .. 85 Economic Services-
-Transport .. .. .. .. .. .. 86 —Water Supply and Electricity .. .. .. .. 95 —Industry Assistance .. .. .. .. .. 96 —Labour and Employment .. .. .. .. 108 —General Administrative . . . . .. .. 110
General Public Services . . .. .. .. .. 110 Natural Disaster Relief . . . . . . . . . . 111
Chapter V. Payments to or for Local Govermnent Authorities .. .. 115 Appendix I. Summary Tables .. .. .. .. .. .. 135 Appendix II. Part I. History of General Revenue Assistance .. .. 153
Part II. Tables of General Revenue Assistance .. . . 165 Appendix III. Tables of General Purpose Capital Funds .. .. .. 169 Appendix IV. Part I. History of Specific Purpose Payments—
Education .. .. .. .. .. .. 178 Health .. .. .. .. .. .. 182 Social Security and Welfare .. .. .. .. 182 Housing .. .. .. .. .. .. 183 Economic Services-
-Transport .. .. .. .. .. .. 185 —Water Supply and Electricity .. .. .. .. 190 —Industry Assistance .. .. .. .. .. 190
Part II. Tables of Specific Purpose Payments .. .. .. 195 111
TABLE OF CONTENTS
PAGE
Appendix V. Tables Relating to Advances to the States .. .. .. 221
Appendix VI. Tables of Payments and Loan Council Borrowings for each State 241
Index .. .. .. .. .. .. .. .. .. 261
No. TABLES
CHAPTER I. INTRODUCTION Payments to or for the States and State Government Loan Council Programs
1972-73 to 1974-75 .. .. .. .. .. .. 5 Functional Classification of Payments to or for the States and States' Loan
Council Programs .. .. .. .. .. .. 6
CHAPTER II. GENERAL REVENUE ASSISTANCE Reductions in Financial Assistance Grants Accompanying Transfer of
Tertiary Education .. .. .. .. .. .. 14 Calculation of Financial Assistance Grants for 1973-74 .. .. .. 17 Calculation of Financial Assistance Grants for 1974-75 (Estimated) .. 18 Financial Assistance Grants, 1959-60 to 1974-75 .. .. .. 19 Special Grants, 1968-69 to 1974-75 .. .. .. .. .. 21 General Revenue Assistance, Summary of, 1970-71 to 1974-75 .. .. 25
CHAPTER III. GENERAL PURPOSE CAPITAL FUNDS Transfer of Financial Responsibility for Tertiary Education—Agreed
Reductions to State Loan Council Programs .. .. .. 28 State Government Loan Council Programs, Comparison Between 1973-74
and 1974-75 .. .. .. .. .. .. .. 29 State Government Loan Council Programs, 1973-74 and 1974-75—State by
State Allocations .. .. .. .. .. .. 29
CHAPTER IV. SPECIFIC PURPOSE PAYMENTS Interest Payments on State Debts .. .. .. .. .. 36 Sinking Fund Payments under the Financial Agreement, 1965-66 to 1974-75 37 Debt Charges Assistance Grants, 1970-71 to 1974-75 .. .. .. 38 Housing for Servicemen, Advances for, 1971-72 to 1974-75 .. .. 39 Universities, Grants for, 1970-71 to 1974-75 .. .. .. .. 42 Colleges of Advanced Education and Teachers Colleges, Grants for, 1970-71
to 1974-75 .. .. .. .. .. .. .. 46 Technical Education, Grants for, 1970-71 to 1974-75 .. .. .. 48
iv
TABLES
No. PAGE
19. Schools, Grants to the States for, 1973-74 and 1974-75, by Program .. 55 20. Government and Non-Government Schools, Total Grants for, 1964-65 to
1974-75.. .. .. .. .. .. .. .. 56 21. Services for Children, Grants for, 1973-74 and 1974-75 .. .. 57 22. Child Migrant Education, Grants for, 1969-70 to 1974-75 .. .. 58 23. Education Research, Grants for, 1970-71 to 1974-75 .. .. .. 59 24. Mental Health Institutions, Grants for Capital Expenditures on, 1969-70 to
1973-74.. .. .. .. .. .. .. .. 60 25. Public Hospitals and Other Health Institutions, Capital Grants for Develop-
ment of, 1973-74 and 1974-75 .. .. .. .. .. 62 26. Nursing Homes, Grants for Capital Expenditures on, 1970-71 to 1974-75 62 27. Community Health Facilities, Grants for, 1973-74 and 1974-75 .. .. 63 28. Tuberculosis Hospitals, Grants for, 1970-71 to 1974-75.. .. .. 64 29. School Dental Scheme, Grants for, 1973-74 and 1974-75 .. .. 65 30. Health Education Campaigns, Grants for, 1970-71 to 1974-75 .. .. 65 31. Blood Transfusion Services, Grants for Recurrent Expenditures on, 1970-71
to 1974-75 .. .. .. .. .. .. .. 66 32. Health Planning Agencies, Grants for Recurrent Expenditures by, 1973-74
and 1974-75 .. .. .. .. .. .. .. 66 33. Disposal of Ships' Garbage, Grants for Capital Expenditures on, 1966-67 to
1974-75.. .. .. .. .. .. .. .. 67 34. Home Care Services, Grants for, 1969-70 to 1974-75 .. .. .. 68 35. Senior Citizens' Centres, Grants for, 1969-70 to 1974-75 .. .. 69 36. Paramedical Services, Grants for, 1971-72 to 1974-75 .. .. .. 70 37. Dwellings for Pensioners, Grants for Capital Expenditures on, 1969-70 to
1974-75.. .. .. .. .. .. .. .. 70 38. Deserted Wives, Grants for, 1967-68 to 1974-75 .. .. .. 71 39. Migrant Centres, Grants for Capital Expenditures on, 1970-71 to 1974-75 .. 72 40. Relief of Unemployment, Grants for, 1971-72 to 1973-74 .. .. 73 41. Aboriginal Advancement, Payments for, 1968-69 to 1974-75 .. .. 74 42. Housing, Advances for, 1972-73 to 1974-75 .. .. .. .. 77 43. Housing, Recurrent Grants for, 1971-72 to 1974-75 .. .. .. 77 44. National Estate, Grants for, 1973-74 and 1974-75 .. .. .. 78 45. Growth Centres and Related Projects, Payments for, 1973-74 and 1974-75 81 46. Area Improvement, Payments for, 1973-74 and 1974-75 .. .. 82 47. Land Acquisition and Development, Payments for, 1973-74 and 1974-75 .. 83 48. Sewerage Works, Payments for, 1973-74 and 1974-75 .. .. .. 85
V
TABLES
No. PAGE
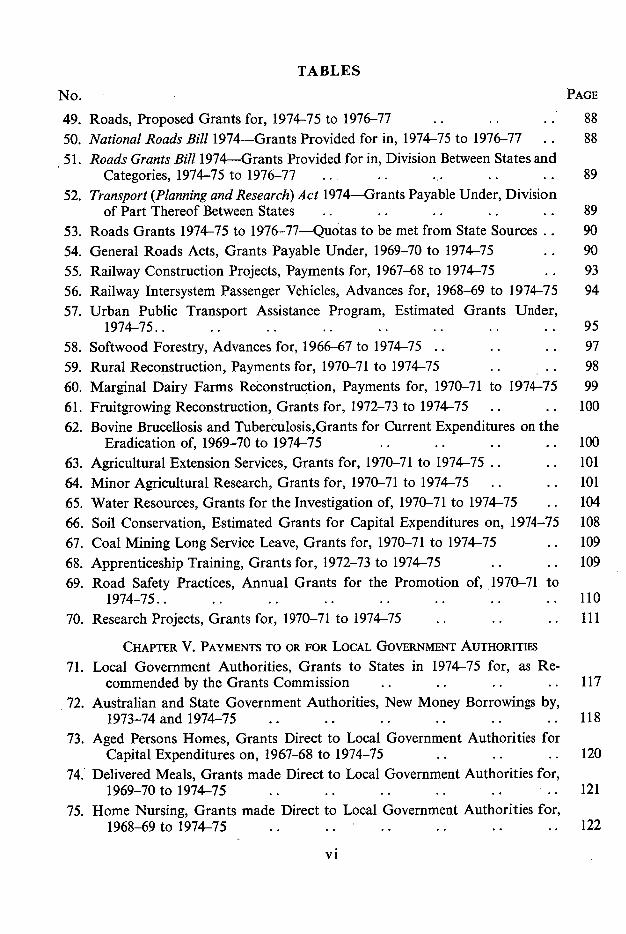
49. Roads, Proposed Grants for, 1974-75 to 1976-77 .. .. .. 88 50. National Roads Bill 1974—Grants Provided for in, 1974-75 to 1976-77 .. 88 51. Roads Grants Bill 1974—Grants Provided for in, Division Between States and
Categories, 1974-75 to 1976-77 ... .. ... .. .. 89 52. Transport (Planning and Research) Act 1974—Grants Payable Under, Division
of Part Thereof Between States .. .. .. .. .. 89 53. Roads Grants 1974-75 to 1976-77—Quotas to be met from State Sources .. 90 54. General Roads Acts, Grants Payable Under, 1969-70 to 1974-75 .. 90 55. Railway Construction Projects, Payments for, 1967-68 to 1974-75 .. 93 56. Railway Intersystem Passenger Vehicles, Advances for, 1968-69 to 1974-75 94 57. Urban Public Transport Assistance Program, Estimated Grants Under,
1974-75.. .. .. .. .. .. .. .. 95 58. Softwood Forestry, Advances for, 1966-67 to 1974-75 .. .. .. 97 59. Rural Reconstruction, Payments for, 1970-71 to 1974-75 .. .. 98 60. Marginal Dairy Farms Reôonstruction, Payments for, 1970-71 to 1974-75 99 61. Fruitgrowing Reconstruction, Grants for, 1972-73 to 1974-75 .. .. 100 62. Bovine Brucellosis and Tuberculosis,Grants for Current Expenditures on the
Eradication of, 1969-70 to 1974-75 .. .. .. .. 100 63. Agricultural Extension Services, Grants for, 1970-71 to 1974-75 .. .. 101 64. Minor Agricultural Research, Grants for, 1970-71 to 1974-75 .. .. 101 65. Water Resources, Grants for the Investigation of, 1970-71 to 1974-75 .. 104 66. Soil Conservation, Estimated Grants for Capital Expenditures on, 1974-75 108 67. Coal Mining Long Service Leave, Grants for, 1970-71 to 1974-75 .. 109 68. Apprenticeship Training, Grants for, 1972-73 to 1974-75 .. .. 109 69. Road Safety Practices, Annual Grants for the Promotion of, 1970-71 to
1974-75.. .. .. .. .. .. .. .. 110 70. Research Projects, Grants for, 1970-71 to 1974-75 .. .. .. 111
CHAPTER V. PAYMENTS TO OR FOR LOCAL GOVERNMENT AUTHORITIES
71. Local Government Authorities, Grants to States in 1974-75 for, as Re- commended by the Grants Commission .. .. .. .. 117
72. Australian and State Government Authorities, New Money Borrowings by, 1973-74 and 1974-75 .. .. .. .. .. .. 118
73. Aged Persons Homes, Grants Direct to Local Government Authorities for Capital Expenditures on, 1967-68 to 1974-75 .. .. .. 120
74. Delivered Meals, Grants made Direct to Local Government Authorities for, 1969-70 to 1974-75 .. .. .. .. .. .. 121
75. Home Nursing, Grants made Direct to Local Government Authorities for, 1968-69 to 1974-75 .. .. .. .. .. .. 122
vi
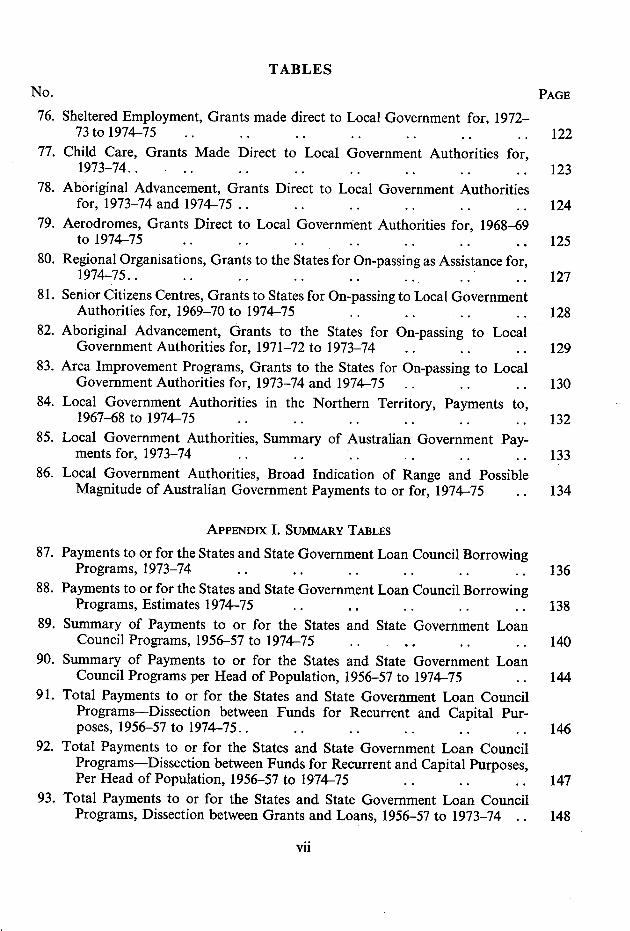
TABLES No. PAGE 76. Sheltered Employment, Grants made direct to Local Government for, 1972-
73to1974-75 .. .. .. .. .. .. .. 122 77. Child Care, Grants Made Direct to Local Government Authorities for,
1973-74.. .. .. .. .. .. .. .. 123 78. Aboriginal Advancement, Grants Direct to Local Government Authorities
for, 1973-74 and 1974-75 .. .. .. .. .. .. 124 79. Aerodromes, Grants Direct to Local Government Authorities for, 1968-69
to 1974-75 .. .. .. .. .. .. .. 125 80. Regional Organisations, Grants to the States for On-passing as Assistance for,
1974-75.. .. .. .. .. .. .. .. 127 81. Senior Citizens Centres, Grants to States for On-passing to Local Government
Authorities for, 1969-70 to 1974-75 .. .. .. .. 128 82. Aboriginal Advancement, Grants to the States for On-passing to Local
Government Authorities for, 1971-72 to 1973-74 .. .. .. 129 83. Area Improvement Programs, Grants to the States for On-passing to Local
Government Authorities for, 1973-74 and 1974-75 .. .. .. 130 84. Local Government Authorities in the Northern Territory, Payments to,
1967-68 to 1974-75 .. .. .. .. .. .. 132 85. Local Government Authorities, Summary of Australian Government Pay-
ments for, 1973-74 .. .. .. . .. .. 133 86. Local Government Authorities, Broad Indication of Range and Possible
Magnitude of Australian Government Payments to or for, 1974-75 .. 134
APPENDIX I. SUMMARY TABLES 87. Payments to or for the States and State Government Loan Council Borrowing
Programs, 1973-74 .. .. .. .. .. .. 136 88. Payments to or for the States and State Government Loan Council Borrowing
Programs, Estimates 1974-75 .. .. .. .. .. 138 89. Summary of Payments to or for the States and State Government Loan
Council Programs, 1956-57 to 1974-75 .. .. .. .. 140 90. Summary of Payments to or for the States and State Government Loan
Council Programs per Head of Population, 1956-57 to 1974-75 .. 144 91. Total Payments to or for the States and State Government Loan Council
Programs—Dissection between Funds for Recurrent and Capital Pur- poses, 1956-57 to 1974-75.. .. .. .. .. .. 146
92. Total Payments to or for the States and State Government Loan Council Programs—Dissection between Funds for Recurrent and Capital Purposes, Per Head of Population, 1956-57 to 1974-75 .. .. .. 147
93. Total Payments to or for the States and State Government Loan Council Programs, Dissection between Grants and Loans, 1956-57 to 1973-74 .. 148
VII
TABLES No. PAGE
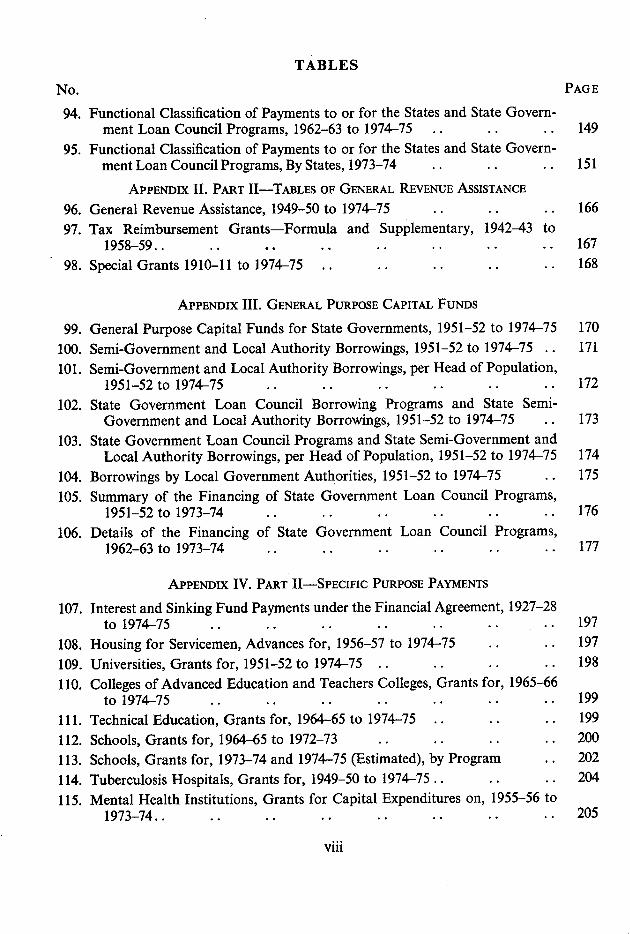
Functional Classification of Payments to or for the States and State Govern-
ment Loan Council Programs, 1962-63 to 1974-75 .. .. .. 149 Functional Classification of Payments to or for the States and State Govern-
ment Loan Council Programs, By States, 1973-74 .. .. .. 151
APPENDIX II. PART II-TABLES OF GENERAL REVENUE ASSISTANCE General Revenue Assistance, 1949-50 to 1974-75 .. .. .. 166 Tax Reimbursement Grants—Formula and Supplementary, 1942-43 to
1958-59.. .. .. .. .. .. .. .. 167 Special Grants 1910-11 to 1974-75 .. .. .. .. .. 168
APPENDIX III. GENERAL PURPOSE CAPITAL FUNDS
99. General Purpose Capital Funds for State Governments, 1951-52 to 1974-75 170 100. Semi-Government and Local Authority Borrowings, 1951-52 to 1974-75 .. 171 101. Semi-Government and Local Authority Borrowings, per Head of Population,
1951-52 to 1974-75 .. .. .. .. .. .. 172 102. State Government Loan Council Borrowing Programs and State Semi-
Government and Local Authority Borrowings, 1951-52 to 1974-75 .. 173 103. State Government Loan Council Programs and State Semi-Government and
Local Authority Borrowings, per Head of Population, 1951-52 to 1974-75 174 104. Borrowings by Local Government Authorities, 1951-52 to 1974-75 .. 175 105. Summary of the Financing of State Government Loan Council Programs,
1951-52 to 1973-74 .. .. .. .. .. .. 176 106. Details of the Financing of State Government Loan Council Programs,
1962-63 to 1973-74 .. .. .. .. .. .. 177
APPENDIX IV. PART 11-SPECIFIC PURPOSE PAYMENTS
Interest and Sinking Fund Payments under the Financial Agreement, 1927-28 to 1974-75 .. .. .. .. .. .. .. 197
Housing for Servicemen, Advances for, 1956-57 to 1974-75 .. .. 197 Universities, Grants for, 1951-52 to 1974-75 .. .. .. .. 198 Colleges of Advanced Education and Teachers Colleges, Grants for, 1965-66
to 1974-75 .. .. .. .. .. .. .. 199 Technical Education, Grants for, 1964-65 to 1974-75 .. .. .. 199 Schools, Grants for, 1964-65 to 1972-73 .. .. .. .. 200 Schools, Grants for, 1973-74 and 1974-75 (Estimated), by Program .. 202 Tuberculosis Hospitals, Grants for, 1949-50 to 1974-75.. .. .. 204 Mental Health Institutions, Grants for Capital Expenditures on, 1955-56 to
1973-74.. .. .. .. .. .. .. .. 205
TABLES
No. PAGE
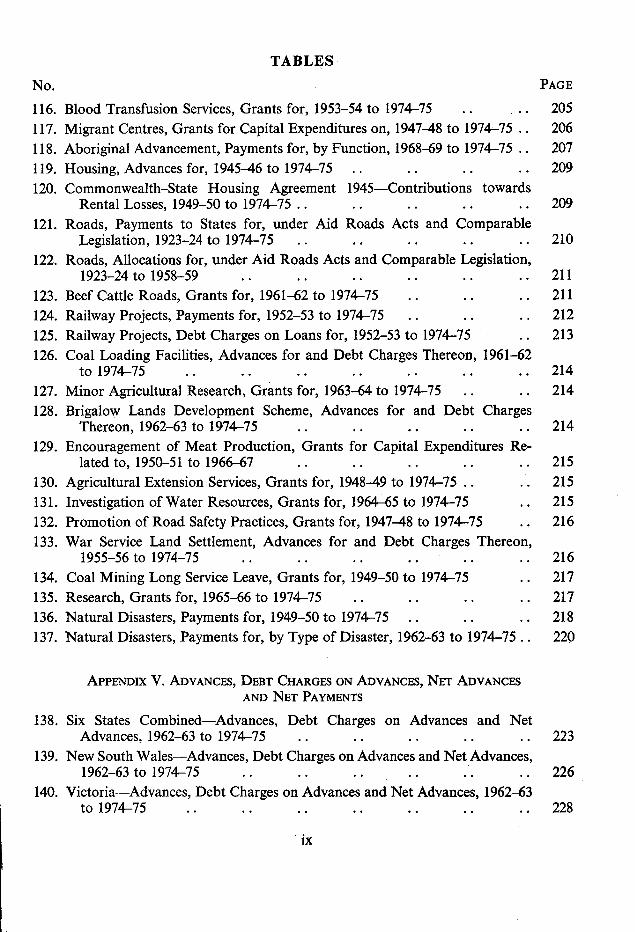
116. Blood Transfusion Services, Grants for, 1953-54 to 1974-75 .. .. 205 117. Migrant Centres, Grants for Capital Expenditures on, 1947-48 to 1974-75 .. 206 118. Aboriginal Advancement, Payments for, by Function, 1968-69 to 1974-75 .. 207 119. Housing, Advances for, 1945-46 to 1974-75 .. .. .. .. 209 120. Commonwealth-State Housing Agreement 1945—Contributions towards
Rental Losses, 1949-50 to 1974-75 .. .. .. .. .. 209 121. Roads, Payments to States for, under Aid Roads Acts and Comparable
Legislation, 1923-24 to 1974-75 .. .. .. .. .. 210 122. Roads, Allocations for, under Aid Roads Acts and Comparable Legislation,
1923-24 to 1958-59 .. .. .. .. .. .. 211 123. Beef Cattle Roads, Grants for, 1961-62 to 1974-75 .. .. .. 211 124. Railway Projects, Payments for, 1952-53 to 1974-75 .. .. .. 212 125. Railway Projects, Debt Charges on Loans for, 1952-53 to 1974-75 .. 213 126. Coal Loading Facilities, Advances for and Debt Charges Thereon, 1961-62
to 1974-75 .. .. .. .. .. .. .. 214 127. Minor Agricultural Research, Grants for, 1963-64 to 1974-75 .. .. 214 128. Brigalow Lands Development Scheme, Advances for and Debt Charges
Thereon, 1962-63 to 1974-75 .. .. .. .. .. 214 129. Encouragement of Meat Production, Grants for Capital Expenditures Re-
lated to, 1950-51 to 1966-67 .. .. .. .. .. 215 130. Agricultural Extension Services, Grants for, 1948-49 to 1974-75 .. .. 215 131. Investigation of Water Resources, Grants for, 1964-65 to 1974-75 .. 215 132. Promotion of Road Safety Practices, Grants for, 1947-48 to 1974-75 .. 216 133. War Service Land Settlement, Advances for and Debt Charges Thereon,
1955-56 to 1974-75 .. .. .. .. .. .. 216 134. Coal Mining Long Service Leave, Grants for, 1949-50 to 1974-75 .. 217 135. Research, Grants for, 1965-66 to 1974-75 .. .. .. .. 217 136. Natural Disasters, Payments for, 1949-50 to 1974-75 .. .. .. 218 137. Natural Disasters, Payments for, by Type of Disaster, 1962-63 to 1974-75.. 220
APPENDIX V. ADVANCES, DEBT CHARGES ON ADVANCES, NET ADVANCES AND NET PAYMENTS
138. Six States Combined—Advances, Debt Charges on Advances and Net Advances, 1962-63 to 1974-75 .. .. .. .. .. 223
139. New South Wales—Advances, Debt Charges on Advances and Net Advances, 1962-63 to 1974-75 .. .. .. .. :. .. 226
140. Victoria—Advances, Debt Charges on Advances and Net Advances, 1962-63 to 1974-75 .. .. .. .. .. .. .. 228
ix
TABLES No. PAGE
Queensland—Advances, Debt Charges on Advances and Net Advances, 1962-63 to 1974-75 .. .. .. .. .. .. 230
South Australia—Advances, Debt Charges on Advances and Net Advances, 1962-63 to 1974-75 .. .. .. .. .. .. 232
Western Australia—Advances, Debt Charges on Advances and Net Advances, 1962-63 to 1974-75 .. .. .. .. .. .. 234
Tasmania—Advances, Debt Charges on Advances and Net Advances, 1962-63 to 1974-75 .. .. .. .. .. .. 236
Total Australian Government Loans to States and State Government Loan
Council Borrowings, Net basis, by States, 1956-57 to 1973-74 .. .. 238 Total Payments to the States and Loan Council Borrowings, Net Basis,
1956-57 to 1974-75 .. .. .. .. .. .. 238 State Governments, Debt Outstanding, 1956 to 1974 .. .. .. 239
APPENDIX VI. AUSTRALIAN GOVERNMENT PAYMENTS AND LOAN COUNCIL BORROWINGS
Six States—Australian Government Payments and Loan Council Borrowings, 1962-63 to 1974-75 .. .. .. .. .. .. 243
New South Wales—Australian Government Payments and Loan Council Borrowings, 1962-63 to 1974-75 .. .. .. .. .. 246
Victoria—Australian Government Payments and Loan Council Borrowings, 1962-63 to 1974-75 .. .. .. .. .. .. 248
Queensland—Australian Government Payments and Loan Council Borrowings, 1962-63 to 1974-75 .. .. .. .. .. 250
South Australia—Australian Government Payments and Loan Council Borrowings, 1962-63 to 1974-75 .. .. .. .. .. 252
Western Australia—Australian Government Payments and Loan Council Borrowings, 1962-63 to 1974-75 .. .. .. .. .. 254
Tasmania—Australian Government Payments and Loan Council Borrowings, 1962-63 to 1974-75 .. .. .. .. .. .. 256
x
CHAPTER I—INTRODUCTION
A document outlining Australian Government payments to or for the States has been issued with the Budget each year since 1961-62. This document repre-sents a continuation of that series, but it differs from its predecessors in two important respects. First, the material in this document has been brought into closer relationship with the figures of Australian Government payments to the States compiled on a national accounting basis and published elsewhere in the budget papers. Secondly, the document includes material (to be found mainly in Chapter V) on Australian Government payments to or for local government authorities. These two aspects are explained in detail below, followed by a brief outline of Australian Government payments to or for the States and the format of this document, and some aggregate figures for recent years.
Relationship with Statements Attached to the Budget Speech In the statements attached to the Budget Speech outlays are classified in two ways. First, they are classified in terms of economic type—that is, as to whether they take the form of expenditure on goods and services, cash benefits to persons, other transfer payments, grants and advances to the States, or advances to other sectors in the economy. One of the purposes of this document can be regarded as being to provide details of those outlay items included in the economic-type category of grants and advances to the States.
Secondly, outlays are classified in the statements attached to the Budget Speech according to function—that is, outlays having like purposes or objectives are brought together under the one functional heading, with certain outlays classified under 'Not Allocated to Function'. One of the main distinctions used in this document is between funds provided to the States for general purposes (that is, 'untied' funds) and those provided for specific purposes (that is, 'tied' funds). All general purpose funds are classified under the 'Not Allocated to Function' heading. Several forms of specific purpose payment are also classified under that heading, but most are classified under specific functional headings. Tables 2, 94 and 95 in this document show a functional classification of outlays included in this document. Details of specific purpose payments provided in Chapter IV and in relevant tables are, with a few exceptions, grouped and ordered on a functional basis.
In the past some items classified as payments to the States for purposes of this document have not been included as payments to the States in the national accounting estimates shown in the statements attached to the Budget Speech and in other documents, and vice versa. This difference, subject to the terminological qualification referred to in the next paragraph, has been eliminated. As a result of changes which were necessary to achieve consistency between the documents, the
1

aggregate figures shown in this document and in the statements attached to this year's Budget Speech are not comparable with those shown in earlier issues of these documents; the same is true of other publications showing payments to or for the States. A consistent series of aggregate figures is shown in this document back to 1956-57. It is hoped that will be possible to publish a consistent series back to at least 1948-49 within the next twelve months.
Reference should be made here to the treatment in this and other Budget documents of the State Governments' Loan Council borrowing programs, which are financed by the issue of Australian Government securities to which that Government itself subscribes from its own revenue sources, as necessary, to fill the programs approved by the Loan Council. The national accounting item 'net advances to the States' used in the statements attached to the Budget Speech and other documents includes these programs. In this document, the term 'payments to the States' does not include these programs; however—and this represents a further development in the format of this document—totals of payments to the States and their Loan Council borrowing programs are also given and, subject to the point referred to in the next paragraph, these totals are comparable with the totals of grants and net advances to the States shown in other Budget documents. The treatment of the States' Loan Council programs in this and other Budget documents is explained in more detail in Chapter III.
As the term implies, the national accounting aggregate 'grants and net advances to the States' includes Australian Government advances (that is, loans) to the States on a net basis—that is, after subtracting repayments by the States of advances they have received from the Australian Government in earlier years. The main tables in this document (including those shown later in this Chapter) are on a gross basis—that is, before deducting repayments of Australian Govern-ment loans. However, figures on a net basis, which are equivalent to the aggre-gates shown in other Budget documents, are given in Appendix V.
Extension of Document to Cover Payments to or for Local Government Authorities Funds which are to be provided for local government authorities in 1974-75 on the recommendation of the Grants Commission represent the first Australian Government program designed specifically and solely to provide financial assistance to local government authorities (leaving aside here assistance which has been provided for some time to the two local government authorities in the Northern Territory). There is, however, a number of other programs, designed to improve standards of services or facilities in particular geographical or functional areas, under which local government authorities are among the bodies eligible to receive Australian Government assistance.
2
The grants to be provided on the recommendation of the Grants Commission are to be paid, in the first instance, to the States under section 96 of the Con-stitution for them to transmit specified amounts to the individual local govern-ment authorities concerned. Similarly, under some of the other programs to which reference has been made, the funds take the form of payments to the States for on-passing to local government. There are further programs under which the Australian Government's payments are made direct to local government authorities, although the aggregate of such payments is relatively small.
The purpose of Chapter V—to which there was no equivalent in earlier issues of this document—is to draw together information on both forms of Australian Government payments for local government authorities, that is, those made in the first instance to the States and those made direct. It should be emphasised, however, that payments taking the first form are included in the totals of pay-ments to the States shown elsewhere in the document.
Consideration is being given to the possibility of extending the economic type category 'grants and net advances to the States' to 'grants and net advances to the States and local government authorities'—that is, so as to include Australian Government payments direct to local government authorities. Such an extension was not practicable in this year's Budget documents.
Outline of Australian Government Payments to the States and Format of this Document Since Federation payments of various descriptions have been made to the States. Prior to World War II, these payments were mainly of a marginal character and were confined, for the most part, to special grants to assist the financially weaker States, and to certain specific purpose grants such as assistance for roads and for debt charges.
Since World War II and the immediate post-war period there has been a marked increase in the amount and scope of assistance to the States. This has reflected, among other things, increases in the range and variety of governmental activities that have accompanied economic and social developments in this period of rapid growth of the Australian economy; greater participation by the national Government in matters that were previously considered to be the sole responsibility of the States; and the effects of the introduction and continuation of uniform income tax.
In this document payments to the States are classified in two main ways—first, in terms of whether they are for general or specific purposes (that is, whether they are 'untied' or 'tied') and, secondly, in terms of whether they are for the purpose of financing recurrent or capital expenditures by the States.
3
The general revenue grants arrangements are discussed in Chapter II and further historical and statistical details are given in Appendix II. The general revenue grants, which comprise the largest element in assistance to the States, are provided as general subventions to the State budgets. They have no conditions attached as to how they may be used, but are intended to finance recurrent expenditures.
The financial assistance grants, which replaced the former tax reimbursement grants, make up the bulk of the general revenue grants. These grants are deter-mined annually on the basis of a formula that is normally subject to review at five-year intervals. In most years, however, special assistance has been provided in various ways to supplement the amounts produced by the formula. In ad-dition, special grants are paid to certain States on the recommendation of the Grants Commission.
Chapter III provides information on the general purpose capital funds available to the States and their authorities under the Loan Council arrangements. These comprise borrowings made on behalf of the State Governments (to which the Australian Government has contributed from its own resources in most years), interest-free grants made to the States and borrowings by State authorities. Further statistical material on these funds is presented in Appendix III.
Specific purpose payments, for both recurrent and capital purposes, are discussed in Chapter IV and further historical and statistical details are given in Appendix IV. These payments finance a wide variety of expenditures.
As noted above, Chapter V brings together information on Australian Govern-ment payments to or for local government authorities.
Appendix I provides figures, in detail and in aggregate, of Australian Govern-ment payments to the States and the State Governments' Loan Council programs in 1973-74 and 1974-75 (estimated) and gives aggregate figures for the period 1956-57 to 1974-75 (estimated). Appendix V provides information on Australian Government advances to the States and debt charges paid by the States thereon, and Appendix VI gives figures, in detail and in aggregate, of payments to the six States combined and to each individual State for the years 1962-63 to 1974-75 (estimated).
Summary of Payments to the States and State Government Loan Council Programs 1972-73 to 1974-75
The table below summarises funds available to the States from Australian Govern-ment payments and Loan Council borrowing programs for the years 1972-73 to 1974-75 (estimated). Further details, including figures for earlier years, are given in subsequent chapters and in appendices.
2
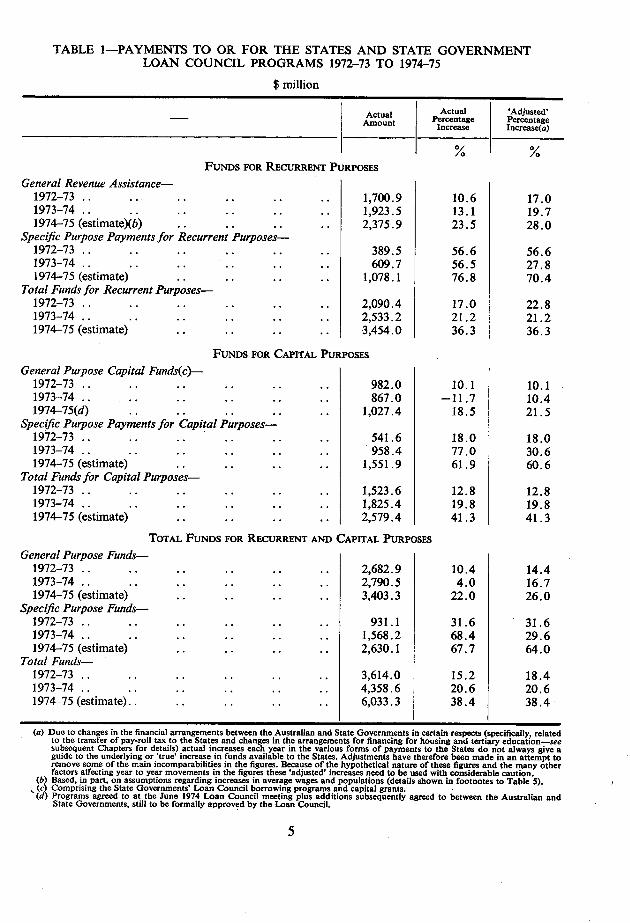
TABLE 1-PAYMENTS TO OR FOR THE STATES AND STATE GOVERNMENT LOAN COUNCIL PROGRAMS 1972-73 TO 1974-75
$ million
Actual Actual I 'Adjusted' - Amount Percentage Percentage Increase Increase(a)
/0 /0
FUNDS FOR RECURRENT PURPOSES
General Revenue Assistance- 1972-73 .. .. .. .. .. .. 1,700.9 10.6 17.0 1973-74 .. .. .. .. .. .. 1,923.5 13.1 19.7 1974-75 (estimate)(b) .. .. .. .. 2,375.9 23.5 28.0
Specific Purpose Payments for Recurrent Purposes- 1972-73 .. .. .. .. .. .. 389.5 56.6 56.6 1973-74 .. .. .. .. .. .. 609.7 56.5 27.8 1974-75 (estimate) .. .. .. .. 1,078.1 76.8 70.4
Total Funds for Recurrent Purposes- 1972-73 .. .. .. .. .. .. 2,090.4 17.0 22.8 1973-74 .. .. .. .. .. .. 2,533.2 21.2 21.2 1974-75 (estimate) .. .. .. .. 3,454.0 36.3 36.3
Fus FOR CAPITAL PURPOSES
General Put - pose Capital Funds(c)- 1972-73 .. .. .. .. .. .. 982.0 10.1 10.1 1973-74 .. .. .. .. .. .. 867.0 -11.7 10.4 1974-75(d) .. .. .. .. .. 1,027.4 18.5 21.5
Specific Purpose Payments for Capital Purposes- 1972-73 .. .. .. .. .. .. 541.6 18.0 18.0 1973-74 .. .. .. .. .. .. 958.4 77.0 30.6 1974-75 (estimate) .. .. .. .. 1,551.9 61.9 60.6
Total Funds for Capital Purposes- 1972-73 .. .. .. .. .. .. 1,523.6 12.8 12.8 1973-74 .. .. .. .. . . .. 1,825.4 19.8 19.8 1974-75 (estimate) .. .. .. .. 2,579.4 41.3 41.3
TOTAL FUNDS FOR RECURRENT AND CAPITAL PURPOSES
General Purpose Funds- 1972-73 .. .. .. .. .. .. 2,682.9 10.4 14.4 1973-74 .. .. .. .. .. .. 2,790.5 4.0 16.7 1974-75 (estimate) .. .. .. .. 3,403.3 22.0 26.0
Specific Purpose Funds- 1972-73 .. .. .. .. .. .. 931.1 31.6 31.6 1973-74 .. .. .. .. .. .. 1,568.2 68.4 29.6 1974-75 (estimate) .. .. .. .. 2,630.1 67.7 64.0
Total Funds- 1972-73 .. .. .. .. .. .. 3,614.0 15.2 18.4 1973-74 .. .. .. .. .. .. 4,358.6 20.6 20.6 1974-75 (estimate).. .. .. .. .. 6,033.3 38.4 38.4
Due to changes in the financial arrangements between the Australian and State Governments in certain respects (specifically, related to the transfer of pay-roll tax to the States and changes in the arrangements for financing for housing and tertiary education-see subsequent Chapters for details) actual increases each year in the various forms of payments to the States do not always give a guide to the underlying or 'true' increase in funds available to the States. Adjustments have therefore been made in an attempt to remove some of the main incomparabilities in the figures. Because of the hypothetical nature of these figures and the many other factors affecting year to year movements in the figures these 'adjusted' increases need to be used with considerable caution. Based, in part, on assumptions regarding increases in average wages and populations (details shown in footnotes to Table 5). Comprising the State Governments' Loan Council borrowing programs and capital grants. Programs agreed to at the June 1974 Loan Council meeting plus additions subsequently agreed to between the Australian and State Governments, still to be formally approved by the Loan Council.
5
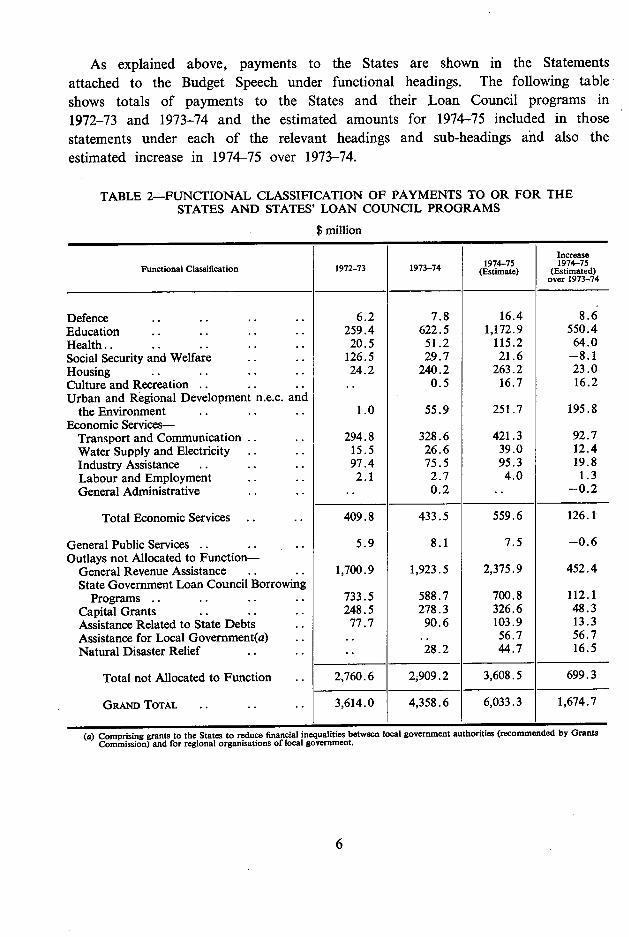
As explained above, payments to the States are shown in the Statements attached to the Budget Speech under functional headings. The following table shows totals of payments to the States and their Loan Council programs in 1972-73 and 1973-74 and the estimated amounts for 1974-75 included in those statements under each of the relevant headings and sub-headings and also the estimated increase in 1974-75 over 1973-74.
TABLE 2-FUNCTIONAL CLASSIFICATION OF PAYMENTS TO OR FOR THE STATES AND STATES' LOAN COUNCIL PROGRAMS
$ million
Increase Functional Classification 1972-73 1973-74(E1974-75
(Estimated) over 1973-74
Defence .. .. .. .. 6.2 7.8 16.4 8.6 Education .. .. .. .. 259.4 622.5 1,172.9 550.4 Health.. .. .. .. .. 20.5 51.2 115.2 64.0 Social Security and Welfare .. .. 126.5 29.7 21.6 -8.1 Housing .. .. .. .. 24.2 240.2 263.2 23.0 Culture and Recreation .. .. .. .. 0.5 16.7 16.2 Urban and Regional Development n.e.c. and
the Environment .. .. .. 1.0 55.9 251.7 195.8 Economic Services-
Transport and Communication .. .. 294.8 328.6 421.3 92.7 Water Supply and Electricity .. .. 15.5 26.6 39.0 12.4 Industry Assistance .. .. .. 97.4 75.5 95.3 19.8 Labour and Employment .. .. 2.1 2.7 4.0 1.3 General Administrative .. .. .. 0.2 .. -0.2
Total Economic Services .. .. 409.8 433.5 559.6 126.1
General Public Services .. .. .. 5.9 8.1 7.5 -0.6 Outlays not Allocated to Function-
General Revenue Assistance .. .. 1,700.9 1,923.5 2,375.9 452.4 State Government Loan Council Borrowing
Programs .. .. .. .. 733.5 588.7 700.8 112.1 Capital Grants .. .. .. 248.5 278.3 326.6 48.3 Assistance Related to State Debts .. 77.7 90.6 103.9 13.3 Assistance for Local Government(a) .. .. .. 56.7 56.7 Natural Disaster Relief .. .. .. 28.2 44.7 16.5
Total not Allocated to Function .. 2,760.6 2j909.2 3,608.5 699.3
GRAND TOTAL .. .. .. 3,614.0 4,358.6 6,033.3 1,674.7
(a) Comprising grants to the States to reduce financial inequalities between local government authorities (recommended by Grants Commission) and for regional organisations of local government.
6

CHAPTER 11—GENERAL REVENUE ASSISTANCE Grants for general revenue purposes, as the name implies, are subject to no conditions as to the purpose for which they may be spent. In one form or another they have been paid by the Australian Government to the States since Federation. Some of the history of these grants and background to the present arrangements is given in Appendix II. This chapter outlines the present basis of the general revenue grants.
In recent years three main types of grant have been paid to the States for general revenue purposes. First, there are the financial assistance grants paid to all States. Secondly, there are the special grants paid on the recommendation of the Grants Commission. Thirdly, special revenue assistance has been provided in most years in addition to the financial assistance and special grants. These three types of payment are discussed below.
THE FINANCIAL ASSISTANCE Gitrs 1959-60 to 1964-65
The financial assistance grants were instituted under arrangements agreed at a Premiers' Conference in June 1959 and replaced the tax reimbursement grants and supplementary grants that had previously been paid to the States. The new arrangements provided for the grants to be determined by a formula under which the grant paid to each State in each financial year was calculated by taking the grant paid to it in the previous year and increasing that grant in proportion to the increase in the preceding financial year in the State's population and in the level of average wages for Australia as a whole—increases in population and average wages being two of the main factors affecting movements from year to year in State current expenditures. In addition, to assist the States improve the standard and range of their services, a 'betterment factor' was introduced equal to 10 per cent of the increase in average wages; for example, an increase of 4 per cent in average wages would be raised to 4.4 per cent. Subject to certain modifications to the grants in 1961-62 (see Appendix II), this formula determined the financial assistance grant payable to each State in each of the years 1960-61 to 1964-65 inclusive.
1965-66 to 1969-70 The 1959 grants arrangements were discussed at Premiers' Conferences in April and June 1965 and the decisions reached at the June Conference were embodied in the States Grants Act 1965. The main change under these arrangements was
7
that the betterment factor was fixed at 1 .2 per cent per annum regardless of the extent of the increase in average wages. As a result of this change the effective size of the betterment factor over the five years 1965-66 to 1969-70 was, on average, approximately double what it would have been if the previous arrangements had continued unaltered. The increase in each State's population used to calculate the grant for each year was changed from that in the preceding financial year to that in the year ending December in the year of payment.
It was also decided that there would be an addition of $2 million each year to the base on which Queensland's grant was calculated, mainly in recognition of that State's large area and relatively small population. In addition, to reduce the difference between the per capita grants for New South Wales and Victoria, the latter State received an addition of $1.2 million to its 1965-66 financial assistance grants and this amount was incorporated into the base for calculating its grants for later years.
As a result of discussions at Premiers' Conferences in February and June 1967 two alterations were made to these arrangements. First, for calculating the grants for 1966-67 and subsequent years, the increase in average wages for the year ending March in the year of payment, instead of for the preceding financial year, was to be used. Secondly, special revenue assistance totalling $5 million paid to the States in 1966-67 was added to the base for that year for the purpose of calculating the formula grants for 1967-68 and subsequent years.
With this last qualification, the formula grant for each State in the years from 1965-66 to 1969-70 was determined by taking that State's grant for the previous year (with the addition of $2 million. each year in the case of Queensland) and:
increasing it by the percentage change in the population of that State during the year ending 31 December in the year of payment; increasing the amount so obtained by the percentage increase in average wages for Australia as a whole for the year ending 31 March in the year of payment (except for 1965-66, when the increase was for the previous financial year); and increasing this amount by the betterment factor of 1.2 per cent.
Following discussions at the June 1968 Premiers' Conference, Western Australia ceased to receive special grants on the recommendation of the Grants Commission after 1967-68 and was paid additional financial assistance grants of $15.5 million in 1968-69 and 1969-70 in lieu thereof.
8
THE PRESENT REVENUE ASSISTANCE ARRANGEMENTS
The 1970 Premiers' Conferences The grants arrangements were again discussed at Premiers' Conferences in February and June 1970. Prior to the February Conference the six State Premiers presented a joint statement entitled 'The Financial Relationship of the Commonwealth and the States' in which they requested that Australian and State Treasury officers be instructed to devise a scheme to give the States access to income tax 'broadly along the lines of the system presently operating in Canada, but adapted to Australian circumstances and to the recognised needs of the less populous States'. Details of the discussions at the Conferences are given in Appendix II.
At these Conferences the Prime Minister indicated that, while the Australian Government did not accept re-entry of the States to the income tax field, it did accept that there was a need for a significant increase in revenue assistance. The Australian Government offered improvements estimated to make the rate of growth in such assistance between 24 and 3 per cent per annum higher than if the previous arrangements had continued unchanged. This improvement was effected in four main ways.
First, an addition of $40 million was made to the 1970-71 grants calculated under the existing formula and this amount was incorporated in the base used to determine the grants for 1971-72 and subsequent years.
Secondly, the betterment factor was increased from 1.2 per cent to 1.8 per cent for determining the grants for 1971-72 and subsequent years.
Thirdly, interest-free capital grants to the States were introduced to replace a part of the moneys previously obtained by the States from borrowings. The purpose of these grants was to relieve the States of debt charges which they would otherwise have had to pay, thus freeing State funds for other purposes. Further details of these grants are given in the following chapter.
Fourthly, grants were to be made to the States in each of the five years of the arrangements equal to the debt charges payable on an increasing proportion of a specified parcel of State debt totalling $1,000 million. Further details of these grants, which will total $172.56 million over the five-year period, are given in Chapter IV.
In addition to the foregoing, it was agreed at the June 1970 Premiers' Conference that further grants would be paid to four States in each of the five years of the arrangements, namely:
Queensland would continue to receive an annual addition of $2 million to the base on which its formula grant was calculated;
Western Australia would receive grants which started at $12.5 million in 1970-71, reducing by $3 million in each of the remaining four years of the arrangements—these grants followed on from additional financial assistance grants of $15.5 million paid to the State in 1968-69 and 1969-70 and which had replaced the special grants previously received on the recommendation of the Grants Commission (the progressive reduction was made because of the relative improvement in the State's revenue position following its withdrawal from claimancy); and
New South Wales and Victoria would receive new annual grants, equal to $2 per head of their respective populations at 31 December each year.
At the June 1970 Conference the Prime Minister said that, if any of the four less populous States considered that the additional per capita grants to New South Wales and Victoria would adversely affect their ability to provide services of a standard comparable with those provided in those two States, they could apply for a special grant on the recommendation of the Grants Commission. (Under the previous arrangements the four non-claimant States were expected not to make any application for special grants for the period of the arrangements.) South Australia applied for a special grant early in 1970-71 and Queensland applied for a special grant in 1971-72. (See below under 'The Special Grants'.)
After the June 1970 Premiers' Conference, the Australian Government agreed to transfer $10 million of Tasmania's special grant to the State's financial assistance grant.
The foregoing arrangements were agreed to by the Australian Government on the basis that there were no significant changes in the existing division of financial responsibilities between the Australian Government and the States during the period of the arrangements (1970-71 to 1974-75), that the distribution of tax resources remained unchanged and that the States and their authorities continued to pay pay-roll tax. They were embodied in the States Grants Act 1970, which repealed the States Grants Act 1965-1968.
10
Developments Following the June 1970 Premiers' Conference Following the settling of the new grants arrangements at the June 1970 Premiers' Conference there has been a number of developments affecting the arrangements. These are described briefly below.
Application of Pay-roll Tax to State Governments In October 1970 the Victorian Government challenged in the High Court the constitutional validity of the Pay-roll Tax Assessment Act 1941-1969 as it applied to the State Government, and was subsequently supported in this action by the South Australian Government. In May 1971 the High Court unanimously ruled that the Act was valid in its application to State Governments. (See Appendix II for further details.)
Cessation of Receipts Duty In response to requests by the States, following decisions of the High Court invalidating State receipts duty in certain cases, the Australian Government agreed to reimburse the States, by additions to their financial assistance grants, for revenue forgone by them. Payments for this purpose were made in 1970-71, and in 1971-72 appropriate amounts were added to the base for determining the financial assistance grants payable under the grants formula in 1971-72 and subsequent years. (See Appendix II for further details.)
Transfer of Pay-roll Tax The Australian Government agreed at the June 1971 Premiers' Conference to transfer pay-roll tax to the States on the basis that off-setting deductions would be made from the financial assistance grants. (See Appendix II for further details.)
It was agreed that the deductions in 1971-72 would be less than the amount of pay-roll tax receivable by the States (at the then rate of 2.5 per cent) by:—
an amount of $20 million to be distributed between the States in pro-portion to pay-roll tax collections in 1971-72 at the rate of 2.5 per cent and further amounts for the less populous States so as to bring their allocations to what they would have been if the amount of $20 million had been distributed in proportion to the financial assistance grants—these extra amounts, estimated at $2.7 million at the time of the Conference, totalled $2.3 million, giving total assistance of $22.3 million; an amount equal to the estimated pay-roll tax payable in respect of non-business activities of local authorities in 1971-72 subsequent to the date of transfer of the tax; and an amount equal to the administrative expenditure incurred by the States in 1971-72 as a result of their imposing pay-roll tax.
11

For 1972-73 and subsequent years, it was agreed that the deductions from the States' grants would be effected by reducing the 1971-72 base used to determine the formula grants for those years. The deductions from the 1971-72 base would, however, be less than the amount of the pay-roll tax receivable in 1971-72 from a full year's collections at the tax rate of 2.5 per cent by:—
the amounts referred to under (a) in the preceding paragraph—thus ensuring that these amounts would continue and escalate in future years; an amount equal to the estimated tax payable in respect of non-business activities of local authorities in the whole of 1971-72 (in this way the Australian Government would, in effect, continue to meet the cost of exemption in future years by way of higher financial assistance grants to State Governments than would have been paid if the authorities had not been exempted); an amount of $3 million, as a rough allowance to take account of the probability that revenues from pay-roll tax would grow somewhat more slowly than the financial assistance grants the States would be losing; and an amount equal to the administrative expenditure that would have been incurred by the States in 1971-72 if they had imposed pay-roll tax for the whole of the year.
Details of the amounts involved in 1971-72 were given in Table 2 of 'Commonwealth Payments to or for the States 1972-73' and corresponding details in respect of 1972-73 were given in Table 4 of 'Payments to or for the States 1973-74.'
Australian and State legislation to transfer pay-roll tax was passed and the transfer took place as from 1 September 1971.
The amendments to the financial assistance grants arrangements which it was agreed would accompany the transfer of pay-roll tax were incorporated in the States Grants Act (No. 2) 1971, which repealed the States Grants Act 1970-1971.
Additional Grants Agreed to at the June 1972 Premiers' Conference At the June 1972 Premiers' Conference the Australian Government and the States agreed to the following three amendments to the financial assistance grants arrangements:—
(a) a permanent increase of $112 million to the financial assistance grants payable in 1972-73—this increase to be built into the formula grants for the purpose of calculating the grants for subsequent years and to be distributed in proportion to the 1971-72 formula grants escalated under the formula as it would apply in 1972-73;
12.
an increase in the per capita grants to New South Wales and Victoria from $2 to $3.50 per head of population in 1972-73—the increased per capita payments to be added to the formula grants for the purpose of calculating the grants in future years (this change increased the grants payable to New South Wales and Victoria in 1972-73 by $7.0 million and $5.4 million respectively); and
a payment of a further amount of $3.5 million to Western Australia in 1972-73 as a special temporary addition to the State's financial assistance grant in that year.
These amendments were authorised in the States Grants Act (No. 2)1972 which amended the States Grants Act 1971-1972.
Adjustments to General Purpose Funds to Offset Financial Effects of Shifts in Responsibilities Between Australian and State Governments
In his opening speech at the June 1973 Premiers' Conference, the Prime Minister stated:—
'Where the national government undertakes new or additional commitments which relieve the States or their authorities of the need to allocate funds for expenditures at present being carried by them, there should be adjustments in the financial arrangements between us to take account of the shift of new financial responsibilities. These adjustments will normally take the form of appropriate reductions in the general purpose funds allocated to States. We have proposed such reductions, for example, as part of the program by which the Australian Government will assume financial responsibility for tertiary education.'
In his opening speech at the June 1974 Conference the Prime Minister said:— 'The Australian Government is firmly committed to this principle and will pursue its application
wherever appropriate. I have informed Premiers of our intention to do so in respect of initiatives we are taking in the fields of Aboriginal affairs and assistance for deserted wives, and I expect that further cases could arise as we develop our policies in other areas.'
At the June 1973 Premiers' Conference the States accepted the Australian Government's offer to take full financial responsibility for financing tertiary education from 1 January 1974 and it was agreed, in pursuance of the 'offsets' policy, that estimated amounts of recurrent expenditure of which the States would thereby be relieved should be deducted from the financial assistance grants other-wise payable. (The estimated capital expenditures of which the States are being relieved are being deducted from the State Loan Council programs—see following
13
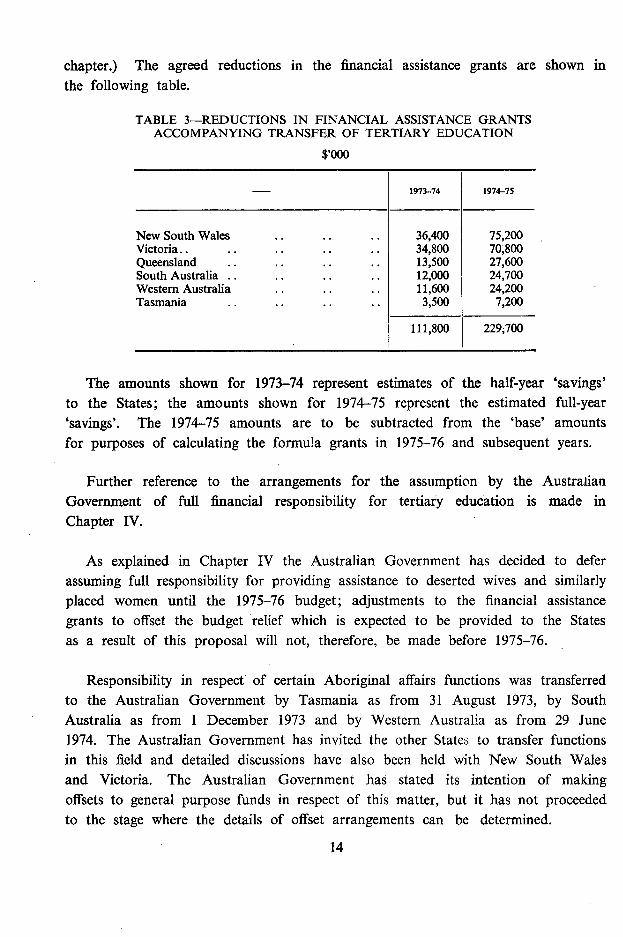
chapter.) The agreed reductions in the financial assistance grants are shown in the following table.
TABLE 3—REDUCTIONS IN FINANCIAL ASSISTANCE GRANTS ACCOMPANYING TRANSFER OF TERTIARY EDUCATION
$,000
1973-74 1974-75
New South Wales .. .. 36,400 75,200 Victoria.. .. .. .. .. 34,800 70,800 Queensland .. .. .. .. 13,500 27,600 South Australia .. .. .. .. 12,000 24,700 Western Australia .. 11,600 24,200 Tasmania .. .. .. .. 3,500 7,200
111,800 229,700
The amounts shown for 1973-74 represent estimates of the half-year 'savings' to the States; the amounts shown for 1974-75 represent the estimated full-year 'savings'. The 1974-75 amounts are to be subtracted from the 'base' amounts for purposes of calculating the formula grants in 1975-76 and subsequent years.
Further reference to the arrangements for the assumption by the Australian Government of full financial responsibility for tertiary education is made in Chapter IV.
As explained in Chapter IV the Australian Government has decided to defer assuming full responsibility for providing assistance to deserted wives and similarly placed women until the 1975-76 budget; adjustments to the financial assistance grants to offset the budget relief which is expected to be provided to the States as a result of this proposal will not, therefore, be made before 1975-76.
Responsibility in respect of certain Aboriginal affairs functions was transferred to the Australian Government by Tasmania as from 31 August 1973, by South Australia as from 1 December 1973 and by Western Australia as from 29 June 1974. The Australian Government has invited the other States to transfer functions in this field and detailed discussions have also been held with New South Wales and Victoria. The Australian Government has stated its intention of making offsets to general purpose funds in respect of this matter, but it has not proceeded to the stage where the details of offset arrangements can be determined.
14
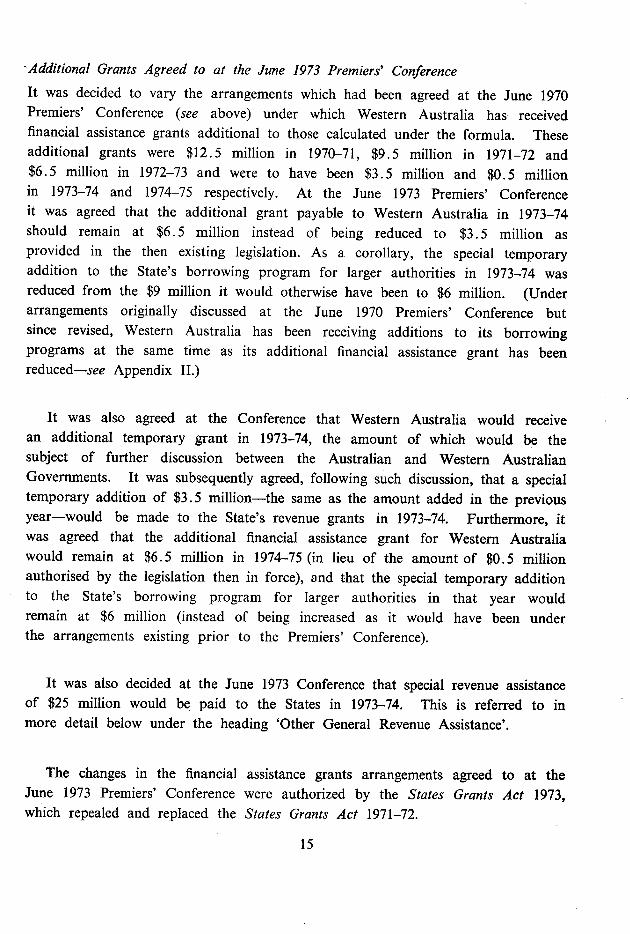
Additional Grants Agreed to at the June 1973 Premiers' Conference It was decided to vary the arrangements which had been agreed at the June 1970 Premiers' Conference (see above) under which Western Australia has received financial assistance grants additional to those calculated under the formula. These additional grants were $12.5 million in 1970-71, $9.5 million in 1971-72 and $6.5 million in 1972-73 and were to have been $3.5 million and $0.5 million in 1973-74 and 1974-75 respectively. At the June 1973 Premiers' Conference it was agreed that the additional grant payable to Western Australia in 1973-74 should remain at $6.5 million instead of being reduced to $3.5 million as provided in the then existing legislation. As a corollary, the special temporary addition to the State's borrowing program for larger authorities in 1973-74 was reduced from the $9 million it would otherwise have been to $6 million. (Under arrangements originally discussed at the June 1970 Premiers' Conference but since revised, Western Australia has been receiving additions to its borrowing programs at the same time as its additional financial assistance grant has been reduced—see Appendix II.)
It was also agreed at the Conference that Western Australia would receive an additional temporary grant in 1973-74, the amount of which would be the subject of further discussion between the Australian and Western Australian Governments. It was subsequently agreed, following such discussion, that a special temporary addition of $3.5 million—the same as the amount added in the previous year—would be made to the State's revenue grants in 1973-74. Furthermore, it was agreed that the additional financial assistance grant for Western Australia would remain at $6.5 million in 1974-75 (in lieu of the amount of $0.5 million authorised by the legislation then in force), and that the special temporary addition to the State's borrowing program for larger authorities in that year would remain at $6 million (instead of being increased as it would have been under the arrangements existing prior to the Premiers' Conference).
It was also decided at the June 1973 Conference that special revenue assistance of $25 million would be paid to the States in 1973-74. This is referred to in more detail below under the heading 'Other General Revenue Assistance'.
The changes in the financial assistance grants arrangements agreed to at the June 1973 Premiers' Conference were authorized by the States Grants Act 1973, which repealed and replaced the States Grants Act 1971-72.
15
June 1974 Premiers' Conference and Withdrawal of Tasmania from Special Grants System No alterations to the financial assistance grant arrangements were agreed to at the June 1974 Premiers' Conference. However, at that Conference, the Premier of Tasmania requested discussions with the Australian Government concerning the possibility of his State withdrawing from the special grants system. Following such discussions, it was agreed that, to enable such .a withdrawal, an amount of $15 million would be added to the financial assistance grants otherwise payable to the State in 1974-75, to be built into the base on which the formula grants for 1975-76 and subsequent years would be calculated. It is expected that legislation to authorise the additional financial assistance grant for Tasmania will be introduced in the Budget sittings of Parliament. Further details of the arrangements agreed with the State are given below under the heading 'The Special Grants'.
Review of Revenue Assistance Arrangements In his opening speech at the June 1974 Premiers' Conference, the Prime Minister stated: 'The present revenue assistance arrangements between the Australian and State Governments were originally settled in June 1970 and were intended to apply over the five years 1970-71 to 1974-75. My Government accepts the obligation to review the arrangements before the end of 1974-75 with a view to determining what changes in them, if any, should apply from 1975-76'.
16
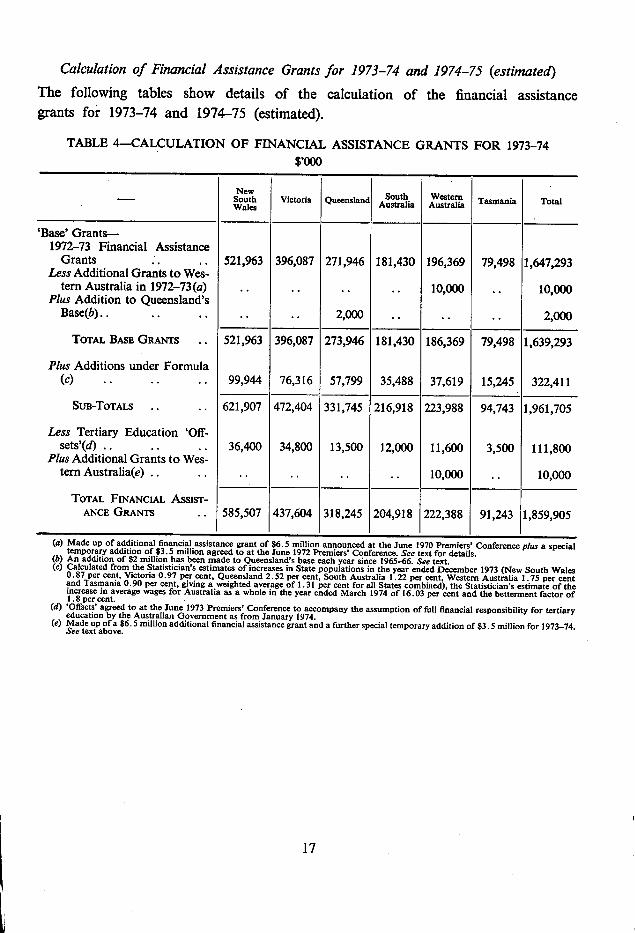
Calculation of Financial Assistance Grants for 1973-74 and 1974-75 (estimated) The following tables show details of the calculation of the financial assistance grants for 1973-74 and 1974-75 (estimated).
TABLE 4-CALCULATION OF FINANCIAL ASSISTANCE GRANTS FOR 1973-74 $,000
- South Wales
Victoria Queensland South Australia
Western Australia Tasmania Total
'Base' Grants- 1972-73 Financial Assistance
Grants .. •. 521,963 396,087 271,946 181,430 196,369 79,498 1,647,293 Less Additional Grants to Wes-
tern Australia in 1972-73(a) 10,000 .. 10,000 Plus Addition to Queensland's
Base(b).. .. .. .. 2,000 .. 2,000
TOTAL BASE GRANTS 521,963 396,087 273,946 181,430 186,369 79,498 1,639,293
Plus Additions under Formula (c) 99,944 76,316 57,799 35,488 37,619 15,245 322,411
SUB-TOTALS .. .. 621,907 472,404 331,745 216,918 223,988 94,743 1,961,705
Less Tertiary Education 'Off- sets'(d) .. 36,400 34,800 13,500 12,000 11,600 3,500 111,800
Plus Additional Grants to Wes- tern Australia(e) .. .. .. .. 10,000 .. 10,000
TOTAL FINANCIAL ASSIST- ANCE GIIAI'i'rs .. 585,507 437,604 318,245 204,918 222,388 91,243 1,859,905
Made up of additional financial assistance grant of $6.5 million announced at the June 1970 Premiers' Conference plus a special temporary addition of $3.5 million agreed to at the June 1972 Premiers' Conference. See text for details. An addition of 82 million has been made to Queensland's base each year since 1965-66. See text. Calculated from the Statistician's estimates of increases in State populations in the year ended December 1973 (New South Wales 0.87 per Cent, Victoria 0.97 per cent, Queensland 2.52 per cent, South Australia 1.22 per Cent, Western Australia 1.75 per cent and Tasmania 0.90 per Cent, giving a weighted average of 1 .31 per cent for all States combined), the Statistician's estimate of the increase in average wages for Australia as a whole in the year ended March 1974 of 16.03 per cent and the betterment factor of 1.8 percent. 'Offsets' agreed to at the June 1973 Premiers' Conference to accompany the assumption of full financial responsibility for tertiary education by the Australian Government as from January 1974. Made up of a $6.5 million additional financial assistance grant and a further special temporary addition of 83.5 million for 1973-74. See text above.
17

TABLE 5—CALCULATION OF FINANCIAL ASSISTANCE GRANTS FOR 1974-75 (ESTIMATED)
$,000
- New South Wales
Victoria Queens- land
South Australia
Western Australia Tasmania Total
TOTAL BASE GRANTS(a) .. 621,907 472,404 333,745 216,918 223,988 94,743 1,963,705 Plus Additions under Formula(b) 176,671 133,479 103,601 63,554 67,621 27,120 572,046 Less Tertiary Education 'Offsets'
(c) .. -. .. 75,200 70,800 27,600 24,700 24,200 7,200 229,700 Plus Additional Grants to West-
ern Australia and Tasmania -. .. .. -. (d)6,500 (e)15,000 21,500
TOTAL FINANCIAL ASSISTANCE GRANTS(1) .. .. 723,400 535,100 409,700 255,800 273,900 129,700 2,327,600
(a) Amounts shown as 'sub-totals' in previous table plus addition of $2 million for Queensland. (6) Assumes that the increase in average wages for Australia as a whole in the year ending March 1975 will be 25.0 per cent and that
increases in the States' populations for the year ending December 1974 will be: New South Wales 0.91 per cent, Victoria 0.79 per cent, Queensland 2.98 per cent, South Australia 1 .61 per cent, Western Australia 2.31 per Cent and Tasmania 1.08 per cent (weighted average of 1.48 per cent). Agreed to at the June 1973 Premiers' Conference. See footnote (d) to previous table and text above. Agreed to following the June 1973 Premiers' Conference—see text. Addition agreed to following the June 1974 Premiers' Conference to enable Tasmania to withdraw from the special grants system. See text for details. Calculated on figures shown above and then rounded to nearest $100,000. The financial assistance grants for 1974-75 are also subject to possible offsets in respect of the assumption of further responsibilities by the Australian Government in respect of certain Aboriginal affairs functions.
18
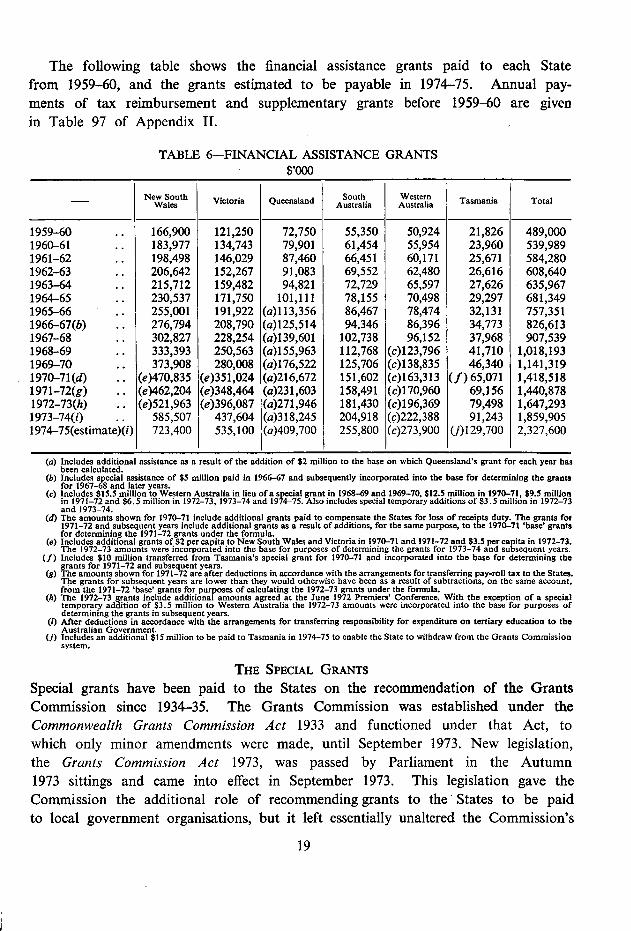
The following table shows the financial assistance grants paid to each State from 1959-60, and the grants estimated to be payable in 1974-75. Annual pay-ments of tax reimbursement and supplementary grants before 1959-60 are given in Table 97 of Appendix II.
TABLE 6-FINANCIAL ASSISTANCE GRANTS $
1000
- Wales
1959-60
New South Victoria Queensland South Australia
Western Tasmania Total
166,900 121,250 72,750 55,350 50,924 21,826 489,000 1960-61 .. 183,977 134,743 79,901 61,454 55,954 23,960 539,989 1961-62 .. 198,498 146,029 87,460 66,451 60,171 25,671 584,280 1962-63 .. 206,642 152,267 91,083 69,552 62,480 26,616 608,640 1963-64 .. 215,712 159,482 94,821 72,729 65,597 27,626 635,967 1964-65 .. 230,537 171,750 101,111 78,155 70,498 29,297 681,349 1965-66 255,001 191,922 (a)113,356 86,467 78,474 32,131 757,351 1966-67(b) .. 276,794 208,790 (a)125,514 94,346 86,396 34,773 826,613 1967-68 302,827 228,254 (a)139,601 102,738 96,152 37,968 907,539 1968-69 333,393 250,563 (a)155,963 112,768 (c)123,796 41,710 1,018,193 1969-70 .. 373,908 280,008 (a)176,522 125,706 (c)138,835 46,340 1,141,319 1970-71(d) (e)470,835 (e)351,024 (a)216,672 151,602 (c)163,313 (1)65,071 1,418,518 1971-72(g) .. (e)462,204 (e)348,464 (a)231,603 158,491 (c)170,960 69,156 1,440,878 1972-73(h) .. (e)521,963 (e)396,087 (a)271,946 181,430 (0196,369 79,498 1,647,293 1973-74(i) .. 585,507 437,604 (a)318,245 204,918 (c)222,388 91,243 1,859,905 1974-75(estitnate)(i) 723,400 535,100 (a)409,700 255,800 (c)273,900 (j)129,700 2,327,600
Includes additional assistance as a result of the addition of $2 million to the base on which Queensland's grant for each year has been calculated. Includes special assistance of $5 million paid in 1966-67 and subsequently incorporated into the base for determining the grants for 1967-68 and later years. Includes $15.5 million to Western Australia in lieu of a special grantin 1968-69 and 1969-70, $12.5 million in 1970-71, 89.5 million in 1971-72 and $6.5 million in 1972-73, 1973-74 and 1974-75. Also includes special temporary additions of $3.5 million in 1972-73 and 1973-74. The amounts shown for 1970-71 include additional grants paid to compensate the States for loss of receipts duty. The grants for 1971-72 and subsequent years include additional grants as a result of additions, for the same purpose, to the 1970-71 'base' grants for determining the 1971-72 grants under the formula. Includes additional grants of 82 per capita to New South Wales and Victoria in 1970-71 and 1971-72 and$3.5 per capita in 1972-73. The 1972-73 amounts were incorporated into the base for purposes of determining the grants for 1973-74 and subsequent years. Includes $10 million transferred from Tasmania's special grant for 1970-71 and incorporated into the base for determining the grants for 1971-72 and subsequent years. The amounts shown for 1971-72 are after deductions in accordance with the arrangements for transferring pay-roll tax to the States. The grants for subsequent years are lower than they would otherwise have been as a result of subtractions, on the same account, from the 1971-72 'base' grants for purposes of calculating the 1972-73 grants under the formula. The 1972-73 grants include additional amounts agreed at the June 1972 Premiers' Conference. With the exception of a special temporary addition of $3.5 million to Western Australia the 1972-73 amounts were incorporated into the base for purposes of determining the grants in subsequent years. After deductions in accordance with the arrangements for transferring responsibility for expenditure on tertiary education to the Australian Government.
i Includes an additional $15 million to be paid to Tasmania n 1974-75 to enable the State to withdraw from the Grants Commission system.
THE SPECIAL GRANTS Special grants have been paid to the States on the recommendation of the Grants Commission since 1934-35. The Grants Commission was established under the Commonwealth Grants Commission Act 1933 and functioned under that Act, to which only minor amendments were made, until September 1973. New legislation, the Grants Commission Act 1973, was passed by Parliament in the Autumn 1973 sittings and came into effect in September 1973. This legislation gave the Commission the additional role of recommending grants to the' States to be paid to local government organisations, but it left essentially unaltered the Commission's
19
traditional function of recommending special grants to be paid to claimant States. The new Act provided for an increase in the maximum number of Commissioners from three to seven (including the Chairman). The Act provides that the Chairman shall be appointed on a full-time basis; the other Commissioners may be either full-time or part-time.
During the initial period of its work in relation to claimant States the Commission considered 'compensation for disabilities arising from federation' as a possible basis for its recommendations. It considered. also the basis of 'financial need'. In its Third Report (1936) the Commission finally chose the principle of financial need, which was expressed in the following terms:—
'Special grants are justified when a State through financial stress from any cause is unable efficiently to discharge its functions as a member of the federation and should be determined by the amount of help found necessary to make it possible for that State by reasonable effort to function at a standard not appreciably below that of other States.'
In arriving at its recommendations, the Commission each year makes a detailed comparison between the financial positions of the claimant States and . those of the 'standard' States. Prior to 1959-60 the Commission used a standard derived from the experience of New South Wales, Victoria and Queensland. From 1959-60 the standard States have been New South Wales and Victoria.
Since 1949 each recommendation by the Commission for payment of a special grant has consisted of two parts. One part is based on an estimate of the claimant State's financial need in the current financial year, and is treated as an advance payment subject to adjustment two years later when the Commission has compared in detail the financial positions in that year of the claimant and standard States. The other part represents the final adjustment to the advance payment made two years earlier and is known as the completion payment.
Special grants were paid to South Australia, Western Australia and Tasmania on the recommendation of the Commission from 1934-35 to 1958-59, when South Australia ceased to apply. Western Australia withdrew from the special grants system as from 1968-69.
Under the 1965 grants arrangements the Australian Government expected the then four non-claimant States not to apply for special grants for the period of the arrangements. However, following the June 1970 Premiers' Conference all four less populous States were free to apply for special grants and South Australia again applied for a special grant in July 1970, Queensland applied for a special grant for 1971-72 in September 1971.
Tasmania . applied continuously for special . grants up to and including 1973-74. The State has withdrawn from the special grants system following the Australian Government's agreement to pay the State an additional financial assistance grant of $15 million in 1974-75, to be built into the 'base' for purposes of calculating the State's formula grants in 1975-76 and subsequent years (see above under
20
the heading 'The Financial Assistance Grants'). In accordance with arrangements agreed between the Australian and State Governments, the Grants Commission has been asked not to recommend completion payments in respect of the advance grants paid to the State in 1972-73 and 1973-74.
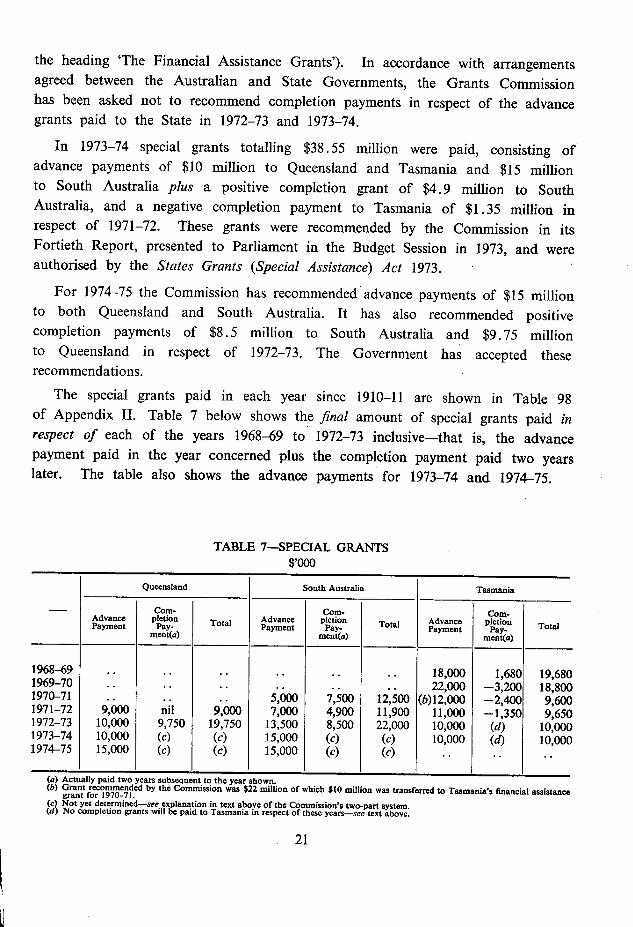
In 1973-74 special grants totalling $38.55 million were paid, consisting of advance payments of $10 million to Queensland and Tasmania and $15 million to South Australia plus a positive completion grant of $4.9 million to South Australia, and a negative completion payment to Tasmania of $1.35 million in respect of 1971-72. These grants were recommended by the Commission in its Fortieth Report, presented to Parliament in the Budget Session in 1973, and were authorised by the States Grants (Special Assistance) Act 1973.
For 1974-75 the Commission has recommended advance payments of $15 million to both Queensland and South Australia. It has also recommended positive completion payments of $8.5 million to South Australia and $9.75 million to Queensland in respect of 1972-73. The Government has accepted these recommendations.
The special grants paid in each year since 1910-11 are shown in Table 98 of Appendix II. Table 7 below shows the final amount of special grants paid in respect of each of the years 1968-69 to 1972-73 inclusive-that is, the advance payment paid in the year concerned plus the completion payment paid two years later. The table also shows the advance payments for 1973-74 and 1974-75.
TABLE 7-SPECIAL GRANTS $'000
Queensland South Australia Tasmania
- Advance Payment
Corn- pletion
Pay- Total Advance Payment
Corn- pletion Pay- Total Advance
Payment
Corn- pletion
Pay- Total ment(a) ment(a) ment(a)
1968-69 .. .. .. .. .. .. 18,000 1,680 19,680 1969-70 .. .. .. .. .. .. 22,000 -3,200 18,800 1970-71 .. .. .. 5,000 7,500 12,500 (012,000 -2,400 9,600 1971-72 9,000 nil 9,000 7,000 4,900 11,900 11,000 -1,350 9,650 1972-73 10,000 9,750 19,750 13,500 8,500 22,000 10,000 (d) 10,000 1973-74 10,000 (c) (c) 15,000 (c) (c) 10,000 (d) 10,000 1974-75 15,000 (c) (c) 15,000 (c) (c)
u) icLuany paiu two years SUOSequent to tile year stiown. Grant recommended by the Commission was $22 million of which $10 million was transferred to Tasmania's financial assistance grant for 1970-71. Not yet determined-see explanation in text above of the Commission's two-part system. No completion grants will be paid to Tasmania in respect of these years-see text above.
21
OTHER GENERAL REVENUE ASSISTANCE From time to time the Australian Government has provided general revenue assistance to the States additional to that payable under the financial assistance grants arrangements or by way of special grants recommended by the Grants Commission. Between 1949-50 and 1958-59, for instance, the Australian Govern-ment made ad hoc grants to each State to supplement the amount yielded by the formula then operating. (For further details see Appendix II and Table 97.) Some of the additional assistance grants paid in the years 1957-58, 1961-62, 1962-63 and 1963-64 were also available for use by the States for general revenue purposes. Details of these grants are given in 'Commonwealth Payments to or for the States, 1967-68'. For details of special assistance paid in the years 1966-67 to 1969-70, see page 18 of 'Commonwealth Payments to or for the States, 1969-70', page 21 of the 1970-71 issue and page 26 of the 1972-73 issue.
Special Assistance in 1970-71 A Premiers' Conference was held in February 1971 to discuss the effects on the States' budgets of the national wage decision announced in December 1970. The States presented information showing that the cost to their budgets of that and other wage awards for State government employees granted since their budgets were brought down was much greater than in previous years and they requested special revenue assistance to help meet those costs. The Australian Government, while conceding that the States were facing budget difficulties, asked them to examine the possibility of taking measures to cope with these financial difficulties from their own resources. However, it was agreed that a further Conference would be held in April at which the States would present revised estimates for 1970-71, as well as estimates for 1971-72, in the light of any measures they may have been able to take in the interim.
Subsequent to the February Conference all the States took special action to improve their financial positions. In most but not all States this action took the form mainly of cuts in expenditure below the levels estimated in February. However, this still left the States facing substantial prospective budget deficits in 1970-71.
At the Premiers' Conference in April 1971 the Australian Government agreed to provide the States with additional revenue assistance of $43 million in 1970-71 on the understanding that the States used this assistance to reduce their prospective budget deficits rather than add to their expenditures. Payment of this assistance, which was distributed between the States in proportion to their financial assistance grants (other than receipts duty compensation grants), was authorised by the States Grants Act 1971.
22
Special Assistance in 1971-72
At the Premiers' Conference in June 1971 the States argued that, even after taking into account additional revenue they might be able to raise from their existing taxes and charges, they would find it very difficult to cope with their prospective 1971-72 budget deficits which, they said, were abnormally high due largely to the unavoidable 'full-year' costs of wage and salary awards granted in 1970-71.
The Australian Government agreed to provide special revenue assistance in 1971-72 in the form of a non-recurring grant of $40 million to be distributed between the States in proportion to their financial assistance grants. The Aus-tralian Government also agreed, as part of the arrangements to transfer pay-roll tax to the States, to provide additional revenue assistance in 1971-72 estimated at the time of the Conference at $22.7 million but which finally amounted to $22.3 million. (See under Transfer of Pay-roll Tax above.) Payment of this additional assistance was authorized by the States Grants Act (No. 2) 1971.
At the February 1972 Premiers' Conference, the Australian Government agreed to provide further special revenue assistance in 1971-72 totalling $32.5 million. Of this amount, $15 million was provided by way of non-recurring grants distributed between the States in proportion to their financial assistance grants and the remaining $17.5 million was a special repayable advance to New South Wales.
In announcing this Joan, the Prime Minister said that New South Wales clearly had a much greater budgetary problem in 1971-72 than any of the other States and the purpose of the loan was to enable that State to avoid taking extreme measures to improve its budgetary position. The loan was made on 30 June 1972 and is to be repaid by 30 June 1977 by annual' instalments of $3.5 million, with provision for the advancement or deferment of repayments similar to the provisions with the loan of $10 million made to Victoria in 1969-70 (see page 26 of 'Commonwealth Payments to or for the States, 1972-73'). As with the loan to Victoria, no interest was payable in the first year. For the following four years interest is payable semi-annually at 5.3 per cent, this being the short-term bond rate offered in the February 1972 cash loan. The repayments due on 30 June 1973 and 30 June 1974 were deferred in accordance with the terms of the loan.
The additional assistance of $15 million was authorised by the States Grants Act 1972. The special advance to New South Wales was authorised in the Appropriation Act (No. 5) 1971-1972.
Thus, special assistance totalling $72.5 million was paid in 1971-72.
23 15176,74-2
Special Assistance in 1972-73 On 20 September 1972, the Australian Government announced that, having regard to the extraordinarily difficult budget situation which was confronting New South Wales, it was prepared to provide special budgetary assistance to the State in 1972-73 in the form of a loan of $15 million. The loan was authorised in the Appropriation Act (No. 4) 1972-73 and was paid to the State on 29 June 1973. The terms of the loan provide that it be repaid by 30 June 1978 by annual instalments of $3 million with provision for the advancement or deferment of repayments similar to the provisions applying to the loans of $10 million made to Victoria in 1969-70 and $17.5 million made to New South Wales in 1971-72. Again, no interest was payable in the first year. In the following four years interest is payable semi-annually at a rate determined to be the rate which would have applied on five-year securities if they had been issued in the Australian Government loan immediately prior to 29 June 1973—that is, the May 1973 loan. The repayment due on .30 June 1974 was deferred.
Special Assistance in 1973-74 At the June 1973 Premiers' Conference the Australian Government, in recognition of the States' expected budgetary problems in 1973-74, agreed to provide special additional revenue assistance of $25 million, to be distributed among the States in proportion to the financial assistance grants payable under the formula. The grants were authorised by the States Grants Act 1973. The amounts paid to each State are shown in Table 87 in Appendix I.
SUMMARY OF GENERAL REVENUE ASSISTANCE, 1970-71 TO 1974-75
Comparisons of general revenue assistance over the years 1970-71 to 1974-75 are complicated by the arrangements which accompanied the transfer of pay-roll tax to the States in 1971-72 and which are accompanying the assumption of full financial responsibility for tertiary education by the Australian Government from January 1974. The following table is designed to show general revenue assistance over this period on a comparable basis by making appropriate adjustments to the grants paid in 1970-71, 1971-72, 1973-74 and those expected to be paid in 1974-75 (estimated) to put them on the basis which applied in 1972-73. The adjustments are made on the assumption that, had the arrangements applying in 1972-73 also applied in the other years concerned, other factors affecting the level of general revenue assistance in those years (for example, the amounts of special revenue assistance) would have remained unchanged.
24
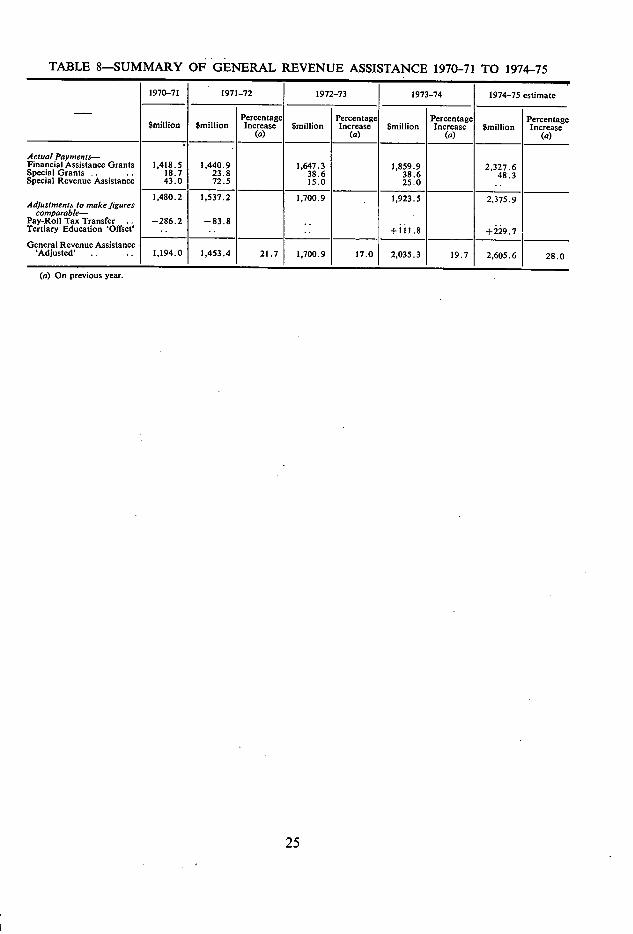
TABLE 8-SUMMARY OF GENERAL REVENUE ASSISTANCE 1970-71 TO 1974-75
1970-71 1971-72 1972-73 1973-74 1974-75 estimate
Smillion $million Percentage Increase
(a) Smillion
Percentage Increase
(a) $million
Percentage Increase
(a) Smillion
Percentage Increase
(a)
-
Actual Payments— Financial Assistance Grants Special Grants .. .. Special Revenue Assistance
1,418.5 18.7 43.0
1,440.9 23.8 72.5
1,647.3 38.6 15.0
1,859.9 38.6 25.0
2,327.6 48.3
Adjustments to make figures 1,480.2 1,537.2 1,700.9 1,923.5 2,375.9
comparable— - Pay-Roll Tax Transfer .. —286.2 —83,8 .. Tertiary Education 'Offset' .. .. .. +111.8 +229.7 General Revenue Assistance
'Adjusted' .. .. 1,194.0 1,453.4 21.7 1,700.9 17.0 2,035.3 19.7 2,605.6 28.0
(a) On previous year.
25
CHAPTER rn—GENERAL PURPOSE CAPITAL FUNDS This Chapter provides information on the general purpose capital funds available to the States and their authorities under the Loan Council arrangements. These comprise borrowings made on behalf of the State Governments (to which the Australian Government has contributed from its own resources in recent years), interest-free grants made by the Australian Government to the States and borrowings by State authorities. Relevant statistical material is presented in Appendix III.
The Loan Council, which is constituted under the Financial Agreement, is composed of representatives of the Australian Government and each State Govern-ment. Under the terms of the Financial Agreement borrowings by the Australian Government and State Governments (except for temporary borrowings and defence borrowings) are subject to approval by the Loan Council. Accordingly, the Loan Council determines annual borrowing programs for the Australian Government and the States, together with the terms and conditions of loans to finance these pro-grams. Subject to the decisions of the Loan Council, borrowings for and on behalf of the State Governments and conversions, renewals, redemptions and consolidations of the public debt of the States are, with limited exceptions, arranged by the Australian Government.
STATE GOVERNMENT LOAN COUNCIL PROGRAMS The Loan Council program for State Governments represents the major source of funds available to the States for capital works. Each State determines the application of its share of the program. As mentioned above, a proportion of a total program for State Governments agreed to in the Loan Council is provided as a capital grant by the Australian Government, which has also undertaken to see that the borrowings element of the States' works program is realised by subscribing any shortfall from its own resources. Further information on these aspects is given below.
The Loan Council borrowing programs for the State Governments do not include amounts granted or advanced to the States for specific purposes by the Australian Government. However, as a matter of procedure, the Loan Council, in each year from 1945-46 to 1970-71, agreed to a total program for each State from which the State nominated the amount it would receive as advances from the Australian Government at concessional interest rates under successive Common-wealth—State Housing Agreements. So that the Australian Government would have authority from the Loan Council to borrow the moneys to finance these advances to the States, an equivalent part of the total program was allocated to the Australian Government as part of its approved borrowing program. The
26
remainder of the program, representing borrowings to be made on behalf of the States, was formally the approved borrowing program of the States (subject to the introduction, in 1970-71, of the interest-free grants—see below).
The Housing Agreement was not renewed on its expiry in 1970-71, and the procedure whereby the Australian Government provided specific advances to the States to finance that part of the total Loan Council program for the States which was to be applied by them for housing, with an equivalent part of the total program being allocated as a borrowing program for the Australian Govern-ment, was discontinued. While this meant the withdrawal of the former interest concession on the funds for housing, specific revenue grants were introduced in lieu of that concession. At the June 1973 Premiers' Conference/Loan Council meeting the arrangements for housing finance were again changed. The Australian Government, beginning in 1973-74, is providing the advances for housing outside the Loan Council arrangements. The State Government Loan Council programs for 1973-74 and 1974-75 are, as a result, lower than they would otherwise have been.
Details of the housing arrangements formerly and currently applying are given in the next Chapter, and further details of past arrangements are given in Appendix IV.
In brief, the position in recent years has been:— Up to and including 1969-70, the Loan Council approved an aggregate program for 'works and housing' for the States, comprising the formally approved borrowing programs of the States and advances under the Commonwealth-State Housing Agreement in force at the time. In 1970-71, the Loan Council approved an aggregate program for 'works and housing' for the States, comprising the formally approved borrowing programs of the States, housing advances and interest-free capital grants. In 1971-72 and 1972-73, the Loan Council approved an aggregate program for 'works and housing' for the States, comprising the formally approved borrowing programs of the States and interest-free capital grants. For 1973-74 and 1974-75, the Loan Council approved an aggregate program for 'works' for the States, comprising the formally approved borrowing programs of the States and interest-free capital grants. The Australian Government is providing advances for welfare housing outside the State Government Loan Council programs.
State Government Programs for 1974-75 The total State Government program for 1974-75 approved by the Loan Council at its meeting in June 1974 was $934,919,000, consisting of a basic program of $925,000,000 and a temporary borrowing allocation of $9,919,000 for Queensland to finance the additional cost of restoring flood-damaged assets to above their
27
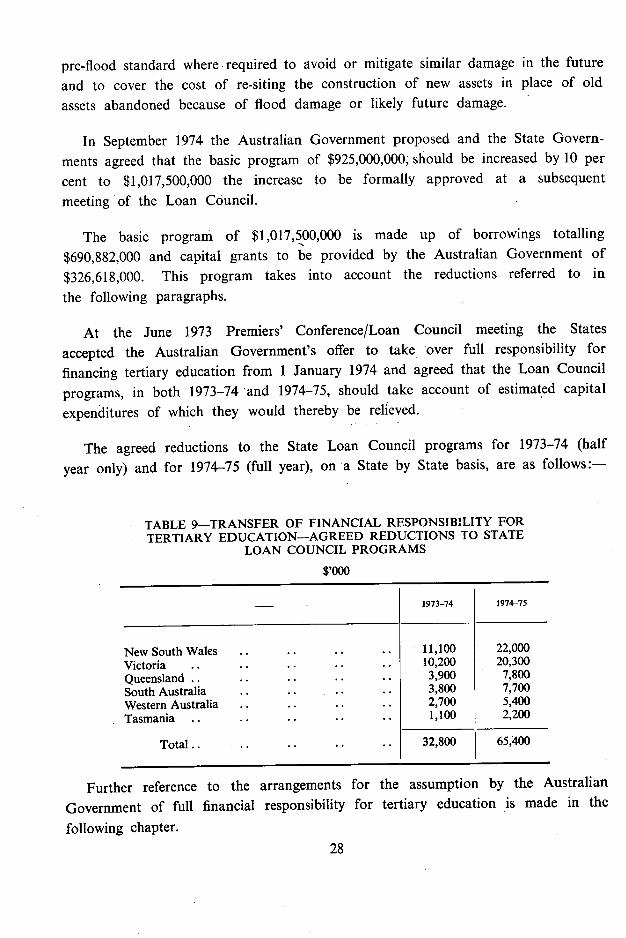
pre-flood standard where required to avoid or mitigate similar damage in the future and to cover the cost of re-siting the construction of new assets in place of old assets abandoned because of flood damage or likely future damage.
In September 1974 the Australian Government proposed and the State Govern-ments agreed that the basic program of $925,000,000, should be increased by 10 per cent to $1,017,500,000 the increase to be formally approved at a subsequent meeting of the Loan Council.
The basic program of $1,017,500,000 is made up of borrowings totalling $690,882,000 and capital grants to be provided by the Australian Government of $326,618,000. This program takes into account the reductions referred to in the following paragraphs.
At the June 1973 Premiers' Conference/Loan Council meeting the States accepted the Australian Government's offer to take over full responsibility for financing tertiary education from 1 January 1974 and agreed that the Loan Council programs, in both 1973-74 and 1974-75, should take account of estimated capital expenditures of which they would thereby be relieved.
The agreed reductions to the State Loan Council programs for 1973-74 (half year only) and for 1974-75 (full year), on a State by State basis, are as follows:—
TABLE 9—TRANSFER OF FINANCIAL RESPONSIBILITY FOR TERTIARY EDUCATION—AGREED REDUCTIONS TO STATE
LOAN COUNCIL PROGRAMS
$,000
- - 1973-74 1974-75
New South Wales .. .. .. .. Victoria .. .. .. .. .. Queensland .. .. .. .. .. South Australia .. .. .. .. Western Australia .. .. .. ..
11,100 10,200
3,900 3,800 2,700
22,000 20,300 7,800 7,700 5,400
Tasmania .. .. .. .. .. 1,100 2,200
32,800 65,400 Total.. .. .. .. ..
Further reference to the arrangements for the assumption by the Australian Government of full financial responsibility for tertiary education is made in the following chapter. -
28
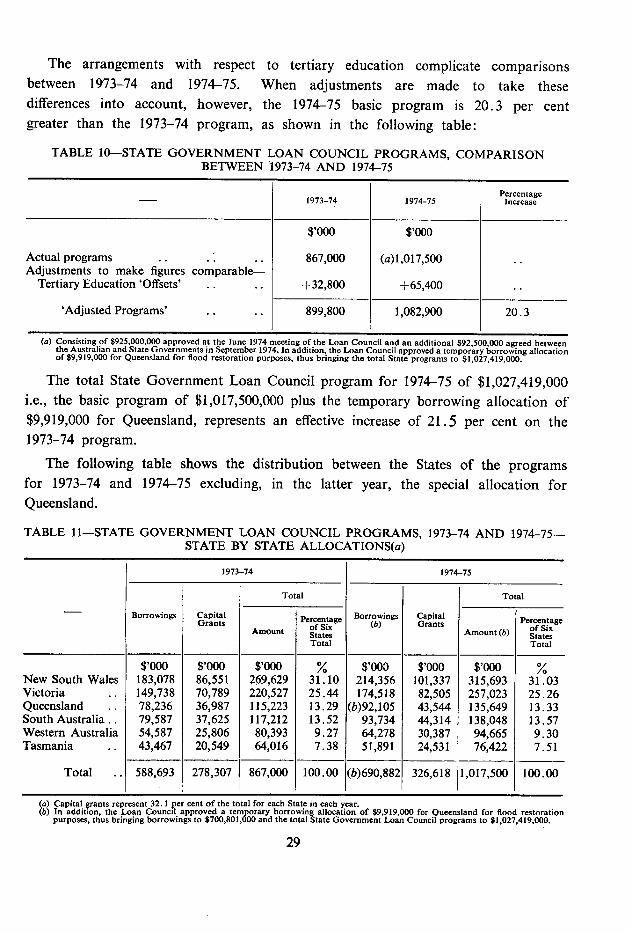
The arrangements with respect to tertiary education complicate comparisons between 1973-74 and 1974-75. When adjustments are made to take these differences into account, however, the 1974-75 basic program is 20.3 per cent greater than the 1973-74 program, as shown in the following table:
TABLE 10-STATE GOVERNMENT LOAN COUNCIL PROGRAMS, COMPARISON BETWEEN 1973-74 AND 1974-75
- 1973-74 1974-75 Percentage
Increase
$,000 $1000
Actual programs .. . .. 867,000 (a)1,017,500 Adjustments to make figures comparable-
Tertiary Education 'Offsets' .. .. +32,800 +65,400
'Adjusted Programs' .. .. 899,800 1,082,900 20.3
(a) Consisting of $925,000,000 approved at the June 1974 meeting of the Loan Council and an additional $92,500,000 agreed between the Australian and State Governments in September 1974. In addition, the Loan Council approved a temporary borrowing allocation of $9,919,000 for Queensland for flood restoration purposes, thus bringing the total State programs to 81,027,419,000.
The total State Government Loan Council program for 1974-75 of $1,027,419,000 i.e., the basic program of $1,017,500,000 plus the temporary borrowing allocation of $9,919,000 for Queensland, represents an effective increase of 21 .5 per cent on the 1973-74 program.
The following table shows the distribution between the States of the programs for 1973-74 and 1974-75 excluding, in the latter year, the special allocation for Queensland.
TABLE 11-STATE GOVERNMENT LOAN COUNCIL PROGRAMS, 1973-74 AND 1974-75 STATE BY STATE ALLOCATIONS(a)
1973-74 1974-75
Total Total
- Borrowings Capital Grants
Borrowings (b)
Capital Grants Percentage Percentage
Amount of Six States Amount (b) of Six
States Total Total
$'OOO $'OOO $'OOO % $'OOO $'OOO $'OOO New South Wales 183,078 86,551 269,629 31.10 214,356 101,337 315,693 31.03 Victoria .. 149,738 70,789 220,527 25.44 174,518 82,505 257,023 25.26 Queensland .. 78,236 36,987 115,223 13.29 (b)92,105 43,544 135,649 13.33 South Australia. . 79,587 37,625 117,212 13.52 93,734 44,314 138,048 13.57 Western Australia 54,587 25,806 80,393 9.27 64,278 30,387 94,665 9.30 Tasmania .. 43,467 20,549 64,016 7.38 51,891 24,531 76,422 7.51
Total .. 588,693 278,307 867,000 100.00 (b)690,882 326,618 1,017,500 100.00
Capital grants represent 32.1 per cent of the total for each State in each year. In addition, the Loan Council approved a temporary borrowing allocation of $9,919,000 for Queensland for flood restoration purposes, thus bringing borrowings to $700,801,000 and the total State Government Loan Council programs to $1,027,419,000.
29
The Australian Government has undertaken to support the total program of $1,027,419,000 for 1974-75 on the basis outlined below under the heading 'Financing of States' Borrowing Programs and the Capital Grants'.
Capital Grants Arrangements At the June 1970 Premiers' Conference, as part of the revised revenue assistance arrangements with the State Governments settled at that Conference, the Australian Government undertook to provide a portion of the States' Loan Council programs in the form of interest-free capital grants. The grants were designed to help the States finance capital works from which debt charges are not normally re-covered such as schools, police buildings and the like. The grants were not, how-ever, to be subject to conditions as to the purposes for which they might be ex-pended. As the grants replaced borrowings that would otherwise have been made by the States, there have been substantial savings to the States in debt charges, and these have been estimated at $12.6 million in 1971-72, $23.8 million in 1972-73, $38.4 million in 1973-74 and $59.7 million in 1974-75.
The States received grants totalling $200 million in 1970-71 distributed be-tween them in the same proportions as their borrowing programs. This represented 24.3 per cent of the total works and housing program in that year. The pro-portion increased to 24.6 per cent in 1971-72 due to a permanent addition of $2 million to the grants in recognition of the costs faced by the States in the changeover to the metric system. (See page 30 of 'Commonwealth Payments to or for the States 1972-73.') In 1972-73 the grants increased further to 25.3 per cent as a result of arrangements associated with the provision of capital grants for expenditure on government schools (see page 31 of 'Commonwealth Payments to or for the States 1972-73' for details). In the absence of the adjustments re-sulting from the change in the method of financing welfare housing, the percentage would have risen to 26.7 per cent in 1973-74 with the payment of a further grant for government schools.
The adjustments to the programs in 1973-74 to take account of the fact that the Australian Government was to provide advances for welfare housing outside, and in addition to, the States' Loan Council programs took the form of sub-tractions from the borrowing component of the programs and did not affect the level of capital grants. This had the effect of increasing the proportion of the programs taking the form of capital grants to 32.1 per cent. The reductions on account of the assumption by the Australian Government of full responsibility for financing tertiary education were made on a pro rata basis against both the borrowing and capital grants components of the programs and did not, therefore,
30
affect the percentage represented by the capital grants. The figure of 32. 1 per cent was retained for 1974-75 and was applied to the basic programs for that year. The whole of the temporary allocation agreed to for Queensland (see above) is taking the form of borrowings.
Financing of States' Borrowing Programs and the Capital Grants As previously mentioned, all borrowings on behalf of the State Governments are, with limited exceptions, arranged by the Australian Government.
When the proceeds of public borrowings available for this purpose are in-sufficient to finance the States' programs the Australian Government makes up the shortfall by subscribing the appropriate amount to a special loan, proceeds of which are allocated to the States. The amounts made available in this way represent State debt. These special loans are raised on terms and conditions similar to those offered in the previous public loan raised in Australia. The effect of this arrangement is that, as necessary, the Australian Government con-tributes amounts from its own resources to help finance the Loan Council program of the State Governments.
These special loan arrangements applied, up until 1970-71, not only to the approved borrowing programs of the State Governments, but also to the Australian Government's advances to the States under successive Commonwealth-State Housing Agreements. That is, special loans were applied, as necessary, to fill that part of the Australian Government's approved borrowing program which was for the purpose of financing the housing advances.
The borrowing program for the Australian Government approved by the Loan Council includes an amount equal to the capital grants. The legislation authorising the payment of the capital grants authorises the Treasurer to borrow the amount concerned, or to meet it wholly or in part from Consolidated Revenue Fund.
A summary of the financing of the States' Loan Council programs since 1951-52 is given in Table 105 in Appendix III; Table 106 shows further details of the financing of the programs since 1962-63.
Following the previous practice, the Australian Government has undertaken to support the total States' Loan Council programs of $1,027,419,000 agreed for 1974-75, conditional on the States agreeing to certain arrangements designed to promote the raising of loans to finance the programs. On this basis, the Aus-tralian Government will support the programs in the following ways:—
(a) by leaving to the States, to the extent necessary to complete their govern-mental borrowing programs, the whole of the proceeds derived from public
31
loan raisings by the Australian Government in Australia (other than the net proceeds of Drought Bonds, Treasury Note Issues, and other borrow-ings for temporary purposes; amounts required to meet encashments of Special Bonds; and amounts applied to redemptions of public securities that cannot be financed out of the National Debt Sinking Fund);
by arranging, to the maximum possible extent, for the redemption of maturing but unconverted State debt that cannot be met from State sinking funds; and
by making monthly advances to the States for the first eight months of the financial year against the borrowing component of the program at an annual rate not exceeding $700,801,000, the position then to be reviewed and a tentative determination made, not later than February 1975, of the amount of any special loan assistance the Australian Government may provide from its own resources. (The amount of the capital grants com-ponent of the program is paid to the States by equal monthly instalments.)
These arrangements are similar to those that have applied in previous years.
BORROWING PROGRAMS FOR STATE AUTHORITIES
Under a 'Gentlemen's Agreement', originating in 1936, the Loan Council approves an aggregate annual borrowing program for larger State semi-government and local authorities. Up to 1961-62 larger authorities were those borrowing $200,000 or more in a financial year; from 1962-63 to 1966-67 authorities borrowing more than $200,000 in a financial year; from 1967-68 to 1971-72 authorities borrowing more than $300,000 in •a financial year; in 1972-73 and 1973-74 authorities borrowing more than $400,000 in a financial year; and in 1974-75 authorities borrowing more than $500,000 in a financial year. From 1962-63 no overall limit has been set by the Loan Council on borrowings by smaller authorities, that is, authorities borrowing within the financial year up to the amounts mentioned above.
The total program approved is distributed by the Loan Council between the States. Each State determines the distribution between individual larger authorities of its share of the overall borrowing program approved for such authorities. The terms and conditions of loans raised by such authorities are subject to Loan Council approval.
32
Borrowings by smaller State authorities are also subject to the terms and conditions applying under the Gentlemen's Agreement and it is the responsibility of the States to ensure that the smaller authorities conform with these terms and conditions.
At its June 1973 meeting the Loan Council agreed to a borrowing program in 1973-74 for larger State authorities of $564,000,000. This included special allocations totalling $19,000,000, of which $10,000,000 was a permanent addition to the program for New South Wales, $3,000,000 was a temporary allocation for Queensland to finance works associated with beach erosion in the Gold Coast area representing a deferral of a temporary addition approved for 1972-73 but not used in that year, and $6,000,000 was a further temporary allocation for Western Australia, under revisions to arrangements originally discussed in June 1970 and referred to in more detail in Appendix II. (A 'permanent' addition to a State's program increases that State's share of the basic program, the distribution of which in turn is used as the basis for determining the distribution of the following year's basic program between the States. A 'temporary' addition is not so added to the State's share of the basic program.)
In May 1974 the Loan Council agreed to increase the 1973-74 program for larger authorities by $2,054,000, taking it to $566,054,000. This increase represented a special temporary allocation for Queensland for the restoration of flood-damaged assets to above pre-flood standard where required to avoid or mitigate similar damage in the future, as well as the cost of re-siting the construction of new assets in place of old assets abandoned because of flood damage or likely future damage. Actual borrowings in 1973-74 were $564,987,000 which was $52,561,000, or 10.3 per cent, greater than borrowings in 1972-73.
At its June 1974 meeting the Loan Council approved a total borrowing program for larger State authorities for 1974-75 of $636,084,000—$70,030,000, or 12.4 per cent, more than the program approved for 1973-74. This total program is made up of the basic program of $610,500,000, a further permanent addition of $10,000,000 for New South Wales and temporary additions of $9,584,000 for Queensland and $6,000,000 for Western Australia. The temporary addition for Queensland was for the restoration of flood-damaged assets and was similar to the temporary allocation for the same purpose approved for 1973-74. The addition for Western Australia was made under the arrangements originally agreed in June 1970 but as revised subsequent to the June 1973 Premiers' Conference/Loan Council meeting (see Chapter II). The basic program of $610,500,000 was divided between the States in the same proportions as the 1973-74 basic program (including for this purpose the $10,000,000 addition made in that year to New South Wales' program).
33

The Loan Council also agreed at its June 1974 meeting that larger authorities would, from 1974-75, be those authorities borrowing more than $500,000 in a financial year, and that the policy adopted in recent years of not imposing any overall limit on borrowings by smaller State authorities would be continued in 1974-75.
The borrowings of both larger and smaller authorities in each State in 1973-74 and previous years, the shares of the program for larger authorities in each State in 1974-75 and estimated borrowings by smaller authorities in 1974-75 are shown in Table 100 in Appendix III. Table 104 in that Appendix shows the amounts that have been borrowed by local government authorities from within the total borrowings of. both larger and smaller authorities. Further reference to the borrow-ing arrangements for local government authorities is made in Chapter V.
Treatment of Loan Council Programs in this and Other Budget Documents The advances for housing (to 1970-71) and capital grants (beginning in that year) which, as explained above, have been agreed to in the context of Loan Council discussions, represent Australian Government payments to the States and are so categorised for purposes of this and other Budget documents concerned.
The State Governments' Loan Council borrowing programs are not included in the totals of payments to the States shown in this document. However, as mentioned in Chapter I, the national accounting item 'grants and net advances to the States' used in the statements attached to the Budget Speech and other docu-ments does include these programs. The equivalent aggregate is described in this document as the total of Australian Government payments -to the States and their Loan Council borrowing programs.
The term 'general purpose funds' is used in Table 1 and in tables in the Appendices to describe the States' borrowing programs and the capital grants. Housing advances paid prior to 1971-72, which were nominated by the States themselves out of aggregate total amounts (referred to over the period concerned as the 'works and housing programs') agreed to in the Loan Council, are not included in the totals of general purpose capital funds shown in this document. However, the fact that the amounts of these advances were so determined over the period concerned needs to be borne in mind in interpreting the figures shown for general purpose capital funds in this document. -
34
CHAPTER IV—SPECIFIC PURPOSE PAYMENTS For many years the Australian Government has provided financial assistance for certain specific types of expenditure by the States. In recent years there has been a considerable expansion in such assistance and further rapid growth will occur in 1974-75. The present Government, in its financial relations with the States, is putting a particular emphasis on specific purpose programs. In his opening speech at the June 1973 Premiers' Conference the Prime Minister said: "From now on, we will expect to be involved in the planning of the function in which we are financially involved. We believe that it would be irresponsible for the national Government to content itself with simply providing funds without being involved in the process by which priorities are met, and by which expendi-tures are planned and by which standards are met".
This chapter outlines specific purpose payments recently made, presently being made or proposed to be made to the States. Appendix IV outlines some of the history of such payments and summarises programs which have been completed in recent years. Table 89 in Appendix I shows aggregate specific purpose payments to each State since 1956-57 classified as to whether they were for recurrent or capital purposes and Table 94 in Appendix I classifies these and other payments by function.
The various payments in this chapter are grouped under the functional headings used in the Statements attached to the Budget Speech—the only exceptions being that payments included in the "Not Allocated to Function" category (namely assistance related to State debts, grants for local government being paid on the recommendation of the Grants Commission, grants for regional organizations of local government and natural disaster relief) are shown under specific headings in appropriate places in the chapter and that payments for Aboriginal advancement are outlined together (in the functional statements they are distributed over a number of functions).
Details further to those provided in this chapter on specific purpose payments made to the States for "on-passing" to local government authorities are given in Chapter V.
ASSISTANCE RELATED TO STATE DEBTS
POyments Under the Financial Agreement Contributions to Interest on State Debts Under the Financial Agreement entered into by the Australian Government and the States in 1927, the Australian Government makes payments to the States expressed as a contribution towards interest payable on State debts. They are therefore treated here as specific purpose grants, although they have some of the characteristics of grants for general purposes. In fact, the payments superseded the general revenue grants of $2.50 per head of the population of each, State made in the period 1910-11 to 1926-27 under the Surplus Revenue Act 1910. (See Appendix 11.)
35
Each year the total contribution is $15,170,000, the amount that was payable in 1926-27 under that Act. The contribution is apportioned between the States in the same way as the 1926-27 per capita grant and is to continue for fifty-eight years from 1 July 1927 (that is, until 1985). It is distributed among the States as shown in the following table:—
TABLE 12—INTEREST PAYMENTS ON STATE DEBTS $,000
New South Wales.. .. .. .. .. 5,835 Victoria .. .. .. .. .. .. 4,254 Queensland .. .. .. .. .. 2,192 South Australia .. .. .. .. .. 1,408 Western Australia .. .. .. .. 947 Tasmania .. .. .. .. .. 534
Total .. .. .. .. .. 15,170
Sinking Fund Contributions The sinking fund contributions on State debt made by the Australian Government under the Financial Agreement vary according to the date and nature of the borrowings. On States' debts existing at 30 June 1927 the Australian Government is making contributions at the rate of 0. 125 per cent per annum for a period of fifty-eight years, and on cash loans raised for the States since that date the Australian Government contributes for fifty-three years at the rate of 0.25 per cent per annum. Each State is obliged to make sinking fund payments for correspond-ing periods at the rate of 0.25 per cent per annum of the debt, regardless of the date on which it was incurred. The main exception is in relation to debt incurred for the purpose of funding revenue deficits. In these instances, the Australian Government makes no sinking fund contribution and the States are obliged to make contributions to the sinking fund of not less than 4 per cent per annum. However, for Treasury Bills totalling $86 million that were issued to cover State revenue deficits accruing between July 1927 and June 1935, special arrangements were made under which the Australian Government contributes 0.25 per cent per annum until June 1983 on the amount outstanding.
Proposed Amendments to Sinking FundProvisions of the Financial Agreement At its meeting in June 1974 the Loan Council adopted a report prepared by a Committee of Australian Treasury and State Treasury officers which proposed amendments to the Financial Agreement incorporating provisions for the formal takeover by the Australian Government of $1,000 million of State debt on 30 June 1975. The report also proposed amendments relating to the sinking fund pro-visions. Following the adoption of the report it is intended that legislation be proposed by the Australian Government and by each State Government in 1974-75 to amend the Financial Agreement to provide for the introduction of new sinking fund arrangements in 1975-76.
36
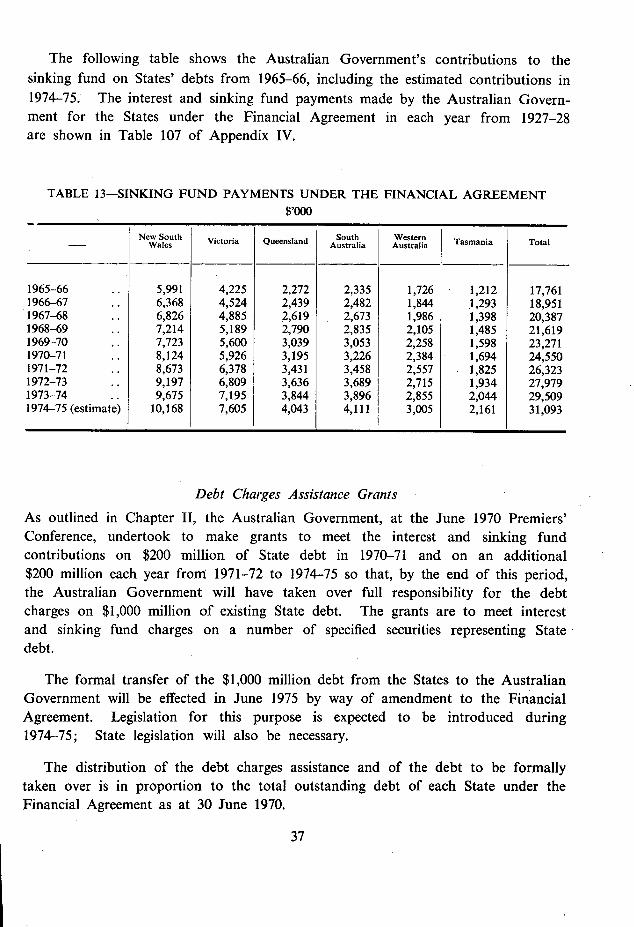
The following table shows the Australian Government's contributions to the sinking fund on States' debts from 1965-66, including the estimated contributions in 1974-75. The interest and sinking fund payments made by the Australian Govern-ment for the States under the Financial Agreement in each year from 1927-28 are shown in Table 107 of Appendix IV.
TABLE 13-SINKING FUND PAYMENTS UNDER THE FINANCIAL AGREEMENT $,000
NeW
esw South Victoria Queensland South Australia
Western Tasmania Total
1965-66 5,991 4,225 2,272 2,335 1,726 1,212 17,761 1966-67 6,368 4,524 2,439 2,482 1,844 1,293 18,951 1967-68 .. 6,826 4,885 2,619 2,673 1,986 1,398 20,387 1968-69 7,214 5,189 2,790 2,835 2,105 1,485 21,619 1969-70 .. 7,723 5,600 3,039 3,053 2,258 1,598 23,271 1970-71 8,124 5,926 3,195 3,226 2,384 1,694 24,550 1971-72 .. 8,673 6,378 3,431 3,458 2,557 1,825 26,323 1972-73 .. 9,197 6,809 3,636 3,689 2,715 1,934 27,979 1973-74 .. 9,675 7,195 3,844 3,896 2,855 2,044 29,509 1974-75 (estimate) 10,168 7,605 4,043 4,111 3,005 2,161 31,093
Debt Charges Assistance Grants As outlined in Chapter II, the Australian Government, at the June 1970 Premiers' Conference, undertook to make grants to meet the interest and sinking fund contributions on $200 million of State debt in 1970-71 and on an additional $200 million each year from 1971-72 to 1974-75 so that, by the end of this period, the Australian Government will have taken over full responsibility for the debt charges on $1,000 million of existing State debt. The grants are to meet interest and sinking fund charges on a number of specified securities representing State debt.
The formal transfer of the $1,000 million debt from the States to the Australian Government will be effected in June 1975 by way of amendment to the Financial Agreement. Legislation for this purpose is expected to be introduced during 1974-75; State legislation will also be necessary.
The distribution of the debt charges assistance and of the debt to be formally taken over is in proportion to the total outstanding debt of each State under the Financial Agreement as at 30 June 1970.
37
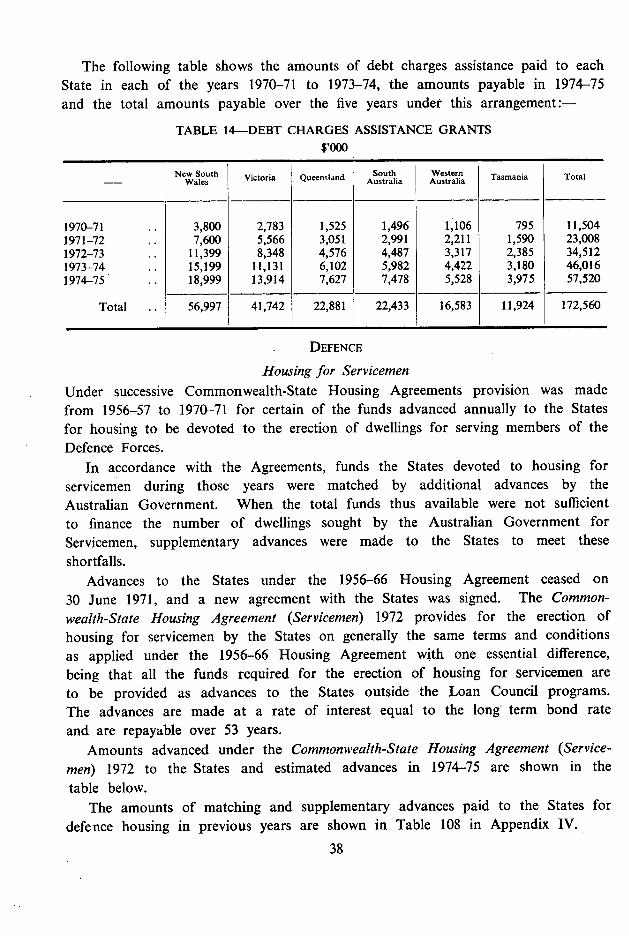
The following table shows the amounts of debt charges assistance paid to each State in each of the years 1970-71 to 1973-74, the amounts payable in 1974-75 and the total amounts payable over the five years under this arrangement:-
TABLE 14-DEBT CHARGES ASSISTANCE GRANTS $,000
New South Wales Victoria Queensland South
Australia Western Australia Tasmania I Total
1970-71 3,800 2,783 1,525 1,496 1,106 795 11,504 1971-72 .. 7,600 5,566 3,051 2,991 2,211 1,590 23,008 1972-73 11,399 8,348 4,576 4,487 3,317 2,385 34,512 1973-74 .. 15,199 11,131 6,102 5,982 4,422 3,180 46,016 1974-75 .. 18,999 13,914 7,627 7,478 5,528 3,975 57,520
Total 56,997 41,742 22,881 22,433 16,583 11,924 172,560
DEFENCE
Housing for Servicemen Under successive Commonwealth-State Housing Agreements provision was made from 1956-57 to 1970-71 for certain of the funds advanced annually to the States for housing to be devoted to the erection of dwellings for serving members of the Defence Forces.
In accordance with the Agreements, funds the States devoted to housing for servicemen during those years were matched by additional advances by the Australian Government. When the total funds thus available were not sufficient to finance the number of dwellings sought by the Australian Government for Servicemen, supplementary advances were made to the States to meet these shortfalls.
Advances to the States under the 1956-66 Housing Agreement ceased on 30 June 1971, and a new agreement with the States was signed. The Common-wealth-State Housing Agreement (Servicemen) 1972 provides for the erection of housing for servicemen by the States on generally the same terms and conditions as applied under the 1956-66 Housing Agreement with one essential difference, being that all the funds required for the erection of housing for servicemen are to be provided as advances to the States outside the Loan Council programs. The advances are made at a rate of interest equal to the long term bond rate and are repayable over 53 years.
Amounts advanced under the commonwealth-State Housing Agreement (Service-men) 1972 to the States and estimated advances in 1974-75 are shown in the table below.
The amounts of matching and supplementary advances paid to the States for defence housing in previous years are shown in Table 108 in Appendix IV.
38
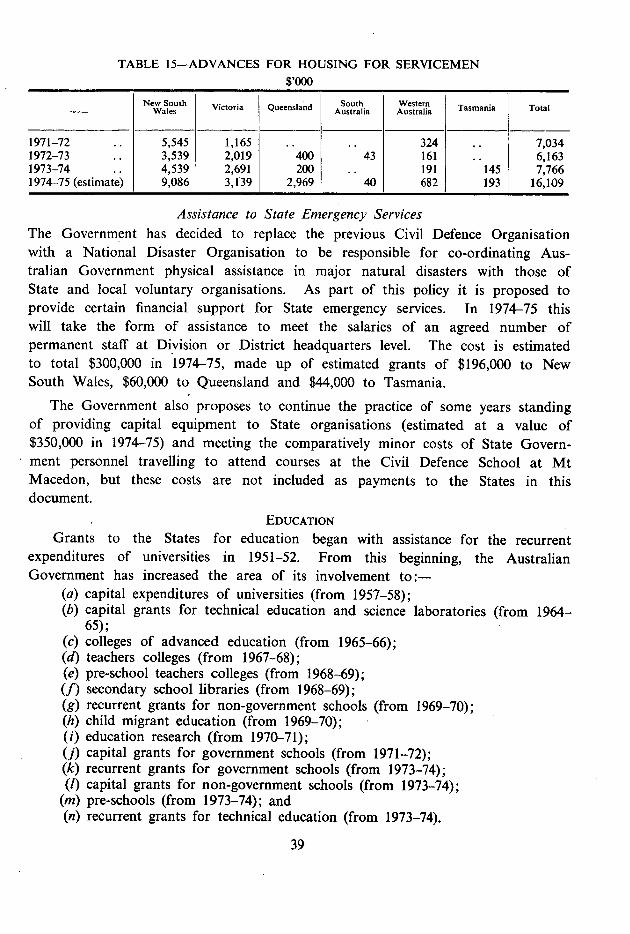
TABLE 15—ADVANCES FOR HOUSING FOR SERVICEMEN $,000
- New South Wales Victoria Queensland South
Australia Western Australia Tasmania Total
1971-72 5,545 1,165 .. .. 324 .. 7,034 1972-73 .. 3,539 2,019 400 43 161 .. 6,163 1973-74 4,539 2,691 200 .. 191 145 7,766 1974-75 (estimate) 9,086 3,139 2,969 40 682 193 16,109
Assistance to State Emergency Services The Government has decided to replace the previous Civil Defence Organisation with a National Disaster Organisation to be responsible for co-ordinating Aus-tralian Government physical assistance in major natural disasters with those of State and local voluntary organisations. As part of this policy it is proposed to provide certain financial support for State emergency services. In 1974-75 this will take the form of assistance to meet the salaries of an agreed number of permanent staff at Division or District headquarters level. The cost is estimated to total $300,000 in 1974-75, made up of estimated grants of $196,000 to New South Wales, $60,000 to Queensland and $44,000 to Tasmania.
The Government also proposes to continue the practice of some years standing of providing capital equipment to State organisations (estimated at a value of $350,000 in 1974-75) and meeting the comparatively minor costs of State Govern- ment personnel travelling to attend courses at the Civil Defence School at Mt Macedon, but these costs are not included as payments to the States in this document.
EDUCATION
Grants to the States for education began with assistance for the recurrent expenditures of universities in 1951-52. From this beginning, the Australian Government has increased the area of its involvement to:—
capital expenditures of universities (from 1957-58); capital grants for technical education and science laboratories (from 1964-65); colleges of advanced education (from 1965-66); teachers colleges (from 1967-68); pre-school teachers colleges (from 1968-69); secondary school libraries (from 1968-69); recurrent grants for non-government schools (from 1969-70); child migrant education (from 1969-70); education research (from 1970-71); capital grants for government schools (from 1971-72); recurrent grants for government schools (from 1973-74);
(1) capital grants for non-government schools (from 1973-74); pre-schools (from 1973-74); and recurrent grants for technical education (from 1973-74).
39
Fundamental changes have been made recently in arrangements for the provision of assistance to the States for education.
First, full responsibility for financing tertiary education was transferred to the Australian Government from the beginning of 1974.
Secondly, the Australian Government has established three new independent bodies to provide it with expert advice—the Schools Commission, the Australian Pre-Schools Committee and the Australian Committee on Technical and Further Education—and is providing new or increased assistance to the States in these fields. With the Australian Universities Commission (established in 1959) and the Australian Commission on Advanced Education (the precursor of which, the Commonwealth Advisory Committee on Advanced Education, was established in 1965), expert and independent advice available to the Australian Government now ranges over the whole field of education.
As a result of these initiatives payments to the States for education have grown rapidly—from $259.4 million in 1972-73 to $622.5 million in 1973-74 and an estimated $1,172.9 million in 1974-75—and such payments now far exceed those being made in respect of any other specific function.
Details of the present and proposed arrangements for specific purpose assistance to the States for education, including details of the matters referred to above, are set out below; details of the history of such payments are to be found in Appendix IV.
Tertiary Education Assistance for tertiary education was, until the beginning of 1974, on a 'matching' basis with the States. In March 1973 the Australian Government offered to take full financial responsibility for tertiary education and to abolish fees at tertiary institutions and technical colleges from 1 January 1974. At the June 1973 Premiers' Conference the States accepted this offer and it was agreed that estimates of the amounts of expenditures of which the State Governments would thereby be relieved would be deducted from the general purpose funds provided to the States—more specifically, reductions to the financial assistance grants in respect of recurrent expenditure, and reductions to the States' Loan Council programs in respect of capital expenditure were agreed on. In 1973-74 a half-year's expendi-ture was involved; the full year offsets are being effected in 1974-75. The amounts of the reductions in the financial assistance grants are shown in Table 3 and the amounts of the reductions in the Loan Council programs are shown in Table 9. Legislation to provide additional grants to the States for tertiary education in accordance with these decisions was passed in the 1973 Budget session of Parlia-ment.
Universities Assistance to the States for the recurrent expenditures of universities dates from 1951-52; in 1957-58 assistance was first given for their capital expenditures. An outline of assistance prior to 1973 is given in Appendix IV.
In August 1972 the Australian Government announced its acceptance of the recommendations contained in the Fifth Report of the Australian Universities Commission, which sought a program of assistance to State universities totalling $895.3 million over the 1973-75 triennium. The States Grants (Universities) Act (No. 2) 1972 authorised the payment of the Australian Government's share of that amount—$256.4 million for recurrent expenditure and $87.1 million for capital expenditure—a total of $343.5 million. These amounts were based on matching arrangements under which for recurrent expenditures the Australian Government met $1 for each $1.85 State grants and university fees combined and for capital expenditures met $1 for each $1 of State contribution. The triennial program included a number of changes in the detail of arrangements for financing univer-sities expenditure which the Commission had recommended in its Report. These included a single grant for equipment for each university rather than provision under separate grants, the provision of special earmarked grants for the Universities of Sydney and Melbourne to meet the problems of mature universities in intro-ducing new academic developments, and assistance with building non-collegiate student accommodation.
In addition to the approved triennial program, the States Grants (Universities) Act (No. 2) 1972 re-appropriated an amount of $316,000 for the Australian Government's share of a student residence project at the University of Tasmania. This amount had originally been approved as part of a larger grant for the 1970-72 triennium but the project was incomplete at the end of the triennium and the full amount had not been taken up.
The total triennial program has increased from the originally approved amount of $895.9 million to $996.4 million as a result of the following increases:—
grants of $2.1 million met in full by the Australian Government and paid to universities in the first six months of 1973 to help students experiencing hardship in commencing or continuing their tertiary studies during 1973; supplementary recurrent grants to meet the costs of academic salary increases from 1 January 1973 as a result of the Government's acceptance of recommendations made by Mr Justice Campbell, and to allow for salary increases resulting from the 1973 National Wage Case Decision; a contribution towards the cost to the New South Wales Government of the acquisition of a site for the proposed new university at Campbell-town; and additional funds to provide for a variety of new Chairs or new or ex-panded courses in particular areas (social work, social planning, education of handicapped children, medicine and post-graduate management edu-cation).
41
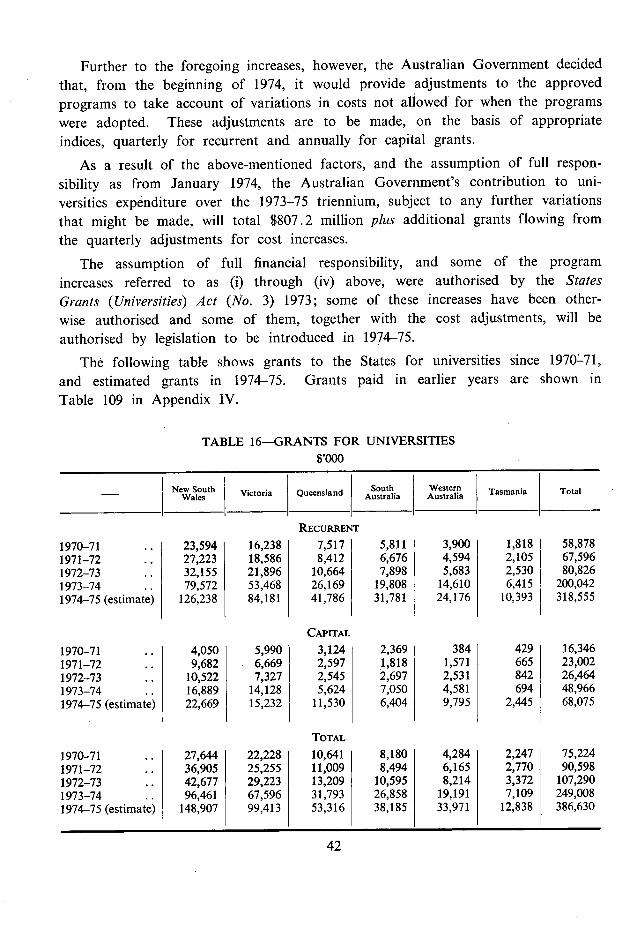
Further to the foregoing increases, however, the Australian Government decided that, from the beginning of 1974, it would provide adjustments to the approved programs to take account of variations in costs not allowed for when the programs were adopted. These adjustments are to be made, on the basis of appropriate indices, quarterly for recurrent and annually for capital grants.
As a result of the above-mentioned factors, and the assumption of full respon-sibility as from January 1974, the Australian Government's contribution to uni-versities expenditure over the 1973-75 triennium, subject to any further variations that might be made, will total $807.2 million plus additional grants flowing from the quarterly adjustments for cost increases.
The assumption of full financial responsibility, and some of the program increases referred to as (i) through (iv) above, were authorised by the States Grants (Universities) Act (No. 3) 1973; some of these increases have been other-wise authorised and some of them, together with the cost adjustments, will be authorised by legislation to be introduced in 1974-75.
The following table shows grants to the States for universities since 1970-71, and estimated grants in 1974-75. Grants paid in earlier years are shown in Table 109 in Appendix IV.
TABLE 16-GRANTS FOR UNIVERSITIES $,000
- I New South Wales victoria I Queensland South
Australia Western Australia
I Tasmania Total
RECURRENT 1970-71 .. I 23,594 16,238 I 7,517 5,811 1 3,900 1,818 58,878 1971-72 .. 27,223 18,586 8,412 6,676 I 4,594 2,105 67,596 1972-73 .. 32,155 I 21,896 10,664 7,898 5,683 I 2,530 80,826 1973-74 .. 79,572 I 53,468 26,169 I 19,808 14,610 I 6,415 200,042 1974-75 (estimate) 126,238 84,181 41,786 31,781 24,176 10,393 318,555
CAPITAL
1970-71 .. 4,050 5,990 3,124 2,369 1 384 429 16,346 1971-72 .. 9,682 6,669 2,597 1,818 1,571 665 23,002 1972-73 .. 10,522 7,327 2,545 2,697 2,531 842 26,464 1973-74 .. 16,889 14,128 5,624 7,050 4,581 694 48,966 1974-75 (estimate) 22,669 15,232 11,530 6,404 9,795 2,445 68,075
TOTAL
1970-71 .. 27,644 22,228 10,641 8,180 4,284 2,247 75,224 1971-72 .. 36,905 25,255 11,009 8,494 6,165 2,770 90,598 1972-73 .. 42,677 29,223 13,209 10,595 8,214 3,372 107,290 1973-74 .. 96,461 67,596 31,793 26,858 19,191 7,109 249,008 1974-75 (estimate) 148,907 99,413 53,316 38,185 33,971 12,838 386,630
42
Colleges of Advanced Education and Teachers Colleges
Grants to the States for colleges of advanced education began in March 1965 when the Australian Government agreed, as an interim measure, to pay capital grants totalling approximately $5 million in the remainder of the 1964-66 triennium. As from the start of the 1967-69 triennium, assistance was extended to recurrent grants for the colleges. Grants to the States for teachers colleges have been made since 1967-68 and 1968-69 respectively; prior to July 1973 these grants were provided under separate programs, but since then they have both been absorbed into a wider program of grants for colleges of advanced education.
Grants to the States for colleges of advanced education were, prior to the beginning of 1974, subject to the same matching arrangements as for universities. For recurrent expenditure the basis was $1 by the Australian Government to $1 .85 State grants plus fees whilst capital grants were made on the basis of $1 by the Australian Government to $1 State. However, these matching arrangements ceased as from 1 January 1974 when the Australian Government assumed full financial responsibility for tertiary education. Tuition fees at tertiary institutions were also abolished as from that date.
In August 1972 the Australian Government announced that, with two exceptions, it would accept the recommendations contained in the Third Report of the Australian Commission on Advanced Education relating to the level of assistance to be provided to colleges of advanced education in the States for the 1973-75 triennium. The first exception was that the Australian Government would share on a $1 for $1 basis with the States the recommended assistance of $1 million for residential places in country colleges rather than provide that amount on an unmatched basis as recommended by the Committee. Secondly, the Australian Government would provide an unmatched grant of $500,000 for library facilities, plus a further $1 million for that purpose subject to matching by the States, instead of an unmatched grant of $5 million as the Commission had recommended. The revised program for the 1973-75 triennium thus amounted to $421.9 million. The Australian Government's share of that amount was $172.3 million, made up of $93.6 million towards recurrent and $78.2 million towards capital expenditure, and $500,000 by way of an unmatched grant for library facilities.
The Australian Government has since decided to amend the existing triennial program for colleges of advanced education by:—
(a) replacement of the grants arrangement for library facilities, as referred to above, with an unmatched grant of $5 million as the Commission had originally recommended;
43
agreement to a supplementary recommendation made by the Commission, at the time that the report of its Special Committee on Teacher Education was presented, that capital grants totalling $3.5 million be provided for colleges of advanced education in New South Wales and Victoria for teacher education purposes; provision of an unmatched grant to the States of $806,000 to help students who were experiencing hardship in commencing or continuing their tertiary studies during 1973—this amount was paid to the States in the first six months of 1973; provision of grants totalling $1.3 million for the introduction of special courses in social work, dental therapy and physical education at various colleges of advanced education; provision of supplementary recurrent grants of $1,280,000 to the Tasman-ian College of Advanced Education to enable it to carry out activities at the required level; provision of supplementary grants to colleges to meet the increased costs of academic salaries resulting from acceptance of the recommendations in the Report by Mr Justice Campbell, and to meet the cost of increased salaries and wages to college staff resulting from the 1973 National Wage Case Decision; and provision, to applrom the beginning of 1974, of additional grants, both recurrent and capital, 'to cover cost increases beyond those allowed for in the original program.
In addition, outside the triennial program, the Australian Government is contributing $115,000 towards the cost of erecting a Great Hall at the Ballarat Institute of Advanced Education.
In April 1973 the Australian Government accepted the recommendations contained in the Report of the Australian Commission on Advanced Education's Special Committee on Teacher Education for a program of support for teachers colleges and for pre-school teachers colleges in the States over the two and a half year period 1 July 1973 to 31 December 1975. The committee recommended that grants for certain pre-school teachers colleges be contingent on those colleges achiev-ing self-government, but the Australian Government decided to make the grants available without applying that condition. The financial assistance program totalled $206.6 million, to be shared by the Australian Government and the States on the same basis as for universities and colleges of advanced education in the period July 1973 to December 1973 and thereafter to be met wholly by the Australian Government. In addition to the recommended program the Australian Government. approved a grant of $425,000 for pre-school teachers colleges for 1974 and 1975 to meet the continuing cost associated with an increased student intake for which $100,000 had already been approved for 1973.
44
This program has since been increased to provide for:—
increased grants to cover the cost of increased salaries as a result of acceptance of the recommendations in the report of Mr Justice Campbell, and to meet the cost of the 1973 National Wage Case Decision; recurrent grants, of up to $6.4 million for certain non-government teachers colleges in the States in 1974 and 1975; and supplementary payments, as from the beginning of 1974, ir respect of cost increases beyond those allowed for in the original programs.
The triennial program for 1973-75 for colleges of advanced education and teachers colleges, as a result of the foregoing increases, now totals $708.3 million plus the effects (which cannot be stated with precision at this stage) of the cost escalation introduced as from January 1974. As a result of the above-mentioned factors, and the assumption of full responsibility as from January 1974, the Aus-tralian Government's contribution to the expenditure of colleges of advanced education and teachers colleges over the 1973-75 triennium, subject to any further variations that might be made, will total $600.1 million plus additina1 grants flowing from the adjustments for cost increases.
Most of the grants, both for colleges of advanced education and teachers colleges, referred to above were authorised by various States Grants (Advanced Education) Acts in 1972 and 1973. Some of the supplementary grants, however, will be authorised by legislation to be introduced in 1974-75.
The following table shows grants to the States for colleges of advanced edu-cation and for teachers colleges combined from 1970-71, and estimates for 1974-75. Amounts paid in earlier years are given in Table 110 in Appendix IV.
45
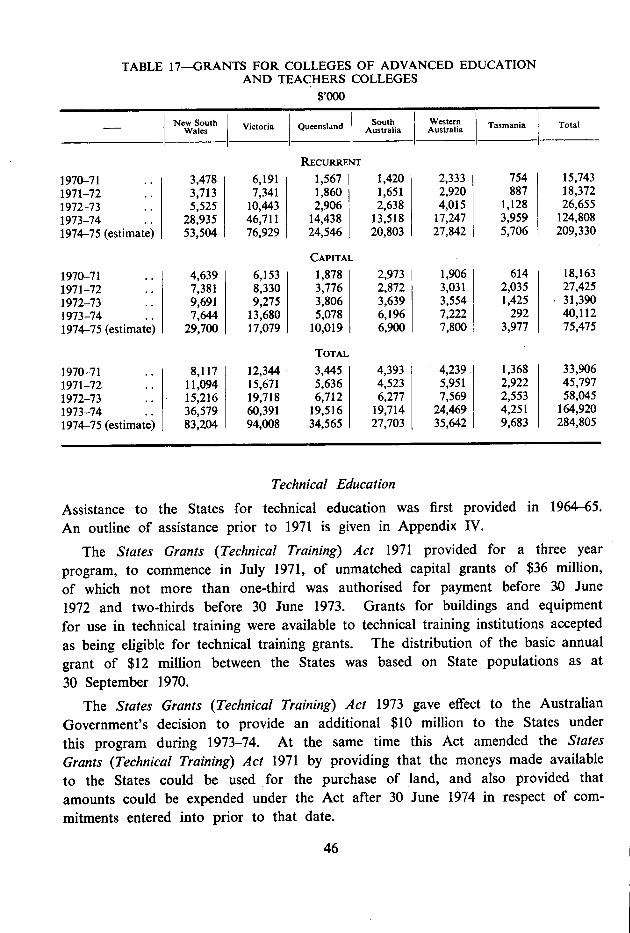
TABLE 17-GRANTS FOR COLLEGES OF ADVANCED EDUCATION AND TEACHERS COLLEGES
$,000
I New South South Western Tasmania Total - 1 Wales Victoria Queensland Australia I Australia
RECURRENT 1970-71 .. 3,478 6,191 1,567 1,420 2,333 754 15,743 1971-72 .. 3,713 7,341 1,860 1,651 2,920 887 18,372 1972-73 .. 5,525 10,443 2,906 2,638 4,015 1,128 26,655 1973-74 .. 28,935 46,711 14,438 13,518 17,247 3,959 124,808 1974-75 (estimate) 53,504 76,929 24,546 20,803 27,842 5,706 209,330
CAPITAL 1970-71 .. 4,639 6,153 1,878 2,973 1,906 614 18,163 1971-72 .. 7,381 8,330 3,776 2,872 3,031 2,035 27,425 1972-73 9,691 9,275 3,806 3,639 3,554 1,425 31,390 1973-74 .. 7,644 13,680 5,078 6,196 7,222 292 40,112 1974-75 (estimate) 29,700 17,079 10,019 6,900 7,800 3,977 75,475
TOTAL 1970-71 8,117 12,344 3,445 4,393 4,239 1,368 33,906 1971-72 11,094 15,671 5,636 4,523 5,951 2,922 45,797 1972-73 .. 15,216 19,718 6,712 6,277 7,569 2,553 58,045 1973-74 .. 36,579 60,391 19,516 19,714 24,469 4,251 164,920 1974-75 (estimate) 83,204 94,008 34,565 27,703 35,642 9,683 284,805
Technical Education Assistance to the States for technical education was first provided in 1964-65. An outline of assistance prior to 1971 is given in Appendix IV.
The States Grants (Technical Training) Act 1971 provided for a three year program, to commence in July 1971, of unmatched capital grants of $36 million, of which not more than one-third was authorised for payment before 30 June 1972 and two-thirds before 30 June 1973. Grants for buildings and equipment for use in technical training were available to technical training institutions accepted as being eligible for technical training grants. The distribution of the basic annual grant of $12 million between the States was based on State populations as at 30 September 1970.
The States Grants (Technical Training) Act 1973 gave effect to the Australian Government's decision to provide an additional $10 million to the States under this program during 1973-74. At the same time this Act amended the States Grants (Technical Training) Act 1971 by providing that the moneys made available to the States could be used for the purchase of land, and also provided that amounts could be expended under the Act after 30 June 1974 in respect of com-mitments entered into prior to that date.
46
As part of its overall policies in the tertiary education field, the Government also provided for the abolition of tuition fees at Government technical training institutions from 1 January 1974; the States Grants (Technical Training Fees Re-imbursement) Act 1974 provided for reimbursement to the States of $10.3 million in fee revenue lost as a consequence. The Act • related to the first six months of 1974.
In April 1973 the Australian Government established the Australian Committee on Technical and Further Education to advise it on the development of technical and further education in Australia and make recommendations for financial assis-tance to the States for this purpose. The Committee's report, which was presented to the Parliament in April 1974, contains a large number of recommendations in relation to the development of this form of education, the general principles of which have been accepted by the Government.
The Committee's recommendations for financial assistance to the States, which relate to the eighteen month period July 1974 to December 1975, are complex. Briefly, however, the report envisaged recurrent grants up to $44.6 million in this period (part, including an amount to reimburse the States for loss of fee revenue, for spending at the States' discretion and part for specific or approved purposes), capital grants for various specified purposes of $54.3 million, and additional capital grants, without limit as to amounts, to match capital expenditure by the States in this field from their own sources in excess of specified amounts.
The Government has decided on a program of assistance designed to enhance the quality of technical and further education and to expand its availability, providing both for individual educational needs as well as manpower needs. Subject to the understanding that the States will not reduce the level of their own activities in technical education the Australian Government has undertaken to grant $96.5 million to the States in the two years 1974-75 and 1975-76, including $49.1 million in 1974-75. This will provide for expenditure on land and buildings including residential facilities for students, equipment, recurrent expenditure, in-service teacher education and library development. The 1974-75 provision includes approximately $7 million not spent by the States and carried over from the program of capital grants contained in the States Grants (Technical Training) Act 1971-73.
It is proposed that a permanent Commission on Technical and Further Edu-cation be established to replace the existing Committee, with power to advise on the development of technical and further education and recommend and administer programs of financial assistance.
The following table shows actual annual payments to the States from 1970-71 and estimated payments in 1974-75; figures for earlier years are given in Table 111 in Appendix IV.
47
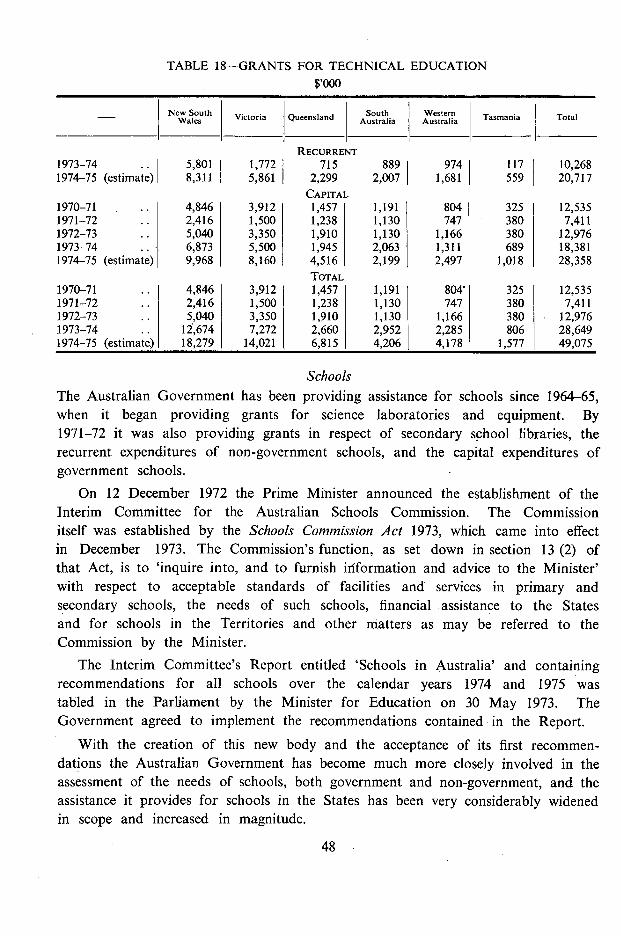
TABLE 18-GRANTS FOR TECHNICAL EDUCATION $,000
New South Victoria Queensland Australia South Western Tasmania Total Wales
RECURRENT 1973-74 .. 5,801 1,772 715 889 974 117 10,268 1974-75 (estimate) 8,311 5,861 2,299 2,007 1,681 559 20,717
CAPITAL 1970-71 . 4,846 3,912 1,457 1,191 804 325 12,535 1971-72 .. 2,416 1,500 1,238 1,130 747 380 7,411 1972-73 5,040 3,350 1,910 1,130 1,166 380 12,976 1973-74 .. 6,873 5,500 1,945 2,063 1,311 689 18,381 1974-75 (estimate) 9,968 8,160 4,516 2,199 2,497 1,018 28,358
TOTAL 1970-71 .. 4,846 3,912 1,457 1,191 804 325 12,535 1971-72 .. 2,416 1,500 1,238 1,130 747 380 7,411 1972-73 .. 5,040 3,350 1,910 1,130 1,166 380 12,976 1973-74 .. 14674 7,272 2,660 2,952 2,285 806 28,649 1974-75 (estimate) 18,279 14,021 6,815 4,206 4,178 1,577 49,075
Schools The Australian Government has been providing assistance for schools since 1964-65, when it began providing grants for science laboratories and equipment. By 1971-72 it was also providing grants in respect of secondary school libraries, the recurrent expenditures of non-government schools, and the capital expenditures of government schools.
On 12 December 1972 the Prime Minister announced the establishment of the Interim Committee for the Australian Schools Commission. The Commission itself was established by the Schools Commission Act 1973, which came into effect in December 1973. The Commission's function, as set down in section 13 (2) of that Act, is to 'inquire into, and to furnish information and advice to the Minister' with respect to acceptable standards of facilities and services in primary and secondary schools, the needs of such schools, financial assistance to the States and for schools in the Territories and other matters as may be referred to the Commission by the Minister.
The Interim Committee's Report entitled 'Schools in Australia' and containing recommendations for all schools over the calendar years 1974 and 1975 was tabled in the Parliament by the Minister for Education on 30 May 1973. The Government agreed to implement the recommendations contained in the Report.
With the creation of this new body and the acceptance of its first recommen-dations the Australian Government has become much more closely involved in the assessment of the needs of schools, both government and non-government, and the assistance it provides for schools in the States has been very considerably widened in scope and increased in magnitude.
48
The recommendations of the Committee envisaged total expenditure by the Australian Government in respect of schools in the States over the two years 1974 and 1975 of $693 million, of which $467 million would be additional to amounts committed under programs in existence prior to 1 January 1974. The amount of $693 million excluded existing payments to the States for Aboriginal education covered in this document under the heading 'Aboriginal Advancement'. It also excluded the cost of programs for the education of migrant children (see section below on 'Child Migrant Education').
The grants being paid under the recommendations of the Interim Committee, and those expected to be paid later on the recommendations of the Commission, are directed towards increasing expenditure in schools and are not in substitution for continuing efforts by the States and non-government schools authorities. To this end, the States were asked to 'continue to allocate to the construction and equipping of schools the same percentage of their total capital expenditure from the works and housing program which had been achieved in the average of the three financial years up to 30 June 1971', and 'to the operation of their schools the same percentage of their total current budget expenditure (excluding expenditure in respect of business undertakings) as had been allocated in the financial year 1971-72'.
The following is a summary of the programs for 1974 and 1975 approved by the Australian Government in 1973 on the recommendations of the Interim Committee (including arrangements existing prior to the establishment of the Committee which are to continue). The amounts to which reference is made will be increased under the Australian Government's subsequent decision to pro-vide, as from July 1974, supplementary grants to allow for cost increases beyond those allowed for in the original program. For this purpose an additional $38.96 million is to be appropriated in 1974-75 for recurrent expenditure and an additional $9.5 million (estimated) for capital expenditure (including $0.3 million and $1.2 million, respectively, for the earlier programs for Science Laboratories and School Libraries). General Recurrent Grants The States Grants (Independent Schools) Act 1969 provided grants to the States for transmission to non-government schools as from 1970. Details are given in Appendix 1V. Since the beginning of 1974 grants have been made to the States for government schools and for non-government schools on the recommendation of the Interim Committee, under the States Grants (Schools) Act 1972-73.
For 1974 and 1975 the Interim Committee recommended total general recurrent grants for primary and secondary schools, both government and non-government, estimated at $309.3 million, their purpose being to boost recurrent resources per pupil being used in schools about one-third of the way towards 1979 targets, established by the Committee. The standards are some 35 to 40 per cent above the 1972 levels.
49
The grants for government schools total $175.9 million over the two years: The distribution between the States of the general recurrent grants for primary schools ($97.4 million) is based on expected pupil numbers, but the distribution of the grants for secondary schools ($78.5 million) also takes into account the Committee's measures of resource use in schools in each State (that is, States with a relatively low resource use per pupil will receive higher per pupil grants than those with a relatively high resource use). It will be a matter for the States to decide upon the allocation of these grants within their own school systems.
Of the grants recommended for non-government schools, $63.0 million will be made through the States to Catholic authorities in each State in 1974 and 1975 for allocation to what the Committee referred to as 'systemic' schools. (Catholic 'systemic' schools are those belonging to the dioceses, generally parochial primary schools. They constitute a system under the supervision of a central authority. 'Non-systemic' non-government schools comprise the remaining non-government schools, including some schools owned by Catholic orders.) The distribution of this total amount between the States again is being based on measures of resource use. For 'non-systemic' non-government schools the Committee recommended specified amounts of assistance per pupil (differing as between primary and secondary schools and as between 1974 and 1975) for schools in eight categories, these categories being based on measures of resource use. It is estimated that 'non-systemic' non-government schools will re'ive approximately $70.3 million in 1974 and 1975, bringing total grants for non-g'Jvernment schools to an estimated $133.3 million.
General Building Grants
The States Grants (Capital Assistance) Act 1971-1972 provided grants totalling $6.66 million in 1971-72 and $13.34 million in 1972-73 for capital expenditure on government primary and secondary schools in the States over the period January 1972 to July 1973. Details of these grants are given in Appendix IV.
The States Grants (Schools) Act 1972 provided capital assistance for government schools and such assistance, for the first time, for non-government schools. For government primary and secondary schools, the Act provides unmatched capital grants over the five-year period commencing July 1973. These grants total $167 million; $31 million is to be paid in both 1973-74 and 1974-75 and $35 million in each of the years 1975-76 to 1977-78. For non-government schools, the Act provides a total of $48 million over the same five-year period; $9 million was to be paid in each of the first two years and $10 million in each of the final three years.
50
The Act provided that, the grants to government and non-government schools will each be distributed between the States in proportion to enrolments. It is a condition of the grants for both government and non-government schools that at least 70 per cent of the funds is used for additional facilities rather than for replacement facilities.
In accordance with 'recommendations of the Interim Committee the grants for government schools authorised by the States Grants (Schools) Act 1972 will be made available as provided by that Act; general building grants for government schools which have been recommended by the Interim Committee are additional to them. For non-government schools, grants from 1 July 1973 to 30 June 1974 were made available as set down in the Act. However, for the remaining four years of the program, commencing 1 July 1974, the allocation of the grants will be as recommended by the Schools Commission. The total amounts involved were embraced as from 1 July 1974 by the Interim Committee's recommendations for building grants for non-government schools (see below).
The general purpose of the new building grants is to replace and upgrade buildings in both kinds of schools and to provide new places in non-government schools.
Under the Interim Committee's' recommendations, general building grants totalling an estimated $200.2 million will be paid in 1974 and 1975, made up of:—
grants to government schools authorised by the States Grants (Schools) Act 1972-1973 estimated at $64 million; additional grants to government schools of $100 million, bringing the total for such schools to an estimated $164 million; grants to non-government schools, estimated at $4.5 million, under the States Grants (Schools) Act 1972-1973 for the period January to June 1974; grants to non-government schools for the two years of $30 million, sub-suming grants of $14 million that would otherwise have been paid over the period July 1974 to December 1975 under the States Grants (Schools) Act 1972-1973; and an estimated $1.7 million of outstanding commitments to non-government schools at 30 June 1975 under the science laboratories arrangements (see below).
The distribution of the grants for both government and non-government schools between the States is based on pupil numbers, and in the case of non-government schools on the projected rate of increase in these numbers. There are, however, arrangements for re-distribution between States of the grants for non-government schools should that prove desirable.
41

Science Laboratories and Equipment in Secondary Schools Grants have been made to the States for this purpose since 1964-65. Details of the arrangements applying from then until 1970-71 are given in Appendix IV. Grants are presently being paid under the States Grants (Science Laboratories) Act 1971 which has application over the period 1971-72 to 1974-75. The Act provides for the payment of $43.3 million, of which not more than one-quarter is autho-rised for payment before 30 June 1972, one-half before 30 June 1973 and three-quarters before 30 June 1974. Of the total of the $43.3 million, $26.1 million is available to government schools and is being divided between the States in proportion to their secondary schools enrolments and $17.2 million is being allocated to non-government schools on the basis of needs as assessed by com-mittees representing non-government schools set up in each State to advise the Minister. It has been decided that all offers of specific amounts for individual projects in non-government schools will be met. Likewise the sums available for government schools will be paid up to 30 June 1975.
The interim Committee for the Australian Schools Commission took the view that the extension of science facilities should be treated like any other school facility and included within general building programs. It did not, therefore, ecommend a continuation of this program beyond June 1975.
Some non-government schools had been informed by the previous Australian Government that additional grants up to the total reasonable cost of a project already approved would be made available provided the Parliament agreed to extend the program and provided sufficient funds were available. Commitments for these projects outstanding at 30 June 1975 will be met from the grants recom-mended by the Committee for general buildings purposes.
School Libraries
Grants have been made to the States for secondary school libraries since 1968-69. Details of the arrangements applying over the three years commencing January 1969 are given in Appendix IV. Grants are presently being made under the States Grants (Secondary Schools Libraries) Act 1971 which has application over the period January 1972 to December 1974. The Act provides for the payment of $30 million over that period, of which not more than one-third may be authorized for payment before 31 December 1972 and two-thirds before 31 December 1973.
The allocation of the $30 million between government and non-government secondary schools is based on the number of secondary school pupils enrolled in
52
each of these two types of schools at school censuses in August 1970. The distribution between the States of the amount thus provided for government secondary schools is on the basis of relative secondary enrolments. The distri-butions of the non-government school component as between States and as between the non-government school sectors in each State is based on entitlements as assessed by the Australian Government.
The Interim Committee took the view that there is a strong case for extending the secondary school libraries program and recommended accordingly.
The Committee recommended grants to increase the numbers of trained teacher-librarians, to extend the existing secondary libraries program (particularly in government schools) and to establish a program to provide libraries ultimately for all primary schools.
Grants in respect of school libraries totalling $56.6 million will be made in 1974 and 1975, made up of $11.5 million for secondary school libraries under the States Grants (Secondary Schools Libraries) Act 1971 and further grants totalling $45.1 million made up of $21.3 million for secondary school libraries, $20 million for libraries in primary schools, and $3.8 million for the training of teacher-librarians. The distribution of the grants for libraries between government and non-government schools and between the States is based mainly on pupil numbers.
Disadvantaged Schools
The Committee recommended grants to provide additional recurrent resources to schools in which pupils come from especially disadvantaged neighbourhoods, and to refurbish the buildings of such schools, especially in inner-city areas. It based its recommendations, in part, on a socio-economic scale, measuring the degree of disadvantage in particular school catchment areas, constructed by the Department of Education in collaboration with the Bureau of Census and Statistics. The grants total $50 million, of which $17.55 million will be paid as recurrent grants to government schools, $26.24 million as building grants for government schools, $2.45 million as recurrent grants for non-government schools and $3.76 million as building grants for non-government schools.
Schools for Handicapped Children
The Committee recommended grants over 1974 and 1975 to increase the number of trained teachers in government schools for the handicapped ($9.38 million), to improve standards of existing special schools conducted by the States ($10.25 million), to assist States to take over those voluntary schools which wish to be taken over ($3.91 million), and to upgrade existing special school buildings and establish new ones ($20 million).
53
Other Programs
The Committee made recommendations for grants for other purposes, not all of which represent payments to the States.
It recommended grants of $10.3 million over the two years for teacher develop-ment—more specifically, to expand in-service training opportunities organised jointly by government and non-government school authorities and to establish Education Centres to be owned and managed corporately by government and non-government teachers together.
The Committee recommended, further, that $6 million be provided to establish a Special Project Fund for innovatory projects at school level on the initiative of teachers or the community, at system level on the initiative of school authorities and at the national level.
Finally, it recommended that $200,000 be provided to procure better information about schools and school systems.
Payment of the new and additional grants for schools for 1974 and 1975 recommended by the Interim Committee were authorised by the States Grants
(Schools) Act 1973, which Act also authorised necessary amendments to the States Grants (Schools) Act 1972.
Summary Tables
Table 112 in Appendix IV shows amounts paid to the States for schools from 1964-65 to 1972-73 under each of the four programs which operated in that period. Table 19 below shows details of grants to the six States combined for schools in 1973-74 and 1974-75 (estimated) and Table 113 in Appendix IV shows the same details on a State by State basis. Table 20 below shows the total amounts paid to the States for schools from 1970-71 to 1974-75 (estimated). These tables include the supplementary grants of $38.96 million .and $9.5 million for recurrent and capital purposes to allow for cost increases beyond those allowed for in the original program.
54
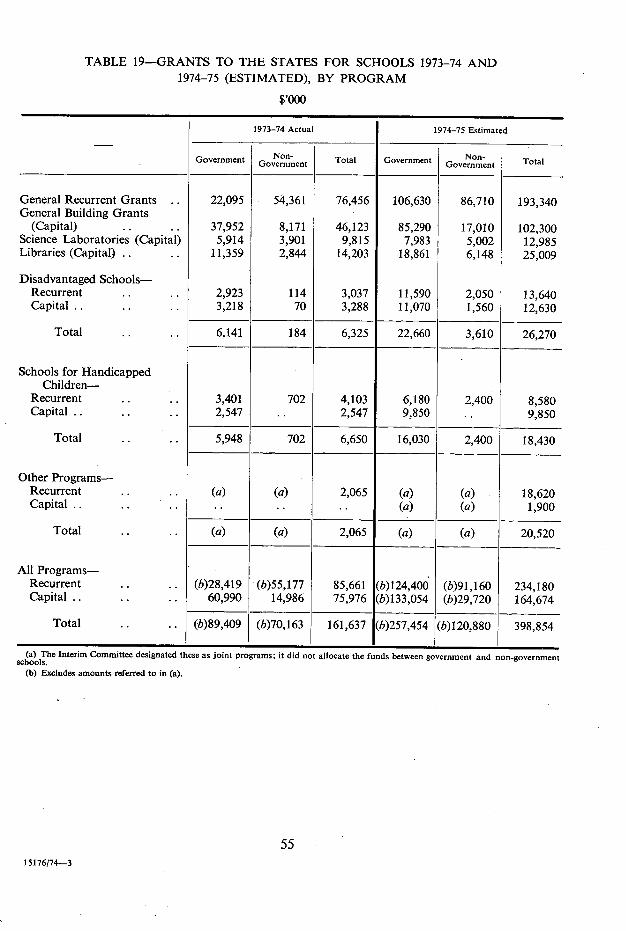
TABLE 19-GRANTS TO THE STATES FOR SCHOOLS 1973-74 AND 1974-75 (ESTIMATED), BY PROGRAM
$,000
1973-74 Actual 1974-75 Estimated
Government Government Total Government Government Total
General Recurrent Grants General Building Grants
22,095 54,361 76,456 106,630 86,710 193,340
(Capital) .. .. 37,952 8,171 46,123 85,290 17,010 102,300 Science Laboratories (Capital) 5,914 3,901 9,815 7,983 5,002 12,985 Libraries (Capital) . . . 11,359 2,844 14,203 18,861 6,148 25,009
Disadvantaged Schools- Recurrent .. .. 2,923 114 3,037 11,590 2,050 13,640 Capital .. 3,218 70 3,288 11,070 1,560 12,630
Total .. 6,141 184 6,325 22,660 3,610 26,270
Schools for Handicapped Children-
Recurrent .. .. Capital .. .. ..
3,401 2,547
702 ..
4,103 2,547
6,180 9,850
2,400 ..
8,580 9,850
Total .. .. 5,948 702 6,650 16,030 2,400 18,430
Other Programs- Recurrent .. .. Capital .. .. ..
(a) ..
(a) ..
2,065 ..
(a) (a)
(a) (a)
18,620 1,900
Total .. .. (a) (a) 2,065 (a) (a) 20,520
&ll Programs- Recurrent .. . . Capital .. .. ..
(b)28,419 60,990
(b)55,177 14,986
85,661 75,976
(b)124,400 (b)133,054
(b)91,160 (b)29,720
234,180 164,674
Total .. .. (b)89,409 (b)70,163 161,637 (b)257,454 (b)120,880 398,854
The Interim Committee designated these as joint programs; it did not allocate the funds between government and non-government schools.
Excludes amounts referred to in (a).
55 15176/74-3
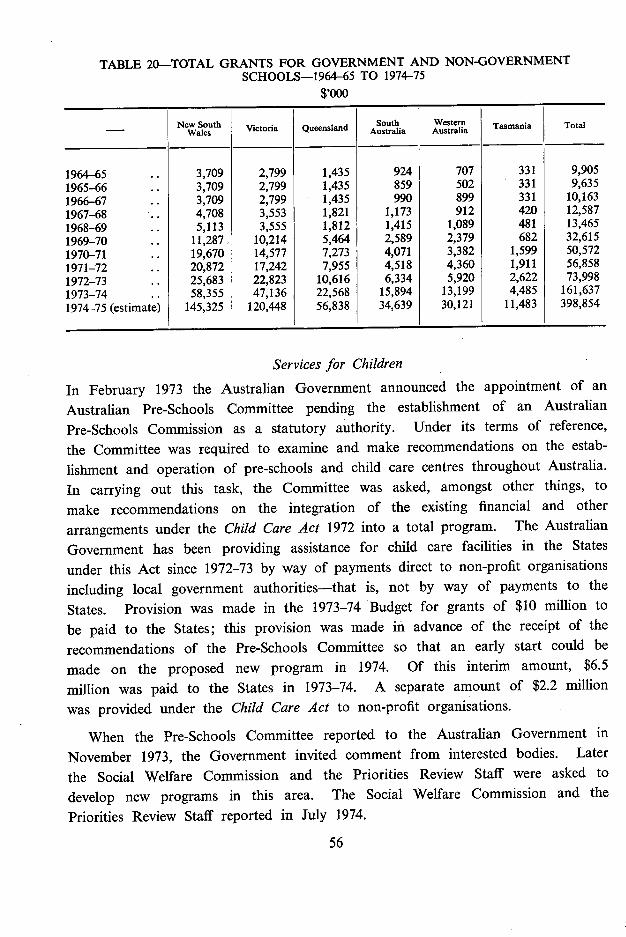
TABLE 20-TOTAL GRANTS FOR GOVERNMENT AND NON-GOVERNMENT SCHOOLS-1964-65 TO 1974-75
$,000
- New South Victoria Queensland Australia South Western Tasmania Total Wales
1964-65 .. 3,709 2,799 1,435 924 707 331 9,905 1965-66 .. 3,709 2,799 1,435 859 502 331 9,635 1966-67 .. 3,709 2,799 1,435 990 899 331 10,163 1967-68 .. 4,708 3,553 1,821 1,173 912 420 12,587 1968-69 .. 5,113 3,555 1,812 1,415 1,089 481 13,465 1969-70 .. 11,287 10,214 5,464 2,589 2,379 682 32,615 1970-71 .. 19,670 14,577 7,273 4,071 3,382 1,599 50,572 1971-72 .. 20,872 17,242 7,955 4,518 4,360 1,911 56,858 1972-73 25,683 22,823 10,616 6,334 5,920 2,622 73,998 1973-74 58,355 47,136 22,568 15,894 13,199 4,485 161,637 1974-75 (estimate) 145,325 120,448 56,838 34,639 30,121 11,483 398,854
Services for Children In February 1973 the Australian Government announced the appointment of an Australian Pre-Schools Committee pending the establishment of an Australian Pre-Schools Commission as a statutory authority. Under its terms of reference, the Committee was required to examine and make recommendations on the estab-lishment and operation of pre-schools and child care centres throughout Australia. In carrying out this task, the Committee was asked, amongst other things, to make recommendations on the integration of the existing financial and other arrangements under the Child Care Act 1972 into a total program. The Australian Government has been providing assistance for child care facilities in the States under this Act since 1972-73 by way of payments direct to non-profit organisations including local government authorities-that is, not by way of payments to the States. Provision was made in the 1973-74 Budget for grants of $10 million to be paid to the States; this provision was made in advance of the receipt of the recommendations of the Pre-Schools Committee so that an early start could be made on the proposed new program in 1974. Of this interim amount, $6.5 million was paid to the States in 1973-74. A separate amount of $2.2 million was provided under the Child Care Act to non-profit organisations.
When the Pre-Schools Committee reported to the Australian Government in November 1973, the Government invited comment from interested bodies. Later the Social Welfare Commission and the Priorities Review Staff were asked to develop new programs in this area. The Social Welfare Commission and the Priorities Review Staff reported in July 1974.
56
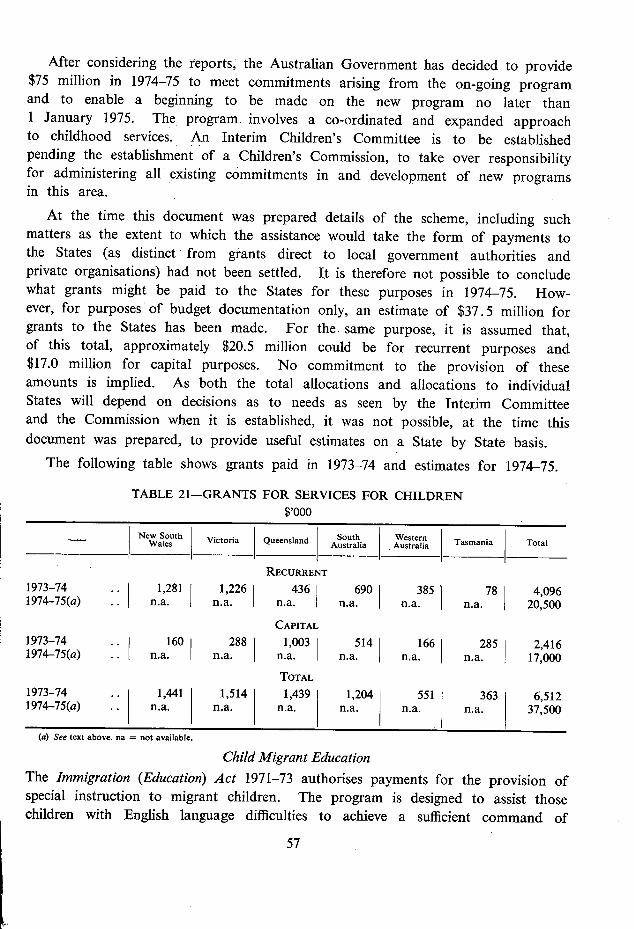
After considering the reports, the Australian Government has decided to provide $75 million in 1974-75 to meet commitments arising from the on-going program and to enable a beginning to be made on the new program no later than 1 January 1975. The program involves a co-ordinated and expanded approach to childhood services. An Interim Children's Committee is to be established pending the establishment of a Children's Commission, to take over responsibility for administering all existing commitments in and development of new programs in this area.
At the time this document was prepared details of the scheme, including such matters as the extent to which the assistance would take the form of payments to the States (as distinct from grants direct to local government authorities and private organisations) had not been settled. It is therefore not possible to conclude what grants might be paid to the States for these purposes in 1974-75. How-ever, for purposes of budget documentation only, an estimate of $37.5 million for grants to the States has been made. For the. same purpose, it is assumed that, of this total, approximately $20.5 million could be for recurrent purposes and $17.0 million for capital purposes. No commitment to the provision of these amounts is implied. As both the total allocations and allocations to individual States will depend on decisions as to needs as seen by the Interim Committee and the Commission when it is established, it was not possible, at the time this document was prepared, to provide useful estimates on a State by State basis.
The following table shows grants paid in 1973-74 and estimates for 1974-75.
TABLE 21—GRANTS FOR SERVICES FOR CHILDREN $,000
New South I South Western Tasmania Total - Wales Victoria Queensland Australia I Australia
RECURRENT
1973-74 .. 1,281l 226 436 690 385 1 78 1974-75(a) .. n.a. n.a. n.a. I n.a. n.a. n.a.
CAPITAL
4,096 20,500
1973-74 .. 160 288 1974-75(a) .. n.a. n.a.
1973-74 .. 1,441 1,514 1974-75(a) .. n.a. n.a.
(a) See text above. na = not available.
1,003 514 166 285 n.a. n.a. n.a. n.a. TOTAL
1,4391 204 551 363 n.a. n.a. n.a. n.a.
2,416 17,000
6,512 37,500
Child Migrant Education The Immigration (Education) Act 1971-73 authorises payments for the provision of special instruction to migrant children. The program is designed to assist those children with English language difficulties to achieve a sufficient command of
57
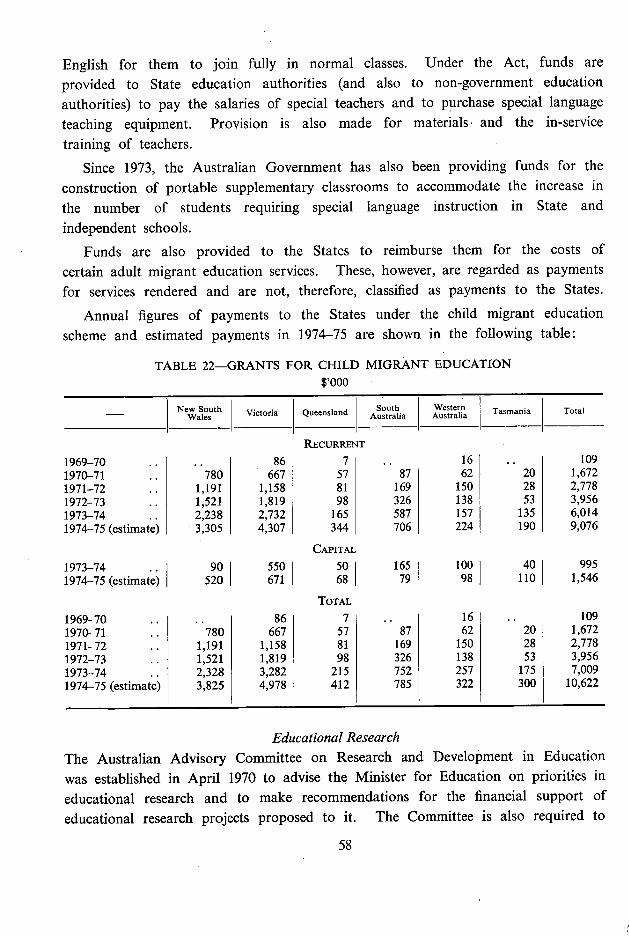
English for them to join fully in normal classes. Under the Act, funds are provided to State education authorities (and also to non-government education authorities) to pay the salaries of special teachers and to purchase special language teaching equipment. Provision is also made for materials• and the in-service training of teachers.
Since 1973, the Australian Government has also been providing funds for the construction of portable supplementary classrooms to accommodate the increase in the number of students requiring special language instruction in State and independent schools.
Funds are also provided to the States to reimburse them for the costs of certain adult migrant education services. These, however, are regarded as payments for services rendered and are not, therefore, classified as payments to the States.
Annual figures of payments to the States under the child migrant education scheme and estimated payments in 1974-75 are shown in the following table:
TABLE 22—GRANTS FOR CHILD MIGRANT EDUCATION $,000
New South Victoria Queensland South Australia
Western Tasmania Total Wales
RECURRENT
1969-70 .. .. 86 7 .. 16 .. 109 1970-71 .. 780 667 57 87 62 20 1,672 1971-72 .. 1,191 1,158 81 169 150 28 2,778 1972-73 .. 1,521 1,819 98 326 138 53 3,956 1973-74 .. 2,238 2,732 165 587 157 135 6,014 1974-75 (estimate) 3,305 4,307 344 706 224 190 9,076
CAPITAL 1973-74 .. 90 550 50 165 100 40 995 1974-75 (estimate) 520 671 68 79 98 110 1,546
TOTAL 1969-70 .. 86 7 .. 16 .. 109 1970-71 .. 780 667 57 87 62 20 1,672 1971-72 .. 1,191 1,158 81 169 150 28 2,778 1972-73 . . 1,521 1,819 98 326 138 53 3,956 1973-74 .. 2,328 3,282 215 752 257 175 7,009 1974-75 (estimate) 3,825 4,978 412 785 322 300 10,622
Educational Research The Australian Advisory Committee on Research and Development in Education was established in April 1970 to advise the Minister for Education on priorities in educational research and to make recommendations for the financial support of educational research projects proposed to it. The Committee is also required to
58
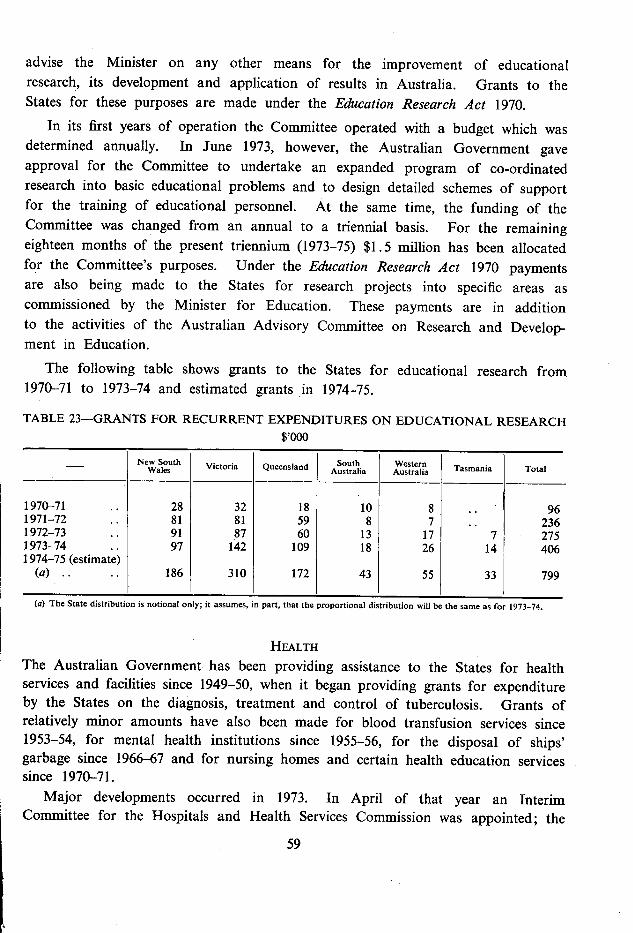
advise the Minister on any other means for the improvement of educational research, its development and application of results in Australia. Grants to the States for these purposes are made under the Education Research Act 1970.
In its first years of operation the Committee operated with a budget which was determined annually. In June 1973, however, the Australian Government gave approval for the Committee to undertake an expanded program of co-ordinated research into basic educational problems and to design detailed schemes of support for the training of educational personnel. At the same time, the funding of the Committee was changed from an annual to a triennial basis. For the remaining eighteen months of the present triennium (1973-75) $1.5 million has been allocated for the Committee's purposes. Under the Education Research Act 1970 payments are also being made to the States for research projects into specific areas as commissioned by the Minister for Education. These payments are in addition to the activities of the Australian Advisory Committee on Research and Develop-ment in Education.
The following table shows grants to the States for educational research from 1970-71 to 1973-74 and estimated grants in 1974-75.
TABLE 23—GRANTS FOR RECURRENT EXPENDITURES ON EDUCATIONAL RESEARCH $,000
- New South Wales Victoria Queensland South
Australia Western Australia Tasmania Total
1970-71 .. 28 32 18 10 8 .. 96 1971-72 .. 81 81 59 8 7 .. 236 1972-73 .. 91 87 60 13 17 7 275 1973-74 .. 97 142 109 18 26 14 406 1974-75 (estimate)
(a) .. .. 186 310 172 43 55 33 799
(a) The State distribution is notional only; it assumes, in part, that the proportional distribution will be the same as for 1973-74.
HEALTH
The Australian Government has been providing assistance to the States for health services and facilities since 1949-50, when it began providing grants for expenditure by the States on the diagnosis, treatment and control of tuberculosis. Grants of relatively minor amounts have also been made for blood transfusion services since 1953-54, for mental health institutions since 1955-56, for the disposal of ships' garbage since 1966-67 and for nursing homes and certain health education services since 1970-71.
Major developments occurred in 1973. In April of that year an Interim Committee for the Hospitals and Health Services Commission was appointed; the
59
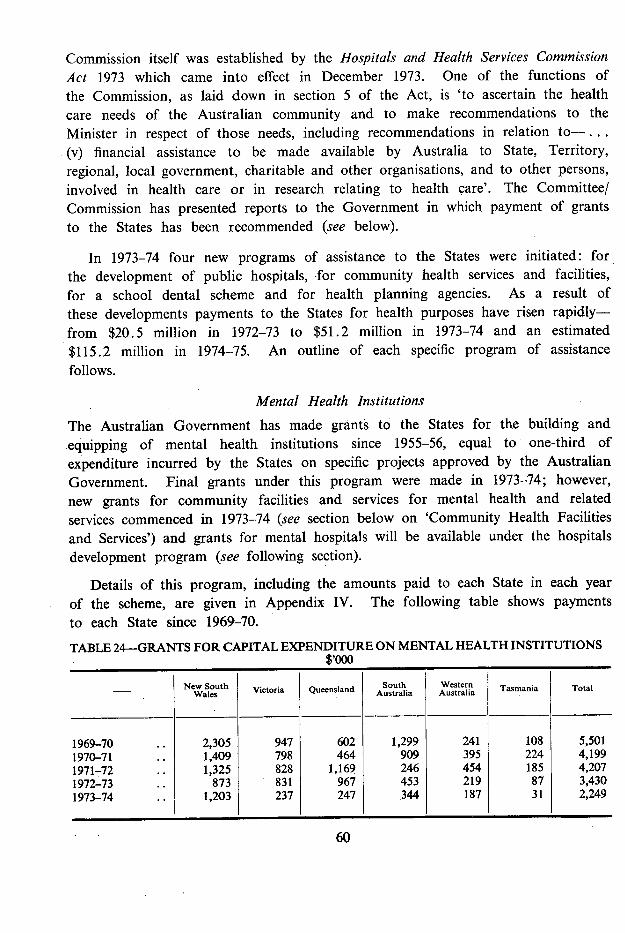
Commission itself was established by the Hospitals and Health Services Commission Act 1973 which came into effect in December 1973. One of the functions of the Commission, as laid down in section 5 of the Act, is 'to ascertain the health care needs of the Australian community and to make recommendations to the Minister in respect of those needs, including recommendations in relation to—. (v) financial assistance to be made available by Australia to State, Territory, regional, local government, charitable and other organisations, and to other persons, involved in health care or in research relating to health care'. The Committee! Commission has presented reports to the Government in which payment of grants to the States has been recommended (see below).
In 1973-74 four new programs of assistance to the States were initiated: for the development of public hospitals, for community health services and facilities, for a school dental scheme and for health planning agencies. As a result of these developments payments to the States for health purposes have risen rapidly—from $20.5 million in 1972-73 to $51.2 million in 1973-74 and an estimated $115.2 million in 1974-75. An outline of each specific program of assistance follows.
Mental Health Institutions The Australian Government has made grants to the States for the building and equipping of mental health institutions since 1955-56, equal to one-third of expenditure incurred by the States on specific projects approved by the Australian Government. Final grants under this program were made in 1973-74; however, new grants for community facilities and services for mental health and related services commenced in 1973-74 (see section below on 'Community Health Facilities and Services') and grants for mental hospitals will be available under the hospitals development program (see following section).
Details of this program, including the amounts paid to each State in each year of the scheme, are given in Appendix IV. The following table shows payments to each State since 1969-70. TABLE 24-GRANTS FOR CAPITAL EXPENDITURE ON MENTAL HEALTH INSTITUTIONS
$,000
New South Wales Victoria Queensland South
Australia Western Australia Tasmania
- Total
1969-70 .. 2,305 947 602 1,299 241 108 5,501 1970-71 .. 1,409 798 464 909 395 224 4,199 1971-72 .. 1,325 828 1,169 246 454 185 4,207 1972-73 .. 873 831 967 453 219 87 3,430 1973-74 .. 1,203 237 247 344 187 31 2,249
60
Hospitals Development Program In the 1973-74 Budget it was announced that capital grants totalling $4.5 million would be offered to New South Wales, Victoria and Queensland towards the cost of hospital projects in the capital cities of those States; it was envisaged that $4.0 million would be made available to New South Wales and $250,000 to each of the other two States. In the event progress with the project in New South Wales (at Westmead) was less rapid than envisaged and, although some of the grants were diverted to another project (at Liverpool) in the State and to projects in other States, grants allocated totalled only $2.4 million.
In April 1974 the Hospitals and Health Services Commission presented to the Government a report on 'Hospitals in Australia' in which it recommended a program of capital expenditure on public general hospitals, mental hospital facilities, public nursing homes and health hostels in the States over the five years 1974-75 to 1978-79 of $1,160 million. It recommended that, of this total, the Australian Government meet $760 million with the States being expected to meet the remaining $400 million by way of annual allocations of $80 million. The Commission recommended that a Joint Hospitals Works Council (consisting of three members of the Commission and not more than three State representatives) be established in each State to review the whole of the public hospital works program in that State; the Commission proposed that allocations by the Australian Government for hospital development in the States be based on recommendations of the Commission, made after consideration of proposals put forward by the Joint Hospitals Works Councils.
The Government has decided to make available funds up to a total of $28 million in 1974-75 for the development of public hospitals and other health institutions in the States. The Government has accepted the need for a five year program but amounts for years subsequent to 1974-75 have not been determined.
The States will be asked to participate in Joint Hospitals Works Councils, as recommended by the Hospitals and Health Services Commission, and will be expected to meet a total of at least $100 million on these facilities from their own sources in 1974-75.
The allocation between the States of the total of $28 million to be made available in 1974-75 will depend on the Commission's assessments of needs in each State. The Australian Government's contribution in respect of any particular facility may take the form either of grants to the State concerned or of direct expenditure on the facility, depending on circumstances in each case. For these reasons, it is not possible to estimate what amounts of grants might be made to the States in 1974-75. The amounts shown in the following tables are notional
61
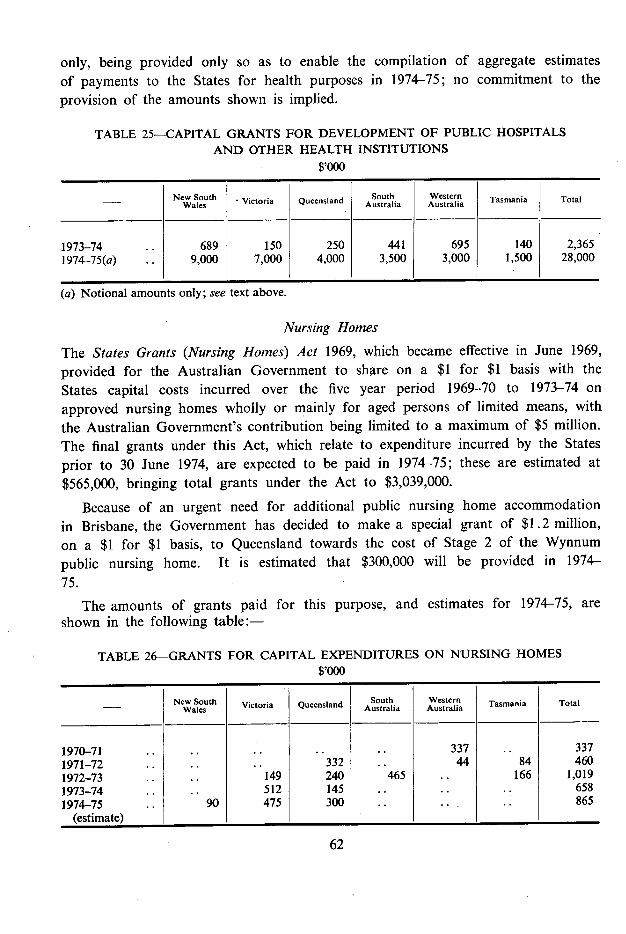
only, being provided only so as to enable the compilation of aggregate estimates of payments to the States for health purposes in 1974-75; no commitment to the provision of the amounts shown is implied.
TABLE 25—CAPITAL GRANTS FOR DEVELOPMENT OF PUBLIC HOSPITALS AND OTHER HEALTH INSTITUTIONS
$,000
New South Wales Victoria Queensland South
Australia Western Australia Tasmania Total
1973-74 .. 689 150 250 441 695 140 2,365 1974-75(a) .. 9,000 7,000 4,000 3,500 3,000 1,500 28,000
(a) Notional amounts only; see text above.
Nursing Homes
The States Grants (Nursing Homes) Act 1969, which became effective in June 1969, provided for the Australian Government to share on a $1 for $1 basis with the States capital costs incurred over the five year period 1969-70 to 1973-74 on approved nursing homes wholly or mainly for aged persons of limited means, with the Australian Government's contribution being limited to a maximum of $5 million. The final grants under this Act, which relate to expenditure incurred by the States prior to 30 June 1974, are expected to be paid in 1974-75; these are estimated at $565,000, bringing total grants under the Act to $3,039,000.
Because of an urgent need for additional public nursing home accommodation in Brisbane, the Government has decided to make a special grant of $1.2 million, on a $1 for $1 basis, to Queensland towards the cost of Stage 2 of the Wynnum public nursing home. It is estimated that $300,000 will be provided in 1974-75.
The amounts of grants paid for this purpose, and estimates for 1974-75, are shown in the following table:—
TABLE 26—GRANTS FOR CAPITAL EXPENDITURES ON NURSING HOMES $,000
New South Wales Victoria Queensland South
Australia Western Australia Tasmania Total
1970-71 .. .. .. .. .. 337 .. 337 1971-72 .. .. .. 332 .. 44 84 460 1972-73 .. .. 149 240 465 .. 166 1,019 1973-74 .. .. 512 145 .. .. .. 658 1974-75 .. 90 475 300 .. .. .. 865
(estimate)
62
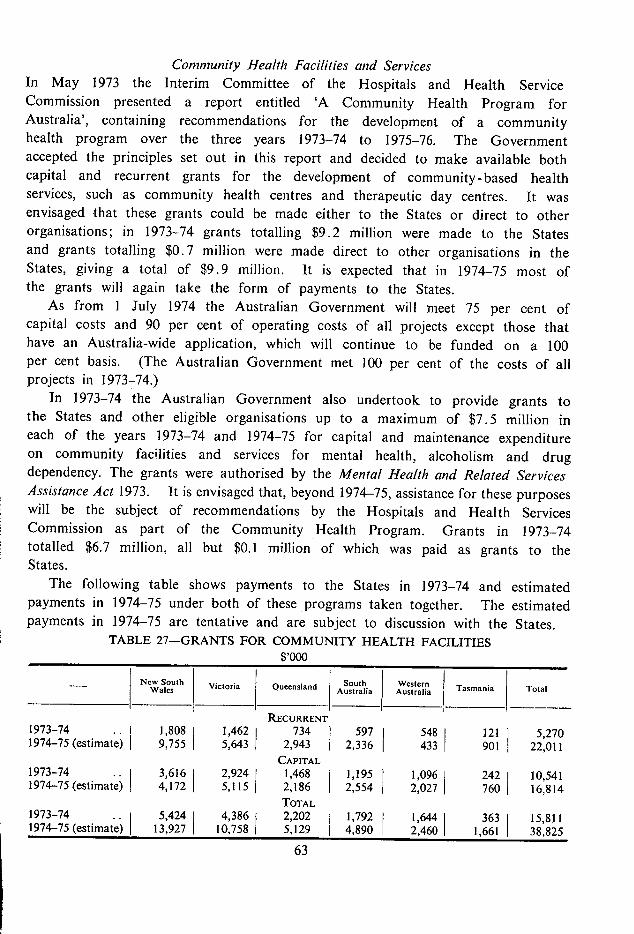
Community Health Facilities and Services In May 1973 the Interim Committee of the Hospitals and Health Service Commission presented a report entitled 'A Community Health Program for Australia', containing recommendations for the development of a community health program over the three years 1973-74 to 1975-76. The Government accepted the principles set out in this report and decided to make available both capital and recurrent grants for the development of community-based health services, such as community health centres and therapeutic day centres. It was envisaged that these grants could be made either to the States or direct to other organisations; in 1973-74 grants totalling $9.2 million were made to the States and grants totalling $0.7 million were made direct to other organisations in the States, giving a total of $9.9 million, it is expected that in 1974-75 most of the grants will again take the form of payments to the States.
As from 1 July 1974 the Australian Government will meet 75 per cent of capital costs and 90 per cent of operating costs of all projects except those that have an Australia-wide application, which will continue to be funded on a 100 per cent basis. (The Australian Government met 100 per cent of the costs of all projects in 1973-74.)
In 1973-74 the Australian Government also undertook to provide grants to the States and other eligible organisations up to a maximum of $7.5 million in each of the years 1973-74 and 1974-75 for capital and maintenance expenditure on community facilities and services for mental health, alcoholism and drug dependency. The grants were authorised by the Mental Health and Related Services Assistance Act 1973. It is envisaged that, beyond 1974-75, assistance for these purposes will be the subject of recommendations by the Hospitals and Health Services Commission as part of the Community Health Program. Grants in 1973-74 totalled $6.7 million, all but $0.1 million of which was paid as grants to the States.
The following table shows payments to the States in 1973-74 and estimated payments in 1974-75 under both of these programs taken together. The estimated payments in 1974-75 are tentative and are subject to discussion with the States.
TABLE 27-GRANTS FOR COMMUNITY HEALTH FACILITIES $,000
New South South Wes Victoria Queensland Australia ter Tasmania I Total
RECURRENT 1973-74 .. I 1,808 1,462 734 597 548 121 5,270 1974-75 (estimate) 9,755 5,643 2,943 2,336 433 901 22,011
CAPITAL 1973-74 .. 3,616 2,924 1,468 1,195 1,096 242 10,541 1974-75 (estimate) 4,172 5,115 2,186 2,554 2,027 760 16,814
TOTAL 1973-74 .. 5,424 4,386 2,202 1,792 1,644 363 15,811 1974-75 (estimate) 13,927 10,758 5,129 4,890 2,460 1,66! 38,825
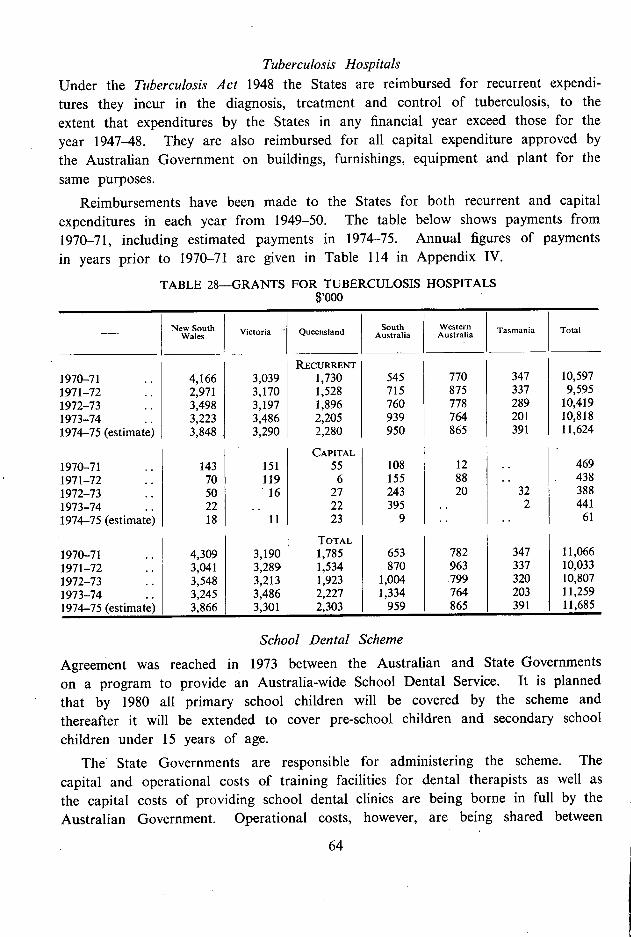
Tuberculosis Hospitals Under the Tuberculosis Act 1948 the States are reimbursed for recurrent expendi-tures they incur in the diagnosis, treatment and control of tuberculosis, to the extent that expenditures by the States in any financial year exceed those for the year 1947-48. They are also reimbursed for all capital expenditure approved by the Australian Government on buildings, furnishings, equipment and plant for the same purposes.
Reimbursements have been made to the States for both recurrent and capital expenditures in each year from 1949-50. The table below shows payments from 1970-71, including estimated payments in 1974-75. Annual figures of payments in years prior to 1970-71 are given in Table 114 in Appendix IV.
TABLE 28-GRANTS FOR TUBERCULOSIS HOSPITALS $,000
New South Wales
RECURRENT
I Victoria Queensland South Australia
Western Tasmania Total
1970-71 .. 4,166 3,039 1,730 545 770 347 10,597 1971-72 .. 2,971 3,170 1,528 715 875 337 9,595 1972-73 3,498 3,197 1,896 760 778 289 10,419 1973-74 .. 3,223 3,486 2,205 939 764 201 10,818 1974-75 (estimate) 3,848 3,290 1 2,280 950 865 391 11,624
CAPITAL 1970-71 .. 143 151 55 108 12 .. 469 1971-72 .. 70 119 6 155 88 .. 438 1972-73 .. 50 16 27 243 20 32 388 1973-74 .. 22 .. 22 395 .. 2 441 1974-75 (estimate) 18 11 23 9 . . . . 61
TOTAL 1970-71 .. 4,309 3,190 1,785 653 782 347 11,066 1971-72 .. 3,041 3,289 1,534 870 963 337 10,033 1972-73 .. 3,548 3,213 1,923 1,004 799 320 10,807 1973-74 .. 3,245 3,486 2,227 1,334 764 203 11,259 1974-75 (estimate) 3,866 3,301 2,303 959 865 391 11,685
School Dental Scheme
Agreement was reached in 1973 between the Australian and State Governments on a program to provide an Australia-wide School Dental Service. It is planned that by 1980 all primary school children will be covered by the scheme and thereafter it will be extended to cover pre-school children and secondary school children under 15 years of age.
The State Governments are responsible for administering the scheme. The capital and operational costs of training facilities for dental therapists as well as the capital costs of providing school dental clinics are being borne in full by the Australian Government. Operational costs, however, are being shared between
64
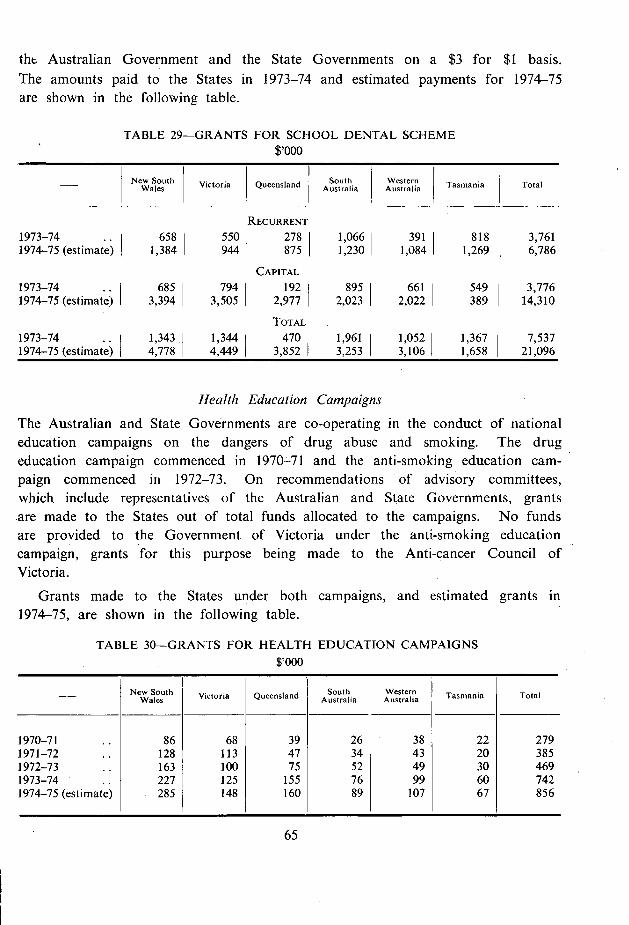
tht Australian Government and the State Governments on a $3 for $1 basis. The amounts paid to the States in 1973-74 and estimated payments for 1974-75 are shown in the following table.
TABLE 29—GRANTS FOR SCHOOL DENTAL SCHEME $,000
I New South South Western I I Wales Victoria Queensland Australia I Australia Tasmania Total
RECURRENT
1973-74.. 658 550 278 1,066 391 818 3,761 1974-75 (estimate) 1,384 944 875 1,230 1,084 1,269 6,786
CAPITAL
1973-74 .. 685 794 192 895 661 549 3,776 1974-75 (estimate) 3,394 3,505 2,977 2,023 2,022 389 14,310
TOTAL
1973-74.. 1,343 1,344 470 1,961 1,052 1,367 7,537 1974-75 (estimate) 4,778 4,449 3,852 3,253 3,106 1 1,658 21,096
Health Education Campaigns The Australian and State Governments are co-operating in the conduct of national education campaigns on the dangers of drug abuse and smoking. The drug education campaign commenced in 1970-71 and the anti-smoking education cam-paign commenced in 1972-73. On recommendations of advisory committees, which include representatives of the Australian and State Governments, grants are made to the States out of total funds allocated to the campaigns. No funds are provided to the Government of Victoria under the anti-smoking education campaign, grants for this purpose being made to the Anti-cancer Council of Victoria.
Grants made to the States under both campaigns, and estimated grants in 1974-75, are shown in the following table.
TABLE 30—GRANTS FOR HEALTH EDUCATION CAMPAIGNS $,000
New South Wales Victoria Queensland South
Australia Western Australia Tasmania Total
1970-71 86 68 39 26 38 22 279 1971-72 128 113 47 34 43 20 385 1972-73 163 100 75 52 49 30 469 1973-74 .. 227 125 155 76 99 60 742 1974-75 (estimate) 285 148 160 89 107 67 856
65
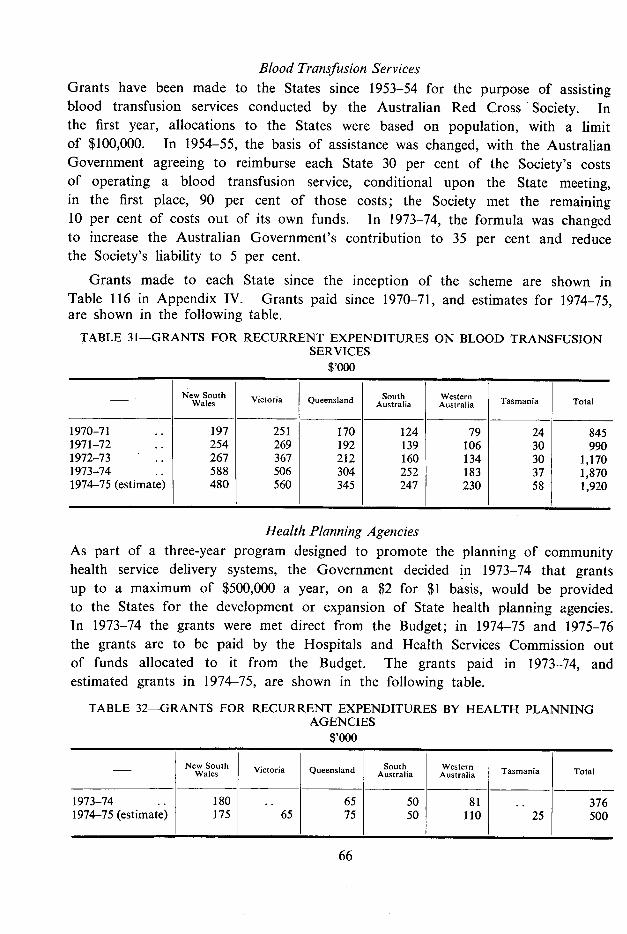
Blood Transfusion Services Grants have been made to the States since 1953-54 for the purpose of assisting blood transfusion services conducted by the Australian Red Cross Society. In the first year, allocations to the States were based on population, with a limit of $100,000. In 1954-55, the basis of assistance was changed, with the Australian Government agreeing to reimburse each State 30 per cent of the Society's costs of operating a blood transfusion service, conditional upon the State meeting, in the first place, 90 per cent of those costs; the Society met the remaining 10 per cent of costs out of its own funds. In 1973-74, the formula was changed to increase the Australian Government's contribution to 35 per cent and reduce the Society's liability to 5 per cent.
Grants made to each State since the inception of the scheme are shown in Table 116 in Appendix IV. Grants paid since 1970-71, and estimates for 1974-75, are shown in the following table.
TABLE 31—GRANTS FOR RECURRENT EXPENDITURES ON BLOOD TRANSFUSION SERVICES
$,000
- New South Wales Victoria Queensland South
Australia Western Australia Tasmania Total
1970-71 .. 197 251 170 124 79 24 845 1971-72 .. 254 269 192 139 106 30 990 1972-73 .. 267 367 212 160 134 30 1,170 1973-74 .. 588 506 304 252 183 37 1,870 1974-75 (estimate) 480 560 345 247 230 58 1,920
Health Planning Agencies As part of a three-year program designed to promote the planning of community health service delivery systems, the Government decided in 1973-74 that grants up to a maximum of $500,000 a year, on a $2 for $1 basis, would be provided to the States for the development or expansion of State health planning agencies. In 1973-74 the grants were met direct from the Budget; in 1974-75 and 1975-76 the grants are to be paid by the Hospitals and Health Services Commission out of funds allocated to it from the Budget. The grants paid in 1973-74, and estimated grants in 1974-75, are shown in the following table.
TABLE 32—GRANTS FOR RECURRENT EXPENDITURES BY HEALTH PLANNING AGENCIES
$,000
New South Wales Victoria Queensland South
Australia Western Australia Tasmania Total
1973-74 .. 180 .. 65 50 81 .. 376 1974-75 (estimate) 175 65 75 50 110 25 500
66
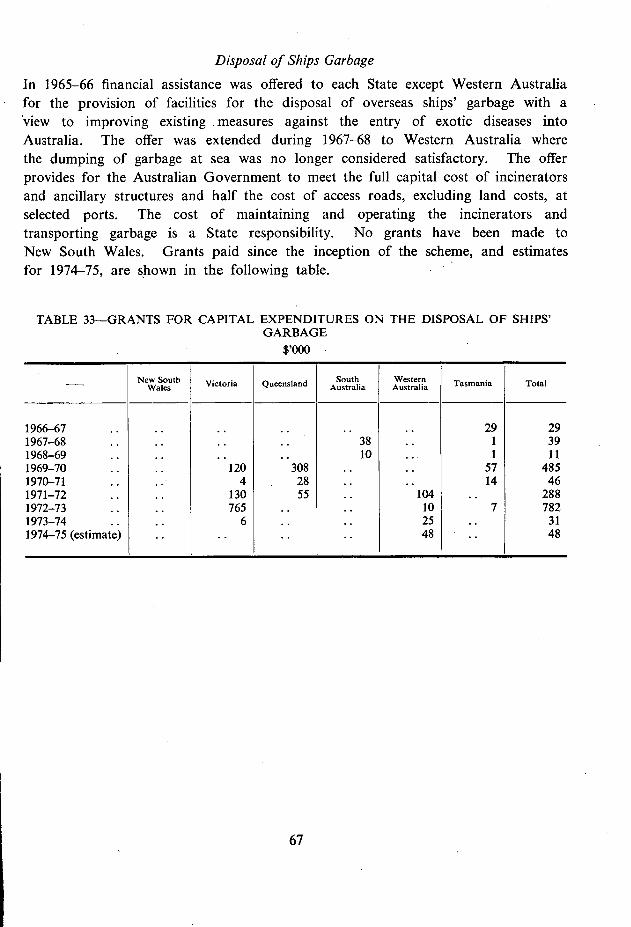
Disposal of Ships Garbage
In 1965-66 financial assistance was offered to each State except Western Australia for the provision of facilities for the disposal of overseas ships' garbage with a view to improving existing measures against the entry of exotic diseases into Australia. The offer was extended during 1967-68 to Western Australia where the dumping of garbage at sea was no longer considered satisfactory. The offer provides for the Australian Government to meet the full capital cost of incinerators and ancillary structures and half the cost of access roads, excluding land costs, at selected ports. The cost of maintaining and operating the incinerators and transporting garbage is a State responsibility. No grants have been made to New South Wales. Grants paid since the inception of the scheme, and estimates for 1974-75, are shown in the following table.
TABLE 33—GRANTS FOR CAPITAL EXPENDITURES ON THE DISPOSAL OF SHIPS' GARBAGE
$,000
- New South Victoria Queensland Australia South Westerp Tasmania Total Wales
1966-67 .. .. .. .. .. .. 29 29 1967-68 .. .. .. .. 38 .. 1 39 1968-69 .. .. .. .. 10 .. 1 11 1969-70 .. .. 120 308 .. .. 57 485 1970-71 .. .. 4 28 .. .. 14 46 1971-72 .. .. 130 55 .. 104 .. 288 1972-73 .. .. 765 .. .. 10 7 782 1973-74 .. .. 6 .. .. 25 .. 31 1974-75 (estimate) .. .. .. .. 48 .. 48
67
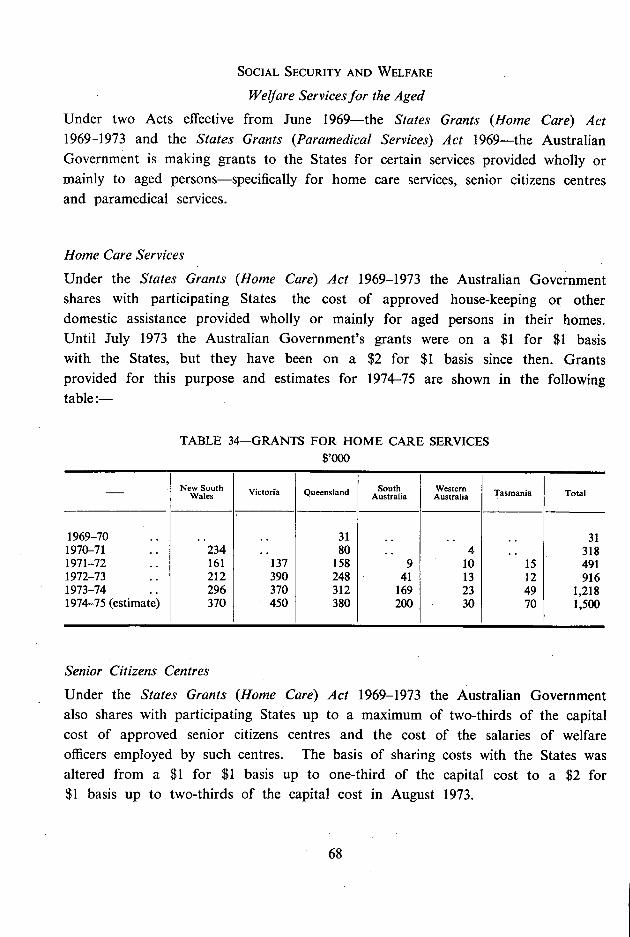
SOCIAL SECURITY AND WELFARE Welfare Services for the Aged
Under two Acts effective from June 1969—the States Grants (Home Care) Act 1969-1973 and the States Grants (Paramedical Services) Act 1969—the Australian Government is making grants to the States for certain services provided wholly or mainly to aged persons—specifically for home care services, senior citizens centres and paramedical services.
Home Care Services Under the States Grants (Home Care) Act 1969-1973 the Australian Government shares with participating States the cost of approved house-keeping or other domestic assistance provided wholly or mainly for aged persons in their homes. Until July 1973 the Australian Government's grants were on a $1 for $1 basis with the States, but they have been on a $2 for $1 basis since then. Grants provided for this purpose and estimates for 1974-75 are shown in the following table:—
TABLE 34—GRANTS FOR HOME CARE SERVICES $,000
• New South Wales Victoria Queensland South
Australia Western Australia Tasmania Total
1969-70 .. .. .. 31 ... .. .. 31 1970-71 .. 234 .. 80 .. 4 .. 318 1971-72 .. 161 137 158 9 10 15 491 1972-73 .. 212 390 248 41 13 12 916 1973-74 .. 296 370 312 169 23 49 1,218 1974-75 (estimate) 370 450 380 200 30 70 1,500
Senior Citizens Centres Under the States Grants (Home Care) Act 1969-1973 the Australian Government also shares with participating States up to a maximum of two-thirds of the capital cost of approved senior citizens centres and the cost of the salaries of welfare officers employed by such centres. The basis of sharing costs with the States was altered from a $1 for $1 basis up to one-third of the capital cost to a $2 for $1 basis up to two-thirds of the capital cost in August 1973.
68
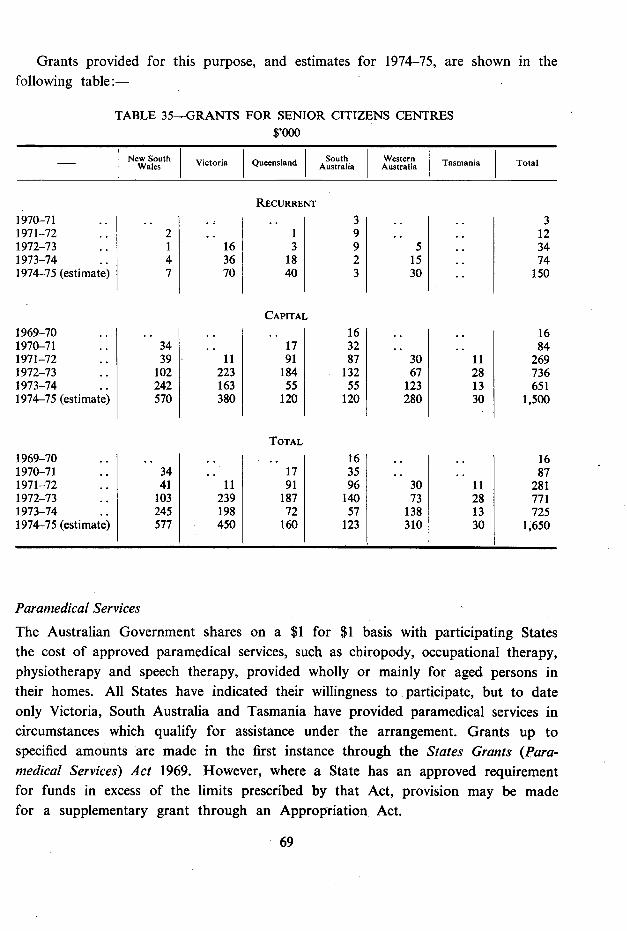
Grants provided for this purpose, and estimates for 1974-75, are following table:—
TABLE 35—.-GRANTS FOR SENIOR CITIZENS CENTRES $,000
shown in the
- New South Victoria Queensland South Australia
Western ~ Tasmania Total Wales
RECURRENT
1970-71 . 3 .. .. 3 1971-72 2 .. 1 9 .. .. 12 1972-73 .. 1 16 3 9 5 34 1973-74 .. 4 36 18 2 15 .. 74 1974-75 (estimate) 7 70 40 3 30 150
CAPITAL
1969-70 .. .. .. 16 .. 16 1970-71 .. 34 .. 17 32 .. 84 1971-72 39 - 11 91 87 30 11 269 1972-73 102 223 184 132 67 28 736 1973-74 .. 242 163 55 55 123 13 651 1974-75 (estimate) 570 380 120 120 280 30 1,500
TOTAL
1969-70 .. .. 16 .. .. 16 1970-71 .. 34 .. 17 35 .. .. 87 1971-72 .. 41 11 91 96 30 11 281 1972-73 •.. 103 239 187 140 73 28 771 1973-74 .. 245 198 72 57 138 13 725 1974-75 (estimate) 577 450 160 123 310 30 1,650
Paramedical Services The Australian Government shares on a $1 for $1 basis with participating States the cost of approved paramedical services, such as chiropody, occupational therapy, physiotherapy and speech therapy, provided wholly or mainly for aged persons in their homes. All States have indicated their willingness to participate, but to date only Victoria, South Australia and Tasmania have provided paramedical services in circumstances which qualify for assistance under the arrangement. Grants up to specified amounts are made in the first instance through the States Grants (Para-medical Services) Act 1969. However, where a State has an approved requirement for funds in excess of the limits prescribed by that Act, provision may be made for a supplementary grant through an Appropriation Act.
69
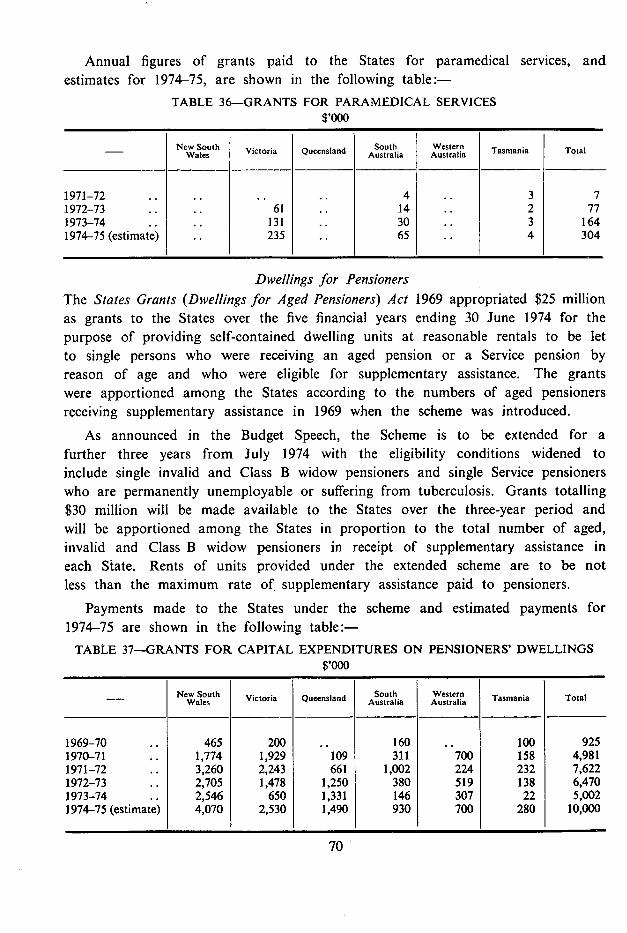
Annual figures of grants paid to the States for paramedical services, and estimates for 1974-75, are shown in the following table:—
TABLE 36—GRANTS FOR PARAMEDICAL SERVICES $,000
New South Wales Vi Victoria Queensland South
Australia Western Australia Tasmania Total
1971-72 .. .. 4 .. 3 7 1972-73 .. .. 61 .. 14 2 77 1973-74 .. .. 131 .. 30 .. 3 164 1974-75 (estimate) .. 235 .. 65 .. 4 304
Dwellings for Pensioners The States Grants (Dwellings for Aged Pensioners) Act 1969 appropriated $25 million as grants to the States over the five financial years ending 30 June 1974 for the purpose of providing self-contained dwelling units at reasonable rentals to be let to single persons who were receiving an aged pension or a Service pension by reason of age and who were eligible for supplementary assistance. The grants were apportioned among the States according to the numbers of aged pensioners receiving supplementary assistance in 1969 when the scheme was introduced.
As announced in the Budget Speech, the Scheme is to be extended for a further three years from July 1974 with the eligibility conditions widened to include single invalid and Class B widow pensioners and single Service pensioners who are permanently unemployable or suffering from tuberculosis. Grants totalling $30 million will be made available to the States over the three-year period and will be apportioned among the States in proportion to the total number of aged, invalid and Class B widow pensioners in receipt of supplementary assistance in each State. Rents of units provided under the extended scheme are to be not less than the maximum rate of supplementary assistance paid to pensioners.
Payments made to the States under the scheme and estimated payments for 1974-75 are shown in the following table:—
TABLE 37—GRANTS FOR CAPITAL EXPENDITURES ON PENSIONERS' DWELLINGS $,000
- New South Wales Victoria Queensland South
Australia Western Australia Tasmania Total
1969-70 .. 465 200 .. 160 .. 100 925 1970-71 .. 1,774 1,929 109 311 700 158 4,981 1971-72 .. 3,260 2,243 661 1,002 224 232 7,622 1972-73 .. 2,705 1,478 1,250 380 519 138 6,470 1973-74 .. 2,546 650 1,331 146 307 22 5,002 1974-75 (estimate) 4,070 2,530 1,490 930 700 280 10,000
70
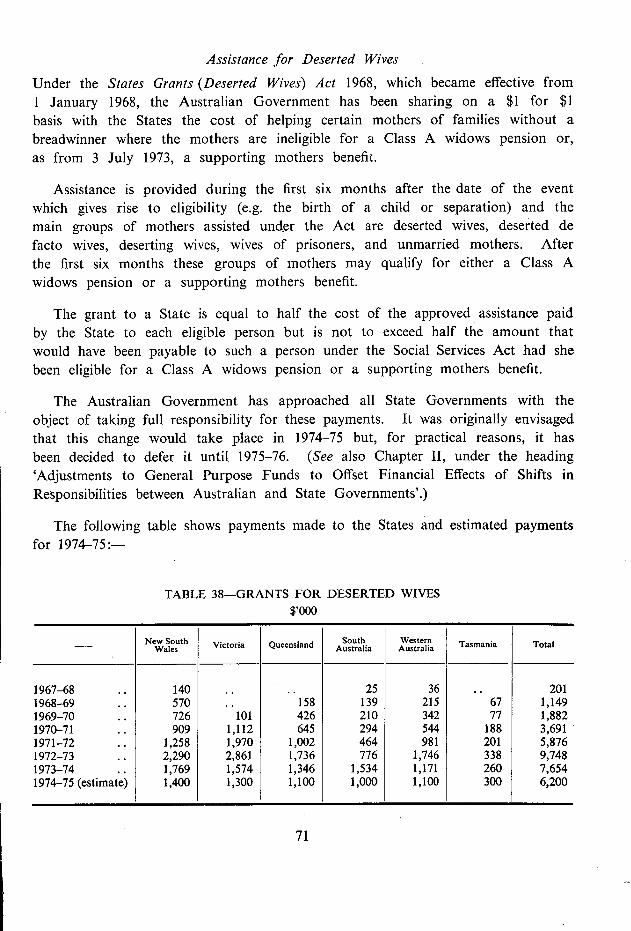
Assistance for Deserted Wives Under the States Grants (Deserted Wives) Act 1968, which became effective from 1 January 1968, the Australian Government has been sharing on a $1 for $1 basis with the States the cost of helping certain mothers of families without a breadwinner where the mothers are ineligible for a Class A widows pension or, as from 3 July 1973, a supporting mothers benefit.
Assistance is provided during the first six months after the date of the event which gives rise to eligibility (e.g. the birth of a child or separation) and the main groups of mothers assisted under the Act are deserted wives, deserted de facto wives, deserting wives, wives of prisoners, and unmarried mothers. After the first six months these groups of mothers may qualify for either a Class A widows pension or a supporting mothers benefit.
The grant to a State is equal to half the cost of the approved assistance paid by the State to each eligible person but is not to exceed half the amount that would have been payable to such a person under the Social Services Act had she been eligible for a Class A widows pension or a supporting mothers benefit.
The Australian Government has approached all State Governments with the object of taking full responsibility for these payments. It was originally envisaged that this change would take place in 1974-75 but, for practical reasons, it has been decided to defer it until 1975-76. (See also Chapter II, under the heading 'Adjustments to General Purpose Funds to Offset Financial Effects of Shifts in Responsibilities between Australian and State Governments'.)
The following table shows payments made to the States and estimated payments for 1974-75:—
TABLE 38—GRANTS FOR DESERTED WIVES $,000
New South Wales Victoria Queensland South
Australia Western Australia Tasmania Total
1967-68 .. 140 .. .. 25 36 .. 201 1968-69 .. 570 .. 158 139 215 67 1,149 1969-70 .. 726 101 426 210 342 77 1,882 1970-71 .. 909 1,112 645 294 544 188 3,691 1971-72 .. 1,258 1,970 1,002 464 981 201 5,876 1972-73 .. 2,290 2,861 1,736 776 1,746 338 9,748 1973-74 .. 1,769 1,574 1,346 1,534 1,171 260 7,654 1974-75 (estimate) 1,400 1,300 1,100 1,000 1,100 300 6,200
71
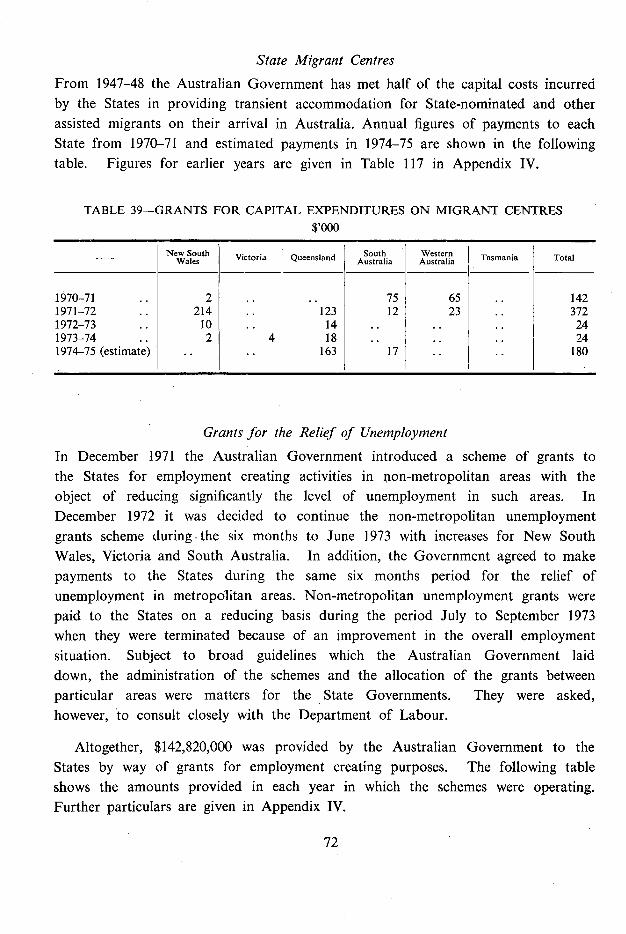
State Migrant Centres From 1947-48 the Australian Government has met half of the capital costs incurred by the States in providing transient accommodation for State-nominated and other assisted migrants on their arrival in Australia. Annual figures of payments to each State from 1970-71 and estimated payments in 1974-75 are shown in the following table. Figures for earlier years are given in Table 117 in Appendix IV.
TABLE 39—GRANTS FOR CAPITAL EXPENDITURES ON MIGRANT CENTRES $,000
New South Wales Victoria Queensland South
Australia Western Australia Tasmania Total
1970-71 .. 2 .. .. 75 65 .. 142 1971-72 .. 214 .. 123 12 23 .. 372 1972-73 .. 10 .. 14 .. .. .. 24 1973-74 .. 2 4 18 .. .. .. 24 1974-75 (estimate) .. .. 163 17 .. .. 180
Grants for the Re1if of Unemployment In December 1971 the Australian Government introduced a scheme of grants to the States for employment creating activities in non-metropolitan areas with the object of reducing significantly the level of unemployment in such areas. In December 1972 it was decided to continue the non-metropolitan unemployment grants scheme during the six months to June 1973 with increases for New South Wales, Victoria and South Australia. In addition, the Government agreed to make payments to the States during the same six months period for the relief of unemployment in metropolitan areas. Non-metropolitan unemployment grants were paid to the States on a reducing basis during the period July to September 1973 when they were terminated because of an improvement in the overall employment situation. Subject to broad guidelines which the Australian Government laid down, the administration of the schemes and the allocation of the grants between particular areas were matters for the State Governments. They were asked, however, to consult closely with the Department of Labour.
Altogether, $142,820,000 was provided by the Australian Government to the States by way of grants for employment creating purposes. The following table shows the amounts provided in each year in which the schemes were operating. Further particulars are given in Appendix IV.
72
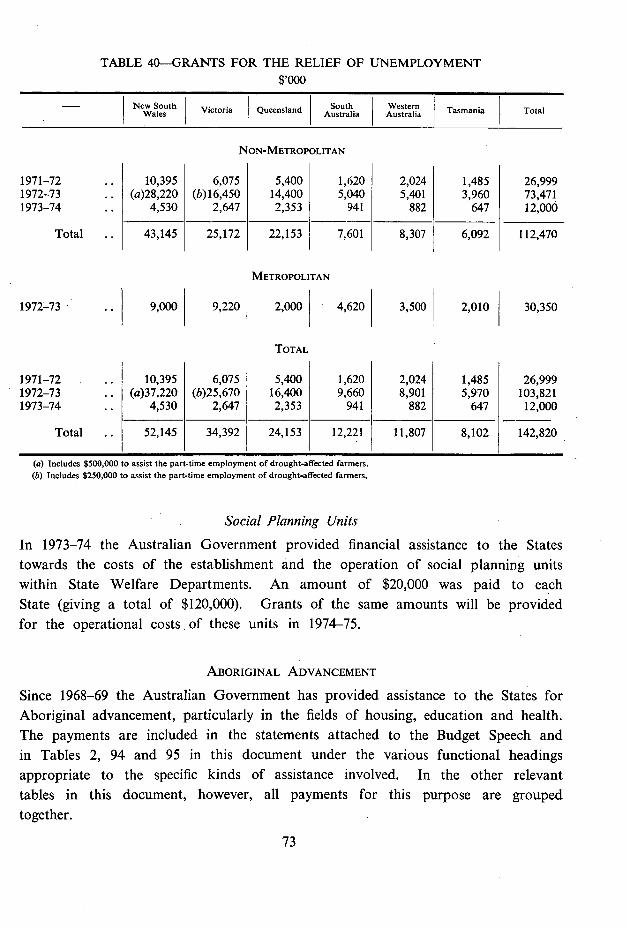
TABLE 40-GRANTS FOR THE RELIEF OF UNEMPLOYMENT $,000
New South Wales Victoria Queensland
I South
Australia I Western
Australia Tasmania Total
NON -METROPOLITAN
1971-72 .. 10,395 6,075 5,400 1,620 2,024 1,485 26,999 1972-73 (a)28,220 (b)16,450 14,400 5,040 5,401 3,960 73,471 1973-74 4,530 2,647 2,3.53 941 882 647 I 12,000
Total .. 8,307 6,092 112,470 43,145 25,172 22,153 7.601
METROPOLITAN
1972-73 .. 9,000 9,220 2,000 1 4,620 3,500 2,010 30,350
TOTAL
1971-72 .. 10,395 6,075 5,400 1,620 2,024 1,485 26,999 1972-73 .. (a)37,220 (b)25,670 16,400 9,660 8,901 5,970 103,821 1973-74 .. 4,530 2,647 2,353 941 882 647 12,000
Total .. 52,145 34,392 24,153 12,221 11,807 8,102 142,820
Includes $500,000 to assist the part-time employment of drought-affected farmers. Includes $250,000 to assist the part-time employment of drought-affected farmers.
Social Planning Units In 1973-74 the Australian Government provided financial assistance to the States towards the costs of the establishment and the operation of social planning units within State Welfare Departments. An amount of $20,000 was paid to each State (giving a total of $120,000). Grants of the same amounts will be provided for the operational costs, of these units in 1974-75.
ABORIGINAL ADVANCEMENT
Since 1968-69 the Australian Government has provided assistance to the States for Aboriginal advancement, particularly in the fields of housing, education and health. The payments are included in the statements attached to the Budget Speech and in Tables 2, 94 and 95 in this document under the various functional headings appropriate to the specific kinds of assistance involved. In the other relevant tables in this document, however, all payments for this purpose are grouped together.
73

Under annual States Grants (Aboriginal Advancement) Acts, payments to the States have increased considerably from $3.7 million in 1968-69 to $32.3 million in 1973-74 and an estimated $40.8 million in 1974-75. With the exception of an amount of $350,000 provided to Queensland in 1969-70 as a loan for the develop-ment of an irrigation and water supply project at Bamaga, all Australian Government assistance has been in the form of grants.
It is to be noted that the Australian Government makes considerable assistance available for Aboriginal advancement in the States other than by way of payments to the States-that is, by way of direct assistance to Aboriginal organisations, local government authorities (on which, see Chapter V) and other bodies.
It is also of relevance that the States have been invited to transfer certain functions in this field to the Australian Government. Transfers have been effected in Tasmania (from 31 August 1973), in South Australia (from 1 December 1973) and in Western Australia (from 29 June 1974). Detailed discussions have also been held with New South Wales and Victoria. Further reference is made to this matter in Chapter II under the heading 'Adjustments to General Purpose Funds to Offset Financial Effects of Shifts in Responsibilities Between Australian and State Governments'.
The following table shows payments made to the States since 1968-69 and estimated payments in 1974-75. For a functional breakdown of these payments, see Table 118 in Appendix IV.
TABLE 41-PAYMENTS FOR ABORIGINAL ADVANCEMENT $,000
- New South Wales Victoria Queensland South
Australia Western Australia Tasmania Total
RECURRENT 1968-69 .. .174 22 84 39 .. .. I 319 1969-70 .. 227 69 246 17 30 7 596 1970-71 .. 185 81 216 161 140 19 800 1971-72 .. 668 116 371 270 223 17 1,665 1972-73 .. 1,929 331 2,269694 1,377 49 6,649 1973-74 .. 1,678 358 975 1,003 2,636 23 6,673 1974-75 (estimate) 1,850 460 2,085 1,474 4,660 23 10,552
CAPITAL 1968-69 .. 601 203 1,366 311 825 25 3,331 1969-70 .. 952 278 (a)2,159 518 1,225 32 5,164 1970-71 .. 1,517 286 2,322 499 1,540 35 6,200 1971-72 .. 1,732 284 2,667 530 2,277 45 7,535 1972-73 .. 2,821 439 5,431 1,046 5,509 105 15,351 1973-74 .. 3,725 590 8,982 3,696 8,454 131 25,577 1974-75 (estimate) 4,750 940 11,467 3,526 9,340 215 30,238
74
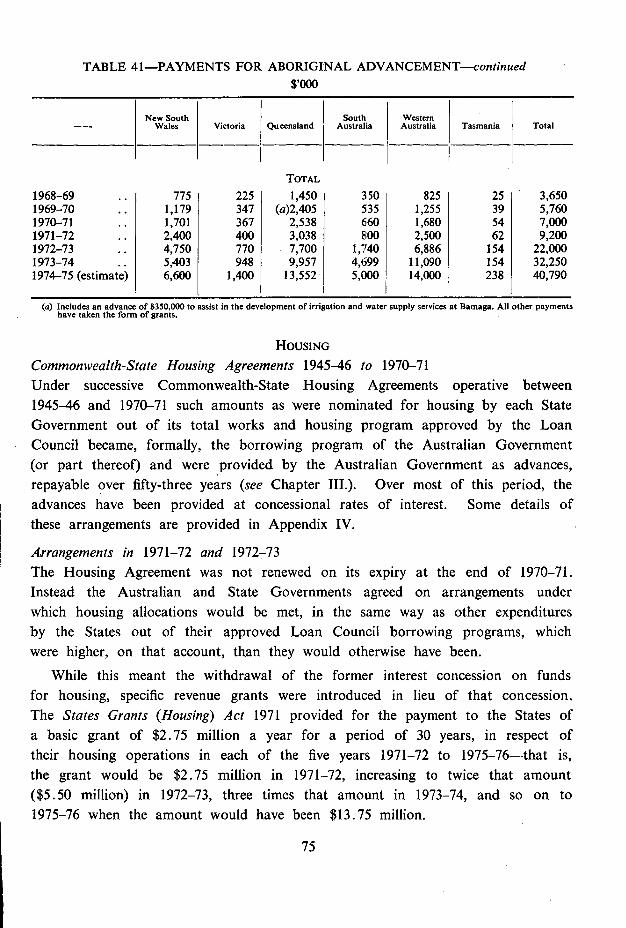
TABLE 41-PAYMENTS FOR ABORIGINAL ADVANCEMENT-continued $,000
- New South Wales Victoria Queensland
South Australia
Western Australia Tasmania Total
TOTAL 1968-69 775 225 1,450 3:50 825 25 3,650 1969-70 .. 1,179 347 (a)2,405 535 1,255 39 5,760 1970-71 .. 1,701 367 2,538 660 1,680 54 7,000 1971-72 .. 2,400 400 3,038 800 2,500 62 9,200 1972-73 .. 4,750 770 7,700 1,740 6,886 154 22,000 1973-74 .. 5,403 948 9,957 4,699 11,090 154 32,250 1974-75 (estimate) 6,600 1,400 13,552 5,000 14,000 238 40,790
(a) Includes an advance of $350,000 to assist in the development of irrigation and water supply services at Bamaga. All other payments have taken the form of grants.
HOUSING
Commonwealth-State Housing Agreements 1945-46 to 1970-71 Under successive Commonwealth-State Housing Agreements operative between 1945-46 and 1970-71 such amounts as were nominated for housing by each State Government out of its total works and housing program approved by the Loan Council became, formally, the borrowing program of the Australian Government (or part thereof) and were provided by the Australian Government as advances, repayable over fifty-three years (see Chapter III.). Over most of this period, the advances have been provided at concessional rates of interest. Some details of these arrangements are provided in Appendix IV.
Arrangements in 1971-72 and 1972-73 The Housing Agreement was not renewed on its expiry at the end of 1970-71. Instead the Australian and State Governments agreed on arrangements under which housing allocations would be met, in the same way as other expenditures by the States out of their approved Loan Council borrowing programs, which were higher, on that account, than they would otherwise have been.
While this meant the withdrawal of the former interest concession on funds for housing, specific revenue grants were introduced in lieu of that concession. The States Grants (Housing) Act 1971 provided for the payment to the States of a basic grant of $2.75 million a year for a period of 30 years, in respect of their housing operations in each of the five years 1971-72 to 1975-76-that is, the grant would be $2.75 million in 1971-72, increasing to twice that amount ($5.50 million) in 1972-73, three times that amount in 1973-74, and so on to 1975-76 when the amount would have been $13.75 million.
75
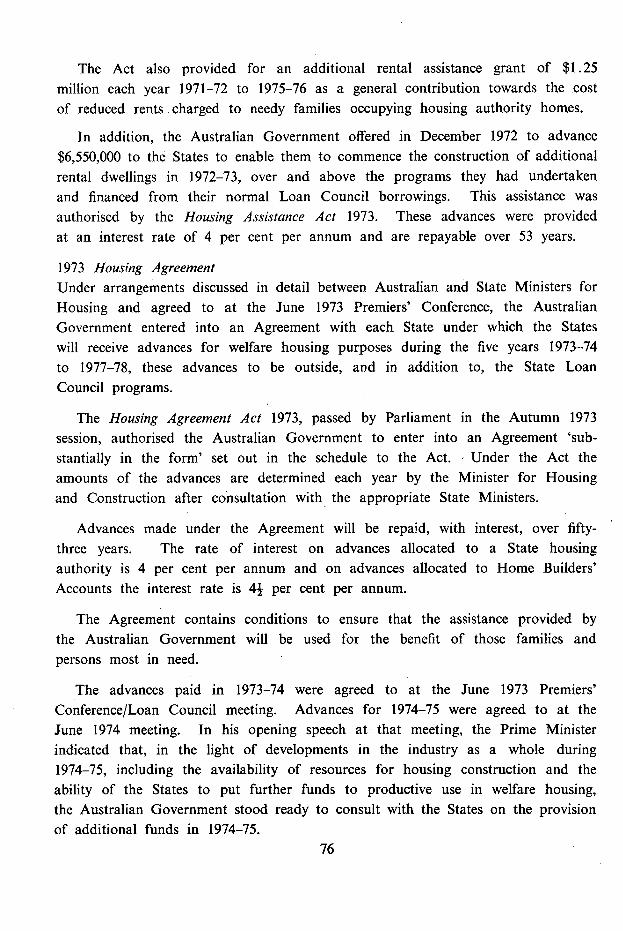
The Act also provided for an additional rental assistance grant of $1.25 million each year 1971-72 to 1975-76 as a general contribution towards the cost of reduced rents charged to needy families occupying housing authority homes.
In addition, the Australian Government offered in December 1972 to advance $6,550,000 to the States to enable them to commence the construction of additional rental dwellings in 1972-73, over and above the programs they had undertaken and financed from their normal Loan Council borrowings. This assistance was authorised by the Housing Assistance Act 1973. These advances were provided at an interest rate of 4 per cent per annum and are repayable over 53 years.
1973 Housing Agreement Under arrangements discussed in detail between Australian and State Ministers for Housing and agreed to at the June 1973 Premiers' Conference, the Australian Government entered into an Agreement with each State under which the States will receive advances for welfare housing purposes during the five years 1973-74 to 1977-78, these advances to be outside, and in addition to, the State Loan Council programs.
The Housing Agreement Act 1973, passed by Parliament in the Autumn 1973 session, authorised the Australian Government to enter into an Agreement 'sub-stantially in the form' set out in the schedule to the Act. Under the Act the amounts of the advances are determined each year by the Minister for Housing and Construction after consultation with the appropriate State Ministers.
Advances made under the Agreement will be repaid, with interest, over fifty- three years. The rate of interest on advances allocated to a State housing authority is 4 per cent per annum and on advances allocated to Home Builders' Accounts the interest rate is 4+ per cent per annum.
The Agreement contains conditions to ensure that the assistance provided by the Australian Government will be used for the benefit of those families and persons most in need.
The advances paid in 1973-74 were agreed to at the June 1973 Premiers' Conference/Loan Council meeting. Advances for 1974-75 were agreed to at the June 1974 meeting. In his opening speech at that meeting, the Prime Minister indicated that, in the light of developments in the industry as a whole during 1974-75, including the availability of resources for housing construction and the ability of the States to put further funds to productive use in welfare housing, the Australian Government stood ready to consult with the States on the provision of additional funds in 1974-75.
76
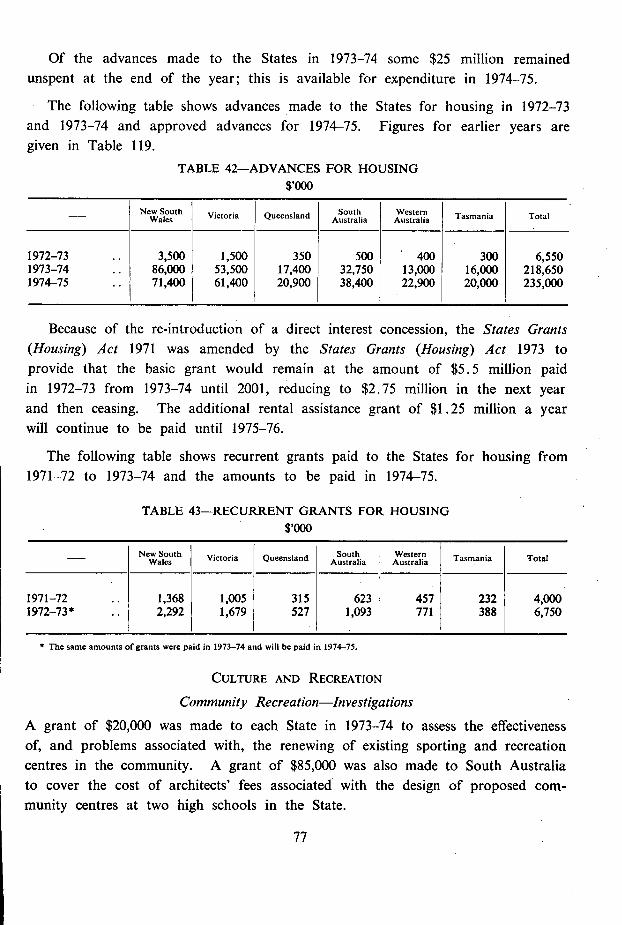
Of the advances made to the States in 1973-74 some $25 million remained unspent at the end of the year; this is available for expenditure in 1974-75.
The following table shows advances made to the States for housing in 1972-73 and 1973-74 and approved advances for 1974-75. Figures for earlier years are given in Table 119.
TABLE 42—ADVANCES FOR HOUSING $,000
New South Wales victoria Queensland South
Australia Western Australia Tasmania Total
1972-73 .. 3,500 1,500 350 500 400 300 6,550 1973-74 .. 86,000 53,500 17,400 32,750 13,000 16,000 218,650 1974-75 .. 71,400 61,400 20,900 38,400 22,900 20,000 235,000
Because of the re-introduction of a direct interest concession, the States Grants (Housing) Act 1971 was amended by the States Grants (Housing) Act 1973 to provide that the basic grant would remain at the amount of $5.5 million paid in 1972-73 from 1973-74 until 2001, reducing to $2.75 million in the next year and then ceasing. The additional rental assistance grant of $1.25 million a year will continue to be paid until 1975-76.
The following table shows recurrent grants paid to the States for housing from 1971-72 to 1973-74 and the amounts to be paid in 1974-75.
TABLE 43—RECURRENT GRANTS FOR HOUSING $,000
New South Wales Victoria Queensland South
Australia Western Australia Tasmania Total
1971-72 .. 1,368 1,005 315 623 457 232 4,000 1972-73 .. 2,292 1,679 527 1,093 771 388 6,750
* The same amounts of grants were paid in 1973-74 and will be paid in 1974-75.
CULTURE AND RECREATION Community Recreation—Investigations
A grant of $20,000 was made to each State in 1973-74 to assess the effectiveness of, and problems associated with, the renewing of existing sporting and recreation centres in the community. A grant of $85,000 was also made to South Australia to cover the cost of architects' fees associated with the design of proposed com-munity centres at two high schools in the State.
77
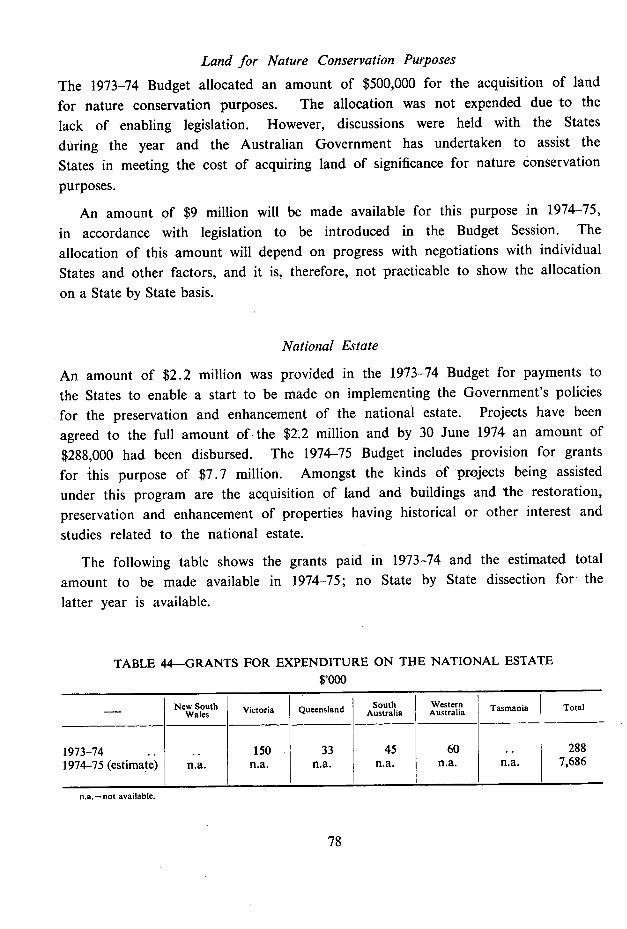
Land for Nature Conservation Purposes The 1973-74 Budget allocated an amount of $500,000 for the acquisition of land for nature conservation purposes. The allocation was not expended due to the lack of enabling legislation. However, discussions were held with the States during the year and the Australian Government has undertaken to assist the States in meeting the cost of acquiring land of significance for nature conservation purposes.
An amount of $9 million will be made available for this purpose in 1974-75, in accordance with legislation to be introduced in the Budget Session. The allocation of this amount will depend on progress with negotiations with individual States and other factors, and it is, therefore, not practicable to show the allocation on a State by State basis.
National Estate
An amount of $2.2 million was provided in the 1973-74 Budget for payments to the States to enable a start to be made on implementing the Government's policies for the preservation and enhancement of the national estate. Projects have been agreed to the full amount of the $12 million and by 30 June 1974 an amount of $288,000 had been disbursed. The 1974-75 Budget includes provision for grants for this purpose of $7.7 million. Amongst the kinds of projects being assisted under this program are the acquisition of land and buildings and the restoration, preservation and enhancement of properties having historical or other interest and studies related to the national estate.
The following table shows the grants paid in 1973-74 and the estimated total amount to be made available in 1974-75; no State by State dissection for the latter year is available.
TABLE 44—GRANTS FOR EXPENDITURE ON THE NATIONAL ESTATE $,000
- New South Wales Victoria Queensland South
Australia Western Australia Tasmania Total
1973-74 .. .. 150 33 45 60 .. 288 1974-75 (estimate) n.a. n.a. n.a. n.a. n.a. n.a. 7,686
n.a.=not available.
78
URBAN AND REGIONAL DEVELOPMENT NEC AND THE ENVIRONMENT
Payments to the States included under this functional heading comprise mainly those being made under new programs initiated in 1973-74 and for which the Minister for Urban and Regional Development is responsible; however, several other relatively minor amounts are included, including some for Aboriginal advance-ment.
Payments under this functional heading grew particularly rapidly in 1973-74 (from only $1.0 million in the previous year to $55.9 million) and are expected to again increase considerably in 1974-75 (to an estimated $251.7 million).
The individual programs are outlined below. Further details are given in a new Budget document entitled 'Urban and Regional Development 1974-75' pre-sented by the Minister for Urban and Regional Development.
Growth Centres and Related Projects A total of $33 million was provided in the 1973-74 Budget for payments to the States for the purpose of initiating development of new metropolitan and regional growth centres and for other urban and regional development projects, of which $6.6 million was expended. Provision is made in the 1974-75 Budget for these purposes of $71.4 million.
Albury-Wodonga In October 1973 the Heads of the Australian, New South Wales and Victorian Governments signed an agreement under which these Governments would co-operate in the development of the Albury-Wodonga region. The Australian Government's involvement was authorised by the Albury-Wodonga Development Act 1973, which came into operation in December 1973.
The Albury-Wodonga Development (Financial Assistance) Act 1973 authorised the provision of Australian Government assistance of $9 million in respect of 1973-74. The Act provided that payments used for the acquisition of land for urban use take the form of loans; these are repayable over periods up to 30 years, but there is provision for deferment of both interest and repayment of principal. The Act also provided that funds used for the acquisition of other land were to take the form of grants; the form of payments to be used for purposes other than land acquisition was left to be agreed between the Australian and State Governments.
A total of $2.13 million was allocated in 1973-74, mainly for land acquisition, of which $1.15 million took the form of loans.
79
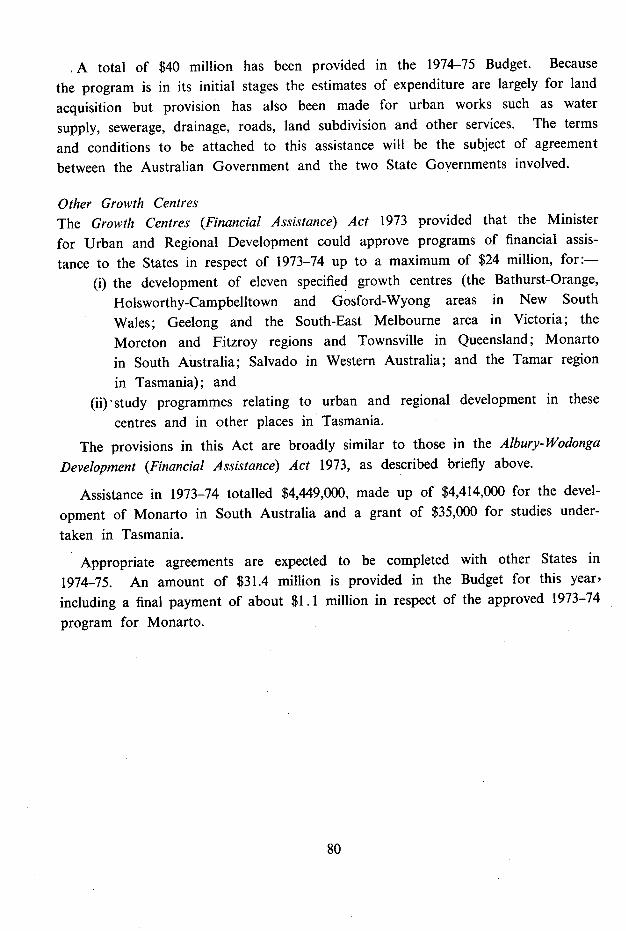
A total of $40 million has been provided in the 1974-75 Budget. Because the program is in its initial stages the estimates of expenditure are largely for land acquisition but provision has also been made for urban works such as water supply, sewerage, drainage, roads, land subdivision and other services. The terms and conditions to be attached to this assistance will be the subject of agreement between the Australian Government and the two State Governments involved.
Other Growth Centres The Growth Centres (Financial Assistance) Act 1973 provided that the Minister for Urban and Regional Development could approve programs of financial assis-tance to the States in respect of 1973-74 up to a maximum of $24 million, for:—
the development of eleven specified growth centres (the Bathurst-Orange, Holsworthy-Campbelltown and Gosford-Wyong areas in New South Wales; Geelong and the South-East Melbourne area in Victoria; the Moreton and Fitzroy regions and Townsville in Queensland; Monarto in South Australia; Salvado in Western Australia; and the Tamar region in Tasmania); and study programmes relating to urban and regional development in these centres and in other places in Tasmania.
The provisions in this Act are broadly similar to those in the Albury-Wodonga Development (Financial Assistance) Act 1973, as described briefly above.
Assistance in 1973-74 totalled $4,449,000, made up of $4,414,000 for the devel-opment of Monarto in South Australia and a grant of $35,000 for studies under-taken in Tasmania.
Appropriate agreements are expected to be completed with other States in 1974-75. An amount of $31.4 million is provided in the Budget for this year, including a final payment of about $1.1 million in respect of the approved 1973-74 program for Monarto.
80
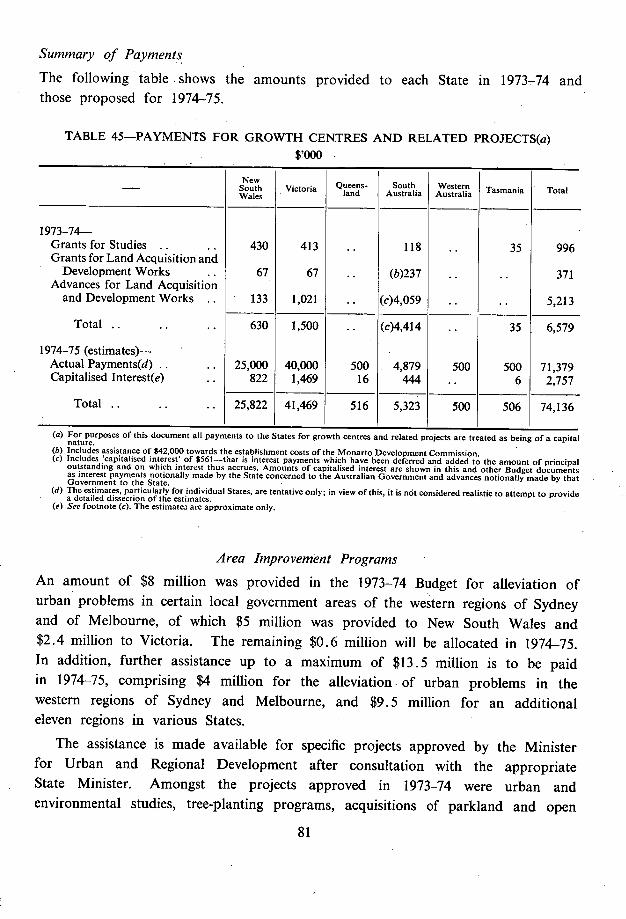
Summary of Payments
The following table shows the amounts provided to each State in 1973-74 and those proposed for 1974-75.
TABLE 45—PAYMENTS FOR GROWTH CENTRES AND RELATED PROJECTS(a) - $,000 -
- New South Wales
Victoria Queens- land
South Australia
Western Australia Tasmania Total
1973-74— Grants for Studies -. - 430 413 . - 118 . - 35 996 Grants for Land Acquisition and
Development Works 67 67 -. (b)237 -. .. 371 Advances for Land Acquisition
and Development Works -. 133 1,021 .. (c)4,059 . - 5,213
Total .. - -. 630 1,500 .. (c)4,414 -. 35 6,579
1974-75 (estimates)— Actual Payments(d) -. 25,000 40,000 500 4,879 500 500 71,379 Capitalised Interest(e) 822 1,469 16 4.44 - 6 2,757
Total .. 25,822 41,469 516 5,323 500 506 74,136
I-or purposes Of this document all payments to the States for growth centres and related projects are treated as being of a capital nature. Includes assistance of $42,000 towards the establishment Costs of the Monarto Development Commission. Includes 'capitalised interest' of $561—that is interest payments which have been deferred and added to the amount of principal outstanding and on which interest thus accrues. Amounts of capitalised interest are shown in this and other Budget documents as interest payments notionally made by the State concerned to the Australian Government and advances notionally made by that Government to the State. The estimates, particularly for individual States, are tentative only; in view of this, it is not considered realistic to attempt to provide a detailed dissection of the estimates. See footnote (c). The estimate.; are approximate only.
Area Improvement Programs An amount of $8 million was provided in the 1973-74 Budget for alleviation of urban problems in certain local government areas of the western regions of Sydney and of Melbourne, of which $5 million was provided to New South Wales and $2.4 million to Victoria. The remaining $0.6 million will be allocated in 1974-75. In addition, further assistance up to a maximum of $13.5 million is to be paid in 1974-75, comprising $4 million for the alleviation of urban problems in the western regions of Sydney and Melbourne, and $9.5 million for an additional eleven regions in various States.
The assistance is made available for specific projects approved by the Minister for Urban and Regional Development after consultation with the appropriate State Minister. Amongst the projects approved in 1973-74 were urban and environmental studies, tree-planting programs, acquisitions of parkland and open
81
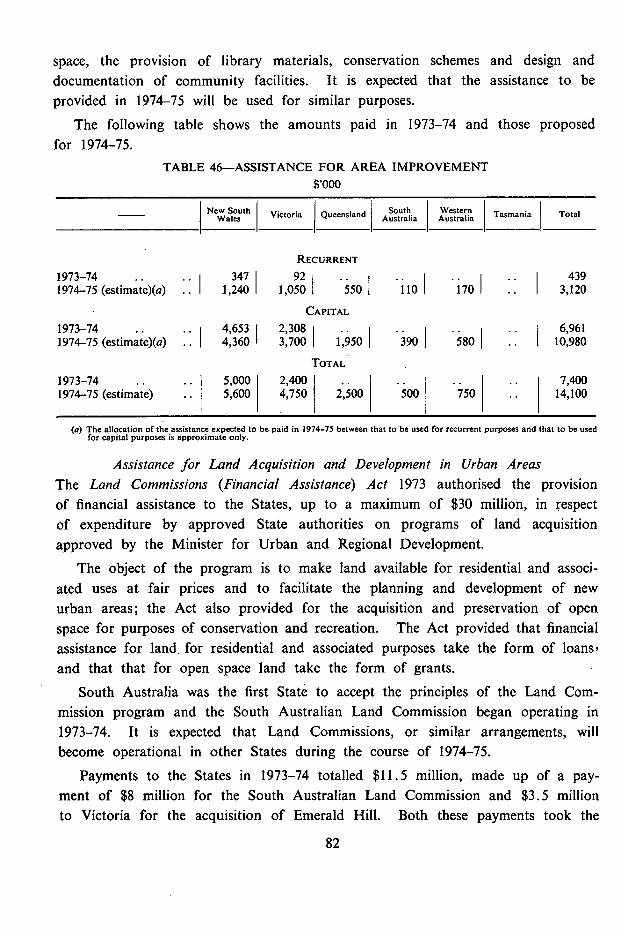
space, the provision of library materials, conservation schemes and design and documentation of community facilities. It is expected that the assistance to be provided in 1974-75 will be used for similar purposes.
The following table shows the amounts paid in 1973-74 and those proposed for 1974-75.
TABLE 46—ASSISTANCE FOR AREA IMPROVEMENT $'000
Wales I New South I Victoria I Queensland South I Australia
I
I Western Australia Tasmania Total
RECURRENT 1973-74 .. .. I 347 I 92 .. 1 .. .. I .. I 439 1974-75 (estimate)(a) . . I 1,240 I 1,050 550 110 170 .. I 3,120
CAPITAL
1973-74 .. .. 4,653 I 2,308 I .. I 3,700 1,950
.. 390
.. .. I 580 I
6,961 1974-75 (eStimate)(a) .. 4,360 .. 10,980
TOTAL
1973-74 .. .. I 5,000 I 2,400 I .. .. I .. I .. I 7,400 1974-75 (estimate) .. I 5,600 I 4,750 2,500 500 750 I .. 14,100
(a) The allocation of the assistance expected to be paid in 1974-75 between that to be used for recurrent purposes and that to be used for capital purposes is approximate only.
Assistance for Land Acquisition and Development in Urban Areas The Land Commissions (Financial Assistance) Act 1973 authorised the provision of financial assistance to the States, up to a maximum of $30 million, in respect of expenditure by approved State authorities on programs of land acquisition approved by the Minister for Urban and Regional Development.
The object of the program is to make land available for residential and associ-ated uses at fair prices and to facilitate the planning and development of new urban areas; the Act also provided for the acquisition and preservation of open space for purposes of conservation and recreation. The Act provided that financial assistance for land for residential and associated purposes take the form of loans' and that that for open space land take the form of grants.
South Australia was the first State to accept the principles of the Land Com-mission program and the South Australian Land Commission began operating in 1973-74. It is expected that Land Commissions, or similar arrangements, will become operational in other States during the course of 1974-75.
Payments to the States in 1973-74 totalled $11 .5 million, made up of a pay-ment of $8 million for the South Australian Land Commission and $3.5 million to Victoria for the acquisition of Emerald Hill. Both these payments took the
82
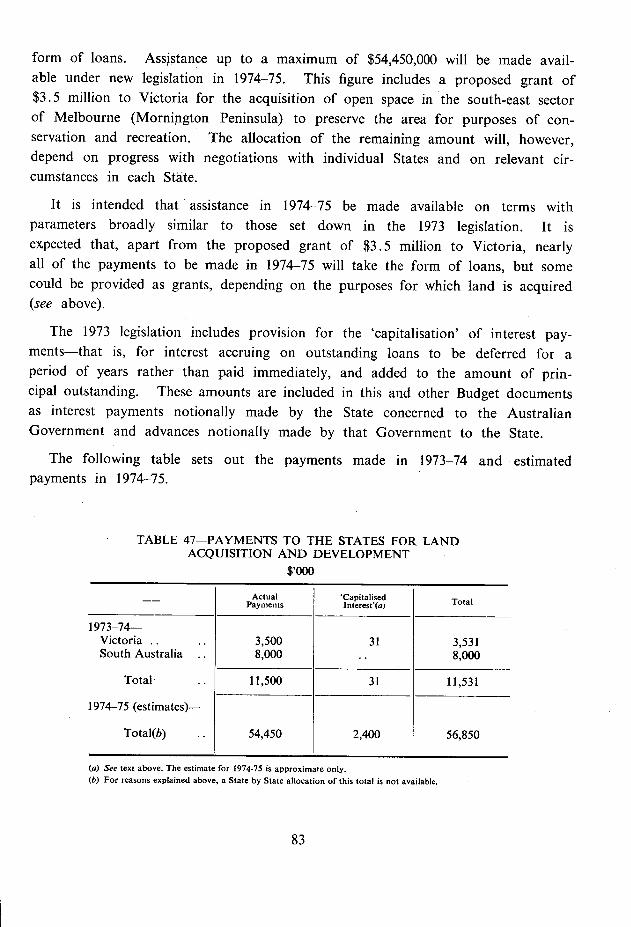
form of loans. Assistance up to a maximum of $54,450,000 will be made avail-able under new legislation in 1974-75. This figure includes a proposed grant of $3.5 million to Victoria for the acquisition of open space in the south-east sector of Melbourne (Mornington Peninsula) to preserve the area for purposes of con-servation and recreation. The allocation of the remaining amount will, however, depend on progress with negotiations with individual States and on relevant cir-cumstances in each State.
It is intended that assistance in 1974-75 be made available on terms with parameters broadly similar to those set down in the 1973 legislation. It is expected that, apart from the proposed grant of $3.5 million to Victoria, nearly all of the payments to be made in 1974-75 will take the form of loans, but some could be provided as grants, depending on the purposes for which land is acquired (see above).
The 1973 legislation includes provision for the 'capitalisation' of interest pay-ments—that is, for interest accruing on outstanding loans to be deferred for a period of years rather than paid immediately, and added to the amount of prin-cipal outstanding. These amounts are included in this and other Budget documents as interest payments notionally made by the State concerned to the Australian Government and advances notionally made by that Government to the State.
The following table sets out the payments made in 1973-74 and estimated payments in 1974-75.
TABLE 47—PAYMENTS TO THE STATES FOR LAND ACQUISITION AND DEVELOPMENT
$,000
Actual Payments
'Capitalised Interest'(a) Total
1973-74— Victoria . . .. 3,500 31 3,531 South Australia .. 8,000 -. 8,000
Total .. 11,500 31 11,531
1974-75 (estimates)—
Total(b) .. 54,450 2,400 56,850
See text above. The estimate for 1974-75 is approximate only. For reasons explained above, a State by State allocation of this total is not available.
83
National Sewerage Program In 1973-74 the Australian Government embarked upon a program of assistance to the States designed to eliminate the backlog of sewerage works in principal urban areas. The Sewerage Agreements Act 1973 authorised the provision of specified amounts of assistance, totalling $30 million, to those States entering into an agreement with the Australian Government in terms set out n a schedule to the Act. The agreement provided for approval, by the Australian Government, of specific programs of sewerage backlog works commenced before 1 July 1974 in principal urban areas (defined as the six capital cities, together with Wollongong, Newcastle, the Gold Coast and Launceston) submitted by the States, and for the payment of Australian Government advances (attracting interest at the long term bond rate) in respect of these programs. Actual payments made in 1973-74 totalled $27.9 million. It is anticipated that all but $0.3 million of the amount of $2. 1 million not paid in 1973-74 will be taken up in 1974-75.
During 1973-74 the Australian Government agreed to provide additional advances of $3.95 million to Victoria, $1.0 million to Queensland and $3.0 million to Western Australia in respect of works commenced by the States before 1 July 1974. These advances will be paid in 1974-75. The Budget also includes provision for a further $95 million, which includes amounts of $5 million to extend the program to smaller cities and $2 million for research, training, monitoring and planning. These further amounts are expected to be paid under new long-term agreements with the States. It is intended that all of the payments for research, training, monitoring and planning will take the form of grants. The assistance for sewerage works will be provided partly by way of grants and partly by way of loans.
A firm State by State allocation of the amount of $95 million was not deter-mined at the time this document was prepared. Accordingly, the estimates given in the following table are tentative only; no commitment to the provision of the precise amounts shown is implied.
84
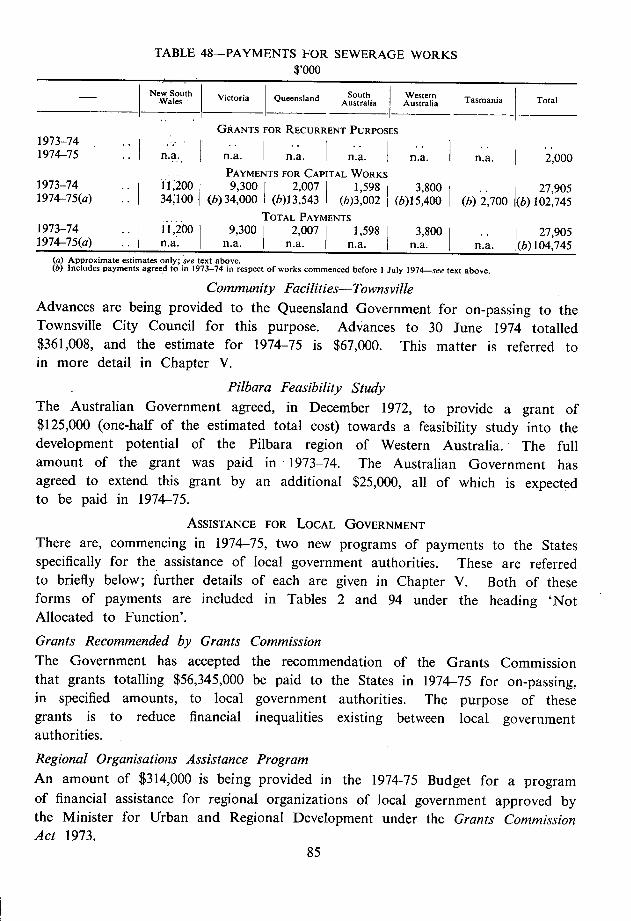
TABLE 48—PAYMENTS FOR SEWERAGE WORKS $,000
NeWalesw South Victoria Queensland South
Australia Western Australia Tasmania Total
GRANTS FOR RECURRENT PURPOSES 1973-74 .. .. 1974-75 .. n.a. n.a. n.a. n.a. n.a. n.a. 2,000
- PAYMENTS FOR CAPITAL WORKS 1973-74 .. 11,200 9,300 2,007 1,598 3,800 .. 27,905 1974-75(a) .. 34100 (b)34,000 (b)13,543 (b)3,002 I (b)15,400 (b) 2,700 (b) 102,745
-. TOTAL PAYMENTS 1973-74 .. 11,200 9,300 2,007 1,598 3,800 .. 27,905 1974-75(a) .. n.a. n.a. n.a. n.a. n.a. n.a. (b)104,745
Approximate estimates only; see text above. Includes payments agreed to in 1973-74 in respect of works commenced before 1 July 1974—see text above.
Community Facilities—Townsville Advances are being provided to the Queensland Government for on-passing to the Townsville City Council for this purpose. Advances to 30 June 1974 totalled $361,008, and the estimate for 1974-75 is $67,000. This matter is referred to in more detail in Chapter V.
Pilbara Feasibility Study The Australian Government agreed, in December 1972, to provide a grant of $125,000 (one-half of the estimated total cost) towards a feasibility study into the development potential of the Pilbara region of Western Australia. The full amount of the grant was paid in 1973-74. The Australian Government has agreed to extend this grant by an additional $25,000, all of which is expected to be paid in 1974-75.
ASSISTANCE FOR LOCAL GOVERNMENT
There are, commencing in 1974-75, two new programs of payments to the States specifically for the assistance of local government authorities. These are referred to briefly below; further details of each are given in Chapter V. Both of these forms of payments are included in Tables 2 and 94 under the heading 'Not Allocated to Function'. Grants Recommended by Grants Commission The Government has accepted the recommendation of the Grants Commission that grants totalling $56,345,000 be paid to the States in 1974-75 for on-passing, in specified amounts, to local government authorities. The purpose of these grants is to reduce financial inequalities existing between local government authorities. Regional Organisations Assistance Program An amount of $314,000 is being provided in the 1974-75 Budget for a program of financial assistance for regional organizations of local government approved by the Minister for Urban and Regional Development under the Grants Commission Act 1973.
85

ECONOMIC SERVICES
TRANSPORT
The Australian Government has been making payments to the States for transport purposes continuously since 1923-24, when it began providing grants for roads. Among the areas of specific purpose assistance to the States payments for transport are second in magnitude only to those for education. Of the estimated total payments of $421.3 million for this function in 1974-75, $350.3 million is for roads, $2.1 million is for railway projects, $67.5 million is provided for urban public transport and $1.4 million is for shipping and harbours. Payments being made in each of these areas are outlined below.
Roads As noted above, the States have received Australian Government assistance for expenditure on roads since 1923-24. The assistance has taken two main forms—general assistance under the various Commonwealth Aid Roads Acts and comparable legislation, and assistance for specific roads or specific road projects. Payments of the latter kind have been relatively small and are, with a minor exception in 1974-75, to be subsumed within the new general program of assistance to the States for roads which is to commence this year.
Arrangements 1969-70 to 1973-74 The arrangements applying over this period were based to a considerable extent on recommendations contained in a 'Report on Commonwealth Financial Assis-tance to the States for Roads' presented to the Government by the Common-wealth Bureau of Roads (which had been established in 1964).
Under the Commonwealth Aid Roads Act 1969 grants totalling $1,252.05 million were paid to the States for roads during the five-year period 1969-70 to 1973-74. The Act provided for a principal grant of $1,200 million and supplementary grants totalling $52.05 million. The principal grant was distributed between the six States by giving equal weight to the distribution under the Commonwealth Aid Roads Act 1964 and the distribution indicated by an analysis undertaken by the Bureau of Roads of the relative needs for roads expenditure. In addition, in recognition of the problems that could be created for the smaller States by too rapid a change from the distribution formula that had applied previously, supplementary grants were provided to South Australia, Western Australia and Tasmania and were phased out at the end of the five-year period. Broadly in accordance with recommendations of the Bureau, the grants (other than the supplementary grants) were allocated between various categories of roads and planning and research.
86
In this period specific grants were also provided for beef cattle roads, for maintenance of the Eyre and Barkly Highways, for the sealing of the Eyre Highway in 1972-73 and 1973-74 and, in 1973-74 only, for safety improvements to roads. With the exception of a small amount expected to be paid for beef roads in 1974-75, there will not be specific grants for these purposes in 1974-75 and subsequent years; they have been subsumed within the general program of assistance for roads.
Details of arrangements applying in this and previous priods are provided in Appendix IV. The new roads arrangements expected to apply in 1974-75 and subsequent years are summarized below, followed by an outline of the present position in relation to the provision of assistance for beef cattle roads.
Roads Arrangements Expected to Apply 1974-75 to 1976-77 In November 1973 the Government received from the Commonwealth Bureau of Roads a 'Report on Roads in Australia 1973' which contained recommendations for a program of expenditure on roads in the States over the five years 1974-75 to 1978-79; it envisaged grants to the States over that period of $2,607 million with a review of the position before the end of 1976-77.
Although the Government, in formulating proposals for a new program, has been guided to a considerable extent by the programs laid down in the Bureau's report, the program adopted differs significantly from that recommended by the Bureau. The proposed new arrangements were outlined to the States at the June 1974 Premiers' Conference and embodied in three Bills—the National Roads Bill 1974, the Roads Grants Bill 1974 and the Transport (Planning and Research) Bill 1974—introduced into the Parliament in July 1974. The last of the three Bills was passed by the Parliament and given Royal Assent in August. The other two Bills have been amended and are to be reconsidered by the Senate in the Budget sittings.
The Act and the two Bills each relate to the three-year period 1974-75 to 1976-77. It is intended to legislate in about 18 months time for the arrange-ments applying for the subsequent three years. It is expected that this legislation will integrate road and urban public transport assistance.
The Act/proposed Acts together provide for payment of grants to the States totalling $1,126 million over the three-year period commencing on 1 July 1974. Provision is made for transfers of grants, subject to Australian Government approval, between categories of expenditure, between the National Roads Bill and the Road Grants Bill and from one year to another (although over the three year period grants provided under each proposed Act are not to exceed the
15176/74-4 87
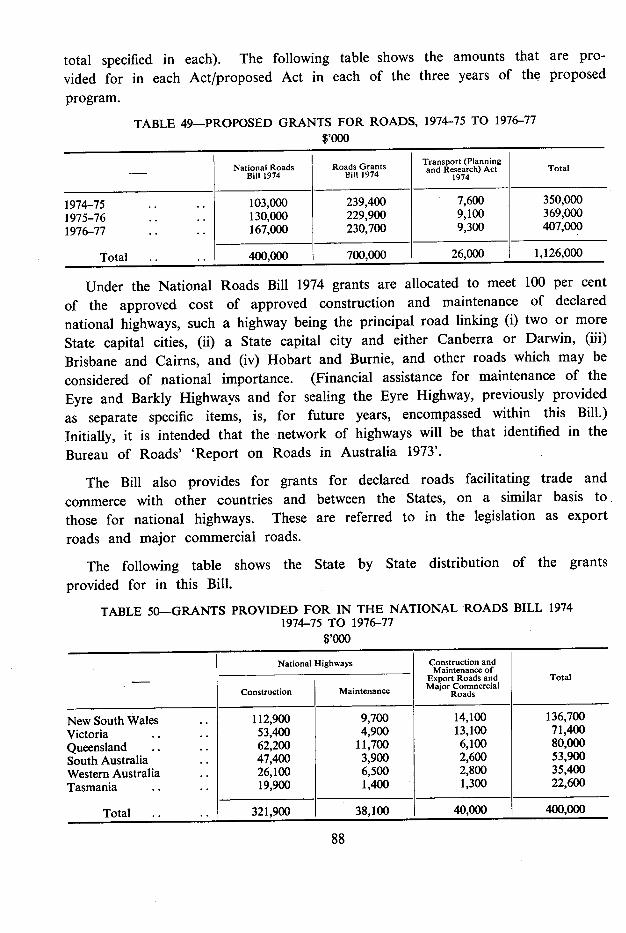
total specified in each). The following table shows the amounts that are pro-vided for in each Act/proposed Act in each of the three years of the proposed program.
TABLE 49-PROPOSED GRANTS FOR ROADS, 1974-75 TO 1976-77 $1000
National Roads Roads Grants Transport (Planning and Research) Act Total
Bill 1974 Bill 1974 1974
1974-75 .. .. 103,000 239,400 7,600 350,000 1975-76 .. .. 130,000 229,900 9,100 369,000 1976-77 .. .. 167,000 230,700 9,300 407,000
Tntl -. 400.000 700,000 26,000 1,126,000
Under the National Roads Bill 1974 grants are allocated to meet 100 per cent of the approved cost of approved construction and maintenance of declared national highways, such a highway being the principal road linking (i) two or more State capital cities, (ii) a State capital city and either Canberra or Darwin, (iii) Brisbane and Cairns, and (iv) Hobart and Burnie, and other roads which may be considered of national importance. (Financial assistance for maintenance of the Eyre and Barkly Highways and for sealing the Eyre Highway, previously provided as separate specific items, is, for future years, encompassed within this Bill.) Initially, it is intended that the network of highways will be that identified in the Bureau of Roads' 'Report on Roads in Australia 1973'.
The Bill also provides for grants for declared roads facilitating trade and commerce with other countries and between the States, on a similar basis to those for national highways. These are referred to in the legislation as export roads and major commercial roads.
The following table shows the State by State distribution of the grants provided for in this Bill.
TABLE 50-GRANTS PROVIDED FOR IN THE NATIONAL ROADS BILL 1974 1974-75 TO 1976-77
$,000
National Highways Construction and Maintenance of - Export Roads and Total
Construction Maintenance Major Commercial Roads
New South Wales .. 112,900 9,700 14,100 136,700 Victoria .. .. 53,400 4,900 13,100 71,400 Queensland .. .. 62,200 11,700 6,100 80,000 South Australia .. 47,400 3,900 2,600 53,900 Western Australia .. 26,100 6,500 2,800 35,400 Tasmania .. .. 19,900 1,400 1,300 22,600
Total .. .. 321,900 38,100 40,000 400,000
88
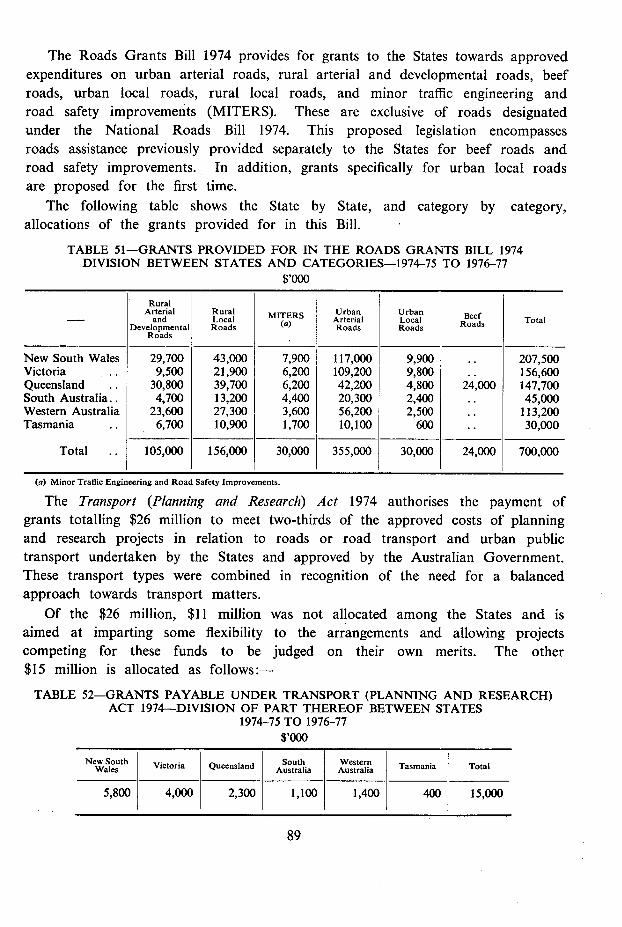
The Roads Grants Bill 1974 provides for grants to the States towards approved expenditures on urban arterial roads, rural arterial and developmental roads, beef roads, urban local roads, rural local roads, and minor traffic engineering and road safety improvements (MITERS). These are exclusive of roads designated under the National Roads Bill 1974. This proposed legislation encompasses roads assistance previously provided separately to the States for beef roads and road safety improvements. In addition, grants specifically for urban local roads are proposed for the first time.
The following table shows the State by State, and category by category, allocations of the grants provided for in this Bill.
TABLE 51-GRANTS PROVIDED FOR IN THE ROADS GRANTS BILL 1974 DIVISION BETWEEN STATES AND CATEGORIES-1974-75 TO 1976-77
$,000
- Rural
Arterial and
Developmental Roads
Rural Local Roads
MITERS Urban Arterial Roads
Urban Local Roads
Beef Total otal
New South Wales 29,700 43,000 7,900 117,000 9,900 .. 207,500 Victoria .. 9,500 21,900 6,200 109,200 9,800 .. 156,600 Queensland .. 30,800 39,700 6,200 42,200 4,800 24,000 147,700 South Australia.. 4,700 13,200 4,400 20,300 2,400 .. 45,000 Western Australia 23,600 27.300 3,600 56,200 2,500 .. 113,200 Tasmania .. 6,700 10,900 1,700 10,100 600 .. 30,000
Total .. 105,000 156,000 30,000 355,000 30,000 24,000 700,000
(a) Minor Traffic Engineering and Road Safety Improvements.
The Transport (Planning and Research) Act 1974 authorises the payment of grants totalling $26 million to meet two-thirds of the approved costs of planning and research projects in relation to roads or road transport and urban public transport undertaken by the States and approved by the Australian Government. These transport types were combined in recognition of the need for a balanced approach towards transport matters.
Of the $26 million, $11 million was not allocated among the States and is aimed at imparting some flexibility to the arrangements and allowing projects competing for these funds to be judged on their own merits. The other $15 million is allocated as follows:-
TABLE 52-GRANTS PAYABLE UNDER TRANSPORT (PLANNING AND RESEARCH) ACT 1974-DIVISION OF PART THEREOF BETWEEN STATES
1974-75 TO 1976-77 $,000
New South Wales I Victoria I Queensland South I Australia
Western Australia I Tasmania Total
5,800 4,000 2,300 1,100 1,400 400 15,000
89
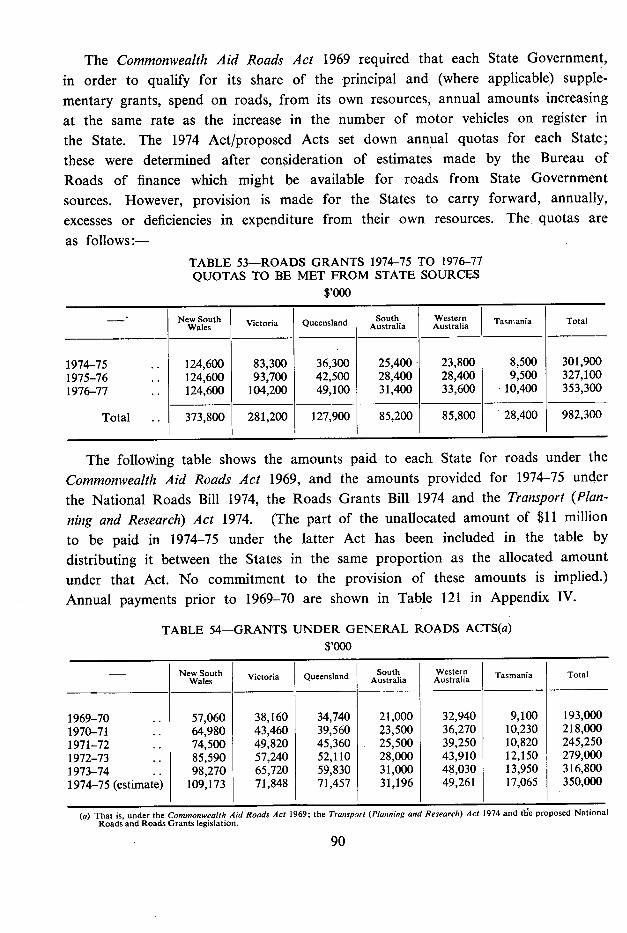
The Commonwealth Aid Roads Act 1969 required that each State Government, in order to qualify for its share of the principal and (where applicable) supple-mentary grants, spend on roads, from its own resources, annual amounts increasing at the same rate as the increase in the number of motor vehicles on register in the State. The 1974 Act/proposed Acts set down annual quotas for each State; these were determined after consideration of estimates made by the Bureau of Roads of finance which might be available for roads from State Government sources. However, provision is made for the States to carry forward, annually, excesses or deficiencies in expenditure from their own resources. The quotas are as follows:-
TABLE 53-ROADS GRANTS 1974-75 TO 1976-77 QUOTAS TO BE MET FROM STATE SOURCES
$,000
-. New South Wales Victoria Queensland South
Australia Western Australia Tasmania Total
1974-75 .. 124,600 83,300 36,300 25,400 23,800 8,500 301,900 1975-76 .. 124,600 93,700 42,500 28,400 28,400 9,500 327,100 1976-77 .. I 124,600 104,200 49,100 31,400 33,600 10,400 353,300
Total .. 373,800 281,200 127,900 85,200 85,800 28,400 982,300
The following table shows the amounts paid to each State for roads under the Commonwealth Aid Roads Act 1969, and the amounts provided for 1974-75 under the National Roads Bill 1974, the Roads Grants Bill 1974 and the Transport (Plan-ning and Research) Act 1974. (The part of the unallocated amount of $11 million to be paid in 1974-75 under the latter Act has been included in the table by distributing it between the States in the same proportion as the allocated amount under that Act. No commitment to the provision of these amounts is implied.) Annual payments prior to 1969-70 are shown in Table 121 in Appendix IV.
TABLE 54-GRANTS UNDER GENERAL ROADS ACTS(a) $,000
- New South Wales Victoria Queensland South
Australia Western Australia Tasmania Total
1969-70 .. 57,060 38,160 34,740 21,000 32,940 9,100 193,000 1970-71 .. 64,980 43,460 39,560 23,500 36,270 10,230 218,000 1971-72 .. 74,500 49,820 45,360 25,500 39,250 10,820 245,250 1972-73 .. 85,590 57,240 52,110 28,000 43,910 12,150 279,000 1973-74 .. 98,270 65,720 59,830 31,000 48,030 13,950 316,800 1974-75 (estimate) 109,173 71,848 71,457 31,196 49,261 17,065 350,000
(a) That is, under the Commonwealth Aid Roads Act 1969; the Transport (Planning and Research) Act 1974 and (lie proposed National Roads and Roads Grants legislation.
90
Beef Cattle Roads For a number of years specific grants and loans have been made available to the States for the construction and improvement of certain roads used for the trans-port of beef cattle. The construction of these roads is aimed particularly at increasing the turn-off of beef cattle for export.
Details are given in Appendix IV of the legislation under which payments of $20.5 million were made to Queensland and of $8.4 million to Western Australia in the period 1961-62 to 1966-67.
Under the States Grants (Beef Cattle Roads) Act 1968 grants were -provided to Queensland, Western Australia and South Australia for a further program of beef cattle road construction over the seven years ending 30 June 1974. The Act authorised payments to the States of up to $39.5 million for Queensland, $9.5 million for Western Australia and $1 million for South Australia. However, at the date of expiry of the Act, the grants provided to Queensland were $279,000 less than the maximum amount provided for under the Act. It is intended to amend the Act so as to make available the remaining grants to Queensland during the first half of 1974-75.
As noted above, grants of $24 million are provided in the Roads Grants Bill 1974 for Queensland towards approved expenditure on beef roads. It is intended that $6 million of these grants be provided in 1974-75.
Payments that have been made to the States for beef cattle roads are shown in Table 123 in Appendix IV.
Railway Construction Projects Financial assistance is provided to the States for expenditure on various railways projects. Brief notes on the projects which have been completed, and details of assistance provided for them, are included in Appendix IV. Financial assistance is currently being made available for the projects outlined below.
In addition to expenditure on these projects there will be grants to the States for railway projects included under the program for assistance for urban public transport (see below).
(a) South Australia The Railway Standardization (South Australia) Agreement Act 1949 provides for the carrying out of various rail gauge standardization works in South Australia, the Australian Government being required to provide initially all the finance and the State to repay 30 per cent of this by instalments over a period of fifty years, plus
91
interest on outstanding balances. Conversion of the 3ft 6in gauge lines of the South-eastern Division of the State to 5ft 3in gauge, pending conversion of the main South Australian and Victorian systems to standard 4ft 8in gauge, was completed in 1959 and work is completed on the conversion to standard gauge of the Port Pirie-Cockburn railway. Payments by the Australian Government for these purposes up to 30 June 1974 totalled $48 million.
In May 1974 the Prime Minister and the Premier of South Australia signed the Adelaide-Crystal Brook Railway Agreement which, once ratified by both Parliaments, will provide financial assistance to the State for the construction of a standard gauge railway to link Adelaide with the east-west railway at Crystal Brook. The Australian Government will be providing finance on the same terms as outlined above for the 1949 Agreement with South Australia. Provision has been made for a payment of $900,000 in 1974-75, subject to the passage of enabling legislation.
The Railway Agreement (New South Wales and South Australia) Act 1968 provided for the construction on behalf of South Australia of a standard gauge railway from Cockburn to Broken Hill together with various railway works associated with the standard gauge connection. This project had been completed to the stage where trans-continental trains were able to begin running during the early part of 1970. The Australian Government is providing finance on the same terms as outlined above for the 1949 Agreement with South Australia. Payments up to 30 June 1974 totalled $14.6 million and provision has been made for a further payment of $25,000 in 1974-75.
(b) Western Australia Under the Railway Agreement (Western Australia) Act 1961 financial assistance is being provided to Western Australia for the construction of a standard gauge railway from Kwinana to Koolyanobbing, with an extension to Kalgoorlie, and for the purchase of rolling stock for the railway. While the project is associated with the development of an iron and steel industry at Kwinana using iron ore from Koolyanobbing, the extension of the railway eastward to Kalgoorlie also provides a standard gauge link between Perth and the Trans-Australian Railway.
For financing purposes the cost of the project is divided equally into two parts, one of which is attributed to development and the other to the creation of a uniform gauge railway between Western Australia and the Eastern States. The Australian Government will provide initially all of the finance for that part of the cost associated with railway standardization and the State will repay 30 per cent by instalments over fifty years, plus interest on outstanding balances.
92
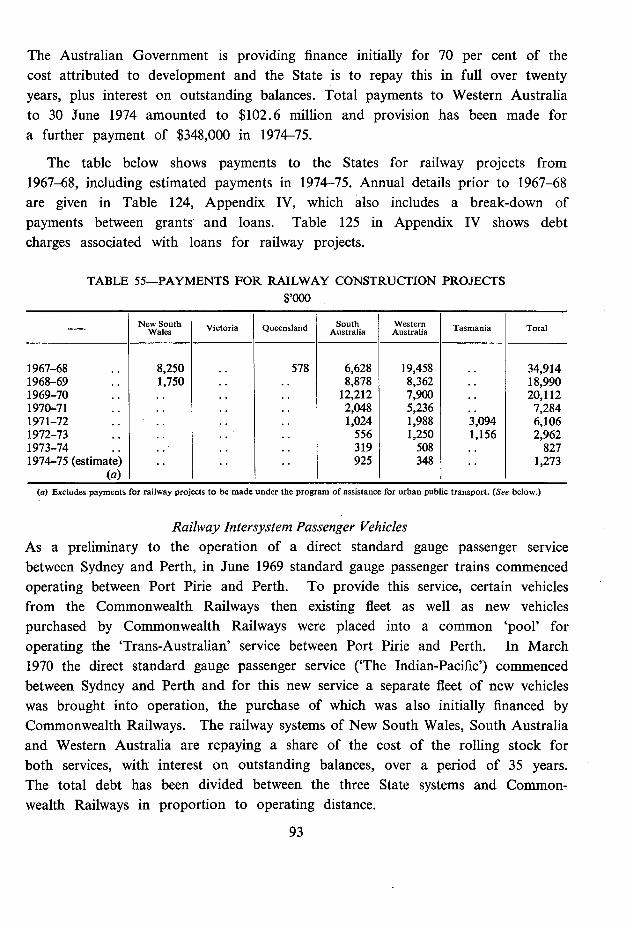
The Australian Government is providing finance initially for 70 per cent of the cost attributed to development and the State is to repay this in full over twenty years, plus interest on outstanding balances. Total payments to Western Australia to 30 June 1974 amounted to $102.6 million and provision has been made for a further payment of $348,000 in 1974-75.
The table below shows payments to the States for railway projects from 1967-68, including estimated payments in 1974-75. Annual details prior to 1967-68 are given in Table 124, Appendix IV, which also includes a break-down of payments between grants and loans. Table 125 in Appendix IV shows debt charges associated with loans for railway projects.
TABLE 55—PAYMENTS FOR RAILWAY CONSTRUCTION PROJECTS $,000
- New South Wales Victor Victoria an Queensland South
Australia Western Australia Tasmania Total
1967-68 .. 8,250 .. 578 6,628 19,458 .. 34,914 1968-69 .. 1,750 .. .. 8,878 8,362 .. 18,990 1969-70 .. .. .. .. 12,212 7,900 .. 20,112 1970-71 .. .. .. .. 2,048 5,236 .. 7,284 1971-72 .. .. .. .. 1,024 1,988 3,094 6,106 1972-73 .. .. .. .. 556 1,250 1,156 2,962 1973-74 .. .. .. .. 319 508 .. 827 1974-75 (estimate) .. .. .. 925 348 .. 1,273
(a) (a) Excludes payments for railway projects to be made under the program of assistance for urban public transport. (See below.)
Railway Intersystem Passenger Vehicles As a preliminary to the operation of a direct standard gauge passenger service between Sydney and Perth, in June 1969 standard gauge passenger trains commenced operating between Port Pine and Perth. To provide this service, certain vehicles from the Commonwealth Railways then existing fleet as well as new vehicles purchased by Commonwealth Railways were placed into a common 'pool' for operating the 'Trans-Australian' service between Port Pine and Perth. In March 1970 the direct standard gauge passenger service ('The Indian-Pacific') commenced between Sydney and Perth and for this new service a separate fleet of new vehicles was brought into operation, the purchase of which was also initially financed by Commonwealth Railways. The railway systems of New South Wales, South Australia and Western Australia are repaying a share of the cost of the rolling stock for both services, with interest on outstanding balances, over a period of 35 years. The total debt has been divided between the three State systems and Common-wealth Railways in proportion to operating distance.
93
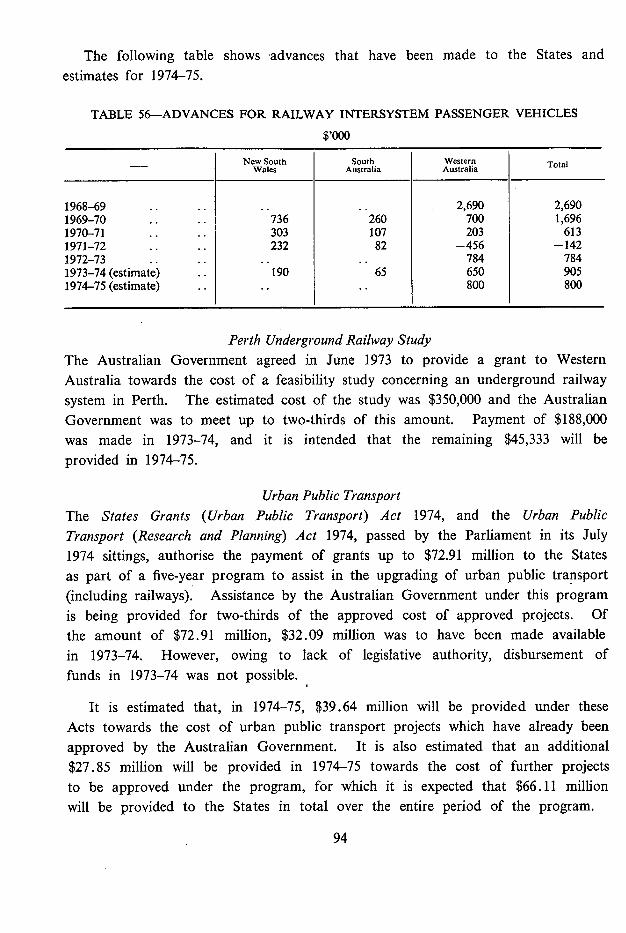
The following table shows advances that have been made to the States and estimates for 1974-75.
TABLE 56—ADVANCES FOR RAILWAY INTERSYSTEM PASSENGER VEHICLES
-- New South Wales
South Australia
Western Australia Total
1968-69 .. .. 2,690 2,690 1969-70 .. 736 260 700 1,696 1970-71 .. .. 303 107 203 613 1971-72 .. .. 232 82 —456 —142 1972-73 .. .. .. .. 784 784 1973-74 (estimate) 190 65 650 905 1974-75 (estimate) .. .. .. 800 800
Perth Underground Railway Study The Australian Government agreed in June 1973 to provide a grant to Western Australia towards the cost of a feasibility study concerning an underground railway system in Perth. The estimated cost of the study was $350,000 and the Australian Government was to meet up to two-thirds of this amount. Payment of $188,000 was made in 1973-74, and it is intended that the remaining $45,333 will be provided in 1974-75.
Urban Public Transport The States Grants (Urban Public Transport) Act 1974, and the Urban Public Transport (Research and Planning) Act 1974, passed by the Parliament in its July 1974 sittings, authorise the payment of grants up to $72.91 million to the States as part of a five-year program to assist in the upgrading of urban public transport (including railways). Assistance by the Australian Government under this program is being provided for two-thirds of the approved cost of approved projects. Of the amount of $72.91 million, $32.09 million was to have been made available in 1973-74. However, owing to lack of legislative authority, disbursement of funds in 1973-74 was not possible.
It is estimated that, in 1974-75, $39.64 million will be provided under these Acts towards the cost of urban public transport projects which have already been approved by the Australian Government. It is also estimated that an additional $27.85 million will be provided in 1974-75 towards the cost of further projects to be approved under the program, for which it is expected that $66.11 million will be provided to the States in total over the entire period of the program.
94
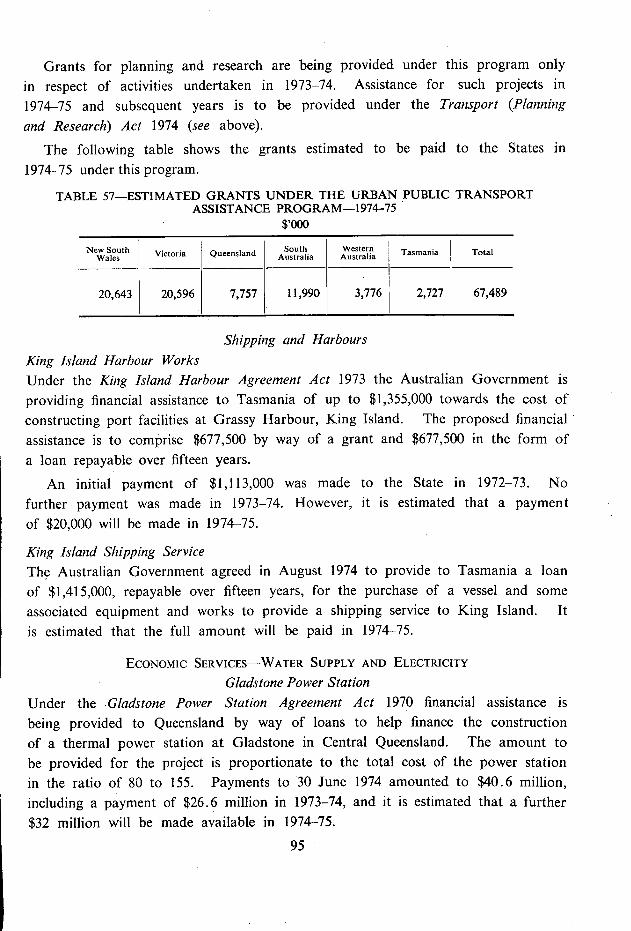
Grants for planning and research are being provided under this program only in respect of activities undertaken in 1973-74. Assistance for such projects in 1974-75 and subsequent years is to be provided under the Transport (Planning and Research) Act 1974 (see above).
The following table shows the grants estimated to be paid to the States in 1974-75 under this program.
TABLE 57-ESTIMATED GRANTS UNDER THE URBAN PUBLIC TRANSPORT ASSISTANCE PROGRAM-1974--75
$,000
New South Wales Victoria Queensland South
Australia Total
Western Australia Tasmania
20,643 20,596 7,757 11,990 3,776 2,727 67,489
Shipping and Harbours King island Harbour Works Under the King island Harbour Agreement Act 1973 the Australian Government is providing financial assistance to Tasmania of up to $1,355,000 towards the cost of constructing port facilities at Grassy Harbour, King Island. The proposed financial assistance is to comprise $677,500 by way of a grant and $677,500 in the form of a loan repayable over fifteen years.
An initial payment of $1,113,000 was made to the State in 1972-73. No further • payment was made in 1973-74. However, it is estimated that a payment of $20,000 will be made in 1974-75.
King Island Shipping Service The Australian Government agreed in August 1974 to provide to Tasmania a loan of $1,415,000, repayable over fifteen years, for the purchase of a vessel and some associated equipment and works to provide a shipping service to King Island. It is estimated that the full amount will be paid in 1974-75.
ECONOMIC SERVICES-WATER SUPPLY AND ELECTRICITY Gladstone Power Station
Under the Gladstone Power Station Agreement Act 1970 financial assistance is being provided to Queensland by way of loans to help finance the construction of a thermal power station at Gladstone in Central Queensland. The amount to be provided for the project is proportionate to the total cost of the power station in the ratio of 80 to 155. Payments to 30 June 1974 amounted to $40.6 million, including a payment of $26.6 million in 1973-74, and it is estimated that a further $32 million will be made available in 1974-75.
95

Julius Darn The Australian Government has agreed to provide loans of up to $2 million to Queensland towards the cost of constructing the Julius Dam to provide additional water supplies in the Mount Isa region. The loans will be repayable over a period of ten years commencing on 15 December 1974. Owing to the lack of legislative authority funds were not disbursed in 1973-74 and it is now estimated that the full amount of $2 million will be paid to the State in 1974-75.
Ross River Darn The Australian Government has agreed to provide grants of up to $2.56 million to Queensland towards the cost of construction of Stage 2 of the Ross River Dam which will supply water to Townsville. Stage 1 of the Ross River Dam was completed recently at a total cost of $11.4 million with the assistance of an earlier Australian Government grant of $1 .5 million. It is estimated that $600,000 will be paid to the State in 1974-75.
Urban Water Supply—South Australia An amount of $4.4 million is proposed to be made available to South Australia in 1974-75 to assist with the construction of a new water treatment plant in Metropolitan Adelaide.
ECONOMIC SERVICES-INDUSTRY ASSISTANCE Softwood Forestry
Under the Softwood Forestry Agreements Act 1967 financial assistance was provided to all States for a program of increased planting of softwood forests over the five-year period ended on 30 June 1971. The assistance to each State was by way of interest-bearing loans repayable over twenty-five years, with repayments and the payment of interest to commence approximately ten years after the date of each advance. Total payments to the States under this Act amounted to $17.7 million, including adjusting payments of $389,000 and $137,000 in 1971-72 and 1972-73 respectively.
Under the Softwood Forestry Agreements Act 1972 financial assistance is being provided for a further five-year planting program ending on 30 June 1976. As under the previous Agreement, the assistance to be provided is to be by way of interest bearing loans repayable over twenty-five years, with repayments and the payment of interest to commence approximately ten years after the date of each advance.
96
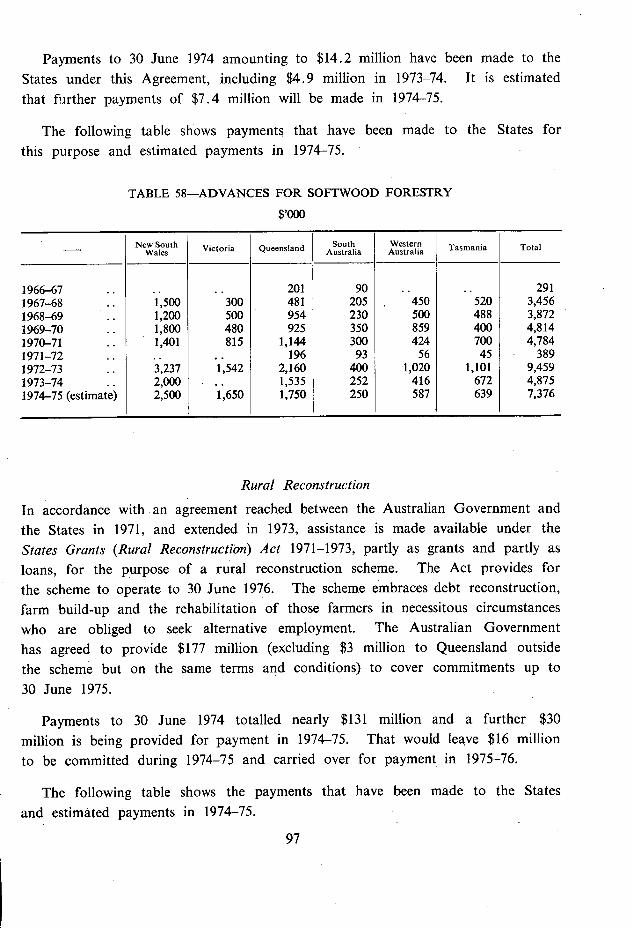
Payments to 30 June 1974 amounting to $14.2 million have been made to the States under this Agreement, including $4.9 million in 1973-74. It is estimated that further payments of $7.4 million will be made in 1974-75.
The following table shows payments that have been made to the States for this purpose and estimated payments in 1974-75.
TABLE 58—ADVANCES FOR SOFTWOOD FORESTRY
-- New South
Wales Victoria Queensland South Australia
Western Australia Tasmania Total
1966-67 .. .. 201 90 .. .. 291 1967-68 1,500 300 481 205 450 520 3,456 1968-69 .. 1,200 500 954 230 500 488 3,872 1969-70 .. 1,800 480 925 350 859 400 4,814 1970-71 .. 1,401 815 1,144 300 424 700 4,784 1971-72 .. .. .. 196 93 56 45 389 1972-73 .. 3,237 1,542 2,160 400 1,020 1,101 9,459 1973-74 .. 2,000 .. 1,535 252 416 672 4,875 1974-75 (estimate) 2,500 1,650 1,750 250 587 639 7,376
Rural Reconstruction In accordance with an agreement reached between the Australian Government and the States in 1971, and extended in 1973, assistance is made available under the States Grants (Rural Reconstruction) Act 1971-1973, partly as grants and partly as loans, for the purpose of a rural reconstruction scheme. The Act provides for the scheme to operate to 30 June 1976. The scheme embraces debt reconstruction, farm build-up and the rehabilitation of those farmers in necessitous circumstances who are obliged to seek alternative employment. The Australian Government has agreed to provide $177 million (excluding $3 million to Queensland outside the scheme but on the same terms and conditions) to cover commitments up to 30 June 1975.
Payments to 30 June 1974 totalled nearly $131 million and a further $30 million is being provided for payment in 1974-75. That would leave $16 million to be committed during 1974-75 and carried over for payment in 1975-76.
The following table shows the payments that have been made to the States and estimated payments in 1974-75.
97
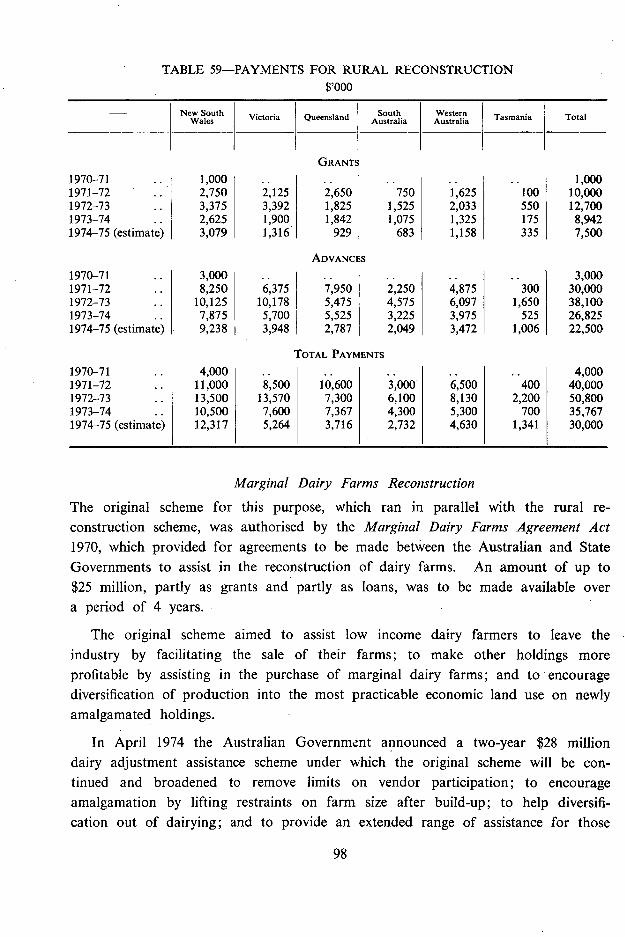
TABLE 59-PAYMENTS FOR RURAL RECONSTRUCTION $,000
New South Wales Victoria Queensland South
Australia Western Australia Tasmania Total
GRANTS
1970-71 .. 1,000 .. 1,000 1971-72 .. 2,750 2,125 2,650 750 1,625 100 10,000 1972-73 .. 3,375 3,392 1,825 1,525 2,033 550 12,700 1973-74 2,625 1,900 1,842 1,075 1,325 175 8,942 1974-75 (estimate) 3,079 1,316 929 683 1,158 335 7,500
ADVANCES
1970-71 3,000 .. .. 3,000 1971-72 .. 8,250 6,375 7,950 2,250 4,875 300 30,000 1972-73 10,125 10,178 5,475 4,575 6,097 1,650 38,100 1973-74 7,875 5,700 5,525 3,225 3,975 525 26,825 1974-75 (estimate) 9,238 3,948 1 2,787 2,049 3,472 1,006 22,500
TOTAL PAYMENTS
1970-71 4,000 .. 4,000 1971-72 .. 11,000 8,500 10,600 3,000 6,500 400 40,000 1972-73 13,500 13,570 7,300 6,100 8,130 2,200 50,800 1973-74 10,500 7,600 7,367 4,300 5,300 700 35,767 1974-75 (estimate) 12,317 5,264 3,716 2,732 4,630 1,341 30,000
Marginal Dairy Farms Reconstruction
The original scheme for this purpose, which ran in parallel with the rural re-construction scheme, was authorised by the Marginal Dairy Farms Agreement Act 1970, which provided for agreements to be made between the Australian and State Governments to assist in the reconstruction of dairy farms. An amount of up to $25 million, partly as grants and partly as loans, was to be made available over a period of 4 years.
The original scheme aimed to assist low income dairy farmers to leave the industry by facilitating the sale of their farms; to make other holdings more profitable by assisting in the purchase of marginal dairy farms; and to encourage diversification of production into the most practicable economic land use on newly amalgamated holdings.
In April 1974 the Australian Government announced a two-year $28 million dairy adjustment assistance scheme under which the original scheme will be con-tinued and broadened to remove limits on vendor participation; to encourage amalgamation by lifting restraints on farm size after build-up; to help diversifi-cation out of dairying; and to provide an extended range of assistance for those
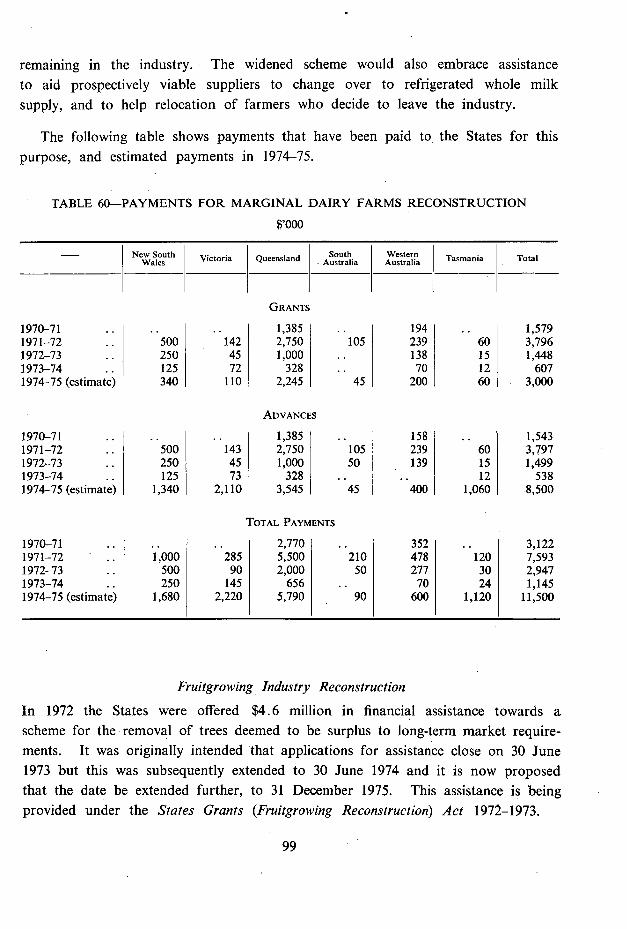
remaining in the industry. The widened scheme would also embrace assistance to aid prospectively viable suppliers to change over to refrigerated whole milk supply, and to help relocation of farmers who decide to leave the industry.
The following table shows payments that have been paid to. the States for this purpose, and estimated payments in 1974-75.
TABLE 60-PAYMENTS FOR MARGINAL DAIRY FARMS RECONSTRUCTION
$,000
- New South Wales Victoria Queensland South
Australia Western Australia Tasmania Total
GRANTS
1970-71 . . .. .. 1,385 . 194 .. 1,579 1971-72 .. 500 142 2,750 105 239 60 3,796 1972-73 .. 250 45 1,000 .. 138 15 1,448 1973-74 125 72 328 .. 70 12 607 1974-75 (estimate) 340 110 2,245 45 200 60 3,000
ADVANCES
1970-71 . . . 1,385 .. 158 . . 1,543 1971-72 .. 500 143 2,750 105 239 60 3,797 1972--73 .. . 250 45 1,000 50 139 15 1,499 1973-74 .. 125 73 328 .. .. 12 538 1974-75 (estimate) 1,340 2,110 3,545 45 400 1,060 8,500
TOTAL PAYMENTS
1970-71 .. I .. .. 2,770 .. 352 .. 3,122 1971-72 .. 1,000 285 5,500 210 478 120 7,593 1972-73 .. 500 90 2,000 50 277 30 2,947 1973-74 .. 250 145 656 .. 70 24 1,145 1974-75 (estimate) 1,680 2,220 5,790 90 600 1,120 11,500
Fruitgrowing Industry Reconstruction
In 1972 the States were offered $4.6 million in financial assistance towards a scheme for the removal of trees deemed to be surplus to long-term market require-ments. It was originally intended that applications for assistance close on 30 June 1973 but this was subsequently extended to 30 June 1974 and it is now proposed that the date be extended further, to 31 December 1975. This assistance is being provided under the States Grants (Fruitgrowing Reconstruction) Act 1972-1973.
99
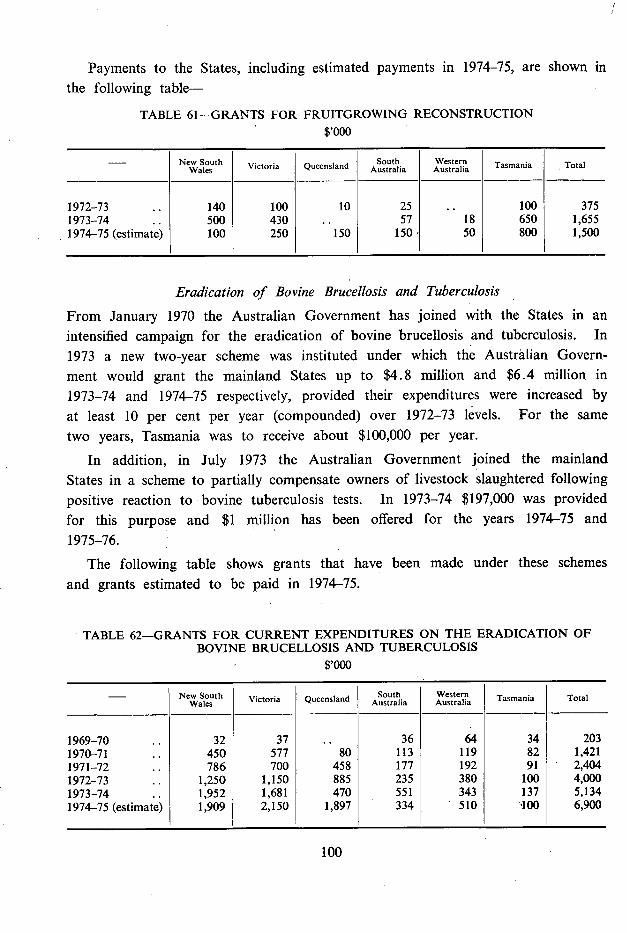
Payments to the States, including estimated payments in 1974-75, are shown in the following table—
TABLE 61—GRANTS FOR FRUITGROWING RECONSTRUCTION $,000
New South Wales Victoria Queensland South
Australia Western Australia Tasmania Total
1972-73 .. 140 100 10 25 .. 100 375 1973-74 .. 500 430 .. 57 18 650 1,655 1974-75 (estimate) 100 250 150 150 50 800 1,500
Eradication of Bovine Brucellosis and Tuberculosis From January 1970 the Australian Government has joined with the States in an intensified campaign for the eradication of bovine brucellosis and tuberculosis. In 1973 a new two-year scheme was instituted under which the Australian Govern-ment would grant the mainland States up to $4.8 million and $6.4 million in 1973-74 and 1974-75 respectively, provided their expenditures were increased by at least 10 per cent per year (compounded) over 1972-73 levels. For the same two years, Tasmania was to receive about $100,000 per year.
In addition, in July 1973 the Australian Government joined the mainland States in a scheme to partially compensate owners of livestock slaughtered following positive reaction to bovine tuberculosis tests. In 1973-74 $197,000 was provided for this purpose and $1 million has been offered for the years 1974-75 and 1975-76.
The following table shows grants that have been made under these schemes and grants estimated to be paid in 1974-75.
TABLE 62—GRANTS FOR CURRENT EXPENDITURES ON THE ERADICATION OF BOVINE BRUCELLOSIS AND TUBERCULOSIS
$,000
New South Wales victoria Queensland South
Australia Western Australia Tasmania Total
1969-70 .. 32 37 .. 36 64 34 203 1970-71 .. 450 577 80 113 119 82 1,421 1971-72 .. 786 700 458 177 192 91 2,404 1972-73 .. 1,250 1,150 885 235 380 100 4,000 1973-74 .. 1,952 1,681 470 551 343 137 5,134 1974-75 (estimate) 1,909 2,150 1,897 334 510 100 6,900
100
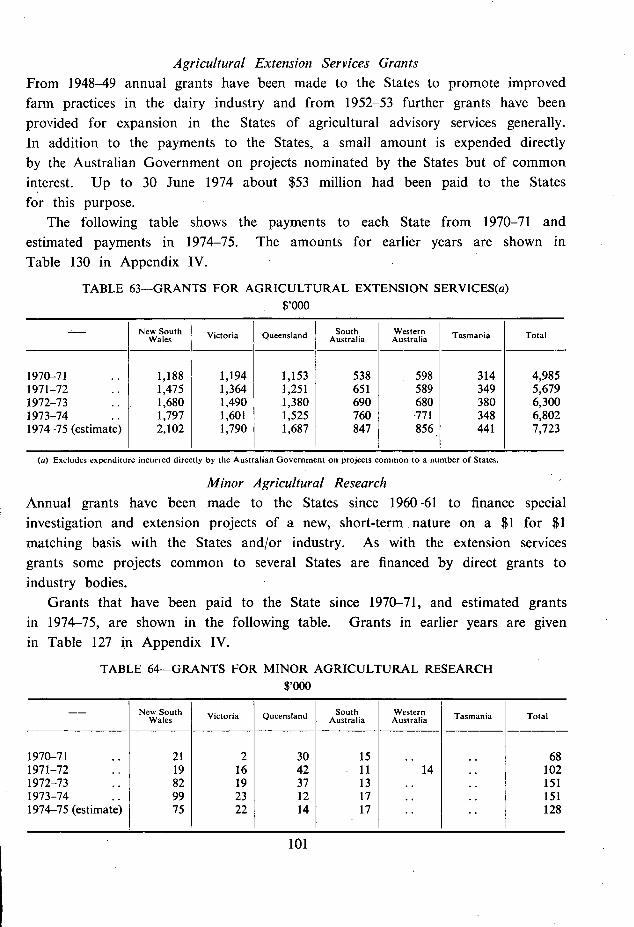
Agricultural Extension Services Grants From 1948-49 annual grants have been made to the States to promote improved farm practices in the dairy industry and from 1952-53 further grants have been provided for expansion in the States of agricultural advisory services generally. In addition to the payments to the States, a small amount is expended directly by the Australian Government on projects nominated by the States but of common interest. Up to 30 June 1974 about $53 million had been paid to the States for this purpose.
The following table shows the payments to each State from 1970-71 and estimated payments in 1974-75. The amounts for earlier years are shown in Table 130 in Appendix IV.
TABLE 63—GRANTS FOR AGRICULTURAL EXTENSION SERVICES(a) $,000
- New South Wales Victoria Queensland South
Australia Western Australia Tasmania Total
1970-71 . . 1,188 1,194 1,153 538 598 314 4,985 1971-72 .. 1,475 1,364 1,251 651 589 349 5,679 1972-73 .. 1,680 1,490 1,380 690 680 380 6,300 1973-74 .. 1,797 1,601 1,525 760 771 348 6,802 1974-75 (estimate) 2,102 1,790 1,687 847 856 441 7,723
(a) Excludes expenditure incurred directly by the Australian Government on projects common to a number of States.
Minor Agricultural Research Annual grants have been made to the States since 1960-61 to finance special investigation and extension projects of a new, short-term nature on a $1 for $1 matching basis with the States and/or industry. As with the extension services grants some projects common to several States are financed by direct grants to industry bodies.
Grants that have been paid to the State since 1970-71, and estimated grants in 1974-75, are shown in the following table. Grants in earlier years are given in Table 127 in Appendix IV.
TABLE 64—GRANTS FOR MINOR AGRICULTURAL RESEARCH $'oOo
-- New South Wales Victoria Queensland South
Australia Western Australia Tasmania Total
1970-71 .. 21 2 30 15 .. .. 68 1971-72 .. 19 16 42 11 14 .. 102 1972-73 .. 82 19 37 13 .. .. 151 1973-74 .. 99 23 12 17 .. .. 151 1974-75 (estimate) 75 22 14 17 .. .. 128
101
Apples—Export Guarantee 1974 Season In early 1974 the Australian Government agreed to join with the Governments of Queensland, Western Australia and Tasmania, on a dollar for dollar matching basis, in underwriting the financial returns on apples exported 'at risk' during 1974 to the United Kingdom and Europe, the maximum Australian Government contribution being $2,642,336. Grants estimated to be payable in 1974-75 are: Queensland $35,000, Western Australia $607,000 and Tasmania $2 million.
Australian Plague Locust Control The Australian Government has agreed to meet half the expenditure incurred by the States from their revenue budgets in 1973-74 on Australian plague locust control, up to a maximum of $500,000. Payments in 1974-75, totalling $60,000, are expected to be: Victoria, $46,000; Queensland, $12,000; and South Australia, $2,000.
Trawl and Danish Seine Fishery Assistance The Australian Government has agreed to provide assistance to the New South Wales Government, on a dollar for dollar sharing basis, for the assessment of the trawl and Danish seine fisheries in the State with a view to formulating practical and constructive management policies. Assistance up to a maximum of $105,000 will be provided over the three years 1974-75 to 1976-77; an initial contribution of $35,000 is expected to be paid in 1974-75.
Supplementary Assistance to Apple and Pear and Canning Fruit Industries In 1973-74, in addition to emergency assistance made available to these industries to assist them in adjusting to the new conditions following revaluation of the Australian dollar, special assistance by way of grants amounting to $327,000 was made available to those fruit growers who were eligible and had applied for assistance under the Fruitgrowing Reconstruction Scheme. This assistance was paid through the States; for the amounts paid to individual States, see Table 87 in Appendix I.
Adjustment Assistance to Fruit Canneries In 1973-74 the Australian Government provided grants, totalling $1 .5 million, to fruit canneries to help offset the effects of currency re-alignments during 1971 and mid 1972. It was agreed that $838,000 of these grants would be applied to reducing loans provided earlier by the Australian Government to certain fruit canneries which are referred to in detail in Appendix IV, and that $662,000 be paid to other fruit canneries through the State Governments.
Details of payments and debt charges are given in the Appendices.
102

Brigalow Lands Development Scheme The Brigalow Lands Agreement Act 1962-1967 approves an agreement with Queensland for the provision of financial assistance to that State for the develop- ment of 11,176,000 acres described as Areas 1, 2 and 3 in the Fitzroy River Basin. The principal purpose of the assistance is to increase the production of beef cattle.
The Act provides for assistance, subject to an overall limit of $23 million, to finance expenditure by the State on specified works during the thirteen years ending 30 June 1975. The assistance is in the form of interest-bearing loans repayable over twenty years. There is provision for the 'capitalisation' of interest payments—that is for interest accruing in a year to be added to the amount of principal outstanding rather than paid to the Australian Government. Amounts of such 'capitalised' interest are included in the relevant tables in this document as interest payments notionally made to the Australian Government, with equivalent amounts advanced to the State. Payments, on this basis, have totalled $15,445,000 to 30 June 1974 (of which $1,495,000 represents capitalized interest) and it is estimated that a total of $4.4 million (of which $216,000 represents capitalised interest) will be paid in 1974-75. Further details of payments and debt charges in respect of this program are given in Table 128 in Appendix IV.
Investigation and Measurement of Water Resources In 1964-65 the Australian Government agreed to provide grants to the States in order to accelerate their programs of surface water measurement and investigation of underground water resources. The surface water program is aimed at com-pleting a basic network of stream gauges throughout Australia; the underground investigations involve a general speeding up of the work of locating and measuring underground water resources.
Under the States Grants (Water Resources) Acts of 1964, 1967 and 1970 grants, totalling $11.4 million, were provided to the States for these purposes. The States Grants (Water Resources Measurement) Act 1973 provides for grants of up to $6,867,000 for the surface water measurement program and up to $8,242,000 for the investigation of underground water resources for the three-year period commencing 1 July 1973. In addition, the legislation is to be amended to provide $808,000 as grants for a two year water quality assessment program. The Budget provides $332,000 for this program in 1974-75.
The following table shows payments made to the States since 1970-71 and estimates for 1974-75; figures for earlier years are given in Table 131 in Appendix IV.
103
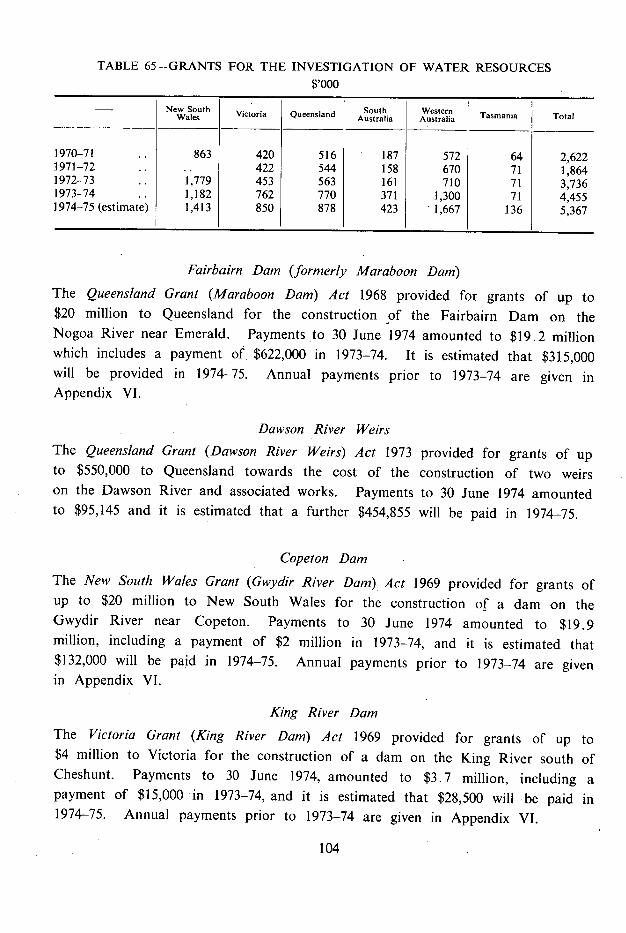
TABLE 65—GRANTS FOR THE INVESTIGATION OF WATER RESOURCES $,000
New South Wales Victoria Queensland South
Australia Western Australia Tasmania Total
1970-71 .. 863 420 516 187 572 64 2,622 1971-72 .. .. 422 544 158 670 71 1,864 1972-73 .. 1,779 453 563 161 710 71 3,736 1973-74 .. 1,182 762 770 371 1,300 71 4,455 1974-75 (estimate) 1,413 850 878 423 1,667 136 5,367
Fairbairn Dam (formerly Maraboon Dam) The Queensland Grant (Maraboon Dam) Act 1968 provided for grants of up to $20 million to Queensland for the construction of the Fairbairn Dam on the Nogoa River near Emerald. Payments to 30 June 1974 amounted to $19.2 million which includes a payment of $622,000 in 1973-74. It is estimated that $315,000 will be provided in 1974-75. Annual payments prior to 1973-74 are given in Appendix VI.
Dawson River Weirs The Queensland Grant (Dawson River Weirs) Act 1973 provided for grants of up to $550,000 to Queensland towards the cost of the construction of two weirs on the Dawson River and associated works. Payments to 30 June 1974 amounted to $95,145 and it is estimated that a further $454,855 will be paid in 1974-75.
Cop eton Dam The New South Wales Grant (Gwydir River Dam) Act 1969 provided for grants of up to $20 million to New South Wales for the construction of a dam on the Gwydir River near Copeton. Payments to 30 June 1974 amounted to $19.9 million, including a payment of $2 million in 1973-74, and it is estimated that $132,000 will be paid in 1974-75. Annual payments prior to 1973-74 are given in Appendix VI.
King River Dam The Victoria Grant (King River Dam) Act 1969 provided for grants of up to $4 million to Victoria for the construction of a dam on the King River south of Cheshunt. Payments to 30 June 1974, amounted to $3.7 million, including a payment of $15,000 in 1973-74, and it is estimated that $28,500 will be paid in 1974-75. Annual payments prior to 1973-74 are given in Appendix VI.
104
River Murray Salinity Reduction The Victoria Grant (River Murray Salinity) Act 1968 provided for grants of up to $3.6 million to Victoria for two salinity reduction projects on the River Murray. Payments by the Australian Government to 30 June 1974 amounted to $1.7 million which includes a payment of $7,000 in 1973-74. It is estimated that $8,000 will be paid in 1974-75. Annual payments prior to 1973-74 are given in Appendix VI.
Bundaberg Irrigation Works The Queensland Grant (Bundaberg Irrigation Works) Act 1970 provided for grants of up to $12.8 million to Queensland for the construction of the Monduran Dam on the Kolan River and associated works to regulate the flows of both the Kolan and Burnett Rivers. Payments to 30 June 1974 amounted to $12.7 million, including payments totalling $3.1 million in 1973-74.
The Australian Government has now decided to extend its assistance towards these works by a further grant of up to $4.4 million.
It is estimated that $2 million will be provided in 1974-75, including the balance of $111,062 available under the present Act.
Annual payments prior to 1973-74 are given in Appendix VI.
Millewa Pipeline Under the Victorian Grant (Millewa Pipelines) Act 1972 grants of up to $2 million are being made to Victoria towards the cost of the construction of pipelines and certain associated works to carry water from the River Murray to rural holdings in the Millewa district of the State.
Payments to 30 June 1974 amounted to $1.4 million, including payments of $800,000 in 1973-74, and it is estimated that a further $600,000 will be paid in 1974-75. Annual payments prior to 1973-74 are given in Appendix VI.
Lock to Kimba Pipeline Under the South Australia Grant (Lock to Kimba Pipeline) Act 1973 grants of up to $2.1 million are being provided to South Australia towards the cost of con-structing a pipeline on the Eyre Peninsula of South Australia. The purpose of the scheme is to provide water for stock and domestic use in the area between the towns of Lock and Kimba.
Payments to 30 June 1974 amounted to $960,000, including payments of $540,000 in 1973-74, and it is estimated that a further $470,000 will be paid in 1974-75. Annual payments prior to 1973-74 are given in Appendix VI.
105
Flood Mitigation Under the New South Wales Grant (Flood Mitigation) Act 1971-1973 grants of up to $9 million are being provided to New South Wales towards the cost of further flood mitigation works on various coastal rivers in the State. Assistance of $8 million was previously provided under the New South Wales Grant (Flood Miti-gation) Act 1964-1968 (see Appendix IV).
The new grant is to assist in financing the cost of a further seven-year program of additional works on the rivers covered under the previous legislation and of flood mitigation works on the Bellinger, Manning, Hawkesbury, Moruya and Hastings Rivers and the Cudgen, Cudgera and Mooball Creeks. Payments to 30 June 1974 amounted to $4.7 million, including a payment of $1.5 million in 1973-74 and it is estimated that $2.5 million will be paid in 1974-75. Annual payments prior to 1973-74 are given in Appendix VI.
A grant of $120,000 will be made available to Queensland also in 1974-75 for restoration of damaged levees along the Proserpine River.
Eton (Mackay) Irrigation Scheme Under the Queensland Grant (Kinchant Dam) Act 1973 grants of up to
$5 million are being provided to Queensland towards the cost of construction of the Kinchant Dam—the main storage for the Eton (Mackay) Irrigation Scheme.
An initial payment of $387,202 was made to the State in 1973-74 and it is estimated that a further payment of $2.5 million will be made in 1974-75.
Clare Weir A grant of $3 million will be made available to Queensland towards the cost of construction of the Clare Weir on the Burdekin River. It is estimated that $300,000 will be provided in 1974-75.
Ord River Irrigation Project Details are given in Appendix IV of the' earlier legislation under which grants totalling $12.2 million were made to Western Australia for Stage I of the Ord River Irrigation Project.
The Western Australia Agreement (Ord River Irrigation) Act 1968 provides for financial assistance of up to $48.2 million to Western Australia for Stage II of the Ord River Irrigation Project. The financial assistance is on the basis of a grant for the construction of the dam, which is expected to cost in the vicinity of $22 million, and interest-bearing loans for the irrigation works. Each loan is repayable over a period of fifteen years commencing approximately nine and a half years after the end of the financial year during which payment was made.
106
Financial assistance made available for Stage II to 30 June 1974 amounted to $23.8 million which includes payments totalling $1.4 million in 1973-74. The payments up to date comprise $21.7 million in the form of grants for the construction of the dam and $2.1 million in the form of loans towards the cost of construction of the irrigation works. It is estimated that $1.1 million will be paid in 1974-75, of which all but a small amount will be part of the loan component of the financial assistance. Annual figures of payments and debt charges, including estimates for 1974-75, are given in tables in Appendices V and VI.
Glenlyon Dam An amount of $880,000 has been included in the Budget in respect of expenditure by New South Wales and Queensland on the Glenlyon Dam.
Dartmouth Dam Under the Dartmouth Reservoir Agreement Act 1970 the Australian Government is providing financial assistance to New South Wales, Victoria and South Australia by way of loans towards their shares of the cost of constructing the Dartmouth Reservoir. The reservoir is being constructed under the River Murray Waters Agreement, to which the three States and the Australian Government are parties, and that Agreement provided for the cost of construction to be shared equally by the four parties.
The Dartmouth Reservoir Agreement provides that the Australian Government will make payments to the three States of amounts equal to one half of the amounts that each State is required from time to time to provide to the River Murray Commission in respect of the cost of the construction of the Dartmouth Reservoir. The total amount of the financial assistance is limited to $7,837,500 to each State, representing one half of each State's one-quarter share of the original estimated cost of construction of $57 million plus 10 per cent of that amount for cost escalation.
Payments to the three States to 30 June 1974 amounted to $4.9 million, which includes payments amounting to $2.9 million in 1973-74. It is estimated that a further $6.0 million will be paid in 1974-75.
Soil Conservation Legislation to be introduced in the Budget Session will provide for an interim program of financial assistance to the States for soil conservation programs. The program will extend over a two year period with grants totalling $2.5 million being made available to the States, of which $0.5 million will be made available in 1974-75. The following table shows the approximate amounts expected to be paid to each State in 1974-75.
107
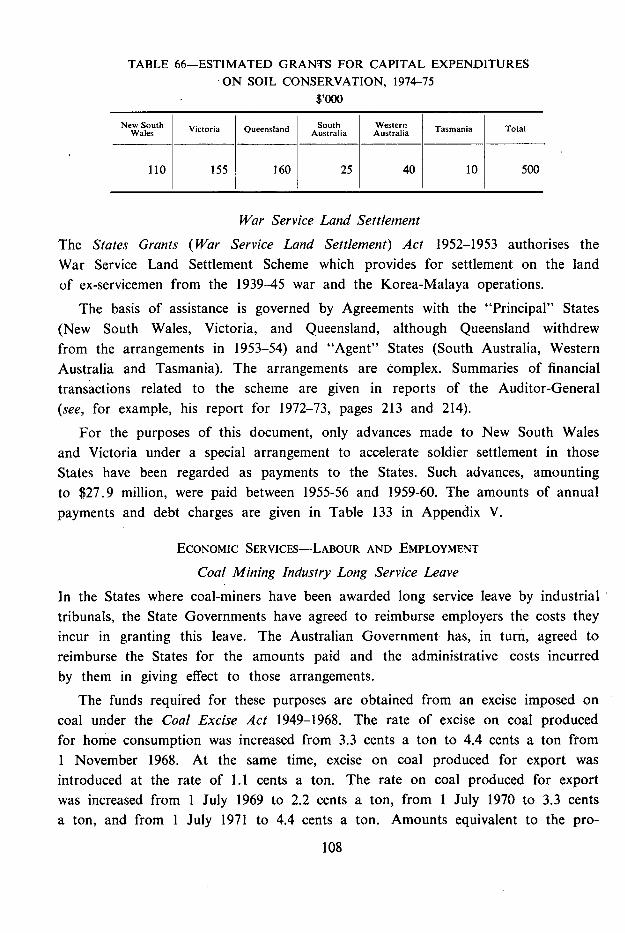
TABLE 66-ESTIMATED GRANTS FOR CAPITAL EXPENDITURES ON SOIL CONSERVATION, 1974-75
$,000
New South Victoria QueenslandSouth I I Western Tasmania Total Wales I I Australia Australia
110 155 160 25 40 10 500
War Service Land Settlement
The States Grants (War Service Land Settlement) Act 1952-1953 authorises the War Service Land Settlement Scheme which provides for settlement on the land of ex-servicemen from the 1939-45 war and the Korea-Malaya operations.
The basis of assistance is governed by Agreements with the "Principal" States (New South Wales, Victoria, and Queensland, although Queensland withdrew from the arrangements in 1953-54) and "Agent" States (South Australia, Western Australia and Tasmania). The arrangements are complex. Summaries of financial transactions related to the scheme are given in reports of the Auditor-General (see, for example, his report for 1972-73, pages 213 and 214).
For the purposes of this document, only advances made to New South Wales and Victoria under a special arrangement to accelerate soldier settlement in those States have been regarded as payments to the States. Such advances, amounting to $27.9 million, were paid between 1955-56 and 1959-60. The amounts of annual payments and debt charges are given in Table 133 in Appendix V.
ECONOMIC SERVICES-LABOUR AND EMPLOYMENT
Coal Mining Industry Long Service Leave In the States where coal-miners have been awarded long service leave by industrial tribunals, the State Governments have agreed to reimburse employers the costs they incur in granting this leave. The Australian Government has, in turn, agreed to reimburse the States for the amounts paid and the administrative costs incurred by them in giving effect to those arrangements.
The funds required for these purposes are obtained from an excise imposed on coal under the Coal Excise Act 1949-1968. The rate of excise on coal produced for home consumption was increased from 3.3 cents a ton to 4.4 cents a ton from 1 November 1968. At the same time, excise on coal produced for export was introduced at the rate of 1.1 cents a ton. The rate on coal produced for export was increased from 1 July 1969 to 2.2 cents a ton, from 1 July 1970 to 3.3 cents a ton, and from 1 July 1971 to 4.4 cents a ton. Amounts equivalent to the pro-
108

ceeds of the excise collections have been appropriated each year from 1949-50 to a Trust Fund under the States Grants (Coal Mining Industry Long Service Leave) Act 1949-1968. Payments have been made to the States from this Trust Fund.
The following table shows payments to the States since 1970-71 and estimated payments in 1974-75. Payments in earlier years are given in Table 134 in Appendix IV.
TABLE 67—GRANTS FOR COAL MINING INDUSTRY LONG SERVICE LEAVE $,000
New South Wales Victoria Queensland South
Australia Western Australia Tasmania Total
1970-71 .. 828 .. 136 .. 93 6 1,063 1971-72 .. 948 .. 185 .. 103 5 1,241 1972-73 .. 1,604 .. 316 .. 90 2 2,012 1973-74 .. 1,782 .. 410 .. 139 16 2,347 1974-75 (estimate) 2,374 .. 620 .. 140 18 .3,152
Apprenticeship' Training The Australian Government and the States agreed late in 1971-72 to collaborate in a scheme to improve supervision and advisory services in relation to the training of apprentices. Payments are being made over the three-year period 1972-73 to 1974-75 to meet the salaries of special officers employed by the States for this purpose. Provision of $400,000 has been made for the employment of 67 advisers during the financial year 1974-75.
The Australian Government has also decided to meet the wage costs of training apprentices, surplus to the States' requirements, within State Government establish-ments where training facilities are available. It is expected that up to 500 apprentices may receive training in 1974-75 and provision has been made for payments to the States of $408,000. A notional payment to each State is included in the following table;, no commitment to the provision of these amounts is implied.
TABLE 68—GRANTS FOR APPRENTICESHIP TRAINING $,000
- New South Wales Victoria Queensland South
Australia Western Australia Tasmania Total
1972-73 .. .. 72 25 19 11 2 129 1973-74 .. 108 92 52 44 44 11 351 1974-75 (estimate) 242 197 126 110 99 34 808
109
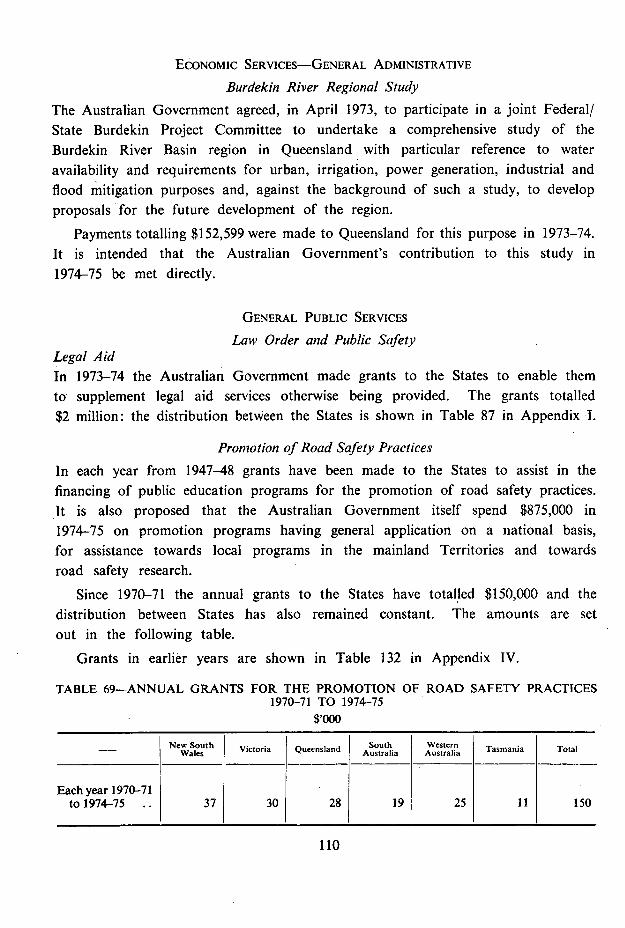
ECONOMIC SERVICES—GENERAL ADMINISTRATIVE Burdekin River Regional Study
The Australian Government agreed, in April 1973, to participate in a joint Federal! State Burdekin Project Committee to undertake a comprehensive study of the Burdekin River Basin region in Queensland with particular reference to water availability and requirements for urban, irrigation, power generation, industrial and flood mitigation purposes and, against the background of such a study, to develop proposals for the future development of the region.
Payments totalling $152,599 were made to Queensland for this purpose in 1973-74. It is intended that the Australian Government's contribution to this study in 1974-75 be met directly.
GENERAL PUBLIC SERVICES Law Order and Public Safety
Legal Aid In 1973-74 the Australian Government made grants to the States to enable them to supplement legal aid services otherwise being provided. The grants totalled $2 million: the distribution between the States is shown in Table 87 in Appendix I.
Promotion of Road Safety Practices In each year from 1947-48 grants have been made to the States to assist in the financing of public education programs for the promotion of road safety practices. It is also proposed that the Australian Government itself spend $875,000 in 1974-75 on promotion programs having general application on a national basis, for assistance towards local programs in the mainland Territories and towards road safety research.
Since 1970-71 the annual grants to the States have totalled $150,000 and the distribution between States has also remained constant. The amounts are set out in the following table.
Grants in earlier years are shown in Table 132 in Appendix IV.
TABLE 69—ANNUAL GRANTS FOR THE PROMOTION OF ROAD SAFETY PRACTICES 1970-71 TO 1974-75
$,000
-- New South Wales Victoria Queensland South
Australia Western Australia Tasmania Total
Each year l970-71 to 1974-75 .. 37 30 28 19 25 11 150
110
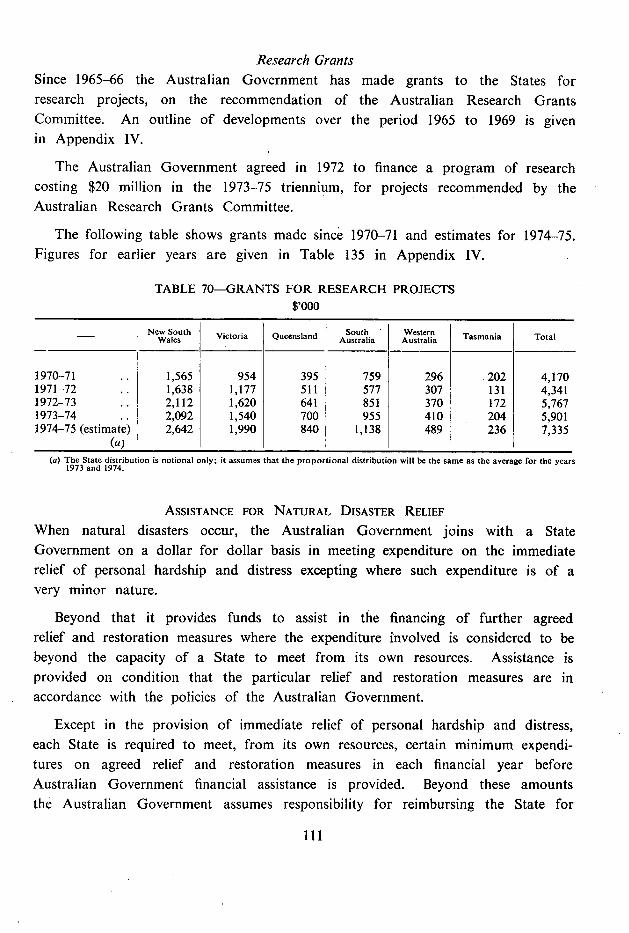
Research Grants Since 1965-66 the Australian Government has made grants to the States for research projects, on the recommendation of the Australian Research Grants Committee. An outline of developments over the period 1965 to 1969 is given in Appendix IV.
The Australian Government agreed in 1972 to finance a program of research costing $20 million in the 1973-75 triennium, for projects recommended by the Australian Research Grants Committee.
The following table shows grants made since 1970-71 and estimates for 1974-75. Figures for earlier years are given in Table 135 in Appendix IV.
TABLE 70—GRANTS FOR RESEARCH PROJECTS $,000
- New South Wales Victoria Queensland South
Australia Western
Australia Tasmania Total
1970-71 .. 1,565 954 395 759 296 202 4,170 1971-72 . 1,638 1,177 511 577 307 131 4,341 1972-73 ... 2,112 1,620 641 851 370 172 5,767 1973-74 .. 2,092 1,540 700 955 410 204 5,901 1974-75 (estimate) 2,642 1,990 840 1,138 489 236 7,335
(a) (a) The State distribution is notional only; it assumes that the proportional distribution will be the same as the average for the years
1973 and 1974.
ASSISTANCE FOR NATURAL DISASTER RELIEF When natural disasters occur, the Australian Government joins with a State Government on a dollar for dollar basis in meeting expenditure on the immediate relief of personal hardship and distress excepting where such expenditure is of a very minor nature.
Beyond that it provides funds to assist in the financing of further agreed relief and restoration measures where the expenditure involved is considered to be beyond the capacity of a State to meet from its own resources. Assistance is provided on condition that the particular relief and restoration measures are in accordance with the policies of the Australian Government.
Except in the provision of immediate relief of personal hardship and distress, each State is required to meet, from its own resources, certain minimum expendi-tures on agreed relief and restoration measures in each financial year before Australian Government financial assistance is provided. Beyond these amounts the Australian Government assumes responsibility for reimbursing the State for
Ill
expenditures incurred in the provision of agreed measures. The annual base expenditure fixed for each State is as follows:—
$ million New South Wales .. .. .. .. 5.0 Victoria . . .. . . .. .. 3.5 Queensland .. .. .. .. .. 2.0 South Australia .. .. .. .. 1 .5 Western Australia . . . . . . .. 1 .5 Tasmania .. .. .. .. .. 0.6
A State Government's share of dollar for dollar expenditure on immediate relief of personal hardship and distress is, however, eligible for inclusion in the annual base expenditure. Expenditure on agreed relief and restoration measures for any particular disaster may also be counted towards the base expenditure in a year where it equals or exceeds one-tenth of the State's base expenditure.
Measures which would be eligible within the terms of Australian Government assistance, as outlined above, usually include the following:—
Relief of personal hardship and distress, including provision of food, clothing, shelter and repairs to homes to make them habitable and secure; grants for the restoration of Government, local, and semi-government authority assets and facilities; semi-government and local authorities are expected to bear a proportion of the cost of restoring their assets, gen-erally one-quarter of the expenditure involved up to the first $100,000 for each authority; loan assistance on concessional terms to primary producers to enable them to get back into operation where finance is not available from other sources and where they can, with such assistance, continue to operate successfully; rail rebates for primary producers for certain purposes and free carriage for donations of food, clothing, etc.; grants to Councils to provide work for those unemployed in drought-affected areas; and certain other miscellaneous forms of expenditure associated with drought.
Australian Government assistance to a State takes the form of interest-free loans where the State Government makes loans, and grants where the State Government provides grants.
112
The Australian Government usually does not provide grant assistance for the repair or restoration of private assets damaged or destroyed as a result of a natural disaster. Major exceptions, have been where widespread damage has occurred; e.g. bushfires in Tasmania in 1967 and flooding in Queensland in the early part of 1974.
Table 137 in Appendix IV shows payments that have been made to each State since 1962-63 in respect of various types of disaster (droughts, floods and storms, bushfires, cyclones and earthquake). It will be seen that all States have received some assistance but, reflecting the differing incidence of disasters, the amounts vary considerably from one State to another and from one year to another.
Floods and Storms 1974 Following widespread and severe flooding in New South Wales and Queensland during the first three months of 1974, the Australian Government undertook to provide financial assistance to these States, in addition to its dollar for dollar contribution for relief of personal hardship and distress, in respect of expenditure for approved relief and restoration measures in excess of their annual base ex-penditures. In addition to the measures referred to earlier, the Australian Govern-ment agreed that loan assistance might be provided to business enterprises (ex-cluding public companies) whose assets were affected by flooding where finance was not available from their own resources or' from normal commercial channels. In the case of Queensland it was also agreed to include, as an eligible measure, grant and loan assistance to owner-occupiers of houses severely 'damaged or des-troyed in the flooding to enable them to repair or rebuild their dwellings, or to assist in the removal costs for houses built on flood-prone land. Grant assistance was also provided to owner-occupiers whose houses, although not inundated by flood waters, were seriously damaged or threatened by landslip, scour or erosion attributable to the floods. Special arrangements were made to provide assistance for the repair or restoration of assets of tertiary education institutions and affiliated bodies damaged by the flooding.
To give legislative effect to the Government's undertakings the Parliament passed the New South Wales Flood Relief Act 1974 and the Queensland Flood Relief Act 1974. These Acts provided for payments to the States concerned up to $5.5 million and $66 million respectively in reimbursement of eligible expendi-tures incurred by them during the period ending 30 June 1976. Payments of $300,000 to New South Wales and $27.9 million to Queensland were made in 1973-74 under these Acts. In 1973-74 the Australian Government also made donations of $350,000 to the Queensland Flood Victims Committee and $250,000 to the Brisbane Lord Mayor's Flood Disaster Fund. These payments, however, were made direct and did not take the form of payments to the State.
113
The Australian Government has also agreed to provide assistance in respect of eligible relief and restoration measures made necessary by storms and flooding occurring in New South Wales after the period covered by the above-mentioned legislation. It has also agreed to provide assistance for flood relief to Victoria and South Australia.
It is estimated that in 1974-75 $12.1 million will be paid to New South Wales, $6 million to Victoria, $26.1 million to Queensland and $0.5 million to South Australia for relief measures necessitated by flood and storm damage that has occurred. The assistance to Queensland, and part of that to New South Wales, will be paid under the Acts referred to above.
Details of payments for natural disaster relief and restoration purposes from 1949-50 to 1973-74 and estimated payments for 1974-75 are shown in Table 136 in Appendix IV. Table 137 classifies natural disaster payments, for 1962-63 to 1974-75, according to type of disaster.
114
CHAPTER V—PAYMENTS TO, OR FOR LOCAL GOVERNMENT AUTHORITIES
Local government authorities in Australia are established under Acts of the State Parliaments' for the purpose of providing certain public services within defined geographical boundaries. The functions of these authorities, which are generally prescribed by State legislation, differ significantly between States and, indeed, within States.
In his speech in February 1973 on the opening of the Twenty-eighth Parliament the Governor-General said: 'My Government aims to make local government a genuine partner in the Federal system. To promote financial equality between regions the Commonwealth Grants Commission Act will be amended to authorise the Commission to inquire into and report upon applications made for local government purposes. Discussions will be held with the States aimed at providing local government in each State with a voice and a vote in the deliberations of the Loan Council.'
Developments that have occurred in respect of each of the two specific matters referred to by the Governor-General are summarised below, followed by an out-line of other Australian Government programs involving payments to or for local government authorities. The Chapter ends with a summary of various forms of such payments.
While the borrowing arrangements of local government authorities do not involve Australian Government payments to or for such authorities, material on them is included in this Chapter because of their relevance in the general context of Australian/State/Local Government financial relations.
GRANTS RECOMMENDED BY GRANTS COMMISSION
In its Autumn Sittings of 1973 the Australian Parliament passed the Grants Com-mission Act 1973, repealing and replacing the Commonwealth Grants Commission Act 1933-66. The Act came into operation by proclamation on 20 September 1973.
Besides authorising the continuation of the Commission's functions in relation to applications by the States for grants of special financial assistance, the Act lays down procedures for regional organisations of local government to apply for financial assistance from the Australian Government (to be paid in the first in-stance to the State Government concerned) and for such applications to be the subject of inquiry and report by the Grants Commission.
There are also two local government bodies, established by ordinance—that is, under laws of the Australian Parliament—in the Northern Territory. Information on Australian Government payments to these bodies is provided below. Generally, however, references to local government authorities in this Chapter should be taken as not including these bodies.
115
In his second reading speech on the Bill the Prime Minister said that: 'the financial assistance to local governing bodies which will flow from the Commission's recom-mendations will in no way be a substitute for the revenues normally raised by them by long established methods such as rates and charges for services, nor will it replace assistance normally provided by State Governments to local governing bodies in one way or another. Rather,' it will be in the nature of a 'topping-up' process of the financial resources of lesser endowed bodies to enable them, by reasonable revenue raising efforts on their part, to provide a standard of services to their communities that will be comparable with that enjoyed by communities elsewhere.'
In summary, the Act provides:— for the Minister for Urban and Regional Development, in consultation with the States, to approve regional organisations to represent or act on behalf of local government bodies within each region (section 17); that such organisations may apply for the grant, under section 96 of the Constitution, of financial assistance to a State for the purpose of enabling the organisation, or one or more of the local government bodies which it represents, to function, by reasonable effort, at a standard not appreciably below the standards of other regional organisations or other local govern-ment bodies (section 18 (1), read in conjunction with section 6); and that such applications may, at the discretion of the Special Minister of State and after consultation with the State Minister concerned, be referred to the Grants Commission for inquiry and report (section 18 (3)).
In December 1973 the Minister for Urban and Regional Development approved 68 regional organisations2 comprising 889 local government authorities in all States.
All regional organisations made application for assistance, although 13 in-dividual local government authorities either declined to participate in their regional organisations or did not seek grants.
The Commission received written and/or oral submissions from regional organ-isations, individual local government bodies, the Australian Council of Local Gov-ernment Associations, State local government associations, representatives of the State Governments, the Australian Treasury and the Department of Urban and Regional Development. It presented its first report on financial assistance for local government to the Australian Government in August 1974. The report recommended grants in 1974-75 totalling $56,345,000 for 806 local government bodies (representing 92 per cent of the 876 bodies which applied for assistance). The Commission recommended that the grants be paid without conditions attached as to their use by the local government authorities.
'Although the Minister originally approved 68 regions, due to a technicality associated with sections 17 and 27 of the Act, one region in South Australia was subsequently amalgamated with another. Thus, for purposes of the Commission's hearings and recommendations, there were 67 regions.
116
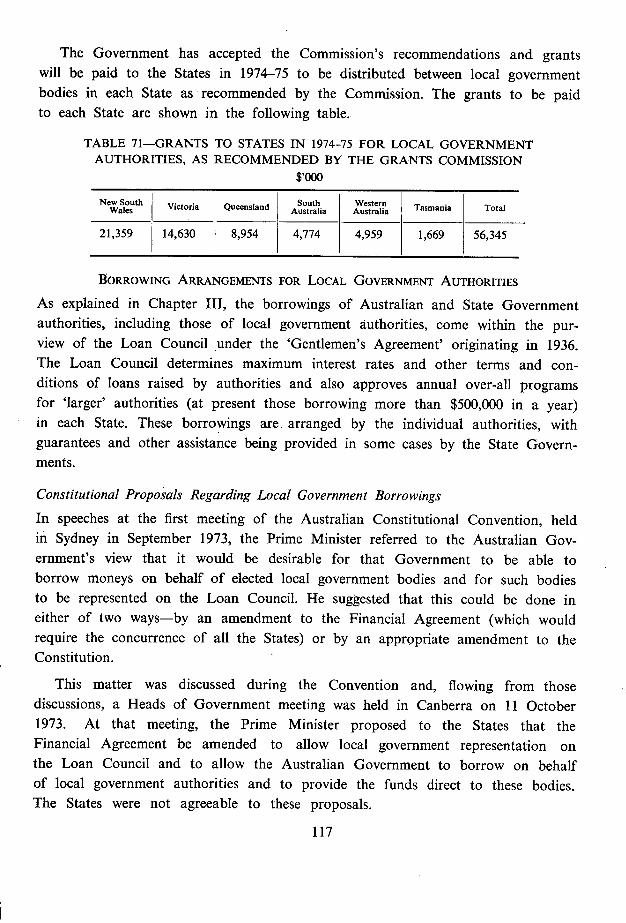
The Government has accepted the Commission's recommendations and grants will be paid to the States in 1974-75 to be distributed between local government bodies in each State as recommended by the Commission. The grants to be paid to each State are shown in the following table.
TABLE 71-GRANTS TO STATES IN 1974-75 FOR LOCAL GOVERNMENT AUTHORITIES, AS RECOMMENDED BY THE GRANTS COMMISSION
$,000
New South Wales Victoria
i Queensland South
Australia Western Australia Tasmania Total
21,359 14,630 8,954 4,774 4,959 1,669 56,345
BORROWING ARRANGEMENTS FOR LOCAL GOVERNMENT AUTHORITIES As explained in Chapter III, the borrowings of Australian and State Government authorities, including those of local government authorities, come within the pur-view of the Loan Council under the 'Gentlemen's Agreement' originating in 1936. The Loan Council determines maximum interest rates and other terms and con-ditions of loans raised by authorities and also approves annual over-all programs for 'larger' authorities (at present those borrowing more than $500,000 in a year) in each State. These borrowings are arranged by the individual authorities, with guarantees and other assistance being provided in some cases by the State Govern-ments.
Constitutional Proposals Regarding Local Government Borrowings In speeches at the first meeting of the Australian Constitutional Convention, held in Sydney in September 1973, the Prime Minister referred to the Australian Gov-ernment's view that it would be desirable for that Government to be able to borrow moneys on behalf of elected local government bodies and for such bodies to be represented on the Loan Council. He suggested that this could be done in either of two ways—by an amendment to the Financial Agreement (which would require the concurrence of all the States) or by an appropriate amendment to the Constitution.
This matter was discussed during the Convention and, flowing from those discussions, a Heads of Government meeting was held in Canberra on 11 October 1973. At that meeting, the Prime Minister proposed to the States that the Financial Agreement be amended to allow local government representation on the Loan Council and to allow the Australian Government to borrow on behalf of local government authorities and to provide the funds direct to these bodies. The States were not agreeable to these proposals.
117
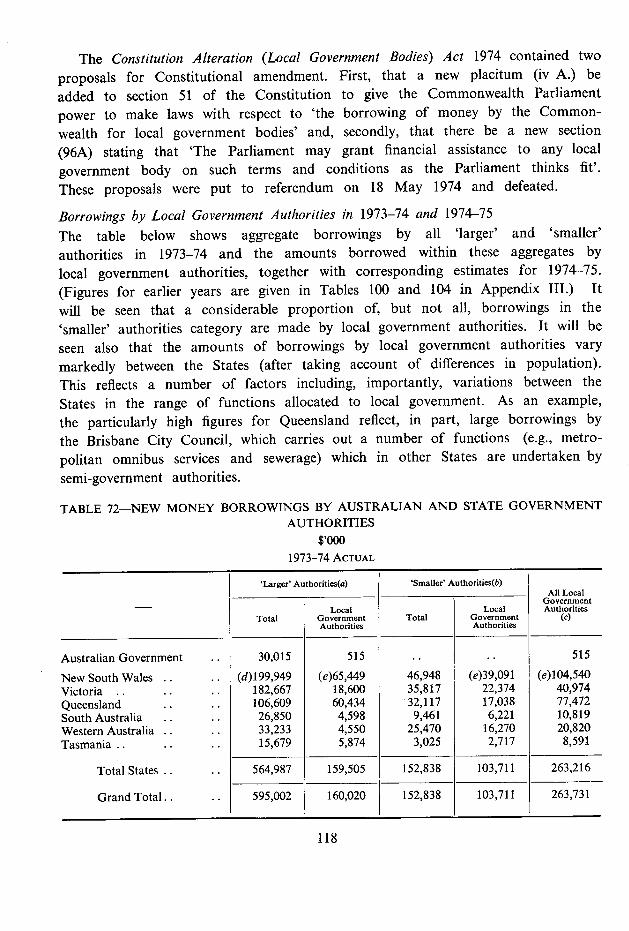
The Constitution Alteration (Local Government Bodies) Act 1974 contained two proposals for Constitutional amendment. First, that a new placitum (iv A.) be added to section 51 of the Constitution to give the Commonwealth Parliament power to make laws with respect to 'the borrowing of money by the Common-wealth for local government bodies' and, secondly, that there be a new section (96A) stating that 'The Parliament may grant financial assistance to any local government body on such terms and conditions as the Parliament thinks fit'. These proposals were put to referendum on 18 May 1974 and defeated.
Borrowings by Local Government Authorities in 1973-74 and 1974-75 The table below shows aggregate borrowings by all 'larger' and 'smaller' authorities in 1973-74 and the amounts borrowed within these aggregates by local government authorities, together with corresponding estimates for 1974-75. (Figures for earlier years are given in Tables 100 and 104 in Appendix III.) It will be seen that a considerable proportion of, but not all, borrowings in the 'smaller' authorities category are made by local government authorities. It will be seen also that the amounts of borrowings by local government authorities vary markedly between the States (after taking account of differences in population). This reflects a number of factors including, importantly, variations between the States in the range of functions allocated to local government. As an example, the particularly high figures for Queensland reflect, in part, large borrowings by the Brisbane City Council, which carries out a number of functions (e.g., metro-politan omnibus services and sewerage) which in other States are undertaken by semi-government authorities.
TABLE 72-NEW MONEY BORROWINGS BY AUSTRALIAN AND STATE GOVERNMENT AUTHORITIES
$,000 1973-74 ACTUAL
- I
Larger' Authorities(a) 'Smaller Authorities(b) All Local
Government Authorities
(c) Total Local
Government Authorities
Total Local
Government Authorities
Australian Government .. 30,015 515 .. .. 515
New South Wales .. .. (d)199,949 (e)65,449 46,948 (e)39,091 (e)104,540 Victoria .. .. .. 182,667 18,600 35,817 22,374 40,974 Queensland . . . . South Australia .. ..
106,609 26,850
60,434 4,598
32,117 9,461
17,038 6,221
77,472 10,819
Western Australia .. . . 33,233 4,550 25,470 16,270 20,820 Tasmania .. .. . . 15,679 5,874 3,025 2,717 8,591
Total States . . . 564,987 159,505 152,838 103,711 263,216
Grand Total. . . 595,002 160,020 152,838 103,711 263,731
118
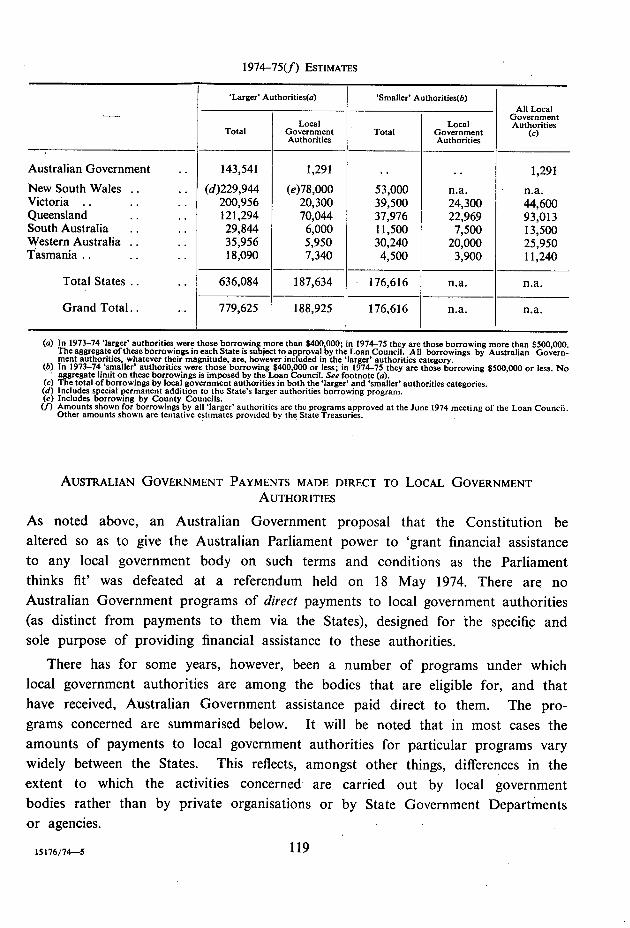
1974-75(f) ESTIMATES
'Larger' Authorities(a) 'Smaller' Authorities(b) All Local
Government Authorities
(c) Total Local
Government Authorities
Total Local
Government Authorities
Australian Government .. 143,541 1,291 .. 1,291 New South Wales .. .. Victoria .. .. ..
(d)229,944 200,956
(e)78,000 20,300
53,000 39,500
n.a. 24,300
n.a. 44,600
Queensland .. .. 121,294 70,044 37,976 22,969 93,013 South Australia .. .. 29,844 6,000 11,500 7,500 13,500 Western Australia .. .. 35,956 5,950 30,240 20,000 25,950 Tasmania .. .. .. 18,090 7,340 4,500 3,900 11,240
Total States .. .. 636,084 187,634 176,616 n.a. n.a.
Grand Total.. .. 779,625 188,925 176,616 n.a. n.a.
In 1973-74 'larger' authorities were those borrowing more than $400,000; in 1974-75 they are those borrowing more than $500,000. The aggregate of these borrowings in each State is subject to approval by the Loan Council. All borrowings by Australian Govern-ment authorities, whatever their magnitude, are, however included in the 'larger' authorities category. In 1973-74 'smaller' authorities were those borrowing $400,000 or less; in 1974-75 they are those borrowing $500,000 or less. No aggregate limit on these borrowings is imposed by the Loan Council. See footnote (a). The total of borrowings by local government authorities in both the 'larger' and 'smaller' authorities categories. Includes special permanent addition to the State's larger authorities borrowing program. Includes borrowing by County Councils. Amounts shown for borrowings by all 'larger' authorities are the programs approved at the June 1974 meeting of the Loan Council. Other amounts shown are tentative estimates provided by the State Treasuries.
AUSTRALIAN GOVERNMENT PAYMENTS MADE DIRECT TO LOCAL GOVERNMENT AUTHORITIES
As noted above, an Australian Government proposal that the Constitution be altered so as to give the Australian Parliament power to 'grant financial assistance to any local government body on such terms and conditions as the Parliament thinks fit' was defeated at a referendum held on 18 May 1974. There are no Australian Government programs of direct payments to local government authorities (as distinct from payments to them via the States), designed for the specific and sole purpose of providing financial assistance to these authorities.
There has for some years, however, been a number of programs under which local government authorities are among the bodies that are eligible for, and that have received, Australian Government assistance paid direct to them. The pro-grams concerned are summarised below. It will be noted that in most cases the amounts of payments to local government authorities for particular programs vary widely between the States. This reflects, amongst other things, differences in the extent to which the activities concerned are carried out by local government bodies rather than by private organisations or by State Government Departments or agencies.
15176/74-5 119
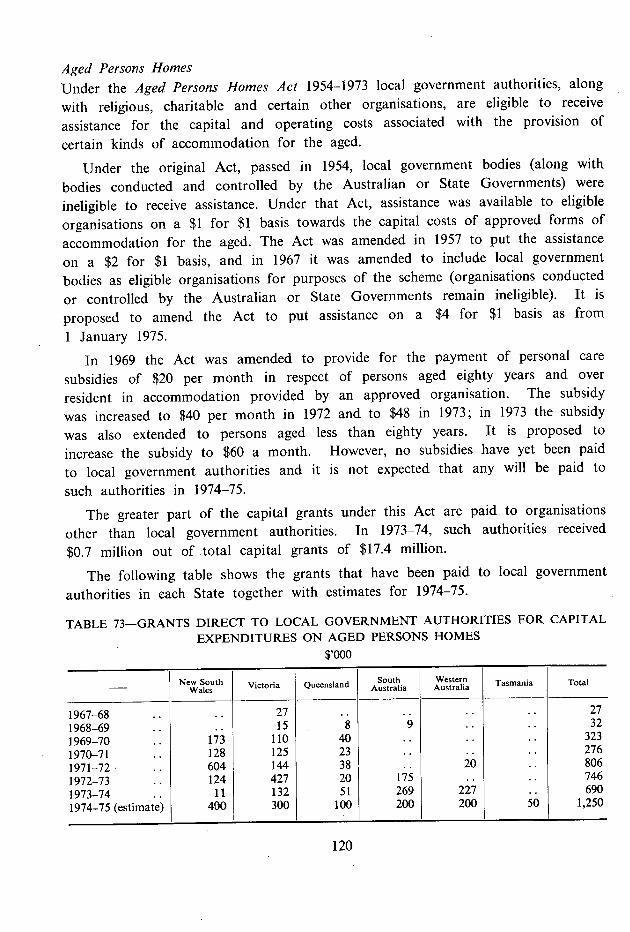
Aged Persons Homes Under the Aged Persons Homes Act 1954-1973 local government authorities, along with religious, charitable and certain other organisations, are eligible to receive assistance for the capital and operating costs associated with the provision of certain kinds of accommodation for the aged.
Under the original Act, passed in 1954, local government bodies (along with bodies conducted and controlled by the Australian or State Governments) were ineligible to receive assistance. Under that Act, assistance was available to eligible organisations on a $1 for $1 basis towards the capital costs of approved forms of accommodation for the aged. The Act was amended in 1957 to put the assistance
on a $2 for $1 basis, and in 1967 it was amended to include local government bodies as eligible organisations for purposes of the scheme (organisations conducted or controlled by the Australian or State Governments remain ineligible). It is proposed to amend the Act to put assistance on a $4 for $1 basis as from
1 January 1975.
In 1969 the Act was amended to provide for the payment of personal care subsidies of $20 per month in respect of persons aged eighty years and over resident in accommodation provided by an approved organisation. The subsidy was increased to $40 per month in 1972 and to $48 in 1973; in 1973 the subsidy was also extended to persons aged less than eighty years. It is proposed to increase the subsidy to $60 a month. However, no subsidies have yet been paid to local government authorities and it is not expected that any will be paid to such authorities in 1974-75.
The greater part of the capital grants under this Act are paid to organisations other than local government authorities. In 1973-74, such authorities received
$0.7 million out of .total capital grants of $17.4 million.
The following table shows the grants that have been paid to local government authorities in each State together with estimates for 1974-75.
TABLE 73—GRANTS DIRECT TO LOCAL GOVERNMENT AUTHORITIES FOR CAPITAL EXPENDITURES ON AGED PERSONS HOMES
$,000
- New South Victoria Wales Queensland South
Australia Western Australia Tasmania Total
1967-68 .. 27 .. .. 27 1968-69 .. 15 8 9 .. 32 1969-70 173 110 40 .. .. .. 323 1970-71 .. 128 125 23 .. .. 276 1971-72 .. 604 144 38 20 806 1972-73 .. 124 427 20 175 746 1973-74 .. 11 132 51 269 227 .. 690 1974-75 (estimate) 400 300 100 200 200 50 1,250
I
120
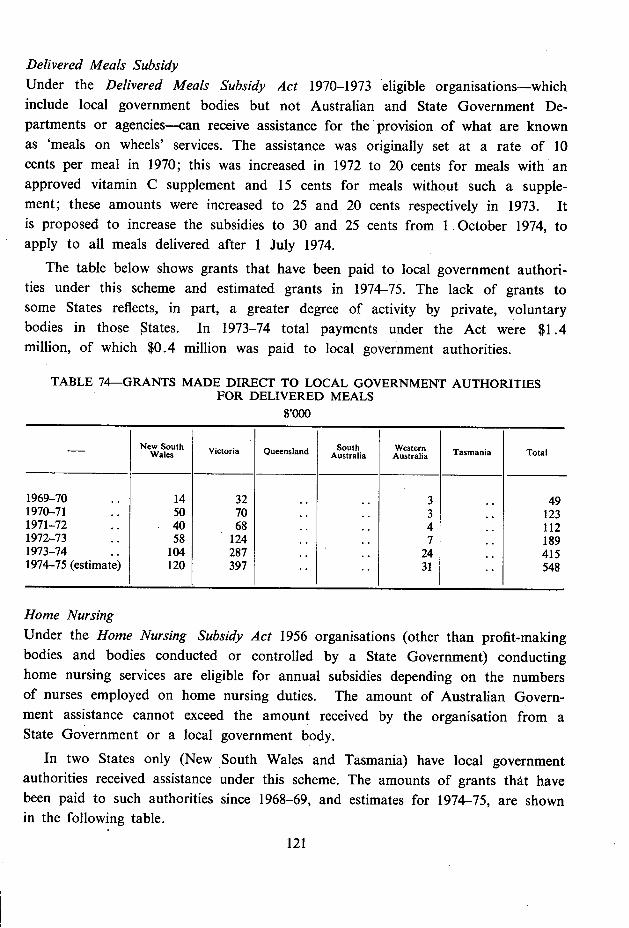
Delivered Meals Subsidy Under the Delivered Meals Subsidy Act 1970-1973 eligible organisations—which include local government bodies but not Australian and State Government De-partments or agencies—can receive assistance for the provision of what are known as 'meals on wheels' services. The assistance was originally set at a rate of 10 cents per meal in 1970; this was increased in 1972 to 20 cents for meals with an approved vitamin C supplement and 15 cents for meals without such a supple-ment; these amounts were increased to 25 and 20 cents respectively in 1973. It is proposed to increase the subsidies to 30 and 25 cents from 1 October 1974, to apply to all meals delivered after 1 July 1974.
The table below shows grants that have been paid to local government authori-ties under this scheme and estimated grants in 1974-75. The lack of grants to some States reflects, in part, a greater degree of activity by private, voluntary bodies in those States. In 1973-74 total payments under the Act were $1.4 million, of which $0.4 million was paid to local government authorities.
TABLE 74—GRANTS MADE DIRECT TO LOCAL GOVERNMENT AUTHORITIES FOR DELIVERED MEALS
$,000
New South Wales Victoria Queensland South
Australia Western Australia Tasmania Total
1969-70 .. 14 32 .. .. 3 .. 49 1970-71 .. 50 70 .. .. 3 .. 123 1971-72 .. 40 68 .. .. 4 .. 112 1972-73 .. 58 124 .. .. 7 .. 189 1973-74 .. 104 287 .. .. 24 .. 415 1974-75 (estimate) 120 397 .. .. 31 .. 548
Home Nursing Under the Home Nursing Subsidy Act 1956 organisations (other than profit-making bodies and bodies conducted or controlled by a State Government) conducting home nursing services are eligible for annual subsidies depending on the numbers of nurses employed on home nursing duties. The amount of Australian Govern-ment assistance cannot exceed the amount received by the organisation from a State Government or a local government body.
In two States only (New South Wales and Tasmania) have local government authorities received assistance under this scheme. The amounts of grants that have been paid to such authorities since 1968-69, and estimates for 1974-75, are shown in the following table.
121
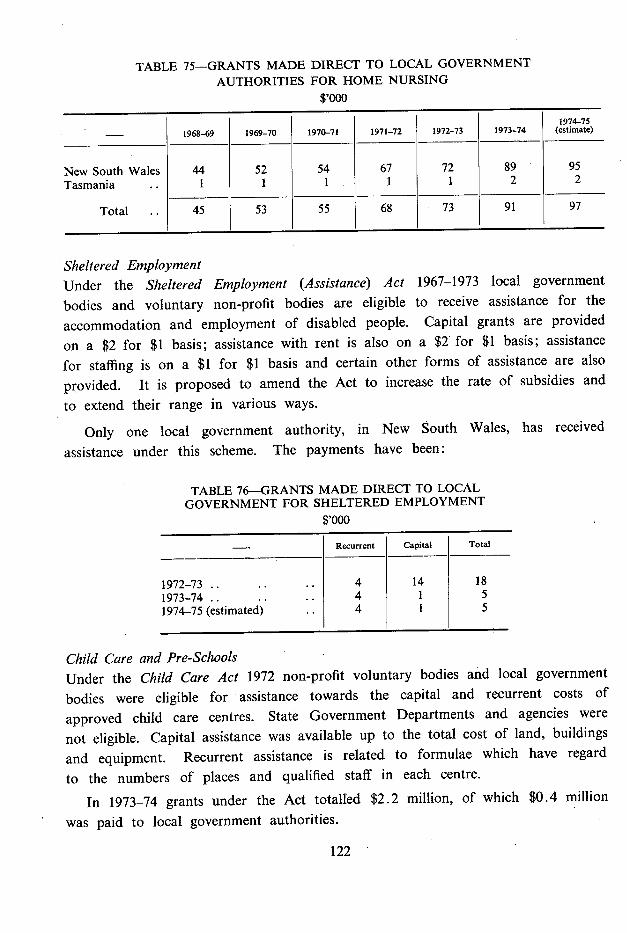
TABLE 75—GRANTS MADE DIRECT TO LOCAL GOVERNMENT AUTHORITIES FOR HOME NURSING
$1 000
- 1968-69 1969-70 1970-71 1971-72 1972-73 1973-74 1974-75
(estimate)
New South Wales 44 52 54 67 72 89 95
Tasmania .. 1 1 1 1 1 2 2
Total .. 45 53 55 68 73 91 97
Sheltered Employment Under the Sheltered Employment (Assistance) Act 1967-1973 local government bodies and voluntary non-profit bodies are eligible to receive assistance for the accommodation and employment of disabled people. Capital grants are provided on a $2 for $1 basis; assistance with rent is also on a $2 for $1 basis; assistance for staffing is on a $1 for $1 basis and certain other forms of assistance are also provided. It is proposed to amend the Act to increase the rate of subsidies and to extend their range in various ways.
Only one local government authority, in New South Wales, has received assistance under this scheme. The payments have been:
TABLE 76—GRANTS MADE DIRECT TO LOCAL GOVERNMENT FOR SHELTERED EMPLOYMENT
$,000
- Recurrent Capital Total
1972-73 .. .. .. 4 14 18 1973-74 .. .. .. 4 1 5 1974-75 (estimated) . 4 1 5
Child Care and Pre-Schools Under the Child Care Act 1972 non-profit voluntary bodies and local government bodies were eligible for assistance towards the capital and recurrent costs of approved child care centres. State Government Departments and agencies were not eligible. Capital assistance was available up to the total cost of land, buildings and equipment. Recurrent assistance is related to formulae which have regard to the numbers of places and qualified staff in each centre.
In 1973-74 grants under the Act totalled $2.2 million, of which $0.4 million was paid to local government authorities.
122
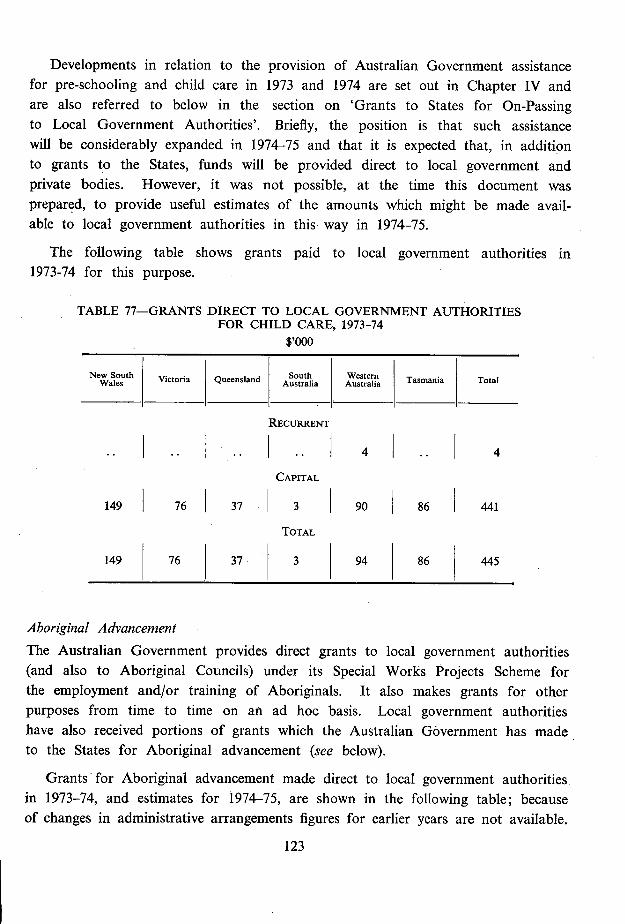
Developments in relation to the provision of Australian Government assistance for pre-schooling and child care in 1973 and 1974 are set out in Chapter IV and are also referred to below in the section on 'Grants to States for On-Passing to Local Government Authorities'. Briefly, the position is that such assistance will be considerably expanded in 1974-75 and that it is expected that, in addition to grants to the States, funds will be provided direct to local government and private bodies. However, it was not possible, at the time this document was prepared, to provide useful estimates of the amounts which might be made avail-able to local government authorities in this way in 1974-75.
The following table shows grants paid to local government authorities in 1973-74 for this purpose.
TABLE 77-GRANTS DIRECT TO LOCAL GOVERNMENT AUTHORITIES FOR CHILD CARE, 1973-74
$,000
New South Wales Victoria Queensland South
Australia Western Australia Tasmania Total
RECURRENT
4 .. 4
CAPITAL
149 76 37 3 90 86 441
TOTAL
149 76 37 3 94 86 445
Aboriginal Advancement The Australian Government provides direct grants to local government authorities (and also to Aboriginal Councils) under its Special Works Projects Scheme for the employment and/or training of Aboriginals. It also makes grants for other purposes from time to time on an ad hoc basis. Local government authorities have also received portions of grants which the Australian Government has made to the States for Aboriginal advancement (see below).
Grants for Aboriginal advancement made direct to local government authorities in 1973-74, and estimates for 1974-75, are shown in the following table; because of changes in administrative arrangements figures for earlier years are not available.
123
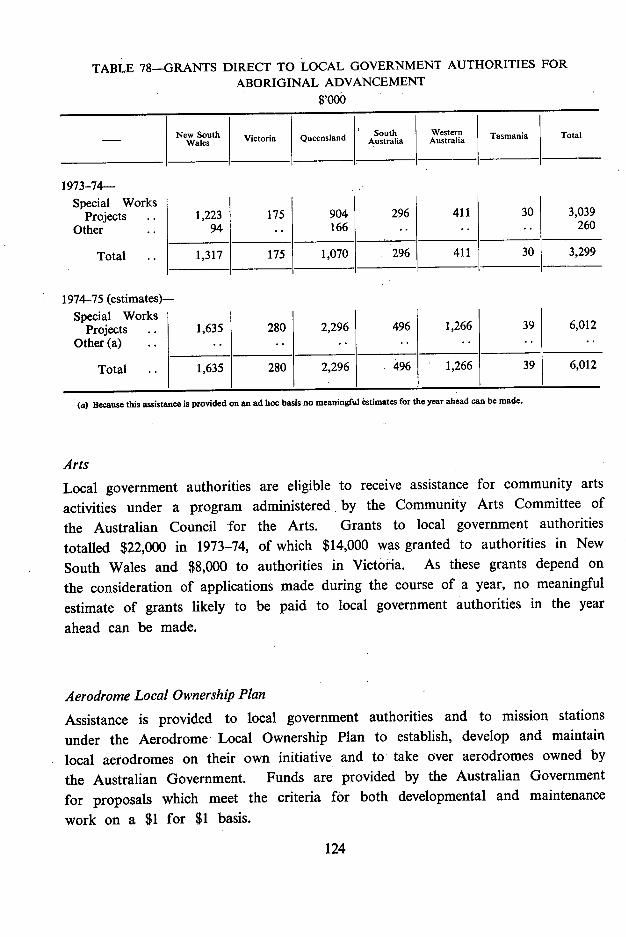
TABLE 78—GRANTS DIRECT TO LOCAL GOVERNMENT AUTHORITIES FOR ABORIGINAL ADVANCEMENT
$'000
New South Vi ctoria Queensland South Australia
Western Australia Tasmania Total - Wales
1973-74— Special Works
Projects Other
Total
1,223 175 904 296 411 30 3,039
94 .. 166 .. .. .. 260
1,317 175 1,070 296 411 30 3,299
1974-75 (estimates)— Special Works
Projects .. 1,635 280 2,296 496 1,266 39 6,012 Other (a) .. .. .. .. ..
Total .. 1,635 280 2,296 496 1,266 39 6,012
(a) Because this assistance is provided on an ad hoc basis no meaningful estimates for the year ahead can be made.
Arts Local government authorities are eligible to receive assistance for community arts activities under a program administered by the Community Arts Committee of the Australian Council -for the Arts. Grants to local government authorities totalled $22,000 in 1973-74, of which $14,000 was granted to authorities in New South Wales and $8,000 to authorities in Victoria. As these grants depend on the consideration of applications made during the course of a year, no meaningful estimate of grants likely to be paid to local government authorities in the year ahead can be made.
Aerodrome Local Ownership Plan Assistance is provided to local government authorities and to mission stations under the Aerodrome Local Ownership Plan to establish, develop and maintain local aerodromes on their own initiative and to take over aerodromes owned by the Australian Government. Funds are provided by the Australian Government for proposals which meet the criteria for both developmental and maintenance work on a $1 for $1 basis.
124
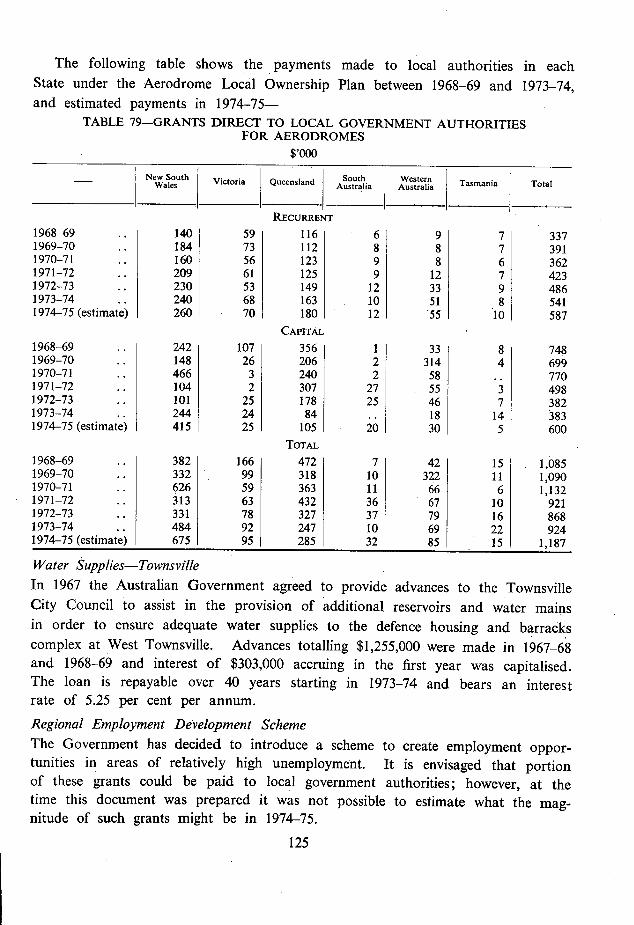
The following table shows the payments made to local authorities in each State under the Aerodrome Local Ownership Plan between 1968-69 and 1973-74, and estimated payments in 1974-75—
TABLE 79—GRANTS DIRECT TO LOCAL GOVERNMENT AUTHORITIES FOR AERODROMES
$,000 I I
New South South Western - Wales Victoria Queensland Australia Australia Tasmania Total
RECURRENT
1968-69 140 59 116 6 9 7 337 1969-70 .. 184 73 112 8 8 7 391 1970-71 .. 160 56 123 9 8 6 362 1971-72 .. 209 61 125 9 12 7 423 1972-73 .. 230 53 149 12 33 9 486 1973-74 .. 240 68 163 10 51 8 541 1974-75 (estimate) 260 70 180 12 55 10 587
CAPITAL 1968-69 .. 242 107 356 1 33 8 748 1969-70 .. 148 26 206 2 314 4 699 1970-71 .. 466 3 240 2 58 .. 770 1971-72 .. 104 2 307 27 55 3 498 1972-73 .. 101 25 178 25 46 7 382 1973-74 244 24 84 .. 18 14 383 1974-75 (estimate) 415 25 105 20 30 5 600
TOTAL 1968-69 382 166 472 7 42 15 1,085 1969-70 .. 332 99 318 10 322 11 1,090 1970-71 .. 626 59 363 11 66 6 1,132 1971-72 .. 313 63 432 36 67 10 921 1972-73 .. 331 78 327 37 79 16 868 1973-74 .. 484 92 247 10 69 22 924 1974-75 (estimate) 675 95 285 32 85 15 1,187
Water Supplies—Townsville In 1967 the Australian Government agreed to provide advances to the Townsville City Council to assist in the provision of additional reservoirs and water mains in order to ensure adequate water supplies to the defence housing and barracks complex at West Townsville. Advances totalling $1,255,000 were made in 1967-68 and 1968-69 and interest of $303,000 accruing in the first year was capitalised. The loan is repayable over 40 years starting in 1973-74 and bears an interest rate of 5.25 per cent per annum. Regional Employment Development Scheme The Government has decided to introduce a scheme to create employment oppor- tunities in areas of relatively high unemployment. It is envisaged that portion of these grants could be paid to local government authorities; however, at the time this document was prepared it was not possible to estimate what the mag- nitude of such grants might be in 1974-75.
125
PAYMENTS TO STATES FOR ON-PASSING TO LOCAL GOVERNMENT AUTHORITIES As noted above, the grants for local government authorities to be paid in 1974-75 on the recommendation of the Grants Commission are to take the form of payments to the State Governments for on-passing to the local government authorities concerned. This, and the proposed scheme of payments to the States for the purpose of assisting regional organisations of local government (see below), are the only Australian Government programs designed specifically and solely to provide financial assistance for local government. There are also other programs of pay-ments to the States under which portions of the funds provided are passed on to local government authorities. These programs may be divided into two cate-gories; first, those under which the amounts paid to local government authorities are determined by the States themselves and, secondly, those under which the amounts so passed on are decided either by the Australian Government or by agreement between that Government and the State Government concerned.
This chapter is not concerned with programs of the first kind, relevant examples of which are grants made under successive aid roads arrangements and grants for the relief of unemployment made in 1971-72, 1972-73 and 1973-74.
The number of programs in the second category, that is, those under which the allocation of the Australian Government's grants to local government authorities (and to other bodies) is based on the approval of that Government, increased considerably in 1973-74. This is consistent with the policy of the Australian Government that it should become more closely involved in the details of the programs which it is financing (see on this the statement by the Prime Minister quoted at the beginning of Chapter IV of this document).
Each of the programs concerned is summarised, in general terms, in Chapter IV. The purpose of this section is to outline the way in which local government is involved and to provide details of the amounts paid to the States for on-passing to local government authorities. As with the programs of direct payments, differences between the States in the amounts of payments in this category which have been made to local government authorities reflect, in part, differences in the extent to which the functions concerned are undertaken by local government authorities rather than by State government departments or agencies or private bodies. It is emphasised that the payments referred to in this section are included in the totals of payments to the States shown in this document.
126
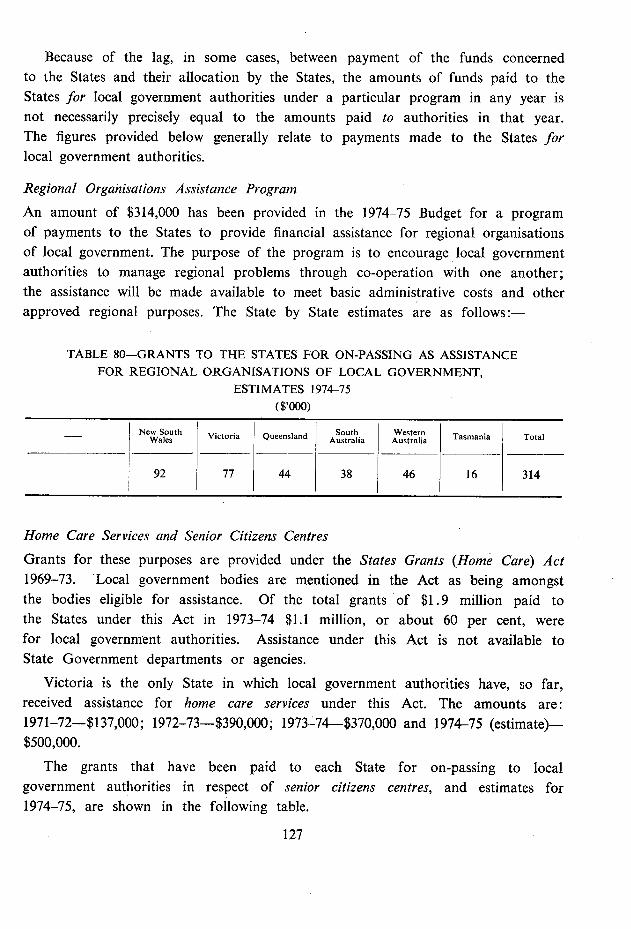
Because of the lag, in some cases, between payment of the funds concerned to the States and their allocation by the States, the amounts of funds paid to the States for local government authorities under a particular program in any year is not necessarily precisely equal to the amounts paid to authorities in that year. The figures provided below generally relate to payments made to the States for local government authorities.
Regional Organisations Assistance Program An amount of $314,000 has been provided in the 1974-75 Budget for a program of payments to the States to provide financial assistance for regional organisations of local government. The purpose of the program is to encourage local government authorities to manage regional problems through co-operation with one another; the assistance will be made available to meet basic administrative costs and other approved regional purposes. The State by State estimates are as follows:—
TABLE 80—GRANTS TO THE STATES FOR ON-PASSING AS ASSISTANCE FOR REGIONAL ORGANISATIONS OF LOCAL GOVERNMENT,
ESTIMATES 1974-75 ($'OOO)
New South Wales Victoria Queensland South
j Australia
Western Australia Tasmania Total
I
92 77 44 38 46 16 314
Home Care Services and Senior Citizens Centres Grants for these purposes are provided under the States Grants (Home Care) Act 1969-73. Local government bodies are mentioned in the Act as being amongst the bodies eligible for assistance. Of the total grants of $1.9 million paid to the States under this Act in 1973-74 $1.1 million, or about 60 per cent, were for local government authorities. Assistance under this Act is not available to State Government departments or agencies.
Victoria is the only State in which local government authorities have, so far, received assistance for home care services under this Act. The amounts are: 1971-72—$137,000; 1972-73—$390,000; 1973-74—$370,000 and 1974-75 (estimate)—$500,000.
The grants that have been paid to each State for on-passing to local government authorities in respect of senior citizens centres, and estimates for 1974-75, are shown in the following table.
127
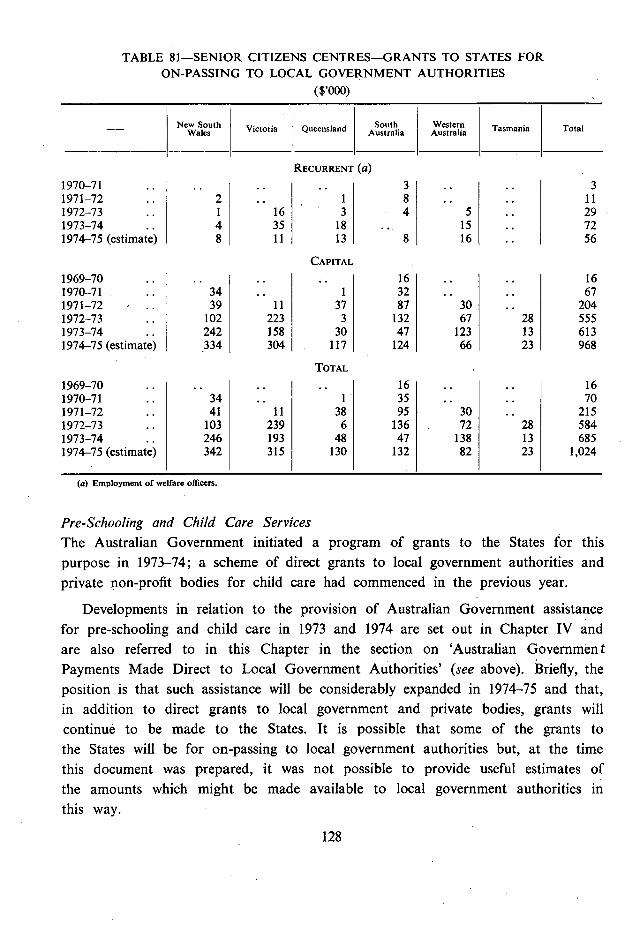
TABLE 81—SENIOR CITIZENS CENTRES—GRANTS TO STATES FOR ON-PASSING TO LOCAL GOVERNMENT AUTHORITIES
($'OOO)
-- New South Wales Victoria Queensland South
Australia Western Australia Tasmania Total
RECURRENT (a) 1970-71 .. .. 3 .. 3 1971-72 .. 2 .. 1 8 .. .. 11 1972-73 1 16 3 4 5 29 1973-74 .. 4 35 18 . 15 .. 72 1974-75 (estimate) 8 11 13 8 16 .. 56
CAPITAL 1969-70 .. .. .. .. 16 .. .. 16 1970-71 .. 34 .. 1 32 .. .. 67 1971-72 .. 39 11 37 87 30 .. 204 1972-73 .. 102 223 3 132 67 28 555 1973-74 .. 242 158 30 47 123 13 613 1974-75 (estimate) 334 304 117 124 66 23 968
TOTAL 1969-70 .. .. .. .. 16 .. .. 16 1970-71 .. 34 .. 1 35 .. .. 70 1971-72 .. 41 11 38 95 30 .. 215 1972-73 .. 103 239 6 136 72 28 584 1973-74 .. 246 193 48 47 138 13 685 1974-75 (estimate) 342 315 130 132 82 23 1,024
(a) Employment of welfare officers.
Pre-Schooling and Child Care Services The Australian Government initiated a program of grants to the States for this purpose in 1973-74; a scheme of direct grants to local government authorities and private non-profit bodies for child care had commenced in the previous year.
Developments in relation to the provision of Australian Government assistance for pre-schooling and child care in 1973 and 1974 are set out in Chapter IV and are also referred to in this Chapter in the section on 'Australian Government Payments Made Direct to Local Government Authorities' (see above). Briefly, the position is that such assistance will be considerably expanded in 1974-75 and that, in addition to direct grants to local government and private bodies, grants will continue to be made to the States. It is possible that some of the grants to the States will be for on-passing to local government authorities but, at the time this document was prepared, it was not possible to provide useful estimates of the amounts which might be made available to local government authorities in this way.
128
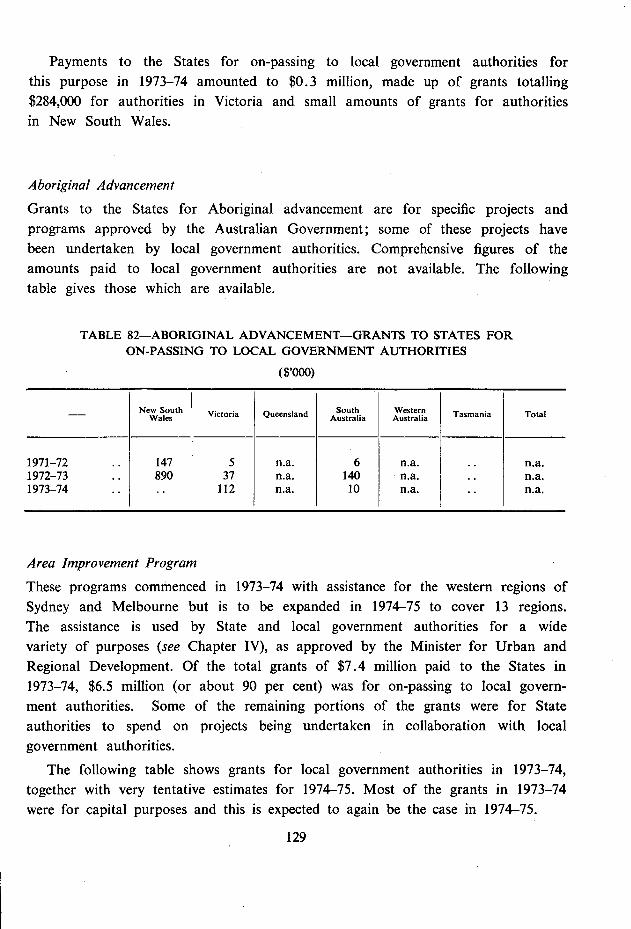
Payments to the States for on-passing to local government authorities for this purpose in 1973-74 amounted to $0.3 million, made up of grants totalling $284,000 for authorities in Victoria and small amounts of grants for authorities in New South Wales.
Aboriginal Advancement
Grants to the States for Aboriginal advancement are for specific projects and programs approved by the Australian Government; some of these projects have been undertaken by local government authorities. Comprehensive figures of the amounts paid to local government authorities are not available. The following table gives those which are available.
TABLE 82—ABORIGINAL ADVANCEMENT—GRANTS TO STATES FOR ON-PASSING TO LOCAL GOVERNMENT AUTHORITIES
($'OOO)
New South Victoria Queensland South Western Tasmania Total Wales Australia Australia
1971-72 .. 147 5 n.a. 6 n.a. .. n.a. 1972-73 .. 890 37 n.a. 140 n.a. .. n.a. 1973-74 .. .. 112 n.a. 10 n.a. .. n.a.
Area Improvement Program
These programs commenced in 1973-74 with assistance for the western regions of Sydney and Melbourne but is to be expanded in 1974-75 to cover 13 regions. The assistance is used by State and local government authorities for a wide variety of purposes (see Chapter IV), as approved by the Minister for Urban and Regional Development. Of the total grants of $7.4 million paid to the States in 1973-74, $6.5 million (or about 90 per cent) was for on-passing to local govern-ment authorities. Some of the remaining portions of the grants were for State authorities to spend on projects being undertaken in collaboration with local government authorities.
The following table shows grants for local government authorities in 1973-74, together with very tentative estimates for 1974-75. Most of the grants in 1973-74 were for capital purposes and this is expected to again be the case in 1974-75.
129
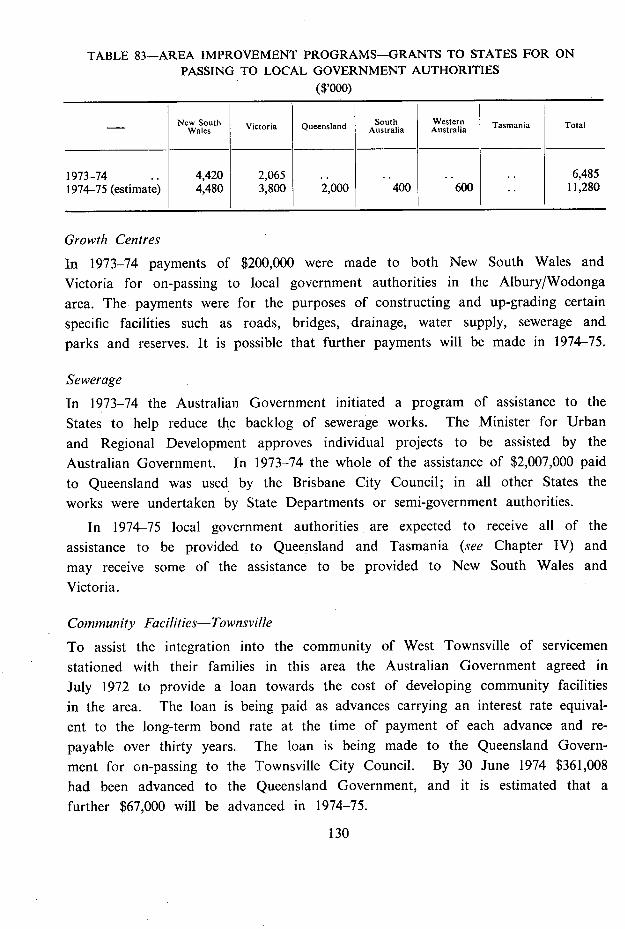
TABLE 83—AREA IMPROVEMENT PROGRAMS—GRANTS TO STATES FOR ON PASSING TO LOCAL GOVERNMENT AUTHORITIES
($'OOO)
- New South Wales Victoria Queensland South
Australia Western Australia Tasmania Total
1973-74 4,420 2,065 .. .. .. 6,485 1974-75 (estimate) 4,480 3,800 2,000 400 600 .. 11,280
Growth Centres In 1973-74 payments of $200,000 were made to both New South Wales and Victoria for on-passing to local government authorities in the Albury/Wodonga area. The payments were for the purposes of constructing and up-grading certain specific facilities such as roads, bridges, drainage, water supply, sewerage and parks and reserves. It is possible that further payments will be made in 1974-75.
Sewerage In 1973-74 the Australian Government initiated a program of assistance to the States to help reduce the backlog of sewerage works. The Minister for Urban and Regional Development approves individual projects to be assisted by the Australian Government. In 1973-74 the whole of the assistance of $2,007,000 paid to Queensland was used by the Brisbane City Council; in all other States the works were undertaken by State Departments or semi-government authorities.
In 1974-75 local government authorities are expected to receive all of the assistance to be provided to Queensland and Tasmania (see Chapter 1V) and may receive some of the assistance to be provided to New South Wales and Victoria.
Community Facilities—Townsville To assist the integration into the community of West Townsville of servicemen stationed with their families in this area the Australian Government agreed in July 1972 to provide a loan towards the cost of developing community facilities in the area. The loan is being paid as advances carrying an interest rate equival-ent to the long-term bond rate at the time of payment of each advance and re-payable over thirty years. The loan is being made to the Queensland Govern-ment for on-passing to the Townsville City Council. By 30 June 1974 $361,008 had been advanced to the Queensland Government, and it is estimated that a further $67,000 will be advanced in 1974-75.
130
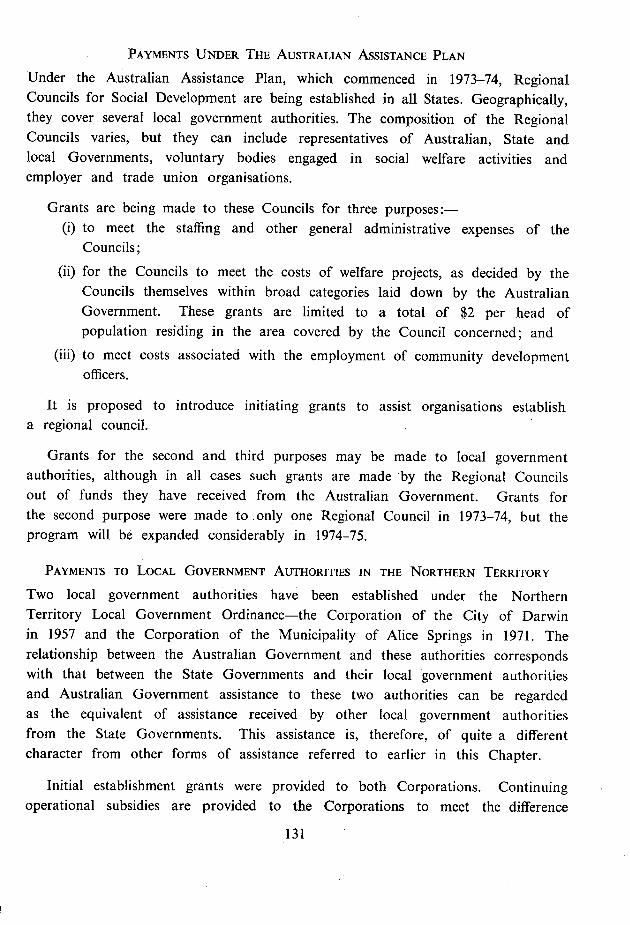
PAYMENTS UNDER THE AUSTRALIAN ASSISTANCE PLAN
Under the Australian Assistance Plan, which commenced in 1973-74, Regional Councils for Social Development are being established in all States. Geographically, they cover several local government authorities. The composition of the Regional Councils varies, but they can include representatives of Australian, State and local Governments, voluntary bodies engaged in social welfare activities and employer and trade union organisations.
Grants are being made to these Councils for three purposes:— (i) to meet the staffing and other general administrative expenses of the
Councils;
for the Councils to meet the costs of welfare projects, as decided by the Councils themselves within broad categories laid down by the Australian Government. These grants are limited to a total of $2 per head of population residing in the area covered by the Council concerned; and to meet costs associated with the employment of community development officers.
It is proposed to introduce initiating grants to assist organisations establish a regional council.
Grants for the second and third purposes may be made to local government authorities, although in all cases such grants are made by the Regional Councils out of funds they have received from the Australian Government. Grants for the second purpose were made to only one Regional Council in 1973-74, but the program will be expanded considerably in 1974-75.
PAYMENTS TO LOCAL GOVERNMENT AUTHORITIES IN THE NORTHERN TERRITORY
Two local government authorities have been established under the Northern Territory Local Government Ordinance—the Corporation of the City of Darwin in 1957 and the Corporation of the Municipality of Alice Springs in 1971. The relationship between the Australian Government and these authorities corresponds with that between the State Governments and their local government authorities and Australian Government assistance to these two authorities can be regarded as the equivalent of assistance received by other local government authorities from the State Governments. This assistance is, therefore, of quite a different character from other forms of assistance referred to earlier in this Chapter.
Initial establishment grants were provided to both Corporations. Continuing operational subsidies are provided to the Corporations to meet the difference
131
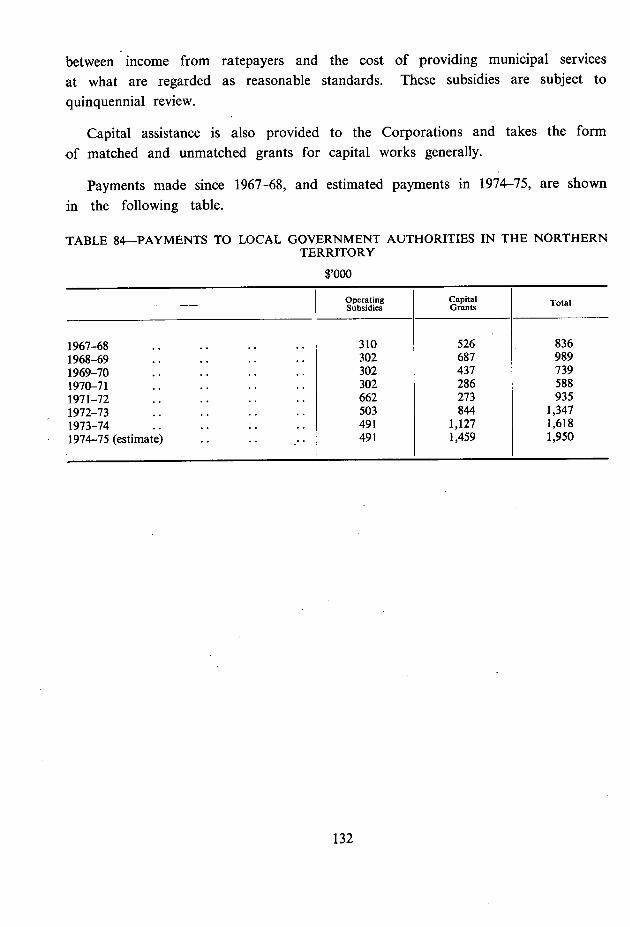
between income from ratepayers and the cost of providing municipal services at what are regarded as reasonable standards. These subsidies are subject to quinquennial review.
Capital assistance is also provided to the Corporations and takes the form of matched and unmatched grants for capital works generally.
Payments made since 1967-68, and estimated payments in 1974-75, are shown in the following table.
TABLE 84—PAYMENTS TO LOCAL GOVERNMENT AUTHORITIES IN THE NORTHERN TERRITORY
$,000
-- Operating Subsidies
Capital Grants Total
1967-68 .. .. .. .. 310 526 836 1968-69 .. .. .. .. 302 687 989 1969-70 .. .. .. .. 302 437 739 1970-71 .. .. .. .. 302 286 588 1971-72 .. .. .. .. 662 273 935 1972-73 .. .. .. .. 503 844 1,347 1973-74 .. .. .. .. 491 1,127 1,618 1974-75 (estimate) .. .. .. 491 1,459 1,950
132
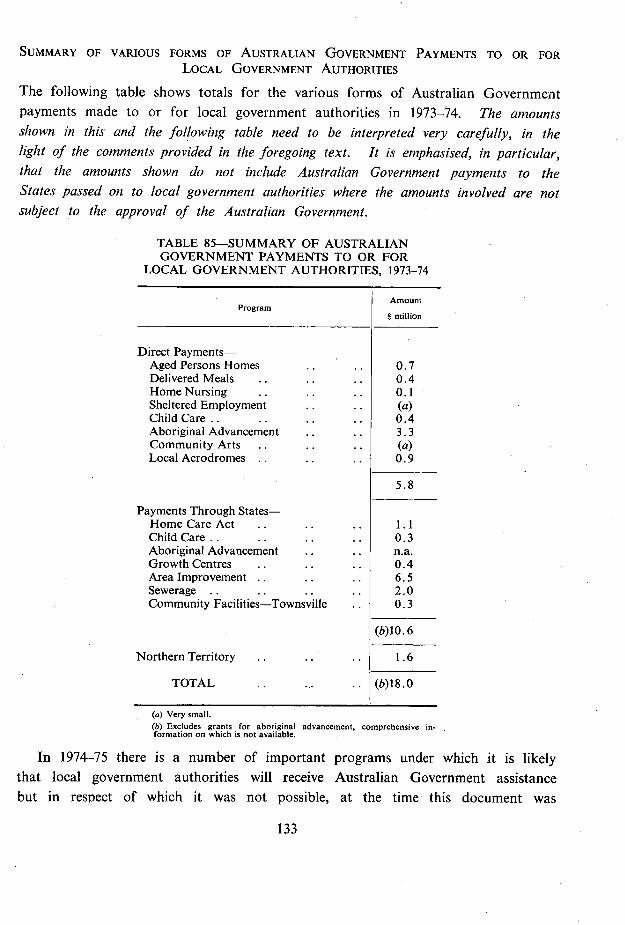
SUMMARY OF VARIOUS FORMS OF AUSTRALIAN GOVERNMENT PAYMENTS TO OR FOR LOCAL GOVERNMENT AUTHORITIES
The following table shows totals for the various forms of Australian Government payments made to or for local government authorities in 1973-74. The amounts shown in this and the following table need to be interpreted very carefully, in the light of the comments provided in the foregoing text. It is emphasised, in particular, that the amounts shown do not include Australian Government payments to the States passed on to local government authorities where the amounts involved are not subject to the approval of the Australian Government.
TABLE 85—SUMMARY OF AUSTRALIAN GOVERNMENT PAYMENTS TO OR FOR
LOCAL GOVERNMENT AUTHORITIES, 1973-74
Program Amount
$ million
Direct Payments— Aged Persons Homes .. .. 0.7 Delivered Meals .. .. .. 0.4 Home Nursing .. .. .. 0.1 Sheltered Employment .. .. (a) Child Care .. .. .. .. 0.4 Aboriginal Advancement .. .. 3.3 Community Arts .. .. .. (a) Local Aerodromes .. .. .. 0.9
I 5.8
Payments Through States— Home Care Act .. .. .. 1 .1 Child Care.. :. .. .. 0.3 Aboriginal Advancement .. .. n.a. Growth Centres .. .. .. 0.4 Area Improvement .. .. .. 6.5 Sewerage .. .. .. .. 2.0 Community Facilities—Townsville .. 0.3
(b)10.6
Northern Territory .. .. .. 1.6
TOTAL .. .. .. (b)18.0
(a) Very small. (5) Excludes grants for aboriginal advancement, comprehensive in-formation on which is not available.
In 1974-75 there is a number of important programs under which it is likely that local government authorities will receive Australian Government assistance but in respect of which it was not possible, at the time this document was
133
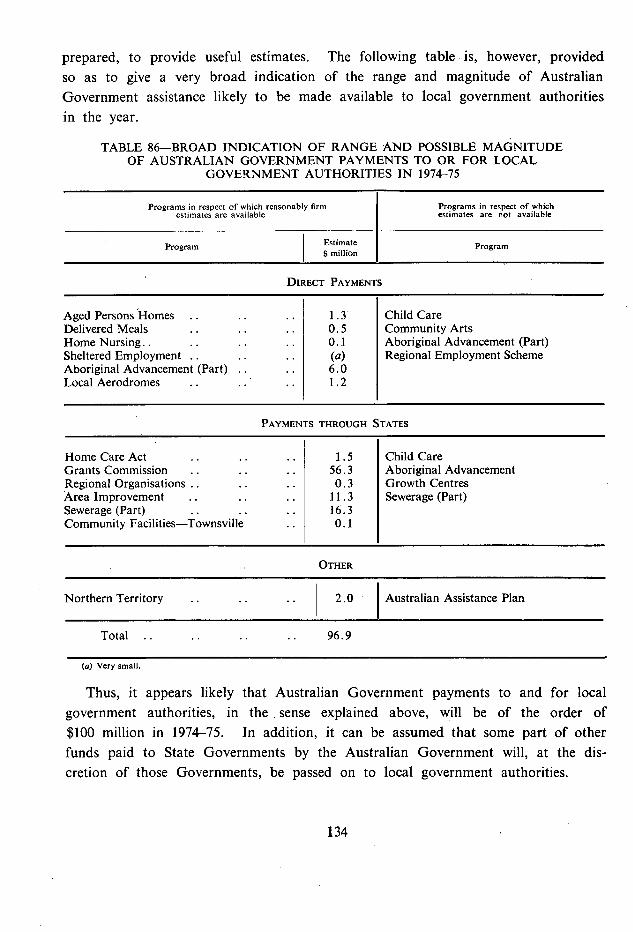
prepared, to provide useful estimates. The following table is, however, provided so as to give a very broad indication of the range and magnitude of Australian Government assistance likely to be made available to local government authorities in the year.
TABLE 86—BROAD INDICATION OF RANGE AND POSSIBLE MAGNITUDE OF AUSTRALIAN GOVERNMENT PAYMENTS TO OR FOR LOCAL
GOVERNMENT AUTHORITIES IN 1974-75
Programs in respect of which reasonably firm Programs in respect of which estimates are available I estimates are not available
I Estimate
Program Program $ million
DIRECT PAYMENTS
Aged Persons Homes .. .. .. 1.3 Child Care Delivered Meals .. .. .. 0.5 Community Arts Home Nursing.. .. .. .. 0.1 Aboriginal Advancement (Part) Sheltered Employment .. .. .. (a) Regional Employment Scheme Aboriginal Advancement (Part) .. .. 6.0 Local Aerodromes .. .. .. 1.2
PAYMENTS THROUGH STATES
Home Care Act .. .. .. 1 .5 Child Care Grants Commission .. .. .. 56.3 Aboriginal Advancement Regional Organisations .. .. .. 0.3 Growth Centres Area Improvement . . . . .. 11.3 Sewerage (Part) Sewerage (Part) .. .. .. 16.3 Community Facilities—Townsville .. 0.1
OTHER
Northern Territory .. .. .. 2.0 Australian Assistance Plan
Total .. .. .. .. 96.9
(a) Very small.
Thus, it appears likely that Australian Government payments to and for local government authorities, in the sense explained above, will be of the order of $100 million in 1974-75. In addition, it can be assumed that some part of other funds paid to State Governments by the Australian Government will, at the dis-cretion of those Governments, be passed on to local government authorities.
134
APPENDIX I—SUMMARY TABLES
TABLE No. SUBJECT
87 Payments to or for the States and State Government Loan Council Borrowing Programs, 1973-74.
88 Payments to or for the States and State Government Loan Council Borrowing Programs, Estimates 1974-75.
89 Summary of Payments to or for the States and State Government Loan Council Programs, 1956-57 to 1974-75.
90 Summary of Payments to or for the States and State Government Loan Council Programs per Head of Population, 1956-57 to 1974-75.
91 Total Payments to or for the States and State Government Loan Council Programs—Dissection between Funds for Recurrent and Capital Purposes-1956-57 to 1974-75.
92 Total Payments to or for the States and State Government Loan Council Programs—Dissection between Funds for Recurrent and Capital Purposes—Per Head of Population, 1956-57 to 1974-75.
93 Total Payments to or for the States and State Government Loan Council Programs—Dissection between Grants and Loans-1956-57 to 1973-74.
94 Functional Classification of Payments to or for the States and State Government Loan Council Programs, 1962-63 to 1974-75.
95 Functional Classification of Payments to or for the States and State Government Loan Council Programs—By States-1973-74.
135
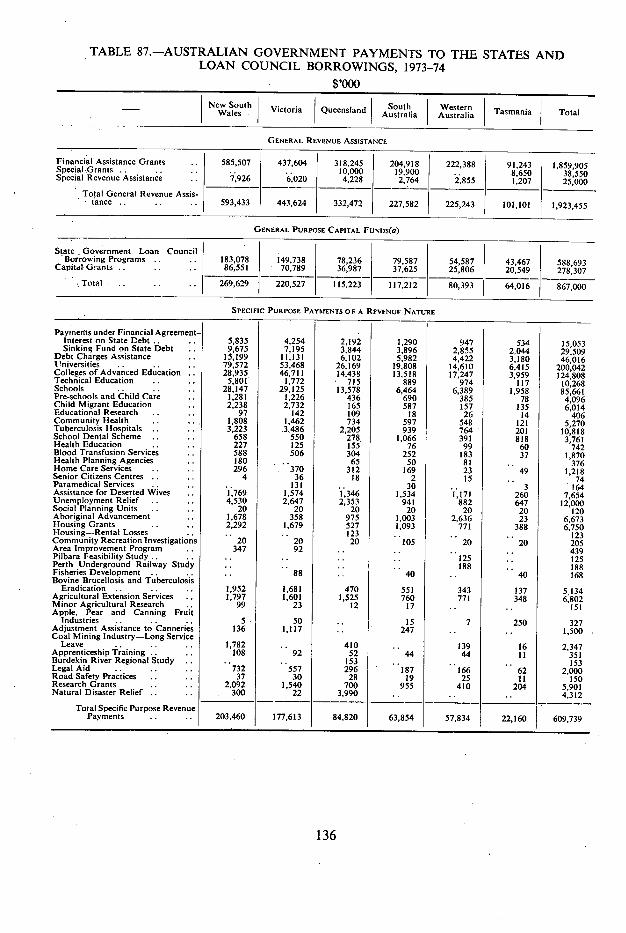
TABLE 87.-AUSTRALIAN GOVERNMENT PAYMENTS TO THE STATES AND LOAN COUNCIL BORROWINGS, 1973-74
$,000 New South I South I Western Tasmania Total Wales Victoria Queensland Australia Australia
GENERAL REVENUE ASSISTANCE
Financial Assistance Grants Special-Grants Special Revenue Assistance
Total General Revenue Assis. - tance
585,507 437,604 318,245 204,918 222,388 91,243 1,859,905 7,926 6,020
10,000 4,228
19,900 2,764 2,855
8,650 1,207
38,550 25,000
593,433 443,624 332,472 227,582 225,243 101,101 1,923,455
- GENERAL PURPOSE CAPITAL FUNI)S(a)
State - Government Loan Council
Borrowing Programs .. .. 183,078 149,738 78,236 79,587 54,587 43,467 588,693
Capital Grants .. .. .. 86,551 - 70.789 36,987 37,625 25,806 20,549 278,307
- •Total .. .. .. 269,629 220,527 115.223 117,212 80,393 64,016 867,000
SPECIFIC PURPOSE PAYMENTS OF A REVENUF NATURE
Payments under Financial Agreement- interest on State Debt . .. 5,835 4,254 2,192 1,290 947 534 15,053 Sinking Fund on State Debt .. 9,675 7,195 3,844 3,896 2,855 2,044 29.509 Debt Charges Assistance .. 15,199 11,131 6.102 5,982 4,422 3,180 46,016 Universities .. .. .. 79,572 53,468 26,169 19,808 14,610 6,415 200,042 Colleges of Advanced Education .. 28,935 46,711 14,438 13,518 17,247 3,959 124,808 Technical Education .. .. 5,801 1,772 - 715 889 974 117 10,268 Schools .. .. .. 28,147 29,125 13,578 6,464 6,389 1,958 85,661 Pre-schools and Child Care .. 1,281 1,226 436 690 385 78 4,096 Child Migrant Education .. 2,238 2,732 165 587 157 135 6,014 Educational Research .. .. 97 142 109 18 26 14 406 Community Health .. . . 1,808 1,462 734 597 548 121 5,270 Tuberculosis Hospitals .. . . 3,223 3.486 2,205 939 764 201 10,818 School Dental Scheme .. . 658 550 278, 1,066 391 818 3,761 Health Education .. .. 227 125 155 76 99 60 742 Blood Transfusion Services .. 588 506 304 252 183 37 1,870 Health Planning Agencies .. 180 - .. 65 50 81 .. 376 Home Care Services . . . . 296 . 370 312 169 23 49 1,218 Senior Citizens Centres .. . 4 36 18 2 15 .. 74 Paramedical Services .. . .. 131 .. 30 ., 3 164 Assistance for Deserted Wives .. 1,769 1,574 1,346 1,534 1,171 260 7,654 Unemployment Relief . . . . 4,530 2,647 2,353 941 882 647 12,000 Social Planning Units .. .. 20 20 20 20 20 20 120 Aboriginal Advancement .. 1,678 358 975 1.003 2,636 23 6,673 Housing Grants .. .. 2,292 1,679 527 1,093 771 388 6,750 Housing-Rental Losses .. .. .. 123 ,. ,. . 123 ommunity Recreation Investigations 20 20 20 105 20 20 205 krea Improvement Program .. 347 92 .. .. .. 439 Pilbara Feasibility Study.. .. .. 125 .. 125 Perth Underground Railway Study . .. .. 188 .. 188 Fisheries Development .. .. . 88 ., 40 .. 40 168 lovine Brucellosis and Tuberculosis Eradication .. .. .. 1,952 1,681 470 551 343 137 5,134 5.gricultural Extension Services .. 1,797 1,601 1,525 760 771 348 6,802 F-linor Agricultural Research . . 99 23 12 17 .. .. 151 pple, Pear and Canning Fruit Industries .. .. .. 5 50 .. 15 7 250 327 Fdjustment Assistance to Canneries 136 1,117 ., 247 .. .. 1,500 oal Mining Industry-Long Service Leave.. .. . . 1,782 . 410 .. 139 16 2,347 pprenticeshipTraining.. .. 108 92 52 44 44 fl 351 Iurdekin River Regional Study .. .. .. 153 .. .. .. 153 .egal Aid .. .. .. 732 557 296 187 166 62 2,000 toad Safety Practices .. .. 37 30 28 19 25 II 150 esearch Grants .. .. 2,092 1,540 700 955 410 204 5,901 Jatural Disaster Relief .. .. - 300 22 3,990 .. .. .. 4,312
Total Specific Purpose Revenue Payments .. .. 203,460 177.613 84,820 63,854 57,834 22,160 609,739
136
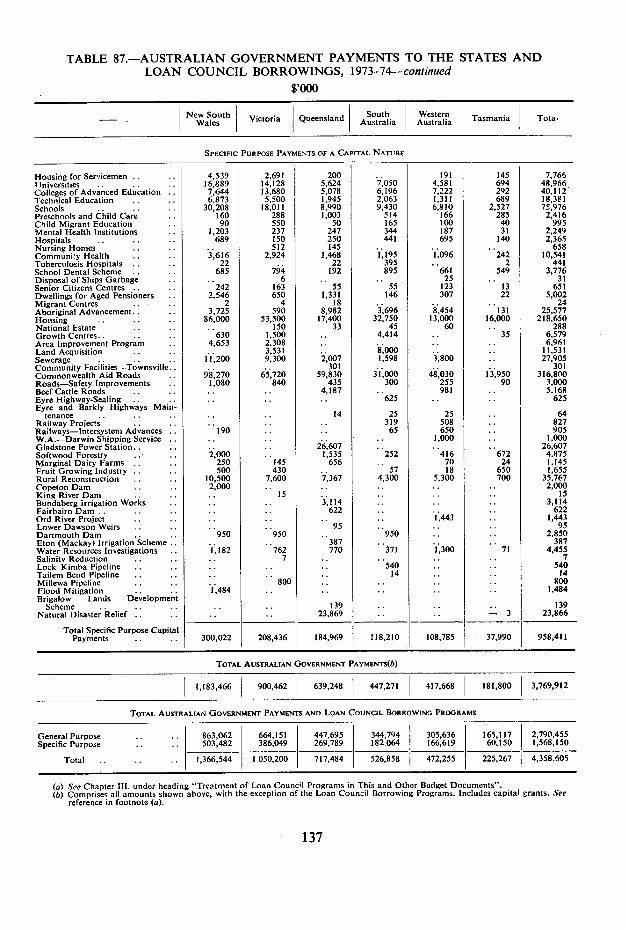
TABLE 87.-AUSTRALIAN GOVERNMENT PAYMENTS TO THE STATES AND LOAN COUNCIL BORROWINGS, 1973-74-continued
$,000
- - New South Victoria Queensland South
Australia Western
~ Tasmania Tota, Wales
SpEciFic PURPOSE PAYMENTS OF A CAPITAL NATURE
Housing for Servicemen .. .. 4,539 2,691 200 . 191 145 7,766 Universities .. 15,889 14,128 5,624 7,050 4.581 694 48,966 Colleges of Advanced Education .. 7,644 13,680 5,078 6,196 7,222 292 40.112 Technical Education .. .. 6,873 5.500 1,945 2,063 1,311 689 18,381 Schools .. .. .. 30,208 18,011 8,990 9,430 6,810 2,527 73,976
Ch Preschnols and ild Care .. 160 288 1,003 514 166 285 2,416 Child Migrant Education . . 90 550 50 165 100 40 995 Mental Health Institutions .. 1,203 237 247 344 187 31 2,249 Hospitals .. . .. 689 150 250 441 695 140 2,365 Nursing Homes .. .. . . 512 145 .. .. .. 658 Community Health .. .. 3,616 2,924 1,468 11195 1.096 242 10,541 Tuberculosis Hospitals .. .. 22 .. 22 395 .. 2 441 School Dental Scheme .. .. 685 794 192 895 661 549 3,776 Disposal of Ships Garbage . . . . 6 . . . . 25 . . 31 Senior Citizens Centres . . . . 242 163 55 55 123 13 651 Dwellings for Aged Pensioners . . 2,546 650 1,331 146 307 22 5,002 Migrant Centres . . . . 2 4 18 . . . . . . 24 Aboriginal Advancement.. .. 3.725 590 8,982 3,696 8,454 131 25,577 Housing .. .. .. 86,000 53,500 17,400 32,750 13,000 16,000 218,650 National Estate . . . . . . 150 33 45 60 . . 288 Growth Centres.. .. .. 630 1,500 .. 4,414 .. 35 6,579 Area Improvement Program .. 4,653 2.308 .. . . .. .. 6.961 Land Acquisition . . . . . . 3,531 . . 8,000 . . ,, 11,531 Sewerage . . . . 11,200 9,300 2,007 1,598 31800 .. 27,905 Community Facilities-Townsville. .. . . 301 . . . . . . 301 Commonwealth Aid Roads .. 98,270 65,720 59,830 31,000 48,030 13,950 316,800 Roads-Safety Improvements .. 1,080 840 435 300 255 90 3,000 Beef Cattle Roads .. .. . . .. 4,187 .. 981 .. 5,168 Eyre Highway-Sealing .. .. .. .. .. 625 .. .. 625 Eyre and Barkly Highways Main-
tenance .. . . .. .. ,. 14 25 25 .. 64 Railway Projects . . . . . . .. . . 319 508 . . 827 Rail ways-Intersystem Advances .. 190 .. .. 65 650 .. 905 W.A.-Darwin Shipping Service .. .. .. .. .. 1,000 .. 1,000 Gladstone Power Station.. .. .. .. 26,607 .. .. .. 26,607 Softwood Forestry .. .. 2,000 . . 1,535 252 416 672 4.875 Marginal Dairy Farms .. .. 250 145 656 .. 70 24 1.145 Fruit Growing Industry . . . . 500 430 . 57 18 650 1,655 Rural Reconstruction .. .. 10,500 7,600 7,367 4,300 5,300 700 35,767 Copeton Dam .. .. 2,000 .. .. .. .. .. 2,000 King River Dam .. .. .. 15 .. .. .. . . 15 Bundaberg irrigation Works .. .. .. 3,114 .. .. .. 3,114 Fairbairn Dam .. .. .. .. .. 622 .. .. .. 622 Ord River Project . . .. . . . . . . . . 11443 . . 1,443 Lower Dawson Weirs .. .. .. .. 95 .. .. .. 95 Dartmouth Dam .. .. 950 950 . . 950 .. .. 2,850 Eton (Mackay) Irrigation Scheme .. .. .. 387 .. .. .. 387 Water Resources Investigations .. 1,182 762 770 371 1,300 71 4,455 Salinity Reduction .. ,. .. 7 .. . . .. .. 7 Lock-1(imha Pipeline .. .. .. .. .. 540 .. .. 540 Tailem Bend Pipeline .. .. . . .. .. 14 .. .. 14 Millewa Pipeline .. .. .. 800 .. .. .. .. 800 Flood Mitigation .. .. 1 ,484 .. .. .. .. .. 1,484 Brigalow Lands Development
Scheme .. .. .. . . .. 139 .. .. ,, 139 Natural Disaster Relief . . . . . . . . 23,869 . . . . - 3 23,866
Total Specific Purpose Capital Payments .. .. 300,022 208,436 184,969 118,210 108,785 37,990 958.411
TOTAL AUSTRALIAN GOVERNMENT PAYMENTS(b)
1,183,466 900,462 639,248 447,271 417,668 181,800 3,769,912
TOTAL AUSTRALIAN GOVERNMENT PAYMENTS AND LOAN COUNCIL BORROWING PROGRAMS
General Purpose .. .. 863,062 664,151 447,695 344,794 305,636 165,117 2,790,455 Specific Purpose .. .. 503,482 386,049 269,789 182.064 166,619 60,150 1,568,150
1,366,544 1050,200 717,484 526,858 472,255 225,267 4,358.605 Total .. . . . .
See Chapter III. under heading "Treatment of Loan Council Programs in This and Other Budget Documents". Comprises all amounts shown above, with the exception of the Loan Council Borrowing Programs. Includes capital grants. See reference in footnote (a).
137
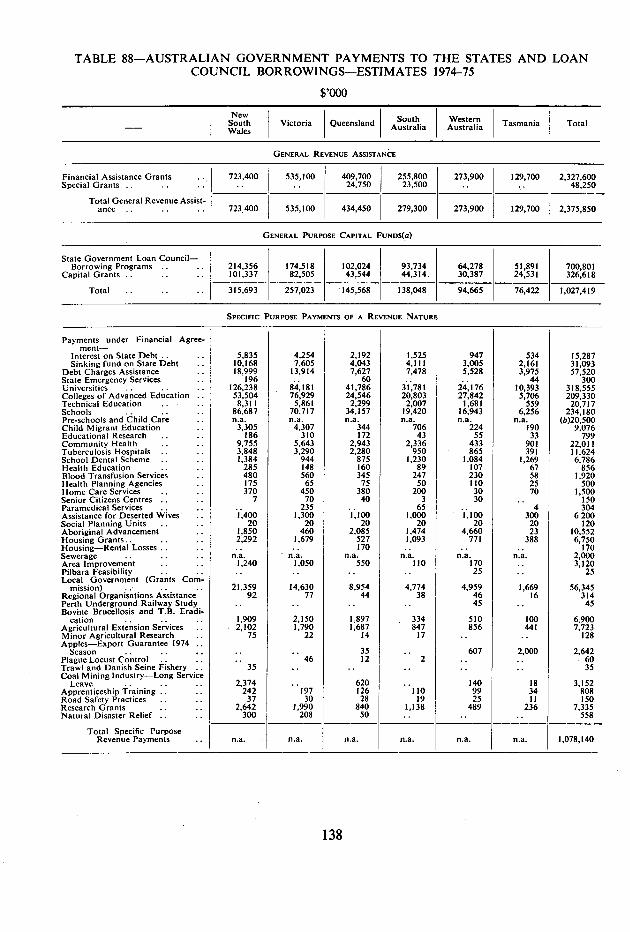
TABLE 88-AUSTRALIAN GOVERNMENT PAYMENTS TO THE STATES AND LOAN COUNCIL BORROWINGS-ESTIMATES 1974-75
$,000
I New SouthI Western I I I South Victoria Queensland Australia Australia Tasmania Total
Wales
GENERAL REVENUE ASSISTANCE
Financial Assistance Grants Special Grants
Total General Revenue Assist-ance
723,400 535,100
409.700 255,800
24,750 23,500 273,900 129,700
.. 2,327,600
48,250
723,400 535,100 434,450 279,300 273,900 129,700 2,375,850
GENERAL PURPOSE CAPITAL FUNDS(a)
State Government Loan Council- Borrowing Programs .. 214,356 174,518 102,024 93,734 64,278 51,891 700,801
Capital Grants 101,337 82,505 43,544 44,314. 30,387 24,531 326,618
Total .. .. 315,693 257,023 145,568 138,048 94,665 76,422 1,027,419
SPECIFIC PURPOSE PAYMENTS OF A REVENUE NATURE
Payments under Financial Agree- ment-
Interest on State Debt .. 5,835 4,254 2,192 1,525 947 534 15,287 Sinking fund on State Debt .. 10.168 7,605 4,043 4,111 3,005 2,161 31,093
Debt Charges Assistance .. 18,999 13,914 7,627 7,478 5,528 3,975 57,520 State Emergency Services 196 60 44 300 Universities 126,238 84,181 41,786 31,781 24,176 10,393 318,555 Colleges of Advanced Education .. 53,504 76,929 24,546 20,803 27,842 5,706 209,330 Technical Education . . -.. 8,311 5,861 2.299 2,007 1.681 559 20717 Schools . . . . . . 86,687 70,717 34,157 19,420 16,943 6,256 234:180 Pre-schools and Child Care .. n.a. n.a. n.a. n.a. n.a. n.a. (b)20,500 Child Migrant Education .. 3,305 4,307 344 706 224 190 9,076 Educational Research . . . . 186 310 172 43 55 33 799 Community Health .. .. 9,755 5,643 2,943 2,336 433 901 22,011 Tuberculosis Hospitals . . . . 3,848 3,290 2,280 950 865 391 11,624 School Dental Scheme . . . 1,384 944 875 1,230 1,084 1,269 6,786 Health Education . .. 285 148 160 89 107 67 856 Blood Transfusion Services .. 480 560 345 247 230 58 1,920 Health Planning Agencies . . 175 65 75 50 110 25 500 Home Care Services .. .. 370 450 380 200 30 70 1,500 Senior Citizens Centres . . . . 7 70 40 3 30 .. 150 Paramedical Services .. -. .. 235 . . 65 .. 4 304 Assistance for Deserted Wives' . . 1 1400 1,300 1,100 1,000 1,100 300 6200 Social Planning Units .. .. 20 20 20 20 20 20 120 Aboriginal Advancement .. 1,850 460 2,085 1,474 4,660 23 10,552 Housing Grants.. . . . . 2,292 1,679 527 1,093 771 388 6,750 Housing-Rental Losses .... .. .. 170 .. .. 170 Sewerage .. .. .. n.a. n.a. n.a. n.a. na. n.a. 2,000 Area Improvement .. .. 1,240 1,050 550 110 170 .. 3,120 Pilbara Feasibility .. .. .. .. .. .. 25 .. 25 Local Government (Grants Corn-
mission) .. .. .. 21,359 14,630 8,954 4,774 4,959 1,669 56,345 Regional Organisations Assistance 92 77 44 38 46 16 314 Perth Underground Railway Study .. .. .. .. 45 , 45 Bovine Brucellosis and T.B. Eradi-
cation . . .. . . 1,909 2,150 1,897 - 334 510 100 6,900 Agricultural Extension Services . . 2,102 1,790 1,687 847 856 441 7,723 Minor Agricultural Research . . 75 22 14 17 .. .. 128 Apples-Export Guarantee 1974
Season .. .. .. .. .. 35 .. 607 2,000 2,642 Plague Locust Control .. .. .. 46 12 2 .. .. 60 Trawl and Danish Seine Fishery . . 35 . . .. .. . . ,, 35 Coal Mining Industry-Long Service
Leave . . .. .. 2,374 .. 620 .. 140 18 3,152 Apprenticeship Training . . .. 242 197 126 110 99 34 808 Road Safety Practices . . .. 37 30 28 19 25 11 ISO Research Grants .. .. 2,642 1,990 840 1,138 489 236 7,335 Natural Disaster Relief . . . . 300 208 50 . . , . .. 558
Total Specific Purpose Revenue Payments .. n.a. n.a. n.a. n.a. n.a. n.a. 1,078,140
138
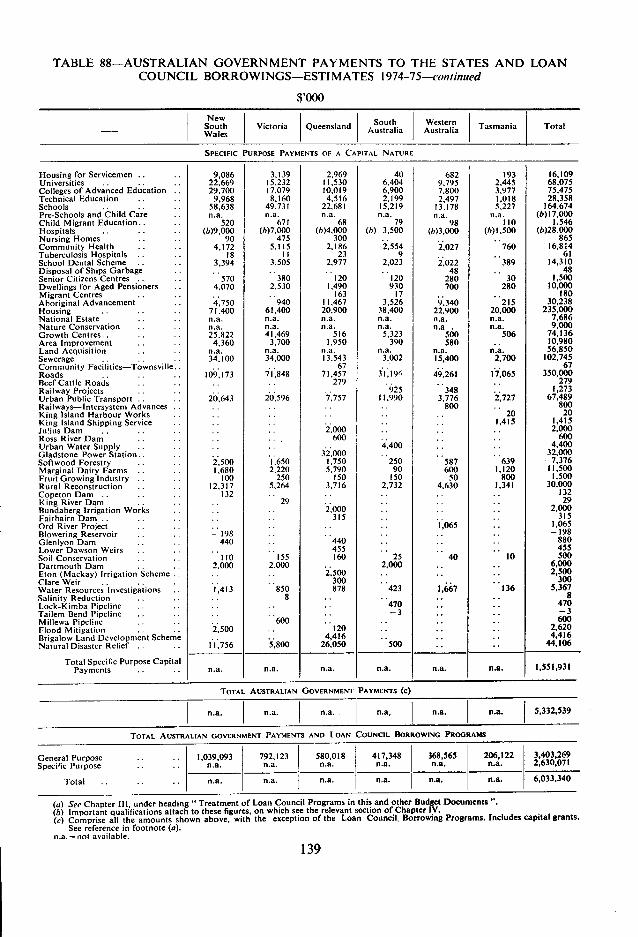
TABLE 88-AUSTRALIAN GOVERNMENT PAYMENTS TO THE STATES AND LOAN COUNCIL BORROWINGS-ESTIMATES 1974-75-continued
$,000
INew I I I South I Western Tasmania Total
Wales I South Victoria I Queensland Australia j Australia
I
- I SPECIFIC PURPOSE PAYMENTS OF A CAPITAL NATURE
Housing for Servicemen . . .. 9,086 3,139 2,969 40 682 193 16,109 Universities .. . .. 22.669 15,232 11,530 6,404 9.795 2.445 68,075 Colleges of Advanced Education .. 29.700 17,079 10,019 6,900 7.800 3,977 75,475 Technical Education . . . . 9,968 8,160 4,516 2.199 2,497 1,018 28,358 Schools . . . . . . 58,638 49,731 22,681 15,219 13.178 5,227 164,674 Pre-Schools and Child Care .. n.a. n.a. n.a. n.a. n.a. n.a. (b)17,000 Child Migrant Education.. . . 520 671 68 79 98 110 1,546 Hospitals . . . . . . (b)9,000 (b)7,000 (6)4,000 (b) 3,500 (6)3,000 (6)1.500 (b)28,000 Nursing Homes .. .. 90 475 300 .. .. .. 865 Community Health . . . . 4.172 5,115 2,186 2.554 2,027 760 16,814 Tuberculosis Hospitals . . . . 18 II 23 9 . . . . 61 School Dental Scheme .. .. 3,394 3,505 2,977 2,023 2.022 389 14,310 Disposal of Ships Garbage . . . . . . . . . . 48 . . 48 Senior Citizens Centres . . . . 570 380 120 120 280 30 1,500 Dwellings for Aged Pensioners .. 4.070 2.530 1,490 930 700 280 10,000 Migrant Centres . . . . . . . . 163 17 . . . . 180 Aboriginal Advancement . . 4.750 940 11.467 3,526 9.340 215 30,238 Housing .. .. .. 71,400 61,400 20,900 38,400 22,900 20,000 235,000 National Estate .. .. n.a. n.a. n.a. n.a. n.a. n.a. 7,686 Nature Conservation .. . . n.a. n.a. n.a. n.a. n.a . n.a. 9,000 Growth Centres.. .. . . 25,822 41.469 516 5,323 500 506 74,136 Area Improvement .. .. 4,360 3,700 1,950 390 580 .. 10,980 Land Acquisition . . . . n.a. n.a. n.a. n.a. n.a. n.a. 56,850 Sewerage . . . . . . 34,100 34,000 13,543 3,002 15,400 2,700 102,745 Community Facilities-Townsvilie. . . . . . 67 .. .. . . 67 Roads .. . . . . 109,173 71,848 71.457 31,19v 49,261 17,065 350,000 Beef Cattle Roads . . .. . . . . 279 . .. , 279 Railway Projects . . .. . . . . . 925 348 . . 1,273 Urban Public Transport .. . . 20,643 20,596 7,757 11,990 3.776 2,727 67,489 Railways- IntersystemAdvances . . . . . . . . .. 800 .. 800 King island Harbour Works . . . . . . . . .. . . 20 20 King island Shipping Service . . . . . . . .. . . 1,415 1,415 Ju!ius Dam .. .. . . . . .. 21000 .. .. ., 2,000 Ross River Dam .. .. 0 600 .. .. .. 600 Urban Water Supply .. .. . . .. .. 4,400 .. .. 4.400 Gladstone Power Station.. . . . . . . 32,000 . . .. . . 32,000 Softwood Forestry .. . . 2,500 1,650 1,750 250 587 639 7.376 Marginal Dairy Farms .. . . 1,680 2.220 5,790 90 600 1,120 11,500 Fruit Growing Industry .. . . 100 250 ISO 150 50 800 1,500 Rural Reconstruction .. . . 12,317 5,264 3,716 2.732 4,630 1,341 30,000 Copeton Dam .. .. . . 132 . . . . .. . . .. 132 King River Dam . . . . . . 29 . . .. . . . . 29 Bundaberg Irrigation Works . . . . . . 2,000 .. . . . . 2,000 Fairhairn Dam .. .. . . . . . . 315 .. . . . . 315 Ord River Project . . . . . . . . . . . . 1,065 . . 1,065 Blotvering Reservoir . . . . - 198 . . . . . . . . . . -198 Glenlyon Dam .. .. 440 .. 440 .. .. .. 880 Lower Dawson Weirs.. . . Soil Conservation . . ..
. . ItO
.. 155
455 160
.. 25
.. 40
.. 10
455 500
Dartmouth Dam .. .. 2.000 2,000 .. 2,000 .. 6,000 Eton (Mackay) Irrigation Scheme .. . . . . 2.500 .. .. .. 2,500 Clare Weir . . . . . . . . . . 300 . . , . 300 Water Resources Investigations . . 11413 850 878 423 1,667 136 5,367 Salinity Reduction .. .. . . 8 . . ..
470 .. .. 8
470 Lock-K imba Pipeline .. .. . . .. .. -3
,, .. -3 Tailem Bend Pipeline .. .. . . ..
600 .. ., ,,
600 Millewa Pipeline .. . . Flood Mitigation •. ..
. . 2,500 ..
.. 120
..
.. ,. ..
,, .. 2,620
Brigatow Land Development Scheme . . .. 4,416 .. ,, .. 4,416 Natural Disaster Relief . . .. 11,756 5,800 26,050 500 ,, ,, 44,106
na. na. na. n.a. n.a. 1,551,931 Total Specific Purpose Capital
Payments .. .. n.a.
TOTAL AUSTRALIAN GOVERNMENT PAYMENTS (c)
I n.a. I n.a. I n.a. n.a, I n.a. I n.a. 1 5,332,539
TOTAL AUSTRALIAN GOVERNMENT PAYMENTS AND LOAN COUNCIL BORROWING PROGRAMS
General Purpose .. .. Speci'Ic Purpose .. ..
Total .. .. ..
1,039,093 n.a.
792,123 n.a.
580,018 n.a.
417,348 n.a.
368,565 n.a.
206,122 n.a.
3,403,269 2,630,071
n.a. n.a. n.a. n.a. n.a. n.a. 6,033,340
See Chapter III. under heading "Treatment of Loan Council Programs in this and other Budget Documents important qualifications attach to these figures, on which see the relevant section of Chapter IV. Comprise all the amounts shown above, with the exception of the Loan Council, Borrowing Programs. Includes capital grants. See reference in footnote (a).
na. = not available.
139
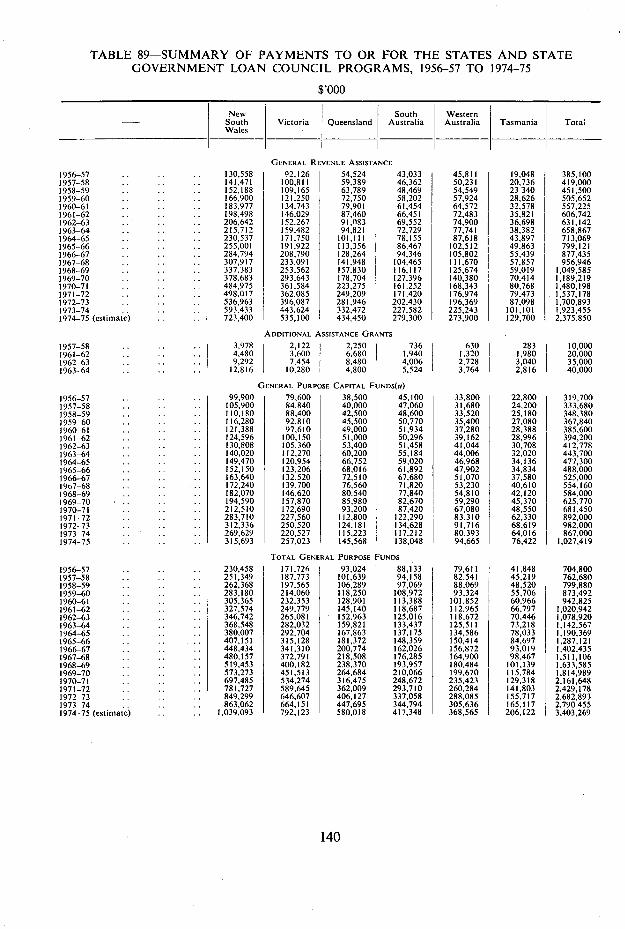
TABLE 89-SUMMARY OF PAYMENTS TO OR FOR THE STATES AND STATE GOVERNMENT LOAN COUNCIL PROGRAMS, 1956-57 TO 1974-75
$,000
- New South Victoria Queensland
South Australia -_Wales
Western Australia Tasmania Total
GENERAL REVENUE ASSISTANCE 1956-57 . 130,558 92,126 54,524 43,033 45,811 19,048 385,100 1957-58 .. 141,471 100,811 59,389 46,362 50,231 20,736 419,000 1958-59 .. .. 152,188 109,165 63,789 48,469 54,549 23 340 451,500 1959-60 .. 166,900 121,250 j 72,750 58,202 57,924 28,626 505,652 1960-61 183,977 134,743 79,901 61,454 64,572 32,578 557,225 1961-62 .. .. .. 198,498 146,029 87,460 66,451 72,483 35,821 606,742 1962-63 .. .. 206,642 152,267 91,083 69,552 74,900 36,698 631,142 1963-64 .. .. .. 215,712 159,482 94,821 72,729 77,741 38,382 658,867 1964-65 . . . . . . 230,537 171,750 101,111 78,155 87,618 43,897 713,069 1965-66 .. . . .. 255,001 191,922 113,356 86,467 102,512 49,863 799,121 1966-67 .. .. . . 284,794 208,790 128,264 94,346 105,802 55,439 877,435 1967-68 .. . . . . 307,917 233,091 141,948 104,465 111,670 57,857 956,946 1968-69 . . . . . . 337,383 253,562 157.830 116,117 125,674 59,019 1,049,585 1969-70 . . . .. 378,683 293,643 178,704 127,396 140,380 70,414 1,189,219 1970-71 . . . . . . 484,975 361,584 223,275 161,252 168,343 80,768 1,480,198 1971-72 . . .. . . 498,017 362.085 249,209 171,420 176,974 79,473 1,537,178 1972-73 .. .. . . 536,963 396,087 281,946 202,430 196,369 87,098 1,700,893 1973-74 .. .. . . 593.433 443,624 332,472 227,582 225,243 101,101 1,923,455 1974-75 (estimate) .. . 723,400 535,100 434,450 279,300 273,900 129,700 2,375,850
ADDITIONAL ASSISTANCE GRANTS
1957-58 .. .. .. 3,978 2,122 2,250 736 630 283 10,000 1961-62 .. .. . 4,480 3,600 6,680 1,940 1,320 1,980 20,000 1962-63 .. . . . 9,292 7,454 8,480 4,006 2,728 3,040 35,000 1963-64 .. .. . 12,816 10,280 I 4,800 5,524 3,764 2,816 40,000
GENERAL PURPOSE CAPITAL FUNDS(a)
1956-57 . . . . . 99,900 79,600 38.500 45,100 33,800 22,800 39,700 1957-58 . .. . 105,900 84,840 40,000 47,060 31,680 24.200 333,680 1958-59 . . . . 110,180 88,400 42,500 48,600 33,520 25,180 348,380 1959-60 . . . . . 116,280 92,810 45.500 50,770 35,400 27,080 367,840 1960-61 . . .. . . 121,388 97,610 49,000 51,934 37,280 28,388 385,600 1961-62 .. .. . . 124,596 100.150 51,000 50,296 39,162 28,996 394,200 1962-63 . . .. . . 130,808 105.360 53,400 51,458 41,044 30,708 412,778 1963-64 .. .. .. 140,020 112,270 60.200 55,184 44,006 32,020 443,700 1964-65 .. . . . . 149,470 120,954 66.752 59,020 46,968 34,136 477,300 1965-66 .. . . . . 152,150 123,206 68,016 61.892 47.902 34,834 488,000 1966-67 .. .. .. 163,640 132.520 72,510 67,680 51.070 37.580 525,000 190-68 . . . . . .. 172,240 139,700 76.560 71,820 53,230 40,610 554,160 1968-69 .. .. .. 182,070 146,620 80.540 77,840 54.810 42.120 584,000 1969-70 ' .. . . . . 194,590 157,870 85,980 82,670 59.290 45,370 625,770 1970-71 .. .. .. 212,510 172.690 93,200 87,420 67,080 48,550 681,450 1971-72 .. .. . . 283,710 227,560 112,800 122,290 83,310 62,330 892,000 1972-73 .. .. . . 312,336 250.520 124.181 134,628 91,716 68.619 982,000 1973-74 . . •. .. 269,629 220,527 115.223 117.212 80.393 64,016 867,000 1974-75 . . .. . . 315,693 257,023 145.568 138,048 94,665 76,422 1,027,419
TOTAL GENERAL PURPOSE FUNDS
1956-57 . . . . . . 230,458 I 171.726 93,024 88,133 79,611 41,848 704,800 1957-58 .. . . . . 251,349 187,773 101,639 94,158 82,541 45,219 762,680 1958-59 . . . . .. 262,368 197,565 106,289 97,069 88,069 48,520 799,880 1959-60 •. . . .. 283,180 214,060 118,250 108,972 93,324 55,706 873,492 1960-61 . . . . .. 305,365 232,353 128,901 113,388 101,852 60,966 942,825 1961-62 . . . . . . 327,574 249,779 145,140 118,687 112,965 66.797 1.020.942 1962-63 . . . . . . 346,742 265,081 152.963 125,016 118,672 70,446 1,078,920 1963-64 .. . . . . 368,548 282.032 159,821 133,437 125,511 73,218 1,142.567 1964-65 . . . . .. 380,007 292,704 167,863 137,175 134,586 78,033 1.190.369 1965-66 .. 407,151 315,128 181,372 148,359 150,414 84,697 1,287,121 1966-67 .. . . . . 448.434 341,310 200,774 162,026 156,872 93.019 1,402.435 1967-68 . . . . . . 480,157 372.791 218.508 176,285 164,900 98,467 1,511.106 1968-69 . . .. . . 519,453 400,182 238,370 193,957 180,484 101.139 1,633,585 1969-70 . . . . . . 573.273 451.513 264,684 210,066 199.670 115.784 1.814.989 1970-71 . . .. . . 697,485 534.274 316.475 248.672 235.423 129.318 2,161,648 1971-72 . . . . . . 781,727 589,645 362.009 293,710 260,284 141.803 2,429,178 1972-73 . . .. . . 849,299 646,607 406,127 337,058 288.085 155,717 2,682,893 1973-74 . . .. . . 863,062 664,151 447,695 344,794 305,636 165,117 2,790 455 1974-75 (estimate) .. . . 1,039,093 792,123 580.018 417,348 368,565 206,122 3.403.269
140
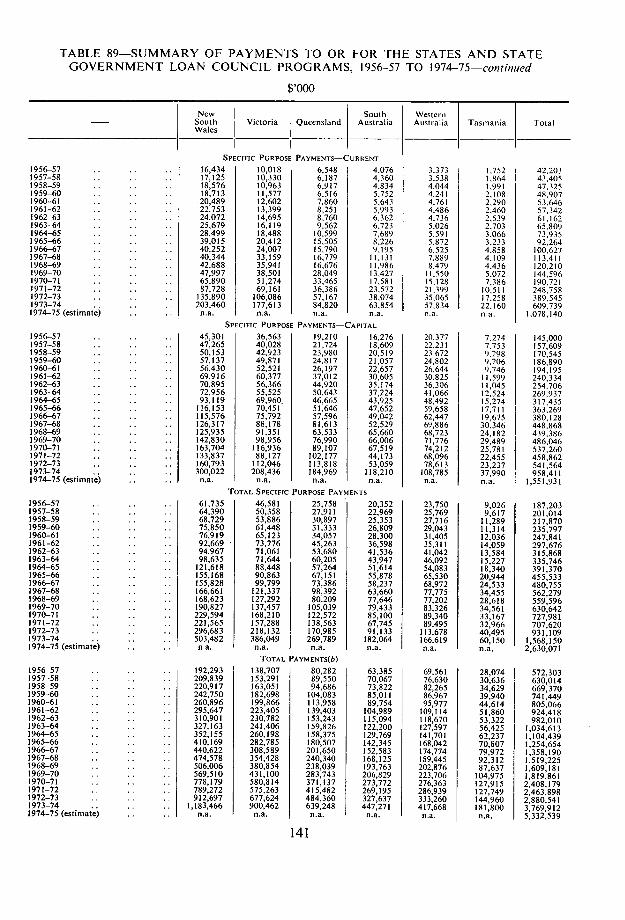
TABLE 89-SUMMARY OF PAYMENTS TO OR FOR THE STATES AND STATE GOVERNMENT LOAN COUNCIL PROGRAMS, 1956-57 TO 1974-75-continued
$,000
South Wales
Victoria New South
Queensland Australia Western Australia Tasmania Total
SPECIFtC PURPOSE PAYMENTS-CURRENT
1956-57 . . . . . . 16,434 10,018 6,548 4,076 3,373 1,752 42,203 1957-58 . . . . . . 17,125 10,330 6,187 4,360 3.538 1.864 43,405 1958-59 . . . . . 18,576 10,963 6,917 4,834 4.044 1,991 47,325 1959-60 . . . . . 18,713 11,577 6,516 5,752 4.241 2,108 48,907 1960-61 20,489 12,602 7,860 5.643 4.761 2,290 53.646 1961-62 .. . . . . 22,753 13,399 8,251 5,993 4,486 2.460 57,342 1962-63 . . ,. .. 24,072 14,695 8,760 6,362 4,736 2,539 61.162 1963-64 . . ,, . . 25,679 16,119 9,562 6.723 5,026 2,703 65.809 1964-65 . . .. .. 28,499 18.488 10,599 7,689 5,591 3,066 73,935 1965-66 . . . . .. 39,015 20,412 15,505 8,226 5.872 3.233 92,264 1966-67 .. .. .. 40,252 24,007 15,790 9.195 6,525 4,858 100.627 1967-68 . . . . . . 40,344 33,159 16.779 11,131 7,889 4,109 113,411 1968-69 .. .. .. 42,688 35,941 16,676 11,986 8,479 4,436 120.210 1969-70 . . .. . . 47,997 38,501 28,049 13,427 11,550 5.072 144,596 1970-71 . . . . . . 65.890 51,274 33,465 17,581 15.128 7,386 190.721 1971-72 . . . . . . 87,728 69.161 36.386 23.572 21,399 10,511 248,758 1972-73 . . . . . . 135.890 106,086 57,167 38,074 35.065 17,258 389.545 1973-74 .. .. .. 203,460 177,613 84,820 63,854 57,834 22.160 609.739 1974-75 (estimate) . . .. na. na. na. na. n. a. na. 1,078,140
SPECIFIC PURPOSE PAYMENTS-CAPITAL
1956-57 . . . . . . 45,301 36,563 19,210 16,276 20,377 7.274 145,000 1957-58 .. . . .. 47,265 40,028 21,724 18,609 22,231 7,753 157,609 1958-59 .. . . . . 50,153 42,923 23,980 20.519 23.672 9.298 170,545 1959-60 . . . . . . 57,137 49,871 24,817 21,057 24,802 9,206 186,890 1960-61 .. . . .. 56,430 52.521 26,197 22,657 26.644 9.746 194,195 1961-62 .. . . .. 69,916 60,377 37,012 30,605 30.825 11,599 240,334 1962-63 .. .. .. 70,895 56,366 44.920 35,174 36,306 11,045 254,706 1963-64 ,, . . .. 72,956 55,525 50,643 37,224 41,066 12,524 269,937 1964-65 .. .. .. 93,119 69,96Q 46,665 43,925 48,492 15,274 317,435 1965-66 .. . . .. 116,153 70,451 51,646 47,652 59,658 17,711 363,269 1966-67 . . .. .. 115,576 75,792 57,596 49,042 62,447 19,675 380,128 1967-68 .. .. .. 126,317 88,178 81,613 52,529 69,886 30,346 448.868 1968-69 .. .. .. 125,935 91,351 63,533 65,660 68,723 24,182 439,386 1969-70 .. .. .. 142,830 98,956 76,990 66,006 71,776 29,489 486.046 1970-71 . . . . . . 163,704 116,936 89,107 67,519 74,212 25,781 537,260 1971-72 .. .. .. 133,837 88,127 102,177 44,173 68,096 22,455 458,862 1972-73 . . . . . . 160,793 112,046 113,818 53,059 78,613 23,237 541,564 1973-74 .. .. .. 300,022 208,436 184,969 118,210 108,785 37,990 958,411 1974-75 (estimate) .. .. na. na. na. na. na. na. 1,551,931
TOTAL SPECIFIC PURPOSE PAYMENTS
1956-57 . . ,. .. 61,735 46,581 25,758 20,352 23,750 9,026 187,203 1957-58 . . .. .. 64,390 50,358 27,911 22,969 25,769 9,617 201,014 1958-59 . . .. .. 68,729 53,886 30,897 25,353 27,716 11.289 217,870 1959-60 . . .. .. 75,850 61,448 31,333 26,809 29,043 11,314 235,797 1960-61 .. . . . . 76,919 65,123 34,057 28,300 31,405 12,036 247,841 1961-62 .. . . .. 92,669 73,776 45,263 36,598 35,311 14,059 297,676 1962-63 .. .. . . 94,967 71,061 53,680 41,536 41,042 13,584 315,868 1963-64 . . . . .. 98,635 71,644 60,205 43,947 46,092 15,227 335,746 1964-65 . . . . .. 121,618 88,448 57,264 51,614 54,083 18,340 391,370 1965-66 . . .. .. 155,168 90,863 67,151 55,878 65,530 20,944 455,533 1966-67 . . .. . . 155,828 99,799 73,386 58,237 68,972 24,533 480,755 1967-68 .. . . .. 166,661 121,337 98,392 63,660 77,775 34,455 562,279 1968-69 . . . . .. 168,623 127,292 80,209 77,646 77,202 28,618 559,596 1969-70 .. .. .. 190,827 137,457 105,039 79,433 83.326 34,561 630,642 1970-71 .. . . .. 229,594 168,210 122,572 85,100 89,340 33,167 727,981 1971-72 .. . . . . 221.565 157,288 138,563 67,745 89,495 32,966 707,620 1972-73 . . . . .. 296,683 218,132 170,985 91,133 113,678 40,495 931,109 1973-74 . . . . . . 503,482 386,049 269,789 182,064 166,619 60,150 1,568,150 1974-75 (estimate) .. .. n a. na. na. na. na. na. 2,630,071
TOTAL PAYMENT5(b)
1956-57 .. .. .. 192,293 138,707 80,282 63,385 69,561 28,074 572,303 1957-58 . . .. .. 209,839 153,291 89,550 70,067 76,630 30,636 630,014 1958-59 .. .. . . 220,917 163,051 94,686 73,822 82,265 34,629 669,370 1959-60 .. .. .. 242,750 182,698 104,083 85,011 86,967 39,940 741,449 1960-61 .. . . . . 260,896 199,866 113,958 89,754 95,977 44,614 805,066 1961-62 .. . . .. 295,647 223,405 139,403 104,989 109,114 51,860 924,418 1962-63 .. .. .. 310,901 230,782 153,243 115,094 118,670 53,322 982,010 1963-64 .. . . .. 327,163 241,406 159,826 122,200 127,597 56,425 1,034 613 1964-65 .. .. .. 352,155 260,198 158,375 129,769 141,701 62,237 1,104439 1965-66 . . . . . . 410,169 282.785 180,507 142,345 168,042 70,807 1,254 654 1966-67 .. .. . . 440,622 308,589 201,650 152,583 174,774 79,972 1,358 190 1967-68 . . .. . . 474,578 354,428 240,340 168,125 189,445 92,312 1,519225 1968-69 .. . . . . 506,006 380,854 238,039 193,763 202,876 87,637 1.609 181 1969-70 .. . . . . 569,510 431,100 283,743 206,829 223,706 104,975 1,819,861 1970-71 .. .. . . 778,179 580,814 371,137 273,772 276,363 127,915 2,408 179 1971-72 .. . . . . 789,272 575,263 415,482 269,195 286,939 127,749 2463 898 1972-73 .. .. . 912,697 677,624 484,360 327,637 333,260 144,960 2,880,541 1973-74 .. .. .. 1,183,466 900,462 639,248 447,271 417,668 181,800 3,769,912 1974-75 (estimate) . . .. na. na. na. na. na. na. 5,332,539
141
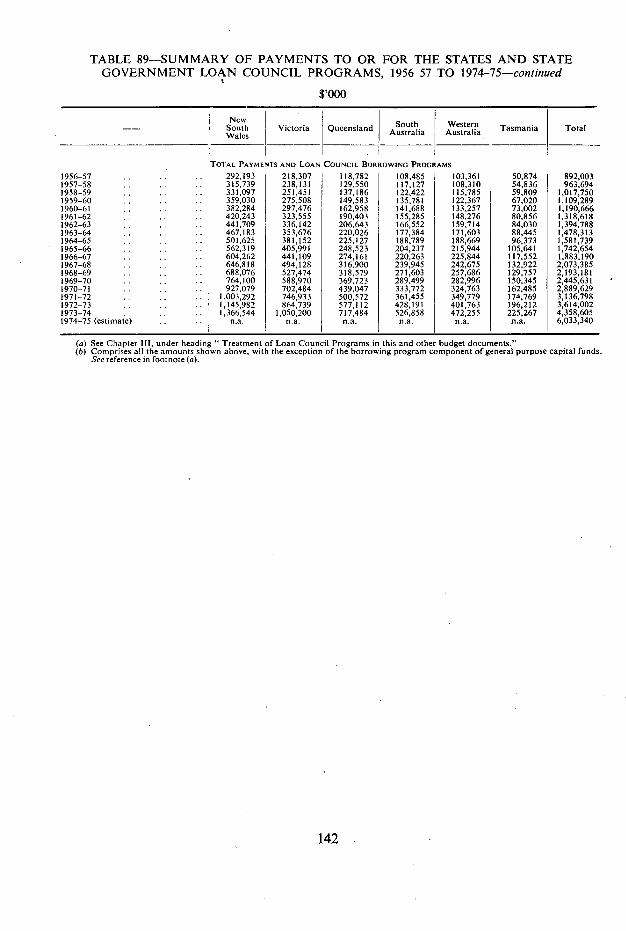
TABLE 89-SUMMARY OF PAYMENTS TO OR FOR THE STATES AND STATE GOVERNMENT LOAN COUNCIL PROGRAMS, 1956-57 TO 1974-75-continued
$,000
New South Victoria Queensland South
Aia We Tasmania Total
Wales
TOTAL PAYMENTS AND LOAN COUNCIL BORROWING PROGRAMS 1956-57 .. 292,193 218,307 118,782 108,485 103,361 50,874 892,003 1957-58 315,739 238,131 129,550 117,127 108,310 54,836 963,694 1958-59 331,097 251,451 137,186 122,422 115,785 59,809 1,017,750 1959-60 359,030 275,508 149,583 135,781 122,367 67.020 1,109,289 1960-61 382,284 297,476 162,958 141,688 133,257 73,002 1,190,666 961-62 . 420,243 323,555 190,403 155,285 148,276 80,856 1,318,618
1962-63 . 441,709 336,142 206.643 166,552 159,714 84,030 1,394.788 1963-64 . . 467,183 353,676 220,026 177,384 171,603 88,445 1,478,313 1964-65 .. 501,625 381,152 225,127 188,789 188,669 96,373 1,581,739 1965-66 . .. 562,319 405,991 248,523 204,237 215,944 105,641 1,742,654 1966-67 .. 604,262 441,109 274,161 220,263 225,844 117,552 1,883,190 1967-68 646,818 494,128 316,900 239,945 242,675 132,922 2,073,385 1968-69 ,. 688,076 527,474 318,579 271,603 257,686 129,757 2,193,181 1969-70 .. .. 764,100 588,970 369,723 289,499 282,996 150,345 2,445,631 1970-71 927,079 702,484 439,047 333,772 324,763 162,485 2,889,629 1971-72 .. .. 1,003,292 746,933 500,572 361,455 349,779 174,769 3,136,798 1972-73 . 1,145,982 864,739 577,112 428,191 401,763 196,212 3,614,002 1973-74 . 1,366,544 1,050,200 717,484 526,858 472,255 225,267 4,358,605 1974-75 (estimate) n.a. na. na. na. na. na. 6,033,340
See Chapter III, under heading "Treatment of Loan Council Programs in this and other budget documents." Comprises all the amounts shown above, with the exception of the borrowing program component of general purpose capital funds. See reference in footnote (a).
142
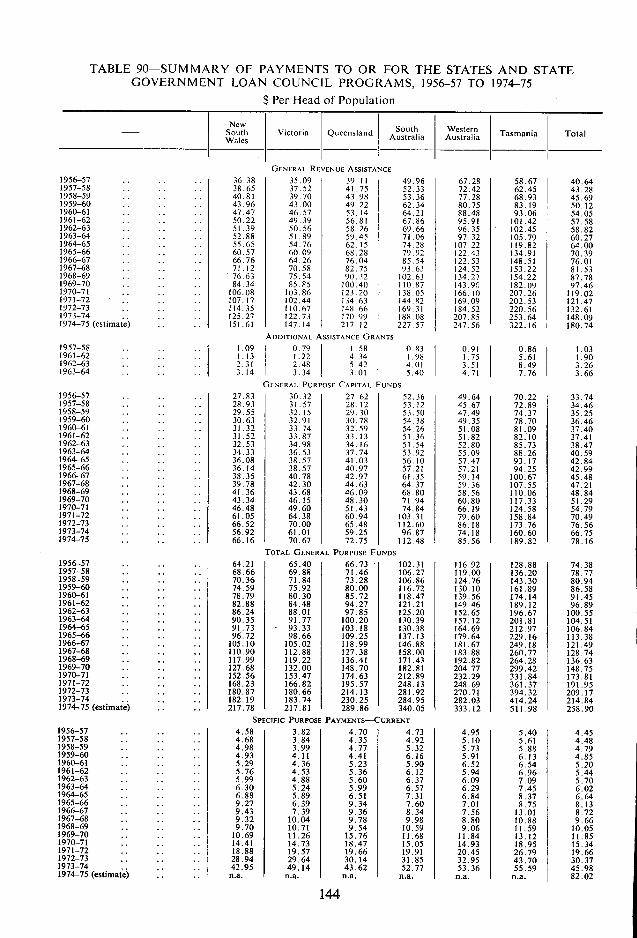
TABLE 90-SUMMARY OF PAYMENTS TO OR FOR THE STATES AND STATE GOVERNMENT LOAN COUNCIL PROGRAMS, 1956-57 TO 1974-75
$ Per Head of Population
- New
South Victoria Queensland South Western Tasmania Total Wales Australia Australia
GENERAL REVENUE ASSISTANCE 1956-57 . . . . . 36.38 35.09 39.11 49.96 67.28 58.67 40.64 1957-58 . . . . . . 38.65 37.52 41.75 52.33 72.42 62.45 43.28 1958-59 . . . . 40.81 39.70 43.98 53.36 77.28 68.93 45.69 1959-60 . . 43.96 43.00 49.22 62.34 80.75 83.19 50.12 1960-61 .. .. . . 47.47 46.57 53.14 64.21 88.48 93.06 54.05 1961-62 . . . . . 50.22 49.39 56.81 67.86 95.91 101.42 57.58 1962-63 .. .. . . 51.39 50.56 58.26 69.66 96.35 102.45 58.82 1963-64 . . . . . . 52.88 51.89 59,45 71.06 97.32 105.79 60.27 1964-65 .. .. .. 55.65 54.76 62.15 74.28 107.22 119.82 64.00 1965-66 . . . . . . 60.57 60.09 68.28 79.92 122.43 134.91 70.39 1966-67 . . . . .. 66.76 64.26 76.04 85.54 122.53 148.51 76.01 1967-68 . . . . . . 71.12 70.58 82.75 93.63 124.52 153.22 81.53 1968-69 . . . . . . 76,63 75.54 90.32 102.63 134.27 154.22 87.78 1969-70 .. . . . . 84.34 85.95 100.40 110.87 143.96 182.09 97.46 1970-71 .. . . . . 106.08 103.86 123.20 138.05 166.10 207.26 119.02 1971-72 .. . . .. 107.17 102.44 134.63 144.82 169.09 202.53 . 121.47 1972-73 . . . . . . 114.35 110.67 148.66 169.31 184.52 220.56 132.61 1973-74 . . . . . 125.27 122.73 170.99 188.08 207.85 253.64 I 148.09 1974-75 (estimate) . . . . 151.61 147.14 217.12 227.57 247.56 322.16 180.74
ADDITIONAL ASSISTANCE GRANTS 1957-58 .. .. .. 1.09 0.79 1.58 0.83 0.91 0.86 1.03 1961-62 .. .. .. 1.13 1.22 4.34 1.98 1.75 5.61 1.90 1962-63 . . . . . 2.31 2.48
1
5.42 4.01 3.51 8.49 3.26 1963-64 . . .. . . 3.14 3.34 3.01 ' 5.40 4.71 7.76 I 3.66
GENERAL PURPOSE CAPITAL FUNDS 1956-57 . . . . . . 27.83 30.32 27.62 52,36 49.64 70.22 33.74 1957-58 .. .. . . 28.93 31,57 28.12 53.12 45.67 72.89 34.46 1958-59 . . . . . . 29.55 32,15 29.30 53.50 47.49 74.37 35.25 1959-60 . . .. .. 30.63 32.91 30.78 54.38 49.35 78.70 36.46 1960-61 .. .. . . 31.32 33,74 32.59 54.26 51.08 81.09 37.40 1961-62 . . . . . . 31.52 33.87 33.13 51,36 51.82 82.10 37.41 1962-63 .. .. .. 32.53 34.98 34.16 51.54 52.80 85.73 38.47 1963-64 .. . . .. 34.33 36.53 37.74 53.92 55,09 88.26 40.59 1964-65 .. .. .. 36.08 38.57 41.03 56.10 57,47 93.17 42.84 1965-66 . . .. .. 36.14 38.57 40.97 57.21 57.21 94.25 42.99 1966-67 . . .. . . 38.35 40,78 42.97 61.35 59,14 100.67 45.48 1967-68 .. . . . . 39.78 42,30 44.63 64,37 59,36 107.55 47.21 1968-69 .. . . . . 41.36 43.68 46.09 68.80 58.56 110.06 48.84 1969-70 .. . . . . 43.34 46.15 48.30 71.94 60.80 117.33 51.29 1970-71 .. . . . . 46.48 49.60 51.43 74.84 66.19 124.58 54.79 1971-72 .. . . .. 61.05 64.38 60,94 103.31 79.60 158.84 70,49 1972-73 .. .. .. 66.52 70.00 65.48 112.60 86.18 173.76 76.56 1973-74 .. .. .. 56.92 61.01 59.25 96.87 74.18 160.60 66.75 1974-75 .. .. .. 66.16 70.67 72.75 112.48 85.56 189.82 78.16
TOTAL GENERAL PURPOSE FUNDS 1956-57 .. .. .. 64.21 65.40 66.73 ' 102.31 116.92 128.88 74.38 1957-58 .. .. .. 68.66 69.88 71.46 106.27 119.00 136.20 78.77 1958-59 . . .. 70.36 71.84 73.28 106.86 124.76 143.30 80.94 1959-60 .. .. .. 74.59 75.92 80.00 116.72 130.10 161.89 86.58 1960-61 .. .. . . 78.79 80.30 85.72 118.47 139.56 174.14 91.45 1961-62 .. .. .. 82.88 84.48 94.27 121.21 149.46 189.12 96.89 1962-63 .. .. .. 86.24 88.01 97.85 125.20 152.65 196.67 100.55 1963-64 .. .. 90.35 91.77 100.20 130.39 157.12 201.81 104.51 1964-65 .. .. 91.73 ' 93.33 103.18 130.38 164.69 212.97 106.84 1965-66 .. .. .. 96.72 98.66 109.25 137.13 179.64 229.16 113.38 1966-67 . . .. .. 105.10 105.02 118.99 146.88 181.67 249.18 121.49 1967-68 .. 110.90 112.88 127.38 158.00 183.88 260.77 128.74 1968-69 .. .. 117.99 119.22 136.41 171.43 192.82 264.28 136.63 1969-70 .. 127.68 132.00 148.70 182.81 204.77 299.42 148.75 1970-71 .. .. 152.56 153.47 174.63 212.89 232.29 331.84 173.81 1971-72 .. . 168.23 166.82 195.57 248.13 248.69 361.37 191.95 1972-73 .. .. 180.87 180.66 214.13 281.92 270.71 394.32 209.17 1973-74 .. .. 182.19 183.74 230.25 284.95 282.03 414.24 214.84 1974-75(estimate) .. .. 217.78 217.81 289.86 340.05 333.12 511.98 258.90
SPECIFIC PURPOSE PAYMENTS -CURRENT 1956-57 .. .. 4.58 3.82 4.70 4.73 4.95 5.40 4.45 1957-58 .. .. . . 4.68 3.84 4.35 4,92 5.10 5.61 4.48 1958-59 .. .. .. 4.98 3.99 4.77 5.32 5.73 5.88 4.79 1959-60 .. . . 4.93 4.11 4.41 6.16 5.91 6.13 4.85 1960-61 .. .. 5.29 4.36 5.23 5.90 6.52 6.54 5.20 1961-62 .. .. . . 5.76 4.53 5.36 6.12 5.94 6.96 5.44 1962-63 .. .. .. 5.99 4.88 5.60 6.37 6.09 7.09 5.70 1963-64 .. . . 6.30 5.24 5.99 6.57 6.29 7.45 6.02 1964-65 .. .. .. 6.88 5.89 6.51 7.31 6.84 8.37 6.64 1965-66 .. . . .. 9.27 6.39 9.34 7.60 7,01 8,75 8.13 1966-67 .. .. 9.43 7.39 9.36 8.34 7.56 13.01 8,72 1967-68 .. . 9.32 10.04 9.78 9.98 8.80 10.88 9.66 1968-69 . . 9.70 10.71 9.54 10.59 9.06 11,59 10.05 1969-70 . . . . . . 10.69 11.26 15.76 11.68 11,84 13.12 11.85 1970-71 .. .. .. 14.41 14.73 18.47 15.05 14.93 18,95 15.34 1971-72 .. .. .. 18.88 19.57 19.66 19.91 20.45 26.79 19.66 1972-73 .. .. .. 28.94 29.64 30.14 31.85 32.95 43.70 30.37 1973-74 .. .. .. 42.95 49.14 43.62 52.77 53.36 55.59 45.98 1974-75 (estimate) .. .. n.a. n.a. n.a. n.a, n.a. n.a. 82.02
144
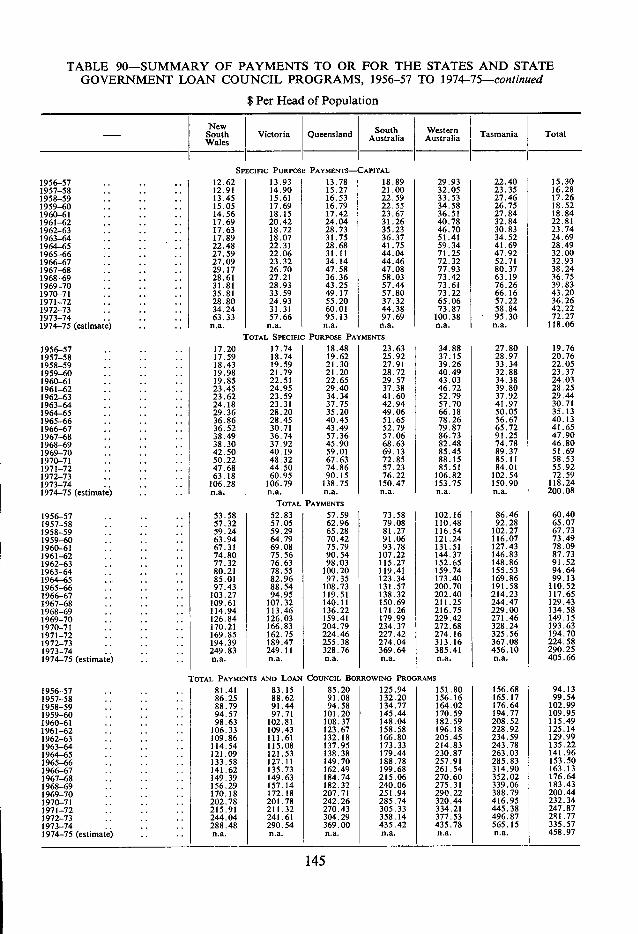
TABLE 90-SUMMARY OF PAYMENTS TO OR FOR THE STATES AND STATE GOVERNMENT LOAN COUNCIL PROGRAMS, 1956-57 TO 1974-75-continued
$ Per Head of Population
- I New I South Victoria Queensland South Western Tasmania Total Wales Australia Australia
SPECIFIC PURPOSE PAYMENTS-CAPITAL 1956-57.. .. 12.62 13.93 13.78 18.89 29.93 22.40 15.30 1957-58 .. .. .. 12.91 14.90 15.27 21.00 3205. 23.35 16.28 1958-59 .. 13.45 15.61 16.53 22.59 33.53 27.46 17.26 1959-60.. .. 15.05 17.69 16.79 22.55 34.58 26.75 18.52 1960-61 .. .. .. 14.56 18.15 17.42 23.67 36.51 27.84 18.84 1961-62 .. .. 17.69 20.42 24.04 31.26 40.78 32.84 22.81 1962-63 .. .. 17.63 18.72 28.73 35.23 46.70 30.83 23.74 1963-64 .. .. 17.89 18.07 31.75 36.37 51.4134.52 24.69 1964-65 .. 22.48 22.31 28.68 41.75 59.34 41.69 28.49 1965-66 .. .. .. 27.59 22.06 31.11 44.04 71.25 47.92 32.00 1966-67 .. .. 27.09 23.32 34.14 44.46 72.32 52.71 32.93 1967-68 .. .. .. 29.17 26.70 47.58 47.08 77.93 80.37 38.24 1968-69 .. .. .. 28.6127.21 36.36 58.03 73.42 63.19 16.75 1969-70 .. .. .. 31.81 28.93 43.25 57.44 73.61 76.26 39.83 1970-71.. .. .. 35.81 33.59 49.17 57.80 73.22 66.16 43.20 1971-72 .. .. .. 28.80 24.93 55.20 37.32 65.06 57.22 36.26 1972-73 .. .. 34.24 31.31 60.01 44.38 73.87 58.84 42.22 1973-74.. .. 63.33 57.66 95.13 97.69 100.38 95.30 72.27 1974-75 (estimate) .. .. n.a. I n.a. n.a. n.a. n.a. n.a. 118.06
TOTAL SPECIFIC PURPOSE PAYMENTS 1956-57 .. .. .. 17.20 17.74 18.48 23.63 34.88 27.80 19.76 1957-58.. .. .. 17.59 18.74 19.62 25.92 37.15 28.97 20.76 1958-59 .. .. .. 18.43 19.59 21.30 27.91 39.26 33.34 22.05 1959-60.. .. .. 19.98 21.79 21.20 28.72 40.49 32.88 23.37 1960-61 .. .. .. 19.85 22.51 22.65 29.57 43.03 34.38 24.03 1961-62 .. .. .. 23.45 24.95 29.40 37.38 46.72 39.80 28.25 1962-63 .. .. .. 23.62 23.59 34.34 41.60 52.79 37.92 29.44 1963-64 .. .. .. 24.18 23.31 37.75 42.94 57.70 41.97 30.71 1964-65 .. .. .. 29.36 28.20 35.20 49.06 66.18 50.05 35.13 1965-66 .. .. .. 36.86 28.45 40.45 51.65 78.26 56.67 40.13 1966-67 .. .. .. 36.52 30.71 43.49 52.79 79.87 65.72 41.65 1967-68 .. .. .. 38.49 36.74 57.36 57.06 86.73 91.25 47.90 1968-69 .. .. .. 38.30 37.92 45.90 68.63 82.48 74.78 46.80 1969-70 .. .. .. 42.50 40.19 59.01 69.13 85.45 89.37 51.69 1970-71 .. .. .. 50.22 48.32 67.63 72.85 88.15 85.11 58.53 1971-72 .. .. .. 47.68 44.50 74.86 57.23 85.51 84.01 55.92 1972-73 .. .. .. 63.18 60.95 90.15 76.22 106.82 102.54 72.59 1973-74.. .. .. 106.28 106.79 138.75 150.47 153.75 150.90 118.24 1974-75 (estimate) .. .. n.a. n.a. n.a. n.a. n.a. n.a. 200.08
TOTAL PAYMENTS 1956-57 .. .. .. 53.5852.83 57.59 73.58 102.16 86.46 60.40 1957-58 .. . . .. 57.32 57.05 62.96 79.08 110.48 92.28 65.07 1958-59 .. .. .. 59.24 59.29 65.28 81.27 116.54 102.27 67.73 1959-60 .. .. .. 63.94 64.79 70.42 91.06 121.24 116.07 73.49 1960-61 .. .. .. 67.31 69.08 75.79 93.78 131.51 127.43 78.09 1961-62 .. .. .. 74.80 75.56 90.54 107.22 144.37 146.83 87.73 1962-63 .. .. .. 77.32 76.63 98.03 115.27 152.65 148.86 91.52 1963-64 .. .. .. 80.21 78.55 100.20 119.41 159.74 155.53 94.64 1964-65 ... .. .. 85.01 82.96 97.35 123.34 173.40 169.86 99.13 1965-66 .. .. .. 97.43 88.54 108.73 131.57 200.70 191.58 110.52 1966-67 .. .. .. 103.27 94.95 119.51 138.32 202.40 214.23 117.65 1967-68 .. .. .. 109.61 107.32 140.11 150.69 211.25 244.47 129.43 1968-69 .. .. .. 114.94 113.46 136.22 171.26 216.75 229.00 134.58 1969-70 .. .. .. 126.84 126.03 159.41 179.99 229.42 271.46 149.15 1970-71 .. .. . . 170.21 166.83 204.79 234.37 272.68 328.24 193.63 1971-72 .. .. .. 169.85 162.75 224.46 227.42 274.16 325.56 194.70 1972-73 .. .. .. 194.39 189.47 255.38 274.04 313.16 367.08 224.58 1973-74 .. .. .. 249.83 249.11 328.76 369.64 385.41 456.10 290.25 1974-75 (estimate) .. .. n.a. n.a. n.a. n.a. n.a. n.a. 405.66
TOTAL PAYMENTS AND LOAN COUNCIL BORROWING PROGRAMS 1956-57 . . .. .. 81.41 83.15 85.20 125.94 151.80 156.68 94.13 1957-58 .. .. .. 86.25 88.62 91.08 132.20 156.16 165.17 99.54 1958-59 .. .. .. 88.79 91.44 94.58 134.77 164.02 176.64 102.99 1959-60 . . .. .. 94.57 97.71 101.20 145.44 170.59 194.77 109.95 1960-61 .. .. .. 98.63 102.81 108.37 148.04 182.59 208.52 115.49 1961-62 .. .. .. 106.33 109.43 123.67 158.58 196.18 228.92 125.14 1962-63 .. .. .. 109.86 111.61 132.18 166.80 205.45 234.59 129.99 1963-64 .. .. .. 114.54 115.08 137.95 173.33 214.83 243.78 135.22 1964-65 .. .. .. 121.09 121.53 138.38 179.44 230.87 263.03 141.96 1965-66 . . . . . . 133.58 127.11 149.70 188.78 257.91 285.83 153.50 1966-67 . . .. . . 141.62 135.73 162.49 199.68 261.54 314.90 163.13 1967-68 .. .. .. 149.39 149.63 184.74 215.06 270.60 352.02 176.64 1968-69 .. .. . . 156.29 157.14 182.32 240.06 275.31 339.06 183.43 1969-70 .. .. .. 170.18 172.18 207.71 251.94 290.22 388.79 200.44 1970-71 .. .. .. 202.78 201.78 242.26 285.74 320.44 416.95 232.34 1971-72 .. .. .. 215.91 211.32 270.43 305.33 334.21 445.38 247.87 1972-73 .. .. .. 244.04 241.61 304.29 358.14 377.53 496.87 21.77 1973-74 .. .. .. 288.48 290.54 369.00 435.42 435.78 565.15 335.57 1974-75 (estimate) .. .. n.a. n.a. n.a. n. a. n.a. n. a. 458.97
145
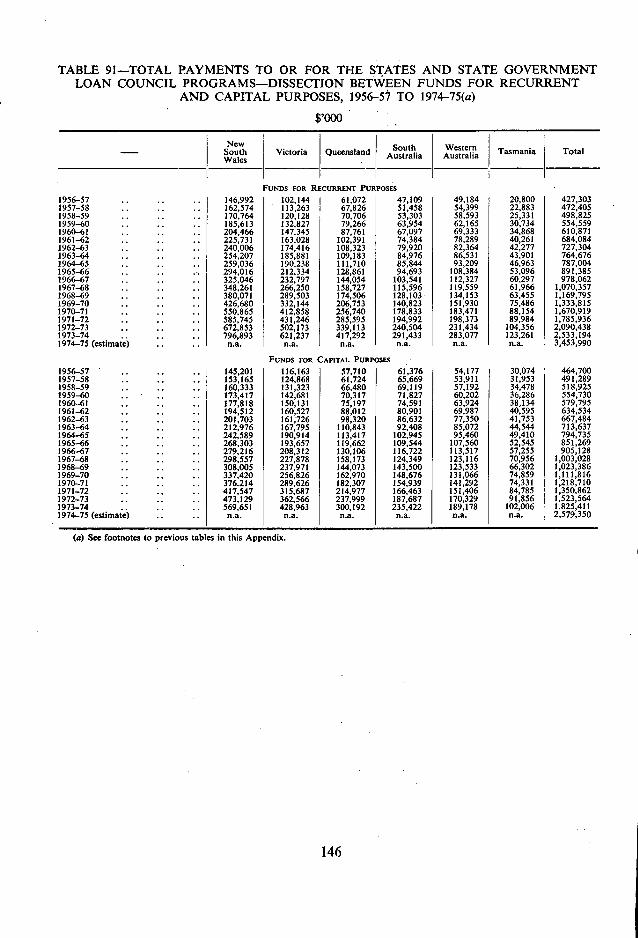
TABLE 91-TOTAL PAYMENTS TO OR FOR THE STATES AND STATE GOVERNMENT LOAN COUNCIL PROGRAMS-DISSECTION BETWEEN FUNDS FOR RECURRENT
AND CAPITAL PURPOSES, 1956-51 TO 1974-75(a)
$,000
- New South Victoria Queensland South
Australia Western Australia Tasmania Total
Wales
FUNDS FOR RECURRENT PURPOSES 1956-57 .. .. 146,992 102,144 61,072 47,109 49,184 20,800 427,303 1957-58 .. .. 162,574 113,263 67,826 51,458 54,399 22,883 472.405 1958-59 .. .. .. 170,764 120,128 70,706 53,303 58,593 25,331 498,825 1959-60 .. .. .. 185,613 132,827 79,266 63,954 62,165 30,734 554,559 1960-61 .. .. 204,466 147,345 87,761 67,097 69,333 34.868 610,871 1961-62 .. .. .. 225,731 163,028 102,391 74,384 78,289 40,261 684,084 1962-63 .. .. 240,006 174,416 108,323 79,920 82,364 42,277 727,304 1963-64 .. .. .. 254,207 185,881 109,183 84,976 86,531 43,901 764,676 1964-65 .. .. .. 259,036 190,238 111,710 85,844 93,209 46,963 787,004 1965-66 .. .. . 294,016 212,334 128,861 94,693 108,384 53,096 891,385 1966-67 .. .. .. 325,046 232,797 144,054 103.541 112,327 60,297 978,062 1967-68 .. .. .. 348,261 266,250 158,727 115,596 119,559 61,966 1,070,357 1968-69 .. .. .. 380,071 289,503 174,506 128,103 134,153 63,455 1,169,795 1969-70 .. .. .. 426,680 332,144 206,753 140,823 151,930 75,486 1,333,815 1970-71 .. .. .. 550,865 412,858 256,740 178,833 183,471 88,154 1,670,919 1971-72 .. .. .. 585,745 1 431,246 285,595 194,992 198,373 89,984 1,785,936 1972-73 .. .. .. 672,853 502,173 339,113 240,504 231,434 104,356 2,090,438 1973-74 .. .. .. 796,893
I 621,237 417,292 291,433 283,077 123,261 2,533,194
1974-75 (estimate) ,. n.a. n.a. n.a. n.a. n.a. n.a. 3,453,990
Fimins FOR CAPITAL PURPOSES - 1956-57 .. .. .. 145,201 116,163 57,710 61,376 54,177 30,074 464,700 1957-58 .. .. .. 153,165 124,868 61,724 65,669 53,911 31,953 491,289 1958-59 .. .. .. 160,333 131,323 66,480 69,119 57,192 34,478 518,925 1959-60 .. .. .. 173,417 142,681 70,317 71,827 60,202 36,286 554,730 1960-61 .. .. .. 177,818 150,131 75,197 74,591 63,924 38,134 579,795 1961-62 .. .. .. 194,512 160,527 88,012 80,901 69,987 40,595 634,534 1962-63 ,. .. .. 201,703 161,726 98,320 86,632 77,350 41,753 667,484 1963-64 .. .. .. 212,976 167,795 110,843 92,408 85,072 44,544 713,637 1964-65 .. .. .. 242,589 190,914 113,417 102,945 95,460 49,410 794,735 1965-66 ,. .. ., 268,303 193,657 119,662 109,544 107,560 52,545 851,269 1966-67 ,. .. .. 279,216 208,312 130,106 116,722 113,517 57,255 905,128 1967-68 .. .. .. 298,557 227,878 158,173 124,349 123,116 70,956 1,003,028 1968-69 .. ,. .. 308,005 237,971 144,073 143,500 123,533 66,302 1,023,386 1969-70 .. .. .. 337,420 256,826 162,970 148.676 131,066 74,859 1,111,816 1970-71 .. .. .. 376.214 289,626 182,307 154,939 141,292 74,331 1,218,710 1971-72 .. .. .. 417,547 315,687 214,9771 66,463 151,406 84,785 1,350.862 1972-73 .. .. .. 473,129 362,566 237.999 187.687 170,329 91,856 1,523,564 1973-74 .. .. .. 569,651 428,963 300,192 235,422 189,178 102,006 1,825,411 1974-75 (estimate) .. .. n.a. n.a. n.a. n.a. n.a. n.a. 2,579,350
(a) Sec footnotes to previous tables in this Appendix.
146
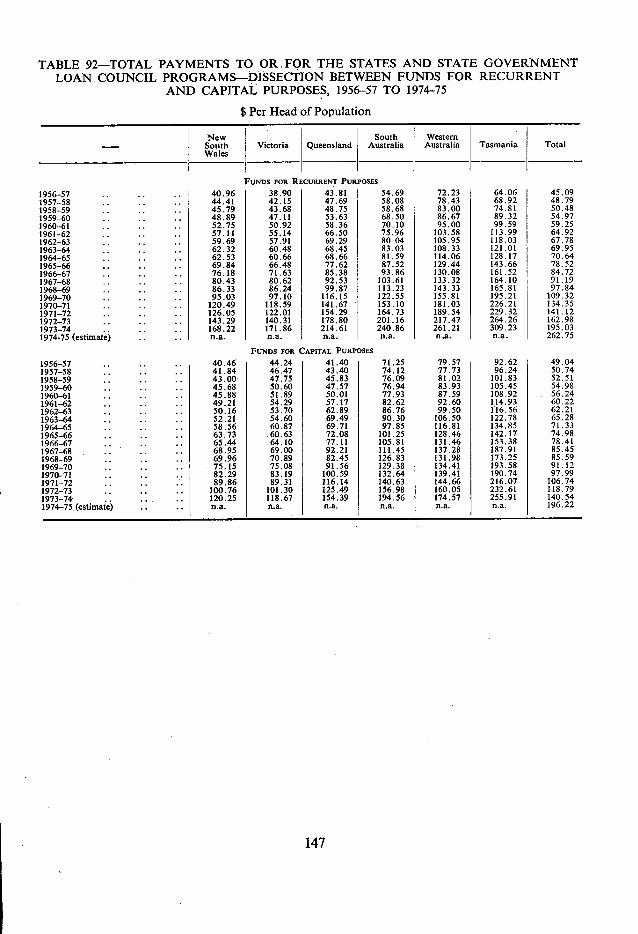
TABLE 92-TOTAL PAYMENTS TO OR FOR THE STATES AND STATE GOVERNMENT LOAN COUNCIL PROGRAMS-DISSECTION BETWEEN FUNDS FOR RECURRENT
AND CAPITAL PURPOSES, 1956-57 TO 1974-75
$ Per Head of Population
- New South Wales
Victoria Queensland South
Australia Western Australia Tasmania Total
FUNDS FOR RECURRENT PURPOSES 1956-57 .. .. .. 40.96 38.90 43.81 54.69 72.23 64.06 45.09 1957-58 .. .. .. 44.41 42.15 47.69 58.08 78.43 68.92 48.79 1958-59 .. .. .. 45.79 43.68 48.75 58.68 83.00 74.81 50.48 1959-60 .. .. .. 48.89 47.1153.63 68.50 86.67 89.32 54.97 1960-61 .. .. .. 52.75 50.92 58.36 70.10 95.00 99.59 59.25 1961-62 .. .. . 57.11 55.14 66.50 75.96 103.58 113.99 64.92 1962-63 .. .. .. 59.69 57.91 69.29 80.04 105.95 118.03 67.78 1963-64 .. .. .. 62.32 60.4868.45 83.03 108.33 121.01 69.95 1964-65 .. .. .. 62.53 60.66 68.66 81.59 114.06 128.17 70.64 1965-66 .. .. 69.84 66.48 77.62 87.52 129.44 143.66 78.52 1966-67 .. .. .. 76.18 71.63 85.3893.86 130.08 161.52 84.72 1967-68 .. .. .. 80.43 80.62 92.53 103.61 133.32 164.10 91.19 1968-69 .. .. .. 86.33 86.24 99.87 113.23 143.33 165.81 97.84 1969-70 .. .. .. 95.03 97.10 116.15 122.55 155.81 195.21 109.32 1970-71 .. .. .. 120.49 118.59 141.67 153.10 181.03 226.21 134.35 1971-72 .. .. 126.05 122.01 154.29 164.73 189.54 229.32 141.12 1972-73 .. .. .. 143.29 140.31 178.80 201.16 217.47 264.26 162.98 1973-74.. .. .. 168.22 171.86 214.61 240.86 261.21 309.23 195.03 1974-75 (estimate) .. .. n.a. n.a. n.a. n.a. n.a. n.a. 262.75
FUNDS FOR CAPITAL PURPOSES 1956-57 .. .. .. 40.46 44.24 41.40 71.25 79.57 92.62 49.04 1957-58 .. .. .. 41.84 46.47 43.40 74.12 77.73 96.24 50.74 1958-59 .. .. .. 43.00 47.75 45.83 76.09 81.02 101.83 52.51 1959-60 .. .. .. 45.68 50.60 47.57 76.94 83.93 105.45 54.98 1960-61 .. .. .. 45.88 51.89 50.01 77.93 87.59 108.92 56.24 1961-62 .. .. .. 49.21 54.29 57.17 82.62 92.60 114.93 60.22 1962-63 .. .. .. 50.16 53.70 62.89 86.76 99.50 116.56 62.21 1963-64 .. .. .. 52.2154.60 69.49 90.30 106.50 122.78 65.28 1964-65 .. .. .. 58.56 60.87 69.71 97.85 116.81 134.85 71.33 1965-66 .. .. .. 63.73 60.63 72.08 101.25 128.46 142.17 74.98 1966-67 .. .. .. 65.44 64.10 77.11 105.81 131.46 153.38 78.41 1967-68 .. .. .. . 68.95 69.00 92.21 111.45 137.28 187.91 85.45 1968-69 .. .. .. 69.96 70.89 82.45 126.83 131.98 173.25 85.59 1969-70 .. .. .. 75.15 75.08 91.56 129.38 134.41 193.58 91.12 1970-71 .. .. .. 82.29 83.19 100.59 132.64 139.41 190.74 97.99 1971-72 .. .. .. 89.86 89.31 116.14 140.63 144.66 216.07 106.74 1972-73 .. .. .. 100.76 101.30 125.49 156.98 160.05 232.61 118.79 1973-74 .. .. .. . 120.25 118.67 154.39 194.56 174.57 255.91 140.54 1974-75 (estimate) .. .. n.a. n.a. n.a. n.a. n.a. n.a. 196.22
147
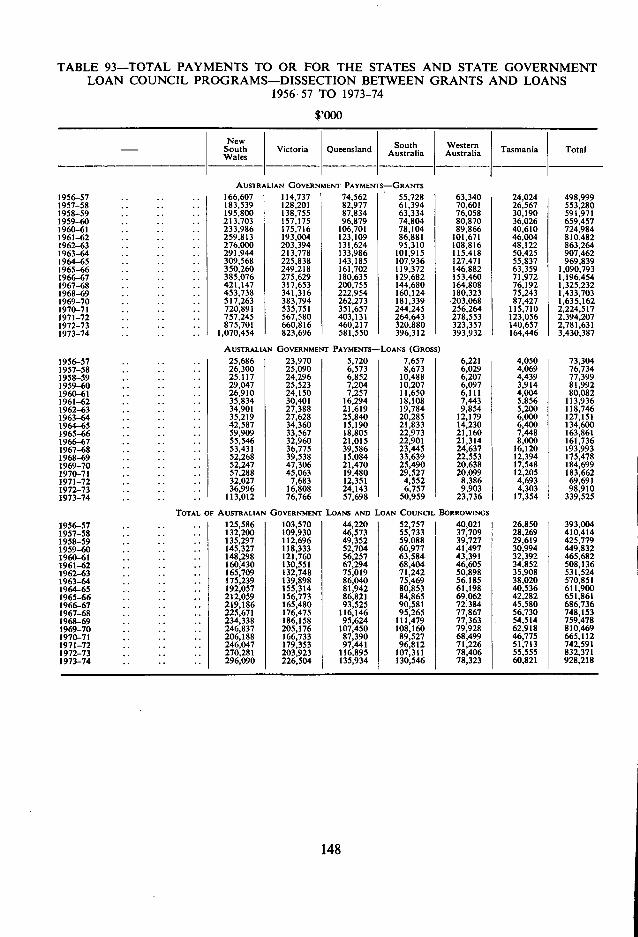
TABLE 93-TOTAL PAYMENTS TO OR FOR THE STATES AND STATE GOVERNMENT LOAN COUNCIL PROGRAMS-DISSECTION BETWEEN GRANTS AND LOANS
1956-57 TO 1973-74
$,000
- New
SOUWalth
Victoria Queensland South Australia
Western Tasmania Total
AUSTRALIAN GOVERNMENT PAYMENTS-GRANTS 1956-57 .. .. 166,607 114,737 74,562 55,728 63,340 24,024 498,999 1957-58 .. .. .. 183,539 128,201 82,977 61,394 70,601 26,567 553,280 1958-59 .. .. .. 195,800 138,755 87,834 63,334 76,058 30,190 591,971 1959-60 .. 213,703 157,175 96,879 74,804 80,870 36,026 65,457 1960-61 .. .. 233.986 175,716 106,701 78,104 89,866 40,610 724,984 1961-62 .. .. .. 259,813 193,004 123,109 86,881 101,671 46,004 810,482 1962-63 .. .. 276,000 203,394 131,624 95,310 108,816 48,122 863,264 1963-64 .. .. 291,944 213,778 133,986 101,915 115,418 50,425 907,462 1964-65 .. .. 309.568 225,838 143,185 107,936 127,471 55,837 969,839 1965-66 .. .. 350,260 249.218 161,702 119,372 146,882 63,359 1,090,793 1966-67 •. ,. 385,076 275,629 180,635 129,682 153,460 71,972 1,196,454 1967-68 .. .. .. 421,147 317,653 200,755 144,680 164,808 76,192 1,325,232 1968-69 .. .. .. 453,738 341,316 222,954 160,124 180,323 75,243 1,433,703 1969-70 .. .. .. 517,263 383,794 262,273 181,339 203,068 87,427 1,635,162 1970-71 .. .. .. 720,891 535,751 351,657 244,245 256,264 115,710 2,224,517 1971-72 .. .. .. 757,245 567,580 403,131 264,643 278,553 123,056 2.394,207 1972-73 .. .. .. 875,701 660,816 460,217 320,880 323,357 140,657 2,781,631 1973-74 .. .. .. 1,070,454 823,696 581,550 396,312 393,932 164,446 3,430,387
AUSTRALIAN GOVERNMENT PAYMENTS-LOANS (GROSS)
1956-57 .. .. .. 25,686 23,970 5,720 7,657 6,221 4,050 73,304 1957-58 .. .. .. 26,300 25,090 6,573 8,673 6,029 4,069 76,734 1958-59 .. .. .. 25,117 24,296 6,852 10,488 6,207 4,439 77,399 1959-60 .. .. .. 29,047 25,523 7,204 10,207 6,097 3,914 81,992 1960-61 .. .. .. 26,910 24,150 7,257 11,650. 6,111 4,004 80,082 1961-62 .. .. .. 35,834 30,401 16,294 18,108 7,443 5.856 113,936 1962-63 .. .. .. 34,901 27,388 21,619 19,784 9,854 5,200 118,746 1963-64 .. .. .. 35,219 27,628 25,840 20,285 12,179 6,000 127,151 1964-65 .. .. .. 42,587 34,360 15,190 21,833 14,230 6,400 134,600 1965-66 .. .. .. 59,909 33,567 18,805 22,973 21,160 7,448 163,861 1966-67 .. .. .. 55,546 32,960 21,015 22,901 21,314 8,000 161,736 1967-68 .. .. .. 53,431 36,775 39,586 23,445 24,637 16,120 193,993 1968-69 .. .. .. 52,268 39,538 15.084 33,639 22,553 12,394 175,478 1969-70 .. .. .. 52,247 47,306 21,470 25,490 20,638 17,548 184,699 1970-71 •. ,. .. 57,288 45,063 19,480 29,527 20,099 12,205 183,662 1971-72 •. ,. .. 32,027 7,683 12,351 4,552 8,386 4,693 69,691 1972-73 .. ,. .. 36,996 16,808 24,143 6,757 9,903 4,303 98,910 1973-74 •. ,. .. 113,012 76,766 57,698 50,959 23,736 17,354 339,525
TOTAL OF AUSTRALIAN GOVERNMENT LOANS AND LOAN COUNCIL BORROWINGS
1956-57 .. .. .. 125,586 103,570 44,220 52,757 40,021 26,850 393,004 1957-58 ,. , .. 132,200 109,930 46,573 55,733 37,709 28.269 410,414 1958-59 .. .. .. 135,297 112,696 49,352 59,088 39,727 29,619 425,779 1959-60 ,. .. .. 145,327 118,333 52,704 60,977 41,497 30,994 449,832 1960-61 •. .. .. 148,298 121,760 56,257 63,584 43,391 32,392 465,682 1961-62 •. .. .. 160,430 130,551 67,294 68,404 46,605 34,852 508,136 1962-63 .. .. .. 165,709 132,748 75,019 71,242 50,898 35,908 531,524 1963-64 •, .. .. 175,239 139,898 86,040 75,469 56.185 38,020 570,851 1964-65 .. .. .. 192,057 155,314 81,942 80,853 61,198 40,536 611,900 1965-66 ., ,. .. 212,059 156,773 86,821 84,865 69,062 42,282 651,861 1966-67 .. .. .. 219,186 165,480 93,525 90,581 72,384 45,580 686,736 1967-68 .. .. .. 225,671 176,475 116,146 95,265 77,867 56,730 748,153 1968-69 ,. ,. .. 234,338 186,158 95,624 111,479 77,363 54,514 759,478 1969-70 .. .. .. 246,837 205,176 107,450 108,160 79,928 62,918 810,469 1970-71 ,. .. .. 206,188 166,733 87,390 89,527 68,499 46,775 665,112 1971-72 ,. .. .. 246,047 179,353 97,441 96,812 71,226 51,713 742,591 1972-73 ,. ,. .. 270,281 203,923 116,895 107,311 78,406 55,555 832,371 1973-74 .. .. .. 296,090 226,504 135,934 130,546 78,323 60,821 928,218
148
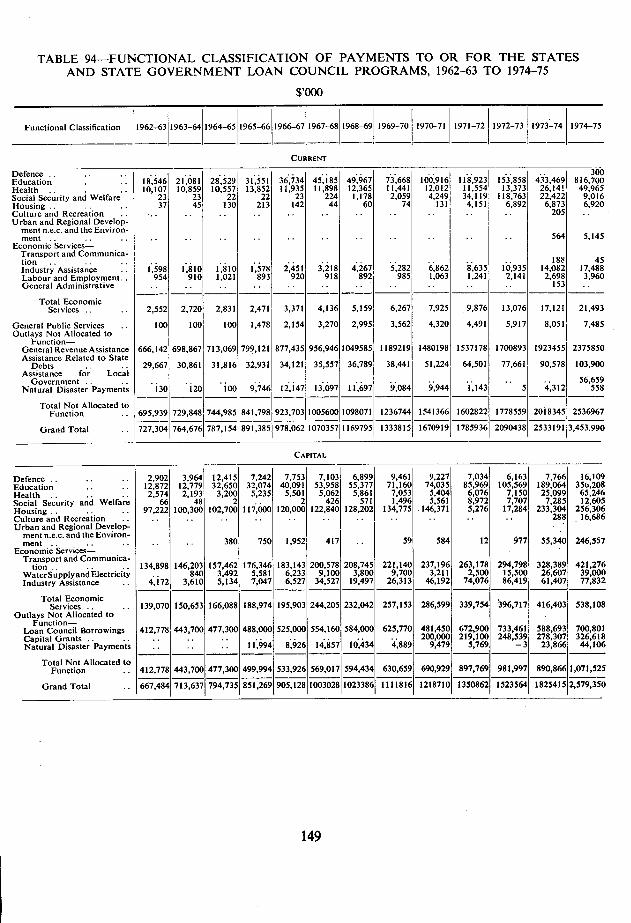
TABLE 94-FUNCTIONAL CLASSIFICATION OF PAYMENTS TO OR FOR THE STATES AND STATE GOVERNMENT LOAN COUNCIL PROGRAMS, 1962-63 TO 1974-75
$,000
Functional Classification 1962-63 1963-64 1964-65
Defence Education Health Social Security and Welfare Housing Culture and Recreation Urban and Regional Develop-
mentn.e.c. and the Environ- ment ..
Economic Services-Transport and Communica-tion Industry Assistance Labour and Employment.. General Administrative
Total Economic Services .
General Public Services Outlays Not Allocated to
Function- General Revenue Assistance Assistance Related to State
Debts Assistance for Local
Government Natural Disaster Payments
Total Not Allocated to Function
Grand Total
1967-68 1968-69 1969-70 1 1970-71 1971-72 1 1972-73 1973-74 1974-75
CURRENT
18,546 21,081 28,529 31.551 36,734 45,185 49,967 73,668 100,916 118,923 153,858 433,469 816,700300
10,107 10,859 10,557 13,852 11,935 11,898 12,365 11,441 12,012 11,554 13,373 26,141 49,965 23 23 22 22 23 224 1,178 2,059 4,249 34,119 118,763 22,422 9,016 37 45 130 213 142 44 60 74 131 4,151 6,892 6,873 6,920
205
564 5,145
188 45 1,598 1,810 1.810 1,578 2,451 3,218 4,267 5,282 6,862 8,635 10,935 14,082 17,488
954 910 1,021 893 920 918 892 985 1,063 1,241 2,141 2,698 3,960 153
2,552 2,720 2,831 2,471 3,371 4,136 5.159 6,267 7,925 9,876 13,076 17,121 21,493
100 100 100 1,478 2,154 3,270 2,995 3,562 4,320 4,491 5,917 8,051 7,485
666,142 698,867 713,069 799,121 877,435 956,946 1049585 1189219 1480198 1537178 1700893 1923455 2375850
29,667 30,861 31,816 32,931 34,121 35,557 36,789 38,441 51,224 64,501 77,661 90,578 103,900
56,659 130 120 100 9,746 12,147 13,097 11,697 9,084 9,944 1,143 5 4,312 558
695,939 729,848 744,985 841.798 923,703 1005600 1098071 1236744 1541366 1602822 1778559 2018345 2536967
727,304 764,676 787,154 891,385 978,062 1070357 1169795 1333815 1670919 1785936 2090438 2533191 3,453.990
CAPITAL
Defence .. .. .. 2,902 3,964 12,415 7.242 7,753 7,103 6,899 9,461 9,227 7,034 6,163 7.766 16,109
Education . . .. 12,872 12,779 32,650 32,074 40.091 53,958 55,377 71,160 74,035 85,969 105,569 189,064 356,208
Health .. .. .. 2,574 2,193 3,200 5,235 5,501 5,062 5,861 7,053 5,404 6,076 7,150 25,099 65,246
Social Security and Welfare 66 48 2 .. 2 426 571 1,496 5,561 8,972 7,707 7.285 12,605
Housing . . .. .. 97,222 100,300 102,700 117,000 120,000 122,840 128,202 134,775 146,371 5,276 17,284 233,304 256,306 Culture and Recreation . . .. .. . . .. . . .. .. .. .. .. .. 288 16,686 Urban and Regional Develop-
ment n.e.c. and the Environ-
ment . . . . . . . . . . 380 750 1,952 417 . . 59 584 12 977 55.340 246,557 Economic Services-
Transport and Communica-
tion .. .. .. 134,898 146,203 157,462 176,346 183,143 200,578 208,745 221,140 237,196 263,178 294,798 328,389 421,276
Water Supply and Electricity .. 840 3,492 5.581 6,233 9,100 3,800 9,700 3,211 2,500 15,500 26,607 39,000 Industry Assistance .. 4,172 3,610 5,134 7,047 6,527 34,527 19,497 26.313 46,192 74,076 86,419 61,407 77,832
Total Economic
Services .. .. 139,070 150,653 166,088 188,974 195,903 244,205 232,042 257,153 286,599 339,754 396,717 416,403 538,108 Outlays Not Allocated to
Function-
Loan Council Borrowings 412,778 443,700 477,300 488,000 525,000 554,160 584,000 625,770 481,450 672,900 733,461 588,693 700,801
Capital Grants.. .. .. .. .. .. .. .. .. .. 200,000 219,100 248,539 278,307 326,618 4
Natural Disaster Payments .. .. .. 11,994 8,926 14,857 10,434 ,889 9,479 5,769 -3 23,866 44,106
Total Not Allocated to Function .. 412,778 443,700 477,300 499,994 533,926 569,017 594,434 630,659 690,929 897,769 981,997 890,866 1,071,525
Grand Total .. 667,484 713,637 794,735 851,269 905,128 1003 1023386 1111816 1218710 1350862 1523564 18254l5 2,579,350
149
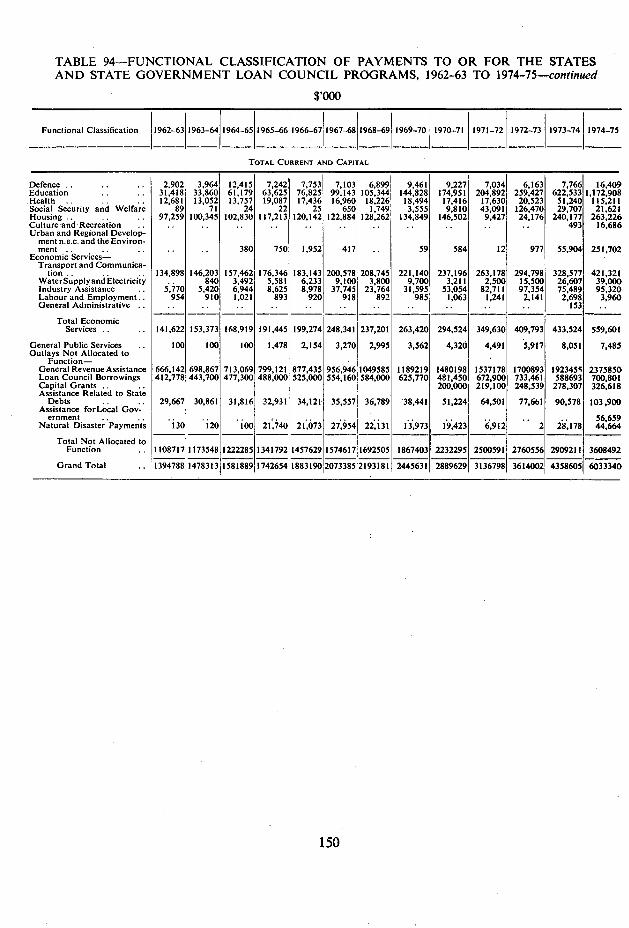
TABLE 94-FUNCTIONAL CLASSIFICATION OF PAYMENTS TO OR FOR THE STATES AND STATE GOVERNMENT LOAN COUNCIL PROGRAMS, 1962-63 TO 1974-75-continued
$,000
Functional Classification 1962-63 1963-64 1964-65 1965-66 1966-67 1967-68 1968-69 1969-70 1970-71 1971-72 1 1972-73 1973-74 1974-75
TOTAL CURRENT AND CAPITAL
Defence .. .. 2,902 3,964 12,415 7,242 7,753 7,1031 6,899 9.461 9,227 7,034 6,163 7,766 16,409 education 31,418 33,860 61,179 63,625 76,825 99.143 105,344 144,828 174,951 204,892 259,427 622,533 1,172,908 Health . .. .. 12,681 13,052 13,757 19,087 17,436 16,960 18.226 18,494 17,416 17.630 20.523 51,240 115,211 80cial Security and Welfare 89 71 24 22 25 650 1,749 3,555 9,810 43,091 126,470 29,707 21,621 Housing.. .. .. 97,259 100,345 102,830 117,213 120,142 122,884 128,262 134,849 146,502 9,427 24,176 240,177 263,226 ulture and Recreation .. .. .. .. .. .. . . .. .. .. .. 493 16,686
Urban and Regional Develop- mentn.e.c. and the Environ- ment .. .. .. .. .. 380 750 1,952 417 .. 59 584 12 977 55,904 251,702
Economic Services- Transport and Communica-
tion.. .. .. 134,898 146,203 157,462 176.346 183,143 200,578 208,745 221,140 237,196 263,178 294,798 328,577 421,321 WaterSupplyandElectricity .. 840 3,492 5,581 6,233 9,100 3,800 9,700 3,211 2,500 15,500 26,607 39,000 Industry Assistance .. 5,770 5,420 6,944 8,625 8,978 37,745 23,764 31,595 53,054 82,711 97,354 75,489 95,320 Labour and Employment.. 954 910 1,021 893 920 918 892 985 1,063 1,241 2,141 2,698 3,960 General Administrative .. . . .. .. .. .. .. .. .. .. .. 153
Total Economic Services .. .. 141,622 153,373 168,919 191,445 199,274 248,341 237,201 263,420 294,524 349,630 409,793 433.524 559,601
General Public Services .. 100 100 100 1,478 2,154 3,270 2,995 3,562 4,326 4,491 5,917 8,051 7,485 Dutlays Not Allocated to
Function- General Revenue Assistance 666.142 698.867 713,069 799,121 877,435 956,9461049585 1189219 1480198 1537178 1700893 192345 2375850 Loan Council Borrowings 412,778 443,700 477,300 488,000 525,000 554,160 584,000 625,770 481,450 672,900 733.461 588693 700,801 Capital Grants .. .. 200,000 219,100 248,539 278,307 326,618 Assistance Related to State
Debts . . . . 29,667 30,861 31,816 32,931 34,121 35,557 36,789 38,441 51,224 64,501 771641 90,578 103,900 Assistance forLocal Gov-
ernment .. .. .. .. .. . .. .. .. .. .. .. .. 56,659 Natural Disaster Payments 130 120 100 21,740 21,073 27,954 22,131 13,973 19,423 6,912 2 28,178 44.664
Total Not Allocated to Function .. 1108717 1173548 1222285 1341792 1457629 1574617 1692505 1867403 2232295 2500591 2760556 2909211 3608492
Grand Total .. 1394788 1478313 1581889 17426.54 1883190 2073385 2193181 2445631 2889629 3136798 3614002 4358605 6033340
150
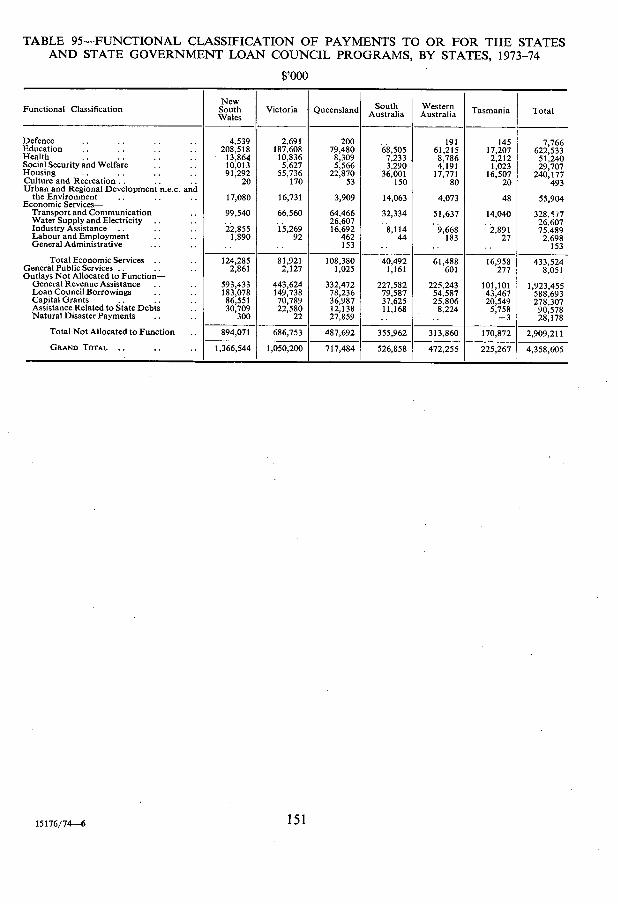
TABLE 95-FUNCTIONAL CLASSIFICATION OF PAYMENTS TO OR FOR THE STATES AND STATE GOVERNMENT LOAN COUNCIL PROGRAMS, BY STATES, 1973-74
$,000
Functional Classification New South Victoria Queensland South.
Australia Western Tasmania Total
Wales
Defence .. , .. 4,539 2,691 200 . 191 145 7,766 Education .. . . .. .. 208,518 187,608 79,480 68,505 61,215 17,207 622,533 Health . . . . . . . . 13,864 10,836 8,309 7,233 8,786 2,212 51,240 Social Security and Welfare . . 10,013 5,627 5,566 3,290 4,191 1,023 29,707 Housing . . . . . . . 91,292 55,736 22,870 36,001 17,771 16,507 240,177 Culture and Recreation .. .. 20 170 53 150 80 20 493 Urban and Regional Development n.e.c. and
the Environment . . . . . . 17,080 16,731 3,909 14,063 4,073 48 55,904 Economic Services- Transport and Communication .. 99,540 66,560 64,466 32,334 51,637 14,040 328,517 Water Supply and Electricity.. .. . .. 26,607 . . . . 26,607 Industry Assistance .. .. .. 'i2,855 22,855 15,269 16,692 8,114 9,668 2,891 75,489 Labour and Employment .. .. 1,890 92 462 44 183 27 2,698 General Administrative -. . .. . . . 153 . . . . . . 153
Total Economic Services .. .. 124,285 81,921 108,380 40,492 61,488 16,958 433,524 General Public Services .. .. .. 2,861 2,127 1,025 1,161 601 277 8,051 Outlays Not Allocated to Function -
General Revenue Assistance .. .. 593,433 443,624 332,472 227,582 225,243 101,101 1,923,455 Loan Council Borrowings .. .. 183,078 149,738 78,236 79,587 54,587 43,467 588,693 Capital Grants . . . . .. 86,551 70,789 36,987 37,625 25,806 20,549 278,307 Assistance Related to State Debts .. 30,709 22,580 12,138 11,168 8,224 5,758 90,578 Natural Disaster Payments .. .. 300 22 27,859 . . .. -3 28,178
Total Not Allocated to Function .. 894,071 686,753 487,692 355,962 313,860 170,872 2,909,211 GRAND TOTAL .. .. .. 1,366,544 1,050,200 717,484 526,858 472,255 225,267 4,358,605
15176/74-6 151
APPENDIX 11-PART 1-HISTORY OF GENERAL REVENUE ASSISTANCE
INTRODUCTION Under Section 87 of the Constitution the Commonwealth was required to pay to the States three-
quarters of customs and excise revenue collected during the first ten years after the establishment of the Commonwealth 'and thereafter until the Parliament otherwise provides'. In addition, Sections 89, 93 and 94 of the Constitution provided that, for a certain period, and thereafter until Parliament otherwise provided, all surplus revenue not required by the Commonwealth was to be paid to the States.
Payments to the States of surplus revenue of the Commonwealth ceased in 1907-08 when the Commonwealth commenced to pay such surplus revenue into a trust account as a reserve for old age and invalid pensioners. However, payment of three-quarters of customs and excise revenue under Section 87 continued until 1909-10 and was then replaced by per capita payments under the Surplus Revenue Act 1910. The Act provided for the payment of $2.50 (25s.) per head of its population to each State. Payments were made to the States on this basis in each year from 1910-11 to 1926-27 inclusive. In addition, 'special grants' were paid to Western Australia from 1910-11 and to Tasmania from 1912-13.
Under the 1927 Financial Agreement between the Commonwealth and the States it was provided that the Commonwealth would pay to the States for fifty-eight years from 1927-28 an annual amount of $15.17 million as a contribution towards interest on State debts. These interest payments replaced the per capita grants and they were (and are) distributed between the States in the same proportions as the 1926-27 per capita grant. The Financial Agreement also provided for Commonwealth contributions towards sinking fund payments in respect of the States' debts existing at 30 June 1927 and those incurred after that date.
In 1929-30 payments of special grants to South Australia were commenced. From 1934-35 onwards these special grants to South Australia, Western Australia and Tasmania were paid on the recommendations of the Grants Commission which was established in 1933.
THE SECOND WORLD WAX At the outbreak of the second world war, the financial resources available to the States were, for the
most part, sufficient to enable them to meet their own expenditures principally from funds which they themselves were responsible for raising. Australian Government payments to them, though they had increased over the years, were still relatively small and confined to a fairly narrow field, e.g., tiding the States over difficult periods, assisting the financially weaker States, or providing funds for purposes in which the Australian Government had a common interest with the States.
The second world war radically changed this situation. To finance its greatly increased war-time expenditure, it was necessary for the Australian Government to maximise its revenue from all sources. The incidence of State income taxes, which were then levied concurrently with Australian Government income tax, differed widely between States and, as the Commonwealth is constitutionally forbidden from discriminating between States in the imposition of taxes, its rates were in practice limited by the scope available for additional tax in the State with the highest rate of tax at each income level. This, of course, meant that in other States there were untapped sources of income tax revenue.
This problem was the subject of discussion between the Australian and State Governments on a number of occasions during the early war years, but no mutually acceptable solution was reached.
THE COMMITTEE ON UNIFORM TAXATION On 23 February 1942 the Treasurer appointed a Committee to consider the questions of the Australian
Government becoming the sole income taxing authority for the duration of the war and of payments, by way of grants, to the States for their retirement from the income tax field.
The Committee presented its report on 28 March 1942 and recommended that for the duration of the war and one year afterwards the Australian Government should be the sole authority to impose taxes on income. It suggested that a scheme of uniform taxation should operate from 1 July 1942 and that the States should be compensated on retiring from the field of income tax.
THE INTRODUCTION OF UNIFORM TAXATION In May 1942 legislation was introduced in the Australian Parliament to implement, with minor
amendments, the recommendations of this Committee. Under this legislation, a uniform income tax scheme came into operation on 1 July 1942.
153
In the same year the validity of the uniform tax legislation was challenged in the High Court by four of the State Governments. The challenge was unsuccessful, the High Court finding that the Aus-tralian Government could enforce priority in the collection of its income tax and could make grants to the States under Section 96 of the Constitution on the condition that they vacated the field of income taxation.
Under this war-time uniform income tax scheme, therefore, the Australian Government was the sole income taxing authority for the period of the war and one year thereafter. By way of compensation, the States were paid tax reimbursement grants (provided they did not impose taxes on income) based upon their average collections from taxes on income in the years 1939-40 and 1940-41.
Later in 1942 the Australian Government, in agreement with the States concerned, established a uniform entertainments tax on a similar basis and provided for annual reimbursement grants, based on collections in 1941-42, to be paid to the five States which had previously levied entertainments tax.
TAX REIMBURSEMENT GRANTS—WAR-TIME BASIS The tax reimbursement grants (less an' arrears of income tax collected by or on behalf of the States)
paid to the States in the period 1942-43 to 1945-46 inclusive, amounted to $68.5 million, of which $67 million was by way of income tax reimbursement grants and $1 .5 million by way of entertainments tax reimbursement grants. The amounts payable to each State in each year are shown in Table 97 following this Appendix.
Under the war-time legislation any State could apply for additional financial assistance if the income tax reimbursement grant appeared to be insufficient to meet that State's revenue requirements in any year. On the recommendation of the Grants Commission, the additional financial assistance given by the Australian Government under this provision was $1.1 million in respect of 1945-46 and $4.3 million in respect of 1946-47. The amounts paid to the States concerned are shown in Table 97 following this Appendix.
Tiir CONTINUATION OF UNIFORM TAXATION AFTER THE WAR At a Premiers' Conference in January 1946 the States were informed that the Australian Government
proposed to continue uniform income tax indefinitely. The Conference decided that the total tax reimbursement grants in both 1946-47 and 1947-48 should be $80 million, and that the grants in subsequent years should be determined by means of a formula under which this base amount would be increased in accordance with variations in population and half of the percentage increase in average wages per person employed for Australia as a whole. The grants continued to be conditional upon the States refraining from levying income tax, but the condition requiring the States to refrain from imposing entertainments tax was discontinued. These provisions were incorporated in the States Grants (Tax Reimbursement) Act 1946.
Following further discussions with the States during the next two years, the total grant for 1947-48 was increased to $90 million and the formula embodied in the 1946 Act was amended. Beginning in 1948-49, the aggregate grant payable to the States in each year under the Act, as amended, was determined by varying the sum of $90 million in accordance with a formula which took account of—
variations in the total population of the six States since 1 July 1947; and the full percentage increase in the level of average wages per person employed in Australia as a whole over the level of 1945-46.
The States Grants (Tax Reimbursement) Act 1946 included a schedule determining the distribution of the aggregate grants in 1946-47 and 1947-48. It further provided that in each of the financial years 1948-49 to 1956-57 inclusive a percentage of the grant was to be distributed in accordance with this schedule and the remainder was to be distributed in proportion to the populations of the States adjusted for density and for numbers of children between 5 and 15 years of age. The percentage to be divided according to the schedule was 90 per cent in 1948-49, 80 per cent in 1949-50 and so on down to 10 per cent in 1956-57 and nothing in 1957-58. Thus, in 1957-58 and 1958-59 the whole of the tax reimbursement grants was distributed in proportion to the States' adjusted populations so that the distribution of the grants between States was no longer determined, directly or indirectly, by reference to the amounts of income tax collected by each State.
154
Although no change was made in the tax reimbursement formula after 1948-49, the Australian Government made ad hoc grants to supplement the amount yielded by the formula in each subsequent year of its operation. These supplementary grants, which in some years took account of special circum-stances, were distributed in some years in proportions which differed from those of the formula grants. The total amount of the tax reimbursement formula grants and supplementary grants paid to the States in 1946-47 was $84.3 million. Between that year and 1958-59 the amounts made available by way of these grants increased year by year so that the total amount paid in 1958-59 was $410 million. Details of the amounts paid each year are shown in Table 97 following this Appendix.
FURTHER DISCUSSIONS ON UNIFORM TAXATION
The question of resumption of State income tax was further discussed at the Premiers' Conferences of September 1950 and August 1951. In October 1952 Victoria took out a writ in the High Court challenging the validity of the uniform tax legislation. However, this challenge was not pursued.
In July 1952 the Australian Government informed the States that it was willing to discuss with them the possibility of resumption of State income tax. A report subsequently prepared by Australian and State Treasury officers on the technical problems involved was presented to a Premiers' Conference held in February 1953. At that Conference Australian and State Treasury officers were asked to prepare a further report as a basis for discussions on the extent to which the Australian Government might vacate the income tax field. This report was received at a Premiers' Conference held in August 1953, together with a report on the special problems facing Queensland in the event of the return of taxing powers. No agreement could be arrived at between the Australian Government and the States on the extent to which the income tax field should be vacated by the Australian Government.
FURTHER LEGAL CHALLENGE TO UNIFORM TAXATION In December 1955 the Victorian Government took out a new writ in the High Court challenging
the validity of the uniform tax legislation. In particular, Victoria disputed— the power of the Australian Government to make tax reimbursement grants conditional upon the States not levying income tax; and the Australian Government's power to provide an absolute priority for payment of Common-wealth income tax over income taxes levied by the States.
In November 1956 the New South Wales Government intervened to support Victoria's challenge. In August 1957 the High Court ruled—
unanimously, that the condition attaching to the tax reimbursement grants that the States should not levy income tax, was valid; and by a majority of four to three, that section 221 (1.) (a) of the Income Tax and Social Services Contribution Assessment Act 1936-1956, which prohibited a taxpayer paying State income tax until Commonwealth income tax was paid, was invalid.
THE MARCH 1959 PREMIERS' CONFERENCE
At a special Premiers' Conference held in March 1959 all of the main aspects of Commonwealth-State financial relations were considered. In particular, extensive discussions took place on the question of the resumption of income tax by the States, but there were considerable differences of opinion on the complex issues involved and no acceptable solutions emerged.
The Conference then turned its attention to the question of revising the tax reimbursement arrange-ments, and it was suggested that the Australian Government might closely examine the whole system of revenue grants to the States with a view to submitting precise proposals at the normal meeting of the Premiers in June 1959.
THE JUNE 1959 PREMIERS' CONFERENCE
The Australian Government's proposals submitted at the Premiers' Conference in June 1959 were for a new system of financial assistance grants to the States to replace the existing tax reimbursement arrangements.
155
The proposals were devised in the light of generally expressed dissatisfaction with the methods of determination and distribution of the tax reimbursement grants, and in the knowledge that two non-claimant States had applied for special grants subject to the recommendation of the Grants Commission. In particular, it was considered desirable—
to amalgamate within some new revenue grant arrangements the large grants which were then being paid to supplement the tax reimbursement formula grants, and to devise a more liberal formula which would avoid the necessity for supplementary grants; to reduce to two the number of States which would in future continue regularly to apply for special grants recommended by the Grants Commission, and to reduce the dependence of these States on special grants to more marginal proportions; and to arrive at a more generally acceptable basis of distribution as between the States of general revenue grants.
With these ends in view, the Australian Government proposed that financial assistance grants amounting to $485 million should be paid to the States in 1959-60. This compared with the sum of $451.5 million paid to the States in 1958-59 by way of tax reimbursement, supplementary and special grants.
It was proposed that the shares of New South Wales, Victoria, Queensland, and South Australia in the sum of $485 million be determined by rounding up to the nearest whole number the percentage shares of those four States in the sum of $451 .5 million paid in 1958-59, which comprised tax reimburse-ment, supplementary and special grants. As regards Western Australia and Tasmania, the effect of these proposed changes in the distribution would be to give them a slightly smaller share of the new financial assistance grants than their share of tax reimbursement and the supplementary grants. However, as it was proposed that these two States would still have regular access to the Grants Commission, their shares of total general revenue grants (i.e. financial assistance grants and special grants) would continue to be determined, in effect, by the size of the special grants recommended by the Commission.
The Australian Government further proposed that, in the years following 1959-60, the financial assistance grants payable to each State should be determined under a formula by which the grant paid to that State in the previous year would be varied in accordance with annual movements in the State's own population and annual increases in the level of average wages for Australia as a whole. In addition, to assist the States to improve the standard and range of services provided by them, it was proposed to introduce a 'betterment factor' equal to 10 per cent of the increase for the year in average wages; thus an increase of 4 per cent in average wages would be raised to 4.4 per cent.
In outlining these proposals the Australian Government emphasized at the outset that it considered that the system of special grants, made upon the recommendation of the Grants Commission, should be continued. At the same time it expressed the view that the machinery which had been developed over the years by the Grants Commission would become unworkable if it were to be asked to consider applications for special grants from as many as five States. Applications for special grants had recently been submitted to the Australian Government by Queensland and Victoria.
The Australian Government suggested that, so far as future arrangements for special grants were concerned, the States might be regarded as falling into three categories. At one extreme were the two wealthier States of New South Wales and Victoria, which should not participate in any arrangements for special grants, and at the other extreme were Western Australia and Tasmania, which for the time being might be regarded as having a continuing need for special grants. In an intermediate category were the States of South Australia, which had been a claimant State up to that time, and Queensland. The Australian Government considered that, while these two States ought not be denied the right of access to the Grants Commission, the main revenue grants to them should be increased sufficiently to enable them, unless exceptional circumstances arose, to avoid applying for special grants.
This approach was accepted by the States and, in agreeing to the new revenue grant arrangements, the Premiers of Queensland and South Australia each gave an undertaking that his State would not exercise the right of applying for special grants in future unless special or unexpected circumstances endangered its budgetary position relative to that of other States.
The Australian Government stated that its proposals were based on the assumptions that the States and their authorities would continue to meet Commonwealth pay-roll tax and that the distribution of taxing powers between the Australian Government and the States would remain unchanged. If any changes in Commonwealth-State relations having a major effect on the finances of the States were to occur during the currency of the new revenue grant arrangements, they would be subject to review.
156
Following representations by New South Wales, the Australian Government agreed to add $2 million to that State's share of the proposed grants for 1959-60, mainly because the rounding of percentage shares had produced a decline in its share of the proposed grants vis-a-vis Victoria. South Australia was also given an extra $2 million; it had argued that it could expect to receive about that amount in respect of 1958-59 by way of final adjustment to the advance payment of its special grant for that year. In the result, the distribution of general revenue grants between the four non-claimant States in 1959-60 was only slightly changed from the distribution in 1958-59; the distribution between New South Wales, Victoria and Queensland largely reflected the distribution of adjusted populations between those States; as South Australia's grant for 1959-60 was in effect determined on the basis of the total of its special grant and tax reimbursement grant for 1958-59, it received a share larger than its share of either adjusted or unadjusted population of the four non-claimant States.
Alter allowing for the additions of $2 million to the proposed grants to New South Wales and South Australia, the total grant proposed for 1959-60 became $489 million. With these adjustments to the grants for New South Wales and South Australia the proposals were unanimously accepted by the Premiers and were embodied in the States Grants Act 1959, which was passed by the Australian Parliament in November of that year.
THE STATES GRANTS ACT 1962 In 1961-62, in addition to the amounts determined under the States Grants Act 1959, further amounts
were paid to Victoria, Western Australia and Tasmania under the States Grants Act 1962. This action was taken because the census held in June 1961 revealed that the populations of those
three States as at 1 July 1960 had been over-estimated. Since the terms of the 1959 Act required the 1961 census results to be compared with unrevised estimates of population as at 1 July 1960 for the purpose of calculating the increase in population of each State during 1960-61, the resulting estimates of population increases for these States were lower than the actual increases. As these three States had framed their budgets on the basis of preliminary estimates made prior to the census results, the Australian Government agreed to pay them grants equal to those preliminary estimates, revised to take account of the finally determined increase in average wages for Australia as a whole. As a result, an additional amount of $2,048,000 was paid to Victoria, $678,000 to Western Australia and $194,000 to Tasmania.
The States Grants Act 1962 also authorised, for the purpose of calculating Victoria's grant in 1962-63 and subsequent years, the adoption of a new 'base amount' for 1961-62. This new base amount of $145.46 million represented the grant which would have been received in 1961-62 by Victoria had the financial assistance grants for that State been calculated, in each year since 1959-60, in accordance with estimates of the population of that State revised in the light of the 1961 census.
PROPOSAL FOR A 'MARGINAL' STATE INCOME TAX In September 1964 the Victorian Government announced its intention of introducing a 'marginal'
income tax to be payable by individuals living in Victoria to operate as from the beginning of 1965-66 and requested the Australian Government to collect the tax on its behalf. The Australian Government refused to accede to the Victorian request, pointing out that an arrangement involving the abandonment or modification of uniform taxation could only be contemplated if it was supported by all States, contained adequate safeguards for the interests of taxpayers and provided a sound basis for future financial relationships between the Australian Government and each of the States. The Victorian Government then indicated that it did not propose to set up the machinery for assessment and collection of its own income tax. Although Victoria again raised the question at the Premiers' Conference held in June 1965, none of the other States supported the idea of a 'marginal' State income tax.
THE JUNE 1965 PREMIERS' CONFERENCE This Conference followed an earlier Premiers' Conference held in April 1965 at which the States
had expressed the view that the annual rate of growth of the financial assistance grants under the 1959 arrangements had been too slow when considered in relation to the rate of growth of their commitments for expenditure on important government services. Variations were suggested including proposals designed to increase the share of the grants going to particular States.
After considering in detail the proposals made by the States at the April Conference the Australian Government put forward a scheme at the June 1965 Conference designed to meet the main points raised by the States.
157
It was proposed that the annual financial assistance grant payable to each State would continue to increase in proportion to variations in population and increases in wages—the two main factors affecting current expenditure of the States. However, it was proposed to improve the betterment factor by fixing it at 1 .2 per cent per annum regardless of the size of the increase in average wages. During the period of the 1959 arrangements the betterment factor had resulted in an increase in the grants of only about 0.4 per cent per annum.
The Australian Government also proposed that, in order to reduce the time lag before changes in population and wages were reflected in the grants, more up-to-date statistics for these two items should be used in calculating the grants. Specifically, it was proposed that the increase in average wages used to determine the grant for a financial year should be that for the year ending March in that financial year (instead of that for the preceding financial year) and that the increase in population used should be the increase during the year ending December in the financial year (instead of the increase during the preceding financial year).
It was suggested that the proposed new arrangements should continue for five years—from 1965-66 to 1969-70.
The proposals were acceptable to the States except that most of them did not favour the proposed reduction in the time-lag in average wages since, in that event, their 1965-66 grants would be determined without reference to the large rise in average wages which was expected to occur in 1964-65. It was therefore agreed that the increase in average wages would continue to be calculated as under the 1959 arrangements.
As regards the distribution of the grants between the States, it was agreed to increase Queensland's share of the grants by adding $2 million to the amount on which Queensland's grant for each year would be calculated. This addition, which had the effect of progressively increasing Queensland's share of the grants relative to the other States, was made mainly in recognition of Queensland's large area and relatively small population. It was also agreed to make an addition of $1.2 million to the grant which Victoria would receive in 1965-66 under the proposed new formula. This addition, which had the effect of reducing the difference between Victoria's grant per head and that of New South Wales, forms part of the base used in calculating the grant paid each year to Victoria under the grants formula.
Thus, the arrangements agreed at the June 1965 Premiers' Conference provided for two main improvements in the grants formula—the increase in the betterment factor and the reduction in the time lag before changes in population were reflected in the grants—as well as for special additions to the grants payable to Queensland and Victoria.
In outlining its proposals at the Conference the Australian Government said that, while it envisaged that Western Australia and Tasmania would continue to be eligible to receive special grants, it expected that each of the other four States would agree to remain 'non-claimant' for the period of the new arrangements. However, the Australian Government indicated that if there were a major change in the financial position of a State through circumstances beyond its control, it would be ready to review the position of that State under the financial assistance arrangements. In contrast to the action taken in 1959, it was agreed that no part of the existing special grants would be incorporated in the claimant States' financial assistance grants.
The Australian Government also made it clear that, as in 1959, the new arrangements were based on the assumption that there would be no significant changes in the financial relationships between the Australian Government and the States. In particular, the proposals were based on the understanding that the distribution of taxing powers would remain unchanged and that the States and their authorities would continue to pay pay-roll tax.
These arrangements were embodied in the States Grants Act 1965.
AMENDMENTS IN 1967 At a Premiers' Conference in February 1967 it was agreed to reduce the time lag before increases
in average wages were reflected in the grants. The percentage increase in average wages used to calculate each year's grant (including the grants for 1966-67) became that for the twelve months ended March in the year of payment instead of that for the financial year immediately preceding the year of payment. The other elements of the formula were not altered.
The Australian Government also agreed at the Conference to pay the States special assistance of $5 million in 1966-67. This amount was distributed among the States in the same proportions as the grants produced by the formula.
158
At a Premiers' Conference in June 1967 the Australian Government agreed that, for purposes of determining the formula grants for 1967-68 and future years, the special assistance of $5 million in 1966-67 would be treated as part of the formula grant of that year.
These amendments were authorized by the Stales Grants Act 1967 and the States Grants Act (No. 2) 1967.
THE JUNE 1968 PREMIERS' CONFERENCE The Australian Government made it clear at the Premiers' Conference in June 1968 that it regarded
State receipts duties on wages and salaries and comparable payments such as superannuation and pensions as an income tax and, as such, in breach of the financial assistance grants arrangements. (Payments of the type mentioned had been made liable to the new form of receipts duty introduced in Western Australia and Victoria in 1966-67 and 1967-68 respectively.) The Australian Government stated that it adhered firmly to the principle of uniform income taxation and was convinced of the desirability of avoiding multiplication of income taxes. If receipts duty on wages and salaries continued in existence when the grants arrangements were being reviewed in 1970, the Australian Government would regard that as a decisive factor in determining its attitude on the allocation to a State imposing that form of taxation. In the meantime, should a State that continued the impost on wages and salaries impose it at a higher rate, the Australian Government would move forthwith to amend its legislation and seek to reduce that State's grant. (The duty as it applied to wages and salaries was subsequently removed by Victoria as from July 1970 and by Western Australia as from January 1971. Receipts duties generally ceased to apply to receipts after the end of September 1970.)
It was also stated at the Conference that the Australian Government did not object in principle to modest extensions of State taxation into the general field of business receipts or business turnover, provided it was not carried to a point where it could significantly affect the Australian Government's ability to carry out national policies or to raise revenue. However, the Australian Government did not favour the imposition of a pay-roll tax by the States.
It was agreed at the Conference to meet Western Australia's request to withdraw from the special grants system as from 1968-69 but that this move should not disturb the existing formula grants arrangements. It was decided that—
in lieu of the special grant the Australian Government would pay Western Australia the sum of $15.5 million in each of the years 1968-69 and 1969-70 in addition to the State's formula grant; the completion payment to be recommended by the Grants Commission in respect of 1966-67 would be paid in the normal way in 1968-69. However, it was agreed that the advance payment of $15.5 million in respect of 1967-68 would be regarded as the final grant for that year; and the sum of Western Australia's formula grant for 1969-70 and the amount of $15.5 million would be regarded for purposes of the 1970 review of the financial assistance arrangements as constituting Western Australia's financial assistance grant for 1969-70.
The additional financial assistance grants payable to Western Australia in 1968-69 and 1969-70 under these arrangements were authorized by the States Grants Act 1968.
THE FEBRUARY 1970 PREMIERS' CONFERENCE Prior to this Conference the six State Premiers presented a joint Statement to the Prime Minister
entitled 'The Financial Relationships of the Commonwealth and the States'. The main argument put forward in this document was that the existing financial assistance grants formula produced an insufficient rate of growth in general revenue assistance to the States when considered in relation to their increasing expenditure commitments, particularly in the areas of debt charges and social services expenditure, and taking into account the restricted revenue fields open to the States.
The proposals advanced by the Premiers, and to which they sought the concurrence of the Australian Government at the Conference, were summarised at the conclusion of the document as follows—
'(1) That the tax reimbursements grants for a transitional period from 1 July 1970, should be determined by adequately increasing the base total as determined under present arrangements, and adopting a new system of increases upon that base in line with the observed rate of growth in income tax yields.
159
That Commonwealth and State Treasury officers be instructed to devise a scheme whereby the States shall have access to income tax broadly along the lines of the system presently operating in Canada, but adapted to Australian circumstances and to the recognized needs of the less populous States. Upon re-entry of the States into the field of income taxation appropriate adjustments be made to financial assistance grants to offset the effects of the lower per capita yields available to the less populous States from income tax, to preserve the financial equalization provisions presently available to the less populous States, and to provide for escalation of the continuing financial assistance grants in line with the expected yield of income taxation. In the course of financial re-arrangements, consideration must be given to permitting participation by the States in such capital and developmental funds as may be secured from revenue sources; to a review of the recent trend to proliferation of Commonwealth "special purpose" grants; and to the possibility of the States securing access to wider revenue fields presently under the control of the Commonwealth, as well as to income tax.'
At the Conference, the Prime Minister said that the Australian Government did not accept the pro-posal that the States re-enter the field of income taxation, or that the annual increases in the general revenue grants to the States should be related to increases in income tax collections. Allowing the States access to income taxation could make the Australian Government's task of managing the economy more difficult and, if a scheme along the Canadian lines were adopted, it could result in different rates of income tax applying in the various States. This would mean the end of uniform income taxation, which was beneficial and which the Australian people had come to accept. Further, as income tax collections fluctuated markedly from time to time, the adoption of the States' proposals could create difficult bud-getary problems for the States in some years. In addition, the fact that the per capita yield of income tax varied markedly between the States would make it difficult to work out 'equalisation' grants satisfactory to the less populous States.
The Prime Minister agreed, however, that there was a need for a significant increase in revenue assistance to the States and outlined, in general terms, four ways in which this might be achieved. He proposed that the burden of State debt charges might be relieved by the Australian Government taking over part of existing State debt and also by providing portion of future borrowing programs for State works in the form of interest-free grants. In addition, the Australian Government was prepared to in-crease the financial assistance grants by an immediate addition to the base level and also by increasing the betterment factor to provide for a faster rate of growth in the grants. The Prime Minister added that the Australian Government was willing to join with the States in examining any proposals made by them for an alternative field of growth tax.
The Prime Minister suggested that the precise details of the Australian Government's proposals could be left to be settled at the usual Premiers' Conference in June and that, before then, Australian and State Treasury officers could meet to discuss them. The Premiers accepted this suggestion and, at two subsequent meetings, Australian and State Treasury officers reached tentative agreement on the procedures for the progressive take-over by the Australian Government of responsibility for $1,000 million of State debt and for an annual capital grant in lieu of loan raisings.
THE JuNF 1970 PpMIms' CONFERENCE At this Conference the Prime Minister gave details of four ways in which the Australian Government
was prepared to increase the revenue assistance to the States. First, an addition of $40 million would be made to the 1970-71 grants determined under the
existing formula and this amount would be incorporated in the 1970-71 base for purposes of deter-mining the formula grants for 1971-72 and later years. The amount of $40 million would be dis-tributed between the States in the same proportions as their 1970-71 formula grants.
Secondly, there would be an increase in the betterment factor from 1.2 per cent to 1.8 per cent to apply from 1971-72.
Thirdly, an interest-free capital grant would be made starting at $200 million in 1970-71 and increasing in future years in proportion to the increase in the total Loan Council works and housing program. This would relieve the States of debt charges they would otherwise have to pay and would free State funds for other purposes.
160
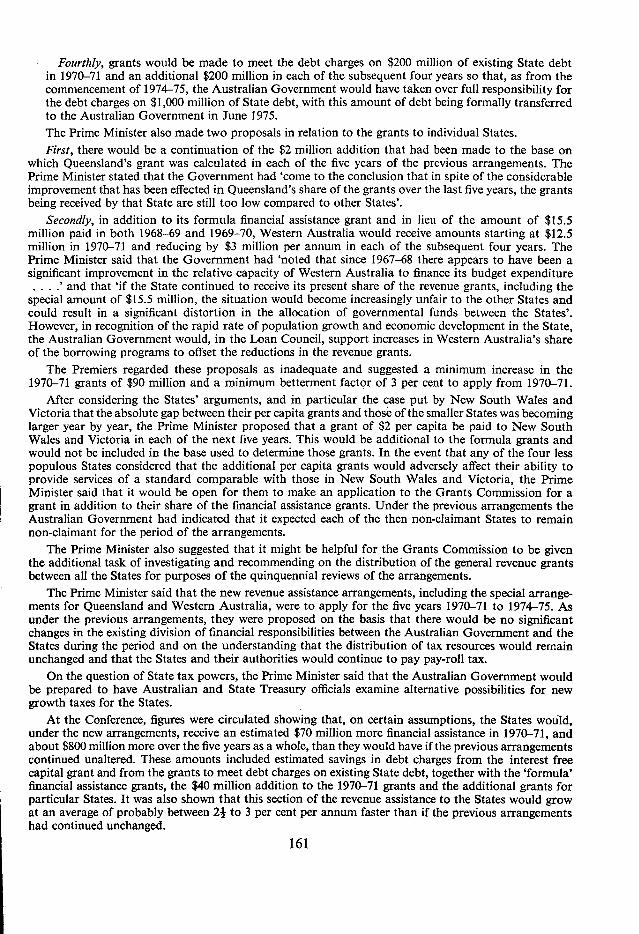
Fourthly, grants would be made to meet the debt charges on $200 million of existing State debt in 1970-71 and an additional $200 million in each of the subsequent four years so that, as from the commencement of 1974-75, the Australian Government would have taken over full responsibility for the debt charges on $1,000 million of State debt, with this amount of debt being formally transferred to the Australian Government in June 1975. The Prime Minister also made two proposals in relation to the grants to individual States. First, there would be a continuation of the $2 million addition that had been made to the base on
which Queensland's grant was calculated in each of the five years of the previous arrangements. The Prime Minister stated that the Government had 'come to the conclusion that in spite of the considerable improvement that has been effected in Queensland's share of the grants over the last five years, the grants being received by that State are still too low compared to other States'.
Secondly, in addition to its formula financial assistance grant and in lieu of the amount of $15.5 million paid in both 1968-69 and 1969-70, Western Australia would receive amounts starting at $12.5 million in 1970-71 and reducing by $3 million per annum in each of the subsequent four years. The Prime Minister said that the Government had 'noted that since 1967-68 there appears to have been a significant improvement in the relative capacity of Western Australia to finance its budget expenditure
.' and that 'if the State continued to receive its present share of the revenue grants, including the special amount of $15.5 million, the situation would become increasingly unfair to the other States and could result in a significant distortion in the allocation of governmental funds between the States'. However, in recognition of the rapid rate of population growth and economic development in the State, the Australian Government would, in the Loan Council, support increases in Western Australia's share of the borrowing programs to offset the reductions in the revenue grants.
The Premiers regarded these proposals as inadequate and suggested a minimum increase in the 1970-71 grants of $90 million and a minimum betterment factor of 3 per cent to apply from 1970-71.
After considering the States' arguments, and in particular the case put by New South Wales and Victoria that the absolute gap between their per capita grants and those of the smaller States was becoming larger year by year, the Prime Minister proposed that a grant of $2 per capita be paid to New South Wales and Victoria in each of the next five years. This would be additional to the formula grants and would not be included in the base used to determine those grants. In the event that any of the four less populous States considered that the additional per capita grants would adversely affect their ability to provide services of a standard comparable with those in New South Wales and Victoria, the Prime Minister said that it would be open for them to make an application to the Grants Commission for a grant in addition to their share of the financial assistance grants. Under the previous arrangements the Australian Government had indicated that it expected each of the then non-claimant States to remain non-claimant for the period of the arrangements.
The Prime Minister also suggested that it might be helpful for the Grants Commission to be given the additional task of investigating and recommending on the distribution of the general revenue grants between all the States for purposes of the quinquennial reviews of the arrangements.
The Prime Minister said that the new revenue assistance arrangements, including the special arrange-ments for Queensland and Western Australia, were to apply for the five years 1970-71 to 1974-75. As under the previous arrangements, they were proposed on the basis that there would be no significant changes in the existing division of financial responsibilities between the Australian Government and the States during the period and on the understanding that the distribution of tax resources would remain unchanged and that the States and their authorities would continue to pay pay-roll tax.
On the question of State tax powers, the Prime Minister said that the Australian Government would be prepared to have Australian and State Treasury officials examine alternative possibilities for new growth taxes for the States.
At the Conference, figures were circulated showing that, on certain assumptions, the States would, under the new arrangements, receive an estimated $70 million more financial assistance in 1970-71, and about $800 million more over the five years as a whole, than they would have if the previous arrangements continued unaltered. These amounts included estimated savings in debt charges from the interest free capital grant and from the grants to meet debt charges on existing State debt, together with the 'formula' financial assistance grants, the $40 million addition to the 1970-71 grants and the additional grants for particular States. It was also shown that this section of the revenue assistance to the States would grow at an average of probably between 2+ to 3 per cent per annum faster than if the previous arrangements had continued unchanged.
161
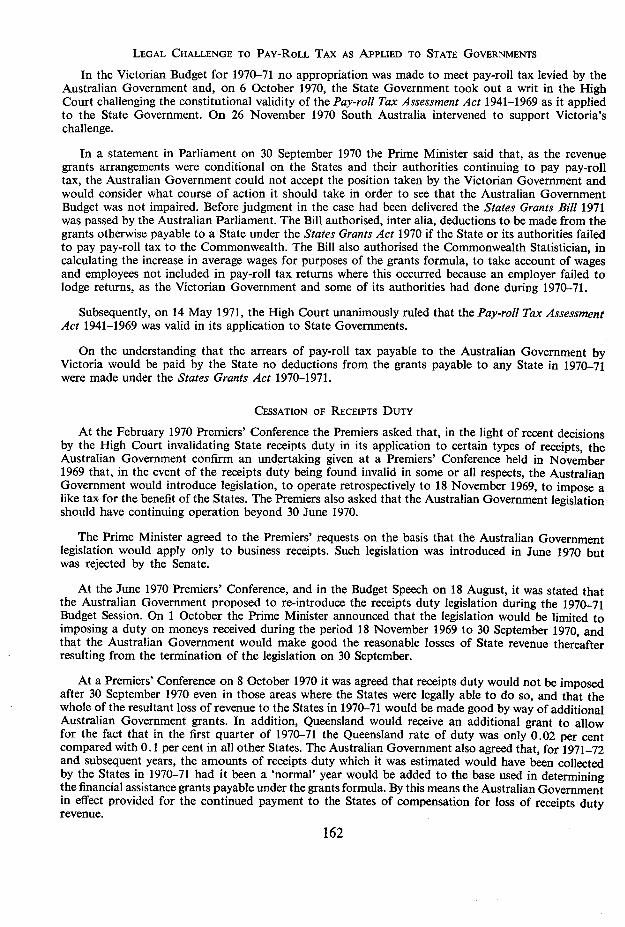
LEGAL CHALLENGE TO PAY-ROLL TAX AS APPLIED TO STATE GOVERNMENTS
In the Victorian Budget for 1970-71 no appropriation was made to meet pay-roll tax levied by the Australian Government and, on 6 October 1970, the State Government took out a writ in the High Court challenging the constitutional validity of the Pay-roll Tax Assessment Act 1941-1969 as it applied to the State Government. On 26 November 1970 South Australia intervened to support Victoria's challenge.
In a statement in Parliament on 30 September 1970 the Prime Minister said that, as the revenue grants arrangements were conditional on the States and their authorities continuing to pay pay-roll tax, the Australian Government could not accept the position taken by the Victorian Government and would consider what course of action it should take in order to see that the Australian Government Budget was not impaired. Before judgment in the case had been delivered the States Grants Bill 1971 was passed by the Australian Parliament. The Bill authorised, inter alia, deductions to be made from the grants otherwise payable to a State under the States Grants Act 1970 if the State or its authorities failed to pay pay-roll tax to the Commonwealth. The Bill also authorised the Commonwealth Statistician, in calculating the increase in average wages for purposes of the grants formula, to take account of wages and employees not included in pay-roll tax returns where this occurred because an employer failed to lodge returns, as the Victorian Government and some of its authorities had done during 1970-71.
Subsequently, on 14 May 1971, the High Court unanimously ruled that the Pay-roll Tax Assessment Act 1941-1969 was valid in its application to State Governments.
On the understanding that the arrears of pay-roll tax payable to the Australian Government by Victoria would be paid by the State no deductions from the grants payable to any State in 1970-71 were made under the States Grants Act 1970-1971.
CESSATION OF RECEIPTS Dui'y
At the February 1970 Premiers' Conference the Premiers asked that, in the light of recent decisions by the High Court invalidating State receipts duty in its application to certain types of receipts, the Australian Government confirm an undertaking given at a Premiers' Conference held in November 1969 that, in the event of the receipts duty being found invalid in some or all respects, the Australian Government would introduce legislation, to operate retrospectively to 18 November 1969, to impose a like tax for the benefit of the States. The Premiers also asked that the Australian Government legislation should have continuing operation beyond 30 June 1970.
The Prime Minister agreed to the Premiers' requests on the basis that the Australian Government legislation would apply only to business receipts. Such legislation was introduced in June 1970 but was rejected by the Senate.
At the June 1970 Premiers' Conference, and in the Budget Speech on 18 August, it was stated that the Australian Government proposed to re-introduce the receipts duty legislation during the 1970-71 Budget Session. On 1 October the Prime Minister announced that the legislation would be limited to imposing a duty on moneys received during the period 18 November 1969 to 30 September 1970, and that the Australian Government would make good the reasonable losses of State revenue thereafter resulting from the termination of the legislation on 30 September.
At a Premiers' Conference on 8 October 1970 it was agreed that receipts duty would not be imposed after 30 September 1970 even in those areas where the States were legally able to do so, and that the whole of the resultant loss of revenue to the States in 1970-71 would be made good by way of additional Australian Government grants. In addition, Queensland would receive an additional grant to allow for the fact that in the first quarter of 1970-71 the Queensland rate of duty was only 0.02 per cent compared with 0.1 per cent in all other States. The Australian Government also agreed that, for 1971-72 and subsequent years, the amounts of receipts duty which it was estimated would have been collected by the States in 1970-71 had it been a 'normal' year would be added to the base used in determining the financial assistance grants payable under the grants formula. By this means the Australian Government in effect provided for the continued payment to the States of compensation for loss of receipts duty revenue.
162
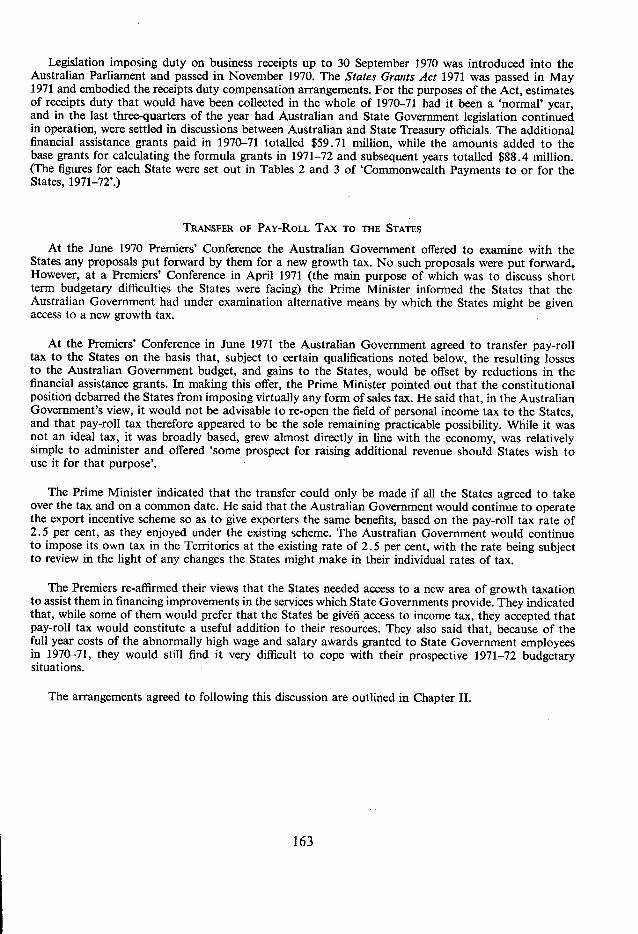
Legislation imposing duty on business receipts up to 30 September 1970 was introduced into the Australian Parliament and passed in November 1970. The States Grants Act 1971 was passed in May 1971 and embodied the receipts duty compensation arrangements. For the purposes of the Act, estimates of receipts duty that would have been collected in the whole of 1970-71 had it been a 'normal' year, and in the last three-quarters of the year had Australian and State Government legislation continued in operation, were settled in discussions between Australian and State Treasury officials. The additional financial assistance grants paid in 1970-71 totalled $59.71 million, while the amounts added to the base grants for calculating the formula grants in 1971-72 and subsequent years totalled $88.4 million. (The figures for each State were set out in Tables 2 and 3 of 'Commonwealth Payments to or for the States, 1971-72'.)
TRANSFER OF PAY-ROLL TAX TO THE STATES
At the June 1970 Premiers' Conference the Australian Government offered to examine with the States any proposals put forward by them for a new growth tax. No such proposals were put forward. However, at a Premiers' Conference in April 1971 (the main purpose of which was to discuss short term budgetary difficulties the States were facing) the Prime Minister informed the States that the Australian Government had under examination alternative means by which the States might be given access to a new growth tax.
At the Premiers' Conference in June 1971 the Australian Government agreed to transfer pay-roll tax to the States on the basis that, subject to certain qualifications noted below, the resulting losses to the Australian Government budget, and gains to the States, would be offset by reductions in the financial assistance grants. In making this offer, the Prime Minister pointed out that the constitutional position debarred the States from imposing virtually any form of sales tax. He said that, in the Australian Government's view, it would not be advisable to re-open the field of personal income tax to the States, and that pay-roll tax therefore appeared to be the sole remaining practicable possibility. While it was not an ideal tax, it was broadly based, grew almost directly in line with the economy, was relatively simple to administer and offered 'some prospect for raising additional revenue should States wish to use it for that purpose'.
The Prime Minister indicated that the transfer could only be made if all the States agreed to take over the tax and on a common date. He said that the Australian Government would continue to operate the export incentive scheme so as to give exporters the same benefits, based on the pay-roll tax rate of 2.5 per cent, as they enjoyed under the existing scheme. The Australian Government would continue to impose its own tax in the Territories at the existing rate of 2.5 per cent, with the rate being subject to review in the light of any changes the States might make in their individual rates of tax.
The Premiers re-affirmed their views that the States needed access to a new area of growth taxation to assist them in financing improvements in the services which State Governments provide. They indicated that, while some of them would prefer that the States be given access to income tax, they accepted that pay-roll tax would constitute a useful addition to their resources. They also said that, because of the full year costs of the abnormally high wage and salary awards granted to State Government employees in 1970-71, they would still find it very difficult to cope with their prospective 1971-72 budgetary situations.
The arrangements agreed to following this discussion are outlined in Chapter II.
163
APPENDIX It—PART 11—TABLES OF GENERAL REVENUE ASSISTANCE
TABLE No. SUBJECT
96 General Revenue Assistance, 1949-50 to 1974-75 97 Tax Reimbursement Grants—Formula and Supplementary Grants, 1942-43 to
1958-59. 98 Special Grants, 1910-11 to 1974-75.
165
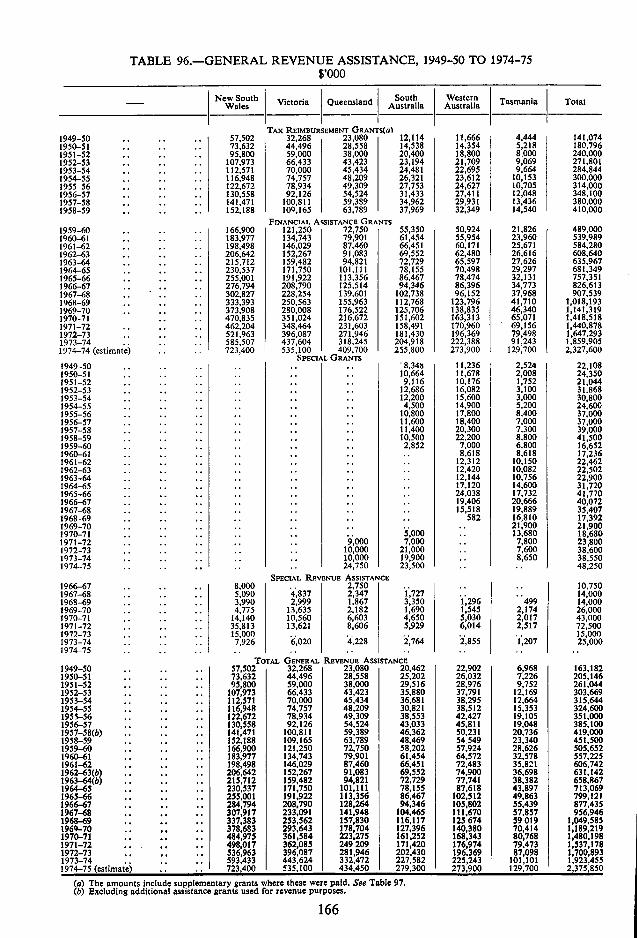
SPECIAL REVENUE ASSISTANCE 2966-67 .. .. .. 8,000 2,750 1967-68 .. .. .. 5,090 4,837 2,347 1968-69 .. .. .. 3,990 2,999 1.867 1969-70 .. .. .. 4,775 13,635 2,182 1970-71 .. .. .. 14,140 10,560 6,603 1971-72 .. .. .. 35,813 13,621 8,606 1972-73 .. ,. ,. 15,000 1973-74 .. .. 7,926 6,020 4,228 1974-75 ..
TOTAL GENERAL REVENUE ASSISTANC 1949-50 .. .. .. 57,502 32,268 23,080 2950-51 .. .. .. 73,632 44,496 28,558 1951-52 .. .. .. 95,800 59,000 38,000 1952-53 .. .. ,, 107,973 66,433 43,423 2 1953-54 .. .. .. 112,571 70,000 45,434 2 1954-55 .. .. .. 116,948 74,757 48,209 2 1955-56 .. ,. ,. 122,672 78,934 49,309 2 1956-57 .. .. .. 130,558 92,126 54,524 4 2957-58(b) ,. ,. ,, 141,471 100,811 59,389 4 2958-59 .. .. .. 152,188 109,165 63,789 4 1959-60 .. .. .. 166,900 121,250 72,750 1960-61 .. .. .. 183.977 134,743 79,901 1961-62 .. .. .. 198,498 146,029 87,460 1962-63(b) .. .. .. 206,642 152,267 92,083 1963-64(b) .. .. .. 215,712 159,482 94,821 2964-65 .. .. .. 230,537 171,750 101,111 1965-66 .. .. .. 255,001 191,922 113,356 2 1966-67 .. ,, ,. 284,794 208,790 128,264 5 1967-68 .. ,, .. 307,917 233,091 141,948 IC 1968-69 .. .. ., 337,383 253,562 157,830 11 1969-70 .. ,, .. 378,683 293,643 178,704 1 1970-71 .. ,. .. 484,975 361,584 223,275 1 2971-72 .. ., .. 498,017 362,085 249209 1 1972-73 ., ., .. 536,963 396,087 281,946 2( 1973-74 ,. .. .. 593,433 443,624 332,472 2 1974-75 (estimate) .. .. 723,400 535,100 434,452
31,720 41,770 40,072 35,407 17,392 22,900 18,680 23,800 38.600 38,550 48,250
10.750 1,727 14,000 3,350 1,296 499 14,000 1,690 1,545 2,174 26,000 4,650 5,030 2,017 43,000 5,929 6,014 2,517 72,500
15,000 2,764 2,855 1,207 25,000
10,462 22,902 6,968 163,182 25.202 26,032 7,226 205,246 29,516 28,976 9,752 261,044 15,880 37,791 12,169 303.669 16,681 38.295 12.664 325,644 10,821 38,512 15,353 324,600 18,553 42.427 19,105 351,000 13,033 45,811 19,048 385,100 16,362 50,231 20,736 419,000 18,469 54.549 23,340 451,500 18.202 57,924 28,626 505,652 11,454 64,572 32.578 557,225 >6,452 72,483 35,821 606,742 >9,552 74.900 36,698 631.142 '2.729 77,741 38.382 658,867 '8,155 87.618 43.897 723,069 6,467 102,512 49,863 799.221 24,346 105,802 55,439 877,435 24,465 111,670 57,857 956,946 6,217 125674 59019 1,049,585 t7,396 140,380 70,414 1,189,219 iI,252 168,343 80,768 1,480.198 rI,420 176,974 79,473 1,537,278 22,430 196,369 87,098 1,700,893 27,582 Qnn 225,243 1714Qflfl 101,101 IQ'7CIfl 1,923,455 l'7RIM
1964-65 .. .. .. .. 1965-66 .. .. .. .. 1966-67 .. .. .. .. 2967-68 .. .. .. .. 1968-69 .. .. .. .. 1969-70 .. .. .. .. .. 2970-71.. .. .. .. .. .. 5,000 1971-72 .. ., ., ., 9,000 7,000 1972-73 ,. •, ,. .. .. 10,000 21,000 1973-74 .. .. .. .. 10,000 19,900 1974-75 .. .. ., .. 24,750 23,500
17,220 24,038 19,406 25,518
582
14,600 17,732 20,666 19,889 16,810 21,900 13.680
7,800 7,600 8,650
TABLE 96.-GENERAL REVENUE ASSISTANCE, 1949-50 TO 1974-75 $,000
- New South Victoria Queensland South _Australia
Western Tasmania Total Wales
TAX REIMBURSEMENT GRANTS(a) 1949-50 .. .. 57,502 32,268 23,080 22,114 11,666 4,444 142,074 1950-51 .. .. ,. 73,632 44,496 28,558 14,538 14,354 5,218 180,796 2951-52 .. .. .. 95,800 59,000 38,000 20,400 18,800 8,000 240,000 1952-53 .. .. .. 107,973 66,433 43,423 23,194 21,709 9,069 271,801 2953-54 .. .. .. 112,571 70,000 45,434 24,481 22,695 9.664 284,844 1954-55 .. .. 116,948 74,757 48,209 26,321 23,612 10,153 300,000 1955 56 ,. .. 122,672 78,934 49,309 27,753 24,627 10,705 314,000 1956-57.. .. 130,558 92.126 54,524 31,433 27.411 12,048 348,100 1957-58 .. .. .. 141,471 100,811 59,389 34,962 29931 23,436 380,000 2958-59 .. .. .. 152,188 109,165 63,789 37,969 32,349 14,540 410,000
FINANCIAL ASSISTANCE GRANTS 1959-60 .. .. .. 166,900 121,250 72,750 55,350 50,924 22,826 489,000 1960-61 .. .. .. 183,977 134,743 79,901 61,454 55,954 23,960 539,989 1961-62 .. .. .. 198,498 146,029 87,460 66,451 60,171 25.671 584.280 1962-63 .. .. .. 206,642 152,267 91,083 69,552 62,480 26,616 608,640 1963-64 .. .. .. 225,712 159,482 94.821 72.729 65,597 27,626 635,967 1964-65 .. ,. ,. 230,537 171,750 201,111 78,155 70,498 29,297 681,349 1965-66 .. .. ,, 255,001 192,922 213,356 86.467 78.474 32.131 757,351 1966-67 .. .. .. 276,794 208,790 225,524 94,346 86,396 34,773 826,613 1967-68 .. - .. .. 302.827 228,254 139.601 102,738 96,152 37,968 907,539 1968-69 .. .. .. 333,393 250,563 155,963 112,768 123.796 41,710 1,018,193 1969-70 .. .. .. 373,908 280,008 176,522 125,706 138,835 46,340 1,241,319 1970-71 .. .. 470,835 351,024 216,672 151,602 163,313 65,071 1,418,518 1972-72 .. .. .. 462,204 348,464 231,603 158,491 170,960 69,156 1,440,878 1972-73 .. .. 521,963 396,087 271,946 181,430 196,369 79,498 1,647.293 1973-74 .. 585,507 437,604 318,245 204,918 222,388 91,243 1,859.905 1974-74 (estimate) .. 723,400 535,100 409,700 255,800 273,900 129,700 2,327,600
SPECIAL GRANTS 2949-50 ., .. .. .. .. 8,344 11,236 2,524 22,208 1950-51 .. .. .. .. .. .. 20,664 11,678 2,008 24,350 2951-52 .. .. .. .. .. .. 9,216 10,176 1,752 21,044 1952-53 .. .. .. .. .. .. 12,686 16,082 3,100 31.868 1953-54 .. .. .. .. .. .. 12.200 15,600 3,000 30,800 1954-55 .. .. .. .. .. .. 4,500 14,900 5,200 24,600 1955-56 .. .. .. .. .. .. 10,800 17.800 8.400 37,000 1956-57 .. .. .. .. .. .. 11,600 18,400 7,000 37,000 1957-58 .. .. .. .. .. .. 11,400 20,300 7.300 39,000 1958-59 .. .. .. .. .. .. 10,500 22.200 8,800 41,500 1959-60 .. .. .. .. .. .. 2,852 7.000 6,800 16,652 2960-62 .. .. .. .. .. .. .. 8,618 8,618 17,236 2961-62 •, •, , .. .. .. 12,322 10,150 22,462 1962-63 .. .. .. .. .. .. .. 12,420 10,082 22,502 2963-64 .. .. .. .. .. .. .. 12,244 10,756 22.900
The amounts include supplementary grants where these were paid. See Table 97 Excluding additional assistance grants used for revenue purposes.
166
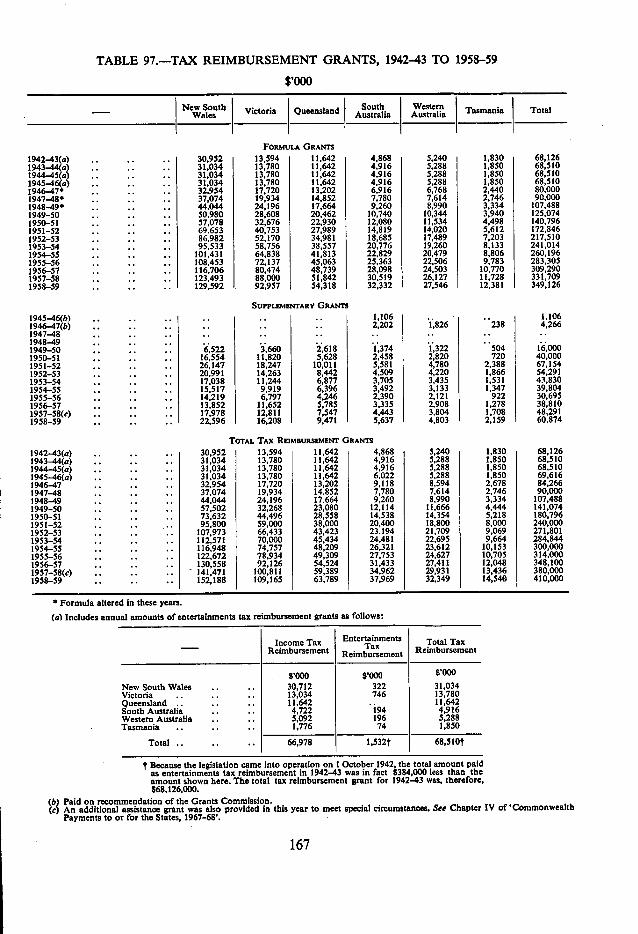
TABLE 97.-TAX REIMBURSEMENT GRANTS, 1942-43 TO 1958-59 $,000
- New SouWales th Victoria Queensland Australia South e stralia Tasmania Total
FORMULA GRANTS
1942-43(a) .. .. .. 30,952 13,594 11,642 4,868 5,240 1,830 68,126 1943-44(a) .. .. .. 31,034 13,780 11,642 4,916 5,288 1,850 68,510 1944-45(a) .. ,. .. 31,034 13,780 11,642 4,916 5,288 1,850 68,510 1945-46(a) .. .. .. 31,034 13,780 11,642 4,916 5,288 1,850 68,510 1946-47 .. .. .. 32,954 17,720 13,202 6,916 6,768 2,440 80,000 1947-48 ,. .. .. 37,074 19,934 14,852 7,780 7,614 2.746 90,000 1948-490 44,044 24,196 17,664 9,260 8,990 3,334 107,488 1949-50 ,. .. ,. 50,980 28,608 20,462 10,740 10,344 3,940 125,074 1950-51 .. .. .. 57,078 32,676 22,930 12,080 11,534 4,498 140,796 1951-52 .. ,, ,. 69.653 40,753 27,9891 4,819 14,020 5,612 172,846 1952-53 ,. ,, .. 86,982 52,170 34,981 18,685 17,489 7,203 217,510 1953-54 .. ,. .. 95,533 58,756 38,557 20,776 19,260 8,133 241,014 1954-55 .. .. .. 101,431 64,838 41,813 22.829 20,4798,806 260,196 1955-56 .. ,. .. 108,453 72,137 45,063 25.363 22,506 9,783 283,305 1956-57 .. .. .. 116,706 80,474 48,739 28,098 24,503 10,770 309,290 1957-58 .. .. ., 123,493 88,000 51,842 30.519 26,127 11,728 331,709 1958-59 .. .. .. 129,592 92,957 54,318 32,332 27,546 12,381 349,126
SUPPLEMENTARY GRANTS
1945-46(6) .. .. .. .. .. .. 1,106 .. .. 1,106 1946-47(b) .. .. ,. ., .. .. 2,202 1,826 238 4,266 1947-48 .. .. .. .. .. .. .. 1948-49 .. 1949-50 .. .. .. .. .. .. 6,522
. 3. ,660 .. 2,618
.. 1,374 1,322 504 16,000
1950-51 ., .. .. 16,554 11,820 5,628 2,458 2,820 720 40,000 1951-52 ,, .. .. 26,147 18,247 10,011 5,581 4,780 2,388 67,154 1952-53 .. .. .. 20,991 14,263 8,442 4,509 4,220 1,866 54,291 1953-54 .. .. .. 17,038 11,244 6,877 3,705 3,435 1,531 43,830 1954-55 .. .. .. 15,517 9.919 6,396 3,492 3,133 1,347 39,804 1955-56 ,. .. .. 14.219 6,797 4,246 2.390 2.121 922 30,695 1956-57 ,. .. .. 13,852 11,652 5,785 3,335 2.908 1,278 38,810 1957-58(c) .. .. .. 17,978 12,811 7,547 4.443 3,804
4,803 1,708 2,159
48,291 60,874 1958-59 .. .. .. 22,596 16,208 9,471 5,637
TOTAL TAX REIMBURSEMENT GRANTS
1942-43(a) .. .. .. 30,952 13,594 11.642 4,868 5,240 1,830 68,126 1943-44(a) .. .. .. 31,034 13,780 11,642 4,916 5,288 1,850 68,510 1944-45(a) .. .. .. 31,034 13,780 11,642 4,916 5,288 1,850 68,510 1945-46(a) .. .. .. 31.034 13,780 11,642 6.022 5,288 1,850 69,616 1946-47 .. .. .. 32,954 17,720 13,202 9,118 8,594 2,678 84,266 1947-48 .. .. .. 37,074 19,934 14.852 7,780 7,614 2,746 90,000 1948-49 .. .. .. 44,044 24,196 17.664 9,260 8,990 3,334 107,488 1949-50 .. .. .. 57,502 32,268 23,080 12,114 11,666 4,444 141,074 1950-51 .. .. .. 73,632 44,496 28,558 14.538 14.354 5,218 180,796 1951-52 .. .. .. 95,800 59,000 38,000 20,400 18,800 8,000 240,000 1952-53 .. .. .. 107,973 66,433 43,423 23.194 21,709 9,069 271,801 1953-54 .. ,. .. 112,571 70,000 45,434 24,481 22,695 9,664 284,844 1954-55 .. ,. ,. 116,948 74,757 48,209 26,321 23,612 10,153 300,000 1955-56 .. .. .. 122,672 78.934 49,309 27,753 24,627 10,705 314.000 1956-57 .. .. .. 130,55892,126 54,524 31,433 27,411 12,048 348,100 1957-58(c) .. .. .. 141,471 100,811 59,389 34,962 29.931 13,436 380,000 1958-59 .. .. .. 152,188 109,165 63,789 37,969 32,349 14,540 410,000
* Formula altered in these years. (a) Includes annual amounts of entertainments tax reimbursement grants as follows:
- Income Tax Reimbursement
Entertainments Tax
Reimbursement Total Tax
Reimbursement
$'OOO $'OOO 8'000 New South Wales ,. .. 30,712 322 31,034 Victoria .. .. .. 13,034 746 13,780 Queensland ,. .. .. 11,642 .. 11,642 South Australia ,. ,. 4,722 194 4,916 Western Australia ,. .. 5,092 196 5,288 Tasmania .. ,. ,. 1,776 74 1,850
Total .. .. .. 66,978 1,532t 68,510t
f Because the legislation came into operation on 1 October 1942, the total amount paid as entertainments tax reimbursement in 1942-43 was in fact $384,000 less than the amount shown here. The total tax reimbursement grant for 1942-43 was, therefore, $68,126,000.
Paid on recommendation of the Grants Commission. An additional assistance grant was also provided In this year to meet special circumstances. See Chapter IV of 'Commonwealth Payments to or for the States. 1967-68'.
167

TABLE 98.-SPECIAL GRANTS 1910-11 TO 1974-75 $,000
- Queensland Australia Australia Tasmania Total
SPECIAL GRANTS PAID PRIOR TO ESTABLISHMENT OF GRANTS COMMISSION 1910-Il .. .. .. .. .. 500 500 1911-12 .. .. .. .. .. 480 .. 480 1912-13 .. .. .. .. .. 460 190 650 1913-14 .. .. .. .. .. 440 180 620 1914-15 .. .. .. .. .. 420 180 600 1915-16 .. .. .. .. .. 400 180 580 1916-17 .. .. .. .. .. 380 180 560 1917-18 .. .. .. .. .. 360 180 540 1918-19 .. .. .. .. .. 340 180 520 1919-20 .. .. .. .. .. 320 180 500 1920-21 .. .. .. .. .. 300 180 480 1921-22 .. .. .. .. .. 280 170 450 1922-23 .. .. .. .. .. 260 170 430 1923-24 .. .. .. .. .. 240 170 410 1924-25 .. .. .. .. .. 220 292 512 1925-26 .. .. .. .. .. 900 136 1.036 1926-27 .. .. .. .. .. 600 756 1,356 1927-28 .. .. .. .. .. 600 756 1,356 1928-29 .. .. .. .. .. 600 440 1,040 1929-30 .. .. .. .. 720 600 500 1,820 1930-31 .. .. .. .. 2,340 600 500 3,440 1931-32 .. .. .. .. 2,000 600 500 3,100 1932-33 .. .. .. .. 2,000 1,000 660 3,660 1933-34 .. .. .. .. 2,300 1.200 760 4,260
SPECIAL GRANTS PAID ON RECOMMENDATION OF GRANTS COMMISsION(a) 1934-35 .. .. .. .. 2,800 1,200 800 4,800 1935-36 .. .. .. .. 3,000 1,600 900 5,500 1936-37 .. .. .. .. 2,660 1,000 1,200 4,860 1937-38 .. .. .. .. 2,400 1,150 1,150 4,700 1938-39 .. .. .. .. 2,080 1,140 820 4,040 1939-40 .. .. .. 1.990 1,190 860 4,040 1940-41 .. .. .. .. 2,000 1,300 800 4,100 194142 . .. .. .. 2,300 1,260 1,040 4,600 194243 .. .. .. 1,600 1,600 1,150 4,350 1943-44 .. .. .. 1,800 1,700 1,440 4,940 1944-45 .. .. .. .. 2,400 1,808 1,484 5.692 1945-46 .. .. .. .. 2,800 1,900 1,292 5.992 1946-47 .. .. .. .. 4,000 3.746 1,750 9,496 1947-48 .. .. .. .. 4,636 5,954 1,494 12.084 194849 .. .. .. 5,700 7,200 2,000 14,900 1949-50 .. .. .. 8,348 11,236 2,524 22,108 1950-51 .. .. .. 10,664 11,678 2.008 24,350 1951-52 .. .. .. .. 9,116 10,176 1,752 21,044 1952-53 .. .. .. 12,686 16,082 3,100 31,868 1953-54 .. .. .. .. 12,200 15,600 3,000 30.800 1954-55 .. .. 4,500 14,900 5,200 24,600 1955-56 .. .. 10,800 17,800 8,400 37,000 1956-57 .. .. .. 11,600 18.400 7,000 37,000 1957-58 .. .. .. .. 11,400 20,300 7,300 39,000 1958-59 .. .. .. 10,500 22,200 8.800 41,500 1959-60 .. .. .. (b) 2,852 7,000 6,800 16,652 1960-61 .. .. .. .. .. 8.618 8.618 17,236 1961-62 .. .. .. .. .. 12,312 10,150 22,462 1962-63 .. .. .. 12,420 10.082 22,502 1963-64. .. .. .. .. 12,144 10,756 22,900 1964-65 .. .. .. .. .. 17,120 14,600 31,720 1965-66 .. .. .. .. .. 24,038 17,732 41,770 1966-67 .. .. .. .. 19,406 20,666 40,072 1967-68 .. .. .. .. .. 15,518 19,889 35,407 1968-69 .. .. .. .. (c) 582 16,810 17,392 1969-70 .. .. .. .. 21,900 21,900 1970-71 .. .. .. 5,000 .. 13,680 (d) 18.680 1971-72 .. .. .. 9,000 7,000 7,800 23,800 1972-73 .. .. 10,000 21,000 .. 7.600 38,600 1973-74 .. .. .. 10,000 19,900 8,650 38,550 1974-75 .. 24,750 23,500 .. .. 48,250
From 1949-50 special grants have been paid in two parts. One part represents the advance payment for the current financial year; the other represents She adjustment to the advance payment made two years earlier and is now known as the completion payment. The figures shown here are the amounts actually paid eachyear. Figures of final special grants paid in respect of each year from 1968-69 are given in Chapter 11. Figures for previous years may be found in the Thirty-seventh Report of the Grants Com- mission, page 119 and in the Fortieth, page 140. Adjustments to special grants for 1957-58 and 1958-59. The amounts were $798,000 and 82,054,000 respectively. Completion payment in respect of 1966-67. Grant recommended by the Commission for Tasmania was $23,680,000, of which $10,000,000 was trans- ferred to the State's financial assistance grant for 1970-71. Tasmania withdrew from the special grants system as from the beginning of 1974-75. See Chapter IT.
168
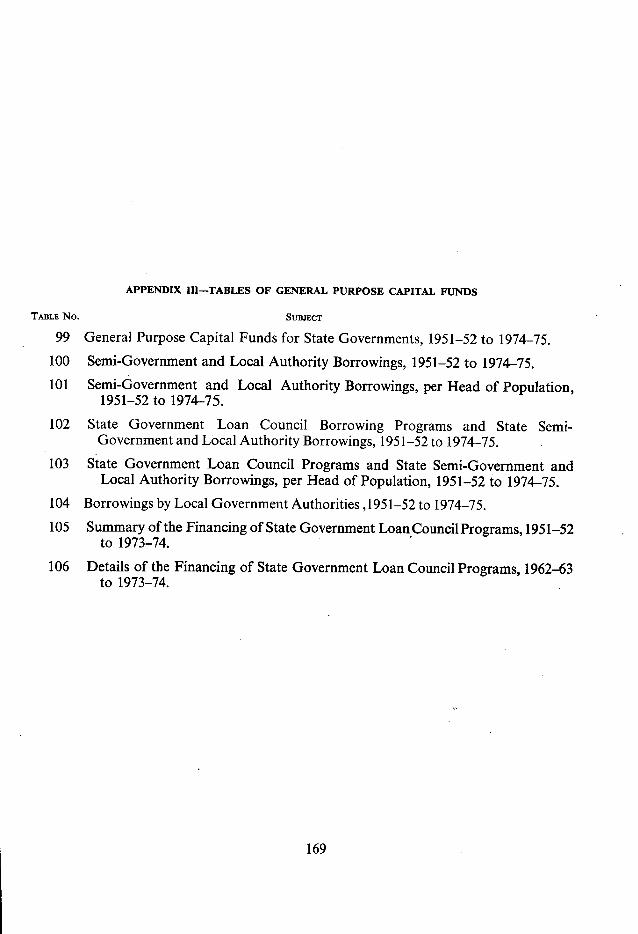
APPENDIX Ill—TABLES OF GENERAL PURPOSE CAPITAL FUNDS
TABLE No. SUBJECT
99 General Purpose Capital Funds for State Governments, 1951-52 to 1974-75. 100 Semi-Government and Local Authority Borrowings, 1951-52 to 1974-75. 101 Semi-Government and Local Authority Borrowings, per Head of Population,
1951-52 to 1974-75.
102 State Government Loan Council Borrowing Programs and State Semi- Government and Local Authority Borrowings, 1951-52 to 1974-75.
103 State Government Loan Council Programs and State Semi-Government and Local Authority Borrowings, per Head of Population, 1951-52 to 1974-75.
104 Borrowings by Local Government Authorities ,1951-52 to 1974-75. 105 Summary of the Financing of State Government Loan Council Programs, 1951-52
to 1973-74. 106 Details of the Financing of State Government Loan Council Programs, 1962-63
to 1973-74.
169
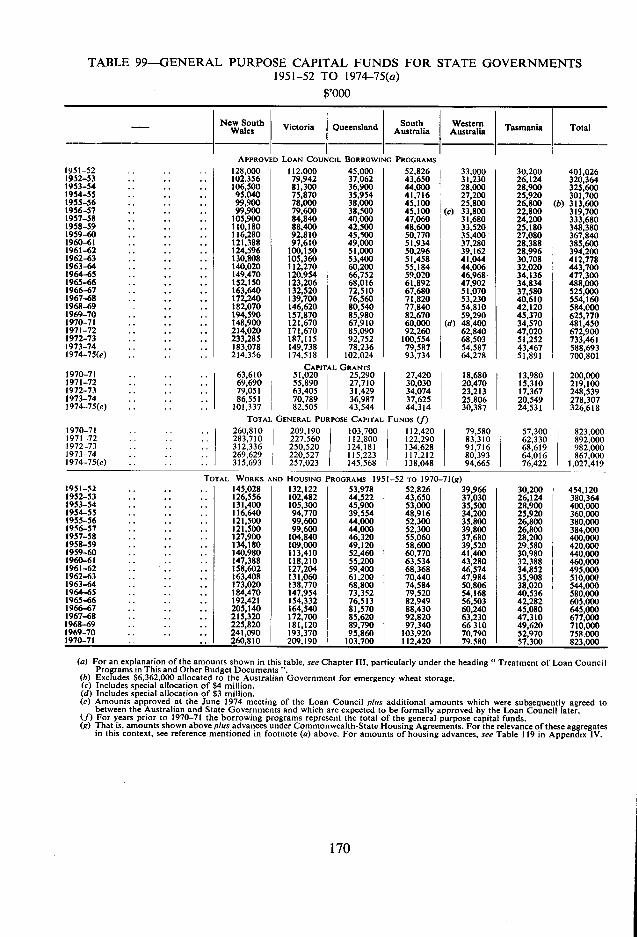
TABLE 99-GENERAL PURPOSE CAPITAL FUNDS FOR STATE GOVERNMENTS 1951-52 TO 1974-75(a)
$,000
- I New South Wales Victoria Queensland South
Australia Western Australia Tasmania Total
APPROVED LOAN LOUNCIL SSORROWING !'ROGRAMS
128,000 112.000 45,000 52,826 102.356 79,942 37,062 43.650 106,500 81,300 36,900 44,000 95.040 75,870 35,954 41,716 99.900 78,000 38.000 45,100 99,900 79,600 38,500 45,100
105,900 84,840 40,000 47,060 110,180 88,400 42.500 48,600 116,280 92.810 45,900 50,770 121.388 97,610 49,000 51,934 124,596 100,150 51,000 50.296 130.808 105,360 53,400 51,458 140,020 112,270 60,200 55,184 149.470 120.954 66.752 59,020 152.150 123,206 68,016 61.892 163,640 132,520 72,510 67,680 172,240 139,700 76,560 71,820 182,070 146,620 80,540 77,840 194,590 157,870 85.980 82.670 148,900 121,670 67,910 60,000 214,020 171,670 85,090 92,260 233.285 187,115 92,752 100,554 183,078 149,738 78,236 79,587 214,356 174,518 102,024 93,734
CAPITAL GRANTS 63,610 51,020 25,290 27,420 69,690 55,890 27,710 30.030 79,051 63,405 31,429 34,074 86,551 I 70,789 36,987 37,625
101,337 I 82,505 43,544 44,314 TOTAl. GENERAL PURPOSE CAPITAL FUNDS (J)
260,810 209,190 103,700 112,420 283,710 227,560 112,800 122,290 312,336 250,520
1
124,181 134,628 269,629 220,527 115,223 117,212 315,693 257,023 145,568 138,048
1951-52 1952-53 1953-54 1954-55 1955-56 1956-57 1957-58 1958-59 1959-60 1960-61 1961-62 1962-63 1963-64 1964-65 1965-66 1966-67 1967-68 1968-69 1969-70 1970-71 1971-72 1972-73 1973-74 1974-75(e)
1970-71 1971-72 1972-73 1973-74 1974-75(e)
1970-71 1971-72 1972-73 1973-74 1974-75(e)
33,000
30,200
31,230
26.124
28,000
28,900
27,200
25,920
25,800
26,800 33,800
22,800
700
31,680
24,200
33.520
25,180
35,400
27,080
37.280
28.388
39.162
28.996
41.044
30,708
44,006
32,020
46,968
34,136
47.902
34,834
51,070
37,580
53,230
40,610
54,810
42,120
59,290
45,370 48,400
34,570
62,840
47,020
68,503
51,252
54,587
43,467
64,278
51,891
18,680
13,980
200,000
20,470
15,310
219,100
23,2 13
17.367
248,539
25,806
20,549
278,307
30,387
24,531
326,618
79,580 57,300 823,000
83,310 62,330 892,000
91,716 68,619 982,000
80,393 64,016 867,000
94,665 76,422 1,027.419
TOTAL WORKS AND HOUSING PROGRAMS 1951-52 TO 1970-71(g) 1951-52 ,. .. 145.028 132,122 53.978 52.826 39,966 30,200 454,120 1952-53 .. .. .. 126,556 102,482 44,522 43,650 37,030 26,124 380,364 1953-54 .. .. .. 131,400 105,300 45,900 53,000 35,500 28,900 400,000 1954-55 .. .. .. 116,640 94,770 39,554 48,916 34,200 25,920 360,000 1955-56 .. .. .. 121.500 99,600 44,000 52.300 35.800 26,800 380,000 196-57 .. ,. .. 121,500 99,600 44,000 52,300 39,800 26,800 384,000 1957-58 .. .. .. 127,900 104,840 46,320 55,060 37,680 28,200 400,000 1958-59 .. .. .. 134,180 109,000 49,120 58,600 39,520 29,580 420,000 1959-60 .. .. .. 140,980 113.410 52,460 60,770 41,400 30,980 440,000 1960-61 .. .. .. 147,388 118,210 55,200 63,534 43,280 32.388 460,000 1961-62 .. .. .. 158,602 127,204 59,400 68,368 46,574 34,852 495,000 1962-63 .. .. .. 163,408 131,060 61.200 70,440 47.984 35,908 510,000 1963-64 .. .. .. 173,020 138,770 68,800 74,584 50.806 38,020 544,000 1964-65 .. .. .. 184,470 147,954 73,352 79,520 54,168 40.536 580,000 1965-66 .. .. .. 192,421 154,332 76,513 82,949 56.503 42,282 605,000 1966-67 .. .. .. 205,140 164,540 81,570 88,430 60,240 45,080 645,000 1967-68 .. .. .. 215,320 172,700 85,620 92,820 63,230 47,310 677,000 1968-69 .. .. .. 225,820 181,120 89,790 97,340 66,310 49,620 710,000 1969-70 .. .. .. 241,090 193,370 95,860 103,920 70,790 52,970 758.000 1970-71 .. 260,810 209.190 103.700 112,420 79,580 57.300 823,000
For an explanation of the amounts shown in this table, see Chapter III, particularly under the heading" Treatment of Loan Council Programs in This and Other Budget Documents Excludes 86,362,000 allocated to the Australian Government for emergency wheat storage. Includes special allocation of $4 million. Includes special allocation of $3 million. Amounts approved at the June 1974 meeting of the Loan Council plus additional amounts which were subsequently agreed to between the Australian and State Governments and which are expected to be formally approved by the Loan Council later. For years prior to 1970-71 She borrowing programs represent the total of the general purpose capital funds. That is, amounts shown above plus advances under Commonwealth-State Housing Agreements. For the relevance of these aggregates in this context, see reference mentioned in footnote (a) above. For amounts of housing advances, see Table 119 in Appendix IV.
170
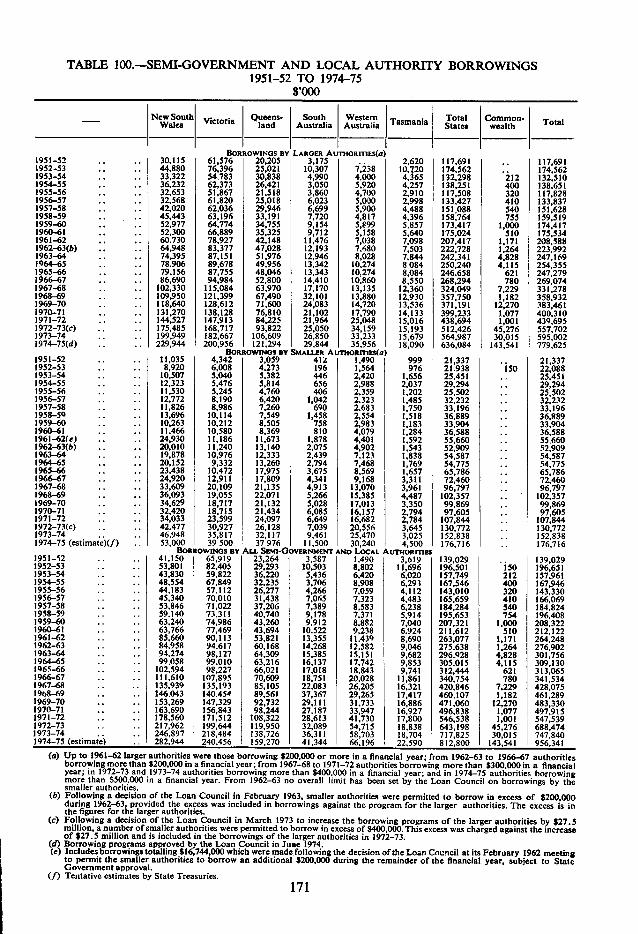
TABLE 100.-SEMI-GOVERNMENT AND LOCAL AUTHORITY BORROWINGS 1951-52 TO 1974-75
$,000
New South t0fl5 Queens. South Western T Tasmania Total Common- Total ota - Wales land Australia Australia States wealth
BORROWINGS BY LARGER AumORrnEs(a) 1951-52 ,. .. 30,115 61,576 20,205 3.175 .. 2,620 117,691 .. 117,691 1952-53 .. .. 44,880 76,396 25.021 10,307 7,238 l0,2O 174.562 .. 174,562 1953-54 .. .. 33,322 54.783 30,838 4,990 4.000 4,365 132,298 212 132,510 1954-55 .. .. 36,232 62,373 26,421 3,050 5,920 4,257 138,251 400 138,651 1955-56 .. .. 32,653 51,867 21.518 3.860 4,700 2,910 117,508 320 117.828 1956-57 .. .. 32,568 61.820 25,018 6,023 5,000 2,998 133,427 410 133,837 1957-58 .. .. 42,020 62,036 29.946 6,699 5,900 4,488 151,088 540 151,628 1958-59 .. .. 45,443 63,196 33,191 7,720 4,817 4.396 158,764 755 159,519 1959-60 ., .. 52,977 64.774 34,755 9,154 5,899 5,857 173,417 1,000 174,417 1960-61 .. .. 52,300 66,889 35,325 9,712 5,158 5,640 175,024 510 175,534 1961-62 .. ,, 60.730 78,927 42,148 11,476 7,038 7,098 207.417 1.171 208,588 1962-63(b) .. .. 64,948 83,377 47,028 12,193 7.680 7,503 222,728 1,264 223,992 1963-64 .. .. 74,395 87,151 51,976 12,946 8,328 7,844 242,341 4,828 247,169 1964-65 .. .. 78,906 89,678 49.956 13,342 10.274 8.084 250,240 4,115 254,355 1965-66 .. .. 79.156 87,755 48,046 13,343 10,274 8,084 246.658 621 247,279 1966-67 .. .. 86,690 94,984 52,800 14.410 10,860 8.550 268,294 780 269,074 1967-68 .. .. 102,330 115,084 63,970 17.170 13,135 12,360 324,049 7,229 331.278 1968-69 ,, .. 109,950 121,399 67,490 32,101 13,880 12.930 357,750 1,182 358.932 1969-70 ,, .. 118,640 128,612 71,600 24,083 14,720 13,536 371,191 12,270 383,461 1970-71 .. .. 131,270 138,128 76,810 21.102 17,790 14,133 399,233 1.077 400.310 1971-72 .. .. 144,527 147.913 84,225 21,964 25,048 15.016 438,694 1,001 439,695 1972-73(c) .. .. 175,485 168,717 93,822 25,050 34,159 15,193 512,426 45,276 557,702 1973-74 .. .. 199,949 182,667 106,609 26,850 33,233 15,679 564,987 30,015 595,002 1974-75(d) .. .. 229,944 200,956 121,294 29,844 35.956 18,090 636,084 143,541 779,625
BoRRowmios BY SMALLER AuThORmEs(a) 1951-52 .. .. 11,035 4,342 3,059 412 1.490 999 21,337 .. 21,337 1952-53 .. .. 8,920 6,008 4.273 196 1,564 976 21.938 150 22,088 1953-54 .. ,. 10,507 5,040 5.382 446 2,420 1,656 25.451 .. 25,451 1954-55 ., .. 12,323 5.476 5,814 656 2,988 2,037 29,294 .. 29,294 1955-56 .. .. 11,530 5.245 4,760 406 2,359 1,202 25,502 ,. 25,502 1956-57 .. .. 12,772 8,190 6,420 1,042 2.323 1,485 32,232 .. 32,232 1957-58 ,. .. 11,826 8,986 7,260 690 2.683 1,750 33.196 ,. 33,196 1958-5 ,. .. 13,696 10,114 7,549 1.458 2,554 1,518 36,889 .. 36,889 1959-60 ,. .. 10,263 10.212 8,505 758 2,983 1,183 33,904 .. 33,904 1960-61 .. .. 11,466 10,580 8.369 810 4.079 1,284 36,588 .. 36,588 1961-62(e) .. ., 24,930 11.186 11,673 1,878 4,401 1,592 55,660 .. 55,660 1962-63(b) ,. .. 20,010 11.240 13,140 2,075 4.902 1,543 52,909 .. 52,909 1963-64 .. .. 19,878 10,976 12.333 2.439 7,123 1.838 54,587 ,. 54,587 1964-65 .. .. 20.152 9,332 13,260 2,794 7,468 1,769 54,775 .. 54,775 1965-66 .. .. 23.438 10.472 17,975 3,675 8.569 1,657 65.786 .. 65,786 1966-67 ,. .. 24,920 12,911 17,809 4,3419,168 3,311 72,460 .. 72,460 1967-68 ,. .. 33,609 20,109 21,135 4,913 13,070 3,961 96.797 .. 96,797 1968-69 ., .. 36,093 19,055 22,071 5.266 15.385 4,487 102,357 .. 102.357 1969-70 .. .. 34,629 18,717 21,132 5,028 17,013 3,350 99,869 .. 99,869 1970-71 .. .. 32,420 18,715 21,434 6,085 16,157 2,794 97.605 .. 97,605 1971-72 .. ,. 34,033 23,599 24.097 6,649 16,682 2.784 107,844 .. 107,844 1972-73(c) .. .. 42.477 30,927 26,128 7,039 20,556 3,645 130,772 .. 130,772 1973-74 .. .. 46,948 35,817 32,117 9,461 25,470 3,025 152,838 .. 152,838 1974-75 (estimate)(f) .. 53,000 39500 37976 11,500 30,240 4,500 176,716 .. 176,716
BORROWINGS BY ALL SEMI-GOVERNMENT xND LOCAL AUTHORITIES 1951-52 .. .. 41,150 65,919 23,264 3,587 1,490 3,619 139,029 .. 139,029 1952-53 .. .. 53.801 82,405 29.293 10,503 8,802 11,696 196.501 150 196,651 1953-54 ., .. 43.830 59.822 36,220 5,436 6.420 6,020 157.749 212 157.961 1954-55 .. .. 48.554 67.849 32.235 3.706 8,908 6,291 167.546 400 167,946 1955-56 .. .. 44,183 57,112 26,277 4,266 7,059 4,112 143,010 320 143.330 1956-57 .. .. 45.340 70.010 31,438 7,065 7.323 4.483 165.659 410 166,069 1957-58 ,. .. 53,846 71.022 37,206 7,389 8,583 6,238 184,284 540 184.824 1958-59 .. .. 59.140 73,311 40,740 9,178 7,371 5,914 195,653 754 196,408 1959-60 .. .. 63,240 74.986 43,260 9.912 8.882 7,040 207,321 1,000 208,322 1960-61 .. .. 63,766 77.469 43,694 10.522 9,238 6.924 211.612 510 212.122 1961-62 .. .. 85,660 90,113 53,821 13,355 11,43 8,690 263,077 1.171 264,248 1962-63 .. .. 84.958 94,617 60,168 14,268 12,582 9,046 275.638 1.264 276,902 1963-64 .. .. 94.274 98.127 64,309 15,385 15,151 9,682 296,928 4,828 301,756 1964-65 .. .. 99.058 99.010 63.216 16,137 17.742 9,853 305,015 4,115 309,130 1965-66 .. .. 102,594 98,227 66,021 17.018 18,843 9.741 312,444 621 313,065 1966-67 .. .. 111,610 107,895 70,609 18,751 20,028 11,861 340,754 780 341,534 1967-68 .. .. 135.939 135,193 85,105 22,083 26.205 16.321 420,846 7.229 428,075 1968-69 . .. 146,043 140.454 89.561 37,367 29,265 17,417 460,107 1,182 461,289 1969-70 ,. .. 153.269 147,329 92,732 29,111 31,733 16,886 471,060 12,270 483,330 1970-71 .. .. 163.690 156,843 98,244 27,187 33,947 16,927 496,838 1,077 497,915 1971-72 .. .. 178,560 171.512 108,322 28.613 41.730 17,800 546,538 1,001 547,539 1972-73 .. .. 217,962 199,644 119,950 32,089 54,715 18,838 643,198 45,276 688,474 1973-74 .. .. 246,897 218,484 138,726 36,311 58,703 18,704 717,825 30,015 747.840 1974-75 (estimate) . . 282,944 240.456 159,270 41,344 66.196 22,590 812,800 143,541 956,341
Up to 1961-62 larger authorities were those borrowing $200,000 or more in a financial year; from 1962-63 to 1966-67 authorities borrowing more than $200,000 in a financial year; from 1967-68 to 1971-72 authorities borrowing more than $300,000 in a financial year; in 1972-73 and 1973-74 authorities borrowing more than $400,000 in a financial year; and in 1974-75 authorities borrowing more than $500,000 in a financial year. From 1962-63 no overall limit has been set by the Loan Council on borrowings by the smaller authorities. Following a decision of the Loan Council in February 1963, smaller authorities were permitted to borrow in excess of $200,000 during 1962-63, provided the excess was included in borrowings against the program for the larger authorities. The excess is in the figures for the larger authorities. Following a decision of the Loan Council in March 1973 to increase the borrowing programs of the larger authorities by $27.5 million, a number of smaller authorities were permitted to borrow in excess of $400,000. This excess was charged against the increase of $27.5 million and is included in the borrowings of the larger authorities in 1972-73, Borrowing programs approved by the Loan Council in June 1974. Includes borrowings totalling $16,744,000 which were made following the decision of the Loan Council at its February 1962 meeting to permit the smaller authorities to borrow an additional $200,000 during the remainder of the financial year, subject to Stale Government approval. Tentative estimates by State Treasuries.
171
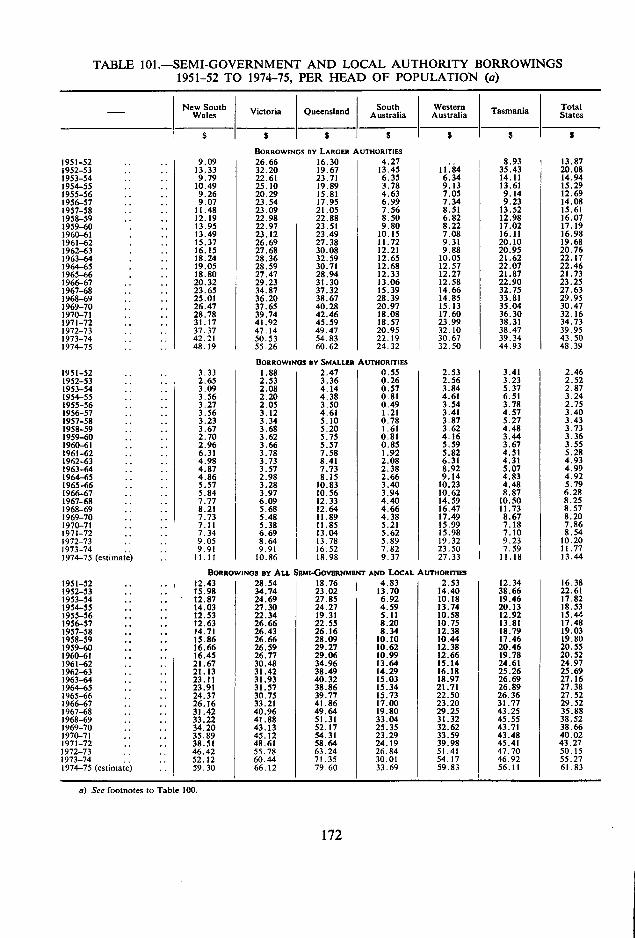
TABLE 101.-SEMI-GOVERNMENT AND LOCAL AUTHORITY BORROWINGS 1951-52 TO 1974-75, PER HEAD OF POPULATION (a)
J.suth New So South Victoria Queensland Australia Western Australia Tasmania Total
States
$ $ $ S $ $ $
BORROWINGS BY LARGER AUTHORITIES 1951-52 .. .. 9.09 26.66 16.30 4.27 8.93 13.87 1952-53 .. .. 13.33 32.20 19.67 13.45 11.84 35.43 20.08 1953-54 .. .. 9.79 22.61 23.71 6.35 6.34 14.11 14.94 1954-55 .. .. 10.49 25.10 19.89 3.78 9.13 13.61 15.29 1955-56 .. .. 9.26 20.29 15.81 4.63 7.05 9.14 12.69 1956-57 .. .. 9.07 23.54 17.95 6.99 7.34 9.23 14.08 1957-58 .. .. 11.48 23.09 21.05 7.56 8.51 13.52 15.61 1958-59 .. .. 12.19 22.98 22.88 8.50 6.82 12.98 16.07 1959-60 . .. 13.95 22.97 23.51 9.80 8.22 17.02 17.19 1960-61 . .. 13.49 23.12 23.49 10.15 7.08 16.11 16.98 1961-62 . .. 15.37 26.69 27.38 11.72 9.31 20.10 19.68 1962-63 . .. 16.15 27.68 30.08 12.21 9.88 20.95 20.76 1963-64 . .. 18.24 28.36 32.59 12.65 10,05 21.62 22.17 1964-65 . .. 19.05 28.59 30.71 12.68 12.57 22.07 22.46 1965-66 . .. 18.80 27.47 28.94 12.33 12.27 21.87 21.73 1966-67 .. ,. 20.32 29.23 31.30 13.06 12.58 22.90 23.25 1967-68 .. .. 23.65 34.87 37.32 15.39 14.66 32.75 27.63 1968-69 .. .. 25.01 36.20 38.67 28.39 14.85 33.81 29.95 1969-70 .. .. 26.47 37.65 40.28 20.97 15.13 35.04 30.47 1970-71 .. .. 28,78 39.74 42.46 18.08 17.60 36.30 32.16 1971-72 .. .. 31.17 41.92 45.59 18.57 23.99 38.31 34.73 1972-73 .. . . 37.37 47.14 49.47 20.95 32.10 38.47 39.95 1973-74 .. .. 42.21 50.53 54.83 22.19 30.67 39.34 43.50 1974-75 .. .. 48.19 55.26 60.62 24.32 32.50 44.93 48.39
BORROWINGS BY SMALLER AumoRrnEs 1951-52 .. .. 3.33 1.88 2.47 0.55 2.53 3.41 2.46 1952-53 .. ,, 2.65 2.53 3.36 0.26 2.56 3.23 2.52 1953-54 .. .. 3.09 2.08 4.14 0.57 3.84 5.37 2.87 1954-55 .. ,, 3.56 2.20 4.38 0.81 4.61 6.51 3.24 1955-56 .. .. 3.27 2.05 3.50 0.49 3.54 3.78 2.75 1956-57 .. .. 3.56 3.12 4.61 1.21 3.41 4.57 3.40 1957-58 .. .. 3.23 3.34 5.10 0.78 3.87 5.27 3.43 1958-59 .. .. 3.67 3.68 5.20 1.61 3.62 4.48 3.73 1959-60 ,, .. 2.70 3.62 5.75 0.81 4.16 3.44 3.36 1960-61 ,. ,. 2.96 3.66 5.57 0.85 5.59 3.67 3.55 1961-62 .. .. 6.31 3.78 7.58 1,92 5.82 4,51 5.28 1962-63 .. .. 4.98 3.73 8.41 2.08 6.31 4.31 4.93 1963-64 .. .. 4.87 3.57 7.73 2.38 8.92 5.07 4.99 1964-65 .. .. 4.86 2.98 8.15 2.66 9,14 4,83 4.92 1965-66 .. .. 5.57 3.28 10,83 3.40 10.23 4.48 5.79 1966-67 .. .. 5.84 3.97 10.56 3.94 10.62 8.87 6.28 1967-68 .. .. 7.77 6.09 12.33 4.40 14.59 10.50 8.25 1968-69 .. .. 8.21 5.68 12.64 4.66 16.47 11.73 8.57 1969-70 .. ,. 7.73 5.48 11.89 4.38 17.49 8.67 8.20 1970-71 .. .. 7.11 5.38 11.85 5.21 15.99 7.18 7,86 1971-72 .. .. 7.34 6.69 13.04 5.62 15.98 7.10 8.54 1972-73 .. .. 9.05 8.64 13.78 5.89 19.32 9.23 10.20 1973-74 . . . . 9.91 9.91 16.52 7.82 23.50 7.59 11.77 1974-75 (estimate) . . 11.11 10.86 18.98 9.37 27.33 I 11.18 13.44
BORROWINGS BY ALL SEMI-GOVERNMENT AND LOCAL AUTHORITIES 1951-52 .. ,. 12.43 28.54 18.76 4.83 2.53 12.34 16.38 1952-53 .. ,. 15.98 34,74 23.02 13.70 14.40 38.66 22.61 1953-54 .. .. - 12.87 24.69 27.85 6.92 10.18 19.46 17.82 1954-55 .. .. 14.03 27.30 24.27 4.59 13.74 20.13 18.53 1955-56 .. .. 12.53 22.34 19.31 5.11 10.58 12.92 15.44 1956-57 .. .. 12.63 26.66 22.55 8.20 10.75 13.81 17.48 1957-58 .. .. 14.71 26.43 26.16 8.34 12.38 18.79 19.03 1958-59 .. .. 15.86 26.66 28.09 10.10 10.44 17.46 19.80 1959-60 .. .. 16.66 26.59 29.27 10.62 12.38 20.46 20.55 1960-61 .. .. 16.45 26.77 29.06 10.99 12.66 19.78 20.52 1961-62 .. .. 21.67 30.48 34.96 13.64 15.14 24.61 24.97 1962-63 .. .. 21.13 31.42 38.49 14.29 16.18 25.26 25.69 1963-64 .. .. 23.11 31.93 40.32 15.03 18.97 26.69 27.16 1964-65 .. .. 23.91 31.57 38.86 15.34 21.71 26.89 27.38 1965-66 .. . . 24.37 30.75 39.77 15,73 22.50 26.36 27.52 1966-67 .. .. 26.16 33.21 41.86 17.00 23.20 31.77 29.52 1967-68 .. .. 31.42 40.96 49.64 19.80 29.25 43.25 35.88 1968-69 .. .. 33.22 41.88 51.31 33.04 31.32 45.55 38.52 1969-70 .. .. 34.20 43.13 52.17 25.35 32.62 43.71 38.66 1970-71 .. .. 35.89 45.12 54.31 23.29 33.59 43.48 40.02 1971-72 .. .. 38.51 48.61 58.64 24.19 39.98 45.41 43.27 1972-73 . . . . 46.42 55.78 63.24 26.84 51.41 47.70 50.15 1973-74 .. .. 52.12 60.44 71.35 30.01 54.17 46.92 55.27 1974-75 (estimate) .. 59.30 66.12 79.60 33.69 59.83 56.11 61.83
a) See footnotes to Table 100
172
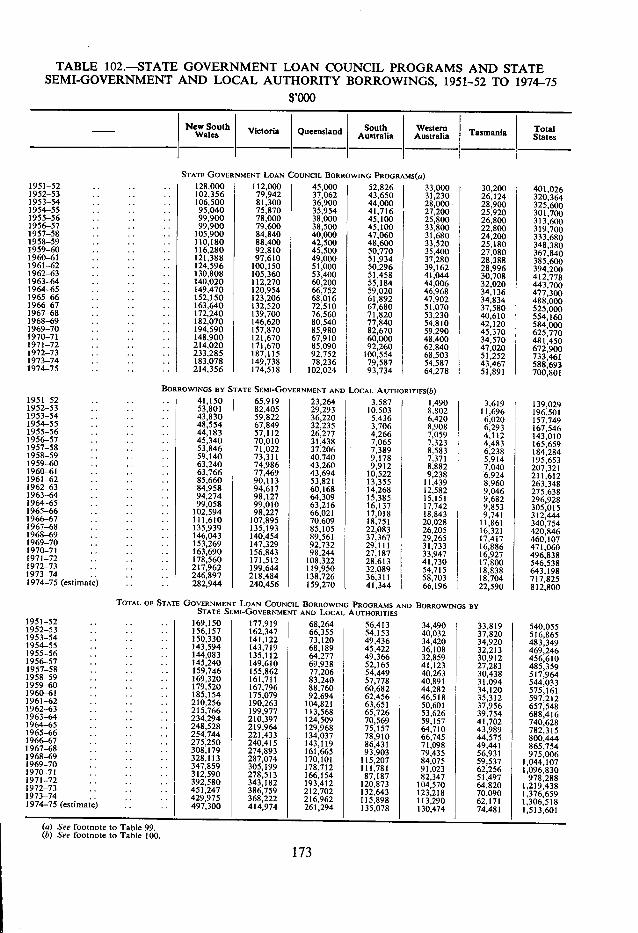
TABLE 102.-STATE GOVERNMENT LOAN COUNCIL PROGRAMS AND STATE SEMI-GOVERNMENT AND LOCAL AUTHORITY BORROWINGS, 1951-52 TO 1974-75
$,000
- NeWales
w South Victoria Queensland South Australia
Western Australia Tasmania
STATE GOVERNMENT LOAN COUNCIL BORROWING PROGRAMS(0) 1951-52 128,000 112,000 45,000 52,826 33,000 30,200 401,026 1952-53 .. .. 102,356 79,942 37,062 43,650 31,230 26,124 320,364 1953-54 106,500 81,300 36,900 44,000 28,000 28,900 325,600 1954-55 95,040 75,870 35,954 41,716 27,200 25,920 301,700 1955-56 .. .. .. 99,900 78,000 38,000 45,100 25,800 26,800 313,600 1956-57 .. 99,900 79,600 38,500 45,100 33,800 22,800 319,700 1957-58 -. .. 105,900 84,840 40,000 47,060 31,680 24,200 333,680 1958-59 -. 110,180 88,400 42,500 48,600 33,520 25,180 348,380 1959-60 .. .. 116,280 92,810 45,500 50,770 35,400 27,080 367,840 1960-61 .. 121,388 97,610 49,000 51,934 37,280 28,388 385,600 1961-62 .. 124,596 100,150 51,000 50,296 39,162 28.996 394,200 1962-63 .. .. 130,808 105,360 53,400 51,458 41,044 30,708 412,778 1963-64 .. 140,020 112,270 60,200 55,184 44,006 32,020 443,700 1964-65 .. .. .. 149,470 120,954 66,752 59,020 46,968 34,136 477,300 1965-66 .. .. .. 152,150 123,206 68,016 61,892 47,902 34,834 488,000 1966-67 -- -. -. 163,640 132,520 72,510 67,680 51,070 37,580 525,000 1967-68 .. 172,240 139,700 76,560 71,820 53,230 40,610 554,160 1968-69 .. -. .. 182,070 146,620 80,540 77,840 54,810 42,120 584,000 1969-70 - - -. - - 194,590 157,870 85,980 82,670 59,290 45,370 625,770 1970-71 -. -. - - 148,900 121,670 67,910 60,000 48,400 34,570 481,450 1971-72 -. .. - - 214,020 171,670 85,090 92,260 62,840 47,020 672,900 1972-73 - - .. . - 233,285 187,115 92,752 100,554 68,503 51,252 733,461 1973-74 - - .. .. 183,078 149,738 78,236 79,587 54,587 43,467 588,693 1974-75 - - -. -. 214,356 174,518 102,024 93,734 64,278 51,891 700,801
BORROWINGS BY STATE SEMI-GOVERNMENT AND LOCAL AUTHORITIES(b) 1951-52 - - .. - - 1952-53 - - . - -.
41,150 53,801
65,919 82,405
23,264 29,293
3.587 10,503
1,490 8,802
3,619 11,696
139,029 196,501 1953-54 - - - - . -
1954-55 . - - - .. 43,830 48,554
59,822 67,849
36,220 32,235
5,436 3,706
6,420 8,908
6,020 6,293
157,749 167,546 1955-56 - - - - -.
1956-57 - - . - . - 44,183 45,340
57,112 70,010
26,277 31,438
4,266 7,065
7,059 7,323
4.112 4,483
143,010 165,659 1957-58 .. .. - -
1958-59 -. . - - - 53,846 59.140
71,022 73,311
37,206 40,740
7,389 9,178
8,583 7,371
6.238 5,914
184,284 1959-60 -. - - - - 1960-61 . - . - - -
63,240 63,766
74,986 77,469
43,260 43,694
9,912 10,522
8,882 9,238
7,040 6,924
195,653 207,321
1961-62 .. - - .. 85,660 90,113 53,821 13,355 11,439 8,960 211,612 263,348 1962-63 - . - - - -
1963-64 -. -. - - 84,958 94,274
94,617 98.127
60,168 64,309
14,268 15,385
12,582 15,151
9,046 9,682
275,638 296,928 1964-65 - - . - - -
1965-66 - - - - - - 99,058
102,594 99,010 98,227
63,216 66,021
16,137 17,018
17,742 18,843
9,853 9,741
305,015 312,444 1966-67 - - - - -.
1967-68 - - .. . - 111,610 135,939
107,895 135,193
70,609 85,105
18,751 22,083
20,028 26,205
11.861 16,321
340,754 420,846 1968-69 . - .. - -
1969-70 -. .. - - 146,043 153,269
140,454 147,329
89,561 92,732
37,367 29,111
29,265 31,733
17,417 16,886
460,107 471,060 1970-71 -. .. ..
1971-72 - - - - - - 163,690 178,560
156,843 171,512
98,244 108,322
27,187 28.613
33,947 41,730
16,927 17,800
496,838 546,538 1972-73 - - -. - -
1973-74 - . .. . - 217,962 246,897
199,644 218,484
119,950 138,726
32.089 36,311
54,715 58,703
18,838 18,704
643,198 1974-75 (estimate) - - - - 282,944 240,456 159,270 41,344 66,196 22,590
717,825 812,800
TOTAL OF STATE GOVERNMENT LOAN COUNCIL BORROWING PROGRAMS AND BORROWINGS BY STATE SEMI-GOVERNMENT AND LOCAL AUTHORITIES
1951-52 . - - - . - 1952-53 - - .. - -
169,150 156,157
177,919 162,347
68,264 66,355
56,413 54.153
34,490 40,032
33,819 37,820
540,055 516,865 1953-54 -. -. - -
1954-55 .. - - . - 150,330 143,594
141,122 143,719
73,120 .68,189
49,436 45,422
34,420 36,108
34,920 32,213
483,349 469,246 1955-56 . - . - - -
1956-57 .. -. - - 144,083 145,240
135,112 149,610
6.4,277 69,938
49,366 52,165
32,859 41,123
30,912 27,283
456,610 485,359 1957-58 - - .. - -
1958-59 - . .. -. 159,746 169,320
155,862 161,711
77,206 83,240
54,449 57,778
40,263 40,891
30,438 31,094
517,964 544,033 1959-60 .. . - - -
1960-61 - - - - - - 179.520 185,154
167,796 175,079
88,760 92,694
60,682 62,456
44,282 46,518
34,120 35,312
575,161 597,212 1961-62 - . .. - -
1962-63 . - -. . - 210,256 215,766
190,263 199,977
104,821 113,568
63,651 65,726
50,601 53,626
37,956 39,754
657,548 688,416 1963-64 - - -. - -
1964-65 . - .. . - 234,294 248,528
210.397 219,964
124,509 129,968
70,569 75,157
59,157 64,710
41,702 43,989
740,628 782,315 1965-66 - - . - ..
1966-67 - . -. - - 254,744 275,250
221,433 240,415
134.037 143,119
78,910 86,431
66,745 71,098
44,575 49,441
800,444 865,754 1967-68 -. -. - -
1968-69 .. -. - - 308,179 328,113
274,893 287,074
161,665 170,101
93,903 115,207
79,435 84,075
56,931 59,537
975,006 1,044,107 1969-70 . - .. - -
1970-71 - - . - - - 347,859 312,590
305,199 278,513 166,154
178,712111,781 87,187 :187,187
91,023 82,347 82,347
62,256 51,497
1,096.830 1971-72 - - -. . - 1972-73
392,580 343,182 193,412 64,820 978,288
1,219,438 - - -. - - 1973-74 - - - - - -
451,247 429,975
386,759 368,222
212,702 216,962
132.643 115,898
123.218 113,290
70,090 62,171
1,376,659 1,306,518 1974-75 (estimate) . - -. 497,300 414,974 261,294 135,078 130,474 74.481 1,513,601
(a) See footnote to Table 99. (6) See footnote to Table 100.
173
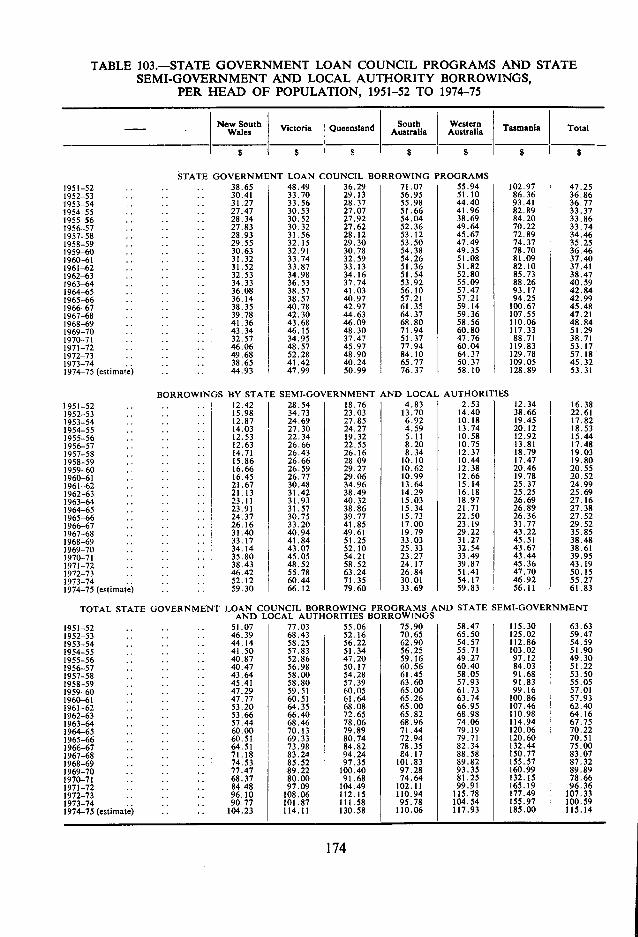
TABLE 103.-STATE GOVERNMENT LOAN COUNCIL PROGRAMS AND STATE SEMI-GOVERNMENT AND LOCAL AUTHORITY BORROWINGS,
PER HEAD OF POPULATION, 1951-52 TO 1974-75
New South Victoria Queensland South Western Tasmania Total Australia Australia
STATE GOVERNMENT LOAN COUNCIL BORROWING PROGRAMS 1951-52 . . .. 38.65 48.49 36.29 71.07 55.94 102.97 47.25 1952-53 . . .. . 30.41 33.70 29.13 56.95 51.10 86.36 36.86 1953-54 .. .. . . 31.27 33.56 28.37 55.98 44.40 93.41 36.77 1954-55 . . .. . 27.47 30.53 27.07 51.66 41.96 82.89 33.37 1955-56 . . .. . . 28.34 30.52 27.92 54.04 38.69 84.20 33.86 1956-57 . . .. 27.83 30.32 27.62 52.36 49.64 70.22 33.74 1957-58 .. .. . . 28.93 31.56 28.12 53.12 45.67 72.89 34.46 1958-59 .. .. . . 29.55 32.15 29.30 53.50 47.49 74.37 35.25 1959-60 .. .. . . 30.63 32.91 30.78 54.38 49.35 78.70 36.46 1960-61.. . .. 31.32 33.74 32.59 54.26 51.08 81.09 37.40 1961-62 .. .. .. 31.52 33.87 33.13 51.36 51.82 82.10 37.41 1962-63 .. .. .. 32.53 34.98 34.16 51.54 52.80 85.73 38.47 1963-64 .. .. .. 34.33 36.53 37.74 53.92 55.09 88.26 40.59 1964-65 .. . . .. 36.08 38.57 41.03 56.10 57.47 93.17 42.84 1965-66 .. . . . . 36.14 38.57 40.97 57.21 57.21 94.25 42.99 1966-67 .. .. . 38.35 40.78 42.97 61.35 59.14 100.67 45.48 1967-68 .. .. .. 39.78 42.30 44.63 64.37 59.36 107.55 47.21 1968-69 .. .. .. 41.36 43.68 46.09 68.80 58.56 110.06 48.84 1969-70 .. .. . 43.34 46.15 48.30 71.94 60.80 117.33 51.29 1970-71 .. .. . . 32.57 34.95 37.47 51.37 47.76 88.71 38.71 1971-72 .. .. . . 46.06 48.57 45.97 77.94 60.04 119.83 53.17 1972-73 .. .. . . 49.68 52.28 48.90 84.10 64.37 129.78 57.18 1973-74 .. .. . . 38.65 41.42 40.24 65.77 50.37 109.05 45.32 1974-75(estimate) .. . . 44.93 47.99 50.99 76.37 58.10 128.89 53.31
BORROWINGS BY STATE SEMI -GOVERNMENT AND LOCAL AUTHORITIES 1951-52 .. .. . . 12.42 28.54 18.76 4.83 2.53 12.34 16.38 1952-53 .. .. . . 15.98 34.73 23.03 13.70 14.40 38.66 22.61 1953-54 .. .. . . 12.87 24.69 27.85 6.92 10.18 19.45 17.82 1954-55 .. .. . . 14.03 27.30 24.27 4.59 13.74 20.12 18.53 1955-56 .. . . .. 12.53 22.34 19.32 5.11 10.58 12.92 15.44 1956-57 .. . . .. 12.63 26.66 22.55 8.20 10.75 13.81 17.48 1957-58 .. . . .. 14.71 26.43 26.16 8.34 12.37 18.79 19.03 1958-59 . . . . .. 15.86 26.66 28.09 10.10 10.44 17.47 19.80 1959-60 .. . . .. 16.66 26.59 29.27 10.62 12.38 20.46 20.55 1960-61 .. .. .. 16.45 26.77 29.06 10.99 12.66 19.78 20.52 1961-62 •. . . .. 21.67 30.48 34.96 13.64 15.14 25.37 24.99 1962-63 .. . . .. 21.13 31.42 38.49 14.29 16.18 25.25 25.69 1963-64 .. . . . . 23.11 31.93 40.32 15.03 18.97 26.69 27.16 1964-65 .. . . . . 23.91 31.57 38.86 15.34 21.71 26.89 27.38 1965-66 .. . . . . 24.37 30.75 39.77 15.73 22.50 26.36 27.52 1966-67 .. .. . . 26.16 33.20 41.85 17.00 23.19 31.77 29.52 1967-68 .. .. . . 31.40 40.94 49.61 19.79 29.22 43.22 35.85 1968-69 . . .. . . 33.17 41.84 51.25 33.03 31.27 45.51 38.48 1969-70 .. .. . - 34.14 43.07 52.10 25.33 32.54 43.67 38.61 1970-71 . . .. . 35.80 45.05 54.21 23.27 33.49 43.44 39.95 1971-72 .. .. . . 38.43 48.52 58.52 24.17 39.87 45.36 43.19 1972-73 . . .. . . 46.42 55.78 63.24 26.84 51.41 47.70 50.15 1973-74 .. .. .. 52.12 60.44 71.35 30.01 54.17 46.92 55.27 1974-75(estimate) .. .. 59.30 66.12 79.60 33.69 59.83 56.11 61.83
TOTAL STATE GOVERNMENT LOAN COUNCIL BORROWING PROGRAMS AND STATE SEMI-GOVERNMENT AND LOCAL AUTHORITIES BORROWINGS
1951-52 . . .. .. 51.07 77.03 55.06 75.90 58.47 115.30 63.63 1952-53 - . .. . . 46.39 68.43 52.16 70.65 65.50 125.02 59.47 1953-54 .. .. .. 44.14 58.25 56.22 62.90 54.57 112.86 54.59 1954-55 . . .. . . 41.50 57.83 51.34 56.25 55.71 103.02 51.90 1955-56 .. .. .. 40.87 52.86 47.20 59.16 49.27 97.12 49.30 1956-57 .. .. .. 40.47 56.98 50.17 60.56 60.40 84.03 51.22 1957-58 .. .. .. 43.64 58.00 54.28 61.45 58.05 91.68 53.50 1958-59 .. .. .. 45.41 58.80 57.39 63.60 57.93 91.83 55.05 1959-60 - . .. .. 47.29 59.51 60.05 65.00 61.73 99.16 57.01 1960-61 . . .. .. 47.77 60.51 61.64 65.26 63.74 100.86 57.93 1961-62 -- .. .. 53.20 64.35 68.08 65.00 66.95 107.46 62.40 1962-63 - . .. . . 53.66 66.40 72.65 65.82 68.98 110.98 64.16 1963-64 . . .. . . 57.44 68.46 78.06 68.96 74.06 114.94 67.75 1964-65 .. .. .. 60.00 70.13 79.89 71.44 79.19 120.06 70.22 1965-66 .. . . . - 60.51 69.33 80.74 72.94 79.71 120.60 70.51 1966-67 .. .. . - 64.51 73.98 84.82 78.35 82.34 132.44 75.00 1967-68 .. .. .. 71.18 83.24 94.24 84.17 88.58 150.77 83.07 1968-69 . . .. . . 74.53 85.52 97.35 101.83 89.82 155.57 87.32 1969-70 .. .. .. 77.47 89.22 100.40 97.28 93.35 160.99 89.89 1970-71 . - .. .. 68.37 80.00 91.68 74.64 81.25 132.15 78.66 1971-72 . . .. .. 84.48 97.09 104.49 102.11 99.91 165.19 96.36 1972-73 .. .. .. 96.10 108.06 112.15 110.94 115.78 177.49 107.33 1973-74 . . .. .. 90.77101.87 111.58 95.78 104.54 155.97 100.59 1974-75 (estimate) . . . . 104.23 114.11 130.58 110.06 117.93 185.00 115.14
174
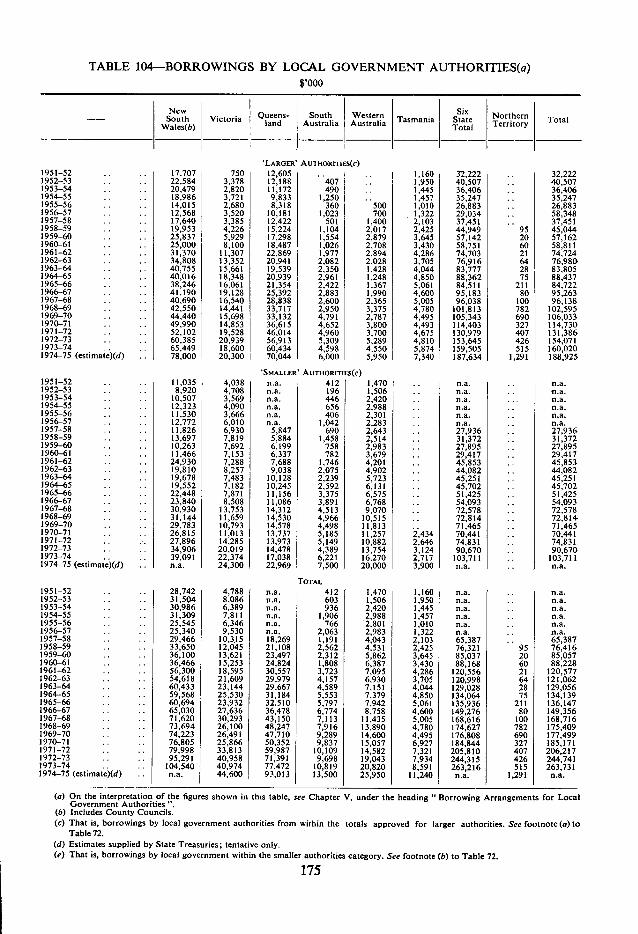
TABLE 104-BORROWINGS BY LOCAL GOVERNMENT AUTHORITIES(a) $'OOO
New South
Wales(b) Victoria Q
landueens-
Australia South Western
~ Tasm ania Six
Total
Northern Territory Total
'LARGER' AUTHORITIES(C) 1951-52 17,707 750 12,605 1,160 32,222 32,222 1952-53 .. 22,584 3,378 12,188 407 1,950 40,507 40,507 1953-54 .. 20,479 2,820 11,172 490 .. 1,445 36,406 .. 36,406 1954-55 .. ,. 18,986 3,721 9,833 1,250 1,457 35,247 . 35,247 1955-56 •. .. 14,015 2,680 8,318 360 500 1,010 26,883 26,883 1956-57 . .. 12,568 3,520 10,181 1,023 700 1,322 29,034 . . 58,348 1957-58 .. .. 17,640 3,385 12,422 501 1,400 2,103 37,451 .. 37,451 1958-59 .. .. 19,953 4,226 15,224 1,104 2,017 2,425 44,949 95 45,044 1959-60 .. 25,837 5,929 17,298 1,554 2,879 3,645 57,142 20 57,162 1960-61 .. . 25,000 8,100 18,487 1,026 2,708 3,430 58,751 60 58,811 1961-62 . .. 31,370 11,307 22,869 1,977 2,894 4,286 74,703 21 74,724 1962-63 . . 34,808 13,352 20,941 2,082 2,028 3,705 76,916 64 76,980 1963-64 .. . . 40,755 15,661 19,539 2,350 1,428 4,044 83,777 28 83,805 1964-65 . . . . 40,016 18,348 20,939 2,961 1,248 4,850 88,362 75 88,437 1965-66 .. .. 38,246 16,061 21,354 2,422 1,367 5,061 84.511 211 84,722 1966-67 .. .. 41,190 19,128 25,392 2,883 1,990 4,600 95,183 80 95,263 1967-68 .. .. 40,690 16,540 28,838 2,600 2,365 5,005 96.038 100 96,138 1968-69 .. . 42,550 14,441 33,717 2,950 3,375 4,780 101,813 782 102,595 1969-70 .. .. 44,440 15,698 33,132 4,791 2,787 4,495 105,343 690 106,033 1970-71 .. .. 49,990 14,853 36,615 4,652 3,800 4,493 114,403 327 114,730 1971-72 .. . 52,102 19,528 46,014 4,960 3,700 4,675 130,979 407 131,386 1972-73 . .. 60,385 20,939 56,913 5,309 5,289 4,810 153,645 426 154,071 1973-74 .. .. 65,449 18,600 60,434 4,598 4,550 5,874 159,505 515 160,020 1974-75 (estimate)(d) .. 78,000 20,300 70,044 6,000 5,950 7,340 187,634 1,291 188,925
'SMALLER' AumoRrnEs(e) 1951-52 . . .. 11,035 4,038 n.a. 412 1,470 1 n.a. .. n.a. 1952-53 .. .. 8,920 4,708 n.a. 196 1,506 i n.a. . . ma. 1953-54 .. . 10,507 3,569 n.a. 446 2,420 .. n.a. .. n.a. 1954-55 .. . 12,323 4,090 n.a. 656 2,988 . . n.a. .. n.a. 1955-56 .. .. 11,530 3,666 n.a. 406 2,301 . . n.a. .. n.a. 1956-57 .. .. 12,772 6,010 n.a. 1,042 2,283 .. n.a. .. n.a. 1957-58 .. . . 11,826 6,930 5,847 690 2,643 .. 27,936 .. 27,936 1958-59 . . . 13,697 7,819 5,884 1,458 2,514 . . 31,372 .. 31,372 1959-60 .. .. 10,263 7,692 6,199 758 2.983 . . 27,895 . . 27,895 1960-61 . . . . 11,466 7,153 6,337 782 3,679 . . 29,417 . . 29,417 1961-62 .. . . 24,930 7,288 7,688 1,746 4,201 . . 45,853 . . 45,853 1962-63 .. .. 19,810 8,257 9,038 2,075 4,902 .. 44,082 .. 44,082 1963-64 .. .. 19,678 7,483 10,128 2,239 5,723 . . 45,251 . . 45,251 1964-65 . . .. 19,552 7,182 10,245 2,592 6,131 . . 45,702 . . 45,702 1965-66 .. .. 22,448 7,871 11,156 3,375 6,575 .. 51,425 . . 51,425 1966-67 .. .. 23,840 8.508 11,086 3,891 6,768 .. 54,093 .. 54,093 1967-68 .. .. 30,930 13,753 14,312 4,513 9,070 . . 72,578 . . 72,578 1968-69 . . .. 31,144 11,659 14,530 4,966 10,515 . . 72,814 . . 72,814 1969-70 . . .. 29,783 10,793 14,578 4,498 11,813 . . 71,465 . . 71,465 1970-71 . . . . 26,815 11,013 13,737 5,185 11,257 2,434 70,441 . . 70,441 1971-72 •. .. 27.896 14,285 13,973 5,149 10,882 2,646 74,831 . . 74,831 1972-73 .. .. 34,906 20,019 14,478 4,389 13,754 3,124 90.670 .. 90,670 1973-74 .. .. 39.091 22,374 17,038 6,221 16,270 2,717 103,711 . . 103,711 1974-75 (estimate)(d) .. n.a. 24,300 22,969 7,500 20,000 3,900 n.a. .. n.a.
TOTAL 1951-52 .. .. 28,742 4,788 n.a. 412 1,470 1,160 n.a. .. n.a. 1952-53 . . .. 31,504 8,086 n.a. 603 1,506 1,950 n.a. .. n.a. 1953-54 .. .. 30,986 6,389 n.a. 936 2,420 1,445 n.a. .. n.a. 1954-55 . . . . 31,309 7,811 n.a. 1,906 2,988 1,457 n.a. .. n.a. 1955-56 . . . . 25,545 6,346 n.a. 766 2,801 1,010 n.a. . . n.a. 1956-57 .. .. 25,340 9,530 n.a. 2,063 2,983 1,322 n.a. . . n.a. 1957-58 .. . . 29,466 10,3.15 18,269 1,191 4,043 2,103 65,387 . . 65,387 1958-59 .. •. 33,650 12,045 21,108 2,562 4,531 2,425 76,321 95 76,416 1959-60 .. .. 36,100 13,621 23,497 2,312 5,862 3,645 85,037 20 85,057 1960-61 .. .. 36,466 15,253 24,824 1,808 6,387 3.430 88,168 60 88,228 1961-62 .. .. 56,300 18,595 30,557 3,723 7,095 4,286 120,556 21 120,577 1962-63 .. . . 54,618 21,609 29,979 4,157 6.930 3,705 120,998 64 121,062 1963-64 .. .. 60,433 23,144 29,667 4.589 7,151 4,044 129,028 28 129,056 1964-65 . . . . 59,568 25,530 31,184 5,553 7,379 4,850 134,064 75 134,139 1965-66 . . .. 60,694 23,932 32,510 5,797 7,942 5,061 135,936 211 136,147 1966-67 .. .. 65,030 27,636 36,478 6,774 8,758 4,600 149,276 80 149,356 1967-68 . . .. 71,620 30,293 43,150 7,113 11,435 5,005 168,616 100 168,716 1968-69 .. . . 73,694 26,100 48,247 7,916 13,890 4,780 174,627 782 175,409 1969-70 .. .. 74,223 26,491 47,710 9,289 14,600 4,495 176,808 690 177,499 1970-71 . . .. 76,805 25,866 50,352 9,837 15,057 6,927 184.844 327 185,171 1971-72 .. .. 79,998 33,813 59,987 10,109 14,582 7,321 205,810 407 206,217 1972-73 .. .. 95,291 40,958 71,391 9,698 19,043 7,934 244,315 426 244,741 1973-74 .. .. 104,540 40,974 77,472 10,819 20,820 8,591 263,216 515 263,731 1974-75 (estimate)(d) •. n.a. 44,fiOO 93,013 13,500 25,950 11,240 n.a. 1,291 n.a.
On the interpretation of the figures shown in this table, see Chapter V, under the heading "Borrowing Arrangements for Local Government Authorities Includes County Councils. That is, borrowings by local government authorities from within the totals approved for larger authorities. See footnote (a) to Table 72. Estimates supplied by State Treasuries; tentative only. That is, borrowings by local government within the smaller authorities category. See footnote (b) to Table 72
175
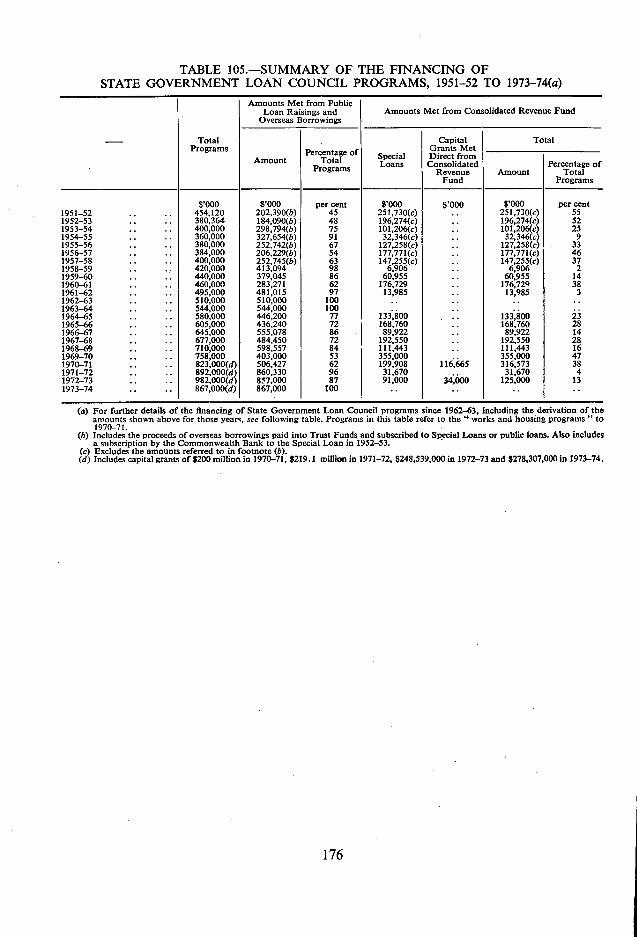
TABLE 105.-SUMMARY OF THE FINANCING OF STATE GOVERNMENT LOAN COUNCIL PROGRAMS. 1951-52 TO 1973-74(a)
Amounts Met from Public Loan Raisings and Amounts Met from Consolidated Revenue Fund
Overseas Borrowings
Capital Total - Total Programs Percentage o Grants Met
Percentage of Amount Total Special Loans
Direct from Consolidated Programs Revenue Amount Total
Fund Programs
8'OOO $'OOO per cent $'OOO 81000 $'OOO per cent 1951-52 .. .. 454,120 202,390(b) 45 251,730(c) 251,730(c) 55 1952-53 .. .. 380.364 184,090(b) 48 196,274(c) .. 196,274(c) 52 1953-54 .. .. 400,000 298,794(b) 75 101,206(c) .. 101,206(c) 25 1954-55 .. .. 360,000 327,654(b) 91 32,346(c) .. 32,346(c) 9 1955-56 .. .. 380,000 252,742(b) 67 127,258(c) .. 127,258(c) 33 1956-57 .. .. 384,000 206,229(b) 54 177,771(c) .. 177,771(c) 46 1957-58 .. .. 400,000 252,745(b) 63 147,255(c) .. 147,255(c) 37 1958-59 .. .. 420,000 413,094 98 6,906 .. 6,906 2 1959-60 .. 440,000 379,045 86 60,955 .. 60,955 14 1960-61 .. .. 460,000 283,271 62 176,729 .. 176,72 38 1961-62 .. .. 495,000 481,015 97 13,985 .. 13,985 3 1962-63 .. .. 510,000 510,000 100 .. 1963-64 .. .. 544,000 544,000 100 .. 1964-65 .. .. 580,000 446,200 77 133,800 .. 133,800 23 1965-66 .. .. 605,000 436,240 72 168,760 .. 168,760 28 1966-67 .. .. 645,000 555,078 86 89,922 .. 89,922 14 1967-68 .. .. 677,000 484,450 72 192,550 .. 192,550 28 1968-69 .. .. 710,000 598,557 84 111,443 .. 111,443 16 1969-70 .. .. 758,000 403,000 53 355,000 .. 355,000 47 1970-71 .. .. 823,000(d) 506,427 62 199,908 116,665 316,573 38 1971-72 .. .. 892,000(d) 860,330 96 31,670 .. 31,670 4 1972-73 .. .. 982.000(d) 857,000 87 91,000 34,000 125,000 13 1973-74 .. .. 867,000(d) 867,000 100 ..
For further details of the financing of State Government Loan Council programs since 1962-63, including the derivation of the amounts shown above for those years, see following table. Programs in this table refer to the "works and housing programs" to 1970-71. Includes the proceeds of overseas borrowings paid into Trust Funds and subscribed to Special Loans or public loans. Also includes a subscription by the Commonwealth Bank to the Special Loan in 1952-53. Excludes the amounts referred to in footnote (b). Includes capital grants of $200 million in 1970-71, 1219.1 million in 1971-72, $248,539,000 in 1972-73 and $278,307,000 in 1973-74.
176
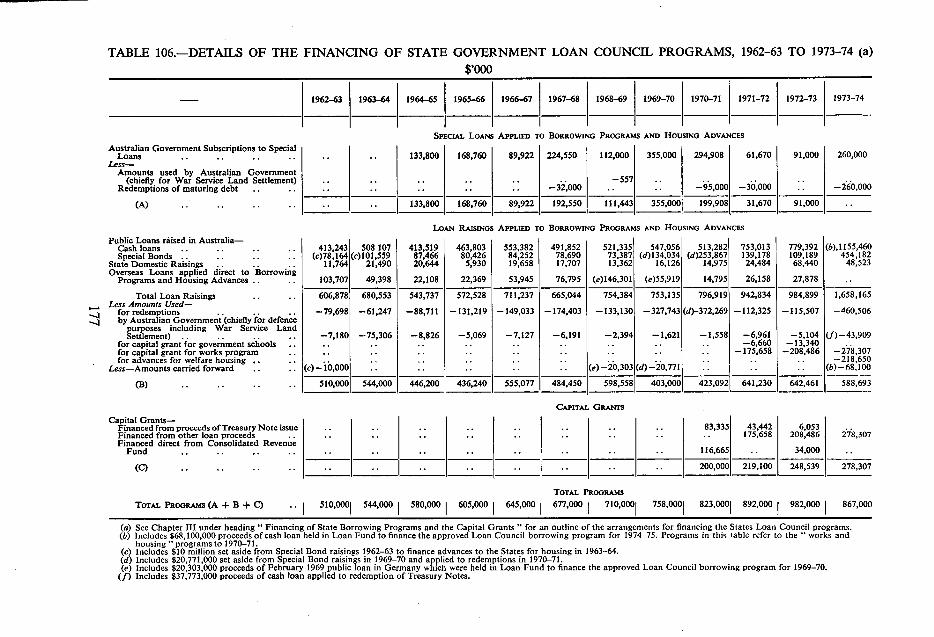
TABLE 106.-DETAILS OF THE FINANCING OF STATE GOVERNMENT LOAN COUNCIL PROGRAMS, 1962-63 TO 1973-74 (a) $,000
- 1962-63 1963-64 1964-65 1965-66 1966-67 1967-68 1968-69 1969-70 1970-71 1971-72 1972-73 1973-74
Australian Government Subscriptions to Special Loans ..
Less- Amounts used by Australian Government
(chiefly for War Service Land Settlement) Redemptions of maturing debt
(A) ..
SPECIAL LOANS APPLIED TO BORROWING PROGRAMS AND HOUSING ADVANCES
133.800 I 168,760 I 89,922 I 224,550 I 112,000 1 355,000 1 294,908 1 61,670 I 91,000 1 260,000
..
-32,000 .. .. -95,000 -30,000 -260,000
133,800 168,760 89,922 192,550 111,443 355,000 199,908 31.670 91,000
LOAN RAISINGS APPLIED TO BORROWING PROGRAMS AND HOUSING ADVANCES Public Loans raised in Australia-
Cash loans .. Special Bonds ..
State Domestic Raisings Overseas Loans applied direct to Borrowing
Programs and Housing Advances
Total Loan Raisings Less Amounts Used-
for redemptions by Australian Government (chiefly for defence
purposes including War Service Land Settlement) .
for capital grant for government schools for capital grant for works program for advances for welfare housing
Less-Amounts carried forward
(B) ..
413,243 (c)78,164
11,764
103,707
508 107 (c)101,559
21,490
49,398
413,519 87,466 20,644
22,108
463,803 80,426
5,930
22,369
553,382 84,252 19,658
53,945
491,852 78,690 17,707
76,795
521,335 73,387 13,362
(e)146,301
547,056 (d)134,034
16,126
(e)55,919
513,282 (d)253,867
14,975
14,795
753,013 I 139,178 24,484
26,158
779,392 109,189 68,440
27,878
(b),1155,460 454,182
48,523
606,878 680,553 543,737 572,528 711,237 665,044 754,384 753,135 796,919 942,834 984,899 1,658,165
-79,698 -61,247 -88,711 -131,219 -149,033 -174,403 -133,130 -327,743 (d)-372,269 -112,325 -115,507 -460,506
-7,180 -75,306 -8,826 -5,069 -7,127 -6,191 -2,394 -1,621 -1,558 -6,961 -5,104 (f)-43,909 -6,660 -13,340
-175,658 -208,486 -278,307 -218,650
(c)-lO,000 .. .. .. .. .. (e)-20,303 (d)-20,771 .. .. .. (b)-68,100
510,000 544,000 446,200 436,240 555,077 484,450 598,558 403,000 423,092 641,230 642,461 588,693
CAPITAL GRANTS Capital Grants-
Financed from proceeds of Treasury Note issue .. .. .. .. .. .. .. 83.335 43,442 6,053 Financed from other loan proceeds .. .. .. .. .. .. .. .. .. .. 175,658 208,486 278,307 Financed direct from Consolidated Revenue
Fund .. .. -. .. .. .. .. .. .. .. .. .. 116,665 .. 34,000
() ,• ,• ,. ,. ,. ,. ., .. .. .. .. 200,000 219,100 248,539 - 278,307
TOTAL PROGRAMS TOTAL PROGRAMS (A + B + C) .. I 510,0001 544,000 I 580,000 I 605,000 1 645,000 I 677,000 I 710,0001 758,0001 823,0001 892,000 I 982,000 I 867,000
See Chapter III under heading " Financing of State Borrowing Programs and the Capital Grants" for an outline of the arrangements for financing the States Loan Council programs. Includes $68,100,000 proceeds of cash loan held in Loan Fund to finance the approved Loan Council borrowing program for 1974-75. Programs in this table refer to the "works and housing "programs to 1970-71. Includes $10 million set aside from Special Bond raisings 1962-63 to finance advances to the States for housing in 1963-64. Includes $20,771,000 set aside from Special Bond raisings in 1969-70 and applied to redemptions in 1970-71. Includes $20,303,000 proceeds of February 1969 public loan in Germany which were held in Loan Fund to finance the approved Loan Council borrowing program for 1969-70, Includes $37,773,000 proceeds of cash loan applied to redemption of Treasury Notes.
APPENDIX IV—PART I—HISTORY OF SPECIFIC PURPOSE PAYMENTS
Chapter IV outlines the payments currently being made or proposed to be made to the States for specific purposes. The sections which follow outline in more detail the history of some of the specific purpose payments, including payments for projects that have been completed in recent years.
EDUCATION
Universities Assistance to the States for universities was first introduced in 1951-52. Details of payments in the
period from 1951 to the end of the 1970-72 triennium are given below. The basis for payments from 1973 is outlined in Chapter IV.
The States Grants (Universities) Acts of 1951, 1953, 1955, 1956 and 1957 provided financial assistance to the States for the running expenses of universities, on condition that the level of university income from State grants and fees reached, and was maintained at, certain basic levels. Additional assistance up to certain fixed amounts was also payable to the States on the basis of $1 for each $3 of State grants and fees in excess of these basic levels. Under the States Grants (Universities) Act 1957 an amount of $4.6 million was made available on this basis in each of the years 1957 and 1958.
Following an inquiry in 1957 by the Committee on Australian Universities under the chairmanship of Sir Keith Murray, C.M.G., assistance to the States for universities was considerably expanded. The States Grants (Universities) Act 1958, which incorporated the main recommendations of the Committee, came into force on 1 January 1958 and authorised payments to the States for universities up to $42.8 million over the three calendar years 1958 to 1960. Apart from increased contributions towards the running expenses of universities, the new basis of assistance included emergency grants. In addition, provision was made, for the first time, for grants for capital works and equipment. Under the States Grants (Universities) Act 1960 assistance for the 1958-1960 triennium was increased to $43.9 million.
1961-63 Triennium An Australian Universities Commission was established by the Australian Universities Commission
Act 1959 to inquire into and make recommendations on the subject of financial assistance to the States for universities.
The main financial recommendations in the Commission's first report, which was presented in October 1960, were incorporated in the States Grants (Universities) Act 1960. This Act carried on the principles of grants for capital works and equipment introduced in the 1958 legislation and it authorised total payments of $84.6 million for the three calendar years 1961 to 1963. Subsequent amendments to that Act in 1962, 1963 and 1964 increased the maximum assistance to $89.9 million. The 1962 amendment, which followed the presentation of the report by the Committee on Teaching Costs of Medical Hospitals, introduced the principle of capital assistance to the States for university projects in teaching hospitals.
1964-66 Triennium For the three calendar years 1964 to 1966 grants to the States were based largely on the recom-
mendations contained in the Second Report of the Australian Universities Commission presented in August 1963. These were incorporated in the Universities (Financial Assistance) Act 1963 which provided for grants totalling $116.8 million during the triennium—$76.8 million for recurrent expenditure and $40 million capital. Subsequent amendments to that Act in 1965 and 1966, following acceptance of proposals in the Reports of three other committees, had the effect of increasing the grants for the triennium. The three reports were—
Report recommending increased academic salaries presented in October 1964 by Mr Justice Eggleston; Report of the Committee on the Future of Tertiary Education in Australia, certain of whose recommendations were accepted in early 1965; and
178
(c) Second Report of the Committee on Teaching Costs of Medical Hospitals presented in May 1965 arising from which it was decided to pay for the first time grants for certain recurrent expenditures of teaching hospitals and additional grants towards specfic university projects of a capital nature in those hospitals.
In addition, it was agreed- that the recurrent grant for the Townsville University College be increased by $38,000 in the last year of the triennium.
Overall, the effect of these various amendments was to increase recurrent grants to $86.6 million and capital grants to $47.6 million, a total of $134.2 million.
1967-69 Triennium After consultation with State Governments the Australian Government agreed to a reduction of
approximately $56 million in the total program recommended in the Third Report of the Australian Universities Commission. As a result, the level of grants authorised by the Universities (Financial Assistance) Act 1966 was $175.6 million, made up of $116.9 million for recurrent expenditure and $58.7 million for capital expenditure. The level of recurrent grants was increased in 1967 to $123.8 million to take account of increased academic salaries from 1 July 1967. The principal Act was amended again in 1968 and 1969 to make minor technical changes to building programs for certain universities and a minor change in the basis upon which matching recurrent funds are made available for teaching hospitals; these modifications did not, however, affect the amount of the triennial program.
In addition to the approved program, as amended, the Universities (Financial Assistance) Act 1967 re-appropriated amounts totalling $701,000 for capital projects at certain universities which had been provided, but were not taken up in the 1964-66 triennium.
1970-72 Triennium The recommendations contained in the Fourth Report of the Australian Universities Commission
were accepted by the Australian Government in August 1969 and were incorporated in the States Grants (Universities) Act 1969. The level of grants provided for the triennium under the Act was $226.8 million—$161.2 million for recurrent expenditure and $65.6 million for capital expenditure. The level of grants for recurrent purposes was increased on four seperate occasions over the triennium to take account of—
the decision to support higher academic salaries from 1 January 1970; the flow-on of the 1970 National Wage Case Decision to academic salaries; the decision to provide supplementary grants over the last eighteen months of the triennium in recognition of exceptional increases that had occurred in non-academic salaries and wages; and the flow-on of the 1972 National Wage Case decision to academic salaries.
The overall effect of these additions to the 1970-72 triennial program was to increase the level of recurrent grants to $186.0 million.
In addition amounts totalling $502,000 for capital projects at certain universities which had been provided but not taken- up during the previous triennium were re-appropriated by the States Grants (Universities) Act 1970.
Colleges of Advanced Education
Grants to the States for colleges of advanced education were first introduced in 1965-66. Details of payments in the neriod from 1965 to the end of the 1970-72 triennium are shown below. The basis for payments made as from the beginning of the 1973-75 triennium is outlined in Chapter IV.
In March 1965 the Australian Government accepted in principle the recommendations in the Report of the Committee on the Future of Tertiary Education in Australia (under the Chairmanship of Sir Leslie Martin, C.B.E.) that a new type of educational institution should be established to supplement universities and to be developed from, and around, the tertiary segments of existing technical colleges. The Government agreed to make available capital grants totalling approximately $5 million for the remainder of the 1964-66 triennium. Later that year the Commonwealth Advisory Committee on Advanced Education was established to promote the balanced development of institutions providing advanced education in Australia and to advise the Australian Government on matters of financial assistance for such institutions.
179

1967-69 Triennium The recommendations contained in the First Report (and supplement) of the Commonwealth
Advisory Committee on Advanced Education were accepted and incorporated in the States Grants (Advanced Education) Act 1966. This Act provided, inter alia, for grants, on the same matching basis as for universities, of $24.5 million for capital expenditure and $10.7 million for recurrent expenditure incurred by the States in excess of the level of such expenditure in the base year 1964-65.
Following the February 1967 Premiers' Conference the Australian Government agreed to waive the base year requirement in determining recurrent grants. The States Grants (Advanced Education) Act 1967 repealed the 1966 Act and provided for total grants of $42.3 million—$17.8 million for recurrent expenditure and $24.5 million for capital (including an unmatched library grant of $500,000). Additions to the level of recurrent grants were approved for 1969 and 1970 to take account of unforseen salary and other costs and increases in academic salaries. The effect of these decisions was to increase the level of recurrent grants during the triennium to $20.0 million.
1970-72 Triennium The financial recommendations contained in the Second Report of the Commonwealth Advisory
Committee on Advanced Education were accepted and accordingly, the States Grants (Advanced Education) Act 1969 provided for grants of $43.2 million for recurrent expenditure and $49.9 million for capital expenditure, a total program of $93.1 million for the triennium. The 1969 Act was amended on four separate occasions during the triennium to provide for:—
increased academic salaries; recurrent grants to affiliated residential colleges; the flow-on of the 1970 National Wage Case decision to academic salaries; supplementary grants over the last eighteen months of the triennium towards the cost of exceptional increases in non-academic salaries and wages; and the flow-on of the 1972 National Wage Case decision to academic salaries.
The effect of these amendments was to increase the level of recurrent grants during the triennium to $50.9 million.
The Australian Commission on Advanced Education was established (Australian Commission on Advanced Education Act 1971) to succeed the Commonwealth Advisory Committee on Advanced Education with broadly the same responsibilities.
Teachers Colleges
Assistance to the States for teachers colleges was first introduced in 1967-68. From 1 July 1973, the Government's assistance for teachers colleges was increased significantly and included within the colleges of advanced education program.
The States Grants (Teachers Colleges) Act 1967 provided for the payment of unmatched grants for the construction and equipping of colleges conducted by the States for the training of teachers.
The provision of this assistance was subject to the understanding that the States did not reduce their own expenditure on teacher training and to the condition that at least 10 per cent of the number of places arising from the accommodation so provided—whether new or replacement and whether teaching or residential—was to be available for student teachers not bonded to State Education Departments.
Under the Act grants totalling $24 million were paid to the States in the three-year period ended June 1970.
The States Grants (Teachers Colleges) Act 1970 extended the operation of the scheme for a further period of three years to 30 June 1973. Under the Act grants totalling $30 million were paid to the States over that period.
A summary of subsequent arrangements is given in Chapter IV.
180
Pre-school Teachers Colleges The States Grants (Pre-school Teachers Colleges) Act 1968 provided for capital grants totalling
$2.5 million to be made available to the States over the three financial years ending June 1971 for the purpose of increasing the physical capacity of approved pre-school teachers colleges. Because of difficulties encountered in some States in proceeding with the building programs, the States Grants (Pre-school Teachers Colleges) Act 1971 was enacted to extend to 31 December 1972 the period over which these grants could be made available. Further delays with the building programs resulted in the introduction of the States Grants (Pre-school Teachers Colleges) Act 1972 which extended the period of operation of the Act to 31 December 1973.
From 1 July 1973 grants for pre-school teachers colleges have been included in the advanced education program. A summary of present arrangements is given in Chapter IV.
Technical Education The States Grants (Science Laboratories and Technical Training) Act 1964 provided for grants to
the States in 1964-65 of $10 million towards the building and equipment costs of technical schools and colleges. The States Grants (Technical Training) Acts 1965 and 1968 each provided for the payment of $30 million to the States for this purpose over further three-year periods ended 30 June 1968 and 30 June 1971, respectively. A summary of current arrangements for the payment of grants to the States for technical colleges is given in Chapter IV.
Schools
Current arrangements for the payment of grants to the States for schools are summarized in Chapter IV. An outline of previous arrangements is given below.
Science Laboratories and Equipment in Secondary Schools Under the States Grants (Science Laboratories and Technical Training) Act 1964 an amount of $9.9
million was made available to the States in 1964-65 for science laboratories and equipment in secondary schools for the purpose of improving science teaching in those schools. The States Grants (Science Laboratories) Act 1965 provided for the payment to 30 June 1968 of a further $29.7 million, of which not more than one-third was to be authorised for payment before 30 June 1966 and two-thirds before 30 June 1967.
Both Acts provided that, of the basic grant of $9.9 million per annum, an amount of $7.2 million was to be available for government schools and $2.7 million for non-government schools; the basis of this allocation was the number of secondary school pupils enrolled in each of these two types of schools at school censuses held in August 1963. The distribution of these two component amounts between the States was related to their populations. For the financial year 1967-68, the States Grants (Science Laboratories) Act 1967 doubled the provision for non-government schools.
The States Grants (Science Laboratories) Act 1968 extended the operation of this scheme for a further three years to 30 June 1971 and provided for a total payment of $37.7 million over that period. The method of dissection of the basic annual grant of $12.6 million between government and non-government schools was the same as applied in 1967-68 and the distribution of these two component amounts among the States was based on 1966 Census population figures. The component of the basic annual grant for non-government schools was allocated between each non-government school sector on the basis of 1966 secondary school enrolment figures.
Secondary School Libraries Under the States Grants (Secondary Schools Libraries) Act 1968, grants totalling $27 million were
made available to the States over the three years commencing 1 January 1969 to finance buildings and associated capital facilities for libraries in government and non-government secondary schools. The Act provided that, of the amount of $27 million, not more than one-third would be authorised for payment before 31 December 1969 and two-thirds before 31 December 1970.
The allocation of the basic annual grant of $9 million between government and non-government schools was based on the number of secondary school pupils enrolled in each of these two types of schools at school censuses in August 1967. The distribution between the States of each of those amounts was based on State populations as at 30 June 1967.
181

Capital Grants for Government Schools The States Grants (Capital Assistance) Act 1971-1972 provided $20 million for capital expenditure
on government primary and secondary schools in the States over the period January 1972 to July 1973. The payments were made by way of additions to the interest-free capital grants which the Australian Government makes available to the States as part of their annual Loan Council programs as a substitute for loan raisings. These interest-free capital grants are paid to assist the States to finance capital works from which debt charges are not normally recovered and are not subject to specific conditions as to the purposes for which they may be expended. However, as the additional $20 million grant was provided in recognition of the need expressed by the States for additional capital expenditure on primary and secondary schools, the Australian Government expected the States to use the funds for this purpose. The grants were distributed between the States in proportion to their shares of the State Loan Council pro-grams and were amalgamated with the interest-free capital grants for the purpose of determining the pro-portion of the program to be provided as grants in future years. For further information on the interest-free capital grants see Chapter III.
Recurrent Grants for Non-Government Schools Payments have been made to the States for transmission to non-government schools since 1969-70.
The States Grants (Independent Schools) Act 1969 authorised payments at the rates of $35 for each primary pupil and $50 for each secondary pupil a year as from the beginning of 1970. The States Grants (Independent Schools) Act 1972 increased these rates to $50 and $68 respectively from the beginning of 1972. The States Grants (Schools) Act 1972-1973 authorised a contribution in 1973 by the Australian Government towards the recurrent costs of non-government schools in the States at rates equivalent to 20 per cent of the assessed Australia-wide cost of educating a child in government primary and secondary schools. The entitlement of each school was calculated on the number of pupils enrolled for full-time education as at the school census date in August of each year. The States were invited to contribute on an equal basis.
Table 112 shows the grants that have been paid to each State for these purposes.
HEALTH
Mental Health Institutions The States Grants (Mental Institutions) Act 1955 authorised the payment of financial assistance of
up to $20 million towards capital expenditure on mental health institutions incurred by the States where the project was approved by the Australian Government. The assistance was on the basis of one-third of the total expenditures by the States with a specified limit for each State.
The 1955 legislation was repealed by the States Grants (Mental Health Institutions) Act 1964 which .authorised assistance to the States amounting to one-third of the total expenditure incurred by them on specific projects approved by the Australian Government in building and equipping mental health institutions in the three year period ending on 30 June 1967. The 1964 Act preserved the States' right to receive at least the amount of their entitlements under the 1955 Act.
Amendments in 1967 and 1970 to the Act authorised continued assistance on the previous basis. The 1970 amendment provided for assistance in respect of State expenditure up to 30 June 1973 on projects approved by the Australian Government not later than 30 June 1972.
Final grants under the scheme were made in 1973-74. The annual grants provided to each State since the inception of the program are shown in Table 115 in Part II of this Appendix.
SOCIAL SECURITY AND WELFARE
Housekeeper Services In 1951 the Australian Government offered financial assistance to the States, up to a limit of $30,000
a year, to encourage the development of housekeeper services conducted by approved organisations to provide assistance to families in emergencies. The offer was made on the basis that the sum of $30,000 would be distributed among the States in proportion to their populations and that the States would not reduce their own expenditures on, or subsidies for, these services.
The State of Queensland declined the offer and payments were made direct to emergency housekeeper services in Queensland. Total payments to the other States under this scheme amounted to $432,000 up to 30 June 1969 of which $224,200 was paid to New South Wales, $155,800 to Victoria, $34,000 to Western Australia and $18,000 to Tasmania. South Australia did not participate in the scheme. Annual figures of payments to each State from 1962-63 are shown in the tables in Appendix VI. From 1 July 1969, the assistance for housekeeper services has been subsumed in the assistance provided under the States Grants (Home Care) Act 1969. (See Chapter IV.)
Grants for the Relief of Unemployment In December 1971 the Australian Government introduced a scheme of grants to the States for employ-
ment creating activities in non-metropolitan areas, where such action was desirable for social and economic reasons. The objective of the scheme was to reduce significantly the level of unemployment in those areas. The grants were for expenditure on additional labour-intensive activities of a productive kind undertaken by State, semi-government and local government authorities.
Details of the scheme, including the amount of the grants, the proportion to be spent on labour and non-labour components and the distribution of the grants between the States were agreed with State Governments.
On average, two-thirds of the funds provided over all projects undertaken in a State were required to be devoted to expenditure on labour costs. The Australian Government indicated, however, that it had no objection to the States or their authorities supplementing from their own resources the funds available under the scheme in order that projects with a labour cost component of less than two-thirds could be undertaken. As far as possible, those given employment under the scheme had to be previously registered for employment with the Commonwealth Employment Service.
The detailed administration of the scheme, including the types of activity undertaken with the grants and the allocation of the grants between particular areas, was left to the State Governments, although they were asked to consult closely with the Department of Labour.
Initially, the grants were at the rate of $2.25 million a month, but an increase to $4.5 million a month was announced at the February 1972 Premiers' Conference. The grants were further increased to $6 million per month at the June 1972 Premiers' Conference and operated at that level to the end of 1972.
After consultation with the State Governments, the Australian Government decided, in December 1972, to continue the non-metropolitan unemployment grants scheme during the six months to June 1973 with increases for some States; South Australia was to receive an additional $120,000 a month while New South Wales and Victoria were to receive additional amounts of $500,000 and $250,000 respectively to assist the part-time employment of drought-affected farmers. In addition, the Australian Government agreed to make payments to the States, totalling $30.35 million during the same six months period, for the relief of unemployment in metropolitan areas.
It was also decided that the State Governments might, at their discretion, deploy some of the non-metropolitan grants to the metropolitan area, and vice versa, and that there would be some relaxation of the rule which formerly applied to the non-metropolitan unemployment grants that at least two-thirds of the funds be expended on labour costs, provided the employment-creating objective of the grants was carefully pursued and that, generally, a high labour cost content was aimed at.
On 26 June 1973 the Prime Minister announced that the Government would, subject to a review of the situation before the end of September 1973, phase out grants under the non-metropolitan relief scheme over the first three months of 1973-74 by providing $5 million in July, $4 million in August and $3 million in September, to be divided amongst the States on the existing proportionate basis.
Although grants for the relief of unemployment in metropolitan areas were terminated earlier, the Australian Government informed the States that, consistent with previous arrangements, they would have discretion to deploy some of the non-metropolitan unemployment relief grants to metropolitan areas should they consider it warranted.
As under the previous arrangements the States, subject to broad guidelines which the Australian Government laid down, administered the scheme and allocate the grants between particular areas. They were asked, however, to continue to consult closely with the Department of Labour.
In September 1973 the Government terminated the non-metropolitan unemployment relief grants scheme because of an improvement in the overall employment situation.
HOUSING
Housing Assis'tance Under successive Commonwealth-State Housing Agreements, substantial long-term loans were made
to the States over the period 1945-46 to 1970-71 for the provision of housing for families of low or moderate means. The first Agreement was entered into in 1945. A new Agreement was entered into in 1956 and further Agreements in 1961 and 1966 extended to 30 June 1971 the period in which advances under that Agreement could be made. Advances made under these Agreements are shown in Table 119.
15176/74-7 183

1945 Agreement In November 1945 the Australian Government entered into an Agreement with the Governments of
the States to provide finance for the construction of dwellings for persons in need of proper housing accommodation. The construction period under this Agreement expired on 30 June 1956.
While the 1945 Housing Agreement provided for advances, repayable over fifty-three years with interest at the long-term bond rate, to be made to the States to assist them in carrying out rental housing projects, the rate of interest actually charged remained at 3 per cent for the whole of the period of the Agreement.
This Agreement provided for the dwellings to be let at an economic rental but provided for the granting of rebates to tenants who did not have the capacity to pay the economic rentals.
Subject to a State observing the terms of the Agreement, there was provision for the Australian Government to contribute three-fifths of any loss incurred in a financial year by the State in connection with the administration of its housing projects.
Initially, dwellings were sold to tenants only upon payment by the State to the Australian Government of the full purchase price of the dwelling payable by the purchaser. However, the 1945 Agreement was amended in 1955 to permit sales on terms specifically laid down and, subsequently, in 1961 was further amended to permit each of the States to determine its own terms and conditions of sale.
Over the eleven years of the 1945 Agreement from 1945-46 to 1955-56, advances totalling $481 million were made to the States.
1956-1966 Commonwealth-State Housing Agreements Under the Housing Agreements that operated for fifteen years to 30 June 1971, the level of Common-
wealth advances made to the States each financial year for housing was nominated by them individually from within their allocations of the total works and housing borrowing program approved by the Australian Loan Council for that year. Over $1,509 million was advanced to the States in the fifteen years.
Advances made to each State under the 1956-1966 Housing Agreement were repayable over a period of fifty-three years.
The rates of interest provided by the Agreement were as follows: in 1956-57 and 1957-58 the rate was J per cent below the long-term bond rate when the long-term bond rate did not exceed 4+ per cent and I per cent below when it did exceed 4+ per cent; from 1958-59 to 1960-61 the rate was as agreed between the Australian Government and the States but was not to exceed the long-term bond rate less I of 1 per cent per annum. From 1961-62 on the rate of interest payable on advances was in all cases to be 1 per cent less than the long-term bond rate.
The 1956-1966 Agreement placed more emphasis on the construction of dwellings for private owner-ship, by providing that not less than 30 per cent of the funds advanced to each State were to be advanced through Home Builders' Accounts to building societies and other approved institutions for lending to private home builders and purchasers. The balance of the advances was to be used by the States for the erection of dwellings for either rental or sale.
Under the Agreement the States were required, as necessary, to set aside in a financial year an amount not exceeding 5 per cent of the amount of the loan funds allocated to its State housing authority, for the erection of dwellings for letting to serving members of the Defence Forces. The Australian Government was obliged to make supplementary advances to the States to match any amount so set aside and when the total funds thus available were not sufficient to finance the number of dwellings sought by the Australian Government for servicemen additional advances were made to the States to meet the shortfall.
The 1956-1966 Housing Agreement expired on 30 Tune 1971 and was not renewed. Subsequent housing arrangements are dealt with in Chapter IV.
Exmouth Township The Australian Government agreed to contribute, by way of grants and loans, towards the cost of
development by the Government of Western Australia of a township at Exmouth to serve an integrated United States/Australian community associated with the United States Naval Communication Station 'Harold E. Holt' at North West Cape.
Payments ceased in 1972-73 and no further payments are expected. Annual figures totalling $4,182,000 including $340,140 by way of loans, appear in Appendix VI.
184
ECONOMIC SERVICES
TRANSPORT
Roads Commonwealth Aid Roads Arrangements
Payments have been made to the States for expenditure on roads since 1923-24. Details of payments between 1923-24 and 1968-69 are given below. Payments under current legislation are dealt with in Chapter IV.
The Main Roads Development Act 1923 provided for payment to the States of a single lump sum of $1 million, subject to a $1 for $1 contribution by the States themselves. The basis of distribution of the total sum amongst the States, although not explicitly stated as such, was 5 per cent to Tasmania and the remainder divided on the basis of the 'two-fifths area, three-fifths population' formula which subsequently applied until 1959-60. Subsequent amendments to the Act increased the sum payable, first by $1 million in 1924 and then by a further $1.5 million in 1925.
Under the Federal Aid Roads Act 1926 annual allocations of $4 million were provided and were distributed amongst the States on the explicitly stated formula of 5 per cent to Tasmania and the remainder divided on the basis of two-fifths area, three-fifths population. Among other changes, the Act reduced the matching contribution required of the States to $1 .50 for each $2 provided by the Australian Government.
The Federal Aid Roads Act 1931 amended the Act of 1926 by repealing the requirement for matching State contributions. Also, instead of the previous provision of a fixed annual amount, the allocations for roads were explicitly associated with the yield from petrol tax, being determined on the basis of 2.083 cents (2d.) and 1 .25 cents (1d.) per gallon of petrol cleared for Customs duty and Excise duty purposes, respectively.
The Federal Aid Roads and Works Act 1937, while maintaining the previous rates of allocations to the States for road works, allocated the equivalent of an additional 0.416 cents (id.) per gallon of petrol subject to either Customs or Excise duty to be used by the States either on road works or on other works connected with transport. Of this additional allocation, the States could be required to use up to one-twelfth on roads adjoining or approaching Australian Government properties.
The Commonwealth Aid Roads and Works Act 1947 provided for allocations of 2.5 cents (3d.) and 1 .666 cents (2d.) per gallon of petrol subject to Customs duty and Excise duty, respectively. Of the proceeds of these allocations, the States could spend up to one-sixth on other works connected with transport. In addition, the Act provided a sum of $2 million per annum to be spent on rural roads. By subsequent amendments to the Act in 1948 and 1949, this sum was raised to $4 million and then to $6 million. An amount of $1 million per annum was also provided for expenditure on strategic roads and roads of access to Australian Government properties. A further $200,000 per annum was provided for the promotion of road safety measures.
The amounts per gallon of dutiable petrol allocated for roads were increased under the Commonwealth Aid Roads Act 1950 to 5 cents (6d.) and 2.91 cents (31d.) respectively. The amount of $1.2 million for expenditure on strategic roads and road safety, which had previously been provided separately, was now provided from the amounts allocated on the basis of petrol clearances. In addition, the former lump sum provision for expenditure by the States on rural roads was replaced by a new provision requiring at least 35 per cent of the total amount allocated to be spent on such roads.
In the Commonwealth Aid Roads Act 1954 the amounts allocated for roads in respect of petrol subject to duty, whether Customs or Excise, were raised to the uniform rate of 5.83 cents (7d.) per gallon. They were subsequently increased to 6.666 cents (8d.) per gallon in March 1956. The minimum proportion to be spent on rural roads was increased from 35 per cent to 40 per cent, and the total amount which could be spent on other works connected with transport by road or water was reduced to a flat sum of $2 million per annum. From the total allocation, $1.8 million per annum was reserved to the Australian Government. This was raised to $1.9 million in 1955.
In association with the imposition of a tax of 10 cents (Is.) per gallon on automotive diesel fuel consumed in road-using vehicles, special assistance for roads of $6 million in each of the years 1957-58 and 1958-59 was provided. $100,000 was retained for Commonwealth road purposes and the balance of this special assistance was distributed between the States on an arbitrary basis.
185
Following a special conference on roads in February 1959, proposals for a new scheme of aid for roads were placed before State Premiers in March of that year. These proposals were later enacted in the Commonwealth Aid Roads Act 1959, which operated for five years commencing 1 July 1959. Under that Act payments totalling $500 million were made to the States for roads, or almost $200 million more than was provided during the five years of the previous legislation. This amount comprised basic grants totalling $440 million and additional grants totalling $60 million which were made available to the States, subject to certain annual limits, on the basis of $1 for each $1 allocated by the State Governments from their own resources for expenditure on roads over and above the amounts allocated by them for roads expenditure in 1958-59.
In the 1959 Act three important changes were made in the bases of road grants to the States. Road grants to the States were no longer determined on the basis of petrol clearances; a change in the distribu-tion of the grants between the States was effected by the inclusion of motor vehicle registrations in the distribution formula as a third and equal factor with area and population; and the condition of $1 for $1 matching expenditure by the States was introduced for that part of the financial assistance described as the additional grant.
The 1959 Act expired on 30 June 1964, and was replaced by the Commonwealth Aid Roads Act 1964 which operated for the five year period 1964-65 to 1968-69 inclusive. Under this Act, the main features of which were agreed at a special Premiers' Conference held in March 1964, payments totalling $750 million were made to the States for roads. This amount was made up of a basic grant of $660 million and an additional grant of $90 million. As in the 1959 Act, the additional grants were payable on the basis of $1 for every $1 spent on roads by the State Governments from their own resources over and above certain base amounts. These base amounts were the sums required to be allocated by the States for roads expenditure in order to qualify for their additional grants in 1963-64, the last year of operation of the 1959 Act. The distribution of the grants among the States was on the same basis as under the 1959 Act outlined above.
Several provisions contained in both the 1954 and the 1959 Aid Roads Acts were repeated in the 1964 legislation. These included the requirement that not less than 40 per cent of the funds made available in each year be spent on roads in rural areas, other than highways, main roads and trunk roads. The States were also permitted to spend between them up to $2 million each year out of the road grants on works, other than the construction of roads, connected with transport by road or water. The 1964 Act extended the provision in the 1959 legislation permitting the States to make payments for, or in connection with, research relating to the construction, maintenance or repair of roads so as to include research relating to the planning and design of roads.
The 1964 Act expired on 30 June 1969 and was replaced by the Commonwealth Aid Roads Act 1969 which operated for the five year period 1969-70 to 1973-74, inclusive. The main arrangements to apply under the Act were announced at a special Premiers' Conference held in March 1969. In considering the new arrangements the Australian Government was guided by the information and advice furnished by the Commonwealth Bureau of Roads which was set up, following the 1964 review of the roads arrange-ments, to undertake a thorough survey and appraisal of the existing roads system and of foreseeable roads requirements. The Australian Government accepted the Bureau's assessment that, provided funds were applied economically, expenditure at a rate considerably higher than at present could be undertaken during the five years under consideration. On this basis grants totalling $1,252.05 million were paid to the States over the five-year period 1969-70 to 1973-74. This represented an increase of about 67 per cent on the amount provided in the preceding five years.
It had been the aim of these arrangements to bring the distribution of Australian Government financial assistance for roads among the States more closely into accord with relative needs for roads expenditure, but the Australian Government also recognised the problems that could be created for the smaller States by too rapid a change from the distribution formula that had applied over the previous five years. The total grant of $1,252.05 million was therefore divided into two parts; a principal grant and supplementary grants. The principal grant totalling $1,200 million was distributed between the six States by giving equal weight to the distribution under the Commonwealth Aid Roads Act 1964 and the distribution indicated by the Bureau of Roads' analysis of the relative needs for roads expenditure. In addition, South Australia, Western Australia and Tasmania received supplementary grants totalling $52.05 million which were phased out during the five year period. The supplementary, grants ensured that the total of each State's grant increased by at least 50 per cent compared with the amounts received under the 1964 legislation.
186
A feature of the arrangements was to direct assistance more specifically to the development of particular classes of road. The 1969 Act provided for specific allocations of the principal grant for urban arterial and sub-arterial roads, rural arterial roads, rural roads other than arterial roads, and for planning and research. The amount allocated for planning and research was 1 .5 per cent of the total principal grant, while the amount allocated for rural roads other than arterial roads was determined by increasing by 5 per cent each year the amount each State was required, under the 1964 Act, to spend on minor rural roads from its 1968-69 grant. Each State's share of the remainder of the principal grant was allocated between rural arterial, and urban arterial and sub-arterial roads, in the same proportions as indicated by the Bureau of Roads' assessment of each State's road needs in these two categories. Provision was made in the legislation for limited transfers of grants from one class of road to another but it was the Australian Government's intention that requests from States for such transfers be approved only in exceptional circumstances. The provision in the 1964 Act permitting expenditure of roads grants up to a total of $2 million on works other than road works was not continued in the 1969 Act.
Table 121 following this Appendix shows annual payments to the States for roads from 1923-24. Prior to 1959-60 payments did not coincide exactly with allocations and figures of these are given in Table 122.
Beef Cattle Roads The Australian Government, in past years, made available specific grants and loans for the con-
struction and improvement of certain roads used for the transport of beef cattle. The construction of these roads is aimed particularly at increasing the turn-off of beef cattle for export.
Queensland The Queensland Grant (Beef Cattle Roads) Act 1961 provided for financial assistance to Queensland
of $10 million during the five-year period from July 1961 for the construction of beef cattle roads. Under the Queensland Beef Cattle Roads Agreement Act 1962, which superseded the 1961 legislation, the amount of assistance was increased by $6.6 million to an amount not exceeding $16.6 million in order to include the cost of bitumen sealing the roads. For amounts of assistance in excess of $3.4 million, half was paid by way of grant and half by way of interest-bearing loans each repayable over 15 years. The last payment to Queensland under this Agreement was made in 1966-67.
The Queensland Beef Cattle Roads Agreement Act 1966 provided further financial assistance during 1966-67 of $3.9 million, one half by way of grant and the other half by way of interest-bearing loans each repayable over 15 years.
Western Australia Under the Western Australia Grant (Beef Cattle Roads) Acts 1961 and 1962, grants were madeto
Western Australia of $1 million in 1961-62, $1.4 million in 1962-63 and $1.5 million in each of the three succeeding years for certain beef cattle road works in the northern part of the State. The State was required to spend at least an equivalent amount in the aggregate from its own resources on roads generally in the north.
Under an amendment to this legislation, a further grant of $1 .5 million was made in 1966-67 on the same terms as applied in previous years.
Payments under these Acts to Queensland and Western Australia for beef roads from 1961-62 until 1966-67 are shown in Table 123 in Part II of the Appendix. Details of payments made since 1966-67 are also shown in that Table and an outline of the recent legislation is given in Chapter IV.
Maintenance of Eyre and Barkly Highways Since 1947-48 financial assistance has been provided towards the cost of maintaining the Eyre
Highway in South Australia and Western Australia and the Barkly Highway in Queensland. These payments were made from the Commonwealth Aid Roads Trust Account prior to 1959-60 and by way of annual appropriations from 1960-61 to 1973-74. Provision in 1974-75 and subsequent years has been incorporated in the National Roads Bill 1974 which is to be considered by the Senate in the Budget sitting (see Chapter IV).
187
Sealing of Eyre Highway In 1972 it was agreed that up to $2.5 million would be provided as assistance to South Australia
towards the cost of completing the sealing of the Eyre Highway. Two payments of $625,000 were made in 1972-73 and 1973-74. Subsequent payments have been taken into account in determining South Australia's allocation of funds under the National Roads Bill 1974 which is to be considered by the Senate in the Budget sitting. Gordon River Road
Under the Tasmania Grant (Gordon River Road) Act 1964-1967 a non-repayable grant of $5 million was made to Tasmania to assist in financing the construction of a road, approximately fifty miles in length, into the Gordon River region of south-west Tasmania. The primary purpose of the road was to enable detailed investigation and development of a further stage of the Tasmanian hydro-electric system. The final payment of $200,000 to Tasmania was made in 1967-68. Annual figures of payments prior to 1967-68 are given in Table 154 in Appendix VI.
Roads—Safety Improvements An amount of $3 million was provided to the States in 1973-74 for a program of traffic management
and other low cost improvements at locations with poor accident records. The amounts paid to each State are shown in Table 87, in Appendix I. Provision in 1974-75 and subsequent years has been incorporated in the Roads Grants Bill 1974 which is to be considered by the Senate in the Budget sitting.
Railways Assistance has been provided to the States for a number of railway projects that have now been
completed. Details of this assistance are outlined below and Table 124 which follows this Appendix gives annual figures of payments to the States for the years 1951-52 to 1974-75 (estimate). Details of payments made by the States for interest and repayment of loans (except debt charges in respect of loans for the Grafton-South Brisbane railway) are given in Table 125.
Grafton-South Brisbane Railway In 1924, an agreement was entered into with New South Wales and Queensland for the construction of
a standard gauge railway between Grafton and South Brisbane. The railway was built at a cost of $9 million and was opened for traffic in 1930. The project was regarded for financing purposes as part of a Wider standardisation scheme, initiated in 1920 but later abandoned, under which 20 per cent of the cost was to have been met by the Australian Government and 80 per cent by the five mainland States in pro-portion to their populations. In this instance, the Australian Government agreed to meet the shares of the three non-participating States as well as its own. The approximate allocation of cost on this basis was—Australian Government 56 per cent; New South Wales 32 per cent; and Queensland 12 per cent. All of the funds were provided initially by the Australian Government but each party became responsible for meeting the debt charges on its agreed share of the cost.
Albury-Melbourne Railway Under the Railway Standardization (New South Wales and Victoria) Agreement Act 1958, $31.9 million
was provided for the construction of the standard gauge rail link between Albury and Melbourne. Each of the two States is repaying 15 per cent of the cost of construction by instalments over a period of fifty years, plus interest on outstanding balances.
Railway Equipment (South Australia) Under the Railway Equipment Agreement (South Australia) Act 1961, $2.6 million was provided to the
State for the purchase of twelve diesel-electric locomotives and 100 wagons of 3 ft 6 in guage for ore traffic on the Broken Hill-Port Pine line. The Equipment Agreement required that the locomotives and wagons be readily convertible to standard gauge when the gauge of the railway is widened, and that the cost of conversion be met entirely by the State. The State is repaying 30 per cent of the cost of the equip-ment by instalments, with interest, over a period of fifty years.
Queensland Advances totalling $35.1 million were made to Queensland under the Railway Agreement (Queens-
land) Acts 1961 and 1968 for the reconstruction of the Mount Isa-Townsville-Collinsville railway. The State is repaying these advances with interest over twenty years.
188
Parkes-Broken Hill Railway Under the Railway Agreement (New South Wales) Act 1968 a grant of $10 million was made to New
South Wales towards the cost of upgrading the railway line between Parkes and Broken Hill.
Tasmania Under the Railway Agreement (Tasmania) Act 1971, $4,250,000 was provided to Tasmania, of which
$2,975,000 was for the construction of a new rail link between the existing rail system and Bell Bay and $1,275,000 was for the upgrading of about eight miles of the existing line from Launceston and for associ-ated works. The financial assistance comprised $2.5 million in the form of loans repayable over thirty years and $1,750,000 by way of grants.
Shipping and Harbours Loading Facilities for Export of Coal
(a) New South Wales Under the Coal Loading Works Agreement (New South Wales) Act 1961 assistance of $5.3 million
was made available to the State, on a $1 for $1 basis, towards the cost of improvements in coal loading works at the ports of Newcastle, Port Kembla and Balmain being undertaken by the State Government. The assistance was designed to expedite completion of the coal loading works and to facilitate expansion of coal exports through these ports. The State, for its part, undertook to carry out the coal loading works and related harbour improvements.
Of the assistance provided, $2 million was made available by way of grant from the Coal Industry Fund of the Joint Coal Board. The remaining amount of $3.3 million was provided in the form of interest-bearing loans each repayable over ten years.
Annual figures of payments to New South Wales for coal loading facilities, and of debt charges paid by the State, are given in table 126.
Queensland The Coal Loading Works Agreement (Queensland) Act 1962 provided $400,000 of the total estimated
cost of $810,000 for improvements to coal loading facilities at Gladstone. Coal from the Moura coal-fields in central Queensland is shipped from this port for export to Japan.
Of the total assistance of $400,000 half was by way of grant and half by way of interest-bearing loans each repayable over fifteen years.
Annual figures of payments to Queensland for coal loading facilities are given in Table 126.
Weipa Harbour Works The Weipa Development Agreement Act 1965 provided $3.3 million to Queensland during 1965-66
and 1966-67 to enable the State to finance the construction of harbour works at Weipa in north Queens-land where large bauxite deposits are being exploited. The assistance was made available in the form of an interest-bearing loan repayable over thirty years commencing July 1967.
Annual figures of payments to the State and of debt charges paid by the State are shown in Table 141. Western Australia Northern Harbours
Under the Western Australia Grant (Northern Development) Act 1958-1959, grants totalling $10 million were made for development of the northern part of the State. While the bulk of this assistance ($8. 1 million) was spent on the Ord River diversion dam and main irrigation channel (Stage 1)—see below—the remaining $1.9 million was spent on harbour works, mainly the Wyndham Jetty. Annual figures of grants paid under this Act from 1962-63 for harbour works are shown under the heading 'Northern Harbours' in Table 153 in Appendix VI. Figures for previous years are given in earlier editions of this document.
Under the Western Australia (Northern Development) Agreement Act 1963 payments of $7 million were made to Western Australia primarily for the construction of a deep-water jetty at Broome and the construction of further irrigation works within the first stage of the Ord irrigation project.
In the case of the Broome jetty a total of $2.95 million was provided, 50 per cent by way of grant and 50 per cent by way of interest-bearing loans each repayable over fifteen years. The final payment of
189
$1.15 million was made in 1965-66. (Details of assistance for the Ord project are given below.) Annual figures of payments and debt charges from 1962-63 for the Broome Jetty are shown under the heading 'Northern Harbours' in Table 143. Figures for previous years are given in earlier editions of this document.
Replacement of Derby Jetty Under the Derby Jetty Agreement Act 1962 financial assistance of $1.6 million was made available
to Western Australia towards the cost of constructing a new jetty with improved facilities at Derby. Half of the assistance was provided by way of grant, the other half by way of interest-bearing loans each repayable over fifteen years. Annual figures of payments and debt charges from 1962-63 are given in Table 143. Figures for previous years are given in earlier editions of this document.
Western Australia-Darwin Shipping Service The Australian Government agreed in March 1972 to provide a grant of $2.5 million to Western
Australia for the purchase of a ship to maintain the State shipping service to Darwin. Payment of the full amount of this grant was made in 1972-73. The grant was extended by $1 million and payment of this further amount was made in 1973-74.
South Australian Natural Gas Pipeline The Natural Gas Pipeline (South Australia) Agreement Act 1967 authorised the provision to South
Australia of bridging financial assistance, up to a maximum of $15 million to help finance the construction of a natural gas pipeline from Gidgealpa-Moomba to Adelaide. The total financial assistance paid of $15 million was by way of interest-bearing loans each repayable over a period of eight years commencing 15 December 1972. Annual figures of payments and debt charges are shown in Table 142.
WATER SUPPLY AND ELECTRICITY Blowering Reservoir
The Blowering Water Storage Works Agreement Act 1963 gave effect to an arrangement with New South Wales for the construction of the Blowering Reservoir on the Tumut River for the control and conservation of water released into that river as a result of the operation of the Snowy Mountains scheme. The reservoir commenced storing water in May. 1968. The bulk of the work involved was undertaken by the Snowy Mountains Hydro-electric Authority at the expense of New South Wales. Under the Agreement, however, the Australian Government financed half of the total expenditure incurred by the State, by means of interest-bearing loans. Repayment of each loan will commence ten years from the date on which it was made and will be spread over a further period of ten years.
Payments amounted to $20.5 million. Annual figures of payments and debt charges from 1963-64 are shown in Table 139.
Tasmanian Power Development The Tasmania Agreement (Hydro-Electric Power Development) Act 1968 authorised the provision
to Tasmania of bridging financial assistance, subject to an overall limit of $47 million for the financing of a five-year program of accelerated electric power development based on the commencement of development of the Gordon River area in the south-west of the State. The financial assistance, which amounted to a total of $23.9 million, was by way of interest-bearing loans each repayable over a period of eight years commencing not later than 15 December 1975. Annual figures of payments and debt charges are shown in Table 144.
Ross River Dam In 1972-73 a grant of $1.5 million was made to Queensland towards the cost of constructing the
Ross River Dam Stage I to augment the urban water supply at Townsville.
INDUSTRY ASSISTANCE Alternative Fisheries Development
In 1973-74 the Australian Government provided assistance to certain States whose fishermen had been affected by the Victorian ban on the taking of school shark for a program of exploratory fishing designed to develop alternative fisheries. This assistance, in the form of once-only grants, was made available on a $1 for $1 basis up to a total $168,000. The payments to the States in 1973-74 are shown in Table 87 in Appendix I.
190
Cattle Tick Control and Research Since the 1920s the Australian Government has been contributing towards the cost of cattle tick control
and research in New South Wales. From 1 July 1951 to 30 June 1972 an amount of $12 million has been made available for this purpose. Annual payments since 1962-63 are shown in Table 148 in Appendix VI.
Canned Fruits Industry Assistance In 1970 and 1971 loans totalling $4.2 million were made to Victoria for on-lending to the Shepparton
Preserving Co. Ltd to enable payment to be made to growers for fruit deliveries to the cannery. During 1971, for the purpose of reducing the indebtedness of the co-operative canneries concerned,
the Australian Government provided assistance of $0.9 million to New South Wales for the Leeton Co-operative Cannery and $1.3 million to South Australia for the Jon Preserving Co-operative and the Riverland Fruit Products Co-operative. (These funds were matched by the States from their own resources.)
In December 1972, the following loans, totalling $1.9 million, were made to the States for on-lending to enable canneries to accelerate payments to growers in respect of fruit of the 1972 season: $0.7 million to New South Wales for the Leeton Cannery; $0.4 million to South Australia for Jon and Riverland; and $0.8 million to Victoria for SPC Limited.
Annual figures of debt charges are shown in Appendix VI.
Sugar Industry Assistance In 1967-68, $23.3 million was paid by way of loan to Queensland to enable the State to provide
loans to the sugar industry to supplement returns from the 1966 and 1967 sugar crops. Repayments with interest are due each year 1971 to 1980. Amounts of interest and repayments paid so far and the amounts to be paid in 1974-75 are shown in Table 151.
Encouragement of Meat Production For the purpose of stimulating pastoral development in accordance with Australia's commitments
under the Fifteen Year Meat Agreement with the United Kingdom, the Australian Government agreed in 1949 to provide financial assistance for new and improved facilities for the movement of cattle in the channel country of Queensland and in the area serving the meatworks at Wyndham, Western Australia.
The Governments of Queensland and Western Australia were responsible for construction work within their respective States, and the Australian Government undertook to provide them with grants amounting to $4.3 million. This undertaking was written into the States Grants (Encouragement of Meat Production) Act 1949-1954.
Annual figures of debt charges are shown in Appendix VI.
Recharging of Cattle Dips Special payments of $96,000 to New South Wales and $10,000 to Queensland were made in 1962-63
towards the costs of changing the chemicals in cattle dips.
Tobacco Industry Extension Services In each of the years 1962-63 and 1963-64 a grant of $48,000 was made to the tobacco-growing
States for additional extension services for tobacco growers. The distribution of this amount in each year was $6,000 to New South Wales, $16,000 to Victoria and $26,000 to Queensland.
Ord River Irrigation Project Under the Western Australia Grant (Northern Development) Act 1958-1959, grants totalling $10
million were made available for development of the northern part of the State. The bulk of this assistance ($8.1 million) was spent on the Ord River diversion dam and main irrigation channel (Stage 1). The remainder was spent on harbour works (see above). Annual figures of grants paid under this Act from 1962-63 for the Ord project are shown in Table 153 in Appendix VI. Figures for previous years are given in earlier editions of this document.
Under the Western Australia (Northern Development) Agreement Act 1963 an amount of $7 million was made available to Western Australia primarily for the construction of a new deep-water jetty at
191

Broome and for the construction of further irrigation works within the first stage of the Ord irrigation project. Grants of $4 million were provided for the Ord project, the final payment of $1.1 million being made in 1965-66. (See above for details of assistance for the Broome Jetty.) Annual figures of grants paid under this Act for the Ord project from 1962-63 are shown in Appendix VI. Figures for previous years are given in earlier editions of this document.
For details of assistance under current legislation see Chapter IV.
Chowilla Reservoir In 1963 the River Murray Waters Agreement between the Australian Government, New South Wales,
Victoria and South Australia was amended to provide for the construction of the Chowilla Reservoir on the River Murray in South Australia and its joint financing by the four Governments concerned.
Under the Chowilla Reservoir Agreement Act 1963 the Australian Government agreed to provide assistance in the form of interest-bearing loans to New South Wales to finance that State's share of the capital cost of the Chowilla Reservoir. Repayment of each loan will commence ten years from the date on which it was made and will spread over a further period of ten years.
Payments to 30 June 1969 amounted to $1.5 million. No payments have been made since that date. Because of significant increases in the estimated cost of the project since it was originally estimated
in 1962, it was decided in August 1967 to suspend further work on the project. Following a reassessment by the River Murray Commission of the relationship between costs and benefits of the scheme, the Dartmouth project on the Mitta Mitta River in Victoria was selected as the next major project for development on the River Murray system and assistance is being provided for that project (see Chapter IV). Annual figures of payments and debt charges are shown in Appendix V.
Western Australia Water Supply Under the Western Australia Grant (Water Supply) Act 1948-1957 non-repayable grants totalling
$10 million were made to Western Australia to finance the cost of construction of a comprehensive water supply scheme. The assistance partly financed the reticulation of water to townships and homesteads in a wheat belt area of about 4 million acres inland from Perth, and to towns along the Great Southern Railway from Beverley to Katanning. It also helped to finance an increased supply of water to the Eastern Goldfields area of the State. The final payment of $122,000 was made in 1961-62. Figures for previous years are given in earlier editions of this document.
Under the Western Australia (South-West Region Water Supplies) Agreement Act 1965-1971, financial assistance of $12 million was provided on a $1 for $1 basis by way of interest-bearing loans to Western Australia to accelerate works undertaken by the State to extend the comprehensive water supply scheme in the South-west portion of the State. The final payment of $158,000 was made in 1972-73. The new areas served total approximately 4 million acres. This assistance extended over the eight-year period ended 30 June 1973 and repayments will be spread over fifteen years, commencing ten years after the date each advance was made. Annual payments to Western Australia and debt charges are shown in Table 143.
Flood Mitigation The New South Wales Grant (Flood Mitigation) Act 1964-1968 authorised the provision of grants
of up to $8 million to New South Wales, over the six-year period to 30 June 1969, to match the State's assistance to local government authorities for approved flood mitigation works on the Macleay, Clarence, Richmond, Tweed, Shoalhaven and Hunter Rivers. Payments amounted to $8 million. Annual payments are given in Appendix VI.
For details of assistance under current legislation see Chapter IV.
Cressy-Longford Irrigation Works Under the Tasmania Grant (Cressy-Longford Irrigation Works) Act 1969 grants of $750,000 were
provided to Tasmania for the construction of a channel system and associated works to carry water from the tailrace of the Poatina Power Station to supply rural holdings. Annual figures of payments to the State are shown in Table 154 in Appendix VI.
Tailem Bend to Keith Pipeline The South Australia Grant (Tailem Bend to Keith Pipeline) Act 1969 provided for grants of up to $6
million to South Australia for the construction of a pipeline and certain associated works, to carry water from Tailem Bend to Keith. Total payments amounted to $5.3 million, including a final payment of $14,000 in 1973-74. Annual figures of payments to the States are shown in Table 152 in Appendix VI.
192
GENERAL PUBLIC SERVICES
Research Grants When the Report of the Committee on the Future of Tertiary Education in Australia was presented
to Parliament in March 1965, it was announced that the Australian Government would make available $2 million in the remainder of the 1964-66 triennium in support of research projects, selected on the basis of relative merit, to be carried out in any academic field by individuals or research teams. Where a research project was to be carried out in a State university the provision of Australian Government assistance was conditional on an equal matching grant to the university by the State Government con-cerned.
The Australian Research Grants Committee was established to evaluate research projects and to make recommendations to the Government concerning the amount and disposition of grants in this field.
1967-69 Triennium In September 1966 the Australian Government agreed to support a research program, the allocation
of which was to be recommended by the Australian Research Grants Committee, to cost $11 million in the 1967-69 triennium provided the States continued to meet 50 per cent of the cost of projects within that program undertaken in State universities. As some States were no longer prepared to support the Australian Research Grants Committee program after 31 December 1966 and as there was uncertainty concerning the position of other States, the Australian Government further indicated that, to the extent that any State did not provide its share of costs in relation to this program, the Australian Government would reduce, to that extent, its support for the special research program at universities for the 1967-69 triennium as envisaged in the Universities (Financial Assistance) Act 1966.
The States Grants (Research) Act 1966 made the necessary legislative changes to the 1965 Act to enable this procedure to be followed. Two States agreed to meet half the costs of both research programs but the other States declined to contribute to the Australian Research Grants Committee program. In the light of this the Australian Government decided to meet the full cost of the Australian Research Grants Committee program, on which a ceiling of $9 million had been set for the triennium, and to leave to the States the responsibility for financing the general university research program. Four States financed in full the general university research program and the remaining States met at least half the cost of that program.
1970-72 Triennium In August 1969 the Australian Government announced that it would meet the full cost of a $12.5
million program for the 1970-72 triennium for the Australian Research Grants Committee. The cost of this program subsequently increased to $13.5 million. A further $4 million was made available for a special program of research and research training in State universities.
An outline of arrangements for the 1973-75 triennium is given in Chapter IV.
193
APPENDIX IV—PART 11—TABLES OF SPECIFIC PURPOSE PAYMENTS
TABLE No. SUBJECT
107 Interest and Sinking Fund Payments under the Financial Agreement, 1927-28 to 1974-75.
108 Housing for Servicemen, Advances for, 1956-57 to 1974-75 109 Universities, Grants for, 1951-52 to 1974-75 110 Colleges of Advanced Education and Teachers Colleges, Grants for, 1965-66
to 1974-75 111 Technical Education, Grants for, 1964-65 to 1974-75 112 Schools, Grants for, 1964-65 to 1972-73. 113 Schools, Grants for, 1973-74 and 1974-75 (Estimated), by Program. 114 Tuberculosis Hospitals, Grants for, 1949-50 to 1974-75. 115 Mental Health Institutions, Grants forCapital Expenditures on, 1955-56 to 1973-
74. 116 Blood Transfusion Services, Grants for, 1953-54 to 1974-75. 117 Migrant Centres, Grants for Capital Expenditures on, 1947-48 to 1974-75. 118 Aboriginal Advancement, Payments for, by Function, 1968-69 to 1974-75. 119 Housing, Advances for, 1945-46 to 1974-75. 120 Commonwealth—State Housing Agreement 1945—Contributions Towards
Rental Losses, 1949-50 to 1974-75. 121 Roads, Payments to States for under Aid Roads Acts and Comparable Legis-
lation, 1923-24 to 1974-75. 122 Roads, Allocations for, under Aid Roads Acts and Comparable Legislation,
1923-24 to 1958-59. 123 Beef Cattle Roads, Grants for, 1961-62 to 1974-75. 124 Railway Projects, Payments for, 1951-52 to 1974-75. 125 Railway Projects, Debt Charges on Loans for, 1952-53 to 1974-75. 126 Coal Loading Facilities, Advances for and Debt Charges thereon, 1961-62 to
1974-75. 127 Minor Agricultural Research, Grants for, 1963-64 to 1974-75. 128 Brigalow Lands Development Scheme, Advances for and Debt Charges thereon,
1962-63 to 1974-74. 129 Encouragement of Meat Production, Grants for Capital Expenditures Related to,
1950-51 to 1966-67. 130 Agricultural Extension Services, Grants for, 1948-49 to 1974-75. 131 Investigation of Water Resources, Grants for, 1964-65 to 1974-75. 132 Promotion of Road Safety Practices, Grants for, 1947-48 to 1974-75.
195
133 War Service Land Settlement, Advances for and Debt Charges thereon, 1955-56 to 1974-75.
134 Coal Mining Industry—Long Service Leave, Grants for, 1949-50 to 1974-75. 135 Research Projects, Grants for, 1965-66 to 1974-75. 136 Natural Disasters, Payments for, 1949-50 to 1974-75. 137 Natural Disasters, Payments for by type of Disaster, 1962-63 to 1974-75.
196
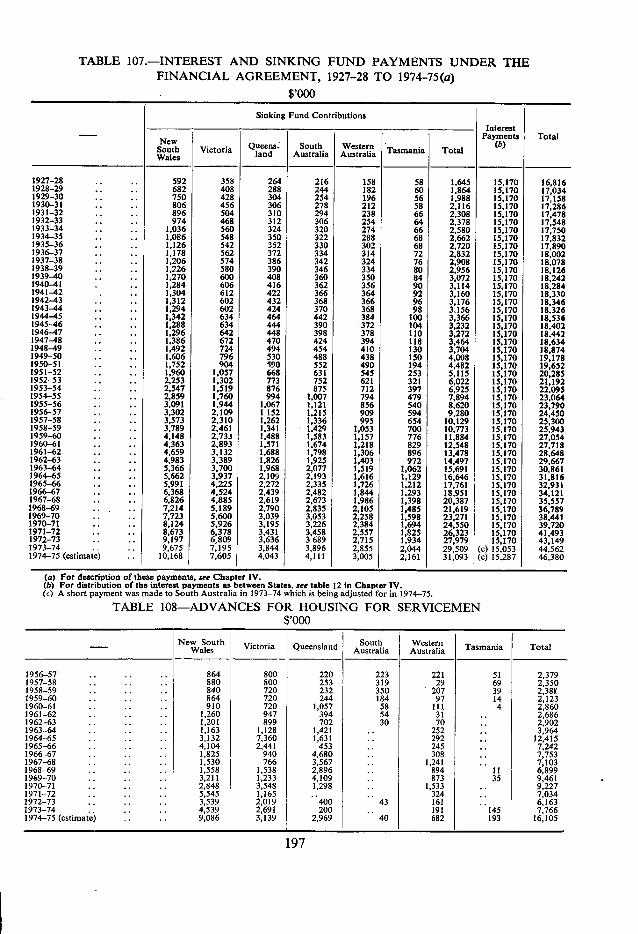
TABLE 107.-INTEREST AND SINKING FUND PAYMENTS UNDER THE FINANCIAL AGREEMENT, 1927-28 TO 1974-75(a)
$,000 Sinking Fund Contributions
Interest Payments Total
South Victoria landWales Queens-
Australia South Western Tasmania Total
(b)
1927-28 .. 592 358 264 216 158 58 1,645 15,170 16,816 1928-29 ,, .. 682 408 288 244 182 60 1,864 15,170 17,034 1929-30 .. .. 750 428 304 254 196 56 1,988 15,170 17,158 1930-31 .. .. 806 456 306 278 212 58 2,116 15,170 17,286 1931-32 .. .. 896 504 310 294 238 66 2.308 15,170 17,478 1932-33 ,. ,, 974 468 312 306 254 64 2,378 15,170 17,548 1933-34 .. .. 1,036 560 324 320 274 66 2,580 15,170 17,750 1934-35 .. .. 1,086 548 350 322 288 68 2,662 15,170 17,832 1935-36 .. .. 1,126 542 352 330 302 68 2,720 15,170 17,890 1936-37 .. .. 1.178 562 372 334 314 72 2,832 15,170 18,002 1937-38 .. ., 1,206 574 386 342 324 76 2,908 15,170 18,078 1938-39 .. .. 1,226 580 390 346 334 80 2,956 15,170 18.126 1939-40 .. ,, 1,270 600 408 360 350 84 3,072 15,170 18,242 1940-41 , .. 1,284 606 416 362 356 90 3,114 15,170 18,284 1941-42 . .. 1,304 612 422 366 364 92 3,160 15,170 18,330 1942-43 .. .. 1,312 602 432 368 366 96 3,176 15,170 18,346 1943-44 .. ,. 1,294 602 424 370 368 98 3,156 15,170 18,326 1944-45 .. .. 1,342 634 464 442 384 100 3,366 15,170 18,536 1945-46 .. .. 1,288 634 444 390 372 104 3,232 15,170 18.402 1946-47 .. .. 1,296 642 448 398 378 110 3,272 15,170 18.442 1947-48 .. .. 1,386 672 470 424 394 118 3,464 15.170 18,634 1948-49 .. .. 1,492 724 494 454 410 130 3,704 15,170 18,874 1949-50 .. .. 1.606 796 530 488 438 150 4,008 15,170 19,178 1950-51 .. .. 1,752 904 IS90 552 490 194 4,482 15,170 19,652 1951-52 .. .. 1,960 1,057 668 631 545 253 5,115 15,170 20,285 1952 53 .. .. 2,253 1,302 773 752 621 321 6,022 15,170 21,192 1953-54 .. .. 2,547 1,519 876 875 712 397 6,925 15,170 22,095 1954-55 .. .. 2,859 1,760 994 1,007 794 479 7,894 15.170 23,064 1955-56 .. .. 3.091 1,944 1,067 1,121 856 540 8.620 15,170 23,790 1956-57 .. .. 3,302 2,109 1,152 1,215 909 594 9,280 15,170 24,450 1957-58 .. .. 3,573 2,310 1,262 1,336 995 654 10,129 15,170 25,300 1958-59 .. .. 3,789 2,461 1,341 1,429 1,053 700 10,773 15,170 25,943 1959-60 .. .. 4,148 2.733 1,488 1,583 1,157 776 11,884 15,170 27.054 1960-61 .. .. 4,363 2.893 1,571 1.674 1,218 829 12.548 15,170 27.718 1961-62 .. ., 4,659 3,132 1,688 1,798 1,306 896 13,478 15,170 28,648 1962-63 .. .. 4,983 3,389 1,826 1,925 1,403 972 14.497 15,170 29,667 1963-64 .. .. 5,366 3.700 1,968 2,077 1,519 1,062 15,691 15,170 30,861 964-65 .. .. 5,662 3,937 2,109 2.193 1,616 1,129 16,646 15,170 31,816 965-66 .. .. 5,991 4.225 2,272 2,335 1,726 1.212 17.761 15,170 32.931 966-67 .. .. 6,368 4,524 2,439 2,482 1,844 1.293 18.951 15,170 34.121 967-68 .. .. 6.826 4,885 2,619 2,673 1.986 1,398 20,387 15,170 35,557 968-69 .. .. 7,214 5,189 2,790 2,835 2,105 1,485 21,619 15,170 36,789 969-70 .. .. 7,723 5,600 3,039 3,053 2,258 1,598 23,271 15,170 38,441
1970-71 .. .. 8,124 5,926 3,195 3,226 2,384 1,694 24,550 15,170 39,720 971-72 .. .. 8,673 6,378 3.431 3,458 2,557 1,825 26,323 15,170 41,493
1972-73 .. .. 9,197 6,809 3,636 3689 2,715 1,934 27,979 15,170 43,149 973_74 .. 9,675 7,195 3,844 3,896 2,855 2,044 29,509 (c) 15,053 44,562
1974-75 (estimate) .. 10,168 7,605 4,043 4,111 3,005 2,161 31,093 (c) 15,287 46,380
For description of these payments, see Chapter IV. For distribution of the interest payments as between States, see table 12 In Chapter IV. A short payment was made to South Australia in 1973-74 which is being adjusted for in 1974-75.
TABLE 108-ADVANCES FOR HOUSING FOR SERVICEMEN $,000
- New South ViWales ctoria Queensland South Australia
Western Tasmania Total
1956-57 ,. ., 864 800 220 223 221 51 2,379 1957-58 .. 880 800 253 319 29 69 2,350 1958-59 ., 840 720 232 350 207 39 2,381 1959-60 .. 864 720 244 184 97 14 2,123 1960-61 ,. ,, 910 720 1,057 58 111 4 2,860 1961-62 .. .. .. 1,260 947 394 54 31 .. 2,686 1962-63 1,201 899 702 30 70 .. 2,902 1963-64 . . .. .. 1,163 1,128 1,421 .. 252 . 3,964 1964-65 . .. 3,132 7,360 1,631 .. 292 .. 12,415 1965-66 .. .. 4,104 2,441 453 .. 245 .. 7,242 1966-67 .. .. 1,825 940 4,680 308 .. 7,753 1967-68 .. .. .. 1,530 766 3,567 1,241 .. 7,103 1968-69 .. .. .. 1,558 1,538 2,896 894 11 6.899 1969-70 .. ,. .. 3,211 1,233 4,109 .. 873 35 9,461 1970-71 . .. 2,848 3,548 1,298 1,533 .. 9,227 1971-72 .. .. 5,545 1,165 .. 324 .. 7,034 1972-73 .. .. 3,539 2,019 400 43 161 .. 6,163 1973-74,, 4,539 2,691 200 .. 191 145 7,766 1974-75 (estimate) 9,086 3,139 2,969 40 682 193 16,105
197
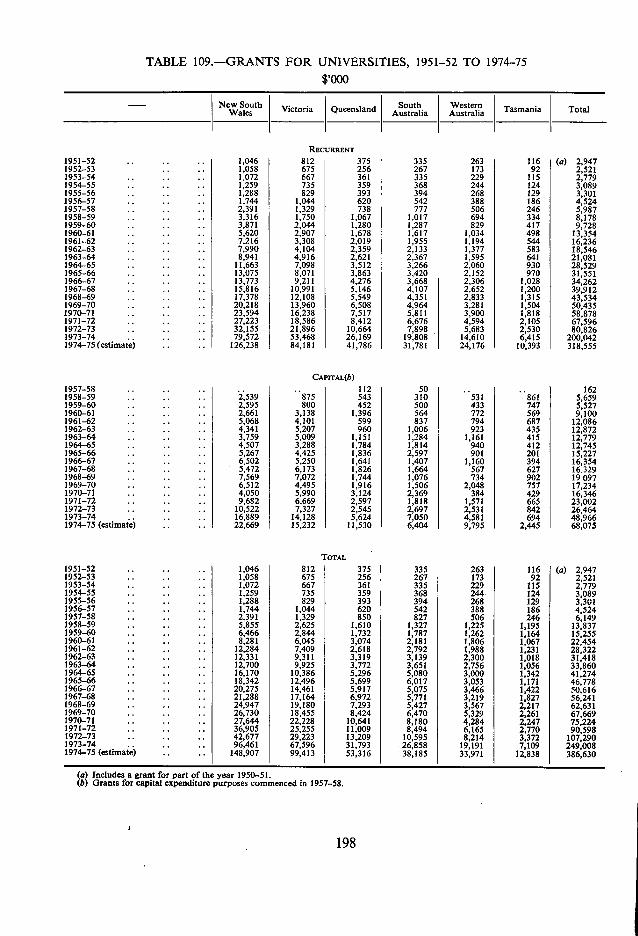
TABLE 109.-GRANTS FOR UNIVERSITIES, 1951-52 TO 1974-75 $,000
- New South Victoria Queensland South Australia
Western Tasmania Total Wales
RECURRENT 1951-52 .. .. 1,046 812 375 335 263 116 (a) 2,947 1952-53 .. .. 1,058 675 256 267 173 92 2,521 1953-54 .. .. 1,072 667 361 335 229 115 2,779 1954-55 . .. .. 1,259 735 359 368 244 124 3,089 1955-56 .. 1,288 829 393 394 268 129 3,301 1956-57 .. .. .. 1,744 1,044 620 542 388 186 4,524 1957-58 .. 2,391 1,329 738 777 506 246 5,987 1958-59 .. .. 3,316 1,750 1,067 1,017 694 334 8,178 1959-60 .. 3,871 2,044 1,280 1,287 829 417 9,728 1960-61 .. 5,620 2.907 1,678 1,617 1,034 498 13,354 1961-62 .. 7.216 3,308 2,019 1,955 1.194 544 16,236 1962-63 .. .. .. 7,990 4,104 2,359 2,133 1,377 583 18,546 1963-64 ,. 8,941 4,916 2,621 2,367 1,595 641 21,081 1964-65 .. .. 11,663 7,098 3,512 3,266 2,060 930 28,529 1965-66 .. .. 13,075 8,071 3,863 3,420 2,152 970 31,551 1966-67 .. 13,773 9,211 4,276 3,668 2,306 1,028 34,262 1967-68 .. .. .. 15,816 10,991 5,146 4,107 2,652 1,200 39,912 1968-69 .. 17,378 12.108 5,549 4,351 2,833 1,315 43,534 1969-70 .. .. 20,218 13,960 6,508 4,964 3,281 1,504 50,435 1970-71 .. 23,594 16,238 7,517 5,811 3,900 1,818 58,878 1971-72 .. 27,223 18,586 8,412 6,676 4,594 2,105 67,596 1972-73 .. .. 32,155 21,896 10,664 7,898 5,683 2,530 80,826 1973-74 .. 79,572 53,468 26,169 19,808 14,610 6,415 200,042 1974-75(estimate) .. 126,238 84,181 41,786 31,781 24,176 10,393 318,555
CAPITAL(b) 1957-58 .. .. 112 50 162 1958-59 .. .. .. 2,539 875 543 310 531 861 5,659 1959-60 .. 2,595 800 452 500 433 747 5,527 1960-61 .. 2,661 3,138 1,396 564 772 569 9,100 1961-62 .. .. .. 5,068 4,101 599 837 794 687 12,086 1962-63 4,341 5,207 960 1,006 923 435 12,872 1963-64 .. .. .. 3,759 5,009 1,151 1,284 1,161 415 12,779 1964-65 .. 4,507 3,288 1,784 1,814 940 412 12,745 1965-66 .. 5,267 4,425 1,836 2,597 901 201 15,227 1966-67 6,502 5,250 1,641 1,407 1,160 394 16,354 1967-68 .. .. .. 5,472 6,173 1,826 1,664 567 627 16.329 1968-69 .. .. 7,569 7,072 1,744 1,076 734 902 19097 1969-70 .. .. 6,512 4,495 1,916 1,506 2,048 757 17,234 1970-71 .. .. 4,050 5,990 3,124 2,369 384 429 16,346 1971-72 .. .. .. 9,682 6,669 2,597 1,818 1,571 665 23,002 1972-73 .. .. 10,522 7,327 2,545 2,697 2,531 842 26,464 1973-74 .. .. 16,889 14,128 5,624 7,050 4,581 694 48,966 1974-75 (estimate) . 22,669 15,232 11,530 6,404 9,795 2,445 68,075
TOTAL 1951-52 1,046 812 375 335 263 116 (a) 2,94 1952-53 1,058 675 256 267 173 92 2,521 1953-54 1,072 667 361 335 229 115 2,775 1954-55 1,259 735 359 368 244 124 3,085 1955-56 1,288 829 393 394 268 129 3,301 1956-57 1,744 1,044 620 542 388 186 4,524 1957-58 2,391 1,329 850 827 506 246 6,149 1958-59 5,855 2,625 1,610 1,327 1,225 1,195 13,83 1959-60 6,466 2,844 1,732 1,787 1,262 1,164 15,255 1960-61 8,281 6,045 3,074 2,181 1,806 1,067 22,454 1961-62 12,284 7,409 2,618 2,792 1,988 1,231 28,322 1962-63 12,331 9,311 3,319 3,139 2,300 1,018 31,418 1963-64 12,700 9,925 3,772 3,651 2,756 1,056 33,860 1964-65 16,170 10,386 5.296 5,080 3,000 1,342 41,274 1965-66 18,342 12,496 5,699 6,017 3,053 1,171 46,778 1966-67 20,275 14,461 5,917 5,075 3,466 1,422 50,616 1967-68 21,288 17,164 6,972 5,771 3,219 1,827 56,241 1968-69 24947 19,180 71293 5,427 3,567 2,217 62,631 1969-70 26,730 18,455 8,424 6,470 5,329 2,261 67,669 1970-71 27,644 22,228 10,641 8,180 4,284 2,247 75,224 1971-72 36,905 25.255 11,009 8,494 6,165 2,770 90,598 1972-73 42,677 29,223 13,209 10,595 8,214 3,372 107,290 1973-74 96,461 67,596 31,793 26,858 19,191 7,109 249,008 1974-75 (estimate) 148,907 99,413 53,316 38,185 33,971 12,838 386,630
Includes a grant for part of the year 1950-51. Grants for capital expenditure purposes commenced in 1957-58.
198
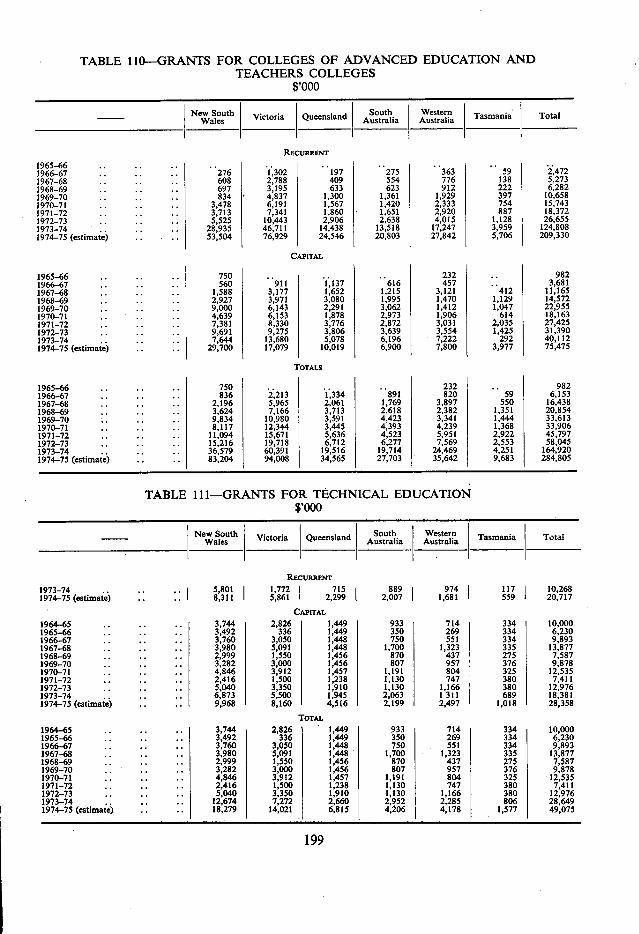
TABLE 110-GRANTS FOR COLLEGES OF ADVANCED EDUCATION AND TEACHERS COLLEGES
$,000
I New South Wales Victoria I Queensland South
Australia I Western
Australia I Tasmania I Total
RECURRENT 1965-66 . . . . . . . . . 1966-67 .. .. .. I 276 1
.,302 I 197 275 I 363 59 I 2,472
1967-68 .. .. .. 608 2,788 409 I 554 I 776 i 138 5,273 1968-69 .. .. .. I 697 3,195 I 633 I 623 912 I 222 6,282 1969-70 .. .. . I 834 ' 4,837 I 1,300 I 1,361 1,929 I 397 I 10,658 1970-71 .. I 3,478 6,191 I 1,567 I 1,420 2,333 I 754 I 15,743 1971-72 .. I 3,713 7,341 I 1,860 1,651 I 2,920 I 887 I 18,372 1972-73 .. I 5,525 10,443 I 2,906 I 2,638 I 4,015 I 1,128 26,655 1973-74 .. I 28,935 46,711 I 14,438 I 13,518 I 17,247 I 3.959 I 124,808 1974-75 (estimate) 53,504 76,929 24,546 20,803 27,842 5,706
I 209,330
CAPITAL
1965-66 .. .. .. 750 .. .. .. 232 .. 982 1966-67 .. .. .. 560 911 1,137 616 457 .. 3,681 1967-68 .. .. .. 1,588 3,177 1,652 1,215 3,121 412 11,165 1968-69 .. .. .. 2,927 3,971 3,080 1,995 1,470 1,129 14,572 1969-70 .. .. .. 9,000 6,143 2,291 3,062 1,412 1,047 22,955 1970-71 .. .. .. 4,639 6,153 1,878 2,973 1,906 614 18,163 1971-72 .. .. .. 7,381 8,330 3,776 2,872 3,031 2,035 27,425 1972-73 .. .. .. 9,691 9,275 3,806 3,639 3,554 1,425 31,390 1973-74.. .. .. 7,644 13,680 5,078 6,196 7,222 292 40,112 1974-75 (estimate) .. .. 29,700 17,079 10,019 6,900 7,800 3,977 75,475
TOTALS
1965-66 .. .. .. 750.. .. .. 232 .. 982 1966-67 .. .. .. 836 2 ,213 1,334 891 820 59 6,153 1967-68 .. .. .. 2,196 5,965 2.061 1,769 3,897 550 16,438 1968-69 .. .. .. 3,624 7,166 3,713 2,618 2,382 1,351 20,854 1969-70 .. .. .. 9,834 10,980 3,591 4,423 3,341 1,444 33,613 1970-71 .. .. .. 8,117 12,344 3,445 4,393 4,239 1,368 33,906 1971-72 .. .. .. 11,094 15,671 5,636 4,523 5,951 2,922 45,797 1972-73 .. .. .. 15,216 19,718 6,712 6,277 7,569 2,553 58,045 1973-74 .. .. .. 36,579 60,391 19,516 19,714 24,469 4.251 164,920 1974-75 (estimate) .. .. 83,204 94,008 34,565 27,703 35,642 9,683 284,805
TABLE 111-GRANTS FOR TECHNICAL EDUCATION $,000
New South Victoria Queensland Australia South Western Tasmania Total Wales
RECURRENT 1973-74 .. .. .. 5,801 1,772 715 889 974 117 10,268 1974-75 (estimate) .. .. 8,311 5,861 2,299 1 2,007 1,681 559 20,717
CAPITAL 1964-65 .. .. 3,744 2,826 1,449 933 714 334 10,000 1965-66 .. .. .. 3,492 336 1,449 350 269 334 6,230 1966-67 .. .. .. 3,760 3,050 1,448 750 551 334 9,893 1967-68 .. .. .. 3,980 5,091 1,448 1,700 1,323 335 13,877 1968-69 .. .. .. 2,999 1,550 1,456 870 437 275 7,587 1969-70 .. .. .. 3,282 3,000 1,456 807 957 376 9,878 1970-71 .. .. .. 4,846 3,912 1,457 1,191 804 325 12,535 1971-72 .. .. 2,416 1,500 1,238 1,130 747 380 7,411 1972-73 •, .. ., 5,040 3,350 1,910 1,130 1,166 380 12,976 1973-74 .. .. .. 6,873 5,500 1,945 2,063 1 311 689 18,381 1974-75 (estimate) .. 9,968 8,160 4,516 2,199 2,497 1,018 28,358
Tomi, 1964-65 .. .. .. 3,744 2,826 1,449 933 714 334 10,000 1965-66 .. .. .. 3,492 336 1,449 350 269 334 6,230 1966-67 .. .. .. 3,760 3,050 1,448 750 551 334 9,893 1967-68 .. .. .. 3,980 5,091 1,448 1,700 1,323 335 13,877 1968-69 .. .. .. 2,999 1,550 1,456 870 437 275 7,587 1969-70 .. .. 3,282 3,000 1,456 807 957 376 9,878 1970-71 .. .. .. 4,846 3,912 1,457 1,191 804 325 12,535 1971-72 .. .. 2,416 1,500 1,238 1,130 747 380 7,411 1972-73 ,. .. .. 5,040 3,350 1,910 1,130 1,166 380 12,976 1973-74 .. .. 12,674 7,272 2,660 2,952 2,285 806 28,649 1974-75 (estimate) .. 18,279 14,021 6,815 4,206 4,178 1,577 49,075
199
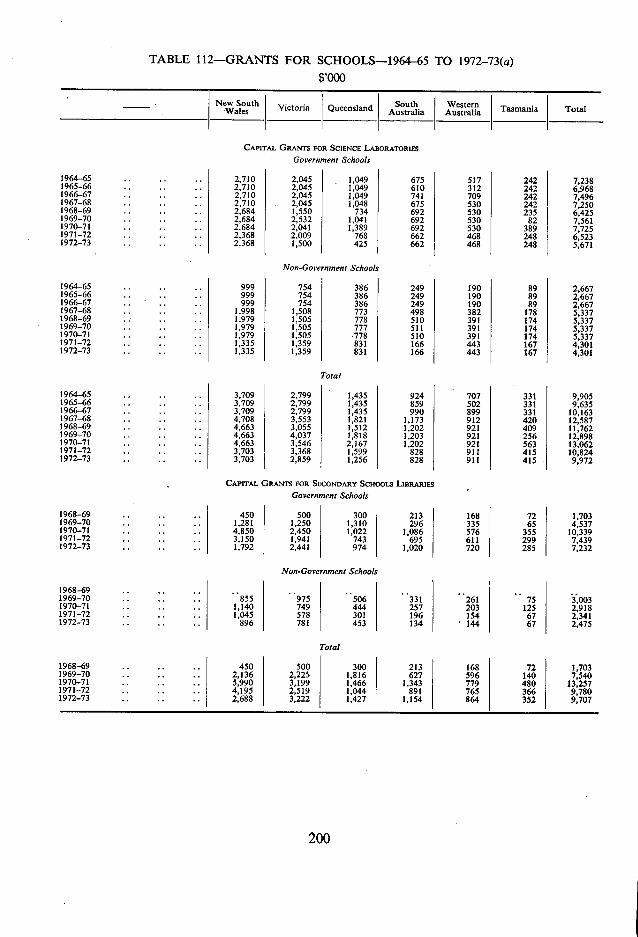
TABLE 112-GRANTS FOR SCHOOLS-1964-65 TO 1972-73(a) $,000
NeWalesw South Victoria Queensland South
Australia Western Australia Tasmania Total
CAPITAL GRANTS FOR SCIENCE LABORATORIES
Government Schools
1964-65 .. .. 2,710 2,045 1,049 675 517 242 7,238 1965-66 .. .. 2,710 2,045 1,049 610 312 242 6,968 1966-67 .. .. 2,710 2,045 1,049 741 709 242 7,496 1967-68 .. .. .. 2,710 2,045 1,048 675 530 242 7,250 1968-69 .. .. 2,684 1,550 734 692 530 235 6,425 1969-70 .. 2,684 2,532 1,041 692 530 82 7,561 1970-71 .. .. 2.684 2,041 1,389 692 530 389 7,725 1971-72 .. .. .. 2,368 2.009 768 662 468 248 6,523 1972-73 .. .. 2,368 1,500 425 662 468 248 5,671
Non-Government Schools
1964-65 .. .. 999 754 386 249 190 89 2.667 1965-66 .. .. .. 999 754 386 249 190 89 2,667 1966-67 .. .. .. 999 754 386 249 190 89 2,667 1967-68 .. .. .. 1,998 1,508 773 498 382 178 5,337 1968-69 . .- .. .. 1,979 1,505 778 510 391 174 5,337 1969-70.. .. .. 1,979 1,505 777 511 391 174 5,337 1970-71 .. .. .. 1979, 1,505 -778 510 391 174 5,337 1971-72 .. .. .. 1,335 1,359 831 166 443 167 4,301 1972-73 .. .. .. 1,335 1,359 831 166 443 167 4,301
Total
1964-65 .. .. .. 3,709 2,799 1,435 924 707 331 9,905 1965-66 .. .. .. 3,709 2,799 1,435 859 502 331 9,635 1966-67 .. .. .. 3,709 2,799 1,435 990 899 331 10,163 1967-68 .. .. .. 4,708 3,553 1,821 1,173 912 420 12,587 1968-69 .. .. .. 4,663 3,055 1,512 1,202 921 409 11,762 1969-70 .. .. .. 4,663 4,037 1,818 1,203 921 256 12,898 1970-71 .. .. .. 4,663 3,546 2,167 1,202 921 563 13,062 1971-72 .. .. .. 3,703 3,368 1,599 828 911 415 10,824 1972-73 .. .. .. 3,703 2,859 1,256 828 911 415 - 9,972
CAPITAL GRANTS FOR SECONDARY SCHOOLS LIBRARIES
Government Schools
1968-69 .. 450 500 300 213 168 72 1,703 1969-70 .. .. .. 1,281 1,250 1,310 296 335 65 4,537 1970-71 .. .. .. 4,850 2,450 1,022 1,086 576 355 10,339 1971-72 .. .. .. 3,150 1,941 743 695 611 299 7,439 1972-73 .. .. .. 1,792 2,441 974 1,020 720 285 7,232
Non-Government Schools
1968-69 .. .. .. .. .. .. .. .. 1969-70 .. .. .. 855 975 506 331 261 75 3,003 1970-71 .. .. .. 1,140 749 444 257 203 125 2,918 1971-72 .. .. -. 1,045 578 301 196 154 67 2,341 1972-73 .. .. .. 896 781 453 134 - 144 67 2,475
Total
1968-69 .. .. .. 450 500 300 213 168 72 1,703 1969-70 .. .. .. 2,136 2,225 1,816 627 596 140 7,540 1970-71 .. .. .. 5,990 3,199 1,466 1,343 779 480 13.257 1971-72 .. .. .. 4,195 2.519 1,044 891 765 366 9,780 1972-73 .. .. .. 2,688 3,222 1,427 1,154 864 352 9,707
WIN
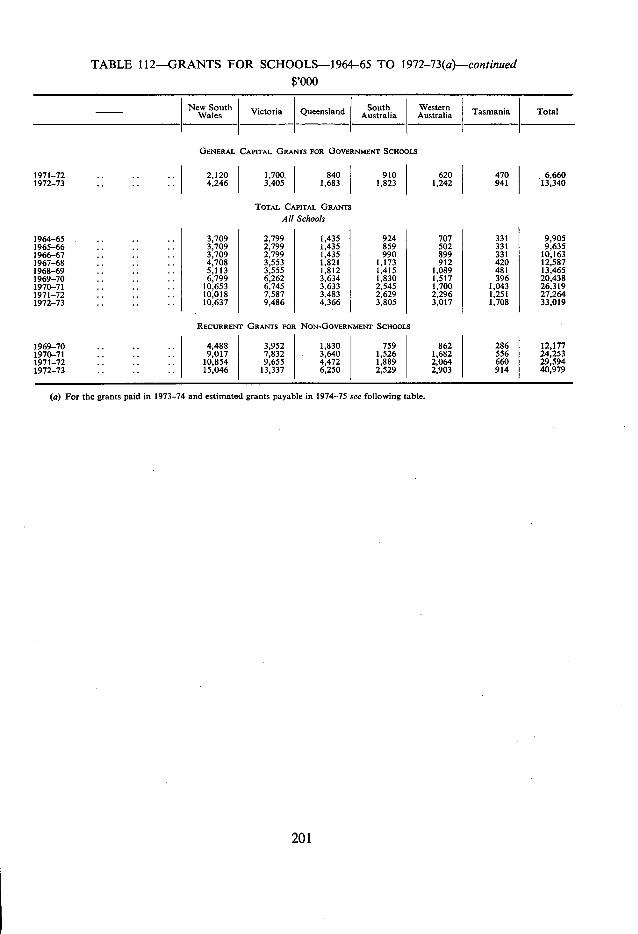
TABLE 112-GRANTS FOR SCHOOLS-1964-65 TO 1972-73(a)-continued $,000
I New South Victoria Ictoria Queensland a Western I Australia Tasmania Total I South
Australi
GENERAL CAPITAL GRANTS FOR GOVERNMENT SCHOOLS
1971-72 .. .. .. 2,120 1,700. 840 910 620 470 6.660 1972-73 .. .. .. 4,246 3,405 1,683 1,823 1,242 941 13,340
TOTAL CAPITAL GRANTS All Schools
1964-65 .. .. .. 3,709 2,799 1,435 924 707 331 9,905 1965-66 .. .. .. 3,709 2,799 1,435 859 502 331 9,635 1966-67 .. .. .. 3,709 2,799 1,435 990 899 331 10,163 1967-68 .. .. 4,708 3,553 1.821 1,173 912 420 12,587 1968-69 .. .. .. 5,113 3,555 1,812 1,415 1,089 481 13,465 1969-70 .. .. .. 6,799 6,262 3,634 1,830 1,517 396 20,438 1970-71 .. .. .. 10,653 6,745 3,633 2,545 1,700 1,043 26,319 1971-72 .. .. .. 10,018 7,587 3,483 2,629 2,296 1,251 27,264 1972-73 .. .. .. 10,637 9,486 4,366 3,805 3,017 1,708 33,019
RECURRENT GRANTS FOR NON-GOVERNMENT SCHOOLS -
1969-70 .. .. .. 4,488 3,952 1,830 759 862 286 12,177 1970-71 .. .. .. 9,017 7,832 3,640 1,526 1,682 556 24,253 1971-72 .. .. .. 10,854 9,655 4,472 1,889 2,064 660 29,594 1972-73 .. .. .. 15,046 13,337 6,250 2,529 2,903 914 40,979
(a) For the grants paid in 1973-74 and estimated grants payable in 1974-75 see following table.
201
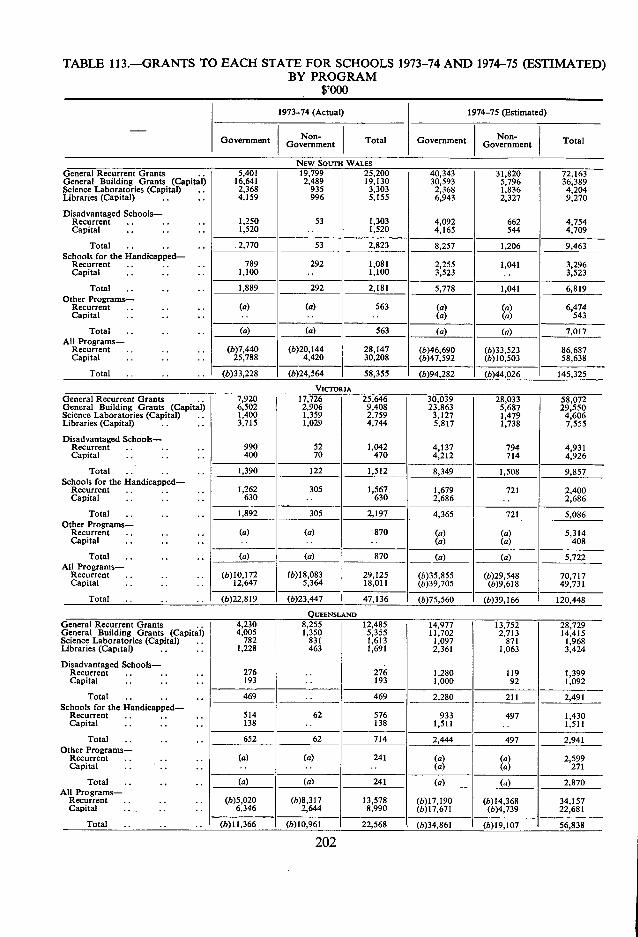
TABLE 113.-GRANTS TO EACH STATE FOR SCHOOLS 1973-74 AND 1974-75 (ESTIMATED) BY PROGRAM
$,000
51401 General Recurrent Grants .. - -- - -- 19,799 25,200 40,343 31,820 72,163
16,641 2,489 19,130 30,593 5,796 36,389 2,368 935 3,303 2,368 1,836 4,204 4,159 996 5,155 6,943 2,327 9.270
1,250 53 1,303 4,092 662 4,754 1,520 1,520 4,165 544 4,709
.2,770 53 Total 2,823 8,257 1,206 9,463
789 292 1,081 2,255 1,041 3,296 1,100 .. 1.100 3,523 .. 3,523 1,889 292 Total 2,181 5,778 1,041 6,819
(a) (a) 563 (a) (a) 6,474 (a) (a) 543
(a) Total __ __________ (a) 563 (a) (a) 7,017
(b)7,440 (b)20,144 28,147 (6)46,690 (b)33,523 86,687 25,788 4,420 30,208 (6)47,592 (b)10,503 58,638
(b)33.228 (6)24.564 58.355 (b)94.282 (6)44.026 145.325 1,rrnn,n
1973-74 (Actual) 1974-75 (Estimated)
Nn-- Non- Government Government Total Government Govemment Total
NEW SOUTH WALES
General Building Grants (Capital) Science Laboratories (Capital) Libraries (Capital)
Disadvantaged Schools-Recurrent Capital ..
Schools for the Handicapped-Recurrent Capital
Other Programs- Recurrent Capital
MI Programs-Recurrent .. Capital .
Total
General Recurrent Grants General Building Grants (Capital) Science Laboratories (Capital) Libraries (Capital)
Disadvantaged Schools- Recurrent Capital
Total Schools for the Handicapped-
Recurrent Capital
Total Other Programs-
Recurrent Capital
Total All Programs-
Recurrent Capital
Total
General Recurrent Grants General Building Grants (Capital) Science Laboratories (Capital) Libraries (Capital)
Disadvantaged Schools- Recurrent Capital
Total Schools for the Handicapped-
Recurrent Capital
Total Other Programs-
Recurrent Capital ..
Total All Programs-
Recurrent Capital
Total
7,920 17,726 25,646 30,039 28,033 58,072 6,502 2,906 9,408 23,863 5,687 29,550 1,400 1,359 2.759 3,127 1,479 4,606 3,715 1,029 4,744 5,817 1,738 7,555
990 52 1,042 4,137 794 4,931 400 70 470 4,212 714 4,926
1,390 122 1,512 8,349 1,508 9,857
1,262 305 1,567 1,679 721 2,400 630 . 630 2,686 .. 2,686
1,892 305 2,197 4,365 721 5,086
(a) (a) 870 (a) (a) 5,314 (a) (a) 408
(a) (a) 870 (a) (a) 5,722
(b)10,172 (6)18,083 29,125 (b)35,855 (b)29,548 70,717 12,647 5,364 18,011 (b)39,705 (b)9,618 49,731
(b)22.819 (6)23.447 47.136 (h75.560 (h)39.16 120 448
OImrHcI swan 4,230 8,255 12,485 14,977 13,752 28,729 4,005 1.350 5,355 11,702 2,713 14,415
782 831 1,613 1,097 871 1,968 1,228 463 1,691 2,361 1,063 3,424
276 .. 276 1,280 119 1,399 193 .. 193 1,000 92 1,092 469 .. 469 2,280 211 2,491
514 62 576 933 497 1,430 138 . . 138 1,511 . . 1,511 652 62 714 2,444 497 2,941
(a) (a) 241 (a) (a) 2,599 (a) (a) 271
(a) (a) 241 (a) (a) 2,870
(6)5,020 (6)8,317 13,578 (b)17,190 (6)14,368 34,157 6,346 2,644 8,990 (b)17,671 (b)4,739 22,681
(b)11.366 (b)10.961 22.568 (h)34.861 M119 107
202
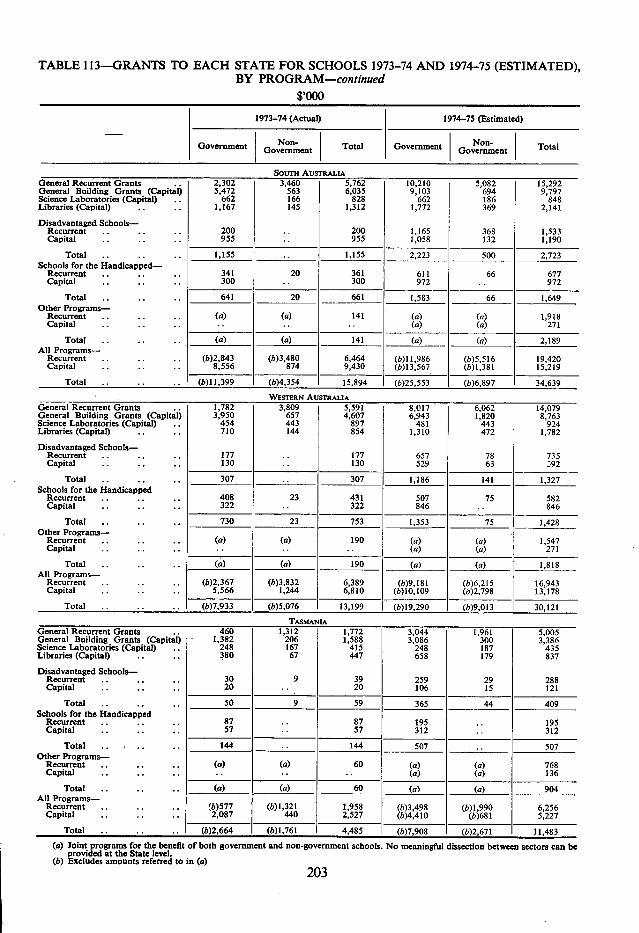
TABLE 113-GRANTS TO EACH STATE FOR SCHOOLS 1973-74 AND 1974-75 (ESTIMATED), BY PROGRAM-continued
--
1973-74 (Actual) 1974-75 (Estimated)
I Non- Non- Total Government i Government Total Government Government
Soum AUSTRALIA
General Building Grants (Capital) Science Laboratories (Capital) Libraries (Capital)
Disadvantaged Schools- Recurrent Capital
Schools for the Handicapped-Recurrent Capital
Other Programs-Recurrent Capital ..
All Programs- Recurrent Capital
Total
WESTERN A TRALIA
General Building Grants (Capital) Science Laboratories (Capital) Libraries (Capital)
Disadvantaged Schools- Recurrent Capital
Schools for the Handicapped Recurrent Capital
Other Programs- Recurrent Capital
All Programs-Recurrent Capital
Total Tscun,,ns
4202 General Recurrent Grants .. - - - - - - - - - - - 3,4t,U 5,1b2 10,210 5,082 15,292 5,472 563 6,035 9,103 694 9,797
662 166 828 662 186 848 1,167 145 1,312 1,772 369 2,141
200 .. 200 1,165 368 1.533 955 955 1,058 132 1,190
1,155 Total 1,155 2,223 500 2,723
341 20 361 611 66 677 300 300 972 972 641 Total 20 661 -- 1,583 - 66 1,649
(a) (a) 141 (a) (a) 1,918 (a) (a) 271
(a) (a) Total 141 (a) (a) 2,189
(6)2,843 (b)3,480 6,464 (b) 11,986 (b)5,516 19,420 8,556 874 9,430 (b)13,567 (b)1,381 15,219
(6)11,399 (b)4,354 15,894 (b)25,553 (6)6,897 34,639
1,152 General Recurrent Grants .. - - - -- - - - - - - 3,509 5,591 8,017 6,062 14,079 3,950 657 4,607 6,943 1,820 8,763
454 443 897 481 443 924 710 144 854 1,310 472 1,782
177 .. 177 657 78 735 130 .. 130 529 63 592
Total 307 .. 307 1,186 141 - 1,327
408 23 431 507 75 582 322 .. 322 846 846
Total 730 23 753 1,353 75 1,428 - (a) (a) 190 (a) (a) 1,547
(a) (a) 271 (a) Total (a) 190 (a) (a) 1,818
(6)2,367 (6)3,832 6,389 (b)9,181 (b)6,215 16,943 5,566 1,244 6,810 (b)l0,109 (6)2,798 13.178
(6)7,933 (b)5,076 13,199 (b)19,290 (6)9,013 1 30,121
General Recurrent Grants General Building Grants (Capital) Science Laboratories (Capital) Libraries (Capital)
Disadvantaged Schools- Recurrent Capital
Total Schools for the Handicapped
Recurrent . . . Capital
Total Other Programs-
Recurrent Capital
Total All Programs-
Recurrent Capital
Total
460 1,312 1,772 3,044 1,961 5,005 1,382 206 1,588 3,086 300 3,386
248 167 415 248 187 435 380 67 447 658 179 837
30 9 39 259 29 288 20 .. 20 106 15 121 50 9 59 365 44 409
87 .. 87 195 .. 195 57 57 312 .. 312
144 144 507 .. 507
(a) (a) 60 (a) (a) 768 (a) (a) 136
(a) - (a) 60 (a) (a) 904
b)577 (b)1,321 1,958 (6)3,498 (b) 1,990 6,256 2,087 440 2,527 (6)4,410 (b)681 5,227
(b)2.664 (b)1,761 4.485 (6)7.908 (6)2.671 11.483 Joint programs for the benefit of both government and non-government schools. No meaningful dissection between sectors can be provided at the State level. Excludes amounts referred to in (a)
203
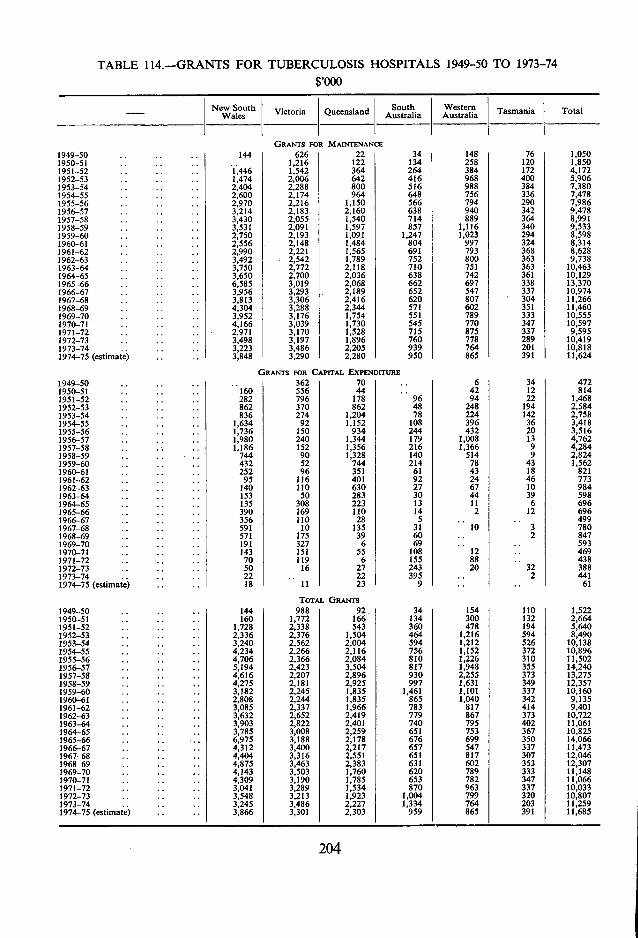
TABLE 114.-GRANTS FOR TUBERCULOSIS HOSPITALS 1949-50 TO 1973-74 $,000
New South Victoria Queensland Australia I Australia South Western Tasmania Total I Wales
I I I I GRANTS FOR MAINTENANCE
I I
1949-50 .. 144 626 22 34 148 76 1,050 1950-51 .. 1,216 122 134 258 120 1,850 1951-52 1,446 1,542 364 264 384 172 4,172 1952-53 .. 1,474 2,006 642 416 968 400 5,906 1953-54 2,404 2,288 800 516 988 384 7,380 1954-55 .. .. 2,600 2,174 964 648 756 336 7,478 1955-56 2,970 2,216 1,150 566 794 290 7,986 1956-57 3,214 2.183 2,160 638 940 342 9,478 1957-58 3,430 2,055 1,540 714 889 364 8,991 1958-59 3,531 2,091 1,597 857 1,116 340 9,533 1959-60 2,750 2,193 1,091 1,247 1,023 294 8,598 1960-61 .. 2,556 . 2,148 1,484 804 997 324 8,314 1961-62 .. 2,990 2,221 1,565 691 793 368 8,628 1962-63 .. 3,492 2,542 1,789 752 800 363 9,738 1963-64 3,750 2,772 2,118 710 751 363 10,463 1964-65 3,650 2,700 2,036 638 742 361 10.129 1965-66 6,585 3,019 2,068 662 697 338 13,370 1966-67 3,956 3,293 2,189 652 547 337 10,974 1967-68 .. 3,813 3,306 2,416 620 807 304 11,266 1968-69 4,304 3,288 2,344 571 602 351 11,460 1969-70. .. 3,952 3,176 1,754 551 789 333 10,555 1970-71 .. 4,166 3,039 1,730 545 770 347 10,597 1971-72 .. .. 2,971 3,170 1,528 715 875 337 9,595 1972-73 .. 3,498 3,197 1,896 760 778 289 10,419 1973-74 3,223 3,486 2,205 939 764 201 10,818 1974-75 (estimate) .. 3,848 3,290 2,280 950 865 391 11,624
GRANTS FOR CAPITAL EXPENDITURE 1949-50 .. 362 70 6 34 472 1950-51 160 556 44 42 12 814 1951-52 •. 282 796 178 96 94 22 1,468 1952-53 .. 862 370 862 48 248 194 2,584 1953-54 836 274 1,204 78 224 142 2,758 1954-55 .. .. 1,634 92 1,152 108 396 36 3,418 1955-56 1,736 150 934 244 432 20 3,516 1956-57 1,980 240 1,344 179 1,008 13 4,762 1957-58 1,186 152 1,356 216 1,366 9 4,284 1958-59 .. . .. 744 90 1,328 140 514 9 2,824 1959-60 .. . 432 52 744 214 78 43 1,562 1960-61 252 96 351 61 43 18 821 1961-62 95 116 401 92 24 46 773 1962-63 .. 140 110 630 27 67 10 984 1963-64 .. 153 50 283 30 44 39 598 1964-65 .. 135 308 223 13 11 6 696 1965-66 .. .. 390 169 110 14 2 12 696 1966-67 .. .. 356 110 28 5 .. .. 499 1967-68 .. .. 591 10 135 31 10 3 780 1968-69 .. .. 571 175 39 60 .. 2 847 1969-70 .. .. 191 327 6 69 .. .. 593 1970-71 .. .. 143 151 55 108 12 .. 469 1971-72 .. .. 70 119 6 155 88 .. 438 1972-73 .. .. 50 16 27 243 20 32 388 1973-74 .. 22 .. 22 395 2 441 1974-75 (estimate) .. 18 11 23 9 .. 61
1949-50 1950-51 .. 1951-52 .. 1952-53 .. 1953-54 .. 1954-55 .. 1955-56 .. 1956-57 1957-58 .. 1958-59 .. 1959-60 .. 1960-61 .. 1961-62 1962-63 .. 1963-64 1964-65 .. 1965-66 .. 1966-67 1967-68 1968-69 .. 1969-70 .. 1970-71 .. 1971-72 .. 1972-73 1973-74 1974-75 (estimate)
TOTAL GRANTS 144 988 92. 34 154 110 1,522 160 1,772 166 134 300 132 2,664
1,728 2,338 543 360 478 194 5,640 2,336 2,376 1,504 464 1,216 594 8,490 3,240 2,562 2,004 594 1,212 526 10,138 4,234 2,266 2,116 756 1,152 372 10,896 4,706 2,366 2,084 810 1,226 310 11,502 5,194 2,423 3,504 817 1,948 355 14,240 4,616 2,207 2,896 930 2,255 373 13,275 4,275 2,181 2,925 997 1,631 349 12,357 3,182 2,245 1,835 1,461 1,101 337 10,160 2,808 2,244 1,835 865 1,040 342 9,135 3,085 2,337 1,966 783 817 414 9,401 3,632 2,652 2,419 779 867 373 10,722 3,903 2,822 2,401 740 795 402 11,061 3,785 3,008 2,259 651 753 367 10,825 6,975 3,188 2,178 676 699 350 14,066 4,312 3,400 2,217 657 547 337 11,473 4,404 3,316 2,551 651 817 307 12,046 4,875 3,463 2,383 631 602 353 12,307 4,143 3,503 1,760 620 789 333 11,148 4,309 3,190 1,785 653 782 347 11,066 3,041 3,289 1,534 870 963 337 10,033 3,548 3,213 1,923 1,004 799 320 10,807 3,245 3,486 2,227 1,334 764 203 11,259 3,866 3,301 2,303 959 865 391 11,685
204
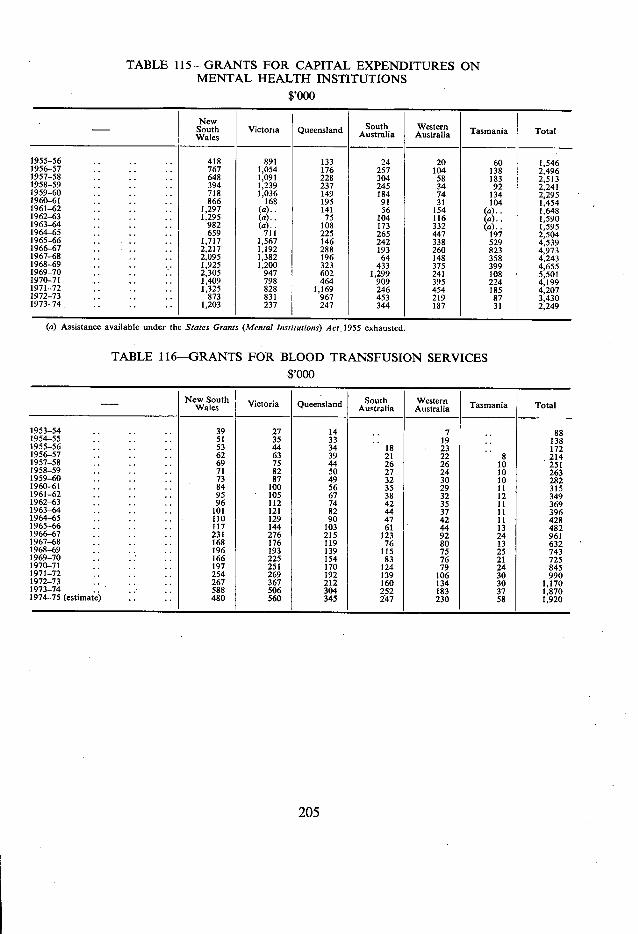
TABLE 115-GRANTS FOR CAPITAL EXPENDITURES ON MENTAL HEALTH INSTITUTIONS
$,000
- South Wales
New Victoria Queensland South
Australia Australia Tasmania Total
1955-56 .. 418 891 133 24 20 60 1,546 1956-57 .. 767 1,054 176 257 104 138 2,496 1957-58 . . . . 648 1,091 228 304 58 183 2,513 1958-59 . 394 1,239 237 245 34 92 2,241 1959-60 .. 718 1,036 149 184 74 134 2,295 1960-61 .. 866 168 195 91 31 104 1,454 1961-62 .. 1,297 (a).. 141 56 154 (a).. 1,648 1962-63 . .. 1.295 (a).. 75 104 116 (a).. 1,590 1963-64 . . . . 982 (a).. 108 173 332 (a).. 1,595 1964-65 . .. 659 711 225 265 447 197 2,504 1965-66 . .. 1,717 1,567 146 242 338 529 4,539 1966-67 .. 2,217 1,192 288 193 260 823 4,973 1967-68 ,, . .. 2,095 1,382 196 64 148 358 4,243 1968-69 -. .. 1,925 1,200 323 433 375 399 4,655 1969-70 .. 2,305 947 602 1,299 241 108 5,501 1970-71 .. 1,409 798 464 909 395 224 4,199 1971-72 , .. 1,325 828 1,169 246 454 185 4,207 1972-73 , .. 873 831 967 453 219 87 3,430 1973-74 .. 1,203 237 247 344 187 31 2,249
(a) Assistance available under the States Grants (Mental Institutions) Act 1955 exhausted.
TABLE 116-GRANTS FOR BLOOD TRANSFUSION SERVICES .$,000
- New out WalesVictoria Queensland South Australia
Western Australia Tasmania Total
1953-54 .. .. .. 39 27 14 .. 7 .. 88 1954-55 . . . . . . 51 35 33 . . 19 . . 138 1955-56 .. .. . . 53 44 34 18 23 .. 172 1956-57 .. .. .. 62 63 39 21 22 8 214 1957-58 .. .. .. 69 75 44 26 26 10 .
251 1958-59 .. .. .. 71 82 50 27 24 10 263 1959-60 .. .. . . 73 87 49 32 30 10 282 1960-61 .. .. . . 84 100 56 35 29 11 315 1961-62 .. .. . . 95 105 67 38 32 12 349 1962-63 . . .. .. 96 112 74 42 35 11 369 1963-64 .. .. . . 101 121 82 44 37 11 396 1964-65 .. .. .. 110 129 90 47 42 11 428 1965-66 .. .. .. 117 144 103 61 44 13 482 1966-67 .. .. .. 231 276 215 123 92 24 961 1967-68 .. .. .. 168 176 119 76 80 13 632 1968-69 .. . . . . 196 193 139 115 75 25 743 1969-70 .. .. . . 166 225 154 83 76 21 725 1970-71 . . .. .. 197 251 170 124 79 24 845 1971-72 .. .. .. 254 269 192 139 106 30 990 1972-73 .. .. .. 267 367 212 160 134 30 1,170 1973-74 .. .. .. 588 506 304 252 183 37 1,870 1974-75 (estimate) .. .. 480 560 345 247 230 58 1,920
205

TABLE 117-GRANTS FOR CAPITAL EXPENDITURES ON MIGRANT CENTRES $,000
- New South Wales Victoria Queensland South
Australia Western Tasmania Total
1947-48 .. n.a. n.a. n.a. na. n.a. n.a. 26 1948-49 .. n.a. n.a. n.a. n.a. n.a. n.a. 61 1949-50 n.a. n.a. n.a. n.a. n.a. n.a. 18 1950-51 n.a. n.a. n.a. n.a. n.a. n.a. 50 1951-52 n.a . n.a. n.a. n.a. n.a. n.a. 35 1952-53 .. n.a. n.a. n.a. n.a. n.a. n.a. 24 1953-54 .. na. n.a. n.a. n.a. n.a. n.a. 92 1954-55 .. n.a. n.a. na. n.a. n.a. n.a. 2 1955-56 4 .. .. 4 1956-57 .. 22 .. 22 1957-58 .. .. I 5 .. .. 6 1958-59 . 3 1 .. .. 4 1959-60 .. .. 1960-61 .. .. .. .. 1961-62 .. .. .. 1962-63 66 .. .. 66 1963-64 14 34 .. 48 1964-65 .. 2 .. .. 2 1965-66 .. .. 1966-67 2 .. .. 2 1967-68 67 2 357 .. 426 1968-69 35 411 .. 446 1969-70 5 .. 60 .. 65 1970-71 .. 2 75 65 .. 142 1971-72 214 123 12 23 .. 372 1972-73 .. 10 14 .. .. 24 1973-74 .. 2 4 18 .. .. 24 1974-75 (estimate) .. 163 17 .. .. 180
n.a. = not available.
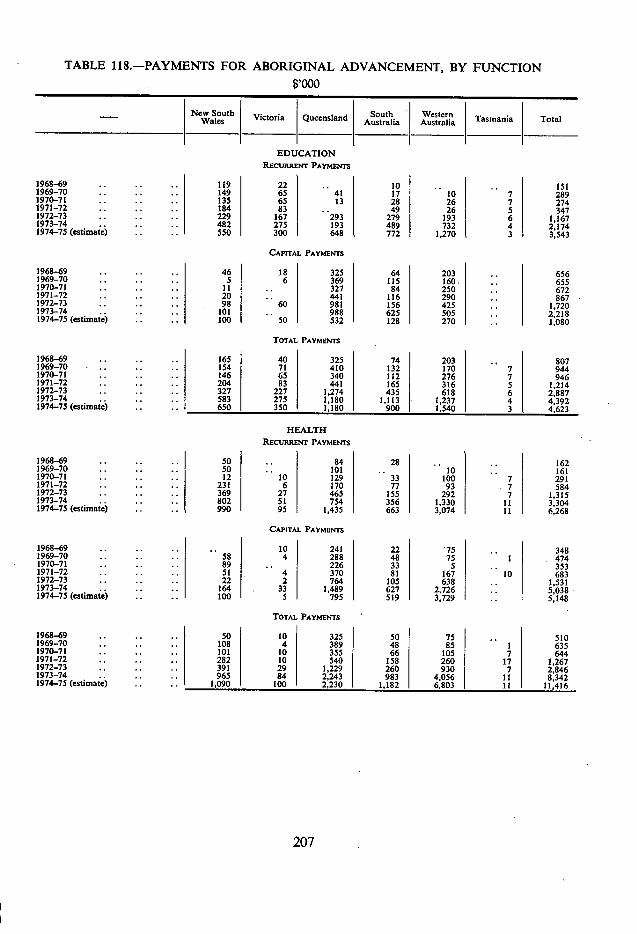
TABLE 118.-PAYMENTS FOR ABORIGINAL ADVANCEMENT, BY FUNCTION $,000
- New South Wales Victoria Queensland I South
Australia Western Australia Tasmania Total
EDUCATION RECURRENT PAYMENTS
1968-69 .. .. 119 22 1969-70 .. .. 149 65 41 1970-71 .. 135 65 13 1971-72 .. .. 184 83 1972-73 .. .. .. 229 167 293 1973-74.. .. .. 482 275 193 1974-75 (estimate) .. .. 550 300 648
CAPITAL PAYMENTS
1968-69 .. .. .. 46 18 325 1969-70 .. .. .. 5 6 369 1970-71 .. .. .. II .. 327 1971-72 .. .. .. 20 .. 441 1972-73 .. .. 98 60 981 1973-74.. .. .. 101 ,. 988 1974-75 (estimate) .. .. 100 50 532
TOTAL PAYMENTS
1968-69 .. .. .. 165 40 325 1969-70 .. .. .. 154 71 410 1970-71 .. .. 146 65 340 1971-72 .. .. .. 204 83 441 1972-73 .. .. 327 227 1,274 1973-74.. .. 583 275 1,180 1974-75 (estimate) .. 650 350 1,180
HEALTH RECURRENT PAYMENTS
1968-69 .. .. 50 .. 84 1969-70 .. .. 50 . 101 1970-71 .. .. 12 10 129 1971-72 .. .. .. 23! 6 170 1972-73 •. .. .. 369 27 465 1973-74 .. .. .. 802 51 754 1974-75 (estimate) .. .. 990 95 1,435
CAPITAL PAYMENTS
1968-69 .. .. .. .. 10 241 1969-70 .. .. .. 58 4 288 1970-71 .. .. .. 89 .. 226 1971-72 .. .. .. 51 4 370 1972-73 .. .. .. 22 2 764 1973-74.. .. .. 164 33 1,489 1974-75 (estimate) .. .. 100 5 795
TOTAL PAYMENTS
1968-69 .. .. .. 50 10 325 1969-70 .. .. .. 108 4 389 1970-71 .. .. .. 101 10 355 1971-72 .. .. .. 282 JO 540 1972-73 .. .. .. 391 29 1,229 1973-74.. .. .. 965 84 2,243 1974-75 (estimate) .. .. 1,090 100 2,230
10 17 10 7 289 28 26 7 274 49 26 5 347
279 193 6 1,167 489 732 4 2,174 772 1,270 3 3,543
64 203 .. 656 115 160. . . 655 84 250 .. 672
116 290 .. 867 156 425 .. 1,720 625 505 .. 2,218 128 270 .. 1,080
74 203 .. 807 132 170 7 944 112 276 7 946 165 316 5 1,214 435 618 6 2,887
1,113 1,237 4 4,392 900 1.540 3 4.623
28 .. .. 162 10 .. 161
33 100 7 291 77 93 .7 584
155 292 7 1,315 356 1.330 11 3.304 663 3,074 11 6,268
22 75 .. 348 48 75 1 . 474 33 5 .. 353 81 167 10 683
lOS 638 . . 1,531 627 2,726 .. 5,038 519 3,729 .. 5,148
50 75 .. 510 48 85 1 635 66 105 7 644
158 260 17 1,267 260 930 7 2,846 983 4.056 11 8,342 182 6.803 11 11.416
207
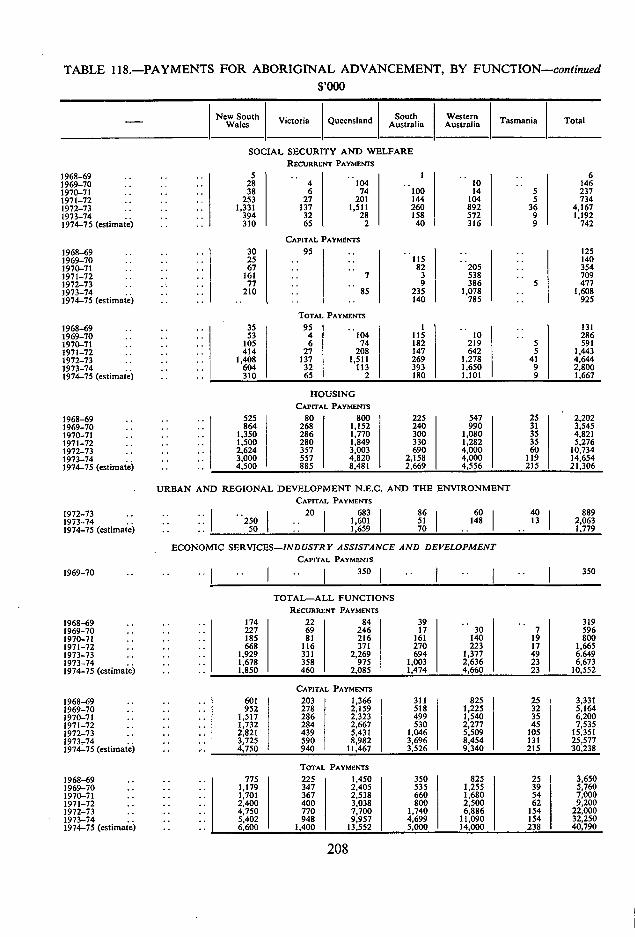
TABLE 118.-PAYMENTS FOR ABORIGINAL ADVANCEMENT, BY FUNCTION-continued $,000
- New South Victoria Queensland South Western Tasmania Total Australia Wales
SOCIAL SECURITY AND WELFARE RECURRENT PAYMENTS
1968-69 .. 5 .. I .. .. 6 1969-70 .. .. 28 4 104 .. 10 .. 146 1970-71 .. .. .. 38 6 74 100 14 5 237 1971-72 .. .. .. 253 27 201 144 104 5 734 1972-73 .. .. . 1,331 137 1,511 260 892 36 4,167 1973-74.. .. 394 32 28 158 572 9 1.192 1974-75 (estimate) 310 65 2 40 316 9 742
CAPITAL PAYMENTS 1968-69 .. .. 30 95 .. .. .. 125 1969-70 .. .. 25 . .. 115 .. .. 140 1970-71 .. .. 67 .. .. 82 205 .. 354 1971-72 .. .. .. 161 .. 7 3 538 709 1972-73 .. .. 77 .. 9 386 5 477 1973-74 210 85 235 1,078 .. 1,608 1974-75 (estimate) .. .. .. .. 140 785 .. I 925
TOTAL PAYMENTS 1968-69 .. .. 35 95 .. I .. .. 131 1969-70 .. .. .. 53 4 104 115 10 .. 286 1970-71 .. .. .. 105 6 74 182 219 5 591 1971-72 .. .. .. 414 27 208 147 642 5 1,443 1972-73 .. . .. 1,408 137 1,511 269 1.278 41 4,644 1973-74 .. .. .. 604 32 113 393 1,650 9 2,800 1974-75 (estimate) .. .. 310 65 2 180 1,101 9 1,667
ROUSING CAPITAL PAYMENTS
1968-69 •. . .. 525 80 800 225 547 25 2,202 1969-70 .. .. .. 864 268 1,152 240 990 31 3,545 1970-71 .. .. .. 1,350 286 1,770 300 1,080 35 4,821 1971-72 .. .. .. 1,500 280 1,849 330 1,282 35 5,276 1972-73 .. .. .. 2,624 357 3,003 690 4,000 60 10,734 1973-74.. .. .. 3,000 557 4,820 2,158 4,000 119 14,654 1974-75 (estimate) .. .. 4,500 - 885 8,481 2,669 4,556 215 21,306
URBAN AND REGIONAL DEVELOPMENT N.E.C. AND THE ENVIRONMENT CAPITAL PAYMENTS
1972-73 .. .. .. .. 20 683 86 60 40 889 1973-74 . .. .. 250 .. 1,601 51 148 13 2,063 1974-75 (estimate
.) .. .. 50 . 1,659 70 .. .. 1,779
ECONOMIC SERVICES -INDUSTRY ASSISTANCE AND DEVELOPMENT CAPITAL PAYMENTS
1969-70 .. .. .. .. ..
350 .. .. ..
350
TOTAL-ALL FUNCTIONS RECURRENT PAYMENTS
1968-69 .. .. .. 174 22
8'
39 .. ,, 319 1969-70 .. .. .. 227 69 246 17 30 7 596 1970-71 .. .. .. 185 81 216 161 140 19 800 1971-72 .. .. .. 668 116 371 270 223 17 1,665 1973-73 .. .. .. 1,929 331 2,269 694 1,377 49 6.649 1973-74 .. .. .. 1,678 358 975 1,003 2,636 23 6,673 1974-75 (estimate) .. .. 1.850 460 2.085 1,474 4,660 23 10,552
CAPITAL PAYMENTS 1968-69 .. .. .. 601 203 1,366 311 825 25 3,331 1969-70 .. .. .. 952 27.8 2,159 518 1,225 32 5,164 1970-71 .. .. .. 1,517 286 2,323 499 1,540 35 6,200 1971-72 .. .. .. 1,732 284 2,667 530 2,277 45 7,535 1972-73 .. .. .. 2,821 439 5,431 1,046 5,509 105 15,351 1973-74 .. .. .. 3,725 590 8,982 3,696 8,454 131 25,577 1974-75 (estimate) .. .-. 4,750 940 11,467 3,526 9,340 215 30,238
TOTAL PAYMENTS 1968-69 .. .. .. 775 225 1,450 350 825 25 3,650 1969-70 .. .. .. 1,179 347 2,405 535 11255 39 5,760 1970-71 .. .. .. 1,701 367 2.538 660 1,680 54 7,000 1971-72 .. .. .. 2,400 400 3,038 800 2,500 62 9,200 1972-73 .. .. .. 4,750 770 7,700 1,740 6,886 154 22,000 1973-74 .. .. .. 5,402 948 9,957 4,699 11,090 154 32,250 1974-75 (estimate) .. .. 6,600 1,400 13,552 5,000 14,000 238 40,790
208
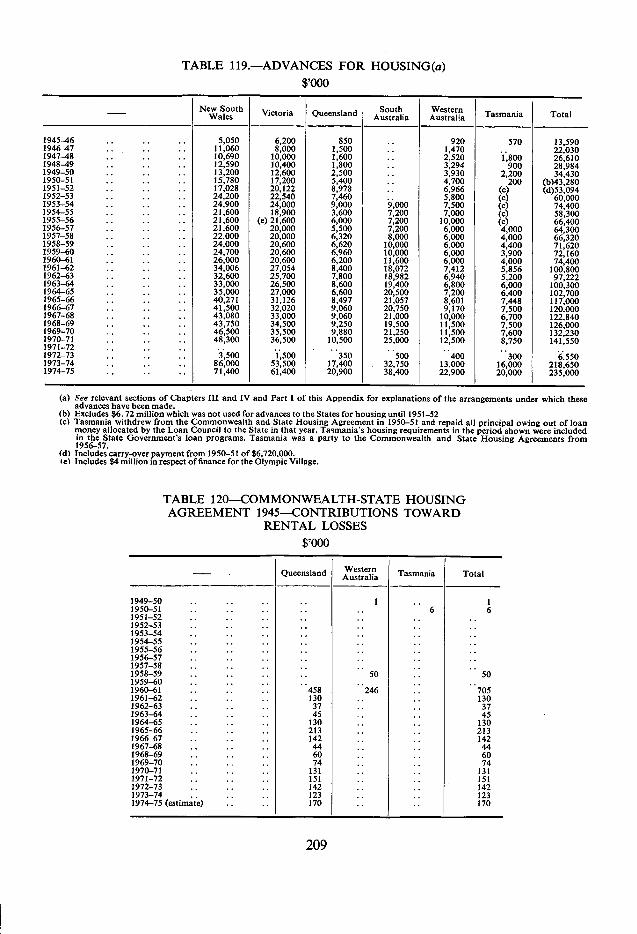
TABLE 119.-ADVANCES FOR HOUSING(a) $,000
- NeWales
w South -Victoria Queensland Australia South Western Tasmania Total
1945-46 .. .. 5,050 6.200 850 .. 920 570 13,590 1946-47 .. .. 11,060 8,000 1,500 .. 1,470 .. 22,030 1947-48 •, .. .. 10,690 10,000 1,600 .. 2,520 1,800 26,610 1948-49 .. .. 12,590 10,400 1,800 .. 3,294 900 28,984 1949-50 .. ,. 13,200 12,600 2,500 .. 3,930 2,200 34,430 1950-51 .. .. .. 15,780 17,200 5,400 .. 4,700 200 (b)43,280 1951-52 ,. .. .. 17,028 20,122 8,978 6,966 (c) (d)53,094 1952-53 •. .. 24,200 22,540 7,460 5,800 (c) 60,000 1953-54 .. .. .. 24,900 24,000 9,000 9,000 7,500 (c) 74,400 1954-55 .. .. .. 21,600 18,900 3,600 7,200 7,000 (c) 58,300 1955-56 .. . .. 21,600 (e) 21,600 6,000 7,200 10,000 (c) 66,400 1956-57 .. . .. 21,600 20,000 5,500 7,200 6,000 4,000 64,300 1957-58 .. .. .. 22,000 20,000 6,320 8,000 6,000 4,000 66,320 1958-59 .. .. .. 24,000 20,600 6,620 10,000 6.000 4,400 71,620 1959-60 .. .. . 24,700 20,600 6,960 10,000 6,000 3,900 72,160 1960-61 .. .. .. 26,000 20,600 6,200 11,600 6,000 4,000 74,400 1961-62 .. .. .. 34,006 27,054 8,400 18,072 7,412 5,856 100,800 1962-63 .. .. .. 32,600 25,700 7,800 18,982 6,940 5,200 97,222 1963-64 .. .. .. 33,000 26,500 8,600 19,400 6,800 6,000 100,300 1964-65 .. .. .. 35,000 27,000 6,600 20,500 7,200 6,400 102,700 1965-66 .. .. .. 40,271 31,126 8,497 21,057 8.601 7,448 117,000 1966-67 .. .. .. 41,500 32,020 9,060 20,750 9,170 7,500 120.000 1967-68 .. .. .. 43,080 33,000 9,060 21,000 10,000 6.700 122,840 1968-69 .. .. .. 43,750 34,500 9,250 19,500 11,500 7,500 126,000 1969-70 .. .. .. 46,500 35,500 9,880 21,250 11,500 7,600 132,230 1970-71 .. .. .. 48,300 36,500 10,500 25,000 12,500 8,750 141,550 1971-72 . .. .. .. .. .. . . 1972-73 .. .. .. 3,500 1500 350 500 400 300 6.550 1973-74 .. .. .. 86,000 53,
,500 17,400 32,750 13,000 16,000 218,650
1974-75 •, .. . 71,400 61,400 20,900 38,400 22,900 20,000 235,000
See relevant sections of Chapters III and IV and Part I of this Appendix for explanations of the arrangements under which these advances have been made. Excludes $6.72 million which was not used for advances to the States for housing until 1951-52 Tasmania withdrew from the Commonwealth and State Housing Agreement in 1950-5I and repaid all principal owing Out of loan money allocated by the Loan Council to the State in that year. Tasmania's housing requirements in the period shown were included in the State Government's loan programs. Tasmania was a party to the Commonwealth and State Housing Agreements from 1956-57. Includes carry-over payment from 1950-51 of 86,720.000.
id Includes $4 million in respect of finance for the Olympic Village.
TABLE 120-COMMONWEALTH-STATE HOUSING AGREEMENT 1945-CONTRIBUTIONS TOWARD
RENTAL LOSSES $,000
- Queensland Western Australia Tasmania Total
1949-50 .. .. .. .. I .. 1950-51 .. .. .. .. .. 6 6 1951-52 .. .. .. .. .. 1952-53 .. .. .. .. . . 1953-54 .. .. .. .. .. 1954-55 .. .. .. .. .. 1955-56 .. .. .. .. .. 1956-57 .. .. .. .. .. 1957-58 .. .. .. .. .. 1958-59 .. .. .. .. 50 .. 50 1959-60 .. .. .. .. .. 1960-61 .. .. .. 458 246 .. 705 1961-62 .. .. .. 130 .. .. 130 1962-63 .. .. .. 37 .. .. 37 1963-64 .. .. .. 45 .. .. 45 1964-65 .. .. .. 130 .. .. 130 1965-66 .. .. .. 213 .. .. 213 1966-67 .. .. .. 142 .. .. 142 1967-68 .. .. .. 44 .. .. 44 1968-69 .. .. .. 60 .. .. 60 1969-70 .. .. .. 74 .. .. 74 1970-71 . . . . . . 131 . . . . 131 1971-72 .. . . . . 151 . . . . 151 1972-73 .. .. .. 142 .. .. 142 1973-74.. .. .. 123 .. . . 123 1974-75 (estimate) .. .. 170 .. .. 170
209
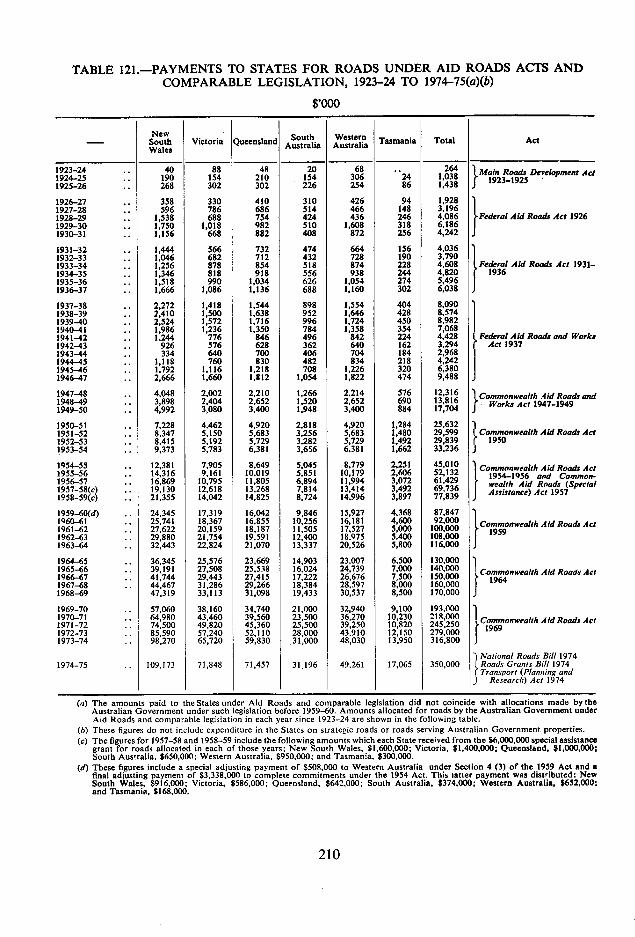
TABLE 121.-PAYMENTS TO STATES FOR ROADS UNDER AID ROADS ACTS AND COMPARABLE LEGISLATION, 1923-24 TO 1974-75(a)(b)
$'OOO
-
New South Wales
Victoria Queensland South Australia
Western Australia Tasmania Total Act
1923-24 1924-25
40 190
88 154
48 210
20 154
68 306
..
24 264
1.038 1 Main Roads Development Act
1925-26 268 302 302 226 254 86 1,438 1 1923-1925
1926-27 ., 358 330 410 310 426 94 1,928 1927-28 .. 596 786 686 514 466 148 3.196 1928-29 .. 1,538 688 754 424 436 246 4,086 Federal Aid Roads Act 1926
} 1929-30 .. 1.750 1,018 982 510 1,608 318 6,186 1930-31 .. 1,156 668 882 408 872 256 4,242
1931-32 .. 1,444 566 732 474 664 156 4.036 '
1932-33 ,. 1,046 682 712 432 728 190 3,790 I 1933-34 .. 1,256 878 854 518 874 228 4,608 ¶,Federal Aid Roads Act 1931 1934-35 .. 1,346 818 918 556 938 244 4,820 i 1936 1935-36 .. 1,518 990 1,034 626 1,054 274 5,496
-
I 1936-37 .. 1,666 1,086 1.136 688 1,160 302 6,038 J 1937-38 .. 2,272 1,418 1,544 898 1,554 404 8,090 1938-39 .. 2,410 1,500 1,638 952 1,64.6 428 8,374 1939-40 .. 2,524 1,572 1,716 996 1,724 450 8,982
1 1940-41 .. 1,986 1,236 1,350 784 1,358 354 7,068 1 Federal Aid Roads and Works 1941-42 .. 1,244 776 846 496 842 224 4,428
1942-43 .. 926 576 628 362 640 162 3.294 Act 1937 1943-44 .. 334 640 700 406 704 184 2,968 1944-45 .. 1,118 760 830 482 834 218 4,242
J 1945-46 .. 1,792 1,116 1,218 708 1,226 320 6,380 1946-47 .. 2,666 1,660 1,812 1,054 1,822 474 9,488
1947-48 .. 4,048 2,002 2,210 1,266 2.214 576 12,316 Commonwealth Roads a,u .41d 1948-49 .. 3,898 2,404 2.652 1,520 2,652 690 13,816 3' Works Act 1947-1949 1949-50 .. 4,992 3,080 3,400 1,948 3,400 884 17,704
1950-51 ,, 7,228 4,462 4,920 2,818 4,920 1,284 25,632 951-52 ,, 8,347 5,150 5,683 1952-53
3,256 5,683 1,480 29,599 Commonwealth Aid Roads Ad .. 8.415 5.192 5.729 3,282 5,729 1,492 29,839 ' 1950
1953-54 ,. 9,373 5,783 6,381 3,656 6.381 1,662 33.236 j
1954-55 .. 12,381 7,905 8,649 5,045 8,779 2,251 45.010 ' Commonwealth Aid RoadsAci 1955-56 .. 14,316 9,161 10,019 5,851 10,179 2,606 52,132 I,, 1954-1956 and Common. 1956-57 .. 16,869 10,795 11,805 6.894 11,994 3,072 61,429 I wealth Aid Roads (Spsctal 1957-58(c) ., 19,130 12,618 13,268 7.814 13,414 3,492 69,736 J Assistance) Act 1957 1958-59(c) ,. 21,355 14,042 14,825 8.724 14.996 3,897 77,839
1959-60(d) ,, 24,345 17,319 16,042 9,846 15,927 4.368 1960-61 .. 25,741 18,367 16,855 92,0001961-62
10,256 16.181 4,600 87.847
Aid Roads Act .. 27.622 20.159 18.187 100.000
1962-63 11,505 17,527 5,000 ~Commonwealth
1959 .. 29,880 21,754 19,591 12,400 18.975 5.400 108,000
116,000 1963-64 .. 32,443 22,824 21,070 13,337 20,526 5,800
1964-65 .. 36,345 25,576 23,669 14,903 23,007 6,500 130,000 1 1965-66 .. 39,191 27,508 25,538 16.024 24,739 7,000 140,000 Commonwealth Aid Roads Act 1966-67 .. 41,744 29,443 27,415 17,222 26,676 7,500 150,000 1964 1967-68 ,. 44,467 31,286 29,266 18,384 28,597 8,000 160,000 1968-69 47,319 33,113 31,098 19,433 30,537 8,500 170,000
1969-70 .. 57,060 38,160 34,740 21,000 32,940 9,100 193,000 1 1970-71 .. 64,980 43,460 39,560 23,500 36,270 10,230 218,000 Commonwealth Aid Roads Act 1971-72 .. 74,500 49,820 45,360 25,500 39,250 10,820 245,250 ' 1969 1972-73 .. 85,590 57,240 52,110 28,000 43.910 12,150 279,000
1973-74 .. 98,270 65,720 59,830 31,000 48,030 13,950 316,800
National Roads Bill 1974 1974-75 .. 109,173 71,848 71,457 31.196 49.261 17,065 350,000 I> Roads Grants Bill 1974
Transport (Planning and J Research) Act 1974
The amounts paid to the States under Aid Roads and comparable legislation did not coincide with allocations made by the Australian Government under such legislation before 1959-60. Amounts allocated for roads by the Australian Government under Aid Roads and comparable legislation in each year since 1923-24 are shown in the following table. These figures do not include expenditure in the States on strategic roads or roads serving Australian Government. properties. The figures for 1957-58 and 1958-59 include the following amounts which each State received from the $6,000,000 special assistance grant for roads allocated in each of those years; New South Wales, $1,600,000; Victoria. $1,400,000; Queensland, $1,000,000; South Australia, $650,000; Western Australia, $950,000; and Tasmania, $300,000. These figures include a special adjusting payment of $508,000 to Western Australia under Section 4 (3) of the 1959 Act and a final adjusting payment of $3,338,000 to complete commitments under the 1954 Act. This latter payment was distributed: New South Wales, $916,000; Victoria, $586,000: Queensland, $642,000: South Australia, $374,000; Western Australia, $652,000; and Tasmania, $168,000.
210
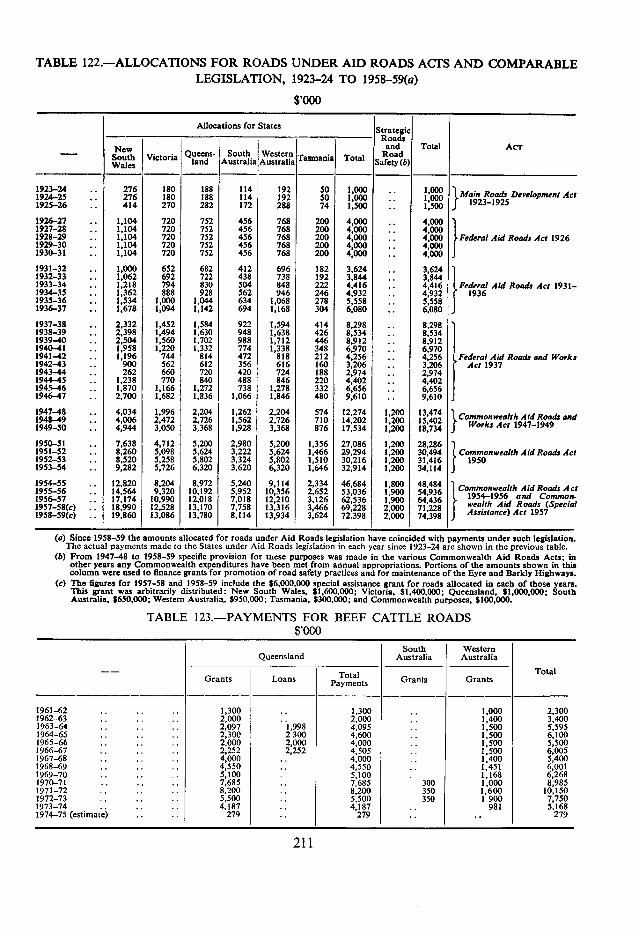
TABLE 122.-ALLOCATIONS FOR ROADS UNDER AID ROADS ACTS AND COMPARABLE LEGISLATION, 1923-24 TO 1958-59(a)
$,000
-
Allocations for States Strategic Roads and
Road Total Acr New
South Victoria Queens- South Western Tasmania Total Wales land Australia Australia Safety (b)
1923-24 .. 1924-25 . - 276
276 180 180
188 188
114 114
192 192
50 50
1,000 1,000
- - - - 1000 1,000 1 Main Roads Development Act
1925-26 . - 414 270 282 172 288 74 1,500 - - 1.500 J 1923-1925
1926-27 . - 1,104 720 752 456 768 200 4,000 - - 4,000 1927-28 . - 1,104 720 752 456 768 200 4,000 4,000 1928-29 -. 1,104 720 752 456 768 200 4,000 4,000 Federal Aid Roads Act 1926
} 1929-30 . - 1,104 720 752 456 768 200 4,000 -. 4,000 1930-31 . - 1,104 720 752 456 768 200 4,000 - - 4,000
1931-32 - - 1,000 652 682 412 696 182 3,624 - - 3,624 1932-33 - - 1,062 692 722 438 738 192 3,844 - - 3,844 1 1933-34 - - 1,218 794 830 504 848 222 4,416 .. 4,416 Federal Aid Roads Act 1931- 1934-35 - - 1,362 888 928 562 946 246 4,932 4,932 1936 1935-36 . - 1 534 1,000 1,044 634 1,068 278 5,558 5,558 1936-37 . - 1:678 1,094 1,142 694 1,168 304 6,080 - - 6,080
1937-38 .. 2,332 1,452 1,584 922 1.594 414 8,298 .. 8,298 1938-39 . - 2,398 1,494 1.630 948 1,638 426 8,534 -. 8,534 1939-40 - - 2,504 1,560 1,702 988 1,712 446 8,912 - - 8,912
1 1940-41 - - 1,958 1,220 1,332 774 1,338 348 6.970 - 6,970 1941-42 -. 1,196 744 814 472 818 212 4,256 - - 4,256 Federal Aid Roads and Works 1942-43 - - 900 562 612 356 616 160 3,206 - - 3,206 Act 1937 1943-44 - - 262 660 720 420 724 188 2,974 - - 2,974 1944-45 -. 1,238 770 840 488 846 220 4,402 - - 4,402 1945-46 . - 1,870 1,166 1,272 738 1,278 332 6,656 - 6,656 1946-47 -. 2,700 1,682 1,836 1,066 1,846 480 9,610 .. 9,610
1947-48 - - 1948-49 ..
4,034 4,006
1,996 2,472
2,204 2,726
1,262 1,562
2,204 2,726
574 710
12.274 14,202
1,200 1,200
13,474 15,402 Commonwealth Aid Roads and
1949-50 - - 4,944 3,050 3,368 1,928 3,368 876 17,534 1,200 18,734 3 Works Act 1947-1949
1950-51 -. 7,638 4,712 5,200 2,980 5,200 1,356 27,086 1,200 28,286 1 1951-52 - - 8,260 5,098 5,624 3.222 5,624 1,466 29,294 1,200 30,494 Commonwealth Aid Roads Act 1952-53 -. 8.520 5,258 5.802 3,324 5,802 1,510 30,216 1,200 31, 416 1950 1953-54 - - 9,282 5,726 6,320 3,620 6,320 1,646 32,914 1,200 34,114
1954-55 . - 1955-56 - - 12,820
14,564 8,204 9,320
8,972 10,192
5,240 5,952
9,114 10,356
2,334 2,652
46.684 53,036
1,800 1,900
48,484 54,936 Commonwealth Aid Roads Act
1956-57 -. 17,174 10,990 12,018 7,018 12,210 3,126 62,536 1,900 64,436 1954-1956 and Common- r wealth Aid Roads (Special 1957-58(c) -. 18,990 12,528 13,170 7,758 13.316 3,466 69,228 2,000 71,228 1958-59(c) - - 19,860 13,086 13,780 8,114 13,934 3,624 72.398 2,000 74,398 j
Assistance) Act 1957
Since 1958-59 the amounts allocated for roads under Aid Roads legislation have coincided with payments under such legislation. The actual payments made to the States under Aid Roads legislation in each year since 1923-24 are shown in the previous table. From 1947-48 to 1958-59 specific provision for tnese purposes was made in the various Commonwealth Aid Roads Acts; in other years any Commonwealth expenditures have been met from annual appropriations. Portions of the amounts shown in this column were used to finance grants for promotion of road safety practices and for maintenance of the Eyre and Barkly Highways. The figures for 1957-58 and 1958-59 include the $6,000,000 special assistance grant for roads allocated in each of those years. This grant was arbitrarily distributed: New South Wales. $1,600,000; Victoria. $1,400,000; Queensland, $1,000,000; South Australia, $650,000: Western Australia. $950,000; Tasmania, $300,000; and Commonwealth purposes, $100,000.
TABLE 123.-PAYMENTS FOR BEEF CATTLE ROADS $,000
--
Queensland South
Australia Western Australia
Total Grants Loans T I
Payments Grants Grants
1961-62 .. .. .. 1,300 .. 1,300 .. 1,000 2,300 1962 63 .. . .. 2,000 .. 2,000 1,400 3,400 1963-64 .. -. .. 2,097 1,998 4,095 .. 1,500 5,595 1964-65 .. .. 2,300 2300 4,600 1,500 6,100 1965-66 -. .. 2.000 2,000 4,000 .. 1,500 5,500 1966-67 .. .. . 2,252 2,252 4,505 .. 1,500 6,005 1967-68 .. .. . 4,000 .. 4,000 -. 1,400 5,400 1968-69 .. - .. 4,550 .. 4,550 .. 1,451 6,001 1969-70 .. .. . 5,100 5,100 1,168 6,268 1970-71 . - - - .. 7,685 .. 7,685 300 1,000 8,985 1971-72 .. .. .. 8.200 .. 8,200 350 1,600 10,150 1972-73 .. .. .. 5,500 .. 5,500 350 1 900 7,750 1973-74 .. .. .. 4,187 .. 4,187 .. 981 5,168 1974-75 (estimate) .. .. 279 .. 279 .. .. 279
211
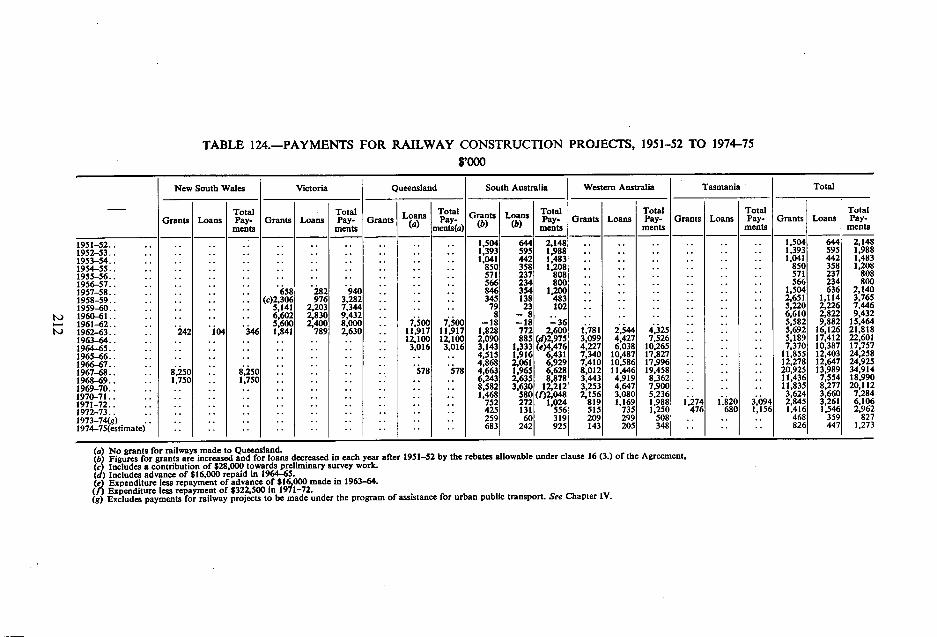
TABLE 124.-PAYMENTS FOR RAILWAY CONSTRUCTION PROJECTS, 1951-52 TO 1974-75 $'OOO
- New South Wales Victoria Queensland South Australia Western Australia Tasmania Total
Grants Loans Total Pay- Grants Loans
Total Pay- Grants L
'a Total Pay- G L Total
Pay- Grants Loses Total Pay- Grants Loans
Total Pay- Grants Loses
Total Pay-
ments ments ments(s) b ments ments ments ments
1951-52 .. .. .. .. .. .. 1,504 644 2,148 .. .. .. .. .. .. 1,504 644 2,148 1952-53 .. .. .. .. .. .. .. .. 1,393 595 1,988 .. .. .. .. 1,393 595 1,988 1953-54 .. .. .. .. .. .. .. .. 1,041 442 1,483 .. .. .. .. .. 1,041 442 1,483 1954-55 .. .. .. .. .. .. .. .. 850 358 1,208 .. .. .. .. .. .. 850 358 1,208 1955-56 .. .. .. .. .. .. .. 571 237 808 .. .. .. .. .. 571 237 808 1956-57 .. .. .. .. .. .. .. 566 234 800 .. .. .. .. .. .. 566 234 800 1957-58 .. .. 658 282 940 .. .. 846 354 1.200 .. .. .. .. .. 1,504 636 2,140 1958-59 .. .. (c)2,306 976 3,282 .. .. 345 138 483 .. .. .. .. .. 2,651 1,114 3,765 1959-60 .. .. 5,141 2,203 7,344 .. .. .. 79 23 102 .. .. .. .. .. .. 5,220 2,226 7,446 1960-61 .. .. 6,602 2,830 9,432 .. .. .. 8 - 8 .. .. .. .. .. .. .. 6,610 2,822 9,432 1961-62 .. .. 5,600 2,400 8,000 .. 7,500 7,500 -18 -18 -36 .. .. .. .. .. .. 5,582 9,882 15,464 1962-63 242 104 346 1,841 789 2,630 .. 11,917 11,917 1,828 772 2,600 1,781 2,544 4,325 .. .. .. 5,692 16,126 21,818 1963-64 .. .. .. .. .. .. 12,100 12,100 2,090 885 (d)2,975 3,099 4,427 7.526 .. .. .. 5,189 17,412 22,601 1964-65 .. .. .. .. .. .. 3,016 3,016 3,143 1,333 (e)4,476 4,227 6,038 10,265 .. .. .. 7,370 10,387 17,757 1965-66 .. .. .. .. .. .. .. .. 4,515 1,916 6,431 7,340 10,487 17,827 .. .. .. 11,855 12,403 24,258 1966-67 .. .. .. .. .. .. .. 4,868 2,061 6,929 7,410 10,586 17,996 .. .. .. 12,278 12,647 24,925 1967-68 8,250 .. 8,250 .. .. .. .. 578 578 4,663 1.965 6,628 8,012 11,446 19,458 .. .. .. 20,925 13,989 34,914 1968-69 1,750 .. 1,750 .. .. .. .. .. .. 6,243 2,635 8,878 3,443 4,919 8,362 .. .. .. 11,436 7,554 18,990 1969-70.. .. .. .. .. .. .. .. .. 8,582 3,630 12,212 3,253 4,647 7,900 .. .. .. 11,835 8,277 20,112 1970-71.. .. .. .. .. .. .. .. .. .. .. 1,468 580 (1)2,048 2,156 3,080 51236 .. .. .. 3,624 3,660 7.284 1971-72.. .. .. .. .. .. .. .. .. .. 752 272 1,024 819 1,169 1,988 1,274 1,820 3,094 2.845 3,261 6,106 1972-73.. .. .. .. .. .. .. .. .. .. .. .. 425 131 556 515 735 1,250 476 680 1,156 1,416 1,546 2,962 1973-74(g) .. .. .. .. .. .. .. .. .. .. 259 60 319 209 299 508 .. .. .. 4683591 827 1974-75(estimate) .. .. .. .. .. .. .. .. .. 683 242 925 143 205 348 .. .. .. 826 447 1,273
No= for railways made to Queensland. Figures for grants are increased and for loans decreased in each year after 1951-52 by the rebates allowable under clause 16 (3.) of the Agreement. Includes a contribution of $28,000 towards preliminary survey work. Includes advance of $16,000 repaid in 1964-65. Expenditure less repayment of advance of $16,000 made in 1963-64.
(I) Expenditure less repayment of $322,500 in 1971-72. (g) Excludes payments for railway projects to be made under the program of assistance for urban public transport. Sec Chapter IV.

TABLE 125.-DEBT CHARGES PAID BY STATES ON LOANS MADE FOR RAILWAY CONSTRUCTION PROJECTS, 1952-53 TO 1974-75(a) $,000
New South Wales(b) Victoria Queensland(b) South Australia Western Australia Tasmania Total
Interest Capital Total Interest Capital Total Interest Capital Total Interest Capital Total Interest Capital Total Interest Capital Total Interest Capital Total
.. .. .. .. .. .. .. 24 11 35 .. .. .. .. .. .. 24 11 35
.. .. .. .. .. .. .. 51 22 73 .. .. .. .. .. .. 51 22 73
.. .. .. .. .. .. .. 70 30 100 .. .. .. .. .. 70 30 100
.. .. .. .. .. . .. 84 36 120 .. .. .. .. .. .. 84 36 120
.. .. .. .. .. .. .. 94 40 134 .. .. .. .. .. 94 40 134
.. .. .. .. .. .. .. 104 44 148 .. .. .. .. .. 104 44 148 1958-59 .. 7 3 10 7 3 10 .. .. .. 119 51 170 .. .. .. .. .. .. 133 57 190
13 44 32 12 44 .. .. .. 124 53 177 .. .. .. .. .. 187 78 265 1960-61 86 .
34 120 86 35 121 .. .. 123 54 177 .. .. .. .. .. .. 295 123 418
1952-53..........
1961-62 160 63 223 160 63 223 129 .. 129 119 53 172 .. .. .. .. .. .. 568 179 747
1953-54 .......... 1954-55 ..........
1962-63 217 87 304 217 87 304 721 .. 721 117 53 170.. .. .. .. .. .. 1,272 227 1,499
1955-56 ..........
1963-64 235 96 331 234 96 330 1.341 .. 1,341 153 69 222 161 15 176 .. .. .. 2,124 276 2,400 1964-65 230 96 326 230 96 326 1,797 50 6 2,303 191 85 276 391 42 433 .. .. .. 2,839 825 3,664
1956-57 ..........
1965-66 225 96 321 225 96 321 1,858 1,009 2,867 257 108 365 727 78 805 .. .. .. 3,292 1.387 4,679
1957-58 ..........
1966-67 220 96 316 220 96 316 1,802 1,065 2,867 353 142 495 1,320 141 1,461 .. .. 3,915 1,540 5,455
1959-60 ......31
1967-68 215 96 311 215 96 311 1.742 1,150 2,892 454 178 632 1,813 204 2,017 .. .. .. 4,439 1,724 6,163 1968-69 210 96 306 210 96 306 1,710 1,208 2,918 549 213 762 2,263 273 2,536 .. 4,942 1,886 6,828 1969-70 205 96 301 205 96 301 1,642 1,276 2,918 680 262 942 2,584 1,281 3,865 .. .. .. 5,316 3,011 8,327 1970-71 200 96 296 200 96 296 1,571 1,347 2,918 920 333 1,253 2,874 1,360 4,234 .. .. .. 5,765 3,232 8,997 1971-72 195 96 291 195 96 291 1,496 1,422 2.918 943 344 1,287 2,971 1,628 4,599 1 1 5,801 3.586 9,387 1972-73 191 96 287 191 96 287 1,417 1,501 2,918 94! 350 1,291 2,942 1,724 4,666 113 72 185 5,795 3,839 9,634 1973-74 186 96 282 18696 282 1,333 1,585 2,918 925 352 1,277 2,908 1,818 4,727 144 83 227 5,682 4,030 9,713 1974-75 (estimate) 181 96 277 181 96 277 1,245 1,673 2,918 912 354 1,265 2,904 1,941 4,846 139 83 222 5,562 4,243 9,805
(a) For description of repayment provisions for these loans, see Chapter IV and Appendix IV. (6) Excludes debt charges for loans made for Grafton-South Brisbane railway.
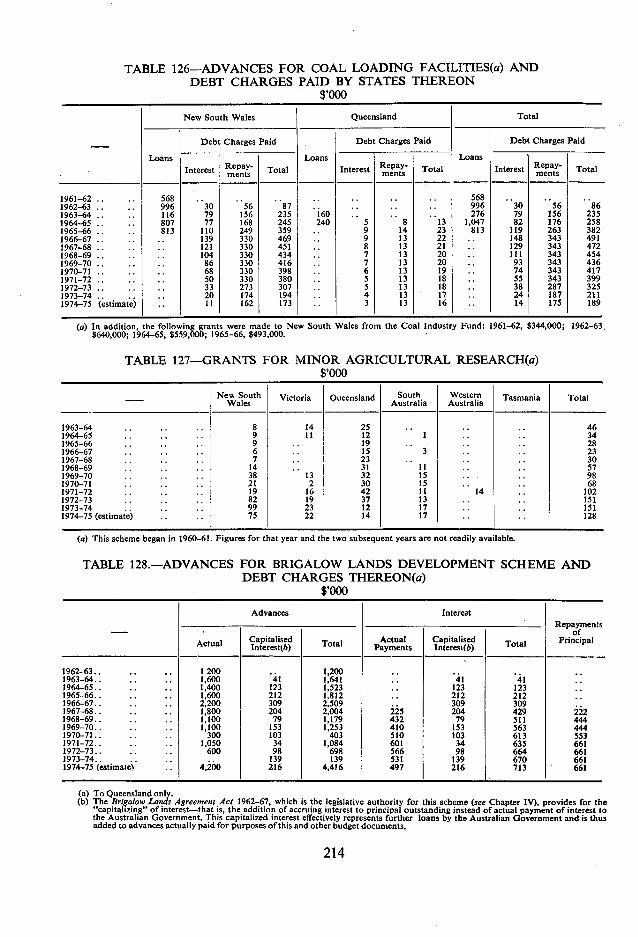
TABLE 126—ADVANCES FOR COAL LOADING FACILITIES(a) AND DEBT CHARGES PAID BY STATES THEREON
$,000
New South Wales Queensland Total
Debt Charges Paid Debt Charges Paid Debt Charges Paid
Loans Loans Loans Interest Total Interest Tmentsotal Interest Total
961-62 .. 568 .. .. ..
ments
1
ments
.. .. .. .. 568 1962-63 .. .. 996 30 56 87.. .. .. .. 996 30 56 86 1963-64 .. .. 116 79 156 235 160 .. .. .. 276 79 156 235 964-65 .. .. 807 77 168 245 240 5 8 13 1,047 82 176 258
1965-66 .. .. 813 110 249 359 .. 9 14 23 813 119 263 382 1966-67 .. .. 139 330 469 .. 9 13 22 .. 148 343 491 1967-68 .. . 121 330 451 .. 8 13 21 129 343 472 1968-69 104 330 434 .. 7 13 20 .. III 343 454 1969-70 .. .. 86 330 416 .. 7 13 20 .. 93 343 436 1970-71 .. .. 68 330 398 .. 6 13 19 .. 74 343 417 1971-72 .. .. 50 330 380 .. 5 13 18 .. 55 343 399 1972-73 .. .. 33 273 307 .. 5 13 18 .. 38 287 325 1973-74 .. .. 20 174 194 .. 4 13 17 .. 24 187 211 1974-75 (estimate) 11 162 173 .. 3 13 16 .. 14 175 189
(a) In addition, the following grants were made to New South Wales from the Coal Industry Fund: 1961-62, $344,000; 1962-63. $640,000; 1964-65, $559,000; 1965-66, $493,000.
TABLE 127—GRANTS FOR MINOR AGRICULTURAL RESEARCH(a) $,000
- Ne South Wales Victoria Queensland South
Australia Western Australia Tasmania Total
1963-64 .. .. .. 8 14 25 .. .. .. 46 1964-65 .. .. .. 9 11 12 1 .. .. 34 1965-66 .. .. .. 9 .. 19 .. .. .. 28 1966-67 .. .. .. 6 .. 15 3 .. . . 23 1967-68 .. .. .. 7 .. 23 .. .. .. 30 1968-69 .. .. .. 14 .. 31 11 .. .. 57 1969-70 .. .. .. 38 13 32 15 .. .. 98 1970-71 .. .. .. 21 2 30 15 .. .. 68 1971-72 .. .. .. 19 16 42 11 14 .. 102 1972-73 .. .. . . 82 19 37 13 .. .. 151 1973-74 .. .. .. 99 23 12 17 .. .. 151 1974-75 (estimate) .. .. 75 22 14 17 .. .. 128
(a) This scheme began in 1960-61. Figures for that year and the two subsequent years are not readily available.
TABLE 128.—ADVANCES FOR BRIGALOW LANDS DEVELOPMENT SCHEME AND DEBT CHARGES THEREON(a)
$,000
- Advances Interest
Repayments of
Actual Capitalised Total Actual Capitalised Total Principal Interest(b) Payments Interest(b)
1962-63.. .. .. 1200 .. 1,200 .. 1963-64.. .. .. 1,600 41 1,641 .. 41 41 1964-65.. .. .. 1,400 123 1,523 .. 123 123 1965-66.. .. .. 1,600 212 1,812 .. 212 212 1966-67.. .. .. 2,200 309 2,509 .. 309 309 1967-68.. .. .. 1,800 204 2,004 225 204 429 222 1968-69.. .. .. 1,100 79 1,179 432 79 511 444 1969-70.. .. .. 1,100 153 1,253 410 153 563 4.44 1970-71.. .. .. 300 103 403 510 103 613 553 1971-72.. .. .. 1,050 34 1,084 601 34 635 661 1972-73.. .. .. 600 98 698 566 98 664 661 .1973-74.... .. .. 139 139 531 139 670 661 1974-75 (estimate) .. 4,200 216 4,416 497 216 713 661
To Queensland only. The Brigalow Lands Agreement Act 1962-67, which is the legislative authority for this scheme (see Chapter IV), provides for the "capitalizing" of interest—that is, the addition of accruing interest to principal outstanding instead of actual payment of interest to the Australian Government. This capitalized interest effectively represents further loans by the Australian Government and is thus added to advances actually paid for purposes of this and other budget documents.
214
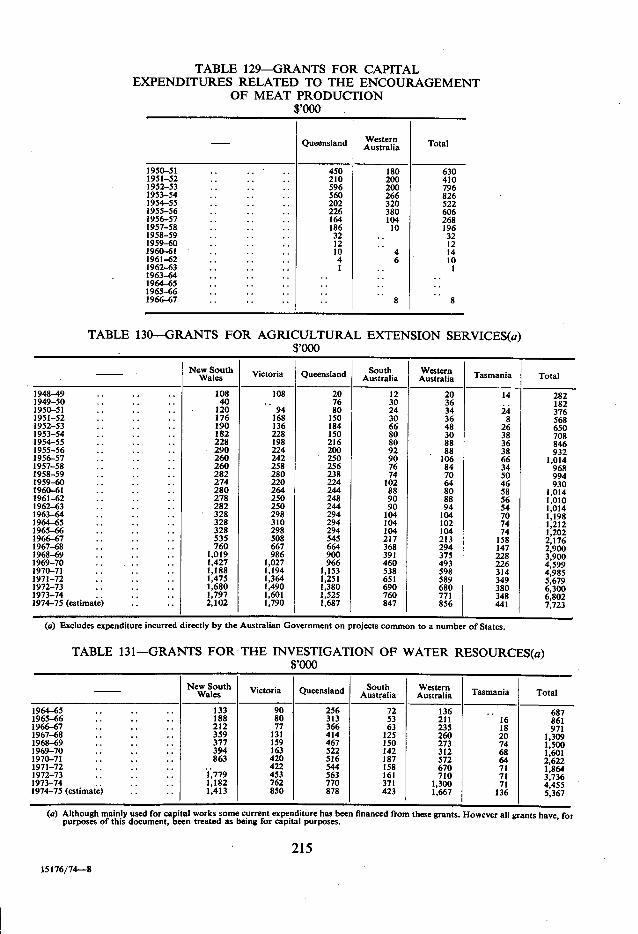
TABLE 129-GRANTS FOR CAPITAL EXPENDITURES RELATED TO THE ENCOURAGEMENT
OF MEAT PRODUCTION $,000
- Queensland Westerp Australia Total
1950-51 .. .. 450 180 630 1951-52 .. .. 210 200 410 1952-53 .. .. .. 596 .200 796 1953-54 .. .. 560 266 826 1954-55 .. .. 202 320 522 1955-56 .. .. .. 226 380 606 1956-57 .. .. .. 164 104 268 1957-58 .. .. 186 10 196 1958-59 .. .. .. 32 .. 32 1959-60 .. .. 12 .. 12 1960-61 .. .. 10 4 14 1961-62 .. . .. 4 6 10 1962-63 .. .. .. I .. 1963-64 .. .. 1964-65 .. .. .. 1965-66 .. .. .. 1966-67 .. .. .. 8 8
TABLE 130-GRANTS FOR AGRICULTURAL EXTENSION SERVICES(a) $
1000
Wales
1948-49
New South Victoria Queensland Australia South Western Tasmania Total
.. 108 108 20 12 20 14 282 1949-50 .. 40 .. 76 30 36 .. 182 1950-51 .. 120 94 80 24 34 24 376 1951-52 .. 176 168 150 30 36 8 568 1952-53 .. 190 136 184 66 48 26 650 1953-54 .. 182 228 150 80 30 38 708 1954-55 .. 228 198 216 80 88 36 846 1955-56 .. 290 224 200 92 88 38 932 1956-57 .. 260 242 250 90 106 66 1,014 1957-58 .. 260 258 256 76 84 34 968 1958-59 .. 282 280 238 74 70 50 994 1959-60 .. 274 220 224 102 64 46 930 1960-61 .. 280 264 244 88 80 58 1,014 1961-62 .. 278 250 248 90 88 56 1,010 1962-63 .. 282 250 244 90 94 54 1,014 1963-64 .. 328 298 294 104 104 70 1.198 1964-65 .. 328 310 294 104 102 74 . 1,212 1965-66 .. 328 298 294 104 104 74 1,202 1966-67 .. 535 508 545 217 213 158 2,176 1967-68 .. 760 667 664 368 294 147 2,900 1968-69 .. 1,019 986 900 391 375 228 3,900 1969-70 .. 1,427 1,027 966 460 493 226 4,599 1970-71 .. .. .. 1,188 1,194 1,153 538 598 314 4,985 1971-72 .. .. .. 1,475 1,364 1,251 651 589 349 5,679 1972-73 .. .. .. 1,680 1,490 1,380 690 680 380 6,300 1973-74 .. .. .. 1,797 1,601 1,525 760 771 348 6,802 1974-75 (estimate) .. .. 2,102 1,790 1.687 847 856 441 7,723
(a) Excludes expenditure incurred directly by the Australian Government on projects common to a number of States.
TABLE 131-GRANTS FOR THE INVESTIGATION OF WATER RESOURCES(a) $,000
New South Wales Victoria Queensland South
Australia Western Australia Tasmania Total
1964-65 ,, .. .. 133 90 . 256 72 136 .. 687 1965-66 .. .. .. 188 80 313 53 211 16 861 1966-67 .. .. .. 212 77 366 63 235 18 971 1967-68 .. 359 131 414 125 260 20 1,309 1968-69 .. .. .. 377 159 467 150 273 74 1,500 1969-70 .. .. .. 394 163 522 142 312 68 1,601 1970-71 .. .. .. 863 420 516 187 572 64 2,622 1971-72 .. .. .. .. 422 544 158 670 71 1,864 1972-73 .. .. .. 1 ,779 453 563 161 710 71 3,736 1973-74 .. .. .. 1,I82 762 770 371 1,300 71 4,455 1974-75 (estimate) .. .. 1,413 850 878 423 1,667 136 5,367
(a) Although mainly used for capital works some current expenditure has been financed from these grants. However all grants have, for purposes of this document, been treated as being for capital purposes.
215 15176/74-8
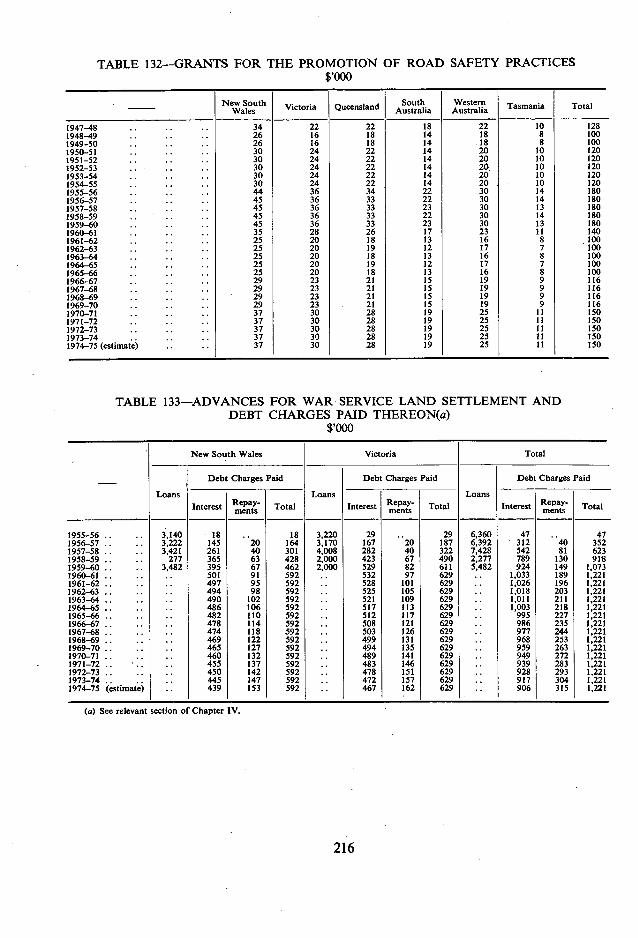
TABLE 132-GRANTS FOR THE PROMOTION OF ROAD SAFETY PRACTICES $,000
New South Victoria Queensland South Australia
Western Tasmania Total Wales
1947-48 .. 34 22 22 18 22 10 128 1948-49 .. 26 16 18 14 18 8 100 1949-50 .. 26 16 18 14 18 8 100 1950-51 .. 30 24 22 14 20 10 120 1951-52 .. 30 24 22 14 20 10 120 1952-53 .. 30 24 22 14 20, 10 120 1953-54 .. 30 24 22 14 20 10 120 1954-55 .. 30 24 22 14 20 10 120 1955-56 .. 44 36 34 22 30 14 180 1956-57 .. 45 36 33 22 30 14 180 1957-58 .. 45 36 33 23 30 13 180 1958-59 .. 45 36 33 22 30 14 180 1959-60 .. 45 36 33 23 30 13 180 1960-61 .. 35 28 26 17 23 11 140 1961-62 .. 25 20 18 13 16 8 100 1962-63 .. 25 20 19 12 17 7 100 196344 .. 25 20 18 13 16 8 100 1964-65 .. 25 20 19 12 17 7 100 1965-66 .. 25 20 18 13 16 8 100 1966-67 .. 29 23 21 15 19 9 116 1967-68 .. 29 23 21 15 19 9 116 1968-69 .. 29 23 21 15 19 9 116 1969-70 .. 29 23 21 15 19 9 116 1970-71 .. 37 30 28 19 25 Ii 150 1971-72 .. 37 30 28 19 25 II 150 1972-73 .. 37 30 28 19 25 11 150 1973-74 .. 37 30 28 19 25 11 150 1974-75 (estimate) .. 37 30 28 19 25 11 150
TABLE 133-ADVANCES FOR WAR SERVICE LAND SETTLEMENT AND DEBT CHARGES PAID THEREON(a)
$,000
New South Wales Victoria Total
- Debt Charges Paid Debt Charges Paid Debt Charges Paid
Loans Loans Loans Interest Total Interest Total Interest Total
1955-56 .. 3,140 18 .. 18 3,220 29 .. 29 6,360 47 .. 47 1956-57 .. 3,222 145 20 164 3,170 167 20 187 6,392 312 40 352 1957-58 .. 3,421 261 40 301 4,008 282 40 322 7,428 542 81 623 1958-59 .. 277 365 63 428 2,000 423 67 490 2.277 789 130 918 1959-60 .. 3,482 395 67 462 2,000 529 82 611 5,482 924 149 1,073 1960-61 501 91 592 .. 532 97 629 .. 1,033 189 1,221 1961-62 497 95 592 .. 528 101 629 .. 1,026 196 1,221 1962-63 .. 494 98 592 .. 525 105 629 .. 1,018 203 1,221 1963-64 490 102 592 .. 521 109 629 .. 1,011 211 1,221 1964-65 486 106 592 .. 517 113 629 .. 1,003 218 1,221 1965-66 482 110 592 .. 512 117 629 .. 995 227 1,221 1966-67 478 114 592 .. 508 121 629 .. 986 235 1,221 1967-68 474 118 592 .. 503 126 629 .. 977 244 1.221 1968-69 469 122 592 .. 499 131 629 .. 968 253 1,221 1969-70 .. 465 127 592 .. 494 135 629 .. 959 263 1,221 1970-71 .. 460 132 592 .. 489 141 629 .. 949 272 1,221 1971-72 ... 455 137 592 .. 483 146 629 .. 939 283 1,221 1972-73 450 142 592 .. 478 151 629 .. 928 293 1,221 1973-74 445 147 592 .. 472 157 629 .. 917 3041,221 1974-75 (estimate) .. 439 153 592 .. 467 162 629 .. 906 315 1,221
(a) See relevant section of Chapter IV.
216
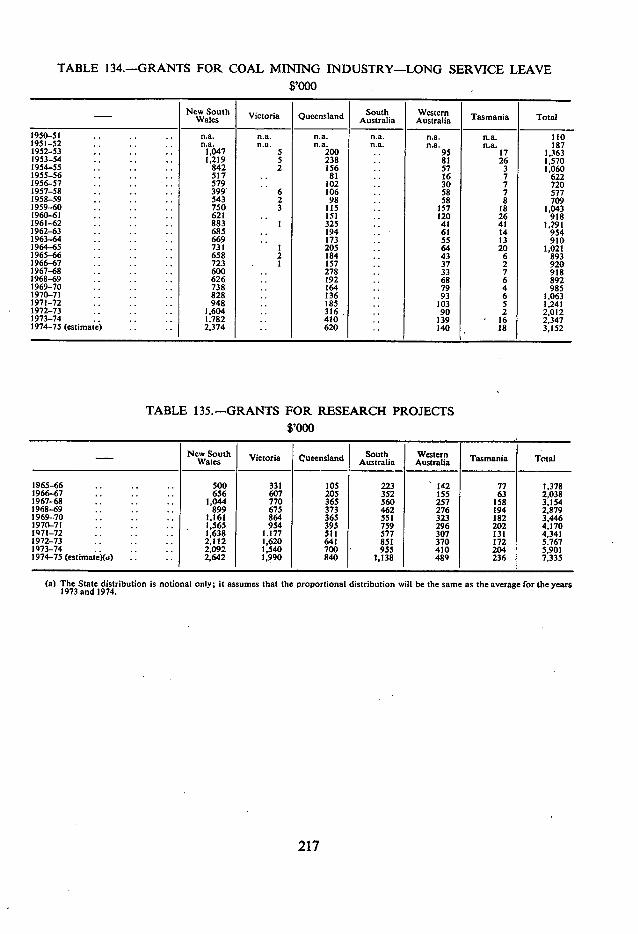
TABLE 134.-GRANTS FOR COAL MINING INDUSTRY-LONG SERVICE LEAVE $,000
New South Victoria Queensland South Australia TasmaniaWales Vestes
ustralia Total
1950-51 n.a. n.a. n.a. n.a. n.a. n.a. 110 1951-52 .. n.a. n.a. n.a. n.a. n.a. n.a. 187 1952-53 .. .. .. 1,047 5 200 .. 95 17 1,363 1953-54 .. .. .. 1,219 5 238 81 26 1.570 1954-55 .. .. 842 2 156 .. 57 3 1,060 1955-56 .. .. 517 .. 81 .. 16 7 622 1956-57 .. .. 579 102 .. 30 7 720 1957-58 .. .. .. 399 6 106 .. 58 7 577 1958-59 543 2 98 58 8 709 1959-60 .. .. .. 750 3 115 .. 157 18 1,043 1960-61 .. .. .. 621 .. 151 .. 120 26 918 1961-62 .. .. .. 883 I 325 .. 41 41 1.291 1962-63 .. .. 685 .. 194 .. 61 14 954 1963-64 .. .. .. 669 .. 173 .. 55 13 910 1964-65 .. .. 731 1 205 64 20 1,021 1965-66 .. .. .. 658 2 184 .. 43 6 893 1966-67 .. 723 1 157 .. 37 2 920 1967-68 600 .. 278 .. 33 7 918 1968-69 .. .. .. 626 .. 192 .. 68 6 892 1969-70 738 164 .. 79 4 985 1970-71 .. .. 828 136 .. 93 6 1,063 1971-72 .. .. 948 185 .. 103 5 1,241 1972-73 .. .. 1,604 316 .. 90 2 2,012 1973-74 .. .. .. 1.782 .. 410 .. 139 16 2,347 1974-75 (estimate) .. .. 2,374 .. 620 .. 140 18 3,152
TABLE 135.-GRANTS FOR RESEARCH PROJECTS $,000
- New South Wales Victoria Cueentland South
Australia Western Australia Tasmania Total
1965-66 .. .. .. 500 331 lOS 223 142 77 1.378 1966-67 .. .. 656 607 205 352 155 63 2,038 1967-68 .. .. .. 1,044 770 365 560 257 158 3,154 1968-69 .. .. 899 675 373 462 276 194 2,879 1969-70 .. .. .. 1.161 864 365 551 323 182 3,446 1970-71 .. .. .. 1,565 954 395 759 296 202 4,170 1971-72 .. .. .. 1,638 1.177 511 577 307 131 4,341 1972-73 .. .. .. 2,112 1,620 641 851 370 172 5.767 1973-74 .. .. .. 2,092 1,540 700 955 410 204 5,901 1974-75 (estimate)(u) .. .. 2,642 1,990 1140 1.138 489 236 7.335
(a) The State distribution is notional only; it assumes that the proportional distribution will be the same as the average for the years 1973 and 1974.
217
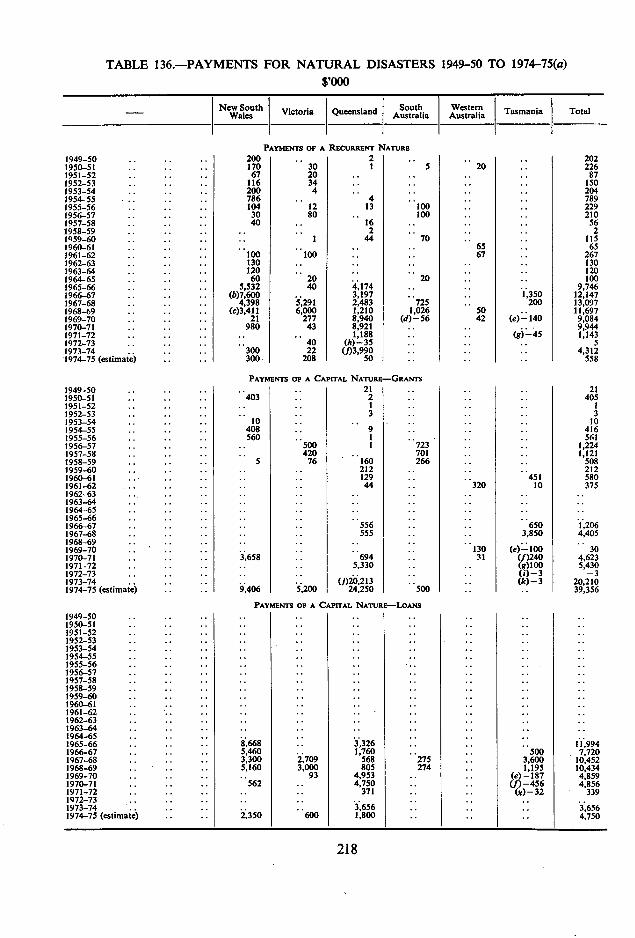
500 3,600 1,195
(e)-187 (f)-456
(g)-32
11.994 7,720
10,452 10,434 4,859 4,856
339
3,656 4,750
TABLE 136.-PAYMENTS FOR NATURAL DISASTERS 1949-50 TO 1974-75(a) $'OOO
New South I Vi South Western I Victoria Queensland I Australia Australia I Tasmania Total - I Wales I
PAYMENTS OF A RECURRENT NATURE 200 .. 2 170 30 1 5 67 20 .. -.
116 34 200 4 786 4 104 12 13 100 30 80 100 40 .. 16
2 1 44 70
100 100 130 120 60 20 -. 20
5,532 40 4,174 (b)7,600 .. 3,197
4,398 5,291 2,483 725 (c)3,411 6,000 1,210 1,026
21 277 8,940 (d)-56 980 43 8,921
.. 1,188 40 (h)-35
300 22 (1)3,990 300 208 50
PAYMENTS OF A CAPITAL NATURE-GRANTs 21
403 - 2
3 10 .. -
408 9 560 1
500 1 723 420 -. 701
5 76 160 266 212 -. 129 44 -.
556 - 555 - -
3,658 694 -. 5,330
(1)20,213 9,406 5,200 24,250 500
PAYMENTS OF A CAPITAL NATURE-LOANS
8,668 3,326 5,460 . 1,760 3,300 2,709 568 275 5,160 3,000 805 274
93 4,953 - 562 4,750
371
3,656 2,350 600 1,800
1949-50 1950-SI 1951-52 1952-53 1953-54 1954-55 1955-56 1956-57 1957-58 1958-59 1959-60 1960-61 1961-62 1962-63 1963-64 1964-63 1965-66 1966-67 1967-68 1968-69 1969-70 1970-71 1971-72 1972-73 1973-74 1974-75 (estimate)
1949-SO 1950-SI 1951-52 1952-53 1953-54 1954-55 1955-56 1956-57 1957-58 1958-59 1959-60 1960-61 1961-62 1962-63 1963-64 1964-65 1965-66 1966-67 1967-68 1968-69 1969-70 1970-71 1971-72 1972-73 1973-74 1974-75 (estimate)
1949-50 1950-51 1951-52 1952-53 1953-54 1954-55 1955-56 1956-57 1957-58 -. 1958-59 -. 1959-60 1960-61 1961-62 1962-63 1963-64 1964-65 1965-66 1966-67 1967-68 1968-69 1969-70 1970-71 1971-72 1972-73 1973-74 1974-75 (estimate)
20
65 67
50 42
320
130 31
1,350 200
(e)- 140
(g)-45
451 10
650 3,850
(4-100 (f)240 (g)100 (i)-3 (k)-3
202 226 87
150 204 789 229 210 56 2
115 65
267 130 120 100
9,746 12,147 13,097 11,697 9,084 9,944 1,143
4,312 558
21 405
3 10
416 561
1,224 1,121
508 212 580 375
1,206 4,405
30 4,623 5,43
20,210 39,356
218
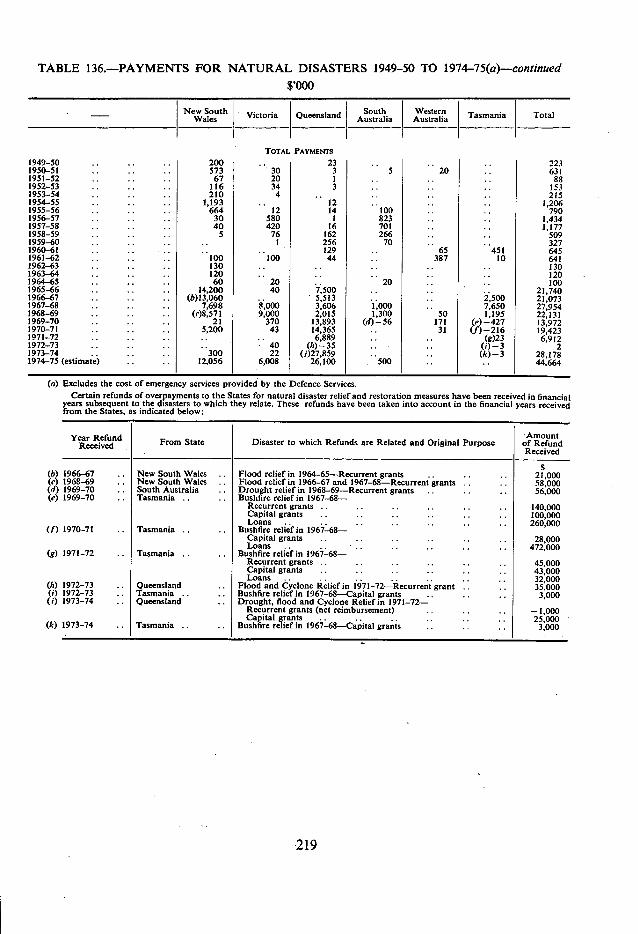
TABLE 136.-PAYMENTS FOR NATURAL DISASTERS 1949-50 TO 1974-75(a)-continued 8'OOO
I New South Victoria Queensland Australia Australia South Western Tasmania Total I
- Wales
TOTAL. PAYMENTS 1949-50 .. .. 200 .. 23 I 223 1950-51 .. .. 573 30 3 5 20 .. 631 1951-52 .. .. 67 20 1 .. .. 88 1952-53 .. .. 116 34 3 153 1953-54 .. 210 4 215 1954-55 .. .. .. 1,193 12 .. .. 1,206 1955-56 .. . 664 12 14 100 .. 790 1956-57 .. .. 30 580 I 823 .. 1,434 1957-58 .. .. .. 40 420 16 701.. .. 1,177 1958-59 .. .. .. 5 76 162 266 .. .. 509 1959-60 .. .. .. .. 1 256 70 327 1960-61 .. .. 129 65 451 645 1961-62 .. .. 100 100 44 .. 387 10 641 1962-63 .. .. .. 130 .. .. .. .. .. 130 1963-64 .. .. .. 120 .. .. .. .. .. 120 1964-65 .. .. .. 60 20 .. 20 .. .. 100 1965-66 .. .. .. 14,200 40 7,500 .. .. 21,740 1966-67 .. .. .. (6)13,060 .. 5,513 .. .. 2,500 21,073 1967-68 .. .. .. 7,698 8,000 3,606 1,000 .. 7,650 27,954 1968-69 .. .. . (r)8,571 9,000 2,015 1,300 50 1,195 22,131 1969-70 .. .. .. 21 370 13,893 (d)-56 171 (e)-427 13,972 1970-71 .. .. .. 5,200 43 14,365 .. 31 (f)-216 19,423 1971-72 .. .. .. .. .. 6,889 .. .. (g)23 6,912 1972-73 .. .. .. .. 40 (h)-35 .. .. (i)-3 2 1973-74 .. .. .. 300 22 (1)27,859 .. .. (k)-3 28,178 1974-75 (estimate) .. .. 12.056 6,008 26,100 500 .. .. 44.664
(a) Excludes the cost of emergency services provided by the Defence Services. Certain refunds of overpayments to the States for natural disaster relief and restoration measures have been received in financial
years subsequent to the disasters to which they relate. These refunds have been taken into account in the financial years received from the States, as indicated below:
Year Refund Received From State Disaster to which Refunds are Related and Original Purpose
Amount of Refund Received
S 1966-67 .. New South Wales .. Flood relief in 1964-65-Recurrent grants .. .. .. 21,000 1968-69 .. New South Wales .. Flood relief in 1966-67 and 1967-68-Recurrent grants .. .. 58,000
(.1) 1969-70 .. South Australia .. Drought relief in 1968-69-Recurrent grants .. .. .. 56,000 (e) 1969-70 .. Tasmania .. .. Bushfire relief in 1967-68-
Recurrent grants .. .. .. .. .. .. 140,000 Capital grants .. .. .. .. .. .. 100,000 Loans .. .. .. .. .. .. . 260,000 (1) 1970-71 .. Tasmania .. .. Bushfire relief in 1967-68- Capital grants .. .. .. .. .. . 28,000 Loans .. .. .. .. .. .. .. 472.000
1971-72 .. Tasmania .. .. Bushfire relief in 1967-68- Recurrent grants .. .. .. .. .. .. 45,000 Capital grants .. .. .. .. .. .. 43,000 Loans .. .. .. .. .. .. 32,000
1972-73 .. Queensland .. Flood and Cyclone Relief in 1971-72-Recurrent grant .. .. 35.000 1972-73 .. Tasmania .. .. Bushfire relief in 1967-68-Capital grants .. .. .. 3,000 (i) 1973-74 .. Queensland .. Drought, flood and Cyclone Relief in 1971-72-
Recurrent grants (net reimbursement) .. .. -1,000 Capital grants .. .. .. .. .. .. 25,000
(k) 1973-74 .. Tasmania .. .. Bushfire relief in 1967-68-Capital grants .. .. 3,000
219
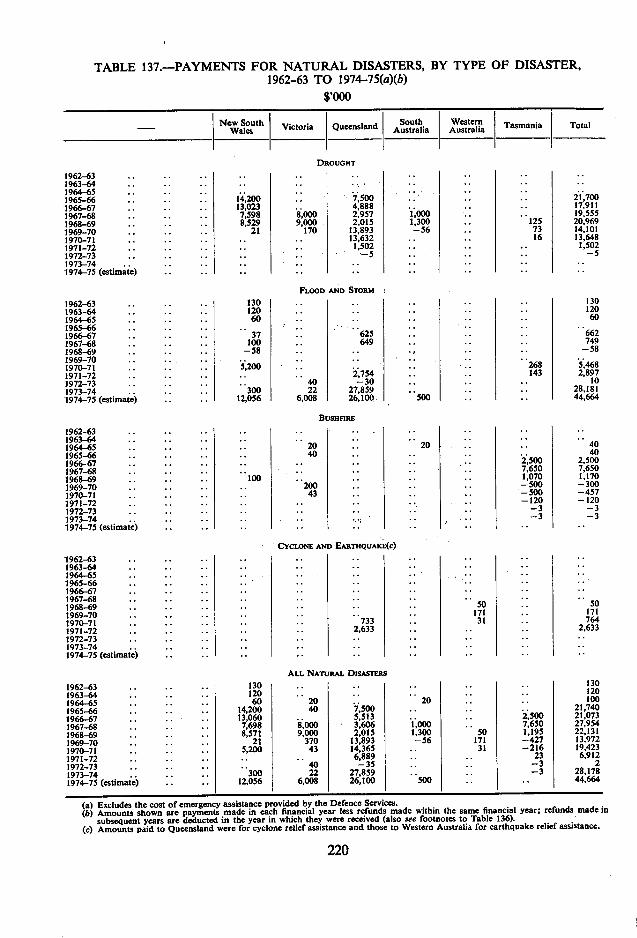
1962-63 1963-64 1964-65 1965-66 1966-67 1967-68 1968-69 1969-70 1970-71 1971-72 1972-73 1973-74 1974-75 (estimate)
1962-63 1963-64 1964-65 1965-66 1966-67 1967-68 1968-69 1969-70 1970-71 1971-72 1972-73 1973-74 1974-75 (estimate)
1962-63 1963-64 1964-65 1965-66 1966-67 1967-68 1968-69 1969-70 1970-71 1971-72 1972-73 1973-74 1974-75 (estimate)
1962-63 1963-64 1964-65 1965-66 1966-67 1967-68 1968-69 1969-70 1970-il 1971-72 1972-73 1973-74 1974-75 (estimate)
130 120 60
37 100 -58
5,200
300 12,056
40 22
6,008
Bu
20 40
200 43
CYCLONE AN
ALL NATS
20 40
000 9,000
370 43
40 22
6,008
130 120 60
14,200 13,060 7,698 8,571
21 5,200
300 12,056
268 143
500
i 20
2,500 7,650 1,070 -500 -500 -120
-3 -3
50 171
31
TABLE 137.-PAYMENTS FOR NATURAL DISASTERS, BY TYPE OF DISASTER, 1962-63 TO 1974-75(a)(b)
$,000
New South Victoria Queensland Australia South Western Tasmania Total Wales
DROUGHT 1962-63 .. .. .. .. 1963-64 .. .. .. .. .. 1964-65 .. .. 1965-66.. .. .. .. ..
14,200 .. ..
.. 7,500
..
.. .. .. 21,700 13,023 4,888.. .. .. 17.911
1967-68 .. .. .. 7,598 8,000 2,957 1,000 .. .. 19,555 1968-69 .. .. .. 8,529 9,000 2,015 1,300 .. 125 20,969 1969-70 .. .. .. 21 170 13,893 -56 .. 73 14.101 1970-71 .. .. .. .. 13,632 .. . 16 13,648 1971-72 .. .. .. .. .. 1,502 .. .. .. 1,502 1972-73 .. .. .. .. .. -5 .. .. .. -5 1973-74 .. .. .. .. .. .. .. 1974-75 (estimate) .. .. .. .. ,•
FLOOD AND STORM
625 649
2,754 -30
27,859 26,100.
JSHFIRE
D EARTHQUAKI
733 2,633
RAL DISASTERS
20 7,500 5,513 .. .. 2,500 3,606 1,000 .. 7,650 2,015 1,300 50 1,195
13,893 -56 171 -427 14,365 .. 31 -216 6,889 .. .. 23 -35 .. .. -3
27,859 .. .. -3 26,100 500
130 120 60
662 749 -58
5,468 2,897
10 28,181 44,664
40 40
2.500 7,650 1,170 -300 -457 -120
50 Ill 764
2,633
130 120 100
21,740 21,073 27,954 22,131 13.972 19.423 6,912
2 28,178 44,664
Excludes the cost of emergency assistance provided by the Defence Services. Amounts shown are payments made in each financial year less refunds made within the same financial year; refunds made in subsequent years are deducted in the year in which they were received (also see footnotes to Table 136). Amounts paid to Queensland were for cyclone relief assistance and those to Western Australia for earthquake relief assistance.
OR

APPENDIX V—TABLES OF ADVANCES, DEBT CHARGES ON ADVANCES NET ADVANCES AND NET PAYMENTS
TABLE No. SUBJECT
138 Six States Combined—Advances, Debt Charges on Advances and Net Advances, 1962-63 to 1974-75.
139 New South Wales—Advances, Debt Charges on Advances and Net Advances, 1962-63 to 1974-75.
140 Victoria—Advances, Debt Charges on Advances and Net Advances, 1962-63 to 1974-75.
141 Queensland—Advances, Debt Charges on Advances and Net Advances, 1962-63 to 1974-75.
142. South Australia—Advances, Debt Charges on Advances and Net Advances, 1962-63 to 1974-75.
143 Western Australia—Advances, Debt Charges on Advances and Net Advances, 1962-63 to 1974-75.
144 Tasmania—Advances, Debt Charges on Advances and Net Advances, 1962-63 to 1974-75.
145 Total Australian Government Loans to States and State Government Loan Council Borrowings—Net Basis, By States, 1956-57 to 1973-74.
146 Payments to the States and Loan Council Borrowings, Net Basis, 1956-57 to 1974-75.
147 State Governments, Debt Outstanding, 1956 to 1974.
221
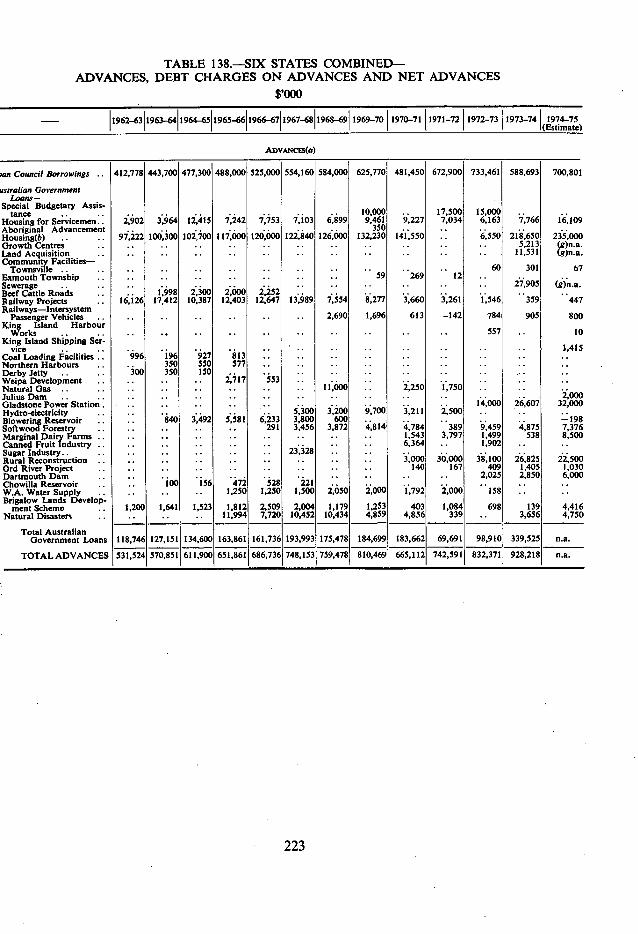
TABLE 138.-SIX STATES COMBINED- ADVANCES, DEBT CHARGES ON ADVANCES AND NET ADVANCES
$,000
1962-63 1963-64 1964-65 1965-66 1966-6711967-6811968-6911969-70 1970-71 1971-72 1972-73 1973-74 1974-75 (Estimate)
ADvANCES(a)
son Council Borrowings .. 412,778 443,700 477,300 488,000 525,000 554,160 584,000 625,770 481,450 672,900 733,461 588,693 700,801
astralian Government Loans-
Special Budgetary Assis- tance .. .. .. .. .. .. .. .. .. 10,000 .. 17,500 15,000
Housing for Servicemen.. 2,902 3,964 12,415 7,242 7,753 7,103 6,899 9,461 9,227 7,034 6,163 7,766 16,109 Aboriginal Advancement .. .. .. .. .. .. .. 350 .. .. Housing(b) .. .. 97,222 100,300 102,700 117,000 120,000 122,840 126,000 132,230 141,550 .. 6,550 218,650 235,000 Growth Centres .. .. .. .. .. .. .. .. .. .. .. .. 5,213 (g)n.a. Land Acquisition .. .. .. .. .. .. .. .. .. .. .. .. 11,531 (g)n.a. Community Facilities-
Townsville .. .. .. .. .. .. .. .. .. .. .. .. 60 301 67 Exmouth Township .. .. .. .. .. .. .. .. 59 269 12 Sewerage .. .. .. .. .. .. .. .. .. .. .. .. .. 27,905 (g)n.a. Beef Cattle Roads .. .. 1,998 2,300 2,000 2,252 .. .. .. .. .. Railway Projects .. 16,126 17,412 10,387 12,403 12,647 13,989 7,554 8,277 3,660 3,261 1,546 359 447 Railways-Intersystem
Passenger Vehicles .. .. .. .. .. .. .. 2,690 1,696 613 -142 784 905 800 King Island Harbour
Works .. .. .. .. .. .. .. .. .. .. .. .. 557 .. 10 King Island Shipping Ser-
vice .. .. .. .. .. .. .. .. .. .. .. .. .. .. 1.415 Coal Loading Facilities .. 996 196 927 813 .. .. .. .. .. .. Northern Harbours.. .. 350 550 577 .. .. .. .. .. .. Derby Jetty .. . 300 350 150 .. .. .. .. .. .. .. Weipa Development .. .. .. .. 2,717 553 .. .. .. .. .. Natural Gas .. .. .. .. .. .. .. .. 11,000 .. 2,250 1,750 Julius Dam .. .. .. .. .. .. .. .. .. .. .. .. .. .. 4000 Gladstone Power Station. .. .. .. .. .. .. .. .. .. .. 14,000 26,607 32,000 Hydro-electricity .. .. .. .. .. .. 5,300 3,200 9,700 3,211 2,500 Blowering Reservoir .. .. 840 3,492 5,581 6,233 3,800 600 .. . .. .. .. -198 Softwood Forestry .. .. .. .. -- 291 3,456 3,872 4,814 4
. ,784 389 9,459 4,875 7,376
Marginal Dairy Farms .. .. .. .. .. .. .. .. .. 1,543 3,797 1,499 538 8,500 Canned Fruit Industry.. .. .. .. .. .. .. .. .. 6,364 .. 1,902 Sugar Industry.. .. .. .. .. .. .. 23,328 .. .. .. .. Rural Reconstruction .. .. .. .. .. .. .. .. .. 3,000 30,000 38,100 26,825 22,500 Ord River Project .. .. .. .. .. .. .. .. .. 140 167 409 1,405 1,030 Dartmouth Dam .. .. .. .. -. .. .. .. .. .. .. 2,025 2,850 6,000 Chowilla Reservoir .. .. 100 156 472 528 221 .. . .. .. W.A. Water Supply .. .. .. .. 1,250 1,250 1,500 2,050 2
. ,000 1,792 2,000 158 Brigalow Lands Develop-
ment Scheme .. 1,200 1,641 1,523 1,812 2,509 2,004 1,179 1,253 403 1,084 698 139 4,416 Natural Disasters .. .. ,, .. 11,994 7,720 10,452 10,434 4,859 4,856 339 .. 3,656 4,750
Total Australian Government Loans 118,746 127,151 134,600 163,861 161,736 193,993 175,478 184,699 183,662 69,691 98,910 339,525 na.
TOTALADVANCES 531,524 570,851 611,900 651,861 686,736 748,153 759,478 810,469 665,112 742,591 832,371 928,218 n.a.
223
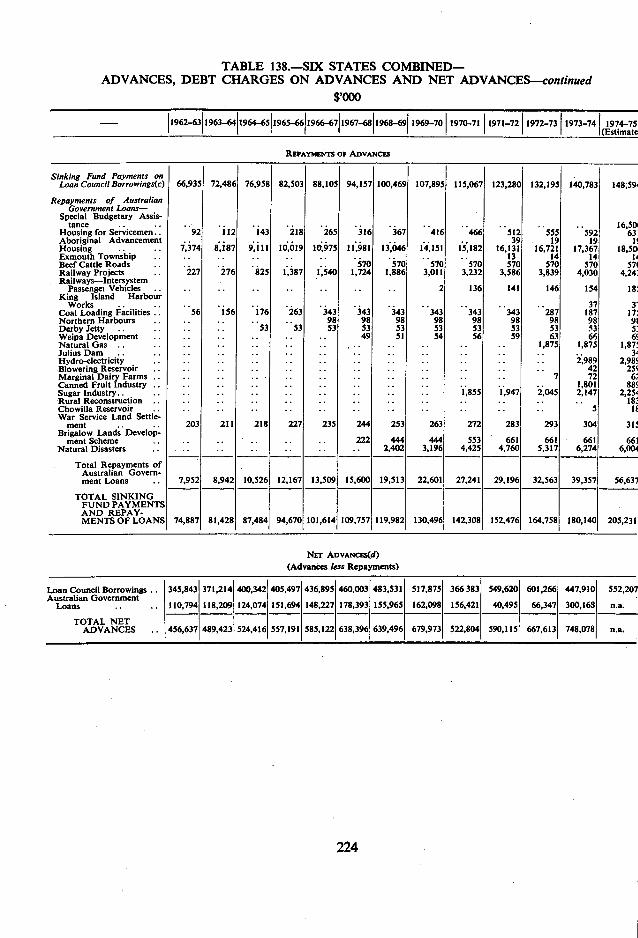
TABLE 138.-SIX STATES COMBINED- ADVANCES, DEBT CHARGES ON ADVANCES AND NET ADVANCES-continued
$,000
- 1962-63 1963-641964-65 1965-66 1966-67 1967-68 1968-69 1969-70 1970-71 1971-72 1972-73 1973-74 1974-75 (Estimate
REPAYMENTS OF ADVANCES
Sinking Fund Payments on Loan Council Borrowings(c) 66,935 72,486 76,958 82,503 88,105 94,157 100,469 107,895 115,067 123,280 132,195 140,783 148,59
Repayments of Australian Government Loans-
Special Budgetary Assis- tance . . .. 16,504
Housing for Servicemen 92 112 143 2 18 265 3 16 367 416 466 512 555 592 631 Aboriginal Advancement .. .. .. .. .. .. .. 39 19 19 1 Housing .. 7,374 8,187 9,111 10,019 10,975 11,981 13,046 14,151 15,182 16,131 16,721 17,367 18,504 Exmouth Township .. .. .. .. .. .. 13 14 14 1 Beef Cattle Roads .. .. .. 570 570 570
.. 570 570 570 570 57(
Railway Projects 227 276 825 1,387 1,540 1,724 1,886 3,011 3,232 3,586 3,839 4,030 4,241 Railways-Intersystem
Passenget Vehicles .. .. .. .. .. 2 136 141 146 154 18 King Island Harbour
Works .. .. .. .. .. .. .. .. .. .. 37 3 Coal Loading Facilities 56 156 176 263 343 343 343 343 343 343 287 187 17 Northern Harbours 98 98 98 98 98 98 98 98 91 Derby Jetty 53 53 53 53 53 53 53 53 53 53 5 Weipa Development 49 51 54 56 59 63 66 6c Natural Gas .. .. .. .. .. 1,875 1,875 1,87 Julius Dam .. .. .. .. .. .. .. .. .. .. .. .. .. 34 Hydro-electricity .. .. .. .. .. .. .. .. .. .. 2,989 2,985 Blowering Reservoir .. .. .. .. .. .. .. .. .. .. 42 25 Marginal Dairy Farms .. .. .. .. .. .. .. 7 72 62 Canned Fruit Industry .. .. .. .. .. .. .. .. .. .. .. .. 1,801 88 Sugar Industry.. .. .. .. .. .. .. .. .. .. 1,855 1,947 2,045 2,147 2,25 Rural Reconstruction .. .. .. .. .. .. .. .. .. .. .. .. .. 182 Chowilla Reservoir .. .. .. .. .. .. .. .. .. .. .. .. II War Service Land Settle-
ment .. .. 203 211 218 227 235 244 253 263 272 283 293 304 315 Brigalow Lands Develop-
ment Scheme .. .. .. .. .. .. 222 444 444 553 661 661 661 661 Natural Disasters .. .. .. ..
..........
.. .. .. 2,402 3,196 4,425 4,760 5,317 6,274 6,004
Total Repayments of Australian Govern- ment Loans .. 7,952 8,942 10,526 12,167 13,509 15,600 19,513 22,601 27,241 29,196 32,563 39,357 56,637
TOTAL SINKING FUND PAYMENTS AND REPAY- MENTS OF LOANS 74,887 81,428 87,484 94,670 101,614 109,757 119,982 130,496 142,308 152,476 164,758 180,140 205,231
NET ADVANCES(d) (Advances less Repayments)
Loan Council Borrowings .. 345,843 371,214 400,342 405,497 436,895 460,003 483,531 517,875 366383 549,620 601,266 447,910 552,207 Australian Government
Loans .. .. 110,794 118,209 124,074 151,694 148,227 178,393 155,965 162,098 156,421 40,495 66,347 300,165 na.
TOTAL NET ADVANCES .. 456,637 489,423 524,416 557,191 585,122 638,396 639,496 679,973 522,804 590,115 667,613 748,078 na.
224
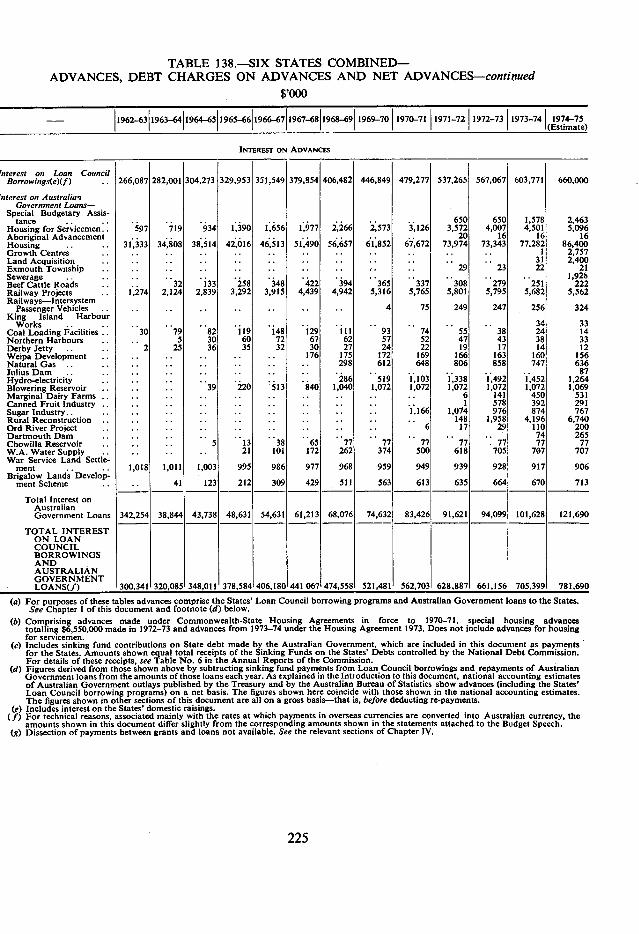
TABLE 138.-SIX STATES COMBINED- ADVANCES, DEBT CHARGES ON ADVANCES AND NET ADVANCES-continued
$,000
- 1962-63 1963-64 1964-65 1965-66 1966-67 1967-68 1968-69 1969-70 1970-71 1971-72 1972-73 1973-74 1974-75 (Estimate)
INTEREST ON ADVANCES
rnferesf on Loan Council Borrowings(e)(f) .. 266,087 282,001 304,273 329,953 351,549 379,854 406,482 446,849 479,277 537,265 567,067 603,771 660,000
nierest on Australia', Government Loans-
Special Budgetary Assis- tance .. .. .. .. .. .. .. . .. .. .. 650 650 1,578 2.463
Housing for Servicemen.. 597 719 934 1,390 1,656 1,977 2,266 2,573 3,126 3,572 4,007 4,501 5,096 Aboriginal Advancement .. .. .. .. .. .. .. .. .. 20 16 16 16 Housing .. .. 31,333 34,808 38,514 42,016 46,513 51,490 56,657 61,852 67,672 73,974 73,343 77.282 86,400 Growth Centres .. .. .. .. .. .. .. .. .. .. .. .. 1 2,757 Land Acquisition .. .. .. .. .. .. .. .. .. .. .. .. 31 2,400 Exmouth Township .. .. .. .. .. .. .. .. . .. 29 23 22 21 Sewerage .. .. .. .. .. .. .. .. .. .. .. .. .. .. 1,926 Beef Cattle Roads .. .. 32 133 258 348 422 394 365 337 308 279 251 222 Railway Projects .. 1,274 2,124 2,839 3,292 3,915 4,439 4,942 5,316 5,765 5,801 5,795 5,682 5,562 Railways-Intersystem
Passenger Vehicles .. .. .. ,. .. .. .. .. 4 75 249 247 256 324 King Island Harbour
Works .. .. .. .. .. .. .. .. .. .. .. .. .. 34 33 Coal Loading Facilities .. 30 79 82 119 148 129 111 93 74 55 38 24 14 Northern Harbours .. .. 5 30 60 72 67 62 57 52 47 43 38 33 Derby Jetty .. .. 2 25 36 35 32 30 27 24 22 19 17 14 12 Weipa Development .. .. .. .. .. .. 176 175 172 169 166 163 160 156 Natural Gas .. .. .. .. .. .. .. .. 298 612 648 806 858 747 636 Julius Dam . .. .. .. .. .. .. .. .. .. .. .. .. 87 Hydro-electricity .. .. .. .. .. .. .. 286 519 1,103 1,338 1,492 1,452 1,264 Blowering Reservoir .. .. .. 39 220 513 840 1,040 1,072 1,072 1,072 1,072 1,072 1,069 Marginal Dairy Farms .. .. .. .. .. .. .. .. .. .. 6 141 450 531 Canned Fruit Industry.. .. .. .. .. .. .. .. .. .. I 578 392 291 Sugar Industry.. .. .. .. .. .. .. .. .. .. 1,166 1,074 976 874 767 Rural Reconstruction .. .. .. .. .. .. .. .. .. .. 148 1,958 4,196 6,740 Ord River Project .. .. .. .. .. .. .. .. .. 6 17 29 110 200 Dartmouth Dam.. .. .. .. .. .. .. .. .. .. .. .. 74 265 Chowilla Reservoir .. .. .. 5 13 38 65 77 77 77 77 77 77 77 W.A. Water Supply .. .. .. .. 21 101 172 262 374 500 618 705 707 707 War Service Land Settle-
ment .. .. 1,018 1,011 1,003 995 986 977 968 959 949 939 928 917 906 Brigalow Lands Develop-
ment Scheme .. .. 41 123 212 309 429 511 563 613 635 664 670 713
Total Interest on Australian Government Loans 342,254 38,844 43,738 48,631 54,631 61,213 68,076 74,632 83,426 91,621 94,099 101,628 121,690
TOTAL INTEREST ON LOAN COUNCIL BORROWINGS AND AUSTRALIAN GOVERNMENT I nANc( fl Inn 141 17n085 348A11 I 378584 406180 441 067 474.5581 521.481 562.703 628.887 661.1561 705.3991 781.690
For purposes of these tables advances comprise the States' -Loan Council borrowing programs and Australian Government loans to the States. See Chapter 1 of this document and footnote (d) below.
Comprising advances made under Commonwealth-State Housing Agreements in force to 1970-71, special housing advances totalling $6,550,000 made in 1972-73 and advances from 1973-74 under the Housing Agreement 1973. Does not include advances for housing for servicemen. . Includes sinking fund contributions on State debt made by the Austral'an Government, which are included in this document as payments for the States. Amounts shown equal total receipts of the Sinking Funds on the States' Debts controlled by the National Debt Commission. For details of these receipts, see Table No. 6 in the Annual Reports of the Commission. Figures derived from those shown above by subtracting sinking fund payments from Loan Council borrowings and repayments of Australian Government loans from the amounts of those loans each year. As explained in the Introduction to this document, national accounting estimates of Australian Government outlays published by the Treasury and by the Australian Bureau of Statistics show advances (including the States' Loan Council borrowing programs) on a net basis. The figures shown here coincide with those shown in the national accounting estimates. The figures shown in other sections of this document are all on a gross basis-that is, before deducting re-payments. Includes interest on the States' domestic raisings. For technical reasons, associated mainly with the rates at which payments in overseas currencies are converted into Australian currency, the amounts shown in this document differ slightly from the corresponding amounts shown in the statements attached to the Budget Speech. Dissection of payments between grants and loans not available. See the relevant sections of Chapter IV.
225
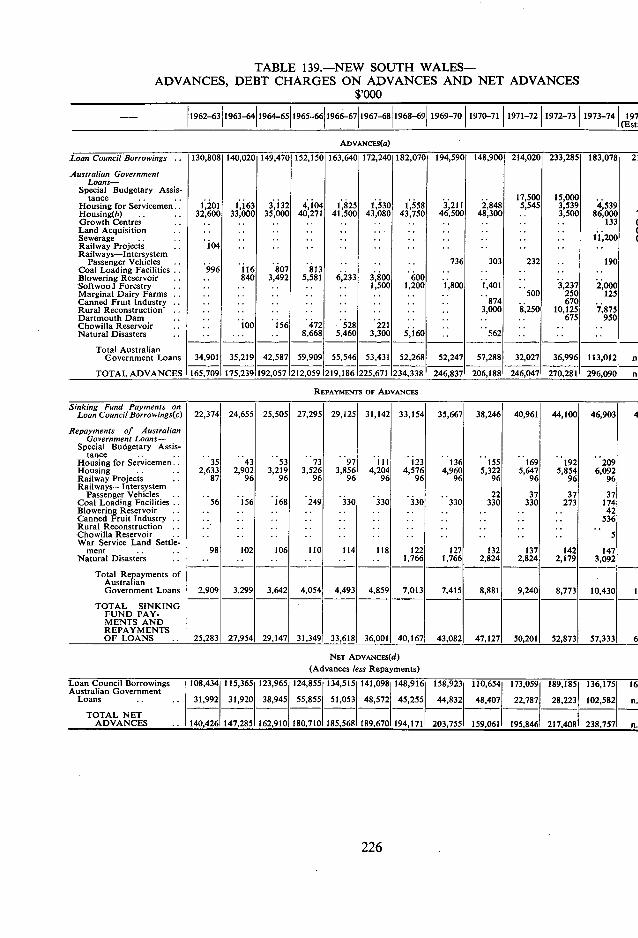
TABLE 139.-NEW SOUTH WALES- ADVANCES, DEBT CHARGES ON ADVANCES AND NET ADVANCES
$,000 - 1962-63 1963-64 1964-65 1965-66 1966-67 1967-68 1968-69 1969-70 1970-71 1971-72 1972-73 1973-74 197
(Esti
ADVANCES(a) Loan Council Borrowings .. 130,808 140,020 149,470 152,150 163,640 172,240 182,070 194,590 148,900 214,020 233,285 183,078 21
Australian Government Loans-
Special Budgetary Assis- tance .. .. .. . .. .. 17,500 15,000
Housing for Servicemen 1,201 1,163 3,132 4,104 1,825 1,530 1,558 3,211 2,848 5,545 3,539 4,539 Housing(h) .. 32,600 33,000 35,000 40,271 41,500 43,080 43,750 46,500 48,300 .. 3,500 86,000 Growth Centres .. .. . . . . . . .. .. .. 133 Land Acquisition .. .. .. .. .. .. Sewerage .. .. .. .. .. .. .. .. 11,200 Railway Projects .. 104 .. .. .. .. .. .. .. .. Railways-Intersystem
Passenger Vehicles . . . . . . . . . . . . . . . . 736 303 232 . . 190 Coal Loading Facilities .. 996 116 807 813 .. .. .. Blowering Reservoir .. .. 840 3,492 5,581 6,233
.. 3,800 '&0
. 600 .. ..
Softwood Forestry .. .. .. .. .. .. 1,500 1,200 100 1,401 .. 3,237 2,000 Marginal Dairy Farms . . . . .. .. .. .. . . .. .. .. 500 250 125 Canned Fruit Industry .. .. .. .. .. .. .. .. .. 874 .. 670 Rural Reconstruction .. .. .. .. . . .. . . .. .. 3,000 8,250 10,125 7,875 Dartmouth Dam . . .. .. . . . . .. .. . . .. .. .. 675 950 Chowilla Reservoir .. .. 100 156 472 528 221 .. .. .. Natural Disasters .. .. .. .. 8,668 5,460 3,300 5,160 . . 562
Total Australian Covernment Loans 34,901 35,219 42,587 59,909 55,546 53,431 52,268 52,247 57,288 32,027 36,996 113,012 a
TOTAL ADVANCES 165.709 175,239 192,057 212,059 219,186 225,671 234,338 246,837 206,188 246,047 270,281 296,0901 n
REPAYMENTS OF ADVANCES Sinking Fund Payments on Loan Council Borrowings(c) 22,374 24,655 25,505 27,295 29,125 31,142 33,154 35,667 38,246 40,961 44,100 46,903 4
Repayments of Australian Government Loans-
Special Budgetary Assis- tance .. .. .. .. .. .. .. .. .. .. ..
Housing for Servicemen. . 35 43 53 73 97 111 123 136 155 169 192 209 Housing .. .. 2,633 2,902 3,219 3,526 3,856 4,204 4,576 4,960 5,322 5,647 5,854 6,092 Railway Projects .. 87 96 96 96 96 96 96 96 96 96 96 96 Railways-Intersystem
Passenger Vehicles.. . . .. . . . . . . . . . 22 37 37 37 Coal Loading Facilities . . 56 156
. . 168 'i49 249 330 330 330 330 330 330 273 174 Blowering Reservoir .. .. .. .. .. .. . . .. .. .. .. .. 42 Canned Fruit Industry .. .. .. .. .. .. .. . . .. .. .. .. 536 Rural Reconstruction . . . . . . . . . . . . . . . . . . .. . . . Chowilla Reservoir .. . . .. .. .. .. . . .. .. .. .. .. s War Service Land Settle-
ment .. .. 98 102 106 110 114 118 122 127 132 137 142 147 Natural Disasters . . . . .. . . .. . . . . 1,766 1,766 2,824 2,824 2,179 3,092
Total Repayments of Australian Government Loans 2,909 3,299 3,642 4,054 4,493 4,859 7,013 7,415 8,881 9,240 8,773 10,430
TOTAL SINKING FUND PAY- MENTS AND REPAYMENTS OF LOANS .. 25,283 27,9541 29.147 31,3491 33,618 36,001 40,1671 43,0821 47,1271 50,201 52.873 57,333 6
NET ADVANcES(d) (Advances less Repayments)
Loan Council Borrowings Australian Government
IO8,434 115,36 123,96 124,65 134,513 141,095 148,916 158,923 110,654 173,059 189,185 136,175 16 Loans .. .. 31,992 31,920 38,945 55,855 51,053 48,572 45,255 44,832 48,407 22,787 28,223 102,582 n.
TOTAL NET ADVANCES .. 140,426 147,285 162,910 180,710 185,568 189,670 194,171 203,755 159.061 195,846 217,408 238,757 n.
226
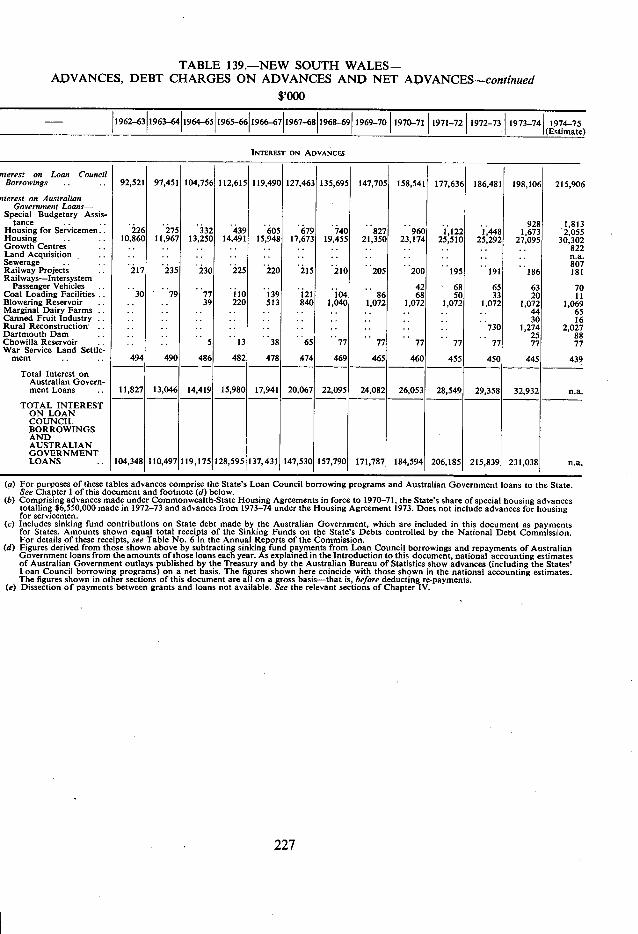
TABLE 139.-NEW SOUTH WALES- ADVANCES, DEBT CHARGES ON ADVANCES AND NET ADVANCES-continued
$,000
1962-63 1963-64 1964-65 1965-66 1966-67 1967-68 1968-69 1969-70 1970-71 1971-72 1972-73 1973-74 1974-75 (Estimate)
INTEREST ON ADVANCES
riterest on Loan Council Borrowings .. .. 92,521 97,451 104,756 112,615 119,490 127,463 135,695 147,705 158,541 177,636 186,481 198,106 215,906
sterest on Australian Government Loans-
Special Budgetary Assis- tance .. ............. .. .. .. .. .. .. . . .. . . 928 1,813
Housing for Servicemen 226 275 332 439 605 679 740 827 960 1,122 1,448 1,673 2,055 Housing .. 10,860 11,967 13,250 14,491 15,948 17,673 19,455 21,350 23,174 25,510 25,292 27,095 30,302 Growth Centres .. .. .. .. .. .. .. .. .. .. .. .. .. 822 Land Acquisition - .. .. .. .. .. .. .. .. .. .. .. na. Sewerage.. .. .. .. .. .. .. .. .. .. .. .. .. 807 Railway Projects 217 235 230 225 220 215 210 205 200 195 191 186 181 Railways-Intersystem
Passenger Vehicles .. .. .. .. .. .. .. 42 68 65 63 70 Coal Loading Facilities 30 ' 79 77 110 139 121 104 86 68 50 33 20 II Blowering Reservoir .. 39 220 513 840 1,040 1,072 1,072 1,072 1,072 1,072 1,069 Marginal Dairy Farms .. .. .. .. .. .. .. .. .. .. 44 65 Canned Fruit Industry .. .. .. .. .. .. .. .. .. .. 30 16 Rural Reconstruction .. .. .. .. .. .. .. .. .. 730 1,274 2,027 Dartmouth Dam .. .. .. .. .. .. .. .. .. .. 25 88 Chowilla Reservoir . . . 5 13 38 65 77 77 77 77 77 77 77 War Service Land Settle-
ment .. 494 490 486 482 478 474 469 465 460 455 450 445 439
Total Interest on Australian Govern- ment Loans .. 11,827 13,046 14,419 15,980 17,941 20,067 22,095 24,082 26,053 28,549 29,358 32,932 na.
TOTAL INTEREST ON LOAN COUNCIL BORROWINGS AND AUSTRALIAN GOVERNMENT LOANS .. 104,348 110,497 119,175 128,595 137,431 147,530 157,790 171,787 184,594 206,185 215,839 231,038 n.a.
For purposes of these tables advances comprise the State's Loan Council borrowing programs and Australian Government loans to the State. See Chapter 1 of this document and footnote (d) below. Comprising advances made under Commonwealth-State Housing Agreements in force to 1970-71, the State's share of special housing advances totalling $6,550,000 made in 1972-73 and advances from 1973-74 under the Housing Agreement 1973. Does not include advances for housing for servicemen. Includes sinking fund contributions on State debt made by the Australian Government, which are included in this document as payments for States. Amounts shown equal total receipts of the Sinking Funds on the State's Debts controlled by the National Debt Commission. For details of these receipts, see Table No. 6 in the Annual Reports of the Commission. Figures derived from those shown above by subtracting sinking fund payments from Loan Council borrowings and repayments of Australian Government loans from the amounts of those loans each year. As explained in the Introduction to this document, national accounting estimates of Australian Government outlays published by the Treasury and by the Australian Bureau of Statistics show advances (including the States' loan Council borrowing programs) on a net basis. The figures shown here coincide with those shown in the national accounting estimates. The figures shown in other sections of this document are all on a gross basis-that is, before deducting re-payments. Dissection of payments between grants and loans not available. See the relevant sections of Chapter IV.
227
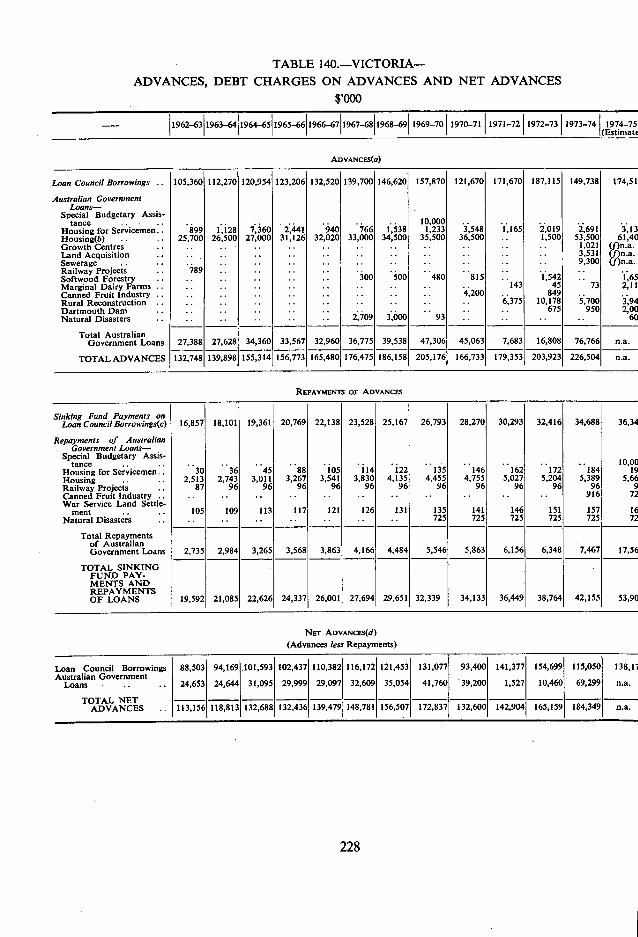
TABLE 140.-VICTORIA- ADVANCES, DEBT CHARGES ON ADVANCES AND NET ADVANCES
$,000
- 1962-63 1963-64 1964-65 1965-66 1966-67 1967-68 1968-69 1969-70 1970-71 1971-72 1972-73 1973-74 1974-75 (Estimate
ADVANCES(a)
Loan Council Borrowings .. 105,360 112,270 120,954 123,206 132,520 139,700 146,620 157,870 121,670 171,670 187,115 149,738 174,51
4ustralian Government Loans-
Special Budgetary Assis- .. .. .. 10,000 .. ..
Housing for Servicemen 899 1,128 7,360 2,441 940 766 1,538 1,233 3,548 1,165 2,019 2,691 3,13 Housing(b) .. 25,700 26,500 27,000 31,126 32,020 33,000 34,500 35,500 36,500 .. 1,500 53,500 61,40 Growth Centres .. .. .. .. .. .. .. .. 1,021 (f)n.a.
tance ...........
Land Acquisition .. .. .. .. .. .. .. .. 3,531 (f)n.a. Sewerage .. .. .. .. .. .. .. .. 9,300 (f)n.a. Railway Projects 789 . .. .. .. .. .. .. .. Softwood Forestry .. .. 300 500 480 815 .. 1,542 .. 1,65 Marginal Dairy Farms .. .. .. .. .. .. 143 45 73 2,11 Canned Fruit Industry .. .. .. .. .. 4,200 .. 849 Rural Reconstruction .. .. .. .. .. .. 6,375 10,178 5,700 3,94 Dartmouth Dam .. .. .. .. .. .. .. 675 950 2,00 Natural Disasters .. .. 2,709 3,000 93 .. .. .. .. 60
Total Australian Government Loans 27,388 27,628 34,360 33,567 32,960 36,775 39,538 47,306 45,063 7,683 16,808 76,766 na.
TOTAL ADVANCES 132,748 139,898 155,314 156,773 165,480 176,475 186,158 205,176 166,733 179,353 203,923 226,504 n.a.
REPAYMENTS or ADVANCES
Sinking Fund Payments on Loan Council Borrowings(c) 16,857 18,101 19,361 20,769 22,138 23,528 25,167 26,793 28,270 30,293 32,416 34,688 36,34
Repayments of Australian - Government Loans-
Special Budgetary Assis- tance .. ..
Housing for Servicemen.. ..
30 ..
36 ..
45 .. 88 .. 105 .. 114
.. 122 135 146
.. 162
.. 172
.. 184
10,00 19
Housing .. .. 2,513 2,743 3,011 3,267 3,541 3,830 4,135 4,455 4,755 5,027 5,204 5,389 5,66 Railway Projects .. 87 96 96 96 96 96 96 96 96 96 96 96 9 Canned Fruit Industry .. .. .. .. .. .. .. .. .. .. .. .. 916 72 War Service Land Settle-
ment . . .. 105 109 113 117 121 126 131 135 141 146 151 157 16 Natural Disasters .. .. .. .. .. .. .. .. 725 725 725 725 725 72
Total Repayments of Australian Government Loans 2,735 2,984 3,265 3.568 3,863 4.166 4,484 5,546 5,863 6,156 6,348 7,467 17,56
TOTAL SINKING FUND PAY- MENTS AND REPAYMENTS OF LOANS 19,592 21,085 22,626 24,337 26,001 27,694 29,651 32,339 34,133 36,449 38,764 42,155 53,90
NET ADVANCES(d) (Advances less Repayments)
Loan Council Borrowings 88,503 94,169 .101,593 102,437 110,382 116,172 121,453 131,077 93,400 141,377 154,699 115,050l38,I Australian Government
Loans .. .. 24,653 24,644 31,095 29,999 29,097 32,609 35,054 41,760 39,200 1,527 10,460 69,299 n.a.
TOTAL NET 113,156 118,813 132,688 132,436 139,479 148,781 156,507 172,837 132,600 142,904 165,159
84,349
n.a. ADVANCES ..
228
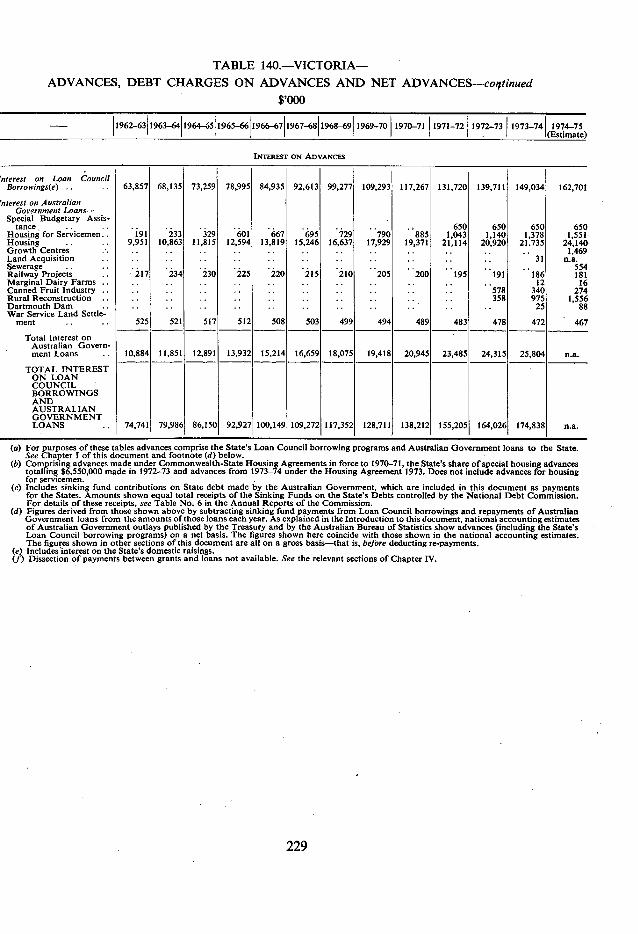
TABLE 140.-VICTORIA- ADVANCES, DEBT CHARGES ON ADVANCES AND NET ADVANCES-co,7tinued
$,000
- 1962-63 1963-64 1964-65 1965-66 1966-67 1967-68 1968-69 1969-70 1970-71 1971-72 1972-73 1973-74 1974-75 (Estimate)
INTEREST ON ADVANCES
nterest on Loan Council Borrowings(e) .. 63,857 68,135 73,259 78,995 84.935 92,613 99,277 109,293 117,267 131,720 139,711 149,034 162,701
rnteresi on Australian Government Loans-
Special Budgetary Assis- tance. .. .. .. .. .. .. 650 650 650 650
Housing for Servjcemen.. 191 233 329 601 667 695 729 790 885 1,043 1,140 1,378 1,551 Housing .. .. 9,951 10,863 11,815 12,594 13,819 15,246 16,637 17,929 19,371 21,114 20,920 21.735 24,140 Growth Centres .. .. .. .. .. .. .. 1,469 Land Acquisition .. .. .. .. .. .. .. 31 n.a. Sewerage .. . .. .. .. .. .. .. 554 Railway Projects 217 234 23 0 225 220 215 210 205 200 195 191 186 181 Marginal Dairy Farms .. .. .. .. .. .. .. .. .. .. .. .. 12 16 Canned Fruit Industry .. .. .. .. .. .. .. 578 340 274 Rural Reconstruction .. .. .. .. .. .. .. 358 975 1,556 Dartmouth Dam .. .. .. .. .. .. .. .. 25 88 War Service Land Settle- -
ment .. .. 525 521 517 512 508 503 499 494 489 483 478 472 467
Total Interest on Australian Govern- ment Loans 10,884 11,851 12,891 13,932 15,214 16,659 18,075 19,418 20,945 23,485 24,315 25,804 n.a.
TOTAL INTEREST ON LOAN COUNCIL BORROWINGS AND AUSTRALIAN GOVERNMENT LOANS .. 74,741 79,986 86,150 92,927 100,149 109,272 117,352 128,711 138,212 155,205 164,026 174,838 n.a.
For purposes of these tables advances comprise the State's Loan Council borrowing programs and Australian Government loans to the State. See Chapter I of this document and footnote (d) below. Comprising advances made under Commonwealth-State Housing Agreements in force to 1970-71, the State's share of special housing advances totalling $6,550,000 made in 1972-73 and advances from 1973-74 under the Housing Agreement 1973. Does not include advances for housing for servicemen. Includes sinking fund contributions on State debt made by the Australian Government, which are included in this document as payments for the States. Amounts shown equal total receipts of the Sinking Funds on the State's Debts controlled by the National Debt Commission. For details of these receipts, see Table No. 6 in the Annual Reports of the Commission. Figures derived from those shown above by subtracting sinking fund payments from Loan Council borrowings and repayments of Australian Government loans from the amounts of those loans each year. As explained in the Introduction to this document, national accounting estimates of Australian Government outlays published by the Treasury and by the Australian Bureau of Statistics show advances (including the State's Loan Council borrowing programs) on a net basis. The figures shown here coincide with those shown in the national accounting estimates. The figures shown in other sections of this document are all on a gross basis-that is, before deducting re-payments. Includes interest on the State's domestic raisings. Dissection of payments between grants and loans not available. See the relevant sections of Chapter IV.
229
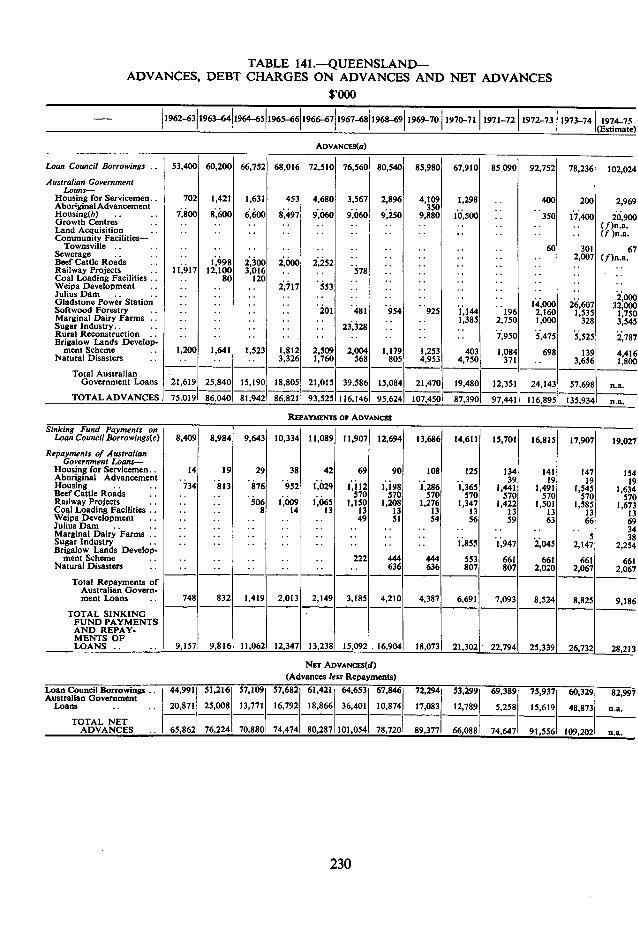
TABLE 141 .-QUEENSLAND- ADVANCES, DEBT CHARGES ON ADVANCES AND NET ADVANCES
$,000
- 1962-6311963-6411964-6511965-66 1966-67 1967-68 1968-69 1969-70 1970-71 1971-72 1972-73 1973-74 1974-75 (Estimate)
ADVANCES(G)
Loan Council Borrowings 53,400 60,200 66,752 68,016 72,510 76,5601 80,5401 85,980 67,910 85.090 92,752 78,236 102,024 Australian Government
Loans- Housing for Servicemen.. 702 1,421 1,631 453 4,680 3,567 2,896 4,109 1,298 400 200 2,969 Aboriginal Advancement 350 Housing(h) .. 7,800 8,600 6,600 8,497 9,060 9,060 9,250 9,880 10,500 350 17,400 20,900 Growth Centres .. .. (f)n.a. Land Acquisition .. (1 )n.a. Community Facilities-
Townsville .. .. .. .. .. .. .. 60 301 67 Sewerage .. .. .. .. .. .. .. .. .. 2,007 (f)n.a. Beef Cattle Roads .. .. 1,998 2,300 2,000 2,252 .. .. .. .. Railway Projects 11,917 12,100 3,016 .. 578 .. .. .. .. .. Coal Loading Facilities .. 80 120 .. . .. .. . Weipa Development .. . 2,717 553 .. .. .. .. .. Julius Dam .. .. .. .. .. .. .. .. 2,000 Gladstone Power Station .. .. . .. .. 14,000 26,607 32,000 Softwood Forestry .. . 201 481 954 925 1,144 196 2,160 1,535 1,750 Marginal Dairy Farms .. .. .. .. .. 1,385 2,750 1,000 328 3,545 Sugar Industry. .. .. .. .. 23,328 .. .. .. .. Rural Reconstruction .. .. .. .. .. .. .. 7,950 5,475 5,525 2,787 Brigalow Lands Develop-
ment Scheme .. 1,200 1,641 1,523 1,812 2,509 2,004 1,179 1,253 403 1,084 698 139 4,416 Natural Disasters 3,326 1,760 568 805 4,953 4,750 371 .. 3.656 1,800 Total Australian
Government Loans 21,619 25,840 15,190 18,805 21,015 39,586 15,084 21,470 19,480 12,351 24,143 57,698 n.a. TOTAL ADVANCES 75.019 86.040 81,942 86,821 93,525 116.146 95,6241 107,4501 87,3901 97,441 116,895 135,934 n.a.
REPAYMENTS OF ADVANCES Sinking Fund Payments on
Loan Council Borrowings(c) 8,409 8,984 9,643 10,334 11,089 11,907 12,694 13,686 14,611 15,701 16,815 17,907 19,027 Repayments of Australian
Government Loans- Housing for Servicemen.. 14 19 29 38 42 69 90 108 125 134 141 147 154 Aboriginal Advancement.. .. .. .. .. .. .. .. 39 19 19 19 Housing .. .. 734 813 876 952 1,029 1,112 1,198 1,286 1,365 1,441 1,49 1 1,545 1,634 Beef Cattle Roads .. .. .. .. .. .. 570 570 570 570 570 570 570 570 Railway Projects .. .. .. 506 1,009 1,065 1,150 1,208 1,276 1,347 1,422 1,501 1,585 1,673 Coal Loading Facilities.. .. .. 8 14 13 13 13 13 13 13 13 13 13 Weipa Development .. .. .. .. .. 49 51 54 56 59 63 66 69 Julius Darn .. .. .. .. .. .. .. .. .. .. . 34 Marginal Dairy Farms .. .. .. .. .. .. .. .. .. .. .• •. 5 38 Sugar Industry .. .. .. .. .. .. 1,855 1,947 2,045 2,147 2,254 Brigalow Lands Develop-
ment Scheme . .. .. .. .. .. 222 444 444 553 661 661 661 661 Natural Disasters .. ,. .. .. .. .. 636 636 807 807 2,020 2,067 2,067 Total Repayments of
Australian Govern- ment Loans .. 748 832 1,419 2,013 2,149 3,185 4,210 4,387 6,691 7,093 8,524 8,825 9,186
TOTAL SINKING FUND PAYMENTS AND REPAY- MENTS OF LOANS .. .. 9,157 9,816 11,062 12,347 13.238 15,092 16,904 18,073 21,302 22,794 25,339 26,732 28,213
NET ADVANCES(d) (Advances less Repayments)
Loan Council Borrowings T 44,991 51,216 57,109 57,682 61,421 64,653 67,846 72,294 53,299 69,3897 37 60,329 82,997 Australian Government Loans .. . . 20,871 25,008 13,771 16,792 18,866 36.401 10,874 17,083 12,789 5,258 15,619 48,873 n.a.
TOTAL S . 65,862 76,224 70.880 74,474 80,287 101,054 78,720 89,377 66,088 74,647 91.556 109.202 n.a.
230
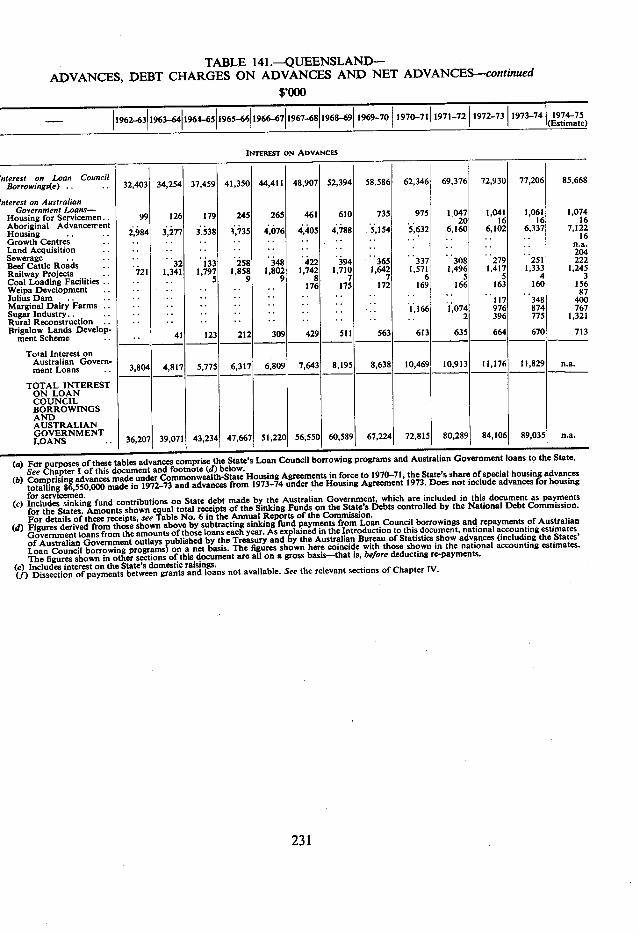
TABLE 141.-QUEENSLAND- ADVANCES, DEBT CHARGES ON ADVANCES AND NET ADVANCES-continued
$,000
1969-70 1970-7111971-7211972-7311973-74
INTEREST ON ADVANCES
mnterest on Loan Council Borrowings(e) .. .. 32,403 34,254 37,459 41,350 44,411 48,907 52,394 58,586 62,346 69,376 72,930 77,206 85,668
nterest on Australian Government Loans-
Housing for Servicemen 99 126 179 245 265 461 610 735 975 1,047 1,041 1,061 16
1,074 16 Aboriginal Advancen'ent
Housing 2,984 ..
3,277 ..
3.538 ..
3,735 . .
4,076 ..
4,405 .. 4,788 .. 5,154 . . 5,632
20 6,160
16 6,102 6,337 .. 7,122
16 Growth Centres .. .. .. .. .. .. .. ..' .. .. .. n.a. Land Acquisition .. .. .. .. .. .. .. . .. .. .. 204 Sewerage Beef Cattle Roads
721
.. 32
1,341
.. 133
1,797
.. 258
1,858
.. 348 1,802
.. 422 1,742
.. 394 1,710
.. 365 1,642
.. 337 1,571
.. 308 1,496
.. 279 1,417
251 1,333
222 1,245 Railway Projects
5 9 9 8 7 7 6 5 5 4 3 Coal Loading Facilities .. 176 175 172 169 166 163 160 156 Weipa Development .. .. .. ..
.. 87 Julius Dam .. .. .. .. .. .. .. .. .. .. 117 348 400 Marginal Dairy Farms .. .. .. .. .. .. .. .. .. 1,166
.. 1,074 976 874 767 Sugar Industry.. .. .. .. .. .. .. .. .. 2 396 775 1,321
Rural Reconstruction .. . . . . . . .. . . . . . . . . . . Brigalow Lands Develop-
41 123 212 309 429 511 563 613 635 664 670 713 ment Scheme .. ..
Total Interest on Australian Govern- ment Loans .. 3,804 4,817 5,775 6,317 6,809 7,643 8,195 8,638 10,469 10,913 11,176 11,829 fl.a.
TOTAL INTEREST ON LOAN COUNCIL BORROWINGS AND AUSTRALIAN GOVERNMENT LOANS .. 36,207 39,071 43,234 47,667 51,220 56,550 60,589 67,224 72,815 80,289 84,106 89,035 n.a,
For purposes of these tables advances comprise the State's Loan Council borrowing programs and Australian Government loans to the State. See Chapter I of this document and footnote (d) below. Comprising advances made under Commonwealth-State Housing Agreements in force to 1970-71, the State's share of special housing advances totallin$ $6,550,000 made in 1972-73 and advances from 1973-74 under the Housing Agreement 1973. Does not include advances for housing for servicemen. Includes sinking fund contributions on State debt made by the Australian Government, which are included in this document as payments for the States. Amounts shown equal total receipts of the Sinking Funds on the State's Debts controlled by the National Debt Commission. For details of these receipts, see Table No. 6 in the Annual Reports of the Commission. Figures derived from those shown above by subtracting sinking fund payments from Loan Council borrowings and repayments of Australian Government loans from the amounts of those loans each year. As explained in the Introduction to this document, national accounting estimates of Australian Government outlays published by the Treasury and by the Australian Bureau of Statistics show advances (including the States' Loan Council borrowing programs) on a net basis. The figures shown here coincide with those shown in the national accounting estimates. The figures shown in other sections of this document are all on a gross basis-that is, before deducting re-payments. Includes interest on the State's domestic raisings. Dissection of payments between grants and loans not available. See the relevant sections of Chapter IV.
231
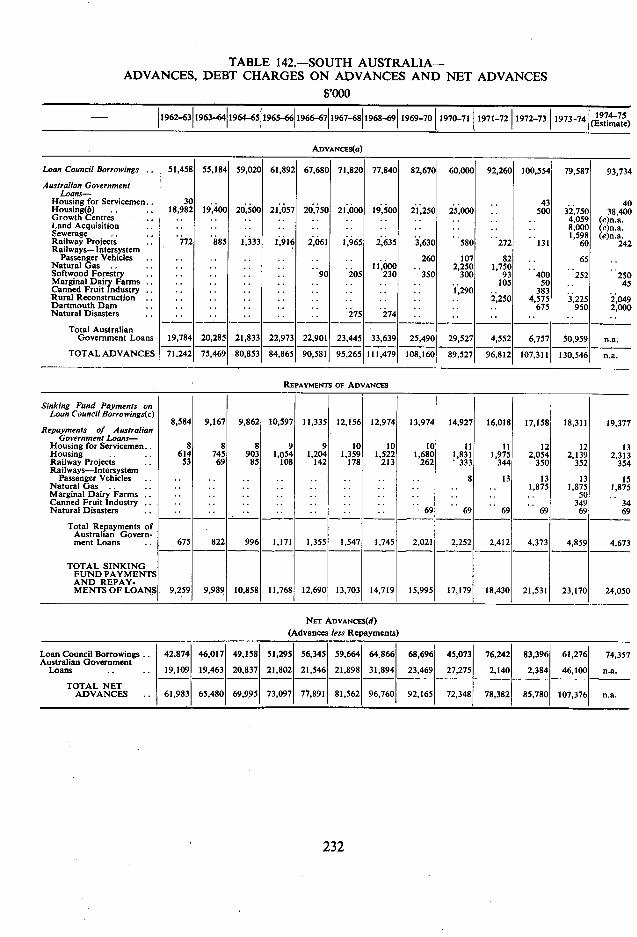
TABLE 142.-SOUTH AUSTRALIA- ADVANCES, DEBT CHARGES ON ADVANCES AND NET ADVANCES
$,000
1962-63 1963-64 1964-65 1965-66 1966-67 1967-68 1968-69 1969_701 1970-71 1 1971_72 1972_73 1973-74 1974-75
ADVANCES(a)
Loan Council Borrowings .. 51,458 55,1841 59,0201 61,8921 67,6801 71 ,8201 77,8401 82,6701 60,0001 92,2601 100,5541 79,5871 93.734 Australian Government
Loans- Housing for Servicemen. Housing(b) .. .. 18, Growth Centres Land Acquisition Sewerage Railway Projects Railways- Intersystem
Passenger Vehicles Natural Gas Softwood Forestry Marginal Dairy Farms Canned Fruit Industry Rural Reconstruction Dartmouth I)axn Natural Disasters
Total Australian Government Loans 19,
TOTAL ADVANCES 71.
REPAYMENTS OF ADVANCES
Sinking Fund Payments on Loan Council Borrowings(c)
8,584 9,167 9,862 10,597 11,335 12,156 12,974 13,974 14,927 16,018 17,158 18,311 19,377 Repayments of Australian Government Loans-
Housing for Servicemen 8 8 8 9 9 10 10 10 11 11 12 12 13 Housing .. 614 745 903 1,054 1,204 1,359 1,522 1,680 1,831 1,975 2,054 2,139 2,313 Railway Projects 53 69 85 108 142 178 213 262 333 344 350 352 354 Railways-Intersystem
Passenger Vehicles . . . .. . . . . . . . . . . 8 13 13 13 15 Natural Gas . . . . . . . . . . . . . . . . .. . . 1,875 1,875 1,875 Marginal Dairy Farms .. .. .. .. .. .. .. .. .. .. 50 Canned Fruit Industry .. .. .. .. .. .. .. .. .. .. 349 34 Natural Disasters .. .. .. .. .. .. 69 69 69 69 69 69
Total Repayments of Australian Govern- ment Loans .. 675 822 996 1,171 1,355 1,547 1,745 2,021 2.252 2,412 4.373 4,859 4,673
TOTAL SINKING FUND PAYMENTS AND REPAY- EPAY.MENTSOFLOANS. MENTS OF LOANS 9,259 9,989 10,858 11,768 12,690 13,703 14,719 15,995 17,179 18,430 21,531 23,170 24,050
NET ADVANCES(d) (Advances less Repayments)
Loan Council Borrowings .. 42.874 46,017 49,158 51,295 56,345 59,664 64,866 68,696 45,073 76,242 83,396 61,276 74,357 Australian Government
Loans .. .. 19,109 19,463 20,837 21,802 21,546 21,898 31,894 23,469 27,275 2,140 2,384 46,100 -_na. TOTAL NET
ADVANCES .. 61,983 65,480 69,995 73,097 77,891 81,562 96,760 92,165 72,348 78,382 85,780 107,376 n.a.
43.. 40 19,400 20,500 21,057 20,750 21,000 19,500 21,250 25,000 .. 500 32,750 38,400 4,059 (e)n.a. 8,000 (e)n.a. 1,598 (e)n.a. 885 1,333 1,916 2,061 11965 2,635 31630 580 272 131 60 242
260 107 82 .. 65 11,000 .. 2,250 1,750
90 205 230 350 300 93 400 252 250 105 50 .. 45
1,290 .. 383 2,250 4,575 3,225 2,049
675 950 2,000 275 274 .. .. ..
20,285 21,833 22,973 22,901 23,445 33,639 25,4901 29,5271 4,552 6,757 50,959 na. 75,469 80,853 84,865 90,581 95,265 111,479 108,160 89,527 96,812 107,311 130,546 na.
232
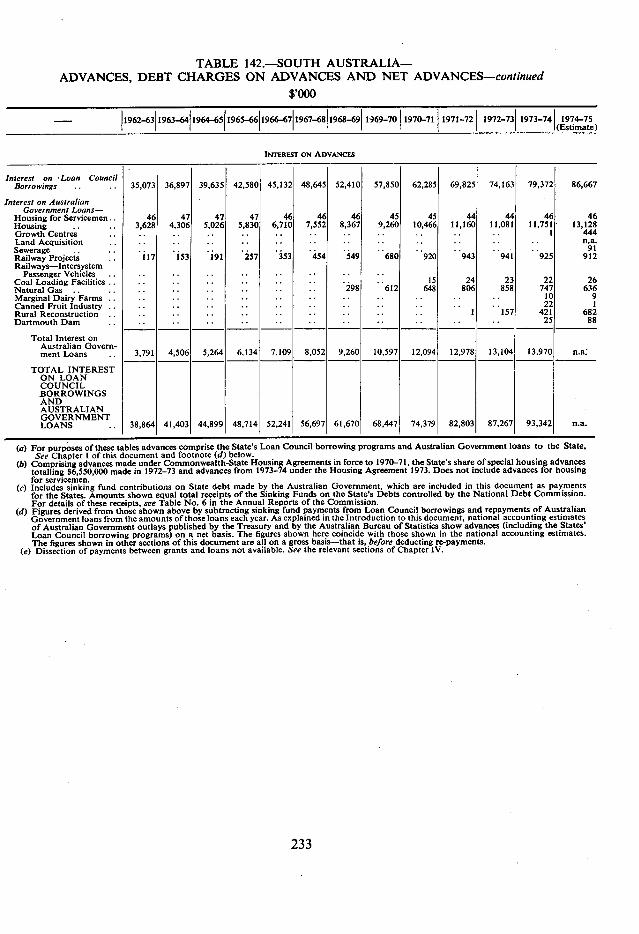
TABLE 142.-SOUTH AUSTRALIA- ADVANCES, DEBT CHARGES ON ADVANCES AND NET ADVANCES-continued
$,000
- 1962-63 1963-64 1964-65 1965-66 1966-67 1967-68 1968-69 1969-70 1970-71 1971-72 1972-73 1973-74 1974-75 (Estimate)
INTEREST ON ADVANCES
rnterest on Loon Council Borrowings .. .. 35,073 36,897 39,635 42,580 45,132 48,645 52,410 57,850 62,285 69,825 74,163 79,372 86,667
rnferest on Australian Government Loans-
Housing for Servicemen 46 47 47 47 46 46 46 45 45 44 44 46 46 Housing 3,628 4,306 5,026 5,830 6,710 7,552 8,367 9,260 10,466 11,160 11,081 11,751 13,128 Growth Centres .. .. .. .. .. .. .. .. .. .. 1 444 Land Acquisition .. .. .. .. .. .. .. .. .. .. .. n.a. Sewerage .. .. .. .. .. .. .. .. .. .. .. .. 91 Railway Projects 117 153 191 257 353 454 549 680 920 943 941 925 912 Railways-Intersystem
Passenger Vehicles .. .. .. .. Coal Loading Facilities .. .. .. .. .. .. .. IS 24 23 22 26 Natural Gas .. .. .. .. .. 298 612 648 806 858 747 636 Marginal Dairy Farms .. .. .. .. .. .. .. .. .. .. 10 9 Canned Fruit Industry .. .. .. .. .. .. .. .. .. .. 22 1 Rural Reconstruction .. .. .. .. .. .. .. .. 1 157 421 682 Dartmouth Dam .. .. .. .. .. .. .. .. .. .. 25 88
Total Interest on Australian Govern- ment Loans .. 3,791 4,506 5,264 6,134 7,109 8,052 9,260 10,597 12,094 12,978 13,104 13,970 n.a.
TOTAL INTEREST ON LOAN COUNCIL BORROWINGS AND AUSTRALIAN GOVERNMENT LOANS .. 38,864 41,403 44,899 48,714 52,241 56,697 61,670 68,447 74,379 82,803 87,267 93,342 n.a.
For purposes of these tables advances comprise the State's Loan Council borrowing programs and Australian Government loans to the State. See Chapter I of this document and footnote (d) below.
Comprising advances made under Commonwealth-State Housing Agreements in force to 1970-71, the State's share of special housing advances totalling $6,550,000 made in 1972-73 and advances from 1973-74 under the Housing Agreement 1973. Does not include advances for housing for servicemen. Includes sinking fund contributions on State debt made by the Australian Government, which are included in this document as payments for the States. Amounts shown equal total receipts of the Sinking Funds on the State's Debts controlled by the National Debt Commission. For details of these receipts, see Table No. 6 in the Annual Reports of the Commission. Figures derived from those shown above by subtracting sinking fund payments from Loan Council borrowings and repayments of Australian Government loans from the amounts of those loans each year. As explained in the Introduction to this document, national accounting estimates of Australian Government outlays published by the Treasury and by the Australian Bureau of Statistics show advances (including the States' Loan Council borrowing programs) on a net basis. The figures shown here coincide with those shown in the national accounting estimates. The figures shown in other sections of this document are all on a gross basis-that is, before deducting re-payments. Dissection of payments between grants and loans not available. See the relevant sections of Chapter IV.
233
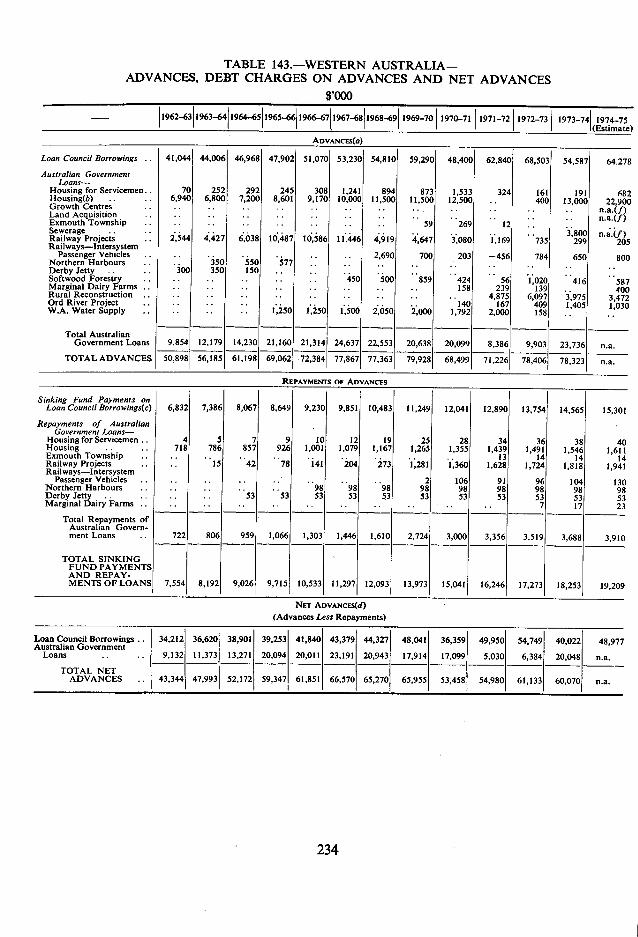
TABLE 143.-WESTERN AUSTRALIA- ADVANCES, DEBT CHARGES ON ADVANCES AND NET ADVANCES
$,000 - 1962-63 1963-64 1964-65 1965-66 1966-67 1967-68 1968-69 1969-70 1970-71 1971-72 1972-73 1973-74 1974-75
(Estimate) ADVANCES(0)
Loan Council Borrowings .. 41,044 44,006 46,968 47,902 51,0701 53,230 54,810 59,290 48,400 62,840 68,503 54,587 64.278 Australian Government
Loans- Housing for Servicemen 70 252 292 245 308 1,241 894 873 1,533 324 161 191 682 Housing(b) 6,940 6,800 7,200 8,601 9,170 10,000 11,500 11,500 12,500 .. 400 13,000 22.900 Growth Centres .. .. .. .. .. .. .. .. .. .. .. n.a.(j) Land Acquisition .. .. .. .. .. .. .. ,. .. .. .. n.a.(f) Exmouth Township .. .. .. .. .. .. 59 269 12 Sewerage .. Railway Projects 2,544 4,427
.. 6,16,48738 17
.. 10,586
.. 11,446
.. 4,919
.. 4,647
.. 3,080
.. 1,169
.. 735 299
3,800 205 Railways-Intersystem
Passenger Vehicles .. .. .. .. .. 2,690 700 203 -456 784 650 800 Northern Harbours 350 550 577 ,. .. .. .. .. .. Derby Jetty . . 300 350 150 . . . . . . . . . . . . .. . . . Softwood Forestry .. .. .. . . 450 500 859 424 56 1,020 416 587 Marginal Dairy Farms .. .. .. .. .. .. .. 158 239 139 .. 400 R Rural econstruction .. .. .. .. .. .. .. .. 4,875 6,097 3.975 3,472 Ord River Project .. .. .. .. . .. 140 167 409 1,405 1,030 W.A. Water Supply .. .. 1,250 1,250
.. 1,500 i,650 2,050 2,000 1,792 2,000 158
Total Australian Government Loans 9,854 12,179 14,230 21,160 21,314 24,637 22,553 20,638 20,099 8,386 9,903 23,736 na.
TOTALADVANCES 50,898 56,185 61,198 69,062 72,384 77,867 77,363 79,928 68,499 71,226 78,406 78,323 n,a.
REPAYMENTS OF ADVANCES
Sinking Fund Payments on Loan CouncilBorrowings(c) 6,832 7,386 8,067 8,649 9,230 9,851 10,483 11,249 12,041 12,890 13,754 14,565 15,301
Repayments of Australian Government Loans-
Housing for Servicemen.. 4 5 7 9 10 12 19 25 28 34 36 38 40 Housing .. .. 718 786 857 926 1,001 1,079 1,167 1,265 1,355 1,439 1,491 1,546 1,611 Exmouth Township .. .. .. .. .. .. .. .. .. .. 13 14 14 14 Railway Projects .. .. 15 42 7'141 204 273 1,281 1,360 1,628 1,724 1,818 1,941 Railways-Intersystem Passenger Vehicles .. .. .. .. .. .. .. .. 2 106 91 96 104 130 Northern Harbours . . . . . . .. . . 98 98 98 98 98 98 98 98 98 Derby Jetty . . . . . . . . 53 53 53 53 53 53 53 53 53 53 53 Marginal Dairy Farms .. .. .. .. .. .. -. .. .. .. .. 7 17 23
Total Repayments of Australian Govern- ment Loans .. 722 806 959 1,066 1,303 1,446 1,610 2,724 3,000 3,356 3,519 3,688 3,910
TOTAL SINKING FUND PAYMENTS AND REPAY- MENTS OF LOANS 7,554 8,192 9.0261 9,715 10,533 11,297 12,093 13,973 15,041 16,246 17,273 18,253 19,209
NET ADVANCES(d) (Advances Less Repayments)
Loan Council Borrowings .. 34,212 36,620 38,901 39.253 41,840 43,379 44,327 48,041 36,359 49.950 54,749 40,022 48,977 Australian Government Loans .. .. 9,132 11,373 13,271 20,094 20,011 23,191 20,943 17,914 17,099 5,030 6,384 20,048 n,a.
TOTAL NET ADVANCES .. 43,344 47,993 52,172 59,347 61,851 66,570 65,270 65,955 53;458 54,980 61,133 60,070 na.
234
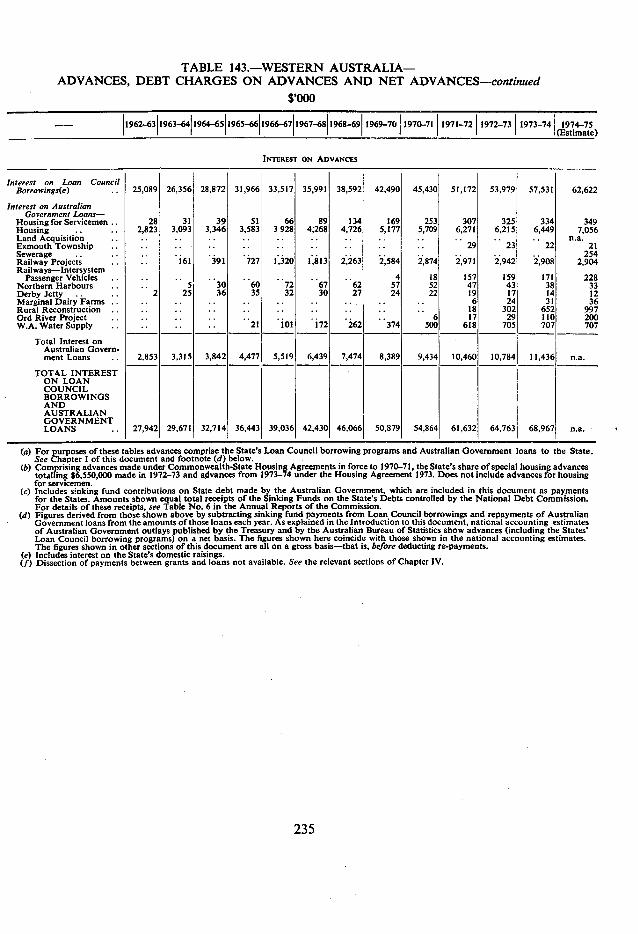
28 31 39 51 66 89 134 169 253 307 325 334 349 2,823 3,093 3,346 3,583 3928 41-268 4,726 5,177 5,709 6,271 6,215 6,449 7,056
na. .. .. .. .. .. .. 29 23 22 21 254
161 391 727 1,320 1,813 2,263 2,584 2,874 2,971 2,942 2,908 2,904
4 18 157 159 171 228
5 30 60 72 67 62 57 52 47 43 38 33
2 25 36 35 32 30 27 24 22 19 17 14 12
6 24 31 36
18 302 652 997
6 17 29 110 200 21 101 172 262 374 500 618 705 707 707
3,8421 4,4771 5,5191 6,439 na.
29,671 32,714 36,443 39,036 42,430 46,066 50,879 54,864 61,632 64,763
TABLE 143.-WESTERN AUSTRALIA- ADVANCES, DEBT CHARGES ON ADVANCES AND NET ADVANCES-continued
$'OOO
-- 1962-63 1963-64 1964-65 1965-66 1966-67 1967-68 1968-69 1969-70 1970-71 1971-72 1972-73 1973-74 1974-75 (Estimate)
INTEREST ON ADVANCES
Interest on Loan Council
Borrowings(e) .. 25,089 26,356 28,872 31,966 33,517 35,991 38,592 42,490 45,430 51,172 53,979 57,531 62,622
Interest on Australian Government Loans-
Housing for Servicemen Housing Land Acquisition Exmouth Township Sewerage Railway Projects Railways-Intersystem
Passenger Vehicles - Northern Harbours Derby Jetty Marginal Dairy Farms Rural Reconstruction Ord River Project W.A. Water Supply
Total Interest on Australian Govern-ment Loans
TOTAL INTEREST ON LOAN COUNCIL BORROWINGS AND AUSTRALIAN GOVERNMENT LOANS
(a)For purposes of these tables advances comprise the State's Loan Council borrowing programs and Australian Government loans to the State. See Chapter I of this document and footnote (d) below. Comprising advances made under Commonwealth-State Housing Agreements in force to 1970-71, the State's share of special housing advances totalling $6,550,000 made in 1972-73 and advances from 1973-74 under the Housing Agreement 1973. Does not include advances for housing for servicemen. Includes sinking fund contributions on State debt made by the Australian Government, which are included in this document as payments for the States. Amounts shown equal total receipts of the Sinking Funds on the State's Debts controlled by the National Debt Commission. For details of these receipts, see Table No. 6 in the Annual Reports of the Commission. Figures derived from those shown above by subtracting sinking fund payments from Loan Council borrowings and repayments of Australian Government loans from the amounts of those loans each year. As explained in the Introduction to this document, national accounting estimates of Australian Government outlays published by the Treasury and by the Australian Bureau of Statistics show advances (including the States' Loan Council borrowing programs) on a net basis. The figures shown here coincide with those shown in the national accounting estimates. The figures shown in other sections of this document are all on a gross basis-that is, before deducting re-payments. Includes interest on the State's domestic raisings. Dissection of payments between grants and loans not available. See the relevant sections of Chapter IV.
235
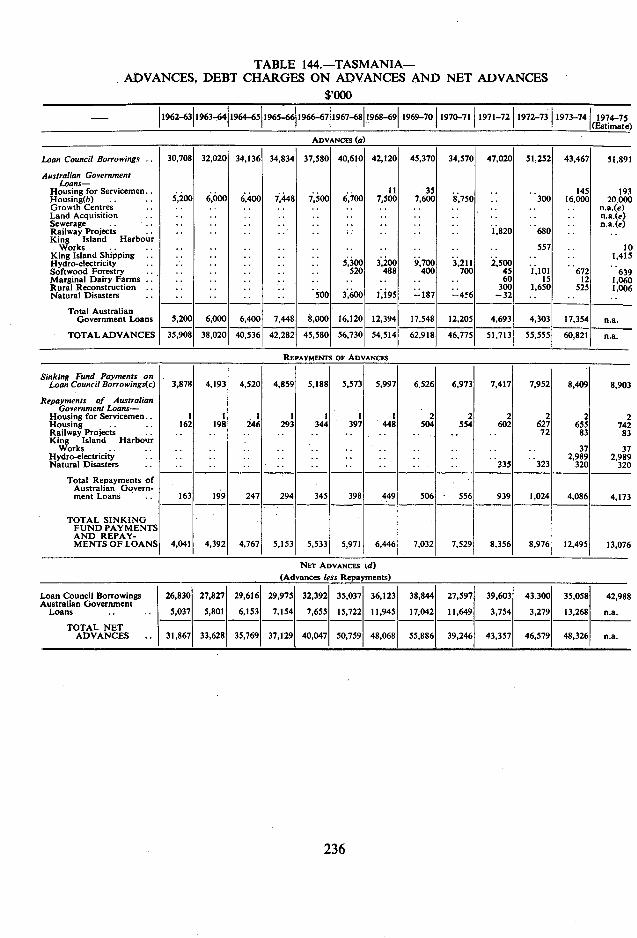
TABLE 144.-TASMANIA- ADVANCES, DEBT CHARGES ON ADVANCES AND NET ADVANCES
$,000
- 1962-63 1963-64 1964-65 1965-66 1966-67 1967-68 1968-69 1969-70 1970-71 1971-72 1972-73 1973-74 1974-75 (Estimate)
ADVANCES (a)
Loan Council Borrowings .. 30,708 32,020 34,136 34,834 37,580 40,610 42,120 45,370 34,570 47,020 51:252 43,467 51,891
Australian Government Loans-
Housing for Servicemen.. . . .. .. .. .. .. 11 35 .. .. .. 145 193 Housing(b) .. .. 5,200 6,000 6,400 7,448 7,500 6,700 7,500 7,600 8,750 .. 300 16,000 20,000 Growth Centres . . . . . . . . . . . . . . . . .. . . . . . . . . n.a.(e) Land Acquisition .. .. .. .. .. .. .. .. .. .. .. .. .. n.a.(e) Sewerage. . . . .. .. .. . . . . .. .. . . . . . . . . . . n.a.(e) Railway Projects .. .. .. .. .. .. ;. .. .. .. 1,820 680 King Island Harbour
Works .. .. .. .. .. .. .. .. .. .. .. .. 557 .. 10 King Island Shipping .. .. .. .. .. .. .. .. .. .. .. .. .. 1,415 Hydro-electricity .. .. .. .. .. .. 5,300 3,200 9,700 3,211 2,500 Softwood Forestry .. .. .. .. .. .. 520 488 400 700 45 1,101 672 639 Marginal Dairy Farms .. .. .. .. .. .. .. .. .. .. 60 15 12 1,060 Rural Reconstruction .. .. .. .. .. .. .. .. .. .. 300 1,650 525 1,006 Natural Disasters .. .. .. .. .. 500 3,600 1,195 -187 -456 -32
Total Australian Government Loans 5,200 6,000 6,400 7,448 8,000 16.120 12,394 17,548 12.205 4,693 4,303 17,354 na.
TOTAL ADVANCES 35,908 38,020 40,536 42,282 45,580 56,730 54,514 62,918 46,775 51,713 55,555 60,821 na.
REPAYMENTS OF ADVANCES
Sinking Fund Payments on Loan Council Borrowings(c) 3,878 4,193 4,520 4,859 5,188 5,573 5,997 6,526 6,973 7,417 7,952 8,409 8,903
Repayments of Australian Government Loans-
Housing for Servicemen.. Housing .. .. Railway Projects .. King Island Harbour
I 162 ..
I 198 ..
I 246 ..
I 293 ..
I 344 ..
1 397 ..
1 448 ..
2 504
2 554 602
..
2 - 2 627 72
2 655 83
2 742 83
Works .. ..
Hydroelectricity ..
Natural Disasters . . .. .. . .
.. ..
. . .. .. . .
.. .. .. .. .. . .
.. .. .. .. .. .. .
..
.. 335
..
.. 323
37 2,989
320
37 2,989
320
Total Repayments of Australian Govern- - ment Loans .. 163 199 247 294 345 398 449 506 556 939 1,024 4.086 4,173
TOTAL SINKING FUND PAYMENTS AND REPAY- MENTSOFIOANS 4,041 4,392 4,767 5.153 5,533 5,971 6,446 7,032 7,529 8,356 8,976 12,495 13,076
NET ADVANCES 4) (Advances less Repayments)
Loan Council Borrowings 26,830 27,827 29,616 29,975 32,392 35,037 36,123 38,844 27,597 39,603 43.300 35,058 42,988 Australian Government
Loans . . .. 5,037 5,801 6,153 7,154 7,655 15,722 11,945 17,042 11,649 3,754 3,279 13,268 na.
TOTAL NET ADVANCES .. 31,867 33,628 35,769 37,129 40,047 50,759 48,068 55,886 39,246 43,357 46,579 48,326 na.
236
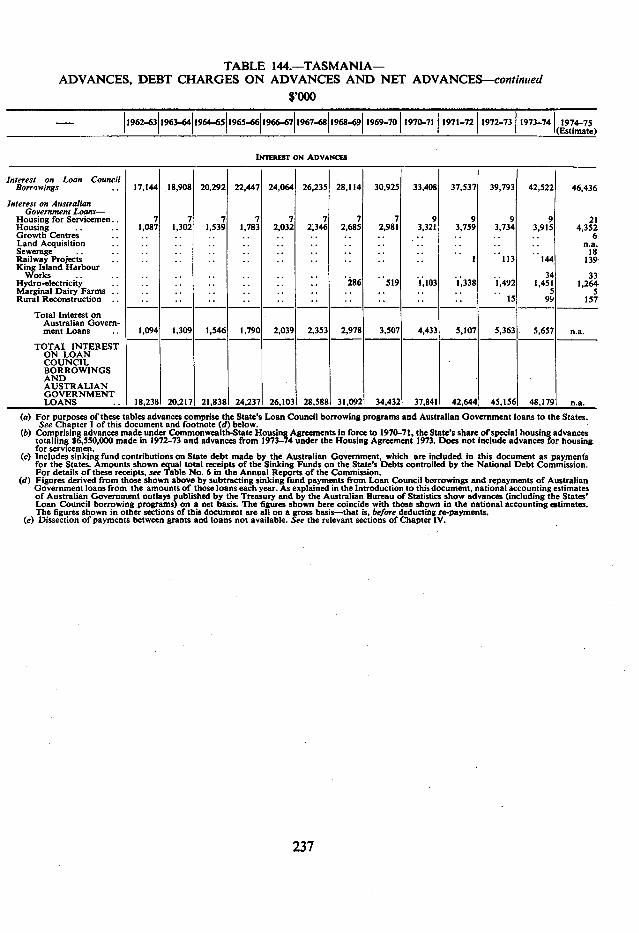
TABLE 144.-TASMANIA- ADVANCES, DEBT CHARGES ON ADVANCES AND NET ADVANCES-continued
$,000
- 1962-63 1963-64 1964-65 1965-66 1966-67 1967-68 1968-69 1969-70 1970-71 1971-72 1972-73 1973-74 1974-75 (Estimate)
INTEREST ON ADVANCES
Interest on Loan Council Borrowings .. 17,144 18,908 20,292 22,447 24,064 26,235 28,114 30,925 33,408 37,537 39,793 42,522 46,436
Interest on Australian Government Loans-
Housing for Servicemen 7 7 7 7 7 7 7 7 9 9 9 9 21 Housing* 1,087 1,302 1,539 1,783 2,032 21346 2,685 2,981 3,321 3,759 3,734 3,915 4,352 Growth Centres .. .. .. .. .. .. .. ., .. .. .. 6 Land Acquisition .. .. .. .. .. .. .. .. .. .. .. n.a. Sewerage .. .. .. .. .. .. .. ., .. .. .. 18 Railway Projects .. .. .. .. .. .. .. .. .. .. I 113 144 139 King Island Harbour
Works .. .. .. .. .. .. .. .. .. .. .. .. 34 33 Hydro-electricity .. .. .. .. .. 286 519 1,103 1,338 1,492 1,451 1,264 Marginal Dairy Farms .. .. .. .. .. .. .. .. .. .. Rural Reconstruction .. .. .. .. .. .. .. .. .. 15 99 157
Total Interest on Australian Govern- ment Loans .. 1,094 1,309 1,546 1,790 2,039 2,353 2,978 3,507 4,433 5,107 5,363 5,657 n.a.
TOTAL INTEREST ON LOAN COUNCIL BORROWINGS AND AUSTRALIAN GOVERNMENT LOANS .. 18,2381 20.2171 21,8381 24,2371 26,1031 28,5881 31,092 34,4321 37,841 42,644 45,1561 48,179 n.a.
For purposes of these tables advances comprise the State's Loan Council borrowing programs and Australian Government loans to the States. See Chapter I of this document and footnote (d) below.
Comprising advances made under Commonwealth-State Housing Agreements in force to 1970-71, the State's share of special housing advances totallin $6,550,000 made in 1972-73 and advances from 1973-74 under the Housing Agreement 1973. Does not, include advances for housing for servicemen. Includes sinking fund contributions on State debt made by the Australian Government, which are included in this document as payments for the States. Amounts shown equal total receipts of the Sinking Funds on the State's Debts controlled by the National Debt Commission. For details of these receipts, see Table No. 6 in the Annual Reports of the Commission. Figures derived from those shown above by subtracting sinking fund payments from Loan Council borrowings and repayments of Australian Government loans from the amounts of those loans each year. As explained in the Introduction to this document, national accounting estimates of Australian Government outlays published by the Treasury and by the Australian Bureau of Statistics show advances (including the States' Loan Council borrowing programs) on a net basis. The figures shown here coincide with those shown in the national accounting estimates. The figures shown in other sections of this document are all on a gross basis-that is, before deducting re-payments. Dissection of payments between grants and loans not available. See the relevant sections of Chapter IV.
237
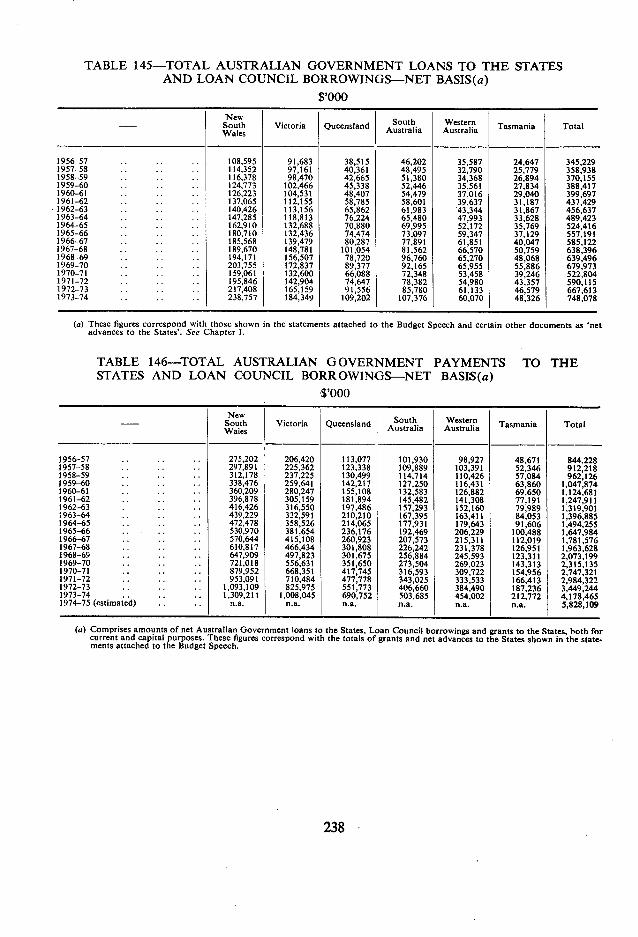
TABLE 145-TOTAL AUSTRALIAN GOVERNMENT LOANS TO THE STATES AND LOAN COUNCIL BORROWINGS-NET BASIS(a)
$,000
- South Wales
Victoria Queensland
I Australia
Western Tasmania Total
1956-57 .. 108,595 91,683 38,515 46,202 35,587 24,647 345,229 1957-58 .. 114,352 97,161 40.361 48,495 32,790 25,779 358,938 1958-59 .. .. 116,378 98,470 42,665 51,380 34,368 26.894 370,155 1959-60 124,773 102,466 45,338 52,446 35,561 27,834 388,417 1960-61 126,223 104,531 48,407 54,479 37,016 29,040 399,697 1961-62 ,. 137,065 112,155 58,785 58,601 39,637 31,187 437,429 1962-63 .. .. . 140,426 113,156 65,862 61,983 43,344 31,867 456,637 1963-64 . .. 147,285 118,813 76,224 65,480 47,993 33,628 489,423 1964-65 . .. 162.910 132,688 70,880 69,995 52,172 35,769 524,416 1965-66 180,710 132,436 74,474 73,097 59,347 37,129 557,191 1966-67 .. . . 185,568 139,479 80,287 77,891 61,851 40,047 585,122 1967-68 .. 189,670 148,781 101.054 81,562 66,570 50,759 638,396 1968-69 .. . 194,171 156,507 78,720 96,760 65,270 48,068 639,496 1969-70 .. 203,755 172,837 89,377 92,165 65,955 55,886 679,973 1970-71 .. .. 159,061 132,600 66,088 72,348 53,458 39,246 522,804 1971-72 . .. 195,846 142,904 74,647 78,382 54,980 43,357 590,115 1972-73 •. .. 217,408 165,159 91,556 85,780 61,133 46,579 667,613 1973-74 .. .. 238,757 184,349 109,202 107,376 60,070 48,326 748,078
(a) These figures correspond with those shown in the statements attached to the Budget Speech and certain other documents as 'net advances to the Stases'. Sec Chapter 1.
TABLE 146-TOTAL AUSTRALIAN GOVERNMENT PAYMENTS TO THE STATES AND LOAN COUNCIL BORROWINGS-NET BASIS(a)
,$,000 New
South Wales
I
Victoria Queensland South Australia
Western Australia Tasmania Total
1956-57 ,. .. . . 275,202 206,420 113,077 101,930 98,927 48,671 844,228 1957-58 .. .. 297,891 225,362 123,338 109,889 103,391 52,346 912,218 1958-59 .. . 312,178 237,225 130,499 114,714 110,426 57,084 962,126 1959-60 . . 338,476 259,641 142,217 127,250 116,431 63,860 1,047,874 1960-61 •. .. . 360,209 280,247 155,108 132,583 126,882 69,650 1.124,681 1961-62 .. .. .. 396,878 305,159 181,894 145,482 141,308 77,191 1,247,911 1962-63 . .. . 416,426 316,550 197,486 157,293 152,160 79,989 1,319,901 1963-64 .. .. 439,229 332,591 210,210 167,395 163,411 84,053 1,396,885 1964-65 ,. .. .. 472,478 358,526 214,065 177,931 179,643 91,606 1,494,255 1965-66 . . . .. 530,970 381,654 236,176 192,469 206,229 100,488 1,647,984 1966-67 . •. .. 570,644 415,108 260,923 207,573 215,311 112,019 1,781,576 1967-68 .. .. . 610,817 466,434 301,808 226,242 231,378 126,951 1,963,628 1968-69 .. .. . 647,909 497,823 301,675 256,884 245,593 123,311 2,073.199 1969-70 .. . 721,018 556,631 351,650 273,504 269,023 143,313 2,315,135 1970-71 .. .. .. 879,952 668,351 417,745 316,593 309,722 154,956 2.747,321 1971-72 .. . . .. 953,091 710,484 477,778 343,025 333,533 166,413 2,984,322 1972-73 .. .. . 1,093,109 825,975 551,773 406,660 384,490 187,236 3,449,244 1973-74 .. .. .. 1,309,211 1,008,045 690,752 503,685 454,002 212,772 4,178,465 1974-75 (estimated) .. n.a. na. na. na. na. na. 5,828,109
(a) Comprises amounts of net Australian Government loans to the States. Loan Council borrowings and grants to the States, both for current and capital purposes. These figures correspond with the totals of grants and net advances to the States shown in the state-ments attached to the Budget Speech.
238
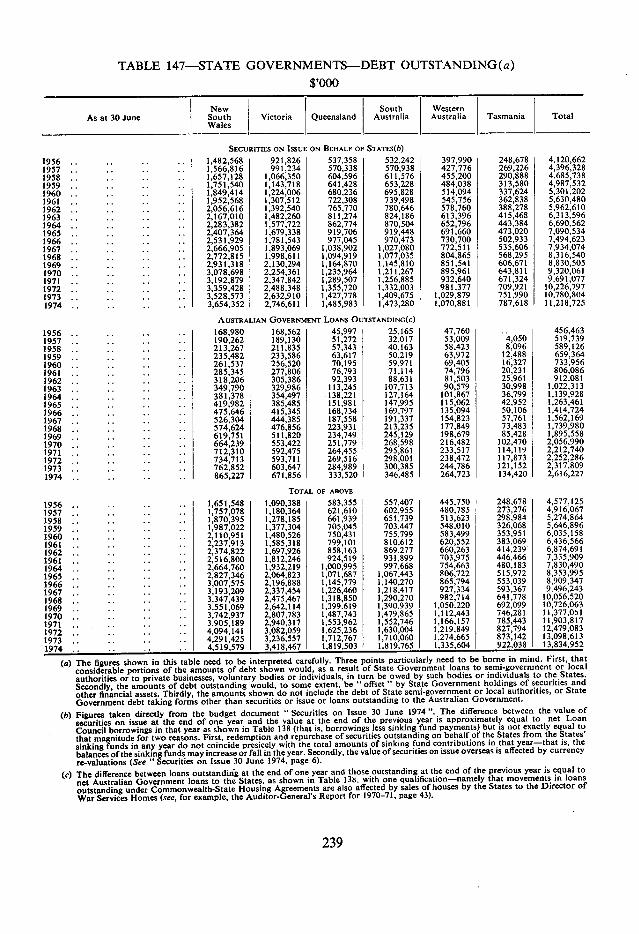
397,990 248,678 4.120,662 427,776 269,226 4,396,328 455,200 290,888 4,685,738 484,038 313,580 4,987,532 514,094 337,624 5,301.202 545,756 362,838 5,630,480 578,760 388,278 5,962,610 613,396 415,468 6,313,596 652,796 443,384 6,690,562 691,660 473,020 7,090,534 730,700 502,933 7,494,623 772,511 535,606 7,934,074 804,865 568,295 8,316,540 851,541 606,671 8,830,505 895,961 643,811 9,320,061 932,640 671,324 9,691,077 981,377 709,921 10,226,797
1,029,879 751,990 10,780,804 1,070,881 787,618 11,218,725
47,760 456,463 53,009 4,050 519,739 58,423 8,096 589,126 63,972 12,488 659,364 69,405 16,327 733,956 74,796 20,231 806,086 81,503 25.961 912,081 90,579 30,998 1,022,313
101,867 36,799 1,139,928 115,062 42,952 1,263,461 135,094 50,106 1,414,724 154,823 57,761 1,562,169 177,849 73,483 1,739,980 198,679 85,428 1,895,558 216,482 102,470 2,056,990 233,517 114,119 2,212,740 238,472 117,873 2,252,286 244,786 121,152 2,317,809 264,723 134,420 2,616,227
445,750
248.678
4,577,125
480,785
273,276
4,916,067
513,623 298,984
5,274,864
548,010
326,068
5,646,896
583,499
353,951 6,035,158
620,552
383,069
6,436,566
660,263
414,239
6,874,691
703,975
446,466
7,335,909
754,663
480,183
7,830,490
806,722
515,972
8,353,995
865,794
553,039
8,909,347
927,334
593,367
199 195', 1951 195S 196( 1961 196 1961 196 196
196 1961 196
1971 1972 1973
TABLE 147-STATE GOVERNMENTS-DEBT OUTSTANDING (a)
$,000
New South Western As at 30 June South Victoria Queensland Australia Australia Tasmania Total
Wales
SECURITIES ON ISSUE ON BEHALF OF STATES(b) 1,482,568 921,826 537,358 532,242 1,566,816 991,234 570,338 570.938 1,657,128 1.066.350 604,596 611,576 1,751,540 1,143,718 641,428 653,228 1,849,414 1,224,006 680,236 695,828 1,952,568 1,307,512 722,308 739,498 2,056,616 1,392,540 765,770 780,646 2,167,010 1,482,260 811,274 824,186 2,283,382 1,577,722 862,774 870,504 2,407,364 1,679,338 919,706 919,448 2,531.929 1,781,543 977,045 970,473 2,666,905 1,893,069 1,038,902 1,027,080 2,772,815 1,998,611 1,094,919 1,077,035 2,931,318 2,130,294 1,164,870 1,145,810 3,078,698 2,254,361 1,235,964 1,211,267 3,192,879 2,347,842 1,289,507 1,256,885 3,359,428 2,488,348 1,355,720 1.332003 3,528,573 2,632,910 1,427,778 1,409,675 3,654,352 2,746,611 1,485,983 1,473,280
AUSTRALIAN GOVERNMENT LOANS OUTSTANDING(C) 168,980 168,562 45,997 25,165 190,262 189,130 51,272 32,017 213.267 211,835 57,343 40,163 235,482 233,586 63,617 50,219 261,537 256,520 70,195 59,971 285,345 277,806 76,793 71,114 318,206 305,386 92,393 88,631 349,790 329,986 113,245 107,713 381,378 354,497 138,221 127,164 419,982 385,485 151,981 147,995 475,646 415,345 168,734 169,797 526,304 444,385 187,558 191,337 574,624 476,856 223,931 213,235 619,751 511,820 234,749 245,129 664,239 553,422 251,779 268,598 712,310 592,475 264,455 295,861 734,713 593,711 269,516 298,001 762,852 603,647 284,989 300,385 865,227 671,856 333,520 346,485
TOTAL OF ABOVE 1,651,548 1,090,388 583,355 557,407 1,757,078 1,180,364 621,610 602,955 1,870,395 1,278,185 661,939 651,739 1,987,022 1,377,304 705,045 703,447 2,110,951 1,480,526 750,431 755,799 2,237,913 1,585,318 799,101 810,612 2,374,822 1,697,926 858.163 869,277 2,516,800 1,812,246 924,519 931,899 2,664,760 1,932,219 11000,995 997,668 2,827,346 2,064,823 1,071,687 1,067,443 3,007,575 2,196,888 1,145,779 1,140,270 3.193.209 2.337.454 1.226,460 1,218.417 3,347,439 2475,467 1318850 1,290,270 982,714 641,778 10,058,520
,. .. .. .. 3,551,069 2,642,114 1,399.619 1,390.939 1,050.220 692,099 10,726,063 3,742,937 2,807,783 1,487,743 1,479,865 1,112,443 746,281 11,377,051
. . . . . 3,905,189 2,940,317 1,553,962 1,552,746 1,166,157 785,443 11,903,817 4,094,141 3,082,059 1,625,236 1,630,004 1,219.849 827,794 12,479,083
. . 4,291,425 3,236,557 1,712,767 1,710,060 1 1,274,665 873,142 13,098,613 4,519,579 3,418,467 1,819,503 1.819.765 1 1,335,604 1 922,038 13,834,952
The figures shown in this table need to he interpreted carefully. Three points particularly need to be borne in mind. First, that considerable portions of the amounts of debt shown would, as a result of State Government loans to semi-government or local authorities or to private businesses, voluntary bodies or individuals, in turn be owed by such bodies or individuals to the States. Secondly, the amounts of debt outstanding would, to some extent, be "offset" by State Government holdings of securities and other financial assets. Thirdly, the amounts shown do not include the debt of State semi-government or local authorities, or State Government debt taking forms other than securities or issue or loans outstanding to the Australian Government. Figures taken directly from the budget document Securities on Issue 30 June 1974 ".The difference between the value of securities on issue at the end of one year and the value at the end of the previous year is approximately equal to net Loan Council borrowings in that year as shown in Table 138 (that is, borrowings less sinking fund payments) but is not exactly equal to that magnitude for two reasons. First, redemption and repurchase of securities outstanding on behalf of the States from the States' sinking funds in any year do not coincide presicely with the total amounts of sinking fund contributions in that year-that is, the balances of the sinking funds may increase or fall in the year. Secondly, the value of securities on issue overseas is affected by currency re-valuations (See "Securities on Issue 30 June 1974, page 6). The difference between loans outstanding at the end of one year and those outstanding at the end of the previous year is equal to net Australian Government loans to the States, as shown in Table 138, with one qualification-namely that movements in loans outstanding under Commonwealth-State Housing Agreements are also affected by sales of houses by the States to the Director of War Services Homes (see, for example, the Auditor-General's Report for 1970-71, page 43).
1956 1957 1958 1959 1960 1961 1962 1963 1964 1965 1966 1967 1968 1969 1970 1971 1972 1973 1974
1956 1957 1958 1959 1960 1961 1962 1963 1964 1965 1966 1967 1968 1969 1970 1971 1972 1973 1974
239
APPENDIX VI—AUSTRALIAN GOVERNMENT PAYMENTS AND LOAN COUNCIL BORROWINGS
TABLE No. SUBJECT
148 Six States—Australian Government Payments and Loan Council Borrowings, 1962-63 to 1974-75
149 New South Wales—Australian Government Payments and Loan Council Borrowings, 1962-63 to 1974-75
150 Victoria—Australian Government Payments and Loan Council Borrowings,, 1962-63 to 1974-75
151 Queensland—Australian Government Payments and Loan Council Borrowings, 1962-63 to 1974-75
152 South Australia—Australian Government Payments and Loan Council Borrow-ings, 1962-63 to 1974-75
153 Western Australia—Australian Government Payments and Loan Council Borrowings, 1962-63 to 1974-75
154 Tasmania—Australian Government Payments and Loan Council Borrowings,, 1962-63 to 1974-75
241

15,170 15,170 15,170
23,271 24,550 26,323 11,504 23,008
50,435 58,878 67,596
10,658 15,743 18,372
12,177 24,253 29,594
109 1,672 2,778
96 236
10,555 10,597 9,595
279 385
725 845 990
31 318 491
3 12 7
1,882 3,691 5,876 26,999
596 • 802 1,665 4,000
74 ..131 ..151
15,170
27,979 34,512
80,826
40,979 8
5,270 10,419 10,818
3,761
469 742
1,170 1,870 376
916 1,218
34 74
77 164
9,748 7,654 103,821 12,000
120
6,649 6,673
6,750 6,750
142 123
439 125
15,170 15,170 15,170 15,1
17,761 18,951 20,387 21,6
31,551 34,262 39,912 43,5
2,472 5,273 6,2
13,370
482
22
961
23
11,266
632
23
201
44
11,460
23
1,149
319
60
15,287
31,093 57,520
300 318,555
209,330 20,717
234,180 20,500 9,076
799 22,011 11,624 6,786
856 1,920
500
1,500 ISO 304
6,200
120 10,552 6,750
170 2,000 3,120
25
56,345
314
348 252
1,202 2,176 28 23
310
3,900 57
382 • 388 450
203 1,421 2,404
599 4,985 5,679 98 68 102
205
188 168
484
4,000 5,134
6,300 6,802
151 151
45
6,900
7,723 128
2,642 60
35
327
1,500
893 920 918. 892
985 1,063 1,241
2,0122,347 3,152 329 351 808
100l'6 116 116
1,378 2,038 3,154 2,879 9,746 12,147 13,0971 11,697
92,2641100.6271113.4l11 120.210
243
116 150 ISO
3,446 4,170 4,341
9,084 9.944 1,143
144,596 190,721 248,758
153 . 2,000
150 150 150 5,767 5,901 7,335
5 4,312 558
389,545 609,739 1.078.140
TABLE 148.-SIX STATES-AUSTRALIAN GOVERNMENT PAYMENTS AND LOAN COUNCIL BORROWINGS, 1962-63 TO 1974-75
$,000 1962-63 1963-64 1964--65 1965-66 1966-67 1967-68 1968-69
I 11969_70 1970-71 1971-72 1972-73 1973-74
GENERAL REVENUE ASSISTANCE
Financial Assistance Grants 608,640 635,967 681,349 757,351 826,613 907,539 1,018,193 1,141,319 1,418,518 1,440,878 1,647,293 1,859,905 2,327,600 Special Grants .. 22,502 22,900 31,720 41,770 40,072 35,407 17,392 21,900 18,680 23,800 38,600 38,550 48,250 Special Revenue Assistance(b) .. .. 10,750 14,000 14,000 26,000 43,000 72,500 15,000 25,000 -
Total .. .. 631,142 658,867 713,069 799,121 877,435 956,946 1,049,585 1,189,219 1,480,198 1,537,178 1,700,893 1,923455 2,375,850
ADDITIONAL ASSISTANCE GRANTS(C)
Total .. 35,000 40,W01
0,000 .. .. ..
GENERAL PURPOSE CAPITAL FUNDs(d)
State Government Loan Council Borrowing Pro- grams .. 412,778 443,700 477,300 488,000 525,000 554,160 584,000 625,770 481,450 672,900 733,461 588,693 700,801
Capital Grants .. .. .. .. .. 200,000 219,100 248,539 278,307 326,618
Total .. 412,778 443,700 477,300 488,000 525,000 554,160 584,000 625,770 681,450 892,000 982,000 867,000 1,027,419
SPECIFIC PURPOSE PAYMENTS-RECURRENT PURPOSES
Payments Under Financial Agreement-
Interest on State Debt 15,170 15,170 15,170 Sinking Fund on State
Debt .. 14,497 15,691 16,646 Debt Charges Assistance .. State Emergency Services .. Universities 18,546 21,081 28,529 Colleges of Advanced
Education .. .. Technical Education .. Schools .. Pre-school and Child Care Child Migrant Education .. Educational Research .. Community Health Tuberculosis Hospitals 9,738 10,463 10,129 School Dental Scheme .. Health Education .. Blood Transfusion Services 369 396 428 Health Planning Agencies .. Housekeeper Services . 23 23 22 Home Care Services . . . Senior Citizens Centres . . . Paramedical Services . . Assistance for Deserted
Wives .. .. Unemployment Relief .. Social Planning Units .. Aboriginal Advancement .. Housing Grants .. .. Housing-Rental Losses 37 45 130 Sewerage .. .. Area Improvement .. Pilbara Feasibility Study .. Local Government (Grants
Commission) .. .. Regional Organisations
Assistance . . . . Community Recreation
Investigations . . . . Perth Underground Railway
Study.. .. .. Fisheries Development . . . Cattle Tick Control . 536 518 414 Bovine Brucellosis and T.B.
Eradication .. .. Agricultural Extension
Services .. 1,014 1,198 1,212 Minor Agricultural Research n.a 46 34 Apples Export Assistance .. Plague Locust Control . . Trawl and Danish Seine
Fishery .. . . Apple, Pear and Canning
Fruit Industries . . . Adjustment Assistance to
Canneries .. . 0
Tobacco Extension Services 48 48 Coal Mining Industry-
LongService Leave 954 910 1,021 Apprenticeship Training . Burdekin River Regional
Study .. .. Legal Aid . . .. Road Safety Practices . 100 100 100 Research Grants . . . . . Natural Disaster Relief . 130 120 100
Total Specific Purpose Recurrent Payments 61.162 65.809 73.935
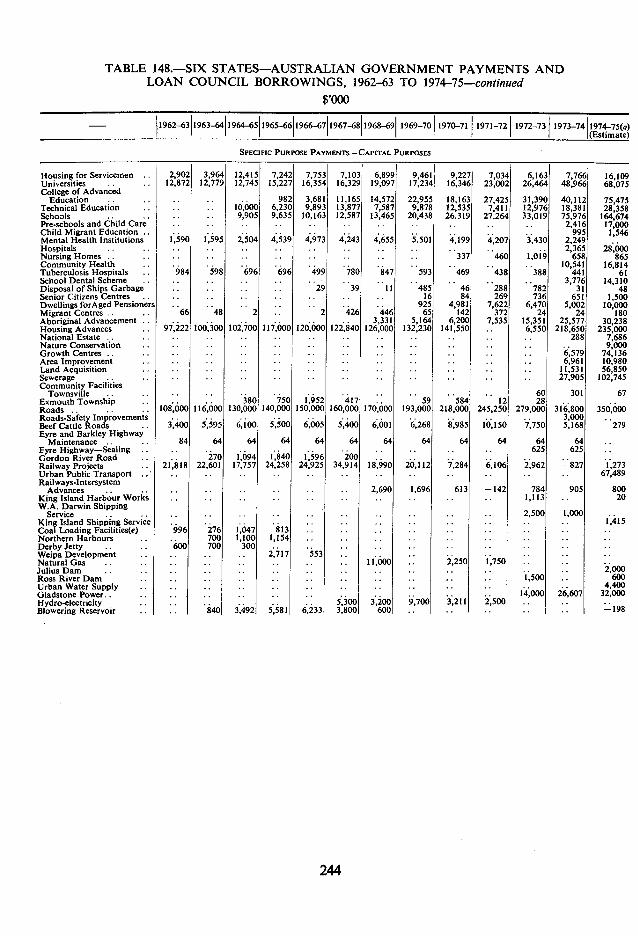
TABLE 148.-SIX STATES-AUSTRALIAN GOVERNMENT PAYMENTS AND LOAN COUNCIL BORROWINGS, 1962-63 TO 1974-75-continued
$,000
1962-63 1963-64 1964-65 1965-66 1966-67 1967-68 1968-69 1969-70 1970-71 1971-72 1972-73 1973-74 1974-75(a) (Estimate)
SPECIFIC PURPOSE PAYMENTS-CAPITAt. PURPOSES
Housing for Servicemen 2,902 3,964 12,415 7,242 7,753 7,103 6,899 9,4611 9,227j 7,034 6,163 7,766 16,109 Universities 12,872 12,779 12,745 15,227 16,354 16,329 19,097 17,234 16,346 23,002 26,464 48,966 68:075 College of Advanced
Education • . . .. 982 3,681 11,165 14,572 22,955 18,163 27,425 31,390 40,112 75,475 Technical Education .. 10,000 6,230 9,893 13,877 7,587 9,878 12,535 7,411 12,976 18,381 28,358 Schools .. 9,905 9,635 10,163 12,587 13,465 20,438 26.319 27,264 33,019 75,976 164,674 Pre-schools and Child Care . .. .. .. .. .. 2,416 17,000 Child Migrant Education .. .. .. .. .. .. .. 995 1,546 Mental Health Institutions 1,590 1,595 2,504 4,539 4,973 4,243 4,655 5,501 4,199 4,207 3,430 2,249 Hospitals . .. .. . .. . . . .. . 2,365 28,000 Nursing Homes .. .. .. .. ., . .. .. 337 460 1,019 658 865 Community Health . . . . .. . . .. .. .. .. . . 10,541 16,814 Tuberculosis Hospitals 984 598 696 696 499 780 847 593 469 438 388 441 61 School Dental Scheme .. .. .. .. .. .. .. .. 3,776 14,310 Disposal of Ships Garbage . . . . . . . 29 39 II 485 46 288 782 31 48 Senior Citizens Centres , .. .. ,. . . .. 16 84 269 736 651 1,500 Dwellings forAged Pensioners.. .. .. .. .. 925 4,981 7,622 6,470 5,002 10,000 Migrant Centres .. 66 48 2 2 426 446 65 142 372 24 24 180 Aboriginal Advancement. . . . . . . . . . 3,331 5,164 6,200 7,535 15,351 25,577 30,238 Housing Advances , 97,222 100,300 102,700 117,000 120,000 122,840 126,000 132,230 141,550 .. 6,550 218,650 235,000 National Estate .. .. .. .. .. .. .. .. .. .. .. 288 7,686 Nature Conservation .. . . .. .. .. . . '' . . .. .. 9,000 Growth Centres .. .. . . .. . .. . . .. .. .. . . .. 6,579 74,136 Area Improvement . . . . . .. . . . . . . . . . . . . . . . 6,961 10,980 Land Acquisition .. .. .. .. .. .. .. .. 11,531 56,850 Sewerage .. .. .. .. .. .. .. .. .. .. .. 27,905 102,745 Community Facilities
Townsville .. .. .. .. .. .. .. .. .. .. .. .. 60 301 67 Exmouth Township .. 380 750 1,952 417 .. 59 584 12 28 Roads .. .. .. 108,000 116,000 130,000 140,000 150,000 160,000 170,000 193,000 218,000 245,250 279,000 316,800 350,000 Roads-Safety Improvements .. .. .. .. .. . .. .. .. .. 3,000 Beef Cattle Roads 3,400 5,595 6,100 5,500 6,005 5,400 6,001 6,268 8,985 10,150 7,750 5,168 279 Eyre and Barkley Highway
Maintenance 84 64 64 64 64 64 64 64 64 64 64 64 Eyre Highway-Sealing .. .. .. .. .. ,. .. .. .. 625 625 Gordon River Road .. .. 270 1,094 1,840 1,596 200 .. .. .. .. Railway Projects . . 21,818 22,601 17,757 24,258 24,925 34,914 18,990 20,112 7,284 6,106 2,962 827 1,273 Urban Public Transport .. .. . .. . . .. . . .. .. .. .. .. .. 67,489 Railways-Intersystem
Advances .. .. .. .. .. .. . . .. 2,690 1,696 613 -142 784 905 800 King Island Harbour Works . . . . .. .. .. . .. . . .. .. 1,113 .. 20 W.A. Darwin Shipping
Service .. .. ., .. .. .. .. .. .. .. ,, .. 2,500 1,000 King Island Shipping Service . . . . . .. .. .. .. .. .. .. .. .. 1,415 :oal Loading Facilities(e) 996 276 1,047 813 4orthern Harbours.. .. 700 1,100 1,154 .. .. .. .. .. .. .. Derby Jetty .. .. 600 700 300 .. .. .. . . .. .. .. . . Neipa Development .. .. . . .. 2,717 553 .. .. .. .. .. .. 14atural Gas .. .. .. .. .. .. .. .. 11,000 .. 2,250 1,750 .. .. lulius Dam .. .. .. .. .. .. .. .. .. .. .. toss River Dam .. .. .. .. .. .. .. .. .. .. .. 1,500 .. 600 Jrban Water Supply .. .. .. .. .. .. .. .. .. .. .. .. .. 4,400 31adstone Power.. .. .. .. .. .. .. .. .. .. .. .. 14,000 26,607 32,000 lydro-electricity .. .. .. .. .. .. 5,300 3,200 9,700 3,211 2,500 .. llowering Reservoir .. .. 840 3,492 5,581 6,233 3,800 600 .. . . .. I ,. I ,, -198
244
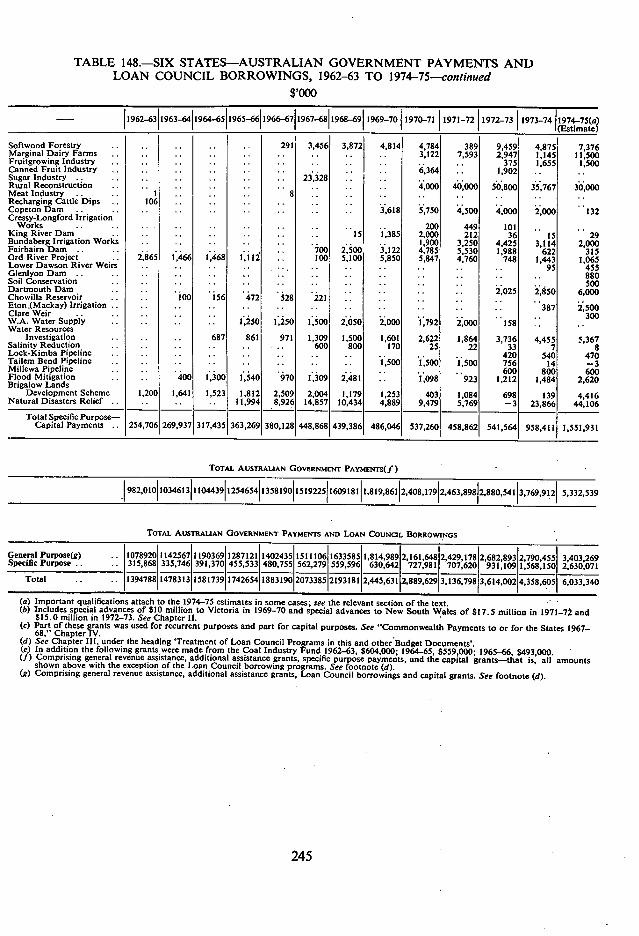
TABLE 148.-SIX STATES-AUSTRALIAN GOVERNMENT PAYMENTS AND LOAN COUNCIL BORROWINGS, 1962-63 TO 1974-75--continued
$,000
1962-63 1963-64 1964-65 1965-6611966-67 1967-68 1968-69 1969-70 1970-71 1971-72 1972-73 1973-74 1974-75(o) (Estimate)
Softwood Forestry 291 3,456 3,872 4,814 4,784 389 9,459! 4,8751 7,376 Marginal Dairy Farms .. .. .. .. 3,122 7,593 2,947 1,145 11,500 Fruitgrowing Industry .. .. .. .. .. .. .. 375 1,655 1,500 Canned Fruit industry .. .. .. .. 6,364 .. 1,902 Sugar Industry .. 23,328 .. .. .. .. . Rural Reconstruction .. .. .. .. .. 4,000 40,000 50,800 35,767 30,000 Meat Industry I 8 .. .. .. .. .. Recharging Cattle Dips 106 . .. .. .. .. .. Copeton Dam .. .. .. 3,618 5,750 4,500 4,000 2,000 132 Cressy-Longford Irrigation
Works .. .. .. .. .. .. 200 449 101 King River Dans .. 15 1,385 2,000 212 36 IS 29 Bundaberg Irrigation Works .. .. .. 1,900 3,250 4,425 3,114 2,000 Fairbairn Darn .. 700 2,500 3,122 4,785 5,530 1,988 622 315 Ord River Project 2,865 11466 1,468 1,112 100 5,100 5,850 5,847 4,760 748 1,443 1,065 Lower Dawson River Weirs .. .. .. .. .. 95 455 Glenlyon Dam .. .. .. .. .. .. .. .. 880 Soil Conservation .. .. .. .. .. .. .. . 500 Dartmouth Dam .. .. .. .. .. 2,025 2,850 6,000 Chowilla Reservoir 100 156 472 528 Eton(Mackay) irrigation .. .. .. .. .. .. 387 2,500 Clare Weir .. . .. .. . . .. . . .. .. 300 W.A. Water Supply 1,250 1,250 1,500 2,050 2,000 1,792 2 ,000 158 Water Resources
Investigation 687 861 971 1,309 1,500 1,601 2,622 1,864 3,736 4,455 5,367 Salinity Reduction 600 800 170 25 22 33 7 8 Lock-Kimba Pipeline .. .. .. .. .. 420 540 470 Tailem Bend Pipeline .. .. 1,500 1,500 1,500 756 14 -3 Millewa Pipeline .. .. .. .. .. 600 800 600 Flood Mitigation 400 1,300 1,540 970 1,309 2,481 .. 1 ,098 923 1.212 1,484 2,620 Brigalow Lands Development Scheme 1,200 1,641 1,523 1,812 2,509 2,004 1,179 1,253 403 1,084 698 139 41416 Natural Disasters Relief 11,994 8,926 14,857 10,434 4,889 9,479 5,769 -3 23,866 44,106 Total Specific Purpose-
Capital Payments .. 254,706 269,937 317,435 363,269 380,128 448,868 439,386 486,046 537,260 458,862 541,564 958,411 1,551,931
TOTAL AUSTRALIAN GOVERNMENT PAYMENTS(f)
982,010 1034613 110"39 1254654 I358190 15l9225 1609181 5,332,539
TOTAL AUSTRALIAN GOVERNMENT PAYMENTS AND LOAN COUNCIL BORROWINGS
General Purpose(g) .. Specific Purpose .. ..
1078920 315,868
1142567 335,746
1190369 391,370
1287121 455,533
1402435 480,755
1511106 562,279
1633585 559,596
1,814,989 630,642
2,161,648 727,981
2,429,178 707,620
2,682,893 931,109
2,790,455 1,568,150
3,403,269 2,630,071
Total .. .. 1394788 1478313 1581739 1742654 1883190 2073385 2193181 2,445,631 2,889,629 3,136,798 3,614,002 4,358,605 6,033,340
Important qualifications attach to the 1974-75 estimates in some cases; see the relevant section of the text. Includes special advances of $10 million to Victoria in 1969-70 and special advances to New South Wales of $17.5 million in 1971-72 and $15.0 million in 1972-73. See Chapter II. Part of these grants was used for recurrent purposes and part for capital purposes. See "Commonwealth Payments to or for the States 1967-68," Chapter IV. See Chapter III, under the heading 'Treatment of Loan Council Programs in this and other Budget Documents'. In addition the following grants were made from the Coal Industry Fund 1962-63, $604,000; 1964-65, $559,000; 1965-66, $493,000. Comprising general revenue assistance, additional assistance grants, specific purpose payments, and the capital grants-that is, all amounts shown above with the exception of the Loan Council borrowing programs. See footnote (d). Comprising general revenue assistance, additional assistance grants, Loan Council borrowings and capital grants. See footnote (d).
245
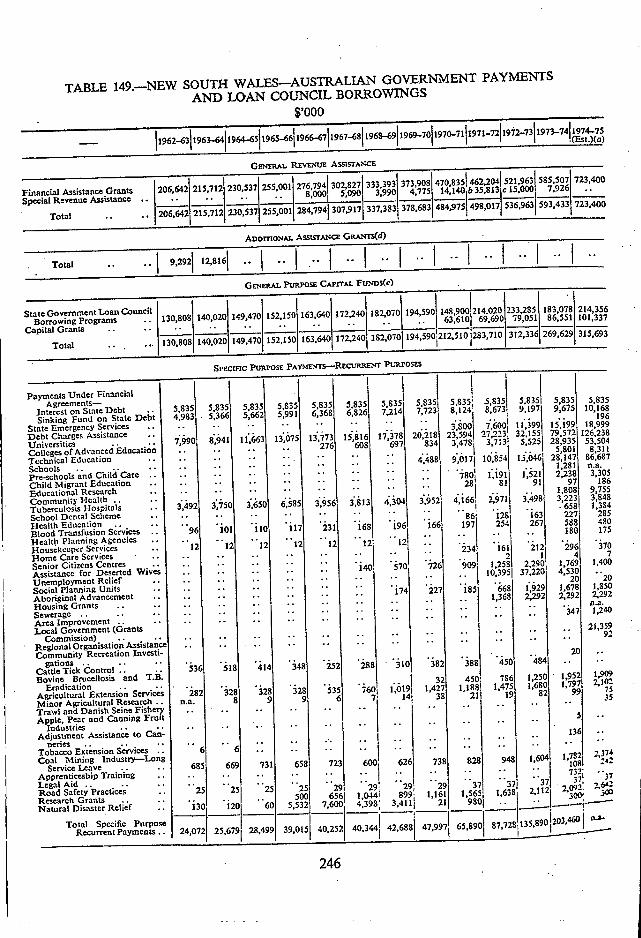
TABLE 149.-NEW SOUTH WALES-AUSTRALIAN GOVERNMENT PAYMENTS AND LOAN COUNCIL BORROWINGS
$,000
-- 1962-63 1963-64 1964-65 1965-6611966-6711967-68 196"911969-7011970-7111971-7211972-73 1973-7411974-75 ,(Est.)(c)
GssL REVENUE Ass*'CE
333,393 373,908 470,835 462,204 521,963 585,507 723,400 Financial Assistance Grants 206,642 215,712 230,537 255,001 276,794 302,827
8,000 5,090 3,990 4,775 14,140 b 35,813 elI.000 7,926 Special Revenue Assistance .. .. .. •. ..
206.642 215,712 230,537 255,001 284,794 307,917 337,383 378,683 484,975 498,017 536,963 593.433 723,400 Total .. .,
ADorrtoNAL ASSISTANCE Gitsarrs(d)
Total ..
GENERAL PURPOSE Crn.L FUNDS(e)
State Government Loan Council 130,808 140,020 149,470 152,150 163,640 172,240 182,070 194,590 148,900 214,020
233,285 183,078
79,051 86,551 214,356 101,337 Borrowing Programs .. .. 63,610 69,690
Capital Grants .. .. 2S3,710 312,336 269,629
.. 130,808 140,020
.. 149,470
.. 152,150
.. 163,640
-. 172,240 182,070 194,5901212510
315,693 Total .. ..
SPECIFIC PURPOSE PAYMENTS-RECURRENT Pt.Rs'OSES
Payments Under Financial Agreements-
Interest on State Debt .. 5,835 5,835 5,835 5,835 5,835 5,835 5,835 5,835 5,835' 5,835 5,835
6,368 6,826 7,214 7,723 8,124 8,673 9,197 5,835 9,615
5,835 10,168
Sinking Fund on State Debt 4,983 5,366 5,662 5,991 196 State Emergency Services .. Debt Charges Assistance .. .. . - .. .. .. .. -. .. . - .. .. .. .. .. .. .. .. •. . 3,800 7,600 11,399
8,941 11,663 13,075 13,773 15,816 17,378 20,218 23,5941 27,223 32,155 . - 15,199
79,572 18,999
126,238 Universities •. .. Col1cgesOfAd%aflcEdcatLon
7,990 .. . - •. .. 276 608 697 834 3147S: 3,713. 5,525 28,935
I 5,801 53,504
8,311 Technical Education .. ..
.. .. .. .. .. .. .. ..
,. 4,488 9,0171 10,854 15,046 28,147 86,687 Schools pre-schools and Child Care .. . , ,. . - •. .. .. .. .. .. .. .. .. .. •. ..
.. 780 1,191 1,521 1,281 2,238
n.a. 3,305
Child Migrant Education '' ,. '' .• .. .. .. 28 81 91 97 186 EucatiOflal Research CommunityHealth .. •. - -- .. .. •. .. .. .. .. .. .. .. ..
3,492 3,750 3,650 6,585 3,956 3,813 4,304 3,952 4,166, 2,971 3,498 1,808 3,223
658
9,755 3,848 1,384 Tuberculosis Hospitals ..
School Dental Scheme .. .. .. .. .. . •. .. 86 128 163 . 227 285
Health Education .. .. Blood Transfusion Services .. ,. .. .. ,.
96 101 110 117 231 168 196 166 197 254 267
.. .. .. •. . 588
180 480 175
Health Planning Agencies .. Housekeeper Services .. .. .. ..
12 12 12 12 12 12 12! .. .. .. 234 161 212 296 310
Home Care Services .. Senior Citizens Centres .. ., • .. ,. ,. ..
.. .. . .. ,. .. 2 140 570 726 909; 1,258 2,290
1 4 1,169
7 1,400
Assistance for Deserted Wives , •. .. . .. .. 10,395 37,220 4,530
20 Unemployment Relief .. Social Planning Units .. .. .. .. .. .. .. , ,. .. ,. .. . - - •. ..
174 227 185 668 1,929 20
1,678 1,850 Aboriginal Advancement .. .. •. ..
, •. 1,368 2,292 2,292 2,292 Housing Grants .. .. .. .. .. .. .. .. .. .. .. . ,. .. .. .. •.
. 347
na. 1,240
Sewerage .. .. .. Local Government (Grants Area Improvement
,- .. ., .. ,. ,. 21,359
Commission) .. .. ., ,. .. ,. .. ,. .. -. ., .. .. 92 .. .. .. .. .. .. Regional Organisation Assistance .. Community Recreation Investi- 20
gations . . .. .. . 518 414 348 252 288 450 484 . .. .. ..CattleTickControl :h6j 1,909 Bovine Brucellosis and T.B.
Eradication .. .. .. .. . 32 450 786 1,250 1,680
1,952 1,797 2,102 . .. . ..
Agricultural Extension Services 282 328 328 328 535 760 1,019 1,427 1.188 1,475
14 38 21 19 82 99 7 35 Minor Agricultural Research .. n.a. 8 9 9 6 7 ..
.. .. .. Trawl and Danish Seine Fishery,. ,. .. .. .. .. ,. .. Apple. Pear and Canning Fruit .. .. .. ..
.. industacs .. .. .. .. .. .. .. ..
Adjustment Assistance to Can- .. .. .. .. ,, ..
.......
136 neries .. .. .. .. .. .. .. ..
Tobacco Extension Services .. 6 6 .. .. .. .. .. .. .. .. Coal Mining Industry-Long 658 723 600 626 738 828 948 1,604 j,782 Z,
Service Leave .. .. 685 669 731 .. .. .. .. .. 1081
732 - Apprenticeship Training .. .. .. .. .. .. .. Legal Aid .. .. Road Safety Practices
.. .. .. .. .. .. .. .. .. .. .. 25 25 25 25 29 29 29. 29 37 500 656 1,044 899 1161! 1,565 1 638 2,112
F . 092, 2,30
1-6&2 Research Grants .. Natural Disaster Relief
.. ,. •. .. .. 130 120 60 5,532 7,600i 4,398 3,411 211 9801 . . ..
Specific Purpose 24,012 25,679 28,499 39,015 40,252 40,344 42,6881 47,997 65,890 87,72S;135,8901203.460 Total
Recurrent Payments.. I I
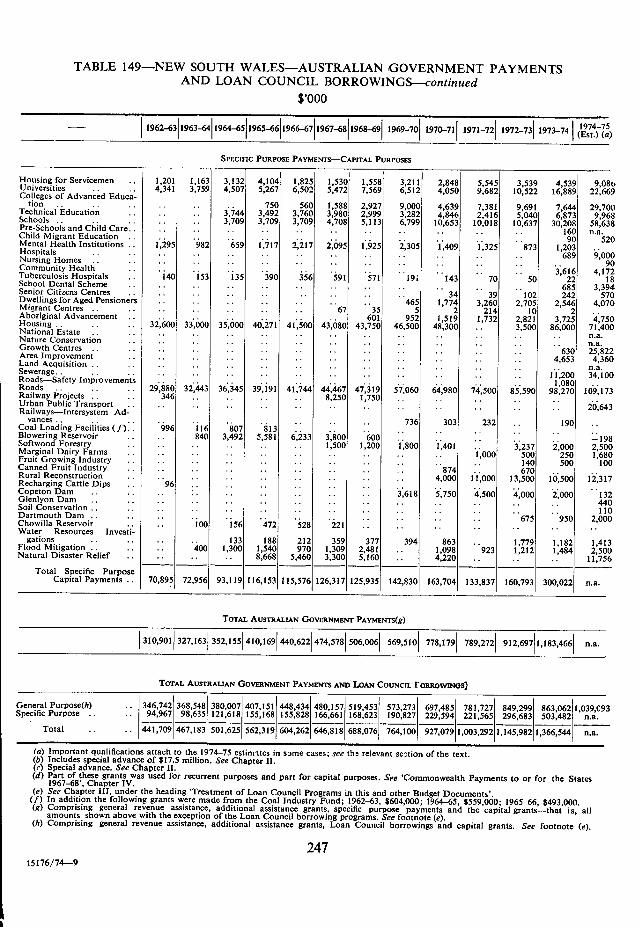
TABLE 149-NEW SOUTH WALES-AUSTRALIAN GOVERNMENT PAYMENTS AND LOAN COUNCIL BORROWINGS-continued
$,000
196263!196364! 1964_65!196566!196667!1967_68!1968_69! 1969-70 1970_71 1971_72j I
! 1972-73 1974-75
1973-74 (Est.) (a)
SPECIFIC PURPOSE PAYMENTS-CAPITAL PURPOSES
Housing for Servicemen 1,201 1,163 3,132 4,104' 825 1,530 1,558 3,211 2,848 5,545 3,539 4,539 9,08 Universities .. .. Colleges of Advanced Educa-
4,341 3,759 4,507 5,267 6,502 5,472 7,569 6,512 4,050 9,682 10,522 16,889 22,66 tion .. .. ..
fechnical Education .. .. ..
..
.. ..
3,744 750
3,492 560
3,760 1,588 3,980
2,927 2,999
9,000 3,282
4,639 4,846
7,381 2,416
9,691 5,040
7,644 6,873
29,701 9,961 schools . . . . .
Pre-Schools and Child Care.. .. .. 3,709 3,709 3,709 4,708 5,113 6,799 10,653 10,018 10,637 30,208 58,631
Child Migrant Education .. .. ..
..
.. .. ..
..
.. .. ..
..
.. .. ..
..
.. .. ..
.. .. 160 90
n.a. 521
1dental Health Institutions . . 1,295 982 659 1,717 2,217 2,095 1,925 2,305 1,409 .. 1,325
.. 873 1,203 lospitats .. ..
Nursing Homes .. .. .. .. .. .. .. .. .. .. .. 689 9,001
.. ..
Community Health .. .. . .. ..
..
.. .. ..
..
.. .. ..
..
.. .. ..
..
.. .. ..
.. 3,616
91 4,111 luberculosis Hospitals .. 140 153 135 390 356 591 571 191 143 70 50 22 Il ichool Dental Scheme .. . . .. . 0 .. .. .. . . .. .. . . .. 685 3,39 enior Citizens Centres .. .. .. .. . . . . .. .. . . 34 39 102 242 57( )wellings for Aged Pensioners .. .. .. .. .. .. .. 465 1,774 3,260 2,705 2,546 4,071 tigrant Centres . . .. .. .. .. .. .. 67 35 5 2 214 10 2 thoriginal Advancement .. .. .. .. .. .. .. 601 952 1,519 1,732 2,821 3,725 4,751 Housing .. .. .. 32,600 33,000 35,000 40,271 41,500 43,080 43,750 46,500 48,300 3,500 86,000 71,40( National Estate .. .. .. . .. .. .. .. .. ..
n.a. Nature Conservation .. . . .. .. . . . . .. ., .. .. ..
n.a. 3rowth Centres .. .. .. .. .. .. .. .. .. .. .. .. .. .. .. . . ..
.. 630 25,82 Area Improvement .. .. .. .. .. .. .. .. .. .. .. .. 4,653 4,36( ..and Acquisition .. .. . .. .. .. .. .. .. .. .. .. n.a. ewerage.. . . ..
toads-Safety Improvements . . .
. . .
. . .. .
..
.. .. ..
..
.. .. ..
. .
. . .. . . .. . .
.. 11,200 1,080
34,10( 5,oads .. .. 29,880 32,443 36,345 39,191 41,744 44,467 47.319 57,060 64,980 74,500 85,590 98,270 109,172 ailway Projects .. .. 346 .. .. .. .. 8,250 1,750 .. .. .. Jrban Public Transport .. .. .. .. .. .. .. .. .. .. .. .. .. 20,643 .ailways-Intersystem Ad-
vances .. . . . . oal Loading Facilities(f). .
.. 996
.. 116
. . 807
.. 813
..
.. . . ..
..
.. 736
.. 303 .. 232 .. . .
. . 190 llowering Reservoir .. . . 840 3,492 5,581 6,233 3,800 600 .. .. . . . . . -198 oftwood Forestry .. .. .. .. .. .. 1,500 1,200 1,800 1,401 .. 3,237 2,000 2,500 Flarginal Dairy Farms •. .. .. .. .. .. .. .. .. .. 1,000 500 250 1,680 rruit Growing Industry .. .. .. .. .. .. .. .. .. .. 140 500 100 ,armed Fruit Industry .. .. .. .. .. .. .. .. .. 874
..
.. 670 uraI Reconstruction .. echarging Cattle Dips ..
.. 96
..
.. .. ..
..
.. .. ..
..
.. .. .. .. .. 4.000 .. 11,000 .. 13,500 10,500 12,317
lopeton Dam .. .. 31enlyon Dam
.. 1. .. .. .. .. .. 3,618 5,750 4,500 4,000 2,000 132
.. ..
oil Conservation .. . . .. ..
.. .
..
.. .. ..
..
.. .. . .
..
.. .. ..
..
.. .. . .
..
. . .. . . 440 110 )artmouth Dam .. .. .. .. .. .. .. .. .. .. .. .. 675 950 2,000 howilla Reservoir .. .. 100 156 472 528 221 .. .. .. ..
Water Resources Investi- gations .. ..
lood Mitigation .. .. .. ..
.. 400
133 1.300
188 1,540
212 970
359 1,309
377 2,481
394 .. 1,098
863.. 923
1,779 1,212
1,182 1,484
1,413 2,500 Iatural Disaster Relief .. .. .. .. 8,668 5,460 3,300 5.160 .. 4,220 .. .. .. 11,756
Total Specific Purpose Capital Payments . . 70,895 72,956 93,119 116,153 115,576 126,317 125,935 142,830 163,704 133,837 160,793 300,022 n.a.
TOTAL AUSTRALIAN GOVERNMENT PAYMENTS(g)
310,901! 327,1631 352.1551 410.1691 440,6221 474,578! 506,0061 569,510 778.1791 789.272! 912,697 1.183.466!
TOTAL AUSTRALIAN GOVERNMENT PAYMENTS AND LOAN COUNCIL FolutowINos]
General Purpose(h) .. 346,742 368,548 380,007 407,151 448,434 480,157 519,453 573,273 697,485 781,727 849,299 863,062 1,039,093
Specific Purpose .. .. 94,967 98,635 121,618 155,168 155,828 166,661 168,623 190,827 229,594 221,565 296,683 503,482 n.a. Total .. .. 441,709 467,183 501.625 562,319 604,262 646,818 688,076 764,100 927,079 1,003,292 1,145,982 1,366,544 n.a.
(a) Important qualifications attach to the 1974-75 estimItes in same cases; see th relevant section of the text. (I') Includes special advance of $17.5 million. See Chapter II. (r) Special advance. See Chapter H.
Part of these grants was used for recurrent purposes and part for capital purposes. See 'Commonwealth Payments to or for the States 1967-68', Chapter IV. See Chapter III, under the heading 'Treatment of Loan Council Programs in this and other Budget Documents'. In addition the following grants were made from the Coal Industry Fund; 1962-63, $604,000; 1964-65, $559,000; 1965-66, 8493,000. Comprising general revenue assistance, additional assistance grants, specific purpose payments and the capital grants-that is, all amounts shown above with the exception of the Loan Council borrowing programs. See footnote (c) Comprising general revenue assistance, additional assistance grants, Loan Council borrowings and capital grants. See footnote (e).
247 15176/74-9
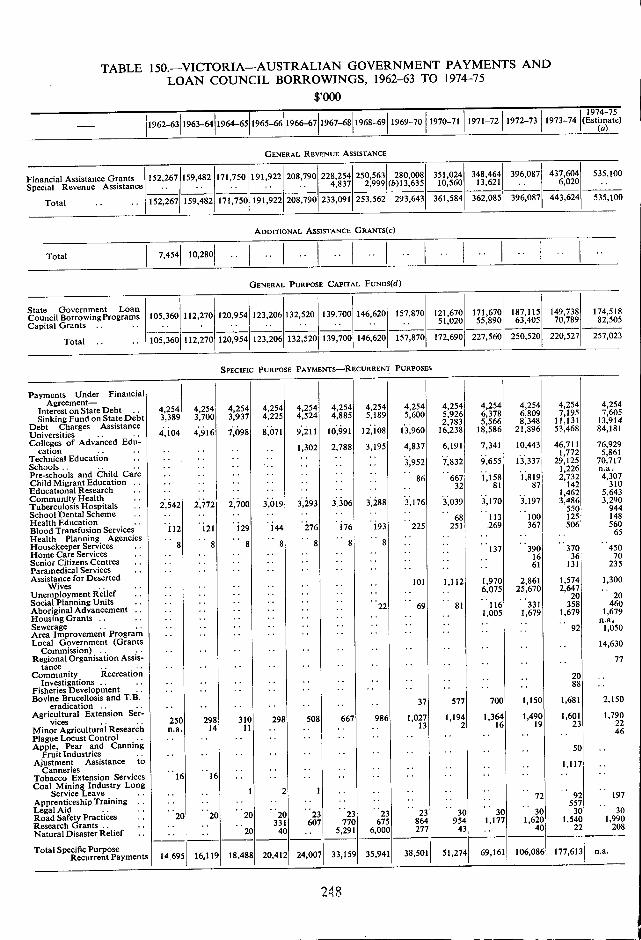
TABLE 150.-VICTORIA-AUSTRALIAN GOVERNMENT PAYMENTS AND LOAN COUNCIL BORROWINGS, 1962-63 TO 1974-75
$,000 i 14- I
1962-63 1963-64 1964-65 1965-66 1966-67 1967-68 1968-69 1969-70 1970-71 1971-72 1972-73 1973-74 (Estimate) (a)
GENERAL REVENUE ASSISTANCE
Financial Assistance Grants Special Revenue Assistance
152,267159,482 171,750 191,922 208,790 228,254 4,837
250,563 2,999
280,008 (b)13,635
351,024 10,560
348,464 13,621
396,087 437,604 6,020
535,100
Total .. 152,267 159,482 171,750 191,922 208,790 233,091 253,562 293.643 361,584 362,085 396,087 443,624 535,100
ADDITIONAL ASSISTANCE GRANTS(C)
Total 7,454 10,280
GENERAL PURPOSE CAPITAL FUNDS(d)
StateGovernment Loan council Borrowing Programs 105,360 112,270 120,954 123,206 132,520 139,700 146,620 157,870 121,670
51,020 171,670 55,890
187,115 63,405
149,738 70,789
174,518 82,505
Capital Grants
Total 105,360 112,270 120,954 123,206 132.5201 139,700 146,620 157,870 172,690 227,560 250,520 220,527 257,023
SPECIFIC PURPOSE PAYMENTS-RECURRENT PURPOSES
Payments Under Financial Agreement-
Interest on State Debt Debt
4,254 3,389
4,254 3,700
4,254 3,937
4,254 4,225
4,254 4,524
4,254 4,885
4,254 5,189
4,254 5,600
4,254 5,926
4,254 6,378
4,254 6,809
4,254 7,195
4,254 7,605
SinkingFundon State 2,783 5,566 8,348 11,131 13,914 Debt Charges Assistance Universities 4,104 4,916 7,098 8,071 9,211 10,991 12,108 13,960 16,238 18,586 21,896 53,468 84,181
Colleges of Advanced Edu- 1,302 2,788 3,195 4,837 6,191 7,341 10,443 46,711 76,929
cation 1,772 5,861 Technical Education 3,952 7,832 9,655 13,337 29,125 70,717 Schools 0 1,226 n.a. Pre-schools and Child Care .. 86 667 1,158 1,819 2,732 4,307 Child Migrant Education 32 81 87 142 310 Educational Research 1,462 5,643 Community Health Tuberculosis Hospitals 2,542 2,772 2,700 3,019 3,293 3306 3,288 3,176 3,039 3,170 3,197 3,486 3,290
944 School Dental Scheme
550 68 113 100 125 148
Health Education Blood Transfusion Services 112 121 129 144 276 176 193 225 251 269 367 506 560
65 Health Planing Agencies Housekeeper
n Services 8 8 8 8 8 8 8
137 390 370 450 Home Care Services 16 36 70 Senior Citizens Centres 61 131 235 Paramedical Services ,. Assistance for Deserted 101 1,112 1,970 2,861 1,574 1,300
Wives Unemployment Relief 6,075 25,670 2,647
20 Social Planning Units
20 22 69 81 116 331 358 460
Aboriginal Advancement .. 1,005 1,679 1,679 1,679 HousingGrants n.a. Sewerage .. 0 92 1,050 Area Improvement Program .. Local Government (Grants 14,630
Commission) Regional Organisation Assis- 77
tance 00 0
Community Recreation 20 Investigations .. .. 88
Fisheries Development 00 0
Bovine Brucellosis and T.B. 37 577 700 1,150 1,681 2,150 eradication
Agricultural Extension Ser- 250
. 298 310 298 508 667 986 1,027 1,194 1,3641,490 1,601 1,790
vices Minor Agricultural Research n.a. 14 Il 13 2 16 19 23 22
46 Plague Locust Control 0 00
Apple, Pear and Canning 50 Fruit Industries
Ajustment Assistance to 1,117 Canneries
Tobacco Extension Services 16 16 00
0 0 0
Coal Mining Industry Long 21 1 0 Service Leave 1 72 92 197 Apprenticeship Training 00 557 Legal Aid •0 Road Safety Practices .. 20 20 20
0
20 331
23 607
23 770
00
23 675
0
23 864
30 954
30 1,177
30 1,620
30 1,540
30 1,990
Research Grants Natural Disaster Relief 20 40 5,291 6,000 277 43 40 22 208
14.695 16,119 18.488 20,412 24,007 33,159 35,941 38,501 51,274 69,161 106,086 177,6131 n.a. Total Specific Purpose Recurrent Payments
2.48
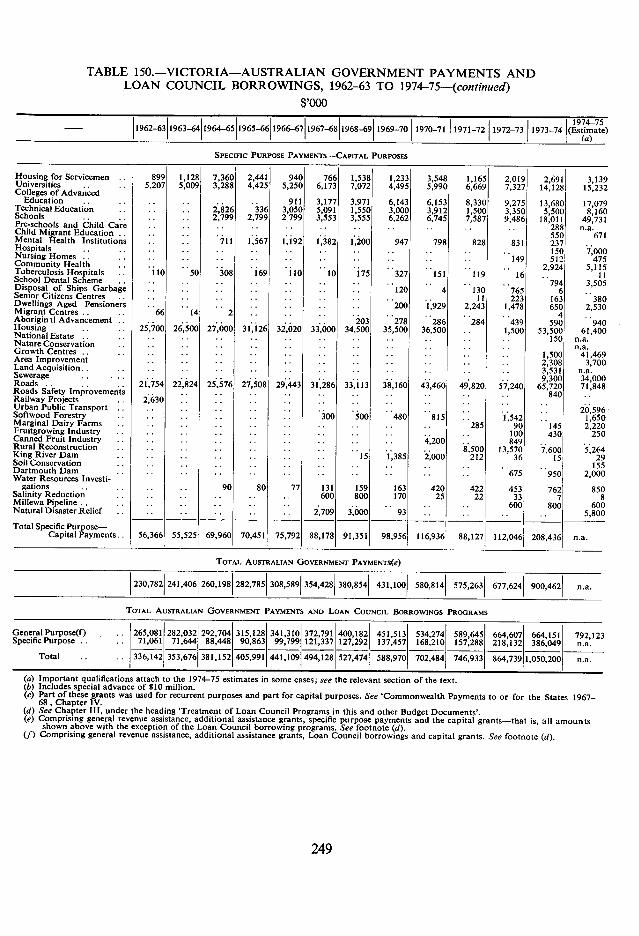
TABLE 150.-VICTORIA-AUSTRALIAN GOVERNMENT PAYMENTS AND LOAN COUNCIL BORROWINGS, 1962-63 TO 1974-75-(continued)
$'OOO 1974-75
1962-63 1963-64 1964-65 1965-66 1966-67 1967-68 1968-69 1969-70 1970-71 1971-72 1972-73 1973-74 (Estimate) I I (a)
SPECIFIC PURPOSE PAYMENTS-CAPITAL PURPOSES
Housing for Servicemen I 899 1,128 7,360 2,441 940 766 1,538 1,233 3,548 1,165 2019 2,691 3,139 Universities . . . 5,207 5,009 3.288 4,425 5,250 6,173 7,072 4,495 5,990 6,669 7,327 14,128 15,232 Colleges of Advanced Education . . . . . 911 3,177 3,971 6.143 6,153 8,330 9,275 13,680 17,079 Technical Education .. .. 2,826 336 3,050 5,091 1,550 3,000 3,912 1.500 3.350 5,500 8,160 Schools . . ,• . .. 2,799 2,799 2,799 3,553 3,555 6,262 6,745 7,587 9,486 18,011 49,731 Pre-schools and Child Care .. .. .. .. .. .. .. .. .. .. 288 n.a. Child Migrant Education .. .. .. .. .. ..
.. 550 671 Mental Health Institutions . . . 711 1,567 1,192 1,382 1,200 947 798 828 831 237
Nursing Homes .. .. .. .. .. .. .. .. .. .. .. .. .. .. .. .. .. .. .. .. ..
149 150 512
7,000 475 Community Health .. . . . . . . . . . .. .. . . 2,924 5,115 Tuberculosis Hospitals 110 50 308 'i69 169 110
.. 10 'i75 175 327 151 119 16 11 School Dental Scheme .. .. .. .. .. .. .. .. .. .. ..
.. 794 3,505
Hospitals .. ............
Disposal of Ships Garbage .. .. .. .. .. .. .. 120 4 130 765 6 Senior Citizens Centres . . . . . . . . . . . . . . . . . . . Il 223 163 380 Dwellings Aged Pensioners .. .. .. .. .. .. .. 200 1,929 2,243 1.478 650 2,530 Migrant Centres .. 66 14 2 .. .. .. .. .. .. .. 4 Aboriginl Advancement .. .. .. .. .. .. 203 278 286 284 ..
439 590 940 Housing 25,700 26,500 27,000 31,126 32,020 33,000 34,500 35,500 36,500 .. 1,500 53,500 61,400 NationalEstate .. .. .. .. .. .. .. .. .. .. .. 150 n.a. Nature Conservation .. .. .. .. .. .. .. .. .. .. .. .. fl.S. Growth Centres .. .. .. .. .. .. .. .. .. .. ..
.. 1,500 41,469 Area Improvement . . . . . . . . .. .. .. . . .. .. . . 2,308 3,700 Land Acquisition.. .. .. .. .. .. .. .. .. .. .. .. 3,531 n.a. Sewerage .. .. .. .. .. .. .. .. .. .. .. 9,300 34,000 Roads .. .. .. 21,754 22,824 25,576 27,508 29,443 31,286 33,113 38,160 43,460 49,820 57,240 65,720 71,848 Roads Safety Improvements .. .. .. .. .. .. .. .. .. .. .. 840 Railway Projects . . 2,630 . . . . . . . . .. .. .. .. . . . . Urban Public Transport .. .. .. .. .. .. .. .. .. .. .. .. . 20,596 Softwood Forestry .. .. .. .. .. .. 300 500 480 815 .. 1,542 .. 1.650 Marginal Dairy Farms .. .. .. .. .. .. .. .. .. .. 285 90 145 2,220 Fruitgrowing Industry .. .. .. .. .. .. .. .. .. .. .. 100 430 250 Canned Fruit Industry .. .. .. .. .. .. .. .. .. 4,200 .. 849 Rural Reconstruction .. .. .. .. .. .. .. .. .. .. 8,500 13,570 7,600 5,264 King River Dam .. .. .. .. .. .. .. 15 1,385 2 ,000 212 36 15 29 Soil Conservation .. .. .. .. .. .. .. .. .. .. .. .. 155 Dartmouth Dam .. .. .. .. .. .. .. .. .. .. .. 675
.. 950 2,000 Water Resources Investi-
gations .. .. .. .. 90 80 77 131 159 163 420 422 453 762 850 Salinity Reduction .. .. . . . . .. .. 600 800 170 25 22 33 7 8 Millewa Pipeline .. .. .. .. .. .. .. .. .. .. .. .. 600 800 600 Natural Disaster Relief .. .. . . . . .. .. 2,709 3,000 93 .. . . . . . . 5,800 Total Specific Purpose-
Capital Payments. . 56,366 55,525 69,960 701451 75,792 88,178 91,351 98.956 116,936 88,127 112,046 208,436 n.a.
TOTAL AUSTRALIAN GOVERNMENT PAYMENTS(e)
230,782 241,406 260,198 282,785 308,589 354,428 380,854 431,100 580,814 575,263 677,624 900,462 na.
TOTAL AUSTRALIAN GOVERNMENT PAYMENTS AND LOAN COUNCIL BORROWINGS PROGRAMS
General Purpose(f) .. Specific Purpose .. . . 265,081
71,061 282,032 71,644
292,704 88,448
315,128 90,863
341,310 99,799
372,791 121,337
400,182 127,292
451,513 137,457
534,274 168,210 157,288
589,645664,607 218,132
664,151 386,049
792,123 n.a.
Total .. .. 336,142 353,676 381,152 405,991 441,109 494,128 527,474 588,970 702,484 746,933 864,739 1,050,200 n.a.
Important qualifications attach to the 1974-75 estimates in some cases; see the relevant section of the text. Includes special advance of 810 million. Part of these grants was used for recurrent purposes and part for capital purposes. See 'Commonwealth Payments to or for the States 1967-68, Chapter IV. See Chapter III, under the heading 'Treatment of Loan Council Programs in this and other Budget Documents'. Comprising general revenue assistance, additional assistance grants, specific purpose payments and the capital grants-that is, all amounts shown above with the exception of the Loan Council borrowing programs. See footnote (d). Comprising general revenue assistance, additional assistance grants, Loan Council borrowings and capital grants. Sec footnote (d).
249
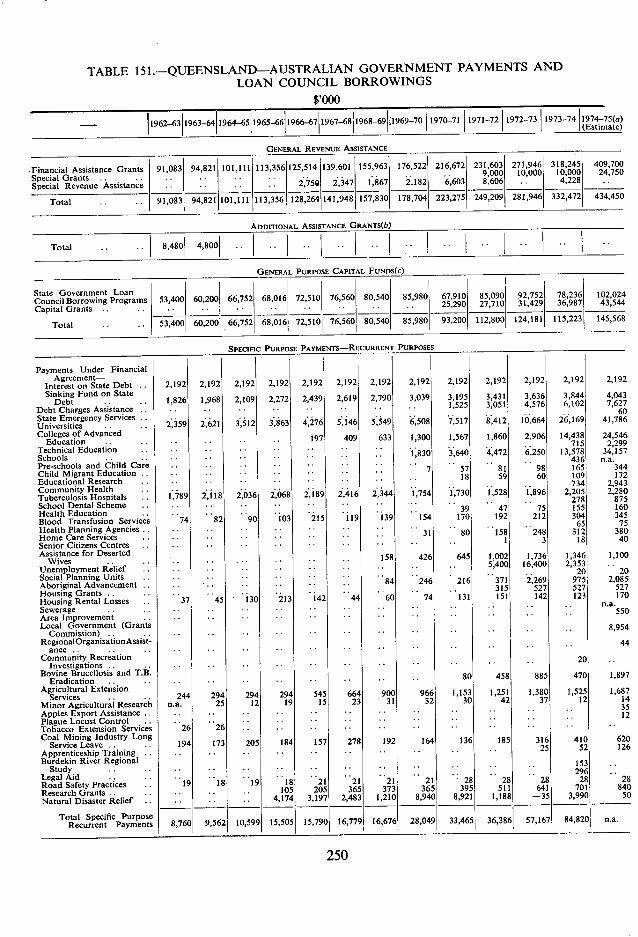
TABLE 151._QUEENSLAND-AUSTRALIAN GOVERNMENT PAYMENTS AND LOAN COUNCIL BORROWINGS
$,000
1962-63 1 1963-641 1964-65 1 1965-661 1966-67
1 1967-68
1 1968-69 - 1969-70 1970-71 1971-72 1972-73 1973-74 I
GENERAL REVENUE ASSISTANCE
Financial Assistance Grants 91,083 94,821 101,111 113,356 125,514 139.601 155,963 176,522 216,672 231,603 271,946 318,245 409,700 Special Grants .. .. 0 .. . .. . 9,000 10,000 10,000 24,750 Special Revenue Assistance . . . . . 2,759 2,347 1,867 2,182 6,603 8,606 . 4,228
Total .. .. 91,083 94,821 101,111 113,356 128,264 141,948 157,830 178,704 223,275 249,209 281,946 332,472 434,450
ADDITIONAL ASSISTANCE GRANTS(b)
Total 8,480 4,800.. .. .. . .. .. .. ..
GENERAL PURPOSE CAPITAL FUNDS(C)
State Government Loan
Council Borrowing Programs 53,400 60,200 66,752 68,016 72.510 76,560 80,540 85.98067,910 85,090 92,752 78,236 102,024 Capital Grants . . - . . . . . .
0 . . 25,290 27,710 31,4291 36,987 43,544
Total .. .. 53,400 60,200 66,752 68,016 72,510 76,560 80,540 85,980 93,200 112,800 124,181 115,223 145,568
SPECIFIC PURPOSE PAYMENTS-RECURRENT PURPOSES
Payments Under Financial I Agreement-
Interest on State Debt 2,192 2,192 2,192 2,192 2,192 2,192 2,192 2,192 2,192 2,192 2,192 2,192 2,192 Sinking Fund on State
Debt .. 1,826 1,968 2,109 2,272 2,439 2,619 2,790 3,039 3,195 3,4313 636 3,844 4,043 Debt Charges Assistance . .. .. .. . . . . .. . . 1,525 3,051 4,576 6,102 7,627 State Emergency Services .. .. .. . .. . . . . .. .. . . . 60 Universities . . 2,359 2,621 3,512 3,863 4,276 5,146 5,549 6,508 7,517 8,412 10,664 26,169 41,786 Colleges of Advanced
Education .. .. .. 197 409 633 1,300 1,567 1,860 2,906 14,438 24,546
Technical Education .. .. .. .. .. .. .. .. .. •. 715 2,299
Schools . .. . . .. .. .. .. . . .. 1,830 31640 4,472 6,250 13,578 34,157 Pre-schools and Child Care .. .. .. .. .. .. .. .. ..
.. 436 na. Child Migrant Education . . . . . . . . . . . . . . 7 57 81 98 165 344 Educational Research . . . . . . . . . . . . . . . . 18 59 60 109 172 Community Health .. .. .. .. .. .. .. .. .. .. 734 2,943 Tuberculosis Hospitals . 1,789 2,118 2,036 2,068 2,189 2,416 2,344 1,754 1,730 1,528 1,896 2,205 2,280 School Dental Scheme .. .. .. .. .. .. .. .. .. .. 278 875 Health Education .. .. .. .. .. . . . . 39 47 75 155 160 Blood Transfusion Services 74 82 90 103 215 119 139 154 170 192 212 304 345 Health Planning Agencies .. .. .. .. .. .. .. .. .. .. 65 75 Home Care Services . . . . . . . . . . . . . . 31 80 158 248 312 380 Senior Citizens Centres .. .. .. .. .. .. .. .. 1 3 18 40 Assistance for Deserted
Wives . . . . . . . . . . . . . . 158 426 645 1,002 1,736 1,346 1,100 Unemployment Relief . . . .. .. .. .. .. .. .. 5,400 16,400 2,353
20 20 Social Planning Units .. .. .. .. .. •. •. .. •. .. Aboriginal Advancement • .. .. .. .. .. 84 246 216 371 2,269 975 2,085 Housing Grants. . . . 0 •, 00 315 527 527 527 Housing Rental Losses 00 37 45 130 213 142 44 60 74 131 151 142 123 170 Sewerage na. Area Improvement . , •. .. .. .. .. .. .. 550 Local Government (Grants
Commission) .. • • •. .. .. .. .. .. .. .. 8,954 RegionalOrganisationAssist- 44
ance .. •. ,. .. •. .. .. .. .. •. •. •. Community Recreation 20 Investigations .. •. .. •. .. .. .. .. •. .. •. Bovine Brucellosis and T.B.
Eradication . . . . . . .. . . . 0 . . 80 458 885 470 1,897 Agricultural Extension
Services . . . 244 294 294 294 545 664 900 966 1,153 1,251 1,380 1,525 1,687 Minor Agricultural Research na 25 12 19 15 23 31 32 30 42 37 12 14
35 Apples Export Assistance • .. .. • 0 .. .. •0 0 0 •'
12 Plague Locust Control Tobacco Extension Services 26 26 .. .. .. .. .. 0 •' 0 0 '
Coal Mining Industry Long Service Leave . 194 173 205 184 157 278 192 164 136 185 316 410 620
Apprenticeship Training . • .. .. .. .. .. •. .. .. .. 25 52 126 Burdekin RIver Regional
Study .. .. .. .. .. .. .. .. .. .. .. 153 Legal Aid .. •0 .. .. .. .. .. .. .. .. 296 Road Safety Practices 19 18 19 18 21 21 21 21 28 28 28 28 28 Research Grants.. .. .. 105 205 365 373 365 395 511 641 701 840 Natural Disaster Relief . . . . 4,174 3,197 2,483 1,210 8,940 8,921 1,188 -35 3,990 50
Recurrent Payments 8,760 9,562 10,599 15,505 15,790 16,779 16,676 28,049 33.4651 36,386 57,167i 84,8201 na. Total Specific Purpose
250
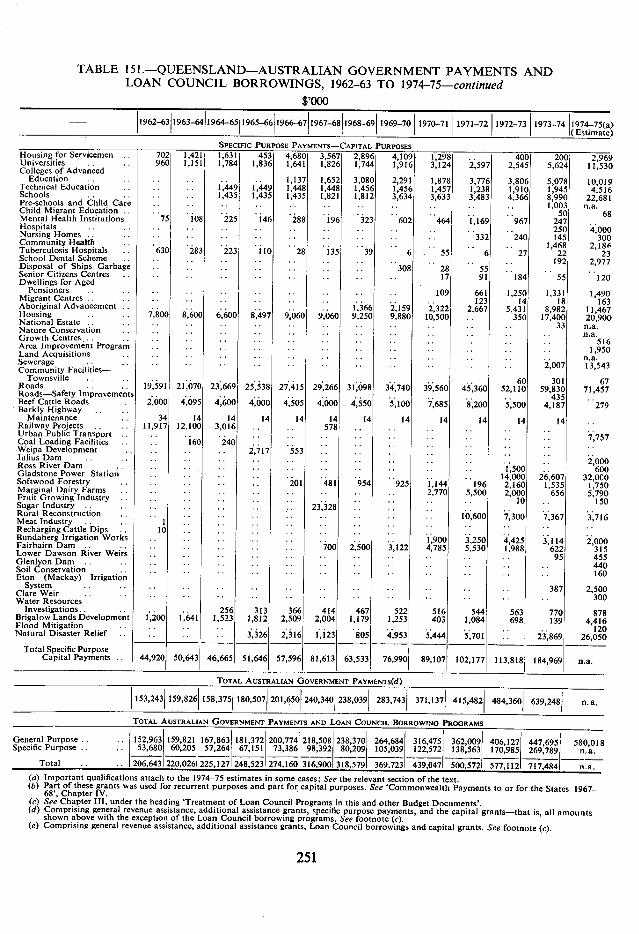
TABLE 151.-QUEENSLAND-AUSTRALIAN GOVERNMENT PAYMENTS AND LOAN COUNCIL BORROWINGS, 1962-63 TO 1974-75-continued
$,000 1962-63 1963-64 1964-65 1965-66 1966-67 1967-68 1968-69 1969-70 1970-71 1971-72 1972-73 1973-74 1974-75(a)
(Estimate) SPECIFIC PURPOSE PAYMENTS-CAPITAL PURPOSES
Housing for Servicemen . . Universities
- - 702 960
1,421 1 ,111
1,631 453 4,680 3,567 2,896 4,109 1,298 .. 400 200 2,961 . . . Colleges of Advanced
1,784 1,836 1,641 1,826 1,744 1,916 3,124 2,597 2,545 5,624 11,531 Education . . . . . . . 1,137 1,652 3,080 2,291 1,878 3,776 3,806 5,078 10,011 Technical Education . . . . 1,449 1,449 1,448 1,448 1,456 1,456 1,457 1,238 1,910 1,945 4,511 Schools . . . . . . 1,435 1,435 1,435 1,821 1,812 3,634 3,633 3,483 4,366 8,990 22.681 Pre-schools and Child Care .. .. .. .. .. .. .. .. .. .. 1,003 na. Child Migrant Education . . . ;. .. .. .. .. .. .. . . .. 50 61 Mental Health Institutions 75 108 225 146 288 196 323 602 464 1,169 967 247 Hospitals .. .. .. .. .. .. .. .. .. .. 250 4,00C Nursing Homes .. .. .. .. .. .. .. .. .. 332 240 145 300 Community Health .. .. .. .. .. .. .. .. .. .. 1,468 2,18( Tuberculosis Hospitals 630 283 223 110 28 135 39 6 . 55 6 27 22 23 School Dental Scheme . . . . .. .. .. .. . . .. .. .. .. 192 2,977 Disposal of Ships Garbage . . . .. .. .. . . .. 308 28 55 .. Senior Citizens Centres . . . . . . . . . . . . . . . . 17 91 184 55 120 Dwellings for Aged Pensioners . . .
Migrant Centres . . . . .
. .
. . .. . .
..
. . .. . .
..
. . .. . . .. . . 109
.. 661 123
1,250 14
1,331 18
1,490 163 Aboriginal Advancement . . . . . . . . . . . 1.366 2,159 2,322 2,667 5,431 8,982 11,467 Housing .. 7,800 8,600 6,600 8,497 9,060 9,060 9,250 9.880 10,500 . . 350 17,400 20,90C National Estate . . . . . . . . . . . . . . . . . . . .. . . . . 33 n.a. Nature Conservation . . . . .. . . .. . . .. .. . . .. . . n.a. Growth Centres . . . . . . . . . . . . . . . . . . . . . . . . . . 516 Area Improvement Program . .. .. . . .. .. .. . . .. . . .. . . 1,950 Land Acquisitions . . . . .. .. . . .. .. .. .. .. na. Sewerage ..
Community Facilities- .. .. .. .. .. .. .. .. .. .. .
2,007 13,543 Townsville .. .. .. .. .. .. .. .. .. 60 301 67 Roads . . . 19,591 21,070 23,669 25,538 27,415 29,266 31,098 34,740 39,560
.. 45,360 52,110 59,830 71,457 Roads-Safety Improvements . . . . . . . . . . . . . . . . . . . . . 435 Beef Cattle Roads 2,000 4,095 4,600 4,000 4,505 4,000 4,550 5,100 7,685 8,200 5,500 4,187 279 Barkly Highway
Maintenance 34 14 14 14 14 14 14 14 14 14 14 14 Railway Projects .....11,917 12,100 3,016 . . . . 578 . . . . . . . . . . Urban Public Transport Coal Loading Facilities . . 160 240 . . . . . . . . . . . . . . . . -Weipa Development . . . . 2,717 553 .. . . .. .. .. .. Julius Dam .. .. .. .. .. .. .. .. .. .. .. 2,000 Ross River Dam . . . .. . . . . . . .. .. .. . . 1.500 .. 600 Gladstone Power Station . . . . .. ..• . . . . .. .. .. 14,000 26,607 32,OCO Softwood Forestry . . . . . .. 201 481 954 925 1,144 196 2,160 1,535 1,750 Marginal Dairy Farms . . . .. . . .. .. .. . . 2,770 5,500 2,000 656 5,790 Fruit Growing Industry . . . . . . . . . . . . . . . . . . . . 10 . . 150 Sugar Industry . . . . . . . . .. 23,328 . . .. .. . . Rural Reconstruction . . . . . . . . . . . . . . .. 10,600 7,300 7.367 3,716 Meat Industry . . . I . . . . . . . . . . . . . . .. . . . . . Recharging Cattle Dips . 10 . . . . . . . . . . . . . . .. . . . . Bundaberg Irrigation Works .. .. .. .. .. .. .. 1,900 3,250 4,425 3,114 2,000 Fairbairn Dam . . . . . . . .. . . 700 2,500 3,122 4,785 5,530 1,988 622 315 Lower Dawson River Weirs . . . .. . . 0 . . .. .. . . . . 95 455 Glenlyon Dam .. .. .. .. .. .. .. .. .. .. .. 440 Soil Conservation . .. . . .. .. .. .. .. .. . . .. .. . . 160 Eton (Mackay) Irrigation
System .. Clare Weir
.. .. .. .. .. ..
.. .. .. .. .. 387 2,500 Water Resources
.. .. .. .. .. .. .. .. .. . 300 Investigations. . . . . . 256 313 366 414 467 522 516 544 563 770 878 Brigalow Lands Development 1,200 1,641 1,523 1.812 2.509 2,004 1,179 1,253 403 1,084 698 139 4,416 Flood Mitigation . . . . . . .. .. . . . . .. .. . . . . 120 Natural Disaster Relief . . . . 3,326 2,316 1,123 805 4,953 5,444 5,701 . . ..
23,869 26,050 Total Specific Purpose-
Capital Payments . . 44,920 50,643 46,665 51,646 57,596 81,613 63,533 76.990 89,107 102,177 113,818 184,969 n.a.
TOTAL AUSTRALIAN GOVERNMENT PAYMENTS(d)
153,243 159,826 158,375 180,507 201,650 240,340 238,039 283,743 371,137 415,482 484,360 639,248 n. a.
TOTAL AUSTRALIAN GOVERNMENT PAYMENTS AND LOAN COUNCIL BORROWING PROGRAMS
General Purpose . . . . 152,963 159,821 167,863 181,372 200,774 218.508 238,370 264,684 316,475 362,009 406,127 447,695 580,018
Specific Purpose . . . . 53,680 60,205 57,264 67,151 73,386 98,392 80,209 105,039 122,572 138,563 170,985 269,789 It. a. Total . . . . 206,6431 220,0261 225.1271 248,5231 274,1601 316.9001 318,5791 369,7231 439,0471 500.5721 577.1121 717.4841 na. Important qualifications attach to the 1974-75 estimates in some cases; See the relevant section of the text. Part of these grants was used for recurrent purposes and part for capital purposes. See 'Commonwealth Payments to or for the States 1967 68', Chapter IV. See Chapter III, under the heading 'Treatment of Loan Council Programs in this and other Budget Documents'. Comprising general revenue assistance, additional assistance grants, specific purpose payments, and the capital grants-that is, all amounts shown above with the exception of the Loan Council borrowing programs. See footnote (c). Comprising general revenue assistance, additional assistance grants, Loan Council borrowings and capital grants. See footnote (c).
251
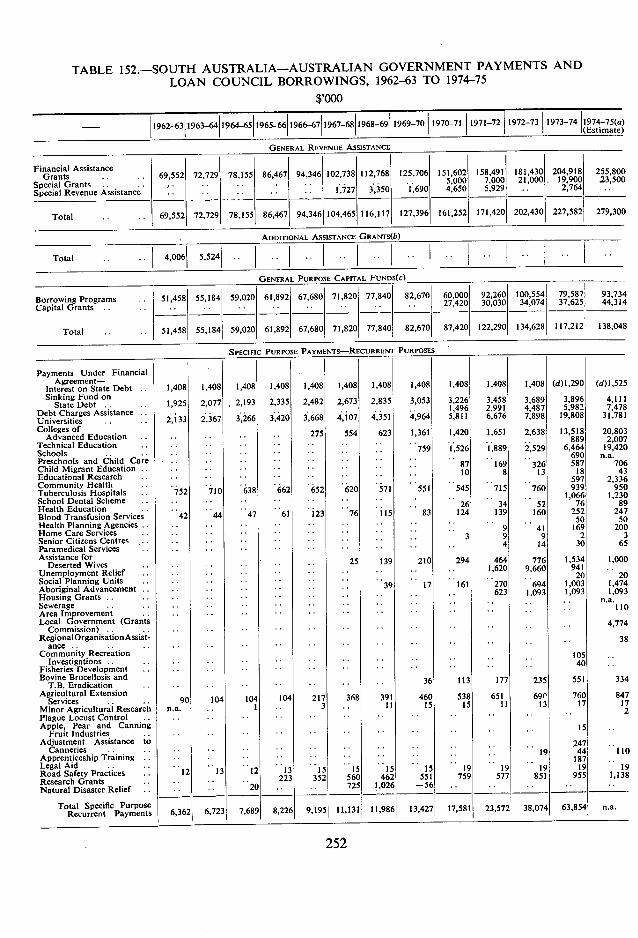
TABLE 152.-SOUTH AUSTRALIA-AUSTRALIAN GOVERNMENT PAYMENTS AND LOAN COUNCIL BORROWINGS, 1962-63 TO 1974-75
$,000
1962-63 1963-64 1964-65 1965-66 1966-67 1967-68 1968-69 1969-70 1970-71 1971-72 1972-73 1973-74 1974-75(a (Estimate)
Financial Assistance Grants 69,552 72,729 78,155 86,467 94,346 102,738 112,768 125,706 151,602 158,491 181,430 204,918 255,800
Special Grants ..,. . . .. .. . 1,727
.. 3,350 1,690
5,000 4,650
7,000 5,929
21,000 .
19,900 2,764
23,500 Special Revenue Assistance 0• 00 0•
Total •. •. 69,552 72,729 78,155 86,467 94,346 104,465 116,117 127,396 161,252 171,420 202,430 227,582 279,300
ADDITIONAL ASSISTANCE
Total 4,006 5,524 0 0 0
PURPOSE CAPITAL FUNDS(C)
Borrowing Programs . Capital Grants •. ..
51,458 0
55,184 59.020 .
61,892 ..
67,680 ..
71,820 ..
77,840 . .
82,670 . .
60,000 27,420
92,260 30,030
100,554 34,074
79,587 37,625
93,734 44,314
Total . .. 51,458 55,184 59,020 61,892 67,680 71,820 77,840 82,670 87,420 122,290 134,628 117,212 138,048
Payments Under Financial Agreement-
Interest on State Debt . 1,408 1,408 1,408 1,408 1,408 1,408 1,408 1,408 1,408 1,408 1,408 (d)1,290 (d)1,525 Sinking Fund on
State Debt . . 1,925 2,077 2,193 2,335 2,482 2,673 2,835 3,053 3,226 3,458 3,689 3,896 4,111 Debt Charges Assistance . . . 0
3,420 0
3,668 0 0
4,107 0
4,351 0 0
4,964 1,496 5,811
2,991 6,676
4,487 7,898
5,982 19,808
7,478 31,781
Universities . . . 2,133 2,367 3,266 Colleges of
Advanced Education . . 0 .. 275 554 623 1,361 1,420 1,651 2,638 13,518 889
20,803 2,007
Technical Education .. . . . .. . . 759 11 526
.. 1,889
. 2,529 6,464 19,420
Schools . . .. .. .. 690 n.a. Preschools and Child Care .. . .. .. . .. .. ..
87 ..
169 . 326 587 706
Child Migrant Education . .. .. .. .. 0 . . 10 8 13 18 43
Educational Research . . . 0• 0 0
0 0 .. 597 2,336 Community Health Tuberculosis Hospitals . 752
0 0
710 638 662 . 652
.. 620
.. 571
0
551 545 ..
715 .
760 939 1,066
950 1,230
School Dental Scheme .. .. .. . .. .. .. 26 34
. 52 76 89
Health Education . . Blood Transfusion Services
.. 42
0 0
44 47 61 .. 123
.. 76
0 0
115 83 124 139 160 252 50
247 50
Health Planning Agencies.0 00 .. . . .. .. 9
. 41 169 200
Home Care Services .0 0• 0 0• 0• 00 0 0 00
3 9 9 2 3 Senior Citizens Centres . . . . 0 0 0 0 0 0 0
4 14 30 65 Paramedical Services . . . . . 0 0 0 0 0 0 0 0 0 0 0 0 0 0
Assistance for 25 139 210 294 464 776 1,534 1,000 Deserted Wives .. . . ..
Unemployment Relief .. . .. 1,620 9,660 941
20 20 Social Planning Units•. . .0 0 .0 00
39 17 0
161 270 . 694 1,003 1,474
Aboriginal Advancement •. .. .0 .. .. . 623 1.093 1,093 1,093
Housing Grants 0 0 0 00 00 00 0 0 00 0 0 0•
.. na. Sewerage . . 0 0 0 0 0 00 0 0 0 0 0
110 Area Improvement . . 0 0 0 0 00 00 . 0 0 0 .0 Local Government (Grants 4,774
Commission) •. .. .. .0 .. . . 0 0 RegionalOrganisationAssist- 0. 00 .0 38
ance .. .. Community Recreation
00 . 0 0 0 0
.. 105 Investigations •. .0 0 00 00 ..
40 Fisheries Development .0 0 0 00 00 00 .0 00 . Bovine Brucellosis and 36 113 177 235 551 334
TB. Eradication . 0 0 .0 0 00 .. Agricultural Extension
Services 90 104 104 104 217 368 391 460 538 651 69" 760 847 . . ..
Minor Agricultural Research na. . . 1 . . 3 . . 11 15 15 II 13 17 17
Plague Locust Control
Apple, Pear and Canning 15 Fruit Industries
Adjustment Assistance to 247 Canneries .. .. 00 .. .. . 0 0 0 0 0
.. ..
19 44 110 Apprenticeship Training .. . 0 0 .. .0 00 ..
187 Legal Aid .. . Road Safety Practices ..
. 12
.. 13
.0 12 13
223 15
352
. 0
15 560
15 462
15 551
. 19
759
.. 19
577
.. 19
851 19
955 19
1,138 Research Grants .. Natural Disaster Relief ..
. ..
..
.. . 20 .. . 725 1,026 -56 .. .. .. ..
6,362 6,723 7,689 8,226 9,195 11,131 11,986 13,427 17,581 23,572 38,074 63,854 n.a. Total Specific Purpose Recurrent Payments
252
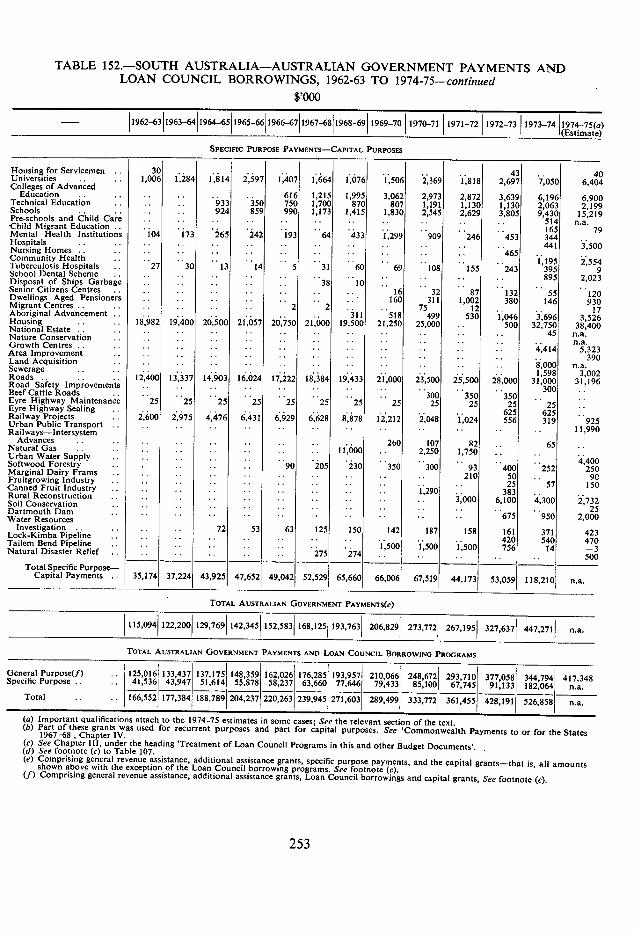
TABLE 152.-SOUTH AUSTRALIA-AUSTRALIAN GOVERNMENT PAYMENTS AND LOAN COUNCIL BORROWINGS, 1962-63 TO 1974-75-continued
$,000
- 1962-63 1963-64 1964-65 1965-66 1966-67 1967-68 1968-69 1969-70 1970-71 1971-72 1972-73 1973-741974-75(a) (Estimate)
SPECIFIC PURPOSE PAYMENTS-CAPITAL PURPOSES
Housing for Servicemen 30 .. .. .. I 43 40 Universities 1,006 1,284 1,814 2,597 1,407 1,664 1,076 1,506 2,369 1,818 2,697 7,050 6,404 Colleges of Advanced Education .. . 616 1,215 1,995 3.062 2,973 2,872 3,639 6,196 6,900 Technical Education 933 350 750 1,700 870 807 1,191 1,130 1,130 2,063 2,199 Schools .. 924 859 990 1,173 11415 1,830 2,545 2,629 3,805 9,430 15,219 Pre-schools and Child Care .. .. .. .. .. .. .. .. 514 n.a. Child Migrant Education . . .. .. .
.. 165 79 Mental Health Institutions 104 173 265 242 193 64 433 1,299 909 246 453 344 Hospitals . .. Nursing Homes .. •.
..
. .. .
..
.• .. . ..
.. .. ..
.. .. ..
.
.. . 465
441 . 3,500
Community Health . .. .. .. . .. .. .. .. . . 1,195 2,554 Tuberculosis Hospitals . 27 30 13 14 5 31 60 69 108 155 243 395 9 School Dental Scheme .. . .. . . . . .. .. .. . .. .. . . 895 2,023 Disposal of Ships Garbage .. .. .. .. .. 38 10 .. .. .. Senior Citizens Centres .. .. . . .. .. . .. 16 32 87 132 55 120 Dwellings Aged Pensioners .. .. .. .. .. .. .. 160 311 1,002 380 146 930 Migrant Centres . .. .. . . .. 2 2 . .. 75 12 . . 17 Aboriginal Advancement .. .. .. .. .. . . 311 518 499 530 1,046
. 3,696 3,526 Housing .. 18,982 19,400 20,500 21,057 20,750 21,000 19,500 21,250 25,000 .. 500 32,750 38,400 National Estate .. .. . . 0 . . . . . 45 n.a. Nature Conservation • . . . . . . . . . 0 Growth Centres . .
Area Improvement .. ..
. .
. . . . .
.. .. . .. .
.. .
.. . . ..4,414
. n.a. 5,323
Land Acquisition . . .. . . . . ..
.. . .
.. . .
..
.. .. ..
. .
.. .. . .
.. 8,000
390 n a. Sewerage ..
Roads . . . . . 12,400 . .
13,337 ..
14,903 .
16,024 ..
17,222 . .
18,384 . .
19,433 . .
21,000 ..
23,500 . .
25,500 . .
28,000 1,598
31,000 3,002
31,196 Road Safety Improvements .. . . . . .. . . . . . . .. .. .. . . 300 Beef Cattle Roads . . . . . . . . . . . . . . . . . . 300 350 350 Eyre Highway Maintenance 25 25 25 25 25 25 25 25 25 25 25 .
25 Eyre Highway Sealing .. .. .. .. .. .. .. .. .. .. .. 625 625 Railway Projects . . 2,600 2,975 4,476 6,431 6,929 6,628 8,878 12,212 2,048 1,024 556 319 925 Urban Public Transport .. . . .. .. . . .. .. .. . . .. .. .. 11,990 Railways-intersystem ..
Advances . . . .
Natural Gas . . . . .. . .
. .
. . .. . .
. . .
..
. . .. . .
.. 11,000
260 . .
107 2,250
82 1,750
.. .. 65 . Urban Water Supply . . .. .. .. . . .. .. . . . . .. .. .. . . 4.400 Softwood Forestry .. Marginal Dairy Frams
.. . . .. . . 90 205 230 350 300 93 400 252 250 .. .. .. .. .. .. .. .. .. .. 210 50 90 25 57 150
1,290 . . 383 . 3,000 6,100 4,300 2,732
25 675 950 2,000
63 125 150 142 187 158 161 371 423 1,500 1,500 1,500
420 756
540 14
470 -3 275 274 .. .. .. .. .. 500
49,042 52,529 65,660 66,006 67,519 44,173 53,059 118,210 n.a.
rruizgrowing Industry Canned Fruit Industry Rural Reconstruction Soil Conservation Dartmouth Dam Water Resources
Investigation Lock-Kimba Pipeline Tailem Bend Pipeline Natural Disaster Relief
Total Specific Purpose- Capital Payments . . 35,1
72 53
37,224 43,925 47,652
TOTAL AUSTRALIAN GOVERNMENT PAYMENTS(e)
115,094 122,200 129,769 142,345 152,583 168,125 193,763 206,829 273,772 267,195 327,637 447,271 n.a._
TOTAL AUSTRALIAN GOVERNMENT PAYMENTS AND LOAN COUNCIL BORROWINC.
General Purpose(f) . . 125,016 133,437 137,1751 148,359 162,026 176,285 193,957 210,066 248,672 293,710 377,058 344,794 417,348 Specific Purpose .. .. 41,536 43,947 51,614! 55,878 58,237 63,660 77,646 79,433 85,100 67,745 91,133 182,064 Total .. .. 166,552 177,384i I88,789 204,237 220,263 239,945 271,603 289,499 333,772 361,455 428,191 526,858 n.a.
kUl iinpuri.ii quaiincations aiiacn to inc iv /4- t3 estimates in some cases; See the relevant section of the text. Part of these grants was used for recurrent purposes and part for capital purposes. See 'Commonwealth Payments to or for the States 1967-68, Chapter IV. See Chapter lIt, under the heading 'Treatment of Loan Council Programs in this and other Budget Documents'. See footnote (c) to Table 107. Comprising general revenue assistance, additional assistance grants, specific purpose payments, and the capital grants-that is, all amounts shown above with the exception of the Loan Council borrowing programs. See footnote (C). Comprising general revenue assistance, additional assistance grants, Loan Council borrowings and capital grants, See footnote (c).
253
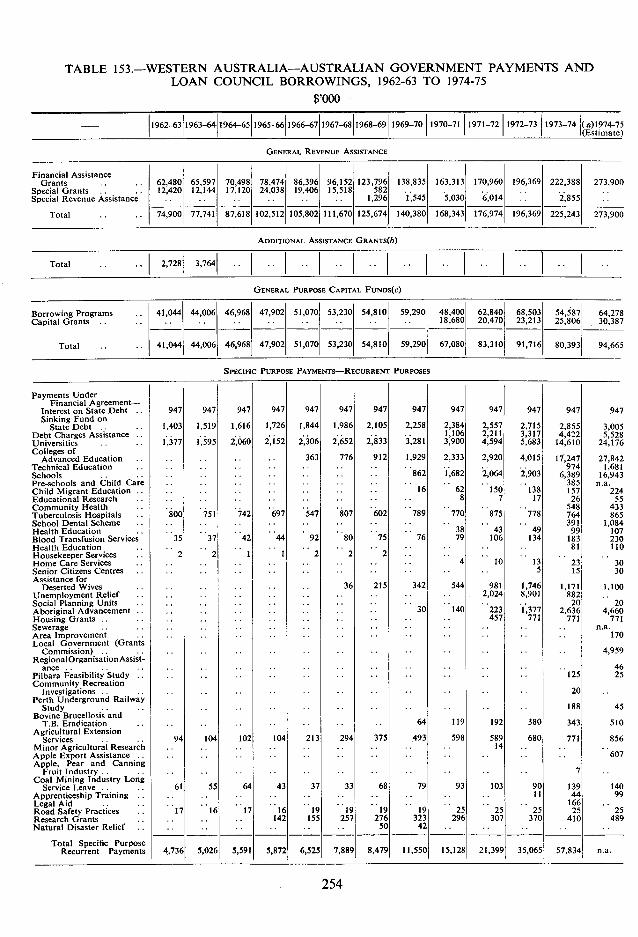
TABLE 153.-WESTERN AUSTRALIA-AUSTRALIAN GOVERNMENT PAYMENTS AND LOAN COUNCIL BORROWINGS, 1962-63 TO 1974-75
$,000
- 1962-63 1963-64 1964-65 1965-66 1966-67 1967-68 1968-69 1969-70 1970-71 1971-72 1972-73 1973-74 (a)1974-75 (Estimate)
GENERAL REVENUE ASSISTANCE
Financial Assistance
Grants 62,480 65,597 70,498 78,474 86,396 96,152 123,796 138,835 163,313 170,960 196,369 222,388 273,900
Special Grants.. 12,420 12,144 17,120 24,038 19,406 15,518 582
A .. ..
Special Revenue ssistance .. 1,296 1,545 5,030 6,014
Total .. 74,900 77,741 87,618 102,512 105,802 111,670 125.674 140,380 168,343 176,974 196,369 225,243 273,900
ADDITIONAL ASSISTANCE GRANTS(b)
Total .. 2,728 3,764 .. .. ..
GENERAL PURPOSE CAPITAL FUNDS(C)
Borrowing Programs Capital Grants
41,044 44,006 ..
46,96847,902 51,070 53,230 54,810 ..
59,290 48,400 18,680
62,840 20,470
68,503 23,213
54,587 25,806
64,278 30,387
Total .. 41,044 44,006 46,968 47,902 51,070 53,230 54,810 59,290 67,080 83.310 91,716 80,393 94,665
SPECIFIC PURPOSE PAYMENTS-RECURRENT PURPOSES
Payments Under Financial Agreement-
Interest on State Debt 947 947 947 947 947 947 947 947 947 947 947 947 947 Sinking Fund on
State Debt .. .. 1,403 1,519 1,616 1,726 1,844 1,986 2,105 2,258 2,384 2,557 2,715 2,855 3,005 Debt Charges Assistance .. .. .. .. 1,106 2,211 3,317 4,422 5528 Universities .. .. 1,377 1,595 2,060 2,152 2,306 2,652 2,833 3,281 3,900 4,594 5,683 14,610 24:176 Colleges of
Advanced Education .. .. .. 363 776 912 1,929 2,333 2,920 4,015 17,247 27,842 Technical Education 974 1,681 Schools .. .. .. . .. .. 862 1,682 2,064 2,903 6,389 16,943 Pre-schools and Child Care .. .. .. .. .. 385 na. Child Migrant Education .. .. .. .. 16 62 150 138 157 224 Educational Research .. 8 7 17 26 55 Community Health .. .. .. .. 548 433 Tuberculosis Hospitals .. 800 751 742 697 547 807 602 789 770 875 778 764 865 School Dental Scheme . 391 1,084 Health Education .. .. . .. .. .. .. .. .. 38 43 49 99 107 Blood Transfusion Services 35 37 42 44 92 80 75 76 79 106 134 183 230 Health Education .. . . .. .• . . .. .. 81 110 Housekeeper Services .. 2 2 1 1 2 2 2 .. . . . . Home Care Services .. . . .. . . . . . . . . . 4 10 13 23 30 Senior Citizens Centres . . . . . . . . . . . 0 . . . . . . 5 15 30 Assistance for
Deserted Wives . . . . .. . . .. .. 36 215 342 544 981 1,746 1,171 1,100 Unemployment Relict .. . . 00 .. .. . .. . . 2,024 8,901 882 Social Planning Units .. .. .. . 0 . .. . . .. 20 20 Aboriginal Advancement •. . .. 00 . . 30 140 223 1,377 2,636 4,660 Housing Grants .. •. .. . 0 0 00 0 0 .. 457 771 771 771 Sewerage . . .. 0 0 0 0 0 0 0 . 0 0 0 0 0 0 na. Area Improvement .. .. .. .. .. 0 .. .. 0 0 . 170 Local Government (Grants
Commission) •. •. . 00 .. .. 0 0 . . 0 4,959 Regional Organisation Assist-
ance 00 0 0 00 . 00 . 46 Pilbara Feasibility Study . . . . 0 0 0 0 0 0 0 . 0 0 0 125 25 Community Recreation
Investigations .. 0 0 00 00 0 00 . . 20 Perth Underground Railway
Study .. •. 0 0 00 .. 0 0 0• 0• 00 188 45 Bovine Brucellosis and
T.B. Eradication .. 00 00 00 00 .. 64 119 192 380 343 510 Agricultural Extension
Services. . •. 94 104 102 104 213 294 375 493 598 589 680 771 856 Minor Agricultural Research . . . 00 0 0 .. 0 0 14 .. Apple Export Assistance .. . . 00 0 0 0 .. . 0 . 0 0 0 00 607 Apple, Pear and Canning
Fruit Industry . . . . 0 0 00 .. .. .. . 0 0 7 Coal Mining Industry Long
Service Leave . . .. 61 55 64 43 37 33 68 79 93 103 90 139 140 Apprenticeship Training •. .. 00 00 00 .. .. .. .. ii 44 99 Legal Aid •. .. 00 .. 00 0 .. 166 Road SafetyPractices .. 17 16 17 16 19 19 19 19 2525 25 25 25 Research Grants .. .. .. .. 142 155 257 276 323 296 307 370 410 489 Natural Disaster Relief .. .. .. 0 0 .. 50 42 .. .. 00 0 0
Total Specific Purpose Recurrent Payments 4,736 5,026 5,591 5,872 6,525 7,889, 8,479 11.550 15,128 21,399 35,065 57,834 na.
254
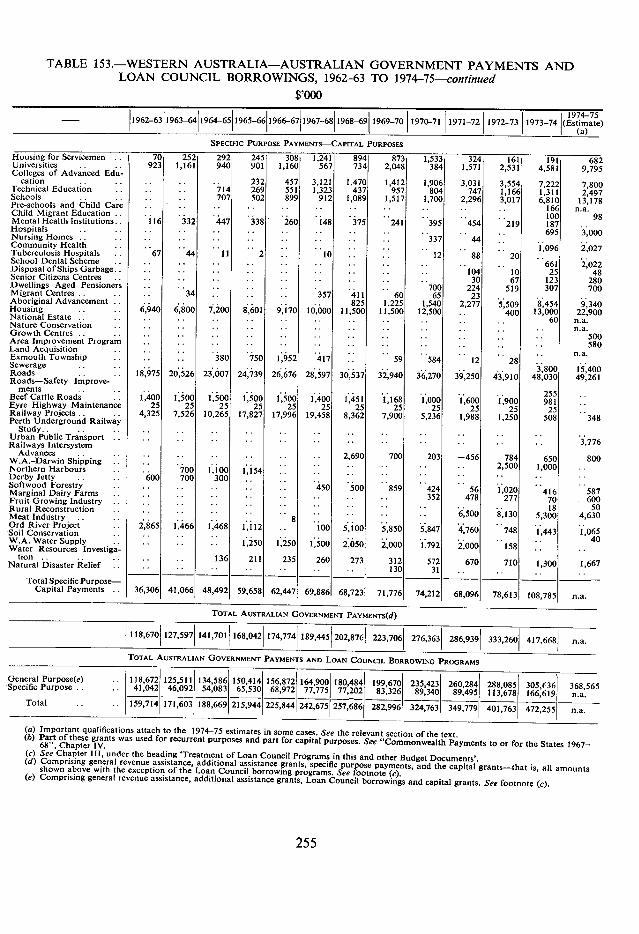
TABLE 153.-WESTERN AUSTRALIA-AUSTRALIAN GOVERNMENT PAYMENTS AND LOAN COUNCIL BORROWINGS, 1962-63 TO 1974-75-continued
$,000 1974-75
1962-63 1963-64 1964-65 1965-66 1966-67 1967-68 1968-69 1969-70 1970-71 1971-72 1972-73 1973-74 (Estimate) (a)
SpEciFic PURPOSE PAYMENTS-CAPITAL PURPOSES
4ousing for Servicemen 70 252 292 245 308 1,241 894 873 1,533 324 161 191 68 Jniversities .. 923 1,161 940 901 1,160 567 734 2.048 384 1,571 2,531 4,581 9,795 olleges of Advanced Edu- cation . . . . . . . . 232 457 3,121 1,470 1,412 1,906 3,031 3,554 7.222 7,80C Eechnical Education .. . . 714 269 551 1,323 437 957 804 747 1,166 1,311 2,49 chools . . . .. . . 707 502 899 912 1,089 1,517 1,700 2,296 3,017 6,810 13,171 're-schools and Child Care .. - .. .. .. .. .. .. .. .. .. 166 n.a. hild Migrant Education .. .. .. .. .. .. .. . .. .. .. 100 99 4entalHeaIth1nstitutions 116 332 447 338 260 148 375 241 395 454 219 187 lospitals . 0 . .. . . . 0 . . . .. 695 3,000 'lursing Homes .. .. .. .. .. .. .. .. 337 44 ommunity Health .. .. .. .. .. .. .. .. .. .. .. .. 1,096 2,027 Euberculosis Hospitals . . 67 44 11 2 .. 10 . . . . 12 88 20 chool Dental Scheme .. .. .. .. .. .. .. .. .. .. .. .. 661 2,022 )isposal of Ships Garbage.. .. .. .. .. .. .. .. .. .. 104 10 25 48 enior Citizens Centres . . . . . . . . . . .. .. .. .. .. 30 67 123 280 )wellings Aged Pensioners .. .. .. .. .. .. .. .. 700 224 519 307 700 Sigrant Centres .. . . .. 34 .. . . .. 357 411 60 65 23 boriginal Advancement .. .. .. .. .. .. .. 825 1,225 1,540 2,277 '5',509 8,454 9,340 lousing .. .. 6,940 6,800 7,200 8,601 9,170 10,000 11,500 11,500 12,500 .. 400 13,000 22,900 lational Estate . . .. . . .. .. .. .. .. . . .. . . .. . . 60 n.a. lature Conservation .. . . .. .. .. .. .. . . . . . . .. na. rowth Centres .. .. .. .. .. .. .. .. .. ., .. ..
..
.. .. .. 500 rea Improvement Program .. .. .. .. .. .. .. .. .. .. .. .. 580 and Acquisition .. .. .. .. .. .. .. .. .. .. .. .. n.a. xmouth Township .. .. .. 380 750 1,952 417 .. 59 584 12 28 ..
ewerage .. .. Loads .. ..
.. 18,975
.. 20,526
.. 23,007
.. 24,739
.. 26,676
.. 28,597
.. 30,537
.. 32,940
.. 36,270
.. 39,250
.. 43,910
3,800 48,030
15,400 49,261 Loads-Safety Improve-
ments . . . . eef Cattle Roads .. '400 1,400
. . 1,500
. . 1,500
. . 1,500
. . 1,500
. . 1,400
. . 1,451
. . 1,168
. . 1,000
. . 1,600
. . 1.900
255 981 yre Highway Maintenance 25 25 25 25 25 25 25 25 25 25 25 25 ailway Projects .. .. 4,325 7,526 10,265 17,827 17,996 19,458 8,362 7,900 5,236 1,988 1,250 508 348 erth Underground Railway
Study.. .. .. .. .. .. .. .. .. .. .. .. .. Irban Public Transport .. .. .. .. .. .. .. .. .. .. .. .. 3,776 ,ailways Intersystem .. Advances . . . .
IA -Darwin Shipping .. . . ..
..
.. . . ..
. . .. .. 2,690 700 203 -456 784 650 800 lorthern Harbours .. .. 700 1,100
.. 1,154
..
.. .. ..
..
.. .. ..
..
.. .. .. 2,500 1,000 terby Jetty .. .. 600 700 300 .. .. .. .. .. oftwood Forestry .. targinal Dairy Farms ..
.. .. .. .. .. 450 500 859 ..
424 ..
56 1,020 416 587 ruit Growing Industry ..
. .
.. .. ..
..
.. . . ..
..
.. .. ..
. .
.. . . 352 478 277 70 600
ural Reconstruction .. leat Industry .. ..
..
. . .. ..
..
.. .. ..
.. 8
..
.. .. ..
..
.. .. ..
. 6,500
.. 8,130
18 5,300
50 4,630
rd River Project .. oil Conservation ..
2,865 ..
1,466 .. 1,468 .. 1,112 .. . . .. 100 5,100
.. 5,850
. . 5,847
.. 4,760
.. 748 1,443 1,065
V.A. Water Supply .. later Resources Investiga-
.. .. .. 1,250 1,250 ..
1,500 ..
2,050 .. 2,000
.. 1,792 2,000 158
40
tion . . .. .. latural Disaster Relief
.. . . 136 211 235 260 273 312 572 670 7101 1,3001 1,667 . . . . . . . . .. . . . . . . 130 31 . . . . . Total Specific Purpose-
Capital Payments .. 36,306 41,066 48,492 59,658 62,447 69.886 68,723 71,776 74,212 68,096 78,613 108,785 n.a.
TOTAL AUSTRALIAN GOVERNMENT PAYMENTS(d)
118,670 127,597 141,701 168,042 174,774 189,445 202,876 223,706 276,363 286,939 333,260 417,668 n.a.
TOTAL AUSTRALIAN GOVERNMENT PAYMENTS AND LOAN COUNCIL BORROWING PROGRAMS
General Purpose(e) .. Specific Purpose .. ..
118,672 41,042
125,511 46,092
134,586 54,083
150,414 65,530
156,872 68,972
164,900 77,775
180,484 77,202
199,670 83.326
235,423 89,340
260,284 89,495
288,085 113,678
305,136 166,619
368,565 n.a.
Total .. .. 159,714 171,603 188,669 215,944 225,844 242,675 257,686 282,996 324,763 349,779 401,763 472,255 n.a.
Important qualifications attach to the 1974-75 estimates in some cases. See the relevant section of the text. Part of these grants was used for recurrent purposes and part for capital purposes. See "Commonwealth Payments to or for the States 1967-68", Chapter IV. See Chapter 111, under the heading 'Treatment of Loan Council Programs in this and other Budget Documents'. Comprising general revenue assistance, additional assistance grants, specific purpose payments, and the capital grants-that is, all amounts shown above with the exception of the Loan Council borrowing programs. See footnote (c). Comprising general revenue assistance, additional assistance grants, Loan Council borrowings and capital grants. See footnote (c).
255
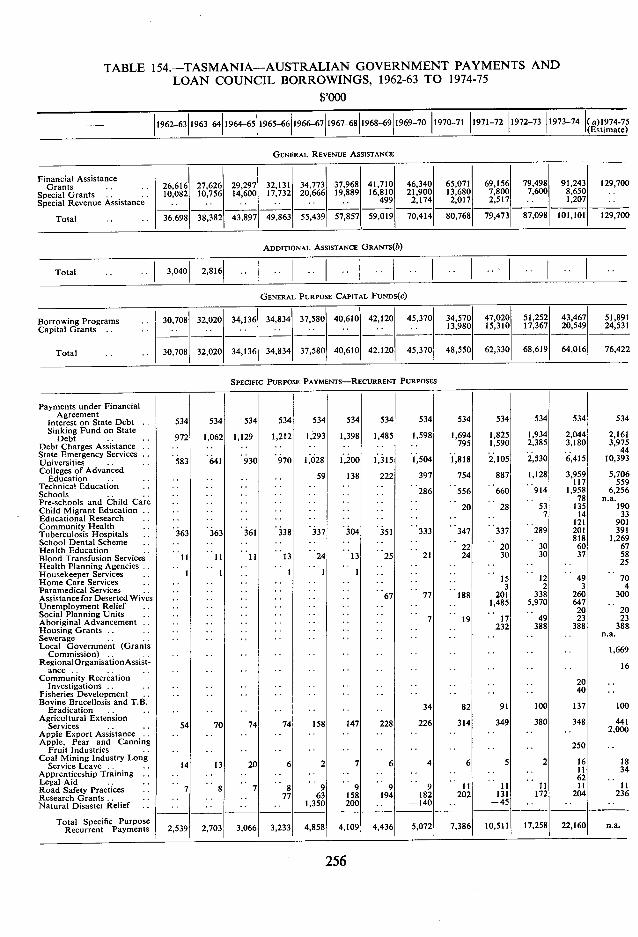
TABLE 154.-TASMANIA-AUSTRALIAN GOVERNMENT PAYMENTS AND LOAN COUNCIL BORROWINGS, 1962-63 TO 1974-75
$,000
- 1962-63 1963-64 1964-65 1965-66 1966-67 1967-68 1968-69 1969-70 1970-71 1971-72 1972-73 1973-74 (a)1974-7 (Estimate)
GENERAL REVENUE ASSISTANCE
Financial Assistance
Grants 26, Special Grants .. .. 10,( Special Revenue Assistance
Total 36.(
Total 3,040 2,816
,297 32,131 34,773 37,968 41,710 461 ,600 17,732 20,666 19,889 16,810 21,
499 2.
1,897 49,863 55,439 57,857 59,019 70,
ADDITIONAL ASSISTANCE GRANTS(b)
GENERAL PURPOSE CAPITAL FUNDS(C)
65,071 69,156 79,498 91,243 129,700
13,680 7,800 7,600 8,650
2,017 2,517 1,207
80,768 79,473 87,098 101,101 129,700
Borrowing Programs .. Capital Grants . .
30,708 . .
32,020 . .
34.136 . .
34,834 . . . .
37,58040,610 . .
42,120 . .
45,370 . .
34,570 13,980
47,020 15,310
51,252 17,367
43,467 20,549
51,891 24,531
Total . . .. 30,708 32,020 34,136 34,834 37,580 40,610 42,120 45,370 48,550 62,330 68,619 64,016 76,422
SPECIFIC PURPOSE PAYMENTS-RECURRENT PURPOSES
ayments under Financial Agreement
Interest on State Debt 534 534 534 534 534 534 534 534 534 534 534 534 534 Sinking Fund on State
Debt 972 1,062 1,129 1,212 1,293 1,398 1,485 1,598 1,694 1,825 1,934 2,044 2,161 Debt Charges Assistance . . .. .. .. .. 795 1,590 2.385 3,180 3,975
44 itate Emergency Services Universities . 583 641 930
.. 970
. 1,028
.. 1,200
.. 1,315
. . 1,504 . . 1,818
. . 2,105 .. 2,530 .. 6,415 10,393
Colleges of Advanced Education . . . 59 138 222 397 754 887 1,128 3,959 5,706 . . .
fechnical Education . . .. .. .. .. .. 286 .. 556 .. 660
.. 914 1,958
117559 6,256 chools .. .. .. .. ..
78 na. 're-schools and Child Care . .. .. .. .. .. 20
. . 28
. . 53 135 190 Child Migrant Education .. .. .. .. .. 7 14 33 Educational Research . . . . . . . . . . . . . . . . . . 121 901 Community Health
ruberculosis Hospitals . 363 363 361 .. 338
.. 337
.. 304 .. 351
. 333 . 347
.. 337
.. 289 201 391
chooI Dental Scheme. . . .. .. .. 22 . . 20 . . 30 818 60
1,269 67 Health Education
Hood Transfusion Services 11 11 11 ..
13 ..
24 ..
13 ..
25 ..
21 24 30 30 37 58 Health Planning Agencies . . .. . . . . .. . . .. . 0 25 Housekeeper Services
15 12 49 70 Home Care Services . .. . . .. . . .. .. 3 2 3 4 Paramedical Services . .. . . . . ..
67 . . 77
. 188 201 338 260 300 ,ssistance for Deserted Wives . . . .. ..
1,485 5,970 647 Unemployment Relief . .. .. .. . . . . .. 20 20 iocial Planning Units .. .. .. .. .. 7 .. 19 .. 17
.. 49 23 23 &boriginal Advancement .. .. .. .
232 388 388 388 HousingGrants .. .. .. .. .. .. fl.. iewerage . .. .. .. .. .. . . . . . . . .
Local Government (Grants 1,669 Commission) .. .. .. .. .. .. .. .. .. RegionalOrganisationAssist-
ance . . .. . . .. .. .. . . .. . . . . 16 . Community Recreation 20 Investigations . . . . . . . . . . . . . . . . . . . 40 Fisheries Development .. . . .. .. .. .. .. .. Sovine Brucellosis and T.B. 34 82 91 100 137 100 Eradication .. .. .. .. &gricultural Extension
Services 54 70 74 74 158 147 228 226 314 349 380 348 441 kpple Export Assistance .. .. .. .. .. .. .. .. .. 2.000 A.pple, Pear and Canning 250 Fruit Industries .. .. .. .. .. .. .. .. Coal Mining Industry Long
2 7 6 4 6 5 2 16 16 Service Leave 14 13 20 6 II 34 pprenticeship Training 0 .. .. .. .. .. .. 62
Road Safety Practices . Legal Aid ..
7 8 7 8 ..
9 .. 9 .. 9 .. 9 .. II .. II
.. II 11 II
Research Grants 77 63 158 194 182 202 131 172 204 236 'latural Disaster Relief . . .. 1,350 200 .. -140 .. -45 0
Total Specific Purpose Recurrent Payments 2,539 2,703 3,066 3,233 4,858 4,109 4,436 5,072 7,386 10,511 17,258 22,160 n.a.
256
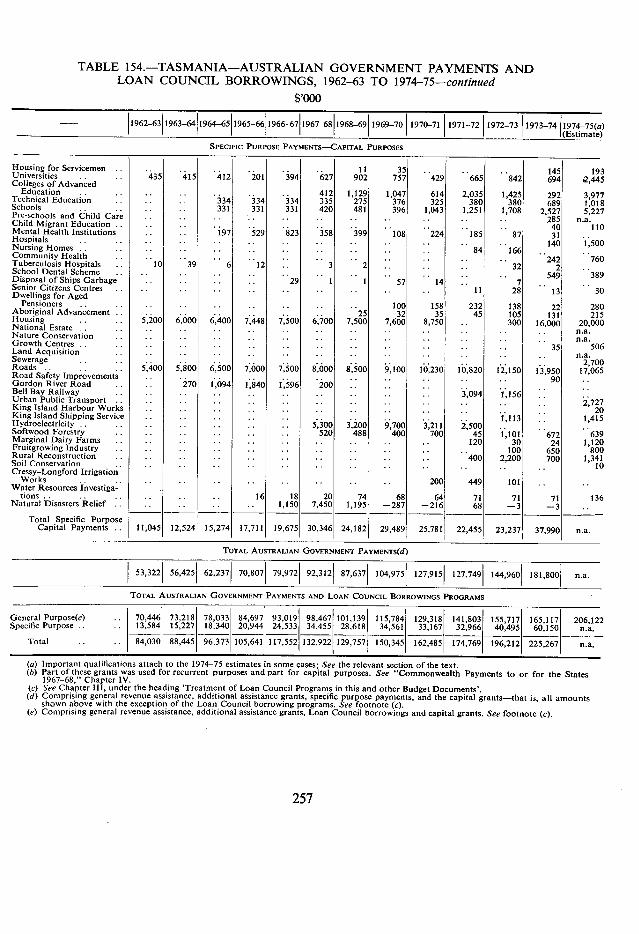
TABLE 154.-TASMANIA-AUSTRALIAN GOVERNMENT PAYMENTS AND LOAN COUNCIL BORROWINGS, 1962-63 TO 1974-75-continued
$,000
- 1962-63 1963-64 1964-65 1965-66 1966-67 1967-68 1968-69 1969-70 1970-71 1971-72 1972-73 1973-74 1974-75(a) (Estimate)
SPECIFIC PURPOSE PAYMENTS-CAPITAL PURPOSES
Housing for Servicemen .. .. .. 11 35 . .. 145 193 Universities 435 415 412 201 394 627 902 757 429 665 842 694 2,445 Colleges of Advanced Education .. . -
Technical Education . . - -
-. .
.. 334
.. 334
- - 334
412 335
1,129 275
1,047 376
614 325
2,035 380
1,425 380
292 689
3,977 1,011 Schools - -
Pre-schools and Child Care 331 331 331 420 481 396 1,043 1,251 1,708 2,527 5,227
Child Migrant Education - -. - - . . .•
.. .. . - -
.. . - . - . -
.. .. ..
..
.. .. .. 285
40 n.a.
110 Mental Health Institutions . . . 197 529 823 358 399 108 224 185 87 31 Hospitals - - .. Nursing Homes - - -. -
..
.. -. ..
- - ..
- - ..
..
.. . - ..
.. -.
.. -.
.. 84
-. 166
140 - 1,500
Community Health - .. . . .. . - -. . . .. -. .. . - 242 760 Tuberculosis Hospitals . - 10 39 6 12 - - 3 2 .. .. .. 32 2 School Dental Scheme -. .. .. .. . - .. .. . - .. 549 389 Disposal of Ships Garbage . - . . . .. 29 1 1 57 14 .. ..
7 Senior Citizens Centres . . . . . - . . . . . . . . . . 11 28 .
13 30 Dwellings for Aged Pensioners - - .
Aboriginal Advancement - . .
- - -
. .
. .
. .
. .
. .
. .
. .
. . . .
25 100
32 158
35 232
45 138 105
22 131
280 215 Housing . . 5,200 6,000 6,400 7,448 7,500 6,700 7,500 7,600 8,750 300 16,000 20,000 National Estate. . . - . - - . . . . - . . . - - - . . .. . . - - n.a. Nature Conservation - - . . - - . . . . - . . . . . . .
- - n.a. Growth Centres - . - - - . . - . . . - . .. . . . . . . . .
. -
. . . .
35 506 Land Acquisition . - - - - . . - .. . - - - - .. . .. . - n.a. Sewerage - . . . . - . . - - . . . . . . . . . . . . . . 2,700 Roads - - 5,400 5,800 6,500 7,000 7,500 8,000 8,500 9,100 10,230 10,820 12,150 13,950 17.065 Road Safety Improvements - . . - - . . . - . . . . .. .. .. 90 Gordon River Road - . . . 270 1,094 1,840 1,596 200 .. - Bell Bay Railway . - .. . - . . . . .. .. . . .. .. 3,094 1,156 - Urban Public Transport .. .. .. .. . - .. .. .. .. - - .. .. .. 2.727 King Island Harbour Works .. . - .. -. .. -. .. .. .. .. .. 20 King Island Shipping Service - . -. . . .. . . .. - - .. . - -. 1,113
..
. . 1,415 Hydroelectricity -. .. - . -. - . . . . . 5,300 3,200 9,700 3,211 2,500 . . . Softwood Forestry . - -. .. . . .. .. 520 488 400 700 45 1,101 672 639 Marginal Dairy Farms .. - . .. . . .. .. .. . - . . .. 120 30 24 1,120 Fruitgrowing Industry .. .. .. . . .. .. .. .. .. .. .. 100 650 800 Rural Reconstruction .. .. .. .. .. .. .. . - .. .. 400 2,200 700 1,341 Soil Conservation .. . - .. .. - - .. .. .. .. .. .. 10 Cressy-Longford Irrigation
-. Works - - .. .. .. .. .. -. .. .. .. 200 449 101 Water Resources Investiga- - - tions - . . .. -. .. . . 16 18 20 74 68 64 71 71 71 136 Natural Disasters Relief - - . . - - - . - 1,150 7,450 1,195 -287 -216 68 -3 -3
Total Specific Purpose Capital Payments .. 11,045 12,524 15,274 17,711 19,675 30,346 24,182 29,489 25,781 22,455 23,237 37,990 n.a.
TOTAL AUSTRALIAN GOVERNMENT PAYMENTS(d)
53,322 56,425 62,237 70,807 79,972 92,312 87,637 104,975 127,915 127,749 144,960 181,800 na.
TOTAL AUSTRALIAN GOVERNMENT PAYMENTS AND LOAN COUNCIL BORROWINGS PROGRAMS
General Purpose(e) .. 70,446 73,218 78,033 84,697 93,019 98,467 101,139 115,784 129,318 141,803 155,717 165,117 206,122 Specific Purpose . . - - 13,584 15,227 18,340 20,944 24,533 34,455 28,618 34,561 33,167 32,966 40,495 60,150 n.a. Total . - . - 84,030 88,445 96,373 105,641 117,552 132,922 129,757 150,345 162,485 174,769 196,212 225,267 n.a.
Important qualifications attach to the 1974-75 estimates in some cases; See the relevant section of the text. Part of these grants was used for recurrent purposes and part for capital purposes. See "Commonwealth Payments to or for the States 1967-68," Chapter IV. See Chapter 111, under the heading 'Treatment of Loan Council Programs in this and other Budget Documents'. Comprising general revenue assistance, additional assistance grants, specific purpose payments, and the capital grants-that is, all amounts shown above with the exception of the Loan Council borrowing programs. See footnote (c). Comprising general revenue assistance, additional assistance grants, Loan Council borrowings and capital grants. See footnote (c).
257
INDEX
INDEX PAGE
Aboriginal Advancement— Payments to States .. .. 7375 Grants to Local Authorities .. .. 123-124, 129
Aboriginal Affairs—Transfer of Responsibility .. .. 13-14,74 Additional Assistance Grants •. .. .. 22 Advanced Education, Commonwealth Advisory Committee on .. .. .. 40 Advanced Education, Australian Commission on .. .. 40. 43, 44 Aerodromes, Grants to Local Authorities for • .. .. 124-125 Aged Persons Homes, Grants to Local Authorities for .. . •. 120 Agricultural Extension Services •. .. .. . . . 101 Agricultural Research, Minor . . .. . . .. . ... 101 Albury—Melbourne Railway .. .. .. .. .. 188 Apple and Pear and Canning Fruit Industries, Supplementary Assistance .. .. 102 Apples, Export Guarantee .. .. .. .. .. 102 Apprenticeship Training .. .. .. .. . 109 Area Improvement .. .. .. 81-82, 129 Arts, Payments to Local Authorities for .. •. .. .. 124 Australian Assistance Plan . . . . . . 131 Australian Schools Commission .. :. .. .. 40, 48, 51 Barkly Highway—Maintenance .. .. .. 187
Beef Cattle Roads— Present Payments .. .. .. 91 History of Payments .. .. .. 187
Bell Bay Railway (Tasmania) • .. .. .. 189
Betterment Factor in Grants Formula .. .. 7, 8, 9, 156, 158, 160
Blood Transfusion Services .. .. .. 66
Blowering Reservoir .. •. .. .. .. .. 190
Bovine Brucellosis, Eradication of .. .. .. .. .. 100
Brigalow Lands Development .. .. .. 103
Bundaberg Irrigation Works .. .. •. . 105
Burdekin River Regional Study .. .. 110
Canned Fruits Industry Assistance .. .. •. 191
Capital Grants .. ... .. .. .. 26,30-31, 160
Cattle Dips .. .. .. .. .. .. .. 191
Cattle Tick Control and Research • .. .. .. 191
Child Care— Grants to States .. .. .. 56-57 Grants for Local Authorities .. 122-123,128-129
Child Migrant Education .. •. .. .. 57-58
Chowilla Reservoir . .. 192
Clare Weir .. .. 106
Coal Mining Industry—Long Service Leave .. 108-109
Coal Loading Facilities .. .. 189
Colleges of Advanced Education • .. .. 43-46,179-180
Community Health Facilities •. .• .. .. 60,63
Community Facilities, Townsville .. . .. .. 85, 130
Community Recreation—Investigations .. .. . 77
261
INDEX—Continued
PAGE Copeton Dam .. .. .. .. .. .. .. 104 Cressy-Longford Irrigation Works .. .. .. .. .. .. .. 192 Culture and Recreation •. .. . . .. . .. 77-78 Dairy Industry Extension Services .. .. .. .. .. 101 Dartmouth Dam •. .. .. .. 107 Dawson Weirs .. .. .. .. .. .. .. .. 104 Debt Charges Assistance Grants . .. . . 37-38, 161 Defence .. .. .. .. .. .. .. .. .. 38-39 Delivered Meals, Grants to Local Authorities for . . . . . .. . . 121 Derby Jetty . . . . . . .. .. . . . .. . . 190 Deserted Wives, Assistance for . . . . . . . . . . 71 Disadvantaged Schools .. .. .. .. .. 53 Dwellings for Aged Pensioners .. 70 Economic Services . . . . . 86-110,185-192 Education—
Present Payments .. . 3959 History of Payments .. 178-182
Education Research .. .. 58-59 Emergency Services .. . . . . . 39 Entertainments Tax .. .. •. 154 Eton (Mackay) Irrigation Scheme •. .. .. .. 106 Exmouth Township .. .. 184 Eyre Highway—Maintenance .. .. 187 Eyre Highway—Sealing .. .. 188 Fairbairn Dam .. .. 104 Financial Agreement, Payments under . . . . . . .. . . 35-37,154 Financial Assistance Grants—
Present Arrangements.. .. .. .. .. .. .. 9-16,159-163 1959 Arrangements . . . . . . . . .. . . . . 7,155-U7 57 1965 Arrangements .. .. .. .. .. .. .. 7-8,157-158 Fisheries—Development .. .. .. •. .. .. .. .. 190 Flood Mitigation .. .. .. .. .. .. .. 106,192 Flood Relief .. . . . . .. . . . . .. . . 111-114 Fruit Canneries, Adjustment Assistance . . . . . . . . . . . 102 Fruit Growing Industry Reconstruction .. •. .. 99-100 Garbage—Disposal of Overseas Ships Garbage .. .. .. .. 67 General Public Services . . . . . . . . .. . . . . 110-111,193 General Purpose Capital Funds .. .. .. .. .. . . 26-34 General Revenue Grants—
Present Arrangements.. .. .. .. .. .. .. .. 7-25 History .. .. .. .. .. .. .. .. 153-163 'Gentlemen's Agreement'—Semi-Government and Local Authority Loan Raisings 32-34,117-119 Gladstone Power Station .. .. .. .. .. .. .. .. 95 Glenlyon Dam .. .. .. .. .. .. .. .. .. 107 Gordon River Road .. .. .. .. .. .. .. .. 188 Grafton-South Brisbane Railway .. .. .. .. .. .. .. 188 Grants Commission .. .. .. .. .. .. .. 19-21,156 Grants Formula .. .. .. .. .. . . .. .. .. 15-18
INDEX—Continued
- PAGE
Growth Centres and Related Projects 79-81, 130 Handicapped Children, Schools for 53 Health 59-67, 182 Health Education 65 Health Planning Agencies 66 Home Care Program 68, 127 Home Nursing, Grants to Local Authorities for 121-122 Hospitals Development Program 61-62 Housekeeper Services 182 Housing 75-77,183-184 Housing—Grants and Advances to States 75-77, 183-184 Housing for Servicemen 38-39 Housing—Rental Losses 184 Hydro-electricity (Tasmania) 190 Income Tax—Resumption by States 9, 153-55, 156,158-159 Industry Assistance 96-108, 190-192 Interest on State Debts, Contributions to 35-36 Julius Dam 96 King Island Harbour Works 95 King Island Shipping Service 95 King River Dam 104 Land Acquisition and Development 82-83 Legal Aid 110 Loan Council 26-34, 117-119 Local Authority Borrowings 32-34,117-119 Local Government Authorities, Payments to or for 2-3, 115-134 Local Government Authorities in the Northern Territory 131-132 Local Government, Grants Recommended by Grants Commission 85, 115-117 Lock to Kimba Pipeline 105 Marginal Dairy Farms Reconstruction Scheme 98-99 Meat Production, Encouragement of 191 Medical Hospitals—Teaching Costs, Committee on 178 Mental Health Institutions 60, 182 Metropolitan Unemployment Relief 72-73,183 Migrant Centres 72 Millewa Pipeline 105 National Debt Sinking Fund 32;36-37 National Estate, The 78 Natural Disaster Relief 111-115 Natural Gas Pipeline - 190 Nature Conservation 78 Non-metropolitan Unemployment Relief 72-73,183 Northern Development (Western Australia) 189, 191 Nursing Homes 62
263
INDEX—continued PAGE
Offsets Principle, Application of ., .. .. .. 13-14, 40,71
Ord River Irrigation Project •. .. .. .. 106-107,191
Parkes-Broken Hill Railway .. .. .. .. .. .. .. 189
Paramedical Services .. ,. .. . .. . . 69-70
Pay-roll Tax— Liability of States and State Authorities 11, 159, 161, 162 Transfer to States . . . 11-12, 163
Pensioners, Dwellings for .. .. .. .. .. .. .. 70
Per Capita Grants .. .. .. .. .. 10,13
Perth Underground Railway Study .. .. .. .. .. .. 94
Pilbara Feasibility Study •. •. .. .. .. .. .. 85
Plague Locust Control .. .. .. .. •. 102
Population— Financial Assistance Grants Formula . . .. 7,8, 13, 17,18 Tax Reimbursement Grants Formula . . . . . . . 154, 156, 157 1961 Census Results .. .. . . . . . . .. .. . . 157
Power Development (Tasmania) .. .. .. .. .. .. .. 190
Pre-schools and Child Care . . .. .. .. 56-57, 128-129
Pre-school Teachers Colleges and Teachers Colleges .. .. 43-45,180-181
Premiers' Conferences . . . 7-19, 20, 23-24, 27, 28, 30, 33, 35, 40, 76, 87, .156-163 Public Hospitals and Other Health Institutions . . . . . . . 61-62
Queensland Railway . . . . . .. . . 188
Railways— Present Payments .. .. .. 91-94 History of Payments . . . . .. 188-189
Railway Equipment (South Australia) . . . . . 188
Railways, Intersystem Advances .. .. .. 93-94
Receipts Duties on Wages and Salaries . . . 159, 162-163 Receipts Duty, Compensation for .. .. .. 11
Regional Employment Development Scheme .. 125
Regional Organisations, Assistance for . . . . . . . 85, 127
Research Grants.. . . . . . . . . . III, 193 Review of Revenue Assistance Arrangements .. .. . 16
Road Safety Practices .. .. .. . . . 110
Roads— Present Arrangements.. . . . . . . . . . . 87-91 History of Payments . . . . . . . . . . . 86-87, 185-188
Roads—Safety Improvements .. .. .. .. 188
Ross River Dam .. .. .. .. .. .. 96,190 Rural Reconstruction .. .. .. .. .. .. 97-98
Salinity Reduction, River Murray .. .. .. .. 105
School Dental Scheme .. .. .. .. . . 64-65
School Libraries .. . . .. . . . . 52-53,181
Schools .. .. .. .. .. .. .. 48-56,181-182
Science Laboratories and Equipment in Secondary Schools .. .. 52,181
Semi-Government Borrowing Programs .. .. .. .. 32-34
Senior Citizen Centres .. .. .. .. .. 68-69, 127-128
264
INDEX—continued
PAGE
Services for Children . . . . . . 56-57, 128-129 Sewerage . .. . . .. .. .. .. 84-85, 130 Sheltered Employment, Grants to Local Authorities for .. . . . 122
Shipping and Harbours .. .. .. .. 95, 189-190 Shipping Service, Western Australia—Darwin .. .. .. .. .. 190 Sinking Fund Contributions .. .. .. .. .. .. .. 36 Social Planning Units, Grants for .. .. .. •. .. 73 Social Security and Welfare . . .. . . .. . . .. 68-73,182-183 Softwood Forestry .. .. .. .. . •. 96-97 Soil Conservation .. .. .. .. .. .. .. 107-108 Special Grants . . . . . . .. .. .. .. . . 10, 19-21, 156 Special Grants System, Withdrawal of Tasmania .. .. .. .. .. 16 Special Revenue Assistance (General Revenue) .. .. . . .. . . 22-24 Specific Purpose Payments—
Present Payments . . .. .. .. .. .. .. . .35-114 History . . . . . . . . . . .. . . . 178-193
State Authorities Borrowing Programs .. .. .. .. •. 32-34 State Debts, Assistance for . . . . .. .. . . . . . . 35-38 State Emergency Services, Assistance to .. .. .. .. .. .. 39 State Government Loan Council Programs .. .. .. .. .. 26-32 Statements attached to Budget Speech—Relationship with .. .. .. .. 1-2 Sugar Industry Assistance .. .. .. .. .. .. .. .. 191 Supplementary Grants .. .. .. .. .. •. 155 Surplus Revenue Act . . .. . . .. .. . . .. 35, 153 Tailem Bend to Keith Pipeline .. .. .. .. .. •. •. 192 Tasmania, Withdrawal from Special Grants System .. .. .. .. .. 16 Tax Reimbursement Grants . . . . 154-157 Teachers Colleges and Pre-school Teachers Colleges .. .. .. 43-45,180-181 Technical Education .. .. 46-48,181 Tertiary Education .. .. .• .. .. .. .. 40-46,178-181
Tertiary Education—Transfer of Financial Responsibility .. 13-14,24,28-29,40,42,43,45,47 Tobacco Industry Extension Services .. .. .. 191 Townsville—Community Services •. .. .. .. 85, 130 Transport . . .. .. . . . .. .. .. 86-95, 185-190 Trawl and Danish Seine Fishery .• .. .. .. 102 Tuberculosis Hospitals .. .. .. .. .. •. 64 Tuberculosis in Cattle, Eradication of .. .. .. .. ioo Unemployment Relief .. .. .. .. 72-73, 183 Uniform Taxation .. •. 153-155 Universities . . . . . . . . .. .. .. . . 41-44,178-179 Universities Commission, Australian .. .. 40,41 Urban and Regional Development and the Environment . 7985 Urban Public Transport .. .. .. 94_95 Urban Water Supply (South Australia) .. 9
265
INDEX—continued
PAGE
Wages (Average)— Financial Assistance Grants Formula . . . . . . 7, 8, 156, 158 Tax Reimbursement Grants Formula .. .. .. .. 154
War Service Land Settlement .. . . . . . . . . . 108 Water Resources—Investigation and Measurement .. .. .. 103-104 Water Supplies—Townsville . . . . . . . . . . . . 125 Water Supply and Electricity .. ... .. .. 95-96, 190 Water Supply, Western Australia .. . . . .. . . . 192 Weipa Development .. .. .. .. .. .. 189 Western Australia—Darwin Shipping Service . . . . . . . 190 Western Australia Water Supply . . . . . . . . . 192
266


![EXHIBIT "A-1" [Hollywood Inventory] - Internet Archive](https://static.fdokumen.com/doc/165x107/63364472e687b37e4f0611b6/exhibit-a-1-hollywood-inventory-internet-archive.jpg)