large-scale assessments in India - Michael & Susan Dell ...
137
Large-scale Assessments In India = + > >
-
Upload
khangminh22 -
Category
Documents
-
view
2 -
download
0
Transcript of large-scale assessments in India - Michael & Susan Dell ...
Large-scale Assessments In India
=
+
>
>

2
List of abbreviations
Foreword
Introduction
Acknowledgements
Executive Summary
Chapter 1: The need for large-scale assessments in India
Chapter 2: Implementing large-scale assessments in states
Chapter 3: Case studies of large-scale assessments in India
Case study 1: Haryana
Case study 2: Rajasthan
Case study 3: Himachal Pradesh
Case study 4: Andhra Pradesh
Case study 5: Chile
Future of Assessments in India
Appendix 1: Self-assessment framework
Appendix 2: Analysis of strengths and weaknesses in learning outcomes in rajasthan and andhra pradesh
Appendix 3: Capacity building in Tamil Nadu
Appendix 4: Role of good questions in assessments
Appendix 5: Di!erent types of questions used in assessments
Appendix 6: Sample diagnostic questions used in large-scale assessments
Appendix 7: De"ining grade level competency
6
8
11
14
15
24
34
60
61
69
78
88
95
98
99
105
108
119
123
134
113
Table Of Contents
=

16
18
20
21
25
26
27
27
31
32
35
37
43
44
47
48
51
52
53
53
55
54
57
58
List of Figures
Figure 1: Key drivers of LSAs
Figure 2: Growth in learning outcomes from November 2017 to February 2018
Figure 3: How to use the Uni"ied Learning Outcome Framework
Figure 4: Assessment cell capacities built
Figure 5: Key Performance Indicators in Education
Figure 6: Use of LSA data for system-level improvements
Figure 7: Features of a well-designed and analysed large-scale assessment
Figure 8: Overview of LSAs in India
Figure 9: A note on private schools
Figure 10: Key recommendations of NEP
Figure 11: Comparison of state ranking by NAS 2017 and ASER 2018
Figure 12: Framework for state self-evaluation
Figure 13: Organogram of Haryana’s Department of School Education
Figure 14: Illustrative example of 3rd grade Math framework used in Himachal Pradesh
Figure 15: Process for increasing internal state capacity
Figure 16: Illustration of a high-quality question
Figure 17: Note on using technology to improve data reliability
Figure 18: Student improvement at the system level
Figure 19: Student improvement at the cohort level for grades 3 to 8
Figure 20:Student learning levels by grade
Figure 21: Illustrative segmenting of students by pro"iciency level
Figure 22: Illustrative state-level competency report
Figure 23: Illustrative of a misconception in Language
Figure 24: Illustrative of a misconception in Mathematics
Figure 25: Illustrative image of Samarth Dashboard, Himachal Pradesh showing grade-wise performance across subjects and performance at the district level
Figure 26: Illustrative analysis showing di!erence in performance by gender
Figure 27: Illustrative analysis showing di!erence in results by category Figure 28: Timeline of assessment reforms and learning outcomes in Haryana
Figure 29: Communication from CMO on Saksham Ghoshna
Figure 30: Saksham Sammaan Samaroh celebrating success of the program
Figure 31: Illustrative image of competencies in Saksham Talika
Figure 32: Growth in learning outcomes from November 2017 to February 2018
Figure 33: No-Cheating Campaign conducted in Haryana
Figure 34: Timeline of assessments for Adarsh School Yojana
Figure 35: Example of student score distribution for Grade 3
Figure 36: Comparison of performance between Adarsh vs Non Adarsh and schools in Rajasthan 56
Figure 37: District wise performance in Rajasthan
Figure 38: Performance by Gender in Rajasthan
Figure 39: Example of what students at di!erent benchmarks know and do in addition
Figure 40: Learning outcomes by distric
Figure 41: Workbooks for remediation
Figure 42: Timeline of reform in Himachal Pradesh
Figure 43: How to use the ULOF?
Figure 44: ULOF for Grade 2 Math
Figure 45: Guidance document for LO-based assessment creation
Figure 46: Illustrative sheet used to record mapping of LOs for each question paper
Figure 47: E#Samwad app for data collection and illustration of data transfer to the app
Figure 48: Samarth data dashboard with data by learning outcomes
Figure 49: Communication of assessment data
Figure 50: Timeline of assessment-linked initiatives in Andhra
3
56
56
58
61
62
62
63
65
68
69
71
72
72
73
74
75
77
79
80
81
81
83
84
85
Figure 1: Key drivers of LSAs
Figure 2: Growth in learning outcomes from November 2017 to February 2018
Figure 3: How to use the Uni"ied Learning Outcome Framework
Figure 4: Assessment cell capacities built
Figure 5: Key Performance Indicators in Education
Figure 6: Use of LSA data for system-level improvements
Figure 7: Features of a well-designed and analysed large-scale assessment
Figure 8: Overview of LSAs in India
Figure 9: A note on private schools
Figure 10: Key recommendations of NEP
Figure 11: Comparison of state ranking by NAS 2017 and ASER 2018
Figure 12: Framework for state self-evaluation
Figure 13: Organogram of Haryana’s Department of School Education
Figure 14: Illustrative example of 3rd grade Math framework used in Himachal Pradesh
Figure 15: Process for increasing internal state capacity
Figure 16: Illustration of a high-quality question
Figure 17: Note on using technology to improve data reliability
Figure 18: Student improvement at the system level
Figure 19: Student improvement at the cohort level for grades 3 to 8
Figure 20:Student learning levels by grade
Figure 21: Illustrative segmenting of students by pro"iciency level
Figure 22: Illustrative state-level competency report
Figure 23: Illustrative of a misconception in Language
Figure 24: Illustrative of a misconception in Mathematics
Figure 25: Illustrative image of Samarth Dashboard, Himachal Pradesh showing grade-wise performance across subjects and performance at the district level
Figure 26: Illustrative analysis showing di!erence in performance by gender
Figure 27: Illustrative analysis showing di!erence in results by category Figure 28: Timeline of assessment reforms and learning outcomes in Haryana
Figure 29: Communication from CMO on Saksham Ghoshna
Figure 30: Saksham Sammaan Samaroh celebrating success of the program
Figure 31: Illustrative image of competencies in Saksham Talika
Figure 32: Growth in learning outcomes from November 2017 to February 2018
Figure 33: No-Cheating Campaign conducted in Haryana
Figure 34: Timeline of assessments for Adarsh School Yojana
Figure 35: Example of student score distribution for Grade 3
Figure 36: Comparison of performance between Adarsh vs Non Adarsh and schools in Rajasthan 56
Figure 37: District wise performance in Rajasthan
Figure 38: Performance by Gender in Rajasthan
Figure 39: Example of what students at di!erent benchmarks know and do in addition
Figure 40: Learning outcomes by distric
Figure 41: Workbooks for remediation
Figure 42: Timeline of reform in Himachal Pradesh
Figure 43: How to use the ULOF?
Figure 44: ULOF for Grade 2 Math
Figure 45: Guidance document for LO-based assessment creation
Figure 46: Illustrative sheet used to record mapping of LOs for each question paper
Figure 47: E#Samwad app for data collection and illustration of data transfer to the app
Figure 48: Samarth data dashboard with data by learning outcomes
Figure 49: Communication of assessment data
Figure 50: Timeline of assessment-linked initiatives in Andhra
List of Figures
4
86
89
29
38
41
45
46
Table 1: Illustrative list of SLAS in India
Table 2: Illustrative rubric description for state self-evaluation framework
Table 3: Budget estimates for Saksham Haryana in 2019#20
Table 4: Di!erent groupings for assessment data communication 34
Table 5: Cost estimates for an assessment partner
List of Tables
90
90
91
92
93
95
109
111
15
17
39
00
87
87
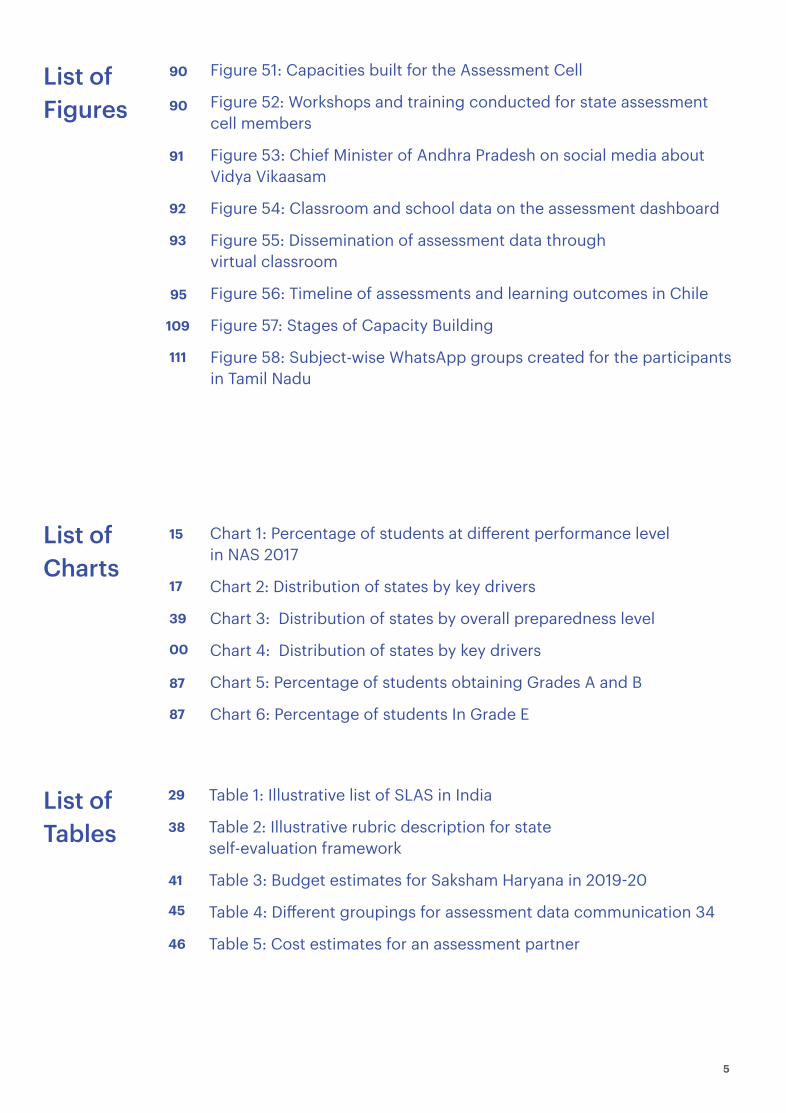
Figure 51: Capacities built for the Assessment Cell
Figure 52: Workshops and training conducted for state assessment cell members
Figure 53: Chief Minister of Andhra Pradesh on social media about Vidya Vikaasam
Figure 54: Classroom and school data on the assessment dashboard
Figure 55: Dissemination of assessment data through virtual classroom
Figure 56: Timeline of assessments and learning outcomes in Chile
Figure 57: Stages of Capacity Building
Figure 58: Subject-wise WhatsApp groups created for the participants in Tamil Nadu
Chart 1: Percentage of students at di!erent performance level in NAS 2017
Chart 2: Distribution of states by key drivers
Chart 3: Distribution of states by overall preparedness level
Chart 4: Distribution of states by key drivers
Chart 5: Percentage of students obtaining Grades A and B
Chart 6: Percentage of students In Grade E
List of Figures
List of Charts
5
Table 6: Saksham 1.0: blocks declared Saksham during di!erent rounds of assessment
Table 7: Saksham 2.0: Comparison of Saksham blocks in assessments conducted in September 2019 and February 2020
Table 8: Summary table of number of blocks that achieved Saksham by grade
Table 9: Sample of students assessed in Round 2$
Table 10: Snapshot: AP school system
Table 11: Number of students by management type covered in SLAS in AP

66
66
67
71
94
94
Table 1: Illustrative list of SLAS in India
Table 2: Illustrative rubric description for state self-evaluation framework
Table 3: Budget estimates for Saksham Haryana in 2019#20
Table 4: Di!erent groupings for assessment data communication 34
Table 5: Cost estimates for an assessment partner
List of Tables
6
Table 6: Saksham 1.0: blocks declared Saksham during di!erent rounds of assessment
Table 7: Saksham 2.0: Comparison of Saksham blocks in assessments conducted in September 2019 and February 2020
Table 8: Summary table of number of blocks that achieved Saksham by grade
Table 9: Sample of students assessed in Round 2$
Table 10: Snapshot: AP school system
Table 11: Number of students by management type covered in SLAS in AP

7
List of Abbreviations
AP Andhra Pradesh
BITE Block Institute of Teacher Education
CGI CG Insights
CRC Cluster Resource Coordinator
CSSL Centre for Science of Student Learning
CTT Classical Test Theory
EI Educational Initiatives
GMI Gray Matters India
IRT Item Response Theory
DIET District Institute for Education and Training
GoAP Government of Andhra Pradesh
HP Himachal Pradesh
LO Learning Outcome
LOF Learning Outcome Framework
MHRD Ministry of Human Resources Development
LSA Large-scale Assessment
NCERT National Council for Educational Research and Training
NEP National Education Policy
ASER Annual Status of Education Report
BRC Block Resource Coordinator
CMO Chief Minister’s O!ice
CRP Cluster Resource Person
NAS National Achievement Survey
NCF National Curriculum Framework

8
List of Abbreviations
PARAKH Performance assessment, review and analysis of knowledge for holistic development
SA Summative Assessment
SIQE State Initiative for Quality Education
ULOF Uni"ied Learning Outcome Framework
PISA Programme for International Student Assessment
SCERT State Council of Educational Research and Training
SLAS State Level Achievement Survey

As India moves towards meeting the UN’s sustainable development goals for quality education, and implementing the new National Education Policy (NEP 2020), assessment of learning outcomes will play a key role in determining our progress.
To shift the system from rote learning to higher order thinking, NEP 2020 ushers in many initiatives, such as assessment of higher order skills% ; board exam reforms; census state exams at end of grades 3, 5 and 8; sample-based national assessment surveys; census state assessment surveys; public disclosure of school performances; and capacity building programs for teachers on assessments. As the policy maker and the system tries to design and implement these assessment-related initiatives, it is important to acknowledge the strong relationship between the institutional capacity for assessment and its quality mechanism. Several Sarva Shiksha Abhiyan (SSA) joint review mission reports point out the gaps in the high levels of technical expertise required to design, conduct, analyze and use assessments. While there are a lot of high-stake tests in India, we do not have institutions that train for large-scale assessments. In such a scenario, it is a challenge for the states to successfully leverage the assessment mechanism to reach the desired learning outcomes.
The most common approach to assessments is usually on the number of passing candidates and their scores against what was learnt and how well they grasped concepts, leading us to an array of questions:
Are such assessments useful? Is it possible to design large-scale assessments that provide a clear picture of not only where we are but where we want to go? Can assessments lead to meaningful insights that can strengthen the teaching-learning process? How can assessments be used to improve learning outcomes for the learner? This collaborative report lays down a useful starting point for the policy makers and education administrators to understand the ’what’ and ‘how’ of large-scale assessments. It is an attempt to learn about some successful assessment-led initiatives leading to improved learning outcomes, and long term excellence in assessment capacity. The accompanying ‘self-evaluation’ framework is expected to support the states in conducting learning assessments that provide as actionable insights, which can be fed back into the education system to improve learning outcomes.
Foreword
Vyjayanthi Sankar, Founder and Executive Director, Centre for Science of Student Learning
9
& NEP aims to prepare our youth for the foundational skills of literacy and numeracy, and higher order cognitive, social and emotional skills.
Sridhar Rajagopalan, Co-Founder and Chief Learning O!icer-Educational Initiatives
The goal of an education system is not merely for children to attend school, but to learn holistically to thrive in the larger economy and society. The term Isomorphic Mimicry describes the phenomenon of an organism or system copying some of the external features of another organism or system without adopting the core underlying characteristics those external features are supposed to represent. In the context of education systems, practices like teachers receiving 10 days of training a year or computers being available in schools are meant to help achieve quality education, but often don’t get implemented in the way that they are meant. 'Rote' learning itself (in which children and teachers go through all the motions of teaching-learning but do not learn meaningfully) is the ultimate example of isomorphic mimicry. How can senior o'icials, parents or even concerned citizens know what is happening beneath these reassuring 'markers'?
The answer lies in large-scale assessments. When developed and executed well, they provide a low-cost and easy way of obtaining a true picture of how well a system is functioning. We call them "large scale” because they sample a large number of students or area and, thus, provide a reliable snapshot that cannot be easily manipulated. Large scale assessments can provide evidence to sharpen relevant educational policies and strategies.
At one level, this is a simple solution. In fact, it is why assessments like the Programme for International Student Assessments (PISA) or the Annual Status of Education Report (ASER) provide a remarkably reliable picture of learning and are not very expensive to conduct.
Yet there are some important prerequisites that are needed for large-scale assessments to truly work.
The "irst sounds tautological but is critical - the assessments themselves must be of good quality. The assessments must measure aspects of learning that are more important (like conceptual understanding and transferability of learning) as against recalling of facts and focus on narrow types of questions). What distinguishes an assessment providing insights from another is usually the quality of the questions in the assessment.
Creating high-quality questions and assessments is both an art and a science. Questions that identify learning gaps e!ectively often rely on the creativity of the question maker. Yet there is also a whole science that identi"ies the questions that have worked e!ectively and helps systematically identify learning gaps in di!erent groups of students. This assessment capacity needs to be built and developed in a system. Successive assessments build on past learning data and deep understanding of the learning ecosystem. Assessment capacity includes the ability of various stakeholders – notably teachers - to understand and interpret assessment results. NEP 2020 announces the creation of a national assessment center (PARAKH) to house this assessment capacity of large-scale assessments.
Finally, it is necessary that both learning and assessments in the larger educational system be focused on students’ understanding. For this to happen, a key pre-requisite is that school-leaving exams (Board Exams) are aligned to testing understanding and not recall. This challenge can be understood in the context of a test like PISA, which measures the ability to apply their knowledge and skills to meet real-life challenges.
Today, there are national initiatives for large-scale assessments, generation and consumption of education data, and the commitment to building assessment capacity at the national level. The NEP makes a strong case for assessment-led reform.
This publication details key principles of large-scale assessments and includes a number of cases from India and abroad. Initiatives like the World Bank-supported Strengthening Teaching-Learning and Results for States Program (STARS) programme are expected to give a new "illip to e!orts on Large Scale Assessment over the coming years. This is, therefore, a very timely publication on large-scale assessments and I hope it will be of use to the larger education community and help achieve quality learning for all students.
10
711
Large-scale assessments have an extraordinary power, more than any singular intervention to move the needle forward on the learning outcomes across an entire state. A well-designed assessment process can help a state focus on the right levers of change for maximizing impact rather than guessing on the right interventions to implement. In addition, ensuring dissemination of results to all stakeholders, combined with target setting and continuous monitoring of growth in learning can shift the learning outcomes of a state forward by leaps. We have seen this happen in Haryana and it is possible to replicate it in every state. The framework and toolkit presented in this report are created based on the immense learnings of successfully implemented large-scale assessments programs. They act as easy-to-use checklists that can help every state to rally the necessary resources and start a large-scale assessment program, without having to go through a steep learning curve.
The goal of an education system is not merely for children to attend school, but to learn holistically to thrive in the larger economy and society. The term Isomorphic Mimicry describes the phenomenon of an organism or system copying some of the external features of another organism or system without adopting the core underlying characteristics those external features are supposed to represent. In the context of education systems, practices like teachers receiving 10 days of training a year or computers being available in schools are meant to help achieve quality education, but often don’t get implemented in the way that they are meant. 'Rote' learning itself (in which children and teachers go through all the motions of teaching-learning but do not learn meaningfully) is the ultimate example of isomorphic mimicry. How can senior o'icials, parents or even concerned citizens know what is happening beneath these reassuring 'markers'?
The answer lies in large-scale assessments. When developed and executed well, they provide a low-cost and easy way of obtaining a true picture of how well a system is functioning. We call them "large scale” because they sample a large number of students or area and, thus, provide a reliable snapshot that cannot be easily manipulated. Large scale assessments can provide evidence to sharpen relevant educational policies and strategies.
At one level, this is a simple solution. In fact, it is why assessments like the Programme for International Student Assessments (PISA) or the Annual Status of Education Report (ASER) provide a remarkably reliable picture of learning and are not very expensive to conduct.
Yet there are some important prerequisites that are needed for large-scale assessments to truly work.
The "irst sounds tautological but is critical - the assessments themselves must be of good quality. The assessments must measure aspects of learning that are more important (like conceptual understanding and transferability of learning) as against recalling of facts and focus on narrow types of questions). What distinguishes an assessment providing insights from another is usually the quality of the questions in the assessment.
Creating high-quality questions and assessments is both an art and a science. Questions that identify learning gaps e!ectively often rely on the creativity of the question maker. Yet there is also a whole science that identi"ies the questions that have worked e!ectively and helps systematically identify learning gaps in di!erent groups of students. This assessment capacity needs to be built and developed in a system. Successive assessments build on past learning data and deep understanding of the learning ecosystem. Assessment capacity includes the ability of various stakeholders – notably teachers - to understand and interpret assessment results. NEP 2020 announces the creation of a national assessment center (PARAKH) to house this assessment capacity of large-scale assessments.
Finally, it is necessary that both learning and assessments in the larger educational system be focused on students’ understanding. For this to happen, a key pre-requisite is that school-leaving exams (Board Exams) are aligned to testing understanding and not recall. This challenge can be understood in the context of a test like PISA, which measures the ability to apply their knowledge and skills to meet real-life challenges.
Today, there are national initiatives for large-scale assessments, generation and consumption of education data, and the commitment to building assessment capacity at the national level. The NEP makes a strong case for assessment-led reform.
This publication details key principles of large-scale assessments and includes a number of cases from India and abroad. Initiatives like the World Bank-supported Strengthening Teaching-Learning and Results for States Program (STARS) programme are expected to give a new "illip to e!orts on Large Scale Assessment over the coming years. This is, therefore, a very timely publication on large-scale assessments and I hope it will be of use to the larger education community and help achieve quality learning for all students.
Sowmya Velayudham , Advisory Consultant, ConveGenius Insights
Introduction
Authors
Centre for Science of Student Learning
ConveGenius Insights (CGI)
This report is co-authored by India’s three premier assessment agencies - Centre for Science of Student learning, CG Insights, and Educational Initiatives alongside Michael & Susan Dell Foundation and Central Square Foundation. The report was compiled by KPMG Advisory Services Private Limited.
Centre for Science of Student Learning (CSSL) is a research-based educational organisation working towards quality improvement in schools and school systems. Their mission is to build capacity for high-quality assessments and research into the science of student learning. CSSL works with the Ministry of Human Resource Development (MHRD), Govt of India (as a technical advisor to develop learning outcome indicators and to improve national and state learning achievement surveys), NITI Aayog, and several state governments in projects related to measuring student learning outcomes, technical support for achievement surveys, school certi"ication programs, teacher assessments and in setting up assessment cells. CSSL regularly partners with the World Bank, UNICEF, UNESCO, Dell Foundation, Tata Trusts, Central Square Foundation (CSF), ICICI Bank, and several NGOs and with organizations for corporate social responsibility initiatives.
CSSL’s assessment cell is the only assessment capacity-building course program recognized by MHRD in 2017 for a scale up across di!erent states through its regional workshops.
ConveGenius Insights (CGI, formerly known as Gray Matters India) believes in the power of data and assessments to unlock the potential of millions of children and make them future-ready. Over the last six years, CGI has adopted a highly nimble approach to understanding the education sector and developed contextualized and customized solutions that bridge the gaps in the Indian assessments space. It is one of the fastest growing assessments company in the country. In the last two years, CGI has collected a few billion data points from learning and assessments data of over 10 million children and worked with about 16 state governments to identify learning gaps from students all over the country. Some of these states include Himachal Pradesh, Madhya Pradesh, Uttar Pradesh, Rajasthan, and Gujarat.
The organization has pioneered models to develop modern measurement techniques in education that are actionable on the ground and contextualized to the diversity of India. From conducting parent surveys to actively seeking client feedback, it is committed to raising standards for education data and customer service.
With a deep focus on functional technology CGI plans to tap on to the growing number of smart phones in the country to create meaningful learning "ingerprints of every child to reduce learning gaps. They have administered over two million (2,000,000+) assessments for over 50 interventions across 15,000 schools in 18 Indian states.
12
Educational Initiatives
Central Square Foundation (CSF)
ConveGenius Insights (CGI, formerly known as Gray Matters India) believes in the power of data and assessments to unlock the potential of millions of children and make them future-ready. Over the last six years, CGI has adopted a highly nimble approach to understanding the education sector and developed contextualized and customized solutions that bridge the gaps in the Indian assessments space. It is one of the fastest growing assessments company in the country. In the last two years, CGI has collected a few billion data points from learning and assessments data of over 10 million children and worked with about 16 state governments to identify learning gaps from students all over the country. Some of these states include Himachal Pradesh, Madhya Pradesh, Uttar Pradesh, Rajasthan, and Gujarat.
The organization has pioneered models to develop modern measurement techniques in education that are actionable on the ground and contextualized to the diversity of India. From conducting parent surveys to actively seeking client feedback, it is committed to raising standards for education data and customer service.
With a deep focus on functional technology CGI plans to tap on to the growing number of smart phones in the country to create meaningful learning "ingerprints of every child to reduce learning gaps. They have administered over two million (2,000,000+) assessments for over 50 interventions across 15,000 schools in 18 Indian states.
Founded in 2001, Educational Initiatives Private Limited (EI), is India’s leading assessment research and educational technology organization, working with the vision to create “a world where children everywhere are learning with understanding”. EI regularly conducts large scale assessments both in government and private schools while its education technology learning programme, Mindspark is used across India, by over 300k students.
Over the past two decades, EI has undertaken over 100+ projects with 50+ government and civil society partners (16+ languages, 40+ detailed studies published) across geographies, socio-linguistic backgrounds in India and abroad, for more than 10 million students across di!erent grades.
EI has o'ices in Bangalore and Ahmedabad in India, with 400+ sta! members specializing on di!erent aspects of assessments, technology, training and project management. The top executives at EI serve/have served as advisors on boards of several educational commitees for State and Central Government of India.
Central Square Foundation is a non-pro"it organization working with the vision of ensuring quality school education for all children in India. They are driven by their mission to transform the school education system by improving the learning outcomes of children, especially from low-income communities. By building an e!ective and inclusive education system, CSF ensures that all children get equal access to opportunities needed for leading a better life.
To achieve their goal, CSF works with the government to execute scalable, sustainable projects. They also collaborate with other ecosystem stakeholders to build public goods and create e!ective proven tools around critical issues such as early learning, technology in education, classroom instruction methods and school innovations.
13
KPMG Advisory Services Private Limited
Michael & Susan Dell Foundation
KPMG in India’s dedicated education practice is part of a global network of education practices across 15+ countries. In India, the team is comprised of 100+ professionals working on education and skill development. The practice has provided cutting-edge solutions to the vast and challenging problems faced by clients through 500+ engagements in the education sector. They have built our presence in the education and skilling ecosystem through our work with key nodal agencies, central and state government departments, as well as donor organizations. KPMG deploys multi-domain and cross functional expertise across teams to inform strategy development, planning, program management, due diligence, monitoring and evaluation, impact assessment in the education sector. They have demonstrated experience of handling large scale projects and driving end to end systemic transformation for central and state governments, in order to enhance the e!ectiveness of public-school education.
The Michael & Susan Dell Foundation in India is focused on enabling children and youth in aspirational India to reach their goals through quality education and employment opportunities. This focus is driven by investments in education; jobs and livelihood; and "inancial inclusion. With over USD200 million in investments over the past 14 years, the foundation has impacted the lives of over 12 million children and families in the country.
14
This report would not have been possible without the valuable contributions of numerous people and institutions. We would like to acknowledge this support and thank them for their time and e!ort.In writing this report, the following people have been invaluable:
Acknowledgements
Boston Consulting Group: Ruchita Brajabasi
Centre for Science of Student Learning: Vyjayanthi Sankar
KPMG Advisory Services Private Limited:Kavita RajagopalanNarayanan RamaswamyNeha RajpalPoornima KharbandaTejaswini Mani
Educational Initiatives:Nishchal ShuklaPranav KothariRaghav RohatgiSridhar Rajagopalan
CG Insights: Sandeep KavetyShikhar GuptaSowmya Velayudham
Central Square Foundation: Aditi Nangia Bikkrama Daulet Singh Prakhar SinghRahul AhluwaliaRuchika Singh
Samagra Governance: Ankur BansalMohit BahriPragya Mathur
Michael & Susan Dell Foundation: Amrit AhujaPrachi Jain WindlassSamar BajajSharvi Dublish
15
Executive Summary
The National Education Policy 2020 (NEP) prioritizes assessments as a critical tool for improving quality of education. The focus on competency-linked assessments and regular monitoring through key stage exams can accelerate India’s growth in learning outcomes. When done well, large-scale assessments (LSAs)4 can be used as diagnostic tools to improve grade level competency by:
guiding curriculum development improving instruction quality enabling e!ective resource allocation5
establishing a marker for system level performance
As of 2016#17, 27 states in India were conducting sample or census-based assessments6. However, only a few of the assessments provided actionable insights. Most states do not have the required infrastructure, governance, or technical capacity to design and implement e!ective LSAs.This report outlines a self-evaluation framework for states that can be used to:
determine readiness to conduct e!ective LSAs identify and bridge gaps in capacity rationalize existing assessments
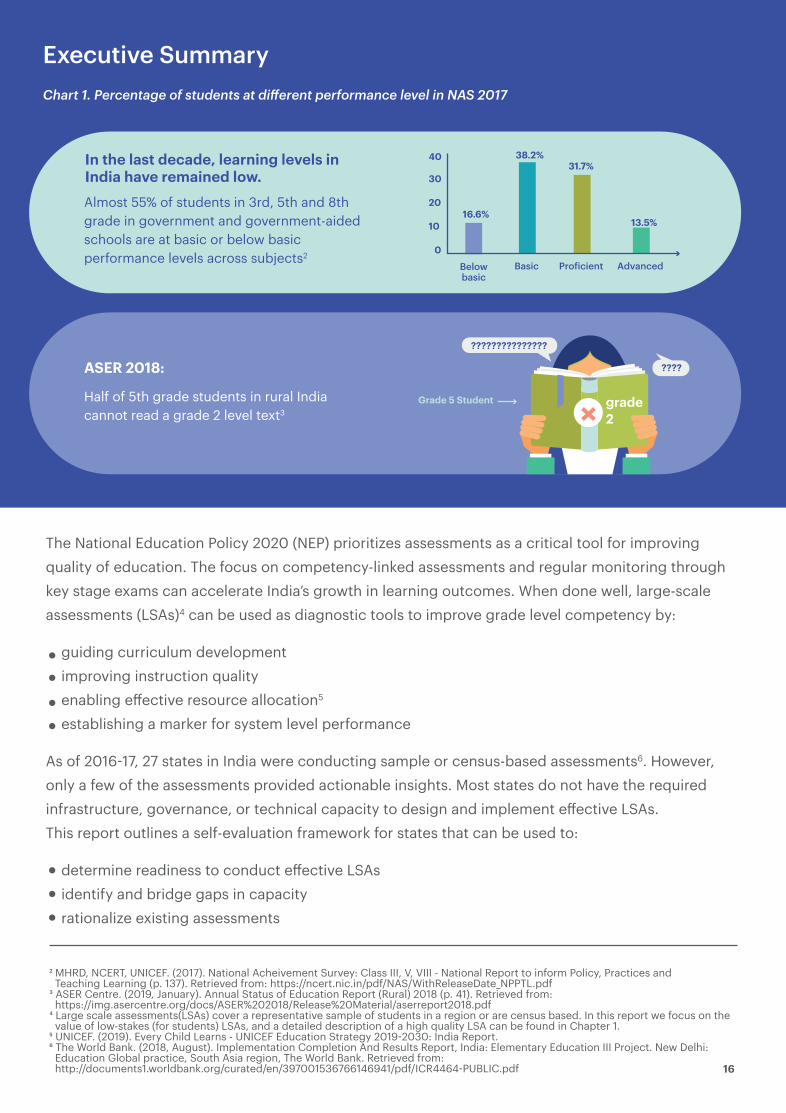
Chart 1. Percentage of students at di!erent performance level in NAS 2017
Almost 55% of students in 3rd, 5th and 8th grade in government and government-aided schools are at basic or below basic performance levels across subjects2
ASER 2018:
Half of 5th grade students in rural India cannot read a grade 2 level text3
( MHRD, NCERT, UNICEF. (2017). National Acheivement Survey: Class III, V, VIII - National Report to inform Policy, Practices and Teaching Learning (p. 137). Retrieved from: https://ncert.nic.in/pdf/NAS/WithReleaseDate_NPPTL.pdf) ASER Centre. (2019, January). Annual Status of Education Report (Rural) 2018 (p. 41). Retrieved from: https://img.asercentre.org/docs/ASER%202018/Release%20Material/aserreport2018.pdf* Large scale assessments(LSAs) cover a representative sample of students in a region or are census based. In this report we focus on the value of low-stakes (for students) LSAs, and a detailed description of a high quality LSA can be found in Chapter 1.+ UNICEF. (2019). Every Child Learns - UNICEF Education Strategy 2019#2030: India Report., The World Bank. (2018, August). Implementation Completion And Results Report, India: Elementary Education III Project. New Delhi: Education Global practice, South Asia region, The World Bank. Retrieved from: http://documents1.worldbank.org/curated/en/397001536766146941/pdf/ICR4464#PUBLIC.pdf 16
grade 2
???????????????
Grade 5 Student
????
0
40
30
20
10
31.7%
Pro!icient
38.2%
Basic
16.6%
Below basic
Advanced
13.5%
In the last decade, learning levels in India have remained low.
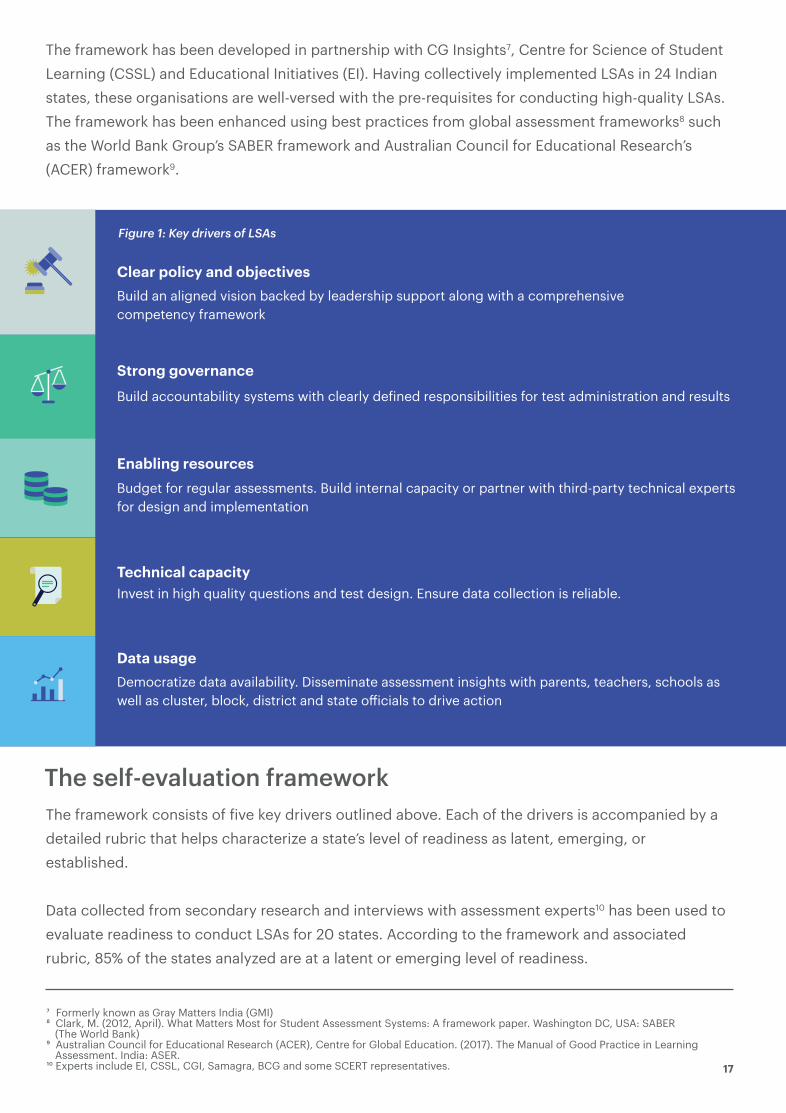
The framework has been developed in partnership with CG Insights7, Centre for Science of Student Learning (CSSL) and Educational Initiatives (EI). Having collectively implemented LSAs in 24 Indian states, these organisations are well-versed with the pre-requisites for conducting high-quality LSAs. The framework has been enhanced using best practices from global assessment frameworks8 such as the World Bank Group’s SABER framework and Australian Council for Educational Research’s (ACER) framework9.
The framework consists of "ive key drivers outlined above. Each of the drivers is accompanied by a detailed rubric that helps characterize a state’s level of readiness as latent, emerging, or established.
Data collected from secondary research and interviews with assessment experts10 has been used to evaluate readiness to conduct LSAs for 20 states. According to the framework and associated rubric, 85% of the states analyzed are at a latent or emerging level of readiness.
The self-evaluation framework
Strong governance
Enabling resources
Technical capacity
Build an aligned vision backed by leadership support along with a comprehensive competency framework
Build accountability systems with clearly de"ined responsibilities for test administration and results
Budget for regular assessments. Build internal capacity or partner with third-party technical experts for design and implementation
Invest in high quality questions and test design. Ensure data collection is reliable.
Democratize data availability. Disseminate assessment insights with parents, teachers, schools as well as cluster, block, district and state o'icials to drive action
Clear policy and objectives
Data usage
- Formerly known as Gray Matters India (GMI). Clark, M. (2012, April). What Matters Most for Student Assessment Systems: A framework paper. Washington DC, USA: SABER (The World Bank)/ Australian Council for Educational Research (ACER), Centre for Global Education. (2017). The Manual of Good Practice in Learning Assessment. India: ASER.&0 Experts include EI, CSSL, CGI, Samagra, BCG and some SCERT representatives. 17
Figure 1: Key drivers of LSAs

Latent Emerging Established
6 8 6
10 8 2
10 5 5
11 5 4
20% 40% 60% 80% 100%
14 3 3
0%
Clear policy and objectives
Strong governance
Enabling resources
Technical capacity
Data usage
An Implementation toolkit has been created to guide states endeavouring to conduct high-quality LSAs. Key recommendations are outlined below:
The Implementation Toolkit
Buy in for LSAs is required all the way from state leadership to the school level.Learning objectives should be clearly de"ined for each grade and subject.
Clear policy and objectives
Strong governance
Enabling resources
Accountability systems with clearly de"ined responsibilities for test administration and results should be established.
Adequate funding should be allocated to cover all aspects of LSAs including design, administration, analysis, reporting, and dissemination.Experienced resources are required for the implementation of LSAs to help build systemic capacity.
18
Chart 2. Distribution of states by key drivers
Technical capacityQuestions should distinguish between rote and conceptual learning and identify misconceptons. Test instruments should be built from a blueprint designed to meet assessment objectives; new test instruments should be piloted on small samples "irst.Assessments should be designed to allow comparison over time and states must put in place strategies to ensure data reliability and representative coverage of students.
Data usageInsightful data analysis coupled with e!ective dissemination is an intrinsic part of an LSA.Relevant analysis includes growth in learning outcomes over time, bucketing students by pro"iciency levels, identifying areas of strength and weakness, and performing misconception analysis.
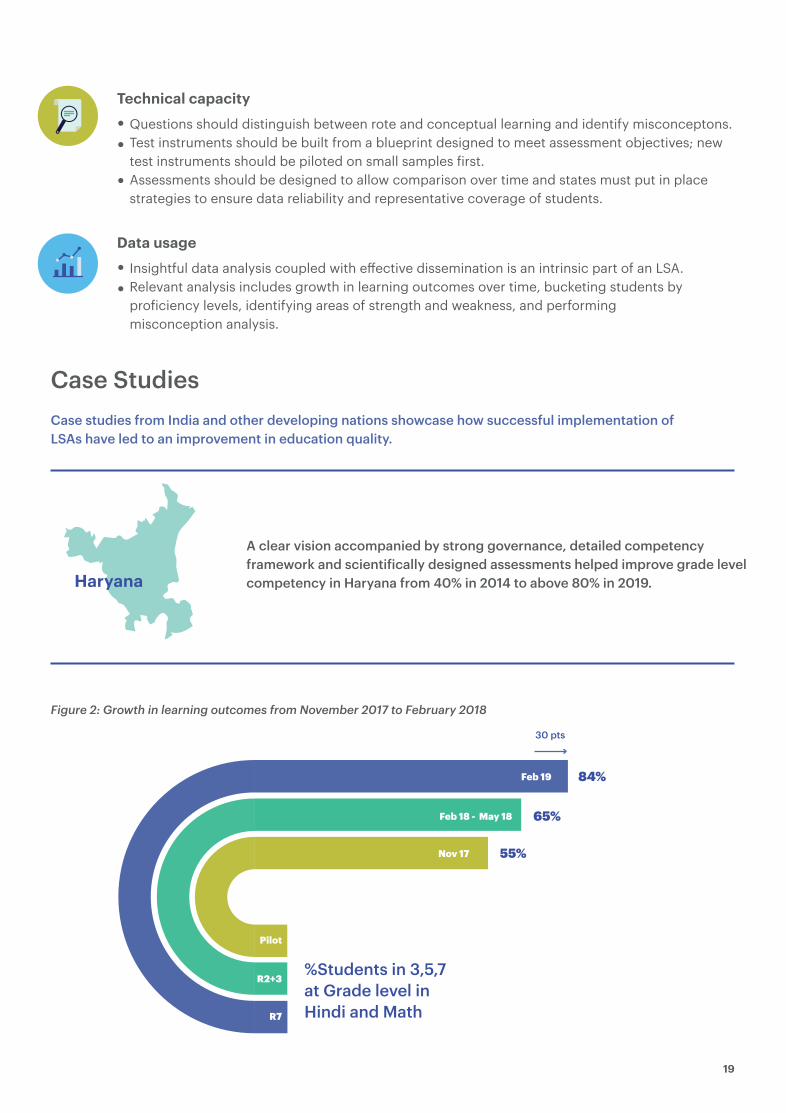
A clear vision accompanied by strong governance, detailed competency framework and scienti!ically designed assessments helped improve grade level competency in Haryana from 40% in 2014 to above 80% in 2019.
Case studies from India and other developing nations showcase how successful implementation of LSAs have led to an improvement in education quality.
Haryana
Figure 2: Growth in learning outcomes from November 2017 to February 2018
%Students in 3,5,7 at Grade level in Hindi and Math
84%
30 pts
65%
55%Nov 17
Feb 18 - May 18
Feb 19
Pilot
R2+3
R7
19
Case Studies
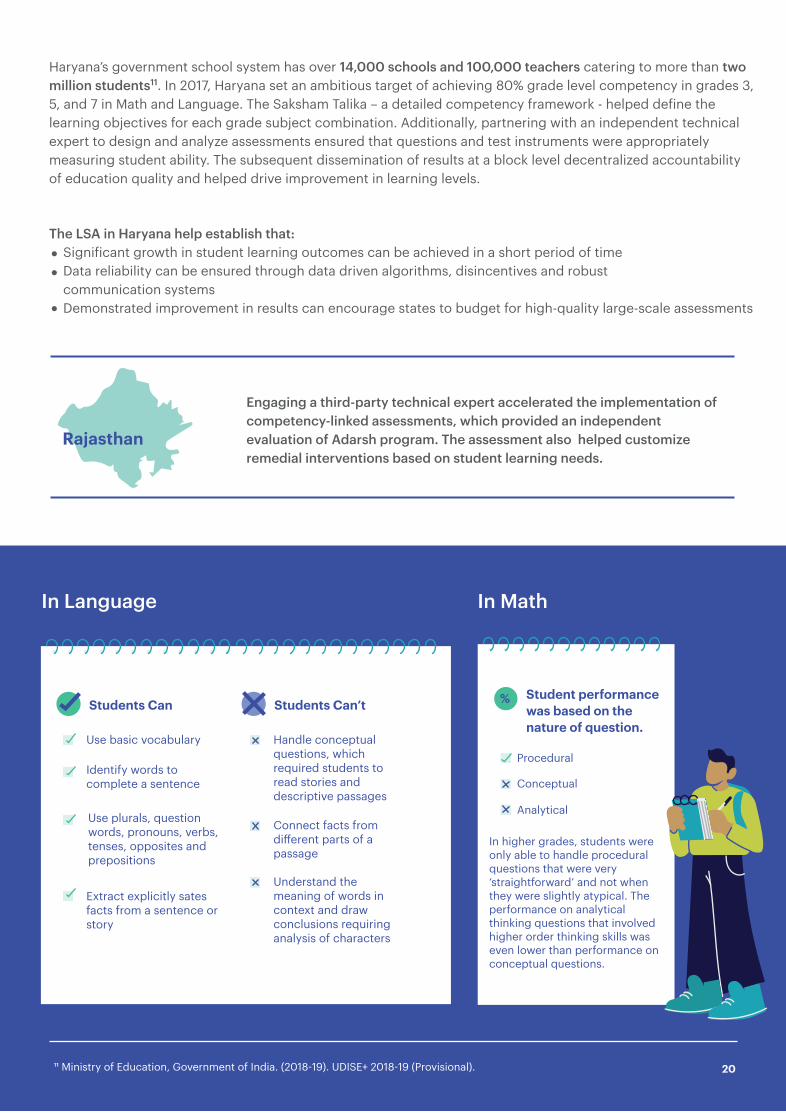
In Language In Math
Identify words to complete a sentence
Use basic vocabulary
Use plurals, question words, pronouns, verbs, tenses, opposites and prepositions
Extract explicitly sates facts from a sentence or story
Students Can
Handle conceptual questions, which required students to read stories and descriptive passages
Connect facts from di!erent parts of a passage
Understand the meaning of words in context and draw conclusions requiring analysis of characters
Students Can’tStudent performance was based on the nature of question.
Procedural
Conceptual
Analytical
In higher grades, students were only able to handle procedural questions that were very ‘straightforward’ and not when they were slightly atypical. The performance on analytical thinking questions that involved higher order thinking skills was even lower than performance on conceptual questions.
%
The LSA in Haryana help establish that: Signi"icant growth in student learning outcomes can be achieved in a short period of time Data reliability can be ensured through data driven algorithms, disincentives and robust communication systems Demonstrated improvement in results can encourage states to budget for high-quality large-scale assessments
Haryana’s government school system has over 14,000 schools and 100,000 teachers catering to more than two million students11. In 2017, Haryana set an ambitious target of achieving 80% grade level competency in grades 3, 5, and 7 in Math and Language. The Saksham Talika – a detailed competency framework - helped de"ine the learning objectives for each grade subject combination. Additionally, partnering with an independent technical expert to design and analyze assessments ensured that questions and test instruments were appropriately measuring student ability. The subsequent dissemination of results at a block level decentralized accountability of education quality and helped drive improvement in learning levels.
Engaging a third-party technical expert accelerated the implementation of competency-linked assessments, which provided an independent evaluation of Adarsh program. The assessment also helped customize remedial interventions based on student learning needs.
Rajasthan
20&& Ministry of Education, Government of India. (2018#19). UDISE+ 2018#19 (Provisional).
In 2015, Government of Rajasthan launched Adarsh School Yojna along with State Initiative for Quality Education (SIQE) to improve learning levels. A year later, the Rajashtan Madhyamik Shiksha Abhiyan (RMSA) decided to commission an independent evaluation of the programs and thereby determine impact on learning outcomes. Close to 34,000 3rd, 5th and 8th grade students were assessed.
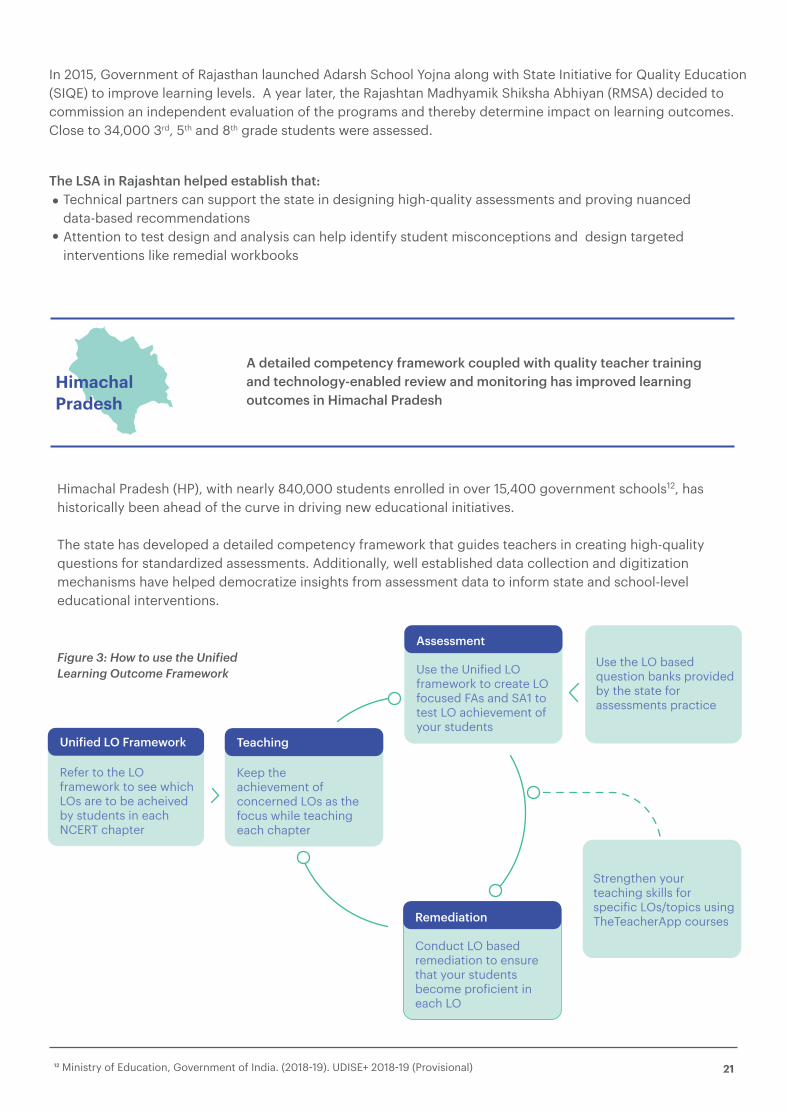
A detailed competency framework coupled with quality teacher training and technology-enabled review and monitoring has improved learning outcomes in Himachal Pradesh
The LSA in Rajashtan helped establish that: Technical partners can support the state in designing high-quality assessments and proving nuanced data-based recommendations Attention to test design and analysis can help identify student misconceptions and design targeted interventions like remedial workbooks
HimachalPradesh
Himachal Pradesh (HP), with nearly 840,000 students enrolled in over 15,400 government schools12, has historically been ahead of the curve in driving new educational initiatives.
The state has developed a detailed competency framework that guides teachers in creating high-quality questions for standardized assessments. Additionally, well established data collection and digitization mechanisms have helped democratize insights from assessment data to inform state and school-level educational interventions.
Figure 3: How to use the Uni"ied Learning Outcome Framework
Conduct LO basedremediation to ensurethat your studentsbecome pro"icient ineach LO
Strengthen yourteaching skills forspeci"ic LOs/topics usingTheTeacherApp courses
Refer to the LOframework to see whichLOs are to be acheived by students in eachNCERT chapter
Use the Uni"ied LO framework to create LOfocused FAs and SA1 totest LO achievement of your students
Use the LO basedquestion banks providedby the state for assessments practice
Keep theachievement ofconcerned LOs as thefocus while teachingeach chapter
Uni!ied LO Framework
Assessment
Remediation
Teaching
21&( Ministry of Education, Government of India. (2018#19). UDISE+ 2018#19 (Provisional)
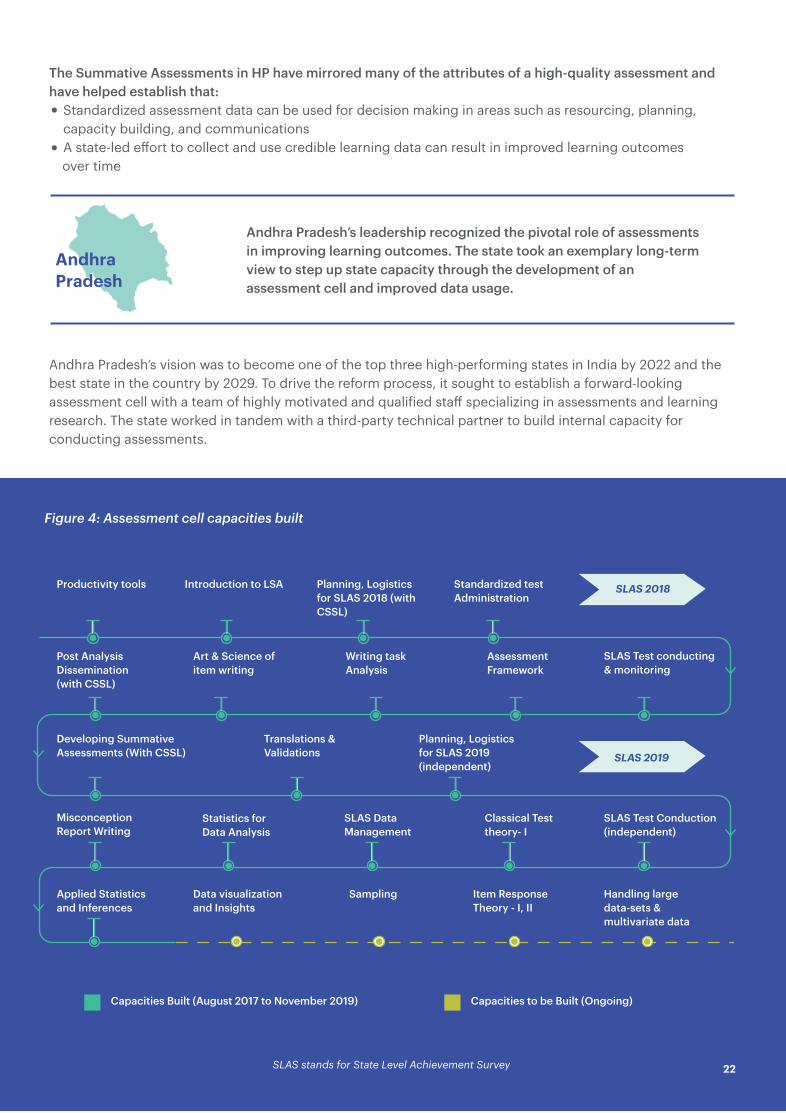
Andhra Pradesh’s vision was to become one of the top three high!performing states in India by 2022 and the best state in the country by 2029. To drive the reform process, it sought to establish a forward!looking assessment cell with a team of highly motivated and quali"ied sta! specializing in assessments and learning research. The state worked in tandem with a third-party technical partner to build internal capacity for conducting assessments.
The Summative Assessments in HP have mirrored many of the attributes of a high-quality assessment and have helped establish that: Standardized assessment data can be used for decision making in areas such as resourcing, planning, capacity building, and communications A state-led e!ort to collect and use credible learning data can result in improved learning outcomes over time
Andhra Pradesh’s leadership recognized the pivotal role of assessments in improving learning outcomes. The state took an exemplary long-term view to step up state capacity through the development of an assessment cell and improved data usage.
AndhraPradesh
SLAS stands for State Level Achievement Survey 22
Figure 4: Assessment cell capacities built
Productivity tools Standardized test Administration
Assessment Framework
SLAS Test conducting & monitoring
Writing task Analysis
Introduction to LSA Planning, Logistics for SLAS 2018 (with CSSL)
Art & Science of item writing
Developing Summative Assessments (With CSSL)
Translations & Validations
Classical Test theory- I
Statistics for Data Analysis
Applied Statistics and Inferences
Sampling Item Response Theory - I, II
Post Analysis Dissemination (with CSSL)
Planning, Logistics for SLAS 2019 (independent)
SLAS Test Conduction (independent)
SLAS Data Management
MisconceptionReport Writing
Data visualization and Insights
Handling large data-sets & multivariate data
SLAS 2019
Capacities Built (August 2017 to November 2019) Capacities to be Built (Ongoing)
SLAS 2018
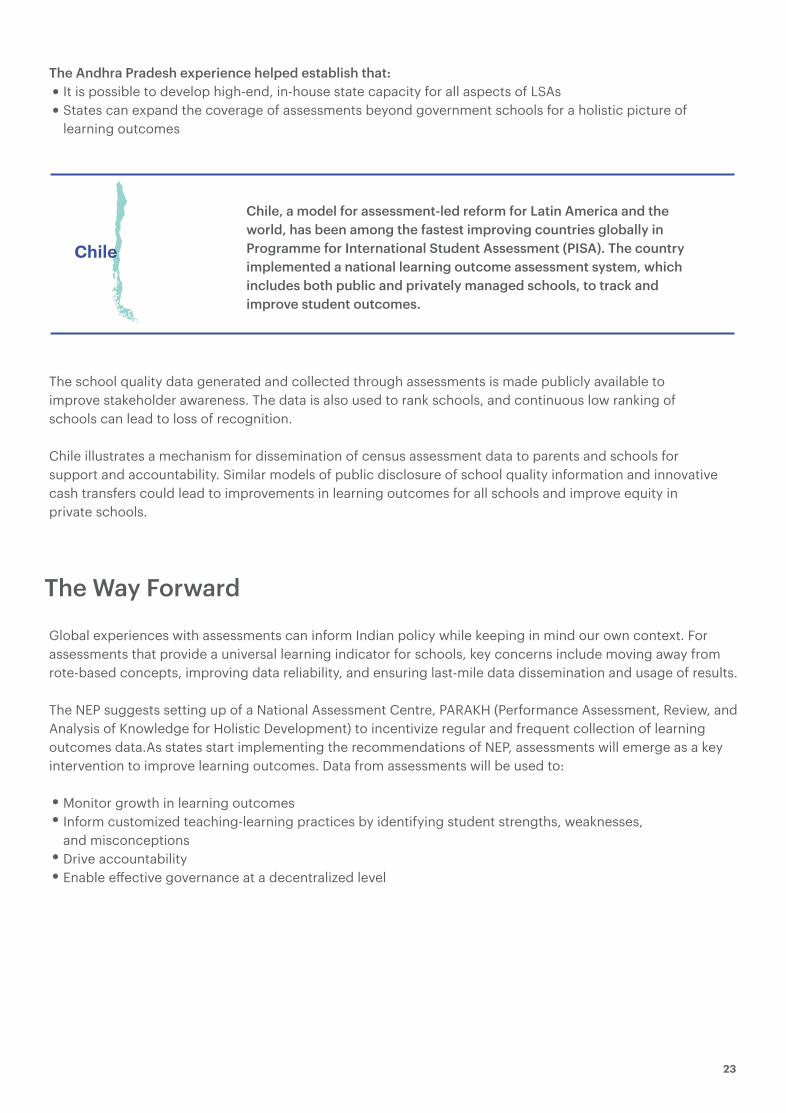
The school quality data generated and collected through assessments is made publicly available to improve stakeholder awareness. The data is also used to rank schools, and continuous low ranking of schools can lead to loss of recognition.
Chile illustrates a mechanism for dissemination of census assessment data to parents and schools for support and accountability. Similar models of public disclosure of school quality information and innovative cash transfers could lead to improvements in learning outcomes for all schools and improve equity in private schools.
Global experiences with assessments can inform Indian policy while keeping in mind our own context. For assessments that provide a universal learning indicator for schools, key concerns include moving away from rote-based concepts, improving data reliability, and ensuring last-mile data dissemination and usage of results. The NEP suggests setting up of a National Assessment Centre, PARAKH (Performance Assessment, Review, and Analysis of Knowledge for Holistic Development) to incentivize regular and frequent collection of learning outcomes data.As states start implementing the recommendations of NEP, assessments will emerge as a key intervention to improve learning outcomes. Data from assessments will be used to:
Monitor growth in learning outcomes Inform customized teaching-learning practices by identifying student strengths, weaknesses, and misconceptions Drive accountability Enable e!ective governance at a decentralized level
The Andhra Pradesh experience helped establish that: It is possible to develop high-end, in-house state capacity for all aspects of LSAs States can expand the coverage of assessments beyond government schools for a holistic picture of learning outcomes
Chile, a model for assessment-led reform for Latin America and the world, has been among the fastest improving countries globally in Programme for International Student Assessment (PISA). The country implemented a national learning outcome assessment system, which includes both public and privately managed schools, to track and improve student outcomes.
Chile
The Way Forward
23
This report has been developed to assist stakeholders who intend to conduct state-level LSAs. It is an attempt to consolidate best practices from states as well as leading assessment organisations to develop the following:
State self-evaluation framework: Developed with the intent to help states assess their current preparedness for conducting a high-quality LSA.
Implementation toolkit: This toolkit is intended to guide states in setting up and implementing high-quality LSAs. It brings together the best practices adopted across the country. Case studies: Learnings from successful implementations of LSAs across states in India and other developing countries.
This report is an e!ort to add to the evolving evidence base for LSAs. It has been authored with the intent to drive improvement in quality of school education in India.
24

The needfor large-scaleassessmentsin India
CHAPTER 1
%

!" Ministry of Education, Government of India. (2018#19). UDISE+ 2018#19 (Provisional). Retrieved from http://dashboard.udiseplus.gov.in/#!/!$ ASER Centre. (2019, January). Annual Status of Education Report (Rural) 2018. Retrieved from: https://img.asercentre.org/docs/ASER%202018/Release%20Material/aserreport2018.pdf!% MHRD, NCERT, UNICEF. (2017). Retrieved from National Achievement Survey: Class III, V, VIII - National Report to inform Policy, Practices and Teaching Learning: Retrieved from: https://ncert.nic.in/pdf/NAS/WithReleaseDate_NPPTL.pdf
1.1 Learning outcomes in India are lagging behind
The Indian education system is home to nearly 248 million students enrolled in 1.55 million schools. In the last decade, signi&icant strides have been made to improve access to and equity in education!". However, India has not seen corresponding advancement in learning outcomes (Figure 5)!" !$ !%
ACCESS
LEARNING OUTCOMES
Figure 5. Key Performance Indicators in Education
Gross enrollment ratio(Grades 1#8), UDISE+ 2018#1991.6%
25
8th graders can perform division ASER 2018
5th graders can read a Grade 2 Text, ASER 2018
5th graders can perform simple division, ASER 2018
students at basic or below basic performance level across subjects in grades 3,5 and 8, NAS 2017
8th graders can read a Grade 2 text, ASER 2018
55% 73% 28%44%50%
, ,

1.2 Large-scale assessments can play a crucial role in improving the quality of learning by providing system-level insights
A 2018 World Bank report identi&ies LSAs assessments as an important tool for realising education’s promise. According to the report, “national and subnational learning assessments provide system-level insights that are essential for guiding an education system.” !' In India, where children are on average two grades below grade-level pro&iciency!(, scienti&ically designed and well-administered LSAs can be used as diagnostic tools to guide curriculum development, design teacher training, improve instruction quality and allocate resources.!) It is essential to recognise that the ultimate purpose of LSAs is to provide data that can help improve the overall quality of learning. Examples of states that have used LSA data well for system-level improvements are shown below in Figure 6.
Haryana Saksham Ghoshna80% students at grade level in 2019 compared with 40% in 2014
Common misconception analysis conducted in Rajasthan to bridge gaps in pedagogy across grades and subjects
Adarsh Program evaluation in Rajasthan provided district-wise results, allowing for the design of customized remedial workbooks
Requests for funding through Project Approval Boards (PAB) for remedial programs in Himachal Pradesh have been supported with assessment data
Figure 6. Use of LSA Data for system level improvements*+
Stronger governance & accountability
Improved pedagogy
Customized intervention design
Data-based budgeting
Haryana
Rajasthan
Rajasthan
HimachalPradesh
!, World Bank Group. (2018). Learning to Realize Education’s Promise (p. 18). Retrieved from: https://www.worldbank.org/en/publication/wdr2018!' World Bank Group. (2018). Learning to Realize Education’s Promise (p. 19). Retrieved from: https://www.worldbank.org/en/publication/wdr2018!( Bhattacharjea, Wadhwa, Banerji 2011 !) UNICEF. (2019). Every Child Learns - UNICEF Education Strategy 2019!2030: India Report*+ Assessment question and data representation used with permission from CSSL 26

1.3 Several LSAs are conducted at the national and state level in India; few provide regular actionable insights on grade-level, competency-linked learning outcomesNot all assessments that are large-scale provide meaningful information. Vyjayanthi Sankar from Centre of Science for Student Learning (CSSL) takes an implementation-focused lens to de&ine a high-quality LSA, as summarised in Figure 7.
An overview of the types of large-scale assessments conducted in India is provided in Figure 8-.,--,-/
Figure 7. Features of a well-designed and analysed large-scale assessment
Based on grade-level competency framework
Standardised design, administration and data collection
Attention to high-quality test design and items
Measures representative sample of students or is census-based
Conducted over a regular frequency
Data is appropriately analyzed and fed back into the system
*! MHRD, NCERT, UNICEF. (2017). National Acheivement Survey: Class III, V, VIII - National Report to inform Policy, Practices and Teaching Learning (pp. 2#3). Retrieved from: https://ncert.nic.in/pdf/NAS/WithReleaseDate_NPPTL.pdf** ASER Centre. (2019, January). Annual Status of Education Report (Rural) 2018. Retrieved from: https://img.asercentre.org/docs/ASER%202018/Release%20Material/aserreport2018.pdf*" This is an overview of low stakes assessments for students across grades, and thus, does not include board exams.
Figure 8: Overview of LSAs in India
National Achievement Survey (NAS)
Competency-linkage: NAS has a grade-level competency-linked testing approach with de&ined Learning Outcomes (LO) up to the elementary stage.
Sampling: In 2017, sampling was done at the distrcit level.
Standard Administration: Students across Grades 3, 5 and 8 were assessed on a single day.
Frequency: NAS is only conducted once every three years.
Overview: NAS is a central government-led large-scale assessment that provides a ‘snapshot of what students know and can do’ at the end of Grades 3, 5, 8 and 10.
27

SLAs present an excellent opportunity to improve learning outcomes. As of 2016#17, twenty-seven states in India have conducted sample or census-based assessments periodically-0. Table 1 shows an illustrative list of SLAS conducted across India.
Data analysis: In 2017, results were reported within the same academic session with a focus on student attainment against LOS.
Data usage: There is limited usage of NAS data at the state level in decision making and interventions.
Competency-linkage: The assessment focuses on measuring basic numeracy and literacy through a one-on-one assessment. While the data provides directional insight on foundational learning at the national level, it cannot be the sole source of learning outcomes data as it doesn’t cover urban areas and grade level competencies.
Sampling: ASER is a household survey that covers a representative sample of children (between 3 and 16 years) across rural India.
Frequency: ASER was conducted annually from 2005 – 2014. Since 2016, the ‘basic’ ASER is conducted every two years.
Overview: ASER is one of the largest and most cited LSAs in India.
Competency-linkage: Varies by state –some states such as Haryana, Rajasthan, Himachal Pradesh, Andhra Pradesh use competency frameworks to design assessments.
Data analysis and usage: Few state-level assessments capture data at the level of rigor, disaggregation and frequency required for e1ective utilization. In addition, there has been limited meaningful analysis carried out.
Overview: Several states have recognized the need for assessments that are closely aligned to the state’s curriculum and intended learning outcomes. As of 2016!17, twenty-seven states and union territories were conducting their own SLAS.
State Level Achievement Survey (SLAS)
Annual Status of Education Report (ASER)
*$ The World Bank. (2018, August). Implementation Completion And Results Report, India: Elementary Education III Project. New Delhi: Education Global practice, South Asia region, The World Bank. Retrieved from: http://documents1.worldbank.org/curated/en/397001536766146941/pdf/ICR4464#PUBLIC.pdf
28
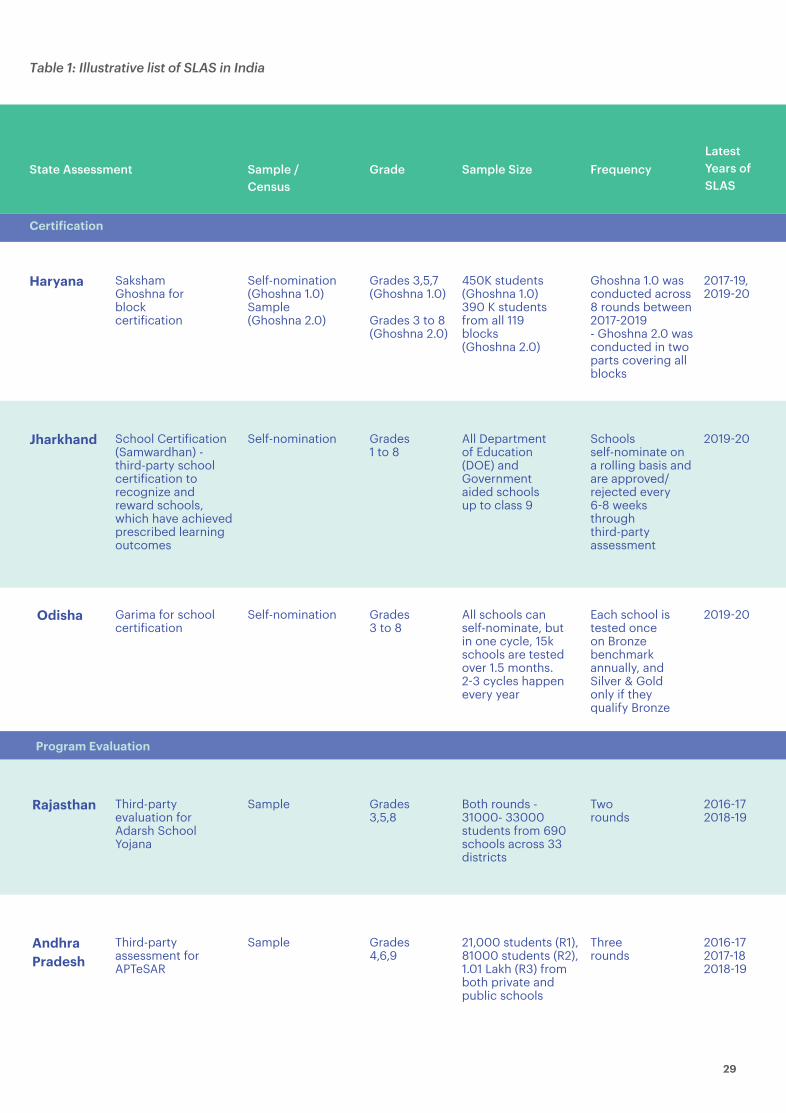
State Assessment Sample / Census
Grade Sample Size FrequencyLatest Years of SLAS
Saksham Ghoshna for block certi&ication
Self-nomination (Ghoshna 1.0)Sample (Ghoshna 2.0)
Grades 3,5,7(Ghoshna 1.0)
Grades 3 to 8 (Ghoshna 2.0)
Ghoshna 1.0 was conducted across 8 rounds between 2017#2019- Ghoshna 2.0 was conducted in two parts covering all blocks
2017#19, 2019#20
2019#20
2019#20
450K students (Ghoshna 1.0)390 K students from all 119 blocks (Ghoshna 2.0)
Haryana
School Certi&ication(Samwardhan) - third-party school certi&ication to recognize and reward schools, which have achieved prescribed learning outcomes
Self-nomination
Self-nomination
All Department of Education (DOE) and Government aided schools up to class 9
All schools can self-nominate, but in one cycle, 15k schools are tested over 1.5 months. 2#3 cycles happen every year
Grades1 to 8
Schools self-nominate on a rolling basis and are approved/ rejected every 6#8 weeks through third-party assessment
Jharkhand
Garima for school certi&ication
Grades3 to 8
Each school is tested once on Bronze benchmark annually, and Silver & Gold only if they qualify Bronze
Odisha
Certi!ication
Table 1: Illustrative list of SLAS in India
Program Evaluation
Third-party assessment for APTeSAR
Sample Grades4,6,9
Three rounds
21,000 students (R1), 81000 students (R2), 1.01 Lakh (R3) from both private and public schools
Andhra Pradesh
Third-party evaluation for Adarsh School Yojana
Sample Grades3,5,8
Two rounds
2016#17 2018#19
2016#172017#182018#19
Both rounds - 31000- 33000 students from 690 schools across 33 districts
Rajasthan
29
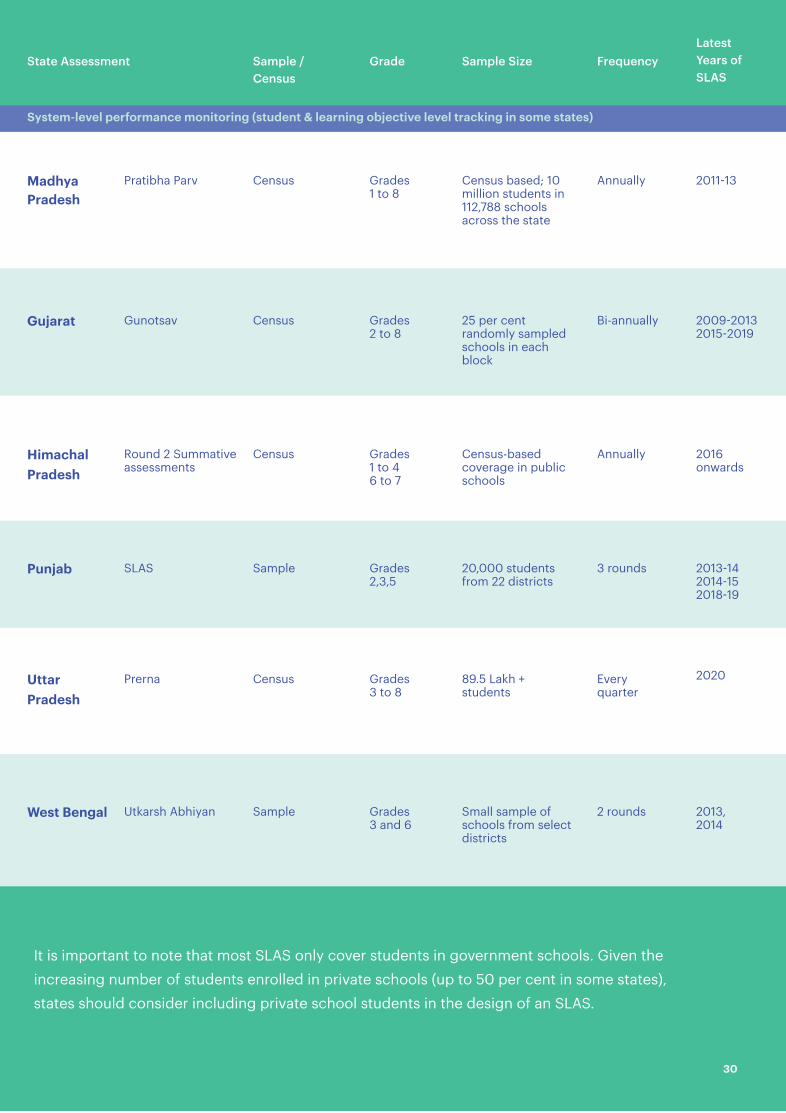
It is important to note that most SLAS only cover students in government schools. Given the increasing number of students enrolled in private schools (up to 50 per cent in some states), states should consider including private school students in the design of an SLAS.
State Assessment Sample / Census
Grade Sample Size FrequencyLatest Years of SLAS
30
2013, 2014
Prerna Census Grades3 to 8
Every quarter
Uttar Pradesh
89.5 Lakh + students
Utkarsh Abhiyan Sample Grades3 and 6
2 roundsWest Bengal Small sample of schools from select districts
Round 2 Summative assessments
Census Grades1 to 46 to 7
AnnuallyCensus-based coverage in public schools
Himachal Pradesh
2016 onwards
2020
Pratibha Parv Census Grades1 to 8
AnnuallyCensus based; 10 million students in 112,788 schools across the state
Madhya Pradesh
2011#13
System-level performance monitoring (student & learning objective level tracking in some states)
Gunotsav Census Grades2 to 8
Bi-annually25 per cent randomly sampled schools in each block
Gujarat 2009#20132015#2019
SLAS Sample Grades2,3,5
3 rounds20,000 students from 22 districts
Punjab 2013#142014#152018#19
31
*% Ministry of Education, Government of India. (2017#18). UDISE+ 2017!18 (Provisional). Privately managed schools include private aided, unaided recognized, unaided unrecognized and others. Retrieved from: http://dashboard.udiseplus.gov.in/#!/schooldashboard *, Azim Premji Research Group. (2018, November). School choice in low information environments: A study of perceptions and realities in four states- Field Studies in Education. Retrieved from: https://azimpremjiuniversity.edu.in/SitePages/pdf/SchoolChoices_Web.pdf, NCERT - National Achievement Survey (NAS) Dashboard. (2017). Retrieved from: http://nas.schooleduinfo.in/dashboard/nas_ncert#/*' DFID Literature Review. (2015). The Role and Impact of Private Schooling in Developing Countries. Retrieved from: https://assets.publishing.service.gov.uk/government/uploads/system/uploads/attachment_data/&ile/439702/private-schools-full-report.pdf, Muralidharan, Karthik and Venkatesh Sundararaman. (2015). The Aggregate E"ect of School Choice: Evidence from a Two-Stage Experiment in India. The Quarterly Journal of Economics. Retrieved from: https://academic.oup.com/qje/article/130/3/1011/1931887#84604204 *( Educational Initiatives supported by Michael & Susan Dell Foundation. (2014, December). Establishing Benchmarks of Student Learning, 2014. Retrieved from: https://www.ei-india.com/newEIWebsite/eiasset/pdf/Establishing-Benchmarks-of-Student-Learning-Final.pdf*) Andrabi, Tahir, Jishnu Das, and Asim Ijaz Khwaja. (2017). “Report Cards: The Impact of Providing School and Child Test Scores on Educational Markets.” American Economic Review 107. Retrieved from: https://doi.org/10.1257/aer.20140774., Afridi, Farzana, Bidisha Barooah and Rohini Somanathan. (2017). “Improving Learning Outcomes through Information Provision: Evidence from Indian Villages.”
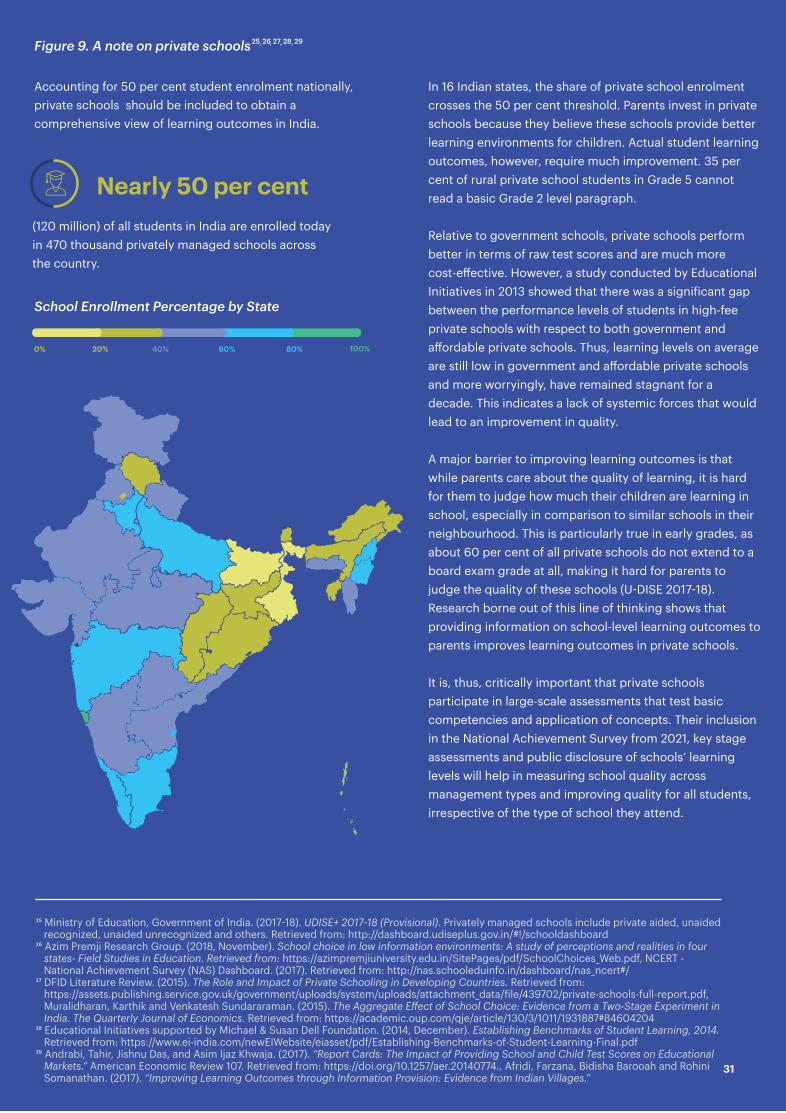
Accounting for 50 per cent student enrolment nationally, private schools should be included to obtain a comprehensive view of learning outcomes in India.
Figure 9. A note on private schools , , , ,25 26 27 28 29
School Enrollment Percentage by State
In 16 Indian states, the share of private school enrolment crosses the 50 per cent threshold. Parents invest in private schools because they believe these schools provide better learning environments for children. Actual student learning outcomes, however, require much improvement. 35 per cent of rural private school students in Grade 5 cannot read a basic Grade 2 level paragraph.
Relative to government schools, private schools perform better in terms of raw test scores and are much more cost-e1ective. However, a study conducted by Educational Initiatives in 2013 showed that there was a signi&icant gap between the performance levels of students in high-fee private schools with respect to both government and a1ordable private schools. Thus, learning levels on average are still low in government and a1ordable private schools and more worryingly, have remained stagnant for a decade. This indicates a lack of systemic forces that would lead to an improvement in quality.
A major barrier to improving learning outcomes is that while parents care about the quality of learning, it is hard for them to judge how much their children are learning in school, especially in comparison to similar schools in their neighbourhood. This is particularly true in early grades, as about 60 per cent of all private schools do not extend to a board exam grade at all, making it hard for parents to judge the quality of these schools (U#DISE 2017#18). Research borne out of this line of thinking shows that providing information on school-level learning outcomes to parents improves learning outcomes in private schools.
It is, thus, critically important that private schools participate in large-scale assessments that test basic competencies and application of concepts. Their inclusion in the National Achievement Survey from 2021, key stage assessments and public disclosure of schools’ learning levels will help in measuring school quality across management types and improving quality for all students, irrespective of the type of school they attend.
0% 20% 40% 60% 80% 100%
(120 million) of all students in India are enrolled today in 470 thousand privately managed schools across the country.
Nearly 50 per cent

1.4 The way forward: High-quality large-scale assessments (LSA) should be an integral part of the Indian education system
The recently released National Education Policy (NEP) 2020 places learning at the center of educational reform. It identi&ies gaps in the current education system, lays out a roadmap for change, and recognises assessment reform as a high-leverage option to achieve these changes. The key recommendations in the NEP on assessments are illustrated in Figure 10.
Figure 10: Key recommendations of NEP
Key stage assessments In the past, the absence of assessments and associated student achievement data at key stages in primary and elementary grades precluded the opportunity for correction in early years. Misconceptions persisted for years, resulting in expanding learning gaps. The proposed system-level assessments for students across grades 3, 5 and 8 will help overcome this challenge.
Shift from rote-based to competency-linked assessmentsAll assessments will be built on a bedrock of clearly de&ined competency frameworks. This will also feed into board exam reform process for grades 10 and 12.
Focus on higher order competenciesThe policy lays impetus on testing skills like critical thinking and problem solving. These skills will help students become lifelong learners and better prepared for life after school.
Finally, the suggested national assessment center in NEP, PARAKH, will guide states to conduct their own census based, high quality, standardized assessments. It will also incentivise regular and frequent collection of learning outcomes data. Thus, assessments will help attain the herculean but achievable objective of quality education for all students.
32
This report has been created to assist stakeholders who intend to conduct state-level LSAs. It is an attempt to collect best practices from states as well as leading assessment organizations - CG Insights, Centre for Science of Student Learning (CSSL) and Educational Initiatives (EI) - to design and implement large-scale assessments in India. In the past decade, these three organisations have supported LSAs in 24 Indian states, assessed close to 18.5 million students and analysed more than one billion data points across elementary grades. Their learnings and extensive experience have helped create the following tools and insights through this report:
State self-evaluation framework: Developed with the intent to help states assess their current preparedness for conducting a high-quality LSA.
Implementation toolkit: This toolkit is meant to guide states in setting up and running high-quality large-scale assessments. It brings together the best practices adopted across the country through helpful recommendations.
Case studies: Best practices and case studies from successful implementations of large-scale assessments.
Purpose and methodology of report
33
Implementinglarge-scaleassessmentsin states
CHAPTER 2
%
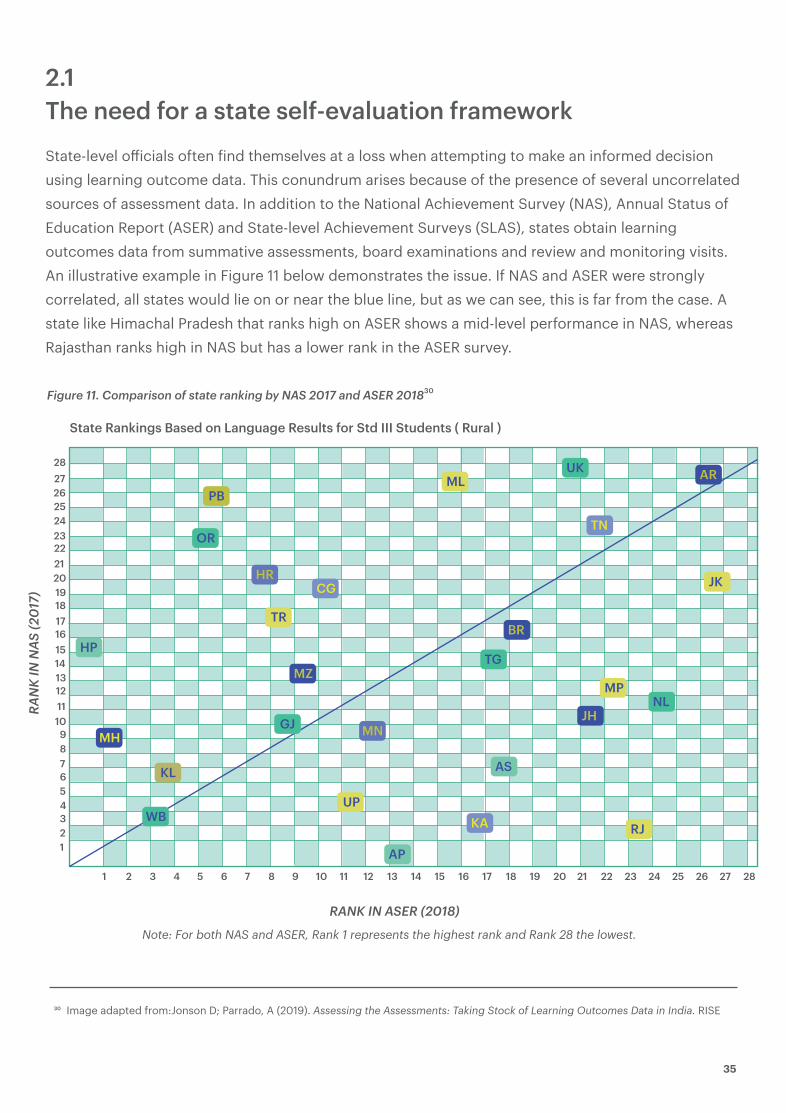
2.1 The need for a state self-evaluation frameworkState-level o!icials often "ind themselves at a loss when attempting to make an informed decision using learning outcome data. This conundrum arises because of the presence of several uncorrelated sources of assessment data. In addition to the National Achievement Survey (NAS), Annual Status of Education Report (ASER) and State-level Achievement Surveys (SLAS), states obtain learning outcomes data from summative assessments, board examinations and review and monitoring visits. An illustrative example in Figure 11 below demonstrates the issue. If NAS and ASER were strongly correlated, all states would lie on or near the blue line, but as we can see, this is far from the case. A state like Himachal Pradesh that ranks high on ASER shows a mid-level performance in NAS, whereas Rajasthan ranks high in NAS but has a lower rank in the ASER survey.
#$ Image adapted from:Jonson D; Parrado, A (2019). Assessing the Assessments: Taking Stock of Learning Outcomes Data in India. RISE
Figure 11. Comparison of state ranking by NAS 2017 and ASER 2018%&
Note: For both NAS and ASER, Rank 1 represents the highest rank and Rank 28 the lowest.
RAN
K IN
NAS
(201
7)
RANK IN ASER (2018)
State Rankings Based on Language Results for Std III Students ( Rural )
1 2 3 4 5 6 7 8 9 10 11 12 13 14 15 16 17 18 19 20 21 22 23 24 25 26 27 28
123456789
10111213141516171819202122232425262728
PB
OR
TG
UK
NLGJ
HP
AS
AP
HR
MN
MZ
BR
AR
JH
CG
TN
KA
MH
TR
UP
MP
JK
ML
RJ
KL
WB
35

With this in mind, we have outlined a self-evaluation framework that can be used by states to:
Determine their readiness to conduct e'ective LSAs
Rationalize existing assessments
Identify and bridge existing gaps in capacity by developing internal resources or
partnering with technical experts
The problem intensi"ies because, despite having multiple sources of data, few states have the required infrastructure, governance, and technical capacity to generate relevant, reliable and regular learning outcomes data that can be utilized to improve the quality of education.
The framework is built on !ive key drivers that capture best practices for the ecosystem, test design and administration, and data dissemination and usage. These "ive drivers are further divided into indicators that together determine the state’s readiness for conducting large-scale assessments.
The framework has been developed in partnership with CG Insights#(, CSSL and EI. Having implemented large-scale assessments in several Indian states, these organisations are well versed with the pre-requisites for conducting high-quality large-scale assessments in India. The framework has been enhanced using best practices from global assessment frameworks, such as the World Bank Group’s SABER framework#) and Australian Council for Educational Research’s (ACER) framework##.
#( CG Insights/ ConveGenius Insights was formerly known as Gray Matters India (GMI)#) Clark, M. (2012, April). What Matters Most for Student Assessment Systems: A framework paper. Washington DC, USA: SABER (The World Bank). Retrieved from http://hdl.handle.net/10986/17471## Australian Council for Educational Research (ACER), Centre for Global Education. (2017). The Manual of Good Practice in Learning Assessment. India: ASER. Retrieved from: http://img.asercentre.org/docs/Bottom%20Panel/Key%20Docs/aserassessment frameworkdocument.pdfA
2.2 There are !ive drivers for a successful large-scale assessment system
36
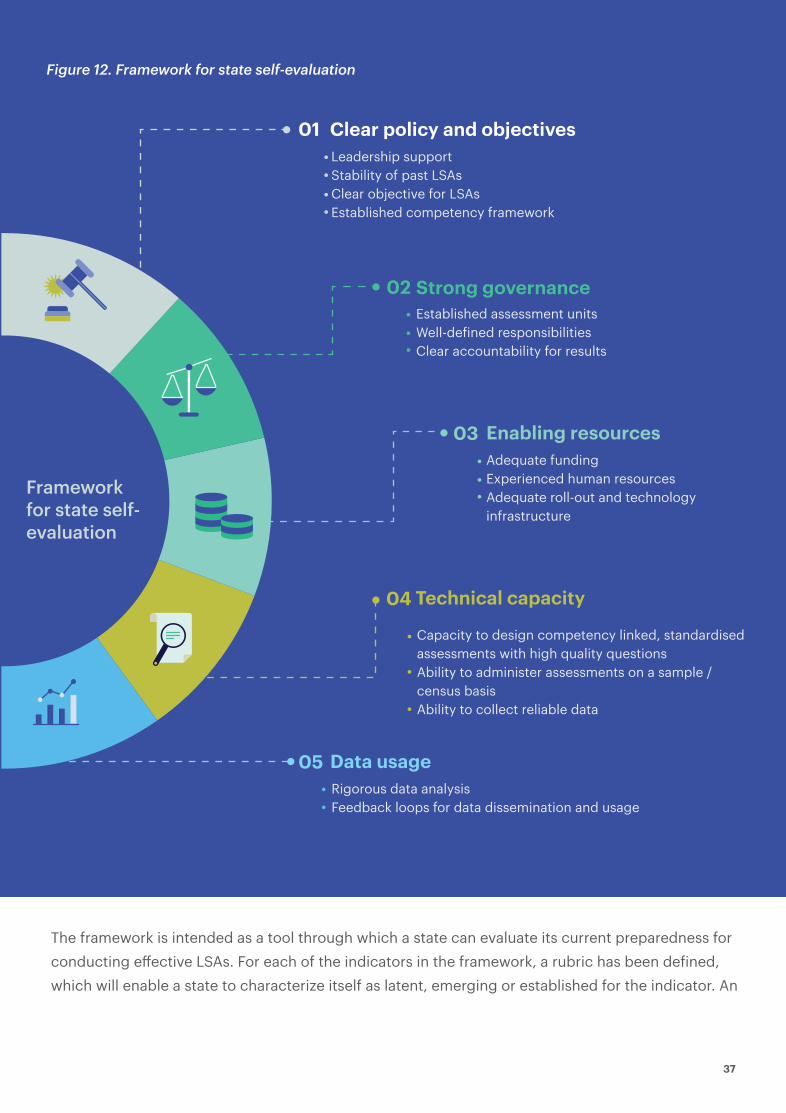
Framework for state self-evaluation
Figure 12. Framework for state self-evaluation
Established assessment unitsWell-de"ined responsibilitiesClear accountability for results
02 Strong governance
Adequate fundingExperienced human resourcesAdequate roll-out and technology infrastructure
03 Enabling resources
Capacity to design competency linked, standardised assessments with high quality questionsAbility to administer assessments on a sample / census basisAbility to collect reliable data
04 Technical capacity
Leadership supportStability of past LSAsClear objective for LSAsEstablished competency framework
Clear policy and objectives01
05Rigorous data analysisFeedback loops for data dissemination and usage
Data usage
The framework is intended as a tool through which a state can evaluate its current preparedness for conducting e'ective LSAs. For each of the indicators in the framework, a rubric has been de"ined, which will enable a state to characterize itself as latent, emerging or established for the indicator. An
37

Table 2: Illustrative rubric description for state self-evaluation framework
Indicator Latent Emerging Established
Dimension: Assessment design
Test design
Robustness of test design that is competency-linked, at the relevant grade level with high-quality questions
Test design was inadequately aligned to state curriculum and learning objectives and/or was not competency based and all questions were not of high quality
Test design was not aligned to state curriculum and learning objectives and wasn’t competency based with high question quality
Test design was su!iciently aligned to state curriculum and learning objectives and was competency based with high-quality questions
Key driver 4: Technical capacity
States can use the self-evaluation framework to identify strengths and gaps of existing assessments, and thereby perform a rationalization exercise. Let us take the case of a state conducting census-level student assessments at least twice a year. If this data is not being used regularly to inform teaching-learning practices at the system and school level, then the state can reduce the frequency of these census assessments or choose to conduct assessments for a representative sample of students.
For several years, states across India have been conducting SLAS using either internal capacity or with the support of technical partners. For this report, secondary research along with interviews with assessment experts#* were conducted to collect information on twenty states. Based on the information collected and analyzed, we have segmented states into three categories – latent, emerging and established.#+
States can use the self-evaluation framework to rationalize the assessments currently in use
2.3 Landscape analysis of readiness to conduct e"ective LSAs for 20 Indian states
#* Experts include EI, CSSL, CGI, Samagra, BCG and some SCERT representatives.#+ This analysis was done based on publicly available data about large scale assessments in various states.
38

39
We considered historical large-scale assessments conducted by states alongside indicators required to conduct future large-scale assessments. At the overall level, more than 50 per cent states were at the latent stage.
This distribution can vary at the individual driver level as showcased in Chart 4. Ability to appropriately use assessment data appears to be the biggest area for improvement.
85% states analyzed were at a latent or emerging stage
Chart 3: Distribution of states by overall preparedness level
Latent Emerging Established
Latent Emerging Established
Chart 4: Distribution of states by key drivers
6 8 6
10 8 2
10 5 5
11 5 4
20% 40% 60% 80% 100%
14 3 3
0%
11 6 3
20%0%
No of States
40% 60% 80% 100%
Clear policy and objectives for large-scale assessments
Strong governance mechanisms
Availability of enabling resources
Technical capacity of state for LSAs
Ability to use data

Based on our analysis, the common trends identi"ied for states at the established level were as follows:
Several states lacked a clear competency framework with learning objectives de"ined for each grade. The focus on competency linkage allows assessments to move beyond rote-based concepts towards higher order thinking and conceptual understanding across grades and subjects.
Saksham Talika in Haryana and Seekhne Ka Pratifal in Himachal Pradesh are two examples of competency frameworks developed by the states that guide the design of large-scale assessments.
70 per cent (14 states) showed a lack of accountability for results, i.e. neither state nor district / sub- district level assessment units had any responsibility for student performance. Few states like Haryana, seemed to have successfully
States at established level
Conducted at least two rounds ofLSAs in the last four years
Had strong buy-in from state-level o!icials for LSAs (either at level of Chief Minister or Principal Secretary)
Established clear objectives for LSAs, assessments were competency-linked and conducted at regular frequency
Used assessment data to improve learning outcomes through speci"ic interventions
Allocated funding (from statebudget or through external partners)for LSAs
Findings
2.3.1 Leadership support is critical for initiating high-quality LSAs; decentralized responsibility helps sustain change
2.3.2 Competency framework forms the bedrock for teaching initiatives and assessments
2.3.3 States lack systems that assign clear accountability for results
Our research indicates that an aligned vision that recognizes the role of assessments in improving education quality leads to the development of robust assessment systems. Signi"icantly, in states that were at the established level, there was a strong leadership buy-in all the way from the education department headquarters to the Chief Minister’s O!ice.
However, leadership buy-in alone is not enough for a sustained impact. It was observed that a change in political or bureaucratic leadership impacted the continuity of assessment-related initiatives. If a state also had a decentralized assessment system with clearly de"ined responsibilities, high-quality LSAs were likely to continue even after a change in leadership.
40

All states budgeted INR 10 lakhs per district annually for “school-based assessments” (0.1,0.2 per cent of their overall education budgets).#- Some states used Samagra Shiksha funding to support LSAs but most relied on some form of external funding. States like Andhra Pradesh and Rajasthan received external funding for assessments in at least two rounds whereas Madhya Pradesh, Odisha and Jharkhand were 100 per cent externally funded by the World Bank. It should be noted that reliance on external funding for assessments can cause hiccups in the journey of securing regular assessment data. Ideally, a government should procure and pay for assessments that provide critical information for improving quality of education. In Haryana, initial LSAs were funded through external partners. Given the success of the program and a steady growth in student learning
ingrained accountability for results by adopting an incentive-driven, bottom-up approach towards assessment results. This ensured that stakeholders at all levels, including teachers and school/block administrators, took responsibility for the results.
2.3.4 Sources of funding for assessments vary by state
Table 3: Budget estimates for Saksham Haryana Assessments in 2019-20#$
All estimates are for one round of assessments
Activity
Printing of question papers and OMR sheets
The assessment covered 119 blocks, 600 students per block per grade (grade 3,8) and 21 grade-subject combinations
INR 70,80 lakhs
INR 20,30 lakhs
INR 50,60 lakhs
Field invigilation training etc.
Third-Party fees
Approximate Budget (per Saksham
Ghoshna Round)
Assessment scale and scope
#- This data was taken from: Department of School education and Literacy (2019) PAB minutes for all states. NIC, New Delhi. Retrieved from: https://dsel.education.gov.in/pab-minutes #. Approximate budget estimates for Saksham Haryana rounds in 2019,20 have been provided by assessment partners
41
outcomes, in 2019, Haryana allocated a budget (including costs for test design, administration, data usage) for conducting LSAs. It undertook a request-for-proposal (RFP) process to on-board a technical partner to design and support administration of the LSAs.
#/ Singh, A. (2020, July). Myths of O!icial Measurement:Auditing and Improving Administrative Data in Developing Countries. RISE Working Paper Series. 20/042.Retrieved from: https://assets.publishing.service.gov.uk/media/5f906c46d3b f7f5d4def ae86/RISE_ WP,042,Singh_0.pdf and Jonson D; Parrado, A (2019). Assessing the Assessments: Taking Stock of Learning Outcomes Data in India. RISE Porgramme. Retrieved from: https://riseprogramme.org/sites/default/"iles/inline-"iles/Johnson_Assessing%20the%20assessments RISE%20version_v2.pdf https://assets.publishing.service.gov.uk/media/5f906c46d3bf7f5d4defae86/RISE_WP,042,Singh_0.pd"https://assets.publishing. service.gov.uk/media/5f906c46d3bf7f5d4defae86/RISE_WP,042,Singh_0.pdf
Several studies on assessments in India have found that student assessment data is often arti"icially in"lated and hence unreliable#0. The root causes of misreporting assessment data in India are largely the following:
Perceived high stakes nature of examinations which creates incentive for stakeholders to arti"icially in"late assessment data
2.3.5 Collecting reliable learning outcomes data at scale continues to be a challenge
Weak state capacity to conduct, monitor and analyze LSAs
The implications of such unreliable data are worse than a lack of reported data, since it misrepresents the real situation and misguides decision making#/.
The organogram of Haryana’s Department of School Education below (Figure 13) illustrates the range of stakeholders involved in state-level decision making and implementation. Given the complex nature of the education system in most states, it is essential that there is buy-in at all levels, starting with the Chief Minister’s O!ice.
It doesn’t come as a surprise that evidence around usage of results for improvements in policy interventions, teaching delivery, pedagogy or learning outcomes was minimal. About 70 per
2.3.6 Most states do not have appropriate data usage and dissemination mechanisms in place
2.4.1 Buy-in for large-scale assessments is required all the way from state leadership down to the school level
#- This data was taken from: Department of School education and Literacy (2019) PAB minutes for all states. NIC, New Delhi. Retrieved from: https://dsel.education.gov.in/pab-minutes #. Approximate budget estimates for Saksham Haryana rounds in 2019,20 have been provided by assessment partners
2.4 Implementation toolkit – recommendations for conducting LSAs
Clear policy and objectives
42
cent of the states analysed (14/20) did not have appropriate data usage and dissemination mechanisms in place. Results were aggregated and analyzed in a manner that wasn’t actionable at district and sub-district levels and rarely percolated down to individual schools or teachers. States were, thus, unable to establish an e'ective feedback loop in the system.
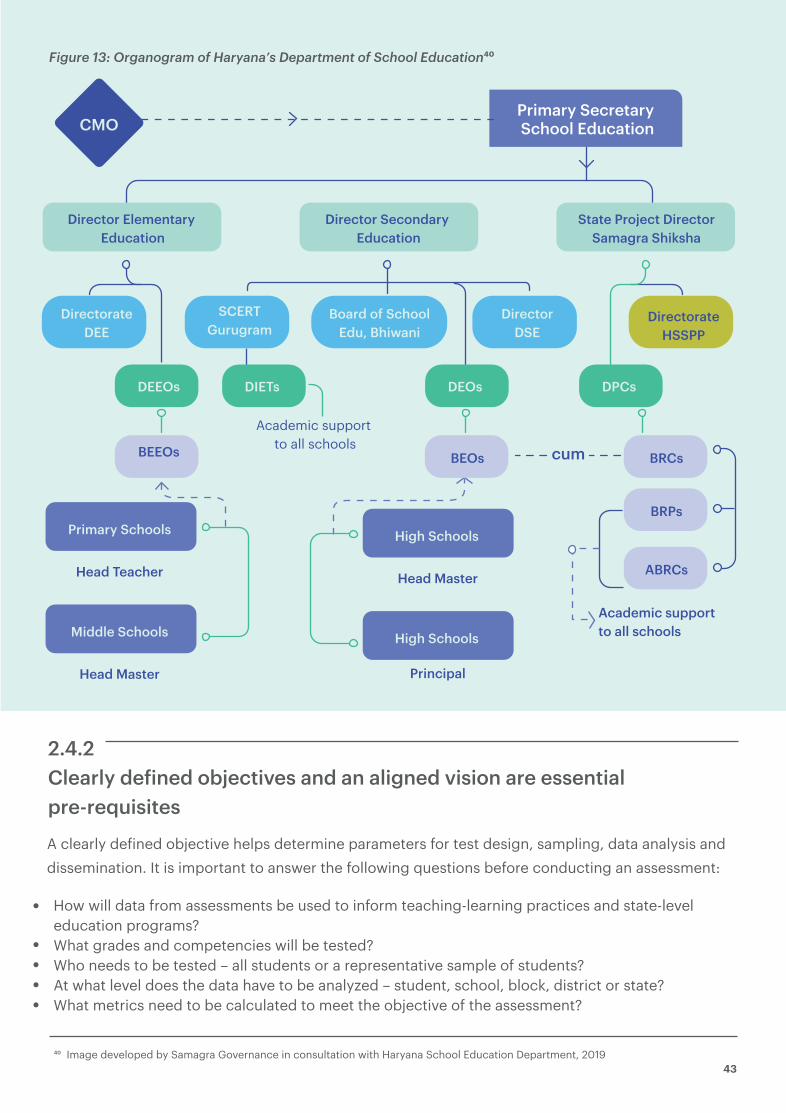
Figure 13: Organogram of Haryana’s Department of School Education%&
CMOPrimary Secretary School Education
cum
Director Elementary Education
Primary Schools
Head Teacher
Academic support to all schools
Head Master
High Schools
Middle Schools
Head Master Principal
Academic supportto all schoolsHigh Schools
Director Secondary Education
State Project DirectorSamagra Shiksha
DEEOs DIETs DEOs DPCs
DirectorateDEE
SCERTGurugram
DirectorDSE
DirectorateHSSPP
Board of SchoolEdu, Bhiwani
BEEOs BEOs BRCs
BRPs
ABRCs
2.4.2 Clearly de!ined objectives and an aligned vision are essential pre-requisitesA clearly de"ined objective helps determine parameters for test design, sampling, data analysis and dissemination. It is important to answer the following questions before conducting an assessment:
How will data from assessments be used to inform teaching-learning practices and state-level education programs?What grades and competencies will be tested?Who needs to be tested – all students or a representative sample of students?At what level does the data have to be analyzed – student, school, block, district or state?What metrics need to be calculated to meet the objective of the assessment?
*$ Image developed by Samagra Governance in consultation with Haryana School Education Department, 201943
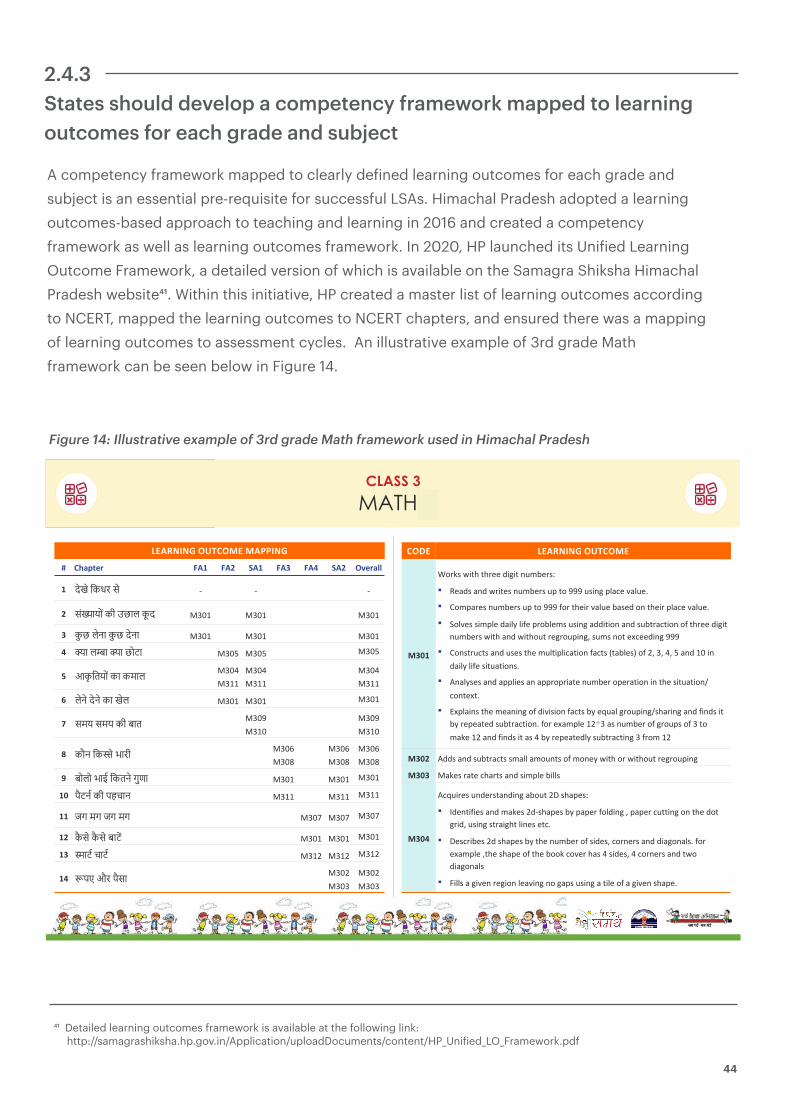
CLASS 3MATHS
���������������� ���� ������ ��� ��� ��� ��� ��� ��� � ���
� �/ /�)��!�%/ 8 8 8
� %4:( 14��+���("��- � DAB DAB DAB
� �, ��"/�(��, ���/�( DAB DAB DAB
� 9(�"<(�9(��1�( DAF DAF DAF
� ��. )� 14��(���(" DAE DBB
DAE DBB
DAE DBB
� "/�/��/�/��(� /" DAB DAB DAB
� %� �%� ��+��(� DAJ DBA
DAJ DBA
� �2��)�?/��(!+� DAG DAI
DAG DAI
DAG DAI
� �1"1��(��)���/��,�(� DAB DAB DAB
�� �0��6��+��&�(�� DBB DBB DBB
�� ������������ DAH DAH DAH
�� �0 %/��0 %/��(�7� DAB DAB DAB
�� >(�6��(�6� DBC DBC DBC
�� 8����!��0%(� DAC DAD
DAC DAD
���� ��������������
����
�$' (�,�)��)�'�������)�#*"��'(3
� ����(��#��,'�)�(�#*"��'(�*%�)$�JJJ�*(�#��%!����+�!*�4
� �$"%�'�(�#*"��'(�*%�)$�JJJ��$'�)���'�+�!*����(���$#�)���'�%!����+�!*�4
� �$!+�(�(�"%!�����!.�!����%'$�!�"(�*(�#������)�$#��#��(*�)'��)�$#�$��)�'�������)�#*"��'(�,�)���#��,�)�$*)�'��'$*%�#�1�(*"(�#$)��-�����#��JJJ
� �$#()'*�)(��#��*(�(�)���"*!)�%!���)�$#����)(�:)��!�(;�$��C1�D1�E1�F��#��BA��#����!.�!����(�)*�)�$#(4
� �#�!.(�(��#���%%!��(��#��%%'$%'��)��#*"��'�$%�'�)�$#��#�)���(�)*�)�$#7��$#)�-)4
� �-%!��#(�)���"��#�#��$����+�(�$#����)(��.��&*�!��'$*%�#�7(��'�#���#����#�(��)��.�'�%��)���(*�)'��)�$#4��$'��-�"%!��BC�D��(�#*"��'�$���'$*%(�$��D�)$�"� ��BC��#����#�(��)��(�E��.�'�%��)��!.�(*�)'��)�#��D��'$"�BC
���� ���(��#��(*�)'��)(�("�!!��"$*#)(�$��"$#�.�,�)��$'�,�)�$*)�'��'$*%�#�
���� � �(�'�)�����')(��#��(�"%!����!!(
����
��&*�'�(�*#��'()�#��#����$*)�C��(��%�(3
� ��#)����(��#��"� �(�C�8(��%�(��.�%�%�'��$!��#��1�%�%�'��*))�#��$#�)����$)��'��1�*(�#��()'����)�!�#�(��)�4
� ��(�'���(�C��(��%�(��.�)���#*"��'�$��(���(1��$'#�'(��#������$#�!(4��$'��-�"%!��1)���(��%��$��)����$$ ��$+�'���(�E�(���(1�E��$'#�'(��#��),$�����$#�!(
� ��!!(�����+�#�'���$#�!��+�#��#$���%(�*(�#����)�!��$������+�#�(��%�4
*( Detailed learning outcomes framework is available at the following link: http://samagrashiksha.hp.gov.in/Application/uploadDocuments/content/HP_Uni"ied_LO_Framework.pdf
2.4.3States should develop a competency framework mapped to learning outcomes for each grade and subject
A competency framework mapped to clearly de"ined learning outcomes for each grade and subject is an essential pre-requisite for successful LSAs. Himachal Pradesh adopted a learning outcomes-based approach to teaching and learning in 2016 and created a competency framework as well as learning outcomes framework. In 2020, HP launched its Uni"ied Learning Outcome Framework, a detailed version of which is available on the Samagra Shiksha Himachal Pradesh website*(. Within this initiative, HP created a master list of learning outcomes according to NCERT, mapped the learning outcomes to NCERT chapters, and ensured there was a mapping of learning outcomes to assessment cycles. An illustrative example of 3rd grade Math framework can be seen below in Figure 14.
44
Figure 14: Illustrative example of 3rd grade Math framework used in Himachal Pradesh
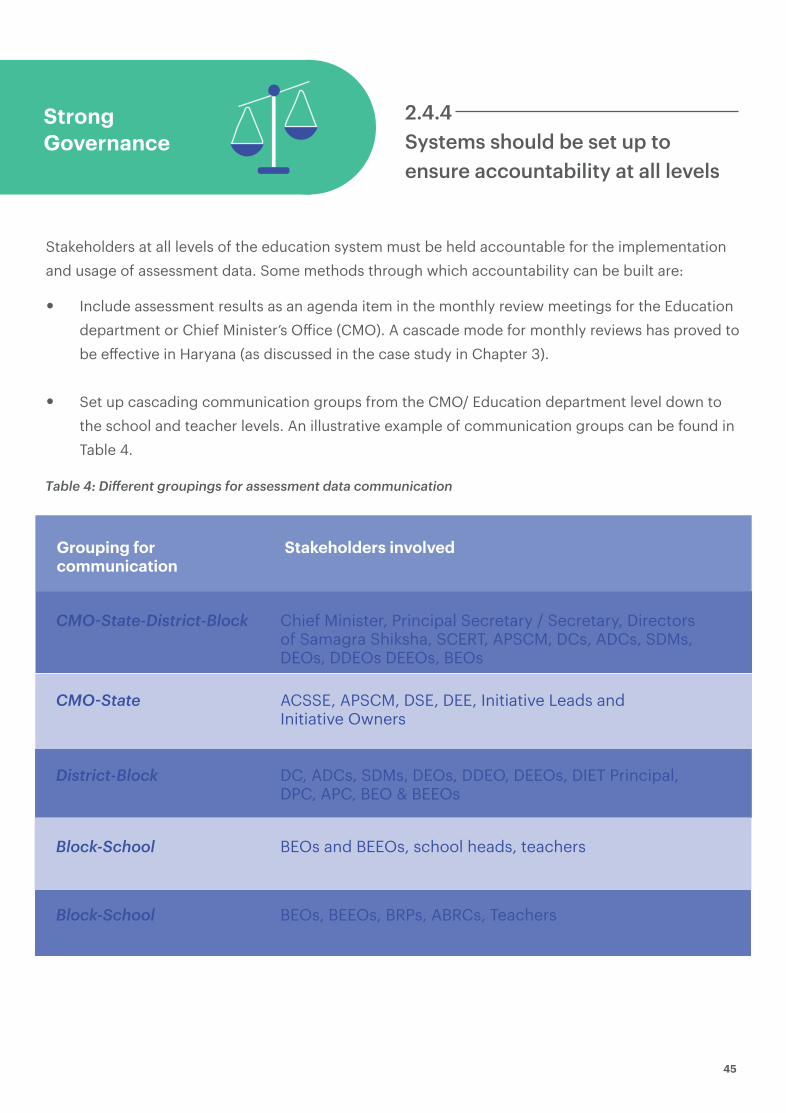
Stakeholders at all levels of the education system must be held accountable for the implementation and usage of assessment data. Some methods through which accountability can be built are:
Include assessment results as an agenda item in the monthly review meetings for the Education department or Chief Minister’s O!ice (CMO). A cascade mode for monthly reviews has proved to be e'ective in Haryana (as discussed in the case study in Chapter 3).
Set up cascading communication groups from the CMO/ Education department level down to the school and teacher levels. An illustrative example of communication groups can be found in Table 4.
2.4.4 Systems should be set up to ensure accountability at all levels
Table 4: Di!erent groupings for assessment data communication
Grouping for communication
CMO"State-District-Block Chief Minister, Principal Secretary / Secretary, Directors of Samagra Shiksha, SCERT, APSCM, DCs, ADCs, SDMs, DEOs, DDEOs DEEOs, BEOs
BEOs and BEEOs, school heads, teachers
BEOs, BEEOs, BRPs, ABRCs, Teachers
Block-School
Block-School
ACSSE, APSCM, DSE, DEE, Initiative Leads and Initiative Owners
DC, ADCs, SDMs, DEOs, DDEO, DEEOs, DIET Principal, DPC, APC, BEO & BEEOs
CMO"State
District-Block
Stakeholders involved
Strong Governance
45
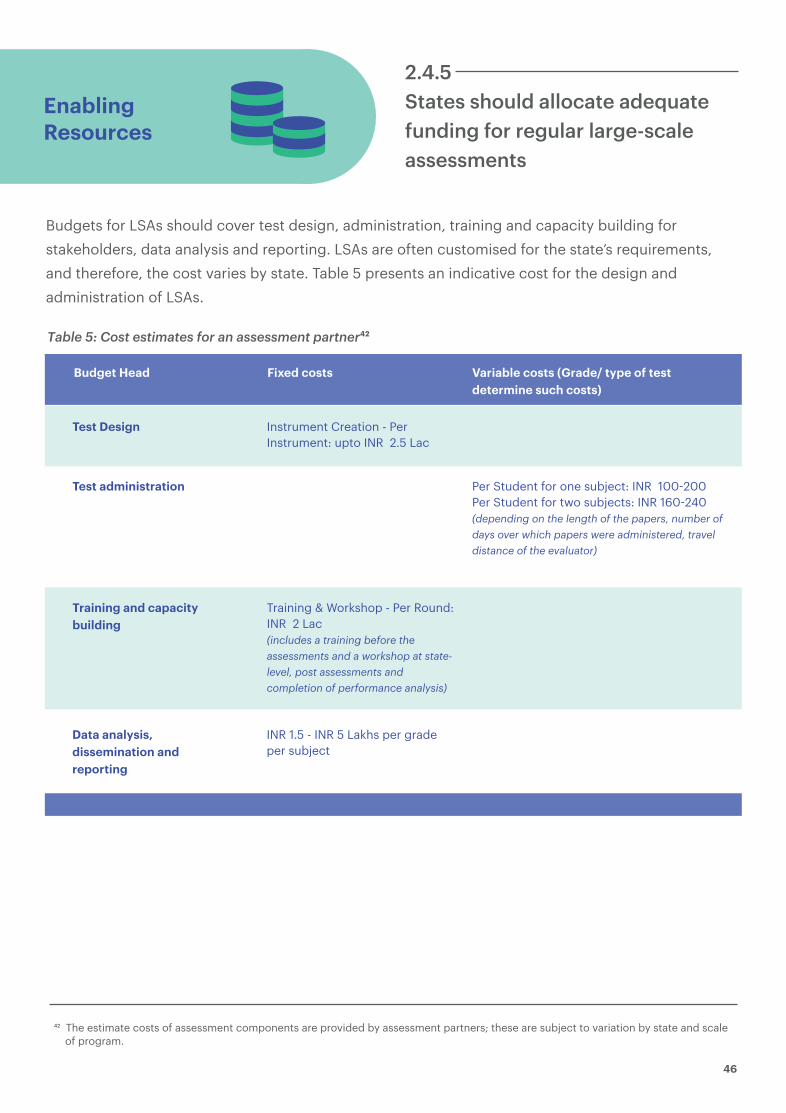
Budgets for LSAs should cover test design, administration, training and capacity building for stakeholders, data analysis and reporting. LSAs are often customised for the state’s requirements, and therefore, the cost varies by state. Table 5 presents an indicative cost for the design and administration of LSAs.
2.4.5 States should allocate adequate funding for regular large-scale assessments
Budget Head Fixed costs Variable costs (Grade/ type of test determine such costs)
Instrument Creation - Per Instrument: upto INR 2.5 Lac
Test Design
Training & Workshop - Per Round: INR 2 Lac(includes a training before the assessments and a workshop at state- level, post assessments and completion of performance analysis)
Per Student for one subject: INR 100,200Per Student for two subjects: INR 160,240(depending on the length of the papers, number of days over which papers were administered, travel distance of the evaluator)
Test administration
Training and capacity building
INR 1.5 - INR 5 Lakhs per grade per subject
Data analysis, dissemination and reporting
Table 5: Cost estimates for an assessment partner%'
Enabling Resources
*) The estimate costs of assessment components are provided by assessment partners; these are subject to variation by state and scale of program.
46
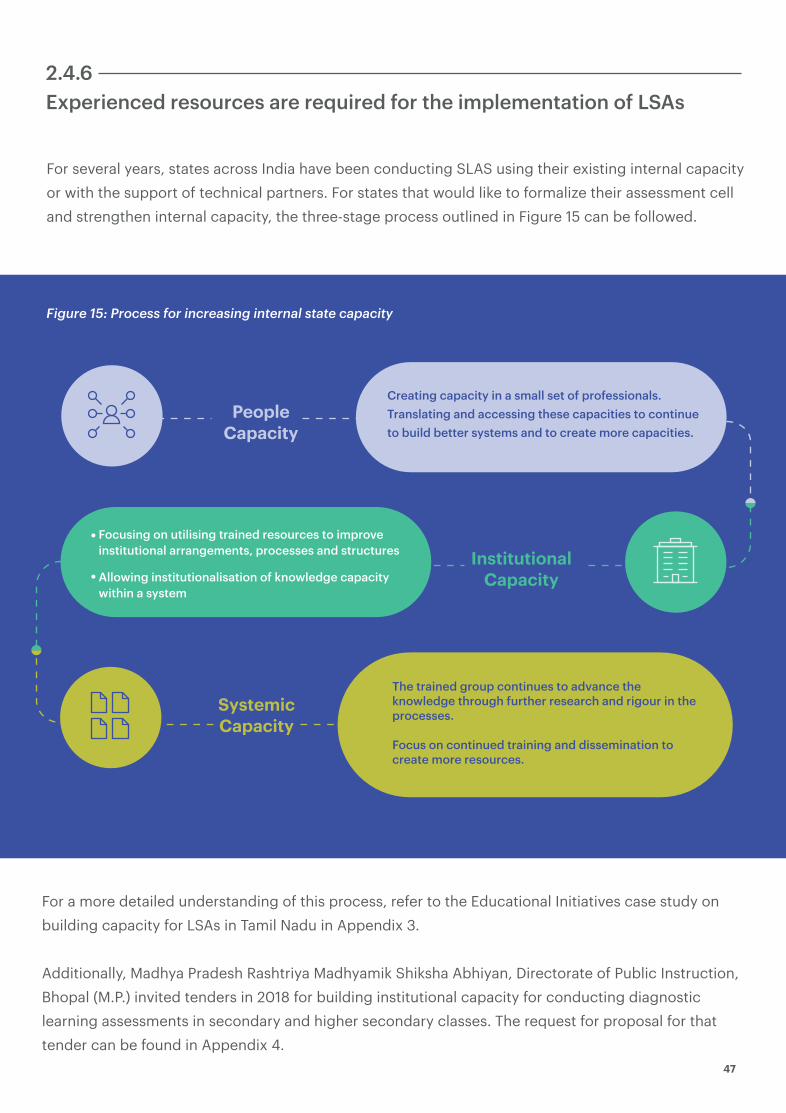
For several years, states across India have been conducting SLAS using their existing internal capacity or with the support of technical partners. For states that would like to formalize their assessment cell and strengthen internal capacity, the three-stage process outlined in Figure 15 can be followed.
For a more detailed understanding of this process, refer to the Educational Initiatives case study on building capacity for LSAs in Tamil Nadu in Appendix 3.
Additionally, Madhya Pradesh Rashtriya Madhyamik Shiksha Abhiyan, Directorate of Public Instruction, Bhopal (M.P.) invited tenders in 2018 for building institutional capacity for conducting diagnostic learning assessments in secondary and higher secondary classes. The request for proposal for that tender can be found in Appendix 4.
2.4.6 Experienced resources are required for the implementation of LSAs
Figure 15: Process for increasing internal state capacity
Creating capacity in a small set of professionals. Translating and accessing these capacities to continue to build better systems and to create more capacities.
Focusing on utilising trained resources to improve institutional arrangements, processes and structures
Allowing institutionalisation of knowledge capacity within a system
People Capacity
Institutional Capacity
Systemic Capacity
The trained group continues to advance the knowledge through further research and rigour in the processes.
Focus on continued training and dissemination to create more resources.
47

“The heart of any assessment is the question. A good question does not just assess, it throws light on learning gaps, it encourages thinking and it helps discriminate between students at di"erent levels of learning. We often focus on the scores of an assessment but whether those scores are valid depend most of all on the quality of the underlying questions.”
-Sridhar Rajagopalan (Co-founder and Chief Learning O!icer, Educational Initiatives)
2.4.7 The quality of test items is one of the most important aspects of a high-quality large-scale assessment and must be prioritized
TechnicalCapacity
The quality of questions is the most important part of the test design process and yet highly under-rated by all stakeholders. If a question is framed well, it will:
Help distinguish mechanical learning from real learning with understanding
Identify misconceptions and common errors made by studentsProvide feedback on what students are really learning
Developed items should be reviewed by a subject matter expert to ensure appropriateness of the test item, language used, clarity of answer choices and the distractors used in the answer choices.
The question below was selected from EI’s Student Learning Study conducted across 18 states.*# The important thing to note is that 95 per cent of students get the answer right if the pencil is placed at zero. However, only 11 per cent get it right if the pencil is o'set as shown below. This means that in the former case, students who don’t actually understand the concept would also get it right.
TechnicalCapacity
*# Rajagopalan, Sridhar V. A.; Sankar, Vyjayanthi (2013). Student learning study: Status of student learning across 18 states of India in Urban and Rural schools. India: Educational Initiatives (EI) and Google.
The length of the line in "igure on the "igure above is 4cm. How long is the pencil shown in the picture? (Use the ruler shown in the picture)
cm
cm
Figure 16: Illustration of a high-quality question
1 2 3 4 5 6 7 8 9 10
1 2 3 4 5 6 7 8 9 10
cm A Class 4 student explaining how he understood the question.
48

The learning construct (state syllabus) de"ines the learning progression for a learner in any given topic/ subject/ area of expertise. The construct is mapped by breaking down the curriculum/syllabus document into speci"ic learning outcomes that we expect a learner to demonstrate after having studied it thoroughly.
An illustrative example of best practices related to test design, aside from the development of high-quality questions, has been outlined below. We describe the methodology CGI followed to develop a standardized test instrument for Haryana. This process can vary depending on assessment objective as well as organization.
Mapping the learning construct
The test items are developed based on the learning construct. Each item (question) has a speci"ic objective on what it is measuring based on the learning construct. The developed items are reviewed by a subject matter expert to ensure appropriateness of the test item, language used, clarity of answer choices and the distractors used in the answer choices.
Development of test items
Based on the objective of the assessments, a test blueprint is developed. The blueprint draws from the construct and shortlists the speci"ic skills or outcomes to be tested along with the di!iculty level of the test. It includes total number of questions per test instrument, strands to be covered, topics within each strand and question types. In Haryana, the instruments were designed to have 20 per cent questions from two grade-levels below, 30 per cent questions from one grade-level below and 50 per cent of the questions at grade-level.
Development of test based on blueprint
The "irst test instruments are trialed with a smaller pool (approximately 300 students) to evaluate how the test instruments and the test items are functioning. In addition to evaluating instrument reliability and validity, the development team collects feedback on appropriateness of test items and test instruments by means of a survey. The pilot data is then analyzed to establish reliability and validity of the test instruments.
Piloting the tests and analysis of pilot data
A standard measurement scale and a conversion table to convert raw scores to scale scores is developed. The scale enables one to compare performance of learners across cohorts and
Test implementation
2.4.8 Assessment objective should determine the blueprint for test design. New test instruments should be piloted on small samples !irst
49

2.4.9 Assessments should be designed to allow comparison over time
States often attempt to compare results from an assessment with its previous rounds, as well as with other national and international assessments. This not only helps them monitor system progress, but also creates accountability and informs teaching practices
CG Insights, CSSL and EI often measure growth in learning levels for the same cohort of students as well as at the system level over multiple years. The steps that help in achieving comparability over time are:
Ensuring the assessment tool is competency linked. To compare data, it is ideal for assessments to have 1/3rd of questions that are identical, 1/3rd that are similar repeats and 1/3rd that are new questions.
Adopting Item Response Theory (IRT) as opposed to Classical Test Theory (CTT) measures the ability of a student as opposed to the score. Item characteristic curves help identify the di!iculty level and the discriminatory power of question items. This allows for di'erent questions with similar parameter values to be chosen for future tests.
Assessment data can only be compared by grade for each subject; data should not be compared across grades and subjects.
Using anchor items linked to di'erent pro"iciency levels across various rounds and types of assessments.
Conducting assessments at roughly the same time of the year and across the same demographic of schools and students.
2.4.10 States must put in place strategies to ensure data reliability
Reliable and accurate data is the backbone of any assessment and the initiatives that ensue from it. As mentioned earlier, incorrect data is worse than no data at all because it embeds a state into assuming a false position. Below we outline some principles and strategies to improvedata reliability in states. It must be emphasized that all messaging and action should be focused on support and improvement, not punishment. Workshops and awareness sessions to showcase importance of data reliability, and support systems for schools and blocks that are falling behind should be key elements of the strategy.
measure growth longitudinally over time. The scale is divided into performance bands and each band is described qualitatively by using standard statements (abilities demonstrated by learners in the band). These parameters are then programmed to generate reports in an automated manner.
50

Figure 17: Note on using technology to improve data reliability
The system can reward schools/blocks to report reliable
assessment data even when their performance on outcomes is not
optimal
Organize workshops and awareness sessions to showcase
the importance of data reliability and support schools and
blocks that are falling behind.
Multiple test booklets: Have more than one question paper,
jumble order of questions, and vary answer order in
multiple-choice questions
External grading: Send answer to di'erent schools for grading
Conduct tablet-based digital assessments
Invite parents / Gram Panchayat leaders during assessments f
for invigilation
Perform analytics to detect patterns in data that could be a
consequence of cheating
Data reliability scores can be generated by retesting a sample of
students. Retesting students by checkers (district education
o!icers, independent third parties) is used to check the reliability
of assessment data reported by teachers in the o!icial school test.
Models of retesting include:
State-led retest conducted by di'erent teachers and schools
Third-party retest at district or state level
STRATEGYPRINCIPLE
In any organization, what gets measured and rewarded is
what gets done** . States should periodically measure the
reliability of the data and attach a high weightage to data
reliability metrics in the monitoring and evaluation framework.
01 Measure data reliability and make it a salient outcome
02 Make it harder to misreport data
States should adopt practices that make it harder for the system to misreport.
Incentivize stakeholders to report true data
03
Messaging and action should be focused on support and improvement
04
Note on using technology to improve data reliability in Andhra Pradesh
As part of a larger e'ort on school transformation, the Government of Andhra Pradesh found that poor data reliability in their summative learning assessments had weakened the system’s ability to determine its own health. It was also an obstruction to providing school quality information publicly to parents. The Government, in partnership with CSF and Abdul Latif Jameel Poverty Action Lab (J,PAL), tested census level tablet-based assessment for all children in grade 4 – in public and private schools - in Prakasam district. J,PAL found tablet-based tests to be signi"icantly more reliable than paper-based equivalents. Students tested on tablets on average scored the same as the J,PAL re-test, while others scored 21,28 percentage points higher on average in paper-based tests, depending on subjects
** Murlidharan, K. (2016, February ) Centre should redirect its energies towards de!ining and measuring outcomes, and linking them to funds for states. Ask for results- The Indian Express. Retrieved from: https://indianexpress.com/article/opinion/columns/union-budget-2016-ask-for-results/
51

Raw assessment data is not actionable until translated into meaningful insights. In this section, we will outline the analysis that can be included in a large-scale assessment report. Some states have created publicly available dashboards showcasing learning outcome data to democratize access to data and insights across all stakeholders.
System level30 per cent points improvement in per cent students at grade level in less than two years for grades 3, 5 and 7 in Math and Hindi
2.4.11 Insightful data analysis coupled with e"ective dissemination form an intrinsic part of a large-scale assessment
Figure 18: Student improvement at the system level%(
*where R2, R3 and R7 refer to respective rounds of Saksham Ghoshna in Haryana
%Students in 3,5,7 at Grade level in Hindi and Math
84%
30 pts
65%
55%Nov 17
Feb 18 - May 18
Feb 19
Pilot
R2+3
R7
01Estimating the expected learning gains in a year: Haryana’s grade-level competency-driven Ghoshna campaign showcases that even "irst-generation learners can improve in a relatively short period of time at a system and cohort level.
Data Usage
*+ Data for analysis in Fig 15, 16 and 17 was derived from Saksham Haryana’s Ghoshna Rounds 2017,2019 where R2, R3 and R7 refer to respective rounds of Saksham Ghoshna in Haryana 52

Cohort level9,18 per cent improvement in performance within six months for grades 3,8 in Math, Hindi, EVS, Science and Social Studies.*-
Figure 19: Student improvement at cohort level for grades 3 to 8.
02Establishing di'erence in learning outcomes across grades: Figure 20 shows that by Feb 2020, the number of blocks with at least 80 per cent students at grade level (Saksham) is higher in grades 3 to 5 compared with grades 6 to 8.
*- EVS was tested for grades 3,5 and Science and Social Science in grades 6,8
Number of blocks Saksham in each grade
117
3
116
4Primary performing strongly Needs improvement -
especially in Science and Social Science
93
5
64
6
40
7
65
8
Grade 3
R1 R2Subject
Grade 4
R1 R2
Grade 5
R1 R2
Grade 6
R1 R2
Grade 7
R1 R2
Grade 8
R1 R2
Average Di"erence in Performance from Baseline (Sep'19) to Endline(Feb'20)
Math 14%
14%
0%
14%
14% 14% 11%
10%
11% 11%
10%
13%
9%
6%10%
10%14%
15%20%
16%18%
- -
- - - - - -
- - - - - -
- - - -
20%21%
12%15%
7%14%
7%13%
9%8%
5%9%
13% 20% 18%
18%
9% 13% 11% 10%11% 15%18% 14%18% 9%11%14%
11%
20% 16% 15% 13%
Hindi
EVS
Science
SSC
Overall
53
Note: Endline was conducted in two rounds represented by R1 and R2
Figure 20: Student learning levels by grade
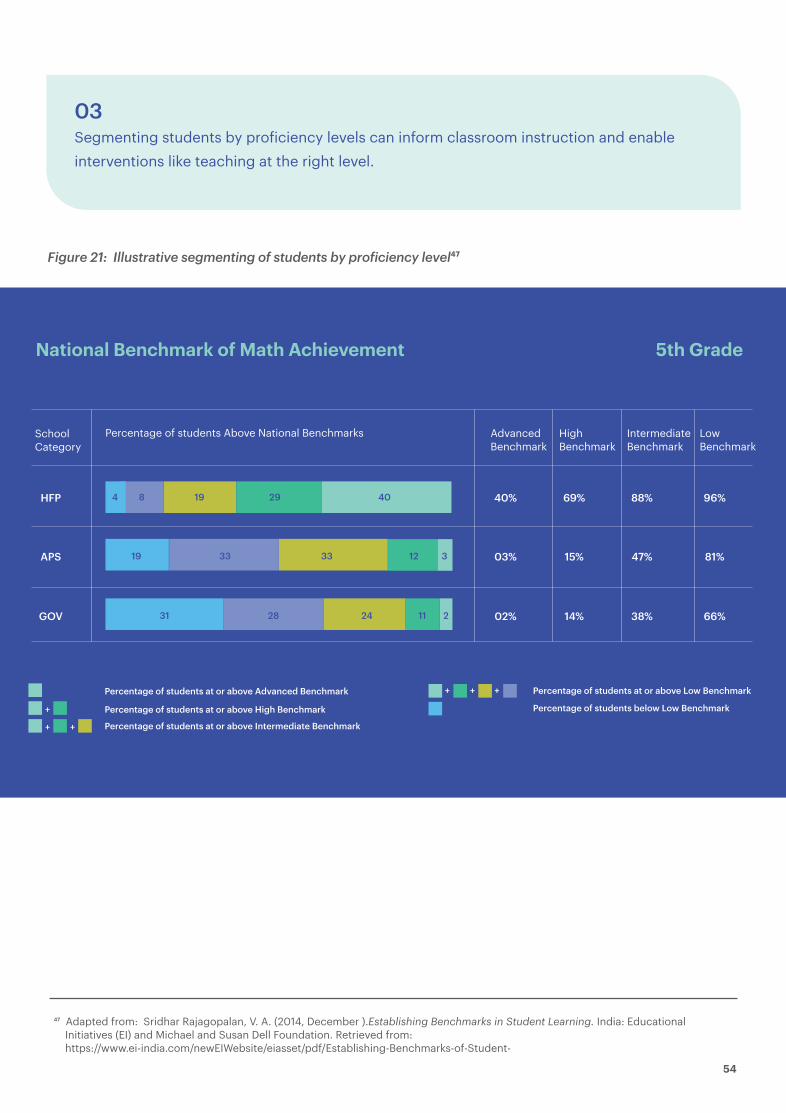
03Segmenting students by pro"iciency levels can inform classroom instruction and enable interventions like teaching at the right level.
5th Grade
Figure 21: Illustrative segmenting of students by proficiency level%$
National Benchmark of Math Achievement
HFP
Advanced Benchmark
High Benchmark
Intermediate Benchmark
Low Benchmark
Percentage of students Above National BenchmarksSchool Category
Percentage of students at or above Low Benchmark
Percentage of students below Low Benchmark
APS
GOV
40%
03%
02%
69%
15%
14%
88%
47%
38%
96%
81%
66%
Percentage of students at or above Advanced Benchmark
Percentage of students at or above High Benchmark+
+ +
+ + +
Percentage of students at or above Intermediate Benchmark
40
312
11 2
3333
2919
19
31 28 24
84
*. Adapted from: Sridhar Rajagopalan, V. A. (2014, December ).Establishing Benchmarks in Student Learning. India: Educational Initiatives (EI) and Michael and Susan Dell Foundation. Retrieved from: https://www.ei-india.com/newEIWebsite/eiasset/pdf/Establishing-Benchmarks-of-Student-
54
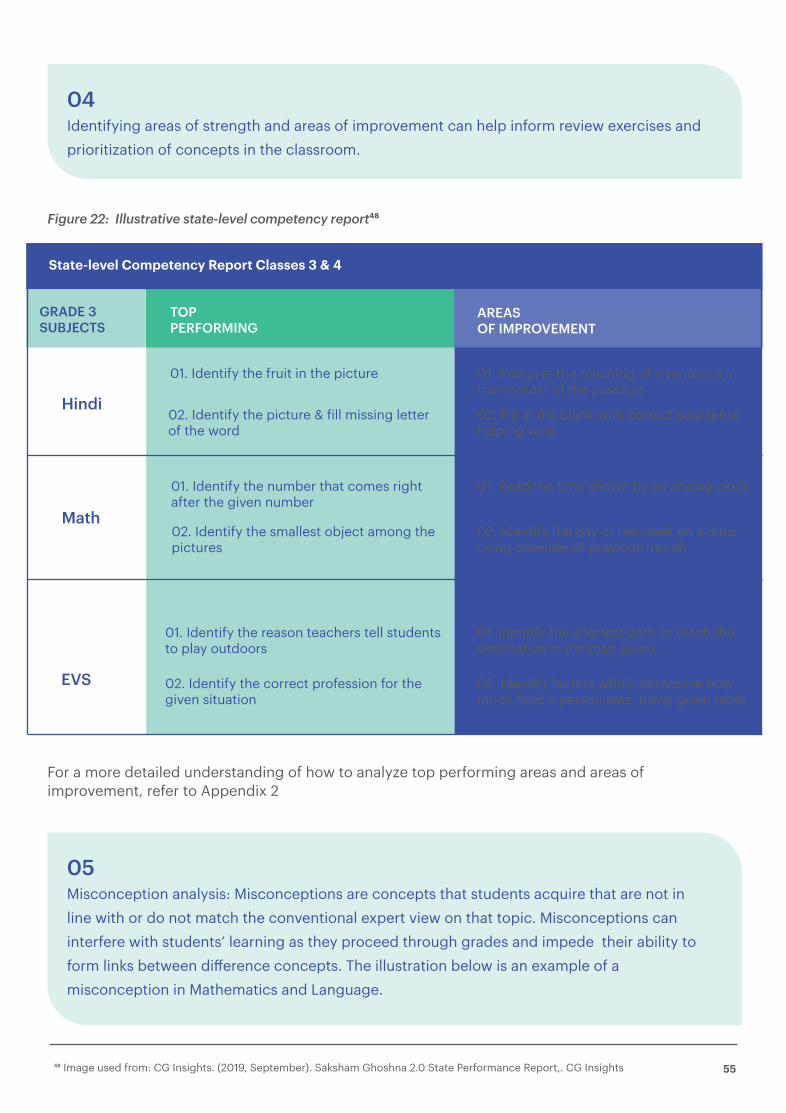
For a more detailed understanding of how to analyze top performing areas and areas of improvement, refer to Appendix 2
04Identifying areas of strength and areas of improvement can help inform review exercises and prioritization of concepts in the classroom.
05Misconception analysis: Misconceptions are concepts that students acquire that are not in line with or do not match the conventional expert view on that topic. Misconceptions can interfere with students’ learning as they proceed through grades and impede their ability to form links between di'erence concepts. The illustration below is an example of a misconception in Mathematics and Language.
Figure 22: Illustrative state-level competency report%)
State-level Competency Report Classes 3 & 4
TOP PERFORMING
GRADE 3SUBJECTS
AREAS OF IMPROVEMENT
Hindi
01. Identify the fruit in the picture
02. Identify the picture & "ill missing letter of the word
01. Interpret the meaning of a sentence in the context of the passage
02. Fill in the blank with correct past tense helping verb
01. Read the time shown by an analog clock
02. Identify the day of the week on a date using calender of previous month
01. Identify the number that comes right after the given number
02. Identify the smallest object among the pictures
Math
01. Identify the reason teachers tell students to play outdoors
02. Identify the correct profession for the given situation
EVS
01. Identify the shortest path to reach the destination in the map given
02. Identify factors which determine how much food a person eats, using given table
*0 Image used from: CG Insights. (2019, September). Saksham Ghoshna 2.0 State Performance Report,. CG Insights 55
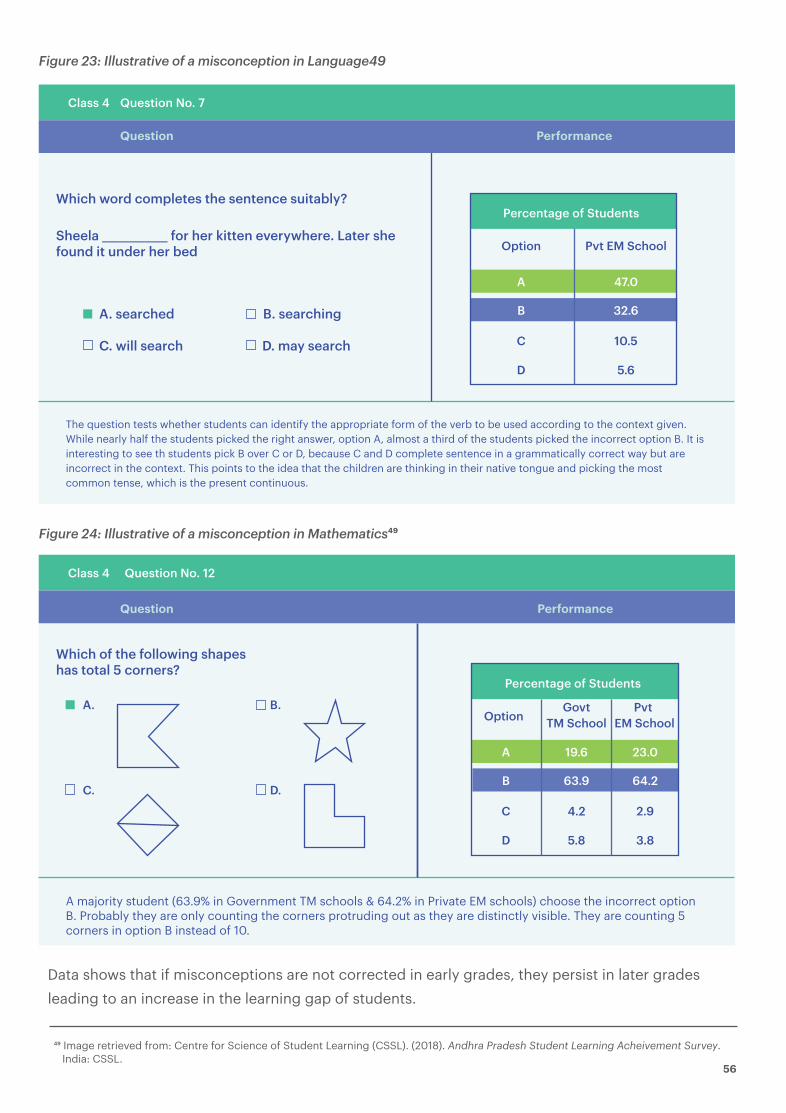
Figure 21: Illustrative of a misconception in mathematics
Class 4 Question No. 12
Question Performance
Which of the following shapes has total 5 corners?
A majority student (63.9% in Government TM schools & 64.2% in Private EM schools) choose the incorrect option B. Probably they are only counting the corners protruding out as they are distinctly visible. They are counting 5 corners in option B instead of 10.
Percentage of Students
OptionPvt
EM SchoolGovt
TM School
C
A. B.
C. D.2.9
D 3.8
A 23.0
B 64.2
4.2
5.8
19.6
63.9
Data shows that if misconceptions are not corrected in early grades, they persist in later grades leading to an increase in the learning gap of students.
Figure 23: Illustrative of a misconception in Language49
Figure 24: Illustrative of a misconception in Mathematics%*
Class 4 Question No. 7
Which word completes the sentence suitably?
Sheela ____________ for her kitten everywhere. Later she found it under her bed
A. searched B. searching
C. will search D. may search
The question tests whether students can identify the appropriate form of the verb to be used according to the context given. While nearly half the students picked the right answer, option A, almost a third of the students picked the incorrect option B. It is interesting to see th students pick B over C or D, because C and D complete sentence in a grammatically correct way but are incorrect in the context. This points to the idea that the children are thinking in their native tongue and picking the most common tense, which is the present continuous.
Percentage of Students
Option Pvt EM School
C 10.5
D 5.6
A 47.0
B 32.6
Question Performance
*/ Image retrieved from: Centre for Science of Student Learning (CSSL). (2018). Andhra Pradesh Student Learning Acheivement Survey. India: CSSL.
56
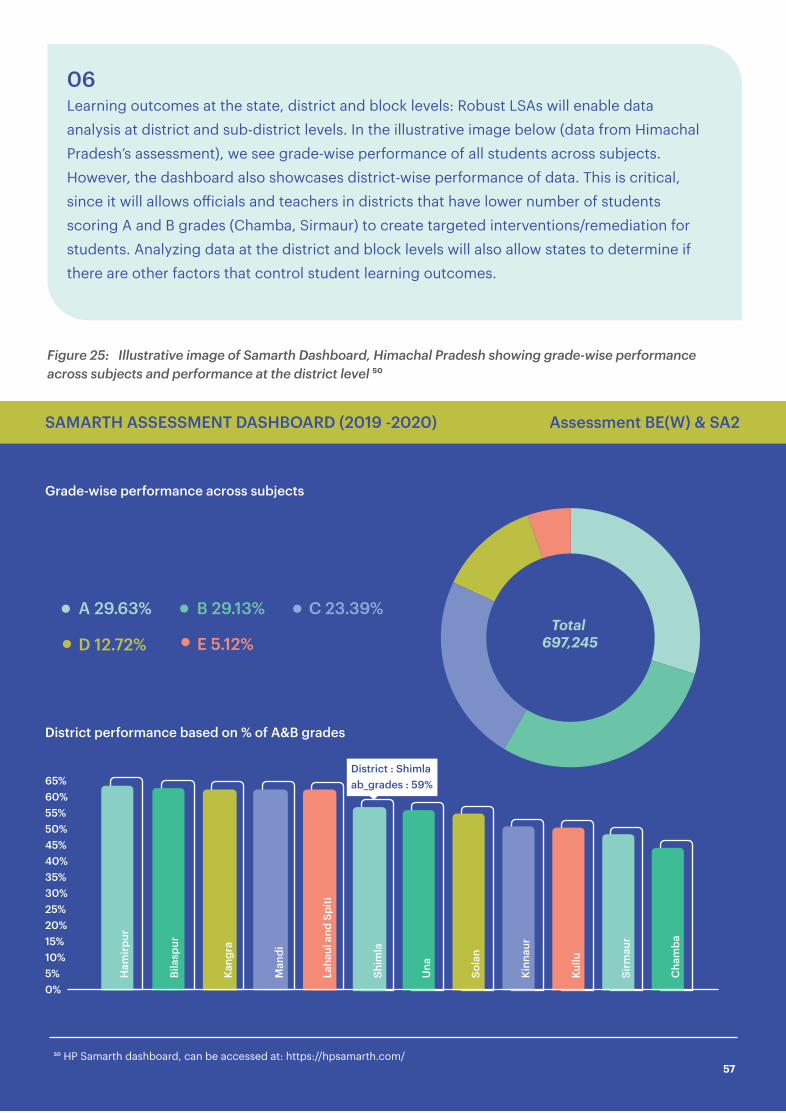
57
0%5%10%15%
25%
35%40%45%
55%
65%
50%
60%
20%
30%
District : Shimlaab_grades : 59%
Ham
irpur
Bila
spur
Kang
ra
Man
di
Laha
ul a
nd S
piti
Shim
la
Una
Sola
n
Kinn
aur
Kullu
Sirm
aur
Cha
mba
06Learning outcomes at the state, district and block levels: Robust LSAs will enable data analysis at district and sub-district levels. In the illustrative image below (data from Himachal Pradesh’s assessment), we see grade-wise performance of all students across subjects. However, the dashboard also showcases district-wise performance of data. This is critical, since it will allows o!icials and teachers in districts that have lower number of students scoring A and B grades (Chamba, Sirmaur) to create targeted interventions/remediation for students. Analyzing data at the district and block levels will also allow states to determine if there are other factors that control student learning outcomes.
Figure 25: Illustrative image of Samarth Dashboard, Himachal Pradesh showing grade-wise performance across subjects and performance at the district level (&
Grade-wise performance across subjects
A 29.63% B 29.13% C 23.39%
D 12.72% E 5.12%
District performance based on % of A&B grades
SAMARTH ASSESSMENT DASHBOARD (2019 -2020) Assessment BE(W) & SA2
Total 697,245
+$ HP Samarth dashboard, can be accessed at: https://hpsamarth.com/
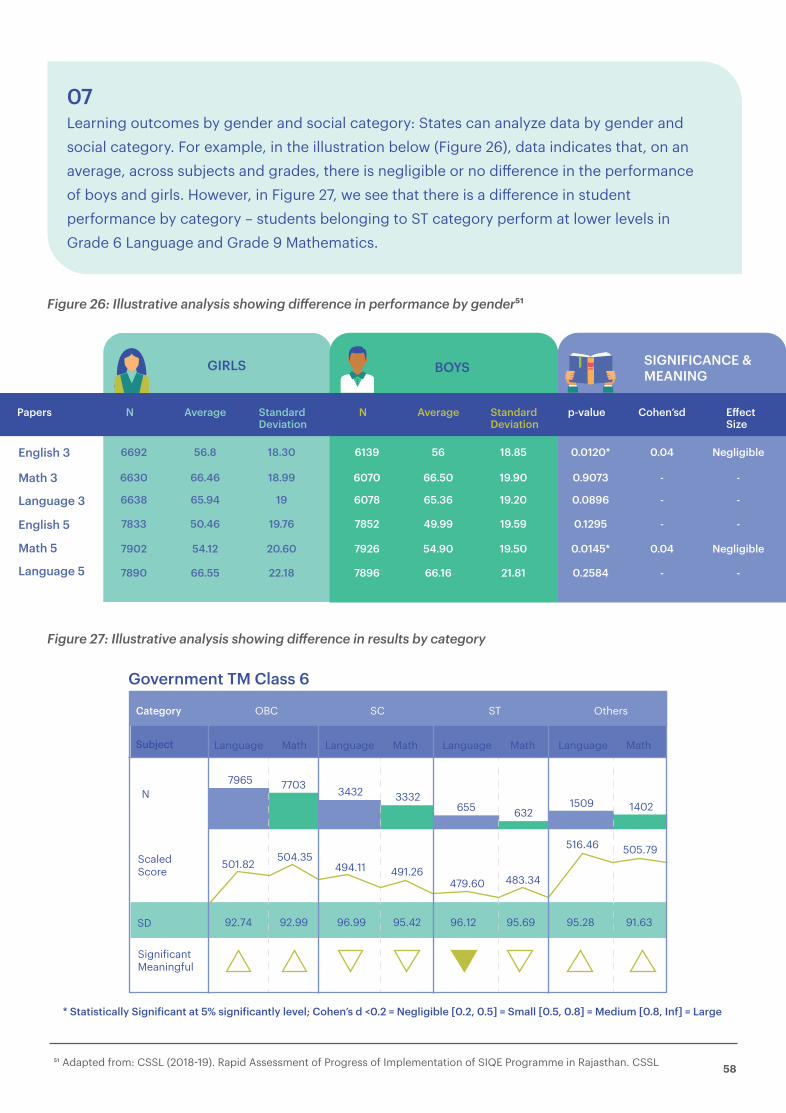
OBC
Language Math Language Math
SC
Language Math
ST
Language Math
Others
7965 7703
501.82 504.35
92.74 92.99
3432 3332
494.11 491.26
96.99 95.42
655 632
479.60 483.34
96.12 95.69
1509 1402
516.46 505.79
95.28 91.63
ScaledScore
Signi"icantMeaningful
SD
Subject
Category
N
Government TM Class 6
Figure 27: Illustrative analysis showing di!erence in results by category
07Learning outcomes by gender and social category: States can analyze data by gender and social category. For example, in the illustration below (Figure 26), data indicates that, on an average, across subjects and grades, there is negligible or no di'erence in the performance of boys and girls. However, in Figure 27, we see that there is a di'erence in student performance by category – students belonging to ST category perform at lower levels in Grade 6 Language and Grade 9 Mathematics.
Figure 26: Illustrative analysis showing di!erence in performance by gender(+
* Statistically Signi!icant at 5% signi!icantly level; Cohen’s d <0.2 = Negligible [0.2, 0.5] = Small [0.5, 0.8] = Medium [0.8, Inf] = Large
English 3
English 5
Math 3
Math 5
Language 3
Language 5
Papers
6692
6630
6638
7833
7902
7890
N
56.8
66.46
65.94
50.46
54.12
66.55
Average
18.30
18.99
19
19.76
20.60
22.18
Standard Deviation
6139
6070
6078
7852
7926
7896
N
56
66.50
65.36
49.99
54.90
66.16
Average
18.85
19.90
19.20
19.59
19.50
21.81
Standard Deviation
0.0120*
0.9073
0.0896
0.1295
0.0145*
0.2584
p-value
0.04
-
-
-
0.04
-
Cohen’sd
Negligible
-
-
-
Negligible
-
E"ectSize
GIRLS BOYS SIGNIFICANCE & MEANING
58+( Adapted from: CSSL (2018,19). Rapid Assessment of Progress of Implementation of SIQE Programme in Rajasthan. CSSL
The next chapter of this report shall delve into the details of assessment mechanisms adopted by four states in India and Chile. In India, Haryana, Himachal Pradesh, Rajasthan and Andhra Pradesh account for over 10% of government school enrolments nationwide+). These states have successfully implemented several aspects of the LSA best practices discussed in Chapter 2 and make for reliable case studies to show linkages between high quality, competency linked assessments and improvement in quality of education. Similarly, developing countries like Chile have also been successful in using LSAs to measure grade speci"ic competencies across the country, monitor the system, create accountability, measure growth in learning outcomes and help inform education practices and policy
Figure 23: Illustrative analysis showing di!erence in results by category
+) Ministry of Education, Government of India. (2018,19). UDISE+ 2018,19 (Provisional). Retrieved from http://dashboard.udiseplus.gov.in/#!/ 59
Case studies of large-scale assessments in India and Chile
CHAPTER 3

!" Math and Hindi, Grades 3,5 and 7!# Saksham 1.0 grades 3,5 and 7 were assessed in Math and Hindi. In Saksham 2.0 this increased to grades 3$8 for Math, Hindi, Science, Social Science and EVS.
61
Case Study 1. Haryana
A clear vision accompanied by strong governance, detailed competency framework and scienti!ically designed assessments helped improve grade level competency53
in Haryana from 40 per cent in 2014 to above 80 per cent in 2019.
Haryana government’s school system has over 14,000 schools and 100,000 teachers catering to more than two million students. Over the last few years, the state has undertaken a series of data-driven academic and administrative reforms to improve the quality of education.
An essential ingredient for success of the Saksham Haryana program was a clearly de%ined objective to enable 80 per cent students in grades 3, 5 and 7 to achieve grade level competency in Math and Hindi.&' Equipped with a technology-driven communication strategy wherein WhatsApp groups were used for two-way communication at all levels, the overarching goal was clearly understood at the school, block, district, and state level. Learning results were also constantly communicated from the CMO’s o(ice for Saksham Ghoshna.
Figure 28: Timeline of assessment reforms and learning outcomes in Haryana
A clear vision was communicated to stakeholders that helped align education interventions towards a common goal: 80 per cent students at grade level
Implementation Highlights
40% students weregrade-level competentas assessed by EI
50!55% students weregrade-level competent
>80% students weregrade-level competent as assessed by CGI
Monthly assessments were driven by SCERT. Data-based reviews were done every month by the Directorate.
Comprehensive academic reform with an aim to ensure 80% of students were grade- level competent. Blocks could nominate themselves for assessment based on self- evaluation of student learning
Scope of Saksham expanded from 3 to 6 grades to include Science, Social Science and EVS in addition to Math and Language; Haryana to be top 5 states in National Achievement Survey
2014 2017 201940% 50-
55% 80%
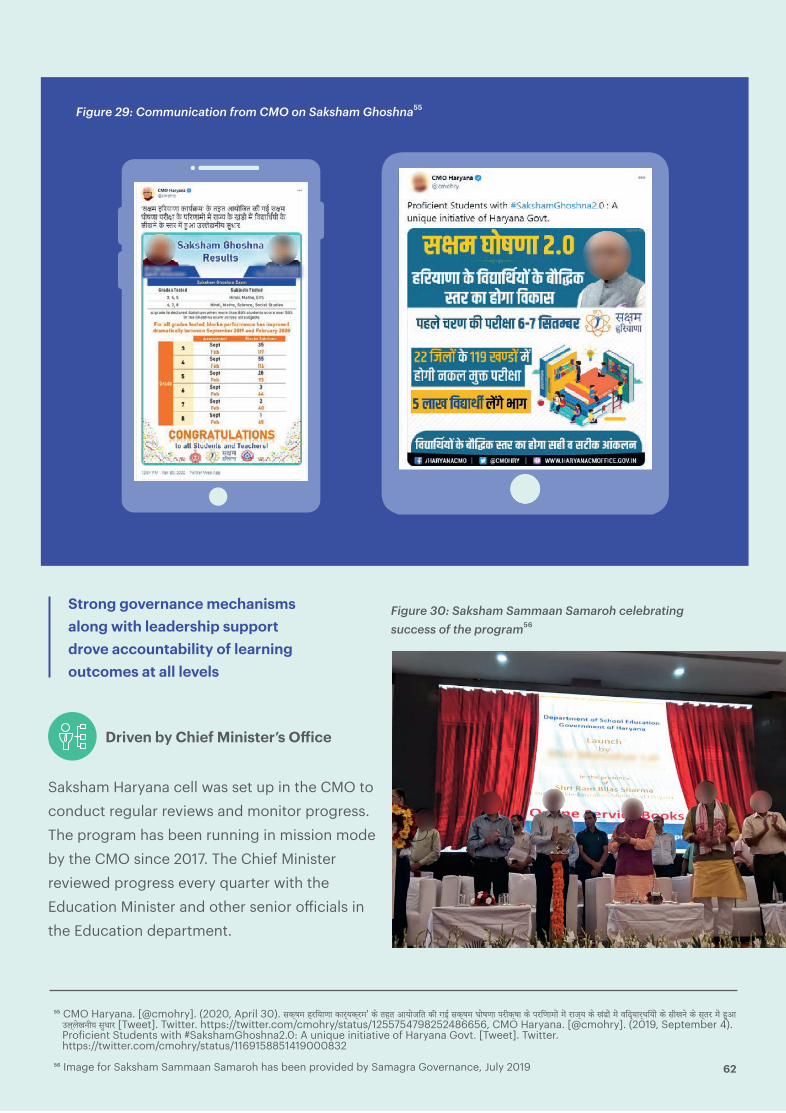
62
!! CMO Haryana. [@cmohry]. (2020, April 30). !"#$% &'()*+* "*'#)"#'%' ", -&- .)/0(- "1 23 !"#$% 4/$+* 5'1"#$* ", 5'(+*%/6 %,6 '*0#) ", 768/6 %,6 9(:#)*'#;()/6 ", !17<, ", !#-' %,6 &=. >?#?,7<1) !=@*' [Tweet]. Twitter. https://twitter.com/cmohry/status/1255754798252486656, CMO Haryana. [@cmohry]. (2019, September 4). Pro%icient Students with #SakshamGhoshna2.0: A unique initiative of Haryana Govt. [Tweet]. Twitter. https://twitter.com/cmohry/status/1169158851419000832
!) Image for Saksham Sammaan Samaroh has been provided by Samagra Governance, July 2019
Strong governance mechanisms along with leadership support drove accountability of learning outcomes at all levels
Figure 29: Communication from CMO on Saksham Ghoshna&&
Figure 30: Saksham Sammaan Samaroh celebrating success of the program&*
Driven by Chief Minister’s O"ice
Saksham Haryana cell was set up in the CMO to conduct regular reviews and monitor progress. The program has been running in mission mode by the CMO since 2017. The Chief Minister reviewed progress every quarter with the Education Minister and other senior o(icials in the Education department.

63
A well-de#ined competency framework tied curriculum, pedagogical practices and assessments to clear learning objectives across grades and subjects. This provided a guided path for teachers and students towards the goal of grade level competency
Haryana created a uni%ied learning outcome framework (LOF), Saksham Talika, that was aligned to NCERT’s 2017 learning-level outcome framework. The LOF was created by SCERT for Grades 1 – 5 for English, Hindi and Mathematics and laid out the learning outcomes to be taught for each summative assessment. Saksham Talika was structured to be a practical and useful document for teachers and administrators. It lists competencies for each grade level, maps to teaching-learning resources and acts as a tracking mechanism that teachers can use. Even with Saksham Talika in place, however, the idea of a competency framework was an abstract concept for teachers. The assessments used as part of Saksham Ghoshna helped teachers visualize how competency frameworks can aid in teaching and learning. Teachers were then able to use this framework to develop competency-linked question papers to assess students.
One of the primary reasons for the overall success of the program was that the state decentralized accountability of results to the block. This made school principals, teachers and block-level o(icers directly responsible for driving learning outcomes. Haryana instituted an incentive mechanism through which education o(icials at the block and cluster levels were recognised and rewarded for achieving Saksham status.
Accountabilty and transparency across state, district and sub-district levels
!+ Further details on Saksham Talika are available at the following link : https://sites.google.com/view/digilepharyana/%E0%A4%B8%E0%A4%95%E0%A4%B7%E0%A4%AE-%E0%A4%A4%E0%A4%B2%E0%A4%95
Following Image has been adapted from the detailed Saksham Talika available on the DigiLEP website.
Figure 31: Illustrative image of competencies in Saksham Talika&,
LEPCycle
LEP
2 (J
uly)
| 2
days
ENG410 26
25
Code Pre-requisite Competencies
LEP Teacher Manual
Lesson
ENG411
Students can write 5$10 simple sentences on given topics/ pictures using vocabulary learnt and with appropriate sentence structure/s
Students can learn new vocabulary from the environment /stories /poems and use them in context in 2$3 written sentences
ENGLISH | GRADE 5
SAKSHAM TALIKA

determined the common learning standards that should comprise grade-level competency. Additionally, a state-wide normative study was conducted to identify norm-referenced benchmarks balanced with the syllabus-based criterion referenced benchmark. Benchmarking helped stakeholders understand and assess the data and focus on speci%ied learning objectives to achieve grade-level competency. For a detailed note on grade level competency, refer to Appendix 7.
64
27,28ENG413Students can use nouns, adjectives (comparative and ending with -ing), conjunctions, prepositions, pre%ix and su(ix, tenses and linkers such as %irst, next etc. to indicate connections between words and sentences in speech and in writing
SATCycle
ENG503 2,3
2,3
2,3
Code Grade Level Competencies
Textbook (My Book of English-5)
ENG504
ENG508
Students can %ind simple information from tables and maps, etc.
Students can answer questions (starting with what, how, where, why) in 3$5 sentences using recall, analysis, and sequencing based on grade 5 appropriate passage
Students can write 5$7 sentences on a given topic using theme related words e.g., traveling experience, annual day at school, etc.
2
2,3
ENG511
ENG513
Students can build grade 5 appropriate vocabulary using crossword puzzles, word chains, etc.
Students can identify and appropriately use nouns, pronouns, verbs, a(irmative and negative sentences, contractions of do not/ did not and cannot/ was not and frame wh- questions
SAT
2 (J
uly)
| re
st o
f the
tim
e
Chapters
Scienti!ically designed and administered assessments ensured that appropriate competencies were tested on a representative sample of students and reliable data was collected for analysis
Haryana recognized the urgency for designing competency-linked high-quality assessments for driving improvement in learning outcomes. It, thus, chose to complement existing state capabilities with the technical expertise of CGI and EI.
Test design
CG Insights followed Item Response Theory (IRT) and developed assessment items, which lent themselves to evaluating learner ability
irrespective of test instrument di(iculty. The process used to develop standardized test instruments in Haryana has been described in the Implementation toolkit in Chapter 2. The assessment was carried out for close to 500 to 600 students per block in every grade. For Saksham 2.0, this resulted in data collection for almost 400,000 students.
De#ining grade-level competency
Since a signi%icant part of Haryana’s goal was to ensure grade-level competency, it was essential to benchmark competency levels for each of the grades tested. A rigorous benchmarking exercise was conducted by CG Insights to determine the grade-level cut-o- for Mathematics andLanguage. A panel of teachers and experts
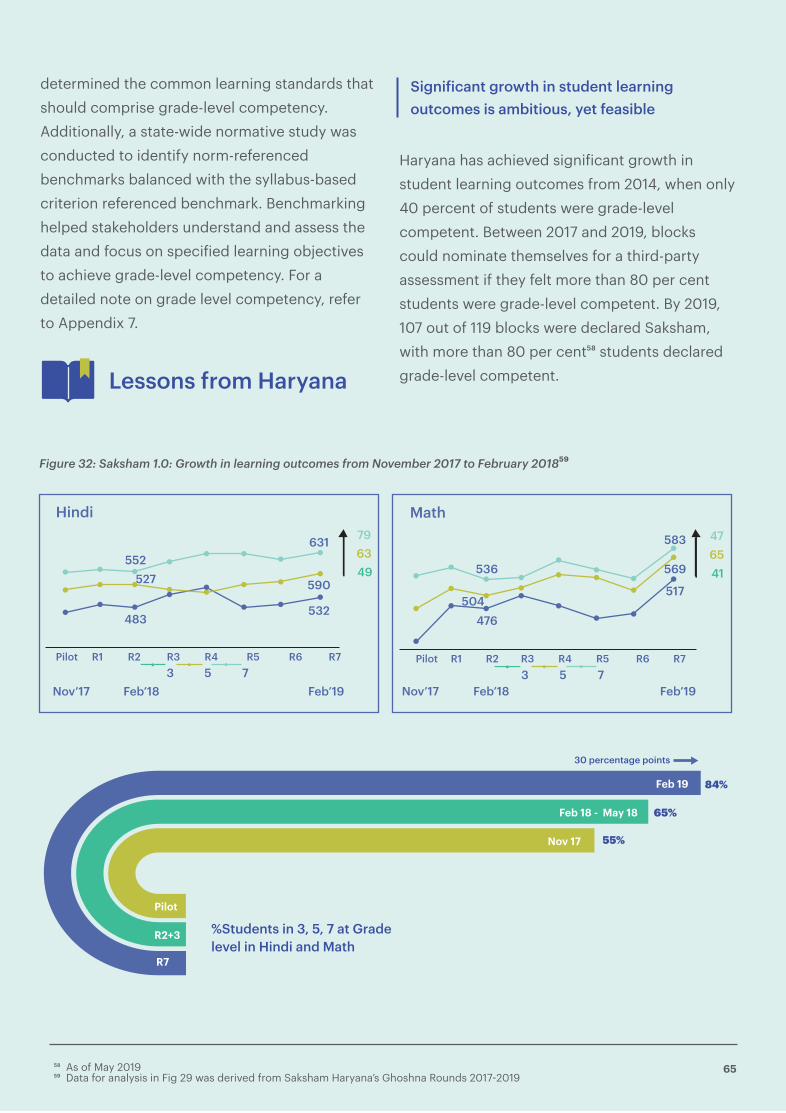
!. As of May 2019!/ Data for analysis in Fig 29 was derived from Saksham Haryana’s Ghoshna Rounds 2017$2019
65
Haryana has achieved signi%icant growth in student learning outcomes from 2014, when only 40 percent of students were grade-level competent. Between 2017 and 2019, blocks could nominate themselves for a third-party assessment if they felt more than 80 per cent students were grade-level competent. By 2019, 107 out of 119 blocks were declared Saksham, with more than 80 per cent&0 students declared grade-level competent.
determined the common learning standards that should comprise grade-level competency. Additionally, a state-wide normative study was conducted to identify norm-referenced benchmarks balanced with the syllabus-based criterion referenced benchmark. Benchmarking helped stakeholders understand and assess the data and focus on speci%ied learning objectives to achieve grade-level competency. For a detailed note on grade level competency, refer to Appendix 7.
Lessons from Haryana
Signi!icant growth in student learning outcomes is ambitious, yet feasible
Figure 32: Saksham 1.0: Growth in learning outcomes from November 2017 to February 2018"#
Pilot
Hindi
Nov’17 Feb’183 5 7
Feb’19
R1 R2 R3
483532
590
631552
527
R4 R5 R6 R7
796349
Math
Nov’17 Feb’183 5 7
Feb’19
476
517
569
583
504
536
Pilot R1 R2 R3 R4 R5 R6 R7
476541
%Students in 3, 5, 7 at Grade level in Hindi and Math
84%
65%
55%Nov 17
Feb 18 - May 18
Feb 19
Pilot
R2+3
R7
30 percentage points
Since a signi%icant part of Haryana’s goal was to ensure grade-level competency, it was essential to benchmark competency levels for each of the grades tested. A rigorous benchmarking exercise was conducted by CG Insights to determine the grade-level cut-o- for Mathematics andLanguage. A panel of teachers and experts

66
In the academic year 2019$20, the scope of Saksham was increased to cover grades 3$8 in Math, Hindi, Science, Social Science and EVS. With focused interventions, teacher inputs and accountability and monitoring, the number of blocks that were at grade level for all grades increased from 0 to 22 in just six months. Table 7 below indicates that it was easier to achieve grade level competency in primary grades (3 to 5) compared to elementary grades ( 6 to 8).
Table 6: Saksham 1.0: Blocks declared Saksham during di!erent rounds of assessment
Table 7: Saksham 2.0: Comparison of Saksham blocks in assessments conducted in September 2019 and February 2020
Parameter Grade
Assessment Cycle
# of blocks
Saksham Blocks
119 119 119 119 119 119
35 117 55 116 28 93
Sept ‘19 Feb ‘20 Sept ‘19 Feb ‘20 Sept ‘19 Feb ‘20
3 4 5
15
25
93
25
3023
9 13
4 13685112 1 3
No. of blocks assessed No. of blocks declared Saksham
Total : 119 (unique blocks) Total : 107 (unique blocks)
May 2018
May 2019
February 2019 *
(Mega Round)
November 2018
September 2018
August 2018
December 2017
Round February 2018
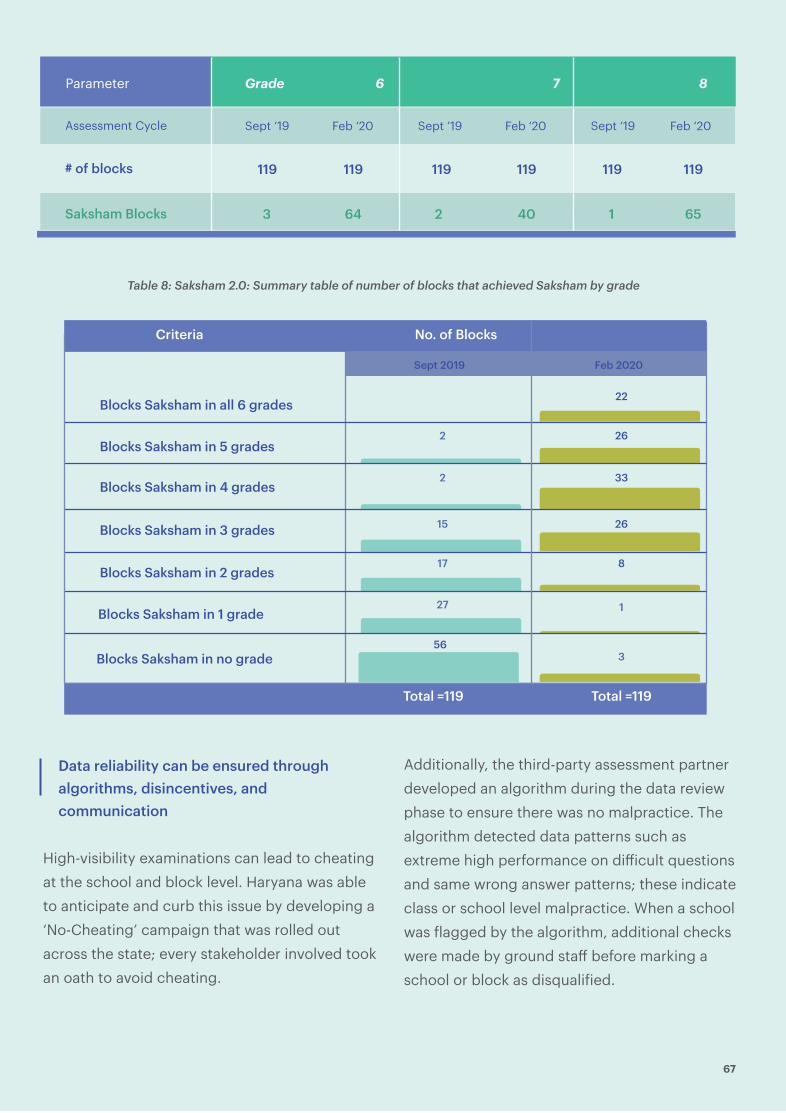
67
Table 8: Saksham 2.0: Summary table of number of blocks that achieved Saksham by grade
High-visibility examinations can lead to cheating at the school and block level. Haryana was able to anticipate and curb this issue by developing a ‘No-Cheating’ campaign that was rolled out across the state; every stakeholder involved took an oath to avoid cheating.
# of blocks
Saksham Blocks 3 64 2 40 1 65
119 119 119 119 119 119
Assessment Cycle Sept ‘19 Feb ‘20 Sept ‘19 Feb ‘20 Sept ‘19 Feb ‘20
Parameter Grade 6 7 8
Blocks Saksham in 3 grades
Blocks Saksham in 2 grades
Blocks Saksham in 1 grade
Blocks Saksham in no grade
Total =119 Total =119
Data reliability can be ensured through algorithms, disincentives, and communication
Additionally, the third-party assessment partner developed an algorithm during the data review phase to ensure there was no malpractice. The algorithm detected data patterns such as extreme high performance on di(icult questions and same wrong answer patterns; these indicate class or school level malpractice. When a school was %lagged by the algorithm, additional checks were made by ground sta- before marking a school or block as disquali%ied.
2
2
15
Blocks Saksham in all 6 grades
Blocks Saksham in 5 grades
Blocks Saksham in 4 grades
1
3
22
26
26
17
27
8
33
56
Criteria
Sept 2019
No. of Blocks
Feb 2020

68)1 Image for No-Cheating Campaign has been provided by Samagra Governance
Initially the assessments conducted in Haryana were funded through external partners. However, given the success of the program and a steady growth in student learning outcomes, Haryana allocated a budget (including costs for test design, administration, data usage) for conducting LSAs in the state, and undertook an RFP process to on-board a technical partner to design and support administration of the LSAs. Data from technical partners shows that it costs approximately INR 1.5 crore to conduct one round of assessment for 4 subjects for grades 3 – 8 across all 119 blocks in the state.
Showcasing results will lead to state budget allocation for assessments
Figure 33. No-Cheating Campaign conducted in Haryana$%
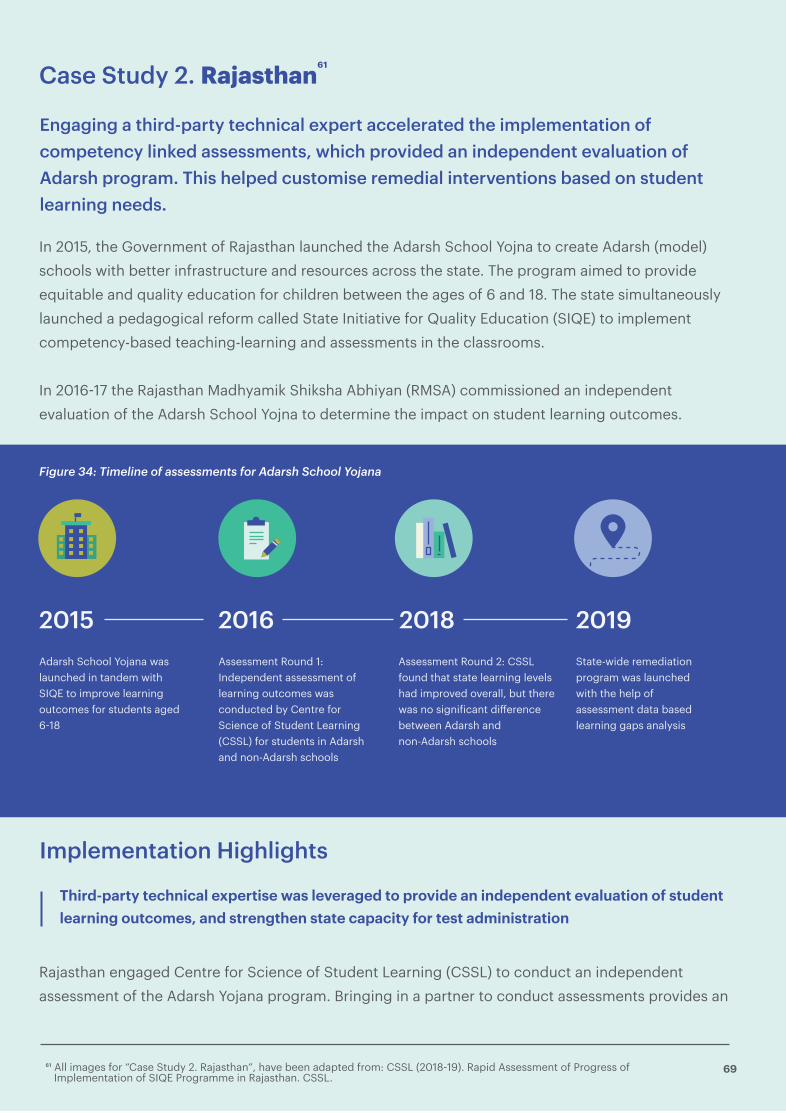
69)2 All images for “Case Study 2. Rajasthan”, have been adapted from: CSSL (2018$19). Rapid Assessment of Progress of Implementation of SIQE Programme in Rajasthan. CSSL.
Case Study 2. Rajasthan&'
Engaging a third-party technical expert accelerated the implementation of competency linked assessments, which provided an independent evaluation of Adarsh program. This helped customise remedial interventions based on student learning needs.
In 2015, the Government of Rajasthan launched the Adarsh School Yojna to create Adarsh (model) schools with better infrastructure and resources across the state. The program aimed to provide equitable and quality education for children between the ages of 6 and 18. The state simultaneously launched a pedagogical reform called State Initiative for Quality Education (SIQE) to implement competency-based teaching-learning and assessments in the classrooms.
In 2016$17 the Rajasthan Madhyamik Shiksha Abhiyan (RMSA) commissioned an independent evaluation of the Adarsh School Yojna to determine the impact on student learning outcomes.
Rajasthan engaged Centre for Science of Student Learning (CSSL) to conduct an independent assessment of the Adarsh Yojana program. Bringing in a partner to conduct assessments provides an
Figure 34: Timeline of assessments for Adarsh School Yojana
Adarsh School Yojana was launched in tandem with SIQE to improve learning outcomes for students aged 6$18
Assessment Round 1: Independent assessment of learning outcomes was conducted by Centre for Science of Student Learning (CSSL) for students in Adarsh and non-Adarsh schools
Assessment Round 2: CSSL found that state learning levels had improved overall, but there was no signi%icant di-erence between Adarsh and non-Adarsh schools
State-wide remediation program was launched with the help of assessment data based learning gaps analysis
2015 2016 2018 2019
Third-party technical expertise was leveraged to provide an independent evaluation of student learning outcomes, and strengthen state capacity for test administration
Implementation Highlights
autonomous and credible review of progress. The state had clear objectives in engaging CSSL, which included:

70)3 Both Adarsh and non-Adarsh schools were either secondary (up to Grade 10) or senior secondary (up to Grade 12) schools.
Rajasthan engaged Centre for Science of Student Learning (CSSL) to conduct an independent assessment of the Adarsh Yojana program. Bringing in a partner to conduct assessments provides an
High quality tests were designed, and assessments were conducted in a standardized manner across a representative sample of schools
Evaluate baseline student performance levels in Adarsh and Non-Adarsh schools*4
Assess changes in student learning outcomes for Grades 3 and 5 in Language, Math and English. For Grade 8, only one round of assessment was conducted in Language, Math, English and Social Science
Identify gaps in student learning across competencies
Generate insights on the di-erence in student performance across districts
CSSL supported the state in building capacity and dedicated resources for LSA by conducting workshops for the SCERT team on aspects such as test design, item writing, test administration, data analysis and report writing. DIETs across the state put together teams to administer the assessment and were trained by CSSL to ensure standardization of the test conduction process.
CSSL developed a list of competencies and cognitive domains to be tested for each subject and grade level. All questions in the test paper were aligned to a skill and cognitive domain.
The full-length learning assessments (105 minutes per subject) included multiple-choice questions and writing tasks, and oral questions for students in Grade 3. Some sections of the test papers were read aloud to students by trained evaluators in Grade 3 to address reading di(iculties, if any. The questions were developed to test not just recall and procedure, but also understanding, application, reasoning, analytical thinking and creativity of students (illustrative questions can be referenced in Appendix 6).
The assessment was conducted with a sample of 690 schools across all 33 districts in Rajasthan. Approximately 13,000 students in Grade 3, 16,000 students in Grade 5 and 3,900 students in Grade 8 were assessed in February 2019 for Round 2 of the assessment. In order to ensure reliability of data, teachers from neighboring schools were trained and were deputed as invigilators for the assessment. The extensive sample ensured that speci%ic insights could be generated at a district level and di-erences between districts could be studied.
autonomous and credible review of progress. The state had clear objectives in engaging CSSL, which included:

71
CSSL used item response theory to conduct analysis of the assessments. Data was cut across multiple parameters to showcase a true picture of learning in the state. A glimpse of the analysis conducted in Rajasthan is provided below:
Overall performance of students across Rounds 1 and 2The percentage of students who could answer at least 6 out of 10 questions increased from 22$52 per cent to 34$66 per cent in di-erent grades and subjects tested
Table 9: Sample of students assessed in Round 2
A detailed analysis across multiple parameters helped generate insights on learning levels
Grades 3 and 5
Districts covered 33
690
Language, Math, English Language, Math, English, Science, Social Science
198
30,000 4,000
33
Number of schools
Subjects tested
Number of students tested
Grade 8
Student score distributionA shift to the right was observed in almost all classes and subjects
Figure 35: Example of student score distribution for Grade 3
0
5
10
15
20
25
30
% Score
10-20
20-30
30-40
40-50
50-60
60-70
70-80
80-90
90-100
0-10
10-20
20-30
30-40
40-50
50-60
60-70
70-80
80-90
90-100
0-10
10-20
20-30
30-40
40-50
50-60
60-70
70-80
80-90
90-100
0-10
% o
f stu
dent
s
Round 1 (2016(17) Round 2 (2018(19)
Language 3 Math 3 English 3
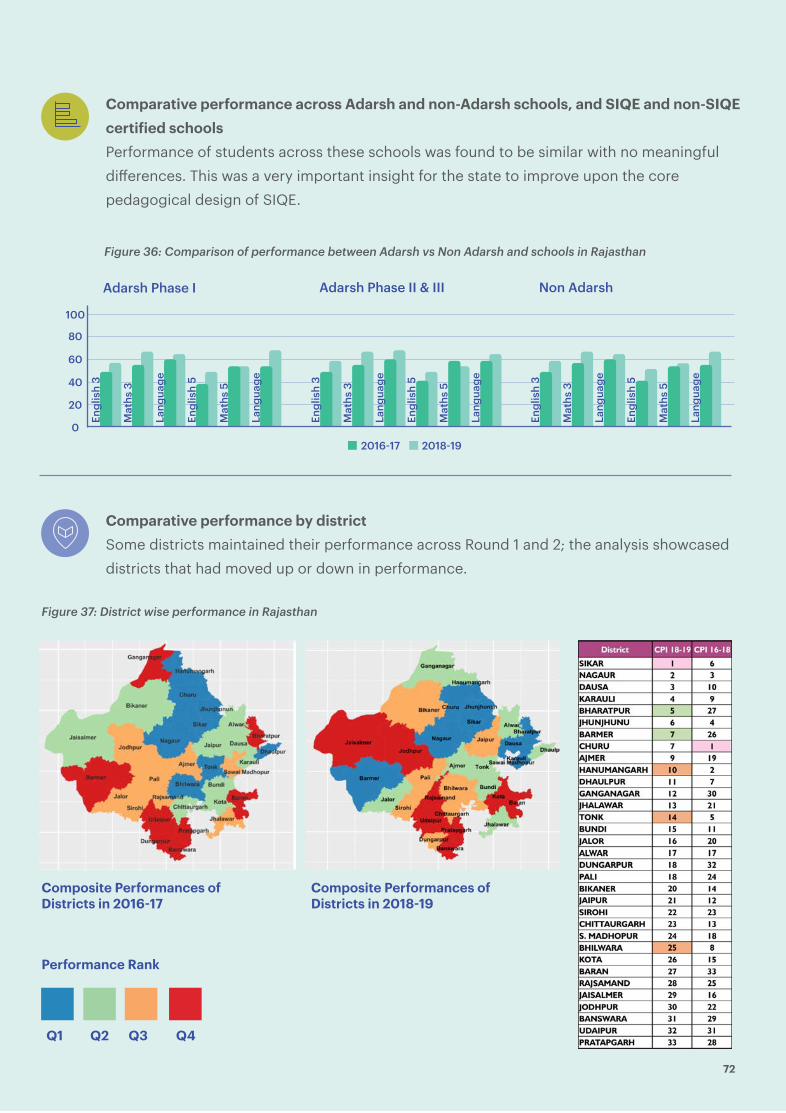
72
Comparative performance across Adarsh and non-Adarsh schools, and SIQE and non-SIQE certi#ied schools Performance of students across these schools was found to be similar with no meaningful di-erences. This was a very important insight for the state to improve upon the core pedagogical design of SIQE.
Comparative performance by districtSome districts maintained their performance across Round 1 and 2; the analysis showcased districts that had moved up or down in performance.
Composite Performances of Districts in 2016!17
Performance Rank
Q1 Q2 Q3 Q4
Composite Performances of Districts in 2018!19
Engl
ish
3
Mat
hs 3
Lang
uage
Engl
ish
5
Mat
hs 5
Lang
uage
Engl
ish
3
Mat
hs 3
Lang
uage
Engl
ish
5
Mat
hs 5
Lang
uage
0
20
40
60
80
100
Adarsh Phase I Adarsh Phase II & III Non Adarsh
Engl
ish
3
Mat
hs 3
Lang
uage
Engl
ish
5
Mat
hs 5
Lang
uage
2016(17 2018(19
Figure 36: Comparison of performance between Adarsh vs Non Adarsh and schools in Rajasthan
Figure 37: District wise performance in Rajasthan
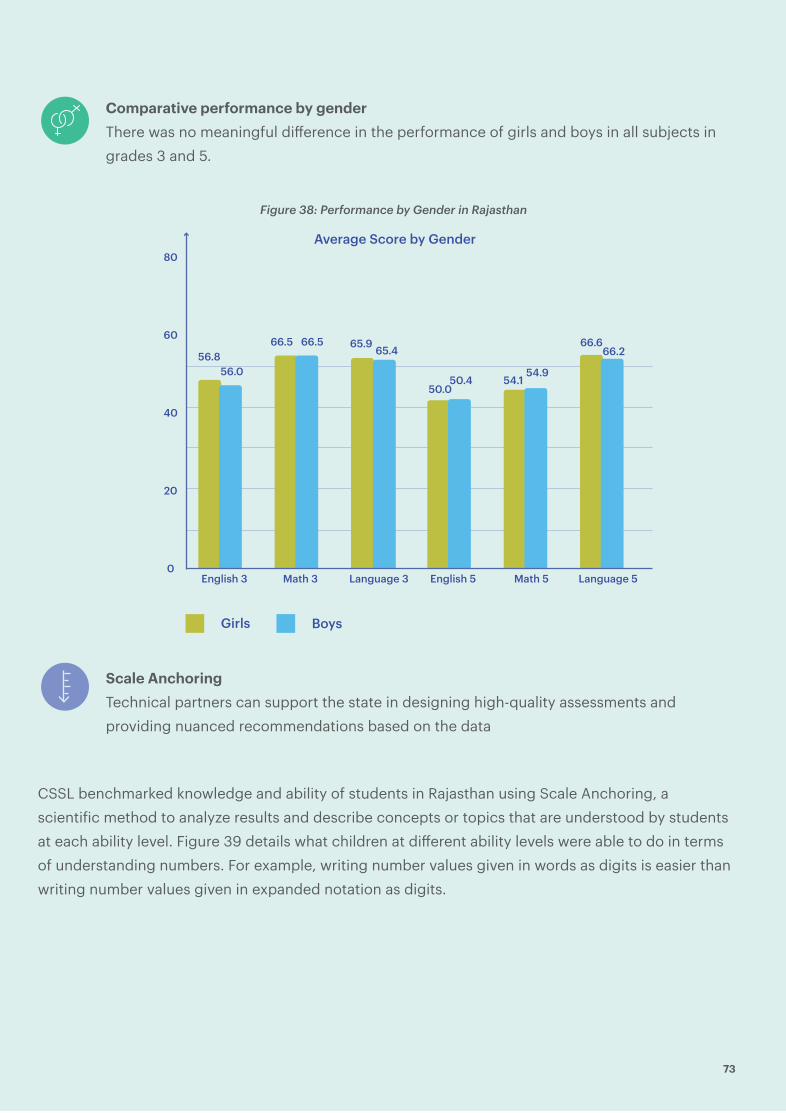
73
Scale AnchoringTechnical partners can support the state in designing high-quality assessments and providing nuanced recommendations based on the data
CSSL benchmarked knowledge and ability of students in Rajasthan using Scale Anchoring, a scienti%ic method to analyze results and describe concepts or topics that are understood by students at each ability level. Figure 39 details what children at di-erent ability levels were able to do in terms of understanding numbers. For example, writing number values given in words as digits is easier than writing number values given in expanded notation as digits.
Comparative performance by genderThere was no meaningful di-erence in the performance of girls and boys in all subjects in grades 3 and 5.
Figure 38: Performance by Gender in Rajasthan
0
20
40
English 3 English 5 Math 5 Language 5Math 3 Language 3
Average Score by Gender
60
80
Girls Boys
56.856.0
66.5 66.5 65.9 65.4
50.050.4 54.1
54.9
66.666.2
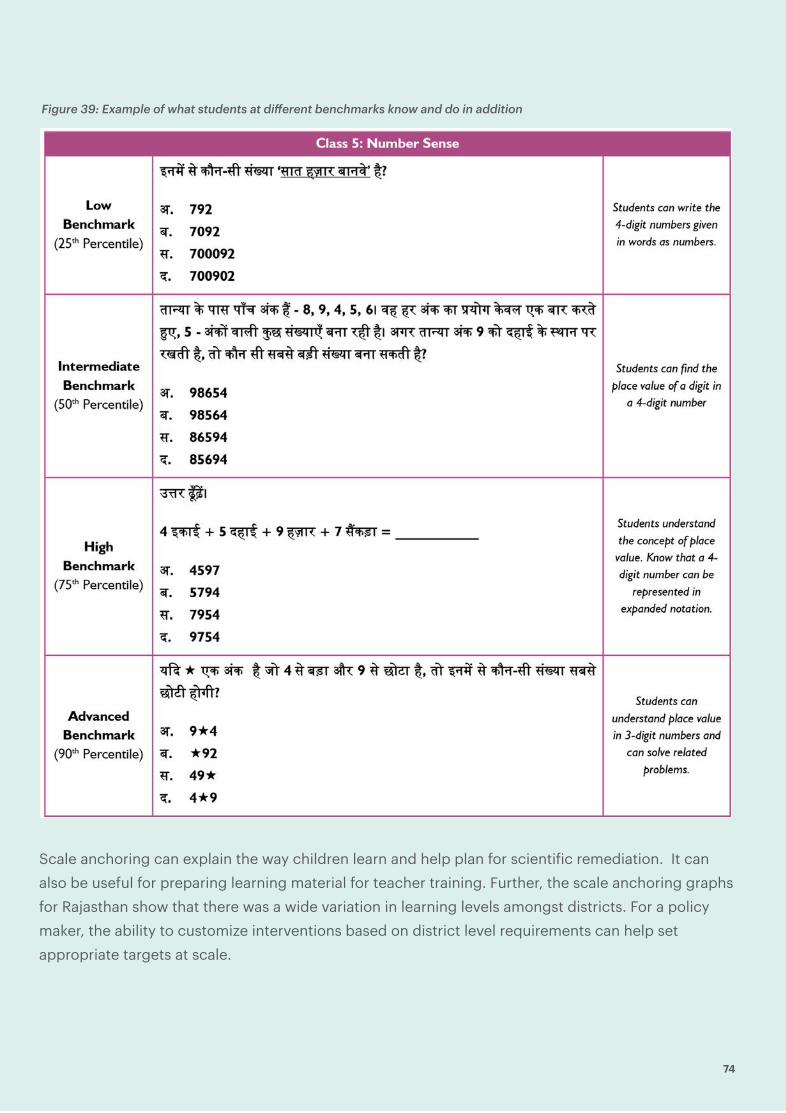
74
Scale anchoring can explain the way children learn and help plan for scienti%ic remediation. It can also be useful for preparing learning material for teacher training. Further, the scale anchoring graphs for Rajasthan show that there was a wide variation in learning levels amongst districts. For a policy maker, the ability to customize interventions based on district level requirements can help set appropriate targets at scale.
Figure 39: Example of what students at di!erent benchmarks know and do in addition

Figure 40: Learning outcomes by district
75
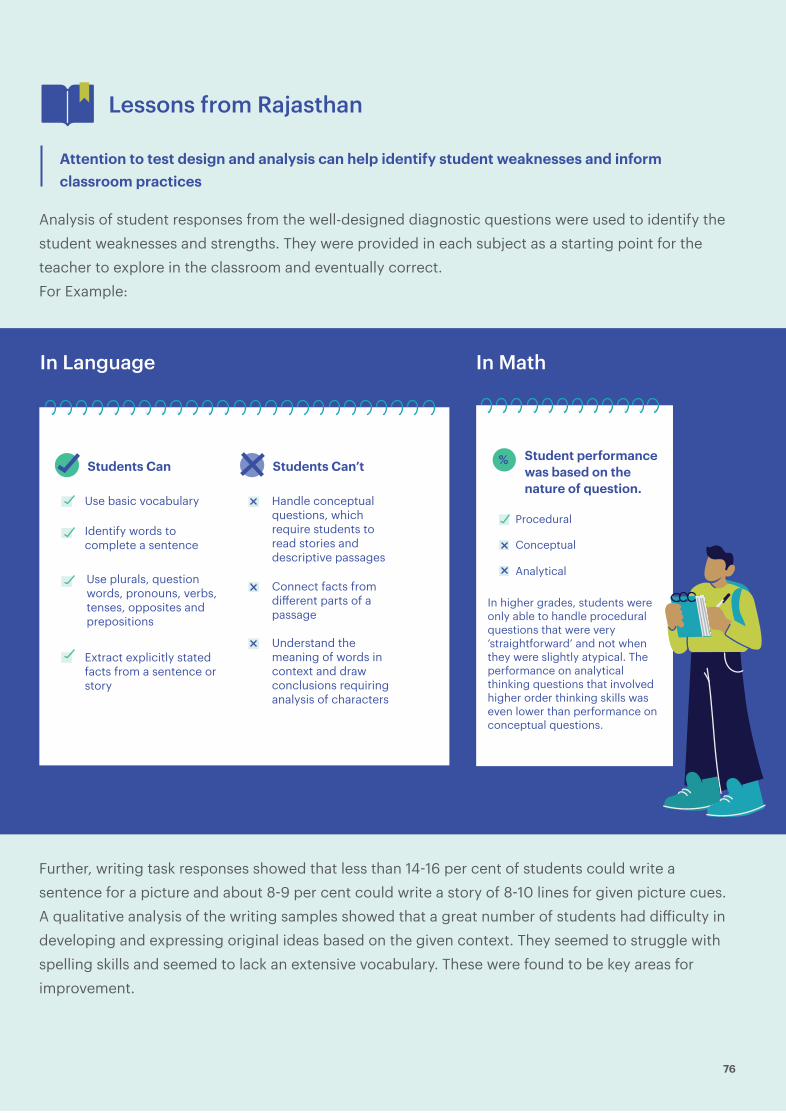
76
Lessons from Rajasthan
Attention to test design and analysis can help identify student weaknesses and inform classroom practices
Analysis of student responses from the well-designed diagnostic questions were used to identify the student weaknesses and strengths. They were provided in each subject as a starting point for the teacher to explore in the classroom and eventually correct. For Example:
Further, writing task responses showed that less than 14$16 per cent of students could write a sentence for a picture and about 8$9 per cent could write a story of 8$10 lines for given picture cues. A qualitative analysis of the writing samples showed that a great number of students had di(iculty in developing and expressing original ideas based on the given context. They seemed to struggle with spelling skills and seemed to lack an extensive vocabulary. These were found to be key areas for improvement.
In Language In Math
Identify words to complete a sentence
Use basic vocabulary
Use plurals, question words, pronouns, verbs, tenses, opposites and prepositions
Extract explicitly stated facts from a sentence or story
Students Can
Handle conceptual questions, which require students to read stories and descriptive passages
Connect facts from di-erent parts of a passage
Understand the meaning of words in context and draw conclusions requiring analysis of characters
Students Can’tStudent performance was based on the nature of question.
Procedural
Conceptual
Analytical
In higher grades, students were only able to handle procedural questions that were very ‘straightforward’ and not when they were slightly atypical. The performance on analytical thinking questions that involved higher order thinking skills was even lower than performance on conceptual questions.
%

Despite the overall positive trends in the assessment, a closer look at the data indicated that 30!50 per cent students in the state were still likely behind grade-level. This indicated a need for targeted remedial support. The state designed competency-based workbooks to bring students to grade-level. Students received these workbooks as per their learning level, and not their grade level. The design of these workbooks was based on the gaps highlighted by the CSSL assessment and the benchmarks released from the assessment for what students know and can do at di-erent ability levels. As illustrated in the image below, remedial workbooks focused on speci%ic concepts that students struggled with. In addition, questions in the workbooks addressed the misconceptions highlighted by the assessment.
Figure 41: Workbooks for remediation
Customized Workbooks
3.1. Reads, writes, compares and understands place value till 999
3.1.1.Students are able to represent 2-digit numbers given as tens and ones as bundles of sticks and loose sticks
3.1.2.Students understand the concept of place value and know that a 3-digit number can be represented in expanded notation as a sum of number of hundreds, tens and ones in it (placed in random order)
3.1.3.Students can make and write the largest 3-digit number using the given digits
3.1.4.Students understand the number line and can estimate 2-digit numbers on the number line
3.1.5.Students are able to write 3-digit numbers in the numeral form when their number names are given and vice versa
3.1.6.Students understand how a 2-digit number can be represented as tens and ones
3.1.9.Students can identify a number right before/after a given number
Skill area: Number sense
Student performance in Math Grade 3 paper
65%
Worksheets on concepts students are
struggling with
Worksheets on remaining concepts
Learning assessment data can be used by the state to design targeted interventions
% of students that struggle with the concept
90% 25% 50% 75% Concept not tested
Competency
Concept Percentage
35%
Rajasthan’s Workbooks have been designed to provide maximum support on the most critical concepts.
3.1.7.Students are able to compare and arrange the given 3-digit numbers from smallest to biggest
3.1.8.Students understand place value of 3-digit numbers using squares, rows and columns of squares and grids of squares
Majority of practice time is designed to be spent on concepts that the data shows children are struggling with.77
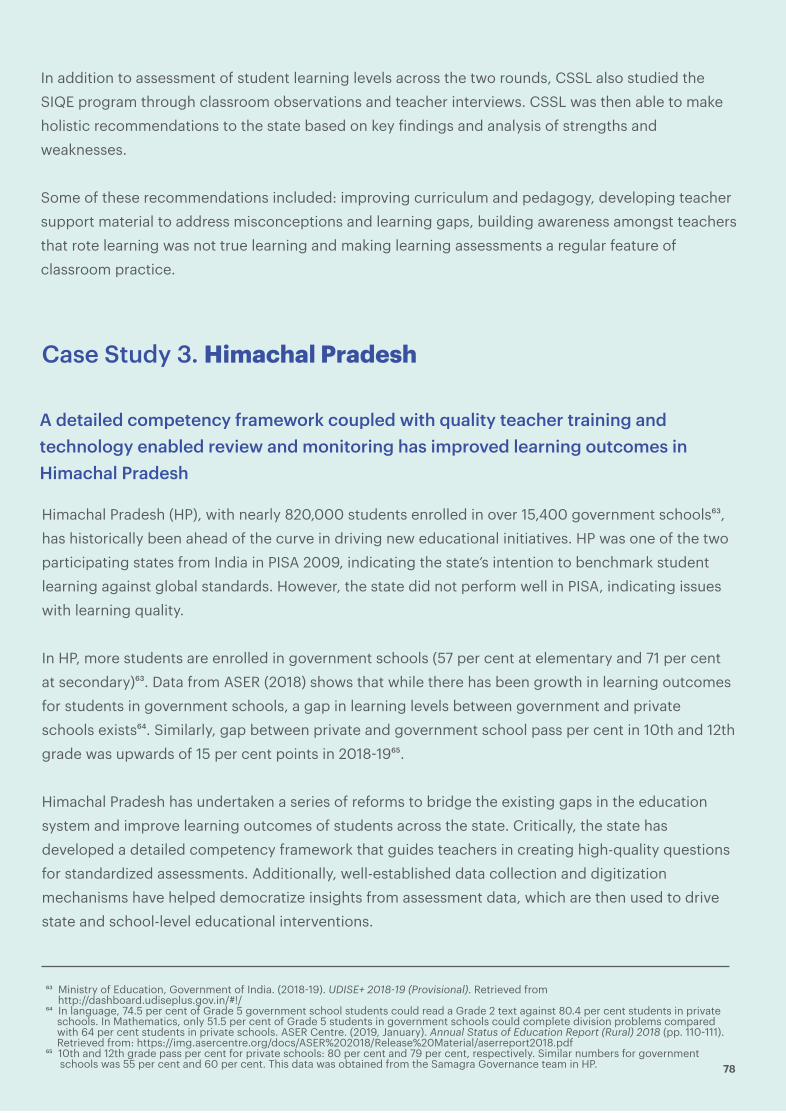
78
)" Ministry of Education, Government of India. (2018$19). UDISE+ 2018!19 (Provisional). Retrieved from http://dashboard.udiseplus.gov.in/#!/)# In language, 74.5 per cent of Grade 5 government school students could read a Grade 2 text against 80.4 per cent students in private schools. In Mathematics, only 51.5 per cent of Grade 5 students in government schools could complete division problems compared with 64 per cent students in private schools. ASER Centre. (2019, January). Annual Status of Education Report (Rural) 2018 (pp. 110$111). Retrieved from: https://img.asercentre.org/docs/ASER%202018/Release%20Material/aserreport2018.pdf)! 10th and 12th grade pass per cent for private schools: 80 per cent and 79 per cent, respectively. Similar numbers for government schools was 55 per cent and 60 per cent. This data was obtained from the Samagra Governance team in HP.
Himachal Pradesh (HP), with nearly 820,000 students enrolled in over 15,400 government schools*5, has historically been ahead of the curve in driving new educational initiatives. HP was one of the two participating states from India in PISA 2009, indicating the state’s intention to benchmark student learning against global standards. However, the state did not perform well in PISA, indicating issues with learning quality.
In HP, more students are enrolled in government schools (57 per cent at elementary and 71 per cent at secondary)*5. Data from ASER (2018) shows that while there has been growth in learning outcomes for students in government schools, a gap in learning levels between government and private schools exists*'. Similarly, gap between private and government school pass per cent in 10th and 12th grade was upwards of 15 per cent points in 2018$19*&.
Himachal Pradesh has undertaken a series of reforms to bridge the existing gaps in the education system and improve learning outcomes of students across the state. Critically, the state has developed a detailed competency framework that guides teachers in creating high-quality questions for standardized assessments. Additionally, well-established data collection and digitization mechanisms have helped democratize insights from assessment data, which are then used to drive state and school-level educational interventions.
Case Study 3. Himachal Pradesh
A detailed competency framework coupled with quality teacher training and technology enabled review and monitoring has improved learning outcomes in Himachal Pradesh
In addition to assessment of student learning levels across the two rounds, CSSL also studied the SIQE program through classroom observations and teacher interviews. CSSL was then able to make holistic recommendations to the state based on key %indings and analysis of strengths and weaknesses.
Some of these recommendations included: improving curriculum and pedagogy, developing teacher support material to address misconceptions and learning gaps, building awareness amongst teachers that rote learning was not true learning and making learning assessments a regular feature of classroom practice.

79
Figure 42: Timeline of reform in Himachal Pradesh
Himachal Pradesh has developed a comprehensive competency framework that drives teaching-learning in the classroom and supports design of standardized summative assessments
In 2016, the government of Himachal Pradesh was one of the %irst states in India to institute a state-wide learning competency framework (Seekhne Ka Pratifal), aligned to NCERT guidelines, and a learning outcomes (LO) framework (Samprapti Soochi). There was an e-ort to build widespread awareness amongst teachers on the LO framework and posters were distributed and pasted on the walls of all schools. The state supported teachers to teach at the LO level by:
A state-wideassessment of studentsin Himachal Pradeshwas conducted by Educational Initiatives
2014
Himachal Pradesh became one of the %irst states to institute a state-wise learning competency framework (Seekhne ka Pratifal),aligned to NCERT guidelines
20162017 State Resource Group further de%ined learning outcomes (LO) for eachgrade and subject, mapped to the National Curriculum Framework
The Summative Assessment 2 (SA2) was remodeled into a low- stakes learning outcomes-based assessment to measure learning outcomes at the elementary level
2018 Specialized state resourcesdeveloped a database ofcompetency-linked questions for each grade and subject to help familiarize teachers and students with LO-based questions
2019
A uni%ied learning outcome framework (ULOF) has been developed and released by the state. This framework informs teaching-learning practices, and assessment design.
Present
Implementation Highlights
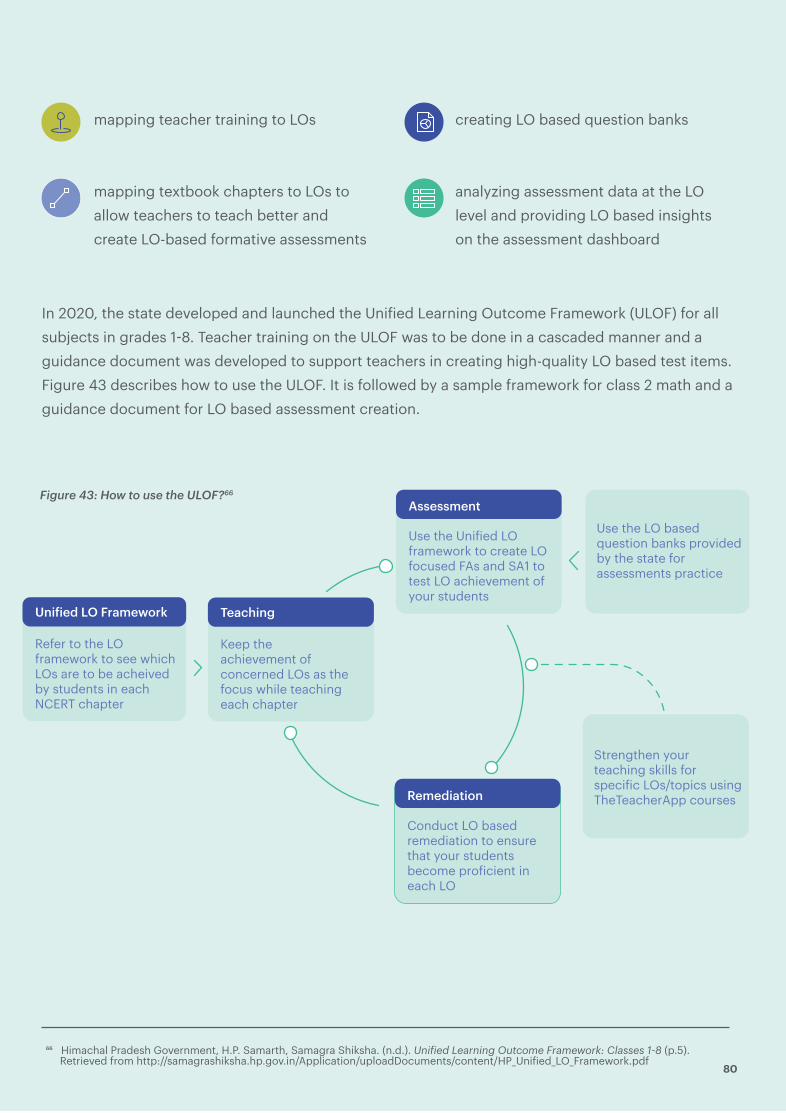
80)) Himachal Pradesh Government, H.P. Samarth, Samagra Shiksha. (n.d.). Uni"ied Learning Outcome Framework: Classes 1!8 (p.5). Retrieved from http://samagrashiksha.hp.gov.in/Application/uploadDocuments/content/HP_Uni%ied_LO_Framework.pdf
mapping teacher training to LOs creating LO based question banks
analyzing assessment data at the LO level and providing LO based insights on the assessment dashboard
mapping textbook chapters to LOs to allow teachers to teach better and create LO-based formative assessments
In 2020, the state developed and launched the Uni%ied Learning Outcome Framework (ULOF) for all subjects in grades 1$8. Teacher training on the ULOF was to be done in a cascaded manner and a guidance document was developed to support teachers in creating high-quality LO based test items. Figure 43 describes how to use the ULOF. It is followed by a sample framework for class 2 math and a guidance document for LO based assessment creation.
Conduct LO basedremediation to ensurethat your studentsbecome pro%icient ineach LO
Strengthen yourteaching skills forspeci%ic LOs/topics usingTheTeacherApp courses
Refer to the LOframework to see whichLOs are to be acheived by students in eachNCERT chapter
Use the Uni%ied LO framework to create LOfocused FAs and SA1 totest LO achievement of your students
Use the LO basedquestion banks providedby the state for assessments practice
Keep theachievement ofconcerned LOs as thefocus while teachingeach chapter
Uni!ied LO Framework
Assessment
Remediation
Teaching
Figure 43: How to use the ULOF?66
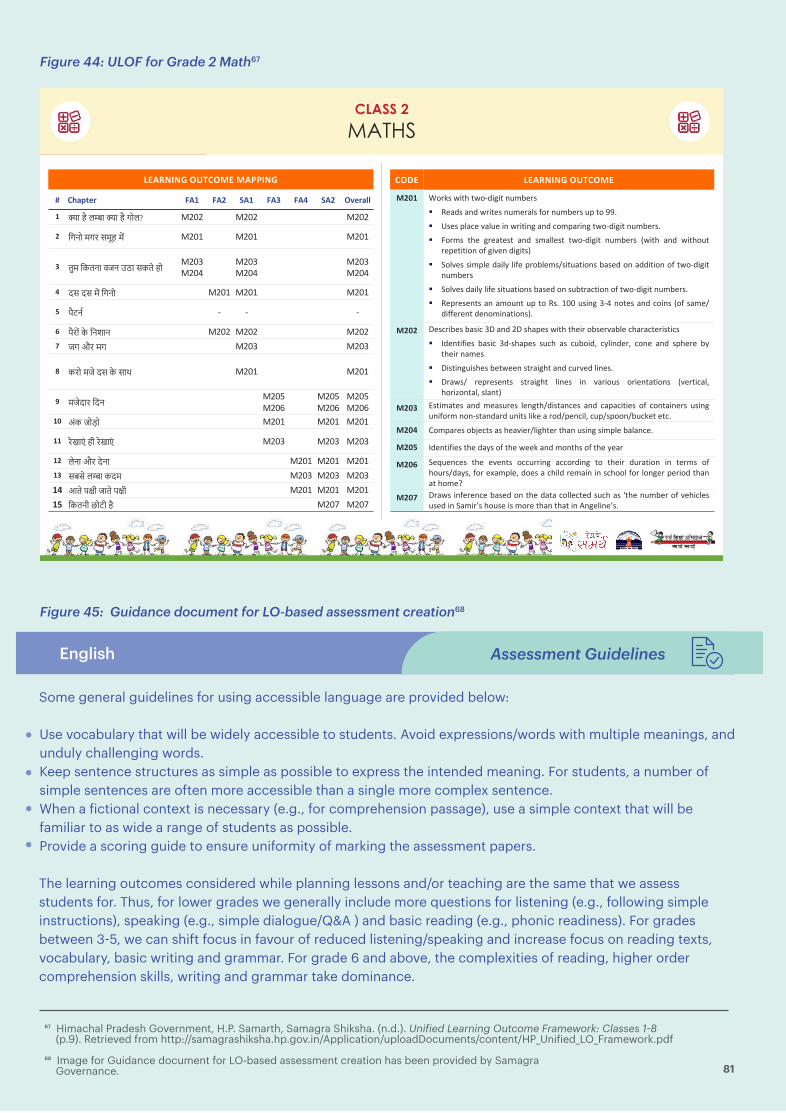
81
)+ Himachal Pradesh Government, H.P. Samarth, Samagra Shiksha. (n.d.). Uni"ied Learning Outcome Framework: Classes 1!8 (p.9). Retrieved from http://samagrashiksha.hp.gov.in/Application/uploadDocuments/content/HP_Uni%ied_LO_Framework.pdf
). Image for Guidance document for LO-based assessment creation has been provided by Samagra Governance.
English
Some general guidelines for using accessible language are provided below:
The learning outcomes considered while planning lessons and/or teaching are the same that we assess students for. Thus, for lower grades we generally include more questions for listening (e.g., following simple instructions), speaking (e.g., simple dialogue/Q&A ) and basic reading (e.g., phonic readiness). For grades between 3$5, we can shift focus in favour of reduced listening/speaking and increase focus on reading texts, vocabulary, basic writing and grammar. For grade 6 and above, the complexities of reading, higher order comprehension skills, writing and grammar take dominance.
Assessment Guidelines
Figure 44: ULOF for Grade 2 Math67
Figure 45: Guidance document for LO-based assessment creation68
CLASS 2MATHS
���������������� ���
� ������ ��� ��� ��� ��� ��� ��� � ���
� +���%��-��+���%�&�� ���� ���� ����
� �&������#���* ���� ���� ����
� �"�� ����������������$��&��������
��������
��������
� �������*� �& ���� ���� ����
� �% �) � � �
� �%�& '��$ � ���� ���� ���� ����� ������ ���� ����
� ��&���$�����$ ���� ���� ����
� ��$���� ��������
������
������
�� �'���&�&� ���� ���� ����
�� �$��' ��!��$��' ���� ���� ����
�� �$�������$��� ���� ���� ������ ���$��-������ ���� ���� ����$' ��$��,!����$��,!� ���� ���� ����$( ���!��& !��%� ���� ����
���� ��������������
���� �$' ( ,�)� ),$8����) #*"��'(� ����( �#� ,'�)�( #*"�'�!( �$' #*"��'( *% )$ JJ4� �(�( %!��� +�!*� �# ,'�)�#� �#� �$"%�'�#� ),$8����) #*"��'(4� �$'"( )�� �'��)�() �#� ("�!!�() ),$8����) #*"��'( :,�)� �#� ,�)�$*)
'�%�)�)�$# $� ��+�# ����)(;� �$!+�( (�"%!� ���!. !��� %'$�!�"(7(�)*�)�$#( ��(�� $# ����)�$# $� ),$8����)
#*"��'(� �$!+�( ���!. !��� (�)*�)�$#( ��(�� $# (*�)'��)�$# $� ),$8����) #*"��'(4� ��%'�(�#)( �# �"$*#) *% )$ �(4 BAA *(�#� D8E #$)�( �#� �$�#( :$� (�"�7
�����'�#) ��#$"�#�)�$#(;4
���� ��(�'���( ��(�� D� �#� C� (��%�( ,�)� )���' $�(�'+��!� ���'��)�'�()��(� ��#)����( ��(�� D�8(��%�( (*�� �( �*�$��1 �.!�#��'1 �$#� �#� (%��'� �.
)���' #�"�(� ��()�#�*�(��( ��),��# ()'����) �#� �*'+�� !�#�(4� �'�,(7 '�%'�(�#)( ()'����) !�#�( �# +�'�$*( $'��#)�)�$#( :+�')���!1
�$'�/$#)�!1 (!�#);
���� �()�"�)�( �#� "��(*'�( !�#�)�7��()�#��( �#� ��%���)��( $� �$#)��#�'( *(�#�*#��$'" #$#8()�#��'� *#�)( !� � � '$�7%�#��!1 �*%7(%$$#7�*� �) �)�4
���� �$"%�'�( $����)( �( ���+��'7!���)�' )��# *(�#� (�"%!� ��!�#��4
���� ��#)����( )�� ��.( $� )�� ,�� �#� "$#)�( $� )�� .��'
���� ��&*�#��( )�� �+�#)( $��*''�#� ���$'��#� )$ )���' �*'�)�$# �# )�'"( $��$*'(7��.(1 �$' �-�"%!�1 �$�( � ���!� '�"��# �# (��$$! �$' !$#��' %�'�$� )��#�) �$"�0
���� �'�,( �#��'�#�� ��(�� $# )�� ��)� �$!!��)�� (*�� �( =)�� #*"��' $� +����!�(*(�� �# ��"�'6( �$*(� �( "$'� )��# )��) �# �#��!�#�6(4
Designing assessments is easier if formative assessment methods (recitations, role plays, presentations, group projects, etc.) are used to check for listening and speaking competencies. Reading, comprehension, writing and grammar questions are more easily incorporated in summative (pen and paper) type assessments.
Use vocabulary that will be widely accessible to students. Avoid expressions/words with multiple meanings, and unduly challenging words.Keep sentence structures as simple as possible to express the intended meaning. For students, a number of simple sentences are often more accessible than a single more complex sentence.When a %ictional context is necessary (e.g., for comprehension passage), use a simple context that will be familiar to as wide a range of students as possible.Provide a scoring guide to ensure uniformity of marking the assessment papers.
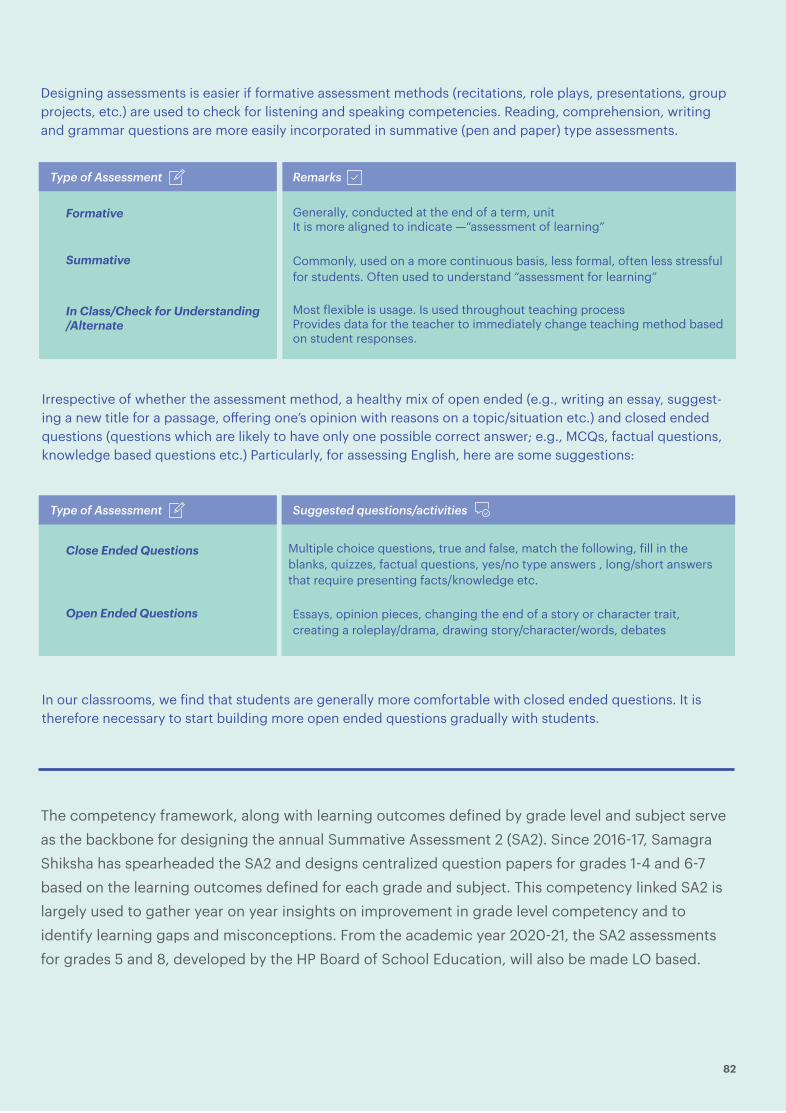
82
Some general guidelines for using accessible language are provided below:
The learning outcomes considered while planning lessons and/or teaching are the same that we assess students for. Thus, for lower grades we generally include more questions for listening (e.g., following simple instructions), speaking (e.g., simple dialogue/Q&A ) and basic reading (e.g., phonic readiness). For grades between 3$5, we can shift focus in favour of reduced listening/speaking and increase focus on reading texts, vocabulary, basic writing and grammar. For grade 6 and above, the complexities of reading, higher order comprehension skills, writing and grammar take dominance.
Irrespective of whether the assessment method, a healthy mix of open ended (e.g., writing an essay, suggest-ing a new title for a passage, o-ering one’s opinion with reasons on a topic/situation etc.) and closed ended questions (questions which are likely to have only one possible correct answer; e.g., MCQs, factual questions, knowledge based questions etc.) Particularly, for assessing English, here are some suggestions:
In our classrooms, we %ind that students are generally more comfortable with closed ended questions. It is therefore necessary to start building more open ended questions gradually with students.
Type of Assessment Remarks
Formative
Summative
In Class/Check for Understanding/Alternate
Generally, conducted at the end of a term, unitIt is more aligned to indicate —“assessment of learning”
Commonly, used on a more continuous basis, less formal, often less stressful for students. Often used to understand “assessment for learning”
Most flexible is usage. Is used throughout teaching processProvides data for the teacher to immediately change teaching method based on student responses.
Type of Assessment Suggested questions/activities
Close Ended Questions
Open Ended Questions
Multiple choice questions, true and false, match the following, fill in the blanks, quizzes, factual questions, yes/no type answers , long/short answers that require presenting facts/knowledge etc.
Essays, opinion pieces, changing the end of a story or character trait, creating a roleplay/drama, drawing story/character/words, debates
The competency framework, along with learning outcomes de%ined by grade level and subject serve as the backbone for designing the annual Summative Assessment 2 (SA2). Since 2016$17, Samagra Shiksha has spearheaded the SA2 and designs centralized question papers for grades 1$4 and 6$7 based on the learning outcomes de%ined for each grade and subject. This competency linked SA2 is largely used to gather year on year insights on improvement in grade level competency and to identify learning gaps and misconceptions. From the academic year 2020$21, the SA2 assessments for grades 5 and 8, developed by the HP Board of School Education, will also be made LO based.
Designing assessments is easier if formative assessment methods (recitations, role plays, presentations, group projects, etc.) are used to check for listening and speaking competencies. Reading, comprehension, writing and grammar questions are more easily incorporated in summative (pen and paper) type assessments.
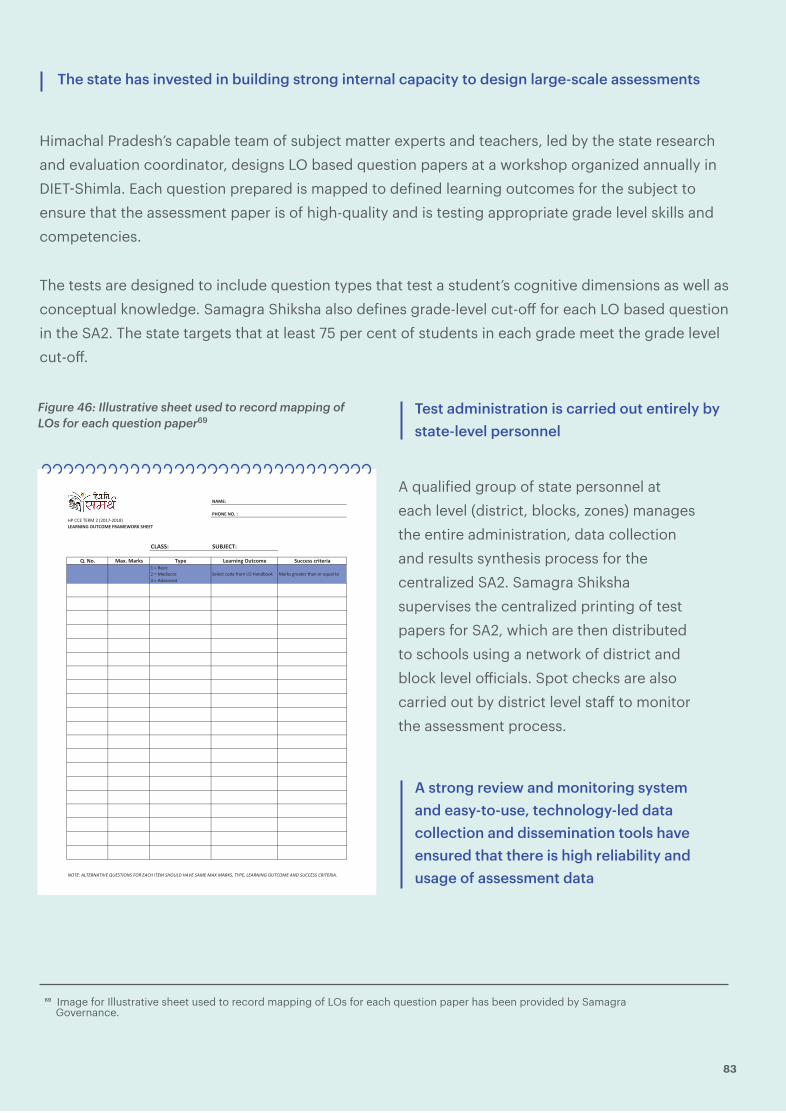
83
)/ Image for Illustrative sheet used to record mapping of LOs for each question paper has been provided by Samagra Governance.
The state has invested in building strong internal capacity to design large-scale assessments
Test administration is carried out entirely by state-level personnel
A strong review and monitoring system and easy-to-use, technology-led data collection and dissemination tools have ensured that there is high reliability and usage of assessment data
Himachal Pradesh’s capable team of subject matter experts and teachers, led by the state research and evaluation coordinator, designs LO based question papers at a workshop organized annually in DIET$Shimla. Each question prepared is mapped to de%ined learning outcomes for the subject to ensure that the assessment paper is of high-quality and is testing appropriate grade level skills and competencies.
A quali%ied group of state personnel at each level (district, blocks, zones) manages the entire administration, data collection and results synthesis process for the centralized SA2. Samagra Shiksha supervises the centralized printing of test papers for SA2, which are then distributed to schools using a network of district and block level o(icials. Spot checks are also carried out by district level sta- to monitor the assessment process.
The tests are designed to include question types that test a student’s cognitive dimensions as well as conceptual knowledge. Samagra Shiksha also de%ines grade-level cut-o- for each LO based question in the SA2. The state targets that at least 75 per cent of students in each grade meet the grade level cut-o-.
Figure 46: Illustrative sheet used to record mapping of LOs for each question paper69
NAME:
PHONE NO. :HP CCE TERM 2 (2017-2018)LEARNING OUTCOME FRAMEWORK SHEET
CLASS: SUBJECT:
Q. No. Max. Marks Type Learning Outcome Success criteria1 = Basic2 = Mediocre3 = Advanced
Select code from LO Handbook Marks greater than or equal to
NOTE: ALTERNATIVE QUESTIONS FOR EACH ITEM SHOULD HAVE SAME MAX MARKS, TYPE, LEARNING OUTCOME AND SUCCESS CRITERIA.

84
+1 Further details on the e-Samwad app are available at the following link: https://sites.google.com/samagragovernance.in/esamwadhp/home?authuser=0+2 Further details on the HP Samarth Dashboard are available at the following link: https://hpsamarth.com/
Data collection through an easy-to-use mobile app.
Publicly available data by grade and learning outcomes at the state, district and sub-district levels
Figure 47: E"Samwad app for data collection and illustration of data transfer to the app70
Himachal Pradesh has developed technology infrastructure to support the collection and dissemination of assessment data. Previously, assessment data was transferred to OMR sheets that were then scanned centrally. Now the state has integrated data collection into the E$Samwad app – a product that was developed by Himachal Pradesh education department to improve teacher-parent communication and transparency,6.
Teachers can now directly upload SA2 results online through the app, circumventing the tedious process of collecting and scanning OMR sheets. Additionally, with the development of the ULOF and creation of LO-based assessments at the class level, data collection has been enabled for all assessments, which will ensure more frequent data collection and analysis, leading to better and more timely decision making.
In academic year 2020$21, Himachal Pradesh became one of the only states in India to digitally collect assessment data. The state achieved data collection for SA1 from 92 per cent of schools (during lockdown due to COVID$19) without an extension of deadline.
The state has built a specialized assessment dashboard to publicly disseminate assessment data at the state, district and sub-district levels. The Samarth data dashboard,7 allows for analysis and management of assessment data. It can be used by teachers and education o(icials to inform education practice.
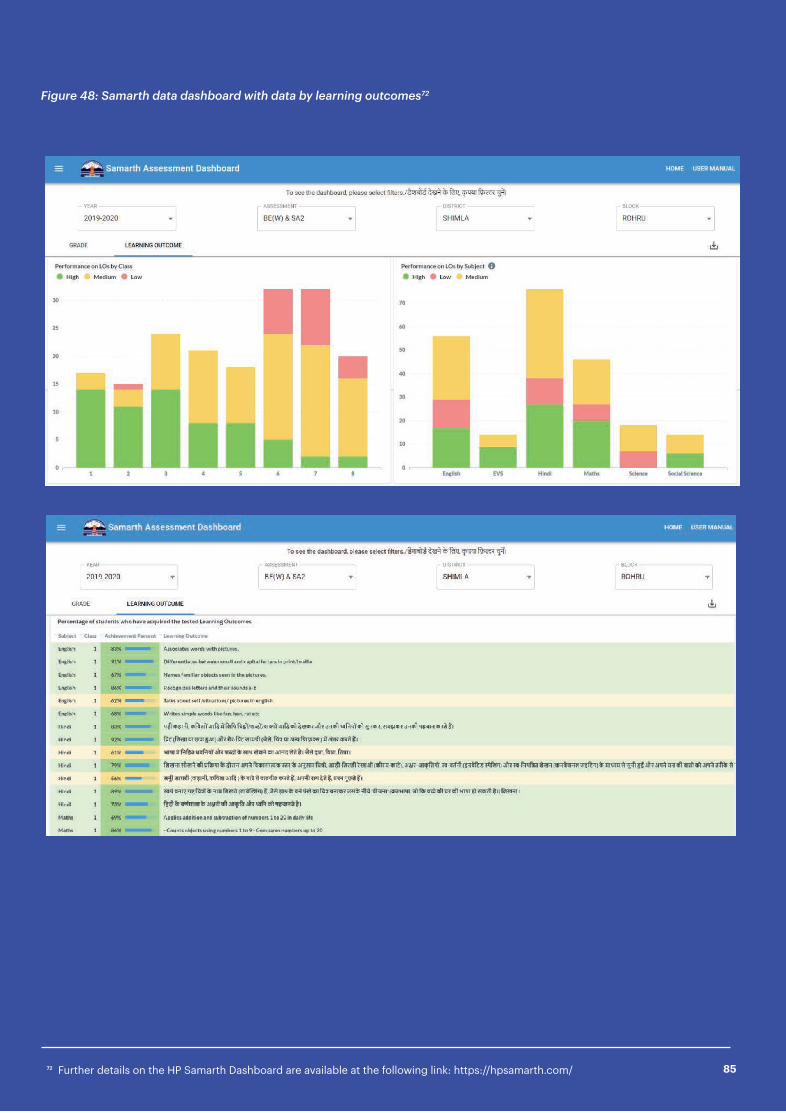
85+3 Further details on the HP Samarth Dashboard are available at the following link: https://hpsamarth.com/
Figure 48: Samarth data dashboard with data by learning outcomes72

86+" Image for Communication of assessment data has been provided by Samagra Governance
Standardized assessment data, based on a detailed LO framework, can be used for decision making in a variety of domains within education
Lessons from Himachal Pradesh
Figure 49: Communication of assessment data73
Himachal Pradesh has consistently and e-ectively used assessment data to drive education reform in the state. This includes:
Resourcing: Assessment data is used for budget planning and allocations for state education interventions
Planning: Assessment data is used extensively at the state level for planning purposes. With the development and use of the Samarth dashboard, there is a growing use of data at the school, cluster and block level to create development plans.
Administrative decisions: Assessment data is used by o(icials to plan visits to weaker performing districts, blocks or schools.
Capacity building: Based on the results of assessment data, teacher training needs are determined, and courses are recommended. Typically, training is provided to teachers on weaker performing LOs.
Rewards and recognition: Better performing schools and blocks are appreciated and awarded based on assessment data. Best practices from the state are also collated and disseminated.
Communication: Assessment data is widely communicated across the state, with campaigns in print and social media. The state also sends personalized, targeted messages to various stakeholders through WhatsApp groups.
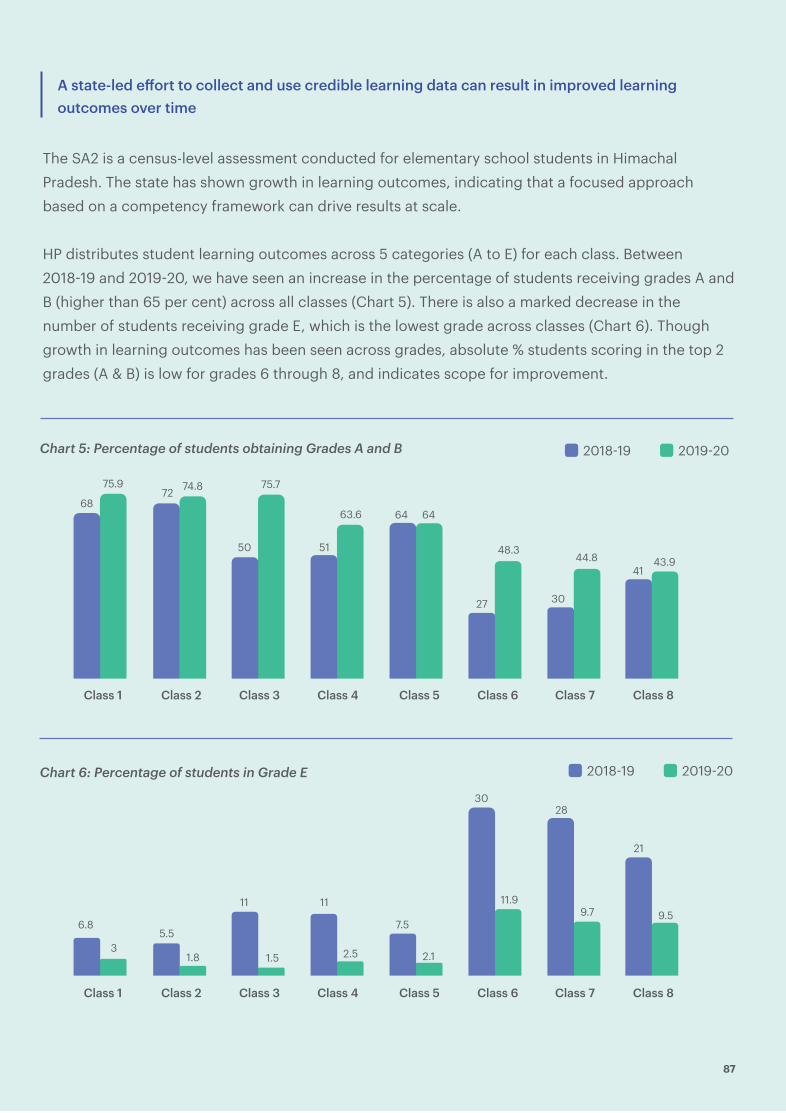
87
A state-led e)ort to collect and use credible learning data can result in improved learning outcomes over time
The SA2 is a census-level assessment conducted for elementary school students in Himachal Pradesh. The state has shown growth in learning outcomes, indicating that a focused approach based on a competency framework can drive results at scale.
HP distributes student learning outcomes across 5 categories (A to E) for each class. Between 2018$19 and 2019$20, we have seen an increase in the percentage of students receiving grades A and B (higher than 65 per cent) across all classes (Chart 5). There is also a marked decrease in the number of students receiving grade E, which is the lowest grade across classes (Chart 6). Though growth in learning outcomes has been seen across grades, absolute % students scoring in the top 2 grades (A & B) is low for grades 6 through 8, and indicates scope for improvement.
Class 1
6872
50 51
27 30
4143.9
64 64
74.8 75.7
63.6
48.344.8
75.9
Class 2 Class 3 Class 4 Class 5 Class 6 Class 7 Class 8
Class 1 Class 2 Class 3 Class 4 Class 5 Class 6 Class 7 Class 8
6.85.5
11 11
21
1.5 2.5 2.1
11.99.7 9.5
7.5
1.83
3028
2018$19 2019$20
2018$19 2019$20
Chart 5: Percentage of students obtaining Grades A and B
Chart 6: Percentage of students in Grade E

88
Andhra Pradesh’s vision was to become one of the top three high!performing states in India by 2022 and the best state in the country by 2029. To drive the reform process, it sought to establish a forward!looking assessment cell with a team of highly motivated and quali%ied sta- specializing in assessments and learning research.
Towards this purpose, the Government of Andhra Pradesh (GoAP) initiated its technology enabled student assessment reforms called VidyaVikaasam. Centre for Science of Student Learning (CSSL) and Samagra Development Associates provided the technical support to meet the objectives of VidyaVikaasam detailed below:
Build long term system and institutional capacity through an assessment cell that can roll out all learning assessments planned and conducted by the state
Strengthen the methodology of designing assessment tools (test papers and background questionnaires) so that data is amenable for actionable insights that are used as inputs for teacher training and pedagogy
Improve report dissemination, all the way to school, so that inputs are utilized in classrooms
Track the e-ectiveness of the assessment cell over time in improving learning outcomes and increase technology utilization in assessment cell work%lows.
Andhra Pradesh’s leadership recognised the pivotal role of assessments in improving learning outcomes. The state took an exemplary long-term view to step up state capacity through the development of an assessment cell and improved data usage.
Case Study 4. Andhra Pradesh
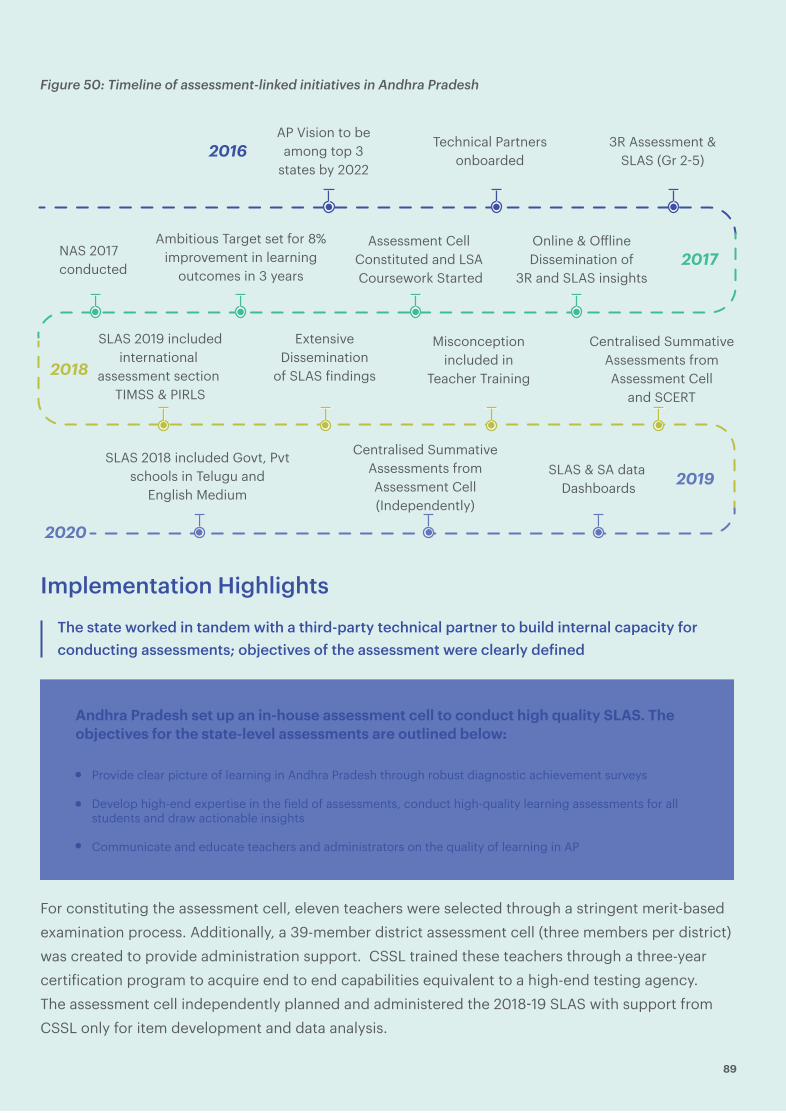
89
The state worked in tandem with a third-party technical partner to build internal capacity for conducting assessments; objectives of the assessment were clearly de!ined
3R Assessment &SLAS (Gr 2$5)
Technical Partnersonboarded
AP Vision to beamong top 3
states by 2022
Online & O(lineDissemination of
3R and SLAS insights
SLAS 2019 includedinternational
assessment section TIMSS & PIRLS
Centralised Summative Assessments from Assessment Cell (Independently)
SLAS & SA data Dashboards
Assessment Cell Constituted and LSA Coursework Started
Ambitious Target set for 8% improvement in learning
outcomes in 3 years
NAS 2017 conducted
SLAS 2018 included Govt, Pvt schools in Telugu and
English Medium
Extensive Dissemination
of SLAS %indings
Misconception included in
Teacher Training
Centralised SummativeAssessments from Assessment Cell
and SCERT
2016
2017
2018
2019
2020
Figure 50: Timeline of assessment-linked initiatives in Andhra Pradesh
Andhra Pradesh set up an in-house assessment cell to conduct high quality SLAS. The objectives for the state-level assessments are outlined below:
Provide clear picture of learning in Andhra Pradesh through robust diagnostic achievement surveys
Develop high-end expertise in the %ield of assessments, conduct high-quality learning assessments for all students and draw actionable insights
Communicate and educate teachers and administrators on the quality of learning in AP
For constituting the assessment cell, eleven teachers were selected through a stringent merit-based examination process. Additionally, a 39-member district assessment cell (three members per district) was created to provide administration support. CSSL trained these teachers through a three-year certi%ication program to acquire end to end capabilities equivalent to a high-end testing agency. The assessment cell independently planned and administered the 2018$19 SLAS with support from CSSL only for item development and data analysis.
Implementation Highlights

Figure 51: Capacities built for the Assessment Cell
Figure 52: Workshops and training conducted for state assessment cell members74
Productivity tools Standardized test Administration
Assessment Framework
SLAS Test conducting & monitoring
Writing task Analysis
Introduction to LSA Planning, Logistics for SLAS 2018 (with CSSL)
Art & Science of item writing
Developing Summative Assessments (With CSSL)
Translations & Validations
Classical Test theory- I
Statistics for Data Analysis
Applied Statistics and Inferences
Sampling Item Response Theory - I, II
Post Analysis Dissemination (with CSSL)
Planning, Logistics for SLAS 2019 (independent)
SLAS Test Conduction (independent)
SLAS Data Management
MisconceptionReport Writing
Data visualization and Insights
Handling large data-sets & multivariate data
SLAS 2019
Capacities Built (August 2017 to November 2019) Capacities to be Built (Ongoing)
SLAS 2018
+# Image for Workshops and training conducted for state assessment cell members has been provided by Centre for Science of Student Learning (CSSL) and Samagra Governance. 90

91
+! N Chandrababu Naidu. [@ncbn]. (2018, September 5). Initiatives like Vidya Vikasam will monitor and review the improvement in learning levels of children in Andhra Pradesh through high-quality assessments [Tweet]. Twitter. https://twitter.com/ncbn/status/1037269511383199744?lang=eneducing-learning-gap+) Shruti Kedia. (2019, April 11). How the Andhra Pradesh govt is working to reduce learning gap among government school students. YourStory. Retrieved from https://yourstory.com/socialstory/2019/04/andhra-pradesh-govt-schools-reducing-learning-gap/amp
Assessment analytics dashboard
On Teacher’s Day in September 2018, the Chief Minister of Andhra Pradesh released a statement stating, “Initiatives like Vidya Vikasam will monitor and review the improvement in learning levels of children in Andhra Pradesh through high-quality assessments.,& In his statement, the Chief Minister listed all the achievements over two years, spearheaded by VidyaVikaasam in the education sector. Commissioner of School Education in Andhra Pradesh in an interview to Yourstory explained, “Our aim was to focus on learning outcome of students, and not on %inishing the curriculum or just conducting examinations. We envisioned to move towards ‘child-centric’ school education, with a goal to create an all-enabling ecosystem that can ensure ‘happy, ful%illed, resilient, and responsible students who are future-ready"76
In March 2017, the Assessment Cell model implemented in Andhra Pradesh was selected by Ministry of Human Resource Development (MHRD), Govt of India as the model suitable for scale-up across all states. This model was subsequently presented in all %ive regional workshops conducted by MHRD as part of its PPP initiative in 2017$18 for senior government o(icials.
Andhra Pradesh had a strong technology ecosystem and data infrastructure, with dedicated IT resources working within the Education Department. This was leveraged to create a unique systemic assessment program (VidyaVikassam). A data and technology warehouse was developed in the state (during Round 2 of SLAS), which facilitated collection and analysis of SLAS data in the successive rounds of the assessment.
The use of technology to collect and analyze data helped increase usage of assessment results towards academic, operational and policy related processes. The main objectives of the dashboard were to:
Both political and bureaucratic support drove the initiatives under Vidya Vikaasam resulting in recognition from central agencies
Andhra Pradesh developed a data collection and analytics system for large-scale assessments to provide insights to all stakeholders
Figure 53: Chief Minister of Andhra Pradesh on social media about Vidya Vikaasam76
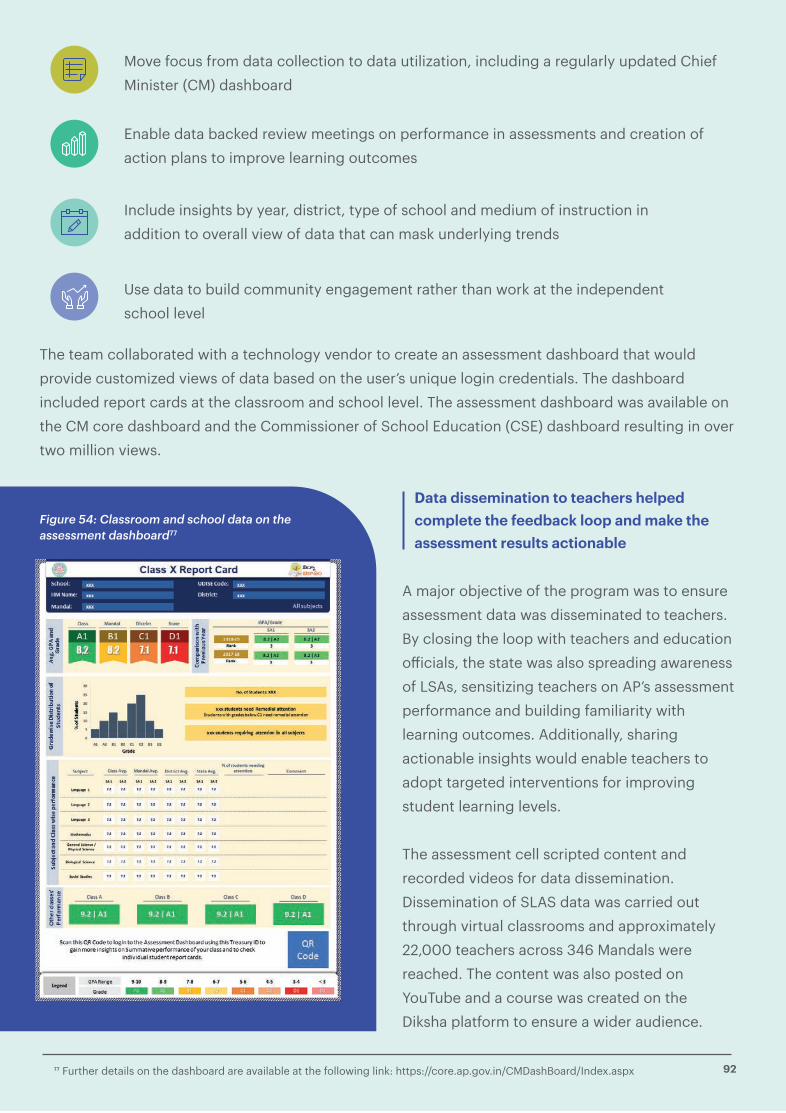
++ Further details on the dashboard are available at the following link: https://core.ap.gov.in/CMDashBoard/Index.aspx 92
Data dissemination to teachers helped complete the feedback loop and make the assessment results actionable
Move focus from data collection to data utilization, including a regularly updated Chief Minister (CM) dashboard
Enable data backed review meetings on performance in assessments and creation of action plans to improve learning outcomes
Include insights by year, district, type of school and medium of instruction in addition to overall view of data that can mask underlying trends
Use data to build community engagement rather than work at the independent school level
The team collaborated with a technology vendor to create an assessment dashboard that would provide customized views of data based on the user’s unique login credentials. The dashboard included report cards at the classroom and school level. The assessment dashboard was available on the CM core dashboard and the Commissioner of School Education (CSE) dashboard resulting in over two million views.
A major objective of the program was to ensure assessment data was disseminated to teachers. By closing the loop with teachers and education o(icials, the state was also spreading awareness of LSAs, sensitizing teachers on AP’s assessment performance and building familiarity with learning outcomes. Additionally, sharing actionable insights would enable teachers to adopt targeted interventions for improving student learning levels.
The assessment cell scripted content and recorded videos for data dissemination. Dissemination of SLAS data was carried out through virtual classrooms and approximately 22,000 teachers across 346 Mandals were reached. The content was also posted on YouTube and a course was created on the Diksha platform to ensure a wider audience.
Figure 54: Classroom and school data on the assessment dashboard77
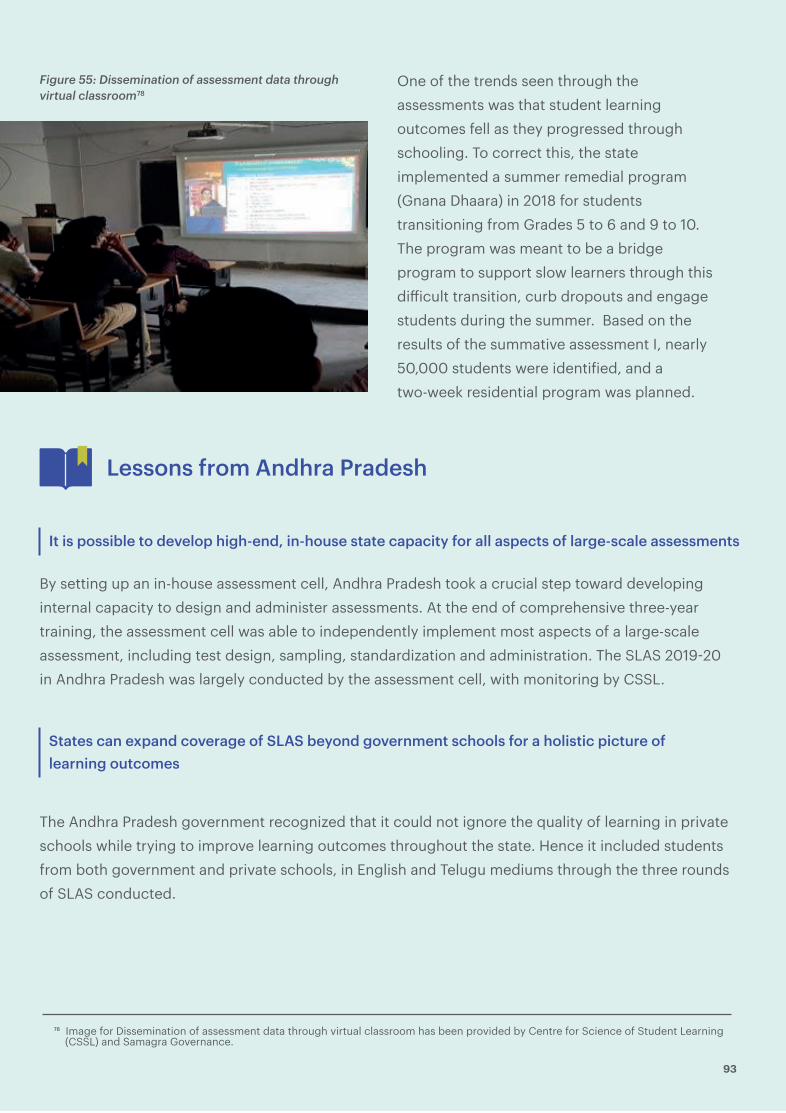
93
+. Image for Dissemination of assessment data through virtual classroom has been provided by Centre for Science of Student Learning (CSSL) and Samagra Governance.
It is possible to develop high-end, in-house state capacity for all aspects of large-scale assessments
States can expand coverage of SLAS beyond government schools for a holistic picture of learning outcomes
Lessons from Andhra Pradesh
Figure 55: Dissemination of assessment data through virtual classroom78
One of the trends seen through the assessments was that student learning outcomes fell as they progressed through schooling. To correct this, the state implemented a summer remedial program (Gnana Dhaara) in 2018 for students transitioning from Grades 5 to 6 and 9 to 10. The program was meant to be a bridge program to support slow learners through this di(icult transition, curb dropouts and engage students during the summer. Based on the results of the summative assessment I, nearly 50,000 students were identi%ied, and a two-week residential program was planned.
By setting up an in-house assessment cell, Andhra Pradesh took a crucial step toward developing internal capacity to design and administer assessments. At the end of comprehensive three-year training, the assessment cell was able to independently implement most aspects of a large-scale assessment, including test design, sampling, standardization and administration. The SLAS 2019$20 in Andhra Pradesh was largely conducted by the assessment cell, with monitoring by CSSL.
The Andhra Pradesh government recognized that it could not ignore the quality of learning in private schools while trying to improve learning outcomes throughout the state. Hence it included students from both government and private schools, in English and Telugu mediums through the three rounds of SLAS conducted.
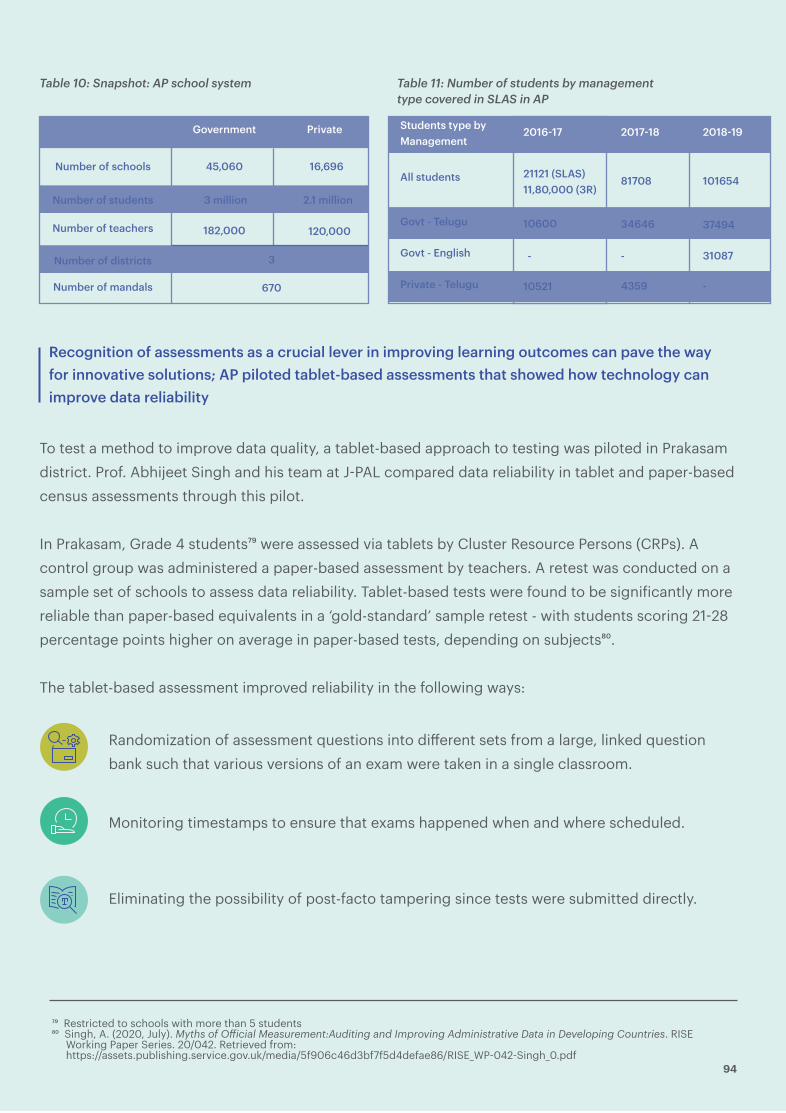
94
Monitoring timestamps to ensure that exams happened when and where scheduled.
Eliminating the possibility of post-facto tampering since tests were submitted directly.
Randomization of assessment questions into di-erent sets from a large, linked question bank such that various versions of an exam were taken in a single classroom.
Recognition of assessments as a crucial lever in improving learning outcomes can pave the way for innovative solutions; AP piloted tablet-based assessments that showed how technology can improve data reliability
To test a method to improve data quality, a tablet-based approach to testing was piloted in Prakasam district. Prof. Abhijeet Singh and his team at J$PAL compared data reliability in tablet and paper-based census assessments through this pilot.
In Prakasam, Grade 4 students,8 were assessed via tablets by Cluster Resource Persons (CRPs). A control group was administered a paper-based assessment by teachers. A retest was conducted on a sample set of schools to assess data reliability. Tablet-based tests were found to be signi%icantly more reliable than paper-based equivalents in a ‘gold-standard’ sample retest - with students scoring 21$28 percentage points higher on average in paper-based tests, depending on subjects06.
The tablet-based assessment improved reliability in the following ways:
Table 10: Snapshot: AP school system Table 11: Number of students by management type covered in SLAS in AP
2016(17 Students type by Management
All students 21121 (SLAS)11,80,000 (3R)
10600 34646 37494
31087--
10521 4359 -
81708 101654
Govt - Telugu
Govt - English
Private - Telugu
2017(18 2018(19Government
Number of schools 45,060
3 million
182,000 120,000
2.1 million
3
670
16,696
Number of students
Number of teachers
Number of districts
Number of mandals
Private
+/ Restricted to schools with more than 5 students.1 Singh, A. (2020, July). Myths of O#icial Measurement:Auditing and Improving Administrative Data in Developing Countries. RISE Working Paper Series. 20/042. Retrieved from: https://assets.publishing.service.gov.uk/media/5f906c46d3bf7f5d4defae86/RISE_WP$042$Singh_0.pdf

95
Case Study 5. Chile
Chile has become a model, in Latin America and the world, for implementing an assessment-led reform of student learning outcomes. The country’s national learning outcome assessment system (Sistema de Medición de Calidad de la Educación or SIMCE) covers all schools, both public and privately managed. Introduced in 1988, SIMCE is a census-based assessment system that generates data at the individual student, school and system performance level. Reforms in Chile led to improvements in Chile’s PISA ranking between 2000$201507. In the last decade, Chile has been among the fastest-improving countries globally in PISA04.
Figure 56: Timeline of assessments and learning outcomes in Chile
Chile, a model for assessment-led reform for Latin America and the world, has been among the fastest-improving countries globally in PISA. The country implemented a national learning outcome assessment system, which covers both public and privately managed schools, to track and improve student outcomes.
Chile sends studentsto participate ininternational math andscience assessment- TIMMS
1970
SIMCE introduced as a census-based assessmentsystem with reporting at thestudent, school and systemperformance levels
19881996 Test scores decline,with gap betweenstudents from poorand middle-incomebackgrounds increasing
Students from poor backgrounds cover one-third of the learning gap thatexisted between them and students from middle and highincome backgrounds in 2005.
2011 Learning gains for studentsfrom poor backgrounds havesustained since 2011
2016
Chile designs objective-linked assessment that is administered at regular frequencies across all students to gather data by type of school and student incomes and background
.2 Economist special report. (2019, April 11). How Chile combines competition and public funding. The Economist. Retrieved from https://www.economist.com/special-report/2019/04/11/how-chile-combines-competition-and-public-funding.3 Neilson, C. A. (n.d.). Working paper: Targeted Vouchers, Competition Among Schools,And The Academic Achievement Of Poor Students. Submitted to Econometrica. Retrieved from https://christopherneilson.github.io/work/documents/Neilson_SEPVouchers.pdf
Implementation Highlights

96
." Raising student learning in Latin America, World Bank; Reviews of national policies for education chile 2004 OECD
.# Ramirez, Maria Jose. (2012, April). Disseminating and using student assessment information in Chile (English). Systems Approach for Better Education Results (SABER) student assessment working paper; no. 3 Washington, D.C.: World Bank Group. Retrieved from http://documents.worldbank.org/curated/en/724411468014980654/Disseminating-and-using-student-assessment-information-in-Chile.! Lorena, M., & Carrasco, R. (2010). Two decades of SIMCE: an overview of the National Assessment System in Chile, Assessment in Education: Principles, Policy & Practice. 17(2), 233$248. doi:09695941003696214.) Vegas, E., & Petrow, J. (2007, September). Raising Student Learning in Latin America. The Challenge for the 21st Century. World Bank Group. doi:10.1596/978$0$8213$7082$7. Retrieved from https://elibrary.worldbank.org/doi/abs/10.1596/978$0$8213$7082$7
Assessment framework
Standard frequency of assessments
The Ministry of Education develops performance standards according to curriculum objectives. The item development process is rigorous and involves Item Response Theory (IRT) testing. The assessment is externally administered, thus ensuring greater data reliability when compared with school/teacher-administered assessments05. The Ministry of Education converts raw student scores into a complex index re%lective of school socio-economic background and certain non-academic outcomes to rank schools0'.
The data collected through the SIMCE assessments is comprehensive - across grades, subjects, and testing cycles. While students in Grade 4 are assessed every year in Mathematics and Spanish, students from Grade 8 and Grade 10 are assessed in alternate years in Mathematics, Natural Sciences, Social Sciences and Spanish0&.
School quality data collected in Chile through SIMCE is used in two ways. First, it is made publicly available to build parent awareness, and second, it is used for high stakes ranking of schools where being ranked at the bottom of the scale for over four years can result in loss of o(icial recognition. Chile uses a multi-pronged mechanism for information dissemination covering various stakeholders apart from parents, including teachers, principals, policymakers, journalists and the general public. Each mechanism of dissemination has a di-erent purpose - whether speci%ic feedback to a teacher or school, building awareness and public involvement in education progress, or, crucially, information distribution to parents to drive informed choice0'.
SIMCE has been long recognized as one of the top performers in the region, and a key reason for this is the quality of dissemination0*. Apart from parent booklets, mass media is a target audience for SIMCE. Journalists are involved in the dissemination process through explainers, special reports on the main %indings, free %low of information and preparation of a list of experts who can be interviewed to analyze the results. SIMCE not only has the greatest political impact, but Chile is
Data on student performance and schools is publicly disseminated across multiple stakeholder groups, resulting in improved accountability and student performance
The media plays a critical role in the dissemination of learning data.
perhaps one of the few countries where results are well covered in the media0,. Since 2005, the Education Ministry has decided to assign one day of the school calendar each year for the analysis of results within each school to ensure that the results can be understood and acted upon.
Essays, opinion pieces, changing the end of a story or character trait, creating a roleplay/drama, drawing story/character/words, debates
97
.+ Lorena, M., & Carrasco, R. (2010). Two decades of SIMCE: an overview of the National Assessment System in Chile, Assessment in Education: Principles, Policy & Practice. 17(2), 233$248. doi:09695941003696214
Lessons for India
SIMCE has been long recognized as one of the top performers in the region, and a key reason for this is the quality of dissemination0*. Apart from parent booklets, mass media is a target audience for SIMCE. Journalists are involved in the dissemination process through explainers, special reports on the main %indings, free %low of information and preparation of a list of experts who can be interviewed to analyze the results. SIMCE not only has the greatest political impact, but Chile is
Global experiences with census assessments can inform Indian policy while keeping in mind our own context. For assessments that provide a universal learning indicator for schools, key concerns include moving away from rote-based concepts, improving data reliability and ensuring last-mile data dissemination and usage of results. Chile’s SIMCE illustrates the mechanism for dissemination of census assessment data to parents and schools for support and accountability. Similar models of public disclosure of school quality information and innovative cash transfers could lead to improvements in learning outcomes for all schools and improve equity in private schools.
perhaps one of the few countries where results are well covered in the media0,. Since 2005, the Education Ministry has decided to assign one day of the school calendar each year for the analysis of results within each school to ensure that the results can be understood and acted upon.

Concluding Remarks: Future of Assessments in India
98
Monitor growth in learning outcomes
Clear policy and objective Develop an aligned vision backed by leadership support along with a comprehensive competency framework.
Strong governance Create accountability for results with stakeholders at every level.
Enabling resources Budget for regular assessments. Build internal capacity or partner with third-party technical experts for design and implementation.
Technical capacity Invest in high quality questions within test design. Ensure data collection is reliable.
Data usage Democratize data availability. Disseminate assessment insights with parents, teachers, schools as well as cluster, block, district and state o!icials to drive action.
Inform customized teaching-learning practices
Drive accountability
Enable e!icient governance at a decentralized level
As states start implementing the recommendations of NEP, assessments will emerge as a front-runner in the list of interventions needed to improve learning outcomes. Assessments will be used to:
However, not all assessments provide meaningful information. The report outlines 5 key drivers of successful large-scale assessments for states:
It is our hope that states use the self-assessment framework to determine their current capabilities across the "ive key drivers for large-scale assessments. The recommendations provided in the implementation toolkit can guide states as they design and administer LSAs in the future. The case studies highlighted in this report show that it is indeed possible for states in India to conduct high-quality LSAs and drive improvements in student learning outcomes.
99
APPENDIX 1
Framework for State Self-Evaluation

Key driver 1: Clear policy and objectives
, ,
Indicator Latent Emerging Established
Dimension: Leadership vision and beliefs
Dimension: Education policy and goals
Leadership Support for LSAs
Past LSA stability
Clear objectives for LSAs
Existing policy on LSA
Curriculum standards and learning goals
LSA awareness within state
Leadership does not believe in the importance of LSAs in improving education quality
No LSA (or SLAS) has been conducted in the state till date
One round of LSA/SLAS was conducted in the last 10 years by current or previous government
More than one round of LSA/SLAS was conducted in the last 10 years and at least one round by the current government
Leadership's opinion on the use of LSAs to improve learning outcomes and drive educational reform
No. of rounds of LSA that have been conducted in the state (to establish continuity)
Availability of a state level policy / charter authorizing LSA
Availability of o!icial documentation on standardized curricula and learning goals for each grade
General workshops, trainings and communications for state o!icials to learn about LSA and its bene"its
Availability of clear objective(s) for past LSAs that is informed by policy and/or learning needs (OR) Ability of leadership to articulate a clear objective / usage for LSAs
No policy document authorized the LSA program (OR) an informal / draft policy document mentions LSAs
The state doesn’t have learning goals/objectives de"ined for each grade
No awareness workshops about LSAs were conducted for key stakeholder groups or no stakeholder consultation was undertaken
A formal / o!icial policy document authorized the LSA, but its contents were not comprehensive.
There was at least one awareness workshop about LSAs among key stakeholder groups at the state level or stakeholder consultations were held
The curriculum and learning goals for each grade are clearly de"ined based on competency framework (aligned to NCF 2005 or state de"ined curriculum) and have been revised more than "ive years ago
A formal / o!icial policy document authorized the LSA program and its contents were comprehensive
The curriculum and learning goals for each grade are clearly de"ined based on competency framework (aligned to latest NCF 2005 or state de"ined curriculum) that have been revised within last "ive years
There were more than one awareness workshops about LSAs among key stakeholder groups at state, district and block levels and stakeholder consultants were held
Leadership is open to conducting LSAs but unsure about their use in improving learning outcomes and drive change in education policy / programs / interventions
Leadership has strong belief in LSAs and their merit in improving learning outcomes and drive change in education policy / programs / interventions
There were no clear objectives or purpose for the LSA
The LSA had a clear objective(s) or purpose, but the objective did not inform any speci"ic education programs / policy / interventions to improve learning outcomes
The LSA had clear objectives and purpose that informed speci"ic education programs / policy/ interventions to improve learning outcomes
100
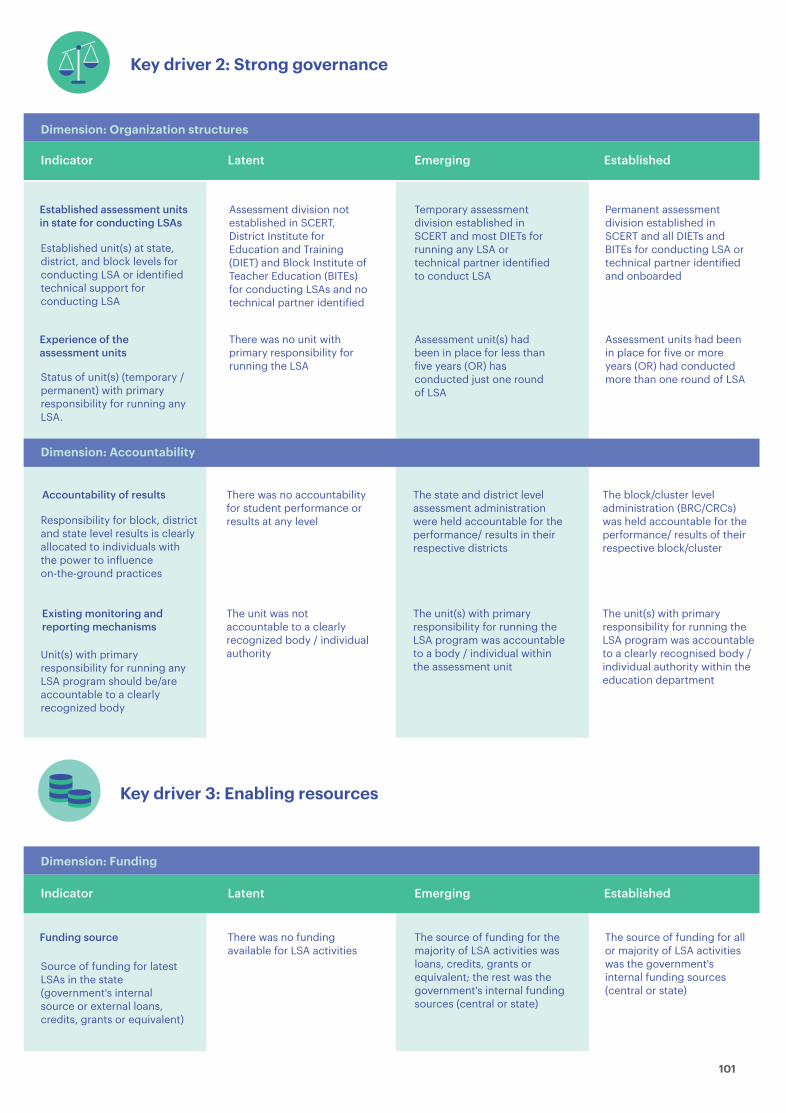
Established unit(s) at state, district, and block levels for conducting LSA or identi"ied technical support for conducting LSA
Status of unit(s) (temporary / permanent) with primary responsibility for running any LSA.
Responsibility for block, district and state level results is clearly allocated to individuals with the power to in"luence on-the-ground practices
Unit(s) with primary responsibility for running any LSA program should be/are accountable to a clearly recognized body
Source of funding for latest LSAs in the state (government's internal source or external loans, credits, grants or equivalent)
Key driver 2: Strong governance
Key driver 3: Enabling resources
Established assessment units in state for conducting LSAs
Experience of the assessment units
Assessment division not established in SCERT, District Institute for Education and Training (DIET) and Block Institute of Teacher Education (BITEs) for conducting LSAs and no technical partner identi"ied
There was no unit with primary responsibility for running the LSA
Assessment unit(s) had been in place for less than "ive years (OR) has conducted just one round of LSA
Assessment units had been in place for "ive or more years (OR) had conducted more than one round of LSA
Temporary assessment division established in SCERT and most DIETs for running any LSA or technical partner identi"ied to conduct LSA
Permanent assessment division established in SCERT and all DIETs and BITEs for conducting LSA or technical partner identi"ied and onboarded
Accountability of results
Existing monitoring and reporting mechanisms
Funding source There was no funding available for LSA activities
The source of funding for the majority of LSA activities was loans, credits, grants or equivalent; the rest was the government's internal funding sources (central or state)
The source of funding for all or majority of LSA activities was the government's internal funding sources (central or state)
There was no accountability for student performance or results at any level
The unit was not accountable to a clearly recognized body / individual authority
The state and district level assessment administration were held accountable for the performance/ results in their respective districts
The unit(s) with primary responsibility for running the LSA program was accountable to a body / individual within the assessment unit
The block/cluster level administration (BRC/CRCs) was held accountable for the performance/ results of their respective block/cluster
The unit(s) with primary responsibility for running the LSA program was accountable to a clearly recognised body / individual authority within the education department
Indicator Latent Emerging Established
Indicator Latent Emerging Established
Dimension: Organization structures
Dimension: Accountability
Dimension: Funding
101
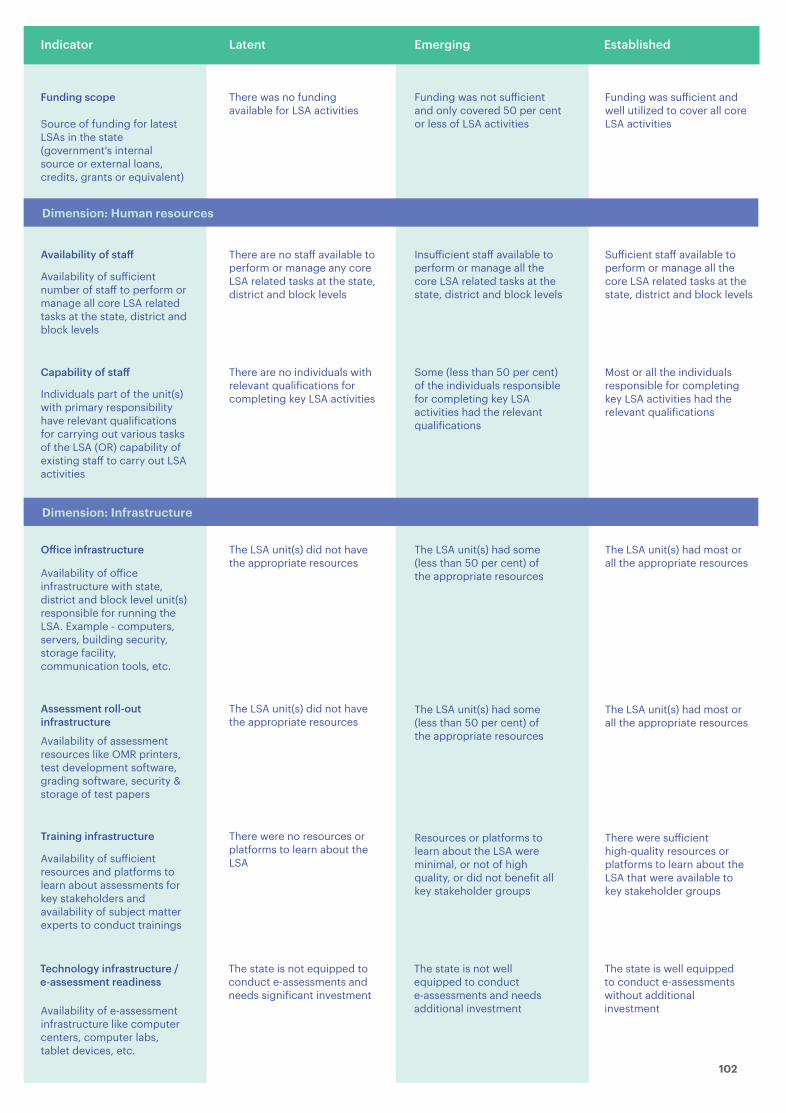
Dimension: Human resources
Dimension: Infrastructure
Funding scope
Availability of sta!
Capability of sta!
O"ice infrastructure
Assessment roll-out infrastructure
Training infrastructure
The LSA unit(s) did not have the appropriate resources
The LSA unit(s) had some (less than 50 per cent) of the appropriate resources
The LSA unit(s) had some (less than 50 per cent) of the appropriate resources
Resources or platforms to learn about the LSA were minimal, or not of high quality, or did not bene"it all key stakeholder groups
The LSA unit(s) did not have the appropriate resources
There were no resources or platforms to learn about the LSA
The LSA unit(s) had most or all the appropriate resources
The LSA unit(s) had most or all the appropriate resources
There were su!icient high-quality resources or platforms to learn about the LSA that were available to key stakeholder groups
Technology infrastructure / e-assessment readiness
The state is not equipped to conduct e-assessments and needs signi"icant investment
The state is not well equipped to conduct e-assessments and needs additional investment
The state is well equipped to conduct e-assessments without additional investment
There are no sta# available to perform or manage any core LSA related tasks at the state, district and block levels
There are no individuals with relevant quali"ications for completing key LSA activities
Insu!icient sta# available to perform or manage all the core LSA related tasks at the state, district and block levels
Some (less than 50 per cent) of the individuals responsible for completing key LSA activities had the relevant quali"ications
Su!icient sta# available to perform or manage all the core LSA related tasks at the state, district and block levels
Most or all the individuals responsible for completing key LSA activities had the relevant quali"ications
There was no funding available for LSA activities
Source of funding for latest LSAs in the state (government's internal source or external loans, credits, grants or equivalent)
Availability of su!icient number of sta# to perform or manage all core LSA related tasks at the state, district and block levels
Availability of assessment resources like OMR printers, test development software, grading software, security & storage of test papers
Availability of su!icient resources and platforms to learn about assessments for key stakeholders and availability of subject matter experts to conduct trainings
Availability of e-assessment infrastructure like computer centers, computer labs, tablet devices, etc.
Availability of o!ice infrastructure with state, district and block level unit(s) responsible for running the LSA. Example - computers, servers, building security, storage facility, communication tools, etc.
Individuals part of the unit(s) with primary responsibility have relevant quali"ications for carrying out various tasks of the LSA (OR) capability of existing sta# to carry out LSA activities
Funding was not su!icient and only covered 50 per cent or less of LSA activities
Funding was su!icient and well utilized to cover all core LSA activities
Indicator Latent Emerging Established
102

Indicator Latent Emerging Established
There was minimal documentation on the methods and procedures used during the LSA, or the documentation that existed was not public
Test design Test design was not aligned to state curriculum and learning objectives and wasn’t competency based with high question quality
Test design was inadequately aligned to state curriculum and learning objectives and/or was not competency based and all questions were not of high quality
Test design was su!iciently aligned to state curriculum and learning objectives and was competency based with high quality questions
Scoring The approach followed for test scoring was not aligned to the design as well as the objectives of the state for LSA
The approach followed for test scoring was poorly aligned to the design and/or the objectives of the state for LSA
The approach followed for test scoring was well aligned to the design as well as the objectives of the state for LSA
Standardization The LSA was not standardized at the system level
Robustness of test design that is competency linked, at the relevant grade level with high quality questions
The approach followed for test scoring is appropriate to the design as well as to meet the objectives of the state for LSAs
Capability for standardization of the LSA at the system level with extensive procedures to ensure standardization
Sampling adequately captured all categories of students in the state in order to provide a clear measure of learning levels in the state.
State capability / capacity for linguistic adaptation of LSA
Availability of documentation on the methods and procedures used during the LSA
Involvement of internal / external body(s) for monitoring quality protocols and processes for LSA and ensuring adequate guidelines exist and were used during quality reviews
The LSA was poorly standardized (less than 50 per cent) at the system level, or minimal or no procedures were in place to ensure standardization
The LSA was su!iciently standardized at the system level, and su!icient procedures were in place to ensure standardization
Sampling A non-random sample or a convenience sample of students participated in the LSA
A random sample of students that was not fully representative of all students at the state-level participated in the LSA
Census-based assessment with full participation of all students in all schools, or an adequately representative sample of students in select schools participated in the LSA
Linguistic adaptability State has no internal capability / capacity nor any guidelines for linguistic adaptation of LSA
State has limited internal capability / capacity and poorly de"ined guidelines for linguistic adaptation of LSA
State has su!icient internal capability / capacity and well-de"ined guidelines for linguistic adaptation of LSA
Methods and procedures documentation
There was no documentation on the methods and procedures used during the LSA
There was su!icient and public documentation on the methods and procedures used during the LSA
Monitoring mechanisms and quality processes
No internal / external body(s) was in place to monitor the quality protocols of the LSA and there were no guidelines on how to assess quality of processes
An internal body was assigned / created to monitor the quality protocols of the LSA but there were insu!icient guidelines on how to assess quality OR quality review was not documented
An external body was assigned / created to monitor the quality protocols of the LSA and there were relevant guidelines on how to assess quality; quality reviews were also documented
Key driver 4: Technical capacity
Dimension: Assessment design
Dimension: Test administration
103
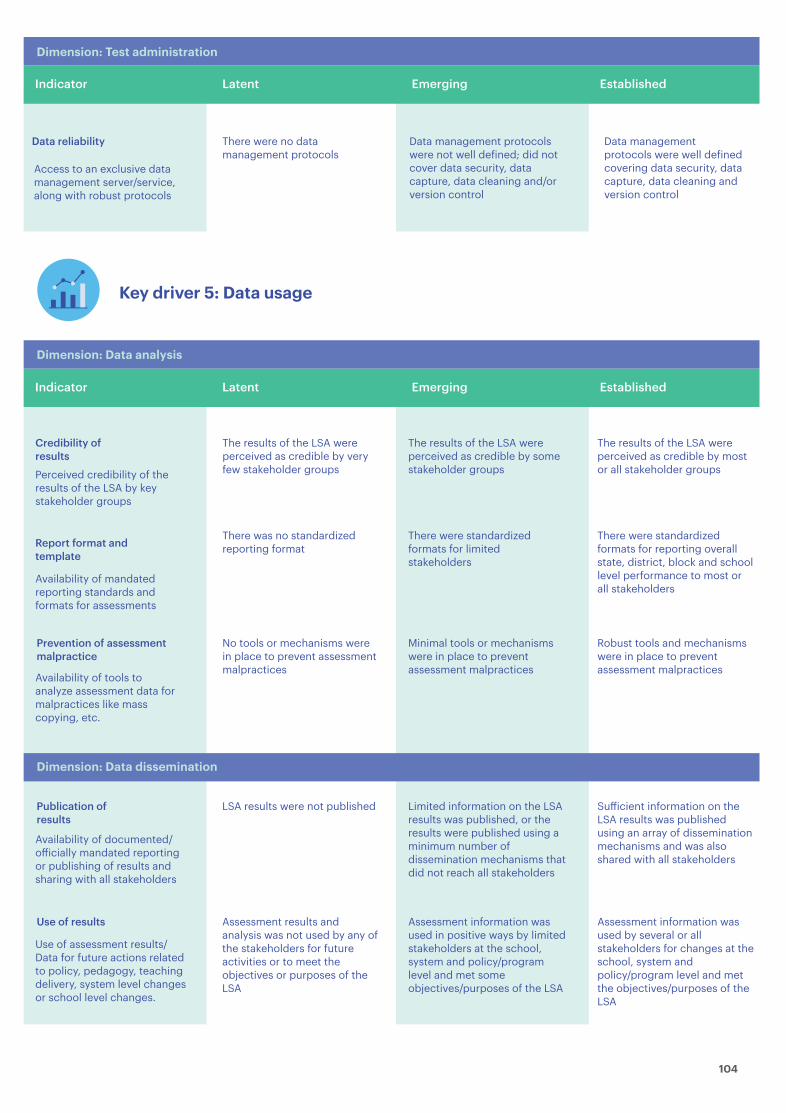
Indicator Latent Emerging Established
Access to an exclusive data management server/service, along with robust protocols
Perceived credibility of the results of the LSA by key stakeholder groups
Availability of mandated reporting standards and formats for assessments
Availability of tools to analyze assessment data for malpractices like mass copying, etc.
Availability of documented/ o!icially mandated reporting or publishing of results and sharing with all stakeholders
Use of assessment results/ Data for future actions related to policy, pedagogy, teaching delivery, system level changes or school level changes.
Data reliability There were no data management protocols
Data management protocols were not well de"ined; did not cover data security, data capture, data cleaning and/or version control
Data management protocols were well de"ined covering data security, data capture, data cleaning and version control
Key driver 5: Data usage
Dimension: Data analysis
Dimension: Data dissemination
Credibility of results
The results of the LSA were perceived as credible by very few stakeholder groups
The results of the LSA were perceived as credible by some stakeholder groups
The results of the LSA were perceived as credible by most or all stakeholder groups
Report format and template
There was no standardized reporting format
There were standardized formats for limited stakeholders
There were standardized formats for reporting overall state, district, block and school level performance to most or all stakeholders
Prevention of assessment malpractice
No tools or mechanisms were in place to prevent assessment malpractices
Minimal tools or mechanisms were in place to prevent assessment malpractices
Robust tools and mechanisms were in place to prevent assessment malpractices
Publication of results
LSA results were not published Limited information on the LSA results was published, or the results were published using a minimum number of dissemination mechanisms that did not reach all stakeholders
Su!icient information on the LSA results was published using an array of dissemination mechanisms and was also shared with all stakeholders
Use of results Assessment results and analysis was not used by any of the stakeholders for future activities or to meet the objectives or purposes of the LSA
Assessment information was used in positive ways by limited stakeholders at the school, system and policy/program level and met some objectives/purposes of the LSA
Assessment information was used by several or all stakeholders for changes at the school, system and policy/program level and met the objectives/purposes of the LSA
Indicator Latent Emerging Established
Dimension: Test administration
104
105
Illustrative analysis of strengths and weaknesses based on assessments in Rajasthan and Andhra Pradesh
APPENDIX 2
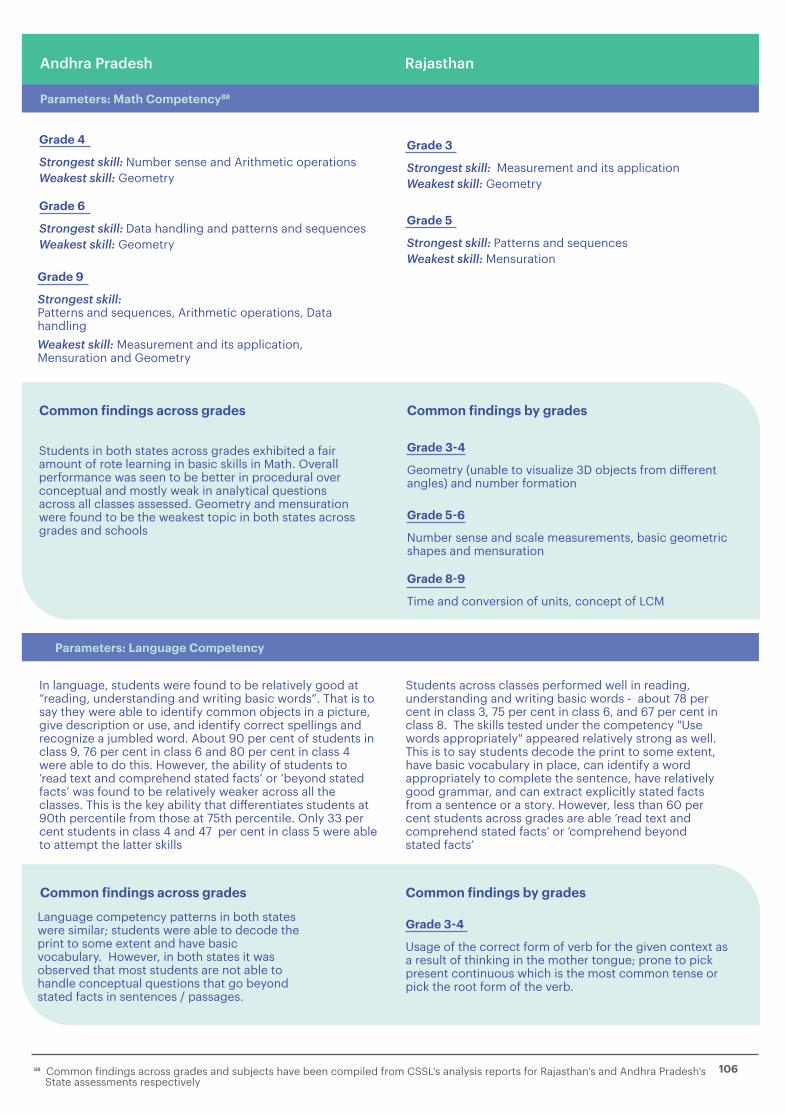
106
Language competency patterns in both states were similar; students were able to decode the print to some extent and have basic vocabulary. However, in both states it was observed that most students are not able to handle conceptual questions that go beyond stated facts in sentences / passages.
Grade 3!4
Usage of the correct form of verb for the given context as a result of thinking in the mother tongue; prone to pick present continuous which is the most common tense or pick the root form of the verb.
Common "indings across grades Common "indings by grades
RajasthanAndhra Pradesh Rajasthan
Grade 4
Strongest skill: Number sense and Arithmetic operationsWeakest skill: Geometry
Grade 6
Strongest skill: Data handling and patterns and sequencesWeakest skill: Geometry
Grade 9
Strongest skill: Patterns and sequences, Arithmetic operations, Data handlingWeakest skill: Measurement and its application, Mensuration and Geometry
Grade 3
Strongest skill: Measurement and its applicationWeakest skill: Geometry
Students in both states across grades exhibited a fair amount of rote learning in basic skills in Math. Overall performance was seen to be better in procedural over conceptual and mostly weak in analytical questions across all classes assessed. Geometry and mensuration were found to be the weakest topic in both states across grades and schools
In language, students were found to be relatively good at “reading, understanding and writing basic words”. That is to say they were able to identify common objects in a picture, give description or use, and identify correct spellings and recognize a jumbled word. About 90 per cent of students in class 9, 76 per cent in class 6 and 80 per cent in class 4 were able to do this. However, the ability of students to ’read text and comprehend stated facts’ or ’beyond stated facts’ was found to be relatively weaker across all the classes. This is the key ability that di#erentiates students at 90th percentile from those at 75th percentile. Only 33 per cent students in class 4 and 47 per cent in class 5 were able to attempt the latter skills
Students across classes performed well in reading, understanding and writing basic words - about 78 per cent in class 3, 75 per cent in class 6, and 67 per cent in class 8. The skills tested under the competency "Use words appropriately" appeared relatively strong as well. This is to say students decode the print to some extent, have basic vocabulary in place, can identify a word appropriately to complete the sentence, have relatively good grammar, and can extract explicitly stated facts from a sentence or a story. However, less than 60 per cent students across grades are able ’read text and comprehend stated facts’ or ’comprehend beyond stated facts’
Grade 5
Strongest skill: Patterns and sequencesWeakest skill: Mensuration
Grade 3!4
Geometry (unable to visualize 3D objects from di#erent angles) and number formation
Grade 5!6
Number sense and scale measurements, basic geometric shapes and mensuration
Grade 8!9
Time and conversion of units, concept of LCM
Common "indings across grades Common "indings by grades
Parameters: Math Competency88
Parameters: Language Competency
$$ Common "indings across grades and subjects have been compiled from CSSL's analysis reports for Rajasthan's and Andhra Pradesh's State assessments respectively
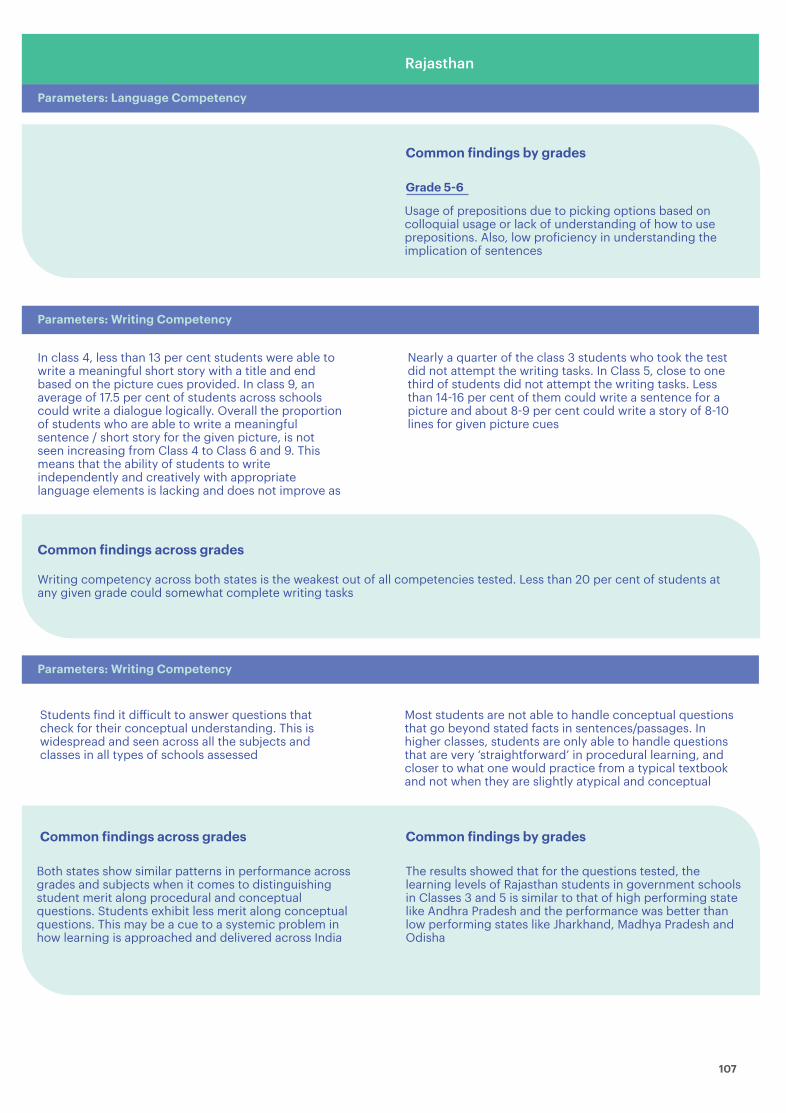
RajasthanRajasthan
Grade 5!6
Usage of prepositions due to picking options based on colloquial usage or lack of understanding of how to use prepositions. Also, low pro"iciency in understanding the implication of sentences
In class 4, less than 13 per cent students were able to write a meaningful short story with a title and end based on the picture cues provided. In class 9, an average of 17.5 per cent of students across schools could write a dialogue logically. Overall the proportion of students who are able to write a meaningful sentence / short story for the given picture, is not seen increasing from Class 4 to Class 6 and 9. This means that the ability of students to write independently and creatively with appropriate language elements is lacking and does not improve as
Students "ind it di!icult to answer questions that check for their conceptual understanding. This is widespread and seen across all the subjects and classes in all types of schools assessed
Most students are not able to handle conceptual questions that go beyond stated facts in sentences/passages. In higher classes, students are only able to handle questions that are very ‘straightforward’ in procedural learning, and closer to what one would practice from a typical textbook and not when they are slightly atypical and conceptual
Nearly a quarter of the class 3 students who took the test did not attempt the writing tasks. In Class 5, close to one third of students did not attempt the writing tasks. Less than 14%16 per cent of them could write a sentence for a picture and about 8%9 per cent could write a story of 8%10 lines for given picture cues
Writing competency across both states is the weakest out of all competencies tested. Less than 20 per cent of students at any given grade could somewhat complete writing tasks
Common "indings across grades
Common "indings by grades
Common "indings across grades Common "indings by grades
Parameters: Language Competency
Parameters: Writing Competency
Parameters: Writing Competency
Both states show similar patterns in performance across grades and subjects when it comes to distinguishing student merit along procedural and conceptual questions. Students exhibit less merit along conceptual questions. This may be a cue to a systemic problem in how learning is approached and delivered across India
The results showed that for the questions tested, the learning levels of Rajasthan students in government schools in Classes 3 and 5 is similar to that of high performing state like Andhra Pradesh and the performance was better than low performing states like Jharkhand, Madhya Pradesh and Odisha
107
108
APPENDIX 3
Tamil Nadu Capacity Building: Case Study Self-Evaluation
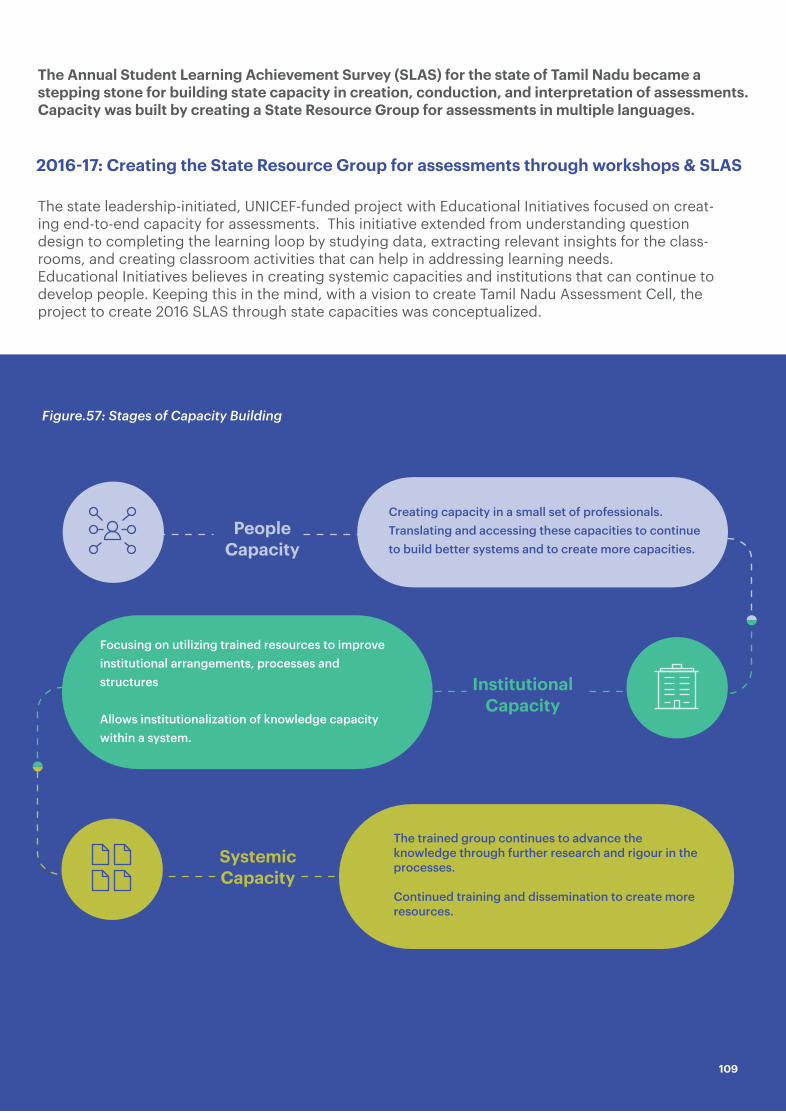
The Annual Student Learning Achievement Survey (SLAS) for the state of Tamil Nadu became a stepping stone for building state capacity in creation, conduction, and interpretation of assessments. Capacity was built by creating a State Resource Group for assessments in multiple languages.
The state leadership-initiated, UNICEF-funded project with Educational Initiatives focused on creat-ing end-to-end capacity for assessments. This initiative extended from understanding question design to completing the learning loop by studying data, extracting relevant insights for the class-rooms, and creating classroom activities that can help in addressing learning needs.Educational Initiatives believes in creating systemic capacities and institutions that can continue to develop people. Keeping this in the mind, with a vision to create Tamil Nadu Assessment Cell, the project to create 2016 SLAS through state capacities was conceptualized.
2016!17: Creating the State Resource Group for assessments through workshops & SLAS
109
Creating capacity in a small set of professionals. Translating and accessing these capacities to continue to build better systems and to create more capacities.
Focusing on utilizing trained resources to improve institutional arrangements, processes and structures
Allows institutionalization of knowledge capacity within a system.
People Capacity
Institutional Capacity
Systemic Capacity
The trained group continues to advance the knowledge through further research and rigour in the processes.
Continued training and dissemination to create more resources.
Figure.57: Stages of Capacity Building
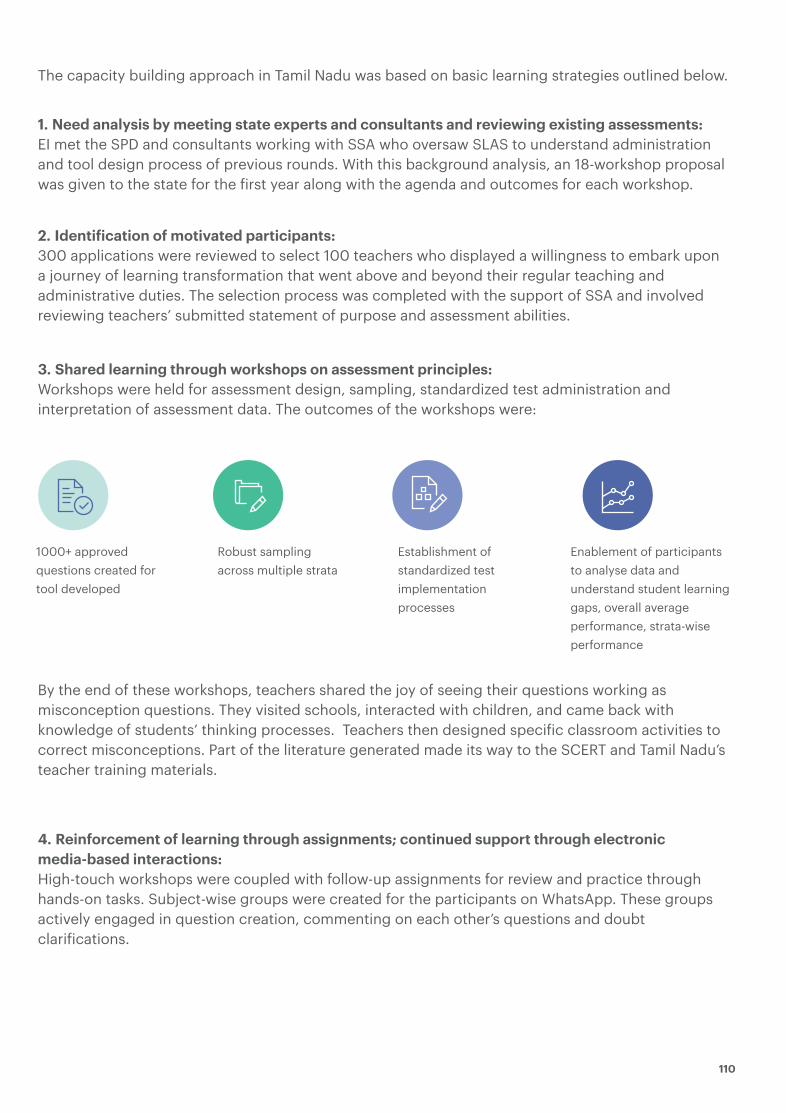
The capacity building approach in Tamil Nadu was based on basic learning strategies outlined below.
1. Need analysis by meeting state experts and consultants and reviewing existing assessments: EI met the SPD and consultants working with SSA who oversaw SLAS to understand administration and tool design process of previous rounds. With this background analysis, an 18-workshop proposal was given to the state for the "irst year along with the agenda and outcomes for each workshop.
2. Identi"ication of motivated participants:300 applications were reviewed to select 100 teachers who displayed a willingness to embark upon a journey of learning transformation that went above and beyond their regular teaching and administrative duties. The selection process was completed with the support of SSA and involved reviewing teachers’ submitted statement of purpose and assessment abilities.
By the end of these workshops, teachers shared the joy of seeing their questions working as misconception questions. They visited schools, interacted with children, and came back with knowledge of students’ thinking processes. Teachers then designed speci"ic classroom activities to correct misconceptions. Part of the literature generated made its way to the SCERT and Tamil Nadu’s teacher training materials.
3. Shared learning through workshops on assessment principles:Workshops were held for assessment design, sampling, standardized test administration and interpretation of assessment data. The outcomes of the workshops were:
4. Reinforcement of learning through assignments; continued support through electronic media-based interactions:High-touch workshops were coupled with follow-up assignments for review and practice through hands-on tasks. Subject-wise groups were created for the participants on WhatsApp. These groups actively engaged in question creation, commenting on each other’s questions and doubt clari"ications.
1000+ approved questions created for tool developed
Robust sampling across multiple strata
Establishment of standardized test implementation processes
Enablement of participants to analyse data and understand student learning gaps, overall average performance, strata-wise performance
110
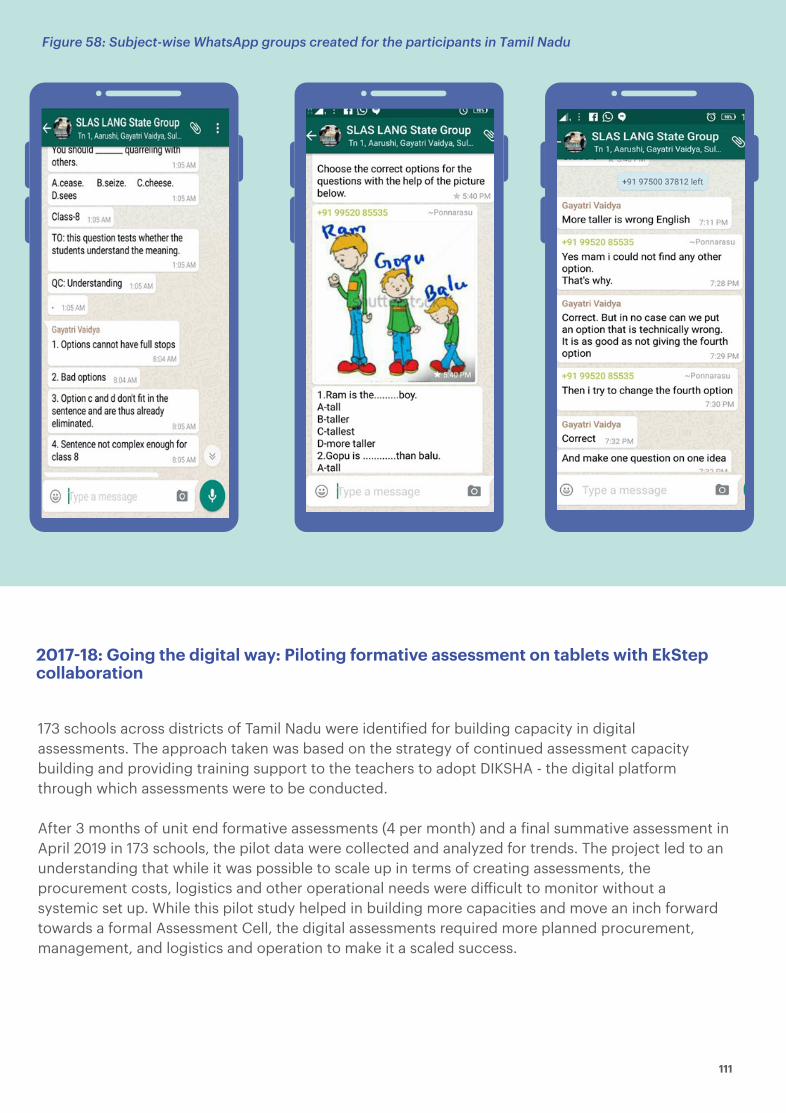
Figure 58: Subject-wise WhatsApp groups created for the participants in Tamil Nadu
2017!18: Going the digital way: Piloting formative assessment on tablets with EkStep collaboration
173 schools across districts of Tamil Nadu were identi"ied for building capacity in digital assessments. The approach taken was based on the strategy of continued assessment capacity building and providing training support to the teachers to adopt DIKSHA - the digital platform through which assessments were to be conducted.
After 3 months of unit end formative assessments (4 per month) and a "inal summative assessment in April 2019 in 173 schools, the pilot data were collected and analyzed for trends. The project led to an understanding that while it was possible to scale up in terms of creating assessments, the procurement costs, logistics and other operational needs were di!icult to monitor without a systemic set up. While this pilot study helped in building more capacities and move an inch forward towards a formal Assessment Cell, the digital assessments required more planned procurement, management, and logistics and operation to make it a scaled success.
111

2018!19: Tamil Nadu Assessment Cell and building of capacities
The State Leadership continued to strive towards establishing an Assessment Cell for the state along with collaborative e#orts from EkStep and Educational Initiatives. In June 2018 the Tamil Nadu Assessment Cell (TNAC) was inaugurated at the Anna Centenary Library, Chennai, Tamil Nadu. The TNAC was inaugurated by Smt. Reena Ray, Education Secretary, Department of School Education, India. The structure was created for the TNAC in a consultative fashion with the state leadership.
Lessons from the Tamil Nadu project
1. Creating systemic capacities and bringing teacher-led assessment reforms is possible.The state resource groups created because of capacity building activities continued to contribute to the state machineries beyond the assessment needs. The teachers could create questions and assessment tools that could help in identifying learning gaps which triggered textbook revision dialogues for all the grades. Six to eight participants from each subject group are now in the core teams for textbook reforms and SCERT trainings for the state. The other participants who were active in their BRC or CRC roles, continue to in"luence their blocks or clusters through their learnings.
2. Accompanying in-person workshops with digital inputs (in terms of video courses or interactives) can help in continued engagement.The continued engagement through instant messaging and assignments through emails supported the capacity building exercise. Engagement can be accentuated by providing more learning content through technology.
3. Capacity building initiatives require a long-term associationLike any reform, assessment reforms led through capacity building requires a consistent, long term focused approach with dedicated resources and continued leadership engagement.
During this project, every year there were leadership changes, and every leader came with an extended vision of the capacity building idea which allowed more explorations. However, it also diluted the e#orts that were planned for assessment cell creation.
4. Constitutionalizing the capacities as an institution can make it administration agnostic and allow for consistent and continuous monitoringCreating the assessment cell as a constitutional entity in itself could have helped with a clear vision, mission and sta!ing for the cell. During this project, the assessment cell carried out multiple functions, other than focusing only on assessments. This also might have in"luenced the sta!ing for the cell di#erently.
112

113
Madhya Pradesh - Rashtriya Madhyamik Shiksha Abhiyan, Directorate of Public Instruction – Request for Proposal Sample
APPENDIX 4
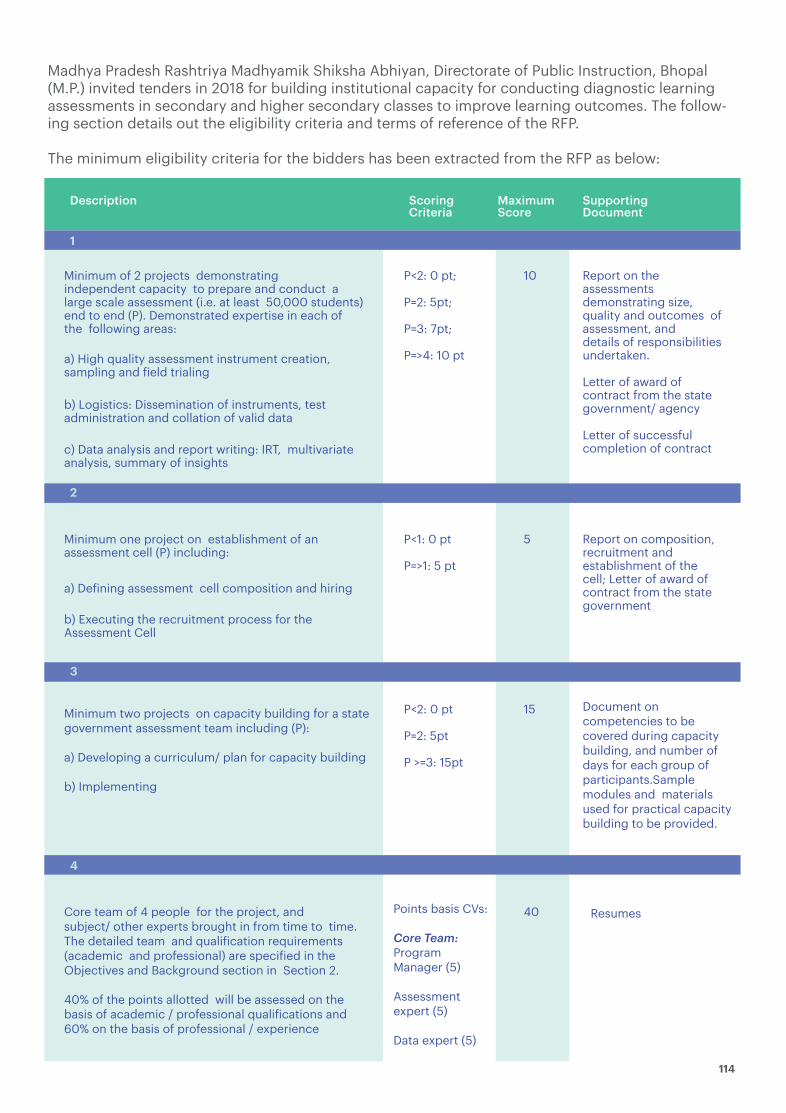
Madhya Pradesh Rashtriya Madhyamik Shiksha Abhiyan, Directorate of Public Instruction, Bhopal (M.P.) invited tenders in 2018 for building institutional capacity for conducting diagnostic learning assessments in secondary and higher secondary classes to improve learning outcomes. The follow-ing section details out the eligibility criteria and terms of reference of the RFP.
The minimum eligibility criteria for the bidders has been extracted from the RFP as below:
Description Scoring Criteria
Maximum Score
Supporting Document
1
2
3
Minimum of 2 projects demonstrating independent capacity to prepare and conduct a large scale assessment (i.e. at least 50,000 students) end to end (P). Demonstrated expertise in each of the following areas:
Minimum one project on establishment of an assessment cell (P) including:
Minimum two projects on capacity building for a state government assessment team including (P):
a) Developing a curriculum/ plan for capacity building b) Implementing
a) High quality assessment instrument creation, sampling and "ield trialing
a) De"ining assessment cell composition and hiring
b) Executing the recruitment process for the Assessment Cell
b) Logistics: Dissemination of instruments, test administration and collation of valid data
c) Data analysis and report writing: IRT, multivariate analysis, summary of insights
P<2: 0 pt;
P=2: 5pt; P=3: 7pt; P=>4: 10 pt
P<1: 0 pt P=>1: 5 pt
P<2: 0 pt P=2: 5pt P >=3: 15pt
10
15
5
Report on the assessments demonstrating size, quality and outcomes of assessment, and details of responsibilities undertaken. Letter of award of contract from the state government/ agency
Letter of successful completion of contract
Report on composition, recruitment and establishment of the cell; Letter of award of contract from the state government
Document on competencies to be covered during capacity building, and number of days for each group of participants.Sample modules and materials used for practical capacity building to be provided.
4
40 Core team of 4 people for the project, and subject/ other experts brought in from time to time. The detailed team and quali"ication requirements (academic and professional) are speci"ied in the Objectives and Background section in Section 2. 40% of the points allotted will be assessed on the basis of academic / professional quali"ications and 60% on the basis of professional / experience
Points basis CVs: Core Team: Program Manager (5) Assessment expert (5) Data expert (5)
Resumes
114

Description Scoring Criteria
Maximum Score
Supporting Document
4
5
Total 90
20 Proposal document and presentation on: a) Technical Approach and Methodology, indicating detailed understanding of scope of work
b) Suggested work plan, deliverables, proposed Organization and Sta!ing
Communication Expert (2)
Other Experts: Expert on values and attitudes assessment (5) Maths Expert, Physics Expert,
Chemistry Expert,
Hindi Expert, English Expert, Economics Expert 3 points per expert (18)
20 points (10 points on the basis of documents provided, 10 points on the basis of presentation)
The terms of reference have been extracted from the RFP as below:Objectives and Background
The broad objectives as envisaged in this Assignment include: 1. Establishing the state assessment team for Classes 9#12 of government schools at state level
2. Building the capacity of the state assessment team to design high-quality diagnostic assessments, e"iciently conduct assessments, perform sophisticated data analytics, and disseminate the results to identi$ied stakeholders so as to inform teaching practices, curricula and materials, trainings etc.; Also building the capacity of the district
115

17. Assisting the School Education Department to establish Assessment Team
Assessments conducted for grades 9%12 include monthly and half yearly exams conducted by the Directorate, and board exams for classes 10th and 12th conducted by the Board of Secondary Education. As of date, the design, data capture and analysis on these assessments is such that it does not provide competency wise understanding of the learning levels of students. Also, in the absence of a unifying rubric, the scores across years are not scienti"ically comparable. The Directorate realizes the need to strengthen the ongoing assessments for grades 9%12 and to build internal capacity to conduct valid, reliable and fair learning assessment systems, which can facilitate evidence-based policy and other decisions. The learning outcomes data thus generated will be the basis of long-term strategic decisions e.g. curricular planning and reforms, teachers’ training design, the development of material for schools, etc., as well as shorter-term interventions e.g. for remediation. The information emerging from these assessments will also o#er an opportunity for discourse with parents on issues related to learning. In order to achieve this vision, it is imperative that the Directorate develops the capacity of its internal resources for assessments and research into student learning, and seeks to establish a forward-looking, reform-oriented state assessment team at the secondary level. The team will be responsible for designing and administering high-quality assessments that test higher order thinking skills and learning competencies. It will also be responsible for collecting the data generated from these assessments and undertaking a robust data analytics exercise. The insights from this data should then be collated to provide state, district and block level 24 o!icers’ actionable information for various purposes. These purposes include the revision of current in-classroom processes and materials, undertaking additional interventions and for accountability related measures. In the medium term, the Directorate also wishes to develop internal capacity to conduct student assessments on non-cognitive aspects like attitudes and values which are equally important for overall success of children beyond cognitive learning alone.
17.1 Need for an assessment team
This section lays out a suggested structure for the state assessment team and recommended quali"ications for each o!icer. This structure is only indicative and the Bidder will be required to design and submit its recommended structure along with job roles and quali!ications for each o"icer of the assessment team.
17.2 Proposed composition of the state assessment team to be deputed by the DPI
key resource group to be able to conduct tests, understand results and engage in their dissemination, as well as drive on-ground actions for improvement thereafter. 3. Assist in conducting an independent diagnostic assessment for two grades (grades 9 and 11) in secondary and higher senior secondary classes for 4 subjects for grade 9 (Maths, Science, English, Hindi) and for 5 subjects for grade 11 (Physics, Chemistry, Maths, Hindi, Economics)
4. Assist in conducting an assessment/ study of values and attitudes of a sample of children from all grades 9#12
The detailed scope of work for each of these objectives is set out below. Each Bidder will be required to propose a timeline for completion of the detailed scope of work as outlined. It is envisaged that this project will require 2 years for the completion of all 4 components of the scope of work. This contract may be extended to a third year on terms mutually acceptable to both parties.
116
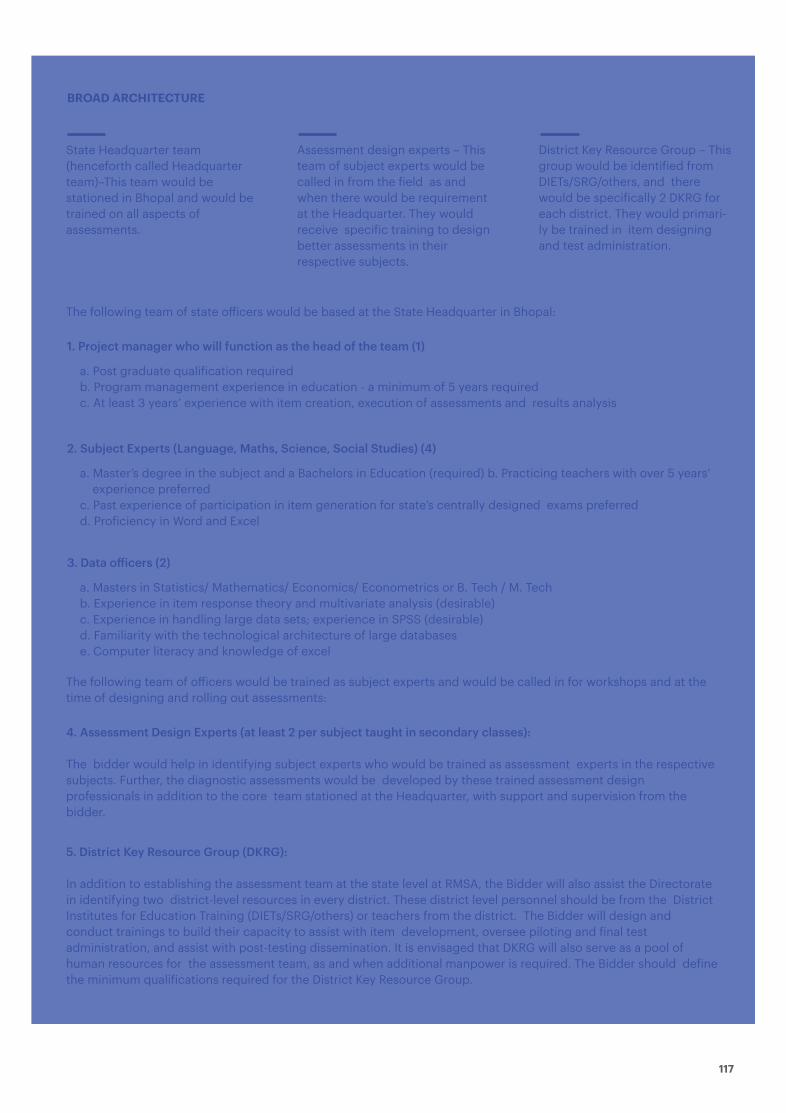
The following team of state o!icers would be based at the State Headquarter in Bhopal:
The following team of o!icers would be trained as subject experts and would be called in for workshops and at the time of designing and rolling out assessments:
1. Project manager who will function as the head of the team (1)
State Headquarter team (henceforth called Headquarter team)–This team would be stationed in Bhopal and would be trained on all aspects of assessments.
a. Post graduate quali"ication required b. Program management experience in education - a minimum of 5 years required c. At least 3 years’ experience with item creation, execution of assessments and results analysis
2. Subject Experts (Language, Maths, Science, Social Studies) (4)
a. Master’s degree in the subject and a Bachelors in Education (required) b. Practicing teachers with over 5 years’ experience preferred c. Past experience of participation in item generation for state’s centrally designed exams preferred d. Pro"iciency in Word and Excel
3. Data o"icers (2)
a. Masters in Statistics/ Mathematics/ Economics/ Econometrics or B. Tech / M. Tech b. Experience in item response theory and multivariate analysis (desirable) c. Experience in handling large data sets; experience in SPSS (desirable) d. Familiarity with the technological architecture of large databases e. Computer literacy and knowledge of excel
4. Assessment Design Experts (at least 2 per subject taught in secondary classes):
The bidder would help in identifying subject experts who would be trained as assessment experts in the respective subjects. Further, the diagnostic assessments would be developed by these trained assessment design professionals in addition to the core team stationed at the Headquarter, with support and supervision from the bidder.
5. District Key Resource Group (DKRG):
In addition to establishing the assessment team at the state level at RMSA, the Bidder will also assist the Directorate in identifying two district-level resources in every district. These district level personnel should be from the District Institutes for Education Training (DIETs/SRG/others) or teachers from the district. The Bidder will design and conduct trainings to build their capacity to assist with item development, oversee piloting and "inal test administration, and assist with post-testing dissemination. It is envisaged that DKRG will also serve as a pool of human resources for the assessment team, as and when additional manpower is required. The Bidder should de"ine the minimum quali"ications required for the District Key Resource Group.
Assessment design experts – This team of subject experts would be called in from the "ield as and when there would be requirement at the Headquarter. They would receive speci"ic training to design better assessments in their respective subjects.
District Key Resource Group – This group would be identi"ied from DIETs/SRG/others, and there would be speci"ically 2 DKRG for each district. They would primari-ly be trained in item designing and test administration.
BROAD ARCHITECTURE
117

1. The Bidder should clearly de"ine the various stages of the selection process and timelines associated with each stage. The Bidder will be required to design all preparatory materials for the selection, including the testing instruments and the interview guides for the process. 2. The Bidder will coordinate with the Directorate to release the call for applications for sta!ing of the Assessment team. 3. On the basis of quali"ications outlined in the call for applications, the Bidder will shortlist candidates for the next stages of the selection process. 4. A combination of a written test and in-persons interviews are recommended for the additional stages of the process. However, the Bidder may "inalize the process as it deems best based on discussions with the Directorate. 5. It is recommended that the Bidder itself conduct one round of in-person interviews to shortlist candidates for a "inal interview, which is then jointly undertaken by the Directorate and Bidder
6. The Bidder should provide the "inal merit list to the Directorate. The Directorate will take "inal decisions for approval and deputation/ hiring as appropriate.
17.3 Selection Process for the above State Assessment team, establishment and sta#ing of the Assessment team
*For complete details and access to the RFP document, please reach out to KPMG
118

119
APPENDIX 5
Role of good questions in assessments89
$& Appendix 6, “ROLE OF GOOD QUESTIONS IN ASSESSMENTS” is contributed by Educational Initiatives (EI)
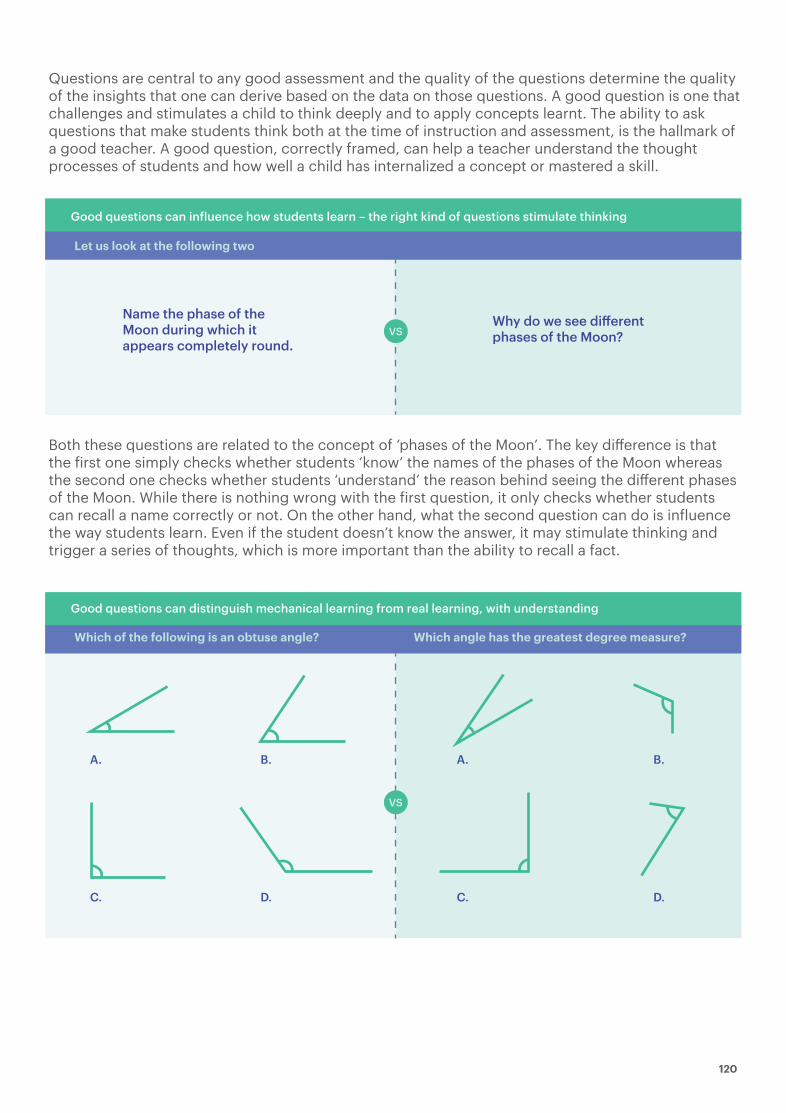
Questions are central to any good assessment and the quality of the questions determine the quality of the insights that one can derive based on the data on those questions. A good question is one that challenges and stimulates a child to think deeply and to apply concepts learnt. The ability to ask questions that make students think both at the time of instruction and assessment, is the hallmark of a good teacher. A good question, correctly framed, can help a teacher understand the thought processes of students and how well a child has internalized a concept or mastered a skill.
Both these questions are related to the concept of ‘phases of the Moon’. The key di#erence is that the "irst one simply checks whether students ‘know’ the names of the phases of the Moon whereas the second one checks whether students ‘understand’ the reason behind seeing the di#erent phases of the Moon. While there is nothing wrong with the "irst question, it only checks whether students can recall a name correctly or not. On the other hand, what the second question can do is in"luence the way students learn. Even if the student doesn’t know the answer, it may stimulate thinking and trigger a series of thoughts, which is more important than the ability to recall a fact.
Let us look at the following two
Name the phase of the Moon during which it appears completely round.
Why do we see di!erent phases of the Moon?
A. B.
C. D.
A. B.
C. D.
Good questions can in$luence how students learn – the right kind of questions stimulate thinking
VS
VS
Good questions can distinguish mechanical learning from real learning, with understanding
Which of the following is an obtuse angle? Which angle has the greatest degree measure?
120

Both these questions are related to the concept of ‘angles’. The "irst question tests whether students know what ‘obtuse angle’ means and can identify the obtuse angle whereas the second question tests whether students understand the concept of angle and can identify the angle of the greatest degree measure. A subtle di#erence is the way the visual options are arranged. In the "irst question, all the angles have a base that is horizontal, whereas in the second question, the angles are arranged in di#erent orientations and the arm lengths are also di#erent. Therefore, the second question can be answered only if students understand what angle means. Data on the second question reveals that many students don’t understand what angle means and harbor di#erent misconceptions. For exam-ple, many children believe that the longer are the arms of an angle, greater is its measure. Only a good question like the second question can distinguish if students have really understood the con-cept or have rote-learnt it.
22, 131 students attempted this question. Around 21 per cent students selected the correct answer, option D. Around 38 per cent students selected option A and 29 per cent students selected option B indicating that they have a misconception that the gaseous exchange happens only in certain organs. They don’t understand that it happens in all the parts of the body. Depending on the choice of distractors, di#erent misconceptions and ways of thinking can be captured using good questions.
What is the length of the eraser?
3cm
4cm
7cm
(The length cannot be measured by a broken ruler)
A.
43 5 6 7 8B.
C.
D.
Good questions can trap misconceptions and common errors
Given below is a diagrammatic representation of a process taking place in the human body.
In which of these regions/organs could it be occurring?1. Lungs | 2. Heart | 3. Brain
A. Only in Lungs
CO2
Red Blood Cell
Blood
O2
B. Only in Heart
C. Only in Heart and Brain
D. All of the above
Good questions can provide feedback on what students are really learning
Sahil used a broken ruler to measure the length of his eraser as shown below.
ERASER
121
A question like the one shown above can be a very powerful way to check whether students really understand what length is and how to measure it. It is di#erent from a typical textbook question asking to measure length because - i) the object is not starting at 0 and ii) the ruler is shown to be broken. The broken ruler is used intentionally to check if students have a misconception that we cannot measure length with a broken ruler. Surprisingly, data indicates that there are around 13 per cent to 15 per cent class 5 students in the private schools who have this misconception. 37 per cent class 5 students count individual points (4, 5, 6, 7) instead of the distance between the points (4%5, 5%6, 6%7) and hence arrive at the incorrect answer B, 4 cm. It is by a simple change in asking question like the one shown above that can reveal what students are really learning.
A good question should:
test a skill or concept that is worth understanding be valid – it should test what it is intended to test be able to distinguish candidates of di#erent abilities be able to point out speci"ic wrong notions/mistakes made by the candidates be interesting and stimulate thinking be appropriate for the target audience state what is expected in clear and unambiguous terms use clear, concise and age-appropriate language be error free A good question should NOT:
be biased towards any speci"ic race, religion or gender check for trivial or inconsequential details be taken directly from the wordings in the reference books
Aspects of a good question
122

123
&' Appendix 5, “SAMPLE DIAGNOSTIC QUESTIONS USED IN LARGE SCALE ASSESSMENTS” is contributed by Centre for Science of Student Learning .
Sample Diagnostic Questions Used in Large Scale Assessments90
APPENDIX 6

The heart of any diagnostic learning assessment is its instrument design. To understand the quality of student learning, questions need to go beyond the ‘rote’ to check whether students have under-stood the concepts and can apply them and be creative. Hence, the questions included in a diagnostic assessment must aim at assessing students’ under-standing and ability to apply what they had learnt and not just the ability to recall information or use formulae or procedures. Further the focus in such questions should not be only on checking if students can give the right answers but in identifying the types of wrong answers to extract the misconceptions students have and identify the common errors they make.CSSL classi"ies questions into 3 di#erent types based on the cognitive dimension addressed. These are the procedural, conceptual and analytical thinking (Mathematics) and Creativity (Language).
Procedural (P)This dimension focuses on tasks that draw largely on memory and do not require much e#ort or thought. Question ideas and item types that are generally seen in the textbooks and which students are very familiar with and which involve responses that have a high element of recall or reproduction are included here. In Math, this dimension includes facts, procedures, theorems, identities, etc. It involves solving problems using methods directly from the textbook and solving straight forward items. In Language, this includes knowledge of letters, words and their spellings, and straight-forward applications of retrieving information that is stated explicitly in a text.
Conceptual (C)This dimension focuses on the ability of students to apply knowledge and conceptual understanding to solve problems. In Math, questions that may have intrinsic elements of comprehension, interpretation, reasoning, logic, etc. will fall under this dimension. In Language, this dimension includes the ability of students to use words appropriate to context, comprehend beyond stated facts in a variety of materials such as narrative, authentic, etc.
Analytical Thinking (A)In math, analytical thinking goes beyond the solution of routine problems to encompass complex situations, contexts and multi-step problems. It involves a methodical step-by-step approach to thinking that allows you to break down complex problems into single and manageable components.
Creativity (C)In language, questions on creativity checks for student ability to think creatively on given contexts and use language as a vehicle to express their thoughts in writing.Given below are some examples of questions and question types that check the di#erent cognitive dimensions described above.
124
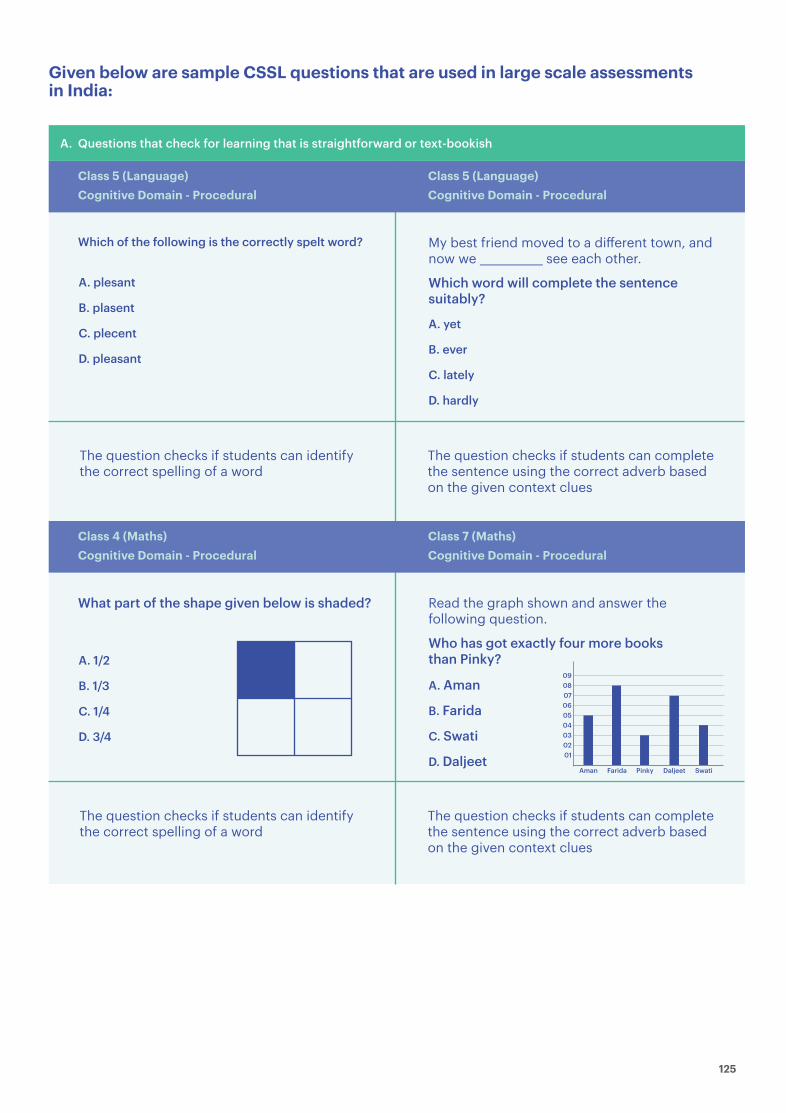
Class 5 (Language)Cognitive Domain - Procedural
Class 5 (Language)Cognitive Domain - Procedural
My best friend moved to a di#erent town, and now we ____________ see each other.
Which of the following is the correctly spelt word?
Which word will complete the sentence suitably?
A. yet
B. ever
C. lately
D. hardly
A. plesant
B. plasent
C. plecent
D. pleasant
Questions that check for learning that is straightforward or text-bookish
The question checks if students can identify the correct spelling of a word
The question checks if students can complete the sentence using the correct adverb based on the given context clues
Read the graph shown and answer the following question.
What part of the shape given below is shaded?
Who has got exactly four more books than Pinky?
A. Aman
B. Farida
C. Swati
D. Daljeet
A. 1/2
B. 1/3
C. 1/4
D. 3/4
The question checks if students can identify the correct spelling of a word
The question checks if students can complete the sentence using the correct adverb based on the given context clues
Aman
010203040506070809
Farida Pinky Daljeet Swati
Given below are sample CSSL questions that are used in large scale assessments in India:
A.
Class 4 (Maths)Cognitive Domain - Procedural
Class 7 (Maths)Cognitive Domain - Procedural
125

Class 5 (Language)Cognitive Domain - Conceptual
Passage Excerpt:
A. because the rooster was not believing him
B. because he wanted to go quickly to the lions and tigers
C. because he had forgotten about an important work
D. because the wild dogs were approaching them
Questions that check for deeper understanding of concepts B.
“Have you heard the good news?” said the Fox.“What news?” asked the rooster curiously.“All animals have agreed to live in peace and friendship. From now on, no animal will kill or eat another.” “Really? Will lions and tigers agree to eat leaves and grass?” asked the rooster.“If you don’t believe me, let’s go together and ask them,” said the fox.For a moment the rooster thought about it. But he made no e#ort to go down the tree.“What are you waiting for?” the fox called out anxiously. …
Why was the fox anxious?
Class 9 (Language)Cognitive Domain - Conceptual
Passage Excerpt:
A. because only few of them will $inally become sweet when ripe
B. because the farmers can then sell them throughout the year
C. because it should be easily available for everyone who wants it
D. because the King prefers only the ones that are available in abundance
At a gathering, a group of people were discussing what qualities a good mango should have. The famous poet, Mirza Ghalib said, “There are only two points, they should be sweet and they should be plentiful.” …
What could possibly be the reason for Mirza Ghalib to specify 'plentiful' as a quality for good mangoes?
The two sample questions given above check for student’s comprehension of unstated information that is implied by reading between the lines and connecting ideas given in di#erent lines.
Class 4 (Maths)Cognitive Domain - Conceptual
126
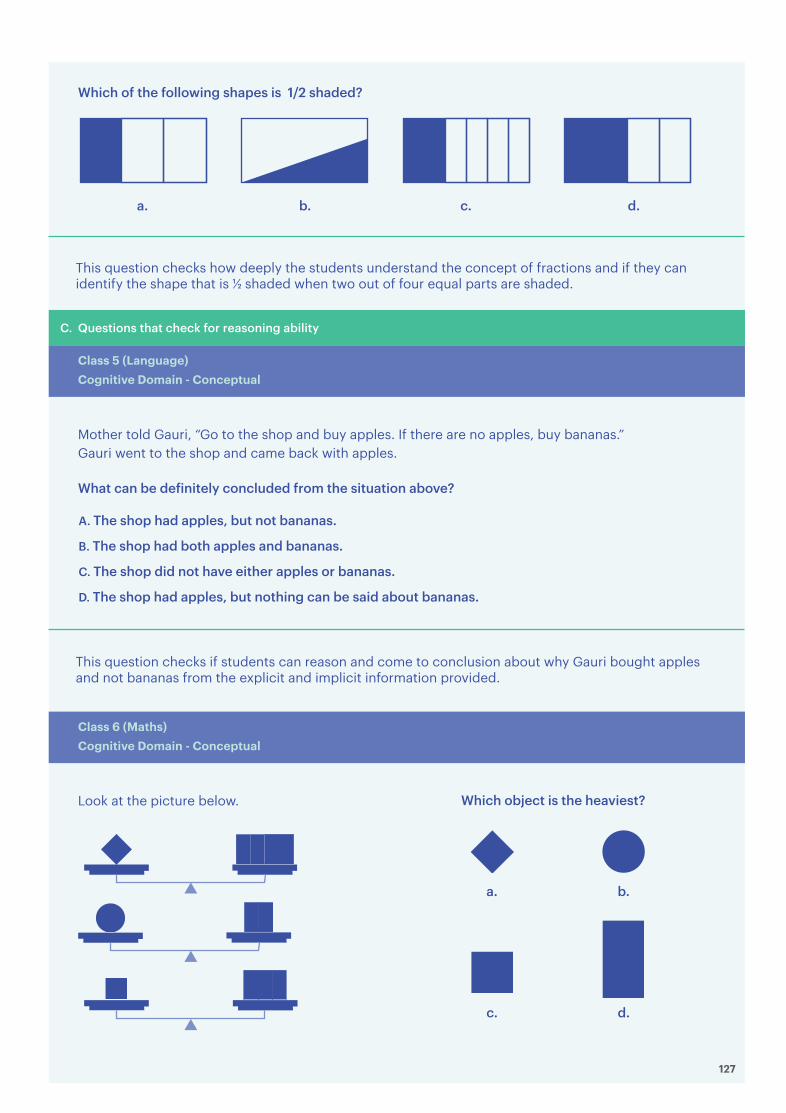
Class 5 (Language)Cognitive Domain - Conceptual
A. The shop had apples, but not bananas.
B. The shop had both apples and bananas.
C. The shop did not have either apples or bananas.
D. The shop had apples, but nothing can be said about bananas.
Questions that check for reasoning ability C.
Mother told Gauri, “Go to the shop and buy apples. If there are no apples, buy bananas.”Gauri went to the shop and came back with apples.
What can be de$initely concluded from the situation above?
Which of the following shapes is 1/2 shaded?
This question checks how deeply the students understand the concept of fractions and if they can identify the shape that is ( shaded when two out of four equal parts are shaded.
This question checks if students can reason and come to conclusion about why Gauri bought apples and not bananas from the explicit and implicit information provided.
Class 6 (Maths)Cognitive Domain - Conceptual
Look at the picture below.
a. b. c. d.
a. b.
c. d.
Which object is the heaviest?
127
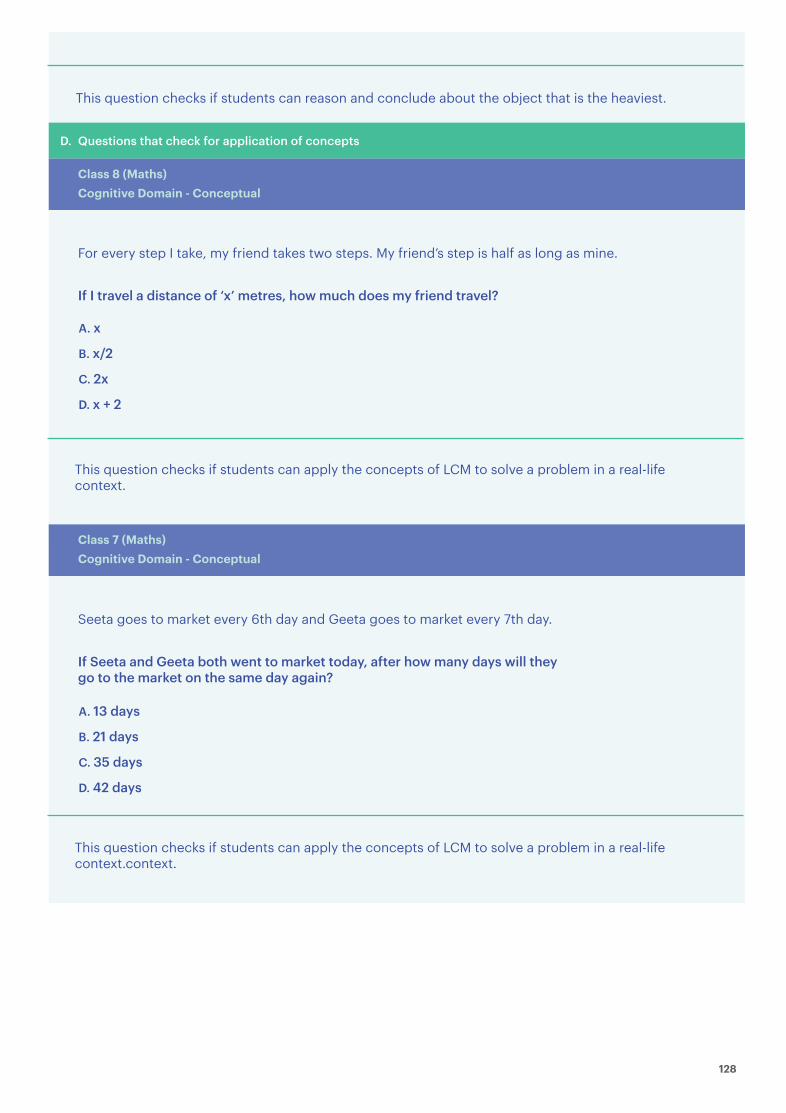
Class 8 (Maths)Cognitive Domain - Conceptual
A. x
B. x/2
C. 2x
D. x + 2
Questions that check for application of concepts D.
For every step I take, my friend takes two steps. My friend’s step is half as long as mine.
If I travel a distance of ‘x’ metres, how much does my friend travel?
This question checks if students can apply the concepts of LCM to solve a problem in a real-life context.
Class 7 (Maths)Cognitive Domain - Conceptual
A. 13 days
B. 21 days
C. 35 days
D. 42 days
Seeta goes to market every 6th day and Geeta goes to market every 7th day.
If Seeta and Geeta both went to market today, after how many days will they go to the market on the same day again?
This question checks if students can apply the concepts of LCM to solve a problem in a real-life context.context.
This question checks if students can reason and conclude about the object that is the heaviest.
128
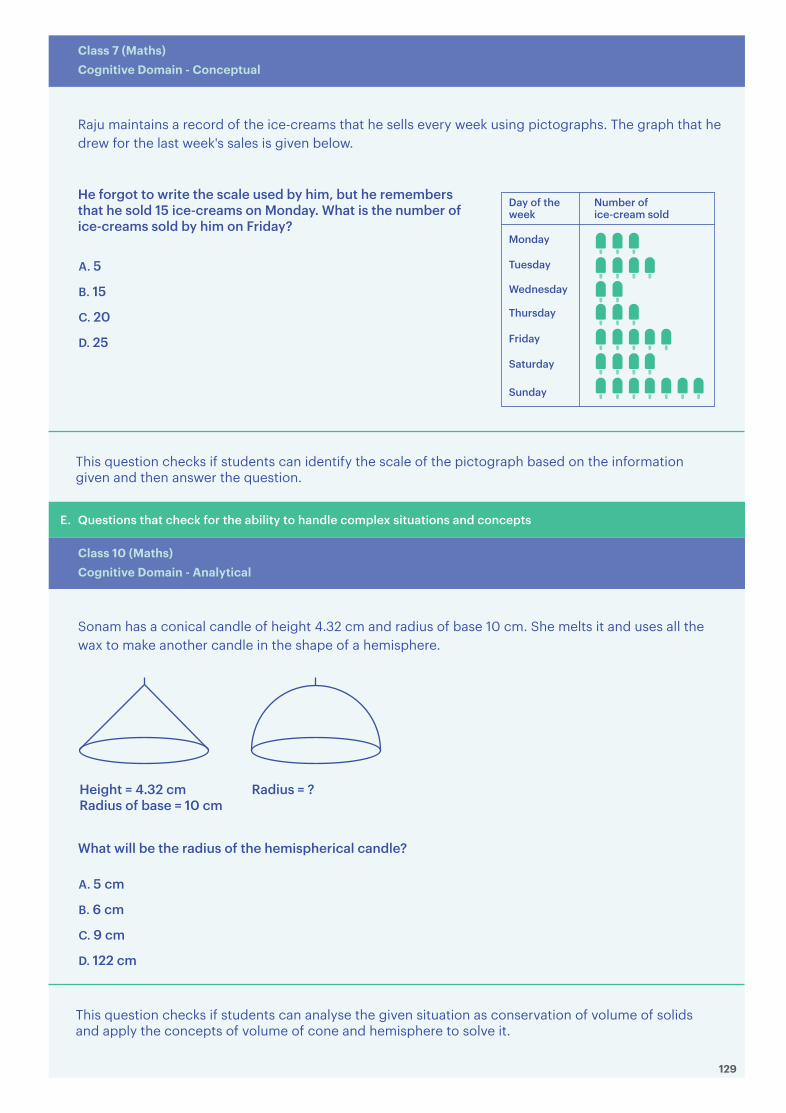
A. 5 cm
B. 6 cm
C. 9 cm
D. 122 cm
Sonam has a conical candle of height 4.32 cm and radius of base 10 cm. She melts it and uses all the wax to make another candle in the shape of a hemisphere.
What will be the radius of the hemispherical candle?
Class 7 (Maths)Cognitive Domain - Conceptual
A. 5
B. 15
C. 20
D. 25
Raju maintains a record of the ice-creams that he sells every week using pictographs. The graph that he drew for the last week's sales is given below.
He forgot to write the scale used by him, but he remembers that he sold 15 ice-creams on Monday. What is the number of ice-creams sold by him on Friday?
This question checks if students can identify the scale of the pictograph based on the information given and then answer the question.
This question checks if students can analyse the given situation as conservation of volume of solids and apply the concepts of volume of cone and hemisphere to solve it.
Class 10 (Maths)Cognitive Domain - Analytical
Questions that check for the ability to handle complex situations and concepts E.
Monday
Day of the week
Number of ice-cream sold
Tuesday
Wednesday
Thursday
Friday
Saturday
Sunday
Height = 4.32 cmRadius of base = 10 cm
Radius = ?
129
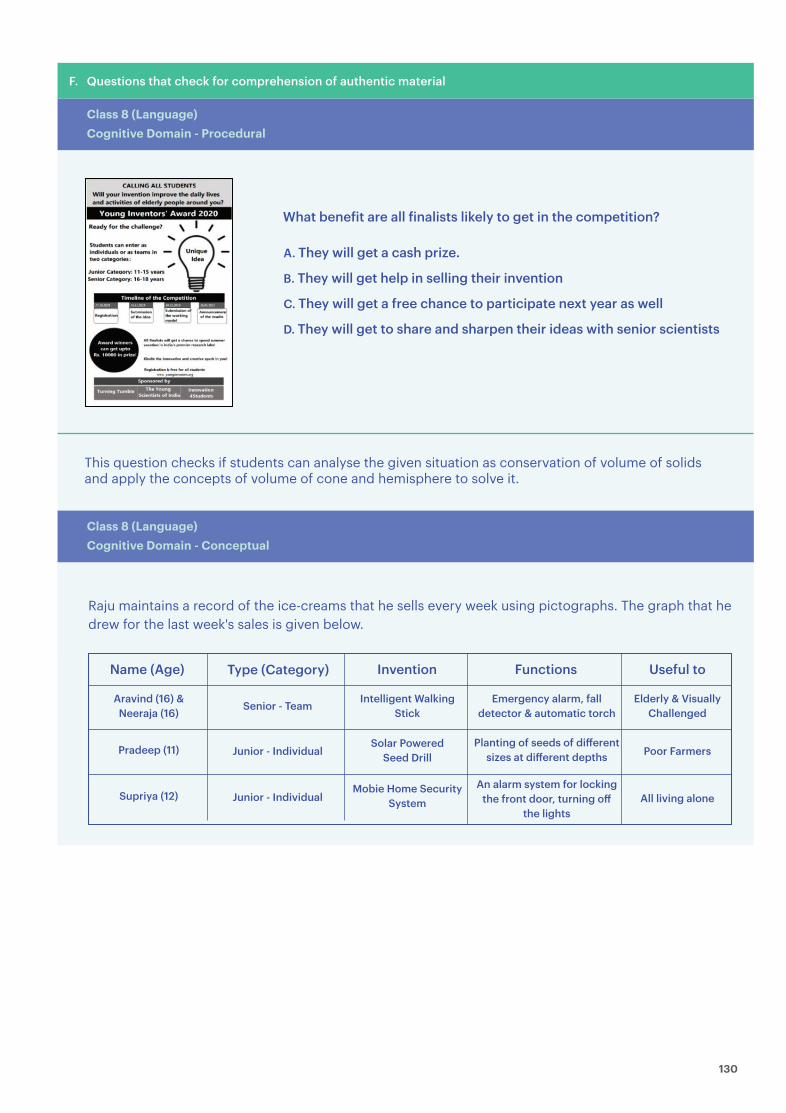
A. They will get a cash prize.
B. They will get help in selling their invention
C. They will get a free chance to participate next year as well
D. They will get to share and sharpen their ideas with senior scientists
What bene$it are all $inalists likely to get in the competition?
This question checks if students can analyse the given situation as conservation of volume of solids and apply the concepts of volume of cone and hemisphere to solve it.
Class 8 (Language)Cognitive Domain - Procedural
Questions that check for comprehension of authentic material F.
Class 8 (Language)Cognitive Domain - Conceptual
Name (Age)
Aravind (16) &Neeraja (16)
Intelligent Walking Stick
Emergency alarm, fall detector & automatic torch
Elderly & Visually Challenged
Poor Farmers
All living aloneAn alarm system for locking
the front door, turning o! the lights
Planting of seeds of di!erent sizes at di!erent depths
Solar Powered Seed Drill
Mobie Home Security System
Pradeep (11)
Senior - Team
Junior - Individual
Junior - IndividualSupriya (12)
Type (Category) Invention Functions Useful to
Raju maintains a record of the ice-creams that he sells every week using pictographs. The graph that he drew for the last week's sales is given below.
130

Class 5 (Language)Cognitive Domain - Conceptual
Questions that check for holistic language learning G.
As a _______________ was riding past a poor man’s hut, his _______________ stumbled and he fell. “I saw your face and fell o# the horse. Your face brought me _______________! You should be hanged!” shouted the zameendar. “Sir, before you hang me, consider this - by seeing my face you only su#ered a _______________, by seeing yours, I’m going to die!” said the poor man.
Which is the correct sequence of words that will $ill the blanks suitably?(Fall, Horse, misfortune, zameendar)
Cloze items are considered as holistic items to test language learning. In addition to general reading and language skills, a cloze test item requires abilities such as – knowledge of vocabulary, attention to nearer and farther context, knowledge of collocation and colligation and "lexibility as to word and context interchangeability. The question given above is a guided cloze question which require students to recognise the correct word to "it in the blanks. The answer choices need not only "it in each blank appropriately, but the choice of all words must complete the passage meaningfully.
A. Pradeep
B. Supriya
C. Aravind and Neeraja
D. Everyone has a chance to win.
A. horse - zameendar - fall - misfortune
B. zameendar - horse - fall - misfortune
C. horse - zameendar - misfortune - fall
D. zameendar - horse - misfortune - fall
Class 4 (Language)Cognitive Domain - Creativity
Questions that check for creative writing abilityH.
Among the competitors given in the table above, who is NOT likely to win a prize?
The question tests the ability of the students to understand and internalise the information given in the competition poster.
131
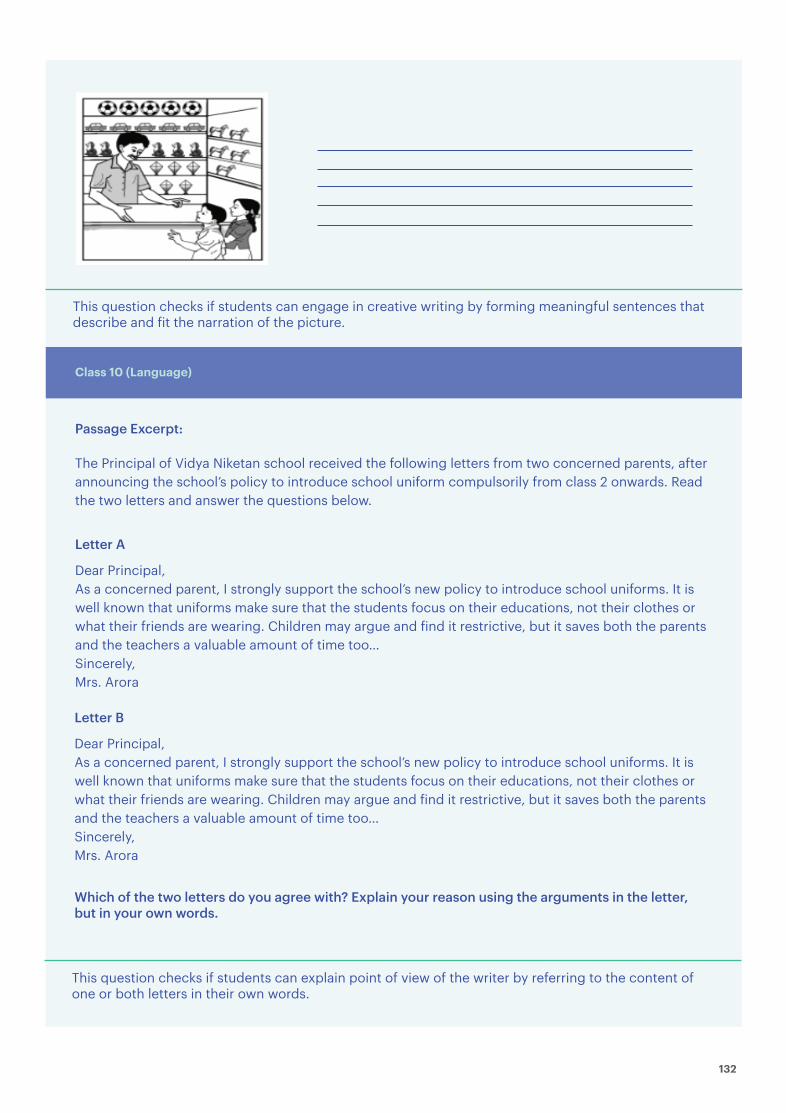
What could the man be telling the children in the picture below? Write in a sentence.
Class 10 (Language)
Passage Excerpt:
The Principal of Vidya Niketan school received the following letters from two concerned parents, after announcing the school’s policy to introduce school uniform compulsorily from class 2 onwards. Read the two letters and answer the questions below.
Dear Principal,As a concerned parent, I strongly support the school’s new policy to introduce school uniforms. It is well known that uniforms make sure that the students focus on their educations, not their clothes or what their friends are wearing. Children may argue and "ind it restrictive, but it saves both the parents and the teachers a valuable amount of time too…Sincerely,Mrs. Arora
Letter A
Dear Principal,As a concerned parent, I strongly support the school’s new policy to introduce school uniforms. It is well known that uniforms make sure that the students focus on their educations, not their clothes or what their friends are wearing. Children may argue and "ind it restrictive, but it saves both the parents and the teachers a valuable amount of time too…Sincerely,Mrs. Arora
Letter B
Which of the two letters do you agree with? Explain your reason using the arguments in the letter, but in your own words.
This question checks if students can explain point of view of the writer by referring to the content of one or both letters in their own words.
This question checks if students can engage in creative writing by forming meaningful sentences that describe and "it the narration of the picture.
132
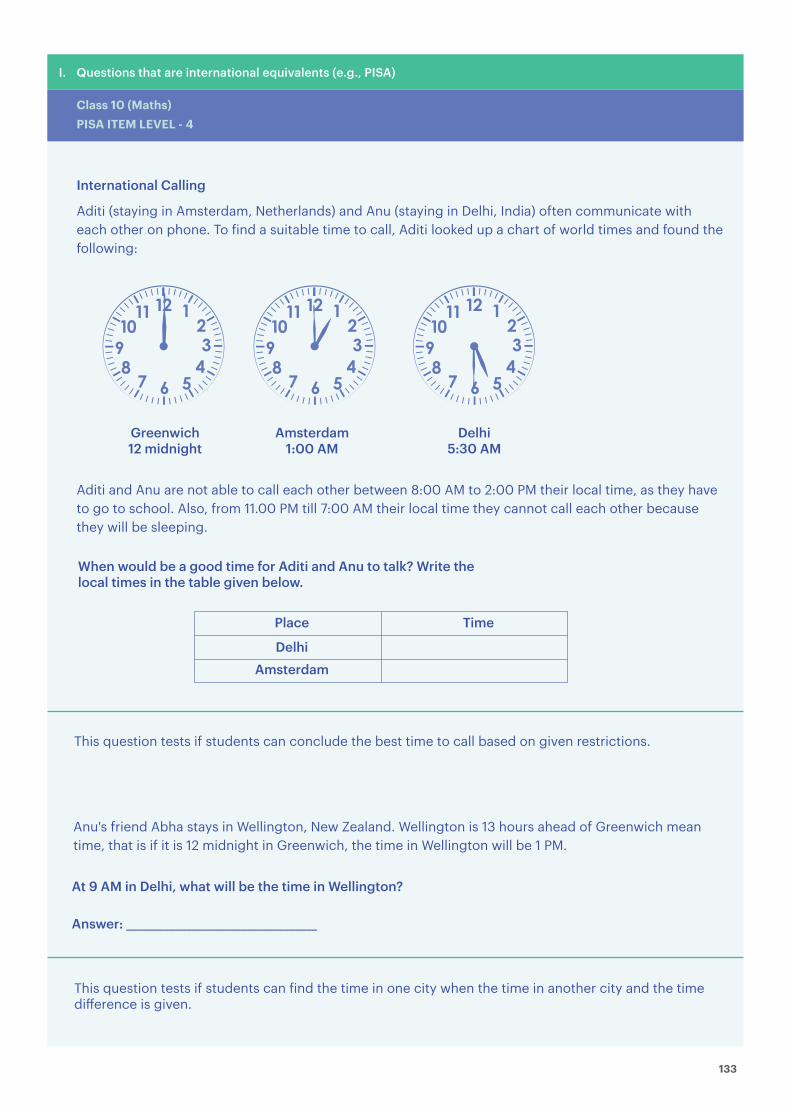
Class 10 (Maths)PISA ITEM LEVEL - 4
Questions that are international equivalents (e.g., PISA) I.
Aditi (staying in Amsterdam, Netherlands) and Anu (staying in Delhi, India) often communicate with each other on phone. To "ind a suitable time to call, Aditi looked up a chart of world times and found the following:
International Calling
This question tests if students can conclude the best time to call based on given restrictions.
This question tests if students can "ind the time in one city when the time in another city and the time di#erence is given.
At 9 AM in Delhi, what will be the time in Wellington?
Answer: ___________________________________
Anu's friend Abha stays in Wellington, New Zealand. Wellington is 13 hours ahead of Greenwich mean time, that is if it is 12 midnight in Greenwich, the time in Wellington will be 1 PM.
When would be a good time for Aditi and Anu to talk? Write the local times in the table given below.
Greenwich12 midnight
Place
DelhiAmsterdam
Time
Amsterdam1:00 AM
Delhi5:30 AM
Aditi and Anu are not able to call each other between 8:00 AM to 2:00 PM their local time, as they have to go to school. Also, from 11.00 PM till 7:00 AM their local time they cannot call each other because they will be sleeping.
133
134
De!ining Grade Level Competency
APPENDIX 7

The de"inition of grade level can vary across assessments and assessment partners. Some believe the right method to use is a test instrument consisting only of grade-appropriate questions, covering a majority of the syllabus, and setting a benchmark of 70%80 per cent accuracy or higher. Others believe that for a country like India, where majority of the students in government schools are "irst generation learners, the ability to measure progress over time is critical. Having a high benchmark with low initial learning levels may not allow for that analysis. Thus, another way of determining grade level is to conduct a pre-assessment benchmarking round where the norm of the population is calculated and used alongside the theoretical benchmark to create the cut-o# for grade level.
It is important to note that grade-level is an arti"icial construct we use to di#erentiate and, therefore, act on student learning levels. Therefore, a child who tests below grade-level on an assessment may still excel at certain topics or skills but, his/her cumulative performance is below the de"ined expectation. The question that then arises is how to determine where the grade-level marker sits. Many students in government schools are "irst generation learners who get minimal or no augmentation at home and the current curriculum design does not take this into account. Therefore, a criterion referenced grade-level becomes a bar that is too high and demotivating for students, teachers and the system alike. Instead, taking a nudge approach and setting growth targets that are more attuned to current learning levels (norm-referenced), but aspirational in terms of gain expected in one academic year are more meaningful, actionable and proven to actually deliver growth in learning outcomes. To arrive at a norm-reference, a benchmark test is conducted to measure current performance levels in the state. This performance is treated as the norm-reference and is usually signi"icantly behind the expected learning levels. A panel of State Council of Educational Research and Training (SCERT) experts are then asked to review the test instrument to understand grade-level as per the curriculum expectations (criterion reference). CGI uses a combination of data analytics and item response theory to set stretch targets that are possible to achieve in an academic year, which may or may not match the criterion reference. The idea is to develop a ’growth mindset’ and focus on continuous improvement, rather than making a judgement based on a reference that is not designed for the existing student population in the state.
135

=