Langley Holdings plc - Marelli Motori
64
langleyholdings.com Langley Holdings plc Annual Report & Accounts 2021
-
Upload
khangminh22 -
Category
Documents
-
view
0 -
download
0
Transcript of Langley Holdings plc - Marelli Motori

langleyholdings.com
Langley Holdings plc Annual Report & Accounts 2021

IFRS ANNUAL REPORT & ACCOUNTS 2021

Gladiator, the group sponsored TP 52 racing yacht, competed at Cowes Week 2021, in August, marking the beginning of a return to pre-pandemic normality.
Contents
Langley Group .................................................................. 2
Power Solutions Division .............................................. 4
Bergen Engines ..................................................... 6
Piller ...................................................................... 8
Marelli Motori ....................................................... 10
Print Technologies Division ........................................ 12
Manroland Sheetfed ............................................ 14
Druck Chemie...................................................... 15
Other Industrials Division ........................................... 16
Claudius Peters ................................................... 18
ARO .................................................................... 19
Bradman Lake ..................................................... 20
Reader ................................................................ 21
Clarke Chapman.................................................. 21
Global Locations ............................................................. 22
Company Information ..................................................... 25
Key Highlights................................................................. 26
10 Year Summary ........................................................... 27
Chairman’s Review ......................................................... 28
Directors’ Report ............................................................ 39
Strategic Report ............................................................. 42
Independent Auditor’s Report to the Member ................. 45
Consolidated Income Statement ..................................... 50
Consolidated Statement of Other Comprehensive Income ... 51
Consolidated Statement of Financial Position .................. 52
Consolidated Statement of Changes in Equity ................ 53
Company Statement of Financial Position ....................... 54
Company Statement of Changes in Equity ...................... 55
Consolidated Statement of Cash Flows .......................... 56
Company Statement of Cash Flows ................................ 57
Notes to the Accounts .................................................... 58
Group Profile
IFRS Annual Report and Accounts 2021

Langley Holdings plc is a diverse, globally operating engineering group headquartered in the United Kingdom. The group’s principal subsidiaries are based in Germany, France, Italy, Norway and the United Kingdom, with a substantial presence in the United States and more than 90 sales and service companies worldwide.
Established in 1975 by the current Chairman and CEO, Anthony Langley, the group is financially independent and remains in family ownership.
The group employs around 5,400 people worldwide.
2
Langley GroupFounded: 1975
3Principal Divisions
18Manufacturing Sites
90+Subsidiaries
c.5,400Employees
€1.3bnRevenues (f.2022)
100%Family Owned
langleyholdings.com
Power Solutions
Print Technologies
Other Industrials
1
2
3
€600mRevenues (f.2022)
2,283Employees
€400mRevenues (f.2022)
1,726Employees
€300mRevenues (f.2022)
1,330Employees

54
The Power Solutions Division comprises Bergen Engines, Piller Power Systems and Marelli Motori groups, based in Norway, Germany and Italy respectively.
The individual groups serve a wide spectrum of customers and markets, together they are focused on the rapidly emerging microgrid sector at the heart of Langley’s sustainability goals.
Power Solutions Division
€600mRevenues (f.2022)
2,283Employees
•• Bergen Engines
• Piller
• Marelli Motors

H2Ready 76
Bergen Engines produces liquid and gas fuelled medium-speed engines for marine and land-based power generation and marine propulsion applications.
The company can trace its Norwegian roots back to 1855. For over 75 years, Bergen Engines have designed and manufactured engines that have become synonymous with efficiency, reliability and innovation.
A Rolls-Royce company since 1999, Bergen Engines was acquired by Langley on 31st December, 2021.
Bergen EnginesFounded: 1855
Power Solutions Division
bergenengines.com

98
Piller Power Systems is Europe’s leading producer of uninterruptible power supply (UPS) systems for mission-critical power applications such as data centres (shown). Piller also manufactures ground power systems for civil and military airports and on-board electrical systems for
naval vessels.
Acquired by Langley in 2004, Piller is headquartered at Osterode am Harz, near Hanover, in Germany.
In 2016 Piller acquired Active Power, the Austin Texas-based flywheel UPS specialist.
PillerFounded: 1909
Power Solutions Division
piller.com
Active Power design and produce battery-free flywheel uninterruptible power supply (UPS) systems for healthcare, retail, industrial and manufacturing facilities
worldwide.
The company is headquartered in Austin Texas with extensive manufacturing facilities.
Active Power protects operations in more than 50 countries with flywheel-based UPS systems.
US customers are served via Austin TX and internationally via the Piller global network of subsidiaries and service centres.
activepower.com
Active PowerFounded: 1996
9

Marelli MotoriFounded: 1891
Power Solutions Division
1110
Marelli Motori is a leading manufacturer of electric motors and generators. Based in northern Italy, the company enjoys worldwide recognition in the marine, oil & gas, power generation, co-generation,
hydro and other industrial sectors.
The company is headquartered in Arzignano, near Verona, and has extensive manufacturing facilities in Italy with subsidiaries in Germany, Malaysia, South Africa, USA and the United Kingdom.
The Marelli Motori group was acquired by Langley in 2019.
marellimotori.com
1312
The Print Technologies Division comprises Manroland Sheetfed, the iconic German press builder and Druck Chemie Group, together with BluePrint and HiTech, the specialist print chemicals producers and distributors, based in Germany and Belgium respectively.
Print Technologies Division
€400mRevenues (f.2022)
1,726Employees
• Manroland Sheetfed
• Druck Chemie

1514
Manroland SheetfedFounded: 1871
Print Technologies Division
Manroland Sheetfed is a leading German manfacturer of sheetfed offset litho printing presses. Offering the very latest in print technology, Manroland is a watchword for quality and reliability to printers around the world.
The Manroland Sheetfed group was acquired by Langley in 2012. The company is headquartered and produces all of its iconic presses in Offenbach am Main, near Frankfurt, in Germany.
manrolandsheetfed.com
Druck ChemieFounded: 1971
Druck Chemie is the leading German producer of chemicals, consumables and services to the printing and graphics industry.
Founded in 1971, the group today has own subsidiaries across Europe and in Brazil.
Acquired by Langley in 2014, Druck Chemie acquired Belgian print chemicals and consumables manufacturers, BluePrint Products and HiTech Chemicals, in December 2020.
druckchemie.com

1716
The Other Industrials Division comprises a number of diverse industrial businesses based in Germany, France and the UK.
Other Industrials
€300mRevenues (f.2022)
1,330Employees
• Claudius Peters
• ARO Technologies
•• Other

ARO Welding Technologies SAS is widely regarded as the world’s leading producer of resistance welding equipment to the automotive industry.
The company was acquired by Langley Holdings in 2006 and is headquartered in Château-du-Loir near Tours, in the Loire region of France. The company also produces in Detroit in the United States and in Wuhan, China.
Reduced model development times, complex structures and the use of aluminium in car production to reduce weight have all led to strong demand for ARO’s products.
arotechnologies.com
1918
For more than a century Claudius Peters has been producing innovative materials handling and processing systems for the global cement, gypsum, alumina and steel industries.
The company’s aerospace division manufactures aircraft stringers, several kilometres of which can be found in every commercial aircraft ever built.
Claudius Peters is headquartered near Hamburg, Germany and was acquired by Langley in 2001.
Claudius PetersFounded: 1906
Other Industrials
claudiuspeters.com
AROFounded: 1949
We know how

2120
Bradman Lake group provides innovative packaging solutions to its client base, helping them excel in today’s competitive and demanding market.
They are a leading designer and manu-facturer of packing machinery and turnkey systems to the bakery & biscuit, chocolate & confectionery, dry foods, chilled and frozen foods, consumer, pharmaceutical and healthcare sectors.
Bradman Lake was acquired by Langley in 2007
Bradman Lake Group
Other Industrials
bradmanlake.com
Reader Cement Products
Clarke Chapman Group
reader.co.uk
Reader Cement Products is the UK’s leading independent manufacturer of dry blended packed cement products.
Founded by Langley in 1985, the company formulates, manufactures and packages cement based products for the DIY, construction and civil engineering sectors. The company’s headquarters and principal manufacturing facility are located in the East Midlands region of the UK.
clarkechapman.co.uk
Clarke Chapman produces specialist materials handling equipment, principally for the UK nuclear, defence and rail sectors.
Founded in 1864, Clarke Chapman’s headquarters and manufacturing facilities are located at Gateshead, in the Northeast of England.
The business was acquired by Langley from Rolls-Royce plc in 2000.

2322
Global Locations
Argentina Buenos Aires I Asia Pacific Singapore I Australia
Sydney I Austria Wiener Neudorf I Bangladesh Dhaka I
Belgium Brussels, Wemmel I Brazil São Paulo I Bulgaria
Sofia I Canada Toronto I Chile Santiago I China Beijing,
Chengdu, Guangzhou, Hong Kong, Shanghai, Shenzhen,
Wuhan I Columbia Bogota I Croatia Zagreb I Czech
Republic Prague, Kuřim I Denmark Ballerup, Nørresundby I
Finland Vantaa I France Château-du-Loir, Mulhouse, Paris,
Soppe-Le-Bas I Germany Augsburg, Elze, Frankfurt, Hamburg,
Hanover, Stuttgart I Hungary Budapest I India Mumbai, New
Delhi I Indonesia Jakarta I Ireland Dublin I Italy Arzignano,
Bergamo, Genova, Milan I Japan Saitama I Malaysia Shah
Alam I Mexico Huimilpan, Puebla I Netherlands Amsterdam,
Helmond, Zwijndrecht I Norway Hordvik I Peru Lima I Poland
Nadarzyn, Gniezno I Portugal Sintra I Romania Bucharest,
Sibiu I Russia Moscow I Slovakia Bratislava I Slovenia
Ljubljana I South Africa Cape Town, Johannesburg I Spain
Barcelona, Madrid, Tarragona I Sweden Fjärås, Trollhättan I
Switzerland Kirchberg I Taiwan New Taipei City I Thailand
Bangkok I United Kingdom Various Locations I USA Austin TX,
Dallas TX, Detroit MI, New York, Norcross GA, Rock Hill SC,
Westmont IL I Venezuela Caracas
90+SubsidiariesWorldwide
18Manufacturing
Sites

2524
DIRECTORS: A J Langley – ChairmanB J Langley W A LangleyM J Neale
COMPANY SECRETARY: P Sexton
REGISTERED OFFICE: Enterprise WayRetfordNottinghamshireDN22 7HHUnited Kingdom
REGISTERED IN ENGLAND NUMBER: 1321615
AUDITOR: Saffery Champness LLP71 Queen Victoria StreetLondonEC4V 4BEUnited Kingdom
PRINCIPAL BANKERS: Barclays Bank plcPO Box 3333One Snowhill Snowhill QueenswayBirminghamB4 6GNUnited Kingdom
Deutsche Bank AGAdolphsplatz 720457 HamburgGermany
Commerzbank AGSand 5-721073 HamburgGermany
Company InformationIFRS Report & Accounts 2021
IFRS ANNUAL REPORT & ACCOUNTS 2021
IFRS Annual Report & Accounts 2021

2726
Year ended
31 December
2021
€’000
Year ended
31 December
2020
€’000
REVENUE 814,627 766,778
PROFIT BEFORE TAXATION 128,240 24,047
NET ASSETS 835,692 707,178
CASH AND CASH EQUIVALENTS 290,988 287,963
ORDERS ON HAND 797,880 220,169
No. No.
EMPLOYEES 5,339 4,661
IFRS ANNUAL REPORT & ACCOUNTS 2021IFRS ANNUAL REPORT & ACCOUNTS 2021
Key HighlightsYear Ended 31 December 2021
REVE
NUE
€m
PBT
€m
1,0001,000
2012
121
527
PBT
Revenue
2013
91
834
2014
101
779
2015
107
875
2016
123
901
2017
112
904
2018
104
848
2019
56
820
2020
24
767
2021
128
815
900
800
700
600
500
400
300
200
100
0
300
250
200
150
100
50
0
10 Year Trading Summary
“ …in 7 of the last 10 years PBT has exceeded €100 million and in 2021, significantly so.”
2928
In the year ended 31st December 2021, the group recorded a profit before tax of €128.2million (2020: €24.0million) and generated revenues of €814.6million (2020: €766.8 million). At the year-end the group’s cash stood at €291.0 million (2020: €288.0 million), net assets were €835.7 million (2020: €707.2million) and orders on hand €797.9 million (2020: €220.1 million). The group has nil net debt (2020: nil) and there were no shareholder dividends during the period (2020: nil).
On 31st December 2021, the group acquired the entire share capital of Norwegian engine builder Bergen Engines AS from Rolls Royce plc for a consideration of €91 million. The transaction was funded from existing cash reserves.
Acquisition of Bergen Engines AS
Bergen Engines generated revenues of circa €250 million for Rolls-Royce in 2021. The year-end balance sheet, order backlog and employee numbers are incorporated in these Accounts. Further details are contained in notes 11, 22 and 39.
Economic Situation
Following the hammer blow that Coronavirus delivered in 2020, the year began with cautious optimism that vaccines were just around the corner. As rollouts gathered pace and social restrictions began to ease, optimism amongst populations, no longer fearful of Coronavirus, turned to a kind of euphoria.
By the middle of the year, demand in the economy rose significantly and by year-end order books in the Langley group were at record levels, in part due to increased demand but also in part due to supply chain restrictions hampering deliverables.
Demand outstripped supply in many areas as suppliers struggled to gear back up. Inevitably, prices rose and lead times increased. This was progressive through the year and the final quarter of 2021 saw the steepest price increases. I expect equilibrium will be restored eventually – a view supported by the IMF’s long term inflation forecast of 2% – but for the immediate future at least, inflation not seen in more than four decades, is here and to be lived with.
Group Organisation
With the arrival of Bergen Engines, the group’s activities can now be broadly categorised into three principal areas:
• Power Solutions • Print Technologies • Other Industrials
Chairman’s ReviewYear Ended 31 December 2021
IFRS ANNUAL REPORT & ACCOUNTS 2021
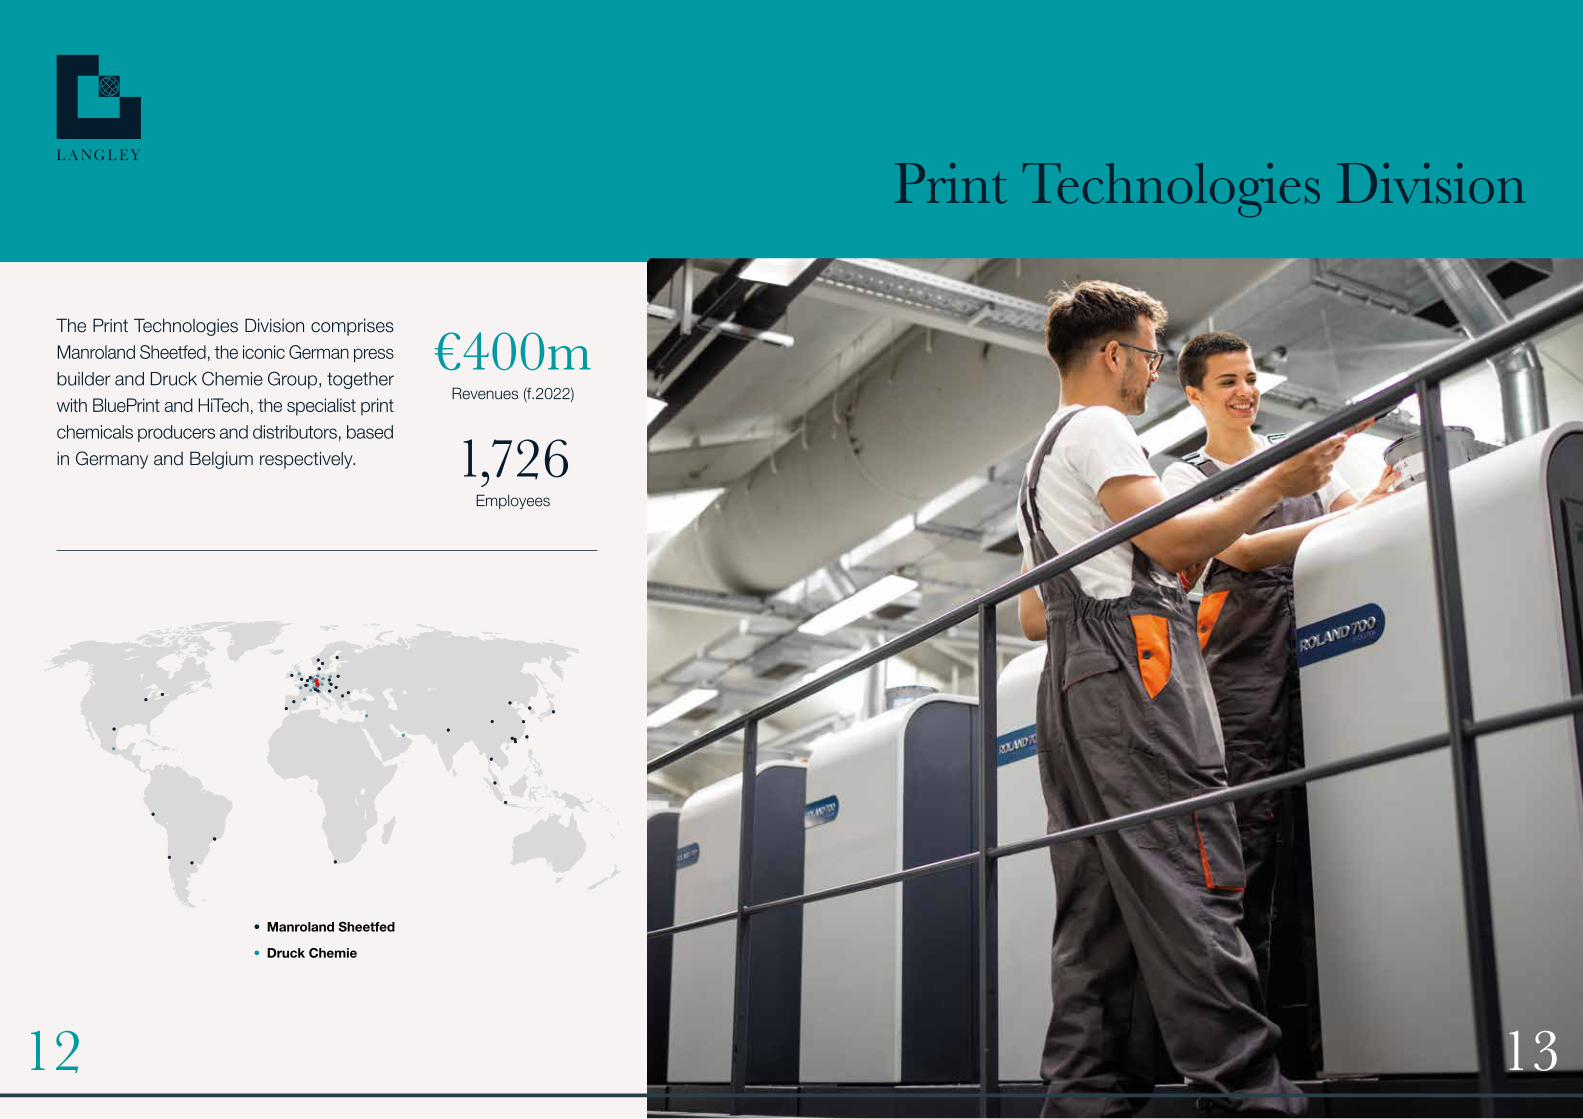
“ On 31st December 2021, the group acquired the entire share capital of Norwegian engine builder Bergen Engines AS from Rolls-Royce plc... ”
“ In the year ended 31st December 2021, the group recorded a profit before tax of €128.2 million. ”
3130
Power SolutionsBergen Engines (acquired 31st December) Medium-speed engine builder (Norway)
Piller Power Systems Power stabilisation technology (Germany)
Marelli Motori Motors and generators producer (Italy)
Revenue 2021: €270 million Forecast Revenue 2022: €600 million Orders on hand: €550 million Employees: 2,283
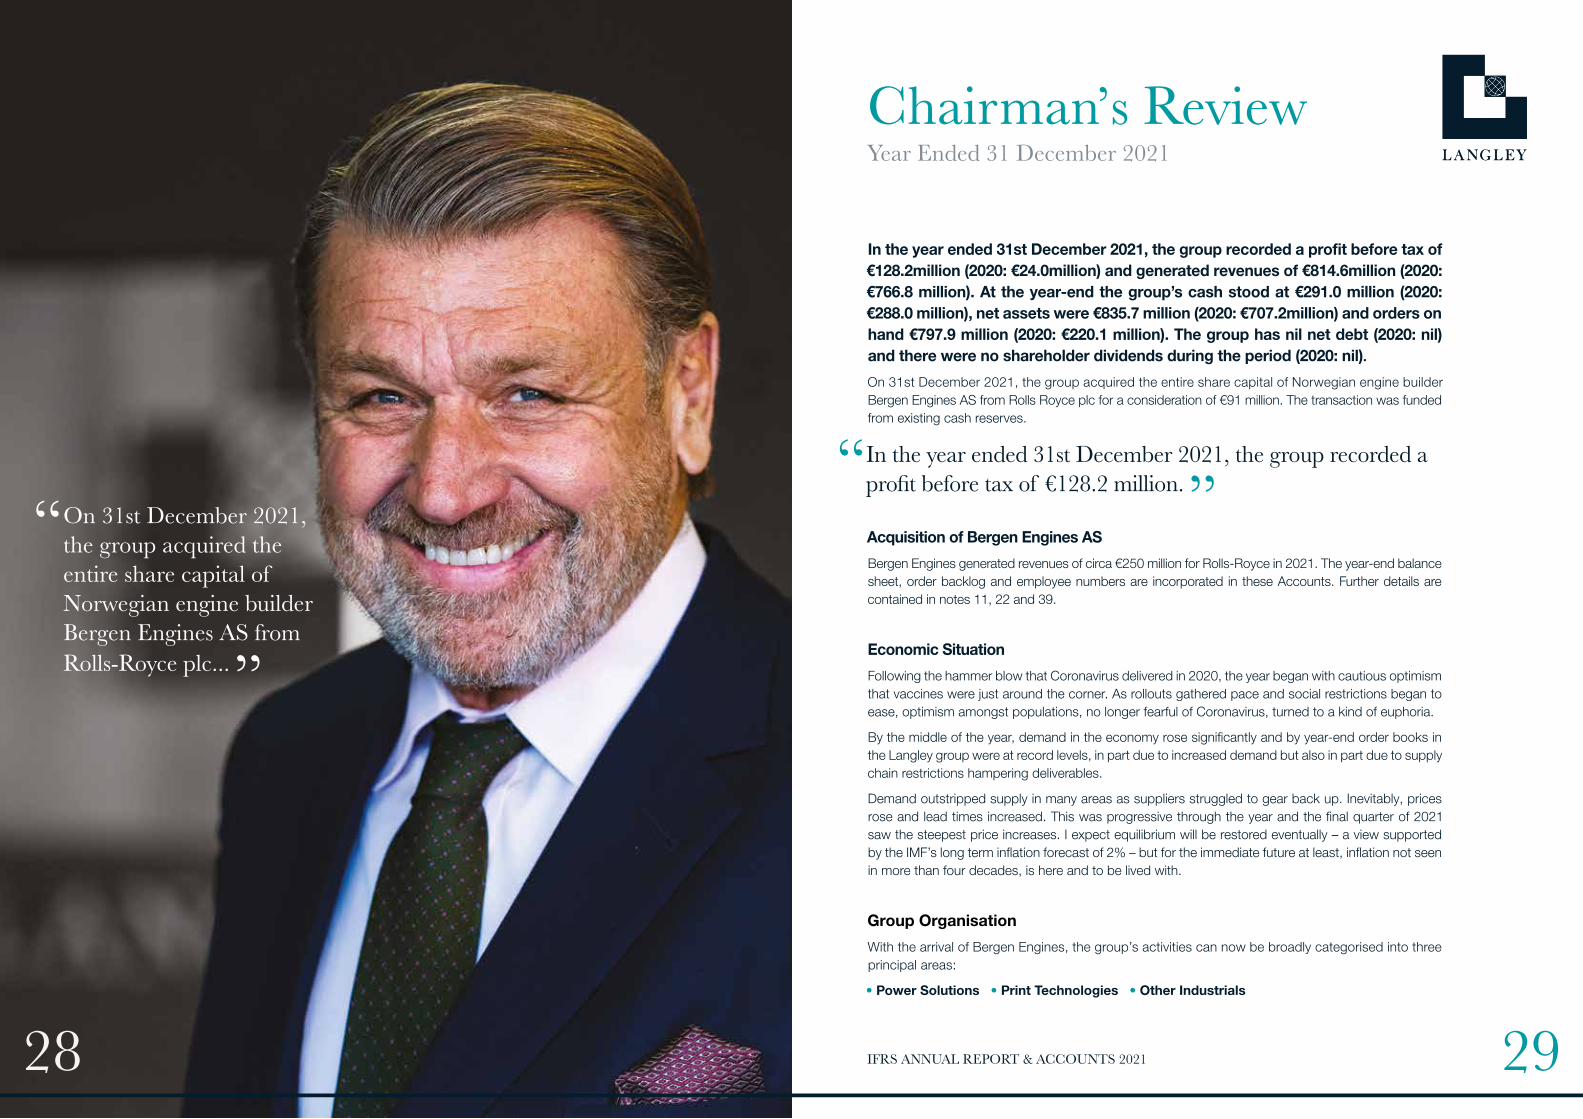
Bergen Engines Bergen Engines AS, which produces large liquid and gas fuelled engines, principally for marine and land-based power generation applications, recorded revenue of circa €250 million for Rolls-Royce in 2021 and a loss before tax of €10.6 million before reversal of impairment losses. A positive contribution from the subsidiaries was negated by a shortfall in the Norwegian parent company.
The company, which had been under Rolls-Royce stewardship since 1999, has a superb reputation and is proving to be highly innovative in adapting its engines to low-carbon and non-fossil fuels.
The Bergen Engines group currently employs 929 people worldwide, of which 688 are based at its headquarters and production facilities near Bergen, in Norway.
The freehold facility, which extends to some 20 hectares (50 acres), is well invested and includes an own foundry. The group has subsidiaries in the USA, Mexico, Denmark, the Netherlands, Spain, Italy, the UK, India and Bangladesh.
Going forward, Bergen Engines will be central to the group’s net zero strategy, working closely with our Marelli Motori and Piller Power Systems divisions to offer power solutions in the rapidly emerging hybrid renewables microgrid sector, whilst continuing to serve traditional markets.
Piller Power SystemsPiller Group GmbH, our German producer of mission-critical electrical equipment – principally UPS systems for data centres, along with its overseas sales and service subsidiaries – was the largest contributor to the group trading result in 2021. Capital projects delayed in 2020 and a surge in new business contributed to an all-time high order intake in 2021 and the backlog at year-end was more than twice that of the previous year, both records during our 17-year stewardship.
2021 revenues were similar to 2020, although margin quality was improved. This was partly due to the company broadening its presence outside of the data centre sector and partly due to increasing uptake of its state-of-the-art UB-V Series UPS, which was four years in development and launched in 2020. Notably Piller also secured its largest ever naval order in 2021, to supply on board electrical equipment for a European submarine project.
Piller’s expertise in power stabilisation lends itself well to the challenge of balancing multiple energy sources in microgrid applications. Going forward, Piller will be working closely with Bergen Engines and Marelli Motori, exploring consortial based solutions in this rapidly emerging sector.
Active Power Inc, the flywheel UPS producer based in Austin, Texas, had a very satisfactory year, its second under new management as a stand-alone business within the Piller group.
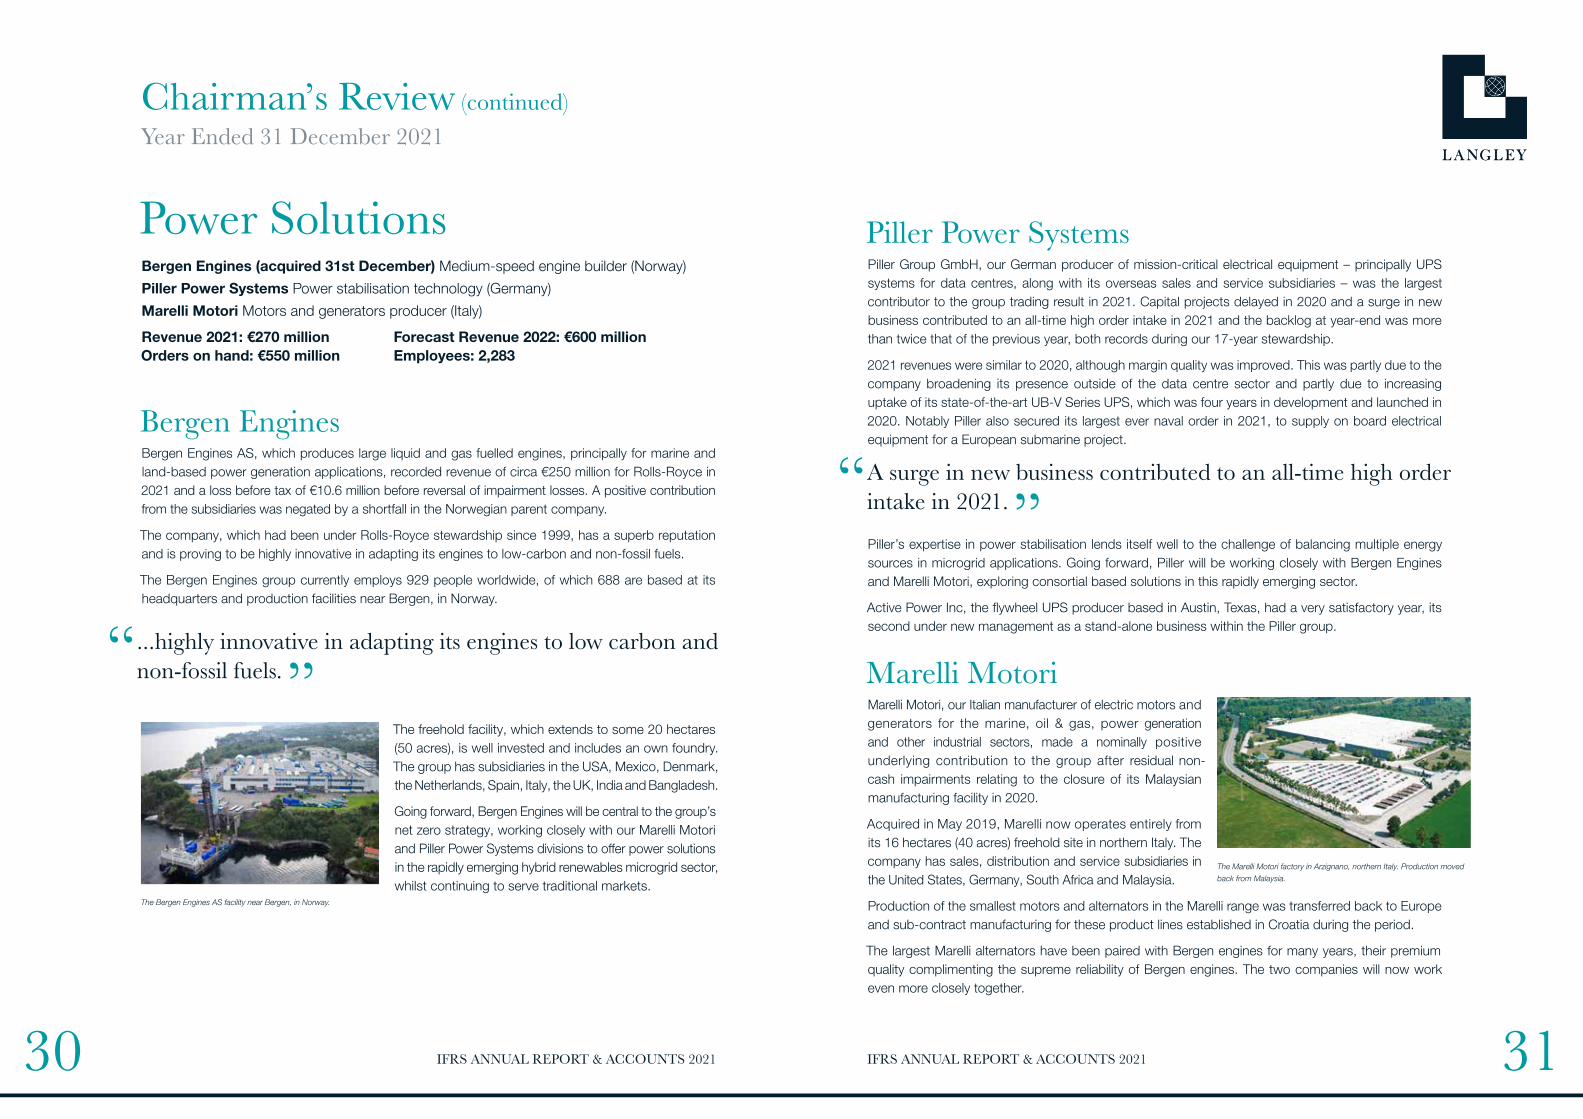
Marelli MotoriMarelli Motori, our Italian manufacturer of electric motors and generators for the marine, oil & gas, power generation and other industrial sectors, made a nominally positive underlying contribution to the group after residual non-cash impairments relating to the closure of its Malaysian manufacturing facility in 2020.
Acquired in May 2019, Marelli now operates entirely from its 16 hectares (40 acres) freehold site in northern Italy. The company has sales, distribution and service subsidiaries in the United States, Germany, South Africa and Malaysia.
Production of the smallest motors and alternators in the Marelli range was transferred back to Europe and sub-contract manufacturing for these product lines established in Croatia during the period.
The largest Marelli alternators have been paired with Bergen engines for many years, their premium quality complimenting the supreme reliability of Bergen engines. The two companies will now work even more closely together.
Chairman’s Review (continued) Year Ended 31 December 2021
IFRS ANNUAL REPORT & ACCOUNTS 2021IFRS ANNUAL REPORT & ACCOUNTS 2021
“ A surge in new business contributed to an all-time high order intake in 2021. ”
The Bergen Engines AS facility near Bergen, in Norway.
The Marelli Motori factory in Arzignano, northern Italy. Production moved back from Malaysia.
“ ...highly innovative in adapting its engines to low carbon and non-fossil fuels. ”

3332
Print TechnologiesManroland Sheetfed GmbH Printing machinery builder (Germany)
Druck Chemie GmbH Print chemicals producer (Germany)
HiTech Chemicals BV & BluePrint Products NV Print chemicals producers (Benelux)
Revenue 2021: €300 million Forecast Revenue 2022: €400 million Orders on hand: €112 million Employees: 1,726
Manroland Sheetfed Manroland Sheetfed GmbH, our German offset litho printing press builder, had a strong year of order intake for new presses but Covid absenteeism and supply chain frustrations at the factory resulted in a negative contribution for the year. Service activities, across the 40 plus subsidiaries worldwide, if not back to pre-Covid normality, were at least closer to those levels.
With its record order backlog, 2022 looks set to be a better year. The ROLAND 700 Evolution, Speed, Elite and Lite variants and the ROLAND 900 Evolution presses, all the culmination of several years of research and development under our stewardship, are considered state-of-the-art and technologically industry leading. This has undoubtedly contributed to the very strong order intake during the year and confirming that confidence has returned to the sector.
However, until such time as productivity returns to normal, sacrifices will need to continue.
Druck Chemie Group(incorporating HiTech Chemicals BV & BluePrint Products NV)
Druck Chemie – our German print chemicals producer, together with its distribution subsidiaries in Belgium, Brasil, the Czech Republic, France, Italy, Poland, Spain and Switzerland – had a very successful year, despite the pandemic, as print shops across Europe geared back up.
The acquisition of HiTech Chemicals BV and BluePrint Products NV from Heidelberger Druckmaschinen AG in December 2020 was well integrated during the year. The state-of-the-art Kruibeke production facility in Belgium compliments Druck Chemie’s facility in Ammerbuch, Germany, very well and 2022 looks set to be another satisfactory year.
Other IndustrialsOther areas of group activity include automotive welding equipment, materials handling, packaging machinery, construction materials, housebuilding and commercial property.
Materials Handling Claudius Peters Group GmbH (Germany) Clarke Chapman Group Ltd (UK)
Automotive Welding Technology ARO Welding Technologies SAS (France)
Packaging Machinery Bradman Lake Ltd (UK)
Construction Materials, Housebuilding & Commercial Property Reader Cement Products Ltd (UK) Oakdale Homes Ltd (UK) Various property holding entities (Global)
Revenue 2021: €250 million Forecast Revenue 2022: €300 million Orders on hand: €136 million Employees: 1,330
Materials HandlingClaudius Peters
Claudius Peters Group GmbH, our materials handling and plant machinery builder to the cement, gypsum and steel industries, and aircraft stringer manufacturer, started the year with an historically low order book. This improved significantly as the year progressed, culminating in a very strong backlog at the year-end, in fact a record during our stewardship of the business, which we acquired in 2001.
Claudius Peters’ aerospace division manufactures aircraft stringers for Airbus, several kilometres of which can be found in the structure of every commercial airplane built. The company has been a supplier of these critical components to Airbus continuously since 1983.
Claudius Peters France, now down sized and trading positively, finally received confirmation of a long awaited materials handling contract from Azerbaijan. Claudius Peters China made a very solid contribution, as did the US subsidiary. The outposts in Spain, Italy, the UK and Romania all contributed positively around or above budget. Only Brazil fell short, the country particularly hard hit by Coronavirus.
Performance of the Claudius Peters group, as elsewhere, was dogged with supply chain issues and Covid absenteeism, but overall the division just made it back into positive territory.
With a much improved order book at the year-end the business should do better in 2022, although structural problems in Germany still need to be addressed.
The aircraft stringer business had a better year than 2020, slightly exceeding its budget. Forecast demand for 2022 is up on 2021, although significantly lower than historically.
IFRS ANNUAL REPORT & ACCOUNTS 2021IFRS ANNUAL REPORT & ACCOUNTS 2021
“ Acquisition of HiTech Chemicals and BluePrint Products …well integrated during the year. ”
“ A strong year of order intake for new presses. ”
Chairman’s Review (continued) Year Ended 31 December 2021

3534
Clarke Chapman
Clarke Chapman Group Ltd, our specialist materials handler, principally to the UK nuclear sector, and service provider to the UK rail network, was more or less on budget. However, order intake was behind, principally due to a large project for the nuclear sector being delayed and now expected in April.
Nonetheless, another satisfactory year for the business that we acquired in 2000, also from Rolls-Royce.
Automotive Welding Technology ARO Welding Technologies
ARO Welding Technologies SAS – our French producer of resistance welding machines to the automotive sector – had an improved year when compared with 2020, almost doubling its albeit modest PBT budget, with revenues exceeding target by around 20%.
However, this was a long way shy of the stellar pre-Covid performances, although 2019 had already seen the beginnings of a slowdown.
In 2021 there was a solid contribution from ARO France, the headquarters and principal manufacturing site, and ARO’s Detroit plant in the USA also performed well. The outposts in Belgium, Spain, Brazil, Mexico, Slovakia and the UK all contributed positively. Only the Wuhan, China and German subsidiaries underperformed their targets.
The automotive sector was hit particularly hard by supply chain issues in 2021, notably the widely reported chip shortage, and this impacted on capital investments. Underlying demand for new cars surged in 2021 though, with the shift to electric vehicles becoming ever stronger; a trend set to continue.
I expect 2022 will see further improvement in ARO’s performance, subject to supply chain disruption and Covid absenteeism not limiting the recovery.
Packaging Machinery Bradman Lake
Bradman Lake Group Ltd, our packaging machinery business, had another successful year. Food packaging, its main market, remained buoyant in 2021.
Revenue and PBT targets were exceeded at both the Bristol and Beccles business units in the UK, and at Rockhill SC in the USA, with healthy order books at the year-end on both sides of the pond.
2022 should see a continuation of the good performance, subject of course to Covid limitation factors.
Construction Materials, Housebuilding & Commercial Property Reader Cement Products
Reader Cement Products Ltd, the UK cement blending and packing specialist, had another very successful year, equalling 2020’s record performance. This was despite missing sales of a high margin imported special cement due to lack of availability, which historically was a substantial contributor to the result. An outstandingly good performance considering.
Oakdale Homes
Oakdale Homes Ltd, the local house builder, posted a positive operating result, albeit nominally. The business is being wound down and no further developments will be commenced.
Commercial Property
The group owns outright over 95% of its manufacturing, warehousing and administrative footprint worldwide which, with the addition of Bergen Engines, now extends to around 1,000,000 square metres or, approximately 11,000,000 square feet.
During the year the final phase of alterations to Senefelderhaus, the headquarters building of the former Manroland AG in Germany, were completed. The project, which began in 2018 to convert the building to a training academy for the Bundespolizei, is now completed and fully occupied. Further redevelopment of adjacent surplus land and buildings is being discussed.
In the UK, surplus land at Clarke Chapman which was redeveloped into a business park, is now largely fully occupied following conversion of the most recent phase to a Covid testing laboratory for the NHS.
Our PeopleAs is customary, no review would be complete without mention of our employees, at the year-end numbering 5,339 worldwide. It is their hard work and commitment that makes the group what it is today.
This year I welcome to our family of businesses, the employees of the Bergen Engines group, adding Norway to the long list of countries where the group provides jobs and security to our people and their families.
Unfortunately, in the near future we will be letting go a small number of employees at Bergen Engines, and restructuring consultations have already begun in Norway.
IFRS ANNUAL REPORT & ACCOUNTS 2021IFRS ANNUAL REPORT & ACCOUNTS 2021
“ Underlying demand for new cars surged in 2021 …the shift to electric vehicles becoming ever stronger. ”
“ ...the group’s manufacturing footprint now extends to over 1,000,000 square metres... ”
Chairman’s Review (continued) Year Ended 31 December 2021

3736
However, the reorganisation is not a major one and is absolutely necessary, along with a raft of other measures, to streamline the company’s cost base.
Only by doing so will the company be able to provide security for the vast majority of people who will remain.
Home Working
As I write, Covid restrictions are relaxing exponentially as the severity of Coronavirus infection diminishes, in part due to the virus weakening and in part due to widespread vaccination rollouts. Within days of writing this, all restrictions in the UK are due to be lifted, other countries will presumably follow.
Mandatory work from home orders are already being scrapped in many jurisdictions and I am conscious that there are some that would prefer to continue working in this way. Of course for the majority of employees in an industrial manufacturing group like Langley, working from home was never an option. For those that can, some would like to continue and others will welcome a return to a normal working environment.
Whatever the personal preference of an individual, it is now not the time to debate the relative merits of home working. The group’s position on this matter is that unless legally required, those that do not normally work from home are to return to their normal place of work.
The time is now to get our businesses back to full strength and efficiency and that means office workers working in offices.
Conclusion and Outlook2021 was the year in which we began to look back on Coronavirus and forward to a post-pandemic world. It’s legacy will likely resonate for many years to come.
The group’s performance overall in 2021 was satisfactory. Despite operations were much improved compared to 2020, they were seriously hampered by supply chain problems, travel restrictions and Covid absenteeism in all divisions. Absenteeisms have increased as the virus, albeit less virulent, is affecting larger numbers.
Overall though, the group has responded well to the unique challenges presented by the pandemic and for the most part our customers were kept satisfied.
Notably, in 7 of the last 10 years PBT has exceeded €100 million and in 2021, significantly so. Moreover, the acquisition of Bergen Engines from Rolls-Royce represents a seminal moment in the group’s history and towards its net zero objectives.
Together with Piller Power Systems and Marelli Motori, Bergen will become the central pillar of our net zero strategy, pursuing opportunities in the rapidly emerging hybrid renewables microgrid power generation sector.
Power Solutions is expected to generate around €600 million of the group’s anticipated €1.3 billion revenues in 2022; Print Technologies approximately €400 million and; Other Industrials around €300 million.
The group ended 2021 with record order books in all three areas. With the combined order backlog of nearly €800 million, which is almost equal to the entire revenue in 2021, the 2022 targets appear to be realistic, marking a step-change not only in the group’s scale of operations for the group, but also in its contribution to net zero emissions.
Anthony J LangleyChairman16th February 2022
IFRS ANNUAL REPORT & ACCOUNTS 2021IFRS ANNUAL REPORT & ACCOUNTS 2021
“ ...a step change, not only in the group’s scale of operations but also in its contribution to net zero. ”
Chairman’s Review (continued) Year Ended 31 December 2021
“ The time is now to get our businesses back to full strength and efficiency and that means office workers working in offices. ”

IFRS ANNUAL REPORT & ACCOUNTS 2021IFRS ANNUAL REPORT & ACCOUNTS 2021 3938
The Directors present their report together with the audited Accounts of the Group for the year ended 31 December 2021.
PRINCIPAL ACTIVITY
The principal activity of the Company continued to be that of a managing and parent company for a number of trading subsidiaries organised in divisions and business units engaged principally in the design, manufacture, supply and servicing of capital equipment. The specific activities of the subsidiary undertakings are as disclosed in note 39 to the Accounts.
RESULTS AND DIVIDENDS
The results of the Group for the year are set out on page 50. The profit attributable to the shareholder for the financial year was €106,470,000 (2020 – €17,810,000).
Dividends of €nil were paid to the ordinary shareholder during the year (2020 – €nil). No final dividend was proposed at the year end.
Financial risk management, research and development and the Group’s employment policy is considered within the Strategic Report.
POLICY ON THE PAYMENT OF CREDITORS
The Group seeks to maintain good relations with all of its trading partners. In particular, it is the Group’s policy to abide by the terms of payment agreed with each of its suppliers. The average number of days’ purchases included within trade creditors for the Group at the year end was 39 days (2020 – 31 days).
INFORMATION CONTAINED IN THE STRATEGIC REPORT
The Group has chosen in accordance with Companies Act 2006 s 414C(11) to set out in the Group’s strategic report the information required by Large and Medium-sized Companies and Groups (Accounts and Reports) Regulations 2008 Sch. 7 to be contained in the directors’ report. It has done so in respect of:
• Principal risks and uncertainties
• Future events
• Employee engagement
• Business relationships
DIRECTORS’ INTERESTS
The Directors of the Company in office during the year and up to the date of signature of the accounts and their beneficial interests in the issued share capital of the Company were as follows:
At 31 Dec 2021 At 31 Dec 2020 Ordinary shares Ordinary shares of £1 each of £1 each
A J Langley (Chairman) 60,100,010 60,100,010B J Langley – –W A Langley – –M J Neale – –
The shareholding of Mr A J Langley represents 100% of the issued share capital of the Company.
STREAMLINED ENERGY AND CARBON REPORTLangley Holdings plc is committed to making careful assessments of its levels of energy consumption and impact of carbon dioxide emissions on the environment. Energy usage covered in this disclosure covers the Company, and is primarily the electricity consumption within our office buildings, and fuel used for business mileage.
Energy usage has been calculated based on gas and electricity meter readings, extrapolated where readings were not available. Fuel used in respect of both reimbursed business mileage and in respect of vehicles owned by the Company have been taken from expense claims and have been extrapolated where data was not available.
Directors’ ReportYear ended 31 December 2021
IFRS ANNUAL REPORT & ACCOUNTS 2021

IFRS ANNUAL REPORT & ACCOUNTS 2021IFRS ANNUAL REPORT & ACCOUNTS 2021 4140
Energy consumption derives from the following fuel types:
Intensity ratio:
The carbon emissions have been calculated in accordance with the Greenhouse Gas (GHG) Protocol. Conversion factors to convert the raw energy and transport figures to Tonnes CO₂ Greenhouse Gas Emissions are taken from the most recent (2019) Department for Business Energy and Industrial Strategy publication: https://www.gov.uk/government/collections/government-conversion-factors-for-company-reporting.
The measure for the intensity ratio has changed from group turnover to company turnover excluding dividends from subsidiaries as the directors consider this to be more appropriate in line with the UK data used.
DISCLOSURE OF INFORMATION TO AUDITORS
In the case of each person who was a Director at the time this report was approved:
• so far as that Director was aware there was no relevant available information of which the Company’s auditors were unaware; and
• that Director had taken all steps that the Director ought to have taken as a Director to make himself or herself aware of any relevant audit information and to establish that the Company’s auditors were aware of that information.
This confirmation is given and should be interpreted in accordance with the provision of s418 of the Companies Act 2006.
AUDITORS
The auditors, Saffery Champness LLP indicated their willingness to continue in office.
STATEMENT OF DIRECTORS’ RESPONSIBILITIES
The Directors are responsible for preparing the Strategic Report, Directors’ Report and the Accounts in accordance with
applicable law and regulations.
Company law requires the directors to prepare Accounts for each financial year. Under that law the Directors have elected
to prepare the Group and Parent Company Accounts in accordance with applicable law and international accounting
standards (IAS) as adopted in the United Kingdom. Under company law the Directors must not approve the Accounts
unless they are satisfied that they give a true and fair view of the state of affairs of the Company and of the Group and of
the profit or loss of the Group for that period.
In preparing these Accounts, the directors are required to:
• select suitable accounting policies and then apply them consistently;
• make judgements and accounting estimates that are reasonable and prudent;
• state whether applicable IASs as adopted by the United Kingdom have been followed subject to any material
departures disclosed and explained in the Accounts; and
• prepare the Accounts on the going concern basis unless it is inappropriate to presume that the Group will
continue in business.
The Directors are responsible for keeping adequate accounting records that are sufficient to show and explain the Company’s
transactions and disclose with reasonable accuracy at any time the financial position of the Company and the Group and
enable them to ensure that the Accounts comply with the Companies Act 2006. They are also responsible for safeguarding
the assets of the Company and the Group and hence for taking reasonable steps for the prevention and detection of fraud
and other irregularities.
The Directors are responsible for the maintenance and integrity of the corporate and financial information included on the
Group’s website. Legislation in the United Kingdom governing the preparation and dissemination of accounts may differ
from legislation in other jurisdictions.
By order of the Board
BERNARD J LANGLEY
Director
Langley Holdings PLC
Registered in England and Wales
Company number 01321615
16 February 2022
Directors’ Report (continued)Year ended 31 December 2021
Directors’ Report (continued)Year ended 31 December 2021
Consumption (KwH)
Consumption %
Equivalent greenhouse
emission (tonnes)Greenhouse gas
emissions (%)
31 December 2021
Transportation (derv/petrol) 78,763 48.77 18,874 52.72
Natural gas 21,956 13.59 4,021 11.23
Electricity 60,786 37.64 12,907 36.05
Total 161,505 100.00 35,802 100.00
31 December 2020
Transportation (derv/petrol) 78,763 52.27 19,176 53.53
Natural gas 2,452 1.63 451 1.26
Electricity 69,457 46.10 16,193 45.21
Total 150,672 100.00 35,820 100.00
2021 2020
Total energy consumption (KwH) 161,505 150,672
Associated GHG emissions (tCO2e) 35,802 35,820
Turnover excluding dividends from subsidiaries (€'000) 7,444 5,239
Intensity ratio (tCO2eper €’000) 4.81 6.84

IFRS ANNUAL REPORT & ACCOUNTS 2021IFRS ANNUAL REPORT & ACCOUNTS 2021 4342
The Directors present their Strategic Report for the year ended 31 December 2021 to provide a review of the Group’s
business, principal risks and uncertainties and performance and position alongside key performance indicators.
(a) Development performance and position
The Directors are satisfied with the trading results of the Group for the year. The Chairman’s Review on pages 28
to 38 contains an analysis of the development and performance of the Group during the year and its position at
the end of the year.
(b) Principal risks and uncertainties
There are a number of risks and uncertainties which may affect the Group’s performance. A risk assessment
process is in place and is designed to identify, manage and mitigate business risks. However it is recognised
that to identify, manage and mitigate risks is not the same as to eliminate them entirely. The Group ensures that it
limits its exposure to any downturn in its traditional trading sector by continuing to diversify its activities, identifying
opportunities for existing product offerings into new markets and for new products for all markets. The Group has
a wide range of customers which limits exposure to any material loss of revenue. The Group’s exposure to the
volatility of exchange rates is mitigated through its geographical spread of operations.
(c) Going Concern
The Group’s business activities, together with the factors likely to affect its future development, performance and
position are set out in the Chairman’s Review on pages 28 to 38. The financial position of the Group, its cash flows
and liquidity position are also described in the Chairman’s Review. In addition, note 30 to the Accounts includes
the Group’s policies and processes for managing its capital; its financial risk management objectives; details of its
financial instruments, and its exposures to credit risk and interest rate risk.
The Group’s subsidiaries are for the most part either market leaders or niche operators in their particular field and
operate across numerous different geographic areas and industries. None of the subsidiaries are reliant on any
individual supplier or customer and the Group has considerable financial resources. Consequently, the Directors
believe that the Group is well placed to manage its business risks successfully and thus they continue to adopt the
going concern basis of accounting in preparing the annual Accounts.
(d) Financial Risk Management
Prudent liquidity risk management implies maintaining sufficient cash on deposit and the availability of funding
through an adequate amount of committed credit facilities. The Directors are satisfied that cash levels retained in the
business, committed credit facilities and surety lines are more than adequate for future foreseeable requirements.
Further details are set out in note 30 to the Accounts.
(e) Section 172 Disclosures
Overview of how the Board performed its duties:
Shareholder
The shareholder is a member of the Board, which allows the other directors to liaise directly with the shareholder
at Board meetings.
Employees
The Company has a well-developed structure through which it engages regularly with employees. Board members
perform regular site visits and meetings are held on operational sites throughout the year which provides an
opportunity for the directors to engage directly with employees on a variety of topics.
Customers
Key employees within each division are in regular contact with our principal customers. In addition, in order to help
directors to develop their understanding of the Company’s relationship with key customers, business unit reporting
is submitted monthly to the Board detailing new orders and any customer issues.
Suppliers
Key employees within each division are in regular contact with our principal suppliers and develop relationships with
companies in our supply chains. Any issues for Board consideration would be reported in the monthly business
unit report.
Community and environment
The Board recognises the importance of leading a company that not only generates value for the shareholder
but also contributes to wider society. Langley Holdings match any charitable donations made by employees and
immediate families of the employees.
As a multi-disciplined engineering and manufacturing company, we recognise that environmental and climate
risks could impact us directly, and we are committed to reducing the environmental impact of our operations and
products, and minimising our environmental footprint.
Culture
The long-standing Group philosophy commits to carrying out business with the utmost integrity and to the highest
ethical standards. Langley culture is forged not from short-term profits, or from creating ‘shareholder value’ by
buying and selling companies, but from long-term development of businesses. This not only gives employees the
will to excel, but also fosters confidence amongst many customers, suppliers and other stakeholders.
The acquisition of Bergen Engines AS during the year demonstrates how the Group capitalised on existing
cash reserves to promote the continued, sustainable growth of the Group for the benefit of the shareholder and
employees, whilst also providing a broader service offering to existing customers.
(f) Key performance indicators (KPI’s)
The Board uses a number of tools to monitor the Group’s performance including a review of key performance
indicators (KPI’s) on a regular and consistent basis across the Group. Examples of KPI’s currently used include:
Targets
• Regular monthly monitoring of sold and developed contract margins
• Orders on hand
• Cash held
Strategic ReportYear ended 31 December 2021
Strategic Report (continued)Year ended 31 December 2021

IFRS ANNUAL REPORT & ACCOUNTS 2021IFRS ANNUAL REPORT & ACCOUNTS 2021 4544
The Board also considers the following non-financial key performance indicator:
• Staff turnover
These are reviewed monthly through information provided to the Board and details are shown on page 26. Analysis
using the above KPI’s is presented in the Chairman’s review.
(g) Research and development
The Group is committed to innovation and technical excellence. The Group, through its divisions, maintains a
programme of research and development to ensure that it remains at the forefront of respective technologies in
its key sectors.
(h) Employment Policy
The Group is committed to a policy of recruitment and promotion on the basis of aptitude and ability, without
discrimination of any kind, and to training for the existing and likely needs of the business.
It is the Group’s policy to keep its employees informed on matters affecting them and actively encourage their
involvement in the performance of the Group. The directors are in regular contact with local and divisional management
who maintain day-to-day responsibility for employee engagement and related decision making.
The Company gives full and fair consideration to application for employment by the Group made by disabled
persons, having regard to their particular aptitudes and abilities. The Group also gives full and fair consideration to
employees of the Group who have become disabled persons during their period of employment, including
arranging appropriate training.
By order of the Board
BERNARD J LANGLEY
Director
16th February 2022
Langley Holdings PLC
Registered in England and Wales
Company number 01321615
Independent Auditor’s Report to the MemberYear ended 31 December 2021
Strategic Report (continued)Year ended 31 December 2021
Opinion
We have audited the financial statements of Langley Holdings plc (the ‘Parent Company’) and its subsidiaries (the ‘Group’)
for the year ended 31 December 2021 which comprise the Consolidated Income Statement, the Consolidated Statement
of Other Comprehensive Income, the Consolidated and Parent Company Statements of Financial Position, the Consolidated
and Parent Company Statement of Changes in Equity, the Consolidated and Parent Company Statements of Cash Flows and
notes to the financial statements, including a summary of significant accounting policies. The financial reporting framework
that has been applied in their preparation is applicable law and UK-adopted international accounting standards (IAS).
In our opinion:
• the financial statements give a true and fair view of the state of affairs of the Group and of the Parent Company as
at 31 December 2021 and of the Group’s profit for the period then ended; and
• the Group and the Parent Company financial statements have been properly prepared in accordance with
UK-adopted international accounting standards (IAS); and
• the financial statements have been prepared in accordance with the requirements of the Companies Act 2006.
Basis for opinion
We conducted our audit in accordance with International Standards on Auditing (UK) (ISAs (UK)) and applicable law. Our
responsibilities under those standards are further described in the Auditor’s responsibilities for the audit of the financial
statements section of our report. We are independent of the Group and the Parent Company in accordance with the ethical
requirements that are relevant to our audit of the financial statements in the UK, including the FRC’s Ethical Standard, and
we have fulfilled our other ethical responsibilities in accordance with these requirements. We believe that the audit evidence
we have obtained is sufficient and appropriate to provide a basis for our opinion.
Conclusions relating to going concern
In auditing the financial statements, we have concluded that the directors’ use of the going concern basis of accounting in
the preparation of the financial statements is appropriate.
Based on the work we have performed, we have not identified any material uncertainties relating to events or conditions
that, individually or collectively, may cast significant doubt on the Group’s or the Parent Company's ability to continue as a
going concern for a period of at least twelve months from when the financial statements are authorised for issue.
Our responsibilities and the responsibilities of the directors with respect to going concern are described in the relevant
sections of this report.
2021 2020
€’000 €’000
Orders on hand 796,692 220,169
Cash held 290,988 287,963

IFRS ANNUAL REPORT & ACCOUNTS 2021IFRS ANNUAL REPORT & ACCOUNTS 2021 4746
Independent Auditor’s Report to the Member (continued)Year ended 31 December 2021
Other information
The directors are responsible for the other information. The other information comprises the information included in the
annual report, other than the financial statements and our auditor’s report thereon. Our opinion on the financial statements
does not cover the other information and, except to the extent otherwise explicitly stated in our report, we do not express
any form of assurance conclusion thereon.
Our responsibility is to read the other information and, in doing so, consider whether the other information is materially
inconsistent with the financial statements or our knowledge obtained in the audit or otherwise appears to be materially
misstated. If we identify such material inconsistencies or apparent material misstatements, we are required to determine
whether there is a material misstatement in the financial statements or a material misstatement of the other information. If,
based on the work we have performed, we conclude that there is a material misstatement of this other information; we are
required to report that fact.
We have nothing to report in this regard.
Opinions on other matters prescribed by the Companies Act 2006
In our opinion, based on the work undertaken in the course of the audit:
• the information given in the Strategic Report and the Directors’ Report for the financial year for which the financial
statements are prepared is consistent with the financial statements; and
• the Strategic Report and the Directors’ Report have been prepared in accordance with applicable legal requirements.
Matters on which we are required to report by exception
In the light of the knowledge and understanding of the Group and the Parent Company and its environment obtained in the
course of the audit, we have not identified material misstatements in the Strategic report or the Directors’ Report.
We have nothing to report in respect of the following matters in relation to which the Companies Act 2006 requires us to
report to you if, in our opinion:
• adequate accounting records have not been kept by the Parent Company, or returns adequate for our audit have
not been received from branches not visited by us; or
• the Parent Company financial statements are not in agreement with the accounting records and returns; or
• certain disclosures of directors’ remuneration specified by law are not made; or
• we have not received all the information and explanations we require for our audit.
Responsibilities of directors
As explained more fully in the Directors’ Responsibilities Statement set out on page 41, the directors are responsible for
the preparation of the financial statements and for being satisfied that they give a true and fair view, and for such internal
control as the directors determine is necessary to enable the preparation of financial statements that are free from material
misstatement, whether due to fraud or error.
In preparing the financial statements, the directors are responsible for assessing the Group’s and the Parent Company’s
ability to continue as a going concern, disclosing, as applicable, matters related to going concern and using the going
concern basis of accounting unless the directors either intend to liquidate the Group or the Parent Company or to cease
operations, or have no realistic alternative but to do so.
Auditor’s responsibilities for the audit of the financial statements
Our objectives are to obtain reasonable assurance about whether the Group and Parent Company financial statements as
a whole are free from material misstatement, whether due to fraud or error, and to issue an auditor’s report that includes our
opinion. Reasonable assurance is a high level of assurance, but is not a guarantee that an audit conducted in accordance
with ISAs (UK) will always detect a material misstatement when it exists. Misstatements can arise from fraud or error and
are considered material if, individually or in the aggregate, they could reasonably be expected to influence the economic
decisions of users taken on the basis of these financial statements.
Irregularities, including fraud, are instances of non-compliance with laws and regulations. We design procedures in line
with our responsibilities, outlined above, to detect material misstatements in respect of irregularities, including fraud. The
specific procedures for this engagement and the extent to which these are capable of detecting irregularities, including
fraud is detailed below.
Identifying and assessing risks related to irregularities:
We assessed the susceptibility of the Group and Parent Company’s financial statements to material misstatement and
how fraud might occur, including through discussions with the directors, discussions within our audit team planning
meeting, updating our record of internal controls and ensuring these controls operated as intended. We evaluated possible
incentives and opportunities for fraudulent manipulation of the financial statements. We identified laws and regulations that
are of significance in the context of the Group and Parent Company by discussions with directors and communication with
component auditors, and by updating our understanding of the sectors in which the Group and Parent Company operate.
Laws and regulations of direct significance in the context of the Group include The Companies Act 2006, pensions
legislation and UK Tax legislation as well as similar laws and regulations prevailing in each country in which we identified a
significant component.
Other laws and regulations that do not have a direct effect on the financial statements but compliance with which may
be fundamental to their ability to operate or to avoid a material penalty include anti-bribery legislation, health and safety
legislation and employment law.
We identified the presentation of the Group’s income statement, the valuation of investment properties, and revenue
recognition to be the areas most susceptible to the risk of material misstatement due to fraud and non-compliance.
Independent Auditor’s Report to the Member (continued)Year ended 31 December 2021

IFRS ANNUAL REPORT & ACCOUNTS 2021IFRS ANNUAL REPORT & ACCOUNTS 2021 4948
Audit response to risks identified
We considered the extent of compliance with these laws and regulations as part of our audit procedures on the related
financial statement items including a review of financial statement disclosures. We reviewed the Group and Parent Company’s
records of breaches of laws and regulations, minutes of meetings and correspondence with relevant authorities to identify
potential material misstatements arising. We discussed the Group and Parent Company’s policies and procedures for
compliance with laws and regulations with members of management responsible for compliance.
During the planning meeting with the audit team, the engagement partner drew attention to the key areas which might
involve non-compliance with laws and regulations or fraud. We enquired of management whether they were aware of
any instances of non-compliance with laws and regulations or knowledge of any actual, suspected or alleged fraud. We
addressed the risk of fraud through management override of controls by testing the appropriateness of journal entries and
identifying any significant transactions that were unusual or outside the normal course of business. We assessed whether
judgements made in making accounting estimates gave rise to a possible indication of management bias. At the completion
stage of the audit, the engagement partner’s review included ensuring that the team had approached their work with
appropriate professional scepticism and thus the capacity to identify non-compliance with laws and regulations and fraud.
As Group auditors, our assessment of matters relating to non-compliance with laws or regulations and fraud differed at
Group and component level according to their particular circumstances. Our communications with component auditors
included a request to identify instances of non-compliance with laws and regulations and fraud that could give rise to a
material misstatement of the Group financial statements in addition to our risk assessment.
In addition, we reviewed the financial statement disclosures and agreed to supporting documentation to assess compliance
with the provisions of relevant laws and regulations. We reviewed the professional property valuation assumptions and
assessment of the suitability of the firm and individual carrying out the valuations; reading of minutes and internal business
unit reports; assessment of whether judgements made in making accounting estimates are indicative of potential bias; and
assessed whether accounting entries have been made in accordance with IFRS 15.
There are inherent limitations in the audit procedures described above and the further removed non-compliance with laws
and regulations is from the events and transactions reflected in the financial statements, the less likely we would become
aware of it. Also, the risk of not detecting a material misstatement due to fraud is higher than the risk of not detecting one
resulting from error, as fraud may involve deliberate concealment by, for example, forgery or intentional misrepresentations,
or through collusion.
A further description of our responsibilities is available on the Financial Reporting Council’s website at:
www.frc.org.uk/auditorsresponsibilities. This description forms part of our auditor’s report
Independent Auditor’s Report to the Member (continued)Year ended 31 December 2021
Use of our report
This report is made solely to the Parent Company’s member, as a body, in accordance with Chapter 3 of Part 16 of the
Companies Act 2006. Our audit work has been undertaken so that we might state to the Parent Company’s member those
matters we are required to state to them in an auditor’s report and for no other purpose. To the fullest extent permitted by
law, we do not accept or assume responsibility to anyone other than the Parent Company and the Parent Company’s
member as a body, for our audit work, for this report, or for the opinions we have formed.
Alistair Hunt (Senior Statutory Auditor)
for and on behalf of Saffery Champness LLP
Chartered Accountants
Statutory AuditorsSaffery Champness LLP71 Queen Victoria StreetLondonEC4V 4BE
16 February 2022
Independent Auditor’s Report to the Member (continued)Year ended 31 December 2021
IFRS ANNUAL REPORT & ACCOUNTS 2021IFRS ANNUAL REPORT & ACCOUNTS 2021 5150
Consolidated Income StatementYear ended 31 December 2021
The notes on pages 51 to 114 form part of these accounts
Notes
2021
€’000
2020
€’000
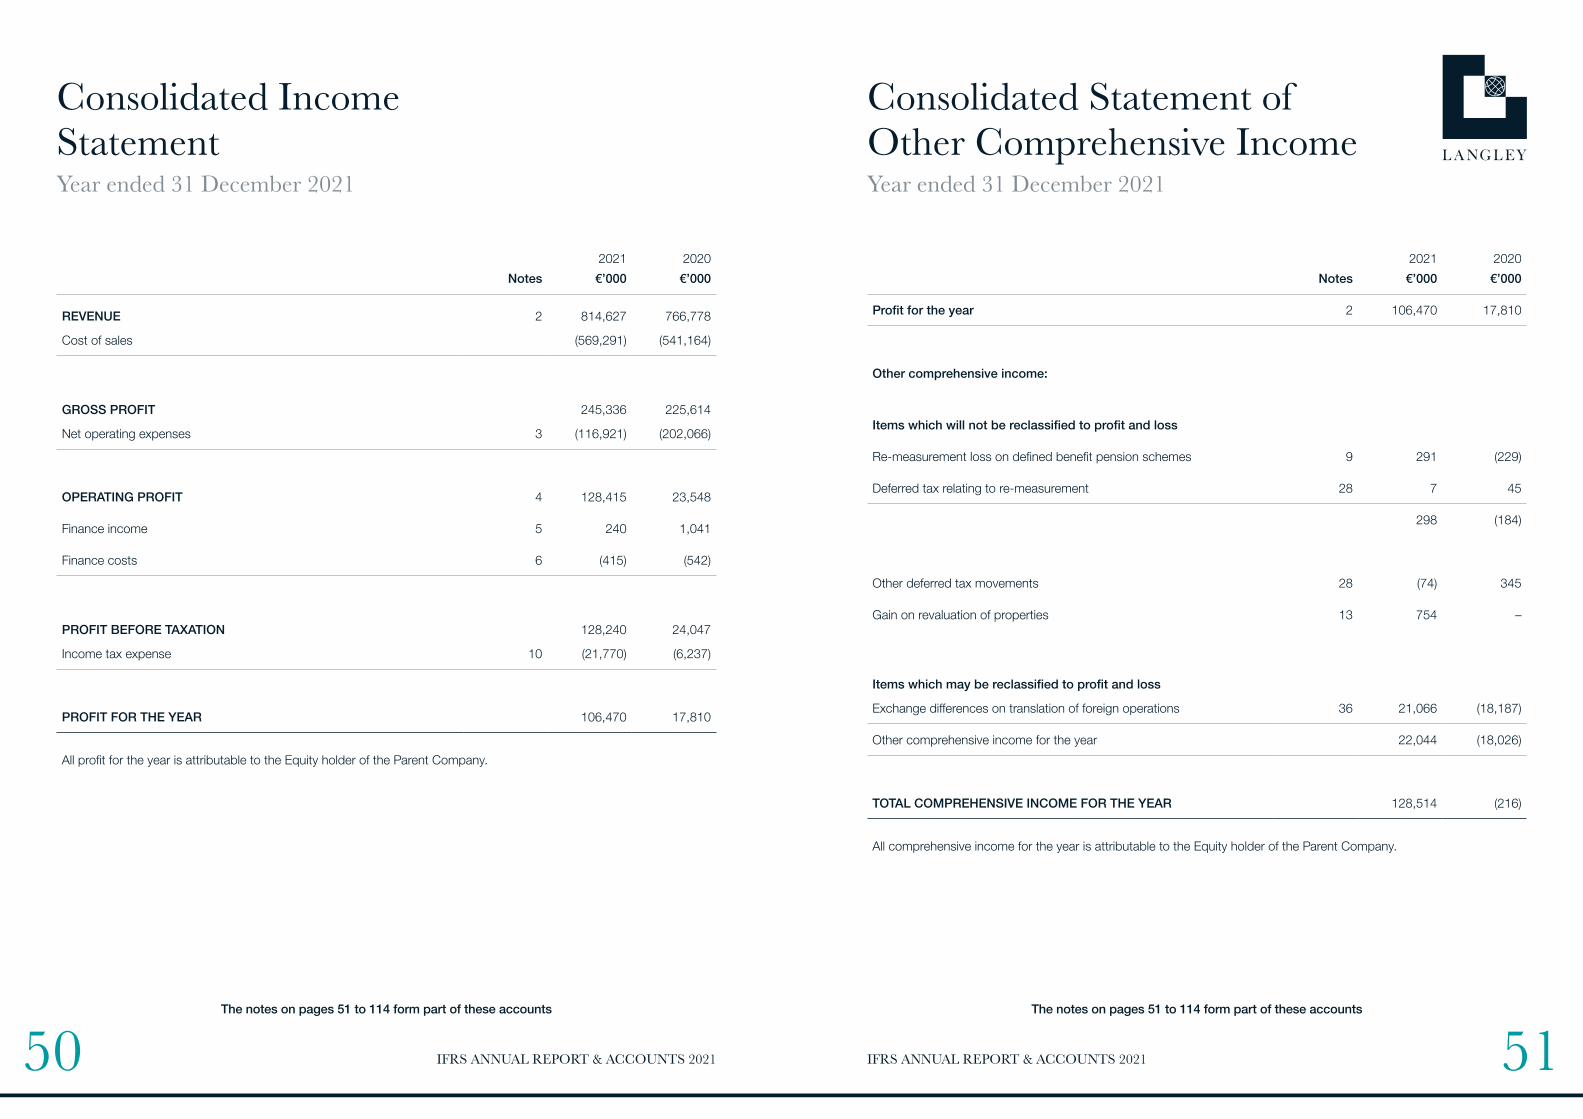
REVENUE 2 814,627 766,778
Cost of sales (569,291) (541,164)
GROSS PROFIT 245,336 225,614
Net operating expenses 3 (116,921) (202,066)
OPERATING PROFIT 4 128,415 23,548
Finance income 5 240 1,041
Finance costs 6 (415) (542)
PROFIT BEFORE TAXATION 128,240 24,047
Income tax expense 10 (21,770) (6,237)
PROFIT FOR THE YEAR 106,470 17,810
All profit for the year is attributable to the Equity holder of the Parent Company.
The notes on pages 51 to 114 form part of these accounts
Consolidated Statement of Other Comprehensive IncomeYear ended 31 December 2021
Notes
2021
€’000
2020
€’000
Profit for the year 2 106,470 17,810
Other comprehensive income:
Items which will not be reclassified to profit and loss
Re-measurement loss on defined benefit pension schemes 9 291 (229)
Deferred tax relating to re-measurement 28 7 45
298 (184)
Other deferred tax movements 28 (74) 345
Gain on revaluation of properties 13 754 –
Items which may be reclassified to profit and loss
Exchange differences on translation of foreign operations 36 21,066 (18,187)
Other comprehensive income for the year 22,044 (18,026)
TOTAL COMPREHENSIVE INCOME FOR THE YEAR 128,514 (216)
All comprehensive income for the year is attributable to the Equity holder of the Parent Company.

IFRS ANNUAL REPORT & ACCOUNTS 2021IFRS ANNUAL REPORT & ACCOUNTS 2021 5352
2021 2020 Note €’000 €’000 €’000 €’000
NON-CURRENT ASSETS Intangible assets 12 16,292 17,672Property, plant and equipment 13 340,735 219,339Investments 14 14 14Investment properties 15 64,626 55,604Trade and other receivables 16 5,704 3,272Deferred income tax assets 28 32,236 34,950
459,607 330,851
CURRENT ASSETS Inventories 17 325,766 188,625 Trade and other receivables 18 257,414 159,400 Current income tax recoverable 19 7,281 5,960Cash and cash equivalents 20 290,988 287,963
881,449 641,948
CURRENT LIABILITIES Current borrowings 24 56 721 Current income tax liabilities 23 9,507 10,697 Trade and other payables 21 339,986 176,866 Provisions 22 47,187 19,324
396,736 207,608
NET CURRENT ASSETS 484,713 434,340
Total assets less current liabilities 944,320 765,191
NON-CURRENT LIABILITIES Provisions 22 1,805 792Long term borrowings 24 117 177Trade and other payables 25 48,346 18,213Retirement benefit obligations 26 13,489 13,322Non-current income tax liabilities 27 1,219 -Deferred income tax liabilities 28 43,652 25,509
108,628 58,013
NET ASSETS 835,692 707,178
EQUITY Share capital 33 71,227 71,227Merger reserve 34 4,491 4,491Revaluation reserve 35 27,966 27,436Retained earnings 36 732,008 604,024
TOTAL EQUITY 835,692 707,178
Approved by the Board of Directors, and authorised for issue on 16th February 2022 and signed on its behalf by
ANTHONY J LANGLEY BERNARD J LANGLEYDirector Director
The notes on pages 58 to 121 form part of these accounts
Consolidated Statement of Financial PositionYear ended 31 December 2021
Consolidated Statement of Changes in EquityYear ended 31 December 2021
Share Merger Revaluation Retained
Capital Reserve Reserve Earnings* Total
€’000 €’000 €’000 €’000 €’000
AT 1 JANUARY 2020 71,227 4,491 28,920 602,756 707,394
Profit for the year – – – 17,810 17,810
Depreciation transfer – – (1,829) 1,829 –
Currency exchange difference arising on retranslation – – – (18,187) (18,187)
Re-measurement of defined benefit schemes net of deferred tax – – – (184) (184)
Deferred tax movement – – 345 – 345
TOTAL COMPREHENSIVE INCOME – – (1,484) 1,268 (216)
Dividends paid – – – – –
AT 31 DECEMBER 2020 71,227 4,491 27,436 604,024 707,178
Profit for the year – – – 106,470 106,470
Depreciation transfer – – (150) 150 –
Currency exchange difference arising on retranslation – – – 21,066 21,066
Re-measurement of defined benefit schemes net of deferred tax – – – 298 298
Revaluation gain – – 754 – 754
Deferred tax movement – – (74) – (74)
TOTAL COMPREHENSIVE INCOME – – 530 127,984 128,514
Dividends paid – – – – –
AT 31 DECEMBER 2021 71,227 4,491 27,966 732,008 835,692
* Movements in foreign currency translation reserves are detailed in note 36.
The notes on pages 58 to 121 form part of these accounts

IFRS ANNUAL REPORT & ACCOUNTS 2021IFRS ANNUAL REPORT & ACCOUNTS 2021 5554
Company Statement of Financial PositionYear ended 31 December 2021
2021 2020
Note €’000 €’000 €’000 €’000
NON-CURRENT ASSETS
Property, plant and equipment 13 17,465 17,528
Investments 14 174,092 80,998
Investment properties 15 13,133 11,926
204,690 110,452
CURRENT ASSETS
Inventories 17 9 8
Trade and other receivables 18 223,914 241,474
Current income tax recoverable 19 3,686 3,136
Cash and cash equivalents 20 87,606 125,816
315,215 370,434
CURRENT LIABILITIES
Trade and other payables 21 3,607 4,072
3,607 4,072
NET CURRENT ASSETS 311,608 366,362
Total assets less current liabilities 516,298 476,814
NON-CURRENT LIABILITIES
Deferred income tax liabilities 28 360 329
NET ASSETS 515,938 476,485
EQUITY
Share capital 33 71,227 71,227
Merger reserve 34 4,491 4,491
Retained earnings 36 440,220 400,767
TOTAL EQUITY 515,938 476,485
During the year ended 31 December 2021, the Company generated a profit of €13,417,000 (2020 – loss of €9,481,000).
Approved by the Board of Directors, and authorised for issue on 16th February 2022 and signed on its behalf by
ANTHONY J LANGLEY BERNARD J LANGLEY Director Director
The notes on pages 58 to 121 form part of these accounts The notes on pages 58 to 121 form part of these accounts
Company Statement of Changes in EquityYear ended 31 December 2021
Share Merger Retained
Capital Reserve Earnings* Total
€’000 €’000 €’000 €’000
AT 1 JANUARY 2020 71,227 4,491 429,282 505,000
Loss for the year – – (9,481) (9,481)
Currency exchange differences arising on retranslation – – (19,034) (19,034)
TOTAL COMPREHENSIVE INCOME – – (28,515) (28,515)
AT 31 DECEMBER 2020 71,227 4,491 400,767 476,485
Profit for the year – – 13,417 13,417
Currency exchange differences arising on retranslation – – 26,036 26,036
TOTAL OTHER COMPREHENSIVE INCOME – – 39,453 39,435
AT 31 DECEMBER 2021 71,227 4,491 440,220 515,938
* Movements in foreign currency translation reserves are detailed in note 36.

IFRS ANNUAL REPORT & ACCOUNTS 2021IFRS ANNUAL REPORT & ACCOUNTS 2021 5756
2021 2020
Note €’000 €’000 €’000 €’000
CASH FLOWS FROM OPERATING ACTIVITIES
Cash generated from operations 37 74,065 81,536
Bank and loan interest paid (273) (366)
Interest received 240 1,041
Income taxes paid (17,224) (12,286)
NET CASH GENERATED FROM / (USED IN) OPERATING ACTIVITIES 56,808 69,925
CASH FLOWS FROM INVESTING ACTIVITIES
Cash acquired on business combinations 11 34,896 3,605
Purchase of business combination 11 (91,529) (20,522)
Purchase of intangible assets 12 (878) (219)
Purchase of property, plant and equipment 13 (8,579) (6,627)
Proceeds from sale of available for sale properties – 16,782
Proceeds from sale of property, plant and equipment 4,449 1,279
NET CASH USED IN INVESTING ACTIVITIES (61,641) (5,702)
CASH FLOWS FROM FINANCING ACTIVITIES
Proceeds of new bank loans – 898
Repayment of bank loans (725) –
Principal payment of lease liabilities (2,094) (4,628)
NET CASH USED IN FINANCING ACTIVITIES (2,819) (3,730)
Net (decrease)/increase in cash and cash equivalents (7,652) 60,493
Cash and cash equivalents at 1 January 287,963 238,858
Effects of exchange rate changes on cash and cash equivalents 10,677 (11,388)
Cash and cash equivalents at 31 December 290,988 287,963
CASH AND CASH EQUIVALENTS CONSISTS OF:
Cash in hand, at bank and short-term deposits 20 290,988 287,963
Consolidated Statement of Cash FlowsYear ended 31 December 2021
The notes on pages 58 to 121 form part of these accounts
2021 2020
Note €’000 €’000 €’000 €’000
CASH FLOWS FROM OPERATING ACTIVITIES
Cash used in operations 37 22,145 (11,342)
Interest received 4,844 8,859
Interest expense (19) (4)
Income taxes paid (816) (4,675)
NET CASH USED IN OPERATING ACTIVITIES 26,154 (7,162)
CASH FLOWS FROM INVESTING ACTIVITIES
Purchase of property, plant and equipment 13 (214) (351)
Purchase of investments 14 (91,529) –
Dividends received from investments 12,896 –
Proceeds from sale of property, plant and equipment 81 222
NET CASH (USED IN) INVESTING ACTIVITIES (78,766) (129)
CASH FLOWS FROM FINANCING ACTIVITIES
NET CASH USED IN FINANCING ACTIVITIES – –
Net decrease in cash and cash equivalents (52,612) (7,291)
Cash and cash equivalents at 1 January 125,816 146,432
Effects of exchange rate changes on cash and cash equivalents 14,402 (13,325)
Cash and cash equivalents at 31 December 87,606 125,816
CASH AND CASH EQUIVALENTS CONSISTS OF:
Cash in hand, at bank and short-term deposits 20 87,606 125,816
Company Statement of Cash FlowsYear ended 31 December 2021
The notes on pages 58 to 121 form part of these accounts

IFRS ANNUAL REPORT & ACCOUNTS 2021IFRS ANNUAL REPORT & ACCOUNTS 2021 5958
1 ACCOUNTING POLICIES
a Basis of preparation
Langley Holdings plc (registered number 01321615) is a public limited company incorporated in the United Kingdom
and limited by shares. The address of its registered office is Enterprise Way, Retford, Nottingham, DN22 7HH.
The Accounts of both the Group and the Company have been prepared in accordance with UK-adopted
international accounting standards.
The Accounts have been prepared on a historical cost basis, except for the revaluation of property, plant and
equipment, measurement of investment property and measurement of defined benefit pension schemes.
New and amended Standards and Interpretations adopted by the Group
There were a number of Amendments to Standards adopted in the current year but none of these had material
impact on the Group.
New and amended Standards and Interpretations issued but not effective for the financial year beginning
1 January 2021
At the date of authorisation of these accounts, there were a number of Standards and Interpretations that were
in issue but not yet effective. The effect of all other new and amended Standards and Interpretations which are in
issue but not yet mandatorily effective is not expected to materially impact the Group.
b Consolidation
The Consolidated Accounts incorporate the Accounts of the Company and all of its subsidiary undertakings
for the year ended 31 December 2021 using the acquisition method, except for common control transactions,
and exclude all intra-group transactions. Assets, liabilities and contingent liabilities of acquired companies are
measured at fair value at the date of acquisition.
Any excess or deficiency between the cost of acquisition and fair value is treated as positive goodwill or a gain
on bargain purchase as described below. Where subsidiary undertakings are acquired or disposed of during the
year, the results and turnover are included in the Consolidated Income Statement from, or up to, the date control
passes.
The Company has taken advantage of the exemption granted by Section 408 of the Companies Act 2006 from
presenting its own Income Statement. The profit generated by the Company is disclosed under the Company
Statement of Financial Position.
Notes to the AccountsYear ended 31 December 2021
1 ACCOUNTING POLICIES (continued)
c Goodwill
When the fair value of the consideration for an acquired undertaking exceeds the fair value of its separable net
assets, the difference is treated as purchased goodwill and is recognised as an asset at cost and reviewed for
impairment annually. Any impairment is recognised immediately in the Consolidated Income Statement and is not
reversed in subsequent years.
Where the fair value of the separable net assets exceeds the fair value of the consideration for an acquired
undertaking the difference is credited to the Consolidated Income Statement in the year of acquisition.
d Impairment of intangible assets
Assets that have an indefinite useful life are not subject to amortisation and are reviewed for impairment annually and
when there are indications that the carrying value may not be recoverable. Assets that are subject to amortisation
are reviewed for impairment wherever events or changes in circumstances indicate that the carrying amount may
not be recoverable. An impairment loss is recognised for the amount by which the carrying amount of the asset
exceeds its recoverable amount. A reversal of impairment is recognised when the carrying amount of the asset is
exceeded by its recoverable amount to the extent of previous impairments made. The recoverable amount is the
higher of the fair value less costs to sell and value in use. For the purposes of assessing impairment, assets are
grouped at the lowest levels for which there are separately identifiable cash flows (cash-generating units).
The amortisation on those intangible assets that do not have an indefinite useful life is charged to net operating
expenses in the Income Statement and is calculated as follows:
Patents and licenses – 2 to 10 years straight line
e Property, plant and equipment
Property, plant and equipment is stated at cost of purchase or valuation, net of depreciation and any impairment
provision.
Freehold land – not depreciated
Freehold buildings – 25 to 50 years straight line
Vehicles – 4 to 20 years straight line
Plant and machinery – 4 to 20 years straight line
Computers – 3 to 8 years straight line
Right-of-use assets – Straight line over the lease term
Revaluations of land and buildings are made when there are indicators that the value has fallen below the book value
in the accounts. The Group holds a number of properties which have been valued at varying intervals over the past 10
years. Independent valuers have been consulted for the purpose of determining these valuations.
Notes to the Accounts (continued)Year ended 31 December 2021

IFRS ANNUAL REPORT & ACCOUNTS 2021IFRS ANNUAL REPORT & ACCOUNTS 2021 6160
1 ACCOUNTING POLICIES (continued)
f Investment properties
Freehold land and buildings are transferred to investment property when they are no longer used to facilitate the
principal activity of the Group. At this point, they are transferred at fair value to investment property, with any
revaluations required recognised in the revaluation reserve. Following the transfer, any subsequent revaluations are
recognised in the income statement.
Investment properties are properties which are held to earn rental income and/or for capital appreciation.
Investment properties are measured at fair value which reflects market conditions at the statement of financial
position date. Any gains or losses arising from changes in fair value are recognised in the income statement in the
period in which they arise. Fair value is derived from expected rental yields that can be gained from the property,
net of associated costs where relevant.
Rental income from investment property is accounted for as other income.
In accordance with IAS 40 ‘Investment Property’, no depreciation is provided in respect of investment properties.
g Financial instruments
Financial assets and financial liabilities are recognised in the Consolidated Statement of Financial Position when the
Group becomes a party to the contractual provisions of the instrument.
Trade receivables and contract assets
Trade receivables and contract assets do not carry any interest and are initially measured at their fair value, and
subsequently at their amortised cost, as reduced by appropriate allowances for estimated irrecoverable amounts.
Trade receivables are impaired when the asset meets one of the following criteria:
a) The financial asset is credit-impaired; or
b) Credit losses are expected on the asset. Any loss allowance relating to trade receivables has been calculated
with reference to historical experience in the recoverability of such receivables, taking into consideration current
conditions and forecasts of future economic conditions.
Borrowings
Interest-bearing loans and overdrafts are recorded initially when the proceeds are received. Finance charges are
accounted for at amortised cost using the effective interest rate method.
Trade payables
Trade payables are non-interest bearing and are initially measured at their fair value and subsequently at their
amortised cost.
Notes to the Accounts (continued)Year ended 31 December 2021
1 ACCOUNTING POLICIES (continued)
h Investments
Investments represent the Parent Company’s holdings in its subsidiaries and are presented as non-current assets
and stated at cost less any impairment in value. Any impairment is charged to the Company Income Statement.
i Inventories and work in progress
Inventories are valued at the lower of cost and net realisable value. Cost is calculated as follows:
Raw materials and consumables – cost of purchase on first in, first out basis.
Finished goods – cost of raw materials and labour together with attributable overheads.
Work in progress – cost of raw materials and labour together with attributable overheads.
Net realisable value is based on estimated selling price less further costs to completion and disposal.
j Revenue recognition
Revenue from construction contracts
Revenue is recognised in accordance with the transfer of promised goods or services to customers (i.e. when the
customer gains control of the good/service), and is measured as the consideration which the Group expects to be
entitled to in exchange for those goods or services. Consideration is typically fixed on the agreement of a contract.
Payment terms are agreed on a contract by contract basis.
Contracts include promises to transfer goods and/or services to a customer (i.e. “performance obligations”) which
are typically indistinct and hence are accounted for together in a single performance obligation. Where multiple
performance obligations exist within one contract, the transaction price is allocated between each performance
obligation on the basis of past experience, with reference to stand-alone selling prices of each component.
A good or service is distinct if the customer can benefit from the good or service on its own or together with other
resources that are readily available to the customer and the entity's promise to transfer the good or service to the
customer is separately identifiable from other promises in the contract.
The group recognises revenue when (or as) it satisfies a performance obligation by transferring a promised good or
service to a customer. A performance obligation is satisfied over time when the vendor’s performance creates an
asset with no alternative use for the vendor and the customer has an obligation to pay the vendor for performance
to date.
The above-mentioned criterion is commonly met for the Claudius Peters and Piller sub-groups as their trade
involves the building of highly specific machinery, and hence revenue is recognised over time.
Notes to the Accounts (continued)Year ended 31 December 2021

IFRS ANNUAL REPORT & ACCOUNTS 2021IFRS ANNUAL REPORT & ACCOUNTS 2021 6362
1 ACCOUNTING POLICIES (continued)
j Revenue recognition (continued)
The Group uses either output methods or input methods to measure the progress towards completion of a
performance obligation satisfied over time, depending on which method is considered to faithfully depict the
entity’s performance.
Output methods recognise revenue on the basis of direct measurement of the value to the customer of the goods
or services transferred to date relative to the remaining goods or services promised under the contract. The output
method used by Group companies is based on milestones reached.
Input methods recognise revenue on the basis of the entity’s efforts or inputs to the satisfaction of a performance
obligation relative to the total expected inputs to the satisfaction of that performance obligation. The input method
used by Group companies is based on costs incurred to date.
If revenue is recognised over a period of time, the Group presents as a contract asset the gross amount due from
customers for contract work for all contracts in progress for which costs incurred plus recognised profits (less
recognised losses) exceeds progress billings. Progress billings not yet paid by customers and retentions (contract
liabilities) are included within ‘trade and other receivables’. The Group presents as a liability the gross amount due
to customers for contract work for all contracts in progress for which progress billings exceed costs incurred plus
recognised profits (less recognised losses). Contract asset and liability balances fluctuate due to the timing and
mix of contracts held across the Group.
Contracts are deemed to be complete, and hence performance obligations fully satisfied, post customer
acceptance of the goods. Amounts disclosed as current deferred income reflect revenue that will be recognised
on performance obligations that will be satisfied within a year.
Sale of goods
The ARO, Manroland, Marelli and Druck Chemie sub-groups recognise revenue at the point in time that goods are
transferred to a customer, which is the point in time that the customer gains control of the goods. This is due to
the nature of goods being fairly standardised and hence specific contract accounting does not apply.
Revenue from standalone maintenance and service contracts across all subgroups is recognised over the time-
period spanned by the contract, as this is considered to best depict the customer’s consumption of the benefit
of this arrangement. Standard warranties included within contracts are accounted for in accordance with note 1r.
The aggregate amount of the transaction price allocated to the performance obligations that are unsatisfied, or
partially unsatisfied, as of the end of the reporting period is disclosed as orders on hand in the strategic report. This
revenue will be recognised in the next accounting period.
Notes to the Accounts (continued)Year ended 31 December 2021
1 ACCOUNTING POLICIES (continued)
k Taxes
Income tax expense represents the sum of the income tax currently payable and deferred income tax.
Deferred income tax is provided, using the liability method, on temporary differences between the tax bases of
assets and liabilities and their carrying amounts in the Accounts. Deferred income tax assets are recognised to
the extent that it is probable that future taxable profits will be available against which the deductible temporary
differences can be utilised. Deferred tax has been calculated at the rate expected to apply at the time at which
temporary differences are forecast to reverse, based on tax rates which have been substantively enacted at the
statement of financial position date.
Current and deferred income tax assets and liabilities are offset when the income taxes are levied by the same
taxation authority and when there is a legally enforceable right to offset them.
l Foreign currencies
Transactions and balances
The functional currency of the companies in the group is the currency of the primary economic environment in
which it operates. Transactions in currencies other than the entities functional currency (foreign currencies) are
recorded at the rates of exchange prevailing on the dates of the transactions. At each year end, monetary assets
and liabilities that are denominated in foreign currencies are retranslated at the rates prevailing at the year end.
Non-monetary assets and liabilities carried at fair value that are denominated in foreign currencies are translated at
the rates prevailing at the date when the fair value was determined. Gains and losses arising on retranslation are
included in net profit or loss for the period.
Accounts of overseas operations
On consolidation, exchange differences arising from the translation of the net investment in foreign operations are
taken to other comprehensive income.
Goodwill and fair value adjustments arising on the acquisition of a foreign entity are treated as assets and liabilities
of the foreign entity and translated at the closing rate.
Preparation of Financial Statements
These Financial Statements have been presented in euro because the majority of the Group’s trade is conducted
in this currency. Income and expense items are translated at the average exchange rates for the period unless
exchange rates fluctuate significantly. Assets and liabilities are translated at the closing exchange rate. Exchange
differences arising are classified as equity and transferred to a separate component of equity.
The average exchange rate during the year was €1.17 (2020 – €1.12, 2019 – €1.14) to the Pound Sterling. The
opening exchange rate was €1.10 (2020 – €1.17, 2019 – €1.11) to the Pound Sterling and the closing exchange
rate was €1.19 (2020– €1.10, 2019 – €1.17) to the Pound Sterling.
Notes to the Accounts (continued)Year ended 31 December 2021

IFRS ANNUAL REPORT & ACCOUNTS 2021IFRS ANNUAL REPORT & ACCOUNTS 2021 6564
1 ACCOUNTING POLICIES (continued)
m Cash and cash equivalents
Cash and cash equivalents comprise cash in hand, cash at bank and short-term deposits with banks and similar
financial institutions with a maturity of six months or less, and bank overdrafts.
n Post-employment benefit obligations
For defined benefit post-employment schemes, the difference between the fair value of the scheme assets (if any) and
the present value of the scheme liabilities is recognised as an asset or liability in the Statement of Financial Position.
Any asset recognised is restricted, if appropriate, to the present value of any amounts the Group expects to recover by
way of refunds from the plan or reductions in future contributions. Re-measurements of the net surplus/ deficit arising
in the year are taken to the Statement of Comprehensive Income.
Other movements in the net surplus or deficit are recognised in the Income Statement, including the current service
cost and any past service cost. The net interest cost on the net defined benefit liability is also charged to the Income
Statement. The amount charged to the Income Statement in respect of these schemes is included within operating
costs. Any changes required following the Guaranteed Minimum Pension (GMP) equalisation, which is determined by
a third-party actuary, are charged or credited to the Income Statement.
The most significant assumptions used in accounting for pension schemes are the discount rate and the mortality
assumptions. The discount rate is used to determine the interest cost and net present value of future liabilities.
The discount rate used is the yield on high quality corporate bonds with maturity and terms that match those of
the post-employment obligations as closely as possible. Where there is no developed corporate bond market in
a country, the rate on government bonds is used. Each year, the unwinding of the discount on the net liabilities is
charged to the Consolidated Income Statement as the interest cost. The mortality assumption is used to project
the future stream of benefit payments, which is then discounted to arrive at a net present value of liabilities.
Valuations of liabilities are carried out using the projected unit method.
The values attributed to scheme liabilities are assessed in accordance with the advice of independent qualified actuaries.
The Group’s contributions to defined contribution pension schemes are charged to the Income Statement in the
period to which the contributions relate.
o Leases
Assets and liabilities arising from a lease are initially measured on a present value basis. Lease payments to be made
under reasonably certain extension options are also included in the measurement of the liability. Lease payments are
discounted using the interest rate implicit in the lease. If that rate cannot be readily determined, the lessee’s incremental
borrowing rate is used, being the rate that the individual lessee would have to pay to borrow the funds necessary to
obtain as asset of a similar value to the right-of-use asset in a similar economic environment with similar terms,
security and conditions.
Notes to the Accounts (continued)Year ended 31 December 2021
1 ACCOUNTING POLICIES (continued)
o Leases (continued)
Lease payments are allocated between principal and finance cost. The finance cost is charged to profit or loss at
constant periodic rate over the term of the lease.
Right-of-use assets are depreciated over the shorter of the assets useful life and the lease term (including any
reasonably certain extension options) on a straight-line basis.
Short term leases for which the underlying asset is of low value (less than €5,000) are expensed on a straight-line basis.
On adoption of the standard, the Group elected not to reassess whether a contract is, or contains a lease at the
date of initial application.
p Rental income from investment properties
Rental income from investment properties is credited to the Consolidated Income Statement on a straight line
basis over the lease term.
q Provisions
A provision is recognised in the Consolidated Statement of Financial Position when the Group has a present legal
or constructive obligation as a result of a past event, and it is probable that an outflow of economic benefits will
be required to settle the obligation. If the effect is material, provisions are determined by discounting the expected
future cash flows at a pre-tax rate that reflects current market assessments of the time value of money and, where
appropriate, the risks specific to the liability.
The Group provides warranties to cover rectifications for certain products. A warranty provision is recognised at
the point that the sale is complete and such a clause is included in the sales contract. Management value these
provisions in line with the clauses in the contract and use historical warranty claim data is used to guide assumptions
about future warranty claims. The provision is released when either the warranty works are completed, or the legal
obligation expires. Discounting is not applied to these provisions as the directors do not consider this to be material.
Other provisions consist of restructuring provisions, onerous contracts and other smaller claims. Restructuring
provisions are recognised at the point that there is a constructive, or legal, obligation. These are valued based on
the costs attributable to the related restructure, including redundancies and relocation costs. Any changes in the
plan to restructure are recognised as additions to the provisions.
Onerous contracts are recognised when management identify that an agreement will be loss making to the Group.
These are valued based on the excess costs that the Group expect to incur to fulfil its obligations, these include
labour and other materials that the Group expects to incur.
Notes to the Accounts (continued)Year ended 31 December 2021

IFRS ANNUAL REPORT & ACCOUNTS 2021IFRS ANNUAL REPORT & ACCOUNTS 2021 6766
1 ACCOUNTING POLICIES (continued)
r Dividend policy
Dividend distribution to the Company’s Shareholder is recognised as a liability in the Group’s Accounts in the
period in which the dividends are approved by the Company’s directors.
s Research and development
Research expenditure is charged to the Income Statement in the period in which it is incurred. Development
expenditure is capitalised when the criteria for recognising an asset is met. Other development expenditure is
recognised in the Income Statement as incurred.
t Government grants
Government grants are initially recognised when there is reasonable assurance that the grant conditions will be
met and the grants will be received. Grants are recognised as income to match the related costs, for which they
are intended to compensate, on a systematic basis.
u Critical accounting judgements and key sources of estimation uncertainty
The preparation of the Accounts in conformity with IFRS requires management to make estimates and judgements
that affect the reported amounts of revenues, expenses, assets and liabilities, and the disclosure of contingent liabilities
at the date of the Accounts. The areas where the most judgement and estimation are required are highlighted below:
Critical accounting judgements
i Revenue recognition
Revenue is recognised in accordance with the satisfaction of performance obligations. A performance
obligation is satisfied over time, and hence revenue is recognised over time, when an asset is created
with no alternative use for the vendor. This requires the application of judgement to determine whether the
asset is sufficiently specialised that it would have no alternative use.
The input method used by the Group to measure the amount of revenue to be recognised is based on
costs incurred to date relative to total expected costs, which requires significant judgement. Contracts
can be highly bespoke and hence historical cost information is not always useful in estimating future
costs. Revenue recognised from construction contracts in the year totalled €144,499,000. The Group’s
policies for the recognition of revenue and profit are set out above.
Key sources of estimation uncertainty
i Freehold land and building valuation
Determining the fair value of freehold land and building requires significant estimates to be made, with
reference to third party information and market conditions. The valuation of freehold land and buildings is
disclosed in note 13.
Notes to the Accounts (continued)Year ended 31 December 2021
1 ACCOUNTING POLICIES (continued)
u Critical accounting judgements and key sources of estimation uncertainty (continued)
ii Fair value of assets and liabilities on acquisition
Determining the fair value of assets and liabilities acquired, including any intangible assets, requires
estimates to be made with reference to market conditions and third-party information. The fair value of
assets and liabilities acquired is detailed in note 11.
iii Pensions
The determination of the pension cost and defined benefit obligation of the Group’s defined benefit
pension schemes depends on the selection of certain assumptions which include the discount rate,
inflation rate, salary growth and mortality. Differences arising from actual experiences or future changes in
assumptions will be reflected in subsequent periods. See note 9 for further details.
iv Property, plant and equipment depreciation
The property, plant and equipment used within the Group have estimated service lives of between 3
and 20 years, with the exception of property which has an estimated service life of 50 years, and the
depreciation charge is clearly sensitive to the lives allocated to the various types of asset.
v Impairment of assets
Property, plant and equipment, and intangible assets are reviewed for impairment if events or changes in Property,
plant and equipment, and intangible assets are reviewed for impairment if events or changes in circumstances
indicate that the carrying amount may not be recoverable. When a review for impairment or reversal of impairment
is conducted, the recoverable amount of an asset or a cash-generating unit is determined based on value- in-use
calculations prepared on the basis of management’s assumptions and estimates.
vi Income taxes
The Group is subject to income taxes in numerous jurisdictions. Significant estimation is required in
determining the provision for income taxes in each territory. There are many transactions and calculations
for which the ultimate tax determination is uncertain during the ordinary course of business. The Group
recognises liabilities for anticipated tax audit issues based on estimates of whether additional taxes will
be due. Where the final tax outcome of these matters is different from the amounts which were initially
recorded, such differences will impact the income tax and deferred tax provision in the period to which
such determination is made. See notes 10 and 28 for further information.
vii Provisions
Provision is made for liabilities that are uncertain in timing or amount of settlement. These include provision
for rectification and warranty claims. Calculations of these provisions are based on cash flows relating to
these costs estimated by management supported by the use of external consultants where needed and
discounted at an appropriate rate where the impact of discounting is material. See note 22 for details.
Notes to the Accounts (continued)Year ended 31 December 2021

IFRS ANNUAL REPORT & ACCOUNTS 2021IFRS ANNUAL REPORT & ACCOUNTS 2021 6968
2 REVENUE
An analysis of the Group’s revenue between each significant category is as follows:
2021 2020
€’000 €’000
Revenue from construction contracts 144,499 135,619
Sale of goods 670,128 631,159
814,627 766,778
Contract assets recognised are disclosed in note 18 and contract liabilities are disclosed in note 21.
An analysis of the Group’s revenue between each subgroup is as follows:
2021 2020
€’000 €’000
Manroland Sheetfed 212,711 214,718
Piller 176,452 171,758
ARO 87,451 71,414
Claudius Peters 77,777 80,247
Druck Chemie 88,195 59,424
Marelli 90,585 98,180
Other businesses 81,456 71,037
814,627 766,778
Information regarding the nature of revenue derived from the above subgroups is provided in note 1.
3 ANALYSIS OF NET OPERATING EXPENSES
2021 2020
€’000 €’000
Distribution costs 57,224 54,264
Administrative expenses 160,070 161,802
Other operating income (14,620) (10,644)
Gain on revaluation of investment properties (7,740) (3,356)
Other gains (note 11) (78,013) –
Net operating expenses 116,921 202,066
Notes to the Accounts (continued)Year ended 31 December 2021
4 OPERATING PROFIT
2021 2020
€’000 €’000
Operating profit has been arrived at after charging:
Directors’ emoluments (note 7) 691 1,134
Depreciation of owned assets (note 13) 17,903 20,036
Depreciation of right-of-use assets (note 13) 2,467 3,823
(Reversal of impairment) / impairment of owned assets (note 13) (1,805) 5,611
Amortisation of intangibles (note 12) 2,052 850
Impairment of intangibles (note 12) – 1
Government grants (5,967) (10,252)
Research and development costs 8,040 7,120
Profit on sale of property, plant and equipment (262) (810)
Profit on disposal of assets held for sale – (500)
Fees payable to the Group’s auditor for the audit of the Group’s Accounts 159 131
Fees payable to the Group’s auditor and its associates for other services
– the auditing of Subsidiary Accounts 1,196 1,212
– other services relating to taxation compliance 139 180
– all other services 248 138
Impairment of trade receivables 1,806 885
Impairment of inventories 1,164 1,611
Cost of inventories recognised as an expense (included in cost of sales) 343,156 375,766
Other gains (note 11) (78,013) –
Net (loss) on foreign currency translation (1,724) (3,792)
Non-recurring expenses of €6,470,000 (2020 – €4,492,000) were included in the Consolidated Income Statement
relating to the reorganisation and reconstruction of the Malaysian operations.
Government grants include amounts received under the UK Government’s Coronavirus Job Retention Scheme and
amounts received under similar schemes in other jurisdictions. These amounts have been set against wage and salary
costs in net operating expenses.
Notes to the Accounts (continued)Year ended 31 December 2021

IFRS ANNUAL REPORT & ACCOUNTS 2021IFRS ANNUAL REPORT & ACCOUNTS 2021 7170
5 FINANCE INCOME
2021 2020
€’000 €’000
Bank interest receivable 240 1,041
240 1,041
6 FINANCE COSTS
2021 2020
€’000 €’000
Interest relating to lease liabilities 142 176
Other interest 273 366
415 542
7 KEY MANAGEMENT PERSONNEL COMPENSATION
2021 2020
€’000 €’000
Salaries and short-term employee benefits 776 1,204
Post-employment benefits 4 3
780 1,207
All of the above key management personnel compensation relates to Directors and their close family members.
Directors’ emoluments
2021 2020
€’000 €’000
Aggregate emoluments as Directors of the Company 687 1,131
Value of Group pension contributions to money purchase schemes 4 3
691 1,134
Emoluments of the highest paid Director 239 429
No. No.
Number of Directors who are accruing benefits under money purchase pension schemes 2 2
Notes to the Accounts (continued)Year ended 31 December 2021
8 EMPLOYEE NUMBERS AND COSTS
The average number of persons employed by the Group (including Directors) during the year was as follows:
2021 2020
No. No.
Management, office and sales 2,160 2,323
Manufacturing and direct labour 2,117 2,407
4,277 4,730
The aggregate payroll costs of these persons were as follows:
2021 2020
€’000 €’000
Wages and salaries 224,597 215,067
Social security costs 49,953 46,305
Other pension costs 3,536 3,783
278,086 265,155
The average number of persons employed by the Company (including Directors) during the year was as follows:
2021 2020
No. No.
Management, office and sales 25 26
The aggregate payroll costs of these persons were as follows:
2021 2020
€’000 €’000
Wages and salaries 1,255 1,241
Social security costs 87 147
Other pension costs 72 50
1,414 1,438
Notes to the Accounts (continued)Year ended 31 December 2021
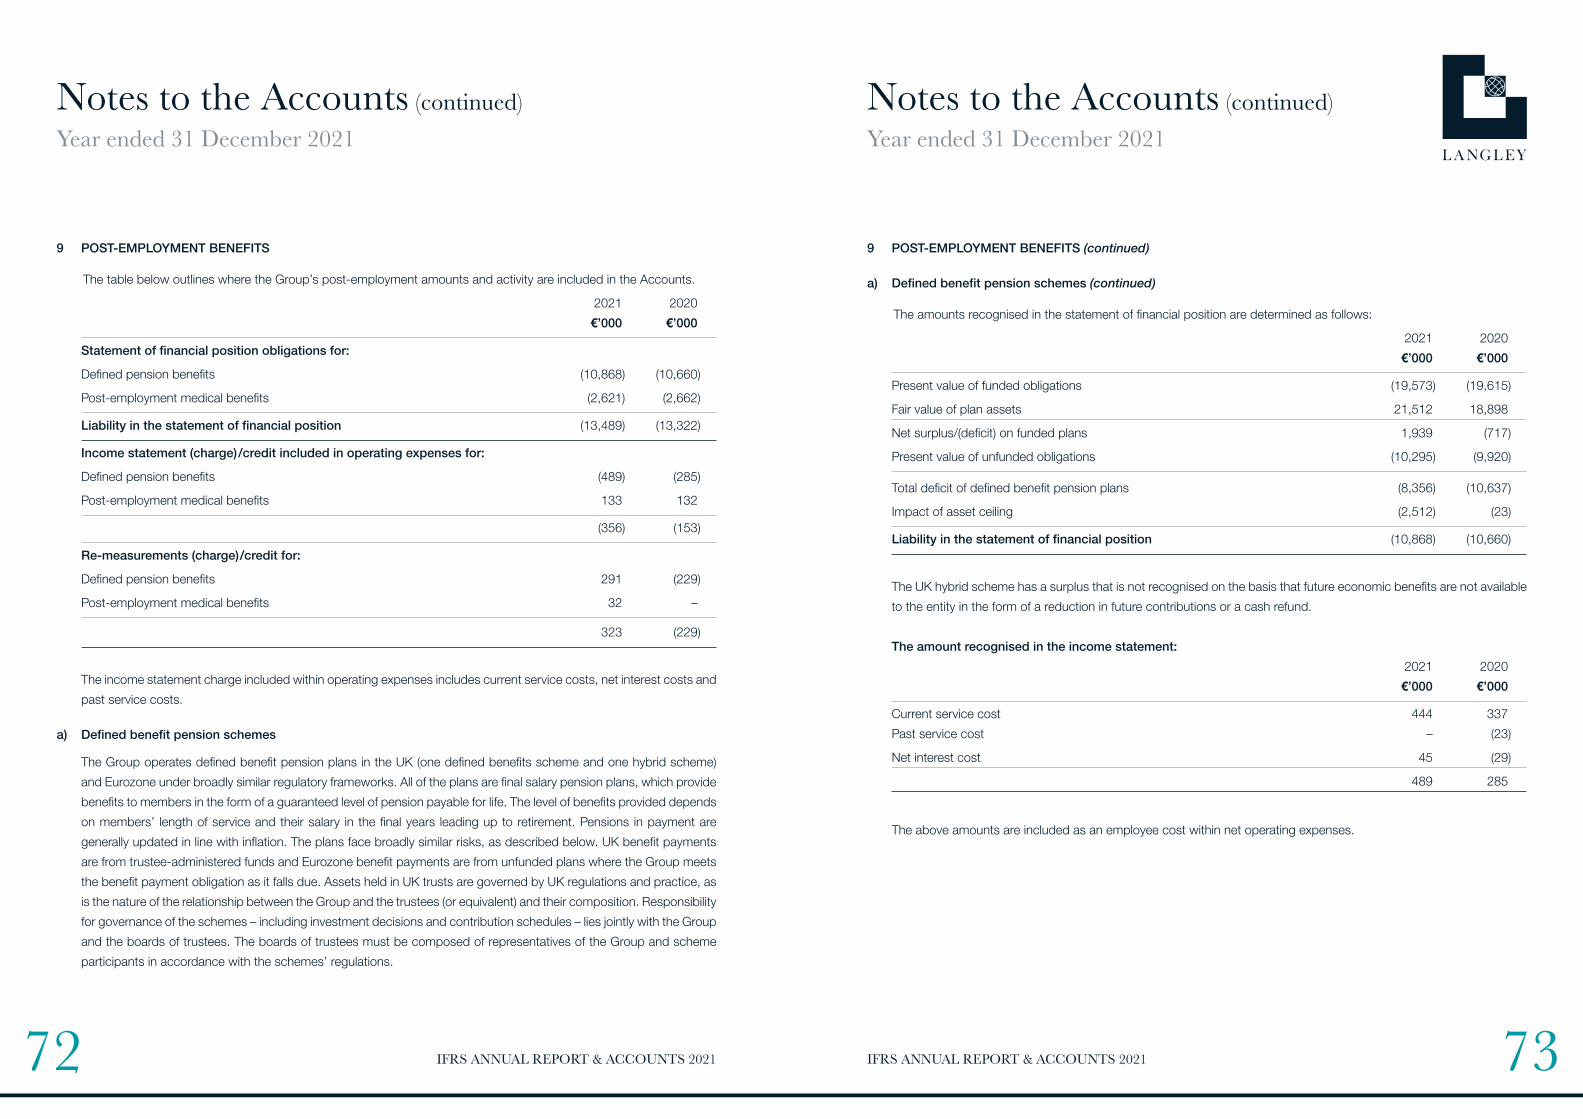
IFRS ANNUAL REPORT & ACCOUNTS 2021IFRS ANNUAL REPORT & ACCOUNTS 2021 7372
9 POST-EMPLOYMENT BENEFITS
The table below outlines where the Group’s post-employment amounts and activity are included in the Accounts.
2021 2020
€’000 €’000
Statement of financial position obligations for:
Defined pension benefits (10,868) (10,660)
Post-employment medical benefits (2,621) (2,662)
Liability in the statement of financial position (13,489) (13,322)
Income statement (charge)/credit included in operating expenses for:
Defined pension benefits (489) (285)
Post-employment medical benefits 133 132
(356) (153)
Re-measurements (charge)/credit for:
Defined pension benefits 291 (229)
Post-employment medical benefits 32 –
323 (229)
The income statement charge included within operating expenses includes current service costs, net interest costs and
past service costs.
a) Defined benefit pension schemes
The Group operates defined benefit pension plans in the UK (one defined benefits scheme and one hybrid scheme)
and Eurozone under broadly similar regulatory frameworks. All of the plans are final salary pension plans, which provide
benefits to members in the form of a guaranteed level of pension payable for life. The level of benefits provided depends
on members’ length of service and their salary in the final years leading up to retirement. Pensions in payment are
generally updated in line with inflation. The plans face broadly similar risks, as described below. UK benefit payments
are from trustee-administered funds and Eurozone benefit payments are from unfunded plans where the Group meets
the benefit payment obligation as it falls due. Assets held in UK trusts are governed by UK regulations and practice, as
is the nature of the relationship between the Group and the trustees (or equivalent) and their composition. Responsibility
for governance of the schemes – including investment decisions and contribution schedules – lies jointly with the Group
and the boards of trustees. The boards of trustees must be composed of representatives of the Group and scheme
participants in accordance with the schemes’ regulations.
Notes to the Accounts (continued)Year ended 31 December 2021
9 POST-EMPLOYMENT BENEFITS (continued)
a) Defined benefit pension schemes (continued)
The amounts recognised in the statement of financial position are determined as follows:
2021 2020
€’000 €’000
Present value of funded obligations (19,573) (19,615)
Fair value of plan assets 21,512 18,898
Net surplus/(deficit) on funded plans 1,939 (717)
Present value of unfunded obligations (10,295) (9,920)
Total deficit of defined benefit pension plans (8,356) (10,637)
Impact of asset ceiling (2,512) (23)
Liability in the statement of financial position (10,868) (10,660)
The UK hybrid scheme has a surplus that is not recognised on the basis that future economic benefits are not available
to the entity in the form of a reduction in future contributions or a cash refund.
The amount recognised in the income statement:
2021 2020
€’000 €’000
Current service cost 444 337
Past service cost – (23)
Net interest cost 45 (29)
489 285
The above amounts are included as an employee cost within net operating expenses.
Notes to the Accounts (continued)Year ended 31 December 2021

IFRS ANNUAL REPORT & ACCOUNTS 2021IFRS ANNUAL REPORT & ACCOUNTS 2021 7574
9 POST-EMPLOYMENT BENEFITS (continued)
a) Defined benefit pension schemes (continued)
Re-measurement of the net defined benefit liability to be shown in other comprehensive income:
2021 2020
€’000 €’000
Gain/(loss) from changes in financial assumptions 1,078 (2,138)
Gain/(loss) from changes in demographic assumptions 140 (11)
Experience gains/(losses) 123 (7)
Return on assets, excluding interest income 1,319 790
Exchange adjustments 85 –
Change in the effect of the asset ceiling excluding interest income (2,454) 1,137
291 (229)
Changes in present value of obligations:
2021 2020
€’000 €’000
Present value of obligations at start of the year (29,535) (29,271)
On acquisition (1,050) –
Current service cost 444 337
Past service cost – (23)
Interest cost (197) (371)
Acturial (loss)/gain on scheme liabilities based on:
- Changes in financial assumptions 1,078 (2,138)
- Changes in demographic assumptions 140 (11)
- Experience gains 124 (7)
- Benefits paid 644 825
Plan contributions (9) –
Exchange differences (1,507) 1,124
Present value of obligation at end of the year (29,868) (29,535)
Notes to the Accounts (continued)Year ended 31 December 2021
9 POST-EMPLOYMENT BENEFITS (continued)
a) Defined benefit pension schemes (continued)
Changes in the fair value of scheme assets:
2021 2020
€’000 €’000
Fair value of scheme assets at the start of the year 18,898 19,266
Interest income 237 362
Re-measurement of scheme assets 1,319 790
Contributions by employers 79 76
Benefits paid (560) (501)
Exchange differences 1,539 (1,095)
Fair value of scheme assets at the end of the year 21,512 18,898
The significant actuarial assumptions were as follows:
2021 2020
UK Eurozone UK Eurozone
Rate of increase in salaries – 1.83% – 1.83%
Discount rate 1.80-1.90% 0.80-1.63% 1.20% 0.50-1.63%
Inflation 3.50-4.20% 1.40-1.63% 3.10% 1.40-1.63%
The inflation assumption shown for the UK is for the Retail Price Index. The assumption for the Consumer Price Index
at 31 December 2021 was 2.5-3.4%.
Assumptions regarding future mortality are set based on actuarial advice in accordance with published statistics and
experience in each territory. These assumptions translate into an average life expectancy in years for a pensioner
retiring at age 65:
2021 2020
Retiring at the end of the reporting period:
Male 22 years 22 - 23 years
Female 24 - 25 years 24 years
Retiring 20 years after the end of the reporting period:
Male 23 - 24 years 23 - 24 years
Female 26 years 26 years
Notes to the Accounts (continued)Year ended 31 December 2021

IFRS ANNUAL REPORT & ACCOUNTS 2021IFRS ANNUAL REPORT & ACCOUNTS 2021 7776
9 POST-EMPLOYMENT BENEFITS (continued)
a) Defined benefit pension schemes (continued)
The sensitivity of the defined benefit obligation to changes in the weighted principal assumptions is:
Change in assumption Increase in assumption Decrease in assumption
Discount rate 0.25% Decrease obligation Increase obligation
by 3.0 – 3.9% by 3.0 – 3.9%
Inflation 0.25% Increase obligation Decrease obligation
by 0.1 – 2.4% by 0.1 – 2.4%
Life expectancy 1 year Increase obligation Decrease obligation
by 4.7 – 4.8% by 4.7 – 4.8%
The above sensitivity analyses are based on a change in an assumption while holding all other assumptions constant.
In practice, this is unlikely to occur, and changes in some of the assumptions may be correlated. When calculating the
sensitivity of the defined benefit obligation to significant actuarial assumptions the same method (present value of the
defined benefit obligation calculated with the projected unit credit method at the end of the reporting period) has been
applied as when calculating the pension liability recognised within the statement of financial position.
The methods and types of assumptions used in preparing the sensitivity analysis did not change compared to the
previous period.
b) Post-employment medical benefits
The Group operates a post-employment medical benefit scheme in the US. This scheme is unfunded. The method of
accounting, significant assumptions and the frequency of valuations are similar to those used for defined benefit pension
schemes set out above with the addition of actuarial assumptions relating to the long-term increase in healthcare costs
of 3.0% a year and claim rates of 5.5%.
The amounts recognised in the statement of financial position are determined as follows:
2021 2020
€’000 €’000
Present value of unfunded obligations (2,621) (2,662)
Liability in the statement of financial position (2,621) (2,662)
Notes to the Accounts (continued)Year ended 31 December 2021
9 POST-EMPLOYMENT BENEFITS (continued)
b) Post-employment medical benefits (continued)
Changes in the present value of defined benefit obligations: 2021 2020
€’000 €’000
Present value of obligation at the start of the year (2,662) (2,929)
The amount recognised in the income statement:
Current service cost (121) (118)
Past service cost 4 –
Interest expense (16) (15)
(133) (133)
Re-measurements of the net defined benefit liability to be shown in other comprehensive income:
Gain from change in demographic assumptions 61 3
gain/(loss) from change in financial assumptions (29) (3)
32 –
Other movement 18 15
Payments from scheme contributions – benefit payments 206 227
Exchange differences (82) 158
Present value of obligations at the end of the year (2,621) (2,662)
c) Post-employment benefits (pension and medical)
Schemes’ assets are comprised as follows: 2021 2020 Total % Total %
€’000 €’000
Equity instruments 14,791 69% 11,653 62% Equities and equity funds 6,048 4,882 Diversified growth fund 8,743 6,771 Debt instruments 2,488 11% 6,503 34% Government 41 4,221 Corporate bonds (investment grade) 2,447 2,282
Other 4,084 19% 203 1% Cash and cash equivalents 149 1% 539 3%
Total 21,512 100% 18,898 100%
Notes to the Accounts (continued)Year ended 31 December 2021

IFRS ANNUAL REPORT & ACCOUNTS 2021IFRS ANNUAL REPORT & ACCOUNTS 2021 7978
9 POST-EMPLOYMENT BENEFITS (continued)
c) Post-employment benefits (pension and medical) (continued)
Through its defined benefit pension schemes and post-employment medical plans, the Group is exposed to a number
of risks, most of which are detailed below:
Asset volatility The schemes’ liabilities are calculated using a discount rate set with reference to corporate bond
yields; if scheme assets underperform this yield, this will create a deficit. The UK schemes hold a
significant proportion of equity instruments, which are expected to outperform corporate bonds
in the long-term while providing volatility and risk in the short-term.
The Group has reduced the level of investment risk by investing in assets that better match the
liabilities. This has been done by the purchase of a mixture of government and corporate bonds.
The government bonds represent investments in UK government securities only. The corporate
bonds are global securities with an emphasis on the UK.
Changes A decrease in corporate bond yields will increase scheme liabilities, although this will be partially
in bond yield offset by an increase in the value of the schemes’ bond holdings.
Inflation risk Some of the Group pension obligations are linked to inflation, and higher inflation will lead to
higher liabilities (although, in most cases, caps on the level of inflationary increases are in place
to protect the schemes against extreme inflation). The majority of the schemes’ assets are either
unaffected by (fixed interest bonds) or loosely correlated with (equities) inflation, meaning that an
increase in inflation will also increase the deficit.
Life expectancy The majority of the schemes’ obligations are to provide benefits for the life of the member, so
increase in life expectancy will result in an increase in the scheme’s liabilities. This is particularly
significant in the UK schemes, where inflationary increases result in higher sensitivity to changes
in life expectancy.
In case of the Eurozone defined benefit scheme, the Group ensures that the investment positions are managed within
an asset-liability matching (ALM) framework that has been developed to achieve long-term investments that are in line
with the obligations under the scheme. Within this framework, the Group’s ALM objective is to match assets to the
pension obligations by investing in long-term fixed interest securities with maturities that match the benefit payments
as they fall due. The UK hybrid scheme currently has no asset-liability matching strategy. The Group has not changed
the processes used to manage its risks from previous periods. The Group does not use derivatives to manage its risk.
Investments are well diversified, such that the failure of any single investment would not have a material impact on the
overall level of assets. A large portion of assets in 2021 consist of equities and bonds, although the Group also invests
in property, liability-driven investments and cash.
The last triennial valuations were due to be completed as at 5 April 2021 and 31 July 2021 for the defined benefits
scheme and hybrid scheme respectively. The valuation for the defined benefits scheme is still ongoing as of the
reporting date. The Group considers that the contribution rates set at the last valuation date are sufficient to eliminate
the deficit over the agreed period.
Notes to the Accounts (continued)Year ended 31 December 2021
9 POST-EMPLOYMENT BENEFITS (continued)
c) Post-employment benefits (pension and medical) (continued)
Expected contributions to post-employment benefit schemes for the year ending 31 December 2022 are €79,347.
The weighted average duration of the defined benefit obligation is 15 years.
(d) Post-employment benefits (defined contribution schemes)
Contributions to defined contribution pension schemes, whereby the scheme assets and liabilities are held separately
from those of the Group, totalled €3,054,000 (2020– €2,640,000).
10 INCOME TAX EXPENSE
(a) Charge for the year 2021 2020
€’000 €’000
Current income tax:
UK corporation tax at 19% (2019 – 19%) 2,135 3,850
Overseas tax 13,871 14,430
Adjustments to prior year UK tax 695 31
Adjustments to prior year overseas tax (1,094) (966)
Other 25 –
Total current taxation 15,632 17,345
Deferred income tax:
Movement in overseas deferred tax 5,966 (10,612)
Movement in UK deferred tax 172 (496)
Total deferred taxation 6,138 (11,108)
Income tax expense 21,770 6,237
Notes to the Accounts (continued)Year ended 31 December 2021

IFRS ANNUAL REPORT & ACCOUNTS 2021IFRS ANNUAL REPORT & ACCOUNTS 2021 8180
10 INCOME TAX EXPENSE (continued)
(b) Factors affecting tax expense 2021 2020
€’000 €’000
Profit before taxation 128,240 24,047
Profit before taxation multiplied by the standard rate of tax of 19% (2018 – 19 %) 24,366 4,569
Expenses not deductible for tax purposes 2,073 1,062
Effect of foreign tax rates (2,622) (4,340)
Utilisation of brought forward losses – (799)
Deferred tax assets not recognised 16,704 10,025
Income not taxable (17,121) –
Other overseas taxes 3,653 3,675
Adjustment to tax charge in previous period (388) (1,196)
Timing differences (4,845) (7,414)
Exchange adjustment (50) 655
Tax expense 21,770 6,237
(c) Factors that may affect future tax charges
The Group had UK tax losses of approximately €6,644,000 at 31 December 2021 (2020 – €6,320,000) available
for carry forward against future trading profits. In addition, the Claudius Peters Group had overseas tax losses of
approximately €8,674,000 at 31 December 2021 (2020 – €6,646,000), the Manroland Group €182,748,000 (2020
– €171,296,000), the Druck Chemie Group €6,254,000 (2020 – €6,451,000), the Bradman Lake Group €397,000
(2020 – €1,403,000), the Piller Group €nil (2020 – €2,194,000) the Marelli Group €66,710,000 – (2020 –€57,013,000)
and the Bergen Engines Group €174,815,000 available for carry forward against future trading profits of that Group.
(d) Impact of future tax rate changes
The UK corporate tax rate is legislated to increase to 25% for companies above the small profits threshold from 1 April
2023, as introduced in the Finance Bill 2021, published on 11 March 2021
Notes to the Accounts (continued)Year ended 31 December 2021
11 ACQUISITIONS DURING THE PERIOD
On 31 December 2021, Langley Holdings Plc purchased 100% of the share capital of Bergen Engines AS. The acquisition of Bergen Engines AS enables the Group to provide complementary goods and services to the Group’s existing similar markets in addition to rapidly developing the Group’s microgrid power generation sector, an area central to Langley’s net zero strategy.
The acquisition had the following effect on the Group’s assets and liabilities:
Book value of Fair value Fair value of net net assets acuired adjustments assets acquired
€’000 €’000 €’000 Identifiable intangible assets 2,008 (2,005) 3
Cash & cash equivalents 34,896 – 34,896
Inventories 100,460 – 100,460 Property, plant and equipment 43,868 70,843 114,711
Other financial assets 78,033 – 78,033
Deferred tax assets 987 – 987
Financial liabilities (current) (106,060) – (106,060)
Financial liabilities (non-current) (6,065) – (6,065)
Provisions (30,434) – (30,434) Deferred tax liabilities (145) (15,585) (15,730)
Net income tax liabilities (209) – (209)
Defined benefit scheme obligations (1,050) – (1,050)
Total identifiable net assets acquired and 124,195 53,252 169,542 liabilities assumed
Gain on bargain purchase (24,761) (53,252) (78,013)
Total cash consideration 91,529 – 91,529
The bargain purchase arose as the tangible fixed assets acquired were fully depreciated or impaired by their previous owners. The gain, after recognition of the fair value of the assets and liabilities acquired, was recognised as “other gains” in net operating expenses.
The material fair value adjustments were made to uplift the valuation of land and buildings following an external valuation and provide for deferred tax. The final consideration may be subject to a working capital adjustment under the share purchase agreement.
Had the acquisition occurred on 1 January 2021, Bergen Engines AS would have contributed revenue of €250,000,000 and a loss before tax of €10,600,000 (before impairment reversal) to the wider group results. This result excludes the
fair value adjustments.
Notes to the Accounts (continued)Year ended 31 December 2021

IFRS ANNUAL REPORT & ACCOUNTS 2021IFRS ANNUAL REPORT & ACCOUNTS 2021 8382
12 INTANGIBLE ASSETS
GROUP Positive Patents and Customer Total
Goodwill Licences Contracts
€’000 €’000 €’000 €’000
Cost
At 1 January 2021 10,274 10,499 5,646 26,419
Additions – 878 – 878
Disposal (342) (515) – (857)
On acquisition – 246 – 246
Exchange adjustment 190 28 – 218
At 31 December 2021 10,122 11,136 5,646 26,904
Aggregate impairment and amortisation
At 1 January 2021 – 8,747 – 8,747
Amortisation charge for the year – 923 1,129 2,052
Disposal – (475) – (475)
On acquisition – 243 – 243
Exchange adjustment – 45 – 45
At 31 December 2021 – 9,483 1,129 10,612
Net book values
At 31 December 2021 10,122 1,653 4,517 16,292
At 31 December 2020 as restated 10,274 1,752 5,646 17,672
Cost
At 1 January 2020 2,535 10,421 – 12,956
Additions – 219 – 219
Disposal – (12) – (12)
On acquisition 7,984 2 5,646 13,632
Exchange adjustment (245) (131) – (376)
At 31 December 2020 as restated 10,274 10,499 5,646 26,419
Notes to the Accounts (continued)Year ended 31 December 2021
12 INTANGIBLE ASSETS (continued)
Aggregate impairment and amortisation At 1 January 2020 – 7,953 – 7,953
Amortisation charge for the year – 850 – 850 Disposal – (4) – (4)
Impairment – 1 – 1 On acquisition – 2 – 2
Exchange adjustment – (55) – (55)
At 31 December 2020 as restated – 8,747 – 8,747
Net book values
At 31 December 2020 as restated 10,274 1,752 5,646 17,672
At 31 December 2019 2,535 2,468 – 5,003
Prior year restatement
In the previous year, the group acquired BluePrint Products NV and Hi-Tech Chemicals BV which resulted in goodwill
totaling €15,920,000. Following this acquisition, the directors determined that customer contracts in place at the date
of acquisition within BluePrint Products NV represented a separable intangible asset. Using the information available
at the date of acquisition, the directors have remeasured goodwill to separate out this intangible asset. The directors
determined these customer contracts held a value of €5,646,000 which was based upon the future net contribution
of these contracts over the subsequent 5-year period, which is determined to be their useful economic life. This
remeasurement did not impact either the net assets or profit of the 2020 year end. The affected financial statement
line items for the prior period have been restated as follows:
Statement of financial position extract
Group Restated
2020 Adjustment Group
€’000 €’000 €’000
Intangible assets - goodwill 15,920 (5,646) 10,274
Intangible assets – customer contracts – 5,646 5,646
Total 15,920 – 15,920
Notes to the Accounts (continued)Year ended 31 December 2021

IFRS ANNUAL REPORT & ACCOUNTS 2021IFRS ANNUAL REPORT & ACCOUNTS 2021 8584
13 PROPERTY, PLANT AND EQUIPMENT
GROUP Freehold Land Plant &
& Buildings Machinery Vehicles Computers Total
€’000 €’000 €’000 €’000 €’000
Cost or valuation
At 1 January 2021 200,229 151,542 56,162 18,771 426,704
Additions – right-of-use assets 13,015 – 10 – 13,025
Additions – owned assets 312 4,014 3,117 1,136 8,579
On acquisition 102,064 68,538 2,013 25,465 198,080
Disposals (2,280) (9,909) (2,509) (2,096) (16,794)
Reclassification – (32) (56) 88 –
Revaluation 754 – – – 754
Exchange adjustments 5,058 3,036 3,410 854 12,358
At 31 December 2021 319,152 217,189 62,147 44,218 642,706
Depreciation
At 1 January 2021 66,291 94,693 30,059 16,322 207,365
Charge for the year – owned assets 4,180 8,440 4,188 1,095 17,903
Charge for the year – right-of-use assets 2,433 13 21 – 2,467
Reversal of impairment – (1,812) – (1,812)
On acquisition 17,582 39,848 772 25,167 83,369
Disposals (1,869) (6,276) (2,220) (2,059) (12,424)
Reclassification – (40) (50) 90 –
Exchange adjustments 1,542 1,474 1,699 388 5,103
At 31 December 2021 90,159 138,152 32,657 41,003 301,971
Net book amount
At 31 December 2021 228,993 79,037 29,490 3,215 340,735
At 31 December 2020 133,938 56,849 26,103 2,449 219,339
Notes to the Accounts (continued)Year ended 31 December 2021
13 PROPERTY, PLANT AND EQUIPMENT (continued)
GROUP Freehold Land Plant &
& Buildings Machinery Vehicles Computers Total
€’000 €’000 €’000 €’000 €’000
Cost or valuation
At 1 January 2020 199,985 154,890 59,106 18,531 432,512
Adjustments – right-of-use assets 1,829 500 11 27 2,367
Additions 306 3,554 2,098 669 6,627
On acquisition 2,259 – 94 – 2,353
Disposals (543) (3,024) (2,389) (172) (6,128)
Transfers (1,387) – – – (1,387)
Exchange adjustments (2,220) (4,378) (2,758) (284) (9,640)
At 31 December 2020 200,229 151,542 56,162 18,771 426,704
Depreciation
At 1 January 2020 59,510 91,290 24,174 16,002 190,976
Charge for the year – owned assets 4,815 9,221 5,050 950 20,036
Charge for the year – right-of-use assets 3,805 3 15 – 3,823
Impairment 497 1,019 4,095 – 5,611
Disposals (556) (3,018) (2,070) (169) (5,813)
On acquisition 243 – 65 – 308
Transfers (1,113) – – – (1,113)
Exchange adjustments (910) (3,822) (1,270) (461) (6,463)
At 31 December 2020 66,291 94,693 30,059 16,322 207,365
Net book amount
At 31 December 2020 133,938 56,849 26,103 2,449 219,339
At 31 December 2019 140,475 63,600 34,932 2,529 241,536
Notes to the Accounts (continued)Year ended 31 December 2021

IFRS ANNUAL REPORT & ACCOUNTS 2021IFRS ANNUAL REPORT & ACCOUNTS 2021 8786
13 PROPERTY, PLANT AND EQUIPMENT (continued)
COMPANY Freehold Land Plant &
& Buildings Machinery Vehicles Computers Total
€’000 €’000 €’000 €’000 €’000
Cost or valuation
At 1 January 2021 18,660 7,076 2,260 366 28,362
Additions – 107 101 6 214
Disposals – (11) (339) (4) (354)
Exchange adjustments 1,596 557 189 19 2,361
At 31 December 2021 20,256 7,729 2,211 387 30,583
Depreciation
At 1 January 2021 4,615 4,152 1,747 320 10,834
Disposals – (11) (312) (4) (327)
Charge for the year – owned assets 655 612 282 48 1,597
Exchange adjustments 503 385 153 (27) 1,014
At 31 December 2021 5,773 5,138 1,870 337 13,118
Net book amount
At 31 December 2021 14,483 2,591 341 50 17,465
At 31 December 2020 14,045 2,924 513 46 17,528
Cost or valuation
At 1 January 2020 19,781 7,427 2,908 364 30,480
Additions – 69 215 67 351
Disposals – – (706) (45) (751)
Exchange adjustments (1,121) (420) (157) (20) (1,718)
At 31 December 2020 18,660 7,076 2,260 366 28,362
Notes to the Accounts (continued)Year ended 31 December 2021
13 PROPERTY, PLANT AND EQUIPMENT (continued)
COMPANY Freehold Land Plant &
& Buildings Machinery Vehicles Computers Total
€’000 €’000 €’000 €’000 €’000
Depreciation
At 1 January 2020 4,240 3,790 2,104 340 10,474
Disposals – – (657) (45) (702)
Charge for the year – owned assets 630 587 415 41 1,673
Exchange adjustments (255) (225) (115) (16) (611)
At 31 December 2020 4,615 4,152 1,747 320 10,834
Net book amount
At 31 December 2020 14,045 2,924 513 46 17,528
At 31 December 2019 15,541 3,637 804 24 20,006
A number of the freehold land and buildings owned by the Group have been revalued at varying intervals over the
past 10 years by independent valuers not connected with the company on the basis of market value. The valuation
conforms to International Valuation Standards and was based on recent market transactions on arm’s length terms for
similar properties.
If these assets had not been revalued they would have been included at the following historical cost amounts:
GROUP 2021 2020
€’000 €’000
Freehold land and buildings
Cost 117,031 131,140
Aggregate depreciation and impairment (52,463) (52,617)
Included within plant and machinery are assets under construction totaling €396,000 (2020: €nil) which have not
been depreciated. Included within freehold land and buildings is land with a carrying value of €15,362,000 (2020:
€15,751,000) which is not depreciated.
The group undertakes an annual impairment assessment on its aircraft owing to the existence of impairment indicators.
The valuation is assessed by third parties using parameters including aircraft type, age and total flying time. In the prior
year, an impairment was recognised in order to align the valuation with this report. In the current year, the valuation
determined that the market value of the aircraft had risen due to an increase in demand for private charter flights. The
directors therefore reversed the impairment charge.
Notes to the Accounts (continued)Year ended 31 December 2021

IFRS ANNUAL REPORT & ACCOUNTS 2021IFRS ANNUAL REPORT & ACCOUNTS 2021 8988
14 NON-CURRENT INVESTMENTS
Group Company
Shares in unlisted undertakings Shares in group undertakings
€’000 €’000
COST
At 1 January 2021 14 95,129
Additions – 91,529
Exchange adjustment – 9,104
At 31 December 2021 14 195,762
IMPAIRMENT
At 1 January 2021 – 14,131
Charge for the year – 6,293
Exchange adjustment – 1,246
At 31 December 2021 – 21,670
CARRYING AMOUNT
At 31 December 2021 14 174,092
At 31 December 2020 14 80,998
A list of unlisted subsidiary companies at 31 December 2021 is provided in note 39.
15 INVESTMENT PROPERTIES
Group
2021 2020
€’000 €’000
Balance at the beginning of the year 55,604 53,160
Additions – –
Disposals – (146)
Transfers (note 13) – 274
Revaluation 7,740 3,356
Exchange adjustments 1,282 (1,040)
Balance at the end of the year 64,626 55,604
Notes to the Accounts (continued)Year ended 31 December 2021
15 INVESTMENT PROPERTIES (continued)
Company
2021 2020
€’000 €’000
Balance at the beginning of the year 11,926 12,902
Additions – –
Transfers – –
Revaluation – –
Exchange adjustments 1,207 (976)
Balance at the end of the year 13,133 11,926
During the year, the group received rental income from their investment properties totaling €4,604,000 (2020 –
€2,300,000).
16 NON-CURRENT TRADE AND OTHER RECEIVABLES
Group
2021 2020
€’000 €’000
Trade and other receivables 4,354 2,054
Other receivables 692 646
Pension scheme prepayment 658 572
5,704 3,272
An analysis of provisions for bad and doubtful debts along with the ageing of trade receivables that were past due but
not impaired is included within note 18
17 INVENTORIES
Group Company
2021 2020 2021 2020
€’000 €’000 €’000 €’000
Raw materials 121,106 78,219 – –
Work in progress 106,556 70,741 – –
Finished goods 98,104 39,665 9 8
325,766 188,625 9 8
Notes to the Accounts (continued)Year ended 31 December 2021

IFRS ANNUAL REPORT & ACCOUNTS 2021IFRS ANNUAL REPORT & ACCOUNTS 2021 9190
18 CURRENT TRADE AND OTHER RECEIVABLES
Group Company
2021 2020 2021 2020
€’000 €’000 €’000 €’000
Trade receivables 168,146 102,836 287 21
Retentions 3,740 4,854 – –
Amounts recoverable on construction contracts 28,994 24,284 – –
Amounts owed by Group undertakings – – 222,159 238,871
Directors’ current accounts 615 574 615 574
Other receivables 17,950 9,673 3 1,209
VAT recoverable 7,596 4,577 503 427
Prepayments 30,373 12,602 347 372
257,414 159,400 223,914 241,474
For terms and conditions relating to related party receivables, refer to note 32.
Trade and other receivables are disclosed net of provisions for bad and doubtful debts, an analysis of which
is as follows:
Group
2021 2020
€’000 €’000
Balance at beginning of the year 12,645 13,213
On acquisition 3,346 –
Exchange differences 119 (5)
Charge for the year 17 322
Unused amounts reversed (476) (885)
Balance at end of the year 15,651 12,645
Trade receivables are non-interest bearing and are generally on 30 – 90 day terms.
The provision for bad and doubtful debts includes estimated potential credit losses.
Notes to the Accounts (continued)Year ended 31 December 2021
18 CURRENT TRADE AND OTHER RECEIVABLES (continued)
At 31 December, the analysis of trade receivables that were past due but not impaired is as follows:
Past due but not impaired
<30 31-60 61-90 91-120 >121
days days days days days
€’000 €’000 €’000 €’000 €’000
Group
2021 146,853 8,103 4,951 1,302 11,291
2020 45,604 5,542 3,390 2,328 9,453
Company
2021 14 – – 4 269
2020 21 – – – –
19 CURRENT INCOME TAX RECOVERABLE
Group Company
2021 2020 2021 2020
€’000 €’000 €’000 €’000
Income tax 7,281 5,960 3,686 3,136
20 CASH AND CASH EQUIVALENTS
Group Company
2021 2020 2021 2020
€’000 €’000 €’000 €’000
Cash in hand, at bank and short term deposits 290,988 287,963 87,606 125,816
Notes to the Accounts (continued)Year ended 31 December 2021

IFRS ANNUAL REPORT & ACCOUNTS 2021IFRS ANNUAL REPORT & ACCOUNTS 2021 9392
21 CURRENT TRADE AND OTHER PAYABLES
Group Company
2021 2020 2021 2020
€’000 €’000 €’000 €’000
Trade payables 81,688 45,906 677 709
Other payables 14,981 8,682 24 509
Other taxes and social security 9,304 9,023 53 52
Accruals and deferred income 92,986 62,963 177 331
VAT payable 8,157 6,172 – –
Amounts owed to Group undertakings – – 1,967 1,670
Payments on account 125,855 36,095 – –
Amounts due on construction contracts 2,093 4,741 – –
Directors’ loan account 709 801 709 801
Lease liabilities 4,213 2,483 – –
339,986 176,866 3,607 4,072
22 PROVISIONS
GROUP Warranty Other
Provision Provision Total
€’000 €’000 €’000
Balance at 1 January 2021 13,687 6,429 20,116
Additional provision recognised 10,709 2,338 13,047
Acquisition 17,339 13,095 30,434
Provision utilised during the year (7,973) (3,953) (11,926)
Provision released during year (2,243) (625) (2,868)
Foreign exchange difference 188 1 189
Balance at 31 December 2021 31,707 17,285 48,992
Current 30,807 16,380 47,187
Non-current 900 905 1,805
Notes to the Accounts (continued)Year ended 31 December 2021
22 PROVISIONS (continued)
Warranty Other
Provision Provision Total
€’000 €’000 €’000
Balance at 1 January 2020 12,414 5,291 17,705
Additional provision recognised 9,110 4,901 14,011
Acquisition 956 – 956
Provision utilised during the year (5,633) (3,578) (9,211)
Provision released during year (2,775) (175) (2,950)
Foreign exchange difference (385) (10) (395)
Balance at 31 December 2020 13,687 6,429 20,116
Current 12,935 6,389 19,324
Non-current 752 40 792
The warranty provision is arrived at using estimates from historical warranty data. The other provision includes specific
claims, redundancy and restructuring provisions. Following the acquisition of Bergen Engines AS, the group assumed
the obligation to honour the warranties for previous sales, valued at €17,339,000.
Other provisions include €12,412,000 that was recognised on acquisition of Bergen Engines AS in relation related to a
to onerous contracts, previously entered, that the group has the obligation to fulfil.
There were no provisions in the Company.
23 CURRENT INCOME TAX LIABILITIES
Group Company
2021 2020 2021 2020
€’000 €’000 €’000 €’000
Income tax 9,507 10,697 – –
24 BORROWINGS
Group
2021 2020
€’000 €’000
Loans – current 56 721
Loans – non-current 117 177
Total 173 898
Notes to the Accounts (continued)Year ended 31 December 2021

IFRS ANNUAL REPORT & ACCOUNTS 2021IFRS ANNUAL REPORT & ACCOUNTS 2021 9594
25 NON-CURRENT TRADE AND OTHER PAYABLES Group
2021 2020
€’000 €’000
Trade payables 430 521
Accruals and deferred income 29,763 11,943
Other 60 –
Lease liabilities 18,093 5,749
48,346 18,213
26 RETIREMENT BENEFIT OBLIGATIONS
GROUP 2021 2020
€’000 €’000
At 1 January 2021 13,322 14,066
Ceiling opening balance 23 –
On acquisition 1,055 –
Total expense recognised in the Income Statement in the year (356) (153)
Actuarial losses/(gains) – financial assumptions (1,049) 2,141
Actuarial gains – demographic assumptions (201) 8
Actuarial (gains)/losses – experience (124) 7
Return on assets (1,319) (811)
Interest expense 2 –
Changes in the effect of asset ceiling 2,467 (1,128)
Contributions paid (88) (63)
Payments from the plan (290) (580)
Exchange differences 47 (165)
At 31 December 2021 13,489 13,322
UK defined benefit pension schemes – 229
Overseas unfunded defined benefit pension obligations 10,868 10,431
Overseas unfunded medical benefits obligations 2,621 2,662
Retirement benefit obligation in balance sheet 13,489 13,322
Notes to the Accounts (continued)Year ended 31 December 2021
27 NON-CURRENT TAX LIABILITIES
Group Company
2021 2020 2021 2020
€’000 €’000 €’000 €’000
Other corporation tax overseas 1,219 – – –
1,219 – – –
28 DEFERRED INCOME TAX
Deferred income tax assets and liabilities are offset when there is a legally enforceable right to offset current tax assets
against current tax liabilities and when the deferred income taxes relate to the same fiscal authority.
Group Company
2021 2020 2021 2020
€’000 €’000 €’000 €’000
Deferred tax assets 32,236 34,950 – –
Deferred tax liabilities (43,652) (25,509) (360) (329)
(11,416) 9,441 (360) (329))
The net movement on the deferred income tax account is as follows:
Group Company
2021 2020 2021 2020
€’000 €’000 €’000 €’000
At 1 January 2021 9,441 (1,919) (329) (305)
Income Statement (expense)/credit (6,138) 11,108 (4) (24)
On acquisition (14,743) – – –
Movement on revaluation (74) 345 – –
Release to equity on actuarial loss 7 45 – –
Exchange differences 91 (138) (27) –
At 31 December 2021 (11,416) 9,441 (360) (329)
Notes to the Accounts (continued)Year ended 31 December 2021

IFRS ANNUAL REPORT & ACCOUNTS 2021IFRS ANNUAL REPORT & ACCOUNTS 2021 9796
28 DEFERRED INCOME TAX (continued)
GROUP
The movement in net deferred tax assets and liabilities during the year is as follows:
Other
Accelerated short-term Retirement
tax Tax temporary benefit Fair value
depreciation losses differences obligations gains Total
€’000 €’000 €’000 €’000 €’000 €’000
At 1 January 2020 4,503 (15,142) (1,729) (2,784) 17,071 1,919
Charge/(credit) to income statement (671) (5,968) (1,611) (12) (2,846) (11,108)
On acquisition – – – – – –
Transfer to revaluation – – – – (345) (345)
Recognised in equity regarding
re-measurement of defined benefit scheme – – – (45) – (45)
Movement on revaluation – – – – – –
Exchange differences (70) (30) (136) 100 274 138
At 31 December 2020 3,762 (21,140) (3,476) (2,741) 14,154 (9,441)
Gross assets (224) (21,140) (10,845) (2,741) - (34,950)
Gross liabilities 3,986 – 7,369 – 14,154 25,509
(Credit)/charge to income statement (169) 6,806 (1,285) 90 696 6,138
On acquisition 5 – (847) – 15,585 14,743
Transfer to revaluation reserve – – – – 74 74
Recognised in equity regarding
re-measurement of defined benefit scheme – – – (7) – (7)
Exchange differences (40) 17 (94) 11 15 (91)
At 31 December 2021 3,558 (14,317) (5,702) (2,647) 30,524 11,416
Gross assets (394) (14,830) (14,365) (2,647) – (32,236)
Gross liabilities 3,952 513 8,663 – 30,524 43,652
Notes to the Accounts (continued)Year ended 31 December 2021
28 DEFERRED INCOME TAX (continued)
COMPANY
Accelerated capital allowances
€’000
At 1 January 2020 305
Credit to income statement 24
Exchange differences –
At 31 December 2020 329
Credit to income statement 4
Exchange differences 27
At 31 December 2021 360
Unprovided deferred taxation
Group Company
2021 2020 2021 2020
€’000 €’000 €’000 €’000
Other short term differences 44,568 40,758 – –
Tax losses 104 212 – –
Retirement benefit obligation 129 170 – –
44,801 41,140 – –
Deferred tax has been calculated at the rate expected to apply at the time at which temporary differences are forecast
to reverse, based on tax rates which have been substantively enacted at the balance sheet date.
No deferred tax asset has been recognised in respect of the above accelerated tax depreciation, other short term
temporary differences, tax losses and retirement benefit obligations because there is uncertainty as to whether the
Group will have sufficient relevant taxable profits to utilise these assets in the near future.
Notes to the Accounts (continued)Year ended 31 December 2021

IFRS ANNUAL REPORT & ACCOUNTS 2021IFRS ANNUAL REPORT & ACCOUNTS 2021 9998
29 CONTINGENT LIABILITIES
The Company has guaranteed the bank facilities of UK subsidiaries and is party to a Group VAT registration.
In view of net cash position held with the same UK bank within the Group, the Directors believe that the likelihood of
the guarantees being invoked is remote, therefore no contingent liability has been disclosed in these Accounts
.
30 FINANCIAL INSTRUMENTS
The Group and parent Company’s principal financial instruments that arise directly from their operations are
detailed below:
Group Company
2021 2020 2021 2020
€’000 €’000 €’000 €’000
Financial assets measured at amortised cost 224,975 144,921 222,950 240,674
Financial liabilities measured at amortised cost 225,815 126,296 3,263 4,019
The main purpose of these financial instruments is to fund the operations of the Group and the parent Company, as
well as to manage their working capital, liquidity and surplus funds.
The main risks arising from the Group’s financial instruments are foreign currency risk, credit risk and interest rate risk.
Liquidity risk is not considered to be a main risk to the Group given the Group’s cash and cash equivalents balances
being considerably higher than any bank borrowings.
Foreign currency risk
The Group is exposed to foreign currency risk on sales, purchases and borrowings that are denominated in a currency
other than the functional currencies of individual Group entities (which are principally sterling, euro and US dollars).
The Group publishes its Consolidated Accounts in euro and as a result, it is subject to foreign currency exchange
translation risk in respect of the results and underlying net assets of its operations where the euro is not the functional
currency of that operation.
Financial risk
The following table demonstrates the sensitivity to a reasonably possible change in the sterling to euro, US dollar to
euro and other currencies to euro exchange rate, with all other variables held constant, of the Group’s profit before tax
due to changes in the fair value of monetary assets and liabilities.
Notes to the Accounts (continued)Year ended 31 December 2021
30 FINANCIAL INSTRUMENTS (continued)
Credit riskThe Group trades only with recognised, creditworthy third parties. It is the Group’s policy that all customers who wish to trade on credit terms are subject to credit verification procedures. In addition, receivable balances are monitored on an ongoing basis with the result that the Group’s exposure to bad debt is not significant.
With respect to credit risk arising from the other financial assets of the Group, comprising of cash and cash equivalents, the Group’s exposure to credit risk arises from default of the counterparty with a maximum exposure equal to the carrying amounts of these instruments.
The amount that best represents the Group’s maximum exposure to credit risk at the end of the reporting period without taking account of any collateral held or other credit enhancements is expected to be the total value of trade receivables and contract assets.
Interest rate risk
The Group’s exposure to the risk of changes in market interest rates relates primarily to the Group’s money on deposit. Cash balances as at year end total €290,988,000 (2020 – €287,963,000) and interest earned on cash balances averaged 0.08% (2020 – 0.34%) during the year.
Capital risk management
The Group defines capital as being share capital plus reserves and manages capital to ensure adequate resources are retained for continued growth of the Group. Access to capital includes the retention of cash on deposit and availability of funding through agreed capital facilities. Long term deposits are used to obtain more favourable rates of return only when adequate cash resources are maintained on shorter term deposit for the Group’s working capital requirements.
Increase / decrease in sterling rate
Effect on profit before tax
Increase / decrease in US
Dollar rateEffect on profit
before tax
Increase / decrease in
other exchange rates
Effect on profit before tax
€’000 €’000 €’000
2021 +20% (3,391) +20% (2,459) +20% (45)
-20% 5,087 -20% 3,689 -20% 67
2020 +20% (680) +20% 1,543 +20% (197)
-20% 1,020 -20% (2,315) -20% 296
Notes to the Accounts (continued)Year ended 31 December 2021
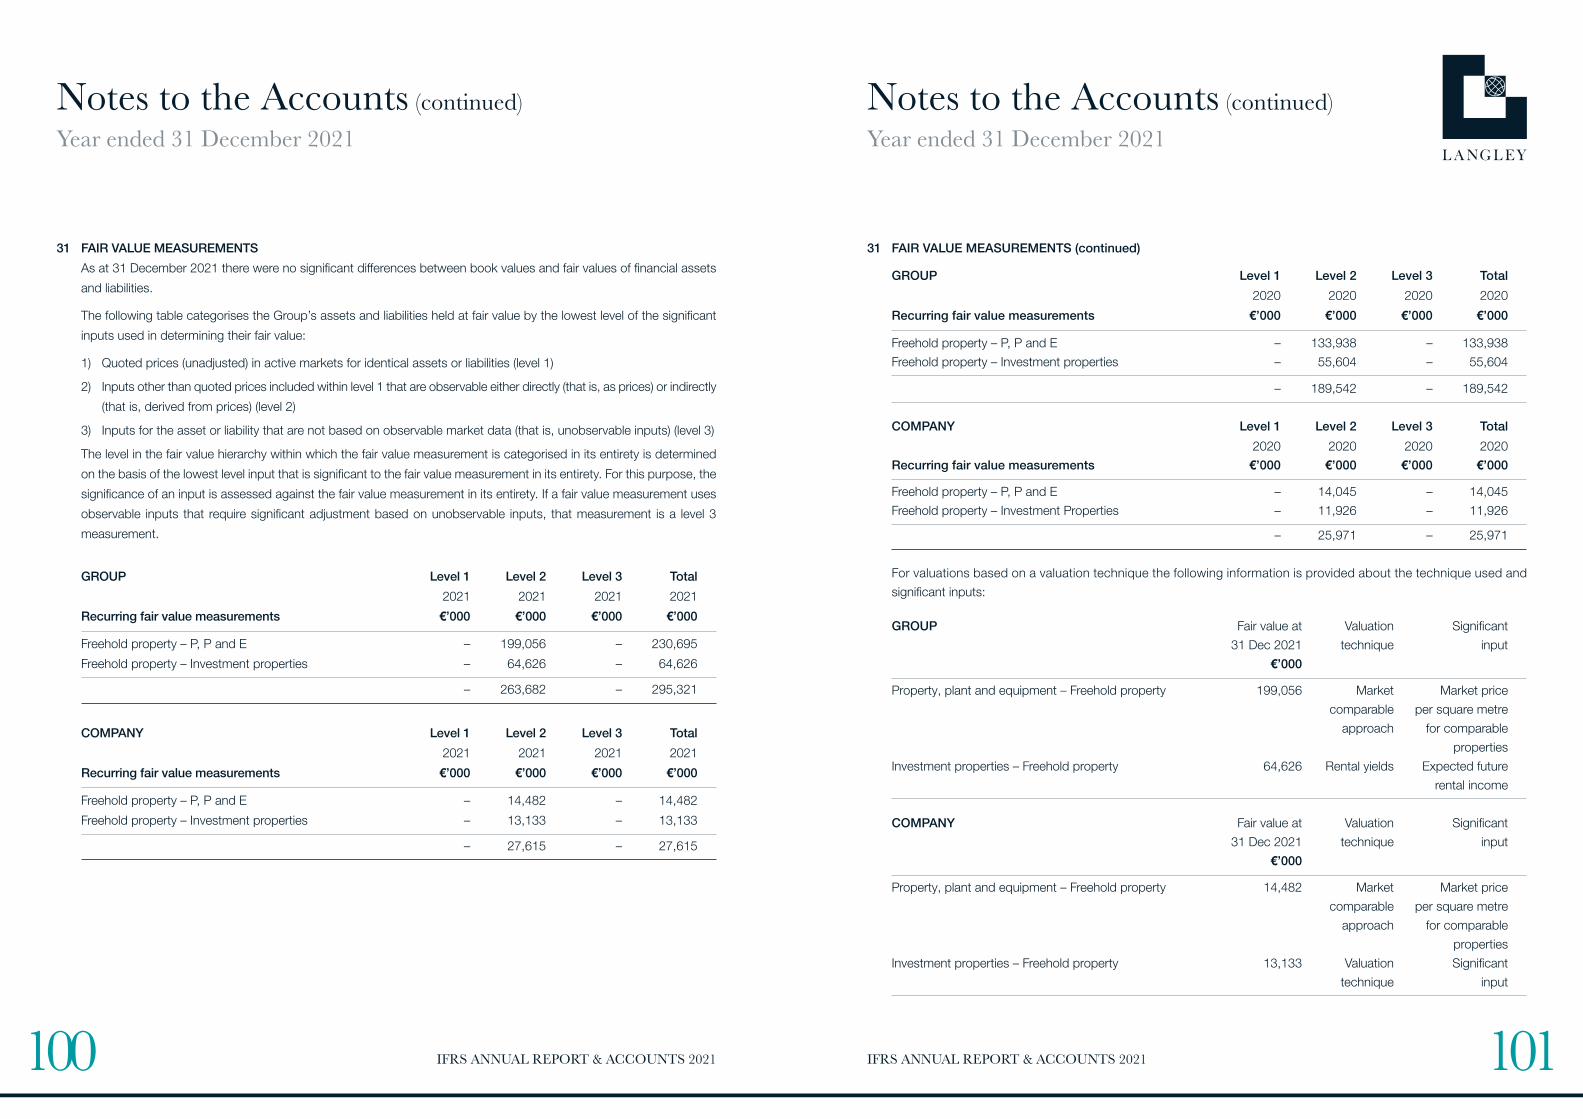
IFRS ANNUAL REPORT & ACCOUNTS 2021IFRS ANNUAL REPORT & ACCOUNTS 2021 101100
31 FAIR VALUE MEASUREMENTS
As at 31 December 2021 there were no significant differences between book values and fair values of financial assets
and liabilities.
The following table categorises the Group’s assets and liabilities held at fair value by the lowest level of the significant
inputs used in determining their fair value:
1) Quoted prices (unadjusted) in active markets for identical assets or liabilities (level 1)
2) Inputs other than quoted prices included within level 1 that are observable either directly (that is, as prices) or indirectly
(that is, derived from prices) (level 2)
3) Inputs for the asset or liability that are not based on observable market data (that is, unobservable inputs) (level 3)
The level in the fair value hierarchy within which the fair value measurement is categorised in its entirety is determined
on the basis of the lowest level input that is significant to the fair value measurement in its entirety. For this purpose, the
significance of an input is assessed against the fair value measurement in its entirety. If a fair value measurement uses
observable inputs that require significant adjustment based on unobservable inputs, that measurement is a level 3
measurement.
GROUP Level 1 Level 2 Level 3 Total
2021 2021 2021 2021
Recurring fair value measurements €’000 €’000 €’000 €’000
Freehold property – P, P and E – 199,056 – 230,695
Freehold property – Investment properties – 64,626 – 64,626
– 263,682 – 295,321
COMPANY Level 1 Level 2 Level 3 Total
2021 2021 2021 2021
Recurring fair value measurements €’000 €’000 €’000 €’000
Freehold property – P, P and E – 14,482 – 14,482
Freehold property – Investment properties – 13,133 – 13,133
– 27,615 – 27,615
Notes to the Accounts (continued)Year ended 31 December 2021
31 FAIR VALUE MEASUREMENTS (continued)
GROUP Level 1 Level 2 Level 3 Total
2020 2020 2020 2020
Recurring fair value measurements €’000 €’000 €’000 €’000
Freehold property – P, P and E – 133,938 – 133,938 Freehold property – Investment properties – 55,604 – 55,604
– 189,542 – 189,542
COMPANY Level 1 Level 2 Level 3 Total
2020 2020 2020 2020Recurring fair value measurements €’000 €’000 €’000 €’000
Freehold property – P, P and E – 14,045 – 14,045 Freehold property – Investment Properties – 11,926 – 11,926
– 25,971 – 25,971
For valuations based on a valuation technique the following information is provided about the technique used and significant inputs:
GROUP Fair value at Valuation Significant 31 Dec 2021 technique input
€’000
Property, plant and equipment – Freehold property 199,056 Market Market price comparable per square metre approach for comparable properties
Investment properties – Freehold property 64,626 Rental yields Expected future rental income
COMPANY Fair value at Valuation Significant 31 Dec 2021 technique input
€’000
Property, plant and equipment – Freehold property 14,482 Market Market price comparable per square metre approach for comparable properties
Investment properties – Freehold property 13,133 Valuation Significant technique input
Notes to the Accounts (continued)Year ended 31 December 2021

IFRS ANNUAL REPORT & ACCOUNTS 2021IFRS ANNUAL REPORT & ACCOUNTS 2021 103102
31 FAIR VALUE MEASUREMENTS (continued)
GROUP Fair value at Valuation Significant
31 Dec 2020 technique input
€’000
Property, plant and equipment – Freehold property 133,938 Market Market price
comparable per square metre
approach for comparable
properties
Investment properties – Freehold property 55,604 Rental yields Expected future
rental income
COMPANY Fair value at Valuation Significant
31 Dec 2020 technique input
€’000
Property, plant and equipment – Freehold property 14,045 Market Market price
comparable per square metre
approach for comparable
properties
Investment properties – Freehold property 11,926 Rental yields Expected future
rental income
Notes to the Accounts (continued)Year ended 31 December 2021
32 RELATED PARTY TRANSACTIONS
At 31 December 2021, the Directors of the Company and their close family were owed €105,000 by the Company
(2020 – €979,000 owed to the Company). The maximum overdrawn balance during the year was €35,043,000
(2020 – €3,511,311).
During the year, the Company invoiced management charges of €4,923,000 (2020 – €3,471,000) and provided
funding to Group companies with the following amounts outstanding at the year end.
Amount outstanding
at the year end
2021 2020
€’000 €’000
COMPANY
The ARO group of companies - (321)
The Bradman Lake group of companies 39 38
The Claudius Peters group of companies 30,886 29,112
The Piller group of companies 604 38,169
The Manroland group of companies 70,405 55,763
CPVA GmbH 1,322 1,050
The Druck Chemie group of companies 19,132 18,628
Retford Investments LLC 17,076 16,720
Langley Aviation Limited 22,332 20,583
The Marelli group of companies 49,717 47,579
Other group companies 8,679 9,880
220,192 237,201
During the year, Langley Aviation Limited invoiced the Company €1,132,000 (2020 – €823,000) in respect of the use
of aircraft.
During the year, the Company received interest on loans to other Group companies of €4,778,000 (2020 – €8,583,000)
and dividends from other Group companies of €12,896 (2020 – €nil).
Transactions with related parties are at market value and are unsecured. The company has recorded a €714,000
impairment of receivables relating to amounts owed by subsidiary undertakings during the year (2020 – €6,754,000)
and reversed €16,000 (2020 – €6,000) against previous impairments.
The Company and Group are controlled by A J Langley, a Director of the Company.
Transactions between subsidiaries have been eliminated on consolidation and are disclosed in the individual company
accounts.
Notes to the Accounts (continued)Year ended 31 December 2021
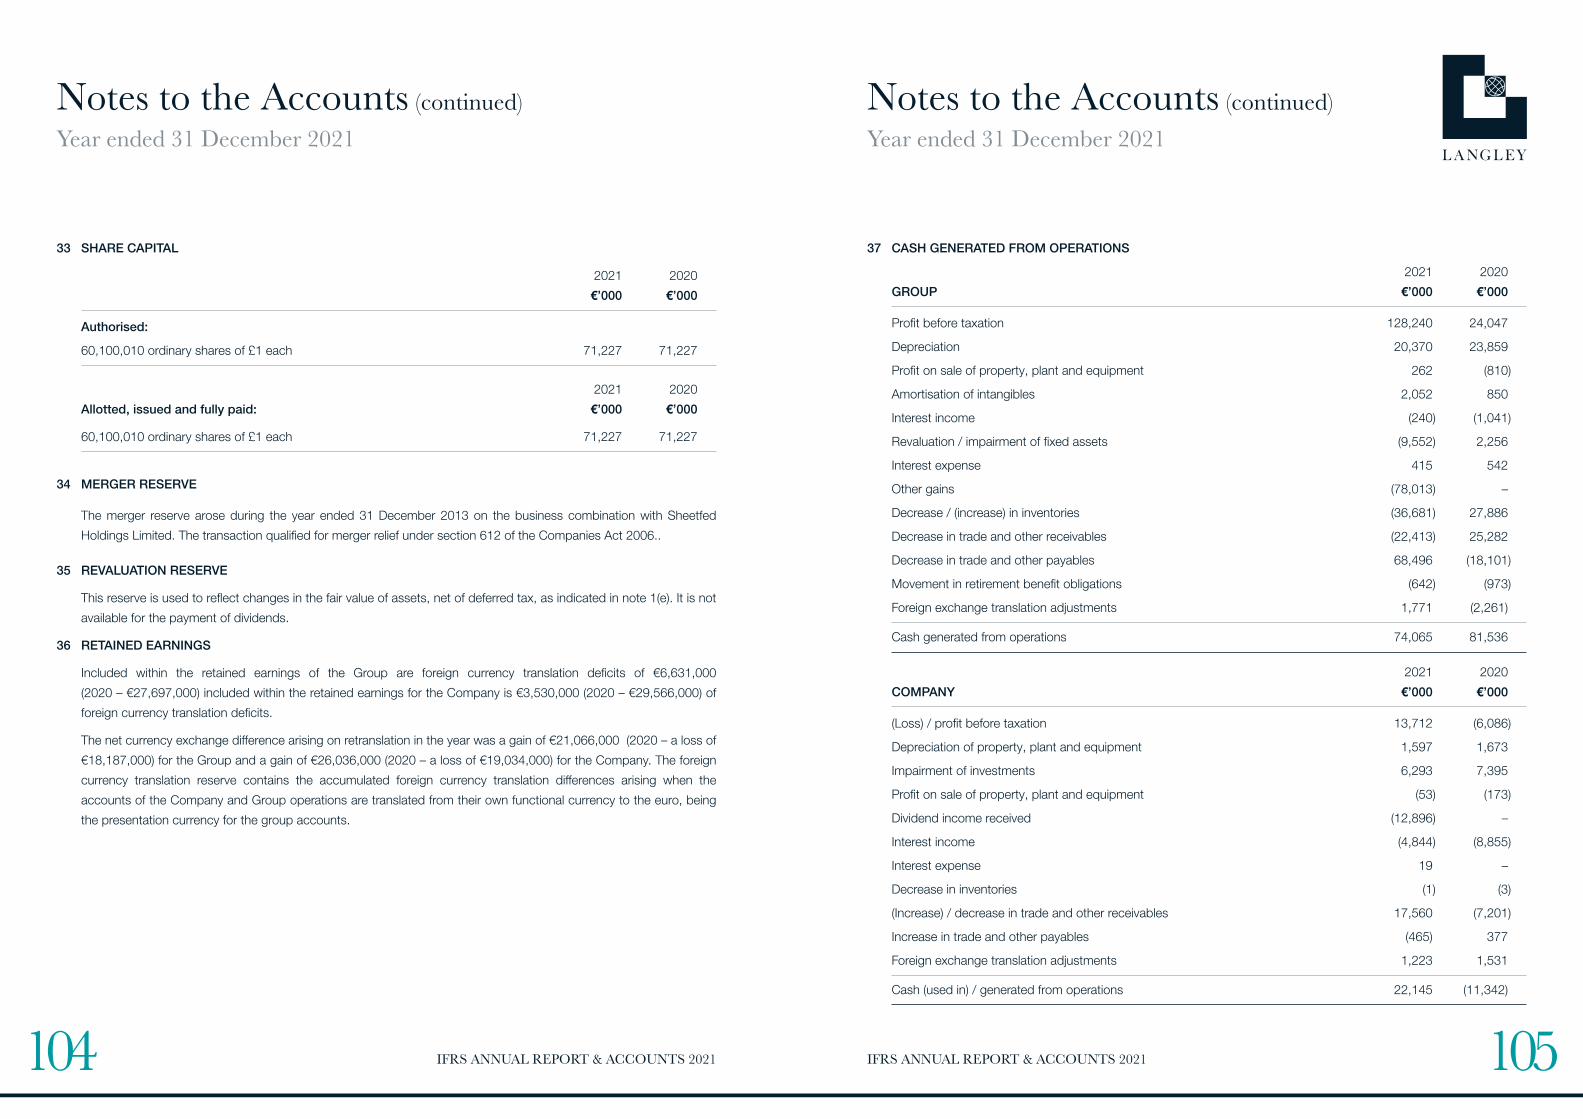
IFRS ANNUAL REPORT & ACCOUNTS 2021IFRS ANNUAL REPORT & ACCOUNTS 2021 105104
33 SHARE CAPITAL
2021 2020
€’000 €’000
Authorised:
60,100,010 ordinary shares of £1 each 71,227 71,227
2021 2020
Allotted, issued and fully paid: €’000 €’000
60,100,010 ordinary shares of £1 each 71,227 71,227
34 MERGER RESERVE
The merger reserve arose during the year ended 31 December 2013 on the business combination with Sheetfed
Holdings Limited. The transaction qualified for merger relief under section 612 of the Companies Act 2006..
35 REVALUATION RESERVE
This reserve is used to reflect changes in the fair value of assets, net of deferred tax, as indicated in note 1(e). It is not
available for the payment of dividends.
36 RETAINED EARNINGS
Included within the retained earnings of the Group are foreign currency translation deficits of €6,631,000
(2020 – €27,697,000) included within the retained earnings for the Company is €3,530,000 (2020 – €29,566,000) of
foreign currency translation deficits.
The net currency exchange difference arising on retranslation in the year was a gain of €21,066,000 (2020 – a loss of
€18,187,000) for the Group and a gain of €26,036,000 (2020 – a loss of €19,034,000) for the Company. The foreign
currency translation reserve contains the accumulated foreign currency translation differences arising when the
accounts of the Company and Group operations are translated from their own functional currency to the euro, being
the presentation currency for the group accounts.
Notes to the Accounts (continued)Year ended 31 December 2021
37 CASH GENERATED FROM OPERATIONS
2021 2020
GROUP €’000 €’000
Profit before taxation 128,240 24,047
Depreciation 20,370 23,859
Profit on sale of property, plant and equipment 262 (810)
Amortisation of intangibles 2,052 850
Interest income (240) (1,041)
Revaluation / impairment of fixed assets (9,552) 2,256
Interest expense 415 542
Other gains (78,013) –
Decrease / (increase) in inventories (36,681) 27,886
Decrease in trade and other receivables (22,413) 25,282
Decrease in trade and other payables 68,496 (18,101)
Movement in retirement benefit obligations (642) (973)
Foreign exchange translation adjustments 1,771 (2,261)
Cash generated from operations 74,065 81,536
2021 2020
COMPANY €’000 €’000
(Loss) / profit before taxation 13,712 (6,086)
Depreciation of property, plant and equipment 1,597 1,673
Impairment of investments 6,293 7,395
Profit on sale of property, plant and equipment (53) (173)
Dividend income received (12,896) –
Interest income (4,844) (8,855)
Interest expense 19 –
Decrease in inventories (1) (3)
(Increase) / decrease in trade and other receivables 17,560 (7,201)
Increase in trade and other payables (465) 377
Foreign exchange translation adjustments 1,223 1,531
Cash (used in) / generated from operations 22,145 (11,342)
Notes to the Accounts (continued)Year ended 31 December 2021

IFRS ANNUAL REPORT & ACCOUNTS 2021IFRS ANNUAL REPORT & ACCOUNTS 2021 107106
38 LEASES
The group holds various leases primarily in relation to building for use in the trade. Depreciation charged on right-of-
use assets is disclosed in note 13. Interest charges relating to lease liabilities are disclosed in note 6.
2021 2020
€’000 €’000
Expenses relating to short term leases 575 697
Expenses relating to low value assets 483 385
Cash outflow for leases 2,641 3,730
The weighted average incremental borrowing rate applied to lease liabilities recognised in the consolidated statement
of financial position at the date of initial application was 1%.
The carrying value of right-of-use assets at 31 December 2021 is broken down as follows:
Notes to the Accounts (continued)Year ended 31 December 2021
Freehold Land & Buildings
Plant & Machinery Vehicles Computers Total
Cost €’000 €’000 €’000 €’000 €’000
At 1 January 2021 23,043 76 61 – 23,180
On acquisition 3,359 – 2,011 – 5,370
Additions 13,015 – 10 – 13,025
Disposals (1,911) – – – (1,911)
Exchange differences 215 – – – 215
At 31 December 2021 37,721 76 2,082 – 39,879
Depreciation
At 1 January 2021 5,525 4 37 – 5,566
Charge for the year 2,433 13 21 – 2,467
On acquisition 1,460 – – – 1,460
Disposals (1,763) – – – (1,763)
Exchange differences 129 – – – 129
At 31 December 2021 7,784 17 58 – 7,859
Carrying value
At 31 December 2021 29,937 59 2,024 – 32,020
At 31 December 2020 17,518 72 24 – 17,614
Notes to the Accounts (continued)Year ended 31 December 2021
38 LEASES (continued)
Lease liabilities in relation to right-of-use assets fall due as follows:
2021 2020
€’000 €’000
Due within 1 year 4,214 2,483
Due within 2-5 years 7,038 4,442
Due after more than 5 years 11,053 1,307
22,305 8,232

IFRS ANNUAL REPORT & ACCOUNTS 2021IFRS ANNUAL REPORT & ACCOUNTS 2021 109108
39 SUBSIDIARY UNDERTAKINGS
A list of wholly owned unlisted subsidiary companies at 31 December 2021 is provided below. The registered office
of each subsidiary is detailed in italics.
Company
Country of
Registration Principal Activity
Retford Investments LLC
3050 Southcross Blvd Rock Hill, SC 29730
United States of
America
Holder of real estate for other group
companies
Marelli Motori SPA
Via Sabbionara 1 36071 Arzignano (VI)
Italy Design and manufacture of generators
and electronic motors
CPVA GmbH
Muehlheimer Strase 341, 63075 Offenbach am Main
Germany Property rental
Sheetfed Holdings Limited
Enterprise Way, Retford, Nottinghamshire, DN22 7HH
England Parent company (see below)
Mikenboard Limited
Enterprise Way, Retford, Nottinghamshire, DN22 7HH
England Dormant Subsidiary
H Q Engineers Limited
Enterprise Way, Retford, Nottinghamshire, DN22 7HH
England Dormant Subsidiary
JND Wefco Limited
Enterprise Way, Retford, Nottinghamshire, DN22 7HH
England Dormant Subsidiary
Sail Cruising Limited
13 Church Street, St Johns, Antigua
Antigua Dormant Subsidiary
The Clarke Chapman Group Limited
PO Box 9, Saltmeadows Road, Gateshead,
Tyne & Wear, NE8 1SW
England Design, manufacture, maintenance,
refurbishment and repair of cranes and
other mechanical handling equipment
JND Technologies Limited
Enterprise Way, Retford, Nottinghamshire, DN22 7HH
England Design, manufacture and refurbishment
of process plant, road tankers and
cementitious grouts
Reader Cement Products Limited
Enterprise Way, Retford, Nottinghamshire, DN22 7HH
England Processing of cementitious grouts
Notes to the Accounts (continued)Year ended 31 December 2021
39 SUBSIDIARY UNDERTAKINGS (continued)
Company
Country of
Registration Principal Activity
Oakdale Homes Limited
Enterprise Way, Retford, Nottinghamshire, DN22 7HH
England House builders
Oakdale Properties Limited
Enterprise Way, Retford, Nottinghamshire, DN22 7HH
England Residential property
Claudius Peters Group GmbH
Schanzenstraße 40, DE-21614, Buxtehude
Germany Parent company (see below)
Piller Holding GmbH
Abgunst 24, 37520 Osterode
Germany Parent company (see below)
Piller Management GmbH
Abgunst 24, 37520 Osterode
Germany Dormant Subsidiary
Pressure Engineering International Limited
Enterprise Way, Retford, Nottinghamshire, DN22 7HH
England Dormant Subsidiary
Langley Aviation Limited
Enterprise Way, Retford, Nottinghamshire, DN22 7HH
England Aircraft Transport
ARO Welding Technologies SAS
1, Avenue de Tours, BP 40161, Château du Loir,
72500 Montval-sur-Loir
France All of the companies are involved in the
design, manufacture, maintenance,
repair and/or distribution of resistance
welding equipment and control
systems.ARO Welding Technologies Inc
48500 Structural Drive, Chesterfield Township, MI 4805
USA
Bradman Lake Group Limited
Common Lane North, Beccles, Suffolk, NR34 9BP
England Parent company (see below)
Notes to the Accounts (continued)Year ended 31 December 2021

IFRS ANNUAL REPORT & ACCOUNTS 2021IFRS ANNUAL REPORT & ACCOUNTS 2021 111110
Company
Country of
Registration Principal Activity
ARO Welding Technologies AB
AB Timotejvägen, 7 439 71, Fjärås
Sweden All of the companies are involved in the design,
manufacture, maintenance, repair and/or
distribution of resistance welding equipment and
control systems.ARO Welding Technologies SA de CV
43B Sur 4720 Estrella del Sur C.P. 72190
Puebla, Pue
Mexico
ARO Welding Technologies SAU
C/ Cuzco, 26-28, nave 2 08030 Barcelona
Spain
ARO Welding Technologies Limited
Unit 15, Planetary Industrial Estate, Planetary
Road, Willenhall, Wolverhampton, WV13 3XA
England
ARO Welding Technologies SA-NV
Koningin Astridlaan 61, 1780 Wemmel
Belgium
ARO Welding Technologies s.r.o
Karloveská 63 84104 Bratislava
Slovakia
ARO Welding Technologies GmbH
Senefelderstraße 4 86368 Gersthofen
Germany
ARO Welding Technologies (Wuhan) Co. Ltd
Building N°1, 1st Floor,
2045 Innovation Valley WEDBI
101 Quanli Second Road, WEDZ, Wuhan,
Hubei, 430056, Wuhan
China
ARO Welding Technologias Ltda
Rua das Figueiras 474 – 3° andar Bairro Jardim,
09080-300 – Santo André SP São Paulo
Brazil
40 SUBSIDIARY UNDERTAKINGS (continued)
The following companies are wholly owned unlisted subsidiaries of ARO Welding Technologies SAS, at
31 December 2021:
Notes to the Accounts (continued)Year ended 31 December 2021
40 SUBSIDIARY UNDERTAKINGS (continued)
The following companies are wholly owned unlisted subsidiaries of The Clarke Chapman Group Limited, at
31 December 2021:
Company
Country of
Registration Principal Activity
Clarke Chapman Facilities Management Limited
Office 104 Golborne Enterprise Park Kid Glove Road Golborne
Warrington Cheshire WA3 3GR
England Provision of facilities
management services
Clarke Chapman Aftermarket Limited
PO Box 9, Saltmeadows Road, Gateshead, Tyne & Wear, NE8 1SW
England Dormant subsidiary
Clarke Chapman Machining Limited
PO Box 9, Saltmeadows Road, Gateshead, Tyne & Wear, NE8 1SW
England Dormant subsidiary
Clarke Chapman Manufacturing Ltd
PO Box 9, Saltmeadows Road, Gateshead, Tyne & Wear, NE8 1SW
England Dormant subsidiary
Mackley Pumps Limited
PO Box 9, Saltmeadows Road, Gateshead, Tyne & Wear, NE8 1SW
England Dormant subsidiary
Cowans Sheldon Limited
PO Box 9, Saltmeadows Road, Gateshead, Tyne & Wear, NE8 1SW
England Dormant subsidiary
Wellman Booth Limited
Unit 2, Kirkfield Industrial & Commercial Centre, Kirk Lane,
Yeadon, Leeds, LS19 7LX
England Dormant subsidiary
Stothert and Pitt Limited
1-9 Yelverton Road, Brislington, Bristol, BS4 5HP
England Dormant subsidiary
Butterley Limited
Enterprise Way, Retford, Nottinghamshire, DN22 7HH
England Dormant subsidiary
Company
Country of
Registration Principal Activity
Bradman-Lake Limited
Common Lane North, Beccles, Suffolk NR34 9BP
England Both of the companies are
involved in the design and
manufacture of packaging
equipment.Bradman-Lake Inc
3050 Southcross Boulevard, Rock Hill, SC 29730
USA
The following companies are wholly owned unlisted subsidiaries of Bradman Lake Group Limited, at
31 December 2021:
Notes to the Accounts (continued)Year ended 31 December 2021

IFRS ANNUAL REPORT & ACCOUNTS 2021IFRS ANNUAL REPORT & ACCOUNTS 2021 113112
39 SUBSIDIARY UNDERTAKINGS (continued)
The following companies are wholly owned unlisted subsidiaries of Claudius Peters Group GmbH, at 31 December 2021.
Company
Country of
Registration Principal Activity
Claudius Peters Projects GmbH
Claudius Peters Projects GmbH, Schanzenstraße 40,
DE-21614 Buxtehude
Germany All of the companies are involved
in the design, manufacture,
maintenance, refurbishment and
repair of materials processing and
handling equipment.Claudius Peters Technologies SAS
Claudius Peters Technologies SAS 34, Avenue de Suisse,
F-68316 Illzach
France
Claudius Peters (Italiana) srl
Via Verdi 2 1-24121 Bergamo
Italy
Claudius Peters (Iberica) SA
Paseo de la Habana 202 bis, 28036 Madrid
Spain
Claudius Peters (China) Limited
Unit 1705-1706, 17/F Laws Commercial Plaza,
788 Cheung Sha Wan Road, Lai Chi Kok, Kowloon
Hong Kong
Claudius Peters (UK) Limited
Unit 10, Thatcham Business Village, Colthrop Way,
Thatcham, Berkshire, RG19 4LW
England
Claudius Peters (Americas) Inc
445 W. President George Bush Hwy Richardson, TX 75080
USA
Claudius Peters do Brasil Ltda
Rua das Figueiras, 474 - 3 º andar - Bairro Jardim
09080-300 - Santo André / SP
Brazil
Claudius Peters Romania srl
Str. Oituz Nr. 25C, et 2 550337 Sibiu
Romania
Claudius Peters (Beijing) Machinery Services Limited
7/G Hong Kong Macau Centre No 2 Chaoyangmen Bei Da
Jie, Beijing 100027
China
Claudius Peters India Pvt. Limited
Unit 408, 4th. Floor, Peninsula Plaza A/16 Fun Republic Lane
Off Link Road, Andheri West Mumbai 400 053
India
Notes to the Accounts (continued)Year ended 31 December 2021
39 SUBSIDIARY UNDERTAKINGS (continued)
The following companies are wholly owned unlisted subsidiaries of Piller Group GmbH and its subsidiaries at
31 December 2021:
Company
Country of
Registration Principal Activity
Piller Australia Pty Limited
2/3 Salisbury Road, Castle Hill, NSW 2154 Sydney
Australia All of the companies are involved
in producing electrical machinery,
specialising in high capacity
uninterruptible power supply (UPS)
systems. The Group is also involved
in the production of converters for
aircraft ground power and naval
military applications.
Piller France SAS
1 Avenue du Président Pompidou CS 70073 – BAT A
F-92508 Rueil-Malmaison Cedex
France
Piller USA Inc
45 Wes Warren Drive, Middletown,
New York 10941-2047
USA
Piller UK Limited
Westgate, Phoenix Way, Cirencester,
Gloucestershire, GL7 1RY
England
Company
Country of
Registration Principal Activity
Piller Group GmbH
Abgunst 24, 37520 Osterode
Germany See below
The following company is a wholly owned unlisted subsidiary of Piller Holding GmbH, at 31 December 2021:
Company
Country of
Registration Principal Activity
Claudius Peters (Asia Pacific) Pte Ltd
25 International Business Park #01-65/66 German Centre
Singapore 609916
Singapore
Claudius Peters Automation srl
Str. Oituz Nr. 25C, et 2 550337 Sibiu
Romania
Plant and Machinery Technical Germany Services
GmbH
Schanzenstraße 40 DE-21614 Buxtehude
Germany
Notes to the Accounts (continued)Year ended 31 December 2021

IFRS ANNUAL REPORT & ACCOUNTS 2021IFRS ANNUAL REPORT & ACCOUNTS 2021 115114
39 SUBSIDIARY UNDERTAKINGS (continued)
Company
Country of
Registration Principal Activity
Piller Italia Srl
Centro Direzionale Colleoni Palazzo Pegaso 3
Viale Colleoni 25 20864 Agrate Brianza (MB)
Italy
Piller Iberica SL
U, Paseo de la Habana, 202 Bis Bj E-28036
Madrid
Spain
Piller Power Singapore Pte. Limited
25 International Business Park #01-65/66
German Centre Singapore 609916
Singapore
Piller Germany GmbH & Co KG
Abgunst 24, 37520 Osterode
Germany
Power India Pvt Ltd
B-4, 2nd Floor, Plot No. 422, Nav Bhavana
Premises, Co-op Society Ltd, S V Savarkar
Marg, Prabhadevi Mumbai, Maharashtra
400025
India
Piller Power Beijing Co. Ltd.
Rm 506-7, Tower A, COFCO Plaza, 8
Jianguomen Nei Ave, Beijing
China
Active Power HongKong (Holding)
A95, Unit A, s/F, Hung To Centre, 94-96 How
Ming Street, Kwun Tong, Kowloon
Hong Kong Dormant Subsidiary
Active Power UK Ltd.
Unit 1.2, Lauriston Business Park, Pitchill,
Evesham, Worcestershire WR11 8SN
England Dormant Subsidiary
Notes to the Accounts (continued)Year ended 31 December 2021
39 SUBSIDIARY UNDERTAKINGS (continued)
The following companies are investments held by Sheetfed Holdings Limited and its subsidiaries, at 31 December 2021:
Company
Country of
Registration
Percentage
Ownership
Principal
Activity
Manroland Sheetfed GmbH
Muehlheimer Strasse 341, 63075 Offenbach am Main
Germany 100% Note 1
Manroland Deutschland GmbH
Muehlheimer Strasse 341, 63075 Offenbach am Main
Germany 100% Note 2
Manroland Used Equipment GmbH
Muehlheimer Strasse 341, 63075 Offenbach am Main
Germany 100% Note 2
Manroland Sheetfed (UK) Limited
1st Floor, Southerton House, Boundary Business Court,
92-94 Church Road, Mitcham, Surrey, CR4 3TD
England 100% Note 2
Manroland Latina S.A.
Mariano Sanchez, Fontecilla No.374, Las Condes, Santiago de Chile,
7550296
Chile 100% Note 2
Manroland Latina S.A. de C.V
Av. Rio San Joaquin, No. 6107, Col. Popo, Del. Miguel Hidalgo,
C.P.11480, Mexico City
Mexico 99.9% Note 2
Manroland do Brasil Serviços Ltda
Rua das Figueiras, 474 – 3 andar Edificio Eiffel Bairro Jardim,
09080-300, Santo Andre, SP
Brazil 99.9% Note 2
Manroland Latina S.A.
Av. Regimiento de Patricios 1054 C1265AEQ CABA, Buenos Aires
Argentina 100% Note 2
Manroland Latina S.A.C
Los Geranios No.328 Lince, Lima
Peru 100% Note 2
PT Manroland Indonesia
Management Building 2nd Floor, JI Buncit Raya Kav.100, Jakarta
Indonesia 100% Note 2
Manroland Thailand Ltd
22/6 Ladprao Soi 21 Jomphol, Jatujak Bangkok 10900
Thailand 100% Note 2
Manroland Nordic Finland Oy
Valimotie 22, 01510 Vantaa
Finland 100% Note 2
Manroland Nordic Sverige AB
Nohabgatan 12H, Byggnad 33, SE-461
Sweden 100% Note 2
Notes to the Accounts (continued)Year ended 31 December 2021

IFRS ANNUAL REPORT & ACCOUNTS 2021IFRS ANNUAL REPORT & ACCOUNTS 2021 117116
CompanyCountry ofRegistration
Percentage Ownership
Principal Activity
Manroland Nordic Danmark A/S Lautruphøj 1-3 DK-2750 Ballerup
Denmark 100% Note 2
Manroland Inc 800 East Oak Hill Drive, Westmont, Illinois, 60559
USA 100% Note 2
Manroland Sheetfed Pvt Ltd A-15, Phase – II, Naraina Industrial Area, New Delhi - 110028
India 100% Note 2
Manroland Canada Inc 120 Jevlan Dr., Unit #3 Vaughan, ON L4L 8G3
Canada 100% Note 2
Manroland Western Europe Group B.V. Kuiperbergweg 50 NL-1101 AG Amsterdam Zuidoost Postbus 61007 NL-1005 HA Amsterdam
Netherlands 100% Note 2
Manroland Österreich GmbH IZ NÖ-Süd, Strasse 16, Objekt 70/1, Wiener Neudorf 2355
Austria 100% Note 2
Manroland Malaysia Sdn. Bhd Unit 315, Laman Seri Industrial Park, Persiaran Sukan, Seksyen 13, 40000 Shah Alam, Selangor Darul Ehsan
Malaysia 100% Note 2
Manroland Japan Co. Ltd 2-3-4, Niizo-Minami, Toda-shi, Saitama 335-0026
Japan 100% Note 2
Manroland (Korea) Ltd 2F, Gaya Building,570-1 Yeonnam-dong Mapo-Gu,Seoul 121-869
Korea 100% Note 2
Manroland (Taiwan) Ltd 17F-9, No. 738, Chung Cheng Road Chung-Ho District, New Taipei City 23511
Taiwan 100% Note 2
Manroland (China) Limited 7/F, Capella HTR, Kwun Tong, Kowloon, Hong Kong
China 100% Note 2
Guangzhou Printcom Printing Supplies Co. Ltd 1/F, 11# Building, Standard Industrial Garden, Taishi Industrial Park, Dongchung Town, Panyu District, 511475, Guangzhou
China 100% Note 2
Manroland Printing Equipment (Shanghai) Co. Ltd Room 901, Bld A, HongKou Plaza, No. 388, West Jiang Wan Rd, Hong Kou District, Shanghai
China 100% Note 2
39 SUBSIDIARY UNDERTAKINGS (continued)
Notes to the Accounts (continued)Year ended 31 December 2021
39 SUBSIDIARY UNDERTAKINGS (continued)
CompanyCountry ofRegistration
Percentage Ownership
Principal Activity
Manroland Printing Equipment (Shenzhen) Ltd Room 101-106, Block C, Huahan Chuangxin Park, LangShan Road, Nanshan District, Shenzhen
China 100% Note 2
Manroland Bulgaria EOOD
Business Park Sofia 1 Mladost 4, Blok 14. Sofia 1715.
Bulgaria 100% Note 2
Manroland Adriatic d.o.o.
Kovinska 4A, 10000 Zagreb
Croatia 100% Note 2
Manroland ROMANIA S.R.L
Str. Ziduri Intre Vii 19, Corp C, Parter, Spatiu C-5, Sector 2,
Bucuresti, 023321
Romania 100% Note 2
Manroland Magyarorzag Kft.
Táblás u. 36-38 1097 Budapest
Hungary 100% Note 2
Manroland Polska Sp. z.o.o
Wolica Aleja Katowicka 11 PL-05 830 Nadarzyn
Poland 100% Note 2
Manroland Czech s.r.o
Prumyslova 10/1428, Praha 10, 102 00
Czech
Republic
100% Note 2
Manroland France S.A.S
Bat. M1 Les Aralias Paris Nord II 66 rue des Vanesses CS 53290
Villepinte 95958 Roissy CDG Cedex
France 100% Note 2
Manroland Swiss A.G.
Schöneich 1, 6265 Roggliswil
Switzerland 100% Note 2
Manroland Ireland Ltd
Unit N2, North Ring Business Park, Santry, Dublin 9
Ireland 100% Note 2
Manroland Iberica Sistemas S.L
Centro de Negocios Eisenhower Avda. Sur Aeropuerto de Barajas, 24
– Edif. 5 – 5º C 28042 Madrid
Spain 100% Note 2
Manroland Iberica Sistemas LDA
Rua de Pé de Mouro Polígono Empresarial Pé de Mouro,
19 2710-335 Sintra
Portugal 100% Note 2
Manroland Italia S.R.L.
Via Lambretta 2 20090 Segrate (MI)
Italy 100% Note 2
Notes to the Accounts (continued)Year ended 31 December 2021
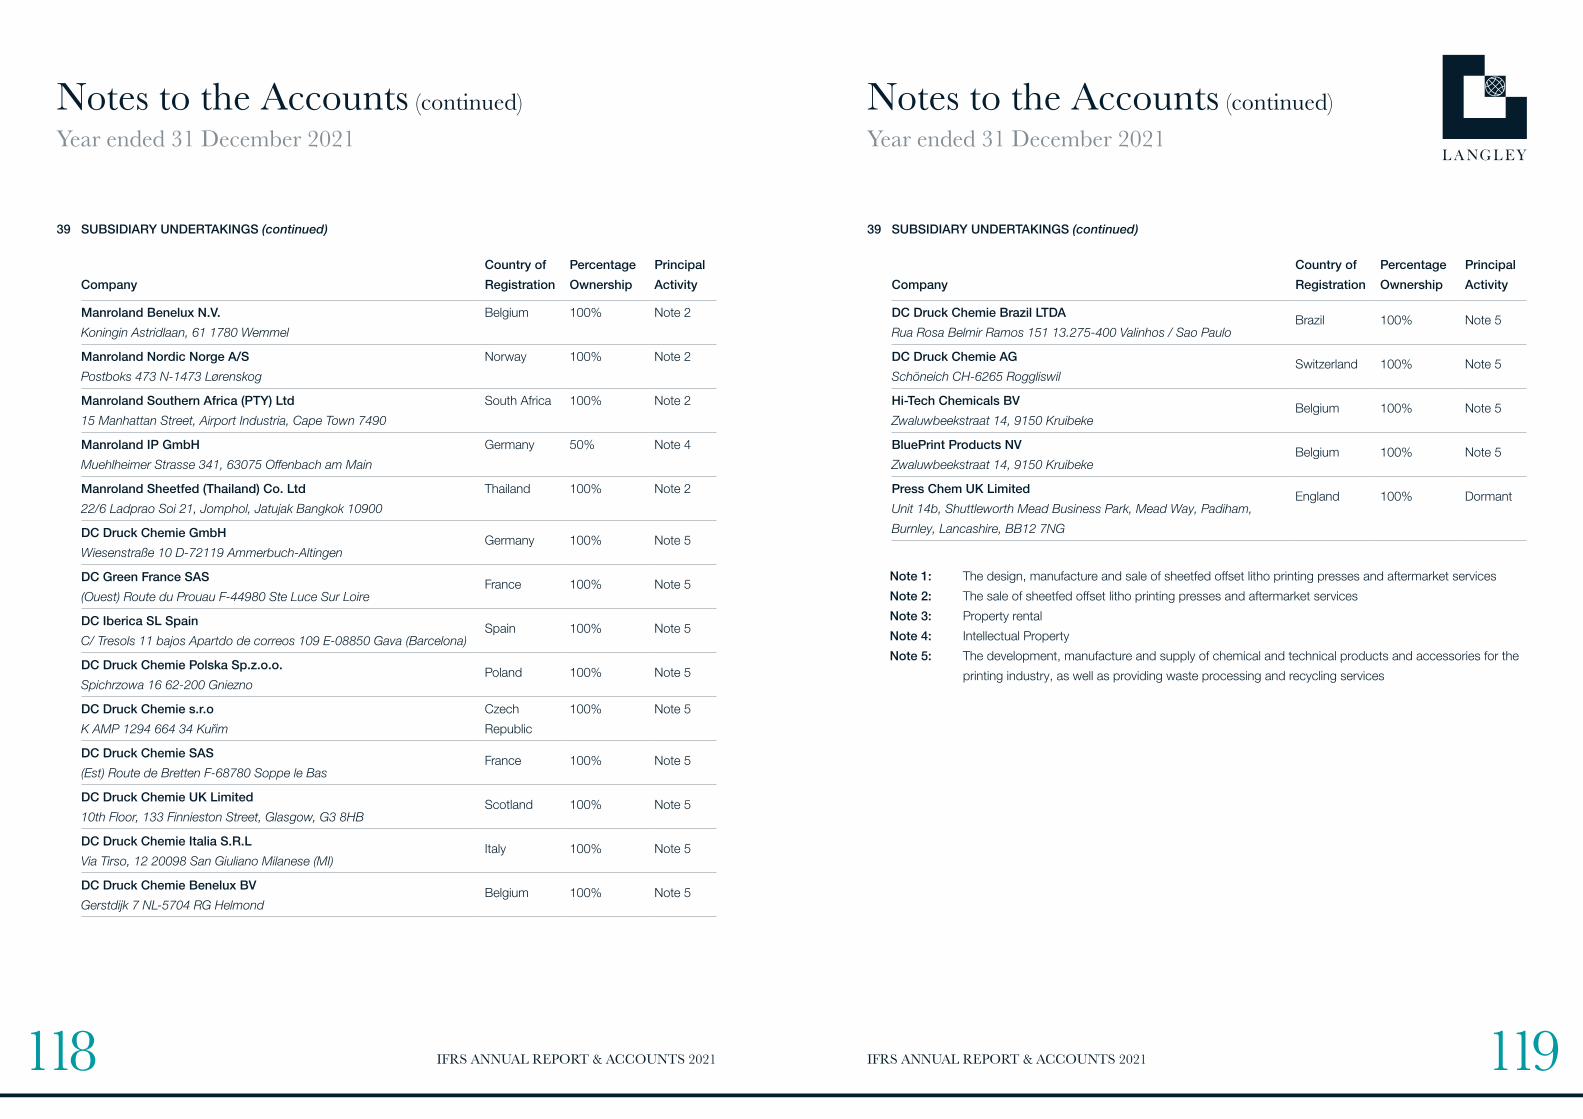
IFRS ANNUAL REPORT & ACCOUNTS 2021IFRS ANNUAL REPORT & ACCOUNTS 2021 119118
39 SUBSIDIARY UNDERTAKINGS (continued)
Company
Country of
Registration
Percentage
Ownership
Principal
Activity
Manroland Benelux N.V.
Koningin Astridlaan, 61 1780 Wemmel
Belgium 100% Note 2
Manroland Nordic Norge A/S
Postboks 473 N-1473 Lørenskog
Norway 100% Note 2
Manroland Southern Africa (PTY) Ltd
15 Manhattan Street, Airport Industria, Cape Town 7490
South Africa 100% Note 2
Manroland IP GmbH
Muehlheimer Strasse 341, 63075 Offenbach am Main
Germany 50% Note 4
Manroland Sheetfed (Thailand) Co. Ltd
22/6 Ladprao Soi 21, Jomphol, Jatujak Bangkok 10900
Thailand 100% Note 2
DC Druck Chemie GmbH
Wiesenstraße 10 D-72119 Ammerbuch-Altingen Germany 100% Note 5
DC Green France SAS
(Ouest) Route du Prouau F-44980 Ste Luce Sur LoireFrance 100% Note 5
DC Iberica SL Spain
C/ Tresols 11 bajos Apartdo de correos 109 E-08850 Gava (Barcelona)Spain 100% Note 5
DC Druck Chemie Polska Sp.z.o.o.
Spichrzowa 16 62-200 GnieznoPoland 100% Note 5
DC Druck Chemie s.r.o
K AMP 1294 664 34 Kuřim
Czech
Republic
100% Note 5
DC Druck Chemie SAS
(Est) Route de Bretten F-68780 Soppe le BasFrance 100% Note 5
DC Druck Chemie UK Limited
10th Floor, 133 Finnieston Street, Glasgow, G3 8HBScotland 100% Note 5
DC Druck Chemie Italia S.R.L
Via Tirso, 12 20098 San Giuliano Milanese (MI)Italy 100% Note 5
DC Druck Chemie Benelux BV
Gerstdijk 7 NL-5704 RG HelmondBelgium 100% Note 5
Notes to the Accounts (continued)Year ended 31 December 2021
Company
Country of
Registration
Percentage
Ownership
Principal
Activity
DC Druck Chemie Brazil LTDA
Rua Rosa Belmir Ramos 151 13.275-400 Valinhos / Sao PauloBrazil 100% Note 5
DC Druck Chemie AG
Schöneich CH-6265 RoggliswilSwitzerland 100% Note 5
Hi-Tech Chemicals BV
Zwaluwbeekstraat 14, 9150 KruibekeBelgium 100% Note 5
BluePrint Products NV
Zwaluwbeekstraat 14, 9150 KruibekeBelgium 100% Note 5
Press Chem UK Limited
Unit 14b, Shuttleworth Mead Business Park, Mead Way, Padiham,
Burnley, Lancashire, BB12 7NG
England 100% Dormant
Note 1: The design, manufacture and sale of sheetfed offset litho printing presses and aftermarket services
Note 2: The sale of sheetfed offset litho printing presses and aftermarket services
Note 3: Property rental
Note 4: Intellectual Property
Note 5: The development, manufacture and supply of chemical and technical products and accessories for the
printing industry, as well as providing waste processing and recycling services
39 SUBSIDIARY UNDERTAKINGS (continued)
Notes to the Accounts (continued)Year ended 31 December 2021

IFRS ANNUAL REPORT & ACCOUNTS 2021IFRS ANNUAL REPORT & ACCOUNTS 2021 121120
39 SUBSIDIARY UNDERTAKINGS (continued)
The following companies are wholly owned unlisted subsidiaries of Marelli Motori SPA at 31 December 2020:
Company
Country of
Registration
Percentage
Ownership
Principal
Activity
Marelli USA Inc
220 Norcross Parkway, Suite 290 Norcross GA 30071
USA 100% All of the
companies are
involved in the
design, and
manufacture
of generators
and electric
motors.
Marelli Motori Asia Sdn Bhd
Lot 1-8, Persiaran Jubli Perak, Seksyen 22, 40300 Shah Alam,
Selangor D.E.
Malaysia 100%
Marelli Asia Pacific Sdn Bhd
Lot 1-8, Persiaran Jubli Perak, Seksyen 22, 40300 Shah Alam,
Selangor D.E.
Malaysia 100%
Marelli Motori South Africa Ltd (Pty)
Unit 2, Corner Director & Megawatt Road, Spartan Ext 23,
Kempton Park 1619 Gauteng
South Africa 100%
Marelli UK Ltd
Kirkby Lane, Pinxton, Nottinghamshire, NG16 6HX
England 100%
Marelli Motori Central Europe GmbH
Heilswannenweg 50, 31008 Elze
Germany 100%
Notes to the Accounts (continued)Year ended 31 December 2021
Notes to the Accounts (continued)Year ended 31 December 2021
39 SUBSIDIARY UNDERTAKINGS (continued)
The following companies are wholly owned unlisted subsidiaries of Marelli Motori SPA at 31 December 2020:
Company
Country of
Registration
Percentage
Ownership
Principal
Activity
Bergen Engines B.V. Werfdijk 2, 3195HV Pernis, Rotterdam, Netherlands
Netherlands 100% All of the companies are involved in the design, manufacture and sale of reciprocating gas and diesel engines.
Bergen Engines Denmark A/S Nørresundby, Amalienborgvej 39, Denmark
Denmark 100%
Bergen Engines India Private Limited 52-b (2nd Floor), Okhla Industrial Estate, Phase III, New Delhi 110020, India
India 100%
Bergen Engines Bangladesh Private Limited Green Granduer, 6th Floor, Plot n.58 E, Kamal Ataturk Avenue Banani, C/A Dhaka, 1213, Bangladesh
Bangladesh 100%
Bergen Engines Limited Moor Lane, Derby, Derbyshire, DE24 8BJ
England 100%
Bergen Engines SRL 13 Via Castel Morrone, 16161, Genoa Italy
Italy 100%
Bergen Engines S.L. Calle Dinamarca s/n (esquina Calle Alemania), Poligono Industrial de Constanti, 43120 Constanti, Tarragona, Spain
Spain 100%
Bergen Engines PropertyCo AS Hordvikneset 125, N-5018, Hordvik, Bergen 1201, Norway
Norway 100%
Rolls-Royce Mexico S. de R.L de C.V. Boulevard Adolfo Ruiz Cortinez 3642-403, Fracc Costa de Oro, Verzcruz CP 94299 6, Mexico
Mexico 100%
Rolls-Royce Mexico Administration S. de R.L. de C.V. Boulevard Adolfo Ruiz Cortinez 3642-403, Fracc Costa de Oro, Verzcruz CP 94299 6, Mexico
Mexico 100%
The following subsidiaries have taken exemption from audit under s479a of Companies Act 2006:
Reader Cement Products Limited (03025049) Oakdale Homes Limited (02922110) Oakdale Properties Limited (07525468)Marelli UK Limited (01787809)Clarke Chapman Facilities Management Limited (04120701)ARO Welding Technologies Limited (02184159Claudius Peters (UK) Limited (01148578))

IFRS ANNUAL REPORT & ACCOUNTS 2021122
World-class engineering solutions for world-class clients, building mutually
beneficial long-term relationships.