Land Value Determinants and Rental Values of Office Spaces ...
19
ISSN 2039 - 2117 Mediterranean Journal of Social Sciences Vol.2, No.2, May 2011 MCSER – Mediterranean Center of Social and Educational Research Rome, Italy, www.mcser.org 232 Land Value Determinants and Rental Values of Office Spaces in Ikeja, Nigeria Oni A. Olawande (Corresponding Author) Department of Estate Management, Covenant University, Ota, Nigeria Email: [email protected]; Tel.: 234-8023122014 Ajayi C. Ayodele Department of Estate Management Obafemi Awolowo University, Ile-Ife, Nigeria E-mail: [email protected]; Tel.: 234-8037258925 Abstract This study was carried out to examine the contributions of land value determinants to variability in rental values of offices in Ikeja, Nigeria. In doing so, road network which has not received much consideration in studies on property value determinants, were decomposed into its explanatory variables of quality, length, connectivity, and density, in addition to other variables like location, demand, accessibility, and supply of commercial properties in the study area. Multiple regression analysis of the data at 95% confidence level showed that accessibility (P-value=0.0045), demand (P-value=0.0022), supply (P-value=0.0115) ANOVA indicated 0.0423 proving that road network have significant effect on rental value of office spaces in the study area. Similarly, step-wise regression analysis returned four variables accessibility (0.0011), demand (0.0004), location (0.0413) and supply (0.0028) as the variables that actually greatly affect the rental values. The study has reinforced the importance of accessibility to development and investors wishing to embark on real estate development should be conversant with the level of accessibility of the arterial roads along which such development will locate. Decision on the location of such development project should be based on a pragmatic approach such that selected locations would bring the highest return that is adequate and sufficient to compensate investors. Keywords: arterial roads, commercial property, property value, road network, valuation, variability 1. Introduction Roads may be classified as international, inter-city or intra-city. International and inter-city roads are usually major or arterial roads, while intra-city roads are routes within a city and may be minor or major. Pattern of road network somewhat influences ease of movements and provides accessibility to various land uses which compete for available spaces along the arterial roads. Commercial properties tend to cluster along such roads to take relative advantages of agglomeration. Competition makes locations along the road to be at their highest and best use also translated in high rental values compared to other locations. Regardless of the advantages, developers, financiers and investors in commercial properties are faced with dearth of data on what level of rental income a development project could reasonably be expected to realize in a transaction involving willing and able parties. The overall impact of risks and uncertainty in the property market calls for tool to predict future trend in commercial property market with some measure of accuracy. This is to ensure that income which a given commercial property generates in the nearest future will be sufficient to recoup the capital outlay and be sustained subsequently. A number of factors affect commercial property values in Nigeria. These include institutional and economic factors, location, complementary uses, competition amongst and between uses, design, degree of obsolescence, accessibility, road network, relationship between
-
Upload
khangminh22 -
Category
Documents
-
view
3 -
download
0
Transcript of Land Value Determinants and Rental Values of Office Spaces ...
ISSN 2039 - 2117 Mediterranean Journal of Social Sciences Vol.2, No.2, May 2011
MCSER – Mediterranean Center of Social and Educational Research
Rome, Italy, www.mcser.org 232
Land Value Determinants and Rental Values of Office Spaces in Ikeja, Nigeria
Oni A. Olawande (Corresponding Author)
Department of Estate Management, Covenant University, Ota, Nigeria
Email: [email protected]; Tel.: 234-8023122014
Ajayi C. Ayodele
Department of Estate Management Obafemi Awolowo University, Ile-Ife, Nigeria
E-mail: [email protected]; Tel.: 234-8037258925
Abstract This study was carried out to examine the contributions of land value determinants to variability in rental values of offices in Ikeja, Nigeria. In doing so, road network which has not received much consideration in studies on property value determinants, were decomposed into its explanatory variables of quality, length, connectivity, and density, in addition to other variables like location, demand, accessibility, and supply of commercial properties in the study area. Multiple regression analysis of the data at 95% confidence level showed that accessibility (P-value=0.0045), demand (P-value=0.0022), supply (P-value=0.0115) ANOVA indicated 0.0423 proving that road network have significant effect on rental value of office spaces in the study area. Similarly, step-wise regression analysis returned four variables accessibility (0.0011), demand (0.0004), location (0.0413) and supply (0.0028) as the variables that actually greatly affect the rental values. The study has reinforced the importance of accessibility to development and investors wishing to embark on real estate development should be conversant with the level of accessibility of the arterial roads along which such development will locate. Decision on the location of such development project should be based on a pragmatic approach such that selected locations would bring the highest return that is adequate and sufficient to compensate investors. Keywords: arterial roads, commercial property, property value, road network, valuation, variability
1. Introduction
Roads may be classified as international, inter-city or intra-city. International and inter-city roads are usually major or arterial roads, while intra-city roads are routes within a city and may be minor or major. Pattern of road network somewhat influences ease of movements and provides accessibility to various land uses which compete for available spaces along the arterial roads. Commercial properties tend to cluster along such roads to take relative advantages of agglomeration. Competition makes locations along the road to be at their highest and best use also translated in high rental values compared to other locations.
Regardless of the advantages, developers, financiers and investors in commercial properties are faced with dearth of data on what level of rental income a development project could reasonably be expected to realize in a transaction involving willing and able parties. The overall impact of risks and uncertainty in the property market calls for tool to predict future trend in commercial property market with some measure of accuracy. This is to ensure that income which a given commercial property generates in the nearest future will be sufficient to recoup the capital outlay and be sustained subsequently.
A number of factors affect commercial property values in Nigeria. These include institutional and economic factors, location, complementary uses, competition amongst and between uses, design, degree of obsolescence, accessibility, road network, relationship between
ISSN 2039 - 2117 Mediterranean Journal of Social Sciences Vol.2, No.2, May 2011
MCSER – Mediterranean Center of Social and Educational Research
Rome, Italy, www.mcser.org 233
landlord and tenant, and negative externalities (McCluskey, et al, 2000; Oyebanji, 2003; Olusegun, 2003; Kauko, 2003; and Omoogun, 2006). For purpose of this study, road network, location, demand and supply, and accessibility established in literature were isolated and regressed with commercial property values.
This study however focused on arterial roads in the intra-urban network of Ikeja city and the isolated factors against the open market rental value. The aim was to determine the relationship (if any) between arterial road network in the presence or absence of other variables and rental values of office spaces in the study area with a view to determining their combined or individual contributions to variability in commercial property values in the study area and derive a model for predicting variability in such property in the study area. 2. Related Studies
In explaining pattern of property values, Lean and Goodall (1977) opined that the centre of an urban area is the position of greatest accessibility where transport routes and systems converge. Competition between firms whose revenue is high when in such a position will force up rents and land values above those in the remainder of the urban area. Firms will compete to locate in the centre to take advantage of complementarities, which to large extent, is a function of accessibility. The larger the urban areas the more distinct will the clusters of complementary uses become. Similarly, the higher the degree of accessibility and complementarities the higher the land values in the centre are likely to be.
According to Aderamo (2003), road network constitutes important element in urban development as roads provide accessibility required by different land uses; and proper functioning of such urban areas depends on efficient transport network, which is backbone to their very existence. The analysis of the road network involves recognition of the patterns and qualities of the roads, which can be emphasized through process of abstraction and symbolization.
Various studies have adopted the graph-theoretic concept amongst which are the works of Garrison and Marble (1960) and Nystuen and Dacey (1961). The former applied graph theory in measuring regional highways in the United States of America, while the latter analyzed functional connection between central places in Washington using communication flows in a network. In addition, Muraco (1972) used the concept in studying intra-urban accessibility in Columbus and Indianapolis, USA, and in estimating traffic flow in Barnsley, U.K. (Ogunsanya, 1986). In Nigeria, Aderamo (2003) studied the growth of intra-urban road network in Ilorin, Nigeria using the graph theoretic analysis. The technique was used to determine degree of accessibility and connectivity of nodal points within a road network using a university community in Nigeria as case study (Oni, 2007a) and in analysing accessibility and connectivity in the road network of a metropolitan area also in Nigeria (Oni, 2007b).
Some earlier studies (Fejerang, 1994; Cervero, 1994; Sedway Group, 1999; Nelson, 1999; Diaz, 1999; Cervero and Duncan, 2002; Hack, 2002; Hillier-Parker, 2002; Chesterton, 2002; and, A.P.T.A., 2002) concluded that properties near rail stations, metro line and roads gain slightly higher value compared with properties farther away. Other studies such as Pharoah (2002) found that sites close to stations were more attractive to commercial and mixed-use developments and those farther from stations are more attractive for residential developments with sites close to station sought for commercial developments.
Stratton (2008) conducted a study of the spatial concentration of office uses and how their combination with other land uses affects values of office properties; this was to determine the relationship between spatial clustering of office uses and office property values. The variables used were cluster size, regional location and relationship to transportation infrastructure, internal
land use mix, and transportation network. The study revealed that recent office development has continued to benefit economically from agglomeration. In addition, office property values were
ISSN 2039 - 2117 Mediterranean Journal of Social Sciences Vol.2, No.2, May 2011
MCSER – Mediterranean Center of Social and Educational Research
Rome, Italy, www.mcser.org 234
positively affected by intensity of office development, a central regional location, and clustering or agglomeration of office parcels. Cloete and Chikafalimani (2001) in a study on property industry in Malawi agreed with Stratton (2008). The study identified eight factors that affect property value, which are architectural design, quality of finishing, maintenance condition of the property, size of property, security, condition of the street, and location.
According to Oyebanji (2003), a number of factors affect property values in Nigeria. These include population change, change in fashion and taste, institutional factors (culture, religious belief, and legislation), economic factors, location, complementary uses, transportation and planning control. He stated further that good spread of road network has tendency to increase accessibility with certain areas becoming less accessible as a result of traffic congestion thereby causing value to shift to areas that are accessible.
From these studies, a number of factors that determine property values were identified, which include infrastructural funding, impact of high-speed mode of transportation especially at new station in peripheral sites where the impact is highest; nearness to rail stations, metro lines, and roads especially where transport infrastructure is poor. Others include accessibility relative to location-distance of land uses, change in population, change in fashion and taste, institutional factor, economic factor, location, transportation, complementary uses, road transport network, political factor, planning regulation, environmental quality, aesthetics, and growth pattern of land use.
In the Nigerian context, earlier studies focused on land use and urban development with considerable works carried out by scholars in various disciplines to explain the determinants, structures and effects of residential land use and land values in the urban areas. Little attention was given to the effects of supply and demand, which interplay to determine values. In this study, accessibility, road network explanatory variables, distance to the most central part of the study area, demand and supply factors were considered to determine variability in commercial property values. In attaining the stated aim of this study one hypothesis was set in the null as: “there is no significant impact of road network and explanatory variables of demand and supply factors, accessibility, location attributes on rental value of office spaces in Ikeja, Nigeria”
3. The Study Area Ikeja city is a large component of the Lagos metropolis. Lagos itself is the largest city in Nigeria, located at 6°34′60″N, 3°19′59″E along the West African coast. There are ninety roads in Ikeja metropolis out which thirty-seven are arterial. From the thirty-seven arterial roads twenty traverse the commercial axes while others serve institutional, industrial, and residential neighbourhoods. This study covered all major roads serving the commercial axis and inner areas of Ikeja metropolis to the exclusion of inter-city roads such as Lagos/Abeokuta Expressway, Oworonsoki/Apapa Expressway, Ikorodu Road, and Lagos/ Ibadan Expressway that form rings around the study area. Oni (2009) described the study area in terms of its operational structures by which he divided it into seven sectors. Sector One lies at the north-central part of the metropolis and consists mainly of residential neighbourhoods with occasional commercial users of banks and service offices. Sector Two is of predominantly industrial concerns around WEMPCO, ACME and Lateef Jakande Roads; Sector Three is almost centrally located in the study area and consists of Oba Akran Avenue, Adeniyi Jones Avenue, Aromire Avenue, and Awolowo Way that serves as demarcation between the Sectors Three and Five. The sector comprises predominantly residential users interspersed by few industrial concerns and commercial outfits that over the years have displaced residential users along the arterial roads.
Sector Four lies at the eastern part of the study area served with Secretariat Road, Ikosi Road, Oregun Road, 7-up Road, bounded by Lagos/Ibadan Expressway and Ikorodu Road. Sector Five is bounded by Sectors Three, Four and Six consists of Allen Avenue, Opebi Road,
ISSN 2039 - 2117 Mediterranean Journal of Social Sciences Vol.2, No.2, May 2011
MCSER – Mediterranean Center of Social and Educational Research
Rome, Italy, www.mcser.org 235
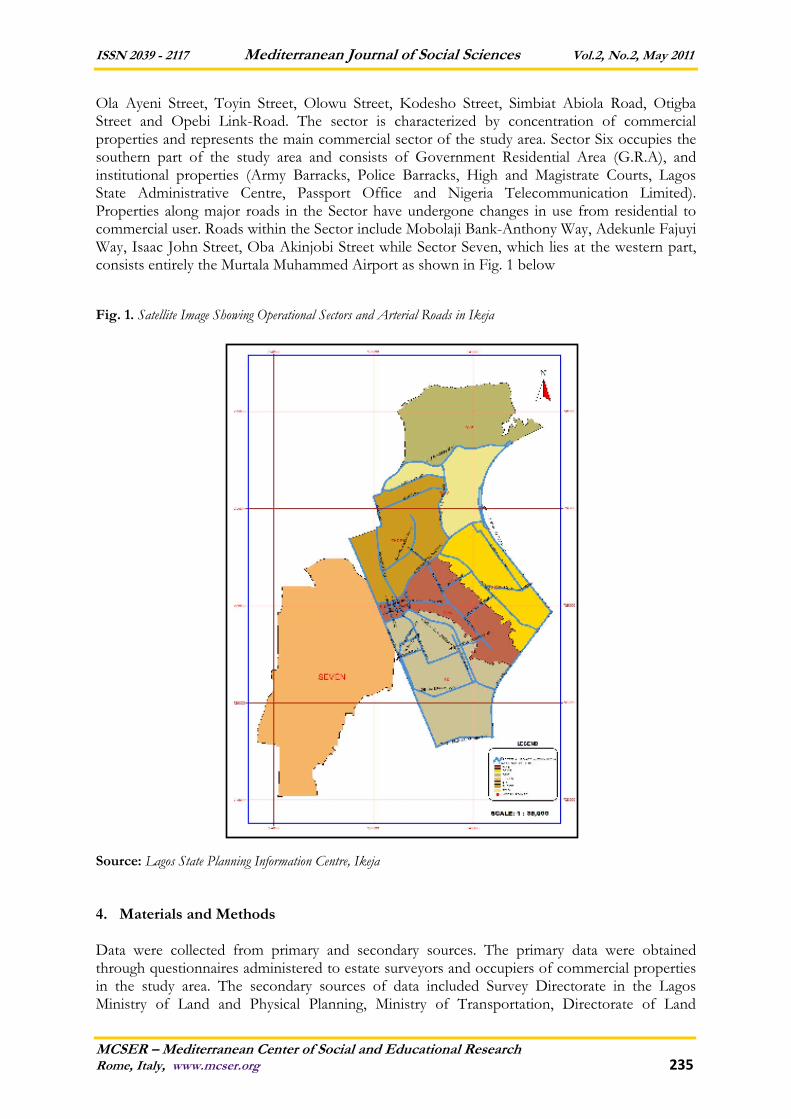
Ola Ayeni Street, Toyin Street, Olowu Street, Kodesho Street, Simbiat Abiola Road, Otigba Street and Opebi Link-Road. The sector is characterized by concentration of commercial properties and represents the main commercial sector of the study area. Sector Six occupies the southern part of the study area and consists of Government Residential Area (G.R.A), and institutional properties (Army Barracks, Police Barracks, High and Magistrate Courts, Lagos State Administrative Centre, Passport Office and Nigeria Telecommunication Limited). Properties along major roads in the Sector have undergone changes in use from residential to commercial user. Roads within the Sector include Mobolaji Bank-Anthony Way, Adekunle Fajuyi Way, Isaac John Street, Oba Akinjobi Street while Sector Seven, which lies at the western part, consists entirely the Murtala Muhammed Airport as shown in Fig. 1 below Fig. 1. Satellite Image Showing Operational Sectors and Arterial Roads in Ikeja
Source: Lagos State Planning Information Centre, Ikeja
4. Materials and Methods
Data were collected from primary and secondary sources. The primary data were obtained through questionnaires administered to estate surveyors and occupiers of commercial properties in the study area. The secondary sources of data included Survey Directorate in the Lagos Ministry of Land and Physical Planning, Ministry of Transportation, Directorate of Land

ISSN 2039 - 2117 Mediterranean Journal of Social Sciences Vol.2, No.2, May 2011
MCSER – Mediterranean Center of Social and Educational Research
Rome, Italy, www.mcser.org 236
Information Systems in the Land Bureau, Ikeja, and West African Book Publishers Limited, Lagos.
Details of road network were derived through the analysis of the satellites road maps while data on volume of traffic was obtained from Lagos State Traffic Management Authority. The entire Lagos metropolis has 9,197 roads consisting of carriageways, cul-de-sac, lanes, streets, avenue, ways, and crescents (Lagos Street Map, 2008). Out of 9,197 roads in Lagos metropolis, only 350 are arterial. When the three hundred and fifty (350) arterial roads were divided according to zones in Lagos metropolis, Lagos Island has 102 arterial routes (representing 29%); Mainland, 119 (34%); Apapa, 39 (11%) and Ikeja, 90 (26%). From the ninety roads that traverse the study area, twenty (20) serve commercial axes while remaining seventy (70) serve inter-city, institutional, industrial, and residential neighbourhoods. This study covered all major roads serving the commercial axis in Ikeja city to the exclusion of inter-city roads that form outlying ring around the study area. Sampling of the arterial roads was not necessary as hundred percent of roads was considered to make complete network.
There are three hundred and twenty-five registered firms of Estate Surveyors and Valuers practicing in Lagos metropolis out of which one hundred and ten (about 34%) operate in Ikeja metropolis. In respect of population of commercial properties in the study area, there are two thousand and eight commercial properties located along the twenty arterial roads giving an estimated five thousand occupiers. The number of commercial properties along arterial roads in the study area was obtained using application of geographical information system while population of occupiers was obtained by direct survey. The population of Estate Surveying firms in the study area was obtained from the register of firms at the Lagos State Branch of the Nigerian Institution of Estate Surveyors and Valuers.
To determine the appropriate sample size for each of the study populations, the Bartlett et al (2001) model was used with alpha level set at 0.05. The model specified minimum sample size for continuous and categorical data based on specific population size and different alpha levels. Using the model, the appropriate sample size of Estate Surveyors obtained from population of one hundred and ten firms was ninety-nine, and six hundred for five thousand occupiers.
Questionnaires were administered on the sampled firms of Estate Surveyors and Valuers to obtain average rental values on commercial properties over a five-year study period. Five years was considered after analysis of respondents’ open market rental values obtained from their records showed marginal differences within the period, whereas wide variations were observed in years preceding the selected period. The average rental values for the study period were derived by summing up the open market rents obtained from all respondent Estate Surveyors for each of the five-year study period and along each arterial road. Total of rental values for each arterial road was divided by five to arrive at the average rental value per annum expressed in Naira per square metre per annum.
5. Analysis and Discussion The attempt was to test the null hypothesis that there is no statistically significant relationship between commercial property values and road network in the presence of other variables. In this respect, the relationship between commercial property value and road network, location, supply and demand, accessibility which were respectively the dependent and independent variables were tested at 0.05 confidence level with the aid of Statgraphic® software package. In doing so, road network was decomposed into its explanatory variables of traffic density, road density, length density, accessibility, connectivity, quality and width of each road in the network. The independent variables were consequently measured. The accessibility and connectivity indexes were derived using graph theoretic analysis of the arterial roads. The process involved tracing out
ISSN 2039 - 2117 Mediterranean Journal of Social Sciences Vol.2, No.2, May 2011
MCSER – Mediterranean Center of Social and Educational Research
Rome, Italy, www.mcser.org 237
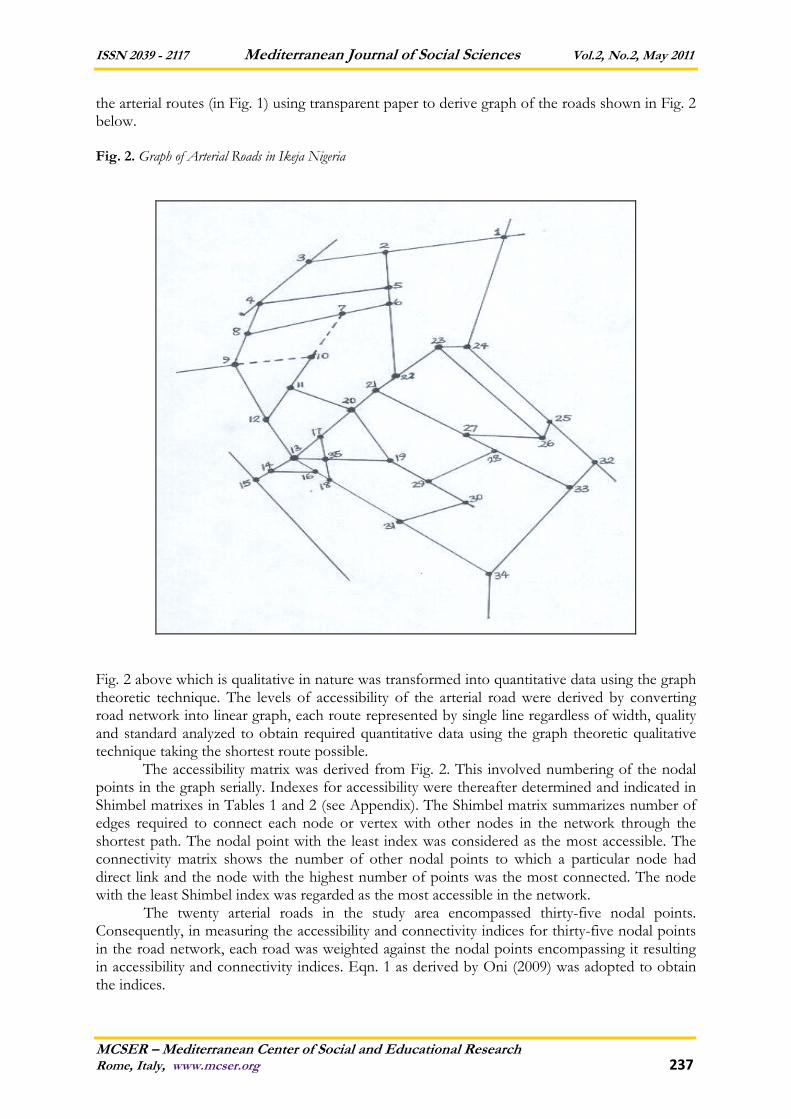
the arterial routes (in Fig. 1) using transparent paper to derive graph of the roads shown in Fig. 2 below. Fig. 2. Graph of Arterial Roads in Ikeja Nigeria
Fig. 2 above which is qualitative in nature was transformed into quantitative data using the graph theoretic technique. The levels of accessibility of the arterial road were derived by converting road network into linear graph, each route represented by single line regardless of width, quality and standard analyzed to obtain required quantitative data using the graph theoretic qualitative technique taking the shortest route possible. The accessibility matrix was derived from Fig. 2. This involved numbering of the nodal points in the graph serially. Indexes for accessibility were thereafter determined and indicated in Shimbel matrixes in Tables 1 and 2 (see Appendix). The Shimbel matrix summarizes number of edges required to connect each node or vertex with other nodes in the network through the shortest path. The nodal point with the least index was considered as the most accessible. The connectivity matrix shows the number of other nodal points to which a particular node had direct link and the node with the highest number of points was the most connected. The node with the least Shimbel index was regarded as the most accessible in the network.
The twenty arterial roads in the study area encompassed thirty-five nodal points. Consequently, in measuring the accessibility and connectivity indices for thirty-five nodal points in the road network, each road was weighted against the nodal points encompassing it resulting in accessibility and connectivity indices. Eqn. 1 as derived by Oni (2009) was adopted to obtain the indices.
ISSN 2039 - 2117 Mediterranean Journal of Social Sciences Vol.2, No.2, May 2011
MCSER – Mediterranean Center of Social and Educational Research
Rome, Italy, www.mcser.org 238
β a,(c)i = δp1i + δp2i × rδ1 …Eqn. 1
∑ (rδ1 + rδ2) rδ2
Where, β a(c)d = weighted accessibility or connectivity index; δp1i = accessibility or connectivity index of lower nodal point; δp2i = accessibility or connectivity index of higher nodal point; rδ1= rank for lower nodal point; rδ2= rank for higher nodal point;
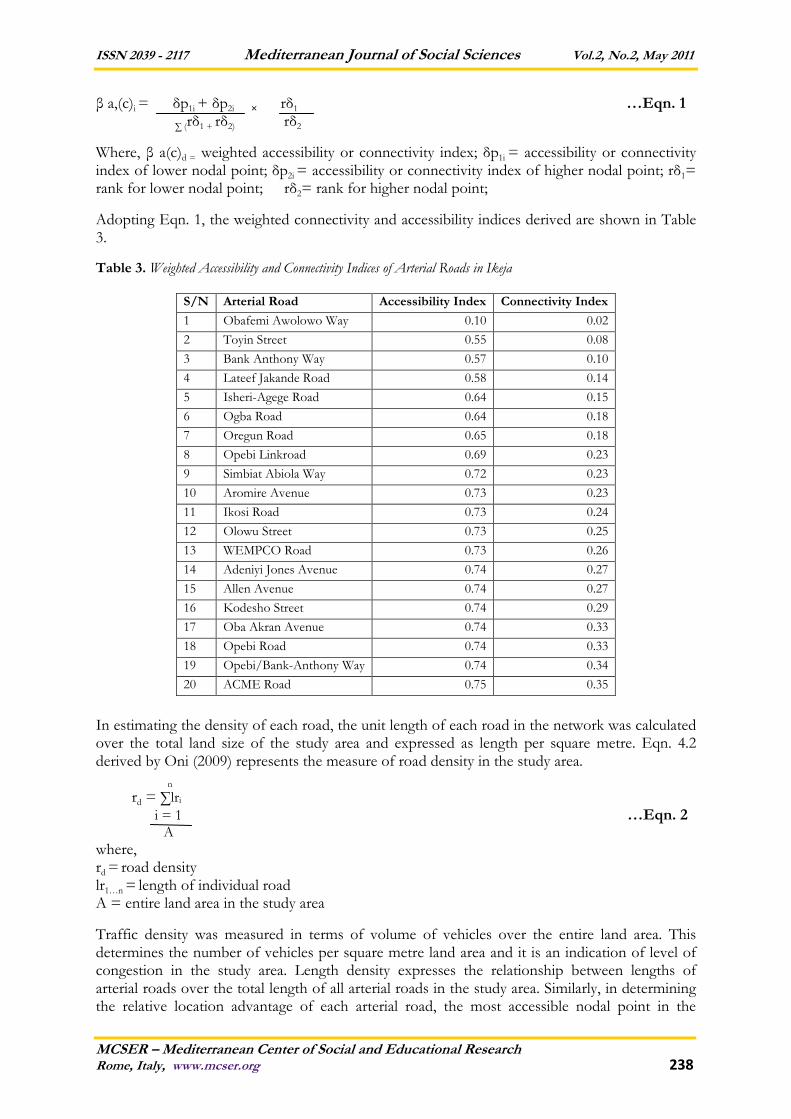
Adopting Eqn. 1, the weighted connectivity and accessibility indices derived are shown in Table 3.
Table 3. Weighted Accessibility and Connectivity Indices of Arterial Roads in Ikeja
In estimating the density of each road, the unit length of each road in the network was calculated over the total land size of the study area and expressed as length per square metre. Eqn. 4.2 derived by Oni (2009) represents the measure of road density in the study area. n rd = ∑lri
i = 1 …Eqn. 2 A where, rd = road density
lr1…n = length of individual road A = entire land area in the study area
Traffic density was measured in terms of volume of vehicles over the entire land area. This determines the number of vehicles per square metre land area and it is an indication of level of congestion in the study area. Length density expresses the relationship between lengths of arterial roads over the total length of all arterial roads in the study area. Similarly, in determining the relative location advantage of each arterial road, the most accessible nodal point in the
S/N Arterial Road Accessibility Index Connectivity Index
1 Obafemi Awolowo Way 0.10 0.02
2 Toyin Street 0.55 0.08
3 Bank Anthony Way 0.57 0.10
4 Lateef Jakande Road 0.58 0.14
5 Isheri-Agege Road 0.64 0.15
6 Ogba Road 0.64 0.18
7 Oregun Road 0.65 0.18
8 Opebi Linkroad 0.69 0.23
9 Simbiat Abiola Way 0.72 0.23
10 Aromire Avenue 0.73 0.23
11 Ikosi Road 0.73 0.24
12 Olowu Street 0.73 0.25
13 WEMPCO Road 0.73 0.26
14 Adeniyi Jones Avenue 0.74 0.27
15 Allen Avenue 0.74 0.27
16 Kodesho Street 0.74 0.29
17 Oba Akran Avenue 0.74 0.33
18 Opebi Road 0.74 0.33
19 Opebi/Bank-Anthony Way 0.74 0.34
20 ACME Road 0.75 0.35
ISSN 2039 - 2117 Mediterranean Journal of Social Sciences Vol.2, No.2, May 2011
MCSER – Mediterranean Center of Social and Educational Research
Rome, Italy, www.mcser.org 239
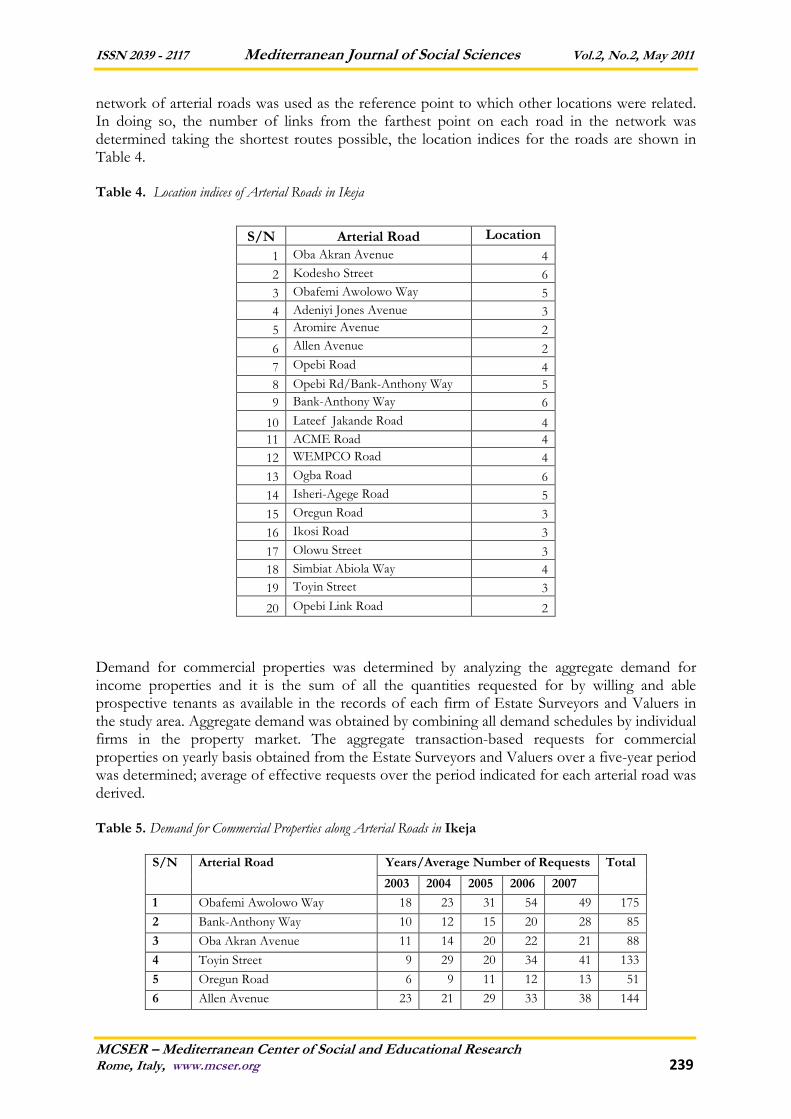
network of arterial roads was used as the reference point to which other locations were related. In doing so, the number of links from the farthest point on each road in the network was determined taking the shortest routes possible, the location indices for the roads are shown in Table 4.
Table 4. Location indices of Arterial Roads in Ikeja
Demand for commercial properties was determined by analyzing the aggregate demand for income properties and it is the sum of all the quantities requested for by willing and able prospective tenants as available in the records of each firm of Estate Surveyors and Valuers in the study area. Aggregate demand was obtained by combining all demand schedules by individual firms in the property market. The aggregate transaction-based requests for commercial properties on yearly basis obtained from the Estate Surveyors and Valuers over a five-year period was determined; average of effective requests over the period indicated for each arterial road was derived. Table 5. Demand for Commercial Properties along Arterial Roads in Ikeja
Years/Average Number of Requests S/N Arterial Road
2003 2004 2005 2006 2007
Total
1 Obafemi Awolowo Way 18 23 31 54 49 175
2 Bank-Anthony Way 10 12 15 20 28 85
3 Oba Akran Avenue 11 14 20 22 21 88
4 Toyin Street 9 29 20 34 41 133
5 Oregun Road 6 9 11 12 13 51
6 Allen Avenue 23 21 29 33 38 144
S/N Arterial Road Location index 1 Oba Akran Avenue 4
2 Kodesho Street 6
3 Obafemi Awolowo Way 5
4 Adeniyi Jones Avenue 3
5 Aromire Avenue
2
6 Allen Avenue
2
7 Opebi Road
4
8 Opebi Rd/Bank-Anthony Way 5
9 Bank-Anthony Way 6
10 Lateef Jakande Road 4
11 ACME Road 4
12 WEMPCO Road 4
13 Ogba Road 6
14 Isheri-Agege Road 5
15 Oregun Road 3
16 Ikosi Road 3
17 Olowu Street 3
18 Simbiat Abiola Way 4
19 Toyin Street 3
20 Opebi Link Road 2
ISSN 2039 - 2117 Mediterranean Journal of Social Sciences Vol.2, No.2, May 2011
MCSER – Mediterranean Center of Social and Educational Research
Rome, Italy, www.mcser.org 240
7 Opebi Road 12 16 18 25 33 104
8 Adeniyi Jones Avenue 16 19 20 22 25 103
9 Lateef Jakande Road 6 11 11 12 12 53
10 WEMPCO Road 3 4 5 6 9 27
11 Isheri Road 5 4 5 5 8 27
12 Kodesho Street 5 7 8 11 14 46
13 Simbiat Abiola Way 6 8 8 9 11 42
14 Aromire Avenue 7 7 7 11 10 43
15 Olowu Street 6 7 9 9 14 46
16 Opebi Link-Road 3 3 4 6 6 23
17 Ikosi Road 2 3 2 3 4 14
18 Ogba Road 3 4 6 5 7 25
19 Bank-Anthony/Opebi Road 6 5 7 7 9 34
20 ACME 6 6 6 7 7 31
Total 163 212 243 315 357 1290
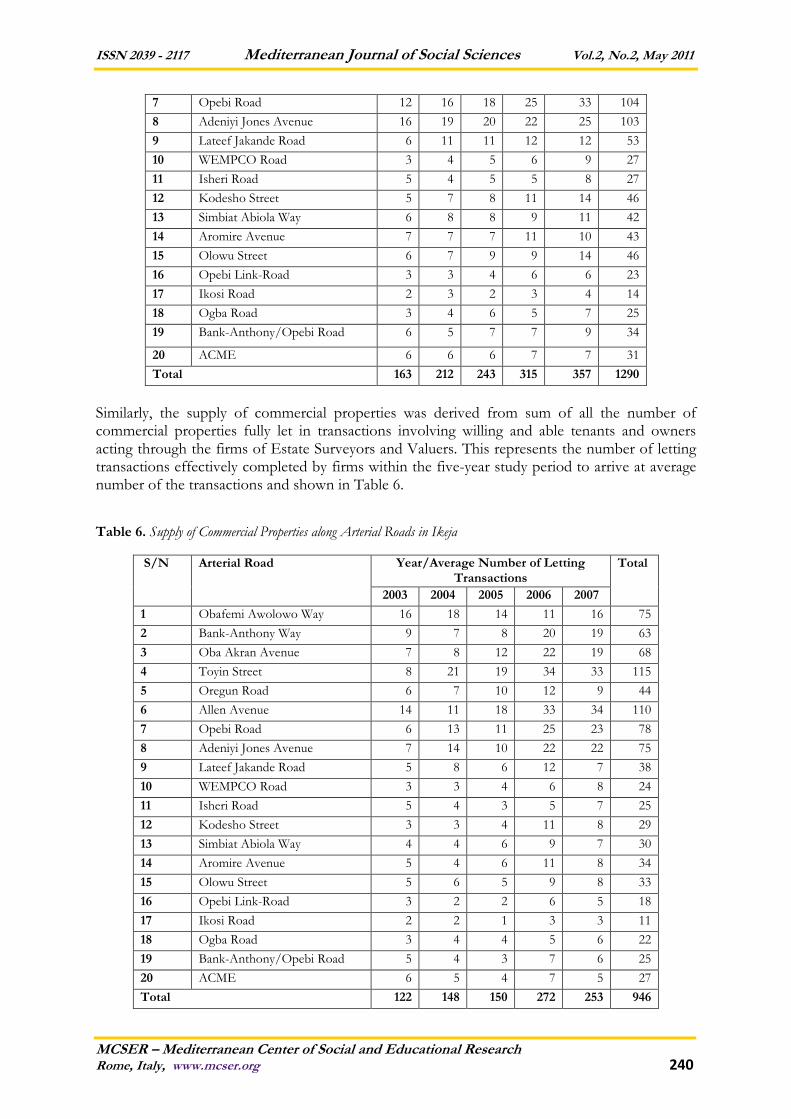
Similarly, the supply of commercial properties was derived from sum of all the number of commercial properties fully let in transactions involving willing and able tenants and owners acting through the firms of Estate Surveyors and Valuers. This represents the number of letting transactions effectively completed by firms within the five-year study period to arrive at average number of the transactions and shown in Table 6.
Table 6. Supply of Commercial Properties along Arterial Roads in Ikeja
Year/Average Number of Letting Transactions
S/N Arterial Road
2003 2004 2005 2006 2007
Total
1 Obafemi Awolowo Way 16 18 14 11 16 75
2 Bank-Anthony Way 9 7 8 20 19 63
3 Oba Akran Avenue 7 8 12 22 19 68
4 Toyin Street 8 21 19 34 33 115
5 Oregun Road 6 7 10 12 9 44
6 Allen Avenue 14 11 18 33 34 110
7 Opebi Road 6 13 11 25 23 78
8 Adeniyi Jones Avenue 7 14 10 22 22 75
9 Lateef Jakande Road 5 8 6 12 7 38
10 WEMPCO Road 3 3 4 6 8 24
11 Isheri Road 5 4 3 5 7 25
12 Kodesho Street 3 3 4 11 8 29
13 Simbiat Abiola Way 4 4 6 9 7 30
14 Aromire Avenue 5 4 6 11 8 34
15 Olowu Street 5 6 5 9 8 33
16 Opebi Link-Road 3 2 2 6 5 18
17 Ikosi Road 2 2 1 3 3 11
18 Ogba Road 3 4 4 5 6 22
19 Bank-Anthony/Opebi Road 5 4 3 7 6 25
20 ACME 6 5 4 7 5 27
Total 122 148 150 272 253 946
ISSN 2039 - 2117 Mediterranean Journal of Social Sciences Vol.2, No.2, May 2011
MCSER – Mediterranean Center of Social and Educational Research
Rome, Italy, www.mcser.org 241
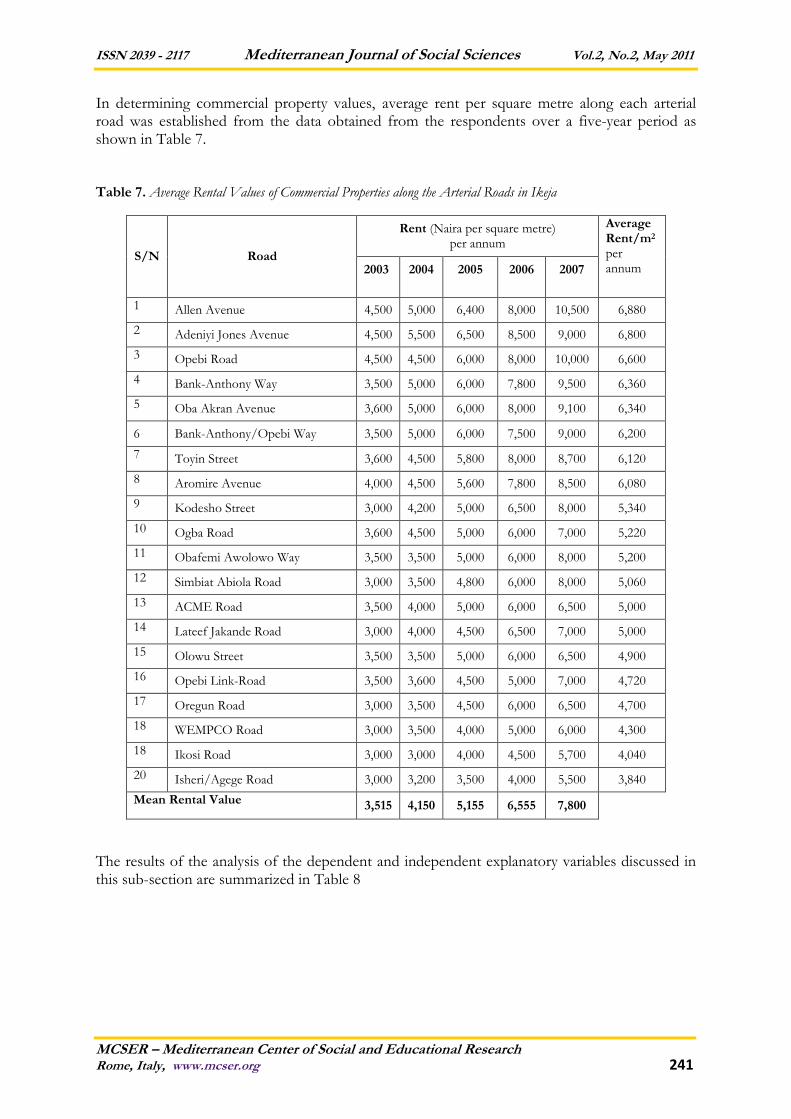
In determining commercial property values, average rent per square metre along each arterial road was established from the data obtained from the respondents over a five-year period as shown in Table 7. Table 7. Average Rental Values of Commercial Properties along the Arterial Roads in Ikeja
Rent (Naira per square metre) per annum
S/N Road 2003 2004 2005 2006 2007
Average Rent/m2 per annum
1 Allen Avenue 4,500 5,000 6,400 8,000 10,500 6,880
2 Adeniyi Jones Avenue 4,500 5,500 6,500 8,500 9,000 6,800
3 Opebi Road 4,500 4,500 6,000 8,000 10,000 6,600
4 Bank-Anthony Way 3,500 5,000 6,000 7,800 9,500 6,360
5 Oba Akran Avenue 3,600 5,000 6,000 8,000 9,100 6,340
6 Bank-Anthony/Opebi Way 3,500 5,000 6,000 7,500 9,000 6,200
7 Toyin Street 3,600 4,500 5,800 8,000 8,700 6,120
8 Aromire Avenue 4,000 4,500 5,600 7,800 8,500 6,080
9 Kodesho Street 3,000 4,200 5,000 6,500 8,000 5,340
10 Ogba Road 3,600 4,500 5,000 6,000 7,000 5,220
11 Obafemi Awolowo Way 3,500 3,500 5,000 6,000 8,000 5,200
12 Simbiat Abiola Road 3,000 3,500 4,800 6,000 8,000 5,060
13 ACME Road 3,500 4,000 5,000 6,000 6,500 5,000
14 Lateef Jakande Road 3,000 4,000 4,500 6,500 7,000 5,000
15 Olowu Street 3,500 3,500 5,000 6,000 6,500 4,900
16 Opebi Link-Road 3,500 3,600 4,500 5,000 7,000 4,720
17 Oregun Road 3,000 3,500 4,500 6,000 6,500 4,700
18 WEMPCO Road 3,000 3,500 4,000 5,000 6,000 4,300
18 Ikosi Road 3,000 3,000 4,000 4,500 5,700 4,040
20 Isheri/Agege Road 3,000 3,200 3,500 4,000 5,500 3,840
Mean Rental Value 3,515 4,150 5,155 6,555 7,800
The results of the analysis of the dependent and independent explanatory variables discussed in this sub-section are summarized in Table 8

ISSN 2039 - 2117 Mediterranean Journal of Social Sciences Vol.2, No.2, May 2011
MCSER – Mediterranean Center of Social and Educational Research
Rome, Italy, www.mcser.org 242
Table 8. Summary Details of the Independent Variables
In determining the relationship between the explanatory variables and commercial property values, attempt was made to test the null hypothesis earlier stated. The variables were represented in the models as follows: dependent variable - commercial property value = y, while the independent variables are traffic density = traden, road density = rodens, connectivity = connt, quality of road = qulrd, accessibility = acces, demand = demnd, supply = suply, and location = loctn. The result of a multiple linear regression of the variables is summarized in Table 9.
S/N
Road
Traffic volume
Road Length
(in
met
res)
Traffic Density
Road Density
Connectivity
Road Quality
Accessibility
Supply (
aver
age
num
ber
of
lett
ings
)
Demand (
aver
age
num
ber
of
reques
ts)
Location (
num
ber
o
f lin
ks t
o t
he
mo
st
acce
ssib
le lo
cati
on
s fr
om
far
thes
t p
oin
t al
on
g ea
ch r
oad
)
1 Oba Akran Avenue
16,651 2,307.18 7.22 0.06 0.18 4 0.74 14 18 4
2 Kodesho Street 16,240 559.465 29.03 0.01 0.08 4 0.74 6 9 6
3 Obafemi Awolowo Way
19,042 4,292.12 4.44 0.11 0.23 5 0.10 15 35 5
4 Adeniyi Jones Avenue
12,211 2,233.46 5.47 0.06 0.27 4 0.74 15 21 3
5 Aromire Avenue 17,414 616.81 28.23 0.02 0.23 4 0.73 7 9 2
6 Allen Avenue 18,038 1,411.30 12.78 0.04 0.23 5 0.74 22 29 2
7 Opebi Road 16,510 1,886.00 8.75 0.05 0.24 4 0.74 16 21 4
8 Opebi Rd/Bank-Anthony Way
18,392 674.13 27.28 0.02 0.26 5 0.74 4 7 5
9 Bank-Anthony Way
17,186 4,718.66 3.64 0.12 0.18 5 0.57 13 17 6
10 Lateef Jakande Road
17,173 2,443.60 7.03 0.06 0.25 4 0.58 8 11 4
11 ACME Road 18,433 2,200.49 8.38 0.06 0.33 4 0.75 6 6 4
12 WEMPCO Road 14,898 1,963.85 7.59 0.05 0.27 4 0.73 5 5 4
13 Ogba Road 15,539 1,121.50 13.86 0.03 0.35 4 0.64 4 5 6
14 Isheri-Agege Road 12,816 5,080.41 2.52 0.13 0.33 5 0.64 5 5 5
15 Oregun Road 18,276 3,888.18 4.70 0.10 0.14 5 0.65 9 10 3
16 Ikosi Road 14,900 1,207.08 12.34 0.03 0.27 3 0.73 2 3 3
17 Olowu Street 14,626 623.96 23.44 0.02 0.34 3 0.73 7 9 3
18 Simbiat Abiola Way
17,517 571.44 30.65 0.02 0.10 4 0.72 6 8 4
19 Toyin Street 13,608 875.48 15.54 0.02 0.15 5 0.55 23 27 3
20 Opebi Link Road 18,796 1,106.57 16.99 0.02 0.02 5 0.69 4 5 2
Total 328,266 39,781.68
ISSN 2039 - 2117 Mediterranean Journal of Social Sciences Vol.2, No.2, May 2011
MCSER – Mediterranean Center of Social and Educational Research
Rome, Italy, www.mcser.org 243
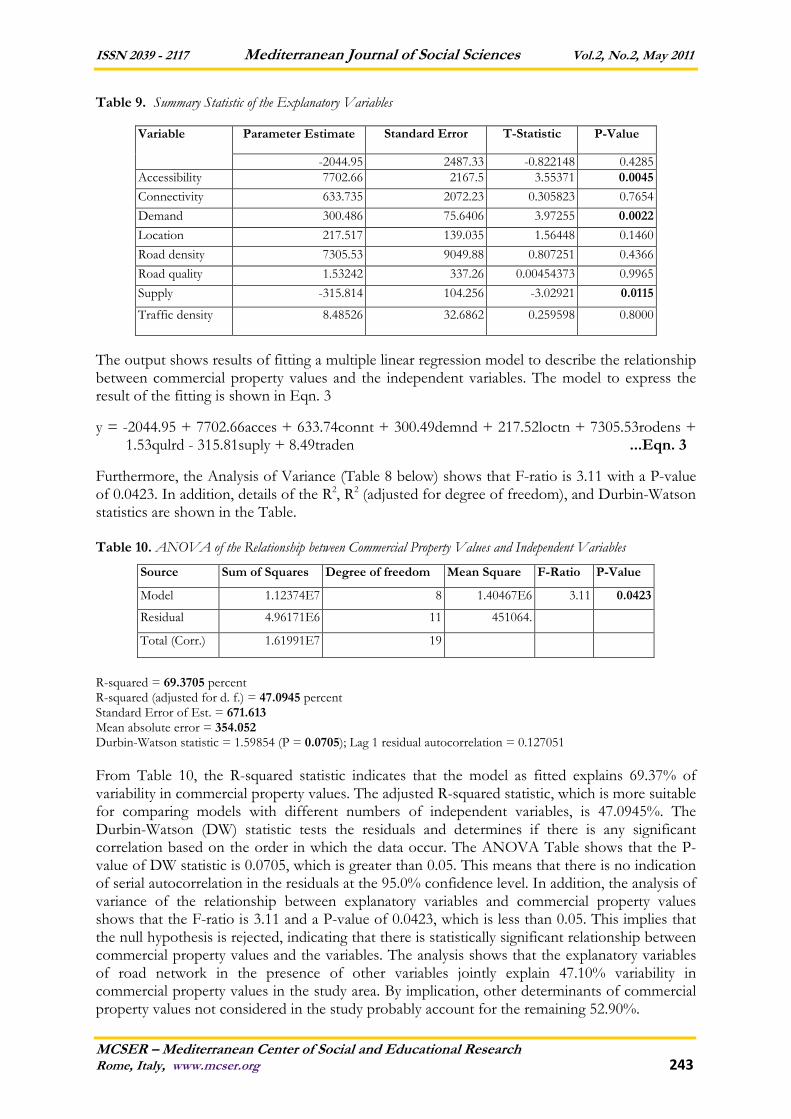
Table 9. Summary Statistic of the Explanatory Variables
Parameter Estimate Standard Error T-Statistic P-Value Variable
-2044.95 2487.33 -0.822148 0.4285 Accessibility 7702.66 2167.5 3.55371 0.0045
Connectivity 633.735 2072.23 0.305823 0.7654
Demand 300.486 75.6406 3.97255 0.0022
Location 217.517 139.035 1.56448 0.1460
Road density 7305.53 9049.88 0.807251 0.4366
Road quality 1.53242 337.26 0.00454373 0.9965
Supply -315.814 104.256 -3.02921 0.0115
Traffic density 8.48526 32.6862 0.259598 0.8000
The output shows results of fitting a multiple linear regression model to describe the relationship between commercial property values and the independent variables. The model to express the result of the fitting is shown in Eqn. 3
y = -2044.95 + 7702.66acces + 633.74connt + 300.49demnd + 217.52loctn + 7305.53rodens + 1.53qulrd - 315.81suply + 8.49traden ...Eqn. 3
Furthermore, the Analysis of Variance (Table 8 below) shows that F-ratio is 3.11 with a P-value of 0.0423. In addition, details of the R2, R2 (adjusted for degree of freedom), and Durbin-Watson statistics are shown in the Table. Table 10. ANOVA of the Relationship between Commercial Property Values and Independent Variables
R-squared = 69.3705 percent R-squared (adjusted for d. f.) = 47.0945 percent Standard Error of Est. = 671.613 Mean absolute error = 354.052 Durbin-Watson statistic = 1.59854 (P = 0.0705); Lag 1 residual autocorrelation = 0.127051
From Table 10, the R-squared statistic indicates that the model as fitted explains 69.37% of variability in commercial property values. The adjusted R-squared statistic, which is more suitable for comparing models with different numbers of independent variables, is 47.0945%. The Durbin-Watson (DW) statistic tests the residuals and determines if there is any significant correlation based on the order in which the data occur. The ANOVA Table shows that the P-value of DW statistic is 0.0705, which is greater than 0.05. This means that there is no indication of serial autocorrelation in the residuals at the 95.0% confidence level. In addition, the analysis of variance of the relationship between explanatory variables and commercial property values shows that the F-ratio is 3.11 and a P-value of 0.0423, which is less than 0.05. This implies that the null hypothesis is rejected, indicating that there is statistically significant relationship between commercial property values and the variables. The analysis shows that the explanatory variables of road network in the presence of other variables jointly explain 47.10% variability in commercial property values in the study area. By implication, other determinants of commercial property values not considered in the study probably account for the remaining 52.90%.
Source Sum of Squares Degree of freedom Mean Square F-Ratio P-Value
Model 1.12374E7 8 1.40467E6 3.11 0.0423
Residual 4.96171E6 11 451064.
Total (Corr.) 1.61991E7 19
ISSN 2039 - 2117 Mediterranean Journal of Social Sciences Vol.2, No.2, May 2011
MCSER – Mediterranean Center of Social and Educational Research
Rome, Italy, www.mcser.org 244
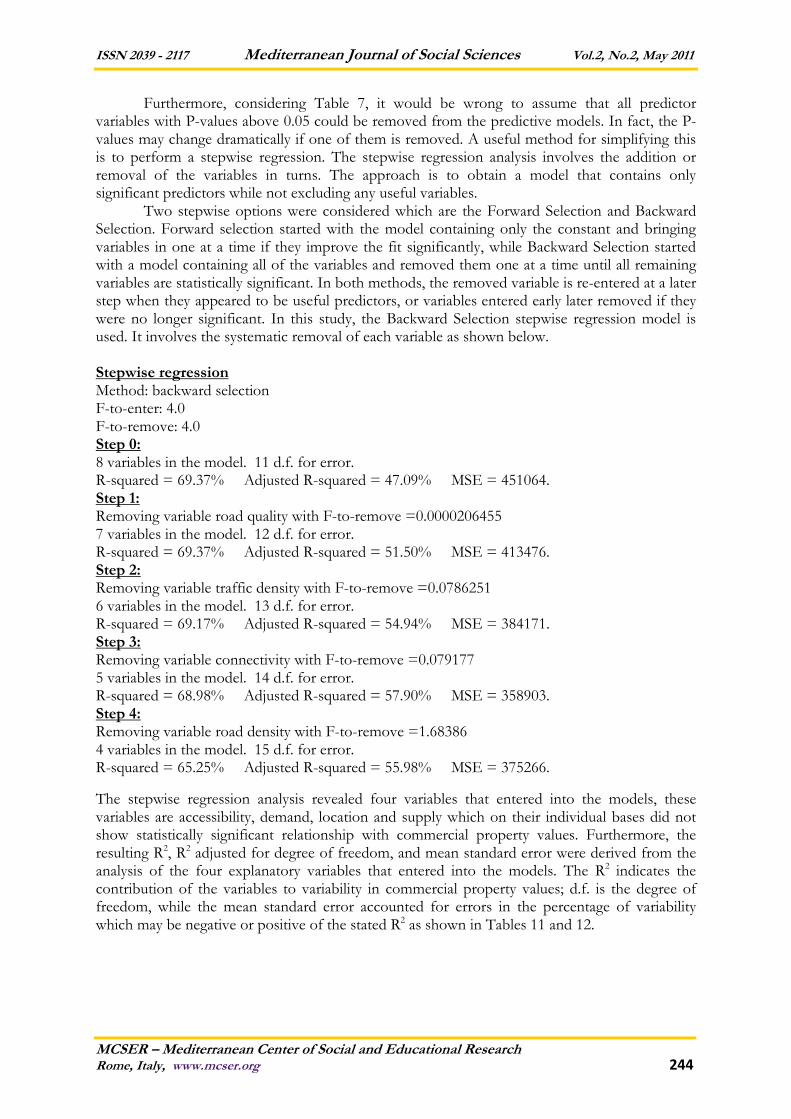
Furthermore, considering Table 7, it would be wrong to assume that all predictor variables with P-values above 0.05 could be removed from the predictive models. In fact, the P-values may change dramatically if one of them is removed. A useful method for simplifying this is to perform a stepwise regression. The stepwise regression analysis involves the addition or removal of the variables in turns. The approach is to obtain a model that contains only significant predictors while not excluding any useful variables.
Two stepwise options were considered which are the Forward Selection and Backward Selection. Forward selection started with the model containing only the constant and bringing variables in one at a time if they improve the fit significantly, while Backward Selection started with a model containing all of the variables and removed them one at a time until all remaining variables are statistically significant. In both methods, the removed variable is re-entered at a later step when they appeared to be useful predictors, or variables entered early later removed if they were no longer significant. In this study, the Backward Selection stepwise regression model is used. It involves the systematic removal of each variable as shown below.
Stepwise regression Method: backward selection F-to-enter: 4.0 F-to-remove: 4.0 Step 0: 8 variables in the model. 11 d.f. for error. R-squared = 69.37% Adjusted R-squared = 47.09% MSE = 451064. Step 1: Removing variable road quality with F-to-remove =0.0000206455 7 variables in the model. 12 d.f. for error. R-squared = 69.37% Adjusted R-squared = 51.50% MSE = 413476. Step 2: Removing variable traffic density with F-to-remove =0.0786251 6 variables in the model. 13 d.f. for error. R-squared = 69.17% Adjusted R-squared = 54.94% MSE = 384171. Step 3: Removing variable connectivity with F-to-remove =0.079177 5 variables in the model. 14 d.f. for error. R-squared = 68.98% Adjusted R-squared = 57.90% MSE = 358903. Step 4: Removing variable road density with F-to-remove =1.68386 4 variables in the model. 15 d.f. for error. R-squared = 65.25% Adjusted R-squared = 55.98% MSE = 375266.
The stepwise regression analysis revealed four variables that entered into the models, these variables are accessibility, demand, location and supply which on their individual bases did not show statistically significant relationship with commercial property values. Furthermore, the resulting R2, R2 adjusted for degree of freedom, and mean standard error were derived from the analysis of the four explanatory variables that entered into the models. The R2 indicates the contribution of the variables to variability in commercial property values; d.f. is the degree of freedom, while the mean standard error accounted for errors in the percentage of variability which may be negative or positive of the stated R2 as shown in Tables 11 and 12.
ISSN 2039 - 2117 Mediterranean Journal of Social Sciences Vol.2, No.2, May 2011
MCSER – Mediterranean Center of Social and Educational Research
Rome, Italy, www.mcser.org 245
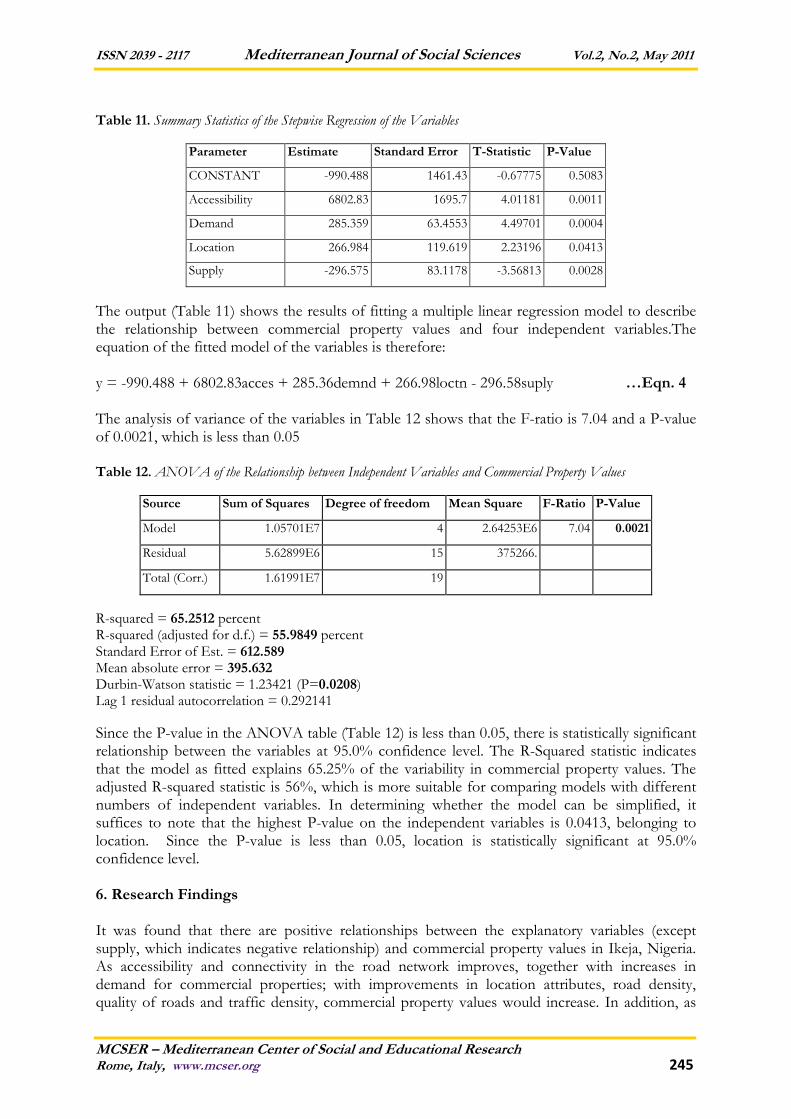
Table 11. Summary Statistics of the Stepwise Regression of the Variables
Parameter Estimate Standard Error T-Statistic P-Value
CONSTANT -990.488 1461.43 -0.67775 0.5083
Accessibility 6802.83 1695.7 4.01181 0.0011
Demand 285.359 63.4553 4.49701 0.0004
Location 266.984 119.619 2.23196 0.0413
Supply -296.575 83.1178 -3.56813 0.0028
The output (Table 11) shows the results of fitting a multiple linear regression model to describe the relationship between commercial property values and four independent variables.The equation of the fitted model of the variables is therefore: y = -990.488 + 6802.83acces + 285.36demnd + 266.98loctn - 296.58suply …Eqn. 4 The analysis of variance of the variables in Table 12 shows that the F-ratio is 7.04 and a P-value of 0.0021, which is less than 0.05 Table 12. ANOVA of the Relationship between Independent Variables and Commercial Property Values
Source Sum of Squares Degree of freedom Mean Square F-Ratio P-Value
Model 1.05701E7 4 2.64253E6 7.04 0.0021
Residual 5.62899E6 15 375266.
Total (Corr.) 1.61991E7 19
R-squared = 65.2512 percent R-squared (adjusted for d.f.) = 55.9849 percent Standard Error of Est. = 612.589 Mean absolute error = 395.632 Durbin-Watson statistic = 1.23421 (P=0.0208) Lag 1 residual autocorrelation = 0.292141
Since the P-value in the ANOVA table (Table 12) is less than 0.05, there is statistically significant relationship between the variables at 95.0% confidence level. The R-Squared statistic indicates that the model as fitted explains 65.25% of the variability in commercial property values. The adjusted R-squared statistic is 56%, which is more suitable for comparing models with different numbers of independent variables. In determining whether the model can be simplified, it suffices to note that the highest P-value on the independent variables is 0.0413, belonging to location. Since the P-value is less than 0.05, location is statistically significant at 95.0% confidence level. 6. Research Findings It was found that there are positive relationships between the explanatory variables (except supply, which indicates negative relationship) and commercial property values in Ikeja, Nigeria. As accessibility and connectivity in the road network improves, together with increases in demand for commercial properties; with improvements in location attributes, road density, quality of roads and traffic density, commercial property values would increase. In addition, as
ISSN 2039 - 2117 Mediterranean Journal of Social Sciences Vol.2, No.2, May 2011
MCSER – Mediterranean Center of Social and Educational Research
Rome, Italy, www.mcser.org 246
supply decreases, commercial property values would increase, all things being equal. As quality of roads improves, accessibility in terms of ease of getting to the locations of commercial activities would increase. The effects would be evident in the number of pedestrian and commercial activities taking advantage of ease of movements in the study area. The consequence would also be noticeable in demand for service products and commercial activities along the arterial roads with concomitant increase in commercial property values.
Further analysis using a stepwise regression revealed four variables that entered into the models, these variables are accessibility, demand, location and supply which on their individual bases did not show statistically significant relationship with commercial property values. For instance, when accessibility is improved probably through factors that induce it while all other variables remain constant, commercial property values would be N14,206.34/m2p.a. {That is, y = -2044.95 + 7702.66(2) + 633.74(1) + 300.49(1) + 217.52l (1) + 7305.53(1) + 1.539(1) - 315.81(1) + 8.49(1)}. Assuming, there is impedance to movement as evident in impedance to accessibility, other variables remaining constant, commercial property value would be N 9,957.88 /m2 p.a., all things being equal {i.e. y = -2044.95 + 7702.66(0.5) + 633.74(1) + 300.49(1) + 217.52l (1) + 7305.53(1) + 1.539(1) - 315.81(1) + 8.49(1)}. This implies that when there is impedance to movements to the extent that accessibility is adversely affected, commercial property values would decrease by about 30% in the long run. This finding is valid and the equation will be useful as a predictive model. 7. Recommendations and Concluding Remarks The following recommendations are made based on the researcher’s findings, to point the way forward on the part of the Estate Surveyors and Valuers, the Nigerian Institution of Estate Surveyors and Valuers (NIESV), investors, and the Government. Analytical mind will be required in an emerging competitive professional terrain in which other professionals are currently challenging Estate Surveyors and Valuers over their relevance. However, the study found that most Estate Surveyors and Valuers have not been actively involved in the use of scientific techniques to measure accessibility in relation to property value. The propensity of error in judgment based on intuitive decisions is very high and the best way to reduce such misjudgment is to adopt scientific techniques. This study has tested and found the technique to be useful tool in analyzing road network.
Empirical decision-making process has become necessary judging from the importance of accessibility delivered by road network in real estate development appraisals, particularly in advising on choice of best sites for development projects. It is therefore suggested that Estate Surveyors and Valuers should consider the use of scientific techniques to assist in making decisions that are reliable. This could be accomplished through seminar, workshops and conferences, while current curriculum in Polytechnics and Universities offering Estate Management should be broadened to include road network analysis. This is achievable through funding of research in this regard. In U.K., the Royal Institution of Chartered Surveyors (RICS) over the years have been funding research towards determining the impacts of rails, roads, and air transportation on property values. Professional bodies in Africa are advised to fund research into the impacts of various modes of transportation on property values. Discussion of the results of such research works should be communicated to Estate Surveyors and Valuers through regular Mandatory Continuous Professional Development (MCPD) Programmes, national and international conferences.
When carrying out feasibility and viability appraisal, attention must be given to the issue of road network, which actually delivers greater accessibility, along with demand, location and supply as major variables in valuation of commercial properties in the study area for their opinions of values to be reliable. The study has further reinforced the importance of accessibility for development and investors wishing to embark on real estate development must be
ISSN 2039 - 2117 Mediterranean Journal of Social Sciences Vol.2, No.2, May 2011
MCSER – Mediterranean Center of Social and Educational Research
Rome, Italy, www.mcser.org 247
conversant with the level of accessibility of the arterial roads along which such development will locate. Decision on the location of such development project should be based on a pragmatic approach such that selected locations would bring the highest return that is adequate and sufficient to compensate investors in such projects.
The model derived to explain relationships between commercial property value, road network and individual explanatory variables would be useful for predicting commercial property values along the arterial roads in the study area. It may become tools useful to Estate Surveyors and Valuers in expressing valuation opinions, and predicting commercial property values especially in feasibility and viability appraisal. However, a tool may not be useful until it is put into proper use. It is recommended that practical approach be taken to adopt the models and assist in making reliable judgments that would stand the test of time.

ISSN 2039 - 2117 Mediterranean Journal of Social Sciences Vol.2, No.2, May 2011
MCSER – Mediterranean Center of Social and Educational Research
Rome, Italy, www.mcser.org 248
Appendix
Table 1
Table 1: Accessibility Indices of Arterial Roads in Ikeja Metropolis
NP 1 2 3 4 5 6 7 8 9 10 11 12 13 14 15 16 17 18 19 20 21 22 23 24 25 26 27 28 29 30 31 32 33 34 35 AI Rank
1 - 1 2 3 2 3 4 4 5 5 6 6 7 8 9 8 6 7 6 5 4 3 2 1 2 3 4 5 6 7 6 3 4 5 7 159 33
2 1 - 1 2 1 2 3 3 4 4 5 5 6 7 8 7 6 8 6 5 4 3 3 2 3 4 5 6 7 8 7 4 5 6 7 158 32
3 2 1 - 1 2 3 3 2 3 4 5 4 5 6 7 6 6 7 7 6 5 4 4 3 4 5 6 7 8 9 8 5 6 7 6 167 34
4 3 2 1 - 1 2 2 1 2 3 4 3 4 5 6 5 5 6 6 5 4 3 4 4 5 5 5 6 7 8 7 6 7 8 5 150 28
5 2 1 2 1 - 1 2 2 3 3 4 4 5 6 7 6 5 7 5 4 3 2 3 3 5 4 4 5 6 7 8 5 6 7 6 144 23
6 3 2 3 2 1 - 1 2 3 2 3 4 5 6 7 6 4 6 4 3 2 1 2 3 4 3 3 4 5 6 7 5 5 6 5 128 11
7 4 3 3 2 2 1 - 1 2 1 2 3 4 5 6 5 4 6 4 3 3 2 3 4 5 4 4 5 5 6 7 6 6 7 5 133 17
8 4 3 2 1 2 2 1 - 1 2 3 2 3 4 5 4 4 5 5 4 4 3 4 5 6 5 5 6 6 7 6 7 7 7 4 139 19
9 5 4 3 2 3 3 2 1 - 1 2 1 2 3 4 3 3 4 4 3 4 4 5 6 7 6 5 6 5 6 5 8 7 6 3 136 18
10 5 4 4 3 3 2 1 2 1 - 1 2 3 4 5 4 3 5 3 2 3 3 4 5 6 5 4 5 4 5 6 7 6 7 4 131 15
11 6 5 5 4 4 3 2 3 2 1 - 1 2 3 4 3 2 4 2 1 2 3 4 5 5 4 3 4 3 4 5 6 5 6 3 119 5
12 6 5 4 3 4 4 3 2 1 2 1 - 1 2 3 2 2 3 3 2 3 4 5 6 6 5 4 5 4 5 4 7 6 5 2 124 9
13 7 6 5 4 5 5 4 3 2 3 2 1 - 1 2 1 1 2 2 2 3 4 5 6 6 5 4 4 3 4 3 6 5 4 1 121 8
14 8 7 6 5 6 6 5 4 3 4 3 2 1 - 1 1 2 2 3 3 4 5 6 7 7 6 5 5 4 4 3 6 5 4 2 145 26
15 9 8 7 6 7 7 6 5 4 5 4 3 2 1 - 2 3 3 4 4 5 6 7 8 8 7 6 6 5 5 4 7 6 5 3 178 35
16 8 7 6 5 6 6 5 4 3 4 3 2 1 1 2 - 2 1 3 3 4 5 6 7 6 6 5 5 4 3 2 5 4 3 2 139 22
17 6 6 6 5 5 4 4 4 3 3 2 2 1 2 3 2 - 2 2 1 2 3 4 5 5 4 3 4 3 4 3 6 5 4 1 119 5
18 7 8 7 6 7 6 6 5 4 5 4 3 2 2 3 1 2 - 2 3 4 5 6 6 5 6 5 4 3 2 1 4 3 2 1 140 20
19 6 6 7 6 5 4 4 5 4 3 2 3 2 3 4 3 2 2 - 1 2 3 4 5 5 4 3 2 1 2 3 4 3 4 1 118 4
20 5 5 6 5 4 3 3 4 3 2 1 2 2 3 4 3 1 3 1 - 1 2 3 4 4 3 2 3 2 3 4 5 4 5 2 107 2
21 4 4 5 4 3 2 3 4 4 3 2 3 3 4 5 4 2 4 2 1 - 1 2 3 3 2 1 2 3 4 5 4 3 4 3 106 1
22 3 3 4 3 2 1 2 3 4 3 3 4 4 5 6 5 3 5 3 2 1 - 1 2 3 2 2 3 4 5 6 4 4 5 4 114 3
23 2 4 5 4 3 2 3 4 5 4 4 5 5 6 7 6 4 6 4 3 2 1 - 1 2 1 2 3 4 5 6 3 4 5 5 130 12
24 1 2 3 4 3 3 4 5 6 5 5 6 6 7 8 7 5 6 5 4 3 2 1 - 1 2 3 4 5 6 5 2 3 4 6 142 23
25 2 3 4 5 5 4 5 6 7 6 5 6 6 7 8 6 5 5 5 4 3 3 2 1 - 1 2 3 4 5 4 1 2 3 6 144 24
26 3 4 5 5 4 3 4 5 6 5 4 5 5 6 7 6 4 6 4 3 2 2 1 2 1 - 1 2 3 4 5 2 3 4 5 131 15
27 4 5 6 5 4 3 4 5 5 4 3 4 4 5 6 5 3 5 3 2 1 2 2 3 2 1 - 1 2 3 4 3 2 3 4 118 5
28 5 6 7 6 5 4 5 6 6 5 4 5 4 5 6 5 4 4 2 3 2 3 3 4 3 2 1 - 1 2 3 2 1 2 3 129 12
29 6 7 8 7 6 5 5 6 5 4 3 4 3 4 5 4 3 3 1 2 3 4 4 5 4 3 2 1 - 1 2 3 2 3 2 130 12
30 7 8 9 7 8 6 6 7 6 5 4 5 4 4 5 3 4 2 2 3 4 5 5 6 5 4 3 2 1 - 1 4 3 2 3 153 30
31 6 7 8 7 8 7 7 6 5 6 5 4 3 3 4 2 3 1 3 4 5 6 6 5 4 5 4 3 2 1 - 3 2 1 2 148 27
32 3 4 5 6 5 5 6 7 8 7 6 7 6 6 7 5 6 4 4 5 4 4 3 2 1 2 3 2 3 4 3 - 1 2 5 151 30
33 4 5 6 7 6 5 6 7 7 6 5 6 5 5 6 4 5 3 3 4 3 4 4 3 2 3 2 1 2 3 2 1 - 1 4 140 20
34 5 6 7 8 7 6 7 7 6 7 6 5 4 4 5 3 4 2 4 5 4 5 5 4 3 4 3 2 3 2 1 2 1 - 3 150 28
35 7 7 6 5 6 5 5 4 3 4 3 2 1 2 3 2 1 1 1 2 3 4 5 6 6 5 4 3 2 3 2 5 4 3 - 125 10
NP - nodal point; AI - accessibility indices

ISSN 2039 - 2117 Mediterranean Journal of Social Sciences Vol.2, No.2, May 2011
MCSER – Mediterranean Center of Social and Educational Research
Rome, Italy, www.mcser.org 249
Appendix
Table 2
Table 2: Connectivity Indices of Arterial Roads in Ikeja Metropolis
NP 1 2 3 4 5 6 7 8 9 10 11 12 13 14 15 16 17 18 19 20 21 22 23 24 25 26 27 28 29 30 31 32 33 34 35 CI
1 - 1 0 0 0 0 0 0 0 0 0 0 0 0 0 0 0 0 0 0 0 0 0 1 0 0 0 0 0 0 0 0 0 0 0 2
2 1 - 1 0 1 0 0 0 0 0 0 0 0 0 0 0 0 0 0 0 0 0 0 0 0 0 0 0 0 0 0 0 0 0 0 3
3 0 1 - 1 0 0 0 0 0 0 0 0 0 0 0 0 0 0 0 0 0 0 0 0 0 0 0 0 0 0 0 0 0 0 0 2
4 0 0 1 - 1 0 0 1 0 0 0 0 0 0 0 0 0 0 0 0 0 0 0 0 0 0 0 0 0 0 0 0 0 0 0 3
5 0 1 0 1 - 1 0 0 0 0 0 0 0 0 0 0 0 0 0 0 0 0 0 0 0 0 0 0 0 0 0 0 0 0 0 3
6 0 0 0 0 1 - 1 0 0 0 0 0 0 0 0 0 0 0 0 0 0 1 0 0 0 0 0 0 0 0 0 0 0 0 0 3
7 0 0 0 0 0 1 - 1 0 1 0 0 0 0 0 0 0 0 0 0 0 0 0 0 0 0 0 0 0 0 0 0 0 0 0 3
8 0 0 0 1 0 0 1 - 1 0 0 0 0 0 0 0 0 0 0 0 0 0 0 0 0 0 0 0 0 0 0 0 0 0 0 3
9 0 0 0 0 0 0 0 1 - 1 0 1 0 0 0 0 0 0 0 0 0 0 0 0 0 0 0 0 0 0 0 0 0 0 0 3
10 0 0 0 0 0 0 1 0 1 - 1 0 0 0 0 0 0 0 0 0 0 0 0 0 0 0 0 0 0 0 0 0 0 0 0 3
11 0 0 0 0 0 0 0 0 0 1 - 1 0 0 0 0 0 0 0 1 0 0 0 0 0 0 0 0 0 0 0 0 0 0 0 3
12 0 0 0 0 0 0 0 0 1 0 1 - 1 0 0 0 0 0 0 0 0 0 0 0 0 0 0 0 0 0 0 0 0 0 0 3
13 0 0 0 0 0 0 0 0 0 0 0 1 - 1 0 0 1 0 0 0 0 0 0 0 0 0 0 0 0 0 0 0 0 0 1 4
14 0 0 0 0 0 0 0 0 0 0 0 0 1 - 1 1 0 0 0 0 0 0 0 0 0 0 0 0 0 0 0 0 0 0 0 3
15 0 0 0 0 0 0 0 0 0 0 0 0 0 1 - 0 0 0 0 0 0 0 0 0 0 0 0 0 0 0 0 0 0 0 0 1
16 0 0 0 0 0 0 0 0 0 0 0 0 0 1 0 - 0 1 0 0 0 0 0 0 0 0 0 0 0 0 0 0 0 0 0 2
17 0 0 0 0 0 0 0 0 0 0 0 0 1 0 0 0 - 0 0 1 0 0 0 0 0 0 0 0 0 0 0 0 0 0 1 3
18 0 0 0 0 0 0 0 0 0 0 0 0 0 0 0 1 0 - 0 0 0 0 0 0 0 0 0 0 0 0 1 0 0 0 1 3
19 0 0 0 0 0 0 0 0 0 0 0 0 0 0 0 0 0 0 - 1 0 0 0 0 0 0 0 0 1 0 0 0 0 0 1 3
20 0 0 0 0 0 0 0 0 0 0 1 0 0 0 0 0 1 0 1 - 1 0 0 0 0 0 0 0 0 0 0 0 0 0 0 4
21 0 0 0 0 0 0 0 0 0 0 0 0 0 0 0 0 0 0 0 1 - 1 0 0 0 0 1 0 0 0 0 0 0 0 0 3
22 0 0 0 0 0 1 0 0 0 0 0 0 0 0 0 0 0 0 0 0 1 - 1 0 0 0 0 0 0 0 0 0 0 0 0 3
23 0 0 0 0 0 0 0 0 0 0 0 0 0 0 0 0 0 0 0 0 0 1 - 1 0 1 0 0 0 0 0 0 0 0 0 3
24 1 0 0 0 0 0 0 0 0 0 0 0 0 0 0 0 0 0 0 0 0 0 1 - 1 0 0 0 0 0 0 0 0 0 0 3
25 0 0 0 0 0 0 0 0 0 0 0 0 0 0 0 0 0 0 0 0 0 0 0 1 - 1 0 0 0 0 0 1 0 0 0 3
26 0 0 0 0 0 0 0 0 0 0 0 0 0 0 0 0 0 0 0 0 0 0 1 0 1 - 1 0 0 0 0 0 0 0 0 3
27 0 0 0 0 0 0 0 0 0 0 0 0 0 0 0 0 0 0 0 0 1 0 0 0 0 1 - 1 0 0 0 0 0 0 0 3
28 0 0 0 0 0 0 0 0 0 0 0 0 0 0 0 0 0 0 0 0 0 0 0 0 0 0 1 - 1 0 0 0 1 0 0 3
29 0 0 0 0 0 0 0 0 0 0 0 0 0 0 0 0 0 0 1 0 0 0 0 0 0 0 0 1 - 1 0 0 0 0 0 3
30 0 0 0 0 0 0 0 0 0 0 0 0 0 0 0 0 0 0 0 0 0 0 0 0 0 0 0 0 1 - 1 0 0 0 0 2
31 0 0 0 0 0 0 0 0 0 0 0 0 0 0 0 0 0 1 0 0 0 0 0 0 0 0 0 0 0 1 - 0 0 1 0 3
32 0 0 0 0 0 0 0 0 0 0 0 0 0 0 0 0 0 0 0 0 0 0 0 0 1 0 0 0 0 0 0 - 1 0 0 2
33 0 0 0 0 0 0 0 0 0 0 0 0 0 0 0 0 0 0 0 0 0 0 0 0 0 0 0 1 0 0 0 1 - 1 0 3
34 0 0 0 0 0 0 0 0 0 0 0 0 0 0 0 0 0 0 0 0 0 0 0 0 0 0 0 0 0 0 1 0 1 - 0 2
35 0 0 0 0 0 0 0 0 0 0 0 0 1 0 0 0 1 1 0 0 0 0 0 0 0 0 0 0 0 0 0 0 0 0 - 3
References
Aderamo, A. J. (2003). A Graph Theoretic Analysis of Intra-Urban Road Network in Ilorin, Nigeria. Research for Development – The Journal of The Nigerian Institute of Social and Economic Research, 17 (1) and (2); 18 (1) and (2) Dec. 2003, 221 – 240.
American Public Transportation Association (APTA) (2002). Rail Transit and Property Values. Information Centre Briefing Number 1, (January, 2002). http//www.apta.com, accessed December 22, 2007.
Bartlett, J. E.; J. W. Kotrlik; and C. C. Higgins (2001). Organizational Research: Determining Appropriate Sample Size in Survey Research. Information Technology, Learning and Performance Journal. 19, 1, Spring 2001
Cervero, R. (1994). Rail Transit and Joint Development: Land Market Impacts in Washington, D.C. and Atlanta. Journal of the American Planning Association 60, 1 (Winter), 83-94.
Cervero, R. and Duncan, M. (2002). Transit’s Value-added: Effects of Light and Commuter Rail Services on Commercial Land Values. Transportation Research Board, 81st Annual Meeting presentation, January 2002.
ISSN 2039 - 2117 Mediterranean Journal of Social Sciences Vol.2, No.2, May 2011
MCSER – Mediterranean Center of Social and Educational Research
Rome, Italy, www.mcser.org 250
Chesterton, G. K. (2002). Property Market Study, Working Paper 32 prepared for Jubilee Line Extension Impact Study Unit. London: University of Westminster.
Cloete, E. C., and Chikafalimani, S. H. P. (2001). Overview of the Property Industry in Malawi. Joint 3rd AfRES/TIVEA/RICS Foundation Conference on Real Estate in Africa held in Arusha, Tanzania, October 23 – 25, 2001.
Diaz, R. B. (1999). Impacts of Rail Transit on Property Values. APTA 1999 Rapid Transit Conference Proceedings Paper.
Fejarang, R. A. (1994). Impact on Property Values: A Study of the Los Angeles Metro Rail. Transportation Research Board, 73rd Annual Meeting, Washington, D.C., January 9 – 13.
Garrison, W. L. and Marble, D. F. (1960). Connectivity of the Inter-state Highway System. Paper of the Regional Science Association. 6, 121 – 137.
Hack, J. (2002). The Role of Transit Investment in Urban Regeneration and Spatial Development: A Review of Research and Current Practice. Paper presented at CIP Annual Conference, Canada.
Hillier-Parker, C. B. (2002). Crossrail: Property Value Enhancement. Report Prepared for Canary Wharf Group Plc, London.
Kauko, T. (2003). Residential Property Value and Locational Externalities - On the Complementarity and Substitutability of Approaches. Journal of Property Investment & Finance, 21 (3), 250-270.
Lagos Street Map 2008, West African Book Publishers Limited, Academy Press: Lagos Lean, W. and Goodall, B. (1977). Aspects of Land Economics. The Estate Gazette Ltd. London, 135 – 141 McCluskey, W. J., Deddis, W. G., Lamont, I. G., & Borst, R. A. (2000). The application of surface generated
interpolation models for the prediction of residential property values. Journal of Property Investment & Finance, 18(2), 162-176.
Muraco, W. A. (1972). Intra-urban Accessibility: A Quantitative Analysis Use of Graph Theoretic Method. Economic Geography. 48, 388 – 405.
Nelson, A. (1999). Transit Stations and Commercial Property Values: A Case Study with Policy and Land-Use Implications. Journal of Public Transportation, 2 (3) 1999, 77-93.
Nystuen, J. C. and Dacey, M. F. (1961). A Graph Theory Interpretation of Nodal Regions. Paper and Proceedings Regional Science 7, 29 - 42
Ogunsanya, A. A. (1986). Graph Theory in Intra-urban Traffic Flow Estimation. Geo-Journal, 12 334 – 336 Olusegun, K. (2003). Principles and Practice of Property Valuation. Climax Communications Ltd. Lagos Omoogun, C. B. (2006). The Centripetal Effects of Location on Rental Values of Residential Property in Metropolitan Lagos. The
Built Environment: Innovation, Policy and Sustainable Development. Proceedings of International Conference organized by Department of Architecture, Covenant University, Ota, Nigeria. Covenant University Press. ISBN 978-37963-0-5
Oni, A. O. (2007a). Graph-Theoretic Analysis of Intra-Community Road Network: Case Study of Covenant University, Nigeria. Paper Presented at the College Seminar/Workshop held at College of Science & Technology Conference Room, Covenant University, Ota, Nigeria on 1st August 2007
Oni, A. O. (2007b). Analysis of Accessibility and Connectivity of Ikeja Arterial Roads. Paper Presented at the 1st National Conference organized by Department of Estate Management, Yaba College of Technology, Lagos, Held on 25th to 27th day of September 2007.
Oni, A. O. (2009). Arterial Road Network and Commercial Property Values in Ikeja, Nigeria. Unpublished Ph.D. Thesis, Department of Estate Management, Covenant University, Ota, Nigeria.
Oyebanji, A. O. (2003). Principles of Land Use Economics. CEPDM Publishers. Lagos. Pharoah, T. (2002) Jubilee Line Extension Impact Study Unit. University of Westminster, London. Sedway Group (1999). Regional Impact Study Study commissioned by Bay Area Rapid Transit District (BART) July 1999. The
Sedway Group, San Francisco, CA http://www.sedway.com/ Stratton, A. (2008). Making an Investment Decision with Commercial Property Analysis in
http://www.streetdirectory.com/travel_guide/64278/property_tips/making_an_investment_decision_with_commercial_property_analysis.html accessed November, 3, 2008.