Arthropod Diversity and Community Structure in Relation to Land Use in the Mekong Delta, Vietnam
Upload
kanazawa-uCategory
view
4download
0
Land Rights and Economic Development:
Evidence from Vietnam ∗
Quy-Toan Do† Lakshmi Iyer‡
November 2003
Work in progress. Please do not cite.
Abstract
This paper examines the impact of the 1993 Land Law of Vietnam which gave households
the power to exchange, transfer, lease, inherit and mortgage their land-use rights. We expect
this change to increase the incentives as well as the ability to undertake long-term investments
on the part of households. We use the variation across provinces in the issuance of land use
certificates to identify the impact of this law. Our results indicate that the additional land rights
led to significant increases in the share of total area devoted to long-term crops, but formal land
titles do not appear to increase households’ access to credit.
∗We thank Abhijit Banerjee, Esther Duflo, Jonathan Haughton, Simon Johnson and several seminar participants
for very helpful comments and suggestions. Special thanks go to Mr. Nguyen Phong and the General Statistical
Office, Hanoi, for allowing us to access the Vietnam Living Standards Survey; to Mrs. Tran Thi Minh Ha, Mr. Do
Duc Doi, Mr. Quach Cong Huan and the General Department of Land Administration, Hanoi, for providing us
with land registration data; and to Ms. Le Thi Thanh Loan for access to the Agricultural Census. We also thank
Christopher Gibbs and Vu Quoc Huy for helpful discussions, and the MIT Schultz Fund for financial support.†Development Research Group, The World Bank. [email protected]‡Harvard Business School. [email protected]
1 Introduction
Land rights are an important issue in developing countries where land is a major asset for most
people and the product of agriculture accounts for a large share of national income. There is
a certain amount of consensus among economists that better property rights institutions lead to
improved economic outcomes (see Knack and Keefer (1995), North and Thomas (1973) or Acemoglu
et. al. (2001) for analysis of general property rights institutions). Economists such as de Soto (2000)
have argued that the major barrier to prosperity in developing countries is the inability to convert
property into usable assets, because of a lack of clear-cut legally recognized rights. However, the
empirical evidence on the importance of formal property rights in land is inconclusive, both on
the overall effect of having property titles and on which dimensions of land rights are crucial.
Alston et. al.(1996) find that investments in land as well as land values are positively associated
with possession of formal titles in Brazil; an analysis of land titling in Indonesia reached similar
conclusions (SMERU (2002)). Field and Torero (2002) find that possession of legal titles leads
to greater credit access for the poor in Peru; however, Boucher et. al.(2002) show that access to
credit remains very low even after land reforms have been implemented in Nicaragua and Honduras.
Braselle et. al. (2002) review a number of studies in African countries which show very little impact
of land titling on investment. In many countries, property rights in land are not formally granted by
the government and are established through custom or informal mechanisms. In such situations, it
is often the case that households undertake investments in land to safeguard their property rights,
as shown in work by Besley(1995) on Ghana and Braselle et. al. (2002) on Burkina Faso. We thus
do not have complete answers to several questions: is ownership of land the most important, or
is it the ability to transform land into working capital that matters? How effective is government
legislation in providing better land rights, or is everything determined by local conditions?
This paper investigates the impact of a specific legal change to land rights implemented in
1993 in Vietnam. Since 1986 and the “Doi Moi” policy, Vietnam has progressively moved towards
a market economy. As far as land rights are concerned, the regulatory environment witnessed two
major changes. In 1988, agricultural land was decollectivized and use rights to land were assigned
to individuals and households for a period of up to fifteen years. However, such rights were not
tradable. In 1993, a new land law was enacted and in addition to an increased lease term, land-use
rights could now be inherited, transferred, exchanged, leased and mortgaged. The law of 1993 is
therefore seen as setting the foundations of a formal market for land. This paper investigates the
2

incremental impact of the 1993 land reform on economic outcomes. Since the law was implemented
through the issuance of Land Use Certificates (LUCs), and the issuance of LUCs was not uniform
across the country, our empirical strategy relies on such heterogeneity to identify the effect of formal
land rights on economic decisions and outcomes.
We briefly outline how the 1993 land law might have a positive impact on efficiency. First,
an increased lease term together with the right to bequeath LUCs makes farmers less liable to
expropriation from the State. More generally, the 1993 land law is perceived as an additional
signal from a government that wants to commit to secure property rights. Households are therefore
expected to have a greater incentive to undertake long-term investments. Second, the right to
mortgage land rights can be expected to make access to credit easier, especially from formal sources
such as State-owned banks. The impact is then twofold: on the one hand, the ability to borrow
ex-ante induces agents to invest more; on the other hand, the ability to borrow ex-post allows
individuals to smooth consumption, and hence avoid costly income smoothing. Third, making land
use rights tradable is likely to translate into allocative efficiency gains. This is very relevant to
Vietnam: as the initial allocation after decollectivization in 1988 was made on a fairness basis,
farmers happened to receive up to twenty small plots each, often far from one another. We then
expect to observe land consolidation aimed at realizing economies of scale. These three channels
suggest that land rights should increase economic efficiency.
In order to assess the impact of the 1993 land law, we use pre-reform and post-reform
household-level data. Although we do not have individual-level information on LUC issuance,
provincial-level status of land titling is available. Hence, individuals will be assigned the percent-
age of LUCs granted in the province they live in, interpreted as the likelihood that they benefited
from the reform. We argue that between-province heterogeneity is probably due to bureaucratic
performance and not correlated with other factors which might simultaneously influence the out-
comes we are interested in. A differences-in-differences estimation strategy then allows us to observe
whether households more exposed to the reform are more willing and able to undertake long-term
investments. We find that farmers in highly-registered provinces devote a greater proportion of their
cultivated area to multi-year crops, but there is no significant increase in the level of short-term
investments in agriculture such as fertilizer usage. We do not find any significant increases in access
to credit or in the amount a household is able to borrow; in fact, some of our specifications indicate
a negative effect. Analysis of land market transactions is hampered by severe under-reporting of
these transactions. We do find that the overall volume of transactions increases after the reform,
3
but the increase is not significantly different in high-issuance provinces.
The paper is structured as follows: sections 2 describe the process of reform and land policies
in Vietnam and section 3 discusses the possible impacts of the land law. Section 4 describe our
data and empirical strategy and and section 5 describes the variation in the implementation of the
land reform across provinces Our main results are discussed in section 6 and some further remarks
are given in section 7. Section 8 concludes.
2 Land Rights in Vietnam
The history of Vietnam in the second half of the twentieth century is punctuated by three key dates:
1954 marked the independence of the country from the French and its division into two parts, North
and South; in 1975, the so-called “Vietnam war” ended with the reunification of North and South
Vietnam, and 1986 corresponds to the implementation of sweeping economic reforms (the “Doi
Moi” policy) and a move towards a market-oriented economy, which continues to the present day.1
2.1 The institutional framework until 1988
Before the Geneva Accord of 1954, Vietnam was under French control. During the Colonial period,
most farmland in Vietnam was owned either by French plantation owners or by large Vietnamese
landlords: 52 percent of the land was owned by only 3 percent of the indigenous population and
more than 60 percent of farmers across the country were landless in the mid-1940s.
After independence in the North, a major land reform was carried out. As a reward for
their war efforts, land and ownership rights were distributed to farmers and a rapid increase in
agricultural output and productivity followed. However, the policy was reversed and land began to
be collectivized in the late 1950s, as Communist ideology gained strength. As a result, 86 percent
of all peasant households and 68 percent of total farmland, were brought into cooperatives by 1960.
Despite significant declines in output, the collectivization process continued so that 90 percent of all
peasant households in the North were working in cooperatives by the mid-1960s. An illuminating
stylized fact illustrates the impact of such an incentive system: while individual rural households
were privately allocated 5 percent of farmland, they derived 60 to 70 percent of their earnings from
this small plot.1This material in this section is largely based on Boothroyd and Pham (2000), Pingali and Vo-Tong (1992), and
Wiegersma (1988)
4
Land institutions in the South during that same period were driven by political conflicts.
At times where the government sought support from the local elites, pro-landowner policies were
adopted. When the war against North Vietnam began, the government tried to gain popular
support by adopting the Land-to-the-Tiller law in 1970. Tillers of the soil were to enjoy all the
benefits of their work, and this would be accomplished by providing ownership rights to cultivators
and putting a retention limit on landlords as low as 20 hectares. However, the law found oppo-
sition from landlords and the lack of independence of the bureaucracy made enforcement uneven
throughout South Vietnam.
In 1975, when the war ended and the country was reunified, land collectivization started in
the South but was implemented with little success: as late as 1986, only 5.9 percent of farmers in
the Mekong Delta and 20 percent in the Southeastern region were part of cooperatives, while this
figure amounted to 85 percent in the Central Lowlands region (Pingali and Vo-Tong 1992). Under
the collective system, all households were paid a share of output according to their recorded labor
hours on the communal land. In 1981, the first changes were made to these arrangements: workers
were now allowed to keep all of the surplus they produced over a contracted output. However, this
policy was later modified and quotas were constantly renegotiated, resulting in a decline of public
confidence. Agricultural yields were extremely low in this period and even as late as 1985, Vietnam
was a net importer of rice.
Faced with a worsening economic crisis, the government announced the program of “Doi
Moi” (literally “change and newness”) in 1986 and began a gradual movement towards a market
economy. As part of a major structural adjustment program, production and consumption subsidies
were eliminated from the State budget, government spending was reduced to 6 percent of Gross
Domestic Product (GDP), the government work force was reduced by 15 percent, 500 000 soldiers
were demobilized, interest rates on loans to State-owned firms were raised and central bank credit
was no longer used to finance the budget deficit. The economy started opening up to trade, and the
central bank undertook a massive devaluation of the currency to the prevailing black market rate
bringing inflation rates from 400 percent in 1986-87 down to 10 percent in 1993. Financial markets
were partly deregulated, foreign banks are now allowed to operate in Vietnam and a stock exchange
was opened in 2000. In the agricultural sector, Resolution 10 of 1988 granted land-use rights to
individual households, while the land law of 1993 made these rights pledgeable and tradable. These
two changes are described in detail in following sections.
These reforms have had a dramatic impact on the economy. Government revenue and spend-
5
ing began increasing after 1991. Agricultural production increased rapidly after 1988, and Vietnam
is currently a major exporter of rice, as well as cash crops like coffee, pepper and cashew. Exports
accounted for 79 percent of GDP by 1995, and the economy has experienced a growth rate of above
8 percent in the 1990’s. Agriculture now accounts for only 25 percent of GDP, down from 40 percent
in 1989. The benefits from growth have been fairly widespread: poverty rates are estimated to have
declined from 75 percent in 1984 to 55 percent in 1993.2
2.2 The 1988 Land Law - Resolution 10
A reform undertaken in 1981 allowed households to keep any surplus above a quota level. Such
reform was a failure partly because the government did not manage to commit not to raise quo-
tas, always extracting more surplus from farmers. The lack of commitment from the authorities
eventually destroyed individual incentives. Then came Resolution 10 of the 1988 land law, aimed
at recovering credibility by further liberalizing the agricultural sector in Vietnam. The reform con-
sisted of transferring control and cash-flow rights from the cooperative to the individual household.
Land was allocated to households with a fifteen-year security of tenure and tacit renewal, output
markets were privatized and investment decisions were decentralized and left to households. Pri-
vate property was virtually instituted. However, as land-use rights were given to families without
the possibility to trade such rights, a proper land market did not develop despite some informal
transactions.
Land allocation to individual households was conducted by the commune authorities, and
encountered some difficulties across the country. In the North and in some regions of the South, land
was distributed on a fairness basis, taking into account soil and socio-demographic characteristics of
the region. Comparing the realized land allocation process with a simulated market-based outcome,
Ravallion and van de Walle (2001) conclude that the realized process generated lower inequality
and made the poorest better off. However, the process sometimes relies on arbitrary considerations,
leading to favoritism and disputes. For instance, Hayami (1993) reports that “a farmer (...) in Hai
Hung Province complained that he received too small a land allocation because his eldest son was
in military service and his other children were so young that they received only one-third of an
adult’s allocation at a time. Thus, he expects that his unfavorable allocation will be corrected at
the end of the ten-year tenure period” (pp 13). The situation in the South was complicated by
the fact that Resolution 10 stipulated that farmers should be assigned the land they owned prior2See Dollar and Litvack (1998)
6
to 1975 and this generated disagreement between farmers and former landlords, although a 1989
ordinance gave rights to farmers. The allocation was thus not immune to controversy and disputes
were still being settled in July 2001, as land allocation was being brought to completion in rural
areas.
To many Vietnamese, Resolution 10 is perceived as the major land reform undertaken since
1975 and some scholars attributed Vietnam’s agricultural output growth to such liberalization (see
e.g. Pingali and Vo-Tong (1992)). There is no denying that newly assigned property rights must
have unleashed farmers’ incentives to invest and put effort, but much remained to be done to
achieve further economic efficiency. The 1993 land law is an additional step towards this end.
2.3 The 1993 Land Law and the Issuance of Land Use Certificates
The main focus of this paper is the 1993 land law. The spirit of the law is in continuation of
the reforms undertaken by the government since 1988. Despite the allocation of land and its
corresponding use-rights, no transaction could yet be made officially. The 1993 land law made up
for this deficiency. It granted five rights to the household: the right to transfer, exchange, inherit,
rent and mortgage.3 The implementation of the land law consisted of provision of LUCs. As the
actual procedure has some interest for our empirical strategy, it is worth going into some details.
The issuance of LUCs is done as follows: individuals have first to apply for a Land Use
Certificate (alternatively known as Land Tenure Certificate or the Red Book) through the commune-
level People’s Committee. The district Bureau of Land Administration then does the groundwork,
which includes making a list of all land users, training the staff, purchasing materials, checking
and updating the documents related to land such as cadastral maps, land survey records etc.
In the meantime, a Land Registration Committee is set up, which includes members from the
District Bureau of Land Administration, as well as officials from the commune-level, district-level
and sometimes province-level People’s Committees. This process takes about four or five weeks.
Application forms for land registration are then given out to all the land-users in the commune,
who are asked to list all the plots of land owned or allocated to them. This form has finally to be
signed, not only by the land user himself, but also by all neighboring households in order to certify
the absence of dispute regarding claims on the land.3There were further modifications to the land law in 1998 and in July 2001. The 1998 revisions granted further
rights by making it possible to sub-lease land and they moreover allowed Vietnamese entrepreneurs to use such rights
as contribution in a joint venture with a foreign company. The 2001 additions simplified procedures in urban areas.
7
The Land Registration Committee scrutinizes all these forms and then decides whether a given
land-user is eligible or not. Land-users are classified as ineligible if (i) they obtain the land through
an illegal land transfer i.e. without registering the transaction, without paying transfer taxes, or
without a legal contract, (ii) they inherit the land from parents without a formal inheritance letter,
so that old documents are still in the parents’ names, (iii) they have no legal documents to prove
their claim to the land, (iv) they are illegally occupying unallocated land, (v) they have not paid all
their land taxes in the past, or (vi) there are disputes regarding their ownership or the boundaries
of the land they claim. Within 10 days of sending these application forms, a public meeting is
held where information regarding eligibility is made public. At this time, the land administration
also tries to resolve these disputes. The list of land users who are eligible for receiving the LUC
is then sent to the district-level People’s Committee. Unresolved disputes are referred to a special
working group within the Department of Land Administration. After approval at the district-level,
work begins on making the actual LUC for the land-user. This stage is estimated to take about
1500-2000 man days per commune in urban areas, and this figure is unlikely to be much different
in rural areas.
Similarly to previous land reforms, the 1993 land law was unevenly implemented throughout
the country. Because province-level differences in the level of registration, i.e. the percentage of
households registered, is the keystone of our empirical strategy, we investigate the sources of such
heterogeneity. According to Vo (1997), district Bureaus of Land Administration have on average
five members and most communes have only one land officer, which makes registration a lengthy
process. Haque and Montesi (1996) also report the major reasons for this slow progress to be “a
lack of adequate finances, a lack of trained cadres, a lack of interest and enthusiasm on the part
of officials, a lack of proper direction and supervision and disputes among the cadres”, which is
consistent with the information given to us by the General Department of Land Administration
(henceforth GDLA). As we mentioned earlier, a phenomenon which is likely to slow down the process
is the number of disputes that can emerge in villages. The way allocation was made, the existence
of pre-existing property rights, the personality of the head of the village are as many determinants
that can cause one region to achieve faster registration than another one. An additional reason
for delay may also be due to the fees related to registration and the backlog of taxes that some
households may be required to pay to become eligible. However fees are not very high, below VND
20 000 (less than USD 1.50) in most areas. Besides, in an effort to increase land registration rates,
the government has even made it free for people residing in remote and mountainous areas, and
8
the payment of overdue taxes was no longer a prerequisite for the issuance of LUCs.
Some aspects of this large land titling program give rise to concern regarding the long-term
sustainability of this reform. The guidelines for implementation of the five rights was formulated and
approved by GDLA in late 1998. In the meantime, substantial volumes of transactions had not been
reported to the commune authorities, raising the concern that commune-level land registries would
be outdated in a few years’ time (ADB Report 1998). The certificates are issued at the household
level rather than a plot level, which can cause problems in updating the land use certificate in
the event of a land transaction. Further, several of the 15 year leases granted during the initial
decollectivization of 1988 will be coming up for renewal soon. Procedures regarding LUC issuance
or re-issuance in such cases have not been clarified.
3 Potential impact of improved land rights
What is likely to be the impact of the land law and more specifically the issuance of LUCs? Rights to
transfer, exchange, lease, inherit, and mortgage LUCs are expected to improve economic efficiency
through different channels. This section reviews briefly the potential impacts of each of the rights,
borrowing intuition and exhaustiveness from Besley(1995).
Tradable Land-Use Certificates: The rights to transfer, exchange, lease, and then sublease
LUCs create a formal market for land. Land transactions are now possible at a larger scale. We
then expect a better allocation of land and the realization of economies of scale, which translate
into higher yields. Indeed, a market for land should induce consolidation of highly fragmented
ownership of land, as we saw earlier on, as well as transfers of land from less productive to more
productive farmers.
Secure Land-Use Certificates: The longer lease term and the right to inherit (and thus be-
queath) that came with LUCs might decrease the likelihood that an individual and her offspring
will be expropriated by the State. However, with Resolution 10, though tenure was given for 10
years, tacit renewal and transfer within the family were the rule. In that respect, the 1993 Land
Law is an incremental improvement of ownership security vis-a-vis Resolution 10, as it makes such
provision formal and constitutes an additional signal sent by a government which seeks to build a
reputation of enforcing private ownership. Thus, we expect the land law of 1993 to increase farmers’
willingness to undertake long-term investments. Furthermore, it is worth noticing that if we look
9
only at the potential impact of the reform on, say, annual crop yields, the effect of secure land rights
on the intensive margin is ambiguous as it depends on the consequences on the extensive margin:
land rights give farmers the incentive to undertake long-term investments, therefore focusing on
perennial crops at the expense of annual crops.
Pledgeable Land-Use Certificates: In a world with imperfect credit markets, property rights
are, as stated by De Soto (2000), a way to transform illiquid assets into money. We expect that
possession of a certificate that can be pledged against a loan enables households to access credit at
lower costs, using formal channels such as banks. While security of tenure increases the willingness
to invest, pledgeable rights boost the ability to do so. The credit channel has moreover a second
dimension. LUCs can be pledged as collateral ex-post, i.e. to smooth consumption in case of a bad
shock. Individuals are now able to smooth consumption directly and hence avoid costly income
smoothing strategies. Depending on risk-aversion, wealth levels and local credit market conditions,
the ability to pledge rights may decrease or increase the extent to which individuals are diversifying
their activities. More diversification would suggest that farmers have a higher ability to self-insure,
while less diversification suggests that the ability to smooth consumption ex-post allows agents to
specialize in the more productive technology available to them. The overall observed impact of
pledgeable land-rights becomes an empirical issue.
4 Data and Empirical Strategy
4.1 Data
Our major source of data is the two rounds of the Vietnam Living Standards Survey (VLSS), con-
ducted by the General Statistical Office (GSO) of the Government of Vietnam and funded by the
United Nations Development Program (UNDP) and the World Bank under the Living Standards
Measurement Study (LSMS). The first round of the survey was conducted in 1992-93 (henceforth
VNLSS-93) and the second round was conducted in 1997-98 (henceforth VNLSS-98). We take the
former as our pre-reform baseline data and the latter as our post-reform outcomes. The surveys
used multi-stage stratified sampling techniques to select 4800 households in the first round. 4285
of these households were re-interviewed in 1998, and replacement households were chosen to bring
the sample size to 6000.4 The surveys followed established LSMS practices and are considered4The attrition rate is higher for smaller, urban, more educated and richer households. The overall attrition is
around 7% in rural areas.
10
high-quality data. They contain detailed information on household size and composition, educa-
tional attainment, health, employment, fertility, migration, household expenditures, agricultural
activities, non-farm economic activities and borrowing and lending activities. Table 1 presents
some basic characteristics of the rural households in the surveys, broken down into whether they
were re-interviewed (“panel”) households or replacement households. We note the large increase in
real household expenditure between 1993 and 1998, consistent with the high growth rates enjoyed
by the Vietnamese economy in this period.
Province-level data on progress of LUC issuance (number of households and communes with
LUC), as well as the number of land department officials in each provice, come from the the
records of the General Department of Land Administration (GDLA) in Hanoi.5 We also have
data on province-level population, agricultural yields, urbanization etc. from the annual Statistical
Yearbooks published by the General Statistical Office (GSO). We also use some information on
infrastructure facilities in rural areas from the 1994 Agricultural and Rural Census conducted by
the Ministry of Agriculture and Rural Development (MARD).
4.2 Empirical Strategy
Ideally we would like to compare investment and productivity across two households that differ
only in the quality of land rights possessed by them. In our setting, we take the possession of a
land-use certificate as an indicator of having good land rights. However we do not have household
level data on land registration, since the VNLSS does not ask this question. We therefore use the
province-level proportion of households with LUC as a measure of the probability that a given
household would have a LUC. We will thus be using the differences in the level of LUC issuance
across provinces to identify the impact of the Land Law. We will also use an alternative measure
(“speed of registration”) which captures how quickly the province issues LUC to at least 50% of
the households, which takes into account the whole process of LUC issuance over time.
Our major focus will be on measures of long-term agricultural investment. We will use the
farmers’ decision to switch crops away from food crops to more valuable cash crops to measure
longer-term investments, since many of these crops (coffee, pepper, fruit trees etc.) require large
initial investments and a longer time before returns are realized. We will also look at at more short-
term measures of agricultural investment such as fertilizer and pesticide use as well as irrigation
(which could be either long-term or short-term). Consistent with the potential effects of the land5GDLA is now a part of the Ministry of Natural Resources and Environment (MONRE).
11
reform discussed in section 3, we will also present results on access to credit, as well as on land
market transactions.
We estimate the impact of the land reform using a differences-in-differences strategy, by
comparing the difference between 1993 and 1998 (before and after reform) for the high-issuance
provinces as compared to the low-issuance provinces. The regression equation we use is:
yijt = β0 + β1Tt + β2Rj + β3(Tt ×Rj) + Xitγ + εit (1)
where yijt represents the outcome of household i of province j at time t (1993 or 1998), Tt represents
the time dummy (equal to 0 for 1993, and 1 for 1998), Rj is the measure of land reform implemen-
tation in province j (proportion of households with LUC in 1998 or number of years since LUC
issuance crossed 50 percent threshold (speed measure))and Xit are other household characteristics.
The coefficient β1 represents the change between 1993 and 1998 for a province which had zero
LUC issuance, while β2 represents the difference between high-issuance and low-issuance provinces
in 1993 (pre-existing difference). Our coefficient of interest is β3, which tells us how much the
high-issuance provinces have increased investment, compared to the low-issuance provinces over
the period 1993-1998. We will be controlling for household characteristics like age, gender and
education of the household head, total household size, ethnicity and total area cultivated. All our
regressions are for households in rural areas only, since our land reform figures are for rural sector.
Since our main explanatory variable, the LUC issuance measure, is measured at the province level,
we will also cluster all our standard errors at the province level.6
4.3 Endogeneity
Our strategy is likely to give biased results if the province-level registration levels are correlated
with other unobserved variables, that also affect our dependent variables. This could be due to both
“supply” and “demand” factors for land registration. For instance, more productive farmers may be
registering their land earlier (demand side effect), or a higher registration level might be indicative
of a more efficient local bureaucracy, which might have a direct effect on any outcomes we examine,
irrespective of the impact of the Land Law itself. The next section examines whether the progress
of LUC issuance across provinces is systematically related to any province-level characteristics.6Bertrand et. al. (2002) suggest clustering as one way to obtain correct standard errors in a difference-in-differences
framework.
12
5 Implementation of the 1993 Land Law
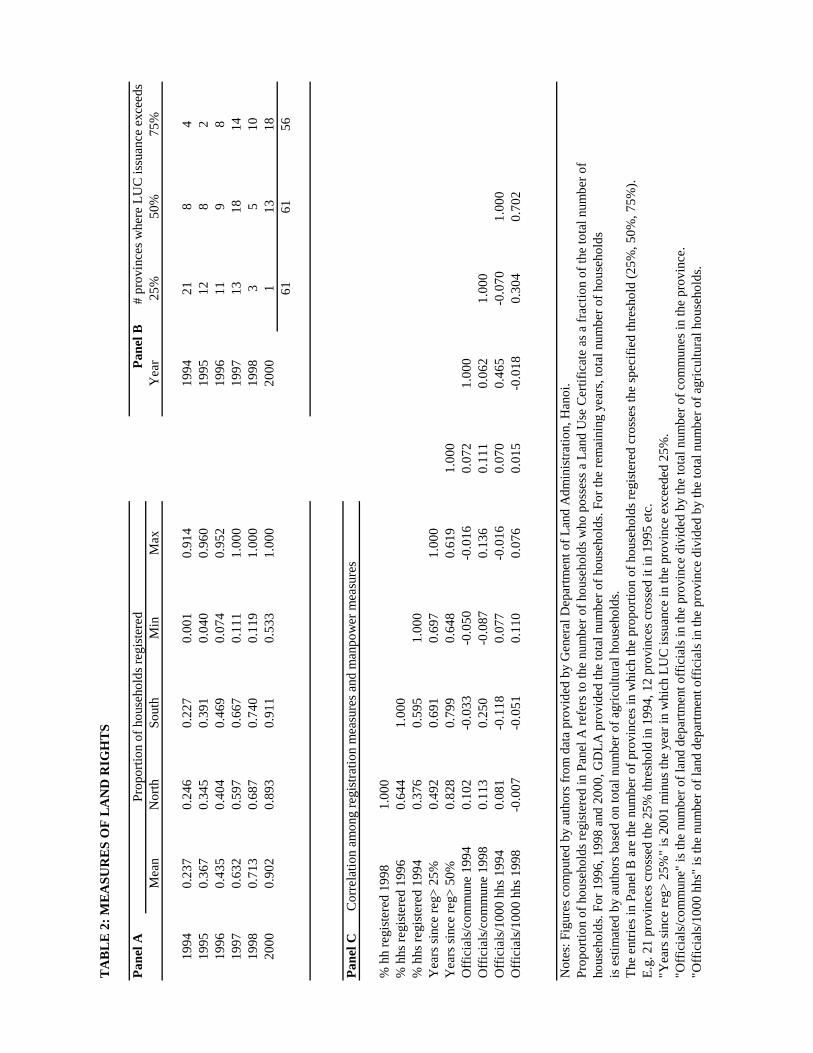
Table 2 documents the progress of LUC issuance in Vietnam. About 24 percent of households
had been issued land-use certificates at the end of 1994; by the end of 2000, this proportion had
increased to 90 percent, consistent with the target of issuing certificates to more than 11 million
rural households by the end of 2001. Table 2 also shows considerable variation across provinces in
the speed of implementing this process. For instance, An Giang province had issued LUCs to 91
percent of households in 1994, at which time Lai Chau and Lang Son had made negligible progress.
Similarly the proportion of households with LUCs varied from 12 percent to 100 percent in 1998.
Another way of seeing this is the variation in the years it took for a province to increase the level
of LUC issuance to 25 percent, 50 percent and 75 percent of the households (Table 2, Panel B). 21
provinces crossed the 25 percent threshold in 1994, while 4 provinces attained this in 1998 or later.
16 provinces had issued LUCs to 50 percent or more of households by 1995, while 13 provinces
took till 2000 to attain this level. As of 2000, five provinces had yet to attain the 75 percent level
of LUC issuance.
We also obtained (from GDLA) data on land department manpower at the province level
in different years. Consistent with the lack of manpower cited by the GDLA, we find that most
provinces had less than two land officials per commune in these years. Most provinces also had
less than two land officials per 1000 agricultural households in the province. As we would expect,
the number of land officials per commune (or per 1000 agricultural households) is somewhat pos-
itively correlated with measures of the speed of LUC issuance (Table 2, Panel C). However, these
correlations are not very large and none of them are statistically significant.
The finding of a positive but low correlation between manpower measures and LUC issuance
also shows up in the regressions reported in Table 3. Our two major measures of the prevalence of
land rights due to the reform are the proportion of households with LUC in 1998,7 and the “speed
of registration” measure which we compute as 2001 minus the year in which LUC issuance reached
50 percent of households. While the first measure captures the status of issuance at a point of
time, the second measure is based on the whole process of land titling over all the years. These
two measures are highly correlated (ρ=0.83). Table 3 further shows that land registration is not
strongly correlated with any other province characteristics such as population density, urbaniza-
tion, proportion of communes having a market, mean level of education or per capita household7We choose 1998 because our household survey data are from this year; see section 4.
13

expenditure.8 The results are qualitatively similar when we use land officials per 1000 agricultural
households instead of land officials per commune; when we include paddy yields as an additional
explanatory variable; and when we use proportion of households with LUC in years other than 1998
as a measure of the progress of land reform. We also tried specifications including weather variables
(rainfall and sunshine hours recorded in 1993), as well as a dummy for whether the province was
already reporting coffee production in 1996: these variables do not have much explanatory power
for our dependent variable; in particular, the coefficient on the coffee dummy is negative and in-
significant. We also note that there is no significant difference in the implementation of the reform
in the North and the South, despite the North’s longer history of collectivization.9 This can also be
seen in the maps in Figure 1, where each province is categorized as low, middle-low, middle-high
or high depending on the quartile it belongs to, quartiles being obtained from the distribution of
registration levels across provinces.
The other major factor cited by the GDLA to explain widely varying levels of LUC issuance
is the number of disputes. We are unable to obtain any quantitative information on this; however,
there have been incidents of peasant unrest in Vietnam during the 1990s.10 While Table 3 still
leaves open the question of why the progress of land reform is so different across different provinces,
it serves as a preliminary, though certainly not conclusive, check on the exogeneity of our main
explanatory variable. For the time being therefore, we take the registration levels in a province to
be exogenously determined in our regression analysis.
6 Impact of land reform on agriculture
6.1 Crop choice
As discussed earlier, the additional land rights conferred by the 1993 law might induce households
to undertake more long-term investments on their land. One way of measuring this is by looking at8Variables used in these regressions have been obtained from Statistical Yearbooks published by the General
Statistical Office. Mean age, education, household size and per capita expenditure are from the 1993 Living Standards
Survey. The significant coefficient for proportion of communes having a highway is driven by one outlier (old Minh
Hai province). The significant coefficient for proportion under perennial crops is also due to one outlier (old Song Be
province).9In 1994, provinces in the North had on average 24 percent of households registered, while provinces in the South
had a registration level of 23 percent. The corresponding figures for 1998 were 74 percent and 69 percent.10It is interesting that Thai Binh province, which witnessed large scale unrest in 1997 (related partly to corruption
by land officials) has the lowest level of LUC issuance in 2000.
14
the allocation of land between annual crops and multi-year industrial or fruit crops, which typically
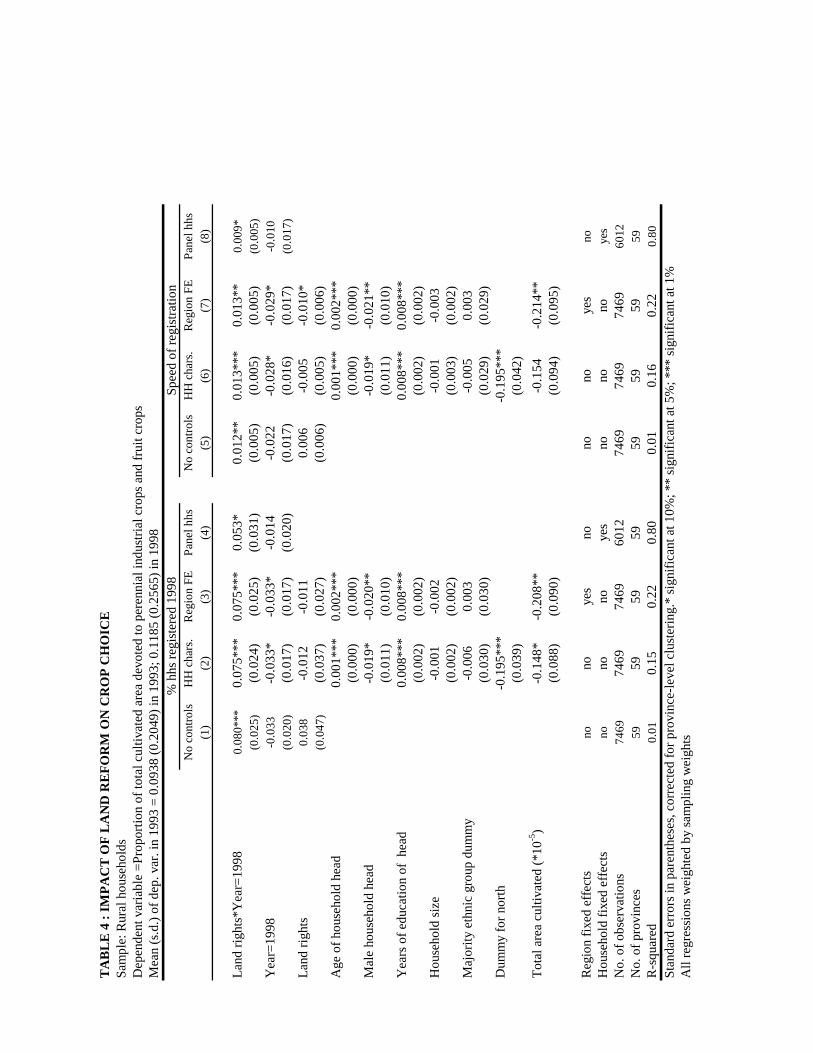
require large investments up-front and yield returns only after a few years. Table 4 shows that the
land reform led to a large and statistically significant increase in the proportion of total cultivated
area devoted to multi-year crops: a household in a province where everybody had a LUC would
increase this proportion by 7.5 percentage points over the period 1993-98, compared to a household
in a province where nobody was issued LUC. This means that if the proportion of households
registered goes up by one standard deviation, the proportional area devoted to long-term crops will
increase by 0.09 standard deviations. This increase comes at the expense of annual crops, which
show a decrease of 6.5 percentage points in their share of total cultivated area (regressions not
shown). We control for household characteristics like age, education, gender, household size and
ethnicity while obtaining these estimates.11 The coefficients are robust to the addition of region
fixed effects (column (3)), to adding the household controls interacted with the time dummy, and to
adding household income in 1993 or province-level mean per-capita income as additional regressors
(last two specifications not shown in the table). Further, the coefficients are similar, though a
little smaller, when we restrict our sample to only the “panel” households, who are interviewed in
both 1993 and 1998, and use household fixed effects to control for any time-invariant household
characteristics (column (4)).
We get very similar results when we use our speed of LUC issuance measure instead of
the level of issuance in 1998 as the main explanatory variable (columns (5)-(8)). These results
indicate that if a province were to reach the 50 percent issuance level one year earlier, households
in that province would on average increase the proportional area devoted to long-term crops by 1.3
percentage points (0.06 standard deviations).12
We might be concerned that our results are driven by other government policies regarding
the promotion of long-term crops such as coffee. We should note that table 3 shows that the area
under long-term crops in 1993 is negatively related to the land reform progress; provinces which
were growing coffee in 1996 also have slightly lower levels of LUC issuance than other provinces.
Any bias in the estimates is thus likely to be downward, rather than in the upward direction.
We can conduct a similar analysis of the area devoted to long-term crops, using province-level11We should note that in the household surveys, some respondents answer questions about long-term crops by
mentioning the number of trees they have, rather than the area devoted to them. Our results are robust to several
ways of converting trees to areas.12We get similar results if we break up the sample into early and late issuers (based on 1994 issuance) and use the
first measure: coefficients are much larger and strongly significant for early issuers and smaller for late issuers.
15
aggregate data from the Statistical Yearbooks of various years. However, the results of the house-
hold level surveys are not replicated in these data. In both a difference-in-differences specification
(replicating the regression for the survey data) and a specification with province and time fixed
effects, we get a negative (though statistically insignificant) coefficient on the measures of LUC
issuance (regressions not shown). However, this is subject to the caveat that we are not quite
sure how the data for the Statistical Yearbooks is collected; the province-level aggregate figures are
somewhat different from the figures obtained by aggregating the household survey data.
6.2 Agricultural inputs
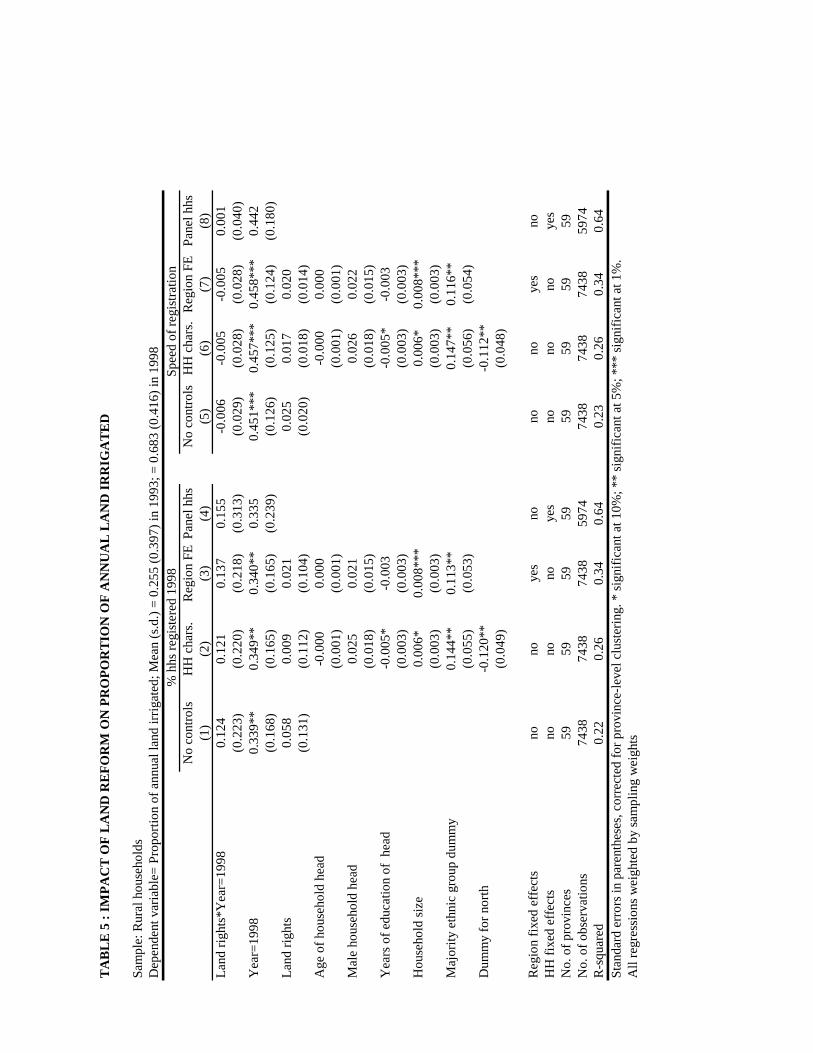
Table 6 shows that households in provinces with greater land rights increase the proportion of
irrigated annual crop area by about 12 percentage points as compared to those in provinces with
lesser extent of formal land rights.13 However, this figure is not statistically significant. Regressions
using the speed of land reform variable also do not yield a significant coefficient. We also do not
see much impact of the land reform on other measures of short-term agricultural investments such
as fertilizer or pesticide usage (results not shown).
7 Impact on credit and land markets
In this section, we check whether the land law has an impact on credit markets. Recall that having
a pledgeable land use certificate was expected to increase a household’s access to credit, especially
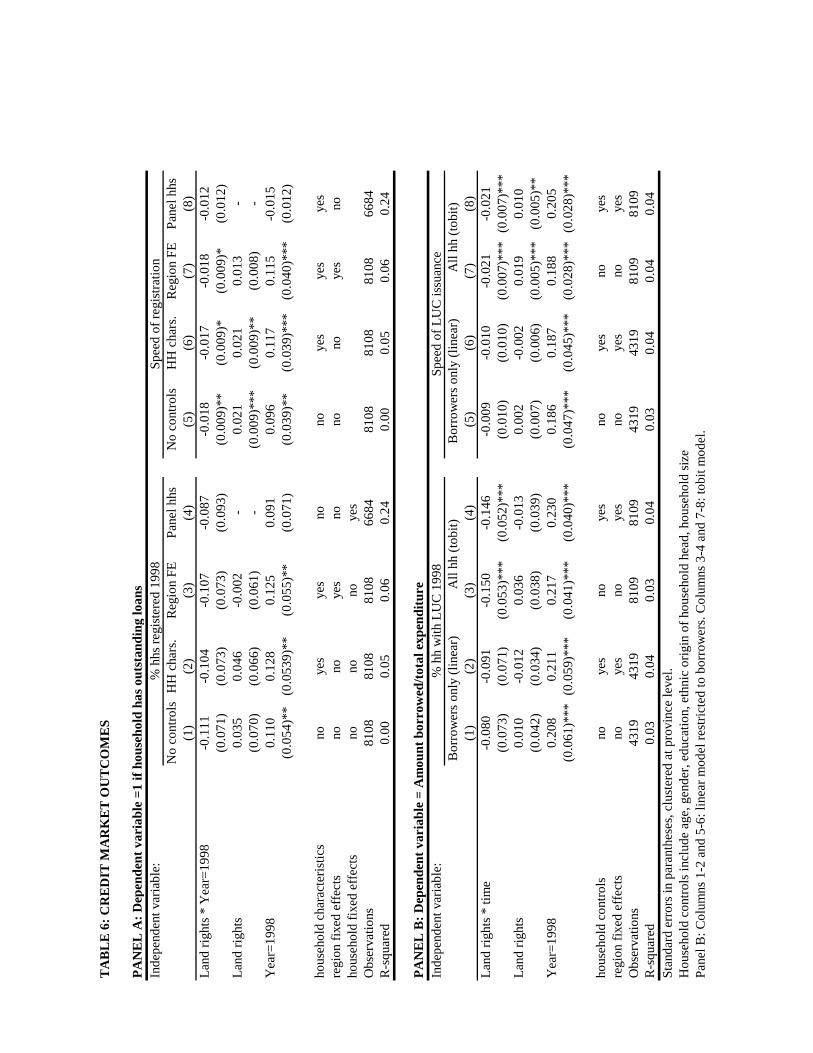
from formal sources like banks and credit cooperative. Table 6, however, shows that the issuance of
LUCs leads to households being less likely to have an outstanding loan. Approximately half of all
households have outstanding loans (51% in 1993 and 54% in 1998): the probability of having a loan
goes down by 11 percentage points when a province implements the land reform fully. Households
in highly-registered provinces also have lower amounts borrowed (as a fraction of total household
expenditure). These results hold overall (statistically significant with a tobit specification) and
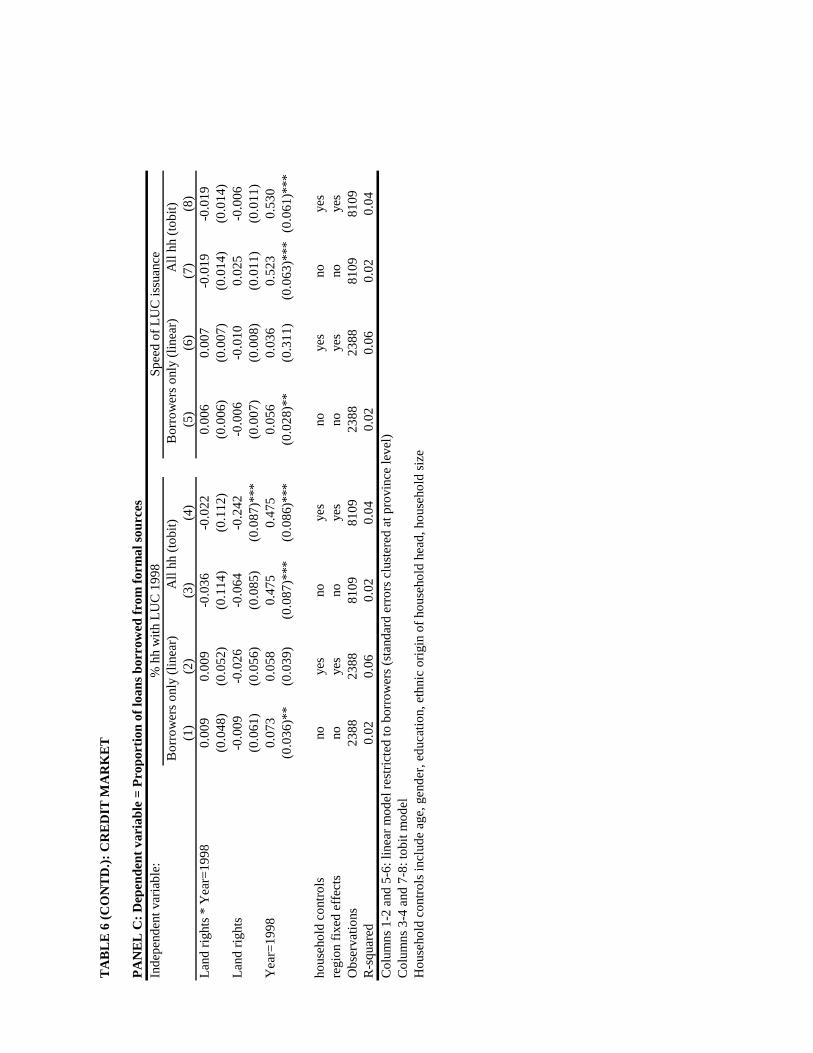
within the sample of borrowers only (statistically insignificant). Further, we see that there is no
change in the fraction of loans from formal sources.
Overall, these results do not suggest a positive impact of the LUC on households’ ability
to borrow in the post-reform period. This is not because households in high-issuance provinces13We are unable to get a measure of how much of the perennial crop land was irrigated, since the 1993 survey asks
this question only for annual crop land.
16
are richer than households in low-issuance provinces: Table 7 shows that households in high-
issuance provinces show a smaller increase in real household expenditure than those in low-issuance
provinces. The lack of an impact on the credit market could be because lenders perceive that land
is hard to seize in case of a default; or because households are restricted in their borrowings once
they have an LUC (because they need to give this to the first lender and cannot pledge the same
land as collateral for another loan); or because credit market institutions are not fully developed
to take advantage of these new rights in land (the major lender in rural areas is the state-owned
Vietnam Bank for Agriculture and Rural Development). We are in the process of investigating
these hypotheses further.
We would also like to investigate whether the land law facilitated land transfers, thereby
making the land market more efficient. Unfortunately, evidence on land market transactions is
hard to come by because of substantial underreporting by respondents. This is mainly because of
the high tax imposed on land transactions. Nevertheless, there seems to be an increase in land
market transactions between 1993 and 1998: the proportion of households who report receiving
land increases ten-fold from 2.5 percent in 1993 to 25 percent in 1998, a similar ten-fold increase
is seen for households reporting sales of land (from 1 percent to 10 percent). This could however
simply reflect less under-reporting after the law was passed. The increase does not seem to be
very different across high issuance vs. low issuance provinces (see Table 8). The participation
of households in the land rental market also increases between 1993 and 1998, but again, is not
systematically related to the progress of land certificate issuance.14
A preliminary analysis of land distribution suggests that there has not been much change
over time. In particular, there is not much evidence that formalizing land rights creates increasing
landlessness (because people are now able to sell land in times of need). The proportion of landless
households decreases from 11.4% to about 7%. High-issuance provinces have slightly lower levels
of landlessness in 1993 itself, but the changes are similar across high-issuance and low-issuance
provinces. Further, province-level Gini coefficients of land ownership also decline over time.15 The
decrease is mainly for provinces in the South (from 0.58 to 0.50) which started at much higher
levels of inequality than the North, where the Gini remains constant at around 0.37. There is no14The data on renting are not fully comparable across the two surveys: the 1993 survey asks separately about land
rented in and land sharecropped, while the 1998 survey does not ask about sharecropping. Figures reported in the
table include sharecropping in 1993.15This might indicate that the increase in land transactions mentioned earlier may be primarily driven by an
increase in reporting, rather than an increase in the actual volume of transactions.
17
difference in the change in Gini by province registration levels.
8 Conclusion
We study a land reform which makes land rights secure, pledgeable and tradable and show that it has
a statistically significant impact on the decisions of households to undertake long-term agricultural
investments. However, we do not find any significant impact on the intensive margin on measures of
short-term investments. Contrary to results obtained in some other countries, we find no evidence
that land titles increase access to credit on the part of poor households; neither are they significant
determinants of land market activity. However, we cannot rule out the possibility that the reform
might lead to significant changes in the functioning of the land and credit markets over time.
18
References
Acemoglu, Daron, Simon Johnson, and James A. Robinson (2001) ‘The colonial origins of compar-
ative development: An empirical investigation.’ American Economic Review 91(5), 1369–1401
Alston, Lee, Gary Libecap, and Robert Schneider (1996) ‘The determinants and impact of property
rights: land titles on the Brazilian frontier.’ Journal of Law, Economics and Organization
12(1), 25–61
Asian Development Bank (1998) ‘Vietnam land information system and agricultural taxation study.’
TA 2225-VIE
Bertrand, Marianne, Esther Duflo, and Sendhil Mullainathan (2002) ‘How much should we trust
differences-in-differences estimates?’ NBER Working Paper
Besley, Timothy (1995) ‘Property rights and investment incentives: theory and evidence from
Ghana.’ Journal of Political Economy 103(5), 903–937
Boothroyd, Peter, and Pham Xuan Nam (2000) Socioeconomic renovation in Vietnam: The Origin,
Evolution and Impact of Doi Moi (Ottawa, Canada: International Development Research
Center)
Boucher, Steve, Brad Barham, Michael Carter, and Juan Sebastian Chamorro (2002) ‘Market-
friendly reforms and the operation of credit and land markets in Central America.’ mimeo
Braselle, Anne-Sophie, Frederic Gaspart, and Jean-Philippe Platteau (2002) ‘Land tenure security
and investment incentives: puzzling evidence from Burkina Faso.’ Journal of Development
Economics 67, 373–418
De Soto, Hernando (2000) The Mystery of Capital: Why Capitalism Triumphs in the West and
Fails Everywhere Else (New York, NY: Basic Books)
Dollar, David, and Jennie Litvack (1998) ‘Macroeconomic reform and poverty reduction in Viet-
nam.’ In Household Welfare and Vietnam’s Transition, ed. David Dollar, Paul Glewwe, and
Jennie Litvack (Washington DC: World Bank)
Field, Erica, and Maximo Torero (2002) ‘Do property titles increase credit access among the urban
poor? Evidence from Peru.’ mimeo
19
Haque, T., and L. Montesi (1996) ‘Tenurial reforms and agricultural development in Vietnam.’
Land Reform Bulletin, Food and Agricultural Organization
Hayami, Yujiro (1993) ‘Strategies for the reform of land property relations in Vietnam.’ mimeo
Knack, Steven, and Philip Keefer (1995) ‘Institutions and economic performance: Cross-country
tests using alternative measures.’ Economics and Politics 7, 207–227
North, Douglass C., and Robert P. Thomas (1973) The Rise of the Western World: A New Eco-
nomic History (Cambridge University Press)
Pingali, Prabhu L., and Vo-Tong Xuan (1992) ‘Vietnam: Decollectivization and rice productivity
growth.’ Economic Development and Cultural Change pp. 697–718
Ravallion, Martin, and Dominique van de Walle (2001) ‘Breaking up the collective farm: Welfare
outcomes of Viet Nam’s massive land privatization.’ Mimeo
SMERU Research Team (2002) ‘An impact evaluation of systematic land titling under the Land
Administration Project(LAP).’ mimeo
Vo, Dang Hung (1997) ‘Land administration reform in Vietnam.’ Presented at FIG Commission 7
Symposium
Wiegersma, Nancy (1988) Vietnam: Peasant Land, Peasant Revolution: Patriarchy and Collectivity
in the Rural economy (New York, NY: St. Martin’s Press)
20
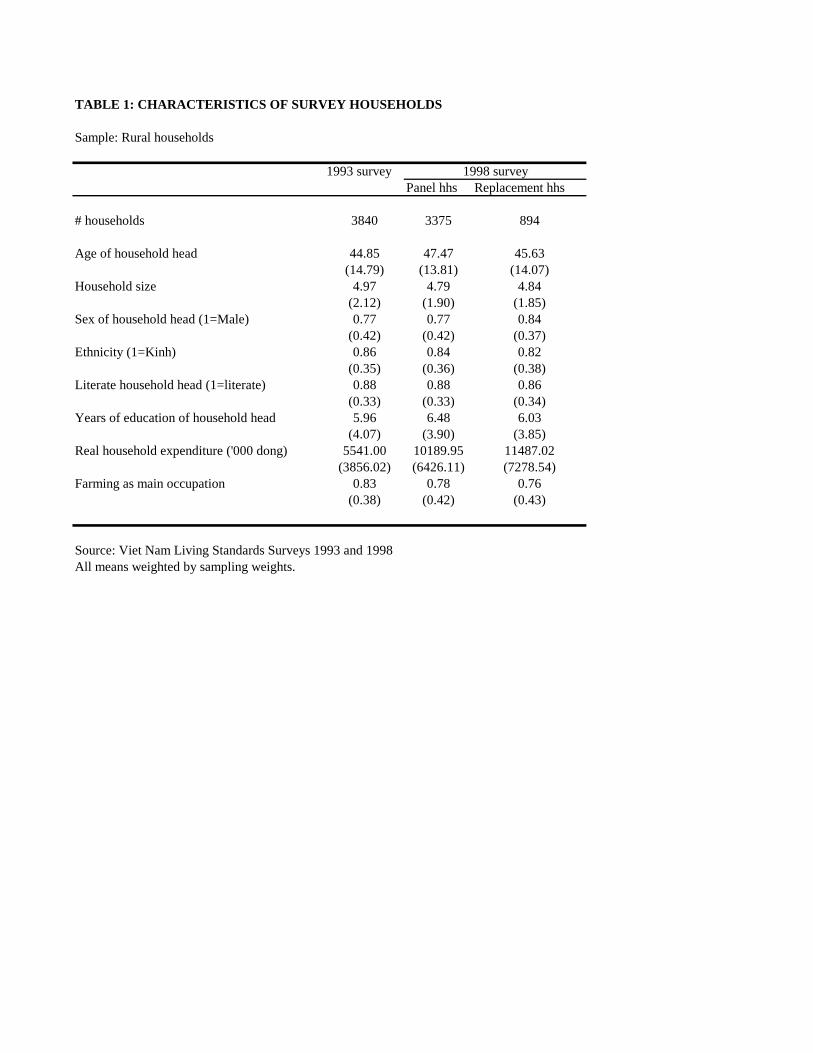
TABLE 1: CHARACTERISTICS OF SURVEY HOUSEHOLDS
Sample: Rural households
1993 surveyPanel hhs Replacement hhs
# households 3840 3375 894
Age of household head 44.85 47.47 45.63(14.79) (13.81) (14.07)
Household size 4.97 4.79 4.84(2.12) (1.90) (1.85)
Sex of household head (1=Male) 0.77 0.77 0.84(0.42) (0.42) (0.37)
Ethnicity (1=Kinh) 0.86 0.84 0.82(0.35) (0.36) (0.38)
Literate household head (1=literate) 0.88 0.88 0.86(0.33) (0.33) (0.34)
Years of education of household head 5.96 6.48 6.03(4.07) (3.90) (3.85)
Real household expenditure ('000 dong) 5541.00 10189.95 11487.02(3856.02) (6426.11) (7278.54)
Farming as main occupation 0.83 0.78 0.76(0.38) (0.42) (0.43)
Source: Viet Nam Living Standards Surveys 1993 and 1998All means weighted by sampling weights.
1998 survey
TA
BL
E 2
: M
EA
SUR
ES
OF
LA
ND
RIG
HT
S
Pan
el A
Mea
nN
orth
Sout
hM
inM
axY
ear
25%
50%
75%
1994
0.23
70.
246
0.22
70.
001
0.91
419
9421
84
1995
0.36
70.
345
0.39
10.
040
0.96
019
9512
82
1996
0.43
50.
404
0.46
90.
074
0.95
219
9611
98
1997
0.63
20.
597
0.66
70.
111
1.00
019
9713
1814
1998
0.71
30.
687
0.74
00.
119
1.00
019
983
510
2000
0.90
20.
893
0.91
10.
533
1.00
020
001
1318
6161
56
Pan
el C
Cor
rela
tion
am
ong
regi
stra
tion
mea
sure
s an
d m
anpo
wer
mea
sure
s
% h
h re
gist
ered
199
81.
000
% h
hs r
egis
tere
d 19
960.
644
1.00
0%
hhs
reg
iste
red
1994
0.37
60.
595
1.00
0Y
ears
sin
ce r
eg>
25%
0.49
20.
691
0.69
71.
000
Yea
rs s
ince
reg
> 5
0%0.
828
0.79
90.
648
0.61
91.
000
Off
icia
ls/c
omm
une
1994
0.10
2-0
.033
-0.0
50-0
.016
0.07
21.
000
Off
icia
ls/c
omm
une
1998
0.11
30.
250
-0.0
870.
136
0.11
10.
062
1.00
0O
ffic
ials
/100
0 hh
s 19
940.
081
-0.1
180.
077
-0.0
160.
070
0.46
5-0
.070
1.00
0O
ffic
ials
/100
0 hh
s 19
98-0
.007
-0.0
510.
110
0.07
60.
015
-0.0
180.
304
0.70
2
Not
es: F
igur
es c
ompu
ted
by a
utho
rs f
rom
dat
a pr
ovid
ed b
y G
ener
al D
epar
tmen
t of
Lan
d A
dmin
istr
atio
n, H
anoi
. P
ropo
rtio
n of
hou
seho
lds
regi
ster
ed in
Pan
el A
ref
ers
to th
e nu
mbe
r of
hou
seho
lds
who
pos
sess
a L
and
Use
Cer
tific
ate
as a
fra
ctio
n of
the
tota
l num
ber
of
hous
ehol
ds. F
or 1
996,
199
8 an
d 20
00, G
DL
A p
rovi
ded
the
tota
l num
ber
of h
ouse
hold
s. F
or th
e re
mai
ning
yea
rs, t
otal
num
ber
of h
ouse
hold
sis
est
imat
ed b
y au
thor
s ba
sed
on to
tal n
umbe
r of
agr
icul
tura
l hou
seho
lds.
The
ent
ries
in P
anel
B a
re th
e nu
mbe
r of
pro
vinc
es in
whi
ch th
e pr
opor
tion
of h
ouse
hold
s re
gist
ered
cro
sses
the
spec
ifie
d th
resh
old
(25%
, 50%
, 75%
).E
.g. 2
1 pr
ovin
ces
cros
sed
the
25%
thre
shol
d in
199
4, 1
2 pr
ovin
ces
cros
sed
it in
199
5 et
c."Y
ears
sin
ce r
eg>
25%
" is
200
1 m
inus
the
year
in w
hich
LU
C is
suan
ce in
the
prov
ince
exc
eede
d 25
%.
"Off
icia
ls/c
omm
une"
is th
e nu
mbe
r of
land
dep
artm
ent o
ffic
ials
in th
e pr
ovin
ce d
ivid
ed b
y th
e to
tal n
umbe
r of
com
mun
es in
the
prov
ince
."O
ffic
ials
/100
0 hh
s" is
the
num
ber
of la
nd d
epar
tmen
t off
icia
ls in
the
prov
ince
div
ided
by
the
tota
l num
ber
of a
gric
ultu
ral h
ouse
hold
s.
Pro
port
ion
of h
ouse
hold
s re
gist
ered
Pan
el B
# pr
ovin
ces
whe
re L
UC
issu
ance
exc
eeds
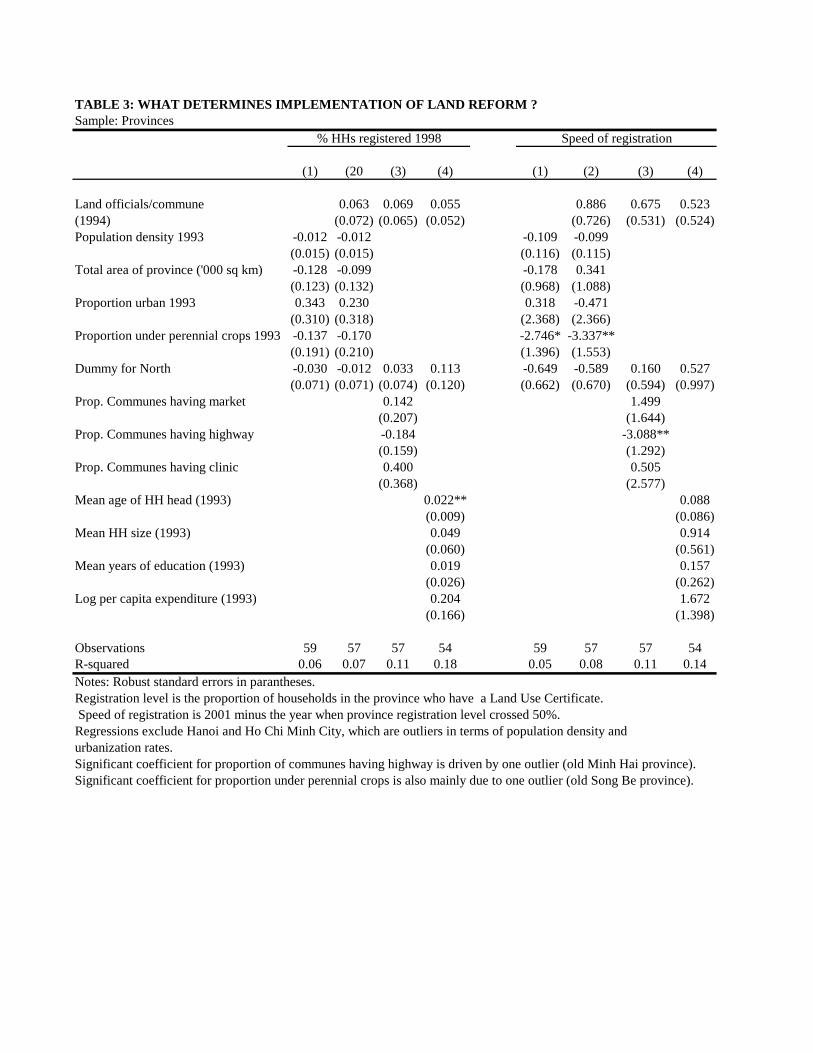
TABLE 3: WHAT DETERMINES IMPLEMENTATION OF LAND REFORM ?Sample: Provinces
(1) (20 (3) (4) (1) (2) (3) (4)
Land officials/commune 0.063 0.069 0.055 0.886 0.675 0.523(1994) (0.072) (0.065) (0.052) (0.726) (0.531) (0.524)Population density 1993 -0.012 -0.012 -0.109 -0.099
(0.015) (0.015) (0.116) (0.115)Total area of province ('000 sq km) -0.128 -0.099 -0.178 0.341
(0.123) (0.132) (0.968) (1.088)Proportion urban 1993 0.343 0.230 0.318 -0.471
(0.310) (0.318) (2.368) (2.366)Proportion under perennial crops 1993 -0.137 -0.170 -2.746* -3.337**
(0.191) (0.210) (1.396) (1.553)Dummy for North -0.030 -0.012 0.033 0.113 -0.649 -0.589 0.160 0.527
(0.071) (0.071) (0.074) (0.120) (0.662) (0.670) (0.594) (0.997)Prop. Communes having market 0.142 1.499
(0.207) (1.644)Prop. Communes having highway -0.184 -3.088**
(0.159) (1.292)Prop. Communes having clinic 0.400 0.505
(0.368) (2.577)Mean age of HH head (1993) 0.022** 0.088
(0.009) (0.086)Mean HH size (1993) 0.049 0.914
(0.060) (0.561)Mean years of education (1993) 0.019 0.157
(0.026) (0.262)Log per capita expenditure (1993) 0.204 1.672
(0.166) (1.398)
Observations 59 57 57 54 59 57 57 54R-squared 0.06 0.07 0.11 0.18 0.05 0.08 0.11 0.14Notes: Robust standard errors in parantheses.Registration level is the proportion of households in the province who have a Land Use Certificate. Speed of registration is 2001 minus the year when province registration level crossed 50%. Regressions exclude Hanoi and Ho Chi Minh City, which are outliers in terms of population density and urbanization rates. Significant coefficient for proportion of communes having highway is driven by one outlier (old Minh Hai province).Significant coefficient for proportion under perennial crops is also mainly due to one outlier (old Song Be province).
Speed of registration% HHs registered 1998
TA
BL
E 4
: I
MP
AC
T O
F L
AN
D R
EF
OR
M O
N C
RO
P C
HO
ICE
Sam
ple:
Rur
al h
ouse
hold
s
No
cont
rols
HH
cha
rs.
Reg
ion
FE
Pan
el h
hsN
o co
ntro
lsH
H c
hars
.R
egio
n F
EP
anel
hhs
(1)
(2)
(3)
(4)
(5)
(6)
(7)
(8)
Lan
d ri
ghts
*Yea
r=19
980.
080*
**0.
075*
**0.
075*
**0.
053*
0.01
2**
0.01
3***
0.01
3**
0.00
9*(0
.025
)(0
.024
)(0
.025
)(0
.031
)(0
.005
)(0
.005
)(0
.005
)(0
.005
)Y
ear=
1998
-0.0
33-0
.033
*-0
.033
*-0
.014
-0.0
22-0
.028
*-0
.029
*-0
.010
(0.0
20)
(0.0
17)
(0.0
17)
(0.0
20)
(0.0
17)
(0.0
16)
(0.0
17)
(0.0
17)
Lan
d ri
ghts
0.03
8-0
.012
-0.0
110.
006
-0.0
05-0
.010
*(0
.047
)(0
.037
)(0
.027
)(0
.006
)(0
.005
)(0
.006
)A
ge o
f ho
useh
old
head
0.00
1***
0.00
2***
0.00
1***
0.00
2***
(0.0
00)
(0.0
00)
(0.0
00)
(0.0
00)
Mal
e ho
useh
old
head
-0.0
19*
-0.0
20**
-0.0
19*
-0.0
21**
(0.0
11)
(0.0
10)
(0.0
11)
(0.0
10)
Yea
rs o
f ed
ucat
ion
of h
ead
0.00
8***
0.00
8***
0.00
8***
0.00
8***
(0.0
02)
(0.0
02)
(0.0
02)
(0.0
02)
Hou
seho
ld s
ize
-0.0
01-0
.002
-0.0
01-0
.003
(0.0
02)
(0.0
02)
(0.0
03)
(0.0
02)
Maj
ority
eth
nic
grou
p du
mm
y-0
.006
0.00
3-0
.005
0.00
3(0
.030
)(0
.030
)(0
.029
)(0
.029
)D
umm
y fo
r no
rth
-0.1
95**
*-0
.195
***
(0.0
39)
(0.0
42)
Tot
al a
rea
culti
vate
d (*
10-5
)-0
.148
*-0
.208
**-0
.154
-0.2
14**
(0.0
88)
(0.0
90)
(0.0
94)
(0.0
95)
Reg
ion
fixe
d ef
fect
sno
noye
sno
nono
yes
noH
ouse
hold
fix
ed e
ffec
tsno
nono
yes
nono
noye
sN
o. o
f ob
serv
atio
ns74
6974
6974
6960
1274
6974
6974
6960
12N
o. o
f pr
ovin
ces
5959
5959
5959
5959
R-s
quar
ed0.
010.
150.
220.
800.
010.
160.
220.
80
Stan
dard
err
ors
in p
aren
thes
es, c
orre
cted
for
pro
vinc
e-le
vel c
lust
erin
g.*
sign
ific
ant a
t 10%
; **
sign
ific
ant a
t 5%
; ***
sig
nifi
cant
at 1
%A
ll re
gres
sion
s w
eigh
ted
by s
ampl
ing
wei
ghts
Dep
ende
nt v
aria
ble
=P
ropo
rtio
n of
tota
l cul
tiva
ted
area
dev
oted
to p
eren
nial
indu
stri
al c
rops
and
fru
it c
rops
Spee
d of
reg
istr
atio
nM
ean
(s.d
.) o
f de
p. v
ar. i
n 19
93 =
0.0
938
(0.2
049)
in 1
993;
0.1
185
(0.2
565)
in 1
998
% h
hs r
egis
tere
d 19
98
TA
BL
E 5
: I
MP
AC
T O
F L
AN
D R
EF
OR
M O
N P
RO
PO
RT
ION
OF
AN
NU
AL
LA
ND
IR
RIG
AT
ED
Sam
ple:
Rur
al h
ouse
hold
sD
epen
dent
var
iabl
e= P
ropo
rtio
n of
ann
ual l
and
irri
gate
d; M
ean
(s.d
.) =
0.2
55 (
0.39
7) in
199
3; =
0.6
83 (
0.41
6) in
199
8
No
cont
rols
HH
cha
rs.
Reg
ion
FEP
anel
hhs
No
cont
rols
HH
cha
rs.
Reg
ion
FEP
anel
hhs
(1)
(2)
(3)
(4)
(5)
(6)
(7)
(8)
Lan
d ri
ghts
*Yea
r=19
980.
124
0.12
10.
137
0.15
5-0
.006
-0.0
05-0
.005
0.00
1(0
.223
)(0
.220
)(0
.218
)(0
.313
)(0
.029
)(0
.028
)(0
.028
)(0
.040
)Y
ear=
1998
0.33
9**
0.34
9**
0.34
0**
0.33
50.
451*
**0.
457*
**0.
458*
**0.
442
(0.1
68)
(0.1
65)
(0.1
65)
(0.2
39)
(0.1
26)
(0.1
25)
(0.1
24)
(0.1
80)
Lan
d ri
ghts
0.05
80.
009
0.02
10.
025
0.01
70.
020
(0.1
31)
(0.1
12)
(0.1
04)
(0.0
20)
(0.0
18)
(0.0
14)
Age
of
hous
ehol
d he
ad-0
.000
0.00
0-0
.000
0.00
0(0
.001
)(0
.001
)(0
.001
)(0
.001
)M
ale
hous
ehol
d he
ad0.
025
0.02
10.
026
0.02
2(0
.018
)(0
.015
)(0
.018
)(0
.015
)Y
ears
of
educ
atio
n of
hea
d-0
.005
*-0
.003
-0.0
05*
-0.0
03(0
.003
)(0
.003
)(0
.003
)(0
.003
)H
ouse
hold
siz
e0.
006*
0.00
8***
0.00
6*0.
008*
**(0
.003
)(0
.003
)(0
.003
)(0
.003
)M
ajor
ity e
thni
c gr
oup
dum
my
0.14
4**
0.11
3**
0.14
7**
0.11
6**
(0.0
55)
(0.0
53)
(0.0
56)
(0.0
54)
Dum
my
for
nort
h-0
.120
**-0
.112
**(0
.049
)(0
.048
)
Reg
ion
fixe
d ef
fect
sno
noye
sno
nono
yes
noH
H f
ixed
eff
ects
nono
noye
sno
nono
yes
No.
of
prov
ince
s59
5959
5959
5959
59N
o. o
f ob
serv
atio
ns74
3874
3874
3859
7474
3874
3874
3859
74R
-squ
ared
0.22
0.26
0.34
0.64
0.23
0.26
0.34
0.64
Stan
dard
err
ors
in p
aren
thes
es, c
orre
cted
for
pro
vinc
e-le
vel c
lust
erin
g. *
sig
nifi
cant
at 1
0%; *
* si
gnif
ican
t at 5
%; *
** s
igni
fica
nt a
t 1%
.A
ll re
gres
sion
s w
eigh
ted
by s
ampl
ing
wei
ghts
% h
hs r
egis
tere
d 19
98Sp
eed
of r
egis
trat
ion
TA
BL
E 6
: C
RE
DIT
MA
RK
ET
OU
TC
OM
ES
PA
NE
L A
: D
epen
dent
var
iabl
e =1
if h
ouse
hold
has
out
stan
ding
loan
sIn
depe
nden
t var
iabl
e:
No
cont
rols
HH
cha
rs.
Reg
ion
FEP
anel
hhs
No
cont
rols
HH
cha
rs.
Reg
ion
FEP
anel
hhs
(1)
(2)
(3)
(4)
(5)
(6)
(7)
(8)
Lan
d ri
ghts
* Y
ear=
1998
-0.1
11-0
.104
-0.1
07-0
.087
-0.0
18-0
.017
-0.0
18-0
.012
(0.0
71)
(0.0
73)
(0.0
73)
(0.0
93)
(0.0
09)*
*(0
.009
)*(0
.009
)*(0
.012
)L
and
righ
ts0.
035
0.04
6-0
.002
-0.
021
0.02
10.
013
-(0
.070
)(0
.066
)(0
.061
)-
(0.0
09)*
**(0
.009
)**
(0.0
08)
-Y
ear=
1998
0.11
00.
128
0.12
50.
091
0.09
60.
117
0.11
5-0
.015
(0.0
54)*
*(0
.053
9)**
(0.0
55)*
*(0
.071
)(0
.039
)**
(0.0
39)*
**(0
.040
)***
(0.0
12)
hous
ehol
d ch
arac
teri
stic
sno
yes
yes
nono
yes
yes
yes
regi
on f
ixed
eff
ects
nono
yes
nono
noye
sno
hous
ehol
d fi
xed
effe
cts
nono
noye
sO
bser
vatio
ns81
0881
0881
0866
8481
0881
0881
0866
84R
-squ
ared
0.00
0.05
0.06
0.24
0.00
0.05
0.06
0.24
PA
NE
L B
: D
epen
dent
var
iabl
e =
Am
ount
bor
row
ed/t
otal
exp
endi
ture
Inde
pend
ent v
aria
ble:
(1)
(2)
(3)
(4)
(5)
(6)
(7)
(8)
Lan
d ri
ghts
* ti
me
-0.0
80-0
.091
-0.1
50-0
.146
-0.0
09-0
.010
-0.0
21-0
.021
(0.0
73)
(0.0
71)
(0.0
53)*
**(0
.052
)***
(0.0
10)
(0.0
10)
(0.0
07)*
**(0
.007
)***
Lan
d ri
ghts
0.01
0-0
.012
0.03
6-0
.013
0.00
2-0
.002
0.01
90.
010
(0.0
42)
(0.0
34)
(0.0
38)
(0.0
39)
(0.0
07)
(0.0
06)
(0.0
05)*
**(0
.005
)**
Yea
r=19
980.
208
0.21
10.
217
0.23
00.
186
0.18
70.
188
0.20
5(0
.061
)***
(0.0
59)*
**(0
.041
)***
(0.0
40)*
**(0
.047
)***
(0.0
45)*
**(0
.028
)***
(0.0
28)*
**
hous
ehol
d co
ntro
lsno
yes
noye
sno
yes
noye
sre
gion
fix
ed e
ffec
tsno
yes
noye
sno
yes
noye
sO
bser
vatio
ns43
1943
1981
0981
0943
1943
1981
0981
09R
-squ
ared
0.03
0.04
0.03
0.04
0.03
0.04
0.04
0.04
Sta
ndar
d er
rors
in p
aran
thes
es, c
lust
ered
at p
rovi
nce
leve
l. H
ouse
hold
con
trol
s in
clud
e ag
e, g
ende
r, e
duca
tion,
eth
nic
orig
in o
f ho
useh
old
head
, hou
seho
ld s
ize
Pan
el B
: Col
umns
1-2
and
5-6
: lin
ear
mod
el r
estr
icte
d to
bor
row
ers.
Col
umns
3-4
and
7-8
: tob
it m
odel
.
% h
hs r
egis
tere
d 19
98Sp
eed
of r
egis
trat
ion
Spe
ed o
f L
UC
issu
ance
% h
h w
ith L
UC
199
8B
orro
wer
s on
ly (
linea
r)A
ll hh
(to
bit)
Bor
row
ers
only
(lin
ear)
All
hh (
tobi
t)
TA
BL
E 6
(C
ON
TD
.):
CR
ED
IT M
AR
KE
T
PA
NE
L C
: D
epen
dent
var
iabl
e =
Pro
port
ion
of lo
ans
borr
owed
fro
m f
orm
al s
ourc
esIn
depe
nden
t var
iabl
e:
(1)
(2)
(3)
(4)
(5)
(6)
(7)
(8)
Lan
d ri
ghts
* Y
ear=
1998
0.00
90.
009
-0.0
36-0
.022
0.00
60.
007
-0.0
19-0
.019
(0.0
48)
(0.0
52)
(0.1
14)
(0.1
12)
(0.0
06)
(0.0
07)
(0.0
14)
(0.0
14)
Lan
d ri
ghts
-0.0
09-0
.026
-0.0
64-0
.242
-0.0
06-0
.010
0.02
5-0
.006
(0.0
61)
(0.0
56)
(0.0
85)
(0.0
87)*
**(0
.007
)(0
.008
)(0
.011
)(0
.011
)Y
ear=
1998
0.07
30.
058
0.47
50.
475
0.05
60.
036
0.52
30.
530
(0.0
36)*
*(0
.039
)(0
.087
)***
(0.0
86)*
**(0
.028
)**
(0.3
11)
(0.0
63)*
**(0
.061
)***
hous
ehol
d co
ntro
lsno
yes
noye
sno
yes
noye
sre
gion
fix
ed e
ffec
tsno
yes
noye
sno
yes
noye
sO
bser
vatio
ns23
8823
8881
0981
0923
8823
8881
0981
09R
-squ
ared
0.02
0.06
0.02
0.04
0.02
0.06
0.02
0.04
Col
umns
1-2
and
5-6
: lin
ear
mod
el r
estr
icte
d to
bor
row
ers
(sta
ndar
d er
rors
clu
ster
ed a
t pro
vinc
e le
vel)
Col
umns
3-4
and
7-8
: tob
it m
odel
Hou
seho
ld c
ontr
ols
incl
ude
age,
gen
der,
edu
catio
n, e
thni
c or
igin
of
hous
ehol
d he
ad, h
ouse
hold
siz
e
% h
h w
ith L
UC
199
8Sp
eed
of L
UC
issu
ance
Bor
row
ers
only
(lin
ear)
All
hh (
tobi
t)B
orro
wer
s on
ly (
linea
r)A
ll hh
(to
bit)
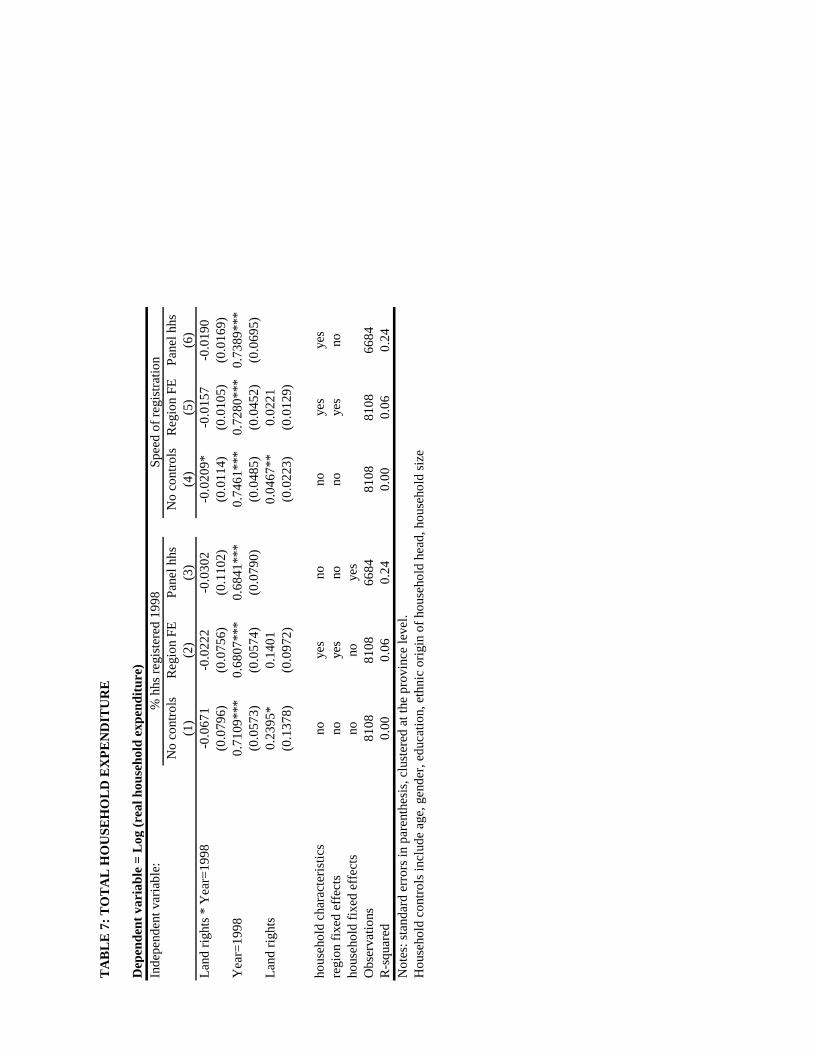
TA
BL
E 7
: T
OT
AL
HO
USE
HO
LD
EX
PE
ND
ITU
RE
Dep
ende
nt v
aria
ble
= L
og (
real
hou
seho
ld e
xpen
ditu
re)
Inde
pend
ent v
aria
ble:
N
o co
ntro
lsR
egio
n FE
Pan
el h
hsN
o co
ntro
lsR
egio
n FE
Pan
el h
hs(1
)(2
)(3
)(4
)(5
)(6
)L
and
righ
ts *
Yea
r=19
98-0
.067
1-0
.022
2-0
.030
2-0
.020
9*-0
.015
7-0
.019
0(0
.079
6)(0
.075
6)(0
.110
2)(0
.011
4)(0
.010
5)(0
.016
9)Y
ear=
1998
0.71
09**
*0.
6807
***
0.68
41**
*0.
7461
***
0.72
80**
*0.
7389
***
(0.0
573)
(0.0
574)
(0.0
790)
(0.0
485)
(0.0
452)
(0.0
695)
Lan
d ri
ghts
0.23
95*
0.14
010.
0467
**0.
0221
(0.1
378)
(0.0
972)
(0.0
223)
(0.0
129)
hous
ehol
d ch
arac
teri
stic
sno
yes
nono
yes
yes
regi
on f
ixed
eff
ects
noye
sno
noye
sno
hous
ehol
d fi
xed
effe
cts
nono
yes
Obs
erva
tions
8108
8108
6684
8108
8108
6684
R-s
quar
ed0.
000.
060.
240.
000.
060.
24N
otes
: sta
ndar
d er
rors
in p
aren
thes
is, c
lust
ered
at t
he p
rovi
nce
leve
l.H
ouse
hold
con
trol
s in
clud
e ag
e, g
ende
r, e
duca
tion,
eth
nic
orig
in o
f ho
useh
old
head
, hou
seho
ld s
ize
% h
hs r
egis
tere
d 19
98Sp
eed
of r
egis
trat
ion
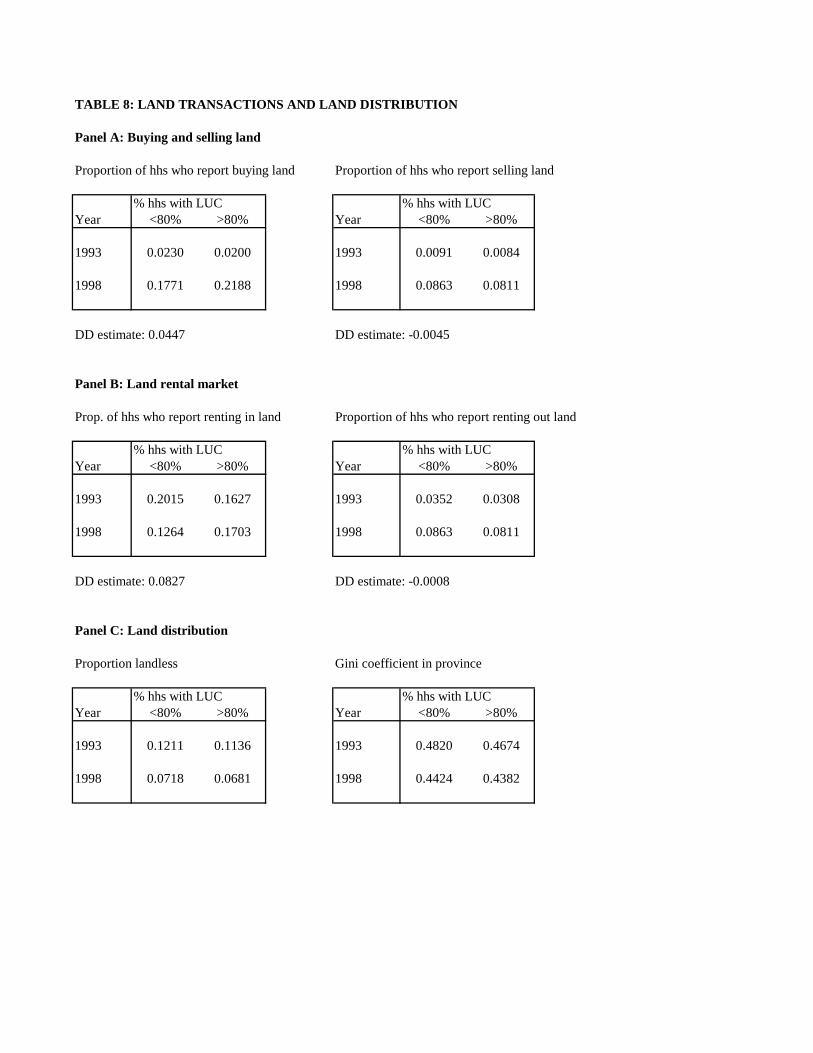
TABLE 8: LAND TRANSACTIONS AND LAND DISTRIBUTION
Panel A: Buying and selling land
Proportion of hhs who report buying land Proportion of hhs who report selling land
% hhs with LUC % hhs with LUCYear <80% >80% Year <80% >80%
1993 0.0230 0.0200 1993 0.0091 0.0084
1998 0.1771 0.2188 1998 0.0863 0.0811
DD estimate: 0.0447 DD estimate: -0.0045
Panel B: Land rental market
Prop. of hhs who report renting in land Proportion of hhs who report renting out land
% hhs with LUC % hhs with LUCYear <80% >80% Year <80% >80%
1993 0.2015 0.1627 1993 0.0352 0.0308
1998 0.1264 0.1703 1998 0.0863 0.0811
DD estimate: 0.0827 DD estimate: -0.0008
Panel C: Land distribution
Proportion landless Gini coefficient in province
% hhs with LUC % hhs with LUCYear <80% >80% Year <80% >80%
1993 0.1211 0.1136 1993 0.4820 0.4674
1998 0.0718 0.0681 1998 0.4424 0.4382
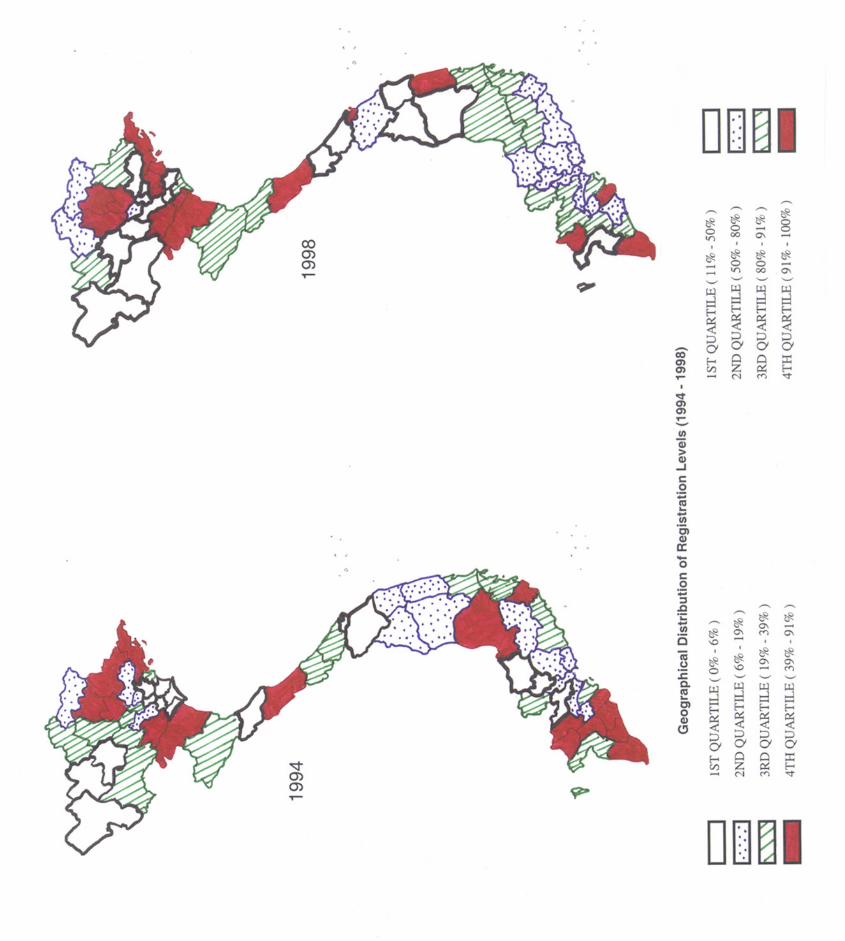
Copyright © 2022 FDOKUMEN