Lake Redó ecosystem response to an increasing warming the Pyrenees during the twentieth century
18
Journal of Paleolimnology 28: 129–145, 2002. © 2002 Kluwer Academic Publishers. Printed in the Netherlands. Lake Redó ecosystem response to an increasing warming in the Pyrenees during the twentieth century J. Catalan 1,* , S. Pla 1 , M. Rieradevall 1 , M. Felip 1 , M. Ventura 1 , T. Buchaca 1 , L. Camarero 1 , A. Brancelj 2 , P.G. Appleby 3 , A. Lami 4 , J.A. Grytnes 5 , A. Agustí-Panareda 6 & R. Thompson 6 1 Department of Ecology, University of Barcelona, Diagonal 645, 08028 Barcelona, Spain (E-mail: [email protected]) 2 Laboratory for Freshwater and Terrestrial Ecosystems Research, National Institute of Biology. Vecna pot 111. Ljubljana 1000, Slovenia 3 Department of Mathematical Sciences, University of Liverpool, P.O. Box 147, Liverpool L69 3BX, UK 4 CNR – Ist. Ital. Idrobiol, Largo Tonolli, 50, Verbania-Pallanza, Italy 5 Botanical Institute, University of Bergen, Allégaten 41, N-5007 Bergen, Norway 6 Department of Geology and Geophysics, University of Edinburgh, West Main Road, Edinburgh EH9 3JW, Scotland, UK *Present address: CEAB-CSIC, Accés Cala St. Francesc 14, 17300 Blanes, Spain Received 6 December 1999; accepted 9 January 2002 Key words: climate change, alpine lake, paleolimnology, lake sediments, fossil pigments, diatoms, cladocera, chironomids, chrysophytes, long-term lake dynamics Abstract The ecosystem response of Lake Redó (Central Pyrenees) to fluctuations in seasonal air temperature during the last two centuries was investigated by comparison of reconstructed air temperatures with the sediment record. Fine slicing allowed a resolution of 3–6 years according to the 210 Pb dating, although it was still difficult to easily inves- tigate the response to air temperature forcing, since extreme fluctuations in temperature occur on interannual time- scales. However, the resolution was sufficient to show responses on decadal and century scales. An overall tendency to warming in mean annual temperature in the Central Pyrenees has been caused by summer and in particular by autumn increases. Many of the measured sediment variables apparently responded to these long term trends, but the significance of the relationships was highly conditioned by the structure of the data. The variables responding most on the finer time scales were the microfossils. For diatoms, chironomids and chrysophytes the main variabil- ity correlated to summer and to autumn temperatures. For two planktonic species, Fragilaria nanana and Cyclotella pseudostelligera, we found a link of their variability with temperature fluctuations in their growing months (Sep- tember and October, respectively). This relationship appeared at a certain point during a general warming trend, indicating a threshold in the response. On the other hand, no significant changes in the dominant species could be linked to temperature, nor in any significant subgroup of the 180 diatom species present in the core. In contrast, for most chironomids (particularly Paratanytarsus austriacus, Heterotrissocladius marcidus and Micropsectra radialis) a negative relationship with summer temperature extended throughout the studied period. This response of the whole group gives chironomids a more robust role as indicators for recording temperature changes on long time-scales (e.g., through the Holocene) and for lake signal inter-comparison. Finally, our results indicated that, in all cases, there was a significant resilience to high frequency changes and hysteresis despite extreme fluctuations. Although we were dealing with organisms with one or many generations per year, their populations seemed to follow the decadal trends in air temperature. Mountain Lake Research MOLAR This is the ninth of 11 papers published in this special issue on the palaeolimnology of remote mountain lakes in Europe resulting from the MOLAR project funded by the European Union. The guest editor was Richard W. Battarbee.
Transcript of Lake Redó ecosystem response to an increasing warming the Pyrenees during the twentieth century

129Journal of Paleolimnology 28: 129–145, 2002.© 2002 Kluwer Academic Publishers. Printed in the Netherlands.
Lake Redó ecosystem response to an increasing warmingin the Pyrenees during the twentieth century
J. Catalan1,*, S. Pla1, M. Rieradevall1, M. Felip1, M. Ventura1, T. Buchaca1, L. Camarero1, A. Brancelj2,P.G. Appleby3, A. Lami4, J.A. Grytnes5, A. Agustí-Panareda6 & R. Thompson6
1Department of Ecology, University of Barcelona, Diagonal 645, 08028 Barcelona, Spain(E-mail: [email protected])2Laboratory for Freshwater and Terrestrial Ecosystems Research, National Institute of Biology. Vecna pot 111.Ljubljana 1000, Slovenia3Department of Mathematical Sciences, University of Liverpool, P.O. Box 147, Liverpool L69 3BX, UK4CNR – Ist. Ital. Idrobiol, Largo Tonolli, 50, Verbania-Pallanza, Italy5Botanical Institute, University of Bergen, Allégaten 41, N-5007 Bergen, Norway6Department of Geology and Geophysics, University of Edinburgh, West Main Road, Edinburgh EH9 3JW,Scotland, UK*Present address: CEAB-CSIC, Accés Cala St. Francesc 14, 17300 Blanes, Spain
Received 6 December 1999; accepted 9 January 2002
Key words: climate change, alpine lake, paleolimnology, lake sediments, fossil pigments, diatoms, cladocera,chironomids, chrysophytes, long-term lake dynamics
Abstract
The ecosystem response of Lake Redó (Central Pyrenees) to fluctuations in seasonal air temperature during thelast two centuries was investigated by comparison of reconstructed air temperatures with the sediment record. Fineslicing allowed a resolution of 3–6 years according to the 210Pb dating, although it was still difficult to easily inves-tigate the response to air temperature forcing, since extreme fluctuations in temperature occur on interannual time-scales. However, the resolution was sufficient to show responses on decadal and century scales. An overall tendencyto warming in mean annual temperature in the Central Pyrenees has been caused by summer and in particular byautumn increases. Many of the measured sediment variables apparently responded to these long term trends, butthe significance of the relationships was highly conditioned by the structure of the data. The variables respondingmost on the finer time scales were the microfossils. For diatoms, chironomids and chrysophytes the main variabil-ity correlated to summer and to autumn temperatures. For two planktonic species, Fragilaria nanana and Cyclotellapseudostelligera, we found a link of their variability with temperature fluctuations in their growing months (Sep-tember and October, respectively). This relationship appeared at a certain point during a general warming trend,indicating a threshold in the response. On the other hand, no significant changes in the dominant species could belinked to temperature, nor in any significant subgroup of the 180 diatom species present in the core. In contrast, formost chironomids (particularly Paratanytarsus austriacus, Heterotrissocladius marcidus and Micropsectra radialis)a negative relationship with summer temperature extended throughout the studied period. This response of the wholegroup gives chironomids a more robust role as indicators for recording temperature changes on long time-scales(e.g., through the Holocene) and for lake signal inter-comparison. Finally, our results indicated that, in all cases,there was a significant resilience to high frequency changes and hysteresis despite extreme fluctuations. Althoughwe were dealing with organisms with one or many generations per year, their populations seemed to follow thedecadal trends in air temperature.
Mountain Lake Research
MOLAR
This is the ninth of 11 papers published in this special issue on the palaeolimnology of remote mountain lakes in Europe resulting from theMOLAR project funded by the European Union. The guest editor was Richard W. Battarbee.

130
Introduction
Predicting the responses of whole ecosystems to glo-bal change is still quite problematic (Schindler et al.,1996). Remote ecosystems independent of direct hu-man influence may provide some clues to the sort ofresponses that might be expected. Although lakes rep-resent only a small part of the biosphere, they are par-ticularly suitable for studying ecosystem responses tochanging external forcing (Catalan & Fee, 1994). Thelife spans of most limnic organisms are short and thusrespond rapidly. So the history of their dynamics andtheir neighbouring ecosystems are recorded in detail intheir sediments (Anderson & Battarbee, 1994). Formany lakes, fluctuations in the loadings of substancesdelivered to the lake are due to anthropogenic activi-ties in the catchment. Thus responses to climate vari-ability are often masked or cannot be untangled fromresponses to human perturbations. In contrast, lakes inremote areas, such as Arctic or high-mountain regions,provide unique opportunities to address climate re-sponse studies, although they are not completely iso-lated from long-range pollution transport.
The potential to study climate-lake linkages at re-mote sites is usually limited by the scarcity of on-sitemeteorological data and long term lake ecosystem moni-toring. To overcome these limitations, in the presentstudy we combined three distinct approaches: (1) on-site air temperature reconstructions from long instru-mental records of nearby stations; (2) multi-parametersediment record analysis, and (3) short seasonal lim-nological studies.
The Pyrenees have experienced a clear warming trendthroughout the 20th century, which has acceleratedduring the last 25 years. In this paper we analyse howthe Lake Redó ecosystem has reacted to this warmingtrend. We show that very specific responses of somespecies were more unambiguously related to air tem-perature changes than were biogeochemical or sed-imentological signatures.
Study site
Lake Redó (42° 38′ N 0° 46′ E) is located at 2,240 ma.s.l. in the Central Pyrenees. It is deep (maximumdepth 73 m, mean depth 32 m) and relatively large fora high mountain lake (24 ha, representing 16% of thewatershed area) (Figure 1). The catchment has an areaof 149 ha, 25% consists of bare rock while the rest iscovered by alpine meadows. The bedrock is gran-
odioritic and soils are umbric-leptosols with an aver-age depth of 35 cm. The lake water is very dilute (meanconductivity, 11.5 µS cm–1), and slightly acidic (averagepH, 6.3). The most abundant cation is Ca2+ (72 µeq l–1);HCO
3– (46 µeq l–1) and SO
42– (26 µeq l–1) are the domi-
nant anions. The lake is oligotrophic: the average con-centration of total phosphorus is 0.2 µmol l–1, and thesoluble reactive fraction is generally lower than0.01 µmol l–1. Among the nitrogen forms, NO
3– is rela-
tively high (11 µeq l–1) compared with dissolved organicnitrogen (4 µeq l–1) and NH
4+ (1 µeq l–1). The ice-cov-
ered period lasts for about 6 months each year, fromlate December to mid June.
Methods
Coring and sampling
Three sediment cores were collected with a gravitycorer in the deepest part of the lake in January, 1997.All three were about 30 cm in length. One was kept asa back-up, and the other two were extruded and slicedimmediately in a hut at the lake shore. Core RCM1 wassliced at 3 mm intervals and subsampled for pigmentsand elemental analysis (C, N, S), cladocera, and chir-onomids. Core RCM2 was sliced at 1.5 mm for the first6 cm and at 3 mm for the rest of the core. Subsampleswere dedicated to particle size analyses, diatom, chry-sophycean stomatocysts and dating with 210Pb. Loss onignition (LOI) at 550 °C was carried out on the twocores and used for core correlation.
Cylindrical sediment traps (110 cm long, 9 cm φ),following the suggestions of Bloesch and Burns (1980)and Blomqvist and Håkanson (1981), were suspendedat depths of 10, 25 and 58 m in the central part of thelake. They were emptied every month from February1997 to April 1998. Subsamples (200 ml) were pre-served in formaldehyde at 4% in plastic bottles for dia-tom and chrysophycean stomatocyst analysis.
Water column samples were taken once a month at9 m intervals from July 1996 to July 1998 using Ruttnerbottles. Subsamples were used for chemical, pigmentand phytoplankton analysis. During the sampling pe-riod, an automatic weather station was running on shoremeasuring air temperature, wind, humidity, radiationand precipitation. A thermistor chain recorded tempera-ture in the lake at ten depths in order to determine thelake dynamics. Details of the analytical methods aregiven in Wathne (1997) and data are described in de-tail in Ventura et al. (2000) and Catalan et al. (2002, this
131
issue). Seasonal samplings were carried out on benthicmacroinvertebrates and diatoms along the ice-free sea-sons, complemented with a SCUBA sampling transectfrom the upper littoral zone to 20 m deep on July 15,1997. Sampling procedures and detailed results ofthese studies can be found in Rieradevall et al. (inpress). The present paper is mainly based on the corestudies and air temperatures, the rest of data are usedonly when relevant for the interpretation of the sedi-ment record.
Core dating
Core RCM2 samples were analysed for 210Pb, 226Ra, and137Cs by direct gamma assay in the Liverpool Univer-sity Environmental Radioactivity Laboratory, usingOrtec HPGe GWL series well-type coaxial low back-ground intrinsic germanium detectors (Appleby et al.,
1986). 210Pb was determined via its gamma emissionsat 46.5 keV, and 226Ra by the 295 and 352 keV γ-raysemitted by its daughter isotope 214Pb following 3 weeksstorage in sealed containers to allow radioactive eq-uilibration. 137Cs was measured by its emissions at662 keV. The absolute efficiencies of the detectorswere determined using calibrated sources and sedimentsamples of known activity. Corrections were made forthe effect of self absorption of low energy γ-rays with-in the sample (Appleby et al., 1992). Radiometric dateswere calculated using either the CRS and CIC 210Pbdating models (Appleby & Oldfield, 1978) followingan assessment as to which model was most appropri-ate following the procedures described in Appleby andOldfield (1983), Appleby et al. (1991), Appleby (1993,1998). Core RCM1 chronology was established by se-quence slotting technique (Thompson & Clark, 1993)using LOI for correlating with the master core RCM2.
Figure 1. Location, catchment and bathymetric map of Lake Redó (Central Pyrenees). Coring and water sampling point, biological transectand on-site lake study facilities locations are indicated.
132
Bulk sediment analyses
Particle size measurements on wet sediment were car-ried out using a laser particle analyser; in this paper weuse two descriptors namely weight percentage corre-sponding to particles smaller than 63 µm (p < 63); andthe mean particle volume in that range size (PMV). El-emental C, N and S from the organic fraction were ana-lysed by means of a NCS analyser FISONS NA 1500.Pigments were extracted using the method described inLami et al. (1994). Total chlorophylls and their deriva-tives; and total carotenoids were estimated spectro-photometrically. Single carotenoid and chlorophyliccompounds were measured by HPLC (Lami et al., 1994).
Diatoms and chrysophycean stomatocysts
All samples were treated with H2O
2 (33%) and mounted
in Naphrax (R.I. = 1.7) following the method of Bat-tarbee (1986). Diatoms and chrysophycean cyst con-centrations in the samples were estimated by additionof a known number of latex microspheres to a knownweight of dried sediment (Battarbee & Kneen, 1982).Diatoms were counted under oil immersion at 1200×
using phase contrast, and cysts under interference con-trast at the same magnification. A minimum of 500diatom valves and 250 cysts were counted from eachslide. Scanning electron microscopy was used to de-termine chrysophycean cysts; we followed Duff et al.(1995) when possible and new cysts were coded ac-cording to Pla (2001). Diatom cells with and withoutchloroplasts, as indicators of alive and dead cells, re-spectively, were evaluated from 100 ml sub-samplesfrom sediment traps at 640× in an inverted microscopefollowing the Utermöhl method (Sournia, 1987). Wa-ter column phytoplankton samples were counted usingthe same method.
Chironomids and cladocera
To obtain the remains of the chironomid head capsules,the sediment was sieved through a 100 µm screen af-ter deflocculation with hot 10% KOH for 15 min. Thehead capsules were hand sorted from a Bolgorov traywith forceps under the magnification of a stereoscopicmicroscope. They were then mounted on slides in Eu-paral media, after dehydratation with 70% absolute etha-nol. For species identification, we followed Wiederholm(1983) and Schmid (1993). Looking for higher tax-onomical resolution, we reared larvae collected in thelake during the ice-free season in 1996 and 1997. Rear-
ings were carried out in constant temperature rooms at18 °C with fourth instar larvae, pre-pupae and pupaewhenever possible. After pigment extraction, the samesediment sub-samples were used for cladocera analy-sis following a similar deflocculation procedure as forchironomids; slides were prepared according to Frey(1986). At least 200 remains were counted per sample.Only chydorid species were considered in this study.
Air temperature reconstructions and data analysis
Data from meteorological stations close to Lake Redócover just a few decades. Therefore, the reconstructionof air temperature in Lake Redó was carried out basedon the long Pic du Midi (Bigorre) (43.07 N, 0.15 W,2862 m.a.s.l.) temperature series, which was taken asrepresentative for the Central Pyrenees. The effect ofdifferent altitude between the lake and the station wascorrected using a temperature lapse rate obtained byspatial interpolation of radiosonde air temperature datafrom 1990–1997, taking into account monthly variabil-ity (–5.24, –5.13, –5.38, –5.82, –5.72, –5.84, –5.65,–5.82, –5.48, –5.27, –5.41, –5.19 °C km–1 from Janu-ary–December, respectively). In order to complete theseries from 1781–1997 a stepwise multiple regressionwas used to establish linear transfer functions of tem-peratures between the Pic du Midi series and twenty-one long lowland records from across Europe. Twelvetransfer functions were obtained, one for each calen-dar month. The skill of these transfer functions wasassessed to range between 40–99%. The low skill val-ues generally corresponded to the winter months. Theprocedure is described in detail by Agustí-Panareda andThompson (2002, this issue). The resulting tempera-ture retrodictions were validated using the data re-corded by the automatic weather station installed at theshore of the lake for the period 1996–1997. Typicalretrodiction errors were estimated to range from 1–2 °Cfor individual low-sun months and 0.5–1 °C for indi-vidual high-sun months. Decadal average temperatureestimates would be expected to be root ten times bet-ter than for the single months.
Results and discussion
The warming trend and their seasonal patterns inthe Pyrenees during the 19th and 20th centuries
The retrodicted monthly mean air temperatures wereaveraged to yield the annual mean air temperature at
133
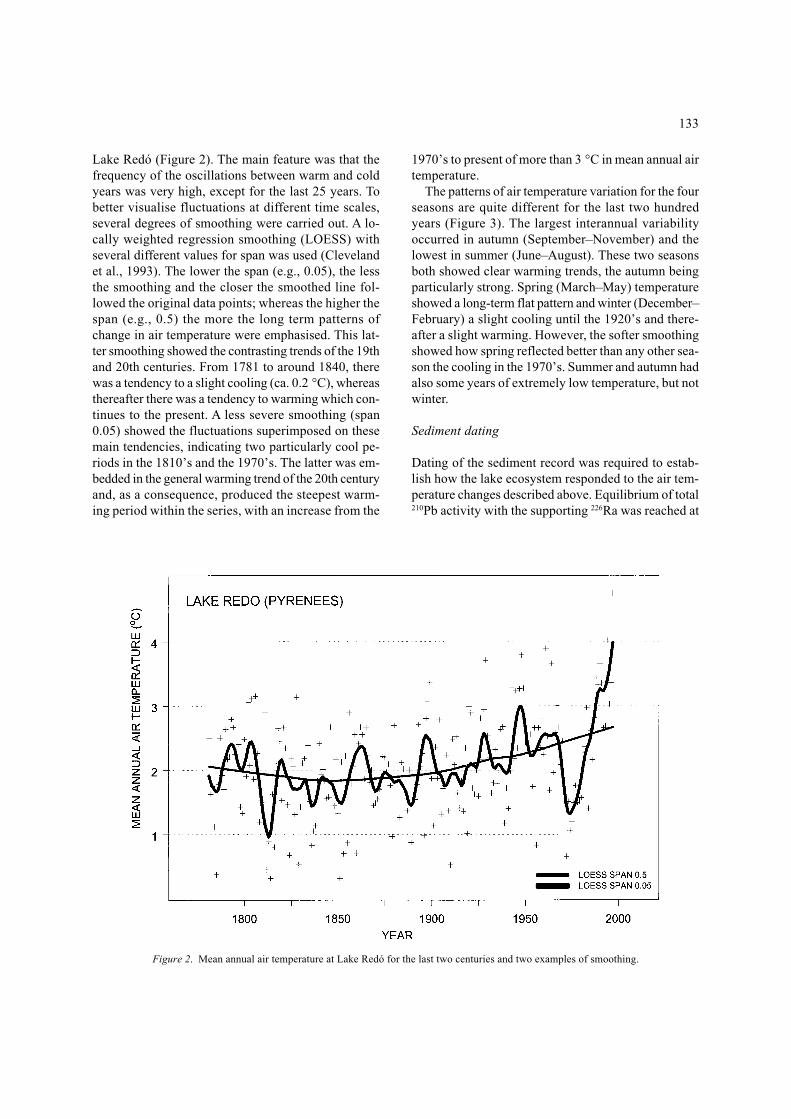
Lake Redó (Figure 2). The main feature was that thefrequency of the oscillations between warm and coldyears was very high, except for the last 25 years. Tobetter visualise fluctuations at different time scales,several degrees of smoothing were carried out. A lo-cally weighted regression smoothing (LOESS) withseveral different values for span was used (Clevelandet al., 1993). The lower the span (e.g., 0.05), the lessthe smoothing and the closer the smoothed line fol-lowed the original data points; whereas the higher thespan (e.g., 0.5) the more the long term patterns ofchange in air temperature were emphasised. This lat-ter smoothing showed the contrasting trends of the 19thand 20th centuries. From 1781 to around 1840, therewas a tendency to a slight cooling (ca. 0.2 °C), whereasthereafter there was a tendency to warming which con-tinues to the present. A less severe smoothing (span0.05) showed the fluctuations superimposed on thesemain tendencies, indicating two particularly cool pe-riods in the 1810’s and the 1970’s. The latter was em-bedded in the general warming trend of the 20th centuryand, as a consequence, produced the steepest warm-ing period within the series, with an increase from the
1970’s to present of more than 3 °C in mean annual airtemperature.
The patterns of air temperature variation for the fourseasons are quite different for the last two hundredyears (Figure 3). The largest interannual variabilityoccurred in autumn (September–November) and thelowest in summer (June–August). These two seasonsboth showed clear warming trends, the autumn beingparticularly strong. Spring (March–May) temperatureshowed a long-term flat pattern and winter (December–February) a slight cooling until the 1920’s and there-after a slight warming. However, the softer smoothingshowed how spring reflected better than any other sea-son the cooling in the 1970’s. Summer and autumn hadalso some years of extremely low temperature, but notwinter.
Sediment dating
Dating of the sediment record was required to estab-lish how the lake ecosystem responded to the air tem-perature changes described above. Equilibrium of total210Pb activity with the supporting 226Ra was reached at
Figure 2. Mean annual air temperature at Lake Redó for the last two centuries and two examples of smoothing.

134
a depth of about 9 cm in RCM2 (Figure 4). The unsup-ported 210Pb activity versus depth profile had two distinctparts, an upper zone (0–3 cm) with a shallow gradientand a number of minor irregularities, and a deeper zone(3–7 cm) with a steeper gradient in which unsupported210Pb activity declines more or less exponentially withdepth. Between 7–9 cm there was a small irregularitythat may record a 19th century disturbance. The 137Csactivity versus depth profile had a well defined butrelatively poorly resolved peak. The maximum activ-ity occurred at 1 cm depth, though the peak was skewedand high concentrations were recorded between 0.8–2.5cm. Traces of 241Am recorded between 0.9–2.8 cm con-firmed the presence of weapons fallout between thesedepths, but did not allow identification of the 1963 depthwith any precision. It is possible that the peak at 1 cmrecorded the 1986 Chernobyl accident. The 137Cs pro-file between 1–2.5 cm would then be due to a blurringof the Chernobyl and weapons fallout records.
210Pb dates calculated using the CRS and CIC dat-
ing models are shown in Figure 4, together with thedated points suggested by the 137Cs record. The CRSmodel placed 1986 and 1963 at depths of 1 and 2.2 cmrespectively, in good agreement with the conjecture ofa Chernobyl origin for the 137Cs peak at 1 cm and a1960’s origin for sediments just above 2.5 cm. In con-trast, the 137Cs results invalidated the much highersediment accumulation rates for the past few decadessuggested by the CIC model. Therefore, dates providedby the CRS model were adopted as a chronology forthe sediment record. Error limits were significantlyhigher for the 19th century period.
The CRS model calculations indicated low accumu-lation rates throughout most of the past 170 years(0.004–0.008 g cm–2 yr–1) with episodes of more rapidsedimentation in the latter half of the 19th century, andagain during the past 20 years. From 1837 (7.5 cm depth)backwards a constant accumulation rate (0.0038 gcm–2 yr–1) was assumed, increasing the dating uncer-tainty for this period.
Figure 3. Temperature deviations from seasonal mean air temperatures at Lake Redó for the last two centuries. The seasonal temperature wascalculated from reconstructed mean monthly values according to the following grouping: winter (December–February); spring (March–May);summer (June–August) and autumn (September–November). The lake is usually ice covered from late December to mid June.

135
Comparison of the air temperature fluctuations withthe sediment record
The core dating indicated an average sediment accu-mulation rate of about 0.5 mm yr–1, hence each samplecorresponded to some 3–6 years of sediment accumu-lation, given the slicing thickness employed. As wehave seen above, the fluctuations between extremelycold and extremely warm years occurred at periodsshorter than the time resolution of our samples (Fig-ures 2 & 3). Each sample potentially integrated responsesof the ecosystem to very diverse, even completely op-posed, weather conditions. This fact introduced a severeconstraint for the comparison between air temperaturefluctuations and the sediment record. However, even inthe case of an annual resolution of the samples, suchas is possible for varved sediments, we should notnecessarily expect equivalent responses to equivalentweather fluctuations, since annual ecosystem dynam-ics depends not only on the actual annual forcing butalso on the initial conditions, which depend on whathappened in the previous year and indeed in severalyears before. Unfortunately, the magnitude of this his-torical dependence is unknown to us. Therefore, wedecided to compare the sediment record with varioustemperature series formed from smoothers of differentstrength. The most severe smoothers provided the long
term tendency (e.g., LOESS span 0.5 in Figure 1),while softer smoothers progressively approached theinter-annual variability. However, it is not sensible toapply span values using time intervals shorter than theresolution of our samples. Since chrysophycean cystswere only analysed for each second sample, we used0.05 as a lower limit for LOESS span, which gave adecadal time scale.
The long-term warming tendency of the air tempera-ture (Figure 2 & 3) provides an additional constraintin our comparisons. Any diagenetic process on-goingin the upper sediment could be confused with a re-sponse to that warming. This risk was made quite evi-dent with the high correlation that existed between airtemperatures and the depth of the samples in the core,which was obviously not a variable responding to anyforcing. To decrease this indeterminacy, we decided tocompare the sediment record with the softest smooth-ing possible. The date of each sample at midpoint wasused to interpolate the corresponding mean tempera-tures (annual, winter, spring, summer, autumn) usingthe LOESS smoothing with span 0.05. This was donefor each core. The interpolated temperatures for com-parison with the different response variable in the sedi-ment record are shown in Figure 5.
Linear regressions between the available responsevariables and temperature predictors were carried out.
Figure 4. Radiometric chronology at Lake Redó core RCM2 showing CRS and CIC model 210Pb dates together with dates determined fromthe 137Cs and 241Am stratigraphy. Sedimentation rates correspond to the CRS model.

136
The response variables were used without any smooth-ing or interpolation. They were taken as representativeof the midpoint of the sample interval. For microfos-sils, the species were ordinated with a principal compo-nent analysis (PCA) of the square root transformationof the percentage data. The more relevant species con-tributing to first four axes of variability are indicatedin Table 1.
In Table 2, the fraction of the variance explained forthe relationships analysed that were apparently signifi-cant are listed. However, their significance (p-values)must be interpreted with caution. In particular one sin-gle p-value should not be interpreted literally for sev-eral reasons. The samples are not independent, but aretemporally autocorrelated (Legendre & Legendre, 1998).This serial or autocorrelation destroys the assumptionsinvolved when the p-values are inferred and often leadsto a higher correlation than if the samples were inde-
pendent. It could be possible to do some permutationswith certain restrictions to give a better estimate of thep-values; but this would only partly avoid the problemwith autocorrelation. As an alternative, we decided touse, instead of the usual 0.05, a lower p-value (0.02)as a significance threshold. On the other hand, the re-maining restriction introduced by the fact that mostpronounced temperature change occurred recently wasillustrated by the correlation between sample depth andtemperature (Table 2). Therefore, the statistical signifi-cance for each single variable has to be taken with cau-tion, as an exploration of the potential link with climate.A conservative test of the relationship between responsevariables and the air temperature would be to acceptonly those response variables with higher correlationswith air temperature than sample depth. Finding plau-sible interpretations in terms of the limnological proc-esses and patterns occurring in lake Redó would also
Figure 5. Interpolated temperature data (LOESS span 0.05) corresponding to mid-sample dates in cores RCM2 and RCM1 plotted down coretogether with measured variables that showed a significant linear relationship with at least one of the seasonal time-series.

137
provide more arguments for trusting the statistical sig-nificance of our results.
A few conclusions can already be derived from thisstatistical screening: (1) relationships between responsevariables and air temperature fluctuations were exclu-sively established through the ice-free season tempera-
tures. As a consequence, there were no apparently de-tectable effects in the sediment record of the variationsin the length of the ice cover; (2) there were more vari-ables significantly responding to autumn temperaturethan to summer temperatures, and on average the vari-ance explained by autumn temperatures was also sig-
Table 1. Microfossils with high scores (> 0.6) on any of the principal components (PC) of group variability for the sediment record of LakeRedó (Central Pyrenees) in the last two centuries. Since the variance is scaled to 1, the axis eigenvalues indicate the proportion of varianceexplained
PC1 PC2 PC3 PC4
Diatoms (180 taxa)Axes eigenvalue 0.174 0.091 0.044 0.038
Cyclotella pseudostelligera 0.97 0.06 –0.19 –0.06Fragilaria nanana 0.93 0.07 0.17 0.11Achnanthes curtissima –0.22 –0.85 0.18 –0.19Aulacoseira distans nivalis –0.29 0.73 –0.16 –0.08Aulacoseira lirata –0.14 0.64 0.30 –0.09Achnanthes sp. –0.01 –0.63 0.07 0.28Achnanthes minutissima –0.28 –0.62 –0.09 0.07Navicula schassmannii –0.24 –0.36 –0.63 0.11Aulacoseira alpigena –0.08 0.13 0.60 0.12
Chrysophytes (65 cysts)Axes eigenvalue 0.169 0.125 0.087 0.081
S317C –0.82 –0.01 0.14 0.49S239.339 –0.74 0.26 0.23 –0.23S019 0.74 –0.05 0.25 0.15S091 0.64 0.17 0.09 –0.10S346 0.64 0.19 0.07 0.21S005A 0.10 –0.71 –0.24 –0.14S345 –0.04 –0.67 –0.45 –0.24S320 0.26 0.60 –0.09 0.29S300 0.10 –0.10 0.70 0.33S034 –0.31 0.49 –0.62 –0.32S243 0.27 –0.06 0.60 –0.15
Chironomids (23 taxa)Axes eigenvalue 0.347 0.120 0.108 0.084
Paratanytarsus austriacus –0.92 –0.20 –0.06 0.02Heterotrissocladius marcidus –0.76 –0.30 0.22 0.09Micropsectra radialis –0.70 0.59 0.33 –0.16Zavrelinyia sp. –0.66 –0.9 0.06 0.26Corynoneura arctica –0.51 0.26 –0.73 0.23Tanytarsus lugens - group –0.15 –0.46 0.17 –0.76
Cladocera (5 species)Axes eigenvalue 0.416 0.252 0.189 0.134
Alona affinis –0.92 0.12 –0.33 –0.01Eurycercus lamellatus 0.91 0.33 –0.25 –0.04Alona sp. 0.42 –0.90 –0.06 –0.11Chydorus sphaericus 0.37 0.31 0.85 –0.10Acroperus harpae 0.37 –0.21 0.03 0.90
138
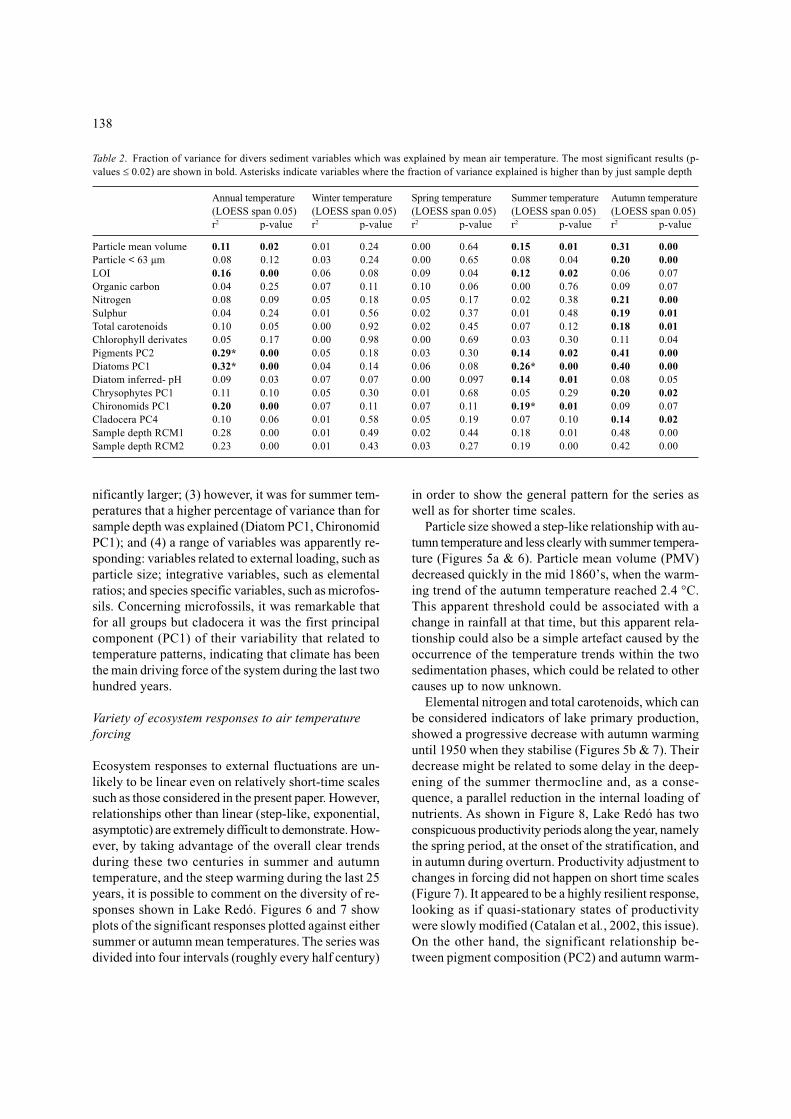
nificantly larger; (3) however, it was for summer tem-peratures that a higher percentage of variance than forsample depth was explained (Diatom PC1, ChironomidPC1); and (4) a range of variables was apparently re-sponding: variables related to external loading, such asparticle size; integrative variables, such as elementalratios; and species specific variables, such as microfos-sils. Concerning microfossils, it was remarkable thatfor all groups but cladocera it was the first principalcomponent (PC1) of their variability that related totemperature patterns, indicating that climate has beenthe main driving force of the system during the last twohundred years.
Variety of ecosystem responses to air temperatureforcing
Ecosystem responses to external fluctuations are un-likely to be linear even on relatively short-time scalessuch as those considered in the present paper. However,relationships other than linear (step-like, exponential,asymptotic) are extremely difficult to demonstrate. How-ever, by taking advantage of the overall clear trendsduring these two centuries in summer and autumntemperature, and the steep warming during the last 25years, it is possible to comment on the diversity of re-sponses shown in Lake Redó. Figures 6 and 7 showplots of the significant responses plotted against eithersummer or autumn mean temperatures. The series wasdivided into four intervals (roughly every half century)
in order to show the general pattern for the series aswell as for shorter time scales.
Particle size showed a step-like relationship with au-tumn temperature and less clearly with summer tempera-ture (Figures 5a & 6). Particle mean volume (PMV)decreased quickly in the mid 1860’s, when the warm-ing trend of the autumn temperature reached 2.4 °C.This apparent threshold could be associated with achange in rainfall at that time, but this apparent rela-tionship could also be a simple artefact caused by theoccurrence of the temperature trends within the twosedimentation phases, which could be related to othercauses up to now unknown.
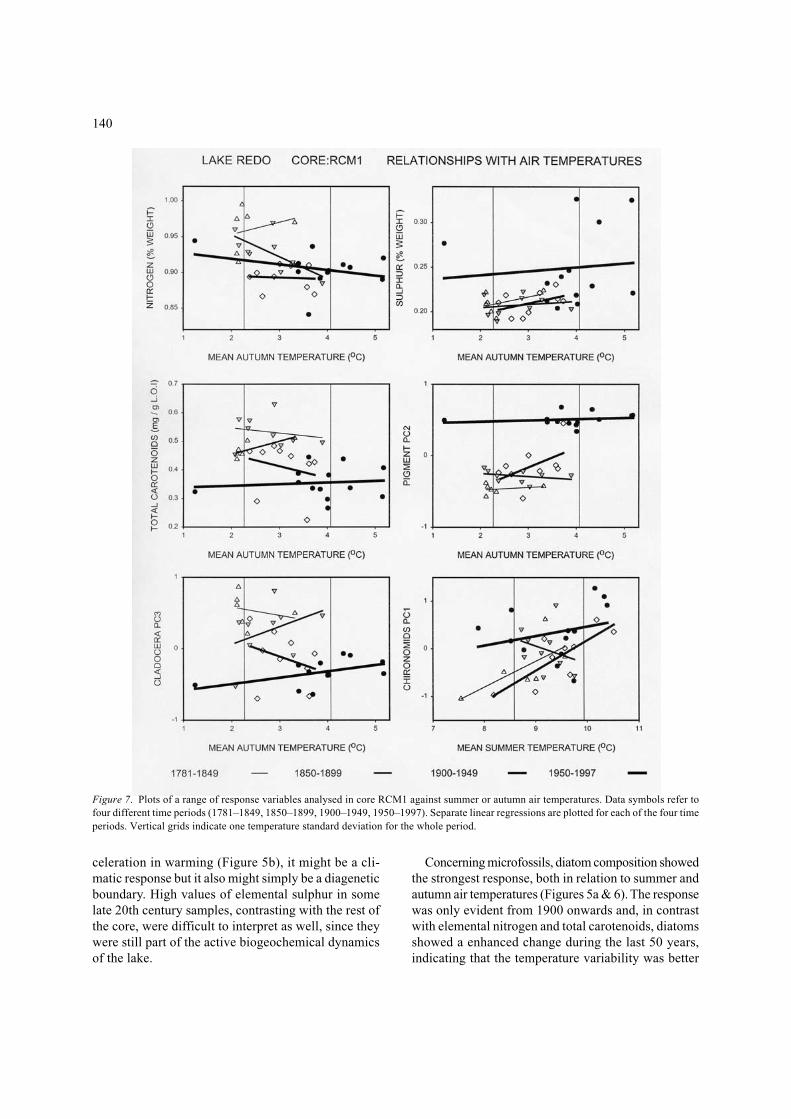
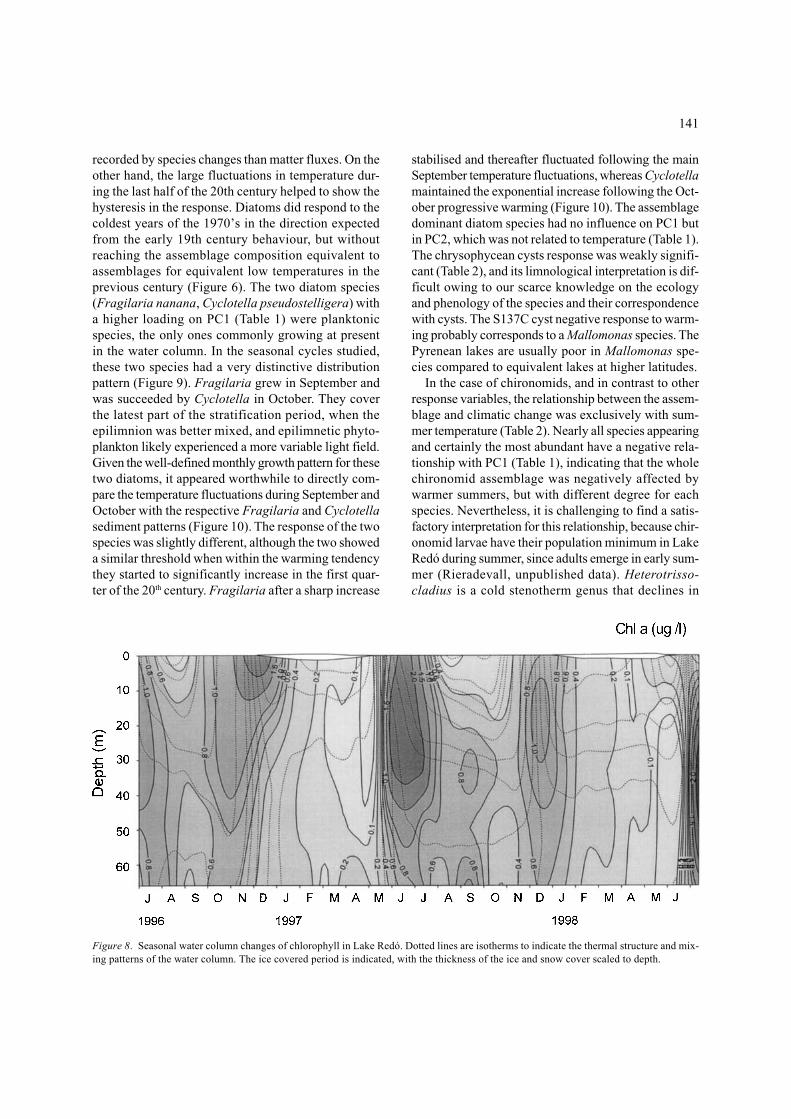
Elemental nitrogen and total carotenoids, which canbe considered indicators of lake primary production,showed a progressive decrease with autumn warminguntil 1950 when they stabilise (Figures 5b & 7). Theirdecrease might be related to some delay in the deep-ening of the summer thermocline and, as a conse-quence, a parallel reduction in the internal loading ofnutrients. As shown in Figure 8, Lake Redó has twoconspicuous productivity periods along the year, namelythe spring period, at the onset of the stratification, andin autumn during overturn. Productivity adjustment tochanges in forcing did not happen on short time scales(Figure 7). It appeared to be a highly resilient response,looking as if quasi-stationary states of productivitywere slowly modified (Catalan et al., 2002, this issue).On the other hand, the significant relationship be-tween pigment composition (PC2) and autumn warm-
Table 2. Fraction of variance for divers sediment variables which was explained by mean air temperature. The most significant results (p-values ≤ 0.02) are shown in bold. Asterisks indicate variables where the fraction of variance explained is higher than by just sample depth
Annual temperature Winter temperature Spring temperature Summer temperature Autumn temperature(LOESS span 0.05) (LOESS span 0.05) (LOESS span 0.05) (LOESS span 0.05) (LOESS span 0.05)r2 p-value r2 p-value r2 p-value r2 p-value r2 p-value
Particle mean volume 0.11 0.02 0.01 0.24 0.00 0.64 0.15 0.01 0.31 0.00Particle < 63 µm 0.08 0.12 0.03 0.24 0.00 0.65 0.08 0.04 0.20 0.00LOI 0.16 0.00 0.06 0.08 0.09 0.04 0.12 0.02 0.06 0.07Organic carbon 0.04 0.25 0.07 0.11 0.10 0.06 0.00 0.76 0.09 0.07Nitrogen 0.08 0.09 0.05 0.18 0.05 0.17 0.02 0.38 0.21 0.00Sulphur 0.04 0.24 0.01 0.56 0.02 0.37 0.01 0.48 0.19 0.01Total carotenoids 0.10 0.05 0.00 0.92 0.02 0.45 0.07 0.12 0.18 0.01Chlorophyll derivates 0.05 0.17 0.00 0.98 0.00 0.69 0.03 0.30 0.11 0.04Pigments PC2 0.29* 0.00 0.05 0.18 0.03 0.30 0.14 0.02 0.41 0.00Diatoms PC1 0.32* 0.00 0.04 0.14 0.06 0.08 0.26* 0.00 0.40 0.00Diatom inferred- pH 0.09 0.03 0.07 0.07 0.00 0.097 0.14 0.01 0.08 0.05Chrysophytes PC1 0.11 0.10 0.05 0.30 0.01 0.68 0.05 0.29 0.20 0.02Chironomids PC1 0.20 0.00 0.07 0.11 0.07 0.11 0.19* 0.01 0.09 0.07Cladocera PC4 0.10 0.06 0.01 0.58 0.05 0.19 0.07 0.10 0.14 0.02Sample depth RCM1 0.28 0.00 0.01 0.49 0.02 0.44 0.18 0.01 0.48 0.00Sample depth RCM2 0.23 0.00 0.01 0.43 0.03 0.27 0.19 0.00 0.42 0.00

139
ing could be a spurious correlation because the pigmentproportions in the top layers of the sediments (corre-sponding to the strongest warming phase) may not yet
have been modified by diagenesis (Hurtley & Arm-strong, 1991). The statistical relationship may havearisen from the step in PC2 near the time of the ac-
Figure 6. Plots of a range of response variables analysed in core RCM2 against summer and autumn air temperatures. Data symbols refer tofour different time periods (1781–1849, 1850–1899, 1900–1949, 1950–1997). Separate linear regression are plotted for each of the four timeperiods. Vertical grids indicate one temperature standard deviation for the whole period.
140
celeration in warming (Figure 5b), it might be a cli-matic response but it also might simply be a diageneticboundary. High values of elemental sulphur in somelate 20th century samples, contrasting with the rest ofthe core, were difficult to interpret as well, since theywere still part of the active biogeochemical dynamicsof the lake.
Concerning microfossils, diatom composition showedthe strongest response, both in relation to summer andautumn air temperatures (Figures 5a & 6). The responsewas only evident from 1900 onwards and, in contrastwith elemental nitrogen and total carotenoids, diatomsshowed a enhanced change during the last 50 years,indicating that the temperature variability was better
Figure 7. Plots of a range of response variables analysed in core RCM1 against summer or autumn air temperatures. Data symbols refer tofour different time periods (1781–1849, 1850–1899, 1900–1949, 1950–1997). Separate linear regressions are plotted for each of the four timeperiods. Vertical grids indicate one temperature standard deviation for the whole period.
141
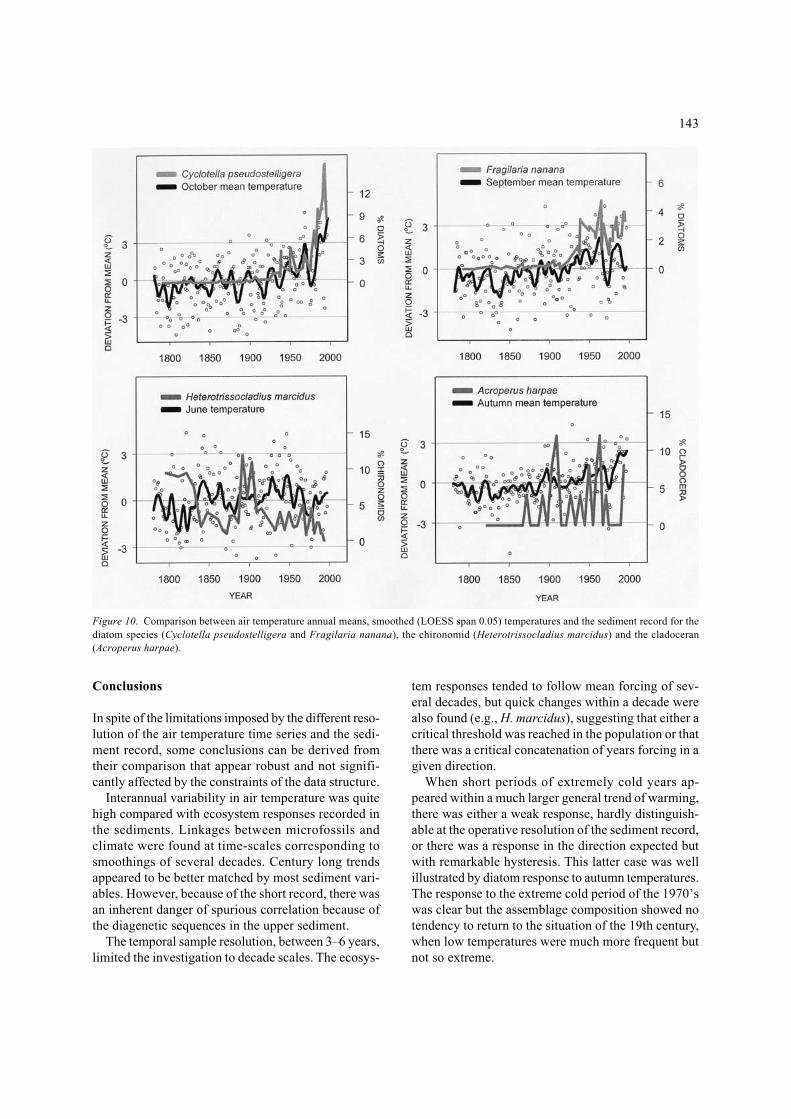
recorded by species changes than matter fluxes. On theother hand, the large fluctuations in temperature dur-ing the last half of the 20th century helped to show thehysteresis in the response. Diatoms did respond to thecoldest years of the 1970’s in the direction expectedfrom the early 19th century behaviour, but withoutreaching the assemblage composition equivalent toassemblages for equivalent low temperatures in theprevious century (Figure 6). The two diatom species(Fragilaria nanana, Cyclotella pseudostelligera) witha higher loading on PC1 (Table 1) were planktonicspecies, the only ones commonly growing at presentin the water column. In the seasonal cycles studied,these two species had a very distinctive distributionpattern (Figure 9). Fragilaria grew in September andwas succeeded by Cyclotella in October. They coverthe latest part of the stratification period, when theepilimnion was better mixed, and epilimnetic phyto-plankton likely experienced a more variable light field.Given the well-defined monthly growth pattern for thesetwo diatoms, it appeared worthwhile to directly com-pare the temperature fluctuations during September andOctober with the respective Fragilaria and Cyclotellasediment patterns (Figure 10). The response of the twospecies was slightly different, although the two showeda similar threshold when within the warming tendencythey started to significantly increase in the first quar-ter of the 20th century. Fragilaria after a sharp increase
stabilised and thereafter fluctuated following the mainSeptember temperature fluctuations, whereas Cyclotellamaintained the exponential increase following the Oct-ober progressive warming (Figure 10). The assemblagedominant diatom species had no influence on PC1 butin PC2, which was not related to temperature (Table 1).The chrysophycean cysts response was weakly signifi-cant (Table 2), and its limnological interpretation is dif-ficult owing to our scarce knowledge on the ecologyand phenology of the species and their correspondencewith cysts. The S137C cyst negative response to warm-ing probably corresponds to a Mallomonas species. ThePyrenean lakes are usually poor in Mallomonas spe-cies compared to equivalent lakes at higher latitudes.
In the case of chironomids, and in contrast to otherresponse variables, the relationship between the assem-blage and climatic change was exclusively with sum-mer temperature (Table 2). Nearly all species appearingand certainly the most abundant have a negative rela-tionship with PC1 (Table 1), indicating that the wholechironomid assemblage was negatively affected bywarmer summers, but with different degree for eachspecies. Nevertheless, it is challenging to find a satis-factory interpretation for this relationship, because chir-onomid larvae have their population minimum in LakeRedó during summer, since adults emerge in early sum-mer (Rieradevall, unpublished data). Heterotrisso-cladius is a cold stenotherm genus that declines in
Figure 8. Seasonal water column changes of chlorophyll in Lake Redó. Dotted lines are isotherms to indicate the thermal structure and mix-ing patterns of the water column. The ice covered period is indicated, with the thickness of the ice and snow cover scaled to depth.

142
relative abundance with decreasing latitude (Walker etal., 1990, 1997). Among the species of the genus, H.marcidus can be considered the most thermophilous,but restricted to waters colder than 18 °C (Saether,1975). It is found in Europe from Fennoscandia downto the Iberian Peninsula (Illies, 1978) and lives fromthe littoral until the deepest and coldest areas of alpinelakes (Rieradevall et al., in press). Similarly, Para-tanytarsus austriacus and particularly Micropsectraradialis are cold stenotherm species (Fjellheim et al.,1997). We could expect that these species came closerto their limits of temperature tolerance in warmer sum-mers, although we cannot discard that indirect mecha-nisms related with food availability may occur. On theother hand, since the response was at the scale of sev-eral decade, the actual control could be on adults, af-fecting lake population through recruitment. In contrastwith autumn responses, highly conditioned by the strong
trend during the last 20 years, the relationship betweenchironomids and temperature covered the whole stud-ied period, the species mirrored the ups and downs ofsummer temperature at scales of several decades (e.g.,H. marcidus particularly followed June temperatures,Figure 11).
Cladocera were the only microfossil group withoutany correlation of their first principal component ofvariation with air temperature. The significative com-ponent (PC4) was exclusively related with Acroperusharpae (Table 1). This was a rare species within thecladocera assemblage of the lake. Its microhabitat aremacrophytes, which in the case of Lake Redó wereaquatic mosses mainly occupying depths above theseasonal thermocline. Its spiky increasing appearancein the sediment record towards the present might beinterpreted as a positive influence on its growth of awarmer epilimnion, late in the stratification period.
Figure 9. Seasonal distribution of Fragilaria nanana and Cyclotella pseudostelligera in the water column of Lake Redó for the ice-free pe-riod of 1997. Isolines indicate cells per ml, and dashed lines isotherms.
143
Conclusions
In spite of the limitations imposed by the different reso-lution of the air temperature time series and the sedi-ment record, some conclusions can be derived fromtheir comparison that appear robust and not signifi-cantly affected by the constraints of the data structure.
Interannual variability in air temperature was quitehigh compared with ecosystem responses recorded inthe sediments. Linkages between microfossils andclimate were found at time-scales corresponding tosmoothings of several decades. Century long trendsappeared to be better matched by most sediment vari-ables. However, because of the short record, there wasan inherent danger of spurious correlation because ofthe diagenetic sequences in the upper sediment.
The temporal sample resolution, between 3–6 years,limited the investigation to decade scales. The ecosys-
tem responses tended to follow mean forcing of sev-eral decades, but quick changes within a decade werealso found (e.g., H. marcidus), suggesting that either acritical threshold was reached in the population or thatthere was a critical concatenation of years forcing in agiven direction.
When short periods of extremely cold years ap-peared within a much larger general trend of warming,there was either a weak response, hardly distinguish-able at the operative resolution of the sediment record,or there was a response in the direction expected butwith remarkable hysteresis. This latter case was wellillustrated by diatom response to autumn temperatures.The response to the extreme cold period of the 1970’swas clear but the assemblage composition showed notendency to return to the situation of the 19th century,when low temperatures were much more frequent butnot so extreme.
Figure 10. Comparison between air temperature annual means, smoothed (LOESS span 0.05) temperatures and the sediment record for thediatom species (Cyclotella pseudostelligera and Fragilaria nanana), the chironomid (Heterotrissocladius marcidus) and the cladoceran(Acroperus harpae).

144
Specific responses of a few species were much clearerthan whole ecosystem responses or biogeochemical re-sponses. The species responding were usually epilim-netic, but not all epilimnetic species responded. In somecases (e.g., F. nanana, C. pseudostilligera), knowledgeof the present ecological features of the species pro-vided evidence that the response was quite direct to theparticular temperature changes of their growing season.
Different taxonomical groups or even particular spe-cies within groups appeared to be particularly suitablefor specific seasons. For instance, chironomids re-sponded to summer temperatures, but did not react tothe warming autumn trends. On the contrary, planktonicdiatoms responded to autumn trends when conditionsfor their growth occurred in Lake Redó. In the case ofdiatoms, clear responses relied on a few species thatwere a small component of the assemblage. This im-plies that the response to temperature fluctuations maytake quite different forms from lake to lake. However,nearly the whole chironomid assemblage reacted totemperature. Therefore, chironomid assemblages seemto be a more robust temperature indicator for lake in-ter-comparison and longer time scale studies (e.g.,through the Holocene).
Acknowledgements
This study was supported by the European Commis-sion, Environment and Climate Programme, contractENV4 CT95 0007 (MOLAR project).
References
Agustí-Panareda, A. & R. Thompson, 2002. Reconstructing of airtemperature at eleven remote alpine and arctic lakes in Europefrom 1781 to 1997. J. Paleolim. 28: 7–23.
Anderson, N. J. & R. W. Battarbee, 1994. Aquatic community per-sistence and variability: a palaeolimnological perspective. InGiller, P. S., A. G. Hildrew & D. G. Raffaelli (eds), AquaticEcology. Scale, Pattern and Process. Blackwell Scientific Pub-lications, Oxford, UK, 233–259.
Appleby, P. G. & F. Oldfield, 1978. The calculation of 210Pb datesassuming a constant rate of supply of unsupported 210Pb to thesediment. Catena 5: 1–8.
Appleby, P. G. & F. Oldfield, 1983. The assessment of 210Pb data fromsites with varying sediment accumulation rates. Hydrobiologia103: 29–35.
Appleby, P. G., 1993. Forward to the 210Pb dating anniversary se-ries. J. Paleolim. 9: 155–160.
Appleby, P. G., 1998. Dating recent sediments by 210Pb: Problemsand solutions. Proc. 2nd NKS/EKO-1 Seminar, Helsinki, 2–4April 1997.
Appleby, P. G., N. Richardson & P. J. Nolan, 1992. Self-absorptioncorrections for well-type germaniun detectors. Nucl. Inst. Meth.B 71: 228–233.
Appleby, P. G., N. Richardson & P. J. Nolan, 1991. 241Am dating oflake sediments. Hydrobiologia 214: 35–42.
Appleby, P. G., P. J. Nolan, D. W .Gifford, M. J. Godfrey, F. Oldfield,N. J. Anderson & R. W. Battarbee, 1986. 210Pb dating by lowbackground gamma counting. Hydrobiologia 141: 21–27.
Battarbee, R. W., 1986. Diatom analysis. In Berglund, B: E. (ed.),Handbook of Holocene Palaeoecology and Palaeohydrology.John Wiley & Sons Ltd., London, UK, 527–570.
Battarbee, R. W. & M. J. Kneen, 1982. The use of electronicallycounted microspheres in alsolute diatom analysis. Limnol.Oceanogr. 27: 184–188.
Bloesch, J & N. M. Burns, 1980. A critical review of sedimentationtrap technique. Schweiz. Z. Hydrol. 42: 15–54.
Blomqvist, S. & L. Håkanson, 1981. A review of sediment traps inaquatic environments. Arch. Hydrobiol. 91: 101–132.
Catalan, J., M. Ventura, A. Brancelj, I. Granados, H. Thies, U.Nickus, A. Korhola, A. F. Lotter, A. Barbieri, E. Stuchlík, L.Lien, P. Bitušík, T. Buchaca, L. Camarero, G. H. Goudsmit, J.Kopácek, G. Lemcke, D. M. Livingstone, B. Müller, M. Rautio,M. Šiško, S. Sorvari, F. Šporka, O. Strunecký & M. Toro, 2002.Seasonal ecosystem variability in remote mountain lakes: impli-cations for detecting climatic signals in sediment records. J.Paleolim. 28: 25–46.
Catalan, J. & E. J. Fee, 1994. Interannual variability in limnic eco-systems: origin, patterns and predictability. In Margalef, R.(ed.), Limnology Now: A Paradigm of Planetary Problems.Elsevier, Armsterdam, The Netherlands, 81–97.
Cleveland, W. S., E. Grosse & W. M. Shyu, 1993. Local regres-sion models. In Cambers, J. M. & T. J. Hastie (eds), Statisti-cal Models in S. Chapman and Hall, London, UK, 309–376.
Duff, K. E., B. A. Zeeb & J. P. Smol, 1995. Atlas of Chrysophyceancysts. Kluwer Academic Publishers.
Fjellheim, A., M. Rieradevall, G. Raddum & O. Schnell, 1997.AL:PE2 report for the period January 1993–June 1995. 3. Con-temporary biology – invertebrates. Unpublished report. 56 pp.
Frey, D. 1986. Cladocera analysis. In Berglund, B. E. (ed.), Palaeo-hydrological Changes in the Temperate Zone in the Last 15,000Years. Lake and Mire Environments. Specific Methods. Inter-national Geological Correlation Programme, Project 158, Vol.II, 227–257.
Hurtley, J. P. & D. E. Armstrong, 1991. Pigment preservation in lakesediments: a comparison of sedimentary environments in TroutLake, Wisconsin. Can. J. Fish. aquat. Sci. 48: 472–486.
Illies, L. (ed.), 1978. Limnofauna Europaea. Gustav Fusher Verlag,Stuttgart, Germany, 532 pp.
Lami, A., F. Niessen, P. Guilizzoni, J. Masaferro & C. A. Belis, 1994.Palaeolimnological studies of the eutrophication of volcanicLake Albano (central Italy). J. Paleolim. 10: 181–197.
Legendre, P. & L. Legendre. 1998. Numerical Ecology. Elsevier,Amsterdam, The Netherlands, 853 pp.
Pla, S., 2001. Chrysophycean cysts from the Pyrenees. J. Cramer,Berlin, Germany, 180 pp.
Rieradevall, M., N. Bonada & N. Prat. (in press). Substrate and depthpreferences of macroinvertebrates along a transect in a Pyreneanhigh mountain lake (Lake Redó, NE Spain). Limnetica.
Saether, O., 1975. Nearctic and Palaearctic Heterotrissocladius(Diptera: Chironomidae). Fisheries Research Board of CanadaBulletin, 193.

145
Schindler, D. W., P. J. Curtis, B. R. Parker & M. P. Stainton, 1996.Consequences of climate warming and lake acidification forUV-B penetration in North American boreal lakes. Science 379:705–708.
Schmid, P. E., 1993. A key to the larval Chironomidae and theirinstars from the Austrian Danube region Streams and Rivers.Part 1: Diamesinae, Prodiamesinae and Orthocladiinae. Wasserund Abwasser Supplement 3/93, 513 pp.
Sournia, A., 1987. Phytoplankton Manual. Unesco, Paris, France,337 pp.
Thompson, R. & R. M. Clark, 1993. Quantitative marine sedimentcore matching using a modified sequence-slotting algorithm.In Hailwood, E. A. & R. B. Kidd (eds), High ResolutionStratigraphy. J. Geol. Soc. Lond. Spec. Publ. 70: 39–49.
Ventura, M., L. Camarero, T. Buchaca, F. Bartumeus, D. Livingstone
& J. Catalan, 2000. The main features of seasonal variabilityin the external forcing and dynamics of a deep mountain lake(Redó, Pyrenees). J. Limnol. 59(suppl. 1): 97–108.
Walker, I. R., A. J. Levesque, L. C. Cwynar & A. F. Lotter, 1997.An expanded surface-water palaeotemperature inference modelfor use with fossil midges from Eastern Canada. J. Paleolim.18: 165–178.
Walker, I. R., J. P. Smol, D. R. Engstrom & H. J. B. Birks, 1990. Anassessment of Chironomidae as quantitative indicators of pastclimatic change. Can. J. Fish. aquat. Sci. 48: 975–987.
Wathne, B. (ed.), 1997. MOLAR Project manual. Norwegian Insti-tute for Water Research. Report No. O-96061, 179 pp.
Wiederholm, T. (ed.), 1983. Chironomidae of the Holarctic region.Keys and diagnoses. Part 1. Larvae. Entomologica Scandinavica,Supplement 19, 457 pp.

146