KOTA BEKASI - DPP Apindo Jabar
332
BADAN PUSAT STATISTIK KOTA BEKASI BPS-STATISTICS OF BEKASI MUNICIPALITY Katalog /Catalog: 1102001.3275 KOTA BEKASI DALAM ANGKA BEKASI MUNICIPALITY IN FIGURES 2021 https://bekasikota.bps.go.id
-
Upload
khangminh22 -
Category
Documents
-
view
0 -
download
0
Transcript of KOTA BEKASI - DPP Apindo Jabar

BADAN PUSAT STATISTIKKOTA BEKASIBPS-STATISTICS OF BEKASI MUNICIPALITY
Katalog /Catalog: 1102001.3275
KOTA BEKASIDALAM ANGKABEKASI MUNICIPALITY IN FIGURES
2021
https:
//bek
asiko
ta.b
ps.go.id

https:
//bek
asiko
ta.b
ps.go.id

https:
//bek
asiko
ta.b
ps.go.id

KOTA BEKASI DALAM ANGKABekasi Municipality in Figures2021
ISSN: 1907.3763No. Publikasi/Publication Number: 32750.2101Katalog /Catalog: 1102001.3275
Ukuran Buku/Book Size: 14,8 cm x 21 cmJumlah Halaman/Number of Pages : xxxii + 298 hal/pages
Naskah/Manuscript:BPS Kota BekasiBPS-Statistics of Bekasi Municipality
Penyunting/Editor:BPS Kota BekasiBPS-Statistics of Bekasi Municipality
Desain Kover/Cover Design:Seksi Integrasi Pengolahan dan Diseminasi StatistikSection of Integration Processing and Statistics Dissemination
Ilustrasi Kover/Cover Illustration:BPS Kota BekasiBPS-Statistics of Bekasi Municipality
Diterbitkan oleh/Published by:©BPS Kota Bekasi/BPS-Statistics of Bekasi Municipality
Dicetak oleh/Printed by:BPS Kota BekasiBPS-Statistics of Bekasi Municipality
Dilarang mengumumkan, mendistribusikan, mengomunikasikan, dan/atau menggandakansebagian atau seluruh isi buku ini untuk tujuan komersil tanpa izin tertulisdari Badan Pusat Statistik.Prohibited to announce, distribute, communicate, and/or copy part or all of this book forcommercial purpose without permission from BPS-Statistics Indonesia.
https:
//bek
asiko
ta.b
ps.go.id

iiiKota Bekasi Dalam Angka 2021
PETA WILAYAH KOTA BEKASIMAP OF BEKASI MUNICIPALITY
https:
//bek
asiko
ta.b
ps.go.id

https:
//bek
asiko
ta.b
ps.go.id

vKota Bekasi Dalam Angka 2021
KEPALA BPS KOTA BEKASICHIEF STATISTICIAN OF BEKASI MUNICIPALITY
AHMAD MUHAMMAD SALEH, SE
https:
//bek
asiko
ta.b
ps.go.id

https:
//bek
asiko
ta.b
ps.go.id

viiKota Bekasi Dalam Angka 2021
Bekasi, Februari 2021Kepala BPSKota Bekasi
AHMAD MUHAMMAD SALEH, SE
KATA PENGANTAR
Kota Bekasi Dalam Angka 2021 merupakan seri publikasi tahunan BPS Kota Bekasi yang menyajikan beragam jenis data yang bersumber dari BPS dan institusi lain. Publikasi ini memuat gambaran umum tentang keadaan geografi dan iklim, pemerintahan, serta perkembangan kondisi sosial demografi dan perekonomian di Kota Bekasi. Untuk memudahkan pemahaman dan pemanfaatan data, disertakan juga penjelasan teknis dari setiap jenis statistik yang disajikan.
Jadwal terbit Publikasi Kota Bekasi Dalam Angka tahun 2021 ini lebih cepat dibandingkan tahun-tahun sebelumnya. Implementasi Sistem Informasi Manajemen Data Statistik Terintegrasi (SIMDASI) juga dilakukan dalam penyusunan Publikasi Kota Bekasi Dalam Angka 2021 untuk mendukung terciptanya Satu Data Indonesia. Seiring dengan meningkatnya kebutuhan konsumen data, publikasi Kota Bekasi Dalam Angka akan terus mengalami penyempurnaan baik struktur maupun muatannya. Untuk mempermudah akses terhadap publikasi Kota Bekasi Dalam Angka dan tabel-tabel berdasarkan subjek, maka publikasi ini bisa dibaca dan diunduh melalui website BPS Kota Bekasi (www.bekasikota. bps.go.id) tanpa berbayar.Pada publikasi Kota Bekasi dalam Angka 2021 ini dilengkapi dengan infografis data strateg is sebagai bagian dari pembatas bab.
Publikasi ini dapat terwujud berkat kerja sama dan partisipasi dari berbagai pihak. Kepada semua pihak yang telah memberikan kontribusi, kami sampaikan penghargaan dan terima kasih. Semoga publikasi yang disajikan bermanfaat bagi pengguna untuk berbagai keperluan. Kami mengharapkan tanggapan dan saran dari para pengguna publikasi ini untuk perbaikan pada edisi yang akan datang.
Kata Pengantar/Preface ....................................................................................................
https:
//bek
asiko
ta.b
ps.go.id

viii Bekasi Municipality in Figures 2021
Bekasi, February 2021Chief Statistician ofBekasi Municipality
AHMAD MUHAMMAD SALEH, SE
P R E F A C E
Bekasi Municipality in Figures 2021 is an annual publication presenting various data from BPS-Statistics of Bekasi Municipality and other agencies. The publication provides general pictures of geographic and climate conditions, government, as well as key socio-demographic and economic characteristics of Bekasi Municapility. Technical notes for each statistics are also featured in this publication to provide a better understanding in interpreting the data.
The Bekasi Municipality in Figures 2021 has been published earlier compared to previous years. The implementation of the Integrated Statistical Data Management Information System (SIMDASI) was also carried out in the preparation of the Bekasi Municipality in Figures 2021 to support Indonesia’s One Data. In line with the increasing consumer data needs, the contents and the structure of this publication have been continuously improved. This publication and a series of the tables by subject can be read and downloaded on our website (www.bps.go.id) for free as our commitment to provide an immediate and easier access to the data.This edition also comes with infographics for some featured data on the chapter break
The release of the publication has been made possible due to the assistance and contribution of various government institutions and private organizations. To all parties who have been involved in the completion of this publication, I would like to express my high appreciation and gratitude. Hopefully this publication will be a useful resource for any purposes. Feedback and suggestions to improve the publication are always welcome.
https:
//bek
asiko
ta.b
ps.go.id

ixKota Bekasi Dalam Angka 2021
Kata Pengantar/Preface .................................................................................................... viiDaftar Isi/Contents .............................................................................................................. ixDaftar Tabel/List of Tables ................................................................................................. xiDaftar Gambar/List of Figures ......................................................................................... xxvDaftar Singkatan/List of Abbreviations ........................................................................ xxixStatistik Kunci/Key Statistics ............................................................................................ xxxi1. Geografi dan Iklim/Geography and Climate ..................................................... 12. Pemerintahan/Government ................................................................................... 153. Penduduk dan Ketenagakerjaan/Population and Employment ................ 374. Sosial dan Kesejahteraan Rakyat/Social and Welfare ................................... 555. Pertanian, Kehutanan, Peternakan, dan Perikanan/Agriculture,
Forestry, Livestock, and Fishery .............................................................................. 1176. Industri, Pertambangan, dan Energi/Industry, Mining, and Energy ........ 1957. Pariwisata/Tourism ................................................................................................... 2078. Transportasi dan Komunikasi/Transportation and Communication ........ 2199. Perbankan,Koperasi, dan Harga-harga/Banking,Cooperative, dan
Prices .............................................................................................................................. 23110. Pengeluaran Penduduk/Population Expenditure ........................................... 24711. Perdagangan/Trade .................................................................................................. 25712. Sistem Neraca Regional/System of Regional Accounts ................................. 26513. Perbandingan Antar Kabupaten/Kota/Regency/Municipal Comparison 285
DAFTAR ISI / CONTENTS
HalamanPage
Daftar Isi/Contents ..............................................................................................................
https:
//bek
asiko
ta.b
ps.go.id

https:
//bek
asiko
ta.b
ps.go.id

xiKota Bekasi Dalam Angka 2021
DAFTAR TABEL/LIST OF TABLES
Daftar Tabel/List of Tables .................................................................................................
HalamanPage
1. GEOGRAFI DAN IKLIM/GEOGRAPHY AND CLIMATE 1.1 KEADAAN GEOGRAFI GEOGRAPHY CONDITION1.1.1 Luas Daerah dan Jumlah Pulau Menurut Kecamatan di Kota Bekasi, 2020 Total Area and Number of Islands by Subdistrict in Bekasi
Municipality, 2020 ................................................................................................ 81.1.2 Tinggi Wilayah dan Jarak ke Ibukota Kota
Menurut Kecamatan di Kota Bekasi, 2020 Altitude and Distance to the Capital of Municipality by Subdistrict in
Bekasi Municipality, 2020 ................................................................................... 101.2 KEADAAN IKLIM CLIMATE CONDITION1.2.1 Pengamatan Unsur Iklim Menurut Bulan di Kota Bekasi, 2020 Observation of Climate Elements By Months at Bekasi Municipality,
2020 ......................................................................................................................... 112. PEMERINTAHAN/GOVERNMENT 2.1 WILAYAH ADMINISTRATIF ADMINISTRATIVE AREA2.1.1 Jumlah Kelurahan Menurut Kecamatan di Kota Bekasi, 2016–2020 Number of Kelurahan by Subdistrict in Bekasi Municipality, 2016–
2020 ......................................................................................................................... 242.2 DEWAN PERWAKILAN RAKYAT DAERAH REGIONAL HOUSE OF REPRESENTATIVE2.2.1 Jumlah Anggota Dewan Perwakilan Rakyat Daerah
Menurut Partai Politik dan Jenis Kelamin di Kota Bekasi, 2020 Number of Regional House of Representatives’s Members by Political
Parties and Sex in Bekasi Municipality, 2020 .................................................. 25
https:
//bek
asiko
ta.b
ps.go.id

xii Bekasi Municipality in Figures 2021
HalamanPage
2.3 SUMBER DAYA MANUSIA HUMAN RESOURCES2.3.1 Jumlah Pegawai Negeri Sipil Menurut Jabatan dan Jenis
Kelamin di Kota Bekasi, Desember 2019 dan Desember 2020 Number of Civil Servants by Occupation and Sex in Bekasi
Municipality, December 2019 dan December 2020 .................................... 262.3.2 Jumlah Pegawai Negeri Sipil Menurut Tingkat Pendidikan dan
Jenis Kelamin di Kota Bekasi, Desember 2019 dan Desember 2020 Number of Civil Servants by Educational Level and Sex in Bekasi
Municipality, Desember 2019 dan Desember 2020 .................................... 282.3.3 Jumlah Pegawai Negeri Sipil Menurut Tingkat Kepangkatan dan
Jenis Kelamin di Kota Bekasi, Desember 2019 dan Desember 2020 Number of Civil Servants by Hierarchy and Sex in Bekasi Municipality,
Desember 2019 dan Desember 2020 .............................................................. 302.4 KEUANGAN PEMERINTAH GOVERNMENT FINANCE2.4.1 Realisasi Pendapatan Pemerintah Kota Bekasi
Menurut Jenis Pendapatan (ribu rupiah), 2017–2020 Actual Bekasi Municipal Government Revenues by Kind of Revenues
(thousand rupiahs), 2017–2020 ....................................................................... 322.4.2 Realisasi Belanja Pemerintah Kota Bekasi
Menurut Jenis Belanja (ribu rupiah), 2017–2020 Actual Bekasi Municipal Government Expenditures by Kind of
Expenditures (thousand rupiahs), 2017–2020 .............................................. 343. PENDUDUK DAN KETENAGAKERJAAN/
POPULATION AND EMPLOYMENT 3.1 PENDUDUK POPULATION3.1.1 Penduduk, Laju Pertumbuhan Penduduk per Tahun, Distribusi
Persentase Penduduk, Kepadatan Penduduk, Rasio Jenis Kelamin Penduduk Menurut Kecamatan di Kota Bekasi, 2020
Population, Annual Population Growth Rate, Percentage Distribution of Population, Population Density, and Population Sex Ratio by Subdistrict in Bekasi Municipality, 2020 ......................................................... 48
https:
//bek
asiko
ta.b
ps.go.id

xiiiKota Bekasi Dalam Angka 2021
HalamanPage
3.2 KETENAGAKERJAAN EMPLOYMENT3.2.1 Jumlah Penduduk Berumur 15 Tahun Keatas
Menurut Jenis Kegiatan Selama Seminggu yang Lalu dan Jenis Kelamin di Kota Bekasi, 2020
Population Aged 15 Years and Over by Type of Activity During The Previous Week and Sex in Bekasi Municipality, 2020 .................................. 51
3.2.2 Penduduk Berumur 15 Tahun ke Atas Menurut Pendidikan Tertinggi yang Ditamatkan dan Jenis Kegiatan Selama Seminggu yang Lalu di Kota Bekasi, 2020
Population 15 Years of Age and Over by Educational Attainment and Type of Activity During the Previous Week in Bekasi Municipality, 2020 ......................................................................................................................... 52
3.2.3 Penduduk Berumur 15 Tahun Ke Atas yang Bekerja Selama Seminggu yang Lalu Menurut Status Pekerjaan Utama dan Jenis Kelamin di Kota Bekasi, 2020
Population 15 Years of Age and Over who Worked During The Previous Week by Main Employment Status and Sex in Bekasi Municipality, 2020 ................................................................................................ 54
4. SOSIAL DAN KESEJAHTERAAN RAKYAT/SOCIAL AND WELFARE 4.1 PENDIDIKAN EDUCATION4.1.1 Jumlah Sekolah, Guru, dan Murid Taman Kanak-Kanak
(TK) di Bawah Kementerian Pendidikan dan Kebudayaan Menurut Kecamatan di Kota Bekasi, 2019/2020 dan 2020/2021
Number of Schools, Teachers, and Pupils in Kindergarten Under The Ministry of Education and Culture by Subdistrict in Bekasi Municipality, 2019/2020 and 2020/2021 ....................................................... 66
4.1.2 Jumlah Sekolah, Guru, dan Murid Raudatul Athfal (RA) di Bawah Kementerian Agama Menurut Kecamatan di Kota Bekasi, 2019/2020 dan 2020/2021
Number of Schools, Teachers, and Pupils in Raudatul Athfal (RA) Under The Ministry of Religious Affairs by Subdistrict in Bekasi Municipality, 2019/2020 and 2020/2021 ....................................................... 69
https:
//bek
asiko
ta.b
ps.go.id

xiv Bekasi Municipality in Figures 2021
HalamanPage
4.1.3 Jumlah Sekolah, Guru, dan Murid Sekolah Dasar (SD) di Bawah Kementerian Pendidikan dan Kebudayaan Menurut Kecamatan di Kota Bekasi, 2019/2020 dan 2020/2021
Number of Schools, Teachers, and Pupils in Primary Schools Under The Ministry of Education and Culture by Subdistrict in Bekasi Municipality, 2019/2020 and 2020/2021 ....................................................... 70
4.1.4 Jumlah Sekolah, Guru, dan Murid Madrasah Ibtidaiyah (MI) di Bawah Kementerian Agama Menurut Kecamatan Menurut Kecamatan di Kota Bekasi, 2019/2020 dan 2020/2021
Number of Schools, Teachers, and Pupils in Madrasah Ibtidaiyah (MI) Under The Ministry of Religious Affairs by Subdistrict in Bekasi Municipality, 2019/2020 and 2020/2021 ....................................................... 73
4.1.5 Jumlah Sekolah, Guru, dan Murid Sekolah Menengah Pertama (SMP) di Bawah Kementerian Pendidikan dan Kebudayaan Menurut Kecamatan di Kota Bekasi, 2019/2020 dan 2020/2021
Number of Schools, Teachers, and Pupils in Lower Secondary Schools Under The Ministry of Education and Culture by Subdistrict in Bekasi Municipality, 2019/2020 and 2020/2021 ....................................................... 76
4.1.6 Jumlah Sekolah, Guru, dan Murid Madrasah Tsanawiyah (MTs) di Bawah Kementerian Agama Menurut Kecamatan di Kota Bekasi, 2019/2020 dan 2020/2021
Number of Schools, Teachers, and Pupils in Madrasah Tsanawiyah (MTs) Under The Ministry of Religious Affairs by Subdistrict in Bekasi Municipality , 2019/2020 and 2020/2021 ...................................................... 79
4.1.7 Jumlah Sekolah, Guru, dan Murid Sekolah Menengah Atas (SMA) di Bawah Kementerian Pendidikan dan Kebudayaan Menurut Kecamatan di Kota Bekasi, 2019/2020 dan 2020/2021
Number of Schools, Teachers, and Pupils in Upper Secondary Schools Under The Ministry of Education and Culture by Subdistrict in Bekasi Municipality, 2019/2020 and 2020/2021 ....................................................... 82
4.1.8 Jumlah Sekolah, Guru, dan Murid Sekolah Menengah Kejuruan (SMK) di Bawah Kementerian Pendidikan dan Kebudayaan Menurut Kecamatan di Kota Bekasi, 2019/2020 dan 2020/2021
Number of Schools, Teachers, and Pupils in Vocational High Schools Under The Ministry of Education and Culture by Subdistrict in Bekasi Municipality, 2019/2020 and 2020/2021 ....................................................... 85
https:
//bek
asiko
ta.b
ps.go.id

xvKota Bekasi Dalam Angka 2021
HalamanPage
4.1.9 Jumlah Sekolah, Guru, dan Murid Madrasah Aliyah (MA) di Bawah Kementerian Agama Menurut Kecamatan di Kota Bekasi, 2019/2020 dan 2020/2021
Number of Schools, Teachers, and Pupils in Madrasah Aliyah (MA) Under the Ministry of Religious Affairs by Subdistrict in Bekasi Municipality, 2019/2020 and 2020/2021 ....................................................... 88
4.1.10 Jumlah Desa1/Kelurahan yang Memiliki Fasilitas Sekolah Menurut Kecamatan dan Tingkat Pendidikan di Kota Bekasi, 2018–2020
Number of Villages1/Kelurahan Having Educational Facilities by Subdistrict and Educational Level in Bekasi Municipality, 2018–2020 ... 91
4.1.11 Angka Partisipasi Murni (APM) dan Angka Partisipasi Kasar (APK) Menurut Jenjang Pendidikan di Kota Bekasi, 2019 dan 2020
Net Participation Rates and Gross Participation Rates by Educational Level in Bekasi Municipality, 2019 and 2020 ................................................. 96
4.1.12 Persentase Penduduk Berumur 15 Tahun ke Atas yang Melek Huruf Menurut Kelompok Umur di Kota Bekasi, 2019 dan 2020
Percentage of Literate People Aged 15 Years and Over by Age Group in Bekasi Municipality, 2019 and 2020 ............................................................ 97
4.2 KESEHATAN HEALTH4.2.1 Jumlah Kelurahan Yang Memiliki Sarana Kesehatan
Menurut Kecamatan di Kota Bekasi, 2018–2020 Number of Kelurahan Having Health Facilities by Subdistrict in Bekasi
Municipality, 2018–2020 .................................................................... 984.2.2 Jumlah Tenaga Kesehatan Menurut Kecamatan di Kota Bekasi, 2020 Number of Health Human Resources by Subdistrict in Bekasi
Municipality, 2020 .............................................................................. 1044.2.3 Jumlah Rumah Sakit Umum, Rumah Sakit Khusus,
Puskesmas, Klinik Pratama, dan Posyandu Menurut Kecamatan di Kota Bekasi, 2019 dan 2020
Number of General Hospital, Specialized Hospital, Public Health Center, Primary Clinic, and Integrated Health Post by Subdistrict in Bekasi Municipality, 2019 and 2020 .................................................... 106
https:
//bek
asiko
ta.b
ps.go.id

xvi Bekasi Municipality in Figures 2021
HalamanPage
4.3 AGAMA DAN SOSIAL LAINNYA RELIGION AND OTHER SOCIAL AFFAIRS4.3.1 Jumlah Penduduk Menurut Kecamatan dan
Agama yang Dianut di Kota Bekasi, 2020 Population by Subdistrict and Religion in Bekasi Municipality, 2020 ..... 1094.3.2 Jumlah Tempat Peribadatan Menurut Kecamatan di Kota Bekasi, 2020 Number of Places of Worship by Subdistrict in Bekasi Municipality,
2020 ......................................................................................................................... 1104.3.3 Jumlah Kelurahan yang Mengalami Bencana Alam1
Menurut Kecamatan di Kota Bekasi, 2018–2020 Number of Kelurahan that Had Natural Disaster1 by Subdistrict in
Bekasi Municipality, 2018–2020 ....................................................................... 1124.4 KEMISKINAN POVERTY4.4.1 Garis Kemiskinan, Jumlah, dan Persentase
Penduduk Miskin di Kota Bekasi, 2013–2020 Poverty Line, Number, and Percentage of Poor People in Bekasi
Municipality, 2013–2020 .................................................................................... 1154.4.2 Indeks Kedalaman Kemiskinan dan Indeks
Keparahan Kemiskinan di Kota Bekasi, 2013–2020 Poverty Gap Index and Poverty Severity Index in Bekasi Municipality,
2013–2020 ............................................................................................................. 1165. PERTANIAN, KEHUTANAN, PETERNAKAN, DAN PERIKANAN/
AGRICULTURE, FORESTRY, LIVESTOCK, AND FISHERY 5.1 TANAMAN PANGAN FOOD CROPS5.1.1 Luas Lahan Sawah Menurut Kecamatan dan
Jenis Pengairan di Kota Bekasi (ha), 2020 Wetland Area by Subdistrict and Type of Irrigation in Bekasi
Municipality (ha), 2020 ....................................................................................... 1305.1.2 Luas Lahan Bukan Sawah Menurut Kecamatan
dan Penggunaannya di Kota Bekasi (ha), 2020 Dryland Area by Subdistrict and Utilizations in Bekasi Municipality
(ha), 2020 ............................................................................................................... 131
https:
//bek
asiko
ta.b
ps.go.id

xviiKota Bekasi Dalam Angka 2021
HalamanPage
5.1.3 Luas Panen, Produksi, dan Produktivitas Tanaman Padi Palawija Menurut Jenis Tanaman di Kota Bekasi, 2020
Harvested Area, Production, and Productivity of Rice Crop by Kind of Plant in Bekasi Municipality, 2020 ................................................................... 133
5.2 HORTIKULTURA HORTICULTURE5.2.1 Luas Panen Tanaman Sayuran Menurut Kecamatan
dan Jenis Tanaman di Kota Bekasi (ha), 2019 dan 2020 Harvested Area of Vegetables by Subdistrict and Kind of Plant in
Bekasi Municipality (ha), 2019 and 2020 ....................................................... 1345.2.2 Produksi Tanaman Sayuran Menurut Kecamatan dan
Jenis Tanaman di Kota Bekasi (kuintal), 2019 dan 2020 Production of Vegetables by Subdistrict and Kind of Plant in Bekasi
Municipality (quintal), 2019 and 2020 ............................................................ 1385.2.3 Luas Panen Tanaman Sayuran dan Buah-buahan Semusim
Menurut Jenis Tanaman di Kota Bekasi (ha), 2017–2020 Harvested Area of Seasonal Vegetables and Fruits by Kind of Plant in
Bekasi Municipality (ha), 2017–2020 .............................................................. 1425.2.4 Produksi Tanaman Sayuran dan Buah-buahan Semusim
Menurut Jenis Tanaman di Kota Bekasi (kuintal), 2017–2020 Production of Seasonal Vegetables and Fruits by Kind of Plant in
Bekasi Municipality (quintal), 2017–2020 ...................................................... 1435.2.5 Luas Panen Tanaman Biofarmaka Menurut Kecamatan
dan Jenis Tanaman di Kota Bekasi (m2), 2019 dan 2020 Harvested Area of Medicinal Plants by Subdistrict and Kind of Plant in
Bekasi Municipality (m2), 2019 and 2020 ....................................................... 1445.2.6 Produksi Tanaman Biofarmaka Menurut Kecamatan
dan Jenis Tanaman di Kota Bekasi (kg), 2019 and 2020 Production of Medicinal Plants by Subdistrict and Kind of Plant in
Bekasi Municipality (kg), 2019 and 2020 ........................................................ 1485.2.7 Luas Panen Tanaman Biofarmaka Menurut
Jenis Tanaman di Kota Bekasi (m2), 2017–2020 Harvested Area of Medicinal Plants by Kind of Plant in Bekasi
Municipality (m2), 2017–2020 ........................................................................... 152
https:
//bek
asiko
ta.b
ps.go.id

xviii Bekasi Municipality in Figures 2021
HalamanPage
5.2.8 Produksi Tanaman Biofarmaka Menurut Jenis Tanaman di Kota Bekasi (kg), 2017–2020
Production of Medicinal Plants by Kind of Plant in Bekasi Municipality (kg),2017–2020 ..................................................................................................... 153
5.2.9 Luas Panen Tanaman Hias Menurut Kecamatan dan Jenis Tanaman di Kota Bekasi (m2), 2019 and 2020
Harvested Area of Ornamental Plants by Subdistrict and Kind of Plant in Bekasi Municipality (m2), 2019 and 2020 ................................................... 154
5.2.10 Produksi Tanaman Hias Menurut Kecamatan dan Jenis Tanaman di Kota Bekasi (tangkai), 2019 and 2020
Production of Ornamental Plants by Subdistrict and Kind of Plant in Bekasi Municipality (stalks), 2019 and 2020 .................................................. 159
5.2.11 Luas Panen Tanaman Hias Menurut Jenis Tanaman di Kota Bekasi (m2), 2017–2020
Harvested Area of Ornamental Plants by Kind of Plant in Bekasi Municipality (m2), 2017–2020 ............................................................................. 164
5.2.12 Produksi Tanaman Hias Menurut Jenis Tanaman di Kota Bekasi (tangkai), 2017–2020
Production of Ornamental Plants by Kind of Plant in Bekasi Municipality (stalks), 2017–2020 ....................................................................... 165
5.2.13 Produksi Buah-buahan Menurut Kecamatan dan Jenis Tanaman di Kota Bekasi (kuintal), 2019 and 2020
Production of Fruits by Subdistrict and Kind of Plant in Bekasi Municipality (kuintal), 2019 and 2020 ............................................................ 166
5.2.14 Produksi Buah–Buahan dan Sayuran Tahunan Menurut Jenis Tanaman di Kota Bekasi (ton), 2017–2020
Production of Annual Fruits and Vegetables by Kind of Plant in Bekasi Municipality (ton), 2017–2020 .......................................................................... 176
5.3 PERKEBUNAN ESTATE CROPS5.2.1 Luas Areal Tanaman Perkebunan Menurut Kecamatan
dan Jenis Tanaman di Kota Bekasi (ha), 2019 dan 2020 Planted Area of Estate Crops by Subdistrict and Type of Crops in
Bekasi Municipality (ha), 2019 and 2020 ....................................................... 178
https:
//bek
asiko
ta.b
ps.go.id

xixKota Bekasi Dalam Angka 2021
HalamanPage
5.2.2 Produksi Perkebunan Menurut Kecamatan dan Jenis Tanaman di Kota Bekasi (ton), 2019 dan 2020
Production of Estate by Subdistrict and Type of Crops in Bekasi Municipality (ton), 2019 and 2020 ................................................................... 182
5.4 PETERNAKAN LIVESTOCK5.4.1 Populasi Ternak Menurut Kecamatan dan
Jenis Ternak di Kota Bekasi (ekor), 2020 Livestock Population by Subdistrict and Kind of Livestock in Bekasi
Municipality (tail), 2020 ...................................................................................... 1865.4.2 Produksi Daging Ternak Menurut Kecamatan
dan Jenis Ternak di Kota Bekasi (kg), 2020 Livestock Production by Subdistrict and Kind of Livestock in Bekasi
Municipality (kg), 2020 ....................................................................................... 1875.4.3 Populasi Unggas Menurut Kecamatan dan
Jenis Unggas di Kota Bekasi (ekor), 2020 Poultry Population by Subdistrict and Kind of Poultry in Bekasi
Municipality (tail), 2020 ...................................................................................... 1885.4.4 Produksi Daging Unggas Menurut Kecamatan
dan Jenis Unggas di Kota Bekasi (kg), 2020 Meat Production of Poultry by Subdistrict and Kind of Poultry in
Bekasi Municipality (kg), 2020 .......................................................................... 1895.4.5 Produksi Telur Unggas Menurut Kecamatan
dan Jenis Unggas di Kota Bekasi (kg), 2020 Poultry Eggs Production by Subdistrict and Kind of Poultry in Bekasi
Municipality (kg), 2020 ....................................................................................... 1905.5 PERIKANAN FISHERY5.5.1 Produksi Perikanan Darat dan Budidaya
Ikan Hias di Kota Bekasi, 2016 - 2020 Production of Inland Fisheries and Ornamental Fish Culture in Bekasi
Municipality, 2016 - 2020 ................................................................................... 1915.5.2 Produksi Perikanan Darat Menurut Jenis Ikan di Kota Bekasi, 2020 Inland Fisheries Production by Kind of Fish in Bekasi Municipality, 2020
https:
//bek
asiko
ta.b
ps.go.id

xx Bekasi Municipality in Figures 2021
HalamanPage
5.5.3 Nilai Produksi Perikanan Darat Menurut Jenis Ikan di Kota Bekasi (Ribu Rupiah), 2020
Inland Fisheries Production Value by Kind of Fish in Bekasi Municipality (thousand rupiahs), 2020 .......................................................... 192
6. INDUSTRI, PERTAMBANGAN, DAN ENERGI/INDUSTRY, MINING, AND ENERGY
6.1 Daya Terpasang, Produksi, dan Distribusi Listrik PT. PLN (Persero) pada Cabang/Ranting PLN Menurut Kecamatan di Kota Bekasi, 2020
Installed Electricity Power, Production, and Distribution of PT. PLN (Persero) at PLN Branch by Subdistrict in Bekasi Municipality, 2020 ....... 202
6.2 Jumlah Pelanggan Listrik Menurut Kecamatan di Kota Bekasi, 2016–2020 Number of Electricity Customers by Subdistrict in Bekasi Municipality,
2016–2020 ............................................................................................................. 2036.3 Jumlah Pelanggan, Listrik Terjual, dan Pendapatan PT PLN pada
Cabang/Ranting PLN Menurut Jenis Pelanggan di Kota Bekasi, 2020 Number of Customers, Electricity Sold and Revenue PT PLN at PLN
Branch by Customer Type in Bekasi Municipality, 2020 .............................. 2046.4 Jumlah Pelanggan dan Air yang Disalurkan
Menurut Kecamatan di Kota Bekasi, 2020 Number of Customers and Distributed Water by Subdistrict in Bekasi
Municipality, 2020 ................................................................................................ 2056.5 Cakupan Pelayanan PDAM Tirta Patriot
Menurut Bulan di Kota Bekasi, 2020 Potency of PDAM Tirta Patriot by Month in Bekasi Municipality, 2020 .. 2067. PARIWISATA/TOURISM 7.1 Jumlah Rumah Makan/Restoran Menurut
Kecamatan di Kota Bekasi, 2017–2020 Number of Restaurants by Subdistrict in Bekasi Municipality, 2017–
2020 ......................................................................................................................... 2167.2 Jumlah Penginapan/Hotel Menurut Kecamatan di Kota Bekasi, 2020 Number of Hotels by Subdistrict in Bekasi Municipality, 2020 .................. 2178. TRANSPORTASI DAN KOMUNIKASI/
TRANSPORTATION AND COMMUNICATION
https:
//bek
asiko
ta.b
ps.go.id

xxiKota Bekasi Dalam Angka 2021
HalamanPage
8.1 TRANSPORTASI TRANSPORTATION8.1.1 Panjang Jalan1 Menurut Tingkat Kewenangan
Pemerintahan di Kota Bekasi (km), 2018–2020 Length of Roads1 by Level of Government Authority in Bekasi
Municipality (km), 2018–2020 .......................................................................... 2268.1.2 Panjang Jalan Menurut Jenis Permukaan
Jalan di Kota Bekasi (km), 2018–2020 Length of Roads by Type of Road Surface in Bekasi Municipality (km),
2018–2020 ........................................................................................................... 2278.1.3 Panjang Jalan Menurut Kondisi Jalan di Kota Bekasi (km), 2018–2020 Length of Roads by Condition of Roads in Bekasi Municipality (km),
2018–2020 ........................................................................................................... 2288.2 KOMUNIKASI COMMUNICATION8.2.1 Jumlah Kantor Pos Pembantu Menurut
Kecamatan di Kota Bekasi, 2017–2020 Number of Post Offices Subsidiaries by Subdistrict in Bekasi
Municipality, 2017–2020 .................................................................................... 2299. PERBANKAN, KOPERASI, DAN HARGA-HARGA/
BANKING, COOPERATIVE, AND PRICES 9.1 Jumlah Koperasi Aktif Menurut Kecamatan di Kota Bekasi, 2017–2020 Number of Active Cooperative by Subdistrict in Bekasi Municipality,
2017–2020 ............................................................................................................. 2389.2 Jumlah Koperasi Menurut Jenis Koperasi
dan Kecamatan di Kota Bekasi, 2020 Number of Cooperative by Kind of Cooperative and Subdistrict in
Bekasi Municipality, 2020 ................................................................................... 239 Expenditure Group ................................................................................................. 2409.3 Indeks Harga Konsumen per Bulan Menurut Kelompok
https:
//bek
asiko
ta.b
ps.go.id

xxii Bekasi Municipality in Figures 2021
HalamanPage
Pengeluaran (2018=100) di Kota Bekasi, 2020 Consumer Price Index per Month by Expenditure Group (2018=100) in
Bekasi Municipality, 2020 ................................................................................... 240Expenditure Group ....................................................................................................... 241Expenditure Group ....................................................................................................... 242Expenditure Group ....................................................................................................... 2439.4 Laju Inflasi Bulanan Menurut Kelompok Pengeluaran
(2018=100) di Kota Bekasi (Persen), 2020 Monthly Inflation Rate by Expenditure Group (2018=100) in Bekasi
Municipality (Percent), 2020 .............................................................................. 243Expenditure Group ....................................................................................................... 244Expenditure Group ....................................................................................................... 2459.5 Jumlah Kantor Bank Menurut Kelompok Bank di Kota Bekasi, 2015–2020 Number of Bank Offices by Bank Group in Bekasi Municipality,
2015–2020 ............................................................................................................. 24610. PENGELUARAN PENDUDUK/POPULATION EXPENDITURE 10.1 Rata-rata Pengeluaran per Kapita Sebulan Menurut
Kelompok Komoditas (rupiah) di Kota Bekasi, 2019 dan 2020 Monthly Average Expenditure per Capita by Commodity Group
(rupiahs) in Bekasi Municipality, 2019 and 2020 .......................................... 25410.2 Persentase Pengeluaran per Kapita Sebulan Menurut
Kelompok Komoditas di Kota Bekasi, 2019 dan 2020 Percentage of Monthly Expenditure per Capita by Commodity Group
in Bekasi Municipality, 2019 and 2020 ............................................................ 25510.3 Persentase Penduduk Menurut Golongan
Pengeluaran Per Kapita Sebulan di Kota Bekasi, 2020 Percentage of Population by Per Capita Spending Group a Month in
Bekasi Municipality, 2020 ................................................................................... 25611. PERDAGANGAN/TRADE 11.1 Jumlah Sarana Perdagangan Menurut Jenisnya di Kota Bekasi, 2017–2020 Number of Trading Facilities by Type of Facility in Bekasi Municipality,
2017–2020 ............................................................................................................. 26412. SISTEM NERACA REGIONAL/SYSTEM OF REGIONAL ACCOUNTS 12.1. Produk Domestik Regional Bruto Atas Dasar Harga Berlaku
https:
//bek
asiko
ta.b
ps.go.id

xxiiiKota Bekasi Dalam Angka 2021
HalamanPage
Menurut Lapangan Usaha di Kota Bekasi (miliar rupiah), 2016–2020 Gross Regional Domestic Product at Current Market Prices by Industry
in Bekasi Municipality (billion rupiahs), 2016–2020 .................................... 27412.2 Produk Domestik Regional Bruto Atas Dasar Harga Konstan 2010
Menurut Lapangan Usaha di Kota Bekasi (miliar rupiah), 2016–2020 Gross Regional Domestic Product at 2010 Constant Market Prices by
Industry in Bekasi Municipality (billion rupiahs), 2016–2020 ................... 27612.3 Distribusi Persentase Produk Domestik Regional Bruto Atas Dasar
Harga Berlaku Menurut Lapangan Usaha di Kota Bekasi, 2016–2020 Percentage Distribution of Gross Regional Domestic Product at
Current Market Prices by Industry in Bekasi Municipality, 2016–2020 .... 27812.4 Laju Pertumbuhan Produk Domestik Regional
Bruto Atas Dasar Harga Konstan 2010 Menurut Lapangan Usaha di Kota Bekasi (persen), 2017–2020
Growth Rate of Gross Regional Domestic Product at 2010 Constant Market Prices by Industry in Bekasi Municipality (percent), 2017–2020 . 280
12.5 Produk Domestik Regional Bruto Atas Dasar Harga Berlaku Menurut Jenis Pengeluaran di Kota Bekasi (miliar rupiah), 2015–2019
Gross Regional Domestic Product at Current Market Prices by Type of Expenditure in Bekasi Municipality (billion rupiahs), 2015–2019 ............ 282
12.6 Produk Domestik Regional Bruto Atas Dasar Harga Konstan 2010 Menurut Jenis Pengeluaran di Kota Bekasi (miliar rupiah), 2015–2019
Gross Regional Domestic Product at 2010 Constant Market Prices by Type of Expenditure in Bekasi Municipality (billion rupiahs), 2015–2019 ......................................................................................................................... 283
13. PERBANDINGAN ANTAR KABUPATEN/KOTA/ REGENCY/MUNICIPAL COMPARISON
13.1 Jumlah Penduduk Menurut Kabupaten/Kota di Provinsi Jawa Barat (ribu), 2016–2020
Population by Regency/Municipality in Jawa Barat Province (thousand), 2016–2020....................................................................................... 292
13.2 Laju Pertumbuhan Produk Domestik Regional Bruto Atas Dasar Harga Konstan 2010 Menurut Kabupaten/Kota di Provinsi Jawa Barat (persen), 2016–2020
Rate of Growth of Gross Regional Domestic Products at Constant 2010 Prices by Regency/Municipality in Jawa Barat Province (percent),
https:
//bek
asiko
ta.b
ps.go.id

https:
//bek
asiko
ta.b
ps.go.id

xxvKota Bekasi Dalam Angka 2021
DAFTAR GAMBAR/LIST OF FIGURES
HalamanPage
1.1 Luas Daerah menurut Kecamatan (km2), 2020 Area of Subdistrict (sq.km), 2020 ...................................................................... 61.2 Jarak dari Ibukota Kecamatan ke Ibukota Kota di Kota Bekasi (km), 2020 Distance between Subdistrict Capital and Municipality Capital in Bekasi
Munivipality (km), 2020 ...................................................................................... 72.1 Jumlah Kelurahan menurut Kecamatan, 2020 Number of Kelurahan by Subdistrict, 2020 .................................................... 222.2 Jumlah PNS Menurut Tingkat Pendidikan (%), 2020 Number of Civil Servants by Level of Education (%), 2020 ........................ 233.1 Jumlah Penduduk menurut Kecamatan (ribu), 2020 Number of Population by Subdistrict (thousand), 2020 ............................. 463.2 Kepadatan Penduduk per km2 menurut Kecamatan, 2020 Population Density per sq.km by Subdistrict, 2020 ...................................... 474.1 Jumlah Sekolah menurut Tingkat Pendidikan, 2020 Number of Schools by Education Level, 2020 ................................................ 644.2 Jumlah Kelurahan Yang Memiliki Sarana Kesehatan, 2020 Number of Kelurahan Having Health Facilities, 2020 .....................5.1 Produksi Daging Ternak menurut Jenis Ternak (kg), 2020 Livestock Production by Kind of Livestock (kg), 2020 .................................. 1285.2 Produksi Daging Unggas Menurut Jenis Unggas (kg),2020 Meat Production of Poultry by Kind of Poultry (kg), 2020 .......................... 1296.1 Jumlah Pelanggan PLN menurut Jenis Pelanggan, 2020 Number of PLN Customers by Customer Type, 2020.................................... 2006.2 Jumlah Listrik Terjual (KWh) menurut Jenis Pelanggan, 2020
Number of Electricity Sold (KWh) by Customer Type, 2020 ................................... 2017.1 Jumlah Restoran di Kota Bekasi, 2017–2020 Number of Restaurants in Bekasi Municipality, 2017–2020 ...................... 2147.2 Jumlah Penginapan/Hotel di Kota Bekasi, 2020 Number of Hotels in Bekasi Municipality, 2020 ..............................
Daftar Gambar/List of Figures .........................................................................................
https:
//bek
asiko
ta.b
ps.go.id

xxvi Bekasi Municipality in Figures 2021
HalamanPage
8.1 Panjang Jalan Menurut Tingkat Kewenangan (km), 2020 Length of Roads by Level of Authority (km), 2020 ....................................8.2 Panjang Jalan Menurut Kondisi Jalan (km), 2020 Length of Roads by Condition of Roads (km), 2020 .............................. 2259.1 Jumlah Koperasi Aktif Menurut Kecamatan, 2020 Number of Active Cooperative by Subdistrict, 2020 .................................... 2369.2 Jumlah Koperasi Menurut Jenis Koperasi, 2020 Number of Cooperative by Kind of Cooperative, 2020 ................................ 23710.1 Persentase Pengeluaran per Kapita Sebulan Menurut
Kelompok Komoditas Makanan di Kota Bekasi, 2020 Percentage of Monthly Expenditure per Capita by Commodity Group of
Food in Bekasi Municipality, 2020 ..................................................................10.2 Persentase Pengeluaran per Kapita Sebulan Menurut
Kelompok Komoditas non-Makanan, 2020 Percentage of Monthly Expenditure per Capita by Commodity Group of non-
Food, 2020 .............................................................................................................. 25311.1 Jumlah Sarana Perdagangan di Kota Bekasi, 2017–2020 Number of Trading Facilities, 2017–2020 ....................................................... 26211.2 Jumlah Sarana Perdagangan Menurut Jenisnya, 2020 Number of Trading Facilities by Type of Facility, 2020 ................................. 26312.1 Laju Pertumbuhan PDRB Atas Dasar Harga Konstan 2010 Menurut
Lapangan Usaha (persen), 2017–2020 ....................Growth Rate of GRDP at 2010 Constant Market Prices by Industry (percent), 2017–2020
12.2 Distribusi Persentase PDRB Atas Dasar Harga Berlaku Menurut Lapangan Usaha, 2020
Percentage Distribution of GRDP at Current Market Prices by Industry,2020 ......................................................................................................... 273
13.1 Jumlah Penduduk Menurut Kabupaten/Kota di Provinsi Jawa Barat (ribu), 2020
Population by Regency/Municipality in Jawa Barat Province(thousand), 2020 ......................................................................................................................... 290
13.2 Jumlah Penduduk Miskin Menurut Kabupaten/Kota (ribu), 2020
https:
//bek
asiko
ta.b
ps.go.id

xxviiKota Bekasi Dalam Angka 2021
PENJELASAN UMUM/EXPLANATORY NOTES
Tanda-tanda, satuan-satuan, dan lain-lainnya yang digunakan dalam publikasi ini adalah sebagai berikut: Symbols, measurement units, and acronyms which are used in this publication, are as follows:
1. TANDA-TANDA/SYMBOLS
Data tidak tersedia/Data not available ........................................................ : ...Tidak ada atau nol /Null or zero ..................................................................... : –
Data dapat diabaikan/Data negligible ........................................................ : 0Tanda decimal/Decimal point ........................................................................ : ,Data tidak dapat ditampilkan/Not applicable .......................................... : NAAngka estimasi/Estimated figures ................................................................. : eAngka diperbaiki/Revised figures ................................................................. : rAngka sementara/Preliminary figures ......................................................... : xAngka sangat sementara/Very preliminary figures ................................ : xxAngka sangat sangat sementara/Very very preliminary figures ........ : xxx
2. SATUAN/UNITS
barel/barrel ..................................................................... : 158,99 liter/litres = 1/6,2898 m3
hektar (ha)/hectare (ha) .............................................. : 10 000 m2
kilometer (km)/kilometres (km) ................................ : 1 000 meter/meters (m)knot/knot ......................................................................... : 1,8523 km/jam (km/hour)kuintal/quintal ............................................................... : 100 kgKWh ................................................................................... : 1 000 Watt hourMWh .................................................................................. : 1 000 KWhliter (untuk beras)/litre (for rice) ............................... : 0,80 kgMMSCF ............................................................................. : 1/35,3 m3
metrik ton (m.ton)/metric ton (m. ton) ................... : 0,98421 long ton = 1 000 kgons/ounce ........................................................................ : 28,31 gram/gramston ...................................................................................... : 1 000 kg
Satuan lain: buah, dus, butir, helai/lembar, kaleng, batang, pulsa, ton kilometer (ton-km), jam, menit, persen (%). Other units: unit, pack, pieces, sheet, tin, pulse, ton-kilometres(ton-km), hour, minute, percent (%).
Perbedaan angka di belakang koma disebabkan oleh pembulatan angka. The difference in decimal numbers is caused by rounding.
https:
//bek
asiko
ta.b
ps.go.id

https:
//bek
asiko
ta.b
ps.go.id

xxixKota Bekasi Dalam Angka 2021
DAFTAR SINGKATAN/ LIST OF ABBREVIATIONS
SI : Stasiun IklimSIMPK : Stasiun Meteorologi Pertanian Khusust.t : Tempat tidurBCG : Bacillus Calmette GuerinDPT : Difteri, Pertusis, TetanusTT : Tetanus ToxoidIOT : Industri Obat Tradisional/Traditional Medicine IndustryIKOT : Industri Kecil Obat Tradisional/Traditional Medicine SmallAlkes : Alat kesehatan/Health KitsPKRT : Perbekalan Kesehatan Rumah tangga/Household Health
LogisticsKompl : Komplemen/ComplementIRTP : Industri Pangan Produksi Rumah Tangga/Foods Home IndustryPBF : Pedagang Besar Farmasi/Pharmacy Whole-sellerGFK : Gudang Farmasi Kab/Kota/Regency/Muncipality Pharmacy
WarehouseRB : Rumah Bersalin/Delivery HousePustu : Puskesmas pembantu/Auxiliary Public Health CenterBP : Balai Pengobatan/PolyclinicTPS : Tempat Pembuangan Sementara /landfillJamkesmas : Jaminan kesehatan masyarakat miskin/Poor public health
insurancePJKMU : Program Jaminan Kesehatan Masyarakat UmumSIUP : Surat Ijin Usaha Perdagangan/Trading Permission LetterTDP : Tanda Daftar Perusahaan/Company Registration IdentityAPI : Angka Pengenal Importir/Importer’s Identity Number
Daftar Singkatan/List of Abbreviations
https:
//bek
asiko
ta.b
ps.go.id

https:
//bek
asiko
ta.b
ps.go.id

xxxiKota Bekasi Dalam Angka 2021
Statistik Kunci, 2018–2020Key Statistics, 2018–2020
Rincian/Description Satuan/Unit 2018 2019 2020
(1) (2) (3) (4) (5)SOSIAL/SOCIAL
Penduduk1/Population1 juta/million 2,9 3,0Laju Pertumbuhan Penduduk1/Population Growth1 % 1,19 2,4Angka Harapan Hidup1-e0/Life Expectancy Rate1 tahun/years 74,7 74,8Angka Melek Huruf Usia 15+/Literacy Rate Aged 15+ % 99,5 99,7Tingkat Partisipasi Angkatan Kerja -TPAK2,3
Labour Force Participation Rate-LFPR2,3
%65,3 65,7
Tingkat Pengangguran Terbuka-TPT2
Unemployment Rate-UR2
%9,1 8,2
Penduduk Miskin5/Poor People4 juta/million 119,8 113,7Persentase Penduduk Miskin4
Percentage of Poor People4
%4,1 3,8
Indeks Pembangunan Manusia-IPM5
Human Development Index5
–81,0 81,6
EKONOMI/ECONOMICProduk Domestik Regional Bruto (PDRB) Harga Berlaku6
Gross Regional Domestic Bruto (GRDP) at Current Price6
triliun rupiahtrillion rupiahs x xx
Laju Pertumbuhan Ekonomi8/Economic Growth 7 % 5,9 x 5,4 xx
PDRB Per Kapita Harga Berlaku 6,8
Per Capita of GRDP at Current Price 6,8
juta rupiahmillion rupiahs x xx
Statistik Kunci/Key Statistics
Catatan/Notes: 1 Hasil proyeksi penduduk Indonesia 2010–2035 (pertengahan tahun/Juni)/The result of Indonesia population prjection 2010–2035 (mid year/June)
2 Kondisi Agustus/Condition at August 3 Menggunakan penimbang hasil proyeksi penduduk tahun 2010–2035/Weighted by the 2010–2035 population
projection 4 Kondisi Maret/Condition at March 5 Sejak tahun 2010, IPM dihitung dengan metode baru. Komponen IPM metode baru adalah angka harapan
hidup saat lahir, harapan lama sekolah, rata-rata lama sekolah, dan pengeluaran per kapita/Since 2010, HDI was calculated using new method. New HDI component are life expectancy at birth, expected years of schooling, means years of schooling, and expenditure per capita
6 Mulai tahun 2010 mengadopsi System of National Account 2008 (SNA 2008)/Since 2010 is in line with System of National Account 2008 (SNA 2008)
7 Menggunakan tahun dasar 2010 (2010=100)/Using 2010 base year (2010=100) 8 Menggunakan proyeksi penduduk berdasarkan hasil SP2010/Using population projection based on SP2010
https:
//bek
asiko
ta.b
ps.go.id

https:
//bek
asiko
ta.b
ps.go.id

1. Geografi dan Iklim/Geography and Climate .....................................................1. GEOGRAFI DAN IKLIM/GEOGRAPHY AND CLIMATE
Chapter
GEOGRAPHY AND CLIMATE
BAB
01 GEOGRAFI DAN IKLIM
Geography Condition of Bekasi Municipality
Kecamatan
Kecamatan
Subdistrict withthe largest area
the smallest areaSubdistrict with
Sumber/Source: Sekretariat Daerah Kota BekasiBekasi Municipality Sekretariat
Kecamatan Mustikajaya26,42km2
LUAS WILAYAH KOTA BEKASITotal Area of Bekasi Municipality 210,49 km2
sq.km
WILAYAH ADMINISTRASI KOTA BEKASIBekasi Municipal Administration Area
KEADAAN GEOGRAFI KOTA BEKASI
Kecamatan
Kecamatan Pondokmelati11,80 km2
12 56Kelurahantentang Pemerintahan Daerah
Kelurahan diatur dengan ketentuanUndang-Undang No 32 tahun 2004
Kecamatan diatur dengan ketentuanUndang-Undang No 23 tahun 2014
tentang Pemerintahan DaerahLaw No.23 Year 2014about Local Government
Law No.32 Year 2004about Local Government
2020
https:
//bek
asiko
ta.b
ps.go.id

https:
//bek
asiko
ta.b
ps.go.id

3
GEOGRAFI DAN IKLIM
Kota Bekasi Dalam Angka 2021
PENJELASAN TEKNIS TECHNICAL NOTES
1. Topografi adalah keadaan muka bumi pada suatu kawasan atau daerah.a. Puncak adalah bagian paling
atas gunung/pegunungan.b. Lereng adalah bagian dari
gunung/pegunungan/bukit yang letaknya di antara puncak sampai lembah.
c. Lembah adalah daerah rendah diantara dua gunung/pegunungan atau daerah yang mempunyai kedudukan lebih rendah dibandingkan daerah sekitarnya. Lembah di daerah pegunungan lipatan sering disebut slinkin. Lembah di daerah pegunungan patahan disebut graben atau slenk. Sedangkan lembah di daerah yang bergunung-gunung disebut lembah antar pegunungan.
2. Dataran adalah bagian atau sisi bidang tanah yang tampak datar, rata, dan membentang.
3. Hujan adalah titik-titik air di udara atau awan yang sudah terlalu berat karena kandungan airnya sudah sangat banyak, sehingga akan jatuh kembali ke permukaan bumi sebagai hujan (presipitasi). Alat untuk mengukur hujan adalah fluviometer.
1. Topography is the state of the earth in a certain area or region.
a. Peak is the highest part of mount/ mountain.
b. Slope is part of the mount/ mountain/hill which lies between the peak to the valley.
c. Valley is a low area between two mounts/mountains or area that have a position lower than the surrounding areas. Valley in mountainous area is often called syncline. Valley in a mountainous area is called graben fault or slenk. While the valley in the mountainous area is called the valley between the mountains.
2. Flat is a part or side of parcels of land that looked plane, flat, and stretches.
3. Rain is water droplets in the air or a cloud that is too heavy because the water content is already very much, so it will fall back to the earth’s surface as rain (precipitation). Tools to measure rainfall is fluviometer.
https:
//bek
asiko
ta.b
ps.go.id

4
GEOGRAPHY AND CLIMATE
Bekasi Municipality in Figures 2021
4. Curah hujan merupakan ketebalan air hujan yang terkumpul pada luasan 1 m2. Satuan curah hujan yang digunakan Badan Meteorologi Klimatologi dan Geofisika (BMKG) adalah millimeter (mm). Curah hujan dihitung dengan satuan mm, yaitu air yang tertampung pada area seluas 1m x 1m (m2). Jadi curah hujan 1 mm adalah jumlah air yang turun dari langit sebanyak 1mmx1mx1m = 0,001 m3 = 1 liter.
4. Rainfall is the thickness of the rainwater collected in an area of 1 m2. Unit precipitation used Meteorology and Geophysics Agency (BMKG) is millimeters (mm). Rainfall is calculated in mm, ie water being stored in an area of 1m x 1m (m2). So rainfall of 1 mm is the amount of water that fell from the sky as much as 1mmx1mx1m = 0,001 m3 = 1 liter.
https:
//bek
asiko
ta.b
ps.go.id

5
GEOGRAFI DAN IKLIM
Kota Bekasi Dalam Angka 2021
ULASAN DESCRIPTION
Secara astronomi, Kota Bekasi terletak antara 106º48’28” - 107º27’29” Bujur Timur dan 6º10’6” - 6º30’6” Lintang Selatan.
Kondisi alam Kota Bekasi merupakan daerah dataran dengan kemiringan antara 0 - 2 % dan ketinggian antara 11 m – 81 m di atas permukaan air laut. Luas wilayah Kota Bekasi adalah 210,49 km2.
Tahun 2020, wilayah administrasi Kota Bekasi terdiri dari 12 wilayah kecamatan, luas daratan masing-masing Kecamatan, yaitu: Pondokgede (15,92 km2), Jatisampurna (19,54 km2), Pondok Melati (11,80 km2), Jatiasih (24,27 km2), Bantargebang (18,44 km2), Mustika Jaya (26,42 km2), Bekasi Timur (14,63 km2), Rawalumbu (16,85 km2), Bekasi Selatan (16,06 km2), Bekasi Barat (14,93 km2), Medan Satria (11,88 km2), serta Bekasi Utara (19,75 km2).
Wilayah Kota Bekasi bagian utara dan bagian timur berbatasan dengan Kabupaten Bekasi, bagian selatan berbatasan dengan Kabupaten Bogor, dan bagian barat berbatasan dengan Provinsi DKI Jakarta.
Astronomically, Bekasi municipality is located between 106º 48’28” - 107º27’29” East longitude and 6º10’6” - 6º30’6” South latitude.
The natural condition of Bekasi municipality is terrain with slope between 0 - 2 % and altitude between 11m - 81m above sea level. The area of Bekasi municipality is in the form of a land area of 210.49 km2.
In 2020, the administrative area of Bekasi municipality is divided into 12 sub-districts, the area of each subdistrict is Pondokgede (15.92 km2), Jatisampurna (19.54 km2), Pondok Melati (11.80 km2), Jatiasih (24.27 km2), Bantargebang (18.44 km2), Mustikajaya (26.42 km2), Bekasi Timur (14.63 km2), Rawalumbu (16.85 km2), Bekasi Selatan (16.06 km2), Bekasi Barat (14.93 km2), Medan Satria (11.88 km2), and Bekasi Utara (19.75 km2).
Territorial Boundaries of Bekasi municipality in northern and eastern area bordered by Bekasi Regency, southern area bordered by Bogor Regency, and the western area bordered by DKI Jakarta province.
https:
//bek
asiko
ta.b
ps.go.id

6
GEOGRAPHY AND CLIMATE
Bekasi Municipality in Figures 2021
1.1 Luas Daerah menurut Kecamatan (km2), 2020 Area of Subdistrict (sq.km), 2020
GambarFigures
Sumber/Source : Bagian Pemerintahan Sekretariat Daerah Kota Bekasi/Bekasi Municipality Secretariat
Pondokgede15.92
Jatisampurna19.54
Pondok Melati11.80
Jatiasih24.27
Bantargebang18.44
Mustika Jaya26.42
Bekasi Timur14.63
Rawalumbu16.85
Bekasi Selatan16.06
Bekasi Barat14.93
Medan Satria11.88
Bekasi Utara19.75
https:
//bek
asiko
ta.b
ps.go.id

7
GEOGRAFI DAN IKLIM
Kota Bekasi Dalam Angka 2021
1.2 Jarak dari Ibukota Kecamatan ke Ibukota Kota di Kota Bekasi (km), 2020
Distance between Subdistrict Capital and Municipality Capital in Bekasi Munivipality (km), 2020
GambarFigures
Sumber/Source : Bagian Pemerintahan Sekretariat Daerah Kota Bekasi/Bekasi Municipality Secretariat
Jatiasih
0.00 5.00 10.00 15.00 20.00 25.00
Jatisampurna
Pondokgede
Pondok Melati
Mustika Jaya
Bantargebang
Jatiasih
Medan Satria
Rawalumbu
Bekasi Selatan
Bekasi Timur
Bekasi Barat
Bekasi Utara
Kota Bekasi
20.80
14.80
13.20
12.10
9.90
8.20
8.00
5.70
5.70
4.70
4.50
4.20
0.00
https:
//bek
asiko
ta.b
ps.go.id

8
GEOGRAPHY AND CLIMATE
Bekasi Municipality in Figures 2021
TabelTable 1.1.1 Luas Daerah dan Jumlah Pulau Menurut Kecamatan di
Kota Bekasi, 2020 Total Area and Number of Islands by Subdistrict in Bekasi
Municipality, 2020
1.1 KEADAAN GEOGRAFI GEOGRAPHY CONDITION
KecamatanSubdistrict
Ibukota KecamatanCapital of Subdistrict
Luas Total Area
(km2/sq.km)
(1) (2) (3)
Pondokgede Jatiwaringin 15,92
Jatisampurna Jatisampurna 19,54
Pondokmelati Jatirahayu 11,80
Jatiasih Jatiasih 24,27
Bantargebang Bantargebang 18,44
Mustikajaya Mustika Jaya 26,42
Bekasi Timur Bekasi Jaya 14,63
Rawalumbu Bojong Rawalumbu 16,85
Bekasi Selatan Pekayon Jaya 16,06
Bekasi Barat Bintara 14,93
Medan Satria Medan Satria 11,88
Bekasi Utara Perwira 19,75
Kota BekasiBekasi Municipality Marga Jaya 210,49
https:
//bek
asiko
ta.b
ps.go.id

9
GEOGRAFI DAN IKLIM
Kota Bekasi Dalam Angka 2021
KecamatanSubdistrict
Persentase terhadap Luas KecamatanPercentage to Subdistrict Area
Jumlah PulauNumber of Islands
(1) (4) (5)
Pondokgede 7,56 –
Jatisampurna 9,28 –
Pondokmelati 5,61 –
Jatiasih 11,53 –
Bantargebang 8,76 –
Mustikajaya 12,55 –
Bekasi Timur 6,95 –
Rawalumbu 8,01 –
Bekasi Selatan 7,63 –
Bekasi Barat 7,09 –
Medan Satria 5,65 –
Bekasi Utara 9,38 –
Kota BekasiBekasi Municipality 100,00 –
Sumber/Source: Bagian Pemerintahan Sekretariat Daerah Kota Bekasi/Bekasi Municipality Secretariat
Lanjutan Tabel/Continued Table 1.1.1
https:
//bek
asiko
ta.b
ps.go.id

10
GEOGRAPHY AND CLIMATE
Bekasi Municipality in Figures 2021
TabelTable 1.1.2 Tinggi Wilayah dan Jarak ke Ibukota Kota Menurut
Kecamatan di Kota Bekasi, 2020 Altitude and Distance to the Capital of Municipality by
Subdistrict in Bekasi Municipality, 2020
KecamatanSubdistrict
Tinggi Wilayah (mdpl)Altitude (m a.s.l)
Jarak ke Ibukota KotaDistance to the Capital of
Municipality
(1) (2) (3)
Pondokgede 11 - 24 14.80
Jatisampurna 25 - 81 20.80
Pondokmelati 25 - 100 13.20
Jatiasih 25 - 100 8.20
Bantargebang 25 - 81 9.90
Mustikajaya 11 - 24 12.10
Bekasi Timur 25 - 81 4.70
Rawalumbu 11 - 24 5.70
Bekasi Selatan 25 - 81 5.70
Bekasi Barat 11 - 24 4.50
Medan Satria 11 - 24 8.00
Bekasi Utara 11 - 81 4.20
Kota BekasiBekasi Municipality 11 - 81 0.00
Sumber/Source: BPS, Potensi Desa (PODES)/BPS, PODES
https:
//bek
asiko
ta.b
ps.go.id

11
GEOGRAFI DAN IKLIM
Kota Bekasi Dalam Angka 2021
TabelTable 1.2.1 Pengamatan Unsur Iklim Menurut Bulan di Kota Bekasi,
2020 Observation of Climate Elements By Months at Bekasi
Municipality, 2020
1.2 KEADAAN IKLIM CLIMATE CONDITION
BulanMonth
Suhu/Temperature (0C) Kelembaban/Humidity (%)
Minimum Rata-rataAverage
MaksimumMaximum Minimum Rata-rata
AverageMaksimumMaximum
(1) (2) (3) (4) (5) (6) (7)
Januari/January 25,80 28,00 30,60 – 83,00 –
Februari/February 25,70 27,80 30,80 – 84,00 –
Maret/March 26,20 28,60 31,80 – 81,00 –
April/April 26,80 29,20 32,50 – 78,00 –
Mei/May 27,10 29,50 32,90 – 77,00 –
Juni/June 26,90 29,30 33,00 – 75,00 –
Juli/July 26,30 28,60 32,10 – 74,00 –
Agustus/August 26,50 29,00 32,70 – 73,00 –
September/September 26,70 29,10 32,80 – 72,00 –
Oktober/October 26,50 29,00 32,60 – 75,00 –
November/November 26,70 28,90 32,50 – 78,00 –
Desember/December 25,60 28,00 31,30 – 79,00 –
https:
//bek
asiko
ta.b
ps.go.id

12
GEOGRAPHY AND CLIMATE
Bekasi Municipality in Figures 2021
BulanMonth
Kecepatan Angin (m/det)Wind Velocity (m/sec)
Tekanan Udara/Atmospheric Pressure (mb)
Minimum Rata-rataAverage
MaksimumMaximum Minimum Rata-rata
AverageMaksimumMaximum
(1) (8) (9) (10) (11) (12) (13)
Januari/January – 5,70 – – 1 010,80 –
Februari/February – 4,10 – – 1 011,30 –
Maret/March – 4,20 – – 1 010,60 –
April/April – 4,40 – – 1 010,90 –
Mei/May – 4,90 – – 1 010,10 –
Juni/June – 5,00 – – 1 010,60 –
Juli/July – 4,50 – – 1 009,90 –
Agustus/August – 5,30 – – 1 010,70 –
September/September – 4,60 – – 1 010,90 –
Oktober/October – 4,50 – – 1 010,10 –
November/November – 5,10 – – 1 010,20 –
Desember/December – 7,00 – – 1 009,40 –
Lanjutan Tabel/Continued Table 1.2.1
https:
//bek
asiko
ta.b
ps.go.id

13
GEOGRAFI DAN IKLIM
Kota Bekasi Dalam Angka 2021
BulanMonth
Jumlah Curah Hujan1
Number of Precipitation1
(mm)
Jumlah Hari Hujan1 (hari)
Number of Rainy Days1
(day)
Penyinaran MatahariDuration of Sunshine
(%)
(1) (14) (15) (16)
Januari/January 1 089,00 31 –
Februari/February 1 898,00 29 –
Maret/March 655,00 31 –
April/April 655,00 30 –
Mei/May 433,00 31 –
Juni/June 190,00 30 –
Juli/July 45,00 31 –
Agustus/August 87,00 31 –
September/September 217,00 30 –
Oktober/October 574,00 17 –
November/November 422,00 23 –
Desember/December 407,00 20 –
Lanjutan Tabel/Continued Table 1.2.1
Catatan/Note: 1 Sumber Data: Perum Jasa Tirta II/Data Source: Perum Jasa Tirta IISumber/Source: Badan Meteorologi, Klimatologi dan Geofisika Stasiun Meteorologi Maritim Tanjung Priok/Meteorology, Climatogy and
Geophysics Agency of Tanjung Priok Maritime Meteorological Station
https:
//bek
asiko
ta.b
ps.go.id

https:
//bek
asiko
ta.b
ps.go.id

2. PEMERINTAHAN/GOVERNMENT 2. Pemerintahan/Government ...................................................................................
ChapterBAB
PEMERINTAHAN
2020Actual Bekasi Municipal GovernmentRevenues and Expenditures
Realisasi Pendapatan danPengeluaran Daerah
Pemerintah Kota Bekasi
Pengeluaran
GovernmentExpenditure
GovernmentRevenues
TOTAL .................
.............
...
...
............ 854,9Belanja K/L Rp
Rp
Rp
Dana Desa
Transfer Daerah
Belanja Non K/L
Rp
Rp
672,2
744,6
69,8
2.341,6
T
T
T
T
T
Meningkat 5,8 %
2017 2019*2018
2.341,6
2.213,1
2.007,3
*Angka Outlook/Outlook Figures
Ministries and o�cials expenditure
Other ministries and o�cial expenditures
Transfer to regions
Village funds
Government Spending
Indonesia GovernmentSpending Increased by 5,8 %
Triliun RupiahTrilion Rupiah
TERBESAR
Belanja K/L
Porsi Belanja
dimiliki oleh
The Largest Portion ofGovernment Spending isministries and officials
expenditure
2020
PendapatanDaerah Daerah
BELANJA DAERAH
BELANJA DAERAHRealisasi Tahun 2020/Actual 2020
02 GOVERNMENT
Sumber/Source: Badan Pengelolaan Keuangan dan Aset Daerah Kota Bekasi/ Regional and Financial Asset Management of Bekasi Municipality
juta rupiahmillion rupiahs
4.893.067 4.583.293
https:
//bek
asiko
ta.b
ps.go.id

https:
//bek
asiko
ta.b
ps.go.id

PEMERINTAHAN
17Kota Bekasi Dalam Angka 2021
PENJELASAN TEKNIS TECHNICAL NOTES
1. Kecamatan adalah bagian wilayah dari daerah kabupaten/kota yang dipimpin oleh Camat. Kecamatan diatur sesuai dengan ketentuan Undang-Undang Nomor 23 Tahun 2014 tentang Pemerintahan Daerah.
2. Kelurahan adalah suatu wilayah yang dipimpin oleh seorang Lurah sebagai perangkat daerah kabupaten dan/atau daerah kota di bawah kecamatan (Undang-Undang Nomor 32 Tahun 2004 tentang Pemerintahan Daerah).
3. Rukun Tetangga (RT) dan Rukun Warga (RW) digunakan untuk mengidentifikasi satuan lingkungan setempat. RT dan RW merupakan organisasi yang dibentuk melalui musyawarah oleh masyarakat setempat serta diakui dan dibina oleh Pemerintah untuk menjadi mitra dalam pemberdayaan masyarakat. Pembentukan RT dan RW sejalan dengan besaran jumlah penduduk di suatu wilayah.
4. Anggota Dewan Perwakilan Rakyat Daerah (DPRD) dipilih melalui pemilihan umum (pemilu) dan dilantik dalam masa jabatan lima tahun.
5. Pegawai Negeri Sipil (PNS) adalah setiap warga negara Republik Indonesia yang telah memenuhi syarat yang ditentukan, diangkat oleh pejabat yang berwenang
1. Subdistrict is part of the Regency/Municipality area led by Camat. Sub-district stipulated in accordance with the provisions of law No. 23 Year 2014 about Local Government.
2. Kelurahan is an area that is led by a kelurahan head (Lurah) as anapparatus of regency and or municipility under the district (Law No.32 Year 2004 about Local Governmental).
3. RT and RW is a term used to identify the unit of the local environment. RT and RW is a community organization that was formed by consensus by the local community as well as recognized and fostered by the government to be a partner in community empowerment. Establishment of RT and RW in line with the amount of the total population in an area.
4. Regional House of Representatives (DPRD) members are elected through a general election and appointed for a five-years membership.
5. Civil servants (PNS) is every citizen of the Republic of Indonesia which have been determined eligible, be appointed by the competent authority and assigned the task in
https:
//bek
asiko
ta.b
ps.go.id

GOVERNMENT
18 Bekasi Municipality in Figures 2021
dan diserahi tugas dalam jabatan negeri, atau diserahi tugas negara lainnya, dan digaji berdasarkan peraturan perundang-undangan yang berlaku. PNS terdiri dari PNS pusat dan PNS daerah.
6. Sekretariat daerah adalah unsur pembantu pimpinan pemerintah daerah, yang dipimpin oleh sekretaris daerah. Sekretaris Daerah diangkat dari Pegawai Negeri Sipil (PNS) yang memenuhi persyaratan.
7. Lembaga teknis daerah adalah unsur pelaksana pemerintah daerah yang dipimpin oleh seorang kepala. Lembaga teknis daerah dapat berbentuk Badan, Kantor, dan Rumah Sakit. Contoh Lembaga teknis daerah yaitu Badan Perencanaan Pembangunan Daerah (Bappeda), Badan Kepegawaian Daerah (BKD), Badan Pelayanan Kesehatan Rumah Sakit Daerah, serta Kantor Satuan Polisi Pamong Praja.
8. Dinas daerah adalah unsur pelaksana pemerintah daerah yang dipimpin oleh seorang kepala, Dinas Daerah mempunyai tugas melaksanakan kewenangan desentralisasi. Pada Dinas Daerah Kabupaten/Kota dapat dibentuk Unit Pelaksana Teknis Dinas Daerah (UPTD) Kabupaten/Kota untuk melaksanakan sebagian tugas Dinas yang mempunyai wilayah kerja satu atau beberapa kecamatan.
a country office, or charge of any other country, and paid based on legislation and regulations. PNS consists of the central and regional civil servants.
6. The regional secretariat is the supporting element of the regional government leader, which is led by the regional secretary. Regional Secretaries are appointed from Civil Servants (PNS) who fulfill the requirements.
7. Regional technical institutions are elements of implementing local government. are headed by a Chief. Regional technical institutions can take the form of agencies, offices and hospitals. Examples of regional technical institutions are the Regional Development Planning Agency (Bappeda), the Regional Personnel Agency (BKD), the Regional Hospital Health Service Board, and the Civil Service Police Unit Office.
8. The regional office is the implementing element of the regional government headed by a Chief. The Regional Office has the task of carrying out the authority of decentralization. At the Regency/City Regional Office a Regency/City Regional Technical Implementation Unit (UPTD) can be formed to carry out part of the tasks of the Office which has one or several sub-district work areas.
https:
//bek
asiko
ta.b
ps.go.id

PEMERINTAHAN
19Kota Bekasi Dalam Angka 2021
ULASAN DESCRIPTION
Kota Bekasi terbagi menjadi 12 kecamatan, dari 12 Kecamatan yang ada di Kota Bekasi pada tahun 2020 terdapat 56 Kelurahan yang dikepalai oleh seorang Lurah, serta memiliki 1.018 RW dan 7.134 RT. Jumlah kelurahan terbanyak ada di Kecamatan Jatiasih dan Kecamatan Bekasi Utara, sedangkan jumlah RW dan RT terbanyak berada di Kecamatan Bekasi Utara.
Jumlah Anggota Dewan Perwakilan Rakyat Daerah di Kota Bekasi pada tahun 2020 sebanyak 50 orang. Dari jumlah tersebut 42 orang adalah laki-laki dan 8 orang perempuan.
Jumlah pegawai negeri sipil (PNS) di lingkungan Pemerintah Kota Bekasi pada tahun 2019 sebanyak 10.747 orang. Dari jumlah tersebut 4.652 (43,29 persen) adalah pegawai berjenis kelamin laki-laki dan 6.095 (56,71 persen) pegawai perempuan sedangakan tahun 2020 jumlah PNS sebanyak 10.148 orang dengan jumlah pegawai jenis kelamin laki-laki 4.359 orang (42,95 persen) dan pegawai perempuan sebanyak 5.789 orang (57,05 persen).
Jumlah PNS dengan jabatan struktural pada tahun 2019 sebanyak 1.150 orang dengan rincian jabatan eselon II sebanyak 40 orang, eselon III 190 orang, dan eselon IV sebanyak 920 orang. Untuk jabatan fungsional sebanyak 9.597 orang yang dirinci berdasarkan jabatan fungsional
Bekasi Municipality is divided into 12 sub-districts, from 12 sub-districts in Bekasi Municipality in 2020 there were 56 villages headed by a Lurah, and has 1,018 RW and 7,134 RT. The number of villages most are in Jatiasih and Bekasi Utara subdistricts, while the number of RW and RT have the most Bekasi Utara Subdistrict.
The number of members of the Regional People’s Representative Council in the government of Bekasi Municipality in 2020 is 50 people. Of these 42 people were male and 8 female.
The number of civil servants (PNS) in the Bekasi Municipality Government environment in 2019 was 10,747 people. Of these 4,652 (43.29 percent) were male employees and 6,095 (56.71 percent) female employees, in the year 2020 the number of civil servants as many as 10,148 people with the number of male employees 4,359 people (42.95 percent) and female employees, as much as 5,789 people (57.05 percent).
In 2019 the number of civil servants in Bekasi Municipality with structural position of 1,150 people with the details of Echelon II of 40 people, Echelon III 190 people, and Echelon IV 920 people. For functional position of 9,597 people are detailed based on specific functional positions of 6,039 people and functional
https:
//bek
asiko
ta.b
ps.go.id

GOVERNMENT
20 Bekasi Municipality in Figures 2021
tertentu sebanyak 6.039 orang dan fungsional umum 3.558 orang. Pada tahun 2020 jabatan strukutral sebanyak 1.137 orang dengan rincian jabatan eselon II sebanyak 37 orang, eselon III 186 orang, dan eselon IV 914 orang, sedangkan jabatan fungsional sebanyak 9.011 orang dengan rincian jabatan fungsional tertentu sebanyak 5.891 orang dan fungsional umum 3.120 orang.
Jika diamati menurut golongan kepangkatan, pada tahun 2019 jumlah PNS golongan III paling banyak, yaitu sebesar 5.556 orang (51,70 persen), menyusul golongan IV sebesar 3.160 orang (29,40 persen) dan golongan II sebanyak 1.785 orang (14,91 persen), sedangkan sisanya 246 orang (2,29 persen) adalah pegawai dengan golongan I. Untuk tahun 2020 jumlah PNS terbanyak ada pada golongan III, yaitu sebesar 5.505 orang (54,25 persen), menyusul golongan IV sebesar 2.930 orang (28,87 persen) dan golongan II sebanyak 1.513 orang (14,91 persen), sedangkan pegawai golongan I sebanyak 200 orang (1,97 persen).
PNS di Kota Bekasi pada tahun 2019 tingkat pendidikan tertinggi yang ditamatkan yang terbanyak adalah Diploma III/Sarjana Muda sekitar 57,11 persen sedangkan untuk tahun 2020 pendidikan tertinggi yang ditamatkan terbanyak adalah Sarjana/Doktor/Ph.D 72,60 persen.
general 3,558 people. In 2020 the structural position of 1,137 people with the details of Echelon II of 37 people, Echelon III 186 people, and Echelon IV 914 people. While the functional position of 9,011 people are detailed based on specific functional position 5,891 people and functional general 3,120 people.
If observed according to rank, in 2019 the highest number of group III civil servants is 5,619 people (51.37 percent), following group IV with 3,241 people (29.63 percent), and group II with 1,823 people (16.67 percent), while the remaining 256 people (2.34 percent) are employees of class I. For the year 2020 the most number of civil servants in group III, which is 5,556 people (51.70 percent), following group IV of 3,160 people (29.40 percent) and group II as many as 1,785 people (16.61 percent), while employees of the group I of 246 people (2.29 percent).
Civil servants in Bekasi Municipality in 2019 the highest level of education completed the most is Diploma III / Bachelor of Youth about 57.11 percent while for 2020 the highest education completed the most is Bachelor / Doctor / Ph.D 72.60 percent.
https:
//bek
asiko
ta.b
ps.go.id

https:
//bek
asiko
ta.b
ps.go.id

22 Bekasi Municipality in Figures 2021
GOVERNMENT
0
1
2
3
4
5
6
5 5
4
6
4 4 4 4
5 5
4
6
2.1 Jumlah Kelurahan menurut Kecamatan, 2020 Number of Kelurahan by Subdistrict, 2020
GambarFigures
Sumber/Source : Bagian Pemerintahan Sekretariat Daerah Kota Bekasi/Bekasi Municipality Secretariat
https:
//bek
asiko
ta.b
ps.go.id

23Kota Bekasi Dalam Angka 2021
PEMERINTAHAN
0.00
10.00
20.00
30.00
40.00
50.00
60.00
70.00
80.00
1.18 1.72
14.89
2.23
7.38
72.60
Sumber/Source : Badan Kepegawaian Pendidikan dan Pelatihan Daerah Kota Bekasi/Regional Civil Service Agency, Education and Training Bekasi Municipality
2.2 Jumlah PNS Menurut Tingkat Pendidikan (%), 2020 Number of Civil Servants by Level of Education (%), 2020
GambarFigures
https:
//bek
asiko
ta.b
ps.go.id

24 Bekasi Municipality in Figures 2021
GOVERNMENT
2.1 WILAYAH ADMINISTRATIF ADMINISTRATIVE AREA
Sumber/Source: Bagian Pemerintahan Sekretariat Daerah Kota Bekasi/Bekasi Municipality Secretariat
TabelTable 2.1.1 Jumlah Kelurahan Menurut Kecamatan di Kota Bekasi,
2016–2020 Number of Kelurahan by Subdistrict in Bekasi Municipality,
2016–2020
KecamatanSubdistrict 2016 2017 2018 2019 2020
(1) (2) (3) (4) (5) (6)
Pondokgede 5 5 5 5 5
Jatisampurna 5 5 5 5 5
Pondokmelati 4 4 4 4 4
Jatiasih 6 6 6 6 6
Bantargebang 4 4 4 4 4
Mustikajaya 4 4 4 4 4
Bekasi Timur 4 4 4 4 4
Rawalumbu 4 4 4 4 4
Bekasi Selatan 5 5 5 5 5
Bekasi Barat 5 5 5 5 5
Medan Satria 4 4 4 4 4
Bekasi Utara 6 6 6 6 6
Kota BekasiBekasi Municipality 56 56 56 56 56
https:
//bek
asiko
ta.b
ps.go.id

25Kota Bekasi Dalam Angka 2021
PEMERINTAHAN
2.2 DEWAN PERWAKILAN RAKYAT DAERAH REGIONAL HOUSE OF REPRESENTATIVE
TabelTable 2.2.1 Jumlah Anggota Dewan Perwakilan Rakyat Daerah
Menurut Partai Politik dan Jenis Kelamin di Kota Bekasi, 2020
Number of Regional House of Representatives’s Members by Political Parties and Sex in Bekasi Municipality, 2020
Sumber/Source: Sekretariat DPRD Kota Bekasi/ Regional House of Representatives’s Members
Partai PolitikPolitical Parties
Laki-lakiMale
PerempuanFemale
JumlahTotal
(1) (2) (3) (4)
Partai Keadilan Sejahterta 10 2 12
Partai Demokrasi Indonesia Perjuangan 11 1 12
Partai Golongan Karya 7 1 8
Partai Gerakan Indonesia Raya 4 2 6
Partai Amanat Nasional 3 2 5
Partai Demokrat 4 – 4
Parati Persatuan Pembangunan 2 – 2
Partai Kebangkitan Bangsa 1 – 1
Kota BekasiBekasi Municipality 42 8 50
https:
//bek
asiko
ta.b
ps.go.id

26 Bekasi Municipality in Figures 2021
GOVERNMENT
TabelTable 2.3.1 Jumlah Pegawai Negeri Sipil Menurut Jabatan dan Jenis
Kelamin di Kota Bekasi, Desember 2019 dan Desember 2020
Number of Civil Servants by Occupation and Sex in Bekasi Municipality, December 2019 dan December 2020
JabatanOccupation
2019
Laki-lakiMale
PerempuanFemale
JumlahTotal
(1) (2) (3) (4)
Fungsional TertentuSpecific Functional 1 629 4 410 6 039
Fungsional UmumStaf General Functional 2 311 1 247 3 558
Struktural/Structural 712 438 1 150
Eselon V/5th Echelon – – –
Eselon IV/4th Echelon 563 357 920
Eselon III/3rd Echelon 116 74 190
Eselon II/2nd Echelon 33 7 40
Eselon I/1st Echelon – – –
Jumlah/Total 4 652 6 095 10 747
2.3 SUMBER DAYA MANUSIA HUMAN RESOURCES
https:
//bek
asiko
ta.b
ps.go.id

27Kota Bekasi Dalam Angka 2021
PEMERINTAHAN
Sumber/Source: Badan Kepegawaian Pendidikan dan Pelatihan Daerah Kota Bekasi/Regional Civil Service Agency, Education and Training Bekasi Municipality
JabatanOccupation
2020
Laki-lakiMale
PerempuanFemale
JumlahTotal
(1) (5) (6) (7)
Fungsional TertentuSpecific Functional 1 563 4 328 5 891
Fungsional UmumStaf General Functional 2 095 1 025 3 120
Struktural/Structural 701 436 1 137
Eselon V/5th Echelon – – –
Eselon IV/4th Echelon 559 355 914
Eselon III/3rd Echelon 110 76 186
Eselon II/2nd Echelon 32 5 37
Eselon I/1st Echelon – – –
Jumlah/Total 4 359 5 789 10 148
Lanjutan Tabel/Continued Table 2.3.1
https:
//bek
asiko
ta.b
ps.go.id

28 Bekasi Municipality in Figures 2021
GOVERNMENT
Tingkat PendidikanEducational Level
2019
Laki-lakiMale
PerempuanFemale
JumlahTotal
(1) (2) (3) (4)
Sampai dengan SDUp to Primary School
127 1 128
SMP/Sederajat General Vocational Junior High School
194 9 203
SMA/SederajatGeneral/Vocational Senior High School
1 290 500 1 790
Diploma I, II/Akta I, IIDiploma I, II/Akta I, II
246 783 1 029
Diploma III/Akta III/Sarjana MudaDiploma III/Akta III/Bachelor
2 116 4 022 6 138
Tingkat Sarjana/Doktor/Ph.DUniversity Graduates
679 780 1 459
Jumlah/Total 4 652 6 095 10 747
TabelTable 2.3.2 Jumlah Pegawai Negeri Sipil Menurut Tingkat Pendidikan
dan Jenis Kelamin di Kota Bekasi, Desember 2019 dan Desember 2020
Number of Civil Servants by Educational Level and Sex in Bekasi Municipality, Desember 2019 dan Desember 2020
https:
//bek
asiko
ta.b
ps.go.id

29Kota Bekasi Dalam Angka 2021
PEMERINTAHAN
Sumber/Source: Badan Kepegawaian Pendidikan dan Pelatihan Daerah Kota Bekasi/Regional Civil Service Agency, Education and Training Bekasi Municipality
Tingkat PendidikanEducational Level
2020
Laki-lakiMale
PerempuanFemale
JumlahTotal
(1) (2) (3) (4)
Sampai dengan SDUp to Primary School
119 1 120
SMP/Sederajat General Vocational Junior High School
168 7 175
SMA/SederajatGeneral/Vocational Senior High School
1 135 376 1 511
Diploma I, II/Akta I, IIDiploma I, II/Akta I, II
71 155 226
Diploma III/Akta III/Sarjana MudaDiploma III/Akta III/Bachelor
158 591 749
Tingkat Sarjana/Doktor/Ph.DUniversity Graduates
2 708 4 659 7 367
Jumlah/Total 4 359 5 789 10 148
Lanjutan Tabel/Continued Table 2.3.2
https:
//bek
asiko
ta.b
ps.go.id

30 Bekasi Municipality in Figures 2021
GOVERNMENT
Pangkat/Golongan/RuangHierarchy
2019
Laki-lakiMale
PerempuanFemale
JumlahTotal
(1) (2) (3) (4)
1. I/A (Juru Muda) 4 – 4
2. I/B (Juru Muda Tingkat I) 27 – 27
3. I/C (Juru) 95 – 95
4. I/D (Juru Tingkat I) 114 6 120
Golongan I/Range I 240 6 246
5. II/A (Pengatur Muda) 153 30 183
6. II/B (Pengatur Muda Tingkat I) 279 72 351
7. II/C (Pengatur) 580 258 838
8. II/D (Pengatur Tingkat I) 283 130 413
Golongan II/Range II 1 295 490 1 785
9. III/A (Penata Muda) 391 615 1 006
10. III/B (Penata Muda Tingkat I) 556 997 1 553
11. III/C (Penata) 670 947 1 617
12. III/D (Penata Tingkat I) 499 881 1 380
Golongan III/Range III 2 116 3 440 5 556
13. IV/A (Pembina) 770 1 638 2 408
14. IV/B (Pembina Tingkat I) 178 451 629
15. IV/C (Pembina Utama Muda) 49 55 104
16. IV/D (Pembina Utama Madya) 3 13 16
17. IV/E (Pembina Utama) 1 2 3
Golongan IV/Range IV 1 001 2 159 3 160
Jumlah/Total 4 652 6 095 10 747
TabelTable 2.3.3 Jumlah Pegawai Negeri Sipil Menurut Tingkat
Kepangkatan dan Jenis Kelamin di Kota Bekasi, Desember 2019 dan Desember 2020
Number of Civil Servants by Hierarchy and Sex in Bekasi Municipality, Desember 2019 dan Desember 2020
https:
//bek
asiko
ta.b
ps.go.id

31Kota Bekasi Dalam Angka 2021
PEMERINTAHAN
Sumber/Source: Badan Kepegawaian Pendidikan dan Pelatihan Daerah Kota Bekasi/Regional Civil Service Agency, Education and Training Bekasi Municipality
Pangkat/Golongan/RuangHierarchy
2020
Laki-lakiMale
PerempuanFemale
JumlahTotal
(1) (5) (6) (7)
1. I/A (Juru Muda) 2 – 2
2. I/B (Juru Muda Tingkat I) 20 – 20
3. I/C (Juru) 47 – 47
4. I/D (Juru Tingkat I) 126 5 131
Golongan I/Range I 195 5 200
5. II/A (Pengatur Muda) 126 8 134
6. II/B (Pengatur Muda Tingkat I) 260 52 312
7. II/C (Pengatur) 414 172 586
8. II/D (Pengatur Tingkat I) 350 131 481
Golongan II/Range II 1 150 363 1 513
9. III/A (Penata Muda) 422 475 897
10. III/B (Penata Muda Tingkat I) 475 1 036 1 511
11. III/C (Penata) 677 924 1 601
12. III/D (Penata Tingkat I) 523 973 1 496
Golongan III/Range III 2 097 3 408 5 505
13. IV/A (Pembina) 664 1 413 2 077
14. IV/B (Pembina Tingkat I) 194 531 725
15. IV/C (Pembina Utama Muda) 50 53 103
16. IV/D (Pembina Utama Madya) 6 14 20
17. IV/E (Pembina Utama) 3 2 5
Golongan IV/Range IV 917 2 013 2 930
Jumlah/Total 4 359 5 789 10 148
Lanjutan Tabel/Continued Table 2.3.3
https:
//bek
asiko
ta.b
ps.go.id

32 Bekasi Municipality in Figures 2021
GOVERNMENT
2.4 KEUANGAN PEMERINTAH GOVERNMENT FINANCE
TabelTable 2.4.1 Realisasi Pendapatan Pemerintah Kota Bekasi Menurut
Jenis Pendapatan (ribu rupiah), 2017–2020 Actual Bekasi Municipal Government Revenues by Kind of
Revenues (thousand rupiahs), 2017–2020
Jenis Pendapatan/Kind of Revenues 2017 2018(1) (2) (3)
1. Pendapatan Asli Daerah (PAD)/Regional Revenue 1 988 356 922,19 2 001 150 459,491.1 Pajak Daerah/Regional Tax 1 393 372 320,40 1 580 754 200,591.2 Retribusi Daerah/Regional Retribution 84 381 838,11 77 320 468,211.3 Hasil Perusahaan Milik Daerah dan Pengelolaan
Kekayaan Daerah yang Dipisahkan/Regional-Owned Company Revenue and Separated Management of Regional Wealth
9 424 723,88 12 086 694,28
1.4 Lain-lain PAD yang Sah/Other Regional Revenue 501 178 039,81 330 989 096,422. Dana Perimbangan/Balance Funds 1 636 851 744,22 1 653 956 944,912.1 Bagi Hasil Pajak/Tax Sharing Revenue 117 678 287,76
146 670 966,842.2 Bagi Hasil Bukan Pajak/Sumber Daya Alam/Non-Tax Sharing Revenue/Natural Resources
26 593 543,09
2.3 Dana Alokasi Umum/General Allocation Fund 1 212 033 531,00 1 212 033 531,002.4 Dana Alokasi Khusus/Special Allocation Fund 280 546 382,36 295 252 447,073. Lain-lain Pendapatan yang Sah/Other Revenue 1 131 494 542,15 1 180 872 852,773.1 Pendapatan Hibah/Grant 2 958 582,35 189 471 225,533.2 Dana Darurat/Emergency Fund – –3.3 Dana Bagi Hasil Pajak dari Provinsi dan Pemerintah
Daerah Lainnya/Tax Sharing Revenue from Provincial and Other Regional Governments
743 133 859,80 791 358 847,78
3.4 Dana Penyesuaian dan Otonomi Daerah/Regional Adjustment and Autonomy Fund
52 941 282,00 –
3.5 Bantuan Keuangan dari Provinsi atau Pemerintah Daerah Lainnya/Financial Assistance from Provincial or Other Regional Governments
332 460 818,00 200 042 779,46
3.6 Lainnya/Others – –Jumlah/Total 4 756 703 208,56 4 835 980 257,17
https:
//bek
asiko
ta.b
ps.go.id

33Kota Bekasi Dalam Angka 2021
PEMERINTAHAN
Sumber/Source: Badan Pengelolaan Keuangan dan Aset Daerah Kota Bekasi/ Regional and Financial Asset Management of Bekasi Municipality
Lanjutan Tabel/Continued Table 2.4.1
Jenis Pendapatan/Kind of Revenues 2019 2020(1) (4) (5)
1. Pendapatan Asli Daerah (PAD)/Regional Revenue 2 442 151 873,75 2 049 078 612,581.1 Pajak Daerah/Regional Tax 1 778 314 661,58 1 557 619 553,181.2 Retribusi Daerah/Regional Retribution 120 560 321,13 75 884 351,761.3 Hasil Perusahaan Milik Daerah dan Pengelolaan
Kekayaan Daerah yang Dipisahkan/Regional-Owned Company Revenue and Separated Management of Regional Wealth
12 173 862,43 11 949 321,85
1.4 Lain-lain PAD yang Sah/Other Regional Revenue 531 103 028,61 403 625 385,802. Dana Perimbangan/Balance Funds 1 686 699 237,83 1 630 792 947,812.1 Bagi Hasil Pajak/Tax Sharing Revenue
114 680 225,38 169 743 592,122.2 Bagi Hasil Bukan Pajak/Sumber Daya Alam/Non-Tax Sharing Revenue/Natural Resources
2.3 Dana Alokasi Umum/General Allocation Fund 1 277 169 857,00 1 147 628 323,002.4 Dana Alokasi Khusus/Special Allocation Fund 294 849 155,46 313 421 032,693. Lain-lain Pendapatan yang Sah/Other Revenue 1 835 081 680,93 1 213 196 327,833.1 Pendapatan Hibah/Grant 192 671 706,54 –3.2 Dana Darurat/Emergency Fund – –3.3 Dana Bagi Hasil Pajak dari Provinsi dan Pemerintah
Daerah Lainnya/Tax Sharing Revenue from Provincial and Other Regional Governments
811 483 111,47 714 228 381,30
3.4 Dana Penyesuaian dan Otonomi Daerah/Regional Adjustment and Autonomy Fund
60 780 190,00 71 382 704,00
3.5 Bantuan Keuangan dari Provinsi atau Pemerintah Daerah Lainnya/Financial Assistance from Provincial or Other Regional Governments
770 146 672,92 427 585 242,53
3.6 Lainnya/Others – –Jumlah/Total 5 963 932 792,51 4 893 067 888,22
https:
//bek
asiko
ta.b
ps.go.id

34 Bekasi Municipality in Figures 2021
GOVERNMENT
TabelTable 2.4.2 Realisasi Belanja Pemerintah Kota Bekasi Menurut Jenis
Belanja (ribu rupiah), 2017–2020 Actual Bekasi Municipal Government Expenditures by Kind
of Expenditures (thousand rupiahs), 2017–2020
Jenis PendapatanKind of Revenues 2017 2018
(1) (2) (3)
1. Belanja Tidak Langsung/Indirect Expenditures 1 785 274 492,42 2 062 103 244,66
1.1 Belanja Pegawai/Personnel Expenditures 1 649 362 115,60 1 918 768 585,97
1.2 Belanja Bunga/Interest Expenditures 35 569,29 8 374,40
1.3 Belanja Subsidi/Subsidies Expenditures – 394 631,52
1.4 Belanja Hibah/Grant Expenditures 56 483 844,80 68 503 996,49
1.5 Belanja Bantuan Sosial/Social Aid Expenditures 78 005 600,00 72 251 400,00
1.6 Belanja Bagi Hasil/Sharing Fund Expenditure – –
1.7 Belanja Bantuan Keuangan/Financial Aids Expenditures
1 151 746,17 1 305 838,50
1.8 Belanja Tidak Terduga/Unpredicted Expenditures 235 616,56 870 417,78
2. Belanja Langsung/Direct Expenditures 3 197 080 848,38 2 939 645 281,76
2.1 Belanja Pegawai/Personnel Expenditures 710 597 454,90 327 218 562,79
2.2 Belanja Barang dan Jasa/Goods and Services Expenditures
1 250 396 770,85 1 832 330 307,17
2.3 Belanja Modal/Capital Expenditure 1 236 086 622,63 780 096 411,80
Jumlah/Total 4 982 355 340,79 5 001 748 526,41
https:
//bek
asiko
ta.b
ps.go.id

35Kota Bekasi Dalam Angka 2021
PEMERINTAHAN
Sumber/Source: Badan Pengelolaan Keuangan dan Aset Daerah Kota Bekasi/ Regional and Financial Asset Management of Bekasi Municipality
Lanjutan Tabel/Continued Table 2.4.2
Jenis PendapatanKind of Revenues 2019 2020
(1) (4) (5)
1. Belanja Tidak Langsung/Indirect Expenditures 1 909 565 700,22 2 101 892 299,56
1.1 Belanja Pegawai/Personnel Expenditures 1 708 561 985,97 1 721 255 186,30
1.2 Belanja Bunga/Interest Expenditures – –
1.3 Belanja Subsidi/Subsidies Expenditures 5 543 886,92 4 441 356,96
1.4 Belanja Hibah/Grant Expenditures 94 504 751,25 56 294 150,65
1.5 Belanja Bantuan Sosial/Social Aid Expenditures 98 669 460,00 99 951 730,00
1.6 Belanja Bagi Hasil/Sharing Fund Expenditure – –
1.7 Belanja Bantuan Keuangan/Financial Aids Expenditures
1 546 647,00 1 668 321,00
1.8 Belanja Tidak Terduga/Unpredicted Expenditures 738 969,08 218 281 554,65
2. Belanja Langsung/Direct Expenditures 3 658 357 676,06 2 481 400 956,50
2.1 Belanja Pegawai/Personnel Expenditures 191 289 754,05 77 328 227,08
2.2 Belanja Barang dan Jasa/Goods and Services Expenditures
2 362 558 547,60 1 644 481 350,51
2.3 Belanja Modal/Capital Expenditure 1 104 509 374,42 759 591 378,91
Jumlah/Total 5 567 923 376,28 4 583 293 256,06
https:
//bek
asiko
ta.b
ps.go.id

https:
//bek
asiko
ta.b
ps.go.id

3. Penduduk dan Ketenagakerjaan/Population and Employment ................3. PENDUDUK DAN KETENAGAKERJAAN/POPULATION AND
EMPLOYMENT
ChapterBAB
KETENAGAKERJAANPOPULATION ANDEMPLOYMENT
Hasil SP2020
Juta2,54 Jiwa
Bertambah 208 Ribu Jiwa dibandingkan tahun 2010
Jumlah Penduduk Kota Bekasi Laju Pertumbuhan Penduduk per Tahun, 2010-2020
0,83%
3,45%
Penduduk Usia Produktif (15-64) Tahun
Kota Bekasi masih dalam
72,56%
PersentasePenduduk Lansia
Jumlah penduduk laki-laki lebih banyak dibandingkan
jumlah penduduk perempuan
Rasio jenis Kelamin
7,91%
101,56
BabyBoomer
Gen Z
Pre-Boomer
Juta Jiwa
Milenial
Gen X
2,54
Post Gen Z
0,92%
11,27%
26,58%
Lahir tahun 1946-1964
Perkiraan usia sekarang
56-74tahun
Perkiraan usia sekarang 40-55 tahun
Lahir tahun 1965-1980
27,67%
Perkiraan usia sekarang 24-39 tahun
Lahir tahun 1981-1996
Perkiraan usia sekarang 8-23 tahun
22,75%
10,81%
Perkiraan usia sekarang s.d. 7 tahun
Lahir tahun 1997-2012
Lahir tahun 2013 dst
Lahir sebelum tahun 1945Perkiraan usia sekarang +75 tahun
Komposisi Penduduk Kota Bekasi
Sumber/Source: BPS, Sensus Penduduk 2020BPS, Population Census 2020
PENDUDUK DAN
03
https:
//bek
asiko
ta.b
ps.go.id

https:
//bek
asiko
ta.b
ps.go.id

39Kota Bekasi Dalam Angka 2021
PENDUDUK DAN KETENAGAKERJAAN
PENJELASAN TEKNIS TECHNICAL NOTES
1. Sumber utama data kependudukan Kota Bekasi adalah data hasil sensus penduduk 2020. Di dalam sensus penduduk, pencacahan dilakukan terhadap seluruh penduduk yang berdomisili di wilayah teritorial Indonesia termasuk warga negara asing kecuali anggota korps diplomatik negara sahabat beserta keluarganya.
2. Penduduk Kota Bekasi adalah semua orang yang berdomisili di wilayah teritorial Kota Bekasi selama satu tahun atau lebih dan atau mereka yang berdomisili kurang dari satu tahun tetapi bertujuan menetap.
3. Laju pertumbuhan penduduk adalah angka yang menunjukkan persentase pertambahan penduduk dalam jangka waktu tertentu.
4. Rasio jenis kelamin adalah perbandingan antara banyaknya penduduk laki-laki dengan banyaknya penduduk perempuan pada suatu daerah dan waktu tertentu. Biasanya dinyatakan dengan banyaknya penduduk laki-laki untuk 100 penduduk perempuan.
5. Kepadatan penduduk adalah rasio banyaknya penduduk per kilometer persegi.
6. Distribusi penduduk adalah pola persebaran penduduk di
1. The main source of demographic data population is 2020 population census (SP2020). The population census enumerates all residents who domicile in the entire territory of Indonesia including foreign citizens except the diplomatic corps members and their families.
2. The population of Bekasi Municipality are all residents in the territory of Bekasi Municipality who have stayed for 1 year or longer, those who intended to stay more than 1 year even though their length of stay is less than 1 year.
3. The growth rate of population is the number that show percentage of population growth within a specified period.
4. Sex ratio is the ratio of males population to females population in a given area and time, usually expressed as the number of males for every 100 females.
5. Population density is ratio of population per square kilometer
6. Population distribution is the pattern of population distribution
https:
//bek
asiko
ta.b
ps.go.id

40 Bekasi Municipality in Figures 2021
POPULATION AND EMPLOYMENT
suatu wilayah, baik berdasarkan batas-batas geografis maupun berdasarkan batas-batas administrasi pemerintahan.
7. Komposisi penduduk adalah pola persebaran penduduk menurut karakteristiknya, contoh: penduduk menurut kelompok umur, penduduk menurut jenis kelamin.
8. Penduduk usia kerja adalah penduduk yang berumur 15 tahun ke atas.
9. Angkatan kerja adalah penduduk usia kerja (15 tahun ke atas) yang bekerja, punya pekerjaan namun sementara tidak bekerja, dan pengangguran.
10. Bekerja adalah kegiatan ekonomi yang dilakukan oleh seseorang dengan maksud memperoleh atau membantu memperoleh pendapatan atau keuntungan dan lamanya bekerja paling sedikit 1 jam secara terus menerus dalam seminggu yang lalu (termasuk pekerja keluarga tanpa upah yang membantu dalam suatu usaha/kegiatan ekonomi).
11. Jumlah jam kerja seluruhnya adalah jumlah jam kerja yang digunakan untuk bekerja (tidak termasuk jam kerja istirahat resmi dan jam kerja yang digunakan untuk hal-hal di luar pekerjaan).
12. Lapangan usaha adalah bidang kegiatan dari pekerjaan/tempat bekerja di mana seseorang
in an area, either by geographic boundaries or by government administrative boundaries.
7. Population compotition is the pattern of population distribution by its characteristics, example: population by age group, population by sex.
8. Working age population is persons of 15 years and over.
9. Labor force or economically active are persons of 15 years and over, who in the previous week were working, temporarily absent from work but having jobs, and unemployment.
10. Working is economic activity conducted by a person and intended to earn income by doing work or helping to do work at least one hour continuously during the reference week (including unpaid family worker/s for any economic activity).
11. Total working hours is the total hours spent by an employee to perform all jobs (excluding the time used for other activities which are not classified as work).
12. Industry is field of a person’s activity or establishment. The classification of industries follows the Indonesia
https:
//bek
asiko
ta.b
ps.go.id

41Kota Bekasi Dalam Angka 2021
PENDUDUK DAN KETENAGAKERJAAN
bekerja. Klasifikasi lapangan usaha mengikuti Klasifikasi Baku Lapangan Usaha Indonesia (KBLI) dalam 1 digit.
13. Status pekerjaan adalah kedudukan seseorang dalam unit usaha/kegiatan dalam melakukan pekerjaan.
14. Berusaha sendiri tanpa dibantu orang lain adalah bekerja atau berusaha dengan menanggung risiko secara ekonomis, yaitu dengan tidak kembalinya ongkos produksi yang telah dikeluarkan dalam rangka usahanya tersebut, serta tidak menggunakan pekerja dibayar maupun pekerja tak dibayar, termasuk yang sifat pekerjaannya memerlukan teknologi atau keahlian khusus.
15. Berusaha dibantu buruh tidak tetap/ buruh tidak dibayar adalah bekerja atau berusaha atas risiko sendiri, dan menggunakan buruh/pekerja tak dibayar dan atau buruh/pekerja tidak tetap.
16. Berusaha dibantu buruh tetap/buruh dibayar adalah berusaha atas risiko sendiri dan mempekerjakan paling sedikit satu orang buruh/pekerja tetap yang dibayar.
17. B u r u h / k a r y a w a n / p e g a w a i adalah seseorang yang bekerja pada orang lain atau instansi/kantor/perusahaan secara tetap dengan menerima upah/gaji baik berupa uang maupun barang. Buruh yang tidak mempunyai
Standard Industrial Classification (KBLI) in one digit.
13. Employment status is the status of a person at his place of work or establishment where he was employed.
14. Own-account worker is a person who works at his own risk without assisted by paid per mount worker or unpaid worker include technical job or skill job.
15. Employer assisted by temporary workers/unpaid worker is a person who works at his own risk and assisted by temporary worker/unpaid worker.
16. Employer assisted by permanent workers/paid workers is a person who does his business at her/his own risk at least one assisted by paid permanent worker.
17. Employee is a person who work permanently for other people or institution/office/ company and gains some money/cash or goods as wage/ salary. Labor who have no permanent employer is not categorized as a laborer/ worker/
https:
//bek
asiko
ta.b
ps.go.id

42 Bekasi Municipality in Figures 2021
POPULATION AND EMPLOYMENT
majikan tetap, tidak digolongkan sebagai buruh/karyawan, tetapi sebagai pekerja bebas. Seseorang dianggap memiliki majikan tetap jika memiliki 1 (satu) majikan (orang/rumah tangga) yang sama dalam sebulan terakhir, khusus pada sektor bangunan batasannya tiga bulan. Apabila majikannya instansi/lembaga, boleh lebih dari satu.
18. Pekerja bebas adalah seseorang yang bekerja pada orang lain/majikan/institusi yang tidak tetap (lebih dari 1 majikan dalam sebulan terakhir) di usaha pertanian baik berupa usaha rumah tangga maupun bukan usaha rumah tangga, ataupun di nonpertanian atas dasar balas jasa dengan menerima upah atau imbalan baik berupa uang maupun barang, dan baik dengan sistem pembayaran harian maupun borongan.
19. Pekerja tak dibayar adalah seseorang yang bekerja membantu usaha untuk memperoleh penghasilan/ keuntungan yang dilakukan oleh salah seorang anggota rumah tangga atau bukan anggota rumah tangga tanpa mendapat upah/gaji baik berupa uang maupun barang.
employee but casual worker. A laborers in general is considered to have a permanent employer if he has the same employer during the past month, particularly for building construction sector is 3 months. If the employer is an institution, more than 1 (one) employer is allowed.
18. Casual employee is a person who does not work permanently for other people/employer/ institution (more than 1 employer during the last 1 month) in agricultural sector, either home industry or not home industry, or in non-agricultural sector based on remuneration paid with money or goods, and based on daily or contact payment system.
19. Unpaid worker is a person who intended to work without pay either with money or good, in an establishment run by other members of the family, relative or neighbour.
https:
//bek
asiko
ta.b
ps.go.id

43Kota Bekasi Dalam Angka 2021
PENDUDUK DAN KETENAGAKERJAAN
ULASAN DESCRIPTION
Kependudukan
Pada tahun 2020 penduduk Kota Bekasi berdasarkan hasil Sensus Penduduk 2020 (SP2020) diperkirakan sebanyak 2,54 juta jiwa. Terdiri atas laki-laki 1,28 juta jiwa dan perempuan 1,26 juta jiwa, sehingga angka sex ratio di Kota Bekasi sebesar 101,56 yang artinya terdapat 101-102 penduduk laki-laki dalam setiap 100 penduduk perempuan, dilihat menurut kecamatan, Kecamatan Bantargebang memiliki sex ratio tertinggi, yaitu 105,06, sedangkan yang terendah Kecamatan Bekasi Selatan yaitu 99,63. Sebagian besar kecamatan di Kota Bekasi memiliki angka sex ratio lebih dari 100, yang artinya jumlah penduduk laki-laki masih lebih mendominasi.
Populasi penduduk terbesar berada di Kecamatan Bekasi Utara yang dihuni sebanyak 337,01 ribu penduduk (13,25 persen), diikuti Kecamatan Bekasi Barat dan Kecamatan Bekasi Timur, masing-masing 281,68 ribu penduduk (11,07 persen) dan 257,03 ribu penduduk (10,10 persen). Sedangkan Kecamatan dengan populasi terkecil adalah Kecamatan Bantargebang yang memiliki jumlah penduduk 107,22 ribu penduduk (4,22 persen).
Luas Kota Bekasi secara keseluruhan mencapai 210,49 km2. Sebagian besar wilayah Kecamatan di Kota Bekasi memiliki kepadatan penduduk yang tinggi. Dari 12 Kecamatan, 9 di antaranya memiliki tingkat kepadatan
Population
In 2020, population of Bekasi Municipality based on data from the results of the Population Census 2020 estimated 2.54 million inhabitants. Consisting of 1.28 million males and 1.26 million females, so the number of sex ratio in the municipality of Bekasi is 101.56 which means there are 101-102 male residents in every a hundred female population. If it considered by subdistrict, Bantargebang Subdistrict has the highest sex ratio which is 105.06, while the lowest of Bekasi Selatan Subdistrict is 99.63. Most subdistricts in Bekasi Municipality has sex ratio of over a hundred, means that men are still bigger than women in number.
The biggest population is Bekasi Utara Subdistrict which is populated by 337.01 thousands residents (13.25 percent), followed by Bekasi Barat Subdistrict and Bekasi Timur Subdistrict, each has 281.68 thousands peoples (11,07 percent) and 257.03 thousands inhabitants (10.10 percent). On the other hand, sub-district with the lowest population is Bantargebang Sub-district which has 107.22 thousands inhabitants (4.22 percent).
Total area of Bekasi Municipality
is 210.49 km2. Most of subdistrict in Bekasi Municipality are classified as high density area. Among 12 subdistrict, 9 of them have density of more than ten
https:
//bek
asiko
ta.b
ps.go.id

44 Bekasi Municipality in Figures 2021
POPULATION AND EMPLOYMENT
penduduk lebih dari 10.000 jiwa/km2. Kecamatan Bekasi Barat menjadi daerah terpadat dengan tingkat kepadatan mencapai 18.867 jiwa/km2.
Ketenagakerjaan
a. Penduduk Usia KerjaPenduduk usia kerja didefinisikan
sebagai penduduk yang berumur 15 tahun dan lebih. Mereka terdiri dari “Angkatan Kerja” dan “Bukan Angkatan Kerja”. Proporsi penduduk yang tergolong “Angkatan Kerja” adalah mereka yang aktif dalam kegiatan ekonomi.
Keterlibatan penduduk dalam kegiatan ekonomi diukur dengan porsi penduduk yang masuk dalam pasar kerja yakni yang bekerja atau mencari pekerjaan. Tingkat Partisipasi Angkatan Kerja (TPAK) merupakan ukuran yang menggambarkan jumlah angkatan kerja untuk setiap 100 penduduk usia kerja.
Penduduk Kota Bekasi berusia 15 tahun atau lebih pada tahun 2020 mencapai 2,33 juta orang. Jumlah angkatan kerja sebanyak 1,51 juta orang, dimana 1,35 juta orang diantaranya bekerja di berbagai sektor usaha, sedangkan sisanya 0,16 juta masih menganggur. Jumlah tersebut menjadikan angka tingkat pengangguran terbuka menjadi 10,68 persen.
thousand people per square kilometres. Bekasi Barat Subdistrict becomes the most populous area with a density of 18,867 people/km2.
Employment
a. Working Ages PopulationWorking age is defined as population
who are 15 years old or older. They are classified as “Economically Active Group” and “Not Economically Active Group”. The “Economically Active Group” is classified as those who took part in economic sector, either in having or looking for a job. Manpower who was economically active is called labor force.
Labour Force Participation Rates (LFPRs) is the number of population who was classified as labor for for every 100 manpowers. Labour Force Participation Rates (LFPRs) is the number of population who was classified as labor for for every 100 manpowers.
Population of ages more than 15 year old in 2020 reached 2.33 miliion people. Labor force are 1.51 million people, as 1.35 million of them are working in various industries, and the rest of them as many as 0.16 million, are not working or defined as unemployment. This numbers make the unemployment rate to become 10.68 percent.
https:
//bek
asiko
ta.b
ps.go.id

45Kota Bekasi Dalam Angka 2021
PENDUDUK DAN KETENAGAKERJAAN
b. Komposisi Penduduk yang BekerjaPenduduk usia produktif (15-64
tahun) mencapai 1,83 juta orang, dan usia nonproduktif sebanyak 0,71 juta menjadikan angka dependency ratio atau rasio ketergantungan menjadi 38,92, yang artinya dalam 100 orang usia produktif menanggung 39 orang usia nonproduktif. Nilai ini menunjukkan di Kota Bekasi 1 orang usia nonproduktif ditanggung oleh setidaknya 6 orang usia produktif.
Pekerja di Kota Bekasi didominasi oleh lulusan SMA, yakni mencapai 45,13 persen, dan persentase angkatan kerja terhadap penduduk usia kerja yang tamat SMA sebesar 65,74 persen
Sedangkan untuk pekerja lulusan perguruan tinggi mencapai 19,93 persen dan persentase angkatan kerja terhadap penduduk usia kerja yang tamat perguruan tinggi sebesar 82,90 persen. Jadi terlihat bahwa perbedaan persentase yang bekerja dengan angkatan kerja antara yang lulus SMA dan perguruan tinggi menjadi cukup siginifikan.
b. Working PopulationNumber of productive age
population mentioned as 1.83 million people and nonproductive as 0.71 million people, makes dependency ratio counted as 38.92 means that on every a hundred productive people bearing of 39 nonproductive people. The value indicated that in Bekasi Municipality every single person of nonproductive people are carried by at least 6 productive people.
Workers in Bekasi Municipality are dominated by high school graduates, reaching 45.13 percent, and the percentage of the workforce of working age population who have graduated from elementary school is 65.74 percent.
Where as for college graduate workers it reaches 19.93 percent and the percentage of the workforce of the working age population who graduated from college amounted to 82.90 percent. So it appears that the difference in the percentage of those working with the workforce between those who graduate from high school and university becomes significant .
https:
//bek
asiko
ta.b
ps.go.id

46 Bekasi Municipality in Figures 2021
POPULATION AND EMPLOYMENT
3.1 Jumlah Penduduk menurut Kecamatan (ribu), 2020 Number of Population by Subdistrict (thousand), 2020
GambarFigures
Sumber/Source : BPS, Sensus Penduduk 2020 (SP2020)/BPS-Statistics Indonesia, Population Census 2020 (SP2020)
PondokgedeJatisampurnaPondokmelatiJatiasihBantargebangMustikajayaBekasi TimurRawalumbuBekasi SelatanBekasi BaratMedan SatriaBekasi Utara
0.00 50.00 100.00 150.00 200.00 250.00 300.00 350.00
Pondokgede
Jatisampurna
Pondokmelati
Jatiasih
Bantargebang
Mustikajaya
Bekasi Timur
Rawalumbu
Bekasi Selatan
Bekasi Barat
Medan Satria
Bekasi Utara
251.20
123.92
131.12
247.36
107.22
213.52
257.03
220.70
210.81
281.68
162.…
337.01
https:
//bek
asiko
ta.b
ps.go.id

47Kota Bekasi Dalam Angka 2021
PENDUDUK DAN KETENAGAKERJAAN
Sumber/Source : BPS, Sensus Penduduk 2020 (SP2020)/BPS-Statistics Indonesia, Population Census 2020 (SP2020)
Jatiasih
Pondokgede, 15,779 Jatisampurna,
6,342
Pondok Melati, 11,112
Jatiasih, 10,192
Bantargebang, 5,814
Mustika Jaya, 8,082
Bekasi Timur, 17,568
Rawalumbu, 13,098
Bekasi Selatan, 13,126
Bekasi Barat, 18,867
Medan Satria, 13,646
Bekasi Utara, 17,064
3.2 Kepadatan Penduduk per km2 menurut Kecamatan, 2020 Population Density per sq.km by Subdistrict, 2020
GambarFigures
https:
//bek
asiko
ta.b
ps.go.id

48 Bekasi Municipality in Figures 2021
POPULATION AND EMPLOYMENT
TabelTable 3.1.1 Penduduk, Laju Pertumbuhan Penduduk per Tahun,
Distribusi Persentase Penduduk, Kepadatan Penduduk, Rasio Jenis Kelamin Penduduk Menurut Kecamatan di Kota Bekasi, 2020
Population, Annual Population Growth Rate, Percentage Distribution of Population, Population Density, and Population Sex Ratio by Subdistrict in Bekasi Municipality, 2020
KecamatanSubdistrict
Penduduk (ribu)Population (thousand)
Laju Pertumbuhan Penduduk per Tahun 2019–2020
Annual Population Growth Rate (%) 2019–2020
(1) (2) (3)
Pondokgede 251,20 –
Jatisampurna 123,92 –
Pondokmelati 131,12 –
Jatiasih 247,36 –
Bantargebang 107,22 –
Mustikajaya 213,52 –
Bekasi Timur 257,03 –
Rawalumbu 220,70 –
Bekasi Selatan 210,81 –
Bekasi Barat 281,68 –
Medan Satria 162,12 –
Bekasi Utara 337,01 –
Kota BekasiBekasi Municipality 2 543,68 –
3.1 PENDUDUK POPULATION
https:
//bek
asiko
ta.b
ps.go.id

49Kota Bekasi Dalam Angka 2021
PENDUDUK DAN KETENAGAKERJAAN
KecamatanSubdistrict
Persentase PendudukPercentage of Total Population
Kepadatan Penduduk per km2
Population Density per sq.km
(1) (7) (8)
Pondokgede 9,88 15 779
Jatisampurna 4,87 6 342
Pondokmelati 5,15 11 112
Jatiasih 9,72 10 192
Bantargebang 4,22 5 814
Mustikajaya 8,39 8 082
Bekasi Timur 10,10 17 568
Rawalumbu 8,68 13 098
Bekasi Selatan 8,29 13 126
Bekasi Barat 11,07 18 867
Medan Satria 6,37 13 646
Bekasi Utara 13,25 17 064
Kota BekasiBekasi Municipality 100,00 12 085
Lanjutan Tabel/Continued Table 3.1.1
https:
//bek
asiko
ta.b
ps.go.id

50 Bekasi Municipality in Figures 2021
POPULATION AND EMPLOYMENT
KecamatanSubdistrict
Rasio Jenis KelaminPopulation Sex Ratio
(1) (11)
Pondokgede 101,01
Jatisampurna 101,25
Pondokmelati 101,53
Jatiasih 101,09
Bantargebang 105,06
Mustikajaya 102,79
Bekasi Timur 100,48
Rawalumbu 101,28
Bekasi Selatan 99,63
Bekasi Barat 100,78
Medan Satria 103,43
Bekasi Utara 102,57
Kota BekasiBekasi Municipality 101,56
Lanjutan Tabel/Continued Table 3.1.1
Sumber/Source: BPS, Sensus Penduduk 2020 (SP2020)/BPS-Statistics Indonesia, Population Census 2020 (SP2020)
https:
//bek
asiko
ta.b
ps.go.id

51Kota Bekasi Dalam Angka 2021
PENDUDUK DAN KETENAGAKERJAAN
3.2 KETENAGAKERJAAN EMPLOYMENT
TabelTable 3.2.1 Jumlah Penduduk Berumur 15 Tahun Keatas Menurut
Jenis Kegiatan Selama Seminggu yang Lalu dan Jenis Kelamin di Kota Bekasi, 2020
Population Aged 15 Years and Over by Type of Activity During The Previous Week and Sex in Bekasi Municipality, 2020
Sumber/Source: BPS, Survei Angkatan Kerja Nasional (Sakernas) Agustus/BPS-Statistics Indonesia, August National Labor Force Survey
Kegiatan UtamaMain Activity
Jenis Kelamin/Sex
Laki-LakiMale
PerempuanFemale
JumlahTotal
(1) (2) (3) (4)
I. Angkatan Kerja/Economically Active 932 805 577 036 1 509 841
1. Bekerja/Working 830 533 517 997 1 348 530
2. Pengangguran Terbuka/Unemployment 102 272 59 039 161 311
II. Bukan Angkatan Kerja/Economically Inactive 238 432 583 867 822 299
1. Sekolah/Attending School 121 655 122 516 244 171
2. Mengurus Rumah Tangga/Housekeeping 32 908 405 612 438 520
3. Lainnya/Others 83 869 55 739 139 608
Jumlah/Total 1 171 237 1 160 903 2 332 140
https:
//bek
asiko
ta.b
ps.go.id

52 Bekasi Municipality in Figures 2021
POPULATION AND EMPLOYMENT
TabelTable 3.2.2 Penduduk Berumur 15 Tahun ke Atas Menurut Pendidikan
Tertinggi yang Ditamatkan dan Jenis Kegiatan Selama Seminggu yang Lalu di Kota Bekasi, 2020
Population 15 Years of Age and Over by Educational Attainment and Type of Activity During the Previous Week in Bekasi Municipality, 2020
Pendidikan Tertinggi yangDitamatkan 1
Educational Attainment 1
Angkatan Kerja/Economically ActivePersentase Bekerjaterhadap Angkatan
KerjaPercentage of
Working to EconomicallyActive
BekerjaWorking
Pengangguran 2
Unemployment 2
JumlahAngkatan Kerja
Total ofEconomically
Active
(1) (2) (3) (4) (5)
0 173 404 8 477 181 881 95,34
1 184 535 26 353 210 888 87,50
2 608 569 75 332 683 901 88,98
3 113 259 8 643 121 902 92,91
4 268 763 42 506 311 269 86,34
Jumlah/Total 1 348 530 161 311 1 509 841 89,32
https:
//bek
asiko
ta.b
ps.go.id

53Kota Bekasi Dalam Angka 2021
PENDUDUK DAN KETENAGAKERJAAN
Lanjutan Tabel/Continued Table 3.2.2
Pendidikan Tertinggi yangDitamatkan 1
Educational Attainment 1
Bukan Angkatan KerjaNot Economically Active
JumlahTotal
Persentase Angkatan Kerja
terhadap Penduduk Usia Kerja
Percentage of EconomicallyActive to Working Age
Population
(1) (6) (7) (8)
0 126 070 307 951 59,06
1 237 456 448 344 47,04
2 356 459 1 040 360 65,74
3 38 126 160 028 76,18
4 64 188 375 457 82,90
Jumlah/Total 822 299 2 332 140 64,74
Catatan/Note: 1 0. ≤ Sekolah Dasar (SD)/≤ Primary School 1. Sekolah Menengah Pertama/Junior High School 2. Sekolah Menengah Atas/Senior High School 3. Diploma I/II/III/Diploma I, II/III 4. Perguruan Tinggi/Collage 2 1. Mencari pekerjaan/Looking for work 2. Mempersiapkan usaha/Establishing a new business/firm 3. Merasa tidak mungkin mendapat pekerjaan/Hopeless of job 4. Sudah punya pekerjaan tetapi belum mulai bekerja/Have a job in future startSumber/Source: BPS, Survei Angkatan Kerja Nasional (Sakernas) Agustus/BPS-Statistics Indonesia, August National Labor Force Survey
https:
//bek
asiko
ta.b
ps.go.id

54 Bekasi Municipality in Figures 2021
POPULATION AND EMPLOYMENT
TabelTable 3.2.3 Penduduk Berumur 15 Tahun Ke Atas yang Bekerja
Selama Seminggu yang Lalu Menurut Status Pekerjaan Utama dan Jenis Kelamin di Kota Bekasi, 2020
Population 15 Years of Age and Over who Worked During The Previous Week by Main Employment Status and Sex in Bekasi Municipality, 2020
Sumber/Source: BPS, Survei Angkatan Kerja Nasional (Sakernas) Agustus/BPS-Statistics Indonesia, August National Labor Force Survey
Status Pekerjaan UtamaMain Employment Status
Laki-LakiMale
PerempuanFemale
JumlahTotal
(1) (2) (3) (4)
Berusaha sendiriOwn account worker
185 782 126 929 312 711
Berusaha dibantu buruh tidak tetap/buruh tidak dibayar Employer assisted by temporary worker/unpaid worker
34 110 27 954 62 064
Berusaha dibantu buruh tetap/buruh dibayarEmployer assisted by permanent worker/paid worker
27 412 8 320 35 732
Buruh/Karyawan/Pegawai/Employee 542 865 300 627 843 492
Pekerja bebasCasual worker
23 590 8 302 31 892
Pekerja keluarga/tak dibayar Family worker/unpaid worker
16 774 45 865 62 639
Jumlah/Total 830 533 517 997 1348 530
https:
//bek
asiko
ta.b
ps.go.id

4. Sosial dan Kesejahteraan Rakyat/Social and Welfare ...................................4. SOSIAL DAN KESEJAHTERAAN RAKYAT/SOCIAL AND WELFARE
Poverty Proflie in Bekasi Municipality
ATAU
RIBUPENDUDUK MISKIN
TERDAPAT
DI KOTA BEKASI
there were
poor people inBekasi Municipality
PENDUDUK MISKINDI KOTA BEKASI
BPS-Statistics Indonesia, March National Socioeconomic SurveySumber/Source: BPS, Survei Sosial Ekonomi Nasional Maret
Kota Bekasi 2020
TAHUN 2020
4,38%134,01
DIBANDINGKAN TAHUN 2019 JUMLAH
20.360 ORANG ATAU 0,57%MENGALAMIKENAIKAN SEBESAR
In 2020
4,38% or134,01 thousand
ChapterBAB
KESEJAHTERAAN RAKYATSOSIAL DAN
SOCIAL AND WELFARE04
https:
//bek
asiko
ta.b
ps.go.id

https:
//bek
asiko
ta.b
ps.go.id

57Kota Bekasi Dalam Angka 2021
SOSIAL DAN KESEJAHTERAAN RAKYAT
PENJELASAN TEKNIS TECHNICAL NOTES
1. Jalur Pendidikan di Indonesia terdiri atas pendidikan formal, pendidikan nonformal, dan pendidikan informal, ketiganya dapat saling melengkapi dan memperkaya. Undang-undang No 20 Tahun 2013 tentang Sitem Pendidikan Nasional.
2. Jenjang pendidikan formal terdiri atas pendidikan dasar, pendidikan menengah, dan pendidikan tinggi. Jenis pendidikan yang diajarkan mencakup pendidikan umum, kejuruan, akademik, profesi, vokasi, keagamaan dan khususa. Pendidikan Dasar berbentuk
Sekolah Dasar (SD) dan Madrasah Ibtidaiyah (MI) atau bentuk lain yang sederajat serta Sekolah Menengah Pertama (SMP) dan Madrasah Tsanawiyah (MTs), atau bentuk lain yang sederajat.
b. Pendidkan Menengah yaitu Sekolah Menengah Atas (SMA), Madrasah Aliyah (MA), Sekolah Menengah Kejuruan (SMK), dan Madrasah Aliyah Kejuruan (MAK), atau bentuk lain yang sederajat.
c. Pendidikan Tinggi merupakan jenjang pendidikan setelah pendidikan menengah yang mencakup program pendidikan diploma, sarjana, magister, spesialis, dan doktor
1. The Education System in Indonesia consists of formal education, nonformal education, and informal education that all three of which can complement and enrich each other. Law No 20 Year 2013 about The National Education System.
2. The Formal Education Level consists of primary education, secondary education, and high education. The kind of education that taught consists of general education, vocational, academic, professional, religious, and specific education.
a. The Primary Education consists of Elementary School (SD) and Madrasah Ibtidaiyah (MI) or other equivalent forms and Junior High School (SMP) and Madrasah Tsanawiyah (MTs), or other equivalent forms.
b. The Secondary Education consists of the Senior High School (SMU), Madrasah Aliyah (MA), Vocational High School (SMK), and Vocational Madrasah Aliyah (MAK), or other equivalent forms.
c. The Tertiary Education consists of the education level after the secondary education that consists of diplomas, bachelor, master degree, specialist, and doctoral degrees that are held
https:
//bek
asiko
ta.b
ps.go.id

58 Bekasi Municipality in Figures 2021
SOCIAL AND WELFARE
yang diselenggarakan oleh perguruan tinggi. Perguruan tinggi dapat berbentuk akademi, politeknik, sekolah tinggi, atau institut.
3. Rumah Sakit adalah tempat pemeriksaan dan perawatan kesehatan, biasanya berada di bawah pengawasan dokter/tenaga medis, yang melayani penderita yang sakit untuk berobat rawat jalan atau rawat inap.
4. Puskesmas (Pusat Kesehatan Masyarakat) adalah unit pelaksana teknis dinas kesehatan kabupaten/kota yang mempunyai fungsi utama sebagai penyelenggara pelayanan kesehatan tingkat pertama. Wilayah kerja puskesmas maksimal adalah satu kecamatan dan untuk dapat menjangkau wilayah kerjanya, puskesmas mempunyai jaringan pelayanan yang meliputi unit puskesmas pembantu (Pustu), Unit Puskesmas Keliling (Puskel), dan unit bidan desa/komunitas (Peraturan Mentri Kesehatan RI No 75 Tahun 2014 Tentang Pusat Kesehatan Masyarakat).
5. Tenaga kesehatan adalah setiap orang yang mengabdikan diri dalam bidang kesehatan serta memiliki pengetahuan dan/atau keterampilan melalui pendidikan di bidang kesehatan yang untuk jenis tertentu memerlukan
by the collage. The universities can be in the form of an academy, polytechnic, college or institute.
3. Hospital is a place for health check, usually controlled/supervised by doctors/medical personnel to serve the ill patients to get outpatient or inpatient treatment services.
4. Public Health Centre is technical implementation unit of regency health department that have the primary function as a first-level health care providers. The working area standard of public health center is one subdistrict and to reach their working areas, public health centers have a service network covering subsidiary of public health center, mobile public health center units, and midwife units (Regulation og the Minister of Health of Indonesia Number 75 Year 2014 about Public Health Center).
5. Health worker is every person who devotes himself in the field of health and has knowledge and / or skills through education in the health sector which for certain types requires authority to carry out health efforts.
https:
//bek
asiko
ta.b
ps.go.id

59Kota Bekasi Dalam Angka 2021
SOSIAL DAN KESEJAHTERAAN RAKYAT
kewenangan untuk melakukan upaya kesehatan.
6. Bencana alam adalah peristiwa atau serangkaian peristiwa yang mengancam dan mengganggu kehidupan masyarakat yang disebabkan oleh faktor alam, antara lain berupa gempa bumi, tsunami, gunung meletus, banjir, kekeringan, angin topan, dan tanah longsor, sehingga mengakibatkan kerugian materi maupun non-materi.
7. Untuk mengukur kemiskinan, BPS menggunakan konsep kemampuan memenuhi kebutuhan dasar (basic needs approach). Dengan pendekatan ini, kemiskinan dipandang sebagai ketidakmampuan dari sisi ekonomi untuk memenuhi kebutuhan dasar makanan dan bukan makanan yang diukur dari sisi pengeluaran. Metode yang digunakan adalah menghitung Garis Kemiskinan (GK), yang terdiri dari dua komponen yaitu Garis Kemiskinan Makanan (GKM) dan Garis Kemiskinan NonMakanan (GKNM). Penghitungan Garis Kemiskinan dilakukan secara terpisah untuk daerah perkotaan dan perdesaan.
8. Penduduk miskin adalah penduduk yang memiliki rata-rata pengeluaran per kapita per bulan di bawah Garis Kemiskinan.
6. Natural disaster is an event or series of events that threaten and disrupt the lives and livelihoods caused by natural factors, such as: earthquake, tsunami, volcanic eruption, flood, flash flood, drought, typhoon/ cyclone, and landslide, so it can lead to result in loss of material and nonmaterial.
7. To measure poverty, BPS-Statistics Indonesia has used the concept of basic needs approach. Therefore, poverty is viewed as economic inability to fulfill food and non-food basic needs which are measured by consumption/ expenditure. The method used is calculating poverty line, which consists of two components that are Food Poverty Line (FPL) and Non-Food Poverty Line (NFPL). The poverty line was calculated separately for urban and rural areas.
8. A person whose expenditure per capita per month is below the poverty line is considered to be poor.
https:
//bek
asiko
ta.b
ps.go.id

60 Bekasi Municipality in Figures 2021
SOCIAL AND WELFARE
ULASAN DESCRIPTION
Pendidikan
Program wajib belajar 9 tahun dan berbagai program pendukung pendidikan lainnya adalah bagian dari upaya pemerintah untuk mempercepat peningkatan kualitas sumber daya manusia (SDM), yang pada akhirnya akan menciptakan SDM yang tangguh, yang siap bersaing di era globalisasi. Tersedianya SDM yang berkualitas merupakan salah satu faktor utama keberhasilan pembangunan. Oleh karena itu, pemerintah secara konsisten berusaha meningkatkan kualitas SDM. Peningkatan kualitas sumber daya manusia difokuskan untuk memberikan kesempatan seluas-luasnya bagi setiap penduduk untuk mengenyam pendidikan.
Tahun 2020/2021 di Kota Bekasi jumlah sekolah dibawah Kementerian Pendidikan dan Kebudayaan sebanyak 1.916 sekolah dengan rincian jumlah Sekolah Dasar (SD) 655, Sekolah Menengah Pertama (SMP) 285, dan Sekolah Menengah Atas (SMA/SMU) 109, sedangkan Sekolah Menengah Kejuruan (SMK) sebanyak 141. Untuk pendidikan usia dini dan TK jumlah sekolah sebanyak 726 sekolah. Untuk sekolah dibawah Kementrian Agama sebanyak 554 sekolah terdiri dari Raudhatul Athfal (RA) sebanyak 303, Madrasah Ibtidaiyah (MI) sebanyak 136, Madrasah Tsanawiyah (MTs) sebanyak 82, dan Madrasah Aliyah (MA) sebanyak 33 sekolah.
Education
compulsory education 9 years, and other education supporting programs are among the efforts of the government in accelerating the goals, to enhance the quality of human resources, (SDM) who could compete in globalization era. The quality of human resources (SDM) is one of important factor in supporting the success of development. Therefore, the government is consistently trying to increase the quality of human resources. The increasing of human resources quality focused on providing a huge opportunity to everyone to attain education evenly.
In 2020/2021 in Bekasi municipality the number of schools under the Ministry of Education and Culture as many as 1,916 schools with details of number of elementary School (SD) 655, Junior High School (SMP) 285, and Senior High School (SMA/SMU) 109, while vocational high School (SMK) as much as 141 school. For early childhood education and KINDERGARTEN the number of 726 schools. For schools under the Ministry of Religious Affairs as many as 554 schools consist of Raudhatul Athfal (RA) as much as 303, Madrasah Ibtidaiyah (MI) as many as 136, Madrasah Tsanawiyah (MTs) as much as 82, and Madrasah Aliyah (MA) as much as 33 schools.
https:
//bek
asiko
ta.b
ps.go.id

61Kota Bekasi Dalam Angka 2021
SOSIAL DAN KESEJAHTERAAN RAKYAT
Kesehatan
Pembangunan bidang kesehatan bertujuan agar semua lapisan masyarakat dapat memperoleh pelayanan kesehatan secara mudah, merata dan murah.
Pembangunan kesehatan harus selalu dilakukan mengingat jumlah penduduk yang selalu bertambah dari tahun ke tahun. Upaya pemerintah untuk meningkatkan derajat dan status kesehatan penduduk dilakukan antara lain dengan meningkatkan fasilitas dan sarana kesehatan.
Tahun 2020 jumlah kelurahan di Kota Bekasi yang memiliki sarana kesehatan berupa rumah sakit sebanyak 28 kelurahan, rumah sakit bersalin 6 kelurahan, poliklinik 54 kelurahan, puskesmas 40 kelurahan, dan puskesmas pembantu sebanyak 8 kelurahan. Disamping sarana kesehatan, Kota Bekasi juga memiliki tenaga kesehatan yang memiliki pengetahuan dan keterampilan melalui pendidikan untuk melakukan upaya kesehatan terhadap masyarakat.
Tenaga kesehatan yang berstatus sebagai pegawai negeri sipil (PNS) di Kota Bekasi sebanyak 668 orang dengan rincian, dokter sebanyak 203 orang, perawat sebanyak 197 orang, bidan sebanyak 196 orang, farmasi sebanyak 37 orang, dan ahli gizi sebanyak 35 orang.
Health
Development of health sector is aimed at improving health condition of the society by providing health facility with easier, convenient, and cheaper access.
The health development will be continuously improved as the number of population will always increase. In line with government policies imposed on other sector as an effort to increase health quality of society and number of medical personnel.
In 2020 the number of kelurahan in Bekasi Municipality that have health facilities in the form of hospitals as many as 28 kelurahan, maternity Hospital 6 kelurahan, polyclinics 54 kelurahan, public health Centers 40 kelurahan, and assistant public health centers as many as 8 kelurahan. Besides health facilities, Bekasi municipality also has health workers who have knowledge and skills through education to make health efforts to the community.
Health workers who status as civil servants in Bekasi Municipality as much as 668 people with details, doctors as many as 203 people, nurses as many as 197 people, midwives as many as 196 people, pharmacy as many as 37 people, and nutritionist as many as 35 people.
https:
//bek
asiko
ta.b
ps.go.id

62 Bekasi Municipality in Figures 2021
SOCIAL AND WELFARE
Agama dan Sosial Lainnya
Kerukunan umat beragama di Kota Bekasi tetap terjaga hingga saat ini. Hal ini dikarenakan semua elemen masyarakat mempunyai komitmen untuk menjaga toleransi beragama, menjadikan perbedaan sebagai kekuatan dan saling berkomunikasi dengan lintas agama yang tergabung dalam Forum Komunikasi Umat Beragama (FKUB) Kota Bekasi.
Pada tahun 2020 jumlah penduduk Kota Bekasi diperkirakan mencapai 2,54 juta jiwa. Jumlah tersebut, dibagi berdasarkan komposisi pemeluk agama. Menempati urutan pertama yakni mayoritas warga beragama Islam dengan jumlah sebanyak 2.145.800 jiwa. Lalu, umat Kristen Protestan dengan jumlah populasi sebanyak 202.767 jiwa.
Selanjutnya, umat Katholik sebesar 88.944 jiwa, umat Budha 30.674 jiwa, umat Hindu 29.341 jiwa, Agama Kong Hu Cu sebanyak 4.234 orang serta aliran Kepercayaan sebanyak 1.585 jiwa.
Religion and Other Social Affairs
The harmony of religious people in Bekasi municipality remains awake to this time. This is because all elements of society have a commitment to maintain religious tolerance, make a difference as a force and communicate with each other with cross-religious communication Forum (FKUB) Bekasi municipality.
In 2020 the population of Bekasi municipality reaches 2.54 million inhabitants. The amount, divided by the composition of adhered religion. The first is the majority of Muslims with a total of 2,145,800 people. Then, Protestant Christians with a population of 202,767 people.
Furthermore, Catholic people amounting to 88,944 inhabitants, Buddhists 30,674 people, the Hindu 29,341 inhabitants, the religion of Kong Hu Cu as much as 4.234 and the flow of trust as much as 1.585 souls.
https:
//bek
asiko
ta.b
ps.go.id

63Kota Bekasi Dalam Angka 2021
SOSIAL DAN KESEJAHTERAAN RAKYAT
Kemiskinan
Untuk mengukur kemiskinan, digunakan konsep kemampuan memenuhi kebutuhan dasar (basic needs approach). Dengan pendekatan ini, kemiskinan dipandang sebagai ketidakmampuan dari sisi ekonomi untuk memenuhi kebutuhan dasar makanan dan bukan makanan yang diukur dari sisi pengeluaran. Metode yang digunakan adalah menghitung Garis Kemiskinan (GK), yang terdiri dari dua komponen yaitu Garis Kemiskinan Makanan (GKM) dan Garis Kemiskinan NonMakanan (GKNM). Penghitungan Garis Kemiskinan dilakukan secara terpisah untuk daerah perkotaan dan perdesaan.
Tahun 2020, Garis Kemiskinan ditentukan pada angka rata-rata pengeluaran per kapita masing-masing Rp. 657.953 per bulan.
Angka kemiskinan di Kota Bekasi sebanyak 134,01 ribu orang (4,38 persen), terjadi peningkatan dibanding tahun 2019. Pada 2019 angka kemiskinan mencapai 113,65 ribu orang (3,81 persen).
Poverty
To measure poverty, BPS-Statistics Indonesia has used the concept of basic needs approach. Therefore, poverty is viewed as economic inability to fulfill food and non-food basic needs which are measured by consumption/ expenditure. The method used is calculating poverty line, which consists of two components that are Food Poverty Line (FPL) and Non-Food Poverty Line (NFPL). The poverty line was calculated separately for urban and rural areas.
In year 2020, the poverty line is determined on the average number of per capita spending of Rp. 657,953 per month.
The poverty rate in Bekasi municipality is 134.01 thousand people (4.38 percent), there is a increase compared to the year 2019. At 2019 the poverty rate reaches 113.65 thousand people (3.81 percent).
https:
//bek
asiko
ta.b
ps.go.id

64 Bekasi Municipality in Figures 2021
SOCIAL AND WELFARE
4.1 Jumlah Sekolah menurut Tingkat Pendidikan, 2020 Number of Schools by Education Level, 2020
GambarFigures
Sumber/Source : Kementerian Pendidikan dan Kebudayaan, Data Semester Ganji/Ministry of Educations and Culture, Odd Semester Data
TKSDSMPSMASMK
0
100
200
300
400
500
600
700
800
TKSD
SMPSMA
SMK
726
655
285
109 141
https:
//bek
asiko
ta.b
ps.go.id

65Kota Bekasi Dalam Angka 2021
SOSIAL DAN KESEJAHTERAAN RAKYAT
Sumber/Source : BPS, Pendataan Potensi Desa (Podes)/BPS-Statistics Indonesia, Village Potential Data Collecting
Rumah SakitRumah Sakit BersalinPuskesmasPuskesmas PembantuPoliklinikApotik
0
10
20
30
40
50
60
70
80
Rumah Sakit Rumah SakitBersalin
PuskesmasPuskesmasPembantu
Poliklinik Apotik
27
0
42
3
76
55
4.2 Jumlah Kelurahan Yang Memiliki Sarana Kesehatan, 2020 Number of Kelurahan Having Health Facilities, 2020
GambarFigures
https:
//bek
asiko
ta.b
ps.go.id

66 Bekasi Municipality in Figures 2021
SOCIAL AND WELFARE
4.1 PENDIDIKAN EDUCATION
KecamatanSubdistrict
Sekolah/Schools
Negeri/Public Swasta/Private Jumlah/Total
2019/2020 2020/2021 2019/2020 2020/2021 2019/2020 2020/2021
(1) (2) (3) (4) (5) (6) (7)
Pondokgede – – 89 74 89 74
Jatisampurna 1 1 51 47 52 48
Pondokmelati 1 1 53 46 54 47
Jatiasih 1 1 78 72 79 73
Bantargebang – – 24 24 24 24
Mustikajaya – – 81 76 81 76
Bekasi Timur – – 70 66 70 66
Rawalumbu – – 60 59 60 59
Bekasi Selatan 1 1 61 47 62 48
Bekasi Barat – – 68 64 68 64
Medan Satria 1 1 65 48 66 49
Bekasi Utara – – 114 98 114 98
Kota BekasiBekasi Municipality 5 5 814 721 819 726
TabelTable 4.1.1 Jumlah Sekolah, Guru, dan Murid Taman Kanak-Kanak
(TK) di Bawah Kementerian Pendidikan dan Kebudayaan Menurut Kecamatan di Kota Bekasi, 2019/2020 dan 2020/2021
Number of Schools, Teachers, and Pupils in Kindergarten Under The Ministry of Education and Culture by Subdistrict in Bekasi Municipality, 2019/2020 and 2020/2021
https:
//bek
asiko
ta.b
ps.go.id

67Kota Bekasi Dalam Angka 2021
SOSIAL DAN KESEJAHTERAAN RAKYAT
Lanjutan Tabel/Continued Table 4.1.1
KecamatanSubdistrict
Guru 1/Teachers 1
Negeri/Public Swasta/Private Jumlah/Total
2019/2020 2020/2021 2019/2020 2020/2021 2019/2020 2020/2021
(1) (8) (9) (10) (11) (12) (13)
Pondokgede – – 394 383 394 383
Jatisampurna 4 9 264 234 268 243
Pondokmelati 3 6 246 222 249 228
Jatiasih 5 9 392 356 397 365
Bantargebang – – 107 105 107 105
Mustikajaya – – 359 353 359 353
Bekasi Timur – – 320 321 320 321
Rawalumbu – – 348 329 348 329
Bekasi Selatan 11 11 284 264 295 275
Bekasi Barat – – 335 315 335 315
Medan Satria 8 10 251 204 259 214
Bekasi Utara – – 423 387 423 387
Kota BekasiBekasi Municipality 31 45 3 723 3 473 3 754 3 518
https:
//bek
asiko
ta.b
ps.go.id

68 Bekasi Municipality in Figures 2021
SOCIAL AND WELFARE
Lanjutan Tabel/Continued Table 4.1.1
Catatan/Note: 2019/2020 - 1 Jumlah guru termasuk kepala sekolah dan guru/ The total of teachers including headmaster and teacher 2020/2021 - 1 Jumlah guru termasuk kepala sekolah dan guru/The total of teachers including headmaster and teacher
Sumber/Source: 2019/2020 - Kementrian Pendidikan dan Kebudayaan, data semester ganjil 2019/ Ministry of Educations and Culture, 2019 odd semester data
2020/2021 - Kementerian Pendidikan dan Kebudayaan, Sistem Data Pokok Pendidikan, data semester ganjil/ Ministry of Educations and Culture, Basic Education Data System, odd semester
KecamatanSubdistrict
Murid/Pupils
Negeri/Public Swasta/Private Jumlah/Total
2019/2020 2020/2021 2019/2020 2020/2021 2019/2020 2020/2021
(1) (14) (15) (16) (17) (18) (19)
Pondokgede – – 3 357 2 527 3 357 2 527
Jatisampurna 37 37 2 209 1 631 2 246 1 668
Pondokmelati 27 62 1 815 1 386 1 842 1 448
Jatiasih 45 86 2 891 2 244 2 936 2 330
Bantargebang – – 859 825 859 825
Mustikajaya – – 3 415 2 706 3 415 2 706
Bekasi Timur – – 2 743 2 271 2 743 2 271
Rawalumbu – – 3 088 2 480 3 088 2 480
Bekasi Selatan 93 91 2 073 1 807 2 166 1 898
Bekasi Barat – – 2 781 2 340 2 781 2 340
Medan Satria 67 84 2 116 1 431 2 183 1 515
Bekasi Utara – – 3 579 2 763 3 579 2 763
Kota BekasiBekasi Municipality 269 360 30 926 24 411 31 195 24 976
https:
//bek
asiko
ta.b
ps.go.id

69Kota Bekasi Dalam Angka 2021
SOSIAL DAN KESEJAHTERAAN RAKYAT
TabelTable 4.1.2 Jumlah Sekolah, Guru, dan Murid Raudatul Athfal (RA) di
Bawah Kementerian Agama Menurut Kecamatan di Kota Bekasi, 2019/2020 dan 2020/2021
Number of Schools, Teachers, and Pupils in Raudatul Athfal (RA) Under The Ministry of Religious Affairs by Subdistrict in Bekasi Municipality, 2019/2020 and 2020/2021
Sumber/Source: 2019/2020 - Kementerian Agama, EMIS, data semester ganjillaporan sampai dengan 15 Maret 2020/ Ministry of Religious Affairs, EMIS, odd semester report data up to March 15th, 2020
2020/2021 - Kementerian Agama, EMIS, data semester ganjil/ Ministry of Religious Affairs, EMIS, odd semester
KecamatanSubdistrict
Sekolah/Schools Guru/Teachers Murid/Pupils
2019/2020 2020/2021 2019/2020 2020/2021 2019/2020 2020/2021
(1) (2) (3) (4) (5) (6) (7)
Pondokgede 29 28 116 115 1 178 824
Jatisampurna 7 8 35 37 234 191
Pondokmelati 11 11 37 35 315 214
Jatiasih 36 35 172 138 1 166 773
Bantargebang 15 14 73 67 754 518
Mustikajaya 24 23 90 82 753 740
Bekasi Timur 17 15 64 57 675 478
Rawalumbu 25 25 85 75 762 560
Bekasi Selatan 24 25 105 100 1 019 800
Bekasi Barat 43 42 171 179 1 715 1 341
Medan Satria 25 25 87 88 1 205 863
Bekasi Utara 54 52 230 234 2 407 1 926
Kota BekasiBekasi Municipality 310 303 1 265 1 207 12 183 9 228
https:
//bek
asiko
ta.b
ps.go.id

70 Bekasi Municipality in Figures 2021
SOCIAL AND WELFARE
KecamatanSubdistrict
Sekolah/Schools
Negeri/Public Swasta/Private Jumlah/Total
2019/2020 2020/2021 2019/2020 2020/2021 2019/2020 2020/2021
(1) (2) (3) (4) (5) (6) (7)
Pondokgede 37 30 28 28 65 58
Jatisampurna 19 19 17 17 36 36
Pondokmelati 19 19 14 14 33 33
Jatiasih 39 38 27 27 66 65
Bantargebang 17 17 9 9 26 26
Mustikajaya 23 22 22 23 45 45
Bekasi Timur 68 58 25 25 93 83
Rawalumbu 37 29 31 31 68 60
Bekasi Selatan 40 33 24 24 64 57
Bekasi Barat 50 40 29 29 79 69
Medan Satria 20 15 35 34 55 49
Bekasi Utara 48 37 35 37 83 74
Kota BekasiBekasi Municipality 417 357 296 298 713 655
TabelTable 4.1.3 Jumlah Sekolah, Guru, dan Murid Sekolah Dasar (SD)
di Bawah Kementerian Pendidikan dan Kebudayaan Menurut Kecamatan di Kota Bekasi, 2019/2020 dan 2020/2021
Number of Schools, Teachers, and Pupils in Primary Schools Under The Ministry of Education and Culture by Subdistrict in Bekasi Municipality, 2019/2020 and 2020/2021
https:
//bek
asiko
ta.b
ps.go.id

71Kota Bekasi Dalam Angka 2021
SOSIAL DAN KESEJAHTERAAN RAKYAT
Lanjutan Tabel/Continued Table 4.1.3
KecamatanSubdistrict
Guru 1/Teachers 1
Negeri/Public Swasta/Private Jumlah/Total
2019/2020 2020/2021 2019/2020 2020/2021 2019/2020 2020/2021
(1) (8) (9) (10) (11) (12) (13)
Pondokgede 597 617 421 449 1 018 1 066
Jatisampurna 268 288 307 355 575 643
Pondokmelati 336 347 236 252 572 599
Jatiasih 612 653 444 478 1 056 1 131
Bantargebang 274 286 141 180 415 466
Mustikajaya 492 522 456 544 948 1 066
Bekasi Timur 921 979 489 524 1 410 1 503
Rawalumbu 511 532 617 674 1 128 1 206
Bekasi Selatan 489 530 399 409 888 939
Bekasi Barat 652 667 453 524 1 105 1 191
Medan Satria 320 323 518 526 838 849
Bekasi Utara 860 886 658 733 1 518 1 619
Kota BekasiBekasi Municipality 6 332 6 630 5 139 5 648 11 471 12 278
https:
//bek
asiko
ta.b
ps.go.id

72 Bekasi Municipality in Figures 2021
SOCIAL AND WELFARE
Lanjutan Tabel/Continued Table 4.1.3
Catatan/Note: 1 Jumlah guru termasuk kepala sekolah dan guru/The total of teachers including headmaster and teacherSumber/Source: Kementerian Pendidikan dan Kebudayaan, Sistem Data Pokok Pendidikan, data semester ganjil/ Ministry of Educations
and Culture, Basic Education Data System, odd semester
KecamatanSubdistrict
Murid/Pupils
Negeri/Public Swasta/Private Jumlah/Total
2019/2020 2020/2021 2019/2020 2020/2021 2019/2020 2020/2021
(1) (14) (15) (16) (17) (18) (19)
Pondokgede 17 231 16 309 6 062 6 266 23 293 22 575
Jatisampurna 7 564 7 493 4 376 4 527 11 940 12 020
Pondokmelati 9 301 8 690 3 618 3 549 12 919 12 239
Jatiasih 15 386 14 759 6 610 6 791 21 996 21 550
Bantargebang 7 919 7 654 2 707 2 511 10 626 10 165
Mustikajaya 16 200 15 312 7 587 8 068 23 787 23 380
Bekasi Timur 22 198 21 307 9 312 9 361 31 510 30 668
Rawalumbu 14 713 13 925 10 023 10 016 24 736 23 941
Bekasi Selatan 11 955 11 565 5 989 5 964 17 944 17 529
Bekasi Barat 17 900 16 565 7 172 7 217 25 072 23 782
Medan Satria 7 759 7 165 7 077 6 795 14 836 13 960
Bekasi Utara 20 713 19 381 11 044 11 665 31 757 31 046
Kota BekasiBekasi Municipality 168 839 160 125 81 577 82 730 250 416 242 855
https:
//bek
asiko
ta.b
ps.go.id

73Kota Bekasi Dalam Angka 2021
SOSIAL DAN KESEJAHTERAAN RAKYAT
4.1.4 Jumlah Sekolah, Guru, dan Murid Madrasah Ibtidaiyah (MI) di Bawah Kementerian Agama Menurut Kecamatan Menurut Kecamatan di Kota Bekasi, 2019/2020 dan 2020/2021
Number of Schools, Teachers, and Pupils in Madrasah Ibtidaiyah (MI) Under The Ministry of Religious Affairs by Subdistrict in Bekasi Municipality, 2019/2020 and 2020/2021
TabelTable
KecamatanSubdistrict
Sekolah/Schools
Negeri/Public Swasta/Private Jumlah/Total
2019/2020 2020/2021 2019/2020 2020/2021 2019/2020 2020/2021
(1) (2) (3) (4) (5) (6) (7)
Pondokgede – – 7 14 7 14
Jatisampurna – – 3 8 3 8
Pondokmelati – – 27 8 27 8
Jatiasih – – 19 22 19 22
Bantargebang 1 1 6 6 7 7
Mustikajaya – – 4 8 4 8
Bekasi Timur – – 3 2 3 2
Rawalumbu – – 4 5 4 5
Bekasi Selatan – – 13 12 13 12
Bekasi Barat – – 16 16 16 16
Medan Satria – – 14 13 14 13
Bekasi Utara – – 21 21 21 21
Kota BekasiBekasi Municipality 1 1 137 135 138 136
https:
//bek
asiko
ta.b
ps.go.id

74 Bekasi Municipality in Figures 2021
SOCIAL AND WELFARE
Lanjutan Tabel/Continued Table 4.1.4
KecamatanSubdistrict
Guru/Teachers
Negeri/Public Swasta/Private Jumlah/Total
2019/2020 2020/2021 2019/2020 2020/2021 2019/2020 2020/2021
(1) (8) (9) (10) (11) (12) (13)
Pondokgede – – 98 177 98 177
Jatisampurna – – 27 127 27 127
Pondokmelati – – 341 118 341 118
Jatiasih – – 244 281 244 281
Bantargebang 17 18 101 109 118 127
Mustikajaya – – 22 129 22 129
Bekasi Timur – – 20 27 20 27
Rawalumbu – – 55 60 55 60
Bekasi Selatan – – 128 129 128 129
Bekasi Barat – – 146 161 146 161
Medan Satria – – 126 128 126 128
Bekasi Utara – – 269 278 269 278
Kota BekasiBekasi Municipality 17 18 1 577 1 724 1 594 1 742
https:
//bek
asiko
ta.b
ps.go.id
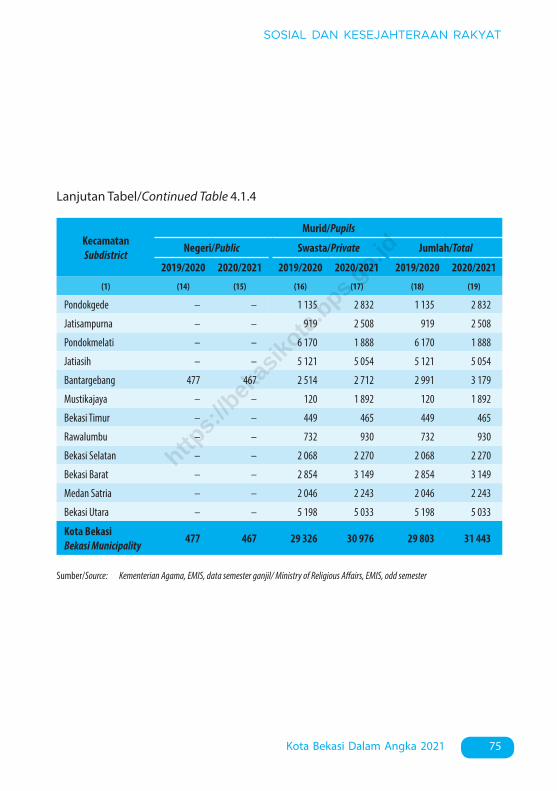
75Kota Bekasi Dalam Angka 2021
SOSIAL DAN KESEJAHTERAAN RAKYAT
Sumber/Source: Kementerian Agama, EMIS, data semester ganjil/ Ministry of Religious Affairs, EMIS, odd semester
Lanjutan Tabel/Continued Table 4.1.4
KecamatanSubdistrict
Murid/Pupils
Negeri/Public Swasta/Private Jumlah/Total
2019/2020 2020/2021 2019/2020 2020/2021 2019/2020 2020/2021
(1) (14) (15) (16) (17) (18) (19)
Pondokgede – – 1 135 2 832 1 135 2 832
Jatisampurna – – 919 2 508 919 2 508
Pondokmelati – – 6 170 1 888 6 170 1 888
Jatiasih – – 5 121 5 054 5 121 5 054
Bantargebang 477 467 2 514 2 712 2 991 3 179
Mustikajaya – – 120 1 892 120 1 892
Bekasi Timur – – 449 465 449 465
Rawalumbu – – 732 930 732 930
Bekasi Selatan – – 2 068 2 270 2 068 2 270
Bekasi Barat – – 2 854 3 149 2 854 3 149
Medan Satria – – 2 046 2 243 2 046 2 243
Bekasi Utara – – 5 198 5 033 5 198 5 033
Kota BekasiBekasi Municipality 477 467 29 326 30 976 29 803 31 443
https:
//bek
asiko
ta.b
ps.go.id

76 Bekasi Municipality in Figures 2021
SOCIAL AND WELFARE
KecamatanSubdistrict
Sekolah/Schools
Negeri/Public Swasta/Private Jumlah/Total
2019/2020 2020/2021 2019/2020 2020/2021 2019/2020 2020/2021
(1) (2) (3) (4) (5) (6) (7)
Pondokgede 4 4 18 18 22 22
Jatisampurna 3 3 13 13 16 16
Pondokmelati 1 1 14 14 15 15
Jatiasih 7 7 26 26 33 33
Bantargebang 3 3 7 7 10 10
Mustikajaya 5 5 20 19 25 24
Bekasi Timur 6 6 24 24 30 30
Rawalumbu 4 4 24 24 28 28
Bekasi Selatan 4 4 16 15 20 19
Bekasi Barat 3 3 19 18 22 21
Medan Satria 3 3 24 24 27 27
Bekasi Utara 6 6 33 34 39 40
Kota BekasiBekasi Municipality 49 49 238 236 287 285
TabelTable 4.1.5 Jumlah Sekolah, Guru, dan Murid Sekolah Menengah
Pertama (SMP) di Bawah Kementerian Pendidikan dan Kebudayaan Menurut Kecamatan di Kota Bekasi, 2019/2020 dan 2020/2021
Number of Schools, Teachers, and Pupils in Lower Secondary Schools Under The Ministry of Education and Culture by Subdistrict in Bekasi Municipality, 2019/2020 and 2020/2021
https:
//bek
asiko
ta.b
ps.go.id

77Kota Bekasi Dalam Angka 2021
SOSIAL DAN KESEJAHTERAAN RAKYAT
Lanjutan Tabel/Continued Table 4.1.5
KecamatanSubdistrict
Guru 1/Teachers 1
Negeri/Public Swasta/Private Jumlah/Total
2019/2020 2020/2021 2019/2020 2020/2021 2019/2020 2020/2021
(1) (8) (9) (10) (11) (12) (13)
Pondokgede 149 154 198 222 347 376
Jatisampurna 99 101 159 171 258 272
Pondokmelati 35 38 153 166 188 204
Jatiasih 292 305 286 318 578 623
Bantargebang 90 90 91 117 181 207
Mustikajaya 176 183 234 258 410 441
Bekasi Timur 274 288 334 356 608 644
Rawalumbu 156 160 381 412 537 572
Bekasi Selatan 189 196 200 212 389 408
Bekasi Barat 136 138 219 237 355 375
Medan Satria 96 94 307 338 403 432
Bekasi Utara 215 254 482 504 697 758
Kota BekasiBekasi Municipality 1 907 2 001 3 044 3 311 4 951 5 312
https:
//bek
asiko
ta.b
ps.go.id

78 Bekasi Municipality in Figures 2021
SOCIAL AND WELFARE
Lanjutan Tabel/Continued Table 4.1.5
Catatan/Note: 1 Jumlah guru termasuk kepala sekolah dan guru/The total of teachers including headmaster and teacherSumber/Source: Kementerian Pendidikan dan Kebudayaan, Sistem Data Pokok Pendidikan, data semester ganjil/ Ministry of Educations
and Culture, Basic Education Data System, odd semester
KecamatanSubdistrict
Murid/Pupils
Negeri/Public Swasta/Private Jumlah/Total
2019/2020 2020/2021 2019/2020 2020/2021 2019/2020 2020/2021
(1) (14) (15) (16) (17) (18) (19)
Pondokgede 3 596 3 770 3 137 3 026 6 733 6 796
Jatisampurna 2 292 2 229 2 486 2 490 4 778 4 719
Pondokmelati 1 061 1 109 2 817 2 772 3 878 3 881
Jatiasih 6 479 6 577 3 688 3 638 10 167 10 215
Bantargebang 2 377 2 296 1 927 1 933 4 304 4 229
Mustikajaya 4 406 4 316 3 417 3 468 7 823 7 784
Bekasi Timur 6 819 7 046 5 056 4 645 11 875 11 691
Rawalumbu 4 191 4 367 5 772 5 640 9 963 10 007
Bekasi Selatan 4 752 5 294 2 903 2 526 7 655 7 820
Bekasi Barat 3 418 3 700 3 951 3 697 7 369 7 397
Medan Satria 2 201 2 228 3 940 3 845 6 141 6 073
Bekasi Utara 5 978 6 380 8 108 7 446 14 086 13 826
Kota BekasiBekasi Municipality 47 570 49 312 47 202 45 126 94 772 94 438
https:
//bek
asiko
ta.b
ps.go.id

79Kota Bekasi Dalam Angka 2021
SOSIAL DAN KESEJAHTERAAN RAKYAT
KecamatanSubdistrict
Sekolah/Schools
Negeri/Public Swasta/Private Jumlah/Total
2019/2020 2020/2021 2019/2020 2020/2021 2019/2020 2020/2021
(1) (2) (3) (4) (5) (6) (7)
Pondokgede – – 13 14 13 14
Jatisampurna – – 3 3 3 3
Pondokmelati – – 6 6 6 6
Jatiasih 1 1 11 10 12 11
Bantargebang – – 3 4 3 4
Mustikajaya 1 1 4 4 5 5
Bekasi Timur 1 1 3 3 4 4
Rawalumbu – – 6 5 6 5
Bekasi Selatan – – 6 6 6 6
Bekasi Barat – – 7 7 7 7
Medan Satria – – 6 6 6 6
Bekasi Utara – – 11 11 11 11
Kota BekasiBekasi Municipality 3 3 79 79 82 82
TabelTable 4.1.6 Jumlah Sekolah, Guru, dan Murid Madrasah Tsanawiyah
(MTs) di Bawah Kementerian Agama Menurut Kecamatan di Kota Bekasi, 2019/2020 dan 2020/2021
Number of Schools, Teachers, and Pupils in Madrasah Tsanawiyah (MTs) Under The Ministry of Religious Affairs by Subdistrict in Bekasi Municipality , 2019/2020 and 2020/2021
https:
//bek
asiko
ta.b
ps.go.id

80 Bekasi Municipality in Figures 2021
SOCIAL AND WELFARE
Lanjutan Tabel/Continued Table 4.1.6
KecamatanSubdistrict
Guru/Teachers
Negeri/Public Swasta/Private Jumlah/Total
2019/2020 2020/2021 2019/2020 2020/2021 2019/2020 2020/2021
(1) (8) (9) (10) (11) (12) (13)
Pondokgede – – 175 203 175 203
Jatisampurna – – 38 33 38 33
Pondokmelati – – 86 68 86 68
Jatiasih 49 49 134 126 183 175
Bantargebang – – 41 70 41 70
Mustikajaya 59 56 48 70 107 126
Bekasi Timur 67 67 66 64 133 131
Rawalumbu – – 90 80 90 80
Bekasi Selatan – – 125 120 125 120
Bekasi Barat – – 87 84 87 84
Medan Satria – – 69 71 69 71
Bekasi Utara – – 174 154 174 154
Kota BekasiBekasi Municipality 175 172 1 133 1 143 1 308 1 315
https:
//bek
asiko
ta.b
ps.go.id

81Kota Bekasi Dalam Angka 2021
SOSIAL DAN KESEJAHTERAAN RAKYAT
Sumber/Source: 2019/2020 - Kementerian Agama, EMIS, data semester ganjillaporan sampai dengan 15 Maret 2020/ Ministry of Religious Affairs, EMIS, odd semester report data up to March 15th, 2020
2020/2021 - Kementerian Agama, EMIS, data semester ganjil/ Ministry of Religious Affairs, EMIS, odd semester
Lanjutan Tabel/Continued Table 4.1.6
KecamatanSubdistrict
Murid/Pupils
Negeri/Public Swasta/Private Jumlah/Total
2019/2020 2020/2021 2019/2020 2020/2021 2019/2020 2020/2021
(1) (14) (15) (16) (17) (18) (19)
Pondokgede – – 2 195 2 187 2 195 2 187
Jatisampurna – – 394 379 394 379
Pondokmelati – – 1 157 981 1 157 981
Jatiasih 705 667 1 516 1 470 2 221 2 137
Bantargebang – – 935 1 583 935 1 583
Mustikajaya 981 912 748 791 1 729 1 703
Bekasi Timur 1 037 1 072 751 830 1 788 1 902
Rawalumbu – – 1 726 1 090 1 726 1 090
Bekasi Selatan – – 2 016 2 160 2 016 2 160
Bekasi Barat – – 1 156 1 294 1 156 1 294
Medan Satria – – 713 780 713 780
Bekasi Utara – – 2 360 2 685 2 360 2 685
Kota BekasiBekasi Municipality 2 723 2 651 15 667 16 230 18 390 18 881
https:
//bek
asiko
ta.b
ps.go.id

82 Bekasi Municipality in Figures 2021
SOCIAL AND WELFARE
KecamatanSubdistrict
Sekolah/Schools
Negeri/Public Swasta/Private Jumlah/Total
2019/2020 2020/2021 2019/2020 2020/2021 2019/2020 2020/2021
(1) (2) (3) (4) (5) (6) (7)
Pondokgede 2 2 4 4 6 6
Jatisampurna 1 1 6 6 7 7
Pondokmelati 1 1 6 6 7 7
Jatiasih 2 2 10 10 12 12
Bantargebang 2 2 - - 2 2
Mustikajaya 2 2 5 4 7 6
Bekasi Timur 2 2 11 10 13 12
Rawalumbu 1 1 9 9 10 10
Bekasi Selatan 4 4 9 9 13 13
Bekasi Barat 1 1 8 8 9 9
Medan Satria 1 1 10 10 11 11
Bekasi Utara 3 3 11 11 14 14
Kota BekasiBekasi Municipality 22 22 89 87 111 109
TabelTable 4.1.7 Jumlah Sekolah, Guru, dan Murid Sekolah Menengah Atas
(SMA) di Bawah Kementerian Pendidikan dan Kebudayaan Menurut Kecamatan di Kota Bekasi, 2019/2020 dan 2020/2021
Number of Schools, Teachers, and Pupils in Upper Secondary Schools Under The Ministry of Education and Culture by Subdistrict in Bekasi Municipality, 2019/2020 and 2020/2021
https:
//bek
asiko
ta.b
ps.go.id

83Kota Bekasi Dalam Angka 2021
SOSIAL DAN KESEJAHTERAAN RAKYAT
Lanjutan Tabel/Continued Table 4.1.7
KecamatanSubdistrict
Guru 1/Teachers 1
Negeri/Public Swasta/Private Jumlah/Total
2019/2020 2020/2021 2019/2020 2020/2021 2019/2020 2020/2021
(1) (8) (9) (10) (11) (12) (13)
Pondokgede 67 70 74 74 141 144
Jatisampurna 50 49 128 138 178 187
Pondokmelati 47 46 126 145 173 191
Jatiasih 98 101 166 160 264 261
Bantargebang 64 66 – – 64 66
Mustikajaya 69 77 63 60 132 137
Bekasi Timur 97 101 216 218 313 319
Rawalumbu 40 38 203 204 243 242
Bekasi Selatan 205 207 180 185 385 392
Bekasi Barat 39 39 82 85 121 124
Medan Satria 52 54 168 160 220 214
Bekasi Utara 105 126 168 166 273 292
Kota BekasiBekasi Municipality 933 974 1 574 1 595 2 507 2 569
https:
//bek
asiko
ta.b
ps.go.id

84 Bekasi Municipality in Figures 2021
SOCIAL AND WELFARE
Lanjutan Tabel/Continued Table 4.1.7
Catatan/Note: 1 Jumlah guru termasuk kepala sekolah dan guru/The total of teachers including headmaster and teacherSumber/Source: Kementerian Pendidikan dan Kebudayaan, Sistem Data Pokok Pendidikan, data semester ganjil/ Ministry of Educations
and Culture, Basic Education Data System, odd semester
KecamatanSubdistrict
Murid/Pupils
Negeri/Public Swasta/Private Jumlah/Total
2019/2020 2020/2021 2019/2020 2020/2021 2019/2020 2020/2021
(1) (14) (15) (16) (17) (18) (19)
Pondokgede 1 475 1 596 1 062 978 2 537 2 574
Jatisampurna 974 969 1 826 1 737 2 800 2 706
Pondokmelati 964 967 2 135 2 139 3 099 3 106
Jatiasih 2 239 2 238 2 095 2 305 4 334 4 543
Bantargebang 1 449 1 647 – – 1 449 1 647
Mustikajaya 1 626 1 938 881 908 2 507 2 846
Bekasi Timur 1 988 2 030 3 286 3 170 5 274 5 200
Rawalumbu 1 006 1 089 2 923 2 924 3 929 4 013
Bekasi Selatan 4 387 4 384 2 309 2 276 6 696 6 660
Bekasi Barat 1 006 1 042 790 840 1 796 1 882
Medan Satria 998 998 2 225 2 105 3 223 3 103
Bekasi Utara 2 649 2 766 2 357 2 390 5 006 5 156
Kota BekasiBekasi Municipality 20 761 21 664 21 889 21 772 42 650 43 436
https:
//bek
asiko
ta.b
ps.go.id

85Kota Bekasi Dalam Angka 2021
SOSIAL DAN KESEJAHTERAAN RAKYAT
TabelTable 4.1.8 Jumlah Sekolah, Guru, dan Murid Sekolah Menengah
Kejuruan (SMK) di Bawah Kementerian Pendidikan dan Kebudayaan Menurut Kecamatan di Kota Bekasi, 2019/2020 dan 2020/2021
Number of Schools, Teachers, and Pupils in Vocational High Schools Under The Ministry of Education and Culture by Subdistrict in Bekasi Municipality, 2019/2020 and 2020/2021
KecamatanSubdistrict
Sekolah/Schools
Negeri/Public Swasta/Private Jumlah/Total
2019/2020 2020/2021 2019/2020 2020/2021 2019/2020 2020/2021
(1) (2) (3) (4) (5) (6) (7)
Pondokgede 1 1 11 10 12 11
Jatisampurna 2 2 4 4 6 6
Pondokmelati 1 1 5 5 6 6
Jatiasih 1 1 19 18 20 19
Bantargebang 1 1 3 3 4 4
Mustikajaya 2 2 11 10 13 12
Bekasi Timur 1 1 20 19 21 20
Rawalumbu 1 1 15 14 16 15
Bekasi Selatan 1 1 8 8 9 9
Bekasi Barat 1 1 9 8 10 9
Medan Satria 1 1 11 11 12 12
Bekasi Utara 2 2 16 16 18 18
Kota BekasiBekasi Municipality 15 15 132 126 147 141
https:
//bek
asiko
ta.b
ps.go.id

86 Bekasi Municipality in Figures 2021
SOCIAL AND WELFARE
Lanjutan Tabel/Continued Table 4.1.8
KecamatanSubdistrict
Guru 1/Teachers 1
Negeri/Public Swasta/Private Jumlah/Total
2019/2020 2020/2021 2019/2020 2020/2021 2019/2020 2020/2021
(1) (8) (9) (10) (11) (12) (13)
Pondokgede 21 21 114 147 135 168
Jatisampurna 62 62 83 84 145 146
Pondokmelati 17 20 81 86 98 106
Jatiasih 47 47 265 271 312 318
Bantargebang 76 78 87 102 163 180
Mustikajaya 83 92 228 230 311 322
Bekasi Timur 53 54 372 382 425 436
Rawalumbu 48 50 265 313 313 363
Bekasi Selatan 27 28 108 139 135 167
Bekasi Barat 84 87 140 145 224 232
Medan Satria 23 23 141 144 164 167
Bekasi Utara 78 79 288 308 366 387
Kota BekasiBekasi Municipality 619 641 2 172 2 351 2 791 2 992
https:
//bek
asiko
ta.b
ps.go.id

87Kota Bekasi Dalam Angka 2021
SOSIAL DAN KESEJAHTERAAN RAKYAT
Catatan/Note: 1 Guru yang mengajar di 2 sekolah atau lebih dihitung di masing-masing sekolah. Jumlah guru termasuk kepala sekolah dan guru/The teacher who tought in two schools or more counted in every school. The total of teachers including headmaster and teacher
Sumber/Source: Kementerian Pendidikan dan Kebudayaan, Sistem Data Pokok Pendidikan, data semester ganjil laporan sampai dengan 2020/Ministry of Educations and Culture, Basic Education Data System, odd semester report data up to 2020
Lanjutan Tabel/Continued Table 4.1.8
KecamatanSubdistrict
Murid/Pupils
Negeri/Public Swasta/Private Jumlah/Total
2019/2020 2020/2021 2019/2020 2020/2021 2019/2020 2020/2021
(1) (14) (15) (16) (17) (18) (19)
Pondokgede 488 517 2 625 2 473 3 113 2 990
Jatisampurna 1 173 1 278 1 637 1 392 2 810 2 670
Pondokmelati 433 479 2 472 2 327 2 905 2 806
Jatiasih 991 1 093 5 309 4 934 6 300 6 027
Bantargebang 1 708 1 787 2 371 2 080 4 079 3 867
Mustikajaya 2 314 2 516 5 554 5 064 7 868 7 580
Bekasi Timur 1 048 1 066 9 281 8 540 10 329 9 606
Rawalumbu 862 941 7 876 7 913 8 738 8 854
Bekasi Selatan 651 702 2 909 2 525 3 560 3 227
Bekasi Barat 1 375 1 420 4 462 4 429 5 837 5 849
Medan Satria 447 495 2 868 2 472 3 315 2 967
Bekasi Utara 1 996 2 191 6 223 6 113 8 219 8 304
Kota BekasiBekasi Municipality 13 486 14 485 53 587 50 262 67 073 64 747
https:
//bek
asiko
ta.b
ps.go.id

88 Bekasi Municipality in Figures 2021
SOCIAL AND WELFARE
TabelTable 4.1.9 Jumlah Sekolah, Guru, dan Murid Madrasah Aliyah (MA) di
Bawah Kementerian Agama Menurut Kecamatan di Kota Bekasi, 2019/2020 dan 2020/2021
Number of Schools, Teachers, and Pupils in Madrasah Aliyah (MA) Under the Ministry of Religious Affairs by Subdistrict in Bekasi Municipality, 2019/2020 and 2020/2021
KecamatanSubdistrict
Sekolah/Schools
Negeri/Public Swasta/Private Jumlah/Total
2019/2020 2020/2021 2019/2020 2020/2021 2019/2020 2020/2021
(1) (2) (3) (4) (5) (6) (7)
Pondokgede – – 10 10 10 10
Jatisampurna – – 2 2 2 2
Pondokmelati – – – – – –
Jatiasih – – 3 2 3 2
Bantargebang – – 3 2 3 2
Mustikajaya – – 1 1 1 1
Bekasi Timur – – 2 2 2 2
Rawalumbu 1 1 – – 1 1
Bekasi Selatan – – 2 2 2 2
Bekasi Barat – – 5 5 5 5
Medan Satria – – – – – –
Bekasi Utara 1 1 5 5 6 6
Kota BekasiBekasi Municipality 2 2 33 31 35 33
https:
//bek
asiko
ta.b
ps.go.id

89Kota Bekasi Dalam Angka 2021
SOSIAL DAN KESEJAHTERAAN RAKYAT
Lanjutan Tabel/Continued Table 4.1.9
KecamatanSubdistrict
Guru/Teachers
Negeri/Public Swasta/Private Jumlah/Total
2019/2020 2020/2021 2019/2020 2020/2021 2019/2020 2020/2021
(1) (8) (9) (10) (11) (12) (13)
Pondokgede – – 95 119 95 119
Jatisampurna – – 37 34 37 34
Pondokmelati – – – – – –
Jatiasih – – 33 24 33 24
Bantargebang – – 23 41 23 41
Mustikajaya – – 9 10 9 10
Bekasi Timur – – 48 49 48 49
Rawalumbu 44 41 – – 44 41
Bekasi Selatan – – 11 17 11 17
Bekasi Barat – – 35 57 35 57
Medan Satria – – – – – –
Bekasi Utara 67 71 64 65 131 136
Kota BekasiBekasi Municipality 111 112 355 416 466 528
https:
//bek
asiko
ta.b
ps.go.id

90 Bekasi Municipality in Figures 2021
SOCIAL AND WELFARE
Lanjutan Tabel/Continued Table 4.1.9
Sumber/Source: 2019/2020 - Kementerian Agama, EMIS, data semester ganjillaporan sampai dengan 15 Maret 2020/ Ministry of Religious Affairs, EMIS, odd semester report data up to March 15th, 2020
2020/2021 - Kementerian Agama, EMIS, data semester ganjil/ Ministry of Religious Affairs, EMIS, odd semester
KecamatanSubdistrict
Murid/Pupils
Negeri/Public Swasta/Private Jumlah/Total
2019/2020 2020/2021 2019/2020 2020/2021 2019/2020 2020/2021
(1) (14) (15) (16) (17) (18) (19)
Pondokgede – – 974 1 019 974 1 019
Jatisampurna – – 80 86 80 86
Pondokmelati – – – – – –
Jatiasih – – 151 120 151 120
Bantargebang – – 159 233 159 233
Mustikajaya – – 96 83 96 83
Bekasi Timur – – 511 536 511 536
Rawalumbu 916 935 – – 916 935
Bekasi Selatan – – 107 113 107 113
Bekasi Barat – – 250 302 250 302
Medan Satria – – – – – –
Bekasi Utara 1 252 1 149 466 507 1 718 1 656
Kota BekasiBekasi Municipality 2 168 2 084 2 794 2 999 4 962 5 083
https:
//bek
asiko
ta.b
ps.go.id

91Kota Bekasi Dalam Angka 2021
SOSIAL DAN KESEJAHTERAAN RAKYAT
TabelTable 4.1.10 Jumlah Desa1/Kelurahan yang Memiliki Fasilitas Sekolah
Menurut Kecamatan dan Tingkat Pendidikan di Kota Bekasi, 2018–2020
Number of Villages1/Kelurahan Having Educational Facilities by Subdistrict and Educational Level in Bekasi Municipality, 2018–2020
KecamatanSubdistrict
SDPrimary School
2018 2019 2020
(1) (2) (3) (4)
Pondokgede 5 5 5
Jatisampurna 5 5 5
Pondokmelati 4 4 4
Jatiasih 6 6 6
Bantargebang 4 4 4
Mustikajaya 4 4 4
Bekasi Timur 4 4 4
Rawalumbu 4 4 4
Bekasi Selatan 5 5 5
Bekasi Barat 5 5 5
Medan Satria 4 4 4
Bekasi Utara 6 6 6
Kota BekasiBekasi Municipality 56 56 56
https:
//bek
asiko
ta.b
ps.go.id

92 Bekasi Municipality in Figures 2021
SOCIAL AND WELFARE
KecamatanSubdistrict
SMPJunior High School
2018 2019 2020
(1) (5) (6) (7)
Pondokgede 5 5 5
Jatisampurna 5 5 5
Pondokmelati 4 4 4
Jatiasih 6 6 6
Bantargebang 4 4 4
Mustikajaya 4 4 4
Bekasi Timur 4 4 4
Rawalumbu 4 4 4
Bekasi Selatan 4 4 5
Bekasi Barat 5 5 5
Medan Satria 4 4 4
Bekasi Utara 6 6 6
Kota BekasiBekasi Municipality 55 55 56
Lanjutan Tabel/Continued Table 4.1.10
https:
//bek
asiko
ta.b
ps.go.id

93Kota Bekasi Dalam Angka 2021
SOSIAL DAN KESEJAHTERAAN RAKYAT
KecamatanSubdistrict
SMASenior High School
2018 2019 2020
(1) (8) (9) (10)
Pondokgede 5 4 4
Jatisampurna 5 5 5
Pondokmelati 3 3 3
Jatiasih 6 6 6
Bantargebang 2 3 3
Mustikajaya 4 4 4
Bekasi Timur 4 4 4
Rawalumbu 3 3 3
Bekasi Selatan 4 4 4
Bekasi Barat 5 4 4
Medan Satria 4 4 4
Bekasi Utara 6 5 5
Kota BekasiBekasi Municipality 51 49 49
Lanjutan Tabel/Continued Table 4.1.10
https:
//bek
asiko
ta.b
ps.go.id

94 Bekasi Municipality in Figures 2021
SOCIAL AND WELFARE
KecamatanSubdistrict
SMKVocational School
2018 2019 2020
(1) (11) (12) (13)
Pondokgede 3 5 5
Jatisampurna 4 5 4
Pondokmelati 3 3 3
Jatiasih 6 6 6
Bantargebang 3 3 3
Mustikajaya 4 4 4
Bekasi Timur 4 4 4
Rawalumbu 4 4 4
Bekasi Selatan 3 4 4
Bekasi Barat 4 4 4
Medan Satria 4 4 4
Bekasi Utara 6 6 6
Kota BekasiBekasi Municipality 48 52 51
Lanjutan Tabel/Continued Table 4.1.10
https:
//bek
asiko
ta.b
ps.go.id

95Kota Bekasi Dalam Angka 2021
SOSIAL DAN KESEJAHTERAAN RAKYAT
KecamatanSubdistrict
Perguruan TinggiUniversity
2018 2019 2020
(1) (14) (15) (16)
Pondokgede 2 3 3
Jatisampurna 1 1 1
Pondokmelati 2 2 2
Jatiasih 4 2 3
Bantargebang 1 1 1
Mustikajaya – – –
Bekasi Timur 2 3 3
Rawalumbu 3 3 3
Bekasi Selatan 3 2 2
Bekasi Barat 4 3 3
Medan Satria 3 3 3
Bekasi Utara 2 2 2
Kota BekasiBekasi Municipality 27 25 26
Lanjutan Tabel/Continued Table 4.1.10
Catatan/Note: 1 Desa pada tabel ini termasuk Unit Permukiman Transmigrasi (UPT) yang masih dibina oleh kementerian terkait dan nagari di Provinsi Sumatera Barat/Villages in this table include Transmigration Settlement Unit which is still fostered by the relevant ministries and the nagari in the Province of Sumatera Barat
Sumber/Source: BPS, Pendataan Potensi Desa (Podes)/ BPS-Statistics Indonesia, Village Potential Data Collection
https:
//bek
asiko
ta.b
ps.go.id

96 Bekasi Municipality in Figures 2021
SOCIAL AND WELFARE
Jenjang PendidikanEducational Level
Angka Partisipasi Murni (APM)Net Participation Rates
Angka Partisipasi Kasar (APK)Gross Participation Rates
2019 2020 2019 2020
(1) (2) (3) (4) (5)
SD/MI/SederajatPrimary School
98,72 98,92 109,06 108,99
SMP/MTs/ SederajatLower Secondary School
84,16 86,74 97,16 98,40
SMA/SMK/MA/SederajatUpper Secondary School
70,37 70,54 107,42 105,35
Sumber/Source: BPS, Survei Sosial Ekonomi Nasional (Susenas)/BPS-Statistics Indonesia, National Socioeconomic Survey
TabelTable 4.1.11 Angka Partisipasi Murni (APM) dan Angka Partisipasi
Kasar (APK) Menurut Jenjang Pendidikan di Kota Bekasi, 2019 dan 2020
Net Participation Rates and Gross Participation Rates by Educational Level in Bekasi Municipality, 2019 and 2020
https:
//bek
asiko
ta.b
ps.go.id

97Kota Bekasi Dalam Angka 2021
SOSIAL DAN KESEJAHTERAAN RAKYAT
TabelTable 4.1.12 Persentase Penduduk Berumur 15 Tahun ke Atas yang
Melek Huruf Menurut Kelompok Umur di Kota Bekasi, 2019 dan 2020
Percentage of Literate People Aged 15 Years and Over by Age Group in Bekasi Municipality, 2019 and 2020
Kelompok UmurAge Group 2019 2020
(1) (2) (3)
15–19 100,00 100,00
20–24 100,00 100,00
25–29 100,00 100,00
30–34 100,00 100,00
35–39 100,00 99,49
40–44 100,00 100,00
45–49 100,00 100,00
50+ 98,26 98,37
Jumlah/Total 99,65
15–24 100,00 100.00
15–44 100,00 99.92
15+ 99,53 99.61
45+ 98,69 98.89
Sumber/Source: BPS, Survei Sosial Ekonomi Nasional (Susenas)/BPS-Statistics Indonesia, National Socioeconomic Survey
https:
//bek
asiko
ta.b
ps.go.id

98 Bekasi Municipality in Figures 2021
SOCIAL AND WELFARE
KecamatanSubdistrict
Rumah SakitHospital
2018 2019 2020
(1) (2) (3) (4)
Pondokgede 2 2 2
Jatisampurna 3 3 3
Pondokmelati 1 1 1
Jatiasih 2 2 2
Bantargebang 1 1 1
Mustikajaya 2 2 2
Bekasi Timur 3 3 3
Rawalumbu 2 2 2
Bekasi Selatan 5 5 5
Bekasi Barat 1 1 1
Medan Satria 2 2 2
Bekasi Utara 2 3 3
Kota BekasiBekasi Municipality 26 27 27
TabelTable 4.2.1 Jumlah Kelurahan Yang Memiliki Sarana Kesehatan
Menurut Kecamatan di Kota Bekasi, 2018–2020 Number of Kelurahan Having Health Facilities by Subdistrict
in Bekasi Municipality, 2018–2020
4.2 KESEHATAN HEALTH
https:
//bek
asiko
ta.b
ps.go.id

99Kota Bekasi Dalam Angka 2021
SOSIAL DAN KESEJAHTERAAN RAKYAT
KecamatanSubdistrict
Rumah Sakit BersalinMaternity Hospital
2018 2019 2020
(1) (5) (6) (7)
Pondokgede – – –
Jatisampurna – – –
Pondokmelati – – –
Jatiasih – – –
Bantargebang – – –
Mustikajaya – – –
Bekasi Timur – – –
Rawalumbu – – –
Bekasi Selatan – – –
Bekasi Barat – – –
Medan Satria – – –
Bekasi Utara – – –
Kota BekasiBekasi Municipality – – –
Lanjutan Tabel/Continued Table 4.2.1
https:
//bek
asiko
ta.b
ps.go.id

100 Bekasi Municipality in Figures 2021
SOCIAL AND WELFARE
KecamatanSubdistrict
Poliklinik1
Polyclinic1
2018 2019 2020
(1) (8) (9) (10)
Pondokgede 8 7 7
Jatisampurna 7 7 7
Pondokmelati 5 6 5
Jatiasih 7 7 7
Bantargebang 2 3 3
Mustikajaya 5 5 5
Bekasi Timur 5 5 5
Rawalumbu 5 6 6
Bekasi Selatan 8 9 9
Bekasi Barat 5 6 6
Medan Satria 7 7 7
Bekasi Utara 8 8 9
Kota BekasiBekasi Municipality 72 76 76
Lanjutan Tabel/Continued Table 4.2.1
https:
//bek
asiko
ta.b
ps.go.id

101Kota Bekasi Dalam Angka 2021
SOSIAL DAN KESEJAHTERAAN RAKYAT
KecamatanSubdistrict
PuskesmasPublic Health Center
2018 2019 2020
(1) (11) (12) (13)
Pondokgede 3 4 4
Jatisampurna 2 2 2
Pondokmelati 2 2 2
Jatiasih 2 2 2
Bantargebang 2 3 3
Mustikajaya 3 4 4
Bekasi Timur 4 4 4
Rawalumbu 3 3 3
Bekasi Selatan 5 5 5
Bekasi Barat 5 5 5
Medan Satria 2 2 2
Bekasi Utara 6 6 6
Kota BekasiBekasi Municipality 39 42 42
Lanjutan Tabel/Continued Table 4.2.1
https:
//bek
asiko
ta.b
ps.go.id

102 Bekasi Municipality in Figures 2021
SOCIAL AND WELFARE
KecamatanSubdistrict
Puskesmas PembantuSubsidiary of Public Health Center
2018 2019 2020
(1) (14) (15) (16)
Pondokgede 1 1 –
Jatisampurna 1 – –
Pondokmelati 2 2 2
Jatiasih 1 1 1
Bantargebang 0 – –
Mustikajaya 0 – –
Bekasi Timur 0 – –
Rawalumbu 1 – –
Bekasi Selatan 0 – –
Bekasi Barat 0 – –
Medan Satria 1 – –
Bekasi Utara 1 1 –
Kota BekasiBekasi Municipality 8 5 3
Lanjutan Tabel/Continued Table 4.2.1
https:
//bek
asiko
ta.b
ps.go.id

103Kota Bekasi Dalam Angka 2021
SOSIAL DAN KESEJAHTERAAN RAKYAT
KecamatanSubdistrict
ApotekPharmacy
2018 2019 2020
(1) (17) (18) (19)
Pondokgede 5 5 5
Jatisampurna 4 5 5
Pondokmelati 4 4 4
Jatiasih 6 6 6
Bantargebang 3 3 3
Mustikajaya 4 4 4
Bekasi Timur 4 4 4
Rawalumbu 4 4 4
Bekasi Selatan 5 5 5
Bekasi Barat 5 5 5
Medan Satria 4 4 4
Bekasi Utara 6 6 6
Kota BekasiBekasi Municipality 54 55 55
Lanjutan Tabel/Continued Table 4.2.1
Sumber/Source: Dinas Kesehatan Kota Bekasi/Bekasi Municipality Health Office
https:
//bek
asiko
ta.b
ps.go.id

104 Bekasi Municipality in Figures 2021
SOCIAL AND WELFARE
TabelTable 4.2.2 Jumlah Tenaga Kesehatan Menurut Kecamatan di Kota
Bekasi, 2020 Number of Health Human Resources by Subdistrict in Bekasi
Municipality, 2020
KecamatanSubdistrict
Dokter 1
Doctor 1Dokter Gigi 2
Dentist 2Perawat
NurseBidan
Midwife
Tenaga kefarmasianPharmacist
(1) (2) (3) (4) (5) (6)
Pondokgede 19 13 35 40 10
Jatisampurna 11 10 23 36 6
Pondokmelati 6 4 11 14 4
Jatiasih 6 4 12 14 3
Bantargebang 13 8 31 41 5
Mustikajaya 11 4 28 33 6
Bekasi Timur 15 4 33 41 6
Rawalumbu 10 7 23 22 3
Bekasi Selatan 17 9 32 35 6
Bekasi Barat 16 8 26 39 4
Medan Satria 8 4 11 21 3
Bekasi Utara 17 10 37 53 8
Kota BekasiBekasi Municipality 149 85 302 389 64
https:
//bek
asiko
ta.b
ps.go.id

105Kota Bekasi Dalam Angka 2021
SOSIAL DAN KESEJAHTERAAN RAKYAT
Lanjutan Tabel/Continued Table 4.2.2
KecamatanSubdistrict
Tenaga Kesehatan
MasyarakatPublic Health
worker
Tenaga Kesehatan
LingkunganEnviromental
Health Worker
Tenaga GiziNutritionist
Ahli Teknologi Laboratorium Medik
MedicalLaboratoryTechnician
(1) (7) (8) (9) (10)
Pondokgede – – 4 –
Jatisampurna – – 2 –
Pondokmelati – – 1 –
Jatiasih – – 1 –
Bantargebang – – 2 –
Mustikajaya – – 4 –
Bekasi Timur – – 6 –
Rawalumbu – – 2 –
Bekasi Selatan – – 7 –
Bekasi Barat – – 6 –
Medan Satria – – 2 –
Bekasi Utara – – 4 –
Kota BekasiBekasi Municipality – – 41 –
Catatan/Note: 1 Dokter dalam tabel ini termasuk dokter spesialis (selain spesialis gigi) dan dokter umum/Doctor in this table include medical specialist (exclude dentist specialist) and general practitioner
2 Dokter gigi dalam tabel ini termasuk dokter spesialis gigi dan dokter gigi/Doctor in this table include dentist dan dentist specialist
Sumber/Source: Dinas Kesehatan Kota Bekasi/Bekasi Municipality Health Office
https:
//bek
asiko
ta.b
ps.go.id

106 Bekasi Municipality in Figures 2021
SOCIAL AND WELFARE
TabelTable 4.2.3 Jumlah Rumah Sakit Umum, Rumah Sakit Khusus,
Puskesmas, Klinik Pratama, dan Posyandu Menurut Kecamatan di Kota Bekasi, 2019 dan 2020
Number of General Hospital, Specialized Hospital, Public Health Center, Primary Clinic, and Integrated Health Post by Subdistrict in Bekasi Municipality, 2019 and 2020
KecamatanSubdistrict
Rumah Sakit UmumGeneral Hospital
Rumah Sakit KhususSpecialized Hospital
2019 2020 2019 2020
(1) (2) (3) (4) (5)
Pondokgede 2 3 1 –
Jatisampurna 4 4 – –
Pondokmelati 1 1 – –
Jatiasih 2 2 – –
Bantargebang 2 2 – –
Mustikajaya 3 3 – –
Bekasi Timur 10 10 – –
Rawalumbu 3 3 – –
Bekasi Selatan 9 9 – –
Bekasi Barat – - 1 1
Medan Satria 3 3 1 1
Bekasi Utara 3 3 1 1
Kota BekasiBekasi Municipality 42 43 4 3
https:
//bek
asiko
ta.b
ps.go.id

107Kota Bekasi Dalam Angka 2021
SOSIAL DAN KESEJAHTERAAN RAKYAT
Lanjutan Tabel/Continued Table 4.2.3
KecamatanSubdistrict
Puskesmas1 Rawat InapPublic Health Center1
with Inpatient Care
Puskesmas1
Non Rawat InapPublic Health Center1
without Inpatient Care
2019 2020 2019 2020
(1) (6) (7) (8) (9)
Pondokgede 4 4 1 –
Jatisampurna 2 2 – –
Pondokmelati 2 2 2 2
Jatiasih 2 2 1 1
Bantargebang 3 3 – –
Mustikajaya 4 4 – –
Bekasi Timur 4 4 – –
Rawalumbu 3 3 – –
Bekasi Selatan 5 5 – –
Bekasi Barat 5 5 – –
Medan Satria 2 2 – –
Bekasi Utara 6 6 1 –
Kota BekasiBekasi Municipality 42 42 5 3
https:
//bek
asiko
ta.b
ps.go.id

108 Bekasi Municipality in Figures 2021
SOCIAL AND WELFARE
Lanjutan Tabel/Continued Table 4.2.3
KecamatanSubdistrict
Klinik PratamaPrimary Clinic
PosyanduIntregrated Health Post
2019 2020 2019 2020
(1) (10) (11) (12) (13)
Pondokgede 32 30 147 147
Jatisampurna 25 26 95 82
Pondokmelati 9 8 82 95
Jatiasih 23 22 160 160
Bantargebang 6 5 53 53
Mustikajaya 22 22 109 109
Bekasi Timur 25 29 193 193
Rawalumbu 19 20 134 134
Bekasi Selatan 38 42 157 157
Bekasi Barat 20 20 182 182
Medan Satria 19 20 105 105
Bekasi Utara 26 29 194 194
Kota BekasiBekasi Municipality 264 273 1 611 1 611
Catatan/Note: 1 Puskesmas yang teregistrasi/Registered Public Health CenterSumber/Source: Dinas Kesehatan Kota Bekasi/Bekasi Municipality Health Office
https:
//bek
asiko
ta.b
ps.go.id

109Kota Bekasi Dalam Angka 2021
SOSIAL DAN KESEJAHTERAAN RAKYAT
CSumber/Source: Kantor Kementerian Agama Kota Bekasi/Office of the Ministry of Religious Affairs of Bekasi Municipality
KecamatanSubdistrict Islam Protestan
ProtestantKatolik Catholic Hindu Budha
BuddhaLainnya Others
(1) (2) (3) (4) (5) (6) (7)
Pondokgede 240 687 20 867 6 759 1 590 976 555
Jatisampurna 93 498 8 112 3 308 530 398 1 144
Pondokmelati 130 675 12 387 6 904 1 460 2 735 68
Jatiasih 186 994 15 645 4 614 1 460 982 199
Bantargebang 93 596 2 689 791 424 323 107
Mustikajaya 125 976 11 772 3 197 635 630 86
Bekasi Timur 237 688 21 199 7 945 7 134 6 317 359
Rawalumbu 159 070 25 323 6 450 2 541 2 533 1 227
Bekasi Selatan 182 078 18 465 7 644 1 736 1 297 48
Bekasi Barat 279 677 19 412 8 730 2 540 1 624 131
Medan Satria 141 349 15 327 7 470 3 879 3 219 77
Bekasi Utara 274 512 31 569 25 132 5 412 9 640 1 818
Kota BekasiBekasi Municipality 2 145 800 202 767 88 944 29 341 30 674 5 819
TabelTable 4.3.1 Jumlah Penduduk Menurut Kecamatan dan Agama yang
Dianut di Kota Bekasi, 2020 Population by Subdistrict and Religion in Bekasi
Municipality, 2020
4.3 AGAMA DAN SOSIAL LAINNYA RELIGION AND OTHER SOCIAL AFFAIRS
https:
//bek
asiko
ta.b
ps.go.id

110 Bekasi Municipality in Figures 2021
SOCIAL AND WELFARE
KecamatanSubdistrict
MasjidMosque
MusholaPray
Room
GerejaProtestanProtestant
Church
GerejaKatholikCatholicChurch
(1) (2) (3) (4) (5)
Pondokgede 103 158 1 -
Jatisampurna 75 144 6 1
Pondokmelati 74 106 23 1
Jatiasih 117 210 5 -
Bantargebang 39 199 0 -
Mustikajaya 110 163 1 -
Bekasi Timur 139 177 28 1
Rawalumbu 130 113 10 1
Bekasi Selatan 99 125 17 1
Bekasi Barat 109 182 16 1
Medan Satria 77 105 16 1
Bekasi Utara 258 247 6 1
Kota BekasiBekasi Municipality 1 330 1 929 129 8
TabelTable 4.3.2 Jumlah Tempat Peribadatan Menurut Kecamatan di Kota
Bekasi, 2020 Number of Places of Worship by Subdistrict in Bekasi
Municipality, 2020
https:
//bek
asiko
ta.b
ps.go.id

111Kota Bekasi Dalam Angka 2021
SOSIAL DAN KESEJAHTERAAN RAKYAT
Lanjutan Tabel/Continued Table 4.3.2
KecamatanSubdistrict
PuraTemple Vihara Klenteng Pasewakan
(1) (6) (7) (8) (9)
Pondokgede - - - 1
Jatisampurna - - - -
Pondokmelati - 1 - -
Jatiasih 1 1 - 1
Bantargebang - - - -
Mustikajaya - - - 1
Bekasi Timur - 5 1 -
Rawalumbu - 2 - -
Bekasi Selatan - - - -
Bekasi Barat 1 - - -
Medan Satria - - - -
Bekasi Utara - 2 - -
Kota BekasiBekasi Municipality 2 11 1 3
Sumber/Source: Kantor Kementerian Agama Kota Bekasi/Office of the Ministry of Religious Affairs of Bekasi Municipality
https:
//bek
asiko
ta.b
ps.go.id

112 Bekasi Municipality in Figures 2021
SOCIAL AND WELFARE
KecamatanSubdistrict
Banjir/Flood
2018 2019 2020
(1) (2) (3) (4)
Pondokgede 1 – 4
Jatisampurna – – 1
Pondokmelati 1 3 2
Jatiasih 3 3 3
Bantargebang – – 4
Mustikajaya 1 2 1
Bekasi Timur 3 3 4
Rawalumbu 4 3 2
Bekasi Selatan 2 – 2
Bekasi Barat 4 5 5
Medan Satria 3 2 3
Bekasi Utara 3 3 5
Kota BekasiBekasi Municipality 25 24 36
TabelTable 4.3.3 Jumlah Kelurahan yang Mengalami Bencana Alam1
Menurut Kecamatan di Kota Bekasi, 2018–2020 Number of Kelurahan that Had Natural Disaster1 by
Subdistrict in Bekasi Municipality, 2018–2020
https:
//bek
asiko
ta.b
ps.go.id

113Kota Bekasi Dalam Angka 2021
SOSIAL DAN KESEJAHTERAAN RAKYAT
KecamatanSubdistrict
Gempa Bumi/Earthquake
2018 2019 2020
(1) (5) (6) (7)
Pondokgede – – –
Jatisampurna – – –
Pondokmelati – – –
Jatiasih – – –
Bantargebang – – –
Mustikajaya – – –
Bekasi Timur – – –
Rawalumbu – – –
Bekasi Selatan – – –
Bekasi Barat 1 – –
Medan Satria – – –
Bekasi Utara – – –
Kota BekasiBekasi Municipality 1 – –
Lanjutan Tabel/Continued Table 4.3.3
https:
//bek
asiko
ta.b
ps.go.id

114 Bekasi Municipality in Figures 2021
SOCIAL AND WELFARE
KecamatanSubdistrict
Tanah Longsor/Landslide
2018 2019 2020
(1) (8) (9) (10)
Pondokgede – – –
Jatisampurna – – 1
Pondokmelati – 1 –
Jatiasih – – –
Bantargebang – – –
Mustikajaya – – –
Bekasi Timur – – –
Rawalumbu – – –
Bekasi Selatan – – –
Bekasi Barat – – –
Medan Satria – – –
Bekasi Utara – – –
Kota BekasiBekasi Municipality – 1 1
Catatan/Note: 1 Kejadian dalam setahun sebelum tahun pencacahan/Occured during the last one year before the enumeration yearsSumber/Source: BPS, Pendataan Potensi Desa (Podes)/BPS-Statistics Indonesia, Village Potential Data Collecting
Lanjutan Tabel/Continued Table 4.3.3
https:
//bek
asiko
ta.b
ps.go.id

115Kota Bekasi Dalam Angka 2021
SOSIAL DAN KESEJAHTERAAN RAKYAT
4.4 KEMISKINAN POVERTY
TahunYear
Garis Kemiskinan(rupiah/kapita/bulan)
Poverty Line(rupiah/capita/month)
Jumlah PendudukMiskin (ribu)
Number of Poor People(thousand)
Persentase Penduduk Miskin
Percentage of Poor People
(1) (2) (3) (4)
2013 449 026 137,80 5,33
2014 466 851 139,70 5,25
2015 497 343 146,94 5,46
2016 521 813 140,03 5,06
2017 544 534 136,01 4,79
2018 582 723 119,82 4,11
2019 617 718 113,65 3,81
2020 657 953 134.01 4.38
Sumber/Source: .BPS, Survei Sosial Ekonomi Nasional Maret/BPS-Statistics Indonesia, March National Socioeconomic Survey
TabelTable 4.4.1 Garis Kemiskinan, Jumlah, dan Persentase Penduduk
Miskin di Kota Bekasi, 2013–2020 Poverty Line, Number, and Percentage of Poor People in
Bekasi Municipality, 2013–2020
https:
//bek
asiko
ta.b
ps.go.id

116 Bekasi Municipality in Figures 2021
SOCIAL AND WELFARE
TahunYear
Indeks Kedalaman KemiskinanPoverty Gap Index
Indeks Keparahan KemiskinanPoverty Severity Index
(1) (2) (3)
2013 0,73 0,16
2014 0,75 0,19
2015 0,68 0,15
2016 0,69 0,15
2017 0,82 0,21
2018 0,72 0,18
2019 0,47 0,10
2020 0,60 0,15
Sumber/Source: .BPS, Survei Sosial Ekonomi Nasional Maret/BPS-Statistics Indonesia, March National Socioeconomic Survey
TabelTable 4.4.2 Indeks Kedalaman Kemiskinan dan Indeks Keparahan
Kemiskinan di Kota Bekasi, 2013–2020 Poverty Gap Index and Poverty Severity Index in Bekasi
Municipality, 2013–2020
https:
//bek
asiko
ta.b
ps.go.id

5. Pertanian, Kehutanan, Peternakan, dan Perikanan/Agriculture, Forestry, Livestock, and Fishery ..............................................................................
5. PERTANIAN, KEHUTANAN, PETERNAKAN, DAN PERIKANAN/AGRICULTURE, FORESTRY, LIVESTOCK, AND FISHERY
t
.
PRODUKSI TANAMANHORTIKULTURADI KOTA BEKASI
TANAMAN BIOFARMAKA
Lengkuas/Laos Kunyit
Kencur
Jahe/Ginger
Lempuyang
PRODUKSI BUAH-BUAHAN TAHUNAN
SEDANGKAN PRODUKSI TERKECIL ADALAHJERUK SIAM/KEPROK DENGAN PRODUKSI
Horticulture SPH-SBSBPS-Statistics Indonesia, agricultural Statistic for
Sumber/Source : BPS, Statistik Pertanian Hortikultura SPH-SBS
2020
ChapterBAB
05PERTANIAN, KEHUTANANPETERNAKAN DAN PERIKANANAGRICULTURE, FORESTRYLIVESTOCK AND FISHERY
172.812 KG
141.430 KG 62.717 KG
36.359 KG 47.822 KG
TERBESAR DI KOTA BEKASI TAHUN 2020ADALAH MANGGA SEBESAR 1.885,3 TON
SEBESAR 21,3 TON
https:
//bek
asiko
ta.b
ps.go.id

https:
//bek
asiko
ta.b
ps.go.id

119Kota Bekasi Dalam Angka 2021
PERTANIAN, KEHUTANAN, PETERNAKAN, DAN PERIKANAN
PENJELASAN TEKNIS TECHNICAL NOTES
1. Lahan sawah adalah lahan pertanian yang berpetak-petak dan dibatasi oleh pematang (galengan), saluran untuk menahan/ menyalurkan air, yang biasanya ditanami padi sawah tanpa memandang dari mana diperoleh atau status lahan tersebut. Lahan yang dimaksud termasuk lahan yang terdaftar di Pajak Bumi Bangunan, Iuran Pembangunan Daerah, lahan bengkok, lahan serobotan, lahan rawa yang ditanami padi dan lahan bekas tanaman tahunan yang telah dijadikan sawah, baik yang ditanami padi, palawija atau tanaman semusim lainnya.
2. Tegal/Kebun adalah lahan pertanian bukan sawah (lahan kering) yang ditanami tanaman semusim atau tahunan dan terpisah dengan halaman sekitar rumah serta penggunaannya tidak berpindah pindah.
3. Ladang/Huma adalah lahan pertanian bukan sawah (lahan kering) yang biasanya ditanami tanaman semusim dan penggunaannya hanya semusim atau dua musim, kemudian akan ditinggalkan bila sudah tidak subur lagi (berpindah-pindah). Kemungkinan lahan ini beberapa tahun kemudian akan dikerjakan kembali jika sudah subur.
1. Wetland is agricultural land that separated by small dykes to resist water,where the main crop is usually wetland paddy without considering where it is got from or the status of the land. It includes the land that is registered at land income tax office, regional development contribution, ‘bengkok’ land, illegal ownership, swamps for rice cultivation, and annual crop land mark that has been used as rice field, which are both planted with paddy, secondary crops or the other seasonal crops.
2. Dry field/Garden is an dryland (unirrigated land) which is planted with seasonal or annual crops and separately from the yard around the house without shifting
3. Unirrigated agricultural field/Shifting cultivation land is dryland (unirrigated land) that usually is cultivated for seasonal crops and utilized only for one or two seasons, then it will be left when it is not fertile (shifting). Maybe, this land will be used again in a few years if it has been fertile.
https:
//bek
asiko
ta.b
ps.go.id

120 Bekasi Municipality in Figures 2021
AGRICULTURE, FORESTRY, LIVESTOCK, AND FISHERY
4. Data pokok tanaman pangan yang dikumpulkan adalah luas panen dan produktivitas (hasil per hektar). Produksi tanaman pangan merupakan hasil perkalian antara luas panen dengan produktivitas. Pengumpulan data luas panen dilakukan setiap bulan dengan pendekatan area kecamatan di seluruh wilayah Indonesia. Pengumpulan data produktivitas dilakukan melalui pengukuran langsung pada plot ubinan berukuran 2½ m x 2½ m. Pengumpulan data produktivitas dilakukan setiap subround (empat bulanan) pada waktu panen petani.
5. Tanaman sayuran dan tanaman buah-buahan semusima. Tanaman sayuran semusim
adalah tanaman sumber vitamin, garam mineral dan lain-lain yang dikonsumsi dari bagian tanaman yang berupa daun, bunga, buah, dan umbinya, yang berumur kurang dari satu tahun.
b. Tanaman buah-buahan semusim adalah tanaman sumber vitamin, garam mineral, dan lain-lain yang dikonsumsi dari bagian tanaman yang berupa buah, berumur kurang dari satu tahun, tidak berbentuk pohon/rumpun tetapi menjalar dan berbatang lunak.
4. The main food crops data collected consists of harvested area and productivity (yield per hectare). Food crops production is generated by harvested area multiplied by productivity. The harvested area data is collected every month using sub district area approach in all sub district in Indonesia. The productivity data collection is conducted by a direct measurement in 2½m x 2½m crop cutting plot. The productivity measurement is conducted in every subround (four monthly) at the time when farmers are harvesting their crops.
5. Seasonal vegetable and fruit plants
a. Seasonal vegetable plants are plants which are the sources of vitamin, mineral salt, etc, consumed from the part of the plant in the form of leaf, flower, fruit, and root with the age of less than one year.
b. Seasonal fruit plants are plants which are the sources of vitamin, mineral salt, and others, consumed from the part of the plant in the form of fruits. These plants are creeps with the age of less than one year.
https:
//bek
asiko
ta.b
ps.go.id

121Kota Bekasi Dalam Angka 2021
PERTANIAN, KEHUTANAN, PETERNAKAN, DAN PERIKANAN
6. Tanaman buah-buahan dan tanaman sayuran tahunana. Tanaman buah-buahan
tahunan adalah tanaman sumber vitamin, garam mineral, dan lain-lain yang dikonsumsi dari bagian tanaman yang berupa buah dan merupakan tanaman tahunan.
a. Tanaman sayuran tahunan adalah tanaman sumber vitamin, garam mineral, dan lain-lain yang dikonsumsi dari bagian tanaman yang berupa daun dan atau buah yang berumur lebih dari satu tahun.
7. Tanaman biofarmaka adalah tanaman yang bermanfaat untuk obat-obatan, kosmetik, dan kesehatan yang dikonsumsi atau digunakan dari bagian-bagian tanaman seperti daun, batang, buah, umbi (rimpang) ataupun akar.
8. Tanaman hias adalah tanaman yang mempunyai nilai keindahan baik bentuk, warna daun, tajuk maupun bunganya, sering digunakan untuk penghias pekarangan dan lain sebagainya.
9. Luas panen tanaman hortikultura adalah luas tanaman sayuran, buahbuahan, biofarmaka, dan tanaman hias yang diambil hasilnya/dipanen pada periode pelaporan.
6. Annual fruit and vegetable plants
a. Annual fruit plants are plants which are the sources of vitamin, contained mineral salt, etc, consumed from the part of plant in the form of fruit and more than one year of age.
b. Annual vegetable plants are plants which are the sources of vitamin, contained mineral salt, etc, consumed from the part of the plant in the form of vegetable and more than one year of age.
7. Medicinal plants are plants which are useful for medicine, cosmetics, and health that is consumed or used from part of the plant such as leaf, flower, fruit, tubber (rizhome), and root.
8. Ornamental plants are plants which have a beauty value, either in shape, colour of leaf or crown of flower, and they are often used as a yard decorator.
9. Harvested area of horticulture is area which vegetable, fruit, medicinal and ornamental plant of crop harvested during the period of report.
https:
//bek
asiko
ta.b
ps.go.id

122 Bekasi Municipality in Figures 2021
AGRICULTURE, FORESTRY, LIVESTOCK, AND FISHERY
10. Luas panen untuk tanaman sayuran adalah luas tanaman yang dipanen sekaligus/habis/dibongkar dan luas tanaman yang dipanen berkali-kali (lebih dari satu kali)/belum habis.
11. Produksi hortikultura adalah hasil menurut bentuk produk dari setiap tanaman sayuran, buah-buahan, biofarmaka dan tanaman hias yang diambil berdasarkan luas yang dipanen/tanaman yang menghasilkan pada bulan/triwulan laporan.
12. Data populasi ternak bersumber dari Dinas Ketahanan Pangan, Pertanian dan Perikanan Kota Bekasi.
13. Data statistik perikanan bersumber dari Dinas Ketahanan Pangan, Pertanian dan Perikanan Kota Bekasi.
10. Harvested area of vegetables is area of entirely plant harvested/ demolished and plant harvested several times/undemolished.
11. Horticulture production is the standard production quantity form of vegetable, fruit, medicinal and ornamental plant based on harvested area/the number of production plants reported monthly/quarterly.
12. Data of domestic ilvestock population are obtain from Agriculture and Fishery Department of Bekasi Municipality.
13. Fishery Statistics are obtain from Agriculture and Fishery Department of Bekasi Municipality.
https:
//bek
asiko
ta.b
ps.go.id

123Kota Bekasi Dalam Angka 2021
PERTANIAN, KEHUTANAN, PETERNAKAN, DAN PERIKANAN
ULASAN DESCRIPTION
Pembangunan ekonomi pada sektor pertanian merupakan hal sangat penting untuk mewujudkan tujuan pembangunan nasional dibidang pertanian, yaitu Peningkatan produksi pangan terutama menuju pencapaian surplus beras, Stabilisasi harga pangan, Pemantapan penganekaragaman Pangan berbasis sumberdaya lokal, dan Perlindungan dan pemberdayaan petani serta peningkatan kesejahteraan petani.
Wilayah Kota Bekasi memiliki lahan yang dikelompokkan menjadi 2 kelompok, yaitu Lahan sawah dan Lahan kering. Tahun 2020 luas lahan sawah mencapai 312 Ha yang tersebar di 9 kecamatan, sedangkan lahan kering yang digunakan untuk pertanian (kebun/ladang) seluas 3.504 Ha tersebar di 12 kecamatan dan untuk kolam/tebat/empang seluas 63 Ha tersebar di 7 kecamatan.
Sebagian besar luas lahan sawah di Kota Bekasi menggunakan jenis pengairan tadah hujan yaitu 77,88 persen dari luas lahan sawah keseluruhan. Kecamatan yang memiliki luas lahan sawah terluas adalah Kecamatan Bantargebang dengan luas mencapai 105 Ha diikuti kecamatan Mustikajaya yang memiliki luas 101 Ha.
Economic development in the agricultural sector is very important to realize the objectives of national development in agriculture, namely Increase in food production, especially towards the achievement of a rice surplus, stabilization of food prices, Strengthening the Food diversification based on local resources, and protection and empowerment of farmers and farmers’ welfare.
The municipality of Bekasi has land grouped into 2 groups, namely paddy fields and dry land. In year 2020 rice Field area reaches 312 Ha spread in 9 subdistrict, while the dry land used for agriculture (garden) area of 3,504 Ha spread in 12 sub districts and for pond/tebat/Empang area of 63 Ha spread in 7 subdistricts.
Most of the paddy fields in the municipality of Bekasi use Raindrops, which is 77.88 percent of the whole field area. Subdistrict that has the widest area of rice field is Bantargebang subdistrict with an area of 105 Ha followed by Mustikajaya subdistrict which has a total area of 101 Ha.
https:
//bek
asiko
ta.b
ps.go.id

124 Bekasi Municipality in Figures 2021
AGRICULTURE, FORESTRY, LIVESTOCK, AND FISHERY
Padi Palawija
Pada tahun 2020 di Kota Bekasi, luas panen padi 458 Ha, sedangkan produksinya 3.137 ton.
Luas panen komoditi palawija lainnya seperti Jagung pada tahun 2020 sebesar 24 Ha dengan produksi sebesar 83 ton dan produktivitas 34,7 kwintal per hektar.
Hortikultura
Tanaman hortikultura terbagi dalam empat jenis, yaitu buah-buahan, Sayur-sayuran, tanaman hias dan biofarmaka.
Pada tahun 2020, Produksi tanaman sayuran terbesar di Kota Bekasi adalah kangkung besar yaitu sebanyak 5.119,9 ton dengan luas panen sebesar 732 hektar. Sedangkan produksi tanaman sayuran terkecil selama tahun 2020 adalah cabe rawit yaitu sebesar 37,4 ton dengan luas panen sebesar 5 hektar.
Produksi tanaman biofarmaka terbesar di Kota Bekasi pada tahun 2020 adalah tanaman Jahe yaitu sebanyak 172.812 kg, dengan luas panen sebesar 80.687 m2, sementara produksi tanaman biofarmaka terkecil selama tahun 2020 adalah tanaman Mengkudu, yaitu 150 kg dengan luas panen 30 pohon.
Produksi tanaman hias terbesar di Kota Bekasi selama tahun 2020 adalah tanaman Kamboja Jepang yaitu sebanyak 116.625 pohon, dengan luas panen sebesar 2.815 pohon.
Food crops
In the year 2020 rice harvest area in Bekasi municipality, 458 Ha, while the production of 3,137 tons.
Other commodity crops such as corn in 2020 amounted to 24 Ha with production of 83 tons and 34.7 quintals productivity per hectare.
Horticultural
Horticultural plants are divided into four types, namely fruits, vegetables, ornamental plants and biopharmaca.
In 2020, the largest vegetable crop production in Bekasi Municipality is a Water Spinach which is 5,119.9 tons with a harvest area of 732 hectares. While the smallest vegetable production in 2020 is Chili/Cayenne Pepper, amounting to 37.4 tons with a harvest area of 5 hectares.
The biggest biopharmaca production in Bekasi Municipality in 2020 is Ginger, which is 172,812 kg, with a harvest area of 80.687 sq.m, while the smallest biopharmaca production in 2020 is a indian mulberry, which is 150 kg with a harvest area of 30 trees.
The largest ornamental plant production in Bekasi Municipality during 2020 is adenium, which is 116,625 tress, with a harvest area of 2,815 tress.
https:
//bek
asiko
ta.b
ps.go.id

125Kota Bekasi Dalam Angka 2021
PERTANIAN, KEHUTANAN, PETERNAKAN, DAN PERIKANAN
Produksi buah-buahan tahunan terbesar selama tahun 2020 di Kota Bekasi adalah Mangga sebanyak 1.111,2 ton. Sedangkan produksi terkecil adalah Jeruk Siam/Keprok sebanyak 3,9 ton.
Peternakan
Jenis ternak yang diusahakan di kota Bekasi berupa ternak besar, kecil dan unggas. Pada tahun 2020 jumlah ternak sapi potong sebesar 6.427 ekor, sapi perah 69 ekor, kerbau 83 ekor, kuda 43 ekor, kambing 9.920 ekor, domba 6.667 ekor dan babi 58 ekor.
Unggas yang dipelihara adalah jenis ayam kampung, ayam petelur dan itik. Jumlah ayam kampung/buras tahun 2020 sebanyak 128.845 ekor, ayam ras petelur 93.947 ekor, ayam ras pedaging 295.742 ekor, dan itik 17.727 ekor.
Pada tahun 2020, produksi daging ternak terbesar di kota Bekasi adalah daging kambing sebesar 3.613.372 kg. Sedangkan produksi untuk daging unggas yang terbesar adalah ayam broiler/pedaging sebesar 3.894.648 kg.
Produksi telur unggas pada tahun 2020 mencapai 1.041.634 kg, dengan rincian ayam buras sebanyak 79.017 kg, ayam ras petelur 846,713 kg, dan itik 115.904 kg.
Perikanan
Pada tahun 2020, produksi Perikanan di perairan umum sebanyak 59,6 ton. Sedangkan produksi
The highest annual fruit production in 2020 in Bekasi Municipality is mango which is 1,111.2 tons. While the smallest production is tangerine/orange which is 3.9 tons.
Animal Husbandry
The types of livestock cultivated in Bekasi municipality are large, small and poultry. In 2020 there were 6,427 beef cattle, 69 dairy cows, 83 buffaloes, 43 horses, 9,920 goats, 6,667 sheep and 58 pigs.
Poultry that are reared are Domestic Hens, laying hens and ducks. The number of Domestic Hens in 2020 was 128,845 tails, layer chicken 93,118 tails, broiler chicken 295,743, and duck 17,272 tails.
In 2020, the largest livestock meat production in Bekasi municipality was goat meat at 3,613,372 kg. While the largest production for poultry meat is broiler/broiler chicken at 3,894,648 kg.
The production of poultry eggs in 2020 reaches 1,041,634 kg, with the details of the chicken range as many as 79,019 kg, laying hens 846.713 kg, and ducks 115,904 kg.
Fishery
In 2020, fisheries production in open waters is 59.6 tons. While the aquaculture production in the cultivation of calm
https:
//bek
asiko
ta.b
ps.go.id

126 Bekasi Municipality in Figures 2021
AGRICULTURE, FORESTRY, LIVESTOCK, AND FISHERY
perikanan budidaya kolam air tenang sebanyak 1.782,6 ton dan hasil produksi budidaya ikan hias sebanyak 22.560.000 ekor.
Jenis ikan lele adalah jenis ikan yang mempunyai produksi terbesar pada tahun 2020 di kota Bekasi yaitu sebanyak 1.309,06 ton dan hasil produksi terendah pada jenis ikan patin sebanyak 99.3 ton.
water ponds was 1,782.6 tons and the production ornamental Fish culture were 22,560,000 tails.
This type of catfish is a type of fish that has the largest production in the year 2020 in Bekasi municipality as much as 1,309.06 tons and the lowest production of patin as much as 99.3 tons.
https:
//bek
asiko
ta.b
ps.go.id

https:
//bek
asiko
ta.b
ps.go.id

128 Bekasi Municipality in Figures 2021
AGRICULTURE, FORESTRY, LIVESTOCK, AND FISHERY
5.1 Produksi Daging Ternak menurut Jenis Ternak (kg), 2020 Livestock Production by Kind of Livestock (kg), 2020
GambarFigures
Sumber/Source : Dinas Ketahanan Pangan, Pertanian dan Perikanan Kota Bekasi/Bekasi Municipal Agriculture and Fisheries Office
SapiKerbauKambingDombaBabi
0
500,000
1,000,000
1,500,000
2,000,000
2,500,000
3,000,000
3,500,000
4,000,000
SapiKerbau
Kambing Domba Babi
2,536,163
6,237
3,613,372
2,516,593
2,249
https:
//bek
asiko
ta.b
ps.go.id

129Kota Bekasi Dalam Angka 2021
PERTANIAN, KEHUTANAN, PETERNAKAN, DAN PERIKANAN
Sumber/Source : Dinas Ketahanan Pangan, Pertanian dan Perikanan Kota Bekasi/Bekasi Municipal Agriculture and Fisheries Office
Itik
0
500,000
1,000,000
1,500,000
2,000,000
2,500,000
3,000,000
3,500,000
4,000,000
Ayam BurasAyam Ras
Petelur Ayam RasPedaging Itik
474,253
42,668
3,894,648
25,308
5.2 Produksi Daging Unggas Menurut Jenis Unggas (kg),2020 Meat Production of Poultry by Kind of Poultry (kg), 2020
GambarFigures
https:
//bek
asiko
ta.b
ps.go.id

130 Bekasi Municipality in Figures 2021
AGRICULTURE, FORESTRY, LIVESTOCK, AND FISHERY
5.1 TANAMAN PANGAN FOOD CROPS
TabelTable 5.1.1 Luas Lahan Sawah Menurut Kecamatan dan Jenis
Pengairan di Kota Bekasi (ha), 2020 Wetland Area by Subdistrict and Type of Irrigation in Bekasi
Municipality (ha), 2020
KecamatanSubdistrict
Jenis Pengairan/Type of Irrigation
Jumlah Total
Irigasi Teknis
Technical Irrigation
Irigasi Setengah
TeknisSemi
Technical Irrigation
Irigasi Sederhana
SimpleIrrigation
Tadah HujanRain
Lainnya Others
(1) (2) (3) (4) (5) (6) (7)
Pondokgede – – – – – –
Jatisampurna – – 3,00 – – 3,00
Pondokmelati – – – 3,00 – –
Jatiasih – – 10,00 2,00 – 10,00
Bantargebang – – 105,00 – – 105,00
Mustikajaya – – 98,00 – – 101,00
Bekasi Timur – – 4,00 – – 4,00
Rawalumbu – – 4,00 – – 4,00
Bekasi Selatan – – – – – –
Bekasi Barat – 23,00 – – – 23,00
Medan Satria 2,00 – – – – 2,00
Bekasi Utara 41,00 – 19,00 – – 60,00
Kota BekasiBekasi Municipality 43,00 23,00 243,00 5,00 – 312,00
Sumber/Source: Dinas ketahanan pangan, pertanian dan perikanan kota Bekasi/Food Security , Agriculture and Fishery Office of Bekasi Municipality
https:
//bek
asiko
ta.b
ps.go.id

131Kota Bekasi Dalam Angka 2021
PERTANIAN, KEHUTANAN, PETERNAKAN, DAN PERIKANAN
TabelTable 5.1.2 Luas Lahan Bukan Sawah Menurut Kecamatan dan
Penggunaannya di Kota Bekasi (ha), 2020 Dryland Area by Subdistrict and Utilizations in Bekasi
Municipality (ha), 2020
KecamatanSubdistrict
Tanah pekarangan
untuk Bangunan dan Halaman
House compounds and
surroundings
Tegal, Kebun, Ladang, Huma
Dry land, Garden for Crop
Cultivation
Padang Rumput
Meadows
RawaSwamp
TambakDyke
Kolam, Tebat,
EmpangWater Pond
(1) (2) (3) (4) (5)
Pondokgede 1 265,00 273,00 – – – 4,00
Jatisampurna 1 650,00 246,00 – – – 6,00
Pondokmelati 964,00 161,00 – – – 15,00
Jatiasih 1 653,00 655,00 – – – 14,00
Bantargebang 1 460,00 125,00 – – – 10,00
Mustikajaya 2 168,00 280,00 – – – 10,00
Bekasi Timur 1 241,00 115,00 – – – 4,00
Rawalumbu 1 168,00 421,00 – – – –
Bekasi Selatan 1 035,00 471,00 – – – –
Bekasi Barat 1 005,00 388,00 – – – –
Medan Satria 975,00 76,00 – – – –
Bekasi Utara 1 432,00 293,00 – – – –
Kota BekasiBekasi Municipality 16 016,00 3 504,00 – – – 63,00
https:
//bek
asiko
ta.b
ps.go.id

132 Bekasi Municipality in Figures 2021
AGRICULTURE, FORESTRY, LIVESTOCK, AND FISHERY
Lanjutan Tabel/Continued Table 5.1.2
KecamatanSubdistrict
Tanah yang sementara
tidak diusahakanTemporarily Fallow Land
Hutan rakyat, Tanaman
Kayu-kayuanWood Land
PerkebunanAgricultural
Estate
LainnyaOthers
JumlahTotal
(1) (2) (3) (4) (5)
Pondokgede – – – 50,00 1 592,00
Jatisampurna – – – 49,00 1 951,00
Pondokmelati – – – 40,00 1 180,00
Jatiasih – – – 95,00 2 417,00
Bantargebang – – – 144,00 1 739,00
Mustikajaya – – – 83,00 2 541,00
Bekasi Timur – – – 99,00 1 459,00
Rawalumbu – – – 92,00 1 681,00
Bekasi Selatan – – – 100,00 1 606,00
Bekasi Barat – – – 77,00 1 470,00
Medan Satria – – – 135,00 1 186,00
Bekasi Utara – – – 190,00 1 915,00
Kota BekasiBekasi Municipality – – – 1 154,00 20 737,00
Sumber/Source: Dinas ketahanan pangan, pertanian dan perikanan kota Bekasi/Food Security , Agriculture and Fishery Office of Bekasi Municipality
https:
//bek
asiko
ta.b
ps.go.id

133Kota Bekasi Dalam Angka 2021
PERTANIAN, KEHUTANAN, PETERNAKAN, DAN PERIKANAN
TabelTable 5.1.3 Luas Panen, Produksi, dan Produktivitas Tanaman Padi
Palawija Menurut Jenis Tanaman di Kota Bekasi, 2020 Harvested Area, Production, and Productivity of Rice Crop
by Kind of Plant in Bekasi Municipality, 2020
Jenis TanamanKind of Plants
Luas Panen (ha) Harvested Area (ha)
Produktivitas (kw/ha) Productivity (qui/ha)
Produksi (ton) Production (ton)
(1) (2) (3) (4)
Padi/ Paddy 458,00 68,50 3 137,00
Jagung/ Maize 24,00 34,70 83,00
Ubi Kayu/ Cassava – – –
Ubi Jalar/ Sweet Potatoes – – –
Sumber/Source: Dinas ketahanan pangan, pertanian dan perikanan kota Bekasi/Food Security , Agriculture and Fishery Office of Bekasi Municipality
https:
//bek
asiko
ta.b
ps.go.id

134 Bekasi Municipality in Figures 2021
AGRICULTURE, FORESTRY, LIVESTOCK, AND FISHERY
5.2 HORTIKULTURA HORTICULTURE
KecamatanSubdistrict
BayamSpinach
Cabai RawitChili/Cayenne Pepper
2019 2020x 2019 2020x
(1) (2) (3) (4) (5)
Pondokgede 12 ,00 12,00 – –
Jatisampurna 48,00 48,00 – –
Pondokmelati 46,00 48,00 2,00 3,00
Jatiasih 165,00 350,00 1,00 2,00
Bantargebang 37,00 26,00 1,00 –
Mustikajaya 15,00 22,00 – –
Bekasi Timur 13,00 12,00 – –
Rawalumbu 12,00 12,00 – –
Bekasi Selatan 60,00 60,00 1,00 –
Bekasi Barat 14,00 12,00 – –
Medan Satria 71,00 32,00 – –
Bekasi Utara 30,00 24,00 – –
Kota BekasiBekasi Municipality 523,00 658,00 5,00 5,00
TabelTable 5.2.1 Luas Panen Tanaman Sayuran Menurut Kecamatan dan
Jenis Tanaman di Kota Bekasi (ha), 2019 dan 2020 Harvested Area of Vegetables by Subdistrict and Kind of
Plant in Bekasi Municipality (ha), 2019 and 2020
https:
//bek
asiko
ta.b
ps.go.id

135Kota Bekasi Dalam Angka 2021
PERTANIAN, KEHUTANAN, PETERNAKAN, DAN PERIKANAN
KecamatanSubdistrict
JamurMushrooms
Kacang PanjangLong Beans
2019 2020x 2019 2020x
(1) (6) (7) (8) (9)
Pondokgede – – – –
Jatisampurna – – – –
Pondokmelati 16,60 0,00 1,00 2,00
Jatiasih – – 1,00 6,00
Bantargebang 6,80 0,60 4,00 –
Mustikajaya – – 2,00 2,00
Bekasi Timur – – – –
Rawalumbu – – – –
Bekasi Selatan – – 2,00 4,00
Bekasi Barat – – – –
Medan Satria – – – –
Bekasi Utara – – – –
Kota BekasiBekasi Municipality 23,40 0,60 10,00 14,00
Lanjutan Tabel/Continued Table 5.2.1
https:
//bek
asiko
ta.b
ps.go.id

136 Bekasi Municipality in Figures 2021
AGRICULTURE, FORESTRY, LIVESTOCK, AND FISHERY
KecamatanSubdistrict
KangkungWater Spinach
KetimunCucumber
2019 2020x 2019 2020x
(1) (10) (11) (12) (13)
Pondokgede 12,00 12,00 – –
Jatisampurna 54,00 55,00 – –
Pondokmelati 34,00 36,00 – –
Jatiasih 220,00 410,00 – –
Bantargebang 27,00 24,00 1,00 –
Mustikajaya 26,00 24,00 2,00 –
Bekasi Timur 16,00 12,00 – –
Rawalumbu 12,00 12,00 – –
Bekasi Selatan 60,00 60,00 1,00 –
Bekasi Barat 14,00 12,00 – –
Medan Satria 68,00 39,00 1,00 –
Bekasi Utara 31,00 36,00 1,00 –
Kota BekasiBekasi Municipality 574,00 732,00 6,00 –
Lanjutan Tabel/Continued Table 5.2.1
https:
//bek
asiko
ta.b
ps.go.id

137Kota Bekasi Dalam Angka 2021
PERTANIAN, KEHUTANAN, PETERNAKAN, DAN PERIKANAN
Catatan/Note: x Angka Sementara (ASEM)/Preliminary Figures Sumber/Source: BPS, Statistik Pertanian Hortikultura SPH-SBS/BPS-Statistics Indonesia, Agricultural Statistic for Horticulture SPH-SBS
KecamatanSubdistrict
Petsai/SawiChinese Cabbage/ mustard green
TerungEggplant
2019 2020x 2019 2020x
(1) (14) (15) (16) (17)
Pondokgede 2,00 1,00 – –
Jatisampurna 55,00 55,00 – –
Pondokmelati 35,00 34,00 3,00 5,00
Jatiasih 13,00 24,00 1,00 5,00
Bantargebang 21,00 24,00 – –
Mustikajaya 13,00 12,00 – –
Bekasi Timur 10,00 12,00 – –
Rawalumbu 12,00 12,00 – –
Bekasi Selatan 2,00 11,00 – 5,00
Bekasi Barat 13,00 12,00 – –
Medan Satria 52,00 16,00 – –
Bekasi Utara 3,00 – – –
Kota BekasiBekasi Municipality 231,00 213,00 4,00 15,00
Lanjutan Tabel/Continued Table 5.2.1
https:
//bek
asiko
ta.b
ps.go.id

138 Bekasi Municipality in Figures 2021
AGRICULTURE, FORESTRY, LIVESTOCK, AND FISHERY
KecamatanSubdistrict
BayamSpinach
Cabai RawitChili/Cayenne Pepper
2019 2020x 2019 2020x
(1) (2) (3) (4) (5)
Pondokgede 900,00 900,00 – –
Jatisampurna 3 600,00 3 620,00 – –
Pondokmelati 3 450,00 3 600,00 203,00 209,00
Jatiasih 12 375,00 26 250,00 115,00 165,00
Bantargebang 2 850,00 1 950,00 200,00 -
Mustikajaya 970,00 1 650,00 – –
Bekasi Timur 975,00 900,00 – –
Rawalumbu 900,00 860,00 – –
Bekasi Selatan 4 500,00 4 500,00 2,00 -
Bekasi Barat 1 050,00 800,00 – –
Medan Satria 4 875,00 2 228,00 – –
Bekasi Utara 2 190,00 1 899,00 – –
Kota BekasiBekasi Municipality 38 635,00 49 157,00 520,00 374,00
TabelTable 5.2.2 Produksi Tanaman Sayuran Menurut Kecamatan dan Jenis
Tanaman di Kota Bekasi (kuintal), 2019 dan 2020 Production of Vegetables by Subdistrict and Kind of Plant in
Bekasi Municipality (quintal), 2019 and 2020
https:
//bek
asiko
ta.b
ps.go.id

139Kota Bekasi Dalam Angka 2021
PERTANIAN, KEHUTANAN, PETERNAKAN, DAN PERIKANAN
KecamatanSubdistrict
JamurMushrooms
Kacang PanjangLong Beans
2019 2020x 2019 2020x
(1) (6) (7) (8) (9)
Pondokgede – – – –
Jatisampurna – – – –
Pondokmelati 2 630,05 0,12 118,00 171,00
Jatiasih – – 115,00 646,00
Bantargebang 1 420,00 625,00 253,00 –
Mustikajaya – – 97,00 77,00
Bekasi Timur – – – –
Rawalumbu – – – –
Bekasi Selatan – – 8,00 85,00
Bekasi Barat – – – –
Medan Satria – – – –
Bekasi Utara – – – –
Kota BekasiBekasi Municipality 4 050,05 625,12 591,00 979,00
Lanjutan Tabel/Continued Table 5.2.2
https:
//bek
asiko
ta.b
ps.go.id

140 Bekasi Municipality in Figures 2021
AGRICULTURE, FORESTRY, LIVESTOCK, AND FISHERY
KecamatanSubdistrict
KangkungWater Spinach
KetimunCucumber
2019 2020x 2019 2020x
(1) (10) (11) (12) (13)
Pondokgede 840,00 840,00 – –
Jatisampurna 3 780,00 3 930,00 – –
Pondokmelati 2 380,00 2 520,00 – –
Jatiasih 15 400,00 28 700,00 – –
Bantargebang 2 100,00 1 680,00 80,00 –
Mustikajaya 1 790,00 1 680,00 98,00 –
Bekasi Timur 1 120,00 840,00 – –
Rawalumbu 840,00 820,00 – –
Bekasi Selatan 4 200,00 4 200,00 1,00 –
Bekasi Barat 980,00 805,00 – –
Medan Satria 4 410,00 2 640,00 9,00 –
Bekasi Utara 2 220,00 2 544,00 70,00 –
Kota BekasiBekasi Municipality 40 060,00 51 199,00 258,00 –
Lanjutan Tabel/Continued Table 5.2.2
https:
//bek
asiko
ta.b
ps.go.id

141Kota Bekasi Dalam Angka 2021
PERTANIAN, KEHUTANAN, PETERNAKAN, DAN PERIKANAN
Catatan/Note: x Angka Sementara (ASEM)/Preliminary Figures Sumber/Source: BPS, Statistik Pertanian Hortikultura SPH-SBS/BPS-Statistics Indonesia, Agricultural Statistic for Horticulture SPH-SBS
KecamatanSubdistrict
Petsai/SawiChinese Cabbage/ mustard green
TerungEggplant
2019 2020x 2019 2020x
(1) (14) (15) (16) (17)
Pondokgede 84,00 83,00 – –
Jatisampurna 4 535,00 4 588,00 – –
Pondokmelati 2 926,00 2 926,00 316,00 230,00
Jatiasih 1 176,00 2 006,00 113,00 322,00
Bantargebang 1 660,00 1 992,00 – –
,00Mustikajaya 1 079,00 996,00 – –
Bekasi Timur 814,00 970,00 – –
Rawalumbu 996,00 925,00 – –
Bekasi Selatan 166,00 913,00 – 74,00
Bekasi Barat 1 079,00 874,00 – –
Medan Satria 4 201,00 1 252,00 – –
Bekasi Utara 236,00 – – –
Kota BekasiBekasi Municipality 18 952,00 17 525,00 429,00 626,00
Lanjutan Tabel/Continued Table 5.2.2
https:
//bek
asiko
ta.b
ps.go.id

142 Bekasi Municipality in Figures 2021
AGRICULTURE, FORESTRY, LIVESTOCK, AND FISHERY
Jenis TanamanKind of Plants 2017 2018 2019 2020x
(1) (2) (3) (4) (5)
Sayuran/Vegetables:
Bayam/Spinach 640,00 580,00 523,00 658,00
Cabai Besar/Chili/Big Chili 6,00 3,00 – –
Cabai Rawit/Chili/Cayenne Pepper 23,00 12,00 5,00 5,00
Jamur/Mushrooms 39,07 42,10 23,40 0,60
Kacang Panjang/Long Beans 8,00 13,00 10,00 14,00
Kangkung/Water Spinach 645,00 639,00 574,00 732,00
Ketimun/Cucumber 10,00 7,00 6,00 –
Petsai/Sawi/Chinese Cabbage/mustard green
319,00 274,00 231,00 213,00
Terung/Eggplant 7,00 4,00 4,00 15,00
Buah–buahan/Fruits:
Blewah/ Cantaloupe 1,00 1,00 – –
TabelTable 5.2.3 Luas Panen Tanaman Sayuran dan Buah-buahan Semusim
Menurut Jenis Tanaman di Kota Bekasi (ha), 2017–2020 Harvested Area of Seasonal Vegetables and Fruits by Kind
of Plant in Bekasi Municipality (ha), 2017–2020
Catatan/Note: x Angka Sementara (ASEM)/Preliminary FiguresSumber/Source: BPS, Statistik Pertanian Hortikultura SPH-SBS/BPS-Statistics Indonesia, Agricultural Statistic for Horticulture SPH-SBS
https:
//bek
asiko
ta.b
ps.go.id

143Kota Bekasi Dalam Angka 2021
PERTANIAN, KEHUTANAN, PETERNAKAN, DAN PERIKANAN
TabelTable 5.2.4 Produksi Tanaman Sayuran dan Buah-buahan Semusim
Menurut Jenis Tanaman di Kota Bekasi (kuintal), 2017–2020
Production of Seasonal Vegetables and Fruits by Kind of Plant in Bekasi Municipality (quintal), 2017–2020
Catatan/Note: x Angka Sementara (ASEM)/Preliminary FiguresSumber/Source: BPS, Statistik Pertanian Hortikultura SPH-SBS/BPS-Statistics Indonesia, Agricultural Statistic for Horticulture SPH-SBS
Jenis TanamanKind of Plants 2017 2018 2019 2020x
(1) (2) (3) (4) (5)
Sayuran/Vegetables:
Bayam/Spinach 38 322,00 35 322,00 38 635,00 49 157,00
Cabai Besar/Chili/Big Chili 173,00 90,00 – –
Cabai Rawit/Chili/Cayenne Pepper 240,00 43,00 520,00 374,00
Jamur/Mushrooms 713,40 6 550,00 4 050,05 625,12
Kacang Panjang/Long Beans 115,00 128,00 591,00 979,00
Kangkung/Water Spinach 40 450,00 42 206,00 40 060,00 51 199,00
Ketimun/Cucumber 400,00 47,00 258,00 –
Petsai/Sawi/Chinese Cabbage/mustard green
23 561,00 18 405,00 18 952,00 17 525,00
Terung/Eggplant 550,00 318,00 429,00 626,00
Buah–buahan/Fruits:
Blewah/ Cantaloupe 6,00 1,00 – –
https:
//bek
asiko
ta.b
ps.go.id

144 Bekasi Municipality in Figures 2021
AGRICULTURE, FORESTRY, LIVESTOCK, AND FISHERY
TabelTable 5.2.5 Luas Panen Tanaman Biofarmaka Menurut Kecamatan
dan Jenis Tanaman di Kota Bekasi (m2), 2019 dan 2020 Harvested Area of Medicinal Plants by Subdistrict and Kind
of Plant in Bekasi Municipality (m2), 2019 and 2020
KecamatanSubdistrict
JaheGinger
Laos/LengkuasGalanga
KencurEast Indian Galangal
2019 2020x 2019 2020x 2019 2020x
(1) (2) (3) (4) (5) (6) (7)
Pondokgede 6 000 1 000 4 500 1 350 2 000 900
Jatisampurna 5 000 10 000 40 000 40 000 10 000 20 000
Pondokmelati 2 600 5 600 4 000 11 000 2 000 5 500
Jatiasih 10 000 61 500 5 000 32 000 1 000 2 500
Bantargebang 10 000 2 000 14 000 1 000 10 000 1 000
Mustikajaya 1 000 – 400 – 200 –
Bekasi Timur – – – – – –
Rawalumbu 40 30 60 35 – –
Bekasi Selatan 50 50 50 50 20 20
Bekasi Barat 45 40 38 60 2 –
Medan Satria 400 395 250 387 300 198
Bekasi Utara 24 72 15 45 4 12
Kota BekasiBekasi Municipality 35 159,00 80 687 68 313 85 927 25 526 30 130 http
s://b
ekas
ikota
.bps.g
o.id

145Kota Bekasi Dalam Angka 2021
PERTANIAN, KEHUTANAN, PETERNAKAN, DAN PERIKANAN
Lanjutan Tabel/Continued Table 5.2.5
KecamatanSubdistrict
KunyitTurmeric
Keji Beling Verbenaceae
LempuyangZingiber Aromaticum
2019 2020x 2019 2020x 2019 2020x
(1) (8) (9) (10) (11) (12) (13)
Pondokgede 5 000 2 100 – – 1 000 200
Jatisampurna 8 000 16 000 – – 5 000 5 000
Pondokmelati 4 500 10 500 – – 4 000 8 500
Jatiasih – 17 250 300 – - –
Bantargebang 9 000 1 000 – – 2 000 –
Mustikajaya 300 – – – – –
Bekasi Timur – – – – – –
Rawalumbu 100 60 – – – –
Bekasi Selatan 50 50 200 200 – –
Bekasi Barat 30 90 – – – –
Medan Satria 300 – – – – –
Bekasi Utara 33 39 – – – –
Kota BekasiBekasi Municipality 27 313 47 089 500 200 12 000 13 700 http
s://b
ekas
ikota
.bps.g
o.id

146 Bekasi Municipality in Figures 2021
AGRICULTURE, FORESTRY, LIVESTOCK, AND FISHERY
Lanjutan Tabel/Continued Table 5.2.5
KecamatanSubdistrict
Lidah BuayaAloevera
SambilotoKing of Bitter
TemukunciChinese Keys
2019 2020x 2019 2020x 2019 2020x
(1) (14) (15) (16) (17) (18) (19)
Pondokgede – – – – – –
Jatisampurna – – – – – –
Pondokmelati – – – – – –
Jatiasih 350 – 330 – – –
Bantargebang – – – – – –
Mustikajaya – – – – – –
Bekasi Timur – – – – – –
Rawalumbu – – – – – –
Bekasi Selatan 350 50 – – – –
Bekasi Barat – – – – – –
Medan Satria – – – – – 250
Bekasi Utara – – – – – -
Kota BekasiBekasi Municipality 700 50 330 – – 250 http
s://b
ekas
ikota
.bps.g
o.id

147Kota Bekasi Dalam Angka 2021
PERTANIAN, KEHUTANAN, PETERNAKAN, DAN PERIKANAN
Lanjutan Tabel/Continued Table 5.2.5
KecamatanSubdistrict
TemulawakJava Turmeric
Mahkota Dewa1
Phaleria Macrocarpa1Mengkudu/Pace1
Indian Mulberry1
2019 2020x 2019 2020x 2019 2020x
(1) (20) (21) (22) (23) (24) (25)
Pondokgede – – – – – –
Jatisampurna – – – – – –
Pondokmelati – – – – – –
Jatiasih – – – – 140 –
Bantargebang 3 500 – – – – –
Mustikajaya – – – – – –
Bekasi Timur – – – – – –
Rawalumbu – – – – – –
Bekasi Selatan – – 230 30 30 30
Bekasi Barat – – – – – –
Medan Satria – – – – – –
Bekasi Utara – – – – – –
Kota BekasiBekasi Municipality 3 500 – 230 30 170 30
Catatan/Note: x Angka Sementara (ASEM)/Preliminary Figures 1 Satuan pohon/tree unitSumber/Source: BPS, Statistik Pertanian Hortikultura SPH-TBF/BPS-Statistics Indonesia, Agricultural Statistic for Horticulture SPH-TBF
https:
//bek
asiko
ta.b
ps.go.id

148 Bekasi Municipality in Figures 2021
AGRICULTURE, FORESTRY, LIVESTOCK, AND FISHERY
TabelTable 5.2.6 Produksi Tanaman Biofarmaka Menurut Kecamatan dan
Jenis Tanaman di Kota Bekasi (kg), 2019 and 2020 Production of Medicinal Plants by Subdistrict and Kind of
Plant in Bekasi Municipality (kg), 2019 and 2020
KecamatanSubdistrict
JaheGinger
Laos/LengkuasGalanga
KencurEast Indian Galangal
2019 2020x 2019 2020x 2019 2020x
(1) (2) (3) (4) (5) (6) (7)
Pondokgede 24 000 2 740 17 300 3 836 5 260 2 181
Jatisampurna 15 000 30 000 200 000 15 000 15 000 20 000
Pondokmelati 7 800 7 212 20 000 43 700 3 000 7 700
Jatiasih 10 000 125 400 25 000 74 100 1 500 3 140
Bantargebang 33 000 6 000 70 000 3 000 16 000 3 000
Mustikajaya 1 000 – 1 400 – 220 –
Bekasi Timur – – – – – –
Rawalumbu 35 30 30 35 – –
Bekasi Selatan 150 12 150 18 60 7
Bekasi Barat 135 60 114 60 6 –
Medan Satria 1 000 1 185 1 081 1 535 322 297
Bekasi Utara 15 173 75 146 3 34
Kota BekasiBekasi Municipality 92 135,00 172 812,00 335 150,00 141 430,00 41 371,00 36 359,00http
s://b
ekas
ikota
.bps.g
o.id

149Kota Bekasi Dalam Angka 2021
PERTANIAN, KEHUTANAN, PETERNAKAN, DAN PERIKANAN
Lanjutan Tabel/Continued Table 5.2.6
KecamatanSubdistrict
KunyitTurmeric
Keji Beling Verbenaceae
LempuyangZingiber Aromaticum
2019 2020x 2019 2020x 2019 2020x
(1) (8) (9) (10) (11) (12) (13)
Pondokgede 17 650 12 488 – – 3 983 322
Jatisampurna 12 000 16 000 – – 7 500 5 000
Pondokmelati 6 750 16 210 – – 16 375 42 500
Jatiasih – 14 675 102 – - –
Bantargebang 14 250 3 000 – – 8 210 –
Mustikajaya 330 – – – – –
Bekasi Timur – – – – – –
Rawalumbu 50 60 – – – –
Bekasi Selatan 150 22 600 730 – –
Bekasi Barat 90 140 – – – –
Medan Satria 130 – – – – –
Bekasi Utara 26 122 – – – –
Kota BekasiBekasi Municipality 51 426,00 62 717,00 702 730 36 068 47 822 http
s://b
ekas
ikota
.bps.g
o.id

150 Bekasi Municipality in Figures 2021
AGRICULTURE, FORESTRY, LIVESTOCK, AND FISHERY
Lanjutan Tabel/Continued Table 5.2.6
KecamatanSubdistrict
Lidah BuayaAloevera
SambilotoKing of Bitter
TemukunciChinese Keys
2019 2020x 2019 2020x 2019 2020x
(1) (14) (15) (16) (17) (18) (19)
Pondokgede – – – – – –
Jatisampurna – – – – – –
Pondokmelati – – – – – –
Jatiasih 175 – 99 – – –
Bantargebang – – – – – –
Mustikajaya – – – – – –
Bekasi Timur – – – – – –
Rawalumbu – – – – – –
Bekasi Selatan 300 200 – – – –
Bekasi Barat – – – – – –
Medan Satria – – – – – 1 250
Bekasi Utara – – – – – –
Kota BekasiBekasi Municipality 475 200 99 – – 1 250 http
s://b
ekas
ikota
.bps.g
o.id

151Kota Bekasi Dalam Angka 2021
PERTANIAN, KEHUTANAN, PETERNAKAN, DAN PERIKANAN
Lanjutan Tabel/Continued Table 5.2.6
KecamatanSubdistrict
TemulawakJava Turmeric
Mahkota DewaPhaleria Macrocarpa
Mengkudu/PaceIndian Mulberry
2019 2020x 2019 2020x 2019 2020x
(1) (20) (21) (22) (23) (24) (25)
Pondokgede – – – – – –
Jatisampurna – – – – – –
Pondokmelati – – – – – –
Jatiasih – – – – 28 –
Bantargebang 12 300 – – – – –
Mustikajaya – – – – – –
Bekasi Timur – – – – – –
Rawalumbu – – – – – –
Bekasi Selatan – – 2 760 400 90 150
Bekasi Barat – – – – – –
Medan Satria – – – – – –
Bekasi Utara – – – – – –
Kota BekasiBekasi Municipality 12 300 – 2 760 400 118 150
Catatan/Note: x Angka Sementara (ASEM)/Preliminary FiguresSumber/Source: BPS, Statistik Pertanian Hortikultura SPH-TBF/BPS-Statistics Indonesia, Agricultural Statistic for Horticulture SPH-TBF
https:
//bek
asiko
ta.b
ps.go.id

152 Bekasi Municipality in Figures 2021
AGRICULTURE, FORESTRY, LIVESTOCK, AND FISHERY
Jenis TanamanKind of Plants 2017 2018 2019 2020x
(1) (2) (3) (4) (5)
Jahe/Ginger 34 805,00 39 105,00 35 159,00 80 687,00
Laos/Lengkuas/Galanga 30 298,00 113 271,00 68 313,00 85 927,00
Kencur/East Indian Galangal 20 817,00 60 784,00 25 526,00 30 130,00
Kunyit/Turmeric 20 208,00 44 715 ,00 27 313,00 47 089,00
Keji Beling/Verbenaceae – 350,00 500,00 200,00
Lempuyang/Zingiber Aromaticum 10 650,00 30 250,00 12 000,00 13 700,00
Lidah Buaya/Aloevera – 350,00 700,00 50,00
Sambiloto/King of Bitter – 275,00 330,00 –
Temuireng/Black Turmeric – 1 000,00 – –
Temukunci/Chinese Keys 200,00 350,00 – 250,00
Temulawak/Java Turmeric 6 350,00 6 750,00 3 500,00 –
Mahkota Dewa/Phaleria Macrocarpa1 200,00 – 230,00 30,00
Mengkudu/Pace/Indian Mulberry1 200,00 140,00 170,00 30,00
TabelTable 5.2.7 Luas Panen Tanaman Biofarmaka Menurut Jenis Tanaman
di Kota Bekasi (m2), 2017–2020 Harvested Area of Medicinal Plants by Kind of Plant in
Bekasi Municipality (m2), 2017–2020
Catatan/Note: x Angka Sementara (ASEM)/Preliminary Figures 1 Satuan pohon/tree unitSumber/Source: BPS, Statistik Pertanian Hortikultura SPH-TBF/BPS-Statistics Indonesia, Agricultural Statistic for Horticulture SPH-TBF
https:
//bek
asiko
ta.b
ps.go.id

153Kota Bekasi Dalam Angka 2021
PERTANIAN, KEHUTANAN, PETERNAKAN, DAN PERIKANAN
TabelTable 5.2.8 Produksi Tanaman Biofarmaka Menurut Jenis Tanaman di
Kota Bekasi (kg), 2017–2020 Production of Medicinal Plants by Kind of Plant in Bekasi
Municipality (kg),2017–2020
Catatan/Note: x Angka Sementara (ASEM)/Preliminary FiguresSumber/Source: BPS, Statistik Pertanian Hortikultura SPH-TBF/BPS-Statistics Indonesia, Agricultural Statistic for Horticulture SPH-TBF
Jenis TanamanKind of Plants 2017 2018 2019 2020x
(1) (2) (3) (4) (5)
Jahe/Ginger 104 560,00 118 888 92 135 172 812
Laos/Lengkuas/Galanga 146 296,00 477 894 335 150 141 430
Kencur/East Indian Galangal 34 452,00 135 001 41 371 36 359
Kunyit/Turmeric 36 109,00 105 590 51 426 62 717
Keji Beling/Verbenaceae – 784 702 730
Lempuyang/Zingiber Aromaticum 37 750,00 100 200 36 068 47 822
Lidah Buaya/Aloevera – 1 504 475 200
Sambiloto/King of Bitter – 507 99 –
Temuireng/Black Turmeric – 1 500 – –
Temukunci/Chinese Keys 868,00 1 219 – 1 250
Temulawak/Java Turmeric 24 985,00 19 149 12 300 –
Mahkota Dewa/Phaleria Macrocarpa 2 400,00 – 2 760 400
Mengkudu/Pace/Indian Mulberry 40,00 2 140 118 150
https:
//bek
asiko
ta.b
ps.go.id

154 Bekasi Municipality in Figures 2021
AGRICULTURE, FORESTRY, LIVESTOCK, AND FISHERY
TabelTable 5.2.9 Luas Panen Tanaman Hias Menurut Kecamatan dan Jenis
Tanaman di Kota Bekasi (m2), 2019 and 2020 Harvested Area of Ornamental Plants by Subdistrict and
Kind of Plant in Bekasi Municipality (m2), 2019 and 2020
KecamatanSubdistrict
Anggrek/Orchid Anthurium Bunga Flamingo Lily Flower
Anthurium DaunAnthurium
2019 2020x 2019 2020x 2019 2020x
(1) (2) (3) (4) (5) (6) (7)
Pondokgede 400 – – – 150 –
Jatisampurna – – 200 200 200 200
Pondokmelati – – 200 500 200 –
Jatiasih – 100 – – 128 –
Bantargebang – – – – – –
Mustikajaya 10 – – – 10 –
Bekasi Timur – – – – – –
Rawalumbu – – – – 110 –
Bekasi Selatan 150 150 200 300 – –
Bekasi Barat – – – – – –
Medan Satria – – – – – –
Bekasi Utara – – – – – –
Kota BekasiBekasi Municipality 560 250 600 1 000 798 200 http
s://b
ekas
ikota
.bps.g
o.id

155Kota Bekasi Dalam Angka 2021
PERTANIAN, KEHUTANAN, PETERNAKAN, DAN PERIKANAN
Lanjutan Tabel/Continued Table 5.2.9
KecamatanSubdistrict
BalancengDieffenbacia Euphorbia/Euphorbia Kamboja Jepang
Adenium
2019 2020x 2019 2020x 2019 2020x
(1) (8) (9) (10) (11) (12) (13)
Pondokgede 100 – 100 – 150 –
Jatisampurna 100 200 100 200 200 400
Pondokmelati – – – – – 1 000
Jatiasih – – – – 450 550
Bantargebang – – – – – –
Mustikajaya – – – – 10 –
Bekasi Timur – – – – – –
Rawalumbu 190 – – – 180 5
Bekasi Selatan – – – – – –
Bekasi Barat – – 1 260 20 1 825 100
Medan Satria – – – – – –
Bekasi Utara – – – – – –
Kota BekasiBekasi Municipality 390 200 1 460 220 2 815 2 055 http
s://b
ekas
ikota
.bps.g
o.id

156 Bekasi Municipality in Figures 2021
AGRICULTURE, FORESTRY, LIVESTOCK, AND FISHERY
Lanjutan Tabel/Continued Table 5.2.9
KecamatanSubdistrict
Mawar/Rose Melati/Jasmine Monstera/Monstera
2019 2020x 2019 2020x 2019 2020x
(1) (14) (15) (16) (17) (18) (19)
Pondokgede – – – – – –
Jatisampurna – 100 200 – – –
Pondokmelati 300 600 - – – –
Jatiasih 300 650 200 500 – –
Bantargebang – – – – – –
Mustikajaya 20 – 5 – – –
Bekasi Timur – – – – – –
Rawalumbu – – – – – –
Bekasi Selatan 300 200 250 350 – –
Bekasi Barat – – – – – 50
Medan Satria – – – – – –
Bekasi Utara – – 5 – – –
Kota BekasiBekasi Municipality 920 1 550 660 850 – 50 http
s://b
ekas
ikota
.bps.g
o.id

157Kota Bekasi Dalam Angka 2021
PERTANIAN, KEHUTANAN, PETERNAKAN, DAN PERIKANAN
Lanjutan Tabel/Continued Table 5.2.9
KecamatanSubdistrict
Pakis/Leather Leaf Fern Palem1/Palm1 Pedang-PedanganSanseviera
2019 2020x 2019 2020x 2019 2020x
(1) (20) (21) (22) (23) (24) (25)
Pondokgede 100 – – – 200 –
Jatisampurna 100 200 – – – –
Pondokmelati – 100 – – – –
Jatiasih – – – – 190 –
Bantargebang – – – – – –
Mustikajaya – – 40 – 20 –
Bekasi Timur – – – – – –
Rawalumbu – – 118 – 225 –
Bekasi Selatan – – – – 150 250
Bekasi Barat – – – – 2 775 125
Medan Satria – – – – – –
Bekasi Utara – – – – 1 –
Kota BekasiBekasi Municipality 200 300 158 – 3 561 375 http
s://b
ekas
ikota
.bps.g
o.id

158 Bekasi Municipality in Figures 2021
AGRICULTURE, FORESTRY, LIVESTOCK, AND FISHERY
Lanjutan Tabel/Continued Table 5.2.9
KecamatanSubdistrict
Pisang-PisanganHeliconia Soka/Ixora Sri Rejeki/Aglaonema
2019 2020x 2019 2020x 2019 2020x
(1) (26) (27) (28) (29) (30) (31)
Pondokgede 700 250 200 - 150 –
Jatisampurna 400 400 200 200 200 400
Pondokmelati 300 5 200 – – 400 3 600
Jatiasih – – – – – –
Bantargebang – – – – – –
Mustikajaya 5 – – – – –
Bekasi Timur – – – – – –
Rawalumbu – – 160 – 100 –
Bekasi Selatan 250 250 – – – –
Bekasi Barat – – – – 1 330 150
Medan Satria – – – – – –
Bekasi Utara – – – – 1 –
Kota BekasiBekasi Municipality 1 655 6 100 560 200 2 181 4 150
Catatan/Note: x Angka Sementara (ASEM)/Preliminary Figures 1 Satuan pohon/tree unitSumber/Source: BPS, Statistik Pertanian Hortikultura SPH-TH/BPS-Statistics Indonesia, Agricultural Statistik for Horticulture SPH-TH
https:
//bek
asiko
ta.b
ps.go.id

159Kota Bekasi Dalam Angka 2021
PERTANIAN, KEHUTANAN, PETERNAKAN, DAN PERIKANAN
TabelTable 5.2.10 Produksi Tanaman Hias Menurut Kecamatan dan Jenis
Tanaman di Kota Bekasi (tangkai), 2019 and 2020 Production of Ornamental Plants by Subdistrict and Kind of
Plant in Bekasi Municipality (stalks), 2019 and 2020
KecamatanSubdistrict
Anggrek/Orchid Anthurium Bunga Flamingo Lily Flower
Anthurium Daun1
Anthurium1
2019 2020x 2019 2020x 2019 2020x
(1) (2) (3) (4) (5) (6) (7)
Pondokgede 6 800 – – – 3 150 –
Jatisampurna – – 2 600 200 4 200 200
Pondokmelati – – 200 6 500 2 100 –
Jatiasih – 100 – – 2 688 –
Bantargebang – – – – – –
Mustikajaya 90 – – – 210 –
Bekasi Timur – – – – – –
Rawalumbu – – – – 2 310 –
Bekasi Selatan 750 2 550 400 3 900 – –
Bekasi Barat – – – – – –
Medan Satria – – – – – –
Bekasi Utara – – – – – –
Kota BekasiBekasi Municipality 7 640 2 650 3 200 10 600 14 658 200 http
s://b
ekas
ikota
.bps.g
o.id

160 Bekasi Municipality in Figures 2021
AGRICULTURE, FORESTRY, LIVESTOCK, AND FISHERY
Lanjutan Tabel/Continued Table 5.2.10
KecamatanSubdistrict
Balanceng1
Dieffenbacia1 Euphorbia1/Euphorbia1 Kamboja Jepang1
Adenium1
2019 2020x 2019 2020x 2019 2020x
(1) (8) (9) (10) (11) (12) (13)
Pondokgede 2 100 – 3 700 – 3 750 –
Jatisampurna 2 100 2 200 3 700 3 800 5 000 5 200
Pondokmelati – – – – – 1 000
Jatiasih – – – – 14 000 4 950
Bantargebang – – – – – –
Mustikajaya – – – – 250 –
Bekasi Timur – – – – – –
Rawalumbu 3 990 – – – 3 600 5
Bekasi Selatan – – – – – –
Bekasi Barat – – 63 000 20 90 025 100
Medan Satria – – – – – –
Bekasi Utara – – – – – –
Kota BekasiBekasi Municipality 8 190 2 200 70 400 3 820 116 625 11 255 http
s://b
ekas
ikota
.bps.g
o.id

161Kota Bekasi Dalam Angka 2021
PERTANIAN, KEHUTANAN, PETERNAKAN, DAN PERIKANAN
Lanjutan Tabel/Continued Table 5.2.10
KecamatanSubdistrict
Mawar/Rose Melati2/Jasmine2 Monstera1/Monstera1
2019 2020x 2019 2020x 2019 2020x
(1) (14) (15) (16) (17) (18) (19)
Pondokgede – – – – – –
Jatisampurna – 300 700 – – –
Pondokmelati 1 500 1 200 – – – –
Jatiasih 3 200 1 350 4 100 652 – –
Bantargebang – – – – – –
Mustikajaya 60 – 18 – – –
Bekasi Timur – – – – – –
Rawalumbu – – – – – –
Bekasi Selatan 500 1 800 875 200 – –
Bekasi Barat – – – – – 50
Medan Satria – – – – – –
Bekasi Utara – – 4 – – –
Kota BekasiBekasi Municipality 5 260 4 650 5 697 852 – 50 http
s://b
ekas
ikota
.bps.g
o.id

162 Bekasi Municipality in Figures 2021
AGRICULTURE, FORESTRY, LIVESTOCK, AND FISHERY
Lanjutan Tabel/Continued Table 5.2.10
KecamatanSubdistrict
Pakis1/Leather Leaf Fern1 Palem1/Palm1 Pedang-Pedangan3
Sanseviera3
2019 2020x 2019 2020x 2019 2020x
(1) (20) (21) (22) (23) (24) (25)
Pondokgede 100 – – – 3 600 –
Jatisampurna 100 200 – – – –
Pondokmelati – 100 – – – –
Jatiasih – – – – 3 420 –
Bantargebang – – – – - –
Mustikajaya – – 40 – 42 –
Bekasi Timur – – – – – –
Rawalumbu – – 118 – 225 –
Bekasi Selatan – – – – 150 2 100
Bekasi Barat – – – – 88 800 125
Medan Satria – – – – – –
Bekasi Utara – – – – 1 –
Kota BekasiBekasi Municipality 200 300 158 – 96 238 2 225 http
s://b
ekas
ikota
.bps.g
o.id

163Kota Bekasi Dalam Angka 2021
PERTANIAN, KEHUTANAN, PETERNAKAN, DAN PERIKANAN
Lanjutan Tabel/Continued Table 5.2.10
KecamatanSubdistrict
Pisang-PisanganHeliconia Soka1/Ixora1 Sri Rejeki1
Aglaonema1
2019 2020x 2019 2020x 2019 2020x
(1) (26) (27) (28) (29) (30) (31)
Pondokgede 9 800 1 400 5 600 – 2 250 –
Jatisampurna 5 600 3 000 5 600 200 3 000 3 200
Pondokmelati 5 100 9 100 – – 3 200 3 600
Jatiasih – – – – – –
Bantargebang – – – – – –
Mustikajaya 70 – – – – –
Bekasi Timur – – – – – –
Rawalumbu – – 170 – 1 500 –
Bekasi Selatan 3 500 3 400 – – – –
Bekasi Barat – – – – 26 030 150
Medan Satria – – – – – –
Bekasi Utara – – – – 20 –
Kota BekasiBekasi Municipality 24 070 16 900 11 370 200 36 000 6 950
Catatan/Note: x Angka Sementara (ASEM)/Preliminary Figures 1 Satuan pohon/tree unit 2 Satuan kg/kg unit 3 Satuan rumpun/clumps unitSumber/Source: BPS, Statistik Pertanian Hortikultura SPH-TH/BPS-Statistics Indonesia, Agricultural Statistik for Horticulture SPH-TH
https:
//bek
asiko
ta.b
ps.go.id

164 Bekasi Municipality in Figures 2021
AGRICULTURE, FORESTRY, LIVESTOCK, AND FISHERY
Jenis TanamanKind of Plants 2017 2018 2019 2020x
(1) (2) (3) (4) (5)
Anggrek/Orchid 550,00 1 300 560 250
Anthurium Bunga/ Flamingo Lily Flower 1 250,00 1 300 600 1 000
Anthurium Daun/ Anthurium 550,00 432 798 200
Anyelir/ Carnation 300,00 600 – –
Balanceng/ Dieffenbacia 200,00 400 390 200
Euphorbia/ Euphorbia 1 590,00 300 1 460 220
Kamboja Jepang/ Adenium 2 435,00 920 2 815 2 055
Krisan/ Chrysantemum – 20 – –
Mawar/ Rose 850,00 1 350 920 1 550
Melati/ Jasmine 1 400,00 401 660 850
Monstera/ Monstera – – – 50
Pakis/ Leather Leaf Fern 200,00 300 200 300
Palem1/ Palm1 300,00 300 158 –
Pedang-Pedangan/ Sanseviera 4 587,00 1 441 3 561 375
Pisang-Pisangan/ Heliconia 700,00 1 500 1 655 6 100
Sedap Malam/ Tuberose – 300 – –
Soka/ Ixora 235,00 130 560 200
Sri Rejeki/ Aglaonema 2 125,00 645 2 181 4 150
TabelTable 5.2.11 Luas Panen Tanaman Hias Menurut Jenis Tanaman di Kota
Bekasi (m2), 2017–2020 Harvested Area of Ornamental Plants by Kind of Plant in
Bekasi Municipality (m2), 2017–2020
Catatan/Note: x Angka Sementara (ASEM)/Preliminary Figures 1 Satuan pohon/tree unitSumber/Source: BPS, Statistik Pertanian Hortikultura SPH-TH/BPS-Statistics Indonesia, Agricultural Statistik for Horticulture SPH-TH
https:
//bek
asiko
ta.b
ps.go.id

165Kota Bekasi Dalam Angka 2021
PERTANIAN, KEHUTANAN, PETERNAKAN, DAN PERIKANAN
TabelTable 5.2.12 Produksi Tanaman Hias Menurut Jenis Tanaman di Kota
Bekasi (tangkai), 2017–2020 Production of Ornamental Plants by Kind of Plant in Bekasi
Municipality (stalks), 2017–2020
Catatan/Note: x Angka Sementara (ASEM)/Preliminary Figures 1 Satuan pohon/tree unit 2 Satuan kg/kg unit 3 Satuan rumpun/clumps unitSumber/Source: BPS, Statistik Pertanian Hortikultura SPH-TH/BPS-Statistics Indonesia, Agricultural Statistik for Horticulture SPH-TH
Jenis TanamanKind of Plants 2017 2018 2019 2020x
(1) (2) (3) (4) (5)
Anggrek/Orchid 9 600,00 19 300 7 640 2 650
Anthurium Bunga/ Flamingo Lily Flower 13 890,00 8 640 3 200 10 600
Anthurium Daun1/ Anthurium1 7 550,00 4 437 14 658 200
Anyelir/ Carnation 8 360,00 16 733 – –
Balanceng1/ Dieffenbacia1 2 200,00 8 400 8 190 2 200
Euphorbia1/ Euphorbia1 7 010,00 11 100 70 400 3 820
Kamboja Jepang1/ Adenium1 8 030,00 13 285 116 625 11 255
Krisan/ Chrysantemum – 40 – –
Mawar/ Rose 3 000,00 2 800 5 260 4 650
Melati2/ Jasmine2 5 050,00 1 154 5 697 852
Monstera1/ Monstera1 – – – 50
Pakis1/ Leather Leaf Fern1 200,00 300 200 300
Palem1/ Palm1 450,00 300 158 –
Pedang-Pedangan3/ Sanseviera3 31 952,00 12 173 96 238 2 225
Pisang-Pisangan/ Heliconia 14 150,00 22 806 24 070 16 900
Sedap Malam/ Tuberose – 5 100 – –
Soka1/ Ixora1 235,00 3 100 11 370 200
Sri Rejeki1/ Aglaonema1 9 825,00 9 045 36 000 6 950
https:
//bek
asiko
ta.b
ps.go.id

166 Bekasi Municipality in Figures 2021
AGRICULTURE, FORESTRY, LIVESTOCK, AND FISHERY
TabelTable 5.2.13 Produksi Buah-buahan Menurut Kecamatan dan Jenis
Tanaman di Kota Bekasi (kuintal), 2019 and 2020 Production of Fruits by Subdistrict and Kind of Plant in
Bekasi Municipality (kuintal), 2019 and 2020
KecamatanSubdistrict
Alpukat/Avocado Belimbing/Star Fruit
2019 2020x 2019 2020x
(1) (2) (3) (4) (5)
Pondokgede 2 5 152 405
Jatisampurna 384 126 1 655 –
Pondokmelati 51 546 54 1 480
Jatiasih 186 611 2 126 2 173
Bantargebang 6 105 409 326
Mustikajaya 39 219 307 1 034
Bekasi Timur 11 148 283 165
Rawalumbu 3 13 113 144
Bekasi Selatan 265 40 914 58
Bekasi Barat 30 60 261 285
Medan Satria 45 16 97 23
Bekasi Utara 6 35 28 36
Kota BekasiBekasi Municipality 1 028 1 924 6 399 6 129 http
s://b
ekas
ikota
.bps.g
o.id

167Kota Bekasi Dalam Angka 2021
PERTANIAN, KEHUTANAN, PETERNAKAN, DAN PERIKANAN
KecamatanSubdistrict
Duku/Langsat/Kokosan/Duku Durian/Durian
2019 2020x 2019 2020x
(1) (6) (7) (8) (9)
Pondokgede 15 – – –
Jatisampurna 1 242 13 313 2 000
Pondokmelati 1 220 1 874 260
Jatiasih – 200 – 200
Bantargebang 2 – – –
Mustikajaya – – 108 12
Bekasi Timur – – – –
Rawalumbu – – 182 45
Bekasi Selatan – 3 – –
Bekasi Barat – 25 288 427
Medan Satria – – 23 3
Bekasi Utara – – 1 1
Kota BekasiBekasi Municipality 1 260 461 2 789 2 948
Lanjutan Tabel/Continued Table 5.2.13
https:
//bek
asiko
ta.b
ps.go.id

168 Bekasi Municipality in Figures 2021
AGRICULTURE, FORESTRY, LIVESTOCK, AND FISHERY
KecamatanSubdistrict
Jambu Air/Water Apple Jambu Biji/Guava
2019 2020x 2019 2020x
(1) (10) (11) (12) (13)
Pondokgede 114 990 340 2 712
Jatisampurna 886 1 642 1 700 40
Pondokmelati 679 789 92 11 566
Jatiasih 635 668 489 490
Bantargebang 117 379 329 245
Mustikajaya 182 1 275 180 242
Bekasi Timur 205 26 308 192
Rawalumbu 49 – 68 157
Bekasi Selatan 177 166 313 104
Bekasi Barat – 1 700 165 1 300
Medan Satria 156 93 198 81
Bekasi Utara 80 119 71 129
Kota BekasiBekasi Municipality 3 280 7 847 4 253 17 258
Lanjutan Tabel/Continued Table 5.2.13
https:
//bek
asiko
ta.b
ps.go.id

169Kota Bekasi Dalam Angka 2021
PERTANIAN, KEHUTANAN, PETERNAKAN, DAN PERIKANAN
KecamatanSubdistrict
Jengkol/Jengkol Jeruk Besar/Pomelo
2019 2020x 2019 2020x
(1) (14) (15) (16) (17)
Pondokgede – – – –
Jatisampurna – – 409 –
Pondokmelati – – – –
Jatiasih 44 61 10 267
Bantargebang 2 2 20 15
Mustikajaya – – – –
Bekasi Timur – – – –
Rawalumbu – – 2 7
Bekasi Selatan 4 42 – –
Bekasi Barat – – – 25
Medan Satria – – – –
Bekasi Utara – – – –
Kota BekasiBekasi Municipality 50 105 441 314
Lanjutan Tabel/Continued Table 5.2.13
https:
//bek
asiko
ta.b
ps.go.id

170 Bekasi Municipality in Figures 2021
AGRICULTURE, FORESTRY, LIVESTOCK, AND FISHERY
KecamatanSubdistrict
Jeruk Siam/KeprokOrange/Tangerine Mangga/ Mango
2019 2020x 2019 2020x
(1) (18) (19) (20) (21)
Pondokgede – – 958 1 200
Jatisampurna – – 1 699 800
Pondokmelati – – 946 4 055
Jatiasih 4 2 2 156 2 573
Bantargebang – – 405 650
Mustikajaya 10 190 783 7 777
Bekasi Timur – – 471 284
Rawalumbu 1 15 830 541
Bekasi Selatan – – 1 661 258
Bekasi Barat – – 314 121
Medan Satria 24 6 749 245
Bekasi Utara – – 140 349
Kota BekasiBekasi Municipality 39 213 11 112 18 853
Lanjutan Tabel/Continued Table 5.2.13
https:
//bek
asiko
ta.b
ps.go.id

171Kota Bekasi Dalam Angka 2021
PERTANIAN, KEHUTANAN, PETERNAKAN, DAN PERIKANAN
KecamatanSubdistrict
Markisa/Konyal/ Passion fruit Melinjo/ Gnetum/Melinjo
2019 2020x 2019 2020x
(1) (22) (23) (24) (25)
Pondokgede – – 322 890
Jatisampurna – – 2 003 1 020
Pondokmelati – – 1 214 1 457
Jatiasih – – 160 299
Bantargebang – – 84 179
Mustikajaya – – 1 044 2 979
Bekasi Timur – – – –
Rawalumbu – – 25 10
Bekasi Selatan – 215 – –
Bekasi Barat – – 10 7
Medan Satria – – 4 4
Bekasi Utara – – – –
Kota BekasiBekasi Municipality – 215 4 866 6 845
Lanjutan Tabel/Continued Table 5.2.13
https:
//bek
asiko
ta.b
ps.go.id

172 Bekasi Municipality in Figures 2021
AGRICULTURE, FORESTRY, LIVESTOCK, AND FISHERY
KecamatanSubdistrict
Nangka/CempedakJackfruit Pepaya/ Papaya
2019 2020x 2019 2020x
(1) (26) (27) (28) (29)
Pondokgede 84 280 3 936 10 642
Jatisampurna 1 803 800 984 513
Pondokmelati 274 1 560 526 655
Jatiasih 914 961 1 452 1 510
Bantargebang 97 148 248 224
Mustikajaya 533 321 355 1 153
Bekasi Timur 217 238 23 43
Rawalumbu 151 117 177 250
Bekasi Selatan 167 62 67 84
Bekasi Barat 140 258 622 1 558
Medan Satria 88 34 69 51
Bekasi Utara 7 74 50 101
Kota BekasiBekasi Municipality 4 475 4 853 8 509 16 784
Lanjutan Tabel/Continued Table 5.2.13
https:
//bek
asiko
ta.b
ps.go.id

173Kota Bekasi Dalam Angka 2021
PERTANIAN, KEHUTANAN, PETERNAKAN, DAN PERIKANAN
KecamatanSubdistrict
Petai/ Twisted Cluster Bean Pisang/ Banana
2019 2020x 2019 2020x
(1) (30) (31) (32) (33)
Pondokgede 22 – 1 898 3 105
Jatisampurna 49 – 1 031 445
Pondokmelati 133 108 372 1 304
Jatiasih 12 121 1 891 7 623
Bantargebang 23 24 2 487 2 456
Mustikajaya 14 159 165 1 173
Bekasi Timur – – 27 27
Rawalumbu – 20 151 251
Bekasi Selatan – – 229 75
Bekasi Barat – 75 516 990
Medan Satria 14 12 353 80
Bekasi Utara 1 4 199 211
Kota BekasiBekasi Municipality 268 523 9 319 17 740
Lanjutan Tabel/Continued Table 5.2.13
https:
//bek
asiko
ta.b
ps.go.id

174 Bekasi Municipality in Figures 2021
AGRICULTURE, FORESTRY, LIVESTOCK, AND FISHERY
KecamatanSubdistrict
Rambutan/ Rambutan Sawo/ Sapodilla/Sawo
2019 2020x 2019 2020x
(1) (34) (35) (36) (37)
Pondokgede 1 045 976 – 2 074
Jatisampurna 1 233 935 240 –
Pondokmelati 1 525 1 000 82 163
Jatiasih 1 638 2 571 – 775
Bantargebang – 597 – –
Mustikajaya 25 19 101 768
Bekasi Timur 97 22 35 35
Rawalumbu 26 – – 9
Bekasi Selatan 502 14 – –
Bekasi Barat – – – 350
Medan Satria 82 – 114 71
Bekasi Utara – – 17 33
Kota BekasiBekasi Municipality 6 173 6 134 589 4 278
Lanjutan Tabel/Continued Table 5.2.13
https:
//bek
asiko
ta.b
ps.go.id

175Kota Bekasi Dalam Angka 2021
PERTANIAN, KEHUTANAN, PETERNAKAN, DAN PERIKANAN
KecamatanSubdistrict
Sirsak/ Soursop Sukun/ Breadfruit
2019 2020x 2019 2020x
(1) (38) (39) (40) (41)
Pondokgede 79 10 22 204
Jatisampurna 317 – 56 –
Pondokmelati 13 22 – 22
Jatiasih 6 270 217 270
Bantargebang – – – –
Mustikajaya 58 999 232 1 484
Bekasi Timur 24 37 125 255
Rawalumbu 9 33 11 –
Bekasi Selatan 12 40 - 26
Bekasi Barat 23 164 243 440
Medan Satria 27 3 33 12
Bekasi Utara 13 75 6 67
Kota BekasiBekasi Municipality 581 1 653 945 2 780
Lanjutan Tabel/Continued Table 5.2.13
Catatan/Note: x Angka Sementara (ASEM)/Preliminary FiguresSumber/Source: BPS, Statistik Pertanian Hortikultura SPH-BST/BPS-Statistics Indonesia, Agricultural Statistic for Horticulture SPH-BST
https:
//bek
asiko
ta.b
ps.go.id

176 Bekasi Municipality in Figures 2021
AGRICULTURE, FORESTRY, LIVESTOCK, AND FISHERY
Jenis TanamanKind of Plants 2017 2018 2019 2020
(1) (2) (3) (4) (5)
Buah–Buahan/Fruits:
Alpukat/ Avocado 61,60 65,20 102,80 192,40
Belimbing/ Star Fruit 397,80 439,70 639,90 612,90
Duku/Langsat/Kokosan/ Duku 42,10 37,40 126,00 46,10
Durian/ Durian 253,70 297,90 278,90 294,80
Jambu Air/ Rose Apple 419,60 297,30 328,00 784,70
Jambu Biji/ Guava 506,70 454,50 425,30 1 725,80
Jeruk Besar/ Pomelo 15,00 14,60 44,10 31,40
Jeruk Siam/Keprok/ Tangerine/Orange 7,00 10,90 3,90 21,30
Mangga/Mango 1 320,40 819,80 1 111,20 1 885,30
Manggis/Mangosteen – 0,10 – –
Markisa/Konyal/Passion fruit – – – 21,50
Nangka/Cempedak/ Jack Fruit 518,40 463,30 447,50 485,30
Pepaya/ Papaya 2 600,40 1 395,20 850,90 1 678,40
Pisang/ Banana 936,70 1 127,20 931,90 1 774,00
Rambutan/ Rambutan 502,60 459,80 617,30 613,40
Sawo/Sapodilla/ Star Apple 58,50 73,00 58,90 427,80
Sirsak/ Soursop 45,90 33,70 58,10 165,30
Sukun/ Bread Fruit 57,00 73,80 94,50 278,00
Sayuran/ Vegetables
Jengkol/ Jengkol 1,00 3,60 5,00 10,50
Melinjo/ Melinjo 614,80 523,10 486,60 684,50
Petai/ Twisted Cluster Bean 94,30 57,40 26,80 52,30
TabelTable 5.2.14 Produksi Buah–Buahan dan Sayuran Tahunan Menurut
Jenis Tanaman di Kota Bekasi (ton), 2017–2020 Production of Annual Fruits and Vegetables by Kind of Plant
in Bekasi Municipality (ton), 2017–2020
Sumber/Source: BPS, Statistik Pertanian Hortikultura SPH-BST/BPS-Statistics Indonesia, Agricultural Statistic for Horticulture SPH-BST
https:
//bek
asiko
ta.b
ps.go.id

https:
//bek
asiko
ta.b
ps.go.id

178 Bekasi Municipality in Figures 2021
AGRICULTURE, FORESTRY, LIVESTOCK, AND FISHERY
TabelTable 5.2.1 Luas Areal Tanaman Perkebunan Menurut Kecamatan dan
Jenis Tanaman di Kota Bekasi (ha), 2019 dan 2020 Planted Area of Estate Crops by Subdistrict and Type of
Crops in Bekasi Municipality (ha), 2019 and 2020
5.3 PERKEBUNAN ESTATE CROPS
KecamatanSubdistrict
Kelapa Sawit/Oil Palm Kelapa/Coconut
2019 2020 2019 2020
(1) (2) (3) (4) (5)
Pondokgede ... ... ... ...
Jatisampurna ... ... ... ...
Pondokmelati ... ... ... ...
Jatiasih ... ... ... ...
Bantargebang ... ... ... ...
Mustikajaya ... ... ... ...
Bekasi Timur ... ... ... ...
Rawalumbu ... ... ... ...
Bekasi Selatan ... ... ... ...
Bekasi Barat ... ... ... ...
Medan Satria ... ... ... ...
Bekasi Utara ... ... ... ...
Kota BekasiBekasi Municipality ... ... ... ...
https:
//bek
asiko
ta.b
ps.go.id

179Kota Bekasi Dalam Angka 2021
PERTANIAN, KEHUTANAN, PETERNAKAN, DAN PERIKANAN
KecamatanSubdistrict
Karet/Rubber Kopi/Coffee
2019 2020 2019 2020
(1) (6) (7) (8) (9)
Pondokgede ... ... ... ...
Jatisampurna ... ... ... ...
Pondokmelati ... ... ... ...
Jatiasih ... ... ... ...
Bantargebang ... ... ... ...
Mustikajaya ... ... ... ...
Bekasi Timur ... ... ... ...
Rawalumbu ... ... ... ...
Bekasi Selatan ... ... ... ...
Bekasi Barat ... ... ... ...
Medan Satria ... ... ... ...
Bekasi Utara ... ... ... ...
Kota BekasiBekasi Municipality ... ... ... ...
Lanjutan Tabel/Continued Table 5.2.1
https:
//bek
asiko
ta.b
ps.go.id

180 Bekasi Municipality in Figures 2021
AGRICULTURE, FORESTRY, LIVESTOCK, AND FISHERY
KecamatanSubdistrict
Kakao/Cocoa Tebu/Sugar cane
2019 2020 2019 2020
(1) (10) (11) (12) (13)
Pondokgede ... ... ... ...
Jatisampurna ... ... ... ...
Pondokmelati ... ... ... ...
Jatiasih ... ... ... ...
Bantargebang ... ... ... ...
Mustikajaya ... ... ... ...
Bekasi Timur ... ... ... ...
Rawalumbu ... ... ... ...
Bekasi Selatan ... ... ... ...
Bekasi Barat ... ... ... ...
Medan Satria ... ... ... ...
Bekasi Utara ... ... ... ...
Kota BekasiBekasi Municipality ... ... ... ...
Lanjutan Tabel/Continued Table 5.2.1
https:
//bek
asiko
ta.b
ps.go.id

181Kota Bekasi Dalam Angka 2021
PERTANIAN, KEHUTANAN, PETERNAKAN, DAN PERIKANAN
KecamatanSubdistrict
Teh/Tea Tembakau/Tobacco
2019 2020 2019 2020
(1) (14) (15) (16) (17)
Pondokgede ... ... ... ...
Jatisampurna ... ... ... ...
Pondokmelati ... ... ... ...
Jatiasih ... ... ... ...
Bantargebang ... ... ... ...
Mustikajaya ... ... ... ...
Bekasi Timur ... ... ... ...
Rawalumbu ... ... ... ...
Bekasi Selatan ... ... ... ...
Bekasi Barat ... ... ... ...
Medan Satria ... ... ... ...
Bekasi Utara ... ... ... ...
Kota BekasiBekasi Municipality ... ... ... ...
Lanjutan Tabel/Continued Table 5.2.1
Catatan/Note: Data tidak tersedia/Data not available
https:
//bek
asiko
ta.b
ps.go.id

182 Bekasi Municipality in Figures 2021
AGRICULTURE, FORESTRY, LIVESTOCK, AND FISHERY
TabelTable 5.2.2 Produksi Perkebunan Menurut Kecamatan dan Jenis
Tanaman di Kota Bekasi (ton), 2019 dan 2020 Production of Estate by Subdistrict and Type of Crops in
Bekasi Municipality (ton), 2019 and 2020
KecamatanSubdistrict
Kelapa Sawit/Oil Palm Kelapa/Coconut
2019 2020 2019 2020
(1) (2) (3) (4) (5)
Pondokgede ... ... ... ...
Jatisampurna ... ... ... ...
Pondokmelati ... ... ... ...
Jatiasih ... ... ... ...
Bantargebang ... ... ... ...
Mustikajaya ... ... ... ...
Bekasi Timur ... ... ... ...
Rawalumbu ... ... ... ...
Bekasi Selatan ... ... ... ...
Bekasi Barat ... ... ... ...
Medan Satria ... ... ... ...
Bekasi Utara ... ... ... ...
Kota BekasiBekasi Municipality ... ... ... ...http
s://b
ekas
ikota
.bps.g
o.id

183Kota Bekasi Dalam Angka 2021
PERTANIAN, KEHUTANAN, PETERNAKAN, DAN PERIKANAN
KecamatanSubdistrict
Karet/Rubber Kopi/Coffee
2019 2020 2019 2020
(1) (6) (7) (8) (9)
Pondokgede ... ... ... ...
Jatisampurna ... ... ... ...
Pondokmelati ... ... ... ...
Jatiasih ... ... ... ...
Bantargebang ... ... ... ...
Mustikajaya ... ... ... ...
Bekasi Timur ... ... ... ...
Rawalumbu ... ... ... ...
Bekasi Selatan ... ... ... ...
Bekasi Barat ... ... ... ...
Medan Satria ... ... ... ...
Bekasi Utara ... ... ... ...
Kota BekasiBekasi Municipality ... ... ... ...
Lanjutan Tabel/Continued Table 5.2.2
https:
//bek
asiko
ta.b
ps.go.id

184 Bekasi Municipality in Figures 2021
AGRICULTURE, FORESTRY, LIVESTOCK, AND FISHERY
KecamatanSubdistrict
Kakao/Cocoa Tebu/Sugar cane
2019 2020 2019 2020
(1) (10) (11) (12) (13)
Pondokgede ... ... ... ...
Jatisampurna ... ... ... ...
Pondokmelati ... ... ... ...
Jatiasih ... ... ... ...
Bantargebang ... ... ... ...
Mustikajaya ... ... ... ...
Bekasi Timur ... ... ... ...
Rawalumbu ... ... ... ...
Bekasi Selatan ... ... ... ...
Bekasi Barat ... ... ... ...
Medan Satria ... ... ... ...
Bekasi Utara ... ... ... ...
Kota BekasiBekasi Municipality ... ... ... ...
Lanjutan Tabel/Continued Table 5.2.2
https:
//bek
asiko
ta.b
ps.go.id

185Kota Bekasi Dalam Angka 2021
PERTANIAN, KEHUTANAN, PETERNAKAN, DAN PERIKANAN
KecamatanSubdistrict
Teh/Tea Tembakau/Tobacco
2019 2020 2019 2020
(1) (14) (15) (16) (17)
Pondokgede ... ... ... ...
Jatisampurna ... ... ... ...
Pondokmelati ... ... ... ...
Jatiasih ... ... ... ...
Bantargebang ... ... ... ...
Mustikajaya ... ... ... ...
Bekasi Timur ... ... ... ...
Rawalumbu ... ... ... ...
Bekasi Selatan ... ... ... ...
Bekasi Barat ... ... ... ...
Medan Satria ... ... ... ...
Bekasi Utara ... ... ... ...
Kota BekasiBekasi Municipality ... ... ... ...
Lanjutan Tabel/Continued Table 5.2.2
Catatan/Note: Data tidak tersedia/Data not available
https:
//bek
asiko
ta.b
ps.go.id

186 Bekasi Municipality in Figures 2021
AGRICULTURE, FORESTRY, LIVESTOCK, AND FISHERY
TabelTable 5.4.1 Populasi Ternak Menurut Kecamatan dan Jenis Ternak di
Kota Bekasi (ekor), 2020 Livestock Population by Subdistrict and Kind of Livestock in
Bekasi Municipality (tail), 2020
5.4 PETERNAKAN LIVESTOCK
KecamatanSubdistrict
Sapi PotongBeef Cattle
Sapi PerahDairy Cattle
KerbauBuffalo
KambingGoat
DombaSheep
BabiPig
KudaHorse
(1) (2) (3) (4) (5) (6) (7) (8)
Pondokgede 192 – – 668 353 – –
Jatisampurna 2 565 37 15 342 395 – 6
Pondokmelati 19 – 6 608 592 58 –
Jatiasih 406 11 14 454 526 – –
Bantargebang 317 – – 1 061 592 – –
Mustikajaya 975 7 33 1 238 592 – 22
Bekasi Timur 300 5 4 1 397 921 – 10
Rawalumbu 187 8 5 617 526 – 2
Bekasi Selatan 639 – 1 1 246 789 – –
Bekasi Barat 668 – – 784 658 – –
Medan Satria – – 1 550 526 – –
Bekasi Utara 159 1 4 955 197 – 3
Kota BekasiBekasi Municipality 6 427 69 83 9 920 6 667 58 43
Sumber/Source: Dinas Ketahanan Pangan, Pertanian dan Perikanan Kota Bekasi/Bekasi Municipal Agriculture and Fisheries Office
https:
//bek
asiko
ta.b
ps.go.id

187Kota Bekasi Dalam Angka 2021
PERTANIAN, KEHUTANAN, PETERNAKAN, DAN PERIKANAN
TabelTable 5.4.2 Produksi Daging Ternak Menurut Kecamatan dan Jenis
Ternak di Kota Bekasi (kg), 2020 Livestock Production by Subdistrict and Kind of Livestock in
Bekasi Municipality (kg), 2020
KecamatanSubdistrict Sapi/Beef Kerbau
BuffaloKambing
GoatDombaSheep Babi/Pig Kuda
Horse(1) (2) (3) (4) (5) (6) (7)
Pondokgede 139 710 – 301 709 210 141 – –
Jatisampurna 99 663 1 247 297 013 206 868 – –
Pondokmelati 107 399 416 310 031 215 922 2 249 –
Jatiasih 315 143 1 455 296 650 206 613 – –
Bantargebang 60 298 – 291 954 203 340 – –
Mustikajaya 105 806 1 663 295 941 206 103 – –
Bekasi Timur 161 326 208 306 422 213 400 – –
Rawalumbu 140 620 416 301 709 210 141 – –
Bekasi Selatan 123 554 624 298 825 208 129 – –
Bekasi Barat 114 908 – 295 216 205 607 – –
Medan Satria 71 903 – 312 552 217 680 – –
Bekasi Utara 1 095 833 208 305 350 212 649 – –
Kota BekasiBekasi Municipality 2 536 163 6 237 3 613 372 2 516 593 2 249 –
Sumber/Source: Dinas Ketahanan Pangan, Pertanian dan Perikanan Kota Bekasi/Bekasi Municipal Agriculture and Fisheries Office
https:
//bek
asiko
ta.b
ps.go.id

188 Bekasi Municipality in Figures 2021
AGRICULTURE, FORESTRY, LIVESTOCK, AND FISHERY
TabelTable 5.4.3 Populasi Unggas Menurut Kecamatan dan Jenis Unggas di
Kota Bekasi (ekor), 2020 Poultry Population by Subdistrict and Kind of Poultry in
Bekasi Municipality (tail), 2020
KecamatanSubdistrict
Ayam BurasDomestic Hens
Ayam Ras Petelur
Layer
Ayam RasPedaging
Broile
ItikDuck
(1) (2) (3) (4) (5)
Pondokgede 9 589 – – 1 124
Jatisampurna 10 888 – 20 004 1 031
Pondokmelati 10 383 – 8 991 1 041
Jatiasih 10 935 – 142 975 1 625
Bantargebang 12 110 – 12 654 2 591
Mustikajaya 11 444 93 947 100 696 1 713
Bekasi Timur 9 415 – 2 247 1 009
Rawalumbu 10 589 – 1 663 521
Bekasi Selatan 10 912 – 2 017 1 869
Bekasi Barat 10 025 – – 1 066
Medan Satria 10 904 – – 1 928
Bekasi Utara 11 651 – 4 495 2 209
Kota BekasiBekasi Municipality 128 845 93 947 295 742 17 727
Sumber/Source: Dinas Ketahanan Pangan, Pertanian dan Perikanan Kota Bekasi/Bekasi Municipal Agriculture and Fisheries Office
https:
//bek
asiko
ta.b
ps.go.id

189Kota Bekasi Dalam Angka 2021
PERTANIAN, KEHUTANAN, PETERNAKAN, DAN PERIKANAN
TabelTable 5.4.4 Produksi Daging Unggas Menurut Kecamatan dan Jenis
Unggas di Kota Bekasi (kg), 2020 Meat Production of Poultry by Subdistrict and Kind of
Poultry in Bekasi Municipality (kg), 2020
KecamatanSubdistrict
Ayam BurasDomestic Hens
Ayam Ras Petelur
Layer
Ayam RasPedaging
Broile
ItikDuck
(1) (2) (3) (4) (5)
Pondokgede 37 307 – 373 217 1 775
Jatisampurna 44 889 – 559 826 1 442
Pondokmelati 30 757 – 234 391 1 969
Jatiasih 50 193 – 536 471 2 800
Bantargebang 62 642 – 425 292 2 486
Mustikajaya 33 172 42 668 491 522 3 250
Bekasi Timur 43 385 – 393 537 1 974
Rawalumbu 39 300 – 97 738 1 733
Bekasi Selatan 50 926 – 330 486 2 045
Bekasi Barat 39 189 – 219 927 1 755
Medan Satria 17 555 – 45 916 2 099
Bekasi Utara 24 938 – 186 325 1 980
Kota BekasiBekasi Municipality 474 253 42 668 3 894 648 25 308
Sumber/Source: Dinas Ketahanan Pangan, Pertanian dan Perikanan Kota Bekasi/Bekasi Municipal Agriculture and Fisheries Office
https:
//bek
asiko
ta.b
ps.go.id

190 Bekasi Municipality in Figures 2021
AGRICULTURE, FORESTRY, LIVESTOCK, AND FISHERY
TabelTable 5.4.5 Produksi Telur Unggas Menurut Kecamatan dan Jenis
Unggas di Kota Bekasi (kg), 2020 Poultry Eggs Production by Subdistrict and Kind of Poultry
in Bekasi Municipality (kg), 2020
KecamatanSubdistrict
Ayam BurasDomestic Hens
Ayam Ras PetelurLayer
ItikDuck
(1) (2) (3) (4)
Pondokgede 5 881 – 7 349
Jatisampurna 6 677 – 6 741
Pondokmelati 6 368 – 6 806
Jatiasih 6 706 – 10 625
Bantargebang 7 427 – 16 941
Mustikajaya 7 018 846 713 11 200
Bekasi Timur 5 774 – 6 597
Rawalumbu 6 494 – 3 406
Bekasi Selatan 6 692 – 12 220
Bekasi Barat 6 148 – 6 970
Medan Satria 6 687 – 12 606
Bekasi Utara 7 145 – 14 443
Kota BekasiBekasi Municipality 79 017 846 713 115 904
Sumber/Source: Dinas Ketahanan Pangan, Pertanian dan Perikanan Kota Bekasi/Bekasi Municipal Agriculture and Fisheries Office
https:
//bek
asiko
ta.b
ps.go.id

https:
//bek
asiko
ta.b
ps.go.id

192 Bekasi Municipality in Figures 2021
AGRICULTURE, FORESTRY, LIVESTOCK, AND FISHERY
TabelTable 5.5.1 Produksi Perikanan Darat dan Budidaya Ikan Hias di Kota
Bekasi, 2016 - 2020 Production of Inland Fisheries and Ornamental Fish Culture
in Bekasi Municipality, 2016 - 2020
5.5 PERIKANAN FISHERY
Jenis PerikananKind of Fisheries 2016 2017 2018 2019 2020
(1) (2) (3) (4) (5) (6)
Perikanan Darat (ton)Inland Fisheries (ton) 2 035,35 2 197,95 1 856,87 1 738,47 1 782,60
Kolam/Tambak (ton)Fresh Water/Brackish (ton)
1 980,85 2 113,55 1 796,61 1 683,53 1 723
Sawah/ Paddy Field – – – – –Perairan Umum (ton)Inland Open Water (ton)
54,50 84,40 60,26 54,94 59,60
Budidaya Ikan Hias (ekor)Ornamental Fish Culture (tail) 4 906 300 21 006 510 18 622 240 20 623 000 22 560 000
Sumber/Source: Dinas Ketahanan Pangan, Pertanian dan Perikanan Kota Bekasi/Bekasi Municipal Agriculture and Fisheries Office
https:
//bek
asiko
ta.b
ps.go.id

193Kota Bekasi Dalam Angka 2021
PERTANIAN, KEHUTANAN, PETERNAKAN, DAN PERIKANAN
TabelTable 5.5.2 Produksi Perikanan Darat Menurut Jenis Ikan di Kota
Bekasi, 2020 Inland Fisheries Production by Kind of Fish in Bekasi
Municipality, 2020
KecamatanSubdistrict Satuan/Unit
Kolam/TambakFresh Water/
Brackish
SawahPaddy Field
JumlahTotal
(1) (2) (3) (4) (5)
Mas/Goldfish ton/ton – – –
Tawes/Tawes Fish ton/ton – – –
Mujair/Mujair ton/ton – – –
Nila/Nila ton/ton 118,65 – 118,65
Gurame/Carp ton/ton 195,98 – 195,98
Sepat siam/Siamese sepat ton/ton – – –
Tambakan/Farm fish ton/ton – – –
Lele/Catfish ton/ton 1 309,06 – 1309,06
gabus/Cork fish ton/ton – – –
ikan darat/Land fish ton/ton – – –
Belanak/Belanak ton/ton – – –
Kakap/Snapper ton/ton – – –
Ikan lain/Others ton/ton 59,60 – 59,60
udang windu/Windu shrimp ton/ton – – –
udang putih/White shrimp ton/ton – – –
udang api-api/Shrimp ton/ton – – –
patin/Catfish ton/ton 99,30 – 99,30
ikan hias/Ornamental Fish ekor/tail 22 560 000 – 22 560 000
Sumber/Source: Dinas Ketahanan Pangan, Pertanian dan Perikanan Kota Bekasi/Bekasi Municipal Agriculture and Fisheries Office
https:
//bek
asiko
ta.b
ps.go.id

194 Bekasi Municipality in Figures 2021
AGRICULTURE, FORESTRY, LIVESTOCK, AND FISHERY
TabelTable 5.5.3 Nilai Produksi Perikanan Darat Menurut Jenis Ikan di Kota
Bekasi (Ribu Rupiah), 2020 Inland Fisheries Production Value by Kind of Fish in Bekasi
Municipality (thousand rupiahs), 2020
KecamatanSubdistrict
Kolam/TambakFresh Water/
Brackish
SawahPaddy Field
JumlahTotal
(1) (3) (4) (5)
Mas/Goldfish – – –
Tawes/Tawes Fish – – –
Mujair/Mujair – – –
Nila/Nila 2 966 259 – 2 966 259
Gurame/Carp 8 819 100 – 8 819 100
Sepat siam/Siamese sepat – – –
Tambakan/Farm fish – – –
Lele/Catfish 23 563 080 – 23 563 080
gabus/Cork fish – – –
ikan darat/Land fish – – –
Belanak/Belanak – – –
Kakap/Snapper – – –
Ikan lain/Others 1 192 000 – 1 192 000
udang windu/Windu shrimp – – –
udang putih/White shrimp – – –
udang api-api/Shrimp – – –
patin/Catfish 1 588800 – 1 588 800
ikan hias/Ornamental Fish 56 400 000 – 56 400 000
Sumber/Source: Dinas Ketahanan Pangan, Pertanian dan Perikanan Kota Bekasi/Bekasi Municipal Agriculture and Fisheries Office
https:
//bek
asiko
ta.b
ps.go.id
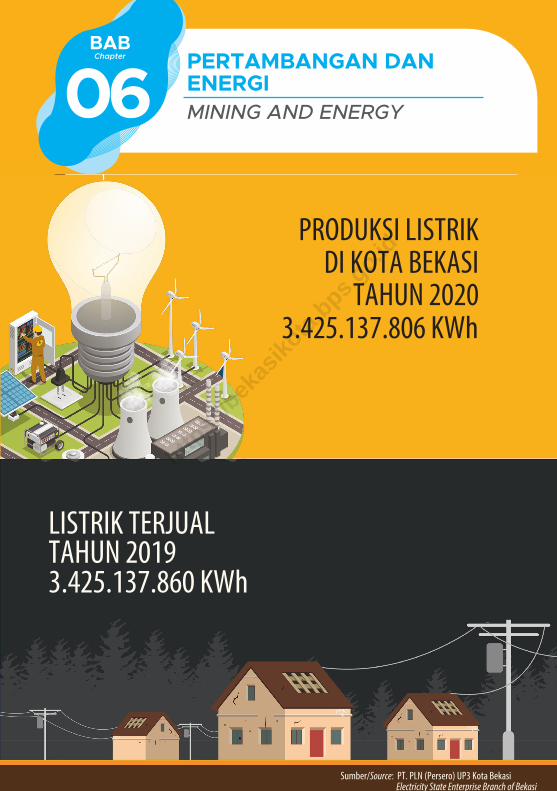
6. Industri, Pertambangan, dan Energi/Industry, Mining, and Energy ........
6. INDUSTRI, PERTAMBANGAN, DAN ENERGI/INDUSTRY, MINING, AND ENERGY
Sumber/Source: PT. PLN (Persero) UP3 Kota Bekasi Electricity State Enterprise Branch of Bekasi
PRODUKSI LISTRIKDI KOTA BEKASI
LISTRIK TERJUALTAHUN 2019
ChapterBAB
06PERTAMBANGAN DANENERGIMINING AND ENERGY
3.425.137.806 KWhTAHUN 2020
3.425.137.860 KWh
https:
//bek
asiko
ta.b
ps.go.id

https:
//bek
asiko
ta.b
ps.go.id

197Kota Bekasi Dalam Angka 2021
INDUSTRI, PERTAMBANGAN, DAN ENERGI
PENJELASAN TEKNIS TECHNICAL NOTES
1. Pertambangan adalah suatu kegiatan pengambilan endapan bahan galian berharga dan bernilai ekonomis dari dalam kulit bumi, di bawah permukaan bumi, dan di bawah permukaan air.
2. Bahan tambang adalah hasil produksi dari kegiatan pertambangan yang merupakan sumber daya alam yang tidak dapat diperbarui.
3. Kapasitas listrik terpasang adalah total kapasitas dai seluruh mesin pembangkit listik yang dioperasikan.
4. Kapasitas produksi potensial adalah hubungan antara output yang sebenarnya diproduksi dengan peralatan yang terpasang dan potensi output yang dapat diproduksi dengan peralatan terpasang tersebut, jika kapasitas sepenuhnya digunakan.
5. Listrik yang dibangkitkan adalah jumlah listrik yang dibangkitkan oleh seluruh mesin pembangkit listrik dan dinyatakan dalam satuan dasar Watt hours.
6. Jumlah listrik/gas/air bersih yang terjual/ didistribusikan adalah banyaknya listrik/gas/air bersih yang disalurkan kepada para pelanggan.
7. Pelanggan adalah individu atau kelompok, baik rumah tangga, perusahaan atau institusi non
1. Mining is an activity of taking valued quarried material from the earth layer, under earth surface, and under water level.
2. Mine material is a natural resource as the production of mining operations that can not be renewabled.
3. Installed electricity capacity is the total capacity of all operated power plants machines.
4. Potential capacity production is relationship between output that is actually produced with the installed equipment, and the potential output which could be produced with it, if capacity was fully used.
5. Electricity generated is the amount of electricity generated by all power plant engine in Watt hours standard unit.
6. Sold/distributed electricity/gas/ cleaned water is total electricity/ gas/cleaned water distributed to customers.
7. Customers are individuals or groups, whether household, company or non-profit institutions
https:
//bek
asiko
ta.b
ps.go.id

198 Bekasi Municipality in Figures 2021
INDUSTRY, MINING, AND ENERGY
profit yang membeli air bersih dari perusahaan air bersih.
8. Volume air bersih yang disalurkan adalah banyaknya air bersih yang disalurkan oleh perusahaan air bersih (dalam satuan m3). Semakin besar volume air bersih yang disalurkan maka akan semakin terpenuhi kebutuhan konsumen akan air bersih.
that buy water supply from water supply establishment.
8. Volume of water distributed is the amount of water that can be distributed by the water company (in units of m3). The greater the volume of water distributed it will be increasingly fulfilled the needs of consumers for clean water.
https:
//bek
asiko
ta.b
ps.go.id

199Kota Bekasi Dalam Angka 2021
INDUSTRI, PERTAMBANGAN, DAN ENERGI
ULASAN DESCRIPTION
Listrik merupakan salah satu komponen vital dalam kehidupan masyarakat, yaitu sebagai salah satu sumber energi yang digunakan baik oleh rumahtangga, bisnis, pemerintah, industri maupun sosial.
Seiring dengan perkembangan masyarakat, kebutuhan akan listrik pun bertambah dari tahun ke tahun, Penggunaan listrik di Kota Bekasi pada tahun 2020 dilihat dari jumlah pelanggan sudah mencapai 918.375 pelanggan. Sementara itu, produksi listrik yang terjual mencapai 3.425.137.806 Kwh dan pajak yang disetorkan mencapai 4.119,99 miliar rupiah.
Selain sektor listrik, yang tidak kalah pentingnya adalah sektor air minum, Berdasarkan data dari PDAM Tirta Patriot Kota Bekasi, pada tahun 2020 tercatat volume air yang disalurkan sebanyak 11.459.878 m3 dengan nilai nominal sebesar 78,26 miliar rupiah.
Electricity is one of the vital components in people's lives, namely as one of the sources of energy used by households, businesses, governments, industries and social.
Along with the development of the community, the need for electricity has increased from year to year, the use of electricity in the city of Bekasi in 2020 judging by the number of customers has reached 918,375 customers. Meanwhile, electricity production sold reached 3,425,137,806 Kwh and taxes deposited reached 4,119.99 billion rupiah.
In addition to the electricity sector, no less important is the drinking water sector, based on data from PDAM Tirta Patriot Bekasi City, in 2020 recorded the volume of water distributed as much as 11,459,878 m3 with a nominal value of 78.26 billion rupiah.
https:
//bek
asiko
ta.b
ps.go.id

200 Bekasi Municipality in Figures 2021
INDUSTRY, MINING, AND ENERGY
Sumber/Source : ....
Sosial
BisnisIndustriPublikLain-lain
0
100,000
200,000
300,000
400,000
500,000
600,000
700,000
800,000
900,000
9,715
863,331
41,539
899 2,657
6.1 Jumlah Pelanggan PLN menurut Jenis Pelanggan, 2020 Number of PLN Customers by Customer Type, 2020
GambarFigures
https:
//bek
asiko
ta.b
ps.go.id

201Kota Bekasi Dalam Angka 2021
INDUSTRI, PERTAMBANGAN, DAN ENERGI
Sumber/Source : ....
Sosial
BisnisIndustriPublikLain-lain
0
200,000,000
400,000,000
600,000,000
800,000,000
1,000,000,000
1,200,000,000
1,400,000,000
1,600,000,000
1,800,000,000
2,000,000,000
SosialRumahtangga Bisnis
IndustriPublik
100,722,859
1,854,553,571
568,913,058
812,296,775
50,996,122
6.2 Jumlah Listrik Terjual (KWh) menurut Jenis Pelanggan, 2020 Number of Electricity Sold (KWh) by Customer Type, 2020
GambarFigures
https:
//bek
asiko
ta.b
ps.go.id

202 Bekasi Municipality in Figures 2021
INDUSTRY, MINING, AND ENERGY
TabelTable 6.1 Daya Terpasang, Produksi, dan Distribusi Listrik PT. PLN
(Persero) pada Cabang/Ranting PLN Menurut Kecamatan di Kota Bekasi, 2020
Installed Electricity Power, Production, and Distribution of PT. PLN (Persero) at PLN Branch by Subdistrict in Bekasi Municipality, 2020
KecamatanSubdistrict
DayaTerpasang
InstalledElectricity
Power(KW)
ProduksiListrik
ElectricityProduction
(KWh)
ListrikTerjual
ElectricitySold
(KWh)
DipakaiSendiri
OwnUsed
(KWh)
Susut/Hilang
Shrinkage/Lost
(KWh)
(1) (2) (3) (4) (5) (6)
Pondokgede ... ... ... ... ...
Jatisampurna ... ... ... ... ...
Pondokmelati ... ... ... ... ...
Jatiasih ... ... ... ... ...
Bantargebang ... ... ... ... ...
Mustikajaya ... ... ... ... ...
Bekasi Timur ... ... ... ... ...
Rawalumbu ... ... ... ... ...
Bekasi Selatan ... ... ... ... ...
Bekasi Barat ... ... ... ... ...
Medan Satria ... ... ... ... ...
Bekasi Utara ... ... ... ... ...
Kota BekasiBekasi Municipality ... ... 3 425 137 806 ... ...
Catatan/Note: Data per Kecamatan tidak tersedia/Data by Subdistrict Not AvailableSumber/Source: PT. PLN (Persero) UP3 Bekasi / Electricity State Enterprise Branch of Bekasi Municipality
https:
//bek
asiko
ta.b
ps.go.id

203Kota Bekasi Dalam Angka 2021
INDUSTRI, PERTAMBANGAN, DAN ENERGI
TabelTable 6.2 Jumlah Pelanggan Listrik Menurut Kecamatan di Kota
Bekasi, 2016–2020 Number of Electricity Customers by Subdistrict in Bekasi
Municipality, 2016–2020
KecamatanSubdistrict 2016 2017 2018 2019 2020
(1) (2) (3) (4) (5) (6)
Pondokgede ... ... ... ... ...
Jatisampurna ... ... ... ... ...
Pondokmelati ... ... ... ... ...
Jatiasih ... ... ... ... ...
Bantargebang ... ... ... ... ...
Mustikajaya ... ... ... ... ...
Bekasi Timur ... ... ... ... ...
Rawalumbu ... ... ... ... ...
Bekasi Selatan ... ... ... ... ...
Bekasi Barat ... ... ... ... ...
Medan Satria ... ... ... ... ...
Bekasi Utara ... ... ... ... ...
Kota BekasiBekasi Municipality 421 669 447 324 662 386 881 680 918 375
Catatan/Note: Data per Kecamatan tidak tersedia/Data by Subdistrict Not AvailableSumber/Source: PT. PLN (Persero) UP3 Bekasi / Electricity State Enterprise Branch of Bekasi Municipality
https:
//bek
asiko
ta.b
ps.go.id

204 Bekasi Municipality in Figures 2021
INDUSTRY, MINING, AND ENERGY
TabelTable 6.3 Jumlah Pelanggan, Listrik Terjual, dan Pendapatan PT PLN
pada Cabang/Ranting PLN Menurut Jenis Pelanggan di Kota Bekasi, 2020
Number of Customers, Electricity Sold and Revenue PT PLN at PLN Branch by Customer Type in Bekasi Municipality, 2020
Jenis PelangganSubdistrict
Jumlah PelangganNumber of Customers
Listrik TerjualElectricity Sold
(KWh)
PendapatanRevenue
(Rp)(1) (2) (3) (4)
Sosial/ Social 9 715 100 722 859 88 920 293 280
Rumah Tangga/ Household 863 331 1 854 553 571 2 275 111 216 045
Bisnis/ Business 41 539 568 913 058 703 749 864 327
Industri/ Industry 899 812 296 775 902 063 992 723
Pemerintah/ Government 2 657 50 996 122 69 835 147 837
Lain - lain/ Others 234 37 655 421 80 309 495 521
Jumlah/ Total 918 375 3 425 137 806 4 119 990 009 733
Sumber/Source: PT. PLN (Persero) UP3 Bekasi / Electricity State Enterprise Branch of Bekasi Municipality
https:
//bek
asiko
ta.b
ps.go.id

205Kota Bekasi Dalam Angka 2021
INDUSTRI, PERTAMBANGAN, DAN ENERGI
TabelTable 6.4 Jumlah Pelanggan dan Air yang Disalurkan Menurut
Kecamatan di Kota Bekasi, 2020 Number of Customers and Distributed Water by Subdistrict
in Bekasi Municipality, 2020
KecamatanSubdistrict
PelangganNumber of Customers
Air DisalurkanDistributed Water
(m3)
NilaiValue(Rp)
(1) (2) (3) (4)
Pondokgede ... ... ...
Jatisampurna ... ... ...
Pondokmelati ... ... ...
Jatiasih ... ... ...
Bantargebang ... ... ...
Mustikajaya ... ... ...
Bekasi Timur ... ... ...
Rawalumbu ... ... ...
Bekasi Selatan ... ... ...
Bekasi Barat ... ... ...
Medan Satria ... ... ...
Bekasi Utara ... ... ...
Kota BekasiBekasi Municipality ... 11 459 878 78 262 971 780
Catatan/Note: Data per Kecamatan tidak tersedia/Data by Subdistrict Not AvailableSumber/Source: PDAM Tirta Patriot Kota Bekasi
https:
//bek
asiko
ta.b
ps.go.id
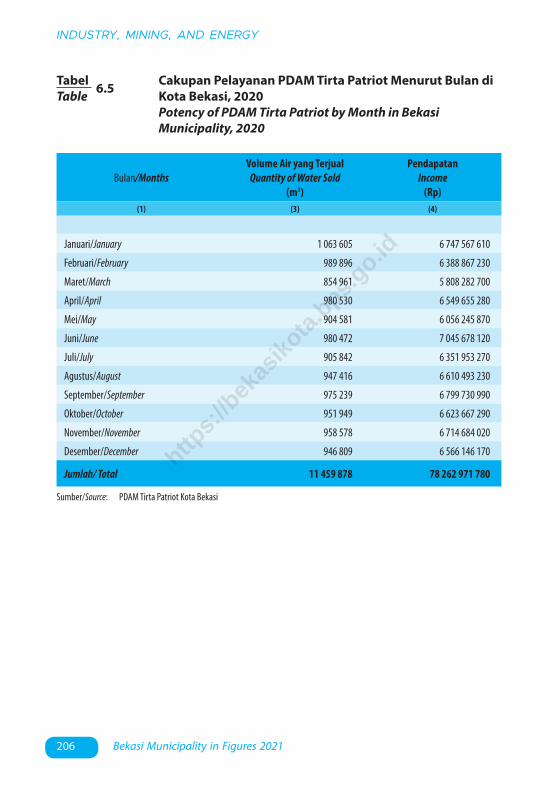
206 Bekasi Municipality in Figures 2021
INDUSTRY, MINING, AND ENERGY
TabelTable 6.5 Cakupan Pelayanan PDAM Tirta Patriot Menurut Bulan di
Kota Bekasi, 2020 Potency of PDAM Tirta Patriot by Month in Bekasi
Municipality, 2020
Bulan/MonthsVolume Air yang Terjual
Quantity of Water Sold(m3)
PendapatanIncome
(Rp)(1) (3) (4)
Januari/January 1 063 605 6 747 567 610
Februari/February 989 896 6 388 867 230
Maret/March 854 961 5 808 282 700
April/April 980 530 6 549 655 280
Mei/May 904 581 6 056 245 870
Juni/June 980 472 7 045 678 120
Juli/July 905 842 6 351 953 270
Agustus/August 947 416 6 610 493 230
September/September 975 239 6 799 730 990
Oktober/October 951 949 6 623 667 290
November/November 958 578 6 714 684 020
Desember/December 946 809 6 566 146 170
Jumlah/ Total 11 459 878 78 262 971 780
Sumber/Source: PDAM Tirta Patriot Kota Bekasi
https:
//bek
asiko
ta.b
ps.go.id

7. Pariwisata/Tourism ...................................................................................................
7. PARIWISATA/TOURISM
Kecamatan
KecamatanKecamatan
Bekasi Timur
Kecamatan
Kecamatan
Bekasi Selatan
5 KECAMATAN DENGAN JUMLAHRUMAH MAKAN/RESTORAN TERBANYAK
DI KOTA BEKASIFive Subdistrict with the most restaurant
in Bekasi Municipality
2020
526
Pondokgede357Bekasi Utara
302253
228Medan Satria
ChapterBAB
07 PARIWISATATOURISM
https:
//bek
asiko
ta.b
ps.go.id

https:
//bek
asiko
ta.b
ps.go.id

209Kota Bekasi Dalam Angka 2021
PARIWISATA
PENJELASAN TEKNIS TECHNICAL NOTES
1. Wisatawan mancanegara adalah setiap pengunjung yang mengunjungi suatu negara di luar tempat tinggalnya, didorong oleh satu atau beberapakeperluan tanpa bermaksud memperoleh penghasilan di tempat yang dikunjungi dan lamanya kunjungan tersebut tidak lebih dari satu tahun. Definisi ini mencakup dua kategori wisatawan mancanegara, yaitu:a. Wisatawan (turis) adalah
setiap pengunjung seperti definisi di atas yang tinggal paling sedikit 24 jam, akan tetapi tidak lebih dari satu tahun di tempat yang dikunjungi, dengan maksud antara lain: berlibur, rekreasi, olahraga, bisnis, menghadiri pertemuan, studi, dan kunjungan dengan alasan kesehatan.
b. Excursionist adalah setiap pengunjung seperti definisi di atas yang tinggal kurang dari 24 jam di tempat yang dikunjungi (termasuk “Cruise passengers”).
Cruise Passengers adalah setiap pengunjung yang tiba di suatu negara di mana mereka tidak menginap di akomodasi yang tersedia di negara tersebut, misalnya dengan kapal laut.
1. An International Visitor is any person visiting a country other than his usual place of residence for any reason other than for earning income in the country visited, and the length of stay is no more than one year. This definition covers two categories of foreign visitors, namely:
a. “Tourist” is any visitor staying or at least 24 hours, but no more than one year, in the country visited, with the intention of visiting, and for any of these purposes: Pleasure, recreation and sports, Business,visiting friends and relatives, missions, attending meetings, conferences, visit for health reasons and study.
b. “Excursionist” is any visitor staying less than 24 hours in the country visited including, “Cruise Passengers”, i.e. visitors arriving in a country without staying in any accommodation available in the visited country.
https:
//bek
asiko
ta.b
ps.go.id

210 Bekasi Municipality in Figures 2021
TOURISM
2. Rata-rata lama tinggal adalah rata-rata waktu tinggal wisatawan mancanegara di Indonesia untuk satu kali kunjungan.
3. Usaha penyediaan akomodasi adalah usaha yang menyediakan pelayanan penginapan yang dapat dilengkapi dengan pelayanan pariwisata lainnya. Usaha penyediaan akomodasi dapat berupa hotel, vila, pondok wisata, bumi perkemahan, persinggahan karavan, dan akomodasi lainnya yang digunakan untuk tujuan pariwisata.
4. Hotel adalah penyediaan akomodasi secara harian berupa kamar-kamar di dalam satu bangunan yang dapat dilengkapi dengan jasa pelayanan makan dan minum, kegiatan hiburan dan atau fasilitas lainnya. Hotel terdiri dari hotel berbintang dan hotel non- bintang.
5. Hotel bintang adalah usaha penyediaan jasa pelayanan penginapan, makan minum serta jasa lainnya bagi umum dengan menggunakan sebagian atau seluruh bangunan. Usaha ini dikelola secara komersial serta memenuhi ketentuan persyaratan sebagai hotel bintang (termasuk berlian) yang ditetapkan dalam surat keputusan instansi yang membinanya. Misalnya hotel bintang lima, hotel bintang empat dan seterusnya.
2. Average length of stay is the average stay duration of foreign visitor in Indonesia for one trip.
3. The business of providing accommodation is a business that provides specialty services that can be equipped with other tourism services. It includes hotel, villa, cottage, camping, caravan stop, and other accommodation that are used for tourism purpose.
4. Hotel is a daily supply of accommodation rooms within a building which can be equipped with eating and drinking services, entertainment activities and/or other facilities. Hotel consists of a classified hotel and a non-classified hotel.
5. A star hotel is the business of providing an accommodation, eating and drinking as well as other services for the public by using a building or a part of a building. It is managed commercially and meets specified requirements as a star hotel (including diamonds) set forth in the decree of fostering agency. For example, five star hotel, four star hotel, and so on.
https:
//bek
asiko
ta.b
ps.go.id

211Kota Bekasi Dalam Angka 2021
PARIWISATA
6. Tingkat penghunian kamar hotel adalah persentase banyaknya malam kamar yang dihuni terhadap banyaknya malam kamar yang tersedia.
7. Rata-rata lamanya tamu menginap adalah banyaknya malam tempat tidur yang terpakai (malam tamu) dengan banyaknya tamu yang menginap di hotel atau akomodasi lainnya.
6. Room occupancy rate is the number of room-nights occupied divided by the number of roomnights available, multiplied by 100 percent.
7. Average length of stay is the number of bed-nights used (guest night) divided by the number of guests coming to spend the night at the accommodation.
https:
//bek
asiko
ta.b
ps.go.id

212 Bekasi Municipality in Figures 2021
TOURISM
ULASAN DESCRIPTION
Dalam mendukung pembangunan ekonomi suatu wilayah, sektor pariwisata memiliki andil yang sangat besar. Dengan memanfaatkan sumber daya alam dan sumber daya manusia yang ada dengan sebaik-baiknya maka suatu daerah dapat menarik para wisatawan baik yang ada di dalam negeri maupun wisatawan asing untuk datang dan berwisata di daerahnya.
Pertumbuhan sektor pariwisata dapat dilihat dari perkembangan wisatawan yang berkunjung, perkembangan hotel/penginapan dan perkembangan fasilitas akomodasi lainnya.
Fasilitas pendukung sektor pariwisata berupa hotel/penginapan tersedia di Kota Bekasi, mulai dari hotel melati sampai hotel berbintang. Berdasarkan data dari Dinas Pariwisata dan Kebudayaan Kota Bekasi terdapat 32 hotel melati dan 15 hotel berbintang di Kota Bekasi, selain itu terdapat juga rumah makan dan restoran. Jika dilihat dari jumlah rumah makan terjadi peningkatan di tahun 2020 yaitu dari 2.312 rumah makan dan restoran pada tahun 2019 menjadi 2.507 rumah makan dan restoran.
In supporting the economic development of a region, the tourism sector has a large contribution. By making use of natural resources and human resources are there with the best the region can attract tourists both in domestic and foreign tourists to come and tour the area.
The growth of the tourism sector can be seen from the development of the tourists who visit, the development of hotel/lodgingandotheraccommodation facilities development.
Tourism sector support facilities in the form of hotels are available in Bekasi Municipality, ranging from budget hotels to star hotels. Based on data from the Bekasi Municipality Tourism and Culture Office there are 32 budget hotels and 15 star hotels in Bekasi Municipality, in addition there are also restaurants. When viewed from the number of restaurants there is an increase in 2020, namely from 2,312 restaurants in 2019 to 2,507 restaurants.
https:
//bek
asiko
ta.b
ps.go.id

https:
//bek
asiko
ta.b
ps.go.id

214 Bekasi Municipality in Figures 2021
TOURISM
Sumber/Source : Dinas Pariwisata dan Kebudayaan Kota Bekasi/Bekasi Municipality Tourism and Culture Office
7.1 Jumlah Restoran di Kota Bekasi, 2017–2020 Number of Restaurants in Bekasi Municipality, 2017–2020
GambarFigures
0
500
1000
1500
2000
2500
3000
2017 2018 2019 2020
1635
1915
2312
2507
https:
//bek
asiko
ta.b
ps.go.id

215Kota Bekasi Dalam Angka 2021
PARIWISATA
Sumber/Source : Dinas Pariwisata dan Kebudayaan Kota Bekasi/Bekasi Municipality Tourism and Culture Office
7.2 Jumlah Penginapan/Hotel di Kota Bekasi, 2020 Number of Hotels in Bekasi Municipality, 2020
GambarFigures
0
5
10
15
20
25
30
35
Melati Bintang 1 Bintang 2 Bintang 3 Bintang 4
32
2 2
4
7
https:
//bek
asiko
ta.b
ps.go.id

216 Bekasi Municipality in Figures 2021
TOURISM
TabelTable 7.1 Jumlah Rumah Makan/Restoran Menurut Kecamatan di
Kota Bekasi, 2017–2020 Number of Restaurants by Subdistrict in Bekasi
Municipality, 2017–2020
Sumber/Source: Dinas Pariwisata dan Kebudayaan Kota Bekasi/Bekasi Municipality Tourism and Culture Office
KecamatanSubdistrict 2017 2018 2019 2020
(1) (2) (3) (4) (5)
Pondokgede 187 249 308 357
Jatisampurna 130 156 198 212
Pondokmelati 69 77 90 101
Jatiasih 86 96 116 127
Bantargebang 10 18 20 20
Mustikajaya 78 87 108 118
Bekasi Timur 183 199 250 253
Rawalumbu 82 103 121 124
Bekasi Selatan 385 428 504 526
Bekasi Barat 88 109 126 139
Medan Satria 163 175 201 228
Bekasi Utara 174 218 270 302
Kota BekasiBekasi Municipality 1 635 1 915 2 312 2 507
https:
//bek
asiko
ta.b
ps.go.id

217Kota Bekasi Dalam Angka 2021
PARIWISATA
TabelTable 7.2 Jumlah Penginapan/Hotel Menurut Kecamatan di Kota
Bekasi, 2020 Number of Hotels by Subdistrict in Bekasi Municipality,
2020
KecamatanSubdistrict Melati Bintang 1 Bintang 2 Bintang 3 Bintang 4 Bintang 5
(1) (2) (3) (4) (5) (6) (7)
Pondokgede 6 – – 1 – –
Jatisampurna 3 – – – 2 –
Pondokmelati – – – – – –
Jatiasih 2 – – – – –
Bantargebang 5 – – – – –
Mustikajaya – – – – – –
Bekasi Timur 7 1 1 – – –
Rawalumbu 1 1 1 – –
Bekasi Selatan 4 – 1 2 3 –
Bekasi Barat 3 – – – – –
Medan Satria 1 – – – 1 –
Bekasi Utara – – – 1 –
Kota BekasiBekasi Municipality 32 2 2 4 7 –
Sumber/Source: Dinas Pariwisata dan Kebudayaan Kota Bekasi/Bekasi Municipality Tourism and Culture Office
https:
//bek
asiko
ta.b
ps.go.id

https:
//bek
asiko
ta.b
ps.go.id

8. Transportasi dan Komunikasi/Transportation and Communication ........
8. TRANSPORTASI DAN KOMUNIKASI/TRANSPORTATION AND COMMUNICATION
JUMLAH KANTOR POS PEMBANTUDI KOTA BEKASI
TERJADI KENAIKANTAHUN 2019
MENCAPAI
15,17%
: Kantor Pos Bekasi/ Bekasi Post Office
ChapterBAB
08TRANSPORTASI DANKOMUNIKASITRANSPORTATION ANDCOMMUNICATION
20172018
2019202055
95 112 ???
https:
//bek
asiko
ta.b
ps.go.id

https:
//bek
asiko
ta.b
ps.go.id

221Kota Bekasi Dalam Angka 2021
TRANSPORTASI DAN KOMUNIKASI
PENJELASAN TEKNIS TECHNICAL NOTES
1. Kendaraan bermotor adalah setiap kendaraan yang digerakkan oleh peralatan teknik yang ada pada kendaraan tersebut, digunakan untuk angkutan orang atau barang di atas jalan raya selain kendaraan di atas rel.
2. Kereta api adalah kendaraan dengan tenaga gerak (listrik, diesel atau tenaga uap) yang berjalan sendiri maupun dirangkai dengan kendaraan lain, yang bergerak di atas rel, terdiri dari kereta penumpang dan barang.
3. Kantor Pos adalah tempat pemberi pelayanan komunikasi tertulis dan atau surat elektronik, layanan paket, layanan logistik, layanan transaksi keuangan, dan layanan keagenan pos untuk kepentingan umum. Rumah pos berfungsi sama seperti kantor pos dan kantor pos pembantu, bedanya rumah pos biasanya terletak di daerah terpencil.
4. Telekomunikasi adalah setiap pemancaran, pengiriman dan atau penerimaan dari setiap informasi dalam bentuk tanda- tanda, isyarat, tulisan, gambar, suara dan bunyi melalui sistem kawat, optik, radio atau sistem elektromagnetik lainnya
1. Motor vehicles are any kind of vehicles motorized by machine set upinthosevehicles, theyare usually used for transporting peoples or goods on roads except vehicles moving along a railway line.
2. Train is a coach or a number of coaches joined together, moving along a railway line. It can be passenger train or freight train.
3. Post Office is a service provider facility of written communication and or electronic mail, parcel service, logistics services, financial transaction services, and postal services to the public. Postal house has the same function as the post office and subsidiary of post office, the difference is that postal house is usually located in remote areas.
4. Telecommunication includes every transmitting, delivering and or receiving from every information of marking, signal, article, picture, sound and voice through strand of wire system, optic, radio or other electromagnetic system.
https:
//bek
asiko
ta.b
ps.go.id

222 Bekasi Municipality in Figures 2021
TRANSPORTATION AND COMMUNICATION
ULASAN DESCRIPTION
Perhubungan Darat
Perhubungan darat merupakan prasarana pengangkutan yang penting untuk memperlancar kegiatan perekonomian. Dengan makin meningkatnya usaha pembangunan maka akan menuntut peningkatan pembangunan jalan untuk memudahkan mobilitas penduduk dan memperlancar lalu lintas barang dari satu daerah ke daerah lain. Di samping itu perhubungan darat merupakan salah satu sektor yang cukup besar peranannya karena kontribusinya untuk menembus isolasi suatu daerah untuk pemerataan pembangunan seluruh daerah.
Panjang jalan di Kota Bekasi pada akhir tahun 2020 adalah 4.573,51 km. Jika dirinci menurut jenis permukaan jalan maka sepanjang 4.542,87 km atau sebesar 99,33 persen sudah beraspal, 30,64 km atau 0,67 persen belum beraspal.
Pos dan Telekomunikasi
Kantor Pos adalah tempat pemberi pelayanan komunikasi tertulis dan atau surat elektronik, layanan paket, layanan logistik, layanan transaksi keuangan, dan layanan keagenan pos untuk kepentingan umum. Rumah pos berfungsi sama seperti kantor pos dan kantor pos pembantu, bedanya rumah pos biasanya terletak
Road Transportation
One of the important infrastructures supporting economic activities is the availability of road transportation. Improvement in all aspects of economic development requires more improvement in transportation, especially in road development. This development is intended to facilitate population mobility and distributive trade from one region to another region. Moreover, road transportation sector plays an important role in Jawa Barat development by helping to reach an isolated area to get equal share in all sectors of national development.
The length of roads in Bekasi Miunicipality at the end of 2020 is 4,573.51 km. If detailed according to the type of road surface, as long as 4,542.87 km or 99.33 percent are paved, 30.64 km or 0.67 percent are not asphal.
Post And Telecomunication
Post Office is a service provider facility of written communication and or electronic mail, parcel service, logistics services, financial transaction services, and postal services to the public. Postal house has the same function as the post office and subsidiary of post office, the difference is that postal house is usually located in remote areas Contribution of
https:
//bek
asiko
ta.b
ps.go.id

223Kota Bekasi Dalam Angka 2021
TRANSPORTASI DAN KOMUNIKASI
di daerah terpencil. Peranan pos dan telekomunikasi dalam struktur perekonomian Kota Bekasi memang tidak begitu dominan, tetapi dalam menunjang pembangunan cukup besar kontribusinya. Tanpa adanya telekomunikasi, dunia usaha di daerah ini tidak semaju seperti sekarang.
Berbagai usaha pemerintah untuk memperlancar pelayanan komunikasi, salah satunya peningkatan mutu layanan jasa Pos. Namun tidak dapat dipungkiri dengan maraknya pengembangan teknologi informasi, pemakaianjasaPossemakinberkurang. Sedangkan pemakaian internet dan telekomunikasi yang menggunakan teknologi wireless terus berkembang pesat.
Pada tahun 2019, jumlah kantor pos pembantu di Kota Bekasi meningkat dibanding tahun 2018. Tahun 2019 jumlah kantor pos pembantu sebanyak 112, sedangkan tahun 2018 sebanyak 95 kantor pos pembantu.
Post and Tele communication Sector to Economic of Bekasi Municipality is not significant.Inspiteofthat,thefunctionof post and telecommunication as special tools for business communication has played a main role.
Generally speaking, Government has tried to improve quality of Post services. However, the incredible progress of information technology has a big impact because people tend not to use airmail service any longer. On the other hand, internet and wireless telecommunication technology had made a significant progress.
In the year 2019, the number of Assistant post offices in Bekasi Municipality increased compared to the year 2018. Year 2019 the number of the Assistant post Office is 112, while the year 2018 as many as 95 post office.http
s://b
ekas
ikota
.bps.g
o.id

224 Bekasi Municipality in Figures 2021
TRANSPORTATION AND COMMUNICATION
Sumber/Source : Dinas Bina Marga dan Sumber Daya Air Kota Bekasi/ Bekasi Municipality Highways and Water Resources Office
8.1 Panjang Jalan Menurut Tingkat Kewenangan (km), 2020 Length of Roads by Level of Authority (km), 2020
GambarFigures
Negara/StateProvinsi/Province
13.63
21.95
4,573.51
0.00 1,000.00 2,000.00 3,000.00 4,000.00 5,000.00
Negara/State
Provinsi/Province
Kabupaten/KotaRegency/Municipality
https:
//bek
asiko
ta.b
ps.go.id
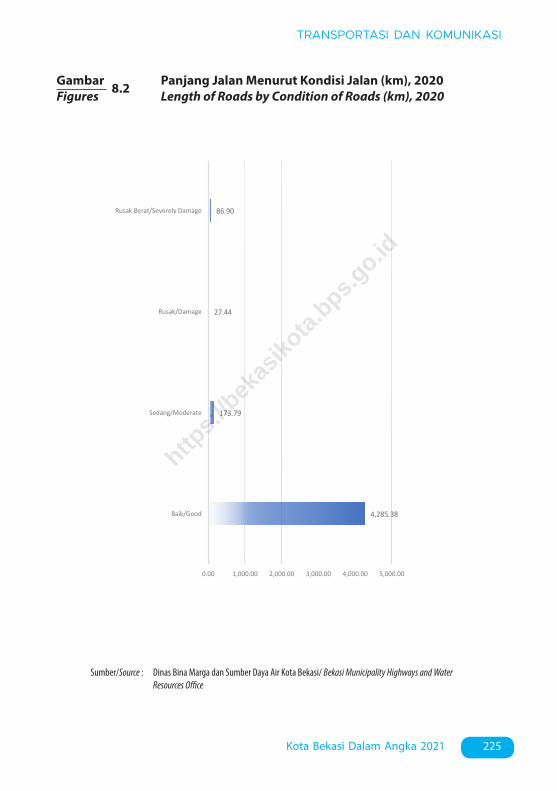
225Kota Bekasi Dalam Angka 2021
TRANSPORTASI DAN KOMUNIKASI
Sumber/Source : Dinas Bina Marga dan Sumber Daya Air Kota Bekasi/ Bekasi Municipality Highways and Water Resources Office
Baik/Good
4,285.38
173.79
27.44
86.90
0.00 1,000.00 2,000.00 3,000.00 4,000.00 5,000.00
Baik/Good
Sedang/Moderate
Rusak/Damage
Rusak Berat/Severely Damage
8.2 Panjang Jalan Menurut Kondisi Jalan (km), 2020 Length of Roads by Condition of Roads (km), 2020
GambarFigures
https:
//bek
asiko
ta.b
ps.go.id

226 Bekasi Municipality in Figures 2021
TRANSPORTATION AND COMMUNICATION
8.1 TRANSPORTASI TRANSPORTATION
Catatan/Note: 1 Data tidak termasuk panjang jalan tol/Excluding toll road 2 Berdasarkan Keputusan Menteri Pekerjaan Umum dan Perumahan Rakyat No. 248/KPTS/M/2015/Based on Public
Work and Public Housing Ministerial Decree No. 248/KPTS/M/2015Sumber/Source: Dinas Bina Marga dan Sumber Daya Air Kota Bekasi/ Bekasi Municipality Highways and Water Resources Office
Tingkat Kewenangan PemerintahanLevel of Government Authority 2018 2019 2020
(1) (2) (3) (4)
Negara2/State2 13,63 13,63 13,63
Provinsi/Province 21,95 21,95 21,95
Kabupaten/KotaRegency/Municipality
4 460,64 4 511 4 573,51
Jumlah/Total 4 496,22 4 546,58 4 609,09
TabelTable 8.1.1 Panjang Jalan1 Menurut Tingkat Kewenangan
Pemerintahan di Kota Bekasi (km), 2018–2020 Length of Roads1 by Level of Government Authority in
Bekasi Municipality (km), 2018–2020
https:
//bek
asiko
ta.b
ps.go.id

227Kota Bekasi Dalam Angka 2021
TRANSPORTASI DAN KOMUNIKASI
TabelTable 8.1.2 Panjang Jalan Menurut Jenis Permukaan Jalan di Kota
Bekasi (km), 2018–2020 Length of Roads by Type of Road Surface in Bekasi
Municipality (km), 2018–2020
Sumber/Source: Dinas Bina Marga dan Sumber Daya Air Kota Bekasi/ Bekasi Municipality Highways and Water Resources Office
Jenis Permukaan JalanType of Road Surface 2018 2019 2020
(1) (2) (3) (4)
Aspal/Paved 4 463,85 4 513,84 4 542,87
Kerikil/Gravel 16,64 16,82 16,98
Tanah/Soil 15,74 15,91 13,66
Lainnya/Others – – –
Jumlah/Total 4 496,23 4 546,57 4 573,51
https:
//bek
asiko
ta.b
ps.go.id

228 Bekasi Municipality in Figures 2021
TRANSPORTATION AND COMMUNICATION
Sumber/Source: Dinas Bina Marga dan Sumber Daya Air Kota Bekasi/ Bekasi Municipality Highways and Water Resources Office
Kondisi JalanCondition of Roads 2018 2019 2020
(1) (2) (3) (4)
Baik/Good 4329.86 4382.79 4285.38
Sedang/Moderate 112.58 109.57 173.79
Rusak/Damage 24.25 24.54 27.44
Rusak Berat/Severely Damage 29.54 29.68 86.90
Jumlah/Total 4496.23 4546.58 4573.51
TabelTable 8.1.3 Panjang Jalan Menurut Kondisi Jalan di Kota Bekasi (km),
2018–2020 Length of Roads by Condition of Roads in Bekasi
Municipality (km), 2018–2020
https:
//bek
asiko
ta.b
ps.go.id

229Kota Bekasi Dalam Angka 2021
TRANSPORTASI DAN KOMUNIKASI
TabelTable 8.2.1 Jumlah Kantor Pos Pembantu Menurut Kecamatan di
Kota Bekasi, 2017–2020 Number of Post Offices Subsidiaries by Subdistrict in Bekasi
Municipality, 2017–2020
8.2 KOMUNIKASI COMMUNICATION
KecamatanSubdistrict 2017 2018 2019 2020
(1) (2) (3) (4) (5)
Pondokgede 6 8 9 ...
Jatisampurna 1 2 2 ...
Pondokmelati 2 8 8 ...
Jatiasih 3 6 7 ...
Bantargebang 1 1 2 ...
Mustikajaya 3 6 7 ...
Bekasi Timur 9 14 16 ...
Rawalumbu 5 10 10 ...
Bekasi Selatan 9 16 18 ...
Bekasi Barat 8 9 10 ...
Medan Satria 2 3 4 ...
Bekasi Utara 6 12 19 ...
Kota BekasiBekasi Municipality 55 95 112 ...
Sumber/Source: Kantor Pos Bekasi/ Bekasi Post Office
https:
//bek
asiko
ta.b
ps.go.id

https:
//bek
asiko
ta.b
ps.go.id

9. Perbankan,Koperasi, dan Harga-harga/Banking,Cooperative, dan Prices
9. PERBANKAN, KOPERASI, DAN HARGA-HARGA/BANKING, COOPERATIVE, AND PRICES
Active Cooperatives
Number of Active Cooperative in Bekasi Municipality hassebelumnya
Jumlah Koperasi Aktif di Kota Bekasi mengalami
Five Subdistricts of the largest active cooperative5 kecamatan dengan jumlah koperasi aktif terbesar
Koperasi Aktif
of active cooperatives
Merupakan kecamatan denganjumlah koperasi aktif terendah
is a subdistrict with the lowest number
Merupakan kecamatan denganjumlah koperasi aktif terbanyak
is a subdistrict with thehighest number of active cooperatives
Koperasi Aktif/ Active Cooperatives
Koperasi Aktif/ Active Cooperatives
Kecamatan
Kecamatan
Kecamatan
Kecamatan
Bekasi Selatan
Department of Cooperatives and Small enterprises of Bekasi municipality Sumber/ Source : Dinas Koperasi dan Usaha Kecil Menengah Kota Bekasi
ChapterBAB
09PERBANKAN, KOPERASIDAN HARGA-HARGABANKING, COOPERATIVEAND PRICES
peningkatan pada tahun 2020 dibanding tahun
increased in 2020 compared to previous year
KECAMATAN BEKASI TIMUR
Bekasi Timur
115
Pondok Melati24
KECAMATAN PONDOK MELATI
115Kecamatan Bekasi Timur
114Bekasi Barat
80Jatiasih
80Pondogede
68
https:
//bek
asiko
ta.b
ps.go.id

https:
//bek
asiko
ta.b
ps.go.id

233Kota Bekasi Dalam Angka 2021
PERBANKAN, KOPERASI, DAN HARGA-HARGA
PENJELASAN TEKNIS TECHNICAL NOTES
1. Kantor bank terdiri dari Kantor Cabang (KC), Kantor Cabang Pembantu (KCP), dan kantor di bawah KCP.
2. Uang beredar dalam arti sempit (M1) adalah kewajiban sistem moneter yang terdiri atas uang kartal dan uang giral.
3. Uang beredar dalam arti luas (M2) atau likuiditas perekonomian adalah kewajiban sistem moneter yang terdiri atas M1, uang kuasi, dan surat berharga selain saham.
4. Uang kartal terdiri atas uang kertas dan uang logam yang berlaku, tidak termasuk uang kas pada K a n t o r Perbendaharaan dan Kas Negara (KPKN) dan bank umum.
5. Uang giral terdiri atas rekening giro, kiriman uang, simpanan berjangka, dan tabungan dalam rupiah yang sudah jatuh waktu, yang seluruhnya merupakan simpanan penduduk dalam rupiah pada sistem moneter.
6. Uang kuasi terdiri atas simpanan berjangka dan tabungan penduduk pada bank umum, baik dalam rupiah maupun valuta asing.
7. Data perkoperasian bersumber dari Dinas Koperasi dan Usaha Kecil dan Menengah.
1. Bank offices consist of branch office (KC), sub branch office (KCP), and offices under KCP.
2. The “broad money (M1)” in specific term is liabilities of the monetary system consisting of currency and demand deposits.
3. The “broad money (M2)” in a broadertermor“domestic liquidity” is liabilities of the monetary system consisting M1, quasi money, and securities other than shares.
4. Currency consists of legal bank notes and coins excluding cash in the government treasury offices and commercial banks.
5. Demand deposit comprises current accounts, transfer, matured time, and savings deposits in rupiah, held by residents in the monetary system.
6. Quasi money consists of time and savings deposits in rupiah and foreign currency held by residents in commercial banks.
7. Data forcooperativesaregenerated from Department of Cooperatives and Small and Medium Enterprises.
https:
//bek
asiko
ta.b
ps.go.id

234 Bekasi Municipality in Figures 2021
BANKING, COOPERATIVE, AND PRICES
8. Koperasi adalah badan usaha yang beranggotakan orang seorang atau badan hukum koperasi dengan melandaskan kegiatannya berdasarkan prinsip koperasi sekaligus sebagai gerakan ekonomi rakyat yang berdasar atas asas kekeluargaan.
9. Sisa hasil usaha koperasi merupakan pendapatan koperasi yang diperoleh dalam satu tahun buku dikurangi dengan biaya, penyusutan, dan kewajiban lainnya termasuk pajak dalam tahun buku yang bersangkutan.
10. Rata-rata harga eceran beras diolah dari survei mingguan Badan Pusat Statistik (BPS) di beberapa kota. Karena beragamnya kualitas beras di masingmasing kota, maka harga yang disajikan adalah rata-rata harga beras tertimbang.
11. IHK adalah indikator inflasi di Indonesia. Sejak Januari 2014, IHK dihitung berdasarkan Survei Biaya Hidup (SBH) di 82 kota tahun 2012 yang mencakup sekitar 225-462 komoditas.
12. IHK mencakup 7 kelompok, yaitu: bahan makanan, makanan jadi, minuman, rokok, dan tembakau; perumahan, air, listrik, gas, dan bahan bakar; sandang; kesehatan; pendidikan, rekreasi, dan olahraga; transpor, komunikasi, dan jasa keuangan.
8. Cooperative is an establishment that its members are people or establisments with legal status of cooperative and its activities based on people economic movement.
9. Net profit of cooperative is gross income in one year minus expenses, depreciation, and other liabilities including taxes in current year.
10. The average retail price of rice is compiled through the weekly price survey conducted by the BPS- Statistics Indonesia in several cities. Due to the different qualities of rice in each city, the weighted average price of rice is used.
11. CPI is the indicator of inflation in Indonesia. Since January 2014, the CPI has been calculated from the 2012 Cost Living Surveys (CLS) of 82 cities, which covered 225-462 commodities.
12. CPI consists of 7 groups as follows: foodstuffs; prepared food, beverages, and tobacco products; housing, water, electricity, gas, and fuel; clothing; health; education, recreation, and sports; transportation, communication, and financial services.
https:
//bek
asiko
ta.b
ps.go.id

235Kota Bekasi Dalam Angka 2021
PERBANKAN, KOPERASI, DAN HARGA-HARGA
ULASAN DESCRIPTION
Perkembangan Koperasi di Kota Bekasi selama ini menunjukkan kemajuan yang signifikan, antara lain terlihat dari terus meningkatnya jumlah Koperasi aktif.
Dalam empat tahun terakhir terus terjadi peningkatan. Tahun 2017 jumlah koperasi aktif di Kota Bekasi sebanyak 629 koperasi, dan tahun 2020 menjadi 760 koperasi aktif. Jumlah tersebut tersebar di seluruh kecamatan di Kota Bekasi.
Kecamatan Bekasi Timur adalah kecamatan yang memiliki jumlah koperasi aktif terbanyak yaitu 115 koperasi, diikuti kecamatan Bekasi Selatan dengan 114 koperasi serta Keamatan Jatiasih dan Kecamatan Bekasi Barat masing-masing memiliki 80 koperasi.
Sedangkan kecamatan yang memliki koperasi aktif terendah adalah kecamatan Pondok Melati dengan 24 koperasi aktif.
The development of cooperatives in Bekasi has shown significant progress, among others seen from the continued increase in the number of active cooperatives.
In the last four years continues the increase. Year 2017 the number of active cooperatives in Bekasi municipality as much as 629 cooperatives, and the year 2020 to 760 active cooperatives. The number is scattered throughout the subdistrict in Bekasi municipality.
Bekasi Timur is a subdistrict that has the highest number of active cooperatives that are 115 cooperatives, followed by the Bekasi Selatan with 114 cooperatives and Jatiasih and Bekasi Barat subdistrict each have 80 cooperatives.
The subdistrict, which has the lowest active cooperatives, is the Pondok Melati subdistrict has 24 active cooperatives.
https:
//bek
asiko
ta.b
ps.go.id

236 Bekasi Municipality in Figures 2021
BANKING, COOPERATIVE, AND PRICES
Sumber/Source : Dinas Koperasi dan Usaha Kecil Menengah Kota Bekasi/ Bekasi Municipality Cooperatives and Small enterprises Office
9.1 Jumlah Koperasi Aktif Menurut Kecamatan, 2020 Number of Active Cooperative by Subdistrict, 2020
GambarFigures
PondokgedeJatisampurnaPondok MelatiJatiasihBantargebangMustika JayaBekasi TimurRawalumbuBekasi SelatanBekasi BaratMedan SatriaBekasi Utara
PondokgedeJatisampurna
Pondok MelatiJatiasih
BantargebangMustika Jaya
Bekasi TimurRawalumbu
Bekasi SelatanBekasi Barat
Medan SatriaBekasi Utara
0
20
40
60
80
100
120
Pondokgede, 68
Jatisampurna, 39
Pondok Melati, 24
Jatiasih, 80
Bantargebang, 43
Mustika Jaya, 35
Bekasi Timur, 115
Rawalumbu, 56
Bekasi Selatan, 114
Bekasi Barat, 80
Medan Satria, 63
Bekasi Utara, 43
https:
//bek
asiko
ta.b
ps.go.id

237Kota Bekasi Dalam Angka 2021
PERBANKAN, KOPERASI, DAN HARGA-HARGA
Sumber/Source : Dinas Koperasi dan Usaha Kecil Menengah Kota Bekasi/ Bekasi Municipality Cooperatives and Small enterprises Office
9.2 Jumlah Koperasi Menurut Jenis Koperasi, 2020 Number of Cooperative by Kind of Cooperative, 2020
GambarFigures
0
50
100
150
200
250
300
350
400
450
KPRI KOPKAR KOPPAS Lainnya
40
146
7
443
https:
//bek
asiko
ta.b
ps.go.id

238 Bekasi Municipality in Figures 2021
BANKING, COOPERATIVE, AND PRICES
Sumber/Source: Dinas Koperasi dan Usaha Kecil Menengah Kota Bekasi/ Bekasi Municipality Cooperatives and Small enterprises Office
KecamatanSubdistrict 2017 2018 2019 2020
(1) (2) (3) (4) (5)
Pondokgede 56 56 63 68
Jatisampurna 28 30 38 39
Pondokmelati 19 22 23 24
Jatiasih 66 67 74 80
Bantargebang 40 41 43 43
Mustikajaya 24 26 34 35
Bekasi Timur 101 102 111 115
Rawalumbu 42 46 55 56
Bekasi Selatan 100 104 111 114
Bekasi Barat 73 76 80 80
Medan Satria 58 60 63 63
Bekasi Utara 22 25 38 43
Kota BekasiBekasi Municipality 629 655 733 760
TabelTable 9.1 Jumlah Koperasi Aktif Menurut Kecamatan di Kota Bekasi,
2017–2020 Number of Active Cooperative by Subdistrict in Bekasi
Municipality, 2017–2020
https:
//bek
asiko
ta.b
ps.go.id

239Kota Bekasi Dalam Angka 2021
PERBANKAN, KOPERASI, DAN HARGA-HARGA
TabelTable 9.2 Jumlah Koperasi Menurut Jenis Koperasi dan Kecamatan
di Kota Bekasi, 2020 Number of Cooperative by Kind of Cooperative and
Subdistrict in Bekasi Municipality, 2020
Sumber/Source: Dinas Koperasi dan Usaha Kecil Menengah Kota Bekasi/ Bekasi Municipality Cooperatives and Small enterprises Office
KecamatanSubdistrict
Jenis Koperasi/ Kind of Cooperative
KUD KPRI KOPKAR KOPPAS LainnyaOther
JumlahTotal
(1) (2) (3) (4) (5) (6) (7)
Pondokgede – 1 8 1 40 50
Jatisampurna – 1 2 1 27 31
Pondokmelati – 1 – 1 16 18
Jatiasih – 1 6 – 48 55
Bantargebang – 1 16 1 16 34
Mustikajaya – 1 – – 27 28
Bekasi Timur – 13 20 – 55 88
Rawalumbu – 1 11 – 37 49
Bekasi Selatan – 12 20 – 57 89
Bekasi Barat – 2 11 1 42 56
Medan Satria – 0 31 2 19 52
Bekasi Utara – 6 21 – 59 86
Kota BekasiBekasi Municipality – 40 146 7 443 636
https:
//bek
asiko
ta.b
ps.go.id

240 Bekasi Municipality in Figures 2021
BANKING, COOPERATIVE, AND PRICES
Kelompok PengeluaranExpenditure Group
JanuariJanuary
FebruariFebruary Maret/March April/April
(1) (2) (3) (4) (5)
Makanan, Minuman dan Tembakau/ Food, Beverages and Tobacco
106.52 107.82 108.61 108.62
Pakaian dan Alas Kaki/Clothing and Footwear 108.22 108.92 109.41 109.68
Perumahan, Air, Listrik dan Bahan Bakar Rumah Tangga/Housing, Water, electricity, and Household Fuels
102.04 102.17 102.43 103.17
Perlengkapan, Peralatan dan Pemeliharaan Rutin Rumah Tangga/ Furnishing, Household Equipment and Routine Household Maintenance
104.26 104.34 104.67 104.08
Kesehatan/ Health 108.55 108.55 109.94 111.13
Transportasi/ Transportation 104.87 104.68 104.68 104.69
Informasi, Komunikasi dan Jasa Keuangan/Information, Communication and Financial Service
100.76 100.86 100.86 100.82
Rekreasi, Olahraga dan Budaya/ Recreation, Sport, and Culture
106.07 106.08 106.07 106.10
Pendidikan/Education 112.08 112.08 112.08 112.08
Penyediaan Makanan dan Minuman/Restoran/ Restoran Food and Beverage Services/Restaurant
106.64 107.05 107.33 107.88
Perawatan Pribadi dan Jasa Lainnya/ Personal Care and Other Services
110.26 111.13 112.96 114.03
Umum/General 105.48 105.88 106.29 106.56
TabelTable 9.3 Indeks Harga Konsumen per Bulan Menurut Kelompok
Pengeluaran (2018=100) di Kota Bekasi, 2020 Consumer Price Index per Month by Expenditure Group
(2018=100) in Bekasi Municipality, 2020
https:
//bek
asiko
ta.b
ps.go.id

241Kota Bekasi Dalam Angka 2021
PERBANKAN, KOPERASI, DAN HARGA-HARGA
Lanjutan Tabel/Continued Table 9.3
Kelompok PengeluaranExpenditure Group Mei/May Juni/June Juli/July Agustus
August
(1) (6) (7) (8) (9)
Makanan, Minuman dan Tembakau/ Food, Beverages and Tobacco
108.05 108.62 108.24 106.94
Pakaian dan Alas Kaki/Clothing and Footwear 109.67 110.07 110.07 110.04
Perumahan, Air, Listrik dan Bahan Bakar Rumah Tangga/Housing, Water, electricity, and Household Fuels
103.58 103.31 103.21 103.18
Perlengkapan, Peralatan dan Pemeliharaan Rutin Rumah Tangga/ Furnishing, Household Equipment and Routine Household Maintenance
103.94 104.02 103.92 103.92
Kesehatan/ Health 111.13 111.73 111.73 111.73
Transportasi/ Transportation 104.57 106.14 106.13 106.13
Informasi, Komunikasi dan Jasa Keuangan/Information, Communication and Financial Service
100.7 99.91 99.73 99.73
Rekreasi, Olahraga dan Budaya/ Recreation, Sport, and Culture
106.06 106.9 106.90 106.88
Pendidikan/Education 112.08 112.08 112.08 113.99
Penyediaan Makanan dan Minuman/Restoran/ Restoran Food and Beverage Services/Restaurant
108.05 109.81 110.25 110.52
Perawatan Pribadi dan Jasa Lainnya/ Personal Care and Other Services
113.36 114.38 116.05 118.52
Umum/General 106.48 106.99 106.98 106.97
https:
//bek
asiko
ta.b
ps.go.id

242 Bekasi Municipality in Figures 2021
BANKING, COOPERATIVE, AND PRICES
Lanjutan Tabel/Continued Table 9.3
Kelompok PengeluaranExpenditure Group
SeptemberSeptember
OktoberOctober
NovemberNovember
DesemberDecember
(1) (10) (11) (12) (13)
Makanan, Minuman dan Tembakau/ Food, Beverages and Tobacco
106.11 106.21 106.87 109.39
Pakaian dan Alas Kaki/Clothing and Footwear 110.04 110.09 110.69 110.69
Perumahan, Air, Listrik dan Bahan Bakar Rumah Tangga/Housing, Water, electricity, and Household Fuels
103.85 103.78 103.87 103.87
Perlengkapan, Peralatan dan Pemeliharaan Rutin Rumah Tangga/ Furnishing, Household Equipment and Routine Household Maintenance
104.03 104.09 104.20 104.17
Kesehatan/ Health 111.73 111.73 115.35 115.35
Transportasi/ Transportation 106.12 106.12 106.14 106.45
Informasi, Komunikasi dan Jasa Keuangan/Information, Communication and Financial Service
99.73 99.73 100.05 100.05
Rekreasi, Olahraga dan Budaya/ Recreation, Sport, and Culture
106.88 106.82 107.29 107.29
Pendidikan/Education 113.99 113.99 113.99 113.99
Penyediaan Makanan dan Minuman/Restoran/ Restoran Food and Beverage Services/Restaurant
110.62 110.71 110.87 113.13
Perawatan Pribadi dan Jasa Lainnya/ Personal Care and Other Services
118.14 117.79 117.50 117.13
Umum/General 106.94 106.95 107.25 108.03
Sumber/Source: BPS, Survei Harga Konsumen/BPS-Statistics Indonesia, Consumer Price Survey
https:
//bek
asiko
ta.b
ps.go.id

243Kota Bekasi Dalam Angka 2021
PERBANKAN, KOPERASI, DAN HARGA-HARGA
Kelompok PengeluaranExpenditure Group
JanuariJanuary
FebruariFebruary Maret/March April/April
(1) (2) (3) (4) (5)
Makanan, Minuman dan Tembakau/ Food, Beverages and Tobacco
1.54 1.00 0.70 -0.01
Pakaian dan Alas Kaki/Clothing and Footwear 0.15 0.27 0.26 0.09
Perumahan, Air, Listrik dan Bahan Bakar Rumah Tangga/Housing, Water, electricity, and Household Fuels
0.11 0.08 0.10 0.28
Perlengkapan, Peralatan dan Pemeliharaan Rutin Rumah Tangga/ Furnishing, Household Equipment and Routine Household Maintenance
0.09 0.18 0.22 -0.17
Kesehatan/ Health 1.08 0.57 0.48 0.36
Transportasi/ Transportation -0.35 -0.16 0.03 -0.05
Informasi, Komunikasi dan Jasa Keuangan/Information, Communication and Financial Service
0.07 0.04 -0.02 -0.03
Rekreasi, Olahraga dan Budaya/ Recreation, Sport, and Culture
0.49 0.00 0.01 0.02
Pendidikan/Education 0.10 0.00 0.00 0.00
Penyediaan Makanan dan Minuman/Restoran/ Restoran Food and Beverage Services/Restaurant
0.45 0.17 0.20 0.20
Perawatan Pribadi dan Jasa Lainnya/ Personal Care and Other Services
0.39 0.52 1.34 1.17
Umum/General 0.47 0.31 0.31 0.13
TabelTable 9.4 Laju Inflasi Bulanan Menurut Kelompok Pengeluaran
(2018=100) di Kota Bekasi (Persen), 2020 Monthly Inflation Rate by Expenditure Group (2018=100) in
Bekasi Municipality (Percent), 2020
https:
//bek
asiko
ta.b
ps.go.id

244 Bekasi Municipality in Figures 2021
BANKING, COOPERATIVE, AND PRICES
Lanjutan Tabel/Continued Table 9.4
Kelompok PengeluaranExpenditure Group Mei/May Juni/June Juli/July Agustus
August
(1) (6) (7) (8) (9)
Makanan, Minuman dan Tembakau/ Food, Beverages and Tobacco
-0.60 0.68 -0.85 -1.22
Pakaian dan Alas Kaki/Clothing and Footwear 0.02 0.15 0.03 0.07
Perumahan, Air, Listrik dan Bahan Bakar Rumah Tangga/Housing, Water, electricity, and Household Fuels
0.18 -0.21 -0.03 -0.01
Perlengkapan, Peralatan dan Pemeliharaan Rutin Rumah Tangga/ Furnishing, Household Equipment and Routine Household Maintenance
-0.03 0.11 0.05 0.11
Kesehatan/ Health 0.02 0.17 0.06 0.05
Transportasi/ Transportation -0.02 0.90 0.34 0.05
Informasi, Komunikasi dan Jasa Keuangan/Information, Communication and Financial Service
-0.04 -0.34 -0.06 -0.01
Rekreasi, Olahraga dan Budaya/ Recreation, Sport, and Culture
-0.01 0.32 0.23 0.11
Pendidikan/Education 0.00 0.01 0.34 1.39
Penyediaan Makanan dan Minuman/Restoran/ Restoran Food and Beverage Services/Restaurant
0.06 0.72 0.17 0.17
Perawatan Pribadi dan Jasa Lainnya/ Personal Care and Other Services
-0.18 0.34 1.21 1.96
Umum/General -0.11 0.32 -0.07 -0.08
https:
//bek
asiko
ta.b
ps.go.id

245Kota Bekasi Dalam Angka 2021
PERBANKAN, KOPERASI, DAN HARGA-HARGA
Lanjutan Tabel/Continued Table 9.4
Kelompok PengeluaranExpenditure Group Mei/May Juni/June Juli/July Agustus
August
(1) (10) (11) (12) (13)
Makanan, Minuman dan Tembakau/ Food, Beverages and Tobacco
-0.45 0.25 0.90 1.82
Pakaian dan Alas Kaki/Clothing and Footwear 0.02 0.08 0.24 0.03
Perumahan, Air, Listrik dan Bahan Bakar Rumah Tangga/Housing, Water, electricity, and Household Fuels
0.24 -0.05 0.00 0.00
Perlengkapan, Peralatan dan Pemeliharaan Rutin Rumah Tangga/ Furnishing, Household Equipment and Routine Household Maintenance
0.07 0.01 0.11 -0.02
Kesehatan/ Health 0.24 0.22 1.07 0.03
Transportasi/ Transportation 0.00 0.01 0.11 0.09
Informasi, Komunikasi dan Jasa Keuangan/Information, Communication and Financial Service
0.00 -0.01 0.13 0.00
Rekreasi, Olahraga dan Budaya/ Recreation, Sport, and Culture
0.03 0.01 0.21 0.04
Pendidikan/Education 0.17 0.00 0.00 0.00
Penyediaan Makanan dan Minuman/Restoran/ Restoran Food and Beverage Services/Restaurant
0.32 0.24 0.11 0.83
Perawatan Pribadi dan Jasa Lainnya/ Personal Care and Other Services
-0.20 -0.17 -0.10 -0.30
Umum/General -0.01 0.07 0.29 0.52
Sumber/Source: BPS, Survei Harga Konsumen/BPS-Statistics Indonesia, Consumer Price Survey
https:
//bek
asiko
ta.b
ps.go.id

246 Bekasi Municipality in Figures 2021
BANKING, COOPERATIVE, AND PRICES
Kelompok BankBank Office 2015 2016 2017 2018 2019 2020
(1) (2) (3) (4) (5)
PERSERO 185 189 194 190 178 167
BPD 34 38 37 37 38 0
BANK SWASTA 123 119 113 115 115 111
BANK ASING 0 0 0 0 0 0
BANK UMUM SYARIAH 35 31 30 30 31 32
Jumlah/Total 377 377 374 372 362 310
TabelTable 9.5 Jumlah Kantor Bank Menurut Kelompok Bank di Kota
Bekasi, 2015–2020 Number of Bank Offices by Bank Group in Bekasi
Municipality, 2015–2020
Sumber/Source: Otoritas Jasa Keuangan/Financial Fervices Authority
https:
//bek
asiko
ta.b
ps.go.id

10. Pengeluaran Penduduk/Population Expenditure ...........................................
10. PENGELUARAN PENDUDUK/POPULATION EXPENDITURE
Sumber/Source: BPS, Survei Sosial Ekonomi Nasional (Susenas) MaretBPS-Statistics Indonesia, National Socioeconomic Survey March
ChapterBAB
PENGELUARAN PENDUDUKPOPULATION EXPENDITURE10
https:
//bek
asiko
ta.b
ps.go.id

https:
//bek
asiko
ta.b
ps.go.id

249Kota Bekasi Dalam Angka 2021
PENGELUARAN PENDUDUK
PENJELASAN TEKNIS TECHNICAL NOTES
1. Kegiatan pengumpulan data sosial dan ekonomi yang dilaksanakan secara rutin oleh BPS melalui Survei Sosial Ekonomi Nasional (Susenas).
2. Data konsumsi/pengeluaran yang dikumpulkan pada Susenas Maret dibagi menjadi dua kelompok, yaitu makanan dan bukan makanan. Jumlah komoditas makanan sebanyak 112 komoditas. Pengumpulan data kelompok makanan meliputi banyaknya komoditas yang dikonsumsi beserta nilai pengeluarannya.
3. Pengeluaran rata-rata per kapita adalah biaya yang dikeluarkan untuk konsumsi semua anggota rumah tangga selama sebulan baik yang berasal dari pembelian, pemberian maupun produksi sendiri dibagi dengan banyaknya anggota rumah tangga dalam rumah tangga tersebut.
1. Socioeconomic data collection activities are carried out regularly by the BPS-Statistics Indonesia through the National Socioeconomic Survey (Susenas).
2. The consumption/expenditure data collected in March Susenas are divided into two groups, namely food and non-food. The number of food commodity are 112 commodities. The food group data collection includes quantity and value of commodities consumed.
3. Per capita Average Expenditure is the cost spent for all household members consumption during the month, whether from purchasing, giving or own production, divided by the number of household members in the household
https:
//bek
asiko
ta.b
ps.go.id

250 Bekasi Municipality in Figures 2021
POPULATION EXPENDITURE
https:
//bek
asiko
ta.b
ps.go.id

251Kota Bekasi Dalam Angka 2021
PENGELUARAN PENDUDUK
ULASAN DESCRIPTION
Kesejahteraan suatu kelompok masyarakat dapat diketahui dari tingkat pendapatan masyarakatnya. Namun data pendapatan yang akurat sulit diperoleh, sehingga dalam Survei Sosial Ekonomi Nasional (Susenas), tingkat kesejahteraan masyarakat diperoleh dengan pendekatan Pengeluaran Rumah Tangga.
Di Kota Bekasi, tahun 2020 proporsi pengeluaran makanan dan non makanan adalah 42,84 persen berbanding 57,16 persen. Pada tahun 2020 secara rata-rata pengeluaran masyarakat Kota Bekasi lebih banyak digunakan untuk pengeluaran non makanan. Hal ini mencirikan sebagian besar masyarakat Kota Bekasi sudah beralih ke ciri masyarakat kelas menengah.
Komoditi yang menyumbang pengeluaran terbesar untuk subgolongan makanan adalah kelompok makanan dan minuman jadi sebesar 17,58 persen. Sedangkan untuk subgolongan bukan makanan sebagian besar dipengaruhi oleh pengeluaran kelompok Perumahan dan fasilitas rumah sebesar 28,86 persen, aneka barang dan jasa 15,14 persen dan barang tahan lama 4,47 persen. Secara keseluruhan, terlihat bahwa pengeluaran rata-rata per kapita sebulan di Kota Bekasi sebesar Rp. 2.347.086 pada tahun 2020.
The income of household can indicates the public welfare. On the other hand, getting accurate and up date data of household income is difficult. The National Socio Economic Survey of BPS- Statistics Indonesia try to approach the household expenditure.
In Bekasi Municipality, in 2020 the proportion of food and non-food expenditure is 42.84 percent compared to 57.16 percent. In 2020 the average expenditure of the West Java community is more used for non-food expenditure. This characterizes most of the people of Bekasi Municipality who have turned to the characteristics of the middle class.
The commodities that contributed the most to the food subgroup were the food and beverages group at 17.58 percent. While for nonfood subgroups, most of it was influenced by housing and housing facilities expenditure of 28.86 percent, various goods and services 15.14 percent and durable goods 4.47 percent. Overall, it was seen that the average expenditure per capita a month in Jawa Barat Rp. 2,347,086 in 2020.
https:
//bek
asiko
ta.b
ps.go.id

252 Bekasi Municipality in Figures 2021
POPULATION EXPENDITURE
Sumber/Source : BPS, Survei Sosial Ekonomi Nasional (Susenas) Maret/BPS-Statistics Indonesia, National Socioeconomic Survey March
10.1 Persentase Pengeluaran per Kapita Sebulan Menurut Kelompok Komoditas Makanan di Kota Bekasi, 2020
Percentage of Monthly Expenditure per Capita by Commodity Group of Food in Bekasi Municipality, 2020
GambarFigures
2.67
0.45
3.76
2.30
2.74
3.24
0.76
2.53
0.67
0.95
0.70
0.74
17.58
3.74
0.00 2.00 4.00 6.00 8.00 10.00 12.00 14.00 16.00 18.00 20.00
Padi-padian/Cereals
Umbi-umbian/Tubers
Ikan/udang/cumi/kerang/Fish/shrimp/commonsquid/shells
Daging/Meat
Telur dan susu/Eggs and milk
Sayur-sayuran/Vegetables
Kacang-kacangan/Legumes
Buah-buahan/Fruits
Minyak dan kelapa/Oil and coconut
Bahan minuman/Beverage stuffs
Bumbu-bumbuan/Spices
Konsumsi lainnya/Miscellaneous food items
Makanan dan minuman jadi/Prepared food andbeverages
Rokok/Cigarettes
https:
//bek
asiko
ta.b
ps.go.id

253Kota Bekasi Dalam Angka 2021
PENGELUARAN PENDUDUK
Sumber/Source : ....
28.86
15.14
2.36
4.47
4.03
2.30
0.00 5.00 10.00 15.00 20.00 25.00 30.00 35.00
Perumahan dan fasilitas rumah tangga/Housing andhousehold facilities
Aneka komoditas dan jasa/Goods and services
Pakaian, alas kaki, dan tutup kepala/Clothing, footwear,and headgear
Komoditas tahan lama/Durable goods
Pajak, pungutan, dan asuransi/Taxes and insurance
Keperluan pesta dan upacara/kenduri/Parties andceremonies
10.2 Persentase Pengeluaran per Kapita Sebulan Menurut Kelompok Komoditas non-Makanan, 2020
Percentage of Monthly Expenditure per Capita by Commodity Group of non-Food, 2020
GambarFigures
https:
//bek
asiko
ta.b
ps.go.id

254 Bekasi Municipality in Figures 2021
POPULATION EXPENDITURE
Kelompok Komoditas/Commodity Group 2019 2020(1) (2) (3)
Makanan/FoodPadi-padian/Cereals 64,417 62,706 Umbi-umbian/Tubers 9,411 10,500 Ikan/udang/cumi/kerang/Fish/shrimp/common squid/shells 75,322 88,334 Daging/Meat 51,567 54,092 Telur dan susu/Eggs and milk 59,895 64,356 Sayur-sayuran/Vegetables 60,041 76,022 Kacang-kacangan/Legumes 16,334 17,817 Buah-buahan/Fruits 49,850 59,342 Minyak dan kelapa/Oil and coconut 15,958 15,631 Bahan minuman/Beverage stuffs 18,928 22,371 Bumbu-bumbuan/Spices 14,572 16,533 Konsumsi lainnya/Miscellaneous food items 14,355 17,435 Makanan dan minuman jadi/Prepared food and beverages 388,104 412,504 Rokok/Cigarettes 75,246 87,880
Jumlah makanan/Total food 913,999 1,005,522
Bukan makanan/Non-food
Perumahan dan fasilitas rumah tangga/Housing and household facilities
619,255 677,280
Aneka komoditas dan jasa/Goods and services 339,948 355,329 Pakaian, alas kaki, dan tutup kepala/Clothing, footwear, and headgear
58,236 55,319
Komoditas tahan lama/Durable goods 86,755 105,011 Pajak, pungutan, dan asuransi/Taxes and insurance 76,176 94,565 Keperluan pesta dan upacara/kenduri/Parties and ceremonies 52,735 54,061
Jumlah bukan makanan/Total non-food 1,233,105 1,341,565
Jumlah/Total 2,147,104 2,347,086
Sumber/Source: BPS, Survei Sosial Ekonomi Nasional (Susenas) Maret/BPS-Statistics Indonesia, National Socioeconomic Survey March
TabelTable 10.1 Rata-rata Pengeluaran per Kapita Sebulan Menurut
Kelompok Komoditas (rupiah) di Kota Bekasi, 2019 dan 2020
Monthly Average Expenditure per Capita by Commodity Group (rupiahs) in Bekasi Municipality, 2019 and 2020
https:
//bek
asiko
ta.b
ps.go.id

255Kota Bekasi Dalam Angka 2021
PENGELUARAN PENDUDUK
Kelompok Komoditas/Commodity Group 2019 2020(1) (2) (3)
Makanan/FoodPadi-padian/Cereals 3.00 2.67 Umbi-umbian/Tubers 0.44 0.45 Ikan/udang/cumi/kerang/Fish/shrimp/common squid/shells 3.51 3.76 Daging/Meat 2.40 2.30 Telur dan susu/Eggs and milk 2.79 2.74 Sayur-sayuran/Vegetables 2.80 3.24 Kacang-kacangan/Legumes 0.76 0.76 Buah-buahan/Fruits 2.32 2.53 Minyak dan kelapa/Oil and coconut 0.74 0.67 Bahan minuman/Beverage stuffs 0.88 0.95 Bumbu-bumbuan/Spices 0.68 0.70 Konsumsi lainnya/Miscellaneous food items 0.67 0.74 Makanan dan minuman jadi/Prepared food and beverages 18.08 17.58 Rokok/Cigarettes 3.50 3.74
Jumlah makanan/Total food 42.57 42.84
Bukan makanan/Non-food
Perumahan dan fasilitas rumah tangga/Housing and household facilities
28.84 28.86
Aneka komoditas dan jasa/Goods and services 15.83 15.14 Pakaian, alas kaki, dan tutup kepala/Clothing, footwear, and headgear
2.71 2.36
Komoditas tahan lama/Durable goods 4.04 4.47 Pajak, pungutan, dan asuransi/Taxes and insurance 3.55 4.03 Keperluan pesta dan upacara/kenduri/Parties and ceremonies 2.46 2.30
Jumlah bukan makanan/Total non-food 57.43 57.16
Jumlah/Total 100.00 100.00
Sumber/Source: BPS, Survei Sosial Ekonomi Nasional (Susenas) Maret/BPS-Statistics Indonesia, National Socioeconomic Survey March
TabelTable 10.2 Persentase Pengeluaran per Kapita Sebulan Menurut
Kelompok Komoditas di Kota Bekasi, 2019 dan 2020 Percentage of Monthly Expenditure per Capita by
Commodity Group in Bekasi Municipality, 2019 and 2020
https:
//bek
asiko
ta.b
ps.go.id

256 Bekasi Municipality in Figures 2021
POPULATION EXPENDITURE
Golongan PengeluaranSpending Group
(Rp)
Persentase PendudukPercentage of Population
(1) (2)
< 150 000 –
150 000–199 999 –
200 000–299 999 –
300 000–499 999 0.83
500 000–749 999 6.47
750 000–999 999 8.06
1 000 000–1 499 999 20.11
> 1 500 000 64.53
Jumlah/Total 100,00
TabelTable 10.3 Persentase Penduduk Menurut Golongan Pengeluaran
Per Kapita Sebulan di Kota Bekasi, 2020 Percentage of Population by Per Capita Spending Group a
Month in Bekasi Municipality, 2020
Sumber/Source: BPS, Survei Sosial Ekonomi Nasional (Susenas) Maret/BPS-Statistics Indonesia, National Socioeconomic Survey March
https:
//bek
asiko
ta.b
ps.go.id

11. Perdagangan/Trade ..................................................................................................
11. PERDAGANGAN/TRADE
htt
Setiap perusahaan, koperasi, persekutuan maupun perusahaan perseorangan, yang melakukan kegiatan usaha perdagangan wajib memperoleh SIUP yang di terbitkan berdasarkan domisili perusahaan dan berlaku di seluruh wilayah Republik Indonesia
by company domicile and valid in all territory of Republic of IndonesiaAny company, cooperative, partnership or individual company, conducting business of trading activity shall obtain SIUP issued
ChapterBAB
PERDAGANGANTRADE11
https:
//bek
asiko
ta.b
ps.go.id

https:
//bek
asiko
ta.b
ps.go.id

259Kota Bekasi Dalam Angka 2021
PERDAGANGAN
PENJELASAN TEKNIS TECHNICAL NOTES
1. Surat Izin Usaha Perdagangan (SIUP), adalah Surat Izin untuk dapat melaksanakan kegiatan usaha perdagangan. Setiap perusahaan, koperasi, persekutuan maupun perusahaan perseorangan, yang melakukan kegiatan usaha perdagangan wajib memperoleh SIUP yang di terbitkan berdasarkan domisili perusahaan dan berlaku di seluruh wilayah Republik Indonesia. Kegunaan kepemilikan Surat Izin Usaha Perdagangan adalah sebagai berikut:a. Sebagai alat pengesahan
yang diberikan oleh pemerintah, sehinggal dalam kegiatan usaha tidak terjadi masalah perizinan.
b. Dengan memiliki surat izin usaha perdagangan dapat memperlancar perdagangan ekspor dan impor.
c. Sebagai syarat untuk mengikuti kegiatan lelang yang di selenggarakan oleh pemerintah.
2. Tanda Daftar Perusahaan (TDP) adalah daftar catatan resmi yang diadakan menurut atau berdasarkan ketentuan undang- undang atau peraturan-peraturan pelaksanaannya, dan memuat hal- hal yang wajib didaftarkan oleh setiap perusahaan serta disahkan oleh pejabat yang berwenang.
1. Trading Business License (SIUP), is a Letter of Permission to be able to conduct trading business activities. Any company, cooperative, partnership or individual company, conducting business of trading activity shall obtain SIUP issued by company domicile and valid in all territory of Republic of Indonesia. The usefulness of ownership of Trading Business License is as follows:
a. As a means of endorsement provided by the government, so in business activities there is no licensing problem.
b. Having a trading license can facilitate export and import trade
c. As a condition to participate in auction activities organized by the government
2. Company Registration Certificate (TDP) is a list of official records held according to or under the provisions of law or regulation of its implementation, and contains matters that must be registered by each company and authorized by authorized officers.
https:
//bek
asiko
ta.b
ps.go.id

260 Bekasi Municipality in Figures 2021
TRADE
https:
//bek
asiko
ta.b
ps.go.id

261Kota Bekasi Dalam Angka 2021
PERDAGANGAN
ULASAN DESCRIPTION
Berdasarkan data Badan Pelayanan Perijinan Terpadu (BPPT) Kota Bekasi, tahun 2020 jumlah pasar di Kota Bekasi sebanyak 15 sedangakan kios sebanyak 7.486.
Integrated Licensing Agency (BPPT) Bekasi municipality base of data, number of market in Bekasi Municipality 15 and stall 7.486
https:
//bek
asiko
ta.b
ps.go.id

262 Bekasi Municipality in Figures 2021
TRADE
Sumber/Source : Badan Pelayanan Perijinan Terpadu (BPPT) Kota Bekasi/ Integrated Licensing Agency (BPPT) Bekasi municipality
11.1 Jumlah Sarana Perdagangan di Kota Bekasi, 2017–2020 Number of Trading Facilities, 2017–2020
GambarFigures
2017201820192020
7,150
7,200
7,250
7,300
7,350
7,400
7,450
7,500
7,550
2017 2018 2019 2020
7,293 7,293 7,293
7,501
https:
//bek
asiko
ta.b
ps.go.id

263Kota Bekasi Dalam Angka 2021
PERDAGANGAN
Sumber/Source : Badan Pelayanan Perijinan Terpadu (BPPT) Kota Bekasi/ Integrated Licensing Agency (BPPT) Bekasi municipality
11.2 Jumlah Sarana Perdagangan Menurut Jenisnya, 2020 Number of Trading Facilities by Type of Facility, 2020
GambarFigures
PasarTokoKiosWarung
0
1,000
2,000
3,000
4,000
5,000
6,000
7,000
8,000
PasarToko
KiosWarung
15 0
7,486
0
https:
//bek
asiko
ta.b
ps.go.id

264 Bekasi Municipality in Figures 2021
TRADE
TabelTable 11.1 Jumlah Sarana Perdagangan Menurut Jenisnya di Kota
Bekasi, 2017–2020 Number of Trading Facilities by Type of Facility in Bekasi
Municipality, 2017–2020
Sumber/Source : Badan Pelayanan Perijinan Terpadu (BPPT) Kota Bekasi/ Integrated Licensing Agency (BPPT) Bekasi municipality
Jenis Sarana PerdaganganType of Trading Facilities 2017 2018 2019 2020
(1) (2) (3) (4) (5)
Pasar/Market 14 14 14 15
Toko/Store – – – –
Kios 7 279 7 279 7 279 7 486
Warung – – – –
Jumlah/Total 7 293 7 293 7 293 7 501
https:
//bek
asiko
ta.b
ps.go.id

12. Sistem Neraca Regional/System of Regional Accounts .................................
12. SISTEM NERACA REGIONAL/SYSTEM OF REGIONAL ACCOUNTS
PDRB
miliar rupiahbillion rupiahs
Economic Growth in 2019
Distribusi Persentase PDRBPercentage Distribution of GRDP
MENURUT LAPANGAN USAHA
Laju Pertumbuhan Ekonomi
KonstruksiConstruction
LAJU PERTUMBUHAN PDRB
KONSTRUKSI
PENGADAAN LISTRIK DAN GAS
CONSTRUCTION
9,71
ELECTRICITY AND GAS
ChapterBAB
SISTEM NERACA REGIONAL12 SYSTEM OF REGIONAL ACCOUNT
2020
KOTA BEKASI 2020
-2,55
2020
Produk Domestik Regional Bruto tahun 2020Gross Regional Domestic Product in 2020
Growth Rate of GRDP by Industry in 202096.569,48
33,79
22,07
11,17
32,98
-12,88
TERJADI KENAIKANMENCAPAI
https:
//bek
asiko
ta.b
ps.go.id

https:
//bek
asiko
ta.b
ps.go.id

267Kota Bekasi Dalam Angka 2021
SISTEM NERACA REGIONAL
PENJELASAN TEKNIS TECHNICAL NOTES
1. Produk Domestik Bruto pada tingkat nasional serta Produk Domestik Regional Bruto (PDRB) pada tingkat regional (provinsi) menggambarkan kemampuan suatu wilayah untuk menciptakan nilai tambah pada suatu waktu tertentu. Untuk menyusun PDB maupun PDRB digunakan 2 pendekatan, yaitu lapangan usaha dan pengeluaran. Keduanya menyajikan komposisi data nilai tambah dirinci menurut sumber kegiatan ekonomi (lapangan usaha) dan menurut komponen penggunaannya. PDB maupun PDRB dari sisi lapangan usaha merupakan penjumlahan seluruh komponen nilai tambah bruto yang mampu diciptakan oleh sektor-sektor ekonomi atas berbagai aktivitas produksinya. Sedangkan dari sisi pengeluaran menjelaskan tentang penggunaan dari nilai tambah tersebut.
2. PDRB menurut lapangan usaha mengalami perubahan klasifikasi dari 9 lapangan usaha menjadi 17 lapangan usaha. PDRB menurut lapangan usaha dirinci menurut total nilai tambah dari seluruh kategori yang mencakup lapangan usaha Pertanian, Kehutanan, dan Perikanan; Pertambangan dan Penggalian; Industri Pengolahan; Pengadaan Listrik dan Gas; Pengadaan Air,
1. The basic measure of the value added arising from economic activity is known as Gross Domestic Product at the national level and Gross Regional Domestic Product (GRDP) at the regional level (provinces/regencies/ municipalities). To compile these statistics, two approaches have been used, i.e. “production approach” and “expenditure approach”. The first approach is to measure value added produced by variouskindsofeconomicactivities, while the second approach is to measure final uses of the country’s output. In other words, GDP/GRDP is the sum of total value added prodiced by all economic industries (activities) and the way of using it.
2. GRDP by industry classification changes from 9 sectors to 17 industries. GRDP by industry is classified by types of all categories such as Agriculture, Forestry and Fishing; Mining and Quarrying; Manufacturing; Electricity and Gas; Water supply, Sewerage, Waste Management and Remediation Activities; Construction; Wholesale and Retail Trade; Repair of Motor Vehicles and Motorcycles;
https:
//bek
asiko
ta.b
ps.go.id

268 Bekasi Municipality in Figures 2021
SYSTEM OF REGIONAL ACCOUNTS
Pengelolaan Sampah, Limbah dan Daur Ulang; Konstruksi; Perdagangan Besar dan Eceran, Reparasi Mobil dan Sepeda Motor; Transportasi dan Pergudangan; Penyediaan Akomodasi dan Makan Minum; Informasi dan Komunikasi; Jasa Keuangan dan Asuransi; Real Estat; Jasa Perusahaan; Administrasi Pemerintahan, Pertahanan dan Jaminan Sosial Wajib; Jasa Pendidikan; Jasa Kesehatan dan Kegiatan Sosial; dan Jasa lainnya.
3. Produk Domestik Regional Bruto maupun agregat turunannya disajikan dalam 2 (dua) versi penilaian, yaitu atas dasar “harga berlaku” dan atas dasar “harga konstan”. Disebut sebagai harga berlaku karena seluruh agregat dinilai dengan menggunakan harga pada tahun berjalan, sedangkan harga konstan penilaiannya didasarkan kepada harga satu tahun dasar tertentu.
4. Laju pertumbuhan PDRB diperoleh dari perhitungan PDRB atas dasar harga konstan, dengan cara mengurangi nilai PDRB pada tahun ke-n terhadap nilai pada tahun ke n-1 (tahun sebelumnya), dibagi dengan nilai pada tahun ke n-1, dikalikan dengan 100 persen. Laju pertumbuhan menunjukkan perkembangan agregat pendapatan dari satu waktu tertentu terhadap waktu sebelumnya.
Transportation and Storage; Accommodation and Food Service Activities; Information and Communication; Financial and Insurance Activities; Real Estate Activities; Business Activities; Public Administration; Defence and Compulsory Social Security; Education; Human Health and Social Work Activities; and Other Services Activities.
3. GRDP and its aggregations are presented in two forms: at current market prices and at constant base year market prices. In presenting current market prices, all aggregates are valued at current market prices, while base year constant market prices are shown by valuing all aggregates at fixed base year prices.
4. Growth rate of Gross Regional Domestic Product is derived from GRDP at constant market prices. It is obtained by subtracting the value of GRDP year n with the value of GRDP year n-1, divided by the value of GRDP year n-1 then multiplied by 100 percent. The growth rate of GRDP explains the income growth during the given period.
https:
//bek
asiko
ta.b
ps.go.id

269Kota Bekasi Dalam Angka 2021
SISTEM NERACA REGIONAL
ULASAN DESCRIPTION
Pertumbuhan PDRBPerekonomian Kota Bekasi tahun
2020 mengalami pertumbuhan negatif sebesar -2,55 persen. Angka ini jauh lebih rendah dibandingkan tahun 2019 yang sebesar 5,41 persen.
Pertumbuhan ekonomi tahun 2020 yang negatif ini dipicu terjadinya pandemi covid-19. Hampir semua kategori mengalami pertumbuhan negatif kecuali kategori pertanian, kehutanan, dan perikanan, kategori pengadaan air, Pengelolaan Sampah, Limbah dan Daur Ulang, kategori informasi dan komunikasi, kategori jasa keuangan dan asuransi, kategori real estate, serta kategori jasa pendidikan. Laju pertumbuhan tertinggi adalah kategori informasi dan komunikasi sebesar 33,57 persen.
Distribusi PDRB Menurut Lapangan Usaha
Sektor industri pengolahan merupakan sektor yang memiliki konstribusi paling besar terhadap PDRB Kota Bekasi tahun 2020 dengan share mencapai 33,79 persen, naik dibanding tahun 2019 yang sebesar 33,30 persen. Disusul oleh sektor perdagangan besar dan eceran; reparasi mobil dan sepeda motor sebesar 22,07 persen turun dari tahun sebelumnya yang mencapai 22,53 persen. Sementara itu, sektor-sektor yang mengalami peningkatan
Growth of GRDPBekasi Municipality's economy in
2020 experienced negative growth of -2.55 percent. This figure lower than the previous year 5.41 percent.
This negative economic growth in 2020 is triggered by the covid-19 pandemic. Almost all categories experienced negative growth except agriculture, forestry, and fisheries categories, water procurement category, Waste Management, Waste and Recycling, information and communication category, financial and insurance services category, real estate category, and education services category. The highest growth rate was the information and communication category at 33.57 percent.
GRDP share by Industrial Origin
The manufacturing sector is the sector that has the greatest contribution to the GRDP of Bekasi Municipality in 2020 with share reached 33.79 percent, increased from the previous year amounting to 33.30 percent. Followed by wholesale and retail trade, repair of cars and motorcycles sector amounted to 22.07 percent, decreased from the previous year which reached 22.53 percent. While other sectors have increased contribution in 2020 are agriculture, forestry, and fisheries; water
https:
//bek
asiko
ta.b
ps.go.id

270 Bekasi Municipality in Figures 2021
SYSTEM OF REGIONAL ACCOUNTS
dari tahun sebelumnya antara lain pertanian, kehutanan, dan perikanan; pengadaan air, pengelolaan sampah, Limbah dan Daur Ulang; informasi dan komunikasi; jasa keuangan dan asuransi; real estate; dan jasa pendidikan.
procurement, waste management, waste and recycling; information and communication; financial and insurance services; real estate; and education services.
https:
//bek
asiko
ta.b
ps.go.id

https:
//bek
asiko
ta.b
ps.go.id

272 Bekasi Municipality in Figures 2021
SYSTEM OF REGIONAL ACCOUNTS
Sumber/Source : BPS, berbagai sensus, survei dan sumber lain/BPS-Statistics Indonesia, various census, survey, and other sources
12.1 Laju Pertumbuhan PDRB Atas Dasar Harga Konstan 2010 Menurut Lapangan Usaha (persen), 2017–2020 Growth Rate of GRDP at 2010 Constant Market Prices by Industry (percent), 2017–2020
GambarFigures
20162017201820192020
-3.00
-2.00
-1.00
0.00
1.00
2.00
3.00
4.00
5.00
6.00
7.00
2016 2017 2018 2019 2020
6.095.73 5.86
5.41
-2.55
https:
//bek
asiko
ta.b
ps.go.id

273Kota Bekasi Dalam Angka 2021
SISTEM NERACA REGIONAL
Sumber/Source : BPS, berbagai sensus, survei dan sumber lain/BPS-Statistics Indonesia, various census, survey, and other sources
12.2 Distribusi Persentase PDRB Atas Dasar Harga Berlaku Menurut Lapangan Usaha, 2020
Percentage Distribution of GRDP at Current Market Prices by Industry,2020
GambarFigures
Konstruksi
0.59
0.00
33.79
1.42
0.10
11.17
22.07
10.08
4.05
2.79
3.13
1.65
0.44
1.77
2.80
1.16
3.00
Pertanian, Kehutanan, dan Perikanan
Pertambangan dan Penggalian
Industri Pengolahan
Pengadaan Listrik dan Gas
Pengadaan Air, Pengelolaan Sampah, Limbahdan Daur Ulang
Konstruksi
Perdagangan Besar dan Eceran; Reparasi Mobildan Sepeda Motor
Transportasi dan Pergudangan
Penyediaan Akomodasi dan Makan Minum
Informasi dan Komunikasi
Jasa Keuangan dan Asuransi
Real Estate
Jasa Perusahaan
Administrasi Pemerintahan, Pertahanan danJaminan Sosial Wajib
Jasa Pendidikan
Jasa Kesehatan dan Kegiatan Sosial
Jasa lainnya
https:
//bek
asiko
ta.b
ps.go.id

274 Bekasi Municipality in Figures 2021
SYSTEM OF REGIONAL ACCOUNTS
TabelTable 12.1. Produk Domestik Regional Bruto Atas Dasar Harga
Berlaku Menurut Lapangan Usaha di Kota Bekasi (miliar rupiah), 2016–2020
Gross Regional Domestic Product at Current Market Prices by Industry in Bekasi Municipality (billion rupiahs), 2016–2020
Lapangan Usaha/Industry 2016 2017 2018 2019 2020
(1) (2) (3) (4) (5) (6)
A Pertanian, Kehutanan, dan Perikanan/Agriculture, Forestry, and Fishing
465.63 493.92 532.91 550.23 569.53
B Pertambangan dan Penggalian/Mining and Quarrying
0.00 0.00 0.00 0.00 0.00
C Industri Pengolahan/Manufacturing
26,619.00 28,615.70 30,819.26 32,674.35 32,634.27
D Pengadaan Listrik dan Gas/Electricity and Gas
2,042.81 1,619.23 1,585.66 1,590.98 1,369.85
E Pengadaan Air; Pengelolaan Sampah, Limbah, dan Daur Ulang/Water Supply; Sewerage, Waste Management, and Remediation Activities
60.50 71.64 80.97 92.74 95.19
F Konstruksi/Construction 8,232.05 9,166.85 10,488.56 11,769.56 10,783.61G Perdagangan Besar dan Eceran;
Reparasi Mobil dan Sepeda Motor/Wholesale and Retail Trade; Repair of Motor Vehicles and Motorcycles
17,334.81 18,832.44 20,480.06 22,108.92 21,313.53
H Transportasi dan Pergudangan/Transportation and Storage
7,709.78 8,482.73 9,153.58 9,888.30 9,732.89
I Penyediaan Akomodasi dan Makan Minum/Accommodation and Food Service Activities
2,930.18 3,236.73 3,707.62 3,989.74 3,911.44
J Informasi dan Komunikasi/Information and Communication
1,549.05 1,720.10 1,876.10 2,031.09 2,692.20
https:
//bek
asiko
ta.b
ps.go.id

275Kota Bekasi Dalam Angka 2021
SISTEM NERACA REGIONAL
Lapangan Usaha/Industry 2016 2017 2018 2019 2020
(1) (2) (3) (4) (5) (6)
K Jasa Keuangan dan Asuransi/Financial and Insurance Activities
2,332.23 2,577.88 2,838.54 2,992.99 3,024.88
L Real Estat/Real Estate Activities 1,206.53 1,310.05 1,417.48 1,548.90 1,589.16M,N Jasa Perusahaan/Business
Activities336.52 371.32 418.64 476.17 420.97
O Administrasi Pemerintahan, Pertahanan, dan Jaminan Sosial Wajib/Public Administration and Defence; Compulsory Social Security
1,495.98 1,649.22 1,771.70 1,805.39 1,707.49
P Jasa Pendidikan/Education 1,687.34 1,918.28 2,172.29 2,518.82 2,703.85Q Jasa Kesehatan dan Kegiatan
Sosial/Human Health and Social Work Activities
834.01 921.11 1,021.93 1,149.42 1,123.07
R,S,T,U Jasa Lainnya/Other Services Activities
2,072.43 2,340.46 2,615.32 2,942.19 2,897.55
Produk Domestik Regional Bruto/Gross Regional Domestic Product
76,908.86 83,327.64 90,980.62 98,129.80 96,569.48
Lanjutan Tabel/Continued Table 12.1
Sumber/Source: BPS, berbagai sensus, survei dan sumber lain/BPS-Statistics Indonesia, various census, survey, and other sources
https:
//bek
asiko
ta.b
ps.go.id

276 Bekasi Municipality in Figures 2021
SYSTEM OF REGIONAL ACCOUNTS
TabelTable 12.2 Produk Domestik Regional Bruto Atas Dasar Harga
Konstan 2010 Menurut Lapangan Usaha di Kota Bekasi (miliar rupiah), 2016–2020
Gross Regional Domestic Product at 2010 Constant Market Prices by Industry in Bekasi Municipality (billion rupiahs), 2016–2020
Lapangan Usaha/Industry 2016 2017 2018 2019 2020
(1) (2) (3) (4) (5) (6)
A Pertanian, Kehutanan, dan Perikanan/Agriculture, Forestry, and Fishing
329.28 330.55 337.24 345.64 350.25
B Pertambangan dan Penggalian/Mining and Quarrying
0.00 0.00 0.00 0.00 0.00
C Industri Pengolahan/Manufacturing
20,450.19 21,423.43 22,411.22 23,262.07 23,002.53
D Pengadaan Listrik dan Gas/Electricity and Gas
1,081.09 841.20 809.58 791.71 689.76
E Pengadaan Air; Pengelolaan Sampah, Limbah, dan Daur Ulang/Water Supply; Sewerage, Waste Management, and Remediation Activities
48.09 51.64 54.38 57.16 58.36
F Konstruksi/Construction 6,407.34 7,073.07 7,748.12 8,500.32 7,758.95G Perdagangan Besar dan Eceran;
Reparasi Mobil dan Sepeda Motor/Wholesale and Retail Trade; Repair of Motor Vehicles and Motorcycles
13,583.48 14,326.49 15,129.51 15,905.23 14,999.01
H Transportasi dan Pergudangan/Transportation and Storage
5,463.65 5,799.08 6,117.54 6,597.89 6,467.19
I Penyediaan Akomodasi dan Makan Minum/Accommodation and Food Service Activities
2,248.29 2,450.12 2,681.40 2,751.72 2,612.51
J Informasi dan Komunikasi/Information and Communication
1,526.91 1,694.67 1,848.18 2,000.60 2,672.20
https:
//bek
asiko
ta.b
ps.go.id

277Kota Bekasi Dalam Angka 2021
SISTEM NERACA REGIONAL
Lanjutan Tabel/Continued Table 12.2
Lapangan Usaha/Industry 2016 2017 2018 2019 2020
(1) (2) (3) (4) (5) (6)
K Jasa Keuangan dan Asuransi/Financial and Insurance Activities
1,698.55 1,788.20 1,884.30 1,924.41 1,935.47
L Real Estat/Real Estate Activities 1,021.45 1,091.85 1,167.45 1,255.84 1,262.77M,N Jasa Perusahaan/Business
Activities262.86 285.16 309.49 330.34 283.38
O Administrasi Pemerintahan, Pertahanan, dan Jaminan Sosial Wajib/Public Administration and Defence; Compulsory Social Security
1,086.60 1,098.70 1,117.11 1,127.35 1,057.71
P Jasa Pendidikan/Education 1,254.04 1,365.23 1,461.79 1,541.22 1,576.77Q Jasa Kesehatan dan Kegiatan
Sosial/Human Health and Social Work Activities
679.65 747.48 807.45 888.14 844.85
R,S,T,U Jasa Lainnya/Other Services Activities
1,689.58 1,835.13 1,960.34 2,128.95 2,066.35
Produk Domestik Regional Bruto/Gross Regional Domestic Product
58,831.08 62,202.01 65,845.09 69,408.57 67,638.06
Sumber/Source: BPS, berbagai sensus, survei dan sumber lain/BPS-Statistics Indonesia, various census, survey, and other sources
https:
//bek
asiko
ta.b
ps.go.id

278 Bekasi Municipality in Figures 2021
SYSTEM OF REGIONAL ACCOUNTS
TabelTable 12.3 Distribusi Persentase Produk Domestik Regional Bruto
Atas Dasar Harga Berlaku Menurut Lapangan Usaha di Kota Bekasi, 2016–2020
Percentage Distribution of Gross Regional Domestic Product at Current Market Prices by Industry in Bekasi Municipality, 2016–2020
Lapangan Usaha/Industry 2016 2017 2018 2019 2020
(1) (2) (3) (4) (5) (6)
A Pertanian, Kehutanan, dan Perikanan/Agriculture, Forestry, and Fishing
0.61 0.59 0.59 0.56 0.59
B Pertambangan dan Penggalian/Mining and Quarrying
– – – – –
C Industri Pengolahan/Manufacturing
34.61 34.34 33.87 33.30 33.79
D Pengadaan Listrik dan Gas/Electricity and Gas
2.66 1.94 1.74 1.62 1.42
E Pengadaan Air; Pengelolaan Sampah, Limbah, dan Daur Ulang/Water Supply; Sewerage, Waste Management, and Remediation Activities
0.08 0.09 0.09 0.09 0.10
F Konstruksi/Construction 10.70 11.00 11.53 11.99 11.17G Perdagangan Besar dan Eceran;
Reparasi Mobil dan Sepeda Motor/Wholesale and Retail Trade; Repair of Motor Vehicles and Motorcycles
22.54 22.60 22.51 22.53 22.07
H Transportasi dan Pergudangan/Transportation and Storage
10.02 10.18 10.06 10.08 10.08
I Penyediaan Akomodasi dan Makan Minum/Accommodation and Food Service Activities
3.81 3.88 4.08 4.07 4.05
J Informasi dan Komunikasi/Information and Communication
2.01 2.06 2.06 2.07 2.79
K Jasa Keuangan dan Asuransi/Financial and Insurance Activities
3.03 3.09 3.12 3.05 3.13
https:
//bek
asiko
ta.b
ps.go.id

279Kota Bekasi Dalam Angka 2021
SISTEM NERACA REGIONAL
Lanjutan Tabel/Continued Table 12.3
Lapangan Usaha/Industry 2016 2017 2018 2019 2020
(1) (2) (3) (4) (5) (6)
L Real Estat/Real Estate Activities 1.57 1.57 1.56 1.58 1.65M,N Jasa Perusahaan/Business
Activities0.44 0.45 0.46 0.49 0.44
O Administrasi Pemerintahan, Pertahanan, dan Jaminan Sosial Wajib/Public Administration and Defence; Compulsory Social Security
1.95 1.98 1.95 1.84 1.77
P Jasa Pendidikan/Education 2.19 2.30 2.39 2.57 2.80Q Jasa Kesehatan dan Kegiatan
Sosial/Human Health and Social Work Activities
1.08 1.11 1.12 1.17 1.16
R,S,T,U Jasa Lainnya/Other Services Activities
2.69 2.81 2.87 3.00 3.00
Produk Domestik Regional Bruto/Gross Regional Domestic Product
100.00 100.00 100.00 100.00 100.00
Sumber/Source: BPS, berbagai sensus, survei dan sumber lain/BPS-Statistics Indonesia, various census, survey, and other sources
https:
//bek
asiko
ta.b
ps.go.id

280 Bekasi Municipality in Figures 2021
SYSTEM OF REGIONAL ACCOUNTS
TabelTable 12.4 Laju Pertumbuhan Produk Domestik Regional Bruto Atas
Dasar Harga Konstan 2010 Menurut Lapangan Usaha di Kota Bekasi (persen), 2017–2020
Growth Rate of Gross Regional Domestic Product at 2010 Constant Market Prices by Industry in Bekasi Municipality (percent), 2017–2020
Lapangan Usaha/Industry 2017 2018 2019 2020
(1) (2) (3) (4) (5)
A Pertanian, Kehutanan, dan Perikanan/Agriculture, Forestry, and Fishing
0.39 2.02 2.49 1.33
B Pertambangan dan Penggalian/Mining and Quarrying
C Industri Pengolahan/Manufacturing 4.76 4.61 3.80 -1.12D Pengadaan Listrik dan Gas/
Electricity and Gas-22.19 -3.76 -2.21 -12.88
E Pengadaan Air; Pengelolaan Sampah, Limbah, dan Daur Ulang/Water Supply; Sewerage, Waste Management, and Remediation Activities
7.38 5.30 5.10 2.10
F Konstruksi/Construction 10.39 9.54 9.71 -8.72G Perdagangan Besar dan Eceran;
Reparasi Mobil dan Sepeda Motor/Wholesale and Retail Trade; Repair of Motor Vehicles and Motorcycles
5.47 5.61 5.13 -5.70
H Transportasi dan Pergudangan/Transportation and Storage
6.14 5.49 7.85 -1.98
I Penyediaan Akomodasi dan Makan Minum/Accommodation and Food Service Activities
8.98 9.44 2.62 -5.06
J Informasi dan Komunikasi/Information and Communication
10.99 9.06 8.25 33.57
K Jasa Keuangan dan Asuransi/Financial and Insurance Activities
5.28 5.37 2.13 0.57
L Real Estat/Real Estate Activities 6.89 6.92 7.57 0.55M,N Jasa Perusahaan/Business Activities 8.49 8.53 6.74 -14.21
https:
//bek
asiko
ta.b
ps.go.id

281Kota Bekasi Dalam Angka 2021
SISTEM NERACA REGIONAL
Lanjutan Tabel/Continued Table 12.4
Lapangan Usaha/Industry 2017 2018 2019 2020
(1) (2) (3) (4) (5)
O Administrasi Pemerintahan, Pertahanan, dan Jaminan Sosial Wajib/Public Administration and Defence; Compulsory Social Security
1.11 1.68 0.92 -6.18
P Jasa Pendidikan/Education 8.87 7.07 5.43 2.31Q Jasa Kesehatan dan Kegiatan
Sosial/Human Health and Social Work Activities
9.98 8.02 9.99 -4.87
R,S,T,U Jasa Lainnya/Other Services Activities
8.61 6.82 8.60 -2.94
Produk Domestik Regional Bruto/Gross Regional Domestic Product
5.73 5.86 5.41 -2.55
Sumber/Source: BPS, berbagai sensus, survei dan sumber lain/BPS-Statistics Indonesia, various census, survey, and other sources
https:
//bek
asiko
ta.b
ps.go.id

282 Bekasi Municipality in Figures 2021
SYSTEM OF REGIONAL ACCOUNTS
TabelTable 12.5 Produk Domestik Regional Bruto Atas Dasar Harga
Berlaku Menurut Jenis Pengeluaran di Kota Bekasi (miliar rupiah), 2015–2019
Gross Regional Domestic Product at Current Market Prices by Type of Expenditure in Bekasi Municipality (billion rupiahs), 2015–2019
Jenis PengeluaranType of Expenditure 2015 2016 2017 2018 2019
(1) (2) (3) (4) (5) (6)
Pengeluaran Konsumsi Rumah TanggaHousehold Consumption Expenditure
83,053.15 89,090.94 95,332.88 103,121.62 110,787.04
Pengeluaran Konsumsi LNPRTNPISH Consumption Expenditure
222.50 235.05 254.62 309.04 331.29
Pengeluaran Konsumsi PemerintahGovernment Consumption Expenditure
3,588.75 3,744.14 4,086.74 4,356.89 4,620.48
Pembentukan Modal Tetap BrutoGross Fixed Capital Formation
24,043.14 26,910.37 29,709.60 33,478.72 37,171.65
Perubahan InventoriChanges in Inventories
2,879.24 3,310.70 3,455.64 3,724.64 3,807.76
Ekspor Barang dan Jasa/Exports of Goods and Services
18,327.36 20,298.89 24,076.64 27,987.56 30,981.92
Dikurangi: Impor Barang dan JasaLess: Import of Goods and Services
61,348.92 66,681.22 73,588.47 81,993.98 89,491.30
Diskrepansi Statistik 1
Statistical Discrepancies 1 – – – – ...
Produk Domestik Regional Bruto/Gross Regional Domestic Product 70,765.23 76,908.86 83,327.64 90,984.49 98,208.84
Sumber/Source: BPS, berbagai sensus, survei dan sumber lain/BPS-Statistics Indonesia, various census, survey, and other sources
https:
//bek
asiko
ta.b
ps.go.id

283Kota Bekasi Dalam Angka 2021
SISTEM NERACA REGIONAL
Jenis PengeluaranType of Expenditure 2015 2016 2017 2018 2019
(1) (2) (3) (4) (5) (6)
Pengeluaran Konsumsi Rumah TanggaHousehold Consumption Expenditure
64,780.72 68,299.96 71,417.17 74,387.92 77,285.88
Pengeluaran Konsumsi LNPRTNPISH Consumption Expenditure
176.48 181.95 190.48 217.89 225.63
Pengeluaran Konsumsi PemerintahGovernment Consumption Expenditure
2,366.34 2,378.63 2,569.92 2,677.71 2,823.22
Pembentukan Modal Tetap BrutoGross Fixed Capital Formation
18,047.03 19,695.75 21,558.07 23,386.14 25,313.90
Perubahan InventoriChanges in Inventories
2,174.61 2,258.49 2,246.12 2,289.26 2,296.94
Ekspor Barang dan Jasa/Exports of Goods and Services
14,296.25 15,595.00 17,152.25 18,764.80 20,081.13
Dikurangi: Impor Barang dan JasaLess: Import of Goods and Services
46,385.36 49,578.70 52,932.01 55,878.63 58,622.08
Diskrepansi Statistik 1
Statistical Discrepancies 1 – – – – –
Produk Domestik Regional Bruto/Gross Regional Domestic Product 55,456.07 58,831.08 62,202.01 65,845.09 69,404.62
Sumber/Source: BPS, berbagai sensus, survei dan sumber lain/BPS-Statistics Indonesia, various census, survey, and other sources
TabelTable 12.6 Produk Domestik Regional Bruto Atas Dasar Harga
Konstan 2010 Menurut Jenis Pengeluaran di Kota Bekasi (miliar rupiah), 2015–2019
Gross Regional Domestic Product at 2010 Constant Market Prices by Type of Expenditure in Bekasi Municipality (billion rupiahs), 2015–2019
https:
//bek
asiko
ta.b
ps.go.id

https:
//bek
asiko
ta.b
ps.go.id

13. Perbandingan Antar Kabupaten/Kota/Regency/Municipal Comparison
13. PERBANDINGAN ANTAR KABUPATEN/KOTA/ REGENCY/MUNICIPAL COMPARISON
BEBERAPA KABUPATEN/KOTA DI JAWA BARATJUMLAH PENDUDUK DAN PERSENTASE KEMISKINAN
Population and Poverty Rate of Selected Regency/Municipality in Jawa Barat Province
Kabupaten Bogor/ Bogor Regency5.965,41 ribu/thousand
Kabupaten Bandung/Bandung Regency3.775,28 ribu/thousand
Kabupaten/Kota
Pendudukdengan
TerbanyakTop 5 Regencies/Municipalities withthe most population
3.763,89 ribu/thousand
Kabupaten Bekasi/ Bekasi Regency
Kota Bekasi/ Bekasi Municipality3.003,92 ribu/thousand
Kabupaten Garut/ Garut Regency2.622,43 ribu/thousand
Jumlah penduduk setiap kabupaten/kota pada data ini merupakan hasil proyeksiyang merujuk pada data hasil sensus penduduk 2010
denganTingkat
TertinggiKemiskinan
Kabupaten/KotaKota Tasikmalaya 11,60 %
Kabupaten Kuningan 11,40 %
Kabupaten Indramayu 11,10 %Kabupaten Majalengka 10,05 %Kabupaten Cirebon 9,92 %
The population of each regency/municipality in this data is the result projection that refers to sensus penduduk 2010 data
Sumber/ Source : Badan Pusat Statistik Provinsi Jawa BaratBPS- Statistics of Jawa Barat Province
Top 5 Regencies/Municipalities withthe highest poverty rates
ChapterBAB
08PERBANDINGAN ANTARKABUPATEN/KOTAREGENCY MUNICIPALCOMPARISON
https:
//bek
asiko
ta.b
ps.go.id

https:
//bek
asiko
ta.b
ps.go.id

287Kota Bekasi Dalam Angka 2021
PERBANDINGAN ANTAR KABUPATEN/KOTA
PENJELASAN TEKNIS TECHNICAL NOTES
1. Sumber data yang digunakan dalam bab ini berasal dari publikasi BPS RI.
2. Jumlah penduduk dan angka harapan hidup penduduk merupakan hasil estimasi yang mengacu pada hasil Sensus Penduduk (SP) 2010. Estimasi tersebut memperhatikan perubahan tingkat kelahiran, kematian, dan perpindahan penduduk
3. Laju pertumbuhan produk domestik regional bruto (PDRB) menggunakan data PDRB per kapita atas dasar harga konstan. Diperoleh dengan cara mengurangi nilai PDRB per kapita pada tahun ke-n dengan nilai pada tahun ke n-1, kemudian dikalikan dengan 100 persen. Laju pertumbuhan tersebut menunjukkan perkembangan agregat pendapatan per kapita penduduk dari satu waktu tertentu terhadap waktu sebelumnya (perkembangan berantai).
1. Data sources in this chapter were mainly from BPS Statistics Indonesia publications.
2. Population data and life expectancy at birth data orefer to population census - based estimation. The estimation took into account the trends in fertility, mortality, and migration.
3. Growth rate of per capita gross regional domestic product (GRDP) is derived from per capita GRDP at constant market prices. It is obtained by subtracting the value of per capita GRDP year-n with the value of per capita GRDP year n-1 then multiplied by 100 percent. The growth rate of per capita GDRP explains the per capita income growth during the given period.
https:
//bek
asiko
ta.b
ps.go.id

288 Bekasi Municipality in Figures 2021
REGENCY/MUNICIPAL COMPARISON
ULASAN DESCRIPTION
Jumlah Penduduk Kabupaten Indramayu sekitar 3,56 persen dari total penduduk Provinsi Jawa Barat
Dibandingkan dengan Laju Pertumbuhan PDRB Provinsi Jawa Barat, Laju Pertumbuhan Produk domestik Regional Bruto Kabupaten Indramayu berada di bawah rata-rata provinsi yaitu 1,45, sedangkan provinsi 5,29.
Jumlah Penduduk yang termasuk dalam kategori miskin di Kabupaten Indramayu Tahun 2018 sekitar 5,60 persen dari total penduduk kategori miskin di Jawa Barat.
Population Indramayu Regency is about 3,56 percent of the total population of Jawa Barat province.
Compared to the Growth Rate of GRDP West Java Province Growth Rate of Gross Regional Domestic Product in Indramayu regency above average the provincial average is 1.45 while the 5.29 province.
Population is included in the category of the poor in Indramayu Regency is about 5,60 percent of total population in the category of the poor in Jawa Barat province.
https:
//bek
asiko
ta.b
ps.go.id

https:
//bek
asiko
ta.b
ps.go.id

290 Bekasi Municipality in Figures 2021
REGENCY/MUNICIPAL COMPARISON
Sumber/Source : Badan Pusat Statistik / BPS-Statistics
13.1 Jumlah Penduduk Menurut Kabupaten/Kota di Provinsi Jawa Barat (ribu), 2020
Population by Regency/Municipality in Jawa Barat Province(thousand), 2020
GambarFigures
BogorSukabumiCianjurBandungGarut
CiamisKuninganCirebon
Subang
KarawangBekasi
5,427,068
2,725,450
2,477,560
3,623,790
2,585,607
1,865,203
1,229,069
1,167,686
2,270,621
1,305,476
1,152,507
1,834,434
1,595,320
997,869
2,439,085
3,113,017
1,788,336
423,667
1,043,070
346,325
2,444,160
333,303
2,543,676
2,056,335
568,400
716,155
200,973
0 1,000,000 2,000,000 3,000,000 4,000,000 5,000,000 6,000,000
Bogor
Sukabumi
Cianjur
Bandung
Garut
Tasikmalaya
Ciamis
Kuningan
Cirebon
Majalengka
Sumedang
Indramayu
Subang
Purwakarta
Karawang
Bekasi
Bandung Barat
Pangandaran
Kota Bogor
Kota Sukabumi
Kota Bandung
Kota Cirebon
Kota Bekasi
Kota Depok
Kota Cimahi
Kota Tasikmalaya
Kota Banjar
https:
//bek
asiko
ta.b
ps.go.id

291Kota Bekasi Dalam Angka 2021
PERBANDINGAN ANTAR KABUPATEN/KOTA
Sumber/Source : Badan Pusat Statistik / BPS-Statistics
BogorSukabumiCianjurBandungGarut
CiamisKuninganCirebon
Subang
KarawangBekasi
Jawa Barat465.67
175.1
234.47
263.6
262.78
181.82
91.39
139.2
247.94
138.21
118.38
220.31
149.81
80.17
195.41
186.3
179.46
36.05
75.04
25.42
100.02
30.61
134.01
60.43
31.64
86.13
11.16
0 50 100 150 200 250 300 350 400 450 500
Bogor
Sukabumi
Cianjur
Bandung
Garut
Tasikmalaya
Ciamis
Kuningan
Cirebon
Majalengka
Sumedang
Indramayu
Subang
Purwakarta
Karawang
Bekasi
Bandung Barat
Pangandaran
Kota Bogor
Kota Sukabumi
Kota Bandung
Kota Cirebon
Kota Bekasi
Kota Depok
Kota Cimahi
Kota Tasikmalaya
Kota Banjar
13.2 Jumlah Penduduk Miskin Menurut Kabupaten/Kota (ribu), 2020
Number of Poor Population by Regency/Municipality in Jawa Barat Province (thousand), 2020
GambarFigures
https:
//bek
asiko
ta.b
ps.go.id

292 Bekasi Municipality in Figures 2021
REGENCY/MUNICIPAL COMPARISON
TabelTable 13.1 Jumlah Penduduk Menurut Kabupaten/Kota di Provinsi
Jawa Barat (ribu), 2016–2020 Population by Regency/Municipality in Jawa Barat Province
(thousand), 2016–2020
Sumber/Source: Badan Pusat Statistik / BPS-Statistics
Kabupaten/KotaRegency/Municipality 2016 2017 2018 2019 2020
(1) (2) (3) (4) (5) (6)
Bogor 5 587 390 5 715 009 5 840 907 5 965 410 5 427 068Sukabumi 2 444 616 2 453 498 2 460 693 2 466 272 2 725 450Cianjur 2 250 977 2 256 589 2 260 620 2 263 072 2 477 560Bandung 3 596 623 3 657 601 3 717 291 3 775 279 3 623 790Garut 2 569 505 2 588 839 2 606 399 2 622 425 2 585 607Tasikmalaya 1 742 276 1 747 318 1 751 295 1 754 128 1 865 203Ciamis 1 175 389 1 181 981 1 188 629 1 195 176 1 229 069Kuningan 1 061 886 1 068 201 1 074 497 1 080 804 1 167 686Cirebon 2 142 999 2 159 577 2 176 213 2 192 903 2 270 621Majalengka 1 188 004 1 193 725 1 199 300 1 205 034 1 305 476Sumedang 1 142 097 1 146 435 1 149 906 1 152 400 1 152 507Indramayu 1 700 815 1 709 994 1 719 187 1 728 469 1 834 434Subang 1 546 000 1 562 509 1 579 018 1 595 825 1 595 320Purwakarta 932 701 943 337 953 414 962 893 997 869Karawang 2 295 778 2 316 489 2 336 009 2 353 915 2 439 085Bekasi 3 371 691 3 500 023 3 630 907 3 763 886 3 113 017Bandung Barat 1 648 387 1 666 510 1 683 711 1 699 896 1 788 336Pangandaran 392 817 395 098 397 187 399 284 423 667Kota Bogor 1 064 687 1 081 009 1 096 828 1 112 081 1 043 070Kota Sukabumi 321 097 323 788 326 282 328 680 346 325Kota Bandung 2 490 622 2 497 938 2 503 708 2 507 888 2 444 160Kota Cirebon 310 486 313 325 316 277 319 312 333 303Kota Bekasi 2 787 205 2 859 630 2 931 897 3 003 923 2 543 676Kota Depok 2 149 813 2 254 513 2 330 333 2 406 826 2 056 335Kota Cimahi 594 021 601 099 607 811 614 304 568 400Kota Tasikmalaya 659 606 661 404 662 723 663 517 716 155Kota Banjar 181 901 182 388 182 819 183 110 200 973
Jawa Barat 47 379 389 48 037 827 48 685 879 49 316 712 48 274 162
https:
//bek
asiko
ta.b
ps.go.id

293Kota Bekasi Dalam Angka 2021
PERBANDINGAN ANTAR KABUPATEN/KOTA
TabelTable 13.2 Laju Pertumbuhan Produk Domestik Regional Bruto Atas
Dasar Harga Konstan 2010 Menurut Kabupaten/Kota di Provinsi Jawa Barat (persen), 2016–2020
Rate of Growth of Gross Regional Domestic Products at Constant 2010 Prices by Regency/Municipality in Jawa Barat Province (percent), 2016–2020
Sumber/Source: Badan Pusat Statistik / BPS-Statistics
Kabupaten/KotaRegency/Municipality 2016 2017 2018 2019* 2020**
(1) (2) (3) (4) (5) (6)
Bogor 5,84 5,92 6,19 5,85 - 1.77Sukabumi 5,85 5,75 5,79 5,75 - 1.08Cianjur 6,43 5,77 6,23 5,47 - 0.78Bandung 6,34 6,15 6,26 6,09 - 1.87Garut 5,90 4,91 4,96 5,02 - 1.26Tasikmalaya 5,91 5,95 5,70 5,43 - 0.98Ciamis 5,99 5,21 5,44 5,38 - 0.14Kuningan 6,09 6,36 6,43 6,56 0.09Cirebon 5,63 5,06 5,02 4,86 - 1.08Majalengka 6,03 6,81 6,10 7,14 0.86Sumedang 5,70 6,23 5,83 6,32 - 1.12Indramayu 0,08 1,43 1,34 3,20 - 1.58Subang 5,40 5,10 4,38 4,27 - 1.27Purwakarta 5,99 5,15 4,98 4,38 - 2.05Karawang 6,55 5,13 6,07 4,06 - 3.59Bekasi 4,84 5,68 6,02 4,18 - 3.30Bandung Barat 5,65 5,21 5,50 5,05 - 2.41Pangandaran 5,29 5,10 5,41 5,96 - 0.05Kota Bogor 6,73 6,12 6,14 6,04 - 0.53Kota Sukabumi 5,64 5,43 5,51 5,49 - 1.48Kota Bandung 7,79 7,21 7,08 6,79 - 2.28Kota Cirebon 6,09 5,80 6,21 6,29 - 0.99Kota Bekasi 6,09 5,73 5,86 5,41 - 2.55Kota Depok 7,28 6,75 6,97 6,74 - 1.92Kota Cimahi 5,63 5,43 6,46 6,84 - 2.26Kota Tasikmalaya 6,91 6,07 5,93 5,97 - 2.01Kota Banjar 5,66 5,30 5,04 5,02 1.04
Jawa Barat 5,66 5,33 5,66 5,07 -2.44
https:
//bek
asiko
ta.b
ps.go.id

294 Bekasi Municipality in Figures 2021
REGENCY/MUNICIPAL COMPARISON
TabelTable 13.3 Jumlah Penduduk Miskin Menurut Kabupaten/Kota di
Provinsi Jawa Barat (ribu), 2016–2020 Number of Poor Population by Regency/Municipality in
Jawa Barat Province (thousand), 2016–2020
Sumber/Source: Badan Pusat Statistik / BPS-Statistics
Kabupaten/KotaRegency/Municipality 2016 2017 2018 2019 2020
(1) (2) (3) (4) (5) (6)
Bogor 490,80 487,28 415,02 395,03 465,67Sukabumi 198,66 197,12 166,33 153,30 175,10Cianjur 261,39 257,41 221,58 207,07 234,47Bandung 272,65 268,02 246,13 223,21 263,60Garut 298,52 291,24 241,31 235,19 262,78Tasikmalaya 195,61 189,35 172,41 159,93 181,82Ciamis 98,77 96,76 85,72 79,41 91,39Kuningan 144,07 141,55 131,16 123,16 139,20Cirebon 288,49 279,55 232,37 217,64 247,94Majalengka 152,50 150,26 129,29 121,06 138,21Sumedang 120,60 120,63 112,14 104,18 118,38Indramayu 237 233,38 204,18 191,86 220,31Subang 170,37 167,79 136,61 129,18 149,81Purwakarta 83,55 85,25 75,94 71,86 80,17Karawang 230,60 236,84 187,96 173,66 195,41Bekasi 164,41 163,95 157,21 149,43 186,30Bandung Barat 192,48 190,89 169 159,03 179,46Pangandaran 40,14 39,46 32,19 30,73 36,05Kota Bogor 77,28 76,53 64,85 63,97 75,04Kota Sukabumi 27,51 27,41 23,20 21,87 25,42Kota Bandung 107,58 103,98 89,38 84,67 100,02Kota Cirebon 30,15 30,19 28,03 26,80 30,61Kota Bekasi 140,03 136,01 119,82 113,65 134,01Kota Depok 50,56 52,34 49,39 49,35 60,43Kota Cimahi 35,07 34,53 29,94 26,91 31,64Kota Tasikmalaya 102,79 97,85 84,22 76,98 86,13Kota Banjar 12,74 12,87 10,41 10,07 11,16
Jawa Barat 4 224,33 4 168,44 3 615,79 3 399,16 3.920,23
https:
//bek
asiko
ta.b
ps.go.id

295Kota Bekasi Dalam Angka 2021
PERBANDINGAN ANTAR KABUPATEN/KOTA
TabelTable 13.4 Indeks Pembangunan Manusia Menurut Kabupaten/Kota
di Provinsi Jawa Barat, 2016–2020 Human Development Index by Regency/Municipality in
Jawa Barat Province, 2016–2020
Sumber/Source: Badan Pusat Statistik / BPS-Statistics
Kabupaten/KotaRegency/Municipality 2016 2017 2018 2019 2020
(1) (2) (3) (4) (5) (6)
Bogor 68,32 69,13 69,69 70,65 70,40Sukabumi 65,13 65,49 66,05 66,87 66,88Cianjur 62,92 63,70 64,62 65,38 65,36Bandung 70,69 71,02 71,75 72,41 72,39Garut 63,64 64,52 65,42 66,22 66,12Tasikmalaya 63,57 64,14 65,00 65,64 65,67Ciamis 68,45 68,87 69,63 70,39 70,49Kuningan 67,51 67,78 68,55 69,12 69,38Cirebon 66,70 67,39 68,05 68,69 68,75Majalengka 65,25 95,92 66,72 67,52 67,59Sumedang 69,45 70,07 70,99 71,46 71,64Indramayu 64,78 65,58 66,36 66,97 67,29Subang 67,14 67,73 68,31 68,69 68,95Purwakarta 68,56 69,28 69,98 70,67 70,82Karawang 68,19 69,17 69,89 70,86 70,66Bekasi 71,83 72,63 73,49 73,99 74,07Bandung Barat 65,81 66,63 67,46 68,27 68,08Pangandaran 65,79 66,60 67,44 68,21 68,06Kota Bogor 74,50 75,16 75,66 76,23 76,11Kota Sukabumi 72,33 73,03 73,55 74,31 74,21Kota Bandung 80,13 80,31 81,06 81,62 81,51Kota Cirebon 73,70 74,00 74,35 74,92 74,89Kota Bekasi 79,95 80,30 81,04 81,59 81,50Kota Depok 79,60 79,83 80,29 80,82 80,97Kota Cimahi 79,69 76,95 77,56 78,11 77,83Kota Tasikmalaya 70,58 71,51 72,03 72,84 73,04Kota Banjar 70,09 70,79 71,25 71,75 71,70
Jawa Barat 70,05 70,69 71,30 72,03 72,09
https:
//bek
asiko
ta.b
ps.go.id

https:
//bek
asiko
ta.b
ps.go.id

https:
//bek
asiko
ta.b
ps.go.id

BADAN PUSAT STATISTIKKOTA BEKASIBPS-STATISTICS OF BEKASI MUNICIPALITYJl. Rawa Tembaga 1 No. 6, Marga Jaya,Kec. Bekasi Selatan, Kota Bekasi, Jawa BaratTelp.: (021) 88953987 Fax.: (021) 88953987Homepage: http://bekasikota.bps.go.idE-mail: [email protected]
https:
//bek
asiko
ta.b
ps.go.id