Knowledge coherence, variety and economic growth: Manufacturing evidence from Italian regions
35
1 Knowledge Coherence, Variety and Productivity Growth: Manufacturing Evidence from Italian Regions 1 . Francesco Quatraro Laboratorio di Economia dell’Innovazione “F. Momigliano” Dipartimento di Economia “S. Cognetti de Martiis” Università di Torino Via Po 53 10124 Torino, Italy and Bureau of Research on Innovation, Complexity and Knowledge (BRICK) Collegio Carlo Alberto, Moncalieri (Torino) ABSTRACT. This paper analyzes the effects of the evolution of knowledge base in the manufacturing sectors on regional productivity growth. Knowledge is viewed as a heterogeneous asset, and an evolutionary perspective is adopted. The results of the empirical estimations corroborate the hypothesis that beyond the traditional measure of knowledge stock, knowledge coherence and variety matter in shaping productivity dynamics. The check for spatial dependence suggests that cross-regional externalities exert additional triggering effects on productivity growth, without debasing the effects of knowledge. Important policy implications stem from the analysis, in that regional innovation strategies should be carefully coordinated so as to reach a higher degree of internal coherence and exert positive effects on productivity. Keywords: Knowledge, Variety, Regional growth, Productivity JEL Classification Codes: O33, R11 1 Part of the background research for this paper has been conducted during my visiting period at Manchester Institute of Innovation Research, University of Manchester. Preliminary versions of this paper have been presented at the conference organized by the Regional Studies Association, held in Prague on 27 th -29 th May 2008; at the one organized by the European Regional Science Association, held in Liverpool on 27 th -31 st August 2008; and at the DIME workshop ‘Resconsidering the regional economy’ organised at the University of Newcastle on 4 th -5 th September 2008. I wish to thank Cristiano Antonelli, Lionel Nesta, Dimitri Pontikakis, Andrè Rodriguez-Pose and Allen J. Scott for their useful comments. I acknowledge the funding of the University of Torino and the Collegio Carlo Alberto as well as the financial support of the European Commission Marie Curie Training Website for the PREPARE summer school on spatial econometrics held in Bratislava in July 2007.
Transcript of Knowledge coherence, variety and economic growth: Manufacturing evidence from Italian regions
1
Knowledge Coherence, Variety and Productivity Growth: Manufacturing Evidence from Italian Regions1. Francesco Quatraro Laboratorio di Economia dell’Innovazione “F. Momigliano” Dipartimento di Economia “S. Cognetti de Martiis” Università di Torino Via Po 53 10124 Torino, Italy and Bureau of Research on Innovation, Complexity and Knowledge (BRICK) Collegio Carlo Alberto, Moncalieri (Torino) ABSTRACT. This paper analyzes the effects of the evolution of knowledge base in the manufacturing sectors on regional productivity growth. Knowledge is viewed as a heterogeneous asset, and an evolutionary perspective is adopted. The results of the empirical estimations corroborate the hypothesis that beyond the traditional measure of knowledge stock, knowledge coherence and variety matter in shaping productivity dynamics. The check for spatial dependence suggests that cross-regional externalities exert additional triggering effects on productivity growth, without debasing the effects of knowledge. Important policy implications stem from the analysis, in that regional innovation strategies should be carefully coordinated so as to reach a higher degree of internal coherence and exert positive effects on productivity. Keywords: Knowledge, Variety, Regional growth, Productivity JEL Classification Codes: O33, R11
1 Part of the background research for this paper has been conducted during my visiting period at Manchester Institute of Innovation Research, University of Manchester. Preliminary versions of this paper have been presented at the conference organized by the Regional Studies Association, held in Prague on 27th-29th May 2008; at the one organized by the European Regional Science Association, held in Liverpool on 27th-31st August 2008; and at the DIME workshop ‘Resconsidering the regional economy’ organised at the University of Newcastle on 4th-5th September 2008. I wish to thank Cristiano Antonelli, Lionel Nesta, Dimitri Pontikakis, Andrè Rodriguez-Pose and Allen J. Scott for their useful comments. I acknowledge the funding of the University of Torino and the Collegio Carlo Alberto as well as the financial support of the European Commission Marie Curie Training Website for the PREPARE summer school on spatial econometrics held in Bratislava in July 2007.
2
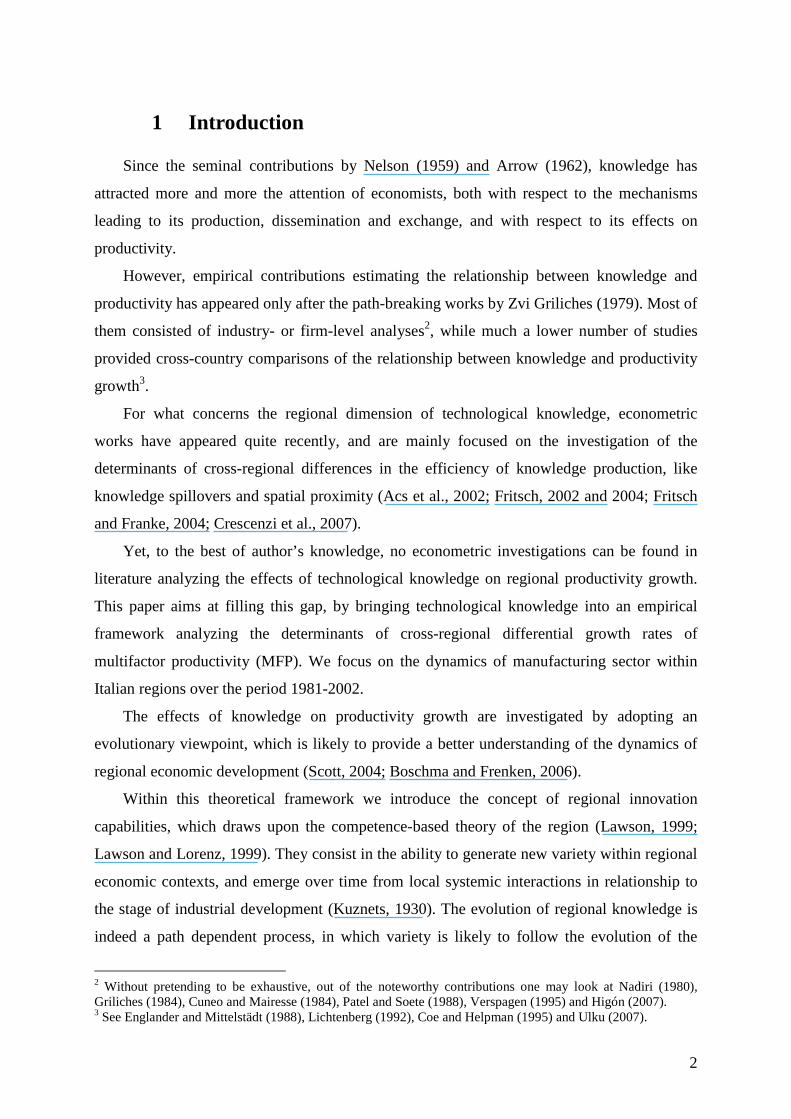
1 Introduction Since the seminal contributions by Nelson (1959) and Arrow (1962), knowledge has
attracted more and more the attention of economists, both with respect to the mechanisms
leading to its production, dissemination and exchange, and with respect to its effects on
productivity.
However, empirical contributions estimating the relationship between knowledge and
productivity has appeared only after the path-breaking works by Zvi Griliches (1979). Most of
them consisted of industry- or firm-level analyses2, while much a lower number of studies
provided cross-country comparisons of the relationship between knowledge and productivity
growth3.
For what concerns the regional dimension of technological knowledge, econometric
works have appeared quite recently, and are mainly focused on the investigation of the
determinants of cross-regional differences in the efficiency of knowledge production, like
knowledge spillovers and spatial proximity (Acs et al., 2002; Fritsch, 2002 and 2004; Fritsch
and Franke, 2004; Crescenzi et al., 2007).
Yet, to the best of author’s knowledge, no econometric investigations can be found in
literature analyzing the effects of technological knowledge on regional productivity growth.
This paper aims at filling this gap, by bringing technological knowledge into an empirical
framework analyzing the determinants of cross-regional differential growth rates of
multifactor productivity (MFP). We focus on the dynamics of manufacturing sector within
Italian regions over the period 1981-2002.
The effects of knowledge on productivity growth are investigated by adopting an
evolutionary viewpoint, which is likely to provide a better understanding of the dynamics of
regional economic development (Scott, 2004; Boschma and Frenken, 2006).
Within this theoretical framework we introduce the concept of regional innovation
capabilities, which draws upon the competence-based theory of the region (Lawson, 1999;
Lawson and Lorenz, 1999). They consist in the ability to generate new variety within regional
economic contexts, and emerge over time from local systemic interactions in relationship to
the stage of industrial development (Kuznets, 1930). The evolution of regional knowledge is
indeed a path dependent process, in which variety is likely to follow the evolution of the
2 Without pretending to be exhaustive, out of the noteworthy contributions one may look at Nadiri (1980), Griliches (1984), Cuneo and Mairesse (1984), Patel and Soete (1988), Verspagen (1995) and Higón (2007). 3 See Englander and Mittelstädt (1988), Lichtenberg (1992), Coe and Helpman (1995) and Ulku (2007).
3
business cycle. Moreover innovation activities are localized in that dynamic irreversibilities
make them highly idiosyncratic, i.e. shaped by the set of competences that have been
accumulated within the region over time (Boschma and Lambooy, 1999; Antonelli, 2008a;
Quatraro 2008a).
The emphasis on systemic interactions, and therefore on the collective character of
knowledge production, allows us to understand the regional knowledge base as a co-relational
structure. Thus, besides the traditional measure of knowledge capital stock, additional
properties of the knowledge base can be derived, drawing upon the co-occurrence of
technological classes within patent documents (Saviotti, 2004 and 2007). In view of this, our
empirical investigation also includes two additional variables able to qualify the regional
knowledge base, i.e. knowledge coherence and variety (Nesta and Saviotti, 2005; Nesta,
2008).
The case of Italian manufacturing within this picture deserves to be investigated for a
number of reasons. First, since the 1980s the Italian economy has showed a relative delay as
to development stage of manufacturing sectors, with respect to most advanced countries, and
still such delay is persistent (Fuà, 1980; Antonelli et al., 2007). Second, the internal economic
structure has long been characterized by a sharp dualism. On the one hand North-West
regions were the cradle of modern industrial firms, and during the 1980s the manufacturing
sectors had already completed their growth phase, leaving the floor to service industries. On
the other hand, North-Eastern-Central (NEC) regions showed a delayed development of
manufacturing activities, carried out mostly by small and medium sized enterprises (SMEs)
often operating in peculiar economic and social environments (Fuà, 1983). Such cross-
regional differences in the development of manufacturing sectors appeared in turn to be
strictly related to differences in the emergence of regional innovation capabilities. In
particular, manufacturing sectors have proved to be the pillars of sustained productivity in
NEC areas along the 1980s and the 1990s, due to their relatively intensive innovative
potentials (Quatraro, 2008a and b).
In this context, the contribution of this paper to the literature is twofold. On the one hand
such analysis is relevant for its general implications concerning the relationships between the
dynamics of technological knowledge and regional productivity growth, in particular with
respect to regional innovation strategies. On the other hand, it also aims at rejuvenating a field
of enquiry which has been lacking appropriate consideration since the 1980s. For this reason,
the debate about the economic development of Italian regions has missed the important
4
opportunity of investigating cross-regional differences in the light of the economics of
knowledge and innovation.
The rest of the paper is organized as follows. In Section 2 we outline the theoretical
framework and propose a model linking regional productivity growth to the characteristics of
knowledge base. Section 3 outlines the empirical context that will constitute the object of our
analysis. Section 4 presents the methodology and describes the regional knowledge indicators.
In section 5 we describe the data sources and provide descriptive statistics for the main
variables. Section 6 presents the results of the empirical estimations and an extension to a
spatial panel data models. Finally, conclusions and policy implications follow in Section 7.
2 The Theoretical Framework
The theoretical underpinnings of evolutionary economics are rooted in the seminal
contributions by Schumpeter. Innovation is regarded as the main engine of economic
development. In the first place, it was the innovative entrepreneur who brings about new
products, process, intermediate goods and markets in the economic system (Schumpeter
1911/1934). Large firms eventually became the main innovating agents, in a context shaped
by the search for extra-profits and by the sacrifice of static to dynamic efficiency
(Schumpeter, 1942).
The triggering effects of innovation on productivity growth are due to the efficiency
gains in the production process. Moreover, the introduction of innovations brings about new
variety within the economic system, providing the basis for restless economic growth
(Metcalfe, 2002). Indeed, the creation of new sectors by means of innovations is likely to
counterbalance the tendency to underemployment in mature sectors and favours the shift of
employment from older and less productive to newer and more productive sectors (Saviotti,
1996).
In this direction evolutionary economics is quite close to Perroux’ growth pole theory
(Perroux, 1955). Following Schumpeter he indeed emphasized the role of technological
change regional development, providing the (neglected) bases for an evolutionary economic
geography. Regional economic systems are characterized by rounds of growth, i.e. periods in
which firms within the propulsive industry grow at faster rates, propagating the positive
effects across firms directly and indirectly related to the propulsive industry. The main driving
factor of such expansion is technical efficiency gained through innovation efforts. Therefore
5
cross-regional differences in innovation dynamics are likely to be associated to differences in
productivity growth.
The competitive forces driving the expansion of such an industry however do not work
indefinitely, as growth rates are expected to slacken. New industries are then likely to emerge,
as an effect of the introduction of radical innovations within the system (Kuznets, 1930;
Burns, 1934). Within the new industry firms will innovate to gain competitive advantages and
gales of incremental innovations show up in a positive climate in which one firm introduces
an innovation, stimulating the creative response of other economic agents4.
The economic development of regions is therefore strictly related to the main
industries they are specialized in. Path-dependence and dynamic irreversibilities make it
difficult for regions locked into earlier specializations with mature lifecycles to promptly
adapt to the emergence of new sectors and new product specialization. Such regions are
therefore expected to decline, unless a set of intentional actions are undertaken aimed at
fostering the shift towards newer and more productive economic activities (Boschma and
Frenken, 2006).
In sum, the dynamics of industrial development within regional context is intertwined
with innovation dynamics, and hence with the dynamics of variety creation. The extension of
the concept of innovation capabilities to the regional domain allows us both to appreciate such
historical dimension and to view the region as a bundle of resources. This in turn makes it
possible to qualify the knowledge base within the region as essentially heterogeneous, as it
stems from the recombination of diverse, and not always related, locally available bits of
knowledge (Antonelli, 2008; Nesta, 2008).
Innovation and technological capabilities specifically denote the firm’s capacity to
combine internal and external sources of both tacit and codified knowledge, directed towards
the introduction of product and process innovations (Lall, 1992; Antonelli, 2008a).
The emphasis on external linkages calls the attention upon factors going beyond the
firm level. Higher-order innovation capabilities relates to knowledge which resides in the
region, and “emerge in a historical process from the systemic interaction among firms” (Foss,
1996: p.3). The different institutions involved in the innovation process need time to learn to
interact. This requires iterate interactions, the development of common communication codes
4 Thomas (1975) articulated the implications of Perroux’ framework on regional economic growth using a product life-cycle perspective, wherein the saturation of product markets are the main responsible for the slowdown of growth rates and the quest for innovations aims at opening new markets.
6
and the availability of effective channels to access external knowledge. Such a kind of
learning is highly localized in the specific context in which it takes place. As a result, regional
innovation capabilities are highly idiosyncratic and related to the conditions of the economic
and institutional environment, and hence they are difficult to replicate in the same way in
other regions (Lawson and Lorenz, 1999; Romijn and Albu, 2002).
Thus, the very essence of knowledge base lies in its collective nature, which confers
the basic properties of being a co-relational structure. This allows for qualifying both the
cumulative character of knowledge and the key role played by complementarity in the activity
of recombination. The knowledge base can be represented as a network in which the nodes
are constituted by units of knowledge at a given level of aggregation. The higher the
complementarity among such diverse smaller units of knowledge, the stronger the degree of
internal coherence of the aggregate knowledge base. This in turn makes it possible the
working of knowledge externalities and the effective cross-fertilization across the diverse
technological activities within the local system of innovation (Saviotti, 2004 and 2007).
2.1 The model
The discussion conducted above leads us to propose a simple model to appreciate the
effects of the properties of technological knowledge on regional economic growth:
)( 1,, −= titi Kfg (1)
Where subscripts i and t refer respectively to the region and to time, g is the growth
rate of productivity and K is the regional knowledge base. Traditionally, K is defined as the
stock of knowledge corrected for technical obsolescence: 1,,, )1( −
•−+= tititi KkK δ , where tik ,
•
is the flow of new knowledge at time t and δ is the rate of obsolescence. This relationship is
able to capture the influence only of intangible capital, neglecting the characteristics of
regional knowledge.
In order to address the issue of knowledge heterogeneity, stemming from the variety of
resources that need to be combined for its production, the K term of Equation (1) can be
modelled by extending to the regional domain the framework that Nesta (2008) develops at
firm level. Let us recall the main passages in what follows.
Assume that a region is a bundle of D productive activities, represented by the
vector [ ]Dd pppP ,...,,...,1= . Each regional activity pd draws mainly upon a core scientific and

7
technological expertise ed, so that the regional total expertise is vector[ ]Dd eeeE ,,,,1 KK= .
The emphasis on the collective character of knowledge implies that an activity pd may also
take advantage of the expertise developed in other activities l ( dl ≠ ), depending on the level
of relatedness τ between the technical expertise ed and el. It follows that the knowledge base k
used by the dth activity is:
∑≠
+≡D
dlldldd eek τ (2)
The meaning of Equation (2) is straightforward. The knowledge base k of each activity
d amounts to the sum of its own expertise and the expertise developed by other activities
weighted by their associate relatedness. Such equation can be generalized at the regional level
to define the aggregate knowledge base:
∑ ∑∑≠
+≡D
d
D
d
D
dlldld eeK τ (3)
Let us assume that ldτ is constant across activities d and l, so that Rld =τ across all
productive activities within the region. Since ∑D
dDe is the regional knowledge stock (E),
Equation (3) boils down to:
[ ]RDEK )1(1 −+≡ (4)
According to Equation (4), the regional knowledge is a function of the knowledge
capital stock, the number of productive activities residing in the region, and the coherence (R)
across activities. If the bundle of activities residing within the region are characterized by a
high degree of coherence (R>0), then the aggregate knowledge base increase with the variety
of technological competences (D), weighted by their average relatedness. Conversely, if
regional activities are featured by no coherence (R=0), then the regional knowledge base is
equal to the knowledge capital stock. Therefore, the traditional approach to the computation
of the knowledge base turns out to be a special case where R=0. Equation (4) can be
approximated as follows:
EDRK ≅ (5)
Substituting Equation (5) in (1) we therefore get:
)( 1,1,1,, −−−= titititi RDEfg (6)
In view of the arguments elaborated so far we are now able to spell out or working
hypotheses. The generation of new knowledge is a core activity strategic for the competitive
advantage of regional economies. Cross-regional differences in the development of
8
technological knowledge provide thus a possible, although not exhaustive, explanation for
differential growth rates (Fagerberg, 1987). We therefore expect E to be positively related to
productivity growth.
A region can be viewed as a locus for the accumulation of diverse competences and
technological knowledge. Not only differences in knowledge stock matter. The creation of
new technological knowledge is likely to engender the introduction of innovations. These in
turn are the main way through which variety is brought about in the economic system. Variety
is therefore a key feature, whose effects deserve to be carefully investigated. The increase in
the variety of technological knowledge is likely to be related to an increase in technological
opportunities and therefore to economic development. We may therefore expect D to be
positively related to productivity growth.
New knowledge emerges from the recombination of different inputs, which are both
internal and external to economic agents. Regional knowledge base is therefore the outcome
of a collective process that gathers together innovation efforts of a variety of actors, which
have to commit additional resources in order to screen the activities residing in the region and
combine the available resources in a non-random way. Knowledge so generated appears to be
heterogeneous rather than homogenous, and the diversification strategies matter in shaping
the effects that it can have on regional productivity dynamics.
The positive effects on productivity stemming from cross-fertilization and knowledge
externalities, are more likely to occur in regions able to combine together different and yet
complementary technological activities. Conversely, the attraction of activities based upon
weak complementarity of technological competences makes it difficult to implement effective
systemic interactions that are at the core of the collective process of knowledge production. In
this case regional productivity dynamics are hardly driven by innovation performances.
Therefore, in order to foster productivity growth, regional actors must pursue diversification
in related activities, which are likely to share related knowledge bases. Knowledge coherence
(R) is thus expected to positively affect productivity growth.
3 The Economic Context
In the 1950s most Italian regions were rural, and populated by a large share of small-
and medium-sized enterprises, as opposed to North-Western regions, specialized in
manufacturing activities, carried out by large firms. Analyzing the distribution of growth rates
and structural change at the regional level in the period 1950-1970, the Ancona School
9
identified and found the clues of a successful diffusion process of manufacturing activities
towards such rural regions in the North-East and eventually in Central Italy, along the
Adriatic coast. For this reason they proposed to group such regions into a larger macro-area
which has been eventually called NEC (North-East-Centre)5. At the same time, the growth of
manufacturing industries was slowing down in the North-West, wherein the growth of
business service industries was already in nuce (Pettenati, 1991; Fuà and Zacchia, 1983).
Different factors were proposed in the 1970s as conducive to the successful territorial
diffusion of manufacturing activities towards the NEC. On the one hand it has been argued
that the widespread presence of small- and medium-sized firms contributed to create a
favourable environment, characterized by low costs of living, intense utilization of labour
potential, and the persistence of pretty informal labour relationships. Firms in turn benefited
from these peculiarities in terms of lower costs and better business efficiency. Moreover they
maintained that the small size scale and the specialization in labour-intensive activities,
permitted in many ways swifter adaptation to changes in markets and technologies (Fuà,
1983, 1991a and 1991b; Fuà and Zacchia, 1983; Garofoli, 1981 and 1983).
On the other hand the relevance of the features of the social texture has been stressed,
whereby the traditions rooted into the sharecropping system largely drawing on the informal
institution of the “extended family” were persisting. The gradual diffusion of manufacturing
did not seem to be paralleled by a simultaneous change of the social organization. Low wages
and temporary jobs were accepted because of the weakness of labour market as an institution,
substituted by the “extended family” which worked as a real self-regulatory system. In such a
context dynamic pressures and attitude toward self-employment represented a key factor for
the successful creation of manufacturing enterprises6 (Paci, 1973 and 1992). The boosting role
of institutional factors (above all embedded in the labour market) and the peculiarities of the
economic structure, were maintained to lead to the set of positive-feedbacks well described by
the industrial district theorists (Brusco, 1982; Becattini, 1989).
More recent evidence shows that the Italian economy has retained its delay in the
industrialization process also during the last decades of the 20th century. The analysis carried
out on the evolution of the regional specialization index in manufacturing sectors reveals that
the geographical pattern has changed significantly over time. Indeed, the North-Eastern and
Central regions are characterized by specialization indexes increasing over the period 1981-
5 The grouping of Italian regions is as follows. North-West: Piedmont, Lombardy, Valle d’Aosta and Liguria. North-East: Veneto, Emilia-Romagna, Friuli Venezia-Giulia,Trentino Alto-Adige. Centre: Tuscany, Abruzzi, Marches, Lazio, Umbria and Molise. South: Campania, Apulia, Calabria, Basilicata, Sicilia and Sardegna. 6 The empirical analysis carried out by Garofoli (1994) addresses the issue of firms creation very exhaustively.
10
2001. It seems that at the turning of the century North-Eastern and Central regions are
characterized by specialization indexes very close to (and in the some cases even higher than)
the values featuring North-Western regions. Moreover the trend appears to be soundly
positive in the former, while the values in the latter are continuously decreasing since the
early 1980s (Quatraro, 2008a and b).
4 Methodology
In order to investigate the effects of the properties of regional knowledge base on
productivity growth, we first calculate an index of multi factor productivity (MFP)7. To this
purpose we follow a standard growth accounting approach (Solow, 1957; Jorgenson, 1995;
OECD, 2001). Let us start by assuming that the regional economy can be represented by a
general Cobb-Douglas production function with constant returns to scale:
itititititit LCAY βα= (7)
where Lit is the total hours worked in the region i at the time t, Cit is the level of the capital
stock in the region i at the time t, and Ait is the level of MFP in the region i at the time t.
Following Euler’s theorem, output elasticities have been calculated (and not
estimated) using accounting data, by assuming constant returns to scale and perfect
competition in both product and factors markets. The output elasticity of labour has therefore
been computed as the factor share in total income:
titititi YLw ,,,, /)(=β (8)
titi ,, 1 βα −= (9)
Where w is the average wage rate in region i at time t. Thus we obtain elasticities that
vary both over time and across regions.
Then the discrete approximation of annual growth rate of regional TFP is calculated as
usual in the following way:
−−
−−−
−=
− )1()(
ln)1(
)(ln)1(
)1()(
ln)1(
)(ln
tL
tL
tC
tC
tY
tY
tA
tA
i
i
i
i
i
i
i
i ββ (10)
7 Some basic questions of course remain as to what interpretations to give to these kinds of index. While Solow (1957) associated TFP growth with technological advances, Abramovitz (1956) defined the residual as some sort of measure of ignorance. Nonetheless it remains a useful signalling device, in that it provides useful hints on where the attention of the analysts should focus (Maddison, 1987).
11
The basic hypothesis of this paper is that growth rates of regions differences are driven
by the characteristics of regional knowledge bases. The increase in the variety of activities is
likely to create negative effects on productivity, due to coordination problems and the
increase of absorption costs. On the contrary the increase in the knowledge stock and in the
knowledge relatedness is likely to positively affect productivity growth.
The test of such hypothesis needs for modelling the growth rate of MFP as a function
of the characteristics of the knowledge base. Moreover, as is usual in this kind of empirical
settings, we include in the structural equation also the lagged value of MFP, 1,ln −tiA , in order
to capture the possibility of mean reversion. Therefore the econometric specification of
Equation (6) becomes:
∑ +++++++=
− −−−− tiititititii
i tRcDcEcAbatA
tA,1,31,21,11, lnlnlnln
)1(
)(ln εψρ (11)
Where the error term is decomposed in ρi and Σψt, which are respectively region and
time effects, and the error component εit. Equation (11) can be estimated using traditional
panel data techniques implementing the fixed effect estimator. It relates the rates of
productivity growth to the characteristics of knowledge base. However, one needs to control
for the impact on the one hand of agglomeration economies, on the other hand of changing
regional industrial specialization, so as to rule out the possibility that such effects are
somehow captured by the knowledge-related variables. In view of this, we can write Equation
(11) as follows:
∑ +++++
+++++=
−
−−
−−−−
tiitt
titititii
i
tLOQcAGGLc
RcDcEcAbatA
tA
,1514
1,31,21,11, lnlnlnln)1(
)(ln
εψρ (12)
Productivity growth rates depend now not only on knowledge capital stock, variety
and coherence (respectively E, D and R). Following Crescenzi et al. (2007), the effects
agglomeration economies are captured by the variable AGGL, which is calculated as the (log)
ratio between regional population and size (square kilometres). The changing specialization is
instead proxied by LOQ, i.e. the location quotient for manufacturing added value.
4.1 Panel Data and Spatial Dependence
The analysis of the effects of knowledge on productivity growth at the regional level
calls for a special focus on the geographical attributes of such relations, i.e. on locational
12
aspects. Regional scientists have indeed showed that geographical proximity may affect
correlation between economic variables.
While the traditional econometric approach has mostly neglected this problem, a new
body of literature has recently developed, dealing with the identification of estimators able to
account for both spatial dependence between the relationships between observations and
spatial heterogeneity in the empirical model to be estimated. Former treatment of spatial
econometric issues can be found in Anselin (1988), subsequently extended by Le Sage
(1999).
The idea behind the concept of spatial dependence is straightforward. The properties
of economic and social activities of an observed individual are likely to influence economic
and social activities of neighbour individuals. Formally this relationship can be expressed as
follows:
)( ,, tjti yhy = , ni ,,1K= , ij ≠ (13)
The dependence can therefore be among several observations. If this is the case,
structural forms like equation (12) are likely to produce a bias the estimation results. There
are different ways to cope with this issue. First, one may apply spatial filters to the sample
data, so as to remove the spatial structure and then apply traditional estimation techniques.
Second, the relationship can be reframed using a spatial error model (SEM), in which the
error term is further decomposed so as to include a spatial autocorrelation coefficient. Third,
one may apple the spatial autoregressive model (SAR), which consists of including the
spatially lagged dependent variable in the structural equation.
We decided to compare the SAR and SEM models in order to have a direct assessment
of the spatial dependence of productivity growth between close regions. However, most of the
existing literature on spatial econometrics propose estimator appropriate for cross-sectional
data. Given the panel data structure of our sample, we therefore follow Elhorst (2003)
extending Equation (12) so as to obtain the SAR (Eq. 14) and the SEM (Eq. 15)
specifications:
∑ +++++++
+++
−=
−
−−−−
−−
tiitttiti
titii
i
i
i
tLOQcAGGLcRcDc
EcAbtA
tAW
tA
tA
,15141,31,2
1,11,
lnln
lnln)1(
)(ln
)1(
)(ln
εψρ
ξ (14)
ttiitt
titititii
i
tLOQcAGGLc
RcDcEcAbtA
tA
φεψρ ++++++
++++=
−
∑−−
−−−−
,1514
1,31,21,11, lnlnlnln)1(
)(ln
(15)
13
ttt W µφδφ += , 0)( =tE µ , Ntt IE 2' )( σµµ =
Where ξ is referred to as spatially autoregressive coefficient and W is a weighting
matrix. This latter can be defined either as a contiguity or as a normalized distance matrix. In
the analysis that follows we chose the second alternative, by building a 19x19 symmetric
matrix reporting the distance in kilometres among the city centre of the regional chief towns.
4.2 The Implementation of Regional Knowledge Indicators
As far as the measures of regional knowledge are concerned, we used patent statistics
to derive three variables. It must be stressed that to introduce some rigidities in the regional
technological portfolio, and to compensate for intrinsic volatility of patenting behaviour, each
patent application is meant to last five years.
1) First of all regional knowledge stock is computed by applying the permanent
inventory method to patent applications. We calculated it as the cumulated stock of
past patent applications using a rate of obsolescence of 15% per annum:
1,,, )1( −
•−+= tititi EhE δ , where tih ,
• is the flow of regional patent applications and δ is
the rate of obsolescence.
2) Secondly, we decided to measure D (variety) in regional knowledge by using the
information entropy index. Entropy measures the degree of disorder or randomness of
the system, so that systems characterized by a high entropy will also be characterized
by a high degree of uncertainty (Saviotti, 1988).
Such index was introduced to economic analysis by Theil (1967). Its earlier
applications aimed at measuring diversity of an industry (or of a sample of firms
within an industry) against a uniform distribution of economic activities in all sectors,
or among firms (Attaran, 1985; Frenken et al., 2007).
Differently from common measures of variety and concentration, the
information entropy has some interesting properties (Frenken, 2004). An important
feature of the entropy measure is its multidimensional extension. Consider a pair of
events (Xi, Yj), and the probability of co-occurrence of both of them pij. A two
dimensional (total) entropy (IE) measure can be expressed as follows:
∑∑= =
=≡
m
i
n
j ijij p
pYXHIE1 1
2
1log),( (16)
14
If one considers pij to be the probability that two technological classes i and j
co-occur within the same patent, then the measure of multidimensional entropy
focuses on the variety of co-occurrences of technological classes within regional
patents applications.
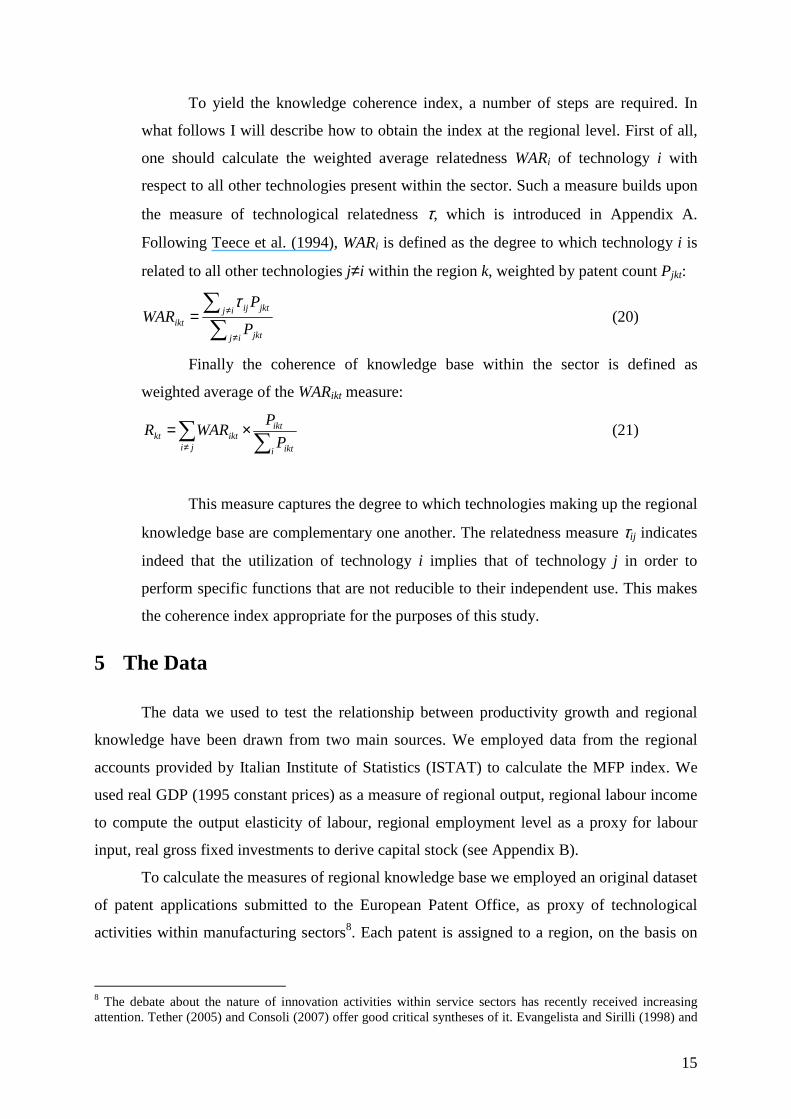
Moreover, the total index can be decomposed in a “within” and a “between”
part anytime the events to be investigated can be aggregated in a smaller numbers of
subsets. Within-entropy measures the average degree of disorder or variety within the
subsets, while between-entropy focuses on the subsets measuring the variety across
them. Frenken et al. (2007) refer to between- and within- group entropy respectively
as unrelated and related variety.
It can be easily shown that the decomposition theorem holds also for the
multidimensional case. Hence if one allows i∈Sg and j∈Sz (g = 1,…,G; z = 1,…, Z), we
can rewrite H(X,Y) as follows:
∑∑= =
+=G
g
Z
zgzgzQ HPHYXH
1 1
),( (17)
Where the first term of the right-hand-side is the between-entropy and the
second term is the (weighted) within-entropy. In particular:
∑∑= =
=≡G
g
Z
z gzgzQ P
PHIEB1 1
2
1log (18)
∑∑= =
≡G
g
Z
zgzgzHPIEW
1 1
(19)
∑∑∈ ∈
=g ZSi Sj
ijgz pP
∑∑∈ ∈
=
g zSi Sj gzijgz
ijgz PpP
pH
/
1log2
We can therefore refer to between- and within-entropy respectively as
unrelated technological variety (IEB) and related technological variety (IEW), while
total information entropy is referred to as general technological variety.
3) Third, as a proxy of knowledge relatedness we calculated the coherence (R) of the
regional knowledge base, defined as the average relatedness of any technology
randomly chosen within a region with respect to any other technology (Nesta and
Saviotti, 2005 and 2006; Nesta, 2008). Thus it is a measure on how much the
technologies present within the region are related each other.
15
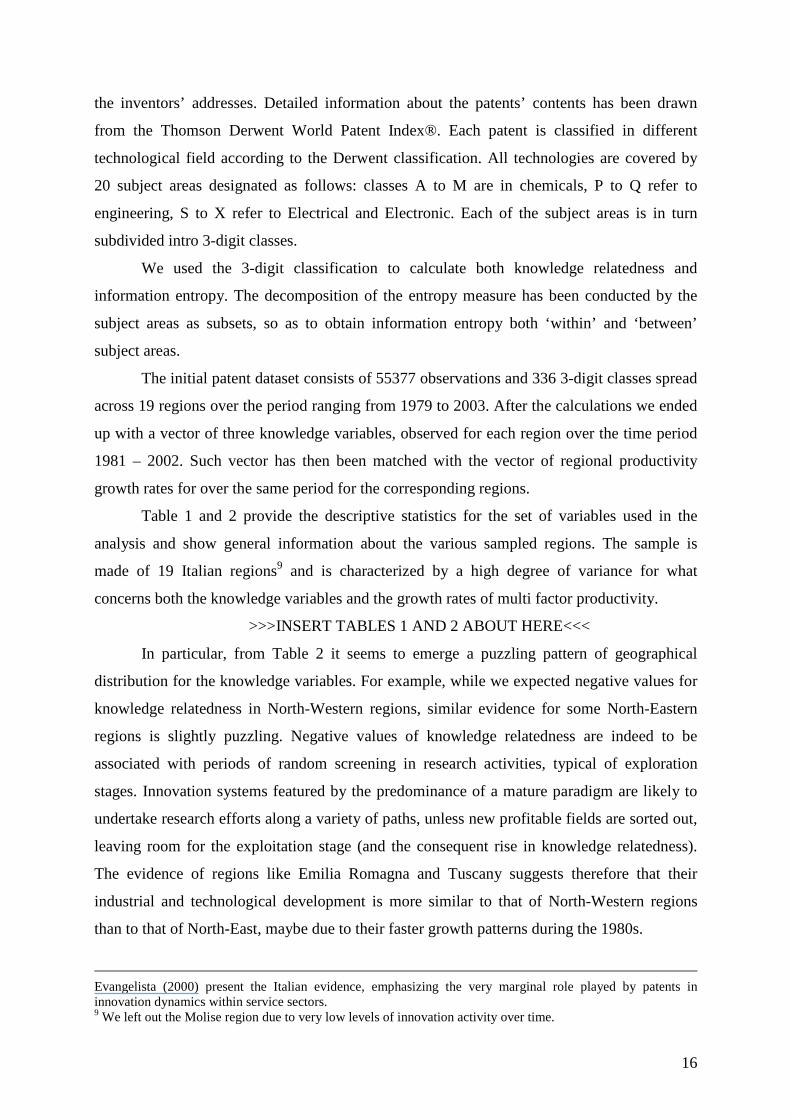
To yield the knowledge coherence index, a number of steps are required. In
what follows I will describe how to obtain the index at the regional level. First of all,
one should calculate the weighted average relatedness WARi of technology i with
respect to all other technologies present within the sector. Such a measure builds upon
the measure of technological relatedness τ, which is introduced in Appendix A.
Following Teece et al. (1994), WARi is defined as the degree to which technology i is
related to all other technologies j≠i within the region k, weighted by patent count Pjkt:
∑∑
≠
≠=ij jkt
ij jktij
ikt P
PWAR
τ (20)
Finally the coherence of knowledge base within the sector is defined as
weighted average of the WARikt measure:
∑∑≠
×=ji i ikt
iktiktkt P
PWARR (21)
This measure captures the degree to which technologies making up the regional
knowledge base are complementary one another. The relatedness measure τij indicates
indeed that the utilization of technology i implies that of technology j in order to
perform specific functions that are not reducible to their independent use. This makes
the coherence index appropriate for the purposes of this study.
5 The Data
The data we used to test the relationship between productivity growth and regional
knowledge have been drawn from two main sources. We employed data from the regional
accounts provided by Italian Institute of Statistics (ISTAT) to calculate the MFP index. We
used real GDP (1995 constant prices) as a measure of regional output, regional labour income
to compute the output elasticity of labour, regional employment level as a proxy for labour
input, real gross fixed investments to derive capital stock (see Appendix B).
To calculate the measures of regional knowledge base we employed an original dataset
of patent applications submitted to the European Patent Office, as proxy of technological
activities within manufacturing sectors8. Each patent is assigned to a region, on the basis on
8 The debate about the nature of innovation activities within service sectors has recently received increasing attention. Tether (2005) and Consoli (2007) offer good critical syntheses of it. Evangelista and Sirilli (1998) and
16
the inventors’ addresses. Detailed information about the patents’ contents has been drawn
from the Thomson Derwent World Patent Index®. Each patent is classified in different
technological field according to the Derwent classification. All technologies are covered by
20 subject areas designated as follows: classes A to M are in chemicals, P to Q refer to
engineering, S to X refer to Electrical and Electronic. Each of the subject areas is in turn
subdivided intro 3-digit classes.
We used the 3-digit classification to calculate both knowledge relatedness and
information entropy. The decomposition of the entropy measure has been conducted by the
subject areas as subsets, so as to obtain information entropy both ‘within’ and ‘between’
subject areas.
The initial patent dataset consists of 55377 observations and 336 3-digit classes spread
across 19 regions over the period ranging from 1979 to 2003. After the calculations we ended
up with a vector of three knowledge variables, observed for each region over the time period
1981 – 2002. Such vector has then been matched with the vector of regional productivity
growth rates for over the same period for the corresponding regions.
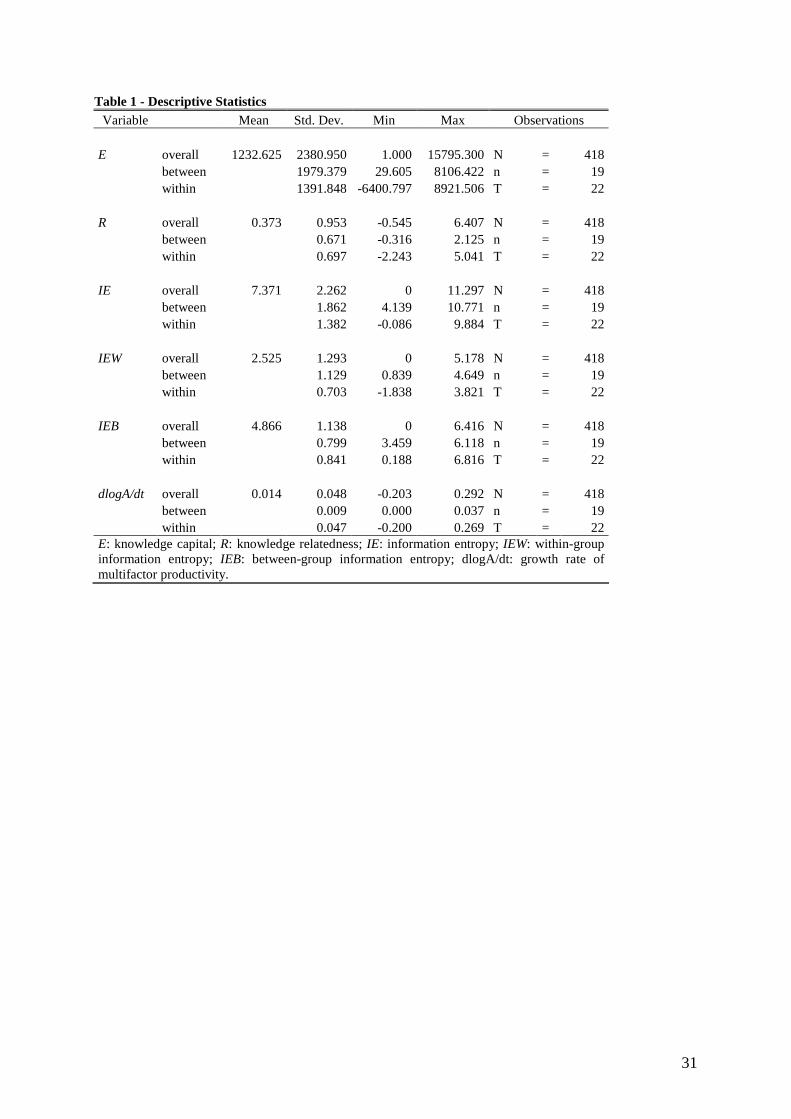
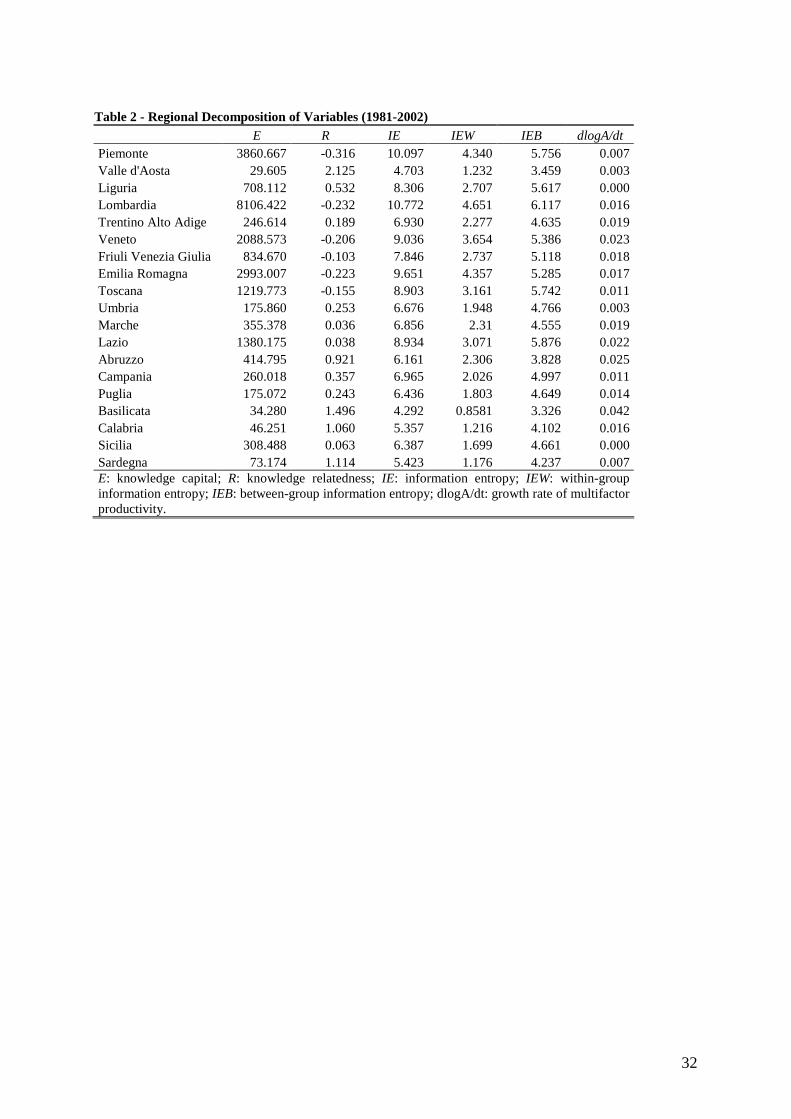
Table 1 and 2 provide the descriptive statistics for the set of variables used in the
analysis and show general information about the various sampled regions. The sample is
made of 19 Italian regions9 and is characterized by a high degree of variance for what
concerns both the knowledge variables and the growth rates of multi factor productivity.
>>>INSERT TABLES 1 AND 2 ABOUT HERE<<<
In particular, from Table 2 it seems to emerge a puzzling pattern of geographical
distribution for the knowledge variables. For example, while we expected negative values for
knowledge relatedness in North-Western regions, similar evidence for some North-Eastern
regions is slightly puzzling. Negative values of knowledge relatedness are indeed to be
associated with periods of random screening in research activities, typical of exploration
stages. Innovation systems featured by the predominance of a mature paradigm are likely to
undertake research efforts along a variety of paths, unless new profitable fields are sorted out,
leaving room for the exploitation stage (and the consequent rise in knowledge relatedness).
The evidence of regions like Emilia Romagna and Tuscany suggests therefore that their
industrial and technological development is more similar to that of North-Western regions
than to that of North-East, maybe due to their faster growth patterns during the 1980s.
Evangelista (2000) present the Italian evidence, emphasizing the very marginal role played by patents in innovation dynamics within service sectors. 9 We left out the Molise region due to very low levels of innovation activity over time.
17
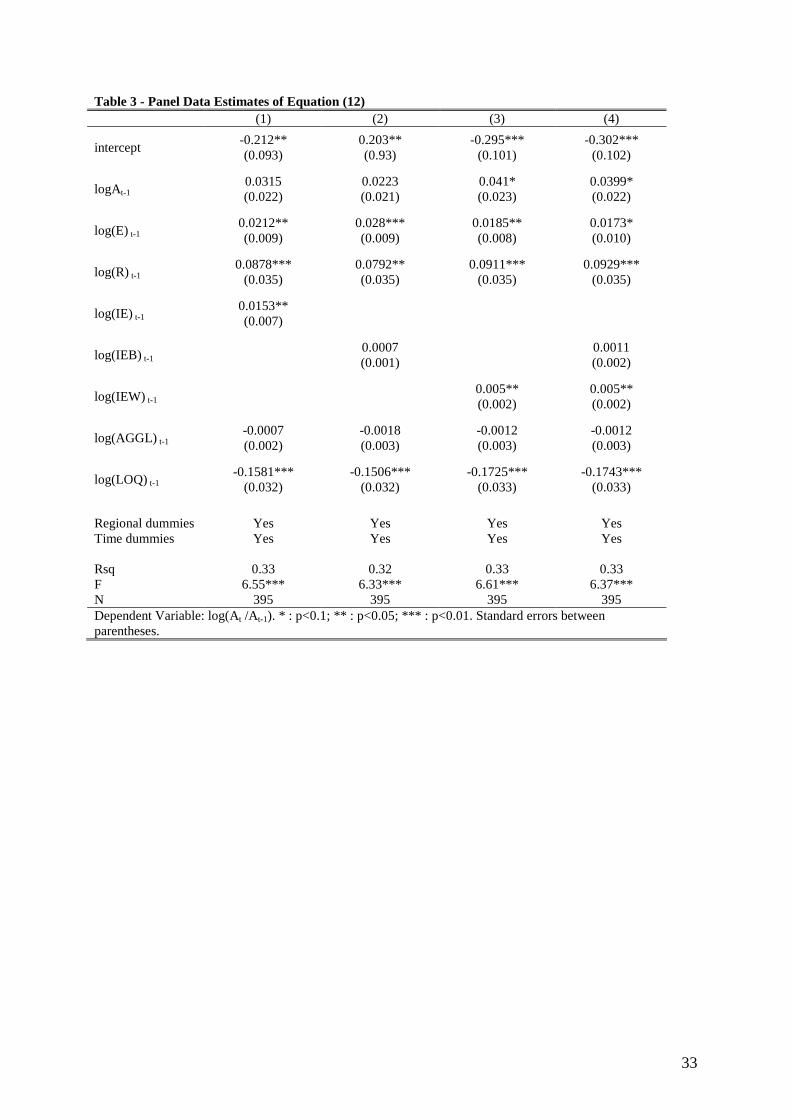
6 Empirical Results
In order to assess the effects of variety and relatedness on regional productivity
growth, we carried out a fixed-effect panel data estimation of Equation (12), which is reported
in table 3. Different estimations are shown, in which we consider alternatively general, related
and unrelated technological variety. The first column shows the results for the estimation
including the measure of general technological variety. The results are quite in line with what
expected according to our working hypotheses. Firstly, cross regional differences in the
accumulation of knowledge capital stock matter in explaining productivity differentials, as is
shown by the positive and significant coefficient on the variable E. Secondly, knowledge
capital stock is not sufficient to characterize the production of knowledge at the regional level.
It is important to account also for qualitative changes in the knowledge base. In this direction,
the internal degree of coherence of regional knowledge base exhibits a positive and significant
coefficient. The more related are the diverse technological activities carried out within the
region, the higher the rates of productivity growth. Dynamic economies of scope are at stake
as long as they are searched through the combination of close technologies. It is also worth
noting that the coefficient of knowledge relatedness (R) is four times that of knowledge
capital, suggesting that the effect of relatedness is far higher. Finally, variety is a measure of
how much the system is able to develop new technological opportunities, and eventually
foster economic growth. As expected, the coefficient of information entropy is positive and
significant, though lower than the other two knowledge-related variables. For what concerns
our control variable, it must be stressed that the proxy for agglomeration economies is not
significant, while the location quotient for manufacturing activities is, as one could expect,
negative and significant.
Column (2) reports the results for the estimation including unrelated technological
variety. Also in this case the coefficient for knowledge capital is positive and significant, like
the one for knowledge relatedness. Again, the effect of the latter appears to be stronger than
that of the former. For what concerns variety, our estimations show that unrelated
technological variety is not likely to exert statistically significant effects on regional
productivity growth. Also in this case the only significant control variable is the location
quotient, which shows a negative sign.
INSERT TABLE 3 ABOUT HERE
The estimation in column (3) takes account of related technological variety.
Differently from the other estimations, the coefficient for the lagged levels of productivity is
18
now (weakly) significant, and with positive sign. This would support the idea, quite realistic
indeed, that growth rates of Italian regions are diverging. For what concerns the effects of
knowledge capital, the results are well in line with what we have seen so far. The coefficient
is indeed positive and significant: The same applies to knowledge relatedness, whose
coefficient is again much higher than knowledge capital. Not surprisingly, the coefficient for
related technological variety is positive and statistically significant. This means that the
positive effects observed in the case of general variety is driven by related variety.
Econometric results in column (4), where unrelated and related technological variety are put
together, are coherent with column (3). Knowledge relatedness affects positively productivity
growth, and to a greater extent than knowledge capital. Again, only related variety appears to
significantly affect productivity growth.
This evidence deserves to be better discussed in light of the peculiarities of
manufacturing sectors in the Italian context. As described in Section 3, they gained
momentum in Italy in the 1960s, i.e. quite later than in the other advanced countries. Within
national borders, NEC regions were in turn characterized by a delayed diffusion of
manufacturing activities in the 1970s, as compared to North-Western regions. Aggregate
productivity dynamics in these sectors along the 1980s appeared to be driven by NEC regions,
which in the 1990s were going through the retardation stage of the lifecycle. Within this
framework, innovation dynamics started spreading along the 1980s and gained momentum in
the 1990s. The massive diffusion of innovation capabilities across North-Western and
eventually NEC regions is likely to be related to the identification of profitable research paths
and the sorting out of the unprofitable ones. Gales of incremental innovations appear as the
result of organized research strategies along well defined trajectories. The relevance of related
technological variety in our sample is therefore to be ascribed to the interplay between
industry and innovation lifecycle (Quatraro, 2008).
6.1 Productivity Growth and Spatial Dependence
The results showed in the previous section provide interesting evidence about the
effects of regional knowledge base on productivity dynamics. However, recent advances in
the analysis of spatial economic dynamics have pointed to the importance of proximity among
economic agents. While the focus on the regional level does not allow for investigating this
issue from a microeconomic viewpoint, nonetheless the presence of cross-regional external
19
economies may cause a bias in the estimation using techniques that do not account for spatial
dependence.
There are good reasons to expect spatial dependence to affect regional productivity
growth. The idea is that productivity growth in one region is likely to boost productivity
growth in neighbour or close regions. This is the case when pecuniary knowledge externalities
are at stake (Scitovski, 1954; Antonelli, 2008b). The commitment of resources to research and
development activities within a region is likely to trigger productivity growth, provided such
efforts are directed towards the integration of closely related activities and the reduction of
variety in technological combinations. Such productivity gains are likely to lower production
costs of the economic agents that take benefits of them. Coeteris paribus, such reduction in
production costs is (at least) partially transferred to final prices of produced goods. Would
these goods be intermediate inputs to other production process, such reduction of the price in
upstream markets translates into a reduction in the production costs for agents in downstream
markets. This is in turn reflected in productivity growth.
Now, a large body of literature has stressed the importance of geography for vertical
relationships. Therefore, productivity gains of agents operating in upstream markets are likely
to influence productivity dynamics of those operating downstream in the value chain. Should
this phenomenon be very significant, it should be also reflected in aggregate industrial
productivity dynamics10.
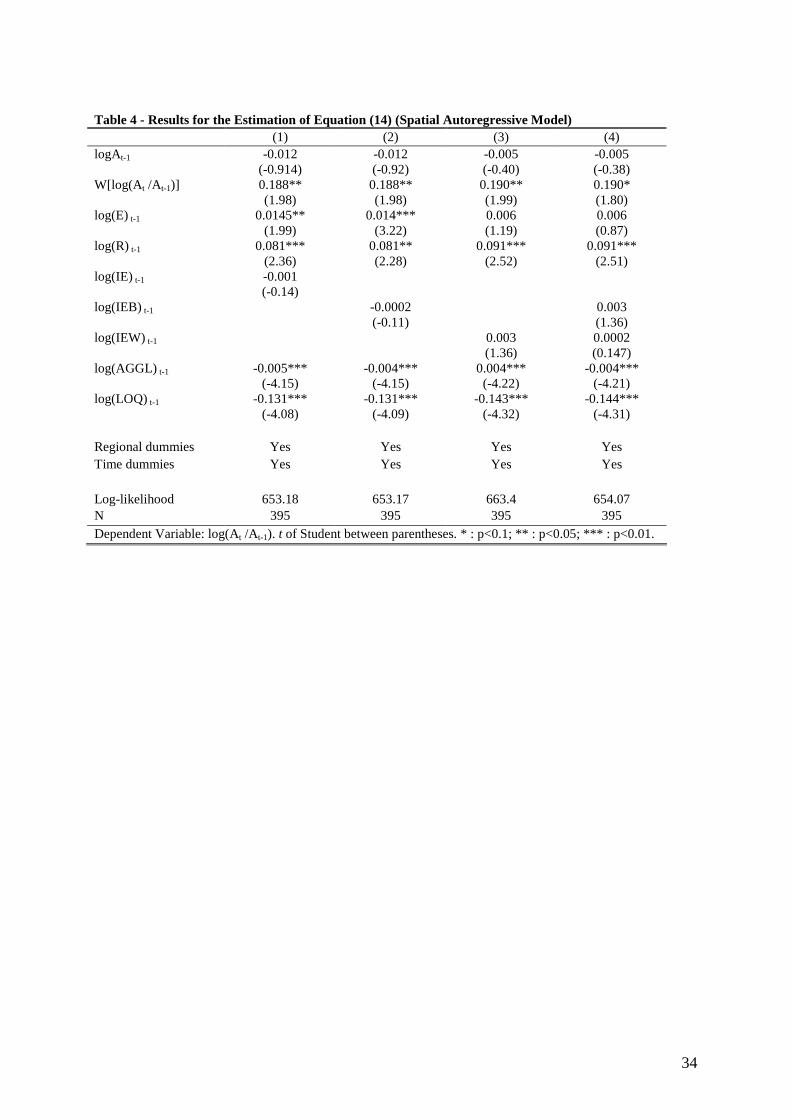
Table 4 reports the results from the econometric estimation of the SAR model
(Equation (14)). For the sake of homogeneity, different models have been estimated,
including alternatively general, related and unrelated technological variety. As is immediately
clear, the inclusion of the spatially lagged dependent variable changes our results only to a
limited extent. Let us start from column (1). First of all, the coefficient for the spatially lagged
variable is positive and significant. This evidence supports the idea that productivity gains are
likely to be also transferred to neighbour regions, through the mechanism of pecuniary
knowledge externalities. The coefficients of both knowledge capital and knowledge
relatedness are significant and, as expected, positive. Moreover, the latter is quite higher than
the former. Interestingly enough, the coefficient for general variety is not statistically
significant. This might be explained by arguing that the positive coefficient of variety
observed in the standard fixed-effects estimations, captures the effects of stimuli coming from
10 One may argue that the exclusion of the service sectors of course does not allow us to fully appreciate the transmission of productivity gains downwards in the value chain. Yet, the emphasis on productivity gains stemming from knowledge production signalled by patents data once again suggests to focus sharply on manufacturing.
20
outside the region. For what concerns the control variables, it may be noted that the location
quotient shows also in this case a negative and significant coefficient. Differently from the
previous estimates, the coefficient for agglomeration is now negative and statistically
significant. Such result also finds explanation in the peculiarity of regional development paths
followed by Italian regions. Population density is indeed likely to be higher in early-
industrialized areas in the North-West, while late-industrialized regions in the so-called ‘third
Italy’ were characterized by lower population density due to diffusion of population across
larger areas rather than its concentration within metropolitan cities.
INSERT TABLE 4 ABOUT HERE
Columns (2) and (3) include respectively unrelated and related technological variety.
The results are fairly persistent, in that still knowledge capital and relatedness are positive and
significant, while none of the two variety measures turns out to be significant. Once again, the
spatially lagged dependent variable exhibits a positive and significant coefficient, while both
the control variables negatively affect regional productivity growth. Finally, the estimation in
column (4) includes related and unrelated variety together, providing results consistent with
the previous estimations.
In order to check for the robustness of our results, we present in table 5 the results for
the estimation of the SEM model (Equation (15)). The results are basically the same across
the four models estimated, and are very coherent with the SAR estimations. The effects of
variety are statistically significant in none of the models, while knowledge capital and
knowledge relatedness confirm to positively and significantly affect regional productivity
growth. Both agglomeration and the relative location quotient show negative and significant
coefficients, supporting the relevance of the idiosyncratic features of regional development
paths in Italy. Finally, the coefficient for spatial autocorrelation is positive and significant
across all the models, corroborating the argument of cross-regional transmission of
productivity gains.
INSERT TABLE 5 ABOUT HERE
7 Conclusions
A wide body of literature has emphasized the importance of knowledge as a strategic
asset for the competitive advantage of regions. Both the regional innovation system approach
and the school emphasizing the concept of learning regions have provided important
contributions to the understanding of the spatial dynamics of knowledge generation.
21
Yet, empirical analyses of the determinants of regional differential growth rates have
quite neglected the investigation of the effects of knowledge and innovation on productivity.
Much attention has been given to the analysis of convergence patterns across regions and to
the identification of the variables allowing for a reliable estimation of conditional
convergence. Recent contributions have partially filled this gap, by focusing on the
investigation of the determinants of the efficiency of knowledge generating activities by
adopting a knowledge production approach.
In this paper we have made some steps forward, by providing an empirical estimation
of the impact of regional knowledge base on multifactor productivity growth. In doing so, we
have adopted a competence-based view of the region, which has allowed us to go beyond the
simplistic view of knowledge as a homogenous asset and to follow the more recent
developments that have proposed notion of knowledge as a collective and heterogeneous good
(Saviotti, 2007; Nesta, 2008).
We have conducted our analysis on a sample of 19 Italian regions over the period
1981-2002, focusing on manufacturing sectors. We have calculated annual multifactor
productivity growth for each region, and then we have tested the explanatory role of
knowledge variables such as the traditional knowledge capital, knowledge coherence and
knowledge variety, both related and unrelated.
The results of empirical analysis confirm that the regional knowledge base do affect
productivity growth rates. In particular, not only the level of knowledge stock matters, but the
characteristics of the knowledge base exert even a higher impact. In particular, as expected,
the degree of internal coherence of the knowledge base has a positive effect across all the
estimations, while the positive effects of technological variety are statistically significant only
when spatial autocorrelation is not accounted for. The issue of spatial dependence is quite
relevant, as both the SAR and the SEM models confirm that productivity gains are likely to be
transferred to neighbour regions through the mechanism of pecuniary knowledge
externalities, boosting their productivity growth rates.
Such results have important policy implications, in terms of regional strategies for
innovation and knowledge production. In particular, an effective regional innovation strategy
should be complemented by intentional and careful coordination mechanisms, able to provide
an integrated direction to research and innovation efforts undertaken by the variety of agents
that made up the innovation system. The regional production system would then take

22
advantage of a bundle of technological activities showing a high degree of relatedness and
therefore more likely to be properly absorbed and successfully exploited.

23
Appendix A
In order to calculate the knowledge coherence index, it is necessary to define the
parameter τ, i.e. technological relatedness, which appears in equation (20). Let us start by
calculating the relatedness matrix. The technological universe consists of k patent
applications. Let Pik = 1 if the patent k is assigned the technology i [i = 1, …, n], and 0
otherwise. The total number of patents assigned to technology i is ∑=k iki PO . Similarly, the
total number of patents assigned to technology j is ∑=k jkj PO . Since two technologies may
occur within the same patent, ≠∩ ji OO ∅, and thus the observed the number of observed co-
occurrences of technologies i and j is ∑=k jkikij PPJ .. Applying this relationship to all
possible pairs, we yield a square matrix Ω (n × n) whose generic cell is the observed number
of co-occurrences:
=Ω
nninn
njijj
ni
JJJ
JJJ
JJJ
LL
MOM
MOM
1
1
1111
(A1)
We assume that the number xij of patents assigned to both technologies i and j is a
hypergeometric random variable of mean and variance:
K
OOxXE ji
ijij === )(µ (A2)
−−
−=1
2
K
OK
K
OK jiijij µσ (A3)
If the observed number of co-occurrences Jij is larger than the expected number of
random co-occurrences µij, then the two technologies are closely related: the fact the two
technologies occur together in the number of patents xij is not casual. The measure of
relatedness hence is given by the difference between the observed number and the expected
number of co-occurrences, weighted by their standard deviation:
ij
ijijij
J
σµ
τ−
= (A4)
It is worth noting that such relatedness measure ha so lower and upper bounds:
] [+∞∞−∈ ;ijτ . Moreover, the index shows a distribution similar to a t-student, so that if
24
] [96.1;96.1 +−∈ijτ , one can safely accept the null hypothesis of non-relatedness of the two
technologies i and j. The technological relatedness matrix Ω’ may hence be thought about as a
weighting scheme to evaluate the technological portfolio of regions.
Appendix B
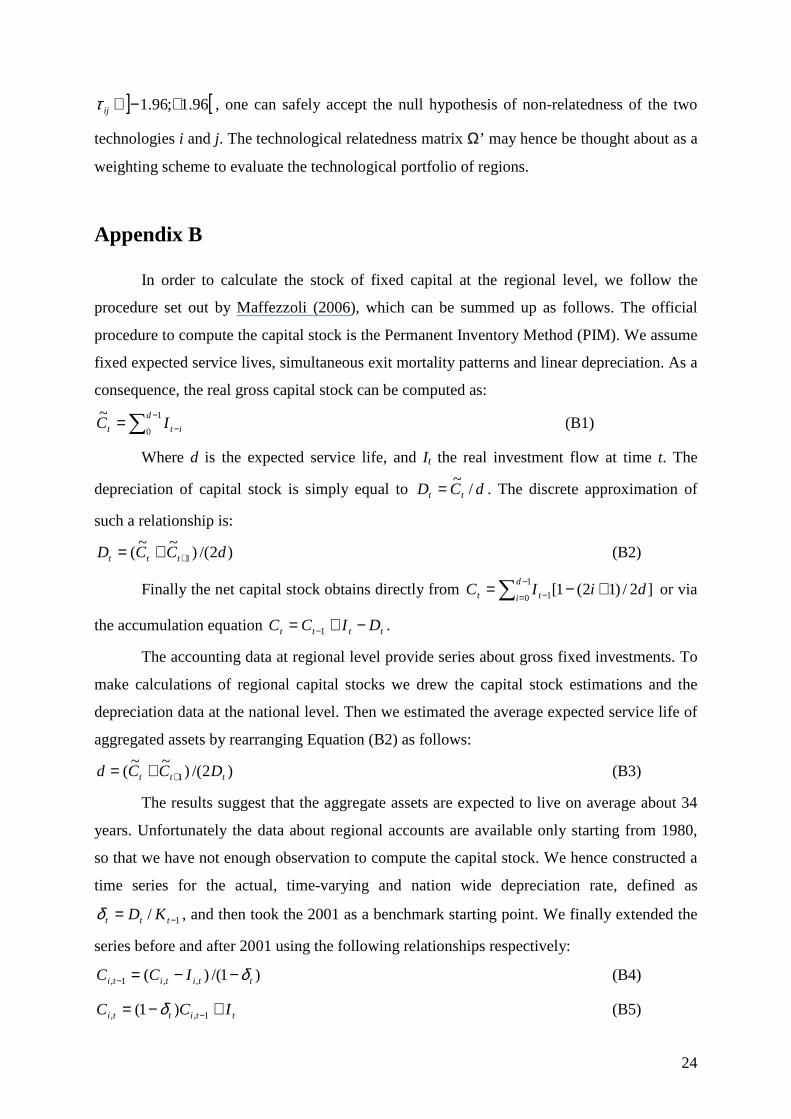
In order to calculate the stock of fixed capital at the regional level, we follow the
procedure set out by Maffezzoli (2006), which can be summed up as follows. The official
procedure to compute the capital stock is the Permanent Inventory Method (PIM). We assume
fixed expected service lives, simultaneous exit mortality patterns and linear depreciation. As a
consequence, the real gross capital stock can be computed as:
∑−
−= 1
0
~ d
itt IC (B1)
Where d is the expected service life, and It the real investment flow at time t. The
depreciation of capital stock is simply equal to dCD tt /~= . The discrete approximation of
such a relationship is:
)2/()~~
( 1 dCCD ttt ++= (B2)
Finally the net capital stock obtains directly from ∑−
= − +−= 1
0 1 ]2/)12(1[d
i tt diIC or via
the accumulation equation tttt DICC −+= −1 .
The accounting data at regional level provide series about gross fixed investments. To
make calculations of regional capital stocks we drew the capital stock estimations and the
depreciation data at the national level. Then we estimated the average expected service life of
aggregated assets by rearranging Equation (B2) as follows:
)2/()~~
( 1 ttt DCCd ++= (B3)
The results suggest that the aggregate assets are expected to live on average about 34
years. Unfortunately the data about regional accounts are available only starting from 1980,
so that we have not enough observation to compute the capital stock. We hence constructed a
time series for the actual, time-varying and nation wide depreciation rate, defined as
1/ −= ttt KDδ , and then took the 2001 as a benchmark starting point. We finally extended the
series before and after 2001 using the following relationships respectively:
)1/()( ,,1, ttititi ICC δ−−=− (B4)
ttitti ICC +−= −1,, )1( δ (B5)

25
This methodology has some drawbacks, like approximating a linear depreciation
scheme with a geometric one, ruling out regional differences in depreciation rates and some
necessary degree of measurement error. However, given the availability of the data, it
provides a good approximation for the purposes of our work.
26
References
Abramovitz, M., 1956, Resource and Output Trends in the United States Since 1870, American Economic Review, 46, 5-23. Acs, Z.J., Anselin, L. and Varga, A. (2002) Patents and innovation counts as measures of regional production of new knowledge, Research Policy, 31, 1069-1085. Anselin, L. (1988) Spatial Econometrics: Methods and models, Dordrecht, Kluwer. Antonelli, C. (2008a) Localised technological change. Towards the economics of complexity, New York, Routledge. Antonelli, C. (2008b), Pecuniary knowledge externalities: The convergence of directed technological change and the emergence of innovation systems, Industrial and Corporate Change, 17, 1049-1070. Antonelli, C., Patrucco, P.P. and Quatraro, F. (2007) Transizioni tecnologiche e modelli economici, in Berta G. (ed.) La Questione Settentrionale. Economia e Società in Trasformazione, Milano, Feltrinelli. Arrow, K. J. (1962) Economic welfare and the allocation of resources for invention, in Nelson, R. R. (Ed.) The rate and direction of inventive activity: Economic and social factors (Princeton: Princeton University Press for N.B.E.R.), pp.609-625.
Attaran, M. (1985) Industrial diversity and economic performance in U.S. areas, The Annals of Regional Science 20, pp. 44-54. Becattini, G. (1989) Modelli Locali di Sviluppo, Bologna, Il Mulino. Boschma, R. and Frenken, K. (2006) Why is economic geography not an evolutionary science? Towards an evolutionary economic geography, Journal of Economic Geography, 6, 273-302. Boschma, R. and Lambooy J.G. (1999), Evolutionary economics and economic geography, Journal of Evolutionary Economics, 9, 411-429. Breschi, S., Lissoni, F. and Malerba, F. (2003) Knowledge-relatedness in firm technological diversification, Research Policy 32, 69-87. Brusco, S., 1982, The Emilian model: Productive decentralization and social integration, Cambridge Journal of Economics, 6, 167-184. Burns A. F. (1934) Production trends in the United States since 1870, Boston, NBER. Coe, D and Helpman, E. (1995) International R&D spillovers, European Economic Review, 39, 859-887.
27
Consoli D. (2007) Services and Systemic Innovation: A Cross-Sectoral Analysis, Journal of Institutional Economics, 3, 71-89. Crescenzi, R., Rodriguez-Pose, A. and Storper, M. (2007) The territorial dynamics of innovation: A Europe-United States comparative analysis, Journal of Economic Geography, 673-709. Cuneo, P. and Mairesse, J. (1984) Productivity and R&D at the firm level in French manufacturing, in Griliches, Z. (ed.) R&D, patents and productivity, Chicago, The University of Chicago Press. Elhorst, P. J. (2003) Specification and estimation of spatial panel data models, International Regional Science Review, 26, 244-268. Englander, A.S. and Mittelstädt (1988) Total factor productivity: Macroeconomic and structural aspects of slowdown, OECD Economic Studies, 11, Summer 1988. Evangelista R. (2000) Sectoral patterns of technological change in services, Economics of Innovation and New Technology, 9, 183-221. Evangelista, R. and G. Sirilli (1998) Innovation in the service sector. results from the Italian innovation survey, Technological Forecasting and Social Change, 58, 251-269. Fagerberg, J. (1987) A technology gap approach to why growth rates differ, Research Policy, 16, 87-99. Foray, D. (2004) The economics of knowledge, Cambridge, The MIT Press. Foss N. J. (1996) Higher-order industrial capabilities and competitive advantage, Journal of Industrial Studies, 3, 1-20. Frenken, K. (2004) Entropy and information theory, in Horst Hanusch and Andreas Pyka (eds.), The Elgar Companion to Neo-Schumpeterian Economics, Cheltenham, Edward Elgar. Frenken, K., van Oort F.G., Verburg, T. (2007) Related variety, unrelated variety and regional economic growth. Regional Studies, 41, 685-697. Fritsch, M. (2002) Measuring the quality of regional innovation systems: A knowledge production function approach, International Review of Regional Science, 25, 86-101. Fritsch, M. (2004) Cooperation and the efficiency of regional R&D activities, Cambridge Journal of Economics, 28, 829-846. Fritsch, M. and Franke, G. (2004) Innovation, regional knowledge spillovers and R&D cooperation, Research Policy, 33, 245-255. Fuà, G. (1980) Problemi dello sviluppo tardivo in Europa: Rapporto su sei paesi appartenenti all’OCSE (Problems of lagged development in OECD Europe: A study of six countries), Bologna, Il Mulino.
28
Fuà G. (1983) Industrializzazione nel Nord Est e nel Centro, in G. Fuà e C. Zacchia (ed.), Industrializzazione senza fratture, Bologna, il Mulino, pp. 7-46. Fuà G. (ed) (1991a) Orientamenti per la Politica del Territorio, Bologna, il Mulino. Fuà, G (1991b) The environmental bases of diffuse industrialization, International Studies of Management & Organization, vol. XXI, n. 1, pp. 5-20. Fuà G. and C. Zacchia (eds.) (1983) Industrializzazione senza fratture, Bologna, il Mulino. Garofoli G. (1981) Lo Sviluppo delle Aree Periferiche nell’Economia Italiana degli Anni Settanta, L’Industria, a. II, n. 3, pp. 391-404. Garofoli G. (1983) Aree di Specializzazione Produttiva e Piccole Imprese in Europa, Economia Marche, a. II, n. 1, pp. 3-43. Garofoli G. (1994) New firm formation and regional development: The Italian case, Regional Studies, 28, 381-393. Griliches Z. (1979) Issues in Assessing the Contribution of Research and Development to Productivity Growth, The Bell Journal of Economics, 10, 92-116. Griliches Z. (ed.) (1985) R&D, patents and productivity, Chicago, The University of Chicago Press. Griliches, Z. (1992), The search for R&D spillovers, Scandinavian Journal of Economics 94, 29-47. Higòn, D. A. (2007) The impact of R&D spillovers on UK manufacturing TFP: A dynamic panel approach, Research Policy, 36, 964-979. Jorgenson, D.W. (1995) Productivity Volume 1: Post-war US Economic Growth, Cambridge, MA, MIT Press. Kuznets S. (1930) Secular Movements in Production and Prices, Boston, Houghton Mifflin. Lall S. (1992) Technological capabilities and industrialization, World Development, 20, 165-186. Lawson C. (1999) Towards a competence theory of the region, Cambridge Journal of Economics, 23, 151-166. Lawson C. and E. Lorenz (1999) Collective learning, tacit knowledge and regional innovative capacity, Regional Studies, 33, 305-317. Le Sage, J.P. (1999) The theory and practice of spatial econometrics, Department of Economics, University of Toledo, available at www.spatial-econometrics.org. Lichtenberg, F. (19929 R&D investment and international productivity differences, NBER Working Paper, no. 4161.
29
Lucas, R. (1988), On the mechanics of economic development, Journal of Monetary Economics, 22, 3-42. Maddison, A., 1987, Growth and Slowdown in Advanced Capitalist Economies: Techniques of Quantitative Assessment, Journal of Economic Literature, 25, 649-698. Maffezzoli, M. (2006), Convergence across Italian regions and the role of technological catch up, Topics in Macroeconomics, 6 (1), Article 15. Metcalfe, S.J. (2002) Knowledge for growth and the growth of knowledge, Journal of Evolutionary Economics, 12, 3-15. Nadiri, M. (1980) Contributions and determinants of research and development expenditures in the US manufacturing, in von Furstenberg, G. (ed.) Capital, efficiency and growth, Cambridge, Ballinger, pp. 361-392. Nelson, R.R. (1959) The simple economics of basic scientific research, Journal of Political Economy 67, 297-306. Nelson, R. R. (1982) The Role of Knowledge in R&D Efficiency, Quarterly Journal of Economics, 97, 453-70. Nesta L. (2008) Knowledge and productivity in the world’s largest manufacturing corporations, Journal of Economic Behavior and Organization, 67, 886-902. Nesta, L., and Saviotti, P.P. (2005) Coherence of the Knowledge Base and the Firm's Innovative Performance: Evidence from the U.S. Pharmaceutical Industry, Journal of Industrial Economics, 53(1), 123-42. Nesta L. and Saviotti P.P. (2006) Firm knowledge and market value in biotechnology, Industrial and Corporate Change, 15, 625-652. OECD (2001), Measuring productivity. Measurement of aggregate and industry-level productivity growth, OECD, Paris. Paci M. (1973) Mercato del Lavoro e Classi Sociali in Italia. Ricerche sulla Composizione del Proletariato, Bologna, il Mulino.
Paci M. (1992) Il Mutamento della Struttura Sociale in Italia, Bologna, il Mulino. Patel, P. and Soete, L. (1988) L’évaluation des effects économiques de la technologie, STI Review, no. 4, 133-183. Pettenati P. (1991) I Modelli di Organizzazione Economica del Territorio, in Fuà, (ed)., Orientamenti per la Politica del Territorio, Bologna, Il Mulino. Perroux F. (1955) Note sur la notion de ‘pole de croissance’, Èconomie Appliquèe, 7, 307-320.
30
Quatraro, F. (2008a) The diffusion of regional innovation capabilities: Evidence from Italian patent data, Regional Studies, http://dx.doi.org/10.1080/00343400802195162. Quatraro, F. (2008b) Innovation, structural change and productivity growth. Evidence from Italian regions, 1980-2003, under revision for Cambridge Journal of Economics. Romijn H. and M. Albu (2002) Innovation, networking and proximity: Lessons from small high technology firms in the UK, Regional Studies, 36, 81-86. Saviotti, P.P. (2007) On the dynamics of generation and utilisation of knowledge: The local character of knowledge, Structural Change and Economic Dynamics, 18, 387-408. Saviotti, P.P. (2004) Considerations about the production and utilization of knowledge, Journal of Institutional and Theoretical Economics, 160, 100-121. Saviotti, P.P. (1996) Technology evolution, variety and the economy, Cheltenham, Edward Elgar. Saviotti, P.P. (1988) Information, variety and entropy in technoeconomic development, Research Policy, 17, 89-103. Schumpeter J. A. (1911) (1934) The theory of economic development, Galaxy Books, Oxford. Schumpeter J. A. (1942) Capitalism, socialism and democracy, Unwin, London. Scitovsky, T. (1954), Two concepts of external economies, Journal of Political Economy 62, 143-151. Scott, A.J. (2004) A perspective on economic geography, Journal of Economic Geography, 4, 479-499. Solow R. M. (1957) Technical change and the aggregate production function, The Review of Economics and Statistics, 39, 312-320. Teece, D. J., Rumelt, R. P., Dosi, G. and Winter, S. (1994) Understanding corporate coherence: Theory and evidence, Journal of Economic Behavior and Organisation 22, 627–634. Tether B. (2005) Do services innovate (differently)? Insights from the European innobarometer survey, Industry and Innovation, 12, 153-184.
Theil, H. (1967) Economics and Information Theory, Amsterdam, North-Holland.
Ulku, H. (2007) R&D, innovation and growth: Evidence from four manufacturing sectors in OECD countries, Oxford Economic Papers, 59, 513-535. Verspagen, B. (1995) R&D and productivity: A broad cross-section cross-country look, Journal of Productivity Analysis, 6, 117-135.
31
Table 1 - Descriptive Statistics Variable Mean Std. Dev. Min Max Observations
E overall 1232.625 2380.950 1.000 15795.300 N = 418 between 1979.379 29.605 8106.422 n = 19 within 1391.848 -6400.797 8921.506 T = 22 R overall 0.373 0.953 -0.545 6.407 N = 418 between 0.671 -0.316 2.125 n = 19 within 0.697 -2.243 5.041 T = 22 IE overall 7.371 2.262 0 11.297 N = 418 between 1.862 4.139 10.771 n = 19 within 1.382 -0.086 9.884 T = 22 IEW overall 2.525 1.293 0 5.178 N = 418 between 1.129 0.839 4.649 n = 19 within 0.703 -1.838 3.821 T = 22 IEB overall 4.866 1.138 0 6.416 N = 418 between 0.799 3.459 6.118 n = 19 within 0.841 0.188 6.816 T = 22 dlogA/dt overall 0.014 0.048 -0.203 0.292 N = 418 between 0.009 0.000 0.037 n = 19 within 0.047 -0.200 0.269 T = 22 E: knowledge capital; R: knowledge relatedness; IE: information entropy; IEW: within-group information entropy; IEB: between-group information entropy; dlogA/dt: growth rate of multifactor productivity.
32
Table 2 - Regional Decomposition of Variables (1981-2002)
E R IE IEW IEB dlogA/dt Piemonte 3860.667 -0.316 10.097 4.340 5.756 0.007 Valle d'Aosta 29.605 2.125 4.703 1.232 3.459 0.003 Liguria 708.112 0.532 8.306 2.707 5.617 0.000 Lombardia 8106.422 -0.232 10.772 4.651 6.117 0.016 Trentino Alto Adige 246.614 0.189 6.930 2.277 4.635 0.019 Veneto 2088.573 -0.206 9.036 3.654 5.386 0.023 Friuli Venezia Giulia 834.670 -0.103 7.846 2.737 5.118 0.018 Emilia Romagna 2993.007 -0.223 9.651 4.357 5.285 0.017 Toscana 1219.773 -0.155 8.903 3.161 5.742 0.011 Umbria 175.860 0.253 6.676 1.948 4.766 0.003 Marche 355.378 0.036 6.856 2.31 4.555 0.019 Lazio 1380.175 0.038 8.934 3.071 5.876 0.022 Abruzzo 414.795 0.921 6.161 2.306 3.828 0.025 Campania 260.018 0.357 6.965 2.026 4.997 0.011 Puglia 175.072 0.243 6.436 1.803 4.649 0.014 Basilicata 34.280 1.496 4.292 0.8581 3.326 0.042 Calabria 46.251 1.060 5.357 1.216 4.102 0.016 Sicilia 308.488 0.063 6.387 1.699 4.661 0.000 Sardegna 73.174 1.114 5.423 1.176 4.237 0.007 E: knowledge capital; R: knowledge relatedness; IE: information entropy; IEW: within-group information entropy; IEB: between-group information entropy; dlogA/dt: growth rate of multifactor productivity.
33
Table 3 - Panel Data Estimates of Equation (12) (1) (2) (3) (4)
intercept -0.212** (0.093)
0.203** (0.93)
-0.295*** (0.101)
-0.302*** (0.102)
logAt-1 0.0315 (0.022)
0.0223 (0.021)
0.041* (0.023)
0.0399* (0.022)
log(E) t-1 0.0212** (0.009)
0.028*** (0.009)
0.0185** (0.008)
0.0173* (0.010)
log(R) t-1 0.0878***
(0.035) 0.0792** (0.035)
0.0911*** (0.035)
0.0929*** (0.035)
log(IE) t-1 0.0153** (0.007)
log(IEB) t-1 0.0007 (0.001)
0.0011 (0.002)
log(IEW) t-1 0.005** (0.002)
0.005** (0.002)
log(AGGL) t-1 -0.0007 (0.002)
-0.0018 (0.003)
-0.0012 (0.003)
-0.0012 (0.003)
log(LOQ) t-1 -0.1581***
(0.032) -0.1506***
(0.032) -0.1725***
(0.033) -0.1743***
(0.033)
Regional dummies Yes Yes Yes Yes Time dummies Yes Yes Yes Yes Rsq 0.33 0.32 0.33 0.33 F 6.55*** 6.33*** 6.61*** 6.37*** N 395 395 395 395 Dependent Variable: log(At /At-1). * : p<0.1; ** : p<0.05; *** : p<0.01. Standard errors between parentheses.
34
Table 4 - Results for the Estimation of Equation (14) (Spatial Autoregressive Model) (1) (2) (3) (4) logAt-1 -0.012
(-0.914) -0.012 (-0.92)
-0.005 (-0.40)
-0.005 (-0.38)
W[log(At /At-1)] 0.188** (1.98)
0.188** (1.98)
0.190** (1.99)
0.190* (1.80)
log(E) t-1 0.0145** (1.99)
0.014*** (3.22)
0.006 (1.19)
0.006 (0.87)
log(R) t-1 0.081*** (2.36)
0.081** (2.28)
0.091*** (2.52)
0.091*** (2.51)
log(IE) t-1 -0.001 (-0.14)
log(IEB) t-1 -0.0002 (-0.11)
0.003 (1.36)
log(IEW) t-1 0.003 (1.36)
0.0002 (0.147)
log(AGGL) t-1 -0.005*** (-4.15)
-0.004*** (-4.15)
0.004*** (-4.22)
-0.004*** (-4.21)
log(LOQ) t-1 -0.131*** (-4.08)
-0.131*** (-4.09)
-0.143*** (-4.32)
-0.144*** (-4.31)
Regional dummies Yes Yes Yes Yes Time dummies Yes Yes Yes Yes Log-likelihood 653.18 653.17 663.4 654.07 N 395 395 395 395 Dependent Variable: log(At /At-1). t of Student between parentheses. * : p<0.1; ** : p<0.05; *** : p<0.01.
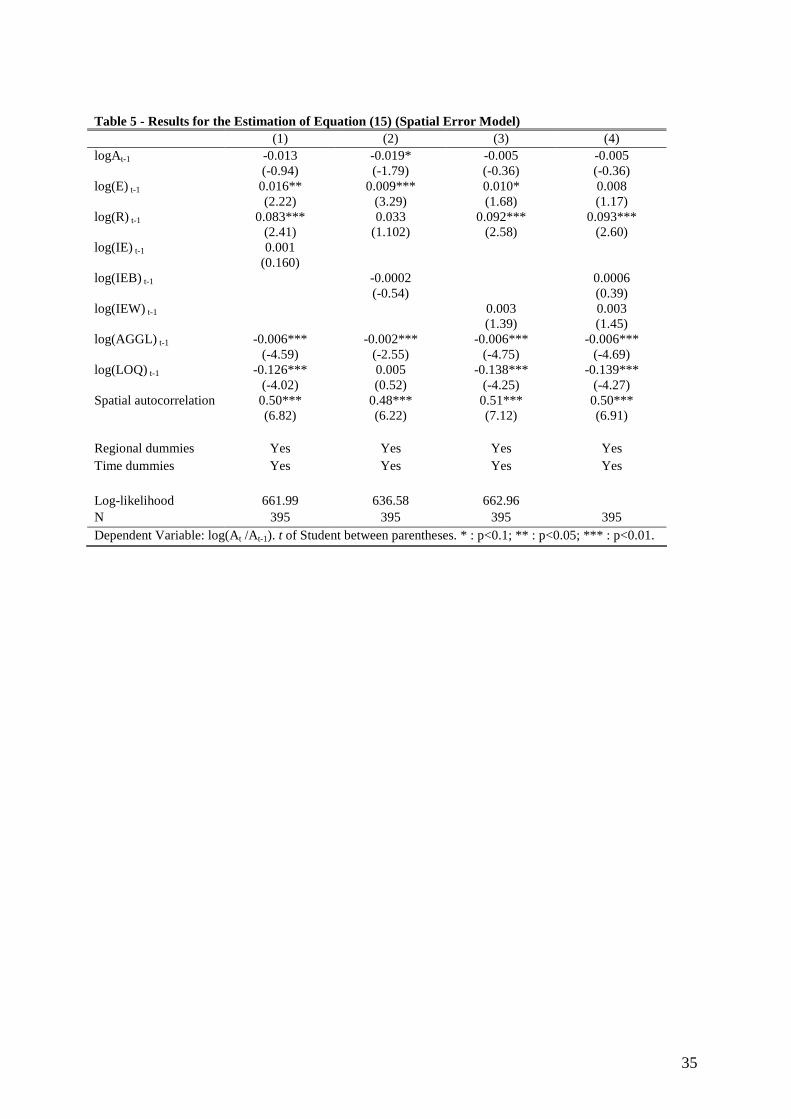
35
Table 5 - Results for the Estimation of Equation (15) (Spatial Error Model) (1) (2) (3) (4) logAt-1 -0.013
(-0.94) -0.019* (-1.79)
-0.005 (-0.36)
-0.005 (-0.36)
log(E) t-1 0.016** (2.22)
0.009*** (3.29)
0.010* (1.68)
0.008 (1.17)
log(R) t-1 0.083*** (2.41)
0.033 (1.102)
0.092*** (2.58)
0.093*** (2.60)
log(IE) t-1 0.001 (0.160)
log(IEB) t-1 -0.0002 (-0.54)
0.0006 (0.39)
log(IEW) t-1 0.003 (1.39)
0.003 (1.45)
log(AGGL) t-1 -0.006*** (-4.59)
-0.002*** (-2.55)
-0.006*** (-4.75)
-0.006*** (-4.69)
log(LOQ) t-1 -0.126*** (-4.02)
0.005 (0.52)
-0.138*** (-4.25)
-0.139*** (-4.27)
Spatial autocorrelation 0.50*** (6.82)
0.48*** (6.22)
0.51*** (7.12)
0.50*** (6.91)
Regional dummies Yes Yes Yes Yes Time dummies Yes Yes Yes Yes Log-likelihood 661.99 636.58 662.96 N 395 395 395 395 Dependent Variable: log(At /At-1). t of Student between parentheses. * : p<0.1; ** : p<0.05; *** : p<0.01.