KIPKORIR Richard Koskei.pdf - Dedan Kimathi University of ...
139
DEDAN KIMATHI UNIVERSITY OF TECHNOLOGY i EFFECTS OF DIFFERENT PROCESSING TECHNOLOGIES ON QUALITY CHARACTERISTICS OF KENYA COFFEE KIPKORIR RICHARD KOSKEI (MSc. Food Science and Technology) F060-351/002/2012 A Research Thesis Submitted to School of Graduate Studies and Research in Partial Fulfillment of the Requirements for the Award of the Degree of Doctor of Philosophy in Food Science and Technology in the Institute of Food Bioresources Technology of Dedan Kimathi University of Technology. MAY 2015
-
Upload
khangminh22 -
Category
Documents
-
view
1 -
download
0
Transcript of KIPKORIR Richard Koskei.pdf - Dedan Kimathi University of ...

DEDAN KIMATHI UNIVERSITY OF
TECHNOLOGY
i
EFFECTS OF DIFFERENT PROCESSING TECHNOLOGIES ON
QUALITY CHARACTERISTICS OF KENYA COFFEE
KIPKORIR RICHARD KOSKEI
(MSc. Food Science and Technology)
F060-351/002/2012
A Research Thesis Submitted to School of Graduate Studies and
Research in Partial Fulfillment of the Requirements for the Award of
the Degree of Doctor of Philosophy in Food Science and Technology
in the Institute of Food Bioresources Technology of Dedan Kimathi
University of Technology.
MAY 2015

DEDAN KIMATHI UNIVERSITY OF
TECHNOLOGY
II
Signature ~~ Date }.~ .q(j~ ..
Dr. Muliro Patrick, PhD. Department of Dairy and Food Science and Technology,
Egerton University.
~ t.
Signature ..6?5¥5 Y.:\s~.~. Date ...I.3.:~.~.$.'.,,:,,:~C?!.? .-
Prof. Muhoho Njoroge, PhD. Department of Food Science, Iomo Kenyatta University
of Agriculture and Technology.
SUPERVISORS:
This thesis is the candidate's original work and has been prepared with our guidance and
assistance; it has been submitted with our approval as the official university supervisors.
RECOMMENDAi&llAN KI~IATHIUNIVERSITY IJIBIlAIY
Kipkorir Richard Koskei
Signature J~~... . Date.. ..L \/?::s.:.i2::::? ~~ .
This thesis is a product of my original work and has not, wholly or in part, been presented
for the award of a PhD degree in any other university.
DECLARATION
DECLARATION AND RECOMMENDATION

DEDAN KIMATHI UNIVERSITY OF
TECHNOLOGY
iii
DEDICATION
I would like to dedicate this research work to my entire family especially my beloved
wife, our three children, my dad, brothers and sisters who through their prayers and moral
support I manage to undertake the studies with lots of success. May God bless you
abundantly.

DEDAN KIMATHI UNIVERSITY OF
TECHNOLOGY
iv
ACKNOWLEDGEMENTS
I would like to express my gratitude to the sponsors of my research; the National Council
of Science and Technology (NACOSTI), Kenya, and DAAD which through the
collaboration between Dedan Kimathi University of Technology and the Technical
University of Applied Science, Wildau (Germany) offered their very valuable
sponsorship. I also give much appreciation to my supervisors; Prof. Simon Muhoho
Njoroge and Dr. Muliro Patrick for their guidance and advice in the course of my
research work. My appreciations also go to the staff of the Institute of Food Bioresources
Technology, DeKUT, and the staff of Molecular Biotechnology (TUAS, Wildau),
Germany for their moral support and assistance in various aspects of my research. I will
not forget the staff of Coffee Research Foundation and JKUAT, for their support in
Laboratory analysis. My greatest appreciations goes to my entire family members for
their prayers and moral support throughout the period of my research. God bless you all.

DEDAN KIMATHI UNIVERSITY OF
TECHNOLOGY
v
ABSTRACT
This research project was done to investigate the influence of different methods of coffee
processing on quality of the final product. The processing methods studied were wet
pulping, hand pulping and eco-pulping. These processing methods vary on their modes
of pulping and mucilage removal. The work was carried out using two cultivars of Kenya
arabica coffee (Coffea arabica) grown in Nyeri County near Mt. Kenya. The quality
parameters determined in the study included; physic-chemical properties, aroma profiles
and sensory qualities of the processed coffee. The results showed that the processing
methods did not have significant variations in most physico-chemical parameters apart
from the mass, density and pH of the green beans. The variations on the mass and density
could indicate some losses of chemical components of coffee due to the effects of
processing methods used. The variation on the pH could indicate the changes which
occurs in the coffee beans during fermentation process with those with lower pH
indicating more acidic components than those with higher pH. The processing methods
showed significant variations in the intensity of aroma compounds with the wet pulper
method showing higher intensities for the alcohols and furan compounds while the hand
pulper method showed higher intensities for the ketones and acid compounds. The eco-
pulper method showed higher intensities for the aldehydes, pyrazines and phenol
compounds. There were variations in the levels of the sensory attributes with the eco-
pulper methods showing higher levels for aroma, body, balance and overall acceptability.
The hand pulper also showed higher intensity for the acidity and overall acceptability.
The results of the sensory attributes were computed to give the final score of the quality
and the eco-pulper and hand pulper methods showed higher final quality than the wet
pulper method. This reveals that the wet pulper method which is using fermentation and
excess water in processing could be losing more chemical components than the hand
pulper and eco-pulper method hence lowering its quality. It was therefore recommended
that the new ecological coffee processing technology which uses mechanical method for
mucilage removal could be adopted for coffee processing since it has no negative effect
on the overall quality of the coffee, more environmental friendly and could reduce cost of
production for coffee.

DEDAN KIMATHI UNIVERSITY OF
TECHNOLOGY
vi
TABLE OF CONTENTS
CONTENTS
DECLARATION AND RECOMMENDATION ............................................................... ii
DEDICATION ................................................................................................................... iii
ACKNOWLEDGEMENTS ............................................................................................... iv
ABSTRACT ........................................................................................................................ v
LIST OF TABLES ........................................................................................................... xiii
LIST OF ABBREVIATIONS .......................................................................................... xiv
CHAPTER ONE ................................................................................................................. 1
INTRODUCTION .............................................................................................................. 1
1.0 Background to the study ................................................................................................1
1.1 Statement of the problem ...............................................................................................4
1.2 Main objective ...............................................................................................................5
1.2.1 Specific objectives ......................................................................................................5
1.3 Hypothesis......................................................................................................................5
1.4 Justification ....................................................................................................................6
1.5 Expected output ..............................................................................................................6
1.6 Limitations .....................................................................................................................7
1.7 Definition of terms .........................................................................................................8
CHAPTER TWO .............................................................................................................. 10
LITERATURE REVIEW ................................................................................................. 10
2.1 Coffee origin and production .......................................................................................10
2.2 Coffee production, post-harvest handling and processing in Kenya ...........................11

DEDAN KIMATHI UNIVERSITY OF
TECHNOLOGY
vii
2.2.1 Harvesting and cherry sorting ...................................................................................12
2.2.2 Pulping and mucilage removal..................................................................................13
2.2.3 Underwater soaking and washing .............................................................................13
2.2.4 Drying .......................................................................................................................14
2.3 Traditional wet processing methods of coffee .............................................................15
2.3.1 Changes during coffee fermentation .........................................................................16
2.3.2 Effects of fermentation on coffee quality .................................................................18
2.3.3 Chemical changes resulting from fermentations of coffee .......................................19
2.4 Ecological coffee processing method ..........................................................................21
2.5 Coffee physico-chemical components .........................................................................22
2.5.1 Caffeine in coffee ......................................................................................................23
2.5.2 Trigonelline in coffee ................................................................................................24
2.5.3 Chlorogenic acids in coffee ......................................................................................24
2.5.4 Carbohydrates in coffee ............................................................................................25
2.5.5 Protein, peptides, and free amino acids in coffee .....................................................26
2.5.6 Lipids in coffee .........................................................................................................26
2.5.6.1 Fatty acid composition of coffee ............................................................................27
2.6 Effects of coffee processing on physico-chemical and sensory qualities ....................28
2.7 Effects of roasting on chemical components of coffee ................................................30
2.8 Volatile compounds in green coffee ............................................................................32
2.8.1 Volatile compounds in roasted coffee .......................................................................33
2.9 Factors affecting coffee quality ...................................................................................34
2.10 Sensory analysis of coffee .........................................................................................35

DEDAN KIMATHI UNIVERSITY OF
TECHNOLOGY
viii
2.11 Health benefits of coffee ............................................................................................36
2.12 Analysis of peptides, proteins and amino acids by Matrix-Assisted Laser Desorption
Ionization (MALDI)...........................................................................................................37
CHAPTER THREE .......................................................................................................... 40
MATERIALS AND METHODS ...................................................................................... 40
3.1 Coffee samples .............................................................................................................40
3.2 Treatments and experimental design ...........................................................................40
3.3 Analysis of physical and chemical composition of coffee...........................................41
3.3.1 Mass, volume and density .........................................................................................42
3.3.2 Moisture content .......................................................................................................42
3.3.3 Crude protein content ................................................................................................42
3.3.4 Total titratable acidity and pH ..................................................................................43
3.3.5 Determination of sugars ............................................................................................43
3.3.6 Lipid extraction .........................................................................................................44
3.3.7 Analysis of fatty acids in coffee ................................................................................45
3.3.8 Determination of chlorogenic acid in coffee ............................................................45
3.3.9 Determination of caffeine and trigonelline ...............................................................46
3.3.10 Determination of protein fingerprint by Matrix Assisted Laser Desorption
Ionization Time of Flight (MALDI-TOF) .........................................................................47
3.3.11 Coffee roasting ........................................................................................................48
3.3.12 Extraction of volatile compounds from ground coffee by Head space – SPME
method................................................................................................................................48
3.3.12.1 Identification of volatile coffee compounds ........................................................49

DEDAN KIMATHI UNIVERSITY OF
TECHNOLOGY
ix
3.3.13 Sensory analysis ......................................................................................................50
3.3.14 Statistical analysis ...................................................................................................50
CHAPTER FOUR ............................................................................................................. 51
RESULTS AND DISCUSSION ....................................................................................... 51
4.1 Effects of processing on physico-chemical composition of coffee .............................51
4.2 Effects of processing on fatty acids, protein profiles and polyphenol content of coffee60
4.2.1.1 Fatty acids profiles of coffee ..................................................................................60
4.2.1.2 Effects of processing methods on the fatty acid concentrations in green coffee ...63
4.2.2 Protein fingerprint for Ruiru 11 and SL 28 coffee cultivars .....................................65
4.2.3 Effects of processing methods on polyphenol content of coffee. .............................69
4.3 Identification of volatile aroma compounds in green and roasted coffee ....................74
4.3.1 Volatile compounds identified in green coffee .........................................................74
4.3.2 Volatile aroma compounds identified in headspace of roasted coffee .....................81
4.4 Effects of coffee processing methods on sensory attributes and quality of coffee ......95
4.4.1 Effects of coffee processing methods on sensory attributes .....................................95
4.4.2 Effects of processing technologies on sensory attributes and overall quality of
coffee cultivars studied ......................................................................................................99
CHAPTER FIVE ............................................................................................................ 104
CONCLUSION AND RECOMMENDATION .............................................................. 104
5.1 Conclusions ................................................................................................................104
5.2 Recommendations ......................................................................................................105
REFERENCES ............................................................................................................... 106
APPENDIX 1 .................................................................................................................. 115

DEDAN KIMATHI UNIVERSITY OF
TECHNOLOGY
x
APPENDIX 2 .................................................................................................................. 116
APPENDIX 3 .................................................................................................................. 117
APPENDIX 4 .................................................................................................................. 118
APPENDIX 5 .................................................................................................................. 119
APPENDIX 6 .................................................................................................................. 123

DEDAN KIMATHI UNIVERSITY OF
TECHNOLOGY
xi
LIST OF FIGURES
Figure 1: Fatty acids levels (%) in green coffee beans processed by three different
processing methods ......................................................................................... 62
Figure 2: Mass spectra for protein fingerprint in Ruiru 11 and SL 28 samples analysed by
MALDI-TOF................................................................................................... 66
Figure 3: Intensity of protein molecules in coffee samples analysed by MALDI-TOF ... 67
Figure 4: Intensities of volatile compounds per their Chemical classes for Ruiru 11 and
SL 28 in green coffee ...................................................................................... 77
Figure 5: Total intensity of volatile compounds as per their chemical classes for roasted
coffee for Ruiru 11 and SL 28 ........................................................................ 83
Figure 6: Level of furan compounds in roasted coffee processed by three different
methods for Ruiru 11 and SL 28 ..................................................................... 87
Figure 7: Level of pyrazine compounds in roasted coffee processed by three different
methods for Ruiru 11 and SL 28 ..................................................................... 88
Figure 8: Level of phenol compounds in roasted coffee processed by three different
methods for Ruiru 11 and SL 28 ..................................................................... 89
Figure 9: Sensory attributes of coffee beverage (SL 28) from three different processing
methods for the two harvesting seasons. ......................................................... 97
Figure 10: Total quality levels for coffee beverage for SL 28 samples processed by three
different methods ............................................................................................ 98
Figure 11: Sensory attributes levels for coffee beverage for SL 28 and Ruiru 11 samples
processes by three different methods ............................................................ 101

DEDAN KIMATHI UNIVERSITY OF
TECHNOLOGY
xii
Figure 12: Total quality levels for coffee beverage for SL 28 and Ruiru 11 samples
processed by three different methods ........................................................... 102

DEDAN KIMATHI UNIVERSITY OF
TECHNOLOGY
xiii
LIST OF TABLES
Table 1: Physico-chemical properties of green coffee samples for SL 28 for main and
short seasons ...................................................................................................... 54
Table 2: Physico-chemical properties of green coffee Samples for Ruiru 11 from different
processing methods for short and main harvesting seasons............................... 55
Table 3: Protein, sucrose and fat content of green coffee samples for SL 28 from three
processing methods for short and main seasons. ............................................... 57
Table 4: Protein, sucrose and fat content of green coffee samples for Ruiru 11 from three
processing methods for short and main seasons. ............................................... 58
Table 5: Concentrations of fatty acids in green coffee for SL 28 and Ruiru 11 from
different processing methods (mg/100g dw) ..................................................... 64
Table 6: Caffeine, trigonelline and chlorogenic acid contents of coffee samples for SL 28
from three different processing methods for short and main seasons. ............... 71
Table 7: Caffeine, trigonelline and chlorogenic acid contents of coffee samples for Ruiru
11 from three different processing methods for short and main seasons. .......... 72
Table 8: Aroma compounds identified in green coffee samples analysed by HS-SPME-
GCMS ................................................................................................................ 76
Table 9: Mean peak area % levels of volatile compounds in green coffee for Ruiru 11 and
SL 28 processed by three different methods analysed by HS-SPME-GCMS ... 79
Table 10: Volatile compounds identified in headspace of roasted coffee ........................ 81
Table 11: Mean relative peak areas (%) for volatile compounds identified in Roasted
coffee of Ruiru 11 and SL 28 cultivars. ............................................................. 84

DEDAN KIMATHI UNIVERSITY OF
TECHNOLOGY
xiv
LIST OF ABBREVIATIONS
AOAC Association of Official Analytical Chemists
ANOVA Analysis of Variance
C. arabica Coffea arabica
C. canephora Coffea canephora
CRD Completely Randomized Design
DW Dry weight basis
DAAD Deutscher Akademischer Austauschdienst Dienst
FAME Fatty Acid Methyl Esters
FAO Food Agricultural Organization
HCl Hydrochloric acid
HPLC High Performance Liquid Chromatography
HS-SPME-GCMS Head Space Solid Phase Microextraction Gas Chromatography
Mass Spectrometry
H2SO4 Sulphuric acid
MALDI-MS Mass Assisted Laser Desorption Ionization Mass Spectrometry
MALDI-TOF Mass Assisted Laser Desorption Ionization Time of Flight
MgO Magnesium oxide
m/z Mass to charge ratio
NaOH Sodium hydroxide
(NH4)2SO4 Ammonium sulphate
pH Potential Hydrogen
SA Sinapinic acid

DEDAN KIMATHI UNIVERSITY OF
TECHNOLOGY
xv
SPSS Statistical Package for Social Scientist
SPME Solid Phase Micro-Extraction
SCAA Special Coffee Association of America
TFA Trifloro-acetic acid

DEDAN KIMATHI UNIVERSITY OF
TECHNOLOGY
1
CHAPTER ONE
INTRODUCTION
1.0 Background to the study
Coffee is a perennial evergreen tropical plant that belongs to the Rubiaceae family
and genus coffea. There are two main species of commercial coffee; Coffea arabica
(Arabica coffee) and Coffea robusta (Robusta coffee). Arabica species dominates the
world trade due to its superior beverage quality (Kathurima et al., 2012). Coffee was
introduced into Kenya by French Missionaries around 1900 A.D. (Mwangi, 1983). Kenya
produces mainly Arabica coffee (Coffea arabica L.). The old cultivars grown in Kenya
are K7 for low altitude areas with serious leaf rust and the SL28 and SL34 for low to
medium altitude areas with good rainfall (Mwangi, 1983). The other cultivars are Ruiru
11 and Batian which are suitable for all coffee growing areas in Kenya because of their
resistance to coffee berry disease (CBD) and coffee leaf rust (CLR) (Kathurima et al.,
2012; Opile and Agwanda, 1993).
The coffee sector in Kenya is important economically in terms of income
generation, employment creation and foreign exchange earnings. Kenya’s mild Arabica
coffee is of the fine quality and well known in the world for its intense flavor, full body,
and pleasant aroma with notes of cocoa. It is highly priced in the world markets and used
for blending with other coffee to improve their aroma and cup quality. Coffee quality is
associated with a set of factors that involve physico-chemical and sensorial aspects
which, in turn, depend on the post-harvest handling and processing conditions (Coradi, et
al., 2007). The major chemical compounds of mature Coffea arabica seeds are cell-wall

DEDAN KIMATHI UNIVERSITY OF
TECHNOLOGY
2
polysaccharides, proteins, lipids, sucrose, caffeine and chlorogenic acids. Each of these
major storage compounds plays several crucial roles in the complex roasting chemistry
(Flament, 2002). For example, proteins and amino acids are essential for the conversion
of reducing sugars into aroma precursors through Maillard reactions. Reducing sugars
themselves result from the degradation of sucrose and cell wall polysaccharides. In
addition, triacylglycerols are the major carriers of aroma in the roasted bean. Their fatty
acid composition determines the generation of thermally-induced oxidation products, in
particular aldehydes, which react readily with Maillard intermediates, giving rise to
additional aroma compounds. Chlorogenic acid and caffeine are responsible for bitterness
(Joet et al., 2010).
Coffee in Kenya is processed by use of two methods namely; dry and wet method.
Dry method is normally employed where there are no processing factories or when
production is low and the weather conditions are favorable. Wet processing is more
common than the dry method due to its production of good quality coffee (Murthy and
Naidu, 2011). The wet method, requires the use of specific equipment and substantial
amounts of water, the pulp is eliminated by a pulper, followed by mucilage removal.
Traditionally, natural fermentation is used to degrade mucilage by means of natural
microorganisms present in coffee cherries and hence facilitate its elimination by washing
with water (Murthy and Naidu, 2011). At the end of fermentation, the wet processed
coffee parchment is washed and dried. Wet pulping could be done under continuous
method or non-continuous where continuous pulping operations utilize large quantities of
water to transport, wash and grade the coffee parchment during processing. Little water is
used for the non-continuous pulping operation and its inclusion helps to soften the coffee

DEDAN KIMATHI UNIVERSITY OF
TECHNOLOGY
3
skin and ease the pulping operation. Traditional wet processing operations uses pulping
machines commonly known as disc or drum pulpers, and involves many stages of
processing and the use of large quantities of water which could contribute to water
pollution problem. The consumption of large amounts of water is considered a major
source of pollution in countries where it is being used (Gonzalez-Rios et al., 2007).
In Kenya, coffee factories are run by cooperatives societies and most pulping
machineries were installed between the 1940 and 1960 (Ooko, 2011). It is estimated that,
almost 80% of these factories still operate with the same old, inefficient pulping
machineries which result to; an average loss of 10-20% of the value of coffee after entire
processing, lack of consistency in the quality of processed coffee, low prices fetched at
coffee auctions, translating to equally low returns to member farmers, high operational
costs in terms of high water usage, energy and labour costs (Ooko, 2011). Due to the
growing production of coffee and the need to improve quality, investment for new
machinery and current technology need to be considered. A new method utilizing a
machine called eco-pulper was developed in Brazil and Columbia and this technology
differs from the traditional methods due to the use of little water in the operation,
involves few stages of processing and removes mucilage by mechanical process without
fermentation (Roa et al., 2012, Gonzalez-Rios et al., 2007). Fermentation has been
considered as an important stage in coffee processing because of its role in removing
mucilage and imparting additional aroma compounds into the coffee beans. The eco-
pulping method not having the fermentation stage is viewed as a risk which could alter
the physico-chemical composition of coffee and the organoleptic characteristics hence
affecting the coffee quality (Gonzalez-Rios et al., 2007).

DEDAN KIMATHI UNIVERSITY OF
TECHNOLOGY
4
The selection of any postharvest processing method in coffee is crucial for the
profitability of the coffee production and it depends on factors such as the cost-benefit
ratio, the need to comply with environmental legislation and the desired standard for
product quality (Ferreira et al., 2013). The new technology is demonstrated to have
additional benefits such as offering significant reduction in the consumption of water,
reduction in the production of waste water and reduction in labour cost due to few stages
of coffee processing (Roa et al., 2012). The main constraint to the adoption of the new
technology is the limited availability of information to demonstrate its effect on coffee
quality. Due to variations in the mode of pulping and mucilage removal processes, these
coffee processing methods may offer significant variations on the coffee quality as a
result of their effects on parameters such as physico-chemical properties and sensory
characteristics of coffee. This research aimed at establishing the effects of traditional and
the new coffee processing technologies on the physico-chemical properties, aroma
profiles and sensory quality of coffee in Kenya.
1.1 Statement of the problem
The new ecological coffee processing technology has been viewed as economical
in terms of water consumption, less production of waste water which reduce, chances of
water pollution and reduction in labour cost due to the few stages of processing. This
technology differs from traditional processing methods in their mode of mucilage
removal and the stages involved in processing. While the traditional wet processing
methods utilize fermentation processes for removing mucilage with use of large
quantities of water during washing and grading stages the new method utilizes
mechanical approach instead of fermentation to remove mucilage with use of little water.

DEDAN KIMATHI UNIVERSITY OF
TECHNOLOGY
5
Due to this variations these methods could also vary on their effects of physico-chemical
components, aroma profiles and sensory quality of coffee. There is limited information
on whether the new method of coffee processing affects quality. This research aimed at
establishing the effects of the traditional and new technologies on the quality parameters
such as physico- chemical composition, aroma profiles and sensory quality of coffee.
1.2 Main objective
The main objective of the study was to establish the effects of different processing
technologies on the quality of Kenyan coffee.
1.2.1 Specific objectives
1. To determine the physico-chemical properties of coffee processed by wet, hand
and eco-pulpers
2. To determine the level of fatty acids profiles, protein profiles and polyphenol
composition of coffee processed by wet, hand and eco-pulpers
3. To determine the aroma profiles of coffee processed by wet, hand and eco-pulpers
4. To determine the sensory qualities of coffee processed by wet, hand and eco-
pulpers
1.3 Hypothesis
Hypothesis 1. There are no differences on the levels of physico-chemical properties
of coffee processed by wet, hand and eco-pulpers

DEDAN KIMATHI UNIVERSITY OF
TECHNOLOGY
6
Hypothesis 2. There are no differences on the level of fatty acids profiles, protein
profiles and polyphenol composition in coffee processed by wet, hand and eco-
pulpers
Hypothesis 3. There are no differences on the aroma profiles of coffee processed by
wet, hand and eco-pulpers
Hypothesis 4. There are no differences on the sensory qualities of coffee processed
by wet, hand and eco-pulpers
1.4 Justification
Coffee processing is an important factors contributing to the quality of coffee
(Musembe et al., 2007) and any changes in the physico-chemical composition of coffee
affects both the sensory characteristics and the overall quality of coffee. Traditional
methods of coffee processing include fermentation stage, which takes long time and
requires a lot of care and knowledge to prevent loss of quality. Introduction of new
technologies could be important in improving coffee processing in terms of cost
reduction and improvement of quality of coffee.
The improvement of coffee processing leads to better quality, increase the demand of the
coffee translating to higher prices of coffee and higher income or revenue to the coffee
producers in Kenya.
1.5 Expected output
1. This research would generate new information on the effects of coffee processing
methods on the physico-chemical composition, sensory quality and aroma profiles
of coffee.

DEDAN KIMATHI UNIVERSITY OF
TECHNOLOGY
7
2. The research findings will help in advising coffee processors on the effects of the
traditional and new processing technologies on the quality of coffee.
3. The research will also help coffee producers to adopt new technologies which are
efficient and cost effective and preserving coffee quality which may translate into
profits to coffee farmers and other players in the coffee value chain.
4. This research will help to gather information which could be disseminated in form
of publications in refereed journals and in writing of a PhD dissertation.
1.6 Limitations
1. The funds for the project were not dispatched on time for the 2013/2014 and
2014/2015 financial periods. This caused delay in implementation of the project,
including laboratory analysis which were supposed to be undertaken. Hence the
coffee samples were preserved in cold storage and few analysis undertaken while
awaiting the availability of the funds.
2. The samples for Ruiru 11 were obtained from Hill farm in Nyeri County and due
to the delay in approval of the application and procurement coffee from the farm,
coffee samples for Ruiru 11 for 2013/2013 harvesting season were not collected.
This made the collection to be done during the 2013/2014 harvesting seasons
3. The analysis of the protein fingerprinting and profiling by MALDI-TOF
techniques were not completed at the Technical University of Applied Science
Wildau, Germany, due to the long procedures used, inadequate time and the lack
of the database for protein to be used in confirmation of the amino acid
sequencing in coffee.

DEDAN KIMATHI UNIVERSITY OF
TECHNOLOGY
8
1.7 Definition of terms
Coffee cherries: are the raw fruit of the coffee plant, which are composed of two coffee
beans covered by a thin parchment like hull and further surrounded by pulp.
Wet coffee processing: consist of removing the pulp from the cherry while still fresh and
subjecting the coffee parchment to fermentation to degrade mucilage which is removed
through washing.
Dry coffee processing method: involves drying of the whole coffee cherries in the sun
or mechanically to a moisture content less than 12% and hulling the dry coffee to obtain
green coffee beans.
Wet pulper: refer to the machine use for pulping coffee under continuous processing
operations
Hand pulper: refer to the manual operated or motor operated pulping machine used for
pulping coffee in small scale.
Eco-pulper: refer to a machine which pulps coffee and removes mucilage by mechanical
process and cleans the parchment with the use of little water.
Coffee roasting: subjecting green coffee beans to a heat treatment in a roaster at
temperatures between 200oC to 230oC to transform the physical and chemical properties
and produce desirable flavor and aroma characteristic of roasted coffee.
Maillard reactions: chemical reactions between amino acids and reducing sugars which
occurs during roasting
Caramelization: chemical reaction occurring during coffee roasting which transform
sugars into brown substances.

DEDAN KIMATHI UNIVERSITY OF
TECHNOLOGY
9
Strecker degradation: a reaction between an amino acid and an α-dicarbonyl with the
formation of an amino-ketone that condenses to form nitrogen heterocyclic compounds or
reacts with formaldehyde to form oxazoles.
Pyrolysis: Heat induced reactions
Processing technologies: are used to refer to the type of processes that have been
developed for the processing of coffee cherries including the machines and the steps
involved in transformation of coffee cherries such as pulping and mucilage removal to
obtain a dry product at recommended moisture content of 10-12%.

DEDAN KIMATHI UNIVERSITY OF
TECHNOLOGY
10
CHAPTER TWO
LITERATURE REVIEW
2.1 Coffee origin and production
Coffee is a tropical plant that grows at 600–1800 m above sea level. It is native of
Ethiopia, from where it spread first to India and then to Indonesia, Brazil, Colombia and
Central America (Buffo and Cardelli-Freire, 2004). What is commonly known as ‘coffee’
is a beverage prepared by brewing roasted, ground beans. The plant produces red cherry-
like fruits containing two seeds, which, after being separated from the fruit pulp, are
known as ‘green coffee’. They are packed in sacks and transported to consuming
countries. When received, they are blended with green beans from other origins and
roasted to produce the characteristic flavour and colour associated with coffee beverage
(Buffo and Cardelli-Freire, 2004). The habit of drinking coffee was developed in Arab
culture, and the beverage was known only for its properties as a stimulant. Coffee fruit
was consumed raw and fed to herds as a stimulant while they were travelling. In 1000
AD, the Arabs began to prepare an infusion of coffee cherries, by boiling them in water.
The roasting process was developed only in the 14th century, and coffee finally became
what we know it in today’s beverage (Schwan et al., 2012). As beverage, coffee is
characterized as energizing and nonalcoholic, with potential beneficial effects on health.
It mainly acts as an antioxidant. There are different types of coffee beverages
characterized by different nuances in terms of body, aroma, acidity and astringency.
One hundred species are associated with genus coffea, but only two species are
agro economically important, Coffea arabica and Coffea canephora. Coffea dewevrei,

DEDAN KIMATHI UNIVERSITY OF
TECHNOLOGY
11
Coffea congensis, Coffea eugenioides, kapakata, Ccoffea salvatrix, Ccoffea stenophyla,
Coffea liberica, Coffea racemosa, and others are primarily used in genetic crosses. Coffea
arabica, known as Arabica in the coffee market, makes up 70% of total production
volume, and C. canephora (Robusta coffee) is responsible for the remaining 30%
(Schwan et al., 2012). Currently, Brazil is the largest producer of Arabica coffees,
followed by Columbia, Paraquay, Venezuela, Indonesia, Ethiopia, India, Mexico and
other 40 countries. The United States, Brazil, and the European countries are the major
consumer markets (Schwan et al., 2012). The African producing countries include;
Kenya (Arabica), Ethiopia (Arabica), Cameroon (Arabica and Robusta), Cote d’Ivoire
(Robusta), Uganda (Robusta and Arabica), Tanzania (Arabica and Robusta), Rwanda
(Arabica and Robusta), Burundi (Arabica and Robusta) among other African countries
(FAO, 2015a).
2.2 Coffee production, post-harvest handling and processing in Kenya
Coffee was introduced into Kenya by French Missionaries around 1900 A.D.
(Mwangi, 1983). Kenya grows the Arabica coffee species almost exclusively, which is
processed by the wet method. The major coffee growing areas in Kenya include the high
plateau around Mt Kenya where acidic soils provide excellent conditions for coffee
growing, Aberdare range, Kisii, Nyanza, Bungoma, Nakuru and Kericho (Patrick, 2005).
The high quality of Kenyan coffee could be attributed to good favourable climatic
conditions, good agronomic practices, rigorous selective harvesting and post-harvest
practices, appropriate processing, proper storage conditions among others factors Omondi
(2008). Coffee in Kenya is mainly exported in form of green coffee beans. The coffee
industry in Kenya is noted for its cooperative system of production, processing, milling,

DEDAN KIMATHI UNIVERSITY OF
TECHNOLOGY
12
marketing, and auctioning coffee (Howden, 2012). Members of cooperative systems are
mainly small scale farmers who come together and employ economies of scale in
processing and marketing of coffee. Small-scale farmers produce the majority of the
coffee. These farmers have formed co-operatives, which have put up pulping units
referred to as Factories. These co-operatives have management committees that oversee
the running of the Factories. Coffee is pulped and dried as parchment coffee in these
factories. The dried parchment is stored temporarily before being transported to centrally
located companies for hulling. The hulling companies are privately owned and hull the
coffee for the farmers at a fee (FAO, 2015b).
2.2.1 Harvesting and cherry sorting
Once the coffee berries turn bright red on the trees, farmers pick them within two
days or they will dry. After plucking, the farmers have 12 hours to get the ripened
cherries to a pulpery, or coffee washing station. Farmers in distant villages far from a
washing station must sun-dry the beans themselves, then take off the husks and transport
them to market. Farmers, however, prefer to get their berries to washing (pulping),
stations to take advantage of higher market prices for "washed" coffee (FAO, 2015b;
Alastair, 2012). Coffee harvesting in Kenya is done by selective picking of the ripe
berries. This is a labour intensive exercise and involves most of the members of a family
and hired labour. Transportation to the factories is by ox-drawn carts, pick-up vehicles,
and sometimes lorries. This is done immediately after harvesting. The cherry is sorted out
before pulping. This helps to remove the immature, diseased, insect damaged and dry
berries as well as the leaves, twigs and other foreign matter. The sorted berries are
processed by the wet method (Alastair, 2012).

DEDAN KIMATHI UNIVERSITY OF
TECHNOLOGY
13
2.2.2 Pulping and mucilage removal
Pulping is the mechanical removal of the pulp from the cherry to have parchment
coffee. After pulping, the coffee is graded into three grades 1, 2 and lights. This is done
by density and size of the coffee. Mucilage can be removed by use of either,
fermentation, chemical method or mechanical methods (Avallone et al., 2002; Alastair,
2012). Fermentation allows the mucilage layer on the parchment to be washed off easily.
Completion of fermentation is determined by washing some parchment with clean water
and then feeling the coffee with the hand. A gritty feel is an indication of the completion
of fermentation. This stage takes 1 to 4 days depending on the prevailing weather
conditions, faster on warm days and slow on cold days. Several chemical products can
also be used for the removal of the mucilage, mainly lime, which precipitates the pectins
in the form of insoluble pectates, which are then easily removed by washing. Alkaline
carbonates have also been used (FAO, 2015b). This method is not common in Kenya.
2.2.3 Underwater soaking and washing
Soaking is a complete immersion of the parchment under water. Studies in Kenya
have shown that soaking of coffee parchment after fermentation for about 12 hours
improves the coffee quality both in colour and taste (Kathurima, 2010, FAO, 2015b). The
parchment is thoroughly washed to remove the degraded mucilage and acids completely
before soaking. After fermentation and soaking, the parchment coffee is thoroughly
washed with clean water to remove any dirt or remains of mucilage or sugars. Final
washing is done in concrete channels by pushing the parchment with wooden paddles
against a stream of water. The washing channels are painted like the fermentation tanks

DEDAN KIMATHI UNIVERSITY OF
TECHNOLOGY
14
with acid resistant black paint. The paint allows heat retention during fermentation and
reduces friction between the coffee and the concrete surfaces during washing. During
final washing, the coffee is graded again by weight into different grades (FAO, 2015b).
2.2.4 Drying
Freshly pulped coffee has a moisture content of about 55%, which has to be
reduced by drying to 11%. This is the ideal level of moisture content required for proper
storage, hulling and roasting. In Kenya, sun drying is predominantly used and mainly by
the co-operatives and the coffee is spread on wire mesh tables for several days (normally
about 14 days), until fully dry. When it rains, the coffee is covered by a polythene sheets
to avoid re-wetting. Some big commercial estates use mechanical drying (FAO, 2015b).
After wet processing, parchment coffee needs to be dried quickly to prevent the
development of microbiological activities of moulds and yeast which can result in severe
cup defects as well as create toxins which can pose health risks to consumers. Coffee
must be dried so that it has a moisture content of at least 11-12% (Patui et al., 2014).
At this level, coffee beans will preserve their inherent quality, mould
development is limited and minimal breakage will occur during hulling, grading and
exporting. Whenever climate conditions allow, sun drying is the preferred drying
technique. It is cheap and in addition, the ultraviolet light of the sun is considered to
bleach out chlorophyll from the beans, reducing green and grassy flavour components.
Sun drying needs to be supervised very carefully as site and climate conditions strongly
influence coffee quality (GTZ, 2002; Coradi et al., 2007). Neither drying too quickly at
excessive temperatures nor drying too slowly with a low temperature will bring good
results in terms of coffee quality. External factors, such as temperature, relative humidity

DEDAN KIMATHI UNIVERSITY OF
TECHNOLOGY
15
and mechanical damage can alter the structure of the membranes, leading to a loss of
their organization and selectivity reducing coffee’s quality potential (Coradi et al., 2007).
2.3 Traditional wet processing methods of coffee
Wet coffee processing consists of removing pulp and skin from the cherries while
still fresh. It involves several stages in which considerable amounts of water are used,
mainly for microbial mucilage removal (Gonzalez-Rios et al., 2007). Pulping of coffee
cherries removes skin and pulp leaving viscous mucilage adhering to the parchment. The
mucilage is removed by natural fermentation with the help of natural microorganisms
present in coffee such as bacteria and yeast. These microorganisms degrade the mucilage
facilitating its removal during washing of parchment (Murthy and Naidu, 2011).
Coffee fermentation may take 12 to 48 hours, depending on temperatures and types of
coffee (Café, 2009). The time vary depending on a number of factors
including the amount of coffee beans, water, temperature and humidity
(Murthy and Naidu, 2011). During the natural fermentation, bacteria, yeasts and
enzymes act to transform the peptic compounds and sugar constituents of the mucilage,
into alcohols and carboxylic, acetic, lactic, propionic and butyric acids, which are then
removed in the washing process (Roa et al., 2012). After fermentation, the parchment is
then washed in a channels, and then spread out in the sun to dry to a moisture content of
11 – 12% to prevent deterioration during storage (Ismail et al., 2013; Musembe, et al.,
2007).
The processing of coffee under wet method requires use of a special machine
called the pulper. The most common pulpers used in traditional wet method are the drum
and the disc pulpers which only vary in their designs. The drum pulpers involve a rotating

DEDAN KIMATHI UNIVERSITY OF
TECHNOLOGY
16
drum with a punched sheet surface and adjustable breast plate between which the coffee
cherries are pulped and the beans separated. The distance between the drum and the
breast plate is normally adjusted so that the pulp is removed without damaging the beans.
The disc pulpers are similar to the drum pulpers in operation only that the cherries are
squeezed between a breast plates and disc with roughened surface. Most pulpers used in
coffee factories under continuous pulping operations are the disc pulpers while drum
pulpers are commonly used by the small scale coffee farmers under manual operations.
When fermentation, in wet processing is carried out under good control, coffees are
obtained with high cup quality (Murthy and Naidu, 2011). However, in many cases there
is little control, especially when the production is low and coffees of 2 or 3 days of being
harvested are mixed in one tank, which may affect quality (Roa et al., 2012). The
fermented mucilage is removed from the coffee beans by washing them in the same tank
or using devices like open channels or the semi-submerged channels. It is indispensable
avoiding over fermentations that originate aroma and off-flavors such as vinegar, onion,
rancid and nauseous. In the same way, before drying the beans, it is necessary that the
coffee is free of mucilage, otherwise the parchment will discolor, the drying would be
hindered and the cup could acquire off flavors (Roa, et al., 2012).
2.3.1 Changes during coffee fermentation
The primary objective of coffee fermentation is to remove mucilage and
development of a number of flavor precursors. The mucilage is degraded by the fruits
own enzymes and microbial extra-enzymes (Murthy and Naidu, 2011). After
fermentation the beans are washed, dried and roasted. Fermentation may instill unique
and complex flavors to the coffee and some are initially developed during the processing

DEDAN KIMATHI UNIVERSITY OF
TECHNOLOGY
17
immediately after harvesting. This flavor development involves the action of various
enzymes on polyphenols, protein and carbohydrates. During fermentation like in cocoa,
microbial activity outside the beans induce biochemical and physiological changes inside
the beans. The external appearance of the beans also change. Initially they are pinkish
with a covering of white mucilage but gradually they darken and mucilage disappears.
This colour change is oxidative. Acetic acid produced during fermentation penetrates the
husk and causes biochemical reactions in the bean to form the chocolate flavor precursors
and to reduce the astringent and bitter taste. Lactic acid bacteria are present at the start of
fermentation although yeast are dominant. The yeast activity becomes initiated by alcohol
concentration, increasing pH and greater aeration. Lactic acid bacteria converts a wide
range of sugars and some organic acids such as citric, malic acids to lactic acid or
depending on species to acetic acid and ethanol and carbon-dioxide. In the first 24-36
hours, mainly in the case of cocoa, sugars are converted to alcohols in condition of low
oxygen and pH below 4. Yeast produce pectinolytic enzymes that breakdown the pulp
cell walls. This process causes the pulp to drain off the beans as sweating. Beans death
occur in the second day caused by acetic acid and ethanol. Rise in temperature play a role
in colour changes and not chemical changes (Nigam and Singh, 2014; Avallone et al.,
2002).
Certain organoleptic and visual deviations are due to the formation of aliphatic
acids which increase in underwater fermentation. This is in contrast to dry fermentation
in which water is drained away immediately. Washing and soaking to eliminate
undesirable components is recommended although some losses in caffeine and
chlorogenic acid may be observed. The end of fermentation is determined by the
DEDAN KIMATHI UNIVERSITY OF
TECHNOLOGY
18
producers based on their tactile perceptions of the fruit. When the parchment are slippery,
there is evidence of presence of mucilage, indicating that fermentation should continue.
However, tactile detection may fail, and as a result periodic measurement of pH as an
alternative is recommended. When this parameter reaches a value of 4.6, this is indicative
of the total release of mucilage and thus the end of fermentation (Nigam and Singh, 2014;
Murthy and Naidu, 2011).
2.3.2 Effects of fermentation on coffee quality
Flavor development occurs within the cotyledons in the beans. The compounds
involve in flavor development are split between two types of cell; storage cell containing
fats carbohydrates and protein and pigment cells containing phenolics compounds and
xanthines. During fermentation germination is initiated first which causes water uptake
by the protein vacuoles within the cells. Later after bean death the membranes breakdown
and various enzymes and substrates are free to mix and subsequent reactions produce
flavor precursors (Nigam and Singh, 2014). The pH determined by diffusion of acetic
acid is important and the reactions are increased during fermentation and drying. During
fermentation reducing sugars are released and proteins are degraded by enzymes to
polypeptides and amino acids, and these sugars form chocolate flavor precursors. A
portion of polyphenols is oxidized forming large tannin molecules. The rest of
polyphenols like caffeine are diffused and exudate from the beans reducing a stringent
and bitter taste (Nigam and Singh, 2014).
During fermentation the levels of methylxanthines fall probably by diffusion from
cotyledons. Polyphenolic compounds impart astringency. Their levels drops during
fermentation and drying. Polyphenols oxidases converts polyphenols to quinones.

DEDAN KIMATHI UNIVERSITY OF
TECHNOLOGY
19
Proteins and peptides complex within polyphenols giving rise to brown colouration.
Maillard reactions precursors are formed from sucrose and storage proteins. Sucrose is
converted by invertase into reducing sugars. The storage proteins are initially hydrolysed
by an aspartic endopeptidase into hydrophobic oligopeptides. A carboxypeptidase (pH
5.4-5.8) then converts these oligopeptides and hydrophobic amino acids (Nigam and
Singh, 2014; Avallone et al., 2002). These are flavor precursors involved in maillard
reactions during roasting. The important components in coffee fermentation is mainly the
cell wall and the intercellular material characteristics of paranchymators cells of the
fruits. The middle lamella of coffee mucilage is primarily, pectinic and the cells contain
pectin and cellulose materials. The insoluble fractions of coffee mucilage cells is mainly
pectin substances in close association with other cell wall and intercellular materials
including hemicellulose, phospholipids and galactolipids. The breakdown of this cellular
material and its detachment from coffee parchment are important biochemical processes
in coffee fermentation (Nigam and Singh, 2014).
2.3.3 Chemical changes resulting from fermentations of coffee
The production of carboxylic acid changes the pH value of fermenting liquors
from 5.9 to 4.0 (Murthy and Naidu 2011). Acetic acid and lactic acid are produced early
in coffee fermentation. Propionic acid and butyric acid are produced later. Carboxylic
acid are produced through degradation of sugars by microorganisms. Ethanol is one of
the fermentation products. The evolution of hydrogen and carbondioxide occurs during
both dry and under water fermentation. Hydrogen is produced through breakdown of
sugars by bacteria of the coliform group. Escherichia coli metabolize glucose by a mixed
acid fermentation at pH 7.8 (Nigam and Singh, 2014). The presence of reducing and non-

DEDAN KIMATHI UNIVERSITY OF
TECHNOLOGY
20
reducing sugars in soluble mucilage fraction is observed after complete fermentation.
Some of the sugars forming part of the structure of mucilage are arabinose, xylose
galactose, fructose and glucose. Arabinose, xylose and galactose are part of insoluble
structure of mucilage. The soluble sugars form an excellent medium for growth of
microorganisms.
Changes in quality of coffee bean are fundamental to the continued practice of
naturally fermented coffee. In two stage fermentation process, the raw bean quality
improves and this improvement is reflected in the roast and final beverage quality. The
improvement is reflected in the roast and final beverage quality. The improvement in
quality is dependent on the diffusion of various compounds from the beans which also
results in weight loss of 3-12%. Higher weight losses are observed in underwater
fermentation. The magnitude of loss would make fermentation an expensive exercise thus
nullifying the gains in raw bean quality (Nigam and Singh, 2014).
The major factors in natural fermentation are extracellular enzymes elaborated by
microorganisms. Because the mucilage contains simple sugars, polysaccharides,
minerals, proteins and lipids it forms a good medium for microbial growth. Bacteria
observed in fermenting coffee includes lactic acid bacteria of genera Leuconostoc and
Lactobacillus, coliforms such as Aerobacter and Escherichia coli and pectinolytic species
of genus Bacillus. A microbial succession involving members of the enterobacteriaceae
species of Enterococcus and lactic acid bacteria plays a role in lowering pH value to
about 4.3 which then inhibit activity of pectinolytic enzymes. The inhibited activity
prevents growth of many spoilage microorganisms. Extensive growth of microorganism
is likely to lead to the development of undesirable flavours. Pectinolytic microorganisms

DEDAN KIMATHI UNIVERSITY OF
TECHNOLOGY
21
belong to genera Bacillus, Erwinia, Aspergillus Penicillium and Fusarium. Molds
enzymes are known to speed up mucilage breakdown. Fungi genera; Aspergillus,
Fusarium and Penicillium are isolated from depulped coffee. Yeast have no ability to
degrade pectin. Some mucilage degrading yeast are found in coffee (Evangelista et al.,
2014; Murthy and Naidu, 2011).
2.4 Ecological coffee processing method
Ecological coffee processing is a recent technology, which came from Brazil and
Colombia, two of the world’s largest coffee producers. The process is the same as for
traditional fully washed coffee, but the new design of the machinery provides for the
additional mechanical unit for the removal of mucilage (Roa et al., 2012). The coffee
passes through the pulping unit to remove the outer cherry skin, and then instead of
passing to the fermentation and washing processes, the parchment goes directly into the
mucilage remover. This mechanical unit removes the mucilage in a matter of minutes,
and the parchment can be taken out and dried immediately, without fermentation or
washing (Café, 2009). Some of the advantages for these new technology are; significant
reduction in the consumption of water, reduction of the contamination, larger yields of
dry coffee due to the elimination of losses of dry matter by respiration of the grain, and
the recovery of good coffee parchment that were covered with dried pulp. There is better
use of the dryers because this equipment can start operation the same day of the harvest
(Roa et al., 2012). It exists in principally two procedures, which consist of eliminating
the stages not strictly necessary as the hydraulic transport and the fermentation of the
mucilage. Ecological processing eliminate use of water in the pulping process, the
excessive classification or separation of the grains and minimizing, the consumption of

DEDAN KIMATHI UNIVERSITY OF
TECHNOLOGY
22
water (Café, 2009). When a mass of pulped coffee becomes agitated it is possible to
remove a large percentage of mucilage in only a few seconds. The fluids mucilage, the
added water, and the particles originated from the pulp present in the pulped coffee,
residuals of grains and other strange materials, give origin to a highly viscous suspension
of pseudoplastic nature (Roa, et al., 2012). When the rotational speed of demucilager is
increased the deformation rate of the suspension mucilage coffee is increased, the cutting
stresses that act in the vicinity of the grains increase and the frequency of the collisions
among grains is also increased. This explains the principle of removal of mucilage by the
demucilager. This allows simultaneously removal of pulp and mucilage, washing and
cleaning of beans with minimum usage of water. The mechanical demucilaging process
carried out with the appropriate equipment, allows the quick removal of the mucilage
compared with the natural fermentation process. After removal of mucilage the coffee
parchment can be taken for drying directly. The quality of coffee is reported to be equally
good to the one obtained with the traditional method of processing with fermentation
(Cafe, 2009).
2.5 Coffee physico-chemical components
The basic chemical composition of green coffee depends primarily on genetic
aspects, especially species, and on physiologic aspects such as degree of maturation. In
addition to these intrinsic factors, extrinsic factors such as soil composition, climate,
agricultural practices, and storage conditions affect seed physiology and chemical
composition (Farah, 2012). The chemical composition of hybrid coffee seeds is similar to
that of the parent species. The flavor of high-quality coffee can vary considerably among
samples from the same species and variety grown in different regions. Climate and soil

DEDAN KIMATHI UNIVERSITY OF
TECHNOLOGY
23
composition (including microbiota) are relevant because chemical compounds and
minerals present in small amounts may produce considerable changes in the sensory
attributes of the beverage. Arabica and Robusta coffees are different in many ways,
including their ideal growing climates, physical aspects, chemical composition, and
characteristics of the brew made with the ground roasted seeds (Farah, 2012).
Robusta coffee trees are more robust; that is, they are stronger, more resistant to
pests and disease, and less demanding than Arabica trees with regard to climate. Robusta
coffee also contains higher amounts of antioxidant compounds and caffeine (Mussatto et
al, 2011). Moreover, Robusta coffee contains more soluble solids; therefore, its inclusion
in commercial blends used for instant coffee adds body to the beverage and increases
yield. On the other hand, Arabica coffee provides superior cup quality and aroma
compared with Robusta, which commonly possesses a more aggressive flavor and, in
light roast coffee, has a flat popcorn-like aroma. The nonvolatile fraction of green coffee
is composed primarily of water, carbohydrates and fiber, proteins and free amino acids,
lipids, minerals, organic acids, chlorogenic acids, trigonelline, and caffeine. Out of these
compounds found in green coffee, chlorogenic acids, caffeine, trigonelline, soluble fiber,
and diterpenes from the lipid fraction are most likely to be bioactive, and they may also
be important contributors to the beverage flavor after roasting (Farah, 2012).
2.5.1 Caffeine in coffee
Caffeine is a methyl-xanthine with bitter characteristics; however, it is responsible
for no more than 10% of the perceived bitterness of the coffee beverage (Farah, 2012).
This alkaloid is heat stable, and its concentration in C. canephora is approximately twice
that found in C. Arabica. Caffeine is a xanthine derivative known to stimulate the

DEDAN KIMATHI UNIVERSITY OF
TECHNOLOGY
24
nervous central system and is generally associated with improvements in alertness,
learning capacity and exercise performance when moderately consumed. Its characteristic
bitter taste is an important determinant for flavor formation (Farah et al., 2006). The
caffeine contents of green coffee vary widely between species. Even within species, there
is a very wide range of values of caffeine (Ky et al., 2001). Robusta coffee in general
have a higher caffeine content with an overall mean value of 2.2%, while that of Arabica
is about 1.2% with a range of 0.6 to 1.9% (Belay et al., 2008).
2.5.2 Trigonelline in coffee
Trigonelline is an alkaloid biologically derived from enzymatic methylation of
nicotinic acid. It contributes to the bitterness of the brew and is a precursor for the
formation of different classes of volatile compounds during roasting such as pyrroles and
pyridines. The amount of trigonelline in C. canephora is approximately two-thirds that
found in C. arabica. Trigonelline is a pyridine derivative known to contribute indirectly
to the formation of appreciated flavor products including furans, pyrazine, alkyl-pyridines
and pyrroles during coffee roasting (Ky et al., 2001). Demethylation of trigonelline
during coffee roasting generates nicotinic acid, a water-soluble B vitamin also known as
niacin (Perrone et al., 2008).
2.5.3 Chlorogenic acids in coffee
Chlorogenic acids comprise a major class of phenolic compounds, which are
derived primarily from esterification of trans-cinnamic acids (e.g., caffeic, ferulic, and p-
coumaric) with quinic acid (Farah, 2012). The main subclasses of chlorogenic acids in
green coffee are caffeoylquinic, acids, dicaffeoylquinic acids, feruloylquinic acids and,

DEDAN KIMATHI UNIVERSITY OF
TECHNOLOGY
25
less abundantly, p-coumaroylquinic acids and caffeoyl-feruloylquinic acids. Among these
classes, caffeoylquinic acids account for approximately 80% of the total chlorogenic
acids content (Belay, 2011). In particular, 5-caffeoylquinic acid, the first of these
compounds identified, accounts for almost 60%. Chlorogenic acids confer astringency,
bitterness, and acidity to the coffee brew. Nevertheless, high amounts in green coffee,
particularly caffeoylquinic and feruloylquinic acids, may produce undesirable flavor
possibly due to oxidation and degradation products formed before roasting (Farah et al,
2006). Chlorogenic acids are precursors of phenols and catechol’s that may confer
unpleasant sensory notes that are formed during roasting. The content of chlorogenic acid
in C. canephora is generally one and a half to two times higher than in C. arabica, but
this concentration varies considerably in both species (Farah, 2012).
2.5.4 Carbohydrates in coffee
Carbohydrates are major constituents of coffee and may account for more than
50% of the dry weight. The poly-, oligo-, di-, and monosaccharides can be divided into
reducing and non-reducing sugars. Polysaccharides (soluble and insoluble) account for
approximately 44% of dry matter in C. arabica and 47% in C. canephora. Sucrose is
important for coffee flavor and quality; it accounts for up to 9% of C. arabica dry weight
and approximately half of it in C. canephora (Mussatto et al, 2011; Farah, 2012).
Small amounts of simple carbohydrates such as fructose, glucose, mannose,
arabinose, and rhamnose and oligosaccharides such as raffinose and stachyose have been
identified in green coffee. Carbohydrates are precursors for the maillard reaction (in the
case of sucrose, after inversion) and caramelization, which are important for color and
aroma development. They also contribute to the acidity of the brew after coffee roasting.

DEDAN KIMATHI UNIVERSITY OF
TECHNOLOGY
26
A higher sucrose content is one of the reasons for the superior aroma and overall flavor of
Arabica coffee. High-molecular-weight polysaccharides give body to the brew. Out of the
main polysaccharides in coffee, galactomannan and arabinogalactan are soluble but
cellulose is not. Sucrose, which is the most abundant simple carbohydrate present in
green coffee, acts as an aroma precursor during roasting, generating several classes of
compounds such as furans, aldehydes and carboxylic acids that will affect the flavor of
the beverage (Perrone et al., 2008).
2.5.5 Protein, peptides, and free amino acids in coffee
Protein, peptides, and free amino acids are vital for coffee flavor since they are
needed for the Maillard reaction. They serve as precursors for the formation of volatile
compounds such as furans, pyridines, pyrazines, pyrroles, aldehydes, and melanoidins.
The melanoidins are responsible for coffee’s color and to some extent, its antioxidant
activity (Farah, 2012). The total nitrogenous compounds (excluding caffeine and
trigonelline) account for 9%–16% of the green coffee chemical composition, with a
slightly higher content in C. canephora than C. arabica. However, coffee is not a good
nutritional source of protein because it lacks essential amino acids (Mussatto et al, 2011).
2.5.6 Lipids in coffee
Lipids are major components of coffee, and their total content varies considerably
between C. arabica and C. canephora species. The lipid fraction of coffee is composed
mainly of triacylglycerols (approximately 75%), free fatty acids (1%), sterols (2.2%
unesterified and 3.2% esterified with fatty acids), and tocopherols (0.05%), which are
typically found in edible vegetable oils. This fraction also contains diterpenes of the

DEDAN KIMATHI UNIVERSITY OF
TECHNOLOGY
27
kaurene family in proportions of up to 20% of the total lipid fraction (Kolling-Speer and
Speer, 2005). The total lipid content in Arabica seeds (approximately 14 g/100 g dry
matter) is approximately two times that of Robusta seeds (Mussato et al., 2011). Fatty
acids in coffee are found primarily in combined forms; most are esterified with glycerol
in the triacylglycerol fraction, 20% esterified with diterpenes, and a small proportion in
sterol esters. Most fatty acids in coffee are unsaturated. Linoleic acid (18:2(n-6)), oleic
acid (18:1(n-9)), and linolenic acid (18:3(n-3)) account for approximately 43%–54%,
7%–14%, and 1%–2.6% of the triacylglycerol (Nikolova-Damyanova et al, 1998). Fatty
acids are not only important for health, but their integrity is important to keep coffee
fresh and avoid the staleness caused by hydrolysis and oxidation of triacylglycerols (Toci
et al., 2008).
2.5.6.1 Fatty acid composition of coffee
Fatty acids are present in the coffee lipid extract either free or mainly esterified by
glycerol or by diterpenic alcohols (Martin et al, 2001). As the composition of fatty acids
depends on several factors, particularly species and variety, the comparison of fatty acid
patterns is a useful tool for classification purposes (Dagne and Jonhson, 1997). The main
fatty acids present in the coffee oil are myristic (C14:0), palmitic (C16:0), palmitoleic
(C16:1), stearic (C18:0), oleic (C18:1), linoleic (C18:2), linolenic (C18:3), arachidic
(C20:0), eicosenoic (C20:1) and behenic acid (C22:0) (Martin et al., 2001). According to
Martin et al. (2001), the coffee oil composition, specifically the fatty acids content can be
considered as chemical descriptor to differentiate between coffee varieties. Studies
carried out on roasted coffee with different extraction methods, reported the presence of
saturated and unsaturated fatty acids, mainly palmitic acid, stearic, oleic, linoleic,

DEDAN KIMATHI UNIVERSITY OF
TECHNOLOGY
28
linolenic and arachidic (Martin et al., 2001). Coffee oil, which comprises about 10% of
the roasted beans, carries most of the coffee aroma. The aroma is made up of a complex
mixture of volatile compounds (Buffo and Cardelli-Freire, 2004).
2.6 Effects of coffee processing on physico-chemical and sensory
qualities
Several physiological, microbiological, agricultural, cultural, processing and
storage related conditions can influence the final quality of the beverage. Natural coffee
are more full-bodied and less acidic than coffees processed using the wet method. The
drying and storage of coffee fruit is important in preserving the sensory and sanitary
quality (Schwan et al., 2012). Sanitary quality is preserved by reducing the water content
and thus preventing colonization by toxigenic fungi during post-processing. The drying
temperature also affects cell integrity. When the cells of the grains are broken, leakage of
cellular material occurs and quality decreases.
Washed coffees have a chemical composition different from that of non-washed
beans because the type of processing influences the metabolism of the seeds (Knopp et
al., 2006). However, environmental factors and genetic factors related to treatment,
agricultural practices, soil and climatic conditions and technical procedures and
postharvest fermentation time can influence the quality of the coffee beverages. This is
because environmental factors such as shading and altitude influence the quality of coffee
through the formation of aroma precursors such as proteins, amino acids, sucrose,
triacylglycerols, chlorogenic acid and caffeine (Vaast et al., 2006). The concentration of
aroma precursor compounds such as caffeine, trigonelline, chlorogenic acids can
positively or negatively affect flavor. Chlorogenic acids are reported to be responsible for

DEDAN KIMATHI UNIVERSITY OF
TECHNOLOGY
29
bitterness, and concentration of these compounds in pulped natural coffees is lower than
when wet processing. Trigonelline provides a pleasant flavor and is present in lower
concentrations in semidry processing than in wet processed grains. Sucrose is the
precursor to volatile compounds and corresponds in dry weight to 7.5g/100g (Farah,
2012). Aldehydes and carboxylic acids are desirable in high concentrations as they are
responsible for production of furans. The concentration of sucrose is higher in semidry
processing than in wet processing (Selmar et al., 2008).
The various physical characteristics of coffee such as weight, volume, size, shape,
color, solubility, moisture content, and texture in its different forms, play an important
part in the way it is treated and in the design of equipment to process it. Bean size, which
is usually determined by screening, is of particular importance to roasters since bean of
the same size would be expected to roast uniformly. In addition, the size and shape
difference of coffee beans are influenced by botanical variety and environmental growth
circumstances. According to Roa et al. (2012) the mass may vary depending on level of
the dry matter and the samples which undergo fermentation may have lower mass due to
the loss of dry matter occurring as a result of the microbial activities taking place during
the process. It is well known that post-harvest processing has pronounced effects on the
chemical composition of coffee seeds, especially in water-soluble components like
sugars, caffeine, trigonelline and chlorogenic acids (Duarte et al., 2010).
Wet processing has no effects on titratable acidity and caffeine contents of the
coffee beans. Fermentation occurring in the degumming tanks can lower the pH of the
beans (Ferreira et al., 2013). Wet processing and dry processing has no significant effects
on non-reducing sugars such as sucrose. It is also reported that non-reducing sugars

DEDAN KIMATHI UNIVERSITY OF
TECHNOLOGY
30
contents varies significantly in the raw bean due to the quality of the coffee beverage
(Ferreira et al., 2013). The lower content of reducing sugars in wet processed coffee,
compared to coffees processed through the dry processing, is due to metabolic processes
occurring in the beans. In wet processing oxygen concentration in the degumming tank
decreases rapidly due to microbial action, with the decrease in fructose and glucose
content being therefore a consequence of anaerobic fermentation in the coffee’s
endosperm (Ferreira et al., 2013).
A study by Arnold and Ludwig (1996) noted that the total concentration of free
amino acids and protein content does not change significantly with the chemical reaction
occurring during the harvest season and the postharvest processing steps, such as pulping,
fermentation, drying and storage. Lowor et al. (2007) found no significant differences on
protein content for coffee samples subjected to different drying methods. Butt et al.
(2011) reported significant difference between coffee samples having varying levels of
caffeine. Roasting is an essential step in coffee production for generation of aroma, flavor
and colour of the coffee beans. The quality of coffee used for beverage is strictly related
to the chemical composition of the roasted beans, which is affected by the composition of
the green beans and post-harvest processing conditions. The roasting process is complex
and several parameters and processes influence each other (Fisk et al., 2012).
2.7 Effects of roasting on chemical components of coffee
The roasting process can be roughly divided into three phases: An initial drying
phase, evidently endothermic, during which moisture is eliminated. The smell of the
beans changes from green to peasy to bread-like, and the colour turns yellowish (Buffo
and Cardelli-Freire, 2004). The actual roasting phase, during which a number of complex

DEDAN KIMATHI UNIVERSITY OF
TECHNOLOGY
31
pyrolytic reactions take place. The chemical composition of the beans is drastically
modified, with release of large amounts of carbon dioxide and the formation of the many
hundreds of substances associated with coffee aroma and taste. The beans change colour
to a dark brown. Initially the process is exothermic. Pyrolytic reactions reach a maximum
at 190–210°C, when the process becomes endothermic with the release of volatile
compounds. The overall reaction becomes exothermic again at about 210 °C. A final step
is the rapid cooling phase to stop the final exothermic part of the roasting operation, using
air or water as the cooling agent (Buffo and Cardelli-Freire, 2004, Gloess et al., 2013).
Roasting causes physical, physical-chemical and chemical changes. These
changes are responsible for characteristics compounds, color, taste and flavor (Thiago, et
al., 2009). Roasting produces a net loss of dry matter, primarily as gaseous carbon
dioxide, water and volatiles products of pyrolysis. There is a considerable degradation of
polysaccharides, sugars, amino acids and chlorogenic acids, and a moderate relative
increase in organic acids and lipid content. Roasting also produces high levels of
caramelization and condensation products (Gloess et al., 2013; Buffo and Cardelli-Freire,
2004). The mechanisms of formation of coffee aroma are extremely complex and there is
clearly a wide range of interactions between all the routes involved. The major
mechanisms include: Maillard reaction (non-enzymatic browning) is a reaction between
nitrogen-containing substances on the one hand (proteins, peptides, amino acids,
serotonine and trigonelline) and reducing carbohydrates, hydroxy-acids and phenols on
the other, to form amino-aldoses and amino-ketones by condensation. Strecker
degradation: a reaction between an amino acid and an α-dicarbonyl with the formation of
an amino-ketone that condenses to form nitrogen heterocyclic compounds or reacts with

DEDAN KIMATHI UNIVERSITY OF
TECHNOLOGY
32
formaldehyde to form oxazoles. Other reactions include; breakdown of sulphur amino
acids, like cystine, cysteine and methionine, are transformed into mercaptans, as well as
thiophenes and thiazoles, after reacting with reducing sugars or intermediate products of
the Maillard reaction. Breakdown of hydroxy-amino acids like serine and threonine, able
to react with sucrose to form mostly alkyl-pyrazines. Breakdown of proline and
hydroxyproline, that react with intermediate maillard products; the former gives
pyridines, pyrroles and pyrrolyzines, whereas the latter forms alkyl-, acyl- and
furfurylpyrroles. Degradation of trigonelline, forming alkyl-pyridines and pyrroles. The
degradation of the quinic acid moiety results in formation of phenols (Semmelroch and
Grosch, 1995).
2.8 Volatile compounds in green coffee
Green beans are largely non-aromatic, contain green-musty notes and contain a
large number of chemical precursors (sucrose, chlorogenic acids, proteins, carbohydrates)
that contribute significantly to the aroma of roast and ground coffee (Fisk et al., 2012).
The poor volatile fraction of unroasted coffee seeds gives them a weak but characteristic
aroma. Approximately 100 different volatile compounds have been identified in green
coffee seeds. The most abundant classes of volatile compounds are alcohols, esters,
hydrocarbons, and aldehydes, ketones, pyrazines, furans, and sulfur compounds have
been identified (Farah, 2012). The maturation stage of the coffee cherries is important for
the volatile composition of green coffee. Ortiz et al. (2004) observed that, as with the
seeds, the volatile composition of coffee berries is dominated by high levels of alcohols,
mainly ethanol, in all stages of ripeness. Overripe coffee berries, which produce black
defective seeds, exhibited high concentrations of volatile compounds dominated by

DEDAN KIMATHI UNIVERSITY OF
TECHNOLOGY
33
esters, followed by alcohols, ketones, and aldehydes, with very low levels of
monoterpenes (Buffo and Cardelli-Freire, 2004).
2.8.1 Volatile compounds in roasted coffee
The types and concentrations of volatile compounds in roasted coffee depend on
the composition of nonvolatile compounds in the raw seeds and on roasting conditions.
More than 950 compounds have been identified after roasting in different types of coffee,
depending on their origin, degree of roasting, and analytical methods used (Farah, 2012).
The classes of volatile compounds typically found in roasted coffee are furans and
pyrans, pyrazines, pyrroles, ketones and phenols, hydrocarbons, alcohols, aldehydes,
acids and anhydrides, esters, lactones, thiophenes, oxazoles, thiazoles, pyridines, amines,
and various sulfur and nitrogen compounds (Fisk et al., 2012). It is difficult to determine
all the reactions that generate these volatile compounds, since a number of them may be
produced by more than one route. Generally, carbohydrates (including soluble
polysaccharides) produce furans, aldehydes, ketones, and phenols; proteins, peptide, and
amino acids produce ketones, pyrroles, and pyrazines; lipids are responsible for only
small amounts of aldehydes and ketones given their resistance to changes during the
roasting process; chlorogenic acids produce phenolic volatile compounds like catechols,
pyrogallol, and phenol while trigonelline produces pyrroles, pyridines, and pyrazines.
Almost all thiophenes, oxazoles, and thiazoles are formed during roasting, since
they are not usually detected in green coffee. The roasting degree and roasting parameters
such as temperature and time affect the volatile composition of coffee (Madihah et al.,
2013). The effect of roasting degree is readily apparent because the aroma of a light
roasted coffee differs considerably from that of a dark roasted coffee. The formation of

DEDAN KIMATHI UNIVERSITY OF
TECHNOLOGY
34
volatile compounds depends on the stability of their precursors and location within the
seed (Farah, 2012). During roasting a complex mixture of aroma compounds is formed
through a number of different chemical reactions such as Maillard reactions, Strecker
degradation, caramelisation and oxidation, to produce a complex mix of aroma
compounds (Fisk et al., 2012). Compounds such as 2, 6-dimethylpyrazine, 5-methyl-1H-
pyrole- 2-carboxyaldehyde, 2-furanmethanolacetate, 4-ethylcatechol, methoxy-4-
vinylphenol, 2,6-dihydroxyacetophenone and ionone, were reported in some Kenyan
coffee genotypes (Kathurima et al., 2012).
2.9 Factors affecting coffee quality
Coffee quality is a complex characteristic which depends on a series of factors
such as the species or variety, environmental conditions, agronomical practices,
processing systems, storage conditions, industrial processing, and preparation of the
beverage and taste of the consumer (Yener et al., 2014, Moreno et al., 1995,). Good
quality coffee is a product that has desirable characteristics such as clean raw and roasted
appearance, attractive aroma and good cup taste (Behailu et al., 2008). Cup quality, often
referred as drinking quality or liquor quality, is an important attribute of coffee and acts
as yardstick for price determination (Agwanda et al., 2003). For this, the assessment of
sensory evaluation can be done organoleptically by panel of experienced coffee tasters
and is determined based on the level of acidity, body, and flavor of the brew (Coradi, et
al., 2007). Thus, coffee cupping is a technique used by cuppers to evaluate the flavor
profile of a coffee, to understand minor differences between growing regions, to evaluate
coffee for consistence and defects to subsequently make buying decision and to crate
coffee blend (Alastair, 2012). For products like coffee, the sensorial characteristics are

DEDAN KIMATHI UNIVERSITY OF
TECHNOLOGY
35
more important than their nutritious value. The quality of the coffee comprehends the
appearance, the color and the smell of the parchment, of the green and of the roasted
coffee, as well as the organoleptic qualities of the drink that comprehend the aroma, the
acidity, the bitterness, the body and the flavor (Roa, et al., 2012). More than four hundred
organic and inorganic compounds contribute to the distinctive flavor of the coffee; the
aroma is constituted by more than seven hundred substances, mainly aldehydes, ketones,
esters and hydrocarbons of low molecular weight. Many of these compounds are present
in a very small quantity and cannot be considered alone as the primary component of the
coffee. So, when it comes to sensory analysis, the characteristics of the beverage are due
to the combination of these beans’ constituents (Ferreira et al., 2013).
2.10 Sensory analysis of coffee
Sensory analysis is an important tool in the characterization of different types of
coffee. One of the methods for sensory evaluation that has been emphasized for
evaluating the quality of specialty coffee beverages is the Specialty Coffee Association of
America (SCAA) method (Borem et al., 2013). This method is based on a quantitative
descriptive sensory analysis of the beverage, which is performed by a team of selected
and trained judges. According to this methodology, coffee beans are scored from 0 to 10
points in the evaluation of the primary attributes that comprise the sensory profile of
coffee: fragrance/aroma, uniformity, clean cup, sweetness, flavor, acidity, body,
aftertaste, balance and the overall impression of the coffee. The sum of the individual
scores of all the attributes constitutes the final score, which represents the overall quality
of the coffee. Coffees that score higher than 80 points are considered specialty coffees

DEDAN KIMATHI UNIVERSITY OF
TECHNOLOGY
36
(Lingle, 1993). The assessor is looking at criteria such as acidity, body, aroma, and flavor
(Alastair, 2012).
Acidity is a desirable characteristic in coffee. It is the sensation of dryness that the
coffee produces under the edges of your tongue and on the back of your palate. The role
that acidity plays in coffee is not unlike its role as related to the flavor of wine. It
provides a sharp, bright, vibrant quality. Without sufficient acidity, the coffee will tend to
taste flat. Acidity should not be confused with sour, which is an unpleasant, negative
flavor characteristic. Body is the feeling that the coffee has in your mouth. It is the
viscosity, heaviness, thickness, or richness that is perceived on the tongue. Coffees with a
heavier body will maintain more of their flavor when diluted with milk. Aroma is a
sensation that is hard to separate from flavor. The aroma contributes to the flavors we
discern on our palates. Subtle nuances, such as ‘floral’ or ‘winy’ characteristics, are
derived from the aroma of brewed coffee.
Flavor is the overall perception of the coffee in the mouth. Acidity, aroma and
body are all components of flavor. Describing the tastes and flavors of different roasts is
as subjective as putting a wine into words. In both cases there’s no substitute for your
own personal tastes (Alastair, 2012).
2.11 Health benefits of coffee
Coffee is a popular beverage all over the world. Bioactive profile of coffee is
enriched with important phytochemicals dominated by the caffeine and chlorogenic acid
(Butt et al., 2011). Coffee possesses enriched antioxidant status compared to other
beverage and this may be due to the basic compounds such as chlorogenic acids (42.2%),
epicatechin (21.6%), isochlorogenic acid I (5.7%) and isochlorogenic acid II (19.3%).

DEDAN KIMATHI UNIVERSITY OF
TECHNOLOGY
37
These chemicals are considered as food antioxidants and may protect animal cells against
somatic mutations associated with cancer (Richelle et al., 2001). Chlorogenic acids
(CGA) are the major contributor of antioxidant activity to coffee and these are a family of
esters formed between trans-cinnamic acids and quinic acid (Ramalakshmi et al., 2000).
Caffeine is a xantine derivative known to stimulate of the nervous central system and is
generally associated with improvements in alertness, learning capacity and exercise
performance when moderately consumed (Farah, et al., 2006).
This beverage also provides an array of minerals and other nutrients (Butt et al.,
2011). A single cup of coffee can provide 8 percent of the daily intake of chromium as
well as being a significant source of magnesium (Santos et al., 2004). Minerals play vital
roles in several physiological functions, including critical involvement in nervous system
functioning, in cellular reactions, in water balance in the body, and in structural systems,
such as the skeletal system (Butt et al, 2011). Demethylation of trigonelline during coffee
roasting generates nicotinic acid, a water-soluble B vitamin also known as niacin. Since
nicotinic acid produced during coffee processing is highly bioavailable in the beverage,
in contrast to natural sources where it is present in bound form (Trugo, 2003). Coffee is a
significant source of this vitamin in the diet (Perrone et al, 2008). Moreover, trigonelline
appears to have anti-invasive activity against cancer cells and may regenerate dendrites
and axons, in addition to memory improvement in animal models (Tohda, et al., 2005).
2.12 Analysis of peptides, proteins and amino acids by Matrix-Assisted
Laser Desorption Ionization (MALDI)
MALDI-TOF mass spectrometry is a powerful tool that enables the simultaneous
detection and identification of different biomolecules including proteins, peptides, amino

DEDAN KIMATHI UNIVERSITY OF
TECHNOLOGY
38
acids, lipids carbohydrates and nucleotides in biological samples. MALDI provides for
the non-destructive vaporization and ionization of both large and small biomolecules
(Kathleen et al., 2000). In the MALDI process, the analyte is first co-crystallized with a
large molar excess of a matrix compound, usually a UV-absorbing weak organic acid, on
the MALDI sample plate. Inside the MALDI machine the dried sample is desorbed and
ionized by laser energy and then accelerated in an electrical field, the resulting speed is
proportional to the molecular mass of the analyte molecule. At the end of a flight tube the
ions hit a detector, the mass can be calculated directly from the time of flight
(Hillenkamp et al., 1991). The matrix plays a key role by strongly absorbing the laser
light energy and causing, indirectly, the analyte to vaporize. The matrix also serves as a
proton donor and receptor, acting to ionize the analyte in both positive and negative
ionization modes, respectively (Kathleen et al., 2000).
The utility of MALDI for protein and peptide analyses lies in its ability to provide
highly accurate molecular weight information on intact molecules. For example, a protein
can often be unambiguously identified by the accurate mass analysis of its constituent
peptides (Kathleen et al., 2000). Furthermore, protein identification can also be facilitated
by analysis of the protein’s proteolytic peptide fragments in the gas phase; fragment ions
generated inside MALDI mass spectrometers via collision-induced dissociation (CID)
yield information about the primary structure and modifications. Amino acid sequence
information can be obtained by one of several methods using MALDI-MS. The first is
called protein mass mapping which consists of the site-specific enzymatic or chemical
degradation of a protein followed by mass spectrometric analysis of the released peptides.

DEDAN KIMATHI UNIVERSITY OF
TECHNOLOGY
39
Owing to the complexity of mixtures generated during proteolysis, MALDI/TOF MS is
most ideally suited for such analyses.
Application of GC requires modification of amino acids to produce volatile
derivatives (Pons et al, 2003). At its best, the analysis time for a single sample is 15–
25min in the case of GC–MS, CE–MS, or LC–MS and is 30–180min in the case of HPLC
(Husek and Simek, 2001). MALDI-TOF method is simple and fast, and it does not
require any amino acid modification, derivatization, or chromatographic separation. The
data acquisition time is decreased to 1–2s for a single sample. This method is considered
to be applicable to the mixtures of free amino acids as well as to HCl hydrolysates of
proteins (Alterman et al., 2004).

DEDAN KIMATHI UNIVERSITY OF
TECHNOLOGY
40
CHAPTER THREE
MATERIALS AND METHODS
3.1 Coffee samples
Coffee cherries of varieties commonly referred as SL 28 and Ruiru 11 (Arabica
coffee) were harvested during the short and peak harvesting seasons for the year
2012/2014. Ruiru 11 was obtained from Hill farm and were harvested during the year
2013/2014. The coffee cherries were harvested from Dedan Kimathi University of
Technology farm and Hill farm located in Nyeri County (0° 25' 0" S / 36° 57' 0" E).
3.2 Treatments and experimental design
Three treatments were used in a Completely Randomized Design (CRD) with
three replications. The treatments involved pulping coffee by the use of a wet pulper,
hand pulper and eco-pulper methods. Ripe cherries were obtained from coffee plants
grown on the same field, picked by selective method, sorted and subjected to the three
treatments. For each treatment 60kg of fresh coffee cherries were used so as to be
adequate for pulping with the larger machines. Wet pulper method was done by
continuous pulping operation with water used in pulping, transport and grading of
parchment. The parchments obtained were put in plastic containers with perforation at the
bottom and allowed to ferment by dry method for 16 to 18 hours. Once fermentation was
complete, the parchments were washed to remove the mucilage and graded by density to
have heavier and the lighter parchment. The heavier parchments (P1) were selected for
research and transferred to the drying tables for drying in the sun to attain moisture
content of 10 + 1%.

DEDAN KIMATHI UNIVERSITY OF
TECHNOLOGY
41
Hand pulper method was done by use of a motorized manual pulping machine and
little water used during pulping operation. The parchment obtained were subjected to
fermentation in plastic containers with perforation at the bottom to allow dry
fermentation which took between 16 to 18 hours. Once fermentation was complete, the
parchment were washed and graded by density to separate lighter and heavier parchment.
The heavier parchments (P1) were selected and transferred to the drying tables for drying
in the sun to the required moisture content of 10 + 1%.
The Eco-pulper method was done by first submerging coffee cherries with water
in a tank to separate the heavier and lighter cherries which were then pulped separately
using an eco-pulper. Heavier cherries were selected for research and after pulping the
parchment were passed through a demucilager unit which removes the mucilage
mechanically with some water poured continuously to clean the parchment. Clean coffee
parchments were put in trays and transferred to drying tables for drying in the sun to the
required moisture content of 10 + 1%. The dry parchments from the three processing
methods were package in sealed polythene bags and stored in a freezer at -180C until time
for analysis. A flow chart for the treatments is given in appendix 1.
3.3 Analysis of physical and chemical composition of coffee
The reagents used in the analysis for the different parameters included;
concentrated sulphuric acid, absolute ethanol, concentrated hydrochloric acid, hexane,
sodium hydroxide, methanol, acetonitrile and standards for chlorogenic acid, caffeine,
trigonelline were all obtained from Sigma Aldrich (Berlin, Germany).

DEDAN KIMATHI UNIVERSITY OF
TECHNOLOGY
42
3.3.1 Mass, volume and density
The mass of 100 coffee beans were determined by use of a digital balance with an
accuracy of 0.01g. Volume of coffee beans were determined according to the method
described by Ismail et al. (2013). According to Dutra et al. (2001), the shape of the bean
can be assumed as half a triaxial ellipsoid. The length, width and height was measured
with a ruler in cm and the volume of each coffee bean calculated according to the formula
below (Ismail et al., 2013)
where a, b and c are the length, width and thickness of the bean respectively.
Density of the beans was determined as a ratio of mass and volume according the method
described by Ismail et al. (2013).
3.3.2 Moisture content
Samples of whole coffee beans (5g) were oven-dried at 105ºC for 24 hours. The
moisture content was expressed as percentage of the original weight of samples (Ismail et
al., 2013).
3.3.3 Crude protein content
Determination of crude protein was done using semi micro Kjeldahl method
according to the method described by Karanja et al (2013). One gram of sample was
taken in digestion tube and 15 ml of concentrated H2SO4 and a catalyst consisting of 7g
of anhydrous potassium sulphate and 0.8g copper sulphate was added. Digestion was
done until the solution was clear and all organic nitrogen is converted to ammonium

DEDAN KIMATHI UNIVERSITY OF
TECHNOLOGY
43
sulphate (NH4)2SO4. The clear solution was transferred to a 100ml volumetric flask and
top up to the mark with distilled water. Decomposition of (NH4)2SO4 with NaOH was
done by mixing 15 ml of 40% NaOH with 10 ml sample and distilled to a flask
containing 4% boric acid and indicator. The nitrogen from ammonia was deduced from
titration of the trapped ammonia with 0.02N HCl using methylene red and methylene
blue (double indicator solution) indicators. The percentage crude proteins was calculated
using the formula below;
% Nitrogen = Titre value- blank × 0.0014 ×normality of acid x vol. of the
digested sample
Weight of dried sample
% Crude proteins = % nitrogen x 6.25
3.3.4 Total titratable acidity and pH
This was done according to the method described by Tawfik and Bader, (2005).
The pH was determined by taking 2.25g of ground samples and mixing with 10ml of hot
water at 800C, cooled to room temperature and the pH determined. Total titratable acidity
was determined by taking, 10g of ground coffee, mixed with 75ml of 80% ethanol and
kept under gentle agitation for 16 hours. A portion of 25ml of the extract was diluted to
100 ml with distilled water. Titratable acidity was determined by titrating with 0.1N
sodium hydroxide and 3 drops of phenolphthalein indicator added. The results were
expressed in percentage.
3.3.5 Determination of sugars
Determination was done according to the method of Mukabane et al (2014). One
gram of sample was weighed into 250 ml round bottomed flask and 50 ml of 95% ethanol

DEDAN KIMATHI UNIVERSITY OF
TECHNOLOGY
44
added. The mixture was reflux for 1 hr, cooled and filtered using filter paper (Whatman
No. 42). It was then evaporated to dryness by use of rotary evaporator and reconstituted
with 10 ml mobile phase containing acetonitrile: water (75:25) and filtered using micro
filter 0.45µm and 20 µm injected to HPLC (Knauer, Germany) fitted with a refractive
Index detector. The mobile phase was acetonitrile / water at ratio of 80:20 (v/v) at a flow
rate of 1 ml/min, and the column and detector temperature was maintained at 35±1°C.
Standards were used to identify the retention time of sucrose from chromatograph.
3.3.6 Lipid extraction
Lipid extraction was done using a modified method of Bligh and dryer (1959).
Coffee ground sample weighing 1 g was placed in a 50 ml glass stoppered centrifuge tube
and denatured at 1000C for 3 minutes then 2 ml water and 7.5ml mixture of methanol –
chloroform (2:1 v/v) were added. The mixture was agitated and left at room temperature
for 3 hours with intermittent shaking. After centrifugation, the supernatant extract was
decanted into another 50 ml glass stoppered centrifuge tube and the residue re-suspended
in another 9.5 ml mixture of methanol - chloroform – water (2:1:0.8, v/v). The
homogenate was then shaken and centrifuge and the extraction repeated 2 times. The
combined supernatant extract was taken and 7.5 ml each of water and chloroform added.
The lower chloroform layer was withdrawn and brought to dryness in a rotary evaporator.
The lipid residue in a flask was completely dried by passing over fresh anhydrous
potassium hydroxide pellets and the weight of lipid measured and reported as percentage
of the initial weight.

DEDAN KIMATHI UNIVERSITY OF
TECHNOLOGY
45
3.3.7 Analysis of fatty acids in coffee
The fatty acid in coffee samples were converted to fatty acid methyl esters
(FAME) according to method of Ogara, (2013). This was done by taking 10mg of oil in a
refluxing flask and 4 ml of 95% methanolic/ HCl were added and reflux at 500C for 1.5
hrs then cool down with running water. The content was transferred to a separating flask
and 4 ml of hexane were added and shaken vigorously at room temperature and left to
settle. The hexane layer was transferred to another separating flask and the aqueous layer
was extracted one more time. The hexane fractions were combined and washed with 3‐4
portions of distilled water to remove acids. The hexane layer was then dried by passing
through anhydrous Sodium sulphate and rotary evaporator and concentrate using nitrogen
gas to 1 ml which was then injected to gas chromatography. Fatty acid profile analysis
was done using gas chromatograph (Shimadzu GC-9A) fitted with capillary column
(15%, Diethylene glycol-succinate) and flame ionization detector temperature of 2200C
and injector temperature of 1700C. Carrier gas used was nitrogen at flow rate of 0.2
kg/cm3. Fatty acid methyl esters were identified by comparison of retention times with
standards and their concentrations expressed as mg/100g dw.
3.3.8 Determination of chlorogenic acid in coffee
This was done according to the method described by Ky et al. (2001). The
defatted sample weighing 70 mg was mixed with 40 ml of 80% methanol. The mixture
was trans-sonicated for 20 minutes and filtered using a filter paper (Whatman No. 42)
into a 50 ml volumetric flask. After rinsing with 10 ml absolute methanol the 20 ml of the
filtrate was transferred into a 100 ml volumetric flask and top up to the mark with 20%

DEDAN KIMATHI UNIVERSITY OF
TECHNOLOGY
46
acetonitrite. This was then filtered with 0.45 µm micro filter and 20 um injected to
HPLC. The HPLC equipment (Knauer, Japan) was used with a column (YMC_ Pack
polyamine _, 250× 4.6 mm, l.d.S_5μm, 12 nm) and detector (knauer K2600A UV).
Mobile phase used was acetonitrile (40%) and formic acid (5%) and the pumps operated
in isocratic mode with solvent flow of A (37%) and B (63%). The flow rate was set at
1ml/min. The peaks were detected at 324nm, wavelength and identification done by use
of retention time of the standards.
3.3.9 Determination of caffeine and trigonelline
Caffeine and trigonelline were extracted according to the method Ky et al. (2001)
and described by Gichimu et al (2014). This was done by taking 0.5 g of the sample in a
250 ml conical flask and 0.5g MgO added with 200 ml of distilled water. The mixture
was refluxed for 25 minutes, cooled and vacuum filtered with filter aid (celite 545). The
filtrate was transferred to 250 ml volumetric flask and top up to the mark with distilled
water. After that 20 ml was taken and transferred to 100 ml volumetric flask and top up
with 20% acetonitrile. It was filtered with 0.45 µm micro filter and 20 µm injected to
HPLC.
The HPLC equipment (Knauer, Japan) was used with a column (YMC_ Pack
polyamine _, 250× 4.6 mm, l.d.S_5μm, 12 nm) and detector (Knauer K2600A UV). The
HPLC software Chromgate was used for the analysis and integration of peaks. Mobile
phase consisted of solvents which include; acetonitrile (40%) and formic acid (5%) and
the pumps were operated in isocratic mode with solvent flow of A (37%) and B (63%).
The flow rate was set at 1ml/min. All solvents and chemicals were of HPLC grade
(Sigma-Aldrich). The elution time was 5 min and 6 min for trigonelline and caffeine

DEDAN KIMATHI UNIVERSITY OF
TECHNOLOGY
47
respectively. The peaks were detected at 263 nm wavelength. Identification was
achieved by comparison of retention times (Rt) of samples with those of the standards.
3.3.10 Determination of protein fingerprint by Matrix Assisted Laser
Desorption Ionization Time of Flight (MALDI-TOF)
The analysis was undertaken according to the MALDI-TOF method developed by
Hanschke (2014). Green coffee powder (20 mg) was weighed in a 2 ml tube and mixed
with 500µl n-hexane and agitation done in the Precellys homogenizer (Bertin, France)
followed by agitation for 30 min before centrifugation at 12000g for 10 min. The pellets
were dried in a vacuum centrifuge. To the degreased coffee powder 300µl of the
extraction solution was added followed by extraction with 15 zirconium oxide beads (1.4
mm) in the Precellys homogenizer (Bertin, France). The extraction solution containing;
175mM tris-HCL (1.06g), 5% sodium dodecyl sulfate (SDS) (2.5g), 15% glycerol
(8.6ml) and 150mM Dithiothreitol (1.16g) diluted with water to 50 ml. The samples were
centrifuged for 1 minutes to eliminate the foam, then agitation for 30 min followed by
centrifugation at 12000g for 10 min to separate lipids and insoluble components. From
the clear extract 100µl was transferred into a 2ml reaction tube and 1.4ml of cold acetone
(-20°C) was added to the extract, and the tube inverted several times to precipitate the
proteins. The extract was stored at -20°C for 45-60 min, followed by centrifugation at
12000g for 10 min. The pellet were washed in 1ml cold 80% acetone (-20°C), centrifuge
at 12000g for 10 min, then the supernatant discarded and the pellet dried in the vacuum
centrifuge (SPD111, Germany).
For MALDI measurement, the protein pellet obtained were re-suspended in 200µl
of the mixture of 50% ACN (acetonitrile) and 0.1% TFA (trifluoroacetic acid), then

DEDAN KIMATHI UNIVERSITY OF
TECHNOLOGY
48
mixed 2 - 5 times in the ultrasonic bath. The suspensions were diluted 1:5 in matrix
solution and 1µl of mixture applied onto a thin layer of sinapinic acid, saturated solution
in ethanol. The matrix solution include; 20mg/ml SA (sinapinic acid), 50% acetonitrile
(CAN) and 0.1% Trifloroacetic acid (TFA). The MALDI measuring parameters were set
at Modus: linear mass range: 1000-16000, blank: 1000, pulsed extraction optimized:
8000, Auto Quality mass range: 2000-8000, start noise: 15000, noise width: 50, min
intensity: 10 mV, S/N: 10, min resolution: 500, S/N %: 50 and power: 60.
3.3.11 Coffee roasting
Roasting of the green coffee was done to attain a medium roast level using
laboratory roaster (Probat BRZ 4, Rhein, Germany) at between 200 and 240OC.The
roasted coffee was allowed to cool for 12 hours before grinding. Grinding was done using
a sample grinder (Probat vtv-633T, Rhein, Germany) and packaged in air tight polythene
bags and stored at -200C to await analysis.
3.3.12 Extraction of volatile compounds from ground coffee by Head
space – SPME method
Solid Phase Micro-Extraction fibre (SPME) coated with 50/30µm
divinylbenzene/carboxen/polydimethylsiloxane (DVB/CAR/PDMS) stableflex (2cm)
purchased from Supelco Inc (Bellefonte, PA, USA) was used for the head space
extraction. The incubation and extraction method was done according to the procedure
described by Gonzales-Rios et al (2007). Prior to the head space analyte extraction, the
fibres was conditioned at 270oc for 1 hour in the GC injector according to the
manufacturer’s recommendation. Ground roasted coffee samples (1g) were placed in a

DEDAN KIMATHI UNIVERSITY OF
TECHNOLOGY
49
10ml Headspace vial. Headspace SPME analyte extraction was done by placing the
sample vial in an oven set at temperatures of 600C, for 30 minutes to reach sample
headspace equilibrium. The SPME fiber was exposed to the coffee powder headspace for
10 min before injection into the Gas Chromatograpgy.
GC-MS analyses were performed in a Konic HRGC 400B Gas Chromatograph
coupled to a Konic MSQ12 (Sant Cugat, Barcelona, Spain) quadrupole mass
spectrometer. A 0.75mm internal diameter liner was used and manual injections done in
split 1 mode into a TechnoKroma TRB5 (Cross-linked 5% Phenyl-95% Methyl Siloxane)
capillary column (30m × 0.25mm ×0.25µm). The SPME fibre were desorbed in a GC
injector heated to 2500C for 15 minutes. Helium was used as the carrier gas at a flow rate
of 1ml/min. The injection port temperature was maintained at 2500C, while the oven
temperature was programmed at 50o C, maintain for 1min and programmed to rise at 100
C/min to 2500 C and held at that temperature for 5minute. Mass spectra were recorded at
detector voltage 0.2 kV scanning from 40-400m/z range, the ion source and transfer line
temperature were maintained at 250oC.
3.3.12.1 Identification of volatile coffee compounds
Coffee volatile aroma compounds in green and roasted coffee were identified by
comparing their calculated relative retention indexes with those given in the literature,
and matching of the mass spectrometric fragmentation pattern corresponding to the
various peaks in the samples total ion chromatogram with those present in the National
Institute of Science and Technology (Gaithersburg, Maryland, USA) mass spectral
database. The relative retention indexes were calculated from the retention times of the
compounds and of the linear alkanes (Retention Index Standard, Sigma-Aldrich).

DEDAN KIMATHI UNIVERSITY OF
TECHNOLOGY
50
Quantification was done by integrating peak areas and calculating the percentage area of
peaks for individual compounds from the total contents of volatiles on the
chromatograms.
3.3.13 Sensory analysis
The sensory analysis of coffee samples were carried out to determine the quality
of coffee and was done by six qualified cuppers according to the method described by
Kathurima et al (2009). Scores were awarded to each sensorial attribute depending on
their intensity in the samples. For each sensorial attribute the samples received a score on
a scale of 0 to 10. The attributes for aroma, aftertaste, acidity, body, flavor, clean, sweet,
balance and overall score were evaluated, resulting in a final score in percentage that
indicated the quality of coffees.
3.3.14 Statistical analysis
All treatments and analysis were done in triplicates and the analysis of data was
evaluated using the Statistical Package for Social Scientist (SPSS version 18).
Experimental design was performed using Completely Randomized design (CRD).
Analysis of variance (ANOVA) was conducted, and the differences between the means
analyzed using the Least Significant Difference (LSD). Statistical significance was
established at p< 0.05.

DEDAN KIMATHI UNIVERSITY OF
TECHNOLOGY
51
CHAPTER FOUR
RESULTS AND DISCUSSION
4.1 Effects of processing on physico-chemical composition of coffee
The data obtained in this study relate to coffee samples obtained during the short
and main harvesting seasons of coffee in Kenya and categorized as season 1, 2, 3 and 4
between 2012 and 2014 harvest. The short season referring to the period when coffee
cherries begins to ripen and low quantities of cherries are normally collected. The main
season referring to the period when most of the cherries have ripen and the quantities are
large with better quality characteristics of cherries. However the samples for Ruiru 11
were only collected for the period of 2013/2014. The results for the physical and
chemical properties of coffee samples processed by three processing methods are shown
in Tables 1 and 2, for SL 28 and Ruiru 11, respectively.
The moisture content varied between 9.47 – 10.84% and 9.47 - 9.77% for SL 28
and Ruiru 11, respectively. Season 1 and 2, for SL 28 showed slightly higher values for
the moisture content which could be attributed to the weather conditions which was
characterized by rainy and cloudy conditions than for season 3 and 4. The moisture
content for the samples were within the recommended levels of 9-12% (Patui et al.,
2014). The eco-pulper method showed slightly lower moisture content than the wet and
hand pulper methods, and this could be attributed to faster rate of drying since parchment
were exposed to drying immediately after processing. These other processes involving
fermentation and washing may take long before the parchment is subjected to drying. The
level of the moisture content is important for storage of coffee because higher levels more

DEDAN KIMATHI UNIVERSITY OF
TECHNOLOGY
52
than 12% will favour the growth of moulds and cause off flavours affecting the taste
qualities of coffee (Bucheli et al., 1998, Subedi, 2011).
The mass of the samples varied between 12 - 18.67g for SL 28 and 16.0 - 18.67g
for Ruiru 11. The wet pulper method showed a significantly lower value for the mass
than the eco-pulper method during season 1 for SL 28 (Table 1). The values were not
significantly different in the other seasons. For Ruiru 11, the mass was not also
significantly different between the processing methods. The reduction in mass in the
processes using fermentation such as wet pulper could be expected mainly due to the
effect of microbial activities and leaching of components to the washing water (Roa et
al., 2012). However the eco-pulper method, though it uses little water could also lead to
some losses of components which may occur due to the squeezing of coffee parchment
during washing as it occurs in the demucilager. There were few variations between the
seasons with the short season (1 and 3) showing significantly lower values than the main
seasons (2 and 4) for SL 28 (Table 1). Similar variation were also noted for Ruiru 11
(Table 2). The variations could be attributed to agronomic and climatic conditions which
favours better productivity during the peak seasons.
The values for the coffee bean volumes varied from 12.97 - 17.55 cm3 and 14.55
– 23.57 cm3, for SL 28 and Ruiru 11, respectively. The results showed no significant
differences between the treatments as observed in the short and main seasons studied.
Since the volume depends on the size of the coffee beans which are influence mainly by
factors such as environmental and agronomic practices, the processing methods may have
little effect. The main seasons represented by season 2 and 4 showed a higher trend for

DEDAN KIMATHI UNIVERSITY OF
TECHNOLOGY
53
these parameters than season 1 and 3 which are the short seasons. Hence conditions in the
main season may be more favorable leading to better quality and larger coffee beans.
In regard to the density, the results were significant for season 1 with the eco-
pulper samples showing higher values compared to the wet pulper samples (Table 1).
This could also be attributed to the variations in mass which was higher in the eco-pulper
samples than for the wet pulper. A report by Ismail et al. (2013) noted that the density of
coffee beans is influence more by mass and not the volume. For Ruiru 11, the treatments
did not show any significant differences in the density, but the eco-pulper showed a
higher trend than the other processes for this parameter. From this study the values of
density varied from 895.81(10-3) to 1227.0 (10-3) g/cm3 for SL 28 and 778.04 (10-3) to
1162 (10-3) g/cm3 for Ruiru 11 (Table 2). This was close to the range reported by other
authors (Ismail et al., 2013, Franca et al., 2005).
The values for the pH varied from 5.90 to 6.04 for SL28 samples and between
5.93 and 5.96 for Ruiru 11 samples (Table 1 and 2). It was noted that the wet and hand
pulper methods which use fermentation process showed significantly lower pH than the
eco-pulper samples. This is expected because fermentation may leads to production of
acids which can lead to the lowering of the pH values such as acetic acid and propionic
acid (Nigam and Singh, 2014).

DEDAN KIMATHI UNIVERSITY OF
TECHNOLOGY
54
Table 1: Physico-chemical properties of green coffee samples for SL 28 for main and short
seasons
Seasons Wet pulper Hand pulper Eco-pulper
Moisture % 1 10.84 + 0.29a1 10.33 + 0.15ab1 10.17 + 0.29b1
2 10.66 + 0.05a1 10.55 + 0.16a1 10.27 + 0.04b1
3 9.88 + 0.05a2 9.65 + 0.26a2 9.47 + 0.12a2
4 9.83 + 0.46a2 9.8 + 0.30a2 9.50 + 0.1aB
Mass (g) 1 12.67 + 0.57b2 14.67 + 0.58ab2 16.67 + 1.15a12
2 16.33 + 0.58a1 17.33 + 0.58a1 18.67 + 3.06a1
3 13.00 + 1.0a2 14.33 + 0.58a2 13.33 + 0.58a2
4 17.0 + 1.0a1 16.67 + 0.58a1 18.3 + 1.53a1
Volume (cm3) 1 14.26 + 1.4a12 14.11 + 3.43a1 13.95 + 3.21a1
2 17.02 + 1.97a1 17.55 + 4.06a1 15.56 + 4.48a1
3 12.97 + 1.38a1 13.92 + 0.77a1 13.19 + 1.54a1
4 16.67 + 1.50a1 17.0 + 1.73a1 16.0 + 2.0a1
Density (10-3
g/cm3)
1 891.82 + 53.4b1 1063.13 + 146a1 1222.62 + 184a1
2 967.46 + 102a1 972.54 + 148a1 1226.2 + 152a1
3 1011.12 + 145a1 1031.35 + 56a1 1019.13 + 107a1
4 1031.33 + 43.15ab1 1007.67 + 81.95b1 1167.0 + 72.64a1
pH 1 5.95 + 0.03b1 5.94 + 0.03b1 6.04 + 0.02a1
2 5.92 + 0.04b1 5.91 + 0.06b1 6.03 + 0.01a1
3 5.90 + 0. 0.02b1 5.92 + 0.01b1 5.95 + 0.01a1
4 5.92 + 0.02ab1 5.91 + 0.01b1 5.94 + 0.01a2
Titratable
acidity
1 1.37 + 0.22a2 1.50 + 0.13a1 1.62 + 0.13a1
2 1.54 + 0.08a1 1.54 + 0.34a1 2.0 + 0.25a1
3 1.42 + 0.14a12 1.42 + 0.29a1 1.50 + 0.25a2
4 1.67 + 0.19a1 1.54 + 0.38a1 1.60 + 0.14a1
1Values are means (± SD) of triplicate determinations.
2means designated by different small letters in a row for each season are significantly
different. The means denoted by different numbers superscript in the column for each
processing method are significantly different at (P <0.05). 3Seasons are denoted with 1 and 2 for short and main seasons during 2012/2013 harvest
period. Season 3 and 4 for short and main seasons during 2013/2014 harvest period.

DEDAN KIMATHI UNIVERSITY OF
TECHNOLOGY
55
Table 2: Physico-chemical properties of green coffee Samples for Ruiru 11 from different
processing methods for short and main harvesting seasons.
Seasons Wet pulper Hand pulper Eco-pulper
Moisture (%)
1 9.73 + 0.21a 9.73 + 0.50a 9.67 + 0.38a
2 9.77 + 0.15a 9.53 + 0.21a 9.47 + 0.12a
Mass (g)
1 16.67 + 0.58a 17.86 + 4.63a 16.00 + 1.0a
2 18.33 + 1.15a 18.67 + 1.53a 18.33 + 2.08a
Volume (cm3)
1 17.86 + 4.63a 14.55 + 3.48a 14.55 + 3.48a
2 23.57 + 1.63a 22.21 + 2.51a 20.58 + 2.71a
Density (10-3
g/cm3)
1 984.02 + 300a 1100.88 + 170a 1162. 18 + 392a
2 778.04 + 21.40a 842.55 + 38.12a 892.37 + 17.29a
pH 1 5.93 + 0.01b 5.95 + 0.01ab 5.96 + 0.01a
2 5.93 + 0.01b 5.93 + 0.02ab 5.96 + 0.01a
Titratable acidity
(%)
1 1.63 + 0.54a 1.38 + 0.13a 1.58 + 0.38a
2 1.33 + 0.12a 1.41 + 0.04a 1.56 + 0.40a
1values are means (± SD) of triplicate determinations. 2means designated by different letters in a row are significantly different at (P <0.05). 3Seasons are denoted with 1 and 2 for short and main seasons during 2013/2014 harvest period.

DEDAN KIMATHI UNIVERSITY OF
TECHNOLOGY
56
Similar observation were reported by other authors such as Ferreira et al (2013) who
explains that pH is reduced in washed coffee due to fermentation. From the study the pH
values were within the range reported in the literature such as Franca et al. (2005)
reporting pH range of 5.3 to 6.52 and Butt et al. (2011) reporting pH range of 4.89 to
5.98 for green coffee samples.
Titratable acidity varied from 1.42 to 2.0% and 1.33 to 1.63% for SL 28 and
Ruiru 11, respectively, with the processing methods showing no significant difference.
However the eco-pulper showed a higher trend for titratable acidity and could be
attributed to more retention of acid compounds due to less washing than in wet and hand
pulper methods. The change in titratable acidity could occur due to the levels of acid
present in the coffee beans. The common acids present in the coffee beans include; citric,
acetic, malic, chlorogenic and quinic acids (Butt et al., 2011). Ferreira et al. (2013)
studying the effects of washed and dry processes did not find any significant differences
in total acidity of coffee beans. There was no significant variations on the level of
titratable acidity between the coffee varieties. The total acidity and pH are important
parameters influencing the quality of coffee beverage (Lowor et al., 2007).
Protein, fats and sucrose are important components of green coffee which are
known to influence the aroma characteristics of roasted coffee. The percentage levels of
protein, sucrose and lipids in coffee samples of SL 28 and Ruiru 11 are presented in
Tables 3 and Tables 4. The level of protein content varied from 13.17 to 17.33% and
14.06 to 14.89% for SL 28 and Ruiru 11 samples, respectively. This was within the range
reported by Rodrigues et al. (2010) as 9.3 to 20.8% in Arabica coffee.

DEDAN KIMATHI UNIVERSITY OF
TECHNOLOGY
57
Table 3: Protein, sucrose and fat content of green coffee samples for SL 28 from three
processing methods for short and main seasons.
Treatments
Season Wet pulper Hand pulper Eco-Pulper
Protein %
1 13.17 + 1.7a2 13.83 + 1.9a2 15.57 + 1.6a12
2 16.51 + 1.4a1 17.33 + 0.5a1 16.61 + 1.2a1
3 14.26+0.8a12 13.62 + 1.9a2 13.40 + 1.0a2
4 15.8 + 1.21a1 16.13 + 0.15a1 15.8 + 0.06a12
Sucrose %
1 8.03 + 0.20a2 7.38 + 0.57a2 8.11 + 0.45a2
2 8.58 + 0.56a2 8.51 + 0.8a12 9.02 + 0.71a12
3 9.87 + 0.69a1 9.34 + 0.91a1 9.19 + 0.80a1
4 10.38 + 0.70a1 7.99 + 0.65b2 10.41 + 0.94a1
Fat %
1 17.39 + 0.64a23 17.08+ 0.39a2 17.54 + 0.29a2
2 17.01 + 0.01a3 16.82 + 0.5a2 16.75 + 0.14a3
3 19.06 + 0.59a1 19.60 + 0.67a1 19.53 + 0.13a1
4 18.41 + 0.84a12 17.46 + 1.26a2 16.76 + 0.73a3
1values are means (± SD) of triplicate determinations.
2means designated by different small letters in a row for each season are significantly different.
The means denoted by different numbers superscript in the column for each processing method
are significantly different at (P <0.05). 3Seasons are denoted with 1 and 2 for short and main seasons during 2012/2013 harvest.
Season 3 and 4 for short and main seasons during 2013/2014 harvest period.

DEDAN KIMATHI UNIVERSITY OF
TECHNOLOGY
58
Table 4: Protein, sucrose and fat content of green coffee samples for Ruiru 11 from three
processing methods for short and main seasons.
Seasons Wet pulper Hand pulper Eco-pulper
Protein % 1 14.06 + 0.09a 14.09 + 0.14a 14.49 + 1.11a
2 14.45 + 0.21a 14.53 + 0.24a 14.89 + 1.00a
Sugar % 1 9.49 + 2.53a 10.22 + 1.16a 9.72 + 1.24a
2 9.58 + 1.44a 10.42 + 1.45a 9.53 + 1.94a
Fat % 1 17.39 + 0.89a 16.96 + 0.35a 16.43 + 0.75a
2 17.75 + 0.71a 16.90 + 0.9a 16.56 + 0.96a
1values are means (± SD) of triplicate determinations. 2means designated by different letters in a row are significantly different at (P
<0.05). 3Seasons are denoted with 1 and 2 for short and main seasons during 2013/2014
harvest.
The results indicate that there were no significant differences between the
processing methods. It has been reported that the enzymes present in green coffee
degrade protein to polypeptides and free amino acids during fermentation for mucilage
removal (Nigam and Singh, 2014). Hence losses could be minimal since protein and
peptides are reported to complex with polyphenols and hence remain intact in the cell
structure (Nigam and Singh, 2014). There were no indication in the study to show any
loss of protein by the processing methods. A study by Arnold and Ludwig (1996) noted
that the total concentration of free amino acids and protein content does not change
significantly with the chemical reaction occurring during the harvest season and the
postharvest processing steps, such as fermentation, drying and storage. Protein, peptides,
and free amino acids are vital for coffee flavor since they are needed for the Maillard
reaction (Joet et al., 2010). They serve as precursors for the formation of volatile

DEDAN KIMATHI UNIVERSITY OF
TECHNOLOGY
59
compounds such as furans, pyridines, pyrazines, pyrroles, aldehydes, and melanoidins
(Farah, 2012). Regarding the sucrose content, there were no significant difference
between treatments with the values ranging from 7.38 to 10.41% and 9.49 to 10.42% for
SL 28 and Ruiru 11 samples, respectively (Tables 3 and 4). Similar observation were
reported by Knopp et al. (2006) who noted that sucrose and other low molecular weight
sugars are not affected by the wet and dry processing of coffee cherries. It is expected
that the processes which use fermentation and excess water during washing loss the
sugars through leaching but no indication of loss was noted in the methods studied.
Literature has indicated that only reducing sugars such as glucose and fructose may be
loss to the processing water and not the non-reducing sugars such as sucrose (Ferreira et
al., 2013). The metabolic processes occurring at the start of drying takes a short period
and mainly affects the reducing sugars such as glucose and fructose and sucrose remains
intact as a storage compound (Kleinwachter and Selmar, 2010). Sucrose, which is the
most abundant simple carbohydrate present in green coffee, acts as an aroma precursor
during roasting, generating several classes of compounds such as furans, aldehydes and
carboxylic acids that will affect the flavor of the beverage (Perrone et al., 2008).
Lipids represent a significant part of dry matter in green coffee consisting mainly
of triacylglycerol with a range of 13 to 17% (Patui et al., 2014, Joet et al., 2010). The
level of lipids in our analysis was slightly higher at a range of 16.75 to 19.60% and 16.43
to 17.75 for SL 28 and Ruiru 11 samples respectively. Butt et al. (2011) reported a lipid
content range of 9.3 to 12.3%. The variations in the levels of lipids with the reported
values could be attributed to the difference in extraction methods, variety or geographical
factors (Hurtado and Dorado, 2013). The results also indicates no significant differences

DEDAN KIMATHI UNIVERSITY OF
TECHNOLOGY
60
between the processing methods on the level of lipid contents of the coffee samples. The
change in the level of lipids in coffee bean may indicate the effect of deterioration of
coffee since any decrease in the level of lipids could occur due to enzymatic actions
which leads to production of fatty acids. In case of any higher concentration of fatty acids
is an indication of deterioration of coffee mainly due to the production of off-flavors
(Ismail, et al., 2013). Joet et al. (2010) noted that significant metabolism occurs during
wet processing which could lead to increase of chemical substances such as lipids. In our
study there were no indication of increase of lipids by the processing methods. We
suggest that the processing methods used may induce similar metabolic processes which
could result at similar levels of the lipid content. Patui et al. (2014) reported the presence
of lipase activity in the coffee seed which is induced mainly by germination process and
could degrade lipids but the presence of parchment on the surface of coffee beans helps
to prevent oxidation of liphophilic fractions.
4.2 Effects of processing on fatty acids, protein profiles and polyphenol
content of coffee
4.2.1.1 Fatty acids profiles of coffee
The results for fatty acids levels in green coffee beans processed by the three
different methods are presented in Figure 1. The type of fatty acids identified in the
coffee samples include; caproic acid, caprylic acid, capric acid, undecanoic acid, lauric
acid, tridecanoic acid, myristic acid, myristoleic acid, pentadecenoic acid cis-10-
pentadecenoic acid, palmitic acid, heptadecanoic acid, cis-10-heptadecenoic acid, stearic
acid, oleic acid, linoleic acid, linolenic acid, gamma linolenic acid and behenic

DEDAN KIMATHI UNIVERSITY OF
TECHNOLOGY
61
acid. The major fatty acids identified include; palmitic acid (36%), stearic acid (6%),
oleic acid (9%), linoleic acid (40%) and linolenic acid (5%). Similar levels of fatty acids
in green coffee samples were reported by Martin et al. (2001) and Hurtado and Dorado
(2013). The other fatty acids present were at less than 1% level.
Fatty acids are present in the coffee lipid extract either as free or mainly esterified
by glycerol or by diterpenic alcohols (Farah, 2012). The composition of fatty acids
depends on several factors, particularly species and variety. The fatty acids concentration
in coffee are indicators of deterioration of coffee mainly due to the production of off-
flavours. The processing methods used did not show any effect on the fatty acid
composition of coffee. Coffee quality could be lowered due to the hydrolysis of
triacylglycerols, the major constituents of coffee lipid, releasing free fatty acids which are
then oxidized (Ismail, et al., 2013). There was no indication of increase of fatty acids due
to the effects of processing in our study. Hence the coffee quality was considered fresh
and good after processing with the wet, hand and eco-pulper methods. Coffee oil, which
comprises about 10% of the roasted beans, carries most of the coffee aroma that is made
up of a complex mixture of volatile compounds (Buffo and Cardelli-Freire, 2004).

DEDAN KIMATHI UNIVERSITY OF
TECHNOLOGY
62
Figure 1: Fatty acids levels (%) in green coffee beans processed by three different
processing methods

DEDAN KIMATHI UNIVERSITY OF
TECHNOLOGY
63
4.2.1.2 Effects of processing methods on the fatty acid concentrations in
green coffee
The concentration of fatty acids in coffee samples processed by different methods
are presented in Table 5. Linoleic acid was observed to be the dominant fatty acid
followed by palmitic acid, stearic acid, oleic acid and linolenic acid in decreasing order.
Linoleic acid showed an average concentration of between 11.70-16.88mg/100g, dw,
palmitic acid (4.47-7.82 mg/100g, dw), stearic acid (1.97-3.12 mg/100g dw), oleic acid
(1.27-2.33 mg/100g, dw) and linolenic acid (1.07 - 1.88 mg/100g, dw). Similar trends in
the concentration of fatty acids were reported by Martin et al. (2001). SL 28 was
observed to have a higher concentration of fatty acids than Ruiru 11 cultivar especially
for fatty acids such as palmitic acid and linoleic acid. The processing methods did not
show any significant differences in their effects on the fatty acid profiles of coffee in SL
28 and Ruiru 11 varieties. Hence the processing methods did not increase or decrease the
fatty acid profiles in the coffee samples.
The degradation of lipids may occur through chemical or enzymatic actions
leading to a mixture of diacylglycerols, monoacylglycerols, free fatty acids and glycerols
molecules (Toci et al., 2012). The lipase activity has been reported to be present in the
coffee seed which can catalyze the hydrolysis of ester bonds in monoacylglycerol,
diacyglycerol and triacylglycerols into free fatty acids and glycerol but the activity is
mainly induced through germination processes, hence this process may not be active
during pulping or fermentation of coffee. At the same time, the presence of parchment in
coffee is known to prevent the oxidation of liphophilic fractions (Patui et al., 2014).
Though the concentration of fatty acids in coffee can be used to differentiate between the

DEDAN KIMATHI UNIVERSITY OF
TECHNOLOGY
64
different processing methods the type of processes used did not show any variations in
the levels of fatty acids indicating no effect on the lipid fractions of coffee.
Table 5: Concentrations of fatty acids in green coffee for SL 28 and Ruiru 11 from different
processing methods (mg/100g dw)
Wet pulper Hand pulper Eco-Pulper
Palmitic acid 7.82 + 1.54a 7.07 + 0.78a 7.25 + 1.68a
Stearic acid 2.44 + 1.35a 2.16 + 0.72a 2.73 + 0.48a
SL 28 Oleic 1.59 + 0.47a 1.69 + 0.27a 1.79 + 0.27a
Linoleic acid 16.87 + 4.29a 15.67 + 2.25a 16.88 + 3.20a
Linolenic acid 1.27 + 0.34a 1.07 + 0.28a 1.27 + 0.38a
Palmitic acid 6.51 + 2.70a 5.44 + 1.70a 4.47 + 1.99a
Stearic acid 2.43 + 1.37a 3.12 + 2.23a 1.97 + 0.19a
Ruiru 11 Oleic 1.40 + 0.52a 2.33 + 0.94a 1.27 + 0.16a
Linoleic acid 14.48 + 5.76a 14.40 + 2.25a 11.70 + 1.42a
Linolenic acid 1.88 + 0.04a 1.88 + 0.04a 1.16 + 0.20a
1values are means (± SD) of triplicate determinations 2means designated by different letters in a row are significantly different at (P
<0.05)

DEDAN KIMATHI UNIVERSITY OF
TECHNOLOGY
65
4.2.2 Protein fingerprint for Ruiru 11 and SL 28 coffee cultivars
Protein analysis for fingerprint of coffee were done by use of Mass Assisted Laser
Desorption Ionization Time of Flight (MALDI_TOF) technique. This was done to
identify the unique fingerprint of protein for the Kenyan coffee cultivars, mainly Ruiru 11
and SL 28. The MALDI-TOF mass spectrum for the fingerprints are shown in Figure 2.
The protein molecules in the chromatograph are displayed in terms of mass to charge
ratio (m/z). From the mass spectrum, the chromatograph for Ruiru 11 samples are
labelled as 1(c) and 2 (c) while for SL 28 samples are labeled as 3 (c) and 4(c). The wet
pulper samples are labeled as 1 (c) and 3 (c) while the eco-pulper samples are presented
as 2 (c) and 4 (c) in the mass spectra (Figure 2). Comparison of the mass spectra between
the varieties indicate that there were no major variations between the fingerprints. The
spectra for Ruiru 11 and SL 28 can fit exactly on each other with little variations on the
masses. This indicate that the two varieties are similar in terms of protein composition.
The common masses that were identified in the samples for both varieties include, 2689,
3476, 4027, 4466, 4495, 4973, 5480 and 5867. The most abundant mass in the spectra
was identified as 4466 and showed slight variation in the values between the different
varieties. This is in agreement with the report of Procida et al. (2003) who stated that the
type of masses identified by MALDI-TOF for same variety could vary slightly mainly
due to glycosylation form of protein and condensation of hexose molecules. The masses
presented in the spectra could be viewed as unique for Ruiru 11 and SL 28 grown at
Nyeri County, Kenya.

DEDAN KIMATHI UNIVERSITY OF
TECHNOLOGY
66
Figure 2: Mass spectra for protein fingerprint in Ruiru 11 and SL 28 samples analysed
by MALDI-TOF.

DEDAN KIMATHI UNIVERSITY OF
TECHNOLOGY
67
Figure 3: Intensity of protein molecules in coffee samples analysed by MALDI-TOF
DEDAN KIMATHI UNIVERSITY OF
TECHNOLOGY
68
Other Arabica coffees from other region vary from the Kenyan coffee in terms of
the masses they display in the MALDI-TOF mass spectra. Conillon vermelho (Arabica
coffee) from Santa Helena-Caputira in Brazil gave an abundant mass of 4030 while
pacamara amarelo (arabica coffee) from the Água Limpa estate in Brazil gave an
abundant mass of 5193 as shown in Appendix 2. The other masses displayed in the
spectra were also different from those of the Kenya varieties, indicating that protein
composition vary in coffee from different regions. The analysis of protein profiles by
MALDI-TOF can be considered an important taxonomic tool. It is reported that the
proteins detected within each variety remain substantially the same, and are specific for
that variety, but their relative abundances vary from one plantation to another (Procida et
al., 2003).
Comparison of the spectra between the eco-pulper and wet pulper samples did
not show much variations. The masses of protein molecules between the processing
methods were similar with few variations in their intensities. The type of masses which
were common and has higher intensities were selected from the spectrum and used to
compare the effect of processing methods on the protein intensity. The hand pulper
samples were not considered in this analysis due to the number of samples that were
analyzed and nature of the analytical procedures involved in preparing the samples for
MALDI-TOF analysis. Hence the samples for the wet pulper and eco-pulper methods
were selected for the analysis. Figure 3 gives the intensity of the common masses of
protein identified in the coffee samples. There was no significant variations between the
intensity of the protein molecules for Ruiru 11 and SL 28 except for some few masses

DEDAN KIMATHI UNIVERSITY OF
TECHNOLOGY
69
such as ; 3441, 4023, and 5474 (m/z). The eco-pulper samples showed a higher trend for
the intensity of the protein molecules especially for the masses such as 4023, 4466 and
4969. This represent the major masses identified in the mass spectra. The wet pulper
showed higher intensities for few of the masses such as 2686 and 3441. Hence the eco-
pulper method showed higher trends for most of the masses indicating higher intensity of
the protein molecules in the eco-pulper samples than in the wet pulper samples.
4.2.3 Effects of processing methods on polyphenol content of coffee.
Caffeine, trigonelline and chlorogenic acid are the main polyphenol components
of coffee. Table 6 and 7 shows the results of these components in coffee samples
processes by the processing methods; eco-pulper, wet pulper and hand pulper methods.
The study was carried out for the short and main seasons and the percentage
concentration of trigonelline in SL 28, range from 1.14 to 1.26, 1.19 to 1.29% and 1.14 to
1.29% for the wet pulper, hand pulper and eco-pulper, samples, respectively. The levels
for caffeine in SL 28, ranged from 1.26 to 1.36%, 1.19 to 1.35% and 1.26 to 1.36% for
the wet pulper, hand pulper and eco-pulper, respectively. The chlorogenic acid level in
SL 28 also ranged from 4.70 to 5.39%, 4.98 to 5.34% and 4.94 to 5.44% for the wet
pulper, hand pulper eco-pulper samples, respectively (Table 6).
For Ruiru 11, trigonelline level range from 1.19 to 1.28%, 1.22 to 1.36% and 1.21
to 1.36% for the wet pulper, hand pulper eco-pulper samples, respectively (Table 7).
Caffeine level ranged from 1.30 to 1.46%, 1.43 to 1.45% and 1.34 to 1.45% for the wet
pulper, hand pulper eco-pulper samples, respectively. Chlorogenic acid level ranged from
5.31 to 5.72%, 5.34 to 5.79 and 5.46 to 6.23% for the wet pulper, hand pulper eco-pulper
samples, respectively as shown in Table 7. The level of these components in the coffee

DEDAN KIMATHI UNIVERSITY OF
TECHNOLOGY
70
samples were within the levels reported by other authors (Gichimu et al., 2014) and
Mussatto et al., 2011). The results indicate that there were no significant difference
between the processing methods on the levels of trigonelline, caffeine and chlorogenic
acid components of green coffee beans.
Though trigonelline is reported as a water soluble component, the processes
which uses fermentation and excess water such as wet pulper and hand pulper methods
did not show any significant reduction. This could be because the compound are strongly
bonded with other components within the endosperm of coffee beans and cannot easily
be loss through washing. Kathurima et al. (2010) on studying the effects of soaking did
not find any significant difference in the levels of trigonelline. There were no variations
also between the seasons on the level of trigonelline (Table 6). The different processing
methods did not show significant variations in the levels of caffeine. Some significant
variations were only noted in the third season with the eco-pulper showing higher values
than the wet and hand pulper methods (Table 6). This could be attributed partly to the use
of excess water during pulping which could lead to some loss of this compound.
However the same effect was not consistent in the other seasons hence the processing
methods could not be viewed to have variations in the levels of caffeine in green coffee.
Duarte et al. (2010) did not also find any significant variations on the level of caffeine
between wet processing and semi dry processing methods. Ferreira et al. (2013) on
studying the effects of wet and dry processing did not find any significant variations on
the levels of caffeine between this methods. This could be because caffeine is strongly
attached to other components within the coffee beans and cannot easily be lost.
Chlorogenic acid level did not also vary significantly between the processing methods.

DEDAN KIMATHI UNIVERSITY OF
TECHNOLOGY
71
Some variations were noted in the second season with the eco-pulper showing a higher
level than the wet and hand pulper methods and this could relate to the loss into the
processing water.
Table 6: Caffeine, trigonelline and chlorogenic acid contents of coffee samples for SL 28
from three different processing methods for short and main seasons.
Seasons Wet pulper Hand pulper Eco-pulper
Trigonelline
%
1 1.26 + 0.10a1 1.24 + 0.06a1 1.29 + 0.10a1
2 1.22 + 0.07a1 1.29 + 0.04a1 1.19 + 0.05a1
3 1.24 + 0.1a1 1.24 + 0.11a1 1.20 + 0.15a1
4 1.14 + 0.08a1 1.19 + 0.11a1 1.14 + 0.16a1
Caffeine %
1 1.32 + 0.05a1 1.28 + 0.07a12 1.26 + 0.02a2
2 1.36 + 0.05a1 1.35 + 0.02a1 1.29 + 0.04a12
3 1.26 + 0.06b2 1.19 + 0.03b2 1.29 + 0.04a12
4 1.31 + 0.12a1 1.31 + 0.08a12 1.36 + 0.04a1
Chlorogenic
acid %
1 4.86 + 0.35a1 4.98 + 0.23a1 4.94 + 0.32a1
2 4.70 + 0.28b1 5.03 + 0.12ab1 5.11 + 0.15a1
3 5.34 + 0.14a1 5.34 + 0.14a1 5.44 + 0.28a1
4 5.39 + 0.44a1 5.33 + 0.43a1 5.41 + 0.48a1
1values are means (± SD) of triplicate determinations.
2means designated by different small letters in a row for each season are significantly different.
The means denoted by different numbers superscript in the column for each processing method
are significantly different at (P <0.05). 3Seasons are denoted with 1 and 2 for short and main seasons during 2012/2013 harvest. Season
3 and 4 for short and main seasons during 2013/2014 harvest period.

DEDAN KIMATHI UNIVERSITY OF
TECHNOLOGY
72
Table 7: Caffeine, trigonelline and chlorogenic acid contents of coffee samples for Ruiru 11
from three different processing methods for short and main seasons.
Seasons Wet pulper Hand pulper Eco-pulper
Trigonelline % 1 1.28 + 0.10a 1.36 + 0.12a 1.36 + 0.19a
2 1.19 + 0.04a 1.22 + 0.06a 1.21 + 0.02a
Caffeine % 1 1.30 + 0.09a 1.45 + 0.18a 1.34 + 0.13a
2 1.46 + 0.10a 1.43 + 0.44a 1.45 + 0.13a
Chlorogenic acid
% 1 5.31 + 0.23a 5.34 + 0.07a 5.46 + 0.09a
2 5.72 + 0.55a 5.79 + 0.37a 6.23 + 0.38a
1values are means (± SD) of triplicate determinations. 2means designated by different letters in a row are significantly different at
p<0.05.

DEDAN KIMATHI UNIVERSITY OF
TECHNOLOGY
73
Chlorogenic acid was reported to be possibly lost from coffee during wet
processing due to the effect of leaching into the processing water (Nigam and Singh,
2014). The eco-pulper using less water compared to the wet and hand pulper methods did
not show significant variations between this methods on the level of chlorogenic acid. It
is either because there was no loss of chlorogenic acid into the water by the wet and hand
pulper method or the eco-pulper method also lost this components through the squeezing
of coffee parchment within the demucilager. The level of chlorogenic acid was within the
levels reported in the literature. Mussatto et al. (2011) reported a range of 6.7 to 9.2% for
chlorogenic acid content in the different samples of Coffea arabica species. Farah et al.
(2006) also reported a range of 4 to 14% in green coffee beans. These compounds are
important in influencing the aroma and flavor of coffee. The thermal degradation of
chlorogenic acids during roasting results in formation of phenolic substances that
contribute to bitterness and aromatic compounds like phenols, which are undesirable to
cup quality (Toci and Farah, 2008). Trigonelline is a pyridine derivative known to
contribute indirectly to the formation of appreciated flavor products including furans,
pyrazine, alkyl-pyridines and pyrroles during coffee roasting (Ky, et al., 2001). Caffeine
with its characteristic bitter taste is an important determinant of coffee flavor (Farah et
al., 2006).

DEDAN KIMATHI UNIVERSITY OF
TECHNOLOGY
74
4.3 Identification of volatile aroma compounds in green and roasted
coffee
4.3.1 Volatile compounds identified in green coffee
The chromatograph for the volatile compounds present in green coffee is
presented in Appendix 3. The list of the volatile compounds identified in green coffee by
the Head space Solid phase microextraction fibre/ Gas chromatography Mass
spectroscopy analysis (HSPME/GC-MS) is presented in Table 8. A total of 27 volatile
compounds were identified in green coffee samples. The compounds were grouped into
different chemical classes which include aldehydes, furans, ketones, alcohols, and acids.
From the total aroma compounds identified in green coffee, 7 were aldehydes, 9
alcohols, 5 ketones, 1 furans and 3 acids. Similar types of aroma compounds have been
reported in green coffee (Gonzalez-Rios et al., 2007; Nebesny et al., 2007). From our
study majority of the compounds were alcohols followed by aldehydes and the least
were furans. Aldehydes components identified in green coffee constituted 25% and 39%
in Ruiru 11 and SL 28, respectively (Figure 4). The presence of this aldehydes in green
coffee has also be reported in the literature (Nebesny et al., 2007; Gonzalez-Rios et al.,
2007). The aldehydes dominated by volatiles such as hexanal, nonanal, decanal, 2-
ethyl-4-pentanal and benzaldehyde. The processing methods showed variations in the
levels of some aldehydes such as hexanal, and nonanal (Table 9). The eco-pulper
showed a higher intensity of 8.98%, wet pulper (6.90%) and hand pulper (8.78%) in
Ruiru 11 samples. For SL 28, the eco-pulper showed a higher intensity of 25.01%, wet
pulper (21.44%) and hand pulper (20.01%). Hence SL 28 samples showed a higher

DEDAN KIMATHI UNIVERSITY OF
TECHNOLOGY
75
levels for hexanal than Ruiru 11 samples. This could be attributed to genetic variations
of the two varieties. The level of nonanal in the eco-pulper method was 5.51%, wet
pulper (4.45%) and hand pulper (4.32%) in Ruiru 11 samples.
Similarly for SL 28, the eco pulper method, wet pulper and hand pulper methods
showed intensities of 4.90%, 4.76% and 4.47%, respectively for nonanal. This indicate
that the eco-pulper methods showed higher levels for these aldehydes than the other
methods. The methods that include fermentation gave low levels for these compounds
which could be due to the effect of fermentation. Green coffee are reported to contained
large amounts of hexanal giving green coffee the fresh note of plants (Nebesny et al.,
2007). Alcohols occupied a headspace of 24% and 20% in Ruiru 11 and SL 28 and this
group was represented by compounds such as 2,4-dimethyl-3-hexanol, 1-hexanol, 2,3-
butanediol, benzyl alcohol and phenylethyl alcohol. Other authors have also reported
presence of similar compounds such as; 1,2-butandiol, 2-methyl-2-buten-1-ol, 3-methyl-
3-buten-2-ol and 3-methyl-1-butanol (Nebesny et al., 2007). Alcohols are among the
major compounds present in green coffee and their concentrations could be increased by
the process of fermentation (Gonzalez-Rios et al., 2007). The processing methods used
in the current study did not show much variations for their intensities except for one
derivative like 2,3-butanediol where the hand pulper methods showed a higher intensity.
The origin of alcohols cannot only be attributed to fermentation alone but is considered
to be initially present in green coffee and this explains why there were no difference
between the processing methods on the intensity of most alcohol compounds. The eco-
pulper method showing similar levels of alcohols as the methods using fermentation
could be attributed to unexpected fermentation occurring during the drying process. This

DEDAN KIMATHI UNIVERSITY OF
TECHNOLOGY
76
is in agreement with the report of Gonzalez-Rios et al. (2007) who indicated that the
eco-pulper method could contribute to some unwanted fermentation due to the residual
mucilage after processing leading to production of some alcohol compounds.
Table 8: Aroma compounds identified in green coffee samples analysed by HS-SPME-
GCMS
Peak Compound
Retention
Index Peak Compound
Retention
Index
1 Hexanal 1093
15 Decanal 1506
2
2,4-Dimethyl-3-
heptanol 1121
16 Benzaldehyde 1530
3 Heptanal 1197
17 2,3-Butanediol 1549
4
2-Ethyl-4-
pentenal 1215
18 1-Octanol 1565
5 2-Pentylfuran 1233
19 2,3-Butanediol 1585
6
2,4-Dimethyl-3-
hexanol 1293
20 Butyrolactone 1633
7 3-Octanone 1305
21 Benzeneacetaldehyde 1643
8
3-Methyl-2-
butenol 1328
22 Acetophenone 1660
9
6-Methyl-2-
Heptanol,
acetate 1344
23 Isovaleric acid 1674
10 1-Hexanol 1361
24 3-Methyl-2-butenoic acid 1802
11 Nonanal 1402
25 Hexanoic acid 1852
12 2-Octenal 1441
26 Benzyl alcohol 1883
13
3-Hydroxy-1-
octene 1455
27 Phenylethyl Alcohol 1921
14
2-Ethyl-1-
hexanol 1496

DEDAN KIMATHI UNIVERSITY OF
TECHNOLOGY
77
Figure 4: Intensities of volatile compounds per their Chemical classes for Ruiru 11 and
SL 28 in green coffee

DEDAN KIMATHI UNIVERSITY OF
TECHNOLOGY
78
The concentration of acids and ketones were higher in Ruiru 11 than SL 28 with
the headspace concentration giving an average of 10% and 8% for the acid compounds
and 15% and 10%, for ketones respectively (Figure 4). The level of acids and ketones
was noted to be higher in the wet and hand pulper methods and was represented by
compounds such as 3-hydroxy-1-octene, 3-hydroxy-2-butanone 3-Octane, and isovaleric
acid and hexanoic acid in the coffee samples. The hand pulper showed significantly
higher concentrations for compounds such as 3-hydroxy-2-butanone and 2,3-butanediol
which has been associated with presence of undesirable flavours in coffee (Nebesny et
al., 2007). The presence of similar compounds in green coffee has been attributed to the
presence of off flavours in coffee. Hence production of higher intensity of these
compounds in the hand pulper samples could be attributed to undesirable fermentation
resulting from more complex mixture of materials containing pulp and mucilage. The
hand pulping machine is known to be inefficient to separate pulp completely from the
parchment leaving too much of the pulp and parchment being subjected to fermentation.
The level of furans accounted to 1% of the headspace and this group was
represented by one compound, 2-pentylfuran. The presence of this compound in green
coffee has been reported by other authors (Nebesny et al., 2007, Gonzalez-Rios et al.,
2007). Furans are compounds which are known to originate mainly from thermal
processes and their low levels in green coffee is expected since drying process may not
cause production of many such compounds in green coffee. The total intensities of
volatile compounds in green coffee were combined into their chemical classes and
presented in Figure 5. Ruiru 11 showed an average of 24%, 15%, 25% and 11% for the
aldehydes, ketones, alcohols and acids, respectively.

DEDAN KIMATHI UNIVERSITY OF
TECHNOLOGY
79
Table 9: Mean peak area % levels of volatile compounds in green coffee for Ruiru 11 and
SL 28 processed by three different methods analysed by HS-SPME-GCMS
Ruiru 11 SL 28
Compound Name
Eco-
pulper
Wet
pulper
Hand
pulper
Eco-
pulper
Wet
pulper
Hand
pulper
Hexanal 8.98a 6.90b 8.78ab 25.01a 21.44ab 20.01b
2,4-Dimethyl-3-heptanol 7.44ab 12.49a 6.73b 10.07a 11.89a 7.28b
2-Ethyl-4-pentenal 5.39a 4.79a 5.76a 3.14a 2.48a 3.24a
2-Pentylfuran 1.37ab 0.98b 1.47a 1.35a 0.99b 1.01b
2,4-Dimethyl-3-hexanol 10.01a 9.59a 7.48b 9.23a 10.16a 5.53b
3-Octanone 4.40a 4.42a 6.38a 2.10a 2.62a 3.86a
Nonanal 5.51a 4.45b 4.32b 4.90a 4.76a 4.47a
3-Hydroxy-1-octene 6.29a 4.53a 6.71a 2.56b 3.54ab 4.44a
2-Ethyl-1-hexanol 1.46a 1.43a 2.22a 0.88a 0.87a 0.88a
Benzaldehyde 3.78a 3.86a 4.06a 3.14a 3.46a 3.46a
2,3-Butanediol 1.88b 2.04b 2.62a 2.17b 2.27b 2.60a
3-Hydroxy-2-butanone 3.22a 2.82b 3.34a 3.36b 2.41b 5.05a
Acetophenone 1.22a 1.28a 1.58a 0.98a 1.13a 1.08a
Isovaleric acid 8.02b 9.45a 9.82a 6.85a 6.07a 6.54a
Hexanoic acid 1.14a 1.10a 0.87a 1.24a 0.99a 1.52a
Benzyl alcohol 2.43b 2.92ab 3.51a 1.96a 1.88a 1.72a
Phenylethyl Alcohol 1.17a 0.95b 1.19a 0.82a 0.66a 0.92a
1values are means of triplicate determinations 2means designated by different letters in a row are significantly different at (P <0.05)

DEDAN KIMATHI UNIVERSITY OF
TECHNOLOGY
80
In SL 28, the average levels were 37%, 12%, 21% and 9% for aldehydes, ketones,
alcohols and acids, respectively. The results indicate that, SL 28 contained significantly
higher levels of aldehydes than in Ruiru 11 which also showed higher levels for the
alcohols. The levels of ketones and acids were not different between the coffee varieties.
The variations in level of components between the coffee varieties could be attributed to
the variations in the levels of chemical components due to genetic effect. The intensities
of aroma compounds between the processing methods indicate that the eco-pulper
showed higher intensities for the aldehyde group while the hand pulper method showed
higher levels of the ketones.
The eco-pulper samples showing higher levels for the aldehydes could be because
the other methods lowers their levels due to oxidation occurring during fermentation such
as in wet and hand pulper methods. The hand pulper method showing higher levels for
the ketone compounds could be due to the availability of more pulp and mucilage
materials during fermentation of the coffee parchment leading to higher production of
these components than in the wet pulper method. This is in agreement with the report of
Gonzalez-Rios et al. (2007) that ketone could originate fermentation process. The hand
pulper method is characterized by more residual pulp and mucilage after pulping due to
inefficiency of machine and lack of enough water to separate pulp from parchment during
the processing. Hence the pulp and mucilage remain and is fermented together with the
parchment.

DEDAN KIMATHI UNIVERSITY OF
TECHNOLOGY
81
4.3.2 Volatile aroma compounds identified in headspace of roasted
coffee
The list of volatile compounds identified in roasted coffee are presented in Table
10. From the 53 volatile compounds identified in roasted coffee, there were 9 pyrazines,
17 furans, 9 ketones, 4 pyrroles, 4 pyridines, 3 phenols, 2 acids and 5 esters. All
processing methods used for our study showed the same aroma profiles and the
chromatograms differed only in the percentage of surface area below the peaks for some
individual peaks. The aroma profiles were also similar between the varieties studied.
Figure 14 (appendix 4), shows the chromatograph for the aroma profiles determined in
the headspace of roasted coffee.
Table 10: Volatile compounds identified in headspace of roasted coffee
Peak Compound
Retention
Index Peak Compound
Retention
Index
1 2,3-Pentanedione 1068 28 2-Furanmethanol 1661
2 Pyridine 1198 29 Isovaleric acid 1670
3
Dihydro-2-methyl-
3(2H)-furanone 1268 30 2-Furfuryl-5-methylfuran 1677
4 2-Methylpyrazine 1274 31
3-Ethyl-2-hydroxy-2-
cyclopenten-1-one 1691
5 Acetoin 1290 32 2-Acetyl-3-methylpyrazine 1703
6 Hydroxypropanone 1304 33 1-Acetyl-1,4-dihydropyridine 1719
7 2,5-Dimethylpyrazine 1332 34 4,5-Dimethyl-4-hexen-3-one 1735
8 2,6-Dimethylpyrazine 1338 35 2,6-Dimethyl-4-thiopyrone 1742
9 2,3-Dimethylpyrazine 1356 36 1-Cyclopentenecarboxylic acid 1748
10
1-Hydroxy-2-
butanone 1376 37 2(5H)-Furanone 1762
11
2-Ethyl-6-
methylpyrazine 1393 38 3-Acetoxypyridine 1777

DEDAN KIMATHI UNIVERSITY OF
TECHNOLOGY
82
12
2-Ethyl-5-
methylpyrazine 1399 39 3-Methyl-2-butenoic acid 1799
13 Trimethylpyrazine 1415 40 Tetrahydro-2-pyranone 1823
14 Acetic acid 1449 41 1-Furfurylpyrrole 1830
15 Furfural 1462 42
3-Methylcyclopentane-1,2-
dione 1839
16
Furfuryl methyl
sulfide 1485 43 Guaiacol 1864
17 Furfuryl formate 1491 44
3-Ethyl-2-hydroxy-2-
cyclopenten-1-one 1906
18 2-Acetylfuran 1507 45 Maltol 1980
19
Propanoic acid,
ethenyl ester 1527 46 Furfuryl ether 1988
20
Furfuryl alcohol,
acetate 1533 47 Phenol 2010
21 5-Methyl-2-furfural 1576 48 2-Furoylacetonitrile 2018
22 3-Octanone 1586 49 Pyrrole-2-carboxaldehyde 2034
23 Furfuryl propionate 1595 50
2,5-Dimethyl-4-hydroxy-
3(2H)-furanone 2047
24 2-Furfurylfuran 1606 51
5-Acetyldihydro-2(3H)-
furanone 2076
25
2-Acetyl-5-
methylfuran 1620 52 2-Formyl-1-methylpyrrole 2116
26
2-Formyl-1-
methylpyrrole 1625 53 4-Vinylguaiacol 2205
27
4-Hydroxybutanoic
acid 1636

DEDAN KIMATHI UNIVERSITY OF
TECHNOLOGY
83
Figure 5: Total intensity of volatile compounds as per their chemical classes for roasted
coffee for Ruiru 11 and SL 28

DEDAN KIMATHI UNIVERSITY OF
TECHNOLOGY
84
Table 11: Mean relative peak areas (%) for volatile compounds identified in Roasted coffee
of Ruiru 11 and SL 28 cultivars.
Ruiru 11 SL 28
Compound Eco-
pulper
Wet
pulper
Hand
pulper
Eco-
pulper
Wet
pulper
Hand
pulper
2,3-Pentanedione 1.84a 2.04a 1.92a 1.84a 1.75a 1.62a
Pyridine 5.99a 5.97a 5.57a 5.39a 5.23a 5.10a
Dihydro-2-methyl-3(2H)-
furanone
1.83b 1.88b 2.07a 1.59b 1.76a 1.65ab
2-Methylpyrazine 4.86a 4.67b 4.66b 4.48a 4.33b 4.34b
Acetoin 1.05b 1.07ab 1.09a 1.39ab 1.45a 1.37b
Hydroxypropanone 0.99a 1.07a 1.28a 1.55b 1.66a 1.68a
2,5-Dimethylpyrazine 2.16a 2.12b 2.17a 1.76ab 1.69b 1.78a
2,6-Dimethylpyrazine 5.29a 5.15b 5.27a 4.67a 4.56b 4.64a
2-Ethyl-6-methylpyrazine 1.56a 1.47b 1.48b 1.23a 1.14b 1.17ab
2-Ethyl-5-methylpyrazine 1.26a 1.24a 1.24a 1.08a 1.09a 1.10a
Acetic acid 3.51b 3.55b 4.01a 3.89b 3.97b 4.20a
Furfural 5.11a 5.10a 5.45a 6.08b 6.35a 6.27a
Furfuryl formate 1.15a 1.16a 1.21a 1.35b 1.42a 1.37b
2-Acetylfuran 3.48b 3.53ab 3.65a 3.48b 3.58a 3.56a
Propanoic acid, ethyl ester 1.76a 1.75a 1.76a 1.65b 1.64b 1.68a
Furfuryl alcohol, acetate 8.75a 8.67a 8.52a 8.26ab 8.41a 8.12b
5-Methyl-2-furfural 5.21a 5.48a 5.58a 5.60a 5.84a 5.87a
4-Hydroxybutanoic acid 2.03a 2.02a 1.95b 2.08a 2.11a 2.01b
2-Furanmethanol 10.84a 10.71a 10.63a 12.10a 12.34a 12.12a
Isovaleric acid 3.04b 3.20a 3.15a 3.36b 3.44ab 3.52a
3-Ethyl-2-hydroxy-2-
cyclopenten-1-one
1.40a 1.40a 1.35a 1.22a 1.14a 1.20a
Guaiacol 1.15a 1.05ab 0.87b 0.95a 0.71b 0.70b
Furfuryl ether 2.61a 1.55b 1.46b 1.44a 1.44a 1.36b
Maltol 2.75a 2.73a 2.55a 2.99a 2.91a 2.84a
1values are means of triplicate determinations 2means designated by different letters in a row are significantly different at (P <0.05)

DEDAN KIMATHI UNIVERSITY OF
TECHNOLOGY
85
The results of aroma compounds in roasted coffee are presented in Table 11and in
Figures 5, 6, 7 and 8. Furans constituted the most abundant group of aroma compounds
with respect to the number of identified compounds and the intensity in the coffee
headspace. They accounted an average of 42% with 17 derivatives (Figure 5). The eco-
pupler method showed a mean of 43.1%, the wet method (41.2%) and the hand pulper
method (41.7%) for Ruiru 11 samples. For the SL 28 samples; the eco-pulper method
showed a mean of 42.9%, wet pulper method (43.8%) and hand pulper method (43.3%)
for the furan levels in the head space of roasted coffee (Figure 5). The level of furans was
in agreement with the report of Clark (1990) who indicated that the intensity of furans
make up 38 to 45% of total volatile compounds of roasted coffee. The processing
methods showed very close values for the intensity of furans and their concentrations
were not significantly different. However there was some variations among specific furan
derivatives identified in the headspace of the roasted coffee. Table 11 shows the relative
peak areas of individual compounds calculated as percentage of the total surface areas
below the peak. The headspace was dominated by furan derivatives such as 2
furanmethanol, furfuryl alcohol acetate, furfuryl formate, furfural acetylfuran and furfuryl
ether. The intensity of 2 furanmethanol was the highest at 10-12% (Table 11). There was
no significant variations between the processing methods in the intensity of 2 furan
methanol but the SL 28 samples showed slightly higher intensity than Ruiru 11 samples.
This could be attributed to variations in the level of sugars between the coffee varieties.
This is in agreement with the report of Ribeiro et al. (2009) that furan compounds
originate from degradation of sugars. Though the variations between the processing
methods were not consistent between the varieties, the wet pulper showed higher

DEDAN KIMATHI UNIVERSITY OF
TECHNOLOGY
86
intensity for furfuryl formate, but was not significantly different from eco-pulper method
on the levels of furfuryl alcohol acetate (Figure 6). The hand pulper showed higher
intensity on the level of furfural and 2-Acetylfuran. The eco pulper also showed higher
variations in the level of furfuryl ether. The key aroma compounds such as furfural,
furfuryl alcohol acetate and furfuryl formate whose concentration occurs in higher levels
are considered to improve the quality of coffee. Ribero et al. (2009) reported that when
the levels of furfural and furfuryl formate occur in higher amounts the quality of coffee is
improved. The presence of 2 furanmethanol gives a burnt aroma to the coffee and its
higher concentration in the headspace of roasted coffee has also been reported by other
authors such as Budryn et al. (2011). Furans are typical ingredients of roasted coffee.
They impart the caramel, burnt aroma (Nebesny et al., 2007). They are generally known
to originate from thermal processes which involve degradation of carbohydrates and
sugars in coffee during roasting (Ribeiro et al., 2009). Petisca et al. (2013) indicated that
the formation of furfural and furfuryl alcohol could be formed due to heating of hexoses
or pentoses. Hence the variations between the processing methods could occur due to the
variations in the type of sugars and reactions occurring during roasting.

DEDAN KIMATHI UNIVERSITY OF
TECHNOLOGY
87
Figure 6: Level of furan compounds in roasted coffee processed by three different
methods for Ruiru 11 and SL 28

DEDAN KIMATHI UNIVERSITY OF
TECHNOLOGY
88
Figure 7: Level of pyrazine compounds in roasted coffee processed by three different
methods for Ruiru 11 and SL 28

DEDAN KIMATHI UNIVERSITY OF
TECHNOLOGY
89
Figure 8: Level of phenol compounds in roasted coffee processed by three different
methods for Ruiru 11 and SL 28
DEDAN KIMATHI UNIVERSITY OF
TECHNOLOGY
90
Pyrazines are ranked the second in abundance in the emissions from the
headspace of coffee brews (Budryn et al., 2011). According to Clark (1990) they
constitute 25 to 30% of the headspace of roasted coffee. From our study they accounted a
level of 15 to 18% with 9 derivatives. Figure 5 shows the total surface area for the
chemical classes of aroma compounds of roasted coffee. The eco-pulper method showed
a level of 17.5%, the wet pulper (16.7%) and the hand pulper (17.4%) for the pyrazines in
Ruiru 11 samples. The SL 28 samples indicate that the eco-pulper method showed a level
of 15.2%, the wet pulper (14.2%) and the hand pulper (15.1%) (Figure 5). Hence the eco-
pulper and hand pulper showed slightly higher levels of the pyrazines than the other
methods. The level of pyrazines were also higher for Ruiru 11 than for the SL 28
samples. Pyrazines are considered to be formed by Maillard reactions, Strecker
degradation and pyrolysis of hydroxyl amino acids in presence of carbohydrates (Baltes
and Bochmann, 1987, Kathurima et al., 2012). Hence the variations in the levels of this
compounds could be attributed to the differences in the levels of proteins and amino
acids.
Pyrazines were dominated by derivatives such as 2-methylpyrazine, 2,6-
dimethylpyrazine, 2,5-dimethylpyrazine, 2-ethyl-6-methylpyrazine, 2-ethyl-5-
methylpyrazine (Table 11). Occurrence of 2,6-dimethylpyrazine in the headspace of
roasted coffee showed the highest intensity than the other derivatives. It is reported to be
one of the most important derivative of pyrazines which contribute to the coffee aroma
due to its low odour threshold of 15 mg/kg water and has a nutty and maize like smell
(Budryn et al. 2011). The other derivative was 2-methyl pyrazine which also occurred at
higher levels but it is considered to be the least important due to its high odour threshold

DEDAN KIMATHI UNIVERSITY OF
TECHNOLOGY
91
of 60 mg/kg water (Budryn et al., 2011). The other important derivative of pyrazine is
2,5-Dimethylpyrazine which occurred as the third in level of abundance with a threshold
of 15 mg/kg water also contributes to the nutty and maize like aroma (Budryn et al.
2011).
The occurrence of other derivatives such as 2-ethyl-6-methylpyrazine and 2-ethyl-
5-methylpyrazine are considered to be the least important because it gives less pleasant
aroma described as soil-like aroma. The intensity of this derivatives were the lowest
among the pyrazines. The eco-pulper showed a higher significant level for most of the
pyrazine derivative such as 2 methypyrazine and 2-ethyl-6-methylpyrazine (Figure 7).
The eco-pulper was not significantly different from the hand pulper in the levels of 2,6-
Dimethylpyrazine and 2,5-dimethylpyrazine. This may not give the eco-pulper an upper
hand in terms of aroma since the compounds which showed higher variations are
considered less important in influencing aroma such as 2 methypyrazine and 2-ethyl-6-
methylpyrazine. However the levels of 2,6-Dimethylpyrazine and 2,5-dimethylpyrazine
were significantly higher in eco-pulper samples than in the wet pulper methods. Higher
concentration of this compounds may give a more nutty and roasted smell to the coffee
(Nebesny and Budryn, 2006). Hence the eco pulper method having more levels of this
pyrazines than the other methods could be attributed to the difference in the levels of
protein and free amino acids contents caused by the residual mucilage (Gonzalez-Rios et
al., 2007). The mucilage in the center cut of coffee beans may not be completely removed
by mechanical methods and this could contribute to high levels of proteins and amino
acids. The levels of protein and sugar content in the mucilage is indicated to be 8.9% and
2.4%, respectively (Murthy and Naidu, 2011).

DEDAN KIMATHI UNIVERSITY OF
TECHNOLOGY
92
The headspace of roasted coffee revealed the presence of carbonyl compounds
such as 2,3-pentanedione and hydroxypropanone. Carbonyl compounds are important
ingredients of coffee aroma. Some of them are very volatile. Carbonyl derivatives have
diverse notes, like pleasant scent of flowers or butter-like, rancid and rotten stench
(Nebesny et al. 2007). During the roasting process, oxidation of wax deposited on the
surface of coffee beans and lipids leached from their core and leads to generation of
numerous carbonyl compounds (Nebesny et al., 2007). Ketones accounted for 9-12% of
the headspace of roasted coffee. The headspace analysis of roasted coffee revealed high
concentration of cyclic ketone such as 3-ethyl-2-hydroxy-2-cyclopenten-1-one and 3-
Methylcyclopentane-1,2-dione (Table 11). Cyclic ketones have a sweet, caramel-like
smell (Budryn et al., 2011). The processing methods studied did not show variations in
the level of these compounds.
The headspace analysis revealed low concentration of phenol compounds
accounting to a level of 2%. The group was represented by derivatives such as phenol,
guaiacol and p-vinylguaiacol. Their aroma contribution is diverse, such as spicy, clove-
like or smoky. Guaiacol was dominant in the group and such compounds are formed
through degradation of free phenolic acids and considered as a character impact odorant
that gives a phenolic note to coffee aroma (Ribeiro et al., 2009, Mondello et al., 2005).
The eco-pulper method showed higher intensity for guaiacol (Figure 8) than the other
processing methods and could indicate presence of more phenolics compounds in the
samples retained after processing than in the wet and hand pulper methods. Pyridines are
considerably less desirable components of coffee aroma because they impart bitter,
astringent aroma (Nebesny et al., 2007). Three compounds of this group were identified

DEDAN KIMATHI UNIVERSITY OF
TECHNOLOGY
93
in the roasted coffee and include; pyridine, 3-acetoxypyridine and 3-hydroxypyridine.
Their concentration accounted to a level of 6 to 7% of the headspace of roasted coffee.
The eco-pulper, wet pulper and hand pulper methods showed an intensity of 7, 7 and
6.5% respectively in Ruiru 11 samples. The concentration in SL 28 samples were 6.2%,
6.3% and 6.1% for the eco-pulper, wet pulper and hand pulper methods respectively.
This indicates that the processing methods did not vary much in the level of pyridines but
were slightly more in Ruiru 11 than in SL 28 samples.
Pyrroles, like pyridines, are reported to give negative effects to the aroma of
coffee (Budryn et al., 2011). This group was represented by 2-Formyl-1-methylpyrrole
pyrrole-2-carboxaldehyde and 1-Furfurylpyrrole. Pyrroles impart aroma that resembles
mushrooms and smoke (Nebesny et al., 2007). The headspace of roasted coffee
accounted an average level of 3% for pyrroles and the processing methods did not show
any significant variations in their concentrations. Pyridines and pyrroles result from
thermal degradation of trigoneline and their lack of variations between the processing
methods could be correlated to the similarity in the levels of trigoneline. Volatiles acids
and esters occupied a headspace of 10% and were dominated by compounds such as
acetic acid, isovaleric acid, propanoic acid, ethenyl ester and 3-Methyl-2-butenoic acid.
There were some variations noted in the concentrations of these compounds between the
processing methods studied. The hand pulper method showed slightly higher intensities
than the eco-pulper and wet pulper samples. This could be attributed to the high level of
mucilage in the samples owing to the high content of pulp mixed with the coffee
parchment during fermentation owing to inefficiency of the method to completely
remove pulp from the coffee beans. The high content of mucilage and pulp during

DEDAN KIMATHI UNIVERSITY OF
TECHNOLOGY
94
fermentation may result in increased release of these compounds which can then
penetrate the coffee beans. Acetic acid and lactic acid are produced early in coffee
fermentation while propionic and butyric acid are produced later (Nigam and Singh
2014).
Maltol is one of the desirable component of roasted coffee which is reported to
add a sweet and burnt smell to coffee aroma (Budryn et al., 2011). The processing
methods did not show variations in the level of maltol and the intensity of this compound
was not significantly different in Ruiru 11 and SL 28 samples. It can be concluded that
Ruiru 11 and SL 28 shows similar aroma compounds in roasted coffee and little
variations occurs in the intensities of most compounds classified as furans, pyrazines,
ketones, pyrrole and pyridines. It was observed that Ruiru 11 samples shows higher
intensities in the levels of some chemical classes such as pyrazines, pyrroles and
pyridines. There were little variations observed in the levels of individual compounds
between the processing methods with the eco-pulper showing higher intensity than the
other methods in the levels of some pyrazines such as 2 methypyrazine and 2-Ethyl-6-
methylpyrazine. The wet pulper method showed higher concentrations for some furan
compounds such as furfuryl formate and furfuryl alcohol acetate. The hand pulper
method showed higher level for the ketones, acid and esters than in the wet and eco-
pulper methods. This variations between processing methods and coffee varieties in the
level of aroma compounds may also lead to variations into the sensory quality of coffee.

DEDAN KIMATHI UNIVERSITY OF
TECHNOLOGY
95
4.4 Effects of coffee processing methods on sensory attributes and
quality of coffee
4.4.1 Effects of coffee processing methods on sensory attributes
The results for analysis of sensory attributes and total quality of coffee are
presented in Figures 9 and 10. The green coffee bean were roasted, grounded, brewed and
evaluated for cup profiles according to the method described by Kathurima et al., (2009).
Ten sensory attributes were evaluated in coffee samples which include aroma, flavor,
aftertaste, acidity, body, balance, clean cup, uniformity, sweetness and overall quality.
The results on evaluation of the attributes for the different processing methods presented
close values (Figure 9). Sensory parameters such as clean cup, uniformity and sweetness
were rated with the highest score of 10 for each of the attributes for all the treatments.
There were no defects noted in all the samples such as stinkers, bitterness and sourness.
The cup parameters such as aroma, flavor, aftertaste, acidity, body, balance and overall
acceptability were rated as 7.6, 7.6, 7.7, 7.8, 7.6, 7.6 and 7.7 respectively for the eco-
pulper samples. For the wet pulper samples, the aroma, flavor, aftertaste, acidity, body,
balance and overall acceptability were rated as 7.5, 7.6, 7.6, 7.7, 7.6, 7.6, and 7.6
respectively. Similar levels were observed for the hand pulper samples with the aroma,
flavor, aftertaste, acidity, body, balance and overall being rated as 7.6, 7.7, 7.7, 7.7, 7.6,
7.6 and 7.7 respectively (Figure 9). The study did not find much variations in the levels
of the sensory attributes from coffee brew for roasted coffee obtained from the wet, hand
and eco-pulper processing methods.

DEDAN KIMATHI UNIVERSITY OF
TECHNOLOGY
96
Considering each of the sensory attributes it was observed that the eco-pulper
showed slightly higher level for the aroma compared to the wet pulper and was at par
with the hand pulper for this attributes. For flavor, the hand pulper showed slightly higher
levels than the other processing methods. The acidity was slightly higher for the eco-
pulper samples than the hand and wet pulper samples. The processing methods were all at
par for the body and balance attributes while the eco-pulper and hand pulper showed
slightly higher levels for the overall acceptability of the coffee brew samples. The values
for the sensory attributes were not statistically significant between the treatments. This
confirms the similarity between the coffee brews processed by the eco-pulper, wet and
hand pulper samples. The coffee samples were described to have attractive flavors such
as fruity, floral, lemon like and caramel. In particular, the eco-pulper samples were
described to have well balance body and acidity with floral flavor. The wet pulper
samples were described with a winny, fruity and slightly floral flavor. The hand pulper
samples also were described to have good body, winny and floral flavor. Hence the
processing methods did not vary on the levels of sensory attributes. Due to lack of
significant variations between the processing methods on the levels of the sensory
attributes then this confirms there similarity in the levels of the chemical components as
observed earlier in green coffee.
The results for the final quality of coffee samples are shown in Figure 10. The
scores for all the sensory attributes were summed up to give a total score which
represents the final quality of coffee. The results indicate that the eco-pulper, wet and
hand pulper samples showed a final quality of 83.45%, 83.11% and 83.58%, respectively
in short season (season 1).

DEDAN KIMATHI UNIVERSITY OF
TECHNOLOGY
97
Figure 9: Sensory attributes of coffee beverage (SL 28) from three different processing
methods for the two harvesting seasons.
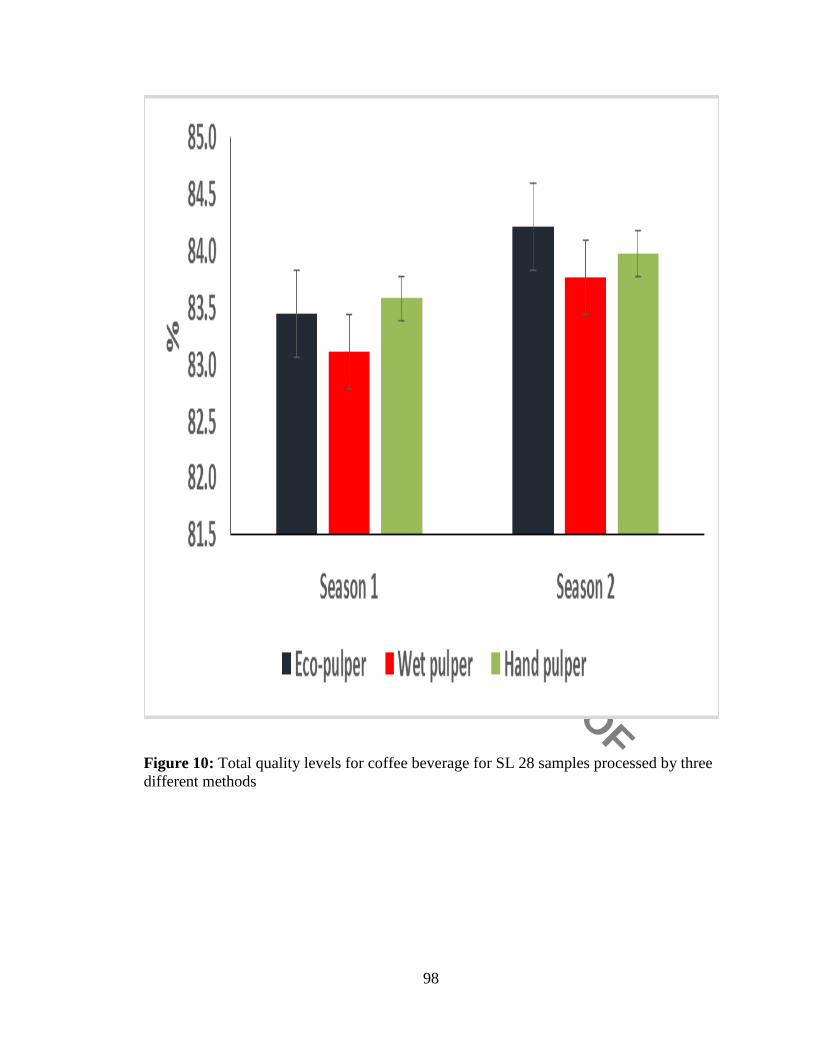
DEDAN KIMATHI UNIVERSITY OF
TECHNOLOGY
98
Figure 10: Total quality levels for coffee beverage for SL 28 samples processed by three
different methods

DEDAN KIMATHI UNIVERSITY OF
TECHNOLOGY
99
In the main season (season 2), similar results were observed with the eco-pulper,
wet and hand pulper giving final quality of 84.0%, 83.77% and 83.98% respectively.
From the results then it was observed that the eco-pulper and hand pulper slightly higher
values for the final quality than the wet pulper samples. The characteristics of the sensory
attributes and final quality of coffee mainly depends on the physico-chemical
components of roasted coffee which relates to the chemical composition of green coffee
(Ferreira et al., 2013). From our study there were no significant variations in the level of
most physico-chemical components of green coffee obtained from the different
processing methods. Therefore it can be concluded that the coffee processing methods
which include; eco-pulper, wet and hand pulper gives similar levels of the sensory
attributes and final quality of coffee.
4.4.2 Effects of processing technologies on sensory attributes and overall
quality of coffee cultivars studied
The results for the sensory attributes for the two cultivars of coffee, SL28 and
Ruiru 11 are shown on Figure 11. Considering the SL 28 samples, the processing
methods showed similar scores of 7.7 for the aroma, flavor and aftertaste. The acidity
showed a score of 7.9, 7.8 and 7.8, for the eco-pulper, wet pulper and hand pulper,
respectively. The body and balance showed same score of 7.7, 7.6 and 7.7 for eco-pulper,
wet pulper and hand pulper, respectively. For the overall acceptability, the eco-pulper and
hand pulper also showed higher scores of 7.8 while wet pulper showed a score of 7.7.
Considering Ruiru 11 samples, the aroma showed scores of 7.7, 7.6 and 7.5 for
the eco-pulper, wet pulper and hand pulper, respectively. The flavor also showed a score
of 7.6, 7.6 and 7.7 for the eco-pulper, wet pulper and hand pulper, respectively. The

DEDAN KIMATHI UNIVERSITY OF
TECHNOLOGY
100
processing methods showed similar score of 7.7 for the aftertaste attribute. For acidity,
the hand pulper showed a higher score of 7.9 while the eco-pulper and wet pulper showed
similar scores of 7.8. The processing methods showed same score of 7.7 for the body
attributes. The eco-pulper method showed higher score of 8.2 for the balance attribute
while the wet and hand pulper methods showed same scores of 8.0. For overall
acceptability, the hand pulper methods showed higher score of 7.8 while the eco-pulper
and wet pulper methods showed same score of 7.7.
It was observed that the SL 28 cultivar showed slightly higher levels for the
aroma, flavor and overall acceptability. Ruiru 11 also showed higher levels for the
balance attribute than SL 28. The aroma of coffee brew is mainly influenced by the
intensity of aroma compounds in coffee. The aroma for Ruiru 11 samples was noted to be
less intense than that of SL 28 according to the descriptions of the panelist. Sensory
attributes such as flavor was described with such attractive notes as fruity, floral, lemon
and caramelly with slightly bitter notes for some samples especially for eco-pulper.
Flavor is a combined perception of taste; smell and mouth feel (Butt et al., 2011). The
sensory attribute such as acidity also affects the coffee quality and its effects on taste
influence the general perception of the product.

DEDAN KIMATHI UNIVERSITY OF
TECHNOLOGY
101
Figure 11: Sensory attributes levels for coffee beverage for SL 28 and Ruiru 11 samples
processes by three different methods

DEDAN KIMATHI UNIVERSITY OF
TECHNOLOGY
102
Figure 12: Total quality levels for coffee beverage for SL 28 and Ruiru 11 samples
processed by three different methods

DEDAN KIMATHI UNIVERSITY OF
TECHNOLOGY
103
Acidity of the samples were described as pleasant. A pleasant acidity contributes
to the vivacity of coffee, as well as increasing the perception of sweetness and gives a
fresh-fruit characteristic (Butt et al., 2011). The samples with an intense body could have
a high score in terms of quality and is due to the presence of more solids dissolved in the
beverage. Aftertaste is defined as the persistence of flavor. If the aftertaste leaves a very
brief or unpleasant sensation, a low score can be given (Borem et al., 2013). The results
for the final quality of coffee samples are shown in Figure 12. For SL 28, the eco-pulper,
wet pulper and hand pulper showed mean final quality of 83.4%, 83.1% and 83.5%,
respectively for short season (season 1) samples. For main season (season 2), the eco-
pulper, wet pulper and hand pulper showed mean final quality of 84.2%, 83.7% and
83.9%, respectively.
The main season showed slightly higher level of final quality than short season
for SL 28 samples. This confirms the expectation that, main season of coffee harvesting
produce coffee with better quality than the short season. Considering Ruiru 11 samples,
the eco-pulper, wet pulper and hand pulper showed mean final quality of 83.4%, 83.7%
and 83.8%, respectively for short season (season 1). For main season (season 2), eco-
pulper, wet pulper and hand pulper showed mean final quality of 83.8%, 83.7% and
83.8%, respectively. The general observations indicate that there were little variations in
the final quality of coffee for SL 28 and Ruiru 11 samples. This could also be attributed
to variations in the levels of aroma compounds and the physico-chemical components.

DEDAN KIMATHI UNIVERSITY OF
TECHNOLOGY
104
CHAPTER FIVE
CONCLUSION AND RECOMMENDATION
5.1 Conclusions
From this study, it was established that, the processing methods did not show
much variations on physico-chemical composition of coffee. Some variations were noted
in the mass, density and pH with the eco-pulper method showing higher levels for these
parameters. The wet and hand pulper methods showed lower significant values for the
pH.
The concentration of fatty acids and protein intensity and polyphenols content
were not significantly different between the processing methods used. The eco-pulper
method showed higher trends for protein intensity and chlorogenic acid contents of the
coffee beans.
The processing methods did not show variations on the aroma profiles but showed
variations on the level of some aroma compounds within the chemical classes of
pyrazines, furans, acids, ketones and phenols of roasted coffee. The eco-pulper methods
showed higher levels for the phenols and pyrazine compounds while the wet pulper
method was high in the level of furans and the hand pulper method being high in the
levels of ketone and acid compounds.
The processing methods showed some variations in the levels of sensory
attributes with the eco-pulper giving higher values for the aroma, body, balance and
overall acceptability while the hand pulper also showed higher levels for the acidity and
overall acceptability. The eco-pulper and hand pulper showed higher level for the final

DEDAN KIMATHI UNIVERSITY OF
TECHNOLOGY
105
quality than the wet pulper method. There were little variations in the level of sensory
attributes for SL 28 and Ruiru 11 and the final quality was slightly higher for SL 28 than
for Ruiru 11. The main season showed better overall quality than the short season.
5.2 Recommendations
The recommendation for policy is that since the new ecological processing technology of
coffee did not cause any negative effects on physico-chemical components and the aroma
and sensory quality of coffee, the method could be recommended for used in coffee
processing. The use of this new technology in coffee processing could contribute to the
reduction of water pollution due to the less waste water production hence environmental
friendly and could reduce production cost to the coffee producers due to the less stages of
coffee processing and hence less labour requirement.
The recommendation for further research; when protein fingerprint was analyzed by
MALDI-TOF technique in the coffee samples there was indication of variation in the masses
of protein molecules in the spectra for coffee obtained from different regions. It is
recommended that more analysis could be undertaken using cultivars from different regions.
This could involve purifications of proteins molecules in samples with aim of determining
the type of amino acids contained in the common masses displayed by the MALDI-TOF
mass spectra. Since this research concentrated on analysis of two Kenyan coffee cultivars;
Ruiru 11 and SL 28. It is recommended that more analysis could be done by using other
cultivars and establishing the effect of having blended coffee from different cultivars on
coffee quality. The project utilized dry fermentation for the removal of mucilage. Hence it
might be necessary to investigate the effect of underwater fermentation and soaking on the
quality of coffee.

DEDAN KIMATHI UNIVERSITY OF
TECHNOLOGY
106
REFERENCES
Agwanda, C.O., Baradat, P, Eskes .A.B., Cilas C. and Charrier, A. (2003). Selection for bean
and liquor qualities within related hybrids of Arabica coffee in
multilocal field trials. Euphytica, 131: 1-14.
Alastair, H. (2012). Post-harvest processing and quality assurance for
specialty and organic coffee products,
http://www.journal.au.edu/au_techno/2002/jan2002/article2.pdf. Web
Visited on January 2012.
Alterman, M.A., Gochichayeva, N. V., and Kornilayev, B.A. (2004). Matrix-
assisted laser desorption/ionization time-of-flight mass spectrometry-
based amino acid analysis, Analytical Biochemetry, 335: 184–191
Arnold, U. and Ludwig, E. (1996). Analysis of free amino acids in green
coffee beans. II. Changes of the amino acid content in arabica
coffees in connection with post-harvest model treatment, Lebensm.
Unters. Forsch. 203: 379-384.
Avallone, S., Brillouet, J.M., Guyot, B., Olguin, E. and Guiraud, J.P. (2002). Involvement of
pectolytic micro-organisms in coffee fermentation International Journal of Food
Science and Technology, 37: 191-198.
Baltes, W. and Bochmann, G. (1987). Model reactions on roast aroma formation, Mass-
spectrometric identification of furans and furanones from the reaction of serine and
threonine with sucrose under the conditions of coffee roasting. Journal of Agriculture
and Food Chemistry, 184: 179-186
Behailu, W.S., Abrare, S., Nugussie, M. and Endries, S. (2008). Coffee processing and quality
research in Ethiopia. In: Girma Adugna, Bayetta Belachew, Tesfaye Shimber, Endale
Taye and Taye Kufa (eds.). Coffee Diversity and Knowledge. Proceedings of a
National Workshop Four Decades of Coffee Research and Development in Ethiopia,
14-17 August 2007, Addis Ababa, Ethiopia, 307-316.
Belay, A. (2011). Some biochemical compounds in coffee beans and methods developed for
their analysis, International Journal of Physical Sciences, 6(28): 6373-6378.
Belay, A., Ture, K., Redi, M. and Asfaw, A. (2008). Caffeine measurement in coffee beans
with UV-Vis spectrometer, Journal of Food Chemistry, 108: 310-315.
DEDAN KIMATHI UNIVERSITY OF
TECHNOLOGY
107
Bligh, E. A. and Dye, W. J. (1959). A rapid method of total lipid extraction and purification.
Journal of Canadian Biochemistry, 37: 911-917.
Borém, F. M. Ribeiro, F. C., Figueiredo, L. P., Giomo, G. S., Fortunato, V. A. and Isquierdo,
E. P. (2013). Evaluation of the sensory and color quality of coffee beans stored in
hermetic packaging, Journal of Stored Products Research, 52: 1- 6
Bucheli, P., Meyer, I., Pittet, A., Vuataz, G. and Viani, R. 1998. Industrial storage of green
Robusta coffee under tropical conditions and its impact on raw material quality and
ochratoxin A content. Journal of Agriculture Food Chemistry, 46: 4507-4511.
Budryn, G., Nebesny, E, Kula J., Majda, T. and Krysiak, W. (2011). HS-SPME/GC/MS
Profiles of convectively and microwave roasted Ivory Coast robusta coffee brews,
Czech Journal of Food Science 29: 151–160.
Buffo, R.A. and Cardelli-Freire, C. (2004). Coffee flavour: an overview, Flavour Fragrance.
Journal, 19: 99–104.
Butt, M.S., Ahmed, M.T., Sultan, A.M, Yasin, M. and Imran, M. (2011). Evaluating the
effects of decaffeination on nutritional and antioxidant status of different coffee
brands. Internet Journal of Food Safety, 13:198-207.
Café, A. (2009). Production of washed coffee – arabica and robusta, feasibility study,
Cameroon. 1-45. http://www.euacpcommodities.eu/files/1CEND03WashedCoffee
CameroonFeasibilityStudy.pdf. Web accessed, January, 2014.
Clarke, R.J. (1990): The volatile compounds of roasted coffee. Italian
Journal of Food Science, 2: 79–88.
Coradi, P. C., Meira F. B., Saath, R. and Marques, E. R. (2007). Effect of
Drying and Storage conditions on the quality of natural and washed
Coffee. Coffee Science., Lavras, 2(1) 38-47.
Dagne, K. and Jonsson, A. (1997). Oil content and fatty acid composition of seeds of Guizotia
Cass. (Compositae). Journal of Science Food Agriculture, 73: 274-278.
Duarte, G.S., Pereira, A.A., Farah, A., (2010). Chlorogenic acids and other relevant
compounds in Brazilian coffees processed by semi-dry and wet post-harvesting
methods, Journal of Food Chemistry, 118, 851–855.
Dutra, E.R., Oliveira, L.S., Franca, A.S., Ferraz, V.P. and Afonso, R.J.C.F. 2001. A
preliminary study on the feasibility of using the composition of coffee roasting exhaust
gas for the determination of the degree of roast. Journal of Food Engineering, 47: 241-
246.

DEDAN KIMATHI UNIVERSITY OF
TECHNOLOGY
108
Evangelista, S.R., Miguel, M. G., Cordeiro, C.S., Silva C.F., Pinheiro A.C. and Schwan, R. F.
(2014). Inoculation of starter cultures in a semi-dry coffee (Coffea arabica)
fermentation process, Food Microbiology, 44: 87-95.
FAO. (2015a). Annex 4. Africa coffee producing countries profiles. FAO Corporate
Documentary Repository. http://www.fao.org/docrep/003/x6939e/X6939e10.htm.
Web accessed, April 2015.
FAO. (2015b). Annex 5. Post-harvest handling and processing of coffee in African countries,
FAO Corporate Documentary Repository.
http://www.fao.org/docrep/003/x6939e/X6939e11.htm, Web accessed, April 2014.
Farah, A. (2012). Coffee Constituents. Chu Y-F. Coffee: Emerging Health Effects and
Disease Prevention, First Edition, John Wiley & Sons, Inc. Blackwell Publishing Ltd.
Page 21-59.
Farah, A., de Paulis, T., Moreira, D. P., Trugo, L. C., & Martin, P. R. (2006). Chlorogenic
acids and lactones in regular and water-decaffeinated arabica coffees. Journal of
Agricultural Food Chemistry, 54, 374–381.
Farah, A., Monteiro, M. C., Calado, V., Franca, A. S., and Trugo, L. C. (2006). Correlation
between cup quality and chemical attributes of Brazilian coffee. Journal of Food
Chemistry, 98, 373.
Flament, I. (2002). Coffee flavour chemistry. Chichester, UK: John Wiley and Sons.
Franca, AS, Mendonca, J.C.F and Oliveira, S.D. 2005. Composition of green and roasted
coffees of different cup qualities. LWT 38: 709–715.
Ferreira, G.F.P., Novaes, Q.S., Malta, M.R. and Souza, S.E. (2013). Quality of coffee
produced in the Southwest Region of Bahia, Brazil subjected to different forms of
processing and drying. African Journal of Agricultural Research, 8(20): 2334-2339.
Fisk, I. D., Kettle A., Hofmeister S., Virdie A. and Kenny J. S. (2012). Discrimination of roast
and ground coffee aroma, Flavour Journal, 1:14, 4-8.
Gichimu, B. M., Gichuru, E K., Mamati, G. E. and. Nyende, A. B. (2014). Biochemical
Composition within Coffea arabica cv. Ruiru 11 and Its Relationship with cup quality,
Journal of Food Research 3(3).
Gloess, A. N., Vietri, A., Wieland, F., Smrke, S., Schönbächler, B., López J. S., Petrozzia, S.,
Bongersc, S., Koziorowski, S. and Yeretziana, C. (2014). Evidence of different flavour
formation dynamics by roasting coffeefrom different origins: On-line analysis with
PTR-ToF-MS, Internati. Journal of Mass Spectrometry, 365–366, 324–337.
Gonzalez-Rios O, Suarez-Quiroz, M.L, Boulanger, R, Barel, M, Guyot, B, Guiraud, J-P,
Schorr-Galindo, S. (2007). Impact of “ecological” post-harvest processing on coffee
aroma: II. Roasted coffee. Journal of Food Composition Analysis, 20:297–307.

DEDAN KIMATHI UNIVERSITY OF
TECHNOLOGY
109
GTZ. (2002). Post-harvest processing. Arabica coffee.
http://www.venden.de/pdfs/Coffee%20dryingV6.pdf. Web accessed, June 2012.
Hanschke, C. (2014). Development of a MALDI-TOF-MS method for quality analysis of
green coffee beans by protein profiling. Bachelor's thesis, Technical University of
Applied Sciences Wildau, Germany.
Hillenkamp, F., Karas, M., Beavis, R.C. and Chait, B.T. (1991). Matrix-assisted laser
desorption ionization mass spectrometry of biopolymers. Journal of Analysis
Chemistry, 63, 1193–1203.
Howden, D. (2012). Kenya coffee wars. http://www.independent.co.uk/news/world/africa
/kenyas-coffee-wars-6666206.html. Web accessed, June 2014.
Hurtado, A. B. and Dorado D. A. (2013). Study of the yield and fatty acid profile of coffee
(coffea arabica) oil from roasted beans obtained with supercritical carbon dioxide.
http://www.nupeg.ufrn.br/prosciba/prosciba2013/Papers/T2-53.pdf. Web accessed,
October 2013.
Husek, P. and Simek, P. (2001). Advances in amino acid analysis, LC–GC N. Am. 19: 986–
999.
Ismail, I., Anuar, M.S. and Shamsudin, R. (2013). Effect on the physico-chemical properties
of liberica green coffee beans under ambient storage. International Food Research
Journal, 20(1): 255-264.
Joët, T., Laffargue, A., Descroix F., Doulbeau S., Bertrand B., de Kochko A., and Dussert
S.(2010). Influence of environmental factors, wet processing and their interactions on
the biochemical composition of green Arabica coffee beans. Journal of Food
Chemistry, 118: 693–701
Karanja, J.K., Mugendi, B.J., Khamis, F.M., and Muchugi, A.N. (2013) Nutritional
Composition of the Pumpkin (Cucurbita spp.) Seed Cultivated from Selected Regions
in Kenya. Journal of Horticultural Letters, 3(1):17-22.
Kathleen, L., Wei, J. and Siuzdak, G. (2000). Matrix- assisted Laser Desorption/Ionization
Mass Spectrometry in Peptide and protein analysis, in Encyclopedia of Analytical
Chemistry, John Wiley and Sons Ltd, Chichester. pg 5880-5894.
Kathurima, C.W. (2010). Effects of soaking parchment on sensory and some biochemical
components of Coffea Arabica L. produced in Kenya. Proceedings 23th International
Conference on Coffee Science (ASIC) 2010. pg. 335—338.
Kathurima, C.W, Gichimu, B.M., Kenji, G.M., Muhoho, S.M and Boulanger, R. (2009).
Evaluation of beverage quality and green bean physical characteristics of selected
Arabica coffee genotypes in Kenya. African Journal of Food Science, 3 (11): 365-
371.

DEDAN KIMATHI UNIVERSITY OF
TECHNOLOGY
110
Kathurima, C., Kenji G., Muhoho S., Boulanger R., Ng’ang’a F. (2012). Volatile Organic
Compounds in Brewed Kenyan Arabica Coffee Genotypes by Solid Phase Extraction
Gas Chromatography Mass Spectrometry, Food Science and Quality Management, 8.
ISSN 2225-0557 (Online). Web accessed in October 2013.
Kleinwächter, M. and Selmar, D. (2010). Influence of drying on the content of sugars in wet
processed green Arabica coffees, Journal of Food Chemistry 119: 500–504
Kolling-Speer, L. and Speer, K. The Raw Seed composition. (2005). In: Espresso Coffee, the
Science of Quality. Illy, A., Viani, R., eds. Italy: Elsevier Academic Press; page. 148–
178.
Knopp, S, Bytof G. and Selmar D (2006). Influence of processing on the content of sugars in
green Arabica coffee beans. European Food Research and Technology, 223(2):95-
201.
Ky, C.-L., Dussert, S., Guyot, B., Hamon, S., and Noirot, M. (2001). Caffeine, trigonelline,
chlorogenic acids and sucrose diversity in wild Coffea arabica L. and C. canephora P.
accessions. Journal of Food Chemistry, 75, 223–230.
Lingle, T.R., (1993). The Basics of Cupping Coffee. Specialty Coffee Association of
America, Long Beach, pg. 43.
Lowor, S. T., Amoah F. M. and Opoku-Ameyaw, K. (2007). Drying process and Ghanaian
green coffee quality crude protein, pH and caffeine levels, African Journal of
Agricultural Research, 2 (12), 698-699.
Madihah, K.Y., Zaibunnisa, A.H., Norashikin, S., Rozita, O. and Misnawi, J. (2013).
Optimization of roasting conditions for high-quality Arabica coffee. International
Food Research Journal 20(4): 1623-1627
Martin, M.J., Pablos, F., Gonzales, A.G., Valdenebro M.S. and Leon-Camacho, M. (2001).
Fatty acid profiles as discriminant parameters for coffee varieties differentiation,
Talanta 54(2): 291–297.
Mondello, L., Costa, R., Tranchida, P.Q., Dugo, P., Presti, M.L., Festa, S., Fazio, A. and
Dugo, G. (2005). Reliable characterization of coffee bean aroma profiles by automated
headspace solid phase micro-extraction-gas chromatography-mass spectrometry with
the support of a dual-filter mass spectra library. Journal of Separation Science,
28:1101–1109.
Moreno, G., Moreno, E. and Cadena. G. (1995). Bean characteristics and cup quality of the
Colombia variety (Coffea arabica) as judged by international tasting panel. 16th
International Conference on Coffee Science (ASIC, 1995). Kyoto (Japan).
Mukabane, B. G., Thiongo, G., Gathitu, B., Murage, H., Ojijo, N. O. and Owino, W. O.
(2014). Evaluating the Potential of Juice from Some Sweet Sorghum Varieties Grown
In Kenya to Crystallize, Food Science and Quality Management, 30:31-39.

DEDAN KIMATHI UNIVERSITY OF
TECHNOLOGY
111
Murthy, P. S. and Naidu, M. M. (2011). Improvement of robusta coffee fermentation with
Microbial Enzymes. European Journal of Applied Science, 3 (4):130-139.
Musembe, R., Agwanda, C. and Mekonen, M. (2007). Primary coffee processing in Ethiopia:
Patterns, constraints, determinants. African Crop Science Society, 8: 1417 – 1421.
Mussatto, S.I., Machado, E.M.S., Martins, S. and Teixeira, J.A. (2011). Production
Composition and Application of Coffee and its Industrial; Residues. Food Bioprocess
Technology, 4:661-672.
Mwangi, C. N. (1983). Coffee Growers’ Handbook. Coffee Research Foundation, Kenya,
page 128.
Nebesny E, Budryn G. (2006). Evaluation of sensory attributes of coffee brews from Robusta
coffee roasted under different conditions. European Food Research Technology,
224:159 -165.
Nebesny, E. Budryn, G. Kula, J. and Majda, T. (2007). The effect of roasting method on
headspace composition of robusta coffee bean aroma, European Food Research
Technology, 225:9–19.
Nigam, P.S. and Singh, A. (2014). Cocoa and coffee fermentations. Encyclopedia of Food
Microbiology (Second Edition), Pg 485-492.
Nikolova-Damyanova, B., Velikova, R., and Jham, G. N. (1998). Lipid classes, fatty acid
composition and triacylglycerol molecular species in crude coffee beans harvested in
Brazil. Food Research Institute, 31: 479–486.
Ogara R. S. (2013). Evaluation of nutritional properties of yellow oleander (Thevetia
Peruviana) Seeds in Kenya, Food Science and Quality Management,
http://pakacademicsearch.com/pdf-files/agr/525/8894%20Vol%2022,%20
Issue%201%20%282013%29.pdf. Web accessed, October 2014.
Omondi C.O. (2008). Coffee quality assessment: the case of two Kenyan
cultivars, Ruiru 11 and SL28. In Proceedings of the 22nd ASIC
International Coffee Conference, Campinas, Brasil, Pg 1307–1311.
Ooko O.G. (2011). Coffee Development Fund. Asset Financing the Coffee Sub-Sector in
Kenya. Coffee Development Fund at the 8th EAFCA Conference: Arusha, Tanzania,
February 2011. http://www.eafca.org/wwc/downloads/AFCCE08/presentations/
George%20O.%20Ooko%20-Asset%20Financing%20The%20Coffee%20Sub-
Sector%20in%20Kenya.pdf Web accessed, January 2012.
Opile, W. R. and Agwanda, C. O. (1993). Propagation and distribution of cultivar Ruiru 11 (A
review). Kenya Coffee, 58: 1496-1508.
Ortiz, A., Veja, F. E. and Posada, F. (2004). Volatile composition of coffee berries at different
stages of ripeness and their possible attraction to the coffee berry borer Hypothenemus

DEDAN KIMATHI UNIVERSITY OF
TECHNOLOGY
112
hampei (Coleoptera: Curculionidae). Journal of Agriculture Food Chemistry, 52,
5914–5918.
Patrick, K. (2005). Kenya coffee. Royal news, June 2005. https://www.sweetmarias.com/
kenya_writeup_royal.pdf. Web accessed, December, 2013.
Patui, S., Clincon, L., Peresson, C., Zancani, M., Conte, L., Del Terra, L., Navarini, L.,
Vianello, A., and Braidot, E. (2014). Lipase activity and antioxidant capacity in coffee
(Coffea arabica L.) seeds during germination. Plant Science, 219– 220: 19– 25
Perrone D., Marino D. C. and Farah A. (2008). Fast simultaneous analysis of caffeine,
trigonelline, nicotinic acid and sucrose in coffee by liquid chromatography–mass
spectrometry. Journal of Food Chemistry, 110:1030–1035.
Petisca, C., Pérez-Palaciosa, T., Farah, A., Pinhoa, O. and Ferreira, I.M. (2013). Furans and
other volatile compounds in ground roasted and espresso coffee using headspace solid-
phase microextraction: Effect of roasting speed, Food and bioproducts processing, 91:
233–241
Pons, A. Richet, C. Robbe, C. Herrmann, A. Timmerman, P. Huet, G. Leroy, Y. Carlstedt, I.
Capon, C. Zanetta, J. (2003). Sequential GC/MS analysis of sialic acids,
monosaccharides, and amino acids of glycoproteins on a single sample as
heptafluorobutyrate derivatives, Journal of Biochemistry, 42: 8342–8353.
Procida, G. Campisi, B., Seraglia, R. and Traldi, P. (2003). Classification of green coffee
beans by differences in protein composition obtained by matrix-assisted laser
desorption/ionization mass spectrometry
Ramalakshmi, K and Raghavan, B. (2000). Caffeine in Coffee: It’s Removal. Why and How.
Critical Reviews in Food Science and Nutrition, 39: 441-56
Ribeiro, J.S., Augusto, F., Salva, T.J.G., Thomaziello, R.A. and Ferreira M. M. C. (2009).
Prediction of sensory properties of Brazilian Arabica roasted coffees by headspace
Solid Phase Microextraction-Gas Chromatography and partial least squares, Analytical
Chemical Acta 634: 172–179
Richelle, M., Tavazzi, I. and Offord E. (2001). Comparison of the Antioxidant Activity of
Commonly Consumed Polyphenolic Beverages (Coffee, Cocoa, and Tea) Prepared per
Cup Serving. Journal of Agriculture and Food Chemistry 49: 3438-3442
Roa, G., Oliveros, C. E., Alvarez, J., Sanz, J. R., Ramirez, C A., Dávila, M. T., Alvarez, J. R.,
Zambrano, D. A., Puerta, G. I., Rodriguez, N. (2012). Ecological Processing of Coffee
at the Farm Level. Cenicafe. http://www.ctahr.hawaii.edu/hawaii/
downloads/Low_Water_use_processing.pdf. Web accessed, January 2012.
Rodrigues, C. I, Maia, R. and Máguas, C. (2010). Comparing total nitrogen and crude protein
content of green coffee beans (coffea spp.) from different geographical origins, Coffee
Science, Lavras, 5(3): 197-205.

DEDAN KIMATHI UNIVERSITY OF
TECHNOLOGY
113
Santos, E.E, Lauria, D.C and Porto, da Silveria C.L. (2004). Assessment of daily intake of
trace elements due to consumption of food stuffs by adult inhabitants of Rio de Janeiro
city. Science, Total Env 327: 69-79.
Selmar, D., Bytof, G., and Knopp, S.-E. (2008). The storage of green coffee (Coffea arabica):
Decrease of viability and changes of potential aroma precursors. Annals of Botany,
101, 31–38.
Semmelroch, P. and Grosch, W: (1995). Analysis of roasted coffee powders and brews by gas
chromatography-olfactometry of headspace samples. LWT Food Science Technology,
28:310–313.
Schwan, R.S., Silva, F.C. and Batista R.L. (2012). Coffee fermentation. Handbook of plant-
Based Fermented Food and Beverage Technology Second Edition, by Hui Y.H and
Evranuz E.O. Pg 677-687.
Subedi, R. N. (2011). Comparative analysis of dry and wet processing of coffee With respect
to quality and cost in Kavre district, Nepal: a Case of Panchkhal village. International
Resear. Journal of Applied and Basic Science, 2 (5):181-193.
Tawfik, M.S. and El Bader, N.A. (2005). Chemical characterization of Harar and Berry coffee
beans with special reference to roasting effect. Journal of Food Technology, 3(4): 601-
604.
Thiago, V. P., Rose, G. A. P., Jefferson, L. G. C. and Jack, R. S. (2009). Roasting processing
of dry coffee cherry: influence of grain shape and temperature on physical, chemical
and sensorial grain properties. B.Ceppa, Curitiba 27(1) 97-106.
Toci, A. T., and Farah, A. (2008). Volatile compounds as potential defective coffee seeds’
markers. Journal of Food Chemistry, 108, 1133–1141.
Toci, A. T., Neto, V. J. F. M., Torres, A. G., Calado, V. and Farah, A. (2008).
Tryacylglicerols changes during the storage of roasted coffee. Proceeding 22nd
International Conference Coffee Science, ASIC. Campinas, SP, Brazil, 504–507.
Toci, A. T. Neto, V.J.M.F., Torres, A.G. and Farah, A. (2012). Changes in triacylglycerols
and free fatty acids composition during storage of roasted coffee,
http://dx.doi.org/10.1016/j.lwt.2012.08.007. Web accessed, March 2015.
Tohda, C., Kuboyama, T., and Komatsu, K. (2005). Search for natural products related to
regeneration of the neuronal network. Neurosignals, 14, 34–45.
Trugo, L. C. (2003). Analysis of coffee products. In B. Caballero, L. C. Trugo, and P. M.
Finglas (Eds.) (1st ed. Encyclopedia of food sciences and nutrition, Vol. 7, pg. 498.
Oxford: Academic Press.

DEDAN KIMATHI UNIVERSITY OF
TECHNOLOGY
114
Vaast, P, Bertrand, B, Perriot, J-J, Guyot, B and Genard, M (2006) Fruit thinning and shade
improve bean characteristics and beverage quality of coffee (Coffea arabica L.) under
optimal conditions. Journal of Science Food and Agriculture, 86(2): 197-204
Yener, S., Romano, A., Cappellin, L., Märk, D.T., Sánchez del Pulgar, J. Gasperi, F., Navarini
L. and Biasioli, F. (2014). PTR-ToF-MS characterisation of roasted coffees (C.
arabica) from different geographic origins. J. Mass Spectrom. 49: 929–935

DEDAN KIMATHI UNIVERSITY OF
TECHNOLOGY
115
APPENDIX 1
Coffee Harvesting and Sorting
Wet processing
Method Manual Hand
pulping method
Eco-pulping method
Pulping with grading
– P1, P2, Lights
Manual grading- Heavy
and lights
Grading before pulping –
Heavy and lights
Fermentation Fermentation Mechanical removal
Washing and grading
– P1, P2, P3, Lights
Washing and grading –
P1, P2, P3, Lights Washing without grading
Drying
Coffee cherry processing

DEDAN KIMATHI UNIVERSITY OF
TECHNOLOGY
116
APPENDIX 2
Presentation 1: Comparison of the protein profiles of 3 different coffee varieties. A:
conillon vermelho (arabica) from Santa Helena-Caputira in Brazil; B: old paradenia
(robusta) from the Palthope estate in India: C: pacamara amarelo (arabica) from the Água
Limpa estate in Brazil. The spectra were generated on a Shimadzu Axima Confidence
mass spectrometer in linear positive mode from a pool of 10 green coffee beans (Brodel
O., Presentation, Wildau, 2013).
A
B
C

DEDAN KIMATHI UNIVERSITY OF
TECHNOLOGY
117
APPENDIX 3
Figure 13: Chromatograph of volatile compounds in green coffee analyzed by HS-
SPME-GCMS
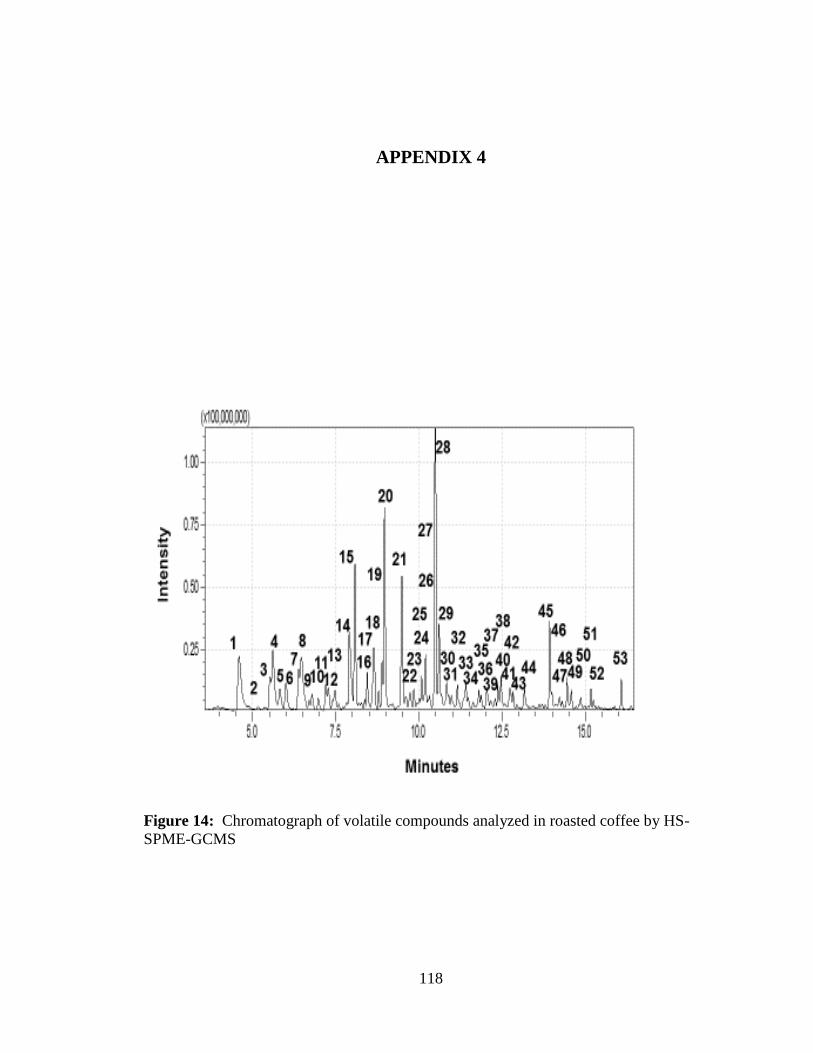
DEDAN KIMATHI UNIVERSITY OF
TECHNOLOGY
118
APPENDIX 4
Figure 14: Chromatograph of volatile compounds analyzed in roasted coffee by HS-
SPME-GCMS

DEDAN KIMATHI UNIVERSITY OF
TECHNOLOGY
119
APPENDIX 5
Photo 1: Coffee plant with red and green coffee cherries
Photo 3: Eco-pulper machine

DEDAN KIMATHI UNIVERSITY OF
TECHNOLOGY
120
Photo 4: Wet pulping machine
Photo 5: Manual pulping machine
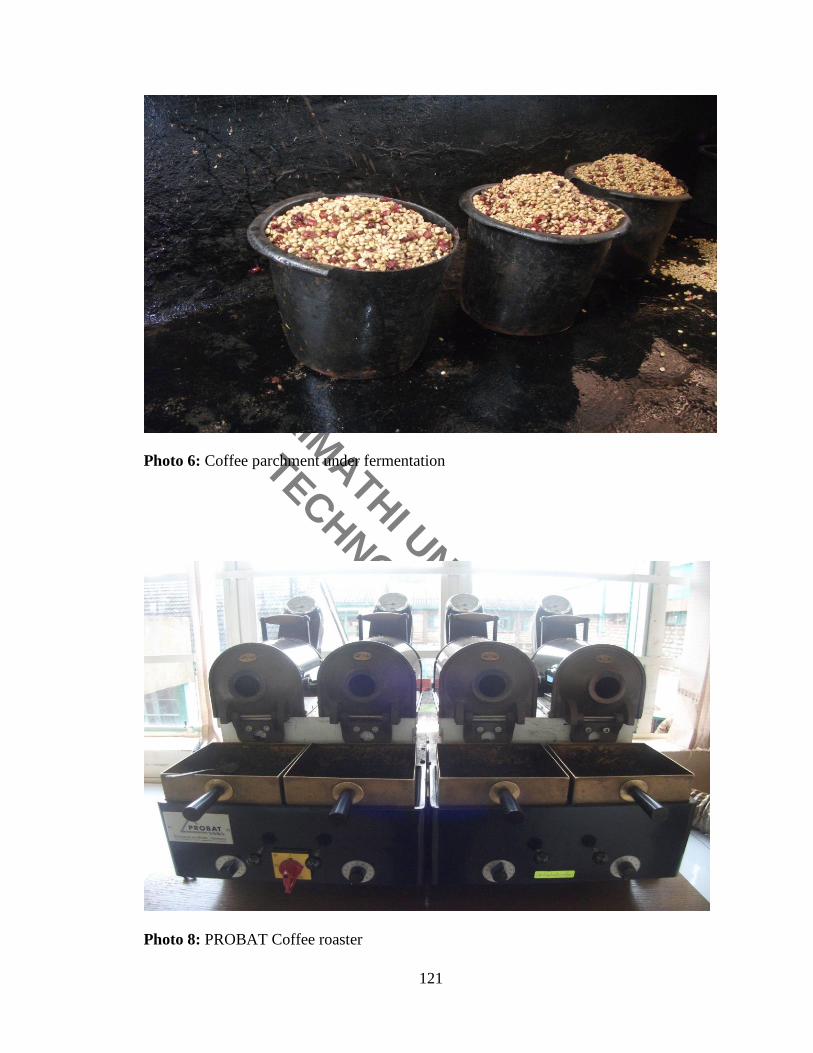
DEDAN KIMATHI UNIVERSITY OF
TECHNOLOGY
121
Photo 6: Coffee parchment under fermentation
Photo 8: PROBAT Coffee roaster

DEDAN KIMATHI UNIVERSITY OF
TECHNOLOGY
122
Photo 10: Brewed coffee for sensory analysis

DEDAN KIMATHI UNIVERSITY OF
TECHNOLOGY
123
APPENDIX 6
PUBLICATIONS
1. Kipkorir, R.K., Muhoho, S., Muliro, P. (2015). Effects of coffee processing
technologies on physico-chemical properties and sensory qualities of coffee, African
Journal of Food Science. 9 (4), 230-236.
ABSTRACT
The study aimed at comparing the effects of three coffee pulping methods on the physico-
chemical properties and sensory qualities of coffee. The coffee cherries were processed
by disc pulper, drum pulper and eco-pulper methods which varied on mode of operations
and mucilage removal methods. The coffee parchment were dried to moisture content of
10 + 1% and green coffee beans evaluated for parameters including moisture content,
mass, volume, density, pH, titratable acidity, protein, sucrose and lipids content of green
coffee beans. The parameters such as moisture, mass, volume and density were
determined by actual measurements. Protein was determine by Kjeldhal method, lipids
were extracted by Soxhlet method and sucrose extracted and determined by HPLC. The
pH showed some significant difference (p<0.05) between the treatments. There was no
significant difference on other parameters such as mass, volume, density and titratable
acidity, protein, lipids and sucrose. The processing methods showed similar levels on the
scores of sensory attributes analyzed by qualified panelist and the scores varied between
7.0 -10. The final quality was not significantly different between the processing methods
and no defects and faults noted in the samples. It was concluded that the three processing
methods do not vary on the levels of physico-chemical components of coffee and gives
similar characteristics on sensory attributes and final quality of coffee beverage.

DEDAN KIMATHI UNIVERSITY OF
TECHNOLOGY
124
2. Kipkorir, R., Muhoho, S., Muliro, P., Mugendi, B, Frohme, M. and Broedel, O. (2015).
Effects of coffee processing technologies on aroma profiles of Ruiru 11 and SL 28
Kenyan varieties, Asian Journal of Agriculture and Food Science, 3:178-188.
ABSTRACT
The study aimed at comparing the effects of three coffee processing methods on aroma
profiles and sensory quality of Ruiru 11 and SL 28 coffee varieties. The processing
methods varied on stages of processing and method of mucilage removal. The green
coffee beans obtained from the three processing methods were graded and roasted,
ground and analyzed for the aroma profiles and sensory quality. Headspace Solid phase
Microextraction fibre (SPME) technique were used for the extraction of aroma
compounds from coffee samples and characterization of the compounds with use of gas
chromatography mass spectrometry (GC-MS). Sensory quality were analyzed by an
expert panelist. Various volatile aroma compounds were identified in roasted coffee and
classified into their chemical classes involving furans, ketones, pyrazines ketones
pyridines, pyrroles and acids. The intensity of aroma compounds were compared in terms
of their peak areas and variations were noted between the processing methods with the
ecopulper showing higher levels of pyrazines such as 2-methylpyrazine, 2-ethyl-6-
methylpyrazine, and wet pulper showing higher levels of furans such as furfuryl formate
and furfuryl alcohol, acetate. The hand pulper was high in the level of acids and esters
such as acetic acid and propanoic acid, ethyl ester. Similar aroma compounds were
identified in headspace of Ruiru 11 and SL 28 and there were variations in the intensities
of aroma groups such as pyrroles and pyridines. It was concluded that the eco-pulper and
hand pulper methods gives better aroma quality than the wet pulper while SL 28 variety
gives higher sensory quality than Ruiru 11.