Kinetics of Fast and Slow Transitions in a Liquid Crystalline Polyimide
15
Kinetics of Fast and Slow Transitions in a Liquid Crystalline Polyimide PIETER VAN MOURIK BEN NORDER 1 EDUARDO MENDES STEPHEN J. PICKEN Delft University of Technology, Faculty of Applied Sciences, NanoStructured Materials, Julianalaan 136, 2628 BL Delft, The Netherlands T. J. DINGEMANS Delft University of Technology, Faculty of Aerospace Engineering, Fundamentals of Advanced Materials, Kluyverweg 1, 2629 HS Delft, The Netherlands (Received 25 October 2007 accepted 19 December 2007) Abstract: Liquid crystal polymers (LCPs) are known to exhibit slow and fast phase transitions upon heating and cooling. The kinetics of both types were investigated for an liquid crystal (LC) polyimide de- rived from pyromellitic dianhydride (PMDA) and 1,3-bis[4 -(4 -aminophenoxy) cumyl] benzene (BACB) (PMDA/BACB). The kinetics were compared with our previous results on poly(bistrifluorethoxyphospha- zene) (PBFP), which also shows LC and non-LC transitions, and with nylon PA6, a non-LC reference sam- ple. Transition kinetics were studied upon cooling using non-isothermal differential scanning calorimetry (DSC), wide angle X-ray diffraction (WAXD) and polarization microscopy. The DSC experiments were performed by cooling our samples from 400 to 100 C using rates between 2.5 and 100 K min 1 . We observed that the LC transitions show a linear dependency on the cooling rate. These transitions were solely governed by super-cooling and these observations are congruent with our earlier results on PBFP. Apparently, we may conclude that all LC transitions show this linear dependence. For PMDA/BACB, the fast LC transitions were related to the formation of a smectic phase. WAXD did not reveal a crystalline phase in PMDA/BACB. The non-LC transition was related to a thermally activated process, having an apparent activation energy, E A , of 360 kJ mol 1 , indicating a re-arrangement of chains previously ran- domly oriented. Crystallization could proceed after cooling from the melt to room temperature followed by annealing based on a thermally activated process, with E A 160 kJ mol 1 . Key Words: Kinetics, polyimide, liquid crystalline polymer High Performance Polymers, 00: 000–000, 2008 DOI:10.1177/0954008308089116 2008 SAGE Publications Figures 2–8 appear in color online: http://hip.sagepub.com High Performance Polymers OnlineFirst, published on March 4, 2008 as doi:10.1177/0954008308089116 Copyright 2008 by SAGE Publications.
-
Upload
independent -
Category
Documents
-
view
3 -
download
0
Transcript of Kinetics of Fast and Slow Transitions in a Liquid Crystalline Polyimide
Kinetics of Fast and Slow Transitions in a LiquidCrystalline Polyimide
PIETER VAN MOURIKBEN NORDER1
EDUARDO MENDESSTEPHEN J. PICKENDelft University of Technology, Faculty of Applied Sciences, NanoStructured Materials,Julianalaan 136, 2628 BL Delft, The Netherlands
T. J. DINGEMANSDelft University of Technology, Faculty of Aerospace Engineering, Fundamentals of AdvancedMaterials, Kluyverweg 1, 2629 HS Delft, The Netherlands
(Received 25 October 2007� accepted 19 December 2007)
Abstract: Liquid crystal polymers (LCPs) are known to exhibit slow and fast phase transitions uponheating and cooling. The kinetics of both types were investigated for an liquid crystal (LC) polyimide de-rived from pyromellitic dianhydride (PMDA) and 1,3-bis[4�-(4� �-aminophenoxy) cumyl] benzene (BACB)(PMDA/BACB). The kinetics were compared with our previous results on poly(bistrifluorethoxyphospha-zene) (PBFP), which also shows LC and non-LC transitions, and with nylon PA6, a non-LC reference sam-ple. Transition kinetics were studied upon cooling using non-isothermal differential scanning calorimetry(DSC), wide angle X-ray diffraction (WAXD) and polarization microscopy. The DSC experiments wereperformed by cooling our samples from 400 to 100 �C using rates between 2.5 and 100 K min�1. Weobserved that the LC transitions show a linear dependency on the cooling rate. These transitions weresolely governed by super-cooling and these observations are congruent with our earlier results on PBFP.Apparently, we may conclude that all LC transitions show this linear dependence. For PMDA/BACB, thefast LC transitions were related to the formation of a smectic phase. WAXD did not reveal a crystallinephase in PMDA/BACB. The non-LC transition was related to a thermally activated process, having anapparent activation energy, EA, of � 360 kJ mol�1, indicating a re-arrangement of chains previously ran-domly oriented. Crystallization could proceed after cooling from the melt to room temperature followedby annealing based on a thermally activated process, with EA � 160 kJ mol�1.
Key Words: Kinetics, polyimide, liquid crystalline polymer
High Performance Polymers, 00: 000–000, 2008 DOI:10.1177/0954008308089116
��2008 SAGE Publications
Figures 2–8 appear in color online: http://hip.sagepub.com
High Performance Polymers OnlineFirst, published on March 4, 2008 as doi:10.1177/0954008308089116
Copyright 2008 by SAGE Publications.
2 P. VAN MOURIK ET AL.
1. INTRODUCTION
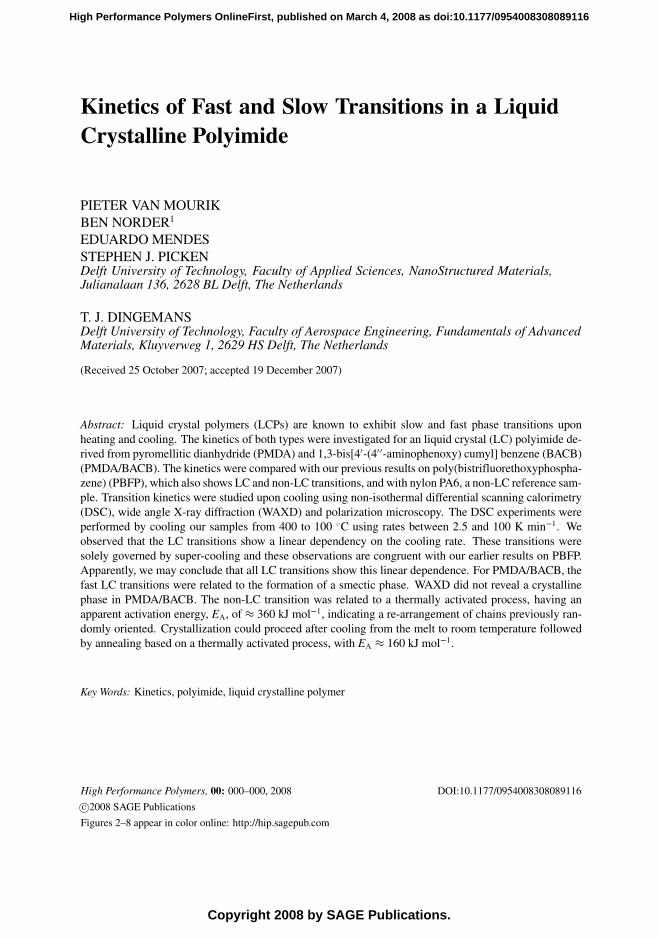
Main-chain all-aromatic thermotropic liquid crystal polymers (TLCPs) are a well knownclass of anisotropic polymers, which offer a variety of unique properties, including out-standing mechanical properties, solvent resistance, and easy processing. The industrialprocessing of main-chain liquid crystalline polymers (LCP) inevitably implies non-iso-thermal conditions. Thus the non-isothermal kinetics of the phase transitions is impor-tant from both an industrial as well as a scientific point of view. The applications ofTLCPs, however, largely rely on the nearly instantaneous character of the changes oftheir liquid crystallinity at the application temperature. The kinetics of the liquid crystalphase transitions remains largely unexplored as is demonstrated by the polyimide derivedfrom pyromellitic dianhydride (PMDA) and 1,3-bis[4�-(4��-aminophenoxy) cumyl] ben-zene (BACB) [1–4], denoted by us as PMDA/BACB polyimide (I).
Differential scanning calorimetry (DSC) experiments on this polymer by Liu et al. [2,4] showed, upon cooling, the presence of three exothermic events at T(2), T(i) and T(1){with T(2) � T(i) � T(1)}. Liu et al. concluded that T(2) and T(i) were related with liq-uid crystal transitions, whereas T(1) was linked with a thermally activated solidificationprocess [4]. In addition, the authors demonstrated that PMDA/BACB (I) showed a dou-ble solidification process. They interpreted their findings by considering solidificationfrom oriented LC domains and from un-oriented amorphous regions of the sample. Thesolidification of the amorphous domains is much slower and highly dependent on the ap-plied thermal conditions. The foregoing strongly suggests that by taking the DSC coolingrate as an independent variable, the dependency of the LC transition temperatures on thecooling rate will differ from that of the non-LC transition temperatures. Being related toalready well-aligned polymer chains, one expects on cooling that the LC transition tem-perature will solely be determined by the temperature of the polymer, which gives riseto a linear relationship between the LC transition temperatures and the DSC cooling rate(i.e. the LC transition is always fast compared to the set DSC cooling rate). In the caseof non-LC transitions, these will always be slow in comparison with the set DSC coolingrate.
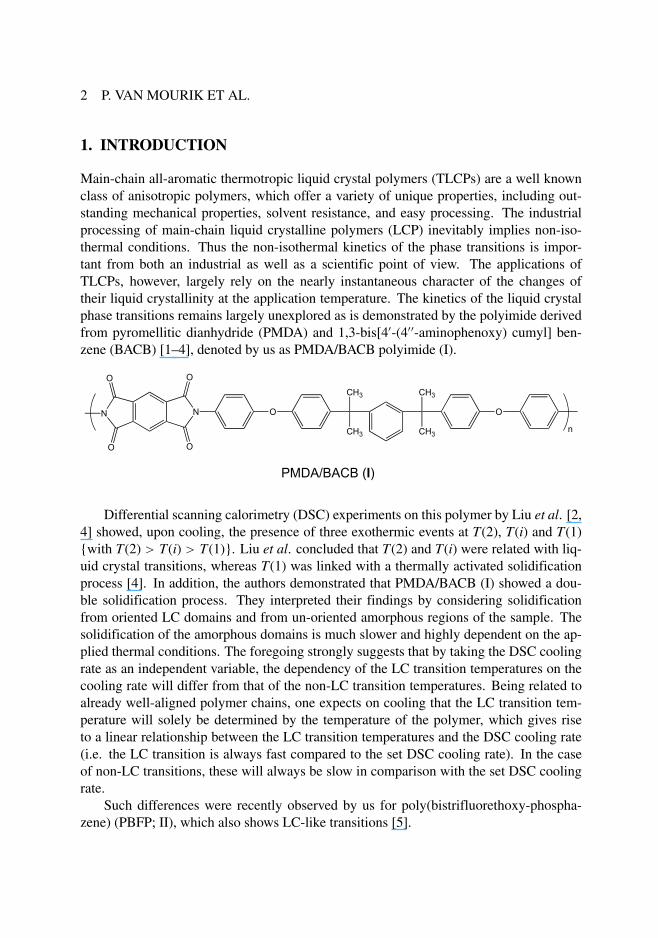
Such differences were recently observed by us for poly(bistrifluorethoxy-phospha-zene) (PBFP� II), which also shows LC-like transitions [5].
KINETICS OF FAST AND SLOW TRANSITIONS IN AN LCP 3
At an upper transition temperature (Tu � 227 �C), PBFP transforms from the isotropicmelt into a two-dimensionally ordered mesophase (denoted as a 2D-mesophase). At alower transition temperature (T l � 67�C) PBFP transforms from the 2D-mesophase intothe final fully crystalline phase. On cooling the upper solidification temperature Tu ap-pears to decrease as a function of the cooling rate. This was interpreted as being due to athermally activated process, i.e. the long-range chain diffusion in the isotropic melt. Thetransition at the lower temperature T l could be understood as a super-cooling event with alinear dependence on the cooling rate. Two questions remain to be answered.
1. Whether or not, the LC transition temperature on cooling will always be solely deter-mined by the temperature of the polymer. If so, a linear relationship holds between LCtransition temperatures and the DSC cooling rate (i.e. the LC transition is always fastin comparison with the set DSC cooling rate).
2. Whether or not, the non-LC transitions on cooling will always be slow in comparisonwith the set DSC cooling rate and can be described as thermally activated processes.
PMDA/BACB polyimide and PBFP largely differ in chemical structure, but both doshow LC and non-LC transitions. If it appears that their behavior on DSC cooling is analo-gous, general conclusions can safely be obtained regarding LC and non-LC transitions. Tostudy the above questions the transition temperatures of the PMDA/BACB polyimide (I)were measured as a function of the DSC cooling rate on the basis of new non-isothermalexperiments. Whether or not the applied cooling rates could provoke a linear relation ofthe solidification temperature with the cooling rate for a non-LC semi-crystalline poly-mer was investigated by subjecting nylon PA6 to the same cooling rates as PMDA/BACBpolyimide (I). PA6 was chosen in view of its solidification temperature, which is rathersimilar to that of our PMDA/BACB polyimide model compound.
2. EXPERIMENTAL PROCEDURES
2.1. Optical microscopy and X-ray diffraction
The PMDA/BACB thermotropic liquid crystalline polyimide (I) was obtained from MitsuiChemicals and used as received. Some relevant data is summarized in table 1 [1, 6]. (forsynthetic details see [1, 4]).
To obtain information about micro-structural changes, optical polarization microscopyanalysis (Nikon equipped with a Linkam hot-stage) was performed. The heating and cool-ing rates applied were about 10 K min�1 with a Tmax = 350 �C. X-ray diffraction (XRD)
4 P. VAN MOURIK ET AL.
Table 1. Thermal data for PMDA/BACB thermotropic polyimide (I).
Event ReferenceGlass-transition 216 [6]T(1) on cooling 244 [1]T(2) on cooling 289 [1]
experiments were performed using a Bruker AXS D8 Discover X-ray diffractometer usingCuK�-radiation filtered by cross-coupled Göbbel mirrors at 40 kV and 40 mA. The dif-fractometer was equipped with a hot-stage and the sample under investigation was heatedto a temperature of 350 �C and then cooled down in the apparatus until a set temperaturewas reached. After the X-ray diffractogram was collected the following set temperaturewas reached by further cooling of the same sample. The temperatures were chosen suchthat the temperature range varied from 350 to 200 �C with most intervals equalling 10 �Cor less when appropriate. The diffraction angle 2� was between 0 and about 25�.
2.2. Differential scanning calorimetry
The DSC experiments were performed on a Perkin Elmer DSC-7 apparatus. To avoidpossible effects of thermal history on the measurements with the cooling rate as an in-dependent variable, cooling took always place after at least one completed melting, i.e.heating for at least 2 min at a temperature well above the upper melting temperature. Thisalso allowed for measuring possible changes of the lower transition temperature duringa repeated heating experiment. The DSC experiments were performed between 400 and100 �C. The specimen mass (7.75 mg) appeared to be unchanged after the measurements.Measurements on two other samples were performed to check the reproducibility. In or-der to study possible effects of the thermal annealing, namely time and temperature, in theisotropic phase, some DSC cooling measurements were also performed between 320 and400 �C for different annealing times up to 60 min. The cooling rates varied from 2.5 to100 K min�1. The applied heating rate was always 10 K min�1. For comparison purposestwo PA6 specimens were studied: A (mass 1.85 mg) and B (mass 2.11 mg). For PA6 thetemperature range was selected to be between 250 and 125 �C. No mass loss could beobserved after performing the DSC measurements. Details of the measurement procedurewere described elsewhere [5].
3. RESULTS AND DISCUSSION
3.1. X-ray diffraction experiments
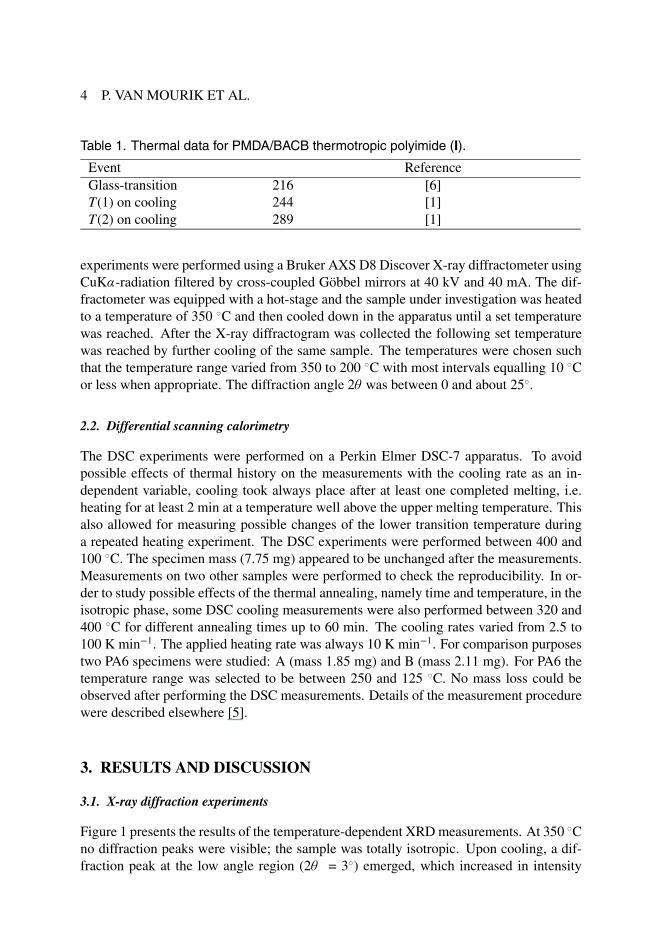
Figure 1 presents the results of the temperature-dependent XRD measurements. At 350 �Cno diffraction peaks were visible� the sample was totally isotropic. Upon cooling, a dif-fraction peak at the low angle region (2� = 3�) emerged, which increased in intensity
KINETICS OF FAST AND SLOW TRANSITIONS IN AN LCP 5
Figure 1. WAXD patterns of PMDA/BACB polyimide (I) at various temperatures.
on cooling from 310 down to 280 �C. The broad peak observed at the wide-angle region(2� = 19�) is indicative of liquid-like in-plane order of the mesogens within the layers,which is typically observed for lower order Smectic phases. The XRD results stronglysuggest the presence of a Smectic-A mesophase [2, 4], which was confirmed by opticalmicroscopy, where we observed textures indicating the presence of a Smectic-A phase.
It has to be noted that we did not observe crystallization upon cooling to room tem-perature. The sample formed a frozen Smectic phase, or Smectic glass, and no conditionscould be found under which we could quench the sample in an amorphous state. In con-tradiction to the literature, no other mesophases could be detected by us. Liu et al. alsoreported a nematic phase at temperatures between 298 and 345 �C [2] with temperatureT(3) indicating the transition to the isotropic state. On heating and on cooling no evidenceof a nematic phase was found at temperatures above 300 �C.
3.2. DSC results on LC and non-LC transitions
Table 2 summarizes our DSC results for PMDA/BACB polyimide (I) obtained on cooling(see also figures 3–5) and the data of Liu et al. [4].
In all cases the peaks of T(1) and T(2) were sufficiently separated to allow the mea-surement of the peak area. The DSC measurements were routinely performed between
6 P. VAN MOURIK ET AL.
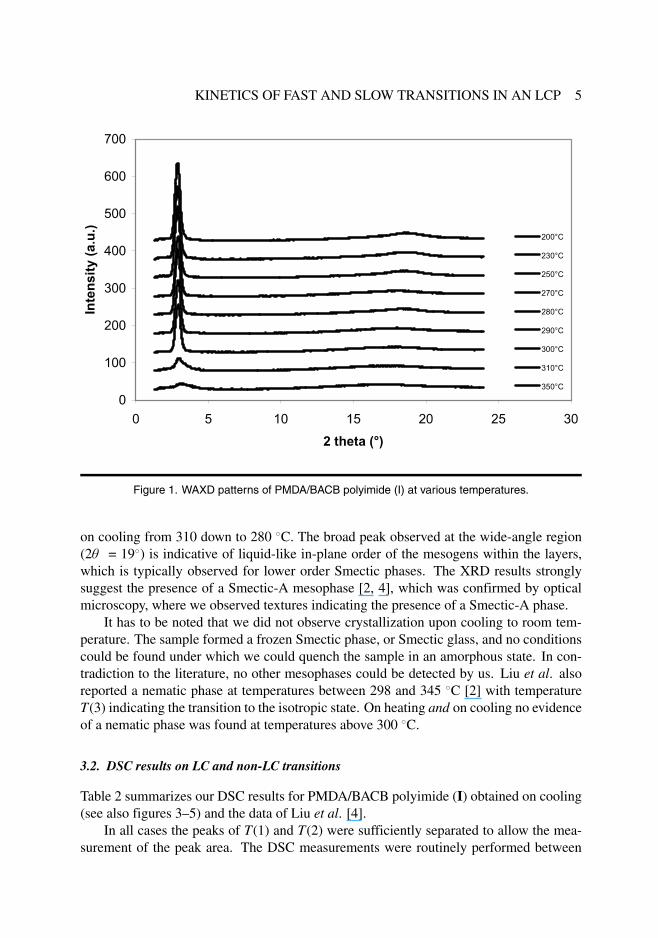
Figure 2. PMDA/BACB polyimide (I) and Nylon PA6: DSC curves taken at a cooling rate of 10 K min�1.
Table 2. DSC results for PMDA/BACB polyimide (I) on cooling compared to resultsfrom [4].
Cooling T �1� T ��� T �2�rate peak �H peak �H peak �H �T = T(2) – T(1)(K min�1) � 1 �C J g�1 � 1 �C J g�1 � 1 �C J g�1 � 2 �C100 221 –7.4 252 –0.3 269 –4.5 4880 [4] 234 –6.8 268 –0.1 284 –4.0 5050 234 –8.1 263 –0.8 279 –5.3 4540 [4] 239 –8.7 273 –0.6 287 –5.1 4825 240 –9.5 266 –0.8 283 –5.4 4320 [4] 244 –10.0 277 –1.3 291 –5.8 4610 245 –10.5 269 –0.7 286 –5.6 4110 246 –10.2 266 –0.6 285 –5.3 3910 247 –9.4 264 –0.3 284 –5.3 3710 [4] 248 –11.6 279 –1.3 292 –5.7 455 250 –10.9 267 –0.5 286 –5.4 365 [4] 251 –12.4 279 –1.4 293 –5.9 422.5 253 –12.1 267 –0.6 286 –5.6 33
400 and 100 �C. To study the effect of a variation in isotropic conditions, DSC measure-ments using a cooling rate of 10 K min�1 were performed after 2 min heating at 320 �Cand after 15 and 60 min heating at 400 �C. No effects on the isotropic annealing conditionscould be observed. Figure 2 shows examples of the DSC curves obtained on cooling forthe PMDA/BACB polyimide (I) and nylon PA6.
KINETICS OF FAST AND SLOW TRANSITIONS IN AN LCP 7
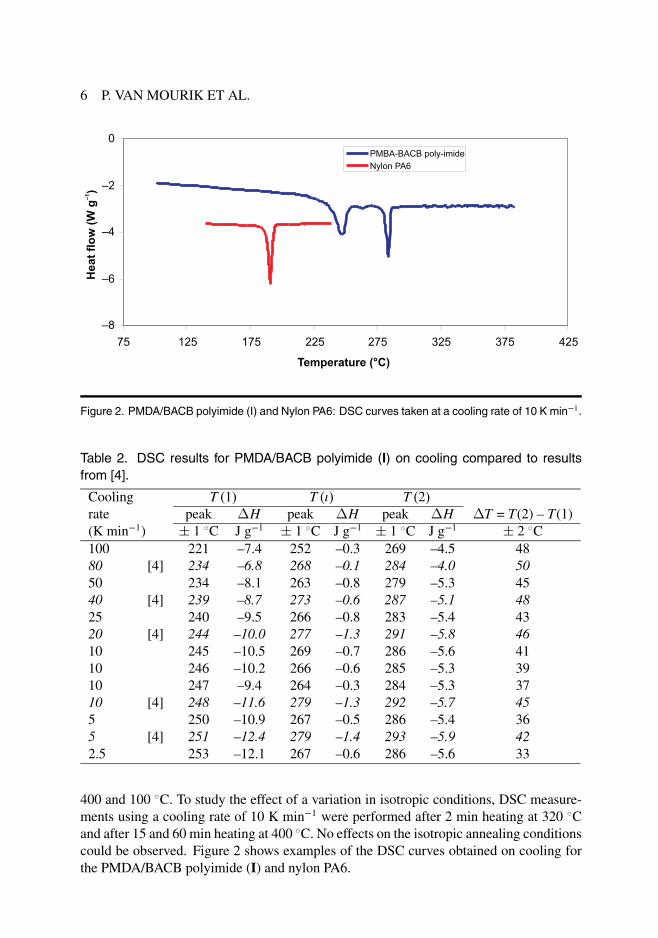
Figure 3. PMDA/BACB polyimide: T �2� as a function of the cooling rate.
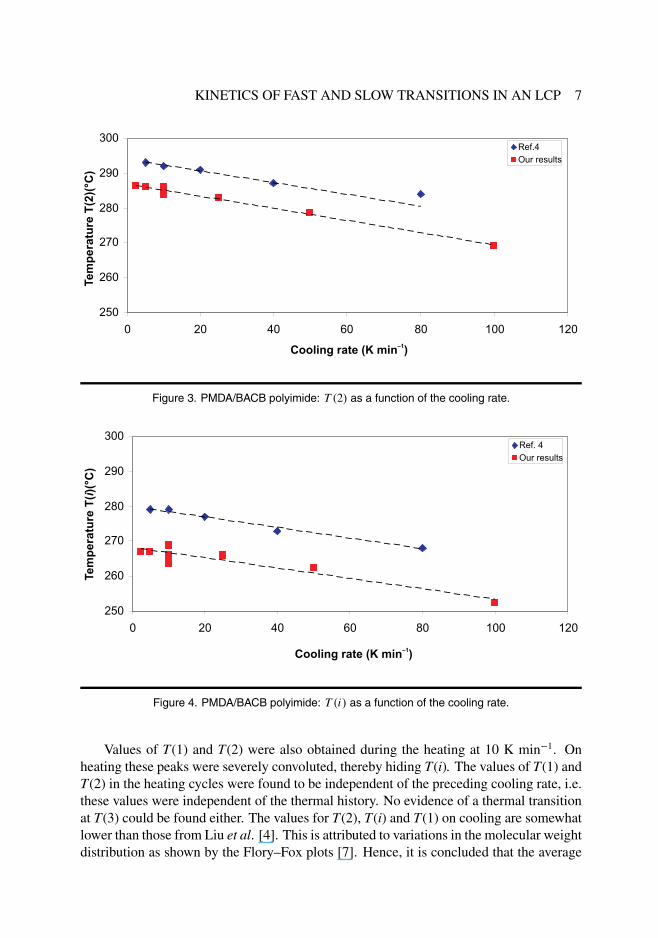
Figure 4. PMDA/BACB polyimide: T �i� as a function of the cooling rate.
Values of T(1) and T(2) were also obtained during the heating at 10 K min�1. Onheating these peaks were severely convoluted, thereby hiding T(i). The values of T(1) andT(2) in the heating cycles were found to be independent of the preceding cooling rate, i.e.these values were independent of the thermal history. No evidence of a thermal transitionat T(3) could be found either. The values for T(2), T(i) and T(1) on cooling are somewhatlower than those from Liu et al. [4]. This is attributed to variations in the molecular weightdistribution as shown by the Flory–Fox plots [7]. Hence, it is concluded that the average
8 P. VAN MOURIK ET AL.
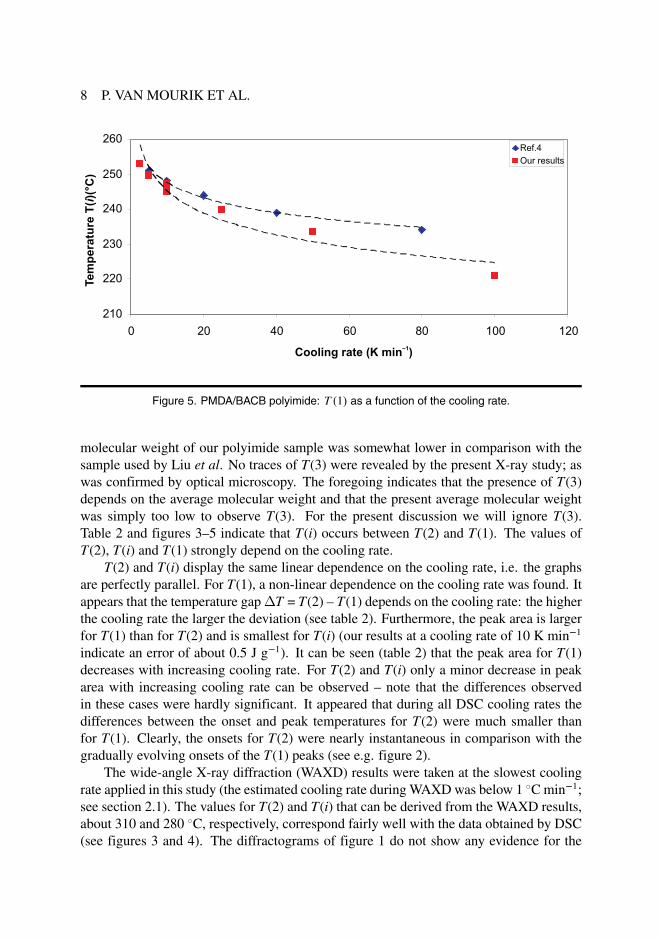
Figure 5. PMDA/BACB polyimide: T �1� as a function of the cooling rate.
molecular weight of our polyimide sample was somewhat lower in comparison with thesample used by Liu et al. No traces of T(3) were revealed by the present X-ray study� aswas confirmed by optical microscopy. The foregoing indicates that the presence of T(3)depends on the average molecular weight and that the present average molecular weightwas simply too low to observe T(3). For the present discussion we will ignore T(3).Table 2 and figures 3–5 indicate that T(i) occurs between T(2) and T(1). The values ofT(2), T(i) and T(1) strongly depend on the cooling rate.
T(2) and T(i) display the same linear dependence on the cooling rate, i.e. the graphsare perfectly parallel. For T(1), a non-linear dependence on the cooling rate was found. Itappears that the temperature gap�T = T(2) – T(1) depends on the cooling rate: the higherthe cooling rate the larger the deviation (see table 2). Furthermore, the peak area is largerfor T(1) than for T(2) and is smallest for T(i) (our results at a cooling rate of 10 K min�1
indicate an error of about 0.5 J g�1). It can be seen (table 2) that the peak area for T(1)decreases with increasing cooling rate. For T(2) and T(i) only a minor decrease in peakarea with increasing cooling rate can be observed – note that the differences observedin these cases were hardly significant. It appeared that during all DSC cooling rates thedifferences between the onset and peak temperatures for T(2) were much smaller thanfor T(1). Clearly, the onsets for T(2) were nearly instantaneous in comparison with thegradually evolving onsets of the T(1) peaks (see e.g. figure 2).
The wide-angle X-ray diffraction (WAXD) results were taken at the slowest coolingrate applied in this study (the estimated cooling rate during WAXD was below 1 �C min�1�see section 2.1). The values for T(2) and T(i) that can be derived from the WAXD results,about 310 and 280 �C, respectively, correspond fairly well with the data obtained by DSC(see figures 3 and 4). The diffractograms of figure 1 do not show any evidence for the
KINETICS OF FAST AND SLOW TRANSITIONS IN AN LCP 9
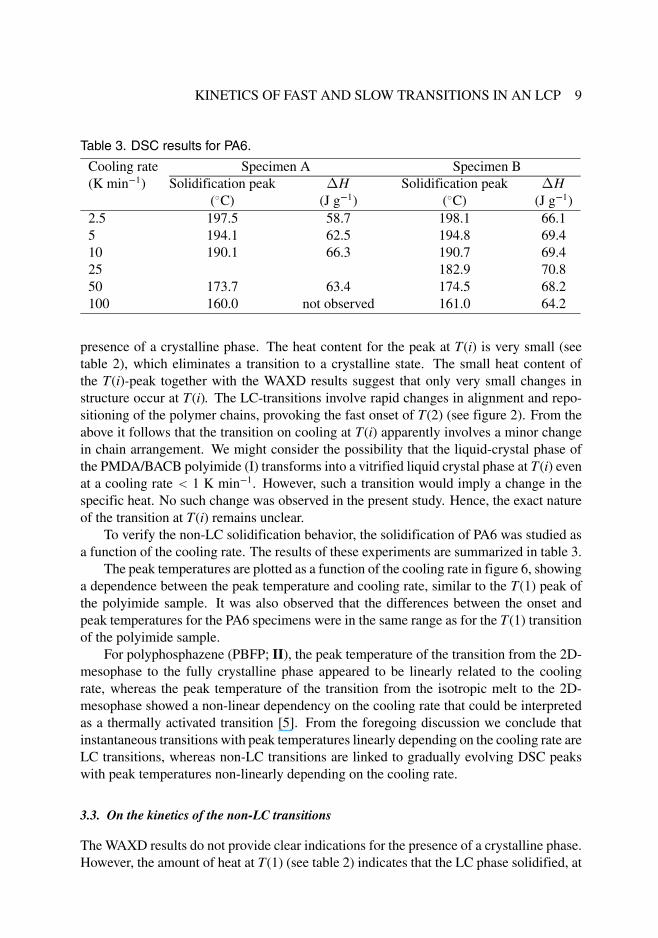
Table 3. DSC results for PA6.
Cooling rate Specimen A Specimen B(K min�1) Solidification peak �H Solidification peak �H
(�C) (J g�1) (�C) (J g�1)2.5 197.5 58.7 198.1 66.15 194.1 62.5 194.8 69.410 190.1 66.3 190.7 69.425 182.9 70.850 173.7 63.4 174.5 68.2100 160.0 not observed 161.0 64.2
presence of a crystalline phase. The heat content for the peak at T(i) is very small (seetable 2), which eliminates a transition to a crystalline state. The small heat content ofthe T(i)-peak together with the WAXD results suggest that only very small changes instructure occur at T(i). The LC-transitions involve rapid changes in alignment and repo-sitioning of the polymer chains, provoking the fast onset of T(2) (see figure 2). From theabove it follows that the transition on cooling at T(i) apparently involves a minor changein chain arrangement. We might consider the possibility that the liquid-crystal phase ofthe PMDA/BACB polyimide (I) transforms into a vitrified liquid crystal phase at T(i) evenat a cooling rate � 1 K min�1. However, such a transition would imply a change in thespecific heat. No such change was observed in the present study. Hence, the exact natureof the transition at T(i) remains unclear.
To verify the non-LC solidification behavior, the solidification of PA6 was studied asa function of the cooling rate. The results of these experiments are summarized in table 3.
The peak temperatures are plotted as a function of the cooling rate in figure 6, showinga dependence between the peak temperature and cooling rate, similar to the T(1) peak ofthe polyimide sample. It was also observed that the differences between the onset andpeak temperatures for the PA6 specimens were in the same range as for the T(1) transitionof the polyimide sample.
For polyphosphazene (PBFP� II), the peak temperature of the transition from the 2D-mesophase to the fully crystalline phase appeared to be linearly related to the coolingrate, whereas the peak temperature of the transition from the isotropic melt to the 2D-mesophase showed a non-linear dependency on the cooling rate that could be interpretedas a thermally activated transition [5]. From the foregoing discussion we conclude thatinstantaneous transitions with peak temperatures linearly depending on the cooling rate areLC transitions, whereas non-LC transitions are linked to gradually evolving DSC peakswith peak temperatures non-linearly depending on the cooling rate.
3.3. On the kinetics of the non-LC transitions
The WAXD results do not provide clear indications for the presence of a crystalline phase.However, the amount of heat at T(1) (see table 2) indicates that the LC phase solidified, at

10 P. VAN MOURIK ET AL.
Figure 6. Nylon PA6: The solidification peak temperature T (s) as a function of the cooling rate.
least partly, into a semi-crystalline phase. Solidification processes inevitably imply ther-mally activated polymer chain rearrangement yielding a non-linear relation between thepeak temperature and the cooling rate, as observed for T(1) for PMDA/BACB polyimide(I) and indeed for PA6 (figures 5 and 6). This is corroborated by the results of Liu etal. [2, 4] indicating that the kinetics of the slow solidification/crystallization is stronglyinfluenced by the thermal conditions. For the study of these thermal conditions basicallytwo different approaches can be applied.
A. Cooling at a certain rate from an ‘isotropic’ temperature down to room temperature:the transformation underlying T(1) proceeds non-isothermally.
B. Cooling at a certain rate from an ‘isotropic’ temperature down to room temperature:Crystallization isothermally proceeds at an annealing temperature Ta rather far belowthe melting temperatures for a given annealing time ta.
3.3.1. Non-isothermal transitions
For non-isothermal conditions (A), an analysis of transitions involved can be based on theKissinger equation [8, 9]:
d
�ln
T 2p
� �
�
d
�1
Tp
� � �EA
R(1)

KINETICS OF FAST AND SLOW TRANSITIONS IN AN LCP 11
Figure 7. PMDA/BACB polyimide: ln�T �1��2�� as a function of the reciprocal temperature.
Assuming one single process of transition, and assuming that the relevant thermodynamicand kinetic parameters are constant within the temperature range studied and that thepeak temperature corresponds to a fixed stage of the thermally activated transition, thisequation relates the peak temperature with the applied cooling rate. When valid, plottingln(Tp)2/�� versus 1/Tp gives a straight line, the slope of which yields a value of the ap-parent activation energy EA. The kinetics of crystallization of a semi-crystalline polymer,like PA6, shows two competing effects. At small super-cooling the nucleation-rate gov-erns the crystallization, whereas at large super-cooling chain mobility is rate determining.This chain mobility is strongly related to the melt viscosity. These two competing effectsmaximize the crystallization rate at temperatures typically about 10–30 �C below the melt-ing temperature and they bring this rate to zero at about the glass transition temperatureTg [10].
Suppose that for PMDA/BACB polyimide (I) T(1) corresponds to a fixed transitionstage, the Kissinger analysis could be applied to our DSC results and the results from Liuet al. [4], see figure 7. Note that our data points and those from Liu et al. [4] can begrouped along two straight parallel lines, except the point corresponding to the coolingrate of 100 K min�1. Apparently the assumptions inherent in the Kissinger equation arenot valid for this cooling rate.
The slope of the lines through the data points yields an apparent activation energyof about 360 kJ mol�1. The value of T(1) observed on cooling at 100 K min�1 differsconsiderably from the corresponding value obtained at 2.5 K min�1. It has to be noted,that the peak temperature observed during cooling at 100 K min�1 is close to the reportedvalue for the glass transition temperature (see table 1: 216 �C).
12 P. VAN MOURIK ET AL.
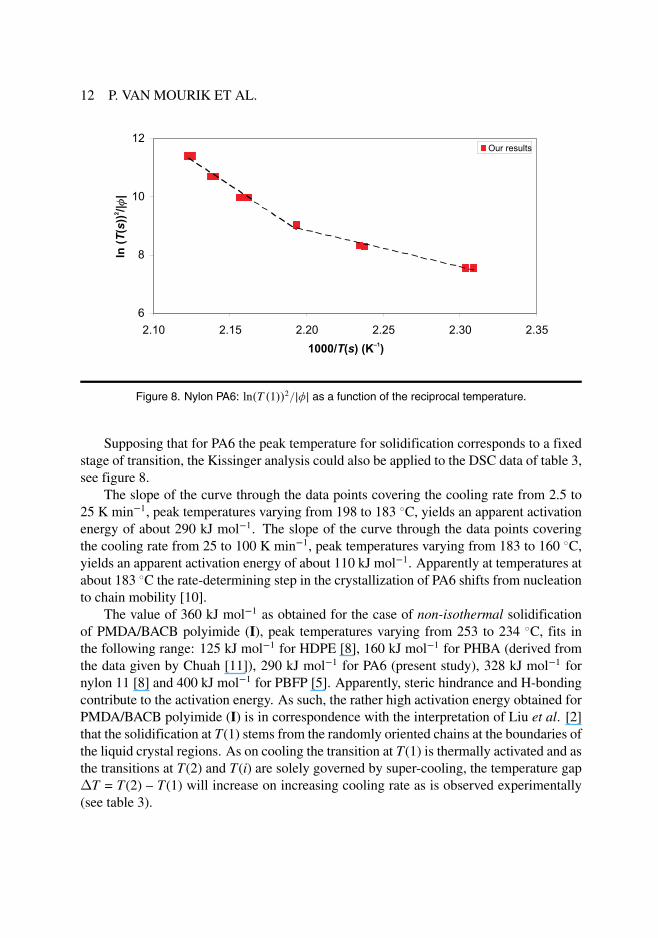
Figure 8. Nylon PA6: ln�T �1��2�� as a function of the reciprocal temperature.
Supposing that for PA6 the peak temperature for solidification corresponds to a fixedstage of transition, the Kissinger analysis could also be applied to the DSC data of table 3,see figure 8.
The slope of the curve through the data points covering the cooling rate from 2.5 to25 K min�1, peak temperatures varying from 198 to 183 �C, yields an apparent activationenergy of about 290 kJ mol�1. The slope of the curve through the data points coveringthe cooling rate from 25 to 100 K min�1, peak temperatures varying from 183 to 160 �C,yields an apparent activation energy of about 110 kJ mol�1. Apparently at temperatures atabout 183 �C the rate-determining step in the crystallization of PA6 shifts from nucleationto chain mobility [10].
The value of 360 kJ mol�1 as obtained for the case of non-isothermal solidificationof PMDA/BACB polyimide (I), peak temperatures varying from 253 to 234 �C, fits inthe following range: 125 kJ mol�1 for HDPE [8], 160 kJ mol�1 for PHBA (derived fromthe data given by Chuah [11]), 290 kJ mol�1 for PA6 (present study), 328 kJ mol�1 fornylon 11 [8] and 400 kJ mol�1 for PBFP [5]. Apparently, steric hindrance and H-bondingcontribute to the activation energy. As such, the rather high activation energy obtained forPMDA/BACB polyimide (I) is in correspondence with the interpretation of Liu et al. [2]that the solidification at T(1) stems from the randomly oriented chains at the boundaries ofthe liquid crystal regions. As on cooling the transition at T(1) is thermally activated and asthe transitions at T(2) and T(i) are solely governed by super-cooling, the temperature gap�T = T(2) – T(1) will increase on increasing cooling rate as is observed experimentally(see table 3).
KINETICS OF FAST AND SLOW TRANSITIONS IN AN LCP 13
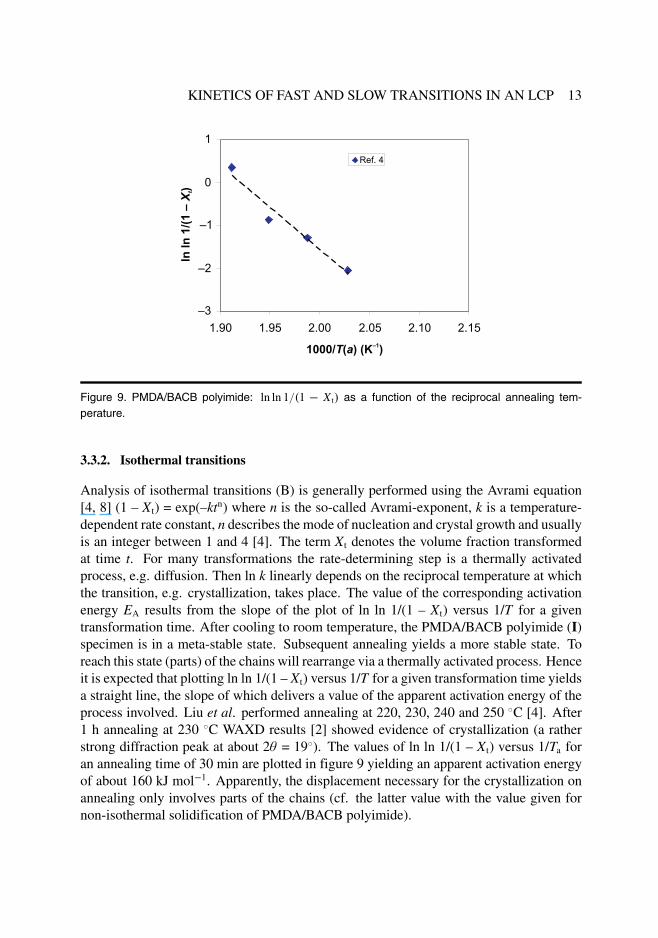
Figure 9. PMDA/BACB polyimide: ln ln 1�1 � X t� as a function of the reciprocal annealing tem-perature.
3.3.2. Isothermal transitions
Analysis of isothermal transitions (B) is generally performed using the Avrami equation[4, 8] (1 – Xt) = exp(–ktn) where n is the so-called Avrami-exponent, k is a temperature-dependent rate constant, n describes the mode of nucleation and crystal growth and usuallyis an integer between 1 and 4 [4]. The term Xt denotes the volume fraction transformedat time t. For many transformations the rate-determining step is a thermally activatedprocess, e.g. diffusion. Then ln k linearly depends on the reciprocal temperature at whichthe transition, e.g. crystallization, takes place. The value of the corresponding activationenergy EA results from the slope of the plot of ln ln 1/(1 – Xt) versus 1/T for a giventransformation time. After cooling to room temperature, the PMDA/BACB polyimide (I)specimen is in a meta-stable state. Subsequent annealing yields a more stable state. Toreach this state (parts) of the chains will rearrange via a thermally activated process. Henceit is expected that plotting ln ln 1/(1 – Xt) versus 1/T for a given transformation time yieldsa straight line, the slope of which delivers a value of the apparent activation energy of theprocess involved. Liu et al. performed annealing at 220, 230, 240 and 250 �C [4]. After1 h annealing at 230 �C WAXD results [2] showed evidence of crystallization (a ratherstrong diffraction peak at about 2� = 19�). The values of ln ln 1/(1 – Xt) versus 1/Ta foran annealing time of 30 min are plotted in figure 9 yielding an apparent activation energyof about 160 kJ mol�1. Apparently, the displacement necessary for the crystallization onannealing only involves parts of the chains (cf. the latter value with the value given fornon-isothermal solidification of PMDA/BACB polyimide).
14 P. VAN MOURIK ET AL.
4. CONCLUSIONS
(1) The LC-type transitions involve (re-)arranging of polymer chains and are always fastas compared to the set DSC cooling rate. This implies that their peak temperatures aresolely governed by the attained super-cooling, yielding a linear relation between thepeak temperature and the cooling rate (see figures 3 and 4).
(2) The non-LC transitions are always slow as compared to the set DSC cooling rate yield-ing a non-linear relation between the relevant peak temperature and the set DSC coolingrate (see figures 5 and 6).
(3) PMDA/BACB polyimide (I) shows during DSC cooling ‘fast’ LC transitions at hightransition temperatures T(2) and T(i) and ‘slow’ solidification at T(1) with T(2)� T(i)� T(1).
(4) For PMDA/BACB polyimide (I) fast crystallization during DSC cooling is related tothe formation of a liquid crystal smectic phase at T(2), whereas at T(i) additional minorrearrangements of the structure take place.
(5) For PMDA/BACB polyimide (I) the ‘slow’ solidification during DSC cooling is a ther-mally activated process that originates from randomly oriented chains, correspondingto an elevated value of the apparent activation energy of about 360 kJ mol�1 (our resultsand [2]).
(6) For PMDA/BACB polyimide (I) isothermal crystallization after cooling to room tem-perature is a thermally activated process that proceeds at temperatures just above theglass transition temperature with an apparent activation energy of about 160 J mol�1�this rather small value may indicate rearrangement of chain segments only.
Acknowledgement: P.G. Malchev (MSc) from the Section NanoStructured Materials, Faculty of Applied Sciencesat Delft University of Technology is acknowledged for his assistance in graphic processing.
NOTE
1. Author to whom correspondence should be addressed: e-mail: [email protected]
REFERENCES
[1] Asanuma, T., Oikawa, H., Ookawa, Y., Yamasita, W., Matsuo, M. and Yamaguchi, A. (1994). Synthesisof Thermotropic Liquid Crystal Polyimide and its Properties, J Polym Sci Part A: Polym Chem., 32: 2111–2118.
[2] Liu, S.L., Chung, T.S., Oikawa, H. and Yamaguchi, A. (2000). The Double Melting Behavior of a LiquidCrystalline Polyimide Derived from PMDA and 1,3-bis[4-(4�-aminophenoxyl) cumyl] Benzene, J PolymSci Part B: Polym Phys., 38: 3018–3031.
[3] Liu, S.L., Chung, T.S., Goh, S.H., Torii, Y., Yamaguchi, A. and Ohta, M. (1998). Crystallization Morphol-ogy of a Thermotropic Liquid Crystalline Polyimide, Polym Eng and Sci., 38: 1845–1853.
[4] Liu, S.L., Chung, T.S., Lu, L., Torii, Y., Oikawa, H. and Yamaguchi, A. (1998). Crystallization Kinetics ofa Thermotropic Liquid Crystalline Polyimide Derived from 1,3-bis[4-(4�-aminophenoxy) cumyl] Benzene,J Polym Sci Part B: Polym Phys., 36: 1679–1694.

KINETICS OF FAST AND SLOW TRANSITIONS IN AN LCP 15
[5] Van Mourik, P., Veldman, E., Norder, B., Van Turnhout, J. and Wübbenhorst, M.R. (2005). Kinetics ofPhase Transitions and Dielectric Relaxations in Poly-bis(trifluorethoxy-phosphazene) (PBFP), J Mat Sc.,40: 1661–1671.
[6] Tanaka, M., Konda, M., Miyamoto, M., Kimura, Y. and Yamaguchi, A. (1998). Structure and ThermalBehaviour of a Thermotropic Liquid Crystalline Polyimide (PI-LC), High Perform. Polym., 10: 147–153.
[7] White, M.L., Montague, R.A., Matyjaszewski, K. and Pakula, T. (1995). The Thermal Properties ofPolyphosphazens Synthesized by the Anionically Initiated Polymerization of Phosphoranimines, Polymer,36: 3493–3502.
[8] di Lorenzo, M.L. and Silvestre, M.L. (1999). Non-isothermal Crystallization of Polymers, Progr. Polym.Sci., 24: 917–950.
[9] Starink, M.J. (1992). Precipitation Phenomena in Aluminium-based Metal Matrix Composites: Effects ofReinforcement on Kinetics, PhD Thesis, Delft University of Technology, Delft, The Netherlands, 1992.
[10] Van der Vegt, A.K. (2006). From Polymers to Plastics, VSSD, Delft, The Netherlands, p. 146.[11] Chuah, K.P., Gan, S.N. and Chee, K.K. (1998). Determination of Avrami Exponent by Differential Scan-
ning Calorimetry for Non-isothermal Crystallization of Polymers, Polymer, 40: 253–259.