Kinetics of enzymatic trans-esterification of glycerides for biodiesel production
10
ORIGINAL PAPER Kinetics of enzymatic trans-esterification of glycerides for biodiesel production Vincenza Calabro ` • Emanuele Ricca • Maria Gabriela De Paola • Stefano Curcio • Gabriele Iorio Received: 23 March 2009 / Accepted: 21 October 2009 / Published online: 10 November 2009 Ó Springer-Verlag 2009 Abstract In this paper, the reaction of enzymatic trans- esterification of glycerides with ethanol in a reaction medium containing hexane at a temperature of 37 °C has been studied. The enzyme was Lipase from Mucor miehei, immobilized on ionic exchange resin, aimed at achieving high catalytic specific surface and recovering, regenerating and reusing the biocatalyst. A kinetic analysis has been carried out to identify the reaction path; the rate equation and kinetic parameters have been also calculated. The kinetic model has been validated by comparison between predicted and experimental results. Mass transport resis- tances estimation was undertaken in order to verify that the kinetics found was intrinsic. Model potentialities in terms of reactors design and optimization are also shown. Keywords Biodiesel Lipase Kinetics Oil trans-esterification Enzyme List of symbols CSTBR Continuous stirred tank bio-reactor D Diolein (in reaction mechanism) d p Catalyst particle diameter [e] Enzyme concentration (g/l) E Enzyme (in reaction mechanism) E 0 Activate complex (in reaction mechanism) E–Et Enzyme–ethanol complex (in reaction mechanism) E–D Enzyme–diolein complex (in reaction mechanism) E–M Enzyme–monolein complex (in reaction mechanism) E–P Enzyme–product complex (in reaction mechanism) E–T Enzyme–triolein complex (in reaction mechanism) EO Ethyloleate (in reaction mechanism) [EO] Ethyloleate molar concentration (mol/l) D[EO] Ethyloleate production (mol/l) Et Ethanol (in reaction mechanism) [Et] Ethanol molar concentration (mol/l) G Glycerol (in reaction mechanism) [G] Glycerol molar concentration (mol/l) Ki Kinetic parameters (various dimension) k s Mass transport coefficient (m/s) M Monolein (in reaction mechanism) me Mass of enzyme (g) mso Mass of simulating oil (g) MW Molecular weight [Da] P Products in terms of total sum of glycerol, monolein and diolein (M ? D ? G) (in reaction mechanism) [P] Concentration of products in terms of total sum of glycerol, monolein and diolein (M ? D ? G) (mol/l) Sh Sherwood number T Triolein (in reaction mechanism) [t] Triolein mass concentration (g/l) [T] Triolein molar concentration (mol/l) t Time (h) t D Diffusion time (h) t v Reaction time (h) U Units of enzyme (Unit) [U] Concentration of enzyme in terms of Unit (Unit/l) V. Calabro ` E. Ricca (&) M. G. De Paola S. Curcio G. Iorio Department of Engineering Modelling, University of Calabria, via P. Bucci Cubo 45/A, Arcavacata di Rende (CS), Italy e-mail: [email protected] 123 Bioprocess Biosyst Eng (2010) 33:701–710 DOI 10.1007/s00449-009-0392-z
Transcript of Kinetics of enzymatic trans-esterification of glycerides for biodiesel production

ORIGINAL PAPER
Kinetics of enzymatic trans-esterification of glyceridesfor biodiesel production
Vincenza Calabro • Emanuele Ricca •
Maria Gabriela De Paola • Stefano Curcio •
Gabriele Iorio
Received: 23 March 2009 / Accepted: 21 October 2009 / Published online: 10 November 2009
� Springer-Verlag 2009
Abstract In this paper, the reaction of enzymatic trans-
esterification of glycerides with ethanol in a reaction
medium containing hexane at a temperature of 37 �C has
been studied. The enzyme was Lipase from Mucor miehei,
immobilized on ionic exchange resin, aimed at achieving
high catalytic specific surface and recovering, regenerating
and reusing the biocatalyst. A kinetic analysis has been
carried out to identify the reaction path; the rate equation
and kinetic parameters have been also calculated. The
kinetic model has been validated by comparison between
predicted and experimental results. Mass transport resis-
tances estimation was undertaken in order to verify that the
kinetics found was intrinsic. Model potentialities in terms
of reactors design and optimization are also shown.
Keywords Biodiesel � Lipase � Kinetics �Oil trans-esterification � Enzyme
List of symbols
CSTBR Continuous stirred tank bio-reactor
D Diolein (in reaction mechanism)
dp Catalyst particle diameter
[e] Enzyme concentration (g/l)
E Enzyme (in reaction mechanism)
E0 Activate complex (in reaction mechanism)
E–Et Enzyme–ethanol complex (in reaction
mechanism)
E–D Enzyme–diolein complex (in reaction
mechanism)
E–M Enzyme–monolein complex (in reaction
mechanism)
E–P Enzyme–product complex (in reaction
mechanism)
E–T Enzyme–triolein complex (in reaction
mechanism)
EO Ethyloleate (in reaction mechanism)
[EO] Ethyloleate molar concentration (mol/l)
D[EO] Ethyloleate production (mol/l)
Et Ethanol (in reaction mechanism)
[Et] Ethanol molar concentration (mol/l)
G Glycerol (in reaction mechanism)
[G] Glycerol molar concentration (mol/l)
Ki Kinetic parameters (various dimension)
ks Mass transport coefficient (m/s)
M Monolein (in reaction mechanism)
me Mass of enzyme (g)
mso Mass of simulating oil (g)
MW Molecular weight [Da]
P Products in terms of total sum of glycerol,
monolein and diolein (M ? D ? G) (in reaction
mechanism)
[P] Concentration of products in terms of total sum
of glycerol, monolein and diolein (M ? D ? G)
(mol/l)
Sh Sherwood number
T Triolein (in reaction mechanism)
[t] Triolein mass concentration (g/l)
[T] Triolein molar concentration (mol/l)
t Time (h)
tD Diffusion time (h)
tv Reaction time (h)
U Units of enzyme (Unit)
[U] Concentration of enzyme in terms of Unit
(Unit/l)
V. Calabro � E. Ricca (&) � M. G. De Paola � S. Curcio �G. Iorio
Department of Engineering Modelling, University of Calabria,
via P. Bucci Cubo 45/A, Arcavacata di Rende (CS), Italy
e-mail: [email protected]
123
Bioprocess Biosyst Eng (2010) 33:701–710
DOI 10.1007/s00449-009-0392-z
v Reaction rate (mol/l h)
VH Hexane volume (ml) or (l)
VSO Simulating oil volume (ml) or (l)
Subscript
0 Referring to initial conditions
Greek symbols
a, b Kinetic parameters
d, e Functions of Et0d0, d1, e0, e1, e2 Parameters
s CSTBR mean residence time (h)
Introduction
Vegetable oils and fats can be used not only for food
industry transformation, but also for applications in energy
field. Three techniques have been proposed to render
vegetable oils feasible for diesel engines: pyrolysis [1],
micro-emulsification [2], trans-esterification [3]: the latter
is the best technique able to give a product very similar to
‘‘petro-diesel’’ [4, 5].
Biodiesel is a mixture of alkyl esters of fatty acids from
biological source. It can be obtained by means of inorganic
or enzymatic catalytic trans-esterification of glycerides of
fatty acids of vegetal oils with short chain alcohols.
Trans-esterification can reduce viscosity, because linear
esters without glycerol are less viscous then ramified chain
of tri-glycerides [6].
To increase the reaction rate a catalyst is normally used.
Trans-esterification can advance with a mechanism of acid,
basic or enzymatic catalysis with the use of lipase. The
latter mechanism has been only recently taken into
account, to overcome the inconveniences of acid catalysis
[4, 7, 8] (the kinetics is too slow) and basic catalysis (faster
but displaying some drawbacks: substrate loss due to the
conversion in soap products, high viscosity, gel formation
and difficulty to separate the glycerol that can be entrapped
in the soap products, [3, 9–12]).
Enzymatic trans-esterification is the most expensive but
it offers some advantages, as:
– the presence of free fatty acids in the reaction mixture
does not give the production of saponification products;
– a higher yield and a better glycerol recovery can be
obtained.
Studies carried out recently have demonstrated that
ethanol, less than methanol used at present, favors high
conversion for all the used solvents: it has been also
demonstrated that the lipase is better performing with
longer chain alcohols [13–16].
Some studies [17–21] carried out with methanol showed
the possibility of introducing alcohol step by step, to avoid
alcohol inhibition: this method requires preliminary kinetic
and dynamic studies for a systematic application.
In the open Literature different kinetic studies have been
reported for lipase-catalyzed reaction in different condi-
tions: lipase from Rhizomucor miehei and Thermomyces
lanuginose on sunflower oil [22, 23], lipase from Mucor
miehei on palm oil [24] and lipase from Pseudomonas
cepacia on simulating waste cooking oil [25].
In this work Lipozyme� MM IM, a commercial lipase
from Mucor Miehei immobilised on a macroporous ion
exchange resin, has been then used for the experiments
finalised to the definition of the reaction mechanism during
trans-esterification of triolein with ethanol. Hexane was
used as solvent; other solvents are suitable (such as tert-
butanol, for example [26]), but hexane was preferred for its
very low boiling point (68.7 �C), implying an extreme ease
of separation from products.
A detailed kinetic study has been carried out taking into
account the inhibitory effect of ethanol. Mass transport
resistances estimation was undertaken in order to verify
that the kinetics found was intrinsic. Prior to the kinetic
study, recovery and reuse tests were run in order to pre-
liminarily evaluate the biocatalyst operational stability in
some of the reaction conditions chosen for kinetic tests.
Materials and methods
Reactants
Simulating oil with 60% of pure triolein has been used for
the kinetic analysis. The absence of free fatty acids is
certified by the supplier (Sigma-Aldrich, code nr. 92862
and lot nr. 423741/1). Moreover, in order to identify
components that could influence the reaction, in this work
the simulating oil used as substrate was tested according to
the analytical procedure shown hereafter, and di- and
mono-glycerides were not present in 60% pure triolein. For
this reason it is assumed that the remaining 40% of the
mixture does not influence the reaction.
Ethanol ([99.8%) from Fluka has been used as the
secondary substrate and hexane ([95%) from Fluka as
solvent, as suggested in the Literature [16]. HPLC grade
acetone and acetonitrile were supplied from Fluka too.
Biocatalyst
The catalyst was Lipozyme� MM IM (Novozymes,
Denmark), a lipase from Mucor miehei immobilised on a
macroporous particulate ion exchange resin. The diameter
of supporting particles ranged between 0.3 and 1.0 mm and
the wet bulk density is 0.42 g/ml. The enzyme is highly 1.3
specific, with a MW of 32 KDa and activity of 37 U/g.
702 Bioprocess Biosyst Eng (2010) 33:701–710
123

Experimental methodology
All the experimental reactions have been carried out at
37 �C and neutral pH.
Experiments have been carried out using a well mixed
batch reactor of 125 ml. The reaction mixture was prepared
in order to guarantee good mixing conditions in the fol-
lowing way: mixing simulating oil and Lipozyme, then
adding hexane, heating and stirring for 30 min; when the
temperature had reached 37 �C ethanol was added to start
the reaction. The reason for adding hexane to the reacting
mixture is to reduce the duration of the transient of mixing
by ethanol which, according to the present loading proce-
dure, has been added as the last substrate in order to avoid
enzyme deactivation.
Reaction samples of 200 ll were collected, more fre-
quently during first phase, less in the end taking care to not
have any catalyst in the sample. They were centrifuged to
separate possible small residuals or fragments of catalyst for
5 min at 5,400 rpm and then the supernatant was collected in
vials for analysis. The total amount of samples collected was
in any case lower than 5% of the total volume.
The feed mass ratios enzyme/triolein [e0/T0] adopted
were 1:8, 1:20, 1:30 and the reactants molar ratios ethanol/
triolein [Et0/T0] were 2:1, 2.5:1, 3:1.
Enzyme recovery and reuse
In order to verify the possibility of recovering and reusing
the enzyme after the reaction, it has been recovered by
filtration, washed three times with acetone, then dried at
room temperature and reused for the new reaction, as
suggested in the literature [27]. More cycles of reaction
have been carried out with high yields.
Residual activities were estimated as the ratio of initial
reaction rate at any cycle (initial slope of the trends) to the
initial reaction rate of the first use (time zero).
Analytical methods
Concentrations of reactants glycerides and product ethyl-
oleate have been measured with a quantitative analysis
carried out by means of a high pressure liquid chroma-
tography, HPLC (JASCO) under the following conditions:
RI detector, eluent phase acetone/acetonitrile 70/30 v/v,
flow rate 1 ml/min, internal normalization as integration
method. Prior to analysis the catalyst has been removed by
centrifugation and hexane by evaporation. Ethanol con-
centrations were not measured, but obtained by means of
the stoichiometric ratio 1:1 with ethyl-oleate.
The column was Alltech Adsorbosphere HS (C18)
5 lm, length of 250 mm and inlet diameter 4.6 mm, inte-
grated with a pre-column Alltech of 7.5 9 4.6 mm.
Experimental results
Analysis of the effect of [e0]/[T0] ratio
Experiments have been carried out at fixed ethanol/triolein
feed molar ratio [Et0]/[T0] = 2:1 (less than the stoichi-
ometric one), with a simulating oil/hexane volumetric ratio
VSO0=VH0
¼ 1:1.
Ethanol has been charged as limiting reactant, to avoid
any possible effect of enzyme inhibition.
The enzyme loading in the feed was equal to 34.4, 13.3,
7.52 g/l, corresponding to enzyme/triolein fed mass ratio
[e0]/[T0] of 1:8, 1:20, 1:30.
Results reported in Fig. 1a as concentration of product
(ethyloleate) and substrate (triolein) permit to calculate the
reaction yield in terms of moles of ethyloleate produced per
moles of fed ethanol (D[EO]/[Et0]) and in terms of moles
of ethyloleate produced per unit of active enzyme
(D[EO]/U0).
In Table 1 the results are reported and it is shown that an
intermediate amount of enzyme seems more effective, with
a low reduction of D[EO]/[Et0].
0
0,1
0,2
0,3
0,4
0,5
0,6
0 6 12 18 24 30time, (h)
Co
nce
ntr
atio
n, (
mo
les/
l)
[eo]/[to] = 1:8 [eo]/[to] = 1:20 [eo]/[to] = 1:30Ethyl Oleate Ethyl Oleate Ethyl OleateTriolein Triolein Triolein
0
0.1
0.2
0.3
50 10 15 20 25 30time, (h)
Co
nce
ntr
atio
n, (
mo
les/
l)
[eo]/[to] = 1:8 [eo]/[to] = 1:20 [eo]/[to] = 1:30Ethyl Oleate Ethyl Oleate Ethyl OleateTriolein Triolein Triolein
(a)
(b)
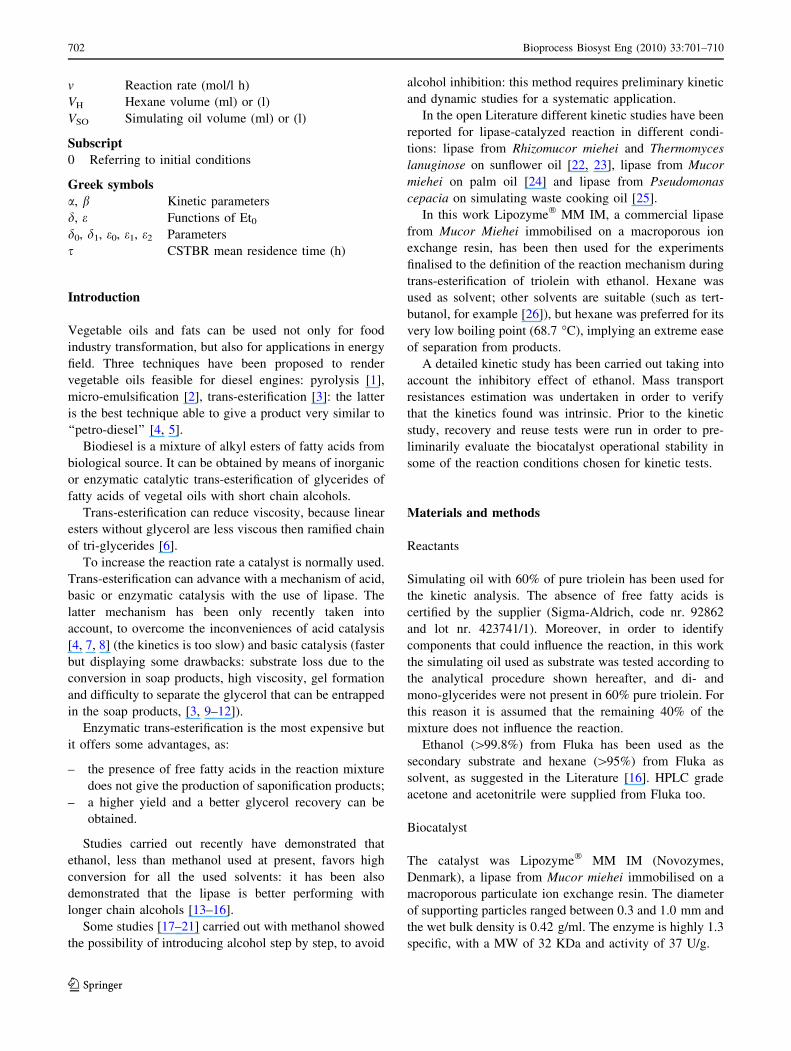
Fig. 1 a Time course of ethyloleate and triolein concentration as
function of enzyme initial amount. [Et0]/[T0] = 2:1, VSO0=VH0
¼ 1 :1: b Zoom of initial points
Bioprocess Biosyst Eng (2010) 33:701–710 703
123
The reaction yield evaluated as the moles of ethyloleate
produced per mole of ethanol (limiting reactant) is related to
enzyme loading in a fashion which is slower than linear, with
ethyloleate production at [e0]/[T0] = 1:30 being much
lower than for [e0]/[T0] = 1:20 and 1:8 (Table 1). A similar
trend can be observed in Fig. 1b where initial velocity data
can be derived from initial slopes of concentration against
time. At high enzyme loading (1:8 and 1:20) the reaction rate
is proportional to enzyme loading, but this is not true for low
loadings. The explanation to this observation is that when
small quantities of enzyme are loaded the effects of alcohol
inhibition (further discussed throughout the text) are more
relevant and they reveal themselves by inactivating the small
amount of enzyme present within the reacting mixture.
When higher loadings are adopted the amount of inhibition
remains the same, since other conditions such as substrates
concentration are unchanged, but the amount of enzyme
supposed to support this effect is higher and the observable
effect of inhibition is consequently lower.
Kinetics seems faster with a higher [e0]/[T0] feed mass
ratio: a ratio of 1:8 permits to achieve in 3 h the maximum
amount of ethyloleate, 0.6 mol/l, whereas after 6 h with a
ratio of 1:20 only 0.45 mol/l of ethyloleate have been
produced; however, the performance per unit of catalyst is
maximal when [e0]/[T0] = 1:20 is adopted.
Analysis of the effect of [Et0]/[T0]
The experiments have been carried out at fixed amount of
enzyme and triolein equivalent to [e0]/[T0] = 1:20 and
with a simulated oil/hexane ratio VSO0=VH0
¼ 1:1.
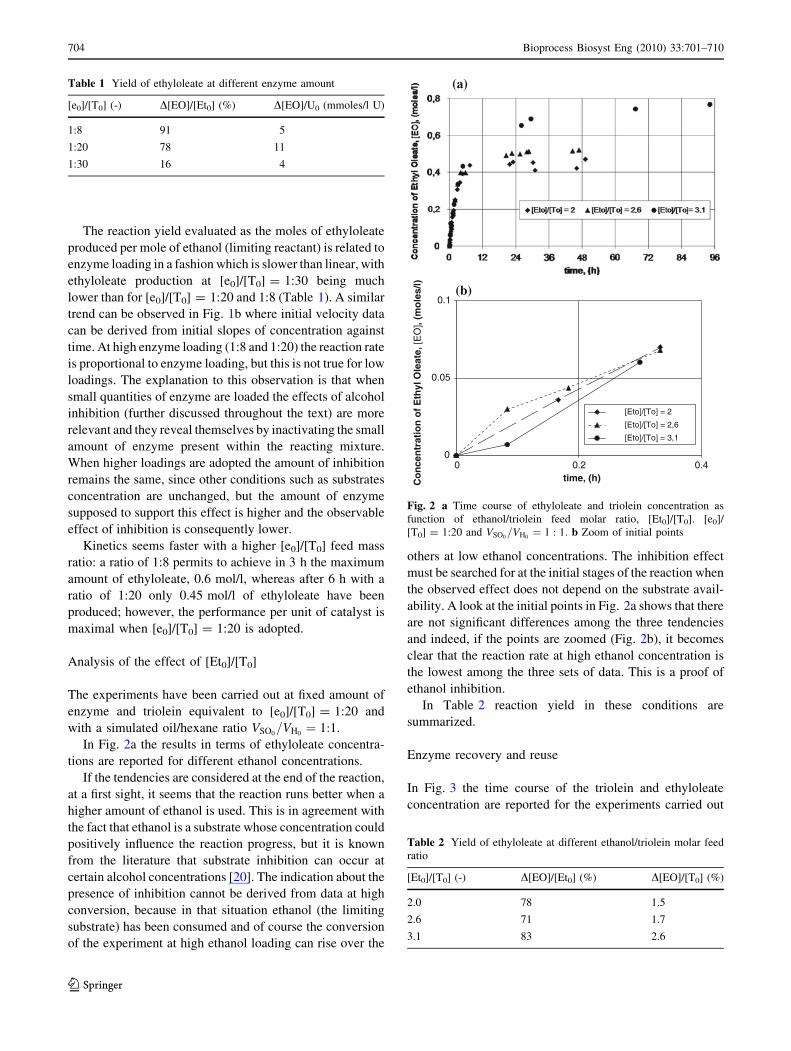
In Fig. 2a the results in terms of ethyloleate concentra-
tions are reported for different ethanol concentrations.
If the tendencies are considered at the end of the reaction,
at a first sight, it seems that the reaction runs better when a
higher amount of ethanol is used. This is in agreement with
the fact that ethanol is a substrate whose concentration could
positively influence the reaction progress, but it is known
from the literature that substrate inhibition can occur at
certain alcohol concentrations [20]. The indication about the
presence of inhibition cannot be derived from data at high
conversion, because in that situation ethanol (the limiting
substrate) has been consumed and of course the conversion
of the experiment at high ethanol loading can rise over the
others at low ethanol concentrations. The inhibition effect
must be searched for at the initial stages of the reaction when
the observed effect does not depend on the substrate avail-
ability. A look at the initial points in Fig. 2a shows that there
are not significant differences among the three tendencies
and indeed, if the points are zoomed (Fig. 2b), it becomes
clear that the reaction rate at high ethanol concentration is
the lowest among the three sets of data. This is a proof of
ethanol inhibition.
In Table 2 reaction yield in these conditions are
summarized.
Enzyme recovery and reuse
In Fig. 3 the time course of the triolein and ethyloleate
concentration are reported for the experiments carried out
Table 1 Yield of ethyloleate at different enzyme amount
[e0]/[T0] (-) D[EO]/[Et0] (%) D[EO]/U0 (mmoles/l U)
1:8 91 5
1:20 78 11
1:30 16 4
0
0.05
0.1
0.40.20time, (h)C
on
cen
trat
ion
of
Eth
yl O
leat
e, [E
O],
(mo
les/
l)
[Eto]/[To] = 2
[Eto]/[To] = 2,6
[Eto]/[To] = 3,1
(a)
(b)
Fig. 2 a Time course of ethyloleate and triolein concentration as
function of ethanol/triolein feed molar ratio, [Et0]/[T0]. [e0]/
[T0] = 1:20 and VSO0=VH0
¼ 1 : 1: b Zoom of initial points
Table 2 Yield of ethyloleate at different ethanol/triolein molar feed
ratio
[Et0]/[T0] (-) D[EO]/[Et0] (%) D[EO]/[T0] (%)
2.0 78 1.5
2.6 71 1.7
3.1 83 2.6
704 Bioprocess Biosyst Eng (2010) 33:701–710
123

under the following operating conditions: [Et0]/[T0] = 2:1,
VSO0=VH0
¼ 1 : 1, [e0] = 34.4 g/l and me0/mso0 = 0.08.
They were chosen in order to have a relatively fast reac-
tion, but appreciable differences in the results of reuse
tests.
Enzyme decay is more significant after the first recov-
ery. In particular, the residual activity, in terms of value of
the initial reaction rate at any cycle (initial slope of the
trends), was always higher than 75%. Differences can also
be observed on the final conversion values; in this respect
one can deduct that reuses damage the enzyme even from
the point of view of completing the reaction progress, i.e.
not only kinetics are slower in the first stages, but the final
ethyl-oleate concentration obtainable after every reuse is
lower and lower.
Kinetic analysis and discussion
Experimental data have been elaborated to evaluate the
kinetic rate as a function of triolein concentration.
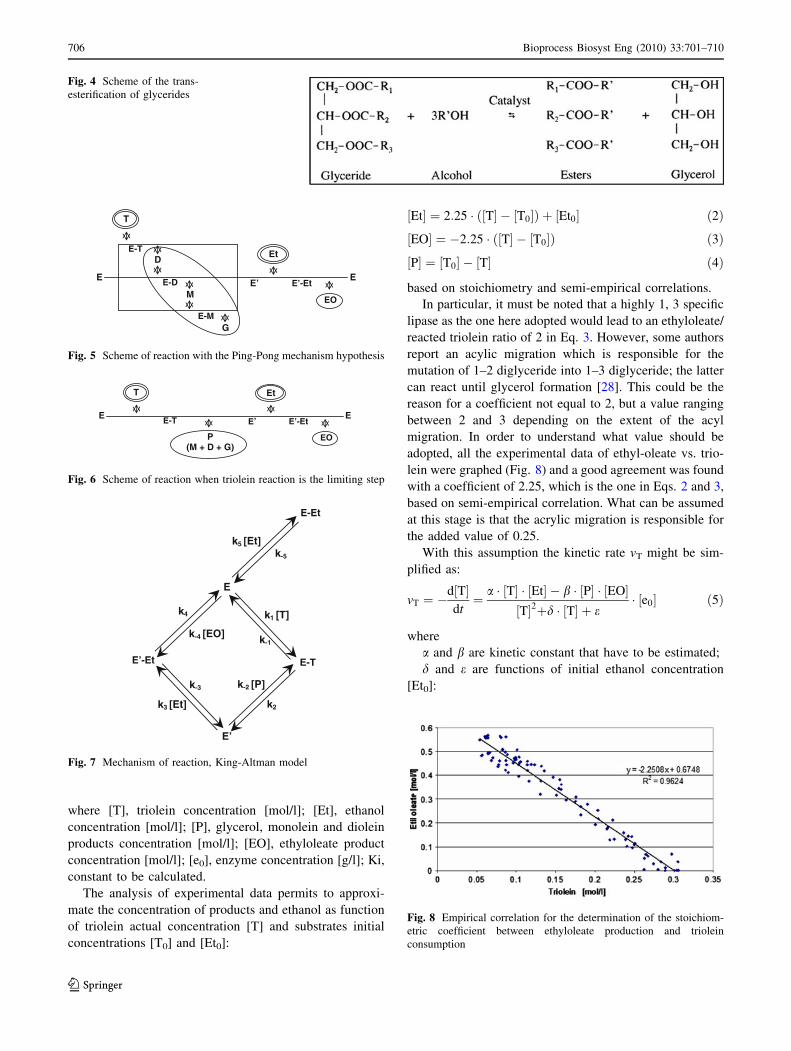
The reaction pattern can be predicted as a sequence of
three reactions in series, with the production of one mole of
ester by each step and the production of glycerol only at the
third step, when monoglycerides are converted (Fig. 4).
But the lipase that has been used shows a 1–3 regio-
specificity, consequently glycerol production is strongly
limited.
The King-Altman kinetics method has been followed:
the method is based on singling out geometrical rules that
permit to evaluate the concentrations of enzyme in all its
complexes (E, ES, EP, etc.).
When the related expressions are introduced in the
elementary kinetic equation that represents the reaction
path, it is possible to obtain the kinetic model.
A Ping-Pong mechanism ethanol inhibition has been
hypothesized to describe the kinetics of the reaction, as
schematised in Fig. 5.
Lipase attacks triolein giving the activated complex E–T
that transforms into the enzyme-substrate complex E0,consisting of the enzyme connected to the oleic chain with
the release of diolein, D.
Diolein will form the activated complex E–D that
releases monolein, M, and again the complex E0.Monolein and enzyme give the complex E–M, releasing
E0 and glycerol G. The complex E0 during these phases
reacts with ethanol, referred to as Et, giving the complex
E0–Et that releases the product ethyloleate, referred to as
EO, and enzyme E again.
The proposed mechanism has been revised and simpli-
fied, considering triolein and ethanol as reactants, and
ethyloleate, glycerol and the other glycerides (monolein
and diolein) as products. These glycerides are found, in
fact, in the reactant mixture at the end of the reaction.
The mechanism might be described as Ping-Pong Bi–Bi.
Assuming that triolein conversion will be the dominant
step, as a consequence of the higher triolein concentration
in the reacting mixture, the scheme of reaction patterns
becomes the one showed in Fig. 6, where glycerides and
glycerol are reported as product P.
The method of King-Altman has been then introduced:
following the scheme reported in Fig. 7, where all the
enzyme complexes are reported and the elementary reac-
tions are expressed with their kinetic constant. In the scheme
the inhibition is reported as a reversible step, giving a dif-
ferent pattern from the one assumed by Ping-Pong-bi_bi
mechanism. Pseudo-steady state is also assumed.
By considering all the kinetic rates for the elementary
reaction reported in Fig. 7, it is possible to formulate the
kinetic rate equation, as disappearance of triolein T, as
follows:
Fig. 3 Time course of triolein and ethyloleate during the n-cycle of
recovery and reuse of lipase. [Et0]/[T0] = 2:1, VSO0=VH0
¼ 1 : 1;me0/mso0 = 0.08
vT ¼ �d½T�dt
� d½T�dt¼ K1½T�½Et� � K2½P�½EO�
K3½T]þ K4½Et]þ K5½T][Et]þ K6½P]þ K7½EO]þ K8½P][EO]þ K9½T][P]þ K10½Et][EO]þ K11½Et�2 þ K12½Et�½P�� e0½ �
ð1Þ
Bioprocess Biosyst Eng (2010) 33:701–710 705
123
where [T], triolein concentration [mol/l]; [Et], ethanol
concentration [mol/l]; [P], glycerol, monolein and diolein
products concentration [mol/l]; [EO], ethyloleate product
concentration [mol/l]; [e0], enzyme concentration [g/l]; Ki,
constant to be calculated.
The analysis of experimental data permits to approxi-
mate the concentration of products and ethanol as function
of triolein actual concentration [T] and substrates initial
concentrations [T0] and [Et0]:
½Et� ¼ 2:25 � ½T� � T0½ �ð Þ þ Et0½ � ð2Þ½EO� ¼ �2:25 � ½T� � T0½ �ð Þ ð3Þ½P� ¼ T0½ � � ½T� ð4Þ
based on stoichiometry and semi-empirical correlations.
In particular, it must be noted that a highly 1, 3 specific
lipase as the one here adopted would lead to an ethyloleate/
reacted triolein ratio of 2 in Eq. 3. However, some authors
report an acylic migration which is responsible for the
mutation of 1–2 diglyceride into 1–3 diglyceride; the latter
can react until glycerol formation [28]. This could be the
reason for a coefficient not equal to 2, but a value ranging
between 2 and 3 depending on the extent of the acyl
migration. In order to understand what value should be
adopted, all the experimental data of ethyl-oleate vs. trio-
lein were graphed (Fig. 8) and a good agreement was found
with a coefficient of 2.25, which is the one in Eqs. 2 and 3,
based on semi-empirical correlation. What can be assumed
at this stage is that the acrylic migration is responsible for
the added value of 0.25.
With this assumption the kinetic rate vT might be sim-
plified as:
vT ¼ �d½T�dt¼ a � T½ � � Et½ � � b � P½ � � EO½ �
T½ �2þd � T½ � þ e� e0½ � ð5Þ
where
a and b are kinetic constant that have to be estimated;
d and e are functions of initial ethanol concentration
[Et0]:
Fig. 4 Scheme of the trans-
esterification of glycerides
D
ME-D
E-M
E-T
G
E’ E’-EtEE
EO
T
Et
Fig. 5 Scheme of reaction with the Ping-Pong mechanism hypothesis
E-T
P(M + D + G)
E’ E’-Et E E
EO
T Et
Fig. 6 Scheme of reaction when triolein reaction is the limiting step
E
E’-Et
E’
E-Et
k-1
k4
E-T
k2
k-2 [P]k-3
k-4 [EO]
k1 [T]
k3 [Et]
k5 [Et]k-5
Fig. 7 Mechanism of reaction, King-Altman model
Fig. 8 Empirical correlation for the determination of the stoichiom-
etric coefficient between ethyloleate production and triolein
consumption
706 Bioprocess Biosyst Eng (2010) 33:701–710
123
d ¼ d1 � Et0½ � þ d0 � e ¼ e 22 � Et0½ � 2þe1 � Et0½ � þ e0 ð6Þ
The values ofd½T�dt
were found according to the procedure
suggested by Levenspiel [29].
Fitting of experimental data
Non linear fitting Pearson VII strong method coupled to the
Table—Curve� software has been used to estimate the
kinetic parameters.
The values of di and ei are resumed in Table 3, whereas
kinetic constants a and b are reported in Table 4.
Model validation
Model validation has been obtained by comparison with
experimental data used for the fitting and data not used for
the fitting.
In Figs. 9, 10, 11 and 12 the validation is presented, for
different operating conditions in terms of feed mass ratio
enzyme/triolein or feed molar ratio ethanol/triolein. It can
be observed that the difference between model results and
experimental trends of triolein concentration is always
nearly undetectable, while some differences between pre-
dicted and experimental data can be seen with respect to
ethyl-oleate and ethanol concentrations; they will be dis-
cussed as they occur in any of the following figures. It is
necessary to remind here that ethanol concentrations are
obtained from a mass balance starting from measured
values of ethyl-oleate concentrations and that the model
was implemented on triolein data only; the theoretical
curves relative to ethyl-oleate are predictions and for this
reason the validity of the model will be assessed on the
basis of their capability to predict the experimental values.
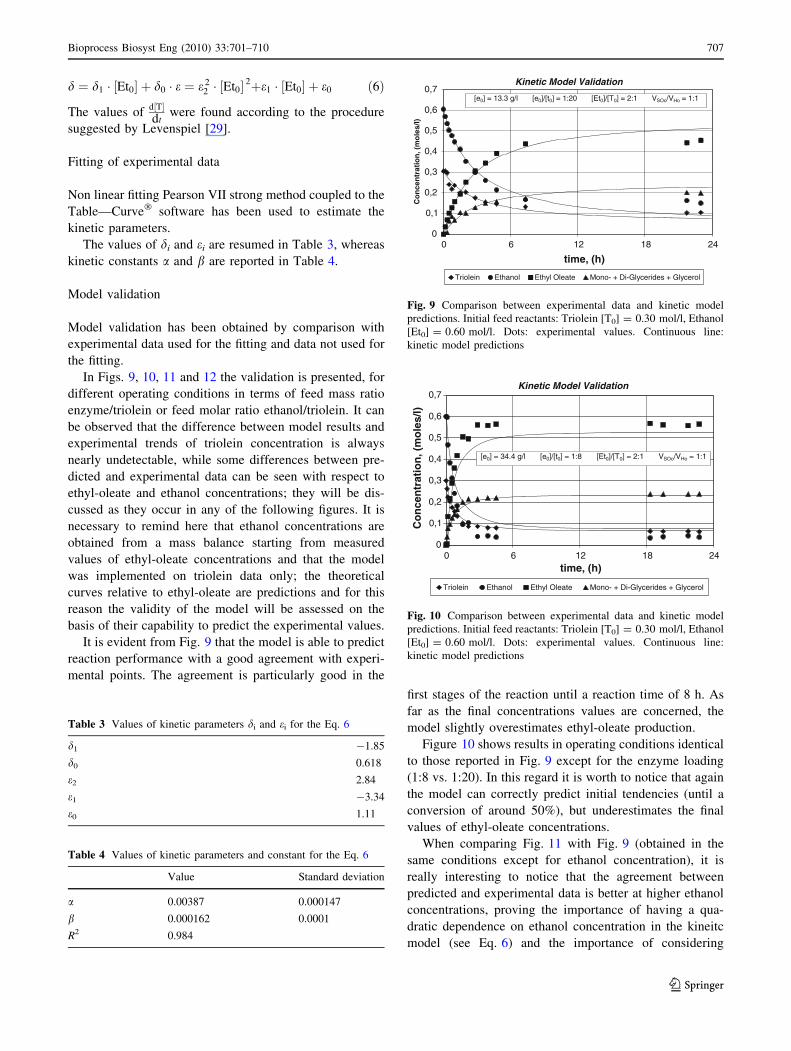
It is evident from Fig. 9 that the model is able to predict
reaction performance with a good agreement with experi-
mental points. The agreement is particularly good in the
first stages of the reaction until a reaction time of 8 h. As
far as the final concentrations values are concerned, the
model slightly overestimates ethyl-oleate production.
Figure 10 shows results in operating conditions identical
to those reported in Fig. 9 except for the enzyme loading
(1:8 vs. 1:20). In this regard it is worth to notice that again
the model can correctly predict initial tendencies (until a
conversion of around 50%), but underestimates the final
values of ethyl-oleate concentrations.
When comparing Fig. 11 with Fig. 9 (obtained in the
same conditions except for ethanol concentration), it is
really interesting to notice that the agreement between
predicted and experimental data is better at higher ethanol
concentrations, proving the importance of having a qua-
dratic dependence on ethanol concentration in the kineitc
model (see Eq. 6) and the importance of considering
Table 3 Values of kinetic parameters di and ei for the Eq. 6
d1 -1.85
d0 0.618
e2 2.84
e1 -3.34
e0 1.11
Table 4 Values of kinetic parameters and constant for the Eq. 6
Value Standard deviation
a 0.00387 0.000147
b 0.000162 0.0001
R2 0.984
Kinetic Model Validation
0
0,1
0,2
0,3
0,4
0,5
0,6
0,7
0 6 12 18 24
time, (h)
Co
nce
ntr
atio
n, (
mo
les/
l)
Triolein Ethanol Ethyl Oleate Mono- + Di-Glycerides + Glycerol
[e0] = 13.3 g/l [e0]/[t0] = 1:20 [Et0]/[T0] = 2:1 VSOo/VHo = 1:1
Fig. 9 Comparison between experimental data and kinetic model
predictions. Initial feed reactants: Triolein [T0] = 0.30 mol/l, Ethanol
[Et0] = 0.60 mol/l. Dots: experimental values. Continuous line:
kinetic model predictions
Kinetic Model Validation
0
0,1
0,2
0,3
0,4
0,5
0,6
0,7
0 6 12 18 24time, (h)
Co
nce
ntr
atio
n, (
mo
les/
l)
Triolein Ethanol Ethyl Oleate Mono- + Di-Glycerides + Glycerol
[e0] = 34.4 g/l [e0]/[t0] = 1:8 [Et0]/[T0] = 2:1 VSOo/VHo = 1:1
Fig. 10 Comparison between experimental data and kinetic model
predictions. Initial feed reactants: Triolein [T0] = 0.30 mol/l, Ethanol
[Et0] = 0.60 mol/l. Dots: experimental values. Continuous line:
kinetic model predictions
Bioprocess Biosyst Eng (2010) 33:701–710 707
123

inhibition effects at [Et0/T0] lower than the stoichiometric
one, as it was also pointed out by Cheirsilp et al. [30].
The comments reported for Fig. 11 are still valid for
Fig. 12 with an even better agreement between theoretical
and experimental data.
As a conclusion, a good agreement between the exper-
imental data and the model prediction is observed for the
products as well as for the substrate, at the beginning and at
the end of the reaction. As a consequence the proposed
model might be assumed valid for the prediction of reac-
tion performances.
The good prediction capability of the model can be
attributed to the presence of terms related to reaction
reversibility within the kinetic equation (Eqs. 1 and 5).
This term is not explicitly reported in other kinetic equa-
tions in the literature [23, 24] and, unfortunately, this did
not allow for a quantitative comparison of the values of the
kinetic parameters.
Due to superficial immobilization of the enzyme, mass
transport resistances are present during the reaction and the
kinetics found could be apparent. To prove that, instead,
the kinetics is intrinsic, mass transfer resistances have been
calculated on the basis of the operating conditions and the
properties of immobilised enzyme. A reaction time tv and a
diffusion time tD have been estimated and compared.
Mass transfer resistance and process rate
To estimate mass transfer resistances it must be taken into
account that lipase was immobilised on a support surface,
thus no internal immobilization or transport is expected.
As a consequence, mass transfer resistance are located
externally to the support.
The mass transport coefficient ks was estimated by
assuming the lowest value for Sherwood number (Sh), that
correspond to no motion of a single particle: Sh = 2 [31].
By that value, the mass transfer coefficients ks has been
calculated as equal to 3.3 9 10-6 m/s which corresponds a
characteristic diffusive time tD equal to:
tD ¼dp
ks
¼ 180 s ¼ 0:05 h ð7Þ
where the mean particle diameter is 600 lm [32].
The characteristic time of the reaction has been calcu-
lated assuming the fastest conditions in terms of kinetic.
That happens when Lipozyme concentration, [e0], is equal
to 34 g/l, which corresponds a specific initial kinetic rate,
jvT0j
of 0.338 mol/l h (equivalent to 9.4 9 10-5 mol/l s) and at
initial triolein concentration [T0] of 0.3 mol/l.
The kinetic time has been calculated as
tv ¼T0
vT0
¼ 0:9 h ¼ 3200 s ð8Þ
By comparison between tD and tv, reaction results much
slower than transport (tv/tD = 20) even though the most
conservative conditions were assumed for calculations. As a
consequence, the reaction can be considered the limiting
step over the entire process and the kinetic model found is
intrinsic. This is a relevant result because it allows designers
to use the model in the calculations of any kind of reactor,
with kinetics separated from mass transport effects.
Bioreactors optimization
A macroscopic mathematical model has been formulated in
order to evaluate the operating conditions in a continuous
stirred tank bioreactor (CSTBR).
Fig. 11 Comparison between experimental data and kinetic model
predictions. Initial feed reactants: Triolein [T0] = 0.30 mol/l, Ethanol
[Et0] = 0.77 mol/l. Dots: experimental values. Continuous line:
kinetic model predictions
Kinetic Model Validation
0
0,2
0,4
0,6
0,8
1
0 12 24 36 48 60 72
time, (h)
Co
nce
ntr
atio
n, (
mo
les/
l)
Triolein Ethanol Ethyl Oleate Mono- + Di-glycerides + Glycerol
[e0] = 13.8 g/l [e0]/[t0] = 1:20 [Et0]/[T0] = 3:1 VSOo/VHo = 1:1
Fig. 12 Comparison between experimental data and kinetic model
predictions. Initial feed reactants: Triolein [T0] = 0.30 mol/l, Ethanol
[Et0] = 0.93 mol/l. Dots: experimental values. Continuous line:
kinetic model predictions
708 Bioprocess Biosyst Eng (2010) 33:701–710
123
From the mass balance on the substrate triolein it is
possible to evaluate the characteristic mean residence
time s:
s ¼ V
F¼ T½ � � T0½ �
vT
ð9Þ
The kinetic rate vT has been obtained from Eq. 5 and a
value of [T0] = 0.3 mol/l has been used.
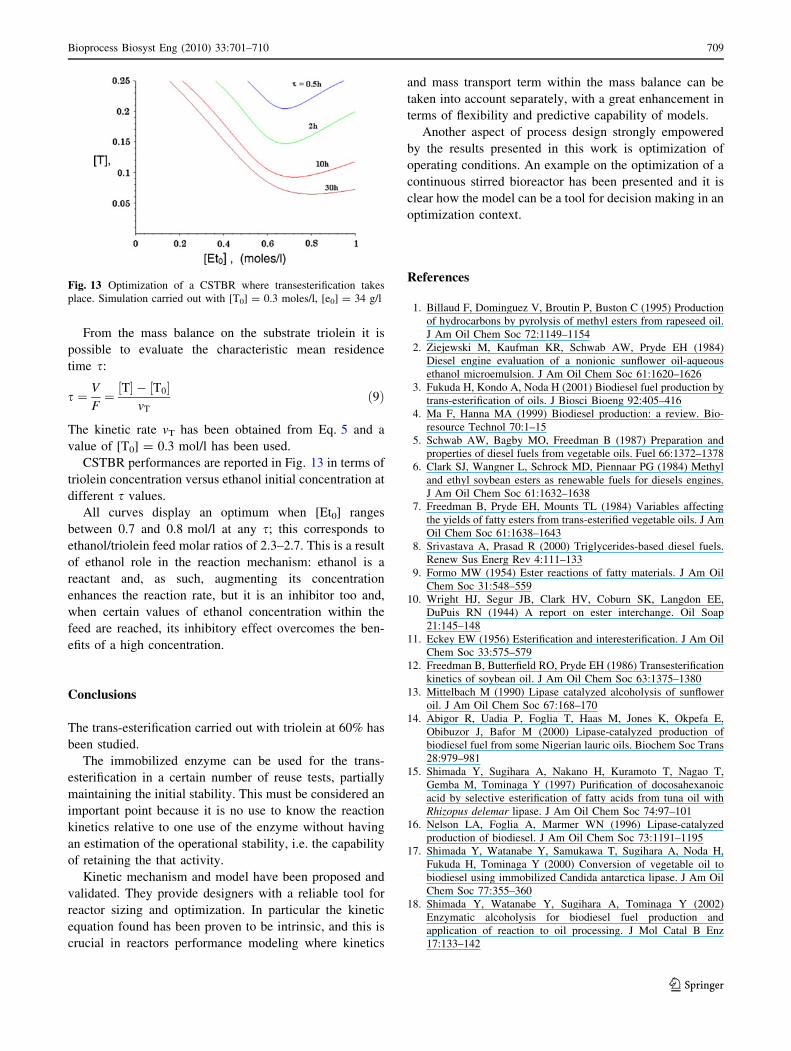
CSTBR performances are reported in Fig. 13 in terms of
triolein concentration versus ethanol initial concentration at
different s values.
All curves display an optimum when [Et0] ranges
between 0.7 and 0.8 mol/l at any s; this corresponds to
ethanol/triolein feed molar ratios of 2.3–2.7. This is a result
of ethanol role in the reaction mechanism: ethanol is a
reactant and, as such, augmenting its concentration
enhances the reaction rate, but it is an inhibitor too and,
when certain values of ethanol concentration within the
feed are reached, its inhibitory effect overcomes the ben-
efits of a high concentration.
Conclusions
The trans-esterification carried out with triolein at 60% has
been studied.
The immobilized enzyme can be used for the trans-
esterification in a certain number of reuse tests, partially
maintaining the initial stability. This must be considered an
important point because it is no use to know the reaction
kinetics relative to one use of the enzyme without having
an estimation of the operational stability, i.e. the capability
of retaining the that activity.
Kinetic mechanism and model have been proposed and
validated. They provide designers with a reliable tool for
reactor sizing and optimization. In particular the kinetic
equation found has been proven to be intrinsic, and this is
crucial in reactors performance modeling where kinetics
and mass transport term within the mass balance can be
taken into account separately, with a great enhancement in
terms of flexibility and predictive capability of models.
Another aspect of process design strongly empowered
by the results presented in this work is optimization of
operating conditions. An example on the optimization of a
continuous stirred bioreactor has been presented and it is
clear how the model can be a tool for decision making in an
optimization context.
References
1. Billaud F, Dominguez V, Broutin P, Buston C (1995) Production
of hydrocarbons by pyrolysis of methyl esters from rapeseed oil.
J Am Oil Chem Soc 72:1149–1154
2. Ziejewski M, Kaufman KR, Schwab AW, Pryde EH (1984)
Diesel engine evaluation of a nonionic sunflower oil-aqueous
ethanol microemulsion. J Am Oil Chem Soc 61:1620–1626
3. Fukuda H, Kondo A, Noda H (2001) Biodiesel fuel production by
trans-esterification of oils. J Biosci Bioeng 92:405–416
4. Ma F, Hanna MA (1999) Biodiesel production: a review. Bio-
resource Technol 70:1–15
5. Schwab AW, Bagby MO, Freedman B (1987) Preparation and
properties of diesel fuels from vegetable oils. Fuel 66:1372–1378
6. Clark SJ, Wangner L, Schrock MD, Piennaar PG (1984) Methyl
and ethyl soybean esters as renewable fuels for diesels engines.
J Am Oil Chem Soc 61:1632–1638
7. Freedman B, Pryde EH, Mounts TL (1984) Variables affecting
the yields of fatty esters from trans-esterified vegetable oils. J Am
Oil Chem Soc 61:1638–1643
8. Srivastava A, Prasad R (2000) Triglycerides-based diesel fuels.
Renew Sus Energ Rev 4:111–133
9. Formo MW (1954) Ester reactions of fatty materials. J Am Oil
Chem Soc 31:548–559
10. Wright HJ, Segur JB, Clark HV, Coburn SK, Langdon EE,
DuPuis RN (1944) A report on ester interchange. Oil Soap
21:145–148
11. Eckey EW (1956) Esterification and interesterification. J Am Oil
Chem Soc 33:575–579
12. Freedman B, Butterfield RO, Pryde EH (1986) Transesterification
kinetics of soybean oil. J Am Oil Chem Soc 63:1375–1380
13. Mittelbach M (1990) Lipase catalyzed alcoholysis of sunflower
oil. J Am Oil Chem Soc 67:168–170
14. Abigor R, Uadia P, Foglia T, Haas M, Jones K, Okpefa E,
Obibuzor J, Bafor M (2000) Lipase-catalyzed production of
biodiesel fuel from some Nigerian lauric oils. Biochem Soc Trans
28:979–981
15. Shimada Y, Sugihara A, Nakano H, Kuramoto T, Nagao T,
Gemba M, Tominaga Y (1997) Purification of docosahexanoic
acid by selective esterification of fatty acids from tuna oil with
Rhizopus delemar lipase. J Am Oil Chem Soc 74:97–101
16. Nelson LA, Foglia A, Marmer WN (1996) Lipase-catalyzed
production of biodiesel. J Am Oil Chem Soc 73:1191–1195
17. Shimada Y, Watanabe Y, Samukawa T, Sugihara A, Noda H,
Fukuda H, Tominaga Y (2000) Conversion of vegetable oil to
biodiesel using immobilized Candida antarctica lipase. J Am Oil
Chem Soc 77:355–360
18. Shimada Y, Watanabe Y, Sugihara A, Tominaga Y (2002)
Enzymatic alcoholysis for biodiesel fuel production and
application of reaction to oil processing. J Mol Catal B Enz
17:133–142
Fig. 13 Optimization of a CSTBR where transesterification takes
place. Simulation carried out with [T0] = 0.3 moles/l, [e0] = 34 g/l
Bioprocess Biosyst Eng (2010) 33:701–710 709
123

19. Samukawa T, Kaieda M, Matsumoto T, Ban K, Kondo A,
Shimada Y, Noda H, Fukuda H (2000) Pretreatment of immo-
bilized Candida antarctica lipase for biodiesel fuel production
from plant oil. Biosci Bioeng 90:180–183
20. Kaieda M, Samukawa T, Kondo A, Fukuda H (2001) Effect of
methanol and water contents on production of biodiesel fuel from
plant oil catalyzed by various lipases in a solvent-free system.
J Biosci Bioeng 91:12–15
21. Kaieda M, Samukawa T, Matsumoto T, Ban K, Kondo A,
Shimada Y, Noda H, Nomoto F, Ohtsuka K, Izumoto E, Fukuda
H (1999) Biodiesel fuel production from plant oil catalyzed by
Rhizopus oryzae lipase in a water-containing system without an
organic solvent. J Biosci Bioeng 88:627–631
22. Dossat V, Combes D, Marty A (2002) Lipase-catalysed transe-
sterification of high oleic sunflower oil. Enzyme Microb Technol
30:90–94
23. Al-Zuhair S (2005) Production of biodiesel by lipase-catalyzed
transesterification of vegetable oils: a kinetic study. Biotechnol
Prog 21:1442–1448
24. Al-Zuhair S, Ling FW, Jun LS (2007) Proposed kinetic mecha-
nism of the production of biodiesel from palm oil using lipase.
Process Biochem 42:951–960
25. Al-Zuhair S, Dowaidar A, Kamal H (2009) Dynamic modeling of
biodiesel production from simulated waste cooking oil using
immobilized lipase. Biochem Eng J 44:256–262
26. Jeong GT, Park DH (2008) Lipase-catalyzed transesterification of
rapeseed oil for biodiesel production with tert-butanol. Appl
Biochem Biotechnol 148:131–139
27. Soumanou MM, Bornscheuer UT (2003) Improvement in lipase-
catalyzed synthesis of fatty acid methyl esters from sunflower oil.
Enz Microb Technol 33:97–103
28. Du W, Xu Y (2005) Study on acyl migration in immobilized
Lipozyme TL catalyzed transesterification of soybean oil for
biodiesel production. J Mol Cat B 37:68–71
29. Levenspiel O (1999) Chemical reaction engineering, 3rd edn.
Wiley, New York, p 63
30. Cheirsilp B, H-Kittikun A, Limkatanyu S (2008) Impact of
transesterification mechanisms on the kinetic modeling of biodiesel
production by immobilized lipase. Biochem Eng J 42:261–269
31. Bird RB, Stewart WE, Lightfoot EN (1960) Transport phenom-
ena. Wiley, New York
32. Berben PH, Groen C, Christensen MW, Holm HC (2001) Inter-
esterification with immobilized enzymes. SCI Lecture Paper
Series, p 121
710 Bioprocess Biosyst Eng (2010) 33:701–710
123