khazar journal of humanities and social sciences
343
-
Upload
khangminh22 -
Category
Documents
-
view
1 -
download
0
Transcript of khazar journal of humanities and social sciences


ISSN: 2223-2613 E-ISSN: 2223-2621
KHAZAR JOURNAL OF HUMANITIES AND SOCIAL SCIENCES
EDITOR-IN-CHIEF
Hamlet İsaxanli Khazar University
EDITORIAL BOARD
Yavuz Akpınar
Salavat Iskhakov
Ege University, İzmir Institute of Oriental Manuscripts, Russian Academy of Sciences
Audrey L. Altstadt
University of Massachusetts
Andrey Korotayev Russian Academy of Sciences& Russian State University for the Humanities
Turaj Atabaki
Haneda Masashi
İnternational İnstitute of Social History University of Tokyo
Antony Black Asef Bayat
University of Dundee University of Illinois, Urbana-Champaign
Han-Woo Choi Michael A. Reynolds
Hondong University Princeton University
Stephen F. Dale Michael Rubin
Ohio State University American Enterprise Institute
Richard Foltz Concordia University, Montreal
Val D.Rust University of California, Los Angeles
Peter B. Golden Tadeusz Swietochowski
Rutgers University MonMouth College Amsterdam
Roy Allison University of Oxford
Nayereh Tohidi California State University, Northridge
EDITORIAL ASSISTANT
Khayala Mammadova Khazar University
KHAZAR UNIVERSITY PRESS

Copyright © Khazar University Press 2017
All Rights Reserved
Khazar University 41 Mehseti str., Baku AZ1096
Republic of Azerbaijan
Tel: (99412) 4217927 Website: www.jhss-khazar.org

Khazar Journal of Humanities and Social Sciences
Special Issue:
Hestourex World Health, Sports Tourism Congress & Exhibition
Table of contents
Ahmet Girgin, Tevfik Yazan, Erkan Karadag Evaluation of the satisfaction of Foreign States in Public Hospitals ........................................ 5 Fikret Soyer, Mehmet Demirel, Zülbiye Kacay, Cihan Ayhan, Duygu Harmandar Demirel Examination of the Opinions of University Students on the Meaning of Leisure Time and the Lesson Study Approaches ................................................................................................ 18 Kursat Yurdakos, Demet Unalan Risk analysis and determination of risk prevention methods in intensive care units ................ 32 Emel Ozcan Organizational relationship and organizational justice relationship in Health Workers ........... 48 Mucize Sarihan, Mehmet Macar, Meryem Paydas Private and Public Employees Health Hospitals Home Care Services Management and Organization on the Relationship with Organizational Commitment of Views ....................... 56 Idris Yılmaz, Fatih Koca, Akın Celik Exploration of the Impact of Religious Belief and Gender on University Students’ Empathy Feelings ............................................................................................................ 64 Dilek Tasdemir The Effects of Risks and Hazards on the Business Stress Levels of Comparative Relevance Within the Relevance of Occupational Health and Safety: A Hospital Example ..................... 73 Selma Nama Evaluation of Views of views on Traditional Applications After Mother Breast Care ........... 81 Nuriye Celmece, Abdullah Ishiklar, Mehmet Macar, Tayfur Kaya Organizational Commitment as a Predictor of Job Life Quality ............................................ 92 Selma Soyuk, Murat Iskender Aktash, Oguz Ozyaral Relationship between organizational cynicism and job satisfaction in health workers …..103 Akın Celik, Burhanettin Hacicaferoglu, Samet Zengin Department of Physical Education and Sport Teaching Students’ Reasons of Occupational Choice and Satisfaction Levels ....................................................................113 Burhanettin Hacicaferoglu, Serkan Hacicaferoglu, Recep Fatih Kayhan Examination of State Anxiety Levels of Athletes Participating in Volleyball Competitions ...127 Serdar Alemdag, Ceyhun Alemdag, Abdullah Bora Ozkara An Investigation of Physical Activity and Social Self-Efficacy of University Students: The Example of Turkey and England ...............................................................................135 Ercument Ergishi Type 1 Health Development Model Effect in Diabetes Management ...................................147

Tuba Uyar , Akin Celik, Fatih Koca
The Effects of Moderate Level Aerobic Exercise on Caregivers of Patients with Alzhiermer Disease: Randomized Controlled Study ...............................................................157 Hanife Avci, Arzu Turkmen Examination of Home Healthcare Services: A Field Study ......................................................167 Shukriye Turgut The Factors Affecting the Motivation of the Health Workers...................................................177 Eryaman Huseyin, Davut Cem Dikmen, Zehra Sevgi Oguz Determination of Ergonomic Conditions and Physical Workload of Infrastructure Employees…………………………………………………………………………………..………. 187 Tevfik Yazan, Ahmet Girgin, Erkan Karadag Health Tourism in Turkey .................................................................................................196 Nihal Ozcan Conformity and Dependency Complex in Yashar Kemal’s Other Face of the Mountain Trilogy ....................................................................................210 Ozge Cakır, Caniz ErsumerTonyalı, Nebahat Kılyumak, Onur Yashar Gokce Bushra Ozcan The Effect of Workplace Calisthenic Exercises on Mechanical Back Pain and Occupational Burnout .........................................................................................................................218 Gozde Yangınlar, Salih Kalaycı Barriers in Implementing Reverse Logistics: Evidence from Turkey .........................................224 Nuriye Celmeche, Abdullah Ishiklar, Serkan Arslan Effect of the Mobbing in Organizational Commitment and Job Life Quality Which is Applied to Health Workers ................................................................................................241 Yunus Kayabas, Mehmet Macar Exposure, Interpretation and Memory Retention in the Perception Process of Consumers ...........253 Osman Shahin, Ibrahim Turut, Erhan Salmanli Organizational Stress and the Effects of Public Bank Employee ..............................................262 Mesut Cevdet Yavuz A Targeted Study to Create Country Tourism, Medical Tourism and Employment Contribution on the Social Security System ..........................................................................268 Adem Sezen, Davut Cem Dikmen, Ahmet Cenk Dikmen, Muslum Kotan, Birkan Tapan Payment methods of foreign patients in Turkey and of Turkish hemodialysis patients abroad . …..280 Serap Ozbash The views of the Cypriot Turkish school students about renewable energy production.................287 Tugay Dikmen, Dudu Duygu Yıldırım, Aykut Yıldırım, Serap Ozbash Examining Internal and External Motivational Factors in Job Satisfaction of Public Institution Managers and Employees ..................................................................................................298 Gulkan Ay, Selahittin Ay The effects of the Immigration on Women’s health................................................................320 Hande Baba Kaya, Fikret Soyer, Murat Sarıkabak, Atike Yılmaz Examination of Control Focus and Psychological Endurance Levels by Various Variables According to Sports Activity…………………………………………………………….…………….326

Khazar Journal of Humanities and Social
Sciences © Khazar University Press 2017
DOI: 10.5782/kjhss.2017.5.17
Evaluation of the Satisfaction of Foreign States in Public Hospitals
Ahmet Girgin
IMBL University, Russian Federation
Tevfik Yazan
IMBL University, Russian Federation
Erkan Karadag
IMBL University, Russian Federation
Introduction
Quality in the health sector is composed of many components. Examples of these
are: The quality of the services in the emergency services, the speed in the
processes, the reduction of the differences between the clinical services and the
creation of a standard, the increase of the relations between the physician-patient
and the staff-patient to a certain level and finally, perhaps the most important; We
may assume that technological innovations and developments are constantly
monitored and adapted to the system.(Akalın & Erdal, 2000, pp. 32-33).
Technology and expertise are constantly evolving; It is becoming increasingly
difficult to keep the quality at the desired level during this period, when costs are
increasing due to the increase in patients' desires. For this reason, the issues that
health institutions need to focus on in the name of increasing balances of workload
are also increasing. The duties of these managers are to use their financial resources
effectively to meet the needs of their hospitals at the highest possible level. At the
same time, they must increase efficiency as much as possible by managing human
resources and performance metrics. Action should be taken according to the
specified objectives and efficiency should always be kept in the foreground (Fisher,
1971, p.238)
5

6 Ahmet Girgin, Tevfik Yazan, Erkan Karadag Patient satisfaction is one of the main outputs of health care institutions. In general
terms, it should be aimed of serving above the needs and expectations of patients.
Factors determining patient satisfaction are divided into two. These; Patient
expectations and perceptions of patients towards health care.
As mentioned before, the managerial and behavioral characteristics that the patients
want to see in the health institutions are composed of many influences. These
characteristics are shaped by experiences and characteristics that vary from person
to person. The patient's previous experiences, age, gender, education and socio-
cultural structure play a major role in shaping these traits. Another factor is
perception; The quality of the service received by the patient and the patient's
views on this service. The perception factor is also shaped by the fact that the
patient satisfaction factor is affected. It differs according to the experiences and
personality traits of the people. (Kavuncubaşı & Yıldırım, 2010, p. 292-295).
The aim of this study is to determine the satisfaction of foreign nationals coming to
public hospitals. In this context, firstly the basic concepts are covered by the
literature study and then the collected data are analyzed and interpreted in SPSS 22
statistical program.
Quality in Health Care Concept
Health services can be defined in various forms. In general terms, it can be defined
as "providing health care organizations with various preventive and therapeutic
activities in line with the needs and expectations of patients given by health
personnel with special needs in various fields in accordance with various health
needs and creating a permanent system organized around the country" (Karabulut,
1998, p. 16).
The health system is important not only for the formation of a dialogue between the
health care staff and the patient but also for the dialogue between these persons
(Tarım, 2000, p.1025) Individual and community health are influenced by many
factors, not just one. For this reason, health services are a multidimensional
concept. They come from many dimensions and activities related to each other
(Somuoğlu, 2012, p.8)
Presentation in health care services has to be high quality. For this reason,
international norms and rules have been established. Examination, diagnosis and

Evaluation of the Satisfaction of Foreign States in Public Hospitals 7 treatment services should be presented in the direction of patients' expectations.
This helps us to describe the concept of quality in presentation (Konca, Ilhan, &
Bumin, 2006, p.42)
Another opinion to healthcare goals is to provide the service that is needed in the
direction of society's desires and expectations with the required quality, speed and
optimum cost (Zerenler & Öğüt, 2007, p.504).
Foundations, institutions and authorities paying for financing expenditures in the
health sector bring high quality standards with sector regulations in order to see the
value that these investments deserve. This also plays an important role in
increasing the quality and efficiency of the service provided. In this way, many
standards and rules that require payment are imposed, which indirectly contributes
positively to the health care that the community receives. Some of the resulting
proposals are; As a result, some of the proposed recommendations are to complete
the necessary evaluations and measurements for a quality presentation, to provide
patient-centered services and to prepare strategic plans and to institutionalize the
institutions to improve themselves on education and development.(Stamatis,2000)
Medical knowledge and science also play an important role in the development of
health services that need to be addressed in a very technical way. Knowledge and
science play a crucial role in the diagnosis and treatment of a disease (Varinli &
Cakir, 2004, p. 34-35).
Patients may not have enough knowledge on technical examination or treatment
while receiving health care. For this reason, he may not be able to decide for
himself. All he can do is obey the doctor's decision about himself. At this point, the
technical quality of the health service and the ability of the health personnel to
provide information arise at this point (Devebakan & Aksarayli, 2003, p.42)
Treatment services are also determinants of service quality. The perception of
personal service quality of the patients receiving the service is also determined by
the experiences and personalities of the persons. Attitudes and behaviors towards
the customer at this point play an important role (Kavuncubaşı & Yıldırım, 2010,
p.445).
A quality health service provides many advantages to the patient and increases the
quality of life. As an example: It allows the patient to recover his / her physical,
mental and mental capabilities as soon as possible and to use the technical,
medical, financial and human resources of the health system in the most efficient
way (Taşlıyan & Gök, 2012, p.74)

8 Ahmet Girgin, Tevfik Yazan, Erkan Karadag There are also various approaches to quality standards in health care institutions.
Donnebedian (1990) summarizes the seventh of these standards as follows
(Kavuncubaşı & Yıldırım, 2010, pp. 455):
1. Efficacy:İt must be aimed that to heal patient as possıble as well by using current
medical and scientific knowledge in optimum levels .There should be no inactive
information and technology elements, and the best medical intervention that can be
implemented and applied should be applied.
2. Effectiveness: In a more different concept, effectiveness, emphasis is placed on
developments that are expected to be realized or potentially realized in the health of
the patient. The most important criterion for accepting the assumption that the
health system is effective is the concrete and positive developments in the patient's
health.
3. Efficiency: Cost is also an important factor in the health care system. To talk
about the efficiency, health care should be given at the lowest possible cost. It is a
concept that is highly related to human life. If two services with the same effect are
offered and one costs more than the other, we can say that the service with the
lower cost is of better quality than the other.
4. Optimal: It is important that the balance between service provided to the patient, benefit to the patient and cost to the institution is at an optimum level.
5. Acceptability: It means that people's expectation and desire from the health
service is consistent with the service they are receiving. 6. Legality: Acceptability is a little more macroscopic. It can be defined as the
acceptance of the service provided by the health institution. If this does not happen,
the community will not accept or prefer this health service.
7. Equality: The concept of equality, which is one of the most important building
blocks of a system, is also influential in an important sector such as health.
Everyone should have the right to health care and benefit from this service on an
equal basis.
The most important factors that can be accepted as a service are classified
as follows:
A. People's access to the service and availability of this service must be acceptable.
B. It is necessary for the health staff to be sensitive and to match the services
that people expect.

Evaluation of the Satisfaction of Foreign States in Public Hospitals 9 C. Health institutions or health care environments must be hygienic, peaceful and
reassuring.
D. Reasonable pricing policies need to be applied in order for health care to be
effective, tangible, and materially acceptable (Kavuncubaşı & Yıldırım, 2010,
p.458)
As in all sectors, competition in the health sector brings quality to an important point while competitive market conditions drive down prices.
Patient and Patient Satisfaction as a Customer in Health Institutions
The concept of satisfaction has become increasingly important in recent years. This
also applies to the health sector. Appropriate and correct use of resources in the
health system is confirmed by to satisfy expectations of people and the higher of
their satisfaction levels.(Yılmaz, 2001, p. 69-74).
Consideration of patient satisfaction as a quality measure; enables the continuity
and increase of qualifications in the sector.(Gugen,2004)Assessing health care
quality is also an important step.There are generally two ways in the methodology.
These are:
A. To establish standards for determining and improving the quality of health care
and to regularly measure and revise these standards.
B. Follow-up of patient satisfaction (Yılmaz, 2001, p. 69-74).
Patients' position and role in the healthcare industry was rather passive in the early
1960s, by the time it started to become active. Today, patient satisfaction is at the
center of the system. Diagnosis and treatment have become a mass of patients who
understand and question instead of just doing what they say. For this reason, not
only those who evaluate the system shouldn't be suppliers but also those who
benefit from the service. (Yılmaz, 2001, p. 69-74).
Initial research on patient satisfaction began in the United States in the mid-1950s.
First examples are given in the field of nursing. Findings have shown that
satisfaction plays an extremely important role in assessing quality of health. At the
same time with the world,our country was also had been succeeded in significant
studies. As time goes on, the number of studies done in this area is also increasing
(Yılmaz, 2001, pp. 69-74).
Leebov and Scott have linked four aspects of patient satisfaction to healthcare
institutions:

10 Ahmet Girgin, Tevfik Yazan, Erkan Karadag A. Humanitarian causes: Quality health care is the right of every patient.
B. Economic reasons: Patient satisfaction means more income for the health care
institutions because patients want to get worth that what they have paid for.
C. Marketing: Patient satisfaction is highly valued in studies conducted to increase
profits.
D. Effectiveness: Patient satisfaction is a complicated concept that connected with
Life style, past experiences, future expectations, individual and social values (Carr-
Hill, 1992).
Unlike the previous studies, the overlap between patient expectations and care,
describes the patient satisfaction for Greeneich (1992) (Yılmaz, 2001, p. 69-74).
It is also as important as the expectation of the patients that the socio-cultural
values of the service they will receive are in conformity. If the expectation is less
than the service it receives, the person is more satisfied. If too, dissatisfaction and
unhappiness arise because it will exceed expectations (Sezer, 1999).
For Hall and Dornan, patient satisfaction is affected by many factors. Some of
these factors are; Cost, continuity, transportation, hygiene, physical conditions and
service diversity (Gügen, 2004).
Risser (1975) studied the research findings of patient satisfaction between 1957 and
1974 in his literature review. In research, wages, knowledge and suitability of the
staff are the most important factors determining patient satisfaction (Akın, 2004).
Jones and colleagues distinguished four groups that the variables affect patient satisfaction. These are: (Karadag, 2007):
A. Patient characteristics in health, expectation and sociocultural sense.
B. Technical and functional aspects of the services provided in the health system and personal characteristics of service providers.
C. Harmony between health personnel and a healthy patient-physician relationship.
D.Environmental factors.
The results of the researches on sociodemographic variables are as follows
(Yılmaz, 2001, p. 69-74):

Evaluation of the Satisfaction of Foreign States in Public Hospitals 11 A. Elderly people are more satisfied with health services than young people (Carr-
Hill, 1992; Jakobsson, Hallberg, Loven, & Ottosson, 1994). However, there are
also studies that suggest opposite (Hart, Neiman, Chaimoff, Wolloch, & Djaldetti,
1996).
B. As regards gender, Every result was found. (Larsson, Larsson, & Starrin, 1999,
Tengilimoglu, 1996, Okumuş, Akçay, Karayurt, & Demircan, 1993, Özmen, 1999).
Women are more satisfied (Lookinland & Pool, 1998). Men are more satisfied
(Gray, and others, 1997).
C.As the level of education increased, the expectation was increased and therefore
relatively low findings were obtained regarding the satisfaction of the
patients.Uneducated people are more satisfied.Satisfaction decreases as expectation
rises.(Lewis, 1994; Esatoğlu, 1997; Carr-Hill, 1992; Özmen, 1999).On the other
hand,(Yılmaz,2000) as the level of education decreases, satisfaction has also
reached its conclusion.But Akyol (1993) concludes that the level of education has
no effect on patient satisfaction at all. Weiss (1988) found that satisfaction
increased as the level of education increased (Gügen, 2004).
The result from the studies examined is; There is no meaningful and consistent
relationship between age, education, gender and patient satisfaction.A system
centered on satisfaction and focused on the patient will always give much more
positive results and accelerate the development in the health field.At the same time,
the attitude of healthcare personnel towards patients also plays a major role in this
system.Education, knowledge and skills are presented in a way that offers a great
contribution to the health staff in terms of communication and how to communicate
with the patient.
Between 1966 and 1990, according to the meta-analyzes on patient satisfaction, the
factors that directly affect patient satisfaction and can be listed as follows:
A. Healthcare personnel give their patients confidence and make them feel peaceful
and safe.
B. They must constantly inform the patient about their illness and enlighten them
on issues they are concerned about.
C. Healthcare organizations are convinced that the patient is subject to reliable and specific standards.
D.Environmental factors include such as hygiene, accessibility, working hours and
food services and their physical competence and suitability.

12 Ahmet Girgin, Tevfik Yazan, Erkan Karadag Materials and Methods
In this study, survey technique was used as data collection method.. XXX scale,
developed by XXX (XXXX), has been applied to XXX people, in XXX.The
universe of your research is xxxxx.
Results
Given the frequency analysis results, foreign nationals are generally satisfied
with policlicnics (mean score: 4,47 ± 0,57). Of the foreign nationals, 97% were
from the examination , 94.6% from the appointment , 94.3% from the timely
examination, 90.8% from the telephone appointment , 89% from the waiting
areas and hygiene and 92.3% were satisfied with the data archiving service.
Table 1.Frequency analysis results of participants' satisfaction about the policlinic I was not
satisfied at Dissatis Undecid I am I'm very Average
all fied ed satisfied satisfied Score
Examination speed 0 0 3.0 36,7 60,3 4.57
Appointment speed 0 0 5.4 38,8 55,9 4.51
Timely examination 0 0 5.7 41,3 53,0 4.47
Appointment speed from 0 1,0 8.2 36,6 54.1 4,44
phone
Regulation of waiting areas 0 2,3 8.7 38.5 50.5 4.37
and hygiene
Data archiving service 0 0.7 7.1 39.1 53,2 4.45
Overall Average: 4,47 ± 0,57
Table 2.Frequency analysis results of participants' satisfaction with doctors
I was not Dissati I am I'm very Average
satisfied sfied Undecided satisfied satisfied Score
at all
Time spent with the doctor 1,0 0,3 5.7 32,4 60,5 4.51
The adequacy of the
physician'spatient care and 0.7 0,3 5.4 36,8 56,9 4,49
examination

Evaluation of the Satisfaction of Foreign States in Public Hospitals 13
Explanation of the analyzes 0,3 0.7 6.4 33,1 59.5 4.51
Attitudes and behaviors of the 0 0,3 6.0 32,4 61,2 4.55
doctor
Examination satisfaction 0.7 0,3 5.7 31,8 61.5 4.53
Overall Average: 4,52 ± 0,6
According to frequency analysis results, foreign nationals are generally satisfied
with the doctors. (mean score: 4,52 ± 0,6). Of the foreign nationals patients; %92,9
from the time spent with the doctor, %93,7 from the adequacy of the
physician'spatient care and examination, %92,6 from the Explanation of the
analyzes, %93,6 from the Attitudes and behaviors of the doctor, %93,3 were
satisfied from the examination
Based on the frequency analysis results, it is seen that foreign patients are generally
satisfied with the International Patient Unit (mean score: 4,66 ± 0,51). Of the
foreign nationals patients %96,9 from satisfied the with the work done, %96,9 from
the attitudes and behaviors, %95,7 from the translation ability, %95,9 from the
ability to make statements, %96,6 from the time spent on a person, %97,6 from the
the trust of the International Patient Unit, %97 were satisfied from ability to
communicate with the International Patient Unit.
Table 3. Frequency Analysis Results of Participants' Satisfaction with the
International Patient Unit
I was not Dissatisfied Undecided
I am I'm very Average
satisfied
at all satisfied satisfied Score
Attitudes and behaviors 0 0 3.0 25,8 71.1 4.68
Satisfied with the work 0 0.7 2,4 27,9 69,0 4.65
done
Translation ability 0,3 1,0 3.0 27,9 67,8 4,62
Ability to make statements 0 0.7 3,4 28,3 67,7 4,63
Is the time spent for the 0.7 0 2.7 27,9 68,7 4.64
person enough?
The trust of the 0,3 0 2.1 19,4 78,2 4.75
International Patient Unit
Ability to communicate
with the International 0,3 0.7 2,0 19,7 77,3 4.73
Patient Unit
Overall Average: 4,66 ± 0,51

14 Ahmet Girgin, Tevfik Yazan, Erkan Karadag
Table 4.Frequency analysis results of the participants' satisfaction with the physical
conditions of the hospitals
I was not Dissatisf Undecided
I am I'm very Average
satisfied
at all ied satisfied satisfied Score
The layout of the waiting 0,3 1,0 12,0 41.8 44,8 4.30
rooms and hygiene
Regular and hygienic toilets 0,3 1.7 12,8 43,8 41,4 4.24
Elevators are hygienic and 0 0,3 13,7 46,4 39,5 4.25
orderly
Toilet for disabled 0 1,4 16,8 40,9 40,9 4.21
Accessibility for disabled 0 1,0 18,3 42,6 38,1 4.18
persons
Directions instructions 0.7 1,4 20,0 38,3 39,7 4,15
Safety and comfort during 0 2,0 21,8 36,2 39,9 4.14
standby
Private life and privacy 0,3 2.7 20,7 36,6 39,7 4,13
Children's playground 0,3 3.8 30,4 33,6 31,8 3.93
Cafeteria and relaxation area 0 4.1 26.3 36,2 33,4 3.99
Easily reach the hospital 0.7 4.4 20.5 34,7 39,7 4.08
building
Easily reach service 1,0 4.1 16,6 32,1 46,3 4,19
Overall Average: 4,66 ± 0,51
According to frequency analysis results, foreign nationals are generally satisfied
with the physical conditions of the hospitals (mean score: 4,14 ± 0,7). Of the
foreign nationals 85.2% from the order and hygiene of the waiting rooms, 85.2%
from the toilet and hygiene, 85.9%from the elevators and hygiene, 81.8 from the
toilets for the disabled, 78.1%from the directions of getting directions, 76.1%from
the security and comfort of waiting period, 76.3%from the privacy and
confidentiality of information, 65.4% from the children's playground, 69.6% from
the cafeteria and rest area, %74.4 satisfied from the hospital area and %78.4
satisfied from the easy access to service.
Result
In this study, the level of satisfaction of foreign nationals who came to public
hospitals was investigated. Based on the results, it is seen that the foreign patients
are very satisfied with the policlinics, doctors, the International Patient Unit and the
physical conditions of the hospital.

Evaluation of the Satisfaction of Foreign States in Public Hospitals 15 Foreign nationals have indicated that they are satisfied with the speed of
examination, the speed of telephone or normal appointment, the timely
examination, the arrangement and hygiene of waiting areas and the data archiving
service. In addition to this, foreign nationals patients stated that they are satisfied
with the attitude and behavior of the doctor, the time which have spent by the
doctor with the patient, the adequacy of the doctor's care and examination, the
explanation of the analysis of the doctor. When we look at the satisfaction of
foreign patients with the International Patient Unit; The attitude and behavior of the
International Patient Unit, the work of the International Patient Unit, the ability of
the International Patient Unit to translate it, the ability of the International Patient
Unit to explain it, the time that spent with the patient by the International Patient
Unit, And the communication of the international patient unit are almost
completely liked by the foreign nationals patients.Finally, when we examined the
opinions of foreign nationals about the physical condition of the hospitals they are
satisfied with the hygienic toilets,elevators and rest rooms, with toilets for disabled,
with accessibility for the disabled, with navigation signs, with privacy ofprivate
life. They are also happy with children playground, cafeteria, easy transportation to
the hospital and easy acces to the service.
References and notes:
Akalın, E., & Erdal, H. (2000). Sağlık Hizmetlerinde Kalite Mi? Sürekli Kalite İyileştirme Kavramı
mı? Hastane Tıp Teknolojisi Dergisi(4), 32-33. Akın, G. (2004). Türkiye'de Yapılmış Hasta Memnuniyeti Araştırmalarının Değerlendirilmesi.
Yayınlanmamış Yüksek Lisans Tezi. Ankara: Ankara Üniversitesi Sağlık Bilimleri Enstitüsü. Akyol, A. D. (1993). Hemodiyalize Giren Hastaların Verilen Bakımdan MemnunOlmalarının
Değerlendirilmesi. Kalite, Maliyet ve Hemşirelik Sempozyumu (s. 80-91). İzmir: Ege
Üniversitesi Basımevi.
Carr-Hill, R. A. (1992). The Measurement of Patient Satisfaction. Journal of Public Health, 14(3),
236-249. Devebakan, N., & Aksaraylı, M. (2003). Sağlık İşletmelerinde Hizmet Kalitesinin Ölçümünde
SERVQUAL Skorlarının Kullanımı ve Özel Altınordu Hastanesi Uygulaması. Dokuz
EylülÜniversitesi Sosyal Bilimler Enstitüsü Dergisi, 5(1), 38-54. Donabedian, A. (1990). The Seven Pillars of Quality. Archives of Pathology & Laboratory
Medicine,114(11), 1115-1118. Esatoğlu, E. A. (1997). Hastanelerde Hasta Tatmininin Hastane Yönetimi Açısından Değerlendrilmesi
ve Kullanıma Yönelik Model Önerisi. Yayınlanmamış Doktora Tezi. Ankara: Hacettepe
Üniversitesi Sağlık Bilimleri Enstitüsü. Fisher, A. W. (1971). Patients' Evaluation of Outpatient Medical Care. Academic Medicine, 46(3),
238-244. Gray, S. F., Spencer, I. C., Spry, P. G., Brookes, S. T., Baker, I. A., Peters, T. J., & Easty, D. L.
(1997). The Bristol Shared Care Glaucoma Study - Validity of Measurements and Patient
Satisfaction. Journal of Public Health, 19(4), 431-436.

16 Ahmet Girgin, Tevfik Yazan, Erkan Karadag Greeneich, D. S., Long, C. O., & Millter, B. K. (1992). Patient Satisfaction Update: Research Applied
to Practice. Applied Nursing Research, 5(1), 43-48. Gügen,B. (2004). Toplam Kalite Çerçevesinde Birinci Basamak Sağlık Hizmetlerinde Hasta
Memnuniyetine İlişkin Bir Uygulama. Yayınlanmamış Yüksek Lisans Tezi. Kütahya:
Dumlupınar Üniversitesi Sosyal Bilimler Enstitüsü. Hart, J., Neiman, V., Chaimoff, C., Wolloch, Y., & Djaldetti, M. (1996). Patient Satisfaction in Two
Department of Surgery in a Commuinty Hospital. Israel Journal of Medical Sciences, 1338-
1343. Jakobsson, L., Hallberg, I. R., Loven, L., & Ottosson, B. (1994). Patient Satisfaction with Nursing
Care, Evaluation Before and After Cutback in Expenditure and Intervention at a Surgical Clinic.
International Journal for Quality in Health Care, 6(9), 361-369. Karabulut, K. (1998). Türkiye’de Sağlık Sektörü Sağlık Harcamaları Üzerine Bir Uygulama.
Yayınlanmamış Doktora Tezi. Erzurum: Atatürk Üniversitesi Sosyal Bilimler Enstitüsü. Karadağ, Z. (2007). Aile Hekimliği Uygulamasının Müşteri / Hasta Memnuniyetine Etkisi.
Yayınlanmamış Yüksek Lisans Tezi. Ankara: Gazi Üniversitesi Sosyal Bilimler Enstitüsü. Kavuncubaşı, Ş., & Yıldırım, S. (2010). Hastane ve Sağlık Kurumları Yönetimi. Ankara: Siyasal
Kitabevi. Konca, G. E., İlhan, M. N., & Bumin, M. A. (2006). Yatarak Tedavi Gören Hastaların Hastane
Çalışanları ve Hastane Hizmetlerinden Beklentileri ve Beklentilerine İlişkin Memnuniyet
Durumlarının Değerlendirilmesi. Gazi Tıp Dergisi, 17(3), 160-170. Larsson, B. W., Larsson, G., & Starrin, B. (1999). Patients' Views on Quality of Care: A Comparison
of Men and Women. Journal of Nursing Management(7), 133-140. Lewis, J. R. (1994). Patient Views on Quality Care in General Practice. Literature Review.
SocialScience Medicine, 39(5), 655-670. Lookinland, S., & Pool, M. (1998). Study on Effect of Methods of Preoperative Education in Women.
AORN Journal, 67(1), 203-213. Okumuş, H., Akçay, H., Karayurt, Ö., & Demircan, G. (1993). Bir Kalite Güvenlik Programı Ölçütü:
Hasta Memnuniyetinin Değerlendirilmesi. Uluslararası Kalite, Maliyet ve
HemşirelikSempozyumu Kitabı (s. 177-183). İzmir: Ege Üniversitesi Basımevi. Özmen,D. (1999). Dokuz Eylül Üniversitesi Tıp Fakültesi Hastanesi'nde Yatan Hastaların
Beklentilerinin Saptanması. II. Ulusal Hemşirelik Kongresi Bildirileri Kitabı, (s. 552-568).
İzmir.
Risser, N. L. (1975). Development of an Instrument to Measure Patient Satisfaction with Nurses and
Nursing Care in Primary Care Settings. Nursing Research, 14(2), 45-51. Sezer, A. (1999). Sağlık Hizmetlerinde Pazarlama Stratejilerinin Müşteri Tatmin Yaratmaya Etkileri.
Yayınlanmamış Yüksek Lisans Tezi. Afyon: Afyon Kocatepe Üniversitesi Sosyal
BilimlerEnstitüsü. Somuoğlu, S. (2012). Sağlık Kurumları Yönetimi-1. Eskişehir: Anadolu Üniversitesi Açıköğretim
Fakültesi Yayınları. Stamatis, D. H. (2000). Total Quality Management in Healthcare. Chicago: Irwin Professional
Publishing. Tarım, M. (2000). Hizmet Organizasyonlarında (Hastanelerde) Kalite.Prof. Dr. Nusret Ekin’e
Armağan, Türk Ağır Sanayii ve Hizmet Sektörü Kamu İşverenleri Sendikası Yayını(38), 1025-
1040.
Taşlıyan, M., & Gök, S. (2012). Kamu ve Özel Hastanelerde Hasta Memnuniyeti: Kahramanmaraş’ta
Bir Alan Çalışması. KSÜİİBF Dergisi(3), 69-94. Tengilimoğlu, D. (1996). Ankara'da Bir Üniversite Hastanesinde Hasta Memnuniyetinin Ölçülmesi.
Sağlık Hizmetlerinde Toplam Kalite Yönetimi ve Performans Ölçümü. M. Çoruh (Dü.) içinde,
Sağlık Hizmetlerinde Toplam Kalite Yönetimi ve Performans Ölçümü (s. 103-111).
Ankara:Haberal Eğitim Vakfı.

Evaluation of the Satisfaction of Foreign States in Public Hospitals 17 Varinli, İ., & Çakır, A. (2004). Hizmet Kalitesi, Değer, Hasta Tatmini ve Davranışsal Niyetler
Arasındaki İlişki Kayseri’de Poliklinik Hastalarına Yönelik Bir Araştırma. Sosyal
BilimlerEnstitüsü Dergisi(17), 33-52. Weiss, G. L. (1988). Patient Satisfaction with Primary Medical Care Evaluation of Sociodemographic
and Predispositional Factors. Medical Care, 26(4), 383-392. Yılmaz, M. (2000). Ameliyat Öncesi Öğretimin Ameliyat Sonrası Komplikasyonlara ve Hasta
Memnuniyetine Etkisi. Yayınlanmamış Doktora Tezi. Ankara: Hacettepe Üniversitesi Sağlık
Bilimleri Enstitüsü.
Yılmaz, M. (2001). Sağlık Bakım Kalitesinin Bir Ölçütü: Hasta Memnuniyeti. C. Ü.
HemşirelikYüksekokulu Dergisi, 5(2), 69-74. Zerenler, M., & Öğüt, A. (2007). Sağlık Sektöründe Algılanan Hizmet Kalitesi ve Hastane Tercih
Nedenleri Araştırması: Konya Örneği. Selçuk Üniversitesi Sosyal Bilimler EnstitüsüDergisi(18),
501-519.
Summary
Evaluation of the satisfaction of Foreign States in Public Hospitals
Ahmet Girgin IMBL University, Russian Federation
Tevfik Yazan IMBL University, Russian Federation
Erkan Karadag IMBL University, Russian Federation
Patient satisfaction is one of the most important concepts for the medical
institutions. There are several factors that provide patient satisfaction. The concepts
of quality and patient satisfaction are the priorities of the study. The main aim of
this study is to evaluate the satisfaction levels of foreign patients, who get service
from the public hospitals. Within this scope, , the sample is determined as the 301
people living in the city of Antalya, and the data is acquired via the survey method.
The collected data is interpreted by analyzing the SPSS 22 statistical program.
Keywords: Patient Satisfaction, Public Hospitals, Medical Institutions,
ForeignPatients

Khazar Journal of Humanities and Social
Sciences © Khazar University Press 2017
DOI: 10.5782/kjhss.2017.5.18.31
Examination of the Opinions of University Students
on the Meaning of Leisure Time and the Lesson
Study Approaches
Fikret Soyer
Sakarya University, Turkey
Mehmet Demirel
Dumlupınar University, Turkey
Zülbiye Kacay
Sakarya University, Turkey
Cihan Ayhan
Sakarya University, Turkey
Duygu Harmandar Demirel
Dumlupınar University, Turkey
1. Introduction
Leisure time as part of a human life begin to gain a meaning and begin to be
effective by an increasing complexity of work and social life (Venkatesh, 2006).
Researchers have explored features of the leisure time to define the individuals’
attitudes towards leisure time (Schulz and Watkins, 2007), and they have defined
leisure time as a concept of time, primarily spent without financial expectation.
Some researchers have identified leisure time as a string of social relationships and
materials that have contributed positively to the increase in human capacity
(Torkildsen, 2005; Caldwell, 2005). The definitions made about the leisure time
shows that, it is the time period that people spent without any expectation and has a
positive effect on human life.
18

Examination of the Opinions of University Students on the Meaning of Leisure … 19
Due to the rapid development of the digital world, the concept of leisure time
differs from person to person (Auger, 2016). Individuals have the capacity to learn
different meanings of leisure, the knowledge they learn about an event can shape
the meaning of leisure time. With these two assumptions, Watkins (2000) studied
on three questions to analyze the meaning of leisure time. "1) How do individuals
have information about leisure and how does it make sense of leisure time? 2) How
do individuals create different meanings of leisure time? 3) How do individuals
change the meaning of leisure time?" Considering the validity of the assumptions
shaped by these questions, it is seen that the meaning of free time in the literature,
corresponds to different theoretical explanations about how individuals evaluate
their leisure time (Watkins, 2000). In one of the first studies, the meaning of leisure
time was defined by Donald and Havighurst (1959) as the pleasure that people
enjoy most from their leisure time activities. The meaning of leisure according to
Porter, Iwasaki and Shank (2010); are emotional and spiritual experiences that has
a personal importance to the individual, occurring in the individual's leisure time
and on a social scene.
Some researchers have emphasized the significance of leisure in terms of mental
health of individuals. It has also been noted that participation in leisure activities
leads to positive emotions affecting motivation. On the other hand, in order to
obtain a healthy life and quality of life, it is necessary to take full advantage of the
meaning given to the individual by the leisure time (Porter, Iwasaki and Shank,
2010). Iwasaki (2008) as a result of an international survey on the meaning of
leisure time; suggests that the leisure time has an important contribution on a)
positive emotions and welfare level, b) self-esteem and spirituality, c) social and
cultural ties, d) human power, e) learning and development.
The beginning of the most important building blocks of social life is, of course, the
universities. The origins of the known university come from the community where
the knowledge gathered to share knowledge (Akyüz, 2003). The universities as an
institution shaped by the society and culture. If the culture has diversity and
complexity, the function of the university will also try to cover the necessities that
emerged. Therefore, it is necessary to learn how to use the time in a good way by
the leisure time training. The learning process can be actualized by creating free
time and spending it correctly (Hacıoğlu et al., 2003).
Along with industrialization, it is known that rapid progress in science and
technology leads the community to the age of information. So the students need to
keep up these innovations. For this reason, the main aim in education is to enable
learners to take an active role in the learning process (Khomeiran et al., 2006).

20 Fikret Soyer, Mehmet Demirel, Zülbiye Kacay, Cihan Ayhan, Duygu Harmandar Demirel Learning is a way of interacting with the world. As we learn, the point of view
towards events changes and the world seems differently (Biggs, 2012). In recent
years there has been a great deal of research on the education of students studying
at universities. In order to define the learning methods of the learners, learning
approaches, in other words, course study approaches have been discussed (Beaten
et al., 2010). The learning approach is used to describe the thinking of the student
and the way he or she manipulates knowledge, and combines a motive and an
appropriate strategy. Today, education and learning environments have changed
shifting from traditional understanding to constructive understanding. Together
with the constructive learning, the responsibility of the students have increased and
it has become inevitable for the increasing number of students to transfer what they
have learned into a an ability. During learning, students exhibit different learning
techniques; some of them by trying to understand with all their dimensions (deep
approach) and some by direct memorization (Geçer, 2012). A superficial approach
is a learning approach based on the need to use knowledge after a short period of
time, with compulsory and compelling implications based on the intention of
completing the task based on the student's performance of the assigned task (Biggs,
1999, Trigwell and Prosser, 1991). A profound approach is a comprehension-
oriented learning approach that deals with the structure of the learning task and that
achieves the appropriate results (Biggs, 1999, Ramsden, 2003).
The study approaches are also related to the motivation of the students. Motivation
is highly correlated with the students' approaches to learning and explains why and
how learners learn (Beaten et al., 2010; Sambel, McDowell, and Brown, 1997,
Zhank and Sternberg, 2000). A student with high motivation is ready for the
learning process (Fidan, 1996).
The leisure time is a time period in which people do not work and direct
themselves in the way they want. The leisure time provides opportunities for
individuals to be good physically and spiritually, it also increase their level of
satisfaction and helps to recognize themselves. University students should benefit
from recreation and leisure activities in order to get rid of mental problems, to
socialize, and to be healthy in sportive sense. Therefore, they will be able to benefit
from the above-mentioned positive effects and it will become easier to achieve
success in both their socio-cultural life and professional life (Kaba, 2009).
According to Zorba et al. (2006), leisure activities have a great proposition in terms
of course work and are part of school life. Every student who spends most of their
time in classrooms, laboratories or libraries needs to participate in leisure activities.
These activities can eliminate intense stress, hopelessness and self-doubt and at the
same time they can increase their motivation in terms of course work. Therefore, it
can be said that the leisure time effects the students’ studying positively and helps
for taking good points from the exams.

Examination of the Opinions of University Students on the Meaning of Leisure … 21
2. Methodology
2.1 Research Group
The research group comprises a total of 463 university students including 206
(44.5%) "Female" and 257 (55.5%) "Male" students who were educated at Sakarya
University Faculty of Sports Sciences and other faculties and they were selected by
convenient sampling method. The students participated voluntarly.
2.2 Data Collection Tool
Survey model was used in the research. As data collection tool; in addition to the
personal information form prepared by the researcher, in order to determine the
leisure perceptions of the participants the LEISURE MEANINGS INVEN-TORY
which was developed by Esteve et al. (1999) and adapted into Turkish by Gürbüz
et al. (2007) was used. It is 6 points Likert Type Scale (1 = do not agree
Absolutely, 6 = totally agree). The Scale includes 35 items, eight subdimensions
(perceived freedom, business relationship, social interaction, leisure time
availability, active-passive participation, target orientation, perceived competence).
In order to determine the students’ learning approaches, APPROACHES to
STUDYING Inventory by Biggs, Kember and Leung (2001) was used in
theresearch. The reliability and validity of the scale done by Yılmaz and Orhan
(2011). The scale consists of 22 questions and 2 sub dimensions (superficial and
deep approaches).
2.3 Analysis of data
In the analysis of the data, percent and frequency descriptive statistical methods
were used to determine the distributions of participants' personal information also,
the skewness and kurtosis values of the data were checked and Shapiro Wilks
normality test was used. It has been determined that the results had anormal
distribution. According to Jondeau and Rockinger (2008), when the coefficients of
skewness and kurtosis of sub-dimensions change between +3 and -3, they stated
that these sub-dimensions have suitable conditions for normal distribution
parameters. In the statistical analysis of the data, pearson correlation analysis
methods (α = 0.05) were used to determine the relationship between t-test, anova
test (E. Jondeau, M. Rockinger (2003) Conditional volatility, skewness, and
kurtosis: existence, persistence, and comovements. Journal of Economic Dynamics
& Control, 27, 1699 – 1737).

22 Fikret Soyer, Mehmet Demirel, Zülbiye Kacay, Cihan Ayhan, Duygu Harmandar Demirel
3. Findings
According to the Table 1, 55.5% of the respondents were male, 70.6% were in the
age range of "21-25", 46.4% of the participants had a "Normal" welfare level,
59.0% were educated in "Other" faculties, and 53.6% did not regularly participate
in sporting events.
Table 1. Distribution of Participants by Gender, Age, Monthly Income and Weekly
Leisure Time
Variables F %
Gender Female 206 44.5
Male 257 55.5
Total 463 100
Age 17-20 103 22.2
21-25 327 70.6
26 and over 33 7.1
Total 463 100
Welfare Level Very bad 18 3.9
Bad 26 5.6
Normal 215 46.4
Good 163 35.2
Very good 41 8.9
Total 463 100
Faculty S.B.F. 190 41.0
Other 273 59.0
Total 463 100
Participation in Sports Yes 215 46.4
Activities No 248 53.6
Total 463 100
Table 2. Study Approaches of the Participants by Gender
Sub Dimension Gender N Mean F t p
Deep Approach
Female 206 31.233 .314 -.949 .343
Male 257 31.980
Superficial Female 206 30.237 2.701 -3.178 .002
Approach Male 257 32.354

Examination of the Opinions of University Students on the Meaning of Leisure … 23
Table 2. shows the results of the T test conducted to determine the study approach
of the participants according to gender. According to the T test results; there was a
statistically significant difference in the "superficial approach" subscale between
male and female participants' scores (p˂0.05).
In Table 3. T-test results shows the meaning of leisure time according to the gender
of the participants. According to test results; statistically significant differences
were determined in the "Job Relation" sub-dimension (p <0.05).
Table 3. The Levels of Leisure Meaning by Gender
Sub dimension Gender N Mean F t p
Active-Passive Female 206 4.282 1.343 .426 .670
Participation Male 257 4.243
Social Interaction
Female 206 4.594 .472 .608 .543
Male 257 4.540
Perceived Female 206 4.669 1.112 .733 .464
Competence Male 257 4.738
Usability of Female 206 4.595 .004 1.429 .154
Leisure Time Male 257 4.476
Perceived Female 206 4.553 2.215 1.768 .078
Freedom Male 257 4.390
Intrinsic Female 206 4.415 .279 .449 .653
Motivation Male 257 4.460
Goal Target
Female 206 4.203 .024 .264 .792
Male 257 4.172
Job Relationship
Female 206 4.548 .918 2.716 .007
Male 257 4.298
Table 4. Study Approach Levels by Age
Sub-Dimension Age N Mean F p
17-20 103 33.66
Deep Approach 21-25 327 31.03 3.897 .021
26 - above 33 31.42
Superficial
17-20 103 32.18
21-25
327 31.07 1.247 .288
Approach
26 - above 33 32.36

24 Fikret Soyer, Mehmet Demirel, Zülbiye Kaçay, Cihan Ayhan, Duygu Harmandar Demirel
Table 4. gives the results of the Anova. According to test results; statistically
significant differences were determined in the "deep approach" sub-dimension (p
<0.05).
Table 5. Mening of Leisure Time Levels by Age Sub Dimension Age N Mean F p
Active-Passive
17-20 103 4.22
21-25 327 4.28 .296 .744
Participation
26 -above 33 4.16
17-20 103 4.53
Social Interaction 21-25 327 4.58 .355 .701
26 -above 33 4.44
Perceived
17-20 103 4.87
21-25 327 4.67 2.362 .095
Competence
26 -above 33 4.49
Usability of Leisure
17-20 103 4.65
21-25 327 4.48 1.333 .265
Time
26 -above 33 4.55
Perceived
17-20 103 4.55
21-25 327 4.43 -.620 .538
Freedom
26 -above 33 4.46
17-20 103 4.45
Intrinsic Motivation 21-25 327 4.45 .500 .607
26 -above 33 4.26
17-20 103 4.52
Goal Target 21-25 327 4.08 4.918 .008
26 -above 33 4.16
17-20 103 4.46
Job Relation 21-25 327 4.40 .391 .677
26 -above 33 4.30
Anova test results were given in Table 5. According to test results; there was a
statistically significant difference only in the "Goal orientation" sub-dimension
between the age groups of the participants and the leisure meaning (p˂0.05).
Table 6. The Sub Dimensions of Study Approach Scale and Leisure Meaning Inventory
Sub Dimension 1 2 3 4 5 6 7 8 9 10
Deep Approach R 1
(1) p

Examination of the Opinions of University Students on the Meaning of Leisure … 25
Superficial R ,540 1
Approach (2)
,000
p
Active-Passive R ,010 -,121 1
Participation
,829 ,009
p
Social R ,049 ,023 ,702 1
Interaction (4)
,291 ,616 ,000
p
Perceived R ,101 ,023 ,604 ,748 1
Competence (5) p ,030 ,622 ,000 ,000
Usability of R ,020 -,044 ,587 ,633 ,642 1
Leisure Time (6) p ,664 ,346 ,000 ,000 ,000
Perceived R ,013 -,099 ,579 ,618 ,610 ,663 1
Freedom (7) p ,785 ,034 ,000 ,000 ,000 ,000
Intrinsic R ,120 ,056 ,554 ,552 ,551 ,544 ,566 1
Motivation (8) p ,010 ,233 ,000 ,000 ,000 ,000 ,000
Goal Target (9)
R ,035 -,067 ,361 ,424 ,441 ,408 ,354 ,392 1
p ,458 ,149 ,000 ,000 ,000 ,000 ,000 ,000
-,087 -,224 ,624 ,627 ,592 ,618 ,613 ,510 ,458 1
Job Relation R
(10) p ,060 ,000 ,000 ,000 ,000 ,000 ,000 ,000 ,000
When the relation between the study approach and the meaning dimension scale of
leisure time is examined, it is seen that there is a significant positive relationship
between the deep approach from the lesson study approach subscale and the
perceived competence, the inner motivation which is the meaning scale of
theleisure time scale, the negative relationship in the work relationship sub-
dimension which is the meaning scale of the leisure time scale. On the other hand,
it is seenthat there is a significant negative correlation between the superficial
approach sub-dimension and active passive participation, perceived freedom, job-
related sub-dimensions.
3. Discussıon and Conclusıon
This study aimed to examine the meaning of leisure time and the study approaches
of the students studying in different departments at university in the light of various
variables. According to the 'Meaning of Leisure Time Scale' points, significant
difference was determined in the job relationship subscale (p <0.05) according to
the gender variable. In all sub-dimensions, except perceived competence and
intrinsic motivation, female participants have a higher score than male participants.
In the study of Gürbüz and Henderson (2013) on university students, female
participants have a higher score than male participants in all sub-dimensions except
perceived competence and goal orientation sub-dimensions. The reason can be
explained that the girls before university are not able to attend leisure activities
because of the pressure in the society and they spend their spare time by studying

26 Fikret Soyer, Mehmet Demirel, Zülbiye Kaçay, Cihan Ayhan, Duygu Harmandar Demirel
and doing housework, but when they began to study at university, they participate
recreational activities as they are more free than before. It can also be said that they
consider leisure activities more than men. The perceived competence subscale is
high in male participants, which is parallel to this study. In the related literature, no
significant difference was found in the results of some studies in terms of gender in
any sub-dimensions (Lakot Atasoy, Öncü, Küçük Sılıç, 2015). When the results of
the surveys applied to different sample groups were examined, it was found that
there was a significant difference in the study of Kara and others (2013) on adult
individuals in the 'Usage of leisure time' and 'Goal orientation' subscales. This
result is in contrast to this study. It can be said that the results of the studies are
different because the scales are applied in different sample groups and the age
averages are different.
When the relationship between the age groups of the participants and the levels of
meaning of leisure time were examined, a significant difference was determined in
the goal target sub-dimension.
In all sub-dimensions except active-passive participation and social interaction,
university students between the ages of 17 and 20 have a higher score than other
age groups. Parallel to this study, Lakot Atasoy and colleagues (2015) found that
participants aged 20 years and younger had higher leisure time perception. This can
be said to be due to the fact that individuals aged 20 years or younger spend more
time in their leisure time activities because their expectation about their life is less
than other age groups.
According to students’ sport participation,it was determined that there was a
significant difference in terms of "social interaction", "leisure time use", "intrinsic
motivation" and "goal orientation" subscales. So, it can be stated that as the
students do sports, all the dimensions increase. Based on this result, it can be said
that the sport has a significant effect on all sub-dimensions of Meaning of Leisure
Scale. According to the results by gender, no significant difference was determined
in the students' deep study approaches but, a significant difference was determined
in the superficial approach sub - dimension (p <0.05). According to Çuhadar,
Gündüz and Tanyeri (2013), while there was a significant difference in the
superficial approach, no significant difference was determined in the deep learning
subdimension. This result, which is parallel to this study, shows that the studying
preferences of male and female students differ in terms of gender. According to
some studies in the literure on this topic, no significant difference was determined
in any subscales of the study approach (Chan, 2003, Ellez and Sezgin, 2002, Tural
Dinçer and Akdeniz, 2008, Wilson, Smart and Watson, 1996, Richardson and

Examination of the Opinions of University Students on the Meaning of Leisure … 27
King, 1991) . It can be said that this result, which contrasts to this study, is due to
the fact that the learning preferences of girls and boys are similar to each other.
Boys preferred the superficial learning approach, where the difference was
determined, more than the female students. When the findings of some studies in
the related field are examined, male students prefer the deep learning approach
more than female students (Miller, Finley, and McKinley, 1990; Severians and Ten
Dam, 1997). On the other hand, contrary to some results of this study, in the related
researches, female students preferred the superficial learning approach more than
male (Smith and Miller, 2005, Gürlen, Turan and Senemoğlu, 2013). In addition,
some researchers have found that female students choose deep learning approach
more than males (Boyaluk and Önder, 2010; Biggs, 1987). It can be said that, in
terms of gender; the city, welfare of the family and society, the possibilities
provided are influencial in the students’ pereferences of learning approaches.
When sub-dimensions of study approaches were examined according to age
variable, a significant difference was found in deep learning approach and it was
determined that individuals with lower age had a higher deeper learning approach.
However, contrary to this study, it is seen that in some researches, as age increases,
deep learning approach increases (Smith, 1996, Hattie, 1981; This can be said to be
due to the difficulty of the courses in universities, education background, the place
they live in and the level of responsibility.
As a result, it can be stated that the leisure time activities have a positive effect on
the study approaches. The motivation of the university students participating in the
activities increases and positive effects on their studies can be observed.
References and notes:
Gürbüz, B. & Henderson, K. (2013) Exploring the Meanings of Leisure among Turkish
University Students, Croatian Journal of Education.15(4), 927-957. Ak,S. (2008). A Conceptual Analysis on the Approaches to Learning. Educational
Sciences: Theory And Practice, 8(3), 707-720 AKYÜZ, Ömür, “Yükseköğretim?”, Üniversite ve Toplum Dergisi, Aralık 2003, Cilt 3, S.
4, http://universite-toplum.org, (21.02.2017. Auger, D. (2016). The diversemeanings of leisure / Les diverses significations du loisir.
Loisir Et Societe, 39(2), 173-176. Baeten, M., Kyndt, E., Struyven, K., & Dochy, F. (2010). Using student-centred learning
environments to stimulate deep approaches to learning: Factors encouraging or
discouraging their effectiveness. Educational Research Review, 5(3), 243-260.

28 Fikret Soyer, Mehmet Demirel, Zülbiye Kaçay, Cihan Ayhan, Duygu Harmandar Demirel
Beşoluk, Ş.,& Önder, İ. (2010). Öğretmen adaylarının öğrenme yaklaşımları, öğrenme
stilleri ve eleştirel düşünme eğilimlerinin incelenmesi. İlköğretim Online,9(2),
679–693. Biggs,J. (1999). What the Student Does: Teaching for Enhanced Learning. Higher
Education Research And Development, 18(1), 57-75. Biggs,J. (2012). What the Student Does: Teaching for Enhanced Learning. Higher
Education Research And Development, 31(1), 39-55. Biggs, J. B., & Australian Council for Educational Research, H. (1987).
Study Process Questionnaire Manual. Student Approaches to Learning
and Studying. Biggs, J.B. (1987). Student approaches to learning and studying. Melbourne: Australian
Council for Educational Research Caldwell L. L. (2005). Leisure and health: Why is leisure therapeutic?, British Journal of
Guidance & Counselling, 33(1), 7-26 Chan, K. (2003). Hong Kong teacher education students’ epistemological beliefs and
approaches to learning. Research in Education, 69(1), 36-50. Donald, M. N., & Havighurst, R. J. (1959). THE MEANINGS OF LEISURE. Social
Forces, 37(4), 355. E. Jondeau, M. Rockinger (2003) Conditional volatility, skewness, and kurtosis: existence,
persistence, and comovements. Journal of Economic Dynamics & Control, 27,
1699 – 1737. Ellez, M.,& Sezgin, G. (2002, Eylül 16). Öğretmen adaylarının öğrenme yaklaşımları. V.
Ulusal Fen Bilimleri ve Matematik Eğitimi Kongresi’nde sunulan bildiri. Esteve, R., San Martin, J., Lopez, A., E. (2007) Grosping The Meaning Of Leisure:
Developing A Self Report Measurement Tool. Leisure Studies, 18 (2):79-91. Fidan, N.(1996). Okulda Öğrenme ve Öğretme.Ankara: Alkım Yayınevi., s. 207-208 Geçer,
A.K. (2012) An examination of studying approaches and information literacy self- efficacy perceptions of prospective teachers. Egitim Arastirmalari-Eurasian
Journal of Educational Research, 49, 151-172. Gürlen, E., Turan, S. & Senemoğlu, N. (2013). The relationship between learning
approaches of prospective teachers and their academic achievement. Educational
Research and Review, 8(5), 171-178. Hacıoğlu, N., Gökdeniz, A. ve Dinç, Y. (2003). Boş zaman ve rekreasyon yönetimi (Örnek
animasyon uygulamaları). Ankara: Detay Yayıncılık. Iwasaki, Y. (2008). Pathways to Meaning-Making Through Leisure-Like Pursuits in Global
Contexts. Journal Of Leisure Research, 40(2), 231-249. Kaba, C.İ. (2009). Türkiye’ deki Üniversitelerde Kampüs Rekreasyonunun Mevcut
Durumu ve Kampus Rekreasyon Modellemesi, Marmara Üniversitesi, Sağlık
Bilimleri Enstitüsü, Beden Eğitimi ve Spor Anabilim Dalı, Yüksek Lisans Tezi. Khomeiran,R. T., Yekta, Z. P., Kiger, A. M., & Ahmadi, F. (2006). Professional
competence: factors described by nurses as influencing their development.
International Nursing Review, 53(1), 66-72. Lakot Atasoy K., Öncü E., Küçük Kiliç S., "Beden eğitimi öğretmeni adaylarında serbest
zaman algısı ve engelleri", III. Rekreasyon Araştırmaları Kongresi, ESKİŞEHİR,
TÜRKIYE, 5-7 Kasım 2015, ss.18-23

Examination of the Opinions of University Students on the Meaning of Leisure … 29
Miller, C. D.,Finley, J.,& McKinley, D. L. (1990). Learning approaches and motives: Male
and female differences and implications for learning assistance programs.
Journal of College Student Development, 31(2), 147–154. Porter, H., Iwasaki, Y., & Shank, J. (2011). Conceptualizing Meaning-Making through
Leisure Experiences. Society And Leisure -Montreal-, 33(2), 167-194. Ramsden, P. (2003). Learning to teach in higher education. (2nd Ed.). London: Routledge Richardson,
J., T., E., & King, E. (1991). Gender Differences in The Experience of Higher Education: Quantitative and Qualitative Approaches. Educational
Psychology, 11, 363– 382. Sambell, K., Brown, S., & McDowell, L. (1997). "But Is It Fair?": An Exploratory Study of
Student Perceptions of the Consequential Validity of Assessment. Studies In
Educational Evaluation, 23(4), 349-71. Schulz,J., & Watkins, M. (2007). The Development of the Leisure Meanings Inventory.
Journal Of Leisure Research, 39(3), 477-497. Severiens, S., & Ten Dam, G. (1997). Gender and Gender Identity Differences in Learning
Styles. Educational Psychology, 17, 79–93. Smith, S. N., & Miller, R. J. (2005). Learning approaches: examination type, discipline of
study, and gender. Educational Psychology: An International Journal of
Experimental Educational Psychology, 25(1), 43- 53. Torkildsen G. (2005). Leisure and recreation management, 5th. Edition, Taylor and Francis
Group, USA. Trigwell, K. & M. Prosser (1991). "Improving the quality of student learning: the influence
of learning context and student approaches to learning on learning outcomes."
Higher Education 22(3): 251-266. Tural Dinçer, G. & Akdeniz, A. R. (2008). Examining learning approaches of science
student teachers according to the class level and gender. US-China Education
Review, 5(12), 54-59. Venkatesh, U. (2006). LEISURE -- MEANING AND IMPACT ON LEISURE TRAVEL
BEHAVIOR. Journal Of Services Research, 687-108. Watkins, M. (2000). Ways of Learning about Leisure Meanings. Leisure Sciences, 22(2),
93-107. Wilson, K., Smart, R. M., & Watson, R. J. (1996). Gender differences in approaches to
learning in first year psychology students. British Journal of Educational
Psychology, 22, 59-71. Yılmaz MB, Orhan F. (2011). Ders Çalışma Yaklaşımı Ölçeği’ nin Türkçe Formunun
Geçerlik ve Güvenirlik Çalışması. Eğitim ve Bilim,36(159), 69-83. Zhang, L., & Sternberg, R. J. (2000). Are Learning Approaches and Thinking Styles
Related? A Study in Two Chinese Populations. Journal Of Psychology, 134(5),
469. Zorba, E., Zorba, E., Kesim, Ü., Ağılönü, A., Cerit, E. (2006). Üniversite Öğrencilerinin
Rekreatif Etkinliklere Katılım Düzeylerinin Belirlenmesi (Muğla Üniversitesi
Örneği), 9.Uluslar Arası Spor Bilimleri Kongresi Bildiri Kitabı, 43-44.

30 Fikret Soyer, Mehmet Demirel, Zülbiye Kaçay, Cihan Ayhan, Duygu Harmandar Demirel
Summary
Examination of the Opinions of University Students on the Meaning of
Leisure Time and the Lesson Study Approaches
Fikret Soyer Sakarya University, Turkey
Mehmet Demirel Dumlupınar University, Turkey
Zülbiye Kaçay
Sakarya University, Turkey
Cihan Ayhan Sakarya University, Turkey
Duygu Harmandar Demirel Dumlupınar University, Turkey
The aim of this study, according to various variables, was to investigate the meaning of
leisure time and the study approaches of the students studying in different departments at
Sakarya university. The research group comprises a total of 463 university students
206(44.5%) of whom "Female" and 257 (55.5%) "Male" and they participated to the
research voluntarly.Survey model was used in the research. As data collection tool; in
addition to the personal information form prepared by the researcher, in order to determine
the leisure perceptions of the participants the LEISURE MEANINGS INVENTORY which
was developed by Esteve et al. (1999) and adapted into Turkish by Gürbüz et al. (2007) was
used. In order to determine the students’ studying approaches, APPROACHES
toSTUDYING Inventory by Biggs, Kember and Leung (2001) was used in the research.
Thereliability and validity of the scale was conducted by Yılmaz and Orhan (2011). In the
analysis of the data, percentage and frequency descriptive statistical methods were used to
determine the distributions of participants' personal information also, the skewness and
kurtosis values of the data were checked by using Shapiro Wilks normality test. It was
determined that the variables hed a normal distribution. In the statistical analysis of the
data, correlation analysis methods were used to determine the relationship between the
measurement tools (p = 0,05).According to the gender variable, it was determined that there
was a significant difference both in subscale of superficial approach and in the work related
subscale of the leisure time scale. While no significant difference was determined according
to the participation to sports in the sub-dimensions of the study approach scale, the
significant difference was determined in the active-passive participation, social interaction,

Examination of the Opinions of University Students on the Meaning of Leisure … 31
leisure time use, intrinsic motivation and target orientation sub-dimensions of Meaning of
Leisure Scale.In the Pearson Correlation Analysis which was made to determine the
relation between the Meaning of Leisure Inventory and The Study Approach Scale, it was
determined that there was a strong, positive and in the same direction relation between all
the sub dimensions. In conclusion, gender, participation in sports activities, age and welfare level are the factors
hat affect both the study approach and the meaning of leisure time.
Key words: Meaning of leisure time, study approach, university student

Khazar Journal of Humanities and Social
Sciences © Khazar University Press 2017
DOI: 10.5782/kjhss.2017.32.47
Risk Analysis and Determination of Risk Prevention Methods in Intensive Care Units
Kursat Yurdakosh
Samsun Province Health Directorate, Public Hospitals Services Authority, Turkey,
Demet Unalan
Kayseri Erciyes University, Turkey
1. Introduction
The most important factor that distinguishes hospitals from other businesses is that
service production and utilization take place at the same time. In other words, there
is no such thing as stocking of health services. For this reason, because the health
services offered vary according to the illness, patients participate in the production
process (Kavuncubaşı and Yıldırım, 2010: 127). In this process, hospital
management must take into account the hazards that health workers, patients and
their relatives may encounter and the risks associated with these hazards. Today,
the tendency to create a safe and healthy environment in hospitals offering services
such as restaurant, hotel management etc. in addition to health personnel and health
services, in which the staff members received by other service, patients and their
relatives, visitors, students are included, has started to gain momentum rapidly
(Nac, 2009: 111-141). In addition, as a result of factors such as the diversity of
health workers and areas serving in health services, the complication of social life,
the developments in health technologies,patient and employee safety has become
an increasingly important process (Çakır, 2007).
Health institutions are at the forefront of the work areas with the highest risk levels
when considering the types of risks and their consequences (Bayılmış and Taş
2015: 94).Risk is the preliminary dimension of any danger, the possibilities that
can cause the danger to develop and take effect.
All activities of a health institution involve risk.According to Article 9 of the Law on
Occupational Health and Safety No. 6331 dated 26.12.2012, "Hazard Classes for
Occupational Health Hazards Classes related to Occupational Health and Safety", the
hazard classes in which workplaces are involved in terms of occupational health and
safety are mentioned.While the health facilities enter the "Very Dangerous" and
32

Risk Analysis and Determination of Risk Prevention Methods in Intensive Care Units 33
"Dangerous" classes in the hazard area, especially hospital services are mentioned
in the "Very Hazardous" class.
The damages to be inflicted upon patients and personnel during healthcare service
provision can result in injury, prolonged hospitalization, disability and even death
for the patients and exposure to more diseases and injuries with respect to the
healthcare workers. In addition to the risks that threaten human health, financial
and environmental risks have recently reached a risk level threatening healthcare
institutions (Aksay, Orhan ve Kurutkan 2012: 123).
When we compare a pricking of a nail and a pricking of a needle, a construction
worker with a nail in his hand or foot may be able to take it simple, while a health
care worker who has a pricking of a needle may be exposed to diseases such as
Hepatitis B, Hepatitis C, HIV, AIDS, etc.which may cost his/her life in the future
(Devebakan 2007).
The major risks that can be encountered in healthcare sector can be listed as follows:
• Infections/Microorganisms/Biological Risks,
• Chemical agents/Hazardous substances,
• Radiation,
• Hazardous wastes,
• Sharp Object and heavy equipment injuries,
• Physical violence
• Psychosocial Risks,
• Noise,
• Ergonomic Risks,
• Cytotoxic Risks, Allergic Reactions,
• Ventilation,
• Food poisoning etc. (Özyurt, 2013:2)
The first step to an effective risk management is to determine what risks the
organization faces and to assess these risks.
Primary aim in identifying the risks is handling the risks that an institution faces on
the way achieving goals in a timely, fast and complete manner (Aydeniz, 2008: 25).

34 Kursat Yurdakosh, Demet Unalan
Risk management is all processes that include defining and evaluating risks,
determining activities to be carried out against them, assigning responsibilities,
implementing and monitoring the activities, and observing the results. The aim of
risk management is to help individuals and organizations develop practical and
simple techniques that clearly indicate risk and uncertainty and also define, analyze
and manage the risks by providing understandable information based on the
decision maker judgement (Ersar 1996: 22-29).The main purpose of risk
management for hospital applications is to identify the risks in the hospital
environment, to carry out risk analysis, to evaluate the risks, to manage these risks
with a proactive approach and to take precautions without accidents take place.
(General Directorate of Health Services [SHGM], 2012). Another contribution of
risk management is to ensure that incidents that occur in the health facility can be
reported safely. The result reports used in the system are primarily used to identify
a risky situation. (Griffin, 2006: 193).
Risk analysis is not required only for regulatory purposes. It is the only way of
determining safety measures required for designing products and it is an essential
part of each process development(Steven ve Krishna 1999). All the units in
institutions, working systems of these units and the quality of the staff should be
taken into consideration while analyzing the risks in health care sector. The units
where the risks may arise and the frequency of encountering these risks must be
determined after identifying the risks detected in units (Güler, Çobanoğlu,
Vaizoğlu ve Tekbaş 2011). An important issue that should not be overlooked here
is that risk-based decision-making, quantification with mathematical models and
techniques will take risk appraisal away from subjectivity (SHGM, 2012).
Intensive care units (ICU) are hospital departments where hospital infections and
resistant microorganisms are most prevalent (Sader et al., 2014). Intensive Care
Unit is the unit where nosocomial infections are included among the most
important causes of morbidity and mortality in which critical patients with poor
general condition are followed. Although only 5-10% of patients in health facilities
are monitored in Intensive Care Units, approximately 25% of health facility
infections are seen in these units (Trilla, 1994:1-4; Öztürk, 2008).
Inadequate number of personnel in the Intensive Care Unit, high workload,
complicated work processes, long working hours and high number of night shifts
cause burnout, fatigue and stress in employees (Çınar and Karadakovan 2016).
In a study conducted by 224 nurses at the Department of Internal Medicine and
Ophthalmology in five hospitals in Turkey, it was determined that 20% of intensive
care nurses and 24% of surgical intensive care nurses were exposed to sharp object

Risk Analysis and Determination of Risk Prevention Methods in Intensive Care Units 35
injuries. In the study, 66% of the nurses had been "1-3 times" injured in the last
year and 21% of the injuries were found out to be caused by contaminated tools. In
the study, the use of gloves for personal protective equipment was found to be
92%, while the isolation, mask wearing, glass wearing, apron wearing, hand
washing and isolation methods were observed to be complied with less
(Samancıoğlu, Ünlü and Akyol 2013).
This research was conducted in the intensive care units of the hospital to identify
and assess the risk foci that may occur during the delivery of services and to
determine and implement measures to prevent high risks.
2.Material and method
This proactive research was conducted between February and December 2016 in
the intensive care units of the Training and Research Hospital affiliated to the
General Secretariat of the Union of Public Hospitals of Samsun. Surgical intensive
care unit is the third step and it has 29 beds, the internal intensive care unit is the
third step and it has 21 beds;Cardio Vascular Surgery (CVS) intensive care is the
third step and has 5 beds, neurology intensive care is the 2nd step and has 14 beds;
general intensive care is the first step and it has 16 beds; coronary (cardiology)
intensive care is the first step and has 10 beds
For each unit, a "Risk Assessment Team" was created by including the chief
physician responsible for the unit, the unit responsibilities and the unit staff, the
quality management director, the occupational health and safety specialist, the
patient and employee safety unit officer.
To identify hazards, assess risks by analyzing, and perform the necessary control
measures; all undesirable events that may lead to death, illness, injury, damage or
other loss at the hospital are defined by taking into account the accident reports,
event notification forms, patient complaints, risk records, quality indicators and
security (building) visits.
When hazard identification is made, the behavior of the system is aimed at when using
the HAZOP (Hazard and Operability Analysis) technique and focusing on the normal
deviation potential or the effect of a change. Contrary to potential hazards, possible
deviations in element behaviors that may cause danger have been identified.
At the second step of the risk rating, it was determined which the risk or risks could
be arising out of the hazards. Upon determining the risks, risk rating was completed

36 Kursat Yurdakosh, Demet Unalan
with the preferred qualitative or quantitative methods. In the present study, Fine-
Kinney method was employed in order to rate the risks.
RISK ASSESSMENT TEAM
Patient Safety Facility Security
Committee
Committee Employee Security
▪Medical device Education
management and Committee
▪Accurate Committee
calibration,
identification, ▪Sharp object ▪Physical Falls, ▪Organization of
▪Safe surgery, injury, ▪Stores, activities and in-
▪Falls, ▪Attack, ▪Waste house training,
▪Drug safety, ▪Exposure to management, ▪Creating
▪Radiation safety, hazardous ▪Building awareness,
▪Effective substances, sketches, ▪Providing
communication ▪Injuries ▪Fire escape stairs, communication
among employees, ▪Air conditioning
etc. systems
Figure 1: Risk Assessment Team
Fine-Kinney is a technique which is used in determining which works should be
prioritized and where the sources should be transferred primarily according to the
rating results in risk rating. Rating is done by calculating the weighted rates and it
is determined whether or not taking precautions is needed. Fine-Kinney risk
assessment method is composed of Probability (P), Severity (S) and Frequency (F)
scales and Risk Rate is calculated as follows (RR):
RR = Probability (P) x Severity(S) x Frequency (F).
Probability: The possibility of occurrence of a hazard.
Severity: Severity is the estimated damage that will be inflicted upon people
and/orenvironment.
Frequency: Frequency is the times of exposure to the hazard.
Corrective actions do not affect frequency or severity, the only variable that is likely to
affect is probability. For example, if a worker working at height without a safety

Risk Analysis and Determination of Risk Prevention Methods in Intensive Care Units 37
belt wears a belt, this affects only the possibility of falling makes him/her less
likely to fall; however, when he/she falls, this does not affect the risk of death or
the frequency of the risk of exposure to danger.
Table 1. Probability, frequency and severity values table
P R O B A B I L I T Y V A L U E S
occurrence
F R E Q U E N C Y V A L U E
FREQUENC
SV
E
RIT
YV
A
LU
E
SEVERITY
PROBABILITY Y the estimated
the probability of
times of damage to be
damage
exposure to inflicted on people
the hazard and/or the
within time environment
Almost all the More than one deathly
10 anticipated,
10 time
100 accidents /
certain
(a few times a
environmental
in few hours) disaster
high / highly
frequent (once Deathly accident /
6 6
or a few times 40
serious environmental
probable
a day)
damage
permanent
damage/injury, labor
sometimes loss /
3 probable 3 (once a week
15 formation of
or a few times
environmental
a week) barriers, complaints
from close
neighborhood
Not often
serious damage/injury,
external first aid need
Probable but low
(once a month
1 2
7
/ environmental
likelihood
or a few times
damage outside the
a month)
field
Small damage/injury,
Not anticipated
rare (a few
internal first aid /
0,5 1
3
imited environmental
but possible
times a year)
damage within the
field
Very rare Having a near miss /
0,2 Not anticipated 0,5 (once a year 1 no environmental
or rarer) damage

38 Kursat Yurdakosh, Demet Unalan
Table 2. Fine-Kinney Method Risk Assessment Result
Intolerable Risk,
400 < R
the necessary precautions must be taken immediately / it should be
contemplated to halt the work or shut down the facility or building or the
environment).
200 < R < 400
Fundamental Risk,
Need to be corrected in the short run (within a few months)
70 < R < 200
Significant Risk,
Need to be corrected in the long run (within year/years)
20 < R < 70
Potential Risk,
Precautions must be applied under control.
R < 20
Insignificant Risk,
Precautions are not prioritized
3. Findings
In the study 15 main dangers and 37 risks related to these dangers for intensive care
unit are identified and improvements for these risks are recommended. When 15
main dangers are studied; according to the risk values, 4 of the risks are considered
as significant risk, 4 as basic risk and 7 as the intolerable risk.
In the Fine-Kinney risk analysis study conducted by Özgür (2013) in a different
sector, 376 risks were detected in the business that the study was conducted and
120 of them were "Intolerable Risk", 196 were "Essential Risk", 51 were
"Important Risk" and 9 were "Possible Risk", and "Corrective / Preventive Action"
has been identified for each of these risks separately.
Following the re-analysis and grading of the same risks, assuming that Corrective /
Preventive Activities have been carried out, a total of 376 risk items were identified
and 125 of them were reduced to "Significant Risk", 247 to "Possible Risk" and 4
to "Significant Risk".
The priority risks, calculated risk scores, and proposed recommendations after
Fine-Kinney analysis applied in this study are as follows: In the coronary intensive
care unit, respiratory tract diseases, "Legionella pneumonia", which can develop
due to the inadequate ventilation system, and the decrease in the sense of belonging
in terms of health personnel, have the priority number 900 and have the highest risk
score (Table 5). This high risk can be avoided by routinely controlling and cleaning
the molds that can be produced in the ventilation system, manually operating the
ventilation system, adjusting the room temperature to be between 23 and 24
degrees and relative humidity of 40 to 50 degrees, and providing appropriate
training to healthcare professionals.

Risk Analysis and Determination of Risk Prevention Methods in Intensive Care Units 39
Table 3: Risk Assessment Table Prepared by Fine-Kinney Method Regarding the
Hazards Identified Following the Application and the Risks that they Might Pose

40 Kursat Yurdakosh, Demet Unalan
Table 4: Risk Assessment Table Prepared by Fine-Kinney Method Regarding the
Hazards Identified Following the Application and the Risks that they Might Pose.

Risk Analysis and Determination of Risk Prevention Methods in Intensive Care Units 41
Table 5: Risk Assessment Table Prepared by Fine-Kinney Method Regarding the
Hazards Identified Following the Application and the Risks that they Might Pose.

42 Kursat Yurdakosh, Demet Unalan
Table 6: Risk Assessment Table Prepared by Fine-Kinney Method Regarding the
Hazards Identified Following the Application and the Risks that they Might Pose

Risk Analysis and Determination of Risk Prevention Methods in Intensive Care Units 43
Table 7: Risk Assessment Table Prepared by Fine-Kinney Method Regarding the
Hazards Identified Following the Application and the Risks that they Might Pose

44 Kursat Yurdakosh, Demet Unalan
In a study to evaluate the working environment in the operating room and intensive
care unit, doctors, nurses and anesthesiologists found that ventilation was
inadequate in these units, that the enlightenment was insufficient and not very
calm, that half felt unpleasant smell and found the environment crowded. In
addition, participants in the study were found to have spinal cord, varicose veins,
legs, feet, back and headache, hypertension, hemorrhoids, hepatitis and
tuberculosis, to have fatigue, drowsiness and chronic fatigue, stress and depression,
stomach complaints, eye, skin and respiratory complaints. (Özyaral, 2005).
In our study, under the heading "Electricity", the RD score was 700, which can be
the result of the plugging in the multiple electrical devices to a plugged-in jump
and the risk score can be reduced by providing electricity from fixed earth sockets
of electrical appliances with high energy attraction power (Table 6).
Under the heading "Biological", the risk of infection was determined depending on
the danger of leaving the waste containers uncovered Hepatitis B, Hepatitis C,
AIDS and other blood-borne infectious disease risks were detected depending on
the risk of sharp object injury (Table 6). Under the heading of accidents and
illnesses, the risk of delaying the emergency intervention to the patient was
determined due to the danger that the number of patient rooms and beds were too
many but the number of health worker are a few, the occurrence of pressure ulcer
in the patient, the occurrence of physical and mental disturbances in the health and
supply workers, and the risk of the patient being left unattended when the nurse
goes out of the room for any reason are detected (Table 3),the risk of developing
cervical spinal cord injury, physical falls, and damage to devices was determined in
health workers, depending on the risk of inaccessible patient monitors (Table 4).
All hazards that may develop and risks related to hazards may be greatly reduced
by taking into account all the precautions that can be taken in the research process.
In the FMEA study on the medical gas system in a university hospital, a 71%
improvement was envisaged when the sum of the Risk Priority Numbers (RPN)
and the sum of the expected RPN after the completion of the proposed activities
were taken into consideration. (Aydınlı, 2010: 138).
In the research conducted by Atasoy et al. (2010) to include the laboratory
processes and to determine the risk factors of the laboratory workers, it is
determined that ergonomic factors such as noise, work stress, working speed and
ambient temperature may increase risk factors for employees. In another study, as
the risks faced by hospital staff, the risks associated with verbal and physical
violence, waist, back, neck pain, sharp object injuries were ranked as the top three
(Ergör et al., 2003).

Risk Analysis and Determination of Risk Prevention Methods in Intensive Care Units 45
4. Conclusions and Recommendations
Risks are seen to be most likely caused by biological, electrical, ergonomic,
physical, accident and disease hazards.
Risk analysis can be carried out before the measures are taken in hospitals and the
continuity of the inspections during service delivery can be ensured. In addition,
the risk assessment team can be encouraged to focus on clinical process-based
assessments of risk in hospitals.
The Fine-Kinney risk analysis method, which is a proactive program, can be applied to all aspects of the hospital.
References and notes:
Aksay, K., Orhan, F., Kurutkan, M.N. (2012). “FMEA as a Risk Management Technique in
Health Services: An Application for the Laboratory Process”, Health
Performanceand Quality Magazine, 4: 123. Atasoy, A., Keskin, F., Başkesen, N., Tekingündüz, S. (2010). “Assessment of Work-
related Musculoskeletal System Problems and Ergonomic Risks in Laboratory
Staff”, Health Performance and Quality Magazine, Year 1, Issue 2, Ankara. Aydeniz, E. Ş. (2008). Future and Option Contracts in Business and Risk
Management,Istanbul. Aydınlı, C., (2010). “Risk Assessment in Health Institutions and Risk Reduction in a
University Hospital”, Uludağ University Administration and Organization Master
Degree Thesis, Bursa.
Bayılmış, Oya., Taş, Yunus. (2015). “Assessment of Occupational Health and Safety
Approaches of Healthcare Workers: The Case of Sakarya”, Business, Power
Industry Relations and Human Resources Magazine, 17.1 (2015): 89-117 Çakır, A. (2007).“Analysis of Relationship between Patient Safety Culture and Quality
Management System”, Dokuz Eylül University Graduate School of Social Sciences
Graduate Thesis, İzmir. Çınar, Derya., Karadakovan, Ayfer. (2016). “Patient and Employee Security in Intensive
Care Units”, Intensive Care Nursing Journal 2016;20(2):116-22 Devebakan,N. (2007), Occupational Health and Safety in Private Health Care
Establishments, Graduate Thesis, Dokuz Eylül University, İzmir. Ergör, A., Kılıç, B., Gürpınar E. (2003). Business Risks in Community Health Services,
Occupational Health and Safety Magazine, 16: 44-50. Ersar, M. A. (1996). “Risk Analysis in Construction Business”, Master Thesis, 22-29. Güler,
Ç., Çobanoğlu, Z., Vaizoğlu, S.A. ve Tekbaş, Ö.F. (2011). Risk Management and Communication, Ankara.
Griffin, Don. (2006). “Hospitals. What They Are and How They Work”, Third Edition,
Jonesand Bartlett Publishers, Inc., 193.

46 Kursat Yurdakosh, Demet Unalan Kavuncubaşı, Şahin., Yıldırım, Selami. (2010), Hospital and Healthcare Administration,
Second Edition, Siyasal Bookstore, Ankara. NAC, A., Spickett, J.T., Rumckev, K.B., Dhaliwal, S.S. (2009). Validity And Reliability Of
The Safety Climate Measurement In Malaysia. International Review Of
BusinessResearch Papers, Vol. 5: 111-141. Özgür M. (2013). “Risk Analysis Application in the Metal Sector”, The Ministry of Labor
and Social Security, Labor Inspection Board, Labor Inspector Assistance Survey,
İzmir, p. 108. Öztürk R (2008) Hospital Infections: Symposium Series on Prevention and Control,
No:60:23-29 Özyaral O., Akyurt N., Keskin Y. et al. (2005), Questioning of Working Environments of
Operating Room and Intensive Care Unit Employees in Terms of Patient-Hospital
Syndrome. Hospital Management, July - September: 32-39. Özyurt, Emine Esen. (2013). Bursa Oral and Dental Health Center Employee Risk Analysis
Table, Unpublished Study (Y.Ç.), Bursa Oral and Dental Health Center Quality
Management System, YÖN. PL.05, Bursa, page: 2 Sader HS, Farrell DJ, Flamm RK, Jones RN. (2014). Antimicrobial susceptibility of Gram-
negative organisms isolated from patients hospitalized in intensive care units in
United States and European hospitals (2009-2011). Diagn Microbiol Infect Dis,
78:443-8. Samancıoğlu S, Ünlü D, Akyol AD. (2013). Examination of sharp object injury cases in
intensive care nurses. Anatolian Journal of Nursing and Health Sciences,
2013;16(1): 43-49.
Steven, S. Sadhra., Krishna, G. Rampal. (1999) ‘Occupational Health, Risk Assessment
andManagement’, Blackwell Science Ltd, UK SHGM, (2012). “ Quality in Health in Health Quality Standards”, Health Services General
Directorate Health Quality and Accreditation Department, Volume 1, Ankara. Trilla, A. (1994). Epidemiology of nosocomial infections in adult intensive care units.
Intensive Care Med, 20:1-4. İSGRDY, (Occupational Health and Safety Risk Assessment Regulation), (2012),
http://www.resmigazete.gov.tr/main.aspx?home=http://www.resmigazete.gov.tr/es kiler/2012/12/20121226.htm&main=http://www.resmigazete.gov.tr/eskiler/2012/1 2/20121226.htm, Official Gazette, S: 28509, 26.12.2012

Risk Analysis and Determination of Risk Prevention Methods in Intensive Care Units 47
Summary
Risk analysis and determination of risk prevention methods in intensive care units
Kursat Yurdakosh
Samsun Province Health Directorate,
Public Hospitals Services Authority, Turkey
Demet Unalan
Kayseri Erciyes University, Turkey
This research is conducted to identify and assess the risk foci that may occur during the
delivery of services in intensive care units within the scope of providing patient and
employee safety and to ensure that high risks are avoided by identifying and implementing
measures accordingly. The study with proactive features was implemented between
February – December 2016 in the intensive care units of the Training and Research Hospital
affiliated to the General Secretariat of the Union of Public Hospitals of Samsun. In risk
management, HAZOP (Hazard and Operability Analysis) technique was used when hazard
identification was made, and The Fine-Kinney method was used to determine the risk rating
and prevention methods. In the study, 15 main dangers for intensive care unit and 37 risks
related to these dangers were determined and corrective / preventive actions are
recommended for these risks. When 15 main risks are studied; according to risk values, they
are evaluated as, 4 Significant Risks, 4 Fundamental Risks and 7 Non-Tolerable Risks.
Risks are most likely caused by biological, electrical, ergonomic, physical, accident and
disease hazards. Risk analysis can be carried out before the measures are taken in hospitals
and continuity of audits during service delivery can be ensured.
Key Words: Fine-Kinney Method, Intensive Care, Risk Management, Risk Analysis

Khazar Journal of Humanities and Social Sciences © Khazar University Press 2017
DOI: 10.5782/kjhss.2017.48.55
Organizational Relationship and Organizational
Justice Relationship in Health Workers
Emel Ozcan
South Russia University, Russian Federation
Introduction
The work is one of the most central areas of human life, extending to the existence
of the past humanity as a social activity that provides the continuity of life.
Working life is the center of human life, and human being is at the center of
working life. The value given to human resources is of great importance in the
regular and correct functioning of human-focused working life. The success of an
organization in the external environment and its ability to distinguish itself from its
competitors depends primarily on its ability to effectively manage the dynamics
within its internal environment. At this point, the most important value in the
internal environment of the organizations is the employees (Eğinli, 2009: 23).
Job outcomes are improving as workers feel that they are being treated equally by
other individuals in their organizations. Thus, the importance of organizational
justice is increasing. Organizational justice perception is an important concept for
organizations seeking to replicate their business output. Perceptions of
organizational justice provide employee happiness, motivation, performance
increase and productivity as well as increase in organizational outcomes.
Organizational justice expresses the respect expressed by management to
employees and provides the perception of organizational legitimacy. When
practices in the organization are fair to employees, their commitment to their
organizations is also increasing. Organizational commitment is related to the
motivation and productivity of the worker. Organizational commitment is seen as a
motivating factor in organizations. Research shows that there is strong and
meaningful relationship between organizational commitment and tendency to leave
work. Organizational commitment also has an effect on productivity, and job
productivity for those who develop commitment to organization is increasing.
48

Organizational relationship and organizational justice relationship in Health Workers 49
Decreased organizational linkage can lead to reduced productivity and ultimately
separation from work. While the likelihood of high involvement in job loyalty
decreases for not coming to work, coming to work or leaving work, this probability
is increasing in individuals with no or low organizational commitment. The
investigations reveal the effects of perceived justice, job satisfaction, organizational
commitment and intent to leave the workplace at work. Organizational culture can
be positively influenced as a predictor of organizational commitment of
individuals. Lack of communication within the organization, unfair practices,
insecure work environments, dissatisfaction from work, alienation and conflict are
among the factors that reduce organizational loyalty. Training and development
activities, personnel empowerment, psychological and environmental factors, and
personality traits of individuals have a positive effect on organizational
commitment (Balay, 2000: 2)
Organizational Justice
Justice is a matter of social sciences that has been studied from many different
perspectives. In particular, he has been interested in philosophers for many years
and has worked on many philosophers, from Aristotle to Nozick and Rawls.
According to John Rawls (1971), justice is "every social institution must be the
primary virtue." The first studies on social justice generally explain the principles
of justice in social interactions and do not specifically focus on organizational
justice (Greenberg, 1990; Konowski 2000 trans. Özmen, Arbak and Özer, 2007).
An important part of social life in the adaptation of social justice along with his
career, began to be accepted and ignored the presence of justice for the first time in
the organization and Greenberg (1987), "organizational justice" has been called
(Folger veCropanzano, 1998: 2).
Organizational justice, decisions regarding the extent to which individuals and
groups are equally distributed between the costs and benefits deriving from
activities carried out and to focus on behavior (İşcanveKarabey, 2007: 27).
A broad definition of organizational justice is the perception of justice in relation
to practices in an individual's organization (Greenberg, 1996: 3).
Employees will compare themselves with others in the organization. The
implementation of the rules equally to everyone, to equal pay for equal work, to
have equal rights in the permits, he expects the team to benefit from social
opportunities equally well with others. However, the focal point of justice detection
is not just a comparison of these outputs and outcomes. The Organization rules, the

50 Emel Ozcan rules of interaction between individuals and the application forms are also the focal
point of justice detection. (Barling and Michelle, 1993 transfer Özdevecioğlu,
2003: 21).
The concept of organizational justice, how to manage the resulting rewards and
punishments, rules and social norms that it will be distributed. These rules and
social norms of how to reward and punishment is dealt out, showing how some
decisions are taken in the distribution business, and all rules and norms related to
interpersonal applications (Folger and Cronpanzano, 1998 transfer Yıldırım, 2003:
3).
Organizational justice literature indicates that perceptions of fairness in the
organization consisted mainly of two dimensions. These are (Pillai et al., 1999);
Distribution justice (justice for the awards received) and procedure justice (justice
for implementation). Procedure justice generally concerns how awards are
distributed within an organization. In other words; Is a term that describes how and
when awards are awarded to the performance of the employees and how fairly
perceived by the employees the decision-making processes and procedures used in
the distribution of the awards. Distribution justice means that employees only
perceive the rewards they receive as fair, regardless of the decision-making process
(Konovsky, 2006: 8).
Concept of Organizational Connectivity
Loyalty is derived from a Latin root, which is the conjunction of meaning. The
Websterian dictionary defines commitment as a state of forced or emotional
activation. People with affinity feel themselves of something and become
motivated to maintain this bond. William Whyte, in his 1956 work entitled "People
of Organization", described the danger of extreme loyalty and defined the person as
a person not only working for the organization but also belonging to him at the
same time. According to this; The group of employees in the organization are the
source of creativity and they believe that sense of belonging is the ultimate need of
the individual. After this work of Whyte, the subject of attachment has been
extensively studied. Most of these reviews are based on the assumption that high
level commitment is useful for organizations. Organizational commitment in the
majority of studies on the relationship between employee loyalty and workplace
productivity and intent to leave the workplace was first described as emotional
commitment by Mowday, Steers and Porter (1979) and suggests that employees
feel loyalty in adopting the values and goals of organizations. In other research,
organizational commitment is defined as a concept that develops as a result of the
investments that employees make in their organizations. In 1984, Meyer and Allen
came up with a model covering these two types of ties. First type of commitment,

Organizational relationship and organizational justice relationship in Health Workers 51
emotional attachment; And the second type of commitment is defined as continuing
commitment. Later, in this model, they added a third dimension, first defined by
Weiner and Vardi as normative or ethical commitment. Normative loyalty occurs
when one sees work as an obligation to work in the organization and feels it is right
to show commitment to the organization (Doğan, 2013: 18)
Materials and Methods
Purpose of the research
The aim of this research is to determine what level of organizational justice
perception is at the level when they are committed to organizations of health
workers working in private hospitals.
Sample of Research
The sample of the research came from 100 health workers of a private hospital in Samsun.
Data Collection Tools
Datalar was obtained using the individual information form, Allen and Meyer's
Organizational Commitment Scale, and Colquitt's Organizational Justice Scale.
Analysis of Data
The data obtained in this study were evaluated with the help of SPSS 23.0 package
program. The frequency and percentage values for the gene were obtained. The
relationship between the variables is analyzed by correlation analysis.
Findings
Mann-Whitney The results shown in Table 1 for justices subgroups by gender test.
Analysis showed significant values of p <0.05, there is no statistically significant
difference between men and women because it is not.

52 Emel Ozcan
Table 1: Distribution of Organizational Justice Dimensions and
Organizational Commitment Values by Gender of Participants
Pro
ced
ure
Dis
tri
buti
o
n
Bet
wee
n P
eo p
le
Info
rmat
ion
al Em
oti
onal
Att
endan
c
e Norm
ativ
e
Man
n-
Whit
ney
U 1
130,5
00
1 1 8 1 , 0 0 0
1057,5
00
1149,5
00
1129,
500
1234,
500
1152,
000
Wil
coxon
W
2407,5
00
245
6,0
00
2332,5
00
2424,5
00
2404,5
0
0 2509,5
0
0
2427,0
0
0
Z
- ,81
1
- , 4 7 8
-1,3
35
- ,69
6
- ,83
7 - ,10
7
- ,67
8
Asy
mp.
Sig
. (2
-
tail
ed)
,417
, 6 3 3
,182 ,487
,403
,915
,498
Table 2: The Dimensions of Organizational Justice By Marital Status of The
Participants and Organizational Commitment Breakdown of Value
Pro
ced
ure
Dis
trib
uti
on
Bet
wee
n
Peo
ple
Info
rmat
ion
al
Em
oti
onal
Att
endan
ce
Norm
ativ
e
Man
n-
Wh
itn
ey
U
1182,0
0
0
1205,5
0
0 1228,5
0
0
1229,5
0
0 1180,5
0
0 10
71
,00
0 1
103,5
0
0
Wil
cox
on
W
26
13
,00
0
26
36
,50
0
26
59
,50
0
23
57
,50
0
23
08
,50
0
25
02
,00
0
25
34
,50
0

Organizational relationship and organizational justice relationship in Health Workers 53
Z
-,439
-,278
-11
8
-,111
-,452
-1,2
09
-,985
t a i l e d )
Asy
m
,661
,781
,90
6
,912
,651
,226
,325
Table 2 shows the results of the analysis of the participants' commitment to marital
status, justice perception and subgroups. According to the findings, there is no
statistically significant difference between married and single participants since the
significance values were not p <0.05.
Table 3: Distribution of Organizational Justice Dimensions and Organizational
Commitment Values by Age Groups of Participants
Pro
cedure
Dis
trib
uti
on
Bet
wee
n P
eo p
le
Info
rmat
ion
al
Em
oti
on
al
Att
end
ance
Norm
ativ
e
Ki-
Kar
e
4,6
48
3,0
95
1,8
19
2,7
96
2,4
85
2,3
9
1 1,8
72
df
3
3
3
3 3 3 3
Asy
mp.
Sig
. (2
-
tail
ed)
,199
,377
,611
,424
,478
,49
5
,59
9
The relationship between justice and loyalty subgroups according to age groups in
Kruskal-Wallis test results given in Table 3 were examined. significant value and
commitment to justice subgroups according to age groups, p <0.05 between age
groups in responses to questions for which there are no statistically significant
differences.
Results
When considering the results obtained from the study of the distribution of the
organization's employees of a private hospital in Samsun said they found unfair.

54 Emel Ozcan
Hospital workers think that they rewarded according to their performance and their
efforts show.
Health workers, the gains obtained by the process according to the ethical and
moral standards, it is seen that consistently evaluated. In addition to this, the
employees think that their impact on the achievements gained from this process,
employees feel that they are meant to bring something of themselves to the
organization. Employees who feel that it is useful to the organization, he will feel
that it is worthwhile for the organization and the organization itself as it is
connected to it will depend on the organization.
References and notes:
Balay, R. (2000), “Yönetici ve Öğretmenlerde Örgütsel Bağlılık”, Nobel Yayın Dağıtım,
Ankara. Doğan, Ebru (2013), “Örgüt Kültürü ve Örgütsel Bağlılık”, Türkmen Kitab evi, İstanbul Eğinli, Ayşen Temel (2009), “Çalışanlarda İş Doyumu: Kamu ve Özel Sektör Çalışanlarının İş
Doyumuna Yönelik Bir Araştırma”, Atatürk Üniversitesi İktisadi ve İdari Bilimler Dergisi,
Cilt: 23, Sayı: 3. Folger, R., Cropanzano, R. (1998) “Organizational Justice and Human Resource Management”,
Thousand Oaks, Sage Publications. Greenberg, J. (1996), “The Quest For Justice On The Job: Essays And Experiments”, Thousand Oaks,
Ca: Sage Publications. İşcan, Ömer Faruk, Karabey (2007), “Örgüt İklimi İle Yeniliğe Destek Algısı Arasındaki İlişki”,
Gaziantep Üniversitesi Sosyal Bilimler Dergisi, Cilt:6, Sayı:2. Konovsky, M.A., Cropanzano, R. ve James, K. (2006), “Dispositional Affectivity As A Predictor Of
Work Attitudes And Job Performance”, Journal of Organizational Behavior, Vol:14. Özdevecioğlu, Mahmut (2003), “Algılanan Örgütsel Adaletin Bireyler Arası Saldırgan Davranışlar
Üzerindeki Etkilerinin BelirlenmesineYönelik Bir Araştırma”, Erciyes Üniversitesi İktisadi
İdari Bilimler Fakültesi Dergisi, Sayı:21. Özmen, Ömür N. T., Arbak, Y., Özer, P. (2007), “Adalete Verilen Değerin Adalet Algıları Üzerindeki
Etkisinin Sorgulanmasına İlişkin Bir Araştırma”, Ege Akademik Bakış Dergisi, Cilt:7, Sayı:1. Yıldırım, Fatma (2003), “Çalışma Yaşamında Örgüte Bağlılık İle Örgütsel Adalet, Örgüt Temelli
Özsaygı ve Bazı Kişisel Ve Örgütsel Değişkenlerin İlişkisi”, Mülkiye Dergisi.

Organizational relationship and organizational justice relationship in Health Workers 55
Summary
Organizational relationship and organizational justice relationship in Health Workers
Emel Ozcan South Russia University, Russian Federation
Organizational justice, one of the fundamental foundations of collective and team-based
behavior in organizations, is being investigated in the fields of psychology, human
resources management and organizational behavior in industries and organizations.
Organizational commitment, on the other hand, is a concept associated with perceptions of
fairness, as well as being one of the most researched issues in organizational reviews. The
aim of this research is to determine what level of organizational justice perception is at the
level when they are committed to organizations of health workers working in private
hospitals. The sample of the research came from 100 health workers of a private hospital in
Samsun. Data were collected using the individual information form, Allen and Meyer's
Organizational Commitment Scale, and Colquitt's Organizational Justice Scale. Within the
framework of the findings of the research; It has been determined that the educational status
of health workers, their titles and working hours in the working life affect the perceptions of
organizational justice and organizational commitment. A statistically significant
relationship was found between organizational commitment and organizational justice
according to the results of correlation analysis for organizational commitment and
organizational justice perception link. There was a linear relationship between
organizational commitment and organizational justice, and organizational commitment
increased when organizational justice increased. From the sub-dimensions of organizational
justice; There is a statistically significant relationship between organizational commitment
and procedural justice, distribution justice, interpersonal justice and informational justice,
according to the results of the correlation analysis conducted on the link between procedure
justice, interpersonal justice, information justice, distribution justice and organizational
commitment.
Keywords: Organizational Justice, Organizational Commitment, Health Care
Workers

Khazar Journal of Humanities and Social Sciences © Khazar University Press 2017
DOI: 10.5782/kjhss.2017.56.63
Private and Public Employees Health Hospitals
Home Care Services Management and Organization
on the Relationship with Organizational
Commitment of Views
Mucize Sarihan
IMBL Health Management Institute, Russian Federation
Mehmet Macar
South Russian University, Russian University
Meryem Paydas
Near East University, Cyprus
Introduction
Mobbing in the workplace in the form of psychological violence or spoken English
is a multidimensional issue involving more unethical behaviors such as violence,
harassment, threat, and intimidation, systematically applied by employees,
superiors, subordinates or others at the same level. Without cultural differences, it
is a serious problem that everybody can encounter in every workplace and every
type of organization, regardless of gender, and its consequences are serious. It
means mobbing as a word, wrapping around, attacking in a collective way,
grinding. (Webster, 2009:870).
Mobbing is considered to be psychological abuse or intimidation by an employee
or manager in an organization. In today's organizational structure, the mobbing
phenomenon takes place in an important dimension. The union of these negative
factors, which leads to strasse and organizational conflict in the organization,
disrupts the working order of the resultant organization and affects the work
performance, job satisfaction and work confusion negatively. The mobbing
phenomenon, which is seen as an important problem in the work place and which is
seen as an important problem in the International Labor Organization, is seen as a
widespread workplace problem in many countries but it is seen that the solution
point is not studied enough. Especially in developed and highly competitive
countries, the mobbing action that is widespread causes harm to individuals and
organizations both materially and spiritually. For this reason, mobbing behaviors
56

Private and Public Employees Health Hospitals Home Care Services Management … 57
must be prevented and managed. Although mobbing is a serious problem that has
existed in the business life from the past to the present day, it has been hesitant to
get rid of every occasion and it has been approached as a taboo. However, after the
Code of Practice No. 4857, which entered into force in 2003, we see that the work
on the issue has increased and that it has begun to pay particular attention to
doctrines and jurisprudence. The purpose of this study is to show how effective the
mobbingin organization is in influencing the perception of justice and the effect of
organizational commitment on job performance and the intention to leave the job.
There is a progressive interaction between organizational justice perception and
organizational commitment that is directly proportional to each other. The aim of
this study is to find out that there is a relationship between organizational justice
and organizational commitment and job performance and intention to leave work.
Definition of Organizational Commitment
Tabak et al. (2004) stated that organizational commitment is "the power of person
identification with organization and the power of knitting participation". According
to Tabak et al. (2004), organizational commitment items;
• Believing and accepting the goals and values of the organizations, • The desire to spend more effort for the benefit of the organization,
• The organization is determined to have a strong desire to
maintain membership.
Organizational commitment is identified with the aims or lives of organizational
members. Employee's embracing the goals and norms of the organization, striving
to reach these goals, is to form the organization by seeing the organization as a part
of itself. According to Celep (2000), organizational commitment is the behavior of
a person towards the goals and values of a person beyond the expectation of
writing or rules in an organization (Celep, 2000: 15). These behaviors vary from
person to person, and combining behavioral integrity within the organization with a
dimension of loyalty will result in organizational commitment. Yüksel (2000)
explained that organizational commitment is not only loyalty to the employer, but
also a process in which employees must put forth their ideas and strive to maintain
their organization's success and life. The organization is loyal to the original, the
organization itself, and all its other members. Human resources in organizations are
an important issue to understand how organizations work, how they can be more
productive and successful. No matter how strong the organization's structure is, no
matter how well-known it is in the sector it is in, the attitudes and abilities of

58 Mucize Sarihan, Mehmet Macar, Meryem Paydas
employees can influence or even change the institution they work in. The harder it
is to bring it to the right staff, it is even more difficult to keep it in the staff.
Workers have many expectations regarding their working conditions, work
experience, job satisfaction, personal needs and organization as well as their
economic expectations. It is not easy to meet these expectations. Organizational
commitment is the desire of the individual to accept the organizational goals and
values, to endeavor to achieve those goals, and to maintain the membership of the
organization. In organizational commitment, the following factors are mainly
emphasized "(Durna, et al., 2005: 211):
• Believing in the sincere belief in the purpose and values of the
organization and accepting them, • Being willing to put out everything for the organization,
• Exhibiting an extremely strong will at the point of staying as a member
of the group.
It is the organizational commitment, the harmony between the employees and the
organization, the integration of the aims of the employees and the organizations,
the believing that the employees and the organizations are taking mutual labor, the
employees and the employees feeling mutual responsibility, in short the employees
feel themselves at home and hear the family warmth. Organizational commitment
is one of the first goals in terms of organizations in recent years, considering that
the organization is human-focused and that the organizational commitment of
employees is high. Because, it is suggested that the employees act with sense of
responsibility that they are productive at high level at the same time. Employees
with high organizational commitment avoid job hunting, absenteeism, and other
injurious situations. They hug their jobs with four hands and work in task
consciousness. In addition, employees with high organizational commitment are
expected to benefit greatly from knitting by lowering the cost of knitting.
Individuals who make up the organization come together for a number of purposes
and beliefs. The more common values shared among these individuals, the stronger
the organizational commitment can be. This brings together efficiency, efficiency
and continuity. As long as organizations and employees contribute to each other,
their commitment to each other will continue to increase. The organization will not
hesitate to spend all the knowledge, skills and energy involved in the organization
as long as the organization does not escape from its sacrifice for the development
of its staff. This will ensure that the organizations survive. Organizational
commitment is important in order to achieve the goal of the organization formed
within specific objectives. With high affinity, binding may increase. The
organizational commitment resulting from the relationship between the

Private and Public Employees Health Hospitals Home Care Services Management … 59
organization and the occupation represents the strong connection that the
occupation has with regard to the work we do. Thus, the performances of
employees and their organizational loyalty are as important as making at least
production and increasing sales figures. It is suggested that organizational
commitment affects organizational performance positively and alsoreduces
negative consequences such as being late to work, not going on, and leaving work.
Organizational commitment makes the occupations an individual that can solve
problems, not problems. Employees who are attached to the organization can also
own the organization and act with the sense of "we". Organizational commitment is
the driving force behind organizational success (Iscan and Naktiyok, 2004: 186).
"Occupations that are committed to the workplace do not hesitate to freely express
their thoughts because they believe that their own thinking is valuable in the name
of the success of the workplace (Nelson, 1999: 16) .The workers who work for
their organizations are those who increase their performance.
Materials and methods
Purpose of the research
The purpose of this study is to determine the opinions of private and public
hospitals health workers regarding the relationship between home care services
management and organizational commitment.
Type of Study
Research is cross-sectional.
Research Universe and Sampling
The research universe is the health workers of private and state hospitals located in
the city center of Istanbul. The sample is 350 health care workers selected
randomly from these hospitals.
Data Collection Tool
Survey form was used to collect data.
Analysis of Data
The information obtained as a result of this research was analyzed using the SPSS
19.0 program. In the analysis of the data descriptive statistics were applied in order

60 Mucize Sarihan, Mehmet Macar, Meryem Paydas to see the demographic features. Alfa Method (Cronbach Alpha Coefficient) was
used to measure the reliability of the measurement tools used. Correlation and
regression analyzes were also used to determine the level of association between
the variables and the hypotheses and the ANOVA test to determine if there were
significant differences between organizational commitment according to
demographic characteristics.
Results Table 1. Demographic Characteristics Table
Socio-demographic Count %
Characteristics
Gender Male 188 61,0
Woman 120 39,0
Age Groups 18-24 53 17,2
25-31 120 39,0
32-38 88 28,6
39-45 28 9,1
46 and over 19 6,2
Marital status The married 185 60,1
Single 123 39,9
Graduation Status Associate 45 14,6
License 246 79,9
Master and above 17 5,5
Working at the same Less than 1 year 90 29,2
institution
1-3 years 84 27,3
4-6 years 52 16,9
7-10 years 23 7,5
Over 10 years 59 19,2
In the health sector, the gender of the participants was determined in this study,
considering that the number of female employees is higher than that of male
employees as supported by previous researches. When analyzed according to the
gender of participants, it is seen that the majority of women are women with a ratio
of 61% with 188 people. Male participants, on the other hand, accounted for 39%
with 120 people. This is a result of women wanting to be in the healthcare sector.
Therefore, the distribution of survey participants by gender shows that a fairly

Private and Public Employees Health Hospitals Home Care Services Management … 61 realistic mass has been selected in terms of reflecting the views of health care
institutions and their employees.
When the data in the demographic information table are analyzed according to the
age range of the participants, the majority of the participants are between the ages
of 25 and 31 with the age of 120 with 39%. The second largest age group, 28.6%,
is between 88 and 32-38 years old. The third greatest proportion is 17-2%, with 53
people in the "18-24" age group. The age range of "39-45" is 28 persons and the
rate of 9,1%. Finally, 19 people constitute the age group of "46 years and over"
with a rate of 6.2%.
The marital status of 185 participants and 60.1% of the participants was identified
as "Married". 123 persons and the marital status of 39.9% was "Single".
It is seen that 45 people and 14.6% of the participants are graduated from
"Associate Degree". The vast majority of participants are 79.9% and
"Undergraduate" graduates with 246 people. 17 persons and 5,5% of the graduates
are "Graduate and above" graduates. Participants have a rate of 29.2% and the first
place with 90 people is the ones who work less than 1 year in the same institution.
In the second place, there are 27.3% and 84 people and 1-3 year employees.
Employees from "4-6 years" constitute 52 persons and 16,9%. The number of
employees working in "7-10 years" is 23 persons and the rate of 7,5% is "more
than 10 years", 59 persons and 19,2% is the rate.
Table 2. Organizational Commitment Regression Analysis Results with Home Care
Management
Model Beta t Sig. F p R R2
Corrected
R2
(Constant) 6,240 ,000
6,754 ,010b ,147
a ,022 ,018
Home Care -,147 - ,010
Management 2,599
When Table 2 is examined, it is seen that the F value is realized at 6,754 level.
Accordingly, Corrected R2
= 0.018 and R2
= 0.022. In line with the information
obtained from the regression analysis, home care management explains the independent variable organizational commitment at the level of 2.2%.

62 Mucize Sarihan, Mehmet Macar, Meryem Paydas
Results
The purpose of this study is to determine the opinions of private and public
hospitals health workers regarding the relationship between home care services
management and organizational commitment. As a result of the analyzes, it was
found that the expression of home care services is insufficient to explain the
organizational commitment. Moreover, when the relationship between home care
services and organizational commitment variables was examined, a positive and a
weak relationship were found. When the researches on the subject are examined, it
is defined the laws and rules about management processes in organizations, the
essential features of applications and how to do them. However, the way in which
practitioners comply with these rules differs in terms of ethical values. For
example, equal treatment is not given to occupations, who is treated first,
discrimination is done, duties and authority are abused, and performance appraisals
do not always reflect reality. The distinction between successful and unsuccessful
has not been clearly defined. Cooperation with employees is not realized,
participation is not achieved, and the statement supports the hypothesis. Leads to a
decrease in the organizational commitment inherent in the organization "hypothesis
has been accepted and when the researches on the subject are examined, results
support the hypothesis. Occupations that have been exposed to psychological
violence in organizations show that their organizational loyalty has diminished
over time. Particularly, organizations that are facing the problem of high,
successful and qualified workshops with their organizational commitment cause the
informed and qualified workshops to leave the work. Considering that the most
important capital of the business is employees who have such characteristics, it is
seen how important it is to decrease the organizational loyalty of these persons and
to leave their jobs. In general, organizational commitment, which is defined as the
employee's identification with the organization, the organization's commitment to
its goals, its goals and values, and its desire to continue to work, is desirable both
for businesses and for employees. Occupancies with high organizational
commitment have a strong desire to stay organized, perform better, achieve greater
satisfaction from the work, and all of which promote organizational effectiveness
and productivity.
References and notes:
Celep, C., (2000), Eğitimde Örgütsel Adanma ve Öğretmenler, Ankara. İçerli, L., (2010), “Örgütsel Adalet: Kuramsal Bir Yaklaşım”, Girişimcilik ve Kalkınma Dergisi (5 -1)
Journal of Enterpreneurship and Development s.67-91. İnce, M., Gül, H., (2005), YönetimdeYeni Bir Paradigma: Örgütsel Bağlılık, Ankara: ÇizgiKitabevi. İpek, C., (1999), “Resmi Liseler İle Özel Liselerde Örgütsel Kültür Ve Öğretmen-Öğrenci
İlişkisi”,Yayınlanmamış Doktora Tezi, Ankara üniversitesi Sosyal Bilimler Enstitüsü, EğitimYönetimi Ve Planlaması Anabilim Dalı, Ankara.

Private and Public Employees Health Hospitals Home Care Services Management … 63 İşcan Ö.F., Naktiyok, A., (2004), “ÇalışanlarınÖrgütsel Bağdaşımlarının Belirleyicileri Olarak
Örgütsel Bağlılık Ve Örgütsel Adalet Algıları”, Ankara Üniversitesi Sosyal Bilimler Fakültesi
(SBF) Dergisi, C. 59, S.1, Ankara. İşçi, E., (2010), “Psikolojik Sözleşme İhlalinin Örgütsel Vatandaşlık Davranışı ve İşten Ayrılma
Niyeti Üzerindeki Etkisinde Güvenin Rolü”, Yayınlanmamış Doktora Tezi. Marmara
Üniversitesi Sosyal Bilimler Enstitüsü İşletme Anabilim Dalı, İstanbul. Jaramillo, F., Nixon, R. and Sams, D.,(2005), “The Effect Of Law Enforcement Stress on
Organizational Commitment”, Policing: an International Journal of Police Strategies and
Management, 28(2): 321-336. Kaymaz, K., Eroğlu, U. veSayılar, Y., (2014), “Effect of Loneliness at Work on the Employees’
Intention to Leave”, İş, Güç Endüstri İlişkileri ve İnsan Kaynakları Dergisi, 16(1), 38-53.
Summary
Private and Public Employees Health Hospitals Home Care Services Management and Organization on the Relationship with
Organizational Commitment of Views
Mucize Sarihan IMBL Health Management Institute , Russian Federation
Mehmet Macar
South Russian University,Russian University
Meryem Paydas Near East University, Cyprus
The purpose of this study is to determine the opinions of private and public hospitals health
workers regarding the relationship between home care services management and
organizational commitment. Research is cross-sectional. The research universe is the health
workers of private and state hospitals located in the city center of Istanbul. The sample is
350 health care workers selected randomly from these hospitals. Survey form was used to
collect data. The information obtained as a result of this research was analyzed using the SPSS 19.0
program. In the analysis of the data descriptive statistics were applied in order to see
demographic characteristics. Alfa Method (Cronbach Alpha Coefficient) was used to
measure the reliability of the measurement tools used. Correlation and regression analyzes
were also used to determine the level of association between the variables and the
hypotheses and the ANOVA test to determine if there were significant differences between
organizational commitment according to demographic characteristics. As a result of the analyzes, it was found that the expression of home care services is
insufficient to explain the organizational commitment. Moreover, when the relationship
between home care services and organizational commitment variables was examined, a
positive and a weak relationship were found.
Keywords: Health care workers, Home care services, Organizational commitment

Khazar Journal of Humanities and Social
Sciences © Khazar University Press 2017
DOI: 10.5782/kjhss.2017.64.72
Exploration of the Impact of Religious Belief and
Gender on University Students’ Empathy Feelings
Idris Yılmaz
Karadeniz Technical University, Turkey
Fatih Koca
Karadeniz Technical University, Turkey
Akın Celik
Karadeniz Technical University, Turkey
Introduction
Empathy refers to the feelings that you understand and share another individual’s
feelings, thoughts, and behaviours (Basch, 1983). The theoretical justification of
the empathy firstly argued that the empathy was cognitive or emotional construct
(Mehrabian & Epstein, 1972). However, recent studies clearly stated that the
construct of empathy is multidimensional (Joliffe & Farrington, 2006; Furrow &
King, 2004). Accordingly, the perspective-taking, empathic interest, fantasy, and
personal stress are four-dimensions of the empathy. Furthermore, Hoffman (1984)
claimed that the individual is firstly able to cognitively and emotionally distinguish
and understand himself/herself from the other person in order to empathize with
him/her. In this sense, expression of mixed-emotions and cognitive perceptions of
the individuals’ feelings around them from birth (Thompson & Gullone, 2003). A
large body of research showed that empathy play a vital role in human life because
the individuals with different empathy level exhibit different behavioral patterns
(Kaukiainen et al., 1999; Thompson & Gullone, 2003).
In fact, the empahty is a crucial skill for all individuals to develop and master
social, emotional, and behavioral competencies in social context. In other words,
the development of emphatic skills is considered to be vital part of social and
emotional adjustment for humanbeing (Ersoy & Kosger, 2016). In this sense,
recent research findings clearly indicated that individuals with higher empatic skills
are tended to be less aggressive, more supportive, and higher level of moral
judgments than the ones with lower empatic skills in social life (e.g., Eisenberg &
64

Exploration of the Impact of Religious Belief and Gender on University Students’ .......... 65 Miller, 1987; Eisenberg & Strayer, 1987; Miller & de Haar, 1997). For instance,
children with higher empathy levels exhibeted more internal motivation, prosocial
behaviors, and self-control competencies (Miller & de Haar, 1997). Similarly,
Loudin and collogues (2003) examined the role of empatic skills in aggressive and
antisocial behaviors. They found that the empatic skills helped the individuals to
reduce agressive and antisocial behaviors as well as bullying tendencies.
Furthermore, Pedersen and collogues (2004) showed that as the level of empathy
increases, ethnic and race discrimination significantly decreases. In addition, there
is a growing tendency regarding the number of helping beahviors and the
development of emphatic skills (Duru, 2004). For teacher training program, it is
crucial to help the students to develop emphatic skills in their professional life. For
example, Kesicioglu and Guven (2014) investigated the relationship between the
teacher candidates’ self-efficacy beliefs and their emphaty levels. They found that
there was a positive correlation between these developmentally important
constructs. Together, the level of empathy as well-established construct in the
literature is crucial to understand and document the individuals’ social, emotional,
and behavioral orientations.
According to numerous research, religous beliefs are a significant part of the
individuals’ social and cognitive process of their lives and religion might positively
influence their personality to empathize with others or make more positive and
warm judgments about the others’ behaviors (e.g., Abu-Nimer, 2001; McCullough & Worthington, 1999; Stebnicki, 2007). Similarly, Furrow and King (2004)
asserted that religiousness are significantly related to the development of positive
social interaction, trust, shared vision, and empatic skills that influence moral
behavior. Therefore, religion might be considered as a rich resource for
individuals’ moral development in social context. For instance, Duriez (2004)
showed that there was a significantly positive relationship between the dignity of
religious belief and the level of emphatic behaviors. However, the paucity of the
current literature on the examination of the relationship between religion and the
development of empatic skills is suprising considering that many individuals report
high levels of religious participation and beliefs in Turkey. Therefore, the goal of
the current research was to examine the impact of religious belief on university
students’ empatic skills.
A growing body of research indicated that girls are more capable of the emotion
related tasks including empatic skills than boys (e.g., Bosacki & Moore, 2004;
Zajdel, Bloom, Fireman, & Larsen, 2013). Namely, gender differences in
individuals’, even in children, emotion regulation and understanding abilities were
detected and girls significantly outperformed boys on the emotion undertanding
tasks after controlling language skills (Bosacki & Moore, 2004) and demographic
characteristics (i.e., SES, parent education) (Brown & Dunn, 1996). Moreover,

66 Idris Yılmaz, Fatih Koca, Akın Celik gender differences were especially found in the stories addressing complex
emotions (Cutting & Dunn, 1999). However, few studies also showed that females’
emotion understansing does not appear to be exceed that of the male’s ones
(Donaldson & Westerman, 1986). This might be becasuse, the gender might have a
mediation role in the process of mixed-emotions including empathy. In this respect,
the second important goal of the study was to examine the gender role in the
development of empatic skills.Moreover, it is an unquestionable reality that
educators and researchers should understand and document the impact of
demographic factors (i.e., gender) on the development of emphatic skills in
professional life. Therefore, the researchers designed the study was to understand
and document whether or not there was a gender difference in the level of empatic
skills.
Method
Participants
The study participants included a group of 838 (508 male ; 330 female) Physical
Education and Sport Science student-teachers in four large urban city universities
in Turkey.All participants were born in Turkey and were Turkish-speaking. The
participants’ mean age was 21.8 (SD = 2.71). The participants were pursuing the
degree from physical education, coaching, sport management training program.
Procedures
Participants voluntarily took part in the current study and the researchers asked
them to rate report their percetions regarding the empathic feelings and
demographic information (e.g., age, gender, parent education, religiousness, and
grade levels).
Instruments
The Toronto Empathy Questionnaire. The questionnaire was developed
bySpreng and collogues (2009) to measure the individuals’ empathy level. The
original scale consists of 16 questions, each rated on a five point likert scale (0 =
Never to 4= Always). Spreng and collogues (2009) conceptualized empathy as a
primarily emotional process by revieving other available empatyh instruments. The
psychometric adaptation of the instrument was conducted by Dogan and Sapmaz
(2012) with 698 university students from Ege and Sakarya universities. The
exploratory and confirmatory factor analysis results yielded a unidimensional
structure of the scale. The internal consitency reliability was moderately high and

Exploration of the Impact of Religious Belief and Gender on University Students’ .......... 67 acceptable (.79). However, the factor loadings for three items were lower than .30;
and therefore, the Turkish version of the TEQ consists of 13-items.
Data Analysis
The main goal of the study was to examine the religioun belief and gender
differences in empathy scores. Therefore, the reseachers employed an indepedent
sample t-test and an ANOVA to understand and document group differences in the
level of empaty feelings. The second aim of the research was to explore the role of
gender and religion beliefs in the participants’ the level of empathy feelings.
Accordingly, the multiple regression analysis was conducted to examine the
predictive role of the study variables in the empathy feelings.
Results
Assumptions testing focusing normality, linearity, and outliers were applied before
the hypothesis testing. The participants , who were reported as strong religious
belief, had a total 50. 41 (SD= .32) mean score for the level of empathy feelings,
empathy mean scores for moderate was 48.86 (SD = .53), and non-believers’
reported 21.85 (SD = .08) mean score for the level of empathy feelings. For gender,
male students’ mean score was 49.07 (SD = .35) and female counterparts reported
51.42 (SD = .43) for empathy. Descriptive findings were detailed in Table 1.
Table 1. Descriptive Statistic for Gender and Religious Belief on the Level of Empaty N M SD
Gender
Male 508 49.07 .34
Female 330 51.42 .43
Religious Belief Strong 608 50.41 .32
Moderate 192 48.86 .53
Low or Non 38 49.02 3.7
An independent-samples t-test was employed to compare the level of empathy
feelings in male and female participants. The results showed that there was a
significant difference between male (M = 49.07, SD = .34) and female students (M
= 51.42, SD = .43) for the level of empathy scores, t (836) = 4.25, p < .05. In other
words, female participants reported higher empathy scores than male ones. A one-
way between subjects ANOVA was employed to compare the effect of religion
belief on the level of empathy scores in strong, moderate, and low or non religious

68 Idris Yılmaz, Fatih Koca, Akın Celik believers. The study findings indicated that there was a significant effect of the
religiosity on the empathy scores at p < . 05 for the three group ( F ( 2, 835) = 3.15
). To scrutinize the group effect, Tukey post-hoc test was conducted. Based on the
results, strong believers (M = 50.41, SD = .32) were statistically and significantly
different from moderate (M = 48.86, SD = .32) and low or non (M = 49.02, SD =
3.7) religious particpants. Furthermore, the findings showed that there was
moderate to low effect size (.01)The general findings were detailed in Table 2 and
Table 3.
Table 2. Gender Diffence in the Level of Empathy Scores M SD T-value df P-value
Male 49.07 .34 4.25 836 .00**
Female 51.42 .43 p < .01**
Table 3. The Effect of Religiosity in the Level of Empathy Scores M SD F P-value ηp 2
Strong 50.41 .32 3.15 .04* .01
Moderate 48.86 .53
Low or Non 40.02 3.7 p < .05*
The second goal of the study was to document the predictive role of gender and religion in the participants’ empathy levels. In this sense, the researchers conducted
a multiple regression method Using the enter method it was found that gender and religion belief explained a statistically signficant amount of the variance in the
scores of empathy (F(2, 835) = 11.93, p < .05, R2 = .28, R
2Adjusted = .26). This
analysis showed that both gender (Beta = .14, t (835) = 2.21, p < .05) and religion belief (Beta = .22, t (835) = -.4.49, p < .05) did significantly predict the level of empathy feelings. The results were detailed in Table 4.
Table 4. Summary of Multiple Regression for Variables Predicting the Level of
Empathy (N = 838)
Predictors SE B
Gender .14* .168*
Religion Belief -.22* .141*
R2 .28 F 11.93 p < .05*

Exploration of the Impact of Religious Belief and Gender on University Students’ .......... 69 Discussion
The current study findings are consistent with the previous studies, which found a
similar results for the differential effects and group differences for gender and
religion belief on the level of emphaty scores (e.g., Bosacki & Moore, 2004;
Zajdel, Bloom, Fireman, & Larsen, 2013). For instance, Bosacki and Moore (2004)
examined gender differences in levels of empathy. They found that there appear to
be straightforward male and female differences in emotion regulation and
understandings addressing the level of empathy. Similarly, the current study found
that female sport science students exhibited higher level of empathy feelings than
male peers. Although the scope of the current research was to just explore the
gender differences in Turkish university settings, a large amount of study showed
that the possibility of this differences might be result of motivation and emotion
regulation skills (e.g., Gault & Sabini, 2000 ; Zajdel, Bloom, Fireman, & Larsen,
2013). In fact, Zajdel and collogues (2013) clealry stated that girls are more
succesful in emotion regulation skills and more tended to understand the other
individuals’ feelings. Therefore, there might need to further examine the role of
gender in order to document the factors underpinning the current findings.
Consistent with the literature, for the predictive power of gender in explaining the
empathy level girls exhibeted better emotinoal experience and understanding than
boys , the results clearly showed that gender had statistically significant predictive
role in this context (Basch, 1983 ; Spreng et al., 2009).
For the religion belief, previous research indicated that caring, helping, and
interpersonal support as a mechanism are significantly linked to the religiosity
(Carol et al., 2010 ; McCullough & Worthington, 1999; Stebnicki, 2007).
Exceptedly, the current study showed that religion belief was crucial predictor of
the level of empathy feelings among university students. In fact, religiosity might
have bridging function between empathy and prosocial behaviors including caring,
affection, volunteerism, and social support (e.g., Batson, 1976 ; Smith & Denton,
2005). In this sense, as religiosity is found as useful source to develop alturism,
sympathy, helping, and caring behaviors within social interactions (Carol et al.,
2010), the findings clearly pointed out that the dignity of religion among
adolescents might be related to cognitive and affective aspects of empathy as
unidimensional construct. Accordingly, Eisenberg (2000) claimed that religiosity is
key to apprehension and comprehension of another individuals’ emotional state.
And, university students with strong religious belief should have better sense of
understanding of the others in this study. Indeed, certain prosocial skills (i.e.,
caring, helping) ,characterized by the religion, might be associated with the
empathy.

70 Idris Yılmaz, Fatih Koca, Akın Celik In fact, conveying respect and empathy key to teacher training program. The
teacher training programs aim to prepare preservice teachers for religiously and
etnically diverse classroom settings while being respectfull of their personal values
and knowledge. Accordingly, the development of the emphatic skills during the
college years might enable them to be mindfull for their instructional and relational
dynamics in the professional life. For instance, Kitchen (2006) and Kesicioglu and
Guven (2004) pointed out that pre- and in-servive teacher with higher emphatic
skills are more successful in building supportive relationships with their students
and teaching their classroom instructions. Thus, the current study’s initial findings
might provide significant insights into the development of emphatic skills in
diverse educational settings.
There are also several significant limitations. The measurement of religiosity
should being assessed together according to both attendance and the perceived
importance of beliefs. More extensive assessments for both religiosity are
suggessted for future research. It would be crucial to examine assess other aspects
of religiosity such as conservatism,volunteerism, and spirituality. Another
limitation of the current study was the distinctiviness of the sample. Namely, only 5 % of the participants reported their religiosity as low or non, and therefore,
religious variations are recommended for the future research.
Together, the importance of religiosity for the individuals are positively correlated
with the cognitive and affective perspective-taking form of empathy. In fact, the
exploratory findings of the current research provided us with initial insights
underlying the relationship between religion and empathy, future researches might
need to scrutinize the dynamic within this conceptual framework. Specifically, we
need to examine empathy in relation to religiosity by potential mediating role of
cognitive and affective components including caring and helping.
References and notes:
Abu-Nimer, Mohammed. "Conflict resolution, culture, and religion: Toward a training
model of interreligious peacebuilding." Journal of Peace Research 38.6 (2001):
685-704. Basch, Michael Franz. "Empathic understanding: A review of the concept and some
theoretical considerations." Journal of the American PsychoanalyticAssociation 31.1
(1983): 101-126.
Batson, C. Daniel, and Patricia A. Schoenrade. "Measuring religion as quest: 1) Validity concerns." Journal for the scientific study of Religion (1991): 416-429.
Bosacki,SandraLeanne, and Chris Moore. "Preschoolers' understanding of simple and
complex emotions: Links with gender and language." Sex roles 50.9 (2004): 659-
675.

Exploration of the Impact of Religious Belief and Gender on University Students’... 71 Brown, Jane R., and Judy Dunn. "Continuities in emotion understanding from three to six
years." Child development 67.3 (1996): 789-802. Cutting, Alexandra L., and Judy Dunn. "Theory of mind, emotion understanding, language,
and family background: Individual differences and interrelations."
Childdevelopment 70.4 (1999): 853-865. Donaldson,Sally K., and Michael A. Westerman. "Development of children's understanding
of ambivalence and causal theories of emotions." Developmental Psychology 22.5
(1986): 655. Duriez, Bart. "Are religious people nicer people? Taking a closer look at the religion–
empathy relationship." Mental Health, Religion & Culture 7.3 (2004): 249-254. Eisenberg,Nancy. "Emotion, regulation, and moral development." Annual review
ofpsychology 51.1 (2000): 665-697. Eisenberg, Nancy, and Paul A. Miller. "The relation of empathy to prosocial and related
behaviors." Psychological bulletin 101.1 (1987): 91. Eisenberg, Nancy, and Janet Strayer. "Critical issues in the study of empathy." (1987).
Erdinç, D. U. R. U. "Öğretmen adaylarinda empati-yardim etme Eğilimi ilişkisi ve." Pamukkale Üniversitesi Eğitim Fakültesi Dergisi 15.15 (2004): 31-41.
Ersoy, Elif Gökçe, and Ferdi Köşger. "Empati: Tanimi ve Önemi/empathy: Definition and its importance." Osmangazi Journal of medicine 38 (2016).
Francis, Leslie J., and Paul R. Pearson. "Empathic development during adolescence:
Religiosity, the missing link?." Personality and Individual Differences 8.1 (1987):
145-148. Furrow, James L., Pamela Ebstyne King, and Krystal White. "Religion and positive youth
development: Identity, meaning, and prosocial concerns." Applied Developmental
Science 8.1 (2004): 17-26. Gault, Barbara A., and John Sabini. "The roles of empathy, anger, and gender in predicting
attitudes toward punitive, reparative, and preventative public policies." Cognition
&Emotion 14.4 (2000): 495-520. Hoffman, Martin L. "Interaction of affect and cognition in empathy." Emotions,
cognition,and behavior (1984): 103-131. Jolliffe, Darrick, and David P. Farrington. " Development and validation of the Basic
Empathy Scale." Journal of adolescence 29.4 (2006): 589-611. Kaukiainen, Ari, et al. "The relationships between social intelligence, empathy, and three
types of aggression." Aggressive behavior 25.2 (1999): 81-89. Kesicioğlu, Oğuz Serdar, and Gülhan Güven. "Okul öncesi öğretmen adaylarının özyeterlik
düzeyleri ile problem çözme, empati ve iletişim becerileri arasındaki ilişkinin
incelenmesi." Turkish Studies 9.5 (2014): 1371-1383. Loudin, Jesse L., Alexandra Loukas, and Sheri Robinson. "Relational aggression in college
students: Examining the roles of social anxiety and empathy." Aggressivebehavior
29.5 (2003): 430-439. McCullough, Michael E., and Everett L. Worthington Jr. "Religion and the forgiving
personality." Journal of personality 67.6 (1999): 1141-1164.

72 Idris Yılmaz, Fatih Koca, Akın Celik
Mehrabian, Albert, and Norman Epstein."A measure of emotional empathy." Journal
ofpersonality 40.4 (1972): 525-543.
Miller, Paul A., and Marian A. Jansen Op De Haar. "Emotional, cognitive, behavioral, and
temperament characteristics of high-empathy children." Motivation andEmotion
21.1 (1997): 109-125. Smith, Christian, and Melina Lundquist Denton. Soul searching: The religious and
spirituallives of American teenagers. Oxford University Press, 2009. Stebnicki, Mark A. "Empathy fatigue: Healing the mind, body, and spirit of professional
counselors." American Journal of Psychiatric Rehabilitation 10.4 (2007): 317-338. Thompson,Kelly L., and Eleonora Gullone. "Promotion of empathy and prosocial behaviour
in children through humane education." Australian Psychologist 38.3 (2003): 175-
182.
Zajdel, Ruth T., et al. "Children's understanding and experience of mixed emotions: The
roles of age, gender, and empathy." The Journal of genetic psychology 174.5 (2013):
582-603.
Summary
Exploration of the Impact of Religious Belief and Gender on University
Students’ Empathy Feelings
Idris Yılmaz
Karadeniz Technical University, Turkey Fatih Koca
Karadeniz Technical University, Turkey
Akın Celik
Karadeniz Technical University, Turkey
The goal of the study was to examine the differential role gender and religious beliefs in the
universiy students’ the level of empatic beliefs. The study participants included a group of
838 (508 male ; 330 female) Physical Education and Sport Science student-teachers in four
large urban city universities in Turkey. The researchers employed the Toronto Empathy
Questionnaire and demographic information scale to collect the data. The findings indicated
that a significant difference between male (M = 49.07, SD = .34) and female students (M =
51.42, SD = .43) for the level of empathy scores, t (836) = 4.25, p < .05. The results also
showed that there was a significant effect of the religiosity on the empathy scores at p < . 05
for the three group ( F ( 2, 835) = 3.15 ). Furthermore, gender (Beta = .14, t (835) = 2.21, p < .05) and religious belief (Beta = .22, t (835) = -.4.49, p < .05 were found two significant
variable to predict the level of empathy feelings among the college students. Directions for
the future research and the limitations were discussed.
Keywords: Empathy, religious belief, gender, researchers, participants

Khazar Journal of Humanities and Social
Sciences © Khazar University Press 2017
DOI: 10.5782/kjhss.2017.73.80
The Effects of Risks and Hazards on the Business
Stress Levels of Comparative Relevance within the
Relevance of Occupational Health and Safety: A
Hospital Example
Dilek Tasdemir
IMBL University, Russian Federation
Introduction
Inpatient hospital services, which require specific specialization for human health
given by health institutions, have been subjected to the requirements for dangerous
work places in the Law on Occupational Health and Safety No. 6331 (Law No.
6331).
According to the categorization made by Law No. 6331 on Occupational Health
and Safety (OSH), there are very dangerous occupational health and safety risks for
the hospitals which are classified as "very dangerous" places, employees employed
by them and subcontracted organizations. Taking preventive measures to prevent
employees from losing their workplace environment and health due to working
conditions refers to the concept of occupational health. Job security, which
represents preventive measures against workers being caught in the accident, is the
use of tools, materials and materials used in the workplace and the protection of
workers against risks that may arise from their existence and taking necessary
precautions (Aktay, 2012: 6).
World Health Organization (WHO) health; Not only the absence of illness and
disability, but also a state of total well-being in the physical, spiritual and social
aspects. In this sense, the concept of "occupational health" must be understood
within a broad framework. The International Labor Organization (ILO) and the
WHO Joint Committee on Occupational Health have set the following goals in the
area of occupational health: "Occupational health, what they do, what they do is to
raise and maintain the physical, mental and social well- Prevention of health
problems caused by working conditions; Workers should be protected from risks
73

74 Dilek Tasdemir that are related to their work and are harmful to their health; To be employed in
occupational settings appropriate to the physical and biological capacities of
workers; In short, human beings are the ones who work, and the people are aimed
to be made suitable for their work. " (Alli, 2001: 2).
The concept of stress was initially debated scientifically by Hans Selye in the
1930s. Hans Selye stress; It is defined as the widespread reaction of the organism
to all kinds of changes. According to Hans Selye's definition, whatever pleases you
are will fit into the body. (Özmutaf, 2006: 75).
Work stress is defined a little differently in our working life in which we spend a
significant part of our time in our daily lives. Work stress can be defined as the
response and reflex of physicians, organizational and operational problems, the
physical environment of the hospital, the patients, the situations or events they
meet, etc. (Koç, 2009: 200).
Occupational health and Safety
Occupational health and safety are an integral part of the health and safety aspects
of conducting work at a workplace. This phenomenon is aimed at ensuring that the
well-being in health conditions is a sustainable structure for the worker who is
working safely in a work that contains many different disciplines.
Concept of Occupational Health and Safety; Turkish Standards Institute (TSE)
Turkish Standard is defined as "Not to be disallowed from harm risk" in the
standard of 18001 Occupational Health and Safety Management Systems. The
concept of occupational health and safety includes protection of workers' health
and safety against workplace limits and work-related hazards. However, with the
assertion that the preservation of workers is necessary, especially in the living
environment, it is becoming clear that these definitions are not sufficient and that
the content needs a wider definition. In a broader sense, the concept of
occupational health and safety is a concept that recognizes that workplace-limited
health and safety precautions can not provide adequate protection, and includes
risks that are related to and affect the health and safety of workers and that arise
from outside the workplace (TSE, 2004: 3).
The concept of health refers to the harmony of the organism to the living
environment and today it is defined not only as the absence of illness and disability,
but also as a state of goodness in the physical, spiritual and social aspects. This
definition in the WHO Constitution sets out a goal and in achieving this goal, the
environment in which the person lives and especially works is of great importance
(Demircioğlu, 1997: 2).

The Effects of Risks and Hazards on the Business Stress Levels of Comparative 75 Business health in general terms; "Maintaining the physical, mental and social
well-being of employees in all professions, ensuring that employees are protected
from the risks arising from working conditions, preventing the deterioration of their
health, placing them in appropriate jobs and ensuring compliance with human and
human work" (Gerek, 2006: 12).
The aim of work safety studies
secure environment, to ensure
situations (Ünsar, 2003: 4).
is; To protect employees, to work in a safe and
operational safety and to eliminate dangerous
OHS; The work environment and the precautions taken within a defined and
systematic system applied to ensure the health and safety of employees.
Occupational and Occupational Disease
Work accident
The following five cases, which are stipulated in Article 13 of Social Insurance and
General Health Law No. 5510, can be defined as work accidents. These situations
are;
a) When the Insured is in the workplace, b) If the insured person is working independently on his / her behalf or
account due to work carried out by the employer or due to his / her duty, c) When the insured employee working under an employer is sent
out elsewhere as an employee, d) When the breastfeeding woman leaves for giving her child milk, e) The insured shall be liable to the insured person for any reason during the
course of his / her visit to the place of employment with a vehicle provided
with employment (5510 numbered law, 2006: 3).
Materials and methods
Purpose of the research
This study was conducted to determine the effects of the risks and dangers
encountered by physicians working in a hospital in Antalya on the level of work
stress.
Researching Deseni
It is a cross-sectional, descriptive work.

76 Dilek Tasdemir The Universe of Research and Sampling
The universe of the work is composed of physicians (100 persons) who work in a
hospital in Antalya. The entire universe was included in the study and 100
medicines were reached.
Analysis of Data
Data from the study; Socio-demographic characteristics, risks and risks originating
from working environment, factors considered to affect OHS applications, Health
Workers Safety Scale and Job Stress Questionnaire were collected under direct
observation. Analysis of the data was done using frequency, Kruskal-wallis, mann-
whitney U and correlation analysis.
Results
Table 1. Distribution of Physicians According to Socio-demographic Characteristics
Socio-demographic Count %
Characteristics
Gender Male 54 54,0
Woman 46 46,0
Age Groups 21-30 18 18,0
31-40 46 46,0
41 years and over 36 36,0
Marital status The married 52 52,0
Single 46 46,0
Other 2 2,0 The physicians were 46% (46 persons) female and 54% (54 persons) male and the
mean age was 38.80 ± 7.86 (Min: 26, Max: 55). The distributions of physicians
according to sociodemographic characteristics are given in Table 2.
Table 2. Distribution of Physicians According to Their Working Stats
Socio-demographic Count %
Characteristics
Position General practitioner 38 38,0
Specialist Physician 62 62,0
Working Time 5 Years and Less 32 32,0
6-10 Years 20 20,0
11-15 Years 32 32,0
16 Years and Over 16 16,0

The Effects of Risks and Hazards on the Business Stress Levels of Comparative 77
Working Time at the 2 Years and Less 8 8,0
Institution
3-5 Years 12 12,0
6-8 Years 38 38,0
9 Years and over 42 42,0
Distribution of doctors according to their working status is given in Table 2.
Table 3. Physicians' Duties Distribution of Working Conditions in the Hospital
Working conditions Count %
Seizure Retention Yes 46 46,0
No 54 54,0
Seizure frequency Once a month 22 22,0
1 time per week 16 16,0
Number of Patients 30 and Less 14 14,0
Observed / Day
31-55 20 20,0
56 and Üer 66 66,0
The distribution of the working conditions of the physicians in the hospital
according to their characteristics are shown in Table 3. Of the doctors, 46.0% (46
persons) were on duty and 22% (22 people) were on duty once a month.
Table 4. Average Rate of physicians SÇGÖ
N Min. Max. Mean SD
Health Worker Safety Scale 100 2,93 5,64 193,26 20,02
Table 5. Physicians' Job Stress Score Averages
N Min. Max. Mean SD
Work Stress Scale 100 1,00 4,71 3,16 1,11
Table 6. Distribution of Isom and SÇGÖ Average score by Socio-
demographic characteristics of physicians
Gender N Ort. Mean U p
İSÖ Male 54 3,41 0,92 -1,758
0,08
Woman
46
2,87
1,26
SÇGÖ Male 54 4,28 0,50 0,113
0,91
Woman
46
4,30
0,36
It was determined that the occupational safety provided in the study included in the
study (SRG score average = 193.26 ± 20.02, SRF score = 4.29 ± 0.44).

78 Dilek Tasdemir In this study, the average stress score of the physicians was 3.16 ± 1.11 E (5th
group) - It was found that they were at the level of work stress, which is highly
stimulant,
Physicians gender, level of education SÇGÖ and İSÖ with no significant difference between mean scores (p> 0.05).
Table 7. Correlation Between Physicians İSÖ with SÇGÖ
SÇGÖ
r p
İSÖ -0,290 0,04 Isom with average scores of physicians in the negative direction between the mean
SÇGÖ points are weak and significant correlation (r = 0.290; p = 0.04). "
Results
Within the scope of the research, occupational safety is provided by physicians
working in hospitals; There is a level of work stress that has a high level of
responsibility, a high level of responsibility, and an attractive personality. In this
study, the effects of health and safety problems of physicians on work stress were
examined and the following results were obtained. In addition, many physicians did
not find the time to participate in the study from extreme intensity.
Those who did not receive Occupational Health and Safety training were found to
have higher job stress than those who did not exercise, those who did not, those
who did not, and those who did not exercise.
Those who were not satisfied with the working environment were found to feel
more secure in the hospital working environment than those who did not have
chronic disease. However, those who are unhappy with the working environment
are at the forefront.
Physicians working at the hospital within our research are confronted with many
safety and health risks from hospitals and occupations. The fact that these risks can
not be prevented and their effects are not reduced to the tolerable levels can lead to
impaired health and stress on physicians.
Continuation of the Occupational Health and Safety practices in the public sector
which officially started on 01 July 2016 and was postponed to 1 July 2020 has
become a necessity for all of our employees, especially our physicians who protect
our health. First, let's ensure their health and safety so that they can maintain their

The Effects of Risks and Hazards on the Business Stress Levels of Comparative 79 health in their service area. Therefore; It is necessary to take necessary precautions
in order to reduce the number of patients, to take preventive, preventive and
corrective measures, to provide healthy and safe environments for patients and
healthcare workers, to provide regular in-service trainings and quality care, Not all
of our health care workers who were taken into the profession were worn out, and
that the wear out was not ignored in the wearers.
References and notes:
Aktay Nizamettin/ Arıcı Kadir/ Kaplan Tuncay, İş Hukuku, 3.baskı, Seçkin, Ankara, 2009. Alli, B. (2001). Fundemantal Principles of Occupational Health and Safety. 2nd ed.
Geneva: ILO Organization Office. Demircioğlu, A. B., 1997, İstanbul Genelinde Orta Öğretim Yapılarının Kullanıcı Sorunları
Açısından İncelenmesi, Yıldız Teknik ÜniversitesiYüksekLisansTezi, İstanbul. Gerek, N. (2006). İşçi Sağlığı ve İş Güvenliği. Eskişehir: Anadolu Üniversitesi Yayınları İş Sağlığı ve Güvenliği Kanunu (Sayı: 6331) Tarihli 28339 Sayılı Resmi Gazete 12.06.2012 Koç H., “Örgütsel Bağlılık ve Sadakat İlişkisi”, Elektronik Sosyal Bilimler Dergisi, 8 (28):
200-211. 2009. Özmutaf, N,M. Ege Üniversitesi Su Ürünleri Dergisi 2006,cilt.23,sayı (1-2),s.75 Sosyal Sigortalar ve Genel Sağlık Sigortası Kanunu (Sayı:5510) Tarihli 26200 Sayılı Resmi
Gazete 16.06.2006. Türk Standartları Enstitüsü. TS 18001 İş Sağlığı ve Güvenliği Yönetim Sistemleri Şartlar,
TS Yayını, Ankara, Şubat 2004, S.3.
Ünsar S, Türkiye’de İşçi Sağlığı ve İş Güvenliği Uygulamalarının Mevcut Durumu ve
Konuyla İlgili Yapılan Bir Araştırma, İstanbul, İ.Ü. Sosyal Bilimler Enstitüsü,
2003, s. 4.

80 Dilek Tasdemir
Summary
The Effects of Risks and Hazards on the Business Stress Levels of
Comparative Relevance Within the Relevance of Occupational Health
and Safety: A Hospital Example
Dilek Tasdemir IMBL University, Russian Federation
This study was conducted to determine the effects of the risks and dangers posed by
physicians working in a state hospital in Antalya on the level of work stress. The cross-
sectional, descriptive type of study is composed of physicians (100 persons) working in a
state hospital in Antalya. The entire universe was included in the study and 100 medicines
were reached. Data from the study; Socio-demographic characteristics, risks and risks
originating from working environment, factors considered to affect OHS applications,
Health Workers Safety Scale and Job Stress Questionnaire were collected under direct
observation. Analysis of the data was done using frequency, Kruskal-wallis, mann-whitney
U and correlation analysis.
54% (54 people) of the physicians were male and 46% (46 people) were female and the
mean age was 38.80 ± 7.86 (Min: 26, Max: 55). It was determined that occupational safety
was provided in the state hospital, but the physicians were at the level of work stress, which
was highly stimulant and more responsive.
While this study provided job security in the state hospital, physicians increased the
productivity by forcing some people in some aspects of work stress, but in some ways it
was seen as threatening health. Intervention studies should be planned to reduce the work
stress of physicians.
Keywords: Occupational Health and Safety, Stress, Health Care Workers,Physicians
Hospital

Khazar Journal of Humanities and Social
Sciences © Khazar University Press 2017
DOI: 10.5782/kjhss.2017.81.91
Evaluation of Views of Views on Traditional Applications after Mother Breast Care
Selma Nama
IMBL University , Russian Federation
Introduction
Nonfunctional (non-functional) beliefs and practices involve practices that are life-
long, often unchanging, and persistent in nature, from initial childhood. What the
individual does is that they believe that someone else's approval is necessary, that
they believe in this past day regardless of whether they are true or false, and that
they are made up of non-existent thoughts and behaviors. In the society, such ideas
and beliefs are constantly supported by cognitive distortions (Yalçın, Koçak, 2012:
157).
Nonfunctional beliefs and practices;;
a) It is often not realistic, b) It is usually solid, tipped and generalized, c) Prevent the person from revealing the true performance of the person, d) It causes extreme, extreme emotions, e) They do not change with everyday living experiences (Yalçın, Koçak, 2012:
158).
Traditional methods of society's beliefs, traditions, values and cultures; Are
methods that are transferred from the ear to the ear. In regions where treatment
forms have become more irrational by changing forms of education and health
services and are not adequately attained as they progress from developed societies
and regions to undeveloped societies and regions, people seem to have made their
own medicine when necessary (Çakırer, Çalışkan, 2010: 343).
In the Turkish society, it is expected that the pregnancy of the woman will obey
many traditions until the birth of the woman. Beliefs and practices related to
pregnancy and childbirth begin to affect women, their families and their
81

82 Selma Nama environment, starting with the desire of the woman to become pregnant. Inadequate
care after delivery in the postnatal period leads to traditional practices to solve the
individual's health problems. Also, there is no health institution unless economic
necessity, distant health centers, lack of trust in health personnel, perception of
postpartum problems as a normal situation, lack of health safety and perception of
birth as a private event in societies is not necessary. For these reasons, individuals
try to solve their health problems with traditional practices they have seen from
their families (Özsoy, Katabi, 2008: 291).
Unconsciously, traditional practices, which are made only by using information
from the remote control, can often be harmful to health. Children are most affected
by these practices (http://www.thefreedictionary.com/Encyclopedia) 04.04.2017.
Despite the rapid progress in modern technology, traditional health practices are
still widely used in villages (ÇalışkanveBayat, 2011: 14).
Today, many mothers and babies lose their lives, especially in developing countries
due to misapplications of pregnancy, birth and postnatal period. This situation,
which is referred to as maternal child health problems, remains a priority problem
for our country (Başçetinçelik, 2009: 11).
The foundations of health are taken during childhood. One of the most important
problems affecting the health of children in our country is the care given to the
child. Maintenance is a set of practices that includes healthy growth and
development. Having a child healthy requires child care, appropriate interventions
for mother and child in prenatal and postnatal periods. Good care not only protects
the child from danger and illness, but also provides the child's growth, psycho-
social, cognitive development and a healthy environment (Uğurlu, 2013: 3).
Çetinkaya, Özmen and Cambaz (2008) study in the province of Manisa; 92.8% of
the women have had at least one newborn health related maternal health practice in
the postpartum period and 60.4% (Çetinkaya, Özmen, Cambaz, 2008: 39).
In the study of Ayaz and Yaman Efe (2008) in Ankara, 81% of the mothers performed in Ordu with the following: Divokbaş, Erbil, Altunbas and Arslan (2009), 53.2% of the mothers They have identified the baby (Ayaz, Yaman, 2008: 282).
Özyazıcıoğlu and Polat (2005) found that 64% of their mothers expect three loser
voices before breastfeeding when they work in Erzurum (Özyazıcıoğlu, Polat,
2005: 63).

Evaluation of Views of Views on Traditional Applications …… 83 Similar results have been shown in studies conducted in Ankara by Aykaz and
YamanEfe (2008), which is performed by Geçkil, Şahin and Ege (2009) in
Adıyaman, Çetinkaya, Özmen and Cambaz (2008) in Manisa (Geçkil, Şahin and
Ege, 2009: 62).
According to the data of Turkey Demographic Health Survey (TDHS-2008); While
the prenatal care rate of the women in Turkey is 92%, it is determined that the
Northeast Anatolia Region, including Erzurum province, is in a lower position than
the other regions. It was determined that the rate of antenatal care was 72.9% and
the rate of delivery in health facility was 75.5%. This shows that one of the four
women in the region is giving birth at home. Traditional midwives help 6.9% of
delivered births. Northeast Anatolia Region is in the backward position according
to the other regions in terms of the rates of women receiving postnatal care.
Postpartum care is highest in Aegean (94%) and Western Marmara (91%), while it
is lowest in Northeast (60%) and Middle East Anatolia (56%). (http://www.hips.
hacettepe.edu.tr/tnsa2008/data/TNSA-2008_ana_Rapor-tr.pdf).
According to the data of Turkey Demographic Health Survey (TDHS-2013); While the
prenatal care rate of the women in Turkey is 97%, it is determined that the Northeast
Anatolia Region, including Erzurum province, is in a lower position than the other
regions. It was determined that the rate of antenatal care was 85% and the rate of birth
in the health institution was 81.3%. 1.0% of deliveries help traditional midwives.
Northeast Anatolia Region is in the backward position according to the other regions in
terms of the rates of women receiving postnatal care. Postpartum care is highest in
Aegean (96.2%) and Western Marmara (94.7%), while it is lowest
in Northeast (80.7%) and Middle East Anatolia (86.4%). (http://www.hips.hacettepe.edu.tr/TNSA_2013_ana_rapor.pdf).
The findings of the TDHS 2008 show that if a woman maintains her current
fertility rate until the end of the period of fertility, she will have an average of 2.16
children at the end of the age of fertility (http://www.hips.hacettepe.edu.tr/
tnsa2008/ data/TNSA-2008_ana_Rapor-tr.pdf).
Turkey Statistics Institution (TSI) total fertility rate is 2.08 when we look at 2012 data. (http://www.tuik.gov.tr/UstMenu.do?metod=temelist).
Dysfunctional Beliefs and Practices Related to Pregnancy Period
When it is understood that a woman is pregnant, a different adaptation process
starts for her and her family. The woman will have a new identity in her status in
society, which is her motherhood. Therefore, pregnancy is not only a biological
change process but also a psychological and social process for women (Erbil, 2010:
1303).

84 Selma Nama At the beginning of traditional practices in the pregnancy comes gender estimates.
One of the predictions based on sex determination by looking at the image of a
pregnant woman concerns the pregnant woman's stomach. If the woman's stomach
is flat, she becomes a daughter; The pointed one becomes his son. Again, according
to the same opinion, if the woman's stomach is up and she is pushing the stomach,
If your wife is down and you are not oppressed, it is believed to be your son. Also,
the boy is very active, he can not stop where he stops, and he wants to go out right
now (Işık, Akçınar, Kadıoğlu, 2010: 71).
Dysfunctional Beliefs and Practices Related to Birth Stage
The moment of birth is a fearful, worrying activity for every woman. As much as
the woman who is going to give birth, everyone, especially her husband, is excited
to be born a moment ago and make a fall for them to take place easily. Among the
preparations made as the birth approaches, the choice of the person who will make
birth in the first place comes. In traditional culture, this person is the "midwife".
The midwife is a person who is familiar with a known eternal or "intermittent"
birth, understands, experiences, has a comfortable birth, and is called "light". When
the moment of birth is approached and the painful starts, a woman who is old from
the family goes and calls a person or person who is known by these handy light
people. To give birth, these people, formerly called "interspersed", were preferred
(Gözüm S, Tezel, 2003: 230).
In this process; Women or family can use a variety of traditional methods to reduce
birth pain. In order to facilitate birth, women do not knot or tie the ends of the tire
passed by the clothes prepared for the baby. If the knot is thrown, it is believed that
the child will be struggling at birth and that the mother will be knotted to the
uterus. Because she is easy to give birth, the woman moves abundantly, does
housework, does not gain much weight. For easy birth, sugar syrup, butter,
molasses are poured, greasy bread is eaten. Apple, orange is eaten and fed. The
pregnant woman makes all the housework of a woman who is easy to deliver, so
that her birth is as easy as her. For the women who have difficulty in birth, the male
horse is beaten or beaten on the threshold of the birth house, and beats are made by
throwing a gun. It is believed that the mother candidate will escape from the forces
that make the birth of the chestnut difficult (Şenol, Ünalan, Çetinkaya, Öztürk,
2004: 47).
In order to facilitate the birth, a number of plants with names such as "Fatma's
mother's hand, Fatma's main herb, Eve's main hand, Mary's main hand, Coral's
main hand" are used. It looks like a human hand in shape. When the water is
thrown, the branches are opened in half an hour as the cells draw water, the swollen
fingers of the hand. The water that this plant is waiting for is given to the

Evaluation of Views of Views on Traditional Applications …… 85 woman who will give birth. The woman who is giving birth is given water by the
hand of the woman who gives birth or the woman who is giving birth easily, or the
shirt on this woman is soaked and watered. (http://ucmaz.home.uludag.edu.tr/PDF/
egitim/htmpdf/2006-19(1)/M3.pdf).
For ease of birth it was determined that the pregnancy was carried out and that it
had been swung into a bed sheet. Balıkçı (2007) 's work in Trabzon in the same
practice, that is, the gentleman is lying in the blanket and swing was determined.
(http://www.folklor.org.tr/Lists/Posts/Post.aspx?ID=13).
Materials and methods
Type of Study
This research; The purpose of this study was to assess the traditional perception of self and newborn during pregnancy, childbirth and postnatal period.
Location and Time of the Study
This research was carried out in a State Hospital of Maternity selected in Istanbul
considering its socio-economic characteristics.
The Universe of Research and Sampling
The state of the research was created in Istanbul by taking into account the socio-
economic characteristics of the state hospital. A sampling group was chosen from
all the pulexes registered at the hospital to represent the universe. The sample of
the study consisted of 430 lohus.
Data Collection Method
The data were collected by face-to-face interview technique. The questions on the
questionnaire were read by the researcher to the women and the women were asked
to answer and about 10-15 minutes were allocated to each individual.
Data Acquisition Equipment
"Non-Functional Beliefs and Applications Scale" was used as the data collection
tool and "Questionnaire Form on the Socio-Demographic Characteristics of
Puerperants" prepared by the researcher. Questionnaire on Socio-demographic
Characteristics of puerperants there are 26 questions about socio-demographic
characteristics of puerperants, belief in gestation and belief in practice of traditional
method.

86 Selma Nama Analysis of Data
The data were analyzed in the SPSS package program and the significance level
was accepted as p <0.05. Number and percentage distributions, variance analysis, t-
test and correlation test were applied in the analyzes.
Findings
Table 1. Distribution of Puerperants and Their Wives by Socio-Demographic
Characteristics
Property Count %
18-23 99 23,0
Age group
24-29 184 42,8
30 and over 147 34,2
Not literate 17 4,0
Literate 36 8,3
Education Status
Primary education 223 51,9
High school 96 22,3
University 58 13,5
16-20 230 53,5
Marriage Age 21-25 169 39,3
26 and over 31 7,2
1-5 223 51,9
Duration of marriage
1-3 years 103 24,0
4-10 years 104 24,1
Less than income 16 26,7
Income Status
Equivalent to the expense Income 6 10,0
More than income 38 63,3
Working status Working 61 14,2
Inoperative 369 85,8
Province 239 55,6
Place of residence District 115 26,7
Village 76 17,7
More than income 89 20,7
Income status
Revenue is equal to 254 59,1
Less than income 87 20,2
18-23 21 4,9
Your husband's age
24-29 164 38,1
30 and over 245 57,0
Literate 11 2,5
Your husband's Primary education 174 40,5
education High school 162 37,7
University 83 19,3
Your husband's Working 411 95,6

Evaluation of Views of Views on Traditional Applications …… 87
working status Inoperative 19 4,4
Civil marriage 18 4,2
Form of Marriage Religious marriage 15 3,5
Both of them 397 92,3
Social Security Status There is 389 90,5
No 41 9,5
Family Type Core Family 43 71,7
Large Family 17 28,3
The distribution according to socio-demographic characteristics of women with
puerperium is shown in Table 1. It was found that 42.8% of the women with
puerperium had a marriage period in the age range of 24-29, 51.9% of primary
school graduates, 53.5% of the marriage age is between 16-20 years and 51.9% of
them are married. It was found that 85.8% of the women with puerperium were not
working, 55.6% were living in the province center and 59.1% were equal to the
income. When the characteristics of spouses of women with puerperium are
examined; 57.0% of them had an age of 30 years or more, 40.5% of them were
primary school graduates and 95.6% were working in any job. It was determined
that 92.3% of the women with puerperium had both formal and religious marriages,
90.5% had social security, and 58.6% had lived in the core family.
Table 2. Distribution of Puerperium with Women and Socio-Demographic
Characteristics of Spouse
Property Count %
1 117 27,2
2 136 31,6
Number of Pregnancy
3 92 21,4
4 45 10,5
5 and over 40 9,3
1 179 41,6
2 118 27,4
Number of Children Living 3 81 18,8
4 30 7,0
5 and over 22 5,2
Number of stillbirths Not existing 402 93,5
There is 28 6,5
Low MOQ Not existing 329 76,5
There is 101 23,5
Number of Abortion Not existing 389 90,5
There is 41 9,5
First Pregnancy Age Less than 18 41 9,5
18-25 335 77,9

88 Selma Nama
26-35 54 12,6 Distribution of women with puerperal disease according to their obstetric
characteristics is shown in Table 2. 31.6% of women with puerperium had 2
pregnancies, 41.6% had 1 living, 93.5% had stillbirth, 76.5% had fallen and 90.5%
had no curettage. 77.9% of women with puerperium were found to be in the age
range of 18-25 years of their first gestational age.
Table 3. Distribution of Women with Puerperal Pregnancies, Births and
Births According to Traditional Practices
Property Count %
Not to practice traditional practice 363 84,4
(to apply for a health institution
The First Step When Health etc.)
Problem Is Encountered I do know some traditional practices 45 10,5
Making traditional practices that 22 5,1
family / neighbor / friend suggests
The Importance of It does not matter at all 153 35,6
Traditional Practice in Important 243 56,5
Preventing Health Problems
Very important 34 7,9
Gestation Making Yes 45 10,5
Traditional Practices Status No 385 89,5
Traditional Practices in Clothes and materials on the skin 21 46,7
Religious practices 13 28,9
Pregnancy
Applications for eating and drinking 11 24,4
Traditional Method Practice Yes 40 9,3
Regarding Birth
No 390 90,7
Sacrifice 18 45,0
Traditional Practices
Prayers / Quran reading 15 37,5
Regarding Birth
Warm shower 5 12,5
Eat the palm fruit 2 5,0
The distribution of women with puerperal pregnancies, births, and births according
to traditional practice is shown in Table 3. It was found that 84.4% of women with
puerperium went to the doctor first when they compared with health problems, and
56% of the traditional practice in preventing health problems. 89.5% of women
with lohusa do not have any traditional practice during pregnancy and 10.5% have
done traditional practice during pregnancy and 46.7% of them are worn or laid on
the skin (rubbing olive oil on the skin, ) Before applying it. It was found that 90.7%
of the women with puerperium did not have traditional practice regarding birth,
9.3% made a traditional practice related to birth and 45.0% applied it to the votive
man in this period.

Evaluation of Views of Views on Traditional Applications …… 89
Results
The following conclusions were obtained in the research conducted to determine
the non-functional beliefs and practices that the poultry practiced on pregnancy,
childbirth and postnatal care and the factors affecting these practices. According to
the points average; Non-functional subscale of pregnancy was 84.55 ± 14.00, mean
of non-functional applications subscale of birth was 31.12 ± 5.27, mean of non-
functional subscale of postpartum was 30.41 ± 6.24, non-functional subscale of
infant care scale the mean score was found as 65.13 ± 13.29 and the scale average
score was found as 211.23 ± 33.94.
As the scores of the poultry decreased, the level of knowledge of women towards
non-functional beliefs and practices decreased. Thus, it has been found out that, in
the light of these conclusions, the paucimeters have misinformation about
traditional practices and tend to tend to more traditional methods.
As the scores of the pensioners increased, the level of knowledge towards non-
functional beliefs and practices increased. In the light of these results, it has been
found that the paucity has accurate information about traditional practices and does
not tend to tend to more or less traditional methods.
References and notes:
Ayaz S, Yaman EŞ. Potentially Harmful Traditional Practices During Pregnancy and
Postpartum. European Journal of Contraception and Reproductive Health Care
2008;13(3):282-8. Başçetinçelik A. Adana Halk Kültüründe Kırk Basması-Nazar-Kırklama. Adana:
AltınKozaYayınları; 2009:11-59. Bölükbaş N, Erbil N, Altunbaş H, Arslan Z. 0-12Aylık Bebeği Olan Annelerin Çocuk
Bakımında Baş vurdukları Geleneksel Uygulamalar. Uluslararası İnsan Bilimleri
Dergisi 2009;6(1):164-176. Çakırer N, Çalışkan Z. Nevşehir İli Ağıllı Köyünde Gebelik, Doğum ve Lohusalığa İlişkin
Geleneksel İnanç ve Uygulamalar. TAF Preventive Medicine Bulletin 2010; 9:343-
348. Çalışkan Z, Bayat M. Annelerin Bebek Bakımı Uygulamaları ve Etkileyen Faktörler: Bir
Kapadokya Örneği. Anadolu Hemşirelik ve Sağlık Bilimleri Dergisi 2011;14(2). Çetinkaya A, Özmen D, Cambaz S. Manisa’da Çocuğu Olan 15-49 Yaş Kadınların Doğum
Sonu Dönemde Yeni doğan Sağlığı İle İlgili Geleneksel Uygulamaları. Cumhuriyet
Üniversitesi Hemşirelik Yüksek okulu Dergisi 2008;12(2): 39-46.

90 Selma Nama Geçkil E, Şahin T, Ege E. Traditional Postpartum Practices of Women and Infants and the
Factors Influencing Such Practices in South Eastern Turkey. Midwifery
2009;25(1):62-71. Özsoy SA, Katabi V. A Comparison of Traditional Practices Used in Pregnancy, Labour
and The Postpartum Period Among Women in Turkey and Iran. Midwifery 2008; 24:
291-300. Özyazıcıoğlu N, Polat S. 12 aylıkÇocuğu Olan Annelerin Çocuk Bakımına İlişkin Başvur-
dukları Geleneksel Uygulamalar. Atatürk Üniversitesi Hemşirelik Yüksekokulu
Dergisi 2005; 8: 63-71 The Free Dictionary By Farlex. [İnternet]. [ErişimTarihi: 04.04.2017]. Erişim adresi:
http://www.thefreedictionary.com/Encyclopedia Uğurlu SE. Ödemişte Bulunan Annelerin Bebek Bakımında Uyguladıkları Geleneksel
Yöntemlerin İncelenmesi. Gümüşhane Üniversitesi Sağlık Bilimleri Dergisi 2013; 2(3). Türkiye Nüfus ve Sağlık Araştırması TNSA 2008 [İnternet dokumanı]. [ ErişimTarihi:
04.04.2017]. ErişimAdresi: http://www.hips.hacettepe.edu.tr/tnsa2008/data/TNSA- 2008_ana_Rapor-tr.pdf
Türkiye Nüfus ve Sağlık Araştırması 2013 [İnternet dokumanı]. [ ErişimTarihi: 04.04.2017]. Erişim Adresi: http://www.hips.hacettepe.edu.tr/TNSA_2013_ana_rapor.pdf
Türkiye İstatistik Kurumu 2012 [İnternet doküman]. [ErişimTarihi: 04.04.2017]. Erişim Adresi: http://www.tuik.gov.tr/UstMenu.do?metod=temelist
Yalçın H, Koçak N. Fonksiyonel Olmayan İnanç ve Uygulamalar Tutum Ölçeğinin
Geçerlik ve Güvenirlik Çalışması. IJSES 2012; 2 (2):157-163.

Evaluation of Views of Views on Traditional Applications …… 91
Summary
Evaluation of Views of Views on Traditional Applications after Mother
Breast Care
Selma Nama
IMBL University, Russian Federation
This research; It was done in a descriptive manner with the aim of evaluating the traditional
per- spective view of the mother and her newborn during the postnatal period.
The state of the research was created in Istanbul by taking into account the socio-economic
characteristics of the state hospital. A sampling group was chosen from all the pulexes
registered at the hospital to represent the universe. The sample of the study consisted of 430
lohus. In gathering the data; "Non-Functional Beliefs and Applications Scale" developed by
Yalçın and "Questionnaire on Socio-demographic Characteristics of Lohusalar" and
"Method of Non-Functional Beliefs and Practices" were used for the socio-demographic
characteristics of the puerperies, the data were analyzed in the SPSS package program and
the significance level was accepted as p <0.05. Number and percentage distributions,
variance analysis, t-test and correlation test were applied in the analyzes.
Mean scores of non-functional applications subscales of the anchors; 84.55 ± 14.00 for the
pregnancy, 31.12 ± 5.27 for the birth, 30.41 ± 6.24 for the postpartum, 65.13 ± 13.29 for
the baby care and 211.23 ± 33.94 for the scale total score.
It was determined that there was no tendency towards non-functional traditional practices
and the level of knowledge was at a good level according to the scale total point average of
the subjects. It was determined that the socio-demographic characteristics of the husbands
and spouses positively affected the behavioral and knowledge levels towards the non-
functional beliefs and practices.
Keywords: Mother, Postpartum Care, Traditional Practices, knowledge levels

Khazar Journal of Humanities and Social
Sciences © Khazar University Press 2017
DOI: 10.5782/kjhss.2017.92.102
Organizational Commitment as a Predictor of Job Life Quality
Nuriye Celmece
Near East University, Cyprus
Abdullah Ishiklar
Bursa Technical University,Turkey
Mehmet Macar
South Russian University, Russian Federation
Tayfur Kaya
Erciyez University,Turkey
Introduction
The most crucial factor that makes the organization successful or unsuccessful in
today's contemporary management concept is accepted by many people and
organizations. Man spends a large part of his time in his work and productivity
increases in the job he is happy with. For the work is not only an inevitable
necessity for man, but also a social and independent character that frees man from
the captivity of nature (Erdem, 2010). The job life that begins with the pacing on
the individual's job life and ends with the retirement period is very important in
terms of providing a certain status, role, social security and economic power within
the society in the life process of the person. In this respect, job life affects the social
life as well as having a decisive role on individuals' values, attitudes and behaviors
(Sezici, 2014).
Job life quality (Martel and Dupuis, 2006), which emphasizes the human
dimension of work by focusing on the quality of the relationship between the
worker and the work environment is an important management process that
includes the factors that directly affect the efficiency and productivity of the staff.
In order to improve the quality of job life, there should be more integrative studies
done (Elmas and Demir, 2014). Studies have found that there is not a full
compromise in these definitions, with a large number of recognitions related to the
quality of job life (Campos and Souza, 2006). Chan and Wyatt (2007) describe the
92

Organizational Commitment as a Predictor of Job Life Quality 93 quality of job life; Sirgy, Efraty, Siegel and Lee (2001) defined the workplace
environment and the appropriate working conditions in which employees are
encouraged and supported by the provision of rewards, job security and
development opportunities, while Sirgy, Efraty, Siegel and Lee (2001) describe the
need to meet various needs through resources, activities and outputs they have
defined it as occupational satisfaction.
There are two vital theoretical approaches to research on job life quality. These are
the elimination of needs and the spreading effect. The approach to addressing needs
is based on the model of meeting the needs developed by Maslow. According to
this approach, people have the basic needs that they need to be fulfilled through
work, and the employees are satisfied with the work they are doing to the extent
that they meet their needs. The diffusion effect approach is based on the
assumption that satisfaction in one area of life can affect satisfaction in other areas
of life. Horizontal directional spreading may affect job satisfaction to family life
satisfaction. Vertical spreading suggests that general life satisfaction involves and
influences the level of satisfaction in hierarchically lower-level family, leisure,
health, financial and other areas (Chan and Wyatt, 2007).
The qualities of workmanship, organizational commitment (Erdem, 2010; Farid,
Izadi, Ismail and Alipour, 2014), leadership (Çelmeçe and Işıklar, 2015),
democratization of work, industrial democracy, humanization of work, workplace
democracy and participatory work (Saklani, 2004) (Gillet, Foukuereau, Bonnoud-
Angiagnac, Mokounkolo and Colombat, 2013), motivation (Sword and Partridge,
2012), health and wellbeing (Rathi, 2009), productivity (Nayeri, Saleh and
Noghabi, 2011) and the concept.
In many researches of these researchers; (Lee, Singhapakdi and Sirgy 2007; Sirgy,
Reilly, Wu and Efraty, 2008) it was all pointed out. In addition, there is a positive
relationship between job quality and organizational commitment and high
organizational commitment.
Organizational commitment generally refers to internalizing organizational com-
mitment, organizational goals and objectives (Valetine, Godkin and Lucero, 2002),
and organizational commitment, in general, while researchers have examined dif-
ferent loyalty definitions within the framework of different opinion lines (Meydan,
BasımveÇetin, 2011) (Efeoğlu, 2006; Guatam, Van Dick and Wagner, 2004).
It is the levelling of organizational commitment by Allen and Meyer (Meydan,
Basım and Çetin, 2011), which is generally accepted, as well as different
classifications related to organizational commitment. Allen and Meyer (1991)
organizational commitment; emotional commitment, continuity and normative

94 Nuriye Celmece, Abdullah Ishiklar, Mehmet Macar,Tayfur Kaya commitment in three dimensions. Emotional commitment is defined as considering
the negativity of the employees who work in the business emotionally and wanting
to remain in the organization with their own preferences, continuity, cost due to the
separation of the employees from the organization and continuing to work as a
necessity. Normative commitment is expressed as employees' sense of duty as a
moral duty and they believe that they should not leave the organization (Allen and
Meyer, 1993). The common connection between these three forms of emotion
(emotional, continuing, and normative) reflects a psychological condition that
affects employees' decisions to connect with the organization and decide whether
their association with the organization will continue or not. (Allen and Meyer,
1993; Guatam, Van Dick and Wagner, David, Stanley and Herscovitch, 2002)
Organizational commitment is believed that it has a positive impression on
organizational performance, which is the determinant of organizational
performance and employee productivity. It is argued that organizational
commitment reduces the adverse consequences such as; late coming to work,
absenteeism and job separation, and also improves the product or service positively
and increases the quality of job life. (Meyer and Allen, 1997; Meyer, Allen and
Smith, 1993; Wyatt, 2007, Rethinam and Maimunah, 2008, Uyguç and Çimrin,
2004).
In This research it is aimed to determine relationship between job life quality and
organiztional commitment of the health workers. In accordance with this aim;
1- Isthere any relationhip between job life quality and organizational commitment of the health workers?
2- Is the job life quality of health workers predictor of their
organizational commitment? Method
The research was conducted in a relational screening model to determine the
relationship between health care workers' quality of life and organizational
commitment. The study universe of the study consists of health workers working in
Gazi Osman Paşa University Hospital. The sample of the study consists of 160
health workers determined by random sampling method from the employees.
Scaling Tools:
1. Job Life Quality Scale: The Work Quality of Life Scale was developed in 2001 by Sirgy, Efraty, Siegel
and Lee. The scale consists of 16 articles related to the satisfaction of 16 needs. All
of the articles that make up the scale are intended to measure the quality of work in
the workplace. The first three articles of the scale (1, 2, 3) measure the satisfaction

Organizational Commitment as a Predictor of Job Life Quality 95 of your health and safety needs. Articles 4, 5 and 6 are intended to measure the
satisfaction of family and economic needs. Articles 7 and 8 are aiming to measure
the satisfaction of social needs. Sections 9 and 10 are aiming to measure the level
of satisfaction with respect. Articles 11 and 12 measure the extent to which self-
realization needs are satisfied. Articles 13 and 14 measure the extent to which
information needs are satisfied. Questions 15 and 16 are intended to measure the
satisfaction level of aesthetic needs. Confirmatory factor analysis was conducted by Sirgy, Efraty, Siegel and Lee
(2001) to test the validity of the original scale and it was found that 16 articles
came from seven factors and these seven factors came from a single factor. The
Cronbach Alpha reliability coefficient of the Job life Quality Scale was 0.78.
2. Organizational Attitude Scale: Table 1. Correlation values between the level of work quality of life and organizational
commitment of health workers
1 2 3 4 5 6 7 8 9 10
1.Health and Trust - Need
2.Domestic and .43** -
Economical Needs
3.Social Need .47** .70** -
4.Respect Need .39** .68** .77** -
5.Self Realization Need .53** .53** .71** .64** -
6.Information Need .45** .49** .70** .61** .87** -
7.Aesthetic Need .45** .49** .47** .47** .31** .36** -
8.Emotional .08 .08 -.04 .01 .07 .10 .07 - Commitment
9.Continuance .33** .33** .34** .34** .42** .44** .21** .12 -
Commitment
10.Normative .47** .44** .50** .48** .55* .48** .33** .12 .63** - Commitment "Organizational Commitment Scale" developed by Meyer and Allen (1991) and
adapted to Turkish by Wasti (2000) was used. This scale, which was formed in the
form of a five-point Likert-type grading format and scored in the form of "never
agree" (1) and "completely agree" (5), consists of 18 articles in three dimensions
(emotional commitment, normative commitment and continuity). The results of
Wasti's (2000) analysis to test the validity of the scale revealed that the scale
verified that the Turkish form was in 3D and that the factor loadings of the scale
articles varied between 20 and 72. Also, reliability coefficients are for emotional

96 Nuriye Celmece, Abdullah Ishiklar, Mehmet Macar,Tayfur Kaya commitment 78, for normative commitment 75 and laslty for continuity of
commitment 58 (Wasti, 2000).
Findings
Findings related to the correlations between the levels of job quality of life of
health workers and organizational commitment given in Table 1.
When Table 1 was examined it was determined that there was no meaningful
relationship between the sub dimension of job life quality health and trust sub
dimension the organizational commitment’s emotional part r=.08 (p > .05), but
there was a positive and meaningful relationship between continuance commitment
r=.33 (p<.01) and normative commitment r=.47 (p<.01). There was no meaningful
relationship found between domestic and economical needs and from the sub
dimension of organizational commitment the emotional part r=.08 (p > .05), but
there was a positive and meaningful relationship between continuance commitment
r=.33 (p<.01) and normative commitment r=.44 (p<.01). There was no meaningful
relationship between the sub dimension of social need and sub dimension of
organizational commitment’s emotional part r=-.04 (p > .05), but there was a
positive and meaningful relationship between continuance commitment r=.34
(p<.01) and normative commitment r=.50 (p<.01). There was no meaningful
relationship between respect need sub dimension and the sub dimension of
organizational commitment’s emotional part r=.01 (p > .05), but there was a
positive and meaningful relationship between continuance commitment r=.34
(p<.01) and normative commitment r=.48 (p<.01). There was no meaningful
relationship between self-realization and organizational commitment’s emotional
part r=.07 (p > .05), but there was a positive and meaningful relationship between
continuance commitment r=.42 (p<.01) and normative commitment r=.55 (p<.01).
There was no meaningful relationship between information need sub dimension
and from the sub dimension of organizational commitment’s emotional part r=.10
(p > .05), but there was a positive and meaningful relationship between
continuance commitment and r=.44 (p<.01) normative commitment r=.48 (p<.01).
There was no meaningful relationship between aesthetic need sub dimension and
from the sub dimension of organizational commitment’s emotional part r=.07 (p > .05), but there was a positive and meaningful relationship between continuance commitment r=.21 (p<.01) and normative commitment r=.33 (p<.01).
In the research there was a multiple regression analysis done between the sub
dimensions of organizational commitment scale and job life quality sub
dimensions, and the results given in the Table2, 3 and 4.

Organizational Commitment as a Predictor of Job Life Quality 97 Multiple regression analysis results related to the prediction of emotional
commitment given in the Table 2.
Table2. Regression Analysis Results Related to Prediction of Emotional Commitment
Emotional Commitment B Sh Β t P
Stable 21.427 3.900 - 5.421 .001
Health and Trust Need .079 .279 .029 .276 .776
Domestic and Economical Needs .297 .161 .215 1.837 .066
Social Need -.817 .312 -.404 -2.514 .010
Respect Need -.037 .243 -.021 -.157 .871
Self Realization Need .155 .381 .071 .417 .673
Information Need .387 .261 .233 1.517 .141
Aesthetic Need .011 .131 .007 .087 .931
R=.276, R2=.77
When the t-test results on the significance of the regression coefficients are
examined, it can be said that the organizational commitment of the social need
dimension is a significant predictor of the emotional commitment dimension. When
Table 2 is examined, regression analysis was conducted to determine the extent to
which organizational commitment of sub-dimensions of work quality qualities
predicted emotional commitment sub-dimension. As a result of the regression
analysis, the organizational commitment of organizational commitment sub-
dimensions (R = .276, R2 = .77) It can be said that it has a power of 77.
The multiple directional regression analysis results related to prediction of continuance commitment given in the Table 3.
Table 3. Regression Analysis Results Related to Prediction of
Continuance Commitment Continuance Commitment B Sh Β t P
Stable 17.47 3.327 - 5.445 .001
Health and Trust Need .341 .273 .131 1.457 .137
Domestic and Economical Needs .112 .131 .071 .718 .467
Social Need -.122 .261 -.070 -.467 .633
Respect Need .137 .202 .081 .689 .477
Self Realization Need .300 .317 .141 .927 .348
Information Need .373 .211 .201 1.327 .145
Aesthetic Need -.006 .114 -.007 -.070 .937 R=.48, R2=.24

98 Nuriye Celmece, Abdullah Ishiklar, Mehmet Macar,Tayfur Kaya As a result of the regression analysis, it was found that the organizational
commitment of the organizational commitment to organizational commitment was
about 24% (R = .48, R2 = .24), and that the organizational commitment of the sub-
dimensions of the work quality was not predictive of the continuity commitment
subscale it can be said that it has the power of explanation. As a result of the
regression analysis, it can be said that the subscales of job quality are not a
significant predictor of the organizational commitment continuity dependency
subscale.
The multiple directional regression analysis results related to prediction of
normative commitment given in the Table4.
Table 4. Regression Analysis Results Related to Prediction of Normative Commitment
Normative Commitment B Sh Β t P
Stable 3.507 2.387 - 1.442 .147
Health and Trust Need .421 .181 .221 2.458 .017
Domestic and Economical Needs .061 .097 .071 .637 .514
Social Need .057 .197 .041 .310 .761
Respect Need .164 .150 .128 1.171 .261
Self Realization Need .601 .231 .357 2.611 .010
Information Need -.084 .167 -.071 -.537 .574
Aesthetic Need .063 .087 .061 .768 .421
R=.632, R2=.42
When it is examined in terms of normative commitment’s sub-dimension, it can be
said that business quality of life sub-dimensions have an explanation strength about
42% on organizational commitment normative commitment sub-dimension (R =
.632; R2 = .42). As a result of the multiple regression analysis, it was found that the
dimensions of health and confidence and the need for self-realization were
significant predictors of the normative commitment sub-dimension of the
organizational commitment of the sub-dimensions of family and economic needs,
social need, respect, it can be said that organizational commitment is not a specific
predictor of normative commitment’s sub-dimension.
Discussion and comments
There was a meaningful relationship between the perceived quality of job life and organizational commitment of health workers in the study. The quality of job life

Organizational Commitment as a Predictor of Job Life Quality 99 of health workers is predicting organizational commitment. Again, there were low,
medium and high level relationships between sub dimensions of job life quality and
sub dimensions of organizational commitment. All of the subscales of job life
quality together account for 77% of the emotional subscale of organizational
commitment and 24% of the continuity dimension and 42% of the normative
dimension.
It has also been found that the quality of job life is predictive of organizational
commitment (Kanten and Sadullah, 2012; Koonmee and Virakul, 2007; Lee et al.,
2007). Koonmee, Singhapakdi, Virakul and Lee (2010) found that 514 managers
from different sectors surveyed executives found that quality of job life affects job
satisfaction, organizational commitment and team spirit positively.
The research conducted by Yalçın (2014) on teachers shows that the quality of
work quality has an important influence on the organizational commitment of
teachers. In a study by Radja, Tawe, Rijal, and Tiro (2013), it was concluded that a
positive relationship between job quality of life and organizational commitment
was a significant predictor of organizational commitment of work quality. In a
study conducted by Birjandi, Birjandi and Ataei (2013), there is a significant
positive relationship between job quality and organizational commitment, job
quality sub-dimensions, an appropriate and fair wage, safe and hygienic working
conditions, social union and social integration, developmental sub-dimensions and
organizational commitment were found to be positively correlated in the positive
direction. In the study conducted by Permapuron, Mamun and Saufi (2013), it is
concluded that there is a significant relationship between work quality of life and
emotional commitment, that high quality of work has a strong emotional
commitment to its institutions and that work quality has a positive effect on the
work attitudes of employees. Researchers’ these findings support the result of our
research.
As it is stated in the researches on the factors affecting the quality of life of the
employees, the quality of life, work environment; wages, earnings, working
environment and conditions, business management, technology used at work,
social security and continuing education. Work quality of life, which is influenced
by objective working conditions, also affects employees' organizational
commitment and as well as the productivity.
Whatever the field of work, the most vital factor of an organization is "human".
Improving working conditions and measures to enhance the quality of work are at
the basic of increasing employee productivity and organizational effectiveness. The
effectiveness of the organization also necessitates the organizational commitment

100 Nuriye Celmece, Abdullah Ishiklar, Mehmet Macar,Tayfur Kaya of the employee, when the working conditions of the worker are developed then the
quality of job life increases.
References and notes: Allen, N.J.,& Meyer, J.P. (1991). A Three-Component conceptualization of organizational
commitment.Human Resource Management Review,1 (1), 61-89. Allen, N.J.,& Meyer, J.P. (1993). Commitment to Organizations and Occupations:
Extension and Test of a Three-Component Conceptualization. Journal of
AppliedPsychology,78(4), 538-551. Birjandi, M., Birjandi, H., &Ataei, M. (2013). The relationship between the quality of job
life and organizational commitment of the employees of Darab cement company:
Case study In Iran. International Journal of Economics, Business and FinanceVol, 1.
Campos, L. C. A., & Souza, A. M. (2006). Study of the Walton’s Criteria of quality of
working life using multivariate analysis in a military organization, Third International Conference on Production Research, 30 July–2 August 2006,
Curitiba/PR-Brazil. Chan, K. W., & Wyatt, T. A. (2007). Quality of Job life: A Study of Employees in
Shanghai, China, Asia Pacific Business Review, 13(4), 501–517. Çelmeçe, N. veIşıklar, A. (2015). Perceived leadership and job life quality relationship in
Helth workers. Academic Social Researches Journal, 3(20), 202-216. Elma, C. ve K. Demir (Ed). (2014). Contemporary approaches in management:
Applications and prblems (4th
Press). Ankara: Anı Publishing. Erdem, M. (2010). According to Teacher perceptions relationship of job life quality and
organizational commitment in high schools. Education Management in Theory
andApplication, 16(4), 511- 536. Farid, H., Izadi, Z., Ismail, I. A., &Alipour, F. (2014). Relationship between quality of job
life and organizational commitment among lecturers in aMalaysian public research
university. The Social Science Journal, Article in Press. 1-8. Gillet, N., Fouquereaua, E., Bonnaud-Antignac, A., Mokounkoloa, R., &Colombat, P.
(2013). The mediating role of organizational justice in the relationship between
transformational leadership and nurses’ quality of job life: A cross-sectional
questionnaire survey. International Journal of Nursing Studies, 50(10), 1359–
1367. Guatam, T., Van Dick, R.,& Wagner, U. (2004). Organizational ıdentification and
organizational commitment: Distinct aspects of two related concepts. Asian
Journal of Social Psychology, 7(3), 301-315. Kanten, S., &Sadullah, Ö. (2012). An empirical research on relationship quality of job life
and work engagement.Procedia - Social and Behavioral Sciences, 62, 360 – 366. Kılıç, R. veKeklik, B.(2012). A research conducted on job life quality of health workers
and its effect on their motivation. Afyon Kocatepe University, İİBF Journal,
XIV(II), 147-160.

Organizational Commitment as a Predictor of Job Life Quality 101 Koonmee, K., Singhapakdi, A., Virakul, B., ve Lee, D. (2010). Ethics institutionalization,
quality of job life, and employee job-related outcomes: A survey of human
resource managers in Thailand. Journal of Business Research, 63, 20–26. Koonmee, K., &Vırakul, B. (2007). Ethics, quality of job life, and employee jobrelated
outcomes: a survey of hr and marketing managers in thai business. Presented at the
2007 ISQOLS Conference (From QOL Concepts to QOL Performance Measures),
December 6-9, San Diego Marriott Mission Valley, San Diego, California. Lee, D.J., Singhapakdi, A.&Sirgy, M. J. (2007). Further validation of a need-based Quality
of Job life (QWL) Measure: Evidence from marketing practitioners. AppliedResearch Quality of Life, 2, 273-287.
Martel, J. P., & Dupuis, G. (2006). Quality of job life: Theoretical and methodological
problems, and presentation of a new model and measuring instrument. SocialIndicators Research, 77, 333-368.
Meydan, C.H., Basım, H.N. ve Çetin, F. (2011). Organizational Justive Perception and
Effect of the Organizational Commitment on the Exhaustion: A research on
Turkish Publica Sector. Turkish World Social Sciences Journal, 57, 175-200. Meyer, J.P. & Allen, N. J. (1991). A Three-Component conceptualization of organizational
commitment. Human Resource Management Review, 1(1), 61-89. Meyer, J. P., Allen, N. J. & Smith, C.A. (1993). Commitment to organizations and
occupations: extension and test of a three-component conceptualization. Journal ofApplied Psychology. 78(4), 538–551.
Meyer, J.P., David, J., Stanley, L. &Herscovitch –Laryssa, T. (2002). Affective,
continuance, and normative commitment to the organization: A Meta-analysis of
antecedents, correlates, and consequences. Journal of Vocational Behavior, 61(1),
20-52.
Nayeri, N. D., Salehi, T., &NoghabI, A. A. A. (2011). Quality of job life and productivity
among Iranian nurses. Contemporary Nurse, 39(1), 106–118. Permarupan, P. Y., Al-Mamun, A., &Saufi, R. A. (2013). Quality of job life on employee’s
job Involvement and affective commitment between the public and private sector
in Malaysia. Asian Social Science, 9(7), 268. Rathi, N. (2009). Relationship of quality of job life with employees’ psychological well-
Radja,
being. International Journal of Business Insights & Transformation,OctoberMarch, 53-60.
J., Tawe, A., Rıjal, S., &Tiro, M.A. (2013). Effect quality of job life and organizational commitment towards work satisfaction ınıncreasing public service
performance. Public Policy and Administration Research, 3(12), 38-45. Rethinam G. S. ve Maimunah I. (2008). Constructs of quality of job life: A perspective of
information and technology professionals. European Journal of Social
Sciences,7(1), 58-70. Saklani, D. R. (2004). Quality of Job life in the Indian Context: An Empirical Investigation.
Decision, 31(2), 101-134. Sezici, E. (2014). Workin life quality, deviant attitude in workolace and quitting from job
tendency relationship. Dumlupınar University Social Sciences Journal,41, 235-
246.

102 Nuriye Celmece, Abdullah Ishiklar, Mehmet Macar,Tayfur Kaya Sirgy, M. J., Efraty, D., Siegel, P & Lee, D. (2001). A new measure of quality of job life
(QWL) based on need satisfaction and spillover theories. Social Indicators
Research, 55, 241-302. Sirgy, M. J., Reilly, N., Wu, J., &Efraty, D. (2008). A Work-Life identity model of well-
being: towards a research agenda linking Quality-of-Work-Life (QWL) programs
with quality of life (QOL). Applied Research in Quality of Life, 3(3), 181-202. Uyguç, N. and Çımrın, D. (2004). DEÜ According to Research and Application Hospital
factors that affect on the organizational commitment and quitting from job
intentions of the labarotory workers. D.E.Ü.İ.B.F. Journal, 19 (1), 91–99. Wasti, S. A. (2000). Meyer and Allen’s 3D Organizational Commitment Scale’s Reliablity
and Validity Analysis. 8th
National Management and Organization Congress Introductions Book, Nevşehir, 401-410.
Yalçın, S. (2014). Examination of the relationship between leadership styles of
schoolmanagers and teachers’ job life quality and organizational commitment.
Doctorate Thesis. Atatürk University Education Sciences Institute.
Summary
Organizational Commitment as a Predictor of Job Life Quality
Nuriye Celmece Near East University, Cyprus
Abdullah Ishiklar Bursa Technical University,Turkey
Mehmet Macar South Russian University, Russian Federation
Tayfur Kaya Erciyez University,Turkey
Today, importance of topics such as quality of working life in businesses and organizational
commitment has been increasing. It has been concluded in many research that quality of working life
at business is effective in increasing the organizational commitment of human resources. The research
was conducted to identify the relationship between health personnel’s quality of working life and
organizational commitment levels. 160 health personnel working at Gazi Osman Paşa University
Hospital participated in the research. It was concluded that there is a positive and significant
relationship among the quality of working life subdimensions and between them and the
organizational commitment subdimensions and that quality of working life is an important predictor
of organizational commitment. Organizational commitment levels increase as health personnel’s
quality of working life becomes higher.
Keywords: Work, quality of working life, organizational commitment, health personnel’s

Khazar Journal of Humanities and Social Sciences © Khazar University Press 2017
DOI: 10.5782/kjhss.2017.103.112
Relationship between organizational cynicism and job
satisfaction in Health Workers
Selma Soyuk
Istanbul University, Turkey
Murat Iskender Aktash
Yakindogu University, Turkey
Oguz Ozyaral
Istanbul Rumeli University, Turkey
Introduction
Organizational cynicism is that a worker despises the management and accuses it with selfishness, contemns and humiliates his colleagues, adopts an extremely adverse attitude toward the organization, and feels suspicion/distrust against the
organization. Job satisfaction on the other hand is the sense of satisfaction workers get from their job when a job and the desires and expectations of the people working at that job match each other. Job satisfaction may lead to several organizational consequences that influence productivity and business relations, just
likecynicism.
However, there are no studies injob satisfaction literature that would indicate that job satisfaction has an influence on organizational cynicism, which is a topic that has begun to be studied in recent times. For this reason, the purpose of this study is to determine the levels of organizational cynicism and job satisfaction of health workers, to reveal the relationship between cynicism and job satisfaction, and to determine the differences between socio-demographic characteristics on one hand and cynicism and job satisfaction on the other.
Wit studies up to the present day, field researchers have made attempts to determine certain aspects of these topics, such as the relationship between cynicismand job satisfactionby Nafei (2013) and Arabacı (2010) or the relationship between job satisfactionand performance by Iaffaldanoand Muchinsky (1985) and Judge et al.
103

104 Selma Soyuk, Murat Iskender Aktash, Oguz Ozyaral
(2009) (2,10,12,17). Yet, studies that examine both variables in the field of health services have recently started to be studied to very limited extent within scope of postgraduate theses and scientific research. This increases the importance of research in terms of the contribution it will make to the scientific field.
Organizational cynicism
Cynical is the word used to define persons who believe that people care only for their own interest and therefore think that everybody is self-seeking, and cynicism is the word used to describe the thought of this concept (13).Cynicism is an individual’s ignorance of principles like faith, honesty, truthfulness, and sincerity for the sake of his/her own individual interests (13). Cynicism as a concept has close meanings to words such as scepticism, incredulity, mistrust, disbelief, pessimism, and negativity. But when we look at the modern interpretation of the term, it is seen that its meaning as a very captious, finical and overcritical person is predominant (7,11).
Many authors have defined cynicism as “distrust in the intentions of other people and belief that their counterparties do not reflect their real character”. Cynicismis not only an attitude that affects society in general, but it is also commonly seen in organizations (13). Dean et al. defined organizational cynicism, which they
regarded as a concept that nourished by diverse disciplines, as an individual’s adverse attitude towards the organization where that individual is employed (6). Organizational cynicismis that a worker despises the management in general and
accuses it with selfishness, contemns and humiliates his colleagues, adopts an extremely adverse attitude toward the organization, and a feeling of suspicion and distrust shared by many persons against the organization(4). Organizational cynicism is an attitude that a worker develops towards the organizations or an
object that is relevant for that organization (20). Organizational cynicismrefers to the negative feelings and critical and negative behaviourof a person against the organization at which the person is employed (19).
According to Dean et al., organizational cynicism comprises three sub-dimensions (6);
Cognitive dimension:a belief that the organization is not honest, Affective dimension:an adverse (negative) feeling towards the
organization, Behavioural dimension: tendency to exhibit degrading and critical
behaviours towards the organization in line with these feelings and beliefs. While the cognitive dimension of organizational cynicism expresses the idea that an organization is devoid of honesty and transparency, the affective dimension
.

Relationship between organizational cynicism ….. 105
refers to emotions and emotional reactions, and the behavioural dimension refers to observable negative behaviours (18).
Job Satisfaction
Job satisfaction is a concept, which organizations have started to attach importance to since the early 1900s, and has ever since developed into one of the most studied topics in the field of human resources. Different definitions of this term can be found in literature. According to Hoppock (1935), who was the first to address the issue, job satisfaction means that workers are satisfied from their job in the overall light of psychological, physical, and environmental events. According to different perspectives in literature, job satisfactionis determined by an individual’s satisfaction of external factors such as the internal and physical environment, financial opportunities, promotion opportunities, interaction with executives and colleagues, and company policies etc. including the extent to which the individual’s need for achievement is fulfilled, providing opportunities for personal development, having a meaning for the individual, the individual identifying himself with the organization, and the feeling of autonomy (9).Emotional pleasure is defined as the happiness that is brought by the positive and negative attitudes of the employees towards the work, the material interests obtained from the work, the work colleagues with whom the employees enjoy working together, and the feeling of achievement brought along by creating something (16,23).
Material and method
The organizational cynicism scale and the Minnesotajob satisfactionscale have
been used in this study. The universe of research comprised hospitals in the provinces of Istanbul and Amasya. Five hospitals were selected from both
provinces by convenience sampling. A total of 875 questionnaires were distributed, while 179 questionnaires had to be excluded from the study due to reasons such as
the staff being on leave, the questionnaire being filled out wrong or incomplete, or the staff refusing to participate in the study. Hence, the study was carried out with
696 persons who agreed to take part in the study. The SPSS 21.0 statistics package program was used to perform statistical analyses when evaluating the findings of
the study. Along with methods of descriptive statistics (frequency, percentage, mean value, standard deviation), the Kolmogorov – Smirnov distribution test was
employed to analyse normal distribution when evaluating the study data. In case of two groups during comparison of quantitative data, independent samples t-test was
employed to perform a comparison of parameters between groups. In the event of more than two groups during comparison of quantitative data, one-way ANOVA
test was used toperform a comparison of parameters between groups, whereas Tukey’s test was employed to determine the group that caused the difference.
Pearson correlation analysis was performed to identify the inter-scale relations.

106 Selma Soyuk, Murat Iskender Aktash, Oguz Ozyaral
Besides, Linear Regression analysis was carried out to analyse the impact of independent variables on the dependent variable (marriage satisfaction).The results have been evaluated at 95% confidence interval, with a significance level of p<0,05.
Data Collection Tools;
Organizational Cynicism Scale
This scale has been developed by Brandeset al. (1999) (4). It comprises three sub-
dimensions, namely cognitive, affective and behavioural, and 13 items. The cognitive dimension comprises five items, the affective dimension four items, and the behavioural dimension four items. Brandeset al. (1999) calculated that the factor
loads of items included in the cognitive dimension ranged between 0,63 and 0,81; while the factor loads of items included in the affective dimension range between 0,75
and 0,80; and the factor loads of items included in thebehavioural dimension range between 0,54 and 0,80. In addition, the Cronbach Alpha Internal Consistency
Coefficients of the dimensions have been calculated to be 0,86 and 0,78.
Job Satisfaction Scale
TheMinnesota job satisfactionscale was developed in 1967 by Weiss, Dawis, England and Lofguist(3,22). In 1985, the scale was translated into Turkish by Baycan. The
scale allows to determine the score of overall satisfaction as well asintrinsicand extrinsic satisfaction.The Cronbach α values, which are the internal reliability coefficients for the scales used in this study, show that the scales of overall job
satisfaction= 0,87, intrinsicjob satisfaction=0,87, and extrinsic job satisfaction= 0,88 are all reliable.
Findings The socio-demographic characteristics of total 696 health workers who agreed to participate in the study are shown in Table 1. Accordingly, 43% of the workers are a midwife/nurse, and 17,3% are a physician.
Table 1. Socio-demographic Characteristics
N %
Physician 120 17,3
Nurse-Midwife 299 43,0
Health officer 78 11,2
Executive 10 1,4
General administrative 50 7,2
services
Auxiliary services 55 7,9
Other 83 11,9
Total 696 100

Relationship between organizational cynicism ….. 107
If we look at the organizational cynicism scores of health worker, it is seen that their “cognitive dimension” average is (3,101 ± 0,905), while their “affective dimension” average and “behavioural dimension” average are (2,629 ± 1,159) and (2,832 ± 0,952), respectively (Table-2).
Table 2. Workers’ Average Scores of Organizational Cynicism
N Ort Ss Min. Max.
Cognitive dimension 696 3,101 0,905 1 5
Affective dimension 696 2,629 1,159 1 5
Behavioural dimension 696 2,832 0,952 1 5
Scale total of 696 2,854 0,824 1 5
organizational cynicism
The job satisfaction scores of health workers participating in the study are given in Table 3. If we look at that table, it is seen that the health workers’ “overall job
satisfaction” average is (3,097 ± 0,664); while their “intrinsicsatisfaction” average and “extrinsic satisfaction” average are (3,245 ± 0,677) and (2,874 ± 0,766), respectively.
Table 3. Health Workers’ Average Scores of Job Satisfaction
N Ort Ss Min. Max.
Job 696 3,097 0,664 1 4,75
satisfaction
Intrinsic 696 3,245 0,677 1 4,83
satisfaction
Extrinsic 696 2,874 0,766 1 4,75
Satisfaction
The correlation analysis performed to determine the relation between the scale total of organizational cynicismand job satisfaction revealed a negatively significant relation between the scores, namely 60,3% (r=-0,603; p=0,000<0,05). Accordingly, the lower the job satisfaction is, the higher becomes theorganizational cynicism. (Table-4)

108 Selma Soyuk, Murat Iskender Aktash, Oguz Ozyaral
Table 4. Relationship between the Job Satisfactionand Organizational Cynicism Scales
Cognitive Affective Behavioural
Scale total of
organizational
dimension dimension dimension
cynicism
Job r -0,525 -0,584 -0,354 -0,603
p 0,000 0,000 0,000 0,000
satisfaction
N 696 696 696 696
Intrinsic r -0,436 -0,508 -0,314 -0,519
p 0,000 0,000 0,000 0,000
satisfaction
N 696 696 696 696
Extrinsic r -0,562 -0,593 -0,351 -0,619
p 0,000 0,000 0,000 0,000
satisfaction
N 696 696 696 696
Table 5. Regression Analysis on the Impact on Job Satisfaction by Sub-
Dimensions of the Organizational CynicismScale
Dependent Independent variable ß t p F
Model R2
variable (p)
Constant 4,401 55,377 0,000
Job Cognitive dimension -0,192 -6,927 0,000 146,85 0,000 39%
satisfaction Affective dimension -0,227 -9,845 0,000
Behavioural dimension -0,039 -1,621 0,106
Constant 4,368 49,891 0,000
Intrinsic Cognitive dimension -0,144 -4,714 0,000 92,40 0,000 28%
satisfaction Affective dimension -0,211 -8,273 0,000
Behavioural dimension -0,043 -1,630 0,104
Constant 4,450 49,716 0,000
Extrinsic Cognitive dimension -0,264 -8,460 0,000 164,68 0,000 41%
satisfaction Affective dimension -0,253 -9,714 0,000
Behavioural dimension -0,033 -1,206 0,228

Relationship between organizational cynicism ….. 109
Conclusion and Evaluations
696 health workers participated in this study which we carried out to determine the relationship between the job satisfaction, organizational cynicismlevels of health workers and their job satisfaction –cynicism. As result of
the evaluations performed, it has been seen that 43% of the workers (N=299) are a midwife/nurse, 17% are (N=120) a physician, and 1.4% (N=10) are executives. When we look at the health workers’ organizational cynicism scores, it can be said that they are cynical above the average. The workers’ “cognitive dimension”
average is (3,101 ± 0,905), while their “affective dimension” average and “behavioural dimension” average are (2,629 ± 1,159) and (2,832 ± 0,952), respectively.
If we look at the job satisfaction scores of the health workers who participated in the study, it is seen that their “overall job satisfaction” average is (3,097 ± 0,664),
while their “intrinsicsatisfaction” average and “extrinsic satisfaction” average are (3,245 ± 0,677) and (2,874 ± 0,766), respectively. The workers have the lowest
score average in extrinsic job satisfaction. Since extrinsic job satisfaction is influenced by factors related to executives and work environment, it can be said
that the external factors in these organizations is poor. The correlation analysis performed to determine the relation between the scale total of organizational
cynicism and job satisfaction revealed a negatively significant relation between the scores, namely 60,3%(r=-0,603; p=0,000<0,05). Accordingly, the lower the job
satisfaction is, the higher becomes the organizational cynicism. It has been seen that the relationship of the level of job satisfaction with the variables of cognitive
dimension, affective dimension, and behavioural dimension is strong (R2=0,386). Hence, job satisfaction is influential on all three dimensions of cynicism. The level
of health workers’ cognitive dimension decreases their level of job satisfaction (ß=-0,192). The level of health workers’ affective dimension decreases their level of job
satisfaction (ß=-0,227). The level of health workers’ behavioural dimension does not have any influence on their job satisfaction. (p=0.106>0.05).
Since cynicismand job satisfaction lead to several organizational consequences
such as productivity of workers, job continuity, and organization commitment, organizations must seek ways to increase their workers’ job satisfaction and reduce their level of cynicism. It is the executives’ responsibility to increase the extrinsic job satisfaction scores which are particularly dependent on organizational factors.

110 Selma Soyuk, Murat Iskender Aktash, Oguz Ozyaral
References and notes:
Andersson, L. M.,&Bateman, T. S. (1997). Cynicism in the work place: Some causes
and effects. Journal of Organizational Behavior, 449-469. Arabacı, I.B. (2010), “The Effects of Depersonalization and Organizational Cynicism
Levels on The Job satisfaction of Educational Inspectors”, African Journal of Business Management, 4 (13), 2802-2811.
Baycan, A. (1985). An Analysis of Several Aspects of Job Satisfaction Between Diffrent Occupational Groups, Bogaziçi Üniversitesi Yayınlanmamış Yüksek Lisans Tezi, İstanbul.
Brandes, P., Dharwadkar, R., Dean, J. W. (1999). “Does Organizational Cynicism
Matter? Employee and Supervisor Perspectives on Work Outcomes”. The 36th Annual Meeting of The Eastern Academy of Management, Philadelphia, p.150- 153.
Brown, M., Cregan, C. (2008). Organizational change cynicism: The role of employee involvement. Human Resource Management, 47(4), 667-686.
Dean, J.W.,Brandes, P. veDharwadkar, R. (1998), “Organizational Cynicism”, Academy of Management Review, 23(2), 341-352.
Eaton, J. A. (2000). A Social Motivation Approach to Organizational Cynicism.
(Unpublished Doctoral dissertation). Graduate Program in Psychology, York
University, Toronto.
Erdost, E.H.,Karacaoglu, K. veReyhanoglu, M. (2007), “Organizational cynicism
Kavramı ve İlgili Ölçeklerin Türkiye’deki Bir Firmada Test Edilmesi”, 15.
Ulusal Yönetim ve Organizasyon Hackman, J. R. ve Oldham, G. R. (1975), “Development of the job diagnosticsurvey”,
Journal of Applied Psychology, 60(2), 159-170.Kongresi Bildiriler Kitabı, Sakarya Üniversitesi, 514-524.
Graef, M. I., Wells, D. L., Hyland, A. M., Muchinsky, P. M. (1985). Life history antecedents of vocational indecision. Journal of Vocational Behavior, 27(3),
276-297.
Çetin, A. (2012). “İlk ögretim Okullarında Görev Yapan
Helvacı, M. A.,
Ögretmenlerin Organizational cynicism Düzeylerinin Belirlenmesi (Uşak İli
Örnegi)”, Turkish Studies, 7(3), s.1475-1497. Iaffaldano, M.T. ve Muchinsky, P.M. (1985). Job satisfaction and job performance: A
meta-analysis. Psychological bulletin, 97(2), 251. James, M. S. L. (2005). Antecedents and Consequences of Cynicism in Organizations:
An Examination of the Potential positive and negative effects on school systems, The Florida State University, College Of Business.
Judge, T.A., Woolf, E.F., Hurst, C. (2009), “Is Emotional Labor More Difficult For
Some Than For Others? A Multilevel, Experience-Sampling Study”, Personnel Psychology, 62(1), 57–88.
Karacaoglu, K. veİnce, F. (2012), “Brandes, DharwadkarveDean’in (1999)
Organizational cynicism ÖlçegI Türkçe Formunun Geçerlilik ve Güvenilirlik Çalışması: Kayseri Organize Sanayi Bölgesi Örnegi”, Business and Economics
Research Journal, 3(2), 77 – 92. Locke, J. (1976). The Correspondence of John Locke.

Relationship between organizational cynicism ….. 111
Nafei, W. A. (2013). The Effects of
Empirical Study on Teaching
Research, 6(7), p52.
Organizational Cynicism on Job Attitudes an Hospitals in Egypt. International Business
Stanley David J. “Employee Cynicism and Resistance to Organizational Change”, Journal of Business and Psychology, 19:4, 2005, 429-458.
Tagraf, H.,Özkaynar, K., Yıldız, Y., Özkan, M. A. (2014). “Örgütsel Güven Duygusu ile
Organizational cynicism Arasındaki İlişkinin Tespitine Yönelik Nicel Bir
Araştırma”, 2. Örgütsel Davranış Kongresi, Melikşah Üniversitesi, Kayseri, s. 489-497.
Yalçınkaya, A. (2014). “Türkiye’de Organizational cynicism: 2007-2012 Yılları
Arasındaki Çalışmalar Üzerine Bir Degerlendirme”, “İş, Güç” Endüstri İlişkileri ve İnsan Kaynakları Dergisi, 16(3), s.106-130.
Wanous, J. P., Reichers, A. E., & Austin, J. T. (1994, August). ORGANIZATIONAL
CYNICISM: AN INITIAL STUDY. In Academy of Management Proceedings (Vol. 1994, No. 1, pp. 269-273). Academy of Management.
Weiss, D. J., Dawis, R. V. England, GW, Lofquist, LH (1967). Manual for the Minnesota
Satisfaction Questionnaire, 22.
Pettigrew, A. M., Wilson, D., Rosenfeld, R. (1990). Is corporate culture manageable?.
Summary
Relationship between organizational cynicism and job satisfaction in health workers
Selma Soyuk
Istanbul University, Turkey
Murat Iskender Aktash Yakindogu University, Turkey
Oguz Ozyaral
Istanbul Rumeli University, Turkey
Organizational cynicism is that a worker contemns and humiliates his colleagues, and
adopts a sceptical, condescending attitude toward the organization. Job satisfaction is the sense of satisfaction workers get from their job. The purpose of this study is to reveal the
relationship between cynicism and job satisfaction in health workers, and to identify the differences between socio-demographic characteristics and cynicism / job satisfaction.

112 Selma Soyuk, Murat Iskender Aktash, Oguz Ozyaral
Five hospitals were selected from both provinces by convenience sampling. A total of 875
questionnaires were distributed, while 179 questionnaires had to be excluded from the study
due to reasons such as the staff being on leave, the questionnaire being filled out wrong or
incomplete, or the staff refusing to participate in the study. Hence, the study was carried out with 696 persons who agreed to take part in the study. Methods of descriptive statistics
(frequency, %, mean value, standard deviation) as well as the Kolmogorov - Smirnov
distribution test,T-test,ANOVA,Tukey’s test, Pearson Correlation and Linear Regression analyses have been employed to evaluate the findings of the study. It has been seen that health workers have an above average cynical level and job
satisfaction. The “cognitive dimension” average of the workers is (3,101 ± 0,905), while
their “affective dimension” average and “behavioural dimension” are (2,629 ± 1,159) and
(2,832 ± 0,952), respectively. The average of their job satisfaction scores is (3,097 ± 0,664). According to correlation analysis, it has been seen that the higher the level of cynicism is,
the lower the level of job satisfaction (r=-0,603; p=0,000<0,05). Besides, significant
differences in the statistical sense have been found between socio-demographic
characteristics and all dimensions of cynicism and job satisfaction, except for marital status. As result of the study, a negative relationship has been found to exist between cynicismand
job satisfaction. It has been determined that the lower the workers’ job satisfaction is, the
higher the increase in all dimensions of organizational cynicism, leading to statistically significant results. This conclusion is in parallel with and supports the results of previous
studies carried out on this topic (1,5,21).
Keywords: Cynicism, organizational cynicism, job satisfaction, health worker

Khazar Journal of Humanities and Social
Sciences © Khazar University Press 2017
DOI: 10.5782/kjhss.2017.113.126
Department of Physical Education and Sport Teaching Students’ Reasons of Occupational Choice
and Satisfaction Levels
Akın Celik
Karadeniz Technical University, Trabzon
Burhanettin Hacicaferoglu
Provincial Directorate of Youth and Sports, Antalya
Samet Zengin
Avrasya University, Trabzon
1. Introduction
People, who are the most important part of a society, are in a hurry to find a place
in the society they live in, and to have an occupation to be able to realize
themselves as Maslow stated. Occupation is a whole in which individuals aimed to
fulfill their purpose for life, and gained ability and skills through a specific training
depending on this aim (Yanıkkerem, Altıparmak, and Karadeniz, 2004). Choice
ofoccupation is that individuals can be directed to different fields of business by
taking into account their personal characteristics, interests and abilities directly
proportional with these efficiencies (Hotaman, 2011). However, when literarure
was searched, it turns out that people consider economic features while choosing
occupation apart from their interests and abilities (Altun, 2000; Danziger; Eden,
2006; Dinç, 2008; Sarıkaya & Khorsid, 2008; and Yanıkkerem, Altıparmak
&Karadeniz, 2004). People have always been under the influence of the stated
circumstance while choosing occupation for many professional groups from
medicine to engineering; and from advocacy to international relations. Teaching
profession has also been included into this circle, and has started to find its place
among the occupational groups that are predominant in terms of economic factors.
Various factors such as economic income, knowledge and skill level have influence
over choosing teaching profession and related branches to this profession which
113

114 Akın Celik, Burhanettin Hacicaferoglu , Samet Zengin has an important role on the scientific and economic development of society,
protection of traditions and customs, providing effective communication among
generations and raising individuals who produce creative ideas (Çelikten, Şanal,
and Yeni, 2005). In the study conducted by Şahin (2011), considering whether
theycan take on professional responsibility as their own profession; evaluating
whether they are appropriate for the profession in line with their own abilities and
interests; being able to provide satisfaction to the profession in terms of material
and immaterial aspect; being affected by the thoughts of family and society, and
score competence determine the choices of profession of teacher candidates; While
the literature is analyzed, it appears that the teacher candidates shape their choices
of profession based on the factors in three main categories as altruistic, internal and
external (Bastick, 2000; Boz, & Boz, 2008; Kyriacou, & Coulthard, 2000;
Saban,2003). Çermik, Doğan and Şahin (2010) have examined the reasons of
primary school teaching canditates for choosing this department under four titles;
these are altruistic, self-seeking, internal and external rationales. Altruistic rationale
is directing person’s own behaviors on request of helping to society with no
thought of personal gain. Internal rationale is that showing person’s dreams and
desires as a reason to own behaviors. External rationale is shaping one’s behaviors
in the direction of the influence of people and stimulants around. Self-seeking
rationale is to perform one’s actions in accordance with expectation.
In order to become a qualified teacher, a person should choose teaching profession
consciously, should love the profession; and there must be a consistence between
one’s personal characteristics and the requirements of the teaching profession
(Şarave Kocabaş, 2012). Because of these reasons, teacher training institutions
should emphasize that this occupation should not be seen only as a job but also it
must be seen as a duty to set light to the ways of students who will shape the future
of a country. As in many teacher training programs, similar situation exists in the
physical education and sport teaching training process. There are studies examining
the attitudes (Dönmez ve Uslu, 2013; Doğan ve Çoban, 2009; Özder, Konedralı ve
Zeki, 2010; Özsoy ve diğerleri, 2010; Demirtaş, Cömert ve Özer, 2011) and
opinions of teacher candidates towards teaching profession (Candaş ve Bebek,
2015; Kartal ve Taşdemir, 2011; Şumuer, Yakın ve Yıldırım, 2010; Şahin, 2011;
Küçükoğlu, Taşgın ve Saadnie, 2014; Hotaman, 2011; Yıldız ve diğerleri, 2006).
There are also some other studies related to the reasons of choosing their
departments of teachers in the body of literature (Candaş & Bebek, 2015;
Tataroğlu, Özgen & Alkan, 2011; Şara & Kocabaş, 2012; Çermik, Doğan & Şahin,
2010; Ubuz & Sarı, 2008; Kılcan et al., 2014; Kaya, Aslan & Günal, 2013).
However, during the teacher training process, there is a gap related to getting
change of the choices that teacher candidates have in the body of literature.
Therefore, analyzing the reasons of choosing the occupation of teacher candidates,

Department of Physical Education and Sport Teaching Students’ Reasons of … 115 and the status of this program over teacher training process can provide information
about the attitudes of teacher candidates towards teaching profession. In addition to
this, functioning of the teacher training process and impact of the situations
experienced in the training process on the professional attitudes may be instructive
for the teachers new on the job.
1.1 Aim of the Research
It is intended to research the reasons of the students studying on physical education
and sport teaching department on choosing this program, and to investigate the
satisfaction levels in physical education and sport teaching department.
1.2 Statement of Research Problem and Sub-Problems • What are the reasons of choosing physical education and sport teaching
department? • What is the information that they have towards physical education and
sport teaching profession? • To what extent were the expectations met related to department of physical
education and sport teaching?
2. Method 2.1 Research Model
When the aim of the research was took into account, this study is a special case
study in which qualitative research approach was used, since it is being struggled
for collecting data detailed and deeply; learning about personal perceptions,
experiences, and point of views of the participants; understanding and explaining
the current situations (Büyüköztürk, et al., 2009) .
2.2 Participants of the Research
Participants of the research comprise of 30 volunteer students, 15 of whom are
studying in the first class and the other 15 students are studying in the last class in a
university, in Trabzon. Participants have been coded as K01, K02, K03, . . .K30 as
a matter of the ethical rules of the research.
2.3 Data Collection Tool and Period
Semi-structured interview made by researchers was used as data collection tool in
the research. In order to bring flexibility in the questions asked to the participants,
and to achieve the research’s objective this data collection tool has been preferred.
Interviews had with the candidates of physical education and sport teaching have

116 Akın Celik, Burhanettin Hacicaferoglu , Samet Zengin been recorded with tape recorders by courtesy of the participants. Tape recordings
have been transcribed and have been subjected to content analysis, and then themes
has been formed. Afterwards, the data have been deleted as a matter of ethical
rules.
3. FINDINGS
Findings obtained from the answers of physical education and sport teaching
candidates to the interview questions used as data collection tool are represented
with tables and graphics in the study conducted with the aim of searching the
reasons of choosing this department by the students studying in physical education
and sport teaching department and analyzing the satisfaction levels in physical
education and sport teaching program.
Table 1. Reasons of the participants’ desire for the department that they want to study while
they are studying in high school
Rationales Reasons Frequency
Altruistic Rationales Contributing to the Country 5
Internal Rationales
Socializing 4
Emotional Factors
8
External Rationales The Effect of the Environment 20
Self-Seeking Rationales
The Effect of the Materiality 15
Positive Aspects of the Profession
12
When Table 1 was analyzed, reasons of the physical education and sport teaching
candidates’ desire for the department that they want to study while they are
studying in high school are collected under four titles as expressed by Çermik,
Doğan and Şahin. Under the title of altruistic rationales theme of contributing
tothe country; under internal rationales title themes of socializing and emotional
factors; under external factors title theme of the effect of the environment;
andunder self-seeking rationales title themes of the effect of the materiality
andpositive aspectsof the profession were mentioned. When the answers of
theparticipants were examined it is understood that candidates of physical
education and sports teaching shape the department they want to study while they
are studying in high school mostly depending on the external rationales. Teacher
candidate coded K08 who indicates that external rationales are important factors
expressed his/her opinion as “There was a boy studying electrical and electronic
engineering in our neighborhood. He was always coming home with a different car
and he was pretty handsome. So I wanted to study electrical and electronic

Department of Physical Education and Sport Teaching Students’ Reasons of … 117 engineering.” Teacher candidate coded K14 expressed his/her opinion as “I had an
interest in computer all my life. I was taking pleasure when I removed computer
case, then collect and modify it. Firstly I broke our opposite neighbor’s computer.
My uncle had a big impact on this. He had a new internet café. A new machine, a
new fun and a new excitement. I assumed that my uncle’s impact was strong on my
opinion.”
Rationales Reasons Frequency
Altruistic Rationales Organizing basis of the Teams 4
Internal Rationales
Life Long Education 12
Effects of Personal Characteristics
16
Score Competence 24
External Rationales Living in separate houses with family 18
Self-Seeking Rationales Effect of the University 7
When Table 2 was analyzed, reasons of the physical education and sport teaching
candidates’ desire for the department of the physical education and sport teaching
are collected under four titles as expressed by Çermik, Doğan and Şahin. Under
altruistic rationales title theme of organizing basis of the teams; under internal
rationales title themes of life long education and effects of
personalcharacteristics; under external rationales title themes of score
competence and living in separate houses with family; Under self-seeking title
theme of effects of the universitywere mentioned. When the answers of the
participants wereexamined it is understood that candidates of physical education
and sports teaching shape the department they want to study while they are
studying in high school mostly depending on the external rationales. Teacher
candidate coded K22 expressed her/his opinion as: “After the exam results were
announced, my family got a small shock when they saw my score. Expectation was
very high, but I couldn’t meet that expectation. I didn’t want to prepare for the
exam one more year. The following process would be so difficult for me. Because I
was playing football since my childhood, my father said to me to become at least a
teacher if I want to study in a university. This was not my dream, because of my
father’s wish and my insufficient score I am here.” Teacher candidate coded K03
stated her/his opinion as “I have never been outside of Ankara since I was born. My
friends studying outside of their hometown are always telling me how cheerful is to
live in separate houses with family. If I had wanted I could have won a university
in my city, but I wanted to live in my own house far away from my family.
Because of this reason, I have chosen here.”
In diagram 1, physical education and sport teaching candidates’ opinions towards
the question of which characteristics physical education and sport teacher should
have are collected under six titles. Participants indicated that a physical education

118 Akın Celik, Burhanettin Hacicaferoglu , Samet Zengin and sport teacher should be well equipped in terms of field knowledge; should
appeal to students in terms of terms of visuality; if it is wanted to be successful in
the education process, teacher should keep discipline; because the sport classes are
mostly depend on practice teacher should have practice skill; also physical
education teacher should have love and respect properties to do his job properly;
and lastly physical education and sport teacher should have pre-experiences
related to subjects to be able to instruct effectively. Teacher candidate coded K07
expressed her/his opinion as “When we say a teacher of physical education he or
she must appeal firstly to the eye. In addition to this, a physical education and sport
teacher should have practice skill since we will do practice in the lessons such as
football, handball, basketball and volleyball. On the other hand, teacher candidate
coded K25 stated her/his opinion as “I don’t say teacher a teacher who could not
answer a question asked during the lesson. Teacher should be master on every
subject, and should respond every kinds of questions. Teacher should never put a
question mark in the minds, should be an expert in the field and provide
satisfaction for students’ questions. If there is lack of information, teacher can
never control the class and remains out of the profession.” Lastly, teacher candidate
coded K12 explained hr7hi opinions as “I play football, and it makes me very upset
that the entrance of someone who has never been to the football field before to my
classes. If a teacher who is experienced and has played football before had given
my football classes, it would have been more effective for me.”
Diagram 1.Characteristics that Physical Education and Sport Teacher Should Have

Department of Physical Education and Sport Teaching Students’ Reasons of … 119
Table 3. Effect of the process on the physical education and
sport teaching candidates’ opinion
Effect of the process Themes Frequency
Course Load 12
Negative Effect
Negative Attitude 6
Lack of knowledge of the field
14
Regret 3
Teaching Understanding 16
Positive Effect
Feeling of Sufficiency 13
Gaining self-confidence
9
Socializing 7
When table 3 was analyzed, opinions of physical education and sport teaching
candidates about how their emotions and thoughts were influenced at the end of
education process are collected under two different titles. Intended for the negative
effects of the education process, themes of course load, negative attitude, lack
ofknowledge of the field and regret came into prominence; and for the
negativeeffects of the education process themes of teaching understanding,
feeling ofsufficiency, gaining self-confidence and socializing came into
prominence. At theend of the process, a teacher candidate with K17 code, who
stated a negativity about lack of field knowledge had an impact on his own,
indicated his/her opinion “At the end of the education for four years, in the practice
school I went to this term I realized that I couldn’t learn anything. I cannot say
even the size of a football field to young students. This situation both caused me to
be ashamed, and it caused sadness of being graduated from the education process
without any qualification on the field. I am going to graduate with lack of field
knowledge.” Another teacher candidate with K01 code, who indicated that negative
results showed up due to the excess of course load, expressed her/his opinion as “ I
have a eight course in a year, and these courses are tiring me a lot. For this reason, I
have problems towards teaching and the department. Was it really important that I
had such a busy course period?” While the teacher candidate coded K16, who
stated that the education process brought competence to the candidate for teaching
understanding, expressed her/his opinion as “As an individual who is thinking
about being physical education teacher or doing a job outside, the process has
given me the feeling and sense of being teacher. It is good to say that the
continuation of the process was in this way.” On the other hand, the teacher
candidate coded K29 expressed her/his opinion as “My mother and father are
teacher, and I was always watching them enthusiastically. I always wanted to be a
teacher, but I did not see myself sufficient. What the education process has given
me is that I qualified in this matter.”

120 Akın Celik, Burhanettin Hacicaferoglu , Samet Zengin 4. Conclusion And Discussion
This research has been conducted with the aim of both analyzing the factors that
are influential on the reasons of choosing physical education and sport teaching
department of physical education and sport teaching candidates; and questioning
how much the level of satisfaction has changed during the process. It is deduced
that candidates have various of causes on choosing their occupation in their ideals.
The internal and external rationales stands out among the reasons why participants
choose the department of physical education and sport teaching. This result
issimilar to the results of Çermik, Dogan and Şahin (2010) studies while
contradicting the results of Kartal and Taşdemir's (2011) studies when the
expressions are searched especially about external factors in the choices of physical
education and sport teaching candidates. It was seen that the ones who gave their
preferences depending on external causes and benefits sees the occupation as
guarantee for the future, and defines it as an occupation giving better opportunities.
It is considered that the examination and evaluation system in our country is
effective in the emergence of the external rationales as an important factor.
Correspondingly, most young people sustain their education life in a department on
which they do not want to study, or they choose the departments which they get no
idea on in order not to face the problems that have occurred during examination
process again. Sinclair (2008) remarks that attraction is not essential for teaching, is
essential for the opportunities that the occupation will provide. In addition, none of
the participants expressed the profession of physical education and sport teaching
as the one in their ideal.
Çermik, Doğan ve Şahin (2010) defines the internal rationales as showing person’s
dreams and desires as a reason to own behavior; and self-seeking rationales as to
performing one’s actions in accordance with expectation. Students are obliged to
tend towards the occupations outside of their interests rather than choosing
appropriate occupation for themselves due to the students’ self-seeking rationales
and the education system in our country for choosing a profession. This appears as
a negative factor in achieving professional success and personal satisfaction. The
fact that students have internal rationales shows students can take the responsibility
that the occupation requires; they see the profession as an appropriate occupation
for themselves; and they love teaching profession.
Within the scope of the study, it is presented that candidates of physical education
and sport teaching have several ideas about the profession, the features required for
teaching profession, and the characteristics that a physical education and sport
teacher should have.

Department of Physical Education and Sport Teaching Students’ Reasons of … 121 At the end of the interviews, researchers realized that the participants could not
distinguish the characteristics that physical education and sport teacher should have
during education process with the characteristics an ordinary teacher should have
when they compare. Participants did not mention especially the abilities of the
participants on reflecting the ideas and opinions of Atatürk about science and
technology on the applications in the teaching process, making social leadership,
and making students to be aware of the importance and meaning of national
holidays and ceremonies, and making them participate actively. The positive and
negative effects of educational process on themselves were determined in
accordance with the opinions got from the candidates of physical education and
sport teaching. The participants have expressed that they had problems especially
on the field knowledge and attitude for the negative effect of teaching process; they
their self-confidence and tendency to the profession increased for the positive
effect of teaching process.
It is considered that for the negative effect of the process on teacher candidates, the
inadequacy of field knowledge derives from teaching the field courses with an
education system based on rote learning; and being able not to associating the
information learned in the process with real life throughout the teaching process.
Additionally, it is considered that increasing participants’ self-confidence towards
the positive effects of the process on teacher candidates derives from making
presentations and playing active role in lab practices in the courses during
educational process.
At the end of the education process in university, when the candidates’ opinions on
their expectations about life was examined, it is discovered that candidates have
positive and negative opinions about life. While most of the teacher candidates
express positive opinion to provide economic freedom and academic career, even if
just a little there are some candidates stating negative opinion because of the desire
to study a new department. Teacher candidates who expressed a positive opinion
on the idea of providing economic freedom was also indicated in the studies of
Altun (2000), Dinç (2008) ve Sarıkaya ve Khorshid (2008). In the study in which
the opinions of the students studying on the nursing department about choosing of
occupation and professional practice was received by Şirin and the friends of her
(2008), most of the students who were studying on nursing department indicated
that they have some goals such as doing academic career at the end of the process.
Similar results have been obtained within the scope of the study have been
conducted. It is considered that the reason under the idea of teacher candidates who
have a positive opinion such as having an academic career is seeing the teachers
who are teaching at universities as in higher level than the teachers in ordinary
schools. The opinion to get away from the stress of KPSS exam influence this

122 Akın Celik, Burhanettin Hacicaferoglu , Samet Zengin situation as well. The results of this study in which negative opinions were stated
because of the desire to study a new department at the end of the process are
parallel with the results of the study conducted by Beydağ, Gündüz, and Özer
(2008).
5. Implications
In parallel with the results of this study which is conducted with the purpose to
determine the opinions and satisfaction levels of physical education and sport
teacher candidates towards physical education and sport teachers, the following
suggestions might be offered;
• Seminars should be given to the candidates of physical education and sport
teaching about the characteristics that a teacher must have in order to fulfill
teaching profession.
• Students newly graduated from high school should be led to be able to do their university choices more consciously.
• The reasons of dissatisfaction of the physical education and sport teaching
candidates who are dissatisfy for their department should be investigated.
• Studies should be done to regain the values and respect that the
teaching profession should have.
References and notes:
Altun, İ. (2000). Kocaeli Sağlık Yüksekokulu Öğrencilerinin Kişisel Değerleri ve Meslek
Seçimlerine Etki Eden Faktörler. I. Uluslararası & VIII. Ulusal
HemşirelikKongresi Kitabı, 75-77. Bastick, T. (2000). Why Teacher Trainees choose The Teaching profession? Comparing
Trainees in Metropolitan and Developing Countries. International Review
ofEducation, 46(3/4), 343-349. Beydağ, K. D., Gündüz, A.ve Özer, F. G. (2008). Sağlık Yüksek okulu Öğrencilerinin
Eğitimlerine ve Mesleklerine Bakış Açıları, Meslekten Beklentileri. PamukkaleTıp Dergisi, 1(3), 137-142.
Boz, Y. ve Boz, N. (2008). Kimya veMatematik Öğretmen Adaylarının Öğretmen Olma
Nedenleri. Kastamonu Eğitim Dergisi, 16(1), 137-144. Büyüköztürk, Ş., Çakmak, E. K., Akgün, Ö. E., Karadeniz, Ş. ve Demirel, F. (2009).
Bilimsel Araştırma Yöntemleri, ( 3. Baskı ). Ankara: Pegem Akademi. Candaş, B. ve Bebek, G. (2015). Fen Bilgisi Öğretmen Adaylarının Mesleği Tercih
Nedenleri ve Memnuniyet Düzeyleri: Fatih Eğitim Fakültesi Örneği.
InternationalConference on New Horizons in Education, Barcelona-SPAIN, June
10-12 2015.

Department of Physical Education and Sport Teaching Students’ Reasons of … 123 Çelikten, M., Şanal, M. ve Yeni, Y. (2005). Öğretmenlik Mesleği ve Özellikleri.
ErciyesÜniversitesi Sosyal Bilimler Enstitüsü Dergisi, 19 (2), 207–237. Çermik, H., Doğan, B. ve Şahin, A. (2010). Sınıf Öğretmenliği Öğretmen Adaylarının
Öğretmenlik Mesleğini Tercih Sebepleri. Pamukkale ÜniversitesiEğitim
FakültesiDergisi, 28 (11), 201 - 212. Danziger, N. ve Eden, Y. (2006) Student Career Aspiratons and Perceptions: The case of
İsraeli Accounting Students. Accounting Education:An International Journal,
15(2), 113-134. Demirtaş, H., Cömert, M. ve Özer, N. (2011). Öğretmen Adaylarının Özyeterlik İnançları
ve Öğretmenlik Mesleğine İlişkin Tutumları. Eğitim ve Bilim, 36 (59), 96 – 111. Dinç, E. (2008). Meslek Seçiminde Etkili Faktörlerin İncelenmesi: Meslek Yüksek Okulu-
Muhasebe Programı Öğrencileri Üzerine Bir Araştırma. Kocaeli Üniversitesi
Sosyal Bilimler Enstitüsü Dergisi, 16(2), 98 - 106. Doğan, T. ve Çoban, A. E. (2009). Eğitim Fakültesi Öğrencilerinin Öğretmenlik Mesleğine
Yönelik Tutumları ile Kaygı Düzeyleri Arasındaki İlişkinin İncelenmesi. Eğitim
veBilim Dergisi, 34 (153), 158–168. Dönmez, C. ve Uslu, S. (2013). Sosyal Bilgiler Öğretmen Adaylarının Öğretmenlik
Mesleğine Yönelik Tutumları. Türk Eğitim Bilimleri Dergisi, 11 (1), 42 – 63. Hotaman, D. (2011). Eğitim Fakülteleri Kendi Öğrencilerini Seçebilir Mi. Kuramsal
EğitimBilim, 4 (1), 126–136. Kartal, T. ve Taşdemir, A. (2011). Fen Bilgisi Öğretmen Adaylarının Öğretmenlik
Mesleğine İlişkin Görüşleri. Abant İzzet Baysal Üniversitesi Eğitim
FakültesiDergisi, 12 (2), 73–96. Kaya, R., Aslan, H. ve Günal, H. (2013). Tarih Öğretmen Adaylarının Bölümü Tercih
Etme Nedenleri ile Bölümünden Beklentilerine İlişkin Görüşleri: Atatürk
üniversitesi örneği. Türk Tarih Eğitim Dergisi, 2 (2), 1–31. Kılcan, B., Keçe, M., Çepni, O. ve Kılınç, A. Ç. (2014). Öğretmen Adaylarının
Öğretmenliği Bir Meslek Olarak Seçme Nedenleri. Kastamonu Eğitim Dergisi, 22 (1), 69–80.
Küçükoğlu, A., Taşgın, A. ve Saadnie, A. (2014). İranlı ve Türk Öğretmen Adaylarının
Öğretmenlik Mesleğine ilişkin Görüşleri Üzerine Karşılaştırmalı Bir Araştırma.
Türkiyat Araştırmaları Enstitüsü Dergisi, 51,395-416. Kyriacou,C. ve Coulthard, M. (2000). Undergraduates’ Views of Teaching As a
Careerchoice. Journal of Education for Teaching, 26(2), 117-126. Özder, H., Konedralı, G. ve Zeki, C. P. (2010). Öğretmen Adaylarının Öğretmenlik
Mesleğine Yönelik Tutumlarının Çeşitli Değişkenler Açısından İncelenmesi.
Kuram ve Uygulamada Eğitim Yönetimi, 16 (2), 253–275. Özsoy, G., Özsoy, S., Özkara, Y. ve Memiş, A. D. (2010). Öğretmen Adaylarının
Öğretmenlik Mesleğini Tercih Etmelerinde Etkili Olan Faktörler. İlköğretimOnline Dergisi, 9 (3), 910–921.
Saban, A. (2003). A Turkish Profile of Prospective Elementary School Teachers and Their
Views of Teaching. Teaching and Teacher Education, 19, 829-846. Sarıkaya, T. ve Khorshid, L. (2009). Üniversite Öğrencilerinin Meslek Seçimini Etkileyen
Etmenlerin İncelenmesi: Üniversite öğrencilerinin meslek seçimi. Türk Eğitim
Bilimleri Dergisi, 7(2), 393-423.

124 Akın Celik, Burhanettin Hacicaferoglu , Samet Zengin Sinclair, C. (2008). Initial and Changing student Teacher Motivation and Commitment to
Teaching. Asia-Pacific Journal of Teacher Education, 36(2), 79-104. Şahin, İ. (2011). Öğretmen Adaylarının Öğretmen İstihdamı ve Mesleki Geleceklerine
İlişkin Görüşleri. Kuram ve Uygulamada Eğitim Bilimleri, 11 (3), 1167 – 1184. Şara, P. ve Kocabaş, A. (2012). Sınıf Öğretmeni Adaylarının Sınıf Öğretmenliğini Tercih
Nedenleri ve Aldıkları Eğitimle İlgili Görüşleri. Turkish International Journal
ofSpecial Education and Guidance &Counceling. 1 (2), 8–17. Şirin, A., Öztürk, R., Bezci, G., Çakar, G. ve Çoban, A. (2008). Hemşirelik Öğrencilerinin
Meslek Seçimi ve Mesleği uygulamaya Yönelik Görüşleri. Dirim Tıp Gazetesi,
83(2), 69-75. Şumuer, E., Yakın, İ. ve Yıldırım, S. (2010). Bilişim Teknolojileri Öğretmen Adaylarının
Demografik Özellikleri, Öğretmenlik Mesleğine İlişkin Tutumları ve Eğitime
İlişkin Görüşleri. Eğitim Bilimleri ve Uygulama Dergisi, 9 (18), 21 – 46. Tataroğlu,B., Özgen, K. ve Alkan, H. (2011). Matematik Öğretmen Adaylarının
Öğretmenliği Tercih Nedenleri ve Beklentileri. 2nd International Conference
onNew Trends in Education and Their Implications, 998–1007. Ubuz, B. ve Sarı, S. (2008). Sınıf Öğretmeni Adaylarının Öğretmenlik Mesleğini Seçme
Nedenleri. Pamukkale Üniversitesi Eğitim Fakültesi Dergisi, 24 (2), 113–119. Yanıkkerem, E.,Altınparmak, S. ve Karadeniz, G. (2004). Gençlerin Meslek Seçimini
Etkileyen Faktörler ve Benlik Saygıları. Nursing Forum Dergisi. 7(2),61- 62. Yıldız, E., Akpınar, E., Aydoğdu, B. ve Ergin, Ö. (2006). Fen Bilgisi Öğretmenlerinin Fen
Deneylerinin Amaçlarına Yönelik Tutumları. Türk Fen Eğitimi Dergisi, 3(2), 318-
336.

Department of Physical Education and Sport Teaching Students’ Reasons of … 125
Summary
Department of Physical Education and Sport Teaching Students’ Reasons of
Occupational Choice and Satisfaction Levels
Akın Celik
Karadeniz Technical University, Trabzon
Burhanettin Hacicaferoglu Provincial Directorate of Youth and Sports, Antalya
Samet Zengin
Avrasya University, Trabzon
In this study with descriptive quality, it has been aimed to investigate department of
physical education and sport teaching students’ reasons of occupational choice and
satisfaction levels in their department. In accordance with this purpose, special case study
method has been preferred in the research. This method has been considered appropriate
because the study calls for answers to the questions “What?”, “How?” and “Why?”; and
provides an in-depth investigation environment. Participants of the research comprise of 30
volunteer students, 15 of whom are studying in the first class and the other 15 students are
studying in the last class in a university, in Trabzon. Participants have been coded as K01,
K02, K03, . . .K30 as a matter of the ethical rules of the research. Semi-structured interview
made by researchers was used as data collection tool in the research. In order to bring
flexibility in the questions asked to the participants, and to achieve the research’s objective
this data collection tool has been preferred. As the data obtained from the participants are in
qualitative structure, the data have been subjected to descriptive analysis by using NVivo
9.0 Program, is a computer assisted qualitative data analysis program. Internal and external
validity factors have been took into consideration for the validity of the research. For
internal validity in the study, member control method was applied by the researchers; and
for the external validity in the study, the data obtained from the participant group was
presented to the reader in a rich and detailed manner. As for the reliability in the study, the
consistency relation of the coding of the data obtained from the classification of two
independent observer has been calculated as 0.72 (Kappa Reliability Co-efficient) by using
NVivo 9 Program. Independent observers have reached an agreement for the different
coding. During the data collection process from participants; data have been collected under
the titles of the department in which students want to study in high school, and their reasons
of wanting that department; reasons of choosing the department of physical education
andsport teaching; the characteristics required for physical education and sport teaching;
and the effects of education process on their opinions towards the department. In direction
of obtained data, it has been realized that department of physical education and sport
teaching

126 Akın Celik, Burhanettin Hacicaferoglu , Samet Zengin was in minority among the departments which the participants wanted to study in high
school; and their reasons of choice of this field derive from self-interested and intrinsic
reasons. With the help of the questions directed to the participants, it is understood that
department of physical education and sport teaching students could not completely
distinguish between sport expert and physical education teacher. Additionally, it has been
noticed that education process has affected participants’ opinions towards the department
positively; and so, it would not be wrong to state the students has come out of identity
confusion. In accordance with the data obtained from the research, it has been suggested
that employment opportunities should be expressed more clearly for the students who are
studying in physical education and sport teaching department; practices for professional
development should be done; high school students should follow an appropriate way about
their university preferences; and lastly, seminars should be organized incrementally to
physical education and sport teachers for the theories and abilities that would be necessary
during their occupational career.
Key Words: Department of Physical Education and Sport Teaching Students, Choice of
Occupation, Satisfaction Level

Khazar Journal of Humanities and Social
Sciences © Khazar University Press 2017
DOI: 10.5782/kjhss.2017.127.134
Examination of State Anxiety Levels of Athletes
Participating in Volleyball Competitions
Burhanettin Hacicaferoglu
Provincial Directorate of Youth and Sports, Antalya, Turkey
Serkan Hacicaferoglu
Recep Tayyip Erdogan University, Turkey
Recep Fatih Kayhan
Recep Tayyip Erdogan University, Turkey
Introduction
Biological and physiological theories and psychoanalytic teachings that have taken
the personal structure and behavior of human into consideration have always
included anxiety. Some researchers have considered anxiety as the primary force
that created the personality, some of them assessed it as secondary, but as a factor
that has an important role in the formation, development and manifestation of
personality (Kaya and Varol, 2004).
In general sense, anxiety can be defined as an emotional reaction existing in human
nature and shown against environmental and physiologic events, and in narrow
sense, a type of experience that is felt consciously although its beginning is not
conscious and that leads to some physical changes such as sweating, paling are
observed. Anxiety is worry and distemper about the future. Waiting for an
unknown and unrecognized danger can awaken uneasiness and distemper as a
person's anxiety (Yavuz, 2002).
In this context, anxiety which is a process of internal and external events that
develop in an unexpected and uncontrollable way is treated in two ways as state
and constant anxiety. State anxiety is the fear that an individual feels due to
stressful situations they are in and is an indication of the individual's feelings of
127

128 Burhanettin Hacicaferoglu,Serkan Hacicaferoglu, Recep Fatih Kayhan tension and uneasiness. Constant anxiety is the dependency of the individual on
anxiety (Aral, 1997). It is a relatively constant concern that does not emerge
according to a specific situation or time. Such anxious individuals may, at any time
or in any case, get anxious (Terzioğlu, Koç and Yazıcı, 2013).
Feeling of anxiety may show different characteristics depending on the individuals.
However, there are also some generally accepted approaches. An important source
of anxiety is fear of failure. Successful and unsuccessful athletes may experience
anxiety differently. Unsuccessful athletes are more anxious after competition
(Budak, 2000). The perceived anxiety can negatively affect the athlete's ability to
make the right decisions. As the level of anxiety rises, the athlete may have
difficulty making the right decisions and exhibiting their talents. Excessive anxiety
during the competition can make some movements that the athletes know very well
and have done many times during the training be forgotten, as well as causing
confusion in their emotions and make some movements in a negative way (Gümüş,
2002). A high level of anxiety affects athlete performance adversely (Gould and
Krane, 1992). In this context, it is stated that the athletes have to exhibit their
performances in case of anxiety at the beginning of the competition (Akarçeşme,
2004).
When the anxiety and intensity of stress experienced by athletes before or during a
competition is considered, uncontrollable anxiety situations can negatively affect
performance of athletes and cause failure. For this reason, it is stated that the level
of anxiety of the athletes and the reasons of anxiety are very important in terms of
the athletes and coaches who will cope with it (Başaran, Taşgın, Sanioğlu and
Taşkın, 2009). Many top athletes owe their skills not only to their physical and
physiological capacities, but also to their psychological characteristics. It is
observed that sportsmen have the ability to prepare themselves psychologically, to
motivate themselves, to manage their concerns and to determine goals (Koç, 2004).
In the light of this information, the level of anxiety of the athletes participating in
the volleyball sports before the competition will be attempted to be determined
considering the demographic variables of sex, age and playing time.
Method
The population of the study consists of 132 university athletes competing in 2nd
league competition of Turkish University Sports Federation in 2016 and the sample
of the study consists of 103 volunteer sportsmen randomly chosen from the
population (TÜSF, 2016). According to Arli and Nazik (2001), it can be said that
the sample number represents the population when it is taken into account that the

Examination of State Anxiety Levels of Athletes Participating in Volleyball … 129 minimum number required to be reached in small population is 20% in the
descriptive researches.
In the research, 'General Screening Model' which is one of the descriptive scanning
methods was used. To gather necessary data in the study, State Anxiety section of
State and Constant Anxiety Scale developed by Spielberger et al. (1970) and
adapted to Turkish by Öner and Compte (1983) was used (Aktaran; Kartopu,
2012). The Alpha reliability coefficient of the scale is 0.94. The Cronbach's alpha
coefficient of 0.70 indicates that the scale is reliable (Arseven, 2001).
The responses of the athletes participating in the study to the scales according to
their demographic variables were calculated by means of a statistical package
program. Frequency, percentage, standard deviation, arithmetic mean, t-test and
one-way analysis of variance (ANOVA) test were used in the analysis of the data.
The level of statistical significance Alpha (α) was accepted as p <.05.
Findings
In this section, the data obtained from the volleyball athletes participating in the study and the statistical findings related to these data are included.
Table 1. State anxiety behaviors of the athletes depending on the gender variable
Gender N % Mean Ss Sd t- p
Female 52 50.5 2.36 .27 101 .304 .762
Male 51 49.5 2.35 .23
Total 103 100 2.36 p>0.05
In the study, it was determined that there was no statistically significant difference
in the pre-competition state anxiety of the athletes depending on the gender
variable (p>.05).
Table 3. State anxiety behaviors of the athletes depending on the age variable
Age N % Mean Ss Source of Square
Sd Square
F p
Variable Total Mean
18-19 4 3.9 2.47 .27 Inter-groups
.067 2 .034
age
.514 .045
20-21 6.529 100 .065
86 83.5 2.36 .24 Intra-groups
age
22-23 13 12.6 2.32 .28 Total
6.596 102 p<0.05
age
Total 103 100

130 Burhanettin Hacicaferoglu,Serkan Hacicaferoglu, Recep Fatih Kayhan
In the study, it was determined that there is a statistically significant difference in
the pre-competition state anxiety of the athletes depending on the age variable
(F(2,100)=.514, p<.05). Therefore, it was determined that the athletes who are between
the ages of 18-19 have more state anxiety prior to the competition than the other
athletes, depending on the age variable of the athletes playing volleyball in terms of
state anxiety situations.
Table 4. State anxiety behaviors of the athletes depending on the playing time variable
Playing Source
Square
Square
N % Mean Ss of Sd F p
time Total Mean
Variable
Less .457 3 .152
than 47 45.6 2.42 .24
Inter-
one groups
2.456 .067 year
1-3 41 39.8 2.34 .23
Intra- 6.139 99 .062
years groups
4-6 10 9.7 2.20 .33 Total
6.596 102
year
7-10 5 4.9 2.29 .16
p>0.05
years
Total 670 100
In the study, it was determined that there is no statistically significant difference in
the pre-competition state anxiety of the athletes depending on the volleyball
playing time variable (p>.05).
Discussion and Conclusion
It was determined that the statistical general arithmetic mean of the state anxiety
situation of the athletes playing volleyball before the competition is 2.36 points. In
this case, it can be said that the athletes playing volleyball in the study group
experience state anxiety before the competition (below middle level). The reason
for the high state anxiety values of the athletes before the match can be said to be
the fact of the stress state of the athletes due to the intense experience of the
athletes during competition period (Baştuğ, 2009). In the literature, there are many
studies showing the increase of athletes` anxiety before the compettion (Gould and
Krane, 1992, Jones and Cale, 1991).
In the study, it was determined that there is no statistically significant difference in
the pre-competition state anxiety of the athletes depending on the gender variable
and they expressed their opinions in close scores in terms of point. Given the

Examination of State Anxiety Levels of Athletes Participating in Volleyball … 131 studies related to the topic, Özgül (2003) states that there is no difference between
state anxiety points of participant students in the study and Gacar and
Karahüseyinoğlu (2010) point out that male athletes` anxiety level is lower than
female athletes in their studies. Budak (2000), on the other hand, states that anxiety
of woman is higher than males in stressful situations. Başaran et al. (2009), in their
studies, indicate that there is a significant difference between pre-competition state
anxiety levels of males compared to females. Yilmaz, Koruç and Acar (2004)
found that there is a significant difference in the level of anxiety of female athletes
before the competition in their study. On the other hand, some research results on
anxiety indicate that there is no significant difference between the anxiety
situations in terms of gender variable (Terzioğlu et al., 2013; Türkmen, Kul and
Bozkuş, 2013; Özbekçi, 1989; Yücel, 2003).
In the study, it is determined that there was a statistically significant difference in
the pre-competition state anxiety of the athletes depending on the age variable.
Therefore, it was determined that the athletes who are between the ages of 18-19
have more state anxiety prior to the competition than the other athletes, depending
on the age variable of the athletes playing volleyball in terms of state anxiety
situations. In this case, it can be said that as the age progresses, the feeling of state
anxiety of the athletes decreases. According to the results of the study conducted by
Başaran et al. (2009) on the subject, participants with lower sport age stated that
their state anxiety scores are higher than those with older sports age. Koç (2004),
on the other hand, found that the participants are affected by increase of age levels
less than factors affecting state anxiety levels and are able to control their emotions
more. On the other hand, some research results for different athletes indicate that
there is no significant difference in the anxiety of the athletes before the
competition depending on the age variable (Bingöl, Çoban, Bingöl and Gündoğdu,
2012; Erbaş, 2005; Yücel, 2003).
In the study, it is determined that there was no statistically significant difference in
the pre-competition state anxiety of the athletes depending on the volleyball
playing time variable. Gümüş (2002) notes that there is a relationship between
anxiety and sportive success in the study conducted on the subject, and that being
experienced or inexperienced athletes is important for the level of anxiety.
Turkmen et al. (2013), however, point out that in their study there is no significant
difference between athletes` anxiety in terms of their experience in the team.
As a result, in this study conducted to determine pre-competition state anxiety
levels of athletes in volleyball sports branch in terms of some variables, it was
determined that the statistical general arithmetic mean of the state anxiety situation
of the athletes playing volleyball before the competition is 2.36 points. In the study,
it was determined that there is no statistically significant difference in terms of

132 Burhanettin Hacicaferoglu,Serkan Hacicaferoglu, Recep Fatih Kayhan athletes` pre-competition state anxiety states in terms of gender and volleyball
playing time and there is a significant difference in terms of variable of age .
Suggestions
Athletes playing volleyball may experience intense stress and state anxiety before
and during the competition. This can affect the performance and success of athletes
adversely. In order to prevent this situation, coaches need to make programs for the
development and rehabilitation of psychological skills of athletes as well as their
physical and technical development. Also, coaches should remind athletes that
losing is a result of competitions as well as winning and instead of tantalizing them
as result-oriented, they should make programs which will drive negative emotional
states away. In addition, suggestions that coaches will make for athletes should be
in a positive way.
References and notes:
Akarçeşme, C. (2004).Voleybol damüs abaka öncesi durumluk kaygıi leper forman
sölçütleri arasındaki ilişki. YayımlanmamışYüksek Lisans Tezi , GaziÜniversitesi,
Ankara. Aral, N. (1997). Fiziksel istismar ve çocuk. Ankara: Tekışık Web Ofset Yayıncılık. Arlı, M.&Nazik, H. (2001). Bilimsel araştırmaya giriş. Ankara: Gazi Kitabevi. Arseven, A. (2001). Alan araştırmayöntemi. Ankara: Gündüz Eğitim ve Yayıncılık. Başaran, M.
H.,Taşğın, Ö., Sanioğlu, A.&Taşkın A. K. (2009). Sporcularda durumluk ve sürekli kaygı düzeylerinin bazı değişkenlere göre incelenmesi. Selçuk Üniversitesi
Sosyal Bilimler Enstitüsü Dergisi, 21: 533–544 Baştuğ, G. (2009). Bayan voleybolcuların müsabaka dönemi kaygı ve umutsuzluk
düzeylerinin incelenmesi. Selçuk Üniversitesi BedenEğitimive Spor BilimDergisi,
11(3): 15–20. Bingöl, H., Çoban, B., Bingöl, Ş.&Gündoğdu, C. (2012). Üniversitelerde öğrenim gören
Taekwondo milli takım sporcularının maç öncesi kaygı düzeylerinin belirlenmesi. Selçuk Üniversitesi Beden Eğitimi ve Spor Bilim Dergisi,14(1):121–125.
Budak, S. (2000). Psikoloji sözlüğü. Ankara: BilimveSanatYayınları. Erbaş, M. K. (2005). Üst düzey basketbolcularda durumluk kaygı düzeyleri ve performans
ilişkisi. YayımlanmamışYüksek LisansTezi, DumlupınarÜniversitesi, Kütahya. Gacar, A.&Karahüseyinoğlu, M. F. (2010). Sporli sesi öğrencilerinin sürekli kaygı
düzeylerinin bazı değişkenler açısından incelenmesi. 11th International
SportSciences Congress, 10–12 November 2010, pp: 1079–1081, Antalya / Turkey. Gümüş, M. (2002). Profesyonel futbol takımlarında puansıralamasına göre durumluk kaygı
düzeylerinin incelenmesi. Yayımlanmamış Yüksek Lisans Tezi,
SakaryaÜniversitesi, Sakarya.

Examination of State Anxiety Levels of Athletes Participating in Volleyball … 133 Gould, D.& Krane, V. (1992). The arousal-athletic performance relationship: Current
status and future directions. İn: Advances in sport psychology. T.S. Horn (Edit).Champaign: Human Kinetics Publishers.
Jones, G.& Cale, A. (1991). Gender differences in precompetition temporal patterning and
antecedents of anxiety and self-confidence. Journal of Sport and
ExercisePsychology, 13: 1–15. Kartopu, S. (2012). Lise öğrenci ve öğretmenlerinin durumluk ve sürekli kaygı
düzeylerinin bazı değişkenler açısından incelenmesi (Kahramanmaraş örneği).
Fırat Üniversitesi İlahiyat Fakültesi Dergisi, 17(2): 147–170. Kaya, M.&Varol, K. (2004). İlahiyat fakültesi öğrencilerinin durumluk-sürekli kaygı
düzeyleri ve kaygınedenleri (Samsun örneği). Ondokuz Mayis
ÜniversitesiİlahiyatFakültesi Dergisi, 17: 31–42. Koç, H. (2004). Profesyonel futbolcularda durumluk kaygıdüzeylerini etkileyen faktörlerin
değerlendirilmesi.Yüksek LisansTezi, Dumlupınar Üniversitesi Sosyal Bilimler Enstitüsü, Kütahya.
Özbekçi, F. (1989). Farklı spordallarında yaşanan müsabaka stres düzeylerinin araştırılması.YayınlanmamışYüksekLisansTezi, Marmara Üniversitesi, İstanbul.
Özgül, F. (2003). Beden Eğitimi ve Spor Yüksek Okulu öğrencilerinde durumluk ve sürekli kaygı düzeyleri. Yayınlanmamış Yüksek LisansTezi, Cumhuriyet
Üniversitesi,Sivas. Terzioğlu, A. E., Koç, Y.&Yazıcı M (2013). Halk oyunları oynayanların durumluk ve
sürekli kaygı düzeyleri (Erzincan YöresiÖrneği). EÜSBED, 6(2): 361–370. TUSF. (2016).http://www.tusf.org/Erişim: 05 Ocak 2017. Türkmen, M., Kul, M.&Bozkuş, T. (2013). Takım sporlarıyla uğraşan sporcuların yarışmak
aygı düzeylerinin cinsiyete ve spor deneyimine göre incelenmesi. Uluslararası
Hakemli Akademik Spor Sağlık ve Tıp Bilimleri Dergisi, 7(3): 106–112. Yavuz, H. U. (2002). Yüzme, paletli yüzme ve atletizm branşlarındaki bazı sporcuların
anksiyete ve depresyon durumları ile reaksiyon zamanlarının belirlenmesi ve karşılaştırılmaları. Yayımlanmamış Yüksek LisansTezi, Hacettepe
Üniversitesi,Ankara. Yılmaz, V., Koruç, Z. &Acar, Z. (2004). Comparison of Pre-Competition and Post-
Competition Anxiety Levels of Volleyball Players. 10th ICHPER-SD
EuropeCongress & The TSSA 8th International Sport Sciences Congress, 17–20
November, Antalya. Yücel, E. O. (2003). Taekwondocuların durumluk ve sürekli kaygıdüzeyleri ve
müsabakalardaki başarılarına etkisi.Yayımlanmamış Yüksek Lisans Tezi,
GaziÜniversitesi, Ankara.

134 Burhanettin Hacicaferoglu,Serkan Hacicaferoglu, Recep Fatih Kayhan
Summary
Examination of State Anxiety Levels of Athletes Participating in
Volleyball Competitions
Burhanettin Hacicaferoglu
Provincial Directorate of Youth and Sports, Antalya, Turkey
Serkan Hacicaferoglu Recep Tayyip Erdogan University, Turkey
Recep Fatih Kayhan
Recep Tayyip Erdogan University, Turkey
This research was carried out in order to determine the state anxiety levels of the
athletes participating in the volleyball sports branch in terms of some variables.
The population of the study conducted by using general screening model consists
of 132 university athletes competing in the 2nd league competition of Turkish
University Sports Federation in 2016, and the sample of the study consists of 103
volunteer sportsmen randomly chosen from the population. In the study, the state
(immediate) anxiety part of the state and trait anxiety scale was used. The
responses of the athletes participating in the study to the scales according to their
demographic variables were calculated by means of a statistical package program.
Frequency, percentage, standard deviation, arithmetic mean, t-test and one-way
analysis of variance (ANOVA) were used in the analysis of the data. At the end of
the study, it was determined that the athletes' anxiety states, especially before the
competition, are in the medium level with the arithmetic mean of 2.36 points in
general. According to the variables of gender, age and volleyball playing time, it
was determined that the athletes have similar pre-competition anxiety situations. In
addition, it was determined that there are not any significant differences in terms of
athletes` pre-competition anxiety states in terms of gender and volleyball playing
time and there is a significant difference in terms of variable of age.
Key words: Anxiety, State Anxiety, Competition, Sportsman, Volleyball.

Khazar Journal of Humanities and Social
Sciences © Khazar University Press 2017
DOI: 10.5782/kjhss.2017.135.146
An Investigation of Physical Activity and Social Self-Efficacy of University Students:
The Example of Turkey and England
Serdar Alemdag
Karadeniz Technical University, Turkey
Ceyhun Alemdag
Karadeniz Technical University, Turkey
Abdullah Bora Ozkara*
Karadeniz Technical University, Turkey
Introduction
It is generally desired and conceived pleasant by university students to be able to
express themselves with ease, saying thoughts out loud and acting freely in their
social environment. A lot of factors that affect the individual's social self-efficacy
were found in the literature. Previous studies have consistently demonstrated that
higher and lower levels of social self-efficacy are related with Shyness, depression,
instrumentality, expressiveness (Hermann and Betz, 2004), physical activity,
environment (Alemdag, 2012; Luszczynska, and et al., 2011; Temple, 2009;
Iskender and Akin, 2010; XiaoXia, S. et al., 2016; Martin, J. J., and Kulinna, P. H.,
2005; Motl, R. W. 2007), emotional well-being (Bandura, et al., 1996), loneliness
and social dissatisfaction (Galanaki and Kalantzi-Azizi, 1999), ..vb.
Self-efficacy is the primary determinant of the social cognitive theory (Bandura,
1997) and is one of the strongest psychosocial predictor of physical activity and
exercise (Netz and Raviv, 2004; Rogers, et al., 2005). Bandura suggests that an
increased level of social support tends to lead to higher level of self-efficacy,
which, in turn, leads to increased level of physical activity (Bandura, 1997).
Physical activity interventions involve targeting social-cognitive variables. Social
cognitive variables correlate with physical activity and are putative influences on
volitional behaviour (Edmundson, et al., 1996; Parcel, et al., 1989). Many human
problems are socio structural, not simply individual. Common problems require
*Corresponding Author 135

136 Serdar Alemdag, Ceyhun Alemdag, Abdullah Bora Ozkara solutions through collective action. Social cognitive theory extends the conception
of human agency to collective agency (Bandura 1997).
Although no unitary definition exists (Smith and Betz, 2000), social self-efficacy is
typically conceptualised as one’s perceived skills and confidence in social
situations (caprara and steca, 2005). Self-efficacy which is mostly related to
interpersonal relationships is called social self-efficacy. It is defined as “an
individual’s confidence in her/his ability to engage in the social interactional tasks
necessary to initiate and maintain interpersonal relationship” (Smith and Betz,
2000). Gesas (1989) noted that individuals with social self-efficacy are capable of
initiating social contact and developing new friendships (Gesas, V., 1989).
Furthermore, individuals with high self-efficacy are more confident in their
abilities to successfully handle stressful situations and thus are more likely to adopt
problem-focused, as opposed to emotion-focused, coping strategies (Bandura,
1986; Boyd, Lewin and Sager, 2009). Perceived social self-efficacy is concerned
with people’s beliefs in their capabilities of exercising control over their own
functioning and environmental events (Bandura 1997). In social cognitive theory,
perceived social self-efficacy operates in concert with other determinants in
regulating lifestyle habits. They include the positive and negative outcomes people
expect their actions to produce. These outcome expectations may take the form of
aversive and pleasurable physical effects, approving and disapproving social
reactions, or self-evaluative consequences expressed as self-satisfaction and self-
censure (Bandura 1997).
Participating in physical activity has been associated with positive mood, greater
self esteem and greater physical and psychological well-being (Brosnahan and et
al., 2004) and beneficial for maintaining physical and mental health. Despite such
benefits, the number of people who do not exercise regularly is relatively high
worldwide (world health organisation, 2004). In addition, the majority of the
populations across the European Union (EU), united states and perhaps worldwide
do not engage in a sufficient level of physical activity to sustain or improve health
(Caspersen et al 2000 and Martinez-Gonzales and et al., 2001). Moreover, there are
noteworthy differences in physical activity levels between different nations, with
Southern Europeans significantly less physically active compared to Northern
Europeans. A majority of people who starts with an exercise programme tends to
drop out within one year (Sallis and Owen, 1999). Stages of change for exercise
have been studied for different populations (Cengiz, 2007; Wakui, Shimomitsu,
Odagiri, Inoue, Takamiya, & Ohya, 2002; Prapavessis, Maddison, & Brading,
2004; Juniper, Oman, Hamm, & Kerby, 2004). These studies, in general, indicated
that males in are higher stages as compared to females. However, most of the
population was found in the lower stages. Similar to the findings, studies of these

An Investigation of Physical Activity and Social Self-Efficacy of University … 137 general populations examining university students’ exercise stages of change level
indicated that most of the students were in lower stages (pre-contemplation,
contemplation and preparation) (Cengiz, 2007; Wakui et al., 2002; Cardinal,
Tuominen, & Rintala, 2004; Juniper et al., 2004; Keating, Guan, Huang, Deng,
Wu, & Qu, 2005b). In addition, male students were in higher stages as compared to
the stages of female students (Wakui et al., 2002).
Individually or collectively performed physical activities play a great role in
establishing social relationships and aiding self-improvement. They support people
in growing up and adjusting to community life, while creating an atmosphere for
new friendships to emerge and finding a place in society. A gap in the literature
reveals that more research is needed studying the influence of participating in
physical activities on the social development of people. The relationship between
the stages of change in exercise adoption and perceived social self-efficacy has not
yet been researched in a comparative study of university students in Turkey and
England. From this perspective, this cross-cultural study is considered to influence
the literature greatly.
Method
Participants: Participants were 1087 (523 women and 564 men) students
fromKaradeniz Technical University and 232 (116 women and 116 men) students
from University of Birmingham who completed a questionnaire package that
included The Stages of Change for Exercise scale and The Perceived Social Self-
Efficacy Scale for the 2014-2015 academic year.
Materials: Personal Information Form:It is consists of four questions related tothe
independent variables studied in the present research. These are as follows:
Student's gender, age, the presence of a family members interested in sports, and
the presence of places suitable for physical activity in student’s neighborhood.
Perceived Social self efficacyScale (PSSE): Smith and Betz (2000) define
socialself-efficacy as “an individual’s confidence in his or her ability to engage in
the social international task necessary to initiate and maintain interpersonal
relationship. The scale of perceived social self-efficacy (PSSE) consists of 25
rationally derived item that measure the level of confidence in a variety of social
situations.
Stages of Change for Exercise Behavior Scale (SCEB): Students’
exercisebehaviour stages were assessed using a measure with five stages (Marcus,
et al., 1992): These stages are Pre-contemplation, Contemplation, Preparation,
Action

138 Serdar Alemdag, Ceyhun Alemdag, Abdullah Bora Ozkara and Maintenance. The participants were required to select only one stage that best
described their current exercise pattern. The participants whose responses classified
them as being in the Action and Maintenance stages also reported the greatest
weekly participation in physical activity. Those classified being in the
Precontemplation and Contemplation stages were “nonexercisers.”
Procedure and Statistical Analysis: This research used questionnaires as
datecollection method. The questionnaires were distributed after obtaining the
necessary permit from universities and consent form from students. The
participation in the survey was voluntary. Descriptive statistics, t test, one-way
ANOVA, Chi-Square and Pearson’s Correlation test were used as an statistical
analysis.
Results
Socio-demographic characteristics of the 1087 University students from Turkey
and 232 from England. The Turkish sample consists of 523 (48.1%) women and
564 (51.9%) man who negated the question. In the English sample the number of
men and women were equal with 116 (50%). 447 (43.9%) of Turkish participant
were younger than 21, 535 (49.2%) between 22-24 of age 75 (6.9%) were older
than 25 in Turkey and 40 (17.2%) of English participant were younger than 21, 71
(30.6%) between 22-24 of age and 121 (52.2%) were older than 25 in England. 523
(48.1%) of Turkish participant’s family members interested in sport in contrast to
564 (51.9%) did not interested any sports in Turkey and 59 (25.4%) of English
participant’s family members interested in sport and 173 (74.6%) did not in
England. Finally, 771 (70.9%) Turkish participants lived close to sport facilities in
contrast to 316 (29.1%) who did not in Turkey and 191(82.3%) English participants
lived close to sport facilities in contrast to 41 (17.7%) who did not in England.
Table 1. T-Test for Perceived Social Self-Efficacy Between Turkey and England
Variables Country N Mean Sd t p
PSSE
TR 1087 90.11 18.71 2.85 .004
ENG 231 86.36 15.90
Table 1 shows that an independent sample t-test was conducted to compare
students’ Perceived Social Self-Efficacy (PSSE) between Turkey and England. As
we see from Table 1, there was a significant difference in the scores for PSSE in
Turkey (M=90.11, SD =18.71) and England (M=86.36, SD=15.90) conditions; t

An Investigation of Physical Activity and Social Self-Efficacy of University … 139 (1316) =2.85, p= .004. These results suggest that Turkish university students have
more PSSE than English university students.
Table 2. Chi-Square Test for The Stages of Change in Exercise Behavior Between
Turkey and England STAGES TURKEY % ENGLAND %
Precontemplation 222 20.4 8 3.4
Contemplation 242 22.3 50 21.6
SCEB Preparation 201 18.5 29 12.5
Action 142 13.1 27 11.6
Maintenance 280 25.8 118 50.9
Total 1087 100 232 100
X2
=75.806, SD=4, p< .001
Note: Pre-contemplation (“Do not exercise, do not intend to start”);Contemplation
(“Do not exercise, thinking about starting”); Preparation (“some exercise,
planning to do more”); Action (“Regular exercise, < 6 months”); Maintenance
(“Regular exercise, > 6 months”).
Presented in Table 2, university students from Turkey and England differ in the
stages of change in exercise behavior. In Turkey, the distribution of the sample
consisted of 222 persons (20.4%) in the stage of pre-contemplation, 242 (22.3%) in
contemplation, 201 (18.5%) in preparation, 142 (13.1%) in action and 280 (25.8%)
in maintenance (Table 2). In contrast, the distribution of the sample consisted of 8
persons (3.4%) in the stage of pre-contemplation, 50 (21.6%) in contemplation, 29
(12.5%) in preparation, 27 (11.6%) in action and 118 (50.9%) in maintenance for
the English sample (Table 2). The result show significant differences between the
stages of change in exercise behavior of Turkish and English university students
(X2
(4) =75.806, p< .001).
The correlation analysis indicates that (Table 3), there was significantly positive
but low correlation between SCEB and PSSE variables for university students in
Turkey (r= .166, p< .001). Consequently, an increase in SCEB leads to a low but
significant increase in PSSE or vice versa. Moreover, we cannot see any significant
correlation between SCEB and PSSE among university students in England (r= .115, p= .80).
Table 3. Corelation for SCEB and PSSE Between Turkey and England
VARIABLES COUNTRIES 1 2
1. SCEB TURKEY -

140 Serdar Alemdag, Ceyhun Alemdag, Abdullah Bora Ozkara
.166**
2. PSSE
(P< .001)
SCEB ENGLAND
-
PSSE .115
(P= .80)
SCEB: Stages of change in exercise behavior, PSSE: Perceived social self-efficacy
Discussion
The purpose of this cross-cultural study is the investigation of physical activity in
relation to perceived social self-efficacy among Turkish and English university
students. Some investigations for the stages of change in exercise behavior (SCEB)
and perceived social self-efficacy (PSSE) were conducted in some countries.
However, no study has yet touched the difference between Turkey and England. To
fill this gap, the relationship between SCEB and PSSE was examined using data
from university students from both countries. We found that perceived self-efficacy
is significantly related to exercise behavior in Turkey. This is in line with the
findings of other studies researching hearth disease and hypertensive patients
(Buapapha, 2004; Tantayothin, 2004), undergraduate students (Alemdag, 2012),
older adults (Anunsuksawat, 2006), and people recruited at a fitness centre
(Wongvilai, 2004). It would appear that self-efficacy is a valid construct when
looking at physical activity behavior in adolescents. Moreover, there was no
significant relation between PSSE and SCEB for English university students. An
unexpected finding was that there was no clear increase in self-efficacy between
action and maintenance. This is not commensurate with the findings of Fallon et
al., (2005). Callaghan et al., (2002) report that significant effects on self-efficacy
were found for stage of change of young Chinese people. Overall, the English
participant in this study tended to be more physically active then their Turkish
counterparts. This result is triggered by the English culture and sport facilities in
the neighborhoods.
We detected significant differences in stages of change between Turkish and
English females as well as Turkish and English males. There was no significant
differences in stages of change among the age groups of Turkey and England.
Similar to our findings, Thogersen-Ntoumani (2009) pointed out that gender and
age predicted stages of change in Greek seniors. Trost et al., 2002 report the same
result for more general samples consisting of European and American adults.
While the findings of this study indicate that there were a significant differences in
stages of change due to the availability of sports facilities in the neighborhood in
the Turkish sample, no such result could be found for England. Environmental
variables were related to stages of change for physical activity between general

An Investigation of Physical Activity and Social Self-Efficacy of University … 141 adult populations (Trost et al., 2002; Ainsworth et al., 2003) and middle and old
aged women (King et al., 2000). In addition to this, Meng Su et al., (2014) point
out that perceived urban built environment attributes significantly correlate with
leisure-time physical activity in Hangzhou, China. However, using a random
sample of Australian seniors, Booth et al., (2000) identified only a non-significant
trend between seeing other exercising in the neighborhood and adequate levels of
physical activity. It is possible that the differences between the current findings and
those of Booth et al., (2000) reflect cultural variation; that is people from more
collectivist societies are more likely to have their behaviour influenced by the
social environment in which they live.
We also examined the effect of parent interested in sports on stages of change
between Turkey and Enland. We found that there were significant differences for
both counties. Similar to our findings, Alemdag (2012) and Ozdinc’s (2005) studies
demonsrated that family members who are interested in sportspositively influence
the stages of change in exercise behaviour of Turkish university students.
No significant differences in PSSE were apparent between Turkish and English
female university students. However, there were significant differences between
Turkish and English males. Hermann and Betz (2004) pointed out that social self-
efficacy indicated no significant gender differences among undergraduate students
at Midwestern University. Rachel Grieve et al.,(2014) identified that there is no
significant gender difference among Australian university students. Moreover,
Jinyan Fan et al., (2010) explored potential gender differences in PSSE mean
scores in Chinese populations. These differences can be explain as cultural.
There were a statistically significant differences between age groups on PSSE in
Turkey but none in England. Similarly, Alemdag (2012) pointed out that social
self-efficacy differs significant among age groups of preservice classroom teachers
in Turkey. This contrasts the findings of Aydiner (2011) who identified that social
self-efficacy did not differ among age groups of Turkish university students. These
differences may have arosen due to regional and cultural differences in students.
The result for PSSE for both countries did not differ when parents were interested
in sports. İn contrast, there were significant differences in PSSE of university
students whose parents are not interested in sports between both countries.
Alemdag (2012) indicates that differences in social self-efficacy are a result of
family members being interested in sports among university students in Turkey.
We lastly looked the differences in due to the presence of sports facilities in the
neighborhood between Turkey and England. We found that, there were no
significant differences in PSSE between Turkish and English university students

142 Serdar Alemdag, Ceyhun Alemdag, Abdullah Bora Ozkara who do not have suitable sport areas in their neighborhoods. In contrast to this
findings, Alemdag (2012) pointed out differences in perceived social self-efficacy
for Turkish uyniversity students with suitable sport facilities in their neighborhood.
Having suitable sport facilities, where students can enjoy during exercise whenever
they want, provide them an opportunity to meet with people from differend culture
which in turn may enhance their social self-efficacy (Alemdag, 2012).
Acknowledgements
The authors would like to thank The Scientific and Technological Research
Council of Turkey (TUBITAK) for support this research and special thanks to Prof.
Nikos Ntoumanis, Dr. Maria Kavussanu and Dr. Ian Boardley for support on this
manuscript.
References and notes:
Ainsworth, B. E, Wilcox, S., Thompson, W. W., Richter, D. L., Henderson, K. A. (2003).
Personal, social, and physical environmental correlates of physical activityin African-
American women in South Carolina. Am J Prev Med. 25(suppl 1):23–9. Doi:
10.1016/S0749-3797(03)00161-2 Alemdag, S. (2013). Investigating participation in physical activity, perceived social self-
efficacy and social self-ımage among university students (Unpublished PhD thesis),
Educational sciences institute, Karadeniz Technical University. Anunsuksawat, W. (2006). Factors influencing to exercise behaviors of elder persons
among Muang district Samutsakhorn province (Unpublished master’s thesis).
Christian University, Nakhon Pathom, Thailand. Aydiner, B. B. (2011). The relationship between sub-dimensions of the life goals with
general self-efficacy, life-satisfaction and some variables(Unpublished master’s
thesis). Sakarya University Education Science Institude, Turkey. Bandura A (1997). Self-efficacy: The Exercise of Control. Freeman W. H., New York. Bandura, A. (1986). Social foundations of thought and action. Englewood Cliffs, N. J.
Prentice-Hall. Bandura, A., Barbaranelli, C., Caprara, G. V.,and Pastorelli, C. (1996). Multifaceted impact
of self-efficacy belief on academic functioning. Child development. 67, 1206-1222.
Doi: 10.1111/j.1467-8624.1996.tb01791.x Booth, M. L. (2000). Assessment of physical activity: an international perspective. Res. Q.
Exerc. Sport 71:S114 S120. Doi: 10.1080/02701367.2000.11082794 Boyd, N. G., Lewin, J. E., & Sager, J. K. (2009). A model of stress and coping and their
influence on individual and organizational outcomes. Journal of Vocational Behavior,
75(2), 197-211. Brosnahan, J., Steffen, L. M., Lytle, L., Patterson, J., & Boostrom, A. (2004). The relation
between physical activity and mental health among Hispanic and non-Hispanic White

An Investigation of Physical Activity and Social Self-Efficacy of University … 143
adolescents. Archives of Pediatrics & Adolescent Medicine, 158(8), 818-823.
Doi:10.1001/archpedi.158.8.818 Buarapha, S. (2004). Relationship between personal factors, perception symptoms severity,
self-efficacy, social support, and physical activity in patients with chronic heart
failure (Unpublished master’s thesis). Chulalongkorn University, Bangkok, Thailand. Callaghan, P., Eves, F. F., Norman, P., Chang, A. M., & Lung, C. Y. (2002). Applying the
transtheoretical model of change to exercise in young Chinese people. British
Journalof Health Psychology, 7(3), 267-282. Doi: 10.1348/135910702760213670 Caprara, G. V., & Steca, P. (2005). Self–efficacy beliefs as determinants of prosocial
behavior conducive to life satisfaction across ages. Journal of Social and
ClinicalPsychology, 24(2), 191-217. Cardinal, B. J., Tuominen, K. J., & Rintala, P. (2004). Cross-cultural comparison of
American and finnish college students’ exercise behavior using transtheoretical model
constructs. Research Quarterly for Exercise and Sport, 75 (1), 92-101. Doi:
10.1080/02701367.2004.10609137 Caspersen, C. J., Pereira, M. A., & Curran, K. M. (2000). Changes in physical activity
patterns in the United States, by sex and cross-sectional age. Medicine and science
insports and exercise, 32(9), 1601-1609. Cengiz, C. (2007). Physical activity and exercise stages of change levels of Middle East
Technical University students (Unpublished master’s thesis). Ankara: Middle East
Technical University. Edmundson, E., Parcel, G. S., Feldman, H. A., Elder, J., Perry, C. L., Johnson, C. C.,
...Webber, L. (1996). The effect of the child and adolescent trial for cardiovascular
health upon psychosocial determinant of diet and physical activity. Prev Med. 25:442-
54. Doi: 10.1006/pmed.1996.0076 Fallon, E. A., Wilcox, S., & Ainsworth, B. E. (2005). Correlates of self-efficacy for
physical activity in African American women. Women & health, 41(3), 47-62. Doi:
10.1300/J013v41n03_03
Fan, J., Meng, H., Gao, X., Lopez, F. J., & Liu, C. (2010). Validation of a us adult social
self-efficacy ınventory in Chinese populations. The Counseling Psychologist, 38(4),
473-496. Doi: 10.1177/0011000009352514 Galanaki, E. P., and Kalantzi-Azizi, A. (1999). Loneliness and social dissatisfaction: ıts
relation with children self-efficacy for peer enteraction. Child study journal 29, 1-22.
Doi: 10.1177/0143034308090061 Gesas, V. (1989). The Social psychology of self-efficacy. Annual Review of Sociology, 15,
291-316
Grieve, R., Witteveen, K., Tolan, G. A., and Jacibson, B. (2014). Development and
validation of a measure of cognitive and behavioural social self-efficacy. Personality
and individual differences. 59, 71-76. Doi: 10.1016/j.paid.2013.11.008 Hermann,K. S., and Betz, N. E. (July 2004). Path models of the relationship of
ınstrumentality and expressiveness to social self-efficacy, shyness and depressive
symptoms. Sex Roles, Vol. 51, Nos. ½. Doi: 10.1023/B:SERS.0000032309.71973.14 Iskender, M. and Akin, A. (2010). Social self-efficacy, academic locus of control and
internet addiction. Computers and Education 54/ 1101-1106. Doi:
10.1016/j.compedu.2009.10.014

144 Serdar Alemdag, Ceyhun Alemdag, Abdullah Bora Ozkara
Juniper, K. C., Oman, R. F., Hamm, R. M., & Kerby, S. S (2004) The relationships among
constructs in the health beliefmodel and the transtheoretical model among african-american
college women for physical activity. American Journal of HealthPromotion, 18 (5), 354-357. Internet: http://www.ncbi.nlm.nih.gov/pubmed/15163135Keating, X. D., Guan,
J.,Huang, Y., Deng, M., Wu, Y., & Qu, S. (2005b). Cross-cultural validation of stages of
exercise change scale among Chinese college students. European Physical Education Review, 11 (1), 71-83. Doi:10.1177/1356336X05049825 King, A. C,
Castro, C., Wilcox, S., Eyler, A. A., Sallis, J. F., Brownson, R. C. (2000).
Personal and environmental factors associated with physical inactivity among different
racial-ethnic groups of U.S. middle-aged and older-aged women. Health Psychol. 19:354–64. Doi:10.1037/0278-6133.19.4.354
Luszczynska, A., Schwarzer, R., Lippike, S., and Mazurkiewicz, M. (2011). Self-Efficacy
as a moderator of the planning-behaviour relationship ınterventions designed to
promote physical activity. Psychology and Health, 26:2, 151-166. Doi:
10.1080/08870446.2011.531571 Marcus, B. H., Banspach, S. W., Lefebvre, R. C., Rossi, J. S., Carleton, R. A., and Abrams,
D. B. (1992). Using the stages of change model to ıncrease the adoption of physical
activity among community participants. American Journal of Health Promotion, Vol.
6, No. 6, pp. 424-429. Doi: 10.4278/0890-1171-6.6.424 Martin, J. J., & Kulinna, P. H. (2005). A social cognitive perspective of physical activity
related behavior in physical education. Journal of Teaching in
PhysicalEducation,24(3), 265-281 Martinez-gonzales, M. A., Varo, J .J., Santos, J. L., De Irala, J., Gibney, M., Kearney, J.,
Martinez, J. A. (2001). Prevalence of physical activity during leisure time in the
European Union. Medicine Science Sport Exercise, 33, 1142-1146 Doi: 00005768-
200107000-00011 Motl, R. W. (2007). Theoretical models for understanding physical activity behavior among
children and adolescents–social cognitive theory and self-determination theory. Journal of Teaching in Physical Education, 26(4), 350-357.
NETZ, Y., &RAVIV, S. (2004). Age differences in motivational orientation towardphysical
activity: An application of social-cognitive theory. Journal of Psychology. 138(1):35-
48. Doi: 10.3200/JRLP.138.1.35-48 Ozdinc, O. (2005). The sentiments of cukurova university students on sports and the sports
participation – socialization relationship. Spormetre Journal of Physical Education
and Sport. 3(2), 77-84.Internet:http://dergiler.ankara.edu.tr/dergiler/17/879/11116.pdf Parcel, G. S., Simons- Morton, B., O’hara, N. M., Baranowski, T., Wilson, B. (1989).
School promotion of healthful diet and physical activity: impact on learning outcomes and self-reported behavior. Health Educ. Q. 16-181-99. Doi:
10.1177/109019818901600204 Prapavessis, H., Maddison, R., & Brading, F. (2004). Understanding exercise behavior
among New Zealand adolescents: a test of the transtheoretical model. Journal of Adolescent Health, 35 (2), 17-27. Internet: http://www.ncbi.nlm.nih.gov/pubmed/15830461

An Investigation of Physical Activity and Social Self-Efficacy of University … 145 Rogers, L. Q., Shah, P., Dunnington, G., Greive, A., Shanmugham, A., Dawson, B., &
Courneya, K. S. (2005). Social cognitive theory and physical activity during breast
cancer treatment. In Oncology Nursing Forum(Vol. 32, No. 4, pp. 807-815).
Oncology Nursing Society. Doi: 10.1188/05.ONF.807-815 Sallis, J. F., and Owen N (1999). Physical activity and behavioural medicine. Thousand
Oanks, CA: Sage Publication Smith, H. & Betz, N. E. (2000). Development and evaluation of a measure of social self-
efficacy ın college students. JOURNAL OF CAREER ASSESSMENT,8, 282-302.
Doi: 10.1177/106907270000800306 Su, M., Tan, Y. Y., Liu, Q. M., Ren, Y. J., Kawachi, I., Li, L. M., & Lv, J. (2014).
Association between perceived urban built environment attributes and leisure-time
physical activity among adults ın hangzhou, china. Preventive medicine, 66, 60-64.
Doi: 10.1016/j.ypmed.2014.06.001 Tantayothin, S. (2004). Factors ınfluences nutritional and exercise behavior of hyper-
tensive patients ın sainoi district, nonthaburi province (Unpublished master’s thesis).
Mahidol University, Bangkok, Thailand Temple, V. A. (2009). Factors associated with high levels of physical activity among adults
with intellectual disability. International Journal of Rehabilitation Research, 32(1),
89-92. Doi: 10.1097/MRR.0b013e328307f5a0. Thøgersen-Ntoumani, C.(2009).An ecological model of predictors of stages of change
forphysical activity in Greek older adults.Scandinavianjournal of medicine & science
insports 19 (2), 286-296.Doi: 10.1111/j.1600-0838.2007.00751.x. Trost S. G., Owen N, Bauman A. E., Sallis J. F., Brown W. (2002). Correlates of adults'
participation in physical activity: Review And Update. Med Sci Sports Exerc: 34:
1996–2001. Doi: 10.1249/01.MSS.0000038974.76900.92 Wakui, S., Shimomitsu, T., Odagiri, Y., Inoue, S., Takamiya, T., & Ohya, Y. (2002).
Relation of the stages of change for exercise behaviors, self-efficacy, decisional
balance, and diet-related psycho-behavioral factors ın young japanese women.
TheJournal of Sports Medicine and Physical Fitness, 42, 224-232.
Internet:http://www.ncbi.nlm.nih.gov/pubmed/12032420 Wongvilai, N. (2004). Psychological factors affecting the continuing exercise behavior of
customers at nalinrut fitness center (Unpublished master’s thesis). Kasem Bundit
University, Bangkok, Thailand. World Health Organization (2004). Global Strategy On Diet, Physical Activity and Health.
XiaoXia, S., Ping, X., McBride, R. E., JiLing, L., & Thornton, M. A. (2016). At-risk boys' social self-efficacy and physical activity self-efficacy in a summer sports camp. Journal of Teaching in Physical Education, 35(2), 159-168.

146 Serdar Alemdag, Ceyhun Alemdag, Abdullah Bora Ozkara
Summary
An Investigation of Physical Activity and Social Self-Efficacy of University Students: The Example of Turkey and England
Serdar Alemdag Karadeniz Technical University, Turkey
Ceyhun Alemdag Karadeniz Technical University, Turkey
Abdullah Bora Ozkara
Karadeniz Technical University, Turkey
The purpose of this cross-cultural study exposes physical activity participation in relation to
perceived social self-efficacy (PSSE) between Turkey and England university students. The
study group of the research consists of 1087 (523 women and 564 men) students from
Turkey and 232 (116 women and 116 men) students from England who completed a
questionnaire package that included The Stages of Change for Exercise Behavior scale and
The Perceived Social Self-Efficacy Scale. Descriptive statistics, t test for independent
groups, one-way analysis of variance (ANOVA), Chi-Square test and Pearson’s Correlation
test were used as an statistical analysis. Results show that the perceived social self-efficacy
was a significant relation on stage of change for exercise behavior (SCEB) in Turkey but
there was no significant relation between PSSE and SCEB in England university students,
and university students in Turkey have more PSSE than university students in England.
Furthermore, it was found significant differences for the stages of change for exercise
behavior between Turkey and England and that university students living in England are
significantly more physically active than students living in Turkey. This result could explain
that England has more sport neighborhood and facilities than Turkey. We conclude that the
cross-cultural effect on the stages of change for exercise is mediated by perceived social
self-efficacy among university students in Turkey.
Keywords: Social self-efficacy, stages of change for exercise, university students

Khazar Journal of Humanities and Social
Sciences © Khazar University Press 2017
DOI: 10.5782/kjhss.2017.147.156
Type 1 Health Development Model Effect in Diabetes Management
Ercument Ergishi
IMBL Business Department, Institute of Social Sciences, Russian Federation
Introduction Type 1 diabetes accounts for 5-10% of diabetics are all over the world (ADA 012a). The incidence of type 1 diabetes in our country and / or there are no current studies that determine the prevalence (www.diyabet2020.org, Date of access: 03.04.2017). In our country, but 0 -15 years of age with type 1 diabetes incidence study conducted in 1996 by UÇADİVET-1, the ratio was found to be 2.52 years 100,000 (Hatun 2001, Saka 2003). Local studies, as well as all over the world, shows that the increase of type 1 diabetes incidence and earlier age of onset registration (www.diyabet2020.org, Date of access: 03.04.2017). Type 1 diabetes is the follow-up of patients who need to be conducted in pediatric endocrinologist centers, but in our country can not be achieved even in large cities seen it. Limited units available in pediatric endocrinology, diabetes nurse, a dietitian less, there is less and less in expert psychologists and social services. In this case, to provide a holistic service prevents diabetes in children and adolescents (www.diyabet2020.org, Date of access: 03.04.2017). However, the planning of daily life in the control of blood glucose levels is an essential part of diabetes management. Diabetes, when managed effectively, preventing long-term complications are / is delayed but many adolescents with diabetes, diabetes management can not adapt to the individual characteristics due to various factors affected (Amsberg et al 2009). Type 1 diabetes manage, four times a day to measure blood glucose, insulin
injections, diet and exercise therapy as indispensable components adapt to very
tight fit and can create a burnout adolescents because it requires continuity and
responsibility (Greening, Stoppelbein, Konishi and Jordan 2007, Amsberg et al
2009).Adolescence begins with sexual and psychosocial maturation caused by the
physical and emotional process, the independence of the individual and social
productivity gains, too chronological ended without a specific time; rapid physical,
psychological and social change with an original term (Çuhadaroğlu 2000).
147

148 Ercument Ergishi The change in emotional emotions causes him to become sensual, to feel
uncomfortable, to oppose, or to be afraid in many ways. The purpose adolescent
and adults to be independent, to be able to give direction to life as he wants. They
immediately accepted the rules are not required to comply (Yavuzer 2005).
Adolescents with chronic diseases, causes anger will lead to the prevention of
emerging independence. Diabetes is a chronic disease which, if you create a
situation that will prevent adolescent relationships with peers, compatibility
problems may be more common. Rules and functioning of the questioning in this
age, diabetes, creates conflict between adolescents and authority figures (Erdoğan
ve Karaman 2008) and it may cause a negative impact on the adolescents' diabetes
management. Diabetes education is an integral part of diabetes and glycemic
control is provided by diabetes education in the world, which reduced
hospitalizations and complications that delay / prevent it are accepted. Education is
effective management of diabetes and metabolic control has been proven by
research to improve (Leite et al 2008, Cochran ve Conn 2008, Nansel et al 2007).
Diabetes education should be based on therapeutic patient education policy.
Therapeutic patient education, patient is a patient-centered approach and
requirements, focus on the possibilities and values. Therapeutic patient education
not only improve the knowledge and skills associated with the disease but also
ensures active participation of individuals in their treatment and care. In particular,
increases the quality of life for individuals with chronic diseases such as diabetes,
prevention of diabetes provides therapeutic compliance and complications (Golay,
Lagger, Chambouleyron, Carrard and Lasserre-Moutet 2008).
Diabetes educators (nurses pediatrician, endocrinologist, dietitians, psychologists,
etc.), different teaching models in diabetes education / theories uses (Bonnet,
Gagnayre ve D’Ivernois 1998).
Adolescents whose faculties are causally related to cause-effect relationships are
different from adults. This feature development of adolescents should be
considered in diabetes education (Rankin and Stallings 2001).
The adolescent feeling of discomfort to many changes in housing, leads to defy or
fear. The purpose adolescent and adults to be independent, to be able to give
direction to life as you want (Yavuzer 2005).
Therefore, there should be no addition to the family in the process of independence
of the adolescent diabetes education is important (Rankin and Stallings 2001).
Therapeutic education of diabetic individuals should not only aim at improving the
individual's abilities but at the same time aim at behavioral change. This is the most

Type 1 Health Development Model Effect in Diabetes Management 149 difficult part of the therapeutic education. Behavior change is a condition that can
be carried out step by step creation of (Golay, Lagger, Chambouleyron, Carrard
and Lasserre-Moutet 2008).
Diabetes and diabetes management behavior-based approach for individuals to
develop their skills in self-management is recommended (Golay, Lagger,
Chambouleyron, Carrard and Lasserre-Moutet 2008, Amsberg et al 2009).
In the last decade, the effects of these models and approaches in therapeutic
education have been clearly seen (Golay, Lagger, Chambouleyron, Carrard and
Lasserre-Moutet 2008).
According to the principle that therapeutic approaches should be specific training
adolescents. Adolescent-specific teaching methods used when diabetes
management may be adversely affected (Amsberg et al 2009).
Metabolic control, especially in adolescence growth hormones, general health,
stress, and so on. Also influenced by many factors (Cook et al. 2001, Silverstein et
al. 2005).
Pathophysiology of Type 1 Diabetes
Type 1 diabetes comprises 5-10% of people with diabetes. This form of diabetes,
the autoimmune destruction of pancreatic beta cells that results in the individual's
insulin-dependent or childhood-onset is seen as (Guariguata, Whiting, Weil,
Unwin, 2011: 322).
One of the characteristics of Type 1 diabetes is the presence of neuroendocrine
adaptive responses to the protein. One such protein Glutamic acid decarboxylase
(GAD 65) is. GAD; A strong inhibitory neurotransmitter and neurophysiological
function which is an important component D-amino butyric acid (GABA) is an
important enzyme in the synthesis.
GAD / GABA, nerve cells are found in organs such as the pancreas and non-neural
cells, especially certain (Reetz, Solimena, Matteoli, Folli, Takei, DeCamilli, 1991:
1275).
Islet is stored in synaptic vesicles in beta cells (Sorenson, Garry, Brelje, 1991:
1365). Although the functional relevance is not known with certainty, it is
considered to have a paracrine effect in modulating the secretion of glucagon in the
alpha cells (Wendt, Birnir, Buschard, Gromada, Salehi, Sewing, Rorsman, Braun,
2004: 1038). Antibodies generated against GAD are an important determinant in
the risk and progression of autoimmune diabetes (Towns, Pietropaolo, 2011: 847).

150 Ercument Ergishi GAD and other islet autoantigens positivity of Type 1 diabetes autoantibodies
determine the accurate and reliable application (Achenbach, Warncke, Reiter,
Naserke, Williams, Bingley, Bonifacio, Ziegler, 2004: 384).
Materials and Methods
Type of research
The research was semi-experimental and was performed in the form of pre-test and
post-test in one group.
Location and Time of the Study
The data were used to identify the form of puberty with diabetes and the use of the
Type 1 diabetes assessment form.
The Universe of Research and Sampling
The aim of this article is to determine the level of effectiveness of diabetes
education based on health promotion model in diabetes management of adolescents
aged 13-17. The study was conducted with 36 type 1 diabetic patients in a special
hospital in the Pediatric Endocrine and Metabolism Outpatient Clinic between the
ages of 13-17 in the form of pre-test and post-test.
Data Collection Method
The data were used to identify the form of puberty with diabetes and the use of the
Type 1 diabetes assessment form.
Findings
This section with type 1 diabetes for adolescent and family demographic
characteristics, treatment compliance / complications / symptoms related to
metabolic measurement results in Table 1 are included.
Table 1. Distribution of Adolescents with Type 1 Diabetes Related Features
Property s %
Gender Woman 19 52,8
Male 17 47,2
Do not go to school 2 5,6
Education Status
Primary education 10 27,7
High school 24 66,7
Mothers Training Status Not literate 5 13,8
Primary education 24 66,7

Type 1 Health Development Model Effect in Diabetes Management 151
High school 6 16,7
University 1 2,8
Not literate 0 0
Father Educational Status
Primary education 23 63,9
High school 10 27,8
University 3 8,3
The presence or absence of Yes 2 5,6
a Type 1 diabetic sibling
No 34 94,4
1-3 years 6 16,7
4-6 years 15 41,7
Age of diabetes 7-9 years 8 22,2
10-12 years 6 16,7
13-15 years 1 2,7
1 times 1 2,8
Blood Glucose
2 times 3 8,3
3 times 8 22,2
Measurement Frequency
4 times 18 50,0
(per day)
5 times 5 13,9
6 times 1 2,8
Nurse 21 58,3
Doctor 2 5,6
Diabetes Education
Diabetes camp 2 5,6
Receiving Status Diabetes Education 11 30,6
Taken to remember
those who
Status of Staying in Last Yes 8 22,2
One Year No 28 78,8
1-3 years 7 19,4
Acute Complication /
4-6 years 8 22,4
Hypoglycemia / In the Last 7-9 years 6 16,7
Month
10 times and over 9 25,0
Never 6 16,7
Acute Complication / 1-3 years 6 16,6
Hyperglycemia / In the Last 4-6 years 8 22,2
Month
7-9 years 4 11,2
10 times and over 12 33,4
Never 6 16,6
TOTAL 36 100,0
Surveyed, 36 type 1 diabetic adolescents age ranged between 13-17 and the
average age of 15.2 ± 1.09. 52.8% of respondents (n = 19) to the girls and 47.2% (n
= 17) of them were male. When education status was examined by 5.6% (n = 2) of

152 Ercument Ergishi them did not go to school, 27.7% (n = 10) reported that they continued to primary
education, 66.7% (n = 24) it shows them it continued to high school. 66.7% of
mothers (n = 24) have primary, 16.7% (n = 6) have high school graduate. The
Father of 63.9% (n = 23) u primary education, 27.8% (n = 10) are graduates of high
school. type 1 diabetic adolescents surveyed 94.4% (n = 34) patients with type 1
diabetes does not have any siblings. Adolescents with diabetes participating in the
study the average age of 2.47 ± 1,05't. This is 41.7% of those adolescents (n = 15)
with diabetes aged 4-6 years, 22.2% (n = 8) of them from diabetes age it is between
7-9 years. Type 1 is observed that measure blood glucose every day all those
adolescents with diabetes. Daily average blood glucose of 3.72 ± 1.00 times (at
least 1kez maximum of 6 times) is measured. 50.0% of participants (n = 18) that
they measure blood glucose at the 4 times a day. Participated in the study
participants, 69.4% (n = 25) as a diagnosis of diabetes they received diabetes
education after being introduced, 30.6% (n = 11) of them while they receive
training after they diagnosed diabetes but education stated that they remember
almost none of it and what is taught who gave . Considering they receive from and
where the diabetes education 58.3% (n = 21) the reputation of the diabetes nurses,
5.6% (n = 2) from the doctor sini's, 5.6% (n = 2), while they receive training from
the tray diabetes camp. When the duration of education of diabetes educators was
examined, it was seen that 33.3% (n = 12) of the participants were educated for one
week and the others were educated during 6 days to one month or during regular
checks. While 52.8% (n = 19) of the participants were educated, 8.3% (n = 3) were
individual and 8.3% (n = 3) were both group and individual educated. 22.2% (n = 8) of adolescents with type 1 diabetes admitted to the hospital with diabetes at least
once in the past year. And 77.8% (n = 28) did not go to hospital with the cause of
diabetes within the past year. Diabetic ketoacidosis was found in 11.1% (s = 4),
blood glucose regulation was 5.6% (s = 2) and blood glucose control was high in
5.6% (s = 2) when the causes of hospitalization in the hospital were examined
Blood glucose. When acute complications of type 1 diabetic adolescents were
evaluated, hypoglycemia occurred 10 times and 25% (n = 9) and over, and 19.4%
(n = 7) 1-3 times in the last month. When hyperglycemia was diagnosed within the
last month, it was experienced 10 times or more and 33,4% (n = 12) and 22,2% (n = 8) 4-6 times. 36.1% (n = 13) had no health, 36.1% (n = 13) did not feel anything,
and 36.1% had no feelings when they answered the question "What makes you feel
like being diabetic? 13.9 (n = 5) felt that they felt different and 13.9% (n = 5) stated
that diabetes was a very bad thing.
Type 1 Health Development Model Effect in Diabetes Management 153 Results
It was observed that 69.4% (n = 25) of the adolescents participating in the study
had diabetes education and 58.3% (n = 21) of these individuals had received
diabetes education when they were diagnosed with diabetes education after taking
the diagnosis of diabetes. Diabetes education has proven effective in the
management of diabetes through research is extremely important. When the
literature is examined, it is seen that studies on the effect of diabetes education on
diabetic children / adolescents with type 1 diabetes on metabolic control have been
made in 1990s. Rubin, Perrotta and Saudek (1989), the 165 diabetes are tabulated
regular training throughout their study with the participation of six months to
people with diabetes and such training results in people with diabetes were found to
improve as the case before training diabetes management and metabolic control. In
a study conducted by Delamater et al (1990) on the effect of diabetes management
training on metabolic control within the next 2 years, 36 children in the 3-16 age
group were trained and the metabolic controls were found to be better than those
who did not. In Couper, Taylor, Fotheringham and Sawyer (1999) 's study, 69 type
1 diabetic adolescents between the ages of 12 and 17 were visited at home for six
months, followed by diabetes education for 18 months. As a result, it was
determined that diabetes management and metabolic control of the given group
showed improvement according to the control group. In Sidorov et al (2000) study,
5332 volunteer diabetics participated in the "disease management program", in
which 84% of diabetic patients had a decrease in HbA1c values in the first 3
months, while 663 diabetic subjects continued to watch for one year had a decrease
in insulin and oral antidiabetic drug doses respectively. Cook et al (2002) 's work
on problem-solving types of education between the ages 13-17 1 diabetes is
detected improvement in diabetes care behaviors and metabolic control in
adolescents. Gage et al (2004) in the 9-21 age type of diabetic adolescents with
diabetes education and the work they studied carried out research on psychosocial
interventions and Warsi, Wang LaValley, Avorn, Solomon (2004) 's chronic
diseases in a systematic review of their work self-management education similar
results were determined. Nansel et al (2007) 's 11-16 years with type 1 diabetes as a
result of improvements in HbA1c diabetes management education they gave about
the adolescents were seen. In the study of Liebman, Heffernan and Sarvela (2007),
similar results were obtained with education given to children with low-income
type 1 diabetes over 3 years of age. In a study by Leite, Zanim, Granzotto, Heupa
and Lamounier (2008) investigating research related to diabetes education between
2000-2007, 40 studies were examined and the positive effect of diabetes education
on glycemic control was emphasized. The meta-analysis of Cochran and Conn
(2008) on adult diabetic individuals also found parallel results with other studies. It
is thought that it is inevitable that all diabetic adolescents should go through basic

154 Ercument Ergishi education because it is possible to improve the metabolic control of diabetes
educated adolescents as well as the acute and chronic complications of diabetes.
According to the results obtained from the research, it is very thought-provoking to
say that about 30% of the adolescents do not remember what they were taught
when they were educated. Diabetes mellitus plays an important role in the
formation of positive behavioral changes in the diabetic individual and in the
success of established education programs within the diabetes team. Fitzner et al.
(2008) 's "diabetes educators" and "diabetes management" keyword role in the
years 1995-2008 with the work they published articles in diabetes nurse scans of
diabetes and the importance of education is emphasized. Funnel et al. (2011) 's
standards they created about the diabetes education is seen that also included the
training of nurses in diabetes associated with diabetes management team. It is
believed that the ineffectiveness of 30% of adolescents in diabetes education
provided by the nurses in the research is due to the fact that education is not
standardized and continuous. The study has been given a standardized training
based on SGM and the Full Learning Theory and its positive results have been
seen. As a standard education has certain rules and steps, all diabetes can get a
chance to receive education until it is at an equal level. Not every teenager has the
same learning ability. However, in our country, diabetes nurses are thought to be
inevitable as a result of the training they give with their own efforts and dedication
without research.
References and notes:
Achenbach P, Warncke K, Reiter J, Naserke HE, Williams AJ, Bingley PJ, Bonifacio E,
Ziegler AG. Stratification of type 1 diabetes risk on the basis of islet autoantibody
characteristics. Diabetes 2004; 53(2): 384– 392. Amsberg S, Anderbro T,Wredling R, Lisspers J, Lins PE, Adamson U, Johansson UB.
(2009). A cognitive behavior therapy-based intervention among poorly controlled
adult type 1 diabetes patients—A randomized controlled trial. Patient Education and
Counseling, 77: 72–80. American Diabetes Association (ADA) (2012a). Diagnosis and Classification of Diabetes
Mellitus. Diabetes Care, 35:S64-S71 (Suppl. 1). Bonnet C, Gagnayre R, D’Ivernois JF. (1998). Learning difficulties of diabetic patients: a
survey of educators. Patient Education and Counseling, 35:139–147. Cochran J, Conn VS. (2008). Meta-Analysis of Quality of Life Outcomes Following
Diabetes Self-Management Training. Diabetes Educator, 34(5): 815-823. Çuhadaroğlu F. (2000). Ergenlik Döneminde Psikolojik Gelişim Özellikleri. Katkı Pediatri,
21(6): 863-868.

Type 1 Health Development Model Effect in Diabetes Management 155 Erdoğan A, Karaman MG. (2008). Kronik ve Ölümcül Hastalığı Olan Çocuk ve Ergenlerde
Ruhsal Sorunların Tanınması ve Yönetilmesi. Anadolu Psikiyatri Dergisi, 9:244-
252. Golay A, Lagger G, Chambouleyron M, Carrard I, Lasserre-Moutet A (2008). Therapeutic
education of diabetic patients. Diabetes/Metabolism Research And Reviews, 24:
192–196. Greening L, Stoppelbein L, Konishi C, Jordan SS, Moll G. (2007). Child Routines and
Youths’ Adherence to Treatment for Type 1 Diabetes. Journal of Pediatric
Psychology, 32(4): 437–447. Guariguata L, Whiting D, Weil C, Unwin N. The International Diabetes Federation
Diabetes Atlas methodology for estimating global and national prevalence of
diabetes in adults. Diabetes Research and Clinical Practice 2011; 94: 322-332 Hatun Ş. (2001). Türk Diabet Yıllığı 2000-2001. Türk Diabet Cemiyeti Yayını, İstanbul,. s.
65- 76. Jun HS, Khil LY, Yoon JW. Role of glutamic acid decarboxylase in the pathogenesis of
type 1 diabetes. Cell Mol Life Sci. 2002; 59(11):1892–1901. Leite SAO, Zanim LM, Granzotto PCD, Heupa S, Lamounier RN. (2008). Educational
Program to Type 1 Diabetes Mellitus Patients: Basic Topics. Arq Bras Endrocrinol
Metab, 52(2): 233-242. Nansel TR, Iannotti RJ, Simons-Morton BG, Cox C, Plotnick LP, Clark LM, Zeitzoff L.
(2007). Short-term and 1-year outcomes of a diabetes personal trainer intervention
among youth with type 1 diabetes. Diabetes Care, 30:2471–2477. Rankin SH, Stallings KD. (2001). Patient Education. 4th ed, Lippincott, Philadelphia, p.99-
107, 134-138. Reetz A, Solimena M, Matteoli M, Folli F, Takei K, DeCamilli P. GABA and pancreatic
beta-cells: colocalization of glutamic acid decarboxylase (GAD) and GABA with
synaptic-like microvesicles suggests their role in GABA storage and secretion. PMJ
1991; 10:1275–1284. Sorenson RL, Garry DG, Brelje TC. Structural and functional considerations of GABA in
islets of Langerhans: beta-cells and nerves. Diabetes. 1991; 40:1365–1374. Towns R, Pietropaolo M. GAD65 autoantibodies and its role as biomarker of Type 1
diabetes and Latent Autoimmune Diabetes in Adults (LADA). PMC 2011; 36(11):
847. Wendt A, Birnir B, Buschard K, Gromada J, Salehi A, Sewing S, Rorsman P, Braun M.
Glucose inhibition of glucagon secretion from rat alpha-cells is mediated by GABA
released from neighboring beta-cells. Diabetes 2004; 53(4):1038–1045. www.diyabet2020.org, Erişim tarihi: 03.04.2017. Yavuzer H. (2005). Gençleri Anlamak. 2.basım, Remzi Kitabevi, İstanbul.

156 Ercument Ergishi
Summary
Type 1 Health Development Model Effect in Diabetes Management
Ercüment Ergishi IMBL Business Department, Institute of Social Sciences, Russian Federation
The aim of this article is to determine the level of effectiveness of diabetes
education based on health promotion model in diabetes management of adolescents
aged 13-17. The study was conducted with 36 type 1 diabetic patients in a special
hospital in the Pediatric Endocrine and Metabolism Outpatient Clinic between the
ages of 13-17 in the form of pre-test and post-test. The data were used to identify
the form of puberty with diabetes and the use of the Type 1 diabetes assessment
form.
The Type 1 diabetes management module on which the health promotion model
was based was provided with training to communicate with each other. The ability
to manage diabetes mellitus (p = 0,000) and self-efficacy levels (p = 0.002)
developed in adolescents as a result of the presentations. There was no change in
the level of commitment of these abilities (p = 0.958). Increased diabetic
knowledge levels of adolescents with education were observed (p = 0,000).
As a result, trainings planned to be given under the Type 1 diabetes management
module can be recommended as an effective model for improving the ability of
individuals with type 1 diabetes and adolescents to manage diabetes mellitus. In
this way, the Pediatric Endocrine and Metabolic Polyclinic will be able to bring the
training programs planned by the health workers into a determined standard.
Keywords: Diabetes, Diabetes management, Ergene, health promotion module,

Khazar Journal of Humanities and Social
Sciences © Khazar University Press 2017
DOI: 10.5782/kjhss.2017.157.166
The Effects of Moderate Level Aerobic Exercise on Caregivers of Patients with
Alzhiermer Disease: Randomized
Controlled Study
Tuba Uyar
Rize Kackar State Hospital, Turkey
Akin Celik
Karadeniz Technical University, Turkey
Fatih Koca
Karadeniz Technical University, Turkey
Introduction
The concept of health has gradually changed in recent years and it became a more
dynamic and easily adaptable to everyday life and personally editable condition.
Social health concept allows people to participate in social activities and targets
independence despite chronic diseases. These new perspectives are becoming
increasingly widespread (Huber, Machteld et al., 2011).
Aging of the population all over the world has led to a gradual increase of chronic
diseases and therefore the number of primary caregivers increased. In Turkey, the
proportion of the elderly in the general population is increasing over the years as
well. Turkey's population according to the census carried out in 1990 revealed that
while the population in Turkey increased 11% over 5 years, the population aged
60-65 increased by 44%. In Turkey, the population over the age of 65 is 6% of the
whole populationYikilkan, Aypak, &Gorpelioglu, 2014).
Functional disability and neuropsychiatric symptoms are observed in Alzheimer’s
disease (AD) due to progressive cognitive decline (Steinberg et al., 2009). Giving
care for patients with dementia is becoming an increasingly common family
experience (Castro et al., 2002). Previous studies have been highlighted the
157

158 Tuba Uyar , Akin Celik , Fatih Koca
importance of burnout syndrome, depressive findings and their negative impacts on
quality of life of the caregivers of the patients (Bauer et al., 2000; Castro et al.,
2002). One of the most probable reasons for this reduction in quality of life and
health status of caregivers is the lack of regular exercises which positively support
physical and psychological health. As already known, doing regular exercises
reduces cardiovascular risk factors, stress, and depression and increases the sleep
quality (King, Taylor, & Haskell, 1993). Previous studies showed that the rate of
regular exercise in caregivers who provide care for long periods in the day is low
(Burton et al., 1997; Castro et al., 2002). Therefore, searching the physiological
effects of exercise on health of the caregivers is essential. To date, negative factors
that affect caregivers have been investigated whereas quite a few studies focused
on positive factors. In a pilot study, the interest of caregivers to physical activity
programs have been identified as high and the authors showed that caregivers can
physically adapt to life styles successfully (Castro et al., 2002).
Giving care for patients with chronic diseases is a very difficult process that
requires support for patients and caregivers as well. This role is shaped by
sociocultural and economic factors and it can become even more difficult. Since
care is not a foreseeable situation, adaptation takes time. The role also may be more
severe depending on the severity of the patient and the disease. A process begins
that surrounds the lives of caregivers both physically and emotionally. Several
studies have been reported that the relationship between the caregivers and the
patient may affect the burnout. In addition to this, this condition indirectly affects
the patient. Caregiver’s trouble and quality of relationship between the caregiver
and the patient determines the emergence of depression and anxiety symptoms
(Etkin et al., 1997; Pearlin et al., 1990). Numerous studies have been reported the
high incidence of depression, anxiety, hypertension, peptic ulcer and other stress
associated disorders in caregivers of patients with Alzheimer’s disease (Knight,
Steven, & Felice, 1993; Schulz & Scott, 1999)..
It is a devastating picture for caregivers that patients with Alzheimer’s disease
become unable to recognize their spouse and children due to destruction of their
memory. In contrast, there are also some reports in the literature that the actual
burnout symptoms of caregivers are not cognitive functions but other clinical
pictures specific to the disease (Tarlow& Diane, 2000). Studies that primarily
evaluating the impairment in cognitive functions showed higher depression,
anxiety and burnout scores in caregivers of older people with dementia compared
to caregivers of older people without dementia (Etters et al., 2008; Kucukguclu et
al., 2017) . Psycho-rehabilitative services arranged according to the needs of the
patient and caregiver may increase the quality of the care, reduce the stress of the
caregiver and increase quality of life of the patient. While a relative improvement

The Effects of Moderate Level Aerobic Exercise on Caregivers of Patients…. 159
in the mental and physical health of caregivers were achieved with studies on this
issue, it has been reported that significant improvements in terms of increasing the
number of centers for patients, and facilitating access to centers have been
accomplished (Christofoletti et al., 2011; Lecture, Wolffe, &Wolffe, 1994).
Even with phone calls made by the physician at regular intervals, the mortality of
patients was reduced and reaching health care in the primary care setting was made
easier. Increased knowledge on medical problems and compliance to drugs lead to
increased awareness on psychiatric problems such as depression and anxiety of
patients and caregivers (Christofoletti et al., 2011). In the light of this views, within
the scope of our project to realize social integration of the patients with chronic
neurodegenerative disease and their caregiver relatives, improve their quality of life
and psychosocial support, this study was conducted as a separate research topic.
Hypothesis
Regular moderate level physical activity in young and older individuals reduces the
cardiovascular disease risk and increases the quality of life. It also creates
wellbeing in certain conditions including coping with stress, depressive symptoms,
and improvement in sleep quality which are common in caregivers for older
people. The present research is the first systematic study investigating the effects of
physical activity in caregivers of dementia patients in our country. Similar studies
in the literature have shown that physical activity significantly increases the quality
of life of caregivers (King et al., 2002). The aim of the present study was to
investigate the effects of regularly exercising on anxiety and depression levels of
caregivers who provides moderate level dementia care.
Method
Procedures
Participants were attended the “I am active, live well and long” study program in
our hospital. The following information of the participants was recorded: date of
birth, gender, duration caregiving for the patient with dementia and degree of
relationship with the patient. Physical examinations of the participants were
performed. Vital signs, blood and electrocardiography tests were observed. Clinical
history of the participants was also retrieved.
Exercise Group

160 Tuba Uyar , Akin Celik , Fatih Koca
Participants with cardiovascular and respiratory illnesses that do not allow exercise
were excluded from the study. Drug treatments of the participants during the 12
weeks period were followed. Participants doing regular weekly exercise and using
antidepressants were also excluded from the study. A moderate level aerobic
exercise program was performed with participants 35-40 minutes a day, three times
a week during 12 weeks period by a sports instructor and a Pilates instructor in our
hospital. Participants were accepted to program as 10 person in each group. This
aerobic exercise program included 15 minutes of arm strengthening, 15 minutes of
leg strengthening and 20 minutes of brisk walking on the treadmill. Written
informed consent was obtained from each participant. Body heights of the
participants were measured. Beck Depression Inventory, Beck Anxiety Inventory
and body weight measurements were performed in both groups before and after
exercise program.
Control Group (diet education)
Participants were chosen randomly. Participants were followed up weekly by a
dietician and a healthy diet program was applied. Before the study was started
written informed consent was obtained from each participant. Body heights of the
participants were measured. Beck Depression Inventory, Beck Anxiety Inventory
and body weight measurements were performed in both groups before and after
exercise program.
Outcome Measures
Beck Depression Inventory (BDI) and Beck Anxiety Inventory (BAI) were
performed to participants. Depressive symptoms were evaluated according to BDI.
This self- reported 21-item questionnaire evaluates the motivational, somatic,
cognitive, and emotional symptoms of the person. The purpose of this scale is not
to diagnose depression but to objectively assess the severity of the existing
depressive symptoms. BDI scores are graded as follows: <13, no depression; 14-
19, low grade depression; 20-28, moderate grade depression; 29-63, severe
depression. Persons with BDI scores equal or greater than 17 indicate depression
(with 90% accuracy) that should be treated.
Anxiety symptoms were evaluated with BAI. BAI is also a self-reported inventory
in which symptom severity is graded as 0, 1, 2, and 3. Total BAI scores are graded
as follows: 0-7, minimal; 8-15, mild; 16-25, moderate; 26-63, severe.
Data Analysis

The Effects of Moderate Level Aerobic Exercise on Caregivers of Patients…. 161
The goal of the study was to examine the effect of physical activity on the
participants, who help the patients with Alzheimer’s disease. Accordingly, the
researchers conducted descriptive and inferential statistics to examine the impact of
the treatment. The research findings were discussed below.
Results
Sociodemographic characteristics, gender, age, and weight as well as the outcome
measures of the baseline, were compared using the independent sample t-test and
descriptive data statistics. The sample included a group of 40 participants (21 in the
treatment group, 19 in the control group) aged 48 to 72 years (M = 58.6, SD =
6.76). A total of 33 participants were female and 7 were male. The independent
sample t-test was conducted to test whether or not there was any difference in terms
of age between the treatment and control groups. The findings indicated that there
was not any significant difference between the groups (t(38)= .328, p = .75). The
demographic characteristics of the participants were presented in Table 1 and Table
2. Table 1: Descriptive statistics of the participants’ gender
The Treatment The Control
N % N %
Female
17 81 16 84
Male 4 19 3 16
Total 21 19
Table 2: Descriptive statistics of the participants’ age
Treatment Control
M SD M SD
Female 57.88 1.57 57.38 1.76
Male 59.75 2.96 67.33 0.33
Total 58.24 1.36 58.95 1.71
In addition, we analyzed the distribution of the participants in terms of the severity
of depression symptoms. A total of 7 participants were in the normal (% 17.5), 20
(%50) were in low level, 8 (% 20) were in middle, and 5 (% 12.5) were in high
rank of the severity regarding the depression. Furthermore, we conducted the
independent sample t-test to see if there was any group difference between baseline
outcome variables (i.e., depression and anxiety). As showed in Table 3, the
participants’ baseline depression and anxiety scores were relatively low to medium.

162 Tuba Uyar , Akin Celik , Fatih Koca
Based on the findings, no statistically significant difference for depression scores (t
(38) = 0.543, p = 0.59) and anxiety scores (t (38) = 1.561, p = 0.13) were
observed. In this sense, the participants in the treatment and control groups were
assumed equal for baseline outcome variables.
We conducted ANCOVA to examine the impact of the treatment on the
participants’ depression and anxiety tendencies. The mean and standard deviation
of pre- and post–test scores of dependent variables for each group were shown in
Table 4. The study findings showed that an ANCOVA revealed a main effect of the
treatment on depression, F (1, 38) = 5.16, p < .05. In other words, there was a
statistically significant decrease in depression severity for the treatment group after
controlling the pre-depression level for both groups. In addition, the effect size for
the main affect was moderately high (.12). For anxiety, there was a statistically
significant main effect of the treatment on the anxiety level after controlling the
baseline scores for the treatment and control groups, F (1, 38) = 4.13, p < .05. The
power of the main effect was moderately high (.09). The findings and baseline
means of each outcome variable were summarized in Table 5.
Table 4: Depression and Anxiety Pre- and Post-Test
Pre-Test Post-Test
Depression M SD M SD
Treatment 18.38 5.66 17.05 4.86
Control 19.37 5.82 20.74 5.41
Anxiety M SD M SD
Treatment 18.71 4.76 16.43 3.69
Control 16.53 4.02 17.00 4.15
Table 4: ANCOVA findings and estimated marginal means and standard deviations for
the study variables
Depression M SD F P ηp 2
Treatment 17.05 4.87 5.16 0.02* 0.12
Control 20.74 5.42
Anxiety M SD F P ηp 2
Treatment 16.43 3.68 4.13 0.03* 0.09
Control 17.97 4.67
p < .05*

The Effects of Moderate Level Aerobic Exercise on Caregivers of Patients…. 163
Discussion
The goal of the study was to examine the impact of the physical activity as a
treatment on the patients’ relatives’ depression and anxiety scores. Findings
showed that the current treatment had statistically significant and moderately high
effect on the decrease in their depression and anxiety problems. Previous studies
clearly pointed out that burnout syndrome, depressive findings and their negative
impacts might be crucial factors on quality of life of the caregivers of the patients
(Bauer et al., 2000; Castro et al., 2002). Accordingly, one of the most probable
reasons for this reduction in quality of life and health status of caregivers is the lack
of regular exercises which positively support physical and psychological health.
Furthermore, previous studies in the literature showed that 78% of the average
caregivers has mild depression and increased anxiety and stress in addition to
reduced social support was observed in this group compared to general population
(Bending et al., 1956; Castro et al., 2002; Rankin et al., 1994). In another study,
depression was not observed approximately 50% of the caregivers of dementia
patients after patient loss (Zhang et al., 2008).
The current preliminary and exploratory research findings showed that regular
physical exercise increased the activity of neuronal activity by triggering brain
blood flow and oxygenation and results in a positive effect on mental states
(Mueller, 2007). In this context, regular physical activities such as walking and
aerobic exercise may reduce neuropsychiatric conditions in patient caregivers who
require ongoing care such as dementia. Similarly, the current research showed that
there was statistically substantial improvement in the caregivers’ the depression,
anxiety, and burnout symptoms as compared to the control group due to the impact
of physical exercises. Moreover, as previous studies indicated that the impairment
in the care givers’ cognitive functions might improve by physical activity (Etters et
al., 2008; Kucukguclu et al., 2017). Aforementioned, giving care for patients with
chronic diseases is very difficult process for the caregivers, and therefore, it is
crucial to provide social, emotional, and physical support for them. Accordingly,
the present study was the first study on this subject in Turkey and therefore the
results might be important to extend the impact for a larger treatment program over
Turkey to help out the caregivers.
References and notes:
Bauer, Moises E., et al. "Chronic stress in caregivers of dementia patients is associated with
reduced lymphocyte sensitivity to glucocorticoids." Journal of neuroimmune-logy
103.1 (2000): 84-92.

164 Tuba Uyar , Akin Celik , Fatih Koca Bendig, A.W., The development of a short form of the manifest anxiety scale. J Consult
Psychol, 1956. 20(5): p. 384. Burton, Lynda C., et al. "Preventive health behaviors among spousal caregivers."
Preventive medicine 26.2 (1997): 162-169. Castro, Cynthia M., et al. "An exercise program for women who are caring for relatives
with dementia." Psychosomatic Medicine 64.3 (2002): 458-468. Christofoletti, Gustavo, et al. "Physical activity attenuates neuropsychiatric disturbances
and caregiver burden in patients with dementia." Clinics 66.4 (2011): 613-618. Etkin, Caryn D., et al. "Recruitment and enrollment of caregivers for a lifestyle physical
activity clinical trial." Research in nursing & health 35.1 (2012): 70-81. Etters, Lynn, Debbie Goodall, and Barbara E. Harrison. "Caregiver burden among dementia
patient caregivers: a review of the literature." Journal of the American Academy
ofNurse Practitioners 20.8 (2008): 423-428. Huber, Machteld, et al. "Health how should we define it?." BMJ 343.7817 (2011): 235-237. Israel, Barbara A., et al. "Review of community-based research: assessing partnership
approaches to improve public health." Annual review of public health 19.1 (1998):
173-202. King, Abby C., et al. "Effects of moderate-intensity exercise on physiological, behavioral,
and emotional responses to family caregiving a randomized controlled trial."
TheJournals of Gerontology Series A: Biological Sciences and Medical Sciences
57.1(2002): M26-M36.
King, Abby C., C. Barr Taylor, and William L. Haskell. "Effects of differing intensities and
formats of 12 months of exercise training on psychological outcomes in older
adults." Health psychology 12.4 (1993): 292. Knight, Bob G., Steven M. Lutzky and Felice Macofsky-Urban. "A meta-analytic review of
interventions for caregiver distress: Recommendations for future research."
TheGerontologist 33.2 (1993): 240-248. Küçükgüçlü, Özlem, et al. "Examining Factors Affecting Caregiver Burden: A Comparison
of Frontotemporal Dementia and Alzheimer’s Disease." American Journal
ofAlzheimer's Disease & Other Dementias® (2017): 1533317517703479. Lecture, Haskell WLJB Wolffe Memorial, and Wolffe Memorial. "Health consequences of
physical activity: understanding and challenges regarding dose-response." Med
SciSports Exerc 26 (1994): 649-660. Mueller, Patrick J. "Exercise training and sympathetic nervous system activity: evidence for
physical activity dependent neural plasticity." Clinical and
experimentalpharmacology and physiology 34.4 (2007): 377-384. Mitchell, Rosas. "Dementia Care. A Practical Photographic Guide." Dementia 5.4 (2006):
585-587.6. Kiecolt-Glaser, J.K., et al., Spousal caregivers of dementia victims: longitudinal changes in
immunity and health.Psychosom Med, 1991.53(4): p. 345-62. Osaki, Tohmi, et al. "Caregiver burden and fatigue in caregivers of people with dementia:
Measuring human herpesvirus (HHV)-6 and-7 DNA levels in saliva." Archives of
gerontology and geriatrics 66 (2016): 42-48.

The Effects of Moderate Level Aerobic Exercise on Caregivers of Patients…. 165
Pearlin, Leonard I., et al. "Caregiving and the stress process: An overview of concepts and their measures." The gerontologist 30.5 (1990): 583-594.
Rankin, Eric D., et al. "The establishment of clinical cutoffs in measuring caregiver burden in dementia." The Gerontologist 34.6 (1994): 828-832.
Steinberg, Martin, et al. "Evaluation of a home ‐based exercise program in the treatment of Alzheimer's disease: The Maximizing Independence in Dementia (MIND) study." International journal of geriatric psychiatry 24.7 (2009): 680-685
Schulz, Richard, and Scott R. Beach. "Caregiving as a risk factor for mortality: the Caregiver Health Effects Study." Jama 282.23 (1999): 2215-2219.
Tarlow, Barbara Amelotte, and Diane Feeney Mahoney. "The cost of recruiting
Alzheimer’s disease caregivers for research." Journal of Aging and Health 12.4
(2000): 490-510. Williams,M.M., et al., An interdisciplinary outreach model of African Americanrecruitment
for Alzheimer's disease research. Gerontologist, 2011. 51 Suppl 1: p.S134-41.
Wright, Lore K., et al. "Emotional and physical health of spouse caregivers of persons with
Alzheimer’s disease and stroke." Journal of Advanced Nursing 30.3 (1999): 552-
563. Yıkılkan, Hülya, Cenk Aypak, and Süleyman Görpelioğlu. "Depression, anxiety and quality
of life in caregivers of long-term home care patients." Archives of
psychiatricnursing 28.3 (2014): 193-196. Zhang, Baohui, et al. "Depressive symptom trajectories and associated risks among
bereaved Alzheimer disease caregivers." The American Journal of Geriatric
Psychiatry 16.2 (2008): 145-155.

166 Tuba Uyar , Akin Celik , Fatih Koca
Summary
The Effects of Moderate Level Aerobic Exercise on Caregivers of
Patients with Alzhiermer Disease: Randomized Controlled Study
Tuba Uyar
Rize Kackar State Hospital, Turkey
Akin Celik
Karadeniz Technical University, Turkey
Fatih Koca Karadeniz Technical University, Turkey
The purpose of the present study was to investigate the effects of a moderate level aerobic
exercise program on health and psychosocial performance of caregivers of Alzheimer’s
patients at home. Study population was randomly selected volunteers of primary caregivers for Alzheimer's patients who followed up at the neurology department of RizeKaçkar State
Hospital. Forty participants were divided into two groups as exercise group (n=20) and control group (n=20). Exercise group were evaluated for cardiovascular and respiratory
diseases. Exercise program consisted of moderate level aerobic arm-leg stretching and strengthening exercises 35-40 minutes a day and 3 days a week during 12 weeks study
period. Control group was interviewed weekly by a dietician. Beck Depression Inventory (BDI), Beck Anxiety Inventory (BAI) and body weight measurements were performed in
both groups before and after exercise program. The current study conducted ANCOVA analysis to test the impact of the treatment effect on the participants’ depression and anxiety
symptoms. Findings indicated that there was a statistically significant effect of the physical activity on the participants’ depression and anxiety scores, F (1, 38) = 5.16, p < .05 and, F
(1, 38) = 4.13, p < .05 respectively. The moderate level aerobic exercise is an effective method to improve psychosocial performance of caregivers of patients with Alzheimer’s
disease.
Keywords: Dementia caregivers, health promotion, effects of exercise on caregiver
burden,depression treatment

Khazar Journal of Humanities and Social
Sciences © Khazar University Press 2017
DOI: 10.5782/kjhss.2017.167.176
Examination of Home Healthcare Services: A Field Study
Hanife Avci
Bandırma State Hospital, Turkey
Arzu Turkmen
South Russian University, Russian Federation
Introduction
In near future, it is known that elder population will have high ratio among the total
population. Requirements of aging population are varied in line with the extension
of life time. Studies performed on this subject indicate that elder population utilizes
the healthcare service more than younger population and also researches indicate
that elder individuals tend to remain in hospitals for longer periods. Elderly
problems are required to be studied with multidisciplinary approach in this period.
In recent days, homecare services are generally provided by private sector and it is
known that government provides this service to certain groups within limits. In
fact, homecare services commonly reduce treatment costs, raise the health level and
provide convenience to elder individuals requiring homecare services. Providing
healthcare services at home has important role relating to socially enabled cost
advantages, protecting health level of individuals by organizing daily life activities
professionally, minimizing the dependency level in treatment and rehabilitation
process and increasing the life quality of individuals. Life time is extended with
numerous innovations in disease diagnosis and treatment by the development of
medical technologies and hope for life during birth is increased. Rate of aging,
freedom and chronic diseases as well as tendencies in aspect of life quality
increased as a result of demographic changes arising in parallel with these
developments have caused emergence of unpredicted demands in healthcare
services. As one of these demands, homecare services are increasingly included to
health and social care system in recent days (1). Individuals receiving homecare
services require protective, treating and rehabilitating services as well as services in
supportive nature. There is no minimum or basic service list agreed on international
level for homecare services. Therefore, each country has formed a
167

168 Hanife Avci, Arzu Turkmen service list that may be renewed frequently in aspect of their facilities and socio-
cultural dynamics. In this regard, this study is important to determine the bed
dependency rate of patients and their homecare requirements, to express their
needs, to create environmental and communal awareness and to develop service
suggestions.
Methodology
Purpose of the Research
Purpose of this study is to determine the requirements of bed dependent individuals
in and over 65 years registered to homecare services department of Balıkesir
Province, Bandırma State Hospital, to identify the services they require and to
determine the dependency rates of patients.
Population and Sample
Research population is comprised of 94 patients requiring continuous care,
dependant to bed and receiving service from Homecare Services Department of
Bandırma State Hospital in November 2016. No sample is selected and entire
population is attempted to be reached. Face to face questionnaire technique is
implemented for 90 people who have accepted to participate into the study.
Data Collection Means
This research is descriptive in nature and data form (relating to elders and care
providers) specifying the socio-demographic characteristics of participants, “Daily
Life Activities Index” developed by Katz et al. and translated into Turkish by
Yardımcı (1995), “Instrumental Daily Life Activities Index” developed by Lawton
and Brody (1969) and translated into Turkish by Yardımcı (1995), “Care Providing
Load Scale” translated into Turkish by İnci and Erdem (2006) are used (2, 3, 4, 5).
“Daily Life Activities Index” Cronbach’s alpha value is 0,84; “Instrumental Daily
Life Activities Index” Cronbach’s alpha value is 0,86; “Care Providing Load
Scale” Cronbach’s alpha value is 0,95 (2, 3, 4, 5).
Analysis of Data
Research data is analyzed with SPSS 19,0 software version by using frequency,
percentage, Pearson Correlation test statistics.
Findings
Socio-Demographic Information of Healthcare Providers

Examination of Home Healthcare Services: A Field Study 169 Women take part in the homecare services more than men (83,3%). When we
consider the educational status of participants, majority of people providing
homecare services are graduated from primary school (43,3%). It is seen that
majority of elder individuals maintain their life in separate rooms and their care
service is provided in these rooms (90%). Majority of people providing care service
to elder individuals have no line of descent and generally comprised of people
acting as caretaker against fee (42,2%). Health conditions of elder individuals
provided with homecare service are generally at average (38,9) and good (41,1%)
level. It is understood that also the people providing homecare service have long
term and diagnosed diseases (52,2%). It is observed that sleep pattern of caretakers
is generally in good condition (50%). It is understood that majority of caretakers
have no responsibility other than caring the elder individuals (68,9). It is seen that
majority of caretakers provide elder caring service for 1-12 months (73,3%). When
we consider the time spent by home caretakers with elder individuals, rate of
caretakers spending entire day is 92,2%.
Socio-Demographic Information of Elder Individuals Provided with
Healthcare Service
47,8 of elder individuals provided with homecare service is married, 40% of them
is graduated from primary school, 33,3% of them benefits from the retirement fund
and %57,8 of them is housewife. When we consider the living time of elder
individuals receiving homecare service with the caretakers, %89,1 of them live
with them between 1-10 months. Rate of elder individuals receiving homecare
service with long term and diagnosed disease is 98,9%.
Daily life Activity Information of Elder Individuals
When we consider the distribution of daily life activity information of elder
individuals; 78,9% of them is fully dependent in wearing activity, 87,8% of them is
fully dependant in bathing activities, 75,6% of them is fully dependent in
movement activities, 61,1% of them is fully dependant in nourishment activities,
73,3% of them is fully dependant in continence and 55,8 % of them is fully
dependant in toilet activities.
Instrumental Daily Life Activity Information of Elder Individuals
When we consider the instrumental daily life activities of elder individuals; 94,4%
of them is fully dependant in housework and laundry activities, 91,1% of them is
fully dependant in food preparation activities, 73,3% of them is fully dependant in
phone calling activities, 94,4% of them is fully dependant in shopping activities,
92,2% of them is fully dependant in public transportation vehicle using activity,

170 Hanife Avci, Arzu Turkmen 70% of them is fully dependant in self-medicating activity and 80% of them is fully
dependant in self sufficiency.
Care Providing Load Scale
It is seen that 33,3% of caretakers has responded as sometimes to the phrase of “Do
you think that you do not spare sufficient time to yourself due to time spent on your
akin?, 31,1% of them has responded as rarely to the phrase of “Do you think your
kin ask assistance more than they need?”, 41,1% of them has responded as rarely to
the phrase of “Are you disturbed of the behaviours of your kin?”, 38,9% of them
has responded as rarely to the phrase of “Do you have any difficulty between
performing your family and work responsibilities by providing healthcare service
to your kin?” , 38,9% of them has responded as sometimes to the phrase of “Do
you think your kin negatively affects the relationship between you and other family
members or your friends?”, 32,2% of them has responded as rarely to the phrase of
“Do you feel angry beside your kin?”. It is seen that 30% of caretakers has
responded as sometimes to the phrase of “Are you afraid of things that may be
brought on your kin by future?”; 31,1% of them has responded as almost always to
the phrase of “Do you think that you kin isdependant on you?”. It is seen that
26,7% of caretakers has responded as sometimes to the phrase of “Does providing
care to your kin derange your health?”, 36,7% of them has responded as sometimes
to the phrase of “Do you think that caring your kin affects your social life?”. 48,9%
of caretakers has responded as almost always to the phrase of “Do you think that
the money remained from your expenses is insufficient for the care of your kin?”.
26,7% of caretakers has responded as sometimes to the phrase of “Do you think
that you kin sees you the only support and expects interest from you?”; 37,8% of
caretakers has responded as rarely to the phrase of “Do you feel that you are no
longer capable of take caring your kin?”; 36,7% of caretakers has responded as
rarely to the phrase of “Do you think that you lost the control of your life when
your kin is ill?”; 32,2% of caretakers has responded as sometimes to the phrase of
“Would you like somebody to take over caring obligation of your kin?”. It is found
that 48,9% of caretakers has responded as rarely to the phrase of “Do you feel any
instability relating to things that must be done for your kin?”; 26,7% of caretakers
has responded as sometimes to the phrase of “Do you think that you do your best
for the care of your kin?”.
Correlation Results for Elders and Their Caretakers
There is very weak linear relation between the ages of elder individuals and
educational status of caretakers (p<0,05; r= -0,062). There is weak positive linear

Examination of Home Healthcare Services: A Field Study 171 relation between the ages of elder individuals and the condition whether they have
separate rooms or not (p<0,05; r= 0,121). There is strong negative relation between
the ages of elder individuals and relationship degree of elder individual and
caretaker (p<0,05; r= -0,443). There is very weak positive relation between the
ages of elder individuals and health assessment of elder individuals (p<0,05; r=
0,094). There is very weak negative relation between the ages of elder individuals
and the condition whether the caretaker has any long term and diagnosed disease or
not (p<0,05; r= -0,002). There is very weak positive relation between the ages of
elder individuals and general sleep pattern of caretaker (p<0,05; r= 0,012). There is
very weak negative relation between ages of elder individuals and other
responsibilities of caretaker in general aspect (p<0,05; r= -0,051). There is strong
negative relation between the ages of elder individuals and the period spent by
caretaker with the elder individual (p<0,05; r= -0,128). There is very weak positive
relation between the ages of elder individuals and the time spent by caretaker in a
day with the elder individual (p<0,05; r= 0,013). There is very weak negative
relation between the ages of elder individuals and the gender of elder individual
(p<0,05; r= -0,165). There is weak positive relation between the ages of elder
individual and marital status of elder individual (p<0,05; r= 0,103). There is strong
negative relation between the ages of elder individuals and educational status of
elder individual (p<0,05; r= -0,168). There is very low positive relation between
ages of elder individuals and health insurance of elder individual (p<0,05; r=
0,024). There is very weak negative relation between ages of elder individuals and
compensation of monthly expenses by monthly income of elder individual (p<0,05;
r= -0,028). There is weak positive relation between ages of elder individuals and
their professions (p<0,05; r= 0,178). There is weak, completely positive linear and
insignificant relation between the ages of elder individuals and period spent by
caretaker with them (p<0,05; r= 0,174). There is very weak, completely positive
linear and insignificant relation between ages of elder individuals and the condition
whether they have long term and diagnosed diseases or not (p<0,05; r= 0,016).
There is very weak, completely negative, linear and insignificant relation between
ages of elder individuals and the condition whether there is any change in the life
of caretakers due to providing care to elder individual (p<0,05; r= 0,024). There is
very weak, completely positive, linear and insignificant relation between ages of
elder individuals and their wearing status (p<0,05; r= 0,020). There is very weak,
completely positive, linear and insignificant relation between ages of elder
individuals and their bathing status (p<0,05; r= 0,011). There is weak, completely
positive, linear and insignificant relation between ages of elder individuals and
their movement status (p<0,05; r= 0,060). There is weak, completely negative,
linear and insignificant relation between the ages of elder individuals and their
nourishment status (p<0,05; r= -0,070).There is weak, completely positive, linear
and insignificant relation between the ages of elder individuals and their continence

172 Hanife Avci, Arzu Turkmen status (p<0,05; r= 0,045).There is weak, completely positive, linear and
insignificant relation between the ages of elder individuals and their toilet status
(p<0,05; r= 0,030).There is weak, completely negative, linear and insignificant
relation between the ages of elder individuals and their capability to perform
housework (p<0,05; r= -0,064).There is weak, completely negative, linear and
insignificant relation between the ages of elder individuals and their capability to
do laundry (p<0,05; r= -0,090).There is weak, completely negative, linear and
insignificant relation between the ages of elder individuals and their capability to
do cooking (p<0,05; r= -0,074).There is weak, completely positive, linear and
insignificant relation between the ages of elder individuals and their capability to
make phone calls (p<0,05; r= 0,046). 0,024 value on the table indicate that there is
There is weak, completely positive, linear and insignificant relation between the
ages of elder individuals and their capability to do shopping (p<0,05; r=
0,024).There is weak, completely positive, linear and insignificant relation between
the ages of elder individuals and their capability to use transportation vehicles
(p<0,05; r= 0,056).There is weak, completely positive, linear and insignificant
relation between the ages of elder individuals and their capability for self-
medication (p<0,05; r= 0,018).There is weak, completely negative, linear and
insignificant relation between the ages of elder individuals and their capability of
self-management (p<0,05; r= -0,038).There is very weak, completely negative,
linear and insignificant relation between the ages of elder individuals and the
condition of caretaker to think that it spares insufficient time for itself (p<0,05; r= -
0,001).There is very weak, completely negative, linear and insignificant relation
between the ages of elder individuals and the condition that caretaker believes that
elder individual asks for assistance without any necessity (p<0,05; r= -0,059).There
is weak, completely positive, linear and insignificant relation between the ages of
elder individuals and the condition disturbing caretakers due to behaviours of kin
of elder individuals (p<0,05; r= 0,061).There is weak, completely positive, linear
and insignificant relation between the ages of elder individuals and the condition of
fulfilling family and work responsibilities by providing caring service to elder
individuals (p<0,05; r= 0,156).There is weak, completely negative, linear and
insignificant relation between the ages of elder individuals and the condition that
caretakers feel angry beside elder individual (p<0,05; r= -0,120).There is weak,
completely positive, linear and insignificant relation between the ages of elder
individuals and the condition whether caretaker is scared of things that may be
brought by future (p<0,05; r= 0,159).There is weak, completely positive, linear and
insignificant relation between the ages of elder individuals and the condition
whether the caretaker believes that its kin is dependant to caretaker or not (p<0,05;
r= 0,139).There is weak, completely negative, linear and insignificant relation
between the ages of elder individuals and the condition caretakers believes that
caring his kin deranges their health (p<0,05; r= -0,116).There is weak, completely

Examination of Home Healthcare Services: A Field Study 173 positive, linear and insignificant relation between the ages of elder individuals and
the condition whether caretaker believes that caring to their kin affects their social
life or not (p<0,05; r= 0,165).There is weak, completely negative, linear and
insignificant relation between the ages of elder individuals and the condition that
caretaker believes that the money remained from expenses is sufficient for the
caring of their kin or not (p<0,05; r= -0,018).There is weak, completely positive,
linear and insignificant relation between the ages of elder individuals and the
condition caretaker believes that their kin sees them as only support and whether
they believe their kin expect interest or not (p<0,05; r= 0,78).There is average,
completely positive, linear and significant relation between the ages of elder
individuals and whether caretakers feel that they may not continue caring to elder
individuals any more (p<0,05; r= 0,224).There is average, completely positive,
linear and significant relation between the ages of elder individuals and whether
caretakers feel that they lose the control of their life when the elder individual is ill
(p<0,05; r= 0,134).There is very weak, completely negative, linear and
insignificant relation between the ages of elder individuals and whether caretakers
believe that caring of their kin must be undertaken by others (p<0,05; r= -
0,152).There is average, completely positive, linear and significant relation
between the ages of elder individuals and whether caretakers feel indecisive
relating to things required to be performed for their kin (p<0,05; r= 0,256).There is
very weak, completely positive, linear and insignificant relation between the ages
of elder individuals and whether caretakers do their best relating to things required
to be performed for the caring of elder individuals (p<0,05; r= 0,006).There is
weak, completely positive, linear and insignificant relation between the ages of
elder individuals and whether caretakers believe that they must do more for the
caring of elder individuals (p<0,05; r= 0,158).There is very weak, completely
negative, linear and insignificant relation between the ages of elder individuals and
how caretakers struggle during caring of the elder individual (p<0,05; r= -0,073).
Discussion and Conclusion
According to results of this research, 83,3% of elder individuals receiving
homecare service is women. Similar to the findings of the study, 74% of the elder
individuals receiving homecare service are women (6). In the study conducted by
Su başı et al. 62,5% of elder individuals receiving homecare service is comprised
of women (7). When we consider the similar studies conducted, rate of women
receiving homecare service is determined as 54,5% in the study conducted by
Çatak in Burdur (8). Rate of women receiving homecare service is 55,1% in the
study of Bilir conducted in Ankara Altındağ Healthcare Centre region (9). Age
average of elder individuals receiving homecare service is over 75. When we
174 Hanife Avci, Arzu Turkmen consider the studies conducted by Çatak and Bilir, age average of elder individuals
receiving homecare service is 65 and over. When we consider the marital status of
elder individuals in the study, total rate of individuals living apart from their
spouses and having their spouse passed away is 47,7%. In the study of Bilir, rate of
elder individuals having their spouse passed away is 23,1% (9). In the study
conducted by Keskinoğlu, this rate is appeared as 34,3% (10). Briefly, according to
study conducted in Bandırma, it is indicated that elder individuals are comprised of
persons over 65 years old, that elder individuals having their spouse passed away
require homecare service more than the ones having their spouse alive. Rate of
illiterate elder individuals in the research is 25,6%. In the study conducted by
Keskinoğlu in İzmir, this rate is indicated as 55,9% (10). In the studies conducted
by Bilir in Ankara, by Ünsal in Kırşehir, these rates vary between 14,7% and
31,6% (8, 11). When we consider the average age in the research being 75-80, birth
dates of elder individuals are between 1930-1940. When we review the
insufficiency of educational institutions in specified years and perspective of
society to education, low rate of literacy is an expected result. In this study, rate of
elder individuals having no social insurance is 4,4%. In the study conducted by
Keskinoğlu in İzmir, this rate is 36,6% (10). According to results in the study, only
3,3% of elder individuals having social insurance has green card, rate of elder
individuals benefitting from SSI, social security organization for artisans and the
self-employed and retirement fund is close to each other. In the study presented by
Çölgeçen at the 1st Homecare Congress in 1998; it is mentioned that 6,5% of elder
individuals is not capable of having bath without support, 2,8% of them is not
capable of dressing-undressing alone, 1,4% of them is not capable of handling
toilet requirements, 1,7% of them is not capable of sitting alone, 0,3% of them is
not capable of eating alone, 1,1% of them is not capable of making phone calls,
35,9% of them is not capable of doing shopping, 44% of them is not capable of
preparing food, 20,3% of them is not capable of participating to housework, 25,4%
of them is not capable of doing laundry, 25,4% of them is not capable of using
medication on correct dosage and on correct time (12). It is seen that the patients
are fully dependant on their caretakers in aspect of daily life activities. It is seen
that they are fully dependant on needs such as dressing, bathing, toilet and half-
dependant on needs such as nourishment. It is observed that participants do not
provide absolute and clear answers in general to the questions relating to phrases
reflecting the feelings of care providers to elder individuals. However, when we
consider their responds to the phrases, it is determined that they feel disturbance
due to behaviours of elder individuals, that they do not spare sufficient time for
themselves, that they have difficulty to fulfil their family and work responsibilities,
that their social life is affected and that they experience various difficulties while
caring their kin.

Examination of Home Healthcare Services: A Field Study 175
References and notes:
OğlakS.(2007), “Evde Bakım Hizmetleri ve Bakım Sigortası: Ülke Örnekleri ve Türkiye”,
İskenderun, 13-14. Katz S, Ford AB, Maskowitz RW, Jackson BA, Jaffe MW. (1963) Studies of illness in the
aged: the index of ADL: A Standardized Measure of Biological and
Psychosocial Function. JAMA , 185: 914-9. Yardımcı E. (1995), İstanbul’da yaşayan yaşlı öğretmenlerin sağlık sonuçlarının günlük
yaşam aktiviteleri ve aletli günlük yaşam aktiviteleri ile ilişkisi, Tıpta
Uzmanlık Tezi, İstanbul: İstanbul Üniversitesi. Lawton MP, Brody EM. (1969), Assessment of older people: Selfmaintaining and
instrumental activities of daily living. Gerontologist;9: 179-86. İnci, F. H. Erdem, M. (2006), “Bakım Verme Yükü Ölçeği’nin Türkiye’ye Uyarlanması
geçerlilik ve güvenirliği”, Atatürk Üniversitesi Hemşirelik Yüksekokulu Dergisi, 11: 4.
Van Campen C, Woittiez IB. (2003),Client demands and theallocation of homecare in the
Netherlands. A multinomiallogit model of clienttypes, careneeds and referrals,
Health Policy, 64 (2): 229-241. SubaşıN,Öztek Z. (2006), “Türkiye’de karşılanamayan bir gereksinim: EvdeBakımHizmeti”
Hacettepe Üniversitesi Tıp FakültesiHalkSağlığı AD, Ankara TSKKoruyucu
Hekimlik Bülteni, Ankara, 5. Çatak B, Sütlü S, Kılınç A.S, Sarıoğlu O. (2011), “Bir Aile HekimineKayıtlı 65 Yaş ve
Üzeri Nüfusta Sağlık Hizmet Kullanımı, Kronik Hastalık SıklığıveBağımlılık Durumu”. Akad Geriatri, 23: 88–94.
Bilir N, Aslan D, Güngör N. (2002),“Ankara Altındağ Sağlık Ocağı Bölgesi Sakarya
Mahallesi’nde Yaşayan 65 Yaş Üzeri Kişilerin Bazı Sağlık ve Sosyal
Durumlarının Saptanması”. Turkish Journal of Geriatrics, 5(3): 97-102. Keskinoğlu P, Pıçakçıefe M, Giray H, Bilgiç N, Uçku R, Tunca Z. (2006), “Yaşlılarda
Depresif Belirtiler ve Risk Etmenleri”. Genel Tıp Dergisi, 16(1): 2-6. Ünsal A, Demir G. (2010), “The Prevalence of Chronic Diseaseand Drug Use İn Elderly in
Central Kırşehir”. Turkish Journal of Geriatrics, 13(4): 244-51. Çölgeçen E, Tümerdem Y. (1998), “Yaşlıların evde bakım hizmetlerine olan
gereksinimleri”. I. Ulusal Evde Bakım Kongre Kitabı, 175-186.

176 Hanife Avci, Arzu Turkmen
Summary
Examination of Home Healthcare Services: A Field Study
Hanife Avci Bandırma State Hospital, Turkey
Arzu Turkmen South Russian University, Russian Federation
This research aims to determine the requirement of persons confined to bed and over 65
years old and registered to home care services department of Balıkesir Province Bandırma
State Hospital, to determine the services they require and to find out the confinement rate of
these patients. Type of the research is relational screening model in descriptive nature.
Research population is patients confined to bed and require continues care who receive
Home Healthcare service from Bandırma State Hospital (N=94). Questionnaires are made
to 90 people by interviewing face to face with patients and caring family members and
“Daily Life Activities Index”, “Instrumental Daily Life Activities Index” and “Caring
Burden Index” were used. Research data is analysed on frequency, percentage, Pearson
Correlation test statistics by using SPSS version 19,0. According to research results; Age
average of elder people receiving home care service is over 75 and 83,3% of them is
women. Rate of illegible elder people is 25,6%. Rate of elder people who have no social
security is 4,4%. When we consider the kinship relation of patients receiving home care
service, it is found that their daughters are more caring, that persons providing care service
to patients are generally together with the patients for 24 hours and in this aspect, the rate of
effecting the life of patients by caregivers is 43,3%. It is also determined that the patients
are fully dependent to their caregivers for daily activities such as clothing, bathing, toilet
needs and semi dependent for nutrition.
Keywords: Home healthcare services, elder care services, Bandırma State Hospital.

Khazar Journal of Humanities and Social
Sciences © Khazar University Press 2017
DOI: 10.5782/kjhss.2017.177.186
The Factors Affecting the Motivation of the Health Workers
Sukriye Turgut
IMBL Business Department, Institute of Social Sciences, Russian Federation
Introduction
Nowadays, the success of the business depends on the human factor to a great
extent, the human factor constitutes the most important competitive power of the
enterprises. The success of an enterprise is directly proportional to the success of its
employees. For this reason, it is very important for employees to be able to
motivate their work environment and work, and to motivate them in the best way to
increase their work efficiency. Motivation is the establishment of the conditions
necessary for employees to work with their own will in the direction of
organizational goals. This is important in order to bring employees' experience and
skills to higher levels. Many economic, psychological, organizational and
managerial tools are influential in the motivation process. The fact that each person
is a unique individual, needs, wishes and anticipations are also the basic elements
that are different from each other. The fact that working conditions, physical
environment, working groups, social opportunities, management style and style
vary according to different situations in working life brings with it a very variable
structure which affects the motivation of employees. For this reason, it is necessary
to examine the issues such as the ways in which the motivation of the employees
can be increased in order for the motivation process to be fully understood.
Achieving the expected productivity from the employees in the working life
depends not only on ensuring a peaceful work environment but also on defining the
needs according to the employees and determining the needs according to the
characteristics of the existing employees. These needs will be met in the best way,
high performance companies will be created which will contribute positively to the
motivation of the employees and formed by the efficient employees. Employees
must be in a positive affirmation to their work in order to be able to perform well.
Factors affecting the motivation of the employees and institutional behaviors
177

178 Sukriye Turgut motivating the employees are the factors which can make positive or negative
contribution to the performance of the employees. In short, in order to capture
corporate success, it is essential to increase individual success first. For this reason,
it is very important for employees to increase their motivation towards their work
so that the success levels of the institutions can be increased. There is a strong
relationship between motivation and performance. It is clear that in today's harsh
competition conditions, companies that have employees with high performance and
individual motivation, who have succeeded in keeping these employees' success
levels and their work perseverance at the top level, will advance one step ahead of
other companies.
Factors Affecting Motivation
In this study, the motivation levels of the people were influenced by various factors
in the business environment, the structure of these factors according to their
situation and the formation of a number of outputs as a result of the motivation
levels. In this section, the two main factors that are expected to affect motivation
are explained with the sub-details. The first is business design-business sense, and
the second is social support concepts including business partnership and
managerial support factors.
Executive support
Today's business affects executives differently than they were in the past. Many
sectors need to be dynamic, which means management can quickly meet this. The
issue of employee motivation, which has been around since the past and still
remains important today, is a situation faced by every manager, because it relates to
successful employee and employee performance. Employees need to act in order
for the company to progress towards its objectives and take a creative approach
from the managers in a way that will increase the loyalty. Although many
theoreticians have designed motivational systems and have been working on them
differently, there has not been a single solution for motivating employees. Both
scholars and administrators have had difficulties with the reasons why people are
more motivated than others, or how people have to be more dependent on the
company they work with, and as a result, many motivation theories and models
have been developed (Rahimic et al. 2012: 12).
Deci et al. (1994) defines managerial support as understanding of manager's
worker, developing his point of view, providing meaningful information to his / her
employees, defining selection opportunities and encouraging employees to take
initiative (Olafsen et al. 2015: 447).

The Factors Affecting the Motivation of the Health Workers 179 The concept of executive support is, according to Baard et al., Described as a
working environment and environment that is directly influenced by the manager
(Baard et al. 2004: 2).
According to Kram (1983), manager support is divided into career support and
psychosocial. The psychosocial side focuses on enhancing the competencies of
employees, ensuring that they feel satisfied, and developing themselves profess-
sionally and personally. Career functions can also refer to behaviors of recognizing
freedom of movement and directing them to progress in the organization.
According to Jung &Tak's (2005) study, both functions increase the employee's
commitment to work, performance and job satisfaction (Jung and Tak, 2008: 187).
Current studies deal with multiple motivational factors, because motivation varies
from person to person, even with time. For these reasons, it is necessary to treat
employees as separate individuals, which is important for managers. For example,
managers need to negotiate with their employees, talk frequently, and always keep
their doors open. The resulting pattern of motivation depends on what the manager
wants. That is, the manager may want the employee to work faster and expect to do
a lot of work, or he may want to work by creating creative ideas using different
methods. Work done at this point emphasizes the importance of your leadership
among motivating factors. It is necessary for the leader to identify key motivational
points by describing the tasks properly with job descriptions and presenting a
participatory approach to decision making. The motivating competency of the
manager is a factor that directly affects the commitment and attitude of the
employees (Rahimic, 2012: 536).
For example, the type of manager providing autonomy support, the employee's
understanding of the point of view, the incentive to take initiative, and the
opportunity to make choices. In many studies conducted in this sense, for example,
in the work of Deci et al. In 1989, it has been found that the employees' job
satisfaction and organizational loyalty are high when the manager provides
autonomous support. Similarly, Blaias and Briere (1992) observed that high
autonomy support brings high job satisfaction, low absenteeism, better physical
and psychological well-being (Baard et al. 2004: 3).
Dynamism in business is causing managers and leaders to change roles, which
means they need to develop new methods in terms of motivation and leadership. It
is necessary to adapt the behaviors, values and primary goals of the managers in
order to increase the motivation of the employee as well as to carry out the work
for the company's purposes (Rahimic, 2012: 537).

180 Sukriye Turgut In a work done, how managers approach their employees is investigated. In the
end, it was revealed that the most important goal of the managers was to treat their
employees equally and justly, and the second important goal was to do team work.
At the lowest level, it was determined that the awards and disciplinary criteria were
included. In the same study, it is stated that the motivational systems that are
designed to include the managerial approach will increase the performance of the
employees while increasing the employee's affiliation and that they can progress
towards the organizational targets as a result of all (Rahimic, 2012).
As you can see, the role of the manager is very critical in order to increase the
motivation. Because, ultimately, companies need to reach their goals and this way
can be based on employee motivation at the beginning. In the same vein, it is stated
that the manager's leadership approach, managerial competence, feedback and
manager's support are effective in achieving organizational goals. According to
Sherman and Bohlander, the behavior and attitude of the manager is affecting those
who work to reduce work-related complaints (Mafini and Dlodlo, 2014: 2).
In Kuvaas' 2009 work in the public sector, it was suggested that if the managers
support autonomy for their employees, their autonomous motivation will increase
and their performance will increase. In another study, autonomous motivation was
found to increase with the autonomy of the manager, which reduced the intention to
leave the work. In addition, in the environments where the manager support
perception is high, the organizational support also perceives the height related
perceptions. This results in decreasing staff turnover, loyalty to the organization,
desire to work in harmony with organizational goals (Gillet et al., 2013).
Materials and Methods
Purpose of the research
The aim of this study is to be able to identify the factors that influence the
motivations of non-physicians.
Universe and Sampling
For this purpose, a sample of 100 physicians working in private hospitals operating
in the province of Samsun was taken and samples were tried to determine the
effects of increasing the motivation motivation of motivation tools.

The Factors Affecting the Motivation of the Health Workers 181 Data Collection Tool
The data collection technique used in the study is surveyed. In this context, a
questionnaire with 26 questions was developed. The questions in the questionnaire
were prepared according to 5-point Likert technique and multiple choice.
Data analysis
Data analysis of the study was done in SPSS 23.0 package program. In data
analysis, descriptive statistics such as frequency, percent, mean and standard
deviation and t test, ANOVA test and Pearson correlation test statistics were used.
Results
Questionnaires prepared in line with the purpose of the survey were applied to 100
health workers working in the bank. Findings of the descriptive characteristics of
the participants are given below.
Table 1. Demographic Characteristics of Participants
Socio-demographic Characteristics Count %
Gender Woman 55 55,0
Male 45 45,0
18-24 25 25,0
Age Groups 25-34 29 29,0
35-44 16 16,0
45 years and over 30 30,0
High school 6 6,0
Education status Associate Degree 12 12,0
License 56 56,0
Graduate 26 26,0
0-1500 TL 4 4,0
Monthly Income 1501-3000 TL 31 31,0
3001 TL – 4500 TL 37 37,0
4500 TL andover 28 28,0
TOTAL 100 100,0
As shown in Table 1, 55 percent of the participants are women and 45 percent are
obese. When the age group of the participants was examined 25% of them were
between 18-24, 29% were between 25-34, 16% were between 35-44, and 30% were
over 45 years old. When the educational status is taken into account, it is
understood that more than half (56%) have a bachelor's degree. While the income

182 Sukriye Turgut of the participants is 4 TL less than 1500 TL, 31% TL 1500-3000, 37% TL 3000-
4500 TL and 8% TL 4500 TL.
Table 5 contains frequency analysis showing the effect of economic instruments on
motivation. As can be seen in the table, the sum of the answers given to increase
the motivation of the economic instruments is certainly close to the statement of
agreeing (4,53). Again, as seen in this table, the most important factors affecting
motivation in economic instruments are additional payments such as food,
transportation, housing and bonuses (F: 4,89). Apart from this, an unexpected
salary increase has also come to the fore among the factors that increase motivation
(4,54).
Table 2. Frequency Analysis for Economic Instruments
Economic Instruments Average Standard
Value deviation
8 Getting a good salary increases my motivation 4,28 ,930
9 An unexpected wage increase increases my motivation. 4,54 ,848
10 Practical pricing increases my motivation 4,41 ,792
11 Additional payments for meals, transport, housing and 4,89 ,341
bonuses increase motivation
TOTAL 4,53 ,727
Table 3. Frequency Analysis for Psycho Social Tools
Average Standard
Value deviation
12 Promotion skills are important to me and increase my 4,81 ,511
motivation
13 Having a career opportunity increases my motivation 4,40 ,876
14 My manager and identification of open competition by 2,94 1,137
ensuring a working environment of open competition
15 Job security increases motivation 4,89 ,309
16 Upper-level managers increase their motivation to work more 4,55 ,696
closely with employees by supporting social meetings (sports,
entertainment, picnic etc.) outside working hours
17 Emphasis on job security in the workplace enhances 4,15 1,015
18 Improving my motivation by getting enough support in 4,38 ,760
TOTAL 4,30 ,757

The Factors Affecting the Motivation of the Health Workers 183
In Table 3, there is a frequency analysis showing the effect of psycho-social tools
on motivation. The tablodan shows that the sum of the answers given to increase
the motivation of the psycho-social tools is close to agreeing (4,30). Among the
psychosocial instruments, the least effective motivation is to define the open
competition conditions by the agents and to provide an open working atmosphere
of the competition. Participants responded positively to the question "Defining
open competition conditions by my administrators and providing an open working
environment for the motivation increases my motivation" (2,94). In addition to this,
it was understood that having job security increased motivation more than other
psychosocial instruments (4,89).
Table 4. Frequency Analysis on Organizational and Management Tools
Average Standard
Value deviation
19 Being a business associate and building good relationships 3,93 ,959
increases my motivation.
20 Having the authority to make decisions increases my 4,08 ,895
21 The support of my colleagues motivates me 4,60 ,626
22 The recognition of my achievements and my praise 4,45 ,740
23 Taking responsibly tasks increases my motivation 4,48 ,616
24 More training opportunities increase my motivation 4,24 ,937
25 Being clean and tidy in the workplace enhances my 4,26 1,132
26 Increases the motivation to be in a good level of physical 4,48 ,821
conditions in the working environment (heating,
ventilation, lighting)
TOTAL 4,31 ,841
In Table 4, there is a frequency analysis showing the effect of organizational and
managerial tools on motivation. The tablodan shows that the sum of the answers
given to increase the motivation of the organizational and administrative tools is
close to agreeing (4,31). Participants' replies were found to have the least effect on
motivation in organizational and managerial tools to be in good working
relationship with the supervisor and to establish good relationships (3,93). In
addition, it has been found that support of colleagues among organizational and
managerial tools is the most motivating factor for employees (4,60).
When the motivational tools were grouped within themselves, participants
indicated that the most economic instruments increased the motivation (4,53).
Opinions about increasing the motivation of psycho-social tools and organizational

184 Sukriye Turgut and administrative tools are close to each other and are determined as 4.30, 4.31
respectively.
Results
Motivation is a kind of mechanism that directs people to behavior, determines the
degree of this behavior (severity) and ensures continuity of behavior. Motive
behaviors are realized for a specific purpose. Motivated employees' work-related
thoughts can also become more positive. As a result, employees can become more
productive in terms of both themselves and the company. Motivation provides
positive emotions for employees about the work they do. However, factors that
motivate employees vary from person to person. The fact that the psychological
structure of each person is different also causes changes in the means to motivate
them. While some employees may be motivated by financial rewards, some
employees may be appreciated, promoted, etc. Can be motivated by spiritual
values. When it comes to the topic of healthcare institutions, dealing with
employees' motivations is a necessity for healthcare institutions. Because the
success of health institutions is directly proportional to the success of their
employees. The adequacy of employees' motivation to work will affect their
success first, and then the success of health institutions they work with. In other
words, there is a relationship between motivation and performance. Employees
with insufficient motivation are not expected to perform adequately.
Performance and performance evaluation are, in a sense, the means of
communication between companies and employees. Through the performance
evaluation, employees can understand how they are seen by their superiors, correct
their missing aspects, plan their careers and find out whether wages and other
material expectations can be met. This is an important element that adds value to
employees' motivation. Performance is not a value of employees themselves, but a
value of what they are doing and what they are doing efficiently. When evaluating
performance for this reason, it should be very objective from personal judgments
and assess the performance of the people. The use of the data obtained at the end of
the performance appraisal may be one of the motivating factors at the point where
the appraisal works.
It is necessary for the performance of the employees to be increased in order for the
companies to reach their corporate targets. From this point of view, keeping
individual performances and motivations of employees high is one of the priority
issues in terms of companies. In this study, the performance, performance
evaluation and motivation tools of the firms were discussed individually and
examined in a general framework. These two concepts, which are closely related to

The Factors Affecting the Motivation of the Health Workers 185 each other, are revealed by literature review. In the practice section of the study,
the factors affecting the motivation of the employees were tried to be determined.
When the factors that increase the motivation of the employees are examined, it is
seen that the economic factors such as meal, transportation, bonus, salary increase
and salary increase are the most influential motivators (F: 4,53). Then psycho-
social tools and environmental and administrative tools It is understood that it is
among the factors that increase motivation. The factors that increase motivation
most in psycho social tools are job security (F: 4,89) and promotion (F: 4,81). In
the organizational and managerial tools, it is concluded that the most important
factor that increases the motivation is the support of the colleagues (F: 4.60). In
addition to this, the least effective factor in enhancing the performance is the
definition of open competition conditions by the managers and providing an open
working environment for the competition (F: 2.94).
References and notes:
Baard, P. P., Deci, E. L. & Ryan, R. M. (2004). Intrinsic need satisfaction: A motivational
basis of performance and well-being in two work settings. Journal of Applied
Social Psychology, 34, 2045–2068. Deci, E. L., Ryan, R. M., Gagne, M., Leone, D.R., Usunov J. &Kornazheva B. P. (2001).
Need Satisfaction, Motivation, and Well-Being in the Work Organizations of a
Former Eastern Bloc Country: A Cross-Cultural Study of Self-Determination.
Society for Personality and Social Psychology, 27(8), 930-942. Gillet, N., Gagne, M., Sauvagere, S. & Fouquereau, E. (2013). The role of supervisor
autonomy support, organizational support, and autonomous and controlled
motivation in predicting employees' satisfaction and turnover intentions. European
Journal of Work and Organizational Psychology, 22 (4), 450-460. Jung, J. &Tak, J. (2008). The Effects of Perceived Career Plateau on Employees' Attitudes
Moderating Effects of Career Motivation and Perceived Supervisor Support with
Korean Employees. Journal of Career Development, 35 (2), 187-201. Mafini, C. &Dlodlo, N. (2014). The relationship between extrinsic motivation, job
satisfaction and life satisfaction amongst employees in a public organization. SA
Journal of Industrial Psychology, 40 (1), 01-13. Olafsen, A. H., Halvari, H., Forest, J. & Deci, E. L. (2015). Show them the money? The
role of pay, managerial need support, and justice in a self-determination theory
model of intrinsic work motivation. Scandinavian Journal of Psychology, 56, 447-
457. Rahimic,Z., Resici, E. & Kozo A. (2012). Determining the Level of Management
Competences in the Process of Employee Motivation. Procedia - Social and
Behavioral Sciences, 41, 535-543.

186 Sukriye Turgut
Summary
The Factors Affecting the Motivation of the Health Workers
Sukriye Turgut
IMBL Business Department, Institute of Social Sciences, Russian
Federation
The competitive conditions that are continuing to change today force both the health care
enterprises and the health professionals to increase their performance continuously. There is
no chance of continuing the work of health care enterprises and health workers who can not
comply with the competition conditions. For this reason, healthcare providers also have a
responsibility to improve the performance levels of healthcare workers. Health businesses
are trying to raise the motivation of health workers through material and spiritual methods.
The aim of this study is to be able to identify the factors that influence the motivations of
non-physicians. For this purpose, a sample of 100 physicians working in private hospitals
operating in the province of Samsun was taken and samples were tried to determine the
effects of increasing the motivation of motivation tools.
The data collection technique used in the study is surveyed. In this context, a questionnaire
with 26 questions was developed. The questions in the questionnaire were prepared
according to the 5-Likert technique and multiple choice. In order to be able to reveal the
results of the survey effectively; Reliability analysis, frequency analysis and correlation
analysis.
As a result, economic, psycho-social and organizational-managerial tools have been found
to be effective in increasing the motivation of non-physicians. In addition, there is a
positive linear relationship between age, monthly income, level of education and work
experience and motivation tools. In short, it is understood that as employees age, monthly
income, level of education and work experience increase, motivation tools increase their
motivation even more.
Keywords: Employee, motivation, motivation tools, education and work experience

Khazar Journal of Humanities and Social
Sciences © Khazar University Press 2017
DOI: 10.5782/kjhss.2017.187.195
Determination of Ergonomic Conditions and Physical Workload of Infrastructure Employees
Eryaman Huseyin
IMBL South Russian University, Russian Federation
Davut Cem Dikmen
UKU, North Cyprus
Zehra Sevgi Oguz
UKU, North Cyprus
Introduction
Ergonomics, which is briefly defined as business intelligence, has become an
extremely important point in the present day, especially when the technology is
developed in a very fast manner and production work is connected to an
automation. Human machine interaction is more important in every business thanin
the past. We use ergonomics to scientifically explain this interaction. Especially
after the Industrial Revolution and the machine age, it caused transformation in the
societies and communities who worked at the factories took farming communities
places. The use of machines instead of hand tools and simple devices has begun.
However today we are in the information age. There is a process where advanced
technology is used, where computer systems are integrated into all areas of life and
processes are managed, and systems and computers are interconnected by
networks. Even today, we are working on extreme subjects such as artificial
intelligence, the development of robots that can think.
Today, especially businesses’ Ar-Ge works are supported by many goverments and
it shows the importance of the innovasions. Depending on the developments in all
sectors, the construction sector is also undergoing this transformation. It continues
to serve as a dynamic sector in which new technologies are constantly incorporated
187

188 Eryaman Huseyin, Davut Cem Dikmen, Zehra Sevgi Oguz into the system in order to ensure that the machines are used and that production
and productivity reach optimum levels.
In order to improve the efficiency in building works, to achieve better performance
and at the same time to ensure better motivation in the work environment, it is
necessary to ensure the compatibility of the worker and the work in optimum level.
The construction sector is divided into various branches within itself. Construction
works, infrastructure and road construction works need distinct specialized staff
and equipment. Experienced and expert personnel are required to use the machines
and the equipment. This makes it necessary to select suitable personnel for the
work done and the mechanisms that used. It is especially important to identify and
use appropriate equipment and tools in order to make the employee more
productive.
When we consider this point of view, the harmonization of the equipment and tools
used with the employees in today's conditions and the work security and health of
the employee, working comfort, commitment to the organization, work efficiency,
quality of production and so on shows the importance of the science of ergonomics.
Ergonomics is designed to optimize human work alignment in terms of
physiologically, psychologically and environmentally scientifically researched
data. In this study, physical workload values of municipal workers' working
environments were calculated and compared. In addition, the values that arise when
the ergonomic conditions change are analyzed.
Within the scope of the study, reflecting the worker’s section of work routinely
performed in the field, 4 workers from Infrastructure branch infrastructure work 1,
7 workers from substructure work 2 and 2 engineers’ who works in substructure
work heart rate values were measured using pulse oximeter device. First of all, the
heart rate values of all the workers were taken before starting work, then the heart
rate values were taken while the work was done at certain periods.
For an engineer who works at infrastructural work, the heart rate values were
calculated after brief 5-minute intense workload. Infinite heart rate values were
calculated for work completed in 30 minutes by four engineers working in concrete
paving and a controlling engineer from infrastructure work. Lastly, heart rate
values were taken for seven workers who worked in asphalt laying works as 30
minutes 60 minutes and 90 minutes.
After the work is completed, the heart rate values of all workers and engineers were
recalculated. Under these conditions, the physiological workload of the employees
was calculated. At the same time, the values that emerged in changing ergonomic
conditions were compared.

Determination of Ergonomic Conditions and Physical Workload of Infrastructure… 189
Physical Workload
When we look at the definition of physical workload in the literature; Physical
workload is the power of a person to do a certain job physically and mentally
[1],various influences on employee performance and reactions [2], and any body
movement that causes energy expenditure through skeletal muscles [3]. Physical
activities, environmental factors and positional anomalies are based on the
pressures that work on human beings and determine workload directly by
influencing [2]. The following physiological responses are the factors that
determine the workload during work done depending on the use of muscles [4]:
Heart rate, - Blood pressure, - Oxygen consumption, - Respiratory frequency, - Body temperature, - Proximate lactic acid level, - Skin resistance.
Work physiology examines the relationship between human body and work. By
studying the structure and functions of the human body, it investigates what effects
the body is exposed to because of work. Work physiology is the science of physical
and mental suppression, which is caused by the influence of workplace conditions,
gender, weight, duration, workplace conditions, and work conditions [5]. The
devices used for measuring in the work area are limited. Therefore, during the
study, values based on heart rate were used.
Heart Rate Measurement
Heart rate frequency is related to oxygen consumptionand can be used to determine
the physical workload. We can calculate the workers’ work pressure that they are
exposed during work by formulas[3].
1. Physical Workload (%HRR) = (H.R.work – H.R.rest) / (H.R.max – H.R.rest) * 100 2. %50 level = H.R.rest + (H.R.max –H.R.rest ) / 2

190 Eryaman Huseyin, Davut Cem Dikmen, Zehra Sevgi Oguz 3. Ratio = KAiş / KAish H.R.work (rate/dak), Heart rate during work H.R.rest (rate/dak), Heart rate during rest H.R.maks (rate/dak), Maximal heart rate (= 220 – yaş) %50 Level, Half of heart rate reserve
Material and Method
This study was carried out on the basis of the fact that the municipal workers had
taken a section of the routine work they had done daily in the city. Employees'
heart rate values are calculated for the tasks described below.
Work Schedule
1-Infrastructure works1. Team:
On a daily basis, they carry out border coverings of approximately 10 square
meters on predetermined pavements.
2- Infrastructure works2. Team:
On the days where hot blast asphalt is available (about 2 days / week), about 10
hours of asphalt laying work is done with hot mix asphalt material for about 2
hours.
3-Engineer:
One of the engineers briefly performs the practical measurement work by leaning
about 5 minutes but the other engineer is doing half an hour of measurement work.
During this time, the control is only done by walking.
Work Time
Infrastructure Team 1 30 minutes
Infrastructure Team 2 90 minutes
Engineer 5 minutes - 30 minutes
Measurement of heart rate values

Determination of Ergonomic Conditions and Physical Workload of Infrastructure… 191 Heart rate rates (beats / mins) were calculated by using finger-type pulse oximeter
device in pre-work, at work and at the end of work. The measurements taken
during the study were taken at the moment when it was most difficult (Table 2)
Table 1. below gives general information above workers.
Table 1. Age of employees and definition of work done
Infrastructure Team 1 Age Definition of the work Vehicles and tools
1. Worker 51 Concrete parquet flooring Trowel
2. Worker 58 Concrete parquet flooring Trowel
3. Worker 51 Material handling -
4. Worker 51 Material handling -
Infrastructure Team 2 Age Definition of the work Vehicles and tools
1. Worker 35 Cleaning Broom
2. Worker 37 Material laying Shovel
3. Worker 47 Material correction Harrow
4. Worker 41 Material laying Shovel
5. Worker 53 Truck driver Truck
6. Worker 47 Cylinder operator Cylinder
7. Worker 34 Digger operator Digger-Loader
Engineer Age Definition of the work Vehicles and tools
1. Engineer 32 Measurement Tape measure
2. Engineer 45 Control -
Physical Workload Calculations
- Physiological Workload(%HRR) = (H.R.work – H.R.rest) / (H.R.max – H.R.rest)
* 100
- %50 level = H.R.rest + (H.R.max –H.R.rest) / 2 - Ratio = H.R.work / H.R.rest
H.R. work (rate/min.), Heart rate during work H.R. rest (rate/min.), Heart rate during rest
H.R. maks (rate/min.), Maximal heart rate (= 220 – age) %50 Level, Half of heart rate reserve
One of the workers working with the shovel, Physical Workload value is the
highest value calculated as 50%. Engineers’ average Physical Workload value was
calculated as 19.69%.

192 Eryaman Huseyin, Davut Cem Dikmen, Zehra Sevgi Oguz These values reflect a specific section depending on the nature of the work being
performed and the duration of the work. The number of heart beats also suggests
the health status of employees [5].
Regarding physiological workload classification, we can determine the workload
group by using the values given in Table 4 below.
Table 2. Herat Rate Value (rate/min.)
Defition of work Before During Work End of Work
Work
Time (dk) 0 530 60 90 10 60 120
Infrastructure Team 1
1.Worker(Head worker) 67 97 75
2.Worker(Head worker) 80 103 97
3.Worker 80 85 81
4.Worker 84 87 87
Infrastructure Team 2
1.Worker(cleaning) 90 93 99 92
2.Worker(shovel) 87 135 117 96 103
3.Worker(rake) 75 86 85 90 77
4.Worker(shovel) 75 88 99 87
5.Worker(T. driver) 88 89
6.Worker(cylinder) 97 101 102 102 97
7.Worker(digger op.) 107 137 122 113
Engineer
1.Engineer 86 102 102 87
2.Engineer 63 88 61

Determination of Ergonomic Conditions and Physical Workload of Infrastructure… 193 Table 3. Heart Rate Values (rate/min) and Physiological Workload
Group Infrastructure
Team 1
1. Worker
2. Worker
3. Worker
4. Worker
Mean
Infrastructure
Team 2 1. Worker
2. Worker
3. Worker
4. Worker
5. Worker
6. Worker
7. Worker
Mean Engineer
1. Engineer
2. Engineer
Mean
Age
H.R
.wor
k
H.R
.res
t
F.İ
.Y(%
HR
R
)
Ra
tio
%50 L
evel
H.R
. w
ork
/%5
0L
evel
51 97 67 29.41 1.45 118.00 0.82
58 103 80 28.05 1.29 121.00 0.85
51 85 80 5.62 1.06 124.50 0.68
51 87 84 3.53 1.04 126.50 0.69
52.75 93 77.75 16.65 1.21 122.50 0.76
35 99 90 9.47 1.10 137.50 0.72
37 135 87 50.00 1.55 135.00 1.00
47 90 75 15.31 1.20 124.00 0.73
41 99 75 23.08 1.32 127.00 0.78
53 89 88 1.27 1.01 127.50 0.70
47 102 97 6.58 1.05 135.00 0.76
34 137 107 37.97 1.28 146.50 0.94
42 107.29 88.43 20.53 1.22 133.21 0.80
32 102 86 15.69 1.19 137.00 0.74
45
88 61 23.68 1.44 118.00 0.75
38.50 95 73.50 19.69 1.31 127.50 0.75
When we look at the Physical Workload calculations above, the mean of
physiological work load of the workers who work in parquet flooring work in
Infrastructure Team 1 was 28.73%, the assistant workers Physical Workload values
were calculated as 4.57%.
Infrastructure Team 2, workers who work with rowing Physical Workload mean
was 36.54% and 37.97% for the Backhoe Loader and digger operator, and Physical
Workload mean of other operators was 3.92% and 12.39% of other workers.

194 Eryaman Huseyin, Davut Cem Dikmen, Zehra Sevgi Oguz
Table 4. Physiological Workload Classification [6]
Workload Pulse(rate/min. Energy consumption Physiological
Group ) (Kcal/min.) Workload(%)
Light Work 70-90 <0.5 0-36
Medium Work 90-110 2.5-5.0 36-78
Heavy Work 110-130 5.0-7.5 78-114
Very Heavy
Work 130-150 7.5-10.0 114-150
Extremely
Heavy Work 150-170 >10.0 >150
When we look at Table 4 for physiological workload classification;
The average of the workers working in the Infrastructure Team 1 was in the Light
Work group, in the Infrastructure Team 2. Average of the Digger-Loader operator
and the row keepers Workers was in the Medium Work group, the average of other
workers was in the Light Work group.
The physiological workload of the engineers can be found in the Light Work
group.
Also, if the K.A. work / 50% level is equal to 1, the work undertaken is always
classified as difficult work [7].In Table 3, when we look at the shovel worker
working in the Infrastructure Team 2, the H.R. work / 50% value is 1.The value of
the backhoe loader operator is 0.94 and it is close to 1.
Conclusion
The physiological workload reveals the diffıculties that the employees are faced at
work, depending on the nature of the job, the duration of the work, ergonomic
conditions and workplace conditions. These analyzes are important in the
preparation of work organization charts and in the efficient use of employees.In
addition, heart rate values ensure that the employee has an idea of the general
health of the employee.
In this study, the physiological workloads of workers working in infrastructure
works are calculated.When the data were evaluated, it appears that teams in
Infrastructure jobs are in the Light Workload group.The average level of flat
workers working in the Infrastructure Team 1 is 4.57% P.W.L. value and quality of
workers 28.73% P.W.L. value indicates that these workers are not being used

Determination of Ergonomic Conditions and Physical Workload of Infrastructure… 195 efficiently.When considering the way of construction and the duration of work, it is
necessary to increase the amount of work done or to divide the teams into two. In
this case, it is seen that there will be no problem in increasing the work load.
Workers who are shoveled in Infrastructure Team 2 are up to 50% physical
workload and workers who clean up and correct work up to 12.39% on average. In
this team, other workers should work together with the rowing workers, and in this
context the average work load should be balanced.
The cylinder worker and the truck driver have an average physical workload of
3.92%. It seems necessary for these employees to be directed to other teams that
need trucks and cylinders.
The Backhoe-Loader operator's physical workload is 37.97%. The workload can be
reduced by improving the ergonomic conditions such as the seat components of the
machine used by the operator are improved.
The average physiological workload calculated for the engineers is 19.69%, which is in line with the quality of work done.
As a result of this study, physiological workload values have revealed the
difficulties of employees due to work, and have provided scientific explanations
about how teams can be evaluated in more efficient and more ergonomic
conditions.

Khazar Journal of Humanities and Social
Sciences © Khazar University Press 2017
DOI: 10.5782/kjhss.2017.196.209
Health Tourism in Turkey
Tevfik Yazan
IMBL University, Russian Federation
Ahmet Girgin
IMBL University, Russian Federation
Erkan Karadag
IMBL University, Russian Federation
Introduction
All travels made by people who seek solutions to health problems are generally
regarded as health tourism. For centuries, mankind has traveled for various
purposes. Some of them are those who want to gain health, to be treated and to find
answers to various health problems. As health services are limited in the past
people who participate in compulsory travel to get definitive results in medical care
are now adding health travel to their leisure travel. In the past years people had to
go where the specialist of a certain subject was. These health professionals were
generally trying to treat people by using traditional methods and the information
they gained from experience. The development of modern medicine has changed
the health tourism from beginning to end. Today, there are alternative medical
doctors and healers at the health centers that modern people can reach with health
tourism, as well as professional medical personnel trained in modern medicine. In
the years when transportation and communication systems were weak, people were
only traveling on a mandatory reasons. These reasons were generally economic and
political. Today the emergence of a welfare has caused the concept of tourism to be
born. The modern man has started to travel with his own demanding for many
reasons such as sightseeing, entertainment, learning and health. With the
understanding significance of tourism, both companies and governments have
taken the first steps in an institutionalized sector as a catalyst for this sector's
transformation into an important sector. Many people who see the tourism sector as
196

Health Tourism in Turkey 197 an important economic contribution, make significant contributions to the
formation of the tourism essentials by investing in this area. The tourism sector,
which has become a huge sector in economic terms, has integrated itself according
to the economic order of the global world. The health tourism sector, which is the
most important sub-sector of this field, is constantly changing and renewing itself
by taking its share from this situation.
As the tourism sector is a driving force for the economy and other sectors are
affected by this sector at a magnificent level, the eyes are turning to this sector
especially during season (Gümüş & Polat, 2012, s. 9). For example, business
agreements made on business trips directly affect the situation of many sectors and
even the related country's economies. Therefore, it is of critical importance for the
guests who come to business travel to be welcomed in good places. A minor
problem with the services provided can lead to significant consequences. The
health tourism sector, which is a sub-sector, is an important sector that is becoming
more institutionalized, increasingly understood, having an economically important
value by the time and being a key sector for some countries. (Castro, Villaraga,
Barreto, Victoria, & Barbosa, 2011, s. 136). In addition to the economic bring-up
of the health sector, social and cultural contributions are caused. Due to health
tourism is banding together the people who has the similar health problems causes
culturel interaction. Increasing institutionalization in the sector facilitates the access
of many people to health centers. Because costs are falling to a certain level and the
staff trained in many countries take part in this sector, the economic imbalance in
this area is deteriorating in favor of developing countries. According to the
researches carried out in developed countries, instead of getting luxury and
expensive health care, there is an increase in the number of individuals choosing
the same quality and affordable service in a developing country. (Freitas, 2010, s.
49). For example, many people living in the US travel to South American countries
as health tourists. (Hopinks, Labonte, Runnels, & Packer, 2010, s. 185). This
provides both an opportunity for individuals to travel and leads to the purchase of
services at more affordable prices.
For example, it seems that an aesthetic surgery in Brazil has a 60% better cost than
the same surgery in a developed country. (Nascimento & Moreira, 2013).
The preference of a country for health tourism cannot be explained only at
reasonable prices. Many factors, such as the location of the country, the existence
of other possibilities and accessibility, are of importance at preferability. For
example the neighbouring countries of Turkey are choosing this country because of
it's location. (Zengingönül, Emeç, İyilikçi, & Bingöl, 2012, s. 18).

198 Tevfik Yazan, Ahmet Girgin, Erkan Karadag Many positive developments are not enough to prevent the deficiencies and
problems in the field of health tourism. Although the sector has developed over
time, the fact that a common strategy has not been established has led to the
emergence of a fragmented and disjointed system.(Özsarı & Karatana, 2013, s.
140). The structure that is away from this integrity causes the potential to be
underestimated.Although health tourism is a sector that stands out in the tourism
sector, there are interpretations of there is no vision that make it unclear to which
direction will go in this sector. (Altın, Bektaş, Antep, & İrban, 2012, s. 163).
The aim of this study is to make an overall study concerning the medical tourism in
Turkey. Within this scope, the literature review is made, and the study is concluded
in the light of the obtained and reviewed sources.
Health Tourism Concept
Health tourism is travel made to end health problems, to treat them, to improve the
quality of life of the individual and to make them feel better and happier. Health
tourism is a type of tourism that constitutes the whole of the services such as
surgical operations, organ transplantation, physical therapy and rehabilitation,
which the health center that the person demands to be healthy. (Yatırım ve
İşletmeler Genel Müdürlüğü, 2017). Accommodation conditions and travel specify
the tourism part and throughout the travel having a health service specify the health
part.(Gülmez, 2012).
Although the individual involved in health tourism has taken on the identity of a
tourist, the first element motivating him when heading journey is a health problem.
The person who comes to find a solution to the health problem is considered as a
health tourist. Having treatment or getting services to improve the quality of life in
the sense of being healthy is expected behavior from the health tourist. (Özkurt,
2007).
Health tourists are not only the ones who go to a health center and seek a remedy
thereA health tourist can also join extensive activities as entertainment, excursions
and trainings. It is obvious that these activities will also have a positive effect on
health. The presence of large numbers of elderly people in developed countries has
made this sector quite large and profitable. In developed countries, however, such
services are luxurious and highly cost, leads individuals to other countries. Due to
high prices, there are many health tourists who take health care from other
countries. In countries where the social state and security are developed and strong,
a wide range of agreements and investments are made in order to spread health
tourism throughout society and attract more tourists. (Göçmen, 2008).

Health Tourism in Turkey 199 The increase in population and average life span, the high demand for quality living
facilities and the rising welfare have led to a great development of the health sector.
Some countries are able to stand out with their private health services. This has led
to the emergence of the concept of health tourism. The reasons leading to health
tourism are :(Metin, 2017):
- Requests from individuals who are not satisfied with the current health services
in their own countries, - The desire to reach full, comprehensive, quality and fast health services, - Demand for improved health technologies,
- Due to expensive health care services, demand for countries where healthcare
is cheaper, - The desire to move away from problems spatially, - Possibility to make a vacation while taking health care, - The adverse effect of climate conditions on the health conditions of the country
(Aslanova, 2013).
The reasons why individuals prefer health tourism include:
- Health care service has appropriate conditions, - Access to healthcare is easy, - The touristic activity is exactly what is demanded, - The services provided are of good quality and healing.
Types of Health Tourism
The generally accepted types of health tourism are: Medical tourism, Thermal
tourism, Spa and wellness, 3rd age tourism and disabled tourist, Climatism
(weather conditions), Uvalism (curries made using fruits and vegetables) and cave
tourism. The following table shows the types of health tourism. (Gonzales, Brenzel,
& Sancho, 2001).
The following three types of health tourism are considered as the type of health
tourism:

200 Tevfik Yazan ,Ahmet Girgin,Erkan Karadag - Thermal tourism and SPA-Wellness,
- Elderly and disabled tourist,
- Medical tourism
Table 1. Types of Health Tourism
Health - Beauty Treatment (Medical) Rehabilitation
• SPA • Elective surgery • Dialysis
• Natural Tourism • Plastic surgery • Additional Programs
• Ecotourism • Articular replacement • Elderly Care Programs
• Mass tourism • Cardiothoracic Services • Addiction Treatment
• Herbal Treatments • Diagnostic Services • Thermal Treatments-FTR
• Aftercare • Cancer Treatment
• Thermal Treatment • Infertility Treatment
Source: (Gonzales, Brenzel, & Sancho, 2001, s. 20)
Thermal Tourism: The presence of rich minerals in underground water
isimportant for human health. The important effect on the human health of these
waters is known. Thermal tourism is also one of the important activities that come
to mind in terms of health tourism.
The thermal word produced from the word thermos, which means hot in Latin, was
used for public baths during the Roman period. Since the healing power of thermal
waters is well known, the concept of thermalism has emerged in this area.
(Tengilimoğlu, 2013, s. 72).
Within the scope of thermal tourism it is possible to do the following activities:
Thermal water bath, sparkling water, inhalation, mud bath, climate cure, physical
education, psychotherapy, physiotheraphy, rehabilitation and diet (Akat, 2000, s.
23-24).
Thermal tourism contributions are:
- Providing service throughout the year,
- Accepting many guests with the possibility of establishing facilities near
the thermal zones, - To offer job opportunities to many people,
- It is always connected with other types of tourism,

Health Tourism in Turkey 201 - Different activities can be easily done in the same facility (Gümüş & Polat,
2012, s. 56).
Spa and Wellness: The word spa, which means health from the water, is also
thegeneral name of the health centers where this service is provided (Ayçeman,
2014). In these facilities where water is used as basis, the health tourists perform
activities of rest and treatment. All activities in these health centers provide guests
with mental and physical renewal. Water-based services include mud and seaweed
baths (Tengilimoğlu, 2013).
Individuals who do not have any health problems can also be rested mentally and
bodily by taking advantage of spa services. Wellness is the concept that meets this
situation (Este Spa, 2017). The same services are also available here (Harahsheh,
2002).
Elderly and Disabled Tourism: Elderly tourism (geriatric tourism), which is
atype of tourism resorted to by elderly people, especially in developed countries, is
sometimes seen as an opportunity to get better health only during retirement days,
although it is sometimes resorted to as a preventive measure for some health
problems. (Bulu & Eraslan, 2007, s. 174).
The number of elderly individuals achieving high rates in developed countries
reveals this tourism. These individuals want to spend their retirement times in
cheaper countries for both health and travel. This situation has also revealed a new
area within the scope of health tourism. The increasing proportion of elderly
population shows that this sector will grow more and more (Selvi, 2008, s. 25). It
also includes the establishment of special facilities to help disabled people to
maintain a healthy life, and the provision of special services here.
Medical tourism: The travel that individuals make to other countries for
healthpurposes is called medical tourism (Gümüş & Polat, 2012, s. 46). Individuals
living in developed countries want to get health care by going to other countries
where their money has a higher value as an alternative to very expensive health
services. This has transformed health tourism into an important sector. Medical
tourism, on the other hand, refers to travel that the individual has made in order to
find a solution to the health problem. It does not matter what the reason is for the
individual to choose another country. The important thing is that motivation is
health when going on a travel. (Gümüş & Polat, 2012, s. 46). With medical
tourism, it is possible to get many health services in the field. Plastic surgery,
dental health, heart surgery, stomach stapling, organ, tissue and cell transplant, eye
surgery and medical services such as diagnosis. (Tengilimoğlu, 2013, s. 104).

202 Tevfik Yazan , Ahmet Girgin,Erkan Karadag Development of Health Tourism in Turkey and Health Tourism Policy:
Health tourism in Turkey has become increasingly important in recent years. It is
understood that health tourism, which is known only through thermal service, is a
valuable sector when its scope and size are understood. In health tourism, when the
income reached to 3 billion dollars in recent years, various initiatives and
investments in this area have increased in Turkey (Aydın, 2012, s. 91).It is very
important that the incentives and supports made in this area come from the public
sector. The information that the ministries of Culture and Health will produce in a
cooperative work is also important for the future of health tourism.
Turkey's geographical location and natural features make it a center country in
terms of health tourism. It is unique for Turkey to be close to different continents
and to have natural resources such as underground waters. Investors who are aware
of this situation and the size of the market have started this business by making
necessary health investments. But high costs have stopped the rapid development
of the industry. For faster development, it has been necessary to develop the ability
to open up to different markets. A unit established in the Ministry of Health
undertook the task of conducting research in the field of health tourism. The fact
that the Tourism Strategy of Turkey which is given in a wide range of health
tourism shows that this sector is getting serious by the public sector. In addition,
global integration studies are carried out in terms of health tourism with
international congresses held every year (Kaya, Yıldırım, Karsavuran, & Özer,
2014, s. 1).
In Turkey, facilities with different qualities are being established in terms of the
development of health tourism. In this context, it is observed that there are
increases in facilities such as health-care facilities, clinical guesthouses and
geriatric treatment centers. Thanks to many breakthroughs in the field of health,
local tourists have also preferred facilities within the country. The intersection
where investments and action plans made in 132 different health fields will directly
affect health tourism. In this context, according to the 2010-2014 Strategic Action
Plan prepared by the Ministry of Health, the distribution of current health personnel
shown in Table 7 stands out as an important data in this respect. The increase in
this number will go parallel to the increase in certified health centers. According to
this action plan, when a clinical guesthouse is established, it will serve with a
hospital stated on the same area. Geriatric treatment centers will be opened within
the scope of elderly tourism and they will be able to provide care and health
servicesTurkey attaches great importance to the elderly tourism, will be certificate
the institutions providing the conditions and will make the necessary checks
themselves in public. At the same time, it will be obligatory to establish a

Health Tourism in Turkey 203 health unit in accommodation places with a bed capacity above 500 It is obvious
that these regulations will carry health tourism to an advanced point.
The positive aspects of Turkey's health tourism from the Western Mediterranean
Development Agency (BAKA, 2011) are:
- The availability of hospitals with strong infrastructure and navy infrastructure, - Trained and experienced health sector staff, - Having 39 hospitals in the International JCI Accrediting Institution, - Affordable health services, - Being an attractive center with its natural beauties and geographical location, - Offering a multitude of services that the diversity of natural conditions reveals, - First place in Europe in terms of thermal wealth, - Always interacting with other types of tourism.
Table 2. Distribution of Health Personnel in Our Country
Healthcare Staff Distribution Ministry University Private sector Total
in Turkey of Health
Expert Physician 24.819 11.569 19.038 55.426
medical practitioner 27.125 234 3.784 31.143
Assistant 8.324 12.606 - 20.930
dentist 5.252 637 12.760 18.649
Pharmacist 1.213 189 23.492 24.894
Nurse 69.204 14.555 15.980 99.739
midwife 43.346 525 3.797 47.668
Other Health Services 65.814 7.702 21.016 94.532
Personnel
Other Staff 59.512 9.651 19.538 88.701
Grand total 304.609 57.668 119.405 481.682
Source: (T. C. Sağlık Bakanlığı, 2010)
Harrant collects certain indicators and positive aspects showing the development of health tourism under four headings. These:
- Thanks to health tourism, the individuals who need it can get the quality
health services they want or demand.
- The quality of health tourism also increases as the information and experiences obtained are shared. In this case it is in the interest of the direct service claimants.
- The number of people who have entered the queue for health care can be reduced
by health tourism. This situation increases customer satisfaction and increases the
safety of the social security.

204 Tevfik Yazan, Ahmet Girgin,Erkan Karadag - Thanks to the fact that health tourism is linked to many fields, economics
stands out as a high added value sector (Harant, Hastert, & Scheres, 2003).
The disadvantages of health tourism are generally related to the emergence of
different legal conditions between countries where the health care provider is
different. If there is any health problem after the health service, coming to the same
health center again brings out an additional cost. In addition, the fact that insurance
companies generally can not cover health expenditures abroad also draws attention
as an important factor in the development of health tourism.
Advantages and Disadvantages of Health Tourism in Turkey
In 2007, the criteria set by Bies and Zacharia reveal a certain framework for
positive aspects of health tourism. With these criteria, it was possible to carefully
examine the variables such as health service quality, accessibility and cost in health
tourism. The advantages brought about by the criteria are (İçöz, 2009):
- Getting health care from quality health centers, - Getting health care services close to the quality of health in developed countries, - Opportunity to receive affordable health services at higher prices in
developed countries, - Benefit from the advantages of geographical location and climatic conditions, - To be able to make other types of tourism (Çetinkaya, 2010). The disadvantages are: - Organizational problems due to lack of knowledge and experience due to the large number of new organizations, - No easy-to-find expert staff on certain issues, - The various sectors that will strengthen and assist health tourism are
not developed or lack adequate services in these areas, - Promotion, advertising and communication activities do not create the expected effect (Çetinkaya, 2010).
Health Tourism Economy
In the world, approximately 4 trillion dollars is reached when health expenditures
are collected. Research on the importance of an individual's health can be
qualitative or quantitative. According to this, activities such as which diseases,
population information, preventive health services constitute qualitative data about

Health Tourism in Turkey 205 health. Quantitatively, health expenditures and budgets come to the forefront.
According to this, while 35% of the health expenditures are realized by the USA,
only 8% of China with the highest population is realized (Tengilimoğlu, 2013, s.
55). The expenditures made provide a basic knowledge. It is of greater importance
that the total expenditure or budget of the country is in which proportion of health
expenditures. In 2009, health expenditures of $ 4.1 trillion were made. Countries
have generally allocated their budget to health spending at rates varying between
2% and 16% of GNP rates. In 2008, Turkey occupied 5.7% of the total health
spending and remained below the OECD average (8.9%). In 2009, it reached a
health expenditure of 38 billion dollars, reaching a rate of 6.2% in GDP (BAKA,
2011, s. 13).
The high health expenditures have led many countries to invest in health tourism.
Countries wishing to benefit from the driving forces of health and tourism want to
make significant leaps in this area and make significant contributions to their
economies. Countries with a high tourist rate that makes good use of this area have
significant advantages. Today, there is a $100 million health tourism expenditure
(Tengilimoğlu, 2013, s. 56).
In 2013, the number of people coming to Turkey for health tourism was 300,000.
In 2014, the target was 400,000 people. The number of 480,000, when it comes to
the number of 2013 patients who apply for health centers for their simpler health
operations such as hair extractions, reveals clearly the clues of potential growth in
this area. (TÜRSAB, 2013).
Conclusion
Tourism is an important sector in many countries with its own economy and
internal dynamics. The health tourism, which is the most important branch of this
gigantic sector, caused the demand to shift to other countries, which appeared in
the developed countries and addressed to a limited audience with the luxurious
services given to the individuals. It is accepted as an important sector for
developing countries because it brings together two important fields such as health
and tourism in one sector. The increase in potential tourists from developed
countries who want to come to health tourism for the developing countries shows
that the competition in this area will increase with time.
This area, which is limited only by thermal tourism, has become an important
sector in developing countries, and the anticipated echoes have also started to be
heard in Turkey. The geographical location and natural beauty of Turkey gives it a
natural advantage in this area. At present, hundreds of thousands of tourists visit

206 Tevfik Yazan ,Ahmet Girgin, Erkan Karadag Turkey every year, health tourism in the field of initiatives and investments will
lead to a very good evaluation of this potential.
Many professional health workers from other countries as well as trained
professional health care workers work in this sector to increase quality In addition,
the support and incentives given by the state in this area are also striking. It is
important to note that public authorities are providing important incentive
programs in this area, leading to the establishment of many health facilities. It is
realistic to state that serious consequences are expected in this area in our country
where the tourism potential is very strong.
The field of health tourism can not with stand the existence and institutional
structuring of the health as a sector historically based on old age. So, industry-
related standards will take time to settle. Many institutions and organizations in
Turkey in order to comply with the determined quality standards are willing to
contribute. Studies in the health tourism legislation are continuing uninterruptedly.
This shows us the efforts of institutionalization in the field of health tourism.
Turkey is seen as an important thermal center thanks to its natural resources
Managing the advantages of these natural features in an integrated way with the
health tourism facilities will cause the health tourism to grow at once. Therefore,
creating a variety of infrastructure in the health field and building a system that
invites open and entrepreneurs with dynamic legislation will be possible by making
critical decisions correctly. In recent years, efforts have been made to create a
legislation in which local and foreign tourists will not face legal problems. A legal
issue to be experienced in the field of health will reduce the attractiveness of
tourists. The establishment of a widespread health infrastructure is also a very
important issue. Establishment of establishments, institutions and foundations in
which the facilities can be reached and the services can be provided in good quality
and hardware standards are observed will determine the future of health tourism in
Turkey.
References and notes: Akat, Ö. (2000). Pazarlama Ağırlıklı Turizm İşletmeciliği. Bursa: Motif Matbaa. Altın, U., Bektaş, G., Antep, Z., & İrban, A. (2012). Sağlık Turizmi ve Uluslararası Hastalar İçin.
Acıbadem Üniversitesi Sağlık Bilimleri Dergisi (3), 157-163. Aslanova, K. (2013). Türkiye'de Sağlık Turizmi ve Sağlık Hukuku. AVRASYA Uluslararası
Araştırmalar Dergisi(2), 131-143. Ayçeman, N. (2014, 11 24). SPA: Salus Per Aquam. Sağlık ve Doğal Terapiler Derneği:
http://www.saglikterapi.org/spa-salus-per-aquam/ adresinden alındı

Health Tourism in Turkey 207
Aydın, O. (2012). Türkiye'de Alternatif Bir Turizm; Sağlık Turizmi. KaramanoğluMehmetbey Üniversitesi, Sosyal ve Ekonomik Araştırmalar Dergisi(14).
BAKA. (2011). Sağlık Turizmi Sektör Raporu. Bulu, M., & Eraslan, İ. H. (2007). Sağlık Turizmi: Sürdürülebilir Rekabet Avantajı EldeEtmede
Turizm Sektörü. İstanbul. Castro, A. M., Villaraga, M. L., Barreto, A. L., Victoria, A. J., & Barbosa, W. G. (2011). Turismo en
Salud: Una Tendencia Mundial que Abre Paso. Ciencia & Tecnologíapara la Salud Visual y
Ocular, 9(1), 125-137. Çetinkaya, T. (2010). Sağlık Turizmi Açısından Bursa İlinin Pazarlanabilirliği Konusunda Sağlık
Çalışanlarının Görüslerinin Belirlenmesi Üzerine Bir Araştırma. Yayınlanmamış Yüksek
Lisans Tezi. Sakarya: Sakarya Üniversitesi Sosyal BilimlerEnstitüsü. Este Spa. (2017, 02 18). SPA (Salus Per Aquam) Nedir? Este Spa:
http://www.estespa.com/spa.asp adresinden alındı Freitas, H. M. (2010). Turismo Medico: A Globalizaçao da Saude. Yayınlanmamış Yüksek
Lisans Tezi. Porto: Faculdade de Economia Universidade do Porto. Gonzales, A., Brenzel, L., & Sancho, J. (2001). Health Tourism and Related Services, Caribbean.
Final Report, 57-58. Göçmen, Z. G. (2008). Turizm Çeşitlendirmesi Kapsamında İzmir’de Termal Turizmin Tedavi
Amaçlı Kullanımı ve Ekonomik Değeri. Yayınlanmamış Yüksek Lisans Tezi. İzmir: Dokuz
Eylül Üniversitesi Sosyal Bilimler Enstitüsü. Gülmez, Z. (2012). Türkiye'de ve Dünya'da Sağlık Turizmi ve Çeşitleri: Sağlık Turizminin
Ülkemizdeki Mevcut Durumu ve Bazı Ülkelerle Kıyaslanması. YayınlanmamışYüksek Lisans
Tezi. İstanbul: İstanbul Üniversitesi Sosyal Bilimler Enstitüsü. Gümüş, S., & Polat, N. (2012). Sağlık Turizminde Pazarlama Değişkenlerine Bir Bakış veİstanbul
Örneği. İstanbul: Hiperlink Yayınları. Harahsheh,S. (2002). Curative Tourism in Jordan and its Potential Development. Yayınlanmamış
Yüksek Lisans Tezi. İngiltere: Bournemouth University, Departmentof European Tourism
Management. Harant, P., Hastert, M., & Scheres, J. (2003). Hospital Cooperation in Border Regions in Europe.
Proceedings of the HOPE Conference and Workshop, (s. 34-37). Luxembourg. Hopinks, L., Labonte, R., Runnels, V., & Packer, C. (2010). Medical Tourism Today: What is the
State of Existing Knowledge. Journal of Public Health Policy, 31(2), 185-198. İçöz, O. (2009). Sağlık Turizmi Kapsamında Medikal (Tıbbi) Turizm ve Türkiye'nin Olanakları.
Journal of Yaşar University, 4(13), 2257-2279. Kaya, S., Yıldırım, H. H., Karsavuran, S., & Özer, Ö. (2014). Türkiye Medikal TurizmDeğerlendirme
Raporu 2013. Ankara: T. C. Sağlık Bakanlığı. Metin, B. (2017, 02 18). Dünya'da ve Türkiye'de Sağlık Turizmi- 2010: Durum Tespit Raporu ve
Çözüm Önerileri. Özel Hastaneler:http://www.ozelhastaneler.org.tr/images/Documents/sanal%20k%C3%BCt%C3 %BCphane/D%C3%9CNYA%E2%80%99%20DA%20VE%20T%C3%9CRK%C4%B 0YE%E2%80%99%20DE%20SA%C4%9ELIK%20TUR%C4%B0ZM%C4%B0-2010.pdf adresinden alındı

208 Tevfik Yazan , Ahmet Girgin, Erkan Karadag Nascimento, R. C., & Moreira, L. A. (2013). Turismo de Saude: A Pratica do Turismo de Saude e
Suas. Revista de Investigacion en Turismo y Desarollo Local, 5(13). Özkurt, H. (2007). Sağlık Turizmi Tahvilleri. Maliye Dergisi, 152(1), 122-142. Özsarı, S. H., & Karatana, Ö. (2013). Sağlık Turizmi Açısından Türkiye’nin Durumu.
Kartal Eğitim ve Araştırma Hastanesi Tıp Dergisi, 24(2), 136-144. Selvi, M. S. (2008). Sağlık Turizmi: Turistik Ürün Çeşitlendirmesi. Ankara: Nobel Yayıncılık. T. C. Sağlık Bakanlığı. (2010). Stratejik Plan 2010-2014. T. C. Sağlık
Bakanlığı. Tengilimoğlu, D. (2013). Sağlık Turizmi. Ankara: Siyasal Kitabevi. TÜRSAB.(2013,08). Türkiye Seyahat Acenteleri Birliği. TÜRSAB:
http://www.tursab.org.tr/yayin/91/tursab_agustosmail_91_5599209.pdf adresinden alındı Yatırım ve İşletmeler Genel Müdürlüğü. (2017, 02 18). Sağlık ve Termal Turizmi Tanımı. T. C. Kültür
ve Turizm Bakanlığı: http://yigm.kulturturizm.gov.tr/TR,11492/saglik-ve-termal-turizmi-
tanimi.html adresinden alındı Zengingönül, O., Emeç, H., İyilikçi, D. E., & Bingöl, P. (2012). Sağlık Turizmi: İstanbul'a
Yönelik Bir Değerlendirme. İstanbul: Ekonomistler Platformu.

Health Tourism in Turkey 209
Summary
Health Tourism in Turkey
Tevfik Yazan
IMBL University, Russian Federation
Ahmet Girgin IMBL University, Russian Federation
Erkan Karadag
IMBL University, Russian Federation
Medical tourism can simply be defined as the travels with the aim of treatment. In other
words, medical tourism is the type of tourism that facilitates the development of medical
institutions by using the international patient potential as well as the ones in need of
physiotherapy and rehabilitation. In recent years, as the medical services provided in
Turkey have also become competent with the qualified medical services of the developed
countries, tourists have started coming from the entire world in order to get medical
treatment. Especially after the 1990s, it is observed that private sector has also made
significant investments in the health services in addition to the public health care. As a
result of these developments, the number of private healthcare organizations has increased
especially in the metropolitan areas, which would be able to compete within the European
standards. It has gradually become a necessity for those health facilities, whose costs are
high in their establishment and operation, to enter the foreign markets so as to reduce those
costs. Additionally, among the important advantages for the medical tourism are the
geographical position of Turkey and the qualified and educated labor force in the health
sector. The aim of this study is to make an overall study concerning the medical tourism in
Turkey. Within this scope, the literature review is made, and the study is concluded in the
light of the obtained and reviewed sources.
Keywords: Health, Medical Tourism, Tourism, Turkey

Khazar Journal of Humanities and Social
Sciences © Khazar University Press 2017
DOI: 10.5782/kjhss.2017.210.217
Conformity and Dependency Complex in Yashar Kemal’s Other
Face of the Mountain Trilogy
Nihal Ozcan
Bursa Technical University, Turkey
Conformity can be briefly defined as attempts of individuals to match the attitudes,
behaviors, and social norms that society has internalized as a whole. One reason for
conformity is dependency complex. People feel that they have to depend on each
other to be at peace, to succeed, and even to exist. People tend to conform due to
the risk of failure in individual action. Even though collective action does not
always bring positive results, people prefer to fail collectively. Yashar Kemal’s
TheOther Face of the Mountain Trilogyis a portrayal of a communal society
thathas fallen into the clutches of a dependency complex in order to survive. In this
trilogy, the villagers believe in collective action and they tend to do everything
collectively. Such behavior results in conformist action. Thus, people are blinded to
truth and can be easily deceived. In The Wind From The Plain, the Yalak villagers
depend on Old Halil and Muhtar Sefer to go to the Chukurova to pick cotton.
Although they know that it’s getting late for the cotton picking season, no
individual tries to initiate the collective travel to the Chukurova. The Muhtar, who
has made a secret agreement with some land owners in the Chukurova, tricks the
villagers to earn money. In Iron Earth Copper Sky, the Yalak villagers depend on
each other and hesitate to do anything individually. Upon the Muhtar’s one
proposal, they hide all their belongings, and upon his other proposal they take their
belongings out. When one believes that Tashbash is a saint, others conform to this
idea. Everybody starts to depend on Tashbash whereas Tashbash does not depend
on anybody. This conformist action of theirs results to the disadvantage of Tasbash
and he is taken away to be sentenced. In The Undying Grass, the villagers refuse to
believe that the destitute person who comes to them is Tashbash. Although some
individuals believe that he is Tashbash, they collectively refuse to believe it, and
they produce a story to justify their argument. The objective of this essay is to
analyze the characteristics of Yashar Kemal’s communal society in TheOther
Faceof the Mountain trilogy in terms of dependency complex.
210

Conformity and Dependency Complex in Yashar Kemal’s… 211
The society portrayed in Yashar Kemal’s Other Face of the Mountain trilogy
conveys specific characteristics that lead them to dependency complex. First and
foremost, the geography described in the trilogy secludes people from other
cultures and places. Yalak village is located in an isolated part of the Taurus
Mountains and it has a harsh climate. In winter, the harsh weather hinders people
from travelling to nearby places, and therefore separates them from the outer world.
In Iron Earth Copper Sky, the limitation and isolation of people in Yalak village is
emphasized many times. The secret lovers, Hüsneh and Rejep run away from the
village freeze to death..Tashbash and KocaHalil are saved from freezing while they
are trying to leave the village. Besides physical hindrances, the village has loose
links with the outer world. A few people have contacts with the outer world and
most of the other villagers know only the Chukurova and the places in which they
did their military services. Therefore, their vision of life is quite limited and their
world consists of just these places. This isolation forces them to depend on each
other more because they only have each other for help and advice.
In communal societies, people have more chance to know each other when
compared to people living in cities, where individuals can do whatever they
wantwithout thinking of moral values because nobody will care about it. In the city,
does not matter if people seem immoral because they do not know these people and
they will probably never see them again. Therefore, anonymity allows their doing
things that are unacceptable by society. However, in villages, everybody knows
each other and knows what they are doing. Therefore individuals are subjected to
greater peer pressure and tend to conform to the whole. The Yalak villagers know
each other very well and they know what people are doing in the village because
the small scale of the village hinders them from doing anything secretly. They even
know each other’s immoral behaviors. For example, they know that Old Halil was
a horse thief when he was young. Moreever, the Yalak villagers need to respect and
depend on each other and to maintain social solidarity.
In Yalak village, there is no school or educational activity. A few people are literate
who probably learnt how to read and write during military services. Tasbash and
Tall Ali are among the literate ones in the village. The lack of education reinforces
the dependency complex of the Yalak villagers. They are like a herd of sheep
waiting to be guided. They believe whatever they hear. They even believe the most
unrealistic stories. For example, in Iron Earth Copper Sky, the story of the
Tashbash is narrated: Ulu Memed Efendi, an ancestor of Tashbash, sees a young
person who has been partly turned into stone; he prays for the young man, and then
Ulu Memed Efendi’s head turns into stone while the young man’s head becomes
normal. The name of Tashbash comes from this story. Villagers

212 Nihal Ozcan
believe in such myths. The illiterate status of the villagers is emphasized when
the captain scorns them after he hears that they made Tashbash a saint.
“What?” he shouted. “Saints in this atom age? Mehdis in this space age?
I’ll break every bone in his body. I’ll show him how to be a Mehdi in the
twentieth century.” He had almost wept with rage. “It’s these exploiters,
these liars, these Tashbashes who keep our poor people from modern
progress. Mehdis in our modern Turkey, eh? Relics of the Ottoman
fanatics, eh?” (Kemal 240)
The Captain’s emphasis on modernity suggest that lack of education is the primary
cause that makes villagers believe whatever they hear and whatever they want to
believe. Such individuals naturally believe in Memedik’s images and stories about
Tashbash. Muhtar Sefer summarizes this phenomenon as he says: “There he
[Memedik] was ready to give his life rather than betray Tashbash. Obviously, he
had made up this story of the lights and then worked himself into believing it was
true” (139.) The Yalak villagers conform to this idea when Memedik says:
When I go now and say to the villagers “I haven’t indeed seen any light or
whatever, and there is neither such a man, that man wasn’t Tashbash,” the
villagers will immediately kill me. Even if they don’t, they’ll force me to
leave the village. They’ll look at me as they’re looking at a dog. Even my
mother won’t talk to me anymore (239)
The Yalak villagers do not question what they hear from follow villagers. They
just believe in them. As they believe in each other without questioning, their ties
are strengthened as well as their dependency on each other.
Yalak village doesn’t have a mosque or a religious leader to lead the prayers.
KelAşık sometimes leads the prayers if needed. Besides being illiterate, the
villagers have little idea about their religion. They misinterpret Islamic rules. They
inject cultural beliefs into Islam and justify whatever they make up. Meryemdje
always personifies God in her speeches. The image of God in her prayers resembles
a human being with black hair and black eyes, and she offers to wash his feet.
However, such personifications of God are against Islamic belief. Meryemdje does
not adhere to proper religious form. For example, she pledges to perform a namaz
with 5 prostrations although Muslims prostrate two, three, or four in a namaz not
five. What is more, Meryemdje pledges to feed a dog under a tree in three
succeeding Fridays to compensate for the sin of breaking a promise. She promises
to perform a namaz toward a holy three. However, such rituals have no place in
Islamic beliefs. Kemal, in these examples, illustrates how some pre-Islamic beliefs
have found their place in the minds of the illiterate villagers. Most

Conformity and Dependency Complex in Yashar Kemal’s… 213
of these rituals have a pagan background which is conveyed through oral culture.
As there are no sharp lines between culture and religion, these rituals are absorbed
into religion. Such heterodox religion, full of superstition and pagan cultural
elements originating makes it easier to believe collectively in Tashbash as a saint.
In Yalak village, everybody is involved with the same job during seasonal work in
the Chukurova. A few of them have animals that are just enough to provide their
homely needs. There isn’t a division of labor in the village. The common seasonal
work forces people to act collectively because they work as a whole when they
arrive in the Chukurova. The Muhtar agrees with the land owners and all the
villagers work in the same field together. People hesitate to leave the group because
they risk not finding a field in which to work. The Muhtar uses this risk as a threat
for those who are unwilling to work in the fields the Muhtar finds for them.
Therefore, they follow a common saying in Anatolia “the wolf eats the one
separated from the herd.” No matter how they are negatively affected, they do not
escape from the clutches of dependency complex.
Common collective fear is also one reason of the dependency complex in the Yalak
villagers. The common element of fear for the Yalak villagers is Adil Efendi. The
villagers are afraid of Adil Efendi because they think that Adil Efendi will come to
the village and take all their possessions for their unpaid depts. Throughout the
novel, this collective fear of theirs influences them psychologically and urges them
to escape from this fear. They have to create a hero who can defend them from the
tyranny of Adil Efendi. This Hero is Tashbash, because he is the only one who is
not afraid of Adil Efendi. Once their hero is chosen, they start making up stories
about Tahsbash in a way to strengthen him against Adil Efendi. As they have been
expecting such a person, they tend to believe the stories that they make up.
Although individuals do not completely internalize these stories, they prefer
believing in the stories collectively. Their dependence upon Tashbash makes him a
saint among the villagers. Their dependency grows stronger as their fear increases.
Even Tashbash, who normally does not conform to the villagers’ ideas, starts
having doubts and questions whether he is really a saint or not.
Once the Yalak villagers’ fear of starvation vanishes in the third volume of the
trilogy, they do not believe in Tashbash. They do not want to believe that the
destitute person who comes to them is Tashbash. Muhtar Sefer’s foreshadowing
becomes real:
From now on you’re nothing but a plaything, Tashbash. A plaything for
the villagers. They’ll shit in your mouth one day and make a saint of you
a couple of days afterwards, just because they need you at the moment.

214 Nihal Ozcan
Then when they’ve done with you they’ll push a finger up your arse, for
in their heart of hearts they don’t want to worship you. You’ll be nothing
but a big plaything for evermore. (Kemal 269)
The Yalak villagers, who collectively made Tashbash a saint, refuse Tashbash
collectively. None of them question their unjust attitude toward Tashbash and the
absurdities they created about Tashbash. Muttalip Bey, the land owner, is the only
one who shows their absurd attitude. When he sees that the Yalak villagers do not
talk to Tashbash, he questions them and shows their abnormal attitudes that change
as their needs change:
“Now look here, villagers” Muttalip Bey said, “why don’t you speak to this
poor fellow? Just because that saint told you not to? Now then, villagers!
Don’t tell me you believe in saints! In this age? Haven’t you seen the jets
that take to the air from the Injirlik Airport? Don’t you know that men are
already travelling into space? A saint in this age? Now villagers!” (239)
The only warning to this collective blindness and absurdity comes from people
who are outside Yalak society.
Although solidarity is usually beneficial in most communal societies, the
dependency complex, which is an exaggerated form of solidarity, does not always
have positive results since some villagers may take advantage of this dependency
complex and collective action of the Yalak villagers. Muhtar Sefer exploits the
Yalak villagers since he is quite aware of their dependency complex. He always
looks for a way to benefit from them. He has no respect for the villagers and looks
down upon them:
It is all the Government’s fault. It’s the Government that has spoilt them,
giving them the right to vote and what not. Think of it! These peasants
electing a government! Hah, just look at this Government formed by
Mangy Mahmud! Much it cares about Mangy Mahmud! But at election
time, you can hardly approach them, they’re so arrogant. You’ve actually
got to beg for their votes. No, really this Government has no idea of what it
is doing. Granting these peasants the right to vote! Why, they’re not even
capable of counting half a dozen goats and herding them properly! (240)
Muhtar Sefer does not want villagers to control anything even by voting. He wants
the full control of the village and dependency of the villagers upon him to enable
him to do whatever he wants for his own benefit.

Conformity and Dependency Complex in Yashar Kemal’s… 215
Muhtar Sefer secretly makes an agreement with the land owner to pay less to the
villagers and more to Muhtar Sefer. Muhtar Sefer knows that the Yalak villagers
cannot do anything without depending on him, no matter what Tashbash does to
persuade them to refuse working with the Muhtar. The Yalak villagers will still
continue following Muhtar; thus, he easily exploits them.
Muhtar Sefer also manipulates the Yalak villagers’ collective fear of Adil
Efendi. He always reminds people that Adil Efendi will come with gendarmes and
will take their all possessions away. The fear grows stronger and stronger until “It
was in their blood, in their skins, in their marrow… Nobody dares to voice his
name; nobody wants to reveal the fear, growing day by day.” (25) Their fear causes
hopelessness among them and is so great that, they even expecthope from
Meryemdje who is old and ill and desperate:
Women began to move and headed towards the steppe. Meryemdje was
coming over from far that side leaning on her pole. They’ve felt a light of
hope. What was the reason for the revival of their hopes when they saw
Meryemdje? What could she do at all? Everybody knew that she couldn’t
do anything either and Adil Efendi couldn’t be coped with. Anyway, they
were happy about the approaching Meryemdje and have invested hopes in
her... They’ve crowded around Meryemdje, expecting a solution from her.
They wanted her to say again “We’ve arrived, haven’t we?” Meryemdje
was a power in their view. (65)
Being aware of their hopeless feelings, the Muhtar creates an outer tension, and
makes use of the fear and hopelessness that he has contributed to. He makes the
villagers depend on him more and he leads them collectively with little effort.
Old Halil also benefits from the dependency of the villagers to each other. For
example, he makes Uzun Ali pity him so that he can use the old horse. Old Halil
also exploits the good feelings of the Yalak villagers coming from their solidarity.
For example, he plays the dead rabbit act to make the Yalak villagers pity him and
help him.
The dependency complex of the Yalak villagers strengthens their solidarity, which
makes them accept one’s problem as their own problem. Sharing problems is good,
but as everybody has a problem in this society, they become a burden to each other
and unable to overcome it. For example, in The Wind from the Plain, Meryemdje
refuses to move when the horse is about to die. Some people return for Meryemdje
to help her and they take the burden of persuading her and taking care of her. In
another example, Uzun Ali takes care of Old Halil and his horse dies because of
him.

216 Nihal Ozcan
To sum up, Yaşarkemal portrays a society which has fallen into the clutches of
dependency complex in his TheOther Face of the Mountain trilogy. The
dependency complex of the Yalak society stems from the place they live in, their
lack of education, misinterpretation of religious norms, and a common collective
fear. Dependency complex brings negative results for the Yalak villagers. They are
collectively exploited and tricked by people such as Muhtar Sefer and Old Hali.
They become a burden for each other and they can never get rid of their desperate
situations because no individual is courageous enough to change or challenge the
system. . The only one who challenges the system is Tashbash who is punished in
the end.
References and notes:
Kemal, Yaşar Orta direk Istanbul: TorosYayınları, 1989. ---. Iron Earth, Copper Sky. Translated by Thilda Kemal, Beyond the Mountain. London:
Collins and Harvill Press, 1974. ---. ÖlmezOtu. İstanbul: Adam Yayınları, 1996 ---. Yer Demir GökBakır. İstanbul:YKY, 2004. ---. The Undying Grass. London: The Harvill Press, 1996. ---. The Wind from the Plain. Translated by Thilda Kemal, Beyond the Mountain. London:
The Harvill Press, 1996.
Summary
Conformity and Dependency
Complex in Yashar Kemal’s Other Face of the Mountain Trilogy
Nihal Ozcan
Bursa Technical University, Turkey
Conformity can be briefly defined as attempts of individual stomatch the attitudes, behaviors, and social norms that society has internalized as a whole. One reason for conformity is depend encycomplex. People feel that they have to depend on each other to be at peace, to succeed, and even to exist. People tend to conform due to the risk of failure in individualaction. Even though collective action does not always bring positive results, people prefer to fail collectively. Yashar Kemal’s The Other Face of the Mountain Trilogy is a portrayal of a communal society that has fallen into the clutches of a dependency complex in order to survive. In this trilogy, the villagers believe in collective action and they tend to do everything

Conformity and Dependency Complex in Yashar Kemal’s… 217
collectively. Such behavior results in conformistaction. Thus, people are blinded to truth and can be easily deceived.
Keywords: Conformity, Dependency, Yashar Kemal, The Other Face of the MountainTrilogy

Khazar Journal of Humanities and Social Sciences © Khazar University Press 2017
DOI: 10.5782/kjhss.2017.218.223
The Effect of Workplace Calisthenic Exercises on
Mechanical Back Pain and Occupational Burnout
Ozge Cakır
Cyprus International University, TRNC
Caniz Ersumer Tonyalı
Cyprus International University, TRNC
Nebahat Kılyumak
Cyprus International University, TRNC
Onur Yashar Gokce
Cyprus International University, TRNC
Bushra Ozcan
Cyprus International University, TRNC
Tugce Kara
Cyprus International University, TRNC
Introduction
Mechanical back pain is a pain caused by a biomechanical disorder with a majority,
which is not based on an inflammatory or pathological cause that increases with
physical activity and decreases with rest[1].Occupations that require long sitting at
the table are considered risky in terms of back pain. Factors such as long standing
in the same position, frequent bending, use of incorrect body mechanics, reduced
flexibility and strength of the abdominal and back muscles play a role in the
formation of mechanical back pain. Those who look at their work as boring,
monotonous, or unsatisfactory are more likely to have back pain[2]. Mechanical
back pain affects both the daily life activities and the social life of the individual
negatively; it impairs the life quality[3]. The multidisciplinary biopsychosocial
218

The Effect of Workplace Calisthenic Exercises on Mechanical Back Pain and................219
rehabilitation model may show effective results in reducing both inadequacy and
pain, according to other conventional methods[4].
Burnout, as described by Maslach in 1981,is a syndrome in which people feel
emotionally exhausted due to physical and psychological deprivation, desensitized
to the people they meet, and decrease in personal accomplishment feelings,
especially in people who are forced to work face to face with people[5, 6].
Individuals who feel exhausted can not use their potential in the work place well
enough, which reduces work efficiency[7].
The aim of our study is to investigate the effect of a standard exercise program
placed at certain intervals of working hours on mechanical back pain and
occupational burnout in deskworkers in the health sector.
Methodology
In Nicosia, Adana and Samsun, 60 volunteer desk-based health workerswho
regularly followed the exercise program in the22-54 age range with mechanical
back pain, which lasted for 3 months without any pathologywere included to the
study. Individuals with chronic disease (due to heart, bloodpressure, diabetes) who
were under going surgery for any reason, who had positive orthopedic and
neurologicalexamination findings, scoliosis, short legs or vertebrae fractures, who
were diagnosed and needed regular medication, and pregnant women were
excluded. Participants were informed about the study and a confirmation form was
signed. The severity of mechanical back pain was assessed by visual analogue scale
(VAS), pain-related disability level by Oswetry disability questionnaire, and
occupational burnout level by Maslach burnout questionnaire. Participantswere
given posture training. By giving an exercise card with divided working hours
(Figure 1), simple calisthenic exercises to be done between thedaily working hours
were taught, requiring 10 repetitions (Figure 2). After 6 weeks, the level of pain,
disability and burnout were reevaluated.
Figure 1. Exercise card
Break times Monday Tuesday Wednesday Thursday Friday
09:30 am
11:30 am
01:30 pm
03:30 pm
Statictical Analysis

220 Ozge Cakır, Caniz Ersumer Tonyalı, Nebahat Kılyumak,
Onur Yashar Gokce, Bushra Ozcan, Tugce Kara
Statistical analyzes were performed usingStatistical PackageforSocial Science for Windows (SPSS) version 16 statistical software. Continuous variables were expressed as arithmetic mean ± standard deviation (X ± SD), and categorical variables as percent (%). Student t test was used to analyze the results before and after treatment in the group. Significance level was accepted as p <0.05.
Figure 2:
Calistenic exercise program
Results
39 women (65%), 21 men (35%); Descriptive and occupational information of
participants with a mean age of 36.38 ± 8.27 (22-54) was collected prior to
exercise (Table 1).
Table 1. Descriptive statistics of participants
Working group
Age (year, X ± SD) 36,38±8,27 (22-54)

The Effect of Workplace Calisthenic Exercises on Mechanical Back Pain and... 221
MI (kg/m2
, X±SD)
25,11±4,32
(17,90- 36,60)
n%
Gender
Woman 3965,0
Male 21 35,0
Education
High school 14 23,3
Highereducation 4676,7
Maritalstatus
Single 14 23,3
Themarried 4676,7
Operation time
1-60 months 20 33,3
61-120 months 1525,0
121-180 months 12 20,0
181-240 months 711,7
+ 241ay 610,0
Dayoff
1 day 13 21,7
2 days 4778,3
The mean values of pain, personalaccomplishment and disability were
statistically significant before and after exercise (p <0.05). Emotional exhaustion
and depersonalization subscales showed improvement but not statistically
significant (p> 0.05) (Table 2).
Table 2. Comparison of participants' pain, burnout and disability levels before and
after exercise
Before exercise After exercise p*
X±SD X±SD
(min-maks) (min-maks)
Pain level - VAS 4,67±2,27 3,26±1,91 0,00
(0,30-9,50) (0,00-8,20)
Maslach-Emotional exhaustion 18,52±6,35 17,83±6,90 0,06
(3-36) (3-38)
Maslach-Personal accomplishment 23,32±6,56 24,53±6,15 0,03
(1-36) (15-37)
Maslach- depersonalization 6,12±3,57 5,75±3,49 0,07
(0-20) (0-20)
Oswestrydisabilitysurvey 25,03±15,21 19,57±14,88 0,00
(0-58) (0-50)

222 Ozge Cakır, Caniz Ersumer Tonyalı, Nebahat Kılyumak,
Onur Yashar Gokce, Bushra Ozcan, Tugce Kara
Conclusion
It has been determinedthat regular calisthenic exercises made during break
intervals of working hours reduce pain, disability and occupational burnout
levels in health workers with mechanical back pain. This study may be a guideto
researches to be analyzed in more cases.
References and notes:
Yılmaz, Ö., et al., Kronik mekanik bel ağrısı olan hastalarda egzersizle beraber fizik
tedaviuygulamalarının sadece egzersiz tedavisi ile karşılaştırılması.Turkish Journal
ofOsteoporosis/Turk Osteoporoz Dergisi, 2015. 21(2). Suyabatmaz, Ö., et al., Kronik bel ağrılı hastalarda bel okulunun etkinliğinin araştırılması.
İstanbul Med J, 2011. 12: p. 5-10. İNANOĞLU, D. and G. BALTACI, Nörolojik defisiti olmayan bel ağrılı hastalarda
farklıbantlama tekniklerinin yaşam kalitesi ve ağrı üzerine etkisi.Journal of
ExerciseTherapy and Rehabilitation, 2014. 1(1): p. 26-34. Kamper, S.J., et al., Multidisciplinary biopsychosocial rehabilitation for chronic low
backpain: Cochrane systematic review and meta-analysis. Bmj, 2015.350: p. h444. Maslach, C., W.B. Schaufeli, and M.P. Leiter, Job burnout. Annual review of
psychology, 2001. 52(1): p. 397-422. YILDIRIM, M.H. and L. İçerli, Tükenmişlik sendromu: Maslach ve Kopenhag
tükenmişlikölçeklerinin karşılaştırmalı analizi. Organizasyon ve Yönetim
Bilimleri Dergisi,2010. 2(1). ŞIKLAR, E. and D. TUNALI, ÇALIŞANLARIN TÜKENMİŞLİK
DÜZEYLERİNİNİNCELENMESİ: ESKİŞEHİR ÖRNEĞİ. Dumlupınar
Üniversitesi Sosyal BilimlerDergisi, 2015. 33(33).

The Effect of Workplace Calisthenic Exercises on Mechanical Back Pain and................223
Summary
The Effect of Workplace Calisthenic Exercises on Mechanical Back Pain and Occupational Burnout
Ozge Cakır Cyprus International University, TRNC
Caniz Ersumer Tonyalı
Cyprus International University, TRNC
Nebahat Kılyumak
Cyprus International University, TRNC
Onur Yashar Gokce
Cyprus International University, TRNC
Bushra Ozcan Cyprus International University, TRNC
Tugce Kara
Cyprus International University, TRNC
To investigate the effect of a standard exercise program, which is placed at certain intervals
of working hours in desk workers, on mechanical back pain and occupational burnout. In
Nicosia, Adana and Samsun, 60 volunteers working in public and private hospitals were
included in the study. The severity of mechanical back pain was assessed by visual
analogue scale (VAS), pain-related disability level by Oswetry disability questionnaire, and
occupational burnout level by Maslash Burnout questionnaire. Participants were asked to
follow an organized exercise program by giving them an exercise card with divided
working hours. After 6 weeks, the level of pain, disability and burnout were reevaluated.
It has been found that regular calisthenic exercises made during break intervals of working
hours reduce the level of pain, disability and occupational burnout in health workers with
mechanical back pain. This study may be a guide to further study of more cases to be
analyzed.
Key words: Standard exercise program, working hours, public and private hospitals,
exercise card

Khazar Journal of Humanities and Social Sciences © Khazar University Press 2017
DOI: 10.5782/kjhss.2017.224.240
Barriers in Implementing Reverse Logistics:
Evidence from Turkey
Gozde Yangınlar
Beykent University, Turkey
Salih Kalaycı
Bursa Technical University, Turkey
1. Introduction
Reverse logistics is primarily implemented by airline and ground handling
companies due to the following reasons: interest of the top management,
sustainable environmental policies, economic pressures and legal obligations.
Environmental, social, and economic reasons influence airlines and ground
handling companies, which are under increasing pressures to implement reverse
logistics. Consumers, regulators, experts and organizational pressures affect air
transportation organizations (Bai et al., 2013). As customers’ environmental
awareness increases governments establish stricter environmental regulations.
Based on this fact, airlines and ground handling firms are eager to implement eco-
friendly practices, derive eco-efficiency, annihilate environmental concerns and
undertake corporate social responsibility in order to create value for customers.
In addition, airlines and ground handling firms possess certain managerial insights
in terms of barriers to reverse logistics. Majority of the barriers, such as the lack of
management training and economic infrastructure, insufficient technological level
and inadequate political sensibilities in terms of the development of reverse
logistics must be considered by the government in order to overcome the
challenges. Interestingly, reverse logistics activities of airline companies are
investigated in academic literature. For instance, Turkey focused on providing
sustainable development to both, developed and developing countries. Reverse
logistics is defined as a crucial component for organizations to create their strategic
advantage (Bouzon et al., 2015). Moreover, researchers provided various benefits
of efficient reverse logistics. It has been considered as an effective tool to improve
resource productivity, their environmental image and performance, and decrease
the negative effect on the environment (Ye et al., 2013). Companies in the air
224

Barriers in Implementing Reverse Logistics: Evidence from Turkey 225
transportation sector are able to reduce environmental damage through the
implementation of solution focused reverse logistics.
Thus, the major goal of this study is to answer the above questions and verify the
results of a survey on four companies located in the Istanbul Atatürk Airport. The
main research question is “whether there a direct positive relationship between
reverse logistics activities and their barriers, such as the management, economic,
technological and infrastructural, and political and legal barriers ?” This study
attempts to present an exhaustive review of published literature in terms of reverse
logistics barriers.
Furthermore, the study analyzes the research gaps in literature, in order to simplify
research directions. The remaining part of the study is organized as follows: section
2 describes reverse logistics implementation; research methodology and literature
review is presented in section 3; in section 4, detailed discussions on reverse
logistics barriers are included; the research design and data collection are
elaborated in section 5; the results of empirical analyses are interpreted in section
6; and the study is summarized in section 7 through comments in the conclusion.
2. Literature Review
Reverse logistics is described from various perspectives in literature. It has
received growing importance from air transportation industries. Reverse logistics is
related to information from the point of consumption to the point of origin, in order
to recover the primary value or to find the most convenient use of goods, elements,
and materials (Ramírez, 2012; Lambert et al., 2011). It is redesigned to
systematically manage the flow of parts and goods destined for remanufacturing,
recycling, or disposal operations (Dowlatshahi, 2010). Reverse logistics is based on
delivery activities, which include reuse, refurbishment, product returns, recycling,
disposal, repair, and remanufacturing. Therefore, recycling, reusing,
remanufacturing, and disposal are the four main factors in the air transportation
sector, facing the challenges of sustainability and globalization. Some airlines and
ground handling companies permit customers to return goods or services without
any reason, in order to improve client satisfaction (Chan et al., 2010).
The lack of appropriate information systems in relation to the implementation of
reverse logistics cause significantly diverse challenges in air transportation.
Effective technological system and infrastructure are required to support the
reverse logistics activities in air transportation services. Infrastructure in air
transportation sectors plays a significant role in reverse logistics practices.

226 Gozde Yangınlar, Salih Kalaycı
Cooperation with suppliers and customers enhance the success of reverse logistics
activities (Abdulrahman et al., 2014). The financial system plays a vital role in
encouraging the infrastructural developments and trained personnel requirements
for reverse logistics. Financial barriers include the lack of funds return monitoring
systems; lack of funds for training, storage, and handling; lack of initial capital; and
lack of funds for technology research in the air transportation sectors. Information
and technological systems are required as capital investments for tracking and
tracing the products returned, and for product recovery through various techniques,
such as reuse, remanufacturing, and recycling (Ravi, 2005). Furthermore, two
economic pressures are faced by airlines and ground handling service enterprises,
namely dematerialization and decomposition, to gain cost advantage in the global
market (Lai and Wong, 2012). Economic barriers could obstruct top managers’
reverse logistics activities in the air transportation industry, despite rivals
possessing enhanced competitive advantages (Ye et al., 2013). Airlines and ground
handling enterprises are adopting reverse logistics activities as a strategic tool for
economic interests and corporate social image. Particularly, in the air transportation
industry where the product life cycle reduces every day, it is possible to rescue the
whole returned goods (outputs) or precious pieces. The key management barriers
for Turkish airlines and ground handling companies to adopt reverse logistics
activities are high commitment to achieve the goals. Enterprises require efficient
leadership in order to attain the missions and values of reverse logistics
implementation (Ravi, 2005). The top management’s commitment can foster
radical changes in the air transportation industry, which is a significant driver for
coordination with members of the supply chain (Abdulrahman et al., 2014). The
lack of personnel is a significant barrier which prevents the application of reverse
logistics in the air transportation sector. It could also be critical for the survival of
organizations in the future. Education and training are initial requirements for
improving organizational performance. Airlines and ground handling companies
seek to improve their brand image with qualified personnel. Political and legal
barriers are related to government agencies. Regulations are generally reflected to
be the most significant source of external impact on airlines and ground handling
companies’ reverse logistics activities. Several governments are ensuring
environmental protection and sustainable development, in order to reduce carbon
dioxide emissions. Several governmental agencies have enforced standards and
regulations that countenance resource reuse and recycling, which could improve
through reverse logistics. These laws and regulations also act as strict institutional
pressures on airlines and ground handling companies to apply reverse logistics, and
may have a recondite influence on the attitudes and behaviors of the top
management (Ye et al., 2013).

Barriers in Implementing Reverse Logistics: Evidence from Turkey 227
In addition to the discussions with experts in the air transportation sector, this
article considers 22 variables of barriers to reverse logistics that have been
primarily selected from literature (Table 1)
Table 1: Summary of previous studies on Reverse Logistics Barriers
Reverse Logistics Barriers Prior studies
(A) Management Barrier (A1) Lack of understanding by the
top management on the importance
of reverse logistics activities
Ravi, 2005; Jayanta et al. 2014; Agrawal et al. 2015; Ravi, 2015; Muchangos et al. 2015; Abdulrahman et al. 2014; Ravi et al. 2005; Shaharudin et al. 2015; Bouzon et al. 2010; Jayanta et al. 2014; Prakash et al. 2015
(A2) Lack of support by the top management for reverse logistics activities
(A3) The general perception is contrary to the opinion that reverse logistics activities will be organized by the government (A4) Lack of training courses for implementing reverse logistics activities
(B) Organizational Barriers (B1) Lack of organizational culture in adopting reverse logistics activities (B2) Lack of belief on successful
reverse logistics activities
(B3) Lack of clearly defining the
benefits of reverse logistics activities
(B4) Lack of sufficient understanding
of the best practices related to reverse
logistics activities (B5) Opinion that reverse logistics
activities will increase cost
Agrawal et al. 2015; Abdulrahman et al. 2014; Ravi et al. 2005; Shaharudin et al. 2015; Bouzon et al. 2010; Jayanta et al. 2014; Prakash et al. 2015
Prakash et al. 2015
Ravi, 2005; Jayanta et al. 2014; Bouzon et al. 2015; Agrawal et al. 2015;
Muchangos et al. 2015; Ravi et al. 2005; Shaharudin
et al. 2015; Xia et al. 2015; Bouzon et al. 2010;
Jayanta et al. 2014; Prakash et al. 2015
Jayanta et al. 2014; Agrawal et al. 2015; Ravi, 2015; Shaharudin et al. 2015; Jayanta et al. 2014; Prakash et al. 2015 Abdulrahman et al. 2014; Shaharudin et al. 2015; Bouzon et al. 2010
Bouzon et al. 2015; Shaharudin et al. 2015; Bouzon et al. 2010
Jayanta et al. 2014; Jayanta et al. 2014; Prakash et al. 2015
Agrawal et al. 2015; Muchangos et al. 2015

228 Gozde Yangınlar, Salih Kalaycı
(C) Economic Barriers
(C1) Expensive IT systems required
for reverse logistics activities
(C2) Reducedvalue to be derived from recycling a product
(C3) High investment and operating costs required for reverse logistics activities
(C4) High costs of disposal
of hazardous waste
(D)Technology and infrastructure Barriers (D1) Lack of IT systems for reverse logistics activities
(D2) Lack of technological infrastructure for reverse logistics activities (D3) Lack of cooperation with suppliers and customers for reverse logistics activities (D4) Lack of necessary equipment
for reverse logistics activities
(E) Political and Legal Barriers
Agrawal et al. 2015;Muchangos et al. 2015; Abdulrahman et al. 2014; Jayanta et al. 2014;
Prakash et al. 2015
Agrawal et al. 2015; Abdulrahman et al. 2014; Shaharudin et al. 2015; Xia et al. 2015; Bouzon et al. 2010; Jayanta et al. 2014; Prakash et al. 2015 Agrawal et al. 2015; Muchangos et al. 2015; Abdulrahman et al. 2014; Ravi et al. 2005; Shaharudin et al. 2015; Xia et al. 2015; Jayanta et al. 2014; Prakash et al. 2015 Muchangos et al. 2015; Abdulrahman et al. 2014; Jayanta et al. 2014; Ravi et al. 2005; Xia et al. 2015; Jayanta et al. 2014
Bouzon et al. 2015; Muchangos et al. 2015; Ravi et al. 2005; Shaharudin et al. 2015; Xia et al. 2015; Xia et al. 2015; Bouzon et al. 2010; Jayanta et al. 2014; Prakash et al. 2015 Agrawal et al. 2015; Muchangos et al. 2015; Shaharudin et al. 2015; Xia et al. 2015; Bouzon et al. 2010; Jayanta et al. 2014; Prakash et al. 2015 Abdulrahman et al. 2014; Ravi et al. 2005;
Shaharudin et al. 2015; Xia et al. 2015; Bouzon et
al. 2010; Jayanta et al. 2014; Prakash et al. 2015 Ravi, 2015; Muchangos et al. 2015; Shaharudin et al. 2015; Xia et al. 2015; Bouzon et
al. 2010; Jayanta et al. 2014; Prakash et al. 2015
(E1) Lack of legal requirements for Agrawal et al. 2015; Muchangos et al. 2015;
reverse logistics activities Abdulrahman et al. 2014; Bouzon et al. 2010;
Jayanta et al. 2014; Prakash et al. 2015 (E2) Lack of incentives for reverse Agrawal et al. 2015; Abdulrahman et al. 2014;
logistics activities Shaharudin et al. 2015; Bouzon et al. 2010; Jayanta
et al. 2014; Prakash et al. 2015
(E3) Lack of sustainable Jayanta et al. 2014; Agrawal et al. 2015;
environmental policies Ravi, 2015; Abdulrahman et al. 2014; Ravi et al.
2005; Bouzon et al. 2010; Jayanta et al. 2014; Prakash et al. 2015

Barriers in Implementing Reverse Logistics: Evidence from Turkey 229
(E4) Lack of sufficient Agrawal et al. 2015; Ravi, 2015; pressuresfrom customers on Muchangos et al. 2015; Abdulrahman et al. 2014;
enterprises Shaharudin et al. 2015; Jayanta et al. 2014; Prakash et al. 2015
(E5) Lack of an adequate level of Jayanta et al. 2014; Muchangos et al. 2015;
social responsibility from the Abdulrahman et al. 2014; Jayanta et al. 2014
enterprises
3. Research Methodology and Literature Review
Several academic research have analyzed the main barriers to the implementation
of reverse logistics. Different authors have discussed multiple barriers of
implementation. Muchangos (2015) identifies certain barriers to a waste
management policy in Maputo City (capital of Mozambique). Structural modeling
methods, interpretive structural modeling (ISM), and the Decision-Making Trial
and Evaluation Laboratory (DEMA-TEL) were used and it was concluded that
institutional structural weaknesses and a lack of cooperation among stakeholders
are the major contributors to poor waste policy performance in Maputo City. The
barriers were investigated under classifications, such as economic instruments,
legislation and regulation, voluntary agreements, education and influence on
behavioral change, observing information and performance, community, and
technology in Muchangos’s (2015) study.
Ravi (2015) emphasizes that barriers have influenced eco-efficiency in the
electronics packaging industry. The study verifies that the top management of
enterprises should encourage developing strategies to raise awareness on eco-
efficiency. Abdulrahman et al. (2014) defines four barriers as financial, manage-
ment, policy, and infrastructure. They separated multinational enterprises and
domestic enterprises in the Chinese manufacturing industry. Low commitment and
insufficient amount of reverse logistics professionals at business management
levels constituted the prominent management barriers to reverse logistics practices
in the Chinese manufacturing industry.
Ravi et al. (2005) investigate the coaction among the major reverse logistics
barriers in the automobile sector. They used the ISM methodology to understand
the influential factors among the barriers. Shaharudin et al. (2015) find that external
barriers are the major impediments to the adoption of product returns and recovery
management. They examined six manufacturers in Malaysia. A comparative
analysis was undertaken between the manufacturers on the reverse logistics barriers
for the adoption of recovery management and product returns. Xia el al. (2015)
explain that internal barriers faced by car piece and component remanufacturers
and appraises cause barriers through the proposed model/ framework. In addition,
this objective was determined by employing the

230 Gozde Yangınlar, Salih Kalaycı
DEMATEL approach. Bouzon et al. (2015) illuminate the relationship among the
barriers that hinder reverse logistics’ development in Brazil. As a result, it was
found that policy barriers significantly influence all the other barrier categories.
The lack of specific laws and motivational legislation continue to be considerable
barriers to reverse logistics practices in Brazil.
4. Research Design and Data Collection
This paper used questionnaire survey to comprehend the reverse logistics barriers
in the air transportation sector. Samples were collected from the air transportation
sector in Turkey, where four companies that operated in the Istanbul Ataturk
Airport were selected for the survey. The survey was executed from September to
December 2016. The questionnaires were distributed to the selected companies,
which were airlines and ground handling companies.
The questionnaire was designed on a “five point Likert scale,” in addition to using
face to face survey method to implement the administration of the questionnaire. In
order to undertake statistical analysis, individual responses were collected on a
five-point scale. Furthermore, the respondents were questioned regarding several
barriers in implementing reverse logistics related to the air transportation sectors in
Turkey by using the five point Likert scale. The respondents represented the
management of the air transportation sector who held senior positions, such as
lower-level managers in air cargo, passenger services, technical, training, IT,
purchasing, and logistics departments. They were in the most suitable position to
provide their opinion on the strategic aspects related to reverse logistics barriers in
the air transportation sector of Turkey.
Data collected was collated in both, SPSS 22 and analyses by using an exploratory
factor analysis. We employed the principal components analysis using varimax
rotation. This contributes to the determination of the presence of meaningful
patterns between the original variables and in extracting the major factors. The
principal component analysis using varimax rotation is employed in order to verify
the dimensions of reverse logistics implementation and reverse logistics barriers in
the air transportation sector.
Based on the above reasoning, the following hypotheses are posited:
H1: Management barriers have negative impacts on reverse logistics activities.
H2: Organizational barriers have negative impacts on reverse logistics activities.

Barriers in Implementing Reverse Logistics: Evidence from Turkey 231
H3: Economic barriers have negative impacts on reverse logistics activities.
H4: Technological and infrastructural barriers have negative impacts on reverse
logistics activities.
H5: Political and legal barriers have negative impacts on reverse logistics activities.
5. Results of Empirical Analyses
Considering reverse logistics activities wherever applicable, Cronbach's coefficient
(Alpha) is calculated. It is used to calculate the internal consistency of responses
and reliability of this survey. In this context, Cronbach's alpha is a measure of the
extent to which all the reverse logistics barriers in our scale are positively
correlated with the other variables.
It declared to share the idea in reverse logistics implementation of over 76% in the
air transportation sector, which is limited to İstanbul. In addition, it was observed
that majority of the respondents (93 % of the respondents responded “I agree and I
absolutely agree”) supported reverse logistics activities as “Damaged products are
transported for repairs and maintenance by our company”. The frequency of
reverse logistics barriers show that they impact 65.1 % of the air transportation
sector, which is limited to Istanbul. Furthermore, it was observed that the
respondents (70 % responded “I agree” and more than 70 % responded “I
absolutely agree”) supported reverse logistics barriers of “B1, B3, B4, D1, D3, E2,
E3, and E4.” Moreover, the results explained that “B3” and “B4”constitute 78.9 %
of the barriers, which are significantly more than the other barriers. On the other
hand, management and economic barriers are lower than the other barriers in the air
transportation sector. Reverse logistics implementation provides a brief summary
of the responses. The mean and standard deviations are calculated to explain the
current situation of reverse logistics activities in the air transportation sector. The
means are in the range of 4.16 and 4.53. This points out that airlines and ground
handling companies in Istanbul have already implemented actions to integrate
reverse logistics activities. The standard deviations are in the range of 0.7and 1.16.
It verified that factor loadings 1, 2, 3, 4, 6, and 7 are above the lower limit of 0.70.
Therefore, reverse logistics implementation in the air transportation sector is
exceptional.

232 Gozde Yangınlar, Salih Kalaycı
Table 2: Reverse Logistics Barriers of Descriptive Statistics
N Mean Std. Error of Mean Std.
Deviation
Management Barrier 90 3,3028 0,10851 1,02941
Organizational Barriers 90 3,9644 0,09351 0,88715
Economic Barriers 90 3,7778 0,10297 0,97687
Technology and infrastructure Barriers 90 3,9389 0,09743 0,92432
Political and Legal Barriers 90 3,8733 0,09520 0,90315
Table 2 provides a brief summary of the responses. The mean and standard
deviations are calculated to explain the current situation of reverse logistics
activities in the air transportation sector. The means shown in table 2 are in the
range of 3.30 and 3.96. This highlights that airlines and ground handling companies
in Istanbul have already implemented actions to integrate reverse logistics
activities. The standard error of mean is in the range of 0.09 and 0.10, and standard
deviations are in the range of 0.88 and 1.02. Table 3: Factor Analysis of Reverse Logistics Barriers
Reverse Logistics Barriers Factor Variance KMO Bartlett's Cron-
loadings explained Test bach’s
(%) alpha
(A) Management Barrier 62,52 0,681 0,005 0,796
(A1) Lack of understanding by the 0,862 top management on the importance of
reverse logistics activities
(A2) Lack of support by the top 0,913
management for reverse logistics
activities
(A3) The general perception is 0,722
contrary to the opinion that reverse
logistics activities will be organized
by the government
(A4) Lack of training courses for 0,632
implementing reverse logistics
activities
(B)Organizational Barriers 64,389 0,815 0,005 0,856
(B1) Lack of organizational culture in 0,821
adopting reverse logistics activities

Barriers in Implementing Reverse Logistics: Evidence from Turkey 233
(B2) Lack of belief on successful 0,758 reverse logistics activities
(B3) Lack of clearly defining the 0,867
benefits of reverse logistics activities
(B4) Lack of sufficient understanding 0,823
enough of the best practices related to
reverse logistics activities
(B5) Opinion that reverse logistics 0,734
activities will increase cost
(C)Economic Barriers 73,685 0,794 0,005 0,879
(C1) Expensive IT systems required 0,781
for reverse logistics activities
(C2) Reduced value to be derived 0,886
from recycling product
(C3) High investment and operating 0,902
costs required for reverse logistics
activities
(C4) High costs of disposal of 0,859
hazardous waste
(D)Technology and infrastructure 65,775 0,619 0,005 0,821
Barriers
(D1) Lack of IT systems for reverse 0,857
logistics activities
(D2) Lack of technological 0,797
infrastructure for reverse logistics
activities
(D3) Lack of cooperation with 0,814
suppliers and customers for reverse
logistics activities
(D4) Lack of necessary equipment for 0,772
reverse logistics activities
(E)Political and Legal Barriers 62,804 0,814 0,005 0,849
(E1) Lack of legal requirements or 0,706
reverse logistics activities
(E2) Lack of incentives for reverse 0,837
logistics activities
(E3) Lack of sustainable 0,787
environmental policies
(E4) Lack of sufficient pressures from 0,836
customers on enterprises
(E5) Lack of an adequate level of 0,788
social responsibility from the
enterprises

234 Gozde Yangınlar, Salih Kalaycı
The results of the exploratory factor analysis for the constructs are shown in table 3. An exploratory factor analysis was used to determine the major constructs
measured by the items. The factors are verified by implementing the varimax
rotation and principal components analysis. An analysis of the factor loadings for
management barriers shows that the first factor contains lack of understanding by
the top management on the importance of logistics activities, lack of support from
the top management for reverse logistics activities, which is exceptional. The KMO
value of 0.8 and above are considered to be outstanding in organizational, political,
and legal barriers’ factor loadings. The questions, which involve the management,
organizational, economic, technological and infrastructural, and political and legal
barriers, are observed to be interrelated.
Composite reliability, Cronbach’ salpha, and average variance extracted are
summarized in table 3. The reliability of these factors is supported. The Cronbach’s
alpha coefficient for management, organizational, economic, technological and
infrastructural, and political and legal barriers are 0.796, 0.856, 0.879, 0.821, and
0.849, respectively. All Cronbach’s alpha values are above the lower limit of 0.70,
which provide validity of a construct and internal consistency. Based on this scale,
reverse logistics barriers are determined to have a high reliability.
Table 4: Correlation Analysis of Reverse Logistics Barriers 1 2 3 4 5 6
Reverse logistics 1,0
activities
Management 0,37; 0,728 1,0
barriers
0,444**
;
Organizational 0,321**; 1,0
barriers 0,002 0,005
Economic barriers 0,336**; 0,365**
; 0,774*;0, 1,0
0,001 0,005 005
Technological and 0,289**; 0,390**
; 0,788*;0, 0,595
**; 1,0
infrastructural 0,006 0,005 005 0,005
barriers
0,344**
; 0,743*;0, 0,594
*; 0,719
**;
Political and legal 0,256*; 1,0
barriers 0,015 0,001 005 0,005 0,005
** Correlation is significant at the 0.01 level (two-tailed). * Correlation is significant at the 0.05 level (two-tailed).
The bivariate correlation results using Pearson’s correlation coefficients are shown
in table 4. An examination was conducted on whether there is a relationship among
reverse logistics activities and reverse logistics barriers in the air transportation

Barriers in Implementing Reverse Logistics: Evidence from Turkey 235
sector. In the correlation analysis, this study finds that used products returned from
customers are transferred to recycling units. We find significant relationships
between reverse logistics activities and economic, organizational, technological and
infrastructural, and politics and legal barriers.
The correlation coefficient (r) appears to be significant at the 0.01 level and in the
same direction of the relationship.
Table 5: Regression Analysis of Reverse Logistics Barriers
A B C D E
Dependent variable
Unstandardized 0,035; 0,33; 0,304; 0,247; 0,267;
Coefficients B;Std 0,101 0,104 0,091 0,087 0,108
Error
Reverse
Standardized 0,037 0,321 0,336 0,289 0,256
Logistics Coefficients Beta
Activities
t 0,35 3,182 3,343 2,833 2,484
sig 0,728 0,002 0,001 0,006 0,015
Note: A: Management Barrier, B: Organizational Barriers, C: Economic Barriers, D: Technology& infrastructure Barriers, E:Political& Legal Barriers.
In the regression analysis, organizational, economic, and political and legal barriers
have a considerable negative impact on organizational, economic, technological
and infrastructural, and political and legal barriers. Hypotheses 2 to 5 are supported
for the air transportation industries. On the other hand, only management barriers
do not have any negative effects on reverse logistics implementation.
Table 6: Hypotheses and results summary
Relationship H1: Management Barrier Reverse Logistics Activities Not supported
H2: Organizational Barriers Reverse Logistics Activities Supported
H3: Economic Barriers Reverse Logistics Activities Supported
H4: Technology& infrastructure Barriers Reverse Logistics Supported
Activities
H5: Political & Legal Barriers Reverse Logistics Activities Supported
A summary of the comparisons and all the results of the hypotheses supported
or not supported are presented in table 6.

236 Gozde Yangınlar, Salih Kalaycı
6. Conclusion
This study investigates the antecedents and outcomes of reverse logistics
implementation in the air transportation sector through a large-scale study,
although previous studies had focused on identifying the relevant issues of reverse
logistics implementation in different sectors. In addition, there is no precise
academic article dealing with the relationship between reverse logistics barriers and
reverse logistics activities, which involve the air transportation sector. This paper
elaborately discusses the antecedents of reverse logistics barriers in the air
transportation sector from the perspective of institutional theory. A relationship
model between the reverse logistics barriers in the air transportation industry is
reviewed, in order to develop different models and change the paradigm.
The main limitation of this study is that data is solely derived from airlines and
ground handling companies in the Istanbul Ataturk Airport, which is a hub center
for logistics. This paper’s results cannot be generalized for all sectors. This
research acts as an additive to existing literature on reverse logistics
implementation. In addition, this study strengthens available evidence on factors
that influence reverse logistics barriers by providing the evidence of stated
research, which exist in prior studies. Considering the increasing level of
requirements for sustainable development, environmental awareness, and stricter
environmental regulations, airlines and ground handling companies have begun to
implement reverse logistics activities. However, reverse logistics activities are
considered as an ideal system in Turkey. In addition, the results of the study also
indicate that there is a relationship between reverse logistics activities and all
barriers, except management barriers, in the air transportation sector. The empirical
results recommend that the organizational, economic, technological and
infrastructural, and political and legal barriers have statistically considerable
negative influences on reverse logistics implementation. They demonstrate that
technological and infrastructural barriers do not have negative effects on reverse
logistics activities.
Further research is proposed to consider the barriers to reverse logistics in freight
forwarder companies in the air transportation sector. As enterprises are expected to
outsource their reverse logistics functions to freight forwarder companies in the
near future, it will be valuable to consider the issues from this perspective in future
research.

Barriers in Implementing Reverse Logistics: Evidence from Turkey 237
References and notes:
Abdulrahman, M., Gunasekaran, A., & Subramanian, N. (2014). Critical barriers in
implementing reverse logistics in the Chinese manufacturing sectors. International
Journal of Production Economics, 147, 460-471. Agrawal, S., Singh, R., & Murtaza, Q. (2015). A literature review and perspectives in
reverse logistics. Resources, Conservation and Recycling, 97, 76-92. Akdoğan, M., & Coşkun, A. (2012). Drivers of reverse logistics activities: An empirical
investigation. Procedia - Social and Behavioral Sciences, 58, 1640-1649. Alfonso-Lizarazo, E., Montoya-Torres, J. Gutierrez-Franco E. (2011). Modeling reverse
logistics process in the agro-industrial sector: The case of the palm oil supply chain.
Applied Mathematical Modelling, 37, 9652–9664. Bai, C., Sarkis, J. (2013). Flexibility in reverse logistics: a framework and evaluation
approach. Journal of Cleaner Production, 47, 306-318. Benedito, E., Corominas, A. (2013). Optimal manufacturing policy in a reverse logistic
system with dependent stochastic returns and limited capacities. International
Journal of Production Research, 51, 1, 189–201.
Biehl, M., Prater, E., Realff, M. (2007). Assessing performance and uncertainty in
developing carpet reverse logistics systems. Computers & Operations Research, 34,
443–463.
Brito, M. P., Dekker, R., Flapper, S. D. (2002). Reverse Logistics: A Review of Case
Studies. Econometric Institute Report, EI - 21. Bouzon, M., Govindan, K., Rodriguez, C., 2015. Reducing the extraction of minerals:
Reverse logistics in the machinery manufacturing industry sector in Brazil using ISM approach. Resources Policy, 46(1), 27-36.
Carter, C.R., Ellram, L.M. (1998). Reverse logistics: A review of the
literature and framework for future investigation. Journal of Business
Logistics, 19, 85-102. Chan, H., Yin, S., Chan, F. (2010). Implementing just-in-time philosophy to reverse
logistics systems: a review. International Journal of Production Research, 48, 21,
6293-6313. Chiu, Y., Lin, P., Hsu, H. (2011). Considering third-party logistics providers in reverse
logistics. Journal of the Chinese Institute of Industrial Engineers, 28, 7, 512–520. Cullen, J., Tsamenyi,M., Bernon, M., Gorst, J. (2013). Reverse logistics in the UK retail
sector: A case study of the role of management accounting in driving organisational
change. Management Accounting Research, 24, 212–227. Daugherty, R., Richey, R., Genchev, S., Chen, H. (2005). Reverse logistics: superior
performance through focused resource commitments to information technology.
Transportation Research Part, 41, 77–92. Dowlatshahi, S. (2010). A cost-benefit analysis for the design and implementation of
reverse logistics systems: case studies approach. International Journal of Production
Research, 48, 5, 1361–1380.

Fleischmann, M., Bloemhof-Ruwaard, J. M., Dekker, R., Van L., Van N., Van W., (1997).
Quantitative models for reverse logistics: A review. European Journal of
Operational Research, 103, 1–17.

238 Gozde Yangınlar, Salih Kalaycı
Garcia-Rodriguez, F.J., Castilla-Gutierrez, C., Bustos-Flores, C. (2013). Implementation of
reverse logistics as a sustainable tool for raw material purchasing in developing
countries: The case of Venezuela. International Journal of Production Economics,
141, 582–592. Jayanta, A., Azharb, M., (2014). Analysis of the barriers for implementing green supply
chain management (GSCM) Practices: An Interpretive Structural Modeling (ISM)
Approach. Procedia Engineering, 97, 2157 – 2166. Lai, K., Wong, C. (2012). Green logistics management and performance: Some empirical
evidence from Chinese manufacturing exporters. Omega, 40, 267–282 Lambert, S., Riopel, D., Abdul-Kader, W. (2011). A reverse logistics decisions conceptual
framework. Computers & Industrial Engineering, 61, 561–581. Lau, K,, Wang Y. (2009). Reverse logistics in the electronic industry of China: a case
study. Supply Chain Management: An International Journal, 14, 447–465. Lee, Y., Baker, T., Jayaraman, V. (2012). Redesigning an integrated forward–reverse
logistics system for a third party service provider: An empirical study. International
Journal of Production Research, 50, 19, 5615–5634. Lee, C., Lam, L. (2012). Managing reverse logistics to enhance sustainability of industrial
marketing. Industrial Marketing Management, 41, 589–598. Muchangos, L., Tokai, A., Hanashima, A., (2015). Analyzing the structure of barriers to
municipal solid waste management policy planning in Maputo city, Mozambique.
Environmental Development, 16, 76-89. Pokharel, S., Mutha A. (2009). Perspectives in reverse logistics: a review. Resources,
Conservation and Recycling, 53, 175-182. Prakash, C., Barua, M., (2015). Integration of AHP-TOPSIS method for prioritizing the
solutionsof reverse logistics adoption to overcome its barriers under fuzzy
environment. Journal of Manufacturing Systems, 37, 599-615. Ramírez, A.M. (2012). Product return and logistics knowledge: Influence on performance
of the firm. Transportation Research, 48, 1137–1151. Ramírez,A.M., Morales, V. (2011). Effect of reverse logistics and flexibility on
organizational performance. Economics and Management, 16, 1822-1840. Ravi, V., (2015). Analysis of interactions among barriers of eco-efficiency in electronics
packaging industry. Journal of Cleaner Production, 101, 16-25. Ravi, V., Shankar, R., (2005). Analysis of interactions among the barriers of reverse
logistics. Technological Forecasting & Social Change 72, 1011–1029. Richey, R., Chen, H., Genchev, S., Daugherty, P. (2005). Developing effective reverse
logistics programs. Industrial Marketing Management, 34, 830– 840. Rogers, D. S., Tibben-Lembke, R. S. (1999). Going backwards: Reverse logistics trends
and practices. Pittsburgh: Reverse Logistics Executive Council (RLEC). Rogers, D.S., Melame, B., Lembke, R.S. (2012). Modeling and analysis of reverse logistics.
Journal of Business Logistics, 33, 2, 107–117. Rogers, D.S., Tibben-Lembke, R. (2001). An Examination of reverse logistics practices.
Journal of Business Logistics, 22, 2, 129-148.

Barriers in Implementing Reverse Logistics: Evidence from Turkey 239
Shaharudin, M., Zailani, S., Tan, K. (2015). Barriers to product returns and recovery
management in a developing country: investigation using multiple methods. Journal
of Cleaner Production, 96, 220-232. Silva, D., Renó, G., Sevegnani, G., Sevegnani, T., Truzz, O. (2013). Comparison of
disposable and returnable packaging: a case study of reverse logistics in Brazil.
Journal of Cleaner Production, 47, 377-387. Srivastava, S.K., Srivastava, R. (2006). Managing product returns for reverse logistics.
International Journal of Physical Distribution & Logistics Management, 36, 7, 524-546.
Stock, J. (2001). Reverse Logistics in The Supply Chain. Global Purchasing & Supply
Chain Strategies, 44-48. Tuzkaya, G., Gülsün, B., Önse, Ş. (2011). A methodology for the strategic design of
reverse logistics networks and its application in the Turkish white goods industry.
International Journal of Production Research, 49, 4543–4571. Xia, X., Govindan, K., Zhu, Q. (2015). Analyzing internal barriers for automotive parts
remanufacturers in China using grey-DEMATEL approach. Journal of Cleaner
Production, 87, 811-825. Wu, Y., Cheng W. (2006). Reverse logistics in the publishing industry: China, Hong Kong
and Taiwan. International Journal of Physical Distribution & Logistics Management,
36, 507-523. Ye, F., Zhao, X., Prahinski, C., Li, Y. (2013). The impact of institutional pressures, top
managers posture and reverse logistics on performance- Evidence from China.
International Journal of Production Economics, 143, 132–143. Zhu, Q., Sarkis J. (2007). The moderating effects of institutional pressures on emergent
green supply chain practices and performance. International Journal of Production
Research, 45, 4333-4355. Zhu, Q., Sarkis, J., Lai, K. (2013). Institutional-basedantecedents and performance
outcomes of internal and external green supply chain management practices. Journal
of Purchasing Supply Management, 19, 106–117.
Summary
Barriers in Implementing Reverse Logistics: Evidence from Turkey
Gozde Yangınlar Beykent University, Turkey
Salih Kalaycı
Bursa Technical University, Turkey
The aim of this article is to analyze the effect of the major barriers, which prevent the
practice of reverse logistics in the air transportation industry. This paper propounds
theoretical reverse logistics implementation and identifies reverse logistics barriers in the
air transportation sectors. In recent years, liberalization and increase in population have led

240 Gozde Yangınlar, Salih Kalaycı
to high levels of competition in the air transportation sectors. The implementation of
reverse logistics has garnered more attention in the last few years in academic literature and
air transportation industry. The air transportation sectors need to decrease the
environmental effect of their supply chain and focus on the exigence of reverse logistics
development. In this study, the reverse logistics barriers have been identified from literature
review, opinion of experts, and air transportation industry. The key barriers identified from
our study are the five categories of management, economic, organizational, technological
and infrastructural, and political and legal. However, the results suggest that organizational,
economic, technological and infrastructural, and political and legal barriers have
statistically negative influences on reverse logistics implementation.
Keywords: Air Transportation, Barriers, Reverse Logistics, International Trade

Khazar Journal of Humanities and Social
Sciences © Khazar University Press 2017
DOI: 10.5782/kjhss.2017.241.252
Effect of the Mobbing in Organizational Commitment and Job Life Quality Which is Applied to Health
Workers
Nuriye Celmeche
Near East University, Cyprus
Abdullah Ishiklar
Bursa Technical University, Turkey
Serkan Arslan
South Russia University, Russian Federation
Introduction
The content of mobbing, which is one of the recent issues of current times and
which is explained by the negative and undesirable behaviors of an employee or
employee group in the workplace towards another worker, is a problem that is
frequently encountered today and presents serious danger both at the individual and
the organizational level (Tınaz et al., 2013).
The notion of mobbing was introduced by the Swedish psychologist Heinz
Leymann in the 1980s (Akbaş, 2009; Tetik, 2010). Leymann (1996) examined the
phenomenon of mobbing or emotional violence, which he described as "spiritual
terror", by investigating different professional groups and systematically directed
an individual to another individual or a group of individuals, leading to a hostile
and immoral communication. The individual who is the target of mobbing is
starting to suffer from physical, psychological and social impairments as a result of
negative and bad behaviors spreading at least once a week and spreading for a
period of at least six months (Leymann, 1996).
The aim of mobbing is to form a systematic pressure on the person or people in the
workplace and to force them to leave their work by destroying their performance
and endurance with immoral approaches. Today, there are many public and private
organizations that are seen as one of the most important reasons of poor
performance and failure in organizations (Chappell and Di Martino, 2006; Kırel,
241

242 Nuriye Celmeche, Abdullah Ishiklar, Serkan Arslan 2007). Although mobbing is a meaningful risk for all professions and
organizations, it is a reality that is most often seen in the health sector in the light
of the research done. The fact that the majority of the news about mobbing in the
press and the media has come to the health sector supports this fact (Fışkın and
Söyük, 2012). Factors such as providing uninterrupted and labor-intensive services
in health institutions, attracting attention with the multiplicity of women workers
compared to other sectors, can make the frequency of mobbing appearing in health
service providers different (Çobanoğlu, 2005; Urhan and Etiler, 2011).
Mobbing behaviors which are applied to the employees of the management affect
their organizational adversity negatively and their future is in danger (Karcıoğlu
and Çelik, 2012; Pelit and Kılıç, 2012). It is emphasized that mobbing in has a
negative effect on the attitudes of businessmen to the operation and causes the
decrease of their organizational commitment in this direction. Finally, the work life
qualities and organizational commitment of the employees are diminishing and the
intention of leaving the work is occurring. The results of research conducted on the
relationship between mobbing organizational Commitment show that the
relationship between the two concepts is generally negative. It is monitored that the
organizational commitment of businessmen who are exposed to mobbing behaviors
generally appears to be weaker (Çalış and Tokat, 2013; Özler, Atalay and Şahin,
2008; Karcıoğlu and Çelik, 2012; Pelit and Kılıç, 2012).
Polat (2011) defined organizational commitment as a high level of belief in the
organization, goals and values of its employees, more effort for the organization
than expected, and a strong desire for organizational commitment. Allen and
Meyer's generally accepted organizational commitment classification (Meydan,
Basım and Çetin, 2011), as well as different dimensions of organizational
commitment. Allen and Meyer (1991) studied on organizational commitment;
emotional commitment, continuance and normative commitment in three
dimensions. Emotional commitment is defined as considering the negativity of the
employees who work in the business emotionally and wanting to remain in the
organization with their own preferences, continuance, cost due to the separation of
the employees from the organization and continuing to work as a necessity.
Normative commitment is expressed as employees' sense of duty as a moral duty
and because they believe that they should not leave the organization (Meyer and
Allen, 1991). The common link between these three cognitive styles (emotional,
continuing, and normative) reflects a psychological condition that affects
employees' decisions to connect and keep their association with the organization
(Allen and Meyer, 1993; Guatam, Van Dick and Wagner, 2004; Meyer, David,
Stanley and Herscovitch, 2002, Obeng and Ugboro, 2003).

Effect of the Mobbing in Organizational Commitment and Job Life Quality ...................243 The most critical factor in achieving success in an organizational sense is the
Commitment to the employee's organization. Organizations must ensure the loyalty
of their members if they want to ensure their existence and continuance and to be
prosperous (İnce and Gül, 2005). In terms of organizational behavior, one of the
most important articles is the attitude of the individual towards his work. If these
attitudes are positive, it can be said that the level of job satisfaction of the
employees and the quality of work life are high and if it is negative, the job
satisfaction and quality of work life are low (Özkalp, 2004).
Job quality (Martel and Dupuis, 2006), which emphasizes the human dimension of
work by focusing on the quality of the relationship between the worker and the
work environment, is an important management process that includes factors
directly affecting employee efficiency and productivity. Chan and Wyatt (2007)
describe the quality of work life; Sirgy, Efraty, Siegel and Lee (2001) defined the
workplace environment and the appropriate working conditions in which
employees are encouraged and supported by the provision of rewards, job security
and development opportunities, while Sirgy, Efraty, Siegel and Lee (2001) describe
the need to meet various needs through resources, activities and outputs they have
defined it as professional desire.
There are two vital theoretical approaches to the quality of work life in the
literature. These are the elimination of needs and spillover effect approaches. The
approach to addressing needs is based on the model of meeting the needs
developed by Maslow. According to this approach, people have the basic needs that
they need to be fulfilled through work, and the employees are satisfied with the
work they are doing to the extent that they meet their needs. The diffusion effect
approach is based on the assumption that satisfaction in one area of life can affect
satisfaction in other parts of life (Chan and Wyatt, 2007, Çelmeçe and Işıklar,
2015).
As specified in the researches on the factors affecting the quality of life of the
employees, the quality of life, demographic factors, wages, earnings, working
environment and conditions, management and organization of the works, leaders,
work technology, industrial relations, participation, employment security,
(Adıgüzel, Erdoğan, Batur, Oğlakkaya and Yalçın, 2014; Çatak and Bahçecik,
2015; Çavuş and Çelik, 2014; Çelmeçe and Işıklar; 2015) are affected by the
objective conditions such as mobbing, social security and life long education.
In this research it was aimed to determine the effect of the mobbing that is applied
to health workers on their organizational commitment and job life quality. In
accordance with this aim;

244 Nuriye Celmeche, Abdullah Ishiklar, Serkan Arslan 1- Is there a relationship between organiational commitment and job life quality of
health workers who are exposed to mobbing?
2- Is the mobbing that is applied to health workers has an effect on organizational commitment and job life quality of them?
Method
The research was conducted in a relational screening model to determine the effects
of mobbing in applied to healthcare workers on organizational longevity and work
quality of life. The study universe consists of health workers working in Tokat
State Hospital. The sample of the study consists of a total of 154 health workers, 88
female (57%) and 66 male (43%), determined by randomized sampling method
from the employees.
Scaling Tools:
1. Socio-demographic Data Form:
There are totally five questions included; age, gender, marital status, education
level, job, working period.
2. Mobbing Scale:
Leymann's 45-item mobbing scale was used. Original translation of the mobbing
scale in German was made by Osman Cem Önertoy and published in the book
"Mobbing: Emotional Harassment at Work" prepared by Davenport, Schwartz and
Elliot (2003). A 5-point likert scale was used in the questionnaire. I use the scale of
"1- I do not agree completely, 2- I do not agree, 3- I neither agree nor disagree, 4- I
agree, 5- I Absolutely agree" scale is used for the answer to each question. The
scale related to the mobbing perception of the employees is handled in 5
dimensions. These are; the attack on preventing self- disclosure and
communication (APSDC), the attack on social relations (ASR), the attack on the
reputation (AR), the attack on the quality of life and occupational status of the
person (AQOSP) and the health of the person (HP) dimensions. These are the
reliability coefficient of Leymann's mobbing scale (Cronbach's Alpha value) was
found as high as 0,91 (Dikmetaş, Top and Ergin, 2011).
3. Organizational Attitude Scale:
"Organizational Commitment Scale" developed by Meyer and Allen (1991) and
adapted to Turkish by Wasti (2000) was used. This scale, which was formed in the
form of a five-point Likert-type grading format and scored in the form of "never

Effect of the Mobbing in Organizational Commitment and Job Life Quality ...................245 agree" (1) and "completely agree" (5), consists of 18 articles in three dimensions
(emotional Commitment, normative Commitment and continuance Commitment).
The results of Wasti's (2000) analysis to test the validity of the scale revealed that
the scale verified that the Turkish form was in 3D and that the factor loadings of
the scale articles varied between 20 and 72. Also, reliability coefficients are for
emotional commitment. 78, for normative Commitment. 75 and for continuance of
Commitment. 58 (Wasti, 2000).
4. Job Life Quality Scale:
The Work Quality of Life Scale was developed in 2001 by Sirgy, Efraty, Siegel
and Lee. The scale consists of 16 articles related to the satisfaction of 16 needs. All
of the articles that make up the scale are intended to measure the quality of work in
the workplace. The first three articles of the scale (1, 2, 3) measure the satisfaction
of your health and safety needs. Articles 4, 5 and 6 are intended to measure the
satisfaction of family and economic needs. Articles 7 and 8 aim to measure the
satisfaction of social needs. Sections 9 and 10 aim to measure the level of
satisfaction with respect. Articles 11 and 12 measure the extent to which self-
realization needs are satisfied. Articles 13 and 14 measure the extent to which
information needs are satisfied. Questions 15 and 16 are intended to measure the
satisfaction level of aesthetic needs. Confirmatory factor analysis was carried out
by Sirgy, Efraty, Siegel and Lee (2001) to test the validity of the original scale and
it was found that 16 articles came from seven factors and these seven factors came
from a single factor. The Cronbach Alpha reliability coefficient of the Work Life
Quality Scale was 0.78.
Findings
The percentage Table of health workers that are exposed to mobbing are given in
the Table1.
Table 1. Distribution of the health workers that are exposed to Mobbing Mobbing Exposure Frequency %
Yes 55 36
No 60 39
Not Sure 39 25
Total 154 100

246 Nuriye Celmeche, Abdullah Ishiklar, Serkan Arslan When the Table1 was examined it was determined that 55 ( 36%) of the health
workers are mobbing exposed, 60 of them (39 %) are not mobbing exposed and 39
(25 %) of them are not sure.
Distributions of the health workers, who are exposed to mobbing depending on
their genders, are given in the Table2.
Table 2. Distributions of the health workers depending on their genders
Gender Frequency %
Female 30 54.5
Male 25 45.5
Total 55 100
When the Table2 was examined it is seen that 54.5% of the mobbed people are female and 45.5 % of them are male workers.
Findings related to relationships between mobbing, organizational commitment
levels and job life qualities of the health workers given in the Table3.
Table 3. Relationships values related to relationship between mobbing,
organizational commitment and job life quality of health workers
1 2 3 4 5 6 7 8 9
1.APSDC -
2.ASR .40** -
3.AR .43** .67** -
4.AQOSP .33** .70** .70** -
5.HP .51** .51** .69** .63** -
6. Emotional Commitment -.46** -.43** -.71** -.60** -.84** -
7.Continuance
Commitment -.41** -.47** -.44** -.44** -.33** .39** -
8.Normative
Commitment -.40** -.37** -.33** -.52** -.54 .11 .09 -
9.Job Life Quality -.31** -.31** -.38** -.31** -.39** .41** .37** .17 -

Effect of the Mobbing in Organizational Commitment and Job Life Quality ...................247
When Table 3 was examined, it was found that there was a meaningful difference
between the mobbing subscale and aggression to avoid communication (CGIES)
subscale and organizational Commitment normative Commitment dimension r = -
40 (p <.01), emotional commitment r = - .46 (p < and continuing Commitment r = -
. 41 (p <.01). The relationship between the attack on social relations (SIS) subscale
and the normative Commitment subdimension of organizational Commitment was r = - 37 (p <.01), emotional commitment r = -. 43 (p <.01), and continuance r = p
<.01) in the negative direction. (P <.01), emotional commitment r = -. 71 (p <.01)
and continuance of commitment r = -. 44 (p < .01) was found to have a meaningful
negative relationship. (P <.01), emotional commitment r = -. 60 (p <.01) and
continuance commitment r = -. 52 between the commitment to Quality of Life and
Occupational Attitude (KMDS) subscale and the normative commitment dimension
of organizational Commitment .44 (p <.01) were found to have a meaningful
negative relationship. The relationship between the attack on the health of the
patient and the normative commitment dimension of organizational Commitment
was r = - 54 (p <.01), emotional commitment r = -. 84 (p <.01), and continuance r =
<.01) was found to be meaningfully related to the negative direction. Again, there
was a meaningful and negative relationship between mobbing and organizational
Commitment and all dimensions of work life quality.
For the scaling of the organizational commitment and job life quality variances of
the workers who are exposed to mobbing the regression analysis findings given in
the Table 4.
As a result of regression analysis; mobbing was found to explain the variance of
normative and emotional attachment by 31% and the variance of continuance by
3%. In other words, 31% of normative and emotional commitment, 21% of
continuance commitment and 21% of work life quality are due to mobbing. As a
result of the multiple regression analysis, mobbing behaviors applied to healthcare
workers are meaningfully related to organizational commitment’s sub dimension, it
can be said that it has an effect.
Table 4. Effect of the Mobbing on the organizational commitment and job life
quality of health workers
Organizational Commitment Variances
Normative Emotional Continuance
Job Life Quality
Commitment Commtiment Commitment
R R2Fp R R2Fp R R2Fp R R2 F P
.541 .310 121.1 .00 .552 .310 141.2 .00 .241 .210 133.4 .00 .512 .211 114 .00

248 Nuriye Celmeche, Abdullah Ishiklar, Serkan Arslan Discussion and Comments
The mobbing exposure rate of the health care workers was found to be 36% in the
study. In their research on Dilman (2007) and Dündar (2010) health workers,
employees' mobbing exposure rates were found to be 70%. According to the survey
conducted by Salin (2001) in Finland and involving 377 people, when asked if
workers were exposed to mobbing, yes the answer was 8.8%, and when asked after
mobbing, it reached out to 24.1%. According to the survey, this is due to the fact
that employees do not know what they are facing.
This rate is almost double compared to Europe. Even in Finland, where mobbing
rates are highest in Europe, the mobbing rate is 15% (Di Martino, Hoel and
Cooper, 2003). In studies conducted in Europe, it was found that mobbing had a
high level of equality risk in the public sector (14%) compared to other sectors
(12%) and in service sectors such as transportation, communication, education and
health, 2005). Mobbing behaviors have been seen in organizations where intense
interpersonal relationships are more prevalent. It is possible to think that the main
reason why mobbing is so high in this research is that it is based on the application
of research to both public and health workers.
When the healthcare workers exposed to mo bine in the survey were evaluated in
terms of their gender, mobbing exposure rates of women were found to be higher
than that of males and mobbinge exposure rates of female workers were found to
be 54.5%. As in other studies in the literature survey (Salin, 2003; Kelly, 2005),
female workers were exposed to more mobbing than male workers. In Özdemir's
(2013) study in Istanbul and Anatolian group hospitals, it was determined that
mobbinge exposure differs according to gender, and that women's health personnel
were exposed to more mobbinge than male health personnel. "According to the
results of the Fourth European Working Conditions Survey, 2007) women were
found to face mobbling three times more than men. Moreover, according to the
same research, it is stated that women are exposed to more mobbing in Ireland,
Finland and Luxembourg compared to other countries. Researchers have supported
the results of our research. Kemaloğlu (2007) has identified male teachers as being
more exposed to mobbing than female teachers in the study titled "Gender
Investigation of Teachers' Emotional Harassment Behavior". It does not support
our research results.
There was a negative relationship between mobbing behaviors applied to health
workers and organizational commitment and work quality. Mobbing applied to
healthcare workers affects their organizational commitment and work quality.
Again, there was a low, medium and high negative relationship between mobbing
sub-dimensions and organizational commitment sub-dimensions. Alper Apak

Effect of the Mobbing in Organizational Commitment and Job Life Quality ...................249 (2009) and Ekinci (2012) found a negative relationship between their level of
exposure to mobbing behaviors and level of organizational commitment in their
research. They found that mobbing in employees' organizational commitment
negatively influenced their work on 80 bank employees of Karcıoğlu and Çelik
(2012). At the same time, Yıldız, Akbolat and Işık (2013) found a negative
relationship between mobbing and organizational commitment in health workers'
research. The researches support our findings by the way.
Consequently; researches in the area of health mobbing is so frequent, however it is
reported to be rare. With its many causes, the general belief is that there are no
legal regulations to defend the rights of workers in our country. Responses related
to verbal attacks, injuries, beatings and killing of health personnel are subject to
general provisions. Research conducted again indicates that mobbing is applied
more to female workers. It is thought that Turkish society has patriarchal
characteristics, male workers and managers are more in the workplace than women,
and also women have more sensitive characteristics.
References and Notes: Adıgüzel, O., Erdoğan, A., Batur, Z., Oğlakkaya, D. ve Yalçın, B. (2014). Job life quality
and organizational attractiveness in health workers. 2. Organizational
attitudecongress proceedings, 621-632. Akbaş, S. (2009).Mobbing in the work place and work satisfaction relationship – an
application towards health workers. Master Degree Thesis, Atatürk
University,Social Sciences Institute. Allen, N.J., & Meyer, J.P. (1991). A Three- Component Conceptualization of
Organizational Commitment. Human Resource Management Review,1 (1), 61-89. Allen, N.J., & Meyer, J.P. (1993). Commitment to Organizations and Occupations:
Extension and Test of a Three-Component Conceptualization. Journal of
AppliedPsychology, 78(4), 538-551. Alper Apak, E. G. (2009). Mobbing and organizational devotion relationship: a researchon
primary school teachers. Unpublished master degree thesis, MarmaraUniversity
Education Sciences Institute. Cemaloğlu,N. (2007). Organizations’ inevitable problem: Mobbing. Ahmet
YeseviUniversity, Bilig Journal, 42, 111-126. Chan, K. W., & Wyatt, T. A. (2007). Quality of Work Life: A Study of Employees in
Shanghai, China. Asia Pacific Business Review, 13(4), 501–517. Chappell,D., & Di Martino, V. (2006). Violence at Work, International
LabourOrganization (3th ed.). Geneva. Çalış, M. ve Tokat, B. (2013). Examination of structure of the organization and mobbing
relationship in private hospitals: Giresun province sample. Ankara University
SSFJournal, 68(04), 103-120. Çatak, T. ve Bahçecik, N. (2015). Determination of the factors that affect the job life
quality of nurses. MUSBED, 5(2), 85-95.

250 Nuriye Celmeche, Abdullah Ishiklar, Serkan Arslan Çavuş, F. ve Çelik, M. (2014). Effect of the decision styles on the workers’ life quality: a
research towards otel workers. 2. Organizational behavior congress proceedingsı,
633-638. Çelmeçe, N. ve Işıklar, A. (2015). The perceived leadership and job life quality relationship
in health workers. Academic Social Researches Journal, 3(20), 202-216.
Çobanoğlu, Ş. (2005). Mobbing workplace emotional attack and struggling methods(19th
Press). İstanbul: Timaş Publishing.
Davenport, N., Schwartz, R.D., & Elliot, G.P. (2003). Mobbing: Emotional abusement in the work place. (Trans.: Osman Cem Önertoy). İstanbul: Sistem Publishing.
Dikmetaş, E., Top, M. and Ergin, G. (2011). Examination of Exhaustion and Mobbing
Levels of Assistant Doctros. Turkish Psychiatry Journal, 22(3), 137-149. Dilman, T. (2007). Determination of emotional abusement exposure of nurses working
inprivate hospitals. .Master Degree Thesis, Marmara University Institute of
Health Sciences. Di Martino, V., Hoel, H., ve Cooper, C. C. (2003). Preventing violence and harassment in
the workplace. european foundation for the improvement of living and working
conditions, http://www.eurofound.eu.int/publications/ files/EFO2109EN.pdf
(12.08.2007). Dündar, T. (2010). Roles of hospital atmosphere and socio demographic characteristics
inthe exposure to mobbing of health workers: bolu province research. Master
degreethesis, Hacettepe University Health Sciences Institute. Fışkın, G. ve Söyük, S. (2012). Mobbing Behavior and İstanbul province Mother Child
Helath Center Research Towards Health Workers. 10th
. National Helath Institutes Management Congress Proceedings, Mardin, 50-58.
Fourth European Working Conditions Survey (2007). Preventing Violence and
Harassmentin the Workplace, European Foundation for the Improvement of Living
and Working Conditions, 14-16. Guatam, T., Van Dick, R. & Wagner, U. (2004). Organizational Identification and
Organizational Commitment: Distinct Aspects of two Related Concepts. Asian
Journal of Social Psychology, 7(3), 301-315. İnce, M. ve Gül, H. (2005). A new paradigm in management: Organizational commitment.
Konya: Çizgi Book store. Karcıoğlu, F. ve Çelik, Ü.H. (2012). Mobbing and Its Effect on the Organizational
Commitment . Atatürk University, İİBF Journal, 26 (1). Kelly, D. J. (2005). Reviewing Workplace Bullying: Strengthening Approaches to a
Complex Phenomenon. Journal of Occupational Health and Safety, 21(6), 551-
564. Kırel, Ç. (2007). Supportive and risk lower suggestions in the management of mobbing in
Organizations. Anadolu University Social Sciences Journal, 7 (2), 317-334. Leymann, H. (1996). The content and development of mobbing at work. European
journalof work and organizational psychology, 5(2), 165-184. Martel, J. P., & Dupuis, G. (2006). Quality of work life: Theoretical and methodological
problems, and presentation of a new model and measuring instrument. Social
indicators research, 77(2), 333-368.

Effect of the Mobbing in Organizational Commitment and Job Life Quality ...................251 Meydan, C. H., Basım, H. N. ve Çetin, F. (2011). Organizational justice perception and its
effect on the exhaustion: A Sreserch on the Turkish Public Sector. Bilig, 57, 175-
200. Meyer, J.P. & Allen, N. J. (1991). A Three-Component conceptualization of organizational
Commitment. Human Resource Management Review, 1(1), 61-89. Meyer, J.P., David,J., Stanley, L., & Herscovitch–Laryssa, T. (2002). Affective,
Continuance, and Normative Commitment to the Organization: A Meta-Analysis
of Antecedents, Correlates, and Consequences. Journal of Vocational
Behavior,61(1), 20-52. Obeng, K., & Ugboro, I. (2003). Organizational Commitment Among Public Transit
Employees: An Assessment Study. Journal of the Transportation ResearchForum,
57(2), 83-98. Özdemir, M.Z. (2013). Mobbing applied to private hospital employees in Istanbul
andmobbing applied to private hospital employees in Anatolia. Master
degreethesis, Institute of Social Sciences, Istanbul Science University. Özkalp, E. (2004), Organizational Learning, Organizational Citizenship Behavior
andOrganizational Commitment. Eskişehir: Anadolu University Publications. Özler, D. E., Atalay, C. G. ve Şahin, M. D. (2008). A research to determine the influence of
mobbing on organizational commitment. Dumlupınar University Journal of Social
Sciences, 22, 37-60. Pelit, E. ve Kılıç, İ. (2012). The relationship of organizational commitment with mobbing:
an application in city and summer hotels. Journal of Business Research, 4(2), 122-
140. Salin, D. (2001). Prevalence and forms of bullying among business professionals: A
comparison of two different strategies for measuring bullying. European Journalof
Work and Organizational Psychology, 10 (4), 425-441. Salin, D. (2003). Ways of explaining workplace bullying: A review of enabling, motivating
and precipitating structures and processes in the work environment.
Humanrelations, 56(10), 1213-1232. Sirgy, M. J., Efraty, D., Siegel, P., & Lee, D. J. (2001). A New Measure of Quality of Work
Life (QWL) Based on Need Satisfaction and Spillover Theories. Social
IndicatorsResearch. 55, 241-302. Tetik, S. (2010). Mobbing notion: its importance for individual and organizations.
Karamanoğlu Mehmet Bey University Social and Economical Researches Journal,
12(18):81-89. Tınaz, P. (2013). Sample events from work life: motivation, job attitudes, job
stress,communication, interview, performance evaluation, education,
organizational climate, organizational culture, work ethics, mobbing. Beta
Publishing Distribution. Urhan, B.ve Etiler, N. (2011). Analysis of women's labor in the health sector in terms of
gender. Journal of Work and Society, 2, 191-216. Wasti, S. A. (2000). Validity and Reliability Analysis of Meyer and Allen's Three
Dimensional Organizational Commitment Scale. 8th National Management and
Organization Congress, Nevşehir, 401-410.

252 Nuriye Celmeche, Abdullah Ishiklar, Serkan Arslan Yıldız, G., Akbolat, M. and Işık, O. (2013). Psychological Harassment and Organizational
Commitment: A Research on Health Care Workers. Manas Social Studies
Journal,2(6), 85-112. Yücetürk, E. ve Öke, M. K. (2005). Mobbing and bullying: Legal aspects related to
workplace bullying in Turkey. South East Review, 2, 61-70.
Summary
Effect of the Mobbing in Organizational Commitment and Job Life Quality Which is Applied to Health Workers
Nuriye Chelmeche
Near East University, Cyprus
Abdullah Ishiklar Bursa Technical University, Turkey
Serkan Arslan
South Russia University, Russian Federation
Mobbing at workplace is defined as a phenomenon which is systematically performed by
one person or a few people on a person and the exhibition of hostile behaviors through non -
ethical communication. The purpose of this research is to investigate the effect of mobbing
on the commitment of victim to his/her organization and his/her quality of working life. The
following measuring instruments were used in the research: the Mobbing Scale based on the
mobbing typology which was introduced by Henz Leyman causes, effects and reactions of
mobbing, the Organizational Commitment Scale developed by Meyer and Allen and the
Quality of Working Life Scale developed by Sirgy, Efraty, Siegel and Lee. The research
population was composed of 154 health personnel working at a state hospital in Tokat. At
the end of the data analysis, a significant relationship was found between the mobbing
behaviors and organizational commitment and its three subdimensions (affective
commitment, normative commitment and continuance commitment) and quality of working
life.
Keywords: Mobbing, Organizational Commitment, Quality of Working Life

Khazar Journal of Humanities and Social
Sciences © Khazar University Press 2017
DOI: 10.5782/kjhss.2017.253.261
Exposure, Interpretation and Memory Retention in
the Perception Process of Consumers
Yunus Kayabas
Near East University, North Cyprus
Mehmet Macar
South Russian University, Russian Federation
I. Introduction
According to scientific research, the working principle of human brain has shown
that how people remembers an event very clearly and do not forget it for a long
time is related to how they feel the situation about that event in all their cells in the
intensity of emotions and to the importance they attribute to that event. With the
modern understanding of marketing, being the last one of the phases through which
marketing communication has been historically, approaching the customers, the
idea of customer focus, intense competition which started to be felt for good by
1980s, technological developments and globalization have created new dynamics in
the field of marketing. Communication lies at the core of today’s marketing
activities as a basic element and value (Bozkurt, 2014). Consumers define
purchasing behavior procedures for products which they think they do or will need
under the influence of stimuli coming from outer environment. A purchasing
behavior procedure is concluded in regard to the influence of stimuli, used by
enterprises to reach consumers, on consumers. Hence, positive perception of
stimuli, to which consumers are exposed, by them and the place of product or
brand in consumers’ minds are of great importance. Emotional pleasure and
integration a product gives to the consumer are the triggers of the purchasing
decision. Each product or brand introduced to the market is positioned in the
market according to the first impression of consumers; this defines how the
presenter of the product in the market is perceived and therefore on which quality
scale it will be evaluated. Positioning is a system of opening a window in mind.
The way of getting into one’s mind is being first (Ries & Trout, 2013).
253

254 Yunus Kayabas, Mehmet Macar
Sticking in consumers’ mind, staying long in their memories, being the preferred
among millions of alternatives, and how intangible or tangible services and
products draw attention of consumers is possible not only by meeting a
physiological need but also satisfying its spirit psychologically. Getting into
consumers’ heads in the first place means everything in marketing. Being the first
brand in the market is important because it helps getting into minds in the first
place. The rule of mind is an extension of the rule of perception. If marketing is not
a war of products but a war of perception, mind should precede market (Ries &
Trout, 2013). Then, the thing to be done is to analyze the place in which signals
sent to consumers’ subconscious position the product or brand well and make them
interpret it with the highest value that can be attributed.
Consumers receive different messages from organizations and their brands through
different sources and integrate those messages within their own learning processes
and save them in the part related to those organizations and their brands. This helps
that consumer develop his/her own attitude and behaviors toward the brand and the
organization (Bozkurt, 2014).
The most important criterion that is defined as a success for companies is to be able
to succeed in making them keep consumers’ brand awareness and positive thoughts
about the product in their memories for a long time.
1.1 Memory Retention Process
Millions of pieces of information reach humans’ five senses every day. Yet, it is
impossible to try to pay attention to and make an effort to perceive all of them.
Indeed, trying to sense and perceive these stimuli may deteriorate individuals’ both
mental and physical health. Thus, individuals let some of the information coming
to their sense organs pass their perception thresholds (mostly automatically,
without even noticing them consciously.) Individuals try to hear and perceive the
information which is important for them (Koç, 2012).
The process of learning the information offered through the message it gives,
keeping it in memory and recalling the information in brain requires mutual
communication among brain functions. To establish that communication, the
message should include a triggering message in its content which enables brain
functions and can leave its mark on the society and their subconscious. Otherwise,
the message presented would not be remembered by the society. The best approach
for winning when establishing communication with the society is a simplified
message. The message should be communicated with a clear expression to make it
permanent. One of the obstacles before messages achieving their objectives is the
volume of communication. One needs to focus on potential customers’ perceptions,

Exposure, Interpretation and Memory Retention in the Perception Process… 255
not the reality of the product. Let us take advertising. Despite composing only 6%
of the world population, USA consumes 57% of the world’s advertisements (Ries
& Trout, 2013).
As diversity of communication tools is expanding at an unprecedented pace, the
most accurate way to communicate messages for companies is to manage the
communicate to manage consumers’ perceptions and stick in their minds once and
for all. The lowest strength of stimulus at which a stimulus can stimulate
individuals’ sense organs is called absolute threshold. Where the stimulus remains
fixed, does not change or is repeated, absolute threshold rises and stimuli starts not
to be paid attention to. This leads to the “concept of sensory adaptation.” And this
concept refers to the fact that we do not perceive what we have been exposed to
and have been perceiving before anymore after a while (Odabaşı & Barış, 2013).
Even though this facilitates our lives as individuals, it makes it difficult for
marketers. What can marketers do when the advertisement broadcasted, shelf
arrangements and sales development efforts are not perceived anymore? It is
recommended to marketers who want to overcome this hardship to know about the
concept of discrimination threshold. Discrimination threshold is the lowest
difference perceived between two similar stimuli. When a marketer wants to
increase the intensity of stimulus “on the lowest level possible” and in such a way
that “individuals can notice it”, it needs to know the ability of its target group to
“notice the differences”; in other words, its “discrimination threshold”. In what
ratio does a packaging which is not perceived anymore due to sensory adaptation
need to be enlarged so customers can perceive the fact that the “packaging has been
enlarged”? The basic principle in answers to this question and such ones is the
strength of the first stimulus. If the first stimulus is strong, the second stimulus can
be perceived differently as it is stronger. It is necessary for information saved on
senses to be transferred into short-term memory so it can transform into being
conscious and meaningful. Which of the stimuli is to be transferred to the short-
term memory is defined by the processes of recognition, attention, and perception.
The process of perceiving starts with sensation. Thanks to sensation, data in outer
environment are communicated to brain to be transformed into neural energy and to
be processed. After the processing in the brain, information is formed and stored.
This is the process of perceiving; the final product is perception. During this
process, brain considers the information acquired by the individuals, their
expectations, and social and cultural values along with the senses coming from
other sense organs, chooses the senses, ignores some of them and categorizes the
new information, evaluating it together with the current one. Hence, perceiving has
a complex structure as it forges a bond among individual’s knowledge,
experiences, and personal and social values (Cüceloğlu, 2005).

256 Yunus Kayabas, Mehmet Macar
1.2 Exposure
The next stage in perceiving is related to the access of marketing communication
elements to us. That is why elements of communication are as important as choice
of strategy, timing of marketing messages and the content of message (Koç,2012).
The most important point to be considered is that the sensation threshold to which
consumers are exposed is well-analyzed and consumers are informed in
moderation. Otherwise, consumers would not perceive the message to be
communicated after a while and would send it to the section of their memories
where the message will not be remembered. Exposure is the physical contact
between consumer and stimulus. Our sense organs (eyes, ears, nose, mouth, and
skin) help us access, that is, be exposed to inputs. Two types of stimulus can be
talked about: physical stimuli coming from environment and stimuli formed by
individuals themselves (expectations, motives, experiences, etc.) Synergy of both
types of input is one of the main reasons for the idiosyncrasy of perceiving
(Odabaşı & Barış, 2013).
Fig. 1. Process of Perceiving
A positive process of perceiving depends on the exposure of consumers to
messages to impress sense organs. Any product which does not address target
groups’ emotions that do not penetrate their sense organs. Effectiveness of the
exposure process is also related to its spectacularism. If the message was not taken
into consideration, consumer exposed to the message would get bored in time and
remove it from his/her memory’s priorities and the process of sensory adaptation
would start.
The process of perceiving starts with exposure, continues with physical stimuli
from environment and individuals’ expectations, demands, attention and the
Exposure, Interpretation and Memory Retention in the Perception Process… 257
involvement process; at this stage, consumer would determine his/her style of
behavior for the product and turn it into buying/not buying it.
1.3 Perception and Process of Perceiving
Perceiving refers to the individual effort to choose, organize and interpret stimuli
during the formation and definition of individual’s environment by himself/herself.
As a concept related to how individuals see the world and how they interpret
stimuli to which they are exposed and which address their five senses, perceiving
may present an original structure differing from person to person. In this context,
selective perceptions developed by individuals for stimuli because they have
different needs, values and expectations, their ways of interpreting stimuli, and
therefore, ways of perceiving them vary (Schiffman & Kanuk, 2004).
Consumers buy a product at the end of a process of learning. For information,
emotions and images about a product to be stuck in memory, consumers need to
notice the messages about that product, or be exposed to those messages, pay
attention to them, consequently perceiving the messages (Ekdi, 2005). The process
of convincing the target groups so a product, service or an idea to be purchased
cannot be managed without being dependent on truths. There is never an exact
correspondence between the value proposition of a product, service, organization,
person or country attributed to itself and its perceived value. The main function of
communication is nothing but building a bridge between those two and closing the
gap between those two elements.
II. Purchasing Process of Consumer
Consumers seek for a product which will meet their needs in the best way possible
and at the lowest cost possible. Diverse options of product, quality, price, brand
and product identity, indicator of status, and emotions to make consumers happy
affect consumer behaviors.
Consumers make decisions following sometimes short-term and sometimes long-
term research. One of the most important issues recently is the fact that
consumption has transformed from a physiological phenomenon into a
psychological or emotional one in developed and developing countries (Kotler,
Kartajaya & Setiawan, 2012). In an increasing manner, physiological satisfaction
with products has been replaced rather by psychological/emotional satisfaction
(status, belonging, loving, being loved, acceptance, being shown respect, being

258 Yunus Kayabas, Mehmet Macar
superior, prestige, achievement, enjoying, etc.) Today, physiological satisfaction
refers to the lowest-level expectation from a product or service. It is observed that
successful firms are trying to achieve psychological satisfaction regarding multiple
needs in addition to physiological satisfaction (Koç, 2012).
Several proposals and models have been developed for consumers’ decision-making processes. Four of them have been widely accepted and examined:
1 Problem-solving model 2 AIDA model 3 Hierarchy of effects model 4 Innovation acceptance model
When comparing the four important approaches, all the stages depend on the
process of convincing and all the models have cognitive, affective and behavioral
dimensions to them (Odabaşı & Barış, 2013). Individuals’ attitudes reflect their
desires and goals. Their desires are organized to direct and maintain all their
psychological activities. Their perceptions, thoughts, emotions; all their activities
such as mobilization of old habits and acquirement of new ones are always under
the influence of their goals through the forces driving them. Molar behavior of a
child that starts with his/her sense of being hungry for cornflake chips ends with
the purchase and consumption of the product (İnceoğlu, 2005). Consumer purchase
decision-making process is like a detailed narration of the problem-solving
behavior. Behavior exhibited by the consumer at a bazaar should not be handled
like a simple action-reaction mechanism. Because each behavior of the consumer
appears as a mental process that affects and directs the purchasing event.
According to this idea that addresses consumer behavior as problem solving, the
act of purchasing is just one of the stages in this process (Nazik, Bayazıt, Erdamar
& Gürcü, 2014).
Marketing starts with a demand and this results from the occurrence of a need;
success of marketing is about the management of this demand and need in the best
way possible and the capability of managing the competition. While marketers
make decisions to orientate consumers toward products and services, consumers try
to choose the most suitable offers out of the ones that have been presented to them;
this lifelong activity becomes a part of daily life and the consumer develops a
shopping style which is effective in the choice of goods and services. Advancing
technology and current economic conditions force today’s consumers to prefer
brands instead of paying for products. Because customers look for extra values
provided by brands compared to similar products (Eriş & Kutlu, 2007).

Exposure, Interpretation and Memory Retention in the Perception Process… 259
Several products or services with almost the same properties are presented to
consumers’ taste, and consumers pick out. Prices of products alone are not enough
to influence and direct consumers’ preference among products anymore and it
becomes even more important to create difference in terms of quality, servicing
facilities, etc. within the competition and to gain a place in consumers’ memories
(Ekdi, 2005).
III. Conclusion
When examining the studies on consumer behaviors, it is seen that studies to stick
in consumers’ memories are in the forefront. Packaging and advertisement of the
product, simplicity of the communication language used and the strength of effect
has become as important as the quality of product offered to consumers. In
consideration of consumer needs, contents for their perceptions should be
presented. Cultural values should be considered and consumer sensitivities should
be taken into account when offering the product to consumers.
When advertising the products, advertisements which do not address consumers’
cognitive, affective and behavioral domains have found not to be effective.
Consumer buys a product at the end of a process of learning. For information,
emotions and images about a product to be stuck in memory, consumers need to
notice the message about that product and pay attention to them.
In consumers’ processes of purchasing, it has been seen that they decide purchasing
the product which will satisfied then in the best way. There are several factors that
trigger consumers’ willingness to purchase and it has also been determined that
supporting this willingness with stimulating arguments by those who introduce the
product to the market is very effective. Satisfaction of consumer needs today is
defined an activity based on psychological satisfaction rather than being just a
physiological phenomenon. The fact that drives determined to be psychological
behaviors such as status, belonging, loving, being loved, acceptance, being shown
respect, being superior, prestige, achievement, and enjoying trigger purchasing
processes and have a great impact on them should be considered by those who
supply the product.

260 Yunus Kayabas, Mehmet Macar
References and notes:
Bozkurt, İ. (2014). Communication-focused marketing: creating a brand out of consumers, İstanbul: Mediacat Pub.
Cüceloğlu, D. (2014). Human and its behavior: basic concepts of psychology,İstanbul: Remzi Pub.
Ekdi, B (2005). Brand image making and salience, Ankara University Institute of Social
Sciences Department of Business Administration, Master’s Thesis, Ankara. Eriş, N., & Kutlu, Ş. (2007). Customer relations management in creating brand
commitment, Ankara University Institute of Social Sciences Department of Business
Administration, Master’s Thesis, Ankara. İnceoğlu, M.(2005). Attitude, perception, communication,İstanbul: Beykent University
Pub.
Koç, E. (2012). Consumer behavior and marketing strategies: global and domestic approaches, Ankara: Seçkin Pub.
Kotler, P., Kartajaya, H., & Setiawan, I. (2012). Marketing 3.0 product, customer, human
spirit, İstanbul: Tor Pub.
Nazik, H., Bayazıt, H., Erdamar, K., & Gürcü, D. H. (2014).Research on Turkish consumer
profile and level of awareness, Ankara: Foundation of Consumers and
Environmental Education. Odabaşı, Y., & Barış, G. (2013). Consumer Behavior, İstanbul: Mediacat Pub. Ries, A., and Trout, J. (2013). 22 Immutable Laws of Marketing, İstanbul: Mediacat Pub. Ries, A.,& Trout, J. (2013). Positioning: The Battle for Your Mind, İstanbul: Mediacat Pub. Saydam, A. (2005). A back-page article,NPQ Turkey, 7(1), 70-81. Schiffman, L.G., & Kanuk, L.L. (2004). Consumer Behaviour. New Jersey USA:
Pearson Education, Inc.

Exposure, Interpretation and Memory Retention in the Perception Process… 261
Summary
Exposure, Interpretation and Memory Retention in the
Perception Process of Consumers
Yunus Kayabas Near East University, North Cyprus
Mehmet Macar
South Russian University, Russian Federation
According to the classical understanding in marketing, how powerfully human brain sends
an event or object it perceives through the sense organs to the memory depends on how it
interprets them, how long it retains them in its memory, or how much it desires that event or
object. According to today’s modern understanding, on the other hand, all events or objects
perceived through the sense organs are sent to and wholly stored in brain so it is not to be
forgotten in future. What should be the absolute threshold for impressing consumers and
make them imprint your products in their memories during a positive perception process? It
is necessary for information saved on senses to be transferred into short-term memory so it
can transform into being conscious and meaningful. Which of the stimuli is to be transferred
to the short-term memory is defined by the processes of recognition, attention, and
perception. When an enterprise wants to increase the intensity of stimulus “on the lowest
level possible” and in such a way that “individuals can notice it”, it needs to know the
ability of its target group to “notice the differences”; in other words, its “discrimination
threshold”. Otherwise, an over-repeated informing process will trigger the process of
sensory adaptation after a while; the meaning will be lost and will not be perceived. In what
ratio does a packaging which is not perceived anymore due to sensory adaptation need to be
enlarged so customers can perceive the fact that the “packaging has been enlarged”? What
is the basic answer to this question and such ones? Through which processes do consumers
go through to prefer a given product or brand?
Keywords: Perception, memory, stimulus, exposure, human brain

Khazar Journal of Humanities and Social
Sciences © Khazar University Press 2017
DOI: 10.5782/kjhss.2017.262.267
Stress Relationship with Employees in Public Service Delivery Bank
Osman Shahin
South Russia University, Russian Federation
Ibrahim Turut
South Russia University, Russian Federation
Erhan Salmanli
South Russia University, Russian Federation
1. Introduction
The banking sector is a sector which is at the forefront of customers. That's why
customer satisfaction .It is of importance. Because our time is the most important
thing it is to maintain customer assets of banks under competitive conditions.
Therefore, it is the banks' provision of services is very important to win the
satisfaction of customers performing. The Bank carries out the service delivery
bank employees. Employee representatives are against the bank's customers. A
bank employee represents the bank's customers based on personality. Therefore,
the bank's employees while the provision of services to customers, they must be
very careful when communicating with them. Because of customer satisfaction it
means ensuring the survival of the bank. Otherwise, this is not possible.
Bank employees to represent the bank should be very careful. However, it can wear
any individuals who work in an industry where there is intense work such as
banking. bank employees who constantly have to deal with customers and establish
healthy communication inevitably they are tired. Also it brings with it stress
fatigue. Exposure to workplace stress is a normal situation for an individual
employee. However, when stress levels rise in the provision of services to
customers can lead to the emergence of a negative situation. Therefore, they need
to pay attention to your stress level while the service delivery of the bank's
262

Stress Relationship with Employees in Public Service Delivery Bank 263 employees. In particular, the public bank employees are required to pay much more
attention to this situation. There is a special case because of public banks.
According to other banks it does business is more possible. Some of his works and
actions on behalf of public bodies can make public.
The study is the subject of the provision of services in relation to the stress of the
employees of state-owned banks. The aim of the study is to demonstrate the
relationship of the stress of the employees of the service delivery of public banks.
Research is a descriptive study based on the method. A study was conducted to
clarify issues and evaluation.
2. Conceptual Framework
2.1. Banking Description and Features
The concept of the Italian bank "Banco" comes from the word. Turkish desks,
tables, benches as meaning in the words used in that credit provision in Turkish
dictionary, which processes related interest, storing valuables in the safe deposit
box and safe, and commercial, are referred to as institutions or organizations
operating in the industry. the public and private identity, which transactions related
to money, enabling people or resources to organizations that transform savings into
investment in the economy is a unit that contributes to other economic business and
operations (I Şendoğ, 2006, s.2-3). According to the current banking approach this
definition remains incomplete. Because banks are also many different jobs to do
(EYÜPGİLLER, 2000, s.21-22). In this respect, it is difficult to make a clear
definition.
Banks are important because of the features they have providing resources to other
units in the economy is one of the most important features. the occurrence of other
sectors is one of the most important things. The opening of new sectors are
contributing very important which facilitates the growth of the sector in the present.
savings banks as deposits lie on the individual savings are transformed into
investments. In this regard, banks gain importance in terms of their contribution to
the economy.
Banks are classified according to type. Investment banks, development banks,
commercial banks, rural banks, as many banks varieties are available. Banks are
resorting to many methods of our age to continue their presence in the competition.
When using this method, particularly seem to care customer-oriented operation.
But today, it is seen that dominate literally customer-focused approach of the
majority of the banking sector. Because customers want in the academic studies

264 Osman Shahin, Ibrahim Turut, Erhan Salmanlı whether a state bank has manifestly failed to meet the expectations get private
banks. However, it also appears to be ahead of the private sector than the public
banks banking (Yilmaz Celik, who Depri, 2007, 234-238). It is understood that the
banks behind in the provision of public services. One of the reasons for this is the
dominant understanding of public administration in public banks. private banking
approach to the lack of competition in public administration cannot be fully
understood.
2.2. Stress and Features
Stress of our age is one of the most common psychological condition. Because it is
a situation that exists in every moment of human life. Stress was first described by
Hans Selye. People outside Selye defines as non-specific response against a factor
'it is. Literature stress caused by the source or starting with number of definitions
are classified into three groups (Falcon, 2015, s.8-13). Stress is defined as the
individual stress resulting from their psychological status of individuals. especially
the employees' work life individuals and organizations in the business environment
faced by the related stress-induced condition is defined as organizational stress.
There are two types of stress that is induced environmental stress from other
environmental causes. al of the individual,
Individual sources of stress is generally related to the individual's inner world. The
sadness of the individual circumstances, such as joy can lead to stress. These
feelings can be effective working life of the individual. Individuals can reduce the
stress levels of work-related motivation to start work at a high state. Individuals
who lose their efficiency and therefore may become unable to work (Sahin et
Salmanlı, 2015, 62-74)
It is made of stress-induced condition relating to the organization of organizational
reasons. The most common and factors causing organizational stress: lack of
communication, assessment issues, leadership style, role conflict, wage inequality,
bullying (bullying) (Sahin and Salmanlı, 2015, 355-368) are organizational
policies. especially employees of individual organizational reasons related stress
has an impact on the individual stress levels. Organizational stress paves the
individual stress.
Environmental stressors stems from a social network of more individuals.
Relatives, friends, and is the kind of stress emerged in public life. The type of
stress on the individual's social life can affect an individual's personal stress levels.

Stress Relationship with Employees in Public Service Delivery Bank 265 3. Level of Stress Employees and Service Delivery in Public Bank
Public banks are obliged to offer such services to their customers every bank. The
difference is in the other bank of the state banks to act as public administration.
They can also do some business and operations are made by the public
administration. Therefore, it offers a variety of services may be greater than the
other banks. Actually, to be more customer satisfaction in terms of service
provision it can be seen as a positive situation. However, increasing the workload
and employees in terms of extra work load being experienced exactly the opposite
situation. Customer satisfaction is also transformed into customer dissatisfaction.
Stress level of the individuals working in state-owned banks is also affecting
customer satisfaction or service quality in service delivery. His job is high stress
levels can also adversely affect individual employees. Service offerings may be
reduced. In addition, due to the stress he experienced individuals working in
attitudes and behavior towards customers in negative situations can arise. The
result is a difficult state to win customer satisfaction.
Quality services to customers by maintaining normal levels of high stress levels
and workload lack of individual banks during the provision of services performed
in public. Otherwise it can not be said. Exhibit a positive attitude towards the need
of customers to be happy and how individuals are possible. In short, it is necessary
for employees to be happy customer can be satisfied.
4. Conclusion
That quality service delivery in public banks might be possible with the change of
management of the understanding and management of state-owned banks. The
introduction of private banking approach is required. works made by public
administrations should receive from public banks. In this way, excessive workload
will be taken out of the bank. It can also provide increasing the quality of service in
this case. Another way of improving the service quality of public banks might be
able to make the customer-centric approach to service-oriented staff. Because the
case presented against employees satisfied and happy customer service quality will
also increase.

266 Osman Shahin, Ibrahim Turut, Erhan Salmanlı References and notes:
AKINCI, A. (1996) Emergence of Development and Investment Banking, International
Development and Transformation experienced today in Size MARA Research and
Planning Directorate, Ankara. AKÇAKOCA, E. (2002) Banking Sector Restructuring Program BRSA, Ankara.
EYÜPGİLLER, S. (2000) Management Information Base for Banks, Banking and Commercial Law Research Institute, Ankara.
Sarisu, A. (1996) General Structure of the Turkish banking system, the Privatization and
Public Bank Splitting the Basics, Turkish Prime Ministry Under secretariat of
Treasury, Research and Analysis Series No: 7, Ankara. Sahin, O. (2015) "Analysis of Effects of Stress on 112 Emergency Service Medical Staff "
The Russian Academic Journal Vol. 32, # 2, 54-59 Sahin, O. (2015) "Examination of Effects of Stress on Public Officers "The Russian
Academic Journal Vol. 32, # 2, 8-13 Sahin, O. (2015) "Check the Effects of Foreign Language Learning Stress "The Russian
Academic Journal Vol. 32, # 2, 94-97 Sahin, He Salmanlı, E. (2015) Effect Of Study On Performance Of Stress And Stress
Sources of Public Employees, The Journal Of Turkish And Islamic World Social
Studies, vol.5, 251-259 Sahin, O, Salmanlı, E. (2015) Potential Health Industry's Commercial As Seen The Nature
Of The Stress, The Journal of International Management Research, vol.1, 62-74 Sahin, He Salmanlı, E. (2015), Made In mobbing Employees On The Concept And Work
Stress Study, The Journal of Academic Social Science, vol. 20, 355-368 I ŞENDOĞ, A. (2006) Introduction to Banking Nobel Publications, Ankara. Yilmaz, V., STEEL, He, earthquake, B. (2007) Comparison of State and Private Sector
Bank in Service Quality: The Case of Dogus University Journal, 8 (2), 234-248 ZAİM, O. (1995), "The Effect of Financial Liberalizalio on the efficiency of Turkish
Commercial Banks", Applied Financial Economics Vol: 5. www.crminturkey.org, Accessed: 10/04/2016 www.tbb.org.t is, Accessed: 03/05/2016 www.econturk.org, 01.04.2016 http://www.capital.com.tr/yonetim/liderlik/mutlu-calisan-satis-artirir-mi-haberdetay-
4258Accessed on: 04.11.2016

Stress Relationship with Employees in Public Service Delivery Bank 267
Summary
Stress Relationship with Employees in Public Service Delivery Bank
Osman Shahin
South Russia University, Russian Federation
Ibrahim Turut South Russia University, Russian Federation
Erhan Salmanli South Russia University, Russian Federation
The banking sector is a sector that contributes to the service sector and other industries
located within. Although the marketing of certain products in a sector that has been made to
predominantly perform service delivery. Therefore, it is a sector that it is important for
customer satisfaction. To ensure customer satisfaction is one of the most important tasks of
bank employees. Because it carries the bank's service delivery employees. Bank employees
are increasing while working in a busy work environment inevitably stress levels.
Therefore, they may exhibit any negative attitudes or behavior towards customers. stress
experienced during the delivery of public service employees of the bank will be examined
in the study.
Keywords: Bank Employees, Service Delivery, Public Stress

Khazar Journal of Humanities and Social Sciences © Khazar University Press 2017
DOI: 10.5782/kjhss.2017.268.279
A Targeted Study to Create Country Tourism,
Medical Tourism and Employment Contribution on
the Social Security System
Mesut Cevdet Yavuz
Southern University, Russian Federation
Introduction
Social security, contributing to the country's tourism in parallel with economic
development in a society, medical tourism development and employment
contribution constitute one of the basic necessities. Because social security is
important not only to protect all sections of the society against various risks and
threats but also to guarantee their future at the same time. Therefore, the structure
of a social security system in a country is directly related to the economic and
social conditions of that country. When the social security system in Turkey is
examined, contributing to the most important functions of social security is to
contribute to the tourism of the country, to develop medical tourism and to
contribute to employment and thus to reduce the differences between the practices
of social security systems. It is also clear that the contribution of Turkish social
security to the country's tourism, the development of medical tourism and the
contribution to employment. In public aid; old pensioners and needy taxpayer; in
the retirement pension, the taxpayers 'memorandum, or rather the civil servants'
pensions, to their widows and orphans; there is a transfer from the employer to the
worker towards the other institutions in the form of social insurance. There are also
transfers within the social insurance institutions. As a result of contribution to the
country tourism, development of medical tourism and employment contribution,
this transfer is carried out in many directions from those who have lost their lives to
those who have lost their support from the non-naysayers to those who have
suffered relatively unsuccessfully from widows and orphans, continues. While the
provision of social peace requires fair distribution of income, it is not possible to
contribute to the country tourism, to develop medical tourism and to contribute to
employment by itself. Therefore, it is seen as a necessity of social state to
contribute to country tourism, to develop medical tourism and to contribute to
268

A Targeted Study to Create Country Tourism, Medical Tourism and Employment .........269
employment. The contribution to the country tourism, the development of the
medical tourism and the reformation of the contribution to the employment is the
change that has taken place in the social security system which is the result of
changing the state by consciously intervening in the situation of the state.
The state is doing this intervention in order to prevent negative effects by providing
support to the country tourism, medical tourism and employment contribution
which cannot get enough share from the social security system. The unemployed
who are unable to work in this situation, the tourism, medical tourism and
employment groups and the unemployed who can not work if they want and the
low income earners who are working can continue their lives with the income
realized towards them. This is also necessary in terms of ensuring social justice and
social peace. This is because the existence of tourism, medical tourism and
employment groups that cannot meet their needs and fall into need is causing both
public conscience and economic and social problems in the society. In order to be
able to examine the impact of the Turkish social security system on tourism,
medical tourism and employment groups, it is first necessary to provide an
understanding on concepts such as social security and tourism, medical tourism and
employment. Structural studies on the social security system implemented in
Turkey have gained momentum. Work on the effects of tourism, medical tourism
and employment of the social security system, which has been lacking, has become
increasingly important nowadays. With this study, it is aimed to carry out a
research for eliminating these deficiencies. It should be mentioned beforehand that
this result will not have a mathematical certainty while the research done is the
result of the Turkish social security system being affected by tourism, medical
tourism and employment. In this research, the social security system, tourism,
medical tourism and employment issues are examined and tourism, medical
tourism and employment effects of Turkish social security system are examined.
Turkish Social Security System
The Social Security Systems have been the reason for the fact that the measures
developed to meet the need for a more humane and more contemporary life of the
industrial society and the activities of established institutions are organized. Social
security systems that constantly change organizational structure and operating
principles to respond to changes in the social structure are intended to provide
protection guarantees for all social hazards in a country. The scope of such
guarantees is such that they will provide a standard of living that will not be in
need of anyone else in the community they are all in. For this reason, social

270 Mesut Cevdet Yavuz
security; It has been the subject of the ILO Conventions, the Universal Declaration
of Human Rights and the constitution of a large number of States, and states have
adopted the principle of fulfilling their social security responsibilities by
establishing a social security system. The provision of social security guarantees in
any country of importance has not been left to individual preferences. In almost all
countries, it is seen that the social security service has a public nature as a necessity
to be a social state and the service is provided under the supervision supervision of
the public institutions (Erkan, 1997: 18).
When we examine the social security system in Turkey, institutional inadequacies
have led our social security system to come to an unsustainable state, despite the
fact that long-term actuarial balances are not sufficiently observed, even though we
are still a young society. Moreover, the social security system could not be
adequately regulated at all, problems arising from management weaknesses,
political approaches that removed the autonomous governance of institutions,
populist policies that erased the retirement age. In addition to these problems, there
are problems of inadequacy of resources, financial crisis, decline in the number of
active insured persons, problem of non-allocating premiums, dissolution of funds
of institutions due to high rate inflation, lack of autonomy of institutions and
complication of work (Tuncay, 1997: 359).
The Turkish social security system has entered a situation that is difficult to fulfill
its basic functions as in many countries after 1990s. Facilitating the conditions for
getting old-age pensions, paying unpaid premiums, premiums, insolvency of the
informal sector that fuels the evasions of the insurance negatively affected the
social security system. As a result, the balance of income and expenditure of social
security institutions has been deteriorated and has become a constant deficit.
According to Law No. 4447, the law 5510 does not provide better conditions for
insured persons in terms of rights acquired. It has been seen that the regulations
called health transformation project have brought great costs. The premiums paid
by the insured and 5283 which was accepted by Social Insurance Institution
Hospitals for which the employer paid for it were passed by law to the Ministry of
Health (İzgi, 2008: 96).
The administrative structure of the Social Security Institution and the Turkish
Social Insurance System, which was established by the Social Security Institution
Law numbered 5502, which was enacted with the publication of the Official
Gazette dated May 20, 2006 and numbered 26173, has changed drastically. SSK,
Bağ-Kur and Emekli Sandığı and Bank and Insurance companies' trust funds in the
form of a single institution instead of the multiple structure was formed. With its
new structure and areas of duty, SSI has become the primary social security

A Targeted Study to Create Country Tourism, Medical Tourism and Employment ......... 271
institution not only engaged in the insurance operations of employees but also the
general health insurance for the whole population and the social welfare services
for the low-income population segments (Alper, 2007: 144).
In Article 3 of Law No. 5502, the social security system is summarized as carrying
out the social security system based on contemporary standards that are effective,
fair, easily accessible, actuarial and financially sustainable, based on the main
purpose social insurance principles of the Social Security Institution (Teksöz, 2006:
146).
In this context, it is stated that the institution intends to give importance and priority
to the social insurance principles, to ensure that the actuarial account balance,
which is the basis of the insurance system, is ensured to be a sustainable system,
and finally to a system that is easily accessible to those who benefit from the
system. In Turkey, the social security system went to a similar structure to the EU
countries social security system and the proposal of consolidating the three social
security institutions under a single roof and the single roof system with the law no.
Firstly, the text prepared by the Ministry of Labor and Social Security, which
envisages a single roof model in our social security system, was presented to the
public opinion with the title of "Draft Law on Pension Insurance and System
Pension Insurances Institution". This text, which contains the basic principles laid
down by the single roof model, is based on the text of the Social Insurance Law No.
506 in terms of the law and repeats many of the provisions of this law in the system
of workers, civil servants and independent employees and includes them on the
same conditions. sickness, sickness, and sickness benefits. When the inadequacy of
this system became clear, the Social Security System Refor m Proposal of 29 July
2004 was prepared and opened for discussion. In this approach, the main objective
was to prevent inequalities in poverty and income distribution, and for this purpose
the distinction between the primary and the non-primitive system has been
abolished. If this subject is to be approached in this frame; it seems that the single
roof approach has some problems. For example, while the status of civil servants
continues, the continuity in the working status of workers and independent workers
is not always the case. Also, the difference between the earnings of the employees
will be reflected in the social insurance premium to be paid and the social insurance
benefit calculated on the basis of this premium. The right of all employees to social
security within the framework of a single law The primary regime that has been
implemented so far in the Turkish social security system (Güzel, 2005: 76).
Public Social Security Expenditures (Social Assistance) are made for those who
cannot benefit from social insurance in Turkey or who are victimized by the gaps

272 Mesut Cevdet Yavuz
in the system when they benefit. There are many applications in this area. These;
Public subsidies (compensation to dependent families, compensation paid to
military and civil servants, aid for Turkish citizens and cultural residents both at
home and abroad), public aid for social protection purposes (needy and orphaned)
social support services (child protection institution), health services (green card)
(Alper, 2003: 55).
The Ministry of Labor and Social Security is working on a one-stop basis to
implement these practices in the form of social assistance. The organizational
structure of the social security system in Turkey is based on a dual footing, the
primary and the non-contributory social security regime. Social security regime in
Turkey; social insurance institutions and private insurances. It is aimed to
redistribute income among people through prudent regime implementation. The
non-premium regime consists of public social security expenditures, social
services, social benefits and voluntary organizations (Güneş, 2004: 84).
The most striking point in the social security system is the existence of different
social security organizations for various groups. Because of this disorganization of
the social security system, beneficiaries of these insurance schemes pay different
premiums for the same risks and benefit from different benefits (Koray ve
Topçuoğlu, 1995: 85).
This disorganization is tried to be solved by the establishment of Social Security
Institution. There are various features in the functioning of social security systems.
In this context, funding principle is provided by distribution or fund method. The
financing source is provided with wage-linked contributions or general taxation.
Intergenerational distribution is very strong in some, but not in others. Benefits are
determined in the form of fixed benefit or proportional to contributions. The orga-
nizational structure can be public or private and can include unions in management.
While the calculations can be collective or individual, the amount of the
contribution to be made to the account and the amount of the benefit to be taken to
the accountant are determined in advance. In addition to systems that have no
guarantee of benefits, there are full guaranteed systems. Implementing social se-
curity systems; the worker's insurance model, the public insurance model, the
mixed model of the workers' and the public insurance model, the state-looking
model, the protective fund model and the private insurance model (Şenden, 2000:
63).
Turkey tourism sector development
Tourism in Turkey has shown a different development. The development of
tourism in Turkey consists of two main periods: pre-planned period (1923-1962)

A Targeted Study to Create Country Tourism, Medical Tourism and Employment .........273
and planned period (1963 and later). The first organization to be established in the
field of tourism prior to the planned period is the "Turkish Seyyah’s Society"
founded by Raşit Saffet Atabinen and a group of intellectuals. This association later
changed its name to "Turkey Turing Club" followed by "Turkey Turing and
Automobile Club". The work of the institution is the result of Turkey's first posters
and promotional brochures and the first road maps printed. The first interpreter and
guidance exams were made and the first tourism related examinations were made
(Yıldız, 2011: 57-58).
According to the report of the Ministry of Development (2014), 129 thousand
tourists came to my country in 1961, leaving a total of 7.5 million USD. The
average expenditure was set at USD 60 for the same year and four days for the
average overnight stay. For Turkey, 1963 was the turning point in terms of tourism.
The Ministry of Tourism and Promotion has been established for the purpose of
dealing with tourism only during the planned development period (Budak, 2000:
65).
For the first time in 1963, the First Five-Year Development Plan (1963-1967)
entered into force. The most important feature of the plans is that it is an incentive
for the private sector and an imperative for the public (Çetin, 2014: 4). Currently,
the 10th Development Plan (2014-2018) is in force.
Table 1: Number of Tourists Coming to Turkey According to Years and Tourism Revenue
Years Foreign Visitor Income (US $) (*)
2003 13.341.000 13.854.000
2004 16.826.000 17.076.000
2005 20.273.000 20.322.000
2006 18.916.000 18.593.000
2007 22.248.000 20.942.000
2008 24.944.000 25.415.000
2009 25.465.000 25.064.000
2010 27.466.000 24.930.000
2011 30.261.000 28.115.000
2012 31.782.000 29.007.000
2013 33.467.000 32.308.000
2014 35.257.000 34.305.000
2015 34.779.000 24.896.000
(*)The last three digits of the figures in the visitor and income column are rounded to (000). Reference: It was taken from the statistical report prepared by the Ekin
Group Research Unit for the EMITT (2015) Fair.

274 Mesut Cevdet Yavuz
With the planned turnover, 199 thousand tourists and 7,7 million USD income
were obtained in 1963, and as a result of the studies carried out, there was a rapid
acceleration in tourist arrivals and foreign exchange increase. When the tourists and
their incomes according to the year are examined, 725 thousand tourists earned
51,6 million USD foreign exchange in 1970, 1 million 338 thousand tourists in
1973 and 171 million USD tourism income. In 1980, 1 million 57 thousand tourists
who came to the country left USD 327 million foreign exchange. (Gülbahar, 2009:
154). By the year 2004, the number of tourists coming to the country was 17
million 516 thousand 908, this figure increased to 23 million 340 thousand 911,
and in 2010 it was 28 million 632 thousand 207 persons
(www.ktbyatirimisletmeler.gov.tr, 05.12.2017). By the year 2015, it increased to 34
million 779 thousand 841 persons. Due to the problems experienced in 2016, there
has not been a good year and it has decreased to 24 million 50 thousand 56 persons
with a decrease of 30.9%. (www.turizmdatabank.com, 05.12.2017).
Employment concept and tourism sector
The term of employment is used in economics in two meanings: one is narrow and
the other is broad. In a broad sense employment refers to the use of all production
factors in an economy. If an economy has all of the production factors possessed,
then the economy will reach its maximum production level, which is called "full
employment national income level". Whereas; If one or more of the production
factors are not fully used, then the "incomplete employment national income level"
is the issue. When it comes to employment in the narrow sense, only labor and its
participation in production comes to mind (Erdoğan, 1996: 227).
The fact that the economy is in balance in underemployment means that some of
the factors of production remain idle. If it is meant for employment in a narrow
sense, there will be unemployment in the labor force at varying levels of
employment at full employment. From this point of view, the employment level of
the economy, which can be used as a basic indicator between advanced and
emerging economies, will show that unemployment in developed countries is lower
than in developing countries. The main purpose of the developing countries is to
transform their countries into an industrial society and realize their economic
development. However, one of the problems in this regard is that the
industrialization is not enough to solve the problem of employment due to
technological development in the developing countries. In other words, because of
the labor saving features of technical progress, there is no significant increase in

A Targeted Study to Create Country Tourism, Medical Tourism and Employment ......... 275
employment, so the unemployment problem cannot be resolved satisfactorily
(İlkin, Dinçer, 1991:26).
Besides the monetary effects of tourism, the most important of the real effects
created in the economy is the employment effect resulting from the labor-intensive
production technique. (Korzay, 1992:289).
Therefore; the tourism sector affects the total employment in the country because it
directly contributes to employment and provides indirect employment opportunities
to other sectors that provide input to this sector (Coltman, 1989: 226-227).
The fact that most of the activities shown in the tourism sector are service-intensive
activities, it is generally a labor intensive sector, the demanded workforce is either
qualified or unqualified and this type of workforce is in abundance in many
developing countries or regions where the economy is deteriorating. For example,
according to a calculation made for the United States, 100 additional overnight
trips per day will bring about a night's stay, 47 new jobs per year, 6 new facilities,
enough tax revenue for 45 children to read, and millions of dollars in business
volume (Özgüç, 1998:187).
There are also many sectors such as accommodation, transport, entertainment,
travel agencies, management, finance and health, which are directly affected by the
tourism sector. It is also indirectly affecting other sectors such as agriculture and
manufacturing, especially the construction sector. This is why it is difficult to
articulate clearly the impact of the tourism sector on employment (Vellas,
Becherel, 1995:218).
In parallel with the development of tourism, the increasing employment effect
brings in three different types of employment, generally direct, indirect and
stimulated. These (Avcıkurt, 2003:28; Vellas, Becherel, 1995:220);
Direct Employment; tourism businesses such as accommodation, food & beverage,
transport operators, travel agencies and tour operators include direct employment.
Indirect Employment; the jobs in the sectors that provide the products and services
that the tourism sector needs and the activities in the activities which benefit from
the expenditures of the tourists are within the scope of indirect employment.
Sectors such as agriculture, fisheries, construction, handicrafts, banks and
manufacturing sectors are the sectors where new employment opportunities are
provided with the development of tourism. Emergent Employment is employment
that includes additional employment created in the economy with the expenditure
of direct and indirect employment.

276 Mesut Cevdet Yavuz
The employment opportunities that the tourism sector has emerged in this way are
very important in terms of the countries facing the problem of unemployment
especially in Turkey.
Tourism in the Turkish economy is a sector that realizes the same employment
volume with less investment than other sectors. The above table shows the results
of a survey conducted by the DPT. According to the table, it is necessary to invest
240.8 in crude oil production in order to find additional employment for 1 person,
this figure is 40.8 for cement and only 1.5 for tourism sector. As a result, when it is
expressed in 1984 forecasted prices, it is revealed that the tourism sector is the
sector that requires the least investment to provide 1 person employment
opportunity in Turkey.
Table 2: Sectors' Employment Opportunity in Turkey
Investment Concept Amount of investment required to provide a job
opportunity for one person (million TL)
Crude Oil Production 240.8
Chemical fertilizers 91.6
Energy 65.0
Iron and Steel 45.0
Cement 40.8
Flour And Bakery Products 20.8
Fruit and Vegetable Processing 20.5
Alcohol free drink industry 12.9
Motor Vehicles 12.6
Weaving 12.1
Electric Appliances 9.9
Shoe Industry 3.3
Tourism (Hospitality) Industry 1.5 Reference: Evaluation of Developments in Tourism Sector in Turkey in Terms
ofEconomic Development, Turkish Trade, Industry, Maritime Chambers and
Commodity Exchanges, p.35.
Since the superstructure facilities built in parallel with tourism development mean
more employment and the use of more construction materials, an increase in
investment expenditures leads to an increase in investment expenditures and, from
the very first moment, the economy spreads and generates an intensive income
stream. According to a calculation by the World Tourism and Travel Council
(WTTC), which defines the tourism industry as "the largest industry in the world,
the largest employer in terms of prosperity and employment," the tourism sector
creates jobs every three seconds (Özgüç, 1998:1). Service is very important in the

A Targeted Study to Create Country Tourism, Medical Tourism and Employment ......... 277
tourism sector and service is realized only by people. As a result, the fact of labor
activity in tourism enterprises arises. The application of technological innovations
in the tourism sector cannot prevent a large part of the work from being done by
people (İlkin, Dinçer, 1991:26). This is because the tourism sector is more labor-
intensive than the other sectors. The source of direct and indirect employment
opportunities in the tourism sector is the consumption expenditures of the tourists
(Tatlıdil, 2001:3). While the revenues obtained in the first stage of touristic
consumption expenditures create the direct employment effect, the re-expenditure
of the income obtained reveals the second employment effect. As a result of the
seasonal nature of the sea, sand and sun tourism in particular, tourist demand
increases in labor demand during periods of intense tourist demand (Çakır,
1999:69). In this respect, the demand for labor, which is revealed in the tourism
sector, is a talept. In other words, the labor force will be demanded as long as the
tourist goods and services are demanded.
Result
It is possible to say that the Turkish social security system has been successful in
contributing to the country's tourism, improving the medical tourism and
contributing to the employment, but it is possible to say that there are problems in
the continuation of this contribution. Although the social security system is one of
the most effective means of solving the problem of inequality in the distribution of
social security in a country, these problems should not be regarded as the only
solution source. Because, demographic structure, labor force participation rate,
general level of wages, unemployment rates and many other factors can eliminate
the inequality and contribute to the country tourism, medical tourism development
and job creation can prevent the lack of search for solutions. As it is clear from the
literature review, such problems have gone beyond developed countries and raised
to the level of development. Here, our country needs to reach the level of
development by taking necessary precautions. In this way, the citizens of the
country will be able to benefit more from the social security system in terms of
contribution to the country tourism, medical tourism development and employment
contribution, and the country will be able to get rid of the image of a backward
country.

278 Mesut Cevdet Yavuz
References and notes: Alper, Y. (2003) Sosyal Sigortalar, Ekin Kitabevi, Bursa. Alper, Y. (2007) “Kurumsal Yapıda Tek Çatı Hayata Geçti”, Sosyal Siyaset Konferansları
Dergisi, S.53, s. 144. Budak, F. (2000), “Türk Turizminin Gelişimi Ekonomiye Katkıları ve Sorunları”,İnönü
Üniversitesi Sosyal Bilimler Enstitüsü, Bilim Uzmanlığı Tezi, Malatya Can T. (1997) “Türk Sosyal Güvenlik Sisteminde Reform İhtiyacı”, Kamu İş Hukuku ve
İktisat Dergisi, c. 4, S. 2, s. 359. Coltman, M. M.(1989), Introduction to Travel and Tourism: an International Approach,
New York. Çakır, P. (1999), Türkiye’nin Turizm Gelirlerinin Ödemeler Dengesine Katkısının Analizi,
Anadolu Üniversitesi Yayınları; No:1119, Eskişehir. Çetin, G., Demirkol, Ş.(2014). Turizm politikaları ve alternatif yönetim yaklaşımları.
Sakarya, Türkiye: Değişim Yayınları. Erdoğan, H. (1996), Ekonomik, Sosyal, Kültürel, Çevresel Yönleriyle Uluslararası Turizm,
Bursa. Erkan, H. (1997) “Sosyal Piyasa Ekonomisinde Devletin Sosyal Politikası”, Konrad
Adenauer Vakfı. Gülbahar, O. (2009). 1990’lardan Günümüze Türkiye’de Kitle Turizminin Gelişimive
Alternatif Yönelimler, Süleyman Demirel Üniversitesi İktisadi ve İdari
BilimlerFakültesi Dergisi, 14(1):151-177 Güneş, İ. (2004) “Sosyal Sigorta Finansman Yöntemleri ve Türkiye’de Sosyal Sigorta
Kurumlarının Finansman Yöntemlerinin Değerlendirilmesi”, Çukurova Üniversitesi
SBE Dergisi, c. 13, S. 2, s. 84. Gürel, Ç. (2014), “Kalkınma Planlarında Turizm”, www.academia.edu/12709151
/Kalkinma_Planlarinda_Turizm, 05.12.2017 Güzel, A. (2005) “Türk Sosyal Güvenlik Sisteminde Öngörülen Reform Mevcut
Sorunlara Çözüm mü?”, Çalışma ve Toplum Dergisi, S. 4, s.76. İlkin, A., Dinçer, M. Z (1991), Ekonomik ve Sosyal Sorunlar-Çözüm Önerileri
Dizisi, TOBB Yayın No:217, Ankara. İzgi, B. B. (2008) “Türk Sosyal Güvenlik Sisteminde Son Gelişmeler”, Çalışma ve
Toplum Dergisi, S.1, s. 96. Koray, M., Topçuoğlu, A. (1995), Sosyal Politika, Ezgi Kitabevi Yayınları, Bursa. Korzay,
M. (1992), “Turizmde İstihdam ve Eğitim”, III. İzmir İktisat Kongresi, Turizm
Çalışma Grupları, 4-7 Haziran, ss. 289-311. Kültür ve Turizm Bakanlığı, Turizm istatistikleri http://www.ktbyatirimisletmeler.gov.tr/
dosya/1-245937/h/sonturizmraporu.DOC (05.12.2017) Özgüç, N. (1998), Turizm Coğrafyası Özellikler Bölgeler, Çantay Kitabevi, İstanbul
Şenden, F. (2000), Sosyal Güvenlik ve Kadın, Minevra Yayınları, İstanbul. Tatlıdil, H.
(2001), “Türk Turizminin Mevcut Durumu ve Geleceğe Yönelik Beklentiler”,
Türkiye Sorunlarına Çözüm Konferansı-IV, 21-24 Mayıs, ss.1-10. Teksöz, T. (2006) “Türk Sosyal Güvenlik Sisteminin Mevcut Sorunları ve Sosyal Güvenlik
Reformu”, Mercek Dergisi, S. 43, s. 146.

A Targeted Study to Create Country Tourism, Medical Tourism and Employment ......... 279
Turizm Databank, (2017), “Türkiye Turizm istatistikleri (Ocak-Kasım 2016)”,
“www.turizmdatabank.com/turizm-istatistikleri/turkiye-turizm-istatistikleriturist-
ocak-kasim-2016” ET: 05.12.2017 Yıldız, Z. (2011), “Turizmin Sektörünün Gelişimi Ve İstihdam Üzerindeki
Etkisi”,Süleyman Demirel Üniversitesi Vizyon Dergisi, Cilt: 3, Sayı: 5, Isparta
Summary
A Targeted Study to Create Country Tourism, Medical Tourism and Employment Contribution on the Social Security System
Mesut Cevdet Yavuz
Southern University, Russian Federation
Two of the fundamental problems of the Republic of Turkey in terms of economy are the
financial deficit and employment of the Social Security Institution. These two problems are
also the result of other problems as well as sources. Turkey is able to solve the problem of
employment with episodic tourism episodes, but in doing so it sacrifices profitability and
quality. In the last period, especially with "health tourism", high profitability is tried to be
provided and it is possible to make the work power quality and continuous. Europe is aging
and the treatment needs are increasing accordingly. Turkey, both in terms of living and
treatment costs, but also due to the weather and natural structure of the elderly or foreigners
who need treatment attracts attention. Legal arrangements also make it easier for foreigners
to acquire property and pass on Turkish citizenship. The study aims to provide two main
benefits and complex side effects; Accordingly, some plans and regulations are proposed to
increase the number of resident foreigners, to make health tourism more profitable and
continuous, to increase the formation of qualified employment and to reduce social security
deficits.
Keywords: Retired, Employment, Health, Social Security, Tourism, Elderly

Khazar Journal of Humanities and Social
Sciences © Khazar University Press 2017
DOI: 10.5782/kjhss.2017.280.286
Payment Methods of Foreign Patients in Turkey and
of Turkish Hemodialysis Patients Abroad
Adem Sezen
Istanbul Science University, Turkey
Davut Cem Dikmen
Cyprus International University, Turkish Republic of
Northern Cyprus
Ahmet Cenk Dikmen
Cyprus International University, Turkish republic of
Northern Cyprus
Muslum Kotan
Medical Park Hospitals Group, Turkey
Birkan Tapan
Istanbul Science University, Turkey
Introduction
The fact that the world becomes gradually global and the removal of borders between countries affected the health sector as well as all different sectors. Health services are structurally a concept which have to be provided as soon as the need arises and which is directly related to the human life. This situation makes it necessary to develop cooperation between sectors and countries and to sustainably finance them in order to uninterruptedly provide health services. One of the reflections of this situation in the health sector is the “Medical Tourism”. A planned trip which is made for any reason to get a health care service from the place of residence to an another place is called Medical Tourism, and the traveler is called medical tourist. The case that the tourists traveling from the place of
280

Payment methods of foreign patients in Turkey… 281
residence to an another place for tourism purpose receive an unplanned health care service is called tourist health. Turkey has the 7th place in terms of number of tourists. About 30 million tourists come to Turkey every year. 50 million tourists and 50 billion US dollars are targeted in the 100th anniversary of our Republic. In 2010 – 2014 strategic action plan of our Ministry of Health and 2023 vision, it’s aimed that Turkey has leading position in medical tourism. The medical tourism is defined under three headings:
• Medical Tourism; is planned practices applied for treatment purpose by physicians usually in 2nd and 3rd degree health institutions and organizations for the tourists having a determined disease. (Further treatments - Cardiovascular Surgery, Radiotherapy, CyberKnife, Transplantation, Infertility, Test Tube Baby IVF procedures, Esthetic Surgery, Eye, Tooth, Dialysis Treatments etc.).
• Thermal tourism and SPA Wellness; are treatment supporting or rehabilitative practices applied by healthcare personnel or another authorized personnel in hot spring or spa centers during post-disease rehabilitation periods or to partially cure disorders leaving permanent damage. (Spa Treatments, Physiotherapies, Thalassotherapy, Hydrotherapies, Balneotherapy, Peloidotherapy, Climatotherapy etc.)
• Tourism of Elderly and Disabled people; For the care and rehabilitation of elder and disabled tourists, Clinic Guest Houses – Geriatric Treatment Centers – The practices applied by certificated trained personnel in aged care homes. ( Excursions, Occupation therapies, activities for disabled people etc.)
Foreign Patient Groups
Health Services provided to foreigners are examined in 3 groups: 1.Emergency Health Services for foreigners staying in Turkey for a short time(Tourist Health), who come for: • a meeting, congress etc. • commercial purpose • tourism purpose
2.Tourists coming from abroad for treatment purpose (Medical Tourism) • who come from Neighboring countries, Central Asia, Africa •who come from the countries not having bilateral Social Security
Agreement with our country (Denmark, Norway, Sweden, UK etc.) – The citizens living abroad • who come from developed western countries (USA, Europe etc)
3.Foreigners staying in Turkey for a long time (routine treatment and emergencies)

282 Adem Sezen, Davut Cem Dikmen, Ahmet Cenk Dikmen,
Muslum Kotan, Birkan Tapan
• Consular employees • Foreign retirees who settle (in Alanya, Marmaris etc.)
Over 2 million people are currently living with renal replacement therapies around the world.It is estimated nowadays that the global cost of renal replacement therapy around the world is over 1 trillion dollars. 6 percent of the health budget in the US, 5 percent in Japan, and 8 percent in Taiwan are spent for the treatment of patients with End Stage Renal Disease. Considering the increasing number of patients in the world, an economic burden which seriously constrains the health budgets of developed countries in the near future and which can’t be overcome in low income countries will appear. It is expected that this number will double in the next 10 years and the total cost of treatment will exceed 1.5 trillion dollars.
Hemodialysis is the most commonly used renal replacement therapy in the world and in our country. Patients having hemodialysis treatment have to be treated at hemodialysis centers 2 or 3 times per week during their lifetime. In case of travel due to work and social life, this treatment should obligatorily continue. The rates of morbidity and mortality increase because of systemic complications associated with renal failure in patients developing End Stage Renal Disease. Complications related to existing chronic diseases and hemodialysis process may develop in hemodialysis patients.Treatment of chronic diseases and cases related to hemodialysis complications are realized independently from hemodialysis process. Treatment costs are invoiced separately from hemodialysis treatment.
The reimbursement of hemodialysis patients coming from abroad are made by two different methods. The first group consists of patients coming from the countries who have signed social security agreement with our country. The prices practiced
for this group are dialysis session prices for domestic patients. The second group consists of hemodialysis patients coming from the countries who haven’t signed social security agreement with our country. By being regarded as particular patients, their treatment is realized after receiving the pre-approval from their
insurance company with which they are affiliated. While private healthcare establishments determine prices agreed with the insurance companies through the protocol they have made, the prices could be set up to 2 times the prices of the
Ministry of Health in healthcare providers attached to the Ministry of Health; and in university hospitals, the prices could be set up to 3 times the prices of the Ministry of Health.
Purpose: With this study, it’s aimed to examine the modes of payment of hemodialysis patients who receive treatment by traveling within the country and the reimbursement models of hemodialysis patients coming from abroad.

Payment methods of foreign patients in Turkey… 283
Method It was aimed to explain the practices in Turkey by examining Turkish Republic-Minister of Health’s strategic plan between 2010 and 2014, the Practical Guide of Medical Tourism in Public Hospitals and Tourist Health prepared in 2011.
Findings Turkey has the 7th place in terms of number of tourists. About 30 million tourists come to Turkey every year. 50 million tourists and 50 billion US dollars are
targeted in the 100th anniversary of our Republic. In 2010-2014 strategic action plan of our Ministry of Health and 2023 vision, it’s aimed that Turkey has the leading position in medical tourism.Patients having hemodialysis treatment have to be treated at hemodialysis centers 2 or 3 times per week during their lifetime. In
case of travel due to work and social life, this treatment should obligatorily continue. Patients receiving hemodialysis treatment in our country are in the group of patients who cannot be charged for extra fees according to the Healthcare
Implementation Notice. The treatment of hemodialysis patients coming from abroad for business or holiday purpose is realized in our country. The reimbursement of hemodialysis patients coming from abroad are made by two different methods. The first group consists of patients coming from the countries
who have signed social security agreement with our country. The prices practiced for this group are dialysis session prices for domestic patients. The second group consists of hemodialysis patients coming from the countries who haven’t signed social security agreement with our country. By being regarded as particular
patients, their treatment is realized after receiving the pre-approval from their insurance company with which they are affiliated. While private healthcare establishments determine prices agreed with the insurance companies through the protocol they have made, the prices could be set up to 2 times the prices of the
Ministry of Health in healthcare providers attached to the Ministry of Health; and in university hospitals, the prices could be set up to 3 times the prices of the Ministry of Health.
Countries having bilateral international convention with Turkey within the scope of Social Security
Turkey has signed social security agreement with; Germany, Albania, Austria, Azerbaijan, Belgium, Bosnia and Herzegovina, Czech Republic, Denmark, Georgia, France, Netherlands, UK, Sweden, Switzerland, T.R.N.C., Canada, Libya, Luxembourg, Macedonia, Norway and Romania. Procedures related to foreigners coming from these countries are applied in accordance with the provisions of our bilateral agreements on social security matters. Those who come to our country from the countries having social security agreement with our country, in order to benefit from health care assistance;

284 Adem Sezen, Davut Cem Dikmen, Ahmet Cenk Dikmen,
Muslum Kotan, Birkan Tapan
• Those having right to benefit from health care assistance in our country on behalf of the contracting country should primarily apply to the foreign procedures services in the provincial directorate of social security / social security centers. • Relevant people will be able to make their examination and treatment within the period of the right to health care assistance registered in the Health Care Assistance Certificate according to the Social Security Agreement. • They will be able to receive health care assistance from health care providers with which our institution has signed agreement. • If it’s necessary to pursue the treatment after the health care assistance period expired or if there is a demand for new treatment, they should apply to theprovincial directorate of social security / the foreign procedures services in the provincial directorate of social security
Conclusion
Health services will be provided in public hospitals to the people coming to our country from abroad within the scope of the present notice of Medical Tourism or Tourist Health. Hospitals affiliated with the Ministry of Health have to fulfill all the obligations, organizations and pricing. However other public hospitals have to price on the basis of the rate at the list and the process and organization are at their own initiative.
References and notes:
Turkish Ministry of Health’s strategic plan between 2010 and 2014 Practical Guide of Medical Tourism in Public Hospitals and Tourist Health, Ankara, 2011 Management of Health Institutions, Murat Editions, Edition code: 7731, Ankara Grassmann A, Gioberge S, Moeller S, Brown G. End-stage renal disease – Global
demographics in 2005 and observed trends. Artif Organs 2006; 308: 95-7. Kidney Disease Prevention Program (2014-2017) report in Turkey http://www.tsn.org.tr/pdf/Turkiye_Bobrek_Hastaliklari_Onleme_ve_Kontrol_Programi.
pdf. s-1 Regulation on Dialysis Centers (www.saglık.gov.tr)
Notice of Health Service.http://www.sgk.gov.tr/wps/portal/sgk The Ministry of Health’sReporting Bulletin (www.tkhk.gov.tr)
Registry of the Nephrology, Dıalysıs and Transplantatıon Turkey-2014 Registry of the Nephrology, Dıalysıs and Transplantatıon Turkey-2015

Payment methods of foreign patients in Turkey… 285
Summary
Payment methods of foreign patients in Turkey and of Turkish hemodialysis patients abroad
Adem Sezen Istanbul Science University, Turkey
Davut Cem Dikmen
Cyprus International University, Turkish Republic of Northern Cyprus
Ahmet Cenk Dikmen Cyprus International University, Turkish republic of Northern Cyprus
Muslum Kotan
Medical Park Hospitals Group, Turkey
Birkan Tapan Istanbul Science University, Turkey
The patients who develop end-stage renal disease need to have a kidney transplant or to receive hemodialysis or peritoneal dialysis in order to maintain their lives. Hemodialysis is the most frequently used renal replacement therapy in the world
and in our country. Patients receiving hemodialysis should go to the hemodialysis center 2 or 3 times a week to follow their treatment during their lifetime. In case of travel due to work and social life as well, this treatment should be continuously followed. Patients receiving hemodialysis treatment in our country are in the group
of patients who cannot be charged for extra fees according to the Healthcare Implementation Notice. The treatment of hemodialysis patients coming from abroad for business or holiday purpose is realized in our country. The reimbursement of hemodialysis patients coming from abroad are made by two
different methods. The first group consists of patients coming from the countries who have signed social security agreement with our country. The prices practiced for this group are dialysis session prices for domestic patients. The second group consists of hemodialysis patients coming from the countries who haven’t signed
social security agreement with our country. By being regarded as particular patients, their treatment is realized after receiving the pre-approval from their insurance company with which they are affiliated. While private healthcare establishments determine prices agreed with the insurance companies through the

286 Adem Sezen, Davut Cem Dikmen, Ahmet Cenk Dikmen,
Muslum Kotan, Birkan Tapan
protocol they have made, the prices could be set up to 2 times the prices of the Ministry of Health in healthcare providers attached to the Ministry of Health; and in university hospitals, the prices could be set up to 3 times the prices of the
Ministry of Health. With this study, it’s aimed to examine the modes of payment of hemodialysis patients who receive treatment by traveling within the country and the reimbursement models of hemodialysis patients coming from abroad.
Keywords: Hemodialysis, hemodialysis patient abroad, reimbursement method, cost of hemodialysis

Khazar Journal of Humanities and Social
Sciences © Khazar University Press 2017
DOI: 10.5782/kjhss.2017.287.297
The views of the Cypriot Turkish school students
about renewable energy production
Serap Ozbash
Near East University, Cyprus
Introduction
Global warming is the greatest threat to life on earth. Global warming is an increase in the temperature of the earth due to the increase in the density of greenhouse gases resulting from human activities. Human activities such as excessive use of fossil fuels, rapid population growth, raising the standard of living
are events that increase the impact of global warming. At the end of global warming makes life conditions of plants and animals especially human life more difficult. In the case of global warming, some serious potential changes, including extreme high temperatures, floods, widespread and severe drought events, shrubs
and forest fires as a natural consequence of them, and the functioning of human health and ecological systems for some regions are envisaged at a very high level of reliability. It is emphasized that in the reports of internationalorganizations (e.g. IPCC: Intergovernmental Panel on Climate Change) urgent measures should be
taken at global level in relation to global warming, which is regarded as a global problem. (Akın, 2017; Bayraç, 2010; Sağlam et al. 2008; Boşgelmez, 2007; Türkeş et al. 2000). For the solution of the problem, effective sustainable energy
management policies are in the first place on the global scale of the use of renewable energy sources and diversity energy production.
Cyprus is one of place that needs diversifying the power generation. The island is highly dependent on imported petroleum products, because of its isolated energy system. To contain increasing energy demand, it gains dependence on
energy imports and causes high fuel prices (Jaramillo-Nieves and del Rio, 2010). At the same time, the new energy sources in the Eastern Mediterranean provide new opportunities for regional countries (e.g. Turkey, Cyprus, Israel) in terms of elements such as economic factors whilecreating potential risks (Üstün 2016;
Karakasis, 2015). The island, however, has a high potential for ample solar and some wind energy from renewable energy sources (Zachariadis & Pashourtidou, 2007). For this reason, energy management policies, the commitments of managers
and the promotion of public opinion(Özerdem & Biricik, 2011; Zachariadis &
287

288 Serap Ozbash Pashourtidou, 2007), as well as the public's acceptance of renewable energy play an important role in the production and dissemination of renewable energy in Cyprus.
Social acceptance is an attitude that directs supportive behaviour against or favor
the placements of the energy tecnology (Hitzeroth, & Megerle, 2013). This attitudeis affected by some factors such as climate change knowledge, technology knowledge, cost, risks and benefits of technology and security. Regardings these factors, perceived advantages and disadvantages affect social acceptance level and
this level affects the success and implementationof technology (Hofman, 2015; Devine-Wright, 2007).When literature is overviewed, it can be noted that severalresearches have been done related to social acceptance of renewable energy
(e.g. Moula et al. 2013). However, there can be found no research on the social acceptance of renewable energy technology and its prodution or views about its by Turkish Cypriots. The aim of this study is to specify high school students’ views about renewables energy production. The results of this study is expected to shed
light on teaching towards an effective way to raise their awareness by defining their positive and negative views about renewable energy production.
Method
Participant 160 volunteers from three high school types (general, college, vocational) selected randomly in the TRNC participated in the research. 40% (64) of the students were female and 60% (96) were male. 34,4% (55) of the students were in general high school; 35% were at the college (56) and 30.6% (49) were at the vocational high school. Participants were between 14 and 15 years of age (Mean: 14.8, sd: 0.37).
Questionnaire
In the research, a questionnaire prepared by Kılınç, Stanisstreet & Boyes (2009) was used to learn participants' thoughts on renewable energy. There are 4 sections in the questionnaire. At the first section;there are some expressions related to thedemands for electricity payment and living near a power station. This section is
a 5-pointed Likert type. In the second section there are some expressions related to the characteristics of renewable energy generation. This section is also rated as a 5 point Likert type from strongly disagree to strongly agree. The third section
consists of statements about the importance of electricity generation in features and is rated as a 4-point Likert type, from very important to not important at all. In the fourth secction, there are 4 statements about Global Warming and being environmental friendly. Three of these statements are rated as 4-point Likert type;
and the other is rated in the Likert type of 5.

The views of the Cypriot Turkish school students ….. 289 Analysis Data collected from the participants were transferred to the SPSS program and analyzed through this program. In the analysis, the percentage and frequency are used.
Application
Beforeapplying the questionnaire, the official permits were taken and the questionnaires were given to the selected schools by explaining the purpose.The questionnaires were made using paper and pen.
3. Finding 3. 1. Cypriot Turkish high school students’ views about to pay price for electricity
and to live near to a power station According to Fig. 1 some of students (35%) disagreed that that they would be willing to pay more for electricity generated from renewable sources, while some of students (33.1%) agreed. However some of students (38.1%) agreed that they would be willing to pay more for electricity, while some of students disagreed. Also the half or students (50.6%) agreed that they would not wish to live close to a renewable electricity generator.
Fig. 1. Cypriot Turkish high school students’ views about to pay for electricity and to live near to a power station
3. 1. Cypriot Turkish high school students’ views about characteristics of renewable electicity generation According to Table 1, over half of Cypriot Turkish high school students (66.9% and 52%) pointed out that renewable power installations were safer than other types of power generators and over half of them (64.4%) also assumed that Global Warming would be reduced if more of our electricity was made from renewable sources. Furthermore over half of them (56.9% and 54.4%) assumed that renewable sources could supply electricity from renewable power generationand make this

290 Serap Ozbash continuously for us. However over half of students envisaged that using power stations that make electricity from renewable sources (wind, waves, sun) for very
longtime might cause environmental damage. Under half of Cypriot Turkish high school students agreed that renewable power generations can harm the animals (43.8%), the people (44.4%) and the plant (38.1%) that live near them, while under half of students disagreed the perceptions related items. It is seen that the
participation rates of the students are very close to each other. At the same time, the percentage of students agreeing (34.4%) and disagreeing (29.4%) was close to one in view of the fact that closing electricity generating stations from renewable
energies was more difficult than the others.In addition while disagreeing rate of students (38.1%) is higher than agreeing rate (32.5%) in the opinion of their friends about rejecting the idea of generating electricity from renewable energy sources; agreeing rate of students (45.6%) is higher than that of disagreeing (26.9%) in view
of the fact that electricity generation from renewable sources takes long time. Table 1. students’ views about characteristics of renewable electicity generation Agree*** Dkn** Disagreed*
% % %
1.It is cheaper to make electricity from
renewable sources (wind, waves, sun) than 45.6 27.5 26.9
by other methods.
2. Power stations that make electricity from renewable sources (wind, waves, sun) are 66.9 21.9 11.3
safer than other types of power station.
3. Power stations that make electricity from
renewable sources (wind, waves, sun) can 43.8 24.4 31.9
harm the animals that live near them.
4. We could make enough electricity for everyone just using renewable sources 56.9 28.8 14.4
(wind, waves, sun). 5. When we have finished with them, power
stations that make electricity from renewable
sources (wind, waves, sun) cost more to 34.4 36.3 29.4
close down than other types of power
station.
6. Power stations that make electricity from
renewable sources (wind, waves, sun) can 44.4 16.3 39.4
harm the people that live near them.
7. Power stations that make electricity from
renewable sources (wind, waves, sun) can 54.4 28.1 17.5
make electricity continuously, so that it is
available all the time.
8. Power stations that make electricity from 38.1 30.0 31.9
renewable sources (wind, waves, sun) can

The views of the Cypriot Turkish school students ….. 291
harm the plants that live near them. 9. We have not been using power stations that make electricity from renewable sources (wind, waves, sun) for very long, so we do 58.8 24.4 16.9
not know about any long-term
environmental problems with them.
10. Most teenagers look down on the idea of
making electricity from renewable sources 32.5 29.4 38.1
(wind, waves, sun), and think those who
support it are damaging the environment.
11. Global warming would be reduced if
more of our electricity was made from 64.4 22.5 13.1
renewable sources (wind, waves, sun).
*This percentage= strongly disagreed plus disagreed ** This percentage= do not know. ***This percentage= strongly agreed plus agreed.
3.2. Cypriot Turkish high school students’ views about the importance of characteristics of energy production According to Table 2, over half of Cypriot Turkish high school students held the views that the respect of their friends about environmental issues (60.6%), the safe of power station making electricity (60.0%), and the reliable supply of electricty
(61.9%) were very important. Also overhalf of students felt it very important that the power station generating electricity does not harm the animals (55.0%), and the people (56.9%) that live near it and making your electricity does not make global warming worse. At the same time nearly half of students judged it very important
that the price of electricity (46.9%) and the power station generating electricity does not harm the plants (43.1%). The proportions of those who didn’t judge it at all important views about the importance of characteristics of energy production were less the percentage than 10%. Table 2. Students’ Views about Importance related to Eneryg Generation
Very Quite Not Very
Not At
All
Important Important Important
Important
% % % %
1. How important is it to you 46.9 34.4 15.0 3.8
that using your electricity does
not cost too much?
2. How important is it to you 60.0 28.8 9.4 1.9
that the power station that makes
your electricity is safe?

292 Serap Ozbash
3. How important is it to you that your electricity supply is 61.9 22.5 11.9 3.8
reliable, and that you have electricity all the time? 4. How important is it to you that the power station that makes 43.1 30.6 18.1 8.1
your electricity does not harm the plants that live near it? 5. How important is it to you that the power station that makes 55.0 30.0 10.6 4.4
your electricity does not harm the animals that live near it? 6. How important is it to you that the power station that makes 56.9 28.8 6.9 7.5
your electricity does not harm
the people that live near it? 7. How important is it to you that making your electricity does 50.6 30.6 15.0 3.8
not make global warming
worse? 8. How important is it to you that your friends respect about 60.6 22.5 7.5 9.4
the environmental issues?
3.3. Cypriot Turkish high school students’ views aboutwhat global warming might do to the environment According to Fig. 2 more than one third of Cypriot Turkish high school students reported that they were quite worried (35.6%) and a little bit worried (36.3%) about global warming. At the same time one fifth of students (20.6%)reported that they were very worried about global warming. Relative few students (7.5%) were not worried at all about global waming.

The views of the Cypriot Turkish school students ….. 293
Fig. 2. Students’ views about Global Warming
3.4. Cypriot Turkish high school students’ views about they know about global warming According to Fig. 3nearly half of theCypriot Turkish high school students knew something (46.9%) and a little (40.0%) about global warming. Also relative few students (2.5%) didn’t know about global waming while one tenth students (10.6%) knew a lot about global warming.
Fig. 3. Students’ views about Global Warming
3.5. Cypriot Turkish high school students’ views aboutthey ‘take care of’ the environment by the things you do According to Fig.4 more than one fifth of Cypriot Turkish high school students (24.4%) thought that they were very environmentally friendly, while nearly half of students (46.9%) assumed that they were quite environmentally friendly. Also about one third of them (27.5%) reported themselves to be a bit environmentally, while a few student (1.3%) reported themselves to not be at all environmentally firendly.

294 Serap Ozbash
Fig. 4. Students’ viewsrelated to be environmentally friendly
3.6. Cypriot Turkish high school students’ views whether global warming is really happening or not now According to Fig.4 nearly half of Cypriot Turkish high school students (44.4%) were sure that global warming is really happening now, while a few students (3.1%) were not sure that. Also more one third of students (36.9%) thought that global warming is really happening now, while a few students (4.4%) didn’t think that. However one tenth of them (11.3%) didn’t know whether this true or not now.
Fig. 5. Students’ views related to be environmentally friendly
Conclusion and Discussion In this research, the opinions of Turkish Cypriot high school students about the production of renewable energy were included. Students do not want to stay close to power stations that generate electricity with renewable energy sources. However, the rate of the students who want to pay more for the electricity generated from renewable energy sources is closer to those who don't want. According to are

The views of the Cypriot Turkish school students ….. 295 search, more than half of the participants in Finland were willing to pay more for renewable energy (Moula et al., 2013). High school students have positive and negative opinions about the characteristics of renewable energy production. There are positive thoughts of more than half of the students such as the safety of power generating with renewable energy sources, there is enough electricity production from these sources, and global warming will be reduced by supplying electricity from renewable energy sources and generating electricity from energy sources will be cheaper than other methods. On the other hand, half of the students agree that renewable energy sources can cause long-term environmental problems. On the other hand, more than half of the students do not agree on their peers’ idea
of rejecting the generation of electricity from renewable energy sources. In addition,the rate of the students who agree on some negative thoughts like renewable energy sources will damage the animals, people and plants living near the renewable energy sources and it will be more expensive to close the stations
that produce electricity from the renewable energy sources is close to those who don't agree. Researches show that society's perception, attitude and acceptance of renewable energy affect the implementation target of the renewable energies (Eg, Devine-Wright, 2011; Duan, 2011; Wüstenhagen, 2007). For example, Fast and
Mcleman (2012) found that participants strongly supported renewable energy sources in their research.
More than half of the students give great importance to the safety of electricity and electricity producing stations, to the fact that those stations do not harm people and animals living near them, and cheap electricity production.On the other hand, nearly half of the students pay much attention to the fact that the electricity is not too expensive and that the power stations damage the plants around them.
Most of the students are very concerned about global warming. However, very few students are not concerned about global warming. While most of the students said that they know a lot and a bit about global warming; a few students have stated that they do not know anything. Most students think that they are sure
and there is global warming. On the other hand, very few of the students think that global warming is not happening and/or they are sure about it. In addition, half of the students see themselves very environmentally friendly, but few students do not
see themselves as environmentally friendly. Similarly, in the study of Kılınç et al (2013), they found that most Turkish secondary school studentswere sure about orthink that global warming exists or that they knew something about global warming. In another research, participants were found to be aware of climate
change (Duan, 2010). Education plays an important role in the growth of environmentally
conscious and sensitive individuals. Thisis the first research to reveal the views of Turkish Cypriot ninth grade students on the renewable energy production. For the more effective teaching of renewable energy, the opinions of the students in the different classes, in which this issue takes place, can also be studied in future researches. At the same time, the psychological elements underlying the Turkish

296 Serap Ozbash Cypriot students’ perceptions of renewable energycan be examined in further research. Also in other researches, for the application success of the renewable energy Technologies, the perception of the Turkish Cypriot community about the subject, the attitude towards these technologies, and the acceptance of renewable energy technologies can be examined.
References and notes:
Akın, G. (2017). Küresel ısınma, nedenleri ve sonuçları. DTCF Dergisi,46(2). Bayraç, H. N. (2010). Enerji kullanımının küresel ısınmaya etkisi ve önleyici politikalar.
Eskişehir Osmangazi Üniversitesi Sosyal Bilimler Dergisi,11(2). Boşgelmez,A. (2007). Küresel ısınma ve sonuçları. 21. Yüzyıl Dergisi,
http://www.21yuzyildergisi.com/assets/uploads/files/66.pdf. Devine-Wright,P. (2007). Reconsidering public attitudes and public acceptance of
renewable energy technologies: a critical review. Manchester: School of Environment and Development, University of Manchester. Available at: http://www. sed. manchester. ac. uk/research/beyond_nimbyism.
Devine-Wright, P. (2011). Place attachment and public acceptance of renewable energy: A tidal energy case study. Journal of Environmental Psychology, 31(4), 336-343.
Duan, H. (2010). The public perspective of carbon capture and storage for CO2 emission
reductions in China. Energy Policy, 38(9), 5281-5289. Fast, S.,& McLeman, R. (2012). Attitudes towards new renewable energy technologies in
the Eastern Ontario Highlands. Journal of Rural and CommunityDevelopment, 7(3).
Huijts, N. M., Molin, E. J., & Steg, L. (2012). Psychological factors influencing sustainable energy technology acceptance: A review-based comprehensive
framework. Renewable and Sustainable Energy Reviews, 16(1), 525-531. Hofman, E. (2015). Social acceptance of renewable energy. Climate Policy Info Hub, 18
February 2015. Online available at: http://climatepolicyinfohub.eu/social-acceptance-renewable-energy
Hitzeroth, M.,& Megerle, A. (2013). Renewable energy projects: acceptance risks and their management. Renewable and Sustainable Energy Reviews, 27, 576-584.
Karakasis, V. P. (2015). Energy security and the Cyprus Question:“Securitization” of Energy in the Eastern Mediterranean. Volume 27: July 2015, 5.
Kılınç, A., Stanisstreet, M., & Boyes, E. (2009). Incentives and disincentives for using renewable energy: Turkish students’ ideas. Renewable and Sustainable EnergyReviews, 13(5), 1089-1095.
Koroneos, C., Fokaidis, P., & Moussiopoulos, N. (2005). Cyprus energy system and the use of renewable energy sources. Energy, 30(10), 1889-1901.
Maxoulis, C. N.,& Kalogirou, S. A. (2008). Cyprus energy policy: the road to the 2006 world renewable energy congress trophy. Renewable Energy, 33(3), 355-365.
Moula, M. M. E., Maula, J., Hamdy, M., Fang, T., Jung, N., & Lahdelma, R. (2013). Researching social acceptability of renewable energy technologies in Finland. International Journal of Sustainable Built Environment, 2(1), 89-98.
Sağlam, N. E., Düzgüneş, E., & Balık, İ. (2008). Küresel ısınma ve iklim değişikliği. EgeUniversty Journal of Fisheries and Aquatic Sciences, 25, 89-94.
Türkeş, M., Sümer, U. M. ve Çetiner, G. 2000. ‘Küresel iklim değişikliği ve olası etkileri’, Çevre Bakanlığı, Birleşmiş Milletler İklim Değişikliği Çerçeve Sözleşmesi

The views of the Cypriot Turkish school students ….. 297
Seminer Notları (13 Nisan 2000, İstanbul Sanayi Odası), 7-24, ÇKÖK Gn. Md., Ankara.
Üstün, N. (2016). Doğu Akdeniz’de Enerji Politikaları Ve Kıbrıs Müzakerelerine Etkisi. Araştırma Raporu. Konya Ticaret Odası, Ekonomik Araştırmalar ve Proje Müdürlüğü. http://www.kto.org.tr/d/file/dogu-akdenizde-enerji-politikalari-ve-kibris-muzakereleri---nazli-ustun.pdf
Wüstenhagen, R., Wolsink, M., & Bürer, M. J. (2007). Social acceptance of renewable energy innovation: An introduction to the concept. Energy policy,35(5), 2683-2691.
Zachariadis, T.,& Pashourtidou, N. (2007). Energy policy in Cyprus: outlook and major challenges. Cyprus Economics Policy Review, 1, 27-48.
Summary
The views of the Cypriot Turkish school students about renewable energy production
Serap Ozbash Near East University, Cyprus
The aim of this study is to examine and specify school students’ views about renewable energy and energy production in 9 years in Nicosia. Data using questionnaire was collected
from 160 volunteer students who joined three type school (general high school, volunter high school, and college) that was selected by using random sampling method. According
to the research results, some of Cypriot Turkish high school students disagreed that that they would be willing to pay more for electricity that was generated from renewable source,
while the half or students agreed that they would not wish to live close to a renewable electricity generator. Over half of them pointed out that renewable power sources were
safer than other types of power generators and global warming would be reduced if more of our electricity was made from renewable sources. Also, over half of students held the views
about the safe of power station making electricity, and the reliable supply of electricty were very important. Furthernore nearly half of the them knew something about global warming.
In addition nearly half of students were sure that global warming is really happening now and more than one third of students were quite worried about global warming. Keywords: Energy production, global waming, high school students, renewable energy

Khazar Journal of Humanities and Social
Sciences © Khazar University Press 2017
DOI: 10.5782/kjhss.2017.298.319
Examining Internal and External Motivational
Factors in Job Satisfaction of Public Institution
Managers and Employees
Tugay Dikmen
Near East University, Cyprus
Dudu Duygu Yıldırım
Near East University, Cyprus
Aykut Yıldırım
Near East University, Cyprus
Serap Ozbash
Near East University, Cyprus
Introduction
In today's society, business has always played an important role in meeting the social, economic and psychological needs of individuals. While the work, which is important in human life both as time spent and as value in terms of
enabling human beings to make their lives possible, is what makes people feel peaceful and happy; unemployment causes unhappiness and despair (Sarpkaya, 2000, 3). With their business, individuals meet their financial needs by getting an economic gain, and also the needs of of being socially beneficial to society, and the
feeling of being proud of being able to feel psychologically helpful and feeling of success. At this point, the positive and negative emotions that develop with business and work conditions, affect the job satisfaction of employees (Çakır, 2001:29). In other words, the work attitude of the individual is job satisfaction or
job satisfaction is the result of evaluation of emotional experience and beliefs related to work.(Brief & Weiss, 2002).
In the 1920s, the concept of job satisfaction as one of the most important factors affecting people's lives psychologically (Tuzgöl-Dost, 2007), became
298

Examining Internal and External Motivational Factors …. 299
important as a result of Hawthorne's research which presented the view that job satisfaction affects self-satisfaction and efficiency, in the 1930s (as cited in
Uyargil, 1988, 3). Davis (1988: 96-97) expressed job satisfaction as happiness or unhappiness that employees feel about their work. In other words, job satisfaction is emotional reactions to work in the direction of anticipated work expectations (Işıkhan, 1996:118). In the most general sense, job satisfaction is the result of the evaluating the wishes of the employees and what is available at work. Achieving job satisfaction is the pleasure that the employee gets from the job (Varoğlu, 1992; Başaran, 2000).
Based on the socio-psychological literature, it has been stated that job satisfaction functions as a moderator variable in job performance (Ziegler et al., 2012). Especially in public institutions, if the employees do their jobs with high
motivation and happiness in the knowledge of their duties, that situation ensures efficient, productive, fast, qualified and economic execution of the tasks (Genç, 1990:155). Otherwise, if the employee can not reach the job satisfaction, the dissatisfaction causes disappointment and displeasure. The employee who carries
these feelings exhibits behaviors affecting both his work and his own life, such as reluctance to work, slowing down work, apathy, absenteeism and incomplete work(Poyrazoglu, 1992:30). For this reason, we appreciate job satisfaction as an important factor in maintaining both professional and social life. Job satisfaction,
an important concept in the field of literature, is based on classical theories such as Maslow's Need Hierarchy Theory and Herzberg's Motivation-Hygiene Theory, and also the modern approaches such as the Cornel Model developed by Kendall and
Hulin (1969) and the Social Information Processing Approach (Salancik and Pfeffer 1978) (Genç, 1990:155)
In this study, job satisfaction was examined in the framework of Herzberg's Motivation-Hygiene Theory of Motivation developed by Herzberg, Mausner and
Snyderman. The Motivation-Hygiene Theory is also known as the "Two Factors Theory" and contains practical approaches to motivate employees. Motivation, derived from the Latin word "movere", means to act (Vroom, 1964) or an internal force that urges people to succeed depending on their needs (Tan, 2011). Based on
the view of "job satisfaction and job dissatisfaction are independent of each other" , Herzberg emphasizes that factors which lead to positive attitudes towards the business and negative business attitudes are different. According to this, while an employee feels happy about some aspects of his work, s/he may be unhappy about
some others (Pinder, 1984:21). According to the Dual Factor Theory, it is suggested that job satisfaction is not a one-dimensional concept.While one of the two variables studied in examining job satisfaction is survival based like avoiding pain and discomfort; the other is psychological development related to the needs
(Accel-Team, 20040; Pinder, 1984:26). According to the results of the study of motivation theory developed by Herzberg et al., the absence of some factors leads to unhappiness, but the presence of these factors does not lead to any satisfaction

300 Tugay Dikmen, Dudu Duygu Yıldırım, Aykut Yıldırım, Serap Ozbash
but provides the necessary environment for motivation (Luthans, 1992: 151; as cited in Ateş et al., 2012). Factors that do not cause additional satisfaction such as salary, status, occupational safety, private life, working conditions are called external (hygien) factors (Eroğlu, 1995: 54). However, it has been determined that the presence of some factors increases the performance of the employees and the
absence leads to dissatisfaction. These factors are named as internal (motivating) factors (Ateş et al., 2012). Recognition, success, opportunity of promotion and the job itself can be shown as examples of internal (motivating) factors (Noell, 1976: 8, Onaran, 1981: 46).
In our world, where the needs of individuals are so important in their working
lives, one of the most basic requirements is undoubtedly security. It is not possible to talk about either freedom or people's rights in a society where security is not ensured sufficiently. At this point, we can not ignore that it is very important to ensure the job satisfaction of members of the Police Organization which is an
organization that may limit the fundamental rights and freedoms of individuals in certain conditions while fighting the crime in order to meet the basic needs of the individuals. At this point, we can not ignore that it is very important to ensure the
job satisfaction of members of the Police Organization, as an organization, that can limit the fundamental rights and freedoms of individuals in some conditions while fighting crime in order to meet the basic needs of the individuals. Employees of the Police Service, a public institution, are constantly confronted with unhappy people
who are either criminals or victims, and this is reflected in the lives of police officers. There are some studies that examine the job satisfaction of police officers (Sertç, 2002; Şanlı, 2006; Deniz, 1999). However, the scales used in these studies are more general. Therefore, in this study, the scale prepared by Magny (2012) for
police and police managers based on Herzberg's theory was adapted to the Turkish language and the job satisfaction according to internal and external factors of police employees was examined. In this study, the internal and external factors affecting the job satisfaction of employees in the Police Department will be presented. It is
also aimed that with the adaptation made in the study, a scale towards the police will be introduced to the literature.
Aim of the research
The aim of this research is to examine the perceptions of internal and external motivational factors in job satisfaction of police officers and managers and to show the effect of independent variables (gender, age, rank, status, educational background and marital status) on this perception.
Question
What are the perceptions of internal and external motivational factors in job satisfaction of employees of the police department?

Examining Internal and External Motivational Factors …. 301
Sub-questions • What are the perceptions of internal and external motivational factors in
the job satisfaction of public managers? • What are the the police officers' perceptions of internal and
external motivational factors in job satisfaction ? • Do the police managers' perceptions of internal and external motivational
factors significantly differ in relation to the independent variables (age, status, educational background, and marital status) in job satisfaction?
• Do the police officers' perceptions of internal and external motivational factors significantly differ in relation to the independent variables (age, status, educational background, and marital status) in job satisfaction?
•Do the internal and external motivational factors of the police managers' significantly differ?
•Do the internal and external motivational factors of the police officers' significantly differ in job satisfaction?
Methodology The research was based on a quantitative review study that revealed the existing situation in order to determine the internal and external factors of the job satisfaction of police organization employees (Büyüköztürk, 2008).
Participants The universe in this research is the employees of the Police Department in Bursa. Because of the time constraints, convenience sampling is used to select the most suitable people from the easily accessible units. The sample of the study is 785 police department employees voluntarily participating in various units. Among the participants, 6.3% (49) were female and 93.8% (735) were male. 6,5% (51) of the participants were between the ages of 20 and 25; 37,4% (293) were 26-30 years, 15,4% (121) were 31-35 years, 10,6% (83) were 36-40 years and 30,1% were 41 years old and above. 89.7% (703) of the participants were police officers; 10%, 3 (81) inspector, deputy inspector, chief inspector and superintendent. While 54.9% (431) of the participants had 10 years and fewer status, 23,6% (185) have 11-20 years and 21,4% (168) have 21 years and over. While 6% (47) of the participants were graduated from police college and police academy; 90.5% (709) has bachelor degree or associate degree graduation and 3.5 (28)were graduated from high school. When we examined the marital status of the participants, 25.4% (199) were single; 74.6% (585) were married.
Questionnaire In the study, questionnaire was used in the electronic environment to determine the internal and external motivation factors that determine job satisfaction of police employees. The questionnaire consists of two parts: a personal information form and an internal-external motivational factors scale.

302 Tugay Dikmen, Dudu Duygu Yıldırım, Aykut Yıldırım, Serap Ozbash
a. Personal Information Form The form includes questions about gender, age, status, professional experience, educational background and marital status to determine the demographic characteristics of police workers. b. Job Satisfaction Scale In this study, job satisfaction scale for police employees was used. The scale was prepared by Maygn (2012) The scale prepared for police officers includes internal and external motivational factors based on Herzberg's motivation-hygiene theory.
The scale consists of 20 items and two dimensions, internal (10 items) and external (10 items). In the internal dimension, there are categories as work itself (2 items), advancement (2 items), responsibility (2 items), achievement (1 item), growth (2 items), recognition (1 item); in the external dimension there are peer relationship (1 item),company policies (2 items), supervision (2 items), job security (1 item), work condition (2 items), salary / benefits (1 item) categories. The scale was rated on the 6 polint Likert type (6=strongly agree, 1= strongly disagree). Translation of the Scale to Turkish The Turkish translation of the job satisfaction scale was provided in several steps. The scale was translated by three English language experts. In order to choose the most appropriate Turkish expression, a form consisting of original and three translations of each item was prepared and sent to three experts who mastered both languages. As a result of expert opinions, the most appropriate translation for each item was placed in another form and presented to two foreign language experts
Dimension Item Factor t-valueDimension Item Factor t-value
Loading Loading
1 0.51 8.16 2 0.46 7.23
3 0.55 9.04 4 0.57 7.33
7 0.46 7.33 5 0.64 10.65
10 0.66 11.17 6 0.66 11.17
11 0.66 8.26 8 0.51 8.26
Internal 12 0.51 9.26 External 9 0.57 9.26
16 0.71 12.86 13 0.66 11.92
17 0.66 11.92 14 0.69 12.00
18 0.69 12.00 15 0.69 11.87
19 0.69 11.87 20 0.47 7.35
2 Sd 2 / sd RMSEA SRMR NFI NNFI CFI GFI AGFI
427.51 169 2.53 0.079 0.059 0.93 0.95 0.96 0.85 0.82

Examining Internal and External Motivational Factors …. 303
for comparison with the original. Within the framework of the views of experts, some changes have been made on the translation of the two items. Then, the Turkish translation of the items was presented to a Turkish language expert and two education experts in terms of clarity and understanding. On the opinion of the experts, the scale was given the final shape by making some arrangements. The scale and the personal information form have been put into a questionnaire form to carry out the application.
The Validity Study of the Scale The structural validity of the Job Satisfaction Scale was tested by confirmatory factor analysis. Confirmatory factor analysis was performed on the dataset generated by randomly selected 250 responders from 784 responders. Confirmatory factor analysis assumptions have been tested, and as a result of the analysis of the assumptions, 50th, 130th and 65th observations were found to have multivariate extreme values. DFA analysis was performed on 247 observations after removing these three observations from the data sets.
Confirmatory Factor Analysis The two-factor structure measuring the internal and external dimensions of the Job Satisfaction Scale was tested by confirmatory factor analysis. Table 1 shows the standardized factor loadings and t values of the Job Satisfaction Scale. Table 1. DFA Results of the Job Satisfaction Scale
In Table 3, when standardized factor loadings of the Job Satisfaction Scale were examined, the intrinsic dimension of the factor loads was 0.46 to 0.71; while those items measure the external dimension vary between 0.46 and 0.69. The coherence of the two-factor structure of the Job Satisfaction Scale to the data set was evaluated through the goodness of coherence indexesWhen the results are evaluated as a whole, it is shown that the original two-factor model proposed for the Job Satisfaction Scale matches the data set.
Comparing the scores of the participants in the 27% lower and 27% upper groups by using the independent t test
Another proof of the structural validity of the scale is the comparison of the differences between the average scores of respondents in the 27% upper and lower groups from the respondent group with the t test. According to Table 2, the difference between the average score of the top group and the average score of the subgroup of the job satisfaction scale t(48)=27.4, p<.01 is significant. For this reason, it can be said that the scale is valid.

304 Tugay Dikmen, Dudu Duygu Yıldırım, Aykut Yıldırım, Serap Ozbash
Table 2. Job Satisfaction Scale T test results
Measurement N X S Sd T P
Subgroup 49 55.36 4.99 48 27.45 .000
Topgroup 49 101.22 6.74
Reliability Study of the Scale Item total correlations, Cronbach Alpha coefficients and two-half reliability were examined for the reliability of the Job Satisfaction Scale. First, the scale was taken into item analysis and item properties were determined (table 3). Table 3. Item total correlation values of the Job Satisfaction Scale items
Item r(jx) Item r(jx) Item r(jx) Item r(jx)
1 0.478 6 0.485 11 0.582 16 0.688
2 0.411 7 0.434 12 0.471 17 0.594
3 0.521 8 0.641 13 0.472 18 0.626
4 0.536 9 0.540 14 0.649 19 0.616
5 0.598 10 0.612 15 0.438 20 0.445
When Table 3 is examined, it is seen that item-total score correlations range
between 0.44 and 0.69. The correlation coefficients, which are statistically significant, were found to be sufficient for the discrimination of the items. The Cronbach alpha coefficient of the job satisfaction scale was 0.91 for the whole scale; 0.85 for internal dimension; And 0.82 for the external dimension.The
coefficients obtained as a result of calculating the split-half of the test and the correlation between the two halves were found to be 0.85 for the whole scale, 0.71 for the internal dimension and 0.70 for the external dimension. The positive, high
and significant correlation between the scores obtained from the two halves gives evidence of the reliability of the scale.
Analysis of Data Data was collected through SPSS 22.0 and LISREL 8.1 programs. In the analysis of the data, both descriptive and parametric and nonparametric tests were used. Before deciding which test to use in terms of parametric and nonparametric tests, the normality of the distribution of each dependent variable in groups was examined. The distributions of the dependent variables were examined by the skewness and kurtosis coefficients, the z-statistics test, which was obtained by dividing them into their standard errors, and the Kolmogorov Smirnov-Shapiro Wilks normality tests (Kalaycı, 2010). In situations where the parametric test

Examining Internal and External Motivational Factors …. 305
assumptions were supplied, the multivariate analysis of variance (MANOVA) and variance analysis (ANOVA) testswere applied but where these assumptions were not supplied, the Kruskall Wallis test was applied. Before doing MANOVA, the assumptions of this analysis were tested by examining the Box M test, the Levene F test, and the ratio of the sizes of the variables. As a result of the assumptions, it was decided to use the Pillia trace statistic (Alpar, 2010).
Collection of Data The data were collected from online questionnaires of police officers and managers.
Results 1) What are perceptions of internal and external motivational factors in the job satisfaction of police officers and managers?
Table 4. Descriptive statistics of the items forming the internal motivational dimension of the managers
Categories Items X s
1.I stay at my job because it is challenging 3.939 1.4918
Work itself
and exciting..
10.I love my job because I am empowered 3.878 1.4381
enough to perform my duties..
3.At my agency, I have sufficient 3.714 1.3994
opportunities to learn new skills for
Advancement
career advancement.
7.It is more important to advance in career 4.000 1.5546
opportunities and responsibility—rather
than achieving a higher income.
11.I am successful because I have 4.184 1.3795
Responsibility
reasonable control over my work product.
12.I value my job here because I am 4.816 1.3643
responsible for the work of others.
Achievement 16. I am satisfied working for this agency 3.612 1.4835
because it recognizes my achievements.
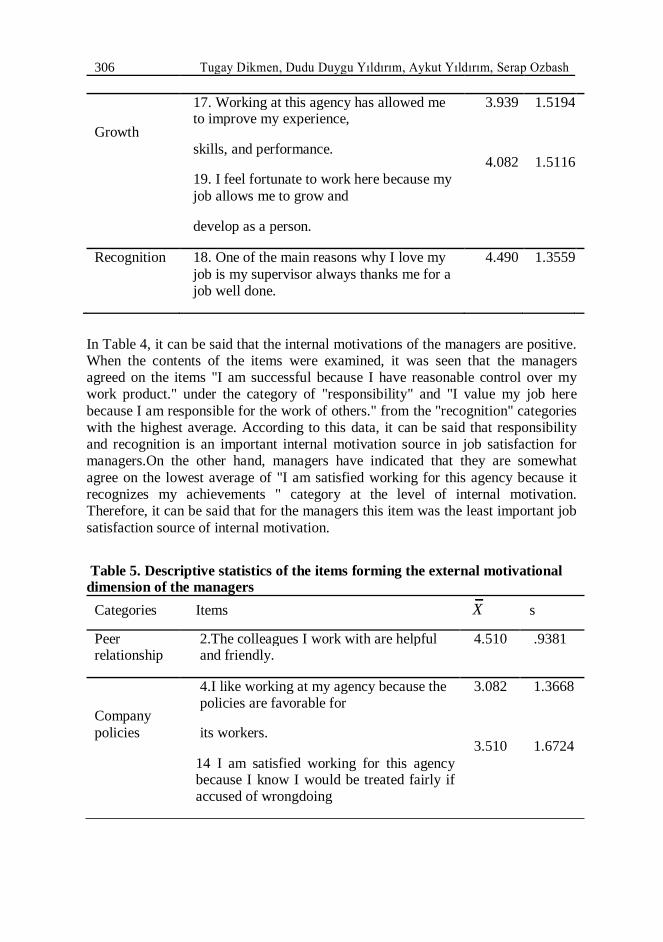
306 Tugay Dikmen, Dudu Duygu Yıldırım, Aykut Yıldırım, Serap Ozbash
17. Working at this agency has allowed me 3.939 1.5194
Growth
to improve my experience,
skills, and performance. 4.082 1.5116
19. I feel fortunate to work here because my
job allows me to grow and
develop as a person.
Recognition 18. One of the main reasons why I love my 4.490 1.3559
job is my supervisor always thanks me for a
job well done.
In Table 4, it can be said that the internal motivations of the managers are positive. When the contents of the items were examined, it was seen that the managers agreed on the items "I am successful because I have reasonable control over my work product." under the category of "responsibility" and "I value my job here
because I am responsible for the work of others." from the "recognition" categories with the highest average. According to this data, it can be said that responsibility and recognition is an important internal motivation source in job satisfaction for managers.On the other hand, managers have indicated that they are somewhat
agree on the lowest average of "I am satisfied working for this agency because it recognizes my achievements " category at the level of internal motivation. Therefore, it can be said that for the managers this item was the least important job
satisfaction source of internal motivation.
Table 5. Descriptive statistics of the items forming the external motivational dimension of the managers
Categories Items X s
Peer 2.The colleagues I work with are helpful 4.510 .9381
relationship and friendly.
4.I like working at my agency because the 3.082 1.3668
Company policies are favorable for
policies its workers. 3.510 1.6724
14 I am satisfied working for this agency because I know I would be treated fairly if accused of wrongdoing

Examining Internal and External Motivational Factors …. 307
5.One of the main reasonswhy I work at my agencyis because my supervisoris a
Supervision strong andtrustworthy leader..
8.Because of my relationship with my
supervisor, I feel satisfied at work.
4.000 1.4720
4.469 1.4009
Job security 6.I believe my job is secure. 3.592 1.3216
Work 9.I am happy to work here because of the 3.245 1.3468
condition comfortable working conditions.
13.The working conditions at my agency 3.184 1.4387
are satisfying, because there are an
adequate number of officers on my shift.
Salary/benefits 15. I think the pay I receive is appropriate 3.224 1.1949
and fair for the work I do.
Status 20. I believe police officers are respected 3.571 1.4860
by the public.
In Table 5, it can be said that the managers' external motivation factors of the job
satisfaction are positive.When the contents of the articles are examined, managers agreed on the items One of the main reasons why I work at my agency is because my supervisor is a strong and trustworthy leader " and " Because of my relationship with my supervisor, I feel satisfied at work " in the category of "supervision" that
measures the external motivation and the item " The colleagues I work with are helpful and friendly " that measures "peer relationship" with the highest average. In the light of this finding, it can be said that the supervisor and friend relations at the workplace are very important external motivation source for the police
administration directors. In the light of this finding, it can be said that the supervisor and friend relations at the workplace are very important external motivation source for the police managers. On the other hand, managers reported an opinion that "somewhat agree" on items that measure "work condition" and
"salary" .When these items are examined, it can be said that the managers have perceptions that the working conditions of the institution, the number of employees and the salary they gain according to their workloads are partially inadequate and that affects their external motivations negatively.

308 Tugay Dikmen, Dudu Duygu Yıldırım, Aykut Yıldırım, Serap Ozbash
Table 6. Descriptive statistics of the items forming the internal motivational dimension of the police Categories Items
s
X
1.I stay at my job because it is challenging 3.854 1.4134
Work itself and exciting.
10.love my job because I am empowered 3.789 1.5173
enough to perform my duties..
3.At my agency, I have sufficient 3.553 1.3864
opportunities to learn new skills for
Advancement career advancement.
7.It is more important to advance in career 4.127 1.4688
opportunities and responsibility—rather than
achieving a higher income.
11.I am successful because I have reasonable 4.207 1.4318
Responsibility control over my work product.
12. I value my job here because I am 4.439 1.4370
responsible for the work of others.
Achievement 16. I am satisfied working for this agency 3.451 1.3369
because it recognizes my
achievements.
17. Working at this agency has allowed me to 3.719 1.3989
Growth improve my experience,
skills, and performance. 3.741 1.4504
19. I feel fortunate to work here because my
job allows me to grow and
develop as a person.
Recognition 18. One of the main reasons why I love my 3.901 1.4673
job is my supervisor always thanks me for a
job well done.
Note. The items are in 6-point Likert type. (1= completely disagree, 2= disagree, 3=somewhat disagree, 4=somewhat agree, 5= agree, 6= completely agree).
In Table 6 it can be said that the internal motivation for the job satisfaction of the police is positive.When the contents of the items were examined, it was seen that
the police officers agreed on the items " I am successful because I have reasonable control over my work product " under the category of "responsibility" and " I value my job here because I am responsible for the work of others" from the
"recognition" categories with the highest average. In the light of this finding, it can be said that "responsibility" and "development" are an important source of internal motivation in job satisfaction of the police.On the other hand, in terms of internal motivation, the police stated that they somewhat agree with the lowest average of ".
I am satisfied working for this agency because it recognizes my achievements " in the "achievement" category.Therefore, it can be said that this item is the least important source of internal motivation for police officers in job satisfaction.

Examining Internal and External Motivational Factors …. 309
Table 7. Descriptive statistics of the elements forming the external dimension of the police
Categories Items X s
Peer 2.The colleagues I work with are helpful 4.473 1.2677
relationship and friendly.
4.I like working at my agency because the 3.268 1.3302
Company policies are favorable for
policies its workers. 3.601 1.4034
14. I am satisfied working for this agency because I know I would be treated fairly if accused of wrongdoing.
5.One of the main reasons why I work at my agency is because my supervisor is a
Supervision strong and trustworthy leader..
8.Because of my relationship with my supervisor, I feel satisfied at work.
3.534 1.3870
4.097 1.3605
Job security 6.I believe my job is secure. 3.648 1.3532
Work 9.I am happy to work here because of the 3.238 1.3311
condition comfortable working conditions.
13.The working conditions at my agency 3.110 1.2063
are satisfying, because there are an
adequate number of officers on my shift.
Salary/benefits 15. I think the pay I receive is appropriate 3.350 1.3166
and fair for the work I do.
Status 20. I believe police officers are respected 3.751 1.3645
by the public.
In Table 7, the point averages and standard deviations of the items measuring the external dimension of the police job satisfaction scale are given. When item averages are examined, it is seen that the police somewhat agree and agree with external motivational items that measure job satisfaction . Accordingly, it can be said that the external motivation of the police for job satisfaction are positive. When the contents of the articles are examined, the police officers agreed on the items " Because of my relationship with my supervisor, I feel satisfied at work " in

310 Tugay Dikmen, Dudu Duygu Yıldırım, Aykut Yıldırım, Serap Ozbash
the category of "supervision" that measures the external motivation and the item " The colleagues I work with are helpful and friendly " that measures "peer relationship" with the highest average. According to this finding, it can be said that the relation of supervisor and friend at work is a very important external motivation source for police officers.On the other hand, police officers reported that they
agreed at the lowest average of the items that measured "work conditions".According to this finding, it can be said that the lowest external motivation for the police is working conditions.
2) Do the perceptions of internal and external motivational factors that
measure job satisfaction of the police managers differ according to the independent variables (age, status, educational background and marital
status)? I. Multivariate variance analysis according to age, educational background and marital status variables of police managers' job satisfaction Table 8. Multivariate analysis of variance of internal and external motivation scores according to educational background, marital status and age variables
Wilks’ F Hypothesis Error p η2
λ df. df.
Educational background
0.987 0.251 2 38 0.780 0.013
Marital Status 0.945 1.104 2 38 0.342 0.055
Age 0.810 2.108 4 76 0.088 0.100
Educational background* 0.983 0.334 2 38 0.718 0.017
Marital Status
Educational 0.818 2.006 4 76 0.102 0.096
background*Age
Marital Status *Age 0.896 2.201 2 38 0.125 0.104
Educational background* 0.983 0.322 2 38 0.727 0.017
Marital Status *Age
the Depen- Levene’s Test Box’s M Test
dent v.
F P Box's M p
Internal 2.074 0.056 29.228
0.215
External 1.602 0.149
p<.05

Examining Internal and External Motivational Factors …. 311
When Table 8 is examined, it is seen that internal and external motivation scores of managers do not change according to educational background, marital status, age variables and their common effects. II. Kruskal Wallis test results according to occupational statusvariable of job satisfaction of police managers
Table 9. Kruskal Wallis test results according to the occupational status of job satisfaction scores
Factor Status n Mean Df 2 P Significant
Rank difference
5 and 11 27,68 4 1.107 0.893 -
less
6-10 5 24,80
years
Internal 11-15 9 21,00
years
16-20 14 25,32
years
21 and 10 25,30
more
5 and 11 25,86 4 1.951 0.745 -
less
6-10 5 24,70
years
External 11-15 9 22,72
years
16-20 14 28,68
years
21 and 10 21,10
more
When the Kruskal Wallis results presented in Table 9 are examined, it is seen that internal and external motivation scores, which measure job satisfaction of the police employees, do not change significantly with respect to occupational status

312 Tugay Dikmen, Dudu Duygu Yıldırım, Aykut Yıldırım, Serap Ozbash
3) Do the perceptions of internal and external motivational factors that measure job satisfaction of the police officers differ according to the
independent variables (age, status, educational background and marital
status)? III. Analysis of variance and Kruskal Wallis test according to the age of police officers' job satisfaction Table 10. Variance Analysis and Kruskal Wallis test results according to age variable
Factor Group N
S F p Significant
X
Difference
20-30 218 36.80 0.54 “20-30”-“41
31-40 122 38.43 0.82
and over”
Internal 16.84 0.000
“31-40”-“41
41 and 134 43.31 0.81
and over”
over
N Mean df 2 p Significant
Rank Difference
20-30 218 217.88 2 “20-30”-“41
and over”
External
31-40 122 224.93 18.967 0.000
“31-40”-“41
and over”
41and 134 280.86
over
When Table 10 is examined, the internal motivation of police officers vary significantly according to their age levels. According to the Tukey test results, it can be said that the increase in the age level has increased the internal motivation for job satisfaction of the police. It is seen that the scores of external motivation, which measure police job satisfaction, differ significantly according to age. When the rank average is examined, it is seen that the rank difference of the police officers "41 and above" is significantly higher than the police officers whose average age is "20-30" and "31-40". IV. Analysis of variance and Kruskal Wallis test according to occupational statusvariable of job satisfactions of police officers
Table 11. Analysis of variance and Kruskal Wallis test results according to occupational status variable

Examining Internal and External Motivational Factors …. 313
Factor Group N
S F p Significant
X
Difference
5 and 158 37.35 0.64
less “5 and less”-
6-10 117 35.74 0.73 “16-20”
years “ 21
Internal 11-15 52 39.15 1.24
12.236 0.000
and over”
years
“6-10” - “16-
16-20 59 43.15 1.19
20”
years “21
21 and 88 42.23 1.01
and over”
over
Age n Mean df 2 p Significant
Range Difference
5 and 158 229.62 4 “5and less”-“6-
less 10”,
6-10 117 190.29 “16-20”
years “ 21
External
11-15 52 234.05 and over”
years
34.106 0.000
“6-10” - “16-
16-20 59 304.69 20”
years “21
21 and 88 271.40 and over”
over “11-15”-“16-
20”
When Table 11 is examined, the internal motivations of police officers vary significantly according to their professional status levels. According to the Tukey test results, it can be said that the increase in the age level has increased the internal motivation for job satisfaction of the police. It can be said that the increase in the professional status has increased the internal motivation for job satisfaction of the police.It is seen that external motivation scores differ significantly according to occupational statusvariable. It can be said that the external motivations that measure the job satisfaction of employees working for "5 and 6" and "6-10" years

314 Tugay Dikmen, Dudu Duygu Yıldırım, Aykut Yıldırım, Serap Ozbash
are significantly lower than the employees of "16-20" and "21 years and above", and generally the increase in the working year affects the external motivation positively. V. The findings of multivariate variance analysis of job satisfaction according to the educational background and marital status of police officers
Table 12. MANOVA results according to the age variable of job satisfaction scores
Variable Facto Group N Min Max
S
X
r
Educational Associate 329 20.00 60.00 37.36 0.46
background Intern
Degree
al Bachelor 145 24.00 60.00 41.99 0.79
Degree
Associate 329 22.00 60.00 35.08 0.39
Extern Degree
al Bachelor 145 21.00 58.00 38.32 0.71
Degree
Pillia
Hypot η
2
F hesis Errordf p
Trace df
0.024 5.773 2 469 0.003 0.02
Educational background 4
0.001 0.311 2 469 0.733 0.00
Marital Status 1
Educational background
0.017 4.102 2 469 0.017 0.01
7
*Marital Status
Levene’s Test Box’s M Test
DependentV. F P Box's P
2.805 0.039 M
0.135
Internal 13.921
External 5.078 0.002
Table 12 shows that there was a significant difference in at least one of the internal and external motivation scores according to the common effects of police officers' educational background and educational background * marital status variables. According to Cohen (1988) 's impact rating classification, the eta square value of the common effect of the educational background and educational

Examining Internal and External Motivational Factors …. 315
background * the marital status variables is at the low level .For this reason, only the variance analysis (ANOVA) results for the educational backgroundvariable were examined because it was considered that the significance of the common effects of educational background and marital status variables was derived from the educational backgroundvariable. According to the results of variance analysis, the educational background of police officers affected both internal and external motivation significantly.
4) Is there a meaningful difference between the average scores of factors (internal, external) of the job satisfaction scale of police officers?
Table 13. T test results of managers' internal and external factor score averages
Measurement N X S Df t p
Internal 49 40.65 9.64 48 4.39 .000
External 49 36.39 7.42
When Table 13 is examined, it is seen that the difference between the factor scores of job satisfaction scale of the police managers is significant t(48)=4.39, p<.01. In other words, the internal dimension score average (= 40.65) is significantly higherthan the external dimension score average (= 36.39) of the job satisfaction of the police managers . According to this finding, it can be said that the internal motivation of the police officers has increased the job satisfaction more. 5) Is there a meaningful difference between the average scores of factors (internal, external) of job satisfaction scale for the police?
Table 3.1. T test results of the average scores of internal and external factors of police
Measurement N X S Df t p
Internal 474 38.78 8.95 473 10.12 .000
External 474 36.07 7.70
When the Table3.1 is examined, it is seen that the difference between the factor scores of job satisfaction scale of the police is meaningful t(473)=10.12, p<.01. In
other words, the internal dimension score average (= 38.78) of the job satisfaction scale of the police is significantly higher than the external dimension score average (= 36.07).In the light of this finding, it can be said that the internal motivation of the police increases the job satisfaction more.

316 Tugay Dikmen, Dudu Duygu Yıldırım, Aykut Yıldırım, Serap Ozbash
Conclusion and Discussion
The motivation seems to be a current issue, but it seems to be an aspect that needs to be elucidated.In this sense, it can be said that while Herzberg's two-factor motivation theory remains insufficient to explain the motivation of the police,it can help us to prepare some conscious activities about the motivation of the police. In this research, the perceptions of internal and external motivational factors in job satisfaction of police officers and managers and the effect of independent variables like gender, age, rank, status, educational background and marital status were examined.
When the perceptions of internal and external motivational factors in police officers' and managers' job satisfaction are evaluated together, it can be said that "responsibility" items that measure internal motivation are the most important internal motivation source for both police managers and officers and the success is the lowest internal motivation source.On the other hand, it can be said that the most important external motivation for both the managers and the police is the relationship between the supervisors and the friends.In addition, police managers and police officers reported opinions to those items that measure internal and
external motivation with the similar means.
If we examine some variables of the motivational factors, it can be stated
thatwhile educational background, age or marital status doesn’t effect the motivation of the police managers, the superiority has an important role in job satisfaction. On the other hand, if we examine the police officers, there is no significant difference between the demographic characteristics and job satisfaction, as Azizoğlu and Özyer (2010) have studied before. It was determined that there is a difference between the job satisfaction scores only according to the type of school they graduated from.It is clear that the educational background effects both their internal and external motivation .
Not only in this research but also in Magny’s results(2012), police managers got the highest scores ofagreement related to both the internal and external motivational statements. This may be an important point as they have more autonomy and power at work than the police officers. Also, the leadership properties of the police managers will develop if their motivation level increases. They will behave their subordinate officers in a positive way and that will effect the police officers’ motivation directly as a chain.
Also, police officers value their relationships with their colleagues. They trust each other as they can understand each other’s issues and problems (Gilmartin, 2002; Toch, 2002).
The employees of the police department has some problems abut their physical working conditions of the police stations such as hygiene, parking problem etc.(Erdağ, 2010).Also, if we suppose that the police officers has safety

Examining Internal and External Motivational Factors …. 317
problems, we can state that the employees of the police department are affected by their physical and psychological working conditions in a negative way.
In the light of the results obtained from this study, if all the external factors that are effective in for the police officers are identified and the improvement is made in a positive way, it can be ensured that they perform theirduties better and willingly. This will increase their job satisfaction and reduce physical and mental occupational burnout levels.Studies on job satisfaction that plays an important role in the quality of human life is increasing. It is also possible to determine the internal and external sources of motivation of the police with this scale adapted to the police who has an important place in today's society. This study, which may be an example in terms of selected sample and applied scales, can be developed in the future studies by identifying the factors that affect job stress, job satisfaction and burnout levels on police officers.
References and notes:
Aksoy, S. (2012) Samsun’ da Çalışan Polislerin İş Doyumu ve Tükenmişlik Düzeylerinin Yapısal Eşitlik Modellemesi ile İncelenmesi, Yüksek Lisans Tezi, Samsun
Alpar, R. (2011). Uygulamalı Çok Değişkenliİstatistiksel Yöntemler. Ankara: Detay Yayıncılık.
Ateş, H.(2012)Herzberg’in Çift Faktör Kuramı Kamu Okullarında Çalışan Öğretmenlerin Motivasyon Algılarını Açıklayabilir mi?: Ampirik bir Araştırma.Bilgi Ekonomisi ve Yönetimi Dergisi / 2012 Cilt: VII Sayı: II
Anderson, J. C., & Gerbing, D. W. (1984). The effect of sampling error on convergence, improper solutions and goodness-of-fit indices for maximum likelihood confirmatory factor analysis. Psychometrika, 49(2), 155-173.
Azizoğlu, Ö., Özyer, K.,( 2010) “Polislerde Tükenmişlik Sendromu Üzerine Bir Ampirik Çalışma”, Anatolia, 21(1) : 137-147.
Başaran, İ., (2000).Örgütsel Davranış, Ankara. Bernstein, I. (2000). Some consequences of violating SEM’s assumptions. Paper presented
at the annual meeting of Southwestern Psychological Association, Dallas, TX. Büyüköztürk, Ş. (2008). Veri Analizi El Kitabı (10. Baskı). Pegem/A Yayıncılık.Ankara.
Çokluk, Ö., Şekercioğlu, G., Büyüköztürk, Ş. (2010). Sosyal Bilimler İçin Çok Değişkenli
İstatistik. Ankara: Pegem Akademi. Cohen, J. (1988). Statistical power analysis for the behavioral sciences (2nd ed.). Hillsdale,
NJ: Lawrence Earlbaum Associates. Cole,D. A. (1987).Utility of confirmatory factor analysis in test validation research. Journal
of consulting and clinical psychology, 55(4), 584. Davis,K., (1988).İşletmelerde İnsan Davranışı; Örgütsel Davranış, A.RuhiSarpkaya,
İstanbul Erdağ,E(2010)Polis-halk ilişkileri bağlaminda, Polisin iş doyumu ve halkın polis
hizmetlerinden memnuniyet düzeyinin incelenmesi, Doktora tezi, Ankara Genç, N. (2005).Yönetim ve Organizasyon.(2. Basım). Ankara: Seçkin Yayıncılık Gilmartin, K. (2002). Emotional survival for law enforcement. Tucson, AZ: E-S Press.

318 Tugay Dikmen, Dudu Duygu Yıldırım, Aykut Yıldırım, Serap Ozbash Harrington, D. (2009). Confirmatory Factor Analysis. (Pocket Guide Series), New York:
Oxford University Press. Hooper, D.,Coughlan, J. ve Mullen, M. R. (2008). Structural Equation Modelling:
Guidelines for Determining Model Fit. Electronic Journal of Business Research
Methods, 6(1), 53–59.
Hu, L. ve Bentler, P. M. (1999). Cutoff criteria for fit indexes in covariance structure
analysis: Conventional criteria versus new alternatives. Structural equation modeling: A multidisciplinary journal, 6(1), 1–55.
Işıkhan, V. (1996). “Sosyal Hizmet Örgütlerinin İşlevsellik Ölçütü, İş Doyumu”,Milli Prodüktivite Merkezi Verimlilik Dergisi, Ankara.
Jöreskog, K. G., ve Sörbom, D. (1993). LISREL 8: Structural equation modeling with the SIMPLIS command language. Scientific Software International.
Kalaycı, S. (2010). SPSS Uygulamalı Çok Değişkenli İstatistik Teknikleri. Ankara: Asil Yayınevi
Keith, T. Z. (2005). Using Confirmatory Factor Analysis to Aid in Understanding the Constructs Measured by Intelligence Tests. D. P. Flanagan ve P. L. Harrison (Ed.),
Contemporary Intellectual Assessment: Theories, Tests, and Issues içinde (ss. 581–614).
New York, NY, US: Guilford Press.
Kelloway, E. K. (1996). Common practices in structural equation modeling. International
review of industrial and organizational psychology, 11, 141-180. Kline, R. B. (2005). Principles and Practice of Structural Equation Modeling. (2nd ed.)
New York: the Guilford Press.
Köklü,N., Büyüköztürk, Ş., ve Bökeoğlu, Ö. Ç. (2007). Sosyal bilimler için
İstatistik.(Geliştirilmiş 2.Baskı) Ankara: Pegem Yayıncılık. Magny, O.(2012) Intrinsic and Extrinsic Factors That Influence Job Satisfaction in Police
Officers Relative to Frederick Herzberg’s Motivation/Hygiene Theory Marsh, H. W., Balla, J. R., & McDonald, R. P. (1988). Goodness-of-fit indexes in
confirmatory factor analysis: The effect of sample size. Psychological bulletin, 103(3), 391.
Mertler, C. A. ve Vandatta, R. A. (2005) Advanced and Multivariate Statistical Methods: Practical
Noell. N. H. (1976). Herzberg’s Two-Factor Theory of Job Satisfaction, Study Project Report (76-1), DefenseSystems Management College, 1-38.
Onaran,O. (1981). Çalışma Yaşamında Güdülenme Kuramları. Ankara: Ankara Üniversitesi Siyasal bilimler
Fakültesi, Sevinç Matbaası, Yayın No.470. Stevens, J. (1996). Applied multivariate statistics for social sciences. (Third Edition).NJ:
Lawrence Erlbaum Publishers. Schumacker, E. R., ve Lomax, G. R. (1996). A beginner’s guide to structural equation
modeling. Mahwah, NJ: Erlbaum.
Şimşek,Ö. F. (2007). Yapısal eşitlik modellemesine giriş temel ilkeler ve LISREL
uygulamaları. Ankara: Ekinoks Yayıncılık. Tabachnick, B. G, Fidel, L. S. (2007).Using Mulivariate Statistics. MA: Allyn&Bacon, Inc Tuzgöl-Dost, M. (2007). Üniversite öğrencilerinin
yaşam doyumunun bazı değişkenlere göreincelenmesi. Pamukkale Üniversitesi Eğitim Fakültesi Dergisi, 2(22), 132-143. Uyargil, C., (1988).İş Tatmini Ve Bireysel Özellikler, İstanbul Üniversitesi

İşletmeFakültesi Yay. Varoğlu,K., (1992). “Türk Bilgisayar Sektöründe Örgütlenme Yapıları
ve Etkililik”,Yayınlanmamış Doktora Tezi, Ankara Üniversitesi.

Examining Internal and External Motivational Factors …. 319
Summary
Examining Internal and External Motivational Factors in Job Satisfaction
of Public Institution Managers and Employees
Tugay Dikmen Near East University, Cyprus
Dudu Duygu Yıldırım
Near East University, Cyprus
Aykut Yıldırım Near East University, Cyprus
Serap Ozbash
Near East University, Cyprus
Management and leadership are the most debated topics in recent times. Effective leadership is in the hands of individuals with high job satisfaction.It is certain that a manager with a high level of job satisfaction is more productive, more self-sacrificing and leading. Motivation plays a major role among the factors that affect
job satisfaction. Motivation can be expressed as meeting the expectations and needs of the individuals to achieve organizational goals. The aim of the research is to examine the internal and external motivational factors in the job satisfaction of the
police officers and their managers, who are important not only in ensuring public order and a safe society but also in reaching the objectives of the Police Department as a public institution. The universe in the research is the police and the managers who work in the Bursa Police Department. The data were obtained
using the Internal and External Motivation Scale, based on Herzberg's Hygiene and Motivation Theory, prepared by Magny (2012).The scale consist of two parts. The scale was rated on the 6th Likert type. After the scale was adapted to Turkish, it was distributed to the police and managers via the internet. The results obtained are
discussed in the article.
Key Words: Manager,leadership, motivation, job Satisfaction

Khazar Journal of Humanities and Social
Sciences © Khazar University Press 2017
DOI: 10.5782/kjhss.2017.320.325
The effects of the Immigration on Women’s health
Gulkan Ay
Selahittin Ay
Introduction
The values of society are shaped by individuals. The values of individuals are also influenced by their attitudes towards the world. Health consciousness and well-being in many societies are a reflection of people's social group or their group
membership. Values, behaviors, opinions, attitudes are conditioned and shaped by the social group that has existed since childhood.Health and healthcare practices differ in different ethnic, racial, religious, social classes (Duran, 2012).
Along with globalization in almost all regions of the world wars, ethnic conflicts, environmental crises, repressive regimes, economic collapse causing many people to intentionally or compulsively migrate to their country or to other countries as immigrant asylum seekers. In this case, multicultural populations of individuals, families and groups from different cultures and subcultures are emerging in the world (Temel, 2008).
International human rights aimed at protecting the concept of human rights, which express fundamental rights and freedoms that all people are born equal and free in terms of dignity and rights. Everyone has equal opportunity and equal rights regardless of freedom equality and the inadmissibility principles of sex-based discrimination have been accepted. However, when evaluated in the historical process there is always a clear distinction between the existence and the use of rights against women and this distinction continues today in different areas and dimensions (Erşen, 2006).
Being healthy is the basic right of every person, maintenance of health and ensuring its continuity is the main goal of the individual as far as health professionals. The health level of a community is assessed by the presence of healthy individuals. For this reason, the family is closely related to the health of society, therefore, women's health must be addressed, protected and promoted. In
320

The effects of the Immigration on Women’s health 321 order to fulfill her motherhood and social duties for women, it is important to be healthy and practice health promotion behaviors (Bilgili, Ayaz 2009).
Women have been the main component of every society since the beginning of humanity. They have provided fertility and increased health and contributed to the economy with their productivity. Health is a state of complete physical, mental and social well-being and not merely the absence of disease or infirmity defined by World Health Organization (WHO) in 1948 and still accepted by the whole world. When examining the situation of women's health in terms of illness and disability it is also necessary to examine the completely well-being situation (Medline).
A fact known accepted by everyone nowadays is the linear relationship between women's social status and their health. Conditions also increases the risk of the migrant women's health such as not working in a paid job which means economically dependent, violence in the society especially in the households, being unable to have a word on their own body (controlling and maintaining sexual and reproductive health), lack of education, regional inequalities and not accessing the health services (Gökkaya 2009).
Being a refugee or immigrant in a country affects women's health negatively. In many countries of the world, the status of immigrant women is low. Due to they both women and immigrants may face problems such as sexual harrasment, rape and violence. The highest risk group for violence against women are the elderly people, homelesses, refugees, immigrants and ethnic minorities (Nandi, Platt 2010). Immigrant women are at risk for preventable diseases but it is very difficult to deal with this population in health improvement efforts. The greatest factor is the language problem in providing healthcare services. Furthermore, inadequate social security, economic troubles, infrastructure problems of the region, and the distance from health centers immigrant women do not access and utilize the healthcare services sufficiently. As a consequence of this situation, they are at risk for any health problem. Many of hospitals, community health organizations, and health departments are trying to provide health care services to the immigrant population. Implementation of health development programs and providing health care services are expensive and can not be improved due to the high attrition rate (Dornelas ve ark 2007, Topçu, Beşer 2006). One of the factors that negatively affect the immigrant women's health is the inability to access health services or the lack of benefiting from existing services. The main reasons for the inability of immigrant women to reach health services are language problems, insufficient education, insufficient job opportunities and inadequate income levels. Education is crucial for individuals to be decisive for future job and income opportunities and to facilitate one's access to information. Immigrant women are not adequately trained in the countries they live in because of economic difficulties, cultural differences and language problems. As a result,

322 Gulkan Ay, Selahittin Ay job opportunities are limited and hard and they have to work in jobs with little financial income and without social security. As a result of this situation, violence against women may encounter situations that affect health negatively such as not receiving reproductive health services, unwanted pregnancies, teenage pregnancies, abortions in unhealthy conditions, sexually transmitted diseases, delays in diagnosis. Consequently, violence against women may encounter situations that affect health negatively such as not receiving reproductive health services, unwanted pregnancies, teenage pregnancies, abortions in unhealthy conditions, sexually transmitted diseases, delays in diagnosis (Şimşek 2011).
Although the concept of disease and health differs according to ethnic differences, it is necessasry to consider the age, family, education, religion, social structure, emotional and social status of women while evaluating and providing healthcare. Women's health is closely related to the social, political, economic and technological development level of societies. Women's health should be considered and evaluated including socioeconomic components of disease and health the
process from mother's womb to childhood and womanhood (Duran, 2012). In migrant women, giving birth depending on the traditional culture is considered very important in terms of the continuity of their status but due to their beliefs, utilization of family planning services are low. Migrant women do not benefit from antenatal care services adequately; birth rates in hospitals are low due to
sociocultural and psychological factors such as economic situation, environment, fear, and birth rates are higher without health personnel at home.It is a known fact that giving birth on unhealthy conditions with unauthorized person affect the maternal and infant health and increase the mortality rates (Topçu, Beşer). In addition to these factors that affect the health of migrant women negatively, lack of healthcare services in the areas where they live and low utilization of existing services also causes health problems to increase. Preventive health centers are numerically inadequate and insufficient to identify the problems of the population
at risk, provides more polyclinic services services instead of preventive health services. This leads to inability of utilizing the health services for immigrant women and ultimately to face preventable health risks. Besides the inadequacy of health services, it is a fact that immigrant women are not able to utilize the health
services because of the economic conditions, lack of health insurance, failure of local services to respond their needs, foreignness, laws, economic reasons, transportation, unable to find someone to look after children for working women, working hours and language problem (Şimşek, 2011). It is a fact known that immigrants accept issues such as to be a part of the community and finding jobs where they live in and having better living conditions as more important than their health behavior. It has been observed that migrant individuals are not utilizing these services sufficiently in terms of maternal infant health and family planning services which are part of primary health care. Immigrant women are unable to reach and use effective family planning methods,

The effects of the Immigration on Women’s health 323
due to cultural differences, inappropriate use of counseling are experiencing unwanted pregnancies because of the cultural pressure for birth to women. The woman, who can not prevent pregnancy, is directed at willful abortions in this case. (Topçu, Beşer 2006). Immigrant families in developing countries are generally at greater risk of unwanted pregnancies and domestic violence compared to the general population due to their poor living in shanty towns. In addition, women are at risk of sexual exploitation, sexually transmitted diseases and sexual violence. Women are usually forced into prostitution. This situation endanger women at risk for unwanted pregnancies, sexually transmitted diseases and HIV infection. Furthermore, factors such as the belief that more than one sexual partner increase the social status of men, tattooing, using of family planning method accepted as a sin causes risk for sexually transmitted diseas in some cultures (Aksu, Sevil 2010). Culture is an important factor in shaping identity. Due to the differences between their own cultures and the cultures of the countries where they live, various problems can emerge in migrants. These problems that may arise as a consequence of accepting new culture, or accepting or influencing both cultures. This situation
can cause significant mental health problems especially in young people. The young people who adapt to the new culture are being oppressed and even violent by the families who are dependent on traditional values. Young people who do not
accept the new culture are exposed to critical approaches to social exclusion. In all this vacillation, young people stand alone and suffer spiritually in this difficult periods. Especially in young girls problems such as drug addiction, smoking and drinking alcohol, unsafe sexual behaviors and eating disorders can occur (Gül,
Kolb 2009).
The most frequently health problems occurred in migrant women can be summarized as; infectious diseases, not using family planning services, inability to utilize prenatal care services, low rate of births at the hospital, high rates of births without health personnel at home, abortions that sometimes occur spontaneously, wide range of pregnancies in short intervals (Aksu, Sevil 2010).
Consequently, health and health care practices vary in different ethnic, racial, religious, and social classes. Immigration has many effects on health and health behaviors. Immigrant women are at risk for preventable diseases, but it is difficult to deal with this population in health improvement efforts. The biggest factor is the language problem in providing health care services. Also, inadequate social security, economic difficulties, infrastructure problems of the region, and the distance from health centers immigrant women do not access and utilize the healthcare services sufficiently.

324 Gulkan Ay, Selahittin Ay References and notes:
Aksu H, Sevil Ü. Göç ve Kadın Sağlığı. Maltepe Üniversitesi Hemşirelik Bilim ve Sanatı Dergisi 2010; Cilt:2, Sayı:3:133-8.
Bilgili N, Ayaz S. Kadınların Sağlığı Geliştirme Davranışları ve Etkileyen Faktörler. TAF Preventive Medicine Bulletin 2009; Cilt: 8(6):497-502.
Duran ET. Prenatal ve Postnatal Dönemde Kültürel Yaklaşım. İn: Kültürlerarası Hemşirelik, Seviğ Ü, Tanrıverdi G, 1. Baskı, İstanbul Tıp Kitapevi, İstanbul, Türkiye,2012; 325-358.
Dornelas EA, Stepnowski RR, Fischer EH, Thompson PD. Urban Ethnic Minority Women’s Attendance at Health Clinic vs. Church Based Exercise Programs. J Cross Cult Gerontol 2007; 22:129–136
Erşen UB.Birleşm,ş Milletler Kadınlara Karşı Her Türlü Ayrımcılığın Önlenmesi Sözleşmesi ve Denetim Mekanizması. Yüksek Lisans Tezi. Ankara Üniversitesi Sosyal Bilimler Enstitüsü Uluslararası İlişkiler Ana Bilim Dalı, 2006 Ankara.
Gökkaya VB. Türkiye'de Şiddetin Kadın Sağlığına Etkileri. C.Ü. İktisadi ve İdari Bilimler Dergisi 2009; Cilt 10, Sayı 2: 167-179.
Gül V, Kolb S. Almanya'da Yaşayan Genç Türk Hastalarda Kültürel Uyum, İki Kültürlülük ve Psikiyatrik Bozukluklar. Türk Psikiyatri Dergisi 2009;20 (2):138-143
Nandi A, Platt L.Ethnic minority women’s poverty and economic well being. Government Equalities Office 2010; 1-174.
Racial and Ethnic Disparities in Women’s Health Coverage and Access To Care Findings from the 2001 Kaiser Women’s Health Survey. ERİŞİM:20.05.2013 http://www.nlm.nih./medlineplus
Şimşek H. Toplumsal Cinsiyet Eşitsizliğinin Kadın Üreme Sağlığına Etkisi: Türkiye Örneği. DEÜ Tıp Fakültesi Dergisi 2011; cilt 25, sayı 2: 119 – 126
Temel AB. Kültürlerarası (Çok Kültürlü) Hemşirelik Eğitimi. Atatürk Üniversitesi Hemşirelik Yüksekokulu Dergisi 2008; Cilt:11, Sayı: 2: 92-101
Topçu S, Beşer A. Göç ve Sağlık. C.Ü. Hemşirelik Yüksekokulu Dergisi 2006; 10(3):37-42.

The effects of the Immigration on Women’s health 325
Summary
The effects of the Immigration on Women’s health
Gulkan Ay
Selahittin Ay
A lot of people intentionally or forcefully migrate within own country or abroad as
asylum seekers with effects of globalisation because of situations such as wars, ethnic conflicts, environmental crisis, oppressive regimes, economical depression in almost every regions of the World. Thus, multicultural populations come forward individuals with different cultures and subcultures, families and groups. Health and and Heallth care differentiate between different ethnic, religious, social levels. There are a lot of effects of being migrant on health and healthcare sytems. The health level of a society can evaluate with existence of healthy individuals. The woman health needs to discuss, preserve and enhance primarily due to relation with health of family with reference to society. The term of migration, effects of migration on women’s health and difficulties to promote health levels of migrant women are discussed in this study.
Keywords: Migration, Migrant Women, Women's Health, Health

Khazar Journal of Humanities and Social Sciences
© Khazar University Press 2017 DOI: 10.5782/kjhss.2017.326.339
Examination of Control Focus and Psychological
Endurance Levels by Various Variables According to
Sports Activity
Hande Baba Kaya
Sakarya University, Sakarya
Fikret Soyer
Sakarya University, Sakarya
Murat Sarıkabak
Bartın University, Bartın
Atike Yılmaz
Bilecik Sheyh Edebali University, Bilecik
Introduction
The individual is exposed to the influence of his/her family and community from the moment of birth. He/she shapes the causes of the behaviors he/she exhibits and
how they relate to these causes and whatresults they will produce, according to the structure of the family and the society in which they grow (Rotter, 1975; Wong-
McDonald and Gorsuch, 2004). It is assumed that individuals has the expectation that the behavior exhibited by the individual will reach the desired result and these
expectations are the most important indicators of the behaviors exhibited by individuals. The concept of control focus developed by Rotter to explain this
process appers (Dağ, 1991; Dilmaç, 2008:3; Kıral, 2012:51; Şahin et al., 2009).
The control focus is a concept regarding on which people the individuals lay burden of the the reasons for the events they face. It refers to the life of the person, the events they encounter, and the assessments that guide the outcome of these events.
326

Examination of Control Focus and Psychological…. 327
In other words, the control focus is the extent to which a person has control over the events (Özmen et al., 2008: 126; Çınar and Karcıoğlu, 2012:286; Rotter, 1966;
Yeşilyaprak, 2014:244) In the studies, the concept of control focus was considered as a dimension of personality and it was stated that it shows two different
characteristics as internal control and external control focus in the individual(Dağ, 2002;Ören, 1991; Phares, 1976; Rouse and Cashin, 2000). Individuals with higher
levels of internal control focus believe that the consequences of events they experience are the result of their own behaviors and responsibilities. External control-oriented individuals, however, associate events and consequences with
factors outside of them (Özmen et al., 2008: 126; Kıral, 2012: 58; Tümkaya, 1998:1; Battle and Rotter, 1963; Rotter and Mulry, 1965; Stipek, 1993).
Another concept related to the concept of control focus is psychological endurance. When the literature is examined, it is seen that psychological endurance is related to the concepts of self-esteem (Fergusson and Lynskey, 1996), self-control (Baumeister and Exline, 2000) and control focus (Cowen et al., 1990).
Psychological endurance is defined as a personality trait that expresses the individual's ability to maintain his/her health and mood positively even under stress and pressure (Maddi, 1994). In other words, psychological endurance can be
defined as the positive psychological potential of the individual,which can be developed to change back by having the power of self-recovery in positive developments such as mishaps, failures, conflicts, and development, progress, and
increased responsibilities (Luthans, 2002).
Although many factors affecting psychological endurance are mentioned, they are
collected in three basic categories and these categories are listed as family harmony and support, personal structural features and external support systems(Haase 2004).
It is emphasized that in family harmony and support, relationship with at least a family member is important. In personal, structural features,the competences and abilities demonstrated in the fields of physical, cognitive and spiritual development
are at the forefront. External support systems include other people, such as friends, teachers, neighbors, who help individuals cope with the challenges they face in their
daily lives.(Olsson et al. 2003¸ Hawley and DeHaan 1996; Brooks 1994).
The emotional state of the athletes influences their performance. This can be
positive or negative(Trotter and Endler, 1999). It isimportant to deal with the excitement, stress and pressure experienced by athletes in sports competitions as
much as fighting against an opponent. Experienced situations such as the extended duration of the match, fatigue, decreased endurance, and injuries put pressure on
athletes both physiologically and psychologically(Fauvel and Ducher, 2009; Li et al., 2009; Christian et al., 2013). The fact that the athletesare able to deal with these
situations which affect and control them positively reveals the importance of psychological endurance and control focus in order to be successful. In this study,
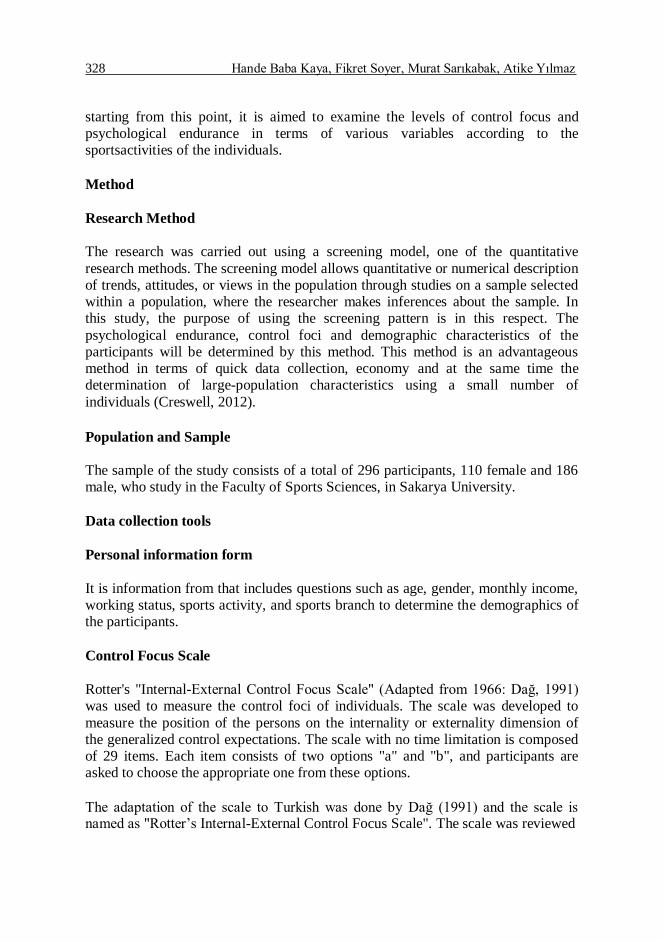
328 Hande Baba Kaya, Fikret Soyer, Murat Sarıkabak, Atike Yılmaz
starting from this point, it is aimed to examine the levels of control focus and psychological endurance in terms of various variables according to the sportsactivities of the individuals.
Method
Research Method
The research was carried out using a screening model, one of the quantitative
research methods. The screening model allows quantitative or numerical description of trends, attitudes, or views in the population through studies on a sample selected within a population, where the researcher makes inferences about the sample. In this study, the purpose of using the screening pattern is in this respect. The
psychological endurance, control foci and demographic characteristics of the participants will be determined by this method. This method is an advantageous method in terms of quick data collection, economy and at the same time the determination of large-population characteristics using a small number of
individuals (Creswell, 2012).
Population and Sample
The sample of the study consists of a total of 296 participants, 110 female and 186 male, who study in the Faculty of Sports Sciences, in Sakarya University.
Data collection tools
Personal information form
It is information from that includes questions such as age, gender, monthly income, working status, sports activity, and sports branch to determine the demographics of the participants.
Control Focus Scale
Rotter's "Internal-External Control Focus Scale" (Adapted from 1966: Dağ, 1991) was used to measure the control foci of individuals. The scale was developed to
measure the position of the persons on the internality or externality dimension of the generalized control expectations. The scale with no time limitation is composed of 29 items. Each item consists of two options "a" and "b", and participants are asked to choose the appropriate one from these options.
The adaptation of the scale to Turkish was done by Dağ (1991) and the scale is named as "Rotter’s Internal-External Control Focus Scale". The scale was reviewed

Examination of Control Focus and Psychological…. 329
and translated by experts in the field of psychometry and clinical psychology, and it was put into the final form, taking cultural suitability into consideration. In the reliability studies performed, Cronbach alpha internal consistency coefficient calculated of scale from 532 samples, where item-total correlations vary between
.08 and .41, is .71, and KR-20 reliability coefficient for 99 samples is .68.
Psychological Endurance Scale for Adults
Psychological Endurance Scale for Adults consists of the dimensions of 'personal power', 'structural style', 'social competence', 'family adjustment' and 'social
resources' developed by Friborg et al.(2003). Confirmatory factor analysis was conducted with the validity and reliability study of the scale by Basım and Çetin
(2011) and the six-factor structure explained a total of 57% variance. Internal consistency values of the structural equation model for reliability of the scale were
found to be 0.80 for 'Self-perception’, 0.75 for 'Perception of the Future', 0.82 for 'Social Competence', 0.86 for 'Family Harmony’, 0.84 for 'Social Resources' and
0.76 for 'Structural Style'(Basım and Çetin, 2011).
Analysis of data
The demographic characteristics of the participants and the scores obtained from the control focus and psychological endurance scales were explained using percentage, frequency, arithmetic mean, standard deviation from descriptive statistical methods. Independent T-test and one-way ANOVA test were used to determine whether scores of control focus and psychological endurance differ according to demographic variables.
Findings
Table 1. Demographic information distribution of participants
Factor Variable f % Age 17-20 45 15,2 21-25 198 66,9 26-30 46 15,5 30 and over 7 2,4 Gender Famale 110 37,2 Male 186 62,8 Monthly income Low 29 9,8 Medium 212 71,6 High 55 18,6 Working status Working 86 29,1 Not working 210 70,9
Sports activity Doing 152 51,4 Not doing 144 48,6 Sports branch Team sports 148 50,0 Individual sports 148 50,0 Total 296 100,0

330 Hande Baba Kaya, Fikret Soyer, Murat Sarıkabak, Atike Yılmaz
Table 1 gives the distribution of personal information of the participants. According
to the data, it was concluded that 66.9% of the participants (n=198) were in the "21-25" age group and 62.8% (n=186) were "Male", monthly income status of 71.6% (n=212) is medium, 70,9% (n=210) do not work, 51,4% actively do sports and 50% (n=148) do team sports.
Table 2. T-test results of participants' control focus and psychological endurance
subscale scores by gender Gender N X S sd t p
Control focus Famale 110 11,09 2,90 294 2,36 ,019
Male 186 10,34 2,44
Structural Style Famale 110 12,49 2,66 294 ,882 ,379
Male 186 12,20 2,72
Perception of the Famale 110 12,24 2,54 294 1,45 ,146
Future Male 186 11,76 2,82
Family harmony Famale 110 19,17 3,35 294 2,15 ,032
Male 186 18,26 3,58
Social Resources Famale 110 19,84 3,97 294 ,072 ,943
Male 186 19,81 3,86
Self-perception Famale 110 17,75 3,61 294 -,235 ,814
Male 186 17,85 3,49
Social Competence Famale 110 18,90 3,54 294 1,59 ,111
Male 186 18,16 4,08
There is a significant difference in the family harmony dimension [t(294)=2,15, p<.05] from the control focus[t(294)= 2,36, p<.05] and psychological endurance
subscales when the participants' control focus and psychological endurance subscale scores were compared by gender. In the family harmony subscale, it is seen that the scores of women (X = 19,17) are higher than that of men (X = 18,26). Regarding the control focus scores, it can be said that women (X = 11,09) have
higher scores than men (X = 10,34) and therefore are externally controlled.

Examination of Control Focus and Psychological…. 331
Table 3. T-test results of participants' control focus and psychological
endurance subscale scores by working status
Working N X S sd t p
status
Control focus Working 86 10,51 2,52 294 -,457 ,648
Not 210 10,66 2,69 working
Structural Style Working 86 12,47 2,70 294 ,676 ,500
Not 210 12,24 2,70 working
Perception of the Working 86 12,05 3,08 294 ,452 ,651 Future
Not 210 11,90 2,57
working
Family harmony Working 86 18,37 3,74 294 -,716 ,475
Not 210 18,69 3,43 working
Social Resources Working 86 20,00 4,08 294 ,495 ,621
Not 210 19,75 3,83 working
Self-perception Working 86 17,55 3,54 294 -,807 ,420
Not 210 17,92 3,53 working
Social Competence Working 86 19,02 3,70 294 1,653 ,099
Not 210 18,20 3,96 working
There is no significant difference between participants' control focus and psychological endurance subscale scores when compared to their working status.

332 Hande Baba Kaya, Fikret Soyer, Murat Sarıkabak, Atike Yılmaz
Table 4. T-test results of participants' control focus and psychological endurance subscale scores by sports activity
Active N X S sd t p
sports
Control focus Doing 15 10,73 2,48 294 ,769 ,443 2
Not doing 14 10,50 2,80
4
Structural Style Doing 15 11,98 2,76 294 -2,17 ,030 2 Not doing 14 12,65 2,59
4
Perception of Doing 15 11,84 2,88 294 -,630 ,529
the Future 2
14 12,04 2,55
4
Family harmony Doing 15 18,11 3,66 294 -2,44 ,015
2 Not doing 14 19,11 3,30
4
Social Doing 15 19,64 3,88 294 -,813 ,417 Resources 2
Not doing 14 20,01 3,92
4
Self-perception Doing 15 17,84 3,64 294 ,155 ,877 2
Not doing 14 17,78 3,43
4
Social Doing 15 18,32 3,84 294 -,529 ,597 Competence 2
Not doing 14 18,56 3,97
4
When the participants' control focus and psychological endurance subscale scores
were compared according to the sports activity, there is a significant difference in the structural style [t(294)= -2,17, p<.05]and family harmony[t(294)= -2,44, p<.05] dimension from the psychological endurance subscales. In the family harmony
subscale, it is seen that those who do not do sports actively (X = 19,11) have higher scores than those who do(X = 18,11). Structural style dimension also shows that those who do not do sports actively (X = 12,65) have higher scores than those who do (X = 11,98).

Examination of Control Focus and Psychological…. 333
Table 5. Anova results of participants' control focus and
psychological endurance subscale scores by age
Source of variance Sum of sd Squares f p Meaning
squares average differences
Control Between 21,96 3 7,32 1,045 ,373 -
focus groups
In groups 2045,65 292 7,00
Total 2067,62 295
Structural Between 30,89 3 10,29 1,417 ,238 -
Style groups
In groups 2122,51 292 7,26
Total 2153,40 295
Perception of Between 34,39 3 11,46 1,551 ,202 -
the Future groups
In groups 2158,74 292 7,39
Total 2193,13 295
Family Between 65,02 3 21,67 1,760 ,155 -
groups
harmony In groups 3595,93 292 12,31
Total 3660,95 295
Social Between 236,10 3 78,70 5,401 ,001 3-1
Resources groups 3-2
In groups 4254,75 292 14,57 3-4
Total 4490,86 295
Self- Between 65,66 3 21,88 1,762 ,154 -
perception groups
In groups 3626,48 292 12,41
Total 3692,14 295
Social Between 31,90 3 10,63 ,696 ,555 -
Competence groups
In groups 4459,00 292 15,27
Total 4490,90 295

334 Hande Baba Kaya, Fikret Soyer, Murat Sarıkabak, Atike Yılmaz
The results of the analysis show that there is a significant difference between the
age variables of the participants in the social resources subscale from the psychological endurance subscales [F(3-292)= 5.401, p<.05]. There is no significant difference observed between other dimensions and control focus and age varible. According to the results of scheffe test performed to find out which groups
have difference in terms of age,it was determined that the social resources level of 3rd group (age 26-30) (X=21,63) is higher than 2nd group(age 21-25) (X=19,69) and 4th group (age 30 and higher) (X=17,14).
Table 6. T-test results of participants' control focus and psychological
endurance subscale scores by branch
Branch N X S sd t p
Control team sports 148 10,58 2,58 294 -,219 ,827
focus individual 148 10,65 2,71
sports
Structural team sports 148 11,86 2,42 286 -2,87 ,004
Style individual 148 12,75 2,88
sports
Perception of team sports 148 11,75 2,73 294 -1,19 ,233
the Future individual 148 12,13 2,71
sports
Family team sports 148 18,20 3,50 294 -1,95 ,050
harmony individual 148 19,00 3,50
sports
Social team sports 148 19,79 3,77 294 -,119 ,905
Resources individual 148 19,85 4,03
sports
Self- team sports 148 17,45 3,27 294 -1,78 ,076
perception individual 148 18,18 3,76
sports
Social team sports 148 18,37 3,78 294 -,297 ,766
Competence individual 148 18,50 4,03
sports
When the participants' control focus and psychological endurance subscale scores
were compared according to the active sports branches, it was found that there is a significant difference in the structural style [t(294) = -2,87, p<.05]and family harmony[t(294) = -1,95, p<.05] dimension from the psychological endurance subscales, but in the self-perception dimension[t(294) = -1,78, p>.05], this
difference is not significant. In the family harmony subscale, it is seen that those who do individual sports activities (X = 19.00) have higher scores than those who do team sports(X = 18.20). In the structural style dimension, it is seen that those

Examination of Control Focus and Psychological…. 335
who do individual sports activities (X = 12,75) are higher than those who do team sports (X = 11,86).
Discussion and Conclusion
In the data obtained from the research; according to the gender variable of the participants, there is a significant difference in the family harmony from the control focus and psychological endurance subscales, and no significant difference was found according to the working status. According to sports activity and sports
branches; there is a significant difference in the structural style and family harmony dimension from the psychological endurance subscales. There is a significant difference in social resources from psychological endurance subscales among age variables.
When examined in terms of gender, the level of psychological endurance of female students is higher than that of male students. In the studies conducted, it was stated that gender variable has an effect on psychological endurance (Önder and Gülay,
2008; Cole et al., 2004; Oktan, 2008). It was pointed out that men are affected more by psychological troubles, domestic disputes and the risky situations brought about than women (Benard, 1993; Garmezy, 1993). The results of the studies made support the findings of our study.
In addition, studies that relate psychological endurance to variables such as gender and age have indicated that there are also inconsistent results (Hannah and Morrisey, 1987; Shepperd and Kashani, 1991).
In the control focus scores according to the gender variable, it can also be said that women(X = 11,09) are more externally controlled because they have a higher score than men (X = 10,34).
In the literature; it was indicated that individuals with internal control focus believe less in chance and coincidence, feel better, have better coping skills, have higher internal motivations, are more successful on tasks and responsibilities, and have higher academic success than externally controlled individuals (Jansenn and Carton, 1999; Park and Kim, 1998; Ozolins and Stenstrom, 2003; Fazey and Fazey, 2001; Elise et al.,1998).
It was observed that individuals with high external control focus have problem
solving and inadequate self-perception tendencies (Malki, 1998), In their study, Martin et al. (2005) found that control focus is effective in human relations and social skills, and that externally controlled individuals are weaker in human relations and social skills.

336 Hande Baba Kaya, Fikret Soyer, Murat Sarıkabak, Atike Yılmaz
According to sports activity and sports branches; there is a significant difference in the structural style and family harmony dimension from the psychological endurance subscales. This difference is in favor of those who do sports actively.
While sports serve for the purpose of participation in healthy lifestyles and sports activities for sedentary individuals, their performance is the most important factor for them as it is a profession for active athletes. Because the goal for the athlete is not only to be physically healthy, but also to achieve success, mentally and
psychologically, with physical performance. Childs and Wit (2014) stated that regular exercise prevents the negative effects on the individual's mental development. In addition, it can be said that the support of these individuals by their families to be successful and their care affect positively both the family relations
and the dynamics within the family, in the high scores of family harmony of those who continue to do sports actively. This supports the findings of our study.
Significant differences were found in social resources from psychological endurance subscales among age variables in the study. Hjemdal et al. (2006) stated that the dimension of social resources includes the perception of social support by the interest and closeness shown by the individual's environment. As a result, it was
observed that actively doing sports creates a significant difference in some of the control focus and psychological endurance subscales. In this context, sedentary individuals can be encouraged to actively do sports, to increase their psychological
endurance and to strengthen their focus.
References and notes:
Basım, N.H., Çetin, F. ‘’Reliability and Validity Studies of Resilience Scale for Adults’’,Turkish Journal of Psychiatry, 22:2 (2011):104-114.
Battle, E. S. and Rotter, J. B. ‘’Children's feelings of personal control as related to social class and ethnic group’’, Journal of Personality, 31:4(1963):482-490.
Baumeister, R. F. and Exline, J. J. ‘’Self-control, morality, and human strength’’,Journal of Social and Clinical Psychology, 19:1(2000): 29-42.
Benard, B.Resiliency: What We Have Learned, WestEd Publishers.San Francisco: 2004
Brooks, R. B. ‘’Children at risk: fostering resilience and hope’’,American Journal of
Orthopsychiatry, 64:4 (1994): 545. Childs, E., & de Wit, H. ‘’Regular exercise is associated with emotional resilience to acute
stress in healthy adults’’,Frontiers in Physiology, 5. 2014 Christian, L. M., Glaser, R., Porter, K. and Iams, J. D. ‘’Stress-induced inflammatory
responses in women: effects of race and pregnancy’’, Psychosomatic Medicine, 75:7(2013): 658-669.

Examination of Control Focus and Psychological…. 337
Cole, P. M., Martin, S. E. and Dennis, T. A. ‘’Emotion regulation as a scientific construct:
Methodological challenges and directions for child development research’’Child Development, 75:2 (2004): 317-333.
Cowen, E. L., Wyman, P. A., Work, W. C. and Parker, G. R. ‘’The Rochester Child Resilience Project: Overview and summary of first year findings’’, Development and Psychopathology, 2:2 (1990): 193-212.
Creswell, J. W. Educational research: Planning, conducting, and evaluating quantitative
(pp. 146-166). Upper Saddle River, NJ: Prentice Hall. 2002 Çınar, O. ve Karcıoğlu, F. ‘’A Study on the Level of Hopelessness and Locus of Control:
The Sample of Office Management Students of Vocational High School in Erzincan University’’Atatürk UniversityJournal of Graduate School of Social Sciences,16:3 (2012):283-296.
Dağ, İ. ‘’Rotter’in İç-Dış Kontrol Odağı Ölçeği (RİDKOÖ)’nin üniversite öğrencileri için güvenirliği ve geçerliği’’, Psikoloji Dergisi, 7:26 (1991): 10-16.
Dağ, İ. ‘’Kontrol odağı ölçeği: ölçek geliştirme geçerlilik ve güvenirlilik çalışması’’ Turkish Journal of Psychology, 17:49 (2002): 77-90.
Dilmaç, O. ‘An examination of the visual art teacher candidate’s focus of control in terms of
different variables’’, Journal of Institute of Fine Arts, 20 (2008): 1-14. Elise, R. H., Bryan, H. and Kathleen, C. ‘’Adolescent Health: The Relationships Betwen
Health Locus of Control, Beliefs and Behaviours’’, Guidance & Counseling, 13:3 (1998): 23-30.
Fauvel, J. P. and Ducher, M. (2009). Racial differences and cardiovascular response to psychological stress.American Journal of Hypertension, 22:7 (2009): 696
Fazey, D. M. and Fazey, J. A. ‘’The potential for autonomy in learning: Perceptions of competence, motivation and locus of control in first-year undergraduate students’’,Studies in Higher Education, 26:3 (2001): 345-361
Fergusson, D. M., Horwood, L. J. and Lynskey, M. T. (1996). ‘’ Childhood sexual abuse and psychiatric disorder in young adulthood: II. Psychiatric outcomes of childhood sexual abuse’’Journal of the American Academy of Child & Adolescent Psychiatry, 35:10 (1996): 1365-1374.
Frıborg, O., Hjemdal, O., Rosenvınge, J. H. and Martınussen, M. ‘’A new rating scale for
adult resilience: What are the central protective resources behind healthy adjustment?’’, International Journal of Methods in Psychiatric Research, 12
(2003): 65-76. Garmezy, N. ‘’Children in poverty: Resilience despite risk’’, Psychiatry, 56:1 (1993): 127-
136. Hannah, T. E., and Morrissey, C. ‘’Correlates of psychological hardiness in Canadian
adolescents’’,The Journal of Social Psychology, 127:4 (1987): 339-344. Hjemdal, O.,Friborg, O., Stiles, T. C., Martinussen, M. and Rosenvinge, J. H. ‘’A new scale
for adolescent resilience: grasping the central protective resources behind healthy development’’, Measurement and Evaluation in Counseling and
Development, 39 (2006): 84- 96. Hawley, D.R, DeHaan, L. ‘’Toward a Definition of Family Resilience: Integrating Life-span
and Family Perspectives’’,Fam Process, 35 (1996):283-298 Janssen, T. and Carton, J. S. ‘’The effects of locus of control and task difficulty on
procrastination’’The Journal of Genetic Psychology, 160:4 (1999): 436-442. Kıral, E. ‘’The relationship between locus of control and perfectionism perception of the
primary school administrators’, PhD Thesis, Ankara University, Ankara: 2012

338 Hande Baba Kaya, Fikret Soyer, Murat Sarıkabak, Atike Yılmaz Li, H., Handsaker, B., Wysoker, A., Fennell, T., Ruan, J., Homer, N. and Durbin, R. ‘’The
sequence alignment/map format and SAMtools’’ Bioinformatics, 25:16 (2009):
2078-2079. Luthans, F. ‘’The need for and meaning of positive organizational behavior’’Journalof
Organizational Behavior, 23:6 (2002): 695-706. Maddi, S. R. The Hardiness Enhancing Lifestyle Program (HELP) for improving physical,
mental, and social wellness. Wellness lecture series, (1994): 1-16. Malki, R. (1998). Davranışlarda iç-dış kontrol odağı ile ruh sağlığı arasındaki ilişkinin
incelenmesi. Yayınlanmamış yüksek lisans tezi. Ege Üniversitesi, İzmir. Martin, R., Thomas, G., Charles, K., Epitropaki, O. and McNamara, R. ‘’The role of leader‐
member exchanges in mediating the relationship between locus of control and
work reactions’’,Journal of Occupational and Organizational Psychology, 78:1 (2005): 141-147.
Oktan, V. ‘’Investigate resilience of adolescents who are getting prepared for the university
entrance exam’’ PhD Thesis, Karadeniz Technical University, Trabzon: 2008
Olsson, C. A., Bond, L., Burns, J. M., Vella-Brodrick, D. A. and Sawyer, S. M. ‘’Adolescent resilience: A concept analysis’’ Journal of Adolescence, 26.1 (2003): 1-11.
Ozolins, A. R. and Stenstrom, U. ‘’Validation of health locus of control patterns in Swedish
adolescents’’ Adolescence, 38:152 (2003): 651. Önder, A. and Gülay, H. (2008). Resilience of 8th grade students in relation to various
variables. Buca Faculty of Education Journal, 23 (2008): 192-197. Ören, N. (1991). Denetim odağı ve kendini kabul arasındaki ilişkiler. Psikolojik Danışma ve
Rehberlik Dergisi. 1:2 (1991): 20-28. Özmen, E., Özmen D., Deveci, A. and Taşkın, O. E. ‘The effect of locus of control on
attitudes towards depression and schizophrenia’’Anatolian Journal of Psychiatry, 9 (2008): 125-131.
Park, K. S. and Kim, S. H. ‘’Artificial intelligence approaches to determination of CNC machining parameters in manufacturing: a review’’Artificial Intelligence in Engineering, 12:1 (1998): 127-134.
Phares, E. C. Locus of control in personality, General Learning Pres.New Jersey: 1976 Rotter, J.
B. ‘’ Some problems and misconceptions related to the consturct of internal versus external control of reinforcement’’Journal of Consulting and Clinical Psychology. 43(1975): 56-57.
Rotter, J. B. and Mulry, R. C. ‘’Internal versus external control of reinforcement and decision time’’Journal of Personality and Social Psychology, 2:4 (1965): 598.
Rotter, J.B. ‘’Generalized ezpectancies for internal versus external of
reinforcement’’Psychological Monographs. 80 (1966): 1-28.
Rouse, K. A. G. and Cashin, S. E. ‘’Assessment of academic self-concept and motivation: Results from three ethnic groups’’Measurement and Evaluation in Counseling and Development, 33:2 (2000): 91-91.
Shepperd, J. A., & Kashani, J. H. ‘’The relationship of hardiness, gender, and stress to
health outcomes in adolescents’’, Journal of Personality, 59:4 (1991): 747-768. Stipek, D. J.
Motivation to learn: From theory to practice.Allyn and Bacon, Needham
Heights: 1993 Şahin, H.N., Basım, N.H., Çetin, F. ‘’Locus of Control and Self-Concept in Interpersonal
Conflict Resolution Approaches’’, Turkish Journal of Psychiatry, 20:2
(2009):153-163.

Examination of Control Focus and Psychological…. 339
Trotter, M. A. and Endler, N. S. ‘’An empirical test of the interaction model of anxiety in a
competitive equestrian setting’’Personality and Individual Differences, 27.5 (1999): 861-875.
Tümkaya, S. ‘’İlkokul öğretmenlerindeki denetim odağı ve tükenmişlikle ilişkisi’’,Pamukkale Üniversitesi Eğitim Fakültesi Dergisi 8:8 (2000):61-68.
Wong-McDonald, A. and Gorsuch, R. L. ‘’A multivariate theory of God concept, religious motivation, locus of control, coping, and spiritual well-being’’,Journalof Psychology and Theology, 32:4 (2004): 318.
Yeşilyaprak, B. Eğitimde Bireysel Farklılıklar. Y. Kuzgun ve D. Deryakulu, (Ed.), Denetim Odağı (241-261). Nobel Yayıncılık,Ankara: 2014
Summary
Examination of Control Focus and Psychological Endurance Levels by Various
Variables According to Sports Activity
Hande Baba Kaya
Sakarya University, Sakarya
Fikret Soyer
Sakarya University, Sakarya
Murat Sarıkabak
Bartın University, Bartın
Atike Yılmaz Bilecik Sheyh Edebali University, Bilecik
This study was carried out with the aim of examining the levels of control focus and
psychological endurance of the students who are studying at Sakarya University, Faculty of Sports Sciences according to various variables. The general screening model was used in the
study. The 'Personal Information Form' developed by researchers, 'Internal-External Control
Focus Scale' adapted to Turkish by Dağ (1991) and 'Psychological Endurance Scale for Adults' adapted to Turkish by Basım and Çetin (2011) were used in the collection of the
data. Independent T-test and one-way ANOVA tests were used in the analysis of the data. In
the findings obtained, subscales of control focus and psychological endurance scale,
significant differences were found in control focus and family harmony according to gender variables, structural style and family harmony according to sports activities variables, social
resources dimension in age variable, structural style and family harmony subscales
according to the branch variable. As a result of the research, it has been observed that the levels of personal characteristics and family harmony of the students who actively do sports
in the sport sciences faculty are higher than those who do not.
Key words: Control Focus, Psychological Endurance, Sport