Key results from the Scottish House Condition Survey (SHCS ...
14
Key results from the Scottish House Condition Survey (SHCS) Local Authority tables 2015-2017 This note provides a short analysis of key points of interest from the Scottish House Condition Survey 2015-2017 local authority level tables which were published on 26 February, 2019. The full list of available tables is included in Annex A and can be accessed at: http://www.gov.scot/Topics/Statistics/SHCS/keyanalyses. Using Local Authority Data: Key Information The release supplements the SHCS 2017 Key Findings 1 report which was published in December 2018 and presents the latest national data for key measures of energy efficiency, fuel poverty, energy perceptions and housing quality. The local authority tables provide key indicators at local authority level relating to households and dwelling types. However they lag the main national data because three years are combined to mitigate the smaller sample sizes involved when analysing sub-national geographies. In this case, survey data from the period 2015-2017 are averaged. Consequently, the national rates presented here, and in the Excel tables, will not match those found in the main Key Findings report. Furthermore, due to overlapping years with previous releases, the tables are a snapshot in time, and should not be used to quantify changes in time by comparing to previous releases. All stated estimates lie at the midpoint of a confidence interval which primarily depends on sample size. The largest local authority sample over the three year period (with the exception of Edinburgh and Glasgow, with 554 and 630 respectively) is Fife with 399 households, while the smallest is Scottish Borders, with 206 households. Comparisons between all estimates should take account of the confidence limits, and caution be taken if simply comparing the stated midpoints. For example, the prevalence of damp in Angus was estimated to lie in the range 2-9%, while in Perth and Kinross, in the range 1-6%. Despite the midpoint in Angus being double Perth and Kinross (6% versus 3%), the extent of overlap between the two ranges means the survey has not detected a statistically significant difference between them. For this reason, and for clarity, this summary focuses on observed differences between local authority and national rates in the 2015-2017 period. National rates use the full sample (for most tables, 8,606 households) and therefore have smaller uncertainties, meaning observed differences are more likely to be real. Confidence intervals are visualised in the accompanying plots, and are calculated at the 95% level, where there is a one in twenty chance the true value will lie outside these ranges. Similarly, only statistically significant differences between estimates at the 95% confidence level are highlighted. A statistical tool provided with the published local authority tables helps users determine if differences between any two estimates are significant at the 95% confidence level or not. This allows users to reproduce any of the analysis in this summary as required. 1 https://www.gov.scot/publications/scottish-house-condition-survey-2017-key-findings/
-
Upload
khangminh22 -
Category
Documents
-
view
0 -
download
0
Transcript of Key results from the Scottish House Condition Survey (SHCS ...
Key results from the Scottish House Condition Survey (SHCS)
Local Authority tables 2015-2017
This note provides a short analysis of key points of interest from the Scottish House
Condition Survey 2015-2017 local authority level tables which were published on 26
February, 2019. The full list of available tables is included in Annex A and can be accessed
at: http://www.gov.scot/Topics/Statistics/SHCS/keyanalyses.
Using Local Authority Data: Key Information
The release supplements the SHCS 2017 Key Findings1 report which was published in
December 2018 and presents the latest national data for key measures of energy efficiency,
fuel poverty, energy perceptions and housing quality. The local authority tables provide key
indicators at local authority level relating to households and dwelling types. However they lag
the main national data because three years are combined to mitigate the smaller sample
sizes involved when analysing sub-national geographies. In this case, survey data from the
period 2015-2017 are averaged. Consequently, the national rates presented here, and in the
Excel tables, will not match those found in the main Key Findings report. Furthermore, due to
overlapping years with previous releases, the tables are a snapshot in time, and should not
be used to quantify changes in time by comparing to previous releases.
All stated estimates lie at the midpoint of a confidence interval which primarily depends on
sample size. The largest local authority sample over the three year period (with the
exception of Edinburgh and Glasgow, with 554 and 630 respectively) is Fife with 399
households, while the smallest is Scottish Borders, with 206 households. Comparisons
between all estimates should take account of the confidence limits, and caution be taken if
simply comparing the stated midpoints.
For example, the prevalence of damp in Angus was estimated to lie in the range 2-9%, while
in Perth and Kinross, in the range 1-6%. Despite the midpoint in Angus being double Perth
and Kinross (6% versus 3%), the extent of overlap between the two ranges means the
survey has not detected a statistically significant difference between them. For this reason,
and for clarity, this summary focuses on observed differences between local authority and
national rates in the 2015-2017 period. National rates use the full sample (for most tables,
8,606 households) and therefore have smaller uncertainties, meaning observed differences
are more likely to be real.
Confidence intervals are visualised in the accompanying plots, and are calculated at the
95% level, where there is a one in twenty chance the true value will lie outside these ranges.
Similarly, only statistically significant differences between estimates at the 95% confidence
level are highlighted. A statistical tool provided with the published local authority tables
helps users determine if differences between any two estimates are significant at the 95%
confidence level or not. This allows users to reproduce any of the analysis in this summary
as required.
1 https://www.gov.scot/publications/scottish-house-condition-survey-2017-key-findings/
Housing Stock Attributes
The age of construction and build form of a dwelling has consequences for energy
performance, improvement potential, affordability and living conditions. At the same time,
types of dwellings can differ in terms of the size of exposed areas with fewer exposed areas
of wall, or shielding by dwellings above and below, leading to lower levels of heat loss than
in buildings with fewer sheltered sides. Household stock attribute data demonstrates that
Scottish housing is diverse and varies across authorities. Such variations will be a factor in
later statistics on energy efficiency and fuel poverty and should be borne in mind.
On average over the period 2015-2017, over two thirds of Scotland’s dwellings were built
after 1945 (69%). However, this figure is as high as 84% in West Lothian and as low as 53%
in City of Edinburgh.
Glasgow City is the authority where households were most likely to live in flats (72%) rather
than houses, followed by City of Edinburgh (68%). On the other hand, households in Orkney
Islands (93%), Na h-Eileanan Siar (94%) and Shetland Islands (92%) were most likely to live
in houses. This compares to, on average, 36% of Scottish households living in flats and 64%
living in houses in this period.
Nationally, roughly half of households lived in dwellings with one or two bedrooms and half
lived in dwellings with 3 or more bedrooms. Households in Glasgow City (31%) were least
likely to have 3 or more bedrooms while those in Na h-Eileanan Siar (72%) were most likely.
In North Lanarkshire, 89% of dwellings had cavity walls compared to 74% on average and
60% in Orkney Islands which had the highest level of solid or other wall construction.
Heating and Insulation
Installing or upgrading insulation is one of the most effective ways to improve the energy
efficiency of a building. On average across 2015-2017, 58% of walls (of all types) were
insulated2 although this ranges from 44% in South Ayrshire to 75% in Clackmannanshire
(Figure 1). 16% of dwellings in East Dunbartonshire had less than 100 mm of loft insulation
compared to 7% on average and just 2% in North Ayrshire (Figure 2).
The heating system is another key factor in the thermal efficiency of a dwelling. Almost all
households in Scotland (96%) have a full central heating system. However, this rate is lower
for Shetland Islands (82%), Orkney Islands (87%), Highland (91%) and Na h-Eileanan Siar
(91%).
2 The presence of Cavity Wall Insulation (CWI) becomes harder to detect as injection holes age, fade or are covered up. Therefore, the SHCS may underestimate the number of homes with CWI installed, despite the high quality of the physical survey.
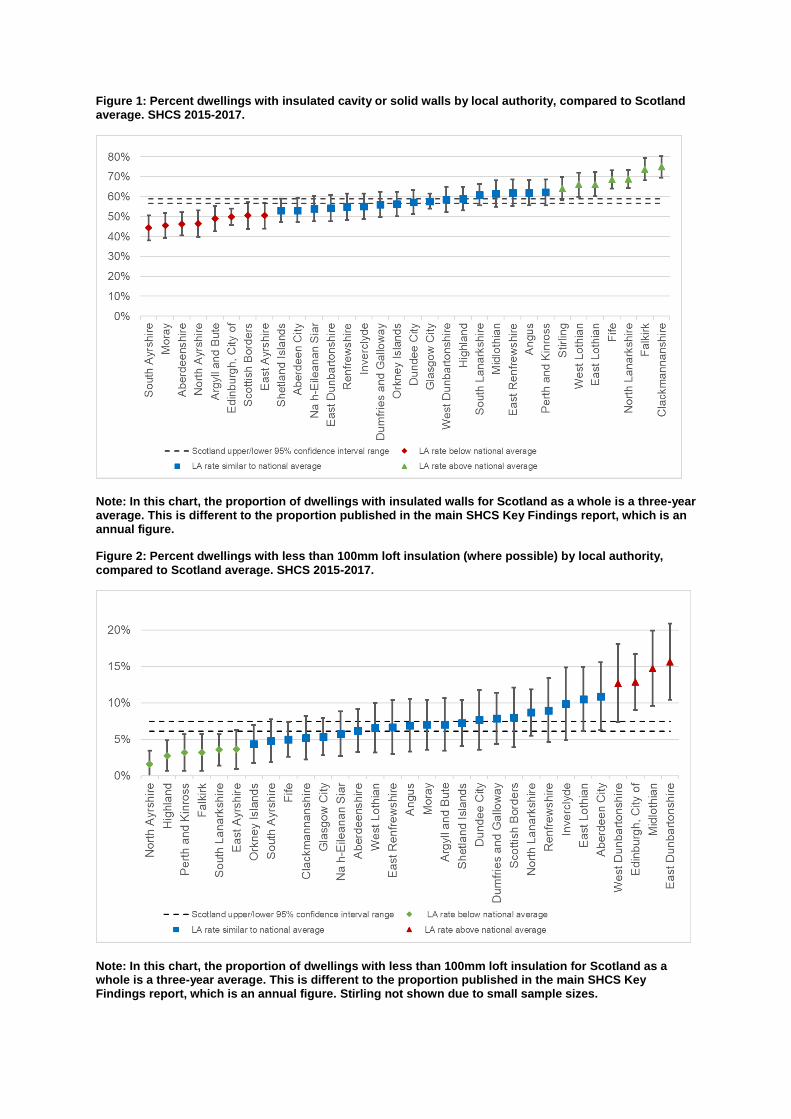
Figure 1: Percent dwellings with insulated cavity or solid walls by local authority, compared to Scotland average. SHCS 2015-2017.
Note: In this chart, the proportion of dwellings with insulated walls for Scotland as a whole is a three-year average. This is different to the proportion published in the main SHCS Key Findings report, which is an annual figure.
Figure 2: Percent dwellings with less than 100mm loft insulation (where possible) by local authority,
compared to Scotland average. SHCS 2015-2017.
Note: In this chart, the proportion of dwellings with less than 100mm loft insulation for Scotland as a whole is a three-year average. This is different to the proportion published in the main SHCS Key Findings report, which is an annual figure. Stirling not shown due to small sample sizes.

Energy Efficiency
A dwelling’s energy efficiency rating is scored between 1 and 100 using the Standard
Assessment Procedure (SAP). Energy Performance Certificates (EPC) display these ratings,
and which broad ranking band they fall into, the highest attainable being an A rating (high
energy efficiency, low running costs), and the worst, G (low energy efficiency, high running
costs).
Figure 3: Percent Dwellings in Lowest Energy Efficiency Bands F or G (SAP 2012) by local authority, compared to Scotland average. SHCS, 2015-2017.
Note: In this chart, the proportion of dwellings with an EPC F&G rating for Scotland as a whole is a three-year average. This is different to the proportion published in the main SHCS Key Findings report, which is an annual figure. East Dunbartonshire, East Renfrewshire and West Lothian not shown due to small sample sizes.
Here, ratings and corresponding bands have been derived using the SAP 2012
methodology. Figure 3 shows the proportion of dwellings in local authorities which had
either of the lowest bands (F or G) - the least energy efficient - and Error! Reference
source not found. the highest rated properties (bands B or C; no A-rated properties were
surveyed in the period 2015 to 2017).
Island and rural local authorities generally had the highest proportion of the least energy
efficient dwellings. For example, Na h-Eileanan Siar (22%), Orkney (21%), and Shetland
(17%) had comparatively more energy inefficient stock than the Scottish average of 4% in
the 2015-2017 period. These local authorities also had lower than average proportions of
properties in the highest efficiency bands.
Other local authorities with rates higher than the national average for F or G rated properties
included: Argyll and Bute (15%), Highland (15%), Dumfries and Galloway (15%), Scottish
Borders (12%), Aberdeenshire (11%), Moray (10%) and East Lothian (8%). These local
authorities had correspondingly lower than average proportions of housing stock with EPC
ratings B or C, apart from East Lothian, which was similar to the Scottish average.

Dundee City is the only city authority where the proportion of the least energy efficient
dwellings (3%) was similar to the Scottish average as a whole, rather than lower. Glasgow
City (1%), Inverclyde (1%), West Dunbartonshire (1%), North Lanarkshire (1%), City of
Edinburgh (2%), Renfrewshire (2%), Fife (2%), East Ayrshire (2%), Clackmannanshire (2%)
and Aberdeen City (2%), all had below national average shares of F and G rated dwellings.
Of these, Glasgow City (51%), Inverclyde (49%), West Dunbartonshire (46%) and City of
Edinburgh (51%) all had higher than average proportions of B and C rated dwellings. The
remaining local authority which had higher than average B and C rated dwellings was Falkirk
(52%).
It is important to bear in mind that the characteristics of the housing stock in an area can
affect energy efficiency. For example, detached houses are more likely to be F or G rated
than other housing types while flats are more likely to be B or C rated. Similarly, housing
which is off the gas grid is more likely to be F or G rated. Of the ten local authorities with
higher proportions of F & G rated stock, seven also had a higher than average proportion of
houses. Similarly, of the five local authorities with higher than average proportions of B and
C rated properties, four also had higher than average proportion of flats as a share of their
dwelling stock.
Poor energy efficiency is one of the drivers of fuel poverty and many of these authorities with
low energy efficient properties (Moray, Aberdeenshire, Dumfries and Galloway, Highland,
Argyll and Bute, Shetland Islands, Orkney Islands, Na h-Eileanan Siar) also had higher than
average fuel poverty rates.
The full local authority release also includes the share of properties rated EPC F&G using
the SAP 2009 methodology. Dwellings with main heating fuels other than mains gas (for
example oil or coal) have systematically lower SAP ratings in SAP 2012 than in SAP 2009
and this is particularly true at the lower end of the SAP range. The main reason for this is
that SAP fuel prices for these fuels have risen more than for mains gas. As a result, average
energy efficiency ratings tend to be slightly lower under SAP 2012 compared to SAP 2009. A
summary of the main differences between the two methodologies can be found in the 2017
SHCS Methodology Report3.
3 https://www2.gov.scot/Topics/Statistics/SHCS/Downloads/MethodologyNotes2017
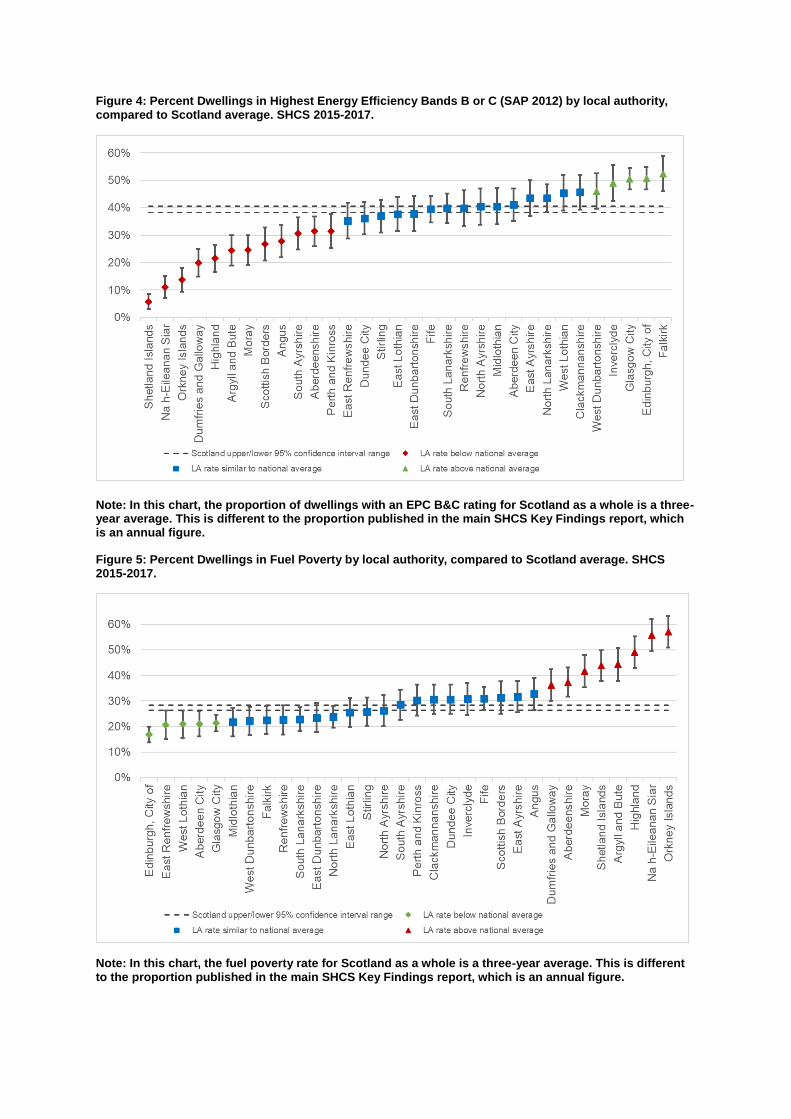
Figure 4: Percent Dwellings in Highest Energy Efficiency Bands B or C (SAP 2012) by local authority, compared to Scotland average. SHCS 2015-2017.
Note: In this chart, the proportion of dwellings with an EPC B&C rating for Scotland as a whole is a three-year average. This is different to the proportion published in the main SHCS Key Findings report, which is an annual figure.
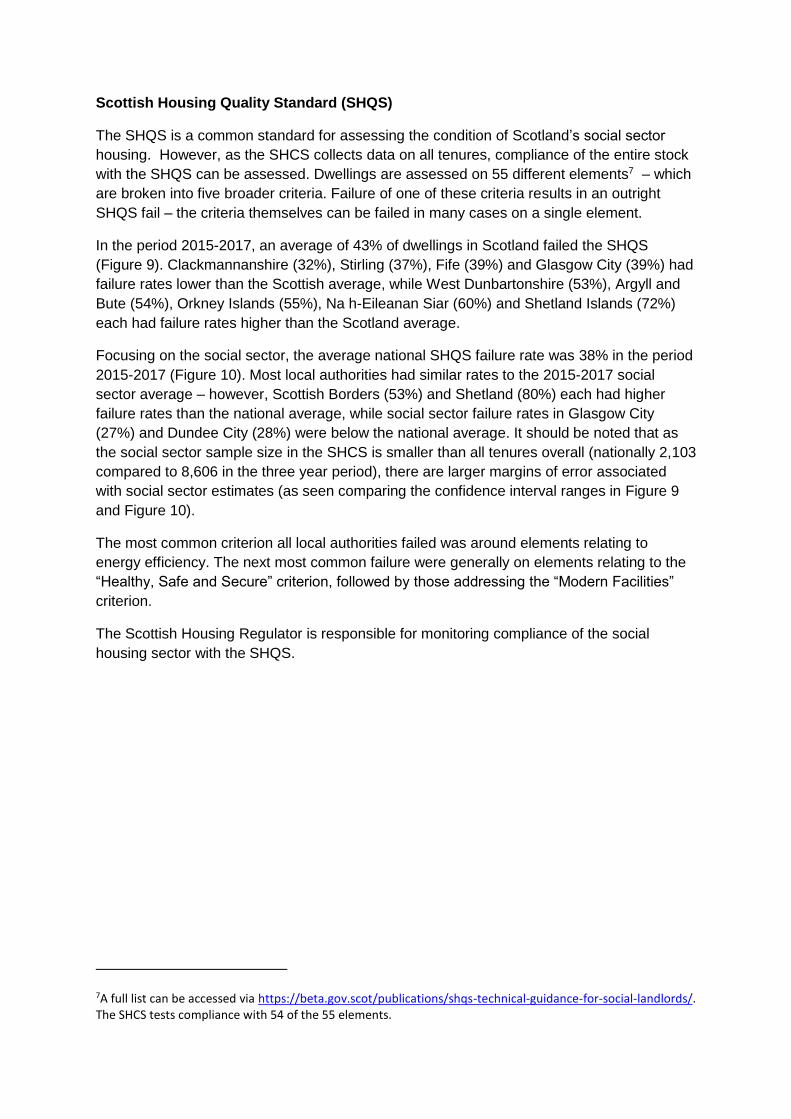
Figure 5: Percent Dwellings in Fuel Poverty by local authority, compared to Scotland average. SHCS 2015-2017.
Note: In this chart, the fuel poverty rate for Scotland as a whole is a three-year average. This is different to the proportion published in the main SHCS Key Findings report, which is an annual figure.

Fuel Poverty
Under the current definition4, a household is in fuel poverty if in order to maintain a
satisfactory heating regime, it would be required to spend more than 10% of its income on all
household fuel use. In the period 2015-2017, the fuel poverty rate varied from 17% in City of
Edinburgh to 57% in Orkney Islands (Figure 5).
Those authorities which had significantly higher fuel poverty rates than the national average
were Dumfries and Galloway (36%), Aberdeenshire (37%), Moray (42%), Shetland Islands
(44%), Argyll and Bute (44%), Highland (49%), Na h-Eileanan Siar (56%) and Orkney
Islands (57%). Each of these Local Authorities also had a higher than average presence of
energy inefficient EPC F&G rated dwellings.
Those authorities which had significantly lower fuel poverty rates than the national average
were City of Edinburgh (17%), East Renfrewshire (21%), West Lothian (21%), Aberdeen City
(21%) and Glasgow City (21%). Of these local authorities City of Edinburgh and Glasgow
City also had a greater prevalence than average of higher energy efficient properties (those
rated EPC B&C). The remaining local authorities – East Renfrewshire, West Lothian and
Aberdeen City – had proportions of EPC B&C rated dwellings similar to the national average.
Damp and Condensation
In the period 2015-2017, the prevalence of rising or penetrative damp in Scotland was 3%
(Figure 6). Most local authorities had a similar rate to the national average, apart from Na h-
Eileanan Siar and Orkney Islands which were higher than the national rate (8% and 7%
respectively); Aberdeenshire (1%) and South Lanarkshire (2%) both had below national
rates of rising or penetrative damp.
Local authorities with higher than average condensation rates were Angus (16%), Aberdeen
City (16%), Dundee City (15%), Falkirk (13%) and Midlothian (13%) (Figure 7). The majority
of remaining local authorities had rates similar to Scotland’s average, apart from South
Ayrshire (3%), Dumfries and Galloway (4%), East Dunbartonshire (4%), West
Dunbartonshire (5%), North Lanarkshire (5%), Glasgow City (6%), which all had lower rates.
4 The Scottish Government recently published a Draft Fuel Poverty Strategy for Scotland, including a proposal for a new fuel poverty definition: https://www.gov.scot/publications/draft-fuel-poverty-scotland-2018/. The Fuel Poverty (Target, Definition and Strategy) (Scotland) Bill, which sets out the proposed new definition and fuel poverty targets, was introduced to Parliament on 26th June 2018.

Figure 6: Percent Dwellings with any damp by local authority, compared to Scotland average. SHCS 2015-2017.
Note: The proportions in this chart are three-year averages and relate to the presence of rising or penetrative damp, while the proportions published in the main SHCS Key Findings report are annual figures, and are reported for rising damp and penetrative damp separately. East Lothian and Midlothian not shown due to small sample sizes.
Figure 7: Percent dwellings with condensation by local authority, compared to Scotland average. SHCS 2015-2017
Note: In this chart, the proportion of dwellings affected by condensation for Scotland as a whole is a three-year average. This is different to the proportion published in the main SHCS Key Findings report, which is an annual figure.

Disrepair
The SHCS quantifies disrepair for a wide range of building elements. The type of disrepair is
categorised into four broad classifications: any disrepair, disrepair to critical elements, urgent
disrepair5 and extensive disrepair, whereby damage observed by the surveyor covers more
than a fifth of the building area.
Here we focus on disrepair to critical elements (Figure 8), which covers building elements
relating to structural stability, weather tightness and property deterioration. Examples include
roof structure, foundations, damp proof course, and gutters6. Critical disrepair is recorded
where there is any disrepair, no matter how small, to these elements. The published tables
allow users to explore all four disrepair types in more detail.
Dundee City (76%) and Angus (77%) had the highest rates of critical disrepair, while
Shetland Islands had the lowest at 37%. Other local authorities with higher than average
rates of disrepair include Falkirk (57%), Midlothian (57%). East Lothian (59%), East Ayrshire
(59%) and Scottish Borders (63%). Local authorities with critical disrepair rates lower than
the national average were Shetland Islands (37%), Aberdeenshire (38%), Fife (39%), Moray
(39%), Inverclyde (41%), Orkney Islands (42%), Dumfries and Galloway (43%) and North
Lanarkshire (45%).
Figure 8: Percent dwellings with critical disrepair by local authority, compared to Scotland average. SHCS 2015-2017.
Note: In this chart, the proportion of dwelling with critical disrepair for Scotland as a whole is a three-year average. This is different to the proportion published in the main SHCS Key Findings report, which is an annual figure.
5 A repair is deemed urgent if it will prevent further damage to the property or a health and safety risk to the occupants. Only common internal and external elements are assessed. 6 A full list of elements can be found in section 7.9.7.3 in the SHCS 2017 Key Findings Report: https://www.gov.scot/publications/scottish-house-condition-survey-2017-key-findings/pages/9/
Scottish Housing Quality Standard (SHQS)
The SHQS is a common standard for assessing the condition of Scotland’s social sector
housing. However, as the SHCS collects data on all tenures, compliance of the entire stock
with the SHQS can be assessed. Dwellings are assessed on 55 different elements7 – which
are broken into five broader criteria. Failure of one of these criteria results in an outright
SHQS fail – the criteria themselves can be failed in many cases on a single element.
In the period 2015-2017, an average of 43% of dwellings in Scotland failed the SHQS
(Figure 9). Clackmannanshire (32%), Stirling (37%), Fife (39%) and Glasgow City (39%) had
failure rates lower than the Scottish average, while West Dunbartonshire (53%), Argyll and
Bute (54%), Orkney Islands (55%), Na h-Eileanan Siar (60%) and Shetland Islands (72%)
each had failure rates higher than the Scotland average.
Focusing on the social sector, the average national SHQS failure rate was 38% in the period
2015-2017 (Figure 10). Most local authorities had similar rates to the 2015-2017 social
sector average – however, Scottish Borders (53%) and Shetland (80%) each had higher
failure rates than the national average, while social sector failure rates in Glasgow City
(27%) and Dundee City (28%) were below the national average. It should be noted that as
the social sector sample size in the SHCS is smaller than all tenures overall (nationally 2,103
compared to 8,606 in the three year period), there are larger margins of error associated
with social sector estimates (as seen comparing the confidence interval ranges in Figure 9
and Figure 10).
The most common criterion all local authorities failed was around elements relating to
energy efficiency. The next most common failure were generally on elements relating to the
“Healthy, Safe and Secure” criterion, followed by those addressing the “Modern Facilities”
criterion.
The Scottish Housing Regulator is responsible for monitoring compliance of the social
housing sector with the SHQS.
7A full list can be accessed via https://beta.gov.scot/publications/shqs-technical-guidance-for-social-landlords/. The SHCS tests compliance with 54 of the 55 elements.

Figure 9: Percent dwellings failing SHQS (all tenures), compared to Scotland average. SHCS 2015-2017.
Note: In this chart, the proportion of SHQS failures for Scotland as a whole is a three-year average. This is different to the proportion published in the main SHCS Key Findings report, which is an annual figure.
Figure 10: Percent social sector dwellings failing the SHQS compared to Scotland average. SHCS 2015-2017.
Note: In this chart, the proportion of social sector SHQS failures for Scotland as a whole is a three-year average. This is different to the proportion published in the main SHCS Key Findings report, which is an annual figure. East Renfrewshire and East Dunbartonshire are not shown due to small sample sizes.

Notes
Where a rate is derived from a sub-sample with fewer than 30 cases or an estimate
represents two or fewer cases, the statistic is suppressed and the local authority will not be
present in the charts published in this summary. Further technical information on the survey
can be found in the 2017 Key Findings Report8, and the SHCS Methodology Notes 2017 9.
Local authority tables for 2015-2017 and earlier years can be accessed via the link below.
http://www.gov.scot/Topics/Statistics/SHCS/keyanalyses
8 https://www.gov.scot/publications/scottish-house-condition-survey-2017-key-findings/ 9 https://www2.gov.scot/Topics/Statistics/SHCS/Downloads/MethodologyNotes2017

Annex A - List of SHCS 2015 - 2017 Local Authority Tables
Local authority estimates in the following tables are broken down by: overall, age of dwelling,
type of dwelling, number of bedrooms, tenure and household type. Wall Insulation however
has a different breakdown, noted below.
Wall Insulation (cavity, solid/other, total) by Tenure, by House/Flat, by Household
Type
Percentage of dwellings built before 1945
Percentage of dwellings which are flats
Percentage of dwellings with 3 or more bedrooms
Percentage of households with one or more Long Term Sick or Disabled members
Percentage of households where one or more members are receiving care services
Percentage of dwellings with adaptations
Percentage of dwellings containing a LTSD individual whose activities are restricted
because of the property
Percentage of dwellings requiring adaptations
Percentage of dwellings with full central heating
Percentage of dwellings with less than 100mm of loft insulation
Percentage of dwellings with an energy efficiency rating of F or G (SAP 2009)
Percentage of dwellings with an energy efficiency rating of F or G (SAP 2012)
Percentage of dwellings with an energy efficiency rating of B or C (SAP 2012)
Percentage of dwellings with an environmental impact rating of F or G (SAP 2012)
Percentage of dwellings with an environmental impact rating of A, B or C (SAP 2012)
Mean energy efficiency SAP 2009 rating
Mean energy efficiency SAP 2012 rating
Mean environmental impact SAP 2012 rating
Mean household income
Number of households (000s) in fuel poverty
Percentage of households in fuel poverty
Percentage of households in extreme fuel poverty
Percentage of dwellings which are overcrowded
Percentage of dwellings which exceed the minimum Bedroom Standard requirements
by 2 or more bedrooms
Percentage of dwellings considered to be Below the Tolerable Standard (BTS)
Percentage of dwellings that fail the Scottish Housing Quality Standard “Free from
Serious Disrepair” criterion (SHQS B)
Percentage of dwellings that fail the Scottish Housing Quality Standard “Energy
Efficiency” criterion (SHQS C)
Percentage of dwellings that fail the Scottish Housing Quality Standard “Modern
Facilities and Services” criterion (SHQS D)
Percentage of dwellings that fail the Scottish Housing Quality Standard “Healthy,
Safe and Secure” criterion (SHQS E)
Percentage of dwellings that fail the SHQS overall
Percentage of dwellings with disrepair
Percentage of dwellings with disrepair to critical elements
Percentage of dwellings with urgent disrepair

Percentage of dwellings with extensive disrepair
Percentage of dwellings with rising or penetrating damp
Percentage of dwellings with condensation