Kerb Channel, Car Parks & Traffic Control Devices Asset ...
70
Kerb Channel, Car Parks & Traffic Control Devices Asset Management Plan S2_V1 Capital - Forward Estimates Works Program Endorsed May 2017 Reviewed December 2018
-
Upload
khangminh22 -
Category
Documents
-
view
7 -
download
0
Transcript of Kerb Channel, Car Parks & Traffic Control Devices Asset ...

Kerb Channel, Car Parks &Traffic Control DevicesAsset Management Plan
S2_V1 Capital - Forward Estimates Works Program
Endorsed May 2017
Reviewed December 2018

CITY OF VICTOR HARBOR – KERB CHANNEL, CAR PARKS & TRAFFIC CONTROL DEVICES ASSETMANAGEMENT PLAN
Document Control
Document ID: 59.299.130925 nams.plus2 amp template v4
Rev No Date Revision Details Author Reviewer Approver1 November 2016 NAMS PLUS2 Asset Plan & Expenditures
Kerb Channel, Car Parks and Traffic ControlDevices S2_V1 Capital Works Program
DEIS - GS DEIS - GSSMTMF - KKSIO - JSMI - BH
2 21 November2016
Elected Members Workshop – Cancelled DEIS
3 5 December2016
Finance Audit Committee DEIS AuditCommittee
4 6 December2016
Elected Members Workshop DEIS EM
5 9 December2016
Amend Capital Renewal & New Projects,Re-Model
DEIS
6 January 2017 Public Consultation DEIS
7 February 2017 Review and Amend Renewal and New/UpgradeProjects – Percentage Amounts
DEIS
8 27 March 2017 Resolution No. OC1752017 - Victor Harbor OvalCar Park Development
DEIS Council
9 27 March 2017 Resolution No. OC1662017 - Encounter BayBowling Club Car Park - Design & Construction
DEIS Council
10 1 May 2017 Finance Audit CommitteeResolution No. AC212017
That the Audit Committee recommends:
That Council approve the Infrastructure AssetManagement Policy, Strategy and Plans asattached and provided.
That the Infrastructure Asset Management Plansas presented are incorporated into Council's LongTerm Financial Plan.
DEIS FinanceAuditCommittee
11 22 May 2017 Ordinary Council MeetingResolution No. OC2682017
That Council approve the Infrastructure AssetManagement Policy, Strategy and Plans (providedto Elected Members on 27 April 2017 underseparate cover to the agenda). That theInfrastructure Asset Management Plans aspresented are incorporated into Council’s LongTerm Financial Plan.
DEIS Council Council
12 December 2018 Review & Amend Condition Assessment / ForwardEstimate Works Program
DEIS SMT/MI/MER/MO/BFO/MI/MF
SMT

CITY OF VICTOR HARBOR – KERB CHANNEL, CAR PARKS & TRAFFIC CONTROL DEVICES ASSETMANAGEMENT PLAN
Table of Contents1. Executive Summary 5
Context 5What does it cost? 5What we will do 5What we cannot do 5Managing the risks 5Confidence levels 5The next steps 5Questions you may have 6
2. Introduction 72.1 Background 72.2 Goals and Objectives of Asset Management 102.3 Plan Framework 102.4 Core and Advanced Asset Management 122.5 Community Consultation 12
3. Levels of Service 123.1 Customer Research and Expectations 123.2 Strategic and Corporate Objectives 133.3 Legislative Requirements 133.4 Current Levels of Service 143.5 Desired Levels of Service 15
4. Future Demand 164.1 Demand Drivers 164.2 Demand Forecast 164.3 Demand Impact on Assets 164.4 Demand Management Plan 174.5 Asset Programs to meet Demand 18
5. Lifecycle Management Plan 185.1 Background Data 185.2 Infrastructure Risk Management Plan 23
© Copyright 2012 – All rights reserved.
The Institute of Public Works Engineering Australia.
www.ipwea.org.au/namsplus

CITY OF VICTOR HARBOR – KERB CHANNEL, CAR PARKS & TRAFFIC CONTROL DEVICES ASSETMANAGEMENT PLAN
5.3 Routine Operations and Maintenance Plan 235.4 Renewal/Replacement Plan 265.5 Creation/Acquisition/Upgrade Plan 305.6 Disposal Plan 315.7 Service Consequences and Risks 31
6. Financial Summary 326.1 Financial Statements and Projections 326.2 Funding Strategy 366.3 Valuation Forecasts 366.4 Key Assumptions made in Financial Forecasts 376.5 Forecast Reliability and Confidence 38
7. Plan Improvement and Monitoring 397.1 Status of Asset Management Practices 397.2 Improvement Program 397.3 Monitoring and Review Procedures 417.4 Performance Measures 41
8. References 42
9. Appendices 43Appendix A Maintenance Response Levels of Service 44Appendix B Projected 10 Year Capital Renewal & Replacement Works Program 45Appendix C Projected Upgrade/Exp/New 10 year Capital Works Program 49Appendix D Budgeted Expenditures Accommodated in LTFP 53Appendix E Gifted Assets 2010 – 30 June 2018 54Appendix F Abbreviations 63Appendix G Glossary 64

CITY OF VICTOR HARBOR – KERB CHANNEL, CAR PARKS & TRAFFIC CONTROL DEVICES ASSETMANAGEMENT PLAN Page 5 of 70
1. Executive SummaryContextCouncil provides a kerb channel, car parks andtraffic control devices to enable a safe, wellmaintained, fit for purpose in accordance withCouncils service delivery objective.
Kerb Channel, Car Parks and Traffic ControlDevices cannot be provided without the properconstruction and maintenance of the supportingassets. The renewal and maintenance of theseassets is critical to successful service delivery.
The kerb channel, car parks and traffic controldevices network comprises: 263,330.36 linear metres kerb & channel 59,286.51 m2 car parks 6,914.51 linear metres guardrail railing
These infrastructure assets have a replacementvalue of $34,945,000
What does it Cost?The projected outlays necessary to provide theservices covered by this Asset Management Plan(AM Plan) includes operations, maintenance,renewal and upgrade of existing assets over the10 year planning period is $5,898,000 or $590,000on average per year.
Estimated available funding for this period is$5,832,000 or $583,000 on average per yearwhich is 99% of the cost to provide the service.This is a funding shortfall of $7,000 on average peryear. Projected expenditure required to provideservices in the AM Plan compared with plannedexpenditure currently included in the Long TermFinancial Plan are shown in the graph below.
What we will doWe plan to provide kerb channel, car parks andtraffic control device services for the following: Operation, maintenance, renewal and
upgrade of kerb channel, car parks and trafficcontrol devices to meet service levels set inannual budgets.
Carry out annual repairs and constructionworks that align with our latest conditionassessments within the 10 year planningperiod.
What we cannot doWe do not have enough funding to provide allservices at the desired service levels or providenew services. Works and services that cannot beprovided under present funding levels are:
Create new assets
Managing the RisksThere are risks associated with providing theservice and not being able to complete allidentified activities and projects. We haveidentified major risks as: Replacement of assets with a condition
assessment of 4 to 5.
We will endeavour to manage these risks withinavailable funding by: Creation of Action Plans and Programs
Confidence LevelsThis AM Plan is based on High level of confidenceinformation.
The Next StepsThe actions resulting from this asset managementplan are: Review Works Program Ongoing review of service levels Advise audit committee Advise Council Annually review useful lives

CITY OF VICTOR HARBOR – KERB CHANNEL, CAR PARKS & TRAFFIC CONTROL DEVICES ASSETMANAGEMENT PLAN Page 6 of 70
Questions you may have
What is this plan about?This asset management plan covers theinfrastructure assets that serve the City of VictorHarbor community’s needs. These assets includekerb channel, car parks and traffic control devicesthroughout the community area that enablespeople to use these assets in a safe manner.
What is an Asset Management Plan?Asset management planning is a comprehensiveprocess to ensure delivery of services frominfrastructure is provided in a financiallysustainable manner.
An asset management plan details informationabout infrastructure assets including actionsrequired to provide an agreed level of service in themost cost effective manner. The plan defines theservices to be provided, how the services areprovided and what funds are required to providethe services.
Why is there a funding shortfall?Most of the organisation’s kerb channel, car parksand traffic control devices network was constructedby developers and from government grants, oftenprovided and accepted without consideration ofongoing operations, maintenance and replacementneeds.
Many of these assets are approaching the lateryears of their life and require replacement, servicesfrom the assets are decreasing and maintenancecosts are increasing.
Our present funding levels are insufficient tocontinue to provide existing services at currentlevels in the medium term.
What options do we have?Resolving the funding shortfall involves severalsteps:1. Improving asset knowledge so that data
accurately records the asset inventory, howassets are performing and when assets are notable to provide the required service levels,
2. Improving our efficiency in operating,maintaining, renewing and replacing existingassets to optimise life cycle costs,
3. Identifying and managing risks associated withproviding services from infrastructure,
4. Making trade-offs between service levels andcosts to ensure that the community receivesthe best return from infrastructure,
5. Identifying assets surplus to needs for disposalto make saving in future operations andmaintenance costs,
6. Consulting with the community to ensure thatkerb channel, car parks and traffic controldevices services and costs meet communityneeds and are affordable,
7. Developing partnership with other bodies,where available to provide services,
8. Seeking additional funding from governmentsand other bodies to better reflect a ‘whole ofgovernment’ funding approach to infrastructureservices.
What happens if we don’t manage theshortfall?It is likely that we will have to reduce service levelsin some areas, unless new sources of revenue arefound. For kerb channel, car parks and trafficcontrol devices, the service level reduction mayinclude a lower standard of infrastructure assetsthat requires higher levels of maintenance due to alonger renewal period.
What can we do?We can develop options, costs and priorities forfuture kerb channel, car parks and traffic controldevices services, consult with the community toplan future services to match the communityservice needs with ability to pay for services andmaximise community benefits against costs.
What can you do?We will be pleased to consider your thoughts on theissues raised in this asset management plan andsuggestions on how we may change or reduce thekerb channel, car parks and traffic control devicesmix of services to ensure that the appropriate levelof service can be provided to the community withinavailable funding.

CITY OF VICTOR HARBOR – KERB CHANNEL, CAR PARKS & TRAFFIC CONTROL DEVICES ASSETMANAGEMENT PLAN Page 7 of 70
2. Introduction2.1 BackgroundThis asset management plan is to demonstrate responsive management of assets (and servicesprovided from assets), compliance with regulatory requirements, and to communicate fundingneeded to provide the required levels of service over a 20 year planning period.
The asset management plan follows the format for AM Plans recommended in Section 4.2.6 of theInternational Infrastructure Management Manual1.
The asset management plan is to be read with the organisation’s Asset Management Policy, AssetManagement Strategy and the following associated planning documents:
Community Plan 2036 and Strategic Directions 2016-2020 Long Term Financial Plan (LTFP) City of Victor Harbor Pedestrian Strategy Victor Harbor Urban Growth Strategy Past Population Growth & Future Projections Report 2005 Victor Harbor Traffic Management Strategy 2005 Victor Harbor Coastal Management Study 2013
The infrastructure assets covered by this asset management plan are shown in Table 2.1. Theseassets are used to provide safe and efficient services to its community.
Table 2.1: Assets covered by this Plan
Kerb Channel, Carparks, Traffic Devices & Lighting at June 2018.
Car Parks
Description Area (m2) ReplacementValue
Asphalt 41,708.21 4,231,429.99Spray Seal 7,687.90 562,679.28Pavers 2,211.00 354,423.30Unsealed 7,679.40 170,482.68TOTAL 59,286.51 $5,319,015.25
Kerb Channel
Description Length ReplacementValue
Barrier Kerb 124,486.93 10,700,979.81Median Kerb 4,312.82 327,750.69Mountable 125,163.28 12,032,721.75Watertable (Spoon) 9,367.33 903,984.28TOTAL 263,330.36 $23,965,436.53
1 IPWEA, 2011, Sec 4.2.6, Example of an Asset Management Plan Structure, pp 4|24 – 27.

CITY OF VICTOR HARBOR – KERB CHANNEL, CAR PARKS & TRAFFIC CONTROL DEVICES ASSETMANAGEMENT PLAN Page 8 of 70
Traffic Control Devices
Description No. ReplacementValue
Roundabout 26 502,030.75Median 72 611,248.89Splitter Island 118 549,280.86Speed Hump 15 321,686.62W-Beam 6,914.51 linear metres 1,879,622.00Signals 6 675,150.00Ticket Machines 4 32,000.00Fences 42 395,736.80Lighting 154 693,345.07TOTAL $5,660,100.99
Key stakeholders in the preparation and implementation of this asset management plan are:Shown in Table 2.1.1.
Table 2.1.1: Key Stakeholders in the AM Plan
Key Stakeholder Role in Asset Management PlanElected Members Represent needs of community/shareholders,
Allocate resources to meet the organisation’s objectives in providingservices while managing risks,
Ensure organisation is financial sustainable.Chief Executive Officer Driver of council plans and directionCommunity Consumers of serviceVisitors Consumers of serviceManager Infrastructure Capital Works ProgramManager Finance Long Term Financial Plan & BudgetsManager Operations Capital Works and Maintenance Programs
Our organisation’s organisational structure for service delivery from infrastructure assets is detailedbelow:

CITY OF VICTOR HARBOR – KERB CHANNEL, CAR PARKS & TRAFFIC CONTROL DEVICES ASSETMANAGEMENT PLAN Page 9 of 70

CITY OF VICTOR HARBOR – KERB CHANNEL, CAR PARKS & TRAFFIC CONTROL DEVICES ASSETMANAGEMENT PLAN Page 10 of 70
2.2 Goals and Objectives of Asset ManagementThe organisation exists to provide services to its community. Some of these services are providedby infrastructure assets. We have acquired infrastructure assets by ‘purchase’, by contract,construction by our staff and by donation of assets constructed by developers and others to meetincreased levels of service.
Our goal in managing infrastructure assets is to meet the defined level of service (as amended fromtime to time) in the most cost effective manner for present and future consumers. The key elementsof infrastructure asset management are:
Providing a defined level of service and monitoring performance, Managing the impact of growth through demand management and infrastructure investment, Taking a lifecycle approach to developing cost-effective management strategies for the long-
term that meet the defined level of service, Identifying, assessing and appropriately controlling risks, and Having a long-term financial plan which identifies required, affordable expenditure and how
it will be financed.2
2.3 Plan FrameworkKey elements of the plan are
Levels of service – specifies the services and levels of service to be provided by theorganisation,
Future demand – how this will impact on future service delivery and how this is to be met, Life cycle management – how we will manage our existing and future assets to provide
defined levels of service, Financial summary – what funds are required to provide the defined services, Asset management practices, Monitoring – how the plan will be monitored to ensure it is meeting the organisation’s
objectives, Asset management improvement plan.
A road map for preparing an asset management plan is shown below.
2 Based on IPWEA, 2011, IIMM, Sec 1.2 p 1|7.

CITY OF VICTOR HARBOR – KERB CHANNEL, CAR PARKS & TRAFFIC CONTROL DEVICES ASSETMANAGEMENT PLAN Page 11 of 70
Road Map for preparing an Asset Management PlanSource: IPWEA, 2006, IIMM, Fig 1.5.1, p 1.11.

CITY OF VICTOR HARBOR – KERB CHANNEL, CAR PARKS & TRAFFIC CONTROL DEVICES ASSETMANAGEMENT PLAN Page 12 of 70
2.4 Core and Advanced Asset ManagementThis asset management plan is prepared as a ‘core’ asset management plan over a 20 year planningperiod in accordance with the International Infrastructure Management Manual3. It is prepared tomeet minimum legislative and organisational requirements for sustainable service delivery and longterm financial planning and reporting. Core asset management is a ‘top down’ approach whereanalysis is applied at the ‘system’ or ‘network’ level.
Future revisions of this asset management plan will move towards ‘advanced’ asset managementusing a ‘bottom up’ approach for gathering asset information for individual assets to support theoptimisation of activities and programs to meet agreed service levels.
2.5 Community ConsultationThis ‘core’ asset management plan is prepared to facilitate community consultation initially throughfeedback on public display of draft asset management plans prior to adoption by the Council. Futurerevisions of the asset management plan will incorporate community consultation on service levelsand costs of providing the service. This will assist the Council and the community in matching thelevel of service needed by the community, service risks and consequences with the community’sability and willingness to pay for the service.
3. Levels of Service3.1 Customer Research and ExpectationsCouncil participated in the 2012 Local Government Roy Morgan Customer Satisfaction survey. Thistelephone survey polls a sample of residents on their level of satisfaction with the organisation’sservices. The most recent customer satisfaction survey reported satisfaction levels for the followingservices.
Table 3.1: Community Satisfaction Survey Levels
Performance Measure Satisfaction LevelVery
SatisfiedFairly
SatisfiedSatisfied Somewhat
satisfiedNot
satisfiedImportance that Council provides& maintains roads, footpaths &cycle tracks.
√
Mean (outof 10) 9.22
Performance in providing &maintaining roads, footpaths &cycle tracks.
√
Mean (outof 10) 5.94
The organisation uses this information in developing its Strategic Plan and in allocation of resourcesin the budget.
3 IPWEA, 2011, IIMM.

CITY OF VICTOR HARBOR – KERB CHANNEL, CAR PARKS & TRAFFIC CONTROL DEVICES ASSETMANAGEMENT PLAN Page 13 of 70
3.2 Strategic and Corporate ObjectivesThe Victor Harbor Community Plan 2036 will help shape the future of Victor Harbor for the next 20years. It highlights the opportunities that have shaped our thinking and describes in broad termshow we plan to achieve our vision - A city that offers opportunity and lifestyle.
To achieve the Vision Council has identified five broad, interlinked objectives.
Objective 1 - Healthy environments
Objective 2 - Attractive lifestyle and inclusive community
Objective 3 - A thriving local economy
Objective 4 - Services and infrastructure supporting the community
Objective 5 - An innovative Council empowering the community
The Strategic Directions inform Council’s annual business plans, work plans and budgets whichdetail what Council will do to achieve its objectives. Council’s Long Term Financial Plan and AssetManagement Plan are also informed by the Community Plan.
Table 3.2: Organisation Goals and how these are addressed in this Plan
Goal Objectives
Assets & Infrastructure that are developed,managed and maintained so that they provide thelevels of service needs to the community.
Objective 1 - Healthy environments
Objective 2 - Attractive lifestyle and inclusive community
Objective 3 - A thriving local economy
Objective 4 - Services and infrastructure supporting thecommunity
Objective 5 - An innovative Council empowering the community
The Council will exercise its duty of care to ensure public safety in accordance with the infrastructurerisk management plan prepared in conjunction with this AM Plan. Management of infrastructurerisks is covered in Section 5.2
3.3 Legislative RequirementsWe have to meet many legislative requirements including Australian and State legislation and Stateregulations. These include:
Table 3.3: Legislative Requirements
Legislation RequirementLocal Government Act 1999 Sets out role, purpose, responsibilities and powers of local governments
including the preparation of a long term financial plan supported by assetmanagement plans for sustainable service delivery.
Environmental Protection Act Sets out role, purpose, responsibilities of local government in protecting theenvironment.

CITY OF VICTOR HARBOR – KERB CHANNEL, CAR PARKS & TRAFFIC CONTROL DEVICES ASSETMANAGEMENT PLAN Page 14 of 70
WHS Act Sets out role, purpose, responsibilities of local government in providing safework practices and worksites.
Australian Road Rules and RoadSafety Act
Set of model road rules developed by the National Road TransportCommission (NRTC) which form the platform for State and Territory roadrules across Australia. The first edition of the Rules was published on 19October 1999, and marked a milestone in road safety policy and legislationacross Australia.
Native Vegetation Act Provides incentives and assistance to landowners in relation to thepreservation and enhancement of native vegetation; to control the clearanceof native vegetation; and for other purposes.
River Murray Act Provides for the protection and enhancement of the River Murray and relatedareas and ecosystems; and for other purposes.
Coastal Protection Act Provides provision for the conservation and protection of the beaches andcoast of this State; and for other purposes.
Mutual Liability Scheme Sets out role, purpose, responsibilities of local government in managing riskand liabilities.
AAS27 Sets out responsibilities of local government for maintaining accountingstandards.
Australian Standards and AUS PEC Covers minor civil works NATSPEC’s major service is providing a nationalmaster specification to the construction industry.
3.4 Current Levels of ServiceWe have defined service levels in two terms.
Community Levels of Service measure how the community receives the service and whether theorganisation is providing community value.
Community levels of service measures used in the asset management plan are:
Quality How good is the service?Function Does it meet users’ needs?Capacity/Utilisation Is the service over or under used?
Technical Levels of Service - Supporting the community service levels are operational or technicalmeasures of performance. These technical measures relate to the allocation of resources to serviceactivities that the organisation undertakes to best achieve the desired community outcomes anddemonstrate effective organisational performance.
Technical service measures are linked to annual budgets covering:
Operations – the regular activities to provide services such as opening hours, cleansingfrequency, mowing frequency, etc.
Maintenance – the activities necessary to retain an asset as near as practicable to anappropriate service condition (eg road patching, unsealed road grading, building andstructure repairs),
Renewal – the activities that return the service capability of an asset up to that which it hadoriginally (eg frequency and cost of road resurfacing and pavement reconstruction, pipelinereplacement and building component replacement),
Upgrade – the activities to provide an higher level of service (eg widening a road, sealing anunsealed road, replacing a pipeline with a larger size) or a new service that did not existpreviously (eg a new library).

CITY OF VICTOR HARBOR – KERB CHANNEL, CAR PARKS & TRAFFIC CONTROL DEVICES ASSETMANAGEMENT PLAN Page 15 of 70
Asset managers plan, implement and control technical service levels to influence the customerservice levels.4
Our current service levels are detailed in Table 3.4.
Table 3.4: Current and Desired Service Levels
KeyPerformance
Measure
Level of ServiceObjective
PerformanceMeasure Process
Current Level ofService
Optimal Level ofService
COMMUNITY LEVELS OF SERVICEQuality Provide service
levels within budgetallocations
LongevityAppearanceFunctionallyCommunity Response
Meets the needs ofthe functionally
Meets the needs of thefunctionally
Function Provide servicelevels that meetsstandardrequirements
LongevityAppearanceFunctionallyCommunity Response
Meets the needs offunctionally andpurpose
Meets the needs offunctionally and purpose
Capacity/Utilisation
As listed in the AMP,consider the needbased on priority
Condition rating <4 Meets the needs offunctionally andpurpose
Meets the needs offunctionally and purpose
TECHNICAL LEVELS OF SERVICEOperations Work within the
allocated budgetNote projects thatcannot be undertakedue to budgetconstraints, thereforeundertake riskassessments
Condition rating <4 Condition rating <4
Maintenance Maintenance toassets is a criticalelement to assetlongevity
LongevityAppearanceFunctionallyCommunity Response
Asset purposebeing met
Asset purpose being met
Renewal Replacement ofexisting assets ‘likefor like’
Condition rating <4 Meets the needs offunctionally andpurpose
Meets the needs offunctionally and purpose
Upgrade/New Creation of newassets and giftedassets
Gifted Assets (nocontrol)Need of New Assets
Meets the need ofpurpose
Meets the need ofpurpose
3.5 Desired Levels of ServiceIndications of desired levels of service are obtained from community consultation/engagement. Theasset management planning process includes the development of 3 scenarios to develop levels ofservice that are financially sustainable.
4 IPWEA, 2011, IIMM, p 2.22

CITY OF VICTOR HARBOR – KERB CHANNEL, CAR PARKS & TRAFFIC CONTROL DEVICES ASSETMANAGEMENT PLAN Page 16 of 70
4. Future Demand4.1 Demand DriversDrivers affecting demand include population change, changes in demographics, seasonal factors,vehicle ownership rates, consumer preferences and expectations, technological changes,economic factors, agricultural practices, environmental awareness, etc.
4.2 Demand ForecastThe present position and projections for demand drivers that may impact future service deliveryand utilisation of assets were identified and are documented in Table 4.3.
4.3 Demand Impact on AssetsThe impact of demand drivers that may affect future service delivery and utilisation of assets areshown in Table 4.3.
Table 4.3: Demand Drivers, Projections and Impact on Services
The Department of Planning, Transport and Infrastructure (DPTI) recently released the officialpopulation projections for local government areas across the State based on the 2011 Censusreport.
The following table shows that latest population projections for Victor Harbor and compares theseto the previous projections.
Table 1: ABS Population
2006 CensusProjections
2011 CensusProjections
2016 Victor Harbor base population – 14,670
2016 16,171 15,6072021 17,673 17,3192026 19,343 19,2042031 21,231
These figures indicate that Victor Harbor’s population is not expected to grow as quickly as initiallythought. Of particular note is the significant reduction in population growth anticipated between 2011and 2016, which when projected over subsequent five-year periods, results in a slightly lowerpopulation for the City by 2026 (by 139 persons or 0.8%). The number of people aged 65 and overwas projected to be in the order of 35.5% of the total population by 2026. The most recent projectionsindicate that by 2031, the number of people aged 65 and over in Victor Harbor will make up nearly40% of the total population.
Demand drivers Present position Projection Impact on services
Population 14,670 21,231 in 2031 Increase in demand forservices.

CITY OF VICTOR HARBOR – KERB CHANNEL, CAR PARKS & TRAFFIC CONTROL DEVICES ASSETMANAGEMENT PLAN Page 17 of 70
Demographics The increase in population isexpected to occur mainly inthe older demographic of65+.
The increase in population of1.5% per annum is expectedto continue in the built uparea of the city rather than inthe rural areas.
The infrastructure willincreasingly have to caterfor additional traffic,involving upgrading existingand supplying newinfrastructure includingfootpaths, pedestrianaccess locations andparking.
Climate Change Coastal Erosion Sea Level Rise – 3mm/year Before year 2050 Sea levelinundation is likely to showsome impact on Councilsinfrastructure. Refer to 2013AWE Coastal ManagementStudy.
Climate Change Coastal Erosion Sea Level Rise – 3mm/year Before year 2100 Sea levelinundation is likely to cause‘significant’ impact onCouncils infrastructure.Refer to 2013 AWE CoastalManagement Study.
4.4 Demand Management PlanDemand for new services will be managed through a combination of managing existing assets,upgrading of existing assets and providing new assets to meet demand and demand management.Demand management practices include non-asset solutions, insuring against risks and managingfailures.
Non-asset solutions focus on providing the required service without the need for the organisation toown the assets and management actions including reducing demand for the service, reducing thelevel of service (allowing some assets to deteriorate beyond current service levels) or educatingcustomers to accept appropriate asset failures5. Examples of non-asset solutions include providingservices from existing infrastructure such as aquatic centres and libraries that may be in anothercommunity area or public toilets provided in commercial premises.
Opportunities identified to date for demand management are shown in Table 4.4. Furtheropportunities will be developed in future revisions of this asset management plan.
Table 4.4: Demand Management Plan Summary
Demand Driver Impact on Services Demand Management Plan
Development of newresidentialsubdivisions
Can affect future capacityand utilisation requirements To meet requirements of township development
plans.
Creation of newassets
Increased service level Utilisation and demand.
5 IPWEA, 2011, IIMM, Table 3.4.1, p 3|58.

CITY OF VICTOR HARBOR – KERB CHANNEL, CAR PARKS & TRAFFIC CONTROL DEVICES ASSETMANAGEMENT PLAN Page 18 of 70
4.5 Asset Programs to meet DemandThe new assets required to meet growth will be acquired free of cost from land developments andconstructed/acquired by the organisation. New assets constructed/acquired by the organisation arediscussed in Section 5.5. The cumulative value of new contributed and constructed asset values aresummarised in Figure 1.
Figure 1: Upgrade and New Assets to meet Demand
Acquiring these new assets will commit the organisation to fund ongoing operations, maintenanceand renewal costs for the period that the service provided from the assets is required. These futurecosts are identified and considered in developing forecasts of future operations, maintenance andrenewal costs in Section 5.
5. Lifecycle Management PlanThe lifecycle management plan details how the organisation plans to manage and operate the assetsat the agreed levels of service (defined in Section 3) while optimising life cycle costs.
5.1 Background Data
5.1.1 Physical parameters
The assets covered by this asset management plan are shown in Table 2.1.
Kerb Channel, Carparks, Traffic Devices & Lighting at June 2018.
Car Parks
Description Area (m2) ReplacementValue
Asphalt 41,708.21 4,231,429.99Spray Seal 7,687.90 562,679.28Pavers 2,211.00 354,423.30Unsealed 7,679.40 170,482.68TOTAL 59,286.51 $5,319,015.25

CITY OF VICTOR HARBOR – KERB CHANNEL, CAR PARKS & TRAFFIC CONTROL DEVICES ASSETMANAGEMENT PLAN Page 19 of 70
Kerb Channel
Description Length ReplacementValue
Barrier Kerb 124,486.93 10,700,979.81Median Kerb 4,312.82 327,750.69Mountable 125,163.28 12,032,721.75Watertable (Spoon) 9,367.33 903,984.28TOTAL 263,330.36 $23,965,436.53
Traffic Control Devices
Description No. ReplacementValue
Roundabout 26 502,030.75Median 72 611,248.89Splitter Island 118 549,280.86Speed Hump 15 321,686.62W-Beam 6,914.51 linear metres 1,879,622.00Signals 6 675,150.00Ticket Machines 4 32,000.00Fences 42 395,736.80Lighting 154 693,345.07TOTAL $5,660,100.99
The age profile of the assets included in this AM Plan is shown in Figure 2.
Figure 2: Asset Age Profile

CITY OF VICTOR HARBOR – KERB CHANNEL, CAR PARKS & TRAFFIC CONTROL DEVICES ASSETMANAGEMENT PLAN Page 20 of 70
5.1.2 Asset capacity and performance
The organisation’s services are generally provided to meet design standards where these areavailable.
Locations where deficiencies in service performance are known are detailed in Table 5.1.2.
Table 5.1.2: Known Service Performance Deficiencies
Location Service Deficiency
Creation of new kerb channel,car parks and traffic controldevice services.
Without addressing council’s kerb channel, car parks and traffic controldevice services assets appropriately to ensure that they weremaintained ‘fit for purpose’ to minimise potential liability claims. It isdifficult to justify the creation and construction of new assets.
Asset maintenance to kerbchannel, car parks and trafficcontrol device services.
The lag in expenditure created over the past 15 years, excluding years2010 to 2014. This lag has impacted on some assets causing failuresand moisture infiltration and tree root intrusion has occurred togetherwith a service level decrease has required greater financial input toaddress the shortfall.
The above service deficiencies were identified from the results of the condition assessment surveyundertaken during 2017.
5.1.3 Asset condition
Condition is monitored in accordance with methods developed by IPWEA outlined in the InternationalInfrastructure Management Manual (IIMM).
The condition profile of our assets is shown in Figure 3.
Fig 3: Asset Condition Profile

CITY OF VICTOR HARBOR – KERB CHANNEL, CAR PARKS & TRAFFIC CONTROL DEVICES ASSETMANAGEMENT PLAN Page 21 of 70
Condition CRC ($'000) Weight (%)0 $0 0%1 $5,273 15%2 $8,657 25%3 $19,315 55%4 $1,464 4%5 $236 1%
*all dollar values in ($'000)'s
Not Rated 0 % 94.9 % 100 %
Good / VeryGood 39.9 % 4.8 % 0 %
Fair 55.3 % 0 % 0 %
Poor / VeryPoor 4.9 % 0.4 % 0 %

CITY OF VICTOR HARBOR – KERB CHANNEL, CAR PARKS & TRAFFIC CONTROL DEVICES ASSETMANAGEMENT PLAN Page 22 of 70
Condition is measured using a 0 – 6 grading system6 as detailed in Table 5.1.3.
Table 5.1.3: Simple Condition Grading Model
ConditionGrading
Description of Condition
0 Brand New: Asset is brand new.
1 Very Good: Near as new condition with no defects.
2 Good: Superficial deterioration. No issue with reliability. No maintenance is required.
3 Fair: Minor deterioration present. Routine maintenance may be required.
4 Poor: Significant deterioration present. Requires maintenance to keep the asset serviceable andprogramming for renewal/rehabilitation on forward 5 year works program.
5 Very Poor: Extensive deterioration present. Requires significant maintenance to keep the assetserviceable and programming for renewal/rehabilitation within the following year.
6 End of Life: Asset is unserviceable and provides no service. Asset cannot be used.
5.1.4 Asset valuations
The value of assets recorded in the asset register at 30 June 2017 covered by this assetmanagement plan is shown below. Assets were last revalued at 2017. Assets are valued atAssets are valued at fair-value asset accounting based on AASB116 (Australian AccountingStandard Board). Refer to Attachment Valuation Methodology.
Current Replacement Cost $34,945,000
Depreciable Amount $34,945,000
Depreciated Replacement Cost7 $25,089,000
Annual Depreciation Expense $491,000
Useful lives were reviewed in June 2014 by detailed condition analysis.
Key assumptions made in preparing the valuations were:
Using local projects Using local data (metric unit rates) Asset Register is a true reflection of the actual network dimensions & composition
Major changes from previous valuations are due to better knowledge of the current network profileand history of works completed as well as the impact of market forces of materials required forconstruction and renewal.
Various ratios of asset consumption and expenditure have been prepared to help guide and gaugeasset management performance and trends over time.
6 IPWEA, 2011, IIMM, Sec 2.5.4, p 2|79.7 Also reported as Written Down Current Replacement Cost (WDCRC).

CITY OF VICTOR HARBOR – KERB CHANNEL, CAR PARKS & TRAFFIC CONTROL DEVICES ASSETMANAGEMENT PLAN Page 23 of 70
Rate of Annual Asset Consumption 1.4%(Depreciation/Depreciable Amount)
Rate of Annual Asset Renewal 0.3%(Capital renewal exp/Depreciable amount)
Rate of Annual Asset Upgrade/New 0%(Capital upgrade exp/Depreciable amount)
Rate of Annual Asset Upgrade/New 0.5%(Including contributed assets)
In 2018 the organisation plans to renew assets at 24.4% of the rate they are being consumed andwill be increasing its asset stock by 0.5% in the year.
5.1.5 Historical Data
Historical data for these various asset categories are located on Councils’ mydata AssetManagement System.
5.2 Infrastructure Risk Management PlanAn assessment of risks8 associated with service delivery from infrastructure assets has identifiedcritical risks that will result in loss or reduction in service from infrastructure assets or a ‘financialshock’ to the organisation. The risk assessment process identifies credible risks, the likelihood ofthe risk event occurring, the consequences should the event occur, develops a risk rating, evaluatesthe risk and develops a risk treatment plan for non-acceptable risks.
Critical risks, being those assessed as ‘Very High’ - requiring immediate corrective action and ‘High’– requiring prioritised corrective action identified in the Infrastructure Risk Management Plan,together with the estimated residual risk after the selected treatment plan is operational aresummarised in Table 5.2. These risks are reported to management and Council.
Table 5.2: Critical Risks and Treatment Plans
Service orAsset at Risk
What can Happen RiskRating
(VH,H)
Risk Treatment Plan ResidualRisk *
TreatmentCosts
Resurfacing ofCar Parks
Motor VehicleAccident
H Ensure funds are allocated forbitumen reseals.
L $ 25,000/car park
Traffic Control Motor VehicleAccident
H Refer to CBD TrafficManagement Plan
M $ 35,000/treatment
Note * The residual risk is the risk remaining after the selected risk treatment plan is operational.Sample above, Refer to Kerb Channel, Car Parks & Traffic Control Infrastructure Risk Management Plan
5.3 Routine Operations and Maintenance PlanOperations include regular activities to provide services such as public health, safety and amenity,eg street sweeping, grass mowing and street lighting.
Routine maintenance is the regular on-going work that is necessary to keep assets operating,including instances where portions of the asset fail and need immediate repair to make the assetoperational again.
8 Refer to Advanced Risk Management Report.

CITY OF VICTOR HARBOR – KERB CHANNEL, CAR PARKS & TRAFFIC CONTROL DEVICES ASSETMANAGEMENT PLAN Page 24 of 70
5.3.1 Operations and Maintenance Plan
Operations activities affect service levels including quality and function through street sweeping andgrass mowing frequency, intensity and spacing of street lights and cleaning frequency and openinghours of building and other facilities.
Maintenance includes all actions necessary for retaining an asset as near as practicable to anappropriate service condition including regular ongoing day-to-day work necessary to keep assetsoperating, eg road patching but excluding rehabilitation or renewal. Maintenance may be classifiesinto reactive, planned and specific maintenance work activities.
Reactive maintenance is unplanned repair work carried out in response to service requests andmanagement/supervisory directions.
Planned maintenance is repair work that is identified and managed through a maintenancemanagement system (MMS). MMS activities include inspection, assessing the condition againstfailure/breakdown experience, prioritising, scheduling, actioning the work and reporting what wasdone to develop a maintenance history and improve maintenance and service delivery performance.
Specific maintenance is replacement of higher value components/sub-components of assets that isundertaken on a regular cycle including repainting, replacing air conditioning units, etc. This workfalls below the capital/maintenance threshold but may require a specific budget allocation.
Actual past maintenance expenditure is shown in Table 5.3.1.
Table 5.3.1: Maintenance Expenditure Trends
Year Maintenance ExpenditurePlanned and Specific Unplanned
2013-14 $65,305.51 $0002014-15 $49,428.87 $0002015-16 $65,256.24 $0002016-17 $59,783.83 $0002017-18 $67,184.89 $0002018-19 (budget) $68,300.00 $000
Planned maintenance work is currently 100% of total maintenance expenditure.
Maintenance expenditure levels are considered to be adequate to meet projected service levels,which may be less than or equal to current service levels. Where maintenance expenditure levelsare such that will result in a lesser level of service, the service consequences and service risks havebeen identified and service consequences highlighted in this AM Plan and service risks consideredin the Infrastructure Risk Management Plan.
Assessment and prioritisation of reactive maintenance is undertaken by the organisation’s staff usingexperience and judgement.
5.3.2 Operations and Maintenance Strategies
The organisation will operate and maintain assets to provide the defined level of service to approvedbudgets in the most cost-efficient manner. The operation and maintenance activities include:
Scheduling operations activities to deliver the defined level of service in the most efficientmanner,
Undertaking maintenance activities through a planned maintenance system to reducemaintenance costs and improve maintenance outcomes. Undertake cost-benefit analysis to

CITY OF VICTOR HARBOR – KERB CHANNEL, CAR PARKS & TRAFFIC CONTROL DEVICES ASSETMANAGEMENT PLAN Page 25 of 70
determine the most cost-effective split between planned and unplanned maintenanceactivities (50 – 70% planned desirable as measured by cost),
Maintain a current infrastructure risk register for assets and present service risks associatedwith providing services from infrastructure assets and reporting Very High and High risks andresidual risks after treatment to management and Council,
Review current and required skills base and implement workforce training and developmentto meet required operations and maintenance needs,
Review asset utilisation to identify underutilised assets and appropriate remedies, and overutilised assets and customer demand management options,
Maintain a current hierarchy of critical assets and required operations and maintenanceactivities,
Develop and regularly review appropriate emergency response capability, Review management of operations and maintenance activities to ensure the organisation is
obtaining best value for resources used.
Asset hierarchy
An asset hierarchy provides a framework for structuring data in an information system to assist incollection of data, reporting information and making decisions. The hierarchy includes the assetclass and component used for asset planning and financial reporting and service level hierarchyused for service planning and delivery.
The organisation’s service hierarchy is shown is Table 5.3.2.
Table 5.3.2: Asset Service Hierarchy
Service Hierarchy Service Level ObjectiveCollection Roads High Service LevelDistributor Roads High Service LevelMinor Streets Lower Service LevelSchools High Service LevelShops Medium Service LevelAged Care Facility High Service Level
Critical Assets
Critical assets are those assets which have a high consequence of failure but not necessarily a highlikelihood of failure. By identifying critical assets and critical failure modes, organisations can targetand refines investigative activities, maintenance plans and capital expenditure plans at theappropriate time.
Operations and maintenances activities may be targeted to mitigate critical assets failure andmaintain service levels. These activities may include increased inspection frequency, highermaintenance intervention levels, etc. Critical assets failure modes and required operations andmaintenance activities are detailed in Table 5.3.2.1.
Table 5.3.2.1: Critical Assets and Service Level Objectives
Critical Assets Critical Failure Mode Operations & Maintenance ActivitiesNA NA NA
Standards and specifications
Maintenance work is carried out in accordance with the following Standards and Specifications.

CITY OF VICTOR HARBOR – KERB CHANNEL, CAR PARKS & TRAFFIC CONTROL DEVICES ASSETMANAGEMENT PLAN Page 26 of 70
DPTI Part 284 – Construction of Secondary Paving AAPA National Sealing Specification Austroads Guide to Spray Sealing City of Victor Harbor Work Method Statements City of Victor Harbor Levels of Service Australian Standard 2150 Hotmix Asphalt
5.3.3 Summary of future operations and maintenance expenditures
Future operations and maintenance expenditure is forecast to trend in line with the value of the assetstock as shown in Figure 4. Note that all costs are shown in current 2018 dollar values (ie realvalues).
Figure 4: Projected Operations and Maintenance Expenditure
Deferred maintenance, ie works that are identified for maintenance and unable to be funded are tobe included in the risk assessment and analysis in the infrastructure risk management plan.
Maintenance is funded from the operating budget where available. This is further discussed inSection 6.2.
5.4 Renewal/Replacement PlanRenewal and replacement expenditure is major work which does not increase the asset’s designcapacity but restores, rehabilitates, replaces or renews an existing asset to its original or lesserrequired service potential. Work over and above restoring an asset to original service potential isupgrade/expansion or new works expenditure.
5.4.1 Renewal plan
Assets requiring renewal/replacement are identified from one of three methods provided in the‘Expenditure Template’.
Method 1 uses Asset Register data to project the renewal costs using acquisition year anduseful life to determine the renewal year, or

CITY OF VICTOR HARBOR – KERB CHANNEL, CAR PARKS & TRAFFIC CONTROL DEVICES ASSETMANAGEMENT PLAN Page 27 of 70
Method 2 uses capital renewal expenditure projections from external condition modellingsystems (such as Pavement Management Systems), or
Method 3 uses a combination of average network renewals plus defect repairs in the RenewalPlan and Defect Repair Plan worksheets on the ‘Expenditure template’.
Method 2 was used for this asset management plan.
The useful lives of assets used to develop projected asset renewal expenditures are shown in Table5.4.1. Asset useful lives were last reviewed on 2017.9
Table 5.4.1: Useful Lives of Assets
Car Parks
Description Useful Life Pavement (yrs.) Useful Life Seal (yrs.)
Asphalt Seal 60 30Spray Seal 60 16Unsealed 25 NAPavers 60 30
Kerb Channel
Description Useful Life Pavement (yrs.) Useful Life Seal (yrs.)
Barrier Kerb NA 70Car Park (Various) NA 70Median Kerb NA 70Mountable NA 70Watertable (Spoon) NA 70
Traffic Control Devices
Description Useful Life Kerbs (yrs.) Useful Life Infill (yrs.)
Roundabout 70 50Medium 70 50Splitter Island 70 50Speed Hump NA 30W-Beam NA 40Signals NA 50Ticket Machines NA 15Fences NA 25Lighting NA Various
9 Valuation Methodology to Comply with AASB116
CITY OF VICTOR HARBOR – KERB CHANNEL, CAR PARKS & TRAFFIC CONTROL DEVICES ASSETMANAGEMENT PLAN Page 28 of 70
5.4.2 Renewal and Replacement Strategies
The organisation will plan capital renewal and replacement projects to meet level of serviceobjectives and minimise infrastructure service risks by:
Planning and scheduling renewal projects to deliver the defined level of service in the mostefficient manner,
Undertaking project scoping for all capital renewal and replacement projects to identify:o the service delivery ‘deficiency’, present risk and optimum time for
renewal/replacement,o the project objectives to rectify the deficiency,o the range of options, estimated capital and life cycle costs for each options that could
address the service deficiency,o and evaluate the options against evaluation criteria adopted by the organisation, ando select the best option to be included in capital renewal programs,
Using ‘low cost’ renewal methods (cost of renewal is less than replacement) whereverpossible,
Maintain a current infrastructure risk register for assets and service risks associated withproviding services from infrastructure assets and reporting Very High and High risks andresidual risks after treatment to management and the Council,
Review current and required skills base and implement workforce training and developmentto meet required construction and renewal needs,
Maintain a current hierarchy of critical assets and capital renewal treatments and timingsrequired,
Review management of capital renewal and replacement activities to ensure the organisationis obtaining best value for resources used.
Renewal ranking criteria
Asset renewal and replacement is typically undertaken to either:
Ensure the reliability of the existing infrastructure to deliver the service it was constructed tofacilitate (eg replacing a bridge that has a 5 t load limit), or
To ensure the infrastructure is of sufficient quality to meet the service requirements (egroughness of a road).10
It is possible to get some indication of capital renewal and replacement priorities by identifying assetsor asset groups that:
Have a high consequence of failure, Have a high utilisation and subsequent impact on users would be greatest, The total value represents the greatest net value to the organisation, Have the highest average age relative to their expected lives, Are identified in the AM Plan as key cost factors, Have high operational or maintenance costs, and Where replacement with modern equivalent assets would yield material savings.11
The ranking criteria used to determine priority of identified renewal and replacement proposals isdetailed in Table 5.4.2.
10 IPWEA, 2011, IIMM, Sec 3.4.4, p 3|60.11 Based on IPWEA, 2011, IIMM, Sec 3.4.5, p 3|66.
CITY OF VICTOR HARBOR – KERB CHANNEL, CAR PARKS & TRAFFIC CONTROL DEVICES ASSETMANAGEMENT PLAN Page 29 of 70
Table 5.4.2: Renewal and Replacement Priority Ranking Criteria
Criteria WeightingCondition Rating (4 and 5) 30%Risks – (residual high and/or extreme risks) 30%Utilisation 20%Public Need 20%Total 100%
Renewal and replacement standards
Renewal work is carried out in accordance with the following Standards and Specifications.
DPTI Part 284 – Construction of Secondary Paving Australian Standard 2150 Hotmix Asphalt AAPA National Sealing Specification Austroads Guide to Spray Sealing
5.4.3 Summary of future renewal and replacement expenditure
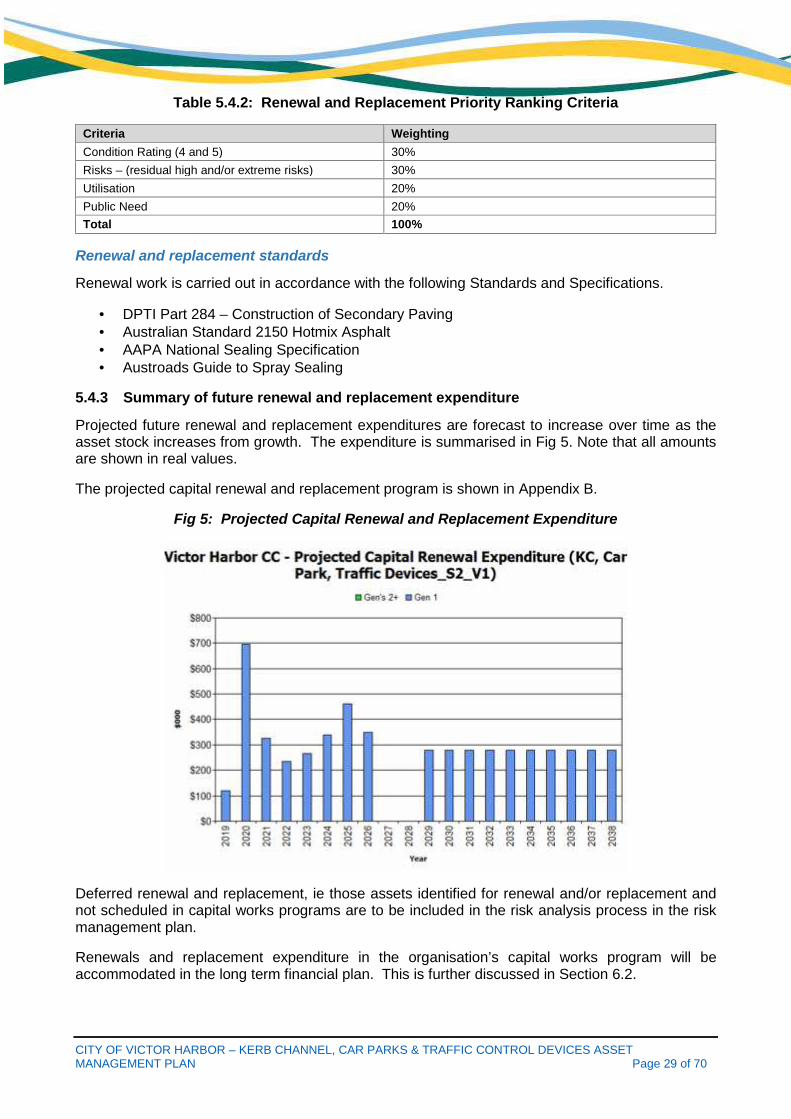
Projected future renewal and replacement expenditures are forecast to increase over time as theasset stock increases from growth. The expenditure is summarised in Fig 5. Note that all amountsare shown in real values.
The projected capital renewal and replacement program is shown in Appendix B.
Fig 5: Projected Capital Renewal and Replacement Expenditure
Deferred renewal and replacement, ie those assets identified for renewal and/or replacement andnot scheduled in capital works programs are to be included in the risk analysis process in the riskmanagement plan.
Renewals and replacement expenditure in the organisation’s capital works program will beaccommodated in the long term financial plan. This is further discussed in Section 6.2.

CITY OF VICTOR HARBOR – KERB CHANNEL, CAR PARKS & TRAFFIC CONTROL DEVICES ASSETMANAGEMENT PLAN Page 30 of 70
5.5 Creation/Acquisition/Upgrade PlanNew works are those works that create a new asset that did not previously exist, or works whichupgrade or improve an existing asset beyond its existing capacity. They may result from growth,social or environmental needs. Assets may also be acquired at no cost to the organisation from landdevelopment. These assets from growth are considered in Section 4.4.
5.5.1 Selection criteria
New assets and upgrade/expansion of existing assets are identified from various sources such ascouncillor or community requests, proposals identified by strategic plans or partnerships with otherorganisations. Candidate proposals are inspected to verify need and to develop a preliminaryrenewal estimate. Verified proposals are ranked by priority and available funds and scheduled infuture works programmes. The priority ranking criteria is detailed below.
Table 5.5.1: New Assets Priority Ranking Criteria
Criteria WeightingPublic Need 30%Risks – (residual high or extreme risks) 20%Utilisation 20%Whole of Life Costing Analysis Considered 30%Total 100%
5.5.2 Capital Investment Strategies
The organisation will plan capital upgrade and new projects to meet level of service objectives by:
Planning and scheduling capital upgrade and new projects to deliver the defined level ofservice in the most efficient manner,
Undertake project scoping for all capital upgrade/new projects to identify:o the service delivery ‘deficiency’, present risk and required timeline for delivery of the
upgrade/new asset,o the project objectives to rectify the deficiency including value management for major
projects,o the range of options, estimated capital and life cycle costs for each options that could
address the service deficiency,o management of risks associated with alternative options,o and evaluate the options against evaluation criteria adopted by Council, ando select the best option to be included in capital upgrade/new programs,
Review current and required skills base and implement training and development to meetrequired construction and project management needs,
Review management of capital project management activities to ensure the organisation isobtaining best value for resources used.
Standards and specifications for new assets and for upgrade/expansion of existing assets are thesame as those for renewal shown in Section 5.4.2.
5.5.3 Summary of future upgrade/new assets expenditure
Projected upgrade/new asset expenditures are summarised in Fig 6. The projected upgrade/newcapital works program is shown in Appendix C. All amounts are shown in real values.

CITY OF VICTOR HARBOR – KERB CHANNEL, CAR PARKS & TRAFFIC CONTROL DEVICES ASSETMANAGEMENT PLAN Page 31 of 70
Fig 6: Projected Capital Upgrade/New Asset Expenditure
Expenditure on new assets and services in the organisation’s capital works program will beaccommodated in the long term financial plan. This is further discussed in Section 6.2.
5.6 Disposal PlanDisposal includes any activity associated with disposal of a decommissioned asset including sale,demolition or relocation. Assets identified for possible decommissioning and disposal are shown inTable 5.6, together with estimated annual savings from not having to fund operations andmaintenance of the assets. These assets will be further reinvestigated to determine the requiredlevels of service and see what options are available for alternate service delivery, if any. Any revenuegained from asset disposals is accommodated in the organisation’s long term financial plan.
Where cashflow projections from asset disposals are not available, these will be developed in futurerevisions of this asset management plan.
Table 5.6: Assets Identified for Disposal
Asset Reason for Disposal Timing Disposal Expenditure Operations &Maintenance Annual
SavingsAll None Proposed N/A N/A N/A
5.7 Service Consequences and RisksThe organisation has prioritised decisions made in adopting this AM Plan to obtain the optimumbenefits from its available resources. Decisions were made based on the development of 3scenarios of AM Plans.
Scenario 1 - What we would like to do based on asset register data
Scenario 2 – What we should do with existing budgets and identifying level of service and riskconsequences (ie what are the operations and maintenance and capital projects we are unable todo, what is the service and risk consequences associated with this position). This may requireseveral versions of the AM Plan.

CITY OF VICTOR HARBOR – KERB CHANNEL, CAR PARKS & TRAFFIC CONTROL DEVICES ASSETMANAGEMENT PLAN Page 32 of 70
Scenario 3 – What we can do and be financially sustainable with AM Plans matching long-termfinancial plans.
The development of scenario 1 and scenario 2 AM Plans provides the tools for discussion with theCouncil and community on trade-offs between what we would like to do (scenario 1) and what weshould be doing with existing budgets (scenario 2) by balancing changes in services and servicelevels with affordability and acceptance of the service and risk consequences of the trade-off position(scenario 3).
5.7.1 What we cannot do
There are some operations and maintenance activities and capital projects that are unable to beundertaken within the next 10 years. These include:
Creation of New Assets
5.7.2 Service consequences
Operations and maintenance activities and capital projects that cannot be undertaken will maintainor create service consequences for users. These include:
None Known
5.7.3 Risk consequences
The operations and maintenance activities and capital projects that cannot be undertaken maymaintain or create risk consequences for the organisation. These include:
Some community members may see a need for a new asset with low utilisation or need.
These risks have been included with the Infrastructure Risk Management Plan summarised inSection 5.2 and risk management plans actions and expenditures included within projectedexpenditures.
6. Financial SummaryThis section contains the financial requirements resulting from all the information presented in theprevious sections of this asset management plan. The financial projections will be improved asfurther information becomes available on desired levels of service and current and projected futureasset performance.
6.1 Financial Statements and ProjectionsThe financial projections are shown in Fig 7 for projected operating (operations and maintenance)and capital expenditure (renewal and upgrade/expansion/new assets). Note that all costs are shownin real values.
Fig 7: Projected Operating and Capital Expenditure

CITY OF VICTOR HARBOR – KERB CHANNEL, CAR PARKS & TRAFFIC CONTROL DEVICES ASSETMANAGEMENT PLAN Page 33 of 70
6.1.1 Sustainability of service delivery
Two key indicators for service delivery sustainability that have been considered in the analysis of theservices provided by this asset category, these being the:
asset renewal funding ratio, and
medium term budgeted expenditures/projected expenditure (over 10 years of the planningperiod).
Asset Renewal Funding Ratio
Asset Renewal Funding Ratio12 100%
The Asset Renewal Funding Ratio is the most important indicator and indicates that over the next10 years of the forecasting that we expect to have 100% of the funds required for the optimal renewaland replacement of assets.
Medium term – 10 year financial planning period
This asset management plan identifies the projected operations, maintenance and capital renewalexpenditures required to provide an agreed level of service to the community over a 10 year period.This provides input into 10 year financial and funding plans aimed at providing the required servicesin a sustainable manner.
These projected expenditures may be compared to budgeted expenditures in the 10 year period toidentify any funding shortfall. In a core asset management plan, a gap is generally due to increasingasset renewals for ageing assets.
The projected operations, maintenance and capital renewal expenditure required over the 10 yearplanning period is $400,000 on average per year.
12 AIFMM, 2015, Version 1.0, Financial Sustainability Indicator 3, Sec 2.6, p 9.

CITY OF VICTOR HARBOR – KERB CHANNEL, CAR PARKS & TRAFFIC CONTROL DEVICES ASSETMANAGEMENT PLAN Page 34 of 70
Estimated (budget) operations, maintenance and capital renewal funding is $393,000 on averageper year giving a 10 year funding shortfall of $7,000 per year. This indicates 98% of the projectedexpenditures needed to provide the services documented in the asset management plan. Thisexcludes upgrade/new assets.
Providing services from infrastructure in a sustainable manner requires the matching and managingof service levels, risks, projected expenditures and financing to achieve a financial indicator ofapproximately 1.0 for the first years of the asset management plan and ideally over the 10-year lifeof the Long Term Financial Plan.
Figure 8 shows the projected asset renewal and replacement expenditure over the 20 years of theAM Plan. The projected asset renewal and replacement expenditure is compared to renewal andreplacement expenditure in the capital works program, which is accommodated in the long termfinancial plan.
Figure 8: Projected and LTFP Budgeted Renewal Expenditure
Table 6.1.1 shows the shortfall between projected renewal and replacement expenditures andexpenditure accommodated in long term financial plan. Budget expenditures accommodated in thelong term financial plan or extrapolated from current budgets are shown in Appendix D.
Table 6.1.1: Projected and LTFP Budgeted Renewals and Financing Shortfall
Year End Projected LTFP Renewal Financing Cumulative Shortfall($'000)Jun-30 Renewals Renewal Budget Shortfall ($'000) (- gap, + surplus)
($'000) ($'000) (- gap, + surplus)2019 $120 $120 $0 $02020 $697 $697 $0 $02021 $325 $325 $0 $02022 $235 $235 $0 $02023 $265 $265 $0 $02024 $340 $340 $0 $0

CITY OF VICTOR HARBOR – KERB CHANNEL, CAR PARKS & TRAFFIC CONTROL DEVICES ASSETMANAGEMENT PLAN Page 35 of 70
2025 $460 $460 $0 $02026 $350 $350 $0 $02027 $0 $0 $0 $02028 $0 $0 $0 $02029 $279 $279 $0 $02030 $279 $279 $0 $02031 $279 $279 $0 $02032 $279 $279 $0 $02033 $279 $279 $0 $02034 $279 $279 $0 $02035 $279 $279 $0 $02036 $279 $279 $0 $02037 $279 $279 $0 $02038 $279 $279 $0 $0
Note: A negative shortfall indicates a financing gap, a positive shortfall indicates a surplus for that year.
Providing services in a sustainable manner will require matching of projected asset renewal andreplacement expenditure to meet agreed service levels with the corresponding capital worksprogram accommodated in the long term financial plan.
A gap between projected asset renewal/replacement expenditure and amounts accommodated inthe LTFP indicates that further work is required on reviewing service levels in the AM Plan (includingpossibly revising the LTFP) before finalising the asset management plan to manage required servicelevels and funding to eliminate any funding gap.
We will manage the ‘gap’ by developing this asset management plan to provide guidance on futureservice levels and resources required to provide these services, and review future services, servicelevels and costs with the community.
6.1.2 Projected expenditures for long term financial plan
Table 6.1.2 shows the projected expenditures for the 10 year long term financial plan.
Expenditure projections are in 2018 real values.
Table 6.1.2: Projected Expenditures for Long Term Financial Plan ($000)
Year Operations MaintenanceProjected Capital
DisposalsCapitalRenewal Upgrade/New
2019 $46.00 $68.00 $120.00 $15.00 $0.002020 $46.25 $68.37 $697.00 $1,075.00 $0.002021 $47.90 $70.80 $325.00 $185.00 $0.002022 $48.37 $71.51 $235.00 $185.00 $0.002023 $48.85 $72.21 $265.00 $100.00 $0.002024 $49.22 $72.75 $340.00 $20.00 $0.002025 $49.48 $73.14 $460.00 $100.00 $0.002026 $49.85 $73.69 $350.00 $20.00 $0.002027 $50.11 $74.08 $0.00 $100.00 $0.002028 $50.48 $74.62 $0.00 $100.00 $0.002029 $50.85 $75.17 $279.20 $190.00 $0.002030 $51.35 $75.90 $279.20 $190.00 $0.002031 $51.84 $76.63 $279.20 $190.00 $0.00

CITY OF VICTOR HARBOR – KERB CHANNEL, CAR PARKS & TRAFFIC CONTROL DEVICES ASSETMANAGEMENT PLAN Page 36 of 70
2032 $52.33 $77.36 $279.20 $190.00 $0.002033 $52.83 $78.09 $279.20 $190.00 $0.002034 $53.33 $78.83 $279.20 $190.00 $0.002035 $53.82 $79.56 $279.20 $190.00 $0.002036 $54.32 $80.30 $279.20 $190.00 $0.002037 $54.82 $81.04 $279.20 $190.00 $0.002038 $55.32 $81.78 $279.20 $190.00 $0.00
6.2 Funding StrategyAfter reviewing service levels, as appropriate to ensure ongoing financial sustainability projectedexpenditures identified in Section 6.1.2 will be accommodated in the organisation’s 10 year long termfinancial plan.
6.3 Valuation ForecastsAsset values are forecast to increase as additional assets are added to the asset stock fromconstruction and acquisition by the organisation and from assets constructed by land developersand others and donated to the organisation. Figure 9 shows the projected replacement cost assetvalues over the planning period in real values.
Figure 9: Projected Asset Values
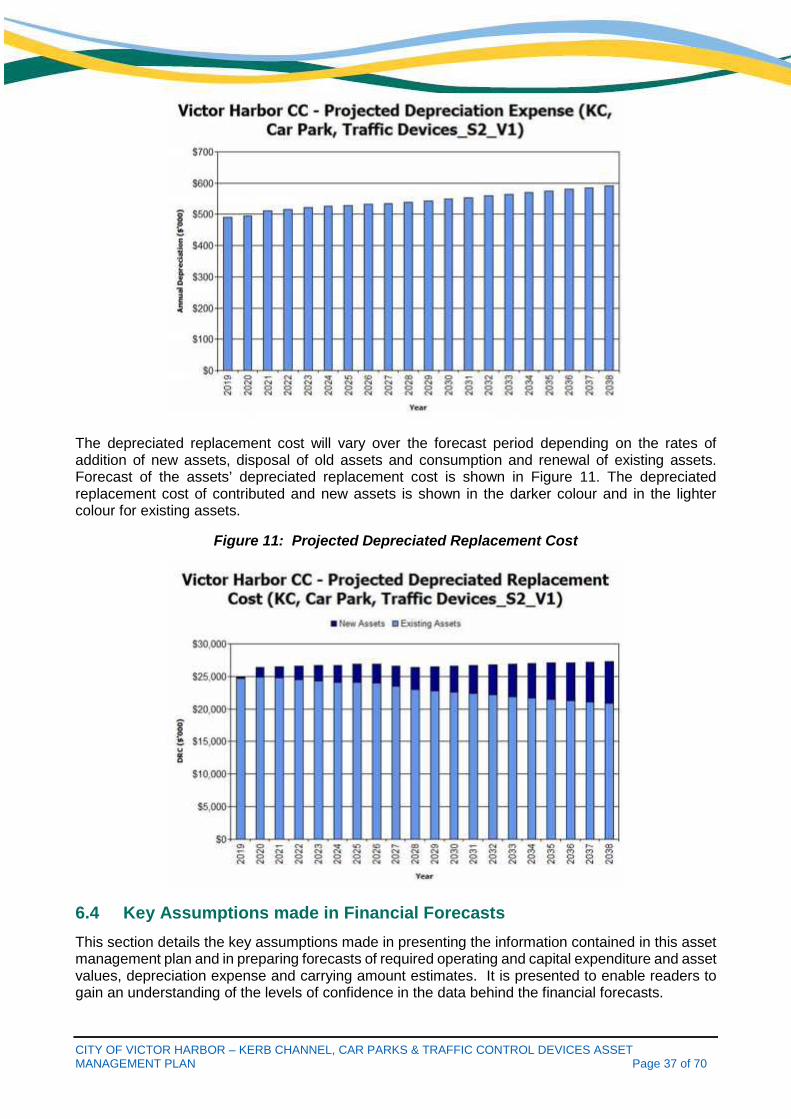
Depreciation expense values are forecast in line with asset values as shown in Figure 10.
Figure 10: Projected Depreciation Expense
CITY OF VICTOR HARBOR – KERB CHANNEL, CAR PARKS & TRAFFIC CONTROL DEVICES ASSETMANAGEMENT PLAN Page 37 of 70
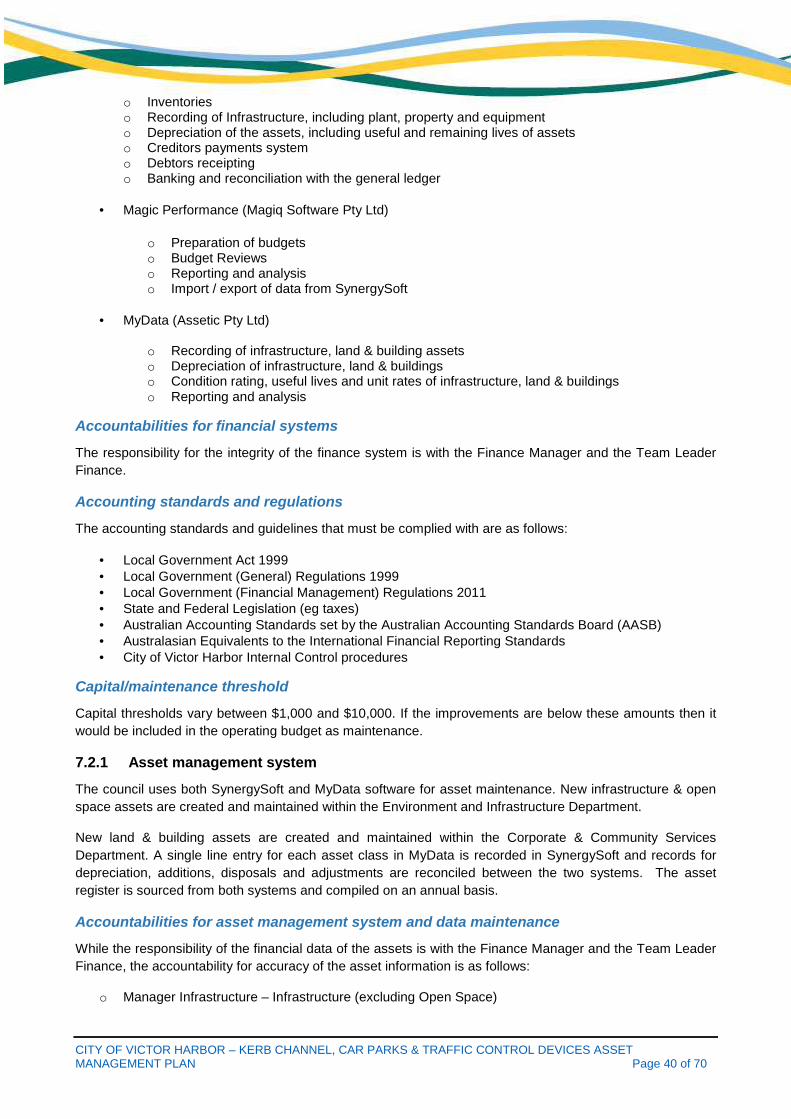
The depreciated replacement cost will vary over the forecast period depending on the rates ofaddition of new assets, disposal of old assets and consumption and renewal of existing assets.Forecast of the assets’ depreciated replacement cost is shown in Figure 11. The depreciatedreplacement cost of contributed and new assets is shown in the darker colour and in the lightercolour for existing assets.
Figure 11: Projected Depreciated Replacement Cost
6.4 Key Assumptions made in Financial ForecastsThis section details the key assumptions made in presenting the information contained in this assetmanagement plan and in preparing forecasts of required operating and capital expenditure and assetvalues, depreciation expense and carrying amount estimates. It is presented to enable readers togain an understanding of the levels of confidence in the data behind the financial forecasts.

CITY OF VICTOR HARBOR – KERB CHANNEL, CAR PARKS & TRAFFIC CONTROL DEVICES ASSETMANAGEMENT PLAN Page 38 of 70
Key assumptions made in this asset management plan and risks that these may change are shownin Table 6.4.
Table 6.4: Key Assumptions made in AM Plan and Risks of Change
Key Assumptions Risks of Change to AssumptionsAll expenditure is stated in dollar values as at 2018with no allowance made for inflation over the 10-year planning period.
All values are in today’s dollars no % increase has beenincluded.
Initial renewal and new costs have been reviewedon the basis of historical costs, conditiondeterioration work, and compared to thedepreciation provision and the funding available.Renewal costs typically increase by an average of3-4% per annum over the life of the Plan to allowfor the impact of an enlarged asset base.
Cost assumptions based on past and known costs.
Similarly, Maintenance costs typically increase byabout 3% per annum to allow for the increase intotal asset value (reflecting the higher costsassociated with managing a larger network base).Again, as asset value is predicted to increase bysome 0.5% over the life of the Plan, thisassumption will need to be closely monitored toensure that sufficient maintenance funds areavailable to optimise long term expenditure and notcreate a backlog.
Cost assumptions based on past and known costs.
Continuation of the current rate and pattern ofurban development.
Population growth factor of 1.5% per year has beenincluded.
Capital forecast costs for ‘Renewal’ &‘Upgrade/New’ have been placed into theirrespective categories; this was based on limitedinformation.
Cost assumptions are based on past and known costsincluding the break-down costs to reflect ‘Renewal’ &‘Upgrade/New’ Capital costs.
6.5 Forecast Reliability and ConfidenceThe expenditure and valuations projections in this AM Plan are based on best available data.Currency and accuracy of data is critical to effective asset and financial management. Dataconfidence is classified on a 5 level scale13 in accordance with Table 6.5.
Table 6.5: Data Confidence Grading System
ConfidenceGrade
Description
A Highly reliable Data based on sound records, procedures, investigations and analysis, documented properly andrecognised as the best method of assessment. Dataset is complete and estimated to be accurate± 2%
B Reliable Data based on sound records, procedures, investigations and analysis, documented properly buthas minor shortcomings, for example some of the data is old, some documentation is missingand/or reliance is placed on unconfirmed reports or some extrapolation. Dataset is complete andestimated to be accurate ± 10%
C Uncertain Data based on sound records, procedures, investigations and analysis which is incomplete orunsupported, or extrapolated from a limited sample for which grade A or B data are available.
13 IPWEA, 2011, IIMM, Table 2.4.6, p 2|59.

CITY OF VICTOR HARBOR – KERB CHANNEL, CAR PARKS & TRAFFIC CONTROL DEVICES ASSETMANAGEMENT PLAN Page 39 of 70
Dataset is substantially complete but up to 50% is extrapolated data and accuracy estimated ±25%
D Very Uncertain Data is based on unconfirmed verbal reports and/or cursory inspections and analysis. Datasetmay not be fully complete and most data is estimated or extrapolated. Accuracy ± 40%
E Unknown None or very little data held.
The estimated confidence level for and reliability of data used in this AM Plan is shown in Table6.5.1.
Table 6.5.1: Data Confidence Assessment for Data used in AM Plan
Data Confidence Assessment CommentDemand drivers Reliable Regional trends available
Growth projections Reliable
Operations expenditures Highly Reliable Extrapolated from previous years
Maintenanceexpenditures
Highly Reliable Extrapolated from previous years
Projected Renewal exps.- Asset values
Highly Reliable Valuation completed in 2017
- Asset residual values Reliable Identified in Condition assessment but not applied toregister
- Asset useful lives Reliable Identified in Condition assessment but not applied toregister
- Condition modelling Highly Reliable Comprehensively completed in 2018
- Network renewals Highly Reliable Based on Condition assessment and operationalexperience
- Defect repairs Highly Reliable Scheduled maintenance is approx. 100% of totalmaintenance
Upgrade/Newexpenditures
Reliable Annual Review of Capital Works Program and AssetRegister
Disposal expenditures Reliable Annual Review of Capital Works Program
Over all data sources, the data confidence is assessed as high confidence level for data used inthe preparation of this AM Plan.
7. Plan Improvement and Monitoring7.1 Status of Asset Management Practices
7.1.1 Accounting and financial systems
The finance system used by the City of Victor Harbor includes:
SynergySoft (IT Vision)
o Actual and historical transactionso Budgeting
CITY OF VICTOR HARBOR – KERB CHANNEL, CAR PARKS & TRAFFIC CONTROL DEVICES ASSETMANAGEMENT PLAN Page 40 of 70
o Inventorieso Recording of Infrastructure, including plant, property and equipmento Depreciation of the assets, including useful and remaining lives of assetso Creditors payments systemo Debtors receiptingo Banking and reconciliation with the general ledger
Magic Performance (Magiq Software Pty Ltd)
o Preparation of budgetso Budget Reviewso Reporting and analysiso Import / export of data from SynergySoft
MyData (Assetic Pty Ltd)
o Recording of infrastructure, land & building assetso Depreciation of infrastructure, land & buildingso Condition rating, useful lives and unit rates of infrastructure, land & buildingso Reporting and analysis
Accountabilities for financial systems
The responsibility for the integrity of the finance system is with the Finance Manager and the Team LeaderFinance.
Accounting standards and regulations
The accounting standards and guidelines that must be complied with are as follows:
Local Government Act 1999 Local Government (General) Regulations 1999 Local Government (Financial Management) Regulations 2011 State and Federal Legislation (eg taxes) Australian Accounting Standards set by the Australian Accounting Standards Board (AASB) Australasian Equivalents to the International Financial Reporting Standards City of Victor Harbor Internal Control procedures
Capital/maintenance threshold
Capital thresholds vary between $1,000 and $10,000. If the improvements are below these amounts then itwould be included in the operating budget as maintenance.
7.2.1 Asset management system
The council uses both SynergySoft and MyData software for asset maintenance. New infrastructure & openspace assets are created and maintained within the Environment and Infrastructure Department.
New land & building assets are created and maintained within the Corporate & Community ServicesDepartment. A single line entry for each asset class in MyData is recorded in SynergySoft and records fordepreciation, additions, disposals and adjustments are reconciled between the two systems. The assetregister is sourced from both systems and compiled on an annual basis.
Accountabilities for asset management system and data maintenance
While the responsibility of the financial data of the assets is with the Finance Manager and the Team LeaderFinance, the accountability for accuracy of the asset information is as follows:
o Manager Infrastructure – Infrastructure (excluding Open Space)
CITY OF VICTOR HARBOR – KERB CHANNEL, CAR PARKS & TRAFFIC CONTROL DEVICES ASSETMANAGEMENT PLAN Page 41 of 70
o Manager Environment & Recreation – Open Space & Buildingso Manager Finance – Land
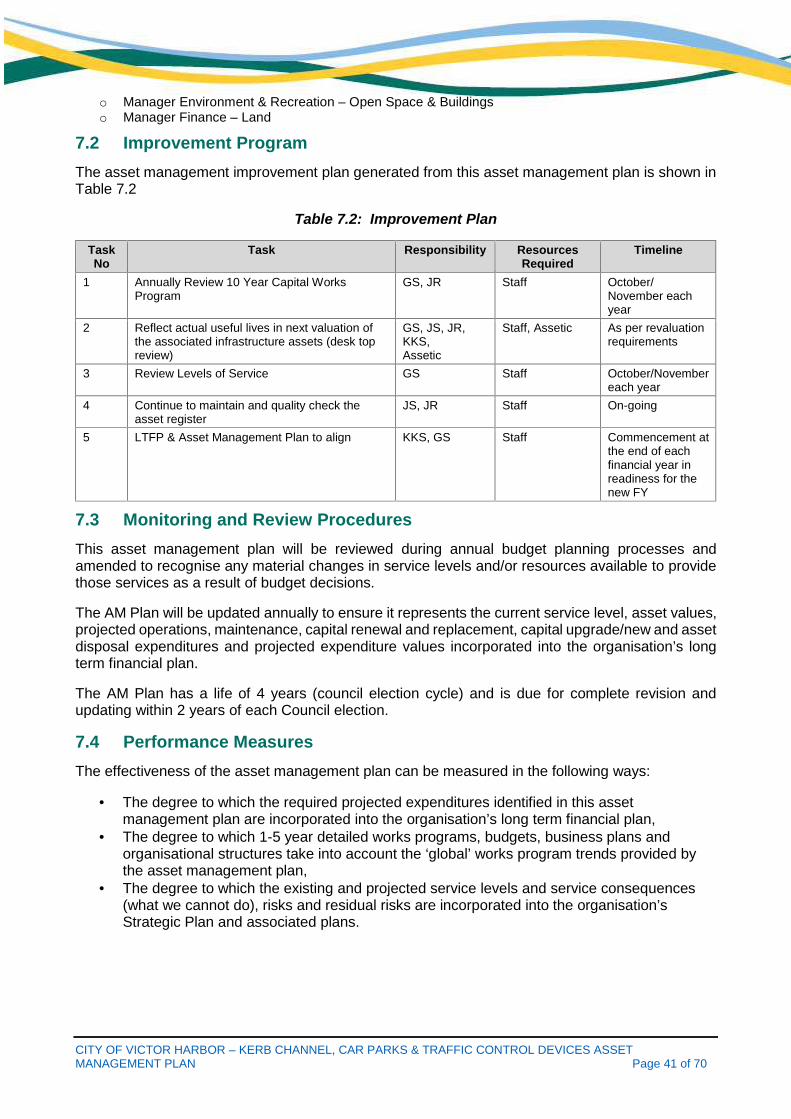
7.2 Improvement ProgramThe asset management improvement plan generated from this asset management plan is shown inTable 7.2
Table 7.2: Improvement Plan
TaskNo
Task Responsibility ResourcesRequired
Timeline
1 Annually Review 10 Year Capital WorksProgram
GS, JR Staff October/November eachyear
2 Reflect actual useful lives in next valuation ofthe associated infrastructure assets (desk topreview)
GS, JS, JR,KKS,Assetic
Staff, Assetic As per revaluationrequirements
3 Review Levels of Service GS Staff October/Novembereach year
4 Continue to maintain and quality check theasset register
JS, JR Staff On-going
5 LTFP & Asset Management Plan to align KKS, GS Staff Commencement atthe end of eachfinancial year inreadiness for thenew FY
7.3 Monitoring and Review ProceduresThis asset management plan will be reviewed during annual budget planning processes andamended to recognise any material changes in service levels and/or resources available to providethose services as a result of budget decisions.
The AM Plan will be updated annually to ensure it represents the current service level, asset values,projected operations, maintenance, capital renewal and replacement, capital upgrade/new and assetdisposal expenditures and projected expenditure values incorporated into the organisation’s longterm financial plan.
The AM Plan has a life of 4 years (council election cycle) and is due for complete revision andupdating within 2 years of each Council election.
7.4 Performance MeasuresThe effectiveness of the asset management plan can be measured in the following ways:
The degree to which the required projected expenditures identified in this assetmanagement plan are incorporated into the organisation’s long term financial plan,
The degree to which 1-5 year detailed works programs, budgets, business plans andorganisational structures take into account the ‘global’ works program trends provided bythe asset management plan,
The degree to which the existing and projected service levels and service consequences(what we cannot do), risks and residual risks are incorporated into the organisation’sStrategic Plan and associated plans.

CITY OF VICTOR HARBOR – KERB CHANNEL, CAR PARKS & TRAFFIC CONTROL DEVICES ASSETMANAGEMENT PLAN Page 42 of 70
8. ReferencesIPWEA, 2006, ‘International Infrastructure Management Manual’, Institute of Public Works
Engineering Australia, Sydney, www.ipwea.org.au/IIMM
IPWEA, 2008, ‘NAMS.PLUS Asset Management’, Institute of Public Works Engineering Australia,Sydney, www.ipwea.org.au/namsplus.
IPWEA, 2009, ‘Australian Infrastructure Financial Management Guidelines’, Institute of PublicWorks Engineering Australia, Sydney, www.ipwea.org.au/AIFMG.
IPWEA, 2011, ‘International Infrastructure Management Manual’, Institute of Public WorksEngineering Australia, Sydney, www.ipwea.org.au/IIMM
Kerb Channel, Car Parks and Traffic Control Devices Infrastructure Risk Management Plan
Organisation, ‘Annual Plan and Budget’
Community Plan 2036 and Strategic Directions 2016-2020
Tonkin Consulting Traffic Management Study 2017
Victor Harbor Pedestrian Strategy
Victor Harbor Urban Growth Management Strategy
Victor Harbor Coastal Management Study 2013

CITY OF VICTOR HARBOR – KERB CHANNEL, CAR PARKS & TRAFFIC CONTROL DEVICES ASSETMANAGEMENT PLAN Page 43 of 70
9. AppendicesAppendix A Maintenance Response Levels of Service
Appendix B Projected 10 Year Capital Renewal and Replacement Works Program
Appendix C Projected 10 Year Capital Upgrade/New Works Program
Appendix D Budgeted Expenditures Accommodated in LTFP
Appendix E Gifted Assets 2010 – 30 June 2018
Appendix F Abbreviations
Appendix G Glossary

CITY OF VICTOR HARBOR – KERB CHANNEL, CAR PARKS & TRAFFIC CONTROL DEVICES ASSETMANAGEMENT PLAN Page 44 of 70
Appendix A Maintenance Response Levels of ServiceRefer to Work Service Requests.

CITY OF VICTOR HARBOR – KERB CHANNEL, CAR PARKS & TRAFFIC CONTROL DEVICES ASSET MANAGEMENT PLAN Page 45 of 70
Appendix B Projected 10 year Capital Renewal and Replacement Works ProgramYr 2019 Renewal New/Upgrade TotalResolution No. OC1752017 - Victor Harbor Oval Car Park - Design $ 50,000 $ - $ 50,000Kerb & Channel Replacement Program $ 70,000 $ - $ 70,000Traffic Management - Left Hand Turn into Henderson Road, Design $ - $ 15,000 $ 15,000
$ 120,000 $ 15,000 $ 135,000
Yr 2020 Renewal New/UpgradeTraffic Management Treatments, Outcomes/Resolutions from 2017 Traffic Study -Carlyle Street/Cornhill Road intersection, closure of lane at Coral Street railwaycrossing, Coral Street/Railway Terrace junction treatment & Grantely Ave LevelCrossing
$ 10,000 $ 20,000 $ 30,000
New Guard Railing for High Risk - Major Culverts $ 50,000 $ - $ 50,000Kerb & Channel Replacement Program (as per condition assessments) $ 120,000 $ - $ 120,000Waitpinga Rd/Battye Rd Intersection - Construction $ 517,000 $ 130,000 $ 647,000Resolution No. OC1662017 - Encounter Bay Bowling Club Car Park - Design $ - $ 35,000 $ 35,000
Resolution No. OC1752017 - Victor Harbor Oval Car Park - Construction. Developmentof the car park in 2018-19 subject to project grant funding and completion – totalarea approximately 3,300m squared - cost estimate: $850,000. Design complete at$50,000 2018-19FY
$ - $ 800,000 $ 800,000
Resolution No. OC3042018 - Franklin Parade Yilki Shops Area, PedestrianImprovement Options Design - 28 May 2018 Council Resolved - That Council considerallocating funding for the Franklin Parade Yilki Shops Area, Pedestrian ImprovementOptions design works in financial year 2019-20.
$ - $ 20,000 $ 20,000
Malen Tce - Create new Vehicle Parking, Northern Side of Malen Tce, betweenTregonning & Harbourview Tce $ - $ 70,000 $ 70,000
$ 697,000 $ 1,075,000 $ 1,772,000

CITY OF VICTOR HARBOR – KERB CHANNEL, CAR PARKS & TRAFFIC CONTROL DEVICES ASSET MANAGEMENT PLAN Page 46 of 70
Yr 2021 Renewal New/Upgrade
Traffic Management Treatments, Outcomes/Resolutions from 2017 Traffic Study -Torrens Street/Coral Street and Stuart Street intersections subject to Stuart Streetclosure
$ 120,000 $ - $ 120,000
New Guard Railing for High Risk - Major Culverts $ 80,000 $ - $ 80,000Crozier/Acraman/Lindsay - Treatment Design $ 15,000 $ 15,000 $ 30,000Kerb & Channel Replacement Program (as per condition assessments) $ 110,000 $ - $ 110,000Resolution No. OC1662017 - Encounter Bay Bowling Club Car Park - Construction $ - $ 95,000 $ 95,000
Traffic Management - Left Hand Turn into Henderson Road - Construction $ - $ 75,000 $ 75,000
$ 325,000 $ 185,000 $ 510,000
Yr 2022 Renewal New/Upgrade
Traffic Management Treatments, Outcomes/Resolutions from 2017 Traffic Study -Burke Street study, Torrens Lane one-way and review of Seaview Road Roundaboutwith DPTI
$ 10,000 $ 40,000.00 $ 50,000
New Guard Railing for High Risk - Major Culverts $ 80,000 $ - $ 80,000Kerb & Channel Replacement Program (as per condition assessments) $ 130,000 $ - $ 130,000
Encounter Bikeway Lighting adjacent Franklin Parade $ 15,000 $ 65,000 $ 80,000
Resolution No. OC3042018 - Franklin Parade Yilki Shops Area), PedestrianImprovement - Construction $ - $ 80,000 $ 80,000
$ 235,000 $ 185,000 $ 420,000
Yr 2023 Renewal New/UpgradeKerb & Channel Replacement Program (per condition assessments) $ 130,000 $ - $ 130,000

CITY OF VICTOR HARBOR – KERB CHANNEL, CAR PARKS & TRAFFIC CONTROL DEVICES ASSET MANAGEMENT PLAN Page 47 of 70
Traffic Management Treatments, Outcomes/Resolutions from 2017 Traffic Study -Victoria Street Pedestrian refuge (near IGA) and implementation of Burke Streetstudy - cost subject to study findings
$ - $ 100,000 $ 100,000
New Guard Railing for High Risk - Major Culverts $ 100,000 $ - $ 100,000
Crozier/Acraman/Lindsay - Treatment - Construct Implement $ 35,000 $ - $ 35,000
$ 265,000 $ 100,000 $ 365,000
Yr 2024 Renewal New/UpgradeKerb & Channel Replacement Program (per condition assessments) $ 210,000 $ - $ 210,000
Traffic Management Treatments, Outcomes/Resolutions from 2017 Traffic Study -Acraman Street Corridor Management Plan $ - $ 20,000 $ 20,000
New Guard Railing for High Risk - Major Culverts $ 130,000 $ - $ 130,000
$ 340,000 $ 20,000 $ 360,000
Yr 2025 Renewal New/Upgrade
Traffic Management Treatments, Outcomes/Resolutions from 2017 Traffic Study -Acraman Street/Hill Street Intersection treatment and implementation of AcramanStreet Corridor Management Plan
$ - $ 100,000.00 $ 100,000
New Guard Railing for High Risk - Major Culverts $ 130,000 $ - $ 130,000Kerb & Channel Replacement Program (as per condition assessments) $ 210,000 $ - $ 210,000New Guard Railing for High Risk - Major Culverts $ 120,000 $ - $ 120,000
$ 460,000 $ 100,000 $ 560,000
Yr 2026 Renewal New/Upgrade

CITY OF VICTOR HARBOR – KERB CHANNEL, CAR PARKS & TRAFFIC CONTROL DEVICES ASSET MANAGEMENT PLAN Page 48 of 70
Kerb & Channel Replacement Program (per condition assessments) $ 210,000 $ - $ 210,000
Traffic Management Treatments, Outcomes/Resolutions from 2017 Traffic Study -Oval Road/Kingford Street intersection $ - $ 20,000 $ 20,000
New Guard Railing for High Risk - Major Culverts $ 140,000 $ - $ 140,000
$ 350,000 $ 20,000 $ 370,000
Yr 2027 Renewal New/Upgrade
Traffic Management Treatments, Outcomes/Resolutions from 2017 Traffic Study -Continue implementation of Acraman Street Corridor Management Plan $ - $ 100,000 $ 100,000
$ - $ 100,000 $ 100,000
Yr 2028 Renewal New/Upgrade
General Traffic Management Treatments $ - $ 100,000 $ 100,000
$ - $ 100,000 $ 100,000

CITY OF VICTOR HARBOR – KERB CHANNEL, CAR PARKS & TRAFFIC CONTROL DEVICES ASSET MANAGEMENT PLAN Page 49 of 70
Appendix C Projected Upgrade/Exp/New 10 year Capital Works ProgramYr 2019 Renewal New/Upgrade TotalResolution No. OC1752017 - Victor Harbor Oval Car Park - Design $ 50,000 $ - $ 50,000Kerb & Channel Replacement Program $ 70,000 $ - $ 70,000Traffic Management - Left Hand Turn into Henderson Road, Design $ - $ 15,000 $ 15,000
$ 120,000 $ 15,000 $ 135,000
Yr 2020 Renewal New/Upgrade
Traffic Management Treatments, Outcomes/Resolutions from 2017 Traffic Study - CarlyleStreet/Cornhill Road intersection, closure of lane at Coral Street railway crossing, CoralStreet/Railway Terrace junction treatment & Grantely Ave Level Crossing
$ 10,000 $ 20,000 $ 30,000
New Guard Railing for High Risk - Major Culverts $ 50,000 $ - $ 50,000Kerb & Channel Replacement Program (as per condition assessments) $ 120,000 $ - $ 120,000Waitpinga Rd/Battye Rd Intersection - Construction $ 517,000 $ 130,000 $ 647,000Resolution No. OC1662017 - Encounter Bay Bowling Club Car Park - Design $ - $ 35,000 $ 35,000
Resolution No. OC1752017 - Victor Harbor Oval Car Park - Construction. Development ofthe car park in 2018-19 subject to project grant funding and completion – total areaapproximately 3,300m squared - cost estimate: $850,000. Design complete at $50,0002018-19FY
$ - $ 800,000 $ 800,000
Resolution No. OC3042018 - Franklin Parade Yilki Shops Area, Pedestrian ImprovementOptions Design - 28 May 2018 Council Resolved - That Council consider allocating fundingfor the Franklin Parade Yilki Shops Area, Pedestrian Improvement Options design works infinancial year 2019-20.
$ - $ 20,000 $ 20,000
Malen Tce - Create new Vehicle Parking, Northern Side of Malen Tce, between Tregonning& Harbourview Tce $ - $ 70,000 $ 70,000
$ 697,000 $ 1,075,000 $ 1,772,000

CITY OF VICTOR HARBOR – KERB CHANNEL, CAR PARKS & TRAFFIC CONTROL DEVICES ASSET MANAGEMENT PLAN Page 50 of 70
Yr 2021 Renewal New/Upgrade
Traffic Management Treatments, Outcomes/Resolutions from 2017 Traffic Study - TorrensStreet/Coral Street and Stuart Street intersections subject to Stuart Street closure $ 120,000 $ - $ 120,000
New Guard Railing for High Risk - Major Culverts $ 80,000 $ - $ 80,000Crozier/Acraman/Lindsay - Treatment Design $ 15,000 $ 15,000 $ 30,000Kerb & Channel Replacement Program (as per condition assessments) $ 110,000 $ - $ 110,000Resolution No. OC1662017 - Encounter Bay Bowling Club Car Park - Construction $ - $ 95,000 $ 95,000
Traffic Management - Left Hand Turn into Henderson Road - Construction $ - $ 75,000 $ 75,000
$ 325,000 $ 185,000 $ 510,000
Yr 2022 Renewal New/Upgrade
Traffic Management Treatments, Outcomes/Resolutions from 2017 Traffic Study - BurkeStreet study, Torrens Lane one-way and review of Seaview Road Roundabout with DPTI $ 10,000 $ 40,000.00 $ 50,000
New Guard Railing for High Risk - Major Culverts $ 80,000 $ - $ 80,000Kerb & Channel Replacement Program (as per condition assessments) $ 130,000 $ - $ 130,000
Encounter Bikeway Lighting adjacent Franklin Parade $ 15,000 $ 65,000 $ 80,000
Resolution No. OC3042018 - Franklin Parade Yilki Shops Area), Pedestrian Improvement -Construction $ - $ 80,000 $ 80,000
$ 235,000 $ 185,000 $ 420,000
Yr 2023 Renewal New/UpgradeKerb & Channel Replacement Program (per condition assessments) $ 130,000 $ - $ 130,000

CITY OF VICTOR HARBOR – KERB CHANNEL, CAR PARKS & TRAFFIC CONTROL DEVICES ASSET MANAGEMENT PLAN Page 51 of 70
Traffic Management Treatments, Outcomes/Resolutions from 2017 Traffic Study - VictoriaStreet Pedestrian refuge (near IGA) and implementation of Burke Street study - costsubject to study findings
$ - $ 100,000 $ 100,000
New Guard Railing for High Risk - Major Culverts $ 100,000 $ - $ 100,000
Crozier/Acraman/Lindsay - Treatment - Construct Implement $ 35,000 $ - $ 35,000
$ 265,000 $ 100,000 $ 365,000
Yr 2024 Renewal New/UpgradeKerb & Channel Replacement Program (per condition assessments) $ 210,000 $ - $ 210,000
Traffic Management Treatments, Outcomes/Resolutions from 2017 Traffic Study -Acraman Street Corridor Management Plan $ - $ 20,000 $ 20,000
New Guard Railing for High Risk - Major Culverts $ 130,000 $ - $ 130,000
$ 340,000 $ 20,000 $ 360,000
Yr 2025 Renewal New/Upgrade
Traffic Management Treatments, Outcomes/Resolutions from 2017 Traffic Study -Acraman Street/Hill Street Intersection treatment and implementation of Acraman StreetCorridor Management Plan
$ - $ 100,000.00 $ 100,000
New Guard Railing for High Risk - Major Culverts $ 130,000 $ - $ 130,000Kerb & Channel Replacement Program (as per condition assessments) $ 210,000 $ - $ 210,000New Guard Railing for High Risk - Major Culverts $ 120,000 $ - $ 120,000
$ 460,000 $ 100,000 $ 560,000
Yr 2026 Renewal New/Upgrade

CITY OF VICTOR HARBOR – KERB CHANNEL, CAR PARKS & TRAFFIC CONTROL DEVICES ASSET MANAGEMENT PLAN Page 52 of 70
Kerb & Channel Replacement Program (per condition assessments) $ 210,000 $ - $ 210,000
Traffic Management Treatments, Outcomes/Resolutions from 2017 Traffic Study - OvalRoad/Kingford Street intersection $ - $ 20,000 $ 20,000
New Guard Railing for High Risk - Major Culverts $ 140,000 $ - $ 140,000
$ 350,000 $ 20,000 $ 370,000
Yr 2027 Renewal New/Upgrade
Traffic Management Treatments, Outcomes/Resolutions from 2017 Traffic Study -Continue implementation of Acraman Street Corridor Management Plan $ - $ 100,000 $ 100,000
$ - $ 100,000 $ 100,000
Yr 2028 Renewal New/Upgrade
General Traffic Management Treatments $ - $ 100,000 $ 100,000
$ - $ 100,000 $ 100,000

CITY OF VICTOR HARBOR – KERB CHANNEL, CAR PARKS & TRAFFIC CONTROL DEVICES ASSET MANAGEMENT PLAN Page 53 of 70
Appendix D Budgeted Expenditures Accommodated in LTFP
Projected Expenditure 2019 2020 2021 2022 2023 2024 2025 2026 2027 2028Capital Expenditure on Renewal/Replacement of existingassets
$120.00 $697.00 $325.00 $235.00 $265.00 $340.00 $460.00 $350.00 $0.00 $0.00
Capital Expenditure on Upgrade/New assets $15.00 $1,075.00 $185.00 $185.00 $100.00 $20.00 $100.00 $20.00 $100.00 $100.00Operational cost of existing assets $46.00 $46.00 $46.00 $46.00 $46.00 $46.00 $46.00 $46.00 $46.00 $46.00Maintenance cost of existing assets $68.00 $68.00 $68.00 $68.00 $68.00 $68.00 $68.00 $68.00 $68.00 $68.00Operational cost of New assets $0.00 $0.25 $1.90 $2.37 $2.85 $3.22 $3.48 $3.85 $4.11 $4.48Maintenance cost of New assets $0.00 $0.37 $2.80 $3.51 $4.21 $4.75 $5.14 $5.69 $6.08 $6.62Disposal of Surplus Assets $0.00 $0.00 $0.00 $0.00 $0.00 $0.00 $0.00 $0.00 $0.00 $0.00
All dollar values in ($'000)'s
Appendix E Gifted Assets 2010 – 30 June 2018
Asset ID Asset Name Segment/Group Name Asset Type Date ofRecognition
Recognition Type
TotalReplacementValue ($)
KG.1537.10.R
AquamarineBoulevard R-10-Ocean Road to Cobalt Drive Mountable 5/04/2011 Gifted 8,598.01
KG.1537.10.L
AquamarineBoulevard L-10-Ocean Road to Royal Court Mountable 5/04/2011 Gifted 14,619.41
KG.1537.05.R
AquamarineBoulevard R-05-Ocean Road to Pram Ramp Barrier 5/04/2011 Gifted 2,386.77
KG.1537.05.L
AquamarineBoulevard L-05-Ocean Road to Pram Ramp Barrier 5/04/2011 Gifted 3,708.93
KG.1538.10.L Royal Court L-10-Aquamarine Boulevard to end Mountable 5/04/2011 Gifted 3,792.25

CITY OF VICTOR HARBOR – KERB CHANNEL, CAR PARKS & TRAFFIC CONTROL DEVICES ASSET MANAGEMENT PLAN Page 54 of 70
KG.1538.10.R Royal Court R-10-Aquamarine Boulevard to end Mountable 5/04/2011 Gifted 3,363.94
KG.1537.20.L
AquamarineBoulevard L-20-Royal Court to Mint Drive Mountable 5/04/2011 Gifted 5,890.50
KG.1539.10.L Mint Drive L-10-Aquamarine Boulevard to Indigo Way
intersection Mountable 5/04/2011 Gifted 6,461.26
KG.1539.20.L Mint Drive L-20-Indigo Way intersection to end Mountable 5/04/2011 Gifted 2,472.66
KG.1539.20.R Mint Drive R-20-Indigo Way intersection to end Mountable 5/04/2011 Gifted 2,219.53
KG.1540.10.L Indigo Way L-10-Mint Drive to Emerald Drive Mountable 5/04/2011 Gifted 6,501.69
KG.1541.30.L Emerald Drive L-30-Indigo way to end Mountable 5/04/2011 Gifted 1,599.68
KG.1541.10.R Emerald Drive R-10-Change of Seal to end Mountable 5/04/2011 Gifted 13,316.19
KG.1541.10.L Emerald Drive L-10-change of seal to Aquamarine
Boulevard Mountable 5/04/2011 Gifted 2,564.10
KG.1541.20.L Emerald Drive L-20-Aquamarine Boulevard to Indigo Way Mountable 5/04/2011 Gifted 5,420.80
KG.1540.10.R Indigo Way R-10-Emerald Drive to Mint Drive Mountable 5/04/2011 Gifted 7,042.61
KG.1539.10.R Mint Drive R-10-Aquamarine Boulevard to Indigo Way Mountable 5/04/2011 Gifted 7,056.09
KG.1537.30.L
AquamarineBoulevard L-30-Mint Drive to Emerald Drive Mountable 5/04/2011 Gifted 5,975.20
KG.1537.20.R
AquamarineBoulevard R-20-Cobalt Drive to Emerald Drive Mountable 5/04/2011 Gifted 19,232.68
KG.1542.10.L Cobalt Drive L-10-Aquamarine Drive to end Mountable 5/04/2011 Gifted 3,570.88
KG.1542.10.R Cobalt Drive R-10-Aquamarine Boulevard to end Mountable 5/04/2011 Gifted 3,607.45
KG.1322.60.L Ocean Road L-60-Entrance to The Rise Development Barrier 5/04/2011 Gifted 1,402.81

CITY OF VICTOR HARBOR – KERB CHANNEL, CAR PARKS & TRAFFIC CONTROL DEVICES ASSET MANAGEMENT PLAN Page 55 of 70
KG.1322.70.L Ocean Road L-70-Entrance to The Rise Development Barrier 5/04/2011 Gifted 4,786.53
$135,589.96 As at30/06/2011
KG.1547.05.L
StrathmoreCourt L-10-Harbour View Terrace to end Mountable 27/01/2012 Gifted 14,162.23
KG.1547.05.R
StrathmoreCourt R-10-Harbour View Terrace to end Barrier 27/01/2012 Gifted 12,863.31
KG.1541.05.L Emerald Drive L-05-Cobalt Drive to Change of Seal Mountable 1/06/2012 Gifted 14,153.56
KG.1542.30.L Cobalt Drive L-30-Change of Seal to Emerald Drive Mountable 1/06/2012 Gifted 2,574.69
KG.1542.40.L Cobalt Drive L-40-Emerald Drive to End Mountable 1/06/2012 Gifted 3,199.35
KG.1543.10.L Sapphire Way L-10-Emerald Drive to end Mountable 1/06/2012 Gifted 3,816.12
KG.1541.05.R Emerald Drive R-05-Sapphire Way to Change of Seal Mountable 1/06/2012 Gifted 5,745.16
KG.1541.02.R Emerald Drive R-02-Cobalt Drive to Sapphire Way Mountable 1/06/2012 Gifted 6,376.56
KG.1543.10.R Sapphire Way R-10-Emerald Drive to End Mountable 1/06/2012 Gifted 3,685.41
KG.1542.20.R Cobalt Drive R-20-Change of Seal to End Mountable 1/06/2012 Gifted 7,931.00
KG.1515.20.L Central Drive L-20-Causeway to Start of Driveway Link Mountable 6/06/2012 Gifted 9,583.61
KG.1515.20.R Central Drive R-20-Causeway to End Mountable 6/06/2012 Gifted 10,541.30
KG.1515.30.L Central Drive L-30- Start of Driveway Link End Mountable 6/06/2012 Gifted 4,855.81
KG.1515.40.L Central Drive L-40- Driveway Link to End Mountable 6/06/2012 Gifted 1,327.29

CITY OF VICTOR HARBOR – KERB CHANNEL, CAR PARKS & TRAFFIC CONTROL DEVICES ASSET MANAGEMENT PLAN Page 56 of 70
KG.1515.30.R Central Drive R-30- Driveway Link Mountable 6/06/2012 Gifted 4,476.59
$105,291.99 As at30/06/2012
KG.1502.12.R
WishartCrescent
R-12-Change of Seal near roundabout toSEP Barrier 21/11/2012 Gifted 8,326.01
KG.1502.12.L
WishartCrescent
L-12-Change of Seal near roundabout toroll over kerb Barrier 21/11/2012 Gifted 4,529.50
KG.1502.14.R
WishartCrescent R-14-SEP (change of Kerb) to Kay Court Mountable 21/11/2012 Gifted 6,523.83
KG.1502.14.L
WishartCrescent L-14-Change of Kerb to Jones Way Mountable 21/11/2012 Gifted 26,058.73
KG.1502.16.R
WishartCrescent R-16-Kay Court to Scarlett Court Mountable 21/11/2012 Gifted 5,334.18
KG.1502.18.R
WishartCrescent
R-18-Change of Seal near roundabout toSEP Mountable 21/11/2012 Gifted 5,545.48
KG.1546.10.R Jones Way R-10-Wishart Crescent to End Mountable 21/11/2012 Gifted 2,836.49
KG.1546.10.L Jones Way L-10-Wishart Crescent to End Mountable 21/11/2012 Gifted 3,835.56
KG.1502.19.R
WishartCrescent
R-19-Intersection of Wishart & Jones wayto end of new Development Mountable 21/11/2012 Gifted 9,880.27
KG.1502.16.L
WishartCrescent
L-16-Intersection of Wishart & Jones way toend of new Development Mountable 21/11/2012 Gifted 11,758.86
KG.1544.20.R Kay Court R-20-End of Culdesac (change of kerb type) Barrier 21/11/2012 Gifted 2,263.89
KG.1545.20.R Scarlett Court R-20-End of Hammerhead (change of kerb
type) Barrier 21/11/2012 Gifted 2,734.66
KG.1544.10.R Kay Court R-10-Wishart Crescent to End of Culdesac Mountable 21/11/2012 Gifted 11,208.31
KG.1544.10.L Kay Court L-10-Wishart Crescent to curve of Culdesac Mountable 21/11/2012 Gifted 9,558.34

CITY OF VICTOR HARBOR – KERB CHANNEL, CAR PARKS & TRAFFIC CONTROL DEVICES ASSET MANAGEMENT PLAN Page 57 of 70
KG.1545.10.R Scarlett Court R-10-Wishart Crescent to end of
Hammerhead Mountable 21/11/2012 Gifted 15,057.96
KG.1545.10.L Scarlett Court L-10-Wishart Crescent to End of
Hammerhead Mountable 21/11/2012 Gifted 16,628.15
SP.1545.311 Scarlett Court CRN - Scarlett Court Hammerhead Spoon Drain 21/11/2012 Gifted 1,407.16
SP.1502.312
WishartCrescent CRN - Wishart Crescent & Scarlett Court Spoon Drain 21/11/2012 Gifted 1,989.06
SP.1502.313
WishartCrescent CRN - Wishart Crescent & Kay Court Spoon Drain 21/11/2012 Gifted 1,834.39
KG.1494.05.L White Close L-05-Start To Change of Seal Mountable 21/12/2012 Gifted 7,763.53
KG.1494.05.R White Close R-05-Start To Change of Seal Mountable 21/12/2012 Gifted 7,640.33
$162,714.69 As at the30/06/2013
KG.1549.10.L Nation Court L-10-Mill Road to Hammerhead Mountable
kerb & gutter 30/06/2014 Gifted 3,703.99
KG.1549.20.L Nation Court L-20-Hammerhead left Mountable
kerb & gutter 30/06/2014 Gifted 3,358.55
KG.1549.30.L Nation Court L-30-Hammerhead Long Mountable
kerb & gutter 30/06/2014 Gifted 7,158.88
KG.1549.20.R Nation Court R-20-Hammerhead Right Mountable
kerb & gutter 30/06/2014 Gifted 2,616.56
KG.1549.10.R Nation Court R-10-Mill Road to Hammerhead Mountable
kerb & gutter 30/06/2014 Gifted 4,159.35
$20,997.32 As at the30/06/2014
KG.1553.10.L
CameronCourt L-10-Shields Crescent to End Mountable 1/05/2015 Gifted 11,058.26
KG.1553.10.R
CameronCourt R-10-Shields Crescent to End Mountable 1/05/2015 Gifted 11,528.15

CITY OF VICTOR HARBOR – KERB CHANNEL, CAR PARKS & TRAFFIC CONTROL DEVICES ASSET MANAGEMENT PLAN Page 58 of 70
KG.1554.10.L
ShieldsCrescent L-10-Murray Street to Culdesac Mountable 1/05/2015 Gifted 10,945.94
KG.1554.10.R
ShieldsCrescent R-10-Cameron Street to Culdesac Mountable 1/05/2015 Gifted 14,138.07
KG.1554.20.L
ShieldsCrescent L-20-Murray Street to Culdesac Mountable 1/05/2015 Gifted 29,875.04
KG.1554.20.R
ShieldsCrescent R-20-Cameron Street to Culdesac Mountable 1/05/2015 Gifted 24,090.51
KG.1552.10.L Murray Street L-10-Inman Valley Road to Shields Crescent Mountable 1/05/2015 Gifted 7,910.79
KG.1552.10.R Murray Street R-10-Inman Valley Road to Shields Crescent Mountable 1/05/2015 Gifted 7,598.65
SP.1542.339 Cobalt Drive CRN - Cobalt Drive & Kleinig Drive Spoon Drain 15/05/2015 Gifted 2,205.68
SP.1542.340 Cobalt Drive CRN - Cobalt Drive & Jade Court Spoon Drain 15/05/2015 Gifted 2,416.98
KG.1542.12.R Cobalt Drive R-12-3 Cobalt Drive to Kleinig Drive Mountable 15/05/2015 Gifted 2,946.69
KG.1542.15.R Cobalt Drive R-15-Kleinig Drive to 16 Cobalt Drive Mountable 15/05/2015 Gifted 10,045.23
KG.1542.20.L Cobalt Drive L-20-3 Cobalt Drive to Jade Court Mountable 15/05/2015 Gifted 9,646.46
KG.1542.25.L Cobalt Drive L-25-Jade Court to 16 Cobalt Drive Mountable 15/05/2015 Gifted 2,597.60
KG.1550.10.R Kleinig Drive R-10-Cobalt Drive to End Mountable 15/05/2015 Gifted 2,868.35
KG.1550.10.L Kleinig Drive L-10-Cobalt Drive to End Mountable 15/05/2015 Gifted 2,813.68
KG.1551.10.R Jade Court R-10- Cobalt Drive to End Mountable 15/05/2015 Gifted 12,333.86
KG.1551.10.L Jade Court L-10-Cobalt Drive to End Mountable 15/05/2015 Gifted 12,785.56
KG.1555.10.R
KookaburraBoulevard R-10-Tabernacle Road to Roundabout Mountable 18/05/2015 Gifted 4,073.97

CITY OF VICTOR HARBOR – KERB CHANNEL, CAR PARKS & TRAFFIC CONTROL DEVICES ASSET MANAGEMENT PLAN Page 59 of 70
KG.1555.10.L
KookaburraBoulevard L-10-Tabernacle Road to Roundabout Mountable 18/05/2015 Gifted 4,222.30
KG.1555.20.R
KookaburraBoulevard R-10- Roundabout temporary end Mountable 18/05/2015 Gifted 3,530.26
KG.1555.20.L
KookaburraBoulevard L-20-Roundabout to Temporary End Mountable 18/05/2015 Gifted 3,479.44
KG.1555.60.R
KookaburraBoulevard R-60-Roundabout to Temporary End Mountable 18/05/2015 Gifted 9,149.91
KG.1555.60.L
KookaburraBoulevard L-60- Roundabout to Kingfisher Crescent Mountable 18/05/2015 Gifted 6,056.82
KG.1555.55.L
KookaburraBoulevard L-55-Kingfisher to Temporary End Mountable 18/05/2015 Gifted 2,848.33
KG.1556.10.L
KingfisherCrescent L-10-Kookaburra Blvd to Temporary End Mountable 18/05/2015 Gifted 6,485.13
KG.1556.20.L
KingfisherCrescent L-20-Side Access to Temporary End Mountable 18/05/2015 Gifted 3,778.20
KG.1556.10.R
KingfisherCrescent R-10-Kookaburra Blvd to Temporary End Mountable 18/05/2015 Gifted 9,537.51
KG.1556.15.R
KingfisherCrescent R-15-Access Road Mountable 18/05/2015 Gifted 3,286.17
KG.1556.15.L
KingfisherCrescent L-15-Access Road Mountable 18/05/2015 Gifted 3,874.35
KG.1557.10.L Rosella Street R-10-Kookaburra Blvd to Temporary End Mountable 18/05/2015 Gifted 9,520.47
KG.1557.15.L Rosella Street L-10-Access Road Mountable 18/05/2015 Gifted 3,888.21
KG.1557.15.R Rosella Street R-15-Access Road Mountable 18/05/2015 Gifted 4,151.65
KG.1557.20.L Rosella Street L-20-Access Road to Temporary End Mountable 18/05/2015 Gifted 4,028.64
KG.1557.10.R Rosella Street R-10-Kookaburra Blvd to Temporary End Mountable 18/05/2015 Gifted 13,276.63
SP.1556.341
KingfisherCrescent CRN - Kingfisher Cres & Access Road Spoon Drain 18/05/2015 Gifted 1,171.59

CITY OF VICTOR HARBOR – KERB CHANNEL, CAR PARKS & TRAFFIC CONTROL DEVICES ASSET MANAGEMENT PLAN Page 60 of 70
SP.1555.342
KookaburraBoulevard CRN - Kookaburra & Kingfisher Cres Spoon Drain 18/05/2015 Gifted 1,230.42
SP.1443.343
TabernacleRoad CRN -Tabernacle & Kookaburra Blvd Spoon Drain 18/05/2015 Gifted 3,607.44
SP.1557.344 Rosella Street CRN - Rosella St & Access Road Spoon Drain 18/05/2015 Gifted 1,340.59
SP.1555.345
KookaburraBoulevard Kookaburra Indented Carpark Spoon Drain 18/05/2015 Gifted 3,821.04
SP.1555.346
KookaburraBoulevard Kookaburra Indented Carpark Spoon Drain 18/05/2015 Gifted 2,042.50
RBT.0024
KookaburraBoulevard Kookaburra Boulevard Roundabout Roundabout 18/05/2015 Gifted 21,026.15
TD.0165 KookaburraBoulevard Splitter Island Splitter Island 18/05/2015 Gifted 3,016.70
TD.0166 KookaburraBoulevard Splitter Island Splitter Island 18/05/2015 Gifted 5,372.34
TD.0167 KookaburraBoulevard Splitter Island Splitter Island 18/05/2015 Gifted 1,827.69
TD.0168 Rosella Street Splitter Island Splitter Island 18/05/2015 Gifted 2,214.92
TD.0169 KookaburraBoulevard Splitter Island Splitter Island 18/05/2015 Gifted 2,425.41
TD.0170 KookaburraBoulevard Splitter Island Splitter Island 18/05/2015 Gifted 2,455.05
CPS.1555.10
KookaburraBoulevard Kookaburra Boulevard On Street 18/05/2015 Gifted 4,194.01
CPS.1555.20
KookaburraBoulevard Kookaburra Boulevard On Street 18/05/2015 Gifted 2,907.96
$331,647.24 As at the30/06/2015
KG.1558.10.R
BuchananCourt R-10-Lincoln Park Drive to Culdesac Mountable 16/02/2016 Gifted 36,903.21
KG.1558.10.L
BuchananCourt L-10-Lincoln Park Drive to Culdesac Mountable 16/02/2016 Gifted 35,545.32

CITY OF VICTOR HARBOR – KERB CHANNEL, CAR PARKS & TRAFFIC CONTROL DEVICES ASSET MANAGEMENT PLAN Page 61 of 70
KG.1494.02.R White Close R-02-Change of Seal to end of Culdesac Mountable 5/04/2016 Gifted 5,326.67
KG.1494.02.L White Close L-02-Change of Seal to end of Culdesac Mountable 5/04/2016 Gifted 5,418.78
$83,193.98 As at the30/06/2016
KG.1517.15.L Dutton Circuit L-15-3 Dutton Circuit to end Mountable 20/09/2017 Gifted 1,977.26
KG.1517.15.R Dutton Circuit R-15-3 Dutton Circuit to end Mountable 20/09/2017 Gifted 2,376.12
KG.1517.30.R
Dutton Circuit(West) R-30-2 Dutton Circuit to end Culdesac Mountable 20/09/2017 Gifted 6,758.68
KG.1517.30.L
Dutton Circuit(West) L-30-3 Dutton Circuit to end Mountable
kerb & gutter 20/09/2017 Gifted 6,621.33
KG.1550.20.L Kleinig Drive L-20-108 Kleinig Drive to 88 Kleinig Drive Mountable 27/10/2017 Gifted 25,353.12
KG.1550.20.R Kleinig Drive R-20-109 Kleining Drive to 73 Kleinig Drive Mountable 27/10/2017 Gifted 27,451.75
SP.1550.364 Kleinig Drive Outside House 103 Kleinig Drive Spoon Drain 27/10/2017 Gifted 1,899.62
KG.1550.30.L Kleinig Drive L-30-88 Kleinig Drive to Sapphire Way Mountable 19/01/2018 Gifted 29,182.71
KG.1550.30.R Kleinig Drive R-30-88 Kleinig Drive to Sapphire Way Barrier kerb &
gutter 19/01/2018 Gifted 29,319.84
KG.1550.40.L Kleinig Drive L-40-Sapphire Way to Temp End Mountable 19/01/2018 Gifted 1,424.40
KG.1543.40.R Sapphire Way R-40- Kleinig Drive to Temp End Mountable 19/01/2018 Gifted 1,385.90
KG.1543.40.L Sapphire Way L-40- Kleinig Drive to Temp End Mountable 19/01/2018 Gifted 1,304.28
SP.1550.363 Kleinig Drive CRN - Kleinig Drive and Sapphire Way Spoon Drain 19/01/2018 Gifted 1,892.49

CITY OF VICTOR HARBOR – KERB CHANNEL, CAR PARKS & TRAFFIC CONTROL DEVICES ASSET MANAGEMENT PLAN Page 62 of 70
$136,947.51 As at the30/06/2018
$976,382.69 Total

CITY OF VICTOR HARBOR – KERB CHANNEL, CAR PARKS &TRAFFIC CONTROL DEVICES ASSET MANAGEMENTPLAN Page 63 of 70
Appendix F AbbreviationsAAAC Average annual asset consumption
AM Asset management
AM Plan Asset management plan
ARI Average recurrence interval
ASC Annual service cost
BOD Biochemical (biological) oxygen demand
CRC Current replacement cost
CWMS Community wastewater management systems
DA Depreciable amount
DRC Depreciated replacement cost
EF Earthworks/formation
IRMP Infrastructure risk management plan
LCC Life Cycle cost
LCE Life cycle expenditure
LTFP Long term financial plan
MMS Maintenance management system
PCI Pavement condition index
RV Residual value
SoA State of the Assets
SS Suspended solids
vph Vehicles per hour
WDCRD Written down current replacement cost

CITY OF VICTOR HARBOR – KERB CHANNEL, CAR PARKS &TRAFFIC CONTROL DEVICES ASSET MANAGEMENTPLAN Page 64 of 70
Appendix G GlossaryAnnual service cost (ASC)1) Reporting actual cost
The annual (accrual) cost of providing aservice including operations, maintenance,depreciation, finance/opportunity and disposalcosts less revenue.
2) For investment analysis and budgetingAn estimate of the cost that would be
tendered, per annum, if tenders were calledfor the supply of a service to a performancespecification for a fixed term. The AnnualService Cost includes operations,maintenance, depreciation, and finance /opportunity and disposal costs, less revenue.
AssetA resource controlled by an entity as a resultof past events and from which future economicbenefits are expected to flow to the entity.Infrastructure assets are a sub-class ofproperty, plant and equipment which are non-current assets with a life greater than 12months and enable services to be provided.
Asset categorySub-group of assets within a class hierarchyfor financial reporting and managementpurposes.
Asset classA group of assets having a similar nature orfunction in the operations of an entity, andwhich, for purposes of disclosure, is shown asa single item without supplementarydisclosure.
Asset condition assessmentThe process of continuous or periodicinspection, assessment, measurement andinterpretation of the resultant data to indicatethe condition of a specific asset so as todetermine the need for some preventative orremedial action.
Asset hierarchyA framework for segmenting an asset baseinto appropriate classifications. The assethierarchy can be based on asset function orasset type or a combination of the two.
Asset management (AM)The combination of management, financial,economic, engineering and other practicesapplied to physical assets with the objective of
providing the required level of service in themost cost effective manner.
Asset renewal funding ratioThe ratio of the net present value of assetrenewal funding accommodated over a 10year period in a long term financial planrelative to the net present value of projectedcapital renewal expenditures identified in anasset management plan for the same period[AIFMG Financial Sustainability Indicator No8].
Average annual asset consumption (AAAC)*The amount of an organisation’s asset baseconsumed during a reporting period (generallya year). This may be calculated by dividing thedepreciable amount by the useful life (or totalfuture economic benefits/service potential)and totalled for each and every asset OR bydividing the carrying amount (depreciatedreplacement cost) by the remaining useful life(or remaining future economic benefits/servicepotential) and totalled for each and everyasset in an asset category or class.
BorrowingsA borrowing or loan is a contractual obligationof the borrowing entity to deliver cash oranother financial asset to the lending entityover a specified period of time or at a specifiedpoint in time, to cover both the initial capitalprovided and the cost of the interest incurredfor providing this capital. A borrowing or loanprovides the means for the borrowing entity tofinance outlays (typically physical assets)when it has insufficient funds of its own to doso, and for the lending entity to make afinancial return, normally in the form of interestrevenue, on the funding provided.
Capital expenditureRelatively large (material) expenditure, whichhas benefits, expected to last for more than 12months. Capital expenditure includes renewal,expansion and upgrade. Where capitalprojects involve a combination of renewal,expansion and/or upgrade expenditures, thetotal project cost needs to be allocatedaccordingly.

CITY OF VICTOR HARBOR – KERB CHANNEL, CAR PARKS &TRAFFIC CONTROL DEVICES ASSET MANAGEMENTPLAN Page 65 of 70
Capital expenditure - expansionExpenditure that extends the capacity of anexisting asset to provide benefits, at the samestandard as is currently enjoyed by existingbeneficiaries, to a new group of users. It isdiscretionary expenditure, which increasesfuture operations and maintenance costs,because it increases the organisation’s assetbase, but may be associated with additionalrevenue from the new user group, eg.extending a drainage or road network, theprovision of an oval or park in a new suburb fornew residents.
Capital expenditure - newExpenditure which creates a new assetproviding a new service/output that did notexist beforehand. As it increases servicepotential it may impact revenue and willincrease future operations and maintenanceexpenditure.
Capital expenditure - renewalExpenditure on an existing asset or onreplacing an existing asset, which returns theservice capability of the asset up to that whichit had originally. It is periodically requiredexpenditure, relatively large (material) in valuecompared with the value of the components orsub-components of the asset being renewed.As it reinstates existing service potential, itgenerally has no impact on revenue, but mayreduce future operations and maintenanceexpenditure if completed at the optimum time,eg. resurfacing or resheeting a material part ofa road network, replacing a material section ofa drainage network with pipes of the samecapacity, resurfacing an oval.
Capital expenditure - upgradeExpenditure, which enhances an existingasset to provide a higher level of service orexpenditure that will increase the life of theasset beyond that which it had originally.Upgrade expenditure is discretionary andoften does not result in additional revenueunless direct user charges apply. It willincrease operations and maintenanceexpenditure in the future because of theincrease in the organisation’s asset base, eg.widening the sealed area of an existing road,replacing drainage pipes with pipes of agreater capacity, enlarging a grandstand at asporting facility.
Capital fundingFunding to pay for capital expenditure.
Capital grantsMonies received generally tied to the specificprojects for which they are granted, which areoften upgrade and/or expansion or newinvestment proposals.
Capital investment expenditureSee capital expenditure definition.
Capitalisation thresholdThe value of expenditure on non-currentassets above which the expenditure isrecognised as capital expenditure and belowwhich the expenditure is charged as anexpense in the year of acquisition.
Carrying amountThe amount at which an asset is recognisedafter deducting any accumulated depreciation/ amortisation and accumulated impairmentlosses thereon.
Class of assetsSee asset class definition
ComponentSpecific parts of an asset having independentphysical or functional identity and havingspecific attributes such as different lifeexpectancy, maintenance regimes, risk orcriticality.
Core asset managementAsset management which relies primarily onthe use of an asset register, maintenancemanagement systems, job resourcemanagement, inventory control, conditionassessment, simple risk assessment anddefined levels of service, in order to establishalternative treatment options and long-termcashflow predictions. Priorities are usuallyestablished on the basis of financial returngained by carrying out the work (rather thandetailed risk analysis and optimised decision-making).
Cost of an assetThe amount of cash or cash equivalents paidor the fair value of the consideration given toacquire an asset at the time of its acquisitionor construction, including any costs necessaryto place the asset into service. This includesone-off design and project management costs.

CITY OF VICTOR HARBOR – KERB CHANNEL, CAR PARKS &TRAFFIC CONTROL DEVICES ASSET MANAGEMENTPLAN Page 66 of 70
Critical assetsAssets for which the financial, business orservice level consequences of failure aresufficiently severe to justify proactiveinspection and rehabilitation. Critical assetshave a lower threshold for action than non-critical assets.
Current replacement cost (CRC)The cost the entity would incur to acquire theasset on the reporting date. The cost ismeasured by reference to the lowest cost atwhich the gross future economic benefitscould be obtained in the normal course ofbusiness or the minimum it would cost, toreplace the existing asset with atechnologically modern equivalent new asset(not a second hand one) with the sameeconomic benefits (gross service potential)allowing for any differences in the quantity andquality of output and in operating costs.
Deferred maintenanceThe shortfall in rehabilitation work undertakenrelative to that required to maintain the servicepotential of an asset.
Depreciable amountThe cost of an asset, or other amountsubstituted for its cost, less its residual value.
Depreciated replacement cost (DRC)The current replacement cost (CRC) of anasset less, where applicable, accumulateddepreciation calculated on the basis of suchcost to reflect the already consumed orexpired future economic benefits of the asset.
Depreciation / amortisationThe systematic allocation of the depreciableamount (service potential) of an asset over itsuseful life.
Economic lifeSee useful life definition.
ExpenditureThe spending of money on goods andservices. Expenditure includes recurrent andcapital outlays.
ExpensesDecreases in economic benefits during theaccounting period in the form of outflows ordepletions of assets or increases in liabilitiesthat result in decreases in equity, other than
those relating to distributions to equityparticipants.
Fair valueThe amount for which an asset could beexchanged, or a liability settled, betweenknowledgeable, willing parties, in an arm’slength transaction.
Financing gapA financing gap exists whenever an entity hasinsufficient capacity to finance asset renewaland other expenditure necessary to be able toappropriately maintain the range and level ofservices its existing asset stock was originallydesigned and intended to deliver. The servicecapability of the existing asset stock should bedetermined assuming no additional operatingrevenue, productivity improvements, or netfinancial liabilities above levels currentlyplanned or projected. A current financing gapmeans service levels have already or arecurrently falling. A projected financing gap ifnot addressed will result in a future diminutionof existing service levels.
Heritage assetAn asset with historic, artistic, scientific,technological, geographical or environmentalqualities that is held and maintained principallyfor its contribution to knowledge and cultureand this purpose is central to the objectives ofthe entity holding it.
Impairment LossThe amount by which the carrying amount ofan asset exceeds its recoverable amount.
Infrastructure assetsPhysical assets that contribute to meeting theneeds of organisations or the need for accessto major economic and social facilities andservices, eg. roads, drainage, footpaths andcycleways. These are typically large,interconnected networks or portfolios ofcomposite assets. The components of theseassets may be separately maintained,renewed or replaced individually so that therequired level and standard of service from thenetwork of assets is continuously sustained.Generally the components and hence theassets have long lives. They are fixed in placeand are often have no separate market value.
Investment property

CITY OF VICTOR HARBOR – KERB CHANNEL, CAR PARKS &TRAFFIC CONTROL DEVICES ASSET MANAGEMENTPLAN Page 67 of 70
Property held to earn rentals or for capitalappreciation or both, rather than for:(a) use in the production or supply of goods or
services or for administrative purposes; or(b) sale in the ordinary course of business.
Key performance indicatorA qualitative or quantitative measure of aservice or activity used to compare actualperformance against a standard or othertarget. Performance indicators commonlyrelate to statutory limits, safety,responsiveness, cost, comfort, assetperformance, reliability, efficiency,environmental protection and customersatisfaction.
Level of serviceThe defined service quality for a particularservice/activity against which serviceperformance may be measured. Servicelevels usually relate to quality, quantity,reliability, responsiveness, environmentalimpact, acceptability and cost.
Life Cycle Cost *1. Total LCC The total cost of an asset
throughout its life including planning, design,construction, acquisition, operation,maintenance, and rehabilitation and disposalcosts.
2. Average LCC The life cycle cost (LCC) isaverage cost to provide the service over thelongest asset life cycle. It comprises averageoperations, maintenance expenditure plusasset consumption expense, represented bydepreciation expense projected over 10 years.The Life Cycle Cost does not indicate the fundsrequired to provide the service in a particularyear.
Life Cycle ExpenditureThe Life Cycle Expenditure (LCE) is theaverage operations, maintenance and capitalrenewal expenditure accommodated in thelong term financial plan over 10 years. LifeCycle Expenditure may be compared toaverage Life Cycle Cost to give an initialindicator of affordability of projected servicelevels when considered with asset ageprofiles.
Loans / borrowingsSee borrowings.
MaintenanceAll actions necessary for retaining an asset asnear as practicable to an appropriate servicecondition, including regular ongoing day-to-daywork necessary to keep assets operating, eg roadpatching but excluding rehabilitation or renewal. Itis operating expenditure required to ensure thatthe asset reaches its expected useful life.• Planned maintenance
Repair work that is identified and managedthrough a maintenance management system(MMS). MMS activities include inspection,assessing the condition againstfailure/breakdown criteria/experience,prioritising scheduling, actioning the work andreporting what was done to develop amaintenance history and improvemaintenance and service deliveryperformance.
• Reactive maintenanceUnplanned repair work that is carried out inresponse to service requests andmanagement/ supervisory directions.
• Specific maintenanceMaintenance work to repair components orreplace sub-components that needs to beidentified as a specific maintenance item inthe maintenance budget.
• Unplanned maintenanceCorrective work required in the short-term torestore an asset to working condition so it cancontinue to deliver the required service or tomaintain its level of security and integrity.
Maintenance expenditure *Recurrent expenditure, which is periodically orregularly required as part of the anticipatedschedule of works required to ensure that theasset achieves its useful life and provides therequired level of service. It is expenditure,which was anticipated in determining theasset’s useful life.
MaterialityThe notion of materiality guides the margin oferror acceptable, the degree of precisionrequired and the extent of the disclosurerequired when preparing general purposefinancial reports. Information is material if itsomission, misstatement or non-disclosure hasthe potential, individually or collectively, toinfluence the economic decisions of userstaken on the basis of the financial report or
CITY OF VICTOR HARBOR – KERB CHANNEL, CAR PARKS &TRAFFIC CONTROL DEVICES ASSET MANAGEMENTPLAN Page 68 of 70
affect the discharge of accountability by themanagement or governing body of the entity.
Modern equivalent assetAssets that replicate what is in existence withthe most cost-effective asset performing thesame level of service. It is the most costefficient, currently available asset which willprovide the same stream of services as theexisting asset is capable of producing. Itallows for technology changes and,improvements and efficiencies in productionand installation techniques
Net present value (NPV)The value to the organisation of the cash flowsassociated with an asset, liability, activity orevent calculated using a discount rate toreflect the time value of money. It is the netamount of discounted total cash inflows afterdeducting the value of the discounted totalcash outflows arising from eg the continueduse and subsequent disposal of the asset afterdeducting the value of the discounted totalcash outflows.
Non-revenue generating investmentsInvestments for the provision of goods andservices to sustain or improve services to thecommunity that are not expected to generateany savings or revenue to the organisation,eg. parks and playgrounds, footpaths, roadsand bridges, libraries, etc.
OperationsRegular activities to provide services such aspublic health, safety and amenity, eg streetsweeping, grass mowing and street lighting.
Operating expenditureRecurrent expenditure, which is continuouslyrequired to provide a service. In common usethe term typically includes, eg power, fuel,staff, plant equipment, on-costs andoverheads but excludes maintenance anddepreciation. Maintenance and depreciation ison the other hand included in operatingexpenses.
Operating expenseThe gross outflow of economic benefits, beingcash and non-cash items, during the periodarising in the course of ordinary activities of anentity when those outflows result in decreasesin equity, other than decreases relating todistributions to equity participants.
Operating expensesRecurrent expenses continuously required toprovide a service, including power, fuel, staff,plant equipment, maintenance, depreciation,on-costs and overheads.
Operations, maintenance and renewalfinancing ratioRatio of estimated budget to projectedexpenditure for operations, maintenance andrenewal of assets over a defined time (eg 5, 10and 15 years).
Operations, maintenance and renewal gapDifference between budgeted expenditures ina long term financial plan (or estimated futurebudgets in absence of a long term financialplan) and projected expenditures foroperations, maintenance and renewal ofassets to achieve/maintain specified servicelevels, totalled over a defined time (e.g. 5, 10and 15 years).
Pavement management system (PMS)A systematic process for measuring andpredicting the condition of road pavementsand wearing surfaces over time andrecommending corrective actions.
PMS ScoreA measure of condition of a road segmentdetermined from a Pavement ManagementSystem.
Rate of annual asset consumption *The ratio of annual asset consumption relativeto the depreciable amount of the assets. Itmeasures the amount of the consumable partsof assets that are consumed in a period(depreciation) expressed as a percentage ofthe depreciable amount.
Rate of annual asset renewal *The ratio of asset renewal and replacementexpenditure relative to depreciable amount fora period. It measures whether assets arebeing replaced at the rate they are wearing outwith capital renewal expenditure expressed asa percentage of depreciable amount (capitalrenewal expenditure/DA).

CITY OF VICTOR HARBOR – KERB CHANNEL, CAR PARKS &TRAFFIC CONTROL DEVICES ASSET MANAGEMENTPLAN Page 69 of 70
Rate of annual asset upgrade/new *A measure of the rate at which assets arebeing upgraded and expanded per annum withcapital upgrade/new expenditure expressedas a percentage of depreciable amount(capital upgrade/expansion expenditure/DA).
Recoverable amountThe higher of an asset's fair value, less coststo sell and its value in use.
Recurrent expenditureRelatively small (immaterial) expenditure orthat which has benefits expected to last lessthan 12 months. Recurrent expenditureincludes operations and maintenanceexpenditure.
Recurrent fundingFunding to pay for recurrent expenditure.
RehabilitationSee capital renewal expenditure definitionabove.
Remaining useful lifeThe time remaining until an asset ceases toprovide the required service level or economicusefulness. Age plus remaining useful life isuseful life.
RenewalSee capital renewal expenditure definitionabove.
Residual valueThe estimated amount that an entity wouldcurrently obtain from disposal of the asset,after deducting the estimated costs ofdisposal, if the asset were already of the ageand in the condition expected at the end of itsuseful life.
Revenue generating investmentsInvestments for the provision of goods andservices to sustain or improve services to thecommunity that are expected to generatesome savings or revenue to offset operatingcosts, eg public halls and theatres, childcarecentres, sporting and recreation facilities,tourist information centres, etc.
Risk managementThe application of a formal process to therange of possible values relating to key factorsassociated with a risk in order to determine the
resultant ranges of outcomes and theirprobability of occurrence.
Section or segmentA self-contained part or piece of aninfrastructure asset.
Service potentialThe total future service capacity of an asset. Itis normally determined by reference to theoperating capacity and economic life of anasset. A measure of service potential is usedin the not-for-profit sector/public sector tovalue assets, particularly those not producinga cash flow.
Service potential remainingA measure of the future economic benefitsremaining in assets. It may be expressed indollar values (Fair Value) or as a percentageof total anticipated future economic benefits. Itis also a measure of the percentage of theasset’s potential to provide services that is stillavailable for use in providing services(Depreciated Replacement Cost/DepreciableAmount).
Specific MaintenanceReplacement of higher valuecomponents/sub-components of assets that isundertaken on a regular cycle includingrepainting, replacement of air conditioningequipment, etc. This work generally fallsbelow the capital/ maintenance threshold andneeds to be identified in a specificmaintenance budget allocation.
Strategic Longer-Term PlanA plan covering the term of office of councillors(4 years minimum) reflecting the needs of thecommunity for the foreseeable future. It bringstogether the detailed requirements in theCouncil’s longer-term plans such as the assetmanagement plan and the long-term financialplan. The plan is prepared in consultation withthe community and details where the Councilis at that point in time, where it wants to go,how it is going to get there, mechanisms formonitoring the achievement of the outcomesand how the plan will be resourced.

CITY OF VICTOR HARBOR – KERB CHANNEL, CAR PARKS &TRAFFIC CONTROL DEVICES ASSET MANAGEMENTPLAN Page 70 of 70
Sub-componentSmaller individual parts that make up acomponent part.
Useful lifeEither:(a) the period over which an asset is expected to
be available for use by an entity, or(b) the number of production or similar units
expected to be obtained from the asset by theentity.
It is estimated or expected time betweenplacing the asset into service and removing itfrom service, or the estimated period of timeover which the future economic benefitsembodied in a depreciable asset, areexpected to be consumed by the organisation.
Value in UseThe present value of future cash flowsexpected to be derived from an asset or cashgenerating unit. It is deemed to bedepreciated replacement cost (DRC) for thoseassets whose future economic benefits are notprimarily dependent on the asset's ability togenerate net cash inflows, where the entitywould, if deprived of the asset, replace itsremaining future economic benefits.
Source: IPWEA, 2009, AIFMG Glossary
Additional and modified glossary itemsshown*