Kellogg Company
160
UNITED STATES SECURITIES AND EXCHANGE COMMISSION Washington, D.C. 20549 FORM 10-K þ ANNUAL REPORT PURSUANT TO SECTION 13 OR 15(d) OF THE SECURITIES EXCHANGE ACT OF 1934 For the Fiscal Year Ended December 30, 2017 ¨ TRANSITION REPORT PURSUANT TO SECTION 13 OR 15(d) OF THE SECURITIES EXCHANGE ACT OF 1934 For The Transition Period From To Commission file number 1-4171 Kellogg Company (Exact name of registrant as specified in its charter) Delaware 38-0710690 (State or other jurisdiction of Incorporation or organization) (I.R.S. Employer Identification No.) One Kellogg Square Battle Creek, Michigan 49016-3599 (Address of Principal Executive Offices) Registrant’s telephone number: (269) 961-2000 Securities registered pursuant to Section 12(b) of the Securities Act: Title of each class: Name of each exchange on which registered: Common Stock, $.25 par value per share New York Stock Exchange 1.750% Senior Notes due 2021 New York Stock Exchange 0.800% Senior Notes due 2022 New York Stock Exchange 1.000% Senior Notes due 2024 New York Stock Exchange 1.250% Senior Notes due 2025 New York Stock Exchange Securities registered pursuant to Section 12(g) of the Securities Act: None Indicate by a check mark if the registrant is a well-known seasoned issuer, as defined in Rule 405 of the Securities Act. Yes þ No ¨ Indicate by check mark if the registrant is not required to file reports pursuant to Section 13 or Section 15 (d) of the Act. Yes ¨ No þ Note — Checking the box above will not relieve any registrant required to file reports pursuant to Section 13 or 15(d) of the Exchange Act from their obligations under those Sections. Indicate by check mark whether the registrant: (1) has filed all reports required to be filed by Section 13 or 15(d) of the Securities Exchange Act of 1934 during the preceding 12 months (or for such shorter period that the registrant was required to file such reports), and (2) has been subject to such filing requirements for the past 90 days. Yes þ No ¨ Indicate by check mark whether the registrant has submitted electronically and posted on its website, if any, every Interactive Data File required to be submitted and posted pursuant to Rule 405 of Regulation S-T during the preceding 12 months (or for such shorter period that the registrant was required to submit and post such files). Yes þ No ¨ Indicate by check mark if disclosure of delinquent filers pursuant to Item 405 of Regulation S-K is not contained herein, and will not be contained, to the best of the registrant’s knowledge in definitive proxy or information statements incorporated by reference in Part III of this Form 10-K or any amendment to this Form 10-K. þ Indicate by check mark whether the registrant is a large accelerated filer, an accelerated filer, a non-accelerated filer, a smaller reporting company, or an emerging growth company. See the definitions of “large accelerated filer,” “accelerated filer,” “smaller reporting company,” and “emerging growth company” in Rule 12b-2 of the Exchange Act.
-
Upload
khangminh22 -
Category
Documents
-
view
0 -
download
0
Transcript of Kellogg Company

UNITED STATES SECURITIES AND EXCHANGE COMMISSIONWashington, D.C. 20549
FORM 10-Kþ ANNUAL REPORT PURSUANT TO SECTION 13 OR 15(d) OF THE SECURITIES EXCHANGE ACT OF 1934
For the Fiscal Year Ended December 30, 2017
¨ TRANSITION REPORT PURSUANT TO SECTION 13 OR 15(d) OF THE SECURITIES EXCHANGE ACT OF 1934
For The Transition Period From To Commission file number 1-4171
Kellogg Company(Exact name of registrant as specified in its charter)
Delaware 38-0710690(State or other jurisdiction of Incorporation
or organization) (I.R.S. Employer Identification No.)
One Kellogg Square
Battle Creek, Michigan 49016-3599
(Address of Principal Executive Offices)
Registrant’s telephone number: (269) 961-2000 Securities registered pursuant to Section 12(b) of the Securities Act:
Title of each class: Name of each exchange on which registered:Common Stock, $.25 par value per share New York Stock Exchange
1.750% Senior Notes due 2021 New York Stock Exchange0.800% Senior Notes due 2022 New York Stock Exchange1.000% Senior Notes due 2024 New York Stock Exchange1.250% Senior Notes due 2025 New York Stock Exchange
Securities registered pursuant to Section 12(g) of the Securities Act: None
Indicate by a check mark if the registrant is a well-known seasoned issuer, as defined in Rule 405 of the Securities Act. Yes þ No ¨
Indicate by check mark if the registrant is not required to file reports pursuant to Section 13 or Section 15 (d) of the Act. Yes ¨ No þ
Note — Checking the box above will not relieve any registrant required to file reports pursuant to Section 13 or 15(d) of the Exchange Act from their obligations under thoseSections.
Indicate by check mark whether the registrant: (1) has filed all reports required to be filed by Section 13 or 15(d) of the Securities Exchange Act of 1934 during the preceding12 months (or for such shorter period that the registrant was required to file such reports), and (2) has been subject to such filing requirements for the past 90 days. Yes þ No ¨
Indicate by check mark whether the registrant has submitted electronically and posted on its website, if any, every Interactive Data File required to be submitted and postedpursuant to Rule 405 of Regulation S-T during the preceding 12 months (or for such shorter period that the registrant was required to submit and post such files). Yes þ No ¨
Indicate by check mark if disclosure of delinquent filers pursuant to Item 405 of Regulation S-K is not contained herein, and will not be contained, to the best of the registrant’sknowledge in definitive proxy or information statements incorporated by reference in Part III of this Form 10-K or any amendment to this Form 10-K. þ
Indicate by check mark whether the registrant is a large accelerated filer, an accelerated filer, a non-accelerated filer, a smaller reporting company, or an emerging growthcompany. See the definitions of “large accelerated filer,” “accelerated filer,” “smaller reporting company,” and “emerging growth company” in Rule 12b-2 of the Exchange Act.

Large accelerated filer þ Accelerated filer ¨Non-accelerated filer ¨(Do not check if a smaller reporting company) Smaller reporting company ¨ Emerging growth company ¨
If an emerging growth company, indicate by check mark if the registrant has elected not to use the extended transition period for complying with any new or revised financialaccounting standards provided pursuant to Section 13(a) of the Exchange Act. ☐
Indicate by check mark whether the registrant is a shell company (as defined in Rule 12b-2 of the Act). Yes ¨ No þ
The aggregate market value of the common stock held by non-affiliates of the registrant (assuming for purposes of this computation only that the W. K. Kellogg Foundation Trust,directors and executive officers may be affiliates) as of the close of business on July 1, 2017 was approximately $18.9 billion based on the closing price of $68.34 for one share ofcommon stock, as reported for the New York Stock Exchange on that date.
As of January 27, 2018, 345,748,749 shares of the common stock of the registrant were issued and outstanding.
Parts of the registrant’s Proxy Statement for the Annual Meeting of Shareowners to be held on April 27, 2018 are incorporated by reference into Part III of this Report.

PART IITEM 1. BUSINESS
The Company. Kellogg Company, founded in 1906 and incorporated in Delaware in 1922, and its subsidiaries are engaged in the manufacture andmarketing of ready-to-eat cereal and convenience foods.
The address of the principal business office of Kellogg Company is One Kellogg Square, P.O. Box 3599, Battle Creek, Michigan 49016-3599. Unlessotherwise specified or indicated by the context, “Kellogg,” “we,” “us” and “our” refer to Kellogg Company, its divisions and subsidiaries.
Financial Information About Segments. Information on segments is located in Note 18 within Notes to the Consolidated Financial Statements.
Principal Products. Our principal products are snacks, such as cookies, crackers, savory snacks, toaster pastries, cereal bars, granola bars and bites,fruit-flavored snacks; and convenience foods, such as, ready-to-eat cereals, frozen waffles and veggie foods. These products were, as of February 20,2018 , manufactured by us in 21 countries and marketed in more than 180 countries. They are sold to retailers through direct sales forces for resale toconsumers. We use broker and distributor arrangements for certain products and channels, as well as less-developed market areas or in those marketareas outside of our focus.
Our snacks brands are marketed under brands such as Kellogg’s, Keebler, Cheez-It, Pringles, Murray, Austin, Famous Amos, Parati, and RXBAR. Our cereals and cereal bars are generally marketed under the Kellogg’s name, with some under the Kashi and Bear Naked brands. Our frozenfoods are marketed under the Eggo and Morningstar Farms brands.
We also market cookies, crackers, crisps, and other convenience foods, under brands such as Kellogg’s, Keebler, Cheez-It, Pringles, Murray, Austinand Famous Amos, to supermarkets in the United States through a variety of distribution methods.
Additional information pertaining to the relative sales of our products for the years 2015 through 2017 is located in Note 18 within Notes to theConsolidated Financial Statements, which are included herein under Part II, Item 8.
Corporate responsibility and sustainability. Climate change and food security are core business issues for Kellogg to ensure the long-term health andviability of the ingredients we use in our products. The Social Responsibility & Public Policy Committee of our Board of Directors oversees thecompany's sustainability efforts and climate policy. All four committee members are independent. At the executive level, environmental and social issuesin our supply chain are overseen by our Chief Sustainability Officer and are aligned and included in parallel work streams within internal audit and auditcommittee. Policies and strategies regarding these topics are aligned in the organization’s lobbying, advocacy, and membership efforts. In multi-stakeholder initiatives, Kellogg partners with suppliers, customers, governments and non-governmental organizations, including the World BusinessCouncil for Sustainable Development and the Consumer Goods Forum.
Kellogg Company relies on natural capital including energy for product manufacturing and distribution, water as an ingredient, for facility cleaning andsteam power, and food crops and commodities as an ingredient. These natural capital dependencies are at risk of shortage, price volatility, regulation,and quality impacts due to climate change which is assessed as part of Kellogg’s overall enterprise risk management approach. Specific risks includingwater stress and social accountability are specifically identified and assessed on a regular basis, especially in emerging market expansion that fuelscompany growth. Due to these risks, Kellogg has implemented major short- and long-term initiatives to mitigate and adapt to these environmentalpressures, as well as the resulting challenge of food security.
Global sustainability commitments. Kellogg has committed to improving efficiency in its owned manufacturing footprint by reducing water use, totalwaste, energy use, and greenhouse gas (GHG) emissions by 15% per metric tonne of food produced by 2020 from a 2015 baseline. We will report 2017energy, GHG, and water use reductions in our 2017/2018 Corporate Responsibility Report. The goal is to reduce the risk of disruptions from unexpectedconstraints in natural resource availability or impacts on raw material pricing. Additionally, Kellogg is committed to implement water reuse projects in atleast 25% of our plants by 2020 from a 2015 baseline, with a specific focus on plants located in water stressed areas. Kellogg has committed toresponsibly sourcing our ten priority ingredients as determined by environmental, social, and business risk by 2020 by partnering with suppliers andfarmers to
1

measure continuous improvement. In addition, Kellogg established third-party approved science-based targets to reduce absolute Scope 1 and 2greenhouse emissions by 65% and Scope 3 greenhouse emissions by 50% by 2050 from a 2015 baseline. Through these commitments, Kelloggsupports the United Nations Sustainable Development Goal #13 to take urgent action to combat climate change and its impacts.
In 2016, the manufacturing organization led sustainability efforts that resulted in a reduction in water use by 2.7%, energy use by 0.1%, an increase inGHG emissions by 1.8% per metric tonne of food produce compared to a 2015 baseline. In the first year of our science-based targets, we’ve reducedabsolute Scope 1 and 2 emissions by 0.2%. Numerous factors contributed to our increased GHG emissions, including 1) in several countries where weoperate, drought conditions have decreased the generation of clean energy from hydropower; 2) the decreasing prices of fossil fuels has encouragedsome countries to generate more electricity from these non-renewable sources; and 3) our growing Pringles® business requires more energy (andwater) to produce than other Kellogg foods. In September 2017, Kellogg joined RE100, an industry platform working together towards 100% renewableelectricity. Increasing our use of renewable electricity will lower business risk and reduce GHG emissions.
Food Loss and Waste: As a global food company, Kellogg is committed to addressing the critical issues of climate and food security, and we’recommitted to address food loss and waste. Kellogg supports the United Nations Sustainable Development Goal (SDG) 12.3, to halve per capita globalfood waste at the retail and consumer levels and reduce food losses along production and supply chains, including post-harvest losses, by 2030. Thesegoals are aligned with Kellogg commitments to reduce waste, with a focus on food waste across our end-to-end supply chain. And through our globalsignature cause platform, Breakfasts for Better Days™ we’re donating food for hunger relief that may otherwise go to waste.
Breakfasts for Better Days : In 2016, this global social purpose platform expanded with the intent to contribute to food security - aligned to UnitedNations Sustainable Development Goal #2 SDG 2: End hunger, achieve food security and improved nutrition, and promote sustainable agriculture. Thegoal of the program is to create 3 billion Better Days by 2025 to address food security risks that can impact the Company as well as create opportunityto engage consumers. The Company’s five key commitments include food donations, expansion of breakfast clubs, supporting 500,000 farmers,committing to 45,000 employee volunteer days, and engaging 300 million people to join Kellogg in its hunger relief efforts. Through Breakfasts for BetterDays, Kellogg has helped make billions of days better for people in need, providing 1.9 billion servings of food since 2013.
As a grain-based food company, the success of Kellogg Company is dependent on having timely access to high quality, low cost ingredients, water andenergy for manufacturing globally. Risks are identified annually through annual reporting and evaluated in the short (<3 years), medium (3 - 6 years) andlong terms (>6 years). The Company has incorporated the risks and opportunities of climate change and food security as part of the Global 2020 GrowthStrategy and global Heart and Soul Strategy by continuing to identify risk, incorporate sustainability indicators into strategic priorities, and reportregularly to leadership, the Board, and publicly. While these risks are not currently impacting business growth, they must be monitored, evaluated, andmitigated.
Raw Materials. Agricultural commodities, including corn, wheat, potato flakes, vegetable oils, sugar and cocoa, are the principal raw materials used inour products. Cartonboard, corrugate, and plastic are the principal packaging materials used by us. We continually monitor world supplies and prices ofsuch commodities (which include such packaging materials), as well as government trade policies. The cost of such commodities may fluctuate widelydue to government policy and regulation, weather conditions, climate change or other unforeseen circumstances. Continuous efforts are made tomaintain and improve the quality and supply of such commodities for purposes of our short-term and long-term requirements.
The principal ingredients in the products produced by us in the United States include corn grits, wheat and wheat derivatives, potato flakes, oats, rice,cocoa and chocolate, soybeans and soybean derivatives, various fruits, sweeteners, vegetable oils, dairy products, eggs, and other ingredients, whichare obtained from various sources. While most of these ingredients are purchased from sources in the United States, some materials are imported dueto regional availability and specification requirements.
We enter into long-term contracts for the materials described in this section and purchase these items on the open market, depending on our view ofpossible price fluctuations, supply levels, and our relative negotiating power. While the cost of some of these materials has, and may continue toincrease over time, we believe that we will be able to purchase an adequate supply of these items as needed. As further discussed herein under Part II,Item 7A, we also use commodity futures and options to hedge some of our costs.
2
Raw materials and packaging needed for internationally based operations are available in adequate supply and are sourced both locally and importedfrom countries other than those where used in manufacturing.
Natural gas and propane are the primary sources of energy used to power processing ovens at major domestic and international facilities, althoughcertain locations may use electricity, oil, propane or solar cells on a back-up or alternative basis. In addition, considerable amounts of diesel fuel areused in connection with the distribution of our products.
Trademarks and Technology. Generally, our products are marketed under trademarks we own. Our principal trademarks are our housemarks, brandnames, slogans, and designs related to cereals, snacks and various other foods manufactured and marketed by us, and we also grant licenses to thirdparties to use these marks on various goods. These trademarks include Kellogg’s for cereals, convenience foods and our other products, and thebrand names of certain ready-to-eat cereals, including All-Bran, Apple Jacks, Choco Zucaritas, Cocoa Krispies, Kellogg’s Corn Flakes, CornPops, Cracklin’ Oat Bran, Crispix, Eggo, Froot Loops, Kellogg’s Frosted Flakes, Krave, Frosted Krispies, Frosted Mini-Wheats, Mueslix, Pops,Kellogg's Raisin Bran, Raisin Bran Crunch , Rice Krispies, Rice Krispies Treats, Smacks/Honey Smacks, Special K, Special K Nourish,Special K Red Berries and Zucaritas in the United States and elsewhere; Sucrilhos, Krunchy Granola, Kellogg's Extra, Kellness, Müsli, andChoco Krispis for cereals in Latin America; Vector in Canada; Ancient Legends, Coco Pops, Choco Krispies, Frosties, Fruit ‘N Fibre, Kellogg’sCrunchy Nut, Krave, Honey Loops, Kellogg’s Extra, Country Store, Smacks, Pops, Honey Bsss, Croco Copters, W.K. Kellogg, Toppas andTresor for cereals in Europe; and Froot Ring, Guardian, Just Right, Sultana Bran, Frosties, Rice Bubbles, Nutri-Grain, and Sustain for cereals inAsia and Australia. Additional trademarks are the names of certain combinations of ready-to-eat Kellogg’s cereals, including Fun Pak and Variety .
Other brand names include Kellogg’s Corn Flake Crumbs; All-Bran, Choco Krispis, Crunchy Nut, Frutela, Special K, Squares, Zucaritas andSucrilhos for cereal bars; Pop-Tarts for toaster pastries; Eggo and Nutri-Grain for frozen waffles and pancakes; Eggo , Special K and MorningStarFarms for breakfast sandwiches; Rice Krispies Treats for convenience foods; Special K protein shakes; Nutri-Grain cereal bars for conveniencefoods in the United States and elsewhere; K-Time, Split Stix, Be Natural, Sunibrite and LCMs for convenience foods in Australia; Choco Krispies,Coco Pops, and Rice Krispies Squares for convenience foods in Europe; Kashi for certain cereals, convenience foods, frozen foods, powders andpilaf; GoLean for cereals and nutrition bars; Special K and Vector for meal bars; Bear Naked for granola cereal and snack bites, Pringles for potatocrisps, corn crisps, grain and vegetable crisps and potato sticks; and Morningstar Farms and Gardenburger for certain meat alternatives.
We also market convenience foods under trademarks and tradenames which include Keebler, Austin, Cheez-It, Chips Deluxe, Club, E. L. Fudge,Famous Amos, Fudge Shoppe, Gripz, Krispy, Minueto, Mother’s, Murray, Murray Sugar Free, Parati, Ready Crust, RXBAR, Sandies, Special K,Soft Batch, Simply Made, Stretch Island, Sunshine, Toasteds, Town House, Trink, Vienna Fingers, Zesta and Zoo Cartoon. One of oursubsidiaries is also the exclusive licensee of the Carr’s cracker line in the United States.
Our trademarks also include logos and depictions of certain animated characters in conjunction with our products, including Snap! Crackle! Pop! forCocoa Krispies and Rice Krispies cereals and Rice Krispies Treats convenience foods; Tony the Tiger for Kellogg’s Frosted Flakes, Zucaritas,Sucrilhos and Frosties cereals and convenience foods; Ernie Keebler for cookies, convenience foods and other products; the Hollow Tree logo forcertain convenience foods; Toucan Sam for Froot Loops cereal; Dig ‘Em for Smacks/Honey Smacks cereal; Sunny for Kellogg’s Raisin Bran andRaisin Bran Crunch cereals; Coco the Monkey for Coco Pops and Chocos cereal; Cornelius (aka Cornelio) for Kellogg’s Corn Flakes ; Melvin theElephant for certain cereal and convenience foods; Chocovore and Sammy the Seal (aka Smaxey the Seal) for certain cereal products; and Mr. P orJulius Pringles for Pringles potato crisps, corn crisps, grain and vegetable crisps and potato sticks.
The slogans The Original & Best, They’re Gr-r-reat! , Show Your Stripes and Follow Your Nose, are used in connection with our ready-to-eatcereals, along with L’ Eggo my Eggo , used in connection with our frozen waffles, pancakes, French toast sticks and breakfast sandwiches,Uncommonly Good and It Takes Heart To Make a Good Cookie used in connection with convenience food products, Taste It To Believe It used inconnection with meat alternatives and Pop Play Eat used in connection with potato crisps are also important Kellogg trademarks.
The trademarks listed above, among others, when taken as a whole, are important to our business. Certain individual trademarks are also important toour business. Depending on the jurisdiction, trademarks are generally valid as long as they are in use and/or their registrations are properly maintainedand they have not been found to
3

have become generic. Registrations of trademarks can also generally be renewed indefinitely as long as the trademarks are in use.
We consider that, taken as a whole, the rights under our various patents, which expire from time to time, are a valuable asset, but we do not believe thatour businesses are materially dependent on any single patent or group of related patents. Our activities under licenses or other franchises orconcessions which we hold are similarly a valuable asset, but are not believed to be material.
Seasonality. Demand for our products has generally been approximately level throughout the year, although some of our convenience foods have abias for stronger demand in the second half of the year due to events and holidays. We also custom-bake cookies for the Girl Scouts of the U.S.A.,which are principally sold in the first quarter of the year.
Working Capital. A description of our working capital is included in the Liquidity section of MD&A within Item 7 of this report.
Customers. Our largest customer, Wal-Mart Stores, Inc. and its affiliates, accounted for approximately 20% of consolidated net sales during 2017 ,comprised principally of sales within the United States. At December 30, 2017 , approximately 17% of our consolidated receivables balance and 26% ofour U.S. receivables balance was comprised of amounts owed by Wal-Mart Stores, Inc. and its affiliates. No other customer accounted for greater than10% of net sales in 2017 . During 2017 , our top five customers, collectively, including Wal-Mart, accounted for approximately 35% of our consolidatednet sales and approximately 49% of U.S. net sales. There has been significant worldwide consolidation in the grocery industry and we believe that thistrend is likely to continue. Although the loss of any large customer for an extended length of time could negatively impact our sales and profits, we donot anticipate that this will occur to a significant extent due to the consumer demand for our products and our relationships with our customers. Ourproducts have been generally sold through our own sales forces and through broker and distributor arrangements, and have been generally resold toconsumers in retail stores, restaurants, and other food service establishments.
Backlog. For the most part, orders are filled within a few days of receipt and are subject to cancellation at any time prior to shipment. The backlog ofany unfilled orders at December 30, 2017 and December 31, 2016 was not material to us.
Competition. We have experienced, and expect to continue to experience, intense competition for sales of all of our principal products in our majorproduct categories, both domestically and internationally. Our products compete with advertised and branded products of a similar nature as well asunadvertised and private label products, which are typically distributed at lower prices, and generally with other food products. Principal methods andfactors of competition include new product introductions, product quality, taste, convenience, nutritional value, price, advertising and promotion.
Research and Development. Research to support and expand the use of our existing products and to develop new food products is carried on at the W.K. Kellogg Institute for Food and Nutrition Research in Battle Creek, Michigan, and at other locations around the world. Our expenditures for researchand development were approximately (in millions): 2017 -$148; 2016 -$182; 2015-$193.
Regulation. Our activities in the United States are subject to regulation by various government agencies, including the Food and Drug Administration,Federal Trade Commission and the Departments of Agriculture, Commerce and Labor, as well as voluntary regulation by other bodies. Various stateand local agencies also regulate our activities. Other agencies and bodies outside of the United States, including those of the European Union andvarious countries, states and municipalities, also regulate our activities.
Environmental Matters. Our facilities are subject to various U.S. and foreign, federal, state, and local laws and regulations regarding the release ofmaterial into the environment and the protection of the environment in other ways. We are not a party to any material proceedings arising under theseregulations. We believe that compliance with existing environmental laws and regulations will not materially affect our consolidated financial condition orour competitive position.
Employees. At December 30, 2017 , we had approximately 33,000 employees.
Financial Information About Geographic Areas. Information on geographic areas is located in Note 18 within Notes to the Consolidated FinancialStatements, which are included herein under Part II, Item 8.
4

Executive Officers. The names, ages, and positions of our executive officers (as of February 20, 2018 ) are listed below, together with their businessexperience. Executive officers are elected annually by the Board of Directors.
Amit Banati 49Senior Vice President, Kellogg CompanyPresident, Asia Pacific
Mr. Banati assumed his current position in March 2012. Prior to joining Kellogg Company, he served in a variety of board and leadership roles at KraftFoods, Cadbury Schweppes and Procter & Gamble. Mr. Banati has worked extensively across the Asia Pacific region, particularly in Australia, India,China, Japan, Korea, Southeast Asia and Singapore. At Kraft Foods, he was President, North Asia and Asia Pacific strategy, leading the company’soperations in Japan, Korea, Taiwan, Hong Kong and Singapore. Prior to that, Mr. Banati served as President, Pacific, for Cadbury Schweppes, leadingits Australia, New Zealand, Japan and Singapore operations. He was also Chairman of Cadbury Schweppes Australia Limited.
John A. Bryant 52Chairman
Mr. Bryant has been Chairman of the Board of Kellogg Company since July 2014. Mr. Bryant retired from his role as President and Chief ExecutiveOfficer on October 1, 2017, having served in that role since January 2011. He has been a member of Kellogg Company’s Board of Directors since July2010. From December 2006 through January 2011, Mr. Bryant held various operating roles, including President, Kellogg International; President,Kellogg North America; and Chief Operating Officer. He was also the Chief Financial Officer of Kellogg Company from February 2002 until June 2004and again from December 2006 through December 2009. Mr. Bryant joined Kellogg Company in 1998 and was promoted during the next four years toa number of key financial and executive leadership roles. He has also been a trustee of the W. K. Kellogg Foundation Trust since 2015, and is adirector of Macy’s Inc.
Steven A. Cahillane 52President and Chief Executive Officer
Mr. Cahillane became President and Chief Executive Officer on October 2, 2017, and has served as a Kellogg Director since October 2017. Prior tojoining Kellogg, Mr. Cahillane served as Chief Executive Officer and President, and as member of the board of directors, of Alphabet Holding Company,Inc., and its wholly-owned operating subsidiary, The Nature’s Bounty Co., since September 8, 2014. Prior to that, Mr. Cahillane served as ExecutiveVice President of The Coca-Cola Company from February 2013 to February 2014 and President of Coca-Cola Americas, the global beverage maker’slargest business, with $25 billion in annual sales at that time, from January 2013 to February 2014. Mr. Cahillane served as President of various Coca-Cola operating groups from 2007 to 2012.
Alistair D. Hirst 58Senior Vice President, Global Supply Chain
Mr. Hirst assumed his current position in April 2012. He joined the company in 1984 as a Food Technologist at the Springs, South Africa, plant. While atthe facility, he was promoted to Quality Assurance Manager and Production Manager. From 1993 to 2001, Mr. Hirst held numerous positions in SouthAfrica and Australia, including Production Manager, Plant Manager, and Director, Supply Chain. In 2001, Mr. Hirst was promoted to Director,Procurement at the Manchester, England, facility and was later named European Logistics Director. In 2005, he transferred to the U.S. when promotedto Vice President, Global Procurement. In 2008, he was promoted to Senior Vice President, Snacks Supply Chain and to Senior Vice President, NorthAmerica Supply Chain, in October 2011.
5

Christopher M. Hood 55Senior Vice President, Kellogg CompanyPresident, Kellogg Europe
Mr. Hood assumed his current position in October 2013. He joined The Procter and Gamble Company in 1993, and had a distinguished 19-year careerin Marketing and General Management, based in Cincinnati, Ohio. Mr. Hood joined Kellogg Company in 2012 as the Vice President of EuropeanSnacks. He has held a number of Board roles across the Food and Beverage Industry. Mr. Hood is currently serving on the Board of Food Drink Europeand the European Brands Association.
Melissa A. Howell 51Senior Vice President, Global Human Services
Ms. Howell assumed her current position in June 2016. Prior to joining Kellogg, she was Chief Human Resource Officer for Rockford, Michigan-basedWolverine since 2014. Prior to Wolverine, Ms. Howell spent 24 years with General Motors where she led a team of 2,800 Human Resourceprofessionals worldwide, supporting a global business at one of the top automotive companies in the world, and also among the largest publiccorporations. Ms. Howell joined General Motors as a Labor Relations Representative at its Ypsilanti, Michigan, assembly plant in 1990. Over thefollowing years, she served in a series of key human resource leadership roles in Europe, Asia and U.S. leading teams on six continents across an arrayof functional areas. Ms. Howell was promoted to Executive Director of North American Human Resources in 2011 and subsequently promoted to SeniorVice President of Global Human Resources.
Fareed Khan 52Senior Vice President and Chief Financial Officer
Mr. Khan has been Senior Vice President, Chief Financial Officer and Principal Financial Officer, Kellogg Company since February 22, 2017. Mr. Khanjoined Kellogg in February 2017. Before joining the Company, he served as Chief Financial Officer of US Foods Holding Corp. since 2013. Prior to that,Mr. Khan had been Senior Vice President and Chief Financial Officer of United Stationers Inc. since July 2011. Prior to United Stationers Inc., he spenttwelve years with USG Corporation, where he most recently served as Executive Vice President, Finance and Strategy. Before joining USG Corporationin 1999, Mr. Khan was a consultant with McKinsey & Company, where he served global clients on a variety of projects.
Maria Fernanda Mejia 54Senior Vice President, Kellogg CompanyPresident, Kellogg Latin America
Ms. Mejia assumed her current position in November 2011. She previously held a variety of global marketing and management roles at the Colgate-Palmolive Company, including Corporate Vice President and General Manager, Global Personal Care and Corporate Fragrance Development,Corporate Vice President of Marketing and Innovation for Europe/South Pacific, and President and CEO of Colgate-Palmolive Spain. She joined Colgatein 1989.
6

Donald O. Mondano 46Vice President and Corporate Controller
Mr. Mondano assumed his current position in March 2016. Prior to joining Kellogg Company, Mr. Mondano was Vice President, Finance and CorporateController at The Manitowoc Company, a Wisconsin-based manufacturer specializing in products for global foodservice and construction industries,since 2012. In this role, he was not only responsible for the enterprise reporting and accounting function, but he was also responsible for overseeingenterprise financial planning and analysis, management reporting and the overall finance function of one of the two business segments, the Cranesbusiness unit. Prior to that role, he worked in various roles of increasing responsibility at PricewaterhouseCoopers at various international and domesticoffices from March 2000 to June 2012. Mr. Mondano previously held positions in Phillip Semiconductors and The Bank of the Philippine Islands, as acost accountant and commercial lender, respectively.
Paul T. Norman 53Senior Vice President, Kellogg CompanyPresident, Kellogg North America
Mr. Norman was appointed President, Kellogg North America in May 2015. He was appointed Senior Vice President, Kellogg Company in December2005. Mr. Norman was appointed Chief Growth Officer in October 2013 and also held the role of interim U.S. Morning Foods President from June 2014to May 2015. Mr. Norman joined Kellogg’s U.K. sales organization in 1987. From 1989 to 1996, Mr. Norman was promoted to several marketing roles inFrance and Canada. He was promoted to director, marketing, Kellogg de Mexico in January 1997; to Vice President, Marketing, Kellogg USA inFebruary 1999; to President, Kellogg Canada Inc. in December 2000; and to Managing Director, United Kingdom/Republic of Ireland in February 2002.In September 2004, Mr. Norman was appointed to Vice President, Kellogg Company, and President, U.S. Morning Foods. In August 2008, Mr. Normanwas promoted to President, Kellogg International.
Gary H. Pilnick 53Vice Chairman, Corporate Developmentand Chief Legal Officer
Mr. Pilnick was appointed Vice Chairman, Corporate Development and Chief Legal Officer in January 2016. In August 2003, he was appointed SeniorVice President, General Counsel and Secretary and assumed responsibility for Corporate Development in June 2004. He joined Kellogg as VicePresident — Deputy General Counsel and Assistant Secretary in September 2000 and served in that position until August 2003. Before joining Kellogg,he served as Vice President and Chief Counsel of Sara Lee Branded Apparel and as Vice President and Chief Counsel, Corporate Development andFinance at Sara Lee Corporation.
Clive M. Sirkin 54Senior Vice President, Kellogg CompanyChief Growth Officer
Mr. Sirkin assumed his current position in December 2015. Prior to joining Kellogg Company, he served as Kimberly-Clark’s Chief Marketing Officer(CMO) since 2012. Prior to joining Kimberly-Clark, Mr. Sirkin served as Principal, Plunger Group, a consulting firm focused on working with CMOs totransform brand building from an analog advertising and communication model to a digitally driven commercial model focused on driving growth. Prior tofounding Plunger Group, he served as Group Managing Director Leo Burnett Worldwide. During his 15-year tenure with Leo Burnett, Mr. Sirkin alsoserved as Executive Vice President - Global Director, and Vice President, Leo Burnett Canada.
7

Availability of Reports; Website Access; Other Information. Our internet address is http://www.kelloggcompany.com. Through “Investor Relations” —“Financial Reports” — “SEC Filings” on our home page, we make available free of charge our proxy statements, our annual report on Form 10-K, ourquarterly reports on Form 10-Q, our current reports on Form 8-K, SEC Forms 3, 4 and 5 and any amendments to those reports filed or furnishedpursuant to Section 13(a) or 15(d) of the Securities Exchange Act of 1934 as soon as reasonably practicable after we electronically file such materialwith, or furnish it to, the Securities and Exchange Commission. Our reports filed with the Securities and Exchange Commission are also made availableto read and copy at the SEC’s Public Reference Room at 100 F Street, N.E., Washington, D.C. 20549. You may obtain information about the PublicReference Room by contacting the SEC at 1-800-SEC-0330. Reports filed with the SEC are also made available on its website at www.sec.gov.
Copies of the Corporate Governance Guidelines, the Charters of the Audit, Compensation and Talent Management, and Nominating and GovernanceCommittees of the Board of Directors, the Code of Conduct for Kellogg Company directors and Global Code of Ethics for Kellogg Company employees(including the chief executive officer, chief financial officer and corporate controller) can also be found on the Kellogg Company website. Anyamendments or waivers to the Global Code of Ethics applicable to the chief executive officer, chief financial officer and corporate controller can also befound in the “Investor Relations” section of the Kellogg Company website. Shareowners may also request a free copy of these documents from: KelloggCompany, P.O. Box CAMB, Battle Creek, Michigan 49016-9935 (phone: (800) 961-1413), Investor Relations Department at that same address (phone:(269) 961-2800) or [email protected].
Forward-Looking Statements. This Report contains “forward-looking statements” with projections concerning, among other things, the Company’sglobal growth and efficiency program (Project K), the integration of acquired businesses, our strategy, zero-based budgeting, financial principles, andplans; initiatives, improvements and growth; sales, margins, advertising, promotion, merchandising, brand building, operating profit, and earnings pershare; innovation; investments; capital expenditures; asset write-offs and expenditures and costs related to productivity or efficiency initiatives; theimpact of accounting changes and significant accounting estimates; our ability to meet interest and debt principal repayment obligations; minimumcontractual obligations; future common stock repurchases or debt reduction; effective income tax rate; cash flow and core working capitalimprovements; interest expense; commodity and energy prices; and employee benefit plan costs and funding. Forward-looking statements includepredictions of future results or activities and may contain the words “expect,” “believe,” “will,” “can,” “anticipate,” “estimate,” “project,” “should,” or wordsor phrases of similar meaning. For example, forward-looking statements are found in this Item 1 and in several sections of Management’s Discussionand Analysis. Our actual results or activities may differ materially from these predictions. Our future results could be affected by a variety of factors,including the ability to implement Project K, including exiting our Direct-Store-Door distribution system, whether the expected amount of costsassociated with Project K will exceed forecasts, whether the Company will be able to realize the anticipated benefits from Project K in the amounts andtimes expected, the ability to realize the benefits we expect from the adoption of zero-based budgeting in the amounts and at the times expected, theability to realize anticipated benefits from revenue growth management, the ability to realize the anticipated benefits and synergies from acquiredbusinesses in the amounts and at the times expected, the impact of competitive conditions; the effectiveness of pricing, advertising, and promotionalprograms; the success of innovation, renovation and new product introductions; the recoverability of the carrying value of goodwill and other intangibles;the success of productivity improvements and business transitions; commodity and energy prices; labor costs; disruptions or inefficiencies in supplychain; the availability of and interest rates on short-term and long-term financing; actual market performance of benefit plan trust investments; the levelsof spending on systems initiatives, properties, business opportunities, integration of acquired businesses, and other general and administrative costs;changes in consumer behavior and preferences; the effect of U.S. and foreign economic conditions on items such as interest rates, statutory tax rates,currency conversion and availability; legal and regulatory factors including changes in food safety, advertising and labeling laws and regulations; theultimate impact of product recalls; adverse changes in global climate or extreme weather conditions; business disruption or other losses from naturaldisasters, war, terrorist acts, or political unrest; and the risks and uncertainties described in Item 1A below. Forward-looking statements speak only as ofthe date they were made, and we undertake no obligation to publicly update them.
ITEM 1A. RISK FACTORS
In addition to the factors discussed elsewhere in this Report, the following risks and uncertainties could materially adversely affect our business,financial condition and results of operations. Additional risks and uncertainties not presently known to us or that we currently deem immaterial also mayimpair our business operations and financial condition.
8

We may not realize the benefits that we expect from our global efficiency and effectiveness program (Project K).
In November 2013, the Company announced a global efficiency and effectiveness program (Project K). The successful implementation of Project Kpresents significant organizational design and infrastructure challenges and in many cases will require successful negotiations with third parties,including labor organizations, suppliers, business partners, and other stakeholders. In addition, the project may not advance our business strategy asexpected. While we are four years into the implementation of Project K and many of the initiatives under the program have been successfullyimplemented or are nearing completion, we may not be able to implement Project K as planned, including the successful exit of our Direct Store Deliverynetwork and transitioning that business to a warehouse model. Events and circumstances, such as financial or strategic difficulties, delays andunexpected costs may occur that could result in our not realizing all or any of the anticipated benefits or our not realizing the anticipated benefits on ourexpected timetable. If we are unable to realize the anticipated savings of the program, our ability to fund other initiatives may be adversely affected. Anyfailure to implement Project K in accordance with our expectations could adversely affect our financial condition, results of operations and cash flows.
In addition, the complexity of Project K has required, and will continue to require a substantial amount of management and operational resources. Ourmanagement team must successfully implement administrative and operational changes necessary to achieve the anticipated benefits of Project K.These and related demands on our resources may divert the organization’s attention from existing core businesses, integrating or separating personneland financial or other systems, have adverse effects on existing business relationships with suppliers and customers, and impact employee morale. Asa result our financial condition, results of operations or cash flows may be adversely affected.
We may not realize the benefits we expect from the adoption of zero-based budgeting.
We adopted zero-based budgeting which presents significant organizational challenges. As a result, we may not realize all or part of the anticipated costsavings or other benefits from the initiative. Other events and circumstances, such as financial or strategic difficulties, delays or unexpected costs, mayalso adversely impact our ability to realize all or part of the anticipated cost savings or other benefits, or cause us not to realize the anticipated costsavings or other benefits on the expected timetable. If we are unable to realize the anticipated cost savings, our ability to fund other initiatives may beadversely affected. In addition, the initiatives may not advance our strategy as expected. Finally, the complexity of the implementation will require asubstantial amount of management and operational resources. Our management team must successfully execute the administrative and operationalchanges necessary to achieve the anticipated benefits of the initiatives. These and related demands on our resources may divert the organization'sattention from other business issues, have adverse effects on existing business relationships with suppliers and customers, and impact employeemorale.
Any failure to implement our cost reduction, organizational design or other initiatives in accordance with our plans could adversely affect our business orfinancial results.
We may not realize the benefits we expect from revenue growth management.
We are establishing a more formal revenue growth management discipline to help us realize price in a more effective way. This approach addressesprice strategy, price-pack architecture, promotion strategy, mix management, and trade strategies. Revenue growth management will involve changes tothe way we do business and may not always be accepted by our customers or consumers causing us not to realize the anticipated benefits. In addition,the complexity of the implementation will require a substantial amount of management and operational resources. Our management team mustsuccessfully execute the administrative and operational changes necessary to achieve the anticipated benefits of the initiative. These and relateddemands on our resources may divert the organization's attention from other business issues and have adverse effects on existing businessrelationships with suppliers and customers. Any failure to implement revenue growth management in accordance with our plans could adversely affectour business or financial condition.
Our results may be materially and adversely impacted as a result of increases in the price of raw materials, including agricultural commodities, fuel andlabor.
Agricultural commodities, including corn, wheat, potato flakes, vegetable oils, sugar and cocoa, are the principal raw materials used in our products.Cartonboard, corrugated, and plastic are the principal packaging materials used by us. The cost of such commodities may fluctuate widely due togovernment policy and regulation, drought and other weather conditions (including the potential effects of climate change) or other unforeseencircumstances. To the extent that any of the foregoing factors affect the prices of such commodities and we are unable to increase our
9

prices or adequately hedge against such changes in prices in a manner that offsets such changes, the results of our operations could be materially andadversely affected. In addition, we use derivatives to hedge price risk associated with forecasted purchases of raw materials. Our hedged price couldexceed the spot price on the date of purchase, resulting in an unfavorable impact on both gross margin and net earnings.
Cereal processing ovens at major domestic and international facilities are regularly fueled by electricity, natural gas or propane, which are obtained fromlocal utilities or other local suppliers. Short-term stand-by propane storage exists at several plants for use in case of interruption in natural gas supplies.Oil may also be used to fuel certain operations at various plants. In addition, considerable amounts of diesel fuel are used in connection with thedistribution of our products. The cost of fuel may fluctuate widely due to economic and political conditions, government policy and regulation, war, orother unforeseen circumstances which could have a material adverse effect on our consolidated operating results or financial condition.
A shortage in the labor pool, failure to successfully negotiate collectively bargained agreements, or other general inflationary pressures or changes inapplicable laws and regulations could increase labor cost, which could have a material adverse effect on our consolidated operating results or financialcondition.
Our labor costs include the cost of providing benefits for employees. We sponsor a number of benefit plans for employees in the United States andvarious foreign locations, including pension, retiree health and welfare, active health care, severance and other postemployment benefits. We alsoparticipate in a number of multiemployer pension plans for certain of our manufacturing locations. Our major pension plans and U.S. retiree health andwelfare plans are funded with trust assets invested in a globally diversified portfolio of equity securities with smaller holdings of bonds, real estate andother investments. The annual cost of benefits can vary significantly from year to year and is materially affected by such factors as changes in theassumed or actual rate of return on major plan assets, a change in the weighted-average discount rate used to measure obligations, the rate or trend ofhealth care cost inflation, and the outcome of collectively-bargained wage and benefit agreements. Many of our employees are covered by collectively-bargained agreements and other employees may seek to be covered by collectively-bargained agreements. Strikes or work stoppages and interruptionscould occur if we are unable to renew these agreements on satisfactory terms or enter into new agreements on satisfactory terms, which couldadversely impact our operating results. The terms and conditions of existing, renegotiated or new agreements could also increase our costs or otherwiseaffect our ability to fully implement future operational changes to enhance our efficiency.
Multiemployer pension plans could adversely affect our business.
We participate in various “multiemployer” pension plans administered by labor unions representing some of our employees. We make periodiccontributions to these plans to allow them to meet their pension benefit obligations to their participants. Our required contributions to these funds couldincrease because of a shrinking contribution base as a result of the insolvency or withdrawal of other companies that currently contribute to these funds,inability or failure of withdrawing companies to pay their withdrawal liability, lower than expected returns on pension fund assets or other fundingdeficiencies. In the event that we withdraw from participation in one of these plans,then applicable law could require us to make an additional lump-sum contribution to the plan, and we would have to reflect that as an expense in ourconsolidated statement of operations and as a liability on our consolidated balance sheet. Our withdrawal liability for any multiemployer plan woulddepend on the extent of the plan’s funding of vested benefits. In the ordinary course of our renegotiation of collective bargaining agreements with laborunions that maintain these plans, we may decide to discontinue participation in a plan, and in that event, we could face a withdrawal liability. Somemultiemployer plans in which we participate are reported to have significant underfunded liabilities. Such underfunding could increase the size of ourpotential withdrawal liability.
We operate in the highly competitive food industry.
We face competition across our product lines, including ready-to-eat cereals and convenience foods, from other companies which have varying abilitiesto withstand changes in market conditions. Most of our competitors have substantial financial, marketing and other resources, and competition with themin our various markets and product lines could cause us to reduce prices, increase capital, marketing or other expenditures, or lose category share, anyof which could have a material adverse effect on our business and financial results. In some cases, our competitors may be able to respond to changingbusiness and economic conditions more quickly than us. Category share and growth could also be adversely impacted if we are not successful inintroducing new products, anticipating changes in consumer preferences with respect to dietary trends or purchasing behaviors or in effectivelyassessing, changing and setting proper pricing.
10
The changing retail environment could negatively impact our sales and profits.
Our businesses are largely concentrated in the traditional retail grocery trade. Our largest customer, Wal-Mart Stores, Inc. and its affiliates, accountedfor approximately 20% of consolidated net sales during 2017 , comprised principally of sales within the United States. At December 30, 2017 ,approximately 17% of our consolidated receivables balance and 26% of our U.S. receivables balance was comprised of amounts owed by Wal-MartStores, Inc. and its affiliates. No other customer accounted for greater than 10% of net sales in 2017 . During 2017 , our top five customers, collectively,including Wal-Mart, accounted for approximately 35% of our consolidated net sales and approximately 49% of U.S. net sales. There can be noassurances that our largest customers will continue to purchase our products in the same mix or quantities or on the same terms as in the past. As theretail grocery trade continues to consolidate and retailers become larger, our large retail customers have sought, and may continue to seek in the future,to use their position to improve their profitability through improved efficiency, lower pricing, increased promotional programs funded by their suppliersand more favorable terms. If we are unable to use our scale, marketing expertise, product innovation and category leadership positions to respond, ourprofitability or volume growth could be negatively affected. The loss of any large customer or severe adverse impact on the business operations of anylarge customer for an extended length of time could negatively impact our sales and profits.
Additionally, alternative retail channels, such as internet-based retailers, mobile applications, subscription services, discount and dollar stores, drugstores and club stores, have become more prevalent. If we are not successful in expanding sales in alternative retail channels, our business or financialresults may be negatively impacted. In addition, these alternative retail channels may create consumer price deflation, affecting our retail customerrelationships and presenting additional challenges to increasing prices in response to commodity or other cost increases. Also, if these alternative retailchannels, such as internet-based retailers were to take significant share away from traditional retailers that could have a flow over effect on our businessand our financial results could be negatively impacted.
Our results may be negatively impacted if consumers do not maintain their favorable perception of our brands.
We have a number of iconic brands with significant value. Maintaining and continually enhancing the value of these brands is critical to the success ofour business. Brand value is based in large part on consumer perceptions. Success in promoting and enhancing brand value depends in large part onour ability to provide high-quality products. Brand value could diminish significantly due to a number of factors, including consumer perception that wehave acted in an irresponsible manner, adverse publicity about our products (whether or not valid), our failure to maintain the quality of our products, thefailure of our products to deliver consistently positive consumer experiences, the products becoming unavailable to consumers, or the failure to meet thenutrition expectations of our products or particular ingredients in our products (whether or not valid), including whether certain of our products areperceived to contribute to obesity. In addition, we might fail to anticipate consumer preferences with respect to dietary trends or purchasing behaviors,invest sufficiently in maintaining, extending and expanding our brand image or achieve the desired efforts of our marketing efforts. The growing use ofsocial and digital media by consumers, Kellogg and third parties increases the speed and extent that information or misinformation and opinions can beshared. Negative posts or comments about Kellogg, our brands or our products on social or digital media could seriously damage our brands, reputationand brand loyalty, regardless of the information’s accuracy. The harm may be immediate without affording us an opportunity for redress or correction.Brand recognition and loyalty can also be impacted by the effectiveness of our advertising campaigns, marketing programs and sponsorships, as well asour use of social media. If we do not maintain the favorable perception of our brands, our results could be negatively impacted.
The impact of recently enacted tax reform legislation in the U.S. on our business is uncertain.
On December 22, 2017, the U.S. government enacted comprehensive tax legislation commonly referred to as the Tax Cuts and Jobs Act (the “TaxAct”). The Tax Act makes broad and complex changes to the U.S. tax code which impact our year ended 12/30/17, including but not limited to, reducingthe corporate tax rate from 35% to 21%, requiring a one-time transition tax on certain unrepatriated earnings of foreign subsidiaries that may beelectively paid over eight years, and accelerating first year expensing of certain capital expenditures.
The Tax Act also introduces new tax laws that may impact our taxable income beginning in 2018 which will include, but not limited to the repeal of thedomestic production activity deduction, generally eliminating U.S. federal income taxes on foreign earnings (subject to certain important exceptions), anew provision designed to tax currently global intangible low taxed income (GILTI), a provision that could limit the amount of deductible interestexpense,
11

limitations on the deductibility of certain executive compensation, creating a base erosion anti-abuse tax (BEAT), and modifying or repealing manydeductions and credits.
The impact of many provisions of the Tax Act lack clarity and is subject to interpretation until additional Internal Revenue Service guidance is issued. The ultimate impact of the act may differ from the Company’s estimates due to changes in the interpretations and assumptions made as well as anyforthcoming regulatory guidance.
Tax matters, including changes in tax rates, disagreements with taxing authorities and imposition of new taxes could impact our results of operationsand financial condition.
The Company is subject to taxes in the U.S. and numerous foreign jurisdictions where the Company’s subsidiaries are organized. Due to economic andpolitical conditions (including shifts in the geopolitical landscape), tax rates in the U.S. and various foreign jurisdictions have been and may be subject tosignificant change. The future effective tax rate could be effected by changes in mix of earnings in countries with differing statutory tax rates, changes invaluation of deferred tax asset and liabilities, or changes in tax laws or their interpretation which includes recently enacted U.S. tax reform andcontemplated changes in other countries of long-standing tax principles if finalized and adopted could have a material impact on our income taxexpense and deferred tax balances.
We are also subject to regular reviews, examinations and audits by the Internal Revenue Service and other taxing authorities with respect to taxesinside and outside of the U.S. Although we believe our tax estimates are reasonable, if a taxing authority disagrees with the positions we have taken, wecould face additional tax liability, including interest and penalties. There can be no assurance that payment of such additional amounts upon finaladjudication of any disputes will not have a material impact on our results of operations and financial position.
The cash we generate outside the U.S. is principally to be used to fund our international development. If the funds generated by our U.S. business arenot sufficient to meet our need for cash in the U.S., we may need to repatriate a portion of our future international earnings to the U.S. Such internationalearnings would be subject to U.S. tax which could cause our worldwide effective tax rate to increase.
We also need to comply with new, evolving or revised tax laws and regulations. The enactment of or increases in tariffs, including value added tax, orother changes in the application of existing taxes, in markets in which we are currently active, or may be active in the future, or on specific products thatwe sell or with which our products compete, may have an adverse effect on our business or on our results of operations.
If our food products become adulterated, misbranded or mislabeled, we might need to recall those items and may experience product liability ifconsumers are injured as a result.
Selling food products involves a number of legal and other risks, including product contamination, spoilage, product tampering, allergens, or otheradulteration. We may need to recall some of our products if they become adulterated or misbranded. We may also be liable if the consumption of any ofour products causes injury, illness or death. A widespread product recall or market withdrawal could result in significant losses due to their costs, thedestruction of product inventory, and lost sales due to the unavailability of product for a period of time. We could also suffer losses from a significantproduct liability judgment against us. A significant product recall or product liability case could also result in adverse publicity, damage to our reputation,and a loss of consumer confidence in our food products, which could have a material adverse effect on our business results and the value of our brands.Moreover, even if a product liability or consumer fraud claim is meritless, does not prevail or is not pursued, the negative publicity surroundingassertions against our company and our products or processes could adversely affect our reputation or brands.
We could also be adversely affected if consumers lose confidence in the safety and quality of certain food products or ingredients, or the food safetysystem generally. If another company recalls or experiences negative publicity related to a product in a category in which we compete, consumers mightreduce their overall consumption of products in this category. Adverse publicity about these types of concerns, whether or not valid, may discourageconsumers from buying our products or cause production and delivery disruptions.
Unanticipated business disruptions could have an adverse effect on our business, financial condition and results of operations.
We manufacture and source products and materials on a global scale. We have a complex network of suppliers, owned manufacturing locations,contract manufacturer locations, distribution networks and information systems that support our ability to provide our products to our customersconsistently. Our ability to make, move and sell
12

products globally is critical to our success. Factors that are hard to predict or beyond our control, such as product or raw material scarcity, weather(including any potential effects of climate change), natural disasters, fires or explosions, terrorism, political unrest, health pandemics or strikes, coulddamage or disrupt our operations or our suppliers' or contract manufacturers' operations. If we do not effectively respond to disruptions in ouroperations, for example, by finding alternative suppliers or replacing capacity at key manufacturing or distribution locations, or cannot quickly repairdamage to our information, production or supply systems, we may be late in delivering or unable to deliver products to our customers. If that occurs, wemay lose our customers' confidence, and long-term consumer demand for our products could decline. These events could adversely affect ourbusiness, financial condition and results of operations.
Evolving tax, environmental, food quality and safety or other regulations or failure to comply with existing licensing, labeling, trade, food quality andsafety and other regulations and laws could have a material adverse effect on our consolidated financial condition.
Our activities or products, both in and outside of the United States, are subject to regulation by various federal, state, provincial and local laws,regulations and government agencies, including the U.S. Food and Drug Administration, U.S. Federal Trade Commission, the U.S. Departments ofAgriculture, Commerce and Labor, as well as similar and other authorities outside of the United States, International Accords and Treaties and others,including voluntary regulation by other bodies. In addition, legal and regulatory systems in emerging and developing markets may be less developed,and less certain. These laws and regulations and interpretations thereof may change, sometimes dramatically, as a result of a variety of factors,including political, economic or social events. In addition, the enforcement of remedies in certain foreign jurisdictions may be less certain, resulting invarying abilities to enforce intellectual property and contractual rights.
The manufacturing, marketing and distribution of food products are subject to governmental regulation that impose additional regulatory requirements.Those regulations control such matters as food quality and safety, ingredients, advertising, product or production requirements, labeling, import orexport of our products or ingredients, relations with distributors and retailers, health and safety, the environment, and restrictions on the use ofgovernment programs, such as Supplemental Nutritional Assistance Program, to purchase certain of our products.
The marketing of food products has come under increased regulatory scrutiny in recent years, and the food industry has been subject to an increasingnumber of proceedings and claims relating to alleged false or deceptive marketing under federal, state and foreign laws or regulations. We are alsoregulated with respect to matters such as licensing requirements, trade and pricing practices, tax, anticorruption standards, advertising and claims, andenvironmental matters. The need to comply with new, evolving or revised tax, environmental, food quality and safety, labeling or other laws orregulations, or new, evolving or changed interpretations or enforcement of existing laws or regulations, may have a material adverse effect on ourbusiness and results of operations. Governmental and administrative bodies within the U.S. are considering a variety of trade and other regulatoryforms. Changes in legal or regulatory requirements (such as new food safety requirements and revised nutrition facts labeling and serving sizeregulations), or evolving interpretations of existing legal or regulatory requirements, may result in increased compliance costs, capital expenditures andother financial obligations that could adversely affect our business or financial results. If we are found to be out of compliance with applicable laws andregulations in these areas, we could be subject to civil remedies, including fines, injunctions, termination of necessary licenses or permits, or recalls, aswell as potential criminal sanctions, any of which could have a material adverse effect on our business. Even if regulatory review does not result in thesetypes of determinations, it could potentially create negative publicity or perceptions which could harm our business or reputation. Further, modificationsto international trade policy, including changes to or repeal of the North American Free Trade Agreement or the imposition of increased or new tariffs,quotas or trade barriers on key commodities, could have a negative impact on us or the industries we serve, including as a result of related uncertainty,and could materially and adversely impact our business, financial condition, results of operations and cash flows.
13

Our operations face significant foreign currency exchange rate exposure and currency restrictions which could negatively impact our operating results.
We hold assets and incur liabilities, earn revenue and pay expenses in a variety of currencies other than the U.S. dollar, including the euro, Britishpound, Australian dollar, Canadian dollar, Mexican peso, Brazilian Real, Nigerian Naira, and Russian ruble. Because our consolidated financialstatements are presented in U.S. dollars, we must translate our assets, liabilities, revenue and expenses into U.S. dollars at then-applicable exchangerates and face exposure to adverse movements in foreign currency exchange rates. For example, the announcement of Brexit has caused, and maycontinue to cause, significant volatility in currency exchange rate fluctuations. Consequently, changes in the value of the U.S. dollar may unpredictablyand negatively affect the value of these items in our consolidated financial statements, even if their value has not changed in their original currency.
If we pursue strategic acquisitions, alliances, divestitures or joint ventures, we may not be able to successfully consummate favorable transactions orsuccessfully integrate acquired businesses.
From time to time, we may evaluate potential acquisitions, alliances, divestitures or joint ventures that would further our strategic objectives. Withrespect to acquisitions, we may not be able to identify suitable candidates, consummate a transaction on terms that are favorable to us, or achieveexpected returns, expected synergies and other benefits as a result of integration challenges, or may not achieve those objectives on a timely basis.Future acquisitions of foreign companies or new foreign ventures would subject us to local regulations and could potentially lead to risks related to,among other things, increased exposure to foreign exchange rate changes, government price control, repatriation of profits and liabilities relating to theU.S. Foreign Corrupt Practices Act.
With respect to proposed divestitures of assets or businesses, we may encounter difficulty in finding acquirers or alternative exit strategies on terms thatare favorable to us, which could delay the accomplishment of our strategic objectives, or our divestiture activities may require us to recognizeimpairment charges. Companies or operations acquired or joint ventures created may not be profitable or may not achieve sales levels and profitabilitythat justify the investments made. Our corporate development activities may present financial and operational risks, including diversion of managementattention from existing core businesses, integrating or separating personnel and financial and other systems, and adverse effects on existing businessrelationships with suppliers and customers. Future acquisitions could also result in potentially dilutive issuances of equity securities, the incurrence ofdebt, contingent liabilities and/or amortization expenses related to certain intangible assets and increased operating expenses, which could adverselyaffect our results of operations and financial condition.
Potential liabilities and costs from litigation could adversely affect our business.
There is no guarantee that we will be successful in defending our self in civil, criminal or regulatory actions, including under general, commercial,employment, environmental, food quality and safety, anti-trust and trade, advertising and claims, and environmental laws and regulations, or in assertingour rights under various laws. For example, our marketing or claims could face allegations of false or deceptive advertising or other criticisms whichcould end up in litigation and result in potential liabilities or costs. In addition, we could incur substantial costs and fees in defending our self or inasserting our rights in these actions or meeting new legal requirements. The costs and other effects of potential and pending litigation and administrativeactions against us, and new legal requirements, cannot be determined with certainty and may differ from expectations.
Our consolidated financial results and demand for our products are dependent on the successful development of new products and processes.
There are a number of trends in consumer preferences which may impact us and the industry as a whole. These include changing consumer dietarytrends and the availability of substitute products.
Our success is dependent on anticipating changes in consumer preferences and on successful new product and process development and productrelaunches in response to such changes. Trends within the food industry change often, and failure to identify and react to changes in these trends couldlead to, among other things, reduced loyalty demand and price reductions for our brands and products. We aim to introduce products or new orimproved production processes on a timely basis in order to counteract obsolescence and decreases in sales of existing products. While we devotesignificant focus to the development of new products and to the research, development and technology process functions of our business, we may notbe successful in developing new products or our new products may not be commercially successful. In addition, if sales generated by new productscause a decline in sales of the Company's existing products, the Company's financial condition and results of operations could be materially adverselyaffected. Our future results and our ability to maintain or improve our competitive position will
14
depend on our capacity to gauge the direction of our key markets and upon our ability to successfully identify, develop, manufacture, market and sellnew or improved products in these changing markets.
Our postretirement benefit-related costs and funding requirements could increase as a result of volatility in the financial markets, changes in interestrates and actuarial assumptions.
Increases in the costs of postretirement medical and pension benefits may continue and negatively affectour business as a result of increased usage of medical benefits by retired employees and medical cost inflation, the effect of potential declines in thestock and bond markets on the performance of our pension and post-retirement plan assets, potential reductions in the discount rate used to determinethe present value of our benefit obligations, and changes to our investment strategy that may impact our expected return on pension and post-retirementplan assets assumptions. U.S. generally accepted accounting principles require that we calculate income or expense for the plans using actuarialvaluations. These valuations reflect assumptions about financial markets and interest rates, which may change based on economic conditions. TheCompany’s accounting policy for defined benefit plans may subject earnings to volatility due to the recognition of actuarial gains and losses, particularlythose due to the change in the fair value of pension and post-retirement plan assets and interest rates. In addition, funding requirements for our plansmay become more significant. However, the ultimate amounts to be contributed are dependent upon, among other things, interest rates, underlyingasset returns, and the impact of legislative or regulatory changes related to pension and post-retirement funding obligations.
We use available borrowings under the credit facilities and other available debt financing for cash to operate our business, which subjects us to marketand counter-party risk, some of which is beyond our control.
In addition to cash we generate from our business, our principal existing sources of cash are borrowings available under our credit facilities and otheravailable debt financing. If our access to such financing was unavailable or reduced, or if such financing were to become significantly more expensivefor any reason, we may not be able to fund daily operations, which would cause material harm to our business or could affect our ability to operate ourbusiness as a going concern. In addition, if certain of our lenders experience difficulties that render them unable to fund future draws on the facilities, wemay not be able to access all or a portion of these funds, which could have similar adverse consequences.
We have a substantial amount of indebtedness.
We have indebtedness that is substantial in relation to our shareholders’ equity, and we may incur additional indebtedness in the future, or enter into off-balance sheet financing, which would increase our leverage risks. As of December 30, 2017 , we had total debt of approximately $8.6 billion and totalKellogg Company equity of $2.2 billion.
Our substantial indebtedness could have important consequences, including:• impairing the ability to access global capital markets to obtain additional financing for working capital, capital expenditures or general corporate
purposes, particularly if the ratings assigned to our debt securities by rating organizations were revised downward or if a rating organizationannounces that our ratings are under review for a potential downgrade;
• a downgrade in our credit ratings, particularly our short-term credit rating, would likely reduce the amount of commercial paper we could issue,increase our commercial paper borrowing costs, or both;
• restricting our flexibility in responding to changing market conditions or making us more vulnerable in the event of a general downturn in economicconditions or our business;
• requiring a substantial portion of the cash flow from operations to be dedicated to the payment of principal and interest on our debt, reducing thefunds available to us for other purposes such as expansion through acquisitions, paying dividends, repurchasing shares, marketing and otherspending and expansion of our product offerings; and
• causing us to be more leveraged than some of our competitors, which may place us at a competitive disadvantage.
Our ability to make scheduled payments or to refinance our obligations with respect to indebtedness or incur new indebtedness will depend on ourfinancial and operating performance, which in turn, is subject to prevailing economic conditions, the availability of, and interest rates on, short-termfinancing, and financial, business and other factors beyond our control.
15

Our performance is affected by general economic and political conditions and taxation policies.
Customer and consumer demand for our products may be impacted by recession, financial and credit market disruptions, or other economic downturnsin the United States or other nations. Our results in the past have been, and in the future may continue to be, materially affected by changes in generaleconomic and political conditions in the United States and other countries, including the interest rate environment in which we conduct business, thefinancial markets through which we access capital and currency, political unrest and terrorist acts in the United States or other countries in which wecarry on business.
Current economic conditions globally may delay or reduce purchases by our customers and consumers. This could result in reductions in sales of ourproducts, reduced acceptance of innovations, and increased price competition. Deterioration in economic conditions in any of the countries in which wedo business could also cause slower collections on accounts receivable which may adversely impact our liquidity and financial condition. Financialinstitutions may be negatively impacted by economic conditions and may consolidate or cease to do business which could result in a tightening in thecredit markets, a low level of liquidity in many financial markets, and increased volatility in fixed income, credit, currency and equity markets. Therecould be a number of effects from a financial institution credit crisis on our business, which could include impaired credit availability and financial stabilityof our customers, including our suppliers, co-manufacturers and distributors. A disruption in financial markets may also have an effect on our derivativecounterparties and could also impair our banking partners on which we rely for operating cash management. Any of these events would likely harm ourbusiness, results of operations and financial condition.
We may not be able to attract and retain the highly skilled people we need to support our business
We depend on the skills and continued service of key personnel, including our experienced management team. In addition, our ability to achieve ourstrategic and operating goals depends on our ability to identify, recruit, hire, train and retain qualified individuals. We compete with other companies bothwithin and outside of our industry for talented personnel, and we may lose key personnel or fail to attract, recruit, train and retain other talentedpersonnel. Any such loss or failure may adversely affect our business or financial results. In addition, activities related to identifying, recruiting, hiringand integrating qualified individuals may require significant time and expense. We may not be able to locate suitable replacements for any keyemployees who leave, or offer employment to potential replacements on reasonable terms, each of which may adversely affect our business andfinancial results
An impairment of the carrying value of goodwill or other acquired intangibles could negatively affect our consolidated operating results and net worth.
The carrying value of goodwill represents the fair value of acquired businesses in excess of identifiable assets and liabilities as of the acquisition date.The carrying value of other intangibles represents the fair value of trademarks, trade names, and other acquired intangibles as of the acquisition date.Goodwill and other acquired intangibles expected to contribute indefinitely to our cash flows are not amortized, but must be evaluated by managementat least annually for impairment. If carrying value exceeds current fair value, the intangible is considered impaired and is reduced to fair value via acharge to earnings. Factors which could result in an impairment include, but are not limited to: (i) reduced demand for our products; (ii) highercommodity prices; (iii) lower prices for our products or increased marketing as a result of increased competition; and (iv) significant disruptions to ouroperations as a result of both internal and external events. Should the value of one or more of the acquired intangibles become impaired, ourconsolidated earnings and net worth may be materially adversely affected.
As of December 30, 2017 , the carrying value of intangible assets totaled approximately $8.1 billion, of which $5.5 billion was goodwill and $2.6 billionrepresented trademarks, tradenames, and other acquired intangibles compared to total assets of $16.4 billion and total Kellogg Company equity of$2.2 billion.
Competition against retailer brands could negatively impact our business.
In nearly all of our product categories, we face branded and price-based competition. Our products must provide higher value and/or quality to ourconsumers than alternatives, particularly during periods of economic uncertainty. Consumers may not buy our products if relative differences in valueand/or quality between our products and retailer brands change in favor of competitors’ products or if consumers perceive this type of change. Ifconsumers prefer retailer brands, then we could lose category share or sales volumes or shift our product mix to lower margin offerings, which couldhave a material effect on our business and consolidated financial position and on the consolidated results of our operations and profitability.
16
We may not achieve our targeted cost savings and efficiencies from cost reduction initiatives.
Our success depends in part on our ability to be an efficient producer in a highly competitive industry. We have invested a significant amount in capitalexpenditures to improve our operational facilities. Ongoing operational issues are likely to occur when carrying out major production, procurement, orlogistical changes and these, as well as any failure by us to achieve our planned cost savings and efficiencies, could have a material adverse effect onour business and consolidated financial position and on the consolidated results of our operations and profitability.
Technology failures could disrupt our operations and negatively impact our business.
We increasingly rely on information technology systems to process, transmit, and store electronic information. For example, our production anddistribution facilities and inventory management utilize information technology to increase efficiencies and limit costs. Information technology systemsare also integral to the reporting of our results of operations. Furthermore, a significant portion of the communications between, and storage of personaldata of, our personnel, customers, consumers and suppliers depends on information technology. Our information technology systems, and the systemsof the parties we communicate and collaborate with, may be vulnerable to a variety of interruptions, as a result of updating our enterprise platform ordue to events beyond our or their control, including, but not limited to, network or hardware failures, malicious or disruptive software, unintentional ormalicious actions of employees or contractors, cyberattacks by common hackers, criminal groups or nation-state organizations or social-activist(hacktivist) organizations, geopolitical events, natural disasters, failures or impairments of telecommunications networks, or other catastrophic events.Moreover, our computer systems have been, and will likely continue to be subjected to computer viruses, malware, ransonware or other maliciouscodes, unauthorized access attempts, and cyber- or phishing-attacks. Cyber threats are constantly evolving and this increases the difficulty of detectingand successfully defending against them. These events could compromise our confidential information, impede or interrupt our business operations, andmay result in other negative consequences, including remediation costs, loss of revenue, litigation and reputational damage. Furthermore, if a breach orother breakdown results in disclosure of confidential or personal information, we may suffer reputational, competitive and/or business harm. To date, wehave not experienced a material breach of cyber security. While we have implemented administrative and technical controls and taken other preventiveactions to reduce the risk of cyber incidents and protect our information technology, they may be insufficient to prevent physical and electronic break-ins,cyber-attacks or other security breaches to our computer systems.
The Company offers promotions, rebates, customer loyalty and other programs through which it may receive personal information, and it or its vendorscould experience cyber-attacks, privacy breaches, data breaches or other incidents that result in unauthorized disclosure of consumer, customer,employee or Company information. If the Company suffers a loss as a result of a breach or other breakdown in its technology, including such cyber-attack, privacy breaches, data breaches or other incident involving one of the Company's vendors, that result in unauthorized disclosure or significantunavailability of business, financial, personal or stakeholder information, the Company may suffer reputational, competitive and/or business harm andmay be exposed to legal liability, which may adversely affect the Company's results of operations and/or financial condition. The misuse, leakage orfalsification of information could result in violations of data privacy laws, the Company may become subject to legal action and increased regulatoryoversight. The Company could also be required to spend significant financial and other resources to remedy the damage caused by a security breach orto repair or replace networks and information systems. In addition, if the Company's suppliers or customers experience such a breach or unauthorizeddisclosure or system failure, their businesses could be disrupted or otherwise negatively affected, which may result in a disruption in the Company'ssupply chain or reduced customer orders, which would adversely affect the Company's business operations.
Our intellectual property rights are valuable, and any inability to protect them could reduce the value of our products and brands.
We consider our intellectual property rights, particularly and most notably our trademarks, but also including patents, trade secrets, copyrights andlicensing agreements, to be a significant and valuable aspect of our business. We attempt to protect our intellectual property rights through acombination of patent, trademark, copyright and trade secret laws, as well as licensing agreements, third party nondisclosure and assignmentagreements and policing of third party misuses of our intellectual property. Our failure to obtain or adequately protect our trademarks, products, newfeatures of our products, or our technology, or any change in law or other changes that serve to lessen or remove the current legal protections of ourintellectual property, may diminish our competitiveness and could materially harm our business.
17

We may be unaware of intellectual property rights of others that may cover some of our technology, brands or products. In addition, if, in the course ofdeveloping new products or improving the quality of existing products, we are found to have infringed the intellectual property rights of others, directly orindirectly, such finding could have an adverse impact on our business, financial condition or results of operations and may limit our ability to introducenew products or improve the quality of existing products. Any litigation regarding patents or other intellectual property could be costly and time-consuming and could divert the attention of our management and key personnel from our business operations. Third party claims of intellectual propertyinfringement might also require us to enter into costly license agreements. We also may be subject to significant damages or injunctions againstdevelopment and sale of certain products.
We are subject to risks generally associated with companies that operate globally.
We are a global company and generated 37% of our 2017 net sales, 35% of 2016 and 37% of our 2015 net sales outside the United States. Wemanufacture our products in 21 countries and have operations in more than 180 countries, so we are subject to risks inherent in multinationaloperations. Those risks include:
• compliance with U.S. laws affecting operations outside of the United States, such as OFAC trade sanction regulations and Anti-Boycott regulations,• compliance with anti-corruption laws, including U.S. Foreign Corrupt Practices Act (FCPA) and U.K. Bribery Act (UKBA),• compliance with antitrust and competition laws, data privacy laws, and a variety of other local, national and multi-national regulations and laws in
multiple regimes,• changes in tax laws, interpretation of tax laws and tax audit outcomes,• fluctuations or devaluations in currency values, especially in emerging markets,• changes in capital controls, including currency exchange controls, government currency policies or other limits on our ability to import raw materials
or finished product or repatriate cash from outside the United States,• changes in local regulations and laws, the uncertainty of enforcement of remedies in foreign jurisdictions, and foreign ownership restrictions and the
potential for nationalization or expropriation of property or other resources;• discriminatory or conflicting fiscal policies,• increased sovereign risk, such as default by or deterioration in the economies and credit worthiness of local governments,• varying abilities to enforce intellectual property and contractual rights,• greater risk of uncollectible accounts and longer collection cycles,• loss of ability to manage our operations in certain markets which could result in the deconsolidation of such businesses,• design and implementation of effective control environment processes across our diverse operations and employee base,• imposition of more or new tariffs, quotas, trade barriers, and similar restrictions on our sales or regulations, taxes or policies that might negatively
affect our sales, and• changes in trade policies and trade relations.
Please refer to Note 16 for more information regarding our operations in Venezuela, including the impact on our operations from currency restrictionsand our decision to deconsolidate our Venezuelan operations effective December 31, 2016.
In addition, political and economic changes or volatility, geopolitical regional conflicts, terrorist activity, political unrest, civil strife, acts of war, publiccorruption, expropriation and other economic or political uncertainties could interrupt and negatively affect our business operations or customer demand.The slowdown in economic growth or high unemployment in some emerging markets could constrain consumer spending, and declining consumerpurchasing power could adversely impact our profitability. Continued instability in the banking and governmental sectors of certain countries in theEuropean Union or the dynamics associated with the federal and state debt and budget challenges in the United States could adversely affect us. All ofthese factors could result in increased costs or decreased revenues, and could materially and adversely affect our product sales, financial condition andresults of operations.
There may be uncertainty as a result of key global events during 2018. For example, the continuing uncertainty arising from the Brexit referendum in theUnited Kingdom as well as ongoing terrorist activity, may adversely impact global stock markets (including The New York Stock Exchange on which ourcommon shares are traded) and general global economic conditions. All of these factors are outside of our control, but may nonetheless cause us to
18

adjust our strategy in order to compete effectively in global markets.
The results of the United Kingdom's referendum on withdrawal from the European Union may have a negative effect on global economic conditions,financial markets and our business.
In June 2016, a majority of voters in the United Kingdom elected to withdraw from the European Union in a national referendum. In February 2017, theBritish Parliament voted in favor of allowing the British government to begin negotiating the terms of the United Kingdom’s withdrawal from the EuropeanUnion, and, in March 2017, the British government invoked Article 50 of the Treaty on European Union, which, per the terms of the treaty, formallytriggered a two-year negotiation process and puts the United Kingdom on a course to withdraw from the European Union by the end of March 2019. Theterms of withdrawal have not been established and the United Kingdom will remain a member of the European Union until conclusion of the withdrawalagreement. If no agreement is concluded within two years of formal notification of withdrawal, however, then the United Kingdom may leave theEuropean Union at such time. Accordingly, the referendum has created significant uncertainty about the future relationship between the United Kingdomand the European Union, including with respect to the laws and regulations that will apply as the United Kingdom determines which European Unionlaws to replace or replicate in the event of a withdrawal. The referendum has also given rise to calls for the governments of other European Unionmember states to consider withdrawal.
The economic conditions and outlook in the United Kingdom, the European Union and elsewhere could be further adversely affected by (i) theuncertainty concerning the timing and terms of the exit, (ii) new or modified trading arrangements between the United Kingdom and other countries,(iii) the risk that one or more other European Union countries could come under increasing pressure to leave the European Union, or (iv) the risk that theeuro as the single currency of the Eurozone could cease to exist. Any of these developments, or the perception that any of these developments arelikely to occur, could affect economic growth or business activity in the United Kingdom or the European Union, and could result in the relocation ofbusinesses, cause business interruptions, lead to economic recession or depression, and impact the stability of the financial markets, availability ofcredit, currency exchange rates, interest rates, financial institutions, and political, financial and monetary systems. Any of these developments, or theperception that any of them could occur, could depress economic activity and restrict our access to capital, which could materially and adversely affectour product sales, financial condition and results of operations.
Our operations in certain emerging markets expose us to political, economic and regulatory risks.
Our growth strategy depends in part on our ability to expand our operations in emerging markets. However, some emerging markets have greaterpolitical, economic and currency volatility and greater vulnerability to infrastructure and labor disruptions than more established markets. In manycountries outside of the United States, particularly those with emerging economies, it may be common for others to engage in business practicesprohibited by laws and regulations with extraterritorial reach, such as the FCPA and the UKBA, or local anti-bribery laws. These laws generally prohibitcompanies and their employees, contractors or agents from making improper payments to government officials, including in connection with obtainingpermits or engaging in other actions necessary to do business. Failure to comply with these laws could subject us to civil and criminal penalties thatcould materially and adversely affect our reputation, financial condition and results of operations.
In addition, competition in emerging markets is increasing as our competitors grow their global operations and low cost local manufacturers expand andimprove their production capacities. Our success in emerging markets is critical to our growth strategy. If we cannot successfully increase our businessin emerging markets and manage associated political, economic and regulatory risks, our product sales, financial condition and results of operationscould be materially and adversely affected.
Adverse changes in the global climate or extreme weather conditions could adversely affect our business or operations
Climate change is a core business issue for Kellogg to ensure the long-term health and viability of the ingredients we use in our products. As set forth inthe Intergovernmental Panel on Climate Change Fifth Assessment Report, there is continuing scientific evidence, as well as concern from members ofthe general public, that emissions of greenhouse gases and contributing human activities have caused and will continue to cause significant changes inglobal temperatures and weather patterns and increase the frequency or severity of weather events, wildfires and flooding. As the pressures fromclimate change and global population growth lead to increased demand, the food
19

system and global supply chain is becoming increasingly vulnerable to acute shocks, leading to increased prices and volatility, especially in the energyand commodity markets. Adverse changes such as these could:
• unfavorably impact the cost or availability of raw or packaging materials, especially if such events have a negative impact on agriculturalproductivity or on the supply of water;
• disrupt our ability, or the ability of our suppliers or contract manufacturers, to manufacture or distribute our products;• disrupt the retail operations of our customers; or• unfavorably impact the demand for, or the consumer's ability to purchase, our products.
Foreign, federal, state and local regulatory and legislative bodies have proposed various legislative and regulatory measures relating to climate change,regulating greenhouse gas emissions and energy policies. In the event that such regulation is enacted, we may experience significant increases in ourcosts of operation and delivery. In particular, increasing regulation of fuel emissions could substantially increase the distribution and supply chain costsassociated with our products. Lastly, consumers and customers may put an increased priority on purchasing products that are sustainably grown andmade, requiring us to incur increased costs for additional transparency, due diligence and reporting. As a result, climate change could negatively affectour business and operations.
ITEM 1B. UNRESOLVED STAFF COMMENTS
None.
ITEM 2. PROPERTIES
Our corporate headquarters and principal research and development facilities are located in Battle Creek, Michigan.
We operated, as of February 20, 2018 , offices, manufacturing plants and distribution and warehousing facilities totaling more than 39 million square feetof building area in the United States and other countries. Our plants have been designed and constructed to meet our specific production requirements,and we periodically invest money for capital and technological improvements. At the time of its selection, each location was considered to be favorable,based on the location of markets, sources of raw materials, availability of suitable labor, transportation facilities, location of our other plants producingsimilar products, and other factors. Our manufacturing facilities in the United States include four cereal plants and warehouses located in Battle Creek,Michigan; Lancaster, Pennsylvania; Memphis, Tennessee; and Omaha, Nebraska and other plants or facilities in San Jose, California; Atlanta, Augusta,and Rome, Georgia; Chicago, Illinois; Seelyville, Indiana; Kansas City, Kansas; Florence, Louisville and Pikeville, Kentucky; Grand Rapids andWyoming, Michigan; Blue Anchor, New Jersey; Cary, North Carolina; Cincinnati and Zanesville, Ohio; Muncy, Pennsylvania; Jackson and Rossville,Tennessee; and Allyn, Washington.
Outside the United States, we had, as of February 20, 2018 , additional manufacturing locations, some with warehousing facilities, in Australia, Austria,Belgium, Brazil, Canada, Colombia, Ecuador, Egypt, Germany, Great Britain, India, Japan, Malaysia, Mexico, Poland, Russia, South Africa, SouthKorea, Spain, Thailand, and Venezuela. We also have joint ventures in China, Nigeria, Ghana and Turkey which own or operate manufacturing orwarehouse facilities.
We generally own our principal properties, including our major office facilities, although some manufacturing facilities are leased, and no owned propertyis subject to any major lien or other encumbrance. Distribution facilities (including related warehousing facilities) and offices of non-plant locationstypically are leased. In general, we consider our facilities, taken as a whole, to be suitable, adequate, and of sufficient capacity for our currentoperations.
ITEM 3. LEGAL PROCEEDINGS
We are subject to various legal proceedings, claims, and governmental inspections, audits or investigations arising out of our business which covermatters such as general commercial, governmental regulations, antitrust and trade regulations, product liability, environmental, intellectual property,employment and other actions. In the opinion of management, the ultimate resolution of these matters will not have a material adverse effect on ourfinancial position or results of operations.
20

ITEM 4. MINE SAFETY DISCLOSURE
Not applicable.
PART II ITEM 5. MARKET FOR THE REGISTRANT’S COMMON EQUITY, RELATED STOCKHOLDER MATTERS AND ISSUER PURCHASES OF EQUITYSECURITIES
Information on the market for our common stock, number of shareowners and dividends is located in Note 17 within Notes to Consolidated FinancialStatements.
In December 2015, the board of directors approved a new authorization to repurchase of up to $1.5 billion of our common stock beginning in 2016through December 2017. In December 2017, a new authorization by the board of directors approved the repurchase of up to $1.5 billion of our commonstock beginning in January 2018 through December 2019.
The following table provides information with respect to purchases of common shares under programs authorized by our board of directors during thequarter ended December 30, 2017 .
(millions, except per share data)
Period
(a)Total
Numberof
SharesPurchased
(b)Average
PricePaid Per
Share
(c)Total
Numberof Shares
Purchasedas Part ofPublicly
AnnouncedPlans or
Programs
(d)Approximate
DollarValue ofShares
that MayYet Be
PurchasedUnder thePlans or
ProgramsMonth #1:10/01/17-10/28/17 — — — $ 558Month #2:10/29/17-11/25/17 — — — $ 558Month #3:11/26/17-12/30/17 — — — $ 558
21

ITEM 6. SELECTED FINANCIAL DATA
Kellogg Company and Subsidiaries
Selected Financial Data
(millions, except per share data and number of employees) 2017 2016 2015 2014 2013Operating trends Net sales $ 12,923 $ 13,014 $ 13,525 $ 14,580 $ 14,792Gross profit as a % of net sales 38.9% 36.5% 34.6% 34.7% 41.3%Depreciation 469 510 526 494 523Amortization 12 7 8 9 9Advertising expense (a) 731 735 898 1,094 1,131Research and development expense (a) 148 182 193 199 199Operating profit 1,946 1,395 1,091 1,024 2,837Operating profit as a % of net sales 15.1% 10.7% 8.1% 7.0% 19.2%Interest expense 256 406 227 209 235Net income attributable to Kellogg Company 1,269 694 614 632 1,807Average shares outstanding: Basic 348 350 354 358 363Diluted 350 354 356 360 365
Per share amounts: Basic 3.65 1.98 1.74 1.76 4.98Diluted 3.62 1.96 1.72 1.75 4.94
Cash flow trends Net cash provided by operating activities $ 1,646 $ 1,628 $ 1,691 $ 1,793 $ 1,807Capital expenditures 501 507 553 582 637Net cash provided by operating activities reduced by capital expenditures (b) 1,145 1,121 1,138 1,211 1,170Net cash used in investing activities (1,094) (893) (1,127) (573) (641)Net cash used in financing activities (604) (642) (706) (1,063) (1,141)Interest coverage ratio (c) 9.5 4.6 6.8 7.3 14.3Capital structure trends Total assets $ 16,350 $ 15,111 $ 15,251 $ 15,139 $ 15,456Property, net 3,716 3,569 3,621 3,769 3,856Short-term debt and current maturities of long-term debt 779 1,069 2,470 1,435 1,028Long-term debt 7,836 6,698 5,275 5,921 6,312Total Kellogg Company equity 2,212 1,910 2,128 2,789 3,545Share price trends Stock price range $59-76 $70-87 $61-74 $57-69 $55-68Cash dividends per common share 2.12 2.04 1.98 1.90 1.80Number of employees 33,000 37,000 34,000 30,000 30,000
(a) Advertising declined in both 2016 and 2015 as a result of foreign currency translation, implementation of efficiency and effectiveness programs including zero-basedbudgeting, the change in media landscape migrating investment to digital, and shifting investment to food innovation and renovation. Research and development declineddue to changes intended to create a more efficient organizational design. We remain committed to invest in our brands at an industry-leading level to maintain the strength ofour many recognizable brands in the marketplace.
(b) We use this non-GAAP financial measure, which is reconciled above, to focus management and investors on the amount of cash available for debt repayment, dividenddistribution, acquisition opportunities, and share repurchase.
(c) Interest coverage ratio is calculated based on net income attributable to Kellogg Company before interest expense, income taxes, depreciation and amortization, divided byinterest expense.
22

ITEM 7. MANAGEMENT’S DISCUSSION AND ANALYSIS OF FINANCIAL CONDITION AND RESULTS OF OPERATIONS
Kellogg Company and Subsidiaries RESULTS OF OPERATIONS
Business overviewThe following Management’s Discussion and Analysis of Financial Condition and Results of Operations (MD&A) is intended to help the readerunderstand Kellogg Company, our operations and our present business environment. MD&A is provided as a supplement to, and should be read inconjunction with, our Consolidated Financial Statements and the accompanying notes thereto contained in Item 8 of this report.
For more than 100 years, consumers have counted on Kellogg for great-tasting, high-quality and nutritious foods. These foods include snacks, such ascookies, crackers, savory snacks, toaster pastries, cereal bars and bites, fruit-flavored snacks; and convenience foods, such as, ready-to-eat cereals,frozen waffles and veggie foods. Kellogg products are manufactured and marketed globally.
SegmentsWe manage our operations through ten operating segments that are based on product category or geographic location. These operating segments areevaluated for similarity with regards to economic characteristics, products, production processes, types or classes of customers, distribution methodsand regulatory environments to determine if they can be aggregated into reportable segments. We report results of operations in the following reportablesegments: U.S. Morning Foods; U.S. Snacks; U.S. Specialty; North America Other; Europe; Latin America; and Asia Pacific. The reportable segmentsare discussed in greater detail in Note 18 within Notes to Consolidated Financial Statements.
Operating Margin Expansion Through 2018In 2016, we announced a plan to increase our currency-neutral comparable operating margin by 350 basis points from 2015 through 2018, excluding theimpact of pending accounting changes beginning in the first quarter of 2018. In 2017, currency-neutral comparable operating margin increased 160basis points as a result of COGS and SG&A savings realized from Project K and ZBB initiatives. Currency-neutral comparable operating margin was16.9% for the full year 2017, which is 250 basis points higher than the level recorded for 2015.
During 2018, we expect to realize more than half of the remaining Project K savings, including savings from our DSD exit, and all remaining plannedZBB savings. These savings are expected to more than offset increased reinvestment in brand building, modest input cost inflation and highertransportation costs. As a result, we are currently on pace to deliver our targeted 3-year goal of margin expansion in 2018, excluding the impact ofaccounting changes.
Non-GAAP Financial MeasuresThis filing includes non-GAAP financial measures that we provide to management and investors that exclude certain items that we do not consider partof on-going operations. Items excluded from our non-GAAP financial measures are discussed in the "Significant items impacting comparability" sectionof this filing. Our management team consistently utilizes a combination of GAAP and non-GAAP financial measures to evaluate business results, tomake decisions regarding the future direction of our business, and for resource allocation decisions, including incentive compensation. As a result, webelieve the presentation of both GAAP and non-GAAP financial measures provides investors with increased transparency into financial measures usedby our management team and improves investors’ understanding of our underlying operating performance and in their analysis of ongoing operatingtrends. All historic non-GAAP financial measures have been reconciled with the most directly comparable GAAP financial measures.
23

2017, 2016, and 2015 Non-GAAP Financial MeasuresNon-GAAP financial measures used for evaluation of 2017, 2016 and 2015 performance include comparable net sales, comparable gross margin,comparable SGA, comparable operating profit, comparable operating profit margin, comparable effective tax rate, comparable net income attributable toKellogg Company, comparable diluted EPS, and cash flow. These non-GAAP financial measures are also evaluated for year-over-year growth and on acurrency-neutral basis to evaluate the underlying growth of the business and to exclude the effect of foreign currency. We determine currency-neutraloperating results by dividing or multiplying, as appropriate, the current-period local currency operating results by the currency exchange rates used totranslate our financial statements in the comparable prior-year period to determine what the current period U.S. dollar operating results would have beenif the currency exchange rate had not changed from the comparable prior-year period. These non-GAAP financial measures may not be comparable tosimilar measures used by other companies.
• Comparable net sales : We adjust the GAAP financial measures to exclude the pre-tax effect of acquisitions, divestitures, shipping daydifferences, and impacts of the Venezuela deconsolidation . We excluded the items which we believe may obscure trends in our underlying netsales performance. By providing this non-GAAP net sales measure, management intends to provide investors with a meaningful, consistentcomparison of net sales performance for the Company and each of our reportable segments for the periods presented. Management uses thisnon-GAAP measure to evaluate the effectiveness of initiatives behind net sales growth, pricing realization, and the impact of mix on ourbusiness results. This non-GAAP measure is also used to make decisions regarding the future direction of our business, and for resourceallocation decisions. Currency-neutral comparable net sales represents comparable net sales excluding the impact of foreign currency.
• Comparable gross profit, comparable gross margin, comparable SGA, comparable SGA%, comparable operating profit, comparable operatingprofit margin, comparable net income attributable to Kellogg Company, and comparable diluted EPS: We adjust the GAAP financial measuresto exclude the effect of Project K and cost reduction activities, acquisitions, divestitures, integration costs, mark-to-market adjustments forpension plans, commodities and certain foreign currency contracts, shipping day differences, impacts of the Venezuela remeasurement anddeconsolidation, costs associated with the VIE deconsolidation, and costs associated with the early redemption of debt outstanding. Weexcluded the items which we believe may obscure trends in our underlying profitability. The impact of acquisitions and divestitures are notexcluded from comparable diluted EPS. By providing these non-GAAP profitability measures, management intends to provide investors with ameaningful, consistent comparison of the Company's profitability measures for the periods presented. Management uses these non-GAAPfinancial measures to evaluate the effectiveness of initiatives intended to improve profitability, such as Project K, ZBB and Revenue GrowthManagement, as well as to evaluate the impacts of inflationary pressures and decisions to invest in new initiatives within each of our segments.Currency-neutral comparable represents comparable excluding foreign currency impact.
• Comparable effective tax rate: We adjust the GAAP financial measure to exclude tax effect of Project K and cost reduction activities, integrationcosts, mark-to-market adjustments for pension plans, commodities and certain foreign currency contracts, shipping day differences, impacts ofthe Venezuela remeasurement and deconsolidation, costs associated with the VIE deconsolidation, and costs associated with the earlyredemption of debt outstanding. In addition, we have excluded the impact of adopting U.S. Tax Reform. We excluded the items which webelieve may obscure trends in our underlying tax rate. By providing this non-GAAP measure, management intends to provide investors with ameaningful, consistent comparison of the Company's effective tax rate for the periods presented. Management uses this non-GAAP measure tomonitor the effectiveness of initiatives in place to optimize our global tax rate.
• Cash flow: Defined as net cash provided by operating activities reduced by expenditures for property additions. Cash flow does not representthe residual cash flow available for discretionary expenditures. We use this non-GAAP financial measure of cash flow to focus management andinvestors on the amount of cash available for debt repayment, dividend distributions, acquisition opportunities, and share repurchases once allof the Company’s business needs and obligations are met. Additionally, certain performance-based compensation includes a component of thisnon-GAAP measure.
These measures have not been calculated in accordance with GAAP and should not be viewed as a substitute for GAAP reporting measures.
24

Significant items impacting comparabilityMark-to-market accounting for pension plans, commodities, and certain foreign currency contractsWe recognized mark-to-market adjustments for pension plans, commodity contracts, and certain foreign currency contracts as incurred. Actuarialgains/losses for pension plans are recognized in the year they occur. Changes between contract and market prices for commodities contracts andcertain foreign currency contracts result in gains/losses that are recognized in the quarter they occur. We recorded a total pre-tax mark-to-market benefitof $45 million for 2017 and pre-tax mark-to-market charges of $261 million and $446 million for 2016, and 2015, respectively. Within this total, the pre-tax mark-to-market benefit for pension plans was $86 million for 2017 and pre-tax mark-to-market charges of $314 million and $471 million for 2016 and2015, respectively.
Project K and cost reduction activitiesIn February 2017, the Company announced an expansion and an extension to its previously-announced global efficiency and effectiveness program("Project K"). Project K continued generating a significant amount of savings used to invest in key strategic areas of focus for the business. We recordedpre-tax charges of $260 million in 2017, $300 million in 2016, and $311 million in 2015.
In support of the ZBB initiative, we incurred pre-tax charges of $3 million in 2017, $25 million in 2016, and $12 million in 2015.
See the Restructuring and cost reduction activities section for more information.
Debt redemptionDuring the quarter ended April 2, 2016, we redeemed $475 million of our 7.45% U.S. Dollar Debentures due 2031. In connection with the debtredemption, we incurred $153 million of interest expense, consisting primarily of a premium on the tender offer and also including accelerated losses onpre-issuance interest rate hedges, acceleration of fees and debt discount on the redeemed debt and fees related to the tender offer.
Variable interest entity (VIE) deconsolidationDuring the quarter ended July 4, 2015, a series of previously executed agreements between Kellogg's and a third party VIE were terminated resulting inour determination that we were no longer the primary beneficiary of the VIE. Accordingly, we deconsolidated the financial statements of the VIE as ofthe end of the quarter. As a result of the agreement terminations and related settlements, we recognized a gain of $6 million in Other income (expense),net during the quarter. This gain, in combination with a related $25 million charge that was recorded during the quarter ended April 4, 2015, resulted in anet loss of $19 million in Other income (expense), net for the year-to-date period ended July 4, 2015.
In connection with the deconsolidation that occurred during the quarter, we derecognized all assets and liabilities of the VIE, including an allocation of aportion of goodwill from the U.S. Snacks operating segment, resulting in a $67 million non-cash gain, which was recorded within operating profit.
Integration and transaction costsWe incurred integration costs related to the integration of various acquisitions in the years presented. We recorded pre-tax integration costs of $5million, $12 million, and $30 million for 2017, 2016, and 2015, respectively.
AcquisitionsIn January 2015, we completed the acquisition of a majority interest in Bisco Misr, the number one packaged biscuits company in Egypt for $125 million,or $117 million net of cash and cash equivalents acquired. In our European reportable segment, the acquisition added $9 million in net sales and lessthan $1 million of operating profit (before integration costs) in 2016 that impacted the comparability to 2015 reported results.
In September 2015, we completed the acquisition of Mass Foods, Egypt's leading cereal company for $46 million, or $44 million net of cash and cashequivalents acquired. In our European reportable segment, the acquisition added $16 million in net sales and approximately $2 million in operating profit(before integration costs) in 2016 that impacted comparability to 2015 reported results.
In December 2016, the Company acquired Ritmo Investimentos, controlling shareholder of Parati S/A, Afical Ltda and Padua Ltda ("Parati Group"), aleading Brazilian food group. In our Latin America reportable segment for the year-to-date period ended December 30, 2017, the acquisition added $203million in net sales and $25 million of operating profit (before integration costs) that impacted the comparability to 2016 reported results.
25

In October of 2017, the Company acquired Chicago Bar Company LLC manufacturer of RXBAR, a high protein snack bar made of simple ingredients. Inour North America Other reportable segment for year-to-date period ended December 30, 2017, the acquisition added $27 million in net sales and $3million of operating profit (before integration costs) that impacted the comparability of 2016 reported results.
Shipping day differencesIn December 2017, we eliminated a one-month timing difference in reporting of financial results for the Parati Group. This update resulted in anadditional month of financial results being reported in the quarter and year-to-date period ended December 30, 2017, which included $14 million of netsales that impacted the comparability of our reported results.
VenezuelaThere was a material change in the business environment, including a worsening of our access to key raw materials subject to restrictions, and a relatedsignificant drop in production volume in the fourth quarter. These supply chain disruptions, along with other factors such as the worsening economicenvironment in Venezuela and the limited access to dollars to import goods through the use of any of the available currency mechanisms, have impairedour ability to effectively operate and fully control our Venezuelan subsidiary.
As of December 31, 2016, we deconsolidated and changed to the cost method of accounting for our Venezuelan subsidiary. We recorded a $72 millionpre-tax charge in Other income (expense), net as we fully impaired the value of our cost method investment in Venezuela. The deconsolidation chargeincluded the historical cumulative translation losses of approximately $63 million related to our Venezuelan operations that had previously beenrecorded in accumulated other comprehensive losses within equity. Additionally, the deconsolidation reduced net sales by $31 million and operatingprofit by $9 million for the year-to-date period ended December 30, 2016 which impacted the comparability of 2017 to 2016 reported results.
In 2015 we concluded that we were no longer able to obtain sufficient U.S. dollars on a timely basis through the DIPRO exchange resulting in a decisionto remeasure our Venezuela subsidiary's financial statements using the DICOM (formerly SIMADI) rate. In connection with the change in rates, werecorded pre-tax charges totaling $152 million, including $112 million in the Latin America operating segment and $40 million in the Corporate operatingsegment. Of the total charges, $100 million was recorded in COGS, $3 million was recorded in SGA, and $49 million was recorded in Other income(expense), net. These charges consisted of $47 million related to the remeasurement of net monetary assets denominated in Venezuelan bolivar at theSIMADI exchange rate (recorded in Other income (expense), net), $56 million related to reducing inventory to the lower of cost or market (recorded inCOGS) and $49 million related to the impairment of long-lived assets in Venezuela (recorded primarily in COGS).
Following the change to the DICOM (formerly SIMADI) rate in 2015, certain non-monetary assets related to our Venezuelan subsidiary continued to beremeasured at historical exchange rates. As these assets were utilized by our Venezuelan subsidiary during 2016 and 2015 they were recognized in theincome statement at historical exchange rates resulting in an unfavorable impact. We experienced an unfavorable pre-tax impact of approximately $11million in 2016 and $17 million in 2015 related to the utilization of these remaining non-monetary assets, primarily impacting COGS.
Foreign currency translationWe evaluate the operating results of our business on a currency-neutral basis. We determine currency-neutral operating results by dividing ormultiplying, as appropriate, the current-period local currency operating results by the currency exchange rates used to translate our financial statementsin the comparable prior-year period to determine what the current period U.S. dollar operating results would have been if the currency exchange ratehad not changed from the comparable prior-year period.
Financial resultsFor the full year 2017, our reported net sales decreased by 0.7% due primarily to the list-price adjustments and other impacts in U.S. Snacks related toits transition from DSD and lower volume in U.S. Morning Foods. These impacts were partially offset by the Parati and RXBAR acquisitions, solidperformance in U.S. Specialty and Asia-Pacific, and favorable foreign currency. Currency-neutral comparable net sales decreased by 2.6%, within ourfull year guidance, after eliminating the impact of acquisitions, shipping day differences, foreign currency and prior year Venezuela results.
26

Reported operating profit increased by 39.5% as a result of productivity savings from Project K restructuring, which includes this year's exit from its U.S.Snacks segment's Direct Store Delivery sales and delivery system. Reported operating profit also benefited from the year-over-year impact of mark-to-market, restructuring, integration costs, acquisitions, and Venezuela remeasurement, partially mitigated by prior year Venezuela results and foreigncurrency. Currency-neutral comparable operating profit increased by 7.6%, within our full-year guidance range, after excluding the impact of mark-to-market, restructuring, acquisitions, integration costs, prior year Venezuela results, Venezuela remeasurement, and foreign currency.
Reported operating margin for the year was favorable 440 basis points due primarily to COGS and SG&A savings realized from Project K and ZBBinitiatives, the impact of mark-to-market accounting for pension, and lower restructuring charges. Currency-neutral comparable operating margin wasfavorable 160 basis points after excluding the year-over-year impact of mark-to-market, restructuring, integration costs, acquisitions, Venezuelaremeasurement, and foreign currency.
Reported diluted EPS of $3.62 was up 84.7% compared to the prior year of $1.96 due primarily to higher operating profit, favorable mark-to-marketadjustments, lower restructuring charges, and prior year debt redemption expense. Currency-neutral comparable diluted EPS of $4.06 was up 9.1%compared to prior year of $3.72, within our full-year guidance range, after excluding the impact of mark-to-market, restructuring, and debt redemptionexpense.
Reconciliation of certain non-GAAP Financial Measures
Consolidated results (dollars in millions, except per share data) 2017 2016Reported net income attributable to Kellogg Company $ 1,269 $ 694Mark-to-market (pre-tax) 45 (261)Project K and cost reduction activities (pre-tax) (263) (325)Debt redemption (pre-tax) — (153)Integration and transaction costs (pre-tax) (5) (12)Shipping day differences (pre-tax) (1) —Venezuela operations impact (pre-tax) — 9Venezuela deconsolidation (pre-tax) — (72)Venezuela remeasurement (pre-tax) — (11)Income tax impact applicable to adjustments, net* 82 200U.S. Tax Reform adoption impact (4) —Comparable net income attributable to Kellogg Company $ 1,415 $ 1,319Foreign currency impact (6) Currency neutral comparable net income attributable to Kellogg Company $ 1,421 Reported diluted EPS $ 3.62 $ 1.96Mark-to-market (pre-tax) 0.13 (0.74)Project K and cost reduction activities (pre-tax) (0.75) (0.92)Debt redemption (pre-tax) — (0.43)Integration and transaction costs (pre-tax) (0.01) (0.03)Venezuela operations impact (pre-tax) — 0.02Venezuela deconsolidation (pre-tax) — (0.20)Venezuela remeasurement (pre-tax) — (0.03)Income tax impact applicable to adjustments, net* 0.22 0.57U.S. Tax Reform adoption impact (0.01) —Comparable diluted EPS $ 4.04 $ 3.72Foreign currency impact (0.02) Currency neutral comparable diluted EPS $ 4.06 Currency neutral comparable diluted EPS growth 9.1% For more information on reconciling items in the table above, please refer to the Significant items impacting comparability section.
* Represents the estimated income tax effect on the reconciling items, using weighted-average statutory tax rates, depending upon the applicable jurisdiction.
27
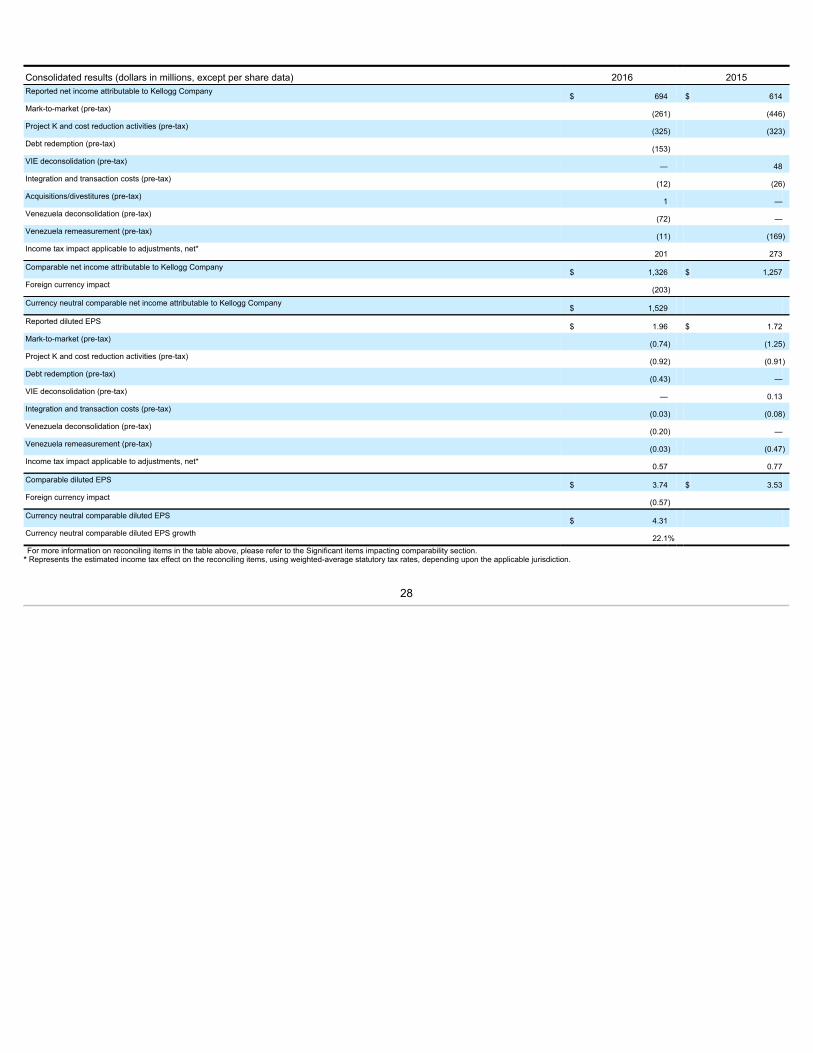
Consolidated results (dollars in millions, except per share data) 2016 2015Reported net income attributable to Kellogg Company $ 694 $ 614Mark-to-market (pre-tax) (261) (446)Project K and cost reduction activities (pre-tax) (325) (323)Debt redemption (pre-tax) (153) VIE deconsolidation (pre-tax) — 48Integration and transaction costs (pre-tax) (12) (26)Acquisitions/divestitures (pre-tax) 1 —Venezuela deconsolidation (pre-tax) (72) —Venezuela remeasurement (pre-tax) (11) (169)Income tax impact applicable to adjustments, net* 201 273Comparable net income attributable to Kellogg Company $ 1,326 $ 1,257Foreign currency impact (203) Currency neutral comparable net income attributable to Kellogg Company $ 1,529 Reported diluted EPS $ 1.96 $ 1.72Mark-to-market (pre-tax) (0.74) (1.25)Project K and cost reduction activities (pre-tax) (0.92) (0.91)Debt redemption (pre-tax) (0.43) —VIE deconsolidation (pre-tax) — 0.13Integration and transaction costs (pre-tax) (0.03) (0.08)Venezuela deconsolidation (pre-tax) (0.20) —Venezuela remeasurement (pre-tax) (0.03) (0.47)Income tax impact applicable to adjustments, net* 0.57 0.77Comparable diluted EPS $ 3.74 $ 3.53Foreign currency impact (0.57) Currency neutral comparable diluted EPS $ 4.31 Currency neutral comparable diluted EPS growth 22.1% For more information on reconciling items in the table above, please refer to the Significant items impacting comparability section.
* Represents the estimated income tax effect on the reconciling items, using weighted-average statutory tax rates, depending upon the applicable jurisdiction.
28

Net sales and operating profit
2017 compared to 2016
The following tables provide an analysis of net sales and operating profit performance for 2017 versus 2016:
Year ended December 30, 2017
(millions) U.S.
MorningFoods U.S.
Snacks U.S.Specialty
NorthAmerica
Other Europe LatinAmerica Asia
Pacific Corporate KelloggConsolidated
Reported net sales $ 2,778 $ 3,067 $ 1,249 $ 1,616 $ 2,291 $ 955 $ 967 $ — $ 12,923
Acquisitions/divestitures — — — 28 11 203 — — 242
Shipping day differences — — — — — 14 — — 14
Comparable net sales $ 2,778 $ 3,067 $ 1,249 $ 1,588 $ 2,280 $ 738 $ 967 $ — $ 12,667
Foreign currency impact — — — 12 (14) 4 26 — 28Currency-neutral comparable netsales $ 2,778 $ 3,067 $ 1,249 $ 1,576 $ 2,294 $ 734 $ 941 $ — $ 12,639
Year ended December 31, 2016
(millions) U.S.
MorningFoods U.S.
Snacks U.S.Specialty
NorthAmericaOther Europe Latin
America AsiaPacific Corporate Kellogg
Consolidated
Reported net sales $ 2,931 $ 3,198 $ 1,214 $ 1,598 $ 2,377 $ 780 $ 916 $ — $ 13,014
Shipping day differences — — — — — — — — —
Venezuela operations impact — — — — — 31 — — 31
Comparable net sales $ 2,931 $ 3,198 $ 1,214 $ 1,598 $ 2,377 $ 749 $ 916 $ — $ 12,983
% change - 2017 vs. 2016:
Reported growth (5.2)% (4.1)% 2.9% 1.1 % (3.6)% 22.3 % 5.6% —% (0.7)%
Acquisitions/divestitures — % — % —% 1.7 % 0.5 % 25.9 % —% —% 1.9 %
Shipping day differences — % — % —% — % — % 1.9 % —% —% 0.1 %
Venezuela operations impact — % — % —% — % — % (4.0)% —% —% (0.3)%
Comparable Growth (5.2)% (4.1)% 2.9% (0.6)% (4.1)% (1.5)% 5.6% —% (2.4)%
Foreign currency impact — % — % —% 0.8 % (0.6)% 0.4 % 2.8% —% 0.2 %Currency-neutral comparablegrowth (5.2)% (4.1)% 2.9% (1.4)% (3.5)% (1.9)% 2.8% —% (2.6)%For more information on reconciling items in the table above, please refer to the Significant items impacting comparability section.
29
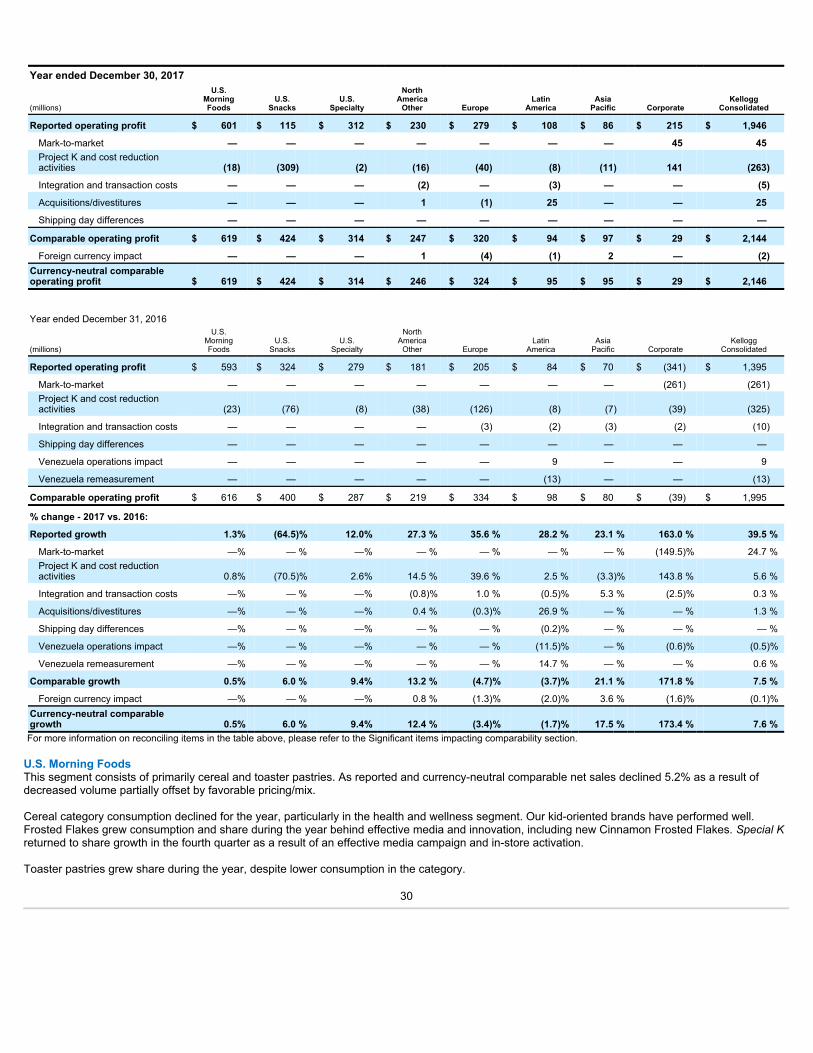
Year ended December 30, 2017
(millions) U.S.
MorningFoods U.S.
Snacks U.S.Specialty
NorthAmerica
Other Europe LatinAmerica Asia
Pacific Corporate KelloggConsolidated
Reported operating profit $ 601 $ 115 $ 312 $ 230 $ 279 $ 108 $ 86 $ 215 $ 1,946
Mark-to-market — — — — — — — 45 45Project K and cost reductionactivities (18) (309) (2) (16) (40) (8) (11) 141 (263)
Integration and transaction costs — — — (2) — (3) — — (5)
Acquisitions/divestitures — — — 1 (1) 25 — — 25
Shipping day differences — — — — — — — — —
Comparable operating profit $ 619 $ 424 $ 314 $ 247 $ 320 $ 94 $ 97 $ 29 $ 2,144
Foreign currency impact — — — 1 (4) (1) 2 — (2)Currency-neutral comparableoperating profit $ 619 $ 424 $ 314 $ 246 $ 324 $ 95 $ 95 $ 29 $ 2,146
Year ended December 31, 2016
(millions) U.S.
MorningFoods U.S.
Snacks U.S.Specialty
NorthAmericaOther Europe Latin
America AsiaPacific Corporate Kellogg
Consolidated
Reported operating profit $ 593 $ 324 $ 279 $ 181 $ 205 $ 84 $ 70 $ (341) $ 1,395
Mark-to-market — — — — — — — (261) (261)Project K and cost reductionactivities (23) (76) (8) (38) (126) (8) (7) (39) (325)
Integration and transaction costs — — — — (3) (2) (3) (2) (10)
Shipping day differences — — — — — — — — —
Venezuela operations impact — — — — — 9 — — 9
Venezuela remeasurement — — — — — (13) — — (13)
Comparable operating profit $ 616 $ 400 $ 287 $ 219 $ 334 $ 98 $ 80 $ (39) $ 1,995
% change - 2017 vs. 2016:
Reported growth 1.3% (64.5)% 12.0% 27.3 % 35.6 % 28.2 % 23.1 % 163.0 % 39.5 %
Mark-to-market —% — % —% — % — % — % — % (149.5)% 24.7 %Project K and cost reductionactivities 0.8% (70.5)% 2.6% 14.5 % 39.6 % 2.5 % (3.3)% 143.8 % 5.6 %
Integration and transaction costs —% — % —% (0.8)% 1.0 % (0.5)% 5.3 % (2.5)% 0.3 %
Acquisitions/divestitures —% — % —% 0.4 % (0.3)% 26.9 % — % — % 1.3 %
Shipping day differences —% — % —% — % — % (0.2)% — % — % — %
Venezuela operations impact —% — % —% — % — % (11.5)% — % (0.6)% (0.5)%
Venezuela remeasurement —% — % —% — % — % 14.7 % — % — % 0.6 %
Comparable growth 0.5% 6.0 % 9.4% 13.2 % (4.7)% (3.7)% 21.1 % 171.8 % 7.5 %
Foreign currency impact —% — % —% 0.8 % (1.3)% (2.0)% 3.6 % (1.6)% (0.1)%Currency-neutral comparablegrowth 0.5% 6.0 % 9.4% 12.4 % (3.4)% (1.7)% 17.5 % 173.4 % 7.6 %For more information on reconciling items in the table above, please refer to the Significant items impacting comparability section.
U.S. Morning FoodsThis segment consists of primarily cereal and toaster pastries. As reported and currency-neutral comparable net sales declined 5.2% as a result ofdecreased volume partially offset by favorable pricing/mix.
Cereal category consumption declined for the year, particularly in the health and wellness segment. Our kid-oriented brands have performed well.Frosted Flakes grew consumption and share during the year behind effective media and innovation, including new Cinnamon Frosted Flakes. Special Kreturned to share growth in the fourth quarter as a result of an effective media campaign and in-store activation.
Toaster pastries grew share during the year, despite lower consumption in the category.
30

As Reported operating profit increased 1.3% due to productivity initiatives and lower restructuring charges partially offset by lower net sales. Currency-neutral comparable operating profit increased 0.5% after eliminating the impact of restructuring charges.
U.S. SnacksThis segment consists of crackers, cookies, savory snacks, wholesome snacks and fruit-flavored snacks.
As reported and currency-neutral comparable net sales declined 4.1% primarily due to impacts related to our conversion from DSD to warehousedistribution; specifically, reduced merchandising during the transition, reduction of SKUs, and a list-price adjustment to eliminate the premium chargedfor DSD services.
Crackers, Cookies and Wholesome Snacks declined in consumption and share for the year due to the reduction of promotion activity related to ourefforts to smoothly transition out of DSD during the second and third quarters. Savory snacks consumption was pulled down, in part, by the eliminationof a promotion-sized can. Focused marketing investment behind key brands resulted in improved consumption in the second half for Cheez-it and Clubcrackers, Keebler Fudge Shoppe cookies, and Rice Krispies Treats wholesome snacks.
As reported operating profit declined 64.5% due to increased Project K restructuring charges in the current year associated with our DSD transition.Currency-neutral comparable operating profit increased 6.0% after excluding the impact of restructuring charges; this was driven by DSD-relatedoverhead reductions partially offset by increased brand investment.
U.S. SpecialtyThis segment sells the full line of Kellogg products to channels such as food service, vending, convenience stores, and Girl Scouts.
As reported and currency-neutral comparable net sales improved 2.9% as a result of higher volume and improved pricing/mix aided by innovation andexpansion in core and emerging growth channels. In addition, the back half of the year benefited from hurricane-related shipments.
As reported operating profit increased 12.0% due to the higher net sales, savings from Project K and ZBB initiatives, and lower restructuring charges.Currency-neutral comparable operating profit increased 9.4% after excluding the impact of restructuring charges.
North America OtherThis segment is composed of our U.S. Frozen Foods, Kashi Company, Canada, and RXBAR businesses.
As reported net sales increased 1.1% due primarily to the RXBAR acquisition, U.S. Frozen growth, and foreign currency. Currency-neutral comparablenet sales declined 1.4% after excluding the impact of acquisitions and foreign currency.
In U.S. Frozen, Eggo ® grew share and consumption during the year, benefiting from the removal of artificial ingredients and the success of Disney-shaped waffles, as well as the exit of a competitor. Our frozen veggie business, under the Morningstar Farms® and Gardenburger® brands, returned toconsumption and share growth during the second half of the year, driven by marketing and in-store support focused on core grilling items.
In Canada, consumption and share performance continued to improve in both cereal and in snacks during the back half of the year. Recent share gainsin cereal were the result of effective innovation and commercial programs.
Kashi Company reported net sales and operating profit were lower versus the prior year, as we continue to stabilize the Kashi brand outside of thenatural channel. The business benefited from the continued success of our Bear Naked brand, which has become the #1 granola brand in the U.S.behind on-trend innovation and expanded distribution. Bear Naked grew both consumption and share for the year.
Reported operating profit increased 27.3% due to lower restructuring charges and by Project K and ZBB savings. Currency-neutral comparableoperating profit increased 12.4% after excluding the impact of restructuring charges and foreign currency.
31

EuropeReported net sales declined 3.6% due to lower volume partially offset by the favorable impact of foreign currency, pricing/mix and acquisitions.Currency-neutral comparable net sales declined 3.5% after excluding the impact of foreign currency and acquisitions.
Pringles volume was lower due primarily to prolonged negotiations with our customers as we sought to price behind our food and packaging upgrades.These negotiations were resolved by April but caused us to miss out on several first and second quarter merchandising programs. Promotional activityresumed in the third quarter and the brand returned to growth during the back half of the year with a particularly strong fourth quarter.
Cereal sales declined versus the prior year across the region but improved during the second half of the year. In the U.K., our largest market in theregion, consumption and share turned positive in the second half of the year as a result of increased advertising behind our core brands, most notablySpecial K .
As reported operating profit increased 35.6% due to lower restructuring charges and incremental Project K savings, partially offset by lower sales andunfavorable foreign currency. Currency-neutral comparable operating profit declined 3.4% after excluding the impact of restructuring charges, prior yearintegration costs, acquisitions and foreign currency.
Latin AmericaReported net sales improved 22.3% due to increased volume as a result of the Parati acquisition, favorable pricing/mix, and foreign currency. This waspartially offset by lower volume in the Caribbean/Central America business and prior year Venezuela results. Currency-neutral comparable net salesdeclined 1.9% after excluding the impact of acquisitions, prior year Venezuela results, and foreign currency.
This decline was due primarily to the Caribbean/Central America sub-region, where first half distributor transitions and economic softness were followedduring the back half of the year by shipment disruptions due to hurricanes Maria and Irma.
We did post solid growth for the year in Mexico and the Mercosur region. Our Mexico business continued to perform well with consumption and salesincreasing versus the prior year in both cereal and snacks. Mercosur posted particularly strong growth in Pringles.
The integration of Parati, our acquisition in Brazil, continues to progress well, and the business posted double digit growth for the year.
As Reported operating profit increased 28.2%, primarily due to the impact of the Parati acquisition partially offset by lower sales in theCaribbean/Central America business. Currency-neutral comparable operating profit decreased 1.7% after excluding the impact of restructuring costs,integration costs, acquisitions, prior year Venezuela operations, Venezuela remeasurement, and foreign currency.
Asia PacificReported net sales improved 5.6% due to favorable foreign currency and pricing/mix as well as higher volume. Currency-neutral comparable net salesincreased 2.8%, after excluding the impact of foreign currency.
Growth in cereal was led by India and Korea. Australia, our largest market in the region, gained share during the second half of the year, reflectingcontinued stabilization. We are experiencing growth in consumption and share through food news and media behind our health and wellness brands, aswell as innovation and brand building behind our taste-oriented brands.
Our Pringles business posted solid growth for the year across the region, driven by emerging markets as well as Australia and Korea. We are alsoseeing the benefits from the expansion of our wholesome snacks business in the region.
As reported operating profit increased 23.1% due to higher net sales and brand-building efficiencies. Currency-neutral comparable operating profitimproved 17.5% after excluding the impact of restructuring, prior year integration costs and foreign currency.
32

Outside of our reported results, our joint ventures in West Africa and China continued to perform extremely well. Double-digit growth was driven bystrong noodles volume in West Africa and e-commerce sales in China.
CorporateAs reported operating expense improved $556 million year on year due primarily to the year over year benefit from pension mark-to-market as well aspension curtailment gains in conjunction with Project K restructuring. Currency-neutral comparable operating profit improved $68 million year on year,primarily due to lower pension costs, after excluding the impact of mark-to-market, restructuring, integration costs, and foreign currency.
33

2016 compared to 2015
The following tables provide an analysis of net sales and operating profit performance for 2016 versus 2015:
Year ended December 31, 2016
(millions) U.S.
MorningFoods U.S.
Snacks U.S.Specialty
NorthAmerica
Other Europe LatinAmerica Asia
Pacific Corporate KelloggConsolidated
Reported net sales $ 2,931 $ 3,198 $ 1,214 $ 1,598 $ 2,377 $ 780 $ 916 $ — $ 13,014Project K and cost reductionactivities — — — — — — — — —
Integration and transaction costs — — — — — — — — —
Acquisitions/divestitures — — — 3 28 — — 31
Shipping day differences — — — — — — — — —
Comparable net sales $ 2,931 $ 3,198 $ 1,214 $ 1,595 $ 2,349 $ 780 $ 916 $ — $ 12,983Comparable net sales excludingVenezuela $ 749 $ 12,952
Foreign currency impact — — — (14) (132) (922) (5) — (1,073)Currency-neutral comparable netsales $ 2,931 $ 3,198 $ 1,214 $ 1,609 $ 2,481 $ 1,702 $ 921 $ — $ 14,056Currency-neutral comparable netsales excluding Venezuela $ 824 $ 13,178
Year ended January 2, 2016
(millions) U.S.
MorningFoods U.S.
Snacks U.S.Specialty
NorthAmericaOther Europe Latin
America AsiaPacific Corporate Kellogg
Consolidated
Reported net sales $ 2,992 $ 3,234 $ 1,181 $ 1,687 $ 2,497 $ 1,015 $ 919 $ — $ 13,525Project K and cost reductionactivities — — — (2) (2) — — — (4)
Integration and transaction costs — — — — — — (1) — (1)
Acquisitions/divestitures — — — — — — 14 — 14
Shipping day differences — — — — (3) — — — (3)
Comparable net sales $ 2,992 $ 3,234 $ 1,181 $ 1,689 $ 2,502 $ 1,015 $ 906 $ — $ 13,519Comparable net sales excludingVenezuela $ 818 $ 13,322
% change - 2016 vs. 2015:
Reported growth (2.0)% (1.1)% 2.8% (5.3)% (4.8)% (23.1)% (0.4)% —% (3.8)%Project K and cost reductionactivities — % — % —% 0.1 % 0.1 % — % — % —% — %
Integration and transaction costs — % — % —% — % — % — % 0.2 % —% — %
Acquisitions/divestitures — % — % —% 0.2 % 1.1 % — % (1.6)% —% 0.1 %
Shipping day differences — % — % —% — % 0.1 % — % — % —% 0.1 %
Comparable growth (2.0)% (1.1)% 2.8% (5.6)% (6.1)% (23.1)% 1.0 % —% (4.0)%Comparable growth excludingVenezuela (8.4)% (2.8)%
Foreign currency impact — % — % —% (0.9)% (5.3)% (90.8)% (0.6)% —% (8.0)%Currency-neutral comparablegrowth (2.0)% (1.1)% 2.8% (4.7)% (0.8)% 67.7 % 1.6 % —% 4.0 %Currency-neutral comparable growthexcluding Venezuela 0.7 % (1.1)%For more information on reconciling items in the table above, please refer to the Significant items impacting comparability section.
34

Year ended December 31, 2016
(millions) U.S.
MorningFoods U.S.
Snacks U.S.Specialty
NorthAmerica
Other Europe LatinAmerica Asia
Pacific Corporate KelloggConsolidated
Reported operating profit $ 593 $ 324 $ 279 $ 181 $ 205 $ 84 $ 70 $ (341) $ 1,395
Mark-to-market — — — — — — — (261) (261)Project K and cost reductionactivities (23) (76) (8) (38) (126) (8) (7) (39) (325)
VIE deconsolidation — — — — — — — — —
Integration and transaction costs — — — — (3) (2) (3) (2) (10)
Acquisitions/divestitures — — — (1) 2 — — — 1
Shipping day differences — — — — — — — — —
Venezuela remeasurement — — — — — (13) — — (13)
Comparable operating profit $ 616 $ 400 $ 287 $ 220 $ 332 $ 107 $ 80 $ (39) $ 2,003Comparable operating profit excludingVenezuela 98 (39) 1,994
Foreign currency impact — — — (2) (30) (250) 2 2 (278)Currency-neutral comparableoperating profit $ 616 $ 400 $ 287 $ 222 $ 362 $ 357 $ 78 $ (41) $ 2,281Currency-neutral comparable operatingprofit excluding Venezuela $ 106 $ (31) $ 2,040
Year ended January 2, 2016
(millions) U.S.
MorningFoods U.S.
Snacks U.S.Specialty
NorthAmericaOther Europe Latin
America AsiaPacific Corporate Kellogg
Consolidated
Reported operating profit $ 474 $ 385 $ 260 $ 178 $ 247 $ 9 $ 54 $ (516) $ 1,091
Mark-to-market — — — — — — — (446) (446)Project K and cost reductionactivities (58) (50) (5) (63) (74) (4) (13) (56) (323)
VIE deconsolidation — 67 — — — — — — 67
Integration and transaction costs — — — — (11) (3) (14) (2) (30)
Acquisitions/divestitures — — — — — — 4 — 4
Shipping day differences — — — — — — — — —
Venezuela remeasurement — — — — — (119) — (1) (120)
Comparable operating profit $ 532 $ 368 $ 265 $ 241 $ 332 $ 135 $ 77 $ (11) $ 1,939Comparable operating profit excludingVenezuela $ 103 $ (6) $ 1,912
% change - 2016 vs. 2015:
Reported growth 25.0% (15.8)% 7.4 % 1.9 % (16.9)% 855.2 % 28.9 % 33.8 % 27.8 %
Mark-to-market —% — % — % — % — % — % — % 48.9 % 20.1 %Project K and cost reductionactivities 9.3% (7.7)% (1.4)% 11.0 % (20.3)% 252.8 % 14.9 % 188.5 % 1.2 %
VIE deconsolidation —% (16.6)% — % — % — % — % — % — % (4.0)%
Integration and transaction costs —% — % — % (0.1)% 2.5 % 95.2 % 15.1 % 46.1 % 1.3 %
Acquisitions/divestitures —% — % — % (0.6)% 0.8 % — % (6.8)% — % (0.3)%
Shipping day differences —% — % — % — % 0.2 % — % — % — % 0.1 %
Venezuela remeasurement —% — % — % — % — % 527.9 % — % 31.6 % 6.1 %
Comparable growth 15.7% 8.5 % 8.8 % (8.4)% (0.1)% (20.7)% 5.7 % (281.3)% 3.3 %Comparable growth excludingVenezuela (5.9)% (573.4)% 4.3 %
Foreign currency impact —% — % — % (0.9)% (9.0)% (185.6)% 3.8 % 13.2 % (14.4)%Currency-neutral comparablegrowth 15.7% 8.5 % 8.8 % (7.5)% 8.9 % 164.9 % 1.9 % (294.5)% 17.7 %Currency-neutral comparable growthexcluding Venezuela 2.5 % (429.9)% 6.7 %For more information on reconciling items in the table above, please refer to the Significant items impacting comparability section.
35

U.S. Morning FoodsThis segment consists primarily of cereal and toaster pastries. As reported and currency-neutral comparable net sales declined 2.0% as a result ofunfavorable volume and pricing/mix. Most of the decline was related to drinks and non-core products.
The cereal category and Kellogg share are both down approximately 1% for the year. However, our core six cereal brands collectively gained 20 basispoints of share, including Special K ® .
Toaster pastries reported an increase in net sales and share gains, with good contribution from innovation.
As reported operating profit increased 25.0% due to Project K savings, brand-building efficiencies resulting from ZBB, net deflation of input costs andreduced restructuring charges. This was partially offset by unfavorable sales performance. Currency-neutral comparable operating profit increased15.7%, excluding the benefit of reduced restructuring charges.
U.S. SnacksThis segment consists of crackers, cereal bars, cookies, savory snacks, and fruit-flavored snacks. As reported and currency-neutral comparable netsales declined 1.1% as a result of unfavorable pricing/mix and a slight decrease in volume.
Crackers posted increased sales and share led by the Big 3 brands in combination ( Cheez-It ® , Town House ® , and Club ® ).
The bars business declined due to weakness in the Special K ® brand as the change in weight-management trends away from counting calories. Thebrand's declines are moderating with the success of on-trend offerings like Protein Trail Mix bars and Fruit & Nut bars. Rice Krispies Treats ® and Nutri-Grain ® gained share during the year.
The cookies business consumption declined for the year resulting in lost share, although share losses moderated in the last half of the year as webenefited from turning on advertising behind our Keebler ® Elves.
Savory snacks reported low-single-digit growth as a result of consumption growth due to core Pringles ® products driven, in part, by accelerated growthin on-the-go pack formats. This growth was partially offset by the lapping of SKU discontinuations during the year.
As reported operating profit declined 15.8% due to the prior year benefit of the VIE deconsolidation, increased restructuring charges in the current year,and unfavorable sales performance. This was partially offset by Project K savings and brand-building efficiencies from ZBB. Currency-neutralcomparable operating profit increased 8.5% after excluding the impact of the prior year VIE deconsolidation and the impact of restructuring charges.
U.S. SpecialtyThis segment sells the full line of Kellogg products to channels such as food service, vending, convenience stores, and Girl Scouts.
As reported and currency-neutral comparable net sales increased 2.8% as a result of favorable pricing/mix and a slight increase in volume. Reportednet sales growth was led by growth in the Foodservice, Convenience and Vending channels. We held or gained share in cereal, crackers, wholesomesnacks, and veggie in the Foodservice channel, and in cereal, crackers, and frozen breakfast in the Convenience channel.
As reported operating profit increased 7.4% due to favorable sales performance and ZBB savings. Currency-neutral comparable operating profitincreased 8.8% after excluding the minor impact of restructuring charges.
North America OtherThis segment is composed of our U.S. Frozen Foods, Kashi Company, and Canada businesses.
As reported net sales decreased 5.3% due to lower volume, unfavorable impact of foreign currency and slightly unfavorable pricing/mix. Currency-neutral comparable net sales declined 4.7% after excluding the impact of foreign currency.
36
The U.S. Frozen business reported a net sales decline as we reshaped the portfolio for Eggo ® and transitioned packaging for Morningstar Farms ®.Despite the impact of these significant changes, the business posted improvement in operating profit and profit margins, driven by Project K and ZBB.
In Canada, net sales were down as a result of volume declines and unfavorable currency impact, partially offset by improved pricing/mix. Beginning inthe second quarter, we increased prices to help offset higher input costs due to significant transactional foreign exchange pressure. The price increasesresulted in lower volume. However, consumption and share declines moderated in the fourth quarter. Special K ® gained share during 2016.
Kashi posted lower sales during the year as the business continues to transition its portfolio. We have exited several non-core product lines, includingfrozen pizza, hot cereal, and trail mix. While these exits negatively impacted sales, they provide tighter focus and better economics going forward. Weare investing heavily in our food. During the year, we completed an overhaul of our cereal portfolio, making every product Non-GMO Project Verified.We also launched several new cereal and wholesome snacks products. Finally, we have redesigned our packaging across our Kashi portfolio.
As reported operating profit increased 1.9% due to lower restructuring charges as well as Project K savings and brand-building efficiencies resultingfrom ZBB in the U.S. Frozen and Canada businesses. These impacts were mitigated somewhat by investments in food and packaging in the Kashibusiness. Currency-neutral comparable operating profit declined 7.5% after excluding the impact of restructuring and foreign currency.
EuropeAs reported net sales declined 4.8% due to unfavorable foreign currency and pricing/mix offset by a slight increase in volume. Currency-neutralcomparable net sales declined 0.8% after excluding the impact of foreign currency and the impact of acquisitions.
The Pringles ® business posted mid-single-digit net sales growth due to sustained momentum in key markets and expansion of Pringles ® Tortilla intonew markets.
The wholesome snacks business posted net sales growth for the year led by emerging markets. In addition, we increased share in the UK and France,where growth in kids' brands accelerated.
The cereal business in Europe posted a net sales decline mostly attributable to the UK, where consumption is down and a deflationary environmentpersists in our categories. We continue working to reposition and renovate Special K ® .
Overall, we continue to see strong growth in emerging markets as currency-neutral comparable net sales increased at a double-digit rate inMediterranean, Middle East, and Russia.
As reported operating profit declined 16.9% due to increased restructuring charges and unfavorable foreign currency impact partially offset by Project Ksavings and productivity initiatives. Currency-neutral comparable operating profit improved 8.9%, excluding the impact of restructuring charges andforeign currency.
Latin AmericaAs reported net sales declined 23.1% due to unfavorable foreign currency and lower volume. This was partially offset by the favorable impact ofpricing/mix, primarily due to Venezuela. Currency-neutral comparable net sales improved 67.7% primarily due to the impact of Venezuela. ExcludingVenezuela, currency-neutral comparable net sales would have grown 0.7%.
Our sales performance was driven by price realization, as we cover the adverse impact of currency, as well as the focus on kids-oriented RTEC brands,the expansion of affordable formats in high-frequency stores, and the benefit of some distributor changes for Pringles ® .
Cereal consumption and share grew in the back half of the year for Mexico led by our focus on kids' RTEC brands. The snacks business posted mid-single-digit net sales growth driven by strong Pringles ® results, with notable growth in the Mexico and Andean markets. We've accelerated consumptiongrowth in wholesome snacks in Mexico, led by new Special K ® offerings.
37

As reported operating profit increased 855.2% due to the year-over-year change in Venezuela remeasurement impact, the favorable impact of pricingactions in Venezuela, and the favorable impact of brand-building efficiencies. Currency-neutral comparable operating profit improved by 164.9%,excluding the impact of Venezuela remeasurement and foreign currency. Excluding Venezuela, currency neutral comparable operating profit increased2.5%.
Asia PacificAs reported net sales declined 0.4% due to unfavorable foreign currency, disposition of a small business and unfavorable pricing/mix. Currency-neutralcomparable net sales increased 1.6% after excluding the impact of foreign currency and disposition of a small business.
Our Australia business stabilized in 2016. The business is focusing media behind our priority brands, executing big “tent-pole” promotions during keyshopper weeks, and launching consumer-driven innovation and renovation. Our largest cereal brand in Australia, Nutri-Grain ® , returned toconsumption and share growth as a result of these efforts.
In Asia, modest growth was led by Southeast Asia and Korea. The Sub-Saharan Africa business continued to perform well. Pringles ® grew at a mid-single-digit rate on the strength of effective promotions as well as renovations like the re-stage of sweet flavors in Korea and the roll-out of Tortilla inAustralia and South Africa. Pringles ® posted share gains for the year in Korea, Japan, South Africa, Indonesia, and the Philippines.
As reported operating profit increased 28.9% due to reduced restructuring charges, Project K savings and productivity initiatives. Currency-neutralcomparable operating profit increased 1.9% excluding the impact of restructuring charges, integration costs and foreign currency.
CorporateAs reported operating expense improved 33.8% due to lower year-over-year mark-to-market cost impacts, and lower restructuring costs partially offsetby higher pension and benefit costs. Currency-neutral comparable operating profit declined after excluding the impact of mark-to-market pension andpostretirement benefit and restructuring costs.
38

Margin performance2017 versus 2016 margin performance was as follows:
Change vs.
prior year (pts.) 2017 2016 Reported gross margin (a) 38.9 % 36.5 % 2.4Mark-to-market (COGS) 0.1 % (1.3)% 1.4Project K and cost reduction activities (COGS) (0.4)% (1.3)% 0.9Integration and transaction costs (COGS) — % — % —Acquisitions/divestitures (COGS) 0.1 % — % 0.1Venezuela remeasurement (COGS) — % (0.1)% 0.1Comparable gross margin 39.1 % 39.2 % (0.1)Foreign currency impact 0.1 % 0.1Currency-neutral comparable gross margin 39.0 % (0.2)Reported SGA% (23.8)% (25.8)% 2.0Mark-to-market (SGA) 0.3 % (0.7)% 1.0Project K and cost reduction activities (SGA) (1.7)% (1.2)% (0.5)Integration and transactions costs (SGA) — % (0.1)% 0.1Acquisitions/divestitures (SGA) (0.2)% — % (0.2)Venezuela remeasurement (SGA) — % — % —Comparable SGA% (22.2)% (23.8)% 1.6Foreign currency impact (0.2)% (0.2)Currency-neutral comparable SGA% (22.0)% 1.8Reported operating margin 15.1 % 10.7 % 4.4Mark-to-market 0.4 % (2.0)% 2.4Project K and cost reduction activities (2.1)% (2.5)% 0.4Integration and transactions costs — % (0.1)% 0.1Acquisitions/divestitures (0.1)% — % (0.1)Venezuela remeasurement — % (0.1)% 0.1Comparable operating margin 16.9 % 15.4 % 1.5Foreign currency impact (0.1)% (0.1)Currency-neutral comparable operating margin 17.0 % 1.6For information on the reconciling items in the table above, please refer to the Significant items impacting comparability section.(a) Reported gross margin as a percentage of net sales. Gross margin is equal to net sales less cost of goods sold.
Reported gross margin for the year was favorable 240 basis points due primarily to productivity and cost savings under our Project K restructuringprogram, the year over year impact of mark-to-market accounting for pension, and lower restructuring charges, largely due to the curtailment benefitresulting from the amendment of certain pension plans in the U.S. and Canada. These impacts were mitigated somewhat by our U.S. Snacks transitionout of DSD distribution, namely the list price adjustment and increased resources in warehouse logistics due to the DSD transition. Currency-neutralcomparable gross margin was 20 basis points lower compared to the prior year after eliminating the impact of mark-to-market, restructuring,acquisitions, Venezuela remeasurement, and foreign currency; this was due to the reset of list prices for U.S. Snacks' transition out of DSD.
Reported SG&A% for the year was favorable 200 basis points due primarily to overhead savings realized from Project K, including the transition out ofDSD, and ZBB, and the year over year impact of mark-to-market pension accounting. These impacts were partially offset by higher year-over-yearProject K restructuring charges and acquisitions. Currency-neutral comparable SG&A% was favorable 180 basis points after excluding the impact ofrestructuring, mark-to-market, integration costs and acquisitions.
Reported operating margin for the year was favorable 440 basis points due primarily to COGS and SG&A savings realized from Project K and ZBBinitiatives, the impact of mark-to-market accounting for pension, and lower restructuring charges. Currency-neutral comparable operating margin wasfavorable 160 basis points after excluding the year-over-year impact of mark-to-market, restructuring, integration costs, acquisitions, Venezuelaremeasurement, and foreign currency.
39

Our 2017 and 2016 comparable gross profit, comparable SGA, and comparable operating profit measures are reconciled to the directly comparableU.S. GAAP measures as follows:
(dollars in millions) 2017 2016Reported gross profit (a) $ 5,022 $ 4,755Mark-to-market (COGS) 8 (159)Project K and cost reduction activities (COGS) (46) (173)Integration and transaction costs (COGS) (1) (2)Acquisitions/divestitures (COGS) 106 —Shipping day differences (COGS) 6 —Venezuela operations impact (COGS) — 11Venezuela remeasurement (COGS) — (12)Comparable gross profit $ 4,949 $ 5,090Foreign currency impact 14 Currency-neutral comparable gross profit $ 4,935 Reported SGA $ 3,076 $ 3,360Mark-to-market (SGA) 37 (102)Project K and cost reduction activities (SGA) (217) (152)Integration and transaction costs (SGA) (4) (8)Acquisitions/divestitures (SGA) (81) —Shipping day differences (SGA) (6) —Venezuela operations impact (SGA) — (2)Venezuela remeasurement (SGA) — (1)Comparable SGA $ 2,805 $ 3,095Foreign currency impact (16) Currency-neutral comparable SGA $ 2,789 Reported operating profit $ 1,946 $ 1,395Mark-to-market 45 (261)Project K and cost reduction activities (263) (325)Integration and transaction costs (5) (10)Acquisitions/divestitures 25 —Shipping day differences — —Venezuela operations impact — 9Venezuela remeasurement — (13)Comparable operating profit $ 2,144 $ 1,995Foreign currency impact (2) Currency-neutral comparable operating profit $ 2,146 For more information on the reconciling items in the table above, please refer to the Significant items impacting comparability section.(a) Gross profit is equal to net sales less cost of goods sold.
40

2016 versus 2015 margin performance was as follows:
Change vs.
prior year (pts.) 2016 2015 Reported gross margin (a) 36.5 % 34.6 % 1.9Mark-to-market (COGS) (1.3)% (2.2)% 0.9Project K and cost reduction activities (COGS) (1.3)% (1.4)% 0.1VIE deconsolidation (COGS) — % — % —Integration and transaction costs (COGS) — % (0.1)% 0.1Venezuela remeasurement (COGS) (0.1)% (0.9)% 0.8Comparable gross margin 39.2 % 39.2 % —Comparable gross margin excluding Venezuela 39.2 % 39.4 % (0.2)Foreign currency impact 0.3 % 0.3Currency-neutral comparable gross margin 38.9 % (0.3)Currency-neutral comparable gross margin excluding Venezuela 39.2 % (0.2)Reported SGA% (25.8)% (26.5)% 0.7Mark-to-market (SGA) (0.7)% (1.1)% 0.4Project K and cost reduction activities (SGA) (1.2)% (1.0)% (0.2)VIE deconsolidation (SGA) — % 0.5 % (0.5)Integration and transactions costs (SGA) (0.1)% (0.1)% —Venezuela remeasurement (SGA) — % 0.1 % (0.1)Comparable SGA% (23.8)% (24.9)% 1.1Comparable SGA% excluding Venezuela (23.8)% (25.0)% 1.2Foreign currency impact (1.1)% (1.1)Currency-neutral comparable SGA% (22.7)% 2.2Currency-neutral comparable SGA% excluding Venezuela (23.7)% 1.3Reported operating margin 10.7 % 8.1 % 2.6Mark-to-market (2.0)% (3.3)% 1.3Project K and cost reduction activities (2.5)% (2.4)% (0.1)VIE deconsolidation — % 0.5 % (0.5)Integration and transactions costs (0.1)% (0.2)% 0.1Venezuela remeasurement (0.1)% (0.8)% 0.7Comparable operating margin 15.4 % 14.3 % 1.1Comparable operating margin excluding Venezuela 15.4 % 14.4 % 1.0Foreign currency impact (0.8)% (0.8)Currency-neutral comparable operating margin 16.2 % 1.9Currency-neutral comparable operating margin excluding Venezuela 15.5 % 1.1For more information on reconciling items in the table above, please refer to the Significant items impacting comparability section.
Reported gross margin for the year was favorable 190 basis points due to savings realized from Project K and ZBB, Venezuela remeasurement,restructuring costs, mark-to-market and integration costs. This was partially offset by the impact of investments we are making in our food andpackaging, unfavorable transactional foreign currency impact, and unfavorable mix. Currency-neutral comparable gross margin declined 30 basis points,after excluding the impact of market-to-market, restructuring, integration costs, Venezuela remeasurement, and foreign currency. Currency-neutralcomparable gross margin excluding Venezuela declined 20 basis points. Reported SGA% for the year was favorable 70 basis points primarily due to the favorable year-over-year impact to brand-building investment from ZBBefficiencies, overhead savings realized from Project K and ZBB, and lower mark-to-market expense. These impacts were partially mitigated by theunfavorable year-over-year impact of a VIE deconsolidation, continued reinvestment of Project K savings into sales capabilities and re-establishing theKashi business, and foreign currency. Currency-neutral comparable SGA% was favorable 220 basis points, after excluding the impact of mark-to-market, VIE deconsolidation, and foreign currency.
Reported operating margin for the year was favorable 260 basis points due to the favorable year-over-year impact to brand-building investment fromZBB efficiencies and overhead savings realized from Project K and ZBB, Venezuela remeasurement, mark-to-market, and integration costs. This waspartially offset by the impact of investments we are making in our food and packaging, general inflationary trends in wages and logistics,
41

unfavorable transactional foreign currency impact, the continued reinvestment of Project K savings into sales capabilities, re-establishing the Kashibusiness, the unfavorable year-over-year impact of foreign currency, and VIE deconsolidation. Currency-neutral comparable operating margin wasfavorable 190 basis points, after excluding the year-over-year impact of restructuring, integration costs, Venezuela remeasurement, VIEdeconsolidation, and foreign currency.
Our 2016 and 2015 comparable gross profit, comparable SGA, and comparable operating profit measures are reconciled to the directly comparableU.S. GAAP measures as follows:
(dollars in millions) 2016 2015Reported gross profit (a) $ 4,755 $ 4,681Mark-to-market (COGS) (159) (296)Project K and cost reduction activities (COGS) (173) (195)VIE deconsolidation (COGS) — —Integration and transaction costs (COGS) (2) (15)Acquisitions/divestitures (COGS) 9 5Venezuela remeasurement (COGS) (12) (112)Comparable gross profit $ 5,092 $ 5,294Comparable gross profit excluding Venezuela 5,081 5,243Foreign currency impact (377) Currency-neutral comparable gross profit $ 5,469 Currency-neutral comparable gross profit excluding Venezuela $ 5,172 Reported SGA $ 3,360 $ 3,590Mark-to-market (SGA) (102) (150)Project K and cost reduction activities (SGA) (152) (128)VIE deconsolidation (SGA) — 67Integration and transaction costs (SGA) (8) (15)Acquisitions/divestitures (SGA) (8) (1)Venezuela remeasurement (SGA) (1) (8)Comparable SGA $ 3,089 $ 3,355Comparable SGA excluding Venezuela $ 3,087 $ 3,331Foreign currency impact 99 Currency-neutral comparable SGA $ 3,188 Currency-neutral comparable SGA excluding Venezuela $ 3,132 Reported operating profit $ 1,395 $ 1,091Mark-to-market (261) (446)Project K and cost reduction activities (325) (323)VIE deconsolidation — 67Integration and transaction costs (10) (30)Acquisitions/divestitures 1 4Venezuela remeasurement (13) (120)Comparable operating profit $ 2,003 $ 1,939Comparable operating profit excluding Venezuela $ 1,994 $ 1,912Foreign currency impact (278) Currency-neutral comparable operating profit $ 2,281 Currency-neutral comparable operating profit excluding Venezuela $ 2,040 For more information on reconciling items in the table above, please refer to the Significant items impacting comparability section.
Restructuring and cost reduction activitiesWe view our restructuring and cost reduction activities as part of our operating principles to provide greater visibility in achieving our long-term profitgrowth targets. Initiatives undertaken are currently expected to recover cash implementation costs within a five-year period of completion. Uponcompletion (or as each major stage is completed in the case of multi-year programs), the project begins to deliver cash savings and/or reduceddepreciation.
Project KIn February 2017, the Company announced an expansion and an extension to its previously-announced global efficiency and effectiveness program(“Project K”), to reflect additional and changed initiatives. Project K is expected to continue generating a significant amount of savings that may beinvested in key strategic areas of focus for the business to drive future growth or utilized to achieve our 2018 Margin Expansion target.
42

In addition to the original program’s focus on strengthening existing businesses in core markets, increasing growth in developing and emerging markets,and driving an increased level of value-added innovation, the extended program also focuses on implementing a more efficient go-to-market model forcertain businesses and creating a more efficient organizational design in several markets. Since inception, Project K has provided significant benefitsand is expected to continue to provide a number of benefits in the future, including an optimized supply chain infrastructure, the implementation of globalbusiness services, a new global focus on categories, increased agility from a more efficient organization design, and improved effectiveness in go-to-market models.
We currently anticipate that Project K will result in total pre-tax charges, once all phases are approved and implemented, of $1.5 to $1.6 billion, withafter-tax cash costs, including incremental capital investments, estimated to be approximately $1.1 billion. Cash expenditures of approximately $950million have been incurred through the end of fiscal year 2017. Total cash expenditures, as defined, are expected to be approximately $175 million for2018. Total charges for Project K in 2018 are expected to be approximately $75 to $125 million.
We expect annual cost savings generated from Project K will be approximately $600 to $700 million in 2019. The savings will be realized primarily inselling, general and administrative expense with additional benefit realized in gross profit as cost of goods sold savings are partially offset by negativevolume and price impacts resulting from go-to-market business model changes. The overall savings profile of the project reflects our go-to-marketinitiatives that will impact both selling, general and administrative expense and gross profit. We have realized approximately $480 million of annualsavings through the end of 2017. Cost savings have been utilized to increase margins and be strategically invested in areas such as in-store execution,sales capabilities, including adding sales representatives, re-establishing the Kashi business unit, and in the design and quality of our products. Wehave also invested in production capacity in developing and emerging markets, and in global category teams.
We funded much of the initial cash requirements for Project K through our supplier financing initiative. We are now able to fund much of the cash costsfor the project through cash on hand as we have started to realize cash savings from the project.
We also expect that the project will have an impact on our consolidated effective income tax rate during the execution of the project due to the timing ofcharges being taken in different tax jurisdictions. The impact of this project on our consolidated effective income tax rate will be excluded from thecomparable income tax rate that will be disclosed on a quarterly basis.We will complete implementation of Project K in 2018, with annual savings expected to increase through 2019. Project charges, after-tax cash costs andannual savings remain in line with expectations.
Refer to Note 5 within Notes to Consolidated Financial Statements for further information related to Project K and other restructuring activities.
Other ProjectsIn 2015 we implemented a zero-based budgeting (ZBB) program in our North America business and during the first half of 2016 the program wasexpanded into our international businesses. We have realized annual savings from the ZBB program of $397 million through 2017 and expectcumulative savings to be approximately $450 to $500 million by the end of 2018, realized largely in selling, general and administrative expense.
In support of the ZBB initiative, we incurred pre-tax charges of approximately $3 million, $25 million and $12 million during 2017, 2016 and 2015,respectively. Total charges of $40 million have been recognized since the inception of the ZBB program which consists primarily of the design andimplementation of business capabilities.
We completed implementation of the ZBB program in 2017, with annual savings expected to increase through 2018. Project charges, after-tax cashcosts and annual savings remain in line with expectations.
Foreign currency translationThe reporting currency for our financial statements is the U.S. dollar. Certain of our assets, liabilities, expenses and revenues are denominated incurrencies other than the U.S. dollar, primarily in the euro, British pound, Mexican peso, Australian dollar, Canadian dollar, Brazilian Real, NigerianNaira, and Russian ruble. To prepare our consolidated financial statements, we must translate those assets, liabilities, expenses and revenues intoU.S. dollars at the applicable exchange rates. As a result, increases and decreases in the value of the U.S. dollar against these other currencies willaffect the amount of these items in our consolidated financial statements, even if their value has not changed in their original currency. This could havesignificant impact on our results if such increase or decrease in the value of the U.S. dollar is substantial.
43

Interest expenseInterest expense was lower in 2017 due to a $153 million pre-tax charge in 2016 to redeem $475 million of 7.45% U.S. Dollar Debentures due 2031.The charge consisted primarily of a premium on the tender offer and also included accelerated losses on pre-issuance interest rate hedges, accelerationof fees and debt discount on the redeemed debt and fees. Also contributing to the increase from 2015 to 2016 was increased weighting of fixed ratedebt and higher average debt levels.
Interest income (recorded in other income (expense), net) was (in millions), 2017 -$9; 2016 -$5; 2015 -$4. We currently expect that our 2018 grossinterest expense will increase from 2017 due to the $600 million, ten-year, 3.4% Senior Notes issued in November 2017 in conjunction with ouracquisition of Chicago Bar Co., LLC, the manufacturer of RXBAR, and higher expected interest rates on floating rate debt.
(dollars in millions)
Change vs.prior year
2017 2016 2015 2017 2016Reported interest expense $ 256 $ 406 $ 227 Amounts capitalized 4 4 4 Gross interest expense $ 260 $ 410 $ 231 (36.6)% 77.5%
Income taxesOn December 22, 2017, the U.S. government enacted comprehensive tax legislation commonly referred to as the Tax Cuts and Jobs Act (Tax Act). TheTax Act makes broad and complex changes to the U.S. tax code which impact our year ended December 30, 2017 including but not limited to, reducingthe corporate tax rate from 35% to 21%, requiring a one-time transition tax on certain unrepatriated earnings of foreign subsidiaries that may beelectively paid over eight years, and accelerating first year expensing of certain capital expenditures.
The Tax Act also introduces new tax laws that may impact our taxable income beginning in 2018 which will include, but not limited to, the repeal of thedomestic production activity deduction, generally eliminating U.S. federal income taxes on foreign earnings (subject to certain important exceptions), anew provision designed to tax currently global intangible low taxed income (GILTI), a provision that could limit the amount of deductible interestexpense, limitations on the deductibility of certain executive compensation, creating a base erosion anti-abuse tax (BEAT), and modifying or repealingmany deductions and credits.
Shortly after the Tax Act was enacted, the SEC staff issued Staff Accounting Bulletin No. 118, Income Tax Accounting Implications of the Tax Cuts andJobs Act (SAB 118) which provides guidance on accounting for the Tax Act’s impact. SAB 118 provides a measurement period, which in no case shouldextend beyond one year from the Tax Act enactment date, during which a company acting in good faith may complete the accounting for the impacts ofthe Tax Act under ASC Topic 740. Per SAB 118, we must reflect the income tax effects of the Tax Act in the reporting period in which the accountingunder ASC Topic 740 is complete. To the extent our accounting for certain income tax effects of the Tax Act is incomplete, we can determine areasonable estimate for those effects and record a provisional estimate in the financial statements in the first reporting period in which a reasonableestimate can be determined. If we cannot determine a provisional estimate to be included in the financial statements, we should continue to apply ASC740 based on the provisions of the tax laws that were in effect immediately prior to the Tax Act being enacted. If we are unable to provide a reasonableestimate of the impacts of the Tax Act in a reporting period, a provisional amount must be recorded in the first reporting period in which a reasonableestimate can be determined.
Our year end income tax provision includes $4 million of net additional income tax expense during the quarter ended December 30, 2017, driven by thereduction in the U.S. corporate tax rate and the transition tax on foreign earnings.
Reduction in U.S. Corporate Tax Rate: The tax provision includes a tax benefit of $153 million for the remeasurement of certain deferred tax assets andliabilities to reflect the corporate tax rate reduction impact to our net deferred tax balances. This adjustment is considered complete.
Transition tax on foreign earnings: The transition tax is a tax on the previously untaxed accumulated and current earnings and profits of certain of ourforeign subsidiaries. In order to determine the amount of the Transition Tax, we must determine, in addition to other factors, the amount of post-1986earnings and profits (E&P) of the relevant
44

subsidiaries, as well as the amount of non-U.S. income taxes paid on such earnings. E&P is similar to retained earnings of the subsidiary, but requiresother adjustments to conform to U.S. tax rules. As of December 30, 2017, based on accumulated foreign earnings and profits of approximately $2.6billion, which are primarily in Europe, we are able to make a reasonable estimate of the transition tax and recorded a transition tax obligation of $157million which the Company expects to elect to pay over eight years. The current portion of $17 million is included in Other current liabilities and theremainder is included within Other liabilities on the balance sheet. However, we are awaiting further interpretative guidance, continuing to assessavailable tax methods and elections, and continuing to gather additional information in order to finalize our calculations and complete the accounting forthe transition tax liability.
In addition to the transition tax, the Tax Act introduced a territorial tax system, which will be effective beginning in 2018. The territorial tax system willimpact our overall global capital and legal entity structure, working capital, and repatriation plan on a go-forward basis. In light of the territorial taxsystem, and other new international provisions within the Tax Act that are effective beginning in 2018, we are continuing to keep the $2.6 billion ofaccumulated foreign earnings and profits in Europe and other non-US jurisdictions and we can continue to support our assertion to indefinitely reinvestthese foreign earnings and profits. As a result, as a reasonable provisional estimate, we are not recording any new deferred tax liabilities associatedwith the territorial tax system or for any changes to our indefinite reinvestment assertion. Further, it is impracticable for us to estimate any future tax costfor any unrecognized future tax liabilities associated with our indefinite reinvestment assertion as of December 30, 2017, because the actual tax liability,if any, would be dependent on complex analysis and calculations considering various tax laws, exchange rates, circumstances existing when arepatriation, sale, or liquidation occurs, and other factors.
If there are any changes to our indefinite reinvestment assertion as a result of finalizing our assessment of the new Tax Act, we will adjust ourprovisional estimates, record, and disclose any tax impacts in the appropriate period, pursuant to SAB 118.
For the year ended December 30, 2017, we did not identify any items from the Tax Act for which a provisional estimate could not be determined. Inaddition, other provisions of the Tax Act for which we have finalized or are continuing to finalize its accounting are not material (or expected to bematerial) to the financial statements as of and for the year ended December 30, 2017.
Our reported effective tax rates for 2017 , 2016 and 2015 were 24.6%, 25.2%, and 20.6%, respectively. Comparable effective tax rates for 2017 , 2016and 2015 were 25.8%, 24.7%, and 25.6%, respectively.
For the year ended December 30, 2017, the effective tax rate benefited from a deferred tax benefit of $39 million resulting from the intercompanytransfer of intellectual property. The 2016 effective income tax rate benefited from excess tax benefits from share-based compensation totaling $36million. The 2015 effective income tax rates benefited from the mark-to-market loss recorded for our pension plans. Refer to Note 13 within Notes toConsolidated Financial Statements for further information.
Fluctuations in foreign currency exchange rates could impact the expected effective income tax rate as it is dependent upon U.S. dollar earnings offoreign subsidiaries doing business in various countries with differing statutory tax rates. Additionally, the rate could be impacted if pending uncertain taxmatters, including tax positions that could be affected by planning initiatives, are resolved more or less favorably than we currently expect.
45

The following table provides a reconciliation of as reported to currency-neutral comparable income taxes and effective income tax rate for 2017 and2016.
Consolidated results (dollars in millions) 2017 2016Reported income taxes $ 412 $ 233Mark-to-market 6 (59)Project K and cost reduction activities (86) (85)Debt redemption — (54)Integration and transaction costs (2) (3)Venezuela operations impact — 1Venezuela deconsolidation — —Venezuela remeasurement — —U.S. Tax Reform adoption impact 4 Comparable income taxes $ 490 $ 433Reported effective income tax rate 24.6 % 25.2 %Mark-to-market (0.3) 0.5Project K and cost reduction activities (1.1) (0.3)Debt redemption — (0.9)Integration and transaction costs — —Venezuela operations impact — (0.1)Venezuela deconsolidation — 1.0Venezuela remeasurement — 0.2U.S. Tax Reform adoption impact 0.2 —Comparable effective income tax rate 25.8 % 24.8 %For more information on reconciling items in the table above, please refer to the Significant items impacting comparability section.
The following table provides a reconciliation of as reported to currency-neutral comparable income taxes and effective income tax rate for 2016 and2015.
Consolidated results (dollars in millions) 2016 2015Reported income taxes $ 233 $ 159Mark-to-market (59) (148)Project K and cost reduction activities (85) (94)Debt redemption (54) —VIE deconsolidation — (2)Integration and transaction costs (3) (9)Venezuela deconsolidation — —Venezuela remeasurement — (20)Comparable income taxes $ 434 $ 432Reported effective income tax rate 25.2 % 20.6 %Mark-to-market 0.5 (4.6)Project K and cost reduction activities (0.3) (0.8)Debt redemption (0.9) —VIE deconsolidation — (0.9)Integration and transaction costs — (0.2)Venezuela deconsolidation 1.0 —Venezuela remeasurement 0.2 1.5Comparable effective income tax rate 24.7 % 25.6 %For more information on reconciling items in the table above, please refer to the Significant items impacting comparability section.
Investments in unconsolidated entitiesAfter-tax earnings from unconsolidated entities for the year ended December 30, 2017 increased to $7 million compared to the prior year of $1 million.The change was driven by increased sales and favorable tax benefits in Multipro Singapore Pte Ltd ('Multipro'), partially offset by inflation on input costsfor both Multipro and our Other unconsolidated entities. Net sales attributed to our share of the unconsolidated entities were approximately $377 millionfor Multipro and approximately $28 million for all other unconsolidated entities.
46

The components of our unconsolidated entities’ net sales growth for 2017 versus 2016 are shown in the following table:
2017 versus 2016 (pts): Multipro Other Total unconsolidated entitiesContributions from volume growth (a) 10.8 20.9 11.0Net price realization and mix 27.1 6.9 26.2Currency-neutral comparable sales growth 37.9 27.8 37.2Foreign currency exchange (24.0) (7.8) (22.9)Reported net sales growth 13.9 20.0 14.3(a) Measured in tons based on the stated weight of our product shipments.
After-tax earnings from unconsolidated entities for the year ended December 31, 2016 increased to $1 million compared to the prior year of less than $1million. The change was driven by increased sales in Multipro partially offset by the other unconsolidated entities. Net sales attributed to our share ofthe unconsolidated entities were approximately $331 million for Multipro and approximately $23 million for all other unconsolidated entities.
The components of our unconsolidated entities’ net sales growth for 2016 versus 2015 are shown in the following table:
2016 versus 2015 (pts): Multipro (a) Other Total unconsolidated entitiesContributions from volume growth (b) (5.8) (1.1) (5.5)Net price realization and mix 51.1 1.7 43.2Currency-neutral comparable sales growth 45.3 0.6 37.7Foreign currency exchange (48.7) (6.8) (41.6)Reported net sales growth (3.4) (6.2) (3.9)(a) 2016 results based on four months of activity to be comparable to 2015. (b) Measured in tons based on the stated weight of our product shipments.
LIQUIDITY AND CAPITAL RESOURCES
Our principal source of liquidity is operating cash flows supplemented by borrowings for major acquisitions and other significant transactions. Our cash-generating capability is one of our fundamental strengths and provides us with substantial financial flexibility in meeting operating and investing needs.
We have historically reported negative working capital primarily as the result of our focus to improve core working capital by reducing our levels of tradereceivables and inventory while extending the timing of payment of our trade payables. In addition, we have a substantial amount of indebtednesswhich results in current maturities of long-term debt and notes payable which can have a significant impact on working capital as a result of the timing ofthese required payments. Working capital is also impacted by the use of our ongoing cash flows from operations to service our debt obligations, paydividends, fund acquisition opportunities, and repurchase our common stock. We had negative working capital of $1.4 billion and $1.5 billion as ofDecember 30, 2017 and December 31, 2016 , respectively.
We believe that our operating cash flows, together with our credit facilities and other available debt financing, will be adequate to meet our operating,investing and financing needs in the foreseeable future. However, there can be no assurance that volatility and/or disruption in the global capital andcredit markets will not impair our ability to access these markets on terms acceptable to us, or at all.
As of December 30, 2017 and December 31, 2016 , we had $204 million and $240 million, respectively, of cash and cash equivalents held ininternational jurisdictions. The cash we generate outside the U.S. is principally to be used to fund our international development. If the funds generatedby our U.S. business are not sufficient to meet our need for cash in the U.S., we may need to repatriate a portion of our international earnings to theU.S. which may be subject to additional taxes. The Tax Act required a one-time transition tax on certain unrepatriated earnings of
47
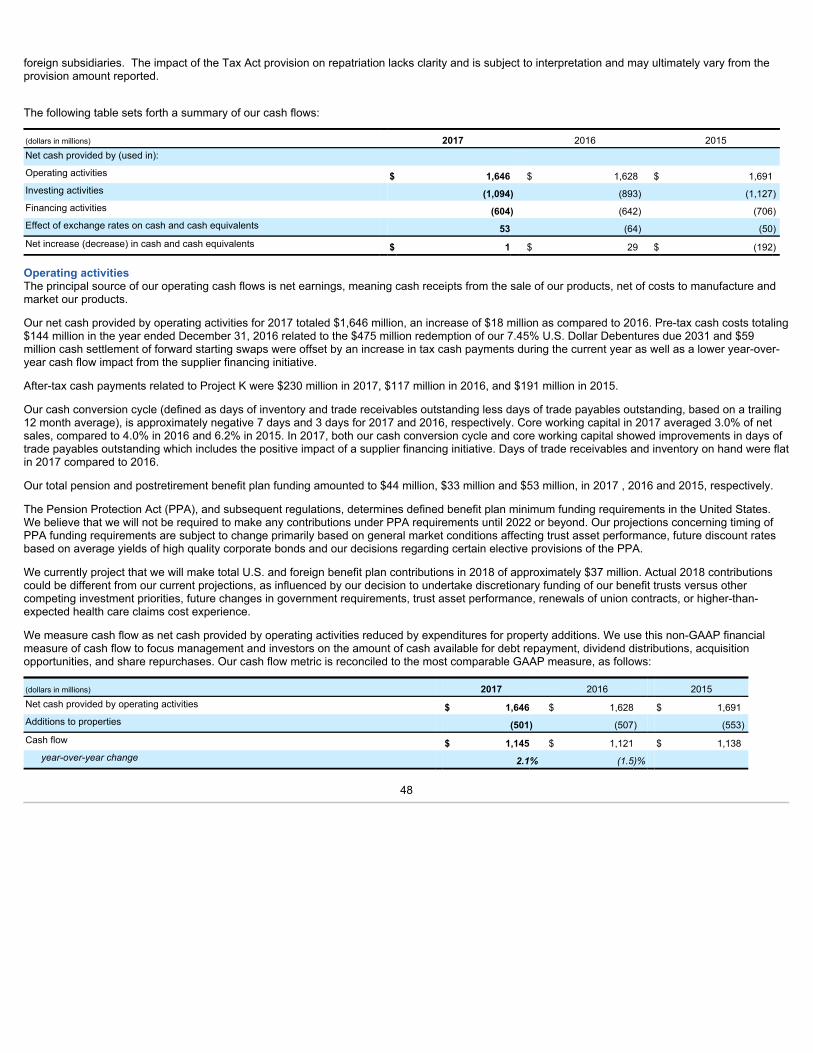
foreign subsidiaries. The impact of the Tax Act provision on repatriation lacks clarity and is subject to interpretation and may ultimately vary from theprovision amount reported.
The following table sets forth a summary of our cash flows:
(dollars in millions) 2017 2016 2015Net cash provided by (used in): Operating activities $ 1,646 $ 1,628 $ 1,691Investing activities (1,094) (893) (1,127)Financing activities (604) (642) (706)Effect of exchange rates on cash and cash equivalents 53 (64) (50)Net increase (decrease) in cash and cash equivalents $ 1 $ 29 $ (192)
Operating activitiesThe principal source of our operating cash flows is net earnings, meaning cash receipts from the sale of our products, net of costs to manufacture andmarket our products.
Our net cash provided by operating activities for 2017 totaled $1,646 million, an increase of $18 million as compared to 2016. Pre-tax cash costs totaling$144 million in the year ended December 31, 2016 related to the $475 million redemption of our 7.45% U.S. Dollar Debentures due 2031 and $59million cash settlement of forward starting swaps were offset by an increase in tax cash payments during the current year as well as a lower year-over-year cash flow impact from the supplier financing initiative.
After-tax cash payments related to Project K were $230 million in 2017, $117 million in 2016, and $191 million in 2015.
Our cash conversion cycle (defined as days of inventory and trade receivables outstanding less days of trade payables outstanding, based on a trailing12 month average), is approximately negative 7 days and 3 days for 2017 and 2016, respectively. Core working capital in 2017 averaged 3.0% of netsales, compared to 4.0% in 2016 and 6.2% in 2015. In 2017, both our cash conversion cycle and core working capital showed improvements in days oftrade payables outstanding which includes the positive impact of a supplier financing initiative. Days of trade receivables and inventory on hand were flatin 2017 compared to 2016.
Our total pension and postretirement benefit plan funding amounted to $44 million, $33 million and $53 million, in 2017 , 2016 and 2015, respectively.
The Pension Protection Act (PPA), and subsequent regulations, determines defined benefit plan minimum funding requirements in the United States.We believe that we will not be required to make any contributions under PPA requirements until 2022 or beyond. Our projections concerning timing ofPPA funding requirements are subject to change primarily based on general market conditions affecting trust asset performance, future discount ratesbased on average yields of high quality corporate bonds and our decisions regarding certain elective provisions of the PPA.
We currently project that we will make total U.S. and foreign benefit plan contributions in 2018 of approximately $37 million. Actual 2018 contributionscould be different from our current projections, as influenced by our decision to undertake discretionary funding of our benefit trusts versus othercompeting investment priorities, future changes in government requirements, trust asset performance, renewals of union contracts, or higher-than-expected health care claims cost experience.
We measure cash flow as net cash provided by operating activities reduced by expenditures for property additions. We use this non-GAAP financialmeasure of cash flow to focus management and investors on the amount of cash available for debt repayment, dividend distributions, acquisitionopportunities, and share repurchases. Our cash flow metric is reconciled to the most comparable GAAP measure, as follows:
(dollars in millions) 2017 2016 2015Net cash provided by operating activities $ 1,646 $ 1,628 $ 1,691Additions to properties (501) (507) (553)Cash flow $ 1,145 $ 1,121 $ 1,138
year-over-year change 2.1% (1.5)%
48

Investing activitiesOur net cash used in investing activities for 2017 amounted to $1,094 million, an increase of $201 million compared with 2016 . In 2017, we acquiredChicago Bar Co., LLC, the manufacturer of RXBAR, for $596 million. In 2016, we acquired Parati, a manufacturer of biscuit, powdered beverage andpasta brands in Brazil for $381 million.
In 2015, we acquired, for $445 million, a 50% interest in Multipro Singapore Pte. Ltd., a leading distributor of a variety of food products in Nigeria andGhana, and an option to purchase a minority interest in an affiliated food manufacturer. In addition to our joint venture investment in 2015, we alsoacquired Mass Foods and a majority interest in Bisco Misr.
Capital spending in 2017 included investments in our supply chain infrastructure and network optimization initiatives in global manufacturing anddistribution.
Cash paid for additions to properties as a percentage of net sales was 3.9% in 2017, 3.9% in 2016, and 4.1% in 2015.
Financing activitiesOur net cash used by financing activities was $604 million, $642 million and $706 million for 2017 , 2016 and 2015, respectively.
Total debt was $8.6 billion and $7.8 billion at year-end 2017 and 2016, respectively.
In November 2017, we issued $600 million of ten-year 3.4% Senior Notes to pay down commercial paper issued in conjunction with the purchase ofChicago Bar Co., LLC, manufacturer of RXBAR.
In May 2017, we issued €600 million of five-year 0.80% Euro Notes due 2022 and repaid our 1.75% fixed rate $400 million U.S. Dollar Notes due 2017at maturity. Additionally, we repaid our 2.05% fixed rate Cdn. $300 million Canadian Dollar Notes at maturity.
In November 2016, we issued $600 million of seven-year 2.65% U.S. Dollar Notes and repaid our 1.875% $500 million U.S. Dollar Notes due 2016 atmaturity.
In May 2016, we issued €600 million of eight-year 1.00% Euro Notes due 2024 and repaid our 4.45% fixed rate $750 million U.S. Dollar Notes due 2016at maturity.
In March 2016, we issued $750 million of ten-year 3.25% U.S. Dollar Notes and $650 million of thirty-year 4.50% U.S. Dollar Notes. Also in March 2016,we redeemed $475 million of our 7.45% U.S. Dollar Debentures due 2031.
In May 2015, we repaid our $350 million 1.125% U.S. Dollar Notes due 2015 at maturity.
In February 2015, we repaid our floating-rate $250 million U.S. Dollar Notes due 2015 at maturity and in March 2015, we issued €600 million of ten-year1.25% Euro Notes due 2025.
In December 2015, the board of directors approved a share repurchase program authorizing us to repurchase shares of our common stock amountingto $1.5 billion beginning in 2016 through December 2017. In December 2017, the board of directors approved the repurchase of up to $1.5 billion of ourcommon stock beginning in January 2018 through December 2019.
During 2017, we purchased 7 million shares totaling $516 million. During 2016, we purchased 6 million shares totaling $426 million. During 2015, wepurchased 11 million shares totaling $731 million.
We paid quarterly dividends to shareholders totaling $2.12 per share in 2017, $2.04 per share in 2016, and $1.98 per share in 2015. Total cash paid fordividends increased by 4.0% in 2017 and 3.0% in 2016. On February 16, 2018, the board of directors declared a dividend of $.54 per common share,payable on March 15, 2018 to shareholders of record at the close of business on March 5, 2018.
We entered into an unsecured Five-Year Credit Agreement in February 2014, allowing us to borrow, on a revolving credit basis, up to $2.0 billion andexpiring in 2019. In January 2018, we entered into an unsecured Five-Year Credit Agreement to replace the existing agreement allowing us to borrowup to $1.5 billion, on a revolving basis.
49

In January 2018, we entered into an unsecured 364-Day Credit Agreement to borrow, on a revolving credit basis, up to $1.0 billion at any timeoutstanding, to replace the $800 million 364-day facility that expired in January 2018. The new credit facilities contains customary covenants andwarranties, including specified restrictions on indebtedness, liens and a specified interest expense coverage ratio. If an event of default occurs, then, tothe extent permitted, the administrative agent may terminate the commitments under the credit facility, accelerate any outstanding loans under theagreement, and demand the deposit of cash collateral equal to the lender's letter of credit exposure plus interest. There are no borrowings outstandingunder the new credit facilities.
Our long-term debt agreements contain customary covenants that limit Kellogg Company and some of its subsidiaries from incurring certain liens orfrom entering into certain sale and lease-back transactions. Some agreements also contain change in control provisions. However, they do not containacceleration of maturity clauses that are dependent on credit ratings. A change in our credit ratings could limit our access to the U.S. short-term debtmarket and/or increase the cost of refinancing long-term debt in the future. However, even under these circumstances, we would continue to haveaccess to our 364-Day Credit Facility, which expires in January 2019, as well as our Five-Year Credit Agreement, which expires in January 2023. Thissource of liquidity is unused and available on an unsecured basis, although we do not currently plan to use it.
We monitor the financial strength of our third-party financial institutions, including those that hold our cash and cash equivalents as well as those whoserve as counterparties to our credit facilities, our derivative financial instruments, and other arrangements.
We are in compliance with all covenants as of December 30, 2017 . We continue to believe that we will be able to meet our interest and principalrepayment obligations and maintain our debt covenants for the foreseeable future, while still meeting our operational needs, including the pursuit ofselected bolt-on acquisitions. This will be accomplished through our strong cash flow, our short-term borrowings, and our maintenance of credit facilitieson a global basis.
During 2016, we initiated a program in which customers could extend their payment terms in exchange for the elimination of early payment discounts(Extended Terms Program).
During the first half of 2016, in order to mitigate the net working capital impact of the Extended Terms Program for a discrete customer, we entered intoan agreement to sell, on a revolving basis, certain trade accounts receivable balances to third party financial institutions (Monetization Program).Transfers under the Monetization Program are accounted for as sales of receivables resulting in the receivables being de-recognized from ourConsolidated Balance Sheet. The Monetization Program provides for the continuing sale of certain receivables on a revolving basis until terminated byeither party; however the maximum funding from receivables that may be sold at any time is currently $800 million, but may be increased as additionalfinancial institutions are added to the Monetization Program. Accounts receivable sold of $601 million and $562 million remained outstanding under thisarrangement as of December 30, 2017 and December 31, 2016, respectively. Approximately $2.2 billion and $1.5 billion of accounts receivable havebeen sold via the Monetization Program during the years ended December 30, 2017 and December 31, 2016, respectively.
In addition to the Monetization Program, during 2016, in order to mitigate the net working capital impact of the Extended Terms Program for othercustomers, we entered into agreements with financial institutions (Securitization Program) to sell these receivables resulting in the receivables being de-recognized from our consolidated balance sheet. The maximum funding from receivables that may be sold at any time is currently $600 million, but maybe increased as additional financial institutions are added to the agreement. As of December 30, 2017, approximately $433 million of accountsreceivable sold under the Securitization Program remained outstanding, for which we received cash of approximately $412 million and a deferredpurchase price asset of approximately $21 million. As of December 31, 2016, approximately $292 million of accounts receivable sold under thesecuritization program remained outstanding, for which we received cash of approximately $255 million and a deferred purchase price asset ofapproximately $37 million. During the years ended December 30, 2017 and December 31, 2016, $2.6 billion and $839 million of accounts receivablewere sold through the Securitization Program, respectively. In December 2017, we terminated the Securitization Program, such that no receivables willbe sold after December 28, 2017. We terminated the Securitization Program as a result of declining customer interest in an extended-terms program,and recent changes to accounting guidelines that (i) no longer treat the advances from the securitization in a way that preserves Cash Flow, defined asCash From Operations less Capital Expenditure, and (ii) require burdensome administration, including daily reconciliations of receivables sold andcollected under the program. Terminating the Securitization Program will have no impact on our Cash Flow.
50

Refer to Note 2 within Notes to Consolidated Financial Statements for further information related to the sale of accounts receivable.
OFF-BALANCE SHEET ARRANGEMENTS AND CONTRACTUAL OBLIGATIONS
Off-balance sheet arrangementsAt December 30, 2017 , we did not have any material off-balance sheet arrangements. Refer to Note 2 within Notes to Consolidated FinancialStatements for information on our accounts receivable securitization and factoring programs.
Contractual obligationsThe following table summarizes our contractual obligations at December 30, 2017 :
Contractual obligations Payments due by period
(millions) Total 2018 2019 2020 2021 2022 2023 andbeyond
Long-term debt: Principal $ 8,319 407 $ 507 $ 850 $ 600 $ 1,079 $ 4,876Interest (a) 2,306 238 221 211 177 160 1,299
Capital leases (b) 3 1 1 1 — — —Operating leases (c) 455 127 89 61 49 40 89Purchase obligations (d) 1,341 924 306 86 21 3 1Uncertain tax positions (e) 8 8 — — — — —Other long-term obligations (f) 794 166 68 83 96 100 281Total $ 13,226 $ 1,871 $ 1,192 $ 1,292 $ 943 $ 1,382 $ 6,546(a) Includes interest payments on our long-term debt and payments on our interest rate swaps. Interest calculated on our variable rate debt was forecasted using the LIBOR
forward rate curve as of December 30, 2017 .(b) The total expected cash payments on our capital leases include interest expense totaling less than $1 million over the periods presented above.(c) Operating leases represent the minimum rental commitments under non-cancelable operating leases.(d) Purchase obligations consist primarily of fixed commitments for raw materials to be utilized in the normal course of business and for marketing, advertising and other
services. The amounts presented in the table do not include items already recorded in accounts payable or other current liabilities at year-end 2017, nor does the tablereflect cash flows we are likely to incur based on our plans, but are not obligated to incur. Therefore, it should be noted that the exclusion of these items from the table couldbe a limitation in assessing our total future cash flows under contracts.
(e) As of December 30, 2017 , our total liability for uncertain tax positions was $60 million, of which $8 million is expected to be paid in the next twelve months. We are not ableto reasonably estimate the timing of future cash flows related to the remaining $52 million.
(f) Other long-term obligations are those associated with noncurrent liabilities recorded within the Consolidated Balance Sheet at year-end 2017 and consist principally ofprojected commitments under deferred compensation arrangements, multiemployer plans, and supplemental employee retirement benefits. The table also includes ourcurrent estimate of minimum contributions to defined benefit pension and postretirement benefit plans through 2023 as follows: 2018-$56; 2019-$47; 2020-$65; 2021-$77;2022-$76; 2023-$117.In addition, the total tax repatriation payable of $157 million which expected to be paid over the next 8 years is included in the total above.
CRITICAL ACCOUNTING ESTIMATES
Promotional expendituresOur promotional activities are conducted either through the retail trade or directly with consumers and include activities such as in-store displays andevents, feature price discounts, consumer coupons, contests and loyalty programs. The costs of these activities are generally recognized at the time therelated revenue is recorded, which normally precedes the actual cash expenditure. The recognition of these costs therefore requires managementjudgment regarding the volume of promotional offers that will be redeemed by either the retail trade or consumer. These estimates are made usingvarious techniques including historical data on performance of similar promotional programs. Differences between estimated expense and actualredemptions are normally insignificant and recognized as a change in management estimate in a subsequent period. On a full-year basis, thesesubsequent period adjustments represent approximately 0.3% of our company’s net sales. However, our company’s total promotional expenditures(including amounts classified as a revenue reduction) are significant, so it is likely our results would be materially different if different assumptions orconditions were to prevail.
51

PropertyLong-lived assets such as property, plant and equipment are tested for impairment when conditions indicate that the carrying value may not berecoverable. Management evaluates several conditions, including, but not limited to, the following: a significant decrease in the market price of an assetor an asset group; a significant adverse change in the extent or manner in which a long-lived asset is being used, including an extended period ofidleness; and a current expectation that, more likely than not, a long-lived asset or asset group will be sold or otherwise disposed of significantly beforethe end of its previously estimated useful life. For assets to be held and used, we project the expected future undiscounted cash flows generated by thelong-lived asset or asset group over the remaining useful life of the primary asset. If the cash flow analysis yields an amount less than the carryingamount we determine the fair value of the asset or asset group by using comparable market data. There are inherent uncertainties associated with thejudgments and estimates we use in these analyses.
At December 30, 2017 , we have property, plant and equipment of $3.7 billion, net of accumulated depreciation, on our balance sheet. Included in thisamount are approximately $22 million of idle assets.
Goodwill and other intangible assetsWe perform an impairment evaluation of goodwill and intangible assets with indefinite useful lives at least annually during the fourth quarter of each yearin conjunction with our annual budgeting process.
Goodwill impairment testing first requires a comparison between the carrying value and fair value of a reporting unit with associated goodwill. Carryingvalue is based on the assets and liabilities associated with the operations of that reporting unit, which often requires allocation of shared or corporateitems among reporting units. For the 2017 goodwill impairment test, the fair value of the reporting units was estimated based on market multiples.Our approach employs market multiples based on sales, if applicable, and/or earnings before interest, taxes, depreciation and amortization (EBITDA)and earnings for companies comparable to our reporting units. In the event the fair value determined using the market multiples approach is close to thecarrying value, we may also supplement our fair value determination using discounted cash flows. Management believes the assumptions used for theimpairment test are consistent with those utilized by a market participant performing similar valuations for our reporting units.
Similarly, impairment testing of indefinite-lived intangible assets requires a comparison of carrying value to fair value of that particular asset. Fair valuesof non-goodwill intangible assets are based primarily on projections of future cash flows to be generated from that asset. For instance, cash flowsrelated to a particular trademark would be based on a projected royalty stream attributable to branded product sales discounted at rates consistent withrates used by market participants. These estimates are made using various inputs including historical data, current and anticipated market conditions,management plans, and market comparables.
We also evaluate the useful life over which a non-goodwill intangible asset with a finite life is expected to contribute directly or indirectly to our cashflows. Reaching a determination on useful life requires significant judgments and assumptions regarding the future effects of obsolescence, demand,competition, other economic factors (such as the stability of the industry, known technological advances, legislative action that results in an uncertain orchanging regulatory environment, and expected changes in distribution channels), the level of required maintenance expenditures, and the expectedlives of other related groups of assets.
At December 30, 2017 , goodwill and other intangible assets amounted to $8.1 billion, consisting primarily of goodwill and brands associated with the2001 acquisition of Keebler Foods Company and the 2012 acquisition of Pringles. Within this total, approximately $2.5 billion of non-goodwill intangibleassets were classified as indefinite-lived, comprised principally of Keebler and Pringles trademarks. The majority of these intangible assets are recordedin our U.S. Snacks reporting unit. We currently believe that the fair value of our goodwill and other intangible assets exceeds their carrying value andthat those intangibles so classified will contribute indefinitely to our cash flows. The percentage of excess fair value over carrying value of the U.S.Snacks reporting unit was approximately 57% and 41% in 2017 and 2016, respectively. However, if we had used materially different assumptions, whichwe do not believe are reasonably possible, regarding the future performance of our business or a different market multiple in the valuation, this couldhave resulted in significant impairment losses.
Additionally, we have $207 million of goodwill related to our Kashi reporting unit, which was primarily a result of establishing Kashi as a separateoperating segment in 2015, which required an allocation of goodwill from our U.S. Snacks operating segment. The 2017 fair value of the Kashi reportingunit was estimated primarily based on a multiple of net sales and discounted cash flows. The percentage of excess over fair value was approximately30%. The use of modestly different assumptions in the valuation could have resulted in an impairment.
52

Retirement benefitsOur company sponsors a number of U.S. and foreign defined benefit employee pension plans and also provides retiree health care and other welfarebenefits in the United States and Canada. Plan funding strategies are influenced by tax regulations and asset return performance. A substantial majorityof plan assets are invested in a globally diversified portfolio of equity securities with smaller holdings of debt securities and other investments. Werecognize the cost of benefits provided during retirement over the employees’ active working life to determine the obligations and expense related to ourretiree benefit plans. Inherent in this concept is the requirement touse various actuarial assumptions to predict and measure costs and obligations many years prior to the settlement date. Major actuarial assumptionsthat require significant management judgment and have a material impact on the measurement of our consolidated benefits expense and accumulatedobligation include the long-term rates of return on plan assets, the health care cost trend rates, the mortality table and improvement scale, and theinterest rates used to discount the obligations for our major plans, which cover employees in the United States, United Kingdom and Canada.
Our expense recognition policy for pension and nonpension postretirement benefits is to immediately recognize actuarial gains and losses in ouroperating results in the year in which they occur. Actuarial gains and losses are recognized annually as of our measurement date, which is our fiscalyear-end, or when remeasurement is otherwise required under generally accepted accounting principles.
Additionally, for purposes of calculating the expected return on plan assets related to pension and nonpension postretirement benefits we use the fairvalue of plan assets.
To conduct our annual review of the long-term rate of return on plan assets, we model expected returns over a 20-year investment horizon with respectto the specific investment mix of each of our major plans. The return assumptions used reflect a combination of rigorous historical performance analysisand forward-looking views of the financial markets including consideration of current yields on long-term bonds, price-earnings ratios of the major stockmarket indices, and long-term inflation. Our U.S. plan model, corresponding to approximately 71% of our trust assets globally, currently incorporates along-term inflation assumption of 2.5% and an active management premium of 1% (net of fees) validated by historical analysis and future returnexpectations. Although we review our expected long-term rates of return annually, our benefit trust investment performance for one particular year doesnot, by itself, significantly influence our evaluation. Our expected rates of return have generally not been revised, provided these rates continue to fallwithin a “more likely than not” corridor of between the 25th and 75th percentile of expected long-term returns, as determined by our modeling process.Our assumed rate of return for U.S. plans in 2017 of 8.5% equated to approximately the 62nd percentile expectation of our model. Similar methods areused for various foreign plans with invested assets, reflecting local economic conditions. Foreign trust investments represent approximately 29% of ourglobal benefit plan assets.
Based on consolidated benefit plan assets at December 30, 2017 , a 100 basis point increase or decrease in the assumed rate of return wouldcorrespondingly increase or decrease 2018 benefits expense by approximately $62 million. For each of the three fiscal years, our actual return on planassets exceeded (was less than) the recognized assumed return by the following amounts (in millions): 2017-$415; 2016-$84; 2015-$(666).
To conduct our annual review of health care cost trend rates, we model our actual claims cost data over a five-year historical period, including ananalysis of pre-65 versus post-65 age groups and other important demographic components in our covered retiree population. This data is adjusted toeliminate the impact of plan changes and other factors that would tend to distort the underlying cost inflation trends. Our initial health care cost trend rateis reviewed annually and adjusted as necessary to remain consistent with recent historical experience and our expectations regarding short-term futuretrends. In comparison to our actual five-year compound annual claims cost growth rate of approximately 5.19%, our initial trend rate for 2018 of 5.75%reflects the expected future impact of faster-growing claims experience for certain demographic groups within our total employee population. Our initialrate is trended downward by 0.25% per year, until the ultimate trend rate of 4.5% is reached. The ultimate trend rate is adjusted annually, as necessary,to approximate the current economic view on the rate of long-term inflation plus an appropriate health care cost premium. Based on consolidatedobligations at December 30, 2017 , a 100 basis point increase in the assumed health care cost trend rates would increase 2018 benefits expense byapproximately $7 million and generate an immediate loss recognition of $117 million. A one percent increase in 2018 health care claims cost over thatprojected from the assumed trend rate would result in an experience loss of approximately $7 million and would increase 2018 expense by $0.3 million.Any arising health care claims cost-related experience gain or loss is recognized in the year in which they occur. The experience loss arising fromrecognition of 2017 claims experience was approximately $54 million.
53

Assumed mortality rates of plan participants are a critical estimate in measuring the expected payments a participant will receive over their lifetime andthe amount of expense we recognize. At the end of 2014, we revised our mortality assumption after considering the Society of Actuaries' (SOA) updatedmortality tables and improvement scale, as well as other mortality information available from the Social Security Administration to develop assumptionsaligned with our expectation of future improvement rates. In determining the appropriate mortality assumptions as of December 30, 2017, we consideredthe SOA's 2017 updated improvement scale. The SOA's 2017 scale incorporates changes consistent with our view of future mortality improvementsestablished in 2014. Therefore, we adopted the 2017 SOA improvement scale. This change to the mortality assumption decreased the year-end U.S.pension and other postretirement benefit obligations by $21 million and $9 million, respectively.
To conduct our annual review of discount rates, we selected the discount rate based on a cash-flow matching analysis using Willis Towers Watson’sproprietary RATE:Link tool and projections of the future benefit payments constituting the projected benefit obligation for the plans. RATE:Linkestablishes the uniform discount rate that produces the same present value of the estimated future benefit payments, as is generated by discountingeach year’s benefit payments by a spot rate applicable to that year. The spot rates used in this process are derived from a yield curve created fromyields on the 40th to 90th percentile of U.S. high quality bonds. A similar methodology is applied in Canada and Europe, except the smaller bondmarkets imply that yields between the 10th and 90th percentiles are preferable and in the U.K. the underlying yield curve was derived after furtheradjustments to the universe of bonds to remove bonds from issuers where it is not clear if they are truly corporate bonds. We use a December 31measurement date for our defined benefit plans. Accordingly, we select yield curves to measure our benefit obligations that are consistent with marketindices during December of each year.
Based on consolidated obligations at December 30, 2017 , a 25 basis point decline in the yield curve used for benefit plan measurement purposeswould decrease 2018 benefits expense by approximately $4 million and would result in an immediate loss recognition of $239 million. All obligation-related actuarial gains and losses are recognized immediately in the year in which they occur.
Despite the previously-described rigorous policies for selecting major actuarial assumptions, we periodically experience material actuarial gains orlosses due to differences between assumed and actual experience and due to changing economic conditions. During 2017, we recognized a netactuarial gain of approximately $126 million compared to a net actuarial loss of approximately $307 million in 2016. The total net gain recognized in2017 was driven by a $415 million gain from better than expected asset returns, offset by a loss of approximately $289 million of plan experience andassumption changes, including declines in the discount rate which were partially offset by the change in mortality assumptions. During 2017, we alsorecognized curtailment gains of $153 million related to benefit changes and certain events affecting our benefit programs.
Of the total net gain recognized in 2016, approximately $393 million was related to assumption changes, primarily declines in the discount rate whichwere partially offset by the change in mortality assumptions. The loss was offset by an $84 million gain from better than expected asset returns.
During 2017, we made contributions in the amount of $31 million to Kellogg’s global tax-qualified pension programs. This amount was mostly non-discretionary. Additionally we contributed $13 million to our retiree medical programs.
Income taxesOur consolidated effective income tax rate is influenced by tax planning opportunities available to us in the various jurisdictions in which we operate. Thecalculation of our income tax provision and deferred income tax assets and liabilities is complex and requires the use of estimates and judgment.
We recognize tax benefits associated with uncertain tax positions when, in our judgment, it is more likely than not that the positions will be sustainedupon examination by a taxing authority. For tax positions that meet the more likely than not recognition threshold, we initially and subsequently measurethe tax benefits as the largest amount that we judge to have a greater than 50% likelihood of being realized upon ultimate settlement. Our liabilityassociated with unrecognized tax benefits is adjusted periodically due to changing circumstances, such as the progress of tax audits, new or emerginglegislation and tax planning. The tax position will be derecognized when it is no longer more likely than not of being sustained. Significant adjustments toour liability for unrecognized tax benefits impacting our effective tax rate are separately presented in the rate reconciliation table of Note 13 within Notesto Consolidated Financial Statements.
54
On December 22, 2017, the U.S. government enacted comprehensive tax legislation commonly referred to as the Tax Cuts and Jobs Act (Tax Act). TheTax Act makes broad and complex changes to the U.S. tax code including a one-time transition tax on certain current and accumulated earnings andprofits of certain of our foreign subsidiaries. In order to determine the amount of the transition tax, we must determine, in addition to other factors, theamount of post-1986 earnings and profits (E&P) of the relevant subsidiaries, as well as the amount of non-U.S. income taxes paid on such earnings.E&P is similar to retained earnings of the subsidiary, but requires other adjustments to conform to U.S. tax rules. We are able to make a reasonableestimate of the transition tax and recorded a transition tax obligation of $157 million which we expect to elect to pay over eight years. The current portionof $17 million is included in Other current liabilities and the remainder is included within Other liabilities on the balance sheet. However, we are awaitingfurther interpretative guidance, continuing to assess available tax methods and elections, and continuing to gather additional information to moreprecisely compute the amount of the transition tax liability.
In addition to the transition tax, the Tax Act introduced a territorial tax system, which will be effective beginning in 2018. As of the year-ended December30, 2017, we have accumulated foreign earnings and profits of approximately $2.6 billion, which are primarily in Europe. As our accumulated foreignearnings and profits continue to be indefinitely reinvested and the company is still finalizing its assessment of the territorial tax system and the Tax Acton its indefinite reinvestment assertion on a go-forward basis, it is impracticable for us to estimate a future tax cost for any unrecognized deferred taxliabilities because the actual tax liability, if any, would be dependent on complex analysis and calculations considering various tax laws, exchange rates,circumstances existing when a repatriation, sale, or liquidation occurs, and other factors.
Management monitors the Company’s ability to utilize certain future tax deductions, operating losses and tax credit carryforwards, prior to expiration.Changes resulting from management’s assessment will result in impacts to deferred tax assets and the corresponding impacts on the effective incometax rate. Valuation allowances were recorded to reduce deferred tax assets to an amount that will, more likely than not, be realized in the future.
ACCOUNTING STANDARDS TO BE ADOPTED IN FUTURE PERIODSDerivatives and Hedging: Targeted Improvements to Accounting for Hedging Activities. In August 2017, the Financial Accounting Standards Board(FASB) issued an Accounting Standards Update (ASU) intended to simplify hedge accounting by better aligning an entity’s financial reporting forhedging relationships with its risk management activities. The ASU also simplifies the application of the hedge accounting guidance. The new guidanceis effective on January 1, 2019, with early adoption permitted. For cash flow hedges existing at the adoption date, the standard requires adoption on amodified retrospective basis with a cumulative-effect adjustment to the Consolidated Balance Sheet as of the beginning of the year of adoption. Theamendments to presentation guidance and disclosure requirements are required to be adopted prospectively. We will adopt the new ASU in the firstquarter of 2018 and are currently evaluating the impact of adoption.
Improving the Presentation of net Periodic Pension Cost and net Periodic Postretirement Benefit Cost. In March 2017, the FASB issued an ASU toimprove the presentation of net periodic pension cost and net periodic postretirement benefit cost. The ASU requires that an employer report the servicecost component in the same line item or items as other compensation costs arising from services rendered by the pertinent employees during theperiod. The other components of net benefit cost are required to be presented in the income statement separately from the service cost component andoutside a subtotal of income from operations, if one is presented. The ASU is effective for fiscal years, and interim periods within those years, beginningafter December 15, 2017. Early adoption is permitted, as of the beginning of an annual reporting period for which financial statements (interim or annual)have not been issued or made available for issuance. That is, early adoption should be the first interim period if an entity issues interim financialstatements. The amendments in this ASU should be applied retrospectively for the presentation of the service cost component and the othercomponents of net periodic pension cost and net periodic postretirement benefit cost in the income statement and prospectively, on and after theeffective date, for the capitalization of the service cost component of net periodic pension cost and net periodic postretirement benefit in assets. We willadopt the ASU in the first quarter of 2018. If we had adopted the ASU in the first quarter of 2017, on an as reported basis, the impact to our Corporatesegment would have been an increase to COGS and SG&A of $325 million and $217 million, respectively, with an offsetting decrease to other income(expense), net (OIE) of $542 million in the year ended December 30, 2017. For the year ended December 31, 2016, the impact to our Corporatesegment would have been a decrease to COGS and SG&A of $54 million and $26 million, respectively, with an offsetting increase to OIE of $80 million.Adoption will have no impact on net
55

income or cash flow. The impact to the Consolidated Balance Sheet at December 30, 2017 and December 31, 2016 would have been immaterial.
On a comparable basis, the impact would have been an increase to COGS and SG&A of $169 million and $99 million, respectively, with an offsettingdecrease to OIE of $274 million in the year ended December 30, 2017. On a comparable basis for the year ended December 31, 2016, the impactwould have been an increase to COGS and SG&A of $143 million and $82 million, respectively, with an offsetting decrease to OIE of $225 million.Simplifying the test for goodwill impairment. In January 2017, the FASB issued an ASU to simplify how an entity is required to test goodwill forimpairment by eliminating Step 2 from the goodwill impairment test. Step 2 measures a goodwill impairment loss by comparing the implied fair value of areporting unit's goodwill with the carrying amount of that goodwill. The ASU is effective for annual or interim goodwill impairment tests in fiscal yearsbeginning after December 15, 2019. Early adoption is permitted for interim or annual goodwill impairment tests performed on testing dates after January1, 2017. The amendments in this ASU should be applied on a prospective basis. We are currently assessing the impact and timing of adoption of thisASU.
Classification of certain cash receipts and payments. In August 2016, the FASB issued an ASU to provide cash flow statement classification guidancefor certain cash receipts and payments including (a) debt prepayment or extinguishment costs; (b) contingent consideration payments made after abusiness combination; (c) insurance settlement proceeds; (d) distributions from equity method investees; (e) beneficial interests in securitizationtransactions and (f) application of the predominance principle for cash receipts and payments with aspects of more than one class of cash flows. TheASU is effective for fiscal years, and interim periods within those years, beginning after December 15, 2017. Early adoption is permitted, includingadoption in an interim period, in which case adjustments should be reflected as of the beginning of the fiscal year that includes the interim period. Theamendments in this ASU should be applied retrospectively. We will adopt the new ASU in the first quarter of 2018 and are currently evaluating theimpact of adoption.Leases. In February 2016, the FASB issued an ASU which will require the recognition of lease assets and lease liabilities by lessees for all leases withterms greater than 12 months. The distinction between finance leases and operating leases will remain, with similar classification criteria as currentGAAP to distinguish between capital and operating leases. The principal difference from current guidance is that the lease assets and lease liabilitiesarising from operating leases will be recognized on the Consolidated Balance Sheet. Lessor accounting remains substantially similar to current GAAP.The ASU is effective for fiscal years, and interim periods within those years, beginning after December 15, 2018. Early adoption is permitted. We willadopt the new ASU in the first quarter of 2019 and are currently evaluating the impact that implementing this ASU will have on our financial statementsand disclosures. Please refer to Note 7 for a summary of our undiscounted minimum rental commitments under operating leases as of December 30,2017.
Recognition and measurement of financial assets and liabilities. In January 2016, the FASB issued an ASU which primarily affects the accounting forequity investments, financial liabilities under the fair value option, and the presentation and disclosure requirements for financial instruments. The ASUis effective for fiscal years, and interim periods within those years, beginning after December 15, 2017. Early adoption can be elected for all financialstatements of fiscal years and interim periods that have not yet been issued or that have not yet been made available for issuance. Entities should applythe update by means of a cumulative-effect adjustment to the balance sheet as of the beginning of the fiscal year of adoption. We will adopt the updatedstandard in the first quarter of 2018 and do not expect the adoption of this guidance to have a material impact on our financial statements.
Revenue from contracts with customers. In May 2014, the FASB issued an ASU which provides guidance for accounting for revenue from contracts withcustomers across all industries, with final amendments issued in 2016. The core principle of this ASU is that an entity should recognize revenue todepict the transfer of promised goods or services to customers in an amount that reflects the consideration the entity expects to be entitled to inexchange for those goods or services. To achieve that core principle, an entity would be required to apply the following five steps: 1) identify thecontract(s) with a customer; 2) identify the performance obligations in the contract; 3) determine the transaction price; 4) allocate the transaction price tothe performance obligations in the contract and 5) recognize revenue when (or as) the entity satisfies a performance obligation. The standard also callsfor additional disclosures around the nature, amount, timing and uncertainty of revenue and cash flows arising from contracts with customers, includingsignificant judgments and changes in judgments. When the ASU was originally
56

issued it was effective for fiscal years, and interim periods within those years, beginning after December 15, 2016, and early adoption was not permitted.On July 9, 2015, the FASB decided to delay the effective date of the new revenue standard by one year. The updated standard will be effective for fiscalyears, and interim periods within those years, beginning after December 15, 2017. Entities will be permitted to adopt the new revenue standard early,but not before the original effective date. Entities will have the option to apply the final standard retrospectively or use a modified retrospective method,recognizing the cumulative effect of the ASU in retained earnings at the date of initial application. We will adopt the guidance in the first quarter of 2018using the full retrospective transition method which requires restating each prior reporting period presented. The adoption is not expected to have amaterial impact on our financial statements and is limited to timing and classification differences as well as disaggregated revenue disclosures.
FUTURE OUTLOOKWe provide net sales guidance on a currency-neutral basis. On this basis, we expect net sales to be flat in 2018. The October acquisition of RXBAR isexpected to contribute 1-2% growth offset by a 1% decline related to the negative impact of our exit from Direct Store Delivery (DSD) in U.S. Snacks,including list-price adjustments and rationalization of stock-keeping units, and a flat to 1% decrease for the remainder of our business.
From a profitability standpoint, we expect currency-neutral adjusted operating profit to increase 4-6% during 2018. RXBAR is expected to contribute 1-2% of this growth, while the remaining growth is driven by remaining Project K and ZBB savings, partially offset by an increase in brand building. Theresultant operating profit margin reaches our publicly stated margin-expansion target, excluding the impact of pending accounting changes.
Finally, we expect currency-neutral adjusted EPS to grow in the range of 9 to 11% in 2018. This growth incorporates an effective tax rate of 20-21%, 5-6% lower than 2017 as a result of U.S. Tax Reform. The tax benefit is partially offset by the impact of de-leveraging our capital structure and de-riskingpension plans by making additional contributions or adjusting target pension asset allocations plans to a more conservative investment mix, which wouldbe accompanied by a reduction in our Expected Return on Assets assumption.
We expect that full-year cash flow will be between $1.2 and $1.3 billion, with year on year growth driven by higher net income, sustained working capitalimprovement, and the benefits of U.S. Tax Reform. Our guidance includes remaining cash outlays related to Project K and capital expenditures ofapproximately $500 million.
2018 Non-GAAP Financial MeasuresStarting in 2018, the Company is modifying its presentation of non-GAAP measurements. This modification aligns with how the Company assesses itsreporting segments, which now includes the delivery of objectives for acquired businesses, and presents performance in a way that is more simple anduseful to investors, using nomenclature that is used by peer companies. Non-GAAP financial measures used for 2018 guidance include organic netsales, adjusted operating profit, adjusted diluted EPS, and cash flow. These non-GAAP financial measures are also evaluated for year-over-year growthand on a currency-neutral basis to evaluate the underlying growth of the business and to exclude the effect of foreign currency. We determine currency-neutral operating results by dividing or multiplying, as appropriate, the current-period local currency operating results by the currency exchange ratesused to translate our financial statements in the comparable prior-year period to determine what the current period U.S. dollar operating results wouldhave been if the currency exchange rate had not changed from the comparable prior-year period. These non-GAAP financial measures may not becomparable to similar measures used by other companies.
• Currency-neutral net sales and organic net sales : We adjust the GAAP financial measure to exclude the impact of foreign currency, resulting incurrency-neutral sales. In addition, we exclude the impact of acquisitions, dispositions, related integration costs, shipping day differences, andforeign currency, resulting in organic net sales. We excluded the items which we believe may obscure trends in our underlying net salesperformance. By providing these non-GAAP net sales measures, management intends to provide investors with a meaningful, consistentcomparison of net sales performance for the Company and each of our reportable segments for the periods presented. Management usesthese non-GAAP measures to evaluate the effectiveness of initiatives behind net sales growth, pricing realization, and the impact of mix on ourbusiness results. These non-GAAP measures are also used to make decisions regarding the future direction of our business, and for resourceallocation decisions.
• Currency-neutral adjusted operating profit and adjusted diluted EPS: We adjust the GAAP financial measures to exclude the effect of Project Kand cost reduction activities, mark-to-market adjustments for
57
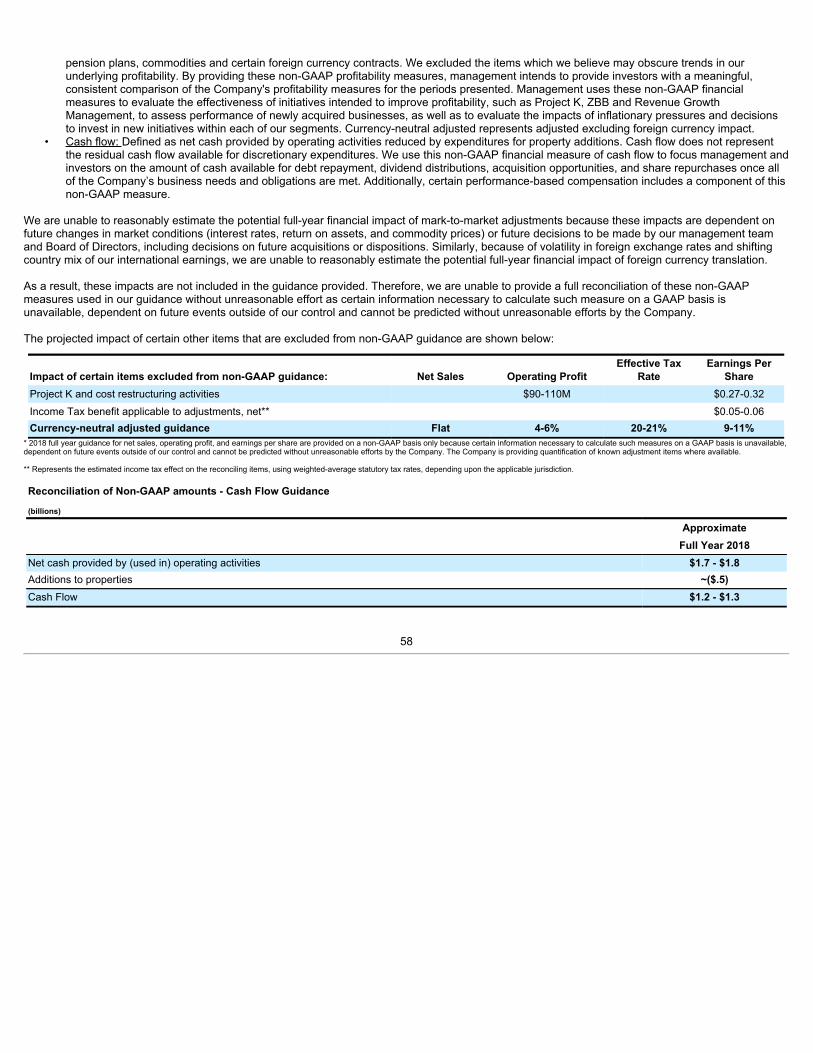
pension plans, commodities and certain foreign currency contracts. We excluded the items which we believe may obscure trends in ourunderlying profitability. By providing these non-GAAP profitability measures, management intends to provide investors with a meaningful,consistent comparison of the Company's profitability measures for the periods presented. Management uses these non-GAAP financialmeasures to evaluate the effectiveness of initiatives intended to improve profitability, such as Project K, ZBB and Revenue GrowthManagement, to assess performance of newly acquired businesses, as well as to evaluate the impacts of inflationary pressures and decisionsto invest in new initiatives within each of our segments. Currency-neutral adjusted represents adjusted excluding foreign currency impact.
• Cash flow: Defined as net cash provided by operating activities reduced by expenditures for property additions. Cash flow does not representthe residual cash flow available for discretionary expenditures. We use this non-GAAP financial measure of cash flow to focus management andinvestors on the amount of cash available for debt repayment, dividend distributions, acquisition opportunities, and share repurchases once allof the Company’s business needs and obligations are met. Additionally, certain performance-based compensation includes a component of thisnon-GAAP measure.
We are unable to reasonably estimate the potential full-year financial impact of mark-to-market adjustments because these impacts are dependent onfuture changes in market conditions (interest rates, return on assets, and commodity prices) or future decisions to be made by our management teamand Board of Directors, including decisions on future acquisitions or dispositions. Similarly, because of volatility in foreign exchange rates and shiftingcountry mix of our international earnings, we are unable to reasonably estimate the potential full-year financial impact of foreign currency translation.
As a result, these impacts are not included in the guidance provided. Therefore, we are unable to provide a full reconciliation of these non-GAAPmeasures used in our guidance without unreasonable effort as certain information necessary to calculate such measure on a GAAP basis isunavailable, dependent on future events outside of our control and cannot be predicted without unreasonable efforts by the Company.
The projected impact of certain other items that are excluded from non-GAAP guidance are shown below:
Impact of certain items excluded from non-GAAP guidance: Net Sales Operating ProfitEffective Tax
RateEarnings Per
ShareProject K and cost restructuring activities $90-110M $0.27-0.32Income Tax benefit applicable to adjustments, net** $0.05-0.06Currency-neutral adjusted guidance Flat 4-6% 20-21% 9-11%
* 2018 full year guidance for net sales, operating profit, and earnings per share are provided on a non-GAAP basis only because certain information necessary to calculate such measures on a GAAP basis is unavailable,dependent on future events outside of our control and cannot be predicted without unreasonable efforts by the Company. The Company is providing quantification of known adjustment items where available.
** Represents the estimated income tax effect on the reconciling items, using weighted-average statutory tax rates, depending upon the applicable jurisdiction.
Reconciliation of Non-GAAP amounts - Cash Flow Guidance
(billions)
Approximate Full Year 2018Net cash provided by (used in) operating activities $1.7 - $1.8Additions to properties ~($.5)Cash Flow $1.2 - $1.3
58

ITEM 7A. QUANTITATIVE AND QUALITATIVE DISCLOSURES ABOUT MARKET RISK
Our company is exposed to certain market risks, which exist as a part of our ongoing business operations. We use derivative financial and commodityinstruments, where appropriate, to manage these risks. As a matter of policy, we do not engage in trading or speculative transactions. Refer to Note 14within Notes to Consolidated Financial Statements for further information on our derivative financial and commodity instruments.
Foreign exchange riskOur company is exposed to fluctuations in foreign currency cash flows related primarily to third-party purchases, intercompany transactions, and whenapplicable, nonfunctional currency denominated third-party debt. Our company is also exposed to fluctuations in the value of foreign currencyinvestments in subsidiaries and cash flows related to repatriation of these investments. Additionally, our company is exposed to volatility in thetranslation of foreign currency denominated earnings to U.S. dollars. Primary exposures include the U.S. dollar versus the euro, British pound, Mexicanpeso, Australian dollar, Canadian dollar, Russian ruble, Brazilian Real and Nigerian Naira and in the case of inter-subsidiary transactions, the Britishpound versus the euro. We assess foreign currency risk based on transactional cash flows and translational volatility and may enter into forwardcontracts, options, and currency swaps to reduce fluctuations in long or short currency positions. Forward contracts and options are generally less than18 months duration. Currency swap agreements may be established in conjunction with the term of underlying debt issuances.
The total notional amount of foreign currency derivative instruments at year-end 2017 was $2.2 billion, representing a settlement obligation of $4 million.The total notional amount of foreign currency derivative instruments at year-end 2016 was $1.4 billion, representing a settlement receivable of $16million. All of these derivatives were hedges of anticipated transactions, translational exposure, or existing assets or liabilities, and mature within18 months. Assuming an unfavorable 10% change in year-end exchange rates, the settlement obligation would have increased by $71 million at year-end 2017 and the settlement receivable at year-end 2016 would have become a settlement obligation of $46 million. These unfavorable changes wouldgenerally have been offset by favorable changes in the values of the underlying exposures.
Interest rate riskOur company is exposed to interest rate volatility with regard to future issuances of fixed rate debt and existing and future issuances of variable ratedebt. Primary exposures include movements in U.S. Treasury rates, London Interbank Offered Rates (LIBOR), and commercial paper rates. Weperiodically use interest rate swaps and forward interest rate contracts to reduce interest rate volatility and funding costs associated with certain debtissues, and to achieve a desired proportion of variable versus fixed rate debt, based on current and projected market conditions.During 2017 and 2016 , we entered into interest rate swaps, and in some instances terminated interest rate swaps, in connection with certain U.S. Dollarand Euro Notes. Refer to Note 8 within Notes to Consolidated Financial Statements. The total notional amount of interest rate swaps at year-end 2017was $2.3 billion, representing a settlement obligation of $54 million. The total notional amount of interest rate swaps at year-end 2016 was $2.2 billion,representing a settlement obligation of $64 million. Assuming average variable rate debt levels during the year, a one percentage point increase ininterest rates would have increased interest expense by approximately $27 million and $17 million at year-end 2017 and 2016, respectively.
Price riskOur company is exposed to price fluctuations primarily as a result of anticipated purchases of raw and packaging materials, fuel, and energy. Primaryexposures include corn, wheat, potato flakes, soybean oil, sugar, cocoa, cartonboard, natural gas, and diesel fuel. We have historically used thecombination of long-term contracts with suppliers, and exchange-traded futures and option contracts to reduce price fluctuations in a desired percentageof forecasted raw material purchases over a duration of generally less than 18 months.
The total notional amount of commodity derivative instruments at year-end 2017 was $544 million, representing a settlement obligation of approximately$1 million. The total notional amount of commodity derivative instruments at year-end 2016 was $437 million, representing a settlement receivable ofapproximately $6 million. Assuming a 10% decrease in year-end commodity prices, the settlement obligation would have increased by $41 million atyear-end 2017 , and the settlement obligation would have increased by approximately $20 million at year-end 2016 , generally offset by a reduction inthe cost of the underlying commodity purchases.
In addition to the commodity derivative instruments discussed above, we use long-term contracts with suppliers to manage a portion of the priceexposure associated with future purchases of certain raw materials, including rice,
59

sugar, cartonboard, and corrugated boxes. It should be noted the exclusion of these contracts from the analysis above could be a limitation in assessingthe net market risk of our company.
Reciprocal collateralization agreementsIn some instances we have reciprocal collateralization agreements with counterparties regarding fair value positions in excess of certain thresholds.These agreements call for the posting of collateral in the form of cash, treasury securities or letters of credit if a net liability position to us or ourcounterparties exceeds a certain amount. As of December 30, 2017 and December 31, 2016 , we had posted collateral of $20 million and $41 million,respectively, in the form of cash, which was reflected as an increase in accounts receivable, net on the Consolidated Balance Sheet. As ofDecember 30, 2017 and December 31, 2016 , we posted $17 million and $7 million, respectively, in margin deposits for exchange-traded commodityderivative instruments, which was reflected as an increase in accounts receivable, net on the Consolidated Balance Sheet.
60

ITEM 8. FINANCIAL STATEMENTS AND SUPPLEMENTARY DATA
Kellogg Company and Subsidiaries
CONSOLIDATED STATEMENT OF INCOME(millions, except per share data) 2017 2016 2015Net sales $ 12,923 $ 13,014 $ 13,525Cost of goods sold 7,901 8,259 8,844Selling, general and administrative expense 3,076 3,360 3,590Operating profit $ 1,946 $ 1,395 $ 1,091Interest expense 256 406 227Other income (expense), net (16) (62) (91)Income before income taxes 1,674 927 773Income taxes 412 233 159Earnings (loss) from unconsolidated entities 7 1 —Net income $ 1,269 $ 695 $ 614Net income (loss) attributable to noncontrolling interests — 1 —Net income attributable to Kellogg Company $ 1,269 $ 694 $ 614Per share amounts: Basic $ 3.65 $ 1.98 $ 1.74Diluted $ 3.62 $ 1.96 $ 1.72
Dividends per share $ 2.12 $ 2.04 $ 1.98
Refer to Notes to Consolidated Financial Statements.
61

Kellogg Company and Subsidiaries
CONSOLIDATED STATEMENT OF COMPREHENSIVE INCOME
2017 2016 2015
(millions) Pre-taxamount
Tax(expense)
benefitAfter-taxamount Pre-tax
amount
Tax(expense)benefit
After-taxamount Pre-tax
amount
Tax(expense)benefit
After-taxamount
Net income $ 1,269 $ 695 $ 614
Other comprehensive income:
Foreign currency translation adjustments $ (34) $ 113 79 $ (230) $ (24) (254) $ (170) $ (26) (196)
Cash flow hedges:
Unrealized gain (loss) on cash flow hedges — — — (55) 22 (33) 8 (3) 5
Reclassification to net income 9 (3) 6 11 (6) 5 (23) 3 (20)
Postretirement and postemployment benefits:
Amounts arising during the period:
Net experience gain (loss) 44 (12) 32 25 (9) 16 — — —
Prior service credit (cost) — — — (4) 2 (2) 63 (24) 39
Reclassification to net income:
Net experience loss — — — 3 (1) 2 3 (1) 2
Prior service cost 1 — 1 5 (1) 4 9 (3) 6
Venezuela deconsolidation loss — — — 63 — 63 — — —
Other comprehensive income (loss) $ 20 $ 98 $ 118 $ (182) $ (17) $ (199) $ (110) $ (54) $ (164)
Comprehensive income $ 1,387 $ 496 $ 450
Net income (loss) attributable to noncontrolling interests — 1 —Other comprehensive income (loss) attributable tononcontrolling interests — — (1)
Comprehensive income attributable to Kellogg Company $ 1,387 $ 495 $ 451
Refer to notes to Consolidated Financial Statements.
62

Kellogg Company and Subsidiaries
CONSOLIDATED BALANCE SHEET
(millions, except share data) 2017 2016Current assets Cash and cash equivalents $ 281 $ 280Accounts receivable, net 1,389 1,231Inventories 1,217 1,238Other current assets 149 191Total current assets 3,036 2,940Property, net 3,716 3,569Goodwill 5,504 5,166Other intangibles, net 2,639 2,369Investment in unconsolidated entities 429 438Other assets 1,026 629Total assets $ 16,350 $ 15,111Current liabilities Current maturities of long-term debt $ 409 $ 631Notes payable 370 438Accounts payable 2,269 2,014Other current liabilities 1,431 1,391Total current liabilities 4,479 4,474Long-term debt 7,836 6,698Deferred income taxes 363 525Pension liability 839 1,024Other liabilities 605 464Commitments and contingencies Equity Common stock, $.25 par value, 1,000,000,000 shares authorizedIssued: 420,514,582 shares in 2017 and 420,472,901 shares in 2016 105 105Capital in excess of par value 878 806Retained earnings 7,103 6,571Treasury stock, at cost74,911,865 shares in 2017 and 69,403,567 shares in 2016 (4,417) (3,997)Accumulated other comprehensive income (loss) (1,457) (1,575)Total Kellogg Company equity 2,212 1,910Noncontrolling interests 16 16Total equity 2,228 1,926Total liabilities and equity $ 16,350 $ 15,111
Refer to Notes to Consolidated Financial Statements.
63
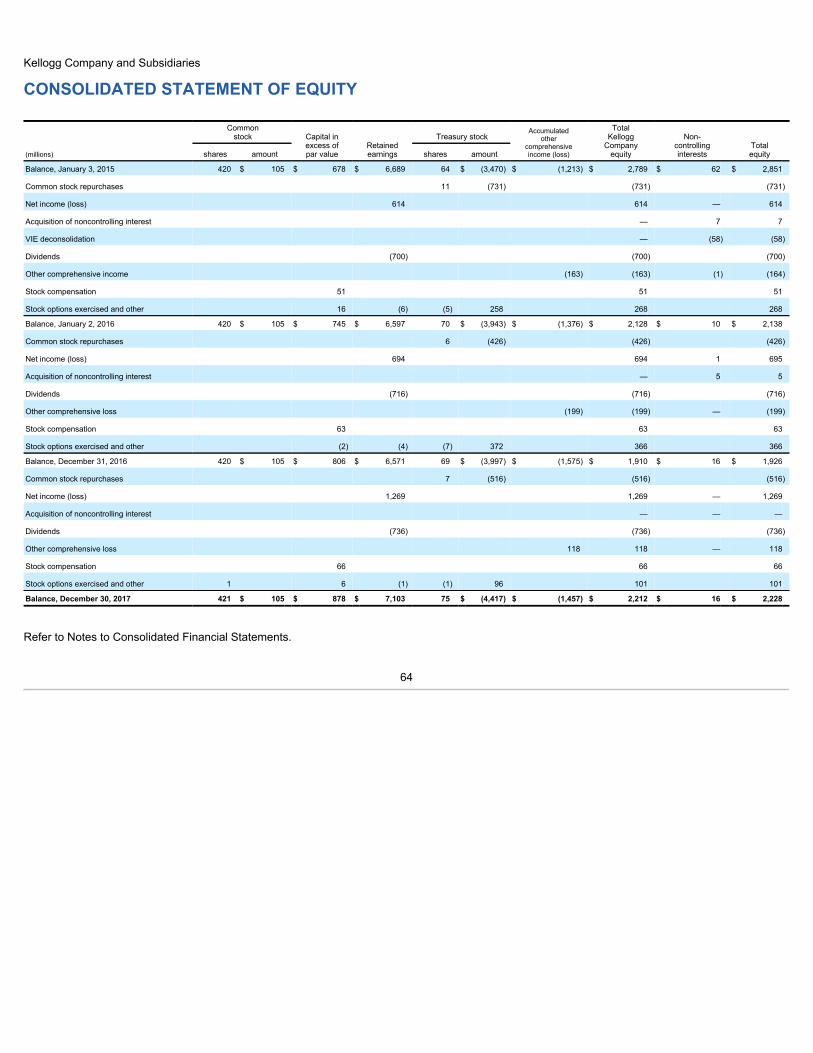
Kellogg Company and Subsidiaries
CONSOLIDATED STATEMENT OF EQUITY
(millions)
Commonstock Capital in
excess ofpar value
Retainedearnings
Treasury stockAccumulated
othercomprehensiveincome (loss)
TotalKelloggCompanyequity
Non-controllinginterests
Totalequityshares amount shares amount
Balance, January 3, 2015 420 $ 105 $ 678 $ 6,689 64 $ (3,470) $ (1,213) $ 2,789 $ 62 $ 2,851
Common stock repurchases 11 (731) (731) (731)
Net income (loss) 614 614 — 614
Acquisition of noncontrolling interest — 7 7
VIE deconsolidation — (58) (58)
Dividends (700) (700) (700)
Other comprehensive income (163) (163) (1) (164)
Stock compensation 51 51 51
Stock options exercised and other 16 (6) (5) 258 268 268
Balance, January 2, 2016 420 $ 105 $ 745 $ 6,597 70 $ (3,943) $ (1,376) $ 2,128 $ 10 $ 2,138
Common stock repurchases 6 (426) (426) (426)
Net income (loss) 694 694 1 695
Acquisition of noncontrolling interest — 5 5
Dividends (716) (716) (716)
Other comprehensive loss (199) (199) — (199)
Stock compensation 63 63 63
Stock options exercised and other (2) (4) (7) 372 366 366
Balance, December 31, 2016 420 $ 105 $ 806 $ 6,571 69 $ (3,997) $ (1,575) $ 1,910 $ 16 $ 1,926
Common stock repurchases 7 (516) (516) (516)
Net income (loss) 1,269 1,269 — 1,269
Acquisition of noncontrolling interest — — —
Dividends (736) (736) (736)
Other comprehensive loss 118 118 — 118
Stock compensation 66 66 66
Stock options exercised and other 1 6 (1) (1) 96 101 101
Balance, December 30, 2017 421 $ 105 $ 878 $ 7,103 75 $ (4,417) $ (1,457) $ 2,212 $ 16 $ 2,228
Refer to Notes to Consolidated Financial Statements.
64

Kellogg Company and Subsidiaries
CONSOLIDATED STATEMENT OF CASH FLOWS(millions) 2017 2016 2015Operating activities Net income $ 1,269 $ 695 $ 614Adjustments to reconcile net income to operating cash flows: Depreciation and amortization 481 517 534Postretirement benefit plan expense (427) 198 320Deferred income taxes (56) (26) (169)Stock compensation 66 63 51Venezuela deconsolidation — 72 —Venezuela remeasurement — 11 169VIE deconsolidation — — (49)Noncurrent income taxes payable 144 (12) (21)Other 27 (62) 8
Postretirement benefit plan contributions (44) (33) (33)Changes in operating assets and liabilities, net of acquisitions: Trade receivables (57) 21 (127)Inventories 80 7 (42)Accounts payable 193 124 427Accrued income taxes (29) 4 29Accrued interest expense 3 7 5Accrued and prepaid advertising, promotion and trade allowances 34 14 7Accrued salaries and wages (27) (7) 20All other current assets and liabilities (11) 35 (52)
Net cash provided by (used in) operating activities $ 1,646 $ 1,628 $ 1,691Investing activities Additions to properties $ (501) $ (507) $ (553)Acquisitions, net of cash acquired (592) (398) (161)Reduction of cash due to Venezuela deconsolidation
— (2) —Investments in unconsolidated entities — 27 (456)Acquisition of cost method investments (7) (2) —Other 6 (11) 43Net cash provided by (used in) investing activities $ (1,094) $ (893) $ (1,127)Financing activities Net increase (reduction) of notes payable, with maturities less than or equal to 90 days 153 (918) 443Issuances of notes payable, with maturities greater than 90 days 17 1,961 214Reductions of notes payable, with maturities greater than 90 days (238) (1,831) (283)Issuances of long-term debt 1,251 2,657 696Reductions of long-term debt (632) (1,737) (606)Net issuances of common stock 97 368 261Common stock repurchases (516) (426) (731)Cash dividends (736) (716) (700)Net cash provided by (used in) financing activities $ (604) $ (642) $ (706)Effect of exchange rate changes on cash and cash equivalents 53 (64) (50)Increase (decrease) in cash and cash equivalents $ 1 $ 29 $ (192)Cash and cash equivalents at beginning of period 280 251 443Cash and cash equivalents at end of period $ 281 $ 280 $ 251
Supplemental cash flow disclosures: Interest paid $ 258 $ 405 $ 228 Income taxes paid $ 352 $ 256 $ 337
Supplemental cash flow disclosures of non-cash investing activities:

Additions to properties included in accounts payable $ 151 $ 161 $ 147
Refer to Notes to Consolidated Financial Statements.
65

Kellogg Company and Subsidiaries
Notes to Consolidated Financial Statements NOTE 1ACCOUNTING POLICIES
Basis of presentationThe consolidated financial statements include the accounts of the Kellogg Company, those of the subsidiaries that it controls due to ownership of amajority voting interest and the accounts of the variable interest entities (VIEs) of which Kellogg Company is the primary beneficiary (Kellogg or theCompany). The Company continually evaluates its involvement with VIEs to determine whether it has variable interests and is the primary beneficiary ofthe VIE. When these criteria are met, the Company is required to consolidate the VIE. The Company’s share of earnings or losses of nonconsolidatedaffiliates is included in its consolidated operating results using the equity method of accounting when it is able to exercise significant influence over theoperating and financial decisions of the affiliate. The Company uses the cost method of accounting if it is not able to exercise significant influence overthe operating and financial decisions of the affiliate. Intercompany balances and transactions are eliminated.
The Company’s fiscal year normally ends on the Saturday closest to December 31 and as a result, a 53rd week is added approximately every sixthyear. The Company’s 2017, 2016 and 2015 fiscal years each contained 52 weeks and ended on December 30, 2017 , December 31, 2016 , andJanuary 2, 2016, respectively.
Use of estimatesThe preparation of financial statements in conformity with accounting principles generally accepted in the United States of America requiresmanagement to make estimates and assumptions that affect the reported amounts of assets and liabilities, the disclosure of contingent liabilities at thedate of the financial statements and the reported amounts of revenues and expenses during the periods reported. Actual results could differ from thoseestimates.
Cash and cash equivalentsHighly liquid investments with remaining stated maturities of three months or less when purchased are considered cash equivalents and recorded atcost.
Accounts receivableAccounts receivable consists principally of trade receivables, which are recorded at the invoiced amount, net of allowances for doubtful accounts andprompt payment discounts. Trade receivables do not bear interest. The allowance for doubtful accounts represents management’s estimate of theamount of probable credit losses in existing accounts receivable, as determined from a review of past due balances and other specific account data.Account balances are written off against the allowance when management determines the receivable is uncollectible. As of year-end 2017 and 2016 ,the Company's off-balance sheet credit exposure related to its customers was immaterial. Please refer to Note 2 for information on sales of accountsreceivable.
Inventories Inventories are valued at the lower of cost or net realizable value. Cost is determined on an average cost basis.
PropertyThe Company’s property consists mainly of plants and equipment used for manufacturing activities. These assets are recorded at cost and depreciatedover estimated useful lives using straight-line methods for financial reporting and accelerated methods, where permitted, for tax reporting. Majorproperty categories are depreciated over various periods as follows (in years): manufacturing machinery and equipment 5 - 30 ; office equipment 4 - 5 ;computer equipment and capitalized software 3 - 7 ; building components 15 - 25 ; building structures 30 - 50 . Cost includes interest associated withsignificant capital projects. Plant and equipment are reviewed for impairment when conditions indicate that the carrying value may not be recoverable.Such conditions include an extended period of idleness or a plan of disposal. Assets to be disposed of at a future date are depreciated over theremaining period of use. Assets to be sold are written down to realizable value at the time the assets are being actively marketed for sale and a sale isexpected to occur within one year. As of year-end 2017 and 2016 , the carrying value of assets held for sale was immaterial.
66

Goodwill and other intangible assetsGoodwill and indefinite-lived intangibles are not amortized, but are tested at least annually for impairment of value and whenever events or changes incircumstances indicate the carrying amount of the asset may be impaired. An intangible asset with a finite life is amortized on a straight-line basis overthe estimated useful life.
For the goodwill impairment test, the fair value of the reporting units are estimated based on market multiples. This approach employs market multiplesbased on earnings before interest, taxes, depreciation and amortization and earnings for companies that are comparable to the Company’s reportingunits. In the event the fair value determined using the market multiple approach is close to carrying value, the Company may supplement the fair valuedetermination using discounted cash flows. The assumptions used for the impairment test are consistent with those utilized by a market participantperforming similar valuations for the Company’s reporting units.
Similarly, impairment testing of other intangible assets requires a comparison of carrying value to fair value of that particular asset. Fair values of non-goodwill intangible assets are based primarily on projections of future cash flows to be generated from that asset. For instance, cash flows related to aparticular trademark would be based on a projected royalty stream attributable to branded product sales, discounted at rates consistent with rates usedby market participants.
These estimates are made using various inputs including historical data, current and anticipated market conditions, management plans, and marketcomparables.
Accounts payableThe Company has agreements with third parties to provide accounts payable tracking systems which facilitate participating suppliers’ ability to monitorand, if elected, sell payment obligations from the Company to designated third-party financial institutions. Participating suppliers may, at their solediscretion, make offers to sell one or more payment obligations of the Company prior to their scheduled due dates at a discounted price to participatingfinancial institutions. The Company’s goal in entering into the agreements is to capture overall supplier savings, in the form of payment terms or vendorfunding, created by facilitating suppliers’ ability to sell payment obligations, while providing them with greater working capital flexibility. The Companyhas no economic interest in the sale of these suppliers’ receivables and no direct financial relationship with the financial institutions concerning theseservices. The Company’s obligations to its suppliers, including amounts due and scheduled payment dates, are not impacted by suppliers’ decisions tosell amounts under the arrangements. However, the Company’s right to offset balances due from suppliers against payment obligations is restricted bythe agreements for those payment obligations that have been sold by suppliers. As of December 30, 2017 , $850 million of the Company’s outstandingpayment obligations had been placed in the accounts payable tracking system, and participating suppliers had sold $674 million of those paymentobligations to participating financial institutions. As of December 31, 2016 , $677 million of the Company’s outstanding payment obligations had beenplaced in the accounts payable tracking system, and participating suppliers had sold $507 million of those payment obligations to participating financialinstitutions.
Revenue recognitionThe Company recognizes sales upon delivery of its products to customers. Revenue, which includes shipping and handling charges billed to thecustomer, is reported net of applicable provisions for discounts, returns, allowances, and various government withholding taxes. Methodologies fordetermining these provisions are dependent on local customer pricing and promotional practices, which range from contractually fixed percentage pricereductions to reimbursement based on actual occurrence or performance. Where applicable, future reimbursements are estimated based on acombination of historical patterns and future expectations regarding specific in-market product performance.
Advertising and promotionThe Company expenses production costs of advertising the first time the advertising takes place. Advertising expense is classified in selling, generaland administrative (SGA) expense.
The Company classifies promotional payments to its customers, the cost of consumer coupons, and other cash redemption offers in net sales. The costof promotional package inserts is recorded in cost of goods sold (COGS). Other types of consumer promotional expenditures are recorded in SGAexpense.
Research and developmentThe costs of research and development (R&D) are expensed as incurred and are classified in SGA expense. R&D includes expenditures for newproduct and process innovation, as well as significant technological improvements to existing products and processes. The Company’s R&Dexpenditures primarily consist of internal salaries, wages,
67

consulting, and supplies attributable to time spent on R&D activities. Other costs include depreciation and maintenance of research facilities andequipment, including assets at manufacturing locations that are temporarily engaged in pilot plant activities.
Stock-based compensationThe Company uses stock-based compensation, including stock options, restricted stock, restricted stock units, and executive performance shares, toprovide long-term performance incentives for its global workforce.
The Company classifies pre-tax stock compensation expense in SGA and COGS expense within its corporate operations. Expense attributable toawards of equity instruments is recorded in capital in excess of par value in the Consolidated Balance Sheet.
Certain of the Company’s stock-based compensation plans contain provisions that accelerate vesting of awards upon retirement, disability, or death ofeligible employees and directors. A stock-based award is considered vested for expense attribution purposes when the employee’s retention of theaward is no longer contingent on providing subsequent service. Accordingly, the Company recognizes compensation cost immediately for awardsgranted to retirement-eligible individuals or over the period from the grant date to the date retirement eligibility is achieved, if less than the stated vestingperiod.
The Company recognizes compensation cost for stock option awards that have a graded vesting schedule on a straight-line basis over the requisiteservice period for the entire award.
Income taxesThe Company recognizes uncertain tax positions based on a benefit recognition model. Provided that the tax position is deemed more likely than not ofbeing sustained, the Company recognizes the largest amount of tax benefit that is greater than 50 percent likely of being ultimately realized uponsettlement. The tax position is derecognized when it is no longer more likely than not of being sustained. The Company classifies income tax-relatedinterest and penalties as interest expense and SGA expense, respectively, on the Consolidated Statement of Income. The current portion of theCompany’s unrecognized tax benefits is presented in the Consolidated Balance Sheet in other current assets and other current liabilities, and theamounts expected to be settled after one year are recorded in other assets and other liabilities.
As of December 30, 2017 substantially all foreign earnings were considered permanently invested. As the Company's accumulated foreign earningsand profits continue to be indefinitely reinvested and the company is still finalizing its assessment of the territorial tax system and the Tax Act on itsindefinite reinvestment assertion on a go-forward basis, it is impracticable for the Company to estimate a future tax cost for any unrecognized deferredtax liabilities because the actual tax liability, if any, would be dependent on complex analyses and calculations considering various tax laws, exchangerates, circumstances existing when a repatriation, sale, or liquidation occurs, and other factors.
Management monitors the Company’s ability to utilize certain future tax deductions, operating losses and tax credit carryforwards, prior to expiration.Changes resulting from management’s assessment will result in impacts to deferred tax assets and the corresponding impacts on the effective incometax rate. Valuation allowances were recorded to reduce deferred tax assets to an amount that will, more likely than not, be realized in the future.
On December 22, 2017, the U.S. government enacted comprehensive tax legislation commonly referred to as the Tax Cuts and Jobs Act (the “TaxAct”). The Tax Act includes a provision designed to tax currently global intangible low taxed income (GILTI) starting in 2018. Under the provision, a U.S.shareholder is required to include in gross income the amount of its GILTI, which is 50% of the excess of the shareholder’s net tested income of itscontrolled foreign corporation over the deemed tangible income return. The amount of GILTI included by a U.S. shareholder is computed by aggregatingall controlled foreign corporations (CFC). Shareholders are allowed to claim a foreign tax credit for 80 percent of the taxes paid or accrued with respectto the tested income of each CFC, subject to some limitations.
Beginning in 2018, the Company intends to account for the GILTI as a period cost and will include a provisional estimate for GILTI in its Q1 2018effective tax rate. The FASB staff has indicated that a company should make and disclose a policy election as to whether it will (1) recognize deferredtaxes for basis differences expected to reverse as GILTI or (2) account for GILTI as a period cost if and when incurred. The Company is currentlyapplying the SAB 118 guidance to the selection of a GILTI accounting policy election and, therefore, as of December 30, 2017, the
68

determination of its GILTI accounting policy is not complete. The Company intends to finalize its GILTI accounting policy in 2018 during themeasurement period.
Derivative InstrumentsThe fair value of derivative instruments is recorded in other current assets, other assets, other current liabilities or other liabilities. Gains and lossesrepresenting either hedge ineffectiveness, hedge components excluded from the assessment of effectiveness, or hedges of translational exposure arerecorded in the Consolidated Statement of Income in other income (expense), net (OIE). In the Consolidated Statement of Cash Flows, settlements ofcash flow and fair value hedges are classified as an operating activity; settlements of all other derivative instruments, including instruments for whichhedge accounting has been discontinued, are classified consistent with the nature of the instrument.
Cash flow hedges. Qualifying derivatives are accounted for as cash flow hedges when the hedged item is a forecasted transaction. Gains and losseson these instruments are recorded in other comprehensive income until the underlying transaction is recorded in earnings. When the hedged item isrealized, gains or losses are reclassified from accumulated other comprehensive income (loss) (AOCI) to the Consolidated Statement of Income on thesame line item as the underlying transaction.
Fair value hedges. Qualifying derivatives are accounted for as fair value hedges when the hedged item is a recognized asset, liability, or firmcommitment. Gains and losses on these instruments are recorded in earnings, offsetting gains and losses on the hedged item.
Net investment hedges. Qualifying derivative and nonderivative financial instruments are accounted for as net investment hedges when the hedgeditem is a nonfunctional currency investment in a subsidiary. Gains and losses on these instruments are included in foreign currency translationadjustments in AOCI.
Derivatives not designated for hedge accounting. Gains and losses on these instruments are recorded in the Consolidated Statement of Income, onthe same line item as the underlying hedged item.
Foreign currency exchange risk. The Company is exposed to fluctuations in foreign currency cash flows related primarily to third-party purchases,intercompany transactions and when applicable, nonfunctional currency denominated third-party debt. The Company is also exposed to fluctuations inthe value of foreign currency investments in subsidiaries and cash flows related to repatriation of these investments. Additionally, the Company isexposed to volatility in the translation of foreign currency denominated earnings to U.S. dollars. Management assesses foreign currency risk based ontransactional cash flows and translational volatility and may enter into forward contracts, options, and currency swaps to reduce fluctuations in long orshort currency positions.Forward contracts and options are generally less than 18 months duration. Currency swap agreements are established in conjunction with the term ofunderlying debt issues.
For foreign currency cash flow and fair value hedges, the assessment of effectiveness is generally based on changes in spot rates. Changes in timevalue are reported in OIE.
Interest rate risk. The Company is exposed to interest rate volatility with regard to future issuances of fixed rate debt and existing and future issuancesof variable rate debt. The Company periodically uses interest rate swaps, including forward-starting swaps, to reduce interest rate volatility and fundingcosts associated with certain debt issues, and to achieve a desired proportion of variable versus fixed rate debt, based on current and projected marketconditions.
Fixed-to-variable interest rate swaps are accounted for as fair value hedges and the assessment of effectiveness is based on changes in the fair valueof the underlying debt, using incremental borrowing rates currently available on loans with similar terms and maturities.
Price risk. The Company is exposed to price fluctuations primarily as a result of anticipated purchases of raw and packaging materials, fuel, andenergy. The Company has historically used the combination of long-term contracts with suppliers, and exchange-traded futures and option contracts toreduce price fluctuations in a desired percentage of forecasted raw material purchases over a duration of generally less than 18 months.
Pension benefits, nonpension postretirement and postemployment benefitsThe Company sponsors a number of U.S. and foreign plans to provide pension, health care, and other welfare benefits to retired employees, as well assalary continuance, severance, and long-term disability to former or inactive employees.
69

The recognition of benefit expense is based on actuarial assumptions, such as discount rate, long-term rate of compensation increase, long-term rate ofreturn on plan assets and health care cost trend rate, and is reported in COGS and SGA expense on the Consolidated Statement of Income.
Postemployment benefits. The Company recognizes an obligation for postemployment benefit plans that vest or accumulate with service. Obligationsassociated with the Company’s postemployment benefit plans, which are unfunded, are included in other current liabilities and other liabilities on theConsolidated Balance Sheet. All gains and losses are recognized over the average remaining service period of active plan participants.
Postemployment benefits that do not vest or accumulate with service or benefits to employees in excess of those specified in the respective plans areexpensed as incurred.
Pension and nonpension postretirement benefits. The Company recognizes actuarial gains and losses in operating results in the year in which theyoccur. Experience gains and losses are recognized annually as of the measurement date, which is the Company’s fiscal year-end, or whenremeasurement is otherwise required under generally accepted accounting principles. The Company uses the fair value of plan assets to calculate theexpected return on plan assets.
Reportable segments are allocated service cost and amortization of prior service cost. All other components of pension and postretirement benefitexpense, including interest cost, expected return on assets, and experience gains and losses are considered unallocated corporate costs and are notincluded in the measure of reportable segment operating results. See Note 18 for more information on reportable segments. Management reviews theCompany’s expected long-term rates of return annually; however, the benefit trust investment performance for one particular year does not, by itself,significantly influence this evaluation. The expected rates of return are generally not revised provided these rates fall between the 25th and 75th percentile of expected long-term returns, as determined by the Company’s modeling process.
For defined benefit pension and postretirement plans, the Company records the net overfunded or underfunded position as a pension asset or pensionliability on the Consolidated Balance Sheet.
New accounting standards
Income Taxes. In October 2016, the Financial Accounting Standards Board (FASB), as part of their simplification initiative, issued an AccountingStandards Update (ASU) to improve the accounting for income tax consequences of intra-entity transfers of assets other than inventory. CurrentGenerally Accepted Accounting Principles (GAAP) prohibit recognition of current and deferred income taxes for intra-entity asset transfers until the assethas been sold to an outside party, which is an exception to the principle of comprehensive recognition of current and deferred income taxes in GAAP.The amendments in the ASU eliminate the exception, such that entities should recognize the income tax consequences of an intra-entity transfer of anasset other than inventory when the transfer occurs. The ASU is effective for fiscal years, and interim periods within those years, beginning afterDecember 15, 2017. Early adoption is permitted, as of the beginning of an annual reporting period for which financial statements have not been issuedor made available for issuance. That is, early adoption should be the first interim period if an entity issues interim financial statements. The amendmentsin this ASU should be applied on a modified retrospective basis through a cumulative-effect adjustment directly to retained earnings as of the period ofadoption. The Company early adopted the ASU in the first quarter of 2017. As a result of intercompany transfers of intellectual property, the Companyrecorded a $39 million reduction in income tax expense during the year ended December 30, 2017. Upon adoption, there was no cumulative effectadjustment to retained earnings.Improvements to employee share-based payment accounting. In March 2016, the FASB issued an ASU as part of its simplification initiative. TheCompany early adopted the accounting standard update in the first quarter of 2016. The ASU includes multiple provisions intended to simplify variousaspects of the accounting for share-based payments. The main provisions of the ASU are as follows:
• Excess tax benefits and deficiencies for share-based payments are recorded as an adjustment of income taxes and reflected in operating cashflows after adoption of this ASU. Excess tax benefits and deficiencies were previously recorded in equity and as financing cash flows prior toadoption of this ASU. See Note 13 for information on the impact of this accounting change.
• The guidance allows the employer to withhold up to the maximum statutory tax rates in the applicable jurisdictions without triggering liabilityaccounting. The Company's accounting treatment of outstanding equity awards was not impacted by its adoption of this provision of the ASU.
70

• The guidance allows for a policy election to account for forfeitures as they occur rather than on an estimated basis. The Company is not makingthis election, and will continue to account for forfeitures on an estimated basis.
Practical expedient for the measurement date of an employer's defined benefit obligation and plan assets. In April 2015, the FASB issued an ASU toprovide a practical expedient for the measurement date of an employer’s defined benefit obligation and plan assets. For an entity with a fiscal year-endthat does not coincide with a month-end, the amendments in this Update provide a practical expedient that permits the entity to measure defined benefitplan assets and obligations using the month-end that is closest to the entity’s fiscal year-end and apply that practical expedient consistently to all plansfrom year to year. The ASU is effective for fiscal years, and interim periods within those years, beginning after December 15, 2015. Early adoption ispermitted. Entities should apply the new guidance on a prospective basis. The Company early adopted the updated standard when measuring the fairvalue of plan assets at the end of its 2015 fiscal year with no impact to the Consolidated Financial Statements.
Simplifying the Measurement of Inventory. In July 2015, the FASB issued an ASU to simplify the measurement of inventory. The ASU requires thatinventory be measured at the lower of cost and net realizable value. Net realizable value is the estimated selling prices in the ordinary course ofbusiness, less reasonably predictable costs of completion, disposal, and transportation. The Company adopted the updated standard in the first quarterof 2017 with no material impact to the financial statements,
Balance sheet classification of deferred taxes. In November 2015, the FASB issued an ASU to simplify the presentation of deferred income taxes. TheASU requires that deferred tax liabilities and assets be classified as noncurrent in a classified statement of financial position. Entities should apply thenew guidance either prospectively to all deferred tax liabilities and assets or retrospectively to all periods presented. The Company early adopted theupdated standard in the first quarter of 2016, on a prospective basis. The year-end 2015 balance for current deferred tax assets and liabilities was $227million and $(9) million , respectively. Please see Note 13 for more information on the Company’s deferred tax assets and liabilities. Prior periodbalances have not been adjusted.
Simplifying the accounting for measurement-period adjustments. In September 2015, the FASB issued an ASU to simplify the accounting formeasurement-period adjustments for items in a business combination. The ASU requires that an acquirer recognize adjustments to provisional amountsthat are identified during the measurement period in the reporting period in which the adjustment amounts are determined. The ASU is effective for fiscalyears, and interim periods within those years, beginning after December 15, 2015. Entities should apply the new guidance prospectively to adjustmentsto provisional amounts that occur after the effective date of the ASU with earlier application permitted for financial statements that have not been issued.The Company adopted the updated standard in the first quarter of 2016 with no material impact to the financial statements.
Accounting standards to be adopted in future periods
Derivatives and Hedging: Targeted Improvements to Accounting for Hedging Activities . In August 2017, the FASB issued an ASU intended to simplifyhedge accounting by better aligning an entity’s financial reporting for hedging relationships with its risk management activities. The ASU also simplifiesthe application of the hedge accounting guidance. The new guidance is effective on January 1, 2019, with early adoption permitted. For cash flowhedges existing at the adoption date, the standard requires adoption on a modified retrospective basis with a cumulative-effect adjustment to theConsolidated Balance Sheet as of the beginning of the year of adoption. The amendments to presentation guidance and disclosure requirements arerequired to be adopted prospectively. The Company will adopt the new ASU in the first quarter of 2018 and is currently assessing the impact and timingof adoption of this ASU.
Improving the Presentation of net Periodic Pension Cost and net Periodic Postretirement Benefit Cost. In March 2017, the FASB issued an ASU toimprove the presentation of net periodic pension cost and net periodic postretirement benefit cost. The ASU requires that an employer report the servicecost component in the same line item or items as other compensation costs arising from services rendered by the pertinent employees during theperiod. The other components of net benefit cost are required to be presented in the income statement separately from the service cost component andoutside a subtotal of income from operations, if one is presented. The ASU is effective for fiscal years, and interim periods within those years, beginningafter December 15, 2017. Early adoption is permitted, as of the beginning of an annual reporting period for which financial statements (interim or annual)have not been issued or made available for issuance. That is, early adoption should be the first interim
71
period if an entity issues interim financial statements. The amendments in this ASU should be applied retrospectively for the presentation of the servicecost component and the other components of net periodic pension cost and net periodic postretirement benefit cost in the income statement andprospectively, on and after the effective date, for the capitalization of the service cost component of net periodic pension cost and net periodicpostretirement benefit in assets. The Company will adopt the ASU in the first quarter of 2018. If the Company had adopted the ASU in the first quarter of2017, the impact to its Consolidated Statement of Income would have been an increase to COGS and SG&A of $325 million and $217 million ,respectively, with an offsetting decrease to Other income (expense), net (OIE) of $542 million in the year ended December 30, 2017. For the year endedDecember 31, 2016, the impact to the Company's Consolidated Statement of Income would have been a decrease to COGS and SG&A of $54 millionand $26 million , respectively, with an offsetting increase to OIE of $80 million . Adoption will have no impact on net income or cash flow. The impact tothe Consolidated Balance Sheet at December 30, 2017 and December 31, 2016 would have been immaterial.
Simplifying the test for goodwill impairment. In January 2017, the FASB issued an ASU to simplify how an entity is required to test goodwill forimpairment by eliminating Step 2 from the goodwill impairment test. Step 2 measures a goodwill impairment loss by comparing the implied fair value of areporting unit's goodwill with the carrying amount of that goodwill. The ASU is effective for annual or interim goodwill impairment tests in fiscal yearsbeginning after December 15, 2019. Early adoption is permitted for interim or annual goodwill impairment tests performed on testing dates after January1, 2017. The amendments in this ASU should be applied on a prospective basis. The Company is currently assessing the impact and timing of adoptionof this ASU.
Statement of Cash Flows. In August 2016, the FASB issued an ASU to provide cash flow statement classification guidance for certain cash receipts andpayments including (a) debt prepayment or extinguishment costs; (b) contingent consideration payments made after a business combination; (c)insurance settlement proceeds; (d) distributions from equity method investees; (e) beneficial interests in securitization transactions and (f) application ofthe predominance principle for cash receipts and payments with aspects of more than one class of cash flows. The ASU is effective for fiscal years, andinterim periods within those years, beginning after December 15, 2017. Early adoption is permitted, including adoption in an interim period, in whichcase adjustments should be reflected as of the beginning of the fiscal year that includes the interim period. The amendments in this ASU should beapplied retrospectively. The Company will adopt the new ASU in the first quarter of 2018 and is currently evaluating the impact of adoption.Leases. In February 2016, the FASB issued an ASU which will require the recognition of lease assets and lease liabilities by lessees for all leases withterms greater than 12 months. The distinction between finance leases and operating leases will remain, with similar classification criteria as currentGAAP to distinguish between capital and operating leases. The principal difference from current guidance is that the lease assets and lease liabilitiesarising from operating leases will be recognized on the Consolidated Balance Sheet. Lessor accounting remains substantially similar to current GAAP.The ASU is effective for fiscal years, and interim periods within those years, beginning after December 15, 2018. Early adoption is permitted. TheCompany will adopt the new ASU in the first quarter of 2019 and is currently evaluating the impact that implementing this ASU will have on its financialstatements and disclosures. Please refer to Note 7 for a summary of the Company's undiscounted minimum rental commitments under operating leasesas of December 30, 2017.
Recognition and measurement of financial assets and liabilities. In January 2016, the FASB issued an ASU which primarily affects the accounting forequity investments, financial liabilities under the fair value option, and the presentation and disclosure requirements for financial instruments. The ASUis effective for fiscal years, and interim periods within those years, beginning after December 15, 2017. Early adoption can be elected for all financialstatements of fiscal years and interim periods that have not yet been issued or that have not yet been made available for issuance. Entities should applythe update by means of a cumulative-effect adjustment to the balance sheet as of the beginning of the fiscal year of adoption. The Company will adoptthe updated standard in the first quarter of 2018 and does not expect the adoption of this guidance to have a material impact on its financial statements.
Revenue from contracts with customers. In May 2014, the FASB issued an ASU which provides guidance for accounting for revenue from contracts withcustomers across all industries with final amendments issued in 2016. The core principle of this ASU is that an entity should recognize revenue to depictthe transfer of promised goods or services to customers in an amount that reflects the consideration the entity expects to be entitled to in exchange forthose goods or services. To achieve that core principle, an entity would be required to apply the following five steps: 1) identify the contract(s) with acustomer; 2) identify the performance obligations in the contract; 3)
72

determine the transaction price; 4) allocate the transaction price to the performance obligations in the contract and 5) recognize revenue when (or as)the entity satisfies a performance obligation. The standard also calls for additional disclosures around the nature, amount, timing and uncertainty ofrevenue and cash flows arising from contracts with customers, including significant judgments and changes in judgments. When the ASU was originallyissued it was effective for fiscal years, and interim periods within those years, beginning after December 15, 2016, and early adoption was not permitted.On July 9, 2015, the FASB decided to delay the effective date of the new revenue standard by one year. The updated standard will be effective for fiscalyears, and interim periods within those years, beginning after December 15, 2017. Entities will be permitted to adopt the new revenue standard early,but not before the original effective date. Entities will have the option to apply the final standard retrospectively or use a modified retrospective method,recognizing the cumulative effect of the ASU in retained earnings at the date of initial application. The Company plans to adopt in the first quarter of2018 using the full retrospective transition method which requires restating each prior reporting period presented. The adoption is not expected to havea material impact its financial statements and is limited to timing and classification differences as well as disaggregated revenue disclosures.
NOTE 2SALE OF ACCOUNTS RECEIVABLEDuring 2016, The Company initiated a program in which a customer could extend their payment terms in exchange for the elimination of early paymentdiscounts (Extended Terms Program).
In 2016, the Company entered into a Receivable Sales Agreement (Monetization Program) and a separate U.S. accounts receivable securitizationprogram (Securitization Program), both described below, which are intended to directly offset the impact the Extended Terms Program would have onthe days-sales-outstanding (DSO) metric that is critical to the effective management of the Company's accounts receivable balance and overall workingcapital.
The Company has no retained interest in the receivables sold, however the Company does have collection and administrative responsibilities for thesold receivables. The Company has not recorded any servicing assets or liabilities as of December 30, 2017 and December 31, 2016 for theseagreements as the fair value of these servicing arrangements as well as the fees earned were not material to the financial statements.
Monetization ProgramIn March 2016, the Company entered into a Monetization Program to sell, on a revolving basis, certain trade accounts receivable balances to third partyfinancial institutions. Transfers under this agreement are accounted for as sales of receivables resulting in the receivables being de-recognized from theConsolidated Balance Sheet. The Monetization Program provides for the continuing sale of certain receivables on a revolving basis until terminated byeither party; however the maximum receivables that may be sold at any time is $800 million . Accounts receivable sold of $601 million and $562 millionremained outstanding under this arrangement as of December 30, 2017 and December 31, 2016, respectively. During 2017 and 2016, approximately$2.2 billion and $1.5 billion of accounts receivable have been sold via the Monetization Program, respectively. The proceeds from these sales ofreceivables are included in cash from operating activities in the Consolidated Statement of Cash Flows. The recorded net loss on sale of receivables isapproximately $11 million and $5 million for the years ended December 30, 2017 and December 31, 2016, respectively, and is included in Other incomeand expense.
Securitization ProgramIn July 2016, the Company entered into the Securitization Program with a third party financial institution. Under the program, the Company receivedcash consideration of up to $600 million and a deferred purchase price asset for the remainder of the purchase price. Transfers under the SecuritizationProgram were accounted for as sales of receivables resulting in the receivables being de-recognized from the Consolidated Balance Sheet. ThisSecuritization Program utilized Kellogg Funding Company (Kellogg Funding), a wholly-owned subsidiary of the Company. Kellogg Funding's solebusiness consisted of the purchase of receivables, from its parent or other subsidiary and subsequent transfer of such receivables and related assets tofinancial institutions. Although Kellogg Funding is included in the Company's consolidated financial statements, it is a separate legal entity with separatecreditors who will be entitled, upon its liquidation, to be satisfied out of Kellogg Funding assets prior to any assets or value in Kellogg Funding becomingavailable to the Company or its subsidiaries. The assets of Kellogg Funding are not available to pay creditors of the Company or its subsidiaries. TheSecuritization Program was structured to expire in July 2018, but was terminated at the end of 2017. The Company terminated the accounts receivablesecuritization program as a result of declining customer interest in an extended-terms program, and recent changes to accounting guidelines that (i) nolonger treat the advances from the securitization in a way that preserves Cash Flow, defined as Cash From Operations less Capital Expenditure, and (ii)require burdensome administration,
73

including daily reconciliations of receivables sold and collected under the program. Terminating the securitization will have no impact on our Cash Flow.
During the years ended December 30, 2017 and December 31, 2016, $2.6 billion and $839 million of accounts receivable were sold via theSecuritization Program, respectively. As of December 30, 2017, approximately $433 million of accounts receivable sold to Kellogg Funding under theSecuritization Program remained outstanding, for which the Company received net cash proceeds of approximately $412 million and a deferredpurchase price asset of approximately $21 million . As of December 31, 2016, approximately $292 million of accounts receivable sold to KelloggFunding under the Securitization Program remained outstanding, for which the Company received net cash proceeds of approximately $255 million anda deferred purchase price asset of approximately $37 million . The portion of the purchase price for the receivables which was not paid in cash by thefinancial institutions is a deferred purchase price asset, which is paid to Kellogg Funding as payments on the receivables are collected from customers.The deferred purchase price asset represents a beneficial interest in the transferred financial assets and is recognized at fair value as part of the saletransaction. The deferred purchase price asset is included in Other current assets on the Consolidated Balance Sheet. The proceeds from these salesof receivables are included in cash from operating activities in the Consolidated Statement of Cash Flows. The recorded net loss on sale of receivablesis approximately $7 million for the year end December 30, 2017 and was not material for year ended December 31, 2016. The recorded net loss on saleof receivables is included in Other income and expense.
Other programsAdditionally, from time to time certain of the Company's foreign subsidiaries will transfer, without recourse, accounts receivable balances of certaincustomers to financial institutions. These transactions are accounted for as sales of the receivables resulting in the receivables being de-recognizedfrom the Consolidated Balance Sheet. During the years ended December 30, 2017 and December 31, 2016, $237 million and $164 million of accountsreceivable were sold via these programs, respectively. Accounts receivable sold of $86 million and $124 million remained outstanding under theseprograms as of December 30, 2017 and December 31, 2016, respectively. The proceeds from these sales of receivables are included in cash fromoperating activities in the Consolidated Statement of Cash Flows. The recorded net loss on the sale of these receivables is included in Other incomeand expense and is not material.
NOTE 3GOODWILL AND OTHER INTANGIBLE ASSETS
RXBAR acquisitionIn October 2017, the Company completed its acquisition of Chicago Bar Co., LLC, the manufacturer of RXBAR, for $600 million , or $596 million net ofcash and cash equivalents. The purchase price is subject to certain working capital and net debt adjustments based on the actual working capital andnet debt existing on the acquisition date compared to targeted amounts. The acquisition was accounted for under the purchase price method and wasfinanced with short-term borrowings.
For the post-acquisition period ended December 30, 2017, the acquisition added $27 million in net sales and less than $1 million of operating profit inthe Company's North America Other reporting segment. The pro forma effects of this acquisition were not material.
The assets and liabilities are included in the Consolidated Balance Sheet as of December 30, 2017 within the North America Other reporting segment.The acquired assets and assumed liabilities include the following:
(millions) October 27, 2017Current assets $ 43Goodwill 375Intangible assets, primarily indefinite-lived brands 201Current liabilities (23) $ 596
The amounts in the above table represent the preliminary allocation of purchase price and are subject to revision when the working capital and net debtadjustments to the purchase price are agreed between the parties and valuations are finalized for intangible assets. These items will be finalized in2018. The goodwill from this acquisition
74

is expected to be deductible for income tax purposes and reflects the value of utilizing the Company’s resources to increase the number of distributionlocations and customers as well as any intangible assets that do not qualify for separate recognition.
Parati acquisitionIn December 2016, the Company acquired Ritmo Investimentos, controlling shareholder of Parati S/A, Afical Ltda and Padua Ltda ("Parati Group"), aleading Brazilian food group for approximately BRL1.38 billion ( $381 million ) or $379 million , net of cash and cash equivalents. The purchase pricewas subject to certain working capital and net debt adjustments based on the actual working capital and net debt existing on the acquisition datecompared to targeted amounts. These adjustments were finalized during 2017 and resulted in a purchase price reduction of BRL14 million ( $4 million ).The acquisition was accounted for under the purchase price method and was financed with cash on hand and short-term borrowings.
For the year ended December 30, 2017 the acquisition added $217 million in net sales and $22 million of operating profit in the Company's LatinAmerica reporting segment.
The assets and liabilities of the Parati Group are included in the Consolidated Balance Sheet as of December 30, 2017 within the Latin Americasegment. The acquired assets and assumed liabilities include the following:
(millions) December 1, 2016Current assets $ 44Property 72Goodwill 165Intangible assets 148Current liabilities (48)Non-current deferred tax liability and other (6) $ 375
During the year ended December 30, 2017, the value of intangible assets subject to amortization increased $39 million , resulting in an immaterialchange to amortization expense, and intangible assets not subject to amortization decreased $11 million with an offsetting $28 million adjustment togoodwill in conjunction with an updated allocation of the purchase price.
A portion of the acquisition price aggregating $67 million was placed in escrow in favor of the seller for general representations and warranties, as wellas pending resolution of certain contingencies arising from the business prior to the acquisition. During the year ended December 30, 2017 , theCompany recognized $7 million for certain pre-acquisition contingencies which are considered to be probable of being incurred, which increasedgoodwill.
During 2017, the Company finalized plans to merge the acquired and pre-existing Brazilian legal entities, which resulted in tax basis of the acquiredintangible assets. Accordingly, deferred tax liabilities and goodwill were both reduced by $58 million .
The amounts in the above table represent the allocation of purchase price as of December 30, 2017 and represent the finalization of the valuations forintangible assets and the Company's evaluation of pre-acquisition contingencies and finalization of the merger. The goodwill from this acquisition isexpected to be deductible for income tax purposes.
Other acquisitionsIn September 2016, the Company acquired a majority ownership interest in a natural, bio-organic certified breakfast company for €3 million , which wasaccounted for under the purchase method and financed with cash on hand. The assets, which primarily consist of indefinite lived intangible assets andgoodwill, and liabilities, including non-controlling interests, are included in the Consolidated Balance Sheet as of December 31, 2016 and December 30,2017 within the Europe segment.
In March 2016, the Company completed the acquisition of an organic and natural snack company for $18 million , which was accounted for under thepurchase method and financed with cash on hand. The assets, which primarily consist of indefinite lived brands, and liabilities are included in theConsolidated Balance Sheet as of December 31, 2016 and December 30, 2017 within the North America Other segment.
75

Bisco Misr acquisitionIn January 2015, the Company completed its acquisition of a majority interest in Bisco Misr, the number one packaged biscuits company in Egypt, for$125 million , or $117 million net of cash and cash equivalents acquired. The acquisition was accounted for under the purchase method and wasfinanced through cash on hand. The assets and liabilities of Bisco Misr are included in the Consolidated Balance Sheet as of December 30, 2017 andDecember 31, 2016 and the results of its operations subsequent to the acquisition date, which are immaterial, are included in the ConsolidatedStatement of Income within the Europe operating segment.
The acquired assets and assumed liabilities include the following:
(millions) January 18, 2015Current assets $ 11Property 79Goodwill 59Intangible assets and other 30Current liabilities (15)Other non current liabilities, primarily deferred taxes (27)Non-controlling interests (20) $ 117
Goodwill, which is not expected to be deductible for statutory tax purposes, is calculated as the excess of the purchase price over the fair value of thenet assets recognized. The goodwill recorded primarily reflects the value of providing an established platform to leverage the Company's existing brandsin the markets served by Bisco Misr as well as any intangible assets that do not qualify for separate recognition. The allocation of purchase price wasfinalized in the 4th quarter of 2015.
In October 2015, the Company acquired additional ownership in Bisco Misr through payment of $13 million to non-controlling interests, which is reportedas financing activity on the consolidated statement of cash flows. As of December 30, 2017 and December 31, 2016 the Company owns greater than95% of Bisco Misr outstanding shares.
Mass Food acquisitionIn September 2015, the Company completed the acquisition of Mass Foods, Egypt's leading cereal company, for $46 million , or $44 million net of cashand cash equivalents acquired. The purchase price was subject to certain working capital and net debt adjustments based on the actual working capitaland net debt existing on the acquisition date compared to targeted amounts. During 2016, the purchase price was finalized resulting in a reduction in thepurchase price of $3 million . The acquisition was accounted for under the purchase method and financed through cash on hand. The assets andliabilities of Mass Foods are included in the Consolidated Balance Sheet as of December 30, 2017 and December 31, 2016 and the results of itsoperations subsequent to the acquisition date, which are immaterial, are included in the Consolidated Statement of Income within the Europe reportablesegment. The acquired assets and liabilities assumed include the following: Current assets - $8 million , Property, intangible assets and goodwill - $46million , Current and non-current liabilities - $13 million . Goodwill, which is not expected to be deductible for statutory tax purposes, is calculated as theexcess of the purchase price over the fair value of the net assets recognized. The goodwill recorded primarily reflects the value of providing anestablished platform to leverage the Company's existing brands in the markets served by Mass Foods as well as any intangibles that do not qualify forseparate recognition. The allocation of purchase price was finalized during 2016.
Goodwill and Intangible AssetsChanges in the carrying amount of goodwill, intangible assets subject to amortization, consisting primarily of customer lists, and indefinite-livedintangible assets, consisting of brands, are presented in the following tables:
76

Carrying amount of goodwill
Changes in the carryingamount of goodwill
(millions)
U.S.MorningFoods
U.S.Snacks
U.S.Specialty
NorthAmericaOther Europe
LatinAmerica
AsiaPacific
Consoli-dated
January 2, 2016 $ 131 $ 3,568 $ 82 $ 456 $ 431 $ 76 $ 224 $ 4,968Additions — — — — 4 241 — 245Currency translation adjustment — — — 1 (59) 11 — (47)
December 31, 2016 $ 131 $ 3,568 $ 82 $ 457 $ 376 $ 328 $ 224 $ 5,166Additions — — — 375 — — — 375Purchase price allocationadjustment — — — — — (79) — (79)Purchase price adjustment — — — — — (4) — (4)Currency translation adjustment — — — 4 38 (1) 5 46
December 30, 2017 $ 131 $ 3,568 $ 82 $ 836 $ 414 $ 244 $ 229 $ 5,504
Intangible assets subject to amortization
Intangible assets subject toamortization
(millions)Gross carrying amount
U.S.MorningFoods
U.S.Snacks
U.S.Specialty
NorthAmericaOther Europe
LatinAmerica
AsiaPacific
Consoli-dated
January 2, 2016 $ 8 $ 42 $ — $ 5 $ 45 $ 6 $ 10 $ 116Additions — — — — — 29 — 29Currency translation adjustment — — — — (5) 1 — (4)December 31, 2016 $ 8 $ 42 $ — $ 5 $ 40 $ 36 $ 10 $ 141Additions — — — 17 — — — 17Purchase price allocationadjustment — — — — — 39 — 39Currency translation adjustment — — — — 5 (1) — 4December 30, 2017 $ 8 $ 42 $ — $ 22 $ 45 $ 74 $ 10 $ 201
Accumulated Amortization January 2, 2016 $ 8 $ 16 $ — $ 4 $ 11 $ 6 $ 2 $ 47Amortization — 3 — — 3 — 1 7December 31, 2016 $ 8 $ 19 $ — $ 4 $ 14 $ 6 $ 3 $ 54Amortization (a) — 3 — 1 3 4 1 12Currency translation adjustment
— — — — 1 — — 1December 30, 2017 $ 8 $ 22 $ — $ 5 $ 18 $ 10 $ 4 $ 67
Intangible assets subject toamortization, net January 2, 2016 $ — $ 26 $ — $ 1 $ 34 $ — $ 8 $ 69Additions — — — — — 29 — 29Amortization — (3) — — (3) — (1) (7)Currency translation adjustment — — — — (5) 1 — (4)December 31, 2016 $ — $ 23 $ — $ 1 $ 26 $ 30 $ 7 $ 87Additions — — — 17 — — — 17Amortization — (3) — (1) (3) (4) (1) (12)Purchase price allocationadjustment — — — — — 39 — 39Currency translation adjustment — — — — 4 (1) — 3December 30, 2017 $ — $ 20 $ — $ 17 $ 27 $ 64 $ 6 $ 134(a) The currently estimated aggregate amortization expense for each of the next five succeeding fiscal periods is approximately $12 million for 2018 and $11 million per year thereafter through 2022.
77

Intangible assets not subject to amortization
Intangible assets not subjectto amortization
(millions)
U.S.MorningFoods
U.S.Snacks
U.S.Specialty
NorthAmericaOther Europe
LatinAmerica
AsiaPacific
Consoli-dated
January 2, 2016 $ — $ 1,625 $ — $ 158 $ 416 $ — $ — $ 2,199Additions — — — 18 3 92 — 113Contribution to joint venture — — — — (5) — — (5)Currency translation adjustment — — — — (31) 6 — (25)December 31, 2016 $ — $ 1,625 $ — $ 176 $ 383 $ 98 $ — $ 2,282Additions — — — 184 — — — 184Purchase price allocationadjustment — — — — — (11) — (11)Currency translation adjustment — — — — 51 (1) — 50December 30, 2017 $ — $ 1,625 $ — $ 360 $ 434 $ 86 $ — $ 2,505
78
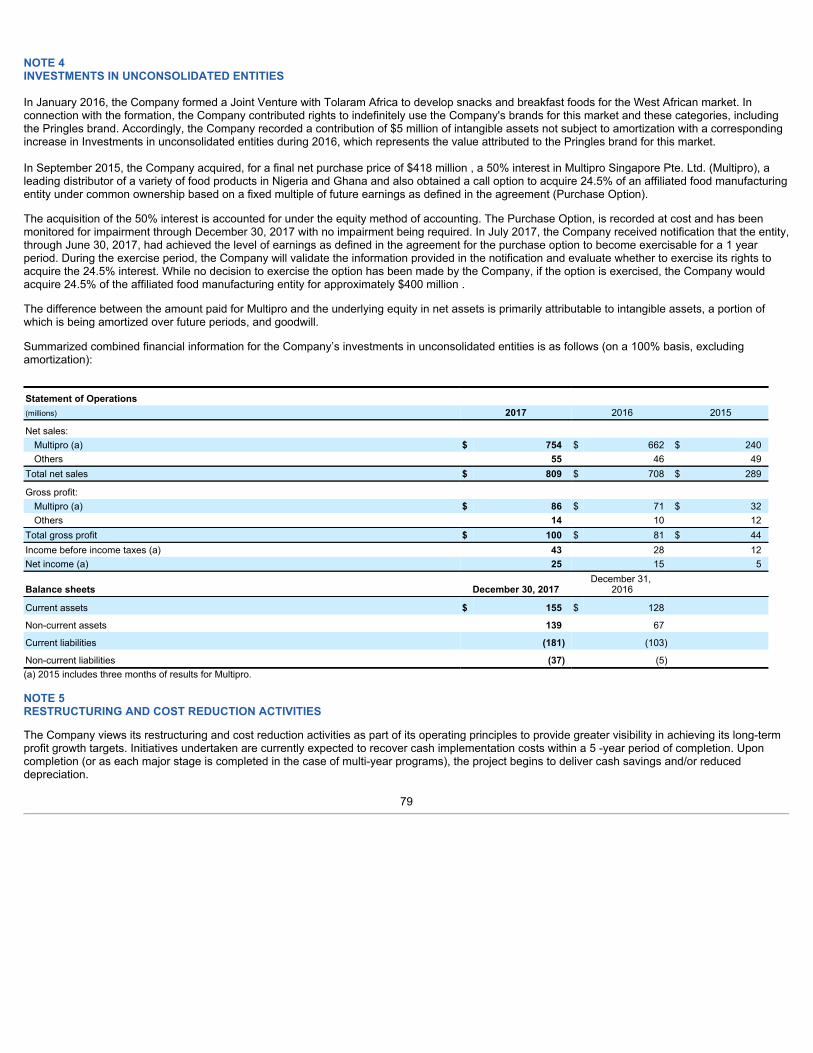
NOTE 4INVESTMENTS IN UNCONSOLIDATED ENTITIES
In January 2016, the Company formed a Joint Venture with Tolaram Africa to develop snacks and breakfast foods for the West African market. Inconnection with the formation, the Company contributed rights to indefinitely use the Company's brands for this market and these categories, includingthe Pringles brand. Accordingly, the Company recorded a contribution of $5 million of intangible assets not subject to amortization with a correspondingincrease in Investments in unconsolidated entities during 2016, which represents the value attributed to the Pringles brand for this market. In September 2015, the Company acquired, for a final net purchase price of $418 million , a 50% interest in Multipro Singapore Pte. Ltd. (Multipro), aleading distributor of a variety of food products in Nigeria and Ghana and also obtained a call option to acquire 24.5% of an affiliated food manufacturingentity under common ownership based on a fixed multiple of future earnings as defined in the agreement (Purchase Option).
The acquisition of the 50% interest is accounted for under the equity method of accounting. The Purchase Option, is recorded at cost and has beenmonitored for impairment through December 30, 2017 with no impairment being required. In July 2017, the Company received notification that the entity,through June 30, 2017, had achieved the level of earnings as defined in the agreement for the purchase option to become exercisable for a 1 yearperiod. During the exercise period, the Company will validate the information provided in the notification and evaluate whether to exercise its rights toacquire the 24.5% interest. While no decision to exercise the option has been made by the Company, if the option is exercised, the Company wouldacquire 24.5% of the affiliated food manufacturing entity for approximately $400 million .
The difference between the amount paid for Multipro and the underlying equity in net assets is primarily attributable to intangible assets, a portion ofwhich is being amortized over future periods, and goodwill.
Summarized combined financial information for the Company’s investments in unconsolidated entities is as follows (on a 100% basis, excludingamortization):
Statement of Operations (millions) 2017 2016 2015
Net sales: Multipro (a) $ 754 $ 662 $ 240Others 55 46 49
Total net sales $ 809 $ 708 $ 289
Gross profit: Multipro (a) $ 86 $ 71 $ 32Others 14 10 12
Total gross profit $ 100 $ 81 $ 44Income before income taxes (a) 43 28 12Net income (a) 25 15 5
Balance sheets December 30, 2017December 31,
2016
Current assets $ 155 $ 128
Non-current assets 139 67
Current liabilities (181) (103)
Non-current liabilities (37) (5) (a) 2015 includes three months of results for Multipro.
NOTE 5RESTRUCTURING AND COST REDUCTION ACTIVITIES
The Company views its restructuring and cost reduction activities as part of its operating principles to provide greater visibility in achieving its long-termprofit growth targets. Initiatives undertaken are currently expected to recover cash implementation costs within a 5 -year period of completion. Uponcompletion (or as each major stage is completed in the case of multi-year programs), the project begins to deliver cash savings and/or reduceddepreciation.
79

Total projectsThe Company recorded $263 million of costs in 2017 associated with cost reduction initiatives. The charges were comprised of $46 million beingrecorded in COGS and $217 million recorded in SGA expense.
During 2016, the Company recorded $325 million of charges associated with all cost reduction initiatives. The charges were comprised of $173 millionbeing recorded in COGS and $152 million recorded in SGA expense.
During 2015, the Company recorded $323 million of charges associated with all cost reduction initiatives. The charges were comprised of $4 millionbeing recorded as a reduction of revenue, $191 million being recorded in COGS and $128 million recorded in SGA expense.
Project KIn 2017, the Company announced an expansion and an extension to its previously-announced global efficiency and effectiveness program (“Project K”),to reflect additional and changed initiatives. Project K is expected to continue generating a significant amount of savings that may be invested in keystrategic areas of focus for the business or utilized to achieve the Company's 2018 Margin Expansion target.In addition to the original program’s focus on strengthening existing businesses in core markets, increasing growth in developing and emerging markets,and driving an increased level of value-added innovation, the extended program will also focus on implementing a more efficient go-to-market model forcertain businesses and creating a more efficient organizational design in several markets. Since inception, Project K has provided significant benefitsand is expected to continue to provide a number of benefits in the future, including an optimized supply chain infrastructure, the implementation of globalbusiness services, a new global focus on categories, increased agility from a more efficient organization design, and improved effectiveness in go-to-market strategies.
The Company currently anticipates that the program will result in total pre-tax charges, once all phases are approved and implemented, ofapproximately $1.5 to $1.6 billion , with after-tax cash costs, including incremental capital expenditures, estimated to be approximately $1.1 billion .Based on current estimates and actual charges incurred to date, the Company expects the total project charges will consist of asset-related costs ofapproximately $500 million which consists primarily of asset impairments, accelerated depreciation and other exit-related costs; employee-related costsof approximately $500 million which includes severance, pension and other termination benefits; and other costs of approximately $600 million whichconsists primarily of charges related to the design and implementation of global business capabilities and a more efficient go-to-market model.
The Company currently expects that total pre-tax charges related to Project K will impact reportable segments as follows: U.S. Morning Foods(approximately 17% ), U.S. Snacks (approximately 34% ), U.S. Specialty (approximately 1% ), North America Other (approximately 13% ), Europe(approximately 22% ), Latin America (approximately 2% ), Asia-Pacific (approximately 6% ), and Corporate (approximately 5% ).
Since inception of Project K, the Company has recognized charges of $1,377 million that have been attributed to the program. The charges werecomprised of $6 million being recorded as a reduction of revenue, $736 million being recorded in COGS and $635 million recorded in SGA.
The Company will complete its implementation of Project K in 2018, with annual savings expected to increase through 2019. Project charges, after-taxcash costs and annual savings remain in line with expectations.
Other projectsIn 2015 the Company implemented a zero-based budgeting (ZBB) program in its North America business that has delivered annual savings. During2016, ZBB was expanded to include the international segments of the business. In support of the ZBB initiative, the Company incurred pre-tax chargesof approximately $3 million , $25 million and $12 million for the years ended December 30, 2017, December 31, 2016 and January 2, 2016, respectively.Total charges of $40 million have been recognized since the inception of the ZBB program.
The Company completed implementation of the ZBB program in 2017, with annual savings expected to increase through 2018. Project charges, after-tax cash costs and annual savings remain in line with expectations.
80

The tables below provide the details for the charges incurred during 2017, 2016 and 2015 and program costs to date for all programs currently active asof December 30, 2017.
Program costs to date
(millions) 2017 2016 2015 December 30, 2017Employee related costs $ 177 $ 108 $ 63 $ 534Pension curtailment (gain) loss, net (148) 1 (1) (137)Asset related costs 77 46 103 269Asset impairment — 50 18 155Other costs 157 120 140 596Total $ 263 $ 325 $ 323 $ 1,417
Program costs to date
(millions) 2017 2016 2015 December 30, 2017U.S. Morning Foods $ 18 $ 23 $ 58 $ 259U.S. Snacks 309 76 50 511U.S. Specialty 2 8 5 21North America Other 16 38 63 144Europe 40 126 74 339Latin America 9 8 4 33Asia Pacific 11 7 13 92Corporate (142) 39 56 18Total $ 263 $ 325 $ 323 $ 1,417
Employee related costs consisted of severance and pension charges. Pension curtailment (gain) loss consists of curtailment gains or losses thatresulted from project initiatives. Asset impairments were recorded for fixed assets that were determined to be impaired and were written down to theirestimated fair value. See Note 14 for more information. Asset related costs consist primarily of accelerated depreciation. Other costs incurred consistprimarily of lease termination costs as well as third-party incremental costs related to the development and implementation of global businesscapabilities and a more efficient to-to-market model. At December 30, 2017 total project reserves were $160 million , related to severance payments and other costs of which a substantial portion will bepaid in 2018 and 2019. The following table provides details for exit cost reserves.
(millions)
EmployeeRelatedCosts
CurtailmentGain Loss, net
AssetImpairment
Asset RelatedCosts
OtherCosts Total
Liability as of January 2, 2016 $ 55 — $ — $ — $ 33 $ 882016 restructuring charges 108 1 50 46 120 325Cash payments (62) — — (14) (124) (200)Non-cash charges and other 1 (1) (50) (32) — (82)Liability as of December 31, 2016 $ 102 — $ — $ — $ 29 $ 1312017 restructuring charges 177 (148) — 77 157 263Cash payments (182) — — (34) (123) (339)Non-cash charges and other — 148 — (43) — 105Liability as of December 30, 2017 $ 97 — $ — $ — $ 63 $ 160
81

NOTE 6EQUITYEarnings per shareBasic earnings per share is determined by dividing net income attributable to Kellogg Company by the weighted average number of common sharesoutstanding during the period. Diluted earnings per share is similarly determined, except that the denominator is increased to include the number ofadditional common shares that would have been outstanding if all dilutive potential common shares had been issued. Dilutive potential common sharesconsist principally of employee stock options issued by the Company, restricted stock units, and to a lesser extent, certain contingently issuableperformance shares. Basic earnings per share is reconciled to diluted earnings per share in the following table:
(millions, except per share data)
Net incomeattributableto KelloggCompany
Averageshares
outstanding
Earningspershare
2017 Basic $ 1,269 348 $ 3.65Dilutive potential common shares 2 (0.03)Diluted $ 1,269 350 $ 3.62
2016 Basic $ 694 350 $ 1.98Dilutive potential common shares 4 (0.02)Diluted $ 694 354 $ 1.96
2015 Basic $ 614 354 $ 1.74Dilutive potential common shares 2 (0.02)Diluted $ 614 356 $ 1.72
The total number of anti-dilutive potential common shares excluded from the reconciliation for each period was (shares in millions): 2017 - 4.9 ; 2016 -2.8 ; 2015- 2.7 .
Stock transactionsThe Company issues shares to employees and directors under various equity-based compensation and stock purchase programs, as further discussedin Note 9 . The number of shares issued during the periods presented was (shares in millions): 2017 – 7 ; 2016 – 7 ; 2015– 5 . The Company issuedshares totaling less than one million in each of the years presented under Kellogg Direct ™ , a direct stock purchase and dividend reinvestment plan forU.S. shareholders.
In December 2015, the board of directors approved a new authorization to repurchase of up to $1.5 billion of the Company's common stock beginning in2016 through December 2017. In December 2017, a new authorization by the board of directors approved the repurchase of up to $1.5 billion of ourcommon stock beginning in January 2018 through December 2019.
During 2017 , the Company repurchased 7 million shares of common stock for a total of $516 million . During 2016 , the Company repurchased 6million shares of common stock for a total of $426 million . During 2015, the Company repurchased 11 million shares of common stock at a total cost of$731 million .
82

Comprehensive incomeComprehensive income includes net income and all other changes in equity during a period except those resulting from investments by or distributionsto shareholders. Other comprehensive income for all years presented consists of foreign currency translation adjustments, fair value adjustmentsassociated with cash flow hedges and adjustments for net experience gains (losses) and prior service credit (cost) related to employee benefit plans.For the years ended December 30, 2017 and December 31, 2016, the Company modified assumptions for a U.S. postemployment benefit plan. As aresult of the U.S. postemployment benefit plan assumption change, a net experience gain was recognized in other comprehensive income with anoffsetting reduction in the accumulated postemployment benefit obligation. During the year ended January 2, 2016, the Company modified assumptionsfor a U.S. postemployment benefit plan and amended a U.S. defined-benefit pension plan. As a result of the U.S. postemployment benefit planassumption change, a net experience gain was recognized in other comprehensive income with an offsetting reduction in the accumulatedpostretirement benefit obligation. The U.S. defined-benefit pension plan amendment increased the Company's pension benefit obligation with anoffsetting increase in prior service costs in other comprehensive income. See Note 10 and Note 11 for further details.
2017 2016 2015Pre-tax Tax (expense) After-tax Pre-tax Tax (expense) After-tax Pre-tax Tax (expense) After-taxamount benefit amount amount benefit amount amount benefit amount
Net income $ 1,269 $ 695 $ 614Other comprehensive income:
Foreign currency translation adjustments $ (34) $ 113 79 $ (230) $ (24) $ (254) $ (170) (26) (196) Cash flow hedges:
Unrealized gain (loss) on cash flow hedges — — — (55) 22 (33) 8 (3) 5 Reclassification to net income 9 (3) 6 11 (6) 5 (23) 3 (20)Postretirement and postemployment benefits:
Amounts arising during the period:
Net experience gain (loss) 44 (12) 32 25 (9) 16 — — — Prior service credit (cost) — — — (4) 2 (2) 63 (24) 39 Reclassification to net income:
Net experience loss — — — 3 (1) 2 3 (1) 2 Prior service cost 1 — 1 5 (1) 4 9 (3) 6 Venezuela deconsolidation loss — — — 63 — 63 — — —Other comprehensive income (loss) $ 20 $ 98 $ 118 $ (182) $ (17) $ (199) $ (110) $ (54) $ (164)Comprehensive income $ 1,387 $ 496 $ 450Net income (loss) attributable to noncontrolling interests — 1 —Other comprehensive income (loss) attributable tononcontrolling interests — — (1)
Comprehensive income attributable to Kellogg Company $ 1,387 $ 495 $ 451
83

Reclassifications from Accumulated Other Comprehensive Income (AOCI) for the year ended December 30, 2017 and December 31, 2016 , consistedof the following:
Details about AOCIComponents
Amountreclassifiedfrom AOCI
Line item impactedwithin IncomeStatement
(millions) 2017 2016 2015 Gains and losses on cash flow hedges: Foreign currency exchange contracts $ (1) $ (14) $ (40) COGSForeign currency exchange contracts — (1) 2 SGAInterest rate contracts 10 13 3 Interest expenseCommodity contracts — 13 12 COGS
$ 9 $ 11 $ (23) Total before tax (3) (6) 3 Tax (expense) benefit $ 6 $ 5 $ (20) Net of taxAmortization of postretirement and postemployment benefits:
Net experience loss $ — $ 3 $ 3 (a)Prior service cost 1 5 9 (a)
$ 1 $ 8 $ 12 Total before tax — (2) (4) Tax (expense) benefit $ 1 $ 6 $ 8 Net of tax Venezuela deconsolidation loss $ — $ 63 $ — Other (income) expenseTotal reclassifications $ 7 $ 74 $ (12) Net of tax(a) See Note 10 and Note 11 for further details .
Accumulated other comprehensive income (loss) as of December 30, 2017 and December 31, 2016 consisted of the following:
(millions) December 30, 2017 December 31,
2016Foreign currency translation adjustments $ (1,426) $ (1,505)Cash flow hedges — unrealized net gain (loss) (61) (67)Postretirement and postemployment benefits: Net experience gain (loss) 34 2Prior service credit (cost) (4) (5)
Total accumulated other comprehensive income (loss) $ (1,457) $ (1,575)
Noncontrolling interestsIn December 2012, the Company entered into a series of agreements with a third party including a subordinated loan (VIE Loan) of $44 million whichwas convertible into approximately 85% of the equity of the entity (VIE). Due to this convertible subordinated loan and other agreements, the Companydetermined that the entity was a variable interest entity, the Company was the primary beneficiary and the Company consolidated the financialstatements of the VIE. During 2015, the 2012 Agreements were terminated and the VIE loan, including related accrued interest and other receivables,were settled, resulting in a charge of $19 million which was recorded as Other income (expense) in the year ended January 2, 2016. Upon terminationof the 2012 Agreements, the Company was no longer considered the primary beneficiary of the VIE, the VIE was deconsolidated, and the Companyderecognized all assets and liabilities of the VIE, including an allocation of a portion of goodwill from the U.S. Snacks operating segment, resulting in a$67 million non-cash gain, which was recorded within SGA expense for the year ended January 2, 2016.
NOTE 7LEASES AND OTHER COMMITMENTS
The Company’s leases are generally for equipment and warehouse space. Rent expense on all operating leases was (in millions): 2017- $195 ; 2016-$176 ; 2015- $189 . During 2017, 2016 and 2015, the Company entered into less than $1 million in capital lease agreements.
84

At December 30, 2017, future minimum annual lease commitments under non-cancelable operating and capital leases were as follows:
(millions) Operatingleases
Capitalleases
2018 127 12019 89 12020 61 12021 49 —2022 40 —2023 and beyond 89 —Total minimum payments $ 455 $ 3Amount representing interest —Obligations under capital leases 3Obligations due within one year (1)Long-term obligations under capital leases $ 2
The Company has provided various standard indemnifications in agreements to sell and purchase business assets and lease facilities over the pastseveral years, related primarily to pre-existing tax, environmental, and employee benefit obligations. Certain of these indemnifications are limited byagreement in either amount and/or term and others are unlimited. The Company has also provided various “hold harmless” provisions within certainservice type agreements. Because the Company is not currently aware of any actual exposures associated with these indemnifications, management isunable to estimate the maximum potential future payments to be made. At December 30, 2017, the Company had not recorded any liability related tothese indemnifications.
NOTE 8DEBT
The following table presents the components of notes payable at year end December 30, 2017 and December 31, 2016 :
(millions) 2017 2016
Principalamount
Effectiveinterest rate
Principalamount
Effectiveinterest rate
U.S. commercial paper $ 196 1.76 % $ 80 0.61 %Europe commercial paper 96 (0.32) 306 (0.18)Bank borrowings 78 52 Total $ 370 $ 438
85

The following table presents the components of long-term debt at year end December 30, 2017 and December 31, 2016 :
(millions) 2017 2016
(a) 4.50% U.S. Dollar Notes due 2046 $ 637 $ 637(b) 7.45% U.S. Dollar Debentures due 2031 620 620
(c) 3.40% U.S. Dollar Notes due 2027 595 —
(d) 3.25% U.S. Dollar Notes due 2026 729 728(e) 1.25% Euro Notes due 2025 712 629
(f) 1.00% Euro Notes due 2024 723 639
(g) 2.65% U.S. Dollar Notes due 2023 589 591(h) 2.75% U.S. Dollar Notes due 2023 201 201(i) 3.125% U.S. Dollar Notes due 2022 354 357(j) 0.80% Euro Notes due 2022 717 —(k) 1.75% Euro Notes due 2021 597 523(l) 4.0% U.S. Dollar Notes due 2020 847 844(m) 4.15% U.S. Dollar Notes due 2019 506 510(n) 3.25% U.S. Dollar Notes due 2018 402 406(o) 2.05% Canadian Dollar Notes due 2017 — 223
(p) 1.75% U.S. Dollar Notes due 2017 — 400Other 16 21
8,245 7,329Less current maturities (409) (631)Balance at year end $ 7,836 $ 6,698 (a) In March 2016, the Company issued $650 million of thirty -year 4.50% U.S. Dollar Notes, using the net proceeds for general corporate purposes, which included repayment
of a portion of the Company's 7.45% U.S. Dollar Debentures due 2031 and a portion of its commercial paper borrowings. The effective interest rate on the Debentures,reflecting issuance discount and hedge settlement, was 4.58% .
(b) In March 2001, the Company issued long-term debt instruments, primarily to finance the acquisition of Keebler Foods Company, of which $625 million of thirty -year 7.45%Debentures remain outstanding. The effective interest rate on the Debentures, reflecting issuance discount and hedge settlement, was 7.54% . The Debentures containstandard events of default and covenants, and can be redeemed in whole or in part by the Company at any time at prices determined under a formula (but not less than100% of the principal amount plus unpaid interest to the redemption date). In March 2016, the Company redeemed $475 million of the Debentures. In connection with thedebt redemption, the Company incurred $153 million of interest expense, consisting primarily of a premium on the tender offer and also including accelerated losses on pre-issuance interest rate hedges, acceleration of fees and debt discount on the redeemed debt and fees related to the tender offer.
(c) In November 2017, the Company issued $600 million of ten -year 3.40% U.S. Dollar Notes, using the net proceeds for general corporate purposes, which includedrepayment of a portion of the Company's commercial paper borrowings used to finance the acquisition of Chicago Bar Company LLC, the maker of RXBAR. The effectiveinterest rate on the Debentures, reflecting issuance discount and hedge settlement, was 3.48% .
(d) In March 2016, the Company issued $750 million of ten -year 3.25% U.S. Dollar Notes, using the net proceeds for general corporate purposes, which included repayment ofa portion of the Company's 7.45% U.S. Dollar Debentures due 2031 and a portion of its commercial paper borrowings. The effective interest rate on these Notes, reflectingissuance discount, hedge settlement and interest rate swaps was 3.66% at December 30, 2017 . In September 2016, the Company entered into interest rate swaps withnotional amounts totaling $300 million , which effectively converted a portion of these Notes from a fixed rate to a floating rate obligation. These derivative instruments weredesignated as fair value hedges of the debt obligation. The fair value adjustment for the interest rate swaps was $17 million at December 30, 2017 , recorded as a decreasein the hedged debt balance.
(e) In March 2015, the Company issued €600 million (approximately $716 million at December 30, 2017 , which reflects the discount, fees and translation adjustments) of ten -year 1.25% Euro Notes due 2025, using the proceeds from these Notes for general corporate purposes, which included repayment of a portion of the Company’s commercialpaper borrowings. The effective interest rate on the Notes, reflecting issuance discount and hedge settlement, was 1.28% at December 30, 2017 . The Notes weredesignated as a net investment hedge of the Company’s investment in its Europe subsidiary when issued. In May 2017, the Company entered into interest rate swaps withnotional amounts totaling €600 million , which effectively converted these Notes from a fixed rate to a floating rate obligation. These derivative instruments were designatedas fair value hedges of the debt obligation. The fair value adjustment for the interest rate swaps was $4 million at December 30, 2017, recorded as a decrease in the hedgeddebt balance.
(f) In May 2016, the Company issued €600 million (approximately $714 million USD at December 30, 2017 , which reflects the discount, fees and translation adjustments) ofeight -year 1.00% Euro Notes due 2024. The proceeds from these Notes were used for general corporate purposes, including, together with cash on hand and additionalcommercial paper borrowings, repayment of the Company's $750 million , seven -year 4.45% U.S. Dollar Notes due 2016 at maturity. The Notes were designated as a netinvestment hedge of the Company’s investment in its Europe subsidiary when issued. The effective interest rate on these Notes, reflecting issuance discount, hedgesettlement and interest rate swaps was 0.71% at December 30, 2017 . During 2016, the Company entered into interest rate swaps which effectively converted these Notesfrom a fixed rate to a floating rate obligation. These derivative instruments were designated as fair value hedges of the debt obligation. The Company subsequentlyterminated the interest rate swaps, and the resulting unamortized gain of $11 million at December 30, 2017 will be amortized to interest expense over the remaining term ofthe Notes. In November 2016, the Company entered into interest rate swaps with notional amounts totaling €300 million , which effectively converted a portion of theseNotes from a fixed rate to a floating rate obligation. These derivative instruments were designated as fair value hedges of the debt
86

obligation. The fair value adjustment for the interest rate swaps was $1 million at December 30, 2017 , recorded as an increase in the hedged debt balance.(g) In November 2016, the Company issued $600 million of seven -year 2.65% U.S. Dollar Notes, using the net proceeds for general corporate purposes, which included
repayment of the Company's 1.875% U.S. Dollar Notes due 2016 at maturity and a portion of its commercial paper borrowings. The effective interest rate on these Notes,reflecting issuance discount, hedge settlement and interest rate swaps was 2.44% at December 30, 2017 . In November 2016, the Company entered into interest rate swapswith notional amounts totaling $300 million , which effectively converted a portion of these Notes from a fixed rate to a floating rate obligation. These derivative instrumentswere designated as fair value hedges of the debt obligation. The fair value adjustment for the interest rate swaps was $7 million at December 30, 2017 , recorded as adecrease in the hedged debt balance.
(h) In February 2013, the Company issued $400 million of ten -year 2.75% U.S. Dollar Notes, using net proceeds from these Notes for general corporate purposes, including,together with cash on hand, to repay a portion of the Company’s $750 million 4.25% U.S. Dollar Notes that matured in March 2013. The effective interest rate on theseNotes, reflecting issuance discount and hedge settlement, was 2.88% . In March 2014, the Company redeemed $189 million of the Notes. In connection with the debtredemption, the Company reduced interest expense by $10 million , including $1 million of accelerated gains on interest rate swaps previously recorded in accumulatedother comprehensive income, and incurred $2 million expense, recorded in Other Income, Expense (net), related to acceleration of fees on the redeemed debt and feesrelated to the tender offer. In September 2016, the Company entered into interest rate swaps with notional amounts totaling $211 million , which effectively converted theseNotes from a fixed rate to a floating rate obligation. These derivative instruments were designated as fair value hedges of the debt obligation. The fair value adjustment forthe interest rate swaps was $9 million at December 30, 2017 , recorded as a decrease in the hedged debt balance.
(i) In May 2012, the Company issued $700 million of ten -year 3.125% U.S. Dollar Notes, using net proceeds from these Notes for general corporate purposes, includingfinancing a portion of the acquisition of Pringles. The effective interest rate on these Notes, reflecting issuance discount and interest rate swaps, was 2.69% at December 30,2017 . In March 2014, the Company redeemed $342 million of the Notes. In connection with the debt redemption, the Company reduced interest expense by $2 million andincurred $2 million expense, recorded in Other Income, Expense (net), related to acceleration of fees on the redeemed debt and fees related to the tender offer. During2016, the Company entered into interest rate swaps which effectively converted these Notes from a fixed rate to a floating rate obligation. These derivative instruments weredesignated as fair value hedges of the debt obligation. The Company subsequently terminated the interest rate swaps. In November 2016, the Company entered into interestrate swaps with notional amounts totaling $358 million , which effectively converted these Notes from a fixed rate to a floating rate obligation. These derivative instrumentswere designated as fair value hedges of the debt obligation. The $13 million gain on termination of the 2016 and prior year interest rate swaps at December 30, 2017 will beamortized to interest expense over the remaining term of the Notes. The fair value adjustment for the outstanding interest rate swaps was $15 million , at December 30, 2017, recorded as a decrease in the hedged debt balance.
(j) In May 2017, the Company issued €600 million (approximately $717 million USD at December 30, 2017 , which reflects the discount and translation adjustments) of five -year 0.80% Euro Notes due 2022, resulting in aggregate net proceeds after debt discount of $656 million . The proceeds from these Notes were used for general corporatepurposes, including, together with cash on hand and additional commercial paper borrowings, repayment of the Company's $400 million , five -year 1.75% U.S. Dollar Notesdue 2017 at maturity. The effective interest rate on the Notes, reflecting issuance discount and hedge settlement, was 0.88% . The Notes were designated as a netinvestment hedge of the Company's investment in its Europe subsidiary when issued.
(k) In May 2014, the Company issued €500 million (approximately $597 million at December 30, 2017 , which reflects the discount and translation adjustments) of seven -year1.75% Euro Notes due 2021, using the proceeds from these Notes for general corporate purposes, which included repayment of a portion of the Company’s commercialpaper borrowings. The effective interest rate on the Notes, reflecting issuance discount and hedge settlement, was 2.36% . The Notes were designated as a net investmenthedge of the Company’s investment in its Europe subsidiary when issued.
(l) In December 2010, the Company issued $1.0 billion of ten -year 4.0% fixed rate U.S. Dollar Notes, using net proceeds from these Notes for incremental pension andpostretirement benefit plan contributions and to retire a portion of its commercial paper. The effective interest rate on these Notes, reflecting issuance discount, hedgesettlement and interest rate swaps, was 3.41% at December 30, 2017 . In March 2014, the Company redeemed $150 million of the Notes. In connection with the debtredemption, the Company incurred $12 million of interest expense offset by $7 million of accelerated gains on interest rate swaps previously recorded in accumulated othercomprehensive income, and incurred $1 million expense, recorded in Other Income, Expense (net), related to acceleration of fees on the redeemed debt and fees related tothe tender offer. During 2016, the Company entered into interest rate swaps with notional amounts of $600 million , which effectively converted a portion of these Notes froma fixed rate to a floating rate obligation. These derivative instruments were designated as fair value hedges of the debt obligation. The Company subsequently terminated theinterest rate swaps. In July 2016, the Company entered into interest rate swaps with notional amounts totaling $700 million , which effectively converted a portion of theseNotes from a fixed rate to a floating rate obligation. These derivative instruments were designated as fair value hedges of the debt obligation. The $1 million gain ontermination of the 2016 and prior year interest rate swaps at December 30, 2017 will be amortized to interest expense over the remaining term of the Notes.
(m) In November 2009, the Company issued $500 million of ten -year 4.15% fixed rate U.S. Dollar Notes, using net proceeds from these Notes to retire a portion of its 6.6%U.S. Dollar Notes due 2011. The effective interest rate on these Notes, reflecting issuance discount, hedge settlement and interest rate swaps was 3.50% at December 30,2017 . In 2012, the Company entered into interest rate swaps which effectively converted these Notes from a fixed rate to a floating rate obligation. These derivativeinstruments were designated as fair value hedges of the debt obligation. During 2015, the Company entered into and terminated a series of interest rate swaps and as ofDecember 30, 2017 had terminated all interest rate swaps. The $7 million gain on termination at December 30, 2017 will be amortized to interest expense over the remainingterm of the Notes.
(n) In May 2011, the Company issued $400 million of seven -year 3.25% fixed rate U.S. Dollar Notes, using net proceeds from these Notes for general corporate purposesincluding repayment of a portion of its commercial paper. The effective interest rate on these Notes, reflecting issuance discount, hedge settlement and interest rate swaps,was 3.41% at December 30, 2017 . In 2011, the Company entered into interest rate swaps which effectively converted these Notes from a fixed rate to a floating rateobligation. These derivative instruments were designated as fair value hedges of the debt obligation. During 2013, the Company terminated all of the interest rate swaps andsubsequently entered into interest rate swaps which effectively converted these Notes from a fixed rate to a floating rate obligation. These derivative instruments weredesignated as fair value hedges of the debt obligation. During 2015, the Company terminated all interest rate swaps, and the resulting unamortized gain of $2 million atDecember 30, 2017 will be amortized to interest expense over the remaining term of the Notes.
87

(o) In May 2014, the Company issued Cdn. $300 million of three -year 2.05% Canadian Dollar Notes due 2017, using the proceeds from these Notes, together with cash onhand, to repay the Company’s Cdn. $300 million , 2.10% Notes due 2014 at maturity. The Company redeemed these Notes in May 2017.
(p) In May 2012, the Company issued $400 million of five -year 1.75% U.S. Dollar Notes, using net proceeds from these Notes for general corporate purposes, includingfinancing a portion of the acquisition of Pringles. In 2013, the Company entered into interest rate swaps with notional amounts totaling $400 million , which effectivelyconverted the Notes from a fixed rate to a floating rate obligation. These derivative instruments were designated as fair value hedges of the debt obligation. During 2015, theCompany terminated all interest rate swaps. The Company redeemed these Notes in May 2017.
All of the Company’s Notes contain customary covenants that limit the ability of the Company and its restricted subsidiaries (as defined) to incur certainliens or enter into certain sale and lease-back transactions and also contain a change of control provision.
The Company and two of its subsidiaries (the Issuers) maintain a program under which the Issuers may issue euro-commercial paper notes up to amaximum aggregate amount outstanding at any time of $750 million or its equivalent in alternative currencies. The notes may have maturities rangingup to 364 days and will be senior unsecured obligations of the applicable Issuer. Notes issued by subsidiary Issuers will be guaranteed by the Company.The notes may be issued at a discount or may bear fixed or floating rate interest or a coupon calculated by reference to an index or formula. There was$96 million and $306 million outstanding under this program as of December 30, 2017 and December 31, 2016 , respectively.
At December 30, 2017 , the Company had $3.1 billion of short-term lines of credit, virtually all of which were unused and available for borrowing on anunsecured basis. These lines were comprised principally of an unsecured Five-Year Credit Agreement, which the Company entered into in February2014 and expires in 2019, replacing the Company’s unsecured Four-year Credit Agreement, which would have expired in March 2015. The Five-YearCredit Agreement allows the Company to borrow, on a revolving credit basis, up to $2.0 billion , which includes the ability to obtain letters of credit in anaggregate stated amount up to $75 million and to obtain U.S. swingline loans in an aggregate principal amount up to $200 million and Europeanswingline loans in an aggregate principal amount up to $400 million . The agreement contains customary covenants and warranties, including specifiedrestrictions on indebtedness, liens and a specified interest coverage ratio. If an event of default occurs, then, to the extent permitted, the administrativeagent may terminate the commitments under the credit facility, accelerate any outstanding loans under the agreement, and demand the deposit of cashcollateral equal to the lender’s letter of credit exposure plus interest.
The Company was in compliance with all covenants as of December 30, 2017 .
In January 2018, the Company entered into an unsecured 364-Day Credit Agreement to borrow, on a revolving credit basis, up to $1.0 billion at any timeoutstanding, to replace the $800 million 364-day facility that expired in January 2018. The new credit facilities contains customary covenants andwarranties, including specified restrictions on indebtedness, liens and a specified interest expense coverage ratio. If an event of default occurs, then, tothe extent permitted, the administrative agent may terminate the commitments under the credit facility, accelerate any outstanding loans under theagreement, and demand the deposit of cash collateral equal to the lender's letter of credit exposure plus interest. There are no borrowings outstandingunder the new credit facilities.
Scheduled principal repayments on long-term debt are (in millions): 2018 – $407 ; 2019 – $507 ; 2020 – $850 ; 2021 – $600 ; 2022 – $1,079 ; 2023 andbeyond– $4,876 .
Interest expense capitalized as part of the construction cost of fixed assets was (in millions): 2017 – $4 ; 2016 – $4 ; 2015 – $4 .
NOTE 9STOCK COMPENSATION
The Company uses various equity-based compensation programs to provide long-term performance incentives for its global workforce. Currently, theseincentives consist principally of stock options, restricted stock units and, to a lesser extent, executive performance shares. The Company also sponsorsa discounted stock purchase plan in the United States and matching-grant programs in several international locations. Additionally, the Companyawards restricted stock to its outside directors. These awards are administered through several plans, as described within this Note.
88

The 2017 Long-Term Incentive Plan (2017 Plan), approved by shareholders in 2017, permits awards to employees and officers in the form of incentiveand non-qualified stock options, performance units, restricted stock or restricted stock units, and stock appreciation rights. The 2017 Plan, whichreplaced the 2013 Long-Term Incentive Plan (2013 Plan), authorizes the issuance of a total of (a) 16 million shares; plus (b) the total number of sharesremaining available for future grants under the 2013 Plan. The total number of shares remaining available for issuance under the 2017 Plan will bereduced by two shares for each share issued pursuant to an award under the 2017 Plan other than a stock option or stock appreciation right, orpotentially issuable pursuant to an outstanding award other than a stock option or stock appreciation right, which will in each case reduce the totalnumber of shares remaining by one share for each share issued. The 2017 Plan includes several limitations on awards or payments to individualparticipants. Options granted under the 2017 and 2013 Plans generally vest over three years. At December 30, 2017, there were 24 million remainingauthorized, but unissued, shares under the 2017 Plan. This amount includes 8 million shares remaining available under the 2013 Plan.
The Non-Employee Director Stock Plan (2009 Director Plan) was approved by shareholders in 2009 andallows each eligible non-employee director to receive shares of the Company’s common stock annually. The number of shares granted pursuant to eachannual award will be determined by the Nominating and Governance Committee of the Board of Directors. The 2009 Director Plan, which replaced the2000 Non-Employee Director Stock Plan (2000 Director Plan), reserves 500,000 shares for issuance, plus the total number of shares as to whichawards granted under the 2009 Director Plan or the 2000 Director Plans expire or are forfeited, terminated or settled in cash. Under both the 2009 and2000 Director Plans, shares (other than stock options) are placed in the Kellogg Company Grantor Trust for Non-Employee Directors (the GrantorTrust). Under the terms of the Grantor Trust, shares are available to a director only upon termination of service on the Board. Under the 2009 DirectorPlan, awards were as follows (number of shares): 2017- 25,209 ; 2016- 24,249 ; 2015- 26,877 .
The 2002 Employee Stock Purchase Plan was approved by shareholders in 2002 and permits eligible employees to purchase Company stock at adiscounted price. This plan allows for a maximum of 2.5 million shares of Company stock to be issued at a purchase price equal to 95% of the fairmarket value of the stock on the last day of the quarterly purchase period. Total purchases through this plan for any employee are limited to a fairmarket value of $25,000 during any calendar year. At December 30, 2017 , there were approximately 0.2 million remaining authorized, but unissued,shares under this plan. Shares were purchased by employees under this plan as follows (approximate number of shares): 2017– 65,000 ; 2016– 63,000; 2015– 73,000 . Options granted to employees to purchase discounted stock under this plan are included in the option activity tables within this note.
Additionally, an international subsidiary of the Company maintains a stock purchase plan for its employees. Subject to limitations, employeecontributions to this plan are matched 1:1 by the Company. Under this plan, shares were granted by the Company to match an equal number of sharespurchased by employees as follows (approximate number of shares): 2017– 60,000 ; 2016– 57,000 ; 2015– 48,000 .
Compensation expense for all types of equity-based programs and the related income tax benefit recognized were as follows:
(millions) 2017 2016 2015Pre-tax compensation expense $ 71 $ 68 $ 55Related income tax benefit $ 26 $ 25 $ 20
As of December 30, 2017 , total stock-based compensation cost related to non-vested awards not yet recognized was $79 million and the weighted-average period over which this amount is expected to be recognized was 2 years.
Cash flows realized upon exercise or vesting of stock-based awards in the periods presented are included in the following table. Tax benefits realizedupon exercise or vesting of stock-based awards generally represent the tax benefit of the difference between the exercise price and the strike price ofthe option.
Cash used by the Company to settle equity instruments granted under stock-based awards was not material.
(millions) 2017 2016 2015Total cash received from option exercises and similar instruments $ 97 $ 368 $ 261Tax benefits realized upon exercise or vesting of stock-based awards: Windfall benefits classified as cash flow from operating activities $ 4 $ 36 NAWindfall benefits classified as cash flow from financing activities NA NA $ 14
89
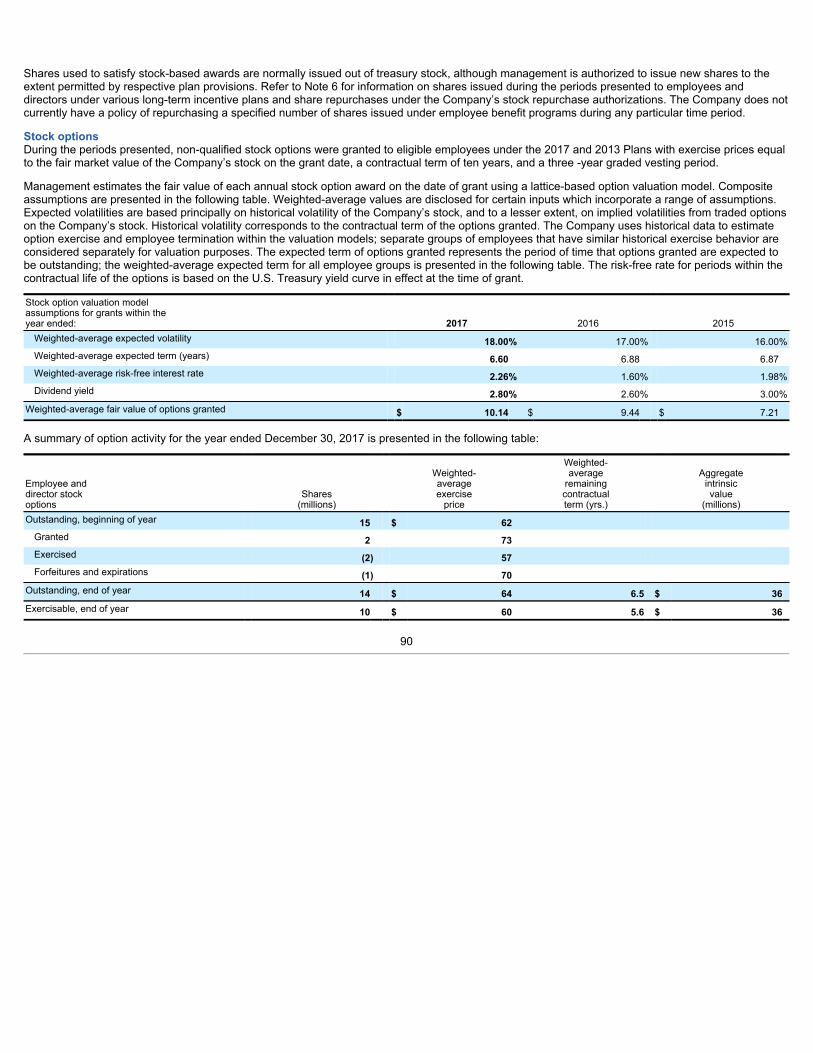
Shares used to satisfy stock-based awards are normally issued out of treasury stock, although management is authorized to issue new shares to theextent permitted by respective plan provisions. Refer to Note 6 for information on shares issued during the periods presented to employees anddirectors under various long-term incentive plans and share repurchases under the Company’s stock repurchase authorizations. The Company does notcurrently have a policy of repurchasing a specified number of shares issued under employee benefit programs during any particular time period.
Stock optionsDuring the periods presented, non-qualified stock options were granted to eligible employees under the 2017 and 2013 Plans with exercise prices equalto the fair market value of the Company’s stock on the grant date, a contractual term of ten years, and a three -year graded vesting period.
Management estimates the fair value of each annual stock option award on the date of grant using a lattice-based option valuation model. Compositeassumptions are presented in the following table. Weighted-average values are disclosed for certain inputs which incorporate a range of assumptions.Expected volatilities are based principally on historical volatility of the Company’s stock, and to a lesser extent, on implied volatilities from traded optionson the Company’s stock. Historical volatility corresponds to the contractual term of the options granted. The Company uses historical data to estimateoption exercise and employee termination within the valuation models; separate groups of employees that have similar historical exercise behavior areconsidered separately for valuation purposes. The expected term of options granted represents the period of time that options granted are expected tobe outstanding; the weighted-average expected term for all employee groups is presented in the following table. The risk-free rate for periods within thecontractual life of the options is based on the U.S. Treasury yield curve in effect at the time of grant.
Stock option valuation modelassumptions for grants within theyear ended: 2017 2016 2015Weighted-average expected volatility 18.00% 17.00% 16.00%Weighted-average expected term (years) 6.60 6.88 6.87Weighted-average risk-free interest rate 2.26% 1.60% 1.98%Dividend yield 2.80% 2.60% 3.00%
Weighted-average fair value of options granted $ 10.14 $ 9.44 $ 7.21
A summary of option activity for the year ended December 30, 2017 is presented in the following table:
Employee anddirector stockoptions
Shares(millions)
Weighted-averageexerciseprice
Weighted-averageremainingcontractualterm (yrs.)
Aggregateintrinsicvalue
(millions)Outstanding, beginning of year 15 $ 62 Granted 2 73 Exercised (2) 57 Forfeitures and expirations (1) 70
Outstanding, end of year 14 $ 64 6.5 $ 36Exercisable, end of year 10 $ 60 5.6 $ 36
90

Additionally, option activity for the comparable prior year periods is presented in the following table:
(millions, except per share data) 2016 2015Outstanding, beginning of year 19 21Granted 3 3Exercised (6) (5)Forfeitures and expirations (1) —
Outstanding, end of year 15 19Exercisable, end of year 8 10Weighted-average exercise price: Outstanding, beginning of year $ 58 $ 56Granted 76 64Exercised 56 53Forfeitures and expirations 67 60
Outstanding, end of year $ 62 $ 58Exercisable, end of year $ 58 $ 55
The total intrinsic value of options exercised during the periods presented was (in millions): 2017– $22 ; 2016– $145 ; 2015– $65 .
Other stock-based awardsDuring the periods presented, other stock-based awards consisted principally of executive performance shares and restricted stock granted under the2017 and 2013 Plans.
In the first quarter of 2017, the Company granted performance shares to a limited number of senior executive-level employees, which entitle theseemployees to receive a specified number of shares of the Company's common stock upon vesting. The number of shares earned could range between0 and 200% of the target amount depending upon performance achieved over the three year vesting period. The performance conditions of the awardinclude three -year currency-neutral comparable operating margin and total shareholder return (TSR) of the Company's common stock relative to aselect group of peer companies.
A Monte Carlo valuation model was used to determine the fair value of the awards. The TSR performance metric is a market condition. Therefore,compensation cost of the TSR condition is fixed at the measurement date and is not revised based on actual performance. The TSR metric was valuedas a multiplier of possible levels of currency-neutral comparable operating margin expansion. Compensation cost related to currency-neutralcomparable operating margin performance is revised for changes in the expected outcome. The 2017 target grant currently corresponds toapproximately 126,000 shares, with a grant-date fair value of $67 per share.
In 2016, the Company granted performance shares to a limited number of senior executive-level employees, which entitle these employees to receive aspecified number of shares of the Company's common stock upon vesting. The number of shares earned could range between 0 and 200% of the targetamount depending upon performance achieved over the three year vesting period. The performance conditions of the award include three -yearcurrency-neutral comparable operating profit growth and total shareholder return (TSR) of the Company's common stock relative to a select group ofpeer companies. The 2016 target grant currently corresponds to approximately 133,000 shares, with a grant-date fair value of $80 per share.
In 2015, the Company granted performance shares to a limited number of senior executive-level employees, which entitle these employees to receive aspecified number of shares of the Company's common stock upon vesting. The number of shares earned could range between 0 and 200% of the targetamount depending upon performance achieved over the three year vesting period. The performance conditions of the award include three -yearcumulative operating cash flow and TSR of the Company's common stock relative to a select group of peer companies. The 2015 target grant currentlycorresponds to approximately 145,000 shares, with a grant-date fair value of $58 per share.
Based on the market price of the Company’s common stock at year-end 2017, the maximum future value that could be awarded on the vesting date was(in millions): 2017 award– $17 ; 2016 award– $18 ; and 2015 award– $20 . The 2014 performance share award, payable in stock, was settled at 35% oftarget in February 2017 for a total dollar equivalent of $5 million .
91

The Company also grants restricted stock and restricted stock units to eligible employees under the 2017 Plan. Restrictions with respect to sale ortransferability generally lapse after three years and, in the case of restricted stock, the grantee is normally entitled to receive shareholder dividendsduring the vesting period. Management estimates the fair value of restricted stock grants based on the market price of the underlying stock on the dateof grant. A summary of restricted stock and restricted stock unit activity for the year ended December 30, 2017, is presented in the following table:
Employee restricted stock and restrictedstock units
Shares(thousands)
Weighted-averagegrant-datefair value
Non-vested, beginning of year 1,166 $ 63Granted 776 65Vested (109) 58Forfeited (160) 65Non-vested, end of year 1,673 $ 65
Additionally, restricted stock and restricted stock unit activity for 2016 and 2015 is presented in the following table:
Employee restricted stock and restricted stock units 2016 2015Shares (in thousands): Non-vested, beginning of year 806 346Granted 601 617Vested (116) (113)Forfeited (125) (44)
Non-vested, end of year 1,166 806Weighted-average exercise price: Non-vested, beginning of year $ 57 $ 54Granted 70 59Vested 56 50Forfeited 63 58
Non-vested, end of year $ 63 $ 57
The total fair value of restricted stock and restricted stock units vesting in the periods presented was (in millions): 2017– $5 ; 2016– $7 ; 2015– $7 .
NOTE 10PENSION BENEFITSThe Company sponsors a number of U.S. and foreign pension plans to provide retirement benefits for its employees. The majority of these plans arefunded or unfunded defined benefit plans, although the Company does participate in a limited number of multiemployer or other defined contributionplans for certain employee groups. See Note 12 for more information regarding the Company’s participation in multiemployer plans. Defined benefits forsalaried employees are generally based on salary and years of service, while union employee benefits are generally a negotiated amount for each yearof service. The Company uses a December 31 measurement date for these plans and, when necessary, adjusts for plan contributions and significantevents between December 31 and its fiscal year-end.
In September 2017, the Company amended certain defined benefit pension plans in the U.S. and Canada for salaried employees. As of December 31,2018, the amendment will freeze the compensation and service periods used to calculate pension benefits for active salaried employees who participatein the affected pension plans. During the third quarter of 2017, the Company recognized related pension curtailment gains totaling $136 million includedwithin Project K restructuring activity.
Beginning January 1, 2019, impacted employees will not accrue additional benefits for future service and eligible compensation received under theseplans. Concurrently, the Company also amended its 401(k) savings plans effective January 1, 2019, to make previously ineligible salaried U.S. andCanada employees eligible for Company retirement contributions, which range from 3% to 7% of eligible compensation based on the employee’s lengthof employment.
92

Obligations and funded statusThe aggregate change in projected benefit obligation, plan assets, and funded status is presented in the following tables.
(millions) 2017 2016Change in projected benefit obligation Beginning of year $ 5,510 $ 5,316Service cost 96 98Interest cost 164 174Plan participants’ contributions 1 1Amendments 6 5Actuarial (gain)loss 264 404Benefits paid (395) (299)Curtailment and special termination benefits (156) (1)Other 1 2Foreign currency adjustments 157 (190)End of year $ 5,648 $ 5,510Change in plan assets Fair value beginning of year $ 4,544 $ 4,584Actual return on plan assets 666 415Employer contributions 31 18Plan participants’ contributions 1 1Benefits paid (364) (268)Other 1 2Foreign currency adjustments 164 (208)Fair value end of year $ 5,043 $ 4,544Funded status $ (605) $ (966)Amounts recognized in the Consolidated Balance Sheet consist of Other assets $ 252 $ 66Other current liabilities (19) (11)Other liabilities (838) (1,021)Net amount recognized $ (605) $ (966)Amounts recognized in accumulated other comprehensive income consist of Prior service cost $ 48 $ 56Net amount recognized $ 48 $ 56
93

The accumulated benefit obligation for all defined benefit pension plans was $5.4 billion and $5.1 billion at December 30, 2017 and December 31,2016 , respectively. Information for pension plans with accumulated benefit obligations in excess of plan assets were:
(millions) 2017 2016Projected benefit obligation $ 4,119 $ 3,940Accumulated benefit obligation $ 4,051 $ 3,737Fair value of plan assets $ 3,279 $ 2,938
ExpenseThe components of pension expense are presented in the following table. Pension expense for defined contribution plans relates to certain foreign-based defined contribution plans and multiemployer plans in the United States in which the Company participates on behalf of certain unionizedworkforces.
(millions) 2017 2016 2015Service cost $ 96 $ 98 $ 114Interest cost 164 174 206Expected return on plan assets (371) (352) (399)Amortization of unrecognized prior service cost 9 13 13Recognized net (gain) loss (36) 323 303Net periodic benefit cost (138) 256 237Curtailment and special termination benefits (151) 1 (1)Pension (income) expense: Defined benefit plans (289) 257 236Defined contribution plans 34 36 40Total $ (255) $ 293 $ 276
The estimated prior service cost for defined benefit pension plans that will be amortized from accumulated other comprehensive income into pensionexpense over the next fiscal year is approximately $8 million .
The Company and certain of its subsidiaries sponsor 401(k) or similar savings plans for active employees. Expense related to these plans was (inmillions): 2017 – $41 million ; 2016 – $39 million ; 2015 – $40 million . These amounts are not included in the preceding expense table. Companycontributions to these savings plans approximate annual expense. Company contributions to multiemployer and other defined contribution pension plansapproximate the amount of annual expense presented in the preceding table.
AssumptionsThe worldwide weighted-average actuarial assumptions used to determine benefit obligations were:
2017 2016 2015Discount rate 3.3% 3.6% 4.1%Long-term rate of compensation increase 3.9% 3.9% 3.9%
The worldwide weighted-average actuarial assumptions used to determine annual net periodic benefit cost were:
2017 2016 2015Discount rate 3.6% 4.1% 3.9%Long-term rate of compensation increase 3.9% 3.9% 4.0%Long-term rate of return on plan assets 8.1% 8.1% 8.3%
To determine the overall expected long-term rate of return on plan assets, the Company models expected returns over a 20-year investment horizonwith respect to the specific investment mix of its major plans. The return assumptions used reflect a combination of rigorous historical performanceanalysis and forward-looking views of the financial markets including consideration of current yields on long-term bonds, price-earnings ratios of themajor stock market indices, and long-term inflation. The U.S. model, which corresponds to approximately 71% of consolidated pension and otherpostretirement benefit plan assets, incorporates a long-term inflation assumption of 2.5% and an active management premium of 1% (net of fees)validated by historical analysis. Similar methods are used for various foreign plans with invested assets, reflecting local economic conditions. Theexpected rate of return for 2017 of 8.5% for the U.S. plans equated to approximately the 62nd percentile expectation. Refer to Note 1 .
94

At the end of 2014, the Company revised its mortality assumption after considering the Society of Actuaries’ (SOA) updated mortality tables andimprovement scale, as well as other mortality information available from the Social Security Administration to develop assumptions aligned with theCompany’s expectation of future improvement rates. In determining the appropriate mortality assumptions as of December 30, 2017, the Companyconsidered the SOA's 2017 updated improvement scale. The SOA's 2017 scale incorporates changes consistent with the Company's view of futuremortality improvements established in 2014. Therefore, the Company adopted the 2017 SOA improvement scales. The change to the mortalityassumption decreased the year-end pension liability by $21 million .
To conduct the annual review of discount rates, the Company selected the discount rate based on a cash-flow matching analysis using TowersWatson’s proprietary RATE:Link tool and projections of the future benefit payments that constitute the projected benefit obligation for the plans.RATE:Link establishes the uniform discount rate that produces the same present value of the estimated future benefit payments, as is generated bydiscounting each year’s benefit payments by a spot rate applicable to that year. The spot rates used in this process are derived from a yield curvecreated from yields on the 40 th to 90 th percentile of U.S. high quality bonds. A similar methodology is applied in Canada and Europe, except thesmaller bond markets imply that yields between the 10 th and 90 th percentiles are preferable and in the U.K. the underlying yield curve was derivedafter further adjustments to the universe of bonds to remove bonds from issuers where it is not clear if they are truly corporate bonds. The measurementdates for the defined benefit plans are consistent with the Company’s fiscal year end. Accordingly, the Company selected discount rates to measure thebenefit obligations consistent with market indices at year-end.
Beginning in 2016, the Company changed the method used to estimate the service and interest costs for pension and postretirement benefits. The newmethod utilized a full yield curve approach to estimate service and interest costs by applying specific spot rates along the yield curve used to determinethe benefit obligation of relevant projected cash outflows. Historically, the Company utilized a single weighted-average discount rate applied to projectedcash outflows. The Company made the change to provide a more precise measurement of service and interest costs by aligning the timing of the plan'sliability cash flows to the corresponding spot rate on the yield curve. The change did not impact the measurement of the plan's obligations. TheCompany accounted for this change as a change in accounting estimate. As a result of the change, 2016 interest and service cost for pension andpostretirement benefit plans were approximately $30 million and $10 million lower, respectively.
Plan assetsThe Company categorized Plan assets within a three level fair value hierarchy described as follows:
Investments stated at fair value as determined by quoted market prices (Level 1) include:
Cash and cash equivalents: Value based on cost, which approximates fair value.
Corporate stock, common: Value based on the last sales price on the primary exchange.
Investments stated at estimated fair value using significant observable inputs (Level 2) include:
Cash and cash equivalents: Institutional short-term investment vehicles valued daily.
Mutual funds: Valued at the net asset value of shares held by the Plan at year end.
Collective trusts : Value based on the net asset value of units held at year end.
Bonds: Value based on matrices or models from pricing vendors.
Limited partnerships: Value based on the ending net capital account balance at year end.
Investments stated at estimated fair value using significant unobservable inputs (Level 3) include:
Real estate: Value based on the net asset value of units held at year end. The fair value of real estate holdings is based on market data includingearnings capitalization, discounted cash flow analysis, comparable sales transactions or a combination of these methods.
Buy-in annuity contracts: Value based on the calculated pension benefit obligation covered by the non-participating annuity contracts at year-end.
Bonds: Value based on matrices or models from brokerage firms. A limited number of the investments are in default.
95

The preceding methods described may produce a fair value calculation that may not be indicative of net realizable value or reflective of future fairvalues. Furthermore, although the Company believes its valuation methods are appropriate and consistent with other market participants, the use ofdifferent methodologies or assumptions to determine the fair value of certain financial instruments could result in a different fair value measurement atthe reporting date.
The Company’s practice regarding the timing of transfers between levels is to measure transfers in at the beginning of the month and transfers out atthe end of the month. For the year ended December 30, 2017 , the Company had no transfers between Levels 1 and 2.
96

The fair value of Plan assets as of December 30, 2017 summarized by level within the fair value hierarchy are as follows:
(millions) Total
Level 1 Total
Level 2 Total
Level 3
TotalNAV (practicalexpedient)(a) 67 Total
Cash and cash equivalents $ 66 $ 21 $ — $ — $ 87Corporate stock, common: Domestic 500 — — — 500International 17 1 — — 18
Mutual funds: International equity — 120 — 38 158
Domestic debt — — — 36 36Collective trusts: Domestic equity — — — 525 525International equity — 176 — 1,390 1,566Other international debt — — — 365 365
Limited partnerships — — — 591 591Bonds, corporate — 482 — — 482Bonds, government — 177 — — 177Bonds, other — 63 — — 63Buy-in annuity contract — — — — —Real estate — — — 284 284Other — 128 — 63 191Total $ 583 $ 1,168 $ — $ 3,292 $ 5,043(a) Certain assets that are measured at fair value using the NAV per share (or its equivalent) practical expedient have not been classified in the fair value hierarchy.
The fair value of Plan assets at December 31, 2016 are summarized as follows:
(millions) TotalLevel 1
TotalLevel 2
TotalLevel 3
TotalNAV (practicalexpedient)(a) Total
Cash and cash equivalents $ 54 $ 12 $ — $ — $ 66Corporate stock, common: Domestic 482 — — — 482International 31 1 — — 32
Mutual funds: International equity — 116 — 32 148
Domestic debt — 24 — 42 66Collective trusts: Domestic equity — — — 653 653International equity — 138 — 1,112 1,250Other international debt — — — 310 310
Limited partnerships — — — 485 485Bonds, corporate — 452 — — 452Bonds, government — 158 — — 158Bonds, other — 41 — — 41Buy-in annuity contract — — 131 — 131Real estate — — — 117 117Other — 96 — 57 153Total $ 567 $ 1,038 $ 131 $ 2,808 $ 4,544(a) Certain assets that are measured at fair value using the NAV per share (or its equivalent) practical expedient have not been classified in the fair value hierarchy.
There were no unfunded commitments to purchase investments at December 30, 2017 or December 31, 2016 .
The Company’s investment strategy for its major defined benefit plans is to maintain a diversified portfolio of asset classes with the primary goal ofmeeting long-term cash requirements as they become due. Assets are invested in a prudent manner to maintain the security of funds while maximizingreturns within the Plan’s investment policy. The investment policy specifies the type of investment vehicles appropriate for the Plan, asset allocationguidelines, criteria for the selection of investment managers, procedures to monitor overall investment performance as well as investment managerperformance. It also provides guidelines enabling Plan fiduciaries to fulfill their responsibilities.
97

The current weighted-average target asset allocation reflected by this strategy is: equity securities– 58% ; debt securities– 20% ; real estate and other–22% . Investment in Company common stock represented 1.2% and 1.5% of consolidated plan assets at December 30, 2017 and December 31, 2016 ,respectively. Plan funding strategies are influenced by tax regulations and funding requirements. The Company currently expects to contribute, beforeconsideration of incremental discretionary contributions, approximately $24 million to its defined benefit pension plans during 2018. Additionally, theCompany anticipates adjusting targeted asset allocation to a more conservative investment mix that will likely result in a lower Expected Rate of Returnassumption for 2018.
Level 3 gains and lossesChanges in the fair value of the Plan’s Level 3 assets are summarized as follows:
(millions) Buy-in Annuity Contract Other TotalJanuary 2, 2016 $ 135 $ 6 $ 141Sales — (3) (3)Purchases — — —Transfers — (3) (3)Realized and unrealized gain (7) — (7)Currency translation 3 — 3
December 31, 2016 $ 131 $ — $ 131Sales (131) — (131)Purchases — — —Transfers — — —Realized and unrealized gain — — —Currency translation — — —
December 30, 2017 $ — $ — $ —
The net change in Level 3 assets includes a gain attributable to the change in unrealized holding gains or losses related to Level 3 assets held atDecember 30, 2017 was zero and $(7) million at December 31, 2016 .
Benefit paymentsThe following benefit payments, which reflect expected future service, as appropriate, are expected to be paid (in millions): 2018– $261 ; 2019– $256 ;2020– $263 ; 2021– $276 ; 2022– $276 ; 2023 to 2027– $1,448 .
NOTE 11NONPENSION POSTRETIREMENT AND POSTEMPLOYMENT BENEFITS
PostretirementThe Company sponsors a number of plans to provide health care and other welfare benefits to retired employees in the United States and Canada, whohave met certain age and service requirements. The majority of these plans are funded or unfunded defined benefit plans, although the Company doesparticipate in a limited number of multiemployer or other defined contribution plans for certain employee groups. The Company contributes to voluntaryemployee benefit association (VEBA) trusts to fund certain U.S. retiree health and welfare benefit obligations. The Company uses a December 31measurement date for these plans and, when necessary, adjusts for plan contributions and significant events between December 31 and its fiscal year-end.
98

Obligations and funded statusThe aggregate change in accumulated postretirement benefit obligation, plan assets, and funded status is presented in the following tables.
(millions) 2017 2016Change in accumulated benefit obligation Beginning of year $ 1,161 $ 1,163Service cost 18 21Interest cost 37 39Actuarial (gain) loss 29 2Benefits paid (61) (65)Curtailments 3 —Amendments — —Foreign currency adjustments 3 1End of year $ 1,190 $ 1,161Change in plan assets Fair value beginning of year $ 1,136 $ 1,084Actual return on plan assets 217 111Employer contributions 13 15Benefits paid (74) (74)Fair value end of year $ 1,292 $ 1,136Funded status $ 102 $ (25)Amounts recognized in the Consolidated Balance Sheet consist of Other non-current assets $ 144 $ 17Other current liabilities (2) (2)Other liabilities (40) (40)Net amount recognized $ 102 $ (25)Amounts recognized in accumulated other comprehensive income consist of Prior service credit (77) (86)Net amount recognized $ (77) $ (86)
ExpenseComponents of postretirement benefit expense (income) were:
(millions) 2017 2016 2015Service cost $ 18 $ 21 $ 29Interest cost 37 39 48Expected return on plan assets (98) (90) (100)Amortization of unrecognized prior service credit (9) (9) (5)Recognized net (gain) loss (90) (19) 112Net periodic benefit cost (142) (58) 84Curtailment 3 — —Postretirement benefit expense: Defined benefit plans (139) (58) 84Defined contribution plans 16 17 14Total $ (123) $ (41) $ 98
The estimated prior service credit that will be amortized from accumulated other comprehensive income into nonpension postretirement benefit expenseover the next fiscal year is expected to be approximately $9 million .
AssumptionsThe weighted-average actuarial assumptions used to determine benefit obligations were:
2017 2016 2015Discount rate 3.6% 4.0% 4.2%
99

The weighted-average actuarial assumptions used to determine annual net periodic benefit cost were:
2017 2016 2015Discount rate 4.0% 4.2% 4.0%Long-term rate of return on plan assets 8.5% 8.5% 8.5%
The Company determines the overall discount rate and expected long-term rate of return on VEBA trust obligations and assets in the same manner asthat described for pension trusts in Note 10 .
The assumed health care cost trend rate is 5.7% for 2018, decreasing 0.25% annually to 4.5% by the year 2023 and remaining at that level thereafter.These trend rates reflect the Company’s historical experience and management’s expectations regarding future trends. A one percentage point changein assumed health care cost trend rates would have the following effects:
(millions) One percentagepoint increase
One percentagepoint decrease
Effect on total of service and interest cost components $ 7 $ (4)Effect on postretirement benefit obligation 117 (79)
100

Plan assetsThe fair value of Plan assets as of December 30, 2017 summarized by level within fair value hierarchy described in Note 10 , are as follows:
(millions) Total
Level 1 Total
Level 2 Total
Level 3
TotalNAV (practicalexpedient)(a) Total
Cash and cash equivalents $ — $ 13 $ — $ — $ 13Corporate stock, common: Domestic 141 — — — 141International 8 — — — 8
Mutual funds: Domestic equity — 52 — — 52International equity — 40 — — 40Domestic debt — 52 — — 52
Collective trusts: Domestic equity — — — 273 273International equity — — — 266 266
Limited partnerships — — — 215 215Bonds, corporate — 117 — — 117Bonds, government — 53 — — 53Bonds, other — 9 — — 9Real estate — — — 51 51Other — 2 — — 2Total $ 149 $ 338 $ — $ 805 $ 1,292(a) Certain assets that are measured at fair value using the NAV per share (or its equivalent) practical expedient have not been classified in the fair value hierarchy.
The fair value of Plan assets at December 31, 2016 are summarized as follows:
(millions) TotalLevel 1
TotalLevel 2
TotalLevel 3
TotalNAV (practicalexpedient)(a) Total
Cash and cash equivalents $ 4 $ 6 $ — $ — $ 10Corporate stock, common: Domestic 143 — — — 143International 6 1 — — 7
Mutual funds: Domestic equity — 57 — — 57International equity — 30 — — 30Domestic debt — 53 — — 53
Collective trusts: Domestic equity — — — 272 272International equity — — — 210 210
Limited partnerships — — — 177 177Bonds, corporate — 117 — — 117Bonds, government — 48 — — 48Bonds, other — 10 — — 10Other — 2 — — 2Total $ 153 $ 324 $ — $ 659 $ 1,136(a) Certain assets that are measured at fair value using the NAV per share (or its equivalent) practical expedient have not been classified in the fair value hierarchy.
The Company’s asset investment strategy for its VEBA trusts is consistent with that described for its pension trusts in Note 10 . The current target assetallocation is 70% equity securities, 23% debt securities, and 7% real estate. The Company currently expects to contribute approximately $13 million toits VEBA trusts during 2018. Additionally, the Company anticipates adjusting targeted asset allocation to a more conservative investment mix that willlikely result in a lower expected rate of return assumption for 2018.
There were no Level 3 assets during 2017 and 2016 .
101
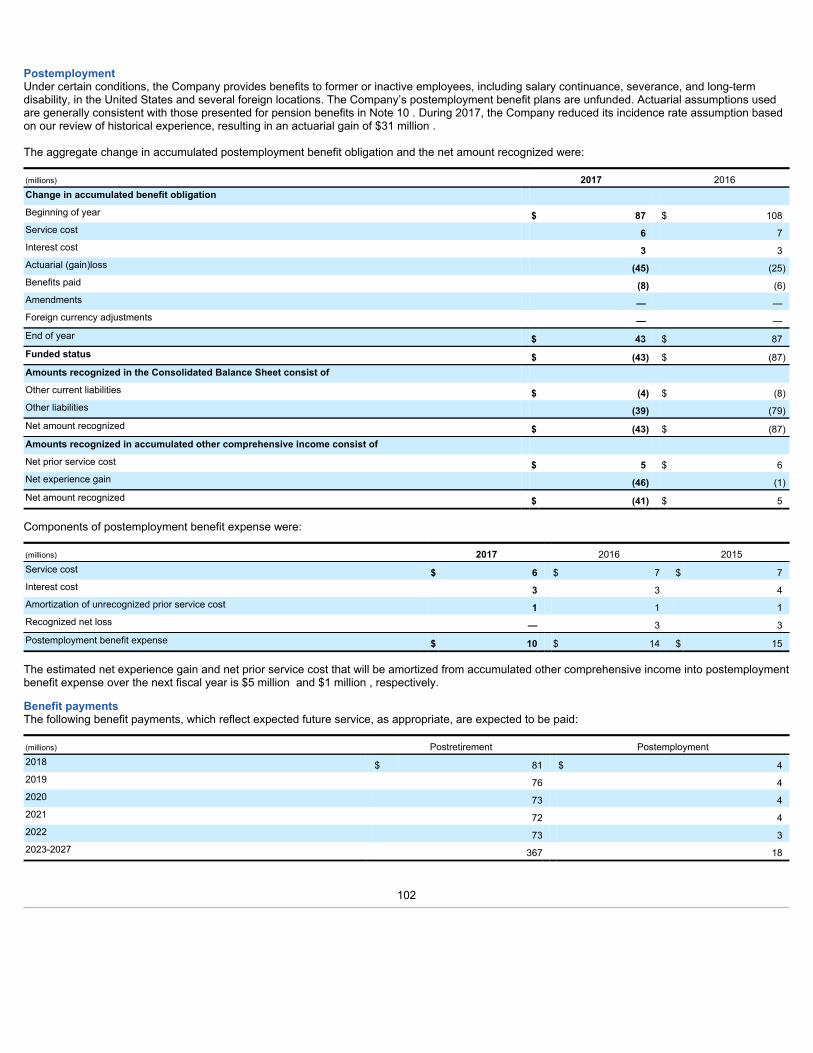
PostemploymentUnder certain conditions, the Company provides benefits to former or inactive employees, including salary continuance, severance, and long-termdisability, in the United States and several foreign locations. The Company’s postemployment benefit plans are unfunded. Actuarial assumptions usedare generally consistent with those presented for pension benefits in Note 10 . During 2017, the Company reduced its incidence rate assumption basedon our review of historical experience, resulting in an actuarial gain of $31 million .
The aggregate change in accumulated postemployment benefit obligation and the net amount recognized were:
(millions) 2017 2016Change in accumulated benefit obligation Beginning of year $ 87 $ 108Service cost 6 7Interest cost 3 3Actuarial (gain)loss (45) (25)Benefits paid (8) (6)Amendments — —Foreign currency adjustments — —End of year $ 43 $ 87Funded status $ (43) $ (87)Amounts recognized in the Consolidated Balance Sheet consist of Other current liabilities $ (4) $ (8)Other liabilities (39) (79)Net amount recognized $ (43) $ (87)Amounts recognized in accumulated other comprehensive income consist of Net prior service cost $ 5 $ 6Net experience gain (46) (1)Net amount recognized $ (41) $ 5
Components of postemployment benefit expense were:
(millions) 2017 2016 2015Service cost $ 6 $ 7 $ 7Interest cost 3 3 4Amortization of unrecognized prior service cost 1 1 1Recognized net loss — 3 3Postemployment benefit expense $ 10 $ 14 $ 15
The estimated net experience gain and net prior service cost that will be amortized from accumulated other comprehensive income into postemploymentbenefit expense over the next fiscal year is $5 million and $1 million , respectively.
Benefit paymentsThe following benefit payments, which reflect expected future service, as appropriate, are expected to be paid:
(millions) Postretirement Postemployment2018 $ 81 $ 42019 76 42020 73 42021 72 42022 73 32023-2027 367 18
102
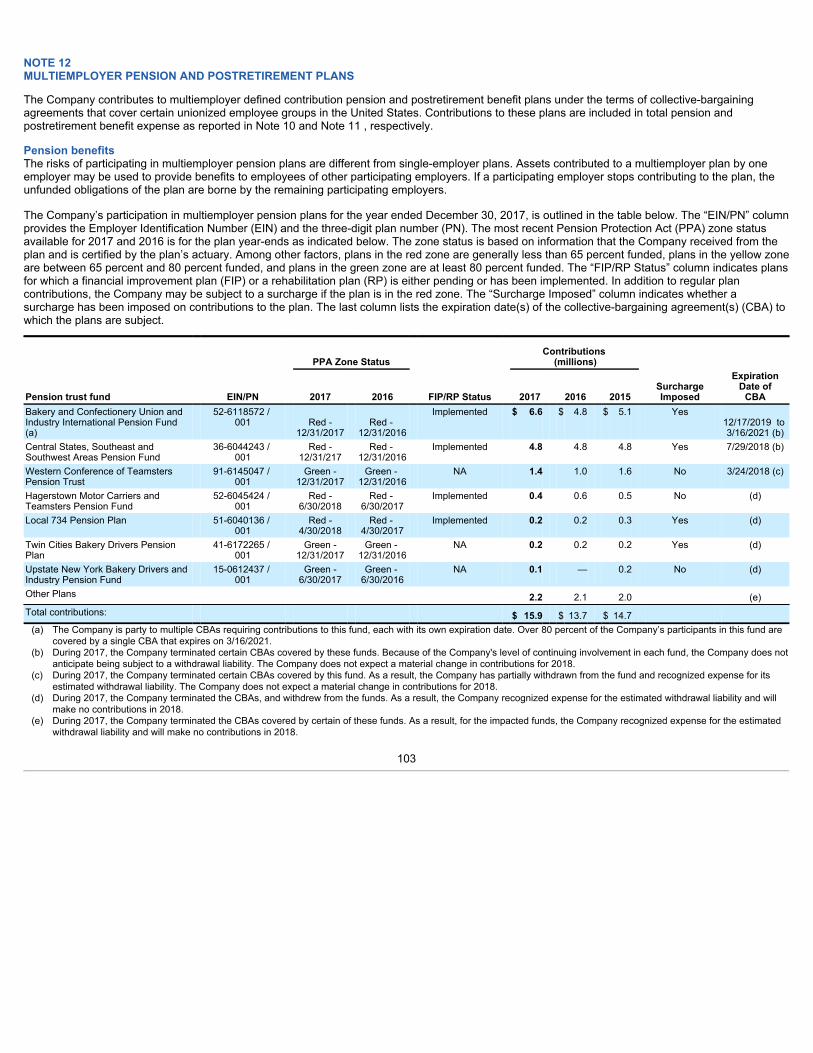
NOTE 12MULTIEMPLOYER PENSION AND POSTRETIREMENT PLANS
The Company contributes to multiemployer defined contribution pension and postretirement benefit plans under the terms of collective-bargainingagreements that cover certain unionized employee groups in the United States. Contributions to these plans are included in total pension andpostretirement benefit expense as reported in Note 10 and Note 11 , respectively. Pension benefitsThe risks of participating in multiemployer pension plans are different from single-employer plans. Assets contributed to a multiemployer plan by oneemployer may be used to provide benefits to employees of other participating employers. If a participating employer stops contributing to the plan, theunfunded obligations of the plan are borne by the remaining participating employers. The Company’s participation in multiemployer pension plans for the year ended December 30, 2017, is outlined in the table below. The “EIN/PN” columnprovides the Employer Identification Number (EIN) and the three-digit plan number (PN). The most recent Pension Protection Act (PPA) zone statusavailable for 2017 and 2016 is for the plan year-ends as indicated below. The zone status is based on information that the Company received from theplan and is certified by the plan’s actuary. Among other factors, plans in the red zone are generally less than 65 percent funded, plans in the yellow zoneare between 65 percent and 80 percent funded, and plans in the green zone are at least 80 percent funded. The “FIP/RP Status” column indicates plansfor which a financial improvement plan (FIP) or a rehabilitation plan (RP) is either pending or has been implemented. In addition to regular plancontributions, the Company may be subject to a surcharge if the plan is in the red zone. The “Surcharge Imposed” column indicates whether asurcharge has been imposed on contributions to the plan. The last column lists the expiration date(s) of the collective-bargaining agreement(s) (CBA) towhich the plans are subject.
PPA Zone Status
Contributions (millions)
Pension trust fund EIN/PN 2017 2016 FIP/RP Status 2017 2016 2015 SurchargeImposed
ExpirationDate of
CBABakery and Confectionery Union andIndustry International Pension Fund(a)
52-6118572 / 001
Red -
12/31/2017 Red -
12/31/2016
Implemented
$ 6.6
$ 4.8
$ 5.1
Yes
12/17/2019 to 3/16/2021 (b)
Central States, Southeast andSouthwest Areas Pension Fund
36-6044243 / 001
Red -12/31/217
Red - 12/31/2016
Implemented
4.8
4.8
4.8
Yes 7/29/2018 (b)
Western Conference of TeamstersPension Trust
91-6145047 / 001
Green -12/31/2017
Green - 12/31/2016
NA
1.4
1.0
1.6
No 3/24/2018 (c)
Hagerstown Motor Carriers andTeamsters Pension Fund
52-6045424 / 001
Red -6/30/2018
Red - 6/30/2017
Implemented
0.4
0.6
0.5
No
(d)
Local 734 Pension Plan
51-6040136 / 001
Red -4/30/2018
Red - 4/30/2017
Implemented
0.2
0.2
0.3
Yes
(d)
Twin Cities Bakery Drivers PensionPlan
41-6172265 / 001
Green -12/31/2017
Green - 12/31/2016
NA
0.2
0.2
0.2
Yes
(d)
Upstate New York Bakery Drivers andIndustry Pension Fund
15-0612437 / 001
Green -6/30/2017
Green - 6/30/2016
NA
0.1
—
0.2
No
(d)
Other Plans 2.2 2.1 2.0 (e)Total contributions: $ 15.9 $ 13.7 $ 14.7 (a) The Company is party to multiple CBAs requiring contributions to this fund, each with its own expiration date. Over 80 percent of the Company’s participants in this fund are
covered by a single CBA that expires on 3/16/2021.(b) During 2017, the Company terminated certain CBAs covered by these funds. Because of the Company's level of continuing involvement in each fund, the Company does not
anticipate being subject to a withdrawal liability. The Company does not expect a material change in contributions for 2018.(c) During 2017, the Company terminated certain CBAs covered by this fund. As a result, the Company has partially withdrawn from the fund and recognized expense for its
estimated withdrawal liability. The Company does not expect a material change in contributions for 2018.(d) During 2017, the Company terminated the CBAs, and withdrew from the funds. As a result, the Company recognized expense for the estimated withdrawal liability and will
make no contributions in 2018.(e) During 2017, the Company terminated the CBAs covered by certain of these funds. As a result, for the impacted funds, the Company recognized expense for the estimated
withdrawal liability and will make no contributions in 2018.
103
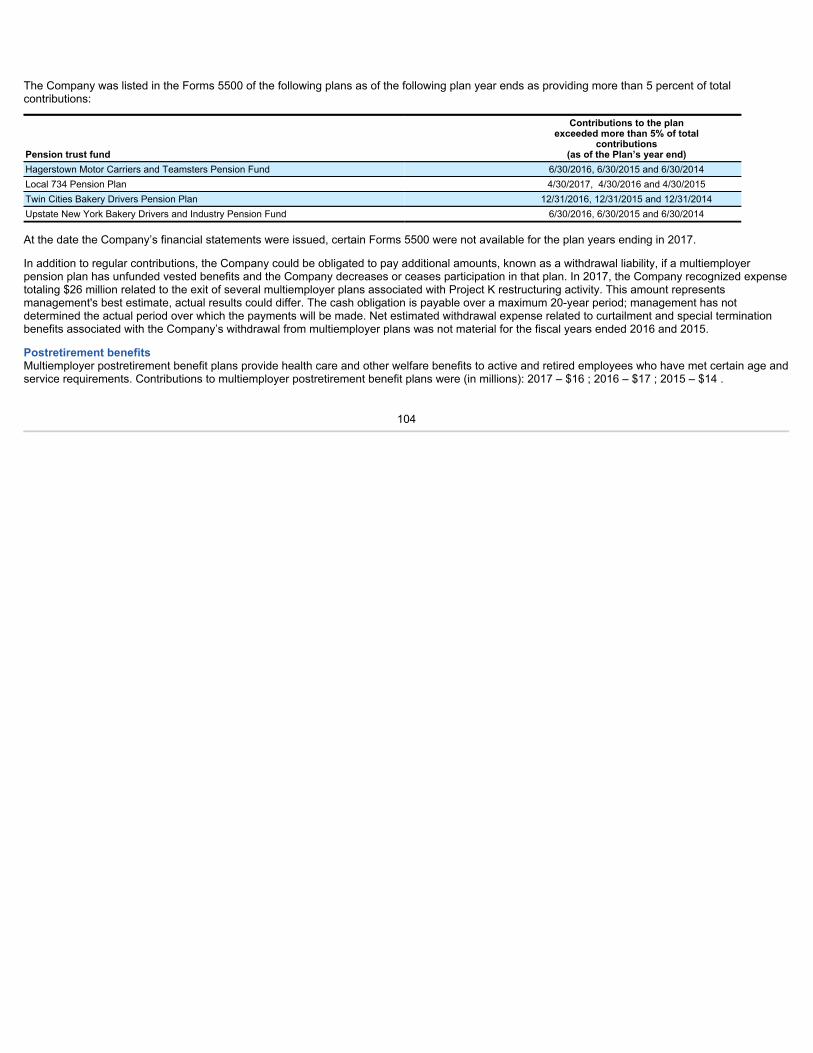
The Company was listed in the Forms 5500 of the following plans as of the following plan year ends as providing more than 5 percent of totalcontributions:
Pension trust fund
Contributions to the planexceeded more than 5% of total
contributions(as of the Plan’s year end)
Hagerstown Motor Carriers and Teamsters Pension Fund 6/30/2016, 6/30/2015 and 6/30/2014Local 734 Pension Plan 4/30/2017, 4/30/2016 and 4/30/2015Twin Cities Bakery Drivers Pension Plan 12/31/2016, 12/31/2015 and 12/31/2014Upstate New York Bakery Drivers and Industry Pension Fund 6/30/2016, 6/30/2015 and 6/30/2014
At the date the Company’s financial statements were issued, certain Forms 5500 were not available for the plan years ending in 2017.
In addition to regular contributions, the Company could be obligated to pay additional amounts, known as a withdrawal liability, if a multiemployerpension plan has unfunded vested benefits and the Company decreases or ceases participation in that plan. In 2017, the Company recognized expensetotaling $26 million related to the exit of several multiemployer plans associated with Project K restructuring activity. This amount representsmanagement's best estimate, actual results could differ. The cash obligation is payable over a maximum 20-year period; management has notdetermined the actual period over which the payments will be made. Net estimated withdrawal expense related to curtailment and special terminationbenefits associated with the Company’s withdrawal from multiemployer plans was not material for the fiscal years ended 2016 and 2015.
Postretirement benefitsMultiemployer postretirement benefit plans provide health care and other welfare benefits to active and retired employees who have met certain age andservice requirements. Contributions to multiemployer postretirement benefit plans were (in millions): 2017 – $16 ; 2016 – $17 ; 2015 – $14 .
104

NOTE 13INCOME TAXES
The components of income before income taxes and the provision for income taxes were as follows:
(millions) 2017 2016 2015Income before income taxes United States $ 1,109 $ 830 $ 551Foreign 565 97 222
1,674 927 773Income taxes Currently payable
Federal 358 173 212State 31 26 42Foreign 79 60 74
468 259 328Deferred
Federal (39) 16 (136)State 8 6 (14)Foreign (25) (48) (19)
(56) (26) (169)Total income taxes $ 412 $ 233 $ 159
The difference between the U.S. federal statutory tax rate and the Company’s effective income tax rate was:
2017 2016 2015U.S. statutory income tax rate 35.0 % 35.0 % 35.0 %Foreign rates varying from 35% (6.7) (5.0) (9.6)Excess tax benefits on share-based compensation (0.3) (3.7) —State income taxes, net of federal benefit 1.4 2.4 2.3Cost (benefit) of remitted and unremitted foreign earnings 0.1 0.1 (4.4)U.S. deduction for qualified production activities (1.4) (2.8) (2.3)Statutory rate changes, deferred tax impact (9.0) (0.1) (0.8)U.S. deemed repatriation tax 10.4 — —Intangible property transfer (2.4) — —Venezuela deconsolidation — 1.8 —Venezuela remeasurement — 0.4 5.0VIE deconsolidation — — (2.3)Other (2.5) (2.9) (2.3)Effective income tax rate 24.6 % 25.2 % 20.6 %As presented in the preceding table, the Company’s 2017 consolidated effective tax rate was 24.6% , as compared to 25.2% in 2016 and 20.6% in2015.
On December 22, 2017, the U.S. government enacted comprehensive tax legislation commonly referred to as the Tax Cuts and Jobs Act (Tax Act). TheTax Act makes broad and complex changes to the U.S. tax code which impact our year ended December 30, 2017 including but not limited to, reducingthe corporate tax rate from 35% to 21% , requiring a one-time transition tax on certain unrepatriated earnings of foreign subsidiaries that may beelectively paid over eight years, and accelerating first year expensing of certain capital expenditures.
Shortly after the Tax Act was enacted, the SEC staff issued Staff Accounting Bulletin No. 118, Income Tax Accounting Implications of the Tax Cuts andJobs Act (SAB 118), which provides guidance on accounting for the Tax Act’s impact. SAB 118 provides a measurement period, which in no caseshould extend beyond one year from the Tax Act enactment date, during which a company may complete the accounting for the impacts of the Tax Actunder ASC Topic 740. Per SAB 118, the Company must reflect the income tax effects of the Tax Act in the reporting period in which the accountingunder ASC Topic 740 is complete. To the extent that a company’s accounting for certain income tax effects of the Tax Act is incomplete, the Companycan determine a reasonable estimate for those effects and record a provisional estimate in the financial statements in the first reporting period in which areasonable estimate can be determined. If a Company cannot determine a provisional estimate to be included in the financial statements, the Companyshould continue to apply ASC 740 based on the provisions of the tax laws that were in
105

effect immediately prior to the Tax Act being enacted. If a Company is unable to provide a reasonable estimate of the impacts of the Tax Act in areporting period, a provisional amount must be recorded in the first reporting period in which a reasonable estimate can be determined.
The Company's year end income tax provision includes $4 million of net additional income tax expense during the quarter ended December 30, 2017,driven by the reduction in the U.S. corporate tax rate and the transition tax on foreign earnings.
Reduction in U.S. Corporate Tax Rate: The tax provision includes a tax benefit of $153 million for the remeasurement of certain deferred tax assets andliabilities to reflect the corporate tax rate reduction impact to the Company's net deferred tax balances. This adjustment is considered complete.
Transition tax on foreign earnings: The transition tax is a tax on the previously untaxed accumulated and current earnings and profits of certain of ourforeign subsidiaries. In order to determine the amount of the transition tax, the Company must determine, in addition to other factors, the amount ofpost-1986 earnings and profits (E&P) of the relevant subsidiaries, as well as the amount of non-U.S. income taxes paid on such earnings. E&P is similarto retained earnings of the subsidiary, but requires other adjustments to conform to U.S. tax rules. As of December 30, 2017, based on accumulatedforeign earnings and profits of approximately $2.6 billion , which are primarily in Europe, the Company was able to make a reasonable estimate of thetransition tax and recorded a transition tax obligation of $157 million , which the Company expects to elect to pay over eight years. The current portion of$17 million is included within Other current liabilities and the remainder is included within Other liabilities on the balance sheet. However, the Companyis awaiting further interpretative guidance, continuing to assess available tax methods and elections, and continuing to gather additional information inorder to finalize calculations and complete the accounting for the transition tax liability.
In addition to the transition tax, the Tax Act introduced a territorial tax system, which will be effective beginning in 2018. The territorial tax system willimpact the Company’s overall global capital and legal entity structure, working capital, and repatriation plan on a go-forward basis. In light of theterritorial tax system, and other new international provisions within the Tax Act that are effective beginning in 2018, the Company is currently analyzingits global capital and legal entity structure, working capital requirements, and repatriation plans. Based on the Company's analysis of the territorial taxsystem and other new international tax provisions as of December 30, 2017, the Company continues to support the assertion to indefinitely reinvest $2.6billion of accumulated foreign earnings and profits in Europe and other non-U.S. jurisdictions. As a result, as a reasonable provisional estimate, theCompany did not record any new deferred tax liabilities associated with the territorial tax system or any changes to the indefinite reinvestment assertion.Further, it is impracticable for the Company to estimate any future tax costs for any unrecognized deferred tax liabilities associated with its indefinitereinvestment assertion as of December 30, 2017, because the actual tax liability, if any, would be dependent on complex analysis and calculationsconsidering various tax laws, exchange rates, circumstances existing when a repatriation, sale, or liquidiation occurs, or other factors. If there are anychanges to our indefinite reinvestment assertion as a result of finalizing our assessment of the new Tax Act, the Company will adjust its provisionalestimates, record, and disclose any tax impacts in the appropriate period, pursuant to SAB 118.
As of December 30, 2017, the Company did not identify any items from the Tax Act for which a provisional estimate could not be determined. Inaddition, other provisions of the Tax Act for which the Company has finalized or is continuing to finalize its accounting are not material (or expected tobe material) to the financial statements as of and for the year ended December 30, 2017.
The 2017 effective income tax rate benefited from a deferred tax benefit of $39 million resulting from intercompany transfers of intellectual propertyunder the application of the newly adopted standard. See discussion regarding the adoption of ASU 2016-16, Intra-Entity Transfers of Assets OtherThan Inventory , in Note 1.
The 2016 effective income tax rate benefited from excess tax benefits from share-based compensation totaling $36 million for federal, state, andforeign income taxes. During 2016, as described in Note 16 , the Company deconsolidated its Venezuelan operations resulting in a pre-tax charge of$72 million with no significant associated tax benefit. As of December 31, 2016 substantially all foreign earnings were considered permanently invested. Accumulated foreign earnings of approximately $1.9 billion , primarily in Europe, were considered indefinitely reinvested. Due to the varying tax lawsaround the world and fluctuation in foreign exchange rates, it is not practicable to determine the unrecognized deferred tax liability on these earningsbecause the actual tax liability, if any, would be dependent on circumstances existing when a repatriation, sale, or liquidation occurs.
106

The 2015 effective income tax rate benefited due to mark-to-market loss adjustments to the Company’s pension plans in primarily higher taxjurisdictions. This resulted in a greater percentage of total income being generated in lower tax jurisdictions and permanent tax differences in the U.S.having a higher percentage impact on the tax rate. In addition, the tax rate benefited from a reduction in tax related to current year remitted andunremitted earnings. The VIE deconsolidation, described in Note 6 , included a $67 million non-cash non-taxable gain which positively impacted the taxrate. During 2015, the Company recorded pre-tax charges of $112 million in the Latin America operating segment due to the devaluation of theVenezuelan currency which had no associated tax benefit. As of January 2, 2016 substantially all foreign earnings were considered permanentlyinvested. Accumulated foreign earnings of approximately $2.0 billion , primarily in Europe, were considered indefinitely reinvested. Due to the varyingtax laws around the world and fluctuation in foreign exchange rates, it is not practicable to determine the unrecognized deferred tax liability on theseearnings because the actual tax liability, if any, would be dependent on circumstances existing when a repatriation, sale, or liquidation occurs.
Management monitors the Company’s ability to utilize certain future tax deductions, operating losses and tax credit carryforwards, prior to expiration.Changes resulting from management’s assessment will result in impacts to deferred tax assets and the corresponding impacts on the effective incometax rate. Valuation allowances were recorded to reduce deferred tax assets to an amount that will, more likely than not, be realized in the future. Thetotal tax benefit of carryforwards at year-end 2017 and 2016 were $239 million and $181 million , respectively, with related valuation allowances atyear-end 2017 and 2016 of $153 million and $131 million , respectively. Of the total carryforwards at year-end 2017 , substantially all will expire after2021.
107

The following table provides an analysis of the Company’s deferred tax assets and liabilities as of year-end 2017 and 2016 . Deferred tax assets onemployee benefits decreased in 2017 due primarily to the impact of the lower U.S. tax rate as a result of the Tax Act, the impact of favorable pensionand postretirement plan asset returns, and a curtailment benefit in conjunction with the amendment of certain defined benefit pension plans in the U.S.and Canada for salaried employees freezing the compensation and service periods used to calculate pension benefits for active salaried employeeswho participate in the affected pension plans. Deferred tax liabilities related to intangible assets decreased as a result of the lower U.S. tax rate.
Deferred tax
assets Deferred taxliabilities
(millions) 2017 2016 2017 2016U.S. state income taxes $ — $ — $ 48 $ 34Advertising and promotion-related 13 17 — —Wages and payroll taxes 26 42 — —Inventory valuation 20 28 — —Employee benefits 154 403 — —Operating loss, credit and other carryforwards 239 181 — —Hedging transactions 42 — — 51Depreciation and asset disposals — — 208 318Trademarks and other intangibles — — 332 602Deferred compensation 25 38 — —Stock options 33 41 — —Other 71 31 — —
623 781 588 1,005Less valuation allowance (153) (131) — —
Total deferred taxes $ 470 $ 650 $ 588 $ 1,005Net deferred tax asset (liability) $ (118) $ (355) Classified in balance sheet as: Other assets $ 245 $ 170 Other liabilities (363) (525) Net deferred tax asset (liability) $ (118) $ (355)
The change in valuation allowance reducing deferred tax assets was:
(millions) 2017 2016 2015Balance at beginning of year $ 131 $ 63 $ 51Additions charged to income tax expense (a) 35 70 23Reductions credited to income tax expense (28) (4) (7)Currency translation adjustments 15 2 (4)Balance at end of year $ 153 $ 131 $ 63(a) During 2017, the Company increased deferred tax assets by $15 million related to a foreign loss carryforward related to the acquisition of a majority ownership interest in a natural, bio-organic certified breakfastcompany. The entire adjustment of $15 million was offset by a corresponding valuation allowance because it is not expected to be used in the future. During 2016, the Company increased its deferred tax assets by $34million relating to a revision of 2014 foreign loss carryforwards. The entire adjustment of $34 million was offset by a corresponding adjustment in the valuation allowance because it is not expected to be used in thefuture. These adjustments are not considered material to the previously issued or current year financial statements. Also during 2016, the Company increased its deferred tax assets by $26 million related to a foreign losscarryforward. The entire amount was offset by a corresponding valuation allowance because it is not expected to be used in the future.
Uncertain tax positionsThe Company is subject to federal income taxes in the U.S. as well as various state, local, and foreign jurisdictions. The Company’s 2017 provision forU.S. federal income taxes represents approximately 80% of the Company’s consolidated income tax provision. The Company was chosen to participatein the Internal Revenue Service (IRS) Compliance Assurance Program (CAP) beginning with the 2008 tax year. As a result, with limited exceptions, theCompany is no longer subject to U.S. federal examinations by the IRS for years prior to 2017. The Company is under examination for income and non-income tax filings in various state and foreign jurisdictions.
As of December 30, 2017 , the Company has classified $8 million of unrecognized tax benefits as a current liability. Management’s estimate ofreasonably possible changes in unrecognized tax benefits during the next twelve months is comprised of the current liability balance expected to besettled within one year, offset by approximately $5 million of projected additions related primarily to ongoing intercompany transfer pricing activity.Management is currently unaware of any issues under review that could result in significant additional payments, accruals, or other material deviation inthis estimate.
108
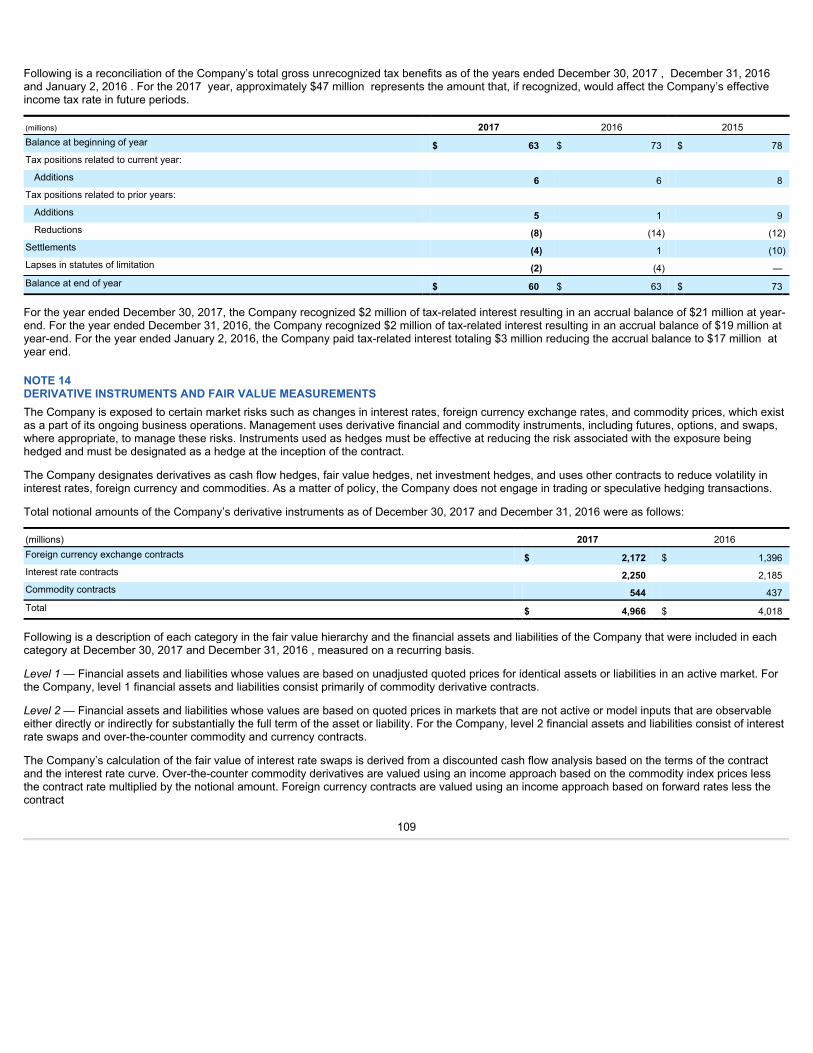
Following is a reconciliation of the Company’s total gross unrecognized tax benefits as of the years ended December 30, 2017 , December 31, 2016and January 2, 2016 . For the 2017 year, approximately $47 million represents the amount that, if recognized, would affect the Company’s effectiveincome tax rate in future periods.
(millions) 2017 2016 2015Balance at beginning of year $ 63 $ 73 $ 78Tax positions related to current year: Additions 6 6 8
Tax positions related to prior years: Additions 5 1 9Reductions (8) (14) (12)
Settlements (4) 1 (10)Lapses in statutes of limitation (2) (4) —Balance at end of year $ 60 $ 63 $ 73
For the year ended December 30, 2017, the Company recognized $2 million of tax-related interest resulting in an accrual balance of $21 million at year-end. For the year ended December 31, 2016, the Company recognized $2 million of tax-related interest resulting in an accrual balance of $19 million atyear-end. For the year ended January 2, 2016, the Company paid tax-related interest totaling $3 million reducing the accrual balance to $17 million atyear end.
NOTE 14DERIVATIVE INSTRUMENTS AND FAIR VALUE MEASUREMENTSThe Company is exposed to certain market risks such as changes in interest rates, foreign currency exchange rates, and commodity prices, which existas a part of its ongoing business operations. Management uses derivative financial and commodity instruments, including futures, options, and swaps,where appropriate, to manage these risks. Instruments used as hedges must be effective at reducing the risk associated with the exposure beinghedged and must be designated as a hedge at the inception of the contract.
The Company designates derivatives as cash flow hedges, fair value hedges, net investment hedges, and uses other contracts to reduce volatility ininterest rates, foreign currency and commodities. As a matter of policy, the Company does not engage in trading or speculative hedging transactions.
Total notional amounts of the Company’s derivative instruments as of December 30, 2017 and December 31, 2016 were as follows:
(millions) 2017 2016Foreign currency exchange contracts $ 2,172 $ 1,396Interest rate contracts 2,250 2,185Commodity contracts 544 437Total $ 4,966 $ 4,018
Following is a description of each category in the fair value hierarchy and the financial assets and liabilities of the Company that were included in eachcategory at December 30, 2017 and December 31, 2016 , measured on a recurring basis.
Level 1 — Financial assets and liabilities whose values are based on unadjusted quoted prices for identical assets or liabilities in an active market. Forthe Company, level 1 financial assets and liabilities consist primarily of commodity derivative contracts.
Level 2 — Financial assets and liabilities whose values are based on quoted prices in markets that are not active or model inputs that are observableeither directly or indirectly for substantially the full term of the asset or liability. For the Company, level 2 financial assets and liabilities consist of interestrate swaps and over-the-counter commodity and currency contracts.
The Company’s calculation of the fair value of interest rate swaps is derived from a discounted cash flow analysis based on the terms of the contractand the interest rate curve. Over-the-counter commodity derivatives are valued using an income approach based on the commodity index prices lessthe contract rate multiplied by the notional amount. Foreign currency contracts are valued using an income approach based on forward rates less thecontract
109

rate multiplied by the notional amount. The Company’s calculation of the fair value of level 2 financial assets and liabilities takes into consideration therisk of nonperformance, including counterparty credit risk.
Level 3 — Financial assets and liabilities whose values are based on prices or valuation techniques that require inputs that are both unobservable andsignificant to the overall fair value measurement. These inputs reflect management’s own assumptions about the assumptions a market participantwould use in pricing the asset or liability. The Company did not have any level 3 financial assets or liabilities as of December 30, 2017 or December 31,2016 .
The following table presents assets and liabilities that were measured at fair value in the Consolidated Balance Sheet on a recurring basis as ofDecember 30, 2017 and December 31, 2016 :
Derivatives designated as hedging instruments
2017 2016
(millions) Level 1 Level 2 Total Level 1 Level 2 TotalAssets: Foreign currency exchangecontracts: Other current assets $ — $ — $ — $ — $ 2 $ 2
Interest ratecontracts (a): Other assets — — — — 1 1
Total assets $ — $ — $ — $ — $ 3 $ 3Liabilities: Interest rate contracts: Other liabilities (a) — (54) (54) — (65) (65)
Total liabilities $ — $ (54) $ (54) $ — $ (65) $ (65)(a) The fair value of the related hedged portion of the Company’s long-term debt, a level 2 liability, was $2.3 billion as of December 30, 2017 .
Derivatives not designated as hedging instruments
2017 2016
(millions) Level 1 Level 2 Total Level 1 Level 2 TotalAssets: Foreign currency exchange contracts: Other current assets $ — $ 10 $ 10 $ — $ 25 $ 25
Commodity contracts: Other current assets 6 — 6 13 — 13
Total assets $ 6 $ 10 $ 16 $ 13 $ 25 $ 38Liabilities: Foreign currency exchange contracts: Other current liabilities $ — (14) $ (14) $ — $ (11) $ (11)
Commodity contracts: Other current liabilities (7) — (7) (7) — (7)
Total liabilities $ (7) $ (14) $ (21) $ (7) $ (11) $ (18)
The Company has designated a portion of its outstanding foreign currency denominated long-term debt as a net investment hedge of a portion of theCompany’s investment in its subsidiaries foreign currency denominated net assets. The carrying value of this debt was $2.7 billion and $1.8 billion as ofDecember 30, 2017 and December 31, 2016 , respectively.
The Company has elected to not offset the fair values of derivative assets and liabilities executed with the same counterparty that are generally subjectto enforceable netting agreements. However, if the Company were to offset and record the asset and liability balances of derivatives on a net basis, theamounts presented in the Consolidated Balance Sheet as of December 30, 2017 and December 31, 2016 would be adjusted as detailed in the followingtable:
110

As of December 30, 2017
Gross Amounts NotOffset in the
Consolidated BalanceSheet
AmountsPresented in
theConsolidated
BalanceSheet
FinancialInstruments
CashCollateralReceived/
Posted Net
AmountTotal asset derivatives $ 16 $ (15) $ — $ 1Total liability derivatives $ (75) $ 15 $ 37 $ (23)
As of December 31, 2016
Gross Amounts NotOffset in the
Consolidated BalanceSheet
AmountsPresented in
theConsolidatedBalanceSheet
FinancialInstruments
CashCollateralReceived/Posted
NetAmount
Total asset derivatives $ 41 $ (24) $ — $ 17Total liability derivatives $ (83) $ 24 $ 48 $ (11)
The effect of derivative instruments on the Consolidated Statement of Income for the years ended December 30, 2017 and December 31, 2016 were asfollows:
Derivatives in fair value hedging relationships
(millions)
Location ofgain (loss)
recognized inincome
Gain (loss)recognized inincome (a)
2017 2016Foreign currency exchange contracts OIE $ (1) $ —
Interest rate contracts Interestexpense
18
18
Total $ 17 $ 18
(a) Includes the ineffective portion and amount excluded from effectiveness testing.
Derivatives in cash flow hedging relationships
(millions)
Gain (loss)recognized in
AOCI
Location ofgain (loss)reclassifiedfrom AOCI
Gain (Loss)reclassified from AOCI
into income
Location ofgain (loss)recognizedin income (a)
Gain (loss)recognized inincome (a)
2017 2016 2017 2016 2017 2016Foreigncurrencyexchangecontracts
$ —
$ 9
COGS
$ 1
$ 14
OIE
$ —
$ (2)
Foreigncurrencyexchangecontracts
—
1
SGA expense
—
1
OIE
—
—
Interest ratecontracts
—
(65)
Interest expense
(10)
(13)
N/A
—
—
Commoditycontracts
—
—
COGS
—
(13)
OIE
—
—
Total $ — $ (55) $ (9) $ (11) $ — $ (2)
(a) Includes the ineffective portion and amount excluded from effectiveness testing.
111

Derivatives and non-derivatives in net investment hedging relationships
(millions)
Gain (loss)recognized in
AOCI
2017 2016Foreign currency denominated long-term debt $ (316) $ 88
Foreign currency exchange contracts — (23)
Total $ (316) $ 65
Derivatives not designated as hedging instruments
(millions)
Location of gain(loss)
recognized inincome
Gain (loss)recognized in
income
2017 2016Foreign currency exchange contracts COGS $ (8) $ 6
Foreign currency exchange contracts SGA (1) (1)
Foreign currency exchange contracts OIE (10) 8
Commodity contracts COGS (18) 3
Commodity contracts SGA (15) 3
Total $ (52) $ 19 During the next 12 months, the Company expects $8 million of net deferred losses reported in accumulated other comprehensive income (AOCI) atDecember 30, 2017 to be reclassified to income, assuming market rates remain constant through contract maturities.
Certain of the Company’s derivative instruments contain provisions requiring the Company to post collateral on those derivative instruments that are in aliability position if the Company’s credit rating falls below BB+ (S&P), or Baa1 (Moody’s). The fair value of all derivative instruments with credit-risk-related contingent features in a liability position on December 30, 2017 was $59 million . If the credit-risk-related contingent features were triggered as ofDecember 30, 2017 , the Company would be required to post additional collateral of $39 million . In addition, certain derivative instruments containprovisions that would be triggered in the event the Company defaults on its debt agreements. There were no collateral posting requirements as ofDecember 30, 2017 triggered by credit-risk-related contingent features.
Other fair value measurementsFair Value Measurements on a Nonrecurring BasisAs part of Project K, the Company will be consolidating the usage of and disposing certain long-lived assets, including manufacturing facilities andCorporate owned assets over the term of the program. See Note 5 for more information regarding Project K.
During 2017, the were no long-lived asset impairments related to Project K.
During 2016, long-lived assets of $26 million and $57 million , related to manufacturing facilities in the Company's US Snacks and Europe reportablesegments, respectively, were written down to estimated fair values of $10 million and $23 million , respectively, due to Project K activities. TheCompany's calculation of the fair value of these long-lived assets is based on level 3 inputs, including market comparables, market trends and thecondition of the assets.
Financial instrumentsThe carrying values of the Company’s short-term items, including cash, cash equivalents, accounts receivable, accounts payable, notes payable andcurrent maturities of long-term debt approximate fair value. The fair value of the Company’s long-term debt, which are level 2 liabilities, is calculatedbased on broker quotes. The fair value and carrying value of the Company's long-term debt was $8.3 billion and $7.8 billion , respectively, as ofDecember 30, 2017 .
112

Counterparty credit risk concentrationThe Company is exposed to credit loss in the event of nonperformance by counterparties on derivative financial and commodity contracts. Managementbelieves a concentration of credit risk with respect to derivative counterparties is limited due to the credit ratings and use of master netting andreciprocal collateralization agreements with the counterparties and the use of exchange-traded commodity contracts.
Master netting agreements apply in situations where the Company executes multiple contracts with the same counterparty. If these counterparties fail toperform according to the terms of derivative contracts, this could result in a loss to the Company. As of December 30, 2017 , there were nocounterparties that represented a significant concentration of credit risk to the Company.
For certain derivative contracts, reciprocal collateralization agreements with counterparties call for the posting of collateral in the form of cash, treasurysecurities or letters of credit if a fair value loss position to the Company or its counterparties exceeds a certain amount. In addition, the company isrequired to maintain cash margin accounts in connection with its open positions for exchange-traded commodity derivative instruments executed withthe counterparty that are subject to enforceable netting agreements. As of December 30, 2017, the Company posted $20 million related to reciprocalcollateralization agreements. As of December 30, 2017 , the Company posted $17 million in margin deposits for exchange-traded commodity derivativeinstruments, which was reflected as an increase in accounts receivable, net.
Management believes concentrations of credit risk with respect to accounts receivable is limited due tothe generally high credit quality of the Company’s major customers, as well as the large number and geographic dispersion of smaller customers.However, the Company conducts a disproportionate amount of business with a small number of large multinational grocery retailers, with the five largestaccounts encompassing approximately 26% of consolidated trade receivables at December 30, 2017 .
Refer to Note 1 for disclosures regarding the Company’s accounting policies for derivative instruments.
NOTE 15CONTINGENCIES
The Company is subject to various legal proceedings, claims, and governmental inspections or investigations in the ordinary course of businesscovering matters such as general commercial, governmental regulations, antitrust and trade regulations, product liability, environmental, intellectualproperty, workers’ compensation, employment and other actions. These matters are subject to uncertainty and the outcome is not predictable withassurance. The Company uses a combination of insurance and self-insurance for a number of risks, including workers’ compensation, general liability,automobile liability and product liability.
The Company has established accruals for certain matters where losses are deemed probable and reasonably estimable. There are other claims andlegal proceedings pending against the Company for which accruals have not been established. It is reasonably possible that some of these matterscould result in an unfavorable judgment against the Company and could require payment of claims in amounts that cannot be estimated at December30, 2017. Based upon current information, management does not expect any of the claims or legal proceedings pending against the Company to have amaterial impact on the Company’s consolidated financial statements.
NOTE 16VENEZUELA
Venezuela is considered a highly inflationary economy. As such, the functional currency for the Company's operations in Venezuela is the U.S. dollar forall reporting periods in which they were included in the Company’s consolidated results. This required bolivar denominated monetary assets andliabilities to be remeasured into U.S. dollars using an exchange rate at which such balances could be settled as of each balance sheet date. In addition,revenues and expenses were recorded in U.S. dollars at an appropriate rate on the date of the transaction and gains and losses resulting from theremeasurement of the bolivar denominated monetary assets and liabilities were recorded in earnings.
113

DeconsolidationEffective as of December 31, 2016, the Company concluded that it no longer met the accounting criteria for consolidation of its Venezuela subsidiarydue to a loss of control over the Venezuelan operations. Historically, the Company took steps to reduce its reliance on imports in order to run itsoperations in Venezuela without the need of foreign currency, including the substitution, where possible, of imported ingredients, materials and partswith locally produced inputs. However, the availability of certain key raw materials, even if locally sourced, was largely controlled by the localgovernment and the Company experienced an increase in government intervention and restrictions on the local supply of these key raw materials.During the fourth quarter of 2016, the Company experienced increased disruptions and restrictions in the procurement of certain locally sourced rawmaterials and packaging due to local government actions, which greatly diminished the Venezuelan operation’s ability to produce products for sale,culminating in record low production volume and capacity utilization during the quarter. These supply chain disruptions, along with other factors such asthe worsening economic environment in Venezuela and the limited access to dollars to import goods through the use of any of the available currencymechanisms, impaired the Company’s ability to effectively operate and fully control its Venezuelan subsidiary.
As of December 31, 2016, the Company deconsolidated and changed to the cost method of accounting for its Venezuelan subsidiary. During the fourthquarter of 2016, the Company recorded a $72 million pre-tax charge in Other income (expense), net as it fully impaired the value of its cost methodinvestment in Venezuela. The deconsolidation charge included the historical cumulative translation losses of approximately $63 million related to theCompany's Venezuelan operations that had previously been recorded in accumulated other comprehensive losses within equity.
Beginning in fiscal year 2017, the Company no longer included the financial statements of its Venezuelan subsidiary within its consolidated financialstatements. Under the cost method of accounting, the Company will recognize earnings only to the extent cash is received from its Venezuelansubsidiary. The Company will continually monitor its ability to control its Venezuelan subsidiary as the facts and circumstances surrounding Venezuelamay change over time and lead to consolidation at a future date. In the meantime, the Company will continue to operate its Venezuelan subsidiary inspite of the restrictive economic and operational environment.
Activity prior to deconsolidationFrom February 2013 through July 4, 2015, the Company used the CENCOEX, official rate, which was 6.3 bolivars to the U.S. dollar, to remeasure itsVenezuelan subsidiary’s financial statements to U.S. dollars. The CENCOEX official rate was restricted toward goods and services for industry sectorsconsidered essential, which are primarily food, medicines and a few others. In February 2015, the Venezuelan government announced the addition of anew foreign currency exchange system referred to as the Marginal Currency System, or SIMADI.
During 2015, the Company experienced an increase in the amount of time it took to exchange bolivars for U.S. dollars through the CENCOEXexchange. Due to this reduced availability of U.S. dollars and upon review of U.S. dollar cash needs in the Company's Venezuela operations as of thequarter ended July 4, 2015, the Company concluded that it was no longer able to obtain sufficient U.S. dollars on a timely basis through the CENCOEXexchange resulting in a decision to remeasure its Venezuela subsidiary's financial statements using the SIMADI rate.
In connection with the change in rates, the Company evaluated the carrying value of its non-monetary assets for impairment and lower of cost or marketadjustments. As a result of moving from the CENCOEX official rate to the SIMADI rate, the Company recorded pre-tax charges totaling $152 million inthe quarter ended July 4, 2015. Of the total charges, $100 million was recorded in COGS, $3 million was recorded in SGA, and $49 million wasrecorded in Other income (expense), net. These charges consisted of $47 million related to the remeasurement of net monetary assets denominated inVenezuelan bolivar at the SIMADI exchange rate (recorded in Other income (expense), net), $56 million related to reducing inventory to the lower ofcost or market (recorded in COGS) and $49 million related to the impairment of long-lived assets in Venezuela (recorded primarily in COGS).
In February 2016, the Venezuelan government announced changes to its foreign currency exchange mechanisms, including a 59% devaluation of theCENCOEX (renamed DIPRO) official rate from 6.3 bolivars to 10.0 bolivars to the U.S. dollar. Additionally the SIMADI exchange rate was replaced bythe DICOM exchange rate, a floating exchange rate for non-essential imports. The DICOM exchange rate was introduced at 206 bolivars to the U.S.dollar.
114

For the years ended December 31, 2016 and January 2, 2016, Venezuela represented less than 1% and approximately 2% of total net sales,respectively.
NOTE 17QUARTERLY FINANCIAL DATA (unaudited)
Net sales Gross profit
(millions) 2017 2016 2017 2016First $ 3,254 $ 3,395 $ 1,204 $ 1,245Second 3,187 3,268 1,265 1,270Third 3,273 3,254 1,232 1,264Fourth 3,209 3,097 1,321 976 $ 12,923 $ 13,014 $ 5,022 $ 4,755
Net income attributable to Kellogg Company Per share amounts
(millions) 2017 2016 2017 2016
Basic Diluted Basic DilutedFirst $ 262 $ 175 $ 0.75 $ 0.74 $ 0.50 $ 0.49Second 282 280 0.81 0.80 0.80 0.79Third 297 292 0.86 0.85 0.83 0.82Fourth 428 (53) 1.24 1.23 (0.15) (0.15) $ 1,269 $ 694
The principal market for trading Kellogg shares is the New York Stock Exchange (NYSE). At December 30, 2017 , the closing price (on the NYSE) was$ 67.98 and there were 33,793 shareholders of record.
Dividends paid per share and the quarterly price ranges on the NYSE during the last two years were:
Dividendper share
Stock price
2017 — Quarter High LowFirst $ 0.52 $ 76.44 $ 71.38Second 0.52 73.49 68.69Third 0.54 70.36 62.37Fourth 0.54 68.29 58.87 $ 2.12 2016 — Quarter First $ 0.50 $ 77.86 $ 69.96Second 0.50 81.65 74.30Third 0.52 86.98 77.13Fourth 0.52 77.25 70.96 $ 2.04
115

During 2017 , the Company recorded the following charges (gains) in operating profit:
2017
(millions) First Second Third Fourth Full YearRestructuring and cost reduction charges $ 142 $ 96 $ 1 $ 24 $ 263(Gains) / losses on mark-to-marketadjustments 21 (7) 104 (163) (45) $ 163 $ 89 $ 105 $ (139) $ 218
During 2016 , the Company recorded the following charges (gains) in operating profit:
2016
(millions) First Second Third Fourth Full YearRestructuring and cost reduction charges $ 52 $ 72 $ 40 $ 161 $ 325(Gains) / losses on mark-to-marketadjustments 24 (20) 31 226 261 $ 76 $ 52 $ 71 $ 387 $ 586
NOTE 18REPORTABLE SEGMENTS
Kellogg Company is the world’s leading producer of cereal, second largest producer of cookies and crackers and a leading producer of savory snacksand frozen foods. Additional product offerings include toaster pastries, cereal bars, fruit-flavored snacks and veggie foods. Kellogg products aremanufactured and marketed globally. Principal markets for these products include the United States and United Kingdom.
The Company has the following reportable segments: U.S. Morning Foods; U.S. Snacks; U.S. Specialty; North America Other; Europe; Latin America;and Asia Pacific. The Company manages its operations through 10 operating segments that are based on product category or geographic location.These operating segments are evaluated for similarity with regards to economic characteristics, products, production processes, types or classes ofcustomers, distribution methods and regulatory environments to determine if they can be aggregated into reportable segments. The reportablesegments are discussed in greater detail below.
The U.S. Morning Foods reportable segment includes primarily cereal and toaster pastries.
U.S. Snacks includes cookies, crackers, cereal bars, savory snacks and fruit-flavored snacks.
U.S. Specialty primarily represents food away from home channels, including food service, convenience, vending, Girl Scouts and food manufacturing.The food service business is mostly non-commercial, serving institutions such as schools and hospitals. The convenience business includes traditionalconvenience stores as well as alternate retailing outlets.
North America Other includes the U.S. Frozen, Kashi, Canada, and RXBAR operating segments. As these operating segments are not consideredeconomically similar enough to aggregate with other operating segments and are immaterial for separate disclosure, they have been grouped togetheras a single reportable segment.
The 3 remaining reportable segments are based on geographic location — Europe which consists principally of European countries; Latin Americawhich consists of Central and South America and includes Mexico; and Asia Pacific which consists of Sub-Saharan Africa, Australia and other Asianand Pacific markets.
The measurement of reportable segment results is based on segment operating profit which is generally consistent with the presentation of operatingprofit in the Consolidated Statement of Income. Intercompany transactions between operating segments were immaterial for all periods presented.
116

(millions) 2017 2016 2015Net sales U.S. Morning Foods $ 2,778 $ 2,931 $ 2,992U.S. Snacks 3,067 3,198 3,234U.S. Specialty 1,249 1,214 1,181North America Other 1,616 1,598 1,687Europe 2,291 2,377 2,497Latin America 955 780 1,015Asia Pacific 967 916 919Consolidated $ 12,923 $ 13,014 $ 13,525
Operating profit U.S. Morning Foods $ 601 $ 593 $ 474U.S. Snacks 115 324 385U.S. Specialty 312 279 260North America Other 230 181 178Europe 279 205 247Latin America 108 84 9Asia Pacific 86 70 54Total Reportable Segments 1,731 1,736 1,607Corporate 215 (341) (516)Consolidated $ 1,946 $ 1,395 $ 1,091
Depreciation and amortization (a) U.S. Morning Foods $ 120 $ 122 $ 123U.S. Snacks 146 159 135U.S. Specialty 13 11 11North America Other 51 56 74Europe 80 114 120Latin America 37 22 28Asia Pacific 33 30 29Total Reportable Segments 480 514 520Corporate 1 3 14Consolidated $ 481 $ 517 $ 534(a) Includes asset impairment charges as discussed in Note 14 .
Certain items such as interest expense and income taxes, while not included in the measure of reportable segment operating results, are regularlyreviewed by Management for the Company’s internationally-based reportable segments as shown below.
(millions) 2017 2016 2015Interest expense North America $ 3 $ 5 $ 5Europe 16 8 5Latin America 2 4 5Asia Pacific 2 2 2Corporate 233 387 210Consolidated $ 256 $ 406 $ 227
Income taxes Europe $ (38) $ (17) $ 10Latin America 33 30 34Asia Pacific 12 14 —Corporate & North America 405 206 115Consolidated $ 412 $ 233 $ 159
Management reviews balance sheet information, including total assets, based on geography. For all North American-based operating segments,balance sheet information is reviewed by Management in total and not on an individual operating segment basis.
117


(millions) 2017 2016 2015Total assets North America $ 10,867 $ 10,533 $ 10,363Europe 4,057 3,824 3,742Latin America 1,094 1,136 587Asia Pacific 1,225 1,158 1,106Corporate 1,426 1,248 1,184Elimination entries (2,319) (2,788) (1,731)Consolidated $ 16,350 $ 15,111 $ 15,251
Additions to long-lived assets North America $ 329 $ 318 $ 342Europe 106 125 110Latin America 32 24 23Asia Pacific 30 36 76Corporate 4 4 2Consolidated $ 501 $ 507 $ 553
The Company’s largest customer, Wal-Mart Stores, Inc. and its affiliates, accounted for approximately 20% of consolidated net sales during 2017 , 20%in 2016 , and 21% in 2015, comprised principally of sales within the United States.
Supplemental geographic information is provided below for net sales to external customers and long-lived assets:
(millions) 2017 2016 2015Net sales United States $ 8,196 $ 8,438 $ 8,560All other countries 4,727 4,576 4,965Consolidated $ 12,923 $ 13,014 $ 13,525
Long-lived assets United States $ 2,195 $ 2,208 $ 2,220All other countries 1,521 1,361 1,401Consolidated $ 3,716 $ 3,569 $ 3,621
Supplemental product information is provided below for net sales to external customers:
(millions) 2017 2016 2015Snacks $ 6,700 $ 6,660 $ 6,698Cereal 5,270 5,440 5,871Frozen 953 914 956
Consolidated $ 12,923 $ 13,014 $ 13,525
118

NOTE 19SUPPLEMENTAL FINANCIAL STATEMENT DATA
Consolidated Statement of Income(millions) 2017 2016 2015Research and development expense $ 148 $ 182 $ 193Advertising expense $ 731 $ 735 $ 898
Consolidated Balance Sheet(millions) 2017 2016Trade receivables $ 1,250 $ 1,106Allowance for doubtful accounts (10) (8)Refundable income taxes 23 24Other receivables 126 109
Accounts receivable, net $ 1,389 $ 1,231Raw materials and supplies $ 333 $ 315Finished goods and materials in process 884 923
Inventories $ 1,217 $ 1,238Land $ 111 $ 131Buildings 2,200 2,020Machinery and equipment 6,018 5,646Capitalized software 403 366Construction in progress 634 686Accumulated depreciation (5,650) (5,280)
Property, net $ 3,716 $ 3,569Other intangibles $ 2,706 $ 2,423Accumulated amortization (67) (54)
Other intangibles, net $ 2,639 $ 2,369Pension $ 252 $ 66Deferred income taxes 245 170Other 529 393
Other assets $ 1,026 $ 629Accrued income taxes $ 31 $ 47Accrued salaries and wages 311 318Accrued advertising and promotion 538 436Other 551 590
Other current liabilities $ 1,431 $ 1,391Income taxes payable $ 192 $ 48Nonpension postretirement benefits 40 40Other 373 376
Other liabilities $ 605 $ 464
Allowance for doubtful accounts(millions) 2017 2016 2015Balance at beginning of year $ 8 $ 8 $ 7Additions charged to expense 14 9 4Doubtful accounts charged to reserve (12) (9) (3)Balance at end of year $ 10 $ 8 $ 8
119

Management’s Responsibility for Financial StatementsManagement is responsible for the preparation of the Company’s consolidated financial statements and related notes. We believe that the consolidatedfinancial statements present the Company’s financial position and results of operations in conformity with accounting principles that are generallyaccepted in the United States, using our best estimates and judgments as required.
The board of directors of the Company has an Audit Committee composed of five non-management Directors. The Committee meets regularly withmanagement, internal auditors, and the independent registered public accounting firm to review accounting, internal control, auditing and financialreporting matters.
Formal policies and procedures, including an active Ethics and Business Conduct program, support the internal controls and are designed to ensureemployees adhere to the highest standards of personal and professional integrity. We have a rigorous internal audit program that independentlyevaluates the adequacy and effectiveness of these internal controls.
120

Management’s Report on Internal Control over Financial Reporting
Management is responsible for establishing and maintaining adequate internal control over financial reporting, as such term is defined in Rule 13a-15(f)under the Securities Exchange Act of 1934, as amended. Our internal control over financial reporting is designed to provide reasonable assuranceregarding the reliability of financial reporting and the preparation of the financial statements for external purposes in accordance with generally acceptedaccounting principles.
We conducted an evaluation of the effectiveness of our internal control over financial reporting based on the framework in Internal Control — IntegratedFramework (2013) issued by the Committee of Sponsoring Organizations of the Treadway Commission.
SEC staff guidance discusses the exclusion of an acquired entity from management's assessment of internal control over financial reporting anddisclosure controls and procedures. Management excluded from its assessment those disclosure controls and procedures of the Chicago Bar CompanyLLC, which was acquired in October, 2017 in a purchase business combination, that are subsumed by internal control over financial reporting. ChicagoBar Co., LLC is wholly owned and accounted for less than 0.1% of consolidated total assets and 0.2% of consolidated net sales as of and for the yearended December 30, 2017.
Because of its inherent limitations, internal control over financial reporting may not prevent or detect misstatements. Also, projections of any evaluationof effectiveness to future periods are subject to the risk that controls may become inadequate because of changes in conditions or that the degree ofcompliance with the policies or procedures may deteriorate.
Based on our evaluation under the framework in Internal Control — Integrated Framework (2013), management concluded that our internal control overfinancial reporting was effective as of December 30, 2017 . The effectiveness of our internal control over financial reporting as of December 30, 2017has been audited by PricewaterhouseCoopers LLP, an independent registered public accounting firm, as stated in their report which follows.
/s/ Steven A. CahillaneSteven A. CahillaneChief Executive Officer
/s/ Fareed KhanFareed KhanSenior Vice President and Chief Financial Officer
121
Report of Independent Registered Public Accounting Firm To the Board of Directors and Shareholders of Kellogg Company
Opinions on the Financial Statements and Internal Control over Financial ReportingWe have audited the consolidated financial statements, including the related notes, of Kellogg Company and its subsidiaries as listed in the indexappearing under Item 15(a)(1), (collectively referred to as the “consolidated financial statements”). We also have audited the Company's internal controlover financial reporting as of December 30, 2017, based on criteria established in Internal Control - Integrated Framework (2013) issued by theCommittee of Sponsoring Organizations of the Treadway Commission (COSO).
In our opinion, the consolidated financial statements referred to above present fairly, in all material respects, the financial position of the Company as ofDecember 30, 2017 and December 31, 2016, and the results of their operations and their cash flows for each of the three years in the period endedDecember 30, 2017 in conformity with accounting principles generally accepted in the United States of America. Also in our opinion, the Companymaintained, in all material respects, effective internal control over financial reporting as of December 30, 2017 based on criteria established in InternalControl - Integrated Framework (2013) issued by the COSO.
Basis for OpinionsThe Company's management is responsible for these consolidated financial statements, for maintaining effective internal control over financial reporting,and for its assessment of the effectiveness of internal control over financial reporting, included in the accompanying Management’s Report on InternalControl over Financial Reporting. Our responsibility is to express opinions on the Company’s consolidated financial statements and on the Company'sinternal control over financial reporting based on our audits. We are a public accounting firm registered with the Public Company Accounting OversightBoard (United States) ("PCAOB") and are required to be independent with respect to the Company in accordance with the U.S. federal securities lawsand the applicable rules and regulations of the Securities and Exchange Commission and the PCAOB.
We conducted our audits in accordance with the standards of the PCAOB. Those standards require that we plan and perform the audits to obtainreasonable assurance about whether the consolidated financial statements are free of material misstatement, whether due to error or fraud, andwhether effective internal control over financial reporting was maintained in all material respects.
Our audits of the consolidated financial statements included performing procedures to assess the risks of material misstatement of the consolidatedfinancial statements, whether due to error or fraud, and performing procedures that respond to those risks. Such procedures included examining, on atest basis, evidence regarding the amounts and disclosures in the consolidated financial statements. Our audits also included evaluating the accountingprinciples used and significant estimates made by management, as well as evaluating the overall presentation of the consolidated financial statements.Our audit of internal control over financial reporting included obtaining an understanding of internal control over financial reporting, assessing the riskthat a material weakness exists, and testing and evaluating the design and operating effectiveness of internal control based on the assessed risk. Ouraudits also included performing such other procedures as we considered necessary in the circumstances. We believe that our audits provide areasonable basis for our opinions.
As described in Management’s Report on Internal Control over Financial Reporting, management has excluded the Chicago Bar Co., LLC, from itsassessment of internal control over financial reporting as of December 30, 2017 because it was acquired by the Company in a purchase businesscombination during 2017. We have also excluded the Chicago Bar Co., LLC from our audit of internal control over financial reporting. The Chicago BarCo., LLC is a wholly-owned subsidiary whose total assets and total revenues excluded from management’s assessment and our audit of internal controlover financial reporting represent less than 0.1% and 0.2%, respectively, of the related consolidated financial statement amounts as of and for the yearended December 30, 2017.
Definition and Limitations of Internal Control over Financial ReportingA company’s internal control over financial reporting is a process designed to provide reasonable assurance regarding the reliability of financial reportingand the preparation of financial statements for external purposes in accordance with generally accepted accounting principles. A company’s internalcontrol over financial reporting includes those policies and procedures that (i) pertain to the maintenance of records that, in reasonable detail, accuratelyand fairly reflect the transactions and dispositions of the assets of the company; (ii) provide reasonable assurance that transactions are recorded asnecessary to permit preparation of financial statements in accordance
122

with generally accepted accounting principles, and that receipts and expenditures of the company are being made only in accordance withauthorizations of management and directors of the company; and (iii) provide reasonable assurance regarding prevention or timely detection ofunauthorized acquisition, use, or disposition of the company’s assets that could have a material effect on the financial statements.
Because of its inherent limitations, internal control over financial reporting may not prevent or detect misstatements. Also, projections of any evaluationof effectiveness to future periods are subject to the risk that controls may become inadequate because of changes in conditions, or that the degree ofcompliance with the policies or procedures may deteriorate.
/s/PricewaterhouseCoopers LLP
Detroit, MichiganFebruary 20, 2018
We have served as the Company’s auditor since at least 1937. We have not determined the specific year we began serving as auditor of the Company.
123
ITEM 9. CHANGES IN AND DISAGREEMENTS WITH ACCOUNTANTS ON ACCOUNTING AND FINANCIAL DISCLOSURE
None.
ITEM 9A. CONTROLS AND PROCEDURES
(a) Disclosure Controls and Procedures.We maintain disclosure controls and procedures that are designed to provide reasonable assurance that information required to be disclosed in ourreports that we file or submit under the Exchange Act is recorded, processed, summarized and reported within the time periods specified in the SEC’srules and forms, and that such information is accumulated and communicated to our management, including our Chief Executive Officer and ChiefFinancial Officer as appropriate, to allow timely decisions regarding required disclosure. Disclosure controls and procedures, no matter how welldesigned and operated, can provide only reasonable, rather than absolute, assurance of achieving the desired control objectives.
As of December 30, 2017 , management carried out an evaluation under the supervision and with the participation of our Chief Executive Officer andour Chief Financial Officer, of the effectiveness of the design and operation of our disclosure controls and procedures. SEC staff guidance discusses theexclusion of an acquired entity from management's assessment of internal control over financial reporting and disclosure controls and procedures.Management excluded from its assessment those disclosure controls and procedures of the Chicago Bar Company LLC, which was acquired inOctober, 2017 in a purchase business combination, that are subsumed by internal control over financial reporting. Chicago Bar Co., LLC is whollyowned and accounted for less than 0.1% of consolidated total assets and 0.2% of consolidated net sales as of and for the year ended December 30,2017. Based on the foregoing evaluation, our Chief Executive Officer and Chief Financial Officer concluded that our disclosure controls and procedureswere effective at the reasonable assurance level.
(b) Internal Control over Financial Reporting.Pursuant to Section 404 of the Sarbanes-Oxley Act of 2002, we have included a report of management’s assessment of the design and effectiveness ofour internal control over financial reporting as part of this Annual Report on Form 10-K. The independent registered public accounting firm ofPricewaterhouseCoopers LLP also audited, and reported on, the effectiveness of our internal control over financial reporting. Management’s report andthe independent registered public accounting firm’s audit report are included in our 2017 financial statements in Item 8 of this Report under the captionsentitled “Management’s Report on Internal Control over Financial Reporting” and “Report of Independent Registered Public Accounting Firm” and areincorporated herein by reference.
(c) Changes in Internal Control over Financial Reporting.Kellogg’s Project K initiative which includes the reorganization and relocation of certain financial, information technology, and logistics and distributionprocesses; internal to the organization was initiated in 2014. This initiative is expected to continue through 2018 and will continue to impact the design ofour control framework. During efforts associated with Project K, we have implemented additional controls to monitor and maintain appropriate internalcontrols over financial reporting. There were no changes during the quarter ended December 30, 2017, that materially affected, or are reasonably likelyto materially affect our internal controls over financial reporting.
ITEM 9B. OTHER INFORMATION
Not applicable.
PART III ITEM 10. DIRECTORS, EXECUTIVE OFFICERS AND CORPORATE GOVERNANCE
Directors — Refer to the information in our Proxy Statement to be filed with the Securities and Exchange Commission for the Annual Meeting ofShareowners to be held on April 27, 2018 (the “Proxy Statement”), under the caption “Proposal 1 — Election of Directors,” which information isincorporated herein by reference.
124

Identification and Members of Audit Committee; Audit Committee Financial Expert — Refer to the information in the Proxy Statement under the caption“Board and Committee Membership,” which information is incorporated herein by reference.
Executive Officers of the Registrant — Refer to “Executive Officers” under Item 1 of this Report.
For information concerning Section 16(a) of the Securities Exchange Act of 1934 — Refer to the information under the caption “Security Ownership —Section 16(a) Beneficial Ownership Reporting Compliance” of the Proxy Statement, which information is incorporated herein by reference.
Code of Ethics for Chief Executive Officer, Chief Financial Officer and Controller — We have adopted a Global Code of Ethics which applies to our chiefexecutive officer, chief financial officer, corporate controller and all our other employees, and which can be found at www.kelloggcompany.com. Anyamendments or waivers to the Global Code of Ethics applicable to our chief executive officer, chief financial officer or corporate controller may also befound at www.kelloggcompany.com.
ITEM 11. EXECUTIVE COMPENSATION
Refer to the information under the captions “ 2017 Director Compensation and Benefits,” “Compensation Discussion and Analysis,” “ExecutiveCompensation,” “Retirement and Non-Qualified Defined Contribution and Deferred Compensation Plans,” and “Potential Post-Employment Payments” ofthe Proxy Statement, which is incorporated herein by reference. See also the information under the caption “Compensation and Talent ManagementCommittee Report” of the Proxy Statement, which information is incorporated herein by reference; however, such information is only “furnished”hereunder and not deemed “filed” for purposes of Section 18 of the Securities Exchange Act of 1934.
ITEM 12. SECURITY OWNERSHIP OF CERTAIN BENEFICIAL OWNERS AND MANAGEMENT AND RELATED STOCKHOLDER MATTERS
Refer to the information under the captions “Security Ownership — Five Percent Holders”, “Security Ownership — Officer and Director StockOwnership” of the Proxy Statement, which information is incorporated herein by reference.
EQUITY COMPENSATION PLAN INFORMATION
(millions, except per share data)
Plan Category
Number of Securities tobe Issued Upon Exerciseof Outstanding Options,Warrants and Rights as
of December 30, 2017 (a)
Weighted-AverageExercise Price of
Outstanding Options,Warrants and Rights as
of December 30, 2017 ($)(b)
Number of SecuritiesRemaining Availablefor Future Issuance
Under EquityCompensation Plans(excluding SecuritiesReflected in Column
(a)) as of December 30,2017(c)(1)
Equity compensation plans approved by security holders 16.3 (2) 64 19.0 (3)Equity compensation plans not approved by security holders — NA 0.3 Total 16.3 64 19.3
125
(1) The total number of shares remaining available for issuance under the 2017 Long-Term Incentive Plan will be reduced by two shares for eachshare issued pursuant to an award other than a stock option or stock appreciation right, or potentially issuable pursuant to an outstanding awardother than a stock option or stock appreciation right, which will in each case reduce the total number of shares remaining by one share for eachshare issued.
(2) Includes 14.6 million stock options and 1.7 million restricted share units.(3) The total number of shares available remaining for issuance as of December 30, 2017 for each Equity Compensation Plan approved by
shareowners are as follows:- The 2017 Long-Term Incentive Plan - 18.6 million;- The Non-Employee Director Stock Plan (2009 Director Plan) - 0.2 million;- The 2002 Employee Stock Purchase Plan - 0.2 million.
Three plans are considered “Equity compensation plans not approved by security holders.” The Kellogg Share Incentive Plan, which was adopted in2002 and is available to most U.K. employees of specified Kellogg Company subsidiaries; a similar plan, which is available to employees in the Republicof Ireland; and the Deferred Compensation Plan for Non-Employee Directors, which was adopted in 1986 and amended in 1993 and 2002.
Under the Kellogg Share Incentive Plan, eligible U.K. employees may contribute up to 1,500 Pounds Sterling annually to the plan through payrolldeductions. The trustees of the plan use those contributions to buy shares of our common stock at fair market value on the open market, with Kelloggmatching those contributions on a 1:1 basis. Shares must be withdrawn from the plan when employees cease employment. Under current law, eligibleemployees generally receive certain income and other tax benefits if those shares are held in the plan for a specified number of years. A similar plan isalso available to employees in the Republic of Ireland. As these plans are open market plans with no set overall maximum, no amounts for these plansare included in the above table. However, approximately 60,000 shares were purchased by eligible employees under the Kellogg Share Incentive Plan,the plan for the Republic of Ireland and other similar predecessor plans during 2017, with approximately an additional 60,000 shares being provided asmatched shares.
The Deferred Compensation Plan for Non-Employee Directors was amended and restated during 2013. Under the Deferred Compensation Plan forNon-Employee Directors, non-employee Directors may elect to defer all or part of their compensation (other than expense reimbursement) into unitswhich are credited to their accounts. The units have a value equal to the fair market value of a share of our common stock on the appropriate date, withdividend equivalents being earned on the whole units in non-employee Directors’ accounts. Units must be paid in shares of our common stock, either ina lump sum or in up to ten annual installments, with the installments to begin as soon as practicable after the non-employee Director’s service as aDirector terminates. No more than 300,000 shares are authorized for use under this plan, of which approximately 22,000 had been issued as ofDecember 30, 2017.
ITEM 13. CERTAIN RELATIONSHIPS AND RELATED TRANSACTIONS, AND DIRECTOR INDEPENDENCE
Refer to the information under the captions “Corporate Governance — Director Independence” and “Related Person Transactions” of the ProxyStatement, which information is incorporated herein by reference.
ITEM 14. PRINCIPAL ACCOUNTANT FEES AND SERVICES
Refer to the information under the captions “Proposal 3 — Ratification of PricewaterhouseCoopers LLP — Fees Paid to Independent Registered PublicAccounting Firm” and “Proposal 3 — Ratification of PricewaterhouseCoopers LLP — Preapproval Policies and Procedures” of the Proxy Statement,which information is incorporated herein by reference.
PART IV ITEM 15. EXHIBITS, FINANCIAL STATEMENT SCHEDULES
The Consolidated Financial Statements and related Notes, together with Management’s Report on Internal Control over Financial Reporting, and theReport thereon of PricewaterhouseCoopers LLP dated February 20, 2018 , are included herein in Part II, Item 8.
(a) 1. Consolidated Financial Statements
126

Consolidated Statement of Income for the years ended December 30, 2017 , December 31, 2016 and January 2, 2016 .
Consolidated Statement of Comprehensive Income for the years ended December 30, 2017 , December 31, 2016 and January 2, 2016 .
Consolidated Balance Sheet at December 30, 2017 and December 31, 2016 .
Consolidated Statement of Equity for the years ended December 30, 2017 , December 31, 2016 and January 2, 2016 .
Consolidated Statement of Cash Flows for the years ended December 30, 2017 , December 31, 2016 and January 2, 2016 .
Notes to Consolidated Financial Statements.
Management’s Report on Internal Control over Financial Reporting.
Report of Independent Registered Public Accounting Firm.
(a) 2. Consolidated Financial Statement Schedule
All financial statement schedules are omitted because they are not applicable or the required information is shown in the financial statements or thenotes thereto.
(a) 3. Exhibits required to be filed by Item 601 of Regulation S-K
The information called for by this Item is incorporated herein by reference from the Exhibit Index included in this Report.
ITEM 16. FORM 10-K SUMMARY
Not applicable.
127

EXHIBIT INDEX
ExhibitNo. Description
Electronic(E),Paper(P) orIncorp. ByRef.(IBRF)
2.01
Amended and Restated Transaction Agreement between us and TheProcter & Gamble Company, incorporated by reference to Exhibit 1.1of our Current Report on Form 8-K dated May 31, 2012, Commissionfile number 1-4171.
IBRF
3.01
Amended Restated Certificate of Incorporation of Kellogg Company,incorporated by reference to Exhibit 4.1 to our Registration Statementon Form S-8, file number 333-56536.
IBRF
3.02
Bylaws of Kellogg Company, as amended, incorporated by referenceto Exhibit 3.1 to our Current Report on Form 8-K dated December 15,2017, Commission file number 1-4171.
IBRF
4.01
Indenture, dated March 15, 2001, between Kellogg Company and BNYMidwest Trust Company, including the form of 7.45% Debentures due2031, incorporated by reference to Exhibit 4.01 to our Quarterly Reporton Form 10-Q for the quarter ending March 31, 2001, Commission filenumber 1-4171.
IBRF
4.02
Supplemental Indenture, dated March 29, 2001, between KelloggCompany and BNY Midwest Trust Company, including the form of7.45% Debentures due 2031, incorporated by reference to Exhibit 4.02to our Quarterly Report on Form 10-Q for the quarter ending March 31,2001, Commission file number 1-4171.
IBRF
4.03
Indenture, dated as of May 21, 2009, between Kellogg Company andThe Bank of New York Mellon Trust Company, N.A., incorporated byreference to Exhibit 4.1 to our Registration Statement on Form S-3,Commission file number 333-209699.
IBRF
4.04
Officers’ Certificate of Kellogg Company (with form of KelloggCompany 4.150% Senior Note Due 2019), incorporated by referenceto Exhibit 4.2 to our Current Report on Form 8-K dated November 16,2009, Commission file number 1-4171.
IBRF
4.05
Officers’ Certificate of Kellogg Company (with form of KelloggCompany 4.000% Senior Note Due 2020), incorporated by referenceto Exhibit 4.1 to our Current Report on Form 8-K dated December 8,2010, Commission file number 1-4171.
IBRF
4.06
Officers’ Certificate of Kellogg Company (with form of KelloggCompany 3.25% Senior Note Due 2018), incorporated by reference toExhibit 4.1 to our Current Report on Form 8-K dated May 15, 2011,Commission file number 1-4171.
IBRF
4.07
Officers’ Certificate of Kellogg Company (with form of 1.125% SeniorNote due 2015, 1.750% Senior Note due 2017 and 3.125% SeniorNote due 2022), incorporated by reference to Exhibit 4.1 to ourCurrent Report on Form 8-K dated May 17, 2012, Commission filenumber 1-4171.
IBRF
128

ExhibitNo. Description
Electronic(E),Paper(P) orIncorp. ByRef.(IBRF)
4.08
Officer’s Certificate of Kellogg Company (with form of Floating RateSenior Notes due 2015 and 2.750% Senior Notes due 2023),incorporated by reference to Exhibit 4.1 to our Current Report on Form8-K dated February 14, 2013, Commission file number 1-4171.
IBRF
4.09
Officer’s Certificate of Kellogg Company (with form of 1.250% SeniorNotes due 2025), incorporated by reference to Exhibit 4.1 to ourCurrent Report on Form 8-K dated March 9, 2015, Commission filenumber 1-4171.
IBRF
4.10
Officers’ Certificate of Kellogg Company (with form of 3.250% SeniorNotes due 2026 and 4.500% Senior Debentures due 2046),incorporated by reference to Exhibit 4.1 to our Current Report on Form8-K dated March 7, 2016, Commission file number 1-4171.
IBRF
4.11
Officers’ Certificate of Kellogg Company (with form of 1.000% SeniorNotes due 2024), incorporated by reference to Exhibit 4.1 to ourCurrent Report on Form 8-K dated May 19, 2016, Commission filenumber 1-4171.
IBRF
4.12
Officers’ Certificate of Kellogg Company (with form of 2.650% SeniorNotes due 2023), incorporated by reference to Exhibit 4.1 to ourCurrent Report on Form 8-K dated November 15, 2016, Commissionfile number 1-4171.
IBRF
4.13
Officers’ Certificate of Kellogg Company (with form of 0.800% SeniorNotes due 2022), incorporated by reference to Exhibit 4.1 to ourCurrent Report on Form 8-K dated May 17, 2017, Commission filenumber 1-4171.
IBRF
4.14
Officers’ Certificate of Kellogg Company (with form of 3.400% SeniorNotes due 2027), incorporated by reference to Exhibit 4.1 to ourCurrent Report on Form 8-K dated November 13, 2017, Commissionfile number 1-4171.
IBRF
10.01
Kellogg Company Supplemental Savings and Investment Plan, asamended and restated as of January 1, 2003, incorporated byreference to Exhibit 10.03 to our Annual Report on Form 10-K for thefiscal year ended December 28, 2002, Commission file number 1-4171.*
IBRF
10.02
Kellogg Company Key Employee Long Term Incentive Plan,incorporated by reference to Exhibit 10.07 to our Annual Report onForm 10-K for the fiscal year ended December 29, 2007, Commissionfile number 1-4171.*
IBRF
10.03
Kellogg Company 2000 Non-Employee Director Stock Plan,incorporated by reference to Exhibit 10.10 to our Annual Report onForm 10-K for the fiscal year ended December 29, 2007, Commissionfile number 1-4171.*
IBRF
129

ExhibitNo. Description
Electronic(E),Paper(P) orIncorp. ByRef.(IBRF)
10.04
Employment Letter between us and James M. Jenness, incorporatedby reference to Exhibit 10.18 to our Annual Report in Form 10-K forthe fiscal year ended January 1, 2005, Commission file number 1-4171.*
IBRF
10.05
Agreement between us and other executives, incorporated byreference to Exhibit 10.05 of our Quarterly Report on Form 10-Q forthe quarter ended June 30, 2000, Commission file number 1-4171.*
IBRF
10.06
Stock Option Agreement between us and James Jenness,incorporated by reference to Exhibit 4.4 to our Registration Statementon Form S-8, file number 333-56536.*
IBRF
10.07
Kellogg Company 2002 Employee Stock Purchase Plan, as amendedand restated as of January 1, 2008, incorporated by reference toExhibit 10.22 to our Annual Report on Form 10-K for the fiscal yearended December 29, 2007, Commission file number 1-4171.*
IBRF
10.08
Kellogg Company 1993 Employee Stock Ownership Plan,incorporated by reference to Exhibit 10.23 to our Annual Report onForm 10-K for the fiscal year ended December 29, 2007, Commissionfile number 1-4171.*
IBRF
10.09
Kellogg Company 2003 Long-Term Incentive Plan, as amended andrestated as of December 8, 2006, incorporated by reference to Exhibit10. to our Annual Report on Form 10-K for the fiscal year endedDecember 30, 2006, Commission file number 1-4171.*
IBRF
10.10
Kellogg Company Severance Plan, incorporated by reference toExhibit 10.25 of our Annual Report on Form 10-K for the fiscal yearended December 28, 2002, Commission file number 1-4171.*
IBRF
10.11
Form of Non-Qualified Option Agreement for Senior Executives under2003 Long-Term Incentive Plan, incorporated by reference to Exhibit10.4 to our Quarterly Report on Form 10-Q for the fiscal period endedSeptember 25, 2004, Commission file number 1-4171.*
IBRF
10.12
Form of Restricted Stock Grant Award under 2003 Long-TermIncentive Plan, incorporated by reference to Exhibit 10.5 to ourQuarterly Report on Form 10-Q for the fiscal period ended September25, 2004, Commission file number 1-4171.*
IBRF
10.13
Form of Non-Qualified Option Agreement for Non-Employee Directorunder 2000 Non-Employee Director Stock Plan, incorporated byreference to Exhibit 10.6 to our Quarterly Report on Form 10-Q for thefiscal period ended September 25, 2004, Commission file number 1-4171.*
IBRF
10.14
First Amendment to the Key Executive Benefits Plan, incorporated byreference to Exhibit 10.39 of our Annual Report in Form 10-K for ourfiscal year ended January 1, 2005, Commission file number 1-4171.*
IBRF
130

ExhibitNo. Description
Electronic(E),Paper(P) orIncorp. ByRef.(IBRF)
10.15
Restricted Stock Grant/Non-Compete Agreement between us andJohn Bryant, incorporated by reference to Exhibit 10.1 of our QuarterlyReport on Form 10-Q for the period ended April 2, 2005, Commissionfile number 1-4171 (the “2005 Q1 Form 10-Q”).*
IBRF
10.16
Executive Survivor Income Plan, incorporated by reference to Exhibit10.42 of our Annual Report in Form 10-K for our fiscal year endedDecember 31, 2005, Commission file number 1-4171.*
IBRF
10.17
Agreement between us and James M. Jenness, incorporated byreference to Exhibit 10.2 to our Current Report on Form 8-K datedOctober 20, 2006, Commission file number 1-4171.*
IBRF
10.18
Letter Agreement between us and John A. Bryant, dated July 23,2007, incorporated by reference to Exhibit 10.2 to our Current Reporton Form 8-K dated July 23, 2007, Commission file number 1-4171.*
IBRF
10.19
Agreement between us and James M. Jenness, dated February 22,2008, incorporated by reference to Exhibit 10.1 to our Current Reporton Form 8-K dated February 22, 2008, Commission file number 1-4171.*
IBRF
10.20
Form of Amendment to Form of Agreement between us and certainexecutives, incorporated by reference to Exhibit 10.1 to our CurrentReport on Form 8-K dated December 18, 2008, Commission filenumber 1-4171.*
IBRF
10.21
Amendment to Letter Agreement between us and John A. Bryant,dated December 18, 2008, incorporated by reference to Exhibit 10.2to our Current Report on Form 8-K dated December 18, 2008,Commission file number 1-4171.*
IBRF
10.22
Form of Restricted Stock Grant Award under 2003 Long-TermIncentive Plan, incorporated by reference to Exhibit 10.2 to ourCurrent Report on Form 8-K dated December 18, 2008, Commissionfile number 1-4171.*
IBRF
10.23
Form of Option Terms and Conditions for SVP Executive Officersunder 2003 Long-Term Incentive Plan, incorporated by reference toExhibit 10.2 to our Current Report on Form 8-K dated February 20,2009, Commission file number 1-4171.*
IBRF
10.24
Kellogg Company 2009 Long-Term Incentive Plan, incorporated byreference to Exhibit 10.1 to our Registration Statement on Form S-8dated April 27, 2009, Commission file number 333-158824.*
IBRF
10.25
Kellogg Company 2009 Non-Employee Director Stock Plan,incorporated by reference to Exhibit 10.1 to our RegistrationStatement on Form S-8 dated April 27, 2009, Commission file number333-158826.*
IBRF
10.26
Form of Option Terms and Conditions under 2009 Long-TermIncentive Plan, incorporated by reference to Exhibit 10.2 to ourCurrent Report on Form 8-K dated February 25, 2011, Commissionfile number 1-4171.
IBRF
131

ExhibitNo. Description
Electronic(E),Paper(P) orIncorp. ByRef.(IBRF)
10.27
Letter Agreement between us and Gary Pilnick, dated May 20, 2008,incorporated by reference to Exhibit 10.54 to our Annual Report onForm 10-K for the fiscal year ended January 1, 2011, commission filenumber 1-4171.*
IBRF
10.28
Kellogg Company Senior Executive Annual Incentive Plan,incorporated by reference to Appendix A of our Board of Directors’proxy statement for the annual meeting of shareholders held on April29, 2011.*
IBRF
10.29
Form of Option Terms and Conditions, incorporated by reference toExhibit 10.2 to our Current Report on Form 8-K dated February 23,2012, Commission file number 1-4171.*
IBRF
10.30
Form of Restricted Stock Terms and Conditions, incorporated byreference to Exhibit 10.45 to our Annual Report on Form 10-K for thefiscal year ended December 31, 2011, Commission file number 1-4171.*
IBRF
10.31
Form of Restricted Stock Unit Terms and Conditions, incorporated byreference to Exhibit 10.45 to our Annual Report on Form 10-K for thefiscal year ended December 29, 2012, Commission file number 1-4171.*
IBRF
10.32
Kellogg Company 2013 Long-Term Incentive Plan, incorporated byreference to Exhibit 10.1 to our Registration Statement on Form S-8,file number 333-188222.*
IBRF
10.33
Kellogg Company Pringles Savings and Investment Plan, incorporatedby reference to Exhibit 4.3 to our Registration Statement on Form S-8,file number 333-189638.*
IBRF
10.34
Amendment Number 1. to the Kellogg Company Pringles Savings andInvestment Plan, incorporated by reference to Exhibit 4.4 to ourRegistration Statement on Form S-8, file number 333-189638.*
IBRF
10.35
Kellogg Company Deferred Compensation Plan for Non-EmployeeDirectors, incorporated by reference to Exhibit 10.49 to our AnnualReport on Form 10-K dated February 24, 2014, Commission filenumber 1-4171.*
IBRF
10.36
Kellogg Company Executive Compensation Deferral Plan,incorporated by reference to Exhibit 10.50 to our Annual Report onForm 10-K dated February 24, 2014, Commission file number 1-4171.*
IBRF
10.37
Kellogg Company Change of Control Severance Policy for KeyExecutives, incorporated by reference to Exhibit 10.1 to our CurrentReport on Form 8-K dated December 11, 2014.*
IBRF
10.38
Amendment to Change of Control between the Company and JohnBryant, dated December 5, 2014, incorporated by reference to Exhibit10.2 to our Current Report on Form 8-K dated December 11, 2014.*
IBRF
10.39
2015-2017 Executive Performance Plan, incorporated by reference toExhibit 10.1 of our Current Report on Form 8-K dated February 24,2015, Commission file number 1-4171.*
IBRF
132

ExhibitNo. Description
Electronic(E),Paper(P) orIncorp. ByRef.(IBRF)
10.40
Kellogg Company Change of Control Severance Policy for KeyExecutives, incorporated by reference to Exhibit 10.1 to our CurrentReport on Form 8-K dated December 11, 2014.*
IBRF
10.41
Amendment to Change of Control between the Company and JohnBryant, dated December 5, 2014, incorporated by reference to Exhibit10.2 to our Current Report on Form 8-K dated December 11, 2014.*
IBRF
10.42
2015-2017 Executive Performance Plan, incorporated by reference toExhibit 10.1 of our Current Report on Form 8-K dated February 24,2015, Commission file number 1-4171.*
IBRF
10.43
Form of Option Terms and Conditions, incorporated by reference toExhibit 10.2 of our Current Report on Form 8-K dated February 24,2015, Commission file number 1-4171.*
IBRF
10.44
2016-2018 Executive Performance Plan, incorporated by reference toExhibit 10.1 of our Current Report on Form 8-K dated February 23,2016, Commission file number 1-4171.*
IBRF
10.45
Form of Option Terms and Conditions, incorporated by reference toExhibit 10.2 of our Current Report on Form 8-K dated February 23,2016, Commission file number 1-4171.*
IBRF
10.46
Receivables Sale Agreement, dated as of July 13, 2016, amongKellogg Sales Company and Kellogg Funding Company, LLC,incorporated by reference to Exhibit 10.1 of our Current Report onForm 8-K dated July 13, 2016, Commission file number 1-4171.
IBRF
10.47
Receivables Purchase Agreement, dated as of July 13, 2016, amongKellogg Funding Company, LLC, Kellogg Business Services Companyand Coöperatieve Rabobank U.A., New York Branch, incorporated byreference to Exhibit 10.2 of our Current Report on Form 8-K datedJuly 13, 2016, Commission file number 1-4171.
IBRF
10.48
Performance Undertaking Agreement, dated as of July 13, 2016,made by Kellogg Company in favor of Coöperatieve Rabobank U.A,New York Branch, incorporated by reference to Exhibit 10.3 of ourCurrent Report on Form 8-K dated July 13, 2016, Commission filenumber 1-4171.
IBRF
10.49
First Amendment to Receivables Purchase Agreement, dated as ofSeptember 29, 2016, among Kellogg Funding Company, LLC, KelloggBusiness Services Company and Coöperatieve Rabobank U.A., NewYork Branch, incorporated by reference to Exhibit 10.1 of our CurrentReport on Form 8-K dated September 29, 2016, Commission filenumber 1-4171.
IBRF
10.50
Joinder Agreement, dated as of September 30, 2016, among KelloggBusiness Services Company, The Bank Of Tokyo-Mitsubishi UFJ,Ltd., New York Branch and Coöperatieve Rabobank U.A., New YorkBranch, incorporated by reference to Exhibit 10.2 of our CurrentReport on Form 8-K dated September 29, 2016, Commission filenumber 1-4171.
IBRF
133

ExhibitNo. Description
Electronic(E),Paper(P) orIncorp. ByRef.(IBRF)
10.51
Second Amendment to Receivables Purchase Agreement, dated as ofNovember 25, 2016, among Kellogg Funding Company, LLC, KelloggBusiness Services Company, Coöperatieve Rabobank U.A., New YorkBranch, and the other Purchasers party thereto, incorporated byreference to Exhibit 10.1 of our Current Report on Form 8-K datedNovember 25, 2016, Commission file number 1-4171.
IBRF
10.52
Joinder Agreement, dated as of November 25, 2016, among KelloggBusiness Services Company, ING Luxembourg S.A., andCoöperatieve Rabobank U.A., New York Branch, incorporated byreference to Exhibit 10.2 of our Current Report on Form 8-K datedNovember 25, 2016, Commission file number 1-4171.
IBRF
10.53
2017-2019 Executive Performance Plan, incorporated by reference toExhibit 10.1 of our Current Report on Form 8-K dated February 24,2017, Commission file number 1-4171.*
IBRF
10.54
Form of Restricted Stock Unit Terms and Conditions, incorporated byreference to Exhibit 10.2 of our Current Report on Form 8-K datedFebruary 24, 2017, Commission file number 1-4171.*
IBRF
10.55
Kellogg Company 2017 Long-Term Incentive Plan, incorporated byreference to Exhibit 10.1 to our Registration Statement on Form S-8,file number 333-217769.*
IBRF
10.56
Third Amendment to Receivables Purchase Agreement, dated as ofJuly 10, 2017, among Kellogg Funding Company, LLC, KelloggBusiness Services Company, Coöperatieve Rabobank U.A., New YorkBranch, and the other Purchasers party thereto, incorporated byreference to Exhibit 10.1 of our Current Report on Form 8-K datedJuly 12, 2017, Commission file number 1-4171.
IBRF
10.57
Letter agreement with Steve Cahillane, dated September 22, 2017,incorporated by reference to Exhibit 10.1 of our Current Report onForm 8-K dated September 28, 2017, Commission file number 1-4171.*
IBRF
10.58
Letter agreement with John Bryant, dated September 22, 2017,incorporated by reference to Exhibit 10.2 of our Current Report onForm 8-K dated September 28, 2017, Commission file number 1-4171.*
IBRF
134

ExhibitNo. Description
Electronic(E),Paper(P) orIncorp. ByRef.(IBRF)
10.59
Five-Year Credit Agreement dated as of January 30, 2018 withJPMorgan Chase Bank, N.A., as Administrative Agent, Barclays BankPLC, as Syndication Agent, Bank of America, N.A., Citibank, N.A.,Cooperatieve Rabobank U.A., New York Branch, Morgan StanleyMUFG Loan Partners, LLC and Wells Fargo Bank, NationalAssociation, as Documentation Agents, JPMorgan Chase Bank, N.A.,Barclays Bank PLC, Merrill Lynch, Pierce, Fenner & SmithIncorporated, Citigroup Global Markets Inc., Cooperatieve RabobankU.A., New York Branch, Morgan Stanley MUFG Loan Partners, LLCand Wells Fargo Securities, LLC, as Joint Lead Arrangers and JointBookrunners and the lenders named therein, incorporated byreference to Exhibit 4.1 of our Current Report on Form 8-K datedFebruary 1, 2018, Commission file number 1-4171.
IBRF
10.60
364-Day Credit Agreement dated as of January 30, 2018 withJPMorgan Chase Bank, N.A., as Administrative Agent, Barclays BankPLC, as Syndication Agent, JPMorgan Chase Bank, N.A. BarclaysBank PLC, Merrill Lynch, Pierce, Fenner & Smith Incorporated,Citigroup Global Markets Inc., Coöperatieve Rabobank U.A., NewYork Branch, Morgan Stanley MUFG Loan Partners, LLC and WellsFargo Securities, LLC, as Joint Lead Arrangers and Joint Bookrunnersand the lenders named therein, incorporated by reference to Exhibit4.2 of our Current Report on Form 8-K dated February 1, 2018,Commission file number 1-4171.
IBRF
21.01 Domestic and Foreign Subsidiaries of Kellogg. E 23.01 Consent of Independent Registered Public Accounting Firm. E 24.01
Powers of Attorney authorizing Gary H. Pilnick to execute our AnnualReport on Form 10-K for the fiscal year ended December 30, 2017, onbehalf of the Board of Directors, and each of them.
E
31.1 Rule 13a-14(a)/15d-14(a) Certification by Steven A. Cahillane. E 31.2 Rule 13a-14(a)/15d-14(a) Certification by Fareed Khan. E 32.1 Section 1350 Certification by Steven A. Cahillane. E 32.2 Section 1350 Certification by Fareed Khan. E 101.INS XBRL Instance Document E 101.SCH XBRL Taxonomy Extension Schema Document E 101.CAL XBRL Taxonomy Extension Calculation Linkbase Document E 101.DEF XBRL Taxonomy Extension Definition Linkbase Document E 101.LAB XBRL Taxonomy Extension Label Linkbase Document E 101.PRE XBRL Taxonomy Extension Presentation Linkbase Document E
* A management contract or compensatory plan required to be filed with this Report.
135

We agree to furnish to the Securities and Exchange Commission, upon its request, a copy of any instrument defining the rights of holders of long-termdebt of Kellogg and our subsidiaries and any of our unconsolidated subsidiaries for which Financial Statements are required to be filed.
We will furnish any of our shareowners a copy of any of the above Exhibits not included herein upon the written request of such shareowner and thepayment to Kellogg of the reasonable expenses incurred in furnishing such copy or copies.
SIGNATURES
Pursuant to the requirements of Section 13 or 15(d) of the Securities Exchange Act of 1934, the Registrant has duly caused this Report to be signed onits behalf by the undersigned, thereunto duly authorized, this 20th day of February, 2018.
KELLOGG COMPANY
By: /s/ Steven A. Cahillane Steven A. Cahillane Chief Executive Officer
136

Pursuant to the requirements of the Securities Exchange Act of 1934, this Report has been signed below by the following persons on behalf of theRegistrant and in the capacities and on the dates indicated.
Name Capacity Date
/s/ Steven A. Cahillane
Steven A. Cahillane Chief Executive Officer (Principal Executive Officer)
February 20, 2018
/s/ Fareed A. Khan
Fareed A. Khan Senior Vice President and Chief Financial Officer
(Principal Financial Officer) February 20, 2018
/s/ Donald O. Mondano
Donald O. Mondano Vice President and Corporate Controller (Principal
Accounting Officer) February 20, 2018
*
John A. Bryant Chairman and Director
February 20, 2018
*
Stephanie A. Burns Director
February 20, 2018
*
Carter A. Cast Director
February 20, 2018
*
John T. Dillon Director
February 20, 2018
*
Richard W. Dreiling Director
February 20, 2018
*
Zachary Gund Director
February 20, 2018
*
James M. Jenness Director
February 20, 2018
*
Donald R. Knauss Director
February 20, 2018
*
Mary Laschinger Director
February 20, 2018
*
Cynthia H. Milligan Director
February 20, 2018
*
La June Montgomery Tabron Director
February 20, 2018
*
Carolyn M. Tastad Director
February 20, 2018
*
Noel R. Wallace Director
February 20, 2018
* By:
/s/ Gary H. Pilnick
Gary H. Pilnick Attorney-in-fact
February 20, 2018

Exhibit 21.01
KELLOGG COMPANY SUBSIDIARIES(COMMON STOCK OWNERSHIP)
North America
Kellogg Company Subsidiaries• Argkel, Inc. - Delaware• CC Real Estate Holdings, LLC - Michigan• Eighteen94 Capital, LLC - Delaware• Kashi Company - California• Keebler USA, Inc. - Delaware• Kellogg Asia Inc. - Delaware• Kellogg Chile Inc. - Delaware• Kellogg Fearn, Inc. - Michigan• Kellogg Holding, LLC - Delaware• Kellogg International Holding Company - Delaware• Kellogg Italia S.p.A. - Delaware• Kellogg (Thailand) Limited - Delaware• Kellogg Transition MA&P L.L.C. - Delaware• Kellogg Treasury Services Company - Delaware• Kellogg USA Inc. - Michigan• K-One Inc. - Delaware• K-Two Inc. - Delaware• McCamly Plaza Hotel Inc. - Delaware• The Eggo Company - Delaware• Trafford Park Insurance Limited - Bermuda• Worthington Foods, Inc. - Ohio
Kashi Company Subsidiaries• Bear Naked, Inc. - Delaware
Kellogg USA Inc. Subsidiaries• Chicago Bar Company LLC - Illinois (d/b/a RXBAR)• Keebler Holding Corp - Georgia
Keebler Holding Corp Subsidiaries• Keebler Foods Company - Delaware
Keebler Foods Company Subsidiaries• Austin Quality Foods, Inc. - Delaware• BDH, Inc.- Delaware• Keebler Company - Delaware• Shaffer, Clarke & Co., Inc. - Delaware
Austin Quality Foods, Inc. Subsidiaries• AQFTM, Inc. - Delaware• Cary Land Corporation - North Carolina
Keebler Company Subsidiaries• Godfrey Transport, Inc.- Delaware• Illinois Baking Corporation - Delaware• Kellogg Business Services Company - Delaware• Kellogg North America Company - Delaware• Kellogg Sales Company - Delaware
1

Kellogg Sales Company Subsidiaries(d/b/a Kellogg’s Snacks d/b/a Kellogg’s Food Away From Home d/b/a Austin Quality Sales Company d/b/a Pure Organic d/b/a Carr’s USA, Inc.)
• 545 LLC - Delaware• Barbara Dee Cookie Company, L.L.C. - Delaware• Famous Amos Chocolate Chip Cookie Company, L.L.C. - Delaware• Gardenburger, LLC - Delaware• Kashi Sales, L.L.C. - Delaware• Kellogg Funding Company, LLC - Delaware• Little Brownie Bakers, L.L.C. - Delaware• Mother’s Cookie Company, L.L.C.- Delaware• Murray Biscuit Company, L.L.C. - Delaware• President Baking Company, L.L.C.- Delaware• Specialty Foods, L.L.C. - Delaware• Stretch Island Fruit Sales L.L.C. - Delaware• Sunshine Biscuits, L.L.C.- Delaware
K-One Inc. Subsidiaries• SIA Kellogg Latvija - Latvia• Kellogg Latvia, Inc. - Delaware
Kellogg North America Company Subsidiaries• Pringles LLC - Delaware
Asia Pacific/Sub-Saharan
Kellogg Company Subsidiaries• K (China) Limited - Delaware• K India Private Limited - Delaware• Kellogg (Thailand) Limited - Thailand• Kellogg Asia Marketing Inc. - Delaware• Kellogg Asia Sdn. Bhd. - Malaysia• Kellogg India Private Limited - India• Kellogg Asia Pacific Pte. Ltd - Singapore• Kellogg Tolaram Pte. Ltd. - Singapore (JV)
Kellogg Latin America Holding Company (One) Limited Subsidiaries• Kellogg Company East Africa Limited - Kenya• Nhong Shim Kellogg Co. Ltd. - South Korea
Kellogg Asia Marketing Inc. Subsidiaries• Shanghai Trading Co. Ltd. - China
Kellogg Tolaram Pte. Ltd. Subsidiaries (JV)• Kellogg Tolaram Ghana Private Limited - Ghana• Kellogg Tolaram Nigeria Limited - Nigeria
K Europe Holding Company Limited Subsidiaries• Kellogg Tolaram Noodles Singapore Pte. Ltd. - Singapore (JV)• Multipro Singapore Pte. Ltd. - Singapore (JV)
Kellogg Tolaram Noodles Singapore Pte. Ltd. Subsidiaries (JV)• Kellogg Tolaram South Africa Proprietary Limited - South Africa• Kellogg Tolaram Noodles Egypt L.L.C - Egypt
2

Multipro Singapore Pte. Ltd. Subsidiaries (JV)• Multipro Private Limited - Ghana• Multipro Consumer Products Limited - Nigeria
Kellogg Hong Kong Holding Company Subsidiaries• Kellogg Hong Kong Private Limited - Hong Kong• Wimble Manufacturing Belgium BVBA - Belgium• Wimble Services Belgium BVBA - Belgium• Pringles Hong Kong Limited - Hong Kong• Yihai Kerry Kellogg Foods (Shanghai) Company Limited - China (JV)• Yihai Kerry Kellogg Foods (Kushan) Company Limited - China (JV)• Wilmar Kellogg (Singapore) Pte. Ltd. (JV)
Canada-Australia-New Zealand
Kellogg Company Subsidiaries• Canada Holding LLC - Delaware
Kellogg Australia Holdings Pty Ltd, Subsidiaries• Kellogg (Aust.) Pty. Ltd. - Australia
Kellogg (Aust.) Pty. Ltd. Subsidiaries• Kashi Company Pty. Ltd. - Australia• Kellogg Superannuation Pty. Ltd. - Australia• Specialty Cereals Pty Limited - Australia• The Healthy Snack People Pty Limited - Australia• Pringles Australia Pty Ltd - Australia
Canada Holding LLC Subsidiaries• Kellogg Kayco - Cayman Islands• Kellogg Group Limited - England and Wales
Kellogg Kayco Subsidiaries
• KBAR SRL - Barbados
Kellogg Group Limited Subsidiaries • Pringles Manufacturing Company - Delaware• Gollek UK Limited - United Kingdom
Gollek UK Limited Subsidiaries• Kellogg Asia Products Sdn. Bhd. - Malaysia• Kellogg Latin America Holding Company (One) Limited - England and Wales• KPAR Limited - England and Wales
KPAR Limited Subsidiaries• Parati Indústria e Comércio De Alimentos Ltda - Brazil
Mexico-Latin America
Kellogg Company Subsidiaries• Gollek Inc. - Delaware• Kelarg, Inc. - Delaware• Kellogg Argentina S.R.L. - Argentina• Kellogg Brasil, Inc. - Delaware• Kellogg Caribbean Inc. - Delaware• Kellogg Caribbean Services Company, Inc. - Puerto Rico• Kellogg Chile Limitada - Chile
3

• Kellogg de Centro America, S.A. - Guatemala• Kellogg de Colombia, S.A. - Colombia
Kellogg Latin America Holding Company (One) Limited Subsidiaries• Alimentos Kellogg de Panama SRL - Panama• Alimentos Kellogg, S.A. - Venezuela• Gollek Argentina S.R.L. - Argentina• Kellogg Company Mexico, S. de R.L. de C.V. - Mexico• Kellogg Costa Rica S. de R.L. - Costa Rica• Kellogg de Peru, S.A.L. - Peru• Kellogg Ecuador C. Ltda. - Ecuador
Kellogg Company Mexico, S. de R.L. de C.V. Subsidiaries• Gollek Interamericas, S. de R.L., de C.V. - Mexico• Gollek Services, S.A. a/k/a Gollek Servicios, S.C. - Mexico• Kellman, S. de R.L. de C.V. - Mexico• Kellogg de Mexico, S. de R.L. de C.V. - Mexico• Kellogg Servicios, S.C. - Mexico• Pronumex, S. de R.L. de C.V. - Mexico• Instituto de Nutricion y Salud Kellogg, A.C. - Mexico
Kellogg de Mexico, S. de R.L. de C.V. Subsidiaries• Servicios Argkel, S.C. - Mexico
Alimentos Kellogg, S.A. Subsidiaries• Alimentos Gollek, S.A. - Venezuela
Gollek, Inc. Subsidiaires• Kellogg Brasil Ltda. - Brasil• Kellogg El Salvador S. de R.L. de C.V. - El Salvador
P arati Indústria e Comércio De Alimentos Ltda - Brazil• Pádua Ltda - Brazil• Afical Ltda - Brazil• Afical Holding LLC - Delaware
Europe
Kellogg Company Subsidiaries• Bisco Misr - Egypt• Gollek B.V. - Netherlands• Kellogg UK Minor Limited - Manchester, England
Kellogg Latin America Holding Company (One) Limited Subsidiaries• Kellogg Company of Great Britain Limited - England• Kellogg Hong Kong Holding Company - England and Wales• Kellogg Latin America Holding Company (Two) Limited - United Kingdom• Kellogg Netherlands Holding B.V. - Netherlands• Prime Bond Holdings Limited - Cyprus• Pringles Overseas Holding S.a.r.l. - Switzerland
Kellogg International Holding Company Subsidiaries• Kellogg Holding Company Limited - Bermuda• Kellogg Italia S.p.A. - Italy• K Europe Holding Company Limited - England and Wales• Klux A S.a.r.l. - Luxembourg• Prime Bond Cyprus Holding Company Limited - Cyprus
4

Kellogg Holding Company Limited Subsidiaries• Kellogg Europe Company Limited - Bermuda• KTRY Limited - Bermuda
Klux A S.a.r.l. Subsidiaries• Klux B S.a.r.l. - Luxembourg
Kellogg Europe Company Limited Subsidiaries• Kellogg Lux I S.a.r.l. - Luxembourg• Pringles S.a.r.l. - Luxembourg• KECL, LLC - Delaware• KT International Finance SRL - Barbados
Kellogg Lux I S.a.r.l. Subsidiaries• Kellogg Europe Trading Limited - Ireland• Kellogg Europe Treasury Services Limited - Ireland• Kellogg Irish Holding Company Limited - Ireland• Kellogg Europe Emerging Markets Services (KEEM) - France• UMA Investments sp. z o.o. - Poland• Kellogg European Logistics Services Company Limited - Ireland
Kellogg Europe Treasury Services Limited Subsidiaries• Vita+ Naturprodukte GmbH - Austria• Vita+ Naturprodukte GmbH - Germany
Pringles S.a.r.l. Subsidiaries• PRUX S.a.r.l. - Luxembourg• Pringles LP - Canada
Kellogg European Logistics Services Company Limited Subsidiaries• Kellogg Snacks Holding Company Europe Limited - Ireland
Kellogg Snacks Holding Company Europe Limited Subsidiaries• Kellogg Lux V S.a.r.l. - Luxembourg
Kellogg Lux V S.a.r.l. Subsidiaries• Kellogg Snacks Financing Limited - Ireland• Pringles International Operations S.a.r.l. - Switzerland
Kellogg Company of Great Britain Limited Subsidiaries• Kellogg Canada Inc. - Canada• Favorite Food Products Limited - England• Kelcone Limited - England• Kelcorn Limited - England• Kelmill Limited - England• Kelpac Limited - England• Saragusa Frozen Foods Limited - England
Kellogg Canada Inc. Subsidiaries• Kellogg Australia Holdings Pty Ltd. - Australia• Keeb Canada, Inc. - Canada
Kellogg Netherlands Holding B.V.• Pringles Japan G.K. - Japan
Prime Bond Holdings Limited Subsidiaries• Kellogg Lux VI S.a.r.l. - Luxembourg• Kellogg Rus LLC - Russian Federation
5

Kellogg Lux VI S.a.r.l. Subsidiaries• Kellogg Europe Services Limited - Ireland
Pringles Overseas Holdings S.a.r.l. Subsidiaries• Pringles (Shanghai) Food Co. Ltd. - China• Mass Food SAE - Egypt
Mass Food SAE Subsidiaries• Mass Food International SAE - Egypt• Mass Trade for Trade and Distribution SAE - Egypt
Pringles Japan G.K. - Japan• Kellogg (Japan) G.K. - Japan
Kellogg Europe Trading Limited Subsidiaries• Kellogg Med Gida Ticaret Limited Sirketi - Turkey (JV)
Kellogg Irish Holding Company Limited Subsidiaries• Kellogg Lux III S.a.r.l. - Luxembourg
Kellogg Lux III S.a.r.l. Subsidiaries• Kellogg Group S.a.r.l. - Luxembourg• Kellogg Europe Finance Limited - Ireland
Kellogg Group S.a.r.l.• Kellogg (Deutschland) GmbH - Germany• Kellogg Company of South Africa (Pty) Limited - South Africa• Kellogg Group, LLC - Delaware• Kellogg Hellas Single Member Limited Liability Company - Greece• Kellogg Services GmbH - Austria• Kellogg Northern Europe GmbH - Germany• Kellogg U.K. Holding Company Limited - England• Kellogg's Produits Alimentaires, S.A.S. - France• Nordisk Kellogg's ApS - Denmark• Portable Foods Manufacturing Company Limited - England
Kellogg (Deutschland) GmbH Subsidiaries• Kellogg (Schweiz) GmbH - Switzerland• Kellogg (Osterreich) GmbH - Austria• Kellogg Services GmbH - Germany• Kellogg Manufacturing GmbH & Co. KG - Germany• Gebrueder Nielsen Reismuehlen und Staerke-Fabrik mit Beschraenkter Haftung - Germany
Kellogg U.K. Holding Company Limited Subsidiaries• Kellogg Company of Ireland, Limited - Ireland• Kellogg Espana, S.L. - Spain• Kellogg Management Services (Europe) Limited - England• Kellogg Manchester Limited - England• Kellogg Marketing and Sales Company (UK) Limited - England• Kellogg Supply Services (Europe) Limited - England
Kellogg's Produits Alimentaires, S.A.S .• Kellogg Belgium Services Company bvba - Belgium
Kellogg Espana, S.L. Subsidiaries• Kellogg Manufacturing Espana, S.L. - Spain
6

Kellogg Management Services (Europe) Limited Subsidiaries• Kellogg European Support Services SRL - Romania
Kellogg Manchester Limited Subsidiaries• KELF Limited - England
KELF Limited Subsidiaries• Kellogg Talbot LLC - Delaware
7

Exhibit 23.01
CONSENT OF INDEPENDENT REGISTERED PUBLIC ACCOUNTING FIRM
We hereby consent to the incorporation by reference in the Registration Statements on Form S-3 (Nos. 333-72312, 333-209699 and 333-205616) andthe Registration Statements on Form S-8 (Nos. 333-56536, 333-88162, 333-109234, 333-109235, 333-109238, 333-158826, 333-217769, and 333-189638) of Kellogg Company of our report dated February 20, 2018 relating to the financial statements and the effectiveness of internal control overfinancial reporting, which appears in this Form 10-K.
/s/ PricewaterhouseCoopers LLP
Detroit, MichiganFebruary 20, 2018

Exhibit 24.01
POWER OF ATTORNEY
KNOW ALL BY THESE PRESENTS, That I, the undersigned Director of Kellogg Company, a Delaware corporation,hereby appoint Gary H. Pilnick, Vice Chairman of Kellogg Company, as my lawful attorney-in-fact and agent, to act on mybehalf, with full power of substitution, in executing and filing the Company’s Annual Report on Form 10-K for fiscal yearended December 30, 2017 and any exhibits, amendments and other documents related thereto, with the Securities andExchange Commission.
Whereupon, I grant unto said Gary H. Pilnick full power and authority to perform all necessary and appropriate actsin connection therewith, and hereby ratify and confirm all that said attorney-in-fact and agent, or his substitute, may lawfullydo, or cause to be done, by virtue hereof.
/s/ John A. Bryant John A. Bryant
Dated: February 16, 2018
POWER OF ATTORNEY
KNOW ALL BY THESE PRESENTS, That I, the undersigned Director of Kellogg Company, a Delaware corporation,hereby appoint Gary H. Pilnick, Vice Chairman of Kellogg Company, as my lawful attorney-in-fact and agent, to act on mybehalf, with full power of substitution, in executing and filing the Company’s Annual Report on Form 10-K for fiscal yearended December 30, 2017 and any exhibits, amendments and other documents related thereto, with the Securities andExchange Commission.
Whereupon, I grant unto said Gary H. Pilnick full power and authority to perform all necessary and appropriate actsin connection therewith, and hereby ratify and confirm all that said attorney-in-fact and agent, or his substitute, may lawfullydo, or cause to be done, by virtue hereof.
/s/ Stephanie A. Burns Stephanie A. Burns
Dated: February 16, 2018

POWER OF ATTORNEY
KNOW ALL BY THESE PRESENTS, That I, the undersigned Director of Kellogg Company, a Delaware corporation,hereby appoint Gary H. Pilnick, Vice Chairman of Kellogg Company, as my lawful attorney-in-fact and agent, to act on mybehalf, with full power of substitution, in executing and filing the Company’s Annual Report on Form 10-K for fiscal yearended December 30, 2017 and any exhibits, amendments and other documents related thereto, with the Securities andExchange Commission.
Whereupon, I grant unto said Gary H. Pilnick full power and authority to perform all necessary and appropriate actsin connection therewith, and hereby ratify and confirm all that said attorney-in-fact and agent, or his substitute, may lawfullydo, or cause to be done, by virtue hereof.
/s/ Carter A. Cast Carter A. Cast
Dated: February 16, 2018
POWER OF ATTORNEY
KNOW ALL BY THESE PRESENTS, That I, the undersigned Director of Kellogg Company, a Delaware corporation,hereby appoint Gary H. Pilnick, Vice Chairman of Kellogg Company, as my lawful attorney-in-fact and agent, to act on mybehalf, with full power of substitution, in executing and filing the Company’s Annual Report on Form 10-K for fiscal yearended December 30, 2017 and any exhibits, amendments and other documents related thereto, with the Securities andExchange Commission.
Whereupon, I grant unto said Gary H. Pilnick full power and authority to perform all necessary and appropriate actsin connection therewith, and hereby ratify and confirm all that said attorney-in-fact and agent, or his substitute, may lawfullydo, or cause to be done, by virtue hereof.
/s/ John T. Dillon John T. Dillon
Dated: February 16, 2018

POWER OF ATTORNEY
KNOW ALL BY THESE PRESENTS, That I, the undersigned Director of Kellogg Company, a Delaware corporation,hereby appoint Gary H. Pilnick, Vice Chairman of Kellogg Company, as my lawful attorney-in-fact and agent, to act on mybehalf, with full power of substitution, in executing and filing the Company’s Annual Report on Form 10-K for fiscal yearended December 30, 2017 and any exhibits, amendments and other documents related thereto, with the Securities andExchange Commission.
Whereupon, I grant unto said Gary H. Pilnick full power and authority to perform all necessary and appropriate actsin connection therewith, and hereby ratify and confirm all that said attorney-in-fact and agent, or his substitute, may lawfullydo, or cause to be done, by virtue hereof.
/s/ Richard W. Dreiling Richard W. Dreiling
Dated: February 16, 2018
POWER OF ATTORNEY
KNOW ALL BY THESE PRESENTS, That I, the undersigned Director of Kellogg Company, a Delaware corporation,hereby appoint Gary H. Pilnick, Vice Chairman of Kellogg Company, as my lawful attorney-in-fact and agent, to act on mybehalf, with full power of substitution, in executing and filing the Company’s Annual Report on Form 10-K for fiscal yearended December 30, 2017 and any exhibits, amendments and other documents related thereto, with the Securities andExchange Commission.
Whereupon, I grant unto said Gary H. Pilnick full power and authority to perform all necessary and appropriate actsin connection therewith, and hereby ratify and confirm all that said attorney-in-fact and agent, or his substitute, may lawfullydo, or cause to be done, by virtue hereof.
/s/ Zachary Gund Zachary Gund
Dated: February 16, 2018
POWER OF ATTORNEY
KNOW ALL BY THESE PRESENTS, That I, the undersigned Director of Kellogg Company, a Delaware corporation,hereby appoint Gary H. Pilnick, Vice Chairman of Kellogg Company, as my lawful attorney-in-fact and agent, to act on mybehalf, with full power of substitution, in executing and filing the Company’s Annual Report on Form 10-K for fiscal yearended December 30, 2017 and any exhibits, amendments and other documents related thereto, with the Securities andExchange Commission.
Whereupon, I grant unto said Gary H. Pilnick full power and authority to perform all necessary and appropriate actsin connection therewith, and hereby ratify and confirm all that said attorney-in-fact and agent, or his substitute, may lawfullydo, or cause to be done, by virtue hereof.
/s/ James M. Jenness James M. Jenness
Dated: February 16, 2018
POWER OF ATTORNEY
KNOW ALL BY THESE PRESENTS, That I, the undersigned Director of Kellogg Company, a Delaware corporation,hereby appoint Gary H. Pilnick, Vice Chairman of Kellogg Company, as my lawful attorney-in-fact and agent, to act on mybehalf, with full power of substitution, in executing and filing the Company’s Annual Report on Form 10-K for fiscal yearended December 30, 2017 and any exhibits, amendments and other documents related thereto, with the Securities andExchange Commission.
Whereupon, I grant unto said Gary H. Pilnick full power and authority to perform all necessary and appropriate actsin connection therewith, and hereby ratify and confirm all that said attorney-in-fact and agent, or his substitute, may lawfullydo, or cause to be done, by virtue hereof.
/s/ Donald R. Knauss Donald R. Knauss
Dated: February 16, 2018

POWER OF ATTORNEY
KNOW ALL BY THESE PRESENTS, That I, the undersigned Director of Kellogg Company, a Delaware corporation,hereby appoint Gary H. Pilnick, Vice Chairman of Kellogg Company, as my lawful attorney-in-fact and agent, to act on mybehalf, with full power of substitution, in executing and filing the Company’s Annual Report on Form 10-K for fiscal yearended December 30, 2017 and any exhibits, amendments and other documents related thereto, with the Securities andExchange Commission.
Whereupon, I grant unto said Gary H. Pilnick full power and authority to perform all necessary and appropriate actsin connection therewith, and hereby ratify and confirm all that said attorney-in-fact and agent, or his substitute, may lawfullydo, or cause to be done, by virtue hereof.
/s/ Mary A. Laschinger Mary A. Laschinger
Dated: February 16, 2018
POWER OF ATTORNEY
KNOW ALL BY THESE PRESENTS, That I, the undersigned Director of Kellogg Company, a Delaware corporation,hereby appoint Gary H. Pilnick, Vice Chairman of Kellogg Company, as my lawful attorney-in-fact and agent, to act on mybehalf, with full power of substitution, in executing and filing the Company’s Annual Report on Form 10-K for fiscal yearended December 30, 2017 and any exhibits, amendments and other documents related thereto, with the Securities andExchange Commission.
Whereupon, I grant unto said Gary H. Pilnick full power and authority to perform all necessary and appropriate actsin connection therewith, and hereby ratify and confirm all that said attorney-in-fact and agent, or his substitute, may lawfullydo, or cause to be done, by virtue hereof.
/s/ Cynthia H. Milligan Cynthia H. Milligan
Dated: February 16, 2018

POWER OF ATTORNEY
KNOW ALL BY THESE PRESENTS, That I, the undersigned Director of Kellogg Company, a Delaware corporation,hereby appoint Gary H. Pilnick, Vice Chairman of Kellogg Company, as my lawful attorney-in-fact and agent, to act on mybehalf, with full power of substitution, in executing and filing the Company’s Annual Report on Form 10-K for fiscal yearended December 30, 2017 and any exhibits, amendments and other documents related thereto, with the Securities andExchange Commission.
Whereupon, I grant unto said Gary H. Pilnick full power and authority to perform all necessary and appropriate actsin connection therewith, and hereby ratify and confirm all that said attorney-in-fact and agent, or his substitute, may lawfullydo, or cause to be done, by virtue hereof.
/s/ La June Montgomery TabronLa June Montgomery Tabron
Dated: February 16, 2018
POWER OF ATTORNEY
KNOW ALL BY THESE PRESENTS, That I, the undersigned Director of Kellogg Company, a Delaware corporation,hereby appoint Gary H. Pilnick, Vice Chairman of Kellogg Company, as my lawful attorney-in-fact and agent, to act on mybehalf, with full power of substitution, in executing and filing the Company’s Annual Report on Form 10-K for fiscal yearended December 30, 2017 and any exhibits, amendments and other documents related thereto, with the Securities andExchange Commission.
Whereupon, I grant unto said Gary H. Pilnick full power and authority to perform all necessary and appropriate actsin connection therewith, and hereby ratify and confirm all that said attorney-in-fact and agent, or his substitute, may lawfullydo, or cause to be done, by virtue hereof.
/s/ Carolyn M. Tastad Carolyn M. Tastad
Dated: February 16, 2018

POWER OF ATTORNEY
KNOW ALL BY THESE PRESENTS, That I, the undersigned Director of Kellogg Company, a Delaware corporation,hereby appoint Gary H. Pilnick, Vice Chairman of Kellogg Company, as my lawful attorney-in-fact and agent, to act on mybehalf, with full power of substitution, in executing and filing the Company’s Annual Report on Form 10-K for fiscal yearended December 30, 2017 and any exhibits, amendments and other documents related thereto, with the Securities andExchange Commission.
Whereupon, I grant unto said Gary H. Pilnick full power and authority to perform all necessary and appropriate actsin connection therewith, and hereby ratify and confirm all that said attorney-in-fact and agent, or his substitute, may lawfullydo, or cause to be done, by virtue hereof.
/s/ Noel R. Wallace Noel R. Wallace
Dated: February 16, 2018

Exhibit 31.1
CERTIFICATIONI, Steven A. Cahillane, certify that:
1. I have reviewed this annual report on Form 10-K of Kellogg Company;
2. Based on my knowledge, this report does not contain any untrue statement of a material fact or omit to state a material fact necessary to make thestatements made, in light of the circumstances under which such statements were made, not misleading with respect to the period covered by thisreport;
3. Based on my knowledge, the financial statements, and other financial information included in this annual report, fairly present in all material respectsthe financial condition, results of operations and cash flows of the registrant as of, and for, the periods presented in this report;
4. The registrant's other certifying officer and I are responsible for establishing and maintaining disclosure controls and procedures (as defined inExchange Act Rules 13a-15(e) and 15d-15(e)) and internal control over financial reporting (as defined in Exchange Act Rules 13a-15(f) and 15d-15(f))for the registrant and we have:
a) Designed such disclosure controls and procedures, or caused such disclosure controls and procedures to be designed under our supervision,to ensure that material information relating to the registrant, including its consolidated subsidiaries, is made known to us by others within thoseentities, particularly during the period in which this report is being prepared;
b) Designed such internal control over financial reporting, or caused such internal control over financial reporting to be designed under oursupervision, to provide reasonable assurance regarding the reliability of financial reporting and the preparation of financial statements forexternal purposes in accordance with generally accepted accounting principles;
c) Evaluated the effectiveness of the registrant's disclosure controls and procedures and presented in this report our conclusions about theeffectiveness of the disclosure controls and procedures, as of the end of the period covered by this report based on such evaluation; and
d) Disclosed in this report any change in the registrant’s internal control over financial reporting that occurred during the registrant’s most recentfiscal quarter (the registrant’s fourth fiscal quarter in the case of an annual report) that has materially affected, or is reasonably likely tomaterially affect, the registrant’s internal control over financial reporting; and
5. The registrant's other certifying officer and I have disclosed, based on our most recent evaluation of internal control over financial reporting, to theregistrant's auditors and the audit committee of the registrant's board of directors (or persons performing the equivalent functions):
a) All significant deficiencies and material weaknesses in the design or operation of internal control over financial reporting which are reasonablylikely to adversely affect the registrant's ability to record, process, summarize and report financial information; and
b) Any fraud, whether or not material, that involves management or other employees who have a significant role in the registrant's internal controlover financial reporting.
_/s/ Steven A. Cahillane__________________________Name: Steven A. CahillaneTitle: Chief Executive Officer
Date: February 20, 2018

Exhibit 31.2
CERTIFICATIONI, Fareed Khan, certify that:
1. I have reviewed this annual report on Form 10-K of Kellogg Company;
2. Based on my knowledge, this report does not contain any untrue statement of a material fact or omit to state a material fact necessary to make thestatements made, in light of the circumstances under which such statements were made, not misleading with respect to the period covered by thisreport;
3. Based on my knowledge, the financial statements, and other financial information included in this annual report, fairly present in all material respectsthe financial condition, results of operations and cash flows of the registrant as of, and for, the periods presented in this report;
4. The registrant's other certifying officer and I are responsible for establishing and maintaining disclosure controls and procedures (as defined inExchange Act Rules 13a-15(e) and 15d-15(e)) and internal control over financial reporting (as defined in Exchange Act Rules 13a-15(f) and 15d-15(f))for the registrant and we have:
a) Designed such disclosure controls and procedures, or caused such disclosure controls and procedures to be designed under our supervision,to ensure that material information relating to the registrant, including its consolidated subsidiaries, is made known to us by others within thoseentities, particularly during the period in which this report is being prepared;
b) Designed such internal control over financial reporting, or caused such internal control over financial reporting to be designed under oursupervision, to provide reasonable assurance regarding the reliability of financial reporting and the preparation of financial statements forexternal purposes in accordance with generally accepted accounting principles;
c) Evaluated the effectiveness of the registrant's disclosure controls and procedures and presented in this report our conclusions about theeffectiveness of the disclosure controls and procedures, as of the end of the period covered by this report based on such evaluation; and
d) Disclosed in this report any change in the registrant’s internal control over financial reporting that occurred during the registrant’s most recentfiscal quarter (the registrant’s fourth fiscal quarter in the case of an annual report) that has materially affected, or is reasonably likely tomaterially affect, the registrant’s internal control over financial reporting; and
5. The registrant's other certifying officer and I have disclosed, based on our most recent evaluation of internal control over financial reporting, to theregistrant's auditors and the audit committee of the registrant's board of directors (or persons performing the equivalent functions):
a) All significant deficiencies and material weaknesses in the design or operation of internal control over financial reporting which are reasonablylikely to adversely affect the registrant's ability to record, process, summarize and report financial information; and
b) Any fraud, whether or not material, that involves management or other employees who have a significant role in the registrant's internal controlover financial reporting.
__/s/ Fareed Khan____________________________________Name: Fareed Khan Title: Senior Vice President and Chief Financial Officer
Date: February 20, 2018

Exhibit 32.1SECTION 1350 CERTIFICATION
I, Steven A. Cahillane, President and Chief Executive Officer, Kellogg Company, hereby certify, on the date hereof, pursuant to 18 U.S.C.Section 1350, as adopted pursuant to Section 906 of the Sarbanes-Oxley Act of 2002, that
(1) the Annual Report on Form 10-K of Kellogg Company for the period ended December 30, 2017 (the “Report”) fully complies with therequirements of Section 13(a) or 15(d) of the Securities Exchange Act of 1934; and
(2) the information contained in the Report fairly presents, in all material respects, the financial condition and results of operations of KelloggCompany.
__/s/ Steven A. Cahillane_________________________________Name: Steven A. Cahillane Title: Chief Executive Officer
A signed copy of this original statement required by Section 906 has been provided to Kellogg Company and will be retained by Kellogg Company andfurnished to the Securities and Exchange Commission or its staff on request.
Date: February 20, 2018

Exhibit 32.2SECTION 1350 CERTIFICATION
I, Fareed Khan, Senior Vice President and Chief Financial Officer, Kellogg Company, hereby certify, on the date hereof, pursuant to 18 U.S.C.Section 1350, as adopted pursuant to Section 906 of the Sarbanes-Oxley Act of 2002, that
(1) the Annual Report on Form 10-K of Kellogg Company for the period ended December 30, 2017 (the “Report”) fully complies with therequirements of Section 13(a) or 15(d) of the Securities Exchange Act of 1934; and
(2) the information contained in the Report fairly presents, in all material respects, the financial condition and results of operations of KelloggCompany.
__/s/ Fareed Khan_________________________________________Name: Fareed Khan Title: Senior Vice President and Chief Financial Officer
A signed copy of this original statement required by Section 906 has been provided to Kellogg Company and will be retained by Kellogg Company andfurnished to the Securities and Exchange Commission or its staff on request.Date: February 20, 2018