Citi DISRUPTIVE INNOVATION Ten Things to Stop and Think About
Upload
khangminh22Category
view
4download
0
UNITED STATES SECURITIES AND EXCHANGE COMMISSION
WASHINGTON, D.C. 20549
FORM 8-K CURRENT REPORT
Pursuant to Section 13 or 15(d) of the Securities Exchange Act of 1934 Date of Report (Date of earliest event reported) August 30, 2013
Citigroup Inc. (Exact name of Registrant as specified in its charter)
Delaware 1-9924 52-1568099
(State or other jurisdiction of incorporation)
(Commission File Number)
(IRS Employer Identification No.)
399 Park Avenue, New York,
New York (Address of principal executive offices)
10022 (Zip Code)
(212) 559-1000
(Registrant's telephone number, including area code)
Check the appropriate box below if the Form 8-K filing is intended to simultaneously satisfy the filing obligation of the registrant under any of the following provisions:
Written communications pursuant to Rule 425 under the Securities Act (17 CFR 230.425)
Soliciting material pursuant to Rule 14a-12 under the Exchange Act (17 CFR 240.14a-12)
Pre-commencement communications pursuant to Rule 14d-2(b) under the Exchange Act (17 CFR 240.14d-2(b))
Pre-commencement communications pursuant to Rule 13e-4(c) under the Exchange Act (17 CFR 240.13e-4(c))
CITIGROUP INC. Current Report on Form 8-K
Item 8.01 Other Events.
On August 2, 2013, Citigroup Inc. (Citigroup or Citi) filed its Quarterly Report on Form 10-Q for the quarter ended June 30, 2013 (the Second Quarter 2013 Form 10-Q) with the U.S. Securities and Exchange Commission (SEC). In the Second Quarter 2013 Form 10-Q, Citigroup reported Credicard, Citi’s non-Citibank branded cards business and consumer finance business in Brazil, as discontinued operations for all periods presented, as well as certain other immaterial reclassifications.
As required by ASC 280, Segment Reporting, attached as Exhibit 99.02 to this Form 8-K are the Historical Audited Consolidated
Financial Statements included in Citigroup’s Annual Report on Form 10-K for the fiscal year ended December 31, 2012 (2012 Form 10-K), conformed to reflect Credicard as discontinued operations for all comparative prior period information, as well as to reflect the previously disclosed re-allocation among Citi’s businesses of both certain administrative costs and certain funding costs, effective January 1, 2013, and other immaterial reclassifications.
Other than the previously disclosed re-allocations and immaterial reclassifications, Exhibits 99.01, 99.02 and 101 only reflect Credicard as discontinued operations in Citigroup’s Consolidated Income Statement and Consolidated Statement of Cash Flows for all periods presented and Notes 3, 4, 5, 6, 10, 11, 17 and 29 to the Consolidated Financial Statements to Citigroup’s 2012 Form 10-K. Exhibits 99.01, 99.02 and 101 do not restate or revise Citigroup’s consolidated net income, earnings per share on net income, total assets or total equity included in its 2012 Form 10-K. The information included in this Form 8-K should be read in conjunction with Citigroup’s 2012 Form 10-K and Second Quarter 2013 Form 10-Q.
Exhibit 99.02 will serve as the Historical Audited Consolidated Financial Statements of Citigroup for existing and future filings made pursuant to the Securities Act of 1933, as amended, until Citigroup files its Annual Report on Form 10-K for the fiscal year ended December 31, 2013. Item 9.01 Financial Statements and Exhibits. (d) Exhibits. Exhibit Number 99.01 Five Year Summary of Selected Financial Data. 99.02 Historical Audited Consolidated Financial Statements of Citigroup Inc. reflecting Credicard as discontinued operations,
as well as updated business segment disclosures related to the re-allocation among Citi’s businesses of both certain administrative costs and certain funding costs. Also included is the Report of Independent Registered Public Accounting Firm dated March 1, 2013, except as to Notes 3, 4, 5, 6, 10, 11 and 17 which are as of August 30, 2013.
99.03 Consent of KPMG LLP, Independent Registered Public Accounting Firm. 101 Financial statements from the Historical Audited Consolidated Financial Statements on Form 8-K of Citigroup, Inc. for
the fiscal year ended December 31, 2012, filed on August 30, 2013, formatted in XBRL: (i) the Consolidated Statement of Income, (ii) the Consolidated Statement of Comprehensive Income (iii) the Consolidated Balance Sheet, (iv) the Consolidated Statement of Changes in Equity, (v) the Consolidated Statement of Cash Flows and (vi) the Notes to Consolidated Financial Statements.
SIGNATURE
Pursuant to the requirements of the Securities Exchange Act of 1934, the registrant has duly caused this report to be signed on its behalf by the undersigned hereunto duly authorized.
CITIGROUP INC.
Dated: August 30, 2013
By: /s/ JEFFREY R. WALSH Name: Jeffrey R. Walsh Title: Controller and Chief Accounting Officer

Exhibit Index Exhibit Number 99.01 Five Year Summary of Selected Financial Data 99.02 Historical Audited Consolidated Financial Statements of Citigroup Inc. reflecting Credicard as discontinued operations,
as well as updated business segment disclosures related to the re-allocation among Citi’s businesses of both certain administrative costs and certain funding costs. Also included is the Report of Independent Registered Public Accounting Firm dated March 1, 2013, except as to Notes 3, 4, 5, 6, 10, 11 and 17 which are as of August 30, 2013.
99.03 Consent of KPMG LLP, Independent Registered Public Accounting Firm. 101 Financial statements from the Historical Audited Consolidated Financial Statements on Form 8-K of Citigroup Inc. for
the fiscal year ended December 31, 2012, filed on August 30, 2013, formatted in XBRL: (i) the Consolidated Statement of Income, (ii) the Consolidated Statement of Comprehensive Income (iii) the Consolidated Balance Sheet, (iv) the Consolidated Statement of Changes in Equity, (v) the Consolidated Statement of Cash Flows and (vi) the Notes to Consolidated Financial Statements.
1
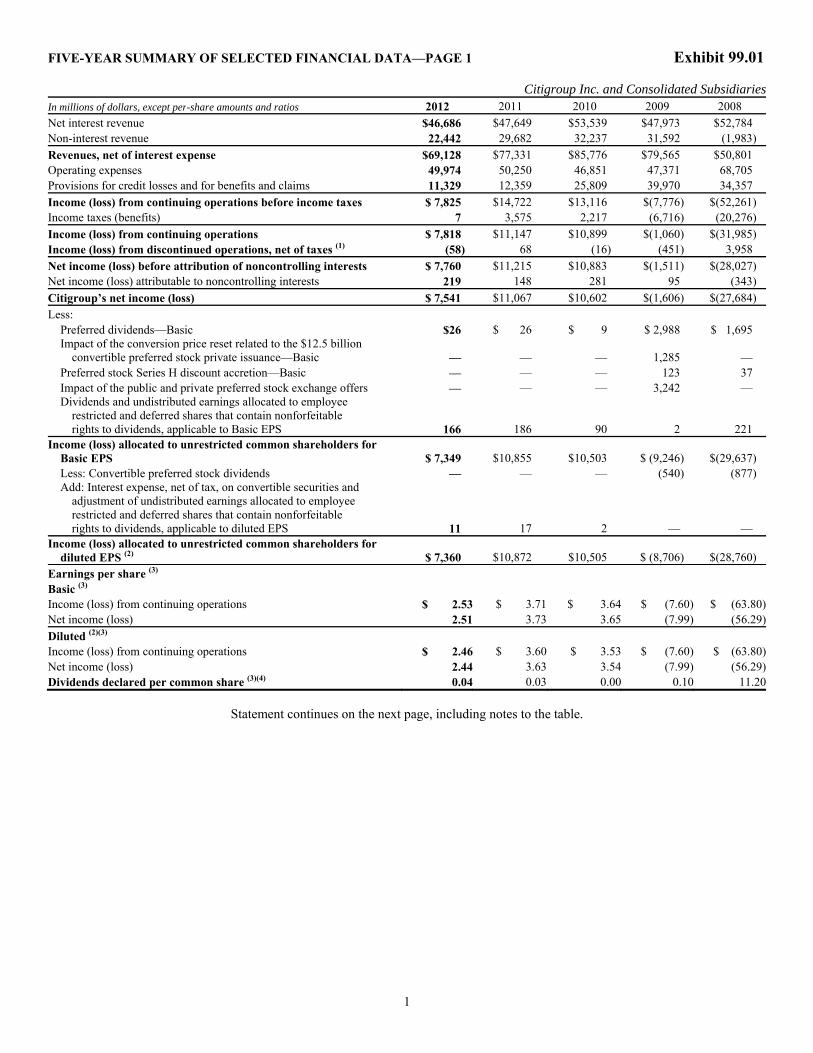
FIVE-YEAR SUMMARY OF SELECTED FINANCIAL DATA—PAGE 1 Exhibit 99.01 Citigroup Inc. and Consolidated SubsidiariesIn millions of dollars, except per-share amounts and ratios 2012 2011 2010 2009 2008 Net interest revenue $46,686 $47,649 $53,539 $47,973 $52,784 Non-interest revenue 22,442 29,682 32,237 31,592 (1,983) Revenues, net of interest expense $69,128 $77,331 $85,776 $79,565 $50,801 Operating expenses 49,974 50,250 46,851 47,371 68,705 Provisions for credit losses and for benefits and claims 11,329 12,359 25,809 39,970 34,357 Income (loss) from continuing operations before income taxes $ 7,825 $14,722 $13,116 $(7,776) $(52,261) Income taxes (benefits) 7 3,575 2,217 (6,716) (20,276) Income (loss) from continuing operations $ 7,818 $11,147 $10,899 $(1,060) $(31,985) Income (loss) from discontinued operations, net of taxes (1) (58) 68 (16) (451) 3,958 Net income (loss) before attribution of noncontrolling interests $ 7,760 $11,215 $10,883 $(1,511) $(28,027) Net income (loss) attributable to noncontrolling interests 219 148 281 95 (343) Citigroup’s net income (loss) $ 7,541 $11,067 $10,602 $(1,606) $(27,684) Less: Preferred dividends—Basic $26 $ 26 $ 9 $ 2,988 $ 1,695 Impact of the conversion price reset related to the $12.5 billion
convertible preferred stock private issuance—Basic — — — 1,285 — Preferred stock Series H discount accretion—Basic — — — 123 37 Impact of the public and private preferred stock exchange offers — — — 3,242 — Dividends and undistributed earnings allocated to employee
restricted and deferred shares that contain nonforfeitable rights to dividends, applicable to Basic EPS 166 186 90 2 221
Income (loss) allocated to unrestricted common shareholders for Basic EPS $ 7,349 $10,855 $10,503 $ (9,246) $(29,637)
Less: Convertible preferred stock dividends — — — (540) (877) Add: Interest expense, net of tax, on convertible securities and
adjustment of undistributed earnings allocated to employee restricted and deferred shares that contain nonforfeitable rights to dividends, applicable to diluted EPS 11 17 2 — —
Income (loss) allocated to unrestricted common shareholders for diluted EPS (2) $ 7,360 $10,872 $10,505 $ (8,706) $(28,760)
Earnings per share (3) Basic (3) Income (loss) from continuing operations $ 2.53 $ 3.71 $ 3.64 $ (7.60) $ (63.80)Net income (loss) 2.51 3.73 3.65 (7.99) (56.29)Diluted (2)(3) Income (loss) from continuing operations $ 2.46 $ 3.60 $ 3.53 $ (7.60) $ (63.80)Net income (loss) 2.44 3.63 3.54 (7.99) (56.29)Dividends declared per common share (3)(4) 0.04 0.03 0.00 0.10 11.20
Statement continues on the next page, including notes to the table.

2
FIVE-YEAR SUMMARY OF SELECTED FINANCIAL DATA—PAGE 2 Citigroup Inc. and Consolidated SubsidiariesIn millions of dollars, except per-share amounts, ratios and direct staff 2012 2011 2010 2009 2008 At December 31: Total assets $1,864,660 $1,873,878 $1,913,902 $1,856,646 $1,938,470 Total deposits 930,560 865,936 844,968 835,903 774,185 Long-term debt 239,463 323,505 381,183 364,019 359,593 Trust preferred securities (included in long-term debt) 10,110 16,057 18,131 19,345 24,060 Citigroup common stockholders’ equity 186,487 177,494 163,156 152,388 70,966 Total Citigroup stockholders’ equity 189,049 177,806 163,468 152,700 141,630 Direct staff (in thousands) 259 266 260 265 323 Ratios Return on average assets 0.4% 0.6% 0.5% (0.08)% (1.28)%Return on average common stockholders’ equity (5) 4.1 6.3 6.8 (9.4) (28.8) Return on average total stockholders’ equity (5) 4.1 6.3 6.8 (1.1) (20.9) Efficiency ratio 72 65 55 60 134 Tier 1 Common (6) 12.67% 11.80% 10.75% 9.60% 2.30%Tier 1 Capital 14.06 13.55 12.91 11.67 11.92 Total Capital 17.26 16.99 16.59 15.25 15.70 Leverage (7) 7.48 7.19 6.60 6.87 6.08 Citigroup common stockholders’ equity to assets 10.00% 9.47% 8.52% 8.21% 3.66%Total Citigroup stockholders’ equity to assets 10.14 9.49 8.54 8.22 7.31 Dividend payout ratio (4) 1.6 0.8 NM NM NM Book value per common share (3) $ 61.57 $ 60.70 $ 56.15 $ 53.50 $ 130.21 Ratio of earnings to fixed charges and preferred stock dividends 1.38x 1.59x 1.51x NM NM (1) Discontinued operations for 2008-2012 includes the announced sale of Citi’s Brazil Credicard business. Discontinued operations in 2012 includes a carve-out of
Citi’s liquid strategies business within Citi Capital Advisors, the sale of which is to occur pursuant to two separate transactions, the first of which closed in February 2013. Discontinued operations in 2012 and 2011 reflect the sale of the Egg Banking PLC credit card business. Discontinued operations for 2008 to 2009 reflect the sale of Nikko Cordial Securities to Sumitomo Mitsui Banking Corporation, the sale of Citigroup’s German retail banking operations to Crédit Mutuel, and the sale of CitiCapital’s equipment finance unit to General Electric. Discontinued operations for 2008 to 2010 also include the operations and associated gain on sale of Citigroup’s Travelers Life & Annuity, substantially all of Citigroup’s international insurance business, and Citigroup’s Argentine pension business sold to MetLife Inc. Discontinued operations for the second half of 2010 also reflect the sale of The Student Loan Corporation. See Note 3 to the Consolidated Financial Statements for additional information on Citi’s discontinued operations.
(2) The diluted EPS calculation for 2009 and 2008 utilizes basic shares and income allocated to unrestricted common stockholders (Basic) due to the negative income allocated to unrestricted common stockholders. Using diluted shares and income allocated to unrestricted common stockholders (Diluted) would result in anti-dilution. As of December 31, 2012, primarily all stock options were out of the money and did not impact diluted EPS. The year-end share price was $39.56. See Note 11 to the Consolidated Financial Statements.
(3) All per share amounts and Citigroup shares outstanding for all periods reflect Citigroup’s 1-for-10 reverse stock split, which was effective May 6, 2011. (4) Dividends declared per common share as a percentage of net income per diluted share. (5) The return on average common stockholders’ equity is calculated using net income less preferred stock dividends divided by average common stockholders’
equity. The return on average total Citigroup stockholders’ equity is calculated using net income divided by average Citigroup stockholders’ equity. (6) As currently defined by the U.S. banking regulators, the Tier 1 Common ratio represents Tier 1 Capital less non-common elements, including qualifying perpetual
preferred stock, qualifying noncontrolling interests in subsidiaries and qualifying trust preferred securities divided by risk-weighted assets. (7) The leverage ratio represents Tier 1 Capital divided by quarterly adjusted average total assets. Note: The following accounting changes were adopted by Citi during the respective years: • On January 1, 2010, Citigroup adopted SFAS 166/167. Prior periods have not been restated as the standards were adopted prospectively. See Note 1 to the
Consolidated Financial Statements. • On January 1, 2009, Citigroup adopted SFAS No. 160, Noncontrolling Interests in Consolidated Financial Statements (now ASC 810-10-45-15, Consolidation:
Noncontrolling Interest in a Subsidiary), and FSP EITF 03-6-1, “Determining Whether Instruments Granted in Share-Based Payment Transactions Are Participating Securities” (now ASC 260-10-45-59A, Earnings Per Share: Participating Securities and the Two-Class Method). All prior periods have been restated to conform to the current period’s presentation.
3
Exhibit 99.02
REPORT OF INDEPENDENT REGISTERED PUBLIC ACCOUNTING FIRM—CONSOLIDATED FINANCIAL STATEMENTS
The Board of Directors and Stockholders Citigroup Inc.: We have audited the accompanying consolidated balance sheets of Citigroup Inc. and subsidiaries (the “Company” or “Citigroup”) as of December 31, 2012 and 2011, and the related consolidated statements of income, comprehensive income, changes in stockholders’ equity and cash flows for each of the years in the three-year period ended December 31, 2012. These consolidated financial statements are the responsibility of the Company’s management. Our responsibility is to express an opinion on these consolidated financial statements based on our audits.
We conducted our audits in accordance with the standards of the Public Company Accounting Oversight Board (United States). Those standards require that we plan and perform the audit to obtain reasonable assurance about whether the financial statements are free of material misstatement. An audit includes examining, on a test basis, evidence supporting the amounts and disclosures in the financial statements. An audit also includes assessing the accounting principles used and significant estimates made by management, as well as evaluating the overall financial statement presentation. We believe that our audits provide a reasonable basis for our opinion.
In our opinion, the consolidated financial statements
referred to above present fairly, in all material respects, the financial position of Citigroup as of December 31, 2012 and 2011, and the results of its operations and its cash flows for each of the years in the three-year period ended December 31, 2012, in conformity with U.S. generally accepted accounting principles.
We also have audited, in accordance with the standards of the Public Company Accounting Oversight Board (United States), Citigroup’s internal control over financial reporting as of December 31, 2012, based on criteria established in Internal Control—Integrated Framework issued by the Committee of Sponsoring Organizations of the Treadway Commission (COSO), and our report dated March 1, 2013 expressed an unqualified opinion on the effectiveness of the Company’s internal control over financial reporting.
New York, New York March 1, 2013, except as to Notes 3, 4, 5, 6, 10, 11 and 17 which are as of August 30, 2013

4
FINANCIAL STATEMENTS AND NOTES TABLE OF CONTENTS CONSOLIDATED FINANCIAL STATEMENTS Consolidated Statement of Income—
For the Years Ended December 31, 2012, 2011 and 2010 5 Consolidated Statement of Comprehensive Income—
For the Years Ended December 31, 2012, 2011 and 2010 6 Consolidated Balance Sheet—December 31, 2012 and 2011 7 Consolidated Statement of Changes in Stockholders’ Equity—
For the Years Ended December 31, 2012, 2011 and 2010 9 Consolidated Statement of Cash Flows—
For the Years Ended December 31, 2012, 2011 and 2010 10 NOTES TO CONSOLIDATED FINANCIAL
STATEMENTS Note 1 – Summary of Significant Accounting Policies 11Note 2 – Business Divestitures 26Note 3 – Discontinued Operations 27Note 4 – Business Segments 29Note 5 – Interest Revenue and Expense 30Note 6 – Commissions and Fees 30Note 7 – Principal Transactions 31Note 8 – Incentive Plans 31Note 9 – Retirement Benefits 37Note 10 – Income Taxes 49Note 11 – Earnings per Share 53Note 12 – Federal Funds/Securities Borrowed, Loaned and
Subject to Repurchase Agreements 54Note 13 – Brokerage Receivables and Brokerage Payables 55Note 14 – Trading Account Assets and Liabilities 55Note 15 – Investments 56Note 16 – Loans 67Note 17 – Allowance for Credit Losses 78Note 18 – Goodwill and Intangible Assets 80Note 19 – Debt 83
Note 20 – Regulatory Capital and Citigroup Inc. Parent Company
Information 85Note 21 – Changes in Accumulated Other Comprehensive
Income (Loss) 88Note 22 – Securitizations and Variable Interest Entities 89Note 23 – Derivatives Activities 107Note 24 – Concentrations of Credit Risk 116Note 25 – Fair Value Measurement 116Note 26 – Fair Value Elections 136Note 27 – Pledged Assets, Collateral, Commitments and
Guarantees 141Note 28 – Contingencies 147Note 29 – Selected Quarterly Financial Data (Unaudited) 155
5
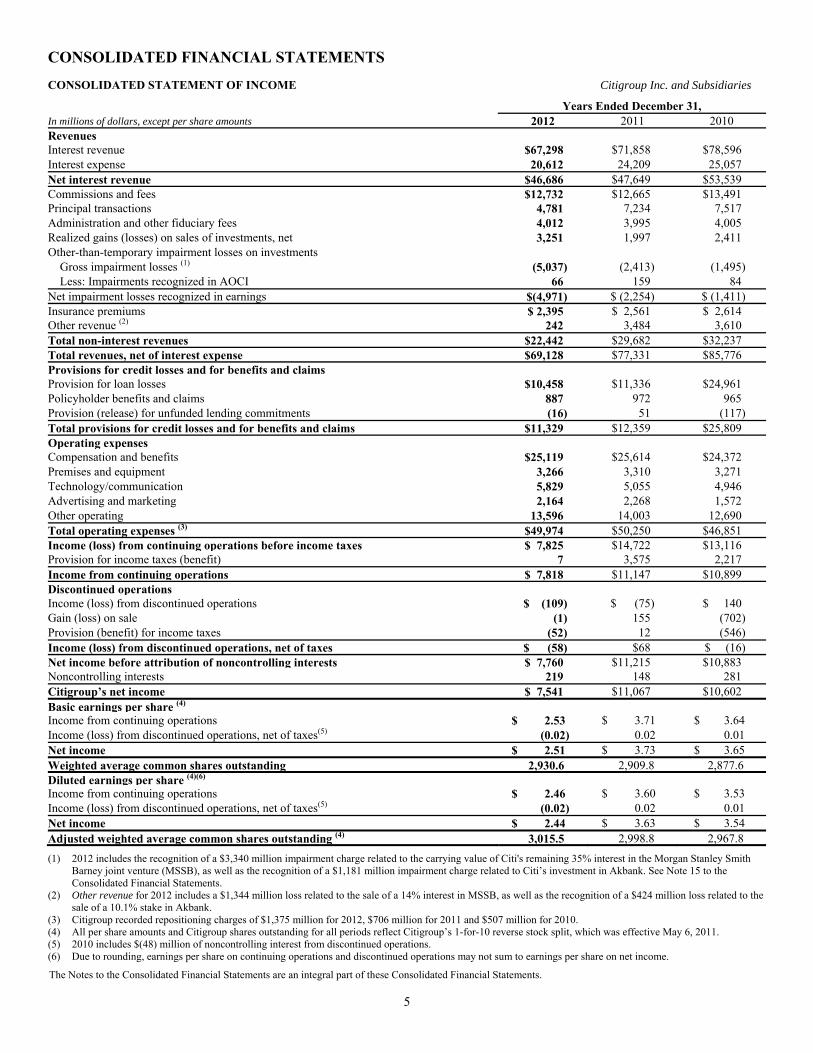
CONSOLIDATED FINANCIAL STATEMENTS CONSOLIDATED STATEMENT OF INCOME Citigroup Inc. and Subsidiaries
Years Ended December 31,In millions of dollars, except per share amounts 2012 2011 2010Revenues Interest revenue $67,298 $71,858 $78,596 Interest expense 20,612 24,209 25,057 Net interest revenue $46,686 $47,649 $53,539Commissions and fees $12,732 $12,665 $13,491Principal transactions 4,781 7,234 7,517 Administration and other fiduciary fees 4,012 3,995 4,005 Realized gains (losses) on sales of investments, net 3,251 1,997 2,411 Other-than-temporary impairment losses on investments
Gross impairment losses (1) (5,037) (2,413) (1,495) Less: Impairments recognized in AOCI 66 159 84
Net impairment losses recognized in earnings $(4,971) $ (2,254) $ (1,411)Insurance premiums $ 2,395 $ 2,561 $ 2,614Other revenue (2) 242 3,484 3,610 Total non-interest revenues $22,442 $29,682 $32,237Total revenues, net of interest expense $69,128 $77,331 $85,776Provisions for credit losses and for benefits and claims Provision for loan losses $10,458 $11,336 $24,961 Policyholder benefits and claims 887 972 965 Provision (release) for unfunded lending commitments (16) 51 (117) Total provisions for credit losses and for benefits and claims $11,329 $12,359 $25,809Operating expenses Compensation and benefits $25,119 $25,614 $24,372 Premises and equipment 3,266 3,310 3,271 Technology/communication 5,829 5,055 4,946 Advertising and marketing 2,164 2,268 1,572 Other operating 13,596 14,003 12,690 Total operating expenses (3) $49,974 $50,250 $46,851Income (loss) from continuing operations before income taxes $ 7,825 $14,722 $13,116Provision for income taxes (benefit) 7 3,575 2,217 Income from continuing operations $ 7,818 $11,147 $10,899Discontinued operations Income (loss) from discontinued operations $ (109) $ (75) $ 140 Gain (loss) on sale (1) 155 (702) Provision (benefit) for income taxes (52) 12 (546) Income (loss) from discontinued operations, net of taxes $ (58) $68 $ (16)Net income before attribution of noncontrolling interests $ 7,760 $11,215 $10,883Noncontrolling interests 219 148 281 Citigroup’s net income $ 7,541 $11,067 $10,602Basic earnings per share (4) Income from continuing operations $ 2.53 $ 3.71 $ 3.64 Income (loss) from discontinued operations, net of taxes(5) (0.02) 0.02 0.01 Net income $ 2.51 $ 3.73 $ 3.65Weighted average common shares outstanding 2,930.6 2,909.8 2,877.6Diluted earnings per share (4)(6) Income from continuing operations $ 2.46 $ 3.60 $ 3.53 Income (loss) from discontinued operations, net of taxes(5) (0.02) 0.02 0.01 Net income $ 2.44 $ 3.63 $ 3.54Adjusted weighted average common shares outstanding (4) 3,015.5 2,998.8 2,967.8
(1) 2012 includes the recognition of a $3,340 million impairment charge related to the carrying value of Citi's remaining 35% interest in the Morgan Stanley Smith Barney joint venture (MSSB), as well as the recognition of a $1,181 million impairment charge related to Citi’s investment in Akbank. See Note 15 to the Consolidated Financial Statements.
(2) Other revenue for 2012 includes a $1,344 million loss related to the sale of a 14% interest in MSSB, as well as the recognition of a $424 million loss related to the sale of a 10.1% stake in Akbank.
(3) Citigroup recorded repositioning charges of $1,375 million for 2012, $706 million for 2011 and $507 million for 2010. (4) All per share amounts and Citigroup shares outstanding for all periods reflect Citigroup’s 1-for-10 reverse stock split, which was effective May 6, 2011. (5) 2010 includes $(48) million of noncontrolling interest from discontinued operations. (6) Due to rounding, earnings per share on continuing operations and discontinued operations may not sum to earnings per share on net income.
The Notes to the Consolidated Financial Statements are an integral part of these Consolidated Financial Statements.

6
CONSOLIDATED STATEMENT OF COMPREHENSIVE INCOME Citigroup Inc. and Subsidiaries
Years Ended December 31,In millions of dollars 2012 2011 2010 Net income before attribution of noncontrolling interests $7,760 $11,215 $10,883 Citigroup’s other comprehensive income (loss) Net change in unrealized gains and losses on investment securities, net of taxes $ 632 $ 2,360 $ 1,952 Net change in cash flow hedges, net of taxes 527 (170) 532 Net change in foreign currency translation adjustment, net of taxes and hedges 721 (3,524) 820 Pension liability adjustment, net of taxes (1) (988) (177) (644)Citigroup’s total other comprehensive income (loss) $ 892 $(1,511) $ 2,660 Other comprehensive income (loss) attributable to noncontrolling interests
Net change in unrealized gains and losses on investment securities, net of taxes $ 32 $ (5) $1 Net change in foreign currency translation adjustment, net of taxes 58 (87) (27)
Total other comprehensive income (loss) attributable to noncontrolling interests $ 90 $ (92) $ (26)Total comprehensive income before attribution of noncontrolling interests $8,742 $ 9,612 $13,517 Total comprehensive income attributable to noncontrolling interests 309 56 255 Citigroup’s comprehensive income $8,433 $ 9,556 $13,262 (1) Primarily reflects adjustments based on the year-end actuarial valuations of the Company’s pension and postretirement plans and amortization of amounts
previously recognized in Other comprehensive income. The Notes to the Consolidated Financial Statements are an integral part of these Consolidated Financial Statements.
7
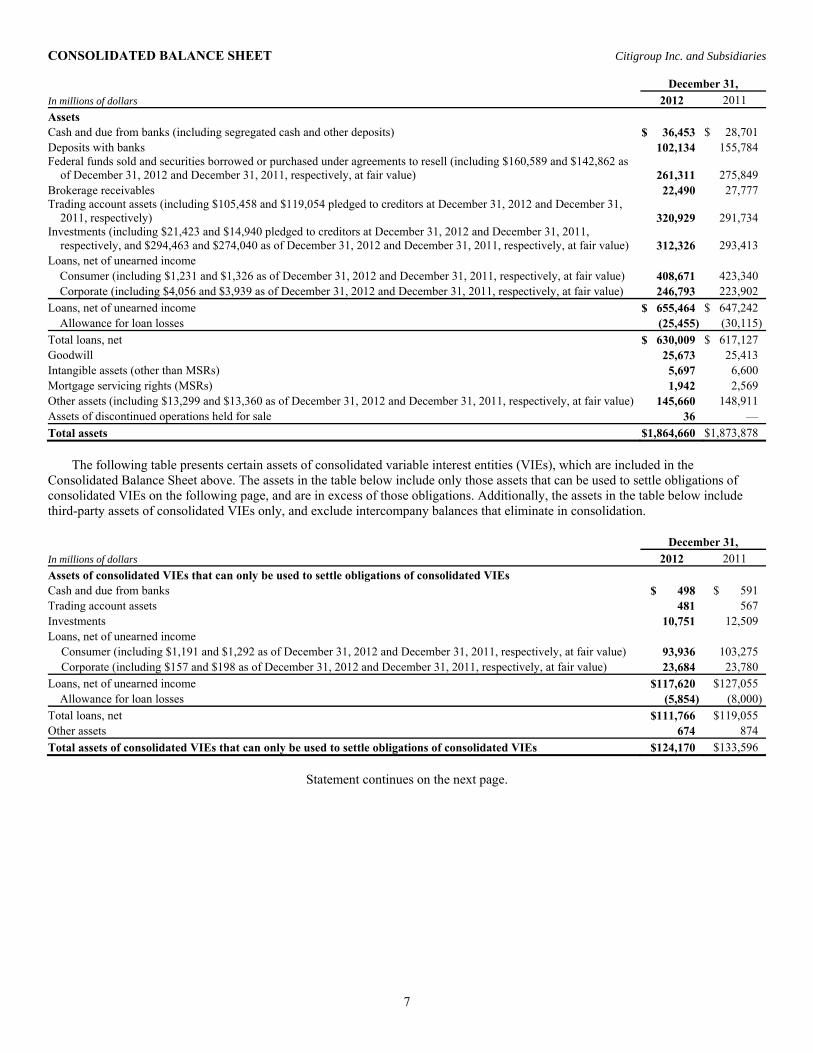
CONSOLIDATED BALANCE SHEET Citigroup Inc. and Subsidiaries December 31,In millions of dollars 2012 2011 Assets Cash and due from banks (including segregated cash and other deposits) $ 36,453 $ 28,701 Deposits with banks 102,134 155,784 Federal funds sold and securities borrowed or purchased under agreements to resell (including $160,589 and $142,862 as
of December 31, 2012 and December 31, 2011, respectively, at fair value) 261,311 275,849 Brokerage receivables 22,490 27,777 Trading account assets (including $105,458 and $119,054 pledged to creditors at December 31, 2012 and December 31,
2011, respectively) 320,929 291,734 Investments (including $21,423 and $14,940 pledged to creditors at December 31, 2012 and December 31, 2011,
respectively, and $294,463 and $274,040 as of December 31, 2012 and December 31, 2011, respectively, at fair value) 312,326 293,413 Loans, net of unearned income
Consumer (including $1,231 and $1,326 as of December 31, 2012 and December 31, 2011, respectively, at fair value) 408,671 423,340 Corporate (including $4,056 and $3,939 as of December 31, 2012 and December 31, 2011, respectively, at fair value) 246,793 223,902
Loans, net of unearned income $ 655,464 $ 647,242 Allowance for loan losses (25,455) (30,115)
Total loans, net $ 630,009 $ 617,127 Goodwill 25,673 25,413 Intangible assets (other than MSRs) 5,697 6,600 Mortgage servicing rights (MSRs) 1,942 2,569 Other assets (including $13,299 and $13,360 as of December 31, 2012 and December 31, 2011, respectively, at fair value) 145,660 148,911 Assets of discontinued operations held for sale 36 — Total assets $1,864,660 $1,873,878 The following table presents certain assets of consolidated variable interest entities (VIEs), which are included in the Consolidated Balance Sheet above. The assets in the table below include only those assets that can be used to settle obligations of consolidated VIEs on the following page, and are in excess of those obligations. Additionally, the assets in the table below include third-party assets of consolidated VIEs only, and exclude intercompany balances that eliminate in consolidation. December 31,In millions of dollars 2012 2011 Assets of consolidated VIEs that can only be used to settle obligations of consolidated VIEs Cash and due from banks $ 498 $ 591 Trading account assets 481 567 Investments 10,751 12,509 Loans, net of unearned income
Consumer (including $1,191 and $1,292 as of December 31, 2012 and December 31, 2011, respectively, at fair value) 93,936 103,275 Corporate (including $157 and $198 as of December 31, 2012 and December 31, 2011, respectively, at fair value) 23,684 23,780
Loans, net of unearned income $117,620 $127,055 Allowance for loan losses (5,854) (8,000)
Total loans, net $111,766 $119,055 Other assets 674 874 Total assets of consolidated VIEs that can only be used to settle obligations of consolidated VIEs $124,170 $133,596
Statement continues on the next page.
8
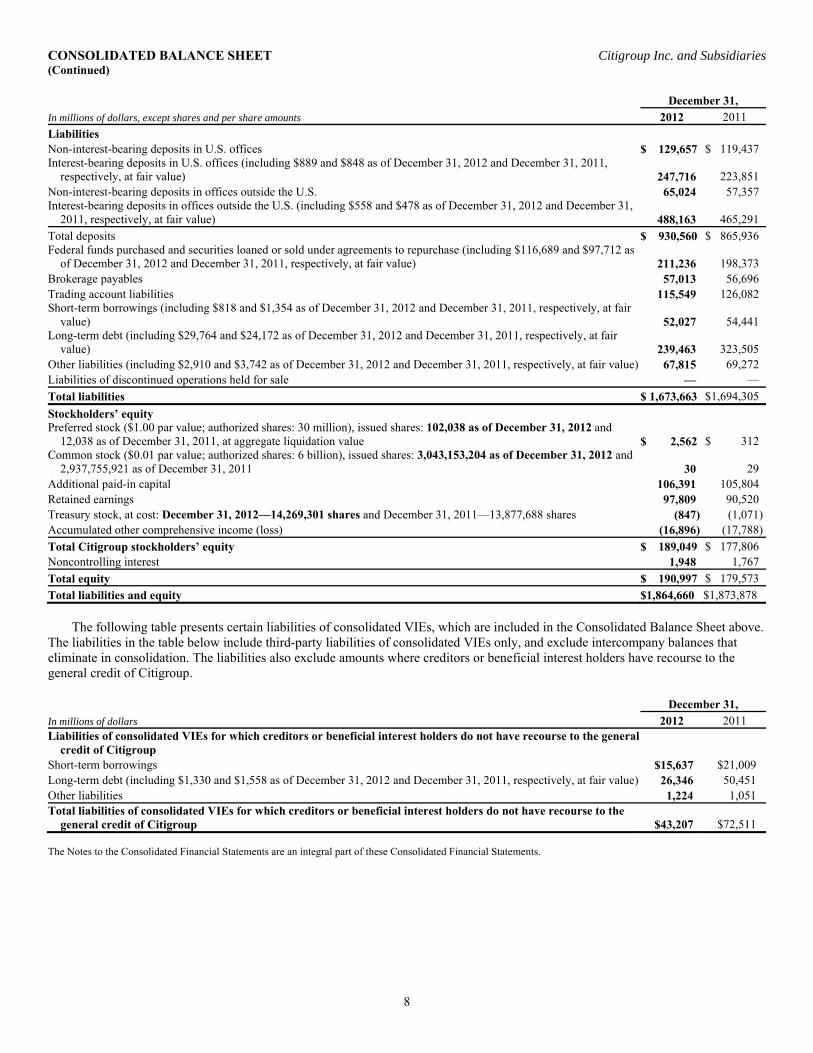
CONSOLIDATED BALANCE SHEET Citigroup Inc. and Subsidiaries (Continued) December 31,In millions of dollars, except shares and per share amounts 2012 2011 Liabilities Non-interest-bearing deposits in U.S. offices $ 129,657 $ 119,437 Interest-bearing deposits in U.S. offices (including $889 and $848 as of December 31, 2012 and December 31, 2011,
respectively, at fair value) 247,716 223,851 Non-interest-bearing deposits in offices outside the U.S. 65,024 57,357 Interest-bearing deposits in offices outside the U.S. (including $558 and $478 as of December 31, 2012 and December 31,
2011, respectively, at fair value) 488,163 465,291 Total deposits $ 930,560 $ 865,936 Federal funds purchased and securities loaned or sold under agreements to repurchase (including $116,689 and $97,712 as
of December 31, 2012 and December 31, 2011, respectively, at fair value) 211,236 198,373 Brokerage payables 57,013 56,696 Trading account liabilities 115,549 126,082 Short-term borrowings (including $818 and $1,354 as of December 31, 2012 and December 31, 2011, respectively, at fair
value) 52,027 54,441 Long-term debt (including $29,764 and $24,172 as of December 31, 2012 and December 31, 2011, respectively, at fair
value) 239,463 323,505 Other liabilities (including $2,910 and $3,742 as of December 31, 2012 and December 31, 2011, respectively, at fair value) 67,815 69,272 Liabilities of discontinued operations held for sale — — Total liabilities $ 1,673,663 $1,694,305 Stockholders’ equity Preferred stock ($1.00 par value; authorized shares: 30 million), issued shares: 102,038 as of December 31, 2012 and
12,038 as of December 31, 2011, at aggregate liquidation value $ 2,562 $ 312 Common stock ($0.01 par value; authorized shares: 6 billion), issued shares: 3,043,153,204 as of December 31, 2012 and
2,937,755,921 as of December 31, 2011 30 29 Additional paid-in capital 106,391 105,804 Retained earnings 97,809 90,520 Treasury stock, at cost: December 31, 2012—14,269,301 shares and December 31, 2011—13,877,688 shares (847) (1,071)Accumulated other comprehensive income (loss) (16,896) (17,788)Total Citigroup stockholders’ equity $ 189,049 $ 177,806 Noncontrolling interest 1,948 1,767 Total equity $ 190,997 $ 179,573 Total liabilities and equity $1,864,660 $1,873,878 The following table presents certain liabilities of consolidated VIEs, which are included in the Consolidated Balance Sheet above. The liabilities in the table below include third-party liabilities of consolidated VIEs only, and exclude intercompany balances that eliminate in consolidation. The liabilities also exclude amounts where creditors or beneficial interest holders have recourse to the general credit of Citigroup. December 31,In millions of dollars 2012 2011 Liabilities of consolidated VIEs for which creditors or beneficial interest holders do not have recourse to the general
credit of Citigroup Short-term borrowings $15,637 $21,009 Long-term debt (including $1,330 and $1,558 as of December 31, 2012 and December 31, 2011, respectively, at fair value) 26,346 50,451 Other liabilities 1,224 1,051 Total liabilities of consolidated VIEs for which creditors or beneficial interest holders do not have recourse to the
general credit of Citigroup $43,207 $72,511 The Notes to the Consolidated Financial Statements are an integral part of these Consolidated Financial Statements.

9
CONSOLIDATED STATEMENT OF CHANGES IN STOCKHOLDERS’ EQUITY Citigroup Inc. and Subsidiaries Years ended December 31, Amounts SharesIn millions of dollars, except shares in thousands 2012 2011 2010 2012 2011 2010 Preferred stock at aggregate liquidation value Balance, beginning of year $ 312 $ 312 $ 312 12 12 12Issuance of new preferred stock 2,250 — — 90 — —Balance, end of period $ 2,562 $ 312 $ 312 102 12 12Common stock and additional paid-in capital Balance, beginning of year $105,833 $101,316 $ 98,428 2,937,756 2,922,402 2,862,610Employee benefit plans 597 766 (736) 9,037 3,540 46,703Issuance of shares and T-DECs for TARP repayment — — — 96,338 — 1,270ADIA Upper DECs equity units purchase contract — 3,750 3,750 — 11,781 11,781Other (9) 1 (126) 22 33 38Balance, end of period $106,421 $105,833 $101,316 3,043,153 2,937,756 2,922,402Retained earnings Balance, beginning of year $ 90,520 $ 79,559 $ 77,440 Adjustment to opening balance, net of taxes (1)(2) (107) — (8,483) Adjusted balance, beginning of period $ 90,413 $ 79,559 $ 68,957 Citigroup’s net income 7,541 11,067 10,602 Common dividends (3) (120) (81) 10 Preferred dividends (26) (26) (9) Other 1 1 (1) Balance, end of period $ 97,809 $ 90,520 $ 79,559 Treasury stock, at cost Balance, beginning of year $ (1,071) $ (1,442) $ (4,543) (13,878) (16,566) (14,283)Issuance of shares pursuant to employee benefit plans 229 372 3,106 (253) 2,714 (2,128)Treasury stock acquired (4) (5) (1) (6) (138) (26) (162)Other — — 1 — — 7Balance, end of period $ (847) $ (1,071) $ (1,442) (14,269) (13,878) (16,566)Citigroup’s accumulated other comprehensive income (loss) Balance, beginning of year $ (17,788) $ (16,277) $ (18,937) Net change in Citigroup’s Accumulated other comprehensive income
(loss) 892 (1,511) 2,660 Balance, end of period $ (16,896) $ (17,788) $ (16,277) Total Citigroup common stockholders’ equity $186,487 $ 177,494 $163,156 3,028,884 2,923,878 2,905,836Total Citigroup stockholders’ equity $189,049 $ 177,806 $163,468 Noncontrolling interest Balance, beginning of year $ 1,767 $ 2,321 $ 2,273
Initial origination of a noncontrolling interest 88 28 412 Transactions between Citigroup and the noncontrolling-interest
shareholders 41 (274) (231) Net income attributable to noncontrolling-interest shareholders 219 148 281 Dividends paid to noncontrolling-interest shareholders (33) (67) (99) Net change in Accumulated other comprehensive income (loss) 90 (92) (26) Other (224) (297) (289)
Net change in noncontrolling interests $ 181 $ (554) $ 48 Balance, end of period $ 1,948 $ 1,767 $ 2,321 Total equity $190,997 $179,573 $165,789 (1) The adjustment to the opening balance for Retained earnings in 2012 represents the cumulative effect of adopting ASU 2010-26, Financial Services—Insurance
(Topic 944): Accounting for Costs Associated with Acquiring or Renewing Insurance Contracts. See Note 1 to the Consolidated Financial Statements. (2) The adjustment to the opening balance for Retained earnings in 2010 represents the cumulative effect of initially adopting ASC 810, Consolidation (SFAS 167)
and ASU 2010-11 (Scope Exception Related to Embedded Credit Derivatives). See Note 1 to the Consolidated Financial Statements. (3) Common dividends declared were $0.01 per share in each of the first, second, third and fourth quarters of 2012, and second, third and fourth quarters of 2011.
Common dividends in 2010 represent a reversal of dividends accrued on forfeitures of previously issued but unvested employee stock awards related to employees who have left Citigroup.
(4) All open market repurchases were transacted under an existing authorized share repurchase plan and relate to customer fails/errors. The Notes to the Consolidated Financial Statements are an integral part of these Consolidated Financial Statements.

10
CONSOLIDATED STATEMENT OF CASH FLOWS Citigroup Inc. and Subsidiaries Years ended December 31,In millions of dollars 2012 2011 2010Cash flows from operating activities of continuing operations Net income before attribution of noncontrolling interests $ 7,760 $11,215 $ 10,883 Net income attributable to noncontrolling interests 219 148 281 Citigroup’s net income $ 7,541 $11,067 $ 10,602
(Loss) income from discontinued operations, net of taxes (57) (27) 267 (Loss) gain on sale, net of taxes (1) 95 (283)
Income from continuing operations—excluding noncontrolling interests $ 7,599 $10,999 $ 10,618 Adjustments to reconcile net income to net cash provided by (used in) operating activities of continuing
operations Amortization of deferred policy acquisition costs and present value of future profits 203 250 302 (Additions) reductions to deferred policy acquisition costs 85 (54) (98)Depreciation and amortization 2,507 2,872 2,664 Deferred tax benefit (4,091) (74) (964)Provision for credit losses 10,832 11,824 25,077 Realized gains from sales of investments (3,251) (1,997) (2,411)Net impairment losses recognized in earnings 4,971 2,254 1,411 Change in trading account assets (29,195) 38,238 15,601 Change in trading account liabilities (10,533) (2,972) (8,458)Change in federal funds sold and securities borrowed or purchased under agreements to resell 14,538 (29,132) (24,695)Change in federal funds purchased and securities loaned or sold under agreements to repurchase 12,863 8,815 35,277 Change in brokerage receivables net of brokerage payables 945 8,383 (6,676)Change in loans held-for-sale (1,106) 1,021 2,483 Change in other assets (524) 14,933 (7,538)Change in other liabilities (1,457) (3,814) (293)Other, net 9,885 3,233 (6,614)
Total adjustments $ 6,672 $ 53,780 $ 25,068 Net cash provided by operating activities of continuing operations $ 14,271 $ 64,779 $ 35,686 Cash flows from investing activities of continuing operations Change in deposits with banks $ 53,650 $ 6,653 $ 4,977 Change in loans (28,817) (31,597) 60,730 Proceeds from sales and securitizations of loans 7,287 10,022 9,918 Purchases of investments (256,907) (314,250) (406,046)Proceeds from sales of investments 143,853 182,566 183,688 Proceeds from maturities of investments 102,020 139,959 189,814 Capital expenditures on premises and equipment and capitalized software (3,604) (3,448) (2,363)Proceeds from sales of premises and equipment, subsidiaries and affiliates, and repossessed assets 1,089 1,323 2,619 Net cash provided by (used in) investing activities of continuing operations $ 18,571 $ (8,772) $ 43,337 Cash flows from financing activities of continuing operations Dividends paid $ (143) $ (107) $ (9)Issuance of preferred stock 2,250 — — Issuance of ADIA Upper DECs equity units purchase contract — 3,750 3,750 Treasury stock acquired (5) (1) (6)Stock tendered for payment of withholding taxes (194) (230) (806)Issuance of long-term debt 27,843 30,242 33,677 Payments and redemptions of long-term debt (117,575) (89,091) (75,910)Change in deposits 64,624 23,858 9,065 Change in short-term borrowings (2,164) (25,067) (47,189)Net cash used in financing activities of continuing operations $(25,364) $(56,646) $(77,428)Effect of exchange rate changes on cash and cash equivalents $274 $ (1,301) $ 691 Discontinued operations Net cash provided by discontinued operations $ — $ 2,669 $ 214 Change in cash and due from banks $ 7,752 $729 $ 2,500 Cash and due from banks at beginning of year 28,701 27,972 25,472 Cash and due from banks at end of year $ 36,453 $ 28,701 $ 27,972 Supplemental disclosure of cash flow information for continuing operations Cash paid during the year for income taxes $ 3,900 $ 2,705 $ 4,307 Cash paid during the year for interest $ 19,739 $ 21,230 $ 23,209 Non-cash investing activities Transfers to OREO and other repossessed assets $ 500 $ 1,284 $2,595 Transfers to trading account assets from investments (available-for-sale) — — $12,001 Transfers to trading account assets from investments (held-to-maturity) — $12,700 — The Notes to the Consolidated Financial Statements are an integral part of these Consolidated Financial Statements.

11
NOTES TO CONSOLIDATED FINANCIAL STATEMENTS 1. SUMMARY OF SIGNIFICANT ACCOUNTING POLICIES Principles of Consolidation The Consolidated Financial Statements include the accounts of Citigroup and its subsidiaries prepared in accordance with U.S. Generally Accepted Accounting Principles (GAAP). The Company consolidates subsidiaries in which it holds, directly or indirectly, more than 50% of the voting rights or where it exercises control. Entities where the Company holds 20% to 50% of the voting rights and/or has the ability to exercise significant influence, other than investments of designated venture capital subsidiaries or investments accounted for at fair value under the fair value option, are accounted for under the equity method, and the pro rata share of their income (loss) is included in Other revenue. Income from investments in less than 20%-owned companies is recognized when dividends are received. As discussed in more detail in Note 22 to the Consolidated Financial Statements, Citigroup consolidates entities deemed to be variable interest entities when Citigroup is determined to be the primary beneficiary. Gains and losses on the disposition of branches, subsidiaries, affiliates, buildings, and other investments are included in Other revenue. Throughout these Notes, “Citigroup,” “Citi” and the “Company” refer to Citigroup Inc. and its consolidated subsidiaries. Certain reclassifications have been made to the prior periods’ financial statements and notes to conform to the current period’s presentation. Citibank, N.A. Citibank, N.A. is a commercial bank and wholly owned subsidiary of Citigroup Inc. Citibank’s principal offerings include: Consumer finance, mortgage lending, and retail banking products and services; investment banking, commercial banking, cash management, trade finance and e-commerce products and services; and private banking products and services. Variable Interest Entities An entity is referred to as a variable interest entity (VIE) if it meets the criteria outlined in ASC 810, Consolidation (formerly SFAS No. 167, Amendments to FASB Interpretation No. 46(R)) (SFAS 167), which are: (i) the entity has equity that is insufficient to permit the entity to finance its activities without additional subordinated financial support from other parties; or (ii) the entity has equity investors that cannot make significant decisions about the entity’s operations or that do not absorb their proportionate share of the entity’s expected losses or expected returns. The Company consolidates a VIE when it has both the power to direct the activities that most significantly impact the VIE’s economic success and a right to receive benefits or absorb losses of the entity that could be potentially significant to the VIE (that is, it is the primary beneficiary).
Along with the VIEs that are consolidated in accordance with these guidelines, the Company has variable interests in other VIEs that are not consolidated because the Company is not the primary beneficiary. These include multi-seller finance companies, certain collateralized debt obligations (CDOs), many structured finance transactions, and various investment funds. However, these VIEs and all other unconsolidated VIEs are monitored by the Company to determine if any events have occurred that could cause its primary beneficiary status to change. These events include:
• additional purchases or sales of variable interests by Citigroup or an unrelated third party, which cause Citigroup’s overall variable interest ownership to change;
• changes in contractual arrangements in a manner that reallocates expected losses and residual returns among the variable interest holders;
• changes in the party that has power to direct the activities of a VIE that most significantly impact the entity’s economic performance; and
• providing support to an entity that results in an implicit variable interest.
All other entities not deemed to be VIEs with which the Company has involvement are evaluated for consolidation under other subtopics of ASC 810 (formerly Accounting Research Bulletin (ARB) No. 51, Consolidated Financial Statements, SFAS No. 94, Consolidation of All Majority-Owned Subsidiaries, and EITF Issue No. 04-5, Determining Whether a General Partner, or the General Partners as a Group, Controls a Limited Partnership or Similar Entity When the Limited Partners Have Certain Rights). Foreign Currency Translation Assets and liabilities of Citi’s foreign operations are translated from their respective functional currencies into U.S. dollars using period-end spot foreign-exchange rates. The effects of those translation adjustments are reported in Accumulated other comprehensive income (loss), a component of stockholders’ equity, along with related hedge and tax effects, until realized upon sale or substantial liquidation of the foreign operation. Revenues and expenses of Citi’s foreign operations are translated monthly from their respective functional currencies into U.S. dollars at amounts that approximate weighted average exchange rates. For transactions whose terms are denominated in a currency other than the functional currency, including transactions denominated in the local currencies of foreign operations with the U.S. dollar as their functional currency, the effects of changes in exchange rates are primarily included in Principal transactions, along with the related hedge effects. Instruments used to hedge foreign currency exposures include foreign currency forward, option and swap contracts and designated issues of non-U.S. dollar debt. Foreign operations in countries with highly inflationary economies designate the U.S. dollar as their functional currency, with the effects of changes in exchange rates primarily included in Other revenue.
12
Investment Securities Investments include fixed income and equity securities. Fixed income instruments include bonds, notes and redeemable preferred stocks, as well as certain loan-backed and structured securities that are subject to prepayment risk. Equity securities include common and nonredeemable preferred stock. Investment securities are classified and accounted for as follows:
• Fixed income securities classified as “held-to-maturity” represent securities that the Company has both the ability and the intent to hold until maturity and are carried at amortized cost. Interest income on such securities is included in Interest revenue.
• Fixed income securities and marketable equity securities classified as “available-for-sale” are carried at fair value with changes in fair value reported in Accumulated other comprehensive income (loss), a component of Stockholders’ equity, net of applicable income taxes and hedges. As described in more detail in Note 15 to the Consolidated Financial Statements, declines in fair value that are determined to be other-than-temporary are recorded in earnings immediately. Realized gains and losses on sales are included in income primarily on a specific identification cost basis. Interest and dividend income on such securities is included in Interest revenue.
• Venture capital investments held by Citigroup’s private equity subsidiaries that are considered investment companies are carried at fair value with changes in fair value reported in Other revenue. These subsidiaries include entities registered as Small Business Investment Companies and engage exclusively in venture capital activities.
• Certain investments in non-marketable equity securities and certain investments that would otherwise have been accounted for using the equity method are carried at fair value, since the Company has elected to apply fair value accounting. Changes in fair value of such investments are recorded in earnings.
• Certain non-marketable equity securities are carried at cost and periodically assessed for other-than-temporary impairment, as described in Note 15 to the Consolidated Financial Statements.
For investments in fixed income securities classified as held-to-maturity or available-for-sale, accrual of interest income is suspended for investments that are in default or on which it is likely that future interest payments will not be made as scheduled. The Company uses a number of valuation techniques for investments carried at fair value, which are described in Note 25 to the Consolidated Financial Statements. Realized gains and losses on sales of investments are included in earnings.
Trading Account Assets and Liabilities Trading account assets include debt and marketable equity securities, derivatives in a receivable position, residual interests in securitizations and physical commodities inventory. In addition, as described in Note 26 to the Consolidated Financial Statements, certain assets that Citigroup has elected to carry at fair value under the fair value option, such as loans and purchased guarantees, are also included in Trading account assets. Trading account liabilities include securities sold, not yet purchased (short positions), and derivatives in a net payable position, as well as certain liabilities that Citigroup has elected to carry at fair value (as described in Note 26 to the Consolidated Financial Statements). Other than physical commodities inventory, all trading account assets and liabilities are carried at fair value. Revenues generated from trading assets and trading liabilities are generally reported in Principal transactions and include realized gains and losses as well as unrealized gains and losses resulting from changes in the fair value of such instruments. Interest income on trading assets is recorded in Interest revenue reduced by interest expense on trading liabilities. Physical commodities inventory is carried at the lower of cost or market with related losses reported in Principal transactions. Realized gains and losses on sales of commodities inventory are included in Principal transactions. Investments in unallocated precious metals accounts (gold, silver, platinum and palladium) are accounted for as hybrid instruments containing a debt host contract and an embedded non-financial derivative instrument indexed to the price of the relevant precious metal. The embedded derivative instrument is separated from the debt host contract and accounted for at fair value. The debt host contract is accounted for at fair value under the fair value option, as described in Note 26 to the Consolidated Financial Statements. Derivatives used for trading purposes include interest rate, currency, equity, credit, and commodity swap agreements, options, caps and floors, warrants, and financial and commodity futures and forward contracts. Derivative asset and liability positions are presented net by counterparty on the Consolidated Balance Sheet when a valid master netting agreement exists and the other conditions set out in ASC 210-20, Balance Sheet—Offsetting are met. The Company uses a number of techniques to determine the fair value of trading assets and liabilities, which are described in Note 25 to the Consolidated Financial Statements.
13
Securities Borrowed and Securities Loaned Securities borrowing and lending transactions generally do not constitute a sale of the underlying securities for accounting purposes, and are treated as collateralized financing transactions. Such transactions are recorded at the amount of proceeds advanced or received plus accrued interest. As described in Note 26 to the Consolidated Financial Statements, the Company has elected to apply fair value accounting to a number of securities borrowing and lending transactions. Fees paid or received for all securities lending and borrowing transactions are recorded in Interest expense or Interest revenue at the contractually specified rate. The Company monitors the fair value of securities borrowed or loaned on a daily basis and obtains or posts additional collateral in order to maintain contractual margin protection. As described in Note 25 to the Consolidated Financial Statements, the Company uses a discounted cash flow technique to determine the fair value of securities lending and borrowing transactions. Repurchase and Resale Agreements Securities sold under agreements to repurchase (repos) and securities purchased under agreements to resell (reverse repos) generally do not constitute a sale for accounting purposes of the underlying securities and are treated as collateralized financing transactions. As described in Note 26 to the Consolidated Financial Statements, the Company has elected to apply fair value accounting to a majority of such transactions, with changes in fair value reported in earnings. Any transactions for which fair value accounting has not been elected are recorded at the amount of cash advanced or received plus accrued interest. Irrespective of whether the Company has elected fair value accounting, interest paid or received on all repo and reverse repo transactions is recorded in Interest expense or Interest revenue at the contractually specified rate. Where the conditions of ASC 210-20-45-11, Balance Sheet—Offsetting: Repurchase and Reverse Repurchase Agreements, are met, repos and reverse repos are presented net on the Consolidated Balance Sheet. The Company’s policy is to take possession of securities purchased under reverse repurchase agreements. The Company monitors the fair value of securities subject to repurchase or resale on a daily basis and obtains or posts additional collateral in order to maintain contractual margin protection. As described in Note 25 to the Consolidated Financial Statements, the Company uses a discounted cash flow technique to determine the fair value of repo and reverse repo transactions.
Repurchase and Resale Agreements, and Securities Lending and Borrowing Agreements, Accounted for as Sales Where certain conditions are met under ASC 860-10, Transfers and Servicing (formerly FASB Statement No. 166, Accounting for Transfers of Financial Assets), the Company accounted for certain repurchase agreements and securities lending agreements as sales. The key distinction resulting in these agreements being accounted for as sales was a reduction in initial margin or restriction in daily maintenance margin. At December 31, 2011, a nominal amount of these transactions were accounted for as sales that reduced Trading account assets. See related discussion of the assessment of the effective control for repurchase agreements in “Accounting Changes” below. Loans Loans are reported at their outstanding principal balances net of any unearned income and unamortized deferred fees and costs except that credit card receivable balances also include accrued interest and fees. Loan origination fees and certain direct origination costs are generally deferred and recognized as adjustments to income over the lives of the related loans. As described in Note 26 to the Consolidated Financial Statements, Citi has elected fair value accounting for certain loans. Such loans are carried at fair value with changes in fair value reported in earnings. Interest income on such loans is recorded in Interest revenue at the contractually specified rate. Loans for which the fair value option has not been elected are classified upon origination or acquisition as either held-for-investment or held-for-sale. This classification is based on management’s initial intent and ability with regard to those loans. Loans that are held-for-investment are classified as Loans, net of unearned income on the Consolidated Balance Sheet, and the related cash flows are included within the cash flows from the investing activities category in the Consolidated Statement of Cash Flows on the line Change in loans. However, when the initial intent for holding a loan has changed from held-for-investment to held-for-sale, the loan is reclassified to held-for-sale, but the related cash flows continue to be reported in cash flows from investing activities in the Consolidated Statement of Cash Flows on the line Proceeds from sales and securitizations of loans.
14
Consumer loans Consumer loans represent loans and leases managed primarily by the Global Consumer Banking and Local Consumer Lending businesses. Non-accrual and re-aging policies As a general rule, interest accrual ceases for installment and real estate (both open- and closed-end) loans when payments are 90 days contractually past due. For credit cards and unsecured revolving loans, however, Citi generally accrues interest until payments are 180 days past due. As a result of OCC guidance issued in the first quarter of 2012, home equity loans in regulated bank entities are classified as non-accrual if the related residential first mortgage is 90 days or more past due. As a result of OCC guidance issued in the third quarter of 2012, mortgage loans in regulated bank entities discharged through Chapter 7 bankruptcy, other than FHA-insured loans, are classified as non-accrual. Commercial market loans are placed on a cash (non-accrual) basis when it is determined, based on actual experience and a forward-looking assessment of the collectability of the loan in full, that the payment of interest or principal is doubtful or when interest or principal is 90 days past due. Loans that have been modified to grant a short-term or long-term concession to a borrower who is in financial difficulty may not be accruing interest at the time of the modification. The policy for returning such modified loans to accrual status varies by product and/or region. In most cases, a minimum number of payments (ranging from one to six) are required, while in other cases the loan is never returned to accrual status. For regulated bank entities, such modified loans are returned to accrual status if a credit evaluation at the time of or subsequent to the modification indicates the borrower’s ability to meet the restructured terms, and the borrower is current and has demonstrated a reasonable period of sustained payment performance (minimum six months of consecutive payments). For U.S. Consumer loans, generally one of the conditions to qualify for modification is that a minimum number of payments (typically ranging from one to three) must be made. Upon modification, the loan is re-aged to current status. However, re-aging practices for certain open-ended Consumer loans, such as credit cards, are governed by Federal Financial Institutions Examination Council (FFIEC) guidelines. For open-ended Consumer loans subject to FFIEC guidelines, one of the conditions for the loan to be re-aged to current status is that at least three consecutive minimum monthly payments, or the equivalent amount, must be received. In addition, under FFIEC guidelines, the number of times that such a loan can be re-aged is subject to limitations (generally once in 12 months and twice in five years). Furthermore, Federal Housing Administration (FHA) and Department of Veterans Affairs (VA) loans are modified under those respective agencies’ guidelines and payments are not always required in order to re-age a modified loan to current.
Charge-off policies Citi’s charge-off policies follow the general guidelines below:
• Unsecured installment loans are charged off at 120 days past due.
• Unsecured revolving loans and credit card loans are charged off at 180 days contractually past due.
• Loans secured with non-real estate collateral are written down to the estimated value of the collateral, less costs to sell, at 120 days past due.
• Real estate-secured loans are written down to the estimated value of the property, less costs to sell, at 180 days contractually past due.
• Non-bank loans secured by real estate are written down to the estimated value of the property, less costs to sell, at the earlier of the receipt of title or 12 months in foreclosure (a process that must commence when payments are 120 days contractually past due).
• Non-bank unsecured personal loans are charged off when the loan is 180 days contractually past due if there have been no payments within the last six months, but in no event can these loans exceed 360 days contractually past due.
• Unsecured loans in bankruptcy are charged off within 60 days of notification of filing by the bankruptcy court or in accordance with Citi’s charge-off policy, whichever occurs earlier.
• As a result of OCC guidance issued in the third quarter of 2012, real estate-secured loans that were discharged through Chapter 7 bankruptcy, other than FHA-insured loans, are written down to the collateral value of the property, less costs to sell. Other real estate-secured loans in bankruptcy are written down to the estimated value of the property, less costs to sell, at the later of 60 days after notification or 60 days contractually past due.
• Non-bank unsecured personal loans in bankruptcy are charged off when they are 30 days contractually past due.
• Commercial market loans are written down to the extent that principal is judged to be uncollectable.
Corporate loans Corporate loans represent loans and leases managed by ICG or the Special Asset Pool. Corporate loans are identified as impaired and placed on a cash (non-accrual) basis when it is determined, based on actual experience and a forward-looking assessment of the collectability of the loan in full, that the payment of interest or principal is doubtful or when interest or principal is 90 days past due, except when the loan is well collateralized and in the process of collection. Any interest accrued on impaired Corporate loans and leases is reversed at 90 days and charged against current earnings, and interest is thereafter included in earnings only to the extent actually received in cash. When there is doubt regarding the ultimate collectability of principal, all cash receipts are thereafter applied to reduce the recorded investment in the loan.
15
Impaired Corporate loans and leases are written down to the extent that principal is deemed to be uncollectable. Impaired collateral-dependent loans and leases, where repayment is expected to be provided solely by the sale of the underlying collateral and there are no other available and reliable sources of repayment, are written down to the lower of cost or collateral value. Cash-basis loans are returned to an accrual status when all contractual principal and interest amounts are reasonably assured of repayment and there is a sustained period of repayment performance in accordance with the contractual terms. Loans Held-for-Sale Corporate and Consumer loans that have been identified for sale are classified as loans held-for-sale and included in Other assets. The practice of Citi’s U.S. prime mortgage business has been to sell substantially all of its conforming loans. As such, U.S. prime mortgage conforming loans are classified as held-for-sale and the fair value option is elected at origination, with changes in fair value recorded in Other revenue. With the exception of these loans for which the fair value option has been elected, held-for-sale loans are accounted for at the lower of cost or market value, with any write-downs or subsequent recoveries charged to Other revenue. The related cash flows are classified in the Consolidated Statement of Cash Flows in the cash flows from operating activities category on the line Change in loans held-for-sale. Allowance for Loan Losses Allowance for loan losses represents management’s best estimate of probable losses inherent in the portfolio, including probable losses related to large individually evaluated impaired loans and troubled debt restructurings. Attribution of the allowance is made for analytical purposes only, and the entire allowance is available to absorb probable loan losses inherent in the overall portfolio. Additions to the allowance are made through the Provision for loan losses. Loan losses are deducted from the allowance and subsequent recoveries are added. Assets received in exchange for loan claims in a restructuring are initially recorded at fair value, with any gain or loss reflected as a recovery or charge-off to the allowance. Corporate loans In the Corporate portfolios, the Allowance for loan losses includes an asset-specific component and a statistically based component. The asset-specific component is calculated under ASC 310-10-35, Receivables—Subsequent Measurement (formerly SFAS 114) on an individual basis for larger-balance, non-homogeneous loans, which are considered impaired. An asset-specific allowance is established when the discounted cash flows, collateral value (less disposal costs), or observable market price of the impaired loan is lower than its carrying value. This allowance considers the borrower’s overall financial condition, resources, and payment record, the prospects for support from any financially responsible guarantors (discussed further below)
and, if appropriate, the realizable value of any collateral. The asset-specific component of the allowance for smaller balance impaired loans is calculated on a pool basis considering historical loss experience. The allowance for the remainder of the loan portfolio is determined under ASC 450, Contingencies (formerly SFAS 5) using a statistical methodology, supplemented by management judgment. The statistical analysis considers the portfolio’s size, remaining tenor, and credit quality as measured by internal risk ratings assigned to individual credit facilities, which reflect probability of default and loss given default. The statistical analysis considers historical default rates and historical loss severity in the event of default, including historical average levels and historical variability. The result is an estimated range for inherent losses. The best estimate within the range is then determined by management’s quantitative and qualitative assessment of current conditions, including general economic conditions, specific industry and geographic trends, and internal factors including portfolio concentrations, trends in internal credit quality indicators, and current and past underwriting standards. For both the asset-specific and the statistically based components of the Allowance for loan losses, management may incorporate guarantor support. The financial wherewithal of the guarantor is evaluated, as applicable, based on net worth, cash flow statements and personal or company financial statements which are updated and reviewed at least annually. Citi seeks performance on guarantee arrangements in the normal course of business. Seeking performance entails obtaining satisfactory cooperation from the guarantor or borrower in the specific situation. This regular cooperation is indicative of pursuit and successful enforcement of the guarantee; the exposure is reduced without the expense and burden of pursuing a legal remedy. A guarantor’s reputation and willingness to work with Citigroup is evaluated based on the historical experience with the guarantor and the knowledge of the marketplace. In the rare event that the guarantor is unwilling or unable to perform or facilitate borrower cooperation, Citi pursues a legal remedy; however, enforcing a guarantee via legal action against the guarantor is not the primary means of resolving a troubled loan situation and rarely occurs. If Citi does not pursue a legal remedy, it is because Citi does not believe that the guarantor has the financial wherewithal to perform regardless of legal action or because there are legal limitations on simultaneously pursuing guarantors and foreclosure. A guarantor’s reputation does not impact Citi’s decision or ability to seek performance under the guarantee. In cases where a guarantee is a factor in the assessment of loan losses, it is included via adjustment to the loan’s internal risk rating, which in turn is the basis for the adjustment to the statistically based component of the Allowance for loan losses. To date, it is only in rare circumstances that an impaired commercial loan or commercial real estate loan is carried at a value in excess of the appraised value due to a guarantee.
16
When Citi’s monitoring of the loan indicates that the guarantor’s wherewithal to pay is uncertain or has deteriorated, there is either no change in the risk rating, because the guarantor’s credit support was never initially factored in, or the risk rating is adjusted to reflect that uncertainty or deterioration. Accordingly, a guarantor’s ultimate failure to perform or a lack of legal enforcement of the guarantee does not materially impact the allowance for loan losses, as there is typically no further significant adjustment of the loan’s risk rating at that time. Where Citi is not seeking performance under the guarantee contract, it provides for loans losses as if the loans were non-performing and not guaranteed. Consumer loans For Consumer loans, each portfolio of non-modified smaller-balance, homogeneous loans is independently evaluated by product type (e.g., residential mortgage, credit card, etc.) for impairment in accordance with ASC 450-20. The allowance for loan losses attributed to these loans is established via a process that estimates the probable losses inherent in the specific portfolio. This process includes migration analysis, in which historical delinquency and credit loss experience is applied to the current aging of the portfolio, together with analyses that reflect current and anticipated economic conditions, including changes in housing prices and unemployment trends. Citi’s allowance for loan losses under ASC 450-20 only considers contractual principal amounts due, except for credit card loans where estimated loss amounts related to accrued interest receivable are also included. Management also considers overall portfolio indicators, including historical credit losses, delinquent, non-performing, and classified loans, trends in volumes and terms of loans, an evaluation of overall credit quality, the credit process, including lending policies and procedures, and economic, geographical, product and other environmental factors. Separate valuation allowances are determined for impaired smaller-balance homogeneous loans whose terms have been modified in a troubled debt restructuring (TDR). Long-term modification programs as well as short-term (less than 12 months) modifications originated beginning January 1, 2011 that provide concessions (such as interest rate reductions) to borrowers in financial difficulty are reported as TDRs. In addition, loans included in the U.S. Treasury’s Home Affordable Modification Program (HAMP) trial period at December 31, 2011 are reported as TDRs. The allowance for loan losses for TDRs is determined in accordance with ASC 310-10-35 considering all available evidence, including, as appropriate, the present value of the expected future cash flows discounted at the loan’s original contractual effective rate, the secondary market value of the loan and the fair value of collateral less disposal costs. These expected cash flows incorporate modification program default rate assumptions. The original contractual effective rate for credit card loans is the pre-modification rate, which may include interest rate increases under the original contractual agreement with the borrower.
Where short-term concessions have been granted prior to January 1, 2011, the allowance for loan losses is materially consistent with the requirements of ASC 310-10-35. Valuation allowances for commercial market loans, which are classifiably managed Consumer loans, are determined in the same manner as for Corporate loans and are described in more detail in the following section. Generally, an asset-specific component is calculated under ASC 310-10-35 on an individual basis for larger-balance, non-homogeneous loans that are considered impaired and the allowance for the remainder of the classifiably managed Consumer loan portfolio is calculated under ASC 450 using a statistical methodology, supplemented by management adjustment. Reserve Estimates and Policies Management provides reserves for an estimate of probable losses inherent in the funded loan portfolio on the Consolidated Balance Sheet in the form of an allowance for loan losses. These reserves are established in accordance with Citigroup’s credit reserve policies, as approved by the Audit Committee of the Board of Directors. Citi’s Chief Risk Officer and Chief Financial Officer review the adequacy of the credit loss reserves each quarter with representatives from the risk management and finance staffs for each applicable business area. Applicable business areas include those having classifiably managed portfolios, where internal credit-risk ratings are assigned (primarily Institutional Clients Group and Global Consumer Banking) or modified Consumer loans, where concessions were granted due to the borrowers’ financial difficulties. The above-mentioned representatives for these business areas present recommended reserve balances for their funded and unfunded lending portfolios along with supporting quantitative and qualitative data. The quantitative data include: Estimated probable losses for non-performing, non-homogeneous exposures within a business line’s classifiably managed portfolio and impaired smaller-balance homogeneous loans whose terms have been modified due to the borrowers’ financial difficulties, and it was determined that a concession was granted to the borrower. Consideration may be given to the following, as appropriate, when determining this estimate: (i) the present value of expected future cash flows discounted at the loan’s original effective rate; (ii) the borrower’s overall financial condition, resources and payment record; and (iii) the prospects for support from financially responsible guarantors or the realizable value of any collateral. In the determination of the allowance for loan losses for TDRs, management considers a combination of historical re-default rates, the current economic environment and the nature of the modification program when forecasting expected cash flows. When impairment is measured based on the present value of expected future cash flows, the entire change in present value is recorded in the Provision for loan losses.

17
Statistically calculated losses inherent in the classifiably managed portfolio for performing and de minimis non-performing exposures. The calculation is based upon: (i) Citigroup’s internal system of credit-risk ratings, which are analogous to the risk ratings of the major rating agencies; and (ii) historical default and loss data, including rating agency information regarding default rates from 1983 to 2010 and internal data dating to the early 1970s on severity of losses in the event of default. Adjustments may be made to this data. Such adjustments include: (i) statistically calculated estimates to cover the historical fluctuation of the default rates over the credit cycle, the historical variability of loss severity among defaulted loans, and the degree to which there are large obligor concentrations in the global portfolio; and (ii) adjustments made for specific known items, such as current environmental factors and credit trends. In addition, representatives from each of the risk management and finance staffs that cover business areas with delinquency-managed portfolios containing smaller-balance homogeneous loans present their recommended reserve balances based upon leading credit indicators, including loan delinquencies and changes in portfolio size as well as economic trends, including current and future housing prices, unemployment, length of time in foreclosure, costs to sell and GDP. This methodology is applied separately for each individual product within each geographic region in which these portfolios exist. This evaluation process is subject to numerous estimates and judgments. The frequency of default, risk ratings, loss recovery rates, the size and diversity of individual large credits, and the ability of borrowers with foreign currency obligations to obtain the foreign currency necessary for orderly debt servicing, among other things, are all taken into account during this review. Changes in these estimates could have a direct impact on the credit costs in any period and could result in a change in the allowance. Allowance for Unfunded Lending Commitments A similar approach to the allowance for loan losses is used for calculating a reserve for the expected losses related to unfunded loan commitments and standby letters of credit. This reserve is classified on the balance sheet in Other liabilities. Changes to the allowance for unfunded lending commitments are recorded in the Provision for unfunded lending commitments. Mortgage Servicing Rights Mortgage servicing rights (MSRs) are recognized as intangible assets when purchased or when the Company sells or securitizes loans acquired through purchase or origination and retains the right to service the loans. Mortgage servicing rights are accounted for at fair value, with changes in value recorded in Other revenue in the Company’s Consolidated Statement of Income. Additional information on the Company’s MSRs can be found in Note 22 to the Consolidated Financial Statements.
Citigroup Residential Mortgages—Representations and Warranties Overview In connection with Citi’s sales of residential mortgage loans to the U.S. government-sponsored entities (GSEs) and, in most cases, other mortgage loan sales and private-label securitizations, Citi makes representations and warranties that the loans sold meet certain requirements. The specific representations and warranties made by Citi in any particular transaction depend on, among other things, the nature of the transaction and the requirements of the investor (e.g., whole loan sale to the GSEs versus loans sold through securitization transactions), as well as the credit quality of the loan (e.g., prime, Alt-A or subprime). These sales expose Citi to potential claims for breaches of its representations and warranties. In the event of a breach of its representations and warranties, Citi could be required either to repurchase the mortgage loans with the identified defects (generally at unpaid principal balance plus accrued interest) or to indemnify (make-whole) the investors for their losses on these loans. To the extent Citi made representation and warranties on loans it purchased from third-party sellers that remain financially viable, Citi may have the right to seek recovery of repurchase losses or make-whole payments from the third party based on representations and warranties made by the third party to Citi (a back-to-back claim). Whole Loan Sales Citi is exposed to representation and warranty repurchase claims primarily as a result of its whole loan sales to the GSEs and, to a lesser extent, private investors, through its Consumer business in CitiMortgage. When selling a loan to these investors, Citi makes various representations and warranties to, among other things, the following:
• Citi’s ownership of the loan; • the validity of the lien securing the loan; • the absence of delinquent taxes or liens against the property
securing the loan; • the effectiveness of title insurance on the property securing
the loan; • the process used in selecting the loans for inclusion in a
transaction; • the loan’s compliance with any applicable loan criteria
established by the buyer; and • the loan’s compliance with applicable local, state and
federal laws. In the case of a repurchase, Citi will bear any subsequent credit loss on the mortgage loan and the loan is typically considered a credit-impaired loan and accounted for under SOP 03-3, “Accounting for Certain Loans and Debt Securities Acquired in a Transfer” (now incorporated into ASC 310-30, Receivables—Loans and Debt Securities Acquired with Deteriorated Credit Quality) (SOP 03-3). These repurchases have not had a material impact on Citi’s non-performing loan statistics because credit-impaired purchased SOP 03-3 loans are not included in non-accrual loans, since they generally continue to accrue interest until write-off. Citi’s repurchases have primarily been due to GSE repurchase claims.

18
Private-Label Residential Mortgage Securitizations Citi is also exposed to representation and warranty repurchase claims as a result of mortgage loans sold through private-label residential mortgage securitizations. These representations were generally made or assigned to the issuing trust and related to, among other things, the following:
• the absence of fraud on the part of the borrower, the seller or any appraiser, broker or other party involved in the origination of the loan (which was sometimes wholly or partially limited to the knowledge of the representation provider);
• whether the property securing the loan was occupied by the borrower as his or her principal residence;
• the loan’s compliance with applicable federal, state and local laws;
• whether the loan was originated in conformity with the originator’s underwriting guidelines; and
• detailed data concerning the loans that were included on the mortgage loan schedule.
Repurchase Reserve Citi has recorded a mortgage repurchase reserve (referred to as the repurchase reserve) for its potential repurchase or make-whole liability regarding representation and warranty claims that is included in Other liabilities in the Consolidated Balance Sheet. Citi’s repurchase reserve primarily relates to whole loan sales to the GSEs and is thus calculated primarily based on Citi’s historical repurchase activity with the GSEs. Repurchase Reserve—Whole Loan Sales The repurchase reserve is based on various assumptions which, as referenced above, are primarily based on Citi’s historical repurchase activity with the GSEs. As of December 31, 2012, the most significant assumptions used to calculate the reserve levels are: (i) the probability of a claim based on correlation between loan characteristics and repurchase claims; (ii) claims appeal success rates; and (iii) estimated loss per repurchase or make-whole payment. In addition, Citi considers reimbursements estimated to be received from third-party sellers, which are generally based on Citi’s analysis of its most recent collection trends and the financial solvency or viability of the third-party sellers, in estimating its repurchase reserve. As referenced above, the repurchase reserve estimation process for potential whole loan representation and warranty claims relies on various assumptions that involve numerous estimates and judgments, including with respect to certain future events, and thus entails inherent uncertainty. Therefore, Citi estimates and discloses the range of reasonably possible loss for whole loan sale representation and warranty claims in excess of amounts accrued. This estimate is derived by modifying the key assumptions discussed above to reflect management’s judgment regarding reasonably possible
adverse changes to those assumptions. Citi’s estimate of reasonably possible loss is based on currently available information, significant judgment and numerous assumptions that are subject to change. In the case of a repurchase of a credit-impaired SOP 03-3 loan, the difference between the loan’s fair value and unpaid principal balance at the time of the repurchase is recorded as a utilization of the repurchase reserve. Make-whole payments to the investor are also treated as utilizations and charged directly against the reserve. The repurchase reserve is estimated when Citi sells loans (recorded as an adjustment to the gain on sale, which is included in Other revenue in the Consolidated Statement of Income) and is updated quarterly. Any change in estimate is recorded in Other revenue. Repurchase Reserve—Private-Label Securitizations Investors in private-label securitizations may seek recovery for alleged breaches of representations and warranties, as well as losses caused by non-performing loans more generally, through repurchase claims or through litigation premised on a variety of legal theories. Citi considers litigation relating to private-label securitizations as part of its contingencies analysis. For additional information, see Note 28 to the Consolidated Financial Statements. Citi cannot reasonably estimate probable losses from future repurchase claims for private-label securitizations because the claims to date have been received at an unpredictable rate, the factual basis for those claims is unclear, and very few such claims have been resolved. Rather, at the present time, Citi records reserves related to private-label securitizations repurchase claims based on estimated losses arising from those claims received that appear to be based on a review of the underlying loan files. These reserves are recorded in Principal transactions in the Consolidated Statement of Income. Goodwill Goodwill represents the excess of acquisition cost over the fair value of net tangible and intangible assets acquired. Goodwill is subject to annual impairment testing and between annual tests if an event occurs or circumstances change that would more-likely-than-not reduce the fair value of a reporting unit below its carrying amount. The Company has an option to assess qualitative factors to determine if it is necessary to perform the goodwill impairment test. If, after assessing the totality of events or circumstances, the Company determines that it is not more-likely-than-not that the fair value of a reporting unit is less than its carrying amount, no further testing is necessary. If, however, the Company determines that it is more-likely-than-not that the fair value of a reporting unit is less than its carrying amount, then the Company is required to perform the first step of the two-step goodwill impairment test. Furthermore, on any business dispositions, goodwill is allocated to the business disposed of based on the ratio of the fair value of the business disposed of to the fair value of the reporting unit. Additional information on Citi’s goodwill impairment testing can be found in Note 18 to the Consolidated Financial Statements.
19
Intangible Assets Intangible assets—including core deposit intangibles, present value of future profits, purchased credit card relationships, other customer relationships, and other intangible assets, but excluding MSRs—are amortized over their estimated useful lives. Intangible assets deemed to have indefinite useful lives, primarily certain asset management contracts and trade names, are not amortized and are subject to annual impairment tests. An impairment exists if the carrying value of the indefinite-lived intangible asset exceeds its fair value. For other intangible assets subject to amortization, an impairment is recognized if the carrying amount is not recoverable and exceeds the fair value of the intangible asset. Other Assets and Other Liabilities Other assets include, among other items, loans held-for-sale, deferred tax assets, equity method investments, interest and fees receivable, premises and equipment, repossessed assets, and other receivables. Other liabilities include, among other items, accrued expenses and other payables, deferred tax liabilities, and reserves for legal claims, taxes, unfunded lending commitments, repositioning reserves, and other matters. Other Real Estate Owned and Repossessed Assets Real estate or other assets received through foreclosure or repossession are generally reported in Other assets, net of a valuation allowance for selling costs and subsequent declines in fair value. Securitizations The Company primarily securitizes credit card receivables and mortgages. Other types of securitized assets include corporate debt instruments (in cash and synthetic form) and student loans. There are two key accounting determinations that must be made relating to securitizations. Citi first makes a determination as to whether the securitization entity would be consolidated. Second, it determines whether the transfer of financial assets to the entity is considered a sale under GAAP. If the securitization entity is a VIE, the Company consolidates the VIE if it is the primary beneficiary (as discussed in “Variable Interest Entities” above). For all other securitization entities determined not to be VIEs in which Citigroup participates, a consolidation decision is based on who has voting control of the entity, giving consideration to removal and liquidation rights in certain partnership structures. Only securitization entities controlled by Citigroup are consolidated. Interests in the securitized and sold assets may be retained in the form of subordinated or senior interest-only strips, subordinated tranches, spread accounts and servicing rights. In credit card securitizations, the Company retains a seller’s interest in the credit card receivables transferred to the trusts, which is not in securitized form. In the case of consolidated securitization entities, including the credit card trusts, these retained interests are not reported on Citi’s Consolidated Balance Sheet; rather, the securitized loans remain on the balance sheet. Substantially all of the Consumer loans sold or securitized through non-consolidated trusts by Citigroup are U.S. prime residential mortgage loans. Retained interests in non-consolidated mortgage securitization trusts are classified as Trading account assets, except for MSRs, which are included in Mortgage servicing rights on Citigroup’s Consolidated Balance Sheet.
Debt Short-term borrowings and long-term debt are accounted for at amortized cost, except where the Company has elected to report the debt instruments, including certain structured notes, at fair value or the debt is in a fair value hedging relationship. Transfers of Financial Assets For a transfer of financial assets to be considered a sale: (i) the assets must have been isolated from the Company, even in bankruptcy or other receivership; (ii) the purchaser must have the right to pledge or sell the assets transferred or, if the purchaser is an entity whose sole purpose is to engage in securitization and asset-backed financing activities and that entity is constrained from pledging the assets it receives, each beneficial interest holder must have the right to sell the beneficial interests; and (iii) the Company may not have an option or obligation to reacquire the assets. If these sale requirements are met, the assets are removed from the Company’s Consolidated Balance Sheet. If the conditions for sale are not met, the transfer is considered to be a secured borrowing, the assets remain on the Consolidated Balance Sheet, and the sale proceeds are recognized as the Company’s liability. A legal opinion on a sale is generally obtained for complex transactions or where the Company has continuing involvement with assets transferred or with the securitization entity. For a transfer to be eligible for sale accounting, those opinions must state that the asset transfer is considered a sale and that the assets transferred would not be consolidated with the Company’s other assets in the event of the Company’s insolvency. For a transfer of a portion of a financial asset to be considered a sale, the portion transferred must meet the definition of a participating interest. A participating interest must represent a pro rata ownership in an entire financial asset; all cash flows must be divided proportionally, with the same priority of payment; no participating interest in the transferred asset may be subordinated to the interest of another participating interest holder; and no party may have the right to pledge or exchange the entire financial asset unless all participating interest holders agree. Otherwise, the transfer is accounted for as a secured borrowing. See Note 22 to the Consolidated Financial Statements for further discussion. Risk Management Activities—Derivatives Used for Hedging Purposes The Company manages its exposures to market rate movements outside its trading activities by modifying the asset and liability mix, either directly or through the use of derivative financial products, including interest-rate swaps, futures, forwards, and purchased options, as well as foreign-exchange contracts. These end-user derivatives are carried at fair value in Other assets, Other liabilities, Trading account assets and Trading account liabilities.
20
To qualify as an accounting hedge under the hedge accounting rules (versus an economic hedge where hedge accounting is not sought), a derivative must be highly effective in offsetting the risk designated as being hedged. The hedge relationship must be formally documented at inception, detailing the particular risk management objective and strategy for the hedge, which includes the item and risk that is being hedged and the derivative that is being used, as well as how effectiveness will be assessed and ineffectiveness measured. The effectiveness of these hedging relationships is evaluated on a retrospective and prospective basis, typically using quantitative measures of correlation with hedge ineffectiveness measured and recorded in current earnings. If a hedge relationship is found to be ineffective, it no longer qualifies as an accounting hedge and hedge accounting would not be applied. Any gains or losses attributable to the derivatives, as well as subsequent changes in fair value, are recognized in Other revenue or Principal transactions with no offset on the hedged item, similar to trading derivatives. The foregoing criteria are applied on a decentralized basis, consistent with the level at which market risk is managed, but are subject to various limits and controls. The underlying asset, liability or forecasted transaction may be an individual item or a portfolio of similar items. For fair value hedges, in which derivatives hedge the fair value of assets or liabilities, changes in the fair value of derivatives are reflected in Other revenue or Principal transactions, together with changes in the fair value of the hedged item related to the hedged risk. These are expected to, and generally do, offset each other. Any net amount, representing hedge ineffectiveness, is reflected in current earnings. Citigroup’s fair value hedges are primarily hedges of fixed-rate long-term debt and available-for-sale securities. For cash flow hedges, in which derivatives hedge the variability of cash flows related to floating- and fixed-rate assets, liabilities or forecasted transactions, the accounting treatment depends on the effectiveness of the hedge. To the extent these derivatives are effective in offsetting the variability of the hedged cash flows, the effective portion of the changes in the derivatives’ fair values will not be included in current earnings, but is reported in Accumulated other comprehensive income (loss). These changes in fair value will be included in earnings of future periods when the hedged cash flows impact earnings. To the extent these derivatives are not effective, changes in their fair values are immediately included in Other revenue. Citigroup’s cash flow hedges primarily include hedges of floating-rate debt and floating-rate assets including loans, as well as rollovers of short-term fixed-rate liabilities and floating-rate liabilities and forecasted debt issuances.
For net investment hedges in which derivatives hedge the foreign currency exposure of a net investment in a foreign operation, the accounting treatment will similarly depend on the effectiveness of the hedge. The effective portion of the change in fair value of the derivative, including any forward premium or discount, is reflected in Accumulated other comprehensive income (loss) as part of the foreign currency translation adjustment. For those accounting hedge relationships that are terminated or when hedge designations are removed, the hedge accounting treatment described in the paragraphs above is no longer applied. Instead, the end-user derivative is terminated or transferred to the trading account. For fair value hedges, any changes in the fair value of the hedged item remain as part of the basis of the asset or liability and are ultimately reflected as an element of the yield. For cash flow hedges, any changes in fair value of the end-user derivative remain in Accumulated other comprehensive income (loss) and are included in earnings of future periods when the hedged cash flows impact earnings. However, if it becomes probable that the hedged forecasted transaction will not occur, any amounts that remain in Accumulated other comprehensive income (loss) are immediately reflected in Other revenue. End-user derivatives that are economic hedges, rather than qualifying for hedge accounting, are also carried at fair value, with changes in value included in Principal transactions or Other revenue. Citigroup often uses economic hedges when qualifying for hedge accounting would be too complex or operationally burdensome; examples are hedges of the credit risk component of commercial loans and loan commitments. Citigroup periodically evaluates its hedging strategies in other areas and may designate either a qualifying hedge or an economic hedge, after considering the relative cost and benefits. Economic hedges are also employed when the hedged item itself is marked to market through current earnings, such as hedges of commitments to originate one-to-four-family mortgage loans to be held for sale and MSRs. Employee Benefits Expense Employee benefits expense includes current service costs of pension and other postretirement benefit plans (which are accrued on a current basis), contributions and unrestricted awards under other employee plans, the amortization of restricted stock awards and costs of other employee benefits. Stock-Based Compensation The Company recognizes compensation expense related to stock and option awards over the requisite service period, generally based on the instruments’ grant date fair value, reduced by expected forfeitures. Compensation cost related to awards granted to employees who meet certain age plus years-of-service requirements (retirement eligible employees) is accrued in the year prior to the grant date, in the same manner as the accrual for cash incentive compensation. Certain stock awards with performance conditions or certain clawback provisions are subject to variable accounting, pursuant to which the associated compensation expense fluctuates with changes in Citigroup’s stock price.

21
Income Taxes The Company is subject to the income tax laws of the U.S. and its states and municipalities, and the foreign jurisdictions in which it operates. These tax laws are complex and subject to different interpretations by the taxpayer and the relevant governmental taxing authorities. In establishing a provision for income tax expense, the Company must make judgments and interpretations about the application of these inherently complex tax laws. The Company must also make estimates about when in the future certain items will affect taxable income in the various tax jurisdictions, both domestic and foreign. Disputes over interpretations of the tax laws may be subject to review and adjudication by the court systems of the various tax jurisdictions or may be settled with the taxing authority upon examination or audit. The Company treats interest and penalties on income taxes as a component of Income tax expense. Deferred taxes are recorded for the future consequences of events that have been recognized for financial statements or tax returns, based upon enacted tax laws and rates. Deferred tax assets are recognized subject to management’s judgment that realization is more-likely-than-not. FASB Interpretation No. 48, “Accounting for Uncertainty in Income Taxes” (FIN 48) (now incorporated into ASC 740, Income Taxes), sets out a consistent framework to determine the appropriate level of tax reserves to maintain for uncertain tax positions. This interpretation uses a two-step approach wherein a tax benefit is recognized if a position is more-likely-than-not to be sustained. The amount of the benefit is then measured to be the highest tax benefit that is greater than 50% likely to be realized. FIN 48 also sets out disclosure requirements to enhance transparency of an entity’s tax reserves. See Note 10 to the Consolidated Financial Statements for a further description of the Company’s tax provision and related income tax assets and liabilities. Commissions, Underwriting and Principal Transactions Commissions revenues are recognized in income generally when earned. Underwriting revenues are recognized in income typically at the closing of the transaction. Principal transactions revenues are recognized in income on a trade-date basis. See Note 6 to the Consolidated Financial Statements for a description of the Company’s revenue recognition policies for commissions and fees. Earnings per Share Earnings per share (EPS) is computed after deducting preferred stock dividends. The Company has granted restricted and deferred share awards with dividend rights that are considered to be participating securities, which are akin to a second class of common stock. Accordingly, a portion of Citigroup’s earnings is allocated to those participating securities in the EPS calculation.
Basic earnings per share is computed by dividing income available to common stockholders after the allocation of dividends and undistributed earnings to the participating securities by the weighted average number of common shares outstanding for the period. Diluted earnings per share reflects the potential dilution that could occur if securities or other contracts to issue common stock were exercised. It is computed after giving consideration to the weighted average dilutive effect of the Company’s stock options and warrants, convertible securities and the shares that could have been issued under the Company’s Management Committee Long-Term Incentive Plan and after the allocation of earnings to the participating securities. Use of Estimates Management must make estimates and assumptions that affect the Consolidated Financial Statements and the related footnote disclosures. Such estimates are used in connection with certain fair value measurements. See Note 25 to the Consolidated Financial Statements for further discussions on estimates used in the determination of fair value. The Company also uses estimates in determining consolidation decisions for special-purpose entities as discussed in Note 22 to the Consolidated Financial Statements. Moreover, estimates are significant in determining the amounts of other-than-temporary impairments, impairments of goodwill and other intangible assets, provisions for probable losses that may arise from credit-related exposures and probable and estimable losses related to litigation and regulatory proceedings, and tax reserves. While management makes its best judgment, actual amounts or results could differ from those estimates. Current market conditions increase the risk and complexity of the judgments in these estimates. Cash Flows Cash equivalents are defined as those amounts included in cash and due from banks. Cash flows from risk management activities are classified in the same category as the related assets and liabilities. Related Party Transactions The Company has related party transactions with certain of its subsidiaries and affiliates. These transactions, which are primarily short-term in nature, include cash accounts, collateralized financing transactions, margin accounts, derivative trading, charges for operational support and the borrowing and lending of funds, and are entered into in the ordinary course of business.

22
ACCOUNTING CHANGES OCC Chapter 7 Bankruptcy Guidance In the third quarter of 2012, the Office of the Comptroller of the Currency (OCC) issued guidance relating to the accounting for mortgage loans discharged through bankruptcy proceedings pursuant to Chapter 7 of the U.S. Bankruptcy Code (Chapter 7 bankruptcy). Under this OCC guidance, the discharged loans are accounted for as troubled debt restructurings (TDRs). These TDRs, other than FHA-insured loans, are written down to their collateral value less cost to sell. FHA-insured loans are reserved for, based on a discounted cash flow model. As a result of implementing this guidance, Citigroup recorded an incremental $635 million of charge-offs in the third quarter of 2012, the vast majority of which related to loans that were current. These charge-offs were substantially offset by a related loan loss reserve release of approximately $600 million, with a net reduction in pretax income of $35 million. In the fourth quarter of 2012, Citigroup recorded a benefit to charge-offs of approximately $40 million related to finalizing the impact of this OCC guidance. Furthermore, as a result of this OCC guidance, TDRs increased by $1.7 billion, and non-accrual loans increased by $1.5 billion in the third quarter of 2012 ($1.3 billion of which was current). Presentation of Comprehensive Income In June 2011, the FASB issued ASU No. 2011-05, Comprehensive Income (Topic 220): Presentation of Comprehensive Income. The ASU requires an entity to present the total of comprehensive income, the components of net income, and the components of other comprehensive income (OCI) either in a single continuous statement of comprehensive income or in two separate but consecutive statements. Citigroup has selected the two-statement approach. Under this approach, Citi is required to present components of net income and total net income in the Statement of Income. The Statement of Comprehensive Income follows the Statement of Income and includes the components of OCI and a total for OCI, along with a total for comprehensive income. The ASU removed the option of reporting other comprehensive income in the statement of changes in stockholders’ equity. This ASU became effective for Citigroup on January 1, 2012 and a Statement of Comprehensive Income is included in these Consolidated Financial Statements. See “Future Application of Accounting Standards” below for further discussion. Credit Quality and Allowance for Credit Losses Disclosures In July 2010, the FASB issued ASU No. 2010-20, Receivables (Topic 310): Disclosures about Credit Quality of Financing Receivables and Allowance for Credit Losses. The ASU required a greater level of disaggregated information about the allowance for credit losses and the credit quality of financing receivables. The period-end balance disclosure requirements for loans and the allowance for loan losses were effective for reporting periods ended on or after December 15, 2010 and were included in the Company’s 2010 Annual Report on Form 10-K, while disclosures for activity during a reporting period in the loan and allowance for
loan losses accounts were effective for reporting periods beginning on or after December 15, 2010 and were included in the Company’s Forms 10-Q beginning with the first quarter of 2011 (see Notes 16 and 17 to the Consolidated Financial Statements). The troubled debt restructuring disclosure requirements that were part of this ASU became effective in the third quarter of 2011 (see below). Troubled Debt Restructurings (TDRs) In April 2011, the FASB issued ASU No. 2011-02, Receivables (Topic 310): A Creditor’s Determination of whether a Restructuring Is a Troubled Debt Restructuring, to clarify the guidance for accounting for troubled debt restructurings. The ASU clarified the guidance on a creditor’s evaluation of whether it has granted a concession and whether a debtor is experiencing financial difficulties, such as:
• Any shortfall in contractual loan payments is considered a concession.
• Creditors cannot assume that debt extensions at or above a borrower’s original contractual rate do not constitute troubled debt restructurings, because the new contractual rate could still be below the market rate.
• If a borrower doesn’t have access to funds at a market rate for debt with characteristics similar to the restructured debt, that may indicate that the creditor has granted a concession.
• A borrower that is not currently in default may still be considered to be experiencing financial difficulty when payment default is considered “probable in the foreseeable future.”
Effective in the third quarter of 2011, as a result of the Company’s adoption of ASU 2011-02, certain loans modified under short-term programs beginning January 1, 2011 that were previously measured for impairment under ASC 450 are now measured for impairment under ASC 310-10-35. At the end of the first interim period of adoption (September 30, 2011), the recorded investment in receivables previously measured under ASC 450 was $1,170 million and the allowance for credit losses associated with those loans was $467 million. The effect of adopting the ASU was an approximate $60 million reduction in pretax income for the quarter ended September 30, 2011. Repurchase Agreements—Assessment of Effective Control In April 2011, the FASB issued ASU No. 2011-03, Transfers and Servicing (Topic 860): Reconsideration of Effective Control for Repurchase Agreements. The amendments in the ASU remove from the assessment of effective control: (i) the criterion requiring the transferor to have the ability to repurchase or redeem the financial assets on substantially the agreed terms, even in the event of default by the transferee, and (ii) the collateral maintenance implementation guidance related to that criterion. Other criteria applicable to the assessment of effective control are not changed by the amendments in the ASU.

23
The ASU became effective for Citigroup on January 1, 2012. The guidance has been applied prospectively to transactions or modifications of existing transactions occurring on or after January 1, 2012. The ASU has not had a material effect on the Company’s financial statements. A nominal amount of the Company’s repurchase transactions that would previously have been accounted for as sales is now accounted for as financing transactions. Fair Value Measurement In May 2011, the FASB issued ASU No. 2011-04, Fair Value Measurement (Topic 820): Amendments to Achieve Common Fair Value Measurement and Disclosure Requirements in U.S. GAAP and IFRS. The ASU created a common definition of fair value for U.S. GAAP and IFRS and aligned the measurement and disclosure requirements. It required significant additional disclosures both of a qualitative and quantitative nature, particularly for those instruments measured at fair value that are classified in Level 3 of the fair value hierarchy. Additionally, the ASU provided guidance on when it is appropriate to measure fair value on a portfolio basis and expanded the prohibition on valuation adjustments where the size of the Company’s position is a characteristic of the adjustment from Level 1 to all levels of the fair value hierarchy. The ASU became effective for Citigroup on January 1, 2012. As a result of implementing the prohibition on valuation adjustments where the size of the Company’s position is a characteristic, the Company released reserves of approximately $125 million, increasing pretax income in the first quarter of 2012. Deferred Asset Acquisition Costs In October 2010, the FASB issued ASU No. 2010-26, Financial Services – Insurance (Topic 944): Accounting for Costs Associated with Acquiring or Renewing Insurance Contracts. The ASU amended the guidance for insurance entities that required deferral and subsequent amortization of
certain costs incurred during the acquisition of new or renewed insurance contracts, commonly referred to as deferred acquisition costs (DAC). The new guidance limited DAC to those costs directly related to the successful acquisition of insurance contracts; all other acquisition-related costs must be expensed as incurred. Under prior guidance, DAC consisted of those costs that vary with, and primarily relate to, the acquisition of insurance contracts. The ASU became effective for Citigroup on January 1, 2012 and was adopted using the retrospective method. As a result of implementing the ASU, DAC was reduced by approximately $165 million and a $58 million deferred tax asset was recorded with an offset to opening retained earnings of $107 million (net of tax). Change in Accounting for Embedded Credit Derivatives In March 2010, the FASB issued ASU No. 2010-11, Scope Exception Related to Embedded Credit Derivatives. The ASU clarifies that certain embedded derivatives, such as those contained in certain securitizations, CDOs and structured notes, should be considered embedded credit derivatives subject to potential bifurcation and separate fair value accounting. The ASU allows any beneficial interest issued by a securitization vehicle to be accounted for under the fair value option at transition on July 1, 2010. As set forth in the table below, the Company elected to account for certain beneficial interests issued by securitization vehicles under the fair value option beginning July 1, 2010. Beneficial interests previously classified as held-to-maturity (HTM) were reclassified to available-for-sale (AFS) on June 30, 2010 because, as of that reporting date, the Company did not have the intent to hold the beneficial interests until maturity. The following table also shows the gross gains and gross losses that make up the pretax cumulative-effect adjustment to retained earnings for reclassified beneficial interests, recorded on July 1, 2010:
July 1, 2010 Pretax cumulative effect adjustment to Retained earnings
In millions of dollars at June 30, 2010 Amortized costGross unrealized losses recognized in AOCI (1)
Gross unrealized gains recognized in AOCI Fair value
Mortgage-backed securities Prime $ 390 $ — $ 49 $ 439 Alt-A 550 — 54 604 Subprime 221 — 6 227 Non-U.S. residential 2,249 — 38 2,287 Total mortgage-backed securities $ 3,410 $ — $147 $3,557 Asset-backed securities Auction rate securities $ 4,463 $401 $ 48 $4,110 Other asset-backed 4,189 19 164 4,334 Total asset-backed securities $ 8,652 $420 $212 $8,444 Total reclassified debt securities $12,062 $420 $359 $ 12,001 (1) All reclassified debt securities with gross unrealized losses were assessed for other-than-temporary-impairment as of June 30, 2010, including an assessment of
whether the Company intends to sell the security. For securities that the Company intends to sell, impairment charges of $176 million were recorded in earnings in the second quarter of 2010.
24
The Company elected to account for these beneficial interests under the fair value option beginning July 1, 2010 for various reasons, including:
• To reduce the operational burden of assessing beneficial interests for bifurcation under the guidance in the ASU;
• Where bifurcation would otherwise be required under the ASU, to avoid the complicated operational requirements of bifurcating the embedded derivatives from the host contracts and accounting for each separately. The Company reclassified substantially all beneficial interests where bifurcation would otherwise be required under the ASU; and
• To permit more economic hedging strategies without generating volatility in reported earnings.
Additional Disclosures Regarding Fair Value Measurements In January 2010, the FASB issued ASU No. 2010-06, Improving Disclosures about Fair Value Measurements. The ASU requires disclosure of the amounts of significant transfers in and out of Levels 1 and 2 of the fair value hierarchy and the reasons for the transfers. The disclosures were effective for reporting periods beginning after December 15, 2009. Additionally, disclosures of the gross purchases, sales, issuances and settlements activity in Level 3 of the fair value measurement hierarchy were required for fiscal years beginning after December 15, 2010. The Company adopted ASU 2010-06 as of January 1, 2010. The required disclosures are included in Note 25 to the Consolidated Financial Statements.
Non-Consolidation of Certain Investment Funds The FASB issued ASU No. 2010-10, Consolidation (Topic 810): Amendments for Certain Investment Funds in the first quarter of 2010. ASU 2010-10 provides a deferral of the requirements of SFAS 167 where the following criteria are met:
• The entity being evaluated for consolidation is an investment company, as defined in ASC 946-10, Financial Services—Investment Companies, or an entity for which it is acceptable based on industry practice to apply measurement principles that are consistent with an investment company;
• The reporting enterprise does not have an explicit or implicit obligation to fund losses of the entity that could potentially be significant to the entity; and
• The entity being evaluated for consolidation is not:
− a securitization entity; − an asset-backed financing entity; or − an entity that was formerly considered a qualifying
special-purpose entity.
The Company has determined that a majority of the investment entities managed by Citigroup are provided a deferral from the requirements of SFAS 167 because they meet these criteria. These entities continue to be evaluated under the requirements of FIN 46(R) (ASC 810-10), prior to the implementation of SFAS 167. Where the Company has determined that certain investment vehicles are subject to the consolidation requirements of SFAS 167, the consolidation conclusions reached upon initial application of SFAS 167 are consistent with the consolidation conclusions reached under the requirements of ASC 810-10, prior to the implementation of SFAS 167.
25
FUTURE APPLICATION OF ACCOUNTING STANDARDS Reclassification out of Accumulated Other Comprehensive Income In February 2013, the FASB issued ASU No. 2013-02, Comprehensive Income (Topic 220): Reporting of Amounts Reclassified out of Accumulated Other Comprehensive Income. The Accounting Standards Update (ASU) requires new footnote disclosures of items reclassified from accumulated OCI to net income. The requirements will be effective for the first quarter of 2013. Testing Indefinite-Lived Intangible Assets for Impairment In July 2012, the FASB issued Accounting Standards Update No. 2012-02, Intangibles—Goodwill and Other (Topic 350): Testing Indefinite-Lived Intangible Assets for Impairment. The ASU is intended to simplify the guidance for testing the decline in the realizable value (impairment) of indefinite-lived intangible assets other than goodwill. Some examples of intangible assets subject to the guidance include indefinite-lived trademarks, licenses and distribution rights. The ASU allows companies to perform a qualitative assessment about the likelihood of impairment of an indefinite-lived intangible asset to determine whether further impairment testing is necessary, similar in approach to the goodwill impairment test. The ASU became effective for annual and interim impairment tests performed for fiscal years beginning after September 15, 2012. Offsetting In December 2011, the FASB issued Accounting Standards Update No. 2011-11, Balance Sheet (Topic 210): Disclosures about Offsetting Assets and Liabilities. The standard requires new disclosures about certain financial instruments and derivative instruments that are either offset in the balance sheet (presented on a net basis) or subject to an enforceable master netting arrangement or similar arrangement. The standard requires disclosures that provide both gross and net information in the notes to the financial statements for relevant assets and liabilities. This ASU does not change the existing offsetting eligibility criteria or the permitted balance sheet presentation for those instruments that meet the eligibility criteria. Citi believes the new disclosure requirements should enhance comparability between those companies that prepare their financial statements on the basis of U.S. GAAP and those that prepare their financial statements in accordance with IFRS. For many financial institutions, the differences in the offsetting requirements between U.S. GAAP and IFRS result in a significant difference in the amounts presented in the balance sheets prepared in accordance with U.S. GAAP and IFRS. The disclosure standard will become effective for annual and quarterly periods beginning January 1, 2013. The disclosures are required retrospectively for all comparative periods presented.
Accounting for Financial Instruments—Credit Losses In December 2012, the FASB issued a proposed Accounting Standards Update (ASU), Financial Instruments—Credit Losses. This proposed ASU, or exposure draft, was issued for public comment in order to allow stakeholders the opportunity to review the proposal and provide comments to the FASB, and does not constitute accounting guidance until such a final ASU is issued. The exposure draft contains accounting guidance developed by the FASB with the goal of improving financial reporting about expected credit losses on loans, securities and other financial assets held by banks, financial institutions, and other public and private organizations. The exposure draft proposes a new accounting model intended to require earlier recognition of credit losses, while also providing additional transparency about credit risk. The FASB’s proposed model would utilize a single “expected credit loss” measurement objective for the recognition of credit losses, replacing the multiple existing impairment models in U.S. GAAP, which generally require that a loss be “incurred” before it is recognized. The FASB’s proposed model represents a significant departure from existing U.S. GAAP, and may result in material changes to the Company’s accounting for financial instruments. The impact of the FASB’s final ASU to the Company’s financial statements will be assessed when it is issued. The exposure draft does not contain a proposed effective date; this would be included in the final ASU, when issued. Other Potential Amendments to Current Accounting Standards The FASB and IASB, either jointly or separately, are currently working on several major projects, including amendments to existing accounting standards governing financial instruments, leases, consolidation and investment companies. As part of the joint financial instruments project, the FASB has issued a proposed ASU that would result in significant changes to the guidance for recognition and measurement of financial instruments, in addition to the proposed ASU that would change the accounting for credit losses on financial instruments discussed above. The FASB is also working on a joint project that would require all leases to be capitalized on the balance sheet. Additionally, the FASB has issued a proposal on principal-agent considerations that would change the way the Company needs to evaluate whether to consolidate VIEs and non-VIE partnerships. Furthermore, the FASB has issued a proposed ASU that would change the criteria used to determine whether an entity is subject to the accounting and reporting requirements of an investment company. The principal-agent consolidation proposal would require all VIEs, including those that are investment companies, to be evaluated for consolidation under the same requirements. All these projects may have significant impacts for the Company. Upon completion of the standards, the Company will need to re-evaluate its accounting and disclosures. However, due to ongoing deliberations of the standard-setters, the Company is currently unable to determine the effect of future amendments or proposals.
26
2. BUSINESS DIVESTITURES The following divestitures occurred in 2011 and 2010 and did not qualify as Discontinued operations. Divestitures that qualified as Discontinued operations are discussed in Note 3 to the Consolidated Financial Statements. In April 2010, Citi completed the IPO of Primerica, which was part of Citi Holdings, and sold approximately 34% to public investors. Also in April 2010, Citi completed the sale of approximately 22% of Primerica to Warburg Pincus, a private equity firm. Citi contributed 4% of the Primerica shares to Primerica for employee and agent stock-based awards immediately prior to the sales. Citi retained an approximate 40% interest in Primerica after the sales and recorded the investment under the equity method. Citi recorded an after-tax gain on sale of $26 million. Concurrent with the sale of the shares, Citi entered into co-insurance agreements with Primerica to reinsure up to 90% of the risk associated with the in-force insurance policies. During 2011, Citi sold its remaining shares in Primerica for an after-tax loss of $11 million.
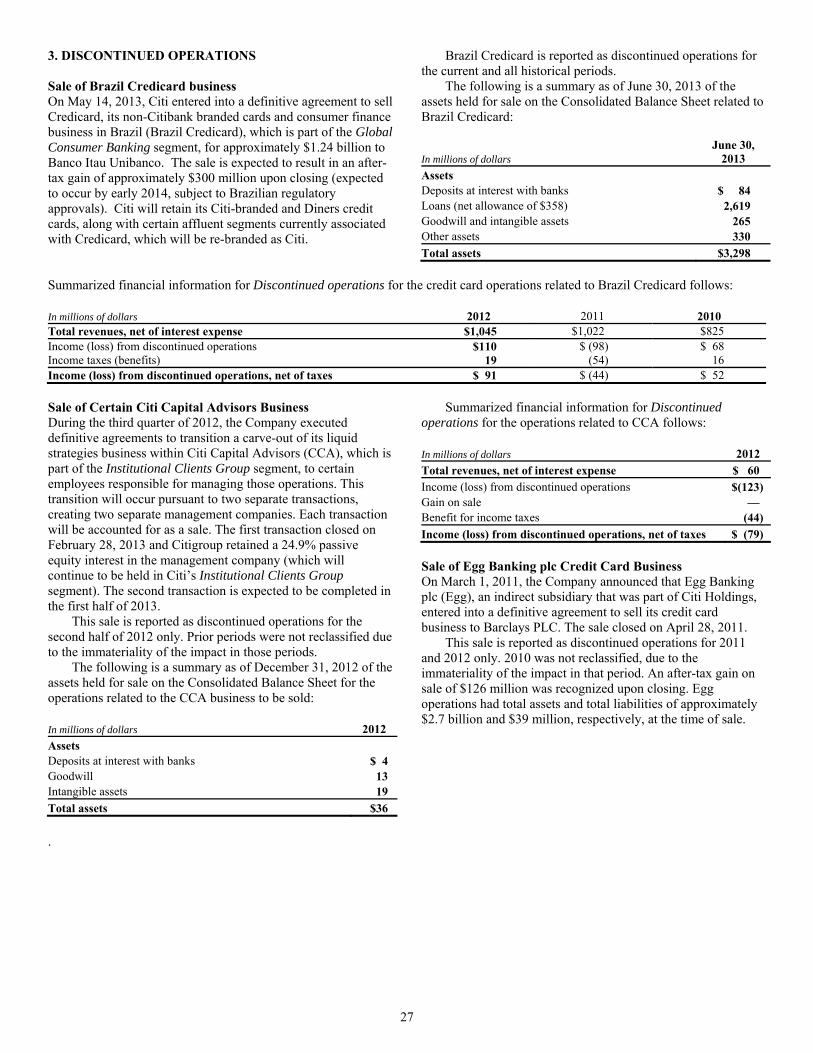
27
3. DISCONTINUED OPERATIONS Sale of Brazil Credicard business On May 14, 2013, Citi entered into a definitive agreement to sell Credicard, its non-Citibank branded cards and consumer finance business in Brazil (Brazil Credicard), which is part of the Global Consumer Banking segment, for approximately $1.24 billion to Banco Itau Unibanco. The sale is expected to result in an after-tax gain of approximately $300 million upon closing (expected to occur by early 2014, subject to Brazilian regulatory approvals). Citi will retain its Citi-branded and Diners credit cards, along with certain affluent segments currently associated with Credicard, which will be re-branded as Citi.
Brazil Credicard is reported as discontinued operations for the current and all historical periods. The following is a summary as of June 30, 2013 of the assets held for sale on the Consolidated Balance Sheet related to Brazil Credicard:
In millions of dollars June 30,
2013Assets Deposits at interest with banks $ 84 Loans (net allowance of $358) 2,619 Goodwill and intangible assets 265 Other assets 330 Total assets $3,298
Summarized financial information for Discontinued operations for the credit card operations related to Brazil Credicard follows: In millions of dollars 2012 2011 2010Total revenues, net of interest expense $1,045 $1,022 $825 Income (loss) from discontinued operations $110 $ (98) $ 68 Income taxes (benefits) 19 (54) 16 Income (loss) from discontinued operations, net of taxes $ 91 $ (44) $ 52 Sale of Certain Citi Capital Advisors Business During the third quarter of 2012, the Company executed definitive agreements to transition a carve-out of its liquid strategies business within Citi Capital Advisors (CCA), which is part of the Institutional Clients Group segment, to certain employees responsible for managing those operations. This transition will occur pursuant to two separate transactions, creating two separate management companies. Each transaction will be accounted for as a sale. The first transaction closed on February 28, 2013 and Citigroup retained a 24.9% passive equity interest in the management company (which will continue to be held in Citi’s Institutional Clients Group segment). The second transaction is expected to be completed in the first half of 2013. This sale is reported as discontinued operations for the second half of 2012 only. Prior periods were not reclassified due to the immateriality of the impact in those periods. The following is a summary as of December 31, 2012 of the assets held for sale on the Consolidated Balance Sheet for the operations related to the CCA business to be sold: In millions of dollars 2012Assets Deposits at interest with banks $ 4Goodwill 13Intangible assets 19Total assets $36
Summarized financial information for Discontinued operations for the operations related to CCA follows: In millions of dollars 2012Total revenues, net of interest expense $ 60Income (loss) from discontinued operations $(123)Gain on sale —Benefit for income taxes (44)Income (loss) from discontinued operations, net of taxes $ (79) Sale of Egg Banking plc Credit Card Business On March 1, 2011, the Company announced that Egg Banking plc (Egg), an indirect subsidiary that was part of Citi Holdings, entered into a definitive agreement to sell its credit card business to Barclays PLC. The sale closed on April 28, 2011. This sale is reported as discontinued operations for 2011 and 2012 only. 2010 was not reclassified, due to the immateriality of the impact in that period. An after-tax gain on sale of $126 million was recognized upon closing. Egg operations had total assets and total liabilities of approximately $2.7 billion and $39 million, respectively, at the time of sale.
.

28
Summarized financial information for Discontinued operations, including cash flows, for the credit card operations related to Egg follows: In millions of dollars 2012 2011 Total revenues, net of interest expense $ 1 $340 Income (loss) from discontinued operations $(96) $ 24 Gain (loss) on sale (1) 143 (Benefit) provision for income taxes (34) 58 Income (loss) from discontinued operations, net of
taxes $(63) $109 Cash Flows from Discontinued Operations In millions of dollars 2012 2011 Cash flows from operating activities $— $ (146)Cash flows from investing activities — 2,827 Cash flows from financing activities — (12)Net cash provided by discontinued operations $— $2,669 Sale of The Student Loan Corporation On September 17, 2010, the Company announced that The Student Loan Corporation (SLC), an indirect subsidiary that was 80% owned by Citibank and 20% owned by public shareholders, and which was part of Citi Holdings, entered into definitive agreements that resulted in the divestiture of Citi’s private student loan business and approximately $31 billion of its approximate $40 billion in assets to Discover Financial Services (Discover) and SLM Corporation (Sallie Mae). The transaction closed on December 31, 2010. As part of the transaction, Citi provided Sallie Mae with $1.1 billion of seller-financing. Additionally, as part of the transactions, Citibank, N.A. purchased approximately $8.6 billion of assets from SLC prior to the sale of SLC. This sale was reported as discontinued operations for the third and fourth quarters of 2010 only. Prior periods were not reclassified, due to the immateriality of the impact in those periods. The total 2010 impact from the sale of SLC resulted in an after-tax loss of $427 million. SLC operations had total assets and total liabilities of approximately $31 billion and $29 billion, respectively, at the time of sale. Summarized financial information for discontinued operations, including cash flows, related to the sale of SLC follows: In millions of dollars 2012 2011 2010 Total revenues, net of interest expense $— $— $(577)Income from discontinued operations $— $— $ 97 Gain (loss) on sale — — (825)Benefit for income taxes — — (339)Income (loss) from discontinued
operations, net of taxes $— $— $ (389) Cash Flows from Discontinued Operations In millions of dollars 2012 2011 2010 Cash flows from operating activities $— $— $5,106 Cash flows from investing activities — — 1,532 Cash flows from financing activities — — (6,483)Net cash provided by discontinued
operations $— $— $ 155
Combined Results for Discontinued Operations The following is summarized financial information for Brazil Credicard, the CCA business, the Egg credit card business, The Student Loan Corporation business and previous discontinued operations, for which Citi continues to have minimal residual costs associated with the sales. In millions of dollars 2012 2011 2010 Total revenues, net of interest expense $ 1,106 $1,374 $415 Income (loss) from discontinued operations $(109) $ (75) $140 Gain (loss) on sale (1) 155 (702)Provision (benefit) for income taxes (52) 12 (546)Income (loss) from discontinued
operations, net of taxes $ (58) $ 68 $ (16) Cash Flows from Discontinued Operations In millions of dollars 2012 2011 2010 Cash flows from operating activities $— $ (146) $4,974 Cash flows from investing activities — 2,827 1,726 Cash flows from financing activities — (12) (6,486)Net cash provided by discontinued
operations $— $2,669 $ 214

29
4. BUSINESS SEGMENTS Citigroup is a diversified bank holding company whose businesses provide a broad range of financial services to Consumer and Corporate customers around the world. The Company’s activities are conducted through the Global Consumer Banking (GCB), Institutional Clients Group (ICG), Corporate/Other and Citi Holdings business segments. The Global Consumer Banking segment includes a global, full-service Consumer franchise delivering a wide array of banking, credit card lending and investment services through a network of local branches, offices and electronic delivery systems and is composed of four Regional Consumer Banking (RCB) businesses: North America, EMEA, Latin America and Asia. The Company’s ICG segment is composed of Securities and Banking and Transaction Services and provides corporate, institutional, public sector and high net-worth clients in approximately 100 countries with a broad range of banking and financial products and services.
Corporate/Other includes net treasury results, unallocated corporate expenses, offsets to certain line-item reclassifications (eliminations), the results of discontinued operations and unallocated taxes. The Citi Holdings segment is composed of Brokerage and Asset Management, Local Consumer Lending and Special Asset Pool. The accounting policies of these reportable segments are the same as those disclosed in Note 1 to the Consolidated Financial Statements.
The prior-period balances reflect reclassifications to conform the presentation in those periods to the current period’s presentation. Reclassifications during the second quarter of 2013 related to the reporting of Citi’s announced sale of its Brazil Credicard business as discontinued operations for all periods presented. Reclassifications during the first quarter of 2013 related to the re-allocation of certain administrative costs among Citi’s businesses and the re-allocation of certain funding costs among Citi’s businesses. The following table presents certain information regarding the Company’s continuing operations by segment:
Revenues,
net of interest expense (1)Provision (benefit) for income taxes
Income (loss) from continuing operations (2)
Identifiable assets
In millions of dollars, except identifiable assets in billions 2012 2011 2010 2012 2011 2010 2012 2011 2010 2012 2011 Global Consumer Banking $39,120 $38,125 $38,495 $3,681 $3,537 $1,506 $ 7,955 $ 7,666 $ 4,875 $ 404 $ 385 Institutional Clients Group 30,730 32,131 33,336 2,162 2,872 3,539 8,093 8,360 10,263 1,062 983 Corporate/Other 70 762 1,633 (1,443) (724) (31) (1,702) (808) 159 243 281 Total Citicorp $69,920 $71,018 $73,464 $4,400 $5,685 $5,014 $14,346 $15,218 $15,297 $1,709 $1,649 Citi Holdings (792) 6,313 12,312 (4,393) (2,110) (2,797) (6,528) (4,071) (4,398) 156 225 Total $69,128 $77,331 $85,776 $ 7 $3,575 $2,217 $ 7,818 $11,147 $10,899 $1,865 $1,874 (1) Includes Citicorp (excluding Corporate/Other) total revenues, net of interest expense, in North America of $30.1 billion, $30.4 billion and $33.8 billion; in EMEA
of $11.4 billion, $12.2 billion and $11.7 billion; in Latin America of $13.4 billion, $12.5 billion and $11.9 billion; and in Asia of $15.0 billion, $15.2 billion and $14.4 billion in 2012, 2011 and 2010, respectively. Regional numbers exclude Citi Holdings and Corporate/Other, which largely operate within the U.S.
(2) Includes pretax provisions (credits) for credit losses and for benefits and claims in the GCB results of $6.2 billion, $6.2 billion and $13.7 billion; in the ICG results of $276 million, $152 million and $(82) million; and in the Citi Holdings results of $4.9 billion, $6.0 billion and $12.2 billion for 2012, 2011 and 2010, respectively.
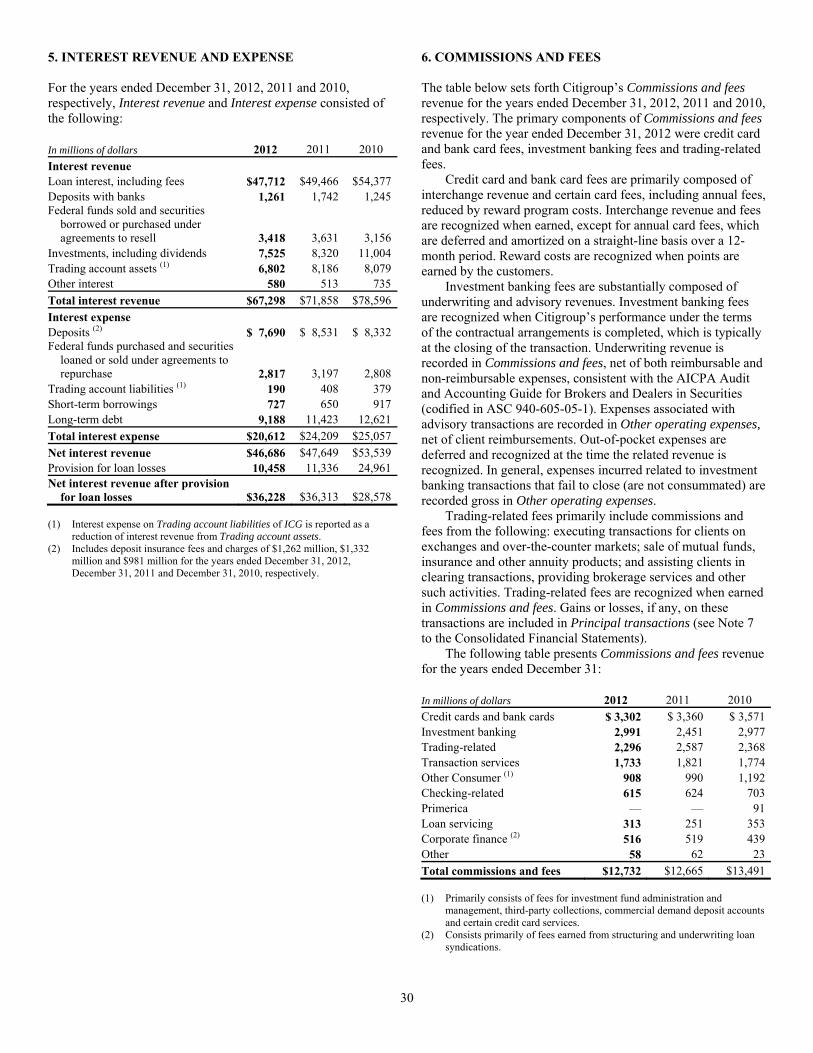
30
5. INTEREST REVENUE AND EXPENSE For the years ended December 31, 2012, 2011 and 2010, respectively, Interest revenue and Interest expense consisted of the following: In millions of dollars 2012 2011 2010 Interest revenue Loan interest, including fees $47,712 $49,466 $54,377 Deposits with banks 1,261 1,742 1,245 Federal funds sold and securities
borrowed or purchased under agreements to resell 3,418 3,631 3,156
Investments, including dividends 7,525 8,320 11,004 Trading account assets (1) 6,802 8,186 8,079 Other interest 580 513 735 Total interest revenue $67,298 $71,858 $78,596 Interest expense Deposits (2) $ 7,690 $ 8,531 $ 8,332 Federal funds purchased and securities
loaned or sold under agreements to repurchase 2,817 3,197 2,808
Trading account liabilities (1) 190 408 379 Short-term borrowings 727 650 917 Long-term debt 9,188 11,423 12,621 Total interest expense $20,612 $24,209 $25,057 Net interest revenue $46,686 $47,649 $53,539 Provision for loan losses 10,458 11,336 24,961 Net interest revenue after provision
for loan losses $36,228 $36,313 $28,578 (1) Interest expense on Trading account liabilities of ICG is reported as a
reduction of interest revenue from Trading account assets. (2) Includes deposit insurance fees and charges of $1,262 million, $1,332
million and $981 million for the years ended December 31, 2012, December 31, 2011 and December 31, 2010, respectively.
6. COMMISSIONS AND FEES The table below sets forth Citigroup’s Commissions and fees revenue for the years ended December 31, 2012, 2011 and 2010, respectively. The primary components of Commissions and fees revenue for the year ended December 31, 2012 were credit card and bank card fees, investment banking fees and trading-related fees. Credit card and bank card fees are primarily composed of interchange revenue and certain card fees, including annual fees, reduced by reward program costs. Interchange revenue and fees are recognized when earned, except for annual card fees, which are deferred and amortized on a straight-line basis over a 12-month period. Reward costs are recognized when points are earned by the customers. Investment banking fees are substantially composed of underwriting and advisory revenues. Investment banking fees are recognized when Citigroup’s performance under the terms of the contractual arrangements is completed, which is typically at the closing of the transaction. Underwriting revenue is recorded in Commissions and fees, net of both reimbursable and non-reimbursable expenses, consistent with the AICPA Audit and Accounting Guide for Brokers and Dealers in Securities (codified in ASC 940-605-05-1). Expenses associated with advisory transactions are recorded in Other operating expenses, net of client reimbursements. Out-of-pocket expenses are deferred and recognized at the time the related revenue is recognized. In general, expenses incurred related to investment banking transactions that fail to close (are not consummated) are recorded gross in Other operating expenses. Trading-related fees primarily include commissions and fees from the following: executing transactions for clients on exchanges and over-the-counter markets; sale of mutual funds, insurance and other annuity products; and assisting clients in clearing transactions, providing brokerage services and other such activities. Trading-related fees are recognized when earned in Commissions and fees. Gains or losses, if any, on these transactions are included in Principal transactions (see Note 7 to the Consolidated Financial Statements). The following table presents Commissions and fees revenue for the years ended December 31: In millions of dollars 2012 2011 2010 Credit cards and bank cards $ 3,302 $ 3,360 $ 3,571Investment banking 2,991 2,451 2,977Trading-related 2,296 2,587 2,368Transaction services 1,733 1,821 1,774Other Consumer (1) 908 990 1,192Checking-related 615 624 703Primerica — — 91Loan servicing 313 251 353Corporate finance (2) 516 519 439Other 58 62 23Total commissions and fees $12,732 $12,665 $13,491 (1) Primarily consists of fees for investment fund administration and
management, third-party collections, commercial demand deposit accounts and certain credit card services.
(2) Consists primarily of fees earned from structuring and underwriting loan syndications.
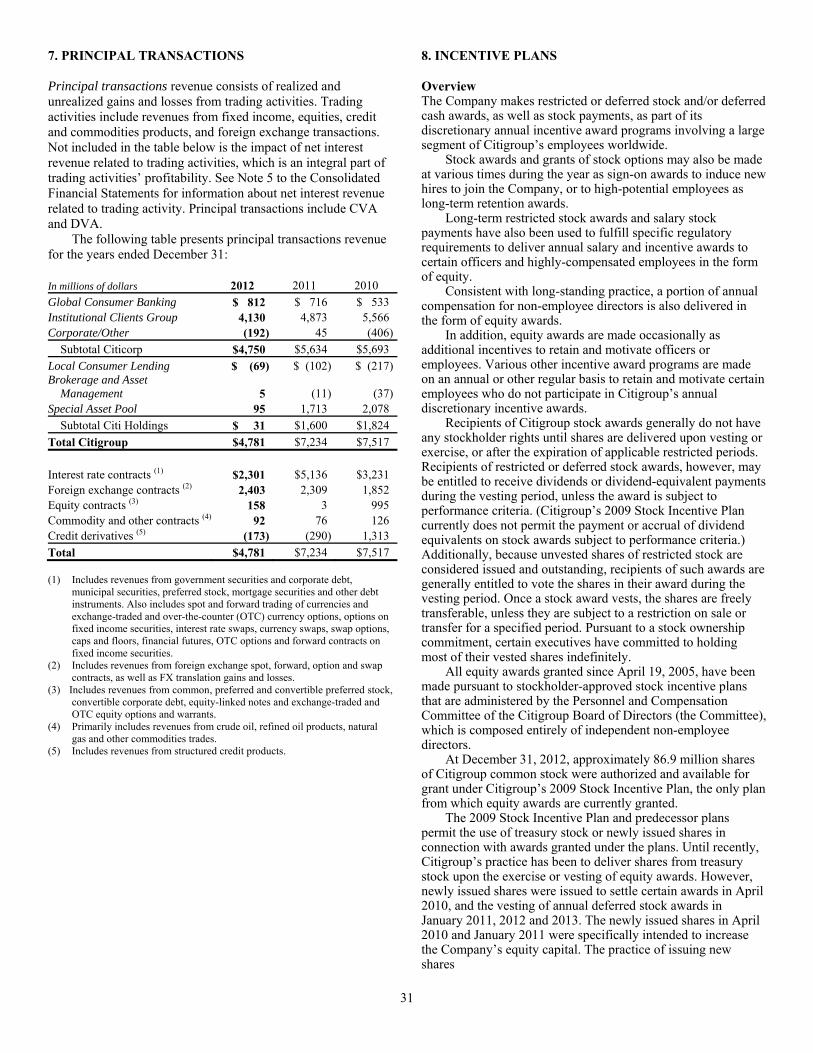
31
7. PRINCIPAL TRANSACTIONS Principal transactions revenue consists of realized and unrealized gains and losses from trading activities. Trading activities include revenues from fixed income, equities, credit and commodities products, and foreign exchange transactions. Not included in the table below is the impact of net interest revenue related to trading activities, which is an integral part of trading activities’ profitability. See Note 5 to the Consolidated Financial Statements for information about net interest revenue related to trading activity. Principal transactions include CVA and DVA. The following table presents principal transactions revenue for the years ended December 31: In millions of dollars 2012 2011 2010 Global Consumer Banking $ 812 $ 716 $ 533 Institutional Clients Group 4,130 4,873 5,566 Corporate/Other (192) 45 (406) Subtotal Citicorp $4,750 $5,634 $5,693 Local Consumer Lending $ (69) $ (102) $ (217)Brokerage and Asset
Management 5 (11) (37)Special Asset Pool 95 1,713 2,078 Subtotal Citi Holdings $ 31 $1,600 $1,824 Total Citigroup $4,781 $7,234 $7,517 Interest rate contracts (1) $2,301 $5,136 $3,231 Foreign exchange contracts (2) 2,403 2,309 1,852 Equity contracts (3) 158 3 995 Commodity and other contracts (4) 92 76 126 Credit derivatives (5) (173) (290) 1,313 Total $4,781 $7,234 $7,517 (1) Includes revenues from government securities and corporate debt,
municipal securities, preferred stock, mortgage securities and other debt instruments. Also includes spot and forward trading of currencies and exchange-traded and over-the-counter (OTC) currency options, options on fixed income securities, interest rate swaps, currency swaps, swap options, caps and floors, financial futures, OTC options and forward contracts on fixed income securities.
(2) Includes revenues from foreign exchange spot, forward, option and swap contracts, as well as FX translation gains and losses.
(3) Includes revenues from common, preferred and convertible preferred stock, convertible corporate debt, equity-linked notes and exchange-traded and OTC equity options and warrants.
(4) Primarily includes revenues from crude oil, refined oil products, natural gas and other commodities trades.
(5) Includes revenues from structured credit products.
8. INCENTIVE PLANS Overview The Company makes restricted or deferred stock and/or deferred cash awards, as well as stock payments, as part of its discretionary annual incentive award programs involving a large segment of Citigroup’s employees worldwide. Stock awards and grants of stock options may also be made at various times during the year as sign-on awards to induce new hires to join the Company, or to high-potential employees as long-term retention awards. Long-term restricted stock awards and salary stock payments have also been used to fulfill specific regulatory requirements to deliver annual salary and incentive awards to certain officers and highly-compensated employees in the form of equity. Consistent with long-standing practice, a portion of annual compensation for non-employee directors is also delivered in the form of equity awards. In addition, equity awards are made occasionally as additional incentives to retain and motivate officers or employees. Various other incentive award programs are made on an annual or other regular basis to retain and motivate certain employees who do not participate in Citigroup’s annual discretionary incentive awards. Recipients of Citigroup stock awards generally do not have any stockholder rights until shares are delivered upon vesting or exercise, or after the expiration of applicable restricted periods. Recipients of restricted or deferred stock awards, however, may be entitled to receive dividends or dividend-equivalent payments during the vesting period, unless the award is subject to performance criteria. (Citigroup’s 2009 Stock Incentive Plan currently does not permit the payment or accrual of dividend equivalents on stock awards subject to performance criteria.) Additionally, because unvested shares of restricted stock are considered issued and outstanding, recipients of such awards are generally entitled to vote the shares in their award during the vesting period. Once a stock award vests, the shares are freely transferable, unless they are subject to a restriction on sale or transfer for a specified period. Pursuant to a stock ownership commitment, certain executives have committed to holding most of their vested shares indefinitely. All equity awards granted since April 19, 2005, have been made pursuant to stockholder-approved stock incentive plans that are administered by the Personnel and Compensation Committee of the Citigroup Board of Directors (the Committee), which is composed entirely of independent non-employee directors. At December 31, 2012, approximately 86.9 million shares of Citigroup common stock were authorized and available for grant under Citigroup’s 2009 Stock Incentive Plan, the only plan from which equity awards are currently granted. The 2009 Stock Incentive Plan and predecessor plans permit the use of treasury stock or newly issued shares in connection with awards granted under the plans. Until recently, Citigroup’s practice has been to deliver shares from treasury stock upon the exercise or vesting of equity awards. However, newly issued shares were issued to settle certain awards in April 2010, and the vesting of annual deferred stock awards in January 2011, 2012 and 2013. The newly issued shares in April 2010 and January 2011 were specifically intended to increase the Company’s equity capital. The practice of issuing new shares
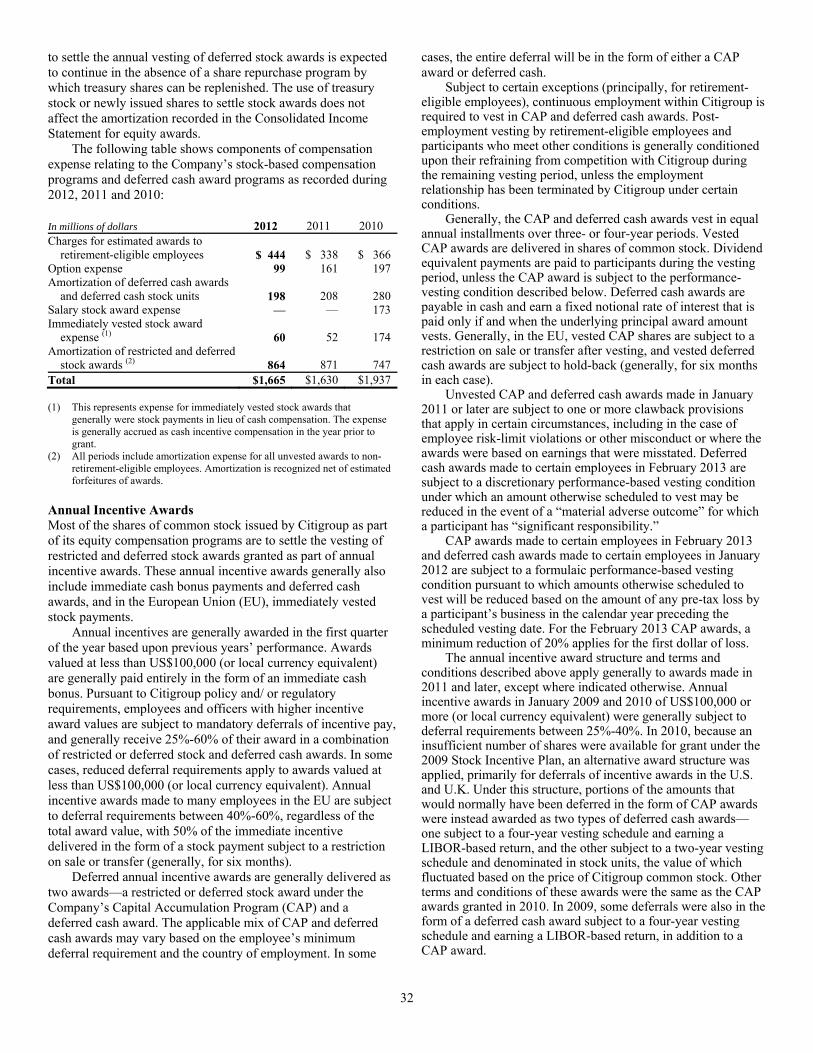
32
to settle the annual vesting of deferred stock awards is expected to continue in the absence of a share repurchase program by which treasury shares can be replenished. The use of treasury stock or newly issued shares to settle stock awards does not affect the amortization recorded in the Consolidated Income Statement for equity awards. The following table shows components of compensation expense relating to the Company’s stock-based compensation programs and deferred cash award programs as recorded during 2012, 2011 and 2010: In millions of dollars 2012 2011 2010 Charges for estimated awards to
retirement-eligible employees $ 444 $ 338 $ 366 Option expense 99 161 197 Amortization of deferred cash awards
and deferred cash stock units 198 208 280 Salary stock award expense — — 173 Immediately vested stock award
expense (1) 60 52 174 Amortization of restricted and deferred
stock awards (2) 864 871 747 Total $1,665 $1,630 $1,937 (1) This represents expense for immediately vested stock awards that
generally were stock payments in lieu of cash compensation. The expense is generally accrued as cash incentive compensation in the year prior to grant.
(2) All periods include amortization expense for all unvested awards to non-retirement-eligible employees. Amortization is recognized net of estimated forfeitures of awards.
Annual Incentive Awards Most of the shares of common stock issued by Citigroup as part of its equity compensation programs are to settle the vesting of restricted and deferred stock awards granted as part of annual incentive awards. These annual incentive awards generally also include immediate cash bonus payments and deferred cash awards, and in the European Union (EU), immediately vested stock payments. Annual incentives are generally awarded in the first quarter of the year based upon previous years’ performance. Awards valued at less than US$100,000 (or local currency equivalent) are generally paid entirely in the form of an immediate cash bonus. Pursuant to Citigroup policy and/ or regulatory requirements, employees and officers with higher incentive award values are subject to mandatory deferrals of incentive pay, and generally receive 25%-60% of their award in a combination of restricted or deferred stock and deferred cash awards. In some cases, reduced deferral requirements apply to awards valued at less than US$100,000 (or local currency equivalent). Annual incentive awards made to many employees in the EU are subject to deferral requirements between 40%-60%, regardless of the total award value, with 50% of the immediate incentive delivered in the form of a stock payment subject to a restriction on sale or transfer (generally, for six months). Deferred annual incentive awards are generally delivered as two awards—a restricted or deferred stock award under the Company’s Capital Accumulation Program (CAP) and a deferred cash award. The applicable mix of CAP and deferred cash awards may vary based on the employee’s minimum deferral requirement and the country of employment. In some
cases, the entire deferral will be in the form of either a CAP award or deferred cash. Subject to certain exceptions (principally, for retirement-eligible employees), continuous employment within Citigroup is required to vest in CAP and deferred cash awards. Post-employment vesting by retirement-eligible employees and participants who meet other conditions is generally conditioned upon their refraining from competition with Citigroup during the remaining vesting period, unless the employment relationship has been terminated by Citigroup under certain conditions. Generally, the CAP and deferred cash awards vest in equal annual installments over three- or four-year periods. Vested CAP awards are delivered in shares of common stock. Dividend equivalent payments are paid to participants during the vesting period, unless the CAP award is subject to the performance-vesting condition described below. Deferred cash awards are payable in cash and earn a fixed notional rate of interest that is paid only if and when the underlying principal award amount vests. Generally, in the EU, vested CAP shares are subject to a restriction on sale or transfer after vesting, and vested deferred cash awards are subject to hold-back (generally, for six months in each case). Unvested CAP and deferred cash awards made in January 2011 or later are subject to one or more clawback provisions that apply in certain circumstances, including in the case of employee risk-limit violations or other misconduct or where the awards were based on earnings that were misstated. Deferred cash awards made to certain employees in February 2013 are subject to a discretionary performance-based vesting condition under which an amount otherwise scheduled to vest may be reduced in the event of a “material adverse outcome” for which a participant has “significant responsibility.” CAP awards made to certain employees in February 2013 and deferred cash awards made to certain employees in January 2012 are subject to a formulaic performance-based vesting condition pursuant to which amounts otherwise scheduled to vest will be reduced based on the amount of any pre-tax loss by a participant’s business in the calendar year preceding the scheduled vesting date. For the February 2013 CAP awards, a minimum reduction of 20% applies for the first dollar of loss. The annual incentive award structure and terms and conditions described above apply generally to awards made in 2011 and later, except where indicated otherwise. Annual incentive awards in January 2009 and 2010 of US$100,000 or more (or local currency equivalent) were generally subject to deferral requirements between 25%-40%. In 2010, because an insufficient number of shares were available for grant under the 2009 Stock Incentive Plan, an alternative award structure was applied, primarily for deferrals of incentive awards in the U.S. and U.K. Under this structure, portions of the amounts that would normally have been deferred in the form of CAP awards were instead awarded as two types of deferred cash awards—one subject to a four-year vesting schedule and earning a LIBOR-based return, and the other subject to a two-year vesting schedule and denominated in stock units, the value of which fluctuated based on the price of Citigroup common stock. Other terms and conditions of these awards were the same as the CAP awards granted in 2010. In 2009, some deferrals were also in the form of a deferred cash award subject to a four-year vesting schedule and earning a LIBOR-based return, in addition to a CAP award.
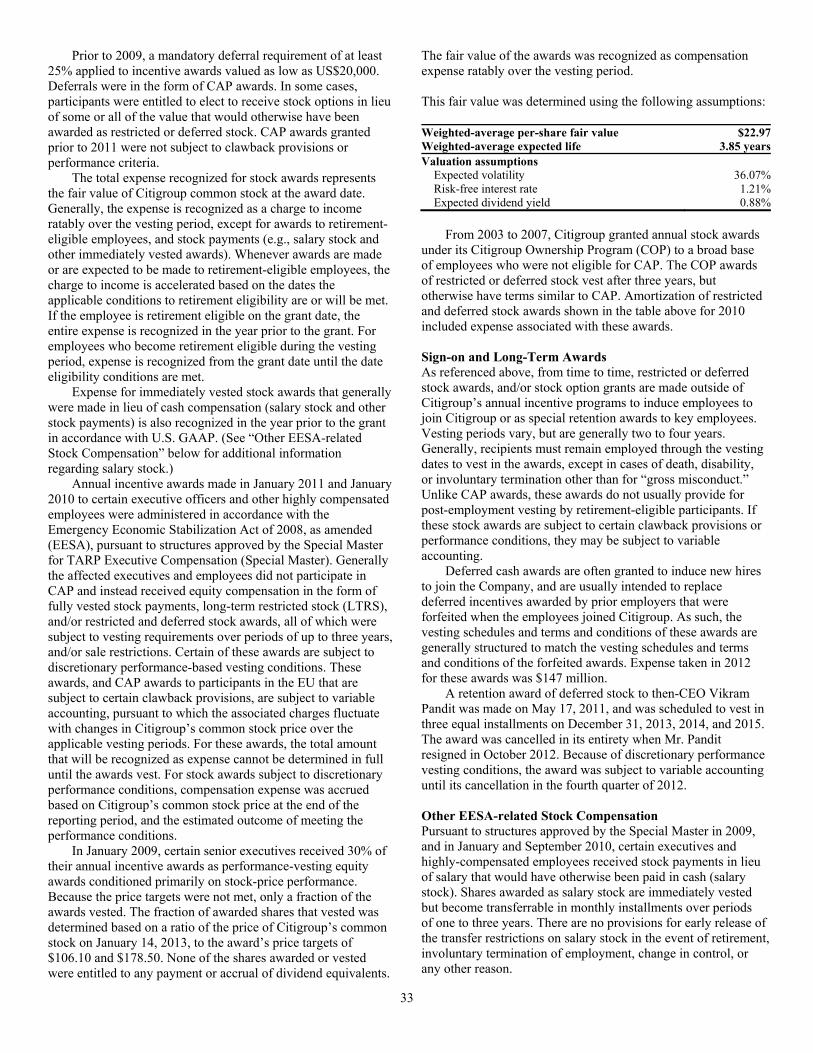
33
Prior to 2009, a mandatory deferral requirement of at least 25% applied to incentive awards valued as low as US$20,000. Deferrals were in the form of CAP awards. In some cases, participants were entitled to elect to receive stock options in lieu of some or all of the value that would otherwise have been awarded as restricted or deferred stock. CAP awards granted prior to 2011 were not subject to clawback provisions or performance criteria. The total expense recognized for stock awards represents the fair value of Citigroup common stock at the award date. Generally, the expense is recognized as a charge to income ratably over the vesting period, except for awards to retirement-eligible employees, and stock payments (e.g., salary stock and other immediately vested awards). Whenever awards are made or are expected to be made to retirement-eligible employees, the charge to income is accelerated based on the dates the applicable conditions to retirement eligibility are or will be met. If the employee is retirement eligible on the grant date, the entire expense is recognized in the year prior to the grant. For employees who become retirement eligible during the vesting period, expense is recognized from the grant date until the date eligibility conditions are met. Expense for immediately vested stock awards that generally were made in lieu of cash compensation (salary stock and other stock payments) is also recognized in the year prior to the grant in accordance with U.S. GAAP. (See “Other EESA-related Stock Compensation” below for additional information regarding salary stock.) Annual incentive awards made in January 2011 and January 2010 to certain executive officers and other highly compensated employees were administered in accordance with the Emergency Economic Stabilization Act of 2008, as amended (EESA), pursuant to structures approved by the Special Master for TARP Executive Compensation (Special Master). Generally the affected executives and employees did not participate in CAP and instead received equity compensation in the form of fully vested stock payments, long-term restricted stock (LTRS), and/or restricted and deferred stock awards, all of which were subject to vesting requirements over periods of up to three years, and/or sale restrictions. Certain of these awards are subject to discretionary performance-based vesting conditions. These awards, and CAP awards to participants in the EU that are subject to certain clawback provisions, are subject to variable accounting, pursuant to which the associated charges fluctuate with changes in Citigroup’s common stock price over the applicable vesting periods. For these awards, the total amount that will be recognized as expense cannot be determined in full until the awards vest. For stock awards subject to discretionary performance conditions, compensation expense was accrued based on Citigroup’s common stock price at the end of the reporting period, and the estimated outcome of meeting the performance conditions. In January 2009, certain senior executives received 30% of their annual incentive awards as performance-vesting equity awards conditioned primarily on stock-price performance. Because the price targets were not met, only a fraction of the awards vested. The fraction of awarded shares that vested was determined based on a ratio of the price of Citigroup’s common stock on January 14, 2013, to the award’s price targets of $106.10 and $178.50. None of the shares awarded or vested were entitled to any payment or accrual of dividend equivalents.
The fair value of the awards was recognized as compensation expense ratably over the vesting period. This fair value was determined using the following assumptions: Weighted-average per-share fair value $22.97Weighted-average expected life 3.85 yearsValuation assumptions Expected volatility 36.07% Risk-free interest rate 1.21% Expected dividend yield 0.88% From 2003 to 2007, Citigroup granted annual stock awards under its Citigroup Ownership Program (COP) to a broad base of employees who were not eligible for CAP. The COP awards of restricted or deferred stock vest after three years, but otherwise have terms similar to CAP. Amortization of restricted and deferred stock awards shown in the table above for 2010 included expense associated with these awards. Sign-on and Long-Term Awards As referenced above, from time to time, restricted or deferred stock awards, and/or stock option grants are made outside of Citigroup’s annual incentive programs to induce employees to join Citigroup or as special retention awards to key employees. Vesting periods vary, but are generally two to four years. Generally, recipients must remain employed through the vesting dates to vest in the awards, except in cases of death, disability, or involuntary termination other than for “gross misconduct.” Unlike CAP awards, these awards do not usually provide for post-employment vesting by retirement-eligible participants. If these stock awards are subject to certain clawback provisions or performance conditions, they may be subject to variable accounting. Deferred cash awards are often granted to induce new hires to join the Company, and are usually intended to replace deferred incentives awarded by prior employers that were forfeited when the employees joined Citigroup. As such, the vesting schedules and terms and conditions of these awards are generally structured to match the vesting schedules and terms and conditions of the forfeited awards. Expense taken in 2012 for these awards was $147 million. A retention award of deferred stock to then-CEO Vikram Pandit was made on May 17, 2011, and was scheduled to vest in three equal installments on December 31, 2013, 2014, and 2015. The award was cancelled in its entirety when Mr. Pandit resigned in October 2012. Because of discretionary performance vesting conditions, the award was subject to variable accounting until its cancellation in the fourth quarter of 2012. Other EESA-related Stock Compensation Pursuant to structures approved by the Special Master in 2009, and in January and September 2010, certain executives and highly-compensated employees received stock payments in lieu of salary that would have otherwise been paid in cash (salary stock). Shares awarded as salary stock are immediately vested but become transferrable in monthly installments over periods of one to three years. There are no provisions for early release of the transfer restrictions on salary stock in the event of retirement, involuntary termination of employment, change in control, or any other reason.

34
Director Compensation Non-employee directors receive part of their compensation in the form of deferred stock awards that vest in two years, and may elect to receive part of their retainer in the form of a stock payment, which they may elect to defer. A summary of the status of Citigroup’s unvested stock awards that are not subject to variable accounting at December 31, 2012 and changes during the 12 months ended December 31, 2012 are presented below:
Unvested stock awards Shares
Weighted-average grant
date fair value
Unvested at January 1, 2012 50,213,124 $50.90New awards 33,452,028 30.51Cancelled awards (2,342,822) 39.15Vested awards (1) (17,345,405) 62.12Unvested at December 31, 2012 63,976,925 $37.62 (1) The weighted-average fair value of the vestings during 2012 was
approximately $32.78 per share. A summary of the status of Citigroup’s unvested stock awards that are subject to variable accounting at December 31, 2012, and changes during the 12 months ended December 31, 2012, are presented below:
Unvested stock awards Shares
Weighted-average award issuance fair
valueUnvested at January 1, 2012 5,290,798 $49.30New awards 2,219,213 30.55Cancelled awards (377,358) 43.92Vested awards (1) (1,168,429) 50.16Unvested at December 31, 2012 5,964,224 $42.50 (1) The weighted-average fair value of the vestings during 2012 was
approximately $29.18 per share. At December 31, 2012, there was $886 million of total unrecognized compensation cost related to unvested stock awards, net of the forfeiture provision. That cost is expected to be recognized over a weighted-average period of 2.1 years. However, the cost of awards subject to variable accounting will fluctuate with changes in Citigroup’s common stock price. Stock Option Programs While the Company no longer grants options as part of its annual incentive award programs, Citigroup may grant stock options to employees or directors on a one-time basis, as sign-on awards or as retention awards, as referenced above. All stock options are granted on Citigroup common stock with exercise prices that are no less than the fair market value at the time of grant (which is defined under the 2009 Stock Incentive Plan to be the NYSE closing price on the trading day immediately preceding the grant date or on the grant date for grants to executive officers). Vesting periods and other terms and conditions of sign-on and retention option grants tend to vary by grant. Beginning in 2009, Citigroup eliminated the stock option election for all directors and employees (except certain CAP participants who were permitted to make a stock option election
for awards made in 2009). This stock option election allowed participants to trade a certain percentage of their annual incentive that would otherwise be granted in CAP shares and elect to have the award delivered instead as a stock option. On February 14, 2011, Citigroup granted options exercisable for approximately 2.9 million shares of Citigroup common stock to certain of its executive officers. The options have six-year terms and vest in three equal annual installments beginning on February 14, 2012. The exercise price of the options is $49.10, which was the closing price of a share of Citigroup common stock on the grant date. On any exercise of the options before the fifth anniversary of the grant date, the shares received on exercise (net of the amount required to pay taxes and the exercise price) are subject to a one-year transfer restriction. On April 20, 2010, Citigroup made an option grant to a group of employees who were not eligible for the October 29, 2009 broad-based grant described below. The options were awarded with an exercise price equal to the NYSE closing price of a share of Citigroup common stock on the trading day immediately preceding the date of grant ($48.80). The options vest in three annual installments beginning on October 29, 2010. The options have a six-year term. On October 29, 2009, Citigroup made a broad-based option grant to employees worldwide. The options have a six-year term, and generally vest in three equal installments over three years, beginning on the first anniversary of the grant date. The options were awarded with an exercise price equal to the NYSE closing price on the trading day immediately preceding the date of grant ($40.80). The CEO and other employees whose 2009 compensation was subject to structures approved by the Special Master did not participate in this grant. In January 2009, members of Citigroup’s Management Executive Committee received 10% of their awards as performance-priced stock options, with an exercise price that placed the awards significantly “out of the money” on the date of grant. Half of each executive’s options have an exercise price of $178.50 and half have an exercise price of $106.10. The options were granted on a day on which the NYSE closing price of a share of Citigroup common stock was $45.30. The options have a 10-year term and vest ratably over a four-year period. Generally, all other options granted from 2003 through 2009 have six-year terms and vest ratably over three- or four-year periods; however, options granted to directors provided for cliff vesting. All outstanding options granted prior to 2009 are significantly out of the money. Prior to 2003, Citigroup options had 10-year terms and generally vested at a rate of 20% per year over five years (with the first vesting date occurring 12 to 18 months following the grant date). All outstanding options that were granted prior to 2003 expired in 2012. From 1997 to 2002, a broad base of employees participated in annual option grant programs. The options vested over five-year periods, or cliff vested after five years, and had 10-year terms but no reload features. No grants have been made under these programs since 2002 and all options that remained outstanding expired in 2012. All unvested options granted to former CEO Vikram Pandit, including premium-priced stock options granted on May 17, 2011, were cancelled upon his resignation in October 2012.
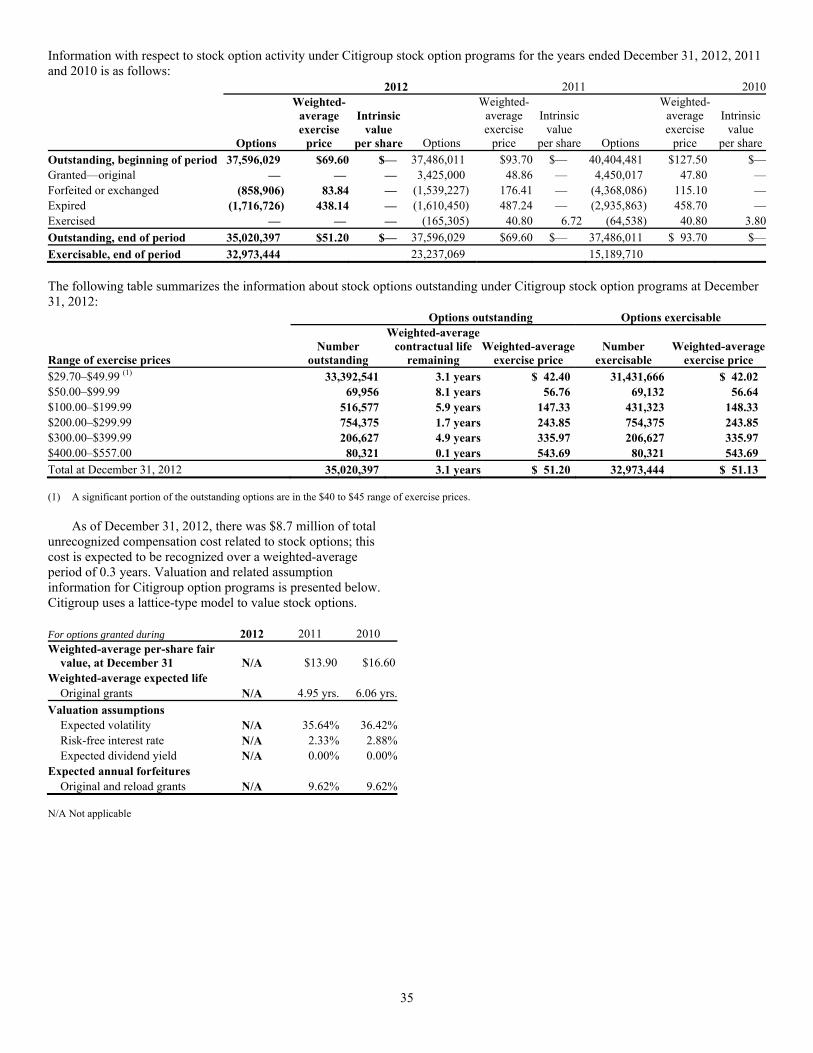
35
Information with respect to stock option activity under Citigroup stock option programs for the years ended December 31, 2012, 2011 and 2010 is as follows:
2012 2011 2010
Options
Weighted-averageexercise
price
Intrinsicvalue
per share Options
Weighted-averageexercise
price
Intrinsic value
per share Options
Weighted-averageexercise
price
Intrinsicvalue
per shareOutstanding, beginning of period 37,596,029 $69.60 $— 37,486,011 $93.70 $— 40,404,481 $127.50 $—Granted—original — — — 3,425,000 48.86 — 4,450,017 47.80 —Forfeited or exchanged (858,906) 83.84 — (1,539,227) 176.41 — (4,368,086) 115.10 —Expired (1,716,726) 438.14 — (1,610,450) 487.24 — (2,935,863) 458.70 —Exercised — — — (165,305) 40.80 6.72 (64,538) 40.80 3.80Outstanding, end of period 35,020,397 $51.20 $— 37,596,029 $69.60 $— 37,486,011 $ 93.70 $—Exercisable, end of period 32,973,444 23,237,069 15,189,710 The following table summarizes the information about stock options outstanding under Citigroup stock option programs at December 31, 2012: Options outstanding Options exercisable
Range of exercise prices Number
outstanding
Weighted-averagecontractual life
remainingWeighted-average
exercise priceNumber
exercisable Weighted-average
exercise price$29.70–$49.99 (1) 33,392,541 3.1 years $ 42.40 31,431,666 $ 42.02$50.00–$99.99 69,956 8.1 years 56.76 69,132 56.64$100.00–$199.99 516,577 5.9 years 147.33 431,323 148.33$200.00–$299.99 754,375 1.7 years 243.85 754,375 243.85$300.00–$399.99 206,627 4.9 years 335.97 206,627 335.97$400.00–$557.00 80,321 0.1 years 543.69 80,321 543.69Total at December 31, 2012 35,020,397 3.1 years $ 51.20 32,973,444 $ 51.13 (1) A significant portion of the outstanding options are in the $40 to $45 range of exercise prices. As of December 31, 2012, there was $8.7 million of total unrecognized compensation cost related to stock options; this cost is expected to be recognized over a weighted-average period of 0.3 years. Valuation and related assumption information for Citigroup option programs is presented below. Citigroup uses a lattice-type model to value stock options. For options granted during 2012 2011 2010 Weighted-average per-share fair
value, at December 31 N/A $13.90 $16.60Weighted-average expected life Original grants N/A 4.95 yrs. 6.06 yrs.Valuation assumptions Expected volatility N/A 35.64% 36.42% Risk-free interest rate N/A 2.33% 2.88% Expected dividend yield N/A 0.00% 0.00%Expected annual forfeitures Original and reload grants N/A 9.62% 9.62% N/A Not applicable
36
Profit Sharing Plan In October 2010, the Committee approved awards under the 2010 Key Employee Profit Sharing Plan (KEPSP), which may entitle participants to profit-sharing payments based on an initial performance measurement period of January 1, 2010 through December 31, 2012. Generally, if a participant remains employed and all other conditions to vesting and payment are satisfied, the participant will be entitled to an initial payment in 2013, as well as a holdback payment in 2014 that may be reduced based on performance during the subsequent holdback period (generally, January 1, 2013 through December 31, 2013). If the vesting and performance conditions are satisfied, a participant’s initial payment will equal two-thirds of the product of the cumulative pretax income of Citicorp (as defined in the KEPSP) for the initial performance period and the participant’s applicable percentage. The initial payment will be paid after January 20, 2013 but no later than March 15, 2013. The participant’s holdback payment, if any, will equal the product of (i) the lesser of cumulative pretax income of Citicorp for the initial performance period and cumulative pretax income of Citicorp for the initial performance period and the holdback period combined (generally, January 1, 2010 through December 31, 2013), and (ii) the participant’s applicable percentage, less the initial payment; provided that the holdback payment may not be less than zero. The holdback payment, if any, will be paid after January 20, 2014 but no later than March 15, 2014. The holdback payment, if any, will be credited with notional interest during the holdback period. It is intended that the initial payment and holdback payment will be paid in cash; however, awards may be paid in Citigroup common stock if required by regulatory authority. Regulators have required that U.K. participants receive at least 50% of their initial payment and at least 50% of their holdback payment, if any, in shares of Citigroup common stock that will be subject to a six-month sales restriction. Clawbacks apply to the award. Independent risk function employees were not eligible to participate in the KEPSP, as the independent risk function participates in the determination of whether payouts will be made under the KEPSP. Instead, key employees in the independent risk function were eligible to receive deferred cash retention awards, which vest two-thirds on January 20, 2013 and one-third on January 20, 2014. The deferred cash awards incentivize key risk employees to contribute to the Company’s long-term profitability by ensuring that the Company’s risk profile is properly aligned with its long-term strategies, objectives and risk appetite, thereby, aligning the employees’ interests with those of Company shareholders. On February 14, 2011, the Committee approved grants of awards under the 2011 KEPSP to certain executive officers, and on May 17, 2011 to the then-CEO Vikram Pandit. These awards have a performance period of January 1, 2011 to December 31, 2012 and other terms of the awards are similar to the 2010 KEPSP. The KEPSP award granted to Mr. Pandit was cancelled upon his resignation in October 2012. Expense recognized in 2012 in respect of the KEPSP was $246 million.
Performance Share Units Certain executive officers were awarded a target number of performance share units (PSUs) on February 19, 2013 for performance in 2012. PSUs will be earned only to the extent that Citigroup attains specified performance goals relating to Citigroup’s return on assets and relative total shareholder return against peers over a three-year period covering 2013, 2014 and 2015. The actual number of PSUs ultimately earned could vary from zero, if performance goals are not met, to as much as 150% of target, if performance goals are meaningfully exceeded. The value of each PSU is equal to the value of one share of Citi common stock. The value of the award will fluctuate with changes in Citigroup’s share price and the attainment of the specified performance goals, until it is settled solely in cash after the end of the performance period. Variable Incentive Compensation Citigroup has various incentive plans globally that are used to motivate and reward performance primarily in the areas of sales, operational excellence and customer satisfaction. These programs are reviewed on a periodic basis to ensure that they are structured appropriately, aligned to shareholder interests and adequately risk balanced. For the years ended December 31, 2012 and 2011, Citigroup expensed $670 million and $1.0 billion, respectively, for these plans globally.
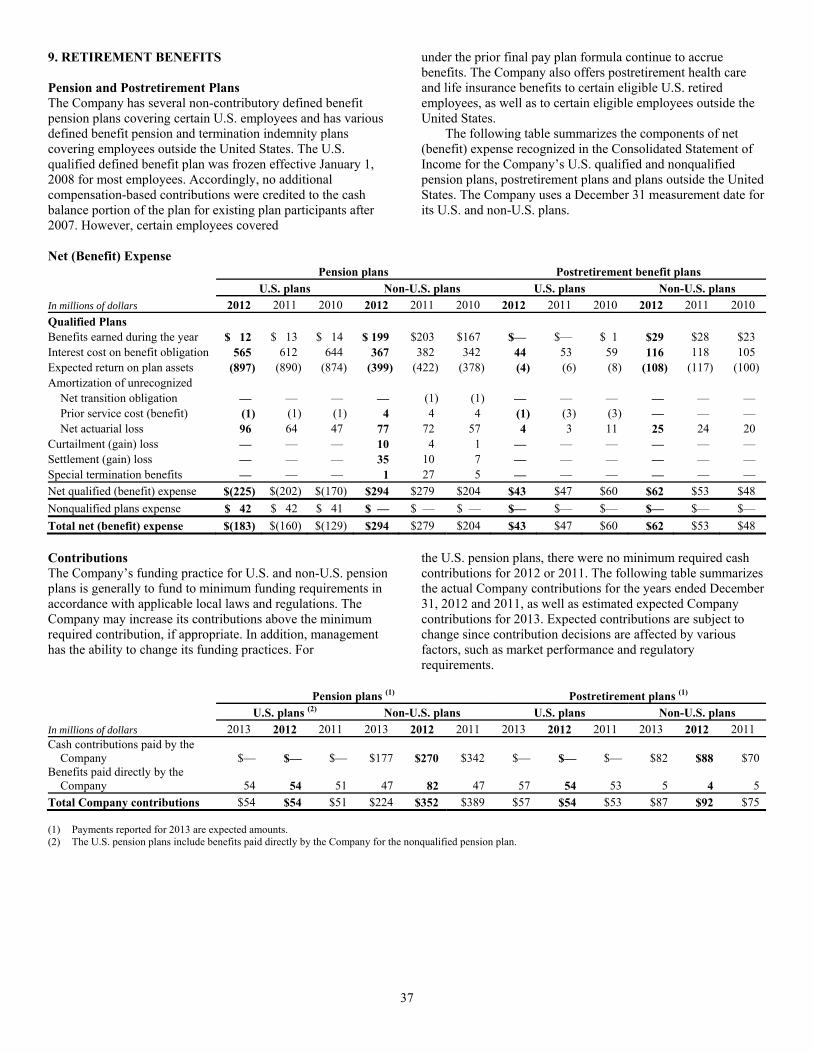
37
9. RETIREMENT BENEFITS Pension and Postretirement Plans The Company has several non-contributory defined benefit pension plans covering certain U.S. employees and has various defined benefit pension and termination indemnity plans covering employees outside the United States. The U.S. qualified defined benefit plan was frozen effective January 1, 2008 for most employees. Accordingly, no additional compensation-based contributions were credited to the cash balance portion of the plan for existing plan participants after 2007. However, certain employees covered
under the prior final pay plan formula continue to accrue benefits. The Company also offers postretirement health care and life insurance benefits to certain eligible U.S. retired employees, as well as to certain eligible employees outside the United States. The following table summarizes the components of net (benefit) expense recognized in the Consolidated Statement of Income for the Company’s U.S. qualified and nonqualified pension plans, postretirement plans and plans outside the United States. The Company uses a December 31 measurement date for its U.S. and non-U.S. plans.
Net (Benefit) Expense Pension plans Postretirement benefit plans U.S. plans Non-U.S. plans U.S. plans Non-U.S. plansIn millions of dollars 2012 2011 2010 2012 2011 2010 2012 2011 2010 2012 2011 2010 Qualified Plans Benefits earned during the year $ 12 $ 13 $ 14 $ 199 $203 $167 $— $— $ 1 $29 $28 $23 Interest cost on benefit obligation 565 612 644 367 382 342 44 53 59 116 118 105 Expected return on plan assets (897) (890) (874) (399) (422) (378) (4) (6) (8) (108) (117) (100) Amortization of unrecognized Net transition obligation — — — — (1) (1) — — — — — — Prior service cost (benefit) (1) (1) (1) 4 4 4 (1) (3) (3) — — — Net actuarial loss 96 64 47 77 72 57 4 3 11 25 24 20 Curtailment (gain) loss — — — 10 4 1 — — — — — — Settlement (gain) loss — — — 35 10 7 — — — — — — Special termination benefits — — — 1 27 5 — — — — — — Net qualified (benefit) expense $(225) $(202) $(170) $294 $279 $204 $43 $47 $60 $62 $53 $48 Nonqualified plans expense $ 42 $ 42 $ 41 $ — $ — $ — $— $— $— $— $— $— Total net (benefit) expense $(183) $(160) $(129) $294 $279 $204 $43 $47 $60 $62 $53 $48 Contributions The Company’s funding practice for U.S. and non-U.S. pension plans is generally to fund to minimum funding requirements in accordance with applicable local laws and regulations. The Company may increase its contributions above the minimum required contribution, if appropriate. In addition, management has the ability to change its funding practices. For
the U.S. pension plans, there were no minimum required cash contributions for 2012 or 2011. The following table summarizes the actual Company contributions for the years ended December 31, 2012 and 2011, as well as estimated expected Company contributions for 2013. Expected contributions are subject to change since contribution decisions are affected by various factors, such as market performance and regulatory requirements.
Pension plans (1) Postretirement plans (1)
U.S. plans (2) Non-U.S. plans U.S. plans Non-U.S. plansIn millions of dollars 2013 2012 2011 2013 2012 2011 2013 2012 2011 2013 2012 2011 Cash contributions paid by the
Company $— $— $— $177 $270 $342 $— $— $— $82 $88 $70 Benefits paid directly by the
Company 54 54 51 47 82 47 57 54 53 5 4 5 Total Company contributions $54 $54 $51 $224 $352 $389 $57 $54 $53 $87 $92 $75 (1) Payments reported for 2013 are expected amounts. (2) The U.S. pension plans include benefits paid directly by the Company for the nonqualified pension plan.
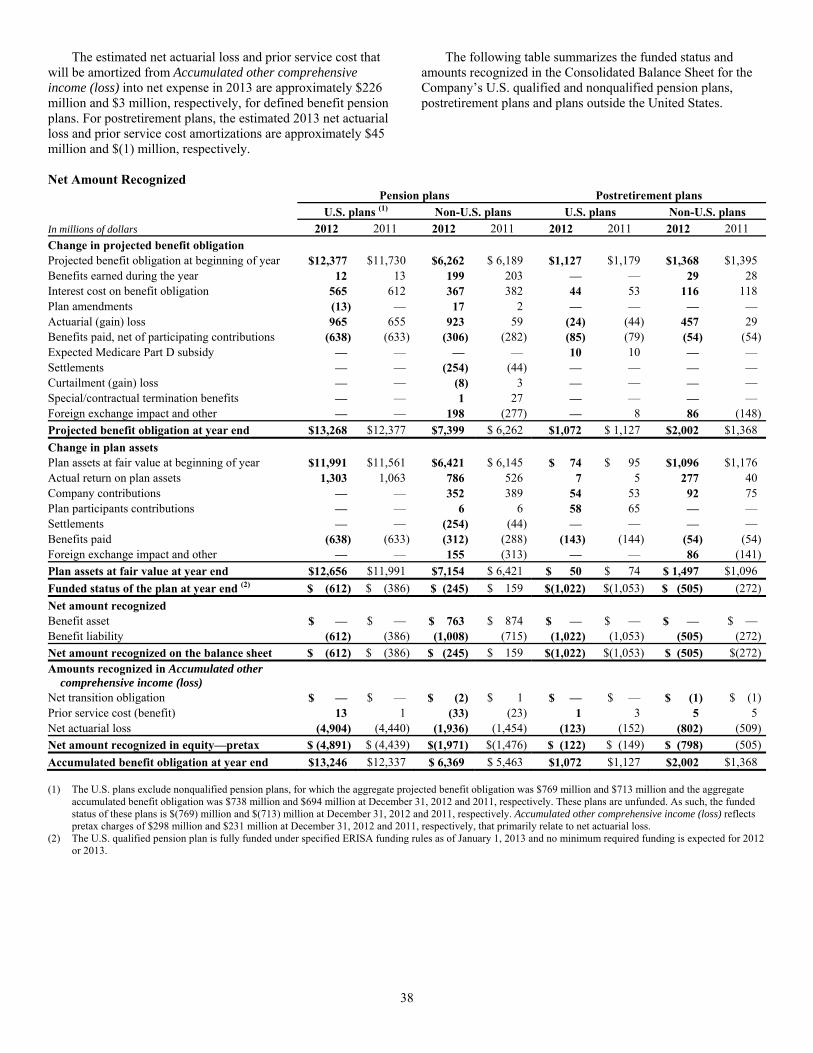
38
The estimated net actuarial loss and prior service cost that will be amortized from Accumulated other comprehensive income (loss) into net expense in 2013 are approximately $226 million and $3 million, respectively, for defined benefit pension plans. For postretirement plans, the estimated 2013 net actuarial loss and prior service cost amortizations are approximately $45 million and $(1) million, respectively.
The following table summarizes the funded status and amounts recognized in the Consolidated Balance Sheet for the Company’s U.S. qualified and nonqualified pension plans, postretirement plans and plans outside the United States.
Net Amount Recognized Pension plans Postretirement plans U.S. plans (1) Non-U.S. plans U.S. plans Non-U.S. plansIn millions of dollars 2012 2011 2012 2011 2012 2011 2012 2011 Change in projected benefit obligation Projected benefit obligation at beginning of year $12,377 $11,730 $6,262 $ 6,189 $1,127 $1,179 $1,368 $1,395 Benefits earned during the year 12 13 199 203 — — 29 28 Interest cost on benefit obligation 565 612 367 382 44 53 116 118 Plan amendments (13) — 17 2 — — — — Actuarial (gain) loss 965 655 923 59 (24) (44) 457 29 Benefits paid, net of participating contributions (638) (633) (306) (282) (85) (79) (54) (54)Expected Medicare Part D subsidy — — — — 10 10 — — Settlements — — (254) (44) — — — — Curtailment (gain) loss — — (8) 3 — — — — Special/contractual termination benefits — — 1 27 — — — — Foreign exchange impact and other — — 198 (277) — 8 86 (148)Projected benefit obligation at year end $13,268 $12,377 $7,399 $ 6,262 $1,072 $ 1,127 $2,002 $1,368 Change in plan assets Plan assets at fair value at beginning of year $11,991 $11,561 $6,421 $ 6,145 $ 74 $ 95 $1,096 $1,176 Actual return on plan assets 1,303 1,063 786 526 7 5 277 40 Company contributions — — 352 389 54 53 92 75 Plan participants contributions — — 6 6 58 65 — — Settlements — — (254) (44) — — — — Benefits paid (638) (633) (312) (288) (143) (144) (54) (54)Foreign exchange impact and other — — 155 (313) — — 86 (141)Plan assets at fair value at year end $12,656 $11,991 $7,154 $ 6,421 $ 50 $ 74 $ 1,497 $1,096 Funded status of the plan at year end (2) $ (612) $ (386) $ (245) $ 159 $(1,022) $(1,053) $ (505) (272)Net amount recognized Benefit asset $ — $ — $ 763 $ 874 $ — $ — $ — $ — Benefit liability (612) (386) (1,008) (715) (1,022) (1,053) (505) (272)Net amount recognized on the balance sheet $ (612) $ (386) $ (245) $ 159 $(1,022) $(1,053) $ (505) $(272)Amounts recognized in Accumulated other
comprehensive income (loss) Net transition obligation $ — $ — $ (2) $ 1 $ — $ — $ (1) $ (1)Prior service cost (benefit) 13 1 (33) (23) 1 3 5 5 Net actuarial loss (4,904) (4,440) (1,936) (1,454) (123) (152) (802) (509)Net amount recognized in equity—pretax $ (4,891) $ (4,439) $(1,971) $(1,476) $ (122) $ (149) $ (798) (505)Accumulated benefit obligation at year end $13,246 $12,337 $ 6,369 $ 5,463 $1,072 $1,127 $2,002 $1,368 (1) The U.S. plans exclude nonqualified pension plans, for which the aggregate projected benefit obligation was $769 million and $713 million and the aggregate
accumulated benefit obligation was $738 million and $694 million at December 31, 2012 and 2011, respectively. These plans are unfunded. As such, the funded status of these plans is $(769) million and $(713) million at December 31, 2012 and 2011, respectively. Accumulated other comprehensive income (loss) reflects pretax charges of $298 million and $231 million at December 31, 2012 and 2011, respectively, that primarily relate to net actuarial loss.
(2) The U.S. qualified pension plan is fully funded under specified ERISA funding rules as of January 1, 2013 and no minimum required funding is expected for 2012 or 2013.
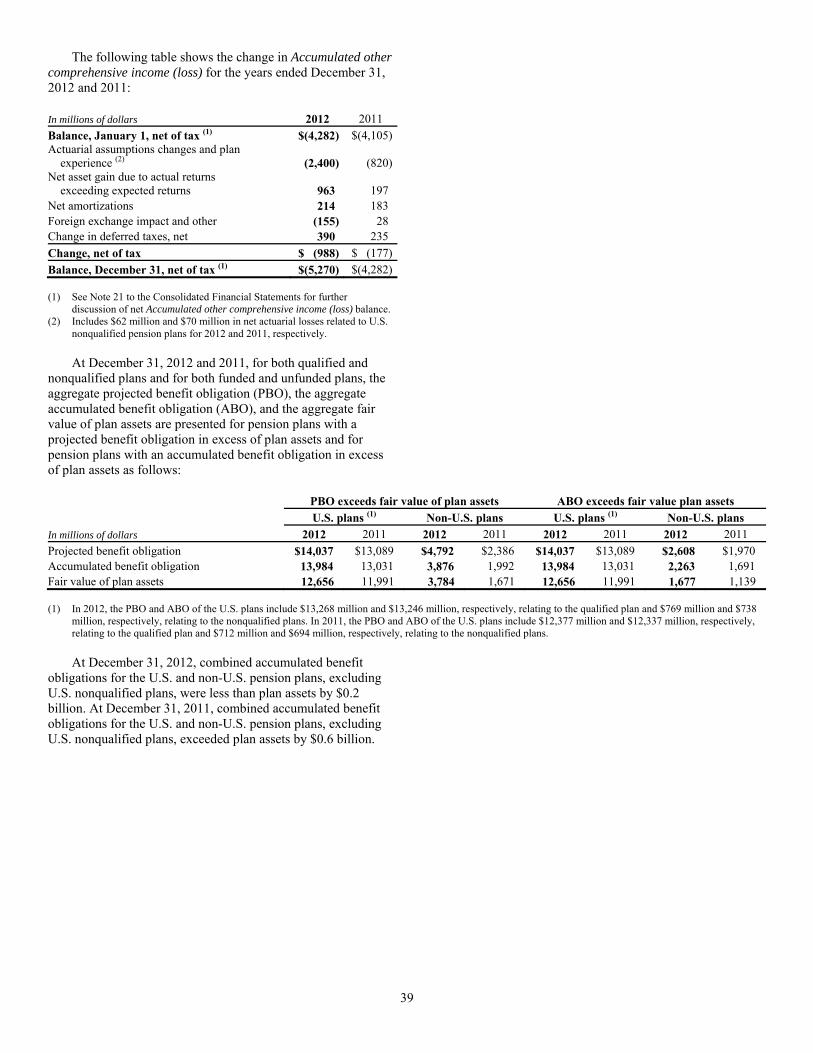
39
The following table shows the change in Accumulated other comprehensive income (loss) for the years ended December 31, 2012 and 2011: In millions of dollars 2012 2011 Balance, January 1, net of tax (1) $(4,282) $(4,105)Actuarial assumptions changes and plan
experience (2) (2,400) (820)Net asset gain due to actual returns
exceeding expected returns 963 197 Net amortizations 214 183 Foreign exchange impact and other (155) 28 Change in deferred taxes, net 390 235 Change, net of tax $ (988) $ (177)Balance, December 31, net of tax (1) $(5,270) $(4,282) (1) See Note 21 to the Consolidated Financial Statements for further
discussion of net Accumulated other comprehensive income (loss) balance. (2) Includes $62 million and $70 million in net actuarial losses related to U.S.
nonqualified pension plans for 2012 and 2011, respectively. At December 31, 2012 and 2011, for both qualified and nonqualified plans and for both funded and unfunded plans, the aggregate projected benefit obligation (PBO), the aggregate accumulated benefit obligation (ABO), and the aggregate fair value of plan assets are presented for pension plans with a projected benefit obligation in excess of plan assets and for pension plans with an accumulated benefit obligation in excess of plan assets as follows: PBO exceeds fair value of plan assets ABO exceeds fair value plan assets U.S. plans (1) Non-U.S. plans U.S. plans (1) Non-U.S. plansIn millions of dollars 2012 2011 2012 2011 2012 2011 2012 2011 Projected benefit obligation $14,037 $13,089 $4,792 $2,386 $14,037 $13,089 $2,608 $1,970 Accumulated benefit obligation 13,984 13,031 3,876 1,992 13,984 13,031 2,263 1,691 Fair value of plan assets 12,656 11,991 3,784 1,671 12,656 11,991 1,677 1,139 (1) In 2012, the PBO and ABO of the U.S. plans include $13,268 million and $13,246 million, respectively, relating to the qualified plan and $769 million and $738
million, respectively, relating to the nonqualified plans. In 2011, the PBO and ABO of the U.S. plans include $12,377 million and $12,337 million, respectively, relating to the qualified plan and $712 million and $694 million, respectively, relating to the nonqualified plans.
At December 31, 2012, combined accumulated benefit obligations for the U.S. and non-U.S. pension plans, excluding U.S. nonqualified plans, were less than plan assets by $0.2 billion. At December 31, 2011, combined accumulated benefit obligations for the U.S. and non-U.S. pension plans, excluding U.S. nonqualified plans, exceeded plan assets by $0.6 billion.
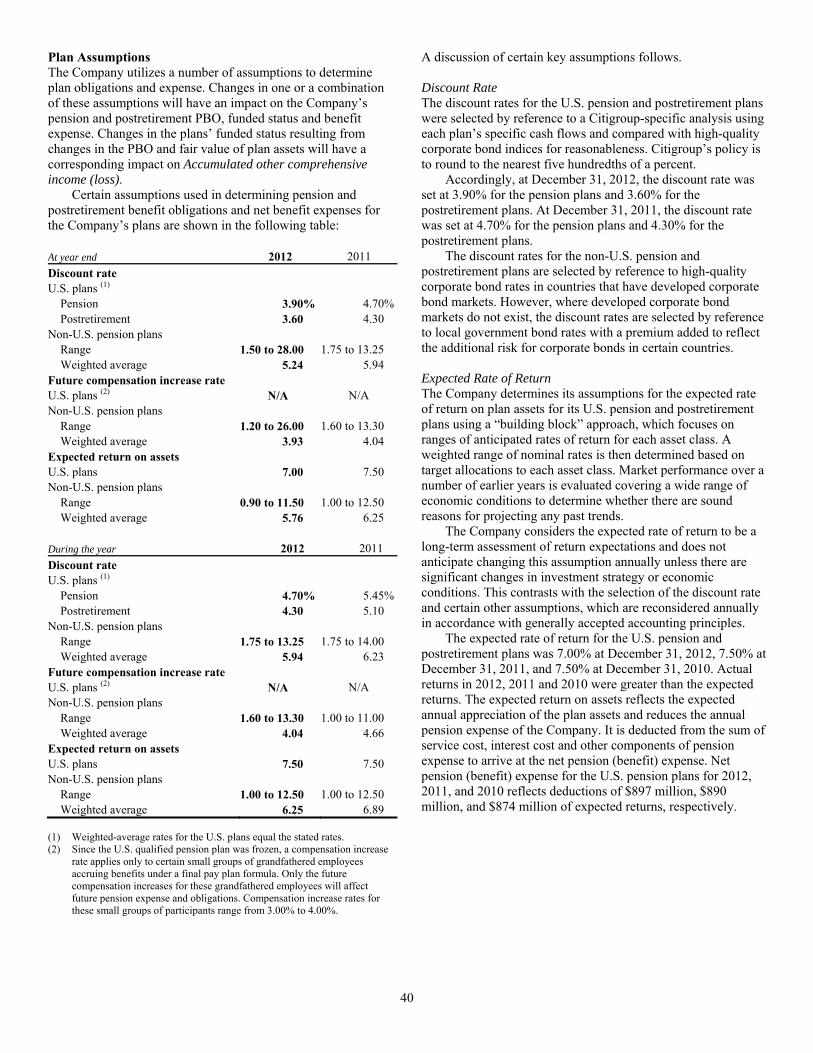
40
Plan Assumptions The Company utilizes a number of assumptions to determine plan obligations and expense. Changes in one or a combination of these assumptions will have an impact on the Company’s pension and postretirement PBO, funded status and benefit expense. Changes in the plans’ funded status resulting from changes in the PBO and fair value of plan assets will have a corresponding impact on Accumulated other comprehensive income (loss). Certain assumptions used in determining pension and postretirement benefit obligations and net benefit expenses for the Company’s plans are shown in the following table: At year end 2012 2011 Discount rate U.S. plans (1) Pension 3.90% 4.70% Postretirement 3.60 4.30 Non-U.S. pension plans Range 1.50 to 28.00 1.75 to 13.25 Weighted average 5.24 5.94 Future compensation increase rate U.S. plans (2) N/A N/A Non-U.S. pension plans Range 1.20 to 26.00 1.60 to 13.30 Weighted average 3.93 4.04 Expected return on assets U.S. plans 7.00 7.50 Non-U.S. pension plans Range 0.90 to 11.50 1.00 to 12.50 Weighted average 5.76 6.25 During the year 2012 2011 Discount rate U.S. plans (1) Pension 4.70% 5.45% Postretirement 4.30 5.10 Non-U.S. pension plans Range 1.75 to 13.25 1.75 to 14.00 Weighted average 5.94 6.23 Future compensation increase rate U.S. plans (2) N/A N/A Non-U.S. pension plans Range 1.60 to 13.30 1.00 to 11.00 Weighted average 4.04 4.66 Expected return on assets U.S. plans 7.50 7.50 Non-U.S. pension plans Range 1.00 to 12.50 1.00 to 12.50 Weighted average 6.25 6.89 (1) Weighted-average rates for the U.S. plans equal the stated rates. (2) Since the U.S. qualified pension plan was frozen, a compensation increase
rate applies only to certain small groups of grandfathered employees accruing benefits under a final pay plan formula. Only the future compensation increases for these grandfathered employees will affect future pension expense and obligations. Compensation increase rates for these small groups of participants range from 3.00% to 4.00%.
A discussion of certain key assumptions follows. Discount Rate The discount rates for the U.S. pension and postretirement plans were selected by reference to a Citigroup-specific analysis using each plan’s specific cash flows and compared with high-quality corporate bond indices for reasonableness. Citigroup’s policy is to round to the nearest five hundredths of a percent. Accordingly, at December 31, 2012, the discount rate was set at 3.90% for the pension plans and 3.60% for the postretirement plans. At December 31, 2011, the discount rate was set at 4.70% for the pension plans and 4.30% for the postretirement plans. The discount rates for the non-U.S. pension and postretirement plans are selected by reference to high-quality corporate bond rates in countries that have developed corporate bond markets. However, where developed corporate bond markets do not exist, the discount rates are selected by reference to local government bond rates with a premium added to reflect the additional risk for corporate bonds in certain countries. Expected Rate of Return The Company determines its assumptions for the expected rate of return on plan assets for its U.S. pension and postretirement plans using a “building block” approach, which focuses on ranges of anticipated rates of return for each asset class. A weighted range of nominal rates is then determined based on target allocations to each asset class. Market performance over a number of earlier years is evaluated covering a wide range of economic conditions to determine whether there are sound reasons for projecting any past trends. The Company considers the expected rate of return to be a long-term assessment of return expectations and does not anticipate changing this assumption annually unless there are significant changes in investment strategy or economic conditions. This contrasts with the selection of the discount rate and certain other assumptions, which are reconsidered annually in accordance with generally accepted accounting principles. The expected rate of return for the U.S. pension and postretirement plans was 7.00% at December 31, 2012, 7.50% at December 31, 2011, and 7.50% at December 31, 2010. Actual returns in 2012, 2011 and 2010 were greater than the expected returns. The expected return on assets reflects the expected annual appreciation of the plan assets and reduces the annual pension expense of the Company. It is deducted from the sum of service cost, interest cost and other components of pension expense to arrive at the net pension (benefit) expense. Net pension (benefit) expense for the U.S. pension plans for 2012, 2011, and 2010 reflects deductions of $897 million, $890 million, and $874 million of expected returns, respectively.

41
The following table shows the expected rate of return during the year versus actual rate of return on plan assets for 2012, 2011 and 2010 for the U.S. pension and postretirement plans: 2012 2011 2010 Expected rate of return (1) 7.50% 7.50% 7.75%Actual rate of return (2) 11.79% 11.13% 14.11% (1) Effective December 31, 2012, the expected rate of return decreased from
7.50% to 7.00%. (2) Actual rates of return are presented gross of fees. For the non-U.S. plans, pension expense for 2012 was reduced by the expected return of $399 million, compared with the actual return of $786 million. Pension expense for 2011 and 2010 was reduced by expected returns of $422 million and $378 million, respectively. Actual returns were higher in 2012, 2011, and 2010 than the expected returns in those years.
Sensitivities of Certain Key Assumptions The following tables summarize the effect on pension expense of a one-percentage-point change in the discount rate:
One-percentage-point increaseIn millions of dollars 2012 2011 2010 U.S. plans $18 $19 $19 Non-U.S. plans (48) (57) (49) One-percentage-point decrease In millions of dollars 2012 2011 2010 U.S. plans $(36) $(34) $(34) Non-U.S. plans 64 70 56 Since the U.S. qualified pension plan was frozen, the majority of the prospective service cost has been eliminated and the gain/loss amortization period was changed to the life expectancy for inactive participants. As a result, pension expense for the U.S. qualified pension plan is driven more by interest costs than service costs, and an increase in the discount rate would increase pension expense, while a decrease in the discount rate would decrease pension expense.
The following tables summarize the effect on pension expense of a one-percentage-point change in the expected rates of return: One-percentage-point increaseIn millions of dollars 2012 2011 2010 U.S. plans $(120) $(118) $(119)Non-U.S. plans (64) (62) (54) One-percentage-point decreaseIn millions of dollars 2012 2011 2010 U.S. plans $120 $118 $119 Non-U.S. plans 64 62 54 Health-Care Cost-Trend Rate Assumed health-care cost-trend rates were as follows: 2012 2011 Health-care cost increase rate for U.S. plans Following year 8.50% 9.00%Ultimate rate to which cost increase is assumed
to decline 5.00 5.00 Year in which the ultimate rate is reached 2020 2020 A one-percentage-point change in assumed health-care cost-trend rates would have the following effects:
One-percentage-
point increase
One- percentage-
point decreaseIn millions of dollars 2012 2011 2012 2011 Effect on benefits earned
and interest cost for U.S. plans $2 $2 $(1) $(2)
Effect on accumulated postretirement benefit obligation for U.S. plans 44 43 (39) (38)
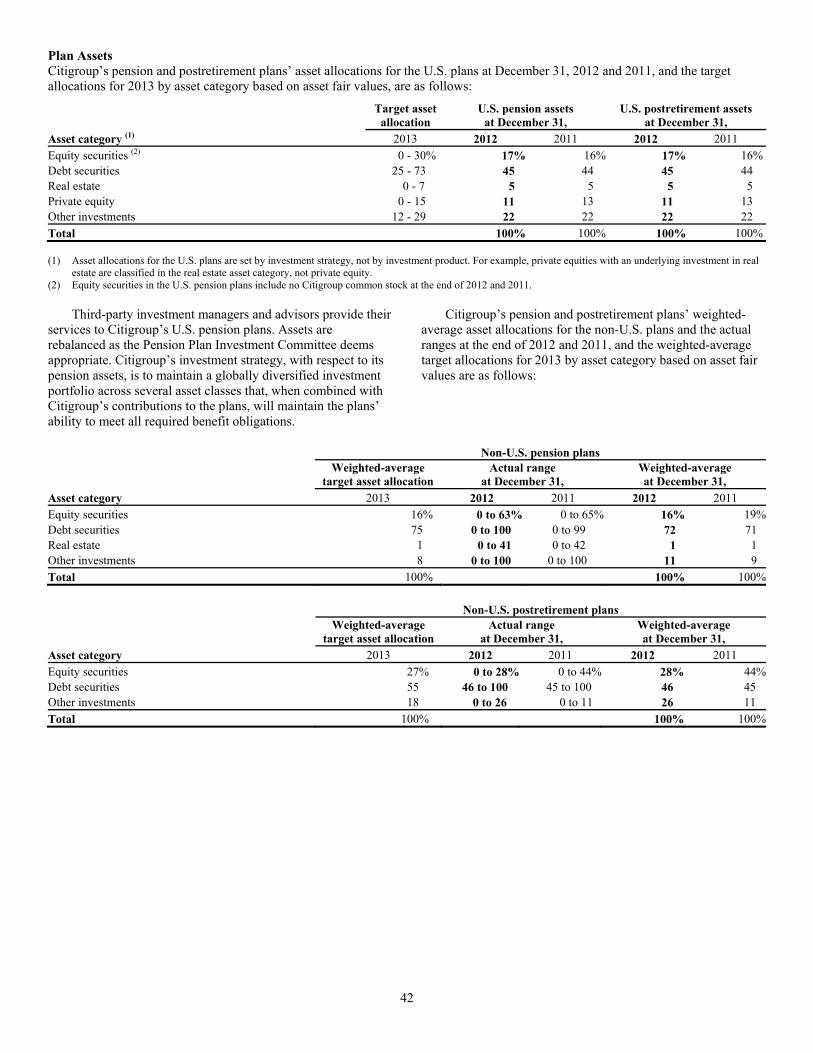
42
Plan Assets Citigroup’s pension and postretirement plans’ asset allocations for the U.S. plans at December 31, 2012 and 2011, and the target allocations for 2013 by asset category based on asset fair values, are as follows:
Target asset
allocationU.S. pension assets
at December 31,U.S. postretirement assets
at December 31,Asset category (1) 2013 2012 2011 2012 2011 Equity securities (2) 0 - 30% 17% 16% 17% 16%Debt securities 25 - 73 45 44 45 44 Real estate 0 - 7 5 5 5 5 Private equity 0 - 15 11 13 11 13 Other investments 12 - 29 22 22 22 22 Total 100% 100% 100% 100% (1) Asset allocations for the U.S. plans are set by investment strategy, not by investment product. For example, private equities with an underlying investment in real
estate are classified in the real estate asset category, not private equity. (2) Equity securities in the U.S. pension plans include no Citigroup common stock at the end of 2012 and 2011. Third-party investment managers and advisors provide their services to Citigroup’s U.S. pension plans. Assets are rebalanced as the Pension Plan Investment Committee deems appropriate. Citigroup’s investment strategy, with respect to its pension assets, is to maintain a globally diversified investment portfolio across several asset classes that, when combined with Citigroup’s contributions to the plans, will maintain the plans’ ability to meet all required benefit obligations.
Citigroup’s pension and postretirement plans’ weighted-average asset allocations for the non-U.S. plans and the actual ranges at the end of 2012 and 2011, and the weighted-average target allocations for 2013 by asset category based on asset fair values are as follows:
Non-U.S. pension plans
Weighted-average
target asset allocationActual range
at December 31,Weighted-average at December 31,
Asset category 2013 2012 2011 2012 2011 Equity securities 16% 0 to 63% 0 to 65% 16% 19%Debt securities 75 0 to 100 0 to 99 72 71 Real estate 1 0 to 41 0 to 42 1 1 Other investments 8 0 to 100 0 to 100 11 9 Total 100% 100% 100% Non-U.S. postretirement plans
Weighted-average
target asset allocationActual range
at December 31,Weighted-average at December 31,
Asset category 2013 2012 2011 2012 2011 Equity securities 27% 0 to 28% 0 to 44% 28% 44%Debt securities 55 46 to 100 45 to 100 46 45 Other investments 18 0 to 26 0 to 11 26 11 Total 100% 100% 100%
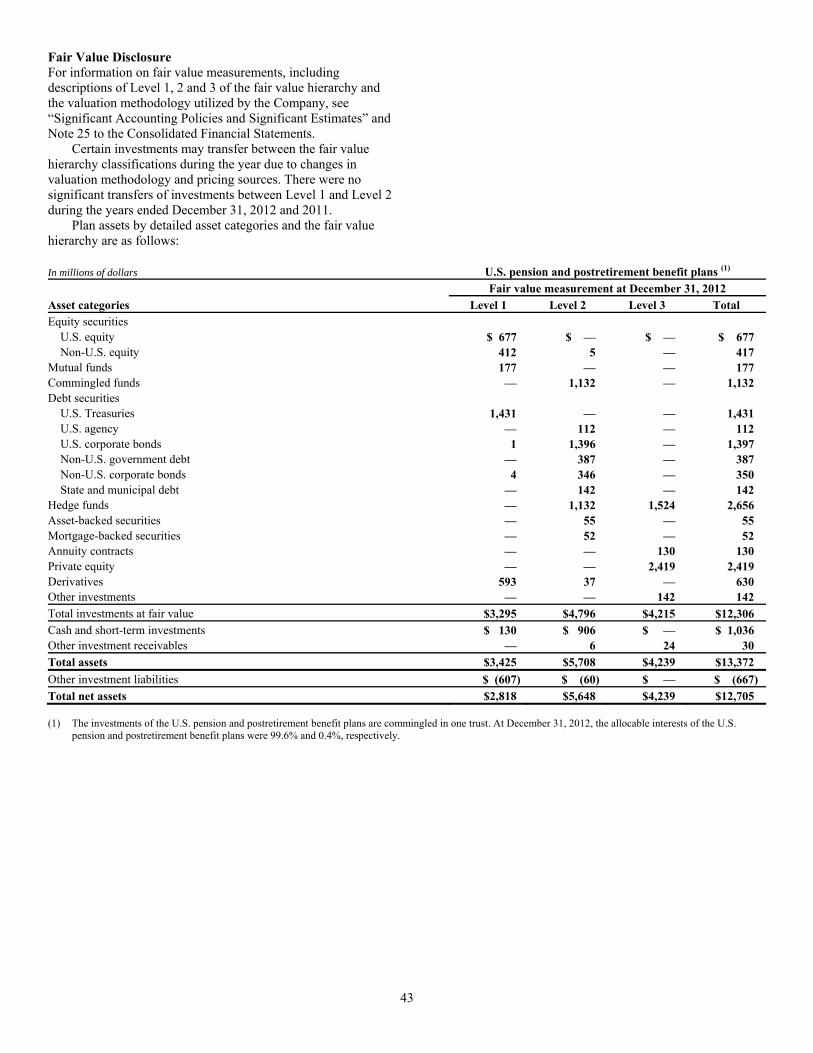
43
Fair Value Disclosure For information on fair value measurements, including descriptions of Level 1, 2 and 3 of the fair value hierarchy and the valuation methodology utilized by the Company, see “Significant Accounting Policies and Significant Estimates” and Note 25 to the Consolidated Financial Statements. Certain investments may transfer between the fair value hierarchy classifications during the year due to changes in valuation methodology and pricing sources. There were no significant transfers of investments between Level 1 and Level 2 during the years ended December 31, 2012 and 2011. Plan assets by detailed asset categories and the fair value hierarchy are as follows: In millions of dollars U.S. pension and postretirement benefit plans (1)
Fair value measurement at December 31, 2012Asset categories Level 1 Level 2 Level 3 TotalEquity securities U.S. equity $ 677 $ — $ — $ 677 Non-U.S. equity 412 5 — 417Mutual funds 177 — — 177Commingled funds — 1,132 — 1,132Debt securities U.S. Treasuries 1,431 — — 1,431 U.S. agency — 112 — 112 U.S. corporate bonds 1 1,396 — 1,397 Non-U.S. government debt — 387 — 387 Non-U.S. corporate bonds 4 346 — 350 State and municipal debt — 142 — 142Hedge funds — 1,132 1,524 2,656Asset-backed securities — 55 — 55Mortgage-backed securities — 52 — 52Annuity contracts — — 130 130Private equity — — 2,419 2,419Derivatives 593 37 — 630Other investments — — 142 142Total investments at fair value $3,295 $4,796 $4,215 $12,306Cash and short-term investments $ 130 $ 906 $ — $ 1,036Other investment receivables — 6 24 30Total assets $3,425 $5,708 $4,239 $13,372Other investment liabilities $ (607) $ (60) $ — $ (667)Total net assets $2,818 $5,648 $4,239 $12,705 (1) The investments of the U.S. pension and postretirement benefit plans are commingled in one trust. At December 31, 2012, the allocable interests of the U.S.
pension and postretirement benefit plans were 99.6% and 0.4%, respectively.
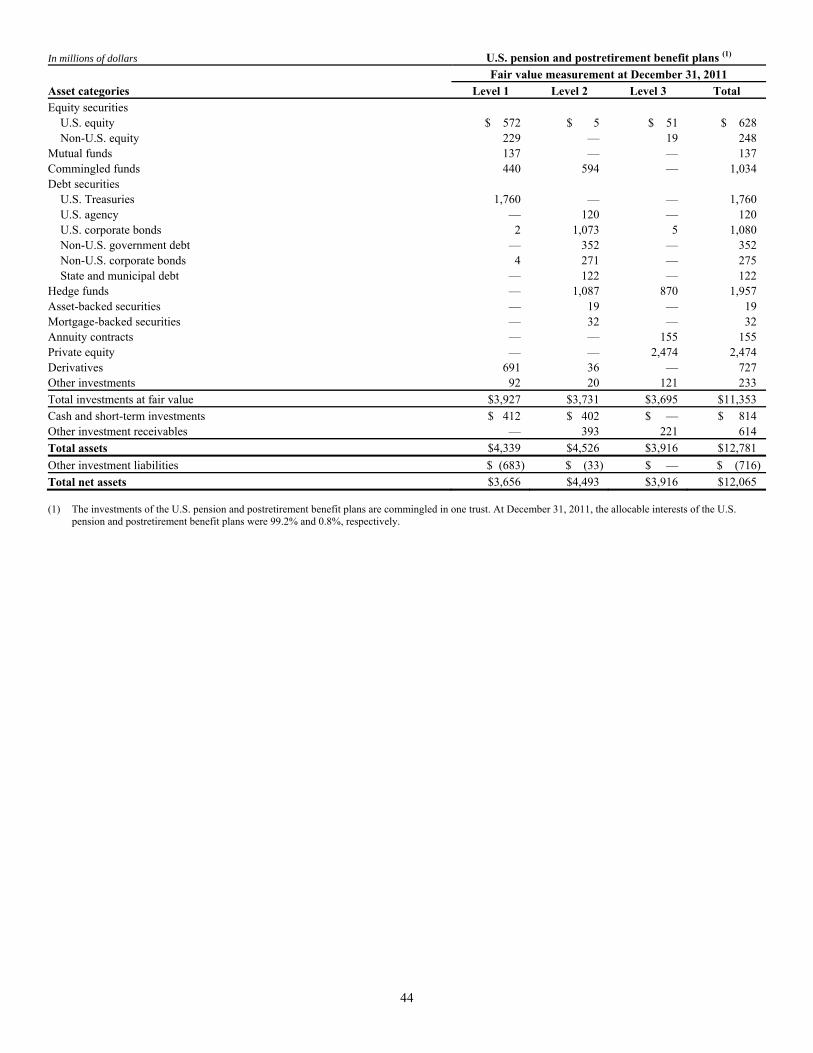
44
In millions of dollars U.S. pension and postretirement benefit plans (1)
Fair value measurement at December 31, 2011Asset categories Level 1 Level 2 Level 3 TotalEquity securities U.S. equity $ 572 $ 5 $ 51 $ 628 Non-U.S. equity 229 — 19 248 Mutual funds 137 — — 137 Commingled funds 440 594 — 1,034 Debt securities U.S. Treasuries 1,760 — — 1,760 U.S. agency — 120 — 120 U.S. corporate bonds 2 1,073 5 1,080 Non-U.S. government debt — 352 — 352 Non-U.S. corporate bonds 4 271 — 275 State and municipal debt — 122 — 122 Hedge funds — 1,087 870 1,957 Asset-backed securities — 19 — 19 Mortgage-backed securities — 32 — 32 Annuity contracts — — 155 155 Private equity — — 2,474 2,474 Derivatives 691 36 — 727 Other investments 92 20 121 233 Total investments at fair value $3,927 $3,731 $3,695 $11,353 Cash and short-term investments $ 412 $ 402 $ — $ 814 Other investment receivables — 393 221 614 Total assets $4,339 $4,526 $3,916 $12,781 Other investment liabilities $ (683) $ (33) $ — $ (716)Total net assets $3,656 $4,493 $3,916 $12,065 (1) The investments of the U.S. pension and postretirement benefit plans are commingled in one trust. At December 31, 2011, the allocable interests of the U.S.
pension and postretirement benefit plans were 99.2% and 0.8%, respectively.

45
In millions of dollars Non-U.S. pension and postretirement benefit plans Fair value measurement at December 31, 2012Asset categories Level 1 Level 2 Level 3 TotalEquity securities U.S. equity $ 12 $ 12 $ — $ 24 Non-U.S. equity 88 77 48 213Mutual funds 31 4,583 — 4,614Commingled funds 26 — — 26Debt securities U.S. Treasuries — 1 — 1 U.S. corporate bonds 10 478 — 488 Non-U.S. government debt 1,806 144 4 1,954 Non-U.S. corporate bonds 162 804 4 970 State and municipal debt — — — —Hedge funds — — 16 16Mortgage-backed securities — 1 — 1Annuity contracts — 5 6 11Derivatives — 40 — 40Other investments 3 9 219 231Total investments at fair value $2,138 $6,154 $297 $8,589Cash and short-term investments $ 56 $ 4 $ 3 $ 63Total assets $2,194 $6,158 $300 $8,652 In millions of dollars Non-U.S. pension and postretirement benefit plans Fair value measurement at December 31, 2011Asset categories Level 1 Level 2 Level 3 TotalEquity securities U.S. equity $ 12 $ — $ — $ 12 Non-U.S. equity 48 180 5 233Mutual funds 11 4,439 32 4,482Commingled funds 26 — — 26Debt securities U.S. Treasuries 1 — — 1 U.S. corporate bonds 1 379 — 380 Non-U.S. government debt 1,484 129 5 1,618 Non-U.S. corporate bonds 5 318 3 326 State and municipal debt — — — —Hedge funds — 3 12 15Mortgage-backed securities 1 — — 1Annuity contracts — 3 — 3Derivatives — 3 — 3Other investments 3 6 240 249Total investments at fair value $1,592 $5,460 $297 $7,349Cash and short-term investments $ 168 $ — $ — $ 168Total assets $1,760 $5,460 $297 $7,517
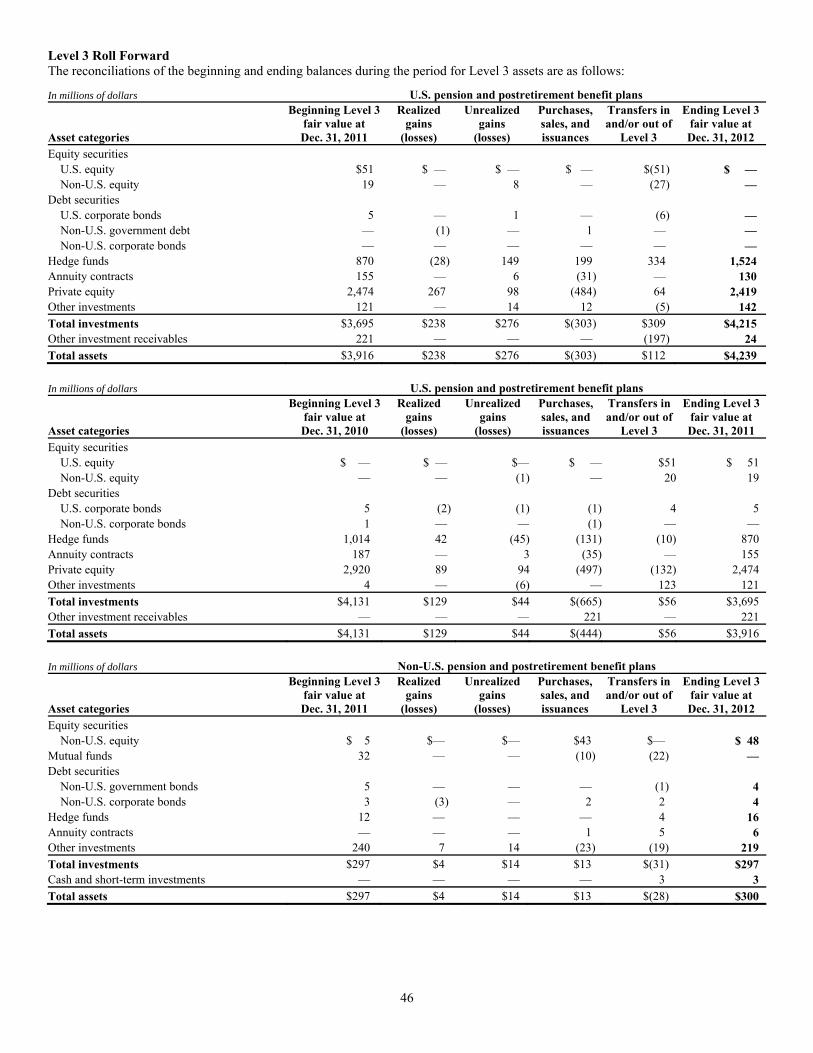
46
Level 3 Roll Forward The reconciliations of the beginning and ending balances during the period for Level 3 assets are as follows:
In millions of dollars U.S. pension and postretirement benefit plans
Asset categories
Beginning Level 3fair value at Dec. 31, 2011
Realized gains
(losses)
Unrealizedgains
(losses)
Purchases, sales, and issuances
Transfers inand/or out of
Level 3
Ending Level 3fair value at Dec. 31, 2012
Equity securities U.S. equity $51 $ — $ — $ — $(51) $ — Non-U.S. equity 19 — 8 — (27) —Debt securities U.S. corporate bonds 5 — 1 — (6) — Non-U.S. government debt — (1) — 1 — — Non-U.S. corporate bonds — — — — — —Hedge funds 870 (28) 149 199 334 1,524Annuity contracts 155 — 6 (31) — 130Private equity 2,474 267 98 (484) 64 2,419Other investments 121 — 14 12 (5) 142Total investments $3,695 $238 $276 $(303) $309 $4,215Other investment receivables 221 — — — (197) 24Total assets $3,916 $238 $276 $(303) $112 $4,239 In millions of dollars U.S. pension and postretirement benefit plans
Asset categories
Beginning Level 3fair value at Dec. 31, 2010
Realized gains
(losses)
Unrealizedgains
(losses)
Purchases, sales, and issuances
Transfers inand/or out of
Level 3
Ending Level 3fair value at Dec. 31, 2011
Equity securities U.S. equity $ — $ — $— $ — $51 $ 51 Non-U.S. equity — — (1) — 20 19 Debt securities U.S. corporate bonds 5 (2) (1) (1) 4 5 Non-U.S. corporate bonds 1 — — (1) — — Hedge funds 1,014 42 (45) (131) (10) 870 Annuity contracts 187 — 3 (35) — 155 Private equity 2,920 89 94 (497) (132) 2,474 Other investments 4 — (6) — 123 121 Total investments $4,131 $129 $44 $(665) $56 $3,695 Other investment receivables — — — 221 — 221 Total assets $4,131 $129 $44 $(444) $56 $3,916 In millions of dollars Non-U.S. pension and postretirement benefit plans
Asset categories
Beginning Level 3fair value at Dec. 31, 2011
Realized gains
(losses)
Unrealizedgains
(losses)
Purchases, sales, and issuances
Transfers inand/or out of
Level 3
Ending Level 3fair value at Dec. 31, 2012
Equity securities Non-U.S. equity $ 5 $— $— $43 $— $ 48Mutual funds 32 — — (10) (22) —Debt securities Non-U.S. government bonds 5 — — — (1) 4 Non-U.S. corporate bonds 3 (3) — 2 2 4Hedge funds 12 — — — 4 16Annuity contracts — — — 1 5 6Other investments 240 7 14 (23) (19) 219Total investments $297 $4 $14 $13 $(31) $297Cash and short-term investments — — — — 3 3Total assets $297 $4 $14 $13 $(28) $300
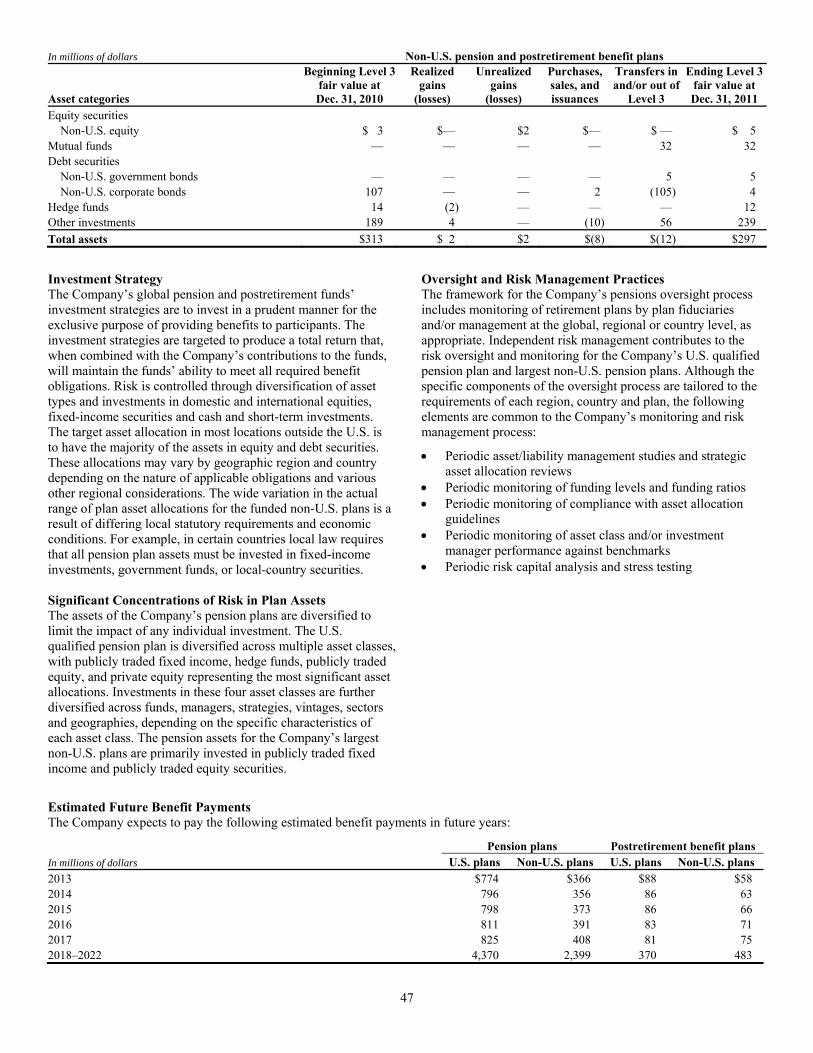
47
In millions of dollars Non-U.S. pension and postretirement benefit plans
Asset categories
Beginning Level 3fair value at Dec. 31, 2010
Realized gains
(losses)
Unrealizedgains
(losses)
Purchases, sales, and issuances
Transfers inand/or out of
Level 3
Ending Level 3fair value atDec. 31, 2011
Equity securities Non-U.S. equity $ 3 $— $2 $— $ — $ 5 Mutual funds — — — — 32 32 Debt securities Non-U.S. government bonds — — — — 5 5 Non-U.S. corporate bonds 107 — — 2 (105) 4 Hedge funds 14 (2) — — — 12 Other investments 189 4 — (10) 56 239 Total assets $313 $ 2 $2 $(8) $(12) $297
Investment Strategy The Company’s global pension and postretirement funds’ investment strategies are to invest in a prudent manner for the exclusive purpose of providing benefits to participants. The investment strategies are targeted to produce a total return that, when combined with the Company’s contributions to the funds, will maintain the funds’ ability to meet all required benefit obligations. Risk is controlled through diversification of asset types and investments in domestic and international equities, fixed-income securities and cash and short-term investments. The target asset allocation in most locations outside the U.S. is to have the majority of the assets in equity and debt securities. These allocations may vary by geographic region and country depending on the nature of applicable obligations and various other regional considerations. The wide variation in the actual range of plan asset allocations for the funded non-U.S. plans is a result of differing local statutory requirements and economic conditions. For example, in certain countries local law requires that all pension plan assets must be invested in fixed-income investments, government funds, or local-country securities. Significant Concentrations of Risk in Plan Assets The assets of the Company’s pension plans are diversified to limit the impact of any individual investment. The U.S. qualified pension plan is diversified across multiple asset classes, with publicly traded fixed income, hedge funds, publicly traded equity, and private equity representing the most significant asset allocations. Investments in these four asset classes are further diversified across funds, managers, strategies, vintages, sectors and geographies, depending on the specific characteristics of each asset class. The pension assets for the Company’s largest non-U.S. plans are primarily invested in publicly traded fixed income and publicly traded equity securities.
Oversight and Risk Management Practices The framework for the Company’s pensions oversight process includes monitoring of retirement plans by plan fiduciaries and/or management at the global, regional or country level, as appropriate. Independent risk management contributes to the risk oversight and monitoring for the Company’s U.S. qualified pension plan and largest non-U.S. pension plans. Although the specific components of the oversight process are tailored to the requirements of each region, country and plan, the following elements are common to the Company’s monitoring and risk management process:
• Periodic asset/liability management studies and strategic asset allocation reviews
• Periodic monitoring of funding levels and funding ratios • Periodic monitoring of compliance with asset allocation
guidelines • Periodic monitoring of asset class and/or investment
manager performance against benchmarks • Periodic risk capital analysis and stress testing
Estimated Future Benefit Payments The Company expects to pay the following estimated benefit payments in future years:
Pension plans Postretirement benefit plansIn millions of dollars U.S. plans Non-U.S. plans U.S. plans Non-U.S. plans2013 $774 $366 $88 $58 2014 796 356 86 63 2015 798 373 86 66 2016 811 391 83 71 2017 825 408 81 75 2018–2022 4,370 2,399 370 483
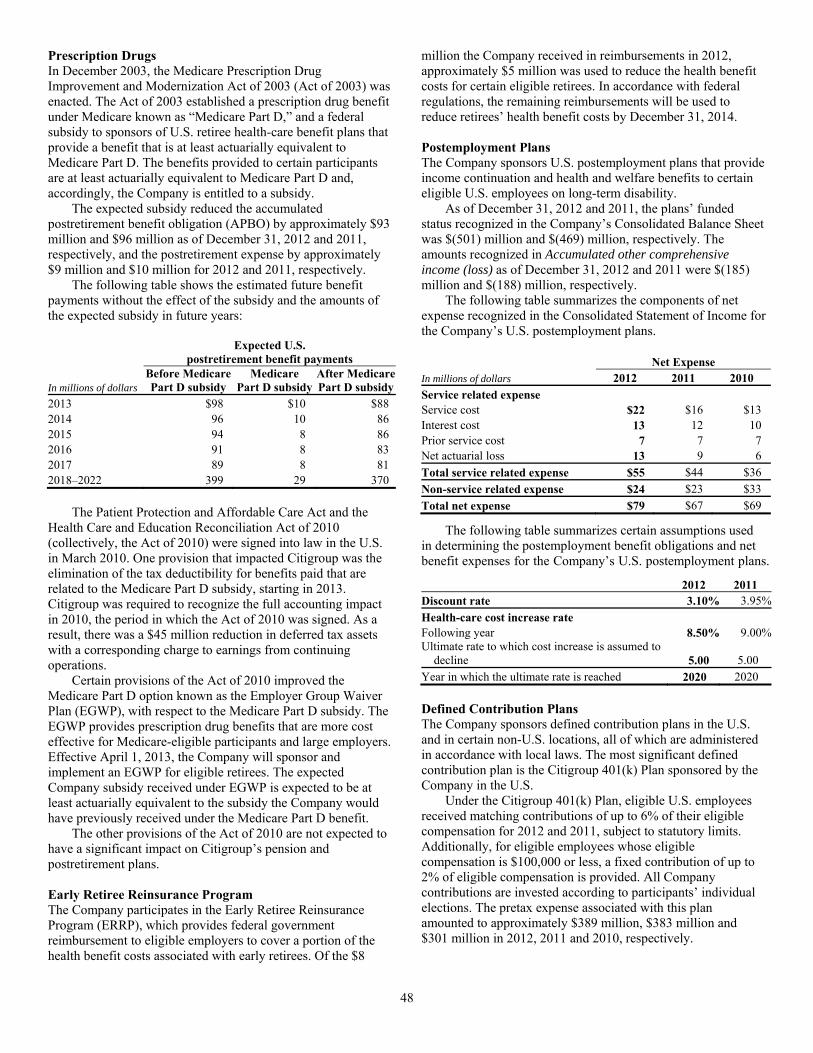
48
Prescription Drugs In December 2003, the Medicare Prescription Drug Improvement and Modernization Act of 2003 (Act of 2003) was enacted. The Act of 2003 established a prescription drug benefit under Medicare known as “Medicare Part D,” and a federal subsidy to sponsors of U.S. retiree health-care benefit plans that provide a benefit that is at least actuarially equivalent to Medicare Part D. The benefits provided to certain participants are at least actuarially equivalent to Medicare Part D and, accordingly, the Company is entitled to a subsidy. The expected subsidy reduced the accumulated postretirement benefit obligation (APBO) by approximately $93 million and $96 million as of December 31, 2012 and 2011, respectively, and the postretirement expense by approximately $9 million and $10 million for 2012 and 2011, respectively. The following table shows the estimated future benefit payments without the effect of the subsidy and the amounts of the expected subsidy in future years: Expected U.S.
postretirement benefit payments
In millions of dollars Before Medicare Part D subsidy
Medicare Part D subsidy
After MedicarePart D subsidy
2013 $98 $10 $88 2014 96 10 86 2015 94 8 86 2016 91 8 83 2017 89 8 81 2018–2022 399 29 370 The Patient Protection and Affordable Care Act and the Health Care and Education Reconciliation Act of 2010 (collectively, the Act of 2010) were signed into law in the U.S. in March 2010. One provision that impacted Citigroup was the elimination of the tax deductibility for benefits paid that are related to the Medicare Part D subsidy, starting in 2013. Citigroup was required to recognize the full accounting impact in 2010, the period in which the Act of 2010 was signed. As a result, there was a $45 million reduction in deferred tax assets with a corresponding charge to earnings from continuing operations. Certain provisions of the Act of 2010 improved the Medicare Part D option known as the Employer Group Waiver Plan (EGWP), with respect to the Medicare Part D subsidy. The EGWP provides prescription drug benefits that are more cost effective for Medicare-eligible participants and large employers. Effective April 1, 2013, the Company will sponsor and implement an EGWP for eligible retirees. The expected Company subsidy received under EGWP is expected to be at least actuarially equivalent to the subsidy the Company would have previously received under the Medicare Part D benefit. The other provisions of the Act of 2010 are not expected to have a significant impact on Citigroup’s pension and postretirement plans. Early Retiree Reinsurance Program The Company participates in the Early Retiree Reinsurance Program (ERRP), which provides federal government reimbursement to eligible employers to cover a portion of the health benefit costs associated with early retirees. Of the $8
million the Company received in reimbursements in 2012, approximately $5 million was used to reduce the health benefit costs for certain eligible retirees. In accordance with federal regulations, the remaining reimbursements will be used to reduce retirees’ health benefit costs by December 31, 2014. Postemployment Plans The Company sponsors U.S. postemployment plans that provide income continuation and health and welfare benefits to certain eligible U.S. employees on long-term disability. As of December 31, 2012 and 2011, the plans’ funded status recognized in the Company’s Consolidated Balance Sheet was $(501) million and $(469) million, respectively. The amounts recognized in Accumulated other comprehensive income (loss) as of December 31, 2012 and 2011 were $(185) million and $(188) million, respectively. The following table summarizes the components of net expense recognized in the Consolidated Statement of Income for the Company’s U.S. postemployment plans. Net ExpenseIn millions of dollars 2012 2011 2010Service related expense Service cost $22 $16 $13 Interest cost 13 12 10 Prior service cost 7 7 7 Net actuarial loss 13 9 6 Total service related expense $55 $44 $36 Non-service related expense $24 $23 $33 Total net expense $79 $67 $69
The following table summarizes certain assumptions used in determining the postemployment benefit obligations and net benefit expenses for the Company’s U.S. postemployment plans.
2012 2011Discount rate 3.10% 3.95%Health-care cost increase rate Following year 8.50% 9.00%Ultimate rate to which cost increase is assumed to
decline 5.00 5.00 Year in which the ultimate rate is reached 2020 2020 Defined Contribution Plans The Company sponsors defined contribution plans in the U.S. and in certain non-U.S. locations, all of which are administered in accordance with local laws. The most significant defined contribution plan is the Citigroup 401(k) Plan sponsored by the Company in the U.S. Under the Citigroup 401(k) Plan, eligible U.S. employees received matching contributions of up to 6% of their eligible compensation for 2012 and 2011, subject to statutory limits. Additionally, for eligible employees whose eligible compensation is $100,000 or less, a fixed contribution of up to 2% of eligible compensation is provided. All Company contributions are invested according to participants’ individual elections. The pretax expense associated with this plan amounted to approximately $389 million, $383 million and $301 million in 2012, 2011 and 2010, respectively.

49
10. INCOME TAXES
In millions of dollars 2012 2011 2010 Current Federal $ (71) $ (144) $ (249)Foreign 3,869 3,552 3,223 State 300 241 207 Total current income taxes $ 4,098 $3,649 $ 3,181 Deferred Federal $(4,943) $ (793) $ (933)Foreign 900 628 279 State (48) 91 (310)Total deferred income taxes $(4,091) $ (74) $ (964)Provision (benefit) for income tax on
continuing operations before noncontrolling interests (1) $ 7 $3,575 $ 2,217
Provision (benefit) for income taxes on discontinued operations (52) 12 (546)
Provision (benefit) for income taxes on cumulative effect of accounting changes (58) — (4,978)
Income tax expense (benefit) reported in stockholders’ equity related to:
Foreign currency translation (709) (609) (739) Securities available-for-sale 369 1,495 1,167 Employee stock plans 265 297 600 Cash flow hedges 311 (92) 325 Pension liability adjustments (390) (235) (434)Income taxes before noncontrolling
interests $ (257) $4,443 $(2,388) (1) Includes the effect of securities transactions and OTTI losses resulting in a
provision (benefit) of $1,138 million and $(1,740) million in 2012, $699 million and $(789) million in 2011 and $844 million and $(494) million in 2010, respectively.
The reconciliation of the federal statutory income tax rate to the Company’s effective income tax rate applicable to income from continuing operations (before noncontrolling interests and the cumulative effect of accounting changes) for the years ended December 31 was as follows: 2012 2011 2010 Federal statutory rate 35.0% 35.0% 35.0%State income taxes, net of federal benefit 3.0 1.5 (0.1) Foreign income tax rate differential (5.0) (8.4) (10.0) Audit settlements (1) (11.7) — (0.5) Effect of tax law changes (2) (0.1) 2.0 (0.1) Basis difference in affiliates (9.1) — — Tax advantaged investments (12.2) (6.0) (6.7) Other, net 0.2 0.2 (0.7) Effective income tax rate 0.1% 24.3% 16.9% (1) For 2012 and 2010, relates to the conclusion of the audit of various issues
in the Company’s 2006–2008 and 2003–2005 U.S. federal tax audits, respectively. 2012 also includes an amount related to the conclusion of a New York City tax audit for 2006–2008.
(2) For 2011, includes the results of the Japan tax rate change which resulted in a $300 million DTA charge.
Deferred income taxes at December 31 related to the following: In millions of dollars 2012 2011 Deferred tax assets Credit loss deduction $10,947 $12,481 Deferred compensation and employee benefits 4,890 4,936 Restructuring and settlement reserves 1,645 1,331 Unremitted foreign earnings 5,114 7,362 Investment and loan basis differences 3,878 2,358 Cash flow hedges 1,361 1,673 Tax credit and net operating loss carry-
forwards 28,087 22,764 Other deferred tax assets 2,651 2,127 Gross deferred tax assets $58,573 $55,032 Valuation allowance — — Deferred tax assets after valuation
allowance $58,573 $55,032 Deferred tax liabilities Deferred policy acquisition costs and value of
insurance in force $ (495) $ (591) Fixed assets and leases (623) (1,361) Intangibles (1,517) (710) Debt valuation adjustment on Citi liabilities (73) (533) Other deferred tax liabilities (543) (307) Gross deferred tax liabilities $ (3,251) $ (3,502) Net deferred tax asset $55,322 $51,530
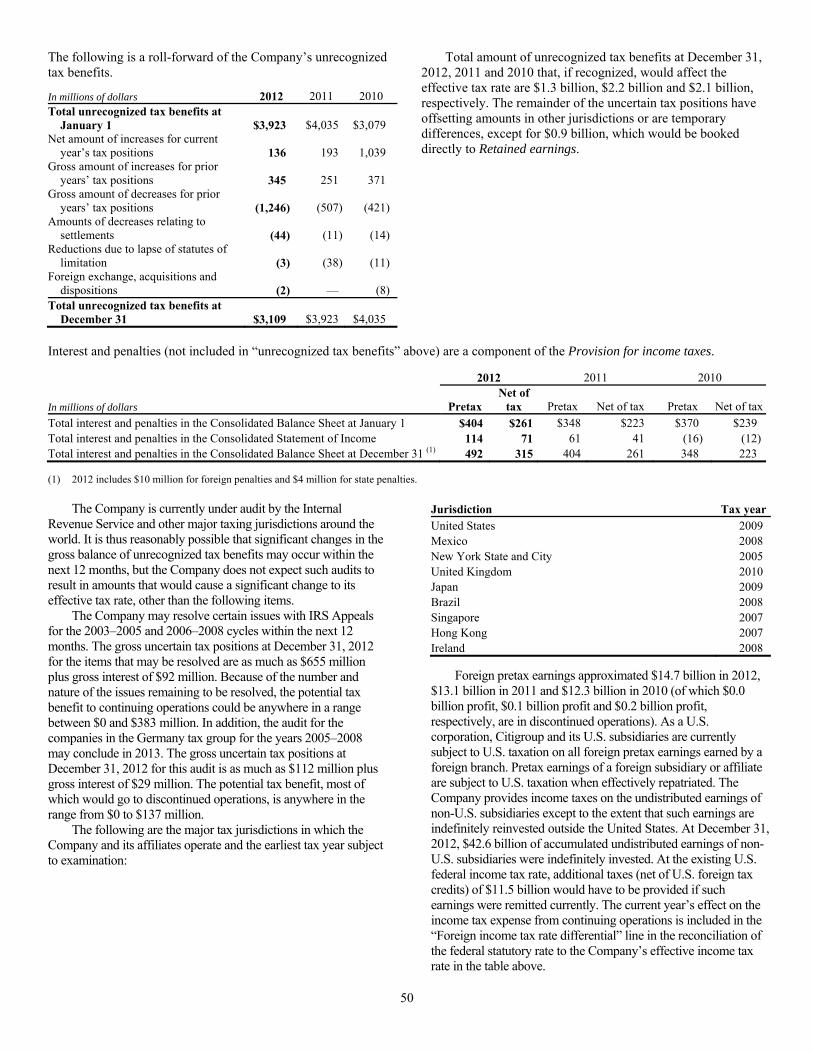
50
The following is a roll-forward of the Company’s unrecognized tax benefits.
In millions of dollars 2012 2011 2010 Total unrecognized tax benefits at
January 1 $3,923 $4,035 $3,079 Net amount of increases for current
year’s tax positions 136 193 1,039 Gross amount of increases for prior
years’ tax positions 345 251 371 Gross amount of decreases for prior
years’ tax positions (1,246) (507) (421) Amounts of decreases relating to
settlements (44) (11) (14) Reductions due to lapse of statutes of
limitation (3) (38) (11) Foreign exchange, acquisitions and
dispositions (2) — (8) Total unrecognized tax benefits at
December 31 $3,109 $3,923 $4,035
Total amount of unrecognized tax benefits at December 31, 2012, 2011 and 2010 that, if recognized, would affect the effective tax rate are $1.3 billion, $2.2 billion and $2.1 billion, respectively. The remainder of the uncertain tax positions have offsetting amounts in other jurisdictions or are temporary differences, except for $0.9 billion, which would be booked directly to Retained earnings.
Interest and penalties (not included in “unrecognized tax benefits” above) are a component of the Provision for income taxes.
2012 2011 2010
In millions of dollars PretaxNet of
tax Pretax Net of tax Pretax Net of taxTotal interest and penalties in the Consolidated Balance Sheet at January 1 $404 $261 $348 $223 $370 $239 Total interest and penalties in the Consolidated Statement of Income 114 71 61 41 (16) (12)Total interest and penalties in the Consolidated Balance Sheet at December 31 (1) 492 315 404 261 348 223
(1) 2012 includes $10 million for foreign penalties and $4 million for state penalties. The Company is currently under audit by the Internal Revenue Service and other major taxing jurisdictions around the world. It is thus reasonably possible that significant changes in the gross balance of unrecognized tax benefits may occur within the next 12 months, but the Company does not expect such audits to result in amounts that would cause a significant change to its effective tax rate, other than the following items. The Company may resolve certain issues with IRS Appeals for the 2003–2005 and 2006–2008 cycles within the next 12 months. The gross uncertain tax positions at December 31, 2012 for the items that may be resolved are as much as $655 million plus gross interest of $92 million. Because of the number and nature of the issues remaining to be resolved, the potential tax benefit to continuing operations could be anywhere in a range between $0 and $383 million. In addition, the audit for the companies in the Germany tax group for the years 2005–2008 may conclude in 2013. The gross uncertain tax positions at December 31, 2012 for this audit is as much as $112 million plus gross interest of $29 million. The potential tax benefit, most of which would go to discontinued operations, is anywhere in the range from $0 to $137 million. The following are the major tax jurisdictions in which the Company and its affiliates operate and the earliest tax year subject to examination:
Jurisdiction Tax yearUnited States 2009 Mexico 2008 New York State and City 2005 United Kingdom 2010 Japan 2009 Brazil 2008 Singapore 2007 Hong Kong 2007 Ireland 2008
Foreign pretax earnings approximated $14.7 billion in 2012, $13.1 billion in 2011 and $12.3 billion in 2010 (of which $0.0 billion profit, $0.1 billion profit and $0.2 billion profit, respectively, are in discontinued operations). As a U.S. corporation, Citigroup and its U.S. subsidiaries are currently subject to U.S. taxation on all foreign pretax earnings earned by a foreign branch. Pretax earnings of a foreign subsidiary or affiliate are subject to U.S. taxation when effectively repatriated. The Company provides income taxes on the undistributed earnings of non-U.S. subsidiaries except to the extent that such earnings are indefinitely reinvested outside the United States. At December 31, 2012, $42.6 billion of accumulated undistributed earnings of non-U.S. subsidiaries were indefinitely invested. At the existing U.S. federal income tax rate, additional taxes (net of U.S. foreign tax credits) of $11.5 billion would have to be provided if such earnings were remitted currently. The current year’s effect on the income tax expense from continuing operations is included in the “Foreign income tax rate differential” line in the reconciliation of the federal statutory rate to the Company’s effective income tax rate in the table above.
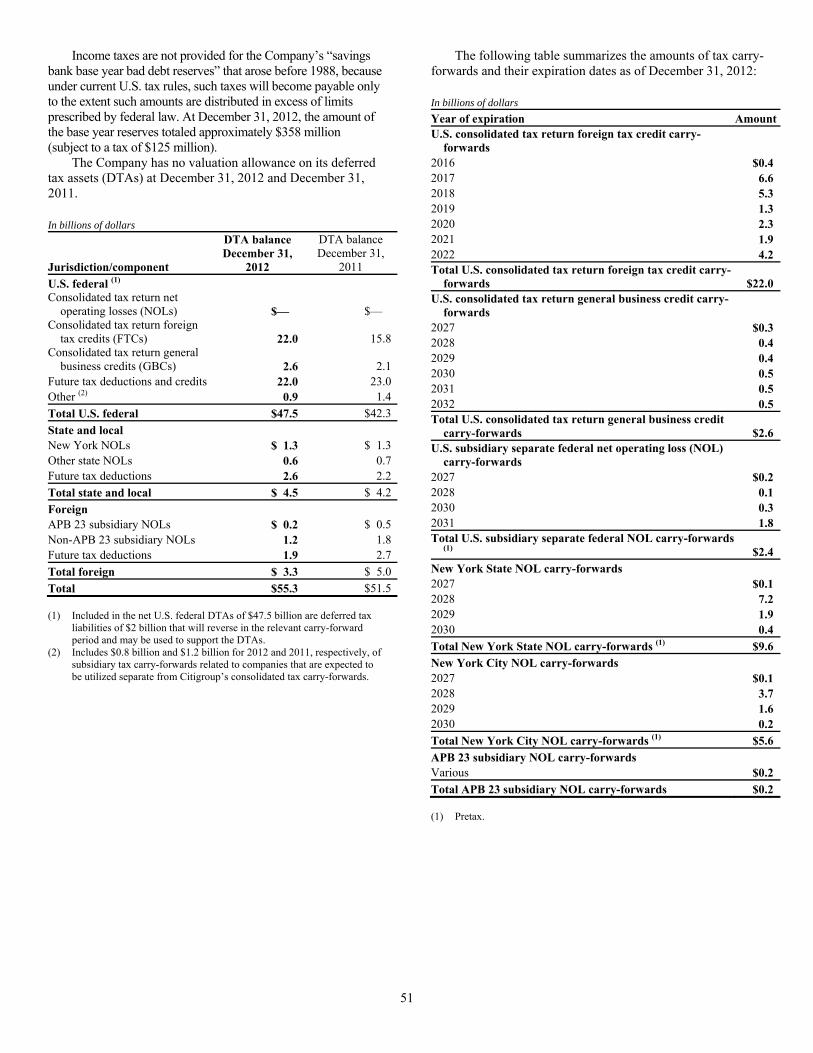
51
Income taxes are not provided for the Company’s “savings bank base year bad debt reserves” that arose before 1988, because under current U.S. tax rules, such taxes will become payable only to the extent such amounts are distributed in excess of limits prescribed by federal law. At December 31, 2012, the amount of the base year reserves totaled approximately $358 million (subject to a tax of $125 million). The Company has no valuation allowance on its deferred tax assets (DTAs) at December 31, 2012 and December 31, 2011. In billions of dollars
Jurisdiction/component
DTA balance December 31,
2012
DTA balance December 31,
2011 U.S. federal (1) Consolidated tax return net
operating losses (NOLs) $— $— Consolidated tax return foreign
tax credits (FTCs) 22.0 15.8 Consolidated tax return general
business credits (GBCs) 2.6 2.1 Future tax deductions and credits 22.0 23.0 Other (2) 0.9 1.4 Total U.S. federal $47.5 $42.3 State and local New York NOLs $ 1.3 $ 1.3 Other state NOLs 0.6 0.7 Future tax deductions 2.6 2.2 Total state and local $ 4.5 $ 4.2 Foreign APB 23 subsidiary NOLs $ 0.2 $ 0.5 Non-APB 23 subsidiary NOLs 1.2 1.8 Future tax deductions 1.9 2.7 Total foreign $ 3.3 $ 5.0 Total $55.3 $51.5 (1) Included in the net U.S. federal DTAs of $47.5 billion are deferred tax
liabilities of $2 billion that will reverse in the relevant carry-forward period and may be used to support the DTAs.
(2) Includes $0.8 billion and $1.2 billion for 2012 and 2011, respectively, of subsidiary tax carry-forwards related to companies that are expected to be utilized separate from Citigroup’s consolidated tax carry-forwards.
The following table summarizes the amounts of tax carry-forwards and their expiration dates as of December 31, 2012: In billions of dollars Year of expiration AmountU.S. consolidated tax return foreign tax credit carry-
forwards 2016 $0.42017 6.62018 5.32019 1.32020 2.32021 1.92022 4.2Total U.S. consolidated tax return foreign tax credit carry-
forwards $22.0U.S. consolidated tax return general business credit carry-
forwards 2027 $0.32028 0.42029 0.42030 0.52031 0.52032 0.5Total U.S. consolidated tax return general business credit
carry-forwards $2.6U.S. subsidiary separate federal net operating loss (NOL)
carry-forwards 2027 $0.22028 0.12030 0.32031 1.8Total U.S. subsidiary separate federal NOL carry-forwards
(1) $2.4New York State NOL carry-forwards 2027 $0.12028 7.22029 1.92030 0.4Total New York State NOL carry-forwards (1) $9.6New York City NOL carry-forwards 2027 $0.12028 3.72029 1.62030 0.2Total New York City NOL carry-forwards (1) $5.6APB 23 subsidiary NOL carry-forwards Various $0.2Total APB 23 subsidiary NOL carry-forwards $0.2 (1) Pretax.
52
While Citi’s net total DTAs increased year-over-year, the time remaining for utilization has shortened, given the passage of time, particularly with respect to the foreign tax credit (FTC) component of the DTAs. Realization of the DTAs will continue to be driven by Citi’s ability to generate U.S. taxable earnings in the carry-forward periods, including through actions that optimize Citi’s U.S. taxable earnings. Although realization is not assured, Citi believes that the realization of the recognized net DTAs of $55.3 billion at December 31, 2012 is more-likely-than-not based upon expectations as to future taxable income in the jurisdictions in which the DTAs arise and available tax planning strategies (as defined in ASC 740, Income Taxes) that would be implemented, if necessary, to prevent a carry-forward from expiring. In general, Citi would need to generate approximately $112 billion of U.S. taxable income during the respective carry-forward periods, substantially all of which must be generated during the FTC carry-forward periods, to fully realize its U.S. federal, state and local DTAs. Citi’s net DTAs will decline primarily as additional domestic GAAP taxable income is generated. Citi has concluded that there are two components of positive evidence that support the full realization of its DTAs. First, Citi forecasts sufficient U.S. taxable income in the carry-forward periods, exclusive of ASC 740 tax planning strategies, although Citi’s estimated future taxable income has decreased due to the ongoing challenging economic environment, which will continue to be subject to overall market and global economic conditions. Citi’s forecasted taxable income incorporates geographic business forecasts and taxable income adjustments to those forecasts (e.g., U.S. tax exempt income, loan loss reserves deductible for U.S. tax reporting in subsequent years), as well as actions intended to optimize its U.S. taxable earnings.
Second, Citi has sufficient tax planning strategies available to it under ASC 740 that would be implemented, if necessary, to prevent a carry-forward from expiring. These strategies include repatriating low taxed foreign source earnings for which an assertion that the earnings have been indefinitely reinvested has not been made, accelerating U.S. taxable income into, or deferring U.S. tax deductions out of, the latter years of the carry-forward period (e.g., selling appreciated intangible assets, electing straight-line depreciation), accelerating deductible temporary differences outside the U.S., and selling certain assets that produce tax-exempt income, while purchasing assets that produce fully taxable income. In addition, the sale or restructuring of certain businesses can produce significant U.S. taxable income within the relevant carry-forward periods. Based upon the foregoing discussion, Citi believes the U.S. federal and New York state and city NOL carry-forward period of 20 years provides enough time to fully utilize the DTAs pertaining to the existing NOL carry-forwards and any NOL that would be created by the reversal of the future net deductions that have not yet been taken on a tax return. The U.S. FTC carry-forward period is 10 years and represents the most time sensitive component of Citi’s DTAs. Utilization of FTCs in any year is restricted to 35% of foreign source taxable income in that year. However, overall domestic losses that Citi has incurred of approximately $63 billion as of December 31, 2012 are allowed to be reclassified as foreign source income to the extent of 50% of domestic source income produced in subsequent years. Resulting foreign source income would cover the FTCs being carried forward. Citi believes the foreign source taxable income limitation will not be an impediment to the FTC carry-forward usage as long as Citi can generate sufficient domestic taxable income within the 10-year carry-forward period. Citi believes that it will generate sufficient U.S. taxable income within the 10-year carry-forward period referenced above to be able to fully utilize the FTC carry-forward, in addition to any FTCs produced in such period.

53
11. EARNINGS PER SHARE The following is a reconciliation of the income and share data used in the basic and diluted earnings per share (EPS) computations for the years ended December 31: In millions, except per-share amounts 2012 2011 (1) 2010 (1) Income from continuing operations before attribution of noncontrolling interests $7,818 $11,147 $10,899 Less: Noncontrolling interests from continuing operations 219 148 329 Net income from continuing operations (for EPS purposes) $7,599 $10,999 $10,570 Income (loss) from discontinued operations, net of taxes (58) 68 (16) Less: Noncontrolling interests from discontinuing operations — — (48) Citigroup’s net income $7,541 $11,067 $10,602 Less: Preferred dividends 26 26 9 Net income available to common shareholders $7,515 $11,041 $10,593 Less: Dividends and undistributed earnings allocated to employee restricted and deferred shares with
nonforfeitable rights to dividends, applicable to basic EPS 166 186 90 Net income allocated to common shareholders for basic EPS $7,349 $10,855 $10,503 Add: Interest expense, net of tax, on convertible securities and adjustment of undistributed earnings
allocated to employee restricted and deferred shares with nonforfeitable rights to dividends, applicable to diluted EPS 11 17 2
Net income allocated to common shareholders for diluted EPS $7,360 $10,872 $10,505 Weighted-average common shares outstanding applicable to basic EPS 2,930.6 2,909.8 2,877.6Effect of dilutive securities T-DECs 84.2 87.6 87.8 Other employee plans 0.6 0.5 1.9 Convertible securities 0.1 0.1 0.1 Options — 0.8 0.4Adjusted weighted-average common shares outstanding applicable to diluted EPS 3,015.5 2,998.8 2,967.8Basic earnings per share (2) Income from continuing operations $ 2.53 $ 3.71 $ 3.64 Discontinued operations (0.02) 0.02 0.01 Net income $ 2.51 $ 3.73 $ 3.65 Diluted earnings per share (2) Income from continuing operations $ 2.46 $ 3.60 $ 3.53 Discontinued operations (0.02) 0.02 0.01 Net income $ 2.44 $ 3.63 $ 3.54
(1) All per-share amounts and Citigroup shares outstanding for all periods reflect Citigroup’s 1-for-10 reverse stock split which was effective May 6, 2011. (2) Due to rounding, earnings per share on continuing operations and discontinued operations may not sum to earnings per share on net income. During 2012, 2011 and 2010 weighted-average options to purchase 35.8 million, 24.1 million and 38.6 million shares of common stock, respectively, were outstanding but not included in the computation of earnings per share because the weighted-average exercise prices of $54.18, $123.47 and $102.89, respectively, were greater than the average market price of the Company’s common stock. Warrants issued to the U.S. Treasury as part of the Troubled Asset Relief Program (TARP) and the loss-sharing agreement (all of which were subsequently sold to the public in January 2011), with an exercise price of $178.50 and $106.10 for approximately 21.0 million and 25.5 million shares of common stock, respectively, were not included in the computation of earnings per share in 2012, 2011 and 2010, because they were anti-dilutive. The final tranche of equity units held by the Abu Dhabi Investment Authority (ADIA) converted into 5.9 million shares of Citigroup common stock during the third quarter of 2011. Equity units of approximately 11.8 million shares of Citigroup common stock held by ADIA were not included in the computation of earnings per share in 2010 because the
exercise price of $318.30 was greater than the average market price of the Company’s common stock. Pursuant to the terms of Citi’s previously outstanding Tangible Dividend Enhanced Common Stock Securities (T-DECs), on December 17, 2012, the Company delivered 96,337,772 shares of Citigroup common stock for the final settlement of the prepaid stock purchase contract. The impact of these additional shares to the weighted-average common shares outstanding applicable to basic EPS for the year ended 2012 was negligible due to the timing of when they were issued. The full impact of the T-DECs settlement will be reflected in the basic earnings per share calculation for the first quarter of 2013. The impact of the T-DECs was fully reflected in the diluted shares and the diluted EPS for 2012, 2011 and 2010. During the fourth quarter of 2012, Citi issued approximately $2.25 billion of non-cumulative perpetual preferred stock. If declared by the Board of Directors, Citi will distribute preferred dividends of approximately $97 million relating to its preferred stock issuance during 2013.

54
12. FEDERAL FUNDS/SECURITIES BORROWED, LOANED, AND SUBJECT TO REPURCHASE AGREEMENTS Federal funds sold and securities borrowed or purchased under agreements to resell, at their respective carrying values, consisted of the following at December 31: In millions of dollars 2012 2011 Federal funds sold $ 97 $ 37 Securities purchased under agreements to resell (1) 138,549 153,492 Deposits paid for securities borrowed 122,665 122,320 Total $261,311 $275,849
(1) Securities purchased under agreements to resell are reported net by counterparty, when applicable requirements for net presentation are met. The amounts in the table above were reduced for allowable netting by $49.4 billion and $53.0 billion at December 31, 2012 and 2011, respectively.
Federal funds purchased and securities loaned or sold under agreements to repurchase, at their respective carrying values, consisted of the following at December 31: In millions of dollars 2012 2011 Federal funds purchased $ 1,005 $ 688 Securities sold under agreements to repurchase (1) 182,330 164,849 Deposits received for securities loaned 27,901 32,836 Total $211,236 $198,373
(1) Securities sold under agreements to repurchase are reported net by counterparty, when applicable requirements for net presentation are met. The amounts in the table above were reduced for allowable netting by $49.4 billion and $53.0 billion at December 31, 2012 and 2011, respectively.
The resale and repurchase agreements represent collateralized financing transactions. The Company executes these transactions through its broker-dealer subsidiaries to facilitate customer matched-book activity and to fund a portion of the Company’s trading inventory efficiently. Transactions executed by the Company’s bank subsidiaries primarily facilitate customer financing activity. It is the Company’s policy to take possession of the underlying collateral, monitor its market value relative to the amounts due under the agreements and, when necessary, require prompt transfer of additional collateral in order to maintain contractual margin protection. Collateral typically consists of government and government-agency securities, corporate and municipal bonds, and mortgage-backed and other asset-backed securities. In the event of counterparty default, the financing agreement provides the Company with the right to liquidate the collateral held.
The majority of the resale and repurchase agreements are recorded at fair value. The remaining portion is carried at the amount of cash initially advanced or received, plus accrued interest, as specified in the respective agreements. A majority of securities borrowing and lending agreements are recorded at the amount of cash advanced or received and are collateralized principally by government and government-agency securities and corporate debt and equity securities. The remaining portion is recorded at fair value as the Company elected the fair value option for certain securities borrowed and loaned portfolios. With respect to securities loaned, the Company receives cash collateral in an amount generally in excess of the market value of the securities loaned. The Company monitors the market value of securities borrowed and securities loaned on a daily basis and obtains or posts additional collateral in order to maintain contractual margin protection.
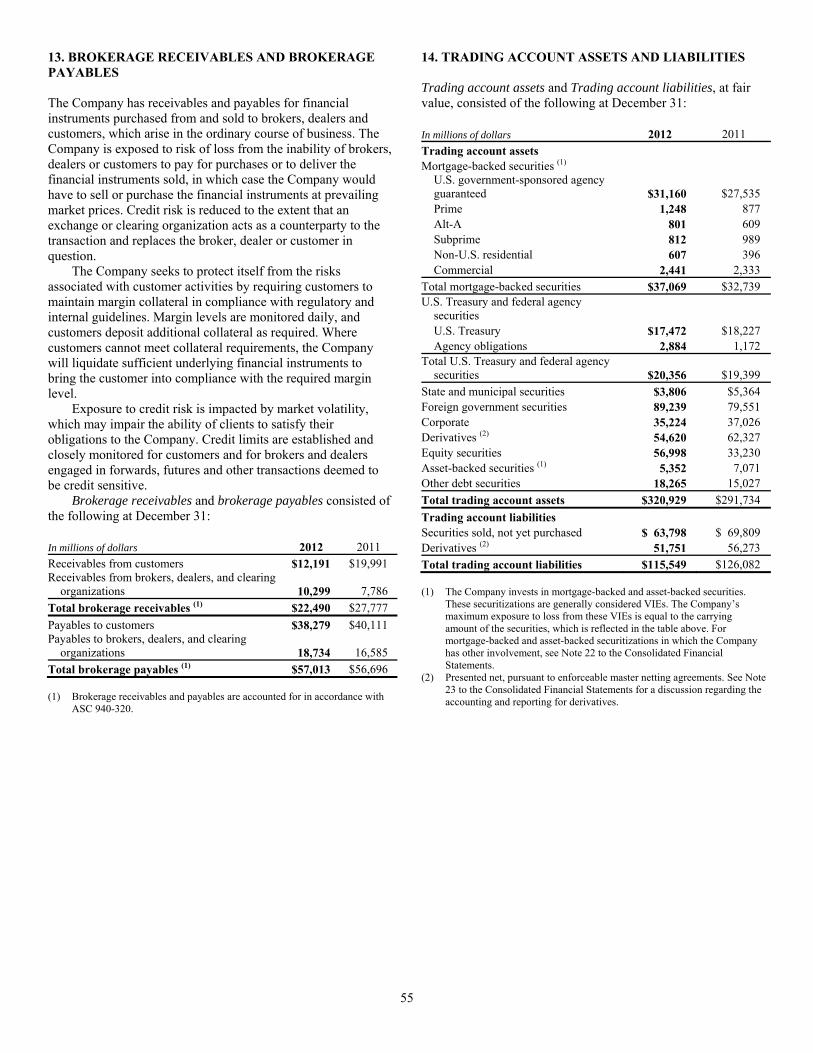
55
13. BROKERAGE RECEIVABLES AND BROKERAGE PAYABLES The Company has receivables and payables for financial instruments purchased from and sold to brokers, dealers and customers, which arise in the ordinary course of business. The Company is exposed to risk of loss from the inability of brokers, dealers or customers to pay for purchases or to deliver the financial instruments sold, in which case the Company would have to sell or purchase the financial instruments at prevailing market prices. Credit risk is reduced to the extent that an exchange or clearing organization acts as a counterparty to the transaction and replaces the broker, dealer or customer in question. The Company seeks to protect itself from the risks associated with customer activities by requiring customers to maintain margin collateral in compliance with regulatory and internal guidelines. Margin levels are monitored daily, and customers deposit additional collateral as required. Where customers cannot meet collateral requirements, the Company will liquidate sufficient underlying financial instruments to bring the customer into compliance with the required margin level. Exposure to credit risk is impacted by market volatility, which may impair the ability of clients to satisfy their obligations to the Company. Credit limits are established and closely monitored for customers and for brokers and dealers engaged in forwards, futures and other transactions deemed to be credit sensitive. Brokerage receivables and brokerage payables consisted of the following at December 31: In millions of dollars 2012 2011 Receivables from customers $12,191 $19,991 Receivables from brokers, dealers, and clearing
organizations 10,299 7,786 Total brokerage receivables (1) $22,490 $27,777 Payables to customers $38,279 $40,111 Payables to brokers, dealers, and clearing
organizations 18,734 16,585 Total brokerage payables (1) $57,013 $56,696 (1) Brokerage receivables and payables are accounted for in accordance with
ASC 940-320.
14. TRADING ACCOUNT ASSETS AND LIABILITIES Trading account assets and Trading account liabilities, at fair value, consisted of the following at December 31: In millions of dollars 2012 2011 Trading account assets Mortgage-backed securities (1) U.S. government-sponsored agency
guaranteed $31,160 $27,535 Prime 1,248 877 Alt-A 801 609 Subprime 812 989 Non-U.S. residential 607 396 Commercial 2,441 2,333 Total mortgage-backed securities $37,069 $32,739 U.S. Treasury and federal agency
securities U.S. Treasury $17,472 $18,227 Agency obligations 2,884 1,172 Total U.S. Treasury and federal agency
securities $20,356 $19,399 State and municipal securities $3,806 $5,364 Foreign government securities 89,239 79,551 Corporate 35,224 37,026 Derivatives (2) 54,620 62,327 Equity securities 56,998 33,230 Asset-backed securities (1) 5,352 7,071 Other debt securities 18,265 15,027 Total trading account assets $320,929 $291,734 Trading account liabilities Securities sold, not yet purchased $ 63,798 $ 69,809 Derivatives (2) 51,751 56,273 Total trading account liabilities $115,549 $126,082 (1) The Company invests in mortgage-backed and asset-backed securities.
These securitizations are generally considered VIEs. The Company’s maximum exposure to loss from these VIEs is equal to the carrying amount of the securities, which is reflected in the table above. For mortgage-backed and asset-backed securitizations in which the Company has other involvement, see Note 22 to the Consolidated Financial Statements.
(2) Presented net, pursuant to enforceable master netting agreements. See Note 23 to the Consolidated Financial Statements for a discussion regarding the accounting and reporting for derivatives.

56
15. INVESTMENTS Overview In millions of dollars 2012 2011 Securities available-for-sale $288,695 $265,204Debt securities held-to-maturity (1) 10,130 11,483 Non-marketable equity securities carried at fair value (2) 5,768 8,836 Non-marketable equity securities carried at cost (3) 7,733 7,890 Total investments $312,326 $293,413 (1) Recorded at amortized cost less impairment for securities that have credit-related impairment. (2) Unrealized gains and losses for non-marketable equity securities carried at fair value are recognized in earnings. During the third quarter of 2012, the Company
sold EMI Music resulting in a total $1.5 billion decrease in non-marketable equity securities carried at fair value. During the second quarter of 2012, the Company sold EMI Music Publishing resulting in a total of $1.3 billion decrease in non-marketable equity securities carried at fair value.
(3) Non-marketable equity securities carried at cost primarily consist of shares issued by the Federal Reserve Bank, Federal Home Loan Banks, foreign central banks and various clearing houses of which Citigroup is a member.
Securities Available-for-Sale The amortized cost and fair value of securities available-for-sale (AFS) at December 31, 2012 and 2011 were as follows:
In millions of dollars
2012 2011
Amortized cost
Gross unrealized
gains
Gross unrealized
lossesFair value
Amortizedcost
Gross unrealized
gains
Gross unrealized
losses Fair
value Debt securities AFS Mortgage-backed securities (1) U.S. government-sponsored
agency guaranteed $ 46,001 $1,507 $ 163 $47,345 $ 44,394 $1,438 $ 51 $45,781 Prime 85 1 — 86 118 1 6 113 Alt-A 1 — — 1 1 — — 1 Non-U.S. residential 7,442 148 — 7,590 4,671 9 22 4,658 Commercial 436 16 3 449 465 16 9 472 Total mortgage-backed securities $ 53,965 $1,672 $ 166 $ 55,471 $ 49,649 $1,464 $ 88 $51,025 U.S. Treasury and federal agency
securities U.S. Treasury $ 64,456 $1,172 $ 34 $ 65,594 $ 48,790 $1,439 $ — $50,229 Agency obligations 25,844 404 1 26,247 34,310 601 2 34,909 Total U.S. Treasury and federal
agency securities $ 90,300 $1,576 $ 35 $ 91,841 $ 83,100 $2,040 $2 $85,138 State and municipal (2) $ 20,020 $132 $1,820 $ 18,332 $ 16,819 $134 $2,554 $14,399 Foreign government 93,259 918 130 94,047 84,360 558 404 84,514 Corporate 9,302 398 26 9,674 10,005 305 53 10,257 Asset-backed securities (1) 14,188 85 143 14,130 11,053 31 81 11,003 Other debt securities 256 2 — 258 670 13 — 683 Total debt securities AFS $281,290 $4,783 $2,320 $283,753 $255,656 $4,545 $3,182 $257,019 Marketable equity securities AFS $ 4,643 $ 444 $ 145 $ 4,942 $ 6,722 $1,658 $ 195 $ 8,185 Total securities AFS $285,933 $5,227 $2,465 $288,695 $262,378 $6,203 $3,377 $265,204 (1) The Company invests in mortgage-backed and asset-backed securities. These securitizations are generally considered VIEs. The Company’s maximum exposure
to loss from these VIEs is equal to the carrying amount of the securities, which is reflected in the table above. For mortgage-backed and asset-backed securitizations in which the Company has other involvement, see Note 22 to the Consolidated Financial Statements.
(2) The unrealized losses on state and municipal debt securities are primarily attributable to the result of yields on taxable fixed income instruments decreasing relatively faster than the general tax-exempt municipal yields and the effects of fair value hedge accounting.
At December 31, 2012, the amortized cost of approximately 3,500 investments in equity and fixed-income securities exceeded their fair value by $2.465 billion. Of the $2.465 billion, the gross unrealized loss on equity securities was $145 million. Of the remainder, $238 million represents fixed-income investments that have been in a gross-unrealized-loss position for less than a year and, of these, 98% are rated investment grade; $2.082 billion represents fixed-income investments that
have been in a gross-unrealized-loss position for a year or more and, of these, 92% are rated investment grade. The AFS mortgage-backed securities portfolio fair value balance of $55.471 billion consists of $47.345 billion of government-sponsored agency securities, and $8.126 billion of privately sponsored securities, of which the majority are backed by mortgages that are not Alt-A or subprime.

57
As discussed in more detail below, the Company conducts and documents periodic reviews of all securities with unrealized losses to evaluate whether the impairment is other than temporary. Any credit-related impairment related to debt securities that the Company does not plan to sell and is not
likely to be required to sell is recognized in the Consolidated Statement of Income, with the non-credit-related impairment recognized in accumulated other comprehensive income (AOCI). For other impaired debt securities, the entire impairment is recognized in the Consolidated Statement of Income.
The table below shows the fair value of AFS securities that have been in an unrealized loss position for less than 12 months or for 12 months or longer as of December 31, 2012 and 2011:
In millions of dollars
Less than 12 months 12 months or longer Total
Fair value
Gross unrealized
lossesFair value
Gross unrealized
losses Fair value
Gross unrealized
lossesDecember 31, 2012 Securities AFS Mortgage-backed securities U.S. government-sponsored agency guaranteed $ 8,759 $138 $ 464 $ 25 $ 9,223 $ 163 Prime 15 — 5 — 20 — Non-U.S. residential 5 — 7 — 12 — Commercial 29 — 24 3 53 3Total mortgage-backed securities $ 8,808 $138 $ 500 $ 28 $ 9,308 $ 166U.S. Treasury and federal agency securities U.S. Treasury $10,558 $ 34 $ — $ — $10,558 $ 34 Agency obligations 496 1 — — 496 1Total U.S. Treasury and federal agency securities $11,054 $ 35 $ — $ — $11,054 $ 35State and municipal $10 $ — $11,095 $1,820 $11,105 $1,820Foreign government 22,806 54 3,910 76 26,716 130Corporate 1,420 8 225 18 1,645 26Asset-backed securities 1,942 4 2,888 139 4,830 143Marketable equity securities AFS 15 1 764 144 779 145Total securities AFS $46,055 $240 $19,382 $2,225 $65,437 $2,465December 31, 2011 Securities AFS Mortgage-backed securities U.S. government-sponsored agency guaranteed $ 5,398 $ 32 $ 51 $ 19 $ 5,449 $ 51 Prime 27 1 40 5 67 6 Non-U.S. residential 3,418 22 57 — 3,475 22 Commercial 35 1 31 8 66 9 Total mortgage-backed securities $ 8,878 $ 56 $ 179 $ 32 $ 9,057 $ 88 U.S. Treasury and federal agency securities U.S. Treasury $553 $ — $ — $ — $ 553 $ — Agency obligations 2,970 2 — — 2,970 2 Total U.S. Treasury and federal agency securities $ 3,523 $ 2 $ — $ — $ 3,523 $ 2 State and municipal $ 59 $ 2 $11,591 $2,552 $11,650 $2,554 Foreign government 33,109 211 11,205 193 44,314 404 Corporate 2,104 24 203 29 2,307 53 Asset-backed securities 4,625 68 466 13 5,091 81 Other debt securities 164 — — — 164 — Marketable equity securities AFS 47 5 1,457 190 1,504 195 Total securities AFS $52,509 $368 $25,101 $3,009 $77,610 $3,377
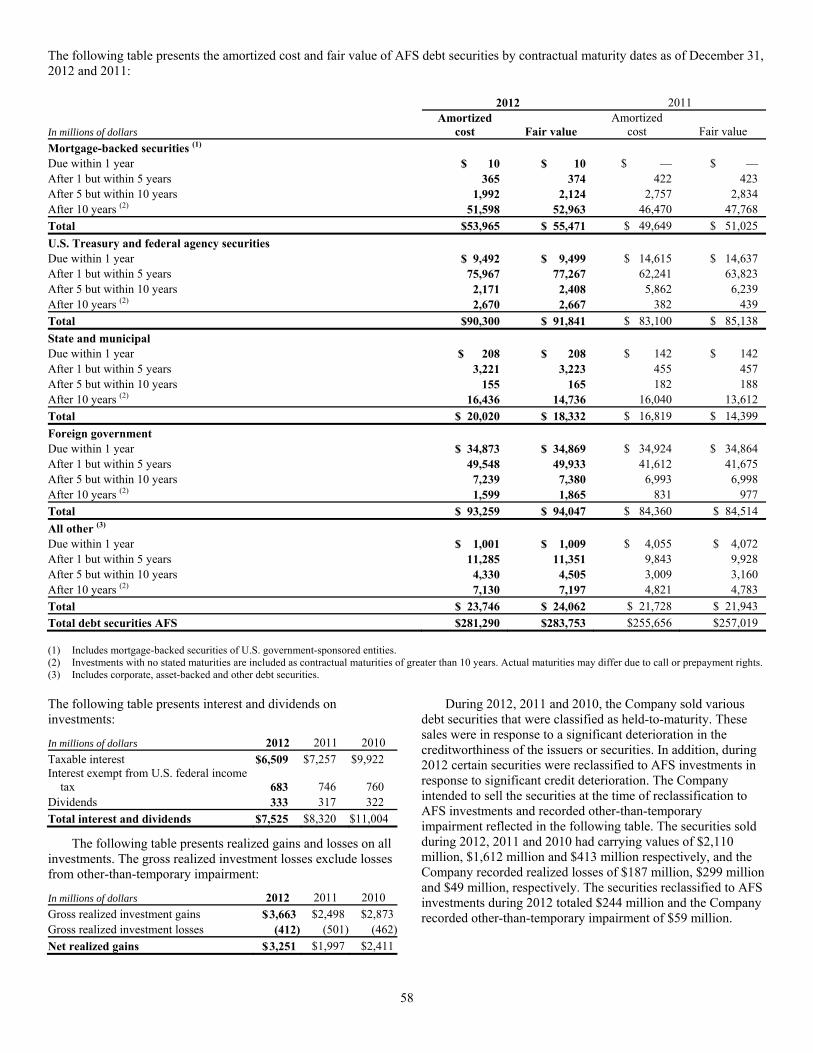
58
The following table presents the amortized cost and fair value of AFS debt securities by contractual maturity dates as of December 31, 2012 and 2011:
In millions of dollars
2012 2011 Amortized
cost Fair value Amortized
cost Fair value Mortgage-backed securities (1) Due within 1 year $ 10 $ 10 $ — $ — After 1 but within 5 years 365 374 422 423 After 5 but within 10 years 1,992 2,124 2,757 2,834 After 10 years (2) 51,598 52,963 46,470 47,768 Total $53,965 $ 55,471 $ 49,649 $ 51,025 U.S. Treasury and federal agency securities Due within 1 year $ 9,492 $ 9,499 $ 14,615 $ 14,637 After 1 but within 5 years 75,967 77,267 62,241 63,823 After 5 but within 10 years 2,171 2,408 5,862 6,239 After 10 years (2) 2,670 2,667 382 439 Total $90,300 $ 91,841 $ 83,100 $ 85,138 State and municipal Due within 1 year $ 208 $ 208 $ 142 $ 142 After 1 but within 5 years 3,221 3,223 455 457 After 5 but within 10 years 155 165 182 188 After 10 years (2) 16,436 14,736 16,040 13,612 Total $ 20,020 $ 18,332 $ 16,819 $ 14,399 Foreign government Due within 1 year $ 34,873 $ 34,869 $ 34,924 $ 34,864 After 1 but within 5 years 49,548 49,933 41,612 41,675 After 5 but within 10 years 7,239 7,380 6,993 6,998 After 10 years (2) 1,599 1,865 831 977 Total $ 93,259 $ 94,047 $ 84,360 $ 84,514 All other (3) Due within 1 year $ 1,001 $ 1,009 $ 4,055 $ 4,072 After 1 but within 5 years 11,285 11,351 9,843 9,928 After 5 but within 10 years 4,330 4,505 3,009 3,160 After 10 years (2) 7,130 7,197 4,821 4,783 Total $ 23,746 $ 24,062 $ 21,728 $ 21,943 Total debt securities AFS $281,290 $283,753 $255,656 $257,019 (1) Includes mortgage-backed securities of U.S. government-sponsored entities. (2) Investments with no stated maturities are included as contractual maturities of greater than 10 years. Actual maturities may differ due to call or prepayment rights. (3) Includes corporate, asset-backed and other debt securities. The following table presents interest and dividends on investments:
In millions of dollars 2012 2011 2010 Taxable interest $6,509 $7,257 $9,922 Interest exempt from U.S. federal income
tax 683 746 760 Dividends 333 317 322 Total interest and dividends $7,525 $8,320 $11,004
The following table presents realized gains and losses on all investments. The gross realized investment losses exclude losses from other-than-temporary impairment:
In millions of dollars 2012 2011 2010 Gross realized investment gains $ 3,663 $ 2,498 $2,873Gross realized investment losses (412) (501) (462)Net realized gains $ 3,251 $ 1,997 $2,411
During 2012, 2011 and 2010, the Company sold various debt securities that were classified as held-to-maturity. These sales were in response to a significant deterioration in the creditworthiness of the issuers or securities. In addition, during 2012 certain securities were reclassified to AFS investments in response to significant credit deterioration. The Company intended to sell the securities at the time of reclassification to AFS investments and recorded other-than-temporary impairment reflected in the following table. The securities sold during 2012, 2011 and 2010 had carrying values of $2,110 million, $1,612 million and $413 million respectively, and the Company recorded realized losses of $187 million, $299 million and $49 million, respectively. The securities reclassified to AFS investments during 2012 totaled $244 million and the Company recorded other-than-temporary impairment of $59 million.
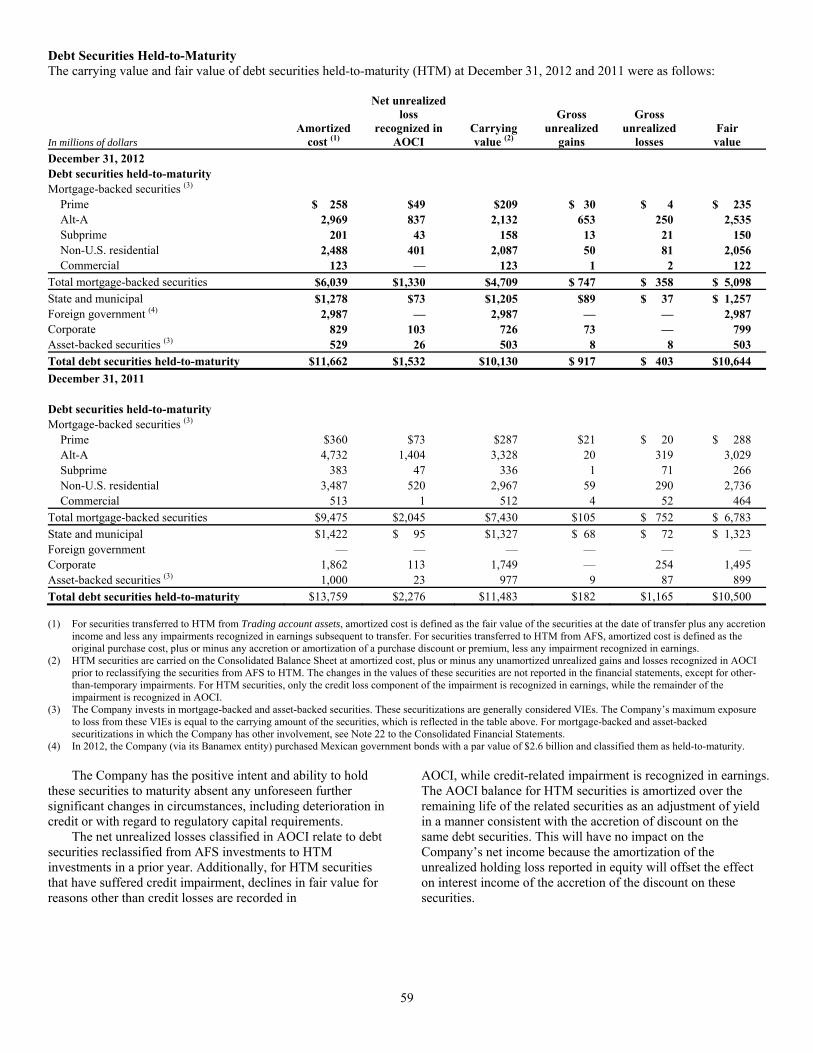
59
Debt Securities Held-to-Maturity The carrying value and fair value of debt securities held-to-maturity (HTM) at December 31, 2012 and 2011 were as follows:
In millions of dollars Amortized
cost (1)
Net unrealizedloss
recognized in AOCI
Carrying value (2)
Gross unrealized
gains
Gross unrealized
lossesFair value
December 31, 2012 Debt securities held-to-maturity Mortgage-backed securities (3) Prime $ 258 $49 $209 $ 30 $ 4 $ 235 Alt-A 2,969 837 2,132 653 250 2,535 Subprime 201 43 158 13 21 150 Non-U.S. residential 2,488 401 2,087 50 81 2,056 Commercial 123 — 123 1 2 122Total mortgage-backed securities $6,039 $1,330 $4,709 $ 747 $ 358 $ 5,098State and municipal $1,278 $73 $1,205 $89 $ 37 $ 1,257Foreign government (4) 2,987 — 2,987 — — 2,987Corporate 829 103 726 73 — 799Asset-backed securities (3) 529 26 503 8 8 503Total debt securities held-to-maturity $11,662 $1,532 $10,130 $ 917 $ 403 $10,644December 31, 2011 Debt securities held-to-maturity Mortgage-backed securities (3) Prime $360 $73 $287 $21 $ 20 $ 288 Alt-A 4,732 1,404 3,328 20 319 3,029 Subprime 383 47 336 1 71 266 Non-U.S. residential 3,487 520 2,967 59 290 2,736 Commercial 513 1 512 4 52 464 Total mortgage-backed securities $9,475 $2,045 $7,430 $105 $ 752 $ 6,783 State and municipal $1,422 $ 95 $1,327 $ 68 $ 72 $ 1,323 Foreign government — — — — — — Corporate 1,862 113 1,749 — 254 1,495 Asset-backed securities (3) 1,000 23 977 9 87 899 Total debt securities held-to-maturity $13,759 $2,276 $11,483 $182 $1,165 $10,500 (1) For securities transferred to HTM from Trading account assets, amortized cost is defined as the fair value of the securities at the date of transfer plus any accretion
income and less any impairments recognized in earnings subsequent to transfer. For securities transferred to HTM from AFS, amortized cost is defined as the original purchase cost, plus or minus any accretion or amortization of a purchase discount or premium, less any impairment recognized in earnings.
(2) HTM securities are carried on the Consolidated Balance Sheet at amortized cost, plus or minus any unamortized unrealized gains and losses recognized in AOCI prior to reclassifying the securities from AFS to HTM. The changes in the values of these securities are not reported in the financial statements, except for other-than-temporary impairments. For HTM securities, only the credit loss component of the impairment is recognized in earnings, while the remainder of the impairment is recognized in AOCI.
(3) The Company invests in mortgage-backed and asset-backed securities. These securitizations are generally considered VIEs. The Company’s maximum exposure to loss from these VIEs is equal to the carrying amount of the securities, which is reflected in the table above. For mortgage-backed and asset-backed securitizations in which the Company has other involvement, see Note 22 to the Consolidated Financial Statements.
(4) In 2012, the Company (via its Banamex entity) purchased Mexican government bonds with a par value of $2.6 billion and classified them as held-to-maturity. The Company has the positive intent and ability to hold these securities to maturity absent any unforeseen further significant changes in circumstances, including deterioration in credit or with regard to regulatory capital requirements. The net unrealized losses classified in AOCI relate to debt securities reclassified from AFS investments to HTM investments in a prior year. Additionally, for HTM securities that have suffered credit impairment, declines in fair value for reasons other than credit losses are recorded in
AOCI, while credit-related impairment is recognized in earnings. The AOCI balance for HTM securities is amortized over the remaining life of the related securities as an adjustment of yield in a manner consistent with the accretion of discount on the same debt securities. This will have no impact on the Company’s net income because the amortization of the unrealized holding loss reported in equity will offset the effect on interest income of the accretion of the discount on these securities.

60
During the first quarter of 2011, the Company determined that it no longer had the intent to hold $12.7 billion of HTM securities to maturity. As a result, the Company reclassified $10.0 billion carrying value of mortgage-backed, other asset-backed, state and municipal, and corporate debt securities from Investments held-to-maturity to Trading account assets and sold the remaining $2.7 billion of such securities. As a result of these actions, a net pretax loss of $709 million ($427 million after-tax) was recognized in the Consolidated Statement of Income, composed of gross unrealized gains of $311 million included in Other revenue, gross unrealized losses of $1,387 million included in Other-than-temporary-impairment losses on investments, and net realized gains of $367 million included in Realized gains (losses) on sales of investments. Prior to the reclassification, unrealized losses totaling $1,656 million pretax ($1,012 million after-tax) had been reflected in AOCI and have now been reflected in the Consolidated Statement of Income, as detailed above. During 2011, the Company sold substantially all of the $12.7 billion of HTM securities.
Citigroup reclassified and sold the securities as part of its overall efforts to mitigate its risk-weighted assets (RWA) in order to comply with significant new regulatory capital requirements which, although not yet implemented or formally adopted, are nonetheless currently being used to assess the forecasted capital adequacy of the Company and other large U.S. banking organizations. These regulatory capital changes, which were largely unforeseen when the Company initially reclassified the debt securities from Trading account assets and Investments available-for-sale to Investments held-to-maturity in the fourth quarter of 2008, include: (i) the U.S. Basel II credit and operational risk capital standards; (ii) the Basel Committee’s agreed-upon, and the U.S.-proposed, revisions to the market risk capital rules, which significantly increased the risk weightings for certain trading book positions; (iii) the Basel Committee’s substantial issuance of Basel III, which raised the quantity and quality of required regulatory capital and materially increased RWA for securitization exposures; and (iv) certain regulatory capital-related provisions in The Dodd-Frank Wall Street Reform and Consumer Protection Act of 2010.
The table below shows the fair value of debt securities in HTM that have been in an unrecognized loss position for less than 12 months or for 12 months or longer as of December 31, 2012 and 2011:
In millions of dollars
Less than 12 months 12 months or longer Total
Fair value
Gross unrecognized
lossesFair value
Gross unrecognized
losses Fair value
Gross unrecognized
lossesDecember 31, 2012 Debt securities held-to-maturity Mortgage-backed securities $ 88 $ 7 $1,522 $ 351 $ 1,610 $ 358State and municipal — — 383 37 383 37Foreign government 294 — — — 294 —Corporate — — — — — —Asset-backed securities — — 406 8 406 8Total debt securities held-to-maturity $ 382 $ 7 $2,311 $ 396 $ 2,693 $ 403December 31, 2011 Debt securities held-to-maturity Mortgage-backed securities $ 735 $ 63 $4,827 $ 689 $ 5,562 $ 752 State and municipal — — 682 72 682 72 Foreign government — — — — — — Corporate — — 1,427 254 1,427 254 Asset-backed securities 480 71 306 16 786 87 Total debt securities held-to-maturity $1,215 $134 $7,242 $1,031 $ 8,457 $ 1,165 Excluded from the gross unrecognized losses presented in the above table are the $1.5 billion and $2.3 billion of gross unrealized losses recorded in AOCI as of December 31, 2012 and December 31, 2011, respectively, mainly related to the HTM securities that were reclassified from AFS investments. Virtually all of these unrecognized losses relate to securities that have been in a loss position for 12 months or longer at December 31, 2012 and December 31, 2011.
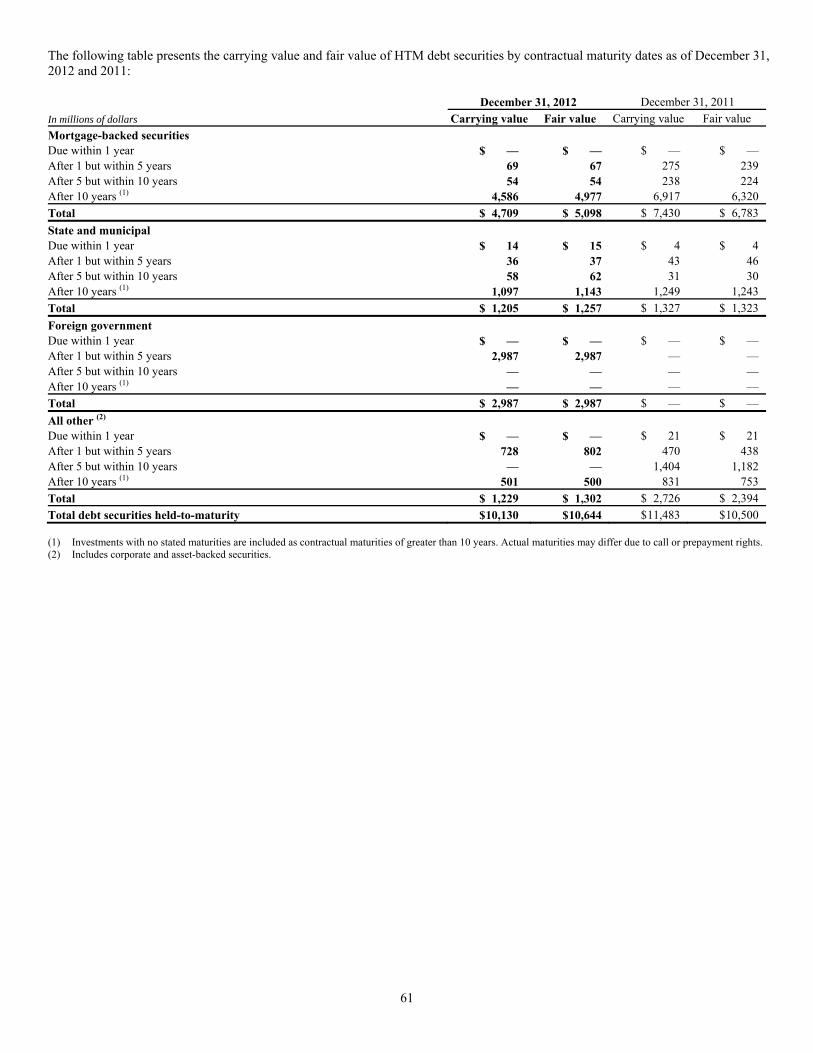
61
The following table presents the carrying value and fair value of HTM debt securities by contractual maturity dates as of December 31, 2012 and 2011:
In millions of dollars December 31, 2012 December 31, 2011
Carrying value Fair value Carrying value Fair value Mortgage-backed securities Due within 1 year $ — $ — $ — $ — After 1 but within 5 years 69 67 275 239 After 5 but within 10 years 54 54 238 224 After 10 years (1) 4,586 4,977 6,917 6,320 Total $ 4,709 $ 5,098 $ 7,430 $ 6,783 State and municipal Due within 1 year $ 14 $ 15 $ 4 $ 4 After 1 but within 5 years 36 37 43 46 After 5 but within 10 years 58 62 31 30 After 10 years (1) 1,097 1,143 1,249 1,243 Total $ 1,205 $ 1,257 $ 1,327 $ 1,323 Foreign government Due within 1 year $ — $ — $ — $ — After 1 but within 5 years 2,987 2,987 — — After 5 but within 10 years — — — — After 10 years (1) — — — — Total $ 2,987 $ 2,987 $ — $ — All other (2) Due within 1 year $ — $ — $ 21 $ 21 After 1 but within 5 years 728 802 470 438 After 5 but within 10 years — — 1,404 1,182 After 10 years (1) 501 500 831 753 Total $ 1,229 $ 1,302 $ 2,726 $ 2,394 Total debt securities held-to-maturity $ 10,130 $ 10,644 $ 11,483 $ 10,500 (1) Investments with no stated maturities are included as contractual maturities of greater than 10 years. Actual maturities may differ due to call or prepayment rights. (2) Includes corporate and asset-backed securities.
62
Evaluating Investments for Other-Than-Temporary Impairment Overview The Company conducts and documents periodic reviews of all securities with unrealized losses to evaluate whether the impairment is other than temporary. An unrealized loss exists when the current fair value of an individual security is less than its amortized cost basis. Unrealized losses that are determined to be temporary in nature are recorded, net of tax, in AOCI for AFS securities. Losses related to HTM securities are not recorded, as these investments are carried at amortized cost. For securities transferred to HTM from Trading account assets, amortized cost is defined as the fair value of the securities at the date of transfer, plus any accretion income and less any impairment recognized in earnings subsequent to transfer. For securities transferred to HTM from AFS, amortized cost is defined as the original purchase cost, plus or minus any accretion or amortization of a purchase discount or premium, less any impairment recognized in earnings. Regardless of the classification of the securities as AFS or HTM, the Company has assessed each position with an unrealized loss for other-than-temporary impairment (OTTI). Factors considered in determining whether a loss is temporary include:
• the length of time and the extent to which fair value has been below cost;
• the severity of the impairment; • the cause of the impairment and the financial condition and
near-term prospects of the issuer; • activity in the market of the issuer that may indicate adverse
credit conditions; and • the Company’s ability and intent to hold the investment for
a period of time sufficient to allow for any anticipated recovery.
The Company’s review for impairment generally entails:
• identification and evaluation of investments that have indications of possible impairment;
• analysis of individual investments that have fair values less than amortized cost, including consideration of the length of time the investment has been in an unrealized loss position and the expected recovery period;
• discussion of evidential matter, including an evaluation of factors or triggers that could cause individual investments to qualify as having other-than-temporary impairment and those that would not support other-than-temporary impairment; and
• documentation of the results of these analyses, as required under business policies.
Debt Under the guidance for debt securities, OTTI is recognized in earnings for debt securities that the Company has an intent to sell or that the Company believes it is more-likely-than-not that it will be required to sell prior to recovery of the amortized cost basis. For those securities that the Company does not intend to sell or expect to be required to sell, credit-related impairment is recognized in earnings, with the non-credit-related impairment recorded in AOCI. For debt securities that are not deemed to be credit impaired, management assesses whether it intends to sell or whether it is more-likely-than-not that it would be required to sell the investment before the expected recovery of the amortized cost basis. In most cases, management has asserted that it has no intent to sell and that it believes it is not likely to be required to sell the investment before recovery of its amortized cost basis. Where such an assertion cannot be made, the security’s decline in fair value is deemed to be other than temporary and is recorded in earnings. For debt securities, a critical component of the evaluation for OTTI is the identification of credit impaired securities, where management does not expect to receive cash flows sufficient to recover the entire amortized cost basis of the security. For securities purchased and classified as AFS with the expectation of receiving full principal and interest cash flows as of the date of purchase, this analysis considers the likelihood of receiving all contractual principal and interest. For securities reclassified out of the trading category in the fourth quarter of 2008, the analysis considers the likelihood of receiving the expected principal and interest cash flows anticipated as of the date of reclassification in the fourth quarter of 2008. The extent of the Company’s analysis regarding credit quality and the stress on assumptions used in the analysis have been refined for securities where the current fair value or other characteristics of the security warrant. Equity For equity securities, management considers the various factors described above, including its intent and ability to hold the equity security for a period of time sufficient for recovery to cost or whether it is more-likely-than-not that the Company will be required to sell the security prior to recovery of its cost basis. Where management lacks that intent or ability, the security’s decline in fair value is deemed to be other-than-temporary and is recorded in earnings. AFS equity securities deemed other-than-temporarily impaired are written down to fair value, with the full difference between fair value and cost recognized in earnings. Management assesses equity method investments with fair value less than carrying value for OTTI. Fair value is measured as price multiplied by quantity if the investee has publicly listed securities. If the investee is not publicly listed, other methods are used (see Note 25 to the Consolidated Financial Statements). For impaired equity method investments that Citi plans to sell prior to recovery of value or would likely be required to sell, with no expectation that the fair value will recover prior to the expected sale date, the full impairment is recognized in earnings as OTTI regardless of severity and duration. The measurement of the OTTI does not include partial projected recoveries subsequent to the balance sheet date.
63
For impaired equity method investments that management does not plan to sell prior to recovery of value and is not likely to be required to sell, the evaluation of whether an impairment is other-than-temporary is based on (i) whether and when an equity method investment will recover in value and (ii) whether the investor has the intent and ability to hold that investment for a period of time sufficient to recover the value. The determination of whether the impairment is considered other-than-temporary is based on all of the following indicators, regardless of the time and extent of impairment:
• Cause of the impairment and the financial condition and near-term prospects of the issuer, including any specific events that may influence the operations of the issuer;
• Intent and ability to hold the investment for a period of time sufficient to allow for any anticipated recovery in market value; and
• Length of time and extent to which fair value has been less than the carrying value.
The sections below describe current circumstances related to certain of the Company’s significant equity method investments, specific impairments and the Company’s process for identifying credit-related impairments in its security types with the most significant unrealized losses as of December 31, 2012. Akbank In March 2012, Citi decided to reduce its ownership interest in Akbank T.A.S., an equity investment in Turkey (Akbank), to below 10%. As of March 31, 2012, Citi held a 20% equity interest in Akbank, which it purchased in January 2007, accounted for as an equity method investment. As a result of its decision to sell its share holdings in Akbank, in the first quarter of 2012 Citi recorded an impairment charge related to its total investment in Akbank amounting to approximately $1.2 billion pretax ($763 million after-tax). This impairment charge was primarily driven by the recognition of all net investment foreign currency hedging and translation losses previously reflected in AOCI as well as a reduction in the carrying value of the investment to reflect the market price of Akbank’s shares. The impairment charge was recorded in other-than-temporary impairment losses on investments in the Consolidated Statement of Income. During the second quarter of 2012, Citi sold a 10.1% stake in Akbank, resulting in a loss on sale of $424 million ($274 million after-tax), recorded in Other revenue. As of December 31, 2012, the remaining 9.9% stake in Akbank is recorded within marketable equity securities available-for-sale. MSSB On September 17, 2012, Citi sold to Morgan Stanley a 14% interest (the “14% Interest”) in MSSB, to which Morgan Stanley exercised its purchase option on June 1, 2012. Morgan Stanley paid to Citi $1.89 billion in cash as the purchase price of the 14% Interest. The purchase price was based on an implied 100% valuation of MSSB of $13.5 billion, as agreed between Morgan
Stanley and Citi pursuant to an agreement dated September 11, 2012. The related approximate $4.5 billion in deposits were transferred to Morgan Stanley at no premium, as agreed between the parties. In addition, Morgan Stanley has agreed, subject to obtaining regulatory approval, to purchase Citi’s remaining 35% interest in MSSB no later than June 1, 2015 at a purchase price of $4.725 billion, which is based on the same implied 100% valuation of MSSB of $13.5 billion. Prior to the September 2012 sale, Citi’s carrying value of its 49% interest in MSSB was approximately $11.3 billion. As a result of the agreement entered into with Morgan Stanley on September 11, 2012, Citi recorded a charge to net income in the third quarter of 2012 of approximately $2.9 billion after-tax ($4.7 billion pretax), consisting of (i) a charge recorded in Other revenue of approximately $800 million after-tax ($1.3 billion pretax), representing a loss on sale of the 14% Interest, and (ii) an other-than-temporary impairment of the carrying value of its remaining 35% interest in MSSB of approximately $2.1 billion after-tax ($3.4 billion pretax). As of December 31, 2012, Citi continues to account for its remaining 35% interest in MSSB under the equity method, with the carrying value capped at the agreed selling price of $4.725 billion. Mortgage-backed securities For U.S. mortgage-backed securities (and in particular for Alt-A and other mortgage-backed securities that have significant unrealized losses as a percentage of amortized cost), credit impairment is assessed using a cash flow model that estimates the cash flows on the underlying mortgages, using the security-specific collateral and transaction structure. The model estimates cash flows from the underlying mortgage loans and distributes those cash flows to various tranches of securities, considering the transaction structure and any subordination and credit enhancements that exist in that structure. The cash flow model incorporates actual cash flows on the mortgage-backed securities through the current period and then projects the remaining cash flows using a number of assumptions, including default rates, prepayment rates and recovery rates (on foreclosed properties). Management develops specific assumptions using as much market data as possible and includes internal estimates as well as estimates published by rating agencies and other third-party sources. Default rates are projected by considering current underlying mortgage loan performance, generally assuming the default of (i) 10% of current loans, (ii) 25% of 30–59 day delinquent loans, (iii) 70% of 60–90 day delinquent loans and (4) 100% of 91+ day delinquent loans. These estimates are extrapolated along a default timing curve to estimate the total lifetime pool default rate. Other assumptions contemplate the actual collateral attributes, including geographic concentrations, rating agency loss projections, rating actions and current market prices.
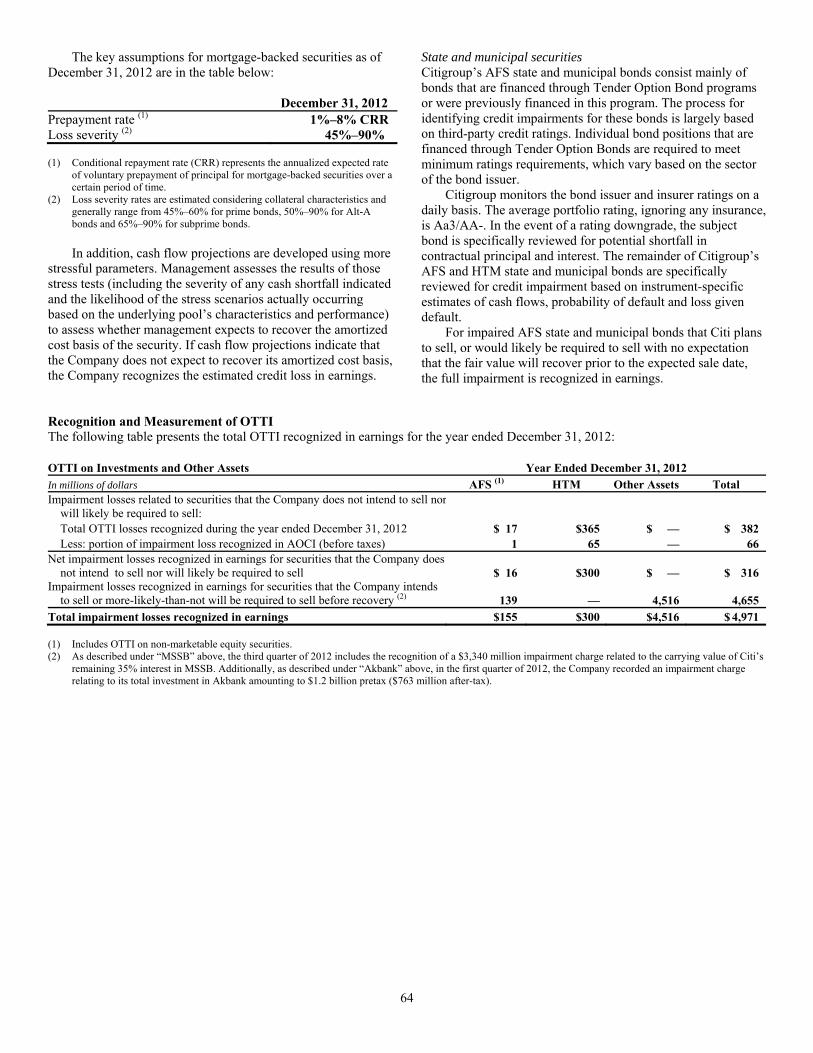
64
The key assumptions for mortgage-backed securities as of December 31, 2012 are in the table below: December 31, 2012Prepayment rate (1) 1%–8% CRRLoss severity (2) 45%–90% (1) Conditional repayment rate (CRR) represents the annualized expected rate
of voluntary prepayment of principal for mortgage-backed securities over a certain period of time.
(2) Loss severity rates are estimated considering collateral characteristics and generally range from 45%–60% for prime bonds, 50%–90% for Alt-A bonds and 65%–90% for subprime bonds.
In addition, cash flow projections are developed using more stressful parameters. Management assesses the results of those stress tests (including the severity of any cash shortfall indicated and the likelihood of the stress scenarios actually occurring based on the underlying pool’s characteristics and performance) to assess whether management expects to recover the amortized cost basis of the security. If cash flow projections indicate that the Company does not expect to recover its amortized cost basis, the Company recognizes the estimated credit loss in earnings.
State and municipal securities Citigroup’s AFS state and municipal bonds consist mainly of bonds that are financed through Tender Option Bond programs or were previously financed in this program. The process for identifying credit impairments for these bonds is largely based on third-party credit ratings. Individual bond positions that are financed through Tender Option Bonds are required to meet minimum ratings requirements, which vary based on the sector of the bond issuer. Citigroup monitors the bond issuer and insurer ratings on a daily basis. The average portfolio rating, ignoring any insurance, is Aa3/AA-. In the event of a rating downgrade, the subject bond is specifically reviewed for potential shortfall in contractual principal and interest. The remainder of Citigroup’s AFS and HTM state and municipal bonds are specifically reviewed for credit impairment based on instrument-specific estimates of cash flows, probability of default and loss given default. For impaired AFS state and municipal bonds that Citi plans to sell, or would likely be required to sell with no expectation that the fair value will recover prior to the expected sale date, the full impairment is recognized in earnings.
Recognition and Measurement of OTTI The following table presents the total OTTI recognized in earnings for the year ended December 31, 2012: OTTI on Investments and Other Assets Year Ended December 31, 2012In millions of dollars AFS (1) HTM Other Assets TotalImpairment losses related to securities that the Company does not intend to sell nor
will likely be required to sell: Total OTTI losses recognized during the year ended December 31, 2012 $ 17 $365 $ — $ 382 Less: portion of impairment loss recognized in AOCI (before taxes) 1 65 — 66Net impairment losses recognized in earnings for securities that the Company does
not intend to sell nor will likely be required to sell $ 16 $300 $ — $ 316Impairment losses recognized in earnings for securities that the Company intends
to sell or more-likely-than-not will be required to sell before recovery (2) 139 — 4,516 4,655Total impairment losses recognized in earnings $155 $300 $4,516 $ 4,971 (1) Includes OTTI on non-marketable equity securities. (2) As described under “MSSB” above, the third quarter of 2012 includes the recognition of a $3,340 million impairment charge related to the carrying value of Citi’s
remaining 35% interest in MSSB. Additionally, as described under “Akbank” above, in the first quarter of 2012, the Company recorded an impairment charge relating to its total investment in Akbank amounting to $1.2 billion pretax ($763 million after-tax).

65
The following is a 12-month roll-forward of the credit-related impairments recognized in earnings for AFS and HTM debt securities held as of December 31, 2012 that the Company does not intend to sell nor will likely be required to sell: Cumulative OTTI credit losses recognized in earnings
In millions of dollars Dec. 31, 2011
balance
Credit impairments recognized inearnings on
securities notpreviously impaired
Credit impairments recognized in earnings on
securities that have
been previously impaired
Reductions due tocredit-impairedsecurities sold,transferred or
maturedDec. 31, 2012
balanceAFS debt securities Mortgage-backed securities Prime $ 292 $— $— $ (1) $ 291 Alt-A 2 — — — 2 Commercial real estate 2 — — — 2Total mortgage-backed securities $ 296 $— $— $ (1) $ 295State and municipal securities 3 4 — — 7U.S. Treasury securities 67 — — — 67Foreign government securities 168 6 — (5) 169Corporate 151 1 4 (40) 116Asset-backed securities 10 — — — 10Other debt securities 52 1 — — 53Total OTTI credit losses recognized for AFS debt
securities $ 747 $12 $ 4 $ (46) $ 717HTM debt securities Mortgage-backed securities Prime $ 84 $6 $ 15 $ (1) $ 104 Alt-A 2,218 45 216 (66) 2,413 Subprime 252 — 2 (2) 252 Non-U.S. residential 96 — — (16) 80 Commercial real estate 10 — — — 10Total mortgage-backed securities $2,660 $51 $233 $(85) $2,859State and municipal securities 9 1 1 — 11Foreign Government — — — — —Corporate 391 3 9 (6) 397Asset-backed securities 113 — — — 113Other debt securities 9 2 — — 11Total OTTI credit losses recognized for HTM debt
securities $3,182 $57 $243 $(91) $3,391
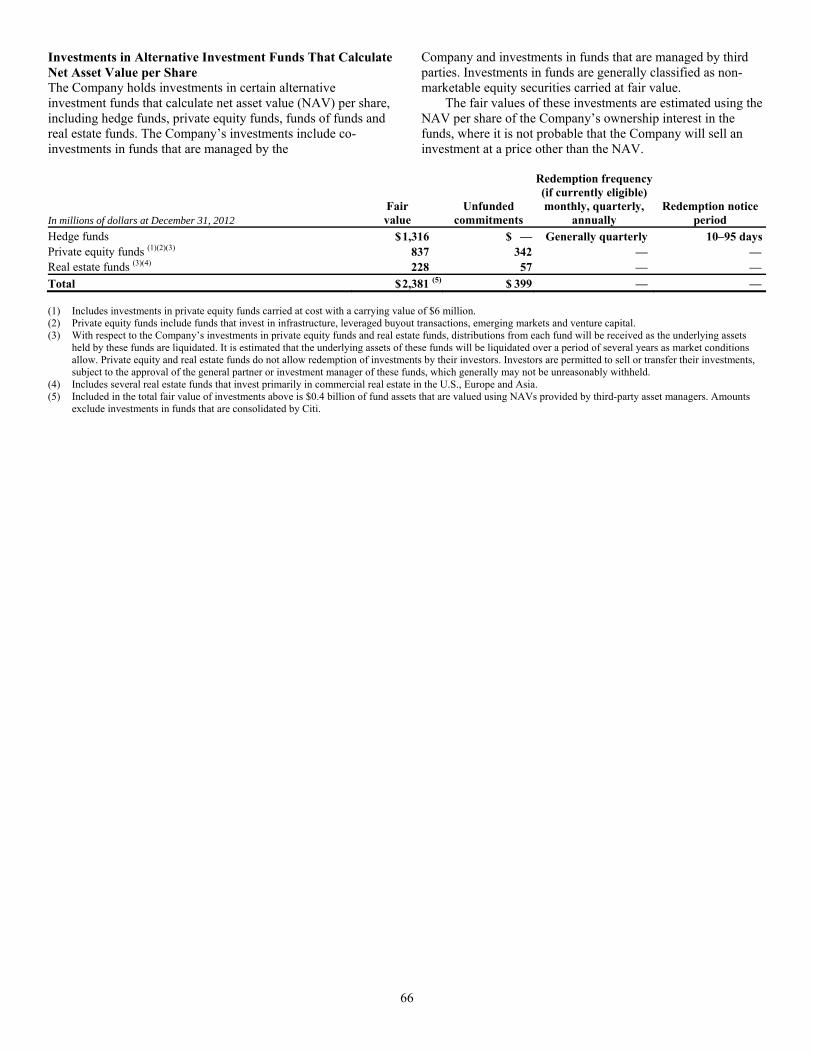
66
Investments in Alternative Investment Funds That Calculate Net Asset Value per Share The Company holds investments in certain alternative investment funds that calculate net asset value (NAV) per share, including hedge funds, private equity funds, funds of funds and real estate funds. The Company’s investments include co-investments in funds that are managed by the
Company and investments in funds that are managed by third parties. Investments in funds are generally classified as non-marketable equity securities carried at fair value. The fair values of these investments are estimated using the NAV per share of the Company’s ownership interest in the funds, where it is not probable that the Company will sell an investment at a price other than the NAV.
In millions of dollars at December 31, 2012 Fair value
Unfunded commitments
Redemption frequency (if currently eligible) monthly, quarterly,
annually Redemption notice
periodHedge funds $ 1,316 $ — Generally quarterly 10–95 daysPrivate equity funds (1)(2)(3) 837 342 — —Real estate funds (3)(4) 228 57 — —Total $ 2,381 (5) $ 399 — — (1) Includes investments in private equity funds carried at cost with a carrying value of $6 million. (2) Private equity funds include funds that invest in infrastructure, leveraged buyout transactions, emerging markets and venture capital. (3) With respect to the Company’s investments in private equity funds and real estate funds, distributions from each fund will be received as the underlying assets
held by these funds are liquidated. It is estimated that the underlying assets of these funds will be liquidated over a period of several years as market conditions allow. Private equity and real estate funds do not allow redemption of investments by their investors. Investors are permitted to sell or transfer their investments, subject to the approval of the general partner or investment manager of these funds, which generally may not be unreasonably withheld.
(4) Includes several real estate funds that invest primarily in commercial real estate in the U.S., Europe and Asia. (5) Included in the total fair value of investments above is $0.4 billion of fund assets that are valued using NAVs provided by third-party asset managers. Amounts
exclude investments in funds that are consolidated by Citi.

67
16. LOANS Citigroup loans are reported in two categories—Consumer and Corporate. These categories are classified primarily according to the segment and subsegment that manages the loans. Consumer Loans Consumer loans represent loans and leases managed primarily by the Global Consumer Banking and Local Consumer Lending businesses. The following table provides information by loan type: In millions of dollars 2012 2011 Consumer loans In U.S. offices Mortgage and real estate (1) $125,946 $139,177 Installment, revolving credit, and other 14,070 15,616 Cards 111,403 117,908 Commercial and industrial 5,344 4,766 Lease financing — 1 $256,763 $277,468 In offices outside the U.S. Mortgage and real estate (1) $54,709 $52,052 Installment, revolving credit, and other 36,182 34,613 Cards 40,653 38,926 Commercial and industrial 20,001 19,975 Lease financing 781 711 $152,326 $146,277 Total Consumer loans $409,089 $423,745 Net unearned income (418) (405) Consumer loans, net of unearned income $408,671 $423,340 (1) Loans secured primarily by real estate. Included in the loan table above are lending products whose terms may give rise to additional credit issues. Credit cards with below-market introductory interest rates and interest-only loans are examples of such products. These products are closely managed using credit techniques that are intended to mitigate their additional inherent risk. During the years ended December 31, 2012 and 2011, the Company sold and/or reclassified (to held-for-sale) $4.3 billion and $21.0 billion, respectively, of Consumer loans. The Company did not have significant purchases of Consumer loans during the years ended December 31, 2012 or December 31, 2011. Citigroup has established a risk management process to monitor, evaluate and manage the principal risks associated with its Consumer loan portfolio. Credit quality indicators that are actively monitored include delinquency status, consumer credit scores (FICO), and loan to value (LTV) ratios, each as discussed in more detail below.
Delinquency Status Delinquency status is carefully monitored and considered a key indicator of credit quality of Consumer loans. Substantially all of the U.S. residential first mortgage loans use the MBA method of reporting delinquencies, which considers a loan delinquent if a monthly payment has not been received by the end of the day immediately preceding the loan’s next due date. All other loans use the OTS method of reporting delinquencies, which considers a loan delinquent if a monthly payment has not been received by the close of business on the loan’s next due date. As a general policy, residential first mortgages, home equity loans and installment loans are classified as non-accrual when loan payments are 90 days contractually past due. Credit cards and unsecured revolving loans generally accrue interest until payments are 180 days past due. As a result of OCC guidance issued in the first quarter of 2012, home equity loans in regulated bank entities are classified as non-accrual if the related residential first mortgage is 90 days or more past due. As a result of OCC guidance issued in the third quarter of 2012, mortgage loans in regulated bank entities discharged through Chapter 7 bankruptcy, other than FHA-insured loans, are classified as non-accrual. Commercial market loans are placed on a cash (non-accrual) basis when it is determined, based on actual experience and a forward-looking assessment of the collectability of the loan in full, that the payment of interest or principal is doubtful or when interest or principal is 90 days past due. The policy for re-aging modified U.S. Consumer loans to current status varies by product. Generally, one of the conditions to qualify for these modifications is that a minimum number of payments (typically ranging from one to three) be made. Upon modification, the loan is re-aged to current status. However, re-aging practices for certain open-ended Consumer loans, such as credit cards, are governed by Federal Financial Institutions Examination Council (FFIEC) guidelines. For open-ended Consumer loans subject to FFIEC guidelines, one of the conditions for the loan to be re-aged to current status is that at least three consecutive minimum monthly payments, or the equivalent amount, must be received. In addition, under FFIEC guidelines, the number of times that such a loan can be re-aged is subject to limitations (generally once in 12 months and twice in five years). Furthermore, Federal Housing Administration (FHA) and Department of Veterans Affairs (VA) loans are modified under those respective agencies’ guidelines, and payments are not always required in order to re-age a modified loan to current.

68
The following tables provide details on Citigroup’s Consumer loan delinquency and non-accrual loans as of December 31, 2012 and December 31, 2011: Consumer Loan Delinquency and Non-Accrual Details at December 31, 2012
In millions of dollars Total
current (1)(2) 30–89 dayspast due (3)
≥ 90 days past due (3)
Past due Governmentguaranteed (4)
Total loans (2)
Total non-accrual (5)
90 days past dueand accruing
In North America offices Residential first mortgages $ 75,791 $3,074 $3,339 $6,000 $ 88,204 $4,922 $4,695 Home equity loans (6) 35,740 642 843 — 37,225 1,797 — Credit cards 108,892 1,582 1,527 — 112,001 — 1,527 Installment and other 13,319 288 325 — 13,932 179 8 Commercial market loans 7,874 32 19 — 7,925 210 11Total $241,616 $5,618 $6,053 $6,000 $259,287 $7,108 $6,241In offices outside North America Residential first mortgages $ 45,496 $ 547 $ 485 $ — $ 46,528 $ 807 $ — Home equity loans (6) 4 — 2 — 6 2 — Credit cards 38,920 970 805 — 40,695 516 508 Installment and other 29,350 496 167 — 30,013 254 — Commercial market loans 31,263 106 181 — 31,550 428 —Total $145,033 $2,119 $1,640 $ — $148,792 $2,007 $ 508Total GCB and LCL $386,649 $7,737 $7,693 $6,000 $408,079 $9,115 $6,749Special Asset Pool (SAP) 545 18 29 — 592 81 —Total Citigroup $387,194 $7,755 $7,722 $6,000 $408,671 $9,196 $6,749 (1) Loans less than 30 days past due are presented as current. (2) Includes $1.2 billion of residential first mortgages recorded at fair value. (3) Excludes loans guaranteed by U.S. government entities. (4) Consists of residential first mortgages that are guaranteed by U.S. government entities that are 30-89 days past due of $1.3 billion and ≥ 90 days past due of $4.7
billion. (5) During 2012, there was an increase in Consumer non-accrual loans in North America of approximately $1.5 billion, as a result of OCC guidance issued in the third
quarter of 2012 regarding mortgage loans where the borrower has gone through Chapter 7 bankruptcy. Of the $1.5 billion non-accrual loans, $1.3 billion were current. Additionally, during 2012, there was an increase in non-accrual Consumer loans in North America during the first quarter of 2012, which was attributable to a $0.8 billion reclassification from accrual to non-accrual status of home equity loans where the related residential first mortgage was 90 days or more past due. The vast majority of these loans were current at the time of reclassification. The reclassification reflected regulatory guidance issued on January 31, 2012. The reclassification had no impact on Citi’s delinquency statistics or its loan loss reserves.
(6) Fixed rate home equity loans and loans extended under home equity lines of credit, which are typically in junior lien positions. Consumer Loan Delinquency and Non-Accrual Details at December 31, 2011
In millions of dollars Total
current (1)(2) 30–89 dayspast due (3)
≥ 90 days past due (3)
Past due Governmentguaranteed (4)
Total loans (2)
Total non-accrual
90 days past dueand accruing
In North America offices Residential first mortgages $ 81,081 $3,550 $4,121 $6,686 $95,438 $4,176 $5,054 Home equity loans (5) 41,585 868 1,022 — 43,475 982 — Credit cards 114,022 2,344 2,058 — 118,424 — 2,058 Installment and other 15,215 340 222 — 15,777 438 10 Commercial market loans 6,643 15 207 — 6,865 220 14 Total $258,546 $7,117 $7,630 $6,686 $279,979 $5,816 $7,136In offices outside North America Residential first mortgages $ 43,310 $ 566 $ 482 $ — $44,358 $ 744 $ — Home equity loans (5) 6 — 2 — 8 2 — Credit cards 38,289 930 785 — 40,004 496 490 Installment and other 26,300 528 197 — 27,025 258 — Commercial market loans 30,491 79 127 — 30,697 401 — Total $138,396 $2,103 $1,593 $ — $142,092 $1,901 $ 490Total GCB and LCL $396,942 $9,220 $9,223 $6,686 $422,071 $7,717 $7,626Special Asset Pool (SAP) 1,193 29 47 — 1,269 115 — Total Citigroup $398,135 $9,249 $9,270 $6,686 $423,340 $7,832 $7,626 (1) Loans less than 30 days past due are presented as current. (2) Includes $1.3 billion of residential first mortgages recorded at fair value. (3) Excludes loans guaranteed by U.S. government entities. (4) Consists of residential first mortgages that are guaranteed by U.S. government entities that are 30-89 days past due of $1.6 billion and ≥ 90 days past due of $5.1
billion. (5) Fixed rate home equity loans and loans extended under home equity lines of credit, which are typically in junior lien positions.

69
Consumer Credit Scores (FICO) In the U.S., independent credit agencies rate an individual’s risk for assuming debt based on the individual’s credit history and assign every consumer a “FICO” credit score. These scores are continually updated by the agencies based upon an individual’s credit actions (e.g., taking out a loan or missed or late payments). The following table provides details on the FICO scores attributable to Citi’s U.S. Consumer loan portfolio as of December 31, 2012 and 2011 (commercial market loans are not included in the table since they are business-based and FICO scores are not a primary driver in their credit evaluation). FICO scores are updated monthly for substantially all of the portfolio or, otherwise, on a quarterly basis.
FICO score distribution in U.S.
portfolio (1)(2) December 31, 2012
In millions of dollars Less than
620 ≥ 620 but less
than 660
Equal to orgreater
than 660Residential first
mortgages $16,754 $ 8,013 $ 50,833Home equity loans 5,439 3,208 26,820Credit cards 7,833 10,304 90,248Installment and other 4,414 2,417 5,365Total $34,440 $23,942 $173,266 (1) Excludes loans guaranteed by U.S. government entities, loans subject to
LTSCs with U.S. government-sponsored entities and loans recorded at fair value.
(2) Excludes balances where FICO was not available. Such amounts are not material.
FICO score
distribution in U.S. portfolio (1)(2) December 31, 2011
In millions of dollars Less than
620 ≥ 620 but less
than 660
Equal to or greater
than 660 Residential first
mortgages $20,370 $ 8,815 $ 52,839 Home equity loans 6,783 3,703 30,884 Credit cards 9,621 10,905 93,234 Installment and other 3,789 2,858 6,704 Total $40,563 $26,281 $183,661 (1) Excludes loans guaranteed by U.S. government entities, loans subject to
LTSCs with U.S. government-sponsored entities and loans recorded at fair value.
(2) Excludes balances where FICO was not available. Such amounts are not material.
Loan to Value Ratios (LTV) LTV ratios (loan balance divided by appraised value) are calculated at origination and updated by applying market price data. The following tables provide details on the LTV ratios attributable to Citi’s U.S. Consumer mortgage portfolios as of December 31, 2012 and 2011. LTV ratios are updated monthly using the most recent Core Logic HPI data available for substantially all of the portfolio applied at the Metropolitan Statistical Area level, if available and the state level if not. The remainder of the portfolio is updated in a similar manner using the Office of Federal Housing Enterprise Oversight indices.
LTV distribution in U.S. portfolio (1)(2) December 31, 2012
In millions of dollars Less than or equal to 80%
> 80% but lessthan or equal to
100%
Greaterthan
100%Residential first
mortgages $41,555 $19,070 $14,995Home equity loans 12,611 9,529 13,153Total $54,166 $28,599 $28,148 (1) Excludes loans guaranteed by U.S. government entities, loans subject to
LTSCs with U.S. government-sponsored entities and loans recorded at fair value.
(2) Excludes balances where LTV was not available. Such amounts are not material.
LTV distribution in
U.S. portfolio (1)(2) December 31, 2011
In millions of dollars Less than or equal to 80%
> 80% but lessthan or equal to
100%
Greaterthan
100% Residential first
mortgages $36,422 $21,146 $24,425Home equity loans 12,724 10,232 18,226Total $49,146 $31,378 $42,651 (1) Excludes loans guaranteed by U.S. government entities, loans subject to
LTSCs with U.S. government-sponsored entities and loans recorded at fair value.
(2) Excludes balances where LTV was not available. Such amounts are not material.
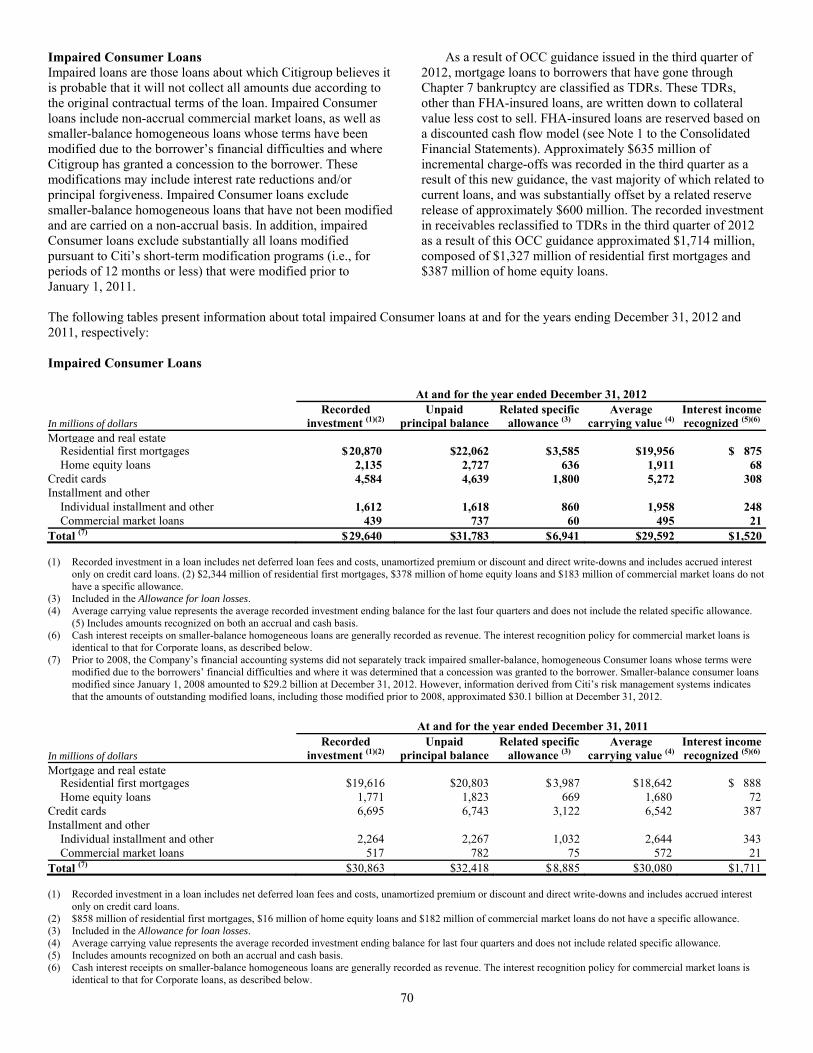
70
Impaired Consumer Loans Impaired loans are those loans about which Citigroup believes it is probable that it will not collect all amounts due according to the original contractual terms of the loan. Impaired Consumer loans include non-accrual commercial market loans, as well as smaller-balance homogeneous loans whose terms have been modified due to the borrower’s financial difficulties and where Citigroup has granted a concession to the borrower. These modifications may include interest rate reductions and/or principal forgiveness. Impaired Consumer loans exclude smaller-balance homogeneous loans that have not been modified and are carried on a non-accrual basis. In addition, impaired Consumer loans exclude substantially all loans modified pursuant to Citi’s short-term modification programs (i.e., for periods of 12 months or less) that were modified prior to January 1, 2011.
As a result of OCC guidance issued in the third quarter of 2012, mortgage loans to borrowers that have gone through Chapter 7 bankruptcy are classified as TDRs. These TDRs, other than FHA-insured loans, are written down to collateral value less cost to sell. FHA-insured loans are reserved based on a discounted cash flow model (see Note 1 to the Consolidated Financial Statements). Approximately $635 million of incremental charge-offs was recorded in the third quarter as a result of this new guidance, the vast majority of which related to current loans, and was substantially offset by a related reserve release of approximately $600 million. The recorded investment in receivables reclassified to TDRs in the third quarter of 2012 as a result of this OCC guidance approximated $1,714 million, composed of $1,327 million of residential first mortgages and $387 million of home equity loans.
The following tables present information about total impaired Consumer loans at and for the years ending December 31, 2012 and 2011, respectively: Impaired Consumer Loans At and for the year ended December 31, 2012
In millions of dollars Recorded
investment (1)(2)Unpaid
principal balanceRelated specific
allowance (3) Average
carrying value (4)Interest incomerecognized (5)(6)
Mortgage and real estate Residential first mortgages $ 20,870 $22,062 $ 3,585 $19,956 $ 875 Home equity loans 2,135 2,727 636 1,911 68Credit cards 4,584 4,639 1,800 5,272 308Installment and other Individual installment and other 1,612 1,618 860 1,958 248 Commercial market loans 439 737 60 495 21Total (7) $29,640 $31,783 $6,941 $29,592 $1,520 (1) Recorded investment in a loan includes net deferred loan fees and costs, unamortized premium or discount and direct write-downs and includes accrued interest
only on credit card loans. (2) $2,344 million of residential first mortgages, $378 million of home equity loans and $183 million of commercial market loans do not have a specific allowance.
(3) Included in the Allowance for loan losses. (4) Average carrying value represents the average recorded investment ending balance for the last four quarters and does not include the related specific allowance.
(5) Includes amounts recognized on both an accrual and cash basis. (6) Cash interest receipts on smaller-balance homogeneous loans are generally recorded as revenue. The interest recognition policy for commercial market loans is
identical to that for Corporate loans, as described below. (7) Prior to 2008, the Company’s financial accounting systems did not separately track impaired smaller-balance, homogeneous Consumer loans whose terms were
modified due to the borrowers’ financial difficulties and where it was determined that a concession was granted to the borrower. Smaller-balance consumer loans modified since January 1, 2008 amounted to $29.2 billion at December 31, 2012. However, information derived from Citi’s risk management systems indicates that the amounts of outstanding modified loans, including those modified prior to 2008, approximated $30.1 billion at December 31, 2012.
At and for the year ended December 31, 2011
In millions of dollars Recorded
investment (1)(2)Unpaid
principal balanceRelated specific
allowance (3) Average
carrying value (4)Interest incomerecognized (5)(6)
Mortgage and real estate Residential first mortgages $19,616 $20,803 $ 3,987 $ 18,642 $ 888 Home equity loans 1,771 1,823 669 1,680 72Credit cards 6,695 6,743 3,122 6,542 387Installment and other Individual installment and other 2,264 2,267 1,032 2,644 343 Commercial market loans 517 782 75 572 21Total (7) $30,863 $32,418 $8,885 $ 30,080 $1,711 (1) Recorded investment in a loan includes net deferred loan fees and costs, unamortized premium or discount and direct write-downs and includes accrued interest
only on credit card loans. (2) $858 million of residential first mortgages, $16 million of home equity loans and $182 million of commercial market loans do not have a specific allowance. (3) Included in the Allowance for loan losses. (4) Average carrying value represents the average recorded investment ending balance for last four quarters and does not include related specific allowance. (5) Includes amounts recognized on both an accrual and cash basis. (6) Cash interest receipts on smaller-balance homogeneous loans are generally recorded as revenue. The interest recognition policy for commercial market loans is
identical to that for Corporate loans, as described below.
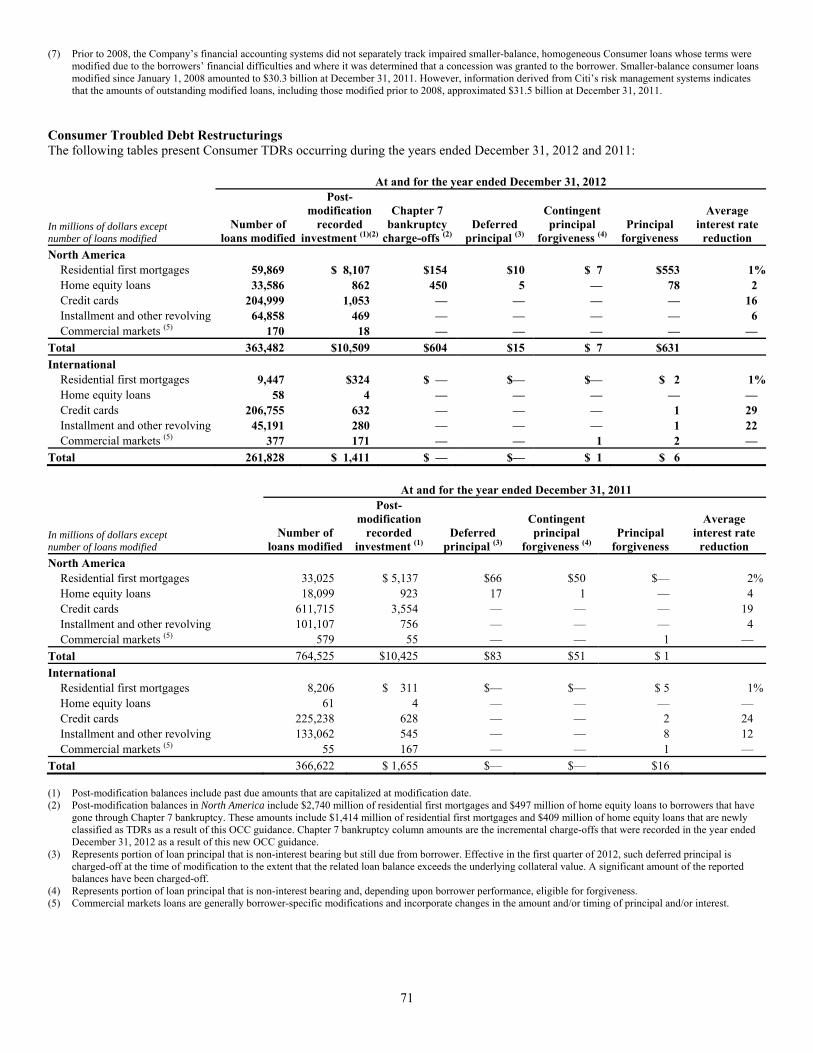
71
(7) Prior to 2008, the Company’s financial accounting systems did not separately track impaired smaller-balance, homogeneous Consumer loans whose terms were modified due to the borrowers’ financial difficulties and where it was determined that a concession was granted to the borrower. Smaller-balance consumer loans modified since January 1, 2008 amounted to $30.3 billion at December 31, 2011. However, information derived from Citi’s risk management systems indicates that the amounts of outstanding modified loans, including those modified prior to 2008, approximated $31.5 billion at December 31, 2011.
Consumer Troubled Debt Restructurings The following tables present Consumer TDRs occurring during the years ended December 31, 2012 and 2011: At and for the year ended December 31, 2012
In millions of dollars except number of loans modified
Number of loans modified
Post-modification
recorded investment (1)(2)
Chapter 7 bankruptcy
charge-offs (2)Deferred
principal (3)
Contingent principal
forgiveness (4) Principal
forgiveness
Average interest rate
reductionNorth America Residential first mortgages 59,869 $ 8,107 $154 $10 $ 7 $553 1% Home equity loans 33,586 862 450 5 — 78 2 Credit cards 204,999 1,053 — — — — 16 Installment and other revolving 64,858 469 — — — — 6 Commercial markets (5) 170 18 — — — — —Total 363,482 $10,509 $604 $15 $ 7 $631 International Residential first mortgages 9,447 $324 $ — $— $— $ 2 1% Home equity loans 58 4 — — — — — Credit cards 206,755 632 — — — 1 29 Installment and other revolving 45,191 280 — — — 1 22 Commercial markets (5) 377 171 — — 1 2 —Total 261,828 $ 1,411 $ — $— $ 1 $ 6 At and for the year ended December 31, 2011
In millions of dollars except number of loans modified
Number of loans modified
Post-modification
recorded investment (1)
Deferred principal (3)
Contingent principal
forgiveness (4) Principal
forgiveness
Average interest rate
reductionNorth America Residential first mortgages 33,025 $ 5,137 $66 $50 $— 2% Home equity loans 18,099 923 17 1 — 4 Credit cards 611,715 3,554 — — — 19 Installment and other revolving 101,107 756 — — — 4 Commercial markets (5) 579 55 — — 1 — Total 764,525 $10,425 $83 $51 $ 1 International Residential first mortgages 8,206 $ 311 $— $— $ 5 1% Home equity loans 61 4 — — — — Credit cards 225,238 628 — — 2 24 Installment and other revolving 133,062 545 — — 8 12 Commercial markets (5) 55 167 — — 1 — Total 366,622 $ 1,655 $— $— $16 (1) Post-modification balances include past due amounts that are capitalized at modification date. (2) Post-modification balances in North America include $2,740 million of residential first mortgages and $497 million of home equity loans to borrowers that have
gone through Chapter 7 bankruptcy. These amounts include $1,414 million of residential first mortgages and $409 million of home equity loans that are newly classified as TDRs as a result of this OCC guidance. Chapter 7 bankruptcy column amounts are the incremental charge-offs that were recorded in the year ended December 31, 2012 as a result of this new OCC guidance.
(3) Represents portion of loan principal that is non-interest bearing but still due from borrower. Effective in the first quarter of 2012, such deferred principal is charged-off at the time of modification to the extent that the related loan balance exceeds the underlying collateral value. A significant amount of the reported balances have been charged-off.
(4) Represents portion of loan principal that is non-interest bearing and, depending upon borrower performance, eligible for forgiveness. (5) Commercial markets loans are generally borrower-specific modifications and incorporate changes in the amount and/or timing of principal and/or interest.
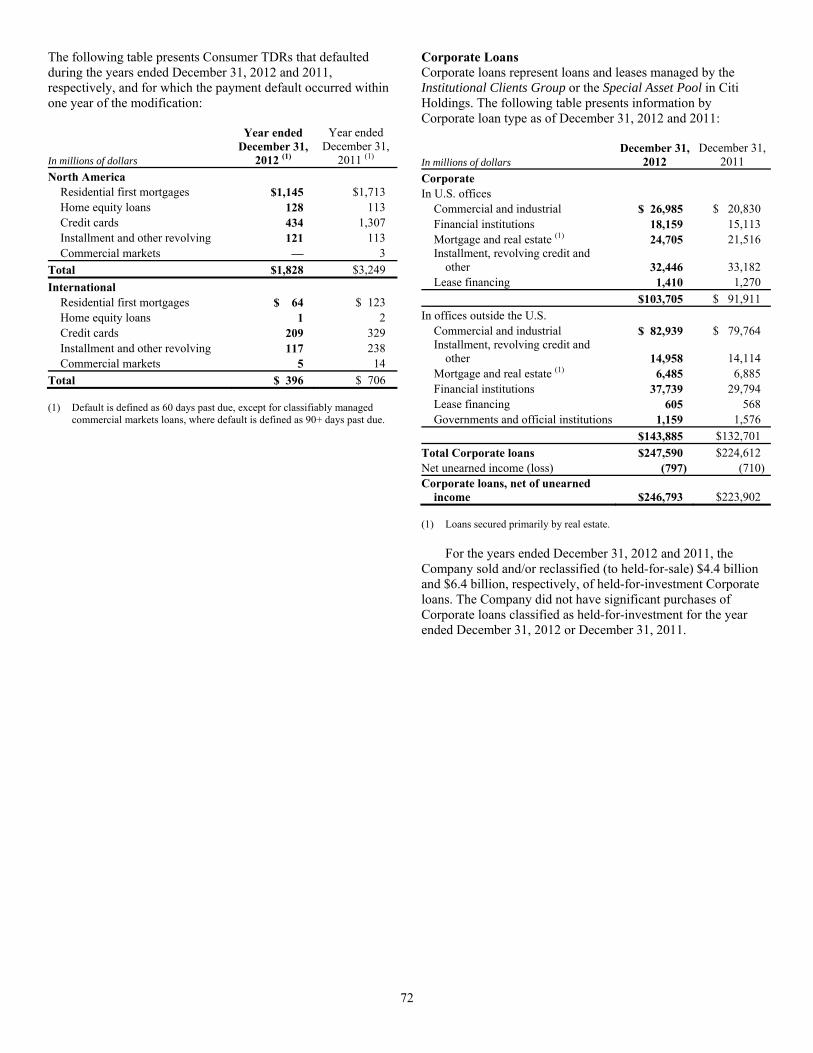
72
The following table presents Consumer TDRs that defaulted during the years ended December 31, 2012 and 2011, respectively, and for which the payment default occurred within one year of the modification:
In millions of dollars
Year ended December 31,
2012 (1)
Year ended December 31,
2011 (1) North America Residential first mortgages $1,145 $1,713 Home equity loans 128 113 Credit cards 434 1,307 Installment and other revolving 121 113 Commercial markets — 3 Total $1,828 $3,249 International Residential first mortgages $ 64 $ 123 Home equity loans 1 2 Credit cards 209 329 Installment and other revolving 117 238 Commercial markets 5 14 Total $ 396 $ 706 (1) Default is defined as 60 days past due, except for classifiably managed
commercial markets loans, where default is defined as 90+ days past due.
Corporate Loans Corporate loans represent loans and leases managed by the Institutional Clients Group or the Special Asset Pool in Citi Holdings. The following table presents information by Corporate loan type as of December 31, 2012 and 2011:
In millions of dollars December 31,
2012December 31,
2011 Corporate In U.S. offices Commercial and industrial $ 26,985 $ 20,830 Financial institutions 18,159 15,113 Mortgage and real estate (1) 24,705 21,516 Installment, revolving credit and
other 32,446 33,182 Lease financing 1,410 1,270 $103,705 $ 91,911 In offices outside the U.S. Commercial and industrial $ 82,939 $ 79,764 Installment, revolving credit and
other 14,958 14,114 Mortgage and real estate (1) 6,485 6,885 Financial institutions 37,739 29,794 Lease financing 605 568 Governments and official institutions 1,159 1,576 $143,885 $132,701 Total Corporate loans $247,590 $224,612 Net unearned income (loss) (797) (710) Corporate loans, net of unearned
income $246,793 $223,902 (1) Loans secured primarily by real estate. For the years ended December 31, 2012 and 2011, the Company sold and/or reclassified (to held-for-sale) $4.4 billion and $6.4 billion, respectively, of held-for-investment Corporate loans. The Company did not have significant purchases of Corporate loans classified as held-for-investment for the year ended December 31, 2012 or December 31, 2011.

73
Corporate loans are identified as impaired and placed on a cash (non-accrual) basis when it is determined, based on actual experience and a forward-looking assessment of the collectability of the loan in full, that the payment of interest or principal is doubtful or when interest or principal is 90 days past due, except when the loan is well collateralized and in the process of collection. Any interest accrued on impaired Corporate loans and leases is reversed at 90 days and charged against current earnings,
and interest is thereafter included in earnings only to the extent actually received in cash. When there is doubt regarding the ultimate collectability of principal, all cash receipts are thereafter applied to reduce the recorded investment in the loan. While Corporate loans are generally managed based on their internally assigned risk rating (see further discussion below), the following tables present delinquency information by Corporate loan type as of December 31, 2012 and 2011:
Corporate Loan Delinquency and Non-Accrual Details at December 31, 2012
In millions of dollars
30–89 days past due
and accruing (1)
≥ 90 days past due andaccruing (1)
Total past dueand accruing
Total non-accrual (2)
Total current (3)
Total loans
Commercial and industrial $ 38 $ 10 $ 48 $1,078 $107,650 $108,776 Financial institutions 5 — 5 454 53,858 54,317 Mortgage and real estate 224 109 333 680 30,057 31,070 Leases 7 — 7 52 1,956 2,015 Other 70 6 76 69 46,414 46,559Loans at fair value 4,056Total $344 $125 $469 $2,333 $239,935 $246,793 (1) Corporate loans that are ≥ 90 days past due are generally classified as non-accrual. Corporate loans are considered past due when principal or interest is
contractually due but unpaid. (2) Citi generally does not manage Corporate loans on a delinquency basis. Non-accrual loans generally include those loans that are ≥ 90 days past due or those loans
for which Citi believes, based on actual experience and a forward-looking assessment of the collectability of the loan in full, that the payment of interest or principal is doubtful.
(3) Corporate loans are past due when principal or interest is contractually due but unpaid. Loans less than 30 days past due are presented as current. Corporate Loan Delinquency and Non-Accrual Details at December 31, 2011
In millions of dollars
30–89 days past due
and accruing (1)
≥ 90 days past due andaccruing (1)
Total past dueand accruing
Total non-accrual (2)
Total current (3)
Total loans
Commercial and industrial $ 93 $ 30 $ 123 $1,134 $ 98,157 $ 99,414 Financial institutions — 2 2 763 42,642 43,407 Mortgage and real estate 224 125 349 1,039 26,908 28,296 Leases 3 11 14 13 1,811 1,838 Other 225 15 240 287 46,481 47,008Loans at fair value 3,939Total $545 $183 $728 $3,236 $215,999 $223,902 (1) Corporate loans that are ≥ 90 days past due are generally classified as non-accrual. Corporate loans are considered past due when principal or interest is
contractually due but unpaid. (2) Citi generally does not manage Corporate loans on a delinquency basis. Non-accrual loans generally include those loans that are ≥ 90 days past due or those loans
for which Citi believes, based on actual experience and a forward-looking assessment of the collectability of the loan in full, that the payment of interest or principal is doubtful.
(3) Corporate loans are past due when principal or interest is contractually due but unpaid. Loans less than 30 days past due are presented as current.

74
Citigroup has a risk management process to monitor, evaluate and manage the principal risks associated with its Corporate loan portfolio. As part of its risk management process, Citi assigns numeric risk ratings to its Corporate loan facilities based on quantitative and qualitative assessments of the obligor and facility. These risk ratings are reviewed at least annually or more often if material events related to the obligor or facility warrant. Factors considered in assigning the risk ratings include: financial condition of the obligor, qualitative assessment of management and strategy, amount and sources of repayment, amount and type of collateral and guarantee arrangements, amount and type of any contingencies associated with the obligor, and the obligor’s industry and geography. The obligor risk ratings are defined by ranges of default probabilities. The facility risk ratings are defined by ranges of loss norms, which are the product of the probability of default and the loss given default. The investment grade rating categories are similar to the category BBB-/Baa3 and above as defined by S&P and Moody’s. Loans classified according to the bank regulatory definitions as special mention, substandard and doubtful will have risk ratings within the non-investment grade categories.
Corporate Loans Credit Quality Indicators at December 31, 2012 and December 31, 2011 Recorded investment in loans (1)
In millions of dollars December 31,
2012December 31,
2011 Investment grade (2) Commercial and industrial $ 73,822 $ 67,282Financial institutions 43,895 35,159Mortgage and real estate 12,587 10,729Leases 1,404 1,161Other 42,575 42,428Total investment grade $174,283 $156,759Non-investment grade (2) Accrual Commercial and industrial $ 33,876 $ 30,998Financial institutions 9,968 7,485Mortgage and real estate 2,858 3,812Leases 559 664Other 3,915 4,293Non-accrual Commercial and industrial 1,078 1,134Financial institutions 454 763Mortgage and real estate 680 1,039Leases 52 13Other 69 287Total non-investment grade $ 53,509 $ 50,488Private Banking loans managed on
a delinquency basis (2) $ 14,945 $ 12,716Loans at fair value 4,056 3,939Corporate loans, net of unearned
income $246,793 $223,902 (1) Recorded investment in a loan includes net deferred loan fees and costs,
unamortized premium or discount, less any direct write-downs. (2) Held-for-investment loans accounted for on an amortized cost basis. Corporate loans and leases identified as impaired and placed on non-accrual status are written down to the extent that principal is judged to be uncollectible. Impaired collateral-dependent loans and leases, where repayment is expected to be provided solely by the sale of the underlying collateral and there are no other available and reliable sources of repayment, are written down to the lower of cost or collateral value, less cost to sell. Cash-basis loans are returned to an accrual status when all contractual principal and interest amounts are reasonably assured of repayment and there is a sustained period of repayment performance, generally six months, in accordance with the contractual terms of the loan.
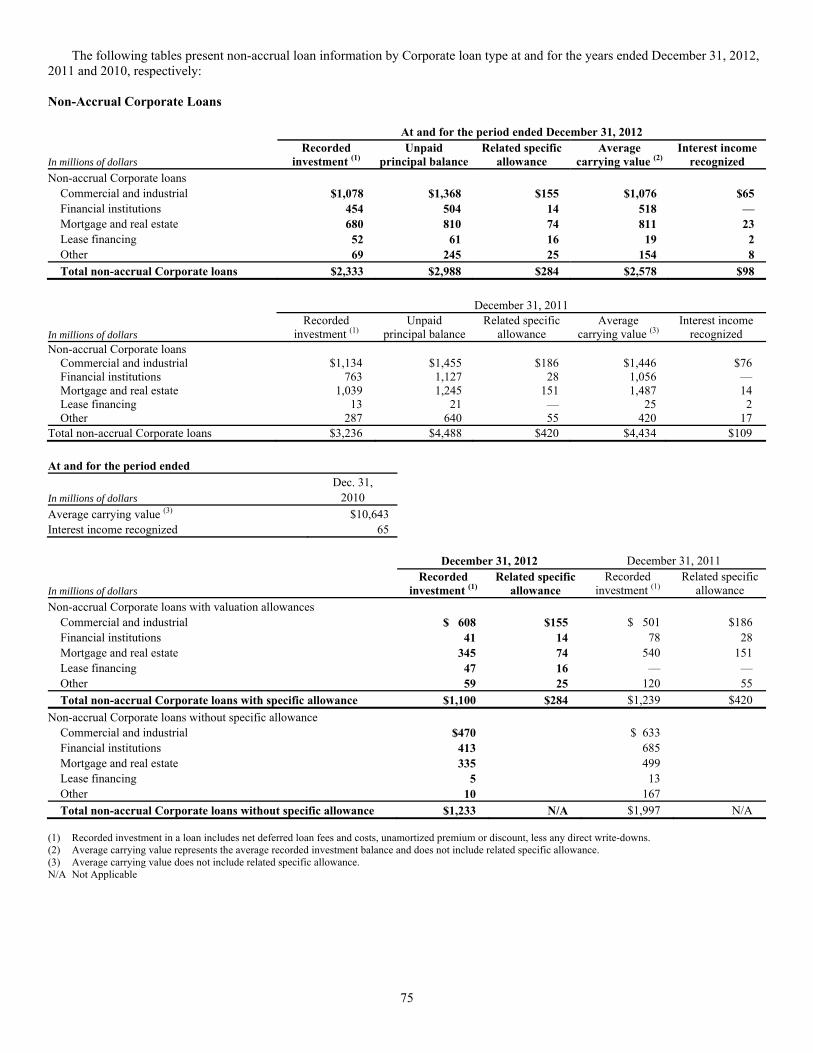
75
The following tables present non-accrual loan information by Corporate loan type at and for the years ended December 31, 2012, 2011 and 2010, respectively: Non-Accrual Corporate Loans At and for the period ended December 31, 2012
In millions of dollars Recorded
investment (1)Unpaid
principal balanceRelated specific
allowanceAverage
carrying value (2)Interest income
recognizedNon-accrual Corporate loans Commercial and industrial $1,078 $1,368 $155 $1,076 $65 Financial institutions 454 504 14 518 — Mortgage and real estate 680 810 74 811 23 Lease financing 52 61 16 19 2 Other 69 245 25 154 8 Total non-accrual Corporate loans $2,333 $2,988 $284 $2,578 $98 December 31, 2011
In millions of dollars Recorded
investment (1) Unpaid
principal balance Related specific
allowance Average
carrying value (3) Interest income
recognized Non-accrual Corporate loans Commercial and industrial $1,134 $1,455 $186 $1,446 $76 Financial institutions 763 1,127 28 1,056 — Mortgage and real estate 1,039 1,245 151 1,487 14 Lease financing 13 21 — 25 2 Other 287 640 55 420 17 Total non-accrual Corporate loans $3,236 $4,488 $420 $4,434 $109 At and for the period ended Dec. 31, In millions of dollars 2010 Average carrying value (3) $10,643 Interest income recognized 65 December 31, 2012 December 31, 2011
In millions of dollars Recorded
investment (1)Related specific
allowanceRecorded
investment (1) Related specific
allowance Non-accrual Corporate loans with valuation allowances Commercial and industrial $ 608 $155 $ 501 $186 Financial institutions 41 14 78 28 Mortgage and real estate 345 74 540 151 Lease financing 47 16 — — Other 59 25 120 55 Total non-accrual Corporate loans with specific allowance $1,100 $284 $1,239 $420 Non-accrual Corporate loans without specific allowance Commercial and industrial $470 $ 633 Financial institutions 413 685 Mortgage and real estate 335 499 Lease financing 5 13 Other 10 167 Total non-accrual Corporate loans without specific allowance $1,233 N/A $1,997 N/A (1) Recorded investment in a loan includes net deferred loan fees and costs, unamortized premium or discount, less any direct write-downs. (2) Average carrying value represents the average recorded investment balance and does not include related specific allowance. (3) Average carrying value does not include related specific allowance. N/A Not Applicable
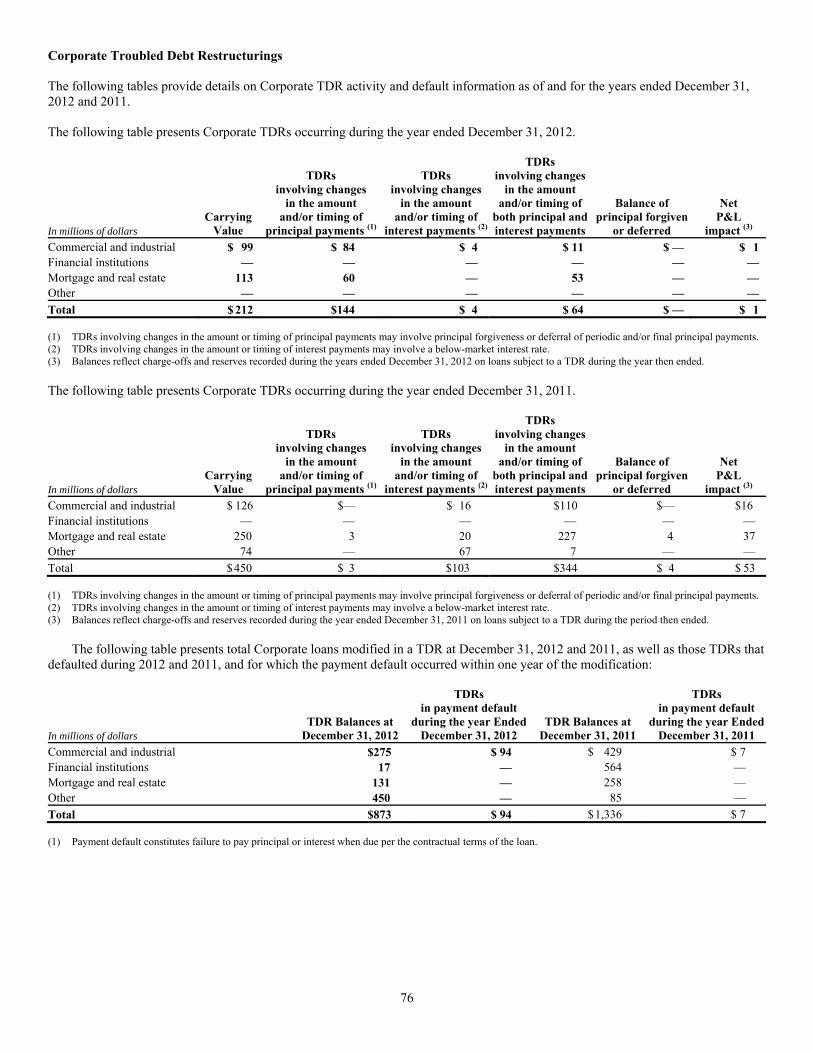
76
Corporate Troubled Debt Restructurings The following tables provide details on Corporate TDR activity and default information as of and for the years ended December 31, 2012 and 2011. The following table presents Corporate TDRs occurring during the year ended December 31, 2012.
In millions of dollars Carrying
Value
TDRs involving changes
in the amount and/or timing of
principal payments (1)
TDRs involving changes
in the amount and/or timing of
interest payments (2)
TDRs involving changes
in the amount and/or timing of
both principal and interest payments
Balance of principal forgiven
or deferred
Net P&L
impact (3)
Commercial and industrial $ 99 $ 84 $ 4 $ 11 $ — $ 1 Financial institutions — — — — — —Mortgage and real estate 113 60 — 53 — —Other — — — — — —Total $ 212 $144 $ 4 $ 64 $ — $ 1 (1) TDRs involving changes in the amount or timing of principal payments may involve principal forgiveness or deferral of periodic and/or final principal payments. (2) TDRs involving changes in the amount or timing of interest payments may involve a below-market interest rate. (3) Balances reflect charge-offs and reserves recorded during the years ended December 31, 2012 on loans subject to a TDR during the year then ended. The following table presents Corporate TDRs occurring during the year ended December 31, 2011.
In millions of dollars Carrying
Value
TDRs involving changes
in the amount and/or timing of
principal payments (1)
TDRs involving changes
in the amount and/or timing of
interest payments (2)
TDRs involving changes
in the amount and/or timing of
both principal and interest payments
Balance of principal forgiven
or deferred
Net P&L
impact (3)
Commercial and industrial $ 126 $— $ 16 $110 $— $16 Financial institutions — — — — — — Mortgage and real estate 250 3 20 227 4 37 Other 74 — 67 7 — — Total $ 450 $ 3 $103 $344 $ 4 $ 53 (1) TDRs involving changes in the amount or timing of principal payments may involve principal forgiveness or deferral of periodic and/or final principal payments. (2) TDRs involving changes in the amount or timing of interest payments may involve a below-market interest rate. (3) Balances reflect charge-offs and reserves recorded during the year ended December 31, 2011 on loans subject to a TDR during the period then ended. The following table presents total Corporate loans modified in a TDR at December 31, 2012 and 2011, as well as those TDRs that defaulted during 2012 and 2011, and for which the payment default occurred within one year of the modification:
In millions of dollars TDR Balances at
December 31, 2012
TDRs in payment default
during the year EndedDecember 31, 2012
TDR Balances at December 31, 2011
TDRs in payment default
during the year EndedDecember 31, 2011
Commercial and industrial $275 $ 94 $ 429 $ 7 Financial institutions 17 — 564 — Mortgage and real estate 131 — 258 — Other 450 — 85 — Total $873 $ 94 $ 1,336 $ 7 (1) Payment default constitutes failure to pay principal or interest when due per the contractual terms of the loan.
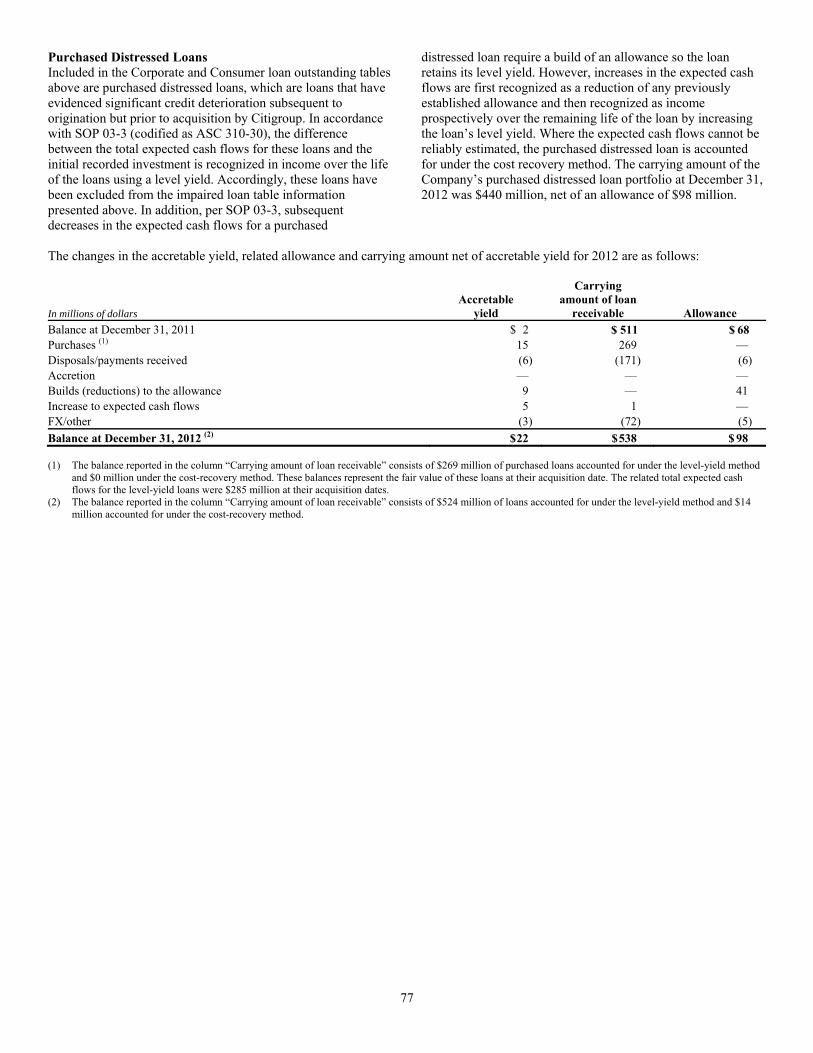
77
Purchased Distressed Loans Included in the Corporate and Consumer loan outstanding tables above are purchased distressed loans, which are loans that have evidenced significant credit deterioration subsequent to origination but prior to acquisition by Citigroup. In accordance with SOP 03-3 (codified as ASC 310-30), the difference between the total expected cash flows for these loans and the initial recorded investment is recognized in income over the life of the loans using a level yield. Accordingly, these loans have been excluded from the impaired loan table information presented above. In addition, per SOP 03-3, subsequent decreases in the expected cash flows for a purchased
distressed loan require a build of an allowance so the loan retains its level yield. However, increases in the expected cash flows are first recognized as a reduction of any previously established allowance and then recognized as income prospectively over the remaining life of the loan by increasing the loan’s level yield. Where the expected cash flows cannot be reliably estimated, the purchased distressed loan is accounted for under the cost recovery method. The carrying amount of the Company’s purchased distressed loan portfolio at December 31, 2012 was $440 million, net of an allowance of $98 million.
The changes in the accretable yield, related allowance and carrying amount net of accretable yield for 2012 are as follows:
In millions of dollars Accretable
yield
Carrying amount of loan
receivable AllowanceBalance at December 31, 2011 $ 2 $ 511 $ 68 Purchases (1) 15 269 — Disposals/payments received (6) (171) (6) Accretion — — — Builds (reductions) to the allowance 9 — 41 Increase to expected cash flows 5 1 — FX/other (3) (72) (5) Balance at December 31, 2012 (2) $ 22 $ 538 $ 98 (1) The balance reported in the column “Carrying amount of loan receivable” consists of $269 million of purchased loans accounted for under the level-yield method
and $0 million under the cost-recovery method. These balances represent the fair value of these loans at their acquisition date. The related total expected cash flows for the level-yield loans were $285 million at their acquisition dates.
(2) The balance reported in the column “Carrying amount of loan receivable” consists of $524 million of loans accounted for under the level-yield method and $14 million accounted for under the cost-recovery method.
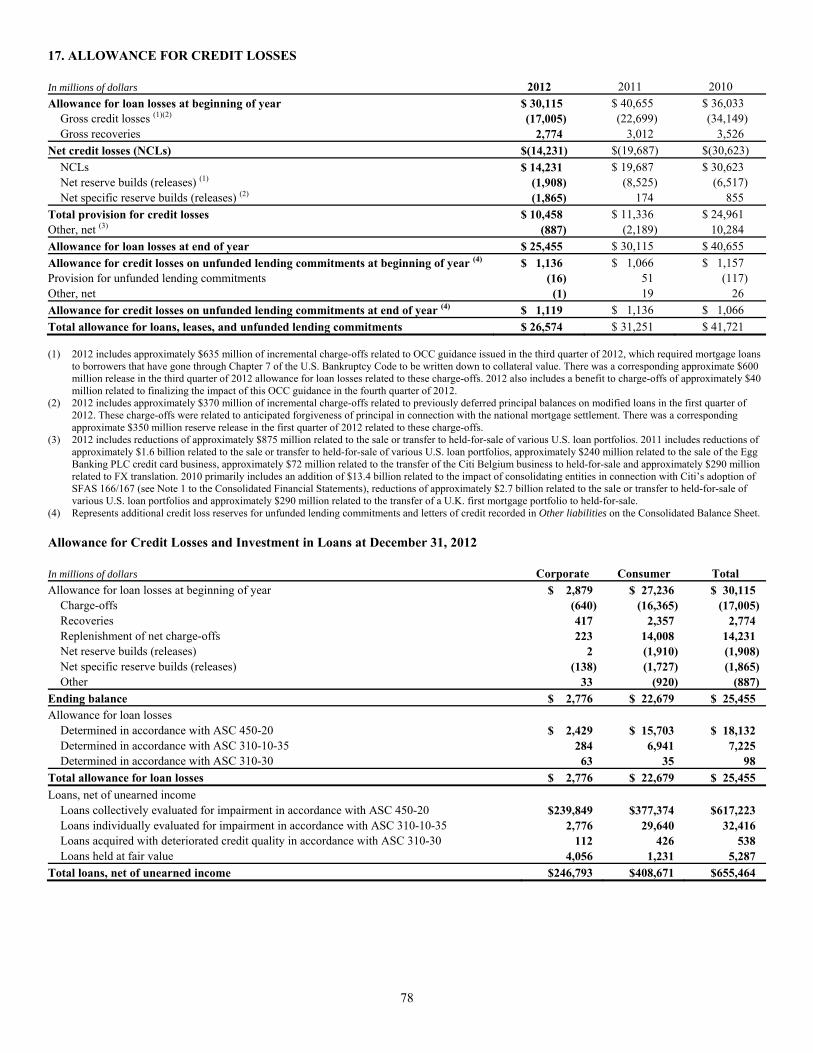
78
17. ALLOWANCE FOR CREDIT LOSSES In millions of dollars 2012 2011 2010 Allowance for loan losses at beginning of year $ 30,115 $ 40,655 $ 36,033 Gross credit losses (1)(2) (17,005) (22,699) (34,149) Gross recoveries 2,774 3,012 3,526 Net credit losses (NCLs) $(14,231) $(19,687) $(30,623) NCLs $ 14,231 $ 19,687 $ 30,623 Net reserve builds (releases) (1) (1,908) (8,525) (6,517) Net specific reserve builds (releases) (2) (1,865) 174 855 Total provision for credit losses $ 10,458 $ 11,336 $ 24,961 Other, net (3) (887) (2,189) 10,284 Allowance for loan losses at end of year $ 25,455 $ 30,115 $ 40,655 Allowance for credit losses on unfunded lending commitments at beginning of year (4) $ 1,136 $ 1,066 $ 1,157 Provision for unfunded lending commitments (16) 51 (117) Other, net (1) 19 26 Allowance for credit losses on unfunded lending commitments at end of year (4) $ 1,119 $ 1,136 $ 1,066 Total allowance for loans, leases, and unfunded lending commitments $ 26,574 $ 31,251 $ 41,721 (1) 2012 includes approximately $635 million of incremental charge-offs related to OCC guidance issued in the third quarter of 2012, which required mortgage loans
to borrowers that have gone through Chapter 7 of the U.S. Bankruptcy Code to be written down to collateral value. There was a corresponding approximate $600 million release in the third quarter of 2012 allowance for loan losses related to these charge-offs. 2012 also includes a benefit to charge-offs of approximately $40 million related to finalizing the impact of this OCC guidance in the fourth quarter of 2012.
(2) 2012 includes approximately $370 million of incremental charge-offs related to previously deferred principal balances on modified loans in the first quarter of 2012. These charge-offs were related to anticipated forgiveness of principal in connection with the national mortgage settlement. There was a corresponding approximate $350 million reserve release in the first quarter of 2012 related to these charge-offs.
(3) 2012 includes reductions of approximately $875 million related to the sale or transfer to held-for-sale of various U.S. loan portfolios. 2011 includes reductions of approximately $1.6 billion related to the sale or transfer to held-for-sale of various U.S. loan portfolios, approximately $240 million related to the sale of the Egg Banking PLC credit card business, approximately $72 million related to the transfer of the Citi Belgium business to held-for-sale and approximately $290 million related to FX translation. 2010 primarily includes an addition of $13.4 billion related to the impact of consolidating entities in connection with Citi’s adoption of SFAS 166/167 (see Note 1 to the Consolidated Financial Statements), reductions of approximately $2.7 billion related to the sale or transfer to held-for-sale of various U.S. loan portfolios and approximately $290 million related to the transfer of a U.K. first mortgage portfolio to held-for-sale.
(4) Represents additional credit loss reserves for unfunded lending commitments and letters of credit recorded in Other liabilities on the Consolidated Balance Sheet. Allowance for Credit Losses and Investment in Loans at December 31, 2012 In millions of dollars Corporate Consumer TotalAllowance for loan losses at beginning of year $ 2,879 $ 27,236 $ 30,115 Charge-offs (640) (16,365) (17,005) Recoveries 417 2,357 2,774 Replenishment of net charge-offs 223 14,008 14,231 Net reserve builds (releases) 2 (1,910) (1,908) Net specific reserve builds (releases) (138) (1,727) (1,865) Other 33 (920) (887)Ending balance $ 2,776 $ 22,679 $ 25,455Allowance for loan losses Determined in accordance with ASC 450-20 $ 2,429 $ 15,703 $ 18,132 Determined in accordance with ASC 310-10-35 284 6,941 7,225 Determined in accordance with ASC 310-30 63 35 98Total allowance for loan losses $ 2,776 $ 22,679 $ 25,455Loans, net of unearned income Loans collectively evaluated for impairment in accordance with ASC 450-20 $ 239,849 $ 377,374 $ 617,223 Loans individually evaluated for impairment in accordance with ASC 310-10-35 2,776 29,640 32,416 Loans acquired with deteriorated credit quality in accordance with ASC 310-30 112 426 538 Loans held at fair value 4,056 1,231 5,287Total loans, net of unearned income $ 246,793 $ 408,671 $ 655,464

79
Allowance for Credit Losses and Investment in Loans at December 31, 2011 In millions of dollars Corporate Consumer TotalAllowance for loan losses at beginning of year $ 5,249 $ 35,406 $ 40,655 Charge-offs (2,000) (20,699) (22,699) Recoveries 386 2,626 3,012 Replenishment of net charge-offs 1,614 18,073 19,687 Net reserve releases (1,083) (7,442) (8,525) Net specific reserve builds (releases) (1,270) 1,444 174 Other (17) (2,172) (2,189) Ending balance $ 2,879 $ 27,236 $ 30,115 Allowance for loan losses Determined in accordance with ASC 450-20 $ 2,408 $ 18,334 $ 20,742 Determined in accordance with ASC 310-10-35 420 8,885 9,305 Determined in accordance with ASC 310-30 51 17 68 Total allowance for loan losses $ 2,879 $ 27,236 $ 30,115 Loans, net of unearned income Loans collectively evaluated for impairment in accordance with ASC 450-20 $ 215,778 $ 390,831 $ 606,609 Loans individually evaluated for impairment in accordance with ASC 310-10-35 3,994 30,863 34,857 Loans acquired with deteriorated credit quality in accordance with ASC 310-30 191 320 511 Loans held at fair value 3,939 1,326 5,265 Total loans, net of unearned income $ 223,902 $ 423,340 $ 647,242

80
18. GOODWILL AND INTANGIBLE ASSETS Goodwill The changes in Goodwill during 2012 and 2011 were as follows: In millions of dollars Balance at December 31, 2010 $26,152 Foreign exchange translation (636)Smaller acquisitions/divestitures, purchase accounting adjustments and other 44 Discontinued operations (147)Balance at December 31, 2011 $25,413 Foreign exchange translation 294Smaller acquisitions/divestitures, purchase accounting adjustments and other (21)Discontinued operations (13)Balance at December 31, 2012 $25,673 The changes in Goodwill by segment during 2012 and 2011 were as follows:
In millions of dollars
Global Consumer Banking
Institutional Clients Group Citi Holdings
Corporate/ Other Total
Balance at December 31, 2010 $10,701 $10,826 $ 4,625 $— $26,152 Goodwill acquired during 2011 $ — $ 19 $ — $— $ 19 Goodwill disposed of during 2011 — (6) (153) — (159) Other (1) (465) (102) (32) — (599) Balance at December 31, 2011 $10,236 $ 10,737 $ 4,440 $— $ 25,413 Goodwill acquired during 2012 $ — $ — $ — $— $ —Goodwill disposed of during 2012 — — (8) — (8)Other (1) 20 244 4 — 268Intersegment transfers in/(out) (2) 4,283 — (4,283) — —Balance at December 31, 2012 $14,539 $ 10,981 $ 153 $— $ 25,673 (1) Other changes in Goodwill primarily reflect foreign exchange effects on non-dollar-denominated goodwill, discontinued operations in 2012, and purchase
accounting adjustments. (2) Primarily includes the transfer of the substantial majority of the Citi retail services business from Citi Holdings—Local Consumer Lending to Citicorp—North
America Regional Consumer Banking during the first quarter of 2012. See Note 4 to the Consolidated Financial Statements for a further discussion of this segment transfer.
Goodwill impairment testing is performed at the level below the business segments (referred to as a reporting unit). The reporting unit structure in 2012 was the same as the reporting unit structure in 2011, although certain underlying businesses were transferred between certain reporting units in the first quarter of 2012, as discussed further below. As of January 1, 2012, a substantial majority of the Citi retail services business previously included within the Local Consumer Lending—Cards reporting unit was transferred to North America—Regional Consumer Banking. In addition, certain small businesses included within the Local Consumer Lending—Cards reporting unit were transferred to Local Consumer Lending—Other. Additionally, an insurance business in El Salvador within Brokerage and Asset Management was transferred to Latin America Regional Consumer Banking. Goodwill affected by the reorganization was reassigned from Local Consumer Lending—Cards and Brokerage and Asset Management to those reporting units that received businesses using a relative fair value approach. Subsequent to January 1, 2012,
goodwill has been allocated to disposals and tested for impairment under the reporting unit structure reflecting these transfers. An interim goodwill impairment test was performed on the impacted reporting units as of January 1, 2012, resulting in no impairment. The Company performed its annual goodwill impairment test as of July 1, 2012 resulting in no impairment for any of the reporting units. As per ASC 350, Intangibles—Goodwill and Other management elected to perform a qualitative assessment for the Transaction Services reporting unit. Through consideration of various factors including excess of fair value over the carrying value in prior year, projected growth via positive cash flows, and no adverse changes anticipated in the business and macroeconomic environment, management determined that it is not more-likely-than-not that the fair value of this reporting unit is less than its carrying amount and therefore the two-step impairment test was not required. No goodwill was deemed impaired in 2010, 2011 and 2012.
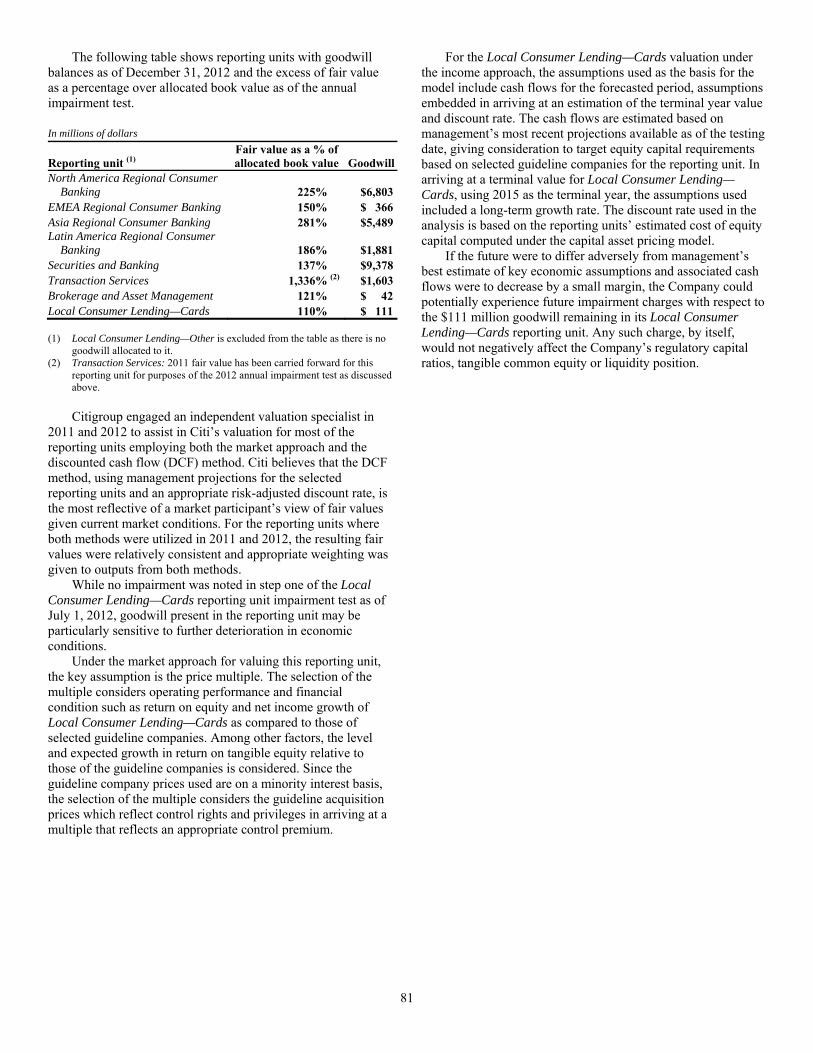
81
The following table shows reporting units with goodwill balances as of December 31, 2012 and the excess of fair value as a percentage over allocated book value as of the annual impairment test. In millions of dollars
Reporting unit (1) Fair value as a % ofallocated book value Goodwill
North America Regional Consumer Banking 225% $6,803
EMEA Regional Consumer Banking 150% $ 366Asia Regional Consumer Banking 281% $5,489Latin America Regional Consumer
Banking 186% $1,881Securities and Banking 137% $9,378Transaction Services 1,336% (2) $1,603Brokerage and Asset Management 121% $ 42Local Consumer Lending—Cards 110% $ 111 (1) Local Consumer Lending—Other is excluded from the table as there is no
goodwill allocated to it. (2) Transaction Services: 2011 fair value has been carried forward for this
reporting unit for purposes of the 2012 annual impairment test as discussed above.
Citigroup engaged an independent valuation specialist in 2011 and 2012 to assist in Citi’s valuation for most of the reporting units employing both the market approach and the discounted cash flow (DCF) method. Citi believes that the DCF method, using management projections for the selected reporting units and an appropriate risk-adjusted discount rate, is the most reflective of a market participant’s view of fair values given current market conditions. For the reporting units where both methods were utilized in 2011 and 2012, the resulting fair values were relatively consistent and appropriate weighting was given to outputs from both methods. While no impairment was noted in step one of the Local Consumer Lending—Cards reporting unit impairment test as of July 1, 2012, goodwill present in the reporting unit may be particularly sensitive to further deterioration in economic conditions. Under the market approach for valuing this reporting unit, the key assumption is the price multiple. The selection of the multiple considers operating performance and financial condition such as return on equity and net income growth of Local Consumer Lending—Cards as compared to those of selected guideline companies. Among other factors, the level and expected growth in return on tangible equity relative to those of the guideline companies is considered. Since the guideline company prices used are on a minority interest basis, the selection of the multiple considers the guideline acquisition prices which reflect control rights and privileges in arriving at a multiple that reflects an appropriate control premium.
For the Local Consumer Lending—Cards valuation under the income approach, the assumptions used as the basis for the model include cash flows for the forecasted period, assumptions embedded in arriving at an estimation of the terminal year value and discount rate. The cash flows are estimated based on management’s most recent projections available as of the testing date, giving consideration to target equity capital requirements based on selected guideline companies for the reporting unit. In arriving at a terminal value for Local Consumer Lending—Cards, using 2015 as the terminal year, the assumptions used included a long-term growth rate. The discount rate used in the analysis is based on the reporting units’ estimated cost of equity capital computed under the capital asset pricing model. If the future were to differ adversely from management’s best estimate of key economic assumptions and associated cash flows were to decrease by a small margin, the Company could potentially experience future impairment charges with respect to the $111 million goodwill remaining in its Local Consumer Lending—Cards reporting unit. Any such charge, by itself, would not negatively affect the Company’s regulatory capital ratios, tangible common equity or liquidity position.
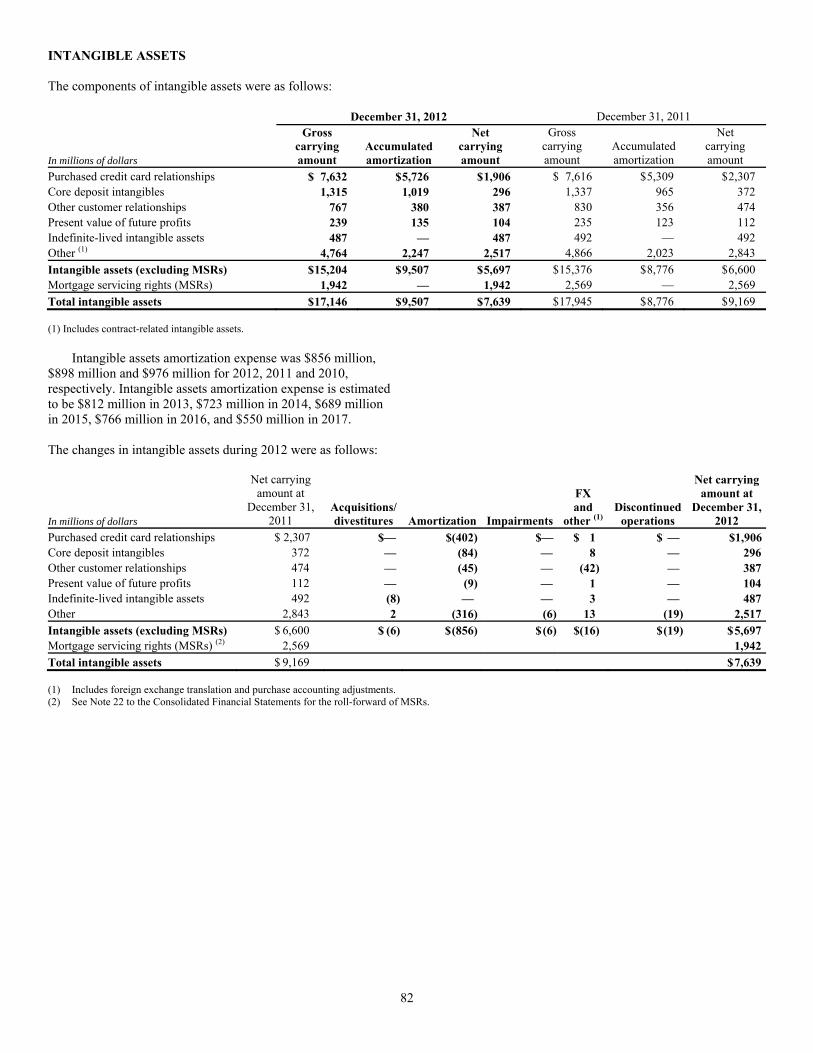
82
INTANGIBLE ASSETS The components of intangible assets were as follows: December 31, 2012 December 31, 2011
In millions of dollars
Gross carrying amount
Accumulatedamortization
Net carrying amount
Gross carrying amount
Accumulatedamortization
Net carrying amount
Purchased credit card relationships $ 7,632 $ 5,726 $ 1,906 $ 7,616 $ 5,309 $ 2,307 Core deposit intangibles 1,315 1,019 296 1,337 965 372 Other customer relationships 767 380 387 830 356 474 Present value of future profits 239 135 104 235 123 112 Indefinite-lived intangible assets 487 — 487 492 — 492 Other (1) 4,764 2,247 2,517 4,866 2,023 2,843 Intangible assets (excluding MSRs) $ 15,204 $ 9,507 $ 5,697 $ 15,376 $ 8,776 $ 6,600 Mortgage servicing rights (MSRs) 1,942 — 1,942 2,569 — 2,569 Total intangible assets $ 17,146 $ 9,507 $ 7,639 $ 17,945 $ 8,776 $ 9,169 (1) Includes contract-related intangible assets. Intangible assets amortization expense was $856 million, $898 million and $976 million for 2012, 2011 and 2010, respectively. Intangible assets amortization expense is estimated to be $812 million in 2013, $723 million in 2014, $689 million in 2015, $766 million in 2016, and $550 million in 2017.
The changes in intangible assets during 2012 were as follows:
In millions of dollars
Net carrying amount at
December 31, 2011
Acquisitions/divestitures Amortization Impairments
FX and
other (1) Discontinued
operations
Net carryingamount at
December 31,2012
Purchased credit card relationships $ 2,307 $— $(402) $— $ 1 $ — $1,906Core deposit intangibles 372 — (84) — 8 — 296Other customer relationships 474 — (45) — (42) — 387Present value of future profits 112 — (9) — 1 — 104Indefinite-lived intangible assets 492 (8) — — 3 — 487Other 2,843 2 (316) (6) 13 (19) 2,517Intangible assets (excluding MSRs) $ 6,600 $ (6) $ (856) $ (6) $(16) $ (19) $ 5,697Mortgage servicing rights (MSRs) (2) 2,569 1,942Total intangible assets $ 9,169 $ 7,639 (1) Includes foreign exchange translation and purchase accounting adjustments. (2) See Note 22 to the Consolidated Financial Statements for the roll-forward of MSRs.
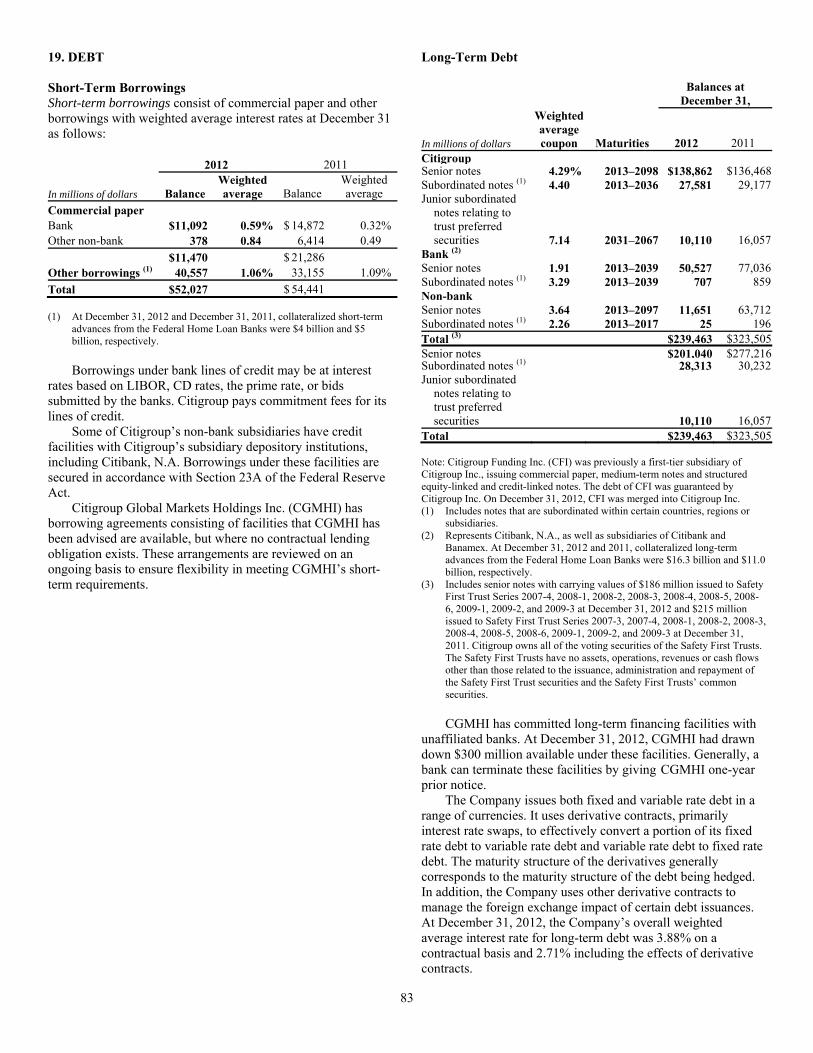
83
19. DEBT Short-Term Borrowings Short-term borrowings consist of commercial paper and other borrowings with weighted average interest rates at December 31 as follows: 2012 2011
In millions of dollars Balance Weighted average Balance
Weightedaverage
Commercial paper Bank $ 11,092 0.59% $ 14,872 0.32% Other non-bank 378 0.84 6,414 0.49 $ 11,470 $ 21,286 Other borrowings (1) 40,557 1.06% 33,155 1.09% Total $ 52,027 $ 54,441 (1) At December 31, 2012 and December 31, 2011, collateralized short-term
advances from the Federal Home Loan Banks were $4 billion and $5 billion, respectively.
Borrowings under bank lines of credit may be at interest rates based on LIBOR, CD rates, the prime rate, or bids submitted by the banks. Citigroup pays commitment fees for its lines of credit. Some of Citigroup’s non-bank subsidiaries have credit facilities with Citigroup’s subsidiary depository institutions, including Citibank, N.A. Borrowings under these facilities are secured in accordance with Section 23A of the Federal Reserve Act. Citigroup Global Markets Holdings Inc. (CGMHI) has borrowing agreements consisting of facilities that CGMHI has been advised are available, but where no contractual lending obligation exists. These arrangements are reviewed on an ongoing basis to ensure flexibility in meeting CGMHI’s short-term requirements.
Long-Term Debt
Balances at
December 31,
In millions of dollars
Weighted average coupon Maturities 2012 2011
Citigroup Senior notes 4.29% 2013–2098 $138,862 $136,468Subordinated notes (1) 4.40 2013–2036 27,581 29,177Junior subordinated
notes relating to trust preferred securities 7.14 2031–2067 10,110 16,057
Bank (2) Senior notes 1.91 2013–2039 50,527 77,036Subordinated notes (1) 3.29 2013–2039 707 859Non-bank Senior notes 3.64 2013–2097 11,651 63,712Subordinated notes (1) 2.26 2013–2017 25 196Total (3) $239,463 $323,505Senior notes $201,040 $277,216Subordinated notes (1) 28,313 30,232Junior subordinated
notes relating to trust preferred securities 10,110 16,057
Total $239,463 $323,505 Note: Citigroup Funding Inc. (CFI) was previously a first-tier subsidiary of Citigroup Inc., issuing commercial paper, medium-term notes and structured equity-linked and credit-linked notes. The debt of CFI was guaranteed by Citigroup Inc. On December 31, 2012, CFI was merged into Citigroup Inc. (1) Includes notes that are subordinated within certain countries, regions or
subsidiaries. (2) Represents Citibank, N.A., as well as subsidiaries of Citibank and
Banamex. At December 31, 2012 and 2011, collateralized long-term advances from the Federal Home Loan Banks were $16.3 billion and $11.0 billion, respectively.
(3) Includes senior notes with carrying values of $186 million issued to Safety First Trust Series 2007-4, 2008-1, 2008-2, 2008-3, 2008-4, 2008-5, 2008-6, 2009-1, 2009-2, and 2009-3 at December 31, 2012 and $215 million issued to Safety First Trust Series 2007-3, 2007-4, 2008-1, 2008-2, 2008-3, 2008-4, 2008-5, 2008-6, 2009-1, 2009-2, and 2009-3 at December 31, 2011. Citigroup owns all of the voting securities of the Safety First Trusts. The Safety First Trusts have no assets, operations, revenues or cash flows other than those related to the issuance, administration and repayment of the Safety First Trust securities and the Safety First Trusts’ common securities.
CGMHI has committed long-term financing facilities with unaffiliated banks. At December 31, 2012, CGMHI had drawn down $300 million available under these facilities. Generally, a bank can terminate these facilities by giving CGMHI one-year prior notice. The Company issues both fixed and variable rate debt in a range of currencies. It uses derivative contracts, primarily interest rate swaps, to effectively convert a portion of its fixed rate debt to variable rate debt and variable rate debt to fixed rate debt. The maturity structure of the derivatives generally corresponds to the maturity structure of the debt being hedged. In addition, the Company uses other derivative contracts to manage the foreign exchange impact of certain debt issuances. At December 31, 2012, the Company’s overall weighted average interest rate for long-term debt was 3.88% on a contractual basis and 2.71% including the effects of derivative contracts.
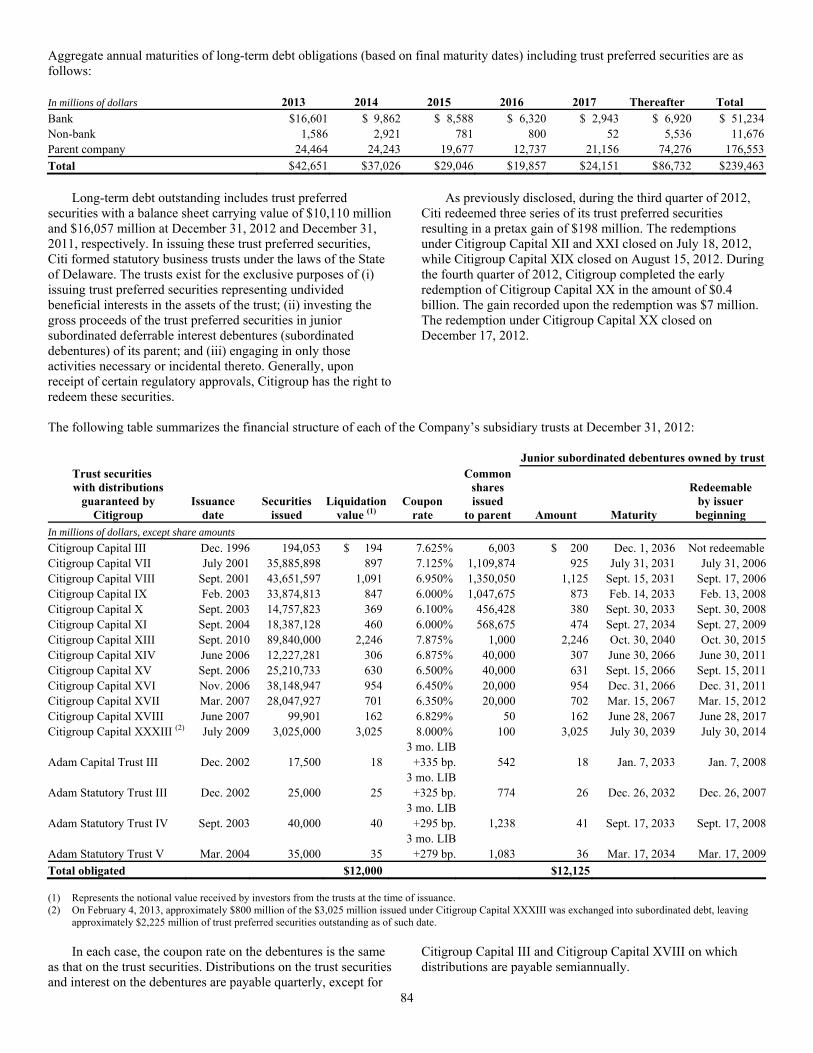
84
Aggregate annual maturities of long-term debt obligations (based on final maturity dates) including trust preferred securities are as follows: In millions of dollars 2013 2014 2015 2016 2017 Thereafter TotalBank $16,601 $ 9,862 $ 8,588 $ 6,320 $ 2,943 $ 6,920 $ 51,234Non-bank 1,586 2,921 781 800 52 5,536 11,676Parent company 24,464 24,243 19,677 12,737 21,156 74,276 176,553Total $ 42,651 $ 37,026 $ 29,046 $ 19,857 $ 24,151 $ 86,732 $ 239,463 Long-term debt outstanding includes trust preferred securities with a balance sheet carrying value of $10,110 million and $16,057 million at December 31, 2012 and December 31, 2011, respectively. In issuing these trust preferred securities, Citi formed statutory business trusts under the laws of the State of Delaware. The trusts exist for the exclusive purposes of (i) issuing trust preferred securities representing undivided beneficial interests in the assets of the trust; (ii) investing the gross proceeds of the trust preferred securities in junior subordinated deferrable interest debentures (subordinated debentures) of its parent; and (iii) engaging in only those activities necessary or incidental thereto. Generally, upon receipt of certain regulatory approvals, Citigroup has the right to redeem these securities.
As previously disclosed, during the third quarter of 2012, Citi redeemed three series of its trust preferred securities resulting in a pretax gain of $198 million. The redemptions under Citigroup Capital XII and XXI closed on July 18, 2012, while Citigroup Capital XIX closed on August 15, 2012. During the fourth quarter of 2012, Citigroup completed the early redemption of Citigroup Capital XX in the amount of $0.4 billion. The gain recorded upon the redemption was $7 million. The redemption under Citigroup Capital XX closed on December 17, 2012.
The following table summarizes the financial structure of each of the Company’s subsidiary trusts at December 31, 2012: Junior subordinated debentures owned by trust
Trust securities with distributions
guaranteed by Citigroup
Issuance date
Securities issued
Liquidationvalue (1)
Coupon rate
Commonshares issued
to parent Amount Maturity
Redeemable by issuer beginning
In millions of dollars, except share amounts Citigroup Capital III Dec. 1996 194,053 $ 194 7.625% 6,003 $ 200 Dec. 1, 2036 Not redeemableCitigroup Capital VII July 2001 35,885,898 897 7.125% 1,109,874 925 July 31, 2031 July 31, 2006Citigroup Capital VIII Sept. 2001 43,651,597 1,091 6.950% 1,350,050 1,125 Sept. 15, 2031 Sept. 17, 2006Citigroup Capital IX Feb. 2003 33,874,813 847 6.000% 1,047,675 873 Feb. 14, 2033 Feb. 13, 2008Citigroup Capital X Sept. 2003 14,757,823 369 6.100% 456,428 380 Sept. 30, 2033 Sept. 30, 2008Citigroup Capital XI Sept. 2004 18,387,128 460 6.000% 568,675 474 Sept. 27, 2034 Sept. 27, 2009Citigroup Capital XIII Sept. 2010 89,840,000 2,246 7.875% 1,000 2,246 Oct. 30, 2040 Oct. 30, 2015Citigroup Capital XIV June 2006 12,227,281 306 6.875% 40,000 307 June 30, 2066 June 30, 2011Citigroup Capital XV Sept. 2006 25,210,733 630 6.500% 40,000 631 Sept. 15, 2066 Sept. 15, 2011Citigroup Capital XVI Nov. 2006 38,148,947 954 6.450% 20,000 954 Dec. 31, 2066 Dec. 31, 2011Citigroup Capital XVII Mar. 2007 28,047,927 701 6.350% 20,000 702 Mar. 15, 2067 Mar. 15, 2012Citigroup Capital XVIII June 2007 99,901 162 6.829% 50 162 June 28, 2067 June 28, 2017Citigroup Capital XXXIII (2) July 2009 3,025,000 3,025 8.000% 100 3,025 July 30, 2039 July 30, 2014 3 mo. LIB Adam Capital Trust III Dec. 2002 17,500 18 +335 bp. 542 18 Jan. 7, 2033 Jan. 7, 2008 3 mo. LIB Adam Statutory Trust III Dec. 2002 25,000 25 +325 bp. 774 26 Dec. 26, 2032 Dec. 26, 2007 3 mo. LIB Adam Statutory Trust IV Sept. 2003 40,000 40 +295 bp. 1,238 41 Sept. 17, 2033 Sept. 17, 2008 3 mo. LIB Adam Statutory Trust V Mar. 2004 35,000 35 +279 bp. 1,083 36 Mar. 17, 2034 Mar. 17, 2009Total obligated $ 12,000 $12,125 (1) Represents the notional value received by investors from the trusts at the time of issuance. (2) On February 4, 2013, approximately $800 million of the $3,025 million issued under Citigroup Capital XXXIII was exchanged into subordinated debt, leaving
approximately $2,225 million of trust preferred securities outstanding as of such date. In each case, the coupon rate on the debentures is the same as that on the trust securities. Distributions on the trust securities and interest on the debentures are payable quarterly, except for
Citigroup Capital III and Citigroup Capital XVIII on which distributions are payable semiannually.
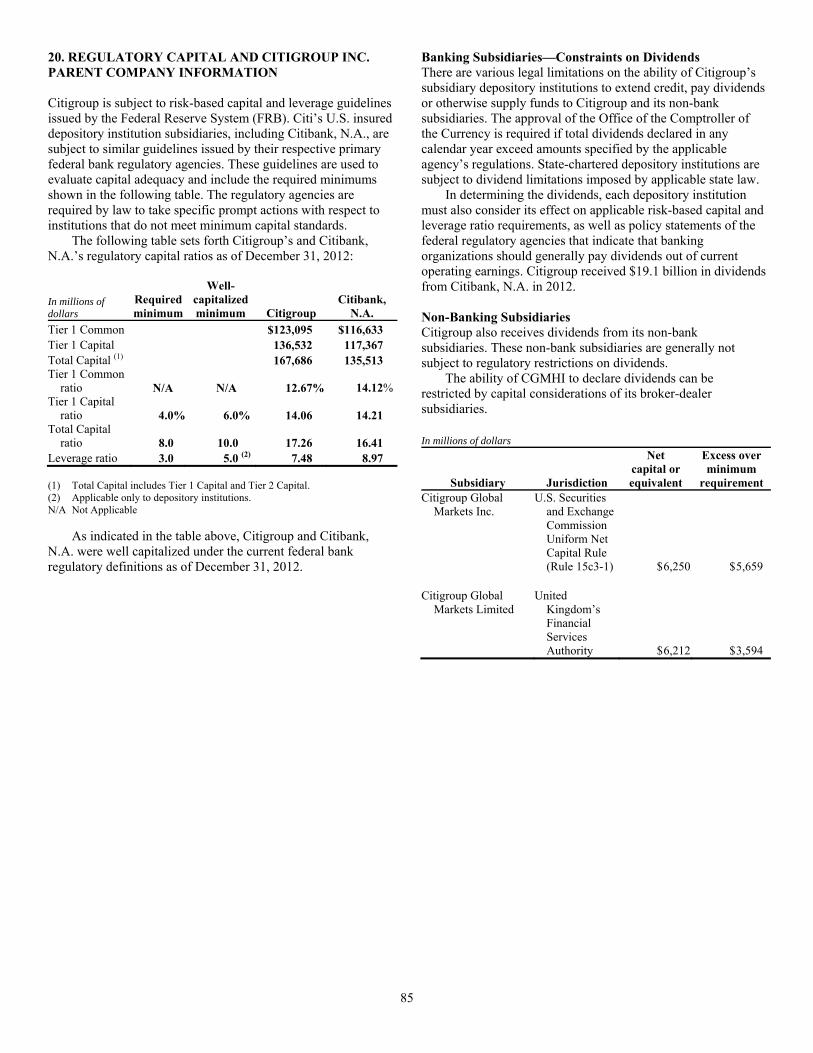
85
20. REGULATORY CAPITAL AND CITIGROUP INC. PARENT COMPANY INFORMATION Citigroup is subject to risk-based capital and leverage guidelines issued by the Federal Reserve System (FRB). Citi’s U.S. insured depository institution subsidiaries, including Citibank, N.A., are subject to similar guidelines issued by their respective primary federal bank regulatory agencies. These guidelines are used to evaluate capital adequacy and include the required minimums shown in the following table. The regulatory agencies are required by law to take specific prompt actions with respect to institutions that do not meet minimum capital standards. The following table sets forth Citigroup’s and Citibank, N.A.’s regulatory capital ratios as of December 31, 2012:
In millions of dollars
Required minimum
Well- capitalized minimum Citigroup
Citibank, N.A.
Tier 1 Common $123,095 $116,633Tier 1 Capital 136,532 117,367Total Capital (1) 167,686 135,513Tier 1 Common
ratio N/A N/A 12.67% 14.12%Tier 1 Capital
ratio 4.0% 6.0% 14.06 14.21Total Capital
ratio 8.0 10.0 17.26 16.41Leverage ratio 3.0 5.0 (2) 7.48 8.97 (1) Total Capital includes Tier 1 Capital and Tier 2 Capital. (2) Applicable only to depository institutions. N/A Not Applicable As indicated in the table above, Citigroup and Citibank, N.A. were well capitalized under the current federal bank regulatory definitions as of December 31, 2012.
Banking Subsidiaries—Constraints on Dividends There are various legal limitations on the ability of Citigroup’s subsidiary depository institutions to extend credit, pay dividends or otherwise supply funds to Citigroup and its non-bank subsidiaries. The approval of the Office of the Comptroller of the Currency is required if total dividends declared in any calendar year exceed amounts specified by the applicable agency’s regulations. State-chartered depository institutions are subject to dividend limitations imposed by applicable state law. In determining the dividends, each depository institution must also consider its effect on applicable risk-based capital and leverage ratio requirements, as well as policy statements of the federal regulatory agencies that indicate that banking organizations should generally pay dividends out of current operating earnings. Citigroup received $19.1 billion in dividends from Citibank, N.A. in 2012. Non-Banking Subsidiaries Citigroup also receives dividends from its non-bank subsidiaries. These non-bank subsidiaries are generally not subject to regulatory restrictions on dividends. The ability of CGMHI to declare dividends can be restricted by capital considerations of its broker-dealer subsidiaries. In millions of dollars
Subsidiary Jurisdiction
Net capital orequivalent
Excess overminimum
requirementCitigroup Global
Markets Inc. U.S. Securities
and Exchange Commission Uniform Net Capital Rule (Rule 15c3-1) $ 6,250 $ 5,659
Citigroup Global
Markets Limited United
Kingdom’s Financial Services Authority $ 6,212 $ 3,594
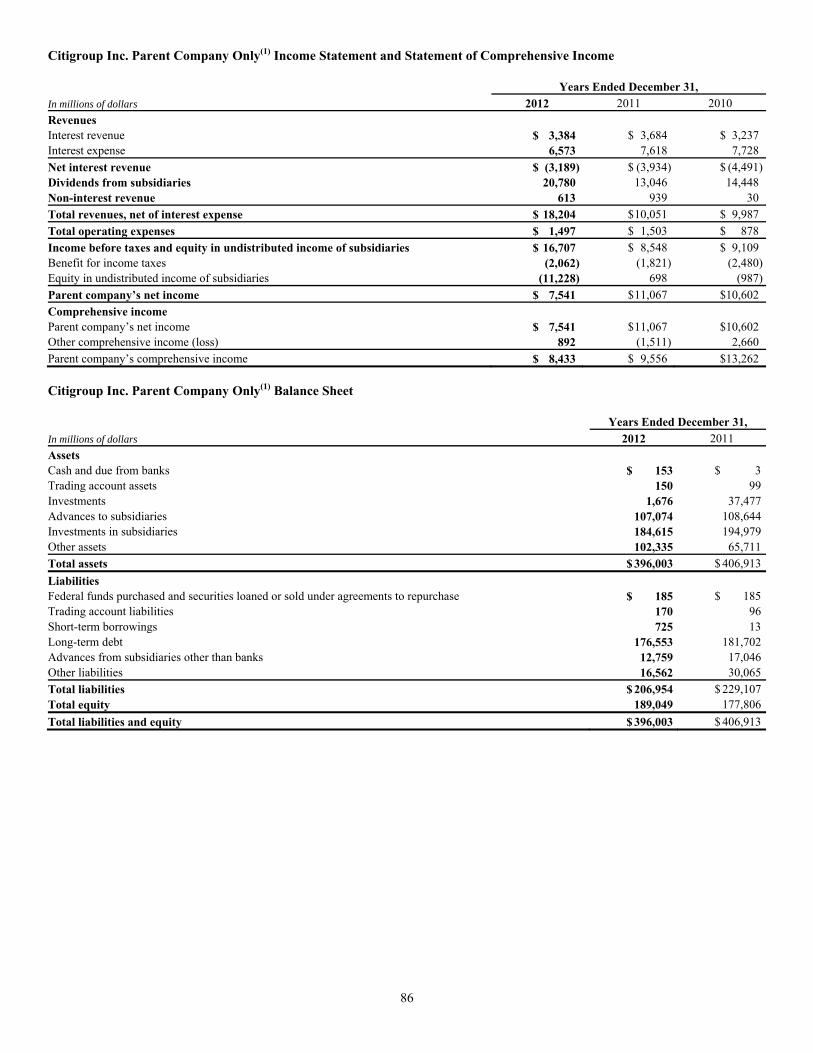
86
Citigroup Inc. Parent Company Only(1) Income Statement and Statement of Comprehensive Income Years Ended December 31,In millions of dollars 2012 2011 2010 Revenues Interest revenue $ 3,384 $ 3,684 $ 3,237 Interest expense 6,573 7,618 7,728 Net interest revenue $ (3,189) $ (3,934) $ (4,491)Dividends from subsidiaries 20,780 13,046 14,448 Non-interest revenue 613 939 30 Total revenues, net of interest expense $ 18,204 $ 10,051 $ 9,987 Total operating expenses $ 1,497 $ 1,503 $ 878 Income before taxes and equity in undistributed income of subsidiaries $ 16,707 $ 8,548 $ 9,109 Benefit for income taxes (2,062) (1,821) (2,480)Equity in undistributed income of subsidiaries (11,228) 698 (987)Parent company’s net income $ 7,541 $ 11,067 $10,602 Comprehensive income Parent company’s net income $ 7,541 $ 11,067 $10,602 Other comprehensive income (loss) 892 (1,511) 2,660 Parent company’s comprehensive income $ 8,433 $ 9,556 $13,262 Citigroup Inc. Parent Company Only(1) Balance Sheet Years Ended December 31,In millions of dollars 2012 2011 Assets Cash and due from banks $ 153 $ 3Trading account assets 150 99Investments 1,676 37,477Advances to subsidiaries 107,074 108,644Investments in subsidiaries 184,615 194,979Other assets 102,335 65,711Total assets $ 396,003 $ 406,913Liabilities Federal funds purchased and securities loaned or sold under agreements to repurchase $ 185 $ 185Trading account liabilities 170 96Short-term borrowings 725 13Long-term debt 176,553 181,702Advances from subsidiaries other than banks 12,759 17,046Other liabilities 16,562 30,065Total liabilities $ 206,954 $ 229,107Total equity 189,049 177,806Total liabilities and equity $ 396,003 $ 406,913

87
Citigroup Inc. Parent Company Only(1) Cash Flows Statement Years Ended December 31,In millions of dollars 2012 2011 2010 Net cash provided by operating activities of continuing operations $ 1,598 $ 1,710 $ 8,756 Cash flows from investing activities of continuing operations Purchases of investments $ (5,701) $ (47,190) $ (31,346) Proceeds from sales of investments 37,056 9,524 6,029 Proceeds from maturities of investments 4,286 22,386 16,834 Changes in investments and advances—intercompany (397) 32,419 13,363 Other investing activities 994 (10) (20) Net cash provided by investing activities of continuing operations $ 36,238 $ 17,129 $ 4,860 Cash flows from financing activities of continuing operations Dividends paid $ (143) $ (113) $ (9) Issuance of preferred stock 2,250 — — Proceeds/(repayments) from issuance of long-term debt—third-party, net (33,434) (16,481) (8,339) Net change in short-term borrowings and other advances—intercompany (6,160) (5,772) (8,211) Other financing activities (199) 3,519 2,949 Net cash used in financing activities of continuing operations $ (37,686) $ (18,847) $ (13,610) Net increase (decrease) in cash and due from banks $ 150 $ (8) $ 6 Cash and due from banks at beginning of period 3 11 5 Cash and due from banks at end of period $ 153 $ 3 $ 11 Supplemental disclosure of cash flow information for continuing operations Cash paid (received) during the year for Income taxes $ 78 $ (458) $ (507) Interest 7,883 9,271 9,317 (1) “Citigroup Inc. parent company only” refers to the parent holding company Citigroup Inc., excluding consolidated subsidiaries. Citigroup Funding Inc. (CFI) was
previously a first-tier subsidiary of Citigroup Inc., issuing commercial paper, medium-term notes and structured equity-linked and credit-linked notes. The debt of CFI was guaranteed by Citigroup Inc. On December 31, 2012, CFI was merged into Citigroup Inc., the parent holding company.
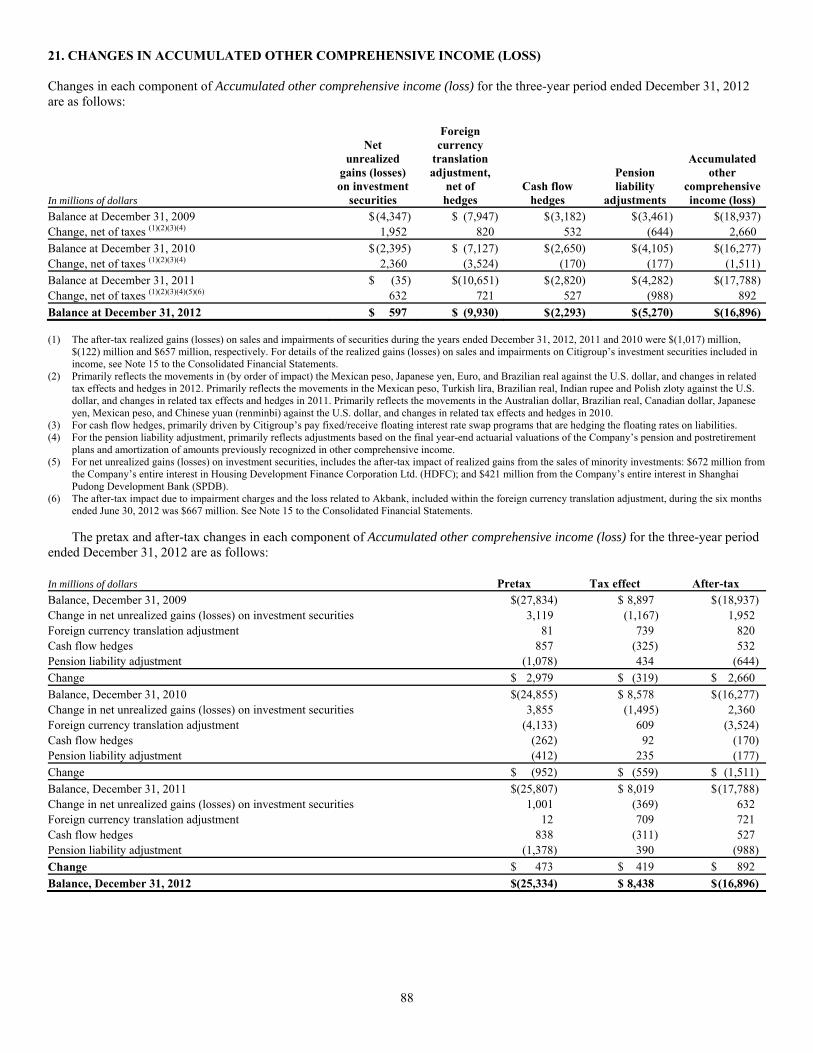
88
21. CHANGES IN ACCUMULATED OTHER COMPREHENSIVE INCOME (LOSS) Changes in each component of Accumulated other comprehensive income (loss) for the three-year period ended December 31, 2012 are as follows:
In millions of dollars
Net unrealized
gains (losses)on investment
securities
Foreign currency
translation adjustment,
net of hedges
Cash flow hedges
Pension liability
adjustments
Accumulatedother
comprehensiveincome (loss)
Balance at December 31, 2009 $ (4,347) $ (7,947) $ (3,182) $ (3,461) $(18,937)Change, net of taxes (1)(2)(3)(4) 1,952 820 532 (644) 2,660 Balance at December 31, 2010 $ (2,395) $ (7,127) $ (2,650) $ (4,105) $(16,277)Change, net of taxes (1)(2)(3)(4) 2,360 (3,524) (170) (177) (1,511)Balance at December 31, 2011 $ (35) $(10,651) $ (2,820) $ (4,282) $(17,788)Change, net of taxes (1)(2)(3)(4)(5)(6) 632 721 527 (988) 892 Balance at December 31, 2012 $ 597 $ (9,930) $ (2,293) $ (5,270) $(16,896) (1) The after-tax realized gains (losses) on sales and impairments of securities during the years ended December 31, 2012, 2011 and 2010 were $(1,017) million,
$(122) million and $657 million, respectively. For details of the realized gains (losses) on sales and impairments on Citigroup’s investment securities included in income, see Note 15 to the Consolidated Financial Statements.
(2) Primarily reflects the movements in (by order of impact) the Mexican peso, Japanese yen, Euro, and Brazilian real against the U.S. dollar, and changes in related tax effects and hedges in 2012. Primarily reflects the movements in the Mexican peso, Turkish lira, Brazilian real, Indian rupee and Polish zloty against the U.S. dollar, and changes in related tax effects and hedges in 2011. Primarily reflects the movements in the Australian dollar, Brazilian real, Canadian dollar, Japanese yen, Mexican peso, and Chinese yuan (renminbi) against the U.S. dollar, and changes in related tax effects and hedges in 2010.
(3) For cash flow hedges, primarily driven by Citigroup’s pay fixed/receive floating interest rate swap programs that are hedging the floating rates on liabilities. (4) For the pension liability adjustment, primarily reflects adjustments based on the final year-end actuarial valuations of the Company’s pension and postretirement
plans and amortization of amounts previously recognized in other comprehensive income. (5) For net unrealized gains (losses) on investment securities, includes the after-tax impact of realized gains from the sales of minority investments: $672 million from
the Company’s entire interest in Housing Development Finance Corporation Ltd. (HDFC); and $421 million from the Company’s entire interest in Shanghai Pudong Development Bank (SPDB).
(6) The after-tax impact due to impairment charges and the loss related to Akbank, included within the foreign currency translation adjustment, during the six months ended June 30, 2012 was $667 million. See Note 15 to the Consolidated Financial Statements.
The pretax and after-tax changes in each component of Accumulated other comprehensive income (loss) for the three-year period ended December 31, 2012 are as follows: In millions of dollars Pretax Tax effect After-taxBalance, December 31, 2009 $(27,834) $ 8,897 $ (18,937) Change in net unrealized gains (losses) on investment securities 3,119 (1,167) 1,952 Foreign currency translation adjustment 81 739 820 Cash flow hedges 857 (325) 532 Pension liability adjustment (1,078) 434 (644) Change $ 2,979 $ (319) $ 2,660 Balance, December 31, 2010 $(24,855) $ 8,578 $ (16,277) Change in net unrealized gains (losses) on investment securities 3,855 (1,495) 2,360 Foreign currency translation adjustment (4,133) 609 (3,524) Cash flow hedges (262) 92 (170) Pension liability adjustment (412) 235 (177) Change $ (952) $ (559) $ (1,511) Balance, December 31, 2011 $(25,807) $ 8,019 $ (17,788) Change in net unrealized gains (losses) on investment securities 1,001 (369) 632 Foreign currency translation adjustment 12 709 721 Cash flow hedges 838 (311) 527 Pension liability adjustment (1,378) 390 (988) Change $ 473 $ 419 $ 892 Balance, December 31, 2012 $(25,334) $ 8,438 $ (16,896)
89
22. SECURITIZATIONS AND VARIABLE INTEREST ENTITIES Uses of SPEs A special purpose entity (SPE) is an entity designed to fulfill a specific limited need of the company that organized it. The principal uses of SPEs are to obtain liquidity and favorable capital treatment by securitizing certain of Citigroup’s financial assets, to assist clients in securitizing their financial assets and to create investment products for clients. SPEs may be organized in various legal forms including trusts, partnerships or corporations. In a securitization, the company transferring assets to an SPE converts all (or a portion) of those assets into cash before they would have been realized in the normal course of business through the SPE’s issuance of debt and equity instruments, certificates, commercial paper and other notes of indebtedness, which are recorded on the balance sheet of the SPE, which may or may not be consolidated onto the balance sheet of the company that organized the SPE. Investors usually only have recourse to the assets in the SPE and often benefit from other credit enhancements, such as a collateral account or over-collateralization in the form of excess assets in the SPE, a line of credit, or from a liquidity facility, such as a liquidity put option or asset purchase agreement. Because of these enhancements, the SPE issuances can typically obtain a more favorable credit rating from rating agencies than the transferor could obtain for its own debt issuances, resulting in less expensive financing costs than unsecured debt. The SPE may also enter into derivative contracts in order to convert the yield or currency of the underlying assets to match the needs of the SPE investors or to limit or change the credit risk of the SPE. Citigroup may be the provider of certain credit enhancements as well as the counterparty to any related derivative contracts. Most of Citigroup’s SPEs are variable interest entities (VIEs), as described below.
Variable Interest Entities VIEs are entities that have either a total equity investment that is insufficient to permit the entity to finance its activities without additional subordinated financial support, or whose equity investors lack the characteristics of a controlling financial interest (i.e., ability to make significant decisions through voting rights, and right to receive the expected residual returns of the entity or obligation to absorb the expected losses of the entity). Investors that finance the VIE through debt or equity interests or other counterparties that provide other forms of support, such as guarantees, subordinated fee arrangements, or certain types of derivative contracts, are variable interest holders in the entity. The variable interest holder, if any, that has a controlling financial interest in a VIE is deemed to be the primary beneficiary and must consolidate the VIE. Citigroup would be deemed to have a controlling financial interest and be the primary beneficiary if it has both of the following characteristics:
• power to direct activities of a VIE that most significantly impact the entity’s economic performance; and
• obligation to absorb losses of the entity that could potentially be significant to the VIE or right to receive benefits from the entity that could potentially be significant to the VIE.
The Company must evaluate its involvement in each VIE and understand the purpose and design of the entity, the role the Company had in the entity’s design and its involvement in the VIE’s ongoing activities. The Company then must evaluate which activities most significantly impact the economic performance of the VIE and who has the power to direct such activities. For those VIEs where the Company determines that it has the power to direct the activities that most significantly impact the VIE’s economic performance, the Company then must evaluate its economic interests, if any, and determine whether it could absorb losses or receive benefits that could potentially be significant to the VIE. When evaluating whether the Company has an obligation to absorb losses that could potentially be significant, it considers the maximum exposure to such loss without consideration of probability. Such obligations could be in various forms, including, but not limited to, debt and equity investments, guarantees, liquidity agreements, and certain derivative contracts. In various other transactions, the Company may: (i) act as a derivative counterparty (for example, interest rate swap, cross-currency swap, or purchaser of credit protection under a credit default swap or total return swap where the Company pays the total return on certain assets to the SPE); (ii) act as underwriter or placement agent; (iii) provide administrative, trustee or other services; or (iv) make a market in debt securities or other instruments issued by VIEs. The Company generally considers such involvement, by itself, not to be variable interests and thus not an indicator of power or potentially significant benefits or losses.

90
Citigroup’s involvement with consolidated and unconsolidated VIEs with which the Company holds significant variable interests or has continuing involvement through servicing a majority of the assets in a VIE as of December 31, 2012 and 2011 is presented below: In millions of dollars As of December 31, 2012
Maximum exposure to loss in significant
unconsolidated VIEs (1)
Funded exposures (2) Unfunded exposures (3)
Citicorp
Total involvement
with SPE assets
ConsolidatedVIE / SPE
assets
Significant unconsolidatedVIE assets (4)
Debt investments
Equity investments
Funding commitments
Guarantees and
derivatives TotalCredit card securitizations $ 79,109 $ 79,109 $ — $ — $ — $ — $ — $ —Mortgage securitizations (5) U.S. agency-sponsored 232,741 — 232,741 3,042 — — 45 3,087 Non-agency-sponsored 9,308 1,686 7,622 382 — — — 382Citi-administered asset-
backed commercial paper conduits (ABCP) 30,002 22,387 7,615 — — 7,615 — 7,615
Third-party commercial paper conduits — — — — — — — —
Collateralized debt obligations (CDOs) 5,539 — 5,539 24 — — — 24
Collateralized loan obligations (CLOs) 15,120 — 15,120 642 19 — — 661
Asset-based financing 41,399 1,125 40,274 14,798 84 2,081 159 17,122Municipal securities tender
option bond trusts (TOBs) 15,163 7,573 7,590 352 — 4,628 — 4,980
Municipal investments 19,693 255 19,438 2,003 3,049 1,669 — 6,721Client intermediation 2,486 151 2,335 319 — — — 319Investment funds 4,286 2,196 2,090 — 14 — — 14Trust preferred securities 12,221 — 12,221 — 126 — — 126Other 2,023 115 1,908 113 382 22 76 593Total $ 469,090 $ 114,597 $ 354,493 $ 21,675 $ 3,674 $ 16,015 $ 280 $ 41,644Citi Holdings Credit card securitizations $ 838 $ 397 $ 441 $ — $ — $ — $ — $ —Mortgage securitizations U.S. agency-sponsored 106,888 — 106,888 700 — — 163 863 Non-agency-sponsored 16,693 1,628 15,065 43 — — 2 45Student loan securitizations 1,681 1,681 — — — — — —Collateralized debt
obligations (CDOs) 4,752 — 4,752 139 — — 124 263Collateralized loan
obligations (CLOs) 4,676 — 4,676 435 — 13 108 556Asset-based financing 4,166 3 4,163 984 6 243 — 1,233Municipal investments 7,766 — 7,766 90 235 992 — 1,317Client intermediation 13 13 — — — — — —Investment funds 1,083 — 1,083 — 47 — — 47Other 6,005 5,851 154 — 3 — — 3Total $ 154,561 $ 9,573 $ 144,988 $ 2,391 $ 291 $ 1,248 $ 397 $ 4,327Total Citigroup $ 623,651 $ 124,170 $ 499,481 $ 24,066 $ 3,965 $ 17,263 $ 677 $ 45,971 (1) The definition of maximum exposure to loss is included in the text that follows this table. (2) Included in Citigroup’s December 31, 2012 Consolidated Balance Sheet. (3) Not included in Citigroup’s December 31, 2012 Consolidated Balance Sheet. (4) A significant unconsolidated VIE is an entity where the Company has any variable interest considered to be significant, regardless of the likelihood of loss or the
notional amount of exposure. (5) Citicorp mortgage securitizations also include agency and non-agency (private-label) re-securitization activities. These SPEs are not consolidated. See “Re-
Securitizations” below for further discussion.
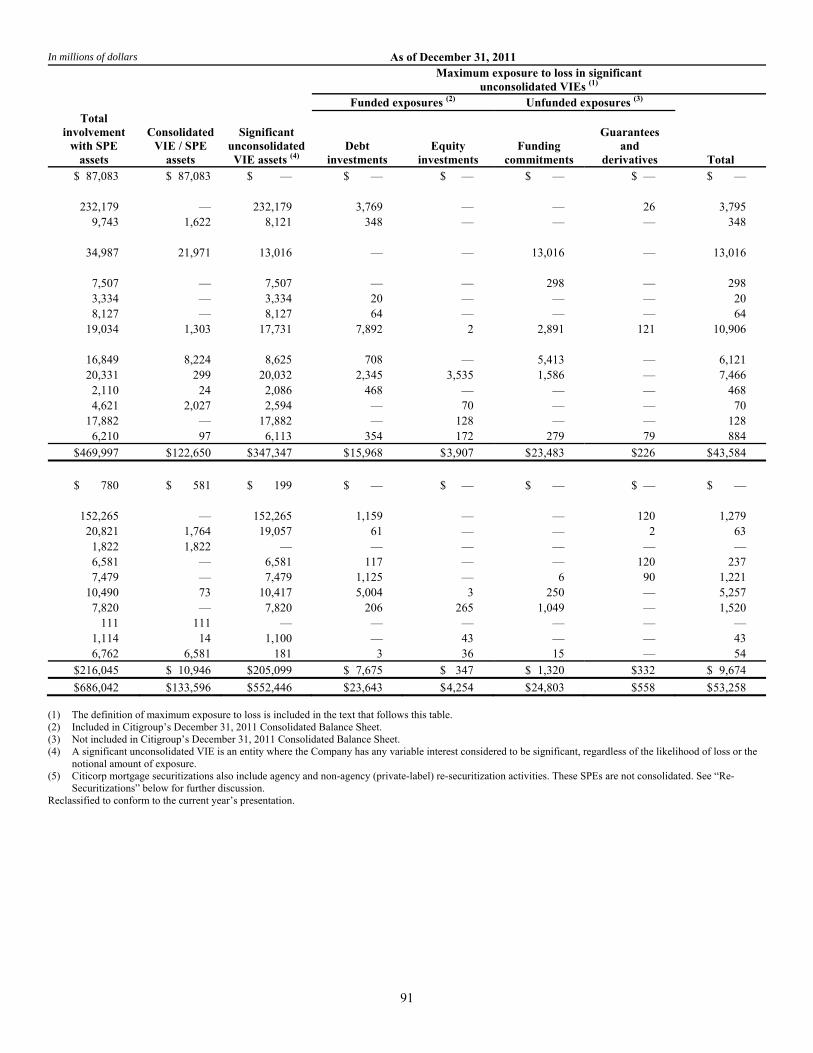
91
In millions of dollars As of December 31, 2011
Maximum exposure to loss in significant unconsolidated VIEs (1)
Funded exposures (2) Unfunded exposures (3) Total
involvement with SPE
assets
Consolidated VIE / SPE
assets
Significant unconsolidated VIE assets (4)
Debt investments
Equity investments
Funding commitments
Guarantees and
derivatives Total $ 87,083 $ 87,083 $ — $ — $ — $ — $ — $ — 232,179 — 232,179 3,769 — — 26 3,795 9,743 1,622 8,121 348 — — — 348 34,987 21,971 13,016 — — 13,016 — 13,016 7,507 — 7,507 — — 298 — 298 3,334 — 3,334 20 — — — 20 8,127 — 8,127 64 — — — 64 19,034 1,303 17,731 7,892 2 2,891 121 10,906 16,849 8,224 8,625 708 — 5,413 — 6,121 20,331 299 20,032 2,345 3,535 1,586 — 7,466 2,110 24 2,086 468 — — — 468 4,621 2,027 2,594 — 70 — — 70 17,882 — 17,882 — 128 — — 128 6,210 97 6,113 354 172 279 79 884 $ 469,997 $ 122,650 $ 347,347 $ 15,968 $ 3,907 $ 23,483 $226 $ 43,584 $ 780 $ 581 $ 199 $ — $ — $ — $ — $ — 152,265 — 152,265 1,159 — — 120 1,279 20,821 1,764 19,057 61 — — 2 63 1,822 1,822 — — — — — — 6,581 — 6,581 117 — — 120 237 7,479 — 7,479 1,125 — 6 90 1,221 10,490 73 10,417 5,004 3 250 — 5,257 7,820 — 7,820 206 265 1,049 — 1,520 111 111 — — — — — — 1,114 14 1,100 — 43 — — 43 6,762 6,581 181 3 36 15 — 54 $ 216,045 $ 10,946 $ 205,099 $ 7,675 $ 347 $ 1,320 $332 $ 9,674 $ 686,042 $ 133,596 $ 552,446 $ 23,643 $ 4,254 $ 24,803 $558 $ 53,258 (1) The definition of maximum exposure to loss is included in the text that follows this table. (2) Included in Citigroup’s December 31, 2011 Consolidated Balance Sheet. (3) Not included in Citigroup’s December 31, 2011 Consolidated Balance Sheet. (4) A significant unconsolidated VIE is an entity where the Company has any variable interest considered to be significant, regardless of the likelihood of loss or the
notional amount of exposure. (5) Citicorp mortgage securitizations also include agency and non-agency (private-label) re-securitization activities. These SPEs are not consolidated. See “Re-
Securitizations” below for further discussion. Reclassified to conform to the current year’s presentation.
92
The previous tables do not include:
• certain venture capital investments made by some of the Company’s private equity subsidiaries, as the Company accounts for these investments in accordance with the Investment Company Audit Guide;
• certain limited partnerships that are investment funds that qualify for the deferral from the requirements of ASC 810 where the Company is the general partner and the limited partners have the right to replace the general partner or liquidate the funds;
• certain investment funds for which the Company provides investment management services and personal estate trusts for which the Company provides administrative, trustee and/or investment management services;
• VIEs structured by third parties where the Company holds securities in inventory, as these investments are made on arm’s-length terms;
• certain positions in mortgage-backed and asset-backed securities held by the Company, which are classified as Trading account assets or Investments, where the Company has no other involvement with the related securitization entity deemed to be significant (for more information on these positions, see Notes 14 and 15 to the Consolidated Financial Statements);
• certain representations and warranties exposures in legacy Securities and Banking—sponsored mortgage-backed and asset-backed securitizations, where the Company has no variable interest or continuing involvement as servicer. The outstanding balance of mortgage loans securitized during 2005 to 2008 where the Company has no variable interest or continuing involvement as servicer was approximately $19 billion at December 31, 2012; and
• certain representations and warranties exposures in Citigroup residential mortgage securitizations, where the original mortgage loan balances are no longer outstanding.
The asset balances for consolidated VIEs represent the carrying amounts of the assets consolidated by the Company. The carrying amount may represent the amortized cost or the current fair value of the assets depending on the legal form of the asset (e.g., security or loan) and the Company’s standard accounting policies for the asset type and line of business. The asset balances for unconsolidated VIEs where the Company has significant involvement represent the most current information available to the Company. In most cases, the asset balances represent an amortized cost basis without regard to impairments in fair value, unless fair value information is readily available to the Company. For VIEs that obtain asset exposures synthetically through derivative instruments (for example, synthetic CDOs), the tables generally include the full original notional amount of the derivative as an asset balance. The maximum funded exposure represents the balance sheet carrying amount of the Company’s investment in the VIE. It reflects the initial amount of cash invested in the VIE adjusted for any accrued interest and cash principal payments received. The carrying amount may also be adjusted for increases or declines in fair value or any impairment in value recognized in earnings. The maximum exposure of unfunded positions represents the remaining undrawn committed amount, including liquidity and credit facilities provided by the Company, or the notional amount of a derivative instrument considered to be a variable interest. In certain transactions, the Company has entered into derivative instruments or other arrangements that are not considered variable interests in the VIE (e.g., interest rate swaps, cross-currency swaps, or where the Company is the purchaser of credit protection under a credit default swap or total return swap where the Company pays the total return on certain assets to the SPE). Receivables under such arrangements are not included in the maximum exposure amounts.
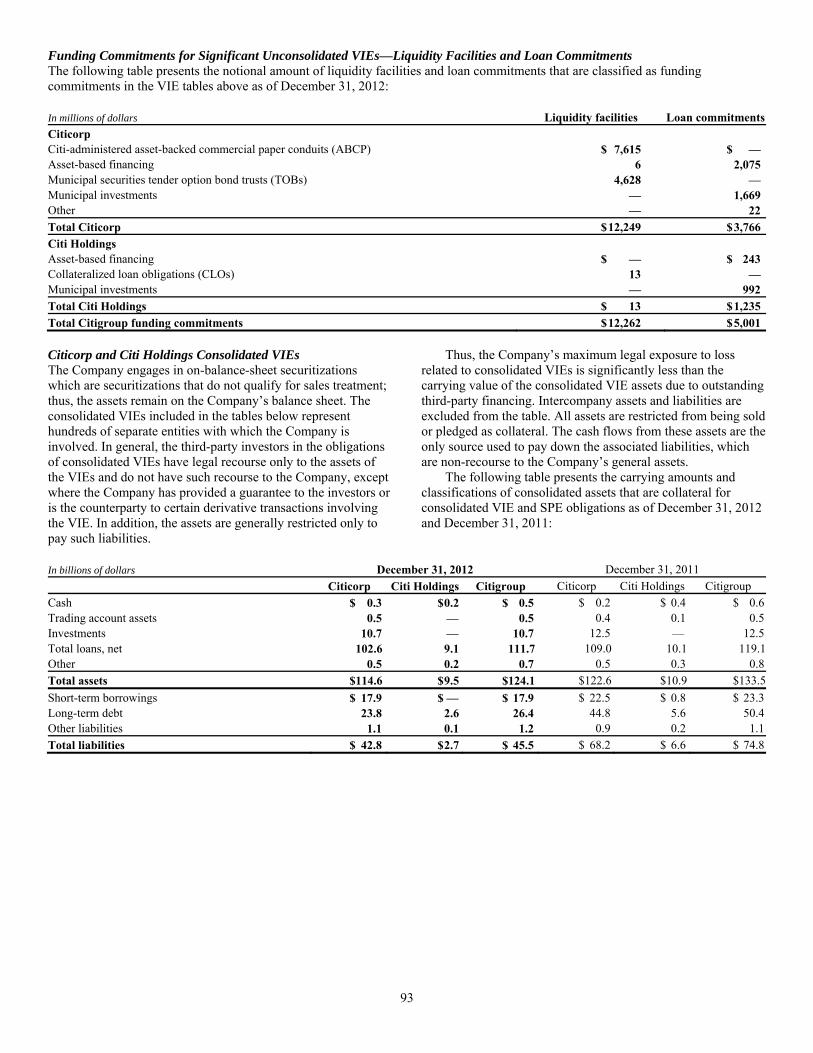
93
Funding Commitments for Significant Unconsolidated VIEs—Liquidity Facilities and Loan Commitments The following table presents the notional amount of liquidity facilities and loan commitments that are classified as funding commitments in the VIE tables above as of December 31, 2012: In millions of dollars Liquidity facilities Loan commitmentsCiticorp Citi-administered asset-backed commercial paper conduits (ABCP) $ 7,615 $ —Asset-based financing 6 2,075Municipal securities tender option bond trusts (TOBs) 4,628 —Municipal investments — 1,669Other — 22Total Citicorp $ 12,249 $ 3,766Citi Holdings Asset-based financing $ — $ 243Collateralized loan obligations (CLOs) 13 —Municipal investments — 992Total Citi Holdings $ 13 $ 1,235Total Citigroup funding commitments $ 12,262 $ 5,001 Citicorp and Citi Holdings Consolidated VIEs The Company engages in on-balance-sheet securitizations which are securitizations that do not qualify for sales treatment; thus, the assets remain on the Company’s balance sheet. The consolidated VIEs included in the tables below represent hundreds of separate entities with which the Company is involved. In general, the third-party investors in the obligations of consolidated VIEs have legal recourse only to the assets of the VIEs and do not have such recourse to the Company, except where the Company has provided a guarantee to the investors or is the counterparty to certain derivative transactions involving the VIE. In addition, the assets are generally restricted only to pay such liabilities.
Thus, the Company’s maximum legal exposure to loss related to consolidated VIEs is significantly less than the carrying value of the consolidated VIE assets due to outstanding third-party financing. Intercompany assets and liabilities are excluded from the table. All assets are restricted from being sold or pledged as collateral. The cash flows from these assets are the only source used to pay down the associated liabilities, which are non-recourse to the Company’s general assets. The following table presents the carrying amounts and classifications of consolidated assets that are collateral for consolidated VIE and SPE obligations as of December 31, 2012 and December 31, 2011:
In billions of dollars December 31, 2012 December 31, 2011 Citicorp Citi Holdings Citigroup Citicorp Citi Holdings Citigroup Cash $ 0.3 $ 0.2 $ 0.5 $ 0.2 $ 0.4 $ 0.6Trading account assets 0.5 — 0.5 0.4 0.1 0.5Investments 10.7 — 10.7 12.5 — 12.5Total loans, net 102.6 9.1 111.7 109.0 10.1 119.1Other 0.5 0.2 0.7 0.5 0.3 0.8Total assets $114.6 $ 9.5 $124.1 $122.6 $10.9 $133.5Short-term borrowings $ 17.9 $ — $ 17.9 $ 22.5 $ 0.8 $ 23.3Long-term debt 23.8 2.6 26.4 44.8 5.6 50.4Other liabilities 1.1 0.1 1.2 0.9 0.2 1.1Total liabilities $ 42.8 $ 2.7 $ 45.5 $ 68.2 $ 6.6 $ 74.8
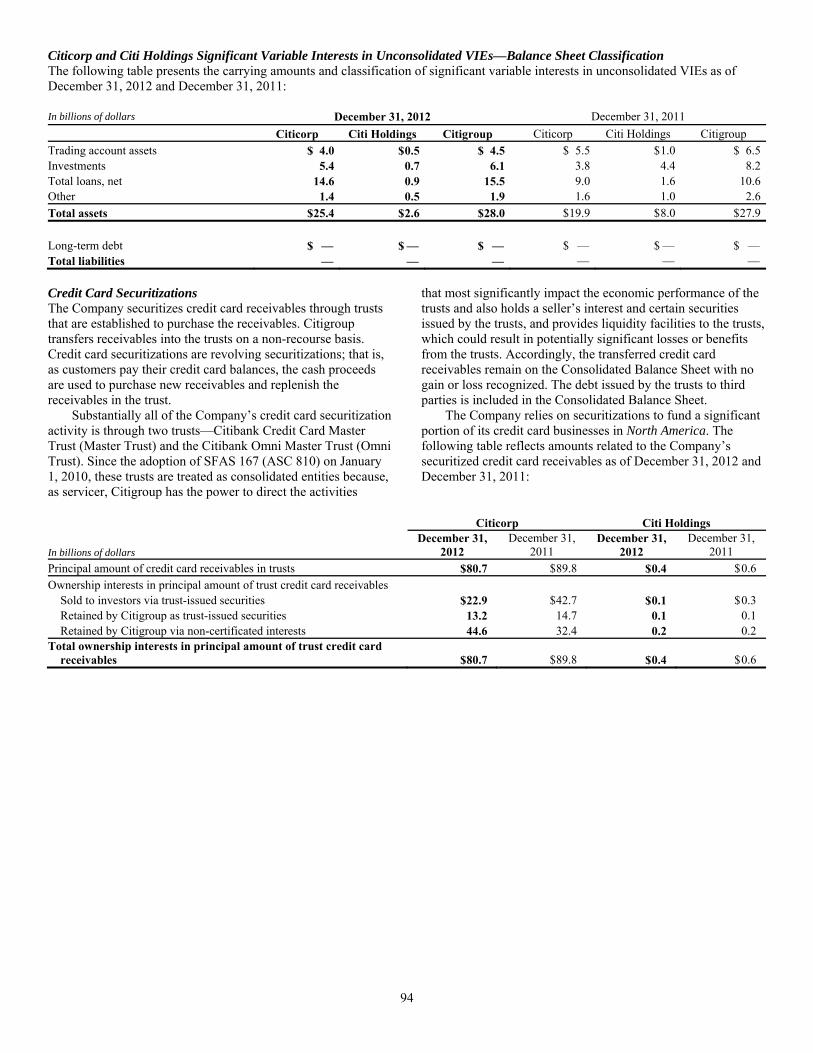
94
Citicorp and Citi Holdings Significant Variable Interests in Unconsolidated VIEs—Balance Sheet Classification The following table presents the carrying amounts and classification of significant variable interests in unconsolidated VIEs as of December 31, 2012 and December 31, 2011: In billions of dollars December 31, 2012 December 31, 2011
Citicorp Citi Holdings Citigroup Citicorp Citi Holdings Citigroup Trading account assets $ 4.0 $ 0.5 $ 4.5 $ 5.5 $ 1.0 $ 6.5Investments 5.4 0.7 6.1 3.8 4.4 8.2Total loans, net 14.6 0.9 15.5 9.0 1.6 10.6Other 1.4 0.5 1.9 1.6 1.0 2.6Total assets $ 25.4 $ 2.6 $ 28.0 $ 19.9 $ 8.0 $ 27.9 Long-term debt $ — $ — $ — $ — $ — $ — Total liabilities — — — — — — Credit Card Securitizations The Company securitizes credit card receivables through trusts that are established to purchase the receivables. Citigroup transfers receivables into the trusts on a non-recourse basis. Credit card securitizations are revolving securitizations; that is, as customers pay their credit card balances, the cash proceeds are used to purchase new receivables and replenish the receivables in the trust. Substantially all of the Company’s credit card securitization activity is through two trusts—Citibank Credit Card Master Trust (Master Trust) and the Citibank Omni Master Trust (Omni Trust). Since the adoption of SFAS 167 (ASC 810) on January 1, 2010, these trusts are treated as consolidated entities because, as servicer, Citigroup has the power to direct the activities
that most significantly impact the economic performance of the trusts and also holds a seller’s interest and certain securities issued by the trusts, and provides liquidity facilities to the trusts, which could result in potentially significant losses or benefits from the trusts. Accordingly, the transferred credit card receivables remain on the Consolidated Balance Sheet with no gain or loss recognized. The debt issued by the trusts to third parties is included in the Consolidated Balance Sheet. The Company relies on securitizations to fund a significant portion of its credit card businesses in North America. The following table reflects amounts related to the Company’s securitized credit card receivables as of December 31, 2012 and December 31, 2011:
Citicorp Citi Holdings
In billions of dollars December 31,
2012December 31,
2011 December 31,
2012 December 31,
2011 Principal amount of credit card receivables in trusts $ 80.7 $ 89.8 $ 0.4 $ 0.6 Ownership interests in principal amount of trust credit card receivables Sold to investors via trust-issued securities $ 22.9 $ 42.7 $ 0.1 $ 0.3 Retained by Citigroup as trust-issued securities 13.2 14.7 0.1 0.1 Retained by Citigroup via non-certificated interests 44.6 32.4 0.2 0.2 Total ownership interests in principal amount of trust credit card
receivables $ 80.7 $ 89.8 $ 0.4 $ 0.6

95
Credit Card Securitizations—Citicorp The following table summarizes selected cash flow information related to Citicorp’s credit card securitizations for the years ended December 31, 2012, 2011 and 2010: In billions of dollars 2012 2011 2010 Proceeds from new securitizations $ 2.4 $ 3.9 $ 5.5 Pay down of maturing notes (21.7) (20.5) (40.3) Credit Card Securitizations—Citi Holdings The proceeds from Citi Holdings’ credit card securitizations were $0.4 billion for the year ended December 31, 2012. Managed Loans After securitization of credit card receivables, the Company continues to maintain credit card customer account relationships and provides servicing for receivables transferred to the trusts. As a result, the Company considers the securitized credit card receivables to be part of the business it manages. As Citigroup consolidates the credit card trusts, all managed securitized card receivables are on-balance sheet. Funding, Liquidity Facilities and Subordinated Interests As noted above, Citigroup securitizes credit card receivables through two securitization trusts—Master Trust, which is part of Citicorp, and Omni Trust, which is also substantially part of Citicorp. The liabilities of the trusts are included in the Consolidated Balance Sheet, excluding those retained by Citigroup. Master Trust issues fixed- and floating-rate term notes. Some of the term notes are issued to multi-seller commercial paper conduits. The weighted average maturity of the term notes issued by the Master Trust was 3.8 years as of December 31, 2012 and 3.1 years as of December 31, 2011.
Master Trust Liabilities (at par value)
In billions of dollars December 31,
2012December 31,
2011 Term notes issued to multi-seller
commercial paper conduits $ — $ —Term notes issued to third parties 18.6 30.4Term notes retained by Citigroup
affiliates 4.8 7.7Total Master Trust liabilities $ 23.4 $38.1 The Omni Trust issues fixed- and floating-rate term notes, some of which are purchased by multi-seller commercial paper conduits. The weighted average maturity of the third-party term notes issued by the Omni Trust was 1.7 years as of December 31, 2012 and 1.5 years as of December 31, 2011. Omni Trust Liabilities (at par value)
In billions of dollars December 31,
2012December 31,
2011 Term notes issued to multi-seller
commercial paper conduits $ — $ 3.4 Term notes issued to third parties 4.4 9.2 Term notes retained by Citigroup
affiliates 7.1 7.1 Total Omni Trust liabilities $11.5 $19.7
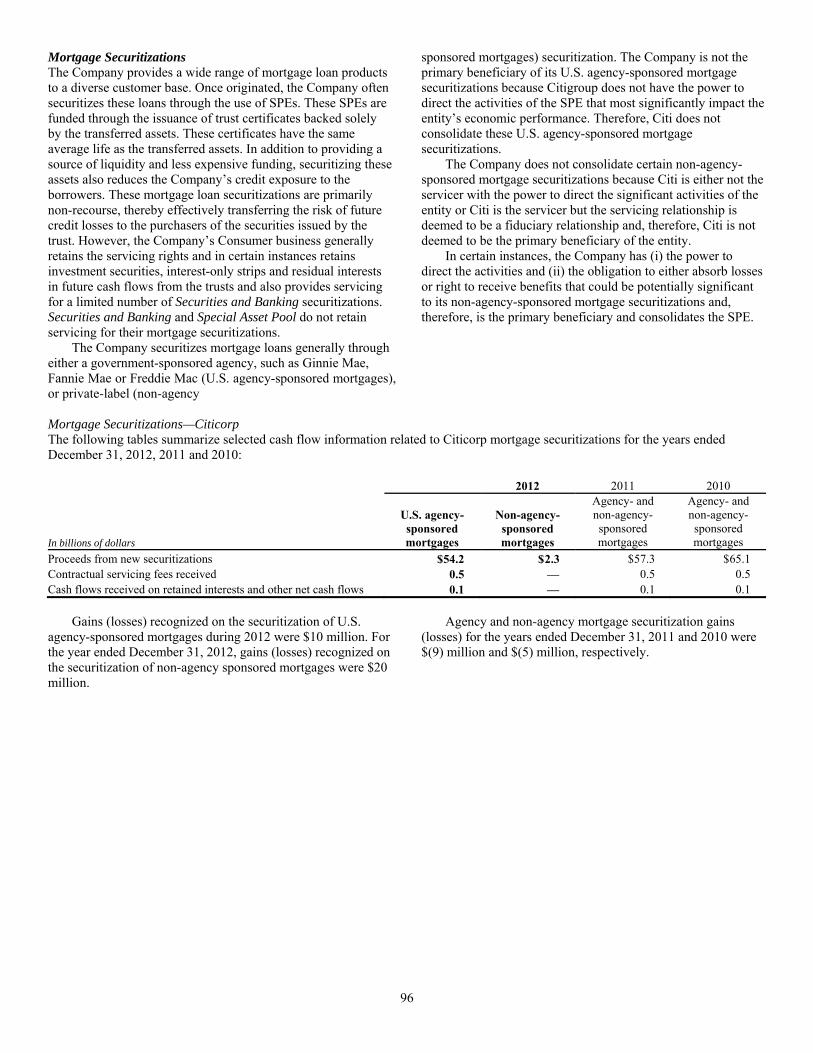
96
Mortgage Securitizations The Company provides a wide range of mortgage loan products to a diverse customer base. Once originated, the Company often securitizes these loans through the use of SPEs. These SPEs are funded through the issuance of trust certificates backed solely by the transferred assets. These certificates have the same average life as the transferred assets. In addition to providing a source of liquidity and less expensive funding, securitizing these assets also reduces the Company’s credit exposure to the borrowers. These mortgage loan securitizations are primarily non-recourse, thereby effectively transferring the risk of future credit losses to the purchasers of the securities issued by the trust. However, the Company’s Consumer business generally retains the servicing rights and in certain instances retains investment securities, interest-only strips and residual interests in future cash flows from the trusts and also provides servicing for a limited number of Securities and Banking securitizations. Securities and Banking and Special Asset Pool do not retain servicing for their mortgage securitizations. The Company securitizes mortgage loans generally through either a government-sponsored agency, such as Ginnie Mae, Fannie Mae or Freddie Mac (U.S. agency-sponsored mortgages), or private-label (non-agency
sponsored mortgages) securitization. The Company is not the primary beneficiary of its U.S. agency-sponsored mortgage securitizations because Citigroup does not have the power to direct the activities of the SPE that most significantly impact the entity’s economic performance. Therefore, Citi does not consolidate these U.S. agency-sponsored mortgage securitizations. The Company does not consolidate certain non-agency-sponsored mortgage securitizations because Citi is either not the servicer with the power to direct the significant activities of the entity or Citi is the servicer but the servicing relationship is deemed to be a fiduciary relationship and, therefore, Citi is not deemed to be the primary beneficiary of the entity. In certain instances, the Company has (i) the power to direct the activities and (ii) the obligation to either absorb losses or right to receive benefits that could be potentially significant to its non-agency-sponsored mortgage securitizations and, therefore, is the primary beneficiary and consolidates the SPE.
Mortgage Securitizations—Citicorp The following tables summarize selected cash flow information related to Citicorp mortgage securitizations for the years ended December 31, 2012, 2011 and 2010: 2012 2011 2010
In billions of dollars
U.S. agency- sponsored mortgages
Non-agency- sponsored mortgages
Agency- and non-agency- sponsored mortgages
Agency- and non-agency- sponsored mortgages
Proceeds from new securitizations $ 54.2 $ 2.3 $ 57.3 $ 65.1 Contractual servicing fees received 0.5 — 0.5 0.5 Cash flows received on retained interests and other net cash flows 0.1 — 0.1 0.1 Gains (losses) recognized on the securitization of U.S. agency-sponsored mortgages during 2012 were $10 million. For the year ended December 31, 2012, gains (losses) recognized on the securitization of non-agency sponsored mortgages were $20 million.
Agency and non-agency mortgage securitization gains (losses) for the years ended December 31, 2011 and 2010 were $(9) million and $(5) million, respectively.
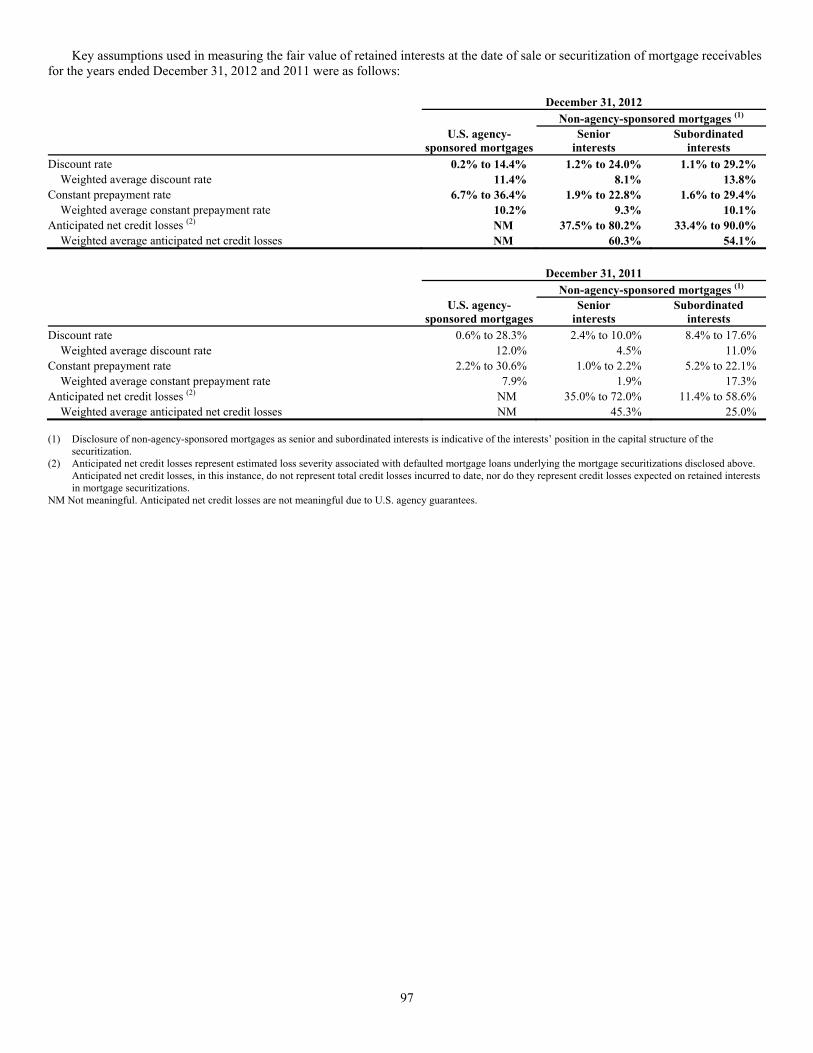
97
Key assumptions used in measuring the fair value of retained interests at the date of sale or securitization of mortgage receivables for the years ended December 31, 2012 and 2011 were as follows: December 31, 2012 Non-agency-sponsored mortgages (1)
U.S. agency-
sponsored mortgagesSenior
interests Subordinated
interestsDiscount rate 0.2% to 14.4% 1.2% to 24.0% 1.1% to 29.2% Weighted average discount rate 11.4% 8.1% 13.8%Constant prepayment rate 6.7% to 36.4% 1.9% to 22.8% 1.6% to 29.4% Weighted average constant prepayment rate 10.2% 9.3% 10.1%Anticipated net credit losses (2) NM 37.5% to 80.2% 33.4% to 90.0% Weighted average anticipated net credit losses NM 60.3% 54.1% December 31, 2011 Non-agency-sponsored mortgages (1)
U.S. agency-
sponsored mortgagesSenior
interests Subordinated
interestsDiscount rate 0.6% to 28.3% 2.4% to 10.0% 8.4% to 17.6% Weighted average discount rate 12.0% 4.5% 11.0% Constant prepayment rate 2.2% to 30.6% 1.0% to 2.2% 5.2% to 22.1% Weighted average constant prepayment rate 7.9% 1.9% 17.3% Anticipated net credit losses (2) NM 35.0% to 72.0% 11.4% to 58.6% Weighted average anticipated net credit losses NM 45.3% 25.0% (1) Disclosure of non-agency-sponsored mortgages as senior and subordinated interests is indicative of the interests’ position in the capital structure of the
securitization. (2) Anticipated net credit losses represent estimated loss severity associated with defaulted mortgage loans underlying the mortgage securitizations disclosed above.
Anticipated net credit losses, in this instance, do not represent total credit losses incurred to date, nor do they represent credit losses expected on retained interests in mortgage securitizations.
NM Not meaningful. Anticipated net credit losses are not meaningful due to U.S. agency guarantees.
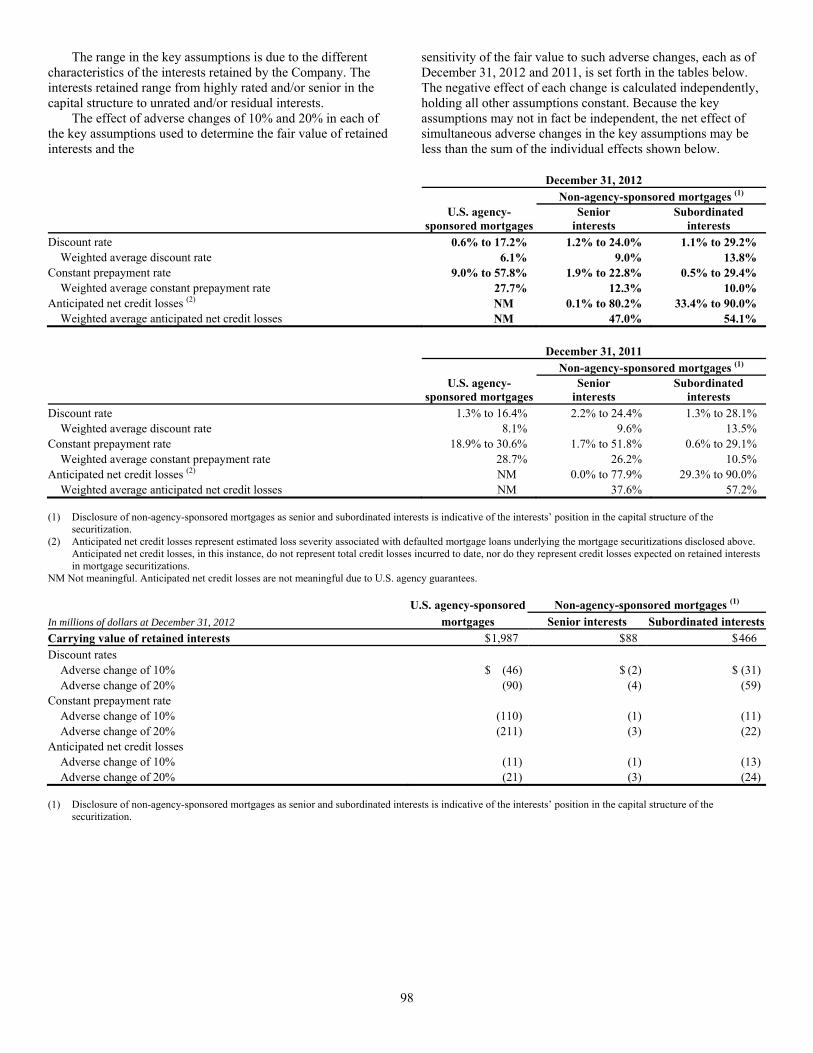
98
The range in the key assumptions is due to the different characteristics of the interests retained by the Company. The interests retained range from highly rated and/or senior in the capital structure to unrated and/or residual interests. The effect of adverse changes of 10% and 20% in each of the key assumptions used to determine the fair value of retained interests and the
sensitivity of the fair value to such adverse changes, each as of December 31, 2012 and 2011, is set forth in the tables below. The negative effect of each change is calculated independently, holding all other assumptions constant. Because the key assumptions may not in fact be independent, the net effect of simultaneous adverse changes in the key assumptions may be less than the sum of the individual effects shown below.
December 31, 2012 Non-agency-sponsored mortgages (1)
U.S. agency-
sponsored mortgagesSenior
interests Subordinated
interestsDiscount rate 0.6% to 17.2% 1.2% to 24.0% 1.1% to 29.2% Weighted average discount rate 6.1% 9.0% 13.8%Constant prepayment rate 9.0% to 57.8% 1.9% to 22.8% 0.5% to 29.4% Weighted average constant prepayment rate 27.7% 12.3% 10.0%Anticipated net credit losses (2) NM 0.1% to 80.2% 33.4% to 90.0% Weighted average anticipated net credit losses NM 47.0% 54.1% December 31, 2011 Non-agency-sponsored mortgages (1)
U.S. agency-
sponsored mortgagesSenior
interests Subordinated
interestsDiscount rate 1.3% to 16.4% 2.2% to 24.4% 1.3% to 28.1% Weighted average discount rate 8.1% 9.6% 13.5% Constant prepayment rate 18.9% to 30.6% 1.7% to 51.8% 0.6% to 29.1% Weighted average constant prepayment rate 28.7% 26.2% 10.5% Anticipated net credit losses (2) NM 0.0% to 77.9% 29.3% to 90.0% Weighted average anticipated net credit losses NM 37.6% 57.2% (1) Disclosure of non-agency-sponsored mortgages as senior and subordinated interests is indicative of the interests’ position in the capital structure of the
securitization. (2) Anticipated net credit losses represent estimated loss severity associated with defaulted mortgage loans underlying the mortgage securitizations disclosed above.
Anticipated net credit losses, in this instance, do not represent total credit losses incurred to date, nor do they represent credit losses expected on retained interests in mortgage securitizations.
NM Not meaningful. Anticipated net credit losses are not meaningful due to U.S. agency guarantees. U.S. agency-sponsored Non-agency-sponsored mortgages (1)
In millions of dollars at December 31, 2012 mortgages Senior interests Subordinated interestsCarrying value of retained interests $ 1,987 $ 88 $ 466 Discount rates Adverse change of 10% $ (46) $ (2) $ (31) Adverse change of 20% (90) (4) (59)Constant prepayment rate Adverse change of 10% (110) (1) (11) Adverse change of 20% (211) (3) (22)Anticipated net credit losses Adverse change of 10% (11) (1) (13) Adverse change of 20% (21) (3) (24) (1) Disclosure of non-agency-sponsored mortgages as senior and subordinated interests is indicative of the interests’ position in the capital structure of the
securitization.
99
Mortgage Securitizations—Citi Holdings The following tables summarize selected cash flow information related to Citi Holdings mortgage securitizations for the years ended December 31, 2012, 2011 and 2010: 2012 2011 2010
In billions of dollars U.S. agency-
sponsored mortgages
Agency- and non-agency-
sponsored mortgages
Agency- and non-agency-
sponsored mortgagesProceeds from new securitizations $ 0.4 $ 1.1 $ 0.6 Contractual servicing fees received 0.4 0.6 0.8 Cash flows received on retained interests and other net cash flows — 0.1 0.1 Gains recognized on the securitization of U.S. agency-sponsored mortgages were $45 million and $78 million for the years ended December 31, 2012 and 2011, respectively. The Company did not securitize non-agency-sponsored mortgages during the years ended December 31, 2012 and 2011. Similar to Citicorp mortgage securitizations discussed above, the range in the key assumptions is due to the different characteristics of the interests retained by the Company. The interests retained range from highly rated and/or senior in the capital structure to unrated and/or residual interests.
The effect of adverse changes of 10% and 20% in each of the key assumptions used to determine the fair value of retained interests, and the sensitivity of the fair value to such adverse changes, each as of December 31, 2012 and 2011, is set forth in the tables below. The negative effect of each change is calculated independently, holding all other assumptions constant. Because the key assumptions may not in fact be independent, the net effect of simultaneous adverse changes in the key assumptions may be less than the sum of the individual effects shown below.
December 31, 2012 Non-agency-sponsored mortgages (1)
U.S. agency-
sponsored mortgagesSenior
interests Subordinated
interestsDiscount rate 9.7% 4.1% to 10.0% 3.4% to 12.4% Weighted average discount rate 9.7% 4.2% 8.0%Constant prepayment rate 28.6% 21.7% 12.7% to 18.7% Weighted average constant prepayment rate 28.6% 21.7% 15.7%Anticipated net credit losses NM 0.5% 50.0% to 50.1% Weighted average anticipated net credit losses NM 0.5% 50.1%Weighted average life 4.1 years 4.4 years 6.0 to 7.4 years December 31, 2011 Non-agency-sponsored mortgages (1)
U.S. agency-
sponsored mortgagesSenior
interests Subordinated
interestsDiscount rate 6.9% 2.9% to 18.0% 6.7% to 18.2% Weighted average discount rate 6.9% 9.8% 9.2% Constant prepayment rate 30.0% 38.8% 2.0% to 9.6% Weighted average constant prepayment rate 30.0% 38.8% 8.1% Anticipated net credit losses NM 0.4% 57.2% to 90.0% Weighted average anticipated net credit losses NM 0.4% 63.2% Weighted average life 3.7 years 3.3 to 4.7 years 0.0 to 8.1 years (1) Disclosure of non-agency-sponsored mortgages as senior and subordinated interests is indicative of the interests’ position in the capital structure of the
securitization. NM Not meaningful. Anticipated net credit losses are not meaningful due to U.S. agency guarantees.

100
U.S. agency-sponsored Non-agency-sponsored mortgages (1)
In millions of dollars at December 31, 2012 mortgages Senior interests Subordinated interestsCarrying value of retained interests $ 618 $ 39 $16 Discount rates Adverse change of 10% $ (22) $ — $ (1) Adverse change of 20% (42) (1) (2) Constant prepayment rate Adverse change of 10% (57) (3) — Adverse change of 20% (109) (7) (1) Anticipated net credit losses Adverse change of 10% (32) (9) (2) Adverse change of 20% (64) (19) (4) (1) Disclosure of non-agency-sponsored mortgages as senior and subordinated interests is indicative of the interests’ position in the capital structure of the
securitization. Mortgage Servicing Rights In connection with the securitization of mortgage loans, the Company’s U.S. Consumer mortgage business generally retains the servicing rights, which entitle the Company to a future stream of cash flows based on the outstanding principal balances of the loans and the contractual servicing fee. Failure to service the loans in accordance with contractual requirements may lead to a termination of the servicing rights and the loss of future servicing fees. The fair value of capitalized mortgage servicing rights (MSRs) was $1.9 billion and $2.6 billion at December 31, 2012 and 2011, respectively. The MSRs correspond to principal loan balances of $325 billion and $401 billion as of December 31, 2012 and 2011, respectively. The following table summarizes the changes in capitalized MSRs for the years ended December 31, 2012 and 2011: In millions of dollars 2012 2011 Balance, beginning of year $ 2,569 $ 4,554 Originations 423 611 Changes in fair value of MSRs due to
changes in inputs and assumptions (198) (1,210)Other changes (1) (852) (1,174)Sale of MSRs — (212)Balance, end of year $ 1,942 $ 2,569 (1) Represents changes due to customer payments and passage of time. The fair value of the MSRs is primarily affected by changes in prepayments of mortgages that result from shifts in mortgage interest rates. In managing this risk, the Company economically hedges a significant portion of the value of its MSRs through the use of interest rate derivative contracts, forward purchase and sale commitments of mortgage-backed securities and purchased securities classified as Trading account assets.
The Company receives fees during the course of servicing previously securitized mortgages. The amounts of these fees for the years ended December 31, 2012, 2011 and 2010 were as follows: In millions of dollars 2012 2011 2010 Servicing fees $ 990 $ 1,170 $ 1,356 Late fees 65 76 87 Ancillary fees 122 130 214 Total MSR fees $ 1,177 $ 1,376 $ 1,657 These fees are classified in the Consolidated Statement of Income as Other revenue. Re-securitizations The Company engages in re-securitization transactions in which debt securities are transferred to a VIE in exchange for new beneficial interests. During the year ended December 31, 2012, Citi transferred non-agency (private-label) securities with an original par value of approximately $1.5 billion to re-securitization entities. These securities are backed by either residential or commercial mortgages and are often structured on behalf of clients. As of December 31, 2012, the fair value of Citi-retained interests in private-label re-securitization transactions structured by Citi totaled approximately $380 million ($128 million of which relates to re-securitization transactions executed in 2012) and are recorded in Trading account assets. Of this amount, approximately $11 million and $369 million related to senior and subordinated beneficial interests, respectively. The original par value of private-label re-securitization transactions in which Citi holds a retained interest as of December 31, 2012 was approximately $7.1 billion.
101
The Company also re-securitizes U.S. government-agency guaranteed mortgage-backed (agency) securities. During the 12 months ended December 31, 2012, Citi transferred agency securities with a fair value of approximately $30.3 billion to re-securitization entities. As of December 31, 2012, the fair value of Citi-retained interests in agency re-securitization transactions structured by Citi totaled approximately $1.7 billion ($1.1 billion of which related to re-securitization transactions executed in 2012) and is recorded in Trading account assets. The original fair value of agency re-securitization transactions in which Citi holds a retained interest as of December 31, 2012 was approximately $71.2 billion. As of December 31, 2012, the Company did not consolidate any private-label or agency re-securitization entities. Citi-Administered Asset-Backed Commercial Paper Conduits The Company is active in the asset-backed commercial paper conduit business as administrator of several multi-seller commercial paper conduits and also as a service provider to single-seller and other commercial paper conduits sponsored by third parties. Citi’s multi-seller commercial paper conduits are designed to provide the Company’s clients access to low-cost funding in the commercial paper markets. The conduits purchase assets from or provide financing facilities to clients and are funded by issuing commercial paper to third-party investors. The conduits generally do not purchase assets originated by the Company. The funding of the conduits is facilitated by the liquidity support and credit enhancements provided by the Company. As administrator to Citi’s conduits, the Company is generally responsible for selecting and structuring assets purchased or financed by the conduits, making decisions regarding the funding of the conduits, including determining the tenor and other features of the commercial paper issued, monitoring the quality and performance of the conduits’ assets, and facilitating the operations and cash flows of the conduits. In return, the Company earns structuring fees from customers for individual transactions and earns an administration fee from the conduit, which is equal to the income from the client program and liquidity fees of the conduit after payment of conduit expenses. This administration fee is fairly stable, since most risks and rewards of the underlying assets are passed back to the clients and, once the asset pricing is negotiated, most ongoing income, costs and fees are relatively stable as a percentage of the conduit’s size. The conduits administered by the Company do not generally invest in liquid securities that are formally rated by third parties. The assets are privately negotiated and structured transactions that are designed to be held by the conduit, rather than actively traded and sold. The yield earned
by the conduit on each asset is generally tied to the rate on the commercial paper issued by the conduit, thus passing interest rate risk to the client. Each asset purchased by the conduit is structured with transaction-specific credit enhancement features provided by the third-party client seller, including over collateralization, cash and excess spread collateral accounts, direct recourse or third-party guarantees. These credit enhancements are sized with the objective of approximating a credit rating of A or above, based on the Company’s internal risk ratings. Substantially all of the funding of the conduits is in the form of short-term commercial paper, with a weighted average life generally ranging from 25 to 45 days. At the respective period ends December 31, 2012 and December 31, 2011, the weighted average lives of the commercial paper issued by consolidated and unconsolidated conduits were approximately 38 and 37 days, respectively. The primary credit enhancement provided to the conduit investors is in the form of transaction-specific credit enhancement described above. In addition, each consolidated conduit has obtained a letter of credit from the Company, which needs to be sized to at least 8–10% of the conduit’s assets with a floor of $200 million. The letters of credit provided by the Company to the consolidated conduits total approximately $2.1 billion. The net result across all multi-seller conduits administered by the Company is that, in the event defaulted assets exceed the transaction-specific credit enhancements described above, any losses in each conduit are allocated first to the Company and then the commercial paper investors. The Company also provides the conduits with two forms of liquidity agreements that are used to provide funding to the conduits in the event of a market disruption, among other events. Each asset of the conduits is supported by a transaction-specific liquidity facility in the form of an asset purchase agreement (APA). Under the APA, the Company has generally agreed to purchase non-defaulted eligible receivables from the conduit at par. The APA is not generally designed to provide credit support to the conduit, as it generally does not permit the purchase of defaulted or impaired assets. Any funding under the APA will likely subject the underlying borrower to the conduits to increased interest costs. In addition, the Company provides the conduits with program-wide liquidity in the form of short-term lending commitments. Under these commitments, the Company has agreed to lend to the conduits in the event of a short-term disruption in the commercial paper market, subject to specified conditions. The Company receives fees for providing both types of liquidity agreements and considers these fees to be on fair market terms.
102
Finally, the Company is one of several named dealers in the commercial paper issued by the conduits and earns a market-based fee for providing such services. Along with third-party dealers, the Company makes a market in the commercial paper and may from time to time fund commercial paper pending sale to a third party. On specific dates with less liquidity in the market, the Company may hold in inventory commercial paper issued by conduits administered by the Company, as well as conduits administered by third parties. The amount of commercial paper issued by its administered conduits held in inventory fluctuates based on market conditions and activity. As of December 31, 2012, the Company owned $11.7 billion and $131 million of the commercial paper issued by its consolidated and unconsolidated administered conduits, respectively. With the exception of the government-guaranteed loan conduit described below, the asset-backed commercial paper conduits are consolidated by the Company. The Company determined that through its role as administrator it had the power to direct the activities that most significantly impacted the entities’ economic performance. These powers included its ability to structure and approve the assets purchased by the conduits, its ongoing surveillance and credit mitigation activities, and its liability management. In addition, as a result of all the Company’s involvement described above, it was concluded that the Company had an economic interest that could potentially be significant. However, the assets and liabilities of the conduits are separate and apart from those of Citigroup. No assets of any conduit are available to satisfy the creditors of Citigroup or any of its other subsidiaries. The Company administers one conduit that originates loans to third-party borrowers and those obligations are fully guaranteed primarily by AAA-rated government agencies that support export and development financing programs. The economic performance of this government-guaranteed loan conduit is most significantly impacted by the performance of its underlying assets. The guarantors must approve each loan held by the entity and the guarantors have the ability (through establishment of the servicing terms to direct default mitigation and to purchase defaulted loans) to manage the conduit’s loans that become delinquent to improve the economic performance of the conduit. Because the Company does not have the power to direct the activities of this government-guaranteed loan conduit that most significantly impact the economic performance of the entity, it was concluded that the Company should not consolidate the entity. The total notional exposure under the program-wide liquidity agreement for the Company’s unconsolidated administered conduit as of December 31, 2012 is $0.6 billion. The program-wide liquidity agreement, along with each asset APA, is considered in the Company’s maximum exposure to loss to the unconsolidated administered conduit. As of December 31, 2012, this unconsolidated government-guaranteed loan conduit held assets and funding commitments of approximately $7.6 billion.
Third-Party Commercial Paper Conduits The Company also provides liquidity facilities to single- and multi-seller conduits sponsored by third parties. These conduits are independently owned and managed and invest in a variety of asset classes, depending on the nature of the conduit. The facilities provided by the Company typically represent a small portion of the total liquidity facilities obtained by each conduit, and are collateralized by the assets of each conduit. The Company is not the party that has the power to direct the activities of these conduits that most significantly impact their economic performance and thus does not consolidate them. As of December 31, 2012, the Company had no involvement in third-party commercial paper conduits. Collateralized Debt and Loan Obligations A securitized collateralized debt obligation (CDO) is an SPE that purchases a pool of assets consisting of asset-backed securities and synthetic exposures through derivatives on asset-backed securities and issues multiple tranches of equity and notes to investors. A cash CDO, or arbitrage CDO, is a CDO designed to take advantage of the difference between the yield on a portfolio of selected assets, typically residential mortgage-backed securities, and the cost of funding the CDO through the sale of notes to investors. “Cash flow” CDOs are entities in which the CDO passes on cash flows from a pool of assets, while “market value” CDOs pay to investors the market value of the pool of assets owned by the CDO at maturity. In these transactions, all of the equity and notes issued by the CDO are funded, as the cash is needed to purchase the debt securities. A synthetic CDO is similar to a cash CDO, except that the CDO obtains exposure to all or a portion of the referenced assets synthetically through derivative instruments, such as credit default swaps. Because the CDO does not need to raise cash sufficient to purchase the entire referenced portfolio, a substantial portion of the senior tranches of risk is typically passed on to CDO investors in the form of unfunded liabilities or derivative instruments. The CDO writes credit protection on select referenced debt securities to the Company or third parties and the risk is then passed on to the CDO investors in the form of funded notes or purchased credit protection through derivative instruments. Any cash raised from investors is invested in a portfolio of collateral securities or investment contracts. The collateral is then used to support the obligations of the CDO on the credit default swaps written to counterparties.
103
A securitized collateralized loan obligation (CLO) is substantially similar to the CDO transactions described above, except that the assets owned by the SPE (either cash instruments or synthetic exposures through derivative instruments) are corporate loans and to a lesser extent corporate bonds, rather than asset-backed debt securities. A third-party asset manager is typically retained by the CDO/CLO to select the pool of assets and manage those assets over the term of the SPE. The Company is the manager for a limited number of CLO transactions. The Company earns fees for warehousing assets prior to the creation of a “cash flow” or “market value” CDO/CLO, structuring CDOs/CLOs and placing debt securities with investors. In addition, the Company has retained interests in many of the CDOs/CLOs it has structured and makes a market in the issued notes. The Company’s continuing involvement in synthetic CDOs/CLOs generally includes purchasing credit protection through credit default swaps with the CDO/CLO, owning a portion of the capital structure of the CDO/CLO in the form of both unfunded derivative positions (primarily super-senior exposures discussed below) and funded notes, entering into interest-rate swap and total-return swap transactions with the CDO/CLO, lending to the CDO/CLO, and making a market in the funded notes. Where a CDO/CLO entity issues preferred shares (or subordinated notes that are the equivalent form), the preferred shares generally represent an insufficient amount of equity (less than 10%) and create the presumption that preferred shares are insufficient to finance the entity’s activities without subordinated financial support. In addition, although the preferred shareholders generally have full exposure to expected losses on the collateral and uncapped potential to receive expected residual returns, they generally do not have the ability to make decisions about the entity that have a significant effect on the entity’s financial results because of their limited role in making day-to-day decisions and their limited ability to remove the asset manager. Because one or both of the above conditions will generally be met, the Company has concluded that, even where a CDO/CLO entity issued preferred shares, the entity should be classified as a VIE. In general, the asset manager, through its ability to purchase and sell assets or—where the reinvestment period of a CDO/CLO has expired—the ability to sell assets, will have the power to direct the activities of the entity that most significantly impact the economic performance of the CDO/CLO. However, where a CDO/CLO has experienced an event of default or an optional redemption period has gone into effect, the activities of the asset manager may be curtailed and/or certain additional rights will generally be provided to the investors in a CDO/CLO entity, including the right to direct the liquidation of the CDO/CLO entity.
The Company has retained significant portions of the “super-senior” positions issued by certain CDOs. These positions are referred to as “super-senior” because they represent the most senior positions in the CDO and, at the time of structuring, were senior to tranches rated AAA by independent rating agencies. The Company does not generally have the power to direct the activities of the entity that most significantly impact the economic performance of the CDOs/CLOs as this power is generally held by a third-party asset manager of the CDO/CLO. As such, those CDOs/CLOs are not consolidated. The Company may consolidate the CDO/CLO when: (i) the Company is the asset manager and no other single investor has the unilateral ability to remove the Company or unilaterally cause the liquidation of the CDO/CLO, or the Company is not the asset manager but has a unilateral right to remove the third-party asset manager or unilaterally liquidate the CDO/CLO and receive the underlying assets, and (ii) the Company has economic exposure to the entity that could be potentially significant to the entity. The Company continues to monitor its involvement in unconsolidated CDOs/CLOs to assess future consolidation risk. For example, if the Company were to acquire additional interests in these entities and obtain the right, due to an event of default trigger being met, to unilaterally liquidate or direct the activities of a CDO/CLO, the Company may be required to consolidate the asset entity. For cash CDOs/CLOs, the net result of such consolidation would be to gross up the Company’s balance sheet by the current fair value of the securities held by third parties and assets held by the CDO/CLO, which amounts are not considered material. For synthetic CDOs/CLOs, the net result of such consolidation may reduce the Company’s balance sheet, because intercompany derivative receivables and payables would be eliminated in consolidation, and other assets held by the CDO/CLO and the securities held by third parties would be recognized at their current fair values. Key Assumptions and Retained Interests—Citi Holdings The key assumptions, used for the securitization of CDOs and CLOs during the year ended December 31, 2012, in measuring the fair value of retained interests were as follows: CDOs CLOsDiscount rate 46.9% to 51.6% 1.9% to 2.1% The effect of an adverse change of 10% and 20% in the discount rates used to determine the fair value of retained interests at December 31, 2012 is set forth in the table below: In millions of dollars CDOs CLOsCarrying value of retained interests $ 16 $428Discount rates Adverse change of 10% $ (2) $ (2) Adverse change of 20% (3) (4)
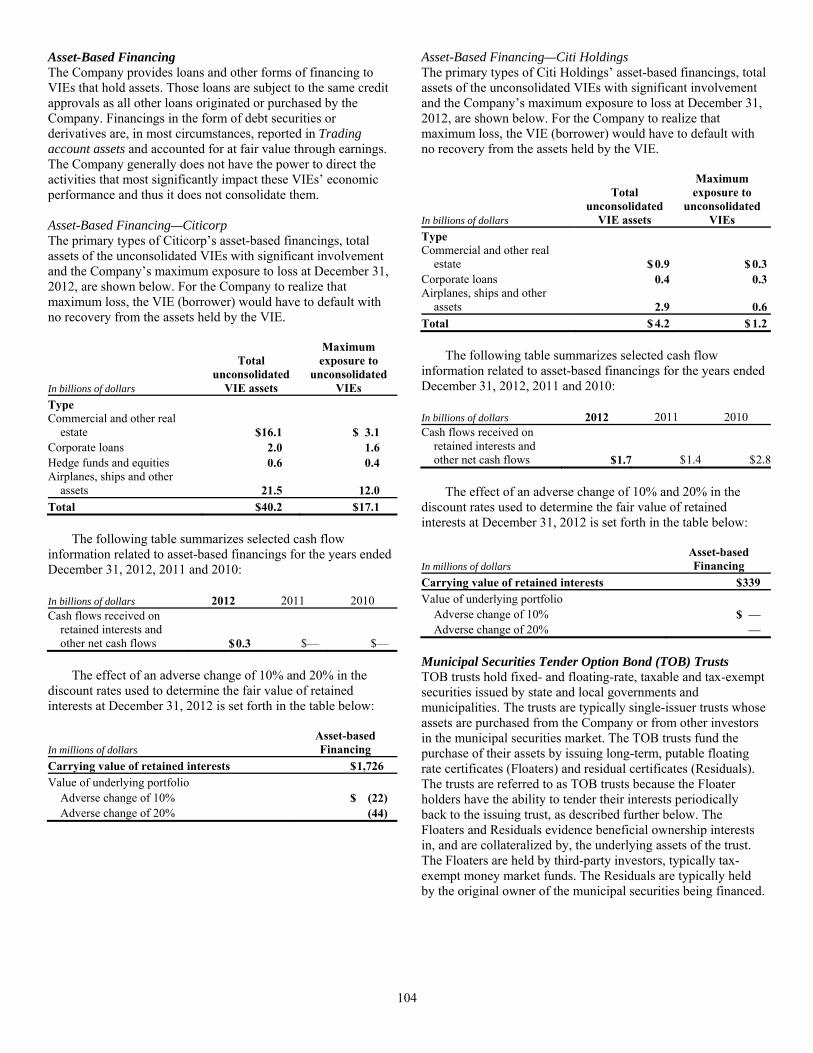
104
Asset-Based Financing The Company provides loans and other forms of financing to VIEs that hold assets. Those loans are subject to the same credit approvals as all other loans originated or purchased by the Company. Financings in the form of debt securities or derivatives are, in most circumstances, reported in Trading account assets and accounted for at fair value through earnings. The Company generally does not have the power to direct the activities that most significantly impact these VIEs’ economic performance and thus it does not consolidate them. Asset-Based Financing—Citicorp The primary types of Citicorp’s asset-based financings, total assets of the unconsolidated VIEs with significant involvement and the Company’s maximum exposure to loss at December 31, 2012, are shown below. For the Company to realize that maximum loss, the VIE (borrower) would have to default with no recovery from the assets held by the VIE.
In billions of dollars
Total unconsolidated
VIE assets
Maximum exposure to
unconsolidated VIEs
Type Commercial and other real
estate $ 16.1 $ 3.1Corporate loans 2.0 1.6Hedge funds and equities 0.6 0.4Airplanes, ships and other
assets 21.5 12.0Total $ 40.2 $ 17.1 The following table summarizes selected cash flow information related to asset-based financings for the years ended December 31, 2012, 2011 and 2010: In billions of dollars 2012 2011 2010 Cash flows received on
retained interests and other net cash flows $ 0.3 $— $—
The effect of an adverse change of 10% and 20% in the discount rates used to determine the fair value of retained interests at December 31, 2012 is set forth in the table below:
In millions of dollars Asset-based Financing
Carrying value of retained interests $ 1,726Value of underlying portfolio Adverse change of 10% $ (22) Adverse change of 20% (44)
Asset-Based Financing—Citi Holdings The primary types of Citi Holdings’ asset-based financings, total assets of the unconsolidated VIEs with significant involvement and the Company’s maximum exposure to loss at December 31, 2012, are shown below. For the Company to realize that maximum loss, the VIE (borrower) would have to default with no recovery from the assets held by the VIE.
In billions of dollars
Total unconsolidated
VIE assets
Maximum exposure to
unconsolidated VIEs
Type Commercial and other real
estate $ 0.9 $ 0.3Corporate loans 0.4 0.3Airplanes, ships and other
assets 2.9 0.6Total $ 4.2 $ 1.2 The following table summarizes selected cash flow information related to asset-based financings for the years ended December 31, 2012, 2011 and 2010: In billions of dollars 2012 2011 2010 Cash flows received on
retained interests and other net cash flows $ 1.7 $ 1.4 $ 2.8
The effect of an adverse change of 10% and 20% in the discount rates used to determine the fair value of retained interests at December 31, 2012 is set forth in the table below:
In millions of dollars Asset-based Financing
Carrying value of retained interests $ 339Value of underlying portfolio Adverse change of 10% $ — Adverse change of 20% — Municipal Securities Tender Option Bond (TOB) Trusts TOB trusts hold fixed- and floating-rate, taxable and tax-exempt securities issued by state and local governments and municipalities. The trusts are typically single-issuer trusts whose assets are purchased from the Company or from other investors in the municipal securities market. The TOB trusts fund the purchase of their assets by issuing long-term, putable floating rate certificates (Floaters) and residual certificates (Residuals). The trusts are referred to as TOB trusts because the Floater holders have the ability to tender their interests periodically back to the issuing trust, as described further below. The Floaters and Residuals evidence beneficial ownership interests in, and are collateralized by, the underlying assets of the trust. The Floaters are held by third-party investors, typically tax-exempt money market funds. The Residuals are typically held by the original owner of the municipal securities being financed.
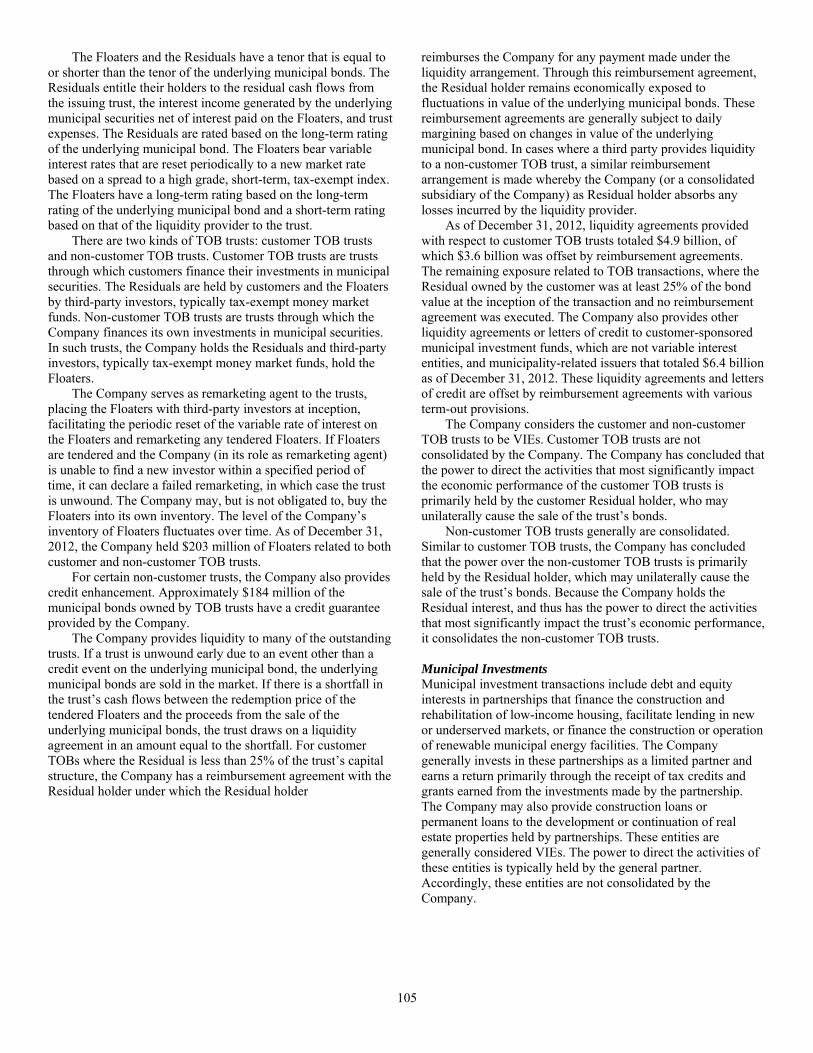
105
The Floaters and the Residuals have a tenor that is equal to or shorter than the tenor of the underlying municipal bonds. The Residuals entitle their holders to the residual cash flows from the issuing trust, the interest income generated by the underlying municipal securities net of interest paid on the Floaters, and trust expenses. The Residuals are rated based on the long-term rating of the underlying municipal bond. The Floaters bear variable interest rates that are reset periodically to a new market rate based on a spread to a high grade, short-term, tax-exempt index. The Floaters have a long-term rating based on the long-term rating of the underlying municipal bond and a short-term rating based on that of the liquidity provider to the trust. There are two kinds of TOB trusts: customer TOB trusts and non-customer TOB trusts. Customer TOB trusts are trusts through which customers finance their investments in municipal securities. The Residuals are held by customers and the Floaters by third-party investors, typically tax-exempt money market funds. Non-customer TOB trusts are trusts through which the Company finances its own investments in municipal securities. In such trusts, the Company holds the Residuals and third-party investors, typically tax-exempt money market funds, hold the Floaters. The Company serves as remarketing agent to the trusts, placing the Floaters with third-party investors at inception, facilitating the periodic reset of the variable rate of interest on the Floaters and remarketing any tendered Floaters. If Floaters are tendered and the Company (in its role as remarketing agent) is unable to find a new investor within a specified period of time, it can declare a failed remarketing, in which case the trust is unwound. The Company may, but is not obligated to, buy the Floaters into its own inventory. The level of the Company’s inventory of Floaters fluctuates over time. As of December 31, 2012, the Company held $203 million of Floaters related to both customer and non-customer TOB trusts. For certain non-customer trusts, the Company also provides credit enhancement. Approximately $184 million of the municipal bonds owned by TOB trusts have a credit guarantee provided by the Company. The Company provides liquidity to many of the outstanding trusts. If a trust is unwound early due to an event other than a credit event on the underlying municipal bond, the underlying municipal bonds are sold in the market. If there is a shortfall in the trust’s cash flows between the redemption price of the tendered Floaters and the proceeds from the sale of the underlying municipal bonds, the trust draws on a liquidity agreement in an amount equal to the shortfall. For customer TOBs where the Residual is less than 25% of the trust’s capital structure, the Company has a reimbursement agreement with the Residual holder under which the Residual holder
reimburses the Company for any payment made under the liquidity arrangement. Through this reimbursement agreement, the Residual holder remains economically exposed to fluctuations in value of the underlying municipal bonds. These reimbursement agreements are generally subject to daily margining based on changes in value of the underlying municipal bond. In cases where a third party provides liquidity to a non-customer TOB trust, a similar reimbursement arrangement is made whereby the Company (or a consolidated subsidiary of the Company) as Residual holder absorbs any losses incurred by the liquidity provider. As of December 31, 2012, liquidity agreements provided with respect to customer TOB trusts totaled $4.9 billion, of which $3.6 billion was offset by reimbursement agreements. The remaining exposure related to TOB transactions, where the Residual owned by the customer was at least 25% of the bond value at the inception of the transaction and no reimbursement agreement was executed. The Company also provides other liquidity agreements or letters of credit to customer-sponsored municipal investment funds, which are not variable interest entities, and municipality-related issuers that totaled $6.4 billion as of December 31, 2012. These liquidity agreements and letters of credit are offset by reimbursement agreements with various term-out provisions. The Company considers the customer and non-customer TOB trusts to be VIEs. Customer TOB trusts are not consolidated by the Company. The Company has concluded that the power to direct the activities that most significantly impact the economic performance of the customer TOB trusts is primarily held by the customer Residual holder, who may unilaterally cause the sale of the trust’s bonds. Non-customer TOB trusts generally are consolidated. Similar to customer TOB trusts, the Company has concluded that the power over the non-customer TOB trusts is primarily held by the Residual holder, which may unilaterally cause the sale of the trust’s bonds. Because the Company holds the Residual interest, and thus has the power to direct the activities that most significantly impact the trust’s economic performance, it consolidates the non-customer TOB trusts. Municipal Investments Municipal investment transactions include debt and equity interests in partnerships that finance the construction and rehabilitation of low-income housing, facilitate lending in new or underserved markets, or finance the construction or operation of renewable municipal energy facilities. The Company generally invests in these partnerships as a limited partner and earns a return primarily through the receipt of tax credits and grants earned from the investments made by the partnership. The Company may also provide construction loans or permanent loans to the development or continuation of real estate properties held by partnerships. These entities are generally considered VIEs. The power to direct the activities of these entities is typically held by the general partner. Accordingly, these entities are not consolidated by the Company.
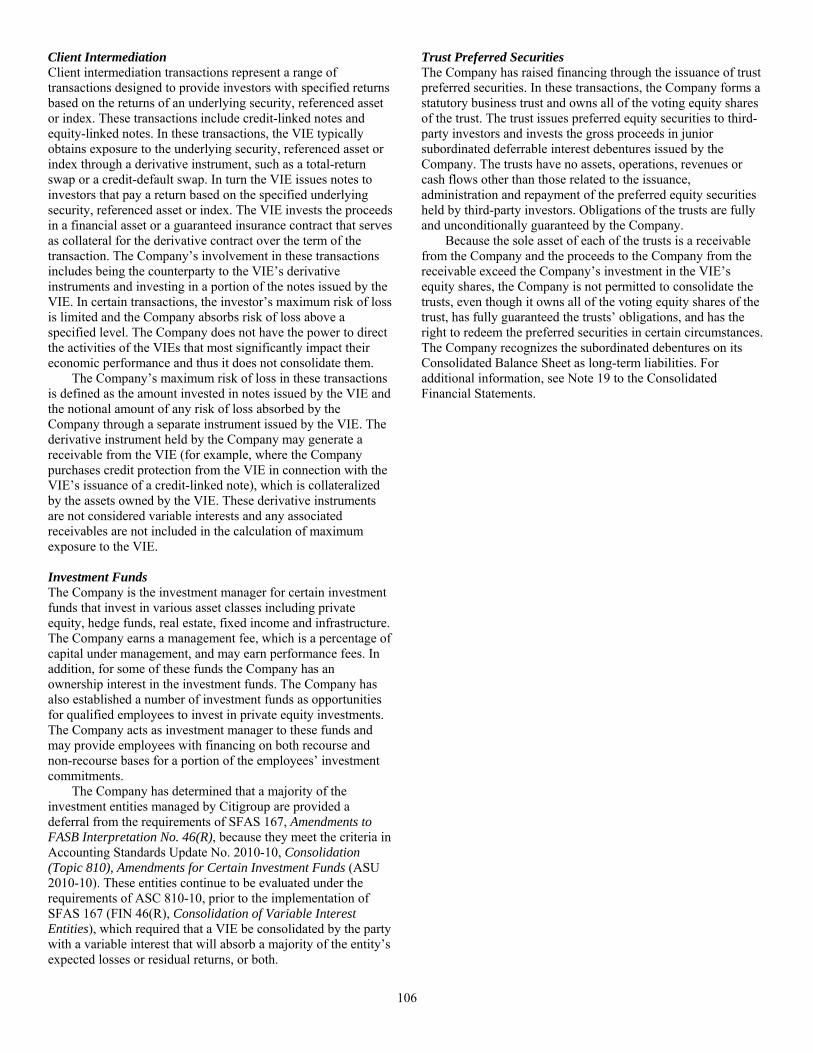
106
Client Intermediation Client intermediation transactions represent a range of transactions designed to provide investors with specified returns based on the returns of an underlying security, referenced asset or index. These transactions include credit-linked notes and equity-linked notes. In these transactions, the VIE typically obtains exposure to the underlying security, referenced asset or index through a derivative instrument, such as a total-return swap or a credit-default swap. In turn the VIE issues notes to investors that pay a return based on the specified underlying security, referenced asset or index. The VIE invests the proceeds in a financial asset or a guaranteed insurance contract that serves as collateral for the derivative contract over the term of the transaction. The Company’s involvement in these transactions includes being the counterparty to the VIE’s derivative instruments and investing in a portion of the notes issued by the VIE. In certain transactions, the investor’s maximum risk of loss is limited and the Company absorbs risk of loss above a specified level. The Company does not have the power to direct the activities of the VIEs that most significantly impact their economic performance and thus it does not consolidate them. The Company’s maximum risk of loss in these transactions is defined as the amount invested in notes issued by the VIE and the notional amount of any risk of loss absorbed by the Company through a separate instrument issued by the VIE. The derivative instrument held by the Company may generate a receivable from the VIE (for example, where the Company purchases credit protection from the VIE in connection with the VIE’s issuance of a credit-linked note), which is collateralized by the assets owned by the VIE. These derivative instruments are not considered variable interests and any associated receivables are not included in the calculation of maximum exposure to the VIE. Investment Funds The Company is the investment manager for certain investment funds that invest in various asset classes including private equity, hedge funds, real estate, fixed income and infrastructure. The Company earns a management fee, which is a percentage of capital under management, and may earn performance fees. In addition, for some of these funds the Company has an ownership interest in the investment funds. The Company has also established a number of investment funds as opportunities for qualified employees to invest in private equity investments. The Company acts as investment manager to these funds and may provide employees with financing on both recourse and non-recourse bases for a portion of the employees’ investment commitments. The Company has determined that a majority of the investment entities managed by Citigroup are provided a deferral from the requirements of SFAS 167, Amendments to FASB Interpretation No. 46(R), because they meet the criteria in Accounting Standards Update No. 2010-10, Consolidation (Topic 810), Amendments for Certain Investment Funds (ASU 2010-10). These entities continue to be evaluated under the requirements of ASC 810-10, prior to the implementation of SFAS 167 (FIN 46(R), Consolidation of Variable Interest Entities), which required that a VIE be consolidated by the party with a variable interest that will absorb a majority of the entity’s expected losses or residual returns, or both.
Trust Preferred Securities The Company has raised financing through the issuance of trust preferred securities. In these transactions, the Company forms a statutory business trust and owns all of the voting equity shares of the trust. The trust issues preferred equity securities to third-party investors and invests the gross proceeds in junior subordinated deferrable interest debentures issued by the Company. The trusts have no assets, operations, revenues or cash flows other than those related to the issuance, administration and repayment of the preferred equity securities held by third-party investors. Obligations of the trusts are fully and unconditionally guaranteed by the Company. Because the sole asset of each of the trusts is a receivable from the Company and the proceeds to the Company from the receivable exceed the Company’s investment in the VIE’s equity shares, the Company is not permitted to consolidate the trusts, even though it owns all of the voting equity shares of the trust, has fully guaranteed the trusts’ obligations, and has the right to redeem the preferred securities in certain circumstances. The Company recognizes the subordinated debentures on its Consolidated Balance Sheet as long-term liabilities. For additional information, see Note 19 to the Consolidated Financial Statements.

107
23. DERIVATIVES ACTIVITIES In the ordinary course of business, Citigroup enters into various types of derivative transactions. These derivative transactions include:
• Futures and forward contracts, which are commitments to buy or sell at a future date a financial instrument, commodity or currency at a contracted price and may be settled in cash or through delivery.
• Swap contracts, which are commitments to settle in cash at a future date or dates that may range from a few days to a number of years, based on differentials between specified financial indices, as applied to a notional principal amount.
• Option contracts, which give the purchaser, for a premium, the right, but not the obligation, to buy or sell within a specified time a financial instrument, commodity or currency at a contracted price that may also be settled in cash, based on differentials between specified indices or prices.
Citigroup enters into these derivative contracts relating to interest rate, foreign currency, commodity and other market/credit risks for the following reasons:
• Trading Purposes—Customer Needs: Citigroup offers its customers derivatives in connection with their risk-management actions to transfer, modify or reduce their interest rate, foreign exchange and other market/credit risks or for their own trading purposes. As part of this process, Citigroup considers the customers’ suitability for the risk involved and the business purpose for the transaction. Citigroup also manages its derivative risk positions through offsetting trade activities, controls focused on price verification, and daily reporting of positions to senior managers.
• Trading Purposes—Citigroup trades derivatives as an active market maker. Trading limits and price verification controls are key aspects of this activity.
• Hedging—Citigroup uses derivatives in connection with its risk-management activities to hedge certain risks or reposition the risk profile of the Company. For example, Citigroup issues fixed-rate long-term debt and then enters into a receive-fixed, pay-variable-rate interest rate swap with the same tenor and notional amount to convert the interest payments to a net variable-rate basis. This strategy is the most common form of an interest rate hedge, as it minimizes interest cost in certain yield curve environments. Derivatives are also used to manage risks inherent in specific groups of on-balance-sheet assets and liabilities, including AFS securities and borrowings, as well as other interest-sensitive assets and liabilities. In addition, foreign-exchange contracts are used to hedge non-U.S.-dollar-denominated debt, foreign-currency-denominated AFS securities and net investment exposures.
Derivatives may expose Citigroup to market, credit or liquidity risks in excess of the amounts recorded on the Consolidated Balance Sheet. Market risk on a derivative product is the exposure created by potential fluctuations in interest rates, foreign-exchange rates and other factors and is a function of the type of product, the volume of transactions, the tenor and terms of the agreement and the underlying volatility. Credit risk is the exposure to loss in the event of nonperformance by the other party to the transaction where the value of any collateral held is not adequate to cover such losses. The recognition in earnings of unrealized gains on these transactions is subject to management’s assessment as to collectability. Liquidity risk is the potential exposure that arises when the size of the derivative position may not be able to be rapidly adjusted at a reasonable cost in periods of high volatility and financial stress. Information pertaining to the volume of derivative activity is provided in the tables below. The notional amounts, for both long and short derivative positions, of Citigroup’s derivative instruments as of December 31, 2012 and December 31, 2011 are presented in the table below.
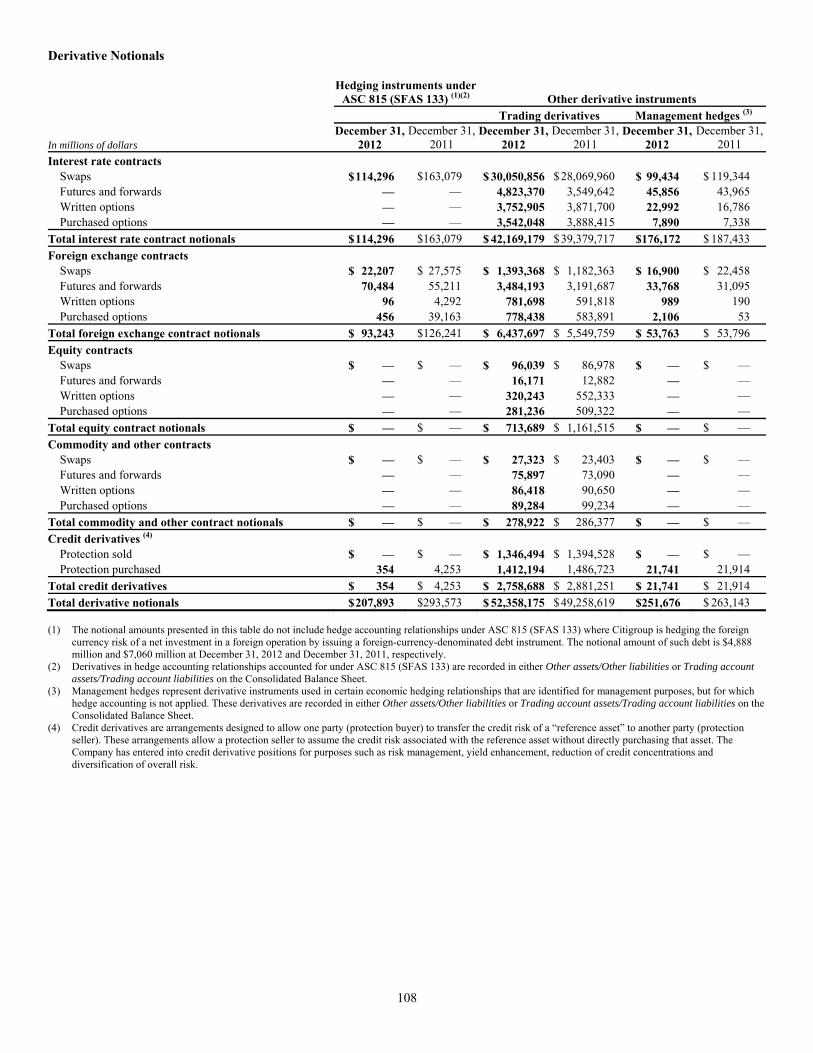
108
Derivative Notionals
Hedging instruments under
ASC 815 (SFAS 133) (1)(2) Other derivative instruments Trading derivatives Management hedges (3)
In millions of dollars December 31,
2012December 31,
2011 December 31,
2012December 31,
2011 December 31,
2012December 31,
2011 Interest rate contracts
Swaps $ 114,296 $163,079 $ 30,050,856 $ 28,069,960 $ 99,434 $ 119,344 Futures and forwards — — 4,823,370 3,549,642 45,856 43,965 Written options — — 3,752,905 3,871,700 22,992 16,786 Purchased options — — 3,542,048 3,888,415 7,890 7,338
Total interest rate contract notionals $ 114,296 $163,079 $ 42,169,179 $ 39,379,717 $176,172 $ 187,433 Foreign exchange contracts
Swaps $ 22,207 $ 27,575 $ 1,393,368 $ 1,182,363 $ 16,900 $ 22,458 Futures and forwards 70,484 55,211 3,484,193 3,191,687 33,768 31,095 Written options 96 4,292 781,698 591,818 989 190 Purchased options 456 39,163 778,438 583,891 2,106 53
Total foreign exchange contract notionals $ 93,243 $126,241 $ 6,437,697 $ 5,549,759 $ 53,763 $ 53,796 Equity contracts
Swaps $ — $ — $ 96,039 $ 86,978 $ — $ — Futures and forwards — — 16,171 12,882 — — Written options — — 320,243 552,333 — — Purchased options — — 281,236 509,322 — —
Total equity contract notionals $ — $ — $ 713,689 $ 1,161,515 $ — $ — Commodity and other contracts
Swaps $ — $ — $ 27,323 $ 23,403 $ — $ — Futures and forwards — — 75,897 73,090 — — Written options — — 86,418 90,650 — — Purchased options — — 89,284 99,234 — —
Total commodity and other contract notionals $ — $ — $ 278,922 $ 286,377 $ — $ — Credit derivatives (4)
Protection sold $ — $ — $ 1,346,494 $ 1,394,528 $ — $ — Protection purchased 354 4,253 1,412,194 1,486,723 21,741 21,914
Total credit derivatives $ 354 $ 4,253 $ 2,758,688 $ 2,881,251 $ 21,741 $ 21,914 Total derivative notionals $ 207,893 $293,573 $ 52,358,175 $ 49,258,619 $251,676 $ 263,143 (1) The notional amounts presented in this table do not include hedge accounting relationships under ASC 815 (SFAS 133) where Citigroup is hedging the foreign
currency risk of a net investment in a foreign operation by issuing a foreign-currency-denominated debt instrument. The notional amount of such debt is $4,888 million and $7,060 million at December 31, 2012 and December 31, 2011, respectively.
(2) Derivatives in hedge accounting relationships accounted for under ASC 815 (SFAS 133) are recorded in either Other assets/Other liabilities or Trading account assets/Trading account liabilities on the Consolidated Balance Sheet.
(3) Management hedges represent derivative instruments used in certain economic hedging relationships that are identified for management purposes, but for which hedge accounting is not applied. These derivatives are recorded in either Other assets/Other liabilities or Trading account assets/Trading account liabilities on the Consolidated Balance Sheet.
(4) Credit derivatives are arrangements designed to allow one party (protection buyer) to transfer the credit risk of a “reference asset” to another party (protection seller). These arrangements allow a protection seller to assume the credit risk associated with the reference asset without directly purchasing that asset. The Company has entered into credit derivative positions for purposes such as risk management, yield enhancement, reduction of credit concentrations and diversification of overall risk.
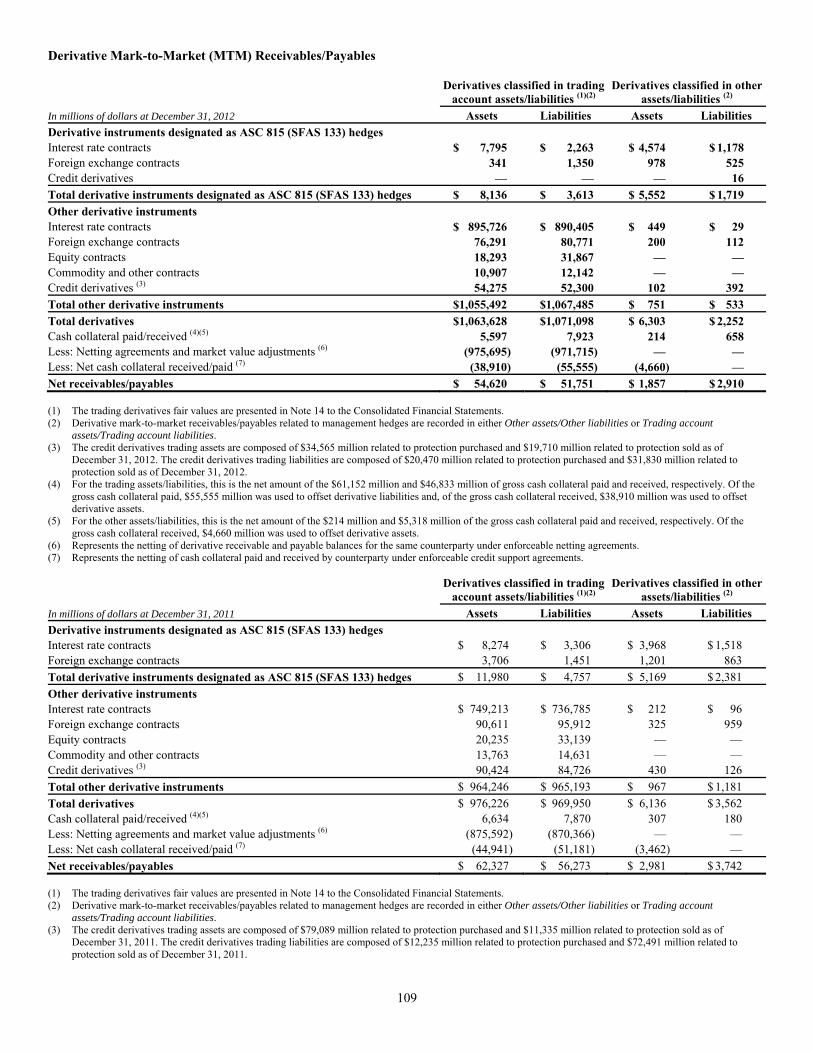
109
Derivative Mark-to-Market (MTM) Receivables/Payables
Derivatives classified in trading
account assets/liabilities (1)(2) Derivatives classified in other
assets/liabilities (2)
In millions of dollars at December 31, 2012 Assets Liabilities Assets LiabilitiesDerivative instruments designated as ASC 815 (SFAS 133) hedges Interest rate contracts $ 7,795 $ 2,263 $ 4,574 $ 1,178Foreign exchange contracts 341 1,350 978 525Credit derivatives — — — 16Total derivative instruments designated as ASC 815 (SFAS 133) hedges $ 8,136 $ 3,613 $ 5,552 $ 1,719Other derivative instruments Interest rate contracts $ 895,726 $ 890,405 $ 449 $ 29Foreign exchange contracts 76,291 80,771 200 112Equity contracts 18,293 31,867 — —Commodity and other contracts 10,907 12,142 — —Credit derivatives (3) 54,275 52,300 102 392Total other derivative instruments $1,055,492 $1,067,485 $ 751 $ 533Total derivatives $1,063,628 $1,071,098 $ 6,303 $ 2,252Cash collateral paid/received (4)(5) 5,597 7,923 214 658Less: Netting agreements and market value adjustments (6) (975,695) (971,715) — —Less: Net cash collateral received/paid (7) (38,910) (55,555) (4,660) —Net receivables/payables $ 54,620 $ 51,751 $ 1,857 $ 2,910 (1) The trading derivatives fair values are presented in Note 14 to the Consolidated Financial Statements. (2) Derivative mark-to-market receivables/payables related to management hedges are recorded in either Other assets/Other liabilities or Trading account
assets/Trading account liabilities. (3) The credit derivatives trading assets are composed of $34,565 million related to protection purchased and $19,710 million related to protection sold as of
December 31, 2012. The credit derivatives trading liabilities are composed of $20,470 million related to protection purchased and $31,830 million related to protection sold as of December 31, 2012.
(4) For the trading assets/liabilities, this is the net amount of the $61,152 million and $46,833 million of gross cash collateral paid and received, respectively. Of the gross cash collateral paid, $55,555 million was used to offset derivative liabilities and, of the gross cash collateral received, $38,910 million was used to offset derivative assets.
(5) For the other assets/liabilities, this is the net amount of the $214 million and $5,318 million of the gross cash collateral paid and received, respectively. Of the gross cash collateral received, $4,660 million was used to offset derivative assets.
(6) Represents the netting of derivative receivable and payable balances for the same counterparty under enforceable netting agreements. (7) Represents the netting of cash collateral paid and received by counterparty under enforceable credit support agreements.
Derivatives classified in trading
account assets/liabilities (1)(2) Derivatives classified in other
assets/liabilities (2)
In millions of dollars at December 31, 2011 Assets Liabilities Assets LiabilitiesDerivative instruments designated as ASC 815 (SFAS 133) hedges Interest rate contracts $ 8,274 $ 3,306 $ 3,968 $ 1,518 Foreign exchange contracts 3,706 1,451 1,201 863 Total derivative instruments designated as ASC 815 (SFAS 133) hedges $ 11,980 $ 4,757 $ 5,169 $ 2,381 Other derivative instruments Interest rate contracts $ 749,213 $ 736,785 $ 212 $ 96 Foreign exchange contracts 90,611 95,912 325 959 Equity contracts 20,235 33,139 — — Commodity and other contracts 13,763 14,631 — — Credit derivatives (3) 90,424 84,726 430 126 Total other derivative instruments $ 964,246 $ 965,193 $ 967 $ 1,181 Total derivatives $ 976,226 $ 969,950 $ 6,136 $ 3,562 Cash collateral paid/received (4)(5) 6,634 7,870 307 180 Less: Netting agreements and market value adjustments (6) (875,592) (870,366) — — Less: Net cash collateral received/paid (7) (44,941) (51,181) (3,462) — Net receivables/payables $ 62,327 $ 56,273 $ 2,981 $ 3,742 (1) The trading derivatives fair values are presented in Note 14 to the Consolidated Financial Statements. (2) Derivative mark-to-market receivables/payables related to management hedges are recorded in either Other assets/Other liabilities or Trading account
assets/Trading account liabilities. (3) The credit derivatives trading assets are composed of $79,089 million related to protection purchased and $11,335 million related to protection sold as of
December 31, 2011. The credit derivatives trading liabilities are composed of $12,235 million related to protection purchased and $72,491 million related to protection sold as of December 31, 2011.

110
(4) For the trading assets/liabilities, this is the net amount of the $57,815 million and $52,811 million of gross cash collateral paid and received, respectively. Of the gross cash collateral paid, $51,181 million was used to offset derivative liabilities and, of the gross cash collateral received, $44,941 million was used to offset derivative assets.
(5) For the other assets/liabilities, this is the net amount of the $307 million and $3,642 million of the gross cash collateral paid and received, respectively. Of the gross cash collateral received, $3,462 million was used to offset derivative assets.
(6) Represents the netting of derivative receivable and payable balances for the same counterparty under enforceable netting agreements. (7) Represents the netting of cash collateral paid and received by counterparty under enforceable credit support agreements. All derivatives are reported on the Consolidated Balance Sheet at fair value. In addition, where applicable, all such contracts covered by master netting agreements are reported net. Gross positive fair values are netted with gross negative fair values by counterparty pursuant to a valid master netting agreement. In addition, payables and receivables in respect of cash collateral received from or paid to a given counterparty are included in this netting. However, non-cash collateral is not included. The amounts recognized in Principal transactions in the Consolidated Statement of Income for the years ended December 31, 2012, 2011 and 2010 related to derivatives not designated in a qualifying hedging relationship as well as the underlying non-derivative instruments are included in the table below. Citigroup presents this disclosure by business classification, showing derivative gains and losses related to its trading activities together with gains and losses related to non-derivative instruments within the same trading portfolios, as this represents the way these portfolios are risk managed. Year ended December 31,In millions of dollars 2012 2011 2010 Interest rate contracts $2,301 $ 5,136 $ 3,231 Foreign exchange 2,403 2,309 1,852 Equity contracts 158 3 995 Commodity and other 92 76 126 Credit derivatives (173) (290) 1,313 Total Citigroup (1) $4,781 $ 7,234 $ 7,517 (1) Also see Note 7 to the Consolidated Financial Statements. The amounts recognized in Other revenue in the Consolidated Statement of Income for the years ended December 31, 2012, 2011 and 2010 are shown below. The table below does not include the offsetting gains/losses on the hedged items, which amounts are also recorded in Other revenue.
Gains (losses) included in Other revenue
Year ended December 31,In millions of dollars 2012 2011 2010 Interest rate contracts $ (427) $ 1,192 $ (205) Foreign exchange contracts 182 224 (2,052) Credit derivatives (1,022) 115 (502) Total Citigroup (1) $ (1,267) $ 1,531 $(2,759) (1) Non-designated derivatives are derivative instruments not designated in
qualifying hedging relationships.
Accounting for Derivative Hedging Citigroup accounts for its hedging activities in accordance with ASC 815, Derivatives and Hedging (formerly SFAS 133). As a general rule, hedge accounting is permitted where the Company is exposed to a particular risk, such as interest-rate or foreign-exchange risk, that causes changes in the fair value of an asset or liability or variability in the expected future cash flows of an existing asset, liability or a forecasted transaction that may affect earnings. Derivative contracts hedging the risks associated with the changes in fair value are referred to as fair value hedges, while contracts hedging the risks affecting the expected future cash flows are called cash flow hedges. Hedges that utilize derivatives or debt instruments to manage the foreign exchange risk associated with equity investments in non-U.S.-dollar-functional-currency foreign subsidiaries (net investment in a foreign operation) are called net investment hedges. If certain hedging criteria specified in ASC 815 are met, including testing for hedge effectiveness, special hedge accounting may be applied. The hedge effectiveness assessment methodologies for similar hedges are performed in a similar manner and are used consistently throughout the hedging relationships. For fair value hedges, the changes in value of the hedging derivative, as well as the changes in value of the related hedged item due to the risk being hedged, are reflected in current earnings. For cash flow hedges and net investment hedges, the changes in value of the hedging derivative are reflected in Accumulated other comprehensive income (loss) in Citigroup’s stockholders’ equity, to the extent the hedge is effective. Hedge ineffectiveness, in either case, is reflected in current earnings.
111
For asset/liability management hedging, the fixed-rate long-term debt would be recorded at amortized cost under current U.S. GAAP. However, by electing to use ASC 815 (SFAS 133) fair value hedge accounting, the carrying value of the debt is adjusted for changes in the benchmark interest rate, with any such changes in value recorded in current earnings. The related interest-rate swap is also recorded on the balance sheet at fair value, with any changes in fair value reflected in earnings. Thus, any ineffectiveness resulting from the hedging relationship is recorded in current earnings. Alternatively, a management hedge, which does not meet the ASC 815 hedging criteria, would involve recording only the derivative at fair value on the balance sheet, with its associated changes in fair value recorded in earnings. The debt would continue to be carried at amortized cost and, therefore, current earnings would be impacted only by the interest rate shifts and other factors that cause the change in the swap’s value and may change the underlying yield of the debt. This type of hedge is undertaken when hedging requirements cannot be achieved or management decides not to apply ASC 815 hedge accounting. Another alternative for the Company is to elect to carry the debt at fair value under the fair value option. Once the irrevocable election is made upon issuance of the debt, the full change in fair value of the debt would be reported in earnings. The related interest rate swap, with changes in fair value, would also be reflected in earnings, and provides a natural offset to the debt’s fair value change. To the extent the two offsets are not exactly equal, the difference is reflected in current earnings. Key aspects of achieving ASC 815 hedge accounting are documentation of hedging strategy and hedge effectiveness at the hedge inception and substantiating hedge effectiveness on an ongoing basis. A derivative must be highly effective in accomplishing the hedge objective of offsetting either changes in the fair value or cash flows of the hedged item for the risk being hedged. Any ineffectiveness in the hedge relationship is recognized in current earnings. The assessment of effectiveness excludes changes in the value of the hedged item that are unrelated to the risks being hedged. Similarly, the assessment of effectiveness may exclude changes in the fair value of a derivative related to time value that, if excluded, are recognized in current earnings.
Fair Value Hedges Hedging of benchmark interest rate risk Citigroup hedges exposure to changes in the fair value of outstanding fixed-rate issued debt and certificates of deposit. Depending on the risk management objectives, these types of hedges are designated as either fair value hedges of only the benchmark interest rate risk or fair value hedges of both the benchmark interest rate and foreign exchange risk. The fixed cash flows from those financing transactions are converted to benchmark variable-rate cash flows by entering into, respectively, receive-fixed, pay-variable interest rate swaps or receive-fixed in non-functional currency, pay variable in functional currency swaps. These fair value hedge relationships use either regression or dollar-offset ratio analysis to determine whether the hedging relationships are highly effective at inception and on an ongoing basis. Citigroup also hedges exposure to changes in the fair value of fixed-rate assets, including available-for-sale debt securities and loans. When certain interest rates do not qualify as a benchmark interest rate, Citigroup designates the risk being hedged as the risk of changes in overall fair value of the hedged AFS securities. The hedging instruments used are receive-variable, pay-fixed interest rate swaps. These fair value hedging relationships use either regression or dollar-offset ratio analysis to determine whether the hedging relationships are highly effective at inception and on an ongoing basis. Hedging of foreign exchange risk Citigroup hedges the change in fair value attributable to foreign-exchange rate movements in available-for-sale securities that are denominated in currencies other than the functional currency of the entity holding the securities, which may be within or outside the U.S. The hedging instrument employed is a forward foreign-exchange contract. In this type of hedge, the change in fair value of the hedged available-for-sale security attributable to the portion of foreign exchange risk hedged is reported in earnings and not Accumulated other comprehensive income—a process that serves to offset substantially the change in fair value of the forward contract that is also reflected in earnings. Citigroup considers the premium associated with forward contracts (differential between spot and contractual forward rates) as the cost of hedging; this is excluded from the assessment of hedge effectiveness and reflected directly in earnings. The dollar-offset method is used to assess hedge effectiveness. Since that assessment is based on changes in fair value attributable to changes in spot rates on both the available-for-sale securities and the forward contracts for the portion of the relationship hedged, the amount of hedge ineffectiveness is not significant.
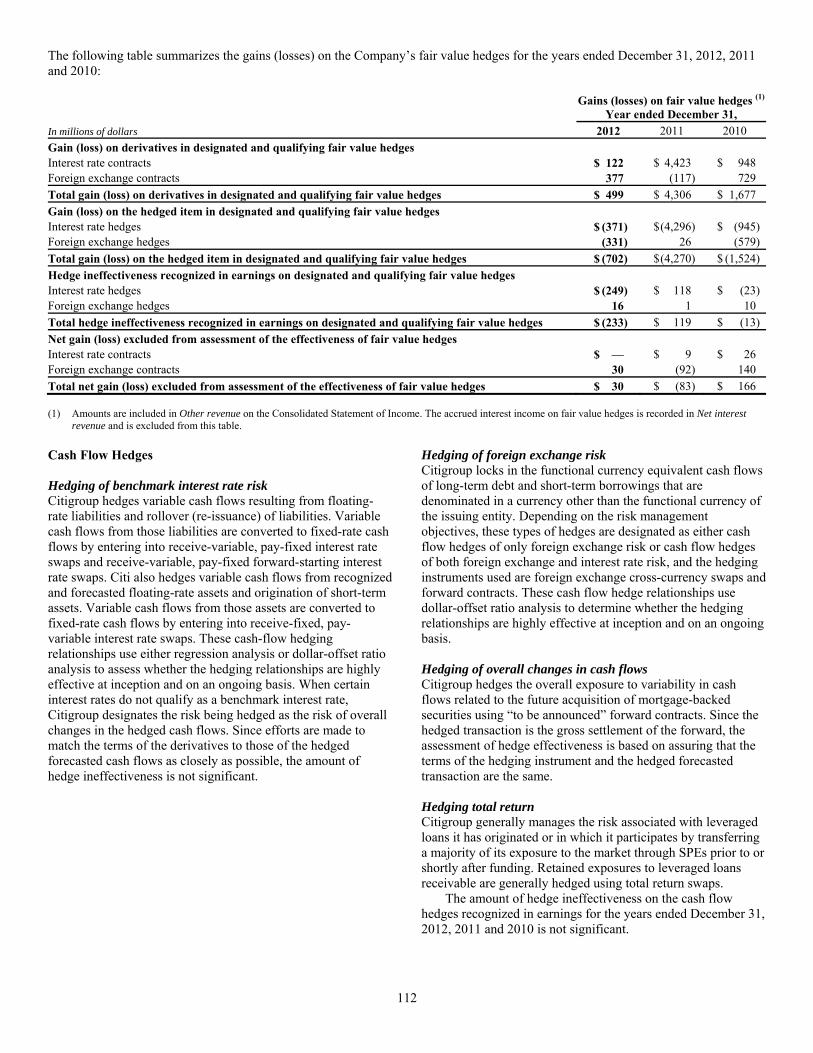
112
The following table summarizes the gains (losses) on the Company’s fair value hedges for the years ended December 31, 2012, 2011 and 2010:
Gains (losses) on fair value hedges (1)
Year ended December 31,In millions of dollars 2012 2011 2010 Gain (loss) on derivatives in designated and qualifying fair value hedges Interest rate contracts $ 122 $ 4,423 $ 948 Foreign exchange contracts 377 (117) 729 Total gain (loss) on derivatives in designated and qualifying fair value hedges $ 499 $ 4,306 $ 1,677 Gain (loss) on the hedged item in designated and qualifying fair value hedges Interest rate hedges $ (371) $ (4,296) $ (945) Foreign exchange hedges (331) 26 (579) Total gain (loss) on the hedged item in designated and qualifying fair value hedges $ (702) $ (4,270) $ (1,524) Hedge ineffectiveness recognized in earnings on designated and qualifying fair value hedges Interest rate hedges $ (249) $ 118 $ (23) Foreign exchange hedges 16 1 10 Total hedge ineffectiveness recognized in earnings on designated and qualifying fair value hedges $ (233) $ 119 $ (13) Net gain (loss) excluded from assessment of the effectiveness of fair value hedges Interest rate contracts $ — $ 9 $ 26 Foreign exchange contracts 30 (92) 140 Total net gain (loss) excluded from assessment of the effectiveness of fair value hedges $ 30 $ (83) $ 166 (1) Amounts are included in Other revenue on the Consolidated Statement of Income. The accrued interest income on fair value hedges is recorded in Net interest
revenue and is excluded from this table. Cash Flow Hedges Hedging of benchmark interest rate risk Citigroup hedges variable cash flows resulting from floating-rate liabilities and rollover (re-issuance) of liabilities. Variable cash flows from those liabilities are converted to fixed-rate cash flows by entering into receive-variable, pay-fixed interest rate swaps and receive-variable, pay-fixed forward-starting interest rate swaps. Citi also hedges variable cash flows from recognized and forecasted floating-rate assets and origination of short-term assets. Variable cash flows from those assets are converted to fixed-rate cash flows by entering into receive-fixed, pay-variable interest rate swaps. These cash-flow hedging relationships use either regression analysis or dollar-offset ratio analysis to assess whether the hedging relationships are highly effective at inception and on an ongoing basis. When certain interest rates do not qualify as a benchmark interest rate, Citigroup designates the risk being hedged as the risk of overall changes in the hedged cash flows. Since efforts are made to match the terms of the derivatives to those of the hedged forecasted cash flows as closely as possible, the amount of hedge ineffectiveness is not significant.
Hedging of foreign exchange risk Citigroup locks in the functional currency equivalent cash flows of long-term debt and short-term borrowings that are denominated in a currency other than the functional currency of the issuing entity. Depending on the risk management objectives, these types of hedges are designated as either cash flow hedges of only foreign exchange risk or cash flow hedges of both foreign exchange and interest rate risk, and the hedging instruments used are foreign exchange cross-currency swaps and forward contracts. These cash flow hedge relationships use dollar-offset ratio analysis to determine whether the hedging relationships are highly effective at inception and on an ongoing basis. Hedging of overall changes in cash flows Citigroup hedges the overall exposure to variability in cash flows related to the future acquisition of mortgage-backed securities using “to be announced” forward contracts. Since the hedged transaction is the gross settlement of the forward, the assessment of hedge effectiveness is based on assuring that the terms of the hedging instrument and the hedged forecasted transaction are the same. Hedging total return Citigroup generally manages the risk associated with leveraged loans it has originated or in which it participates by transferring a majority of its exposure to the market through SPEs prior to or shortly after funding. Retained exposures to leveraged loans receivable are generally hedged using total return swaps. The amount of hedge ineffectiveness on the cash flow hedges recognized in earnings for the years ended December 31, 2012, 2011 and 2010 is not significant.
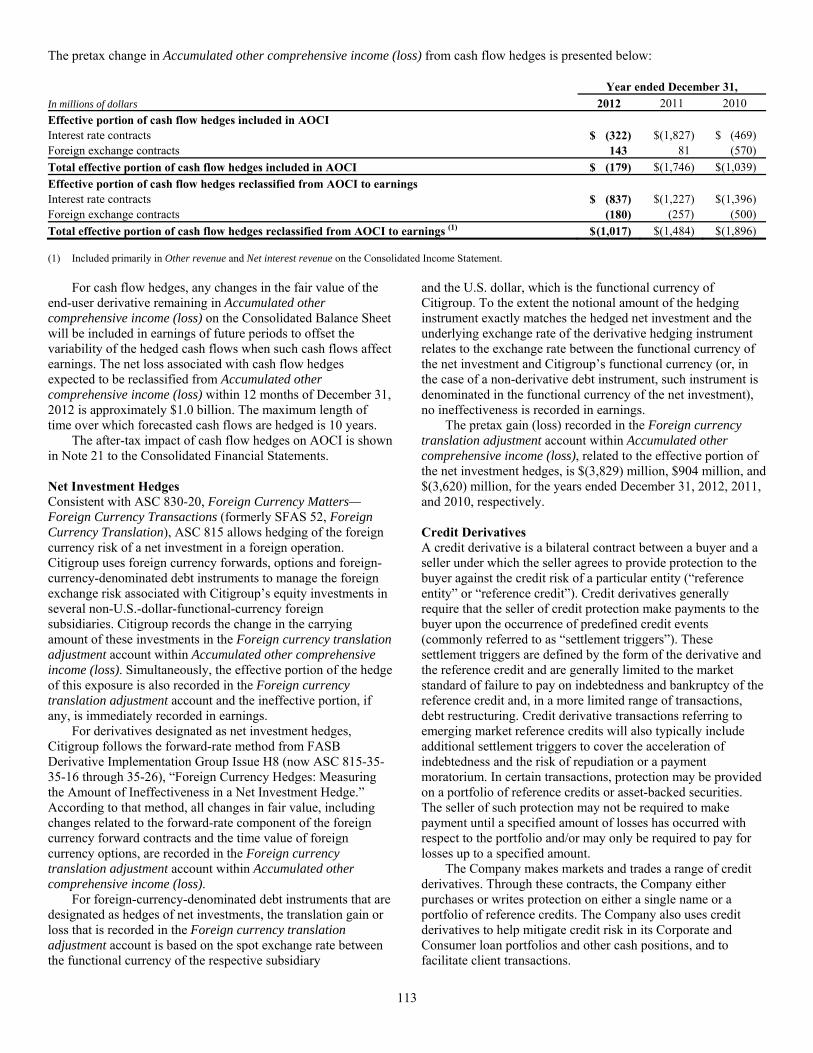
113
The pretax change in Accumulated other comprehensive income (loss) from cash flow hedges is presented below: Year ended December 31,In millions of dollars 2012 2011 2010 Effective portion of cash flow hedges included in AOCI Interest rate contracts $ (322) $(1,827) $ (469) Foreign exchange contracts 143 81 (570) Total effective portion of cash flow hedges included in AOCI $ (179) $(1,746) $ (1,039) Effective portion of cash flow hedges reclassified from AOCI to earnings Interest rate contracts $ (837) $(1,227) $ (1,396) Foreign exchange contracts (180) (257) (500) Total effective portion of cash flow hedges reclassified from AOCI to earnings (1) $ (1,017) $(1,484) $ (1,896) (1) Included primarily in Other revenue and Net interest revenue on the Consolidated Income Statement. For cash flow hedges, any changes in the fair value of the end-user derivative remaining in Accumulated other comprehensive income (loss) on the Consolidated Balance Sheet will be included in earnings of future periods to offset the variability of the hedged cash flows when such cash flows affect earnings. The net loss associated with cash flow hedges expected to be reclassified from Accumulated other comprehensive income (loss) within 12 months of December 31, 2012 is approximately $1.0 billion. The maximum length of time over which forecasted cash flows are hedged is 10 years. The after-tax impact of cash flow hedges on AOCI is shown in Note 21 to the Consolidated Financial Statements. Net Investment Hedges Consistent with ASC 830-20, Foreign Currency Matters—Foreign Currency Transactions (formerly SFAS 52, Foreign Currency Translation), ASC 815 allows hedging of the foreign currency risk of a net investment in a foreign operation. Citigroup uses foreign currency forwards, options and foreign-currency-denominated debt instruments to manage the foreign exchange risk associated with Citigroup’s equity investments in several non-U.S.-dollar-functional-currency foreign subsidiaries. Citigroup records the change in the carrying amount of these investments in the Foreign currency translation adjustment account within Accumulated other comprehensive income (loss). Simultaneously, the effective portion of the hedge of this exposure is also recorded in the Foreign currency translation adjustment account and the ineffective portion, if any, is immediately recorded in earnings. For derivatives designated as net investment hedges, Citigroup follows the forward-rate method from FASB Derivative Implementation Group Issue H8 (now ASC 815-35-35-16 through 35-26), “Foreign Currency Hedges: Measuring the Amount of Ineffectiveness in a Net Investment Hedge.” According to that method, all changes in fair value, including changes related to the forward-rate component of the foreign currency forward contracts and the time value of foreign currency options, are recorded in the Foreign currency translation adjustment account within Accumulated other comprehensive income (loss). For foreign-currency-denominated debt instruments that are designated as hedges of net investments, the translation gain or loss that is recorded in the Foreign currency translation adjustment account is based on the spot exchange rate between the functional currency of the respective subsidiary
and the U.S. dollar, which is the functional currency of Citigroup. To the extent the notional amount of the hedging instrument exactly matches the hedged net investment and the underlying exchange rate of the derivative hedging instrument relates to the exchange rate between the functional currency of the net investment and Citigroup’s functional currency (or, in the case of a non-derivative debt instrument, such instrument is denominated in the functional currency of the net investment), no ineffectiveness is recorded in earnings. The pretax gain (loss) recorded in the Foreign currency translation adjustment account within Accumulated other comprehensive income (loss), related to the effective portion of the net investment hedges, is $(3,829) million, $904 million, and $(3,620) million, for the years ended December 31, 2012, 2011, and 2010, respectively. Credit Derivatives A credit derivative is a bilateral contract between a buyer and a seller under which the seller agrees to provide protection to the buyer against the credit risk of a particular entity (“reference entity” or “reference credit”). Credit derivatives generally require that the seller of credit protection make payments to the buyer upon the occurrence of predefined credit events (commonly referred to as “settlement triggers”). These settlement triggers are defined by the form of the derivative and the reference credit and are generally limited to the market standard of failure to pay on indebtedness and bankruptcy of the reference credit and, in a more limited range of transactions, debt restructuring. Credit derivative transactions referring to emerging market reference credits will also typically include additional settlement triggers to cover the acceleration of indebtedness and the risk of repudiation or a payment moratorium. In certain transactions, protection may be provided on a portfolio of reference credits or asset-backed securities. The seller of such protection may not be required to make payment until a specified amount of losses has occurred with respect to the portfolio and/or may only be required to pay for losses up to a specified amount. The Company makes markets and trades a range of credit derivatives. Through these contracts, the Company either purchases or writes protection on either a single name or a portfolio of reference credits. The Company also uses credit derivatives to help mitigate credit risk in its Corporate and Consumer loan portfolios and other cash positions, and to facilitate client transactions.
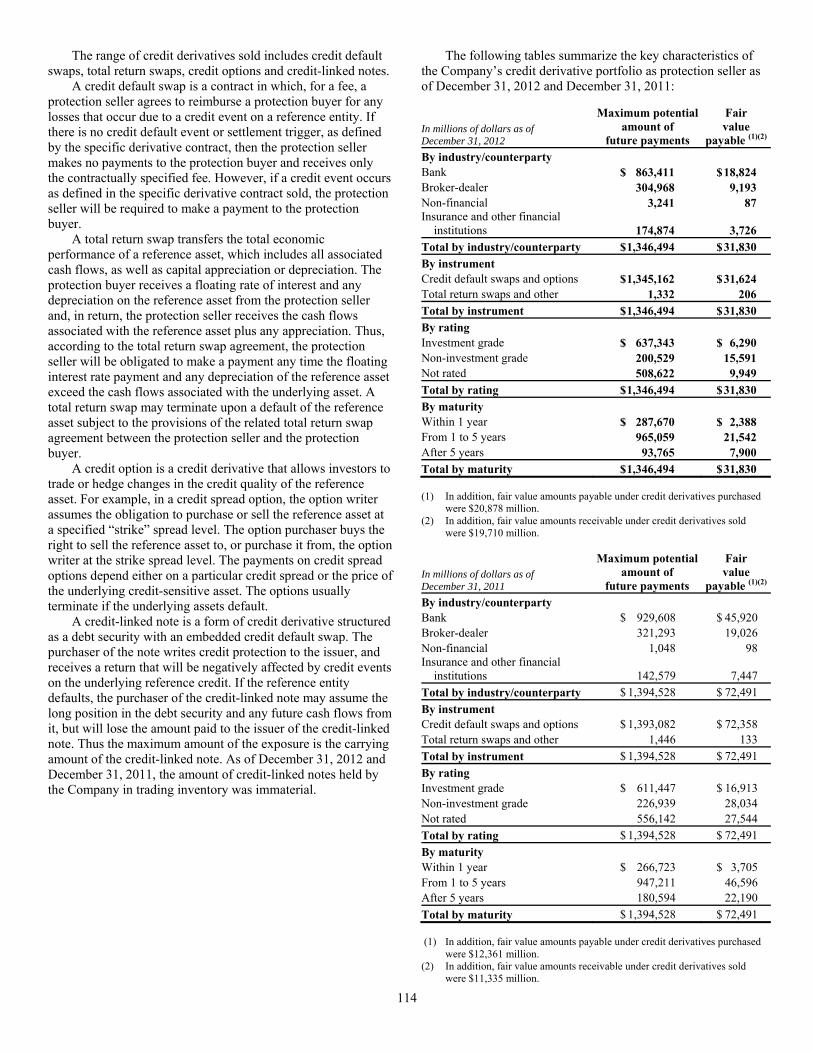
114
The range of credit derivatives sold includes credit default swaps, total return swaps, credit options and credit-linked notes. A credit default swap is a contract in which, for a fee, a protection seller agrees to reimburse a protection buyer for any losses that occur due to a credit event on a reference entity. If there is no credit default event or settlement trigger, as defined by the specific derivative contract, then the protection seller makes no payments to the protection buyer and receives only the contractually specified fee. However, if a credit event occurs as defined in the specific derivative contract sold, the protection seller will be required to make a payment to the protection buyer. A total return swap transfers the total economic performance of a reference asset, which includes all associated cash flows, as well as capital appreciation or depreciation. The protection buyer receives a floating rate of interest and any depreciation on the reference asset from the protection seller and, in return, the protection seller receives the cash flows associated with the reference asset plus any appreciation. Thus, according to the total return swap agreement, the protection seller will be obligated to make a payment any time the floating interest rate payment and any depreciation of the reference asset exceed the cash flows associated with the underlying asset. A total return swap may terminate upon a default of the reference asset subject to the provisions of the related total return swap agreement between the protection seller and the protection buyer. A credit option is a credit derivative that allows investors to trade or hedge changes in the credit quality of the reference asset. For example, in a credit spread option, the option writer assumes the obligation to purchase or sell the reference asset at a specified “strike” spread level. The option purchaser buys the right to sell the reference asset to, or purchase it from, the option writer at the strike spread level. The payments on credit spread options depend either on a particular credit spread or the price of the underlying credit-sensitive asset. The options usually terminate if the underlying assets default. A credit-linked note is a form of credit derivative structured as a debt security with an embedded credit default swap. The purchaser of the note writes credit protection to the issuer, and receives a return that will be negatively affected by credit events on the underlying reference credit. If the reference entity defaults, the purchaser of the credit-linked note may assume the long position in the debt security and any future cash flows from it, but will lose the amount paid to the issuer of the credit-linked note. Thus the maximum amount of the exposure is the carrying amount of the credit-linked note. As of December 31, 2012 and December 31, 2011, the amount of credit-linked notes held by the Company in trading inventory was immaterial.
The following tables summarize the key characteristics of the Company’s credit derivative portfolio as protection seller as of December 31, 2012 and December 31, 2011:
In millions of dollars as of December 31, 2012
Maximum potentialamount of
future payments
Fair value
payable (1)(2)
By industry/counterparty Bank $ 863,411 $ 18,824Broker-dealer 304,968 9,193Non-financial 3,241 87Insurance and other financial
institutions 174,874 3,726Total by industry/counterparty $ 1,346,494 $ 31,830By instrument Credit default swaps and options $ 1,345,162 $ 31,624Total return swaps and other 1,332 206Total by instrument $ 1,346,494 $ 31,830By rating Investment grade $ 637,343 $ 6,290Non-investment grade 200,529 15,591Not rated 508,622 9,949Total by rating $ 1,346,494 $ 31,830By maturity Within 1 year $ 287,670 $ 2,388From 1 to 5 years 965,059 21,542After 5 years 93,765 7,900Total by maturity $ 1,346,494 $ 31,830 (1) In addition, fair value amounts payable under credit derivatives purchased
were $20,878 million. (2) In addition, fair value amounts receivable under credit derivatives sold
were $19,710 million.
In millions of dollars as of December 31, 2011
Maximum potentialamount of
future payments
Fair value
payable (1)(2)
By industry/counterparty Bank $ 929,608 $ 45,920 Broker-dealer 321,293 19,026 Non-financial 1,048 98 Insurance and other financial
institutions 142,579 7,447 Total by industry/counterparty $ 1,394,528 $ 72,491 By instrument Credit default swaps and options $ 1,393,082 $ 72,358 Total return swaps and other 1,446 133 Total by instrument $ 1,394,528 $ 72,491 By rating Investment grade $ 611,447 $ 16,913 Non-investment grade 226,939 28,034 Not rated 556,142 27,544 Total by rating $ 1,394,528 $ 72,491 By maturity Within 1 year $ 266,723 $ 3,705 From 1 to 5 years 947,211 46,596 After 5 years 180,594 22,190 Total by maturity $ 1,394,528 $ 72,491 (1) In addition, fair value amounts payable under credit derivatives purchased
were $12,361 million. (2) In addition, fair value amounts receivable under credit derivatives sold
were $11,335 million.

115
Citigroup evaluates the payment/performance risk of the credit derivatives for which it stands as a protection seller based on the credit rating assigned to the underlying referenced credit. Where external ratings by nationally recognized statistical rating organizations (such as Moody’s and S&P) are used, investment grade ratings are considered to be Baa/BBB or above, while anything below is considered non-investment grade. The Citigroup internal ratings are in line with the related external credit rating system. On certain underlying reference credits, mainly related to over-the-counter credit derivatives, ratings are not available, and these are included in the not-rated category. Credit derivatives written on an underlying non-investment grade reference credit represent greater payment risk to the Company. The non-investment grade category in the table above primarily includes credit derivatives where the underlying referenced entity has been downgraded subsequent to the inception of the derivative. The maximum potential amount of future payments under credit derivative contracts presented in the table above is based on the notional value of the derivatives. The Company believes that the maximum potential amount of future payments for credit protection sold is not representative of the actual loss exposure based on historical experience. This amount has not been reduced by the Company’s rights to the underlying assets and the related cash flows. In accordance with most credit derivative contracts, should a credit event (or settlement trigger) occur, the Company is usually liable for the difference between the protection sold and the recourse it holds in the value of the underlying assets. Thus, if the reference entity defaults, Citi will generally have a right to collect on the underlying reference credit and any related cash flows, while being liable for the full notional amount of credit protection sold to the buyer. Furthermore, this maximum potential amount of future payments for credit protection sold has not been reduced for any cash collateral paid to a given counterparty as such payments would be calculated after netting all derivative exposures, including any credit derivatives with that counterparty in accordance with a related master netting agreement. Due to such netting processes, determining the amount of collateral that corresponds to credit derivative exposures alone is not possible. The Company actively monitors open credit risk exposures and manages this exposure by using a variety of strategies, including purchased credit derivatives, cash collateral or direct holdings of the referenced assets. This risk mitigation activity is not captured in the table above.
Credit-Risk-Related Contingent Features in Derivatives Certain derivative instruments contain provisions that require the Company to either post additional collateral or immediately settle any outstanding liability balances upon the occurrence of a specified credit-risk-related event. These events, which are defined by the existing derivative contracts, are primarily downgrades in the credit ratings of the Company and its affiliates. The fair value (excluding CVA) of all derivative instruments with credit-risk-related contingent features that are in a net liability position at December 31, 2012 and December 31, 2011 is $36 billion and $33 billion, respectively. The Company has posted $32 billion and $28 billion as collateral for this exposure in the normal course of business as of December 31, 2012 and December 31, 2011, respectively. Each downgrade would trigger additional collateral or cash settlement requirements for the Company and its affiliates. In the event that each legal entity was downgraded a single notch by the three rating agencies as of December 31, 2012, the Company would be required to post an additional $4.0 billion, as either collateral or settlement of the derivative transactions. Additionally, the Company would be required to segregate with third-party custodians collateral previously received from existing derivative counterparties in the amount of $1.1 billion upon the single notch downgrade, resulting in aggregate cash obligations and collateral requirements of approximately $5.1 billion.
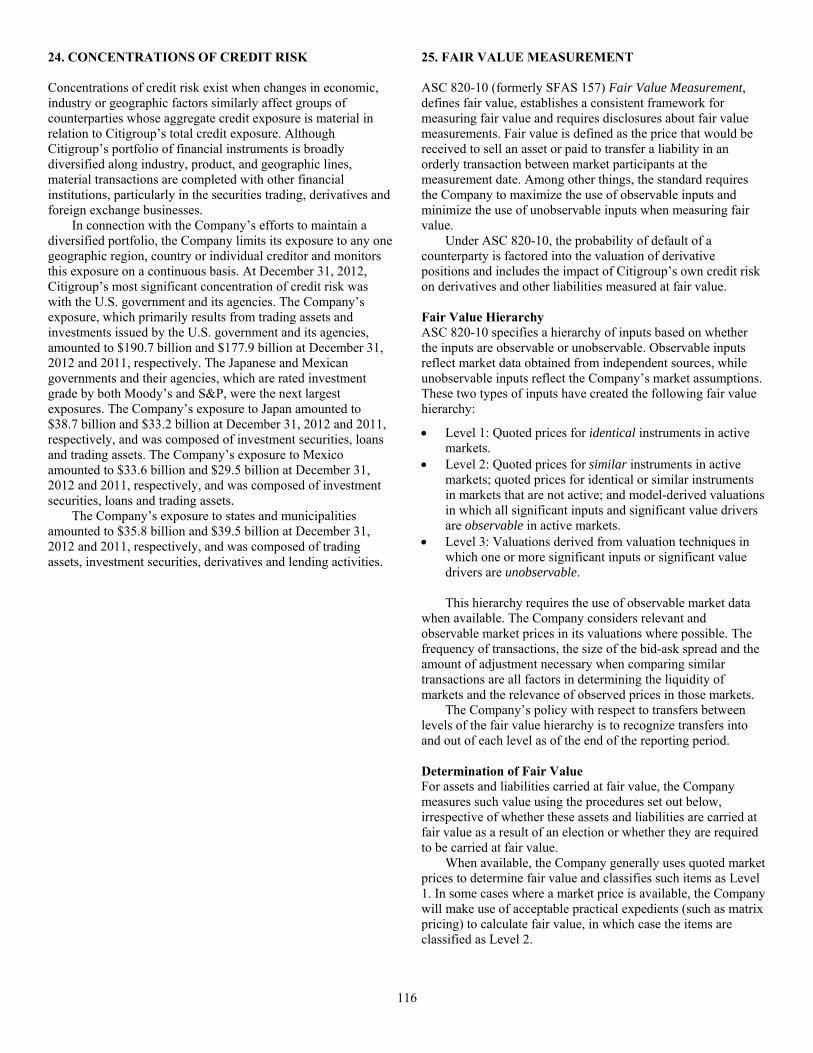
116
24. CONCENTRATIONS OF CREDIT RISK Concentrations of credit risk exist when changes in economic, industry or geographic factors similarly affect groups of counterparties whose aggregate credit exposure is material in relation to Citigroup’s total credit exposure. Although Citigroup’s portfolio of financial instruments is broadly diversified along industry, product, and geographic lines, material transactions are completed with other financial institutions, particularly in the securities trading, derivatives and foreign exchange businesses. In connection with the Company’s efforts to maintain a diversified portfolio, the Company limits its exposure to any one geographic region, country or individual creditor and monitors this exposure on a continuous basis. At December 31, 2012, Citigroup’s most significant concentration of credit risk was with the U.S. government and its agencies. The Company’s exposure, which primarily results from trading assets and investments issued by the U.S. government and its agencies, amounted to $190.7 billion and $177.9 billion at December 31, 2012 and 2011, respectively. The Japanese and Mexican governments and their agencies, which are rated investment grade by both Moody’s and S&P, were the next largest exposures. The Company’s exposure to Japan amounted to $38.7 billion and $33.2 billion at December 31, 2012 and 2011, respectively, and was composed of investment securities, loans and trading assets. The Company’s exposure to Mexico amounted to $33.6 billion and $29.5 billion at December 31, 2012 and 2011, respectively, and was composed of investment securities, loans and trading assets. The Company’s exposure to states and municipalities amounted to $35.8 billion and $39.5 billion at December 31, 2012 and 2011, respectively, and was composed of trading assets, investment securities, derivatives and lending activities.
25. FAIR VALUE MEASUREMENT ASC 820-10 (formerly SFAS 157) Fair Value Measurement, defines fair value, establishes a consistent framework for measuring fair value and requires disclosures about fair value measurements. Fair value is defined as the price that would be received to sell an asset or paid to transfer a liability in an orderly transaction between market participants at the measurement date. Among other things, the standard requires the Company to maximize the use of observable inputs and minimize the use of unobservable inputs when measuring fair value. Under ASC 820-10, the probability of default of a counterparty is factored into the valuation of derivative positions and includes the impact of Citigroup’s own credit risk on derivatives and other liabilities measured at fair value. Fair Value Hierarchy ASC 820-10 specifies a hierarchy of inputs based on whether the inputs are observable or unobservable. Observable inputs reflect market data obtained from independent sources, while unobservable inputs reflect the Company’s market assumptions. These two types of inputs have created the following fair value hierarchy:
• Level 1: Quoted prices for identical instruments in active markets.
• Level 2: Quoted prices for similar instruments in active markets; quoted prices for identical or similar instruments in markets that are not active; and model-derived valuations in which all significant inputs and significant value drivers are observable in active markets.
• Level 3: Valuations derived from valuation techniques in which one or more significant inputs or significant value drivers are unobservable.
This hierarchy requires the use of observable market data when available. The Company considers relevant and observable market prices in its valuations where possible. The frequency of transactions, the size of the bid-ask spread and the amount of adjustment necessary when comparing similar transactions are all factors in determining the liquidity of markets and the relevance of observed prices in those markets. The Company’s policy with respect to transfers between levels of the fair value hierarchy is to recognize transfers into and out of each level as of the end of the reporting period. Determination of Fair Value For assets and liabilities carried at fair value, the Company measures such value using the procedures set out below, irrespective of whether these assets and liabilities are carried at fair value as a result of an election or whether they are required to be carried at fair value. When available, the Company generally uses quoted market prices to determine fair value and classifies such items as Level 1. In some cases where a market price is available, the Company will make use of acceptable practical expedients (such as matrix pricing) to calculate fair value, in which case the items are classified as Level 2.
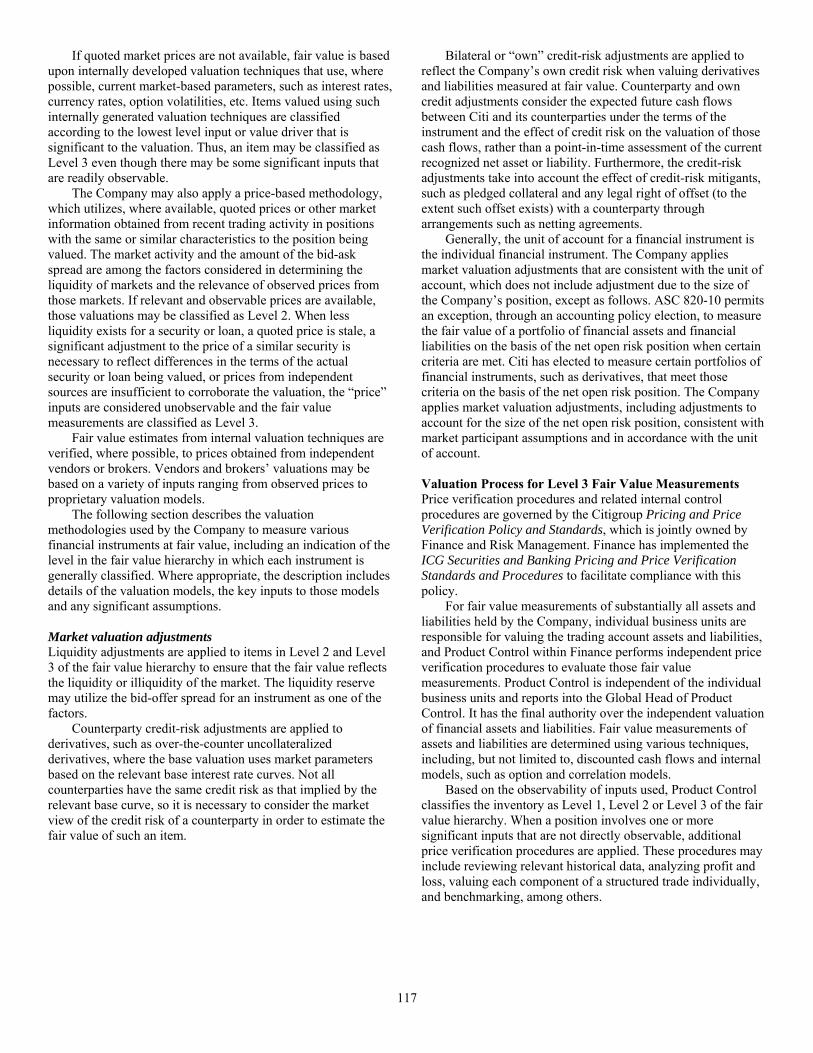
117
If quoted market prices are not available, fair value is based upon internally developed valuation techniques that use, where possible, current market-based parameters, such as interest rates, currency rates, option volatilities, etc. Items valued using such internally generated valuation techniques are classified according to the lowest level input or value driver that is significant to the valuation. Thus, an item may be classified as Level 3 even though there may be some significant inputs that are readily observable. The Company may also apply a price-based methodology, which utilizes, where available, quoted prices or other market information obtained from recent trading activity in positions with the same or similar characteristics to the position being valued. The market activity and the amount of the bid-ask spread are among the factors considered in determining the liquidity of markets and the relevance of observed prices from those markets. If relevant and observable prices are available, those valuations may be classified as Level 2. When less liquidity exists for a security or loan, a quoted price is stale, a significant adjustment to the price of a similar security is necessary to reflect differences in the terms of the actual security or loan being valued, or prices from independent sources are insufficient to corroborate the valuation, the “price” inputs are considered unobservable and the fair value measurements are classified as Level 3. Fair value estimates from internal valuation techniques are verified, where possible, to prices obtained from independent vendors or brokers. Vendors and brokers’ valuations may be based on a variety of inputs ranging from observed prices to proprietary valuation models. The following section describes the valuation methodologies used by the Company to measure various financial instruments at fair value, including an indication of the level in the fair value hierarchy in which each instrument is generally classified. Where appropriate, the description includes details of the valuation models, the key inputs to those models and any significant assumptions. Market valuation adjustments Liquidity adjustments are applied to items in Level 2 and Level 3 of the fair value hierarchy to ensure that the fair value reflects the liquidity or illiquidity of the market. The liquidity reserve may utilize the bid-offer spread for an instrument as one of the factors. Counterparty credit-risk adjustments are applied to derivatives, such as over-the-counter uncollateralized derivatives, where the base valuation uses market parameters based on the relevant base interest rate curves. Not all counterparties have the same credit risk as that implied by the relevant base curve, so it is necessary to consider the market view of the credit risk of a counterparty in order to estimate the fair value of such an item.
Bilateral or “own” credit-risk adjustments are applied to reflect the Company’s own credit risk when valuing derivatives and liabilities measured at fair value. Counterparty and own credit adjustments consider the expected future cash flows between Citi and its counterparties under the terms of the instrument and the effect of credit risk on the valuation of those cash flows, rather than a point-in-time assessment of the current recognized net asset or liability. Furthermore, the credit-risk adjustments take into account the effect of credit-risk mitigants, such as pledged collateral and any legal right of offset (to the extent such offset exists) with a counterparty through arrangements such as netting agreements. Generally, the unit of account for a financial instrument is the individual financial instrument. The Company applies market valuation adjustments that are consistent with the unit of account, which does not include adjustment due to the size of the Company’s position, except as follows. ASC 820-10 permits an exception, through an accounting policy election, to measure the fair value of a portfolio of financial assets and financial liabilities on the basis of the net open risk position when certain criteria are met. Citi has elected to measure certain portfolios of financial instruments, such as derivatives, that meet those criteria on the basis of the net open risk position. The Company applies market valuation adjustments, including adjustments to account for the size of the net open risk position, consistent with market participant assumptions and in accordance with the unit of account. Valuation Process for Level 3 Fair Value Measurements Price verification procedures and related internal control procedures are governed by the Citigroup Pricing and Price Verification Policy and Standards, which is jointly owned by Finance and Risk Management. Finance has implemented the ICG Securities and Banking Pricing and Price Verification Standards and Procedures to facilitate compliance with this policy. For fair value measurements of substantially all assets and liabilities held by the Company, individual business units are responsible for valuing the trading account assets and liabilities, and Product Control within Finance performs independent price verification procedures to evaluate those fair value measurements. Product Control is independent of the individual business units and reports into the Global Head of Product Control. It has the final authority over the independent valuation of financial assets and liabilities. Fair value measurements of assets and liabilities are determined using various techniques, including, but not limited to, discounted cash flows and internal models, such as option and correlation models. Based on the observability of inputs used, Product Control classifies the inventory as Level 1, Level 2 or Level 3 of the fair value hierarchy. When a position involves one or more significant inputs that are not directly observable, additional price verification procedures are applied. These procedures may include reviewing relevant historical data, analyzing profit and loss, valuing each component of a structured trade individually, and benchmarking, among others.
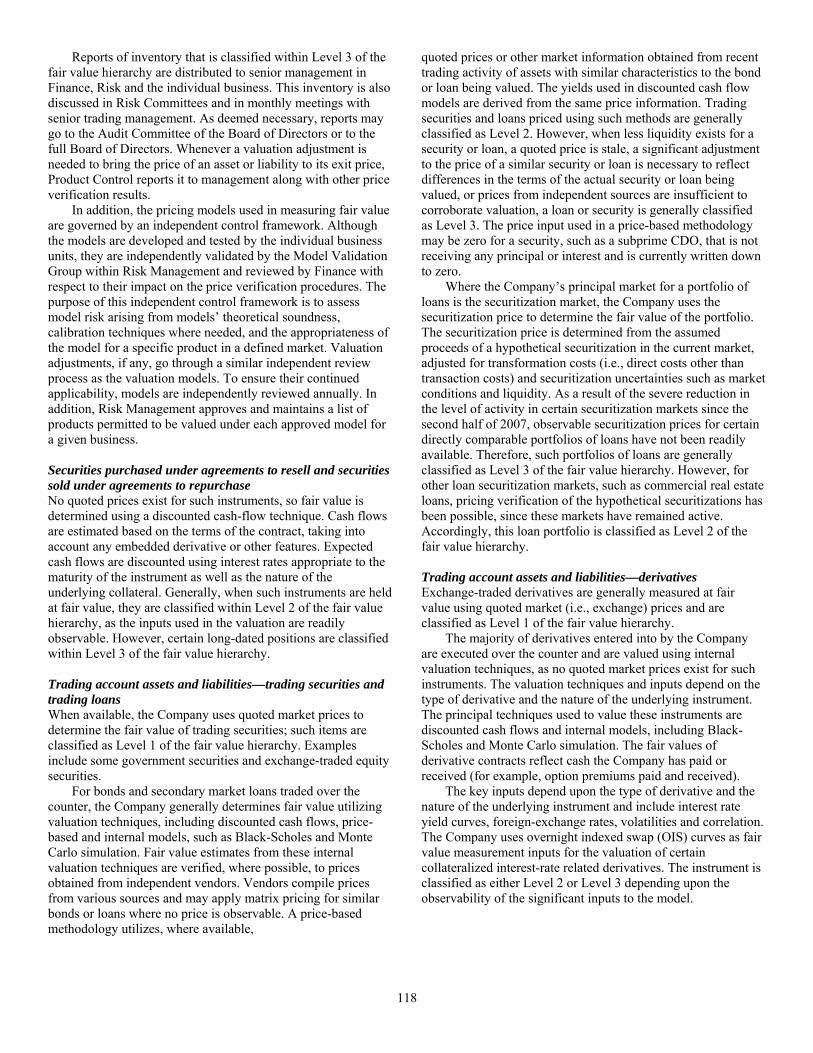
118
Reports of inventory that is classified within Level 3 of the fair value hierarchy are distributed to senior management in Finance, Risk and the individual business. This inventory is also discussed in Risk Committees and in monthly meetings with senior trading management. As deemed necessary, reports may go to the Audit Committee of the Board of Directors or to the full Board of Directors. Whenever a valuation adjustment is needed to bring the price of an asset or liability to its exit price, Product Control reports it to management along with other price verification results. In addition, the pricing models used in measuring fair value are governed by an independent control framework. Although the models are developed and tested by the individual business units, they are independently validated by the Model Validation Group within Risk Management and reviewed by Finance with respect to their impact on the price verification procedures. The purpose of this independent control framework is to assess model risk arising from models’ theoretical soundness, calibration techniques where needed, and the appropriateness of the model for a specific product in a defined market. Valuation adjustments, if any, go through a similar independent review process as the valuation models. To ensure their continued applicability, models are independently reviewed annually. In addition, Risk Management approves and maintains a list of products permitted to be valued under each approved model for a given business. Securities purchased under agreements to resell and securities sold under agreements to repurchase No quoted prices exist for such instruments, so fair value is determined using a discounted cash-flow technique. Cash flows are estimated based on the terms of the contract, taking into account any embedded derivative or other features. Expected cash flows are discounted using interest rates appropriate to the maturity of the instrument as well as the nature of the underlying collateral. Generally, when such instruments are held at fair value, they are classified within Level 2 of the fair value hierarchy, as the inputs used in the valuation are readily observable. However, certain long-dated positions are classified within Level 3 of the fair value hierarchy. Trading account assets and liabilities—trading securities and trading loans When available, the Company uses quoted market prices to determine the fair value of trading securities; such items are classified as Level 1 of the fair value hierarchy. Examples include some government securities and exchange-traded equity securities. For bonds and secondary market loans traded over the counter, the Company generally determines fair value utilizing valuation techniques, including discounted cash flows, price-based and internal models, such as Black-Scholes and Monte Carlo simulation. Fair value estimates from these internal valuation techniques are verified, where possible, to prices obtained from independent vendors. Vendors compile prices from various sources and may apply matrix pricing for similar bonds or loans where no price is observable. A price-based methodology utilizes, where available,
quoted prices or other market information obtained from recent trading activity of assets with similar characteristics to the bond or loan being valued. The yields used in discounted cash flow models are derived from the same price information. Trading securities and loans priced using such methods are generally classified as Level 2. However, when less liquidity exists for a security or loan, a quoted price is stale, a significant adjustment to the price of a similar security or loan is necessary to reflect differences in the terms of the actual security or loan being valued, or prices from independent sources are insufficient to corroborate valuation, a loan or security is generally classified as Level 3. The price input used in a price-based methodology may be zero for a security, such as a subprime CDO, that is not receiving any principal or interest and is currently written down to zero. Where the Company’s principal market for a portfolio of loans is the securitization market, the Company uses the securitization price to determine the fair value of the portfolio. The securitization price is determined from the assumed proceeds of a hypothetical securitization in the current market, adjusted for transformation costs (i.e., direct costs other than transaction costs) and securitization uncertainties such as market conditions and liquidity. As a result of the severe reduction in the level of activity in certain securitization markets since the second half of 2007, observable securitization prices for certain directly comparable portfolios of loans have not been readily available. Therefore, such portfolios of loans are generally classified as Level 3 of the fair value hierarchy. However, for other loan securitization markets, such as commercial real estate loans, pricing verification of the hypothetical securitizations has been possible, since these markets have remained active. Accordingly, this loan portfolio is classified as Level 2 of the fair value hierarchy. Trading account assets and liabilities—derivatives Exchange-traded derivatives are generally measured at fair value using quoted market (i.e., exchange) prices and are classified as Level 1 of the fair value hierarchy. The majority of derivatives entered into by the Company are executed over the counter and are valued using internal valuation techniques, as no quoted market prices exist for such instruments. The valuation techniques and inputs depend on the type of derivative and the nature of the underlying instrument. The principal techniques used to value these instruments are discounted cash flows and internal models, including Black-Scholes and Monte Carlo simulation. The fair values of derivative contracts reflect cash the Company has paid or received (for example, option premiums paid and received). The key inputs depend upon the type of derivative and the nature of the underlying instrument and include interest rate yield curves, foreign-exchange rates, volatilities and correlation. The Company uses overnight indexed swap (OIS) curves as fair value measurement inputs for the valuation of certain collateralized interest-rate related derivatives. The instrument is classified as either Level 2 or Level 3 depending upon the observability of the significant inputs to the model.
119
Subprime-related direct exposures in CDOs The valuation of high-grade and mezzanine asset-backed security (ABS) CDO positions utilizes prices based on the underlying assets of each high-grade and mezzanine ABS CDO. The high-grade and mezzanine positions are largely hedged through the ABX and bond short positions. This results in closer symmetry in the way these long and short positions are valued by the Company. Citigroup uses trader marks to value this portion of the portfolio and will do so as long as it remains largely hedged. For most of the lending and structuring direct subprime exposures, fair value is determined utilizing observable transactions where available, other market data for similar assets in markets that are not active and other internal valuation techniques. Investments The investments category includes available-for-sale debt and marketable equity securities, whose fair value is generally determined by utilizing similar procedures described for trading securities above or, in some cases, using consensus pricing as the primary source. Also included in investments are nonpublic investments in private equity and real estate entities held by the S&B business. Determining the fair value of nonpublic securities involves a significant degree of management resources and judgment, as no quoted prices exist and such securities are generally very thinly traded. In addition, there may be transfer restrictions on private equity securities. The Company uses an established process for determining the fair value of such securities, utilizing commonly accepted valuation techniques, including comparables analysis. In determining the fair value of nonpublic securities, the Company also considers events such as a proposed sale of the investee company, initial public offerings, equity issuances or other observable transactions. As discussed in Note 15 to the Consolidated Financial Statements, the Company uses net asset value (NAV) to value certain of these investments. Private equity securities are generally classified as Level 3 of the fair value hierarchy. Short-term borrowings and long-term debt Where fair value accounting has been elected, the fair value of non-structured liabilities is determined by utilizing internal models using the appropriate discount rate for the applicable maturity. Such instruments are generally classified as Level 2 of the fair value hierarchy, as all inputs are readily observable. The Company determines the fair value of structured liabilities (where performance is linked to structured interest rates, inflation or currency risks) and hybrid financial instruments (where performance is linked to risks other than interest rates, inflation or currency risks) using the appropriate derivative valuation methodology (described above) given the nature of the embedded risk profile. Such instruments are classified as Level 2 or Level 3 depending on the observability of significant inputs to the model.
Alt-A mortgage securities The Company classifies its Alt-A mortgage securities as held-to-maturity, available-for-sale and trading investments. The securities classified as trading and available-for-sale are recorded at fair value with changes in fair value reported in current earnings and AOCI, respectively. For these purposes, Citi defines Alt-A mortgage securities as non-agency residential mortgage-backed securities (RMBS) where (i) the underlying collateral has weighted average FICO scores between 680 and 720 or (ii) for instances where FICO scores are greater than 720, RMBS have 30% or less of the underlying collateral composed of full documentation loans. Similar to the valuation methodologies used for other trading securities and trading loans, the Company generally determines the fair values of Alt-A mortgage securities utilizing internal valuation techniques. Fair value estimates from internal valuation techniques are verified, where possible, to prices obtained from independent vendors. Consensus data providers compile prices from various sources. Where available, the Company may also make use of quoted prices for recent trading activity in securities with the same or similar characteristics to the security being valued. The valuation techniques used for Alt-A mortgage securities, as with other mortgage exposures, are price-based and discounted cash flows. The primary market-derived input is yield. Cash flows are based on current collateral performance with prepayment rates and loss projections reflective of current economic conditions of housing price change, unemployment rates, interest rates, borrower attributes and other market indicators. Alt-A mortgage securities that are valued using these methods are generally classified as Level 2. However, Alt-A mortgage securities backed by Alt-A mortgages of lower quality or subordinated tranches in the capital structure are mostly classified as Level 3 due to the reduced liquidity that exists for such positions, which reduces the reliability of prices available from independent sources.
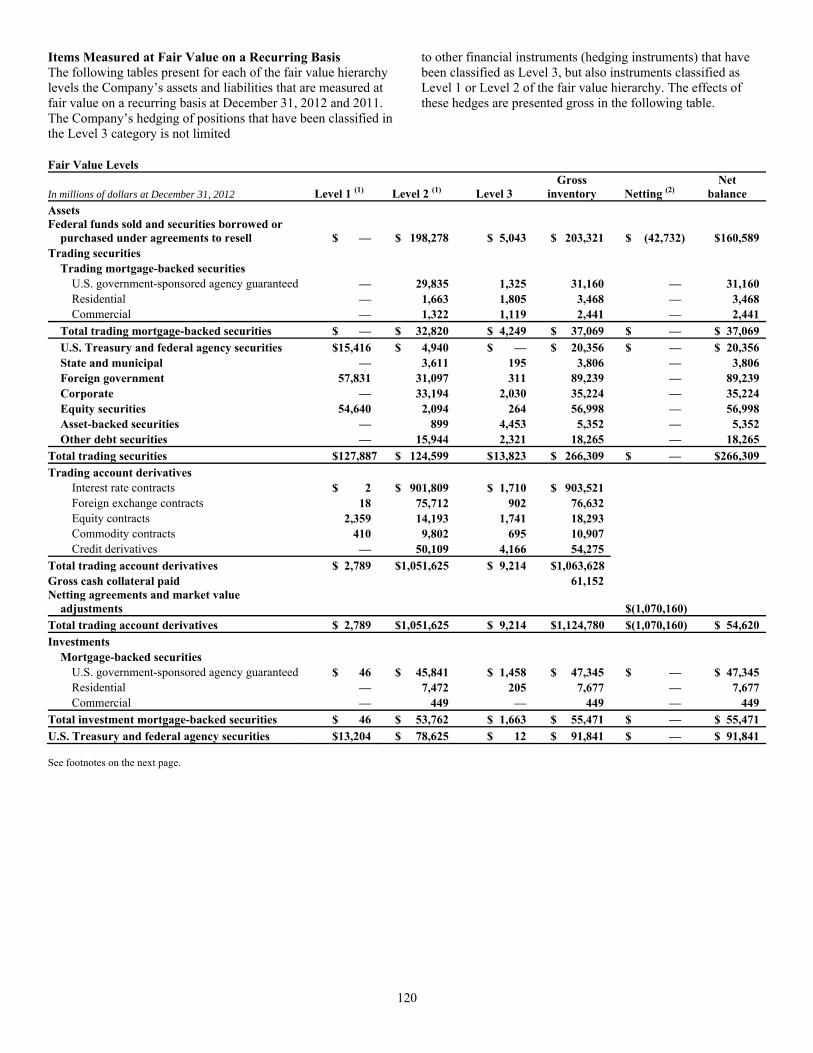
120
Items Measured at Fair Value on a Recurring Basis The following tables present for each of the fair value hierarchy levels the Company’s assets and liabilities that are measured at fair value on a recurring basis at December 31, 2012 and 2011. The Company’s hedging of positions that have been classified in the Level 3 category is not limited
to other financial instruments (hedging instruments) that have been classified as Level 3, but also instruments classified as Level 1 or Level 2 of the fair value hierarchy. The effects of these hedges are presented gross in the following table.
Fair Value Levels
In millions of dollars at December 31, 2012 Level 1 (1) Level 2 (1) Level 3Gross
inventory Netting (2)Net
balanceAssets Federal funds sold and securities borrowed or
purchased under agreements to resell $ — $ 198,278 $ 5,043 $ 203,321 $ (42,732) $ 160,589Trading securities Trading mortgage-backed securities U.S. government-sponsored agency guaranteed — 29,835 1,325 31,160 — 31,160 Residential — 1,663 1,805 3,468 — 3,468 Commercial — 1,322 1,119 2,441 — 2,441 Total trading mortgage-backed securities $ — $ 32,820 $ 4,249 $ 37,069 $ — $ 37,069 U.S. Treasury and federal agency securities $15,416 $ 4,940 $ — $ 20,356 $ — $ 20,356 State and municipal — 3,611 195 3,806 — 3,806 Foreign government 57,831 31,097 311 89,239 — 89,239 Corporate — 33,194 2,030 35,224 — 35,224 Equity securities 54,640 2,094 264 56,998 — 56,998 Asset-backed securities — 899 4,453 5,352 — 5,352 Other debt securities — 15,944 2,321 18,265 — 18,265Total trading securities $127,887 $ 124,599 $ 13,823 $ 266,309 $ — $ 266,309Trading account derivatives Interest rate contracts $ 2 $ 901,809 $ 1,710 $ 903,521 Foreign exchange contracts 18 75,712 902 76,632 Equity contracts 2,359 14,193 1,741 18,293 Commodity contracts 410 9,802 695 10,907 Credit derivatives — 50,109 4,166 54,275 Total trading account derivatives $ 2,789 $1,051,625 $ 9,214 $1,063,628 Gross cash collateral paid 61,152 Netting agreements and market value
adjustments $(1,070,160) Total trading account derivatives $ 2,789 $1,051,625 $ 9,214 $1,124,780 $(1,070,160) $ 54,620Investments Mortgage-backed securities U.S. government-sponsored agency guaranteed $ 46 $ 45,841 $ 1,458 $ 47,345 $ — $ 47,345 Residential — 7,472 205 7,677 — 7,677 Commercial — 449 — 449 — 449Total investment mortgage-backed securities $ 46 $ 53,762 $ 1,663 $ 55,471 $ — $ 55,471U.S. Treasury and federal agency securities $13,204 $ 78,625 $ 12 $ 91,841 $ — $ 91,841 See footnotes on the next page.
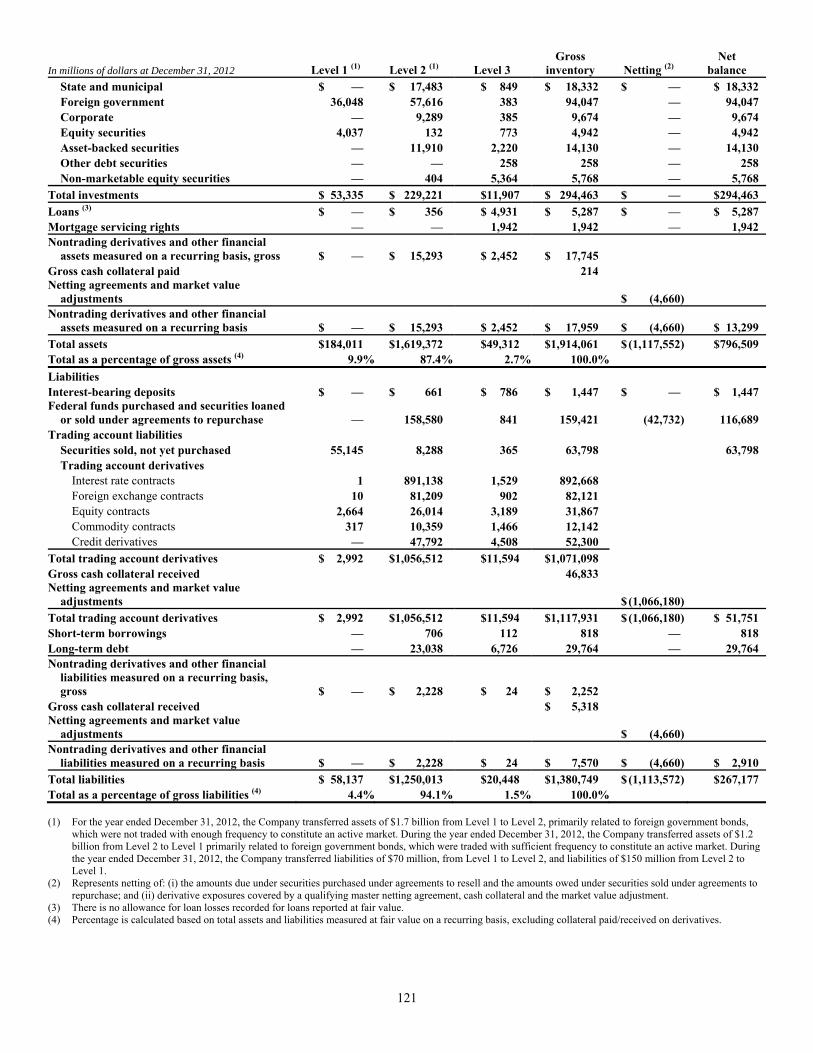
121
In millions of dollars at December 31, 2012 Level 1 (1) Level 2 (1) Level 3Gross
inventory Netting (2)Net
balance State and municipal $ — $ 17,483 $ 849 $ 18,332 $ — $ 18,332 Foreign government 36,048 57,616 383 94,047 — 94,047 Corporate — 9,289 385 9,674 — 9,674 Equity securities 4,037 132 773 4,942 — 4,942 Asset-backed securities — 11,910 2,220 14,130 — 14,130 Other debt securities — — 258 258 — 258 Non-marketable equity securities — 404 5,364 5,768 — 5,768Total investments $ 53,335 $ 229,221 $11,907 $ 294,463 $ — $ 294,463Loans (3) $ — $ 356 $ 4,931 $ 5,287 $ — $ 5,287Mortgage servicing rights — — 1,942 1,942 — 1,942Nontrading derivatives and other financial
assets measured on a recurring basis, gross $ — $ 15,293 $ 2,452 $ 17,745 Gross cash collateral paid 214 Netting agreements and market value
adjustments $ (4,660) Nontrading derivatives and other financial
assets measured on a recurring basis $ — $ 15,293 $ 2,452 $ 17,959 $ (4,660) $ 13,299Total assets $ 184,011 $1,619,372 $49,312 $1,914,061 $ (1,117,552) $ 796,509Total as a percentage of gross assets (4) 9.9% 87.4% 2.7% 100.0% Liabilities Interest-bearing deposits $ — $ 661 $ 786 $ 1,447 $ — $ 1,447Federal funds purchased and securities loaned
or sold under agreements to repurchase — 158,580 841 159,421 (42,732) 116,689Trading account liabilities Securities sold, not yet purchased 55,145 8,288 365 63,798 63,798 Trading account derivatives Interest rate contracts 1 891,138 1,529 892,668 Foreign exchange contracts 10 81,209 902 82,121 Equity contracts 2,664 26,014 3,189 31,867 Commodity contracts 317 10,359 1,466 12,142 Credit derivatives — 47,792 4,508 52,300 Total trading account derivatives $ 2,992 $1,056,512 $11,594 $1,071,098 Gross cash collateral received 46,833 Netting agreements and market value
adjustments $ (1,066,180) Total trading account derivatives $ 2,992 $1,056,512 $11,594 $1,117,931 $ (1,066,180) $ 51,751Short-term borrowings — 706 112 818 — 818Long-term debt — 23,038 6,726 29,764 — 29,764Nontrading derivatives and other financial
liabilities measured on a recurring basis, gross $ — $ 2,228 $ 24 $ 2,252
Gross cash collateral received $ 5,318 Netting agreements and market value
adjustments $ (4,660) Nontrading derivatives and other financial
liabilities measured on a recurring basis $ — $ 2,228 $ 24 $ 7,570 $ (4,660) $ 2,910Total liabilities $ 58,137 $1,250,013 $20,448 $1,380,749 $ (1,113,572) $ 267,177Total as a percentage of gross liabilities (4) 4.4% 94.1% 1.5% 100.0% (1) For the year ended December 31, 2012, the Company transferred assets of $1.7 billion from Level 1 to Level 2, primarily related to foreign government bonds,
which were not traded with enough frequency to constitute an active market. During the year ended December 31, 2012, the Company transferred assets of $1.2 billion from Level 2 to Level 1 primarily related to foreign government bonds, which were traded with sufficient frequency to constitute an active market. During the year ended December 31, 2012, the Company transferred liabilities of $70 million, from Level 1 to Level 2, and liabilities of $150 million from Level 2 to Level 1.
(2) Represents netting of: (i) the amounts due under securities purchased under agreements to resell and the amounts owed under securities sold under agreements to repurchase; and (ii) derivative exposures covered by a qualifying master netting agreement, cash collateral and the market value adjustment.
(3) There is no allowance for loan losses recorded for loans reported at fair value. (4) Percentage is calculated based on total assets and liabilities measured at fair value on a recurring basis, excluding collateral paid/received on derivatives.
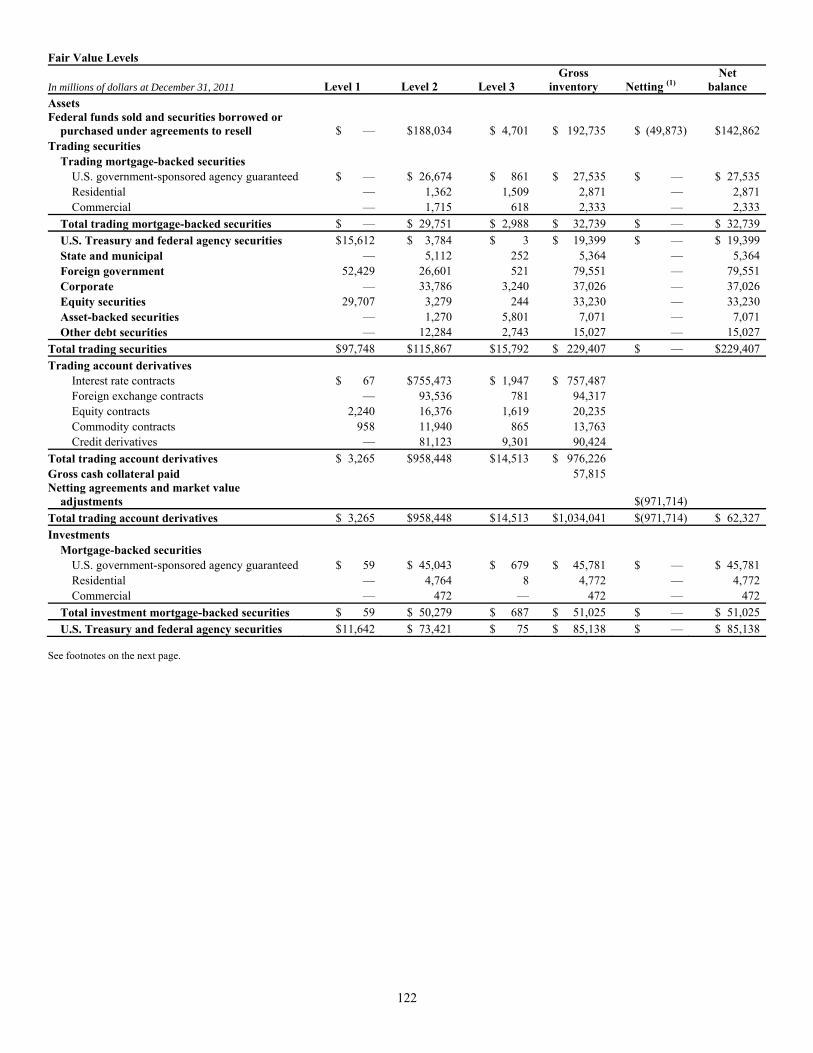
122
Fair Value Levels
In millions of dollars at December 31, 2011 Level 1 Level 2 Level 3Gross
inventory Netting (1)Net
balanceAssets Federal funds sold and securities borrowed or
purchased under agreements to resell $ — $ 188,034 $ 4,701 $ 192,735 $ (49,873) $ 142,862 Trading securities Trading mortgage-backed securities U.S. government-sponsored agency guaranteed $ — $ 26,674 $ 861 $ 27,535 $ — $ 27,535 Residential — 1,362 1,509 2,871 — 2,871 Commercial — 1,715 618 2,333 — 2,333 Total trading mortgage-backed securities $ — $ 29,751 $ 2,988 $ 32,739 $ — $ 32,739 U.S. Treasury and federal agency securities $ 15,612 $ 3,784 $ 3 $ 19,399 $ — $ 19,399 State and municipal — 5,112 252 5,364 — 5,364 Foreign government 52,429 26,601 521 79,551 — 79,551 Corporate — 33,786 3,240 37,026 — 37,026 Equity securities 29,707 3,279 244 33,230 — 33,230 Asset-backed securities — 1,270 5,801 7,071 — 7,071 Other debt securities — 12,284 2,743 15,027 — 15,027 Total trading securities $ 97,748 $ 115,867 $ 15,792 $ 229,407 $ — $ 229,407 Trading account derivatives Interest rate contracts $ 67 $ 755,473 $ 1,947 $ 757,487 Foreign exchange contracts — 93,536 781 94,317 Equity contracts 2,240 16,376 1,619 20,235 Commodity contracts 958 11,940 865 13,763 Credit derivatives — 81,123 9,301 90,424 Total trading account derivatives $ 3,265 $ 958,448 $ 14,513 $ 976,226 Gross cash collateral paid 57,815 Netting agreements and market value
adjustments $(971,714) Total trading account derivatives $ 3,265 $ 958,448 $ 14,513 $1,034,041 $(971,714) $ 62,327 Investments Mortgage-backed securities U.S. government-sponsored agency guaranteed $ 59 $ 45,043 $ 679 $ 45,781 $ — $ 45,781 Residential — 4,764 8 4,772 — 4,772 Commercial — 472 — 472 — 472 Total investment mortgage-backed securities $ 59 $ 50,279 $ 687 $ 51,025 $ — $ 51,025 U.S. Treasury and federal agency securities $ 11,642 $ 73,421 $ 75 $ 85,138 $ — $ 85,138 See footnotes on the next page.
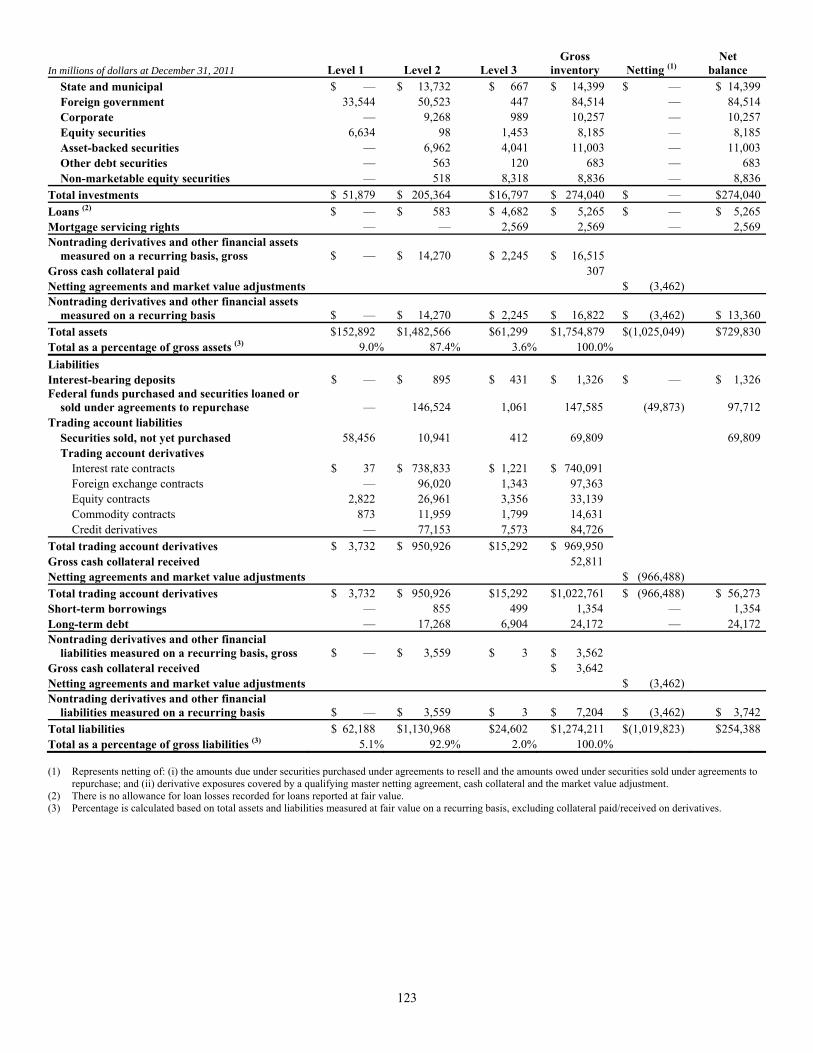
123
In millions of dollars at December 31, 2011 Level 1 Level 2 Level 3Gross
inventory Netting (1)Net
balance State and municipal $ — $ 13,732 $ 667 $ 14,399 $ — $ 14,399 Foreign government 33,544 50,523 447 84,514 — 84,514 Corporate — 9,268 989 10,257 — 10,257 Equity securities 6,634 98 1,453 8,185 — 8,185 Asset-backed securities — 6,962 4,041 11,003 — 11,003 Other debt securities — 563 120 683 — 683 Non-marketable equity securities — 518 8,318 8,836 — 8,836Total investments $ 51,879 $ 205,364 $ 16,797 $ 274,040 $ — $ 274,040Loans (2) $ — $ 583 $ 4,682 $ 5,265 $ — $ 5,265Mortgage servicing rights — — 2,569 2,569 — 2,569Nontrading derivatives and other financial assets
measured on a recurring basis, gross $ — $ 14,270 $ 2,245 $ 16,515 Gross cash collateral paid 307 Netting agreements and market value adjustments $ (3,462) Nontrading derivatives and other financial assets
measured on a recurring basis $ — $ 14,270 $ 2,245 $ 16,822 $ (3,462) $ 13,360Total assets $ 152,892 $1,482,566 $61,299 $1,754,879 $ (1,025,049) $ 729,830Total as a percentage of gross assets (3) 9.0% 87.4% 3.6% 100.0% Liabilities Interest-bearing deposits $ — $ 895 $ 431 $ 1,326 $ — $ 1,326Federal funds purchased and securities loaned or
sold under agreements to repurchase — 146,524 1,061 147,585 (49,873) 97,712Trading account liabilities Securities sold, not yet purchased 58,456 10,941 412 69,809 69,809 Trading account derivatives Interest rate contracts $ 37 $ 738,833 $ 1,221 $ 740,091 Foreign exchange contracts — 96,020 1,343 97,363 Equity contracts 2,822 26,961 3,356 33,139 Commodity contracts 873 11,959 1,799 14,631 Credit derivatives — 77,153 7,573 84,726 Total trading account derivatives $ 3,732 $ 950,926 $15,292 $ 969,950 Gross cash collateral received 52,811 Netting agreements and market value adjustments $ (966,488) Total trading account derivatives $ 3,732 $ 950,926 $15,292 $1,022,761 $ (966,488) $ 56,273Short-term borrowings — 855 499 1,354 — 1,354Long-term debt — 17,268 6,904 24,172 — 24,172Nontrading derivatives and other financial
liabilities measured on a recurring basis, gross $ — $ 3,559 $ 3 $ 3,562 Gross cash collateral received $ 3,642 Netting agreements and market value adjustments $ (3,462) Nontrading derivatives and other financial
liabilities measured on a recurring basis $ — $ 3,559 $ 3 $ 7,204 $ (3,462) $ 3,742Total liabilities $ 62,188 $1,130,968 $24,602 $1,274,211 $ (1,019,823) $ 254,388Total as a percentage of gross liabilities (3) 5.1% 92.9% 2.0% 100.0% (1) Represents netting of: (i) the amounts due under securities purchased under agreements to resell and the amounts owed under securities sold under agreements to
repurchase; and (ii) derivative exposures covered by a qualifying master netting agreement, cash collateral and the market value adjustment. (2) There is no allowance for loan losses recorded for loans reported at fair value. (3) Percentage is calculated based on total assets and liabilities measured at fair value on a recurring basis, excluding collateral paid/received on derivatives.
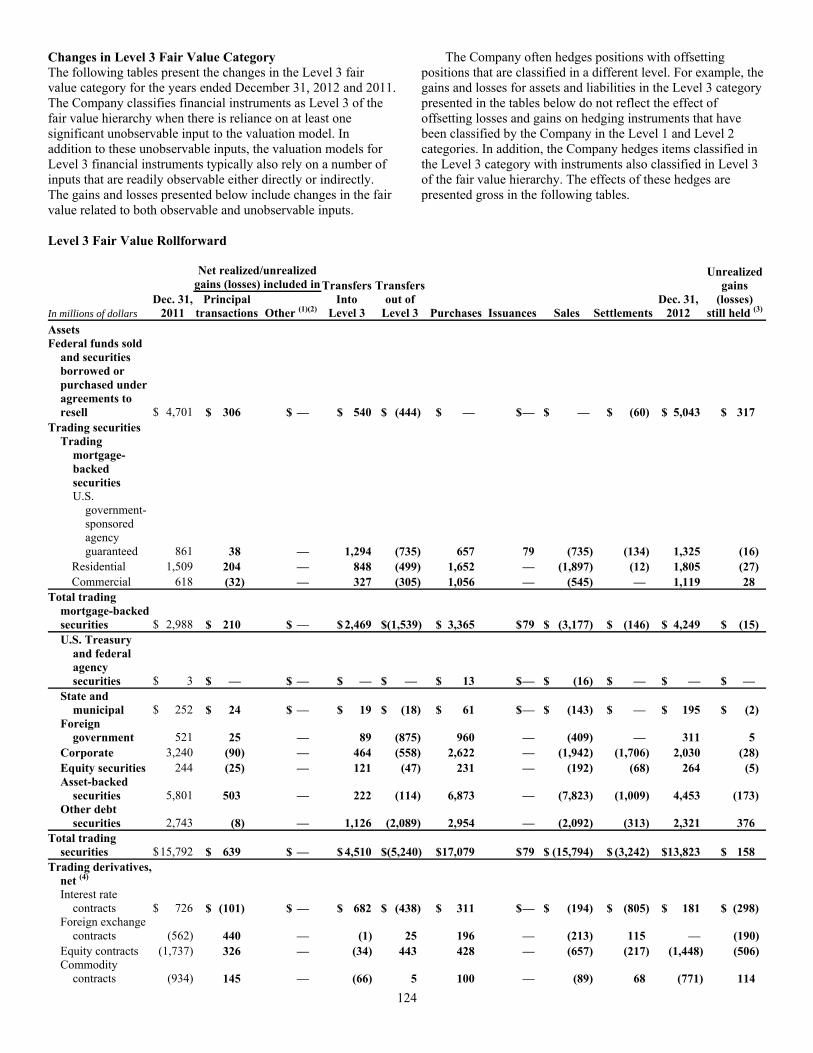
124
Changes in Level 3 Fair Value Category The following tables present the changes in the Level 3 fair value category for the years ended December 31, 2012 and 2011. The Company classifies financial instruments as Level 3 of the fair value hierarchy when there is reliance on at least one significant unobservable input to the valuation model. In addition to these unobservable inputs, the valuation models for Level 3 financial instruments typically also rely on a number of inputs that are readily observable either directly or indirectly. The gains and losses presented below include changes in the fair value related to both observable and unobservable inputs.
The Company often hedges positions with offsetting positions that are classified in a different level. For example, the gains and losses for assets and liabilities in the Level 3 category presented in the tables below do not reflect the effect of offsetting losses and gains on hedging instruments that have been classified by the Company in the Level 1 and Level 2 categories. In addition, the Company hedges items classified in the Level 3 category with instruments also classified in Level 3 of the fair value hierarchy. The effects of these hedges are presented gross in the following tables.
Level 3 Fair Value Rollforward
Dec. 31,
2011
Net realized/unrealized gains (losses) included in Transfers
Into Level 3
Transfersout of
Level 3
Dec. 31,
2012
Unrealizedgains
(losses) still held (3)In millions of dollars
Principal transactions Other (1)(2) Purchases Issuances Sales Settlements
Assets Federal funds sold
and securities borrowed or purchased under agreements to resell $ 4,701 $ 306 $ — $ 540 $ (444) $ — $ — $ — $ (60) $ 5,043 $ 317
Trading securities Trading
mortgage-backed securities U.S.
government-sponsored agency guaranteed 861 38 — 1,294 (735) 657 79 (735) (134) 1,325 (16)
Residential 1,509 204 — 848 (499) 1,652 — (1,897) (12) 1,805 (27) Commercial 618 (32) — 327 (305) 1,056 — (545) — 1,119 28Total trading
mortgage-backed securities $ 2,988 $ 210 $ — $ 2,469 $(1,539) $ 3,365 $ 79 $ (3,177) $ (146) $ 4,249 $ (15)U.S. Treasury
and federal agency securities $ 3 $ — $ — $ — $ — $ 13 $ — $ (16) $ — $ — $ —
State and municipal $ 252 $ 24 $ — $ 19 $ (18) $ 61 $ — $ (143) $ — $ 195 $ (2)
Foreign government 521 25 — 89 (875) 960 — (409) — 311 5
Corporate 3,240 (90) — 464 (558) 2,622 — (1,942) (1,706) 2,030 (28)Equity securities 244 (25) — 121 (47) 231 — (192) (68) 264 (5)Asset-backed
securities 5,801 503 — 222 (114) 6,873 — (7,823) (1,009) 4,453 (173)Other debt
securities 2,743 (8) — 1,126 (2,089) 2,954 — (2,092) (313) 2,321 376Total trading
securities $ 15,792 $ 639 $ — $ 4,510 $(5,240) $ 17,079 $ 79 $ (15,794) $ (3,242) $13,823 $ 158Trading derivatives,
net (4) Interest rate
contracts $ 726 $ (101) $ — $ 682 $ (438) $ 311 $ — $ (194) $ (805) $ 181 $ (298)Foreign exchange
contracts (562) 440 — (1) 25 196 — (213) 115 — (190)Equity contracts (1,737) 326 — (34) 443 428 — (657) (217) (1,448) (506)Commodity
contracts (934) 145 — (66) 5 100 — (89) 68 (771) 114
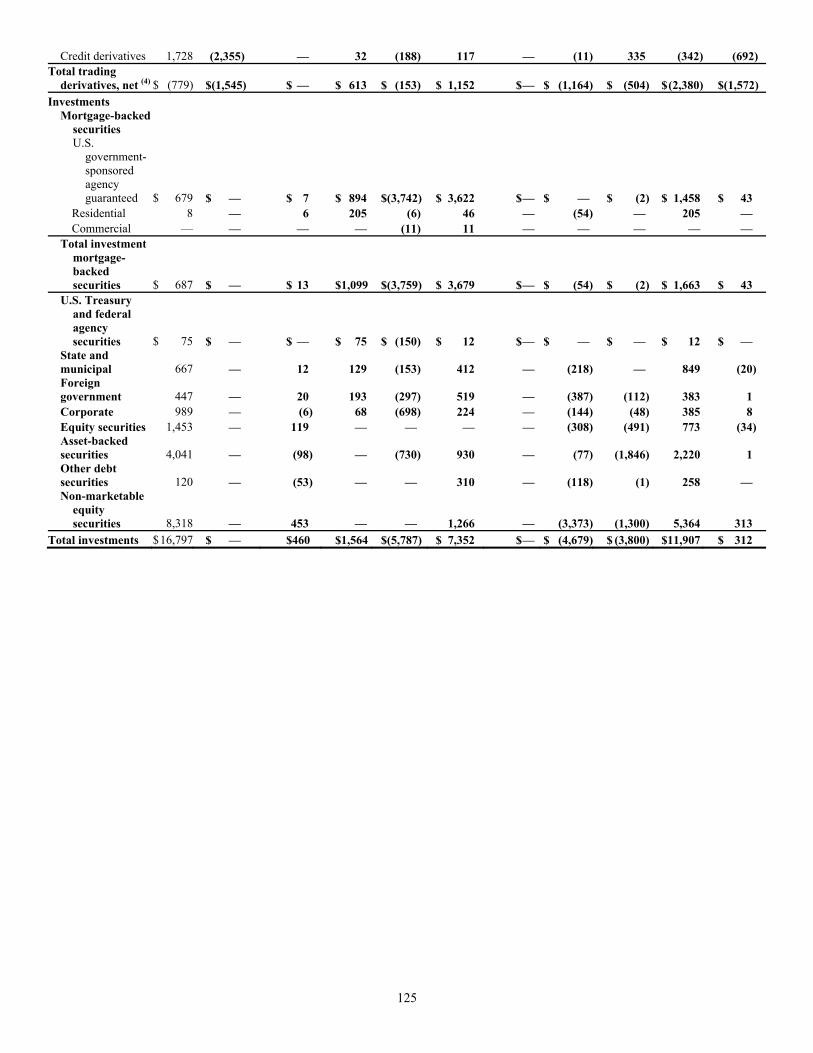
125
Credit derivatives 1,728 (2,355) — 32 (188) 117 — (11) 335 (342) (692)Total trading
derivatives, net (4) $ (779) $(1,545) $ — $ 613 $ (153) $ 1,152 $ — $ (1,164) $ (504) $ (2,380) $(1,572)Investments
Mortgage-backed securities U.S.
government-sponsored agency guaranteed $ 679 $ — $ 7 $ 894 $(3,742) $ 3,622 $ — $ — $ (2) $ 1,458 $ 43
Residential 8 — 6 205 (6) 46 — (54) — 205 — Commercial — — — — (11) 11 — — — — —
Total investment mortgage-backed securities $ 687 $ — $ 13 $1,099 $(3,759) $ 3,679 $ — $ (54) $ (2) $ 1,663 $ 43
U.S. Treasury and federal agency securities $ 75 $ — $ — $ 75 $ (150) $ 12 $ — $ — $ — $ 12 $ —
State and municipal 667 — 12 129 (153) 412 — (218) — 849 (20)
Foreign government 447 — 20 193 (297) 519 — (387) (112) 383 1
Corporate 989 — (6) 68 (698) 224 — (144) (48) 385 8 Equity securities 1,453 — 119 — — — — (308) (491) 773 (34) Asset-backed
securities 4,041 — (98) — (730) 930 — (77) (1,846) 2,220 1 Other debt
securities 120 — (53) — — 310 — (118) (1) 258 —Non-marketable
equity securities 8,318 — 453 — — 1,266 — (3,373) (1,300) 5,364 313
Total investments $ 16,797 $ — $460 $1,564 $(5,787) $ 7,352 $ — $ (4,679) $ (3,800) $11,907 $ 312

126
In millions of dollars Dec. 31,
2011
Net realized/unrealized gains (losses) included in Transfers
into Level 3
Transfersout of
Level 3 Purchases Issuances Sales SettlementsDec. 31,
2012
Unrealizedgains
(losses) still held (3)
Principal transactions Other (1)(2)
Loans $ 4,682 $ — $ (34) $ 1,051 $ (185) $301 $ 930 $ (251) $ (1,563) $ 4,931 $ 156Mortgage
servicing rights 2,569 — (426) — — 2 421 (5) (619) 1,942 (427)
Other financial assets measured on a recurring basis 2,245 — 366 21 (35) 4 1,700 (50) (1,799) 2,452 101
Liabilities Interest-bearing
deposits $ 431 $ — $(141) $ 213 $ (36) $ — $ 268 $ — $ (231) $ 786 $ (414)Federal funds
purchased and securities loaned or sold under agreements to repurchase 1,061 (64) — — (14) — — (179) (91) 841 43
Trading account liabilities
Securities sold, not yet purchased 412 (1) — 294 (47) — — 216 (511) 365 (42)
Short-term borrowings 499 (108) — 47 (20) — 268 — (790) 112 (57)
Long-term debt 6,904 98 119 2,548 (2,694) — 2,480 — (2,295) 6,726 (688)Other financial
liabilities measured on a recurring basis 3 — (31) 2 (2) (4) 6 — (12) 24 (13)
(1) Changes in fair value for available-for-sale investments (debt securities) are recorded in Accumulated other comprehensive income (loss), unless other-than-temporarily impaired, while gains and losses from sales are recorded in Realized gains (losses) from sales of investments on the Consolidated Statement of Income.
(2) Unrealized gains (losses) on MSRs are recorded in Other revenue on the Consolidated Statement of Income. (3) Represents the amount of total gains or losses for the period, included in earnings (and Accumulated other comprehensive income (loss) for changes in fair value
for available-for-sale investments), attributable to the change in fair value relating to assets and liabilities classified as Level 3 that are still held at December 31, 2012 and 2011.
(4) Total Level 3 derivative assets and liabilities have been netted in these tables for presentation purposes only.
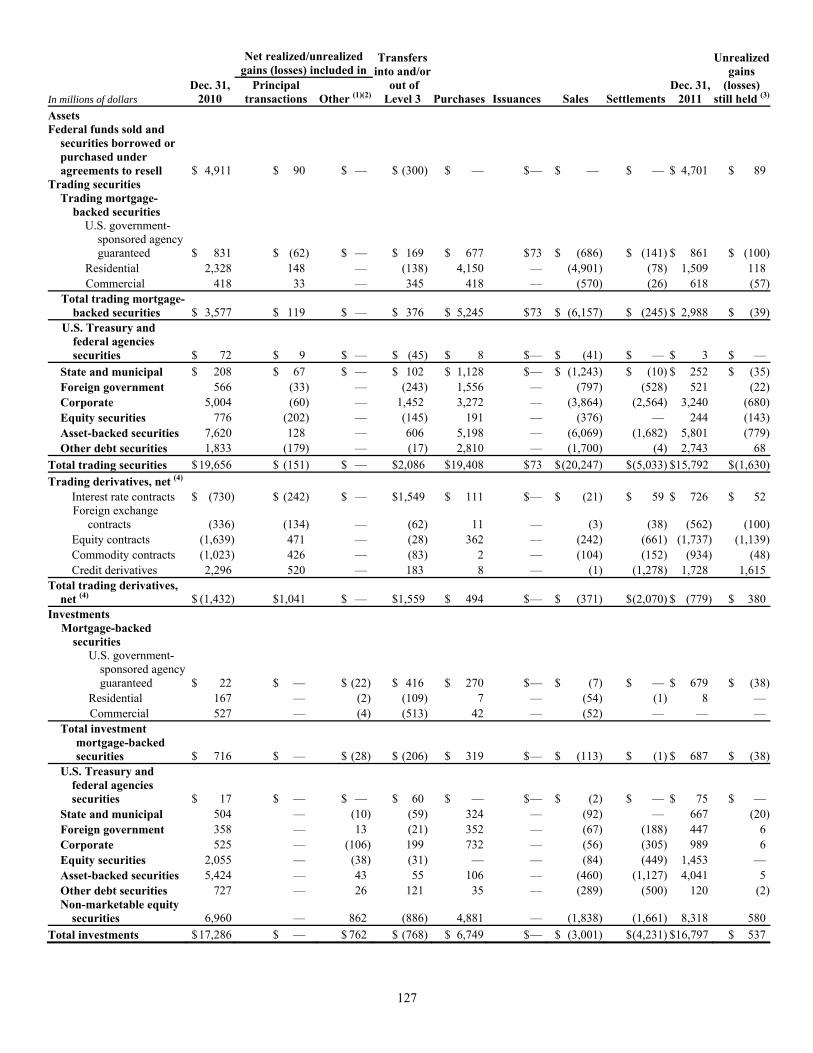
127
Net realized/unrealized
gains (losses) included inTransfers
into and/or out of Level 3
Unrealized
gains (losses)
still held (3)In millions of dollars Dec. 31,
2010 Principal
transactions Other (1)(2) Purchases Issuances Sales SettlementsDec. 31,
2011Assets Federal funds sold and
securities borrowed or purchased under agreements to resell $ 4,911 $ 90 $ — $ (300) $ — $ — $ — $ — $ 4,701 $ 89
Trading securities Trading mortgage-
backed securities U.S. government-
sponsored agency guaranteed $ 831 $ (62) $ — $ 169 $ 677 $ 73 $ (686) $ (141) $ 861 $ (100)
Residential 2,328 148 — (138) 4,150 — (4,901) (78) 1,509 118 Commercial 418 33 — 345 418 — (570) (26) 618 (57) Total trading mortgage-
backed securities $ 3,577 $ 119 $ — $ 376 $ 5,245 $ 73 $ (6,157) $ (245) $ 2,988 $ (39) U.S. Treasury and
federal agencies securities $ 72 $ 9 $ — $ (45) $ 8 $ — $ (41) $ — $ 3 $ —
State and municipal $ 208 $ 67 $ — $ 102 $ 1,128 $ — $ (1,243) $ (10) $ 252 $ (35) Foreign government 566 (33) — (243) 1,556 — (797) (528) 521 (22) Corporate 5,004 (60) — 1,452 3,272 — (3,864) (2,564) 3,240 (680) Equity securities 776 (202) — (145) 191 — (376) — 244 (143) Asset-backed securities 7,620 128 — 606 5,198 — (6,069) (1,682) 5,801 (779) Other debt securities 1,833 (179) — (17) 2,810 — (1,700) (4) 2,743 68Total trading securities $ 19,656 $ (151) $ — $2,086 $ 19,408 $ 73 $ (20,247) $ (5,033) $15,792 $ (1,630)Trading derivatives, net (4) Interest rate contracts $ (730) $ (242) $ — $1,549 $ 111 $ — $ (21) $ 59 $ 726 $ 52 Foreign exchange
contracts (336) (134) — (62) 11 — (3) (38) (562) (100) Equity contracts (1,639) 471 — (28) 362 — (242) (661) (1,737) (1,139) Commodity contracts (1,023) 426 — (83) 2 — (104) (152) (934) (48) Credit derivatives 2,296 520 — 183 8 — (1) (1,278) 1,728 1,615Total trading derivatives,
net (4) $ (1,432) $1,041 $ — $1,559 $ 494 $ — $ (371) $ (2,070) $ (779) $ 380Investments Mortgage-backed
securities U.S. government-
sponsored agency guaranteed $ 22 $ — $ (22) $ 416 $ 270 $ — $ (7) $ — $ 679 $ (38)
Residential 167 — (2) (109) 7 — (54) (1) 8 — Commercial 527 — (4) (513) 42 — (52) — — — Total investment
mortgage-backed securities $ 716 $ — $ (28) $ (206) $ 319 $ — $ (113) $ (1) $ 687 $ (38)
U.S. Treasury and federal agencies securities $ 17 $ — $ — $ 60 $ — $ — $ (2) $ — $ 75 $ —
State and municipal 504 — (10) (59) 324 — (92) — 667 (20) Foreign government 358 — 13 (21) 352 — (67) (188) 447 6 Corporate 525 — (106) 199 732 — (56) (305) 989 6 Equity securities 2,055 — (38) (31) — — (84) (449) 1,453 — Asset-backed securities 5,424 — 43 55 106 — (460) (1,127) 4,041 5 Other debt securities 727 — 26 121 35 — (289) (500) 120 (2) Non-marketable equity
securities 6,960 — 862 (886) 4,881 — (1,838) (1,661) 8,318 580Total investments $ 17,286 $ — $ 762 $ (768) $ 6,749 $ — $ (3,001) $ (4,231) $16,797 $ 537
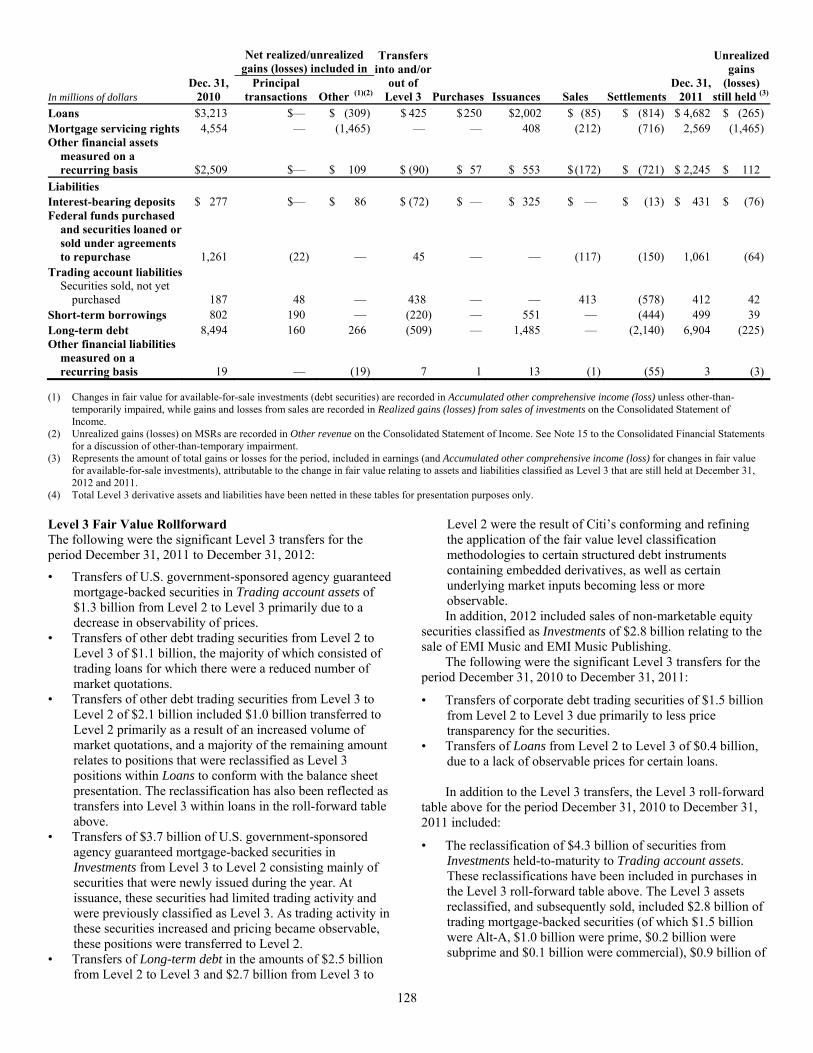
128
Net realized/unrealized
gains (losses) included inTransfers
into and/orout of
Level 3
Unrealized
gains (losses)
still held (3)In millions of dollars Dec. 31,
2010 Principal
transactions Other (1)(2) Purchases Issuances Sales SettlementsDec. 31,
2011Loans $ 3,213 $— $ (309) $ 425 $ 250 $2,002 $ (85) $ (814) $ 4,682 $ (265) Mortgage servicing rights 4,554 — (1,465) — — 408 (212) (716) 2,569 (1,465) Other financial assets
measured on a recurring basis $ 2,509 $— $ 109 $ (90) $ 57 $ 553 $ (172) $ (721) $ 2,245 $ 112
Liabilities Interest-bearing deposits $ 277 $— $ 86 $ (72) $ — $ 325 $ — $ (13) $ 431 $ (76) Federal funds purchased
and securities loaned or sold under agreements to repurchase 1,261 (22) — 45 — — (117) (150) 1,061 (64)
Trading account liabilities Securities sold, not yet
purchased 187 48 — 438 — — 413 (578) 412 42 Short-term borrowings 802 190 — (220) — 551 — (444) 499 39 Long-term debt 8,494 160 266 (509) — 1,485 — (2,140) 6,904 (225) Other financial liabilities
measured on a recurring basis 19 — (19) 7 1 13 (1) (55) 3 (3)
(1) Changes in fair value for available-for-sale investments (debt securities) are recorded in Accumulated other comprehensive income (loss) unless other-than-temporarily impaired, while gains and losses from sales are recorded in Realized gains (losses) from sales of investments on the Consolidated Statement of Income.
(2) Unrealized gains (losses) on MSRs are recorded in Other revenue on the Consolidated Statement of Income. See Note 15 to the Consolidated Financial Statements for a discussion of other-than-temporary impairment.
(3) Represents the amount of total gains or losses for the period, included in earnings (and Accumulated other comprehensive income (loss) for changes in fair value for available-for-sale investments), attributable to the change in fair value relating to assets and liabilities classified as Level 3 that are still held at December 31, 2012 and 2011.
(4) Total Level 3 derivative assets and liabilities have been netted in these tables for presentation purposes only. Level 3 Fair Value Rollforward The following were the significant Level 3 transfers for the period December 31, 2011 to December 31, 2012:
• Transfers of U.S. government-sponsored agency guaranteed mortgage-backed securities in Trading account assets of $1.3 billion from Level 2 to Level 3 primarily due to a decrease in observability of prices.
• Transfers of other debt trading securities from Level 2 to Level 3 of $1.1 billion, the majority of which consisted of trading loans for which there were a reduced number of market quotations.
• Transfers of other debt trading securities from Level 3 to Level 2 of $2.1 billion included $1.0 billion transferred to Level 2 primarily as a result of an increased volume of market quotations, and a majority of the remaining amount relates to positions that were reclassified as Level 3 positions within Loans to conform with the balance sheet presentation. The reclassification has also been reflected as transfers into Level 3 within loans in the roll-forward table above.
• Transfers of $3.7 billion of U.S. government-sponsored agency guaranteed mortgage-backed securities in Investments from Level 3 to Level 2 consisting mainly of securities that were newly issued during the year. At issuance, these securities had limited trading activity and were previously classified as Level 3. As trading activity in these securities increased and pricing became observable, these positions were transferred to Level 2.
• Transfers of Long-term debt in the amounts of $2.5 billion from Level 2 to Level 3 and $2.7 billion from Level 3 to
Level 2 were the result of Citi’s conforming and refining the application of the fair value level classification methodologies to certain structured debt instruments containing embedded derivatives, as well as certain underlying market inputs becoming less or more observable.
In addition, 2012 included sales of non-marketable equity securities classified as Investments of $2.8 billion relating to the sale of EMI Music and EMI Music Publishing.
The following were the significant Level 3 transfers for the period December 31, 2010 to December 31, 2011:
• Transfers of corporate debt trading securities of $1.5 billion from Level 2 to Level 3 due primarily to less price transparency for the securities.
• Transfers of Loans from Level 2 to Level 3 of $0.4 billion, due to a lack of observable prices for certain loans.
In addition to the Level 3 transfers, the Level 3 roll-forward table above for the period December 31, 2010 to December 31, 2011 included:
• The reclassification of $4.3 billion of securities from Investments held-to-maturity to Trading account assets. These reclassifications have been included in purchases in the Level 3 roll-forward table above. The Level 3 assets reclassified, and subsequently sold, included $2.8 billion of trading mortgage-backed securities (of which $1.5 billion were Alt-A, $1.0 billion were prime, $0.2 billion were subprime and $0.1 billion were commercial), $0.9 billion of

129
state and municipal debt securities, $0.3 billion of corporate debt securities and $0.2 billion of asset-backed securities.
• Purchases of non-marketable equity securities classified as Investments included approximately $2.8 billion relating to Citi’s acquisition of the share capital of Maltby Acquisitions Limited, the holding company that controls EMI Group Ltd. (which were sold in 2012).
Valuation Techniques and Inputs for Level 3 Fair Value Measurements The Company’s Level 3 inventory consists of both cash securities and derivatives of varying complexities. The valuation methodologies applied to measure the fair value of these positions include discounted cash flow analyses, internal models and comparative analysis. A position is classified within Level 3 of the fair value hierarchy when at least one input is unobservable and is considered significant to its valuation. The specific reason an input is deemed unobservable varies. For example, at least one significant input to the pricing model is not observable in the market, at least one significant input has been adjusted to make it more representative of the position being valued, or the price quote available does not reflect sufficient trading activities. The following table presents the valuation techniques covering the majority of Level 3 inventory and the most significant unobservable inputs used in Level 3 fair value measurements as of December 31, 2012. Differences between this table and amounts presented in the Level 3 Fair Value Rollforward table represent individually immaterial items that have been measured using a variety of valuation techniques other than those listed.
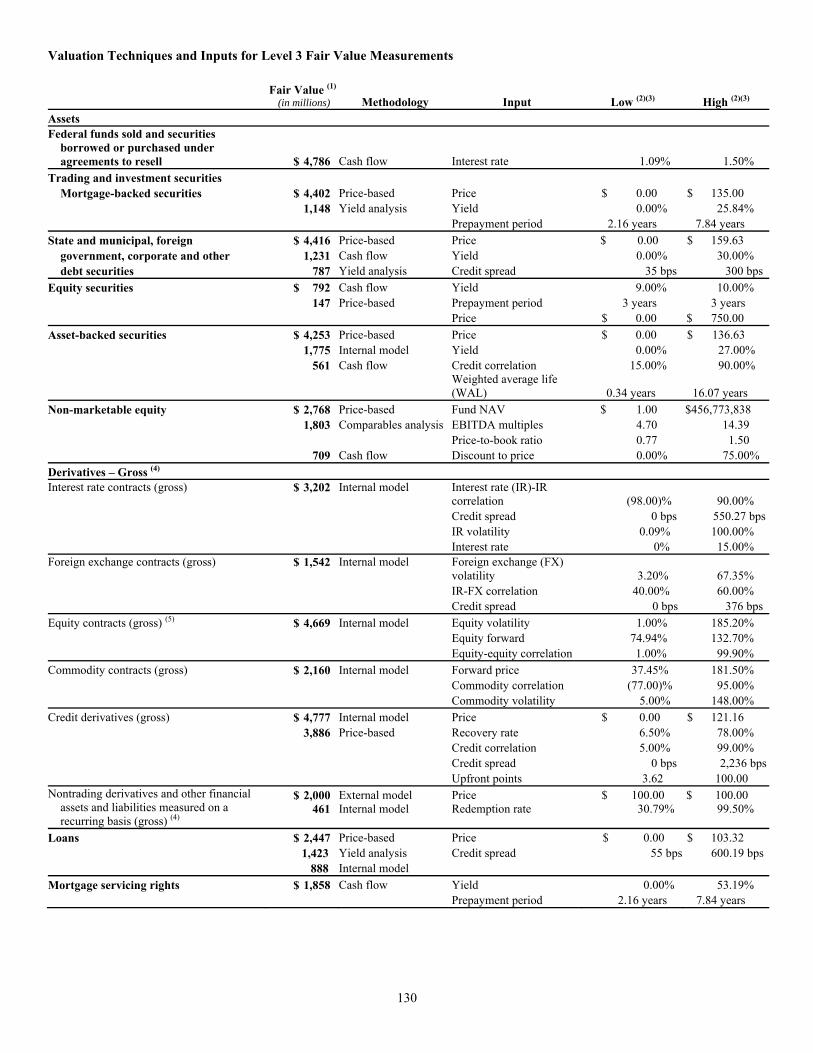
130
Valuation Techniques and Inputs for Level 3 Fair Value Measurements Fair Value (1)
(in millions)
Methodology Input Low (2)(3) High (2)(3)
Assets Federal funds sold and securities
borrowed or purchased under agreements to resell $ 4,786 Cash flow Interest rate 1.09% 1.50%
Trading and investment securities Mortgage-backed securities $ 4,402 Price-based Price $ 0.00 $ 135.00 1,148 Yield analysis Yield 0.00% 25.84% Prepayment period 2.16 years 7.84 years State and municipal, foreign $ 4,416 Price-based Price $ 0.00 $ 159.63 government, corporate and other 1,231 Cash flow Yield 0.00% 30.00% debt securities 787 Yield analysis Credit spread 35 bps 300 bps Equity securities $ 792 Cash flow Yield 9.00% 10.00% 147 Price-based Prepayment period 3 years 3 years Price $ 0.00 $ 750.00 Asset-backed securities $ 4,253 Price-based Price $ 0.00 $ 136.63 1,775 Internal model Yield 0.00% 27.00% 561 Cash flow Credit correlation 15.00% 90.00%
Weighted average life (WAL) 0.34 years 16.07 years
Non-marketable equity $ 2,768 Price-based Fund NAV $ 1.00 $456,773,838 1,803 Comparables analysis EBITDA multiples 4.70 14.39 Price-to-book ratio 0.77 1.50 709 Cash flow Discount to price 0.00% 75.00% Derivatives – Gross (4) Interest rate contracts (gross) $ 3,202 Internal model Interest rate (IR)-IR
correlation (98.00)% 90.00% Credit spread 0 bps 550.27 bps IR volatility 0.09% 100.00% Interest rate 0% 15.00% Foreign exchange contracts (gross) $ 1,542 Internal model Foreign exchange (FX)
volatility 3.20% 67.35% IR-FX correlation 40.00% 60.00% Credit spread 0 bps 376 bps Equity contracts (gross) (5) $ 4,669 Internal model Equity volatility 1.00% 185.20% Equity forward 74.94% 132.70% Equity-equity correlation 1.00% 99.90% Commodity contracts (gross) $ 2,160 Internal model Forward price 37.45% 181.50% Commodity correlation (77.00)% 95.00% Commodity volatility 5.00% 148.00% Credit derivatives (gross) $ 4,777 Internal model Price $ 0.00 $ 121.16 3,886 Price-based Recovery rate 6.50% 78.00% Credit correlation 5.00% 99.00% Credit spread 0 bps 2,236 bps Upfront points 3.62 100.00 Nontrading derivatives and other financial
assets and liabilities measured on a recurring basis (gross) (4)
$ 2,000 External model Price $ 100.00 $ 100.00 461 Internal model Redemption rate 30.79% 99.50%
Loans $ 2,447 Price-based Price $ 0.00 $ 103.32 1,423 Yield analysis Credit spread 55 bps 600.19 bps 888 Internal model Mortgage servicing rights $ 1,858 Cash flow Yield 0.00% 53.19% Prepayment period 2.16 years 7.84 years
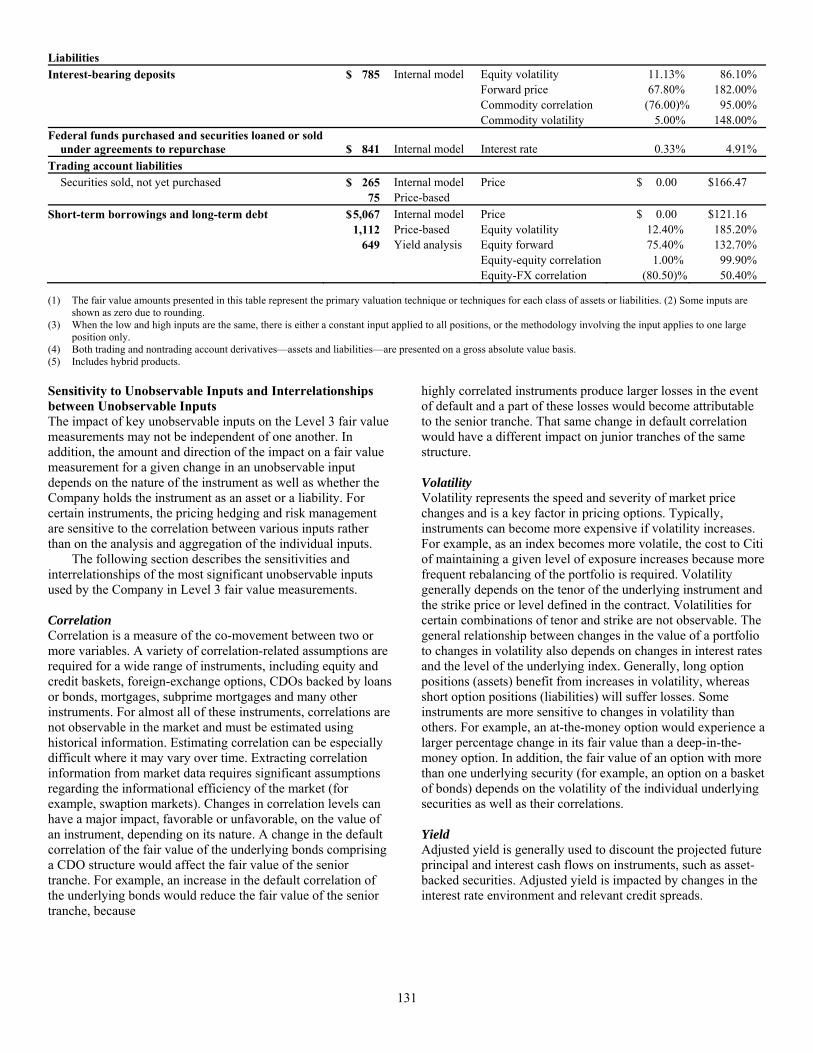
131
Liabilities Interest-bearing deposits $ 785 Internal model Equity volatility 11.13% 86.10% Forward price 67.80% 182.00% Commodity correlation (76.00)% 95.00% Commodity volatility 5.00% 148.00% Federal funds purchased and securities loaned or sold
under agreements to repurchase $ 841 Internal model Interest rate 0.33% 4.91% Trading account liabilities Securities sold, not yet purchased $ 265 Internal model Price $ 0.00 $166.47 75 Price-based Short-term borrowings and long-term debt $ 5,067 Internal model Price $ 0.00 $121.16 1,112 Price-based Equity volatility 12.40% 185.20% 649 Yield analysis Equity forward 75.40% 132.70% Equity-equity correlation 1.00% 99.90% Equity-FX correlation (80.50)% 50.40%
(1) The fair value amounts presented in this table represent the primary valuation technique or techniques for each class of assets or liabilities. (2) Some inputs are shown as zero due to rounding.
(3) When the low and high inputs are the same, there is either a constant input applied to all positions, or the methodology involving the input applies to one large position only.
(4) Both trading and nontrading account derivatives—assets and liabilities—are presented on a gross absolute value basis. (5) Includes hybrid products. Sensitivity to Unobservable Inputs and Interrelationships between Unobservable Inputs The impact of key unobservable inputs on the Level 3 fair value measurements may not be independent of one another. In addition, the amount and direction of the impact on a fair value measurement for a given change in an unobservable input depends on the nature of the instrument as well as whether the Company holds the instrument as an asset or a liability. For certain instruments, the pricing hedging and risk management are sensitive to the correlation between various inputs rather than on the analysis and aggregation of the individual inputs. The following section describes the sensitivities and interrelationships of the most significant unobservable inputs used by the Company in Level 3 fair value measurements. Correlation Correlation is a measure of the co-movement between two or more variables. A variety of correlation-related assumptions are required for a wide range of instruments, including equity and credit baskets, foreign-exchange options, CDOs backed by loans or bonds, mortgages, subprime mortgages and many other instruments. For almost all of these instruments, correlations are not observable in the market and must be estimated using historical information. Estimating correlation can be especially difficult where it may vary over time. Extracting correlation information from market data requires significant assumptions regarding the informational efficiency of the market (for example, swaption markets). Changes in correlation levels can have a major impact, favorable or unfavorable, on the value of an instrument, depending on its nature. A change in the default correlation of the fair value of the underlying bonds comprising a CDO structure would affect the fair value of the senior tranche. For example, an increase in the default correlation of the underlying bonds would reduce the fair value of the senior tranche, because
highly correlated instruments produce larger losses in the event of default and a part of these losses would become attributable to the senior tranche. That same change in default correlation would have a different impact on junior tranches of the same structure. Volatility Volatility represents the speed and severity of market price changes and is a key factor in pricing options. Typically, instruments can become more expensive if volatility increases. For example, as an index becomes more volatile, the cost to Citi of maintaining a given level of exposure increases because more frequent rebalancing of the portfolio is required. Volatility generally depends on the tenor of the underlying instrument and the strike price or level defined in the contract. Volatilities for certain combinations of tenor and strike are not observable. The general relationship between changes in the value of a portfolio to changes in volatility also depends on changes in interest rates and the level of the underlying index. Generally, long option positions (assets) benefit from increases in volatility, whereas short option positions (liabilities) will suffer losses. Some instruments are more sensitive to changes in volatility than others. For example, an at-the-money option would experience a larger percentage change in its fair value than a deep-in-the-money option. In addition, the fair value of an option with more than one underlying security (for example, an option on a basket of bonds) depends on the volatility of the individual underlying securities as well as their correlations. Yield Adjusted yield is generally used to discount the projected future principal and interest cash flows on instruments, such as asset-backed securities. Adjusted yield is impacted by changes in the interest rate environment and relevant credit spreads.
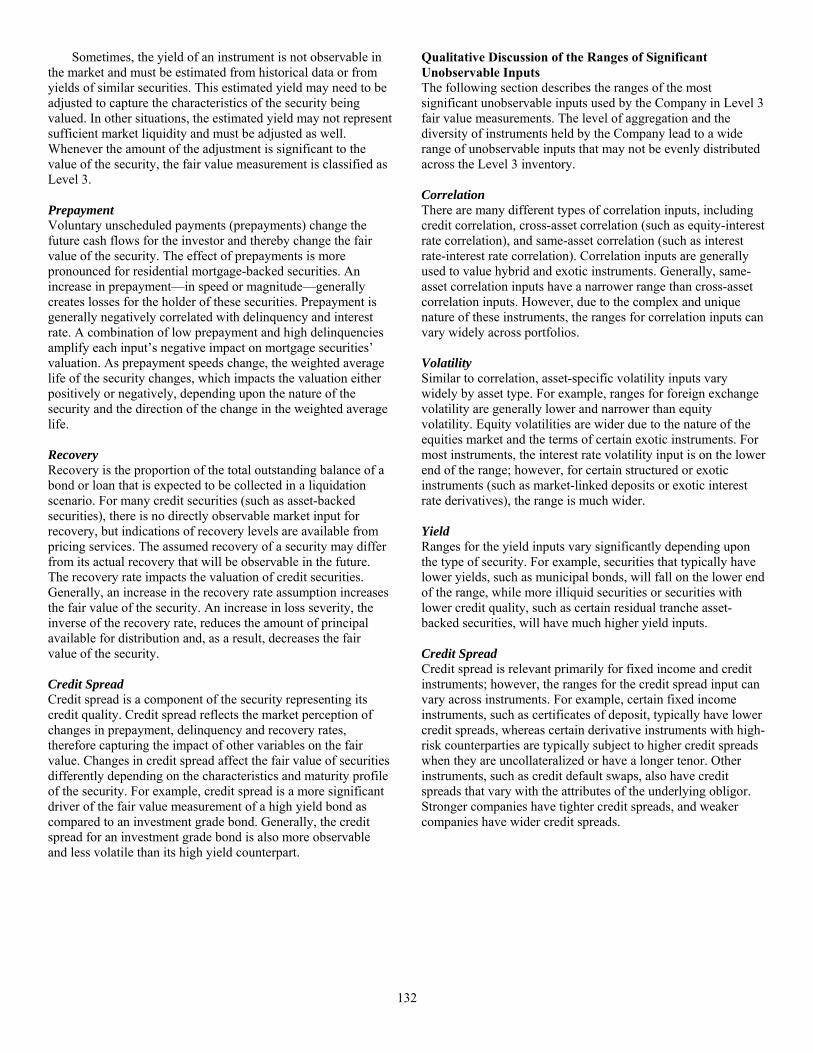
132
Sometimes, the yield of an instrument is not observable in the market and must be estimated from historical data or from yields of similar securities. This estimated yield may need to be adjusted to capture the characteristics of the security being valued. In other situations, the estimated yield may not represent sufficient market liquidity and must be adjusted as well. Whenever the amount of the adjustment is significant to the value of the security, the fair value measurement is classified as Level 3. Prepayment Voluntary unscheduled payments (prepayments) change the future cash flows for the investor and thereby change the fair value of the security. The effect of prepayments is more pronounced for residential mortgage-backed securities. An increase in prepayment—in speed or magnitude—generally creates losses for the holder of these securities. Prepayment is generally negatively correlated with delinquency and interest rate. A combination of low prepayment and high delinquencies amplify each input’s negative impact on mortgage securities’ valuation. As prepayment speeds change, the weighted average life of the security changes, which impacts the valuation either positively or negatively, depending upon the nature of the security and the direction of the change in the weighted average life. Recovery Recovery is the proportion of the total outstanding balance of a bond or loan that is expected to be collected in a liquidation scenario. For many credit securities (such as asset-backed securities), there is no directly observable market input for recovery, but indications of recovery levels are available from pricing services. The assumed recovery of a security may differ from its actual recovery that will be observable in the future. The recovery rate impacts the valuation of credit securities. Generally, an increase in the recovery rate assumption increases the fair value of the security. An increase in loss severity, the inverse of the recovery rate, reduces the amount of principal available for distribution and, as a result, decreases the fair value of the security. Credit Spread Credit spread is a component of the security representing its credit quality. Credit spread reflects the market perception of changes in prepayment, delinquency and recovery rates, therefore capturing the impact of other variables on the fair value. Changes in credit spread affect the fair value of securities differently depending on the characteristics and maturity profile of the security. For example, credit spread is a more significant driver of the fair value measurement of a high yield bond as compared to an investment grade bond. Generally, the credit spread for an investment grade bond is also more observable and less volatile than its high yield counterpart.
Qualitative Discussion of the Ranges of Significant Unobservable Inputs The following section describes the ranges of the most significant unobservable inputs used by the Company in Level 3 fair value measurements. The level of aggregation and the diversity of instruments held by the Company lead to a wide range of unobservable inputs that may not be evenly distributed across the Level 3 inventory. Correlation There are many different types of correlation inputs, including credit correlation, cross-asset correlation (such as equity-interest rate correlation), and same-asset correlation (such as interest rate-interest rate correlation). Correlation inputs are generally used to value hybrid and exotic instruments. Generally, same-asset correlation inputs have a narrower range than cross-asset correlation inputs. However, due to the complex and unique nature of these instruments, the ranges for correlation inputs can vary widely across portfolios. Volatility Similar to correlation, asset-specific volatility inputs vary widely by asset type. For example, ranges for foreign exchange volatility are generally lower and narrower than equity volatility. Equity volatilities are wider due to the nature of the equities market and the terms of certain exotic instruments. For most instruments, the interest rate volatility input is on the lower end of the range; however, for certain structured or exotic instruments (such as market-linked deposits or exotic interest rate derivatives), the range is much wider. Yield Ranges for the yield inputs vary significantly depending upon the type of security. For example, securities that typically have lower yields, such as municipal bonds, will fall on the lower end of the range, while more illiquid securities or securities with lower credit quality, such as certain residual tranche asset-backed securities, will have much higher yield inputs. Credit Spread Credit spread is relevant primarily for fixed income and credit instruments; however, the ranges for the credit spread input can vary across instruments. For example, certain fixed income instruments, such as certificates of deposit, typically have lower credit spreads, whereas certain derivative instruments with high-risk counterparties are typically subject to higher credit spreads when they are uncollateralized or have a longer tenor. Other instruments, such as credit default swaps, also have credit spreads that vary with the attributes of the underlying obligor. Stronger companies have tighter credit spreads, and weaker companies have wider credit spreads.
133
Price The price input is a significant unobservable input for certain fixed income instruments. For these instruments, the price input is expressed as a percentage of the notional amount, with a price of $100 meaning that the instrument is valued at par. For most of these instruments, the price varies between zero to $100, or slightly above $100. Relatively illiquid assets that have experienced significant losses since issuance, such as certain asset-backed securities, are at the lower end of the range, whereas most investment grade corporate bonds will fall in the middle to the higher end of the range. For certain structured debt instruments with embedded derivatives, the price input may be above $100 to reflect the embedded features of the instrument (for example, a step-up coupon or a conversion option). For the following classes of fixed income instruments, the weighted average price input below provides insight regarding the central tendencies of the ranges of this input reported for each instrument class as of December 31, 2012: Mortgage-backed securities $86.02State and municipal, foreign government, corporate, and other
debt securities 90.95Asset-backed securities 79.71Loans 91.25Short-term borrowings and long-term debt 93.38 The price input is also a significant unobservable input for certain equity securities; however, the range of price inputs varies depending on the nature of the position, the number of shares outstanding and other factors. Because of these factors, the weighted average price input for equity securities does not provide insight regarding the central tendencies of the ranges for equity securities, as equity prices are generally independent of one another and are not subject to a common measurement scale (for example, the zero to $100 range applicable to debt instruments). Items Measured at Fair Value on a Nonrecurring Basis Certain assets and liabilities are measured at fair value on a nonrecurring basis and therefore are not included in the tables above. These include assets measured at cost that have been written down to fair value during the periods as a result of an impairment. In addition, these assets include loans held-for-sale and other real estate owned that are measured at the lower of cost or market (LOCOM).
The following table presents the carrying amounts of all assets that were still held as of December 31, 2012 and 2011, and for which a nonrecurring fair value measurement was recorded during the year then ended: In millions of dollars Fair value Level 2 Level 3December 31, 2012 Loans held-for-sale $ 2,647 $ 1,159 $ 1,488Other real estate owned 201 22 179Loans (1) 5,732 5,160 572Other assets (2) 4,725 4,725 —Total assets at fair value on a
nonrecurring basis $ 13,305 $11,066 $2,239
(1) Represents impaired loans held for investment whose carrying amount is based on the fair value of the underlying collateral, including primarily real-estate secured loans.
(2) Represents Citi’s remaining 35% investment in the Morgan Stanley Smith Barney joint venture whose carrying amount is the agreed purchase price. See Note 15 to the Consolidated Financial Statements.
In millions of dollars Fair value Level 2 Level 3December 31, 2011 Loans held-for-sale $2,644 $1,668 $ 976Other real estate owned 271 88 183Loans (1) 3,911 3,185 726Total assets at fair value on a
nonrecurring basis $6,826 $4,941 $1,885
(1) Represents impaired loans held for investment whose carrying amount is based on the fair value of the underlying collateral, including primarily real-estate secured loans.
The fair value of loans-held-for-sale is determined where possible using quoted secondary-market prices. If no such quoted price exists, the fair value of a loan is determined using quoted prices for a similar asset or assets, adjusted for the specific attributes of that loan. Fair value for the other real estate owned is based on appraisals. For loans whose carrying amount is based on the fair value of the underlying collateral, the fair values depend on the type of collateral. Fair value of the collateral is typically estimated based on quoted market prices if available, appraisals or other internal valuation techniques. Where the fair value of the related collateral is based on an unadjusted appraised value, the loan is generally classified as Level 2. Where significant adjustments are made to the appraised value, the loan is classified as Level 3. Additionally, for corporate loans, appraisals of the collateral are often based on sales of similar assets; however, because the prices of similar assets require significant adjustments to reflect the unique features of the underlying collateral, these fair value measurements are generally classified as Level 3.
134
Valuation Techniques and Inputs for Level 3 Nonrecurring Fair Value Measurements The following table presents the valuation techniques covering the majority of Level 3 nonrecurring fair value measurements and the most significant unobservable inputs used in those measurements as of December 31, 2012:
Fair Value (1)
(in millions) Methodology Input Low HighLoans held-for-sale $747 Price-based Price $ 63.42 $ 100.00 485 External model Credit spread 40 bps 40 bps 174 Recovery analysis Other real estate owned 165 Price-based Discount to price 11.00% 50.00% Price (2) $ 39,774 $15,457,452 Loans (3) 351 Price-based Discount to price 25.00% 34.00% 111 Internal model Price (2) $6,272,242 $86,200,000 Discount rate 6.00% 16.49%
(1) The fair value amounts presented in this table represent the primary valuation technique or techniques for each class of assets or liabilities. (2) Prices are based on appraised values. (3) Represents loans held for investment whose carrying amounts are based on the fair value of the underlying collateral. Nonrecurring Fair Value Changes The following table presents total nonrecurring fair value measurements for the period, included in earnings, attributable to the change in fair value relating to assets that are still held at December 31, 2012 and 2011: In millions of dollars December 31, 2012Loans held-for-sale $ (19)Other real estate owned (29)Loans (1) (1,489)Other assets (2) (3,340)Total nonrecurring fair value gains (losses) $ (4,877)
(1) Represents loans held for investment whose carrying amount is based on the fair value of the underlying collateral, including primarily real-estate loans.
(2) Includes the recognition of a $3,340 million impairment charge related to the carrying value of Citi's remaining 35% interest in the Morgan Stanley Smith Barney joint venture. See Note 15 to the Consolidated Financial Statements.
In millions of dollars December 31, 2011Loans held-for-sale $ (201) Other real estate owned (71) Loans (1) (973) Total nonrecurring fair value gains (losses) $(1,245)
(1) Represents loans held for investment whose carrying amount is based on the fair value of the underlying collateral, including primarily real-estate loans.
Estimated Fair Value of Financial Instruments Not Carried at Fair Value The table below presents the carrying value and fair value of Citigroup’s financial instruments which are not carried at fair value. The table below therefore excludes items measured at fair value on a recurring basis presented in the tables above. The disclosure also excludes leases, affiliate investments, pension and benefit obligations and insurance policy claim reserves. In addition, contract-holder fund amounts exclude certain insurance contracts. Also, as required, the disclosure excludes the effect of taxes, any premium or discount that could result from offering for sale at one time the entire holdings of a particular instrument, excess fair value associated with deposits with no fixed maturity, and other expenses that would be incurred in a market transaction. In addition, the table excludes the values of non-financial assets and liabilities, as well as a wide range of franchise, relationship and intangible values, which are integral to a full assessment of Citigroup’s financial position and the value of its net assets. The fair value represents management’s best estimates based on a range of methodologies and assumptions. The carrying value of short-term financial instruments not accounted for at fair value, as well as receivables and payables arising in the ordinary course of business, approximates fair value because of the relatively short period of time between their origination and expected realization. Quoted market prices are used when available for investments and for liabilities, such as long-term debt not carried at fair value. For loans not accounted for at fair value, cash flows are discounted at quoted secondary market rates or estimated market rates if available. Otherwise, sales of comparable loan portfolios or current market origination rates for loans with similar terms and risk characteristics are used. Expected credit losses are either embedded in the estimated future cash flows or incorporated as an adjustment to the discount rate used. The value of collateral is also considered. For liabilities such as long-term debt not accounted for at fair value and without quoted market prices, market borrowing rates of interest are used to discount contractual cash flows.
135
December 31, 2012 Estimated fair valueIn billions of dollars Carrying value Estimated fair value Level 1 Level 2 Level 3Assets Investments $ 17.9 $ 18.4 $ 3.0 $ 14.3 $ 1.1Federal funds sold and securities borrowed or purchased under
agreements to resell 100.7 100.7 — 94.8 5.9Loans (1)(2) 621.9 612.2 — 4.2 608.0Other financial assets (2)(3) 192.8 192.8 11.4 128.3 53.1Liabilities Deposits $ 929.1 $ 927.4 $ — $748.7 $ 178.7Federal funds purchased and securities loaned or sold under
agreements to repurchase 94.5 94.5 — 94.4 0.1Long-term debt (4) 209.7 215.3 — 177.0 38.3Other financial liabilities (5) 139.0 139.0 — 31.1 107.9 December 31, 2011
In billions of dollars Carrying
value Estimatedfair value
Assets Investments $ 19.4 $ 18.4 Federal funds sold and securities borrowed or
purchased under agreements to resell 133.0 133.0 Loans (1)(2) 609.3 598.7 Other financial assets (2)(3) 245.7 245.7 Liabilities Deposits $864.6 $864.5 Federal funds purchased and securities loaned
or sold under agreements to repurchase 100.7 100.7 Long-term debt (4) 299.3 289.7 Other financial liabilities (5) 141.1 141.1
(1) The carrying value of loans is net of the Allowance for loan losses of $25.5 billion for December 31, 2012 and $30.1 billion for December 31, 2011. In addition, the carrying values exclude $2.8 billion and $2.5 billion of lease finance receivables at December 31, 2012 and December 31, 2011, respectively.
(2) Includes items measured at fair value on a nonrecurring basis. (3) Includes cash and due from banks, deposits with banks, brokerage receivables, reinsurance recoverable and other financial instruments included in Other assets on
the Consolidated Balance Sheet, for all of which the carrying value is a reasonable estimate of fair value. (4) The carrying value includes long-term debt balances carried at fair value under fair value hedge accounting. (5) Includes brokerage payables, separate and variable accounts, short-term borrowings (carried at cost) and other financial instruments included in Other liabilities
on the Consolidated Balance Sheet, for all of which the carrying value is a reasonable estimate of fair value. Fair values vary from period to period based on changes in a wide range of factors, including interest rates, credit quality and market perceptions of value, and as existing assets and liabilities run off and new transactions are entered into. The estimated fair values of loans reflect changes in credit status since the loans were made, changes in interest rates in the case of fixed-rate loans, and premium values at origination of certain loans. The carrying values (reduced by the Allowance for loan losses) exceeded the estimated fair values of Citigroup’s loans, in aggregate, by $9.7 billion and by $10.6 billion at December 31, 2012 and December 31, 2011, respectively. At December 31, 2012, the carrying values, net of allowances, exceeded the estimated fair values by $7.4 billion and $2.3 billion for Consumer loans and Corporate loans, respectively.
The estimated fair values of the Company’s corporate unfunded lending commitments at December 31, 2012 and December 31, 2011 were liabilities of $4.9 billion and $4.7 billion, respectively, which are substantially fair valued at Level 3. The Company does not estimate the fair values of consumer unfunded lending commitments, which are generally cancelable by providing notice to the borrower.

136
26. FAIR VALUE ELECTIONS The Company may elect to report most financial instruments and certain other items at fair value on an instrument-by-instrument basis with changes in fair value reported in earnings. The election is made upon the acquisition of an eligible financial asset, financial liability or firm commitment or when certain specified reconsideration events occur. The fair value election may not be revoked once an election is made. The changes in fair value are recorded in current earnings. Additional discussion regarding the applicable areas in which fair value elections were made is presented in Note 25 to the Consolidated Financial Statements. All servicing rights are recognized initially at fair value. The Company has elected fair value accounting for its mortgage servicing rights. See Note 22 to the Consolidated Financial Statements for further discussions regarding the accounting and reporting of MSRs. The following table presents, as of December 31, 2012 and 2011, the fair value of those positions selected for fair value accounting, as well as the changes in fair value gains and losses for the years ended December 31, 2012 and 2011:
Fair value at December 31,
Changes in fair value gains (losses) for the years ended December 31,
In millions of dollars 2012 2011 2012 2011 Assets Federal funds sold and securities borrowed or purchased under agreements to resell
Selected portfolios of securities purchased under agreements to resell and securities borrowed (1) $ 160,589 $ 142,862 $ (409) $ (138)
Trading account assets 17,206 14,179 838 (1,775)Investments 443 526 (50) 233 Loans Certain Corporate loans (2) 4,056 3,939 77 82 Certain Consumer loans (2) 1,231 1,326 (104) (281)Total loans $ 5,287 $ 5,265 $ (27) $ (199)Other assets MSRs $ 1,942 $ 2,569 $ (427) $(1,465) Certain mortgage loans held for sale 6,879 6,213 350 172 Certain equity method investments 22 47 3 (17)Total other assets $ 8,843 $ 8,829 $ (74) $(1,310)Total assets $ 192,368 $ 171,661 $ 278 $(3,189)Liabilities Interest-bearing deposits $ 1,447 $ 1,326 $ (218) $ 107 Federal funds purchased and securities loaned or sold under agreements to
repurchase Selected portfolios of securities sold under agreements to repurchase and
securities loaned (1) 116,689 97,712 66 (108)Trading account liabilities 1,461 1,763 (143) 872 Short-term borrowings 818 1,354 (2) (15)Long-term debt 29,764 24,172 (2,225) 1,611 Total liabilities $ 150,179 $ 126,327 $(2,522) $ 2,467 (1) Reflects netting of the amounts due from securities purchased under agreements to resell and the amounts owed under securities sold under agreements to
repurchase. (2) Includes mortgage loans held by mortgage loan securitization VIEs consolidated upon the adoption of SFAS 167 on January 1, 2010.
137
Own Debt Valuation Adjustments for Structured Debt Own debt valuation adjustments are recognized on Citi’s debt liabilities for which the fair value option has been elected using Citi’s credit spreads observed in the bond market. The fair value of debt liabilities for which the fair value option is elected (other than non-recourse and similar liabilities) is impacted by the narrowing or widening of the Company’s credit spreads. The estimated change in the fair value of these debt liabilities due to such changes in the Company’s own credit risk (or instrument-specific credit risk) was a loss of $2,009 million and a gain of $1,774 million for the years ended December 31, 2012 and 2011, respectively. Changes in fair value resulting from changes in instrument-specific credit risk were estimated by incorporating the Company’s current credit spreads observable in the bond market into the relevant valuation technique used to value each liability as described above. The Fair Value Option for Financial Assets and Financial Liabilities Selected portfolios of securities purchased under agreements to resell, securities borrowed, securities sold under agreements to repurchase, securities loaned and certain non-collateralized short-term borrowings The Company elected the fair value option for certain portfolios of fixed-income securities purchased under agreements to resell and fixed-income securities sold under agreements to repurchase, securities borrowed, securities loaned (and certain non-collateralized short-term borrowings) on broker-dealer entities in the United States, United Kingdom and Japan. In each case, the election was made because the related interest-rate risk is managed on a portfolio basis, primarily with derivative instruments that are accounted for at fair value through earnings. Changes in fair value for transactions in these portfolios are recorded in Principal transactions. The related interest revenue and interest expense are measured based on the contractual rates specified in the transactions and are reported as interest revenue and expense in the Consolidated Statement of Income.
Selected letters of credit and revolving loans hedged by credit default swaps or participation notes The Company has elected the fair value option for certain letters of credit that are hedged with derivative instruments or participation notes. Citigroup elected the fair value option for these transactions because the risk is managed on a fair value basis and mitigates accounting mismatches. There was no notional amount of these unfunded letters of credit at December 31, 2012 and $0.6 billion at December 31, 2011. The amount funded was insignificant with no amounts 90 days or more past due or on non-accrual status at December 31, 2012 and 2011. These items have been classified in Trading account assets or Trading account liabilities on the Consolidated Balance Sheet. Changes in fair value of these items are classified in Principal transactions in the Company’s Consolidated Statement of Income. Certain loans and other credit products Citigroup has elected the fair value option for certain originated and purchased loans, including certain unfunded loan products, such as guarantees and letters of credit, executed by Citigroup’s lending and trading businesses. None of these credit products are highly leveraged financing commitments. Significant groups of transactions include loans and unfunded loan products that are expected to be either sold or securitized in the near term, or transactions where the economic risks are hedged with derivative instruments such as purchased credit default swaps or total return swaps where the Company pays the total return on the underlying loans to a third party. Citigroup has elected the fair value option to mitigate accounting mismatches in cases where hedge accounting is complex and to achieve operational simplifications. Fair value was not elected for most lending transactions across the Company, including where management objectives would not be met. Certain investments in unallocated precious metals Citigroup invests in unallocated precious metals accounts (gold, silver, platinum and palladium) as part of its commodity trading business or to economically hedge certain exposures from issuing structured liabilities. Under ASC 815, the investment is bifurcated into a debt host contract and a commodity forward derivative instrument. Citigroup elects the fair value option for the debt host contract, and reports the debt host contract within Trading account assets on the Company’s Consolidated Balance Sheet. The total carrying amount of debt host contracts across unallocated precious metals accounts at December 31, 2012 was approximately $5.5 billion. The amounts are expected to fluctuate based on trading activity in the future periods.

138
The following table provides information about certain credit products carried at fair value at December 31, 2012 and 2011: December 31, 2012 December 31, 2011 In millions of dollars Trading assets Loans Trading assets Loans Carrying amount reported on the Consolidated Balance Sheet $11,658 $ 3,893 $14,150 $ 3,735 Aggregate unpaid principal balance in excess of (less than) fair value 31 (132) 540 (54)Balance of non-accrual loans or loans more than 90 days past due 104 — 134 — Aggregate unpaid principal balance in excess of fair value for non-accrual
loans or loans more than 90 days past due 85 — 43 — In addition to the amounts reported above, $1,891 million and $648 million of unfunded loan commitments related to certain credit products selected for fair value accounting were outstanding as of December 31, 2012 and 2011, respectively. Changes in fair value of funded and unfunded credit products are classified in Principal transactions in the Company’s Consolidated Statement of Income. Related interest revenue is measured based on the contractual interest rates and reported as Interest revenue on Trading account assets or loan interest depending on the balance sheet classifications of the credit products. The changes in fair value for the years ended December 31, 2012 and 2011 due to instrument-specific credit risk totaled to a gain of $39 million and $53 million, respectively. Certain investments in private equity and real estate ventures and certain equity method investments Citigroup invests in private equity and real estate ventures for the purpose of earning investment returns and for capital appreciation. The Company has elected the fair value option for certain of these ventures, because such investments are considered similar to many private equity or hedge fund activities in Citi’s investment companies, which are reported at fair value. The fair value option brings consistency in the accounting and evaluation of these investments. All investments (debt and equity) in such private equity and real estate entities are accounted for at fair value. These investments are classified as Investments on Citigroup’s Consolidated Balance Sheet. Citigroup also holds various non-strategic investments in leveraged buyout funds and other hedge funds for which the Company elected fair value accounting to reduce operational and accounting complexity. Since the funds account for all of their underlying assets at fair value, the impact of applying the equity method to Citigroup’s investment in these funds was equivalent to fair value accounting. These investments are classified as Other assets on Citigroup’s Consolidated Balance Sheet. Changes in the fair values of these investments are classified in Other revenue in the Company’s Consolidated Statement of Income.
Certain mortgage loans (HFS) Citigroup has elected the fair value option for certain purchased and originated prime fixed-rate and conforming adjustable-rate first mortgage loans HFS. These loans are intended for sale or securitization and are hedged with derivative instruments. The Company has elected the fair value option to mitigate accounting mismatches in cases where hedge accounting is complex and to achieve operational simplifications.
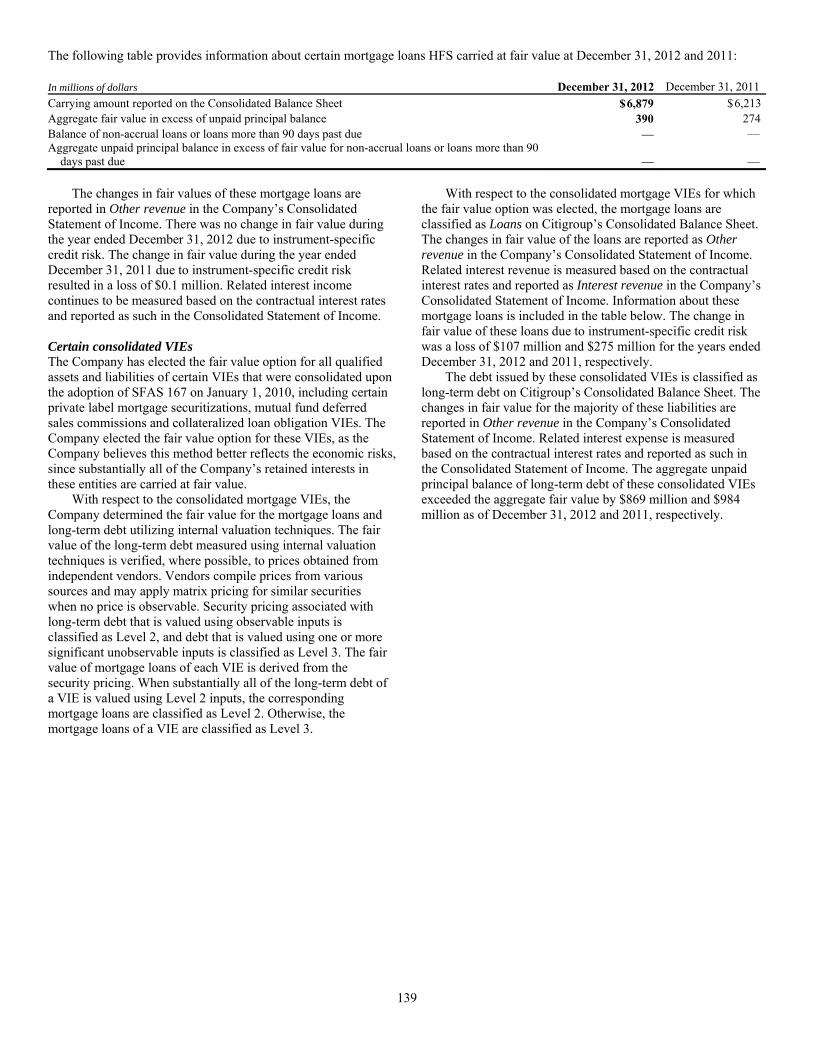
139
The following table provides information about certain mortgage loans HFS carried at fair value at December 31, 2012 and 2011: In millions of dollars December 31, 2012 December 31, 2011 Carrying amount reported on the Consolidated Balance Sheet $ 6,879 $ 6,213Aggregate fair value in excess of unpaid principal balance 390 274Balance of non-accrual loans or loans more than 90 days past due — — Aggregate unpaid principal balance in excess of fair value for non-accrual loans or loans more than 90
days past due — — The changes in fair values of these mortgage loans are reported in Other revenue in the Company’s Consolidated Statement of Income. There was no change in fair value during the year ended December 31, 2012 due to instrument-specific credit risk. The change in fair value during the year ended December 31, 2011 due to instrument-specific credit risk resulted in a loss of $0.1 million. Related interest income continues to be measured based on the contractual interest rates and reported as such in the Consolidated Statement of Income. Certain consolidated VIEs The Company has elected the fair value option for all qualified assets and liabilities of certain VIEs that were consolidated upon the adoption of SFAS 167 on January 1, 2010, including certain private label mortgage securitizations, mutual fund deferred sales commissions and collateralized loan obligation VIEs. The Company elected the fair value option for these VIEs, as the Company believes this method better reflects the economic risks, since substantially all of the Company’s retained interests in these entities are carried at fair value. With respect to the consolidated mortgage VIEs, the Company determined the fair value for the mortgage loans and long-term debt utilizing internal valuation techniques. The fair value of the long-term debt measured using internal valuation techniques is verified, where possible, to prices obtained from independent vendors. Vendors compile prices from various sources and may apply matrix pricing for similar securities when no price is observable. Security pricing associated with long-term debt that is valued using observable inputs is classified as Level 2, and debt that is valued using one or more significant unobservable inputs is classified as Level 3. The fair value of mortgage loans of each VIE is derived from the security pricing. When substantially all of the long-term debt of a VIE is valued using Level 2 inputs, the corresponding mortgage loans are classified as Level 2. Otherwise, the mortgage loans of a VIE are classified as Level 3.
With respect to the consolidated mortgage VIEs for which the fair value option was elected, the mortgage loans are classified as Loans on Citigroup’s Consolidated Balance Sheet. The changes in fair value of the loans are reported as Other revenue in the Company’s Consolidated Statement of Income. Related interest revenue is measured based on the contractual interest rates and reported as Interest revenue in the Company’s Consolidated Statement of Income. Information about these mortgage loans is included in the table below. The change in fair value of these loans due to instrument-specific credit risk was a loss of $107 million and $275 million for the years ended December 31, 2012 and 2011, respectively. The debt issued by these consolidated VIEs is classified as long-term debt on Citigroup’s Consolidated Balance Sheet. The changes in fair value for the majority of these liabilities are reported in Other revenue in the Company’s Consolidated Statement of Income. Related interest expense is measured based on the contractual interest rates and reported as such in the Consolidated Statement of Income. The aggregate unpaid principal balance of long-term debt of these consolidated VIEs exceeded the aggregate fair value by $869 million and $984 million as of December 31, 2012 and 2011, respectively.
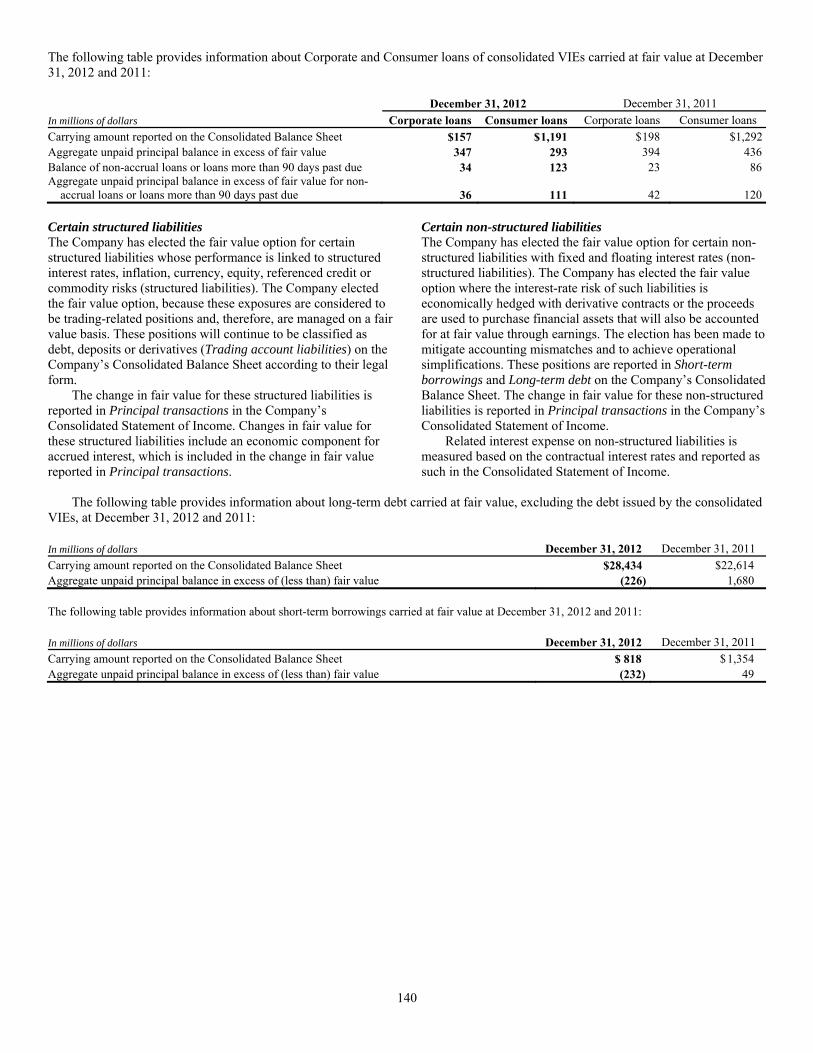
140
The following table provides information about Corporate and Consumer loans of consolidated VIEs carried at fair value at December 31, 2012 and 2011: December 31, 2012 December 31, 2011 In millions of dollars Corporate loans Consumer loans Corporate loans Consumer loans Carrying amount reported on the Consolidated Balance Sheet $157 $ 1,191 $ 198 $1,292Aggregate unpaid principal balance in excess of fair value 347 293 394 436Balance of non-accrual loans or loans more than 90 days past due 34 123 23 86Aggregate unpaid principal balance in excess of fair value for non-
accrual loans or loans more than 90 days past due 36 111 42 120 Certain structured liabilities The Company has elected the fair value option for certain structured liabilities whose performance is linked to structured interest rates, inflation, currency, equity, referenced credit or commodity risks (structured liabilities). The Company elected the fair value option, because these exposures are considered to be trading-related positions and, therefore, are managed on a fair value basis. These positions will continue to be classified as debt, deposits or derivatives (Trading account liabilities) on the Company’s Consolidated Balance Sheet according to their legal form. The change in fair value for these structured liabilities is reported in Principal transactions in the Company’s Consolidated Statement of Income. Changes in fair value for these structured liabilities include an economic component for accrued interest, which is included in the change in fair value reported in Principal transactions.
Certain non-structured liabilities The Company has elected the fair value option for certain non-structured liabilities with fixed and floating interest rates (non-structured liabilities). The Company has elected the fair value option where the interest-rate risk of such liabilities is economically hedged with derivative contracts or the proceeds are used to purchase financial assets that will also be accounted for at fair value through earnings. The election has been made to mitigate accounting mismatches and to achieve operational simplifications. These positions are reported in Short-term borrowings and Long-term debt on the Company’s Consolidated Balance Sheet. The change in fair value for these non-structured liabilities is reported in Principal transactions in the Company’s Consolidated Statement of Income. Related interest expense on non-structured liabilities is measured based on the contractual interest rates and reported as such in the Consolidated Statement of Income.
The following table provides information about long-term debt carried at fair value, excluding the debt issued by the consolidated VIEs, at December 31, 2012 and 2011: In millions of dollars December 31, 2012 December 31, 2011 Carrying amount reported on the Consolidated Balance Sheet $ 28,434 $22,614 Aggregate unpaid principal balance in excess of (less than) fair value (226) 1,680 The following table provides information about short-term borrowings carried at fair value at December 31, 2012 and 2011: In millions of dollars December 31, 2012 December 31, 2011 Carrying amount reported on the Consolidated Balance Sheet $ 818 $ 1,354 Aggregate unpaid principal balance in excess of (less than) fair value (232) 49

141
27. PLEDGED ASSETS, COLLATERAL, COMMITMENTS AND GUARANTEES Pledged Assets In connection with the Company’s financing and trading activities, the Company has pledged assets to collateralize its obligations under repurchase agreements, secured financing agreements, secured liabilities of consolidated VIEs and other borrowings. At December 31, 2012 and 2011, the approximate carrying values of the significant components of pledged assets recognized on the Company’s Consolidated Balance Sheet include: In millions of dollars 2012 2011 Investment securities $ 187,295 $ 129,093Loans 234,797 235,031Trading account assets 123,178 114,539Total $ 545,270 $ 478,663 In addition, included in cash and due from banks at December 31, 2012 and 2011 are $13.4 billion and $13.6 billion, respectively, of cash segregated under federal and other brokerage regulations or deposited with clearing organizations. At December 31, 2012 and 2011, the Company had $286 million and $1.4 billion, respectively, of outstanding letters of credit from third-party banks to satisfy various collateral and margin requirements. Collateral At December 31, 2012 and 2011, the approximate fair value of collateral received by the Company that may be resold or repledged by the Company, excluding the impact of allowable netting, was $305.9 billion and $350.0 billion, respectively. This collateral was received in connection with resale agreements, securities borrowings and loans, derivative transactions and margined broker loans. At December 31, 2012 and 2011, a substantial portion of the collateral received by the Company had been sold or repledged in connection with repurchase agreements, securities sold, not yet purchased, securities borrowings and loans, pledges to clearing organizations, segregation requirements under securities laws and regulations, derivative transactions and bank loans.
In addition, at December 31, 2012 and 2011, the Company had pledged $418 billion and $345 billion, respectively, of collateral that may not be sold or repledged by the secured parties. Lease Commitments Rental expense (principally for offices and computer equipment) was $1.5 billion, $1.6 billion and $1.6 billion for the years ended December 31, 2012, 2011 and 2010, respectively. Future minimum annual rentals under noncancelable leases, net of sublease income, are as follows: In millions of dollars 2013 $1,2202014 1,1252015 1,0012016 8812017 754Thereafter 2,293Total $7,274 Guarantees The Company provides a variety of guarantees and indemnifications to Citigroup customers to enhance their credit standing and enable them to complete a wide variety of business transactions. For certain contracts meeting the definition of a guarantee, the guarantor must recognize, at inception, a liability for the fair value of the obligation undertaken in issuing the guarantee. In addition, the guarantor must disclose the maximum potential amount of future payments that the guarantor could be required to make under the guarantee, if there were a total default by the guaranteed parties. The determination of the maximum potential future payments is based on the notional amount of the guarantees without consideration of possible recoveries under recourse provisions or from collateral held or pledged. As such, the Company believes such amounts bear no relationship to the anticipated losses, if any, on these guarantees. The following tables present information about the Company’s guarantees at December 31, 2012 and December 31, 2011:
Maximum potential amount of future payments
In billions of dollars at December 31, 2012 except carrying value in millions Expire within
1 yearExpire after
1 yearTotal amount outstanding
Carrying value (in millions of dollars)
Financial standby letters of credit $ 22.3 $ 79.8 $102.1 $ 432.8Performance guarantees 7.3 4.7 12.0 41.6Derivative instruments considered to be guarantees 11.2 45.5 56.7 2,648.7Loans sold with recourse — 0.5 0.5 87.0Securities lending indemnifications (1) 80.4 — 80.4 —Credit card merchant processing (1) 70.3 — 70.3 —Custody indemnifications and other — 30.2 30.2 —Total $191.5 $160.7 $352.2 $ 3,210.1 (1) The carrying values of securities lending indemnifications and credit card merchant processing are not material, as the Company has determined that the amount
and probability of potential liabilities arising from these guarantees are not significant.
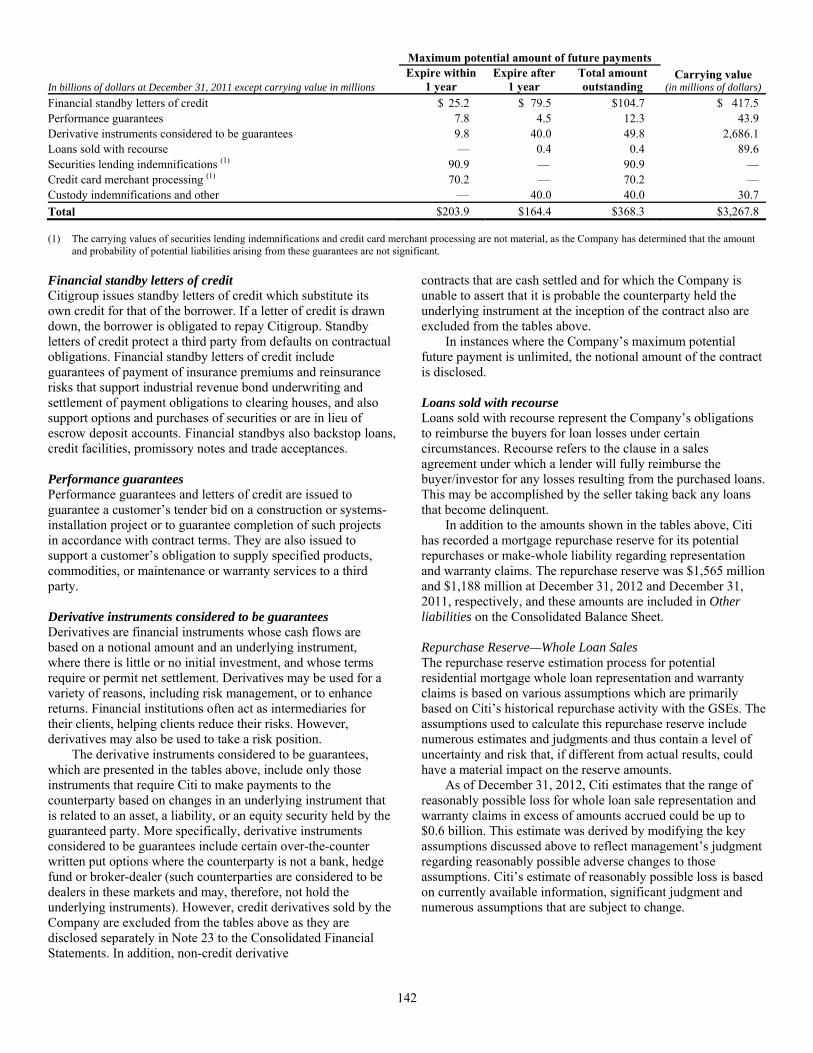
142
Maximum potential amount of future payments
In billions of dollars at December 31, 2011 except carrying value in millions Expire within
1 yearExpire after
1 yearTotal amount outstanding
Carrying value (in millions of dollars)
Financial standby letters of credit $ 25.2 $ 79.5 $104.7 $ 417.5 Performance guarantees 7.8 4.5 12.3 43.9 Derivative instruments considered to be guarantees 9.8 40.0 49.8 2,686.1 Loans sold with recourse — 0.4 0.4 89.6 Securities lending indemnifications (1) 90.9 — 90.9 — Credit card merchant processing (1) 70.2 — 70.2 — Custody indemnifications and other — 40.0 40.0 30.7 Total $203.9 $ 164.4 $368.3 $3,267.8 (1) The carrying values of securities lending indemnifications and credit card merchant processing are not material, as the Company has determined that the amount
and probability of potential liabilities arising from these guarantees are not significant. Financial standby letters of credit Citigroup issues standby letters of credit which substitute its own credit for that of the borrower. If a letter of credit is drawn down, the borrower is obligated to repay Citigroup. Standby letters of credit protect a third party from defaults on contractual obligations. Financial standby letters of credit include guarantees of payment of insurance premiums and reinsurance risks that support industrial revenue bond underwriting and settlement of payment obligations to clearing houses, and also support options and purchases of securities or are in lieu of escrow deposit accounts. Financial standbys also backstop loans, credit facilities, promissory notes and trade acceptances. Performance guarantees Performance guarantees and letters of credit are issued to guarantee a customer’s tender bid on a construction or systems-installation project or to guarantee completion of such projects in accordance with contract terms. They are also issued to support a customer’s obligation to supply specified products, commodities, or maintenance or warranty services to a third party. Derivative instruments considered to be guarantees Derivatives are financial instruments whose cash flows are based on a notional amount and an underlying instrument, where there is little or no initial investment, and whose terms require or permit net settlement. Derivatives may be used for a variety of reasons, including risk management, or to enhance returns. Financial institutions often act as intermediaries for their clients, helping clients reduce their risks. However, derivatives may also be used to take a risk position. The derivative instruments considered to be guarantees, which are presented in the tables above, include only those instruments that require Citi to make payments to the counterparty based on changes in an underlying instrument that is related to an asset, a liability, or an equity security held by the guaranteed party. More specifically, derivative instruments considered to be guarantees include certain over-the-counter written put options where the counterparty is not a bank, hedge fund or broker-dealer (such counterparties are considered to be dealers in these markets and may, therefore, not hold the underlying instruments). However, credit derivatives sold by the Company are excluded from the tables above as they are disclosed separately in Note 23 to the Consolidated Financial Statements. In addition, non-credit derivative
contracts that are cash settled and for which the Company is unable to assert that it is probable the counterparty held the underlying instrument at the inception of the contract also are excluded from the tables above. In instances where the Company’s maximum potential future payment is unlimited, the notional amount of the contract is disclosed. Loans sold with recourse Loans sold with recourse represent the Company’s obligations to reimburse the buyers for loan losses under certain circumstances. Recourse refers to the clause in a sales agreement under which a lender will fully reimburse the buyer/investor for any losses resulting from the purchased loans. This may be accomplished by the seller taking back any loans that become delinquent. In addition to the amounts shown in the tables above, Citi has recorded a mortgage repurchase reserve for its potential repurchases or make-whole liability regarding representation and warranty claims. The repurchase reserve was $1,565 million and $1,188 million at December 31, 2012 and December 31, 2011, respectively, and these amounts are included in Other liabilities on the Consolidated Balance Sheet. Repurchase Reserve—Whole Loan Sales The repurchase reserve estimation process for potential residential mortgage whole loan representation and warranty claims is based on various assumptions which are primarily based on Citi’s historical repurchase activity with the GSEs. The assumptions used to calculate this repurchase reserve include numerous estimates and judgments and thus contain a level of uncertainty and risk that, if different from actual results, could have a material impact on the reserve amounts. As of December 31, 2012, Citi estimates that the range of reasonably possible loss for whole loan sale representation and warranty claims in excess of amounts accrued could be up to $0.6 billion. This estimate was derived by modifying the key assumptions discussed above to reflect management’s judgment regarding reasonably possible adverse changes to those assumptions. Citi’s estimate of reasonably possible loss is based on currently available information, significant judgment and numerous assumptions that are subject to change.
143
Repurchase Reserve—Private-Label Securitizations Investors in private-label securitizations may seek recovery for alleged breaches of representations and warranties, as well as losses caused by non-performing loans more generally, through repurchase claims or through litigation premised on a variety of legal theories. Citi considers litigation relating to private-label securitizations as part of its contingencies analysis. For additional information, see Note 28 to the Consolidated Financial Statements. Of the repurchase claims received, Citi believes some are based on a review of the underlying loan files, while others are not based on such a review. In either case, upon receipt of a claim, Citi typically requests that it be provided with the underlying detail supporting the claim. To date, Citi has received little or no response to these requests for information. Citi cannot reasonably estimate probable losses from future repurchase claims for private-label securitizations because the claims to date have been received at an unpredictable rate, the factual basis for those claims is unclear, and very few such claims have been resolved. Rather, at the present time, Citi records reserves related to private-label securitizations repurchase claims based on estimated losses arising from those actual claims received that appear to be based on a review of the underlying loan files. The estimation reflected in this reserve is based on currently available information and relies on various assumptions that involve numerous estimates and judgments that are inherently uncertain and subject to change. If actual experiences differ from Citi’s assumptions, future provisions may differ substantially from Citi’s current reserves. Securities lending indemnifications Owners of securities frequently lend those securities for a fee to other parties who may sell them short or deliver them to another party to satisfy some other obligation. Banks may administer such securities lending programs for their clients. Securities lending indemnifications are issued by the bank to guarantee that a securities lending customer will be made whole in the event that the security borrower does not return the security subject to the lending agreement and collateral held is insufficient to cover the market value of the security.
Credit card merchant processing Credit card merchant processing guarantees represent the Company’s indirect obligations in connection with the processing of private label and bank card transactions on behalf of merchants. Citigroup’s primary credit card business is the issuance of credit cards to individuals. In addition, the Company: (i) provides transaction processing services to various merchants with respect to its private-label cards and (ii) has potential liability for bank card transaction processing services. The nature of the liability in either case arises as a result of a billing dispute between a merchant and a cardholder that is ultimately resolved in the cardholder’s favor. The merchant is liable to refund the amount to the cardholder. In general, if the credit card processing company is unable to collect this amount from the merchant, the credit card processing company bears the loss for the amount of the credit or refund paid to the cardholder. With regard to (i) above, the Company continues to have the primary contingent liability with respect to its portfolio of private-label merchants. The risk of loss is mitigated as the cash flows between the Company and the merchant are settled on a net basis and the Company has the right to offset any payments with cash flows otherwise due to the merchant. To further mitigate this risk the Company may delay settlement, require a merchant to make an escrow deposit, include event triggers to provide the Company with more financial and operational control in the event of the financial deterioration of the merchant, or require various credit enhancements (including letters of credit and bank guarantees). In the unlikely event that a private-label merchant is unable to deliver products, services or a refund to its private-label cardholders, the Company is contingently liable to credit or refund cardholders. With regard to (ii) above, the Company has a potential liability for bank card transactions where Citi provides the transaction processing services as well as those where a third party provides the services and Citi acts as a secondary guarantor, should that processor fail to perform. The Company’s maximum potential contingent liability related to both bank card and private-label merchant processing services is estimated to be the total volume of credit card transactions that meet the requirements to be valid charge-back transactions at any given time. At December 31, 2012 and December 31, 2011, this maximum potential exposure was estimated to be $70 billion. However, the Company believes that the maximum exposure is not representative of the actual potential loss exposure based on the Company’s historical experience. This contingent liability is unlikely to arise, as most products and services are delivered when purchased and amounts are refunded when items are returned to merchants. The Company assesses the probability and amount of its contingent liability related to merchant processing based on the financial strength of the primary guarantor, the extent and nature of unresolved charge-backs and its historical loss experience. At December 31, 2012 and December 31, 2011, the losses incurred and the carrying amounts of the Company’s contingent obligations related to merchant processing activities were immaterial.
144
Custody indemnifications Custody indemnifications are issued to guarantee that custody clients will be made whole in the event that a third-party subcustodian or depository institution fails to safeguard clients’ assets. Other guarantees and indemnifications Credit Card Protection Programs The Company, through its credit card business, provides various cardholder protection programs on several of its card products, including programs that provide insurance coverage for rental cars, coverage for certain losses associated with purchased products, price protection for certain purchases and protection for lost luggage. These guarantees are not included in the table, since the total outstanding amount of the guarantees and the Company’s maximum exposure to loss cannot be quantified. The protection is limited to certain types of purchases and certain types of losses, and it is not possible to quantify the purchases that would qualify for these benefits at any given time. The Company assesses the probability and amount of its potential liability related to these programs based on the extent and nature of its historical loss experience. At December 31, 2012 and December 31, 2011, the actual and estimated losses incurred and the carrying value of the Company’s obligations related to these programs were immaterial. Other Representation and Warranty Indemnifications In the normal course of business, the Company provides standard representations and warranties to counterparties in contracts in connection with numerous transactions and also provides indemnifications, including indemnifications that protect the counterparties to the contracts in the event that additional taxes are owed due either to a change in the tax law or an adverse interpretation of the tax law. Counterparties to these transactions provide the Company with comparable indemnifications. While such representations, warranties and indemnifications are essential components of many contractual relationships, they do not represent the underlying business purpose for the transactions. The indemnification clauses are often standard contractual terms related to the Company’s own performance under the terms of a contract and are entered into in the normal course of business based on an assessment that the risk of loss is remote. Often these clauses are intended to ensure that terms of a contract are met at inception. No compensation is received for these standard representations and warranties, and it is not possible to determine their fair value because they rarely, if ever, result in a payment. In many cases, there are no stated or notional amounts included in the indemnification clauses, and the contingencies potentially triggering the obligation to indemnify have not occurred and are not expected to occur. These indemnifications are not included in the tables above.
Value-Transfer Networks The Company is a member of, or shareholder in, hundreds of value-transfer networks (VTNs) (payment, clearing and settlement systems as well as exchanges) around the world. As a condition of membership, many of these VTNs require that members stand ready to pay a pro rata share of the losses incurred by the organization due to another member’s default on its obligations. The Company’s potential obligations may be limited to its membership interests in the VTNs, contributions to the VTN’s funds, or, in limited cases, the obligation may be unlimited. The maximum exposure cannot be estimated as this would require an assessment of future claims that have not yet occurred. We believe the risk of loss is remote given historical experience with the VTNs. Accordingly, the Company’s participation in VTNs is not reported in the Company’s guarantees tables above, and there are no amounts reflected on the Consolidated Balance Sheet as of December 31, 2012 or December 31, 2011 for potential obligations that could arise from the Company’s involvement with VTN associations. Long-Term Care Insurance Indemnification In the sale of an insurance subsidiary, the Company provided an indemnification to an insurance company for policyholder claims and other liabilities relating to a book of long-term care (LTC) business (for the entire term of the LTC policies) that is fully reinsured by another insurance company. The reinsurer has funded two trusts with securities whose fair value (approximately $4.9 billion at December 31, 2012 and $4.4 billion at December 31, 2011) is designed to cover the insurance company’s statutory liabilities for the LTC policies. The assets in these trusts are evaluated and adjusted periodically to ensure that the fair value of the assets continues to cover the estimated statutory liabilities related to the LTC policies, as those statutory liabilities change over time. If the reinsurer fails to perform under the reinsurance agreement for any reason, including insolvency, and the assets in the two trusts are insufficient or unavailable to the ceding insurance company, then Citigroup must indemnify the ceding insurance company for any losses actually incurred in connection with the LTC policies. Since both events would have to occur before Citi would become responsible for any payment to the ceding insurance company pursuant to its indemnification obligation, and the likelihood of such events occurring is currently not probable, there is no liability reflected in the Consolidated Balance Sheet as of December 31, 2012 related to this indemnification. Citi continues to closely monitor its potential exposure under this indemnification obligation. Carrying Value—Guarantees and Indemnifications At December 31, 2012 and December 31, 2011, the total carrying amounts of the liabilities related to the guarantees and indemnifications included in the tables above amounted to approximately $3.2 billion and $3.3 billion, respectively. The carrying value of derivative instruments is included in either Trading account liabilities or Other liabilities, depending upon whether the derivative was entered into for trading or non-trading purposes. The carrying value of financial and performance guarantees is included in Other liabilities. For loans sold with recourse, the carrying value of the liability is included in Other liabilities. In addition, at December 31, 2012 and December 31, 2011, Other liabilities on the Consolidated Balance Sheet included an allowance for credit losses of $1,119 million and $1,136 million, respectively, relating to letters of credit and unfunded lending commitments.
145
Collateral Cash collateral available to the Company to reimburse losses realized under these guarantees and indemnifications amounted to $39 billion and $35 billion at December 31, 2012 and December 31, 2011, respectively. Securities and other marketable assets held as collateral amounted to $51 billion and $65 billion at December 31, 2012 and December 31, 2011, respectively. The majority of collateral is held to reimburse losses realized under securities lending indemnifications. Additionally, letters of credit in favor of the Company held as collateral amounted to $3.4 billion and $3.2 billion at December 31, 2012 and December 31, 2011, respectively. Other property may also be available to the Company to cover losses under certain guarantees and indemnifications; however, the value of such property has not been determined.
Performance risk Citi evaluates the performance risk of its guarantees based on the assigned referenced counterparty internal or external ratings. Where external ratings are used, investment-grade ratings are considered to be Baa/BBB and above, while anything below is considered non-investment grade. The Citi internal ratings are in line with the related external rating system. On certain underlying referenced credits or entities, ratings are not available. Such referenced credits are included in the “not rated” category. The maximum potential amount of the future payments related to guarantees and credit derivatives sold is determined to be the notional amount of these contracts, which is the par amount of the assets guaranteed. Presented in the tables below are the maximum potential amounts of future payments that are classified based upon internal and external credit ratings as of December 31, 2012 and December 31, 2011. As previously mentioned, the determination of the maximum potential future payments is based on the notional amount of the guarantees without consideration of possible recoveries under recourse provisions or from collateral held or pledged. As such, the Company believes such amounts bear no relationship to the anticipated losses, if any, on these guarantees.
Maximum potential amount of future payments
In billions of dollars as of December 31, 2012 Investment
gradeNon-investment
gradeNot
rated TotalFinancial standby letters of credit $ 80.9 $11.0 $ 10.2 $102.1Performance guarantees 7.3 3.0 1.7 12.0Derivative instruments deemed to be guarantees — — 56.7 56.7Loans sold with recourse — — 0.5 0.5Securities lending indemnifications — — 80.4 80.4Credit card merchant processing — — 70.3 70.3Custody indemnifications and other 30.1 0.1 — 30.2Total $118.3 $14.1 $219.8 $352.2 Maximum potential amount of future payments
In billions of dollars as of December 31, 2011 Investment
gradeNon-investment
gradeNot
rated TotalFinancial standby letters of credit $ 79.3 $17.2 $ 8.2 $ 104.7Performance guarantees 6.9 3.2 2.2 12.3Derivative instruments deemed to be guarantees — — 49.8 49.8Loans sold with recourse — — 0.4 0.4Securities lending indemnifications — — 90.9 90.9Credit card merchant processing — — 70.2 70.2Custody indemnifications and other 40.0 — — 40.0Total $126.2 $20.4 $221.7 $ 368.3
146
Credit Commitments and Lines of Credit The table below summarizes Citigroup’s credit commitments as of December 31, 2012 and December 31, 2011:
In millions of dollars U.S.Outside
U.S. December 31,
2012December 31,
2011 Commercial and similar letters of credit $ 1,427 $ 5,884 $ 7,311 $ 8,910 One- to four-family residential mortgages 2,397 1,496 3,893 3,504 Revolving open-end loans secured by one- to four-family residential properties 14,897 3,279 18,176 19,326 Commercial real estate, construction and land development 2,067 1,429 3,496 1,968 Credit card lines 485,569 135,131 620,700 653,985 Commercial and other consumer loan commitments 138,219 90,273 228,492 224,109 Other commitments and contingencies 1,175 1,084 2,259 3,201 Total $ 645,751 $ 238,576 $ 884,327 $ 915,003 The majority of unused commitments are contingent upon customers’ maintaining specific credit standards. Commercial commitments generally have floating interest rates and fixed expiration dates and may require payment of fees. Such fees (net of certain direct costs) are deferred and, upon exercise of the commitment, amortized over the life of the loan or, if exercise is deemed remote, amortized over the commitment period. Commercial and similar letters of credit A commercial letter of credit is an instrument by which Citigroup substitutes its credit for that of a customer to enable the customer to finance the purchase of goods or to incur other commitments. Citigroup issues a letter on behalf of its client to a supplier and agrees to pay the supplier upon presentation of documentary evidence that the supplier has performed in accordance with the terms of the letter of credit. When a letter of credit is drawn, the customer is then required to reimburse Citigroup. One- to four-family residential mortgages A one- to four-family residential mortgage commitment is a written confirmation from Citigroup to a seller of a property that the bank will advance the specified sums enabling the buyer to complete the purchase. Revolving open-end loans secured by one- to four-family residential properties Revolving open-end loans secured by one- to four-family residential properties are essentially home equity lines of credit. A home equity line of credit is a loan secured by a primary residence or second home to the extent of the excess of fair market value over the debt outstanding for the first mortgage. Commercial real estate, construction and land development Commercial real estate, construction and land development include unused portions of commitments to extend credit for the purpose of financing commercial and multifamily residential properties as well as land development projects. Both secured-by-real-estate and unsecured commitments are included in this line, as well as undistributed loan proceeds, where there is an obligation to advance for construction progress payments. However, this line only includes those extensions of credit that, once funded, will be classified as Total loans, net on the Consolidated Balance Sheet.
Credit card lines Credit card lines are unconditionally cancellable by the issuer. Commercial and other consumer loan commitments Commercial and other consumer loan commitments include overdraft and liquidity facilities, as well as commercial commitments to make or purchase loans, to purchase third-party receivables, to provide note issuance or revolving underwriting facilities and to invest in the form of equity. Amounts include $53 billion and $65 billion with an original maturity of less than one year at December 31, 2012 and December 31, 2011, respectively. In addition, included in this line item are highly leveraged financing commitments, which are agreements that provide funding to a borrower with higher levels of debt (measured by the ratio of debt capital to equity capital of the borrower) than is generally considered normal for other companies. This type of financing is commonly employed in corporate acquisitions, management buy-outs and similar transactions. Other commitments and contingencies Other commitments and contingencies include all other transactions related to commitments and contingencies not reported on the lines above.
147
28. CONTINGENCIES Overview In addition to the matters described below, in the ordinary course of business, Citigroup, its affiliates and subsidiaries, and current and former officers, directors and employees (for purposes of this section, sometimes collectively referred to as Citigroup and Related Parties) routinely are named as defendants in, or as parties to, various legal actions and proceedings. Certain of these actions and proceedings assert claims or seek relief in connection with alleged violations of consumer protection, securities, banking, antifraud, antitrust, anti-money laundering, employment and other statutory and common laws. Certain of these actual or threatened legal actions and proceedings include claims for substantial or indeterminate compensatory or punitive damages, or for injunctive relief, and in some instances seek recovery on a class-wide basis. In the ordinary course of business, Citigroup and Related Parties also are subject to governmental and regulatory examinations, information-gathering requests, investigations and proceedings (both formal and informal), certain of which may result in adverse judgments, settlements, fines, penalties, restitution, disgorgement, injunctions or other relief. In addition, certain affiliates and subsidiaries of Citigroup are banks, registered broker-dealers, futures commission merchants, investment advisers or other regulated entities and, in those capacities, are subject to regulation by various U.S., state and foreign securities, banking, commodity futures, consumer protection and other regulators. In connection with formal and informal inquiries by these regulators, Citigroup and such affiliates and subsidiaries receive numerous requests, subpoenas and orders seeking documents, testimony and other information in connection with various aspects of their regulated activities. From time to time Citigroup and Related Parties also receive grand jury subpoenas and other requests for information or assistance, formal or informal, from federal or state law enforcement agencies, including among others various United States Attorneys’ Offices, the Asset Forfeiture and Money Laundering Section and other divisions of the Department of Justice, the Financial Crimes Enforcement Network of the United States Department of the Treasury, and the Federal Bureau of Investigation, relating to Citigroup and its customers. Because of the global scope of Citigroup’s operations, and its presence in countries around the world, Citigroup and Related Parties are subject to litigation and governmental and regulatory examinations, information-gathering requests, investigations and proceedings (both formal and informal) in multiple jurisdictions with legal and regulatory regimes that may differ substantially, and present substantially different risks, from those Citigroup and Related Parties are subject to in the United States. In some instances Citigroup and Related Parties may be involved in proceedings involving the same subject matter in multiple jurisdictions, which may result in overlapping, cumulative or inconsistent outcomes. Citigroup seeks to resolve all litigation and regulatory matters in the manner management believes is in the best interests of Citigroup and its shareholders, and contests liability, allegations of wrongdoing and, where applicable, the amount of damages or scope of any penalties or other relief sought as appropriate in each pending matter.
Accounting and Disclosure Framework ASC 450 (formerly SFAS 5) governs the disclosure and recognition of loss contingencies, including potential losses from litigation and regulatory matters. ASC 450 defines a “loss contingency” as “an existing condition, situation, or set of circumstances involving uncertainty as to possible loss to an entity that will ultimately be resolved when one or more future events occur or fail to occur.” It imposes different requirements for the recognition and disclosure of loss contingencies based on the likelihood of occurrence of the contingent future event or events. It distinguishes among degrees of likelihood using the following three terms: “probable,” meaning that “the future event or events are likely to occur”; “remote,” meaning that “the chance of the future event or events occurring is slight”; and “reasonably possible,” meaning that “the chance of the future event or events occurring is more than remote but less than likely.” These three terms are used below as defined in ASC 450. Accruals. ASC 450 requires accrual for a loss contingency when it is “probable that one or more future events will occur confirming the fact of loss” and “the amount of the loss can be reasonably estimated.” In accordance with ASC 450, Citigroup establishes accruals for all litigation and regulatory matters, including matters disclosed herein, when Citigroup believes it is probable that a loss has been incurred and the amount of the loss can be reasonably estimated. When the reasonable estimate of the loss is within a range of amounts, the minimum amount of the range is accrued, unless some higher amount within the range is a better estimate than any other amount within the range. Once established, accruals are adjusted from time to time, as appropriate, in light of additional information. The amount of loss ultimately incurred in relation to those matters may be substantially higher or lower than the amounts accrued for those matters. Disclosure. ASC 450 requires disclosure of a loss contingency if “there is at least a reasonable possibility that a loss or an additional loss may have been incurred” and there is no accrual for the loss because the conditions described above are not met or an exposure to loss exists in excess of the amount accrued. In accordance with ASC 450, if Citigroup has not accrued for a matter because Citigroup believes that a loss is reasonably possible but not probable, or that a loss is probable but not reasonably estimable, and the matter thus does not meet the criteria for accrual, and the reasonably possible loss is material, it discloses the loss contingency. In addition, Citigroup discloses matters for which it has accrued if it believes a reasonably possible exposure to material loss exists in excess of the amount accrued. In accordance with ASC 450, Citigroup’s disclosure includes an estimate of the reasonably possible loss or range of loss for those matters as to which an estimate can be made. ASC 450 does not require disclosure of an estimate of the reasonably possible loss or range of loss where an estimate cannot be made. Neither accrual nor disclosure is required for losses that are deemed remote.
148
Inherent Uncertainty of the Matters Disclosed. Certain of the matters disclosed below involve claims for substantial or indeterminate damages. The claims asserted in these matters typically are broad, often spanning a multi-year period and sometimes a wide range of business activities, and the plaintiffs’ or claimants’ alleged damages frequently are not quantified or factually supported in the complaint or statement of claim. As a result, Citigroup is often unable to estimate the loss in such matters, even if it believes that a loss is probable or reasonably possible, until developments in the case have yielded additional information sufficient to support a quantitative assessment of the range of reasonably possible loss. Such developments may include, among other things, discovery from adverse parties or third parties, rulings by the court on key issues, analysis by retained experts, and engagement in settlement negotiations. Depending on a range of factors, such as the complexity of the facts, the novelty of the legal theories, the pace of discovery, the court’s scheduling order, the timing of court decisions, and the adverse party’s willingness to negotiate in good faith toward a resolution, it may be months or years after the filing of a case before an estimate of the range of reasonably possible loss can be made. Matters as to Which an Estimate Can Be Made. For some of the matters disclosed below, Citigroup is currently able to estimate a reasonably possible loss or range of loss in excess of amounts accrued (if any). For some of the matters included within this estimation, an accrual has been made because a loss is believed to be both probable and reasonably estimable, but an exposure to loss exists in excess of the amount accrued; in these cases, the estimate reflects the reasonably possible range of loss in excess of the accrued amount. For other matters included within this estimation, no accrual has been made because a loss, although estimable, is believed to be reasonably possible, but not probable; in these cases the estimate reflects the reasonably possible loss or range of loss. As of December 31, 2012, Citigroup estimates that the reasonably possible unaccrued loss in future periods for these matters ranges up to approximately $5 billion in the aggregate. These estimates are based on currently available information. As available information changes, the matters for which Citigroup is able to estimate will change, and the estimates themselves will change. In addition, while many estimates presented in financial statements and other financial disclosure involve significant judgment and may be subject to significant uncertainty, estimates of the range of reasonably possible loss arising from litigation and regulatory proceedings are subject to particular uncertainties. For example, at the time of making an estimate, Citigroup may have only preliminary, incomplete, or inaccurate information about the facts underlying the claim; its assumptions about the future rulings of the court or other tribunal on significant issues, or the behavior and incentives of adverse parties or regulators, may prove to be wrong; and the outcomes it is attempting to predict are often not amenable to the use of statistical or other quantitative analytical tools. In addition, from time to time an outcome may occur that Citigroup had not accounted for in its estimate because it had deemed such an outcome to be remote. For all these reasons, the amount of loss in excess of accruals ultimately incurred for the matters as to which an estimate has been made could be substantially higher or lower than the range of loss included in the estimate.
Matters as to Which an Estimate Cannot Be Made. For other matters disclosed below, Citigroup is not currently able to estimate the reasonably possible loss or range of loss. Many of these matters remain in very preliminary stages (even in some cases where a substantial period of time has passed since the commencement of the matter), with few or no substantive legal decisions by the court or tribunal defining the scope of the claims, the class (if any), or the potentially available damages, and fact discovery is still in progress or has not yet begun. In many of these matters, Citigroup has not yet answered the complaint or statement of claim or asserted its defenses, nor has it engaged in any negotiations with the adverse party (whether a regulator or a private party). For all these reasons, Citigroup cannot at this time estimate the reasonably possible loss or range of loss, if any, for these matters. Opinion of Management as to Eventual Outcome. Subject to the foregoing, it is the opinion of Citigroup’s management, based on current knowledge and after taking into account its current legal accruals, that the eventual outcome of all matters described in this Note would not be likely to have a material adverse effect on the consolidated financial condition of Citigroup. Nonetheless, given the substantial or indeterminate amounts sought in certain of these matters, and the inherent unpredictability of such matters, an adverse outcome in certain of these matters could, from time to time, have a material adverse effect on Citigroup’s consolidated results of operations or cash flows in particular quarterly or annual periods. Credit Crisis–Related Litigation and Other Matters Citigroup and Related Parties have been named as defendants in numerous legal actions and other proceedings asserting claims for damages and related relief for losses arising from the global financial credit crisis that began in 2007. Such matters include, among other types of proceedings, claims asserted by: (i) individual investors and purported classes of investors in Citigroup’s common and preferred stock and debt, alleging violations of the federal securities laws, foreign laws, state securities and fraud law, and the Employee Retirement Income Security Act (ERISA); and (ii) individual investors and purported classes of investors in securities and other investments underwritten, issued or marketed by Citigroup, including securities issued by other public companies, collateralized debt obligations (CDOs), mortgage-backed securities (MBS), auction rate securities (ARS), investment funds, and other structured or leveraged instruments, which have suffered losses as a result of the credit crisis. These matters have been filed in state and federal courts across the U.S. and in foreign tribunals, as well as in arbitrations before the Financial Industry Regulatory Authority (FINRA) and other arbitration associations.
149
In addition to these litigations and arbitrations, Citigroup continues to cooperate fully in response to subpoenas and requests for information from the Securities and Exchange Commission (SEC), FINRA, state attorneys general, the Department of Justice and subdivisions thereof, bank regulators, and other government agencies and authorities, in connection with various formal and informal (and, in many instances, industry-wide) inquiries concerning Citigroup’s mortgage-related conduct and business activities, as well as other business activities affected by the credit crisis. These business activities include, but are not limited to, Citigroup’s sponsorship, packaging, issuance, marketing, servicing and underwriting of CDOs and MBS, and its origination, sale or other transfer, servicing, and foreclosure of residential mortgages. Mortgage-Related Litigation and Other Matters Securities Actions: Beginning in November 2007, Citigroup and Related Parties were named as defendants in a variety of class action and individual securities lawsuits filed by investors in Citigroup’s equity and debt securities in state and federal courts relating to the Company’s disclosures regarding its exposure to subprime-related assets. Citigroup and Related Parties have been named as defendants in the consolidated putative class action IN RE CITIGROUP INC. SECURITIES LITIGATION, pending in the United States District Court for the Southern District of New York. The consolidated amended complaint asserts claims under Sections 10(b) and 20(a) of the Securities Exchange Act of 1934 on behalf of a putative class of purchasers of Citigroup common stock from January 1, 2004 through January 15, 2009. On November 9, 2010, the court issued an opinion and order dismissing all claims except those arising out of Citigroup’s exposure to CDOs for the time period February 1, 2007 through April 18, 2008. On August 30, 2012, the court entered an order preliminarily approving the parties’ proposed settlement, pursuant to which Citigroup will pay $590 million in exchange for a release of all claims asserted on behalf of the settlement class. A fairness hearing is scheduled for April 8, 2013. Additional information concerning this action is publicly available in court filings under the consolidated lead docket number 07 Civ. 9901 (S.D.N.Y.) (Stein, J.). Citigroup and Related Parties also have been named as defendants in the consolidated putative class action IN RE CITIGROUP INC. BOND LITIGATION, also pending in the United States District Court for the Southern District of New York. The plaintiffs assert claims under Sections 11, 12 and 15 of the Securities Act of 1933 on behalf of a putative class of purchasers of $71 billion of debt securities and preferred stock issued by Citigroup between May 2006 and August 2008. On July 12, 2010, the court issued an opinion and order dismissing plaintiffs’ claims under Section 12 of the Securities Act of 1933, but denying defendants’ motion to dismiss certain claims under Section 11. Fact discovery began in November 2010, and plaintiffs’ motion to certify a class is pending. Additional information concerning this action is publicly available in court filings under the consolidated lead docket number 08 Civ. 9522 (S.D.N.Y.) (Stein, J.).
Citigroup and Related Parties also have been named as defendants in a variety of other putative class actions and individual actions arising out of similar facts to those alleged in the actions described above. These actions assert a wide range of claims, including claims under the federal securities laws, Section 90 of the Financial Services and Markets Act of 2000 (Eng.), ERISA, and state law. Additional information concerning these actions is publicly available in court filings under the docket numbers 09 Civ. 7359 (S.D.N.Y.) (Stein, J.), 09 Civ. 8755 (S.D.N.Y.) (Stein, J.), 11 Civ. 7672 (S.D.N.Y.) (Koeltl, J.), 12 Civ. 6653 (S.D.N.Y.) (Stein, J.), 12 Civ. 9050 (S.D.N.Y.) (Stein, J.), and Case No. 110105028 (Pa. Commw. Ct.) (Sheppard, J.). Beginning in November 2007, certain Citigroup affiliates also have been named as defendants arising out of their activities as underwriters of securities in actions brought by investors in securities of public companies adversely affected by the credit crisis. Many of these matters have been dismissed or settled. As a general matter, issuers indemnify underwriters in connection with such claims, but in certain of these matters Citigroup affiliates are not being indemnified or may in the future cease to be indemnified because of the financial condition of the issuer. Regulatory Actions: On October 19, 2011, in connection with its industry-wide investigation concerning CDO-related business activities, the SEC filed a complaint in the United States District Court for the Southern District of New York regarding Citigroup’s structuring and sale of the Class V Funding III CDO transaction (Class V). On the same day, the SEC and Citigroup announced a settlement of the SEC’s claims, subject to judicial approval, and the SEC filed a proposed final judgment pursuant to which Citigroup’s U.S. broker-dealer Citigroup Global Markets Inc. (CGMI) agreed to disgorge $160 million and to pay $30 million in prejudgment interest and a $95 million penalty. On November 28, 2011, the court issued an order refusing to approve the proposed settlement and ordering trial to begin on July 16, 2012. The parties appealed from this order to the United States Court of Appeals for the Second Circuit, which, on March 15, 2012, granted a stay of the district court proceedings pending resolution of the appeals. The parties have fully briefed their appeals, and the Second Circuit held oral argument on February 8, 2013. Additional information concerning this matter is publicly available in court filings under the docket numbers 11 Civ. 7387 (S.D.N.Y.) (Rakoff, J.) and 11-5227 (2d Cir.). Mortgage-Backed Securities and CDO Investor Actions and Repurchase Claims: Beginning in July 2010, Citigroup and Related Parties have been named as defendants in complaints filed by purchasers of MBS and CDOs sold or underwritten by Citigroup. The MBS-related complaints generally assert that the defendants made material misrepresentations and omissions about the credit quality of the mortgage loans underlying the securities, such as the underwriting standards to which the loans conformed, the loan-to-value ratio of the loans, and the extent to which the mortgaged properties were owner-occupied, and typically assert claims under Section 11 of the Securities Act of 1933, state blue sky laws, and/or common-law misrepresentation-based causes of action. The CDO-related complaints further allege that the defendants adversely selected or permitted the adverse selection of CDO collateral without full disclosure to investors. The plaintiffs

150
in these actions generally seek rescission of their investments, recovery of their investment losses, or other damages. Other purchasers of MBS and CDOs sold or underwritten by Citigroup have threatened to file additional suits, for some of which Citigroup has agreed to toll (extend) the statute of limitations. The filed actions generally are in the early stages of proceedings, and certain of the actions or threatened actions have been resolved through settlement or otherwise. The aggregate original purchase amount of the purchases at issue in the filed suits is approximately $10.8 billion, and the aggregate original purchase amount of the purchases covered by tolling agreements with investors threatening litigation is approximately $6.4 billion. The largest MBS investor claim against Citigroup and Related Parties, as measured by the face value of purchases at issue, has been asserted by the Federal Housing Finance Agency, as conservator for Fannie Mae and Freddie Mac. This suit was filed on September 2, 2011, and has been coordinated in the United States District Court for the Southern District of New York with 15 other related suits brought by the same plaintiff against various other financial institutions. Motions to dismiss in the coordinated suits have been denied in large part, and discovery is proceeding. An interlocutory appeal currently is pending in the United States Court of Appeals for the Second Circuit on issues common to all of the coordinated suits. Additional information concerning certain of these actions is publicly available in court filings under the docket numbers 11 Civ. 6196 (S.D.N.Y.) (Cote, J.), 12 Civ. 4000 (S.D.N.Y.) (Swain, J.), 12 Civ. 00790 (M.D. Al.) (Watkins, C.J.), 12 Civ. 4354 (C.D. Cal.) (Pfaezler, J.), 650212/12 (N.Y. Sup. Ct.) (Oing, J.), 652607/2012 (N.Y. Sup. Ct.) (Schweitzer, J.), and CGC-10-501610 (Cal. Super. Ct.) (Kramer, J.). In addition to these actions, various parties to MBS securitizations and other interested parties have asserted that certain Citigroup affiliates breached representations and warranties made in connection with mortgage loans sold into securitization trusts (private-label securitizations). In connection with such assertions, Citi has received significant levels of inquiries and demands for loan files, as well as requests to toll (extend) the applicable statutes of limitation for, among others, representation and warranty claims relating to its private-label securitizations. These inquiries, demands and requests have come from trustees of securitization trusts and others. Among these requests, in December 2011, Citigroup received a letter from the law firm Gibbs & Bruns LLP, which purports to represent a group of investment advisers and holders of MBS issued or underwritten by Citigroup affiliates. Through that letter and subsequent discussions, Gibbs & Bruns LLP has asserted that its clients collectively hold certificates in 87 MBS trusts purportedly issued and/or underwritten by Citigroup affiliates, and that Citigroup affiliates have repurchase obligations for certain mortgages in these trusts. Citi has also received repurchase claims for breaches of representations and warranties related to private-label securitizations. These claims have been received at an unpredictable rate, although the number of claims increased substantially during 2012 and is expected to remain elevated, particularly given the level of inquiries, demands and requests noted above. Upon receipt of a claim, Citi typically requests that it be provided
with the underlying detail supporting the claim; however, to date, Citi has received little or no response to these requests for information. As a result, the vast majority of the repurchase claims received on Citi’s private-label securitizations remain unresolved. Citi expects unresolved repurchase claims for private-label securitizations to continue to increase because new claims and requests for loan files continue to be received, while there has been little progress to date in resolving these repurchase claims. Independent Foreclosure Review: On January 7, 2013, Citi, along with other major mortgage servicers operating under consent orders dated April 13, 2011 with the Federal Reserve Board and the Office of the Comptroller of the Currency (OCC), entered into a settlement agreement with those regulators to modify the requirements of the independent foreclosure review mandated by the consent orders. Under the settlement, Citi agreed to pay approximately $305 million into a qualified settlement fund and to offer $487 million of mortgage assistance to borrowers in accordance with agreed criteria. Upon completion of Citi’s payment and mortgage assistance obligations under the agreement, the Federal Reserve Board and the OCC have agreed to deem the requirements of the independent foreclosure review under the consent orders to be satisfied. Abu Dhabi Investment Authority In 2010, Abu Dhabi Investment Authority (ADIA) commenced an arbitration against Citigroup and Related Parties alleging statutory and common law claims in connection with its $7.5 billion investment in Citigroup in December 2007. ADIA sought rescission of the investment agreement or, in the alternative, more than $4 billion in damages. Following a hearing in May 2011 and post-hearing proceedings, on October 14, 2011, the arbitration panel issued a final award and statement of reasons finding in favor of Citigroup on all claims asserted by ADIA. On January 11, 2012, ADIA filed a petition to vacate the award in New York state court. On January 13, 2012, Citigroup removed the petition to the United States District Court for the Southern District of New York. On April 3, 2012, Citigroup filed an opposition to ADIA’s petition and a cross-petition to confirm the award. Both ADIA’s petition and Citigroup’s cross-petition are pending. Additional information concerning this matter is publicly available in court filings under the docket number 12 Civ. 283 (S.D.N.Y.) (Daniels, J.). Alternative Investment Fund–Related Litigation and Other Matters The SEC is investigating the management and marketing of the ASTA/ MAT and Falcon funds, alternative investment funds managed and marketed by certain Citigroup affiliates that suffered substantial losses during the credit crisis. In addition to the SEC inquiry, on June 11, 2012, the New York Attorney General served a subpoena on a Citigroup affiliate seeking documents and information concerning certain of these funds, and on August 1, 2012, the Massachusetts Attorney General served a Civil Investigative Demand on a Citigroup affiliate seeking similar documents and information. Citigroup is cooperating fully with these inquiries. In October 2012, Citigroup Alternative Investments LLC (CAI) was named as a defendant in a putative class action lawsuit filed on behalf of investors in CSO Ltd., CSO US Ltd., and Corporate Special Opportunities Ltd., whose investments were managed indirectly by a CAI affiliate. The plaintiff
151
asserts a variety of state common law claims, alleging that he and other investors were misled into investing in the funds and were further misled into not redeeming their investments. The complaint seeks to recover more than $400 million on behalf of a putative class of investors. Additional information concerning this action is publicly available in court filings under the docket number 12-cv-7717 (S.D.N.Y.) (Castel, J.). In addition, numerous investors in the ASTA/MAT funds have filed lawsuits or arbitrations against Citigroup and Related Parties seeking damages and related relief. Although most of these investor disputes have been resolved, some remain pending. Auction Rate Securities–Related Litigation and Other Matters Beginning in March 2008, Citigroup and Related Parties have been named as defendants in numerous actions and proceedings brought by Citigroup shareholders and purchasers or issuers of ARS, asserting claims under the federal securities laws, Section 1 of the Sherman Act and state law arising from the collapse of the ARS market in early 2008, which plaintiffs contend Citigroup and other ARS underwriters foresaw or should have foreseen but failed adequately to disclose. Most of these matters have been dismissed or settled. Additional information concerning certain of the pending actions is publicly available in court filings under the docket numbers 08 Civ. 3095 (S.D.N.Y.) (Swain, J.), 10-722, 10-867, and 11-1270 (2d Cir.). KIKOs Prior to the devaluation of the Korean won in 2008, several local banks in Korea, including a Citigroup subsidiary (CKI), entered into foreign exchange derivative transactions with small and medium-size export businesses (SMEs) to enable the SMEs to hedge their currency risk. The derivatives had “knock-in, knock-out” features. Following the devaluation of the won, many of these SMEs incurred significant losses on the derivative transactions and filed civil lawsuits against the banks, including CKI. The claims generally allege that the products were not suitable and that the risk disclosure was inadequate. As of December 31, 2012, there were 88 civil lawsuits filed by SMEs against CKI. To date, 82 decisions have been rendered at the district court level, and CKI has prevailed in 64 of those decisions. In the other 18 decisions, plaintiffs were awarded only a portion of the damages sought. The damage awards total in the aggregate approximately $28.5 million. CKI is appealing the 18 adverse decisions. A significant number of plaintiffs that had decisions rendered against them are also filing appeals, including plaintiffs that were awarded less than all of the damages they sought. Of the 82 cases decided at the district court level, 60 have been appealed to the high court, including the 18 in which an adverse decision was rendered against CKI in the district court. Of the 17 appeals decided at high court level, CKI prevailed in 11 cases, and in the other six plaintiffs were awarded partial damages, which increased the aggregate damages awarded against CKI by a further $10.9 million. CKI is appealing five of the adverse decisions to the Korean Supreme Court.
Lehman Structured Notes Matters Like many other financial institutions, certain Citigroup affiliates and subsidiaries distributed structured notes (Notes) issued and guaranteed by Lehman entities to retail customers outside the United States, principally in Europe and Asia. After the relevant Lehman entities filed for bankruptcy protection in September 2008, certain regulators commenced investigations and some purchasers of the Notes filed civil actions or otherwise complained about the sales process. Citigroup has resolved the vast majority of these regulatory proceedings and customer complaints. In Belgium, criminal charges were brought against a Citigroup subsidiary (CBB) and three former employees. On December 1, 2010, the court acquitted all defendants of fraud and anti-money laundering charges but convicted all defendants under the Prospectus Act, and convicted CBB under Fair Trade Practices legislation. Both CBB and the Public Prosecutor appealed the judgment. On May 21, 2012, the Belgian appellate court dismissed all criminal charges against CBB. The Public Prosecutor has appealed this decision to the Belgian Supreme Court. Lehman Brothers Bankruptcy Proceedings Beginning in September 2010, Citigroup and Related Parties have been named as defendants in various adversary proceedings in the Chapter 11 bankruptcy proceedings of Lehman Brothers Holdings Inc. (LBHI) and the liquidation proceedings of Lehman Brothers Inc. (LBI). On March 18, 2011, Citigroup and Related Parties were named as defendants in an adversary proceeding asserting claims under federal bankruptcy and state law to recover a $1 billion deposit LBI placed with Citibank, N.A., to avoid a setoff taken by Citibank, N.A. against the deposit, and to recover additional assets of LBI held by Citibank, N.A. and its affiliates. On December 13, 2012, the court entered an order approving a settlement between the parties resolving all of LBI’s claims. Under the settlement, Citibank, N.A. retained $1.05 billion of assets to set off against its claims and received an allowed unsecured claim in the amount of $245 million. Additional information concerning this adversary proceeding is publicly available in court filings under the docket numbers 11-01681 (Bankr. S.D.N.Y.) (Peck, J.) and 08-01420 (Bankr. S.D.N.Y.) (Peck, J.). On February 8, 2012, Citigroup and Related Parties were named as defendants in an adversary proceeding asserting objections to proofs of claim filed by Citibank, N.A. and its affiliates totaling approximately $2.6 billion, and claims under federal bankruptcy and state law to recover $2 billion deposited by LBHI with Citibank, N.A. against which Citibank, N.A. asserts a right of setoff. Plaintiffs also seek avoidance of a $500 million transfer and an amendment to a guarantee in favor of Citibank, N.A., and other relief. Additional information concerning this adversary proceeding is publicly available in court filings under the docket numbers 12-01044 (Bankr. S.D.N.Y.) (Peck, J.) and 08-13555 (Bankr. S.D.N.Y.) (Peck, J.).
152
Terra Firma Litigation In December 2009, the general partners of two related private equity funds filed a complaint in New York state court, subsequently removed to the United States District Court for the Southern District of New York, asserting multi-billion-dollar fraud and other common law claims against certain Citigroup affiliates arising out of the May 2007 auction of the music company EMI, in which Citigroup acted as advisor to EMI and as a lender to plaintiffs’ acquisition vehicle. Following a jury trial, a verdict was returned in favor of Citigroup on November 4, 2010. Plaintiffs have appealed the judgment with respect to certain of their claims to the United States Court of Appeals for the Second Circuit. Argument was held on October 4, 2012, and the matter is pending. Additional information concerning this action is publicly available in court filings under the docket numbers 09 Civ. 10459 (S.D.N.Y.) (Rakoff, J.) and 11-0126 (2d Cir.). Terra Securities–Related Litigation Certain Citigroup affiliates have been named as defendants in an action brought by seven Norwegian municipalities, asserting claims for fraud and negligent misrepresentation arising out of the municipalities’ purchase of fund-linked notes acquired from the now-defunct securities firm, Terra Securities, which in turn acquired those notes from Citigroup. Plaintiffs seek approximately $120 million in compensatory damages, plus punitive damages. Defendants’ motion for summary judgment is pending. Additional information related to this action is publicly available in court filings under the docket number 09 Civ. 7058 (S.D.N.Y.) (Marrero, J.). Tribune Company Bankruptcy Certain Citigroup affiliates have been named as defendants in adversary proceedings related to the Chapter 11 cases of Tribune Company (Tribune) filed in the United States Bankruptcy Court for the District of Delaware, asserting claims arising out of the approximately $11 billion leveraged buyout of Tribune in 2007. On July 23, 2012, the Bankruptcy Court confirmed the Fourth Amended Joint Plan of Reorganization, which provides for releases of claims against Citigroup, other than those against CGMI relating to its role as advisor to Tribune. Certain Citigroup affiliates also have been named as defendants in actions brought by Tribune creditors alleging state law constructive fraudulent conveyance claims. These matters are pending in the United States District Court for the Southern District of New York as part of a multi-district litigation. Additional information concerning these actions is publicly available in court filings under the docket numbers 08-13141 (Bankr. D. Del.) (Carey, J.), 11 MD 02296 (S.D.N.Y.) (Pauley, J.), and 12 MC 2296 (S.D.N.Y.) (Pauley, J.).
Interbank Offered Rates–Related Litigation and Other Matters Regulatory Actions: Government agencies in the U.S., including the Department of Justice, the Commodity Futures Trading Commission, the SEC, and a consortium of state attorneys general, as well as agencies in other jurisdictions, including the European Commission, the U.K. Financial Services Authority, the Japanese Financial Services Agency (JFSA), the Canadian Competition Bureau, the Swiss Competition Commission and the Monetary Authority of Singapore, are conducting investigations or making inquiries regarding submissions made by panel banks to bodies that publish various interbank offered rates and other benchmark rates. As members of a number of such panels, Citigroup subsidiaries have received requests for information and documents. Citigroup is cooperating with the investigations and inquiries and is responding to the requests. On December 16, 2011, the JFSA took administrative action against Citigroup Global Markets Japan Inc. (CGMJ) for, among other things, certain communications made by two CGMJ traders about the Euroyen Tokyo interbank offered rate (TIBOR) and the Japanese yen London interbank offered rate (LIBOR). The JFSA issued a business improvement order and suspended CGMJ’s trading in derivatives related to yen LIBOR and Euroyen and yen TIBOR from January 10 to January 23, 2012. On the same day, the JFSA also took administrative action against Citibank Japan Ltd. (CJL) for conduct arising out of CJL’s retail business and also noted that the communications made by the CGMJ traders to employees of CJL about Euroyen TIBOR had not been properly reported to CJL’s management team. Antitrust and Other Litigation: Citigroup and Citibank, N.A., along with other U.S. Dollar (USD) LIBOR panel banks, are defendants in a multi-district litigation (MDL) proceeding before Judge Buchwald in the United States District Court for the Southern District of New York captioned IN RE LIBOR-BASED FINANCIAL INSTRUMENTS ANTITRUST LITIGATION, appearing under docket number 1:11-md-2262 (S.D.N.Y.). Judge Buchwald has appointed interim lead class counsel for, and consolidated amended complaints have been filed on behalf of, three separate putative classes of plaintiffs: (i) over-the-counter (OTC) purchasers of derivative instruments tied to USD LIBOR; (ii) purchasers of exchange-traded derivative instruments tied to USD LIBOR; and (iii) indirect OTC purchasers of U.S. debt securities. Each of these putative classes alleges that the panel bank defendants conspired to suppress USD LIBOR in violation of the Sherman Act and/or the Commodity Exchange Act, thereby causing plaintiffs to suffer losses on the instruments they purchased. Also consolidated into the MDL proceeding are individual civil actions commenced by various Charles Schwab entities alleging that the panel bank defendants conspired to suppress the USD LIBOR rates in violation of the Sherman Act, the Racketeer Influenced and Corrupt Organizations Act (RICO), and California state law, causing the Schwab entities to suffer losses on USD LIBOR-linked financial instruments they owned. Plaintiffs in these actions seek compensatory damages and restitution for losses caused by the alleged violations, as well as treble damages under the Sherman Act. The Schwab and OTC plaintiffs also seek injunctive relief.

153
Citigroup and Citibank, N.A., along with other defendants, have moved to dismiss all of the above actions that were consolidated into the MDL proceeding as of June 29, 2012. Briefing on the motion to dismiss was completed on September 27, 2012. Judge Buchwald has stayed all subsequently filed actions that fall within the scope of the MDL until the motion to dismiss has been resolved. Citigroup and/or Citibank, N.A. are named in the 17 such stayed actions that have been consolidated with or marked as related to the MDL proceeding. Eleven of these actions have been brought on behalf of various putative plaintiff classes, including (i) banks, savings and loans institutions and credit unions that allegedly suffered losses on loans they made at interest rates tied to USD LIBOR, (ii) holders of adjustable-rate mortgages tied to USD LIBOR, and (iii) individual and municipal purchasers of various financial instruments tied to USD LIBOR. The remaining six actions have been brought by individual plaintiffs, including an entity that allegedly purchased municipal bonds and various California counties, municipalities, and related public entities that invested in various derivatives tied to USD LIBOR. Plaintiffs in each of the 17 stayed actions allege that the panel bank defendants manipulated USD LIBOR in violation of the Sherman Act, RICO, and/or state antitrust and racketeering laws, and several plaintiffs also assert common law claims, including fraud, unjust enrichment, negligent misrepresentation, interference with economic advantage, and/or breach of the implied covenant of good faith and fair dealing. Plaintiffs seek compensatory damages and, where authorized by statute, treble damages and injunctive relief. Additional information concerning the stayed actions is publicly available in court filings under docket numbers 1:12-cv-4205 (S.D.N.Y.) (Buchwald, J.), 1:12-cv-5723 (S.D.N.Y.) (Buchwald, J.), 1:12-cv-5822 (S.D.N.Y.) (Buchwald, J.), 1:12-cv-6056 (S.D.N.Y.) (Buchwald, J.), 1:12-cv-7461 (S.D.N.Y.) (Buchwald, J.), 2:12-cv-10903 (C.D. Calif.) (Snyder, J.), 3:12-cv-6571 (N.D. Calif.) (Conti, J.), 3:13-cv-106 (N.D. Calif.) (Beeler, J.), 4:13-cv-108 (N.D. Calif.) (Ryu, J.), 3:13-cv-109 (N.D. Calif.) (Laporte, J.), 5:13-cv-62 (C.D. Calif.) (Phillips, J.), 3:13-cv-48 (S.D. Calif.) (Huff, J.), 1:13-cv-346 (S.D.N.Y.) (Buchwald, J.), 1:13-cv-407 (S.D.N.Y.) (Buchwald, J.), 5:13-cv-122 (C.D. Calif.) (Bernal, J.), 1:13-cv-981 (S.D.N.Y.) (Buchwald, J.), and 1:13-cv-1016 (S.D.N.Y.) (Buchwald, J.). In addition, on November 27, 2012, an action captioned MARAGOS V. BANK OF AMERICA CORP. ET AL. was filed on behalf of the County of Nassau against various USD LIBOR panel banks, including Citibank, N.A., and the other defendants with whom the plaintiff had entered into interest rate swap transactions. The action was commenced in state court and subsequently removed to the United States District Court for the Eastern District of New York. The plaintiff asserts claims for fraud and deceptive trade practices under New York law against the panel bank defendants based on allegations that the panel banks colluded to artificially suppress USD LIBOR, thereby lowering the payments the plaintiff received in connection with various interest rate swap transactions. The plaintiff seeks compensatory damages and treble damages. The defendants have sought consolidation of this action with the MDL proceeding. Additional information concerning this action is publicly available in court filings under docket number 2:12-cv-6294 (E.D.N.Y.) (Spatt, J.).
Separately, on April 30, 2012, an action was filed in the United States District Court for the Southern District of New York on behalf of a putative class of persons and entities who transacted in exchange-traded Euroyen futures and option contracts between June 2006 and September 2010. This action is captioned LAYDON V. MIZUHO BANK LTD. ET AL. The plaintiff filed an amended complaint on November 30, 2012, naming as defendants banks that are or were members of the panels making submissions used in the calculation of Japanese yen LIBOR and TIBOR, and certain affiliates of some of those banks, including Citibank, N.A., Citigroup, CJL and CGMJ. The complaint alleges that the plaintiffs were injured as a result of purported manipulation of those reference interest rates, and asserts claims arising under the Commodity Exchange Act and the Sherman Act and for unjust enrichment. Plaintiffs seek compensatory damages, treble damages under the Sherman Act, and injunctive relief. Additional information concerning this action is publicly available in court filings under the docket number 12-cv-3419 (S.D.N.Y.) (Daniels, J.). Interchange Fees Litigation Beginning in 2005, several putative class actions were filed against Citigroup and Related Parties, together with Visa, MasterCard and other banks and their affiliates, in various federal district courts and consolidated with other related cases in a multi-district litigation proceeding before Judge Gleeson in the United States District Court for the Eastern District of New York. This proceeding is captioned IN RE PAYMENT CARD INTERCHANGE FEE AND MERCHANT DISCOUNT ANTITRUST LITIGATION. The plaintiffs, merchants that accept Visa- and MasterCard-branded payment cards as well as membership associations that claim to represent certain groups of merchants, allege, among other things, that defendants have engaged in conspiracies to set the price of interchange and merchant discount fees on credit and debit card transactions and to restrain trade through various Visa and MasterCard rules governing merchant conduct, all in violation of Section 1 of the Sherman Act and certain California statutes. Plaintiffs seek, on behalf of classes of U.S. merchants, treble damages, including all interchange fees paid to all Visa and MasterCard members with respect to Visa and MasterCard transactions in the U.S. since at least January 1, 2004, as well as injunctive relief. Supplemental complaints have also been filed against defendants in the putative class actions alleging that Visa’s and MasterCard’s respective initial public offerings were anticompetitive and violated Section 7 of the Clayton Act, and that MasterCard’s initial public offering constituted a fraudulent conveyance. On July 13, 2012, all parties to the putative class actions, including Citigroup and Related Parties, entered into a Memorandum of Understanding (MOU) setting forth the material terms of a class settlement. The class settlement contemplated by the MOU provides for, among other things, a total payment by all defendants to the class of $6.05 billion; a rebate to merchants participating in the damages class settlement of 10 basis points on interchange collected for a period of eight months by the Visa and MasterCard networks; changes to certain network rules that would permit merchants to surcharge some payment card transactions subject to certain limitations and conditions, including disclosure to consumers at the point of sale; and broad releases in favor of the defendants. Subsequently, all defendants and certain of the plaintiffs who had entered into the MOU executed a settlement agreement consistent with the terms of the MOU.
154
On November 27, 2012, the court entered an order granting preliminary approval of the proposed class settlements and provisionally certified two classes for settlement purposes only. The court scheduled a final approval hearing for September 12, 2013. Several large merchants and associations have stated publicly that they intend to object to or opt out of the settlement, and have appealed from the court’s preliminary approval of the proposed class settlements. Visa and MasterCard have also entered into a settlement agreement with merchants that filed individual, non-class actions. While Citigroup and Related Parties are not parties to the individual merchant non-class settlement agreement, they are contributing to that settlement, and the agreement provides for a release of claims against Citigroup and Related Parties. Additional information concerning these consolidated actions is publicly available in court filings under the docket number MDL 05-1720 (E.D.N.Y.) (Gleeson, J.). Regulatory Review of Consumer “Add-On” Products Certain of Citi’s consumer businesses, including its Citi-branded and retail services cards businesses, offer or have in the past offered or participated in the marketing, distribution, or servicing of products, such as payment protection and identity monitoring, that are ancillary to the provision of credit to the consumer (add-on products). These add-on products have been the subject of enforcement actions against other institutions by regulators, including the Consumer Financial Protection Bureau (CFPB), the OCC, and the FDIC, that have resulted in orders to pay restitution to customers and penalties in substantial amounts. Certain state attorneys general also have filed industry-wide suits under state consumer protection statutes, alleging deceptive marketing practices in connection with the sale of payment protection products and demanding restitution and statutory damages for instate customers. In light of the current regulatory focus on add-on products and the actions regulators have taken in relation to other credit card issuers, one or more regulators may order that Citi pay restitution to customers and/or impose penalties or other relief arising from Citi’s marketing, distribution, or servicing of add-on products. Parmalat Litigation and Related Matters On July 29, 2004, Dr. Enrico Bondi, the Extraordinary Commissioner appointed under Italian law to oversee the administration of various Parmalat companies, filed a complaint in New Jersey state court against Citigroup and Related Parties alleging, among other things, that the defendants “facilitated” a number of frauds by Parmalat insiders. On October 20, 2008, following trial, a jury rendered a verdict in Citigroup’s favor on Parmalat’s claims and in favor of Citibank, N.A. on three counterclaims. Parmalat has exhausted all appeals, and the judgment is now final. Additional information concerning this matter is publicly available in court filings under docket number A-2654-08T2 (N.J. Sup. Ct.).
Prosecutors in Parma and Milan, Italy, have commenced criminal proceedings against certain current and former Citigroup employees (along with numerous other investment banks and certain of their current and former employees, as well as former Parmalat officers and accountants). In the event of an adverse judgment against the individuals in question, the authorities could seek administrative remedies against Citigroup. On April 18, 2011, the Milan criminal court acquitted the sole Citigroup defendant of market-rigging charges. The Milan prosecutors have appealed part of that judgment and seek administrative remedies against Citigroup, which may include disgorgement of 70 million Euro and a fine of 900,000 Euro. Additionally, the Parmalat administrator filed a purported civil complaint against Citigroup in the context of the Parma criminal proceedings, which seeks 14 billion Euro in damages. In January 2011, certain Parmalat institutional investors filed a civil complaint seeking damages of approximately 130 million Euro against Citigroup and other financial institutions. Allied Irish Bank Litigation In 2003, Allied Irish Bank (AIB) filed a complaint in the United States District Court for the Southern District of New York seeking to hold Citibank, N.A. and Bank of America, N.A., former prime brokers for AIB’s subsidiary Allfirst Bank (Allfirst), liable for losses incurred by Allfirst as a result of fraudulent and fictitious foreign currency trades entered into by one of Allfirst’s traders. AIB seeks compensatory damages of approximately $500 million, plus punitive damages, from Citibank, N.A. and Bank of America, N.A. collectively. In 2006, the court granted in part and denied in part defendants’ motion to dismiss. In 2009, AIB filed an amended complaint. In 2012, the parties completed discovery and the court granted Citibank, N.A.’s motion to strike AIB’s demand for a jury trial. Citibank, N.A. also filed a motion for summary judgment, which is pending. AIB has announced a settlement with Bank of America, N.A. for an undisclosed amount, leaving Citibank, N.A. as the sole remaining defendant. Additional information concerning this matter is publicly available in court filings under docket number 03 Civ. 3748 (S.D.N.Y.) (Batts, J.). Settlement Payments Payments required in settlement agreements described above have been made or are covered by existing litigation accruals.
* * * Additional matters asserting claims similar to those described above may be filed in the future.

155
29. SELECTED QUARTERLY FINANCIAL DATA (UNAUDITED)
2012 2011 In millions of dollars, except per share amounts Fourth Third Second First Fourth Third Second First Revenues, net of interest expense $17,917 $ 13,703 $18,387 $ 19,121 $16,918 $ 20,551 $ 20,372 $ 19,490 Operating expenses 13,709 12,092 11,994 12,179 13,053 12,284 12,758 12,155 Provisions for credit losses and for benefits and
claims 3,113 2,620 2,696 2,900 2,748 3,238 3,275 3,098 Income from continuing operations before
income taxes $ 1,095 $ (1,009) $ 3,697 $ 4,042 $ 1,117 $ 5,029 $ 4,339 $ 4,237 Income taxes (benefits) (214) (1,494) 718 997 105 1,286 986 1,198 Income from continuing operations $ 1,309 $ 485 $ 2,979 $ 3,045 $ 1,012 $ 3,743 $ 3,353 $ 3,039 Income (loss) from discontinued operations, net
of taxes (85) 8 7 12 (14) — 50 32 Net income before attribution of
noncontrolling interests $ 1,224 $ 493 $ 2,986 $ 3,057 $ 998 $ 3,743 $ 3,403 $ 3,071 Noncontrolling interests 28 25 40 126 42 (28) 62 72 Citigroup’s net income $ 1,196 $ 468 $ 2,946 $ 2,931 $ 956 $ 3,771 $ 3,341 $ 2,999 Earnings per share (1)(2) Basic Income from continuing operations $ 0.42 $ 0.15 $ 0.98 $ 0.98 $ 0.32 $ 1.27 $ 1.11 $ 1.01 Net income 0.39 0.15 0.98 0.98 0.32 1.27 1.12 1.02 Diluted Income from continuing operations 0.41 0.15 0.95 0.95 0.32 1.23 1.08 0.98 Net income 0.38 0.15 0.95 0.95 0.31 1.23 1.09 0.99 Common stock price per share (2) High $ 40.17 $ 34.79 $ 36.87 $ 38.08 $ 34.17 $ 42.88 $ 45.90 $ 51.30 Low 32.75 25.24 24.82 28.17 23.11 23.96 36.81 43.90 Close 39.56 32.72 27.41 36.55 26.31 25.62 41.64 44.20 Dividends per share of common stock 0.01 0.01 0.01 0.01 0.01 0.01 0.01 — This Note to the Consolidated Financial Statements is unaudited due to the Company’s individual quarterly results not being subject to an audit. (1) Due to averaging of shares, quarterly earnings per share may not add up to the totals reported for the full year. (2) All per-share amounts for all periods reflect Citigroup’s 1-for-10 reverse stock split, which was effective May 6, 2011.
[End of Consolidated Financial Statements and Notes to Consolidated Financial Statements]
156
Exhibit 99.03
Consent of Independent Registered Public Accounting Firm
The Board of Directors Citigroup Inc.: We consent to the incorporation by reference in the Registration Statements on: � Form S-3 Nos. 33-55542, 33-56940, 33-68760, 33-51101, 33-62903, 33-63663, 333-04809, 333-12439, 333-27155, 333-
37992, 333-42575, 333-44549, 333-48474, 333-49442, 333-51201, 333-68949, 333-90079, 333-57364, 333-75554, 333-102206, 333-103940, 333-105316, 333-106510, 333-106598, 333-108047, 333-117615, 333-122925, 333-125845, 333-126744, 333-132177, 333-132370, 333-132373, 333-135163, 333-135867, 333-142849, 333-146471, 333-152454, 333-154914, 333-157386, 333-157459, 333-172554, 333-172555, 333-172562, and 333-186425.
� Form S-8 Nos. 333-58460, 333-58458, 333-02811, 333-56589, 333-63016, 333-101134, 333-107166, 333-124635, 333-
163852, 333-166242, 333-166215, 333-173683 and 333-181647. of Citigroup Inc. of our report dated March 1, 2013, except as to Notes 3, 4, 5, 6, 10, 11 and 17 which are as of August 30, 2013, with respect to the consolidated balance sheets of Citigroup Inc. and subsidiaries (“Citigroup”) as of December 31, 2012 and 2011, the related consolidated statements of income, comprehensive income, changes in stockholders’ equity and cash flows for each of the years in the three-year period ended December 31, 2012, which report appears in Exhibit 99.02 of Citigroup’s Current Report on Form 8-K filed on August 30, 2013.
New York, New York August 30, 2013
Copyright © 2022 FDOKUMEN