
b3p3d201231b.pdf - Citi
91
Pillar 3 Disclosures December 2020 0 Citibank Holdings Ireland Limited and its Operating Entity, Citibank Europe Plc Pillar 3 Disclosures 31 December 2020
-
Upload
khangminh22 -
Category
Documents
-
view
0 -
download
0
Transcript of b3p3d201231b.pdf - Citi

Pillar 3 Disclosures December 2020 0
Citibank Holdings Ireland Limited and its
Operating Entity, Citibank Europe Plc
Pillar 3 Disclosures 31 December 2020

Pillar 3 Disclosures December 2020 1
Contents Tables ........................................................................................................................................................................................................................ 2
Forward Looking Statements ...................................................................................................................................................................................... 4
Introduction ................................................................................................................................................................................................................ 5
Overview of Pillar 3 Disclosures ................................................................................................................................................................................. 6
Regulatory Outlook ..................................................................................................................................................................................................... 7
CEP Independent Risk Management Objectives and Policies................................................................................................................................... 10
Credit Risk ................................................................................................................................................................................................................ 13
Market Risk .............................................................................................................................................................................................................. 17
Liquidity Risk ............................................................................................................................................................................................................ 20
Operational Risk ....................................................................................................................................................................................................... 22
Securitisation ............................................................................................................................................................................................................ 24
Regulatory Framework for Disclosures ..................................................................................................................................................................... 26
Capital Resources and Minimum Capital Requirements ........................................................................................................................................... 27
Leverage .................................................................................................................................................................................................................. 36
Non-trading Book Exposures .................................................................................................................................................................................... 40
Quantitative Disclosures of Credit Risk Profile and Credit Risk Mitigation (CRM) ...................................................................................................... 41
Credit Risk Profile and CRM in the Standardised Approach ...................................................................................................................................... 60
Market Risk .............................................................................................................................................................................................................. 63
COVID-19 Disclosures ............................................................................................................................................................................................. 64
Liquidity Risk Disclosures ......................................................................................................................................................................................... 66
2020 Remuneration Statement ................................................................................................................................................................................. 69
CEP & CHIL Board and Senior Management Disclosures ........................................................................................................................................ 76
CEP Committees ...................................................................................................................................................................................................... 78
Conflict of Interest Policy .......................................................................................................................................................................................... 84
Business Continuity Management ............................................................................................................................................................................ 85
Appendix 1: CEP & CHIL Board Member Biographies .............................................................................................................................................. 86
Appendix 2: Non-disclosed Tables ........................................................................................................................................................................... 88
Glossary ................................................................................................................................................................................................................... 89

Pillar 3 Disclosures December 2020 2
Tables
Table 1: KM1- Key Metrics for CEP 2020 all quarters & 31 December 2019 ............................................................................................................... 9
Table 2: KM1- Key Metrics for CHIL 2020 all quarters & 31 December 2019 .............................................................................................................. 9
Table 3: Portfolio VaR .............................................................................................................................................................................................. 17
Table 4: Sensitivity of Economic Value and Net Interest Revenue ............................................................................................................................ 18
Table 5: SEC1: Securitisation Exposures in the Non-Trading book as at 31 December 2020 ................................................................................... 24
Table 6: SEC4: Securitisation exposures in the non-trading book and associated regulatory capital requirements - institution acting as investor as at 31 December 2020 ................................................................................................................................................................................................... 24
Table 7: LI1 - Differences between accounting and regulatory scopes of consolidation and the mapping of financial statement categories with regulatory risk categories 31 December 2020 ........................................................................................................................................................... 26
Table 8: LI2 – Main sources of differences between regulatory exposure amounts and carrying values in financial statements ................................ 26
Table 9: LI3– Outline of the differences in the scopes of consolidation (entity by entity)............................................................................................ 26
Table 10: Own Funds CEP 31 December 2020 & 2019 ........................................................................................................................................... 28
Table 11: Own Funds CHIL 31 December 2020 & 2019 .......................................................................................................................................... 29
Table 12: Regulatory Capital Resources Reconciliation to Audited Financial Statements CEP 31 December 2020 .................................................. 30
Table 13: Regulatory Capital Resources Reconciliation to Audited Financial Statements CHIL 31 December 2020 ................................................. 30
Table 14: Capital Instruments Features .................................................................................................................................................................... 31
Table 15: EU OV1 – Overview of RWAs 30 September & 31 December 2020 – CEP .............................................................................................. 33
Table 16: EU OV1 – Overview of RWAs 30 September & 31 December 2020 – CHIL ............................................................................................. 33
Table 17: Geographical distribution of credit exposures relevant for the calculation of the countercyclical buffer 31 December 2020 ....................... 34
Table 18: Amount of institution-specific countercyclical buffer 31 December 2020 .................................................................................................... 34
Table 19: Geographical distribution of credit exposures relevant for the calculation of the countercyclical buffer 31 December 2019 ....................... 34
Table 20: Amount of institution-specific countercyclical buffer 31 December 2019 .................................................................................................... 35
Table 21: Summary Reconciliation of Accounting Assets and Leverage Ratio Exposures for CEP .......................................................................... 36
Table 22: Summary Reconciliation of Accounting Assets and Leverage Ratio Exposures for CHIL ......................................................................... 37
Table 23: Leverage Ratio Common Disclosure for CEP........................................................................................................................................... 37
Table 24: Leverage Ratio Common Disclosure for CHIL .......................................................................................................................................... 38
Table 25: Split of On Balance Sheet Exposures (excluding derivatives and SFTs) for CEP ..................................................................................... 38
Table 26: Split of On Balance Sheet Exposures (excluding derivatives and SFTs) for CHIL .................................................................................... 39
Table 27: Non-Trading Book Equity Exposures ........................................................................................................................................................ 40
Table 28: CRB-B - Total and average net amount of exposures ............................................................................................................................... 41
Table 29: CRB-C – Geographical breakdown of exposures 31 December 2020 ....................................................................................................... 42
Table 30: CRB-C – Geographical breakdown of exposures 31 December 2019 ....................................................................................................... 43
Table 31: CRB-D – Concentration of exposures by industry 31 December 2020 ...................................................................................................... 44
Table 32: CRB-D – Concentration of exposures by industry 31 December 2019 ...................................................................................................... 45
Table 33: CRB-E – Maturity of exposures 31 December 2020 .................................................................................................................................. 46
Table 34: CRB-E – Maturity of exposures 31 December 2019 .................................................................................................................................. 46
Table 35: CR1-A – Credit quality of exposures by exposures class and instrument 31 December 2020 ................................................................... 47
Table 36: CR1-A – Credit quality of exposures by exposures class and instrument 31 December 2019 ................................................................... 47
Table 37: CR1-B – Credit quality of exposures by industry or counterparty types 31 December 2020 ...................................................................... 48
Table 38: CR1-B – Credit quality of exposures by industry or counterparty types 31 December 2019 ...................................................................... 48
Table 39: CR1-C - Credit quality of exposures by geography 31 December 2020 ..................................................................................................... 49
Table 40: CR1-C - Credit quality of exposures by geography 31 December 2019 ..................................................................................................... 49
Table 41: Credit quality of forborne exposures 31 December 2020 ........................................................................................................................... 50
Table 42: Credit quality of forborne exposures 31 December 2019 ........................................................................................................................... 50
Table 43: Credit quality of performing and non-performing exposures by past due days 31 December 2020 ............................................................ 51
Table 44: Credit quality of performing and non-performing exposures by past due days 31 December 2019 ............................................................ 52
Table 45: Performing and non-performing exposures and related provisions 31 December 2020 ............................................................................. 53

Pillar 3 Disclosures December 2020 3
Table 46: Performing and non-performing exposures and related provisions 30 December 2019 ............................................................................. 54
Table 47: CR2-A – Changes in the stock of general and specific credit risk adjustments 2020 ................................................................................. 55
Table 48: CR2-B – Changes in the stock of defaulted and impaired loans and debt securities 2020 ......................................................................... 55
Table 49: CR3 - CRM techniques – Overview 31 December 2020 ............................................................................................................................ 55
Table 50: CR3 - CRM techniques – Overview 31 December 2019 ............................................................................................................................ 55
Table 51: CCR1: Analysis of CCR exposure by approach 31 December 2020 .......................................................................................................... 56
Table 52: CCR1: Analysis of CCR exposure by approach 31 December 2019 .......................................................................................................... 56
Table 53: CCR2 - Credit valuation adjustment (CVA) capital charge ......................................................................................................................... 57
Table 54: CCR8 - Exposures to CCPs 31 December 2020 ....................................................................................................................................... 57
Table 55: CCR3: Standardised approach – CCR exposures by regulatory portfolio and risk 31 December 2020 ...................................................... 58
Table 56: CCR3: Standardised approach – CCR exposures by regulatory portfolio and risk 31 December 2019 ...................................................... 58
Table 57: CCR5-A - Impact of netting and collateral held on exposure values 31 December 2020 ........................................................................... 58
Table 58: CCR5-A - Impact of netting and collateral held on exposure values 31 December 2019 ........................................................................... 58
Table 59: CCR5-B - Composition of collateral for exposures to CCR 31 December 2020 ......................................................................................... 59
Table 60: CCR6: Credit derivatives exposures 31 December 2020........................................................................................................................... 59
Table 61: CCR6: Credit derivatives exposures 31 December 2019........................................................................................................................... 59
Table 62: Credit Quality Assessment Scale .............................................................................................................................................................. 60
Table 63: Simplified Summary of Risk Weightings by Credit Quality Step ................................................................................................................. 60
Table 64: CR4 - Standardised approach – Credit risk exposure and CRM effects 31 December 2020 ...................................................................... 61
Table 65: CR4 - Standardised approach – Credit risk exposure and CRM effects 31 December 2019 ...................................................................... 61
Table 66: CR5 - Standardised approach - Risk Weighted 31 December 2020 .......................................................................................................... 62
Table 67: CR5 - Standardised approach - Risk Weighted 31 December 2019 .......................................................................................................... 62
Table 68: MR1 - Market risk under the standardised approach 31 December 2020 and 2019................................................................................... 63
Table 69: Information on newly originated loans and advances provided under newly applicable public guarantee schemes introduced in response to COVID-19 crisis 31 December 2020 ..................................................................................................................................................................... 64
Table 70: Information on loans and advances subject to legislative and non-legislative moratoria 31 December 2020 ............................................. 65
Table 71: Breakdown of loans and advances subject to legislative and non-legislative moratoria by residual maturity of moratoria 31 December 2020 ......................................................................................................................................................................................................................... 65
Table 72: LIQ1 – LCR disclosure .............................................................................................................................................................................. 66
Table 73: Asset encumbrance .................................................................................................................................................................................. 68
Table 74: Remuneration Awarded to CEP MRTs 2020 Performance Year ................................................................................................................ 73
Table 75: Guaranteed bonus, sign-on and severance payments made to MRTs in 2020 .......................................................................................... 73
Table 76: MRT Deferred Remuneration .................................................................................................................................................................... 74
Table 77: 2020 Remuneration Banding for Annual Compensation of Individuals Earnings at least EUR 1 million ..................................................... 75
Table 78: Directorships held by Citibank Europe plc Board of Directors 31 December 2020 (including Citi Directorships) ........................................ 76
Table 79: Memberships of the CEP Board of Directors 31 December 2020 .............................................................................................................. 77
Table 80: Directorships held by CHIL Board of Directors 31 December 2020 ........................................................................................................... 77
Table 81: Memberships of the CHIL Board 31 December 2020 ............................................................................................................................... 77
Table 82: CEP Board Risk Committee Composition ................................................................................................................................................. 78
Table 83: CEP Audit Committee Composition........................................................................................................................................................... 78
Table 84: CEP Remuneration Committee Composition ............................................................................................................................................ 79
Table 85: CEP Nomination Committee Composition ................................................................................................................................................. 79
Table 86: CEP Related Party Lending Committee Composition ................................................................................................................................ 79
Table 87: CEP Executive Committee Composition ................................................................................................................................................... 80
Table 88: CEP Risk Management Committee Composition ...................................................................................................................................... 81
Table 89: CEP Operating Committee Composition ................................................................................................................................................... 81
Table 90: CEP Business Risk and Control Committee Composition ......................................................................................................................... 82
Table 91: CEP Asset and Liability Committee Composition ...................................................................................................................................... 83
Table 92: Non-disclosed tables ................................................................................................................................................................................. 88

Pillar 3 Disclosures December 2020 4
Forward Looking Statements
This document contains certain forward-looking statements. Citigroup cautions readers that no forward looking statement is a guarantee of future performance. Citigroup’s actual results may differ materially from those included in any forward-looking statements, which are indicated by words such as “believe”, “expect”, “anticipate”, “intend”, “estimate”, “may increase”, “may fluctuate”, and similar expressions, or future or conditional verbs such as “will”, “should”, “would”, and “could”.
Any forward-looking statements are based on management’s current expectations and involve external risks and uncertainties including, but not limited to: levels of activity and volatility in the capital markets, global economic and business conditions, including the level of interest rates and exchange rates, the credit environment, unemployment rates, and political and regulatory developments in the U.S. and around the world, as well as the outcome of legal, regulatory and other proceedings.
For a more detailed discussion of potential risk factors, the reader is directed to Citigroup’s 2020 Annual Report. Except as required by any competent regulator or applicable law, Citigroup expressly disclaims any obligation or undertaking to release publicly any updates or revisions to any forward-looking statements contained in this document to reflect any change in Citigroup’s expectations with regard thereto or any change in events, conditions or circumstances on which any such statement is based. The reader should, however, consult any additional disclosures that Citigroup has made or may make in documents it has filed or may file with the SEC, including Citigroup’s 2020 Annual Report and CHIL & CEP’s 2020 financial statements.

Pillar 3 Disclosures December 2020 5
Introduction
Citibank Holdings Ireland Limited (CHIL), which is a wholly-owned subsidiary of Citigroup Inc., is the parent of Citi’s principal European banking entity, Citibank Europe plc (CEP), together “CEP” unless otherwise specified. CEP is recognised as being an integral part of the Citi network, both regionally and globally as a Material Legal Entity. The core activities of CEP comprise the Institutional Clients Group (ICG) with Markets and Securities Services and Banking businesses. The activities in Banking comprise Treasury and Trade Solutions (TTS), corporate and commercial lending and private banking services. CEP is authorised by the Central Bank of Ireland (CBI) and, as a significant European financial institution, falls under the Single Supervisory Mechanism (SSM). CEP being designated as an Other Systemically Important Institutions (O-SII) is overseen by European Central Bank (ECB). Supervision is performed by a Joint Supervisory Team (JST), comprised of both the ECB and the CBI. CEP has a long term single “A” rating or equivalent assigned by all three primary Credit Rating Agencies. As at 31 December 2020, CEP has 10,500 employees across 22 European jurisdictions and is Citigroup’s principal European banking subsidiary, providing services to Citi’s clients who require or wish to transact via an EU licensed bank. The principal products offered by CEP are from Citi’s ICG product groups. CEP’s key business segments include Markets and Securities Services (MSS), Corporate Banking, Treasury and Trade Solutions (TTS), and Private Banking. These businesses service a wide range of target market clients including financial institutions, fund managers, governments, public sector clients, large local and multinational corporations, and high net worth individuals.
Markets The Markets business activities in CEP consist of Foreign Exchange Sales and Trading, Interest Rate products, Markets Treasury, Spread Products and Margin Lending businesses. One of the primary purposes for CEP Markets business activities is to support the clients’ need to conduct business across EU. The suite of Markets activities conducted on CEP has been broadened as part of execution of CEP’s Brexit strategy.
Custody and Funds Services
CEP’s Custody and Funds Services business has the following three offerings:
• Global Fund Services (GFS): provides valuation, fund accounting, investment administration and transfer agency services to asset managers and operators or promoters of Collective Investment Schemes (CIS).
• CEP GFS: provides Fund Services in Ireland and Luxembourg to funds predominantly domiciled within the EU.
• Depositary Services: provides Trustee, Custodial and Depositary services to operators or promoters of EU-regulated / domiciled Collective Investment Schemes.
• Global Custody: provides settlement, safekeeping, and asset servicing to Luxembourg based funds as well as asset owners/ managers based in other jurisdictions.
Direct Custody and Clearing Direct Custody and Clearing (DCC) provides asset servicing and transaction functions primarily to intermediaries such as broker-dealers, banks, fund managers, insurance companies and global custodians (including Citi) through the proprietary network in over 60 markets globally. DCC provides securities settlement, clearing,
custody and asset servicing to these clients and International Central Securities Depositories (ICSDs).
Corporate and Commercial Banking The CEP Banking business supports Institutional Clients Group (ICG) client financing and other activities across Europe as part of Citi’s global network. Local bankers provide comprehensive relationship coverage to ensure the best possible service and responsiveness to clients. CEP is the primary bank for clients based in EEA. In certain countries tax and/or regulatory reasons are an additional factor that drives clients to be booked on CEP. CEP’s corporate banking business broadly operates with Corporates, Public Sector and Financial Institutions spanning across all Industries. The primary focus is to cover the largest European Multinational and Regional Clients, offering Citi’s global network and the full suite of financial products. CEP’s commercial banking business operates mostly out of the Central and Eastern European cluster (CE5) and services Small to Medium sized Enterprises (SME) and Middle Market Enterprises (MME) clients.
Treasury & Trade Solutions
The TTS business provides integrated Treasury (primarily Cash Management) Solutions and Trade Solutions to multinational corporations, Financial Institutions and Public Sector organizations across the globe. With the industry’s most comprehensive suite of digital and mobile enabled platforms, tools and analytics, and its global network reach.
Issuer Services
Issuer Services, Agency & Trust (A&T), is a global Corporate Trust provider, offering agency, fiduciary and depository services. A&T provides services to institutional clients who are raising, deploying or mobilizing capital. Typical Corporate Trust clients include major international and national-level corporations, financial institutions and public sector / sovereign debt issuers, as well as the International Central Securities Depositories (ICSD), investment banks, asset managers, and stand-alone collateral managers.
Citi Private Bank (CPB)
Citi Private Bank provides an extensive range of services from banking, custody and cash management to investment finance, investment strategies, trust and specialized services to two client segments:
• Ultra-High Net Worth (UHNW) individuals (and their associated structures (such as Trusts) with investable assets of $25 million or higher through CEP Luxembourg branch and,
• the Law Firm Group (LFG) comprised of partners and employees of law firms and, through their Professional Services Group (PSG)] the partners and employees of accountancy, consulting, asset management and executive recruitment on CEP UK branch

Pillar 3 Disclosures December 2020 6
Overview of Pillar 3 Disclosures The Capital Requirements Directive (CRD IV) package, which came into effect on 1 January 2014 and implements the provisions of the Basel Capital Accord in the European Union (EU), mandates a framework of capital adequacy regulation for banks and investment firms incorporating three distinct pillars:
• Pillar 1 prescribes the minimum capital requirements for such firms
• Pillar 2 addresses the associated supervisory review process; and,
• Pillar 3 specifies further public disclosure requirements in respect of their capital and risk profile.
The Pillar 3 disclosures complement both the group level materials included in the Citigroup Annual Report, and CHIL and CEP’s own 2020 financial statements. The basis of the disclosure for CHIL and CEP, is on a consolidated basis. These disclosures are made in accordance with Part 8 of the Capital Requirements Regulation (CRR) within the CRD IV package. In addition, we have implemented the European Banking Authority (EBA) final guidelines on revised Pillar 3 disclosures (EBA/GL/2016/11), amended in June 2017, which bring into force the disclosure of new quantitative tables to further enhance comparability and consistency across the industry. The following disclosures have been made purely for explaining the basis on which CEP has prepared and disclosed information about capital requirements and the management of certain risks and for no other purpose. They do not constitute any form of financial statement and must not be relied upon in making any investment or judgement on the entity
Scope In accordance with Pillar 3 requirements, the scope covered by CEP’s Pillar 3 disclosures include CRD IV capital requirements and resources, capital ratios, credit risk, market risk, operational risk, liquidity risk, leverage ratio, non-trading book exposures, securitisation activity, encumbered /unencumbered assets and remuneration disclosures. Some of the areas covered are also dealt within CHIL’s and CEP’s Annual Financial Statements 31 December 2020. In other areas, more detail is provided in these Pillar 3 disclosures. For instance, the section on capital requirements includes additional information on the amount of capital held against various risks and exposure classes, and the section on capital resources provides details on the composition of CHIL’s and CEP’s own funds as well as a reconciliation of accounting equity to regulatory capital. It should be noted that while some quantitative information in this document is based on financial data contained in CHIL’s and CEP’s Annual Report 31 December 2020, other quantitative data is sourced from prudential returns and is calculated according to regulatory requirements.
Frequency of disclosure CEP publishes Pillar 3 disclosures semi-annually, with a more comprehensive disclosure on an annual basis in line with the CRR and EBA requirements. CEP publishes its Pillar 3 disclosures at https://www.citigroup.com/citi/investor/reg.htm
Quantitative Disclosure Where not relevant to the activities of CEP, specific rows and columns have been deleted from tables. Tables may not sum due to rounding.
Any information deemed as immaterial, proprietary and confidential to CEP has been omitted. Details of disclosures omitted can be found in Appendix 2.
Policy and Verification In accordance with Article 431 (3) of the Capital Requirement Regulation (CRR), CEP’s Pillar 3 disclosures are covered under the Citi EU Pillar 3 Standard, which outlines the principles and minimum standards to be applied when developing a set of Pillar 3 disclosures for legal entities within the EU regulatory framework. The firm operates within a framework of internal controls and procedures for assessing the appropriateness of this disclosure. CEP’s Pillar 3 document is subject to a formal governance process and has been reviewed by appropriate senior management within the Finance, Risk, Treasury and HR functions. The document was reviewed by the CEP Executive Committee and the CEP Audit Committee; and was approved by the CEP & CHIL Board of Directors.

Pillar 3 Disclosures December 2020 7
Regulatory Outlook
Emergence of COVID-19 The Covid-19 pandemic has had a significant impact on the economy and global regulators have responded with a range of measures to support firms through this period. Regulatory updates are still evolving and they vary by jurisdiction. The responses include reductions in countercyclical capital buffers, clarifications on the use of capital buffers, prudential valuation adjustment relief and proposed revisions to the securitisation framework and associated amendments to the CRR. In addition, a 'CRR Quick Fix' package was enacted in the EU in June 2020, making amendments to the regulatory framework. These measures are intended to help firms to mitigate the economic impacts of the pandemic on their businesses and to allow them to continue to lend to the wider economy.
Basel Reforms
CEP will be impacted by a number of regulatory rule changes introduced by the Basel Committee on Banking Supervision (BCBS) and other standard setters that have been legislated for in Europe by CRR II /CRD V. Key elements in CRR II include changes to Counterparty Credit Risk (SA-CCR), the Large Exposures framework, the Leverage Ratio, Net Stable Funding Ratio (NSFR), Minimum Requirements for Own Funds and Eligible Liabilities (MREL) and The Fundamental Review of the Trading Book (FRTB).
CRR II / CRD V (the CRD V package) was published in the Official Journal of the EU in June 2019. The majority of the package applies two years later, however some applied immediately following the entry into force, such as MREL, whilst other provisions have a longer implementation period, such as elements of FRTB.
Minimum Requirements for Own Funds and Eligible Liabilities (MREL)
MREL is a requirement for firms to maintain a minimum amount of loss-absorbing resources over and above the own funds requirements. MREL resources can take the form of regulatory capital (own funds) and certain types of liabilities (eligible liabilities) that will be written down and/or converted to equity if a firm is likely to fail.
Fundamental Review of the Trading Book (FRTB)
FRTB represents a comprehensive revision of the market risk rules, including revisions to both the standardised and the internal models approaches. It introduces risk sensitivity into the standardised approach and equips it to act as a credible alternative to internal models. The revised internal models approach applies the model approval process at a desk, rather than company, level and uses an expected shortfall measure, rather than VaR, to quantify market risk requirements. FRTB also reduces the scope for inconsistent application of the boundary between the trading book and non-trading books. The rules require firms to capture and utilise a significantly increased amount of data and processing capability in order to calculate the capital requirements. CRR II introduces many of the rules for FRTB, however, it maintains the existing market risk framework as this remains the basis for calculating market risk requirements. FRTB will become the binding requirement according to a timeline to be determined in CRR III.
The Standardised Approach for Measuring Counterparty Credit Risk Exposures (SA-CCR)
In 2014, the Basel committee published the final framework for SA-CCR. This approach replaces the Current Exposure Method (CEM) and addresses historical deficiencies by distinguishing between bilateral and cleared trades, margined and unmargined transactions, allowing better reflection of netting, hedging and collateral benefits.
The Large Exposures framework
The capital that can be considered for the purposes of large exposures will be limited to Tier 1 capital only, a change from the previous 'eligible capital' which was inclusive of Tier 2 capital. The introduction of SA-CCR further impacts the large exposures as the use of internal models is no longer permitted for calculating the exposure value used in the large exposures framework.
The Leverage Ratio
CRR II imposes a binding requirement for institutions to maintain a leverage ratio of at least 3% effective 1 January 2022. Additionally, leverage exposures are also subject to calculation under SA-CRR.
Net Stable Funding Ratio (NSFR)
NSFR rules were finalised and published in the EU as part of the CRD V package. CEP is required to comply with the CRR II NSFR requirements from July 2021 that also includes the binding requirement of maintaining a ratio of at least 100% at both solo and consolidated levels. NSFR is the minimum amount of required stable funding firms must maintain based on the liquidity, residual maturity and counterparty of the assets over one year time horizon. The ratio is calculated as available stable funding (ASF) over required stable funding (RSF) taking into account the accounting value of assets, liabilities, off-balance sheet items and regulatory capital.
CRR III/ CRD VI
A further proposal to revise the CRR (known as CRR III) is expected to be published by the European Commission in 2021. This will incorporate other changes proposed by the BCBS such as a new Standardised Approach to Credit Risk (SA-CR), a new Credit Valuation Adjustment (CVA) framework, revisions to the approach to Securities Financing Transactions, further elements of FRTB, the Output Floor and a new Standardised Approach to Operational.
Climate Change
Climate change presents immediate and long-term risks to Citi and to its clients and customers, with the risks expected to increase over time. Climate risk refers to the risk of loss arising from climate change and is divided into physical risk and transition risk.
• Physical risk considers how chronic and acute climate change (e.g., increased storms, drought, fires, floods) can directly damage physical assets (e.g., real estate, crops) or otherwise impact their value or productivity.
• Transition risk considers how changes in policy, technology, and market preference to address climate change (e.g., carbon price policies, power generation shifts from fossil fuels to renewable energy) can lead to changes in the value of assets, commodities and companies.
Climate risk is an overarching risk that can act as a driver of other types of risk in the Citi risk taxonomy, such as credit risk from obligors exposed to high climate risk, reputation risk from increased stakeholder concerns about financing high carbon industries, and operational risk from physical climate risks to Citi’s facilities.
Citi currently identifies climate risk as an“emerging risk” within its risk
governance framework. Emerging risks are risks or thematic issues that are either new to the landscape, or in the case of climate risk, existing risks that are rapidly changing or evolving in an escalating fashion, which are difficult to assess due to limited data or other uncertainties. With the increased importance and focus on climate risk, Citi has continued to expand its governance of climate risk and integrate climate considerations into the priorities of Citigroup’s and CEP’s Board of Directors and senior management.

Pillar 3 Disclosures December 2020 8
Citi manages and mitigates the credit and reputation risks from climate change through a number of internal initiatives, including Citi’s Environmental and Social Risk Management (ESRM) Policy. First established in 2003, the ESRM Policy is part of Citi’s broader credit risk management policy and is applicable to all Citi entities globally. The ESRM Policy provides the framework for how Citi identifies, mitigates, and manages the potential environmental and social risks (including climate risks) associated with clients’ activities that could lead to credit or reputation risks to the firm. It guides how Citi evaluates lending, underwriting and advisory in environmentally sensitive and/or high-carbon sectors, and presents opportunities for Citi to engage clients on solutions to thematic risks. Citi’s ESRM Policy covers lending and underwriting with identified use of proceeds directed to physical assets and activities, as well as sector standards for corporate relationships in higher-risk sectors, including carbon-intensive sectors. Citi has also made climate risk one of the three key pillars of its 2025 Sustainable Progress Strategy. Under this pillar, Citi intends to measure, manage and reduce the climate risk and impact of its client portfolios and enhance its Taskforce on Climate-Related Financial Disclosures (TCFD) implementation and disclosure through policy development, portfolio analysis and client engagement. In December 2020, Citi released its second report detailing its implementation of the TCFD recommendations: Finance for a Climate-Resilient Future II. In this report, Citi discusses its implementation of the TCFD recommendations, and Citi's recent pilot testing of climate scenario analyses to assess climate-related impacts and risks in specific sectors, spanning both transition and physical climate risks. Climate data is still improving in terms of its accessibility and reliability, and the industry and Citi continue to develop better methodological approaches towards assessing climate change impacts. Nonetheless, Citi expects to integrate more quantitative analysis of climate risks into credit assessments in the future and to quantify the carbon emissions associated with its client portfolios. Additionally, Citi continues to participate in financial industry collaborations to develop and pilot new methodologies and approaches for measuring and assessing the potential financial risks of climate change. Citi is also closely monitoring regulatory developments on climate risk and sustainable finance, and actively engaging with regulators on these topics. As Citi’s main pan-European bank, CEP is currently beginning the implementation of regulatory requirements and expectations. European supervisors have been active in codifying regulatory expectations on ESG risks, including climate risk, into guidance. Two recently published guides are in the process of being implemented by CEP and used to embed climate risk management (EBA Guidelines on Loan Origination and Monitoring and ECB guide in climate-related and environmental risks). CEP has performed a self-assessment on practices against the supervisory expectations as set out in the ECB guide on climate-related and environmental risks. The self-assessment formed the basis for CEP’s implementation plans from 2021-2023 and the establishment of an ESG Working Group and ESG Steering Group. Detailed planning is underway to integrate these risks into strategy, governance, risk appetite, risk management and disclosures, in preparation for a supervisory review of CEP’s practices and SSM Climate Risk Stress Test, in 2022. CEP is also preparing to implement upcoming EU Taxonomy Regulation and the non-financial disclosure report (NFDR) on which it is based, Following the publication of the EBA Guidelines on Loan Origination and Monitoring, CEP has developed the ESG Factors Credit Assessment Procedure which includes in its credit-decision process the assessment of borrower’s exposure to ESG factors including climate risk. This procedure will be effective from 1st July 2021.

Pillar 3 Disclosures December 2020 9
Table 1: KM1- Key Metrics for CEP 2020 all quarters & 31 December 2019
31 December 2020
30 September 2020
30 June 2020
31 March 2020
31 December 2019
Available capital € million € million € million € million € million
Common Equity Tier 1 (CET1) 8,435 8,134 8,557 9,035 8,886
Tier 1 8,435 8,134 8,557 9,035 8,886
Total capital 8,435 8,134 8,557 9,035 8,886
Risk-weighted assets
Total risk-weighted assets (RWA) 42,028 42,025 43,128 43,764 39,579
Risk-based capital ratios as a percentage of RWA
Common Equity Tier 1 ratio (%) 20.07% 19.36% 19.84% 20.64% 22.45%
Tier 1 ratio (%) 20.07% 19.36% 19.84% 20.64% 22.45%
Total capital ratio (%) 20.07% 19.36% 19.84% 20.64% 22.45%
Additional CET1 buffer requirements as a percentage of RWA
Capital conservation buffer requirement (%) 2.50% 2.50% 2.50% 2.50% 2.50%
Countercyclical buffer requirement (%) 0.04% 0.04% 0.05% 0.18% 0.36%
Bank G-SIB and/or D-SIB additional requirements (%) 0.00% 0.00% 0.25% 0.25% 0.00%
Total of bank CET1 specific buffer requirements (%) 2.54% 2.54% 2.80% 2.93% 2.86%
CET1 available after meeting the bank's minimum capital requirements (%) 1
12.07% 11.36% 11.84% 12.64% 14.45%
Basel III Leverage Ratio 2
Total Basel III leverage ratio measure 84,213 82,736 87,960 87,225 79,457
Basel III leverage ratio (%) 10.02% 9.83% 9.73% 10.36% 11.18%
Liquidity Coverage Ratio 3
Total HQLA 22,738 21,116 22,430 20,874 21,828
Total net cash outflow 16,379 15,213 16,612 15,550 15,760
LCR ratio (%) 138.83% 138.80% 135.02% 134.24% 138.50%
Net Stable Funding Ratio
Total available stable funding 23,015 22,943 24,966 25,505 25,936
Total required stable funding 20,246 19,895 21,464 24,166 22,459
NSFR ratio (%) 113.68% 115.32% 116.30% 105.50% 115.48%
Table 2: KM1- Key Metrics for CHIL 2020 all quarters & 31 December 2019
31 December 2020
30 September 2020
30 June 2020
31 March 2020
31 December 2019
Available capital € million € million € million € million € million
Common Equity Tier 1 (CET1) 8,445 8,145 8,568 9,046 8,897
Tier 1 8,445 8,145 8,568 9,046 8,897
Total capital 8,445 8,145 8,568 9,046 8,897
Risk-weighted assets
Total risk-weighted assets (RWA) 42,106 42,101 43,194 43,804 39,606
Risk-based capital ratios as a percentage of RWA
Common Equity Tier 1 ratio (%) 20.06% 19.35% 19.84% 20.65% 22.46%
Tier 1 ratio (%) 20.06% 19.35% 19.84% 20.65% 22.46%
Total capital ratio (%) 20.06% 19.35% 19.84% 20.65% 22.46%
Additional CET1 buffer requirements as a percentage of RWA
Capital conservation buffer requirement (%) 2.50% 2.50% 2.50% 2.50% 2.50%
Countercyclical buffer requirement (%) 0.04% 0.04% 0.05% 0.18% 0.36%
Bank G-SIB and/or D-SIB additional requirements (%) 0.00% 0.00% 0.25% 0.25% 0.00%
Total of bank CET1 specific buffer requirements (%) 2.54% 2.54% 2.80% 2.93% 2.86%
CET1 available after meeting the bank's minimum capital requirements (%) 1
12.06% 11.35% 11.84% 12.65% 14.46%
Basel III Leverage Ratio 2
Total Basel III leverage ratio measure 84,290 82,809 87,900 87,263 79,477
Basel III leverage ratio (%) 10.02% 9.84% 9.75% 10.37% 11.19%
Liquidity Coverage Ratio 3
Total HQLA 22,738 21,116 22,430 20,874 21,828
Total net cash outflow 16,382 15,219 16,618 15,557 15,760
LCR ratio (%) 138.80% 138.74% 134.97% 134.18% 138.50%
Net Stable Funding Ratio
Total available stable funding 23,014 22,941 24,966 25,503 25,934
Total required stable funding 20,277 19,897 21,454 24,169 22,459
NSFR ratio (%) 113.50% 115.30% 116.40% 105.50% 115.47%
1 CEP has adopted IFRS 9 and the full impact is therefore the reported own funds, capital and leverage ratios. 2 Leverage ratio exposure is disclosed on a fully phased-in basis in accordance with the EU delegated act
CEP’s CET1 ratio decreased to 20.07% as at 31 December 2020 (31 December 2019: 22.45%) driven by the following:
• A decrease in CET1 capital of €451 million due to a decrease in retained earnings and other reserves;
• RWA increased by €2.5 billion, primarily due to increased Markets business activity as a result of Brexit changes.

Pillar 3 Disclosures December 2020 10
CEP Independent Risk Management Objectives and Policies
Risk Overview To achieve its business strategy, CEP selectively takes risks. The objective of CEP’s risk management system is to ensure that the risks associated with CEP’s strategy are identified, understood, quantified, mitigated, communicated and are consistent with CEP’s commitment to the principle of Responsible Finance in accordance with Citi standards. The CEP Board of Directors (Board) considers that the risk management systems in place, briefly outlined in the sections following, are adequate with regard to CEP's profile and strategy.
Risk Governance & Reporting CEP has a comprehensive risk governance framework in place to provide oversight of CEP’s monitoring and management of risks, ensuring that the risk profile of CEP is well documented and managed. Risk governance at CEP is cascaded through risk frameworks and risk policies, which describe how CEP identifies, analyses, evaluates, manages and monitors risk. This ensures transparent lines of responsibility and accountability for the core governance processes performed by CEP. Risk management oversight is conducted at both Board and executive level, supported by the workings of various committees. This includes the Board Risk Committee (BRC), Board Audit Committee (BAC), Remuneration Committee and Nomination Committee. It also includes the Management Committees such as the Executive Committee, Asset & Liability Committee (ALCO), Credit Committee, Operating Committee, Operational Risk Committee, Outsourcing Committee, Financial Crime Governance Committee and Product Review Committee (PRC). In the last quarter of 2020 the CEP Board of Directors approved a revised risk governance structure. This involves the Credit Risk Committee and the Market Risk Sub Committee being subsumed into a new Risk Management Committee, and the Operational Risk Committee being subsumed into a new Business Risk and Controls Committee. These new Committees will be fully operational from 2021. Enhancements in good governance are monitored on an ongoing basis via interaction with peer institutions and benchmarking surveys, reviewing emerging guidance from regulators and supervisory bodies and reviewing Citigroup developments. The Board has overall responsibility for CEP's risk strategy, including Risk Appetite Limits. The BRC is a sub-committee of the Board and is governed by Terms of Reference approved by the Board. The BRC has responsibility for the oversight and advice to the Board on the current risk exposures of CEP and future risk strategy. The BRC monitors risk trends and reviews the level of resourcing and capabilities required to ensure governance standards are met. The BRC oversees Independent Risk Management and provides recommendations to the Board on risk related matters. The BRC convenes at least quarterly and in 2020 met on seven occasions.
Risk Mission CEP’s risk mission is to take intelligent risk with shared responsibility, without forsaking individual accountability. The management of risk is the collective responsibility of all CEP employees. The Board and senior management set the tone from the top and cascade accountability and responsibility for risk management throughout CEP. This ensures comprehensive risk dialogue among senior management and provides crucial leadership and guidance which enables senior management to make better risk and reward trade-off decisions.
CEP has in addition a robust and sound remuneration strategy in place, supported by effective employee compensation structures balancing strategic goals and behaviour. The CEP remuneration strategy promotes sound and effective risk management, and supports CEP’s strategy, objectives and the long term interests of the organisation.
Three Lines of Defence Risk management in CEP follows the principle of the three lines of defence model:
• Each of CEP’s businesses (First Line of Defence) owns and manages the risks inherent in, or arising from, the business, and is responsible for establishing and operating controls to mitigate key risks, performing manager assessments of the design and effectiveness of internal controls, and promoting a culture of compliance and control;
• CEP’s independent control functions (Second Line of Defence), comprising of Independent Risk Management and Independent Compliance Risk Management set standards against which the businesses and functions are required to manage and oversee their risks, including compliance with applicable laws, regulatory requirements, policies and standards of ethical conduct. These functions are involved in identifying, measuring, monitoring, and controlling aggregate risks, and are independent of front line units; and,
• CEP’s Internal Audit function (Third Line of Defence) independently reviews the activities of the first two lines of defence. This is undertaken based on a risk-based audit plan and a methodology approved by the Audit Committee. Internal Audit provides objective, reliable, valued and timely assurance to the Board, senior management and regulators regarding the effectiveness of governance, risk management, and controls which mitigate current and evolving risks and enhance the control culture within CEP.
Independent Risk Management In pursuit of its mission, CEP Independent Risk Management acts as a strong independent partner of the business to support effective risk management across all risks to which CEP is exposed in a manner consistent with CEP’s risk appetite. CEP Independent Risk Management is an independent function within the CEP legal vehicle. The CEP Chief Risk Officer (CRO) reports directly to both the Citi EMEA CRO and the CEP CEO. The CEP CRO has frequent, direct and independent access to the Board and the BRC. CEP Independent Risk Management maintains appropriate representation on all CEP management committees and other governance fora as appropriate. The CRO reports on the risk profile of the bank on an ongoing basis to the BRC and Board. CEP aims to ensure that CEP Independent Risk Management employees possess the appropriate expertise, stature, authority and independence and are empowered to make decisions and escalate issues.
Enterprise Risk Governance Framework CEP has in place comprehensive, documented risk management frameworks and policies to support the management of the material risks identifying for its activities, and ensure accountability through its three lines of defence model. CEP’s Enterprise Risk Governance Framework is an overarching risk governance framework, based on sound principles of good risk governance and management and on guidance issued by regulatory authorities. The Framework outlines the risk governance structure in CEP, the core governance processes of the bank and the roles and responsibilities.

Pillar 3 Disclosures December 2020 11
Formalised risk management frameworks by material risk type codify the processes and practices involved in the management of risk in CEP. The purpose of these risk frameworks is to clearly set out:
• the principles of sound risk management for each material risk type;
• clear lines of authority and risk responsibility, including roles and membership of both management and risk committees, with the responsibility to monitor adherence to frameworks and policies;
• how the risk is governed under the three lines of defence approach;
• supporting policies and processes.
Core Risk Governance Processes Appropriate processes and tools are in place to manage, measure and actively mitigate risks taken by CEP. CEP Independent Risk Management ensures that key risks are identified, managed, reported and monitored effectively by executing the following processes:
• CEP’s Material Risk Identification and Assessment Process which identifies and assesses risk exposures, concentrations and positions, both quantitative and qualitative, identified as the most significant risks to CEP, and how these risks are monitored and mitigated;
• Assess and challenge the CEP 3-Year Strategic Plan and provide a report outlining the results of that challenge to the Board on an annual basis;
• Enable Board review and approval of the CEP Risk Appetite Statement on an annual basis, This articulates the amount of risk which the Board is prepared to tolerate in pursuit of its strategy;
• Adopt Policies that establish standards, risk limits, and policy adherence processes;
• Stress testing and ensuring appropriate shocks and models are used to assess CEP’s material risks;
• Documenting an annual, Board-approved Risk Plan which outlines key deliverables which support and enhance risk management. Progress against the plan is tracked and reported to the BRC on an ongoing basis; and,
• The CEP branch network and reporting lines to ensure all branches are operating in line with the CEP Enterprise Risk Governance Framework.
Stress Testing In CEP, stress testing is integrated into CEP’s risk management processes and supports business decisions and processes including strategic decisions. The stress test programme:
• Supports bottom-up and top-down stress testing, including reverse stress-testing;
• Is a flexible platform that enables modelling of a wide variety of stress tests across business lines and risk types;
• Draws data from across the organisation, as needed; and,
• Enables intervention to adjust assumptions.
Sensitivity analysis supports ongoing risk monitoring by risk teams as appropriate. It is performed at regular intervals dependent on internal and regulatory requirements.
CEP utilises scenario analyses, which are both dynamic and forward looking. Scenarios appropriately impact all material risk types and risk factors and specific vulnerabilities relevant to CEP. Reverse stress testing is used by CEP to assess its business model vulnerabilities and is appropriate to the nature, size and complexity of its business and the risks it bears. Risk Monitoring & Reporting CEP Independent Risk Management complete ongoing monitoring of the risk environment which enables a comprehensive set of reports to be produced. These reports ensure Management, relevant Committees and the Board appropriately assess and understand the key risks facing CEP:
• Detailed reports on Risk exposures covering all material risks are sent to the BRC and Board at each sitting;
• Transparent, and rigorous reporting on exposures and concentrations by risk area are sent to Risk Committees; and,
Monthly adherence to CEP RAS reports are sent to Management to ensure that CEP risk taking remains consistent with the limits set by the CEP Board CEP uses a global Citi risk reporting system to monitor credit and market risk exposure. CEP uses both systems and processes to monitor operational risk, the output of which is consolidated to provide an operational risk profile. Further information on the scope and nature of risk monitoring & reporting is provided in the following sections dedicated to individual risk areas Credit Risk, Market Risk, Liquidity Risk and Operational Risk.

Pillar 3 Disclosures December 2020 12
Risk Profile and Risk Appetite For 2020, CEP identified the following risks as being material to its business:
Material Risk Definition
Credit Risk Risk to earnings or capital from a borrower failing to meet the terms of any contract
Operational Risk Risk of failed internal processes or systems, human errors or misconduct or adverse external events
Compliance Risk Risk of loss arising from violations of, or non-conformance with, local, national, or cross-border laws, rules, or regulations, our own internal policies and procedures, or relevant standards of conduct
Liquidity Risk Risk of inability to fund assets and meet obligations as they come due at a reasonable cost
Market Risk (incl IRRBB) Risk due to adverse movements in market rates or prices, such as interest rates and equity prices
Strategic Risk Risk resulting from adverse business decisions, inappropriate business plans, ineffective business strategy execution, or the failure to respond to changes in the macro- economic environment.
Reputational Risk Threat or danger to the good name or standing of the entity vis-à-vis customers, shareholders or other stakeholders
Inter-Affiliate Risk
Risk of loss due to Credit or Liquidity risk exposure to affiliated entities within Citi. Inter-Affiliate Risk also captures the potential Operational Risk (including Execution risk) due to dependence on major Citi-wide Programs covering remediation, transformation and strategic development.
Risk Profile CEP’s strategy, approved annually by the Board, is articulated with respect to target markets and clients and includes an outlook on the global economy, an overview of the evolving regulatory environment, and a view on the competitive landscape. The overall strategic objective of CEP is to generate sustainable earnings while protecting its capital and liquidity, proactively managing product positioning and driving client led innovation. CEP’s strategy is therefore focused on optimising returns within a targeted Board-approved Risk Appetite Statement to maintain its strong capital and funding position.
An overview of CEP’s management of Credit Risk, Market Risk, Liquidity Risk and Operational Risk is provided in the following sections on these individual risk areas.
Risk Appetite
CEP has a defined Risk Appetite, aligned to business strategy. The Risk Appetite Statement formally articulates the levels and types of risk that the Board is willing to accept, or avoid, in order to achieve CEP’s strategic objectives. It includes qualitative statements with associated Risk Review Thresholds, and quantitative statements with associated Risk Limits. It aims to support business growth whilst restricting any excessive accumulation of risk in CEP’s risk profile. The Risk Appetite Statement is the cornerstone in CEP’s risk strategy and is core in aligning overall corporate strategy, capital allocation, and risk. It is embedded in CEP’s corporate strategy and risk culture, and continuously monitored and revised, with Board approval at least annually or more frequently as required. In line with CEP’s business model, with a balance sheet that is relatively stable, diversified and of high credit quality, key prudential and risk profile metrics remain within limits set by the Board in the Risk Appetite Statement. These key risk metrics associated with the risk profile are provided in Table 1: KM1 for CEP and Table 2: KM1 for CHIL.
.
Pillar 3 Disclosures December 2020 13
Credit Risk
Credit and Counterparty Risk Overview
Credit Risk Credit risk is the potential for financial loss resulting from the failure of a borrower or counterparty to honour its financial or contractual obligations. Concentration risk, within credit risk, is the risk associated with having credit exposure concentrated within a specific client, industry, region or other category. Credit risk in CEP arises from on-balance sheet and off-balance sheet items, mainly through exposures to large corporates, financial institutions, and governments along with inter-company affiliates, and predominantly through Wholesale Credit Risk and Available for Sale (AFS) exposure. CEP has limited retail exposure through Consumer and Private Banking. Wholesale Credit Risk exposure is comprised of direct risk, contingent risk and clearing risk. Typical financial reporting categories that include wholesale exposures are deposits with banks, debt securities held-to-maturity, loans and off-balance sheet commitments such as unused commitments to lend and letters of credit. Available For Sale (AFS) assets are those financial assets that are designated as available for sale or are not classified as loans and receivables, held-to-maturity investments or financial assets at fair value through profit or loss. Consumer and Private Banking is comprised of Cards & Personal Instalment Loans (PIL). The consumer PIL portfolio includes all types of loans provided to individuals – secured or unsecured, term/instalment or revolving, and direct or indirect. Credit risk also arises from settlement and clearing activities, when CEP transfers an asset in advance of receiving its counter-value or advances funds to settle a transaction on behalf of a client.
Counterparty Risk Counterparty risk is the risk arising from the possibility that the counterparty could default before the settlement of a transaction, without fulfilling its financial obligation. Counterparty credit risk for CEP is small. It arises as a result of sales and trading business activities including:
• Capital Markets OTC (Over-the-Counter) Derivatives;
• Securities Financing Transactions (SFT) such as repurchase agreements and reverse repurchase transactions; and,
• Settlement Exposure. Quantitative Credit, Credit Concentration and Counterparty Risk related disclosures made in accordance with the CRR requirement and the EBA final guidelines on revised Pillar 3 disclosures are provided in the Quantitative Disclosures of Credit Risk Profile and Credit Risk Mitigation section.
Credit Risk Governance and Reporting CEP manages credit risk on a day-to-day basis through a three lines of defence approach. The first line of defence in CEP are involved in acquiring and evaluating applications for lines of credit, along with conducting regular (at least annual) assessments and evaluations of material obligors.
Responsibility for oversight and challenge of these risks sits with Independent Risk Management led by the CRO. CEP’s Head Credit Risk reports to the CEP CRO. The Credit Risk Management function reports to the Head of Credit Risk and is responsible for approving credit lines and exposures in line with delegated approval authority limits set out in the CEP Credit Management Policy, and for ongoing monitoring and reporting on credit risk exposures and trends including portfolio and delinquency based monitoring and management. The CEP Board has the ultimate responsibility for ensuring that there is an appropriate credit risk management framework in place. Credit risk governance is provided by the Board, BRC, Executive Committee, Risk Management Committee and Product Review Committee. The Board is also responsible for articulating CEP’s risk appetite for credit risk. The Remedial Management function, which reports to the Head of Credit Risk, evaluates and determines obligors deemed non-performing in line with CEP’s Remedial Management Policy. It assesses higher risk and non-performing cases on a quarterly basis for loan loss provisioning on a discounted cash flow basis, and takes the necessary remedial actions to manage clients or exposures in financial difficulty where possible and otherwise minimise losses to CEP. CEP has a dedicated Fundamental Credit Risk function which reports to the CRO and which is responsible for providing independent assurance on credit risk by monitoring adherence to the CEP Credit Risk Management Framework, associated credit policies and applicable regulations. Credit risk limits for CEP are governed by CEP’s Risk Appetite Framework. CEP’s Risk Management Committee sets more granular level exposure and concentration limits in the context of Board Risk Appetite Statement limits. CEP Risk Management monitor the Credit Risk profile on an ongoing basis and ensure detailed reports are sent to the Risk Management Committee and the BRC/Board on the Credit risk portfolio which also outline adherence to agreed limits.
Credit and Counterparty Risk Management CEP has adopted sound principles for the management of credit risk informed by regulatory guidance and Group practices. These key principles on which CEP bases its Credit Risk Management Framework are:
• CEP has an appropriate credit risk management environment;
• CEP operates sound credit granting, credit measurement, and credit monitoring processes;
• CEP monitors asset quality and maintains appropriate provisions for bad and doubtful debts;
• CEP maintains adequate controls over credit risk and appropriate disclosures; and,
• Credit risk is also comprehensively assessed from a Risk Capital and Stress Loss perspective.
Credit risk is deemed a material risk to CEP and is captured as part of CEP’s approved Risk Appetite Statement. CEP uses the global CitiRisk transaction and exposure processing system to manage credit exposure to its wholesale obligors and counterparties such as:

Pillar 3 Disclosures December 2020 14
• Extension of Credit;
• Collateral Management; and,
• Exposure Monitoring.
Methodology Used to Assign Credit Limits The process for approving a credit risk exposure limit is guided by:
• core credit policies;
• procedures and standards;
• experience and judgment of credit risk professionals; and,
• the amount of exposure at risk. The process also applies to all counterparty credit risk products - OTC derivative contracts, repo-style transactions and eligible margin loans. The process includes the determination of maximum potential exposure after recognition of netting agreements and collateral as appropriate. While internal ratings are the starting point in establishing credit assessments, a range of factors, such as quality of management and strategy, nature of industry, and regulatory environment, among others, are also taken into consideration for obligor limits and approval levels. Exposure to credit risk on derivatives is also impacted by market volatility, which may impair the ability of clients to satisfy their obligations to CEP. Credit risk analysts conduct daily monitoring versus limits and any issues are escalated to credit officers and business management as appropriate.
Stress Testing Stress Testing is performed on expected credit losses conditional on a given macroeconomic scenario, and includes the projection of credit losses for all facilities in the credit risk portfolio and all businesses. CEP Independent Risk Management, in conjunction with the businesses, develops stress scenarios, reviews the output of periodic stress testing exercises and uses the information to make judgements as to the ongoing appropriateness of exposure levels and limits.
Credit and Counterparty Risk Measurement
Credit Risk Regulatory Capital Requirement CEP has adopted the Standardised Approach for calculating credit risk and counterparty risk capital requirements, which is based on ratings from External Credit Assessment Institutions. Credit exposures are assigned a risk weighting based on the external credit rating of the counterparty to arrive at a risk adjusted or Risk Weighted Asset (RWA). Risk weights reduce with increasing credit quality of the obligor. For off-balance sheet items, a Credit Conversion Factor (CRR, Art 111) is used to transform the nominal value into an exposure-at-default. For all on-balance sheet items, the exposure value is measured as the on-balance sheet carrying, or accounting value. For OTC Derivatives, CEP uses the Current Exposure Method (CEM) approach to measure the replacement cost within a derivative contract in the case of a counterparty default. CEM assigns to each transaction a regulatory stipulated exposure based on the mark-to-market value and a measure of potential future exposure which is a percentage of notional exposure driven by residual maturity and the type of contract, i.e. interest rate, equities etc.
1 Capital Requirements Regulation
CEP leverages the Financial Collateral Comprehensive Method (CRR1, Article 223) to determine the appropriate haircuts for liquid and marketable collateral, and in doing so, calculate a net exposure-at-default (e.g. for SFTs). Where appropriate for SFT and OTC derivatives, netting and collateral may be recognised as credit risk mitigants provided that they meet certain eligibility criteria. For clarity, sovereign bond holdings in AFS are risk-weighted per CRR, Art 114(2).
Internal Credit Risk Capital Assessment Wholesale Credit Risk is assessed using a Monte Carlo simulation model that estimates defaults and economic losses during a 1-year time horizon. The model estimates a range of loss scenarios based on simulated distributions for Probabilities of Default (PD), Loss Given Defaults (LGD), facility usage/Exposure at Default (EAD) and credit rating migration loss estimates. The model also captures correlated movements in credit spreads to infer price movements on AFS holdings from downgrades. The internal risk capital assessment for credit risk also considers both Single Name and Sectorial Credit Concentration risk. From an internal risk capital perspective, counterparty exposures that do not require Credit Valuation Adjustment (CVA) treatment are included in the wholesale credit risk capital model.
Credit and Counterparty Risk Mitigation Credit risk mitigation is of vital importance to CEP in the effective management of its counterparty and credit risk exposures. Netting agreements, collateral and other techniques have a material beneficial impact on the level of such risks borne by the organisation. CEP’s credit risk mitigation processes are governed by CEP credit risk management policies. Five types of collateral are recognized within CEP: cash, securities, financial assets, real estate and physical assets.
CEP’s core principles of collateral management are:
• Documentation;
• Legal enforceability;
• Valuation; and,
• Collateral control. These core principles are designed to ensure that the risks associated with the value and liquidity of collateral being held in support of a facility are fully understood and documented and that they form part of the approval of the facility. Collateral received is subject to continuous monitoring. This includes establishing the legal enforceability of the collateral and ensuring it is valued regularly.
CEP has processes and procedures in place to ensure that appropriate information is available to support the collateral process, including timely and accurate information relating to margin calls, though this process is required for only a very small number of customers. Key to the process is a daily credit exposure report as well as reports identifying counterparties that have not met their requirement for additional collateral to satisfy specified initial margin amount and variation margin thresholds. In addition, there is firm wide risk reporting of counterparty exposures at an individual and an aggregated level.

Pillar 3 Disclosures December 2020 15
Quantitative collateral related disclosures in line with the CRR requirements and the EBA Guidelines (EBA/GL/2016/11) are provided in section the Quantitative Disclosures of Credit Risk Profile and Credit Risk Mitigation.
Credit Risk Generally, in consultation with legal counsel, CEP determines whether collateral documentation is legally enforceable and gives CEP the right to liquidate or take possession of collateral in a timely manner in the event of the default, insolvency, bankruptcy or other defined credit event of the obligor. Collateral is defined as pledged, transferred, and other secured assets that achieve enforceable security interests. For all collateral, CEP will have a perfected lien and the legal ability to gain possession of collateral if required. In addition, CEP leverages from legal guarantee(s) provided by an affiliate of the obligor that will cover commercial risk and be legally enforceable. It constitutes one of the primary sources of repayment, or one of the principal considerations in the decision to extend credit if the support provider has the financial ability and willingness to meet the obligations of the supported obligor without harming its own credit ratings.
Valuation Each CEP business sets appropriate loan-to-value ratios, loanable values, or haircuts for each appropriate type of collateral involved, as applicable:
• Loan-to-value ratio: the ratio of a loan to the value of posted collateral;
• Loanable value: the most likely recovery value of the collateral considering all potential resolution;
• Haircut: the amount by which the market value of posted collateral must exceed the cash advance or associated exposure against the collateral.
The value of collateral is generally determined at inception and on an ongoing basis per agreed methodology. In the case of the Insurance Letters of Credit business (“ILOCS”) where daily margining exists, the pricing for securities is generated on an automated daily basis based upon publically available sources. The recoverability of collateral instruments is reviewed on a regular basis during the term of a loan as part of the credit review.
Collateral Concentrations Apart from a concentration of cash and high grade liquid bonds such as AAA Rated U.S. Treasury, OECD Government or U.S. Agency bonds, there were no other material concentrations of collateral as at 31 December 2020.
Counterparty Risk CEP adopts Citi policies and procedures in respect of the management and governance of financial assets, including those relating to the securing and valuing of collateral, utilised for the purpose of mitigating the credit risk of OTC derivatives, repo-style transactions and eligible margin loans.
Credit Reserve Prior to quoting a price to a client for a derivatives transaction, CEP checks with the relevant Credit Valuation Adjustment (CVA) desk for a credit reserve charge which is offset against the profit and loss account for the transaction. Derivative Master Netting Agreements Counterparty credit risk from derivatives is mitigated where possible through netting agreements whereby derivative assets and liabilities with the same counterparty can be offset. Off-balance sheet netting and netting of collateral against exposure is permitted under approved
circumstances. CEP policy requires all netting arrangements to be legally documented. ISDA (International Swaps and Derivative Association) master agreements are CEP’s preferred manner for documenting OTC derivatives. The agreements provide the contractual framework within which dealing activities across a full range of OTC products are conducted and contractually binds both parties to apply close-out netting across all outstanding transactions covered by an agreement if either party defaults or other predetermined events occur. CEP considers the level of legal certainty regarding enforceability of its offsetting rights under master netting agreements and credit support annexes to be an important factor in its risk management process. Industry standard legal agreements combined with internal reviews for legal enforceability are used to achieve a perfected security interest in the collateral.
Primary Types of Collateral Where CEP uses margining, cash collateral and security collateral in the form of G10 (Group of Ten) government debt securities are generally posted to secure the net open exposure of OTC derivative transactions, at a counterparty level, whereby the receiving party is free to co-mingle or re-hypothecate such collateral in the ordinary course of business. Non-standard collateral, such as corporate bonds, municipal bonds, U.S. agency securities and mortgage-backed securities, may also be pledged as collateral for OTC derivative transactions. Security collateral posted to open and maintain a master netting agreement with a counterparty in the form of cash and securities may from time to time be segregated in an account at a third-party custodian pursuant to a tri-party account control agreement.
Valuation Collateral valuations are performed daily for SFTs and OTC derivatives. Collateral haircuts may be applied in the form of instrument margins and foreign exchange margins where appropriate. With regards to instrument margins, the level of haircut is driven by asset type and duration to maturity whereas a foreign exchange margin arises when there is a currency mismatch between the credit exposure and the collateral. CEP has sound and well managed systems and procedures for requesting and promptly receiving additional collateral for transactions whose terms require maintenance of collateral values at specified thresholds as documented in the respective legal agreements.
Wrong Way Risk and Rating Downgrades
Wrong Way Risk An integral aspect of portfolio management is overseeing concentrations. Portfolio management is further complicated when the assumption of independence between potential exposure and potential default proves not to be true. The interdependence between the exposure and any underlying collateral can exacerbate and magnify the speed in which a portfolio deteriorates. For this reason, a best practice of portfolio management includes an assessment of correlated or “wrong way risks”. For CEP, Insurance Letter of Credit (ILOC) products and SFTs (reverse repos & securities borrowing), and OTC derivatives may incur general wrong way risk. For ILOC facilities, obligors are not permitted to post their own security as collateral, and therefore specific wrong way risk is not applicable. For SFT counterparties, national central banks for example, are allowed to post own collateral, which incurs specific wrong way risk. Should general and specific wrong way risk arise, where there is a material correlation between the credit quality of the counterparty and the value of the collateral, or any significant degree of dependence between the risk to the counterparty and that of the collateral, then this aspect of accounting for, managing, and reflecting both general and specific wrong way risks could be reflected through the definition of acceptable collateral, which ensures that the quality and liquidity value of the collateral received is in excess of the credit extended, as

Pillar 3 Disclosures December 2020 16
well as identification and quantification metrics to ensure these risks are managed and reflected. Other aspects of wrong way risk are monitored by credit and other analysis, such as the use of stress tests conducted on at least a bi-annual basis for the ILOC product. General wrong way risk will be applied for pledged securities within the ILOC portfolio with the collateral comprising of securities and cash. General wrong way risk for SFTs/OTC trades will be applied to transactions where the underlying and counterparty are from institutions or governments domiciled in the same country (positive correlation with general market factors).
Credit Risk Adjustments From 1 January 2018, the IFRS 9 impairment standard applies to any debt instruments measured at amortised cost or at fair value through other comprehensive income and also to off balance sheet loan commitments and financial guarantees. The guiding principle of the expected credit loss (ECL) model is to reflect the general pattern of deterioration or improvement in the credit quality of financial instruments. The amount of ECLs recognised as a loss allowance or provision depends on the extent of credit deterioration since initial recognition of the asset. The measurement of an ECL is primarily determined by an assessment of the financial asset’s probability of default (PD), loss given default (LGD) and exposure at default (EAD) where the cash shortfalls are discounted to the reporting date. The ECL model is a three-Stage model under which financial assets are classified in 3 stages depending on the extent of credit deterioration. Stage 1 includes assets with no significant increase in credit risk (SICR) since initial recognition. ECL is estimated over the next 12 months of the asset; Stage 2 includes assets that have experienced SICR since initial recognition, but the exposure is not yet defaulted. ECL is estimated over the lifetime; and Stage 3 includes assets deemed to be credit-impaired for which a credit loss has already been suffered. ECL is estimated over the lifetime. For a detailed description of CEP’s accounting policies and risk management practices, please refer to Note 1J, “Impairment of financial assets“ in the CEP Annual Report and Financial Statements 2020.
Definitions of Past Due and Impairment
Definitions of past due and impairment Exposures are considered to be past due if material contractually agreed payments of principal, interest or fee has not been paid at the date it was due. For overdrafts, days past due commence once an obligor has breached an advised limit, has been advised a limit smaller than current outstandings, or has drawn credit without authorisation and the underlying amount is material. An advised limit comprises any credit limit determined by CEP and about which the obligor has been informed. In line with the ECB Regulation (EU) 2018/1845, CEP assesses an amount to be material for past due purposes if the amount past due is equal to or above €500 or represents an amount greater than 1% of the total amount of all on-balance sheet exposures to the obligor excluding equity exposures. CEP recognises exposures as being past due in accordance with section 4 of the EBA Guidelines on the application of the definition of default and Commission Delegated Regulation (EU) 2018/171 on the materiality threshold for credit obligations past due. An exposure can only be past due if there is a
legal obligation to make a payment and the payment is compulsory. In the event there is no legal obligation or payment is not compulsory, non-payment does not constitute a breach. Once the legal obligation for a mandatory payment has been established, the counting of days past due starts as soon as any amount of principal, interest or fee has not been paid at the date when it was due. In line with the default definition under Article 178 of the Capital Requirements Regulation (CRR), exposures which are 90 days past due are treated as defaulted, and classified Stage 3 from an IFRS9 perspective. Financial assets are deemed to be credit-impaired when a credit loss event has occurred. Credit-impaired assets are classified Stage 3 and in default. A loss allowance for financial assets with material exposure is determined through an individual impairment assessment. Material exposures are aggregate Outstanding and Unused Commitments (OSUC) above $10million in Institutional Clients Group (ICG); $2.5million in Citi Commercial Banking (CCB) and $500,000 in Citi Private Bank (CPB). A loss allowance is determined using the IFRS9 ECL Model for financial assets which do not have material exposures. Interest revenue is calculated based on the carrying amount of the asset, net of the loss allowance, rather than on its gross carrying amount. Further information can be found in the Market Risk section.

Pillar 3 Disclosures December 2020 17
Market Risk
Market Risk Overview Market risk is the risk to earnings or capital from adverse changes in market factors, such as interest rates, foreign exchange rates, credit spreads or equity prices. CEP is exposed to market risk through both its trading book and non-trading book activities. The trading portfolio comprises positions held with trading intent, where the business looks for short-term price differences between buying and selling prices. Non-linear risk in CEP is managed according to a back to back model where market risk is transferred to a Citi affiliate. The non-trading portfolio primarily comprises loans held at amortised cost, deposits, available for sale (AFS) securities. The principal risk on the non-trading portfolio is Interest Rate Risk in the Banking Book (IRRBB).
Market Risk Governance and Reporting CEP manages market risk including IRRBB on a day-to-day basis through a lines of defence approach. The Markets business forms the first line of defence for market risk, with CEP’s Head of Markets having primary responsibility for trading related risk in CEP, whilst CEP’s Corporate Treasury forms the first line of defence for all IRRBB in CEP. Responsibility for oversight and challenge of these risks sits with Independent Risk Management led by the CRO. CEP’s Head of Market and Liquidity Risk reports directly to the CEP CRO. The Market Risk Management function reports to the Head of Market and Liquidity Risk and is responsible for the independent assessment of market risk in CEP. The CEP Board has the ultimate responsibility for ensuring that there is an appropriate market risk management framework in place, including in respect of IRRBB. Market risk governance is provided by the Board, BRC, Executive Committee, Risk Management Committee and ALCO. The Board is also responsible for articulating CEP’s risk appetite for market risk. Market risk limits for CEP are governed by CEP’s Risk Appetite Framework. CEP’s RMC and ALCO sets more granular level VaR, sensitivity and other limits in the context of Board Risk Appetite Statement limits. In the case of the trading book, additional limits and triggers are then set for individual Markets businesses and trading desks. Triggers are an important mechanism to signal increased risk taking and if exceeded they prompt a discussion between CEP Independent Risk Management and front line businesses. Trading book market risk in CEP is governed by the CEP Market Risk Management Framework and the Citi Mark-To-Market Risk Policy. Non-trading book market risk in CEP is also governed by the CEP Market Risk Management Framework, and by the Citi Market Risk Management for Accrual Portfolios Policy. CEP Risk Management monitor the market risk profile on an ongoing basis and ensure detailed reports are sent to the RMC and the BRC/Board on the Trading book and Non-trading book which also outline adherence to agreed limits.
Trading Book Risk Management Market risk in trading portfolios is monitored by CEP using a series of measures, including:
• Factor Sensitivities;
• VaR; and,
• Stress Testing.
Factor sensitivities represent the change in the value of a position for a defined change in a market risk factor, such as a change in the value of a bond for a one-basis-point change in interest rates. Independent Risk Management ensure that factor sensitivities are calculated, monitored and, in most cases, limited, for all relevant risks taken in a trading portfolio. Value at Risk (VaR) estimates the potential decline in the value of a position or a portfolio under normal market conditions at a 99% confidence level over a one-day time period. Citi’s VaR methodology, adopted by CEP, incorporates the factor sensitivities of the trading portfolio with the volatilities and correlations of those factors. The VaR model is based on the volatilities of, and correlations between, a comprehensive set of market risk factors. The variance/covariance matrix is calibrated using three years of market data, with volatilities adjusted to capture fat tail effects at a 99% confidence level over a one-day period. Market variables simulated from the matrix by a Monte Carlo methodology are applied to factor sensitivities to generate a forecast distribution of one-day profit or loss, from which the VaR can be computed. The factor sensitivities are designed to capture all material market risks on each trading asset. Stress testing is performed on trading portfolios on a weekly basis to estimate the impact of extreme market movements. It is performed on both individual trading portfolios and the overall portfolios and businesses. Independent Risk Management, in conjunction with the businesses, develops stress scenarios, reviews the output of weekly and other periodic stress testing exercises and uses the information to make judgements as to the ongoing appropriateness of exposure levels and limits. CEP employs top-down systemic stresses to monitor risks in its portfolio. Systemic stresses are designed to quantify the potential impact of extreme market movements and are constructed using both historical periods of market stress and projections of adverse economic scenarios. CEP maintains the necessary systems, controls and documentation to demonstrate appropriate standards in respect of valuation, reporting, reserving and valuation adjustments. CEP Independent Risk Management monitors limit utilisation on a daily basis and in addition limit utilisation is reviewed by the ALCO and the Market Risk Sub-Committee. Additional controls on trading book activity include permitted product lists and a new product approval process. The highest, lowest, mean and year end level of the daily VaR measure during 2020 and 2019 were as follows:
Table 3: Portfolio VaR

Pillar 3 Disclosures December 2020 18
Trading Book Risk Measurement
Trading Book Regulatory Capital CEP has adopted the standardised approach to calculate its market risk capital requirement, capturing specific risk, general market risk and foreign exchange position risk. Specific risk and general market risk are calculated on trading book exposures and foreign exchange risk is calculated on both trading and banking book exposures. CEP also applies the standardised approach to calculate its credit valuation adjustment capital requirement (CRR, Art 384), and incorporates an exemption for inter-affiliate exposures within that charge, pursuant to CRR, Art 382(4)(b). Quantitative disclosures on market risk capital requirements made in accordance with the CRR requirement and the EBA final guidelines on revised Pillar 3 disclosures are provided in the Market Risk section.
Internal Trading Book Risk Capital Assessment CEP uses the Citi iVAST (Integrated VaR and Stress Testing) model aligned to the Global Citi risk capital methodology to determine economic risk capital for the trading book. The model combines a scenario-based approach (stress P&Ls) with a simulation-based approach (VaR P&L) to calculate risk capital over a one year time horizon at a 99.97% confidence level.
Non-Trading Book Risk Management and Measurement Positions in the Non-Trading Book arise primarily from customer flows. As noted above the main products include loans held at amortised cost, deposits and Available For Sale (AFS) securities. The risks arising through CEP’s non-traded portfolios are estimated using
a common set of standards that define, measure, limit and report the market risk. As previously noted the principal risk in CEP’s non-trading book is interest rate risk in the banking book (IRRBB). CEP uses a cashflow-based approach for the measurement, management and monitoring of IRRBB in line with industry best practice. CEP’s measure of IRRBB from an earnings perspective is Interest Rate Exposure (IRE). IRE measures the potential pre-tax impact on NIR for non-trading book positions due to defined shifts in interest rates over a 12 month period. Net Interest revenue (NIR) is the difference between the yield earned on the non-trading book portfolio assets (including customer loans) and the rate paid on the liabilities (including customer deposits or company borrowings). In addition CEP measures Economic Value Sensitivity (EVS) for its non-trading book. EVS captures the impact of interest rate changes on CEP’s Economic Value of Equity (EVE) and is calculated by discounting all interest rate sensitive instruments on the balance sheet using a base and stressed interest rate curve and calculating the difference. Runoff assumptions for deposit balances, which are derived using statistical analysis of historical customer information, are applied to the balance sheet to derive the lifetime balances of liabilities. Prepayment risk is not a feature of the CEP balance sheet. The principal market risk on the non-trading portfolio is Interest Rate Risk in the Banking Book (IRRBB) which is mitigated through the purchase and sale of AFS securities. The following table shows the IRE and EVS measure as at 31 December 2020 and 31 December 2019 assuming parallel upward and downward shifts of interest rates by 100 bps. A positive IRE/EVS indicates a potential increase in earning/economic value while a negative IRE/EVS indicates a potential decline in earning/economic value. In 2020, CEP incorporated a -200bps floor which forms the basis of its IRE/EVS metric computation to reflect the current low rate environment versus a 0bp floor in the 2019 Pillar III disclosures as per Table 4 below. IRE and EVS are calculated on a monthly basis.
Table 4: Sensitivity of Economic Value and Net Interest Revenue
EUR thousands Economic Value Sensitivity
Dec-20 Dec-19
+100bps -100bps +100bps -100bps
EUR 169,205 -127,768 209,432 3,552
USD 78,238 -56,681 65,043 -62,854 GBP 9,636 -2,918 5,466 -7,838
CZK 971 -3,608 11,995 -13,313
Total 283,710 -212,298 307,670 -79,356
EUR thousands Interest Rate Exposure Dec-20 Dec-19 +100bps -100bps +100bps -100bps
EUR 92,954 -62,786 105,483 -1,099 USD 44,431 -35,927 19,889 -19,184 GBP 14,276 -12,064 16,548 -13,612 CZK 9,098 -9,302 8,823 -8,835
Total 171,614 -129,182 153,060 -48,229

Pillar 3 Disclosures December 2020 19
Stress testing is performed for IRRBB on a monthly basis. Systemic stresses are designed to quantify the potential impact of extreme market movements and are constructed using both historical periods of market stress and projections of adverse economic scenarios.
Non-Trading Book Risk Measurement
Non Trading Book Risk Capital Assessment CEP calculates risk capital based on an interest rate simulation for a one year holding period. The model essentially covers all non-traded positions related to interest rate risks in compliance with the Citigroup Market Risk Management for Accrual Portfolio Policy. The model generates 200,000 EVS scenarios, and Risk Capital is estimated as the 99.97% percentile of the one-year EVS distribution.
Market Risk Mitigation As outlined in the previous chapters Market Risk in the trading book is managed within agreed risk limits with ongoing monitoring and reporting processes in place. The principal risk on the non-trading portfolio is Interest Rate Risk in the Banking Book (IRRBB) which is mitigated through the purchase and sale of securities and managed within agreed risk limits with ongoing monitoring and reporting processes in place.

Pillar 3 Disclosures December 2020 20
Liquidity Risk
Liquidity Risk Overview CEP defines liquidity risk as the risk that it will not be able to meet efficiently both expected and unexpected current and future cash flow and collateral needs without adversely affecting either daily operations or its financial condition. CEP’s Liquidity Risk Management Framework formally articulates the principals of good governance, the roles and responsibilities of the Board and other committees and CEP’s three lines of defence for liquidity risk management. The CEP Liquidity Risk Management Framework and accompanying CEP liquidity policy, establish the standards for defining, measuring, limiting and reporting liquidity risk. This is in order to ensure the transparency and comparability of liquidity risk taking activities and the establishment of an appropriate risk appetite. In addition, CEP ensures at all times, it adheres to external Regulatory requirements and guidelines in relation to liquidity, including the LCR Delegated Act established through CRDIV.
Liquidity Risk Governance CEP manages Liquidity risk on a day-to-day basis through a three lines of defence approach. CEP Treasury form the first line of defence in CEP and own the responsibility for managing liquidity risks. CEP Treasury, are responsible for managing CEP’s liquidity on a day to day basis and ensuring liquidity management strategies and processes adhere to regulatory requirements and CEP’s Liquidity Risk Management Framework and Policy. Review, challenge and oversight is provided by Independent Risk and Internal Audit. The CEP Asset and Liability Committee (ALCO) is the primary committee for liquidity management, which reports to the Executive Committee (EXCO). Review, challenge and oversight is also provided by the CEP Board and the CEP Board Risk Committee. Ultimate responsibility for liquidity risk management in CEP rests with the Board. Responsibility for oversight and challenge of these risks sits with the second line of defence; Independent Risk Management led by the CRO. CEP’s Head Market & Liquidity Risk reports to the CEP CRO. The Market & Liquidity Risk Management function reports to the Head of Market & Liquidity Risk and are responsible for overseeing and challenging the effectiveness of controls and management of liquidity risk in CEP. The review of both first and second line activity is undertaken by the Internal Audit function, who represent the third line of defence. The CEP Board has the ultimate responsibility for ensuring that there is an appropriate liquidity risk management framework in place. Liquidity risk governance is provided by the Board, BRC, Executive Committee, Operational Risk Committee and Product Review Committee. The Board is also responsible for articulating CEP’s risk appetite for liquidity risk. Liquidity risk limits for CEP are governed by CEP’s Risk Appetite Framework. The ALCO is responsible for maintaining oversight on Liquidity Risks and also over the adequacy and effectiveness of the Liquidity Risk Management Framework and associated policies. CEP Risk Management monitor the Liquidity risk profile on an ongoing basis and ensure detailed reports are sent to the ALCO and the BRC/Board on the Liquidity risk profile which also outline adherence to agreed limits. As part of the ILAAP, a Liquidity Adequacy Statement is signed by the Board. In April 2021 the Board concluded that in the context of CEP’s strategy, business model, governance and risk management framework, CEP’s current and forecasted liquidity position are adequate and capable of withstanding a severe but plausible stress scenario under both Economic and Normative perspectives.
Liquidity Risk Management and Measurement A significant amount of CEP’s liquidity is sourced from operational deposits from third-party clients, CEP’s own equity, as well as intercompany funding. As at end of 2020, approximately 37% of the assets on CEP Balance Sheet of €61Bn were deemed to be high quality and liquid (e.g. cash at central bank). The holding of a significant buffer of high quality liquid assets is the primary mitigation of the liquidity risks faced by CEP. Liquidity risk is measured, managed and mitigated in CEP by using metrics for monitoring, limiting, and reserving against adverse scenarios or conditions in relation to liquidity risks. The framework employed by CEP for managing liquidity risk measures the potential impacts of these liquidity risks and establishes a target for reserve sufficiency across these risks. Further, CEP employs a suite of limits to manage and appropriately restrict liquidity risks on the CEP balance sheet. As part of the ILAAP (Internal Liquidity Adequacy Assessment Process) and FLP (Funding Liquidity Plan), CEP prepares a detailed plan of its liquidity position, which also considers a forecast of future business activities over the next three-year period. Through these processes, CEP identifies strategic liquidity issues, establishes the parameters for identifying, measuring, monitoring and limiting liquidity risk, and sets forth key assumptions for liquidity risk management. Liquidity stress testing results assist in deriving the liquidity risk appetite, which is approved by the CEP Board. The liquidity risk appetite forms the basis for legal entity and business liquidity limits. Assumptions used to develop stress testing metrics, which define the risk appetite and the liquidity buffer required to sufficiently mitigate liquidity risks, are reviewed and updated periodically through the internal governance framework including the ALCO. The LCR Delegated Act is calculated and reported on a consolidated basis and in significant currencies. In accordance with the HQLA Operational Requirements in the LCR Delegated Act, CEP ensures that the currency denomination of its liquid assets are consistent with the distribution by significant currency of its net liquidity outflows. Implemented as part of the CEP HQLA Procedure, currency limits are monitored daily at a consolidated level. In the ordinary course of business, CEP enters into various types of derivative transactions, including bilateral transactions that are over-the-counter (OTC) and transactions settled via exchanges with central counterparties. CEP maintains liquidity reserves to counter potential liquidity outflows from derivatives activities under various stress scenarios. CEP is a direct participant in Settlement Systems where it offers General Clearing Member (GCM) services across EMEA and Settlement Agent services in multiple European markets through CEP’s branches and the centralised Target 2 Securities clearing platform. To support direct clearing activity CEP must post cash and securities collateral in order to access credit lines and fund payment obligations. To ensure there is sufficient liquidity to meet CEP’s intraday liquidity needs, any cash amount regularly used for intraday payments and any collateral pledged for intraday credit are reported as encumbered for CEP’s regulatory liquidity reporting. The Intraday and Collateral Management (ICM) Sub-Committee of ALCO serves as the supporting committee for the monitor and review of intraday and collateral related. The liquidity position for CEP is calculated and reported to senior management and reviewed by the CEP Asset and Liability Committee (ALCO), CEP Risk Committee and CEP Board of Directors. CEP’s Board reviews and approves the Liquidity Risk Management Policy and the Internal Liquidity Adequacy Assessment Process (ILAAP), the Liquidity Risk Management Framework, Funding and Liquidity Plan, Contingency Funding Plan. To provide for resilience under stress, CEP holds a buffer of High Quality Liquid Assets (HQLA), which is comprised of cash (held at central banks), as well as high quality securities, mainly EU and US government bonds. As at month-end December 2020, this HQLA, as

Pillar 3 Disclosures December 2020 21
per CRDIV eligibility criteria, equated to €22.7 billion (this HQLA split between cash of €14.2 billion and bonds of €8.5 billion). CEP’s CRD IV LCR was 138.8% as of 31 December 2020 with a surplus of €6.4bn above the minimum 100% requirement; the average LCR DA CEP in 2020 was 138%

Pillar 3 Disclosures December 2020 22
Operational Risk
Operational Risk Overview Operational risk is the risk of loss resulting from inadequate or failed internal processes, systems or human factors, or from external events, and includes the reputation and franchise risk associated with business practices or market conduct. Operational Risk Management (ORM), operating within the second line of defence, proactively assists the businesses, operations, technology and other functions in enhancing the effectiveness of controls and managing operational risks across products, business lines and regions. Furthermore, operational risks are considered as new products and business activities are developed and processes are designed, modified or sourced through alternative means. The objective is to keep operational risk at appropriate levels relative to the characteristics of CEP businesses, the markets in which it operates, its capital and liquidity, and the competitive, economic and regulatory environment. The following sub-categories are considered the Key Operational Risks for CEP in 2020:
• Processing Risk (Inc. Execution & Integration)
• Information Security and Communication Risk & Cyber Risk
• Human Capital Risk
• Data management Risk
• Reporting Risk
• Information Technology Risk
• Third Party Risk
• Fraud Risk
• Governance and Risk Oversight (incl. Regulatory Change)
• Money Laundering Risk
• Markets Integrity Conduct Risk
• Physical Damage Risk
• Bribery Risk
• Sanctions Risk
• Customer or Client Conduct Risk
• Model Risk
Operational Risk Governance and Reporting
CEP manages operational risk on a day-to-day basis through the three lines of defence approach. Business and functions form the first line of defence in CEP and own the responsibility for managing operational risks and controls in their area. Responsibility for oversight and challenge of these risks sits with Independent Risk Management (second line of defence) led by the CRO. CEP’s Head of Operational Risk reports to the CEP CRO. The Operational Risk Management function reports to the Head of Operational Risk and are responsible for overseeing and challenging the effectiveness of controls and management of operational risk in CEP. CEP’s Internal Audit function (third line of defence) independently reviews the activities of the first two lines of defence. The CEP Board has the ultimate responsibility for ensuring that there is an appropriate operational risk management framework in place. Operational risk governance is provided by the Board, BRC, Executive Committee, Risk Management Committee and the Business Risk and Control Committee (BRCC). The Board is also responsible for articulating CEP’s risk appetite for operational risk.
Operational risk limits for CEP are governed by CEP’s Risk Appetite Framework. The CEP BRCC is responsible for reviewing and monitoring CEP’s operational risk profile, material operational risks, significant events and new and emerging risks while promoting a culture of risk awareness and high standards of culture and conduct across CEP. CEP Risk Management monitor the Operational risk profile on an ongoing basis and ensure detailed reports are sent to the BRCC and the BRC/Board on the Operational risk profile which also outline adherence to agreed limits.
Operational Risk Management
Citi maintains a system of policies to anticipate, mitigate and control operational risk. Furthermore, CEP has established an Operational Risk Management Framework to monitor, assess and communicate operational risk and the overall effectiveness of the internal control environment. This framework is consistent with Citi’s Three Lines of Defence approach to risk management. The CEP ORM Framework establishes minimum standards for consistent identification, measurement, monitoring, reporting, and management of operational risk across CEP. Operational risk management proactively assists the businesses, operations, technology and other functions in enhancing the effectiveness of controls and managing operational risks. This is achieved through the application of various components of the Operational Risk Management Framework:
• Annual Risk Assessment in respect of internal controls within the entity;
• Capture of Operational Risk Event Data to support stress loss and capital modelling and management;
• Formal Assurance Programme in respect of the design and operating effectiveness of CEP’s key internal controls and systems deployed across the business;
• Issue/Corrective Action Plans in respect of control effectiveness;
• CEP Management Control Assessment (MCA), a key component of the Business Environment and Internal Control Factors (BEICFs) required under Basel Capital Standards;
• Operational Risk Scenario Analysis to identify and quantify tail and emerging operational risks.
The process established by the ORM Framework is expected to lead to effective anticipation and mitigation of operational risk and improved operational risk loss experience and includes the following steps:
• Identify and assess Key Operational Risks;
• Design controls to mitigate identified risks;
• Establish Key Risk Indicators (KRIs);
• Implement a process for early problem recognition and timely escalation; and,
• Produce comprehensive operational risk reporting.
Pillar 3 Disclosures December 2020 23
Operational Risk Measurement
Operational Risk Regulatory Capital Requirement CEP has adopted the Standardised Approach for calculating CEP’s operational risk capital requirement. Under this approach, CEP’s business activities are divided into business lines as prescribed in the CRR and a beta factor (12%, 15% or 18%) is applied to a 3-year rolling average of gross revenues. CEP uses audited financial statements as the basis for the input of the calculation. CEP’s Pillar 1 operational risk capital requirement is €306m as at 31 December 2020. For CEP’s assessment of its economic risk capital requirement for operational risk a hybrid approach was used taking into account stress losses calculated at a 1/50 confidence level and severe idiosyncratic scenarios. This approach resulted in economic risk capital of €172m as at 31 December 2020.
Operational Risk Mitigation In addition to the robust suite of operational risk frameworks, policies and processes as outlined above, CEP also mitigate some potential operational risk events through appropriate insurance arrangements e.g. building insurance for physical damage events.

Pillar 3 Disclosures December 2020 24
Securitisation
Securitisation activity
CEP had nine securitisation positions as at 31 December 2020. CEP acted as arranger and lead manager on these securitisations. As a means of compensation for the role, CEP received the positions in the form of S-class certificates. These positions are deemed traditional securitisations in the banking book and are subject to the new securitisation framework for capital requirements as outlined in the CRR amended Regulation on Securitisation. CEP did not originate the securitisations, but is an investor in these positions. There are no re-securitisation exposures and no assets awaiting securitisation. In addition, there was no instance of CEP
acting as a sponsor for third party securitisation deals. Additionally, there are no off balance sheet securitisation exposures. CEP has adopted the new hierarchy of methods under the CRR amended Regulation and in line with this, the securitisation positions are treated under the SEC-SA method to calculate risk-weighted exposure amounts. The exposure amount, risk weighted assets and capital requirement applied to the positions held at 31 December 2020 are set out in the below table:
From an Accounting Policy perspective, CEP’s holdings of the S–class certificates in both structures are viewed as trading assets under IFRS, because some of the valuation inputs to calculate the value of the S-class certificates are unobservable (customer prepayment rates). The S-class certificates are classified as a level 3 asset and the day 1 P&L is amortised over the life of the deal.
Table 5: SEC1: Securitisation Exposures in the Non-Trading book as at 31 December 2020
31 December 2020 31 December 2019
Institution acts as investor Institution acts as investor
Traditional Synthetic Sub-total Traditional Synthetic Sub-total
Non-STS
Non-STS
€ million € million € million € million € million € million
Retail (total), of which; 37 - 37 5 - 5
Residential mortgage 37 - 37 5 - 5
Credit card - - - - - -
Other retail exposures - - - - - -
Re-securitisation - - - - - -
Wholesale (total), of which; - - - - - -
Loans to corporates - - - - - -
Commercial mortgage - - - - - -
Lease and receivables - - - - - -
Other wholesale - - - - - -
Re-securitisation - - - - - -
Total as at 31 December 2020 37 - 37 5 - 5
Table 6: SEC4: Securitisation exposures in the non-trading book and associated regulatory capital requirements - institution acting as investor as at 31 December 2020
Exposure values (by risk weight bands) Exposure values (by regulatory approach)
≤20% RW >20% to
<50% RW
>50% to <100%
RW
>100% to
<1250% RW
1250% RW
SEC-IRBA SEC-ERBA and
SEC-IAA SEC-SA 1250%
€ million € million € million € million € million € million € million € million € million
Traditional securitisation 31 6 - - - - 15 22 -
Of which securitisation 31 6 - - - - 15 22 -
Of which retail underlying 31 6 - - - - 15 22 -
Of which STS - - - - - - - - -
Of which wholesale - - - - - - - - -
Of which STS - - - - - - - - -
Of which re-securitisation - - - - - - - - -
Synthetic securitisation - - - - - - - - -
Total as at 31 December 2020
31 6 - - - - 15 22 -
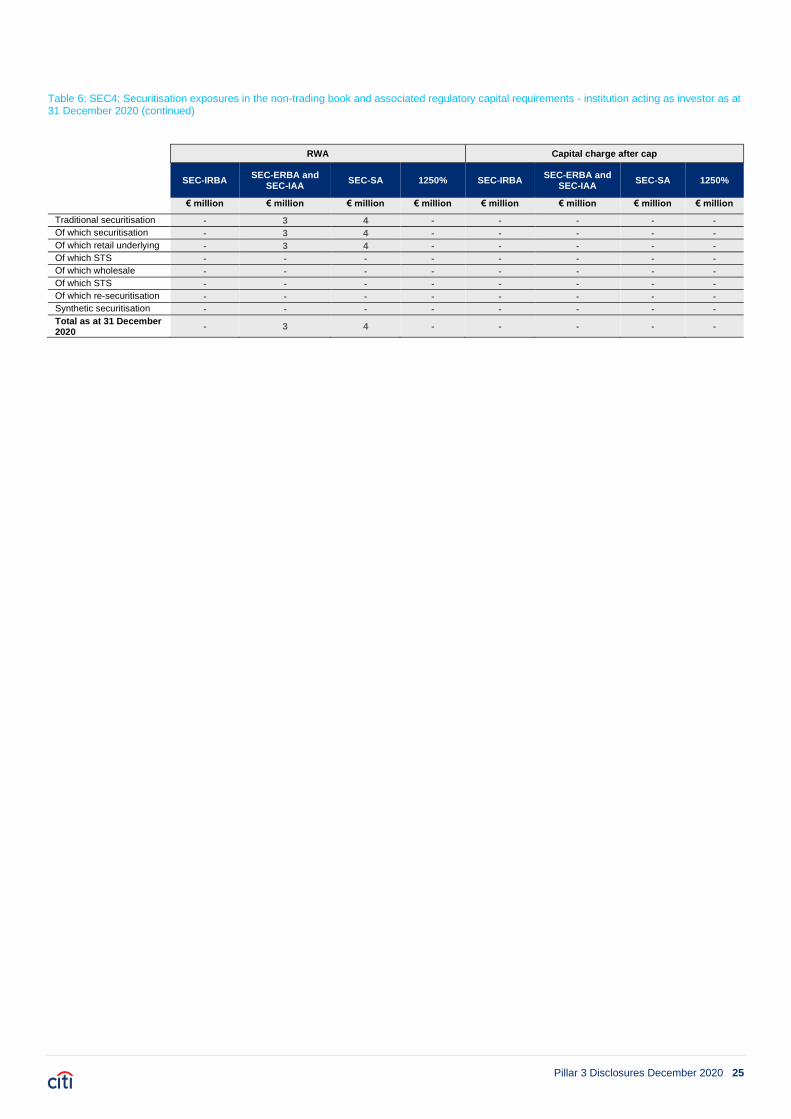
Pillar 3 Disclosures December 2020 25
Table 6: SEC4: Securitisation exposures in the non-trading book and associated regulatory capital requirements - institution acting as investor as at 31 December 2020 (continued)
RWA Capital charge after cap
SEC-IRBA SEC-ERBA and
SEC-IAA SEC-SA 1250% SEC-IRBA
SEC-ERBA and SEC-IAA
SEC-SA 1250%
€ million € million € million € million € million € million € million € million
Traditional securitisation - 3 4 - - - - -
Of which securitisation - 3 4 - - - - -
Of which retail underlying - 3 4 - - - - -
Of which STS - - - - - - - -
Of which wholesale - - - - - - - -
Of which STS - - - - - - - -
Of which re-securitisation - - - - - - - -
Synthetic securitisation - - - - - - - -
Total as at 31 December 2020
- 3 4 - - - - -
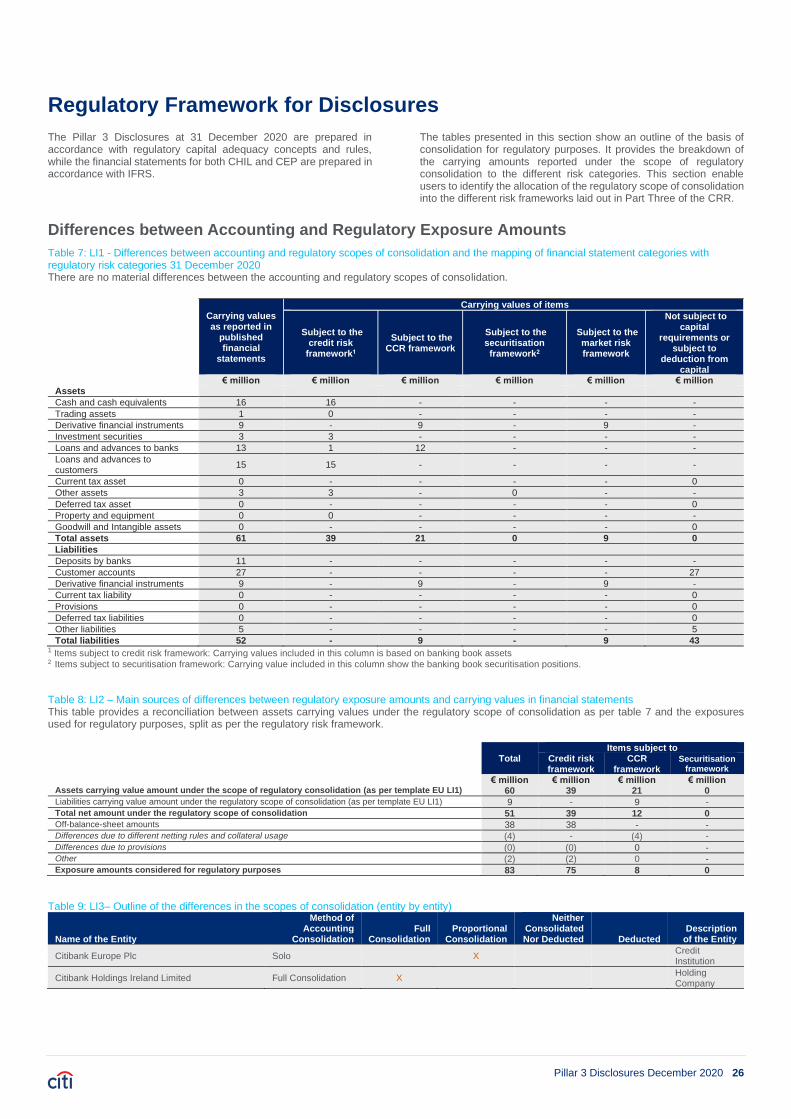
Pillar 3 Disclosures December 2020 26
Regulatory Framework for Disclosures The Pillar 3 Disclosures at 31 December 2020 are prepared in accordance with regulatory capital adequacy concepts and rules, while the financial statements for both CHIL and CEP are prepared in accordance with IFRS.
The tables presented in this section show an outline of the basis of consolidation for regulatory purposes. It provides the breakdown of the carrying amounts reported under the scope of regulatory consolidation to the different risk categories. This section enable users to identify the allocation of the regulatory scope of consolidation into the different risk frameworks laid out in Part Three of the CRR.
Differences between Accounting and Regulatory Exposure Amounts
Table 7: LI1 - Differences between accounting and regulatory scopes of consolidation and the mapping of financial statement categories with regulatory risk categories 31 December 2020 There are no material differences between the accounting and regulatory scopes of consolidation.
Carrying values as reported in
published financial
statements
Carrying values of items
Subject to the credit risk
framework1
Subject to the CCR framework
Subject to the securitisation framework2
Subject to the market risk framework
Not subject to capital
requirements or subject to
deduction from capital
€ million € million € million € million € million € million Assets
Cash and cash equivalents 16 16 - - - -
Trading assets 1 0 - - - -
Derivative financial instruments 9 - 9 - 9 -
Investment securities 3 3 - - - -
Loans and advances to banks 13 1 12 - - -
Loans and advances to customers
15 15 - - - -
Current tax asset 0 - - - - 0
Other assets 3 3 - 0 - -
Deferred tax asset 0 - - - - 0
Property and equipment 0 0 - - - -
Goodwill and Intangible assets 0 - - - - 0
Total assets 61 39 21 0 9 0
Liabilities
Deposits by banks 11 - - - - -
Customer accounts 27 - - - - 27
Derivative financial instruments 9 - 9 - 9 -
Current tax liability 0 - - - - 0
Provisions 0 - - - - 0
Deferred tax liabilities 0 - - - - 0
Other liabilities 5 - - - - 5
Total liabilities 52 - 9 - 9 43 1 Items subject to credit risk framework: Carrying values included in this column is based on banking book assets 2 Items subject to securitisation framework: Carrying value included in this column show the banking book securitisation positions.
Table 8: LI2 – Main sources of differences between regulatory exposure amounts and carrying values in financial statements This table provides a reconciliation between assets carrying values under the regulatory scope of consolidation as per table 7 and the exposures used for regulatory purposes, split as per the regulatory risk framework.
Total
Items subject to Credit risk framework
CCR framework
Securitisation framework
€ million € million € million € million Assets carrying value amount under the scope of regulatory consolidation (as per template EU LI1) 60 39 21 0 Liabilities carrying value amount under the regulatory scope of consolidation (as per template EU LI1) 9 - 9 - Total net amount under the regulatory scope of consolidation 51 39 12 0 Off-balance-sheet amounts 38 38 - - Differences due to different netting rules and collateral usage (4) - (4) - Differences due to provisions (0) (0) 0 - Other (2) (2) 0 - Exposure amounts considered for regulatory purposes 83 75 8 0
Table 9: LI3– Outline of the differences in the scopes of consolidation (entity by entity)
Name of the Entity
Method of Accounting
Consolidation Full
Consolidation Proportional
Consolidation
Neither Consolidated Nor Deducted Deducted
Description of the Entity
Citibank Europe Plc Solo X Credit Institution
Citibank Holdings Ireland Limited Full Consolidation X Holding Company
Pillar 3 Disclosures December 2020 27
Capital Resources and Minimum Capital Requirements
Capital Resources
The CRD requires that CHIL and CEP comply with minimum capital standards and maintain a prescribed excess of total capital resources over Pillar I capital requirement. Capital resources are measured and reported in accordance with the CRD. CHIL and CEP’s regulatory capital resources comprise of the following distinct elements:
• Common Equity Tier 1 Capital, which includes ordinary share capital, share premium, retained earnings and capital reserves;
• Deductions from capital include:
• Intangible assets, including goodwill;
• Prudent valuation;
• Deferred tax relying on future profitability; and,
• Significant investments.
Table 10 and 11 shows the regulatory capital resources of CHIL and CEP as at 31 December 2020 and 31 December 2019. Tables 12 and 13 show the reconciliation between the balance sheet values and the regulatory capital values of the items included in CHIL and CEP’s Capital Resources as at 31 December 2020. Further details on the composition of CHIL and CEP’s Capital resources are shown in Table 14.

Pillar 3 Disclosures December 2020 28
Table 10: Own Funds CEP 31 December 2020 & 2019 This table presents CEP’s capital resources as at 31 December 2020. The template is prepared using the format set out in Annex I of the final ‘Implementing technical standards with regard to disclosure of own funds requirements for institutions’ (Commission implementing regulation- EU 1423/2013).
31 December 2020
31 December 2019
€ million € million
Common Equity Tier 1 (CET1) capital: Instruments and reserves
1 Capital Instruments and the related share premium accounts 1,608 1,757
2 Retained earnings 1 6,497 6,726
3 Accumulated other comprehensive instruments (and other reserves) 627 708
5a Independently reviewed interim profits net of any foreseeable charge or dividend
6 Common Equity Tier 1 (CET1) capital before regulatory adjustments 8,732 9,190
Common Equity Tier 1 (CET1) capital: regulatory adjustments
7 Additional value adjustments (negative value) (19) (11)
8 Intangible assets (net of related tax liabilities) (negative amount) (60) (81)
10 Deferred tax assets that rely on future profitability excluding those arising from temporary difference (net of related tax liability where the conditions in Article 38 (3) are met) (negative amount)
(202) (200)
19 Direct, indirect and synthetic holdings by the institution of the CET1 instruments of financial sector entities where the institution has a significant investment in those entities (amount above 10% threshold and net of eligible short positions) (negative amount)
(12) (13)
20a Exposure amount of the following items which qualify for a RW of 1250 %, where the institution opts for the deduction alternative
0 0
20c of which: securitisation positions (negative amount) 0 0
20d of which: free deliveries (negative amount) 0 0
24 CET1 capital elements or deductions - other (4) 0
28 Total regulatory adjustments to Common Equity Tier 1 (CET1) (297) (292)
29 Common Equity Tier 1 (CET1) capital 8,435 8,898
Additional Tier 1 (AT1) capital: instruments
30 Capital instruments and the related share premium accounts 0 0
31 of which: classified as equity under applicable accounting standards 0 0
36 Additional Tier 1 (AT1) capital before regulatory adjustments 0 0
Additional Tier 1 (AT1) capital: regulatory adjustments
43 Total Regulatory Adjustments to Additional Tier 1 (AT1) Capital 0 0
44 Additional Tier 1 (AT1) capital 0 0
45 Tier 1 capital (T1 = CET1 + AT1) 8,435 8,898
Tier 2 (T2) capital: instruments and provisions
46 Capital instruments and the related share premium accounts 0 0
51 Tier 2 (T2) capital before regulatory adjustments 0 0
57 Total regulatory adjustments to Tier 2 (T2) capital
58 Tier 2 (T2) capital 0 0
59 Total capital (TC = T1 + T2) 8,435 8,898
60 Total risk weighted assets 42,028 39,579
Capital ratios and buffers
61 Common Equity Tier 1 (as a percentage of total risk exposure amount) 20.07% 22.48%
62 Tier 1 (as a percentage of total risk exposure amount) 20.07% 22.48%
63 Total capital (as a percentage of total risk exposure amount) 20.07% 22.48%
64 Institution specific buffer requirement (CET1 requirement in accordance with article 92 (1) (a) plus capital conservation and countercyclical buffer requirements, plus systemic risk buffer, plus systemically important institution buffer expressed as a percentage of risk exposure amount)
7.04% 4.86%
65 of which: capital conservation buffer requirement 2.50% 2.50%
66 of which: countercyclical buffer requirement 0.04% 0.36%
67 of which: systemic risk buffer requirement 0.00% 0.00%
67a of which: Global Systemically Important Institution (G-811) or Other Systemically Important Institution (0-811) buffer
0.00% 0.00%
68 Common Equity Tier 1 available to meet buffers (as a percentage of risk exposure amount) 12.07% 0.00%
Amounts below the thresholds for deduction (before risk weighting)
72 Direct and indirect holdings of the capital of financial sector entities where the institution does not have a significant investment in those entities (amount below 10% threshold and net of eligible short positions) 2
0 0
73 Direct and indirect holdings by the institution of the CET1 instruments of financial sector entities where the institution has a significant investment in those entities (amount below 10 % threshold and net of eligible short positions) 2
12 13
75 Deferred tax assets arising from temporary differences (amount below 10% threshold, net of related tax liability where the conditions in Article 38 (3) are met)
202 200

Pillar 3 Disclosures December 2020 29
Table 11: Own Funds CHIL 31 December 2020 & 2019 This table presents CEP’s capital resources as at 31 December 2020 & 2019.
31 December 2020
31 December 2019
€ million € million
Common Equity Tier 1 (CET1) capital: Instruments and reserves
1 Capital Instruments and the related share premium accounts 560 612
2 Retained earnings 1 6,699 6,946
3 Accumulated other comprehensive instruments (and other reserves) 1,471 1,630
5a Independently reviewed interim profits net of any foreseeable charge or dividend 0
6 Common Equity Tier 1 (CET1) capital before regulatory adjustments 8,730 9,188
Common Equity Tier 1 (CET1) capital: regulatory adjustments
7 Additional value adjustments (negative value) (19) (11)
8 Intangible assets (net of related tax liabilities) (negative amount) (60) (64)
10 Deferred tax assets that rely on future profitability excluding those arising from temporary difference (net of related tax liability where the conditions in Article 38 (3) are met) (negative amount)
(202) (200)
19 Direct, indirect and synthetic holdings by the institution of the CET1 instruments of financial sector entities where the institution has a significant investment in those entities (amount above 10% threshold and net of eligible short positions) (negative amount)
0 0
20a Exposure amount of the following items which qualify for a RW of 1250 %, where the institution opts for the deduction alternative
0 0
20c of which: securitisation positions (negative amount) 0 0
20d of which: free deliveries (negative amount) 0 0
24 CET1 capital elements or deductions - other (4) 0
28 Total regulatory adjustments to Common Equity Tier 1 (CET1) (285) (274)
29 Common Equity Tier 1 (CET1) capital 8,445 8,914
Additional Tier 1 (AT1) capital: instruments
30 Capital instruments and the related share premium accounts 0 0
31 of which: classified as equity under applicable accounting standards 0 0
36 Additional Tier 1 (AT1) capital before regulatory adjustments 0 0
Additional Tier 1 (AT1) capital: regulatory adjustments
43 Total Regulatory Adjustments to Additional Tier 1 (AT1) Capital 0 0
44 Additional Tier 1 (AT1) capital 0 0
45 Tier 1 capital (T1 = CET1 + AT1) 8,445 8,914
Tier 2 (T2) capital: instruments and provisions
46 Capital instruments and the related share premium accounts 0 0
51 Tier 2 (T2) capital before regulatory adjustments 0 0
57 Total regulatory adjustments to Tier 2 (T2) capital
58 Tier 2 (T2) capital 0 0
59 Total capital (TC = T1 + T2) 8,445 8,914
60 Total risk weighted assets 42,106 39,606
Capital ratios and buffers
61 Common Equity Tier 1 (as a percentage of total risk exposure amount) 20.06% 22.51%
62 Tier 1 (as a percentage of total risk exposure amount) 20.06% 22.51%
63 Total capital (as a percentage of total risk exposure amount) 20.06% 22.51%
64 Institution specific buffer requirement (CET1 requirement in accordance with article 92 (1) (a) plus capital conservation and countercyclical buffer requirements, plus systemic risk buffer, plus systemically important institution buffer expressed as a percentage of risk exposure amount)
7.04% 7.36%
65 of which: capital conservation buffer requirement 2.50% 2.50%
66 of which: countercyclical buffer requirement 0.04% 0.36%
67 of which: systemic risk buffer requirement 0.00% 0.00%
67a of which: Global Systemically Important Institution (G-811) or Other Systemically Important Institution (0-811) buffer
0.00% 0.00%
68 Common Equity Tier 1 available to meet buffers (as a percentage of risk exposure amount) 12.06% 14.46%
Amounts below the thresholds for deduction (before risk weighting)
72 Direct and indirect holdings of the capital of financial sector entities where the institution does not have a significant investment in those entities (amount below 10% threshold and net of eligible short positions) 2
0 0
73 Direct and indirect holdings by the institution of the CET1 instruments of financial sector entities where the institution has a significant investment in those entities (amount below 10 % threshold and net of eligible short positions) 2
0 0
75 Deferred tax assets arising from temporary differences (amount below 10% threshold, net of related tax liability where the conditions in Article 38 (3) are met)
202 200

Pillar 3 Disclosures December 2020 30
Table 12 and 13 provide a reconciliation of CEP’s and CHIL’s audited shareholders’ equity to regulatory capital.
Table 12: Regulatory Capital Resources Reconciliation to Audited Financial Statements CEP 31 December 2020
Balance per Audited
Financial Statements
Adj to Balance Sheet Items for Regulatory Capital Resources
CET1 capital elements or deductions -
other
Balance per Regulatory
Capital Resources
Intangible
Assets Deferred
Tax Prudent
Valuation Significant
Investments € million € million € million € million € million € million € million Tier 1 Capital
Share Capital 9 - - - - - 9
Share Premium 1,600 - - - - - 1,600
Capital Reserves 674 - - - - - 674
Other Reserves (47) - - - - - (47)
Retained Earnings 6,497 - - - - - 6,497
Tier 1 Capital Before Deductions 8,732 - - - - - 8,732
Intangible Assets - (60) - - - - (60)
Deferred Tax Asset - - (202) - - - (202)
Prudent Valuation - - - (19) - - (19)
Significant Investments - - - - (12) - (12)
CET1 capital elements or deductions - other - - - - - (4) (4)
Tier 1 Capital After Deductions 8,732 (60) (202) (19) (12) (4) 8,435
Total Capital Resources 8,732 (60) (202) (19) (12) (4) 8,435
Table 13: Regulatory Capital Resources Reconciliation to Audited Financial Statements CHIL 31 December 2020
Balance per Audited
Financial Statements
Adj to Balance Sheet Items for Regulatory Capital Resources
CET1 capital elements or deductions -
other
Balance per Regulatory
Capital Resources
Intangible
Assets Deferred
Tax Prudent
Valuation Significant
Investments
€ million € million € million € million € million € million € million Tier 1 Capital
Share Capital - - - - - - -
Share Premium 560 - - - - - 560
Capital Reserves 1,506 - - - - - 1,506
Other Reserves (35) - - - - - (35)
Retained Earnings 6,699 - - - - - 6,699
Tier 1 Capital Before Deductions 8,730 - - - - - 8,730
Intangible Assets - (60) - - - - (60)
Deferred Tax Asset - - (202) - - - (202)
Prudent Valuation - - - (19) - - (19)
Significant Investments - - - - - - -
CET1 capital elements or deductions - other
(4) (4)
Tier 1 Capital After Deductions 8,730 (60) (202) (19) - (4) 8,445
Total Capital Resources 8,730 (60) (202) (19) - (4) 8,445

Pillar 3 Disclosures December 2020 31
Table 14: Capital Instruments Features
Capital Instruments Main FeaturesCET1 CET1
1 Issuer Citibank Europe Plc Citibank Holdings Ireland
Limited2 Unique identifier (eg. CUSIP, ISIN or Bloomberg
identifier for private placement)
Private placement Private Placement
3 Governing law(s) of the instrument* Irish Irish
Regulatory treatment
4 Transitional CCR rules CET 1 CET1
5 Post-transitional CRR rules CET 1 CET1
6 Eligible at solo/(sub-) consolidated/ solo & (sub-
)consolidated
Solo
7 Instrument type (types to be specified by each
jurisdiction)
Ordinary issed shares with full
voting rights
Ordinary issed shares with full
voting rights
8 Amount recognised in regulatory capital (as of most
recent reporting date)
€1,756,524 comprising nominal
and premium
€ 611,860 comprising nominal
and premium
9 Nominal amount of instrument 1
9a Issue price €22,192 15/03/2001
€6,348,689 17/04/2001
€180,703 28/09/2001
€908,846 01/01/2008
€1,857,824 31/12/2009
€423,036 01/01/2016
€2 30/10/2003
€1 31/12/2009
9b Redemption price N/A N/A
10 Accounting classification Share holders equity Share holders equity
11 Original date of issuance €22,192 15/03/2001
€6,348,689 17/04/2001
€180,703 28/09/2001
€908,846 01/01/2008
€1,857,824 31/12/2009
€423,036 01/01/2016
€2 30/10/2003
€1 31/12/2009
12 Perpetual or dated Perpetual Perpetual
13 Original maturity date No maturity No maturity
14 Issuer call subject to prior supervisory approval No No
15 Optional call date, contigent call dates and
redemption amount
N/A N/A
16 Subsequent call dates, if applicable N/A N/A
Coupons / dividends
17 Fixed or floating dividend/coupon N/A N/A
18 Coupon rate and any related index N/A N/A
19 Existence of a dividend stopper No No
20a Fully discretionary, partially or mandatory (in terms of
timing)
Fully discretionary Fully discretionary
20b Fully discretionary, partially or mandatory (in terms of
amount)
Fully discretionary Fully discretionary
21 Existence of step up or other incentive to redeem No No
22 Noncumulative or cumulative** Non comulative Non comulative
23 Convertible or non-convertible Non-convertible Non-convertible
24 If convertible, conversion trigger(s) N/A N/A
25 If convertible, fully or partially N/A N/A
26 If convertible, conversion rate N/A N/A
27 If convertible, mandatory or optional conversion N/A N/A
28 If convertible, specify instrument type convertible
into
N/A N/A
29 If convertible, specify issuer of instrument it converts
into
N/A N/A
30 Write-down features N/A N/A
31 If write-down, features, write down trigger(s)*** N/A N/A
32 If write-down, full or partial N/A N/A
33 If write-down, permanent or temporary N/A N/A
34 If temporary write-down, description of write-down
mechanism
N/A N/A
35 Positionin subordination hierarchy in liquidation
(specify instrument type immediately senior to
instrument)
All subordinated liabilities All subordinated liabilities
36 Non-compliant transitioned features No No
37 If yes, specify non-compliant features N/A N/A
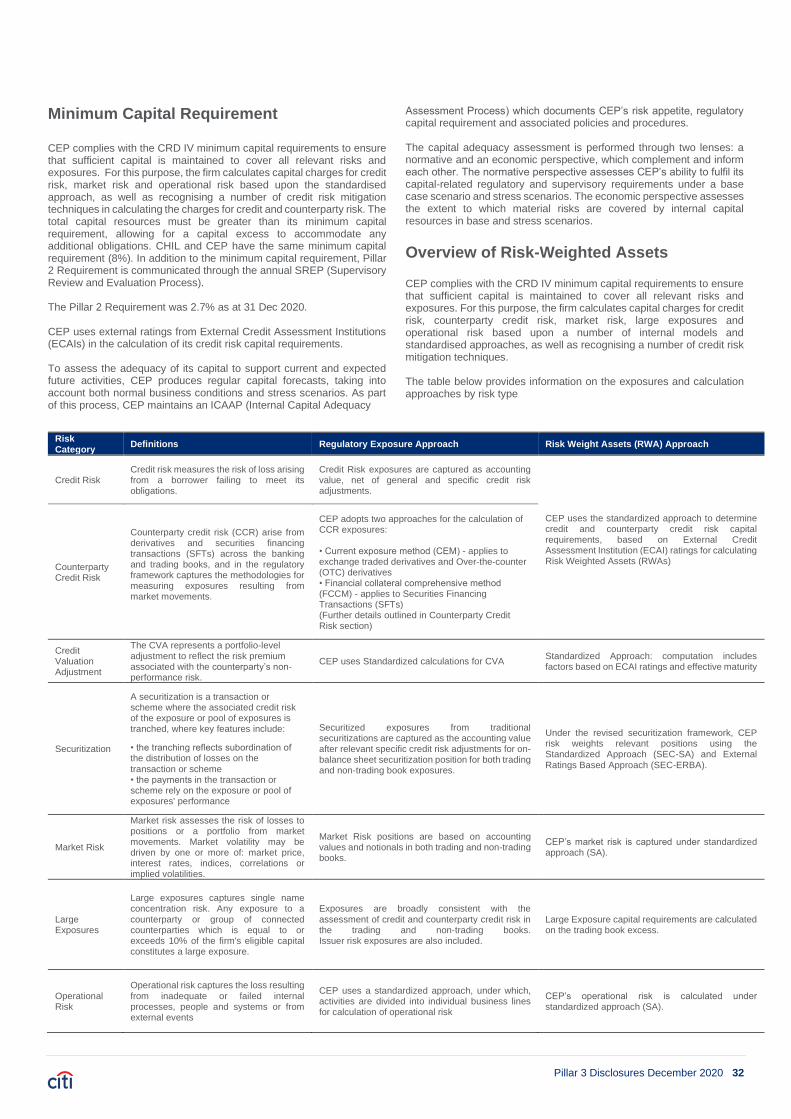
Pillar 3 Disclosures December 2020 32
Minimum Capital Requirement
CEP complies with the CRD IV minimum capital requirements to ensure that sufficient capital is maintained to cover all relevant risks and exposures. For this purpose, the firm calculates capital charges for credit risk, market risk and operational risk based upon the standardised approach, as well as recognising a number of credit risk mitigation techniques in calculating the charges for credit and counterparty risk. The total capital resources must be greater than its minimum capital requirement, allowing for a capital excess to accommodate any additional obligations. CHIL and CEP have the same minimum capital requirement (8%). In addition to the minimum capital requirement, Pillar 2 Requirement is communicated through the annual SREP (Supervisory Review and Evaluation Process). The Pillar 2 Requirement was 2.7% as at 31 Dec 2020. CEP uses external ratings from External Credit Assessment Institutions (ECAIs) in the calculation of its credit risk capital requirements. To assess the adequacy of its capital to support current and expected future activities, CEP produces regular capital forecasts, taking into account both normal business conditions and stress scenarios. As part of this process, CEP maintains an ICAAP (Internal Capital Adequacy
Assessment Process) which documents CEP’s risk appetite, regulatory capital requirement and associated policies and procedures. The capital adequacy assessment is performed through two lenses: a normative and an economic perspective, which complement and inform each other. The normative perspective assesses CEP’s ability to fulfil its capital-related regulatory and supervisory requirements under a base case scenario and stress scenarios. The economic perspective assesses the extent to which material risks are covered by internal capital resources in base and stress scenarios.
Overview of Risk-Weighted Assets CEP complies with the CRD IV minimum capital requirements to ensure that sufficient capital is maintained to cover all relevant risks and exposures. For this purpose, the firm calculates capital charges for credit risk, counterparty credit risk, market risk, large exposures and operational risk based upon a number of internal models and standardised approaches, as well as recognising a number of credit risk mitigation techniques. The table below provides information on the exposures and calculation approaches by risk type
Risk Category
Definitions Regulatory Exposure Approach Risk Weight Assets (RWA) Approach
Credit Risk Credit risk measures the risk of loss arising from a borrower failing to meet its obligations.
Credit Risk exposures are captured as accounting value, net of general and specific credit risk adjustments.
CEP uses the standardized approach to determine credit and counterparty credit risk capital requirements, based on External Credit Assessment Institution (ECAI) ratings for calculating Risk Weighted Assets (RWAs)
Counterparty Credit Risk
Counterparty credit risk (CCR) arise from derivatives and securities financing transactions (SFTs) across the banking and trading books, and in the regulatory framework captures the methodologies for measuring exposures resulting from market movements.
CEP adopts two approaches for the calculation of CCR exposures: • Current exposure method (CEM) - applies to exchange traded derivatives and Over-the-counter (OTC) derivatives • Financial collateral comprehensive method (FCCM) - applies to Securities Financing Transactions (SFTs) (Further details outlined in Counterparty Credit Risk section)
Credit Valuation Adjustment
The CVA represents a portfolio-level adjustment to reflect the risk premium associated with the counterparty’s non-performance risk.
CEP uses Standardized calculations for CVA Standardized Approach: computation includes factors based on ECAI ratings and effective maturity
Securitization
A securitization is a transaction or scheme where the associated credit risk of the exposure or pool of exposures is tranched, where key features include:
• the tranching reflects subordination of the distribution of losses on the
transaction or scheme • the payments in the transaction or scheme rely on the exposure or pool of exposures' performance
Securitized exposures from traditional securitizations are captured as the accounting value after relevant specific credit risk adjustments for on-balance sheet securitization position for both trading and non-trading book exposures.
Under the revised securitization framework, CEP risk weights relevant positions using the Standardized Approach (SEC-SA) and External
Ratings Based Approach (SEC-ERBA).
Market Risk
Market risk assesses the risk of losses to positions or a portfolio from market movements. Market volatility may be driven by one or more of: market price, interest rates, indices, correlations or implied volatilities.
Market Risk positions are based on accounting values and notionals in both trading and non-trading books.
CEP’s market risk is captured under standardized approach (SA).
Large Exposures
Large exposures captures single name concentration risk. Any exposure to a counterparty or group of connected counterparties which is equal to or exceeds 10% of the firm's eligible capital constitutes a large exposure.
Exposures are broadly consistent with the assessment of credit and counterparty credit risk in the trading and non-trading books. Issuer risk exposures are also included.
Large Exposure capital requirements are calculated on the trading book excess.
Operational Risk
Operational risk captures the loss resulting from inadequate or failed internal processes, people and systems or from external events
CEP uses a standardized approach, under which, activities are divided into individual business lines for calculation of operational risk
CEP’s operational risk is calculated under standardized approach (SA).

Pillar 3 Disclosures December 2020 33
Table 15: EU OV1 – Overview of RWAs 30 September & 31 December 2020 – CEP
31 December 2020 30 September 2020 31 December 2020
RWAs RWAs Minimum capital
requirements € million € million € million
Credit risk (excluding CCR) 31,163 31,706 2,493
Of which the standardised approach 31,163 31,706 2,493
Of which the foundation IRB (FIRB) approach - - -
Of which the advanced IRB (AIRB) approach - - -
Of which equity IRB under the simple risk-weighted approach or the IMA - - -
CCR 4,786 4,120 383
Of which mark to market 3,819 3,195 305
Of which Financial collateral comprehensive method (for SFTs)1 18 16 1
Of which original exposure - - -
Of which the standardised approach - - -
Of which internal model method (IMM) - - -
Of which risk exposure amount for contributions to the default fund of a CCP 23 20 2
Of which CVA 926 887 74
Settlement risk 1 2 0
Securitisation exposures in the banking book 7 3 1
Of which internal ratings-based approach ("SEC-IRBA") - - -
Of which external ratings-based approach ("SEC-ERBA") 3 - 0
Of which internal assessment approach (IAA) - - -
Of which standardised approach ("SEC-SA") 4 3 0
Market risk 2,159 2,183 173
Of which the standardised approach 2,159 2,183 173
Of which IMA - - -
Large exposures - - -
Operational risk 3,912 4,011 313
Of which basic indicator approach - - -
Of which standardised approach 3,912 4,011 313
Of which advanced measurement approach - - -
Amounts below the thresholds for deduction (subject to 250% risk weight) - - -
Floor adjustment - - -
Total 42,028 42,025 3,362
1 Financial collateral comprehensive method for SFTs have been separated from Mark to Market to give a better representation of CEP’s RWA’s. Prior period have been
amended accordingly.
Table 16: EU OV1 – Overview of RWAs 30 September & 31 December 2020 – CHIL
31 December 2020 30 September 2020 31 December 2020
RWAs RWAs Minimum capital
requirements € million € million € million
Credit risk (excluding CCR) 31,231 31,772 2,498
Of which the standardised approach 31,231 31,772 2,498
Of which the foundation IRB (FIRB) approach - - -
Of which the advanced IRB (AIRB) approach - - -
Of which equity IRB under the simple risk-weighted approach or the IMA - - -
CCR 4,786 4,120 383
Of which mark to market 3,819 3,195 305
Of which Financial collateral comprehensive method (for SFTs) 18 16 1
Of which original exposure - - -
Of which the standardised approach - - -
Of which internal model method (IMM) - - -
Of which risk exposure amount for contributions to the default fund of a CCP 23 20 2
Of which CVA 926 887 74
Settlement risk 1 2 0
Securitisation exposures in the banking book 7 3 1
Of which internal ratings-based approach ("SEC-IRBA") - - -
Of which external ratings-based approach ("SEC-ERBA") 3 - 0
Of which internal assessment approach (IAA) - - -
Of which standardised approach ("SEC-SA") 4 3 0
Market risk 2,169 2,194 174
Of which the standardised approach 2,169 2,194 174
Of which IMA - - -
Large exposures - - -
Operational risk 3,912 4,011 313
Of which basic indicator approach - - -
Of which standardised approach 3,912 4,011 313
Of which advanced measurement approach - - -
Amounts below the thresholds for deduction (subject to 250% risk weight) - - -
Floor adjustment - - -
Total 42,106 42,101 3,368

Pillar 3 Disclosures December 2020 34
Capital Buffers Under CRD IV, CEP is required to hold additional capital buffers including the capital conservation buffer and the institution-specific countercyclical buffer. Countercyclical Buffer The countercyclical capital buffer aims to ensure that capital requirements take into account the macro-financial environment. Its primary objective is to protect the banking sector from periods of excess aggregate credit growth. The designated authorities can set the countercyclical capital buffer rates between 0% and 2.5%. CEP is required to calculate its institution-specific countercyclical buffer rate as a weighted average of the buffer rates that have been announced
for each jurisdiction to which the firm has relevant credit exposures. Relevant credit exposures are as follows;
• credit risk
• specific risk
• securitizations
The institution-specific countercyclical buffer rate consists of the weighted average of the countercyclical buffer rates that apply in the jurisdictions where the relevant credit exposures of the institutions are located. The following tables set out CEP’s countercyclical buffer requirement for 31 December 2020.
Table 17: Geographical distribution of credit exposures relevant for the calculation of the countercyclical buffer 31 December 2020
General credit exposures
Trading book exposure
Securitisation Own funds requirements
Institution specific
countercyclical buffer
Countercyclical capital buffer
rate Breakdown by country Exposure
value for SA
Sum of long and short
position of trading book
Exposure value of
securitisation positions in the banking book
under the Standardised
Approach
Of which: Credit risk exposures
Of which: Trading
book exposures
Securitisation positions in the banking
book
Total
€ million € million € million € million € million € million € million BERMUDA 807 - - 45 - - 45 0.0000% 0.00%
CZECH REPUBLIC 858 - - 68 - - 68 0.0133% 0.50%
FRANCE 6,108 11 - 400 1 - 401 0.0000% 0.00%
GERMANY 2,992 48 - 205 4 - 209 0.0000% 0.00%
IRELAND 1,696 4 8 135 0 0 135 0.0000% 0.00%
NETHERLANDS 2,243 33 - 171 3 - 173 0.0000% 0.00%
SPAIN 2,692 1 - 223 0 - 223 0.0000% 0.00%
SWITZERLAND 1,977 1 - 131 0 - 131 0.0000% 0.00%
UNITED KINGDOM 3,427 150 29 265 12 0 278 0.0000% 0.00%
UNITED STATES 1,981 14 - 141 1 - 142 0.0000% 0.00%
HONG KONG 55 - - 4 - - 4 0.0000% 1.00%
NORWAY 365 3 - 28 0 - 29 0.0113% 1.00%
SLOVAKIA 336 - - 28 - - 28 0.0109% 1.00%
BULGARIA 131 - - 10 - - 10 0.0000% 0.50%
LUXEMBOURG 689 34 - 53 3 - 56 0.0055% 0.25%
ALL OTHER COUNTRIES 7,686 46 - 617 4 - 621 0.0447% 0.00%
Total 34,043 346 37 2,525 28 1 2,553
Table 18: Amount of institution-specific countercyclical buffer 31 December 2020
Amount of Institution-specific Countercyclical Capital Buffer
Total Risk Exposure Amount (EUR million) 42,106
Institution Specific Countercyclical Buffer Rate 0.04%
Institution Specific Countercyclical Buffer Requirement (EUR million) 19
Table 19: Geographical distribution of credit exposures relevant for the calculation of the countercyclical buffer 31 December 2019 General credit
exposures Trading book
exposure Securitisation Own funds requirements
Institution specific
countercyclical buffer
Countercyclical capital buffer
rate Breakdown by
country Exposure
value for SA
Sum of long and short position of
trading book
Exposure value of securitisation
positions in the banking book
under the Standardised
Approach
Of which: Credit risk exposures
Of which: Trading
book exposures
Securitisation positions in the banking
book
Total
€ million € million € million € million € million € million € million Hong Kong 69 - - 5 - - 5 0.0042% 2.00%
Norway 245 0 - 15 0 - 15 0.0145% 2.50%
Sweden 581 20 - 45 2 - 46 0.0454% 2.50%
Czech Republic 1,030 - - 81 - - 81 0.0474% 1.50%
Iceland 49 - - 4 - - 4 0.0027% 1.75%
Slovakia 290 - - 24 - - 24 0.0140% 1.50%
United Kingdom 4,515 161 5 347 13 0 360 0.1409% 1.00%
Lithuania 14 - - 1 - - 1 0.0004% 1.00%
Denmark 253 24 - 16 2 - 18 0.0071% 1.00%
Ireland 1,250 2 - 95 0 - 95 0.0373% 1.00%
France 6,473 183 - 409 15 - 424 0.0415% 0.25%
Bulgaria 194 - - 15 - - 15 0.0030% 0.50%
Total 14,962 389 5 1,058 31 0 1,089 0.3585%

Pillar 3 Disclosures December 2020 35
Table 20: Amount of institution-specific countercyclical buffer 31 December 2019
Amount of Institution-specific Countercyclical Capital Buffer
Total Risk Exposure Amount (EUR million) 39,606
Institution Specific Countercyclical Buffer Rate 0.36%
Institution Specific Countercyclical Buffer Requirement (EUR million) 142
Capital Conservation Buffer
CEP is also required to hold a capital conservation buffer. The buffer was introduced 1 January 2016 at 0.625% of RWAs. The buffer is scheduled to increase by 0.625% per year until it reaches 2.5% of RWAs on 1 January 2019. The buffer held by CEP as at 31 December 2020 was €1,053 million and 31 December 2019 was €990 million.
Other Systemically Important Buffers
Represents a capital buffer requirement on institutions deemed systemically important to the local domestic economy. The Central Bank of Ireland has set a rate of 1.0% for CEP, beginning in 2019 at 0.25% and increasing up to 1.0% by 1 July 2021.

Pillar 3 Disclosures December 2020 36
Leverage
Leverage ratio
Leverage risk is the risk that excessive growth in exposure or a decrease in capital will lead to an entity becoming more vulnerable to leverage or contingent leverage that may require unintended corrective measures, including distressed selling of assets which might result in losses or in valuation adjustments to its remaining assets. The leverage ratio is a measure which allows for the assessment of institutions’ exposure to the risk of excessive leverage. It is a simple non-risk based measure to reinforce the risk-based capital framework. The Basel III Framework ensures broad and adequate capture of both the on- and off-balance sheet sources of banks and investment firms’ leverage and aims to constrain the build-up of excess leverage in the financial sector. CEP calculates the leverage ratio in accordance with the Delegated Act. This provides for a minimum requirement of 3%, currently this is not set as a binding requirement however, this will become binding on the implementation of CRR II/CRD V on 28 June 2021. CHIL and CEP’s ratio is in excess of this 3% minimum as both entities have a leverage ratio of at 10.02% at 31 December 2020.
Management of Excessive Leverage Risk
The following points describe CEP’s approach to managing the risk of excessive leverage.
• Daily capital monitoring: for both CHIL and CEP, capital ratios (CET1, Tier 1 and total capital ratio) are monitored on a daily basis. The excess capital over Pillar 1 requirements, over the ICG and over the capital action trigger are also monitored daily. The latter is an internal trigger set to ensure we manage
the entities with enough of a capital ‘buffer’ to permit timely management decisions in case of a capital shortfall. This report is sent out to senior management every day.
• Daily large exposure monitoring: this shows the concentration to our largest counterparties (those to whom we have exposure equal to 10% or more of our eligible capital).
• Leverage ratio/Risk Appetite limit: CEP and CHIL’s Risk Appetite limit is set at 5%, and it is being monitored and reported on a quarterly basis
• New Products Approval Committee: new products, new activities or complex transactions are reviewed in this forum which has representatives from the relevant business area and each support function in the firm.
• Regulatory advisory pre-notification process: the regulatory advisory team provide regular feedback to the businesses on the regulatory capital needed to support any new trade.
• Product Control daily P&L meeting: this meeting allows each product control team to highlight the P&L of their desk and this information is widely shared amongst the finance management team. This allows all the finance areas to be alerted if an expected or realised loss is incurred.
• Liquidity monitoring/stresses/mismatch between assets and liabilities: Citi employs multiple daily liquidity stress tests which measure Citi’s ability to survive a range of potential stress environments. In doing this Citi’s liquidity resources are measured against potential stressed liquidity outflows that may result as a consequence of liquidity mismatches, among other considerations. The requirement to cover these projected losses on a standalone basis acts as a governor against excessive leverage through overuse of maturity transformation or maturity gaps.
• Forward-looking leverage ratio forecasts are being produced as part of CHIL & CEP’s ICAAP process
The following disclosure templates provide additional details on the Leverage Ratio.
Table 21: Summary Reconciliation of Accounting Assets and Leverage Ratio Exposures for CEP This table summarises the total leverage exposure, comprising of the total assets in the statutory financial statement and other regulatory adjustments for leverage purposes.
31 December 2020 31 December 2019 € million € million
Total assets as per published financial statements 60,902 55,236
Adjustment for entities which are consolidated for accounting purposes but are outside the scope of regulatory consolidation 0 0
(Adjustment for fiduciary assets recognised on the balance sheet pursuant to the applicable accounting framework but excluded from the leverage ratio total exposure measure in accordance with Article 429(13) of Regulation (EU) No 575/2013)
0 0
Adjustments for derivative financial instruments (3,245) (244)
Adjustment for securities financing transactions (SFTs) 28 27
Adjustment for off-balance sheet items (ie conversion to credit equivalent amounts of off-balance sheet exposures) 24,113 24,732
(Adjustment for intragroup exposures excluded from the leverage ratio total exposure measure in accordance with Article 429(7) of Regulation (EU) No 575/2013) 0 0
(Adjustment for exposures excluded from the leverage ratio total exposure measure in accordance with Article 429(14) of Regulation (EU) No 575/2013) (0) 0
Other adjustments - differences in Statutory and Regulatory consolidation 2,416 (294)
Leverage ratio total exposure measure 84,213 79,457

Pillar 3 Disclosures December 2020 37
Table 22: Summary Reconciliation of Accounting Assets and Leverage Ratio Exposures for CHIL 31 December 2020 31 December 2019
€ million € million
Total assets as per published financial statements 60,957 55,234
Adjustment for entities which are consolidated for accounting purposes but are outside the scope of regulatory consolidation 0 0
(Adjustment for fiduciary assets recognised on the balance sheet pursuant to the applicable accounting framework but excluded from the leverage ratio total exposure measure in accordance with Article 429(13) of Regulation (EU) No 575/2013)
0 0
Adjustments for derivative financial instruments (3,245) (250)
Adjustment for securities financing transactions (SFTs) 28 27
Adjustment for off-balance sheet items (ie conversion to credit equivalent amounts of off-balance sheet exposures) 24,122
24,747
(Adjustment for intragroup exposures excluded from the leverage ratio total exposure measure in accordance with Article 429(7) of Regulation (EU) No 575/2013) 0 0
(Adjustment for exposures excluded from the leverage ratio total exposure measure in accordance with Article 429(14) of Regulation (EU) No 575/2013) (0) 0
Other adjustments - differences in Statutory and Regulatory consolidation 2,428 (281)
Leverage ratio total exposure measure 84,290 79,477
Table 23: Leverage Ratio Common Disclosure for CEP This table shows the breakdown of the Leverage exposure disclosed in Table 10 – Summary reconciliation of accounting assets and leverage ratio exposures and the leverage ratio.
31 December
2020 31 December
2019 € million € million
On-balance sheet exposures (excluding derivatives and SFTs)
1 On-balance sheet items (excluding derivatives, SFTs and fiduciary assets, but including collateral) 39,859 41,932
2 (Asset amounts deducted in determining Tier 1 capital) (274) 294
3 Total on-balance sheet exposures (excluding derivatives, SFTs and fiduciary assets)
39,585 42,226
Derivative exposures
4 Replacement cost associated with all derivatives transactions (ie net of eligible cash variation margin) 2,431 1,030
5 Add-on amounts for PFE associated with all derivatives transactions (mark- to-market method) 4,602 1,992
Exposure determined under Original Exposure Method - -
Gross-up for derivatives collateral provided where deducted from the balance sheet assets pursuant to the applicable accounting framework
- -
7 (Deductions of receivables assets for cash variation margin provided in derivatives transactions) (1,122) 404
8 (Exempted CCP leg of client-cleared trade exposures) - -
9 Adjusted effective notional amount of written credit derivatives 1,098 -
10 (Adjusted effective notional offsets and add-on deductions for written credit derivatives) (1,098) -
11 Total derivatives exposures (sum of lines 4 to 10) 5,912 3,426
SFT exposures
12 Gross SFT assets (with no recognition of netting), after adjusting for sales accounting transactions 1 14,576 10,469
13 (Netted amounts of cash payables and cash receivables of gross SFT assets) 1 0 0
14 Counterparty credit risk exposure for SFT assets 28 27
Derogation for SFTs: Counterparty credit risk exposure in accordance with Articles 429b(4) and 222 of Regulation (EU) No 575/2013
- -
15 Agent transaction exposures - -
(Exempted CCP leg of client-cleared SFT exposure) - -
16 Total securities financing transaction exposures (sum of lines 12 to 15a) 14,604 10,469
Other off-balance sheet exposures
17 Off-balance sheet exposures at gross notional amount 24,113 24,732
18 (Adjustments for conversion to credit equivalent amounts) 0 0
19 Total other off-balance sheet exposures (sum of lines 17 and 18) 24,113 24,732
Exempted exposures in accordance with Article 429(7) and (14) of Regulation (EU) No 575/2013 (on and off balance sheet)
(0) -
19a (Intragroup exposures (solo basis) exempted in accordance with Article 429(7) of Regulation (EU) No 575/2013 (on and off balance sheet))
- -
19b (Exposures exempted in accordance with Article 429 (14) of Regulation (EU) No 575/2013 (on and off balance sheet))
(0) -
Capital and total exposure measure
20 Tier 1 capital 8,435 8,886
21 Leverage ratio total exposure measure (sum of lines 3, 11, 16, 19, EU-19a and EU-19b) 84,213 79,457
22 Leverage ratio 10.02% 11.18%
Leverage ratio’ (excluding the impact of any applicable temporary exemption of central bank exposures)
10.02%
EU-23 Choice on transitional arrangements for the definition of the capital measure Fully phased in

Pillar 3 Disclosures December 2020 38
Table 24: Leverage Ratio Common Disclosure for CHIL 31 December
2020 31 December
2019
€ million € million
On-balance sheet exposures (excluding derivatives and SFTs)
1 On-balance sheet items (excluding derivatives, SFTs and fiduciary assets, but including collateral) 39,915 41,925
2 (Asset amounts deducted in determining Tier 1 capital) (263) 281
3 Total on-balance sheet exposures (excluding derivatives, SFTs and fiduciary assets)
39,652 41,644
Derivative exposures
4 Replacement cost associated with all derivatives transactions (ie net of eligible cash variation margin) 2,431 1,030
5 Add-on amounts for PFE associated with all derivatives transactions (mark- to-market method) 4,602 1,992
Exposure determined under Original Exposure Method - -
Gross-up for derivatives collateral provided where deducted from the balance sheet assets pursuant to the applicable accounting framework
- -
7 (Deductions of receivables assets for cash variation margin provided in derivatives transactions) (1,122) 404
8 (Exempted CCP leg of client-cleared trade exposures) - -
9 Adjusted effective notional amount of written credit derivatives 1,098 -
10 (Adjusted effective notional offsets and add-on deductions for written credit derivatives) (1,098) -
11 Total derivatives exposures (sum of lines 4 to 10) 5,912 3,426
SFT exposures
12 Gross SFT assets (with no recognition of netting), after adjusting for sales accounting transactions 1 14,576 10,469
13 (Netted amounts of cash payables and cash receivables of gross SFT assets) 1 - -
14 Counterparty credit risk exposure for SFT assets 28 27
Derogation for SFTs: Counterparty credit risk exposure in accordance with Articles 429b(4) and 222 of Regulation (EU) No 575/2013
- -
15 Agent transaction exposures - -
(Exempted CCP leg of client-cleared SFT exposure) - -
16 Total securities financing transaction exposures (sum of lines 12 to 15a) 14,604 10,469
Other off-balance sheet exposures
17 Off-balance sheet exposures at gross notional amount 24,122 24,747
18 (Adjustments for conversion to credit equivalent amounts) 0 0
19 Total other off-balance sheet exposures (sum of lines 17 and 18) 24,122 24,747
Exempted exposures in accordance with Article 429(7) and (14) of Regulation (EU) No 575/2013 (on and off balance sheet)
(0) -
19a (Intragroup exposures (solo basis) exempted in accordance with Article 429(7) of Regulation (EU) No 575/2013 (on and off balance sheet))
- -
19b (Exposures exempted in accordance with Article 429 (14) of Regulation (EU) No 575/2013 (on and off balance sheet))
(0) -
Capital and total exposure measure
20 Tier 1 capital 8,445 8,897
21 Leverage ratio total exposure measure (sum of lines 3, 11, 16, 19, EU-19a and EU-19b) 84,290 79,477
22 Leverage ratio 10.02% 11.19%
Leverage ratio’ (excluding the impact of any applicable temporary exemption of central bank exposures)
10.02%
EU-23 Choice on transitional arrangements for the definition of the capital measure Fully phased in
CEP’s and CHIL’s leverage ratio decreased to 10.02% as at 31 December 2020, reflecting a €500 million decrease in Tier 1 capital along with an increase in leverage exposures mainly attributed to higher gross SFT assets and derivative exposures. In line with the ‘CRR quick fix’ amendments, exposures against the Central Bank of Ireland are temporarily excluded from CEP’s and CHIL’s leverage ratio calculation. Due to the immaterial amount of such exposures, the leverage ratio of both entity would remain at the same level without the exclusions.
Table 25: Split of On Balance Sheet Exposures (excluding derivatives and SFTs) for CEP
31 December 2020 31 December 2019
€ million € million
Total on-balance sheet exposures (excluding derivatives, SFTs, and exempted exposures), of which: 39,859 41,932
Trading book exposures 595 825
Banking book exposures, of which: 39,264 41,107
Covered bonds 0 0
Exposures treated as sovereigns 17,930 18,620
Exposures to regional governments, MDB, international organisations and PSE not treated as sovereigns 293 365
Institutions 2,904 2,781
Secured by mortgages of immovable properties 358 406
Retail exposures 1 3
Corporate 12,947 14,460
Exposures in default 97 84
Other exposures (eg equity, securitisations, and other non-credit obligation assets) 4,734 4,388

Pillar 3 Disclosures December 2020 39
Table 26: Split of On Balance Sheet Exposures (excluding derivatives and SFTs) for CHIL
31 December 2020 31 December 2019
€ million € million
Total on-balance sheet exposures (excluding derivatives, SFTs, and exempted exposures), of which: 39,915 41,925
Trading book exposures 595 825
Banking book exposures, of which: 39,320 41,100
Covered bonds 0 0
Exposures treated as sovereigns 17,930 18,620
Exposures to regional governments, MDB, international organisations and PSE not treated as sovereigns 293 365
Institutions 2,921 2,781
Secured by mortgages of immovable properties 358 406
Retail exposures 1 3
Corporate 12,997 14,460
Exposures in default 97 84
Other exposures (eg equity, securitisations, and other non-credit obligation assets) 4,722 4,381

Pillar 3 Disclosures December 2020 40
Non-trading Book Exposures
Non-trading Book Equity Exposures CEP has a small number of equity investments, which are held outside the trading book. This category includes investments in clearing houses,
exchanges and other strategic investments which are required to be held for membership, access or relationship purposes, and which are otherwise not traded. They are carried on the balance sheet at cost.
Table 27: Non-Trading Book Equity Exposures
31 December 2020 31 December 2019
€ €
Investments Held at Fair Value 13,597 13,638
Investments Held at Cost - -
Total 13,597 13,638

Pillar 3 Disclosures December 2020 41
Quantitative Disclosures of Credit Risk Profile and Credit Risk
Mitigation (CRM)
Credit Risk Disclosures of Off- and On-Balance Sheet exposures For completeness the tables in this section are disclosed at the CHIL level and difference to CEP called out as relevant.
The below tables detail CHIL’s credit risk profile focusing on on-balance sheet and off-balance sheet regulatory exposures. As of 31 December 2020 CHIL’s and CEP’s total on-balance sheet and off-balance sheet exposures were €74.85 billion and €74.76 billion respectively. The risk profile is further analysed into exposure classes, industry, regions, maturities and defaulted exposures.
Table 28: CRB-B - Total and average net amount of exposures The table below provide a breakdown of credit risk exposures pre CCF (Credit Conversion Factor) and CRM by exposure class and average over four quarters. Average net exposure values are calculated by aggregating the last four-quarter ends of the year and dividing it by four.
Net value of exposures at the end of the
period Average net exposures over the period
31 December 2020 31 December 2019 31 December 2020 31 December 2019
€ million € million € million € million
Standardised approach
Central governments or central banks 17,717 18,339 16,690 18,581
Regional governments or local authorities 102 107 102 106
Public sector entities 376 417 455 393
Multilateral development banks 208 298 235 316
International organisations 20 2 21 17
Institutions 4,212 3,704 4,750 4,138
Corporates 48,164 49,460 48,817 48,877
Of which: SMEs 273 460 315 517
Retail 2 4 4 10
Of which: SMEs 2 3 3 3
Secured by mortgages on immovable property 425 542 317 370
Of which: SMEs 0 0
Exposures in default 106 103 217 658
Items associated with particularly high risk 1,783 1,101 1,948 954
Covered bonds 0 0
Claims on institutions and corporates with a short-term credit assessment
1,701 1,862 1,745 2,062
Collective investments undertakings 0 4
Equity exposures 0 0 0 0
Other exposures 33 14 39 28
Total Standardised approach 74,851 75,953 75,341 76,514

Pillar 3 Disclosures December 2020 42
Table 29: CRB-C – Geographical breakdown of exposures 31 December 2020
This table provide a breakdown of credit risk exposures pre CCF and CRM by geographical areas and exposure classes.
France Germany Netherlands UK Spain Switzerland Romania Ireland Hungary Sweden Rest of EMEA
USA Rest of America
APAC Total
€ million € million € million € million € million € million € million € million € million € million € million € million € million € million € million
Standardised approach
Central governments or central banks 1,600 4,040 5,605 1,304 5 0 1,404 0 853 788 1,518 530 64 4 17,717
Regional governments or local authorities - - - 0 101 - - - - - - 2 - - 102
Public sector entities 130 0 0 0 0 - - 0 - 4 196 47 0 0 376
Multilateral development banks - - - 54 - - - - - - 65 5 - 84 208
International organisations - - - - - 20 - - - - - - - - 20
Institutions 401 157 34 787 176 5 9 112 0 3 910 1,034 70 513 4,212
Corporates 10,822 4,995 3,056 3,759 3,274 2,873 669 1,725 817 668 7,974 2,497 4,013 1,022 48,164
Retail - 0 0 0 - - 1 - 1 - 1 - - 0 2
Secured by mortgages on immovable property 67 - - - 67 - - - - - 291 - - - 425
Exposures in default - - 8 1 0 5 14 3 1 - 73 - - 0 106
Items associated with particularly high risk 290 163 269 52 265 6 23 123 23 0 412 78 7 73 1,783
Covered bonds
-
Claims on institutions and corporates with a short-term credit assessment
189 106 27 559 30 93 0 37 49 5 461 106 1 38 1,701
Collective investments undertakings
-
Equity exposures 0 0 0 0 0 0 0 0 0 0 0 0 0 0 0
Other exposures 0 0 0 0 0 0 2 22 0 1 4 0 4 0 33
Total as at 31 December 2020 13,498 9,462 8,999 6,516 3,918 3,004 2,121 2,022 1,745 1,469 11,907 4,298 4,158 1,734 74,851

Pillar 3 Disclosures December 2020 43
Table 30: CRB-C – Geographical breakdown of exposures 31 December 2019
Switzerland Czech
Republic Germany Spain France UK Hungary Ireland Luxembourg Netherlands Romania Sweden
Rest of EMEA
USA Rest of
Americas APAC Total
€ million € million € million € million € million € million € million € million € million € million € million € million € million € million € million € million € million
Standardised approach
Central governments or central banks 0 76 4,794 14 1,700 1,120 793 0 26 6,000 1,315 565 715 1,123 95 1 18,339
Regional governments or local authorities 0 0 0 104 0 1 0 0 0 0 0 0 0 3 0 0 107
Public sector entities 0 0 0 0 130 0 0 0 0 156 0 1 34 97 0 0 417
Multilateral development banks 0 0 0 0 0 2 0 0 163 0 0 0 95 22 0 15 298
International organisations 1 0 0 0 1 0 0 0 0 0 0 0 0 0 0 0 2
Institutions 5 4 107 51 399 1,019 0 89 2 52 9 1 631 980 73 283 3,704
Corporates 2,631 1,264 4,722 3,454 10,433 5,405 947 1,592 578 2,173 701 742 5,693 2,944 4,827 1,354 49,460
Retail 0 2 0 0 0 0 1 0 0 0 1 0 1 0 0 0 4
Secured by mortgages on immovable property 0 0 0 472 70 0 0 0 0 0 0 0 0 0 0 0 542
Exposures in default 6 5 32 0 0 0 40 4 0 0 8 0 9 0 0 0 103
Items associated with particularly high risk 2 28 67 61 371 25 29 20 0 82 8 0 381 3 23 0 1,101
Covered bonds 0 0 0 0 0 0 0 0 0 0 0 0 0 0 0 0 0
Claims on institutions and corporates with a short-term credit assessment
23 51 107 26 311 450 45 28 0 43 0 2 666 87 7 15 1,862
Collective investments undertakings 0 0 0 0 0 0 0 0 0 0 0 0 0 0 0 0 0
Equity exposures 0 0 0 0 0 0 0 0 0 0 0 0 0 0 0 0 0
Other exposures 0 1 0 0 0 0 0 3 0 0 3 1 7 0 0 0 14
Total as at 31 December 2019 2,667 1,431 9,830 4,182 13,415 8,024 1,856 1,734 769 8,505 2,044 1,312 8,233 5,258 5,025 1,669 75,953
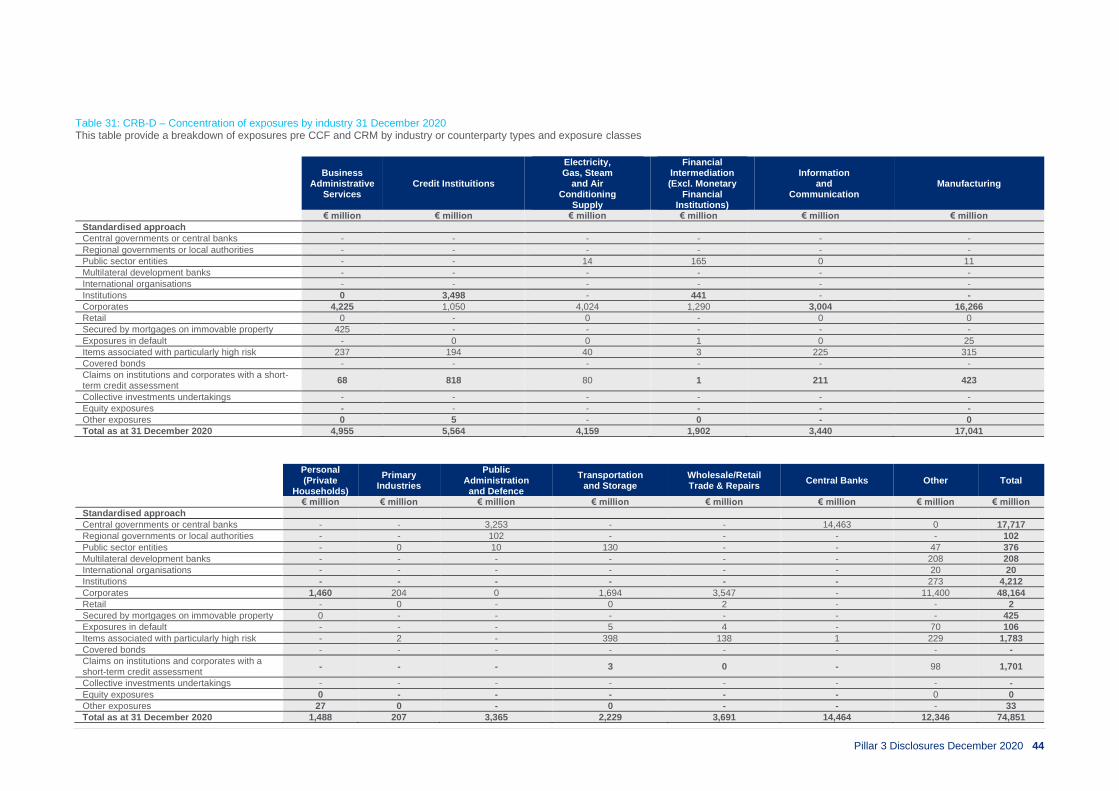
Pillar 3 Disclosures December 2020 44
Table 31: CRB-D – Concentration of exposures by industry 31 December 2020 This table provide a breakdown of exposures pre CCF and CRM by industry or counterparty types and exposure classes
Business Administrative
Services Credit Instituitions
Electricity, Gas, Steam
and Air Conditioning
Supply
Financial Intermediation (Excl. Monetary
Financial Institutions)
Information and
Communication Manufacturing
€ million € million € million € million € million € million
Standardised approach
Central governments or central banks - - - - - -
Regional governments or local authorities - - - - - -
Public sector entities - - 14 165 0 11
Multilateral development banks - - - - - -
International organisations - - - - - -
Institutions 0 3,498 - 441 - -
Corporates 4,225 1,050 4,024 1,290 3,004 16,266
Retail 0 - 0 - 0 0
Secured by mortgages on immovable property 425 - - - - -
Exposures in default - 0 0 1 0 25
Items associated with particularly high risk 237 194 40 3 225 315
Covered bonds - - - - - -
Claims on institutions and corporates with a short-term credit assessment
68 818 80 1 211 423
Collective investments undertakings - - - - - -
Equity exposures - - - - - -
Other exposures 0 5 - 0 - 0
Total as at 31 December 2020 4,955 5,564 4,159 1,902 3,440 17,041
Personal (Private
Households)
Primary Industries
Public Administration and Defence
Transportation and Storage
Wholesale/Retail Trade & Repairs
Central Banks Other Total
€ million € million € million € million € million € million € million € million
Standardised approach
Central governments or central banks - - 3,253 - - 14,463 0 17,717
Regional governments or local authorities - - 102 - - - - 102
Public sector entities - 0 10 130 - - 47 376
Multilateral development banks - - - - - - 208 208
International organisations - - - - - - 20 20
Institutions - - - - - - 273 4,212
Corporates 1,460 204 0 1,694 3,547 - 11,400 48,164
Retail - 0 - 0 2 - - 2
Secured by mortgages on immovable property 0 - - - - - - 425
Exposures in default - - - 5 4 - 70 106
Items associated with particularly high risk - 2 - 398 138 1 229 1,783
Covered bonds - - - - - - - -
Claims on institutions and corporates with a short-term credit assessment
- - - 3 0 - 98 1,701
Collective investments undertakings - - - - - - - -
Equity exposures 0 - - - - - 0 0
Other exposures 27 0 - 0 - - - 33
Total as at 31 December 2020 1,488 207 3,365 2,229 3,691 14,464 12,346 74,851

Pillar 3 Disclosures December 2020 45
Table 32: CRB-D – Concentration of exposures by industry 31 December 2019
Business
Administrative Services
Credit Institutions
Electricity, Gas, Steam
and Air Conditioning
Supply
Financial Intermediation (Excl. Monetary
Financial Institutions)
Information and
Communication Manufacturing
€ million € million € million € million € million € million
Standardised approach
Central governments or central banks - - - - - -
Regional governments or local authorities - - - - - -
Public sector entities - 156 18 0 0 11
Multilateral development banks - - - - - -
International organisations - - - - - -
Institutions 0 3,166 - 0 - -
Corporates 4,020 1,265 4,473 259 3,803 14,348
Retail 0 - 0 - 0 0
Secured by mortgages on immovable property 144 - - - - -
Exposures in default 35 - - - 0 24
Items associated with particularly high risk 45 303 5 0 208 169
Covered bonds - - - - - -
Claims on institutions and corporates with a short- term credit assessment
31 953 121 - 222 323
Collective investments undertakings - - - - - -
Equity exposures - - - - - -
Other exposures - 5 - - - -
Total as at 31 December 2019 4,275 5,848 4,618 259 4,233 14,874
Personal (Private
Households)
Primary Industries
Public Administration and Defence
Transportation and Storage
Wholesale/Retail Trade & Repairs
Central Banks Other Total
€ million € million € million € million € million € million € million € million
Standardised approach
Central governments or central banks - - 3,257 - - 15,064 17 18,339
Regional governments or local authorities - - 107 - - - - 107
Public sector entities - 0 2 133 - - 97 417
Multilateral development banks - - - - - - 298 298
International organisations - - - - - 1 1 2
Institutions 2 - - - - - 535 3,704
Corporates 1,438 254 0 2,269 3,177 - 14,153 49,460
Retail 0 0 - 0 3 - - 4
Secured by mortgages on immovable property 0 - - - - - 398 542
Exposures in default - 0 - 9 32 - 3 103
Items associated with particularly high risk - 10 - 182 114 5 60 1,101
Covered bonds - - - - - - - -
Claims on institutions and corporates with a short- term credit assessment
- - - 7 - - 205 1,862
Collective investments undertakings - - - - - - - -
Equity exposures 0 - - - - 0 - 0
Other exposures 9 - - - - - - 14
Total as at 31 December 2019 1,449 265 3,367 2,601 3,327 15,071 15,767 75,953

Pillar 3 Disclosures December 2020 46
Table 33: CRB-E – Maturity of exposures 31 December 2020 The table below provide a breakdown of net exposures pre CCF and CRM by residual maturity and exposure classes. Net exposure value
On demand <= 1 year
> 1 year < = 5 years
> 5 years Undated Total
€ million € million € million € million € million € million
Central governments or central banks - 11,988 2,355 3,336 38 17,717
Regional governments or local authorities - 101 - 2 0 102
Public sector entities - 22 293 61 - 376
Multilateral development banks - 170 - 38 - 208
International organisations - - - 20 - 20
Institutions - 666 304 2,363 879 4,212
Corporates 2 23,677 20,607 2,637 1,240 48,164
Retail - 2 0 0 - 2
Secured by mortgages on immovable property - 0 0 - 425 425
Exposures in default - 75 18 13 - 106
Items associated with particularly high risk - 864 507 88 324 1,783
Covered bonds - - - - - -
Claims on institutions and corporates with a short- term credit assessment 2 1,686 - - 13 1,701
Collective investments undertakings - - - - - -
Equity exposures - - - - 0 0
Other exposures - - - 33 - 33
Total standardised approach as at 31 December 2020 5 39,251 24,085 8,592 2,919 74,851
Table 34: CRB-E – Maturity of exposures 31 December 2019
Net exposure value
On demand <= 1 year > 1 year <
= 5 years > 5 years Undated Total
€ million € million € million € million € million € million
Central governments or central banks - 15,831 0 2,507 - 18,339
Regional governments or local authorities - 104 - 3 - 107
Public sector entities - 302 17 98 - 417
Multilateral development banks - 296 - 2 - 298
International organisations - 1 - 1 - 2
Institutions - 1,364 0 2,340 - 3,704
Corporates - 46,919 96 2,445 - 49,460
Retail - 3 - 1 - 4
Secured by mortgages on immovable property - 542 - - - 542
Exposures in default - 59 - 45 - 103
Items associated with particularly high risk - 1,038 0 62 - 1,101
Covered bonds - - - - - -
Claims on institutions and corporates with a short- term credit assessment
- 1,862 - - - 1,862
Collective investments undertakings - - - - - -
Equity exposures - - - 0 - 0
Other exposures - - - 14 - 14
Total standardised approach as at 31 December 2019 - 68,322 113 7,518 - 75,953

Pillar 3 Disclosures December 2020 47
Table 35: CR1-A – Credit quality of exposures by exposures class and instrument 31 December 2020
Defaulted exposures
Non-defaulted
exposures
Specific credit risk adjustment
General credit risk adjustment
Accumulated write-offs
Credit risk adjustment
charges of the period
Net values
€ million € million € million € million € million € million € million
Standardised approach - - - - - -
Central governments or central banks - 17,722 (6) - - - 17,717
Regional governments or local authorities - 102 (0) - - - 102
Public sector entities - 377 (0) - - - 376
Multilateral development banks - 212 (4) - - - 208
International organisations - 20 (0) - - - 20
Institutions - 4,226 (14) - - - 4,212
Corporates - 48,223 (59) - - - 48,164
Of which: SMEs - 277 (4) - - - 273
Retail - 2 (0) - - - 2
Of which: SMEs - 2 (0) - - - 2
Secured by mortgages on immovable property
- 432 (7) - - - 425
Of which: SMEs - - - - - - -
Exposures in default 106 - 0 - - - 106
Items associated with particularly high risk 438 1,668 (322) - - - 1,783
Covered bonds - - - - - - -
Claims on institutions and corporates with a short- term credit assessment
- 1,703 (1) - - - 1,701
Collective investments undertakings - - - - - - -
Equity exposures - 0 - - - - 0
Other exposures - 33 - - - - 33
Total standardised approach at 31 December 2020
544 74,721 (414) - - - 74,851
Total as at 31 December 2020
Of which: Loans - 17,680 - - - - 17,680
Table 36: CR1-A – Credit quality of exposures by exposures class and instrument 31 December 2019 Gross carrying values of
Defaulted exposures
Non-defaulted exposures
Specific credit risk
adjustment
General credit risk
adjustment
Accumulated write-offs
Credit risk adjustment charges of the period
Net values
€ million € million € million € million € million € million € million
Standardised approach
Central governments or central banks - 18,340 (2) - - - 18,339
Regional governments or local authorities - 107 - - - - 107
Public sector entities 0 417 (0) - - - 417
Multilateral development banks - 298 (0) - - - 298
International organisations - 2 (0) - - - 2
Institutions - 3,705 (1) - - - 3,704
Corporates 103 49,489 (29) - - - 49,564
Of which: SMEs - 461 (1) - - - 460
Retail - 4 (0) - - - 4
Of which: SMEs - 3 (0) - - - 3
Secured by mortgages on immovable property - 542 (0) - - - 542
Of which: SMEs - - - - - - -
Exposures in default - - - - - - -
Items associated with particularly high risk 56 1,080 (35) - - - 1,101
Covered bonds - - - - - - -
Claims on institutions and corporates with a short- term credit assessment
- 1,863 (0) - - - 1,862
Collective investments undertakings - - - - - - -
Equity exposures - 0 - - - - 0
Other exposures - 14 (0) - - - 14
Total as at 31 December 2019 159 75,862 (68) - - - 75,953
Of which: Loans - 15,923 - - - - 15,923

Pillar 3 Disclosures December 2020 48
Table 37: CR1-B – Credit quality of exposures by industry or counterparty types 31 December 2020 The table provide a picture of the credit quality of CHIL’s on-balance-sheet and off-balance sheet exposures by industry or counterparty types.
Gross carrying values of
Defaulted exposures
Non-defaulted exposures
Specific credit risk adjustment
General credit risk adjustment
Accumulated write-offs
Credit risk adjustment
charges
Net values
€ million € million € million € million € million € million € million
Business Administrative Services 251 4,829 (59) - - - 5,021
Credit Instituitions 4 5,572 (12) - - - 5,564
Electricity, Gas, Steam and Air Conditioning Supply 0 4,163 (4) - - - 4,159
Financial Intermediation (Excl. Monetary Financial Institutions)
2 1,909 (9) - - - 1,902
Information and Communication 3 3,452 (15) - - - 3,440
Manufacturing 55 17,030 (45) - - - 17,041
Personal (Private Households) - 1,493 (5) - - - 1,488
Primary Industries - 207 (0) - - - 207
Public Administration and Defence - 3,371 (5) - - - 3,365
Transportation and Storage 12 2,295 (78) - - - 2,229
Wholesale/Retail Trade & Repairs 11 3,701 (0) - - - 3,712
Central Banks - 14,485 (0) - - - 14,485
Other 205 12,215 (181) - - - 12,239
Total as at 31 December 2020 544 74,721 (414) - - - 74,851
Table 38: CR1-B – Credit quality of exposures by industry or counterparty types 31 December 2019
Gross carrying values of
Defaulted exposures
Non-defaulted exposures
Specific credit risk adjustment
General credit risk adjustment
Accumulated write-offs
Credit risk adjustment
charges
Net values
€ million € million € million € million € million € million € million
Business Administrative Services 38 4,244 (6) - - - 4,275
Credit Instituitions - 5,852 (4) - - - 5,848
Electricity, Gas, Steam and Air Conditioning Supply 2 4,618 (2) - - - 4,618
Financial Intermediation (Excl. Monetary Financial Institutions)
0 2,448 (1) - - - 2,447
Information and Communication 3 4,235 (5) - - - 4,233
Manufacturing 58 14,837 (22) - - - 14,873
Personal (Private Households) - 1,452 (3) - - - 1,450
Primary Industries 0 265 (1) - - - 265
Public Administration and Defence - 3,368 (2) - - - 3,367
Transportation and Storage 13 2,597 (8) - - - 2,601
Wholesale/Retail Trade & Repairs 42 3,296 (11) - - - 3,327
Central Banks - 15,071 (0) - - - 15,071
Other 3 13,579 (3) - - - 13,580
Total as at 31 December 2019 159 75,862 (68) - - - 75,953
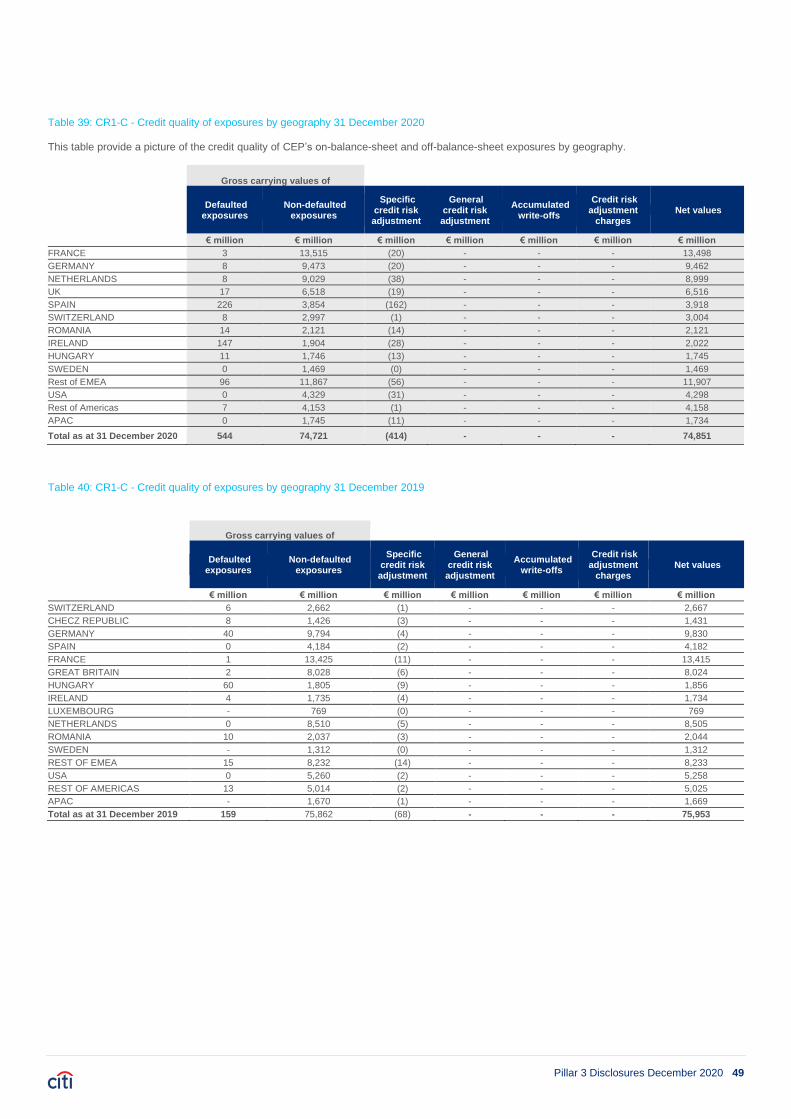
Pillar 3 Disclosures December 2020 49
Table 39: CR1-C - Credit quality of exposures by geography 31 December 2020 This table provide a picture of the credit quality of CEP’s on-balance-sheet and off-balance-sheet exposures by geography.
Gross carrying values of
Defaulted exposures
Non-defaulted exposures
Specific credit risk adjustment
General credit risk adjustment
Accumulated write-offs
Credit risk adjustment
charges Net values
€ million € million € million € million € million € million € million
FRANCE 3 13,515 (20) - - - 13,498
GERMANY 8 9,473 (20) - - - 9,462
NETHERLANDS 8 9,029 (38) - - - 8,999
UK 17 6,518 (19) - - - 6,516
SPAIN 226 3,854 (162) - - - 3,918
SWITZERLAND 8 2,997 (1) - - - 3,004
ROMANIA 14 2,121 (14) - - - 2,121
IRELAND 147 1,904 (28) - - - 2,022
HUNGARY 11 1,746 (13) - - - 1,745
SWEDEN 0 1,469 (0) - - - 1,469
Rest of EMEA 96 11,867 (56) - - - 11,907
USA 0 4,329 (31) - - - 4,298
Rest of Americas 7 4,153 (1) - - - 4,158
APAC 0 1,745 (11) - - - 1,734
Total as at 31 December 2020 544 74,721 (414) - - - 74,851
Table 40: CR1-C - Credit quality of exposures by geography 31 December 2019
Gross carrying values of
Defaulted exposures
Non-defaulted exposures
Specific credit risk adjustment
General credit risk adjustment
Accumulated write-offs
Credit risk adjustment
charges Net values
€ million € million € million € million € million € million € million
SWITZERLAND 6 2,662 (1) - - - 2,667
CHECZ REPUBLIC 8 1,426 (3) - - - 1,431
GERMANY 40 9,794 (4) - - - 9,830
SPAIN 0 4,184 (2) - - - 4,182
FRANCE 1 13,425 (11) - - - 13,415
GREAT BRITAIN 2 8,028 (6) - - - 8,024
HUNGARY 60 1,805 (9) - - - 1,856
IRELAND 4 1,735 (4) - - - 1,734
LUXEMBOURG - 769 (0) - - - 769
NETHERLANDS 0 8,510 (5) - - - 8,505
ROMANIA 10 2,037 (3) - - - 2,044
SWEDEN - 1,312 (0) - - - 1,312
REST OF EMEA 15 8,232 (14) - - - 8,233
USA 0 5,260 (2) - - - 5,258
REST OF AMERICAS 13 5,014 (2) - - - 5,025
APAC - 1,670 (1) - - - 1,669
Total as at 31 December 2019 159 75,862 (68) - - - 75,953

Pillar 3 Disclosures December 2020 50
In accordance with the EBA/GL/2018/10 requirements, the following tables disclose additional information on non-performing and forborne exposures (NPEs & FBEs).
Table 41: Credit quality of forborne exposures 31 December 2020
Gross carrying amount/nominal amount of exposures with forbearance measures
Accumulated impairment, accumulated negative
changes in fair value due to credit risk and
provisions
Collateral received and financial guarantees received on forborne
exposures
Performing forborne
Non-performing forborne
On performing
forborne exposures
On non-performing
forborne exposures
Of which collateral and financial guarantees
received on non-performing
exposures with forbearance measures
Of which defaulted
Of which impaired
€ million € million € million € million € million € million € million € million
Loans and advances 161 89 89 89 (35) (14) 5 1
Central banks - - - - - - - -
General governments - - - - - - - -
Credit institutions - - - - - - - -
Other financial corporations - - - - - - - -
Non-financial corporations 161 89 89 89 (35) (14) 5 1
Households - - - - - - - -
Debt Securities - - - - - - - -
Loan commitments given 68 18 18 18 (3) (1) - -
Total as at 31 December 2020 229 107 107 107 (38) (16) 5 1
Table 42: Credit quality of forborne exposures 31 December 2019
Gross carrying amount/nominal amount of exposures with forbearance measures
Accumulated impairment, accumulated negative
changes in fair value due to credit risk and
provisions
Collateral received and financial guarantees received on forborne
exposures
Performing forborne
Non-performing forborne
On performing
forborne exposures
On non-performing
forborne exposures
Of which collateral
and financial guarantees received on non-performing
exposures with forbearance measures
Of which defaulted
Of which impaired
€ million € million € million € million € million € million € million € million
Loans and advances 26 18 18 18 (1) (4) 24 11
Central banks - - - - - - - -
General governments - - - - - - - -
Credit institutions - - - - - - - -
Other financial corporations - - - - - - - -
Non-financial corporations 26 18 18 18 (1) (4) 24 11
Households - - - - - - - -
Debt Securities - - - - - - - -
Loan commitments given 0 14 14 14 (0) (2) - -
Total as at 31 December 2019 26 33 33 33 (1) (5) 24 11
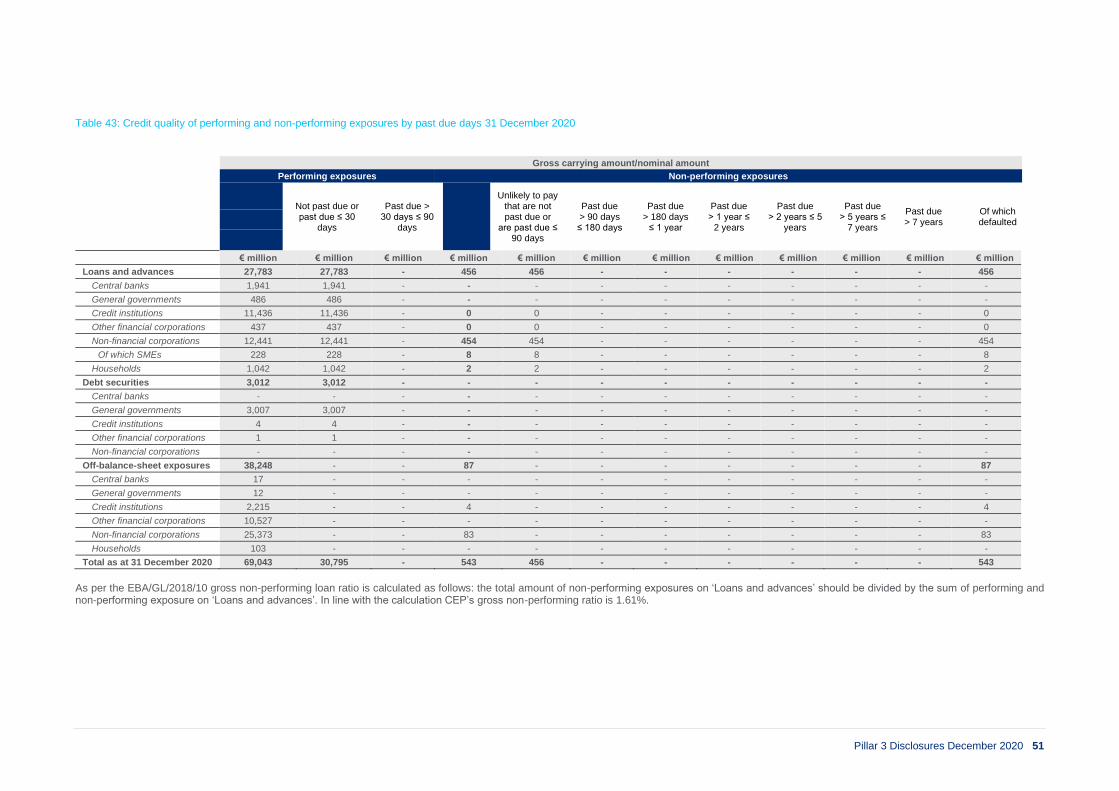
Pillar 3 Disclosures December 2020 51
Table 43: Credit quality of performing and non-performing exposures by past due days 31 December 2020
Gross carrying amount/nominal amount
Performing exposures Non-performing exposures
Not past due or past due ≤ 30
days
Past due > 30 days ≤ 90
days
Unlikely to pay that are not past due or
are past due ≤ 90 days
Past due > 90 days ≤ 180 days
Past due > 180 days
≤ 1 year
Past due > 1 year ≤
2 years
Past due > 2 years ≤ 5
years
Past due > 5 years ≤
7 years
Past due > 7 years
Of which defaulted
€ million € million € million € million € million € million € million € million € million € million € million € million
Loans and advances 27,783 27,783 - 456 456 - - - - - - 456
Central banks 1,941 1,941 - - - - - - - - - -
General governments 486 486 - - - - - - - - - -
Credit institutions 11,436 11,436 - 0 0 - - - - - - 0
Other financial corporations 437 437 - 0 0 - - - - - - 0
Non-financial corporations 12,441 12,441 - 454 454 - - - - - - 454
Of which SMEs 228 228 - 8 8 - - - - - - 8
Households 1,042 1,042 - 2 2 - - - - - - 2
Debt securities 3,012 3,012 - - - - - - - - - -
Central banks - - - - - - - - - - - -
General governments 3,007 3,007 - - - - - - - - - -
Credit institutions 4 4 - - - - - - - - - -
Other financial corporations 1 1 - - - - - - - - - -
Non-financial corporations - - - - - - - - - - - -
Off-balance-sheet exposures 38,248 - - 87 - - - - - - - 87
Central banks 17 - - - - - - - - - - -
General governments 12 - - - - - - - - - - -
Credit institutions 2,215 - - 4 - - - - - - - 4
Other financial corporations 10,527 - - - - - - - - - - -
Non-financial corporations 25,373 - - 83 - - - - - - - 83
Households 103 - - - - - - - - - - -
Total as at 31 December 2020 69,043 30,795 - 543 456 - - - - - - 543
As per the EBA/GL/2018/10 gross non-performing loan ratio is calculated as follows: the total amount of non-performing exposures on ‘Loans and advances’ should be divided by the sum of performing and non-performing exposure on ‘Loans and advances’. In line with the calculation CEP’s gross non-performing ratio is 1.61%.

Pillar 3 Disclosures December 2020 52
Table 44: Credit quality of performing and non-performing exposures by past due days 31 December 2019
Gross carrying amount/nominal amount
Performing exposures Non-performing exposures
Not past due or past due ≤
30 days
Past due > 30 days ≤ 90 days
Unlikely to pay that are not past due or are past
due ≤ 90 days
Past due > 90 days ≤ 180 days
Past due > 180 days
≤ 1 year
Past due > 1 year ≤ 2
years
Past due > 2 years ≤
5 years
Past due > 5 years ≤
7 years
Past due > 7 years
Of which defaulted
€ million € million € million € million € million € million € million € million € million € million € million € million
Loans and advances 27,574 27,574 - 115 111 - - - 3 - - 115
Central banks 2,535 2,535 - - - - - - - - - -
General governments 319 319 - - - - - - - - - -
Credit institutions 9,771 9,771 - - - - - - - - - -
Other financial corporations 724 724 - - - - - - - - - -
Non-financial corporations 13,129 13,129 - 111 111 - - - - - - 111
Of which SMEs 344 344 - 20 20 - - - - - - 20
Households 1,096 1,096 - 3 - - - - 3 - - 3
Debt securities 3,313 3,313 - - - - - - - - - -
Central banks - - - - - - - - - - - -
General governments 2,905 2,905 - - - - - - - - - -
Credit institutions 398 398 - - - - - - - - - -
Other financial corporations 11 11 - - - - - - - - - -
Non-financial corporations - - - - - - - - - - - -
Off-balance-sheet exposures 37,355 - - 43 - - - - - - - 43
Central banks 14 - - - - - - - - - - -
General governments 152 - - - - - - - - - - -
Credit institutions 1,698 - - - - - - - - - - -
Other financial corporations 11,336 - - - - - - - - - - -
Non-financial corporations 24,072 - - 43 - - - - - - - 43
Households 83 - - - -
Total as at 31 December 2019 68,242 30,887 - 158 111 - - - 3 - - 158
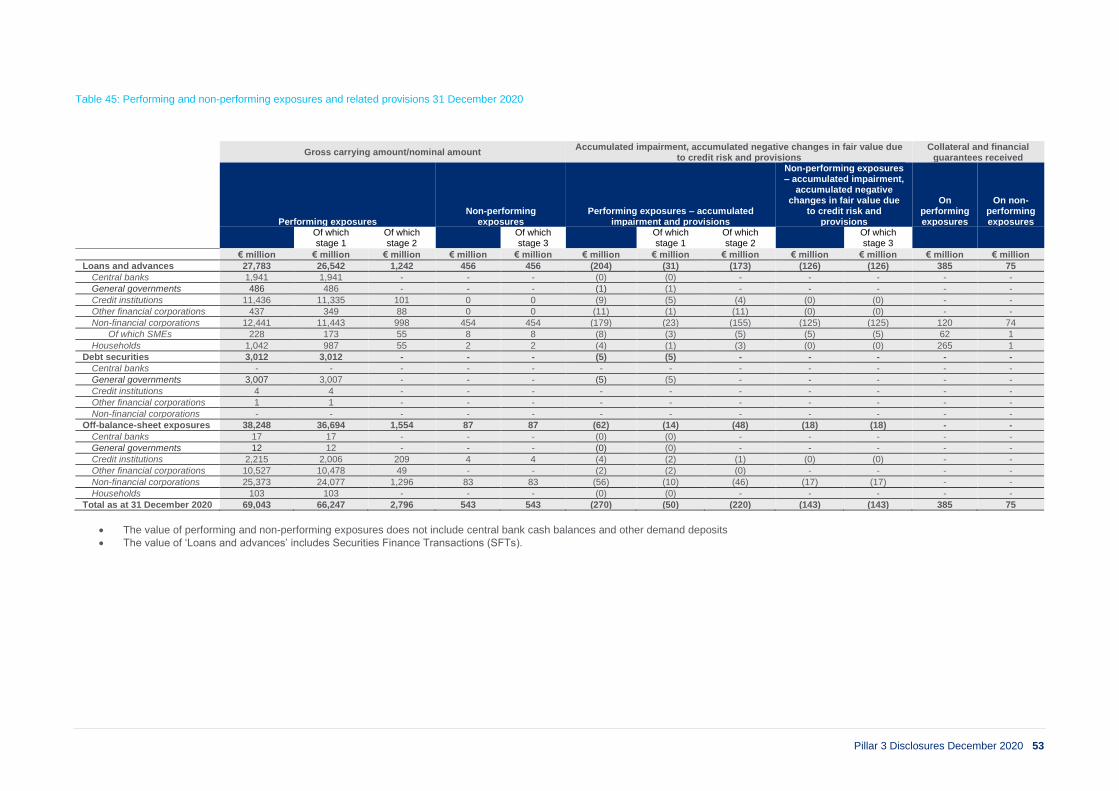
Pillar 3 Disclosures December 2020 53
Table 45: Performing and non-performing exposures and related provisions 31 December 2020
Gross carrying amount/nominal amount Accumulated impairment, accumulated negative changes in fair value due
to credit risk and provisions Collateral and financial
guarantees received
Performing exposures Non-performing
exposures Performing exposures – accumulated
impairment and provisions
Non-performing exposures – accumulated impairment,
accumulated negative changes in fair value due
to credit risk and provisions
On performing exposures
On non-performing exposures
Of which stage 1
Of which stage 2
Of which stage 3
Of which stage 1
Of which stage 2
Of which stage 3
€ million € million € million € million € million € million € million € million € million € million € million € million
Loans and advances 27,783 26,542 1,242 456 456 (204) (31) (173) (126) (126) 385 75
Central banks 1,941 1,941 - - - (0) (0) - - - - -
General governments 486 486 - - - (1) (1) - - - - -
Credit institutions 11,436 11,335 101 0 0 (9) (5) (4) (0) (0) - -
Other financial corporations 437 349 88 0 0 (11) (1) (11) (0) (0) - -
Non-financial corporations 12,441 11,443 998 454 454 (179) (23) (155) (125) (125) 120 74
Of which SMEs 228 173 55 8 8 (8) (3) (5) (5) (5) 62 1
Households 1,042 987 55 2 2 (4) (1) (3) (0) (0) 265 1
Debt securities 3,012 3,012 - - - (5) (5) - - - - -
Central banks - - - - - - - - - - - -
General governments 3,007 3,007 - - - (5) (5) - - - - -
Credit institutions 4 4 - - - - - - - - - -
Other financial corporations 1 1 - - - - - - - - - -
Non-financial corporations - - - - - - - - - - - -
Off-balance-sheet exposures 38,248 36,694 1,554 87 87 (62) (14) (48) (18) (18) - -
Central banks 17 17 - - - (0) (0) - - - - -
General governments 12 12 - - - (0) (0) - - - - -
Credit institutions 2,215 2,006 209 4 4 (4) (2) (1) (0) (0) - -
Other financial corporations 10,527 10,478 49 - - (2) (2) (0) - - - -
Non-financial corporations 25,373 24,077 1,296 83 83 (56) (10) (46) (17) (17) - -
Households 103 103 - - - (0) (0) - - - - -
Total as at 31 December 2020 69,043 66,247 2,796 543 543 (270) (50) (220) (143) (143) 385 75
• The value of performing and non-performing exposures does not include central bank cash balances and other demand deposits
• The value of ‘Loans and advances’ includes Securities Finance Transactions (SFTs).

Pillar 3 Disclosures December 2020 54
Table 46: Performing and non-performing exposures and related provisions 30 December 2019
Gross carrying amount/nominal amount Accumulated impairment, accumulated negative changes in fair value
due to credit risk and provisions Collateral and financial
guarantees received
Performing exposures Non-performing exposures Performing exposures – accumulated
impairment and provisions
Non-performing exposures – accumulated impairment,
accumulated negative changes in fair value due
to credit risk and provisions
On performing exposures
On non-performing exposures
Of which stage 1
Of which stage 2
Of which stage 3
Of which stage 1
Of which stage 2
Of which stage 3
€ million € million € million € million € million € million € million € million € million € million € million € million
Loans and advances 27,574 26,896 678 115 115 (29) (12) (17) (9) (9) 1,029 15
Central banks 2,535 2,535 - - - (0) (0) - - - - -
General governments 319 319 0 - - (0) (0) (0) - - - -
Credit institutions 9,771 9,740 31 - - (2) (2) (0) - - 0 -
Other financial corporations 724 724 0 - - (1) (1) (0) - - - -
Non-financial corporations 13,129 12,531 598 111 111 (24) (8) (16) (9) (9) 1,029 15
Of which SMEs 344 344 - 20 20 (1) (1) - (6) (6) 231 10
Households 1,096 1,047 49 3 3 (1) (1) (0) (1) (1) 0 -
Debt securities 3,313 3,313 - - - (2) (2) - - - - -
Central banks - - - - - - - - - - - -
General governments 2,905 2,905 - - - (1) (1) - - - - -
Credit institutions 398 398 - - - (0) (0) - - - - -
Other financial corporations 11 11 - - - - - - - - - -
Non-financial corporations - - - - - - - - - - - -
Off-balance-sheet exposures 37,355 36,073 1,281 43 43 (26) (8) (18) (2) (2) - -
Central banks 14 9 5 - - (0) (0) (0) - - - -
General governments 152 152 - - - (0) (0) - - - - -
Credit institutions 1,698 1,424 274 - - (2) (0) (2) - - - -
Other financial corporations 11,336 11,329 7 - - (2) (1) (0) - - - -
Non-financial corporations 24,072 23,076 996 43 43 (23) (6) (17) (2) (2) - -
Households 83 83 - - - (0) (0) - - - - -
Total as at 31 December 2019 68,242 66,282 1,960 158 158 (57) (22) (35) (12) (12) 1,029 15

Pillar 3 Disclosures December 2020 55
Table 47: CR2-A – Changes in the stock of general and specific credit risk adjustments 2020
Accumulated specific credit risk adjustment
Accumulated general credit risk adjustment
€ million € million
Opening balance 01 January 2020 62 0
Increases due to amounts set aside for estimated loan losses during the period 368 -
Decreases due to amounts reversed for estimated loan losses during the period (16) -
Decreases due to amounts taken against accumulated credit risk adjustments (1) -
Transfers between credit risk adjustments - -
Impact of exchange rate differences - -
Business combinations, including acquisitions and disposals of subsidiaries - -
Other adjustments (0.09) -
Closing balance 31 December 2020 414 0
Recoveries on credit risk adjustments recorded directly to the statement of profit or loss 3 -
Specific credit risk adjustments directly recorded to the statement of profit or loss (51) -
Table 48: CR2-B – Changes in the stock of defaulted and impaired loans and debt securities 2020
Gross carrying value defaulted
exposures
€ million
Opening balance 01 January 2020 115
Loans and debt securities that have defaulted or impaired since the last reporting period 427
Returned to non-defaulted status (59)
Amounts written off (44)
Other changes 17
Closing balance 31 December 2020 456
Credit Risk Mitigation (CRM)
Table 49: CR3 - CRM techniques – Overview 31 December 2020 The table below shows the extent of the use of CRM techniques used in total credit risk exposures.
Exposures unsecured –
Carrying amount
Exposures secured – Carrying
amount
Exposures secured by collateral
Exposures secured by financial guarantees
Exposures secured by credit derivatives
€ million € million € million € million € million
Total loans 17,680 845 194 652 -
Total debt securities 0 - - - -
Total exposures as at 31 December 2020
17,680 845 194 652 0
Of which defaulted 443 0 0 - -
Table 50: CR3 - CRM techniques – Overview 31 December 2019
Exposures unsecured – Carrying amount
Exposures to be secured
Exposures secured by collateral
Exposures secured by financial guarantees
Exposures secured by credit derivatives
€ million € million € million € million € million
Total loans 15,923 938 54 884 -
Total debt securities - - - - -
Total Other - - - - -
Total exposures as at 31 December 2019 15,923 938 54 884 -
Of which defaulted - - - - -
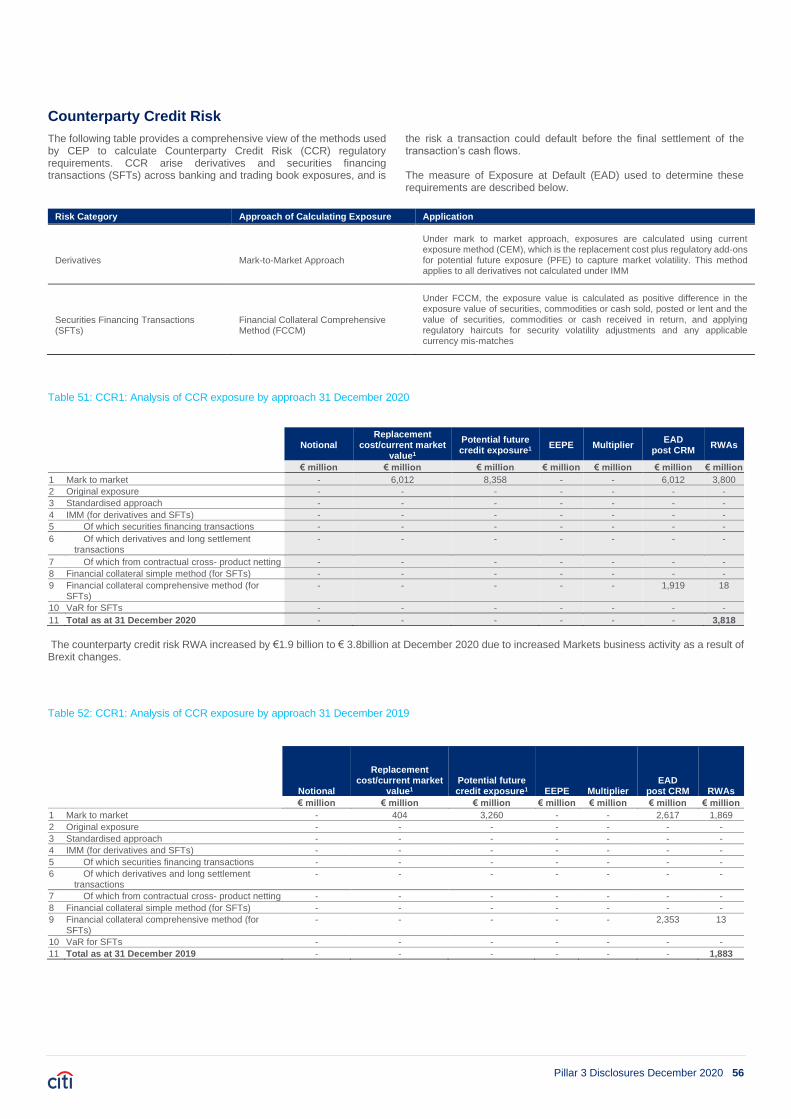
Pillar 3 Disclosures December 2020 56
Counterparty Credit Risk
The following table provides a comprehensive view of the methods used by CEP to calculate Counterparty Credit Risk (CCR) regulatory requirements. CCR arise derivatives and securities financing transactions (SFTs) across banking and trading book exposures, and is
the risk a transaction could default before the final settlement of the transaction’s cash flows. The measure of Exposure at Default (EAD) used to determine these requirements are described below.
Risk Category Approach of Calculating Exposure Application
Derivatives Mark-to-Market Approach
Under mark to market approach, exposures are calculated using current exposure method (CEM), which is the replacement cost plus regulatory add-ons for potential future exposure (PFE) to capture market volatility. This method applies to all derivatives not calculated under IMM
Securities Financing Transactions (SFTs)
Financial Collateral Comprehensive Method (FCCM)
Under FCCM, the exposure value is calculated as positive difference in the exposure value of securities, commodities or cash sold, posted or lent and the value of securities, commodities or cash received in return, and applying regulatory haircuts for security volatility adjustments and any applicable currency mis-matches
Table 51: CCR1: Analysis of CCR exposure by approach 31 December 2020
Notional Replacement
cost/current market value1
Potential future credit exposure1
EEPE Multiplier EAD
post CRM RWAs
€ million € million € million € million € million € million € million
1 Mark to market - 6,012 8,358 - - 6,012 3,800
2 Original exposure - - - - - - -
3 Standardised approach - - - - - - -
4 IMM (for derivatives and SFTs) - - - - - - -
5 Of which securities financing transactions - - - - - - -
6 Of which derivatives and long settlement transactions
- - - - - - -
7 Of which from contractual cross- product netting - - - - - - -
8 Financial collateral simple method (for SFTs) - - - - - - -
9 Financial collateral comprehensive method (for SFTs)
- - - - - 1,919 18
10 VaR for SFTs - - - - - - -
11 Total as at 31 December 2020 - - - - - - 3,818
The counterparty credit risk RWA increased by €1.9 billion to € 3.8billion at December 2020 due to increased Markets business activity as a result of Brexit changes.
Table 52: CCR1: Analysis of CCR exposure by approach 31 December 2019
Notional
Replacement cost/current market
value1 Potential future credit exposure1 EEPE Multiplier
EAD post CRM RWAs
€ million € million € million € million € million € million € million
1 Mark to market - 404 3,260 - - 2,617 1,869
2 Original exposure - - - - - - -
3 Standardised approach - - - - - - -
4 IMM (for derivatives and SFTs) - - - - - - -
5 Of which securities financing transactions - - - - - - -
6 Of which derivatives and long settlement transactions
- - - - - - -
7 Of which from contractual cross- product netting - - - - - - -
8 Financial collateral simple method (for SFTs) - - - - - - -
9 Financial collateral comprehensive method (for SFTs)
- - - - - 2,353 13
10 VaR for SFTs - - - - - - -
11 Total as at 31 December 2019 - - - - - - 1,883

Pillar 3 Disclosures December 2020 57
Table 53: CCR2 - Credit valuation adjustment (CVA) capital charge The table below provides the regulatory calculations for CVA under the standardised method approaches. 31 December 2020 31 December 2019
Exposure value RWAs Exposure value RWAs
€ million € million € million € million
Total portfolios subject to the advanced method - - - -
(i) VaR component (including the 3× multiplier) - - - -
(ii) SVaR component (including the 3× multiplier) - - - -
All portfolios subject to the standardised method 1,793 926 666 701
Total subject to the CVA capital charge 1,793 926 666 701
Table 54: CCR8 - Exposures to CCPs 31 December 2020 The following table provides a comprehensive picture of the institution’s exposures to CCPs. In particular, the template includes all types of exposures (due to operations, margins, and contributions to default funds) and related capital requirements.
As at 31 December 2020 As at 31 December 2019 EAD post CRM RWAs EAD post CRM RWAs € million € million € million € million
Exposures to QCCPs (total) - - - -
Exposures for trades at QCCPs (excluding initial margin and default fund contributions); of which
- - - -
(i) OTC derivatives - - - -
(ii) Exchange-traded derivatives - - - -
(iii) SFTs - - - -
(iv) Netting sets where cross-product netting has been approved
- - - -
Segregated initial margin - - - -
Non-segregated initial margin 169 18 30 -
Prefunded default fund contributions 18 23 2 1
Alternative calculation of own funds requirements for exposures - - - -
Exposures to non-QCCPs (total) - - - -
Exposures for trades at non-QCCPs (excluding initial margin and default fund contributions); of which
- - - -
(i) OTC derivatives - - - -
(ii) Exchange-traded derivatives - - - -
(iii) SFTs - - - -
(iv) Netting sets where cross-product netting has been approved - - - -
Segregated initial margin - - - -
Non-segregated initial margin - - - -
Prefunded default fund contributions - - - -
Unfunded default fund contributions - - - -
*Comprises initial and variation margin posted in relation to client clearing.

Pillar 3 Disclosures December 2020 58
Table 55: CCR3: Standardised approach – CCR exposures by regulatory portfolio and risk 31 December 2020 The table below provides a breakdown of Counterparty Credit Risk exposures and risk-weighted by portfolio (type of counterparties) and by risk weight (riskiness attributed according to the standardised approach)
Risk weight
0% 2% 4% 20% 50% 100% 150% Others Total Of which: unrated
€ million € million € million € million € million € million € million € million € million € million
Central governments or central banks 2,003 - - - 37 3 - - 2,043 -
Regional government or local authorities - - - - - - - - - -
Public sector entities - - - 616 35 - - - 651 0
Multilateral development banks 57 - - - - - - - 57 -
International organisations - - - - - - - - - -
Institutions - 85 - 330 2,416 34 - - 2,865 282
Corporates - - - 93 177 2,075 2 - 2,346 1,377
Retail - - - - - - - - - 0
Institutions and corporates with a short-term credit assessment
- - - 2 10 22 9 - 43 -
Other items - - - - - 10 86 - 96 3
Claims in the form of CIU - - - - - - - - - -
Total as at 31 December 2020 2,059 85 - 1,040 2,675 2,144 97 - 8,100 3,664
Table 56: CCR3: Standardised approach – CCR exposures by regulatory portfolio and risk 31 December 2019
Risk weight
0% 2% 4% 20% 50% 100% 150% Others Total Of which: unrated
€ million
€ million
€ million
€ million
€ million
€ million € million
€ million € million € million
Central governments or central banks 2,330 - - 4 38 - - - 2,372
Regional government or local authorities - - - - - - - - - -
Public sector entities - - - 179 - - - - 179 12
Multilateral development banks - - - - - - - - 1 -
International organisations - - - - - - - - - -
Institutions - 30 - 7 938 5 0 - 979 106
Corporates - - - 79 66 1,184 2 - 1,331 948
Retail - - - - - - - 0 0 0
Institutions and corporates with a short-term credit assessment
- - - 1 8 44 1 - 53 -
Other items - - - - - 33 22 - 55 41
Claims in the form of CIU -
Total as at 31 December 2019 2,330 30 - 270 1,050 1,267 25 0 4,971 3,435
Table 57: CCR5-A - Impact of netting and collateral held on exposure values 31 December 2020 The following table provides an overview of the impact of netting and collateral held on exposures for SFT and derivatives, including exposures arising from transactions cleared through a CCP.
Gross positive fair
value or net carrying amount
Netting benefits Netted current credit
exposure Collateral held Net credit exposure
€ million € million € million € million € million
Derivatives 7,322 - 7,322 1,122 6,180
SFTs 11,913 - 11,913 9,994 1,919
Non-eligible collateral under the CRR - - - - -
Total as at 31 December 2020 19,235 - 19,235 11,116 8,100
Table 58: CCR5-A - Impact of netting and collateral held on exposure values 31 December 2019 Gross positive fair
value or net carrying amount
Netting benefits Netted current credit
exposure Collateral held Net credit exposure
€ million € million € million € million € million
Derivatives 3,022 - 3,022 404 2,617
SFTs 2,353 - 2,353 - 2,353
Non-eligible collateral under the CRR - - - - -
Total as at 31 December 2019 5,375 - 5,375 404 4,971
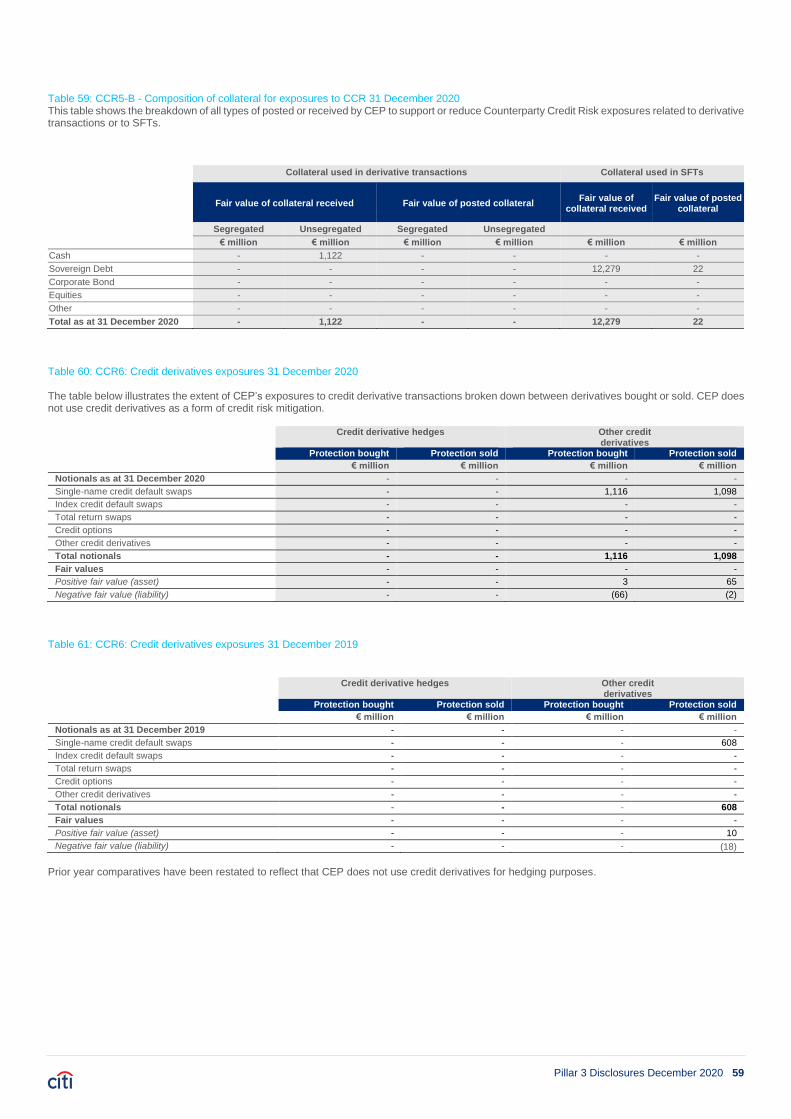
Pillar 3 Disclosures December 2020 59
Table 59: CCR5-B - Composition of collateral for exposures to CCR 31 December 2020 This table shows the breakdown of all types of posted or received by CEP to support or reduce Counterparty Credit Risk exposures related to derivative transactions or to SFTs. Collateral used in derivative transactions Collateral used in SFTs
Fair value of collateral received Fair value of posted collateral Fair value of
collateral received Fair value of posted
collateral
Segregated Unsegregated Segregated Unsegregated
€ million € million € million € million € million € million
Cash - 1,122 - - - -
Sovereign Debt - - - - 12,279 22
Corporate Bond - - - - - -
Equities - - - - - -
Other - - - - - -
Total as at 31 December 2020 - 1,122 - - 12,279 22
Table 60: CCR6: Credit derivatives exposures 31 December 2020 The table below illustrates the extent of CEP’s exposures to credit derivative transactions broken down between derivatives bought or sold. CEP does not use credit derivatives as a form of credit risk mitigation.
Credit derivative hedges Other credit derivatives
Protection bought Protection sold Protection bought Protection sold
€ million € million € million € million
Notionals as at 31 December 2020 - - - -
Single-name credit default swaps - - 1,116 1,098
Index credit default swaps - - - -
Total return swaps - - - -
Credit options - - - -
Other credit derivatives - - - -
Total notionals - - 1,116 1,098
Fair values - - - -
Positive fair value (asset) - - 3 65
Negative fair value (liability) - - (66) (2)
Table 61: CCR6: Credit derivatives exposures 31 December 2019
Credit derivative hedges Other credit
derivatives Protection bought Protection sold Protection bought Protection sold
€ million € million € million € million
Notionals as at 31 December 2019 - - - -
Single-name credit default swaps - - - 608
Index credit default swaps - - - -
Total return swaps - - - -
Credit options - - - -
Other credit derivatives - - - -
Total notionals - - - 608
Fair values - - - -
Positive fair value (asset) - - - 10
Negative fair value (liability) - - - (18)
Prior year comparatives have been restated to reflect that CEP does not use credit derivatives for hedging purposes.

Pillar 3 Disclosures December 2020 60
Credit Risk Profile and CRM in the Standardised Approach
Credit Quality Analysis
Standardised credit risk exposures
The nominated External Credit Assessment Institutions (ECAIs) used by CEP are Standard & Poor’s, Moody’s and Fitch. These are used for all credit risk exposure classes. Credit assessments applied to items in the trading book and banking book alike, are assigned in accordance with the requirements laid out in the CRD, including the use of the credit quality assessment scale. The credit quality assessment scale assigns a
credit quality step to each rating provided by the ECAIs, as set out in the Table 60 below. Risk weightings are assigned to each exposure depending on its credit quality step and other factors, including exposure class and maturity. Exposures for which no rating is available receive the rating of the central government where the entity is incorporated or 100% if the central government is unrated. Table 61 below sets out a simplified summary of how credit quality is linked to risk weighting.
Table 62: Credit Quality Assessment Scale
Credit Quality Step Standard & Poor’s Moody’s Fitch
Step 1 AAA to AA- Aaa to Aa3 AAA to AA-
Step 2 A+ to A- A1 to A3 A+ to A-
Step 3 BBB+ to BBB- Baa1 to Baa3 BBB+ to BBB-
Step 4 BB+ to BB- Ba1 to Ba3 BB+ to BB-
Step 5 B+ to B- B1 to B3 B+ to B-
Step 6 CCC+ and below Caa1 and below CCC+ and below
Table 63: Simplified Summary of Risk Weightings by Credit Quality Step
Credit Quality Step Governments and central
banks Corporates Institutions < 3 months maturity
Institutions > 3 months maturity
Step 1 0% 20% 20% 20%
Step 2 20% 50% 20% 50%
Step 3 50% 100% 20% 50%
Step 4 100% 100% 50% 100%
Step 5 100% 150% 50% 100%
Step 6 150% 150% 150% 150%

Pillar 3 Disclosures December 2020 61
The below tables detail CEP’s credit risk profile focusing on on-balance sheet and off-balance sheet credit risk exposures and credit risk mitigation effects. As of 31 December 2020 CHIL’s and CEP’s total on-balance sheet and off-balance sheet exposures were €74.85 billion and €74.76 billion respectively.
Table 64: CR4 - Standardised approach – Credit risk exposure and CRM effects 31 December 2020 The below table shows the effect of CCF and CRM techniques applied on total on-balance sheet and off-balance sheet credit risk exposures, across exposure classes. RWA density is expressed as total risk weighted exposures divided by exposures post-CCF and post-CRM.
Exposures before CCF and CRM Exposures post CCF and CRM RWAs and RWA density On-balance-sheet
amount Off-balance-sheet
amount On-balance-sheet
amount Off-balance-sheet
amount RWAs
RWA density
€ million € million € million € million € million € million
Exposure classes Central governments or central banks 17,693 24 18,137 84 60 0.33%
Regional government or local authorities 102 - 102 - 0 0.31%
Public sector entities 240 137 226 68 116 39.41%
Multilateral development banks 167 41 167 33 60 30.11%
International organisations 20 - 20 - - 0.00%
Institutions 2,921 1,291 2,880 974 1,798 46.65%
Corporates 12,997 35,167 12,441 15,731 25,161 89.31%
Retail 1 1 1 0 1 75.00%
Secured by mortgages on immovable property 358 67 358 33 391 100.00%
Exposures in default 97 9 97 5 153 150.00%
Exposures associated with particularly high risk 967 816 938 553 2,237 150.00%
Covered bonds - - - - - -
Institutions and corporates with a short-term credit assessment
998 703 996 370 1,226 89.67%
Collective investment undertakings - - - - - -
Equity 0.0136 - 0.0136 - 0.0136 100.00%
Other exposures 33 - 33 - 28 86.56%
Total as at December 31, 2020 36,595 38,256 36,398 17,852 31,231 57.57%
Table 65: CR4 - Standardised approach – Credit risk exposure and CRM effects 31 December 2019 Exposures before CCF and CRM Exposures post CCF and CRM RWAs and RWA density On-balance-sheet
amount Off-balance-sheet
amount On-balance-sheet
amount Off-balance-sheet
amount RWAs
RWA density
€ million € million € million € million € million € million
Exposure classes
Central governments or central banks 18,317 21 18,964 84 185 0.97%
Regional government or local authorities 107 - 107 - 1 0.49%
Public sector entities 286 131 265 66 74 22.51%
Multilateral development banks 274 24 274 12 86 29.92%
International organisations 1 1 1 1 - 0.00%
Institutions 2,782 922 2,782 630 1,414 41.45%
Corporates 14,460 35,000 13,810 16,041 26,291 88.07%
Retail 3 1 3 0 3 75.00%
Secured by mortgages on immovable property
406 136 406 68 474 99.99%
Exposures in default 108 40 108 30 206 149.66%
Higher-risk categories 560 496 526 411 1,406 150.02%
Covered bonds - - - - - 0.00%
Institutions and corporates with a short-term credit assessment
1,281 582 1,280 309 1,439 90.55%
Collective investment undertakings - - - - - 0.00%
Equity 0 - 0 - 0 100.00%
Other items 14 - 14 - 8 59.89%
Total as at 31 December 2019 38,599 37,354 38,540 17,652 31,586 56.21%

Pillar 3 Disclosures December 2020 62
Table 66: CR5 - Standardised approach - Risk Weighted 31 December 2020 This table provides the breakdown of exposures under the standardised approach by asset class and risk weight.
0% 2% 20% 35% 50% 75% 100% 150% Total Of
which: unrated
€
million €
million €
million €
million €
million €
million €
million €
million €
million €
million
Exposure classes
Central governments or central banks 18,114 - 16 - 69 - 22 - 18,221 -
Regional government or local authorities 101 - 2 - - - - - 102 101
Public sector entities 0 - 120 - 164 - 10 - 294 2
Multilateral development banks 140 - - - - - 60 - 200 64
International organisations 20 - - - - - - - 20 20
Institutions - 504 543 - 2,267 - 530 11 3,854 1
Corporates - - 1,110 - 4,547 - 22,217 299 28,172 16,195
Retail - - - - - 2 - - 2 2
Secured by mortgages on immovable property - - - 0 - - 391 - 391 0
Exposures in default - - - - - - - 102 102 102
Exposures associated with particularly high risk - - - - - - - 1,491 1,491 1,035
Covered bonds - - - - - - - - - -
Institutions and corporates with a short-term credit assessment
- - 145 - 377 - 518 327 1,367 -
Collective investment undertakings - - - - - - - - - -
Equity - - - - - - 0 - 0 -
Other items 0 - 5 - - - 27 - 33 24
Total as at 31 December 2020 18,375 504 1,941 0 7,423 2 23,776 2,229 54,250 17,545
Table 67: CR5 - Standardised approach - Risk Weighted 31 December 2019
Risk weight
0% 2% 20% 35% 50% 75% 100% 150% Others Total Of
which unrated
€ million
€ million
€ million
€ million
€ million
€ million
€ million
€ million
€ million
€ million
€ million
Exposure classes
Central governments or central banks 18,648 - 20 - 128 - 72 - 179 19,048 15,364
Regional government or local authorities 105 - 3 - - - - - - 107 107
Public sector entities - - 320 - 1 - 10 - - 331 99
Multilateral development banks 200 - - - - - 86 - - 286 86
International organisations 2 - - - - - - - - 2 1
Institutions - 294 951 - 1,897 - 269 0 - 3,411 511
Corporates - - 1,895 - 4,340 - 23,368 250 - 29,852 18,451
Retail - - - - - 4 - - - 4 4
Secured by mortgages on immovable property
- - - 0 - - 474 - - 474 474
Exposures in default - - - - - - 0 137 - 138 129
Higher-risk categories - - - - - - - 937 - 937 497
Covered bonds - - - - - - - - - - -
Institutions and corporates with a short-term credit assessment
- - 67 - 624 - 468 431 - 1,590 - 0
Collective investment undertakings - - - - - - - - - - -
Equity - - - - - - 0 - - 0 0
Other items 2 - 5 - - - 7 - - 14 14
Total 18,957 294 3,259 0 6,990 4 24,755 1,754 179 56,192 35,735

Pillar 3 Disclosures December 2020 63
Market Risk Market risk assesses the risk of losses to positions or a portfolio from market movements. Market volatility may be driven by one or more of: market price, rates, indices, correlations or implied volatilities.
CEP uses the standardised approach to calculate regulatory capital requirements for market risk
Risk Category Description
Interest rate risk (general and specific) Risk arising from fluctuations in the level of interest rates due to monetary policies and impacts prices of interest rate sensitivities assets
Equity risk (general and specific) Risk arising from fluctuations in equity prices, volatilities and dividend yields
Foreign exchange risk Risk arising from fluctuations in foreign exchange rates and impacts transactions denominated in a currency other than the domestic currency of CEP
Commodity risk Risk arising from fluctuations in the prices of commodities
Table 68: MR1 - Market risk under the standardised approach 31 December 2020 and 2019 The table displays CEP’s components of own funds requirements under the standardised approach for market risk. The RWA of Foreign exchange risk was €301 million as at 31 December 2020.
31 December 2020 31 December 2019
RWAs Capital requirements RWAs Capital requirements € million € million € million € million
Outright products
Interest rate risk (general and specific) 1,868 149 1,130 90
Equity risk (general and specific) - - - -
Foreign exchange risk 301 24 302 24
Commodity risk - - - -
Options
Simplified approach - - - -
Delta-plus method - - - -
Scenario approach - - - -
Securitisation (specific risk) - - - -
Total 2,169 174 1,432 114

Pillar 3 Disclosures December 2020 64
COVID-19 Disclosures
The Covid-19 pandemic has had a significant impact on the economy and global regulators have responded with a range of measures to support firms through this period. Regulatory updates are still evolving and they vary by jurisdiction. They cover many topics including reductions in countercyclical capital buffers, the payment of dividends, the use of capital buffers and amendments to the CRR. These measures are intended to help firms to mitigate the economic impacts of the pandemic on their businesses and to allow them to continue to lend to the wider economy. In June 2020, the EBA released its Guidelines on reporting and disclosure of exposures subject to measures applied in response to the COVID-19 pandemic (EBA/GL/2020/07). The following tables aim to disclose information on exposures subject to the EBA Guidelines
on legislative and non‐ legislative moratoria on loan repayments
applied in the light of the COVID‐ 19 crisis and on newly
originated exposures subject to public guarantee scheme. The number of clients and the size of the exposure part of loan moratoria have been limited, with vast majority being part of legislated moratoria currently in place in Hungary and the Czech Republic and to smaller extent in Romania and Slovakia. Most of the companies under the loan moratoria in the referenced countries are small and medium sized companies and Commercial Bank clients. While the amount of exposure subject to moratoria is fluid, and can change at any time, at the date of publication less than €100mm of principal and interest repayments have been deferred. The following disclosure templates provide additional details on loan moratoria.
Table 69: Information on newly originated loans and advances provided under newly applicable public guarantee schemes introduced in response to COVID-19 crisis 31 December 2020
Gross carrying amount
Maximum amount of the guarantee that can be considered
Gross carrying amount
of which: forborne
Public guarantees
received
Inflows to non-
performing exposures
€ million € million € million € million Newly originated loans and advances subject to public guarantee schemes 60 - 57 -
of which: Households - - - -
of which: Collateralised by residential immovable property - - - -
of which: Non-financial corporations 60 - 57 -
of which: Small and Medium-sized Enterprises 11 - - -
of which: Collateralised by commercial immovable property - - - -

Pillar 3 Disclosures December 2020 65
Table 70: Information on loans and advances subject to legislative and non-legislative moratoria 31 December 2020
Table 71: Breakdown of loans and advances subject to legislative and non-legislative moratoria by residual maturity of moratoria 31 December 2020
Number of obligors
Gross carrying amount
Of which: legislative moratoria
Of which: expired
Residual maturity of moratoria
<= 3 months
> 3 months <= 6
months
> 6 months <= 9 months
> 9 months <= 12
months > 1 year
€ million € million € million € million € million € million € million € million
Loans and advances for which moratorium was offered 92 186
Loans and advances subject to moratorium (granted) 92 186 140 37 135 4 - 46 -
of which: Households - - - - - - - -
of which: Collateralised by residential immovable property - - - - - - - -
of which: Non-financial corporations 186 140 37 135 4 - 46 -
of which: Small and Medium-sized Enterprises 53 53 19 53 - - - -
of which: Collateralised by commercial immovable property 47 47 32 42 4 - - -
A ccumulated impairment, accumulated negative changes in fair value due to credit risk Gro ss carrying amo unt
€ millio n € millio n € millio n € millio n € millio n € millio n € millio n € millio n € millio n € millio n € millio n € millio n € millio n € millio n € millio n
1 Lo ans and advances subject to mo rato rium 148 138 - 45 11 11 11 (9) (3) - (3) (6) (6) (6) -
2 of which: Households - - - - - - - - - - - - - - -
3 of which: Collateralised by residential immovable property - - - - - - - - - - - - - - -
4 of which: Non-financial corporations 148 138 - 45 11 11 11 (9) (3) - (3) (6) (6) (6) -
5 of which: Small and M edium-sized Enterprises 35 29 - 11 6 6 6 (6) (2) - (1) (4) (4) (4) -
6 of which: Collateralised by commercial immovable property 15 6 - 3 8 8 8 (5) (1) - (1) (4) (4) (4) -
Gro ss carrying amo unt
P erfo rming N o n perfo rming P erfo rming
Inf lo ws to
no n-perfo rming
expo sures
Of which:
exposures
with
forbearance
measures
Of which:
Instruments with
significant increase in
credit risk since initial
recognition but not
credit-impaired
(Stage 2)
Of which:
exposures
with
forbearance
measures
Of which:
Unlikely to pay
that are not
past-due or
past-due <=
90 days
Of which:
exposures
with
forbearance
measures
Of which:
Instruments
with
significant
increase in
credit risk
since initial
Of which:
exposures
with
forbearance
measures
Of which:
Unlikely to pay
that are not past-
due or past-due
<= 90 days
N o n perfo rming

Pillar 3 Disclosures December 2020 66
Liquidity Risk Disclosures
LCR Disclosure The amounts reported in each quarter below, are the average of the previous 12-month end amounts preceding that particular quarter. The below table shows a stable trend for the CHIL LCR throughout 2020.
Table 72: LIQ1 – LCR disclosure
Total unweighted value Total weighted value 31 Mar
2020 30 Jun
2020 30 Sep
2020 31 Dec
2020 31 Mar
2020 30 Jun
2020 30 Sep
2020 31 Dec
2020
Number of data points used in the calculation of averages
12 12 12 12 12 12 12 12
€ million € million € million € million € million € million € million € million
HIGH-QUALITY LIQUID ASSETS
1 Total high-quality liquid assets (HQLA) 20,622 20,581 20,635 21,370
CASH-OUTFLOWS
2 Retail deposits and deposits from small business customers, of which:
1,986 1,091 509 569 554 313 144 141
3 Stable deposits - - - - - - - -
4 Less stable deposits 1,790 973 456 536 358 195 91 107
5 Unsecured wholesale funding 26,997 27,171 27,471 28,252 14,448 14,259 14,308 14,602
6 Operational deposits (all counterparties) and deposits in networks of cooperative banks
9,624 10,008 10,287 10,845 2,406 2,502 2,572 2,710
7 Non-operational deposits (all counterparties)
17,373 17,164 17,185 17,407 12,042 11,758 11,737 11,892
8 Unsecured debt - - - - - - - -
9 Secured wholesale funding - - - - - - - -
10 Additional requirements 20,310 21,198 21,543 21,755 3,921 4,160 4,248 4,328
11 Outflows related to derivative exposures and other collateral requirements
850 948 1,063 1,264 820 926 1,048 1,252
12 Outflows related to loss of funding on debt
products
- - - - - - - -
13 Credit and liquidity facilities 19,460 20,250 20,480 20,492 3,101 3,234 3,201 3,076
14 Other contractual funding obligations 2,006 1,911 1,751 1,959 1,937 1,844 1,684 1,890
15 Other contingent funding obligations 16,927 17,107 16,764 16,687 947 968 958 961
16 TOTAL CASH OUTFLOWS 21,808 21,545 21,342 21,922
CASH-INFLOWS
17 Secured lending (e.g. reverse repos) 4,345 4,548 4,735 5,111 1,018 1,018 1,004 1,003
18 Inflows from fully performing exposures 4,570 4,678 4,603 4,760 3,325 3,403 3,323 3,475
19 Other cash inflows 2,154 2,372 2,412 2,709 1,481 1,708 1,746 2,018
EU-19a
(Difference between total weighted inflows and total weighted outflows arising from transactions in third countries where there are transfer restrictions or which are denominated in non-convertible currencies)
- - - - - - - -
EU-19b
(Excess inflows from a related specialised credit institution)
- - - - - - - -
20 TOTAL CASH INFLOWS 11,070 11,597 11,749 12,579 5,824 6,129 6,073 6,495
EU-20a
Fully exempt inflows - - - - - - - -
EU-20b
Inflows Subject to 90% Cap - - - - - - - -
EU-20c
Inflows Subject to 75% Cap 11,070 11,597 11,749 12,579 5,824 6,129 6,073 6,495
Total Adjusted Value
21 LIQUIDITY BUFFER 20,622 20,581 20,635 21,370
22 TOTAL NET CASH OUTFLOWS 15,984 15,416 15,269 15,427
23 LIQUIDITY COVERAGE RATIO (%)1 130% 134% 135% 138%

Pillar 3 Disclosures December 2020 67
Asset encumbrance Assets or collateral are considered encumbered when they have been pledged or used to secure, collateralize or credit enhance a transaction which impacts their transferability and free use. As at 31 December 2020, €8.1 billion of assets were encumbered. The assets available on the CEP consolidated IFRS balance sheet were €60.9 billion with a further €12.7 billion of collateral received. The asset encumbrance ratio for the December 2020 was 11%. The encumbrance ratio decrease slightly from 12.2% in December 2019. Items which have been reported as encumbered are listed below:
• Pledges for intraday liquidity requirements;
• Derivative assets (margin placed with counterparties to cover negative net mark to market derivative balances);
• Amounts placed with the Central Bank, which are part of the minimum or required reserves has been conservatively assigned as encumbered on the basis that they cannot be “freely withdrawn”;
• Cash placed with clearing houses;
• Collateral pledged in repurchase agreements;
• Past due exposure from loans.

Pillar 3 Disclosures December 2020 68
Table 73: Asset encumbrance The values shown below represent the median values of the quarter-end numbers in 2020.
Carrying amount of encumbered assets
Fair value of encumbered assets
Carrying amount of unencumbered assets
Fair value of unencumbered assets
As at 31 December 2020 € million € million € million € million
Assets of the reporting institution 2,456 0 58,394 0
Equity instruments 0 0 108 0
Debt securities 401 391 3,649 3,472
of which: covered bonds 0 0 0 0
of which: asset-backed securities 0 0 16 16
of which: issued by general governments 252 242 3,229 3,229
of which: issued by financial corporations 149 149 441 443
of which: issued by non- financial corporations
0 0 4 17
Other assets 2,147 0 54,380 0
31 December 2020 Fair value of encumbered collateral received or own debt securities issued
Fair value of collateral received or own debt securities issued available for encumbrance
€ million € million
Collateral received by the reporting institution 6,011 6,045
Loans on demand 0 0
Equity instruments 0 0
Debt securities 6,011 5,423
of which: covered bonds 0 0
of which: asset-backed securities 1,096 0
of which: issued by general governments 4,866 5,279
of which: issued by financial corporations 71 121
of which: issued by non-financial corporations 26 13
Loans and advances other than loans on demand 0 0
Other collateral received 0 593
Own debt securities issued other than own covered bonds or asset-backed securities
0 0
Own covered bonds and asset-backed securities issued and not yet pledged 0 0
Total assets, collateral received and own debt securities issued 8,467 0
Matching liabilities, contingent liabilities or
securities lent
Assets, collateral received and own debt securities issued other than covered
bonds and ABSs encumbered 31 December 2020 € million € million
Carrying amount of selected financial liabilities 1,365 724
Derivatives 1,340 703
of which: Over-The-Counter 1,340 703
Deposits 20 21
Repurchase agreements 10 10
Other sources of encumbrance 527 7,743
Total sources of encumbrance 1,990 8,467

Pillar 3 Disclosures December 2020 69
2020 Remuneration Statement
Introduction
This remuneration disclosure is applicable to Citibank Holdings Ireland Limited (CHIL) and its operating entity Citibank Europe plc (CEP). As CEP is the sole subsidiary and employing entity of CHIL, the remuneration section of this disclosure is prepared at the CEP level and covers all jurisdictions in which CEP operates.
Remuneration Governance
CEP Remuneration Committee The CEP Remuneration Committee (RemCo) was formed in September 2014 per Regulation 83(1) of SI 158/2014 - European Union (Capital Requirements) Regulations 2014 (SI 158). The RemCo has delegated responsibility from the Board of CEP for the review and approval of proposed decisions regarding remuneration of CEP employees, and CEP Material Risk Takers (MRTs). This includes decisions which have implications for risk and risk management of CEP and which are required to be taken by the Board of Directors of CEP (Board). When reviewing such decisions, to ensure compliance by CEP with its obligations under the Capital Requirements Directive 2013/36/EU (known as CRD IV), SI 158 and European Banking Authority Guidelines on Sound Remuneration Policies (EBA Guidelines), the RemCo shall take into account the long-term interest of shareholders, investors, other stakeholders in CEP and the public interest. The RemCo acts as the Remuneration Committee of CEP, whereas the Personnel and Compensation Committee2 fulfils the same role at the group level. The role and responsibilities of the RemCo are set out in its Terms of Reference, as approved by the Board and which are available from the CEP Company Secretary. The RemCo is empowered to draw upon internal and external expertise and advice as it determines appropriate. It has the ability to review the appointment of external remuneration consultants that the Board and/or Committee may decide to engage for advice or support. Throughout 2020, all members of the Remuneration Committee were also members of both the CEP Risk Committee and the Audit Committee. The RemCo met eight times in 2020 and for the 2020 performance year, the RemCo members were:
Member Name Role
Desmond Crowley (appointed Chair effective from 27th April
20203)
Independent Non-Executive Director
Jeanne Short (Interim Chair until 5th February 2020)
Independent Non-Executive Director
Breffni Byrne Independent Non-Executive Director
2 The Personnel and Compensation Committee of the Board of Directors of Citigroup Inc. 3 There were no RemCo meetings between 5th February 2020 (when Jeanne Short ceased to be Interim Chair) and 27th April 2020 when Desmond
Crowley became Chair. 4 Citigroup Inc.
Global Remuneration Committee The Personnel and Compensation Committee (P&C Committee), oversees Citi’s4 global remuneration policies and practices. It annually reviews the compensation structures for members of senior management and a number of highly compensated and/or regulated individuals, in accordance with guidelines established by the P&C Committee, and provides oversight of the design and structure of incentive programs globally in the context of risk management. The P&C Committee’s Terms of Reference are documented in the P&C Committee Charter, which establishes the scope and mandate of the P&C Committee’s responsibilities and the general principles governing the remuneration policy of the firm globally. The latest Charter is available online.There were no material changes made to the Charter in 2020. P&C Committee members are all Independent Non-Executive Directors of Citi who are selected and appointed based on their background and experience in business generally and in remuneration, corporate governance and/or regulatory matters specifically, and their capability to fulfil their responsibilities as P&C Committee members. Material Risk Takers In accordance with the CRD IV and SI 158, which transposes Directive 2013/36/EU into Irish law, CEP annually identifies its MRTs and maintains a record of those identified. This process captures the categories of individuals whose professional activities are determined as having a material impact on CEP’s risk profile. CEP identifies MRTs principally using its understanding of the criteria for identification as set out in the Commission Delegated Regulation (EU) No 604/2014 and the EBA Regulatory Technical Standards (RTS) for MRT identification. Appropriate judgement will be exercised when considering who should be captured as an MRT.
Compensation Philosophy
CEP’s Compensation Philosophy is consistent with Citi’s Compensation Philosophy which is available online at: https://www.citigroup.com/citi/investor/data/comp_phil_policy.pdf?ieNocache=805. Employee compensation is a critical tool in the successful execution of Citi’s corporate goals. Citi’s compensation policies and practices are designed to support achievement of business strategy by attracting, retaining and motivating the best talent available to execute the strategy whilst ensuring an effective risk management framework and incentivising appropriate behaviours. The Compensation Philosophy describes Citi’s approach to balancing the five primary objectives that Citi’s compensation programs and structures are designed to achieve. Citi’s Compensation Philosophy is closely linked to the ongoing work on embedding appropriate culture, including through the Citi Mission and Values Proposition and the Citi Leadership Standards. The Compensation Philosophy also sets out Citi’s commitment to managing risk, and management receives clear direction from the P&C Committee to use discretion in awarding incentive compensation consistently with risk mitigation principles. Citi’s Compensation Philosophy applies to all

Pillar 3 Disclosures December 2020 70
of its foreign subsidiaries and branches, save where exceptions are required by local law. There were no material changes made to Citi’s Compensation Philosophy in 2020.
Design and Structure of Remuneration
Ratio of Fixed to Variable Remuneration CEP seeks to balance the components of reward between fixed and variable remuneration, and short- and long-term components. An annual review of the balance between fixed and variable remuneration takes place and, adjustments are made to the fixed element of pay to ensure that an appropriate balance of fixed versus variable continues to be maintained on an ongoing basis. The aggregate of fixed remuneration paid MRTs for 2020 is set out in the “Remuneration awarded to CEP MRTs for 2020 performance year” Table 74. Following the introduction of CRD IV, CEP annually seeks formal shareholder approval to apply a maximum fixed-to-variable ratio of 1:2 for MRTs in CEP, with the most recent approval being granted in the fourth quarter of 2020 for the 2020 performance year. Approval of the ratio was sought from P&C Committee, which is the committee of the ultimate parent company (Citigroup Inc.) as well as from CHIL as the sole shareholder of CEP, following recommendation from the Board. Fixed Remuneration – Salary, Role Based Allowances and Benefits CEP’s fixed remuneration is set to appropriately attract, retain and motivate employees, in line with market practices. Fixed remuneration primarily reflects an employee’s professional experience and organisational responsibilities as set out in the employee’s job description and terms of employment, and includes the following elements:
• Salary,
• Pension and other non-cash benefits are offered to employees as part of their overall reward package,
• Role Based Allowances (RBA) forming part of the package for a limited number of roles.
All of these elements are classified as fixed remuneration on the basis of the EBA Guidelines (including that they are permanent and do not depend on performance). In line with regulatory requirements, RBAs are limited to a small number of roles. The decision as to whether a particular role is eligible for an RBA is made according to specific and objective eligibility criteria, subject to approval as delegated by the CEP RemCo to management. The rationale for granting an RBA must be clearly articulated by reference to eligibility criteria, including specific details on the responsibilities and scope of the role. Variable Remuneration Discretionary Incentive and Retention Award Plan (DIRAP) is Citi’s main discretionary variable remuneration plan and applies globally. It is designed to incentivise, reward and retain employees based on their current and prospective performance and contribution. Citi operates a flexible remuneration policy, including the possibility to pay zero variable remuneration.
5 MRTs are eligible for a supplemental cash award. 6 Senior Management as defined under articles 3(1) and 3(3) of the EBA regulatory technical standards on criteria to identify categories of
employees whose professional activities have a material impact on an institution’s risk profile under Article 94(2) of Directive 2013/36/EU. 7 Proportionate approach applied in 2020, for MRTs whose annual variable remuneration did not exceed €50,000 and did not represent more than
one fourth of their annual total remuneration.
Deferrals and Retention Periods
Awards made under the DIRAP are typically in the form of cash, deferred cash, Citi equity and/or Citi deferred equity5. DIRAP awards are subject to mandatory deferral where the individual’s total annual variable remuneration awarded under DIRAP exceeds globally set thresholds. The Citi standard deferral policy period is four years. Typically, at least 50% of deferred awards are in the form of Citi equity or, in certain circumstances, share-linked instruments and are therefore inherently performance-based. For MRTs at least 50% of the upfront and deferred components of variable remuneration are delivered in equity. Citi believes that awarding equity and deferred awards is an effective means of aligning employee interests with those of shareholders and other stakeholders. MRTs are subject to deferral rates of between 40% and 100% of total variable remuneration, with a minimum 60% deferral being employed when total variable remuneration is of a particularly high amount, in line with regulatory requirements. Deferred awards to Standard MRTs typically vest over three years; deferred awards for CEP Senior Management6 MRTs vest over five years; and deferred awards for CEP MRTs performing as Senior Managers designated under UK Prudential Regulation Authority (PRA) or Financial Conduct Authority (FCA) regulation vest over seven years. Awards for MRTs are subject to a further retention period post-vesting:
• For Standard MRTs deferred cash awards are typically subject to a six-month retention period and deferred equity awards are typically subject to a twelve-month retention period,
• For CEP Senior Management MRTs and CEP MRTs who are performing as Senior Managers designated under UK PRA / FCA regulations, deferred cash awards are typically subject to a six-month retention period and deferred equity awards are subject to a six-month retention period, except as detailed below,
• CEP Senior Management MRTs and CEP MRTs who are performing as Senior Managers under UK PRA / FCA regulations, who are identified under articles 3(1) and 3(3) of the EBA RTS are subject to a twelve-month retention period on their deferred equity awards.
Citi does not pay dividends on deferred equity or interest on deferred cash to MRTs. MRTs who fall within the 2020 approved CEP de-minimis threshold7 were subject to deferrals under other applicable regulations or under Citi’s standard mandatory deferral structure. Total variable remuneration to CEP MRTs and the composition between cash, equity and deferred elements are included in the “Remuneration awarded to CEP MRTs for the 2020 performance year” Table 74. Performance Based Vesting
Deferred awards that are subject to MRT deferral schedules have Performance Based Vesting (PBV) conditions as an additional ex-post adjustment mechanism that may result in the cancellation of all or part of unvested amounts. These conditions ensure an appropriate balance for risk and also align the actual pay-out to employees with business performance.
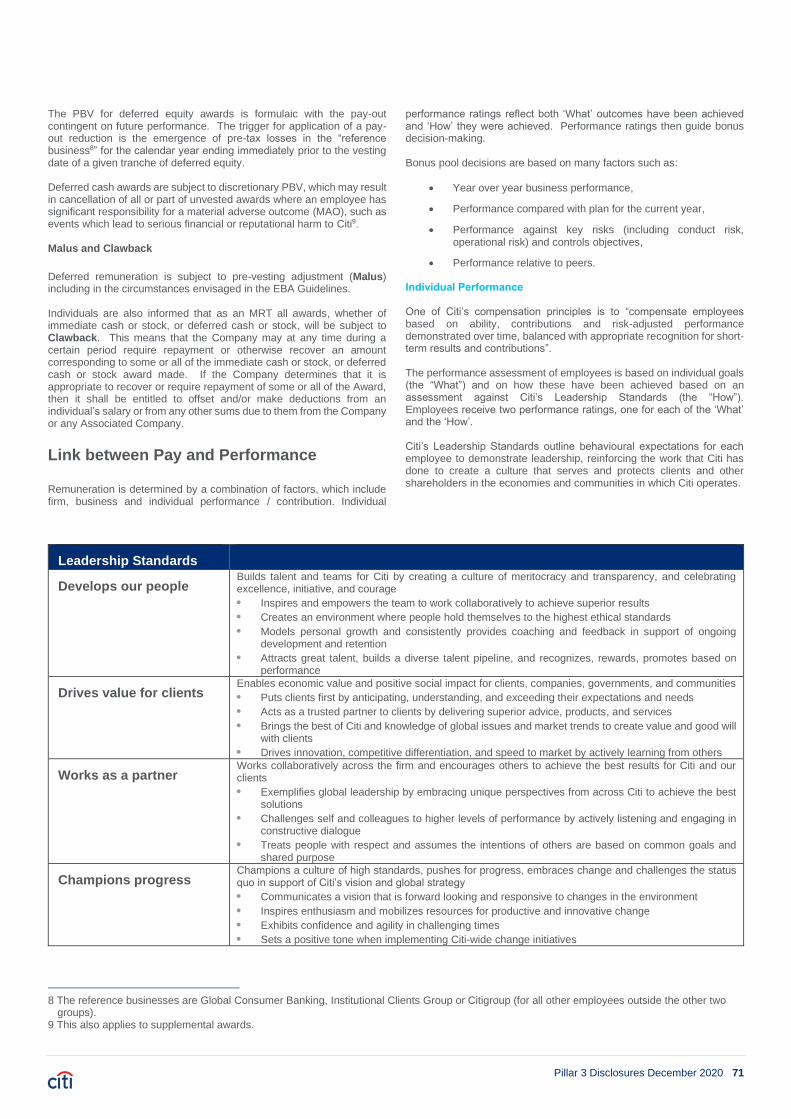
Pillar 3 Disclosures December 2020 71
The PBV for deferred equity awards is formulaic with the pay-out contingent on future performance. The trigger for application of a pay-out reduction is the emergence of pre-tax losses in the “reference business8” for the calendar year ending immediately prior to the vesting date of a given tranche of deferred equity. Deferred cash awards are subject to discretionary PBV, which may result in cancellation of all or part of unvested awards where an employee has significant responsibility for a material adverse outcome (MAO), such as events which lead to serious financial or reputational harm to Citi9. Malus and Clawback
Deferred remuneration is subject to pre-vesting adjustment (Malus) including in the circumstances envisaged in the EBA Guidelines. Individuals are also informed that as an MRT all awards, whether of immediate cash or stock, or deferred cash or stock, will be subject to Clawback. This means that the Company may at any time during a certain period require repayment or otherwise recover an amount corresponding to some or all of the immediate cash or stock, or deferred cash or stock award made. If the Company determines that it is appropriate to recover or require repayment of some or all of the Award, then it shall be entitled to offset and/or make deductions from an individual’s salary or from any other sums due to them from the Company or any Associated Company.
Link between Pay and Performance
Remuneration is determined by a combination of factors, which include firm, business and individual performance / contribution. Individual
performance ratings reflect both ‘What’ outcomes have been achieved and ‘How’ they were achieved. Performance ratings then guide bonus decision-making. Bonus pool decisions are based on many factors such as:
• Year over year business performance,
• Performance compared with plan for the current year,
• Performance against key risks (including conduct risk, operational risk) and controls objectives,
• Performance relative to peers.
Individual Performance One of Citi’s compensation principles is to “compensate employees based on ability, contributions and risk-adjusted performance demonstrated over time, balanced with appropriate recognition for short-term results and contributions”. The performance assessment of employees is based on individual goals (the “What”) and on how these have been achieved based on an assessment against Citi’s Leadership Standards (the “How”). Employees receive two performance ratings, one for each of the ‘What’ and the ‘How’. Citi’s Leadership Standards outline behavioural expectations for each employee to demonstrate leadership, reinforcing the work that Citi has done to create a culture that serves and protects clients and other shareholders in the economies and communities in which Citi operates.
Leadership Standards
Develops our people Builds talent and teams for Citi by creating a culture of meritocracy and transparency, and celebrating excellence, initiative, and courage
• Inspires and empowers the team to work collaboratively to achieve superior results
• Creates an environment where people hold themselves to the highest ethical standards
• Models personal growth and consistently provides coaching and feedback in support of ongoing development and retention
• Attracts great talent, builds a diverse talent pipeline, and recognizes, rewards, promotes based on performance
Drives value for clients Enables economic value and positive social impact for clients, companies, governments, and communities
• Puts clients first by anticipating, understanding, and exceeding their expectations and needs
• Acts as a trusted partner to clients by delivering superior advice, products, and services
• Brings the best of Citi and knowledge of global issues and market trends to create value and good will with clients
• Drives innovation, competitive differentiation, and speed to market by actively learning from others
Works as a partner Works collaboratively across the firm and encourages others to achieve the best results for Citi and our clients
• Exemplifies global leadership by embracing unique perspectives from across Citi to achieve the best solutions
• Challenges self and colleagues to higher levels of performance by actively listening and engaging in constructive dialogue
• Treats people with respect and assumes the intentions of others are based on common goals and shared purpose
Champions progress Champions a culture of high standards, pushes for progress, embraces change and challenges the status quo in support of Citi’s vision and global strategy
• Communicates a vision that is forward looking and responsive to changes in the environment
• Inspires enthusiasm and mobilizes resources for productive and innovative change
• Exhibits confidence and agility in challenging times
• Sets a positive tone when implementing Citi-wide change initiatives
8 The reference businesses are Global Consumer Banking, Institutional Clients Group or Citigroup (for all other employees outside the other two
groups). 9 This also applies to supplemental awards.

Pillar 3 Disclosures December 2020 72
Leadership Standards
Lives our values Ensures systemically responsible outcomes while driving performance and balancing short and long-term risks
• Sets the standard for the highest integrity in every decision
• Leads by example; willing to make difficult choices in support of Citi and our stakeholders
• Makes Citi better for all by putting the clients’ and Citi’s interests ahead of individual or team interests
• Has the courage to always do what’s right and the humility to learn from mistakes
Delivers results Sets high standards and achieves performance objectives by creating a clear path toward ethical and sustainable results
• Translates Citi’s strategy into effective business plans while proactively overcoming obstacles
• Prioritizes and provides a clear line of sight to the most critical work
• Sets goals and measures progress to ensure the organization is focused on ethics, execution, and results
• Expects self and team to consistently meet/exceed expectations
CEP also conducts an annual independent review process pursuant to which functions provide an evaluation of risk behaviours of MRTs. The risk behaviour rating from this independent review process is considered in the performance review conducted by the individual’s manager. The CEP Senior Leadership Team are also subject to an enhanced performance assessment approach that captures feedback from the Board at year-end. Conduct and risk performance processes were materially enhanced in 2019 and continued to be refined in 2020, including to drive expectations for appropriate behaviour and individual responsibility, transparency, and the alignment with consistency over how managers assess and make performance adjustments. MRTs who are PRA / FCA designated Senior Managers are also subject to an enhanced performance assessment approach capturing achievement of goals relating to regulatory priorities, Voice of Employee scores, and accountability process outcomes. This was further supplemented in 2020 with enhanced performance management for individuals involved in regulatory remediations.
Remuneration of Control Function Employees
In terms of remuneration for employees in functions, whilst remuneration levels are influenced by Citi’s overall performance, individual compensation is determined by reference to performance against objectives relevant to their function and assessed within their respective functions. CEP maintains the independence of the compensation process for key functions (e.g. Independent Compliance and Risk Management and Independent Risk Management) to minimise any scope for potential conflicts of interests. No business unit has the potential to influence individual awards in the functions. CEP ensures performance management and compensation decisions for function personnel, are directed by function management, and not the business.
Other Key Remuneration Policies
Guarantees, Buyouts and Retention Payments Citi has guidelines in place with respect to guarantees that apply to all employees across the EMEA region, including CEP employees. These guidelines provide that guaranteed incentive awards for employees can only be made in exceptional circumstances, in the context of recruitment and with reference to the first year of service and provided the legal entity has a sound and strong capital base. As part of the governance framework, the award of guarantees for CEP MRTs, requires RemCo review and approval. The “Guaranteed bonus, sign-on and severance payments made to MRTs in 2020” Table 75 includes 2020 guaranteed awards made to MRT hires.
Awards which buy out equity or similar instruments which are forfeited as a result of terminating employment with another employer and joining CEP are generally permitted but must not be more generous in either amount or terms than that provided by the former employer, and be subject to appropriate retention, deferral, performance and clawback arrangements. These awards are included in “MRT Deferred Remuneration” Table 76. Retention payments can only be made in exceptional circumstances, for example, during major restructuring, during a merger process, or where a business is winding down and particular key employees need to be retained on business grounds. Severance Severance payments are subject to appropriate governance and approvals. CEP’s severance payment guidelines are in line with the EBA Guidelines on Sound Remuneration Policies and provide that severance:
• Should not provide for a disproportionate reward but should represent appropriate compensation for early termination of employment,
• Should not reward failure, misconduct or be paid where immediate termination of the employment contract is permitted,
• Are not paid to employees transferring between Citi legal entities, unless required by law.
The “Guaranteed bonus, sign-on and severance payments made to MRTs in 2020” Table 75 includes severance payments made to MRTs, whose employment terminated in 2020. Personal Hedging Citi has trading policies that limit hedging strategies that might otherwise undermine the risk alignment effects of their remuneration arrangements. Citi’s Code of Conduct applies to all Citi employees, and states that, when considering personal investments in Citi securities, an individual must avoid any personal trade or investment in a security, derivative, futures contract, commodity, or other financial instrument if the trade or investment might affect or appear to affect the individual’s ability to make unbiased business decisions for Citi. Further, employees subject to the EBA Guidelines on Sound Remuneration Policies are prohibited from engaging in personal hedging strategies or taking out remuneration or liability related contracts of insurance that undermine or may undermine any risk alignment effects of their remuneration arrangements. Citi's Personal Trading & Investment Policy prohibits “Covered Persons” which include MRTs as defined in this Policy and related persons from hedging in any manner (other than currency hedges) unvested restricted equity or deferred equity awarded under Citi’s Capital Accumulation Program (CAP).

Pillar 3 Disclosures December 2020 73
Table 74: Remuneration Awarded to CEP MRTs 2020 Performance Year
All other MRTs EUR millions (i) Management
Body (ii) Senior
Management (iii) Investment
Banking Independent
Control Functions
All Other (iv)
Number of employees (v) 9 16 74 16 10
Total fixed remuneration (vi) 1.9 5.9 22.9 2.9 2.6
Total variable remuneration (vii) 0.5 3.6 18.1 1.0 1.1
Of which: cash-based 0.3 1.8 8.9 0.7 0.6
Of which: deferred 0.2 0.7 4.2 0.1 0.2
Of which: shares or other share-linked instruments (viii) 0.3 1.8 9.3 0.3 0.5
Of which: deferred 0.2 0.8 4.9 0.2 0.2
Of which: other forms - - - - -
Of which: deferred - - - - -
Total remuneration 2.4 9.5 41.0 4.0 3.7
Additional Notes i. All non-EUR awards are converted using the European Commission exchange rate for financial programming and the budget for December 2020. ii. Management Body as defined under articles 3(1) and 3(2) of the EBA regulatory technical standard on criteria to identify categories of staff whose professional activities have a material impact on an institution’s risk profile under Article 94(2) of Directive 2013/36/EU. iii. Senior Management as defined under article 3(3) of the EBA regulatory technical standard on criteria to identify categories of staff whose professional activities have a material impact on an institution’s risk profile under Article 94(2) of Directive 2013/36/EU. iv. All Other category includes all other employees who cannot be mapped into one of the other categories e.g. Operations & Technology, Retail Banking and Corporate Functions. v. Number of employees reflects CEP MRTs as at 31st December 2020. Remuneration data excludes individuals where figures are already captured in PRA regulatory returns. vi. As at 31st December 2020, four CEP MRTs were also members of the CHIL Board of Directors. External Directors receive additional fixed remuneration for their roles. vii. Fixed remuneration includes salary, role based allowance and the value of pension and benefits. viii. Variable remuneration awarded in respect of 2020 performance year. In accordance with the shareholder approval obtained in 2020, variable component of remuneration of an MRT for any one year can be set up to a maximum of 200% of the fixed remuneration. ix. Share-based awards are made in Citi shares and represent value at grant.
Table 75: Guaranteed bonus, sign-on and severance payments made to MRTs in 2020
Guaranteed bonuses Sign-on awards Severance payments (ii)
EUR millions (i) Number of employees Total amount
Number of employees Total amount
Number of employees
Total amount (iii)(iv)
Management Body - - - - - -
Senior Management - - - - - -
Other MRTs - - - - 2 1.8
Investment Banking - - - - 1 1.3
Independent Control Functions - - - - 1 0.5
All Other - - - - - -
Additional Notes i. All non-EUR awards are converted using the European Commission exchange rate for financial programming and the budget for December 2020. ii. Severance payments allocated to MRTs terminated during 2020, which include redundancy payments and statutory severance. None of these severance payments were included in the ratio of variable to fixed remuneration for 2020 performance year in line with the EBA Guidelines (paragraph 154 (a) – (c)). iii. The highest severance in 2020 was a redundancy payment made to an employee for the amount of EUR 1.27m. iv. The total amount of severance payments reflects final amounts paid out to individuals.

Pillar 3 Disclosures December 2020 74
Table 76: MRT Deferred Remuneration
EUR millions (i)
Outstanding deferred and retained remuneration as at December 31, 2020 (ii),
of which:
Of which: Total amount of outstanding deferred and retained remuneration exposed to ex post explicit and/or implicit adjustment
Total amount of amendment during the year due to ex post explicit adjustments
Total amount of amendment during the year due to ex post implicit adjustments
Total amount of deferred remuneration paid out in the financial year (v)
Total amount of deferred remuneration awarded in the financial year (vi)
Unvested Vested (iii)
Management Body 0.3 0.2 0.5 - - 0.2 0.3
Of which: cash-based 0.2 - 0.2 - - 0.0 0.1
Of which: shares or other share-linked instruments 0.2 0.2 0.3 - - 0.2 0.2
Of which: other forms - - - - - - -
Senior Management 3.0 1.2 4.1 - - 2.1 2.2
Of which: cash-based 1.5 - 1.5 - - 0.5 0.6
Of which: shares or other share-linked instruments (iv) 1.5 1.2 2.6 - - 1.6 1.5
Of which: other forms - - - - - - -
All other MRTs 15.1 7.0 22.1 - - 11.9 11.9
Investment Banking 14.0 6.4 20.4 - - 11.0 10.9
Of which: cash-based 6.9 - 6.9 - - 2.9 3.5
Of which: shares or other share-linked instruments 7.1 6.4 13.5 - - 8.1 7.4
Of which: other forms - - - - - - -
Independent Control Functions 0.4 0.2 0.6 - - 0.3 0.3
Of which: cash-based 0.1 - 0.1 - - 0.1 0.1
Of which: shares or other share-linked instruments 0.3 0.2 0.4 - - 0.2 0.3
Of which: other forms - - - - - - -
All Other 0.7 0.4 1.1 - - 0.6 0.7
Of which: cash-based 0.3 - 0.3 - - 0.1 0.2
Of which: shares or other share-linked instruments 0.4 0.4 0.8 - - 0.5 0.5
Of which: other forms - - - - - - -
Additional Notes i. Value of all non-EUR cash and share awards are converted using the European Commission exchange rate for financial programming and the budget for December 2020. ii. Value of outstanding share awards is calculated using Citi closing share price as at December 31, 2020. iii. Total outstanding deferred remuneration that has vested but is under restriction as at December 31, 2020. Value of shares has been calculated as of vest date. iv. Includes both shares and any stock units granted v. Shares are considered paid when vested. The Fair Market Value (FMV) at vest is determined by the closing New York Stock Exchange stock price for Citigroup common stock the trading day immediately prior to the award’s vest date. vi. Value of share-based awards made in 2020 represents value at grant.

Pillar 3 Disclosures December 2020 75
Table 77: 2020 Remuneration Banding for Annual Compensation of Individuals Earnings at least EUR 1 million
Total Remuneration (in EUR)(i) Number of individuals(ii)(ii)
1,000,000 to 1,500,000 8
1,500,000 to 2,000,000 2
2,000,000 to 2,500,000 -
2,500,000 to 3,000,000 -
3,000,000 to 3,500,000 -
3,500,000 to 4,000,000 -
4,000,000 to 4,500,000 -
4,500,000 to 5,000,000 -
5,000,000 to 6,000,000 -
6,000,000 to 7,000,000 -
7,000,000 to 8,000,000 -
8,000,000 to 9,000,000 -
9,000,000 to 10,000,000 -
Greater than 10,000,000 -
Total 10
Additional Notes i. All non-EUR awards are converted using the European Commission exchange rate for financial programming and the budget for December 2020. ii. The number of individuals reflects those remunerated over EUR 1 Million within the MRT population as at 31st December 2020. iii. Individuals included in above count are located across a number of European countries i.e. Bulgaria, Luxembourg, UK, Spain, Sweden

Pillar 3 Disclosures December 2020 76
CEP & CHIL Board and Senior Management Disclosures The following senior management disclosures are made in accordance with CRR Article 435.2 and pertain to the regulated operating company, CEP.
Board Composition
The CEP Board of Directors (Board) is comprised of nine directors as follows:
• Four Independent Non-Executive Directors, meaning that they are considered to meet the criteria for independence.
• Three Non-Executive Directors, one being a director without executive management responsibility in CEP but who has executive management responsibilities within the Group and two being directors without executive management responsibilities within CEP or Group.
• Two Executive Directors, being directors employed by CEP, with executive day-to-day management responsibilities.
The CEP Board is committed to identifying and appointing appropriately suitable and skilled people to serve on the Board. Board appointments are based on merit and candidates are considered against objective criteria, having due regard for the benefits of diversity on the Board, including gender. The Board Diversity Policy applies to the recruitment of all directors of the Board and sets out the approach to increasing the diversity of management at Board level, including specific targets for gender representation. The Board aspires to have a composition in which female representation is 30 percent. As of 31 December 2020, 44 percent of the Board were female.
The selection criteria for Non-Executive Directors of CEP are designed to ensure that they bring a viewpoint to the deliberations of the Board that is objective and independent of the activities of management and CEP. A key responsibility of the CEP Nomination Committee is to lead the process for Board appointments and for identifying and nominating, for approval by the Board, candidates for appointment to the Board. The Board’s breath of expertise is outlined in further detail in the biographical summaries later in this appendix.
All newly appointed Directors receive induction training, which includes training on directors’ duties under Irish law (Companies Act 2014, relevant governance provisions of Statutory Instrument No. 158 of 2014 and the Corporate Governance Requirements for Credit Institutions 2015).
The Board is responsible for the appointment of the Chief Executive Officer and Senior Management (i.e. Pre-Approved Control Functions per the 2014 Fitness & Probity Standards issued by the Central Bank of Ireland (Standards)) with appropriate integrity and adequate knowledge, experience, skill and competence. Candidates are recruited and selected in accordance with Citi Human Resources standard recruitment policy and procedures and relevant CEP policies.
The Nomination Committee is mandated to consider the appointment of Senior Management on behalf of the Board. All Senior Management appointments are required to comply with the Standards.
Distinction between the Roles of Executive and Non-Executive Directors
A fundamental distinction is drawn between the roles of Executive and Non-Executive directors.
The Non-Executive Directors must have a knowledge and understanding of the business, risks and material activities of CEP to enable them to contribute effectively. The Independent Non-Executive Directors must comprise individuals with relevant skills, experience and knowledge (such as accounting, auditing and risk management knowledge) that provide independent challenge to the Executive Directors of the Board.
CEP’s Audit Committee is comprised of four Independent Non-Executive Directors. CEP’s Board Risk Committee is comprised of Non-Executive Directors, the majority being independent. The Chairperson of these committees set the agenda for the committee meetings. Dedicated support is available to Independent Non-Executive Directors on any matter requiring additional and/or separate advice to that available in the normal Board process, including:
• Full and unhindered access to the business, which involves the receipt of detailed presentations given by business or control functions; and
• Technical training in the form of Board tutorials. These regular tutorials cover a wide range of subjects including: capital and liquidity requirements, anti-money laundering rules and recovery and resolution planning.
Table 78: Directorships held by Citibank Europe plc Board of Directors 31 December 2020 (including Citi Directorships)
Name
Total number of Directorships
Susan Dean 2
Breffni Byrne 3
Silvia Carpitella 3
Desmond Crowley 6
Patrick Dewilde 3
John Gollan 5
Peter McCarthy 2
Cecilia Ronan 3
Jeanne Short 1
Total 28

Pillar 3 Disclosures December 2020 77
Please note that the full biographies of CEP’s Board are available in the Appendix.
Table 79: Memberships of the CEP Board of Directors 31 December 2020
Membership 31 December 2020
Name Gender Role Duration of Board Membership
Susan Dean Female Non-Executive Director – Chair 4 yrs 9 mths
Breffni Byrne Male Independent Non-Executive Director 7 yrs 8 mths
Silvia Carpitella Female Executive Director 1 mth
Desmond Crowley Male Independent Non-Executive Director 1 yr 2 mths
Patrick Dewilde Male Non-Executive Director 1 yr 11 mths
John Gollan Male Independent Non-Executive Director 1 yr 9 mths
Peter McCarthy Male Non-Executive Director 9 mths
Cecilia Ronan Female Executive Director – Chief Executive Officer and
Citi Country Officer 10 yrs 5 mth
Jeanne Short Female Independent Non-Executive Director 3 yrs 6 mths
CHIL Board Composition The CHIL Board reviews and approves the Pillar 3 Disclosures. CHIL does not currently have any committees.
Table 80: Directorships held by CHIL Board of Directors 31 December 2020
Name
Total number of Directorships
Susan Dean 2
John Gollan 5
Silvia Carpitella 3
Cecilia Ronan 3
Total 13
Table 81: Memberships of the CHIL Board 31 December 2020
Membership 31 December 2020
Name Gender Role Duration of Board Membership
Susan Dean Female Non-Executive Director – Chair 4 yrs 2 mths
Silvia Carpitella Female Executive – Chief Financial Officer 1 yr 8 mths
John Gollan Male Independent Non-Executive Director 1 yr 8 mths
Cecilia Ronan Female Executive Director – Chief Executive Officer and
Citi Country Officer 8 mths

Pillar 3 Disclosures December 2020 78
CEP Committees Board Risk Committee The Board Risk Committee (BRC) is a Committee of the Board and is governed by Terms of Reference approved by the Board. The BRC has responsibility for the oversight and advice to the Board on the current risk exposures of CEP and future risk strategy taking account of the overall risk appetite and the current and future financial position of CEP, whilst ensuring the development and on-going maintenance of an effective risk management system.
The BRC plays an active role in the development of CEP’s ICAAP and ILAAP along with reviewing and recommending the ICAAP and ILAAP for approval by the Board.
On an ongoing basis, the BRC is responsible for advising the Board on the effectiveness of the strategies and policies with respect to maintaining, on an ongoing basis, amounts, types and distribution of both internal capital and own funds adequate to cover the risks of CEP.
The BRC must also advise the Board of its recommendations on necessary adjustments of the risk strategy resulting from changes in the CEP business model or market developments, or from
recommendations made by the risk function. The BRC is furthermore tasked with overseeing the implementation of strategies for capital and liquidity management as well as for all the remaining relevant risks applicable to CEP, including market, credit, operational, reputational and IT risks.
The BRC’s annual review of the CEP Recovery Plan prior to submission to the Board ensures that a comprehensive view of capital and liquidity risk is considered in this analysis.
To fulfil its risk monitoring responsibilities, the BRC relies on a number of management committees to ensure all material risks are being appropriately identified, measured, managed and where possible and appropriate, mitigated. The Executive Committee is the delegated committee of the Board with responsibility for overseeing the risk management committees. In addition, the Chief Risk Officer (CRO) reports to the BRC on material risks and how these are being managed at each scheduled meeting.
The current composition of the BRC is set out below:
Table 82: CEP Board Risk Committee Composition
Membership 31 December 2020
Jeanne Short Chair – Independent Non-Executive Director
John Gollan Independent Non-Executive Director
Breffni Byrne Independent Non-Executive Director
Desmond Crowley Independent Non-Executive Director
Susan Dean Non-Executive Director
Patrick Dewilde Non-Executive Director
Audit Committee The Audit Committee is a Committee of the Board and is governed by its Terms of Reference approved by the Board. The purpose of the Audit Committee is to assist the Board in fulfilling its oversight responsibility for the integrity of CEP’s consolidated financial statements, financial reporting process, CEP’s systems of internal accounting and financial controls, and the performance of Internal Audit.
The Audit Committee has a responsibility to raise any concerns or recommendations regarding the audit of CEP’s consolidated financial
statements or the effectiveness of the CEP’s internal control over financial reporting to Citigroup’s Audit Committee. The Audit Committee also assists the Board in fulfilling its oversight responsibility relating to compliance with policy standards, guidelines for risk assessment and compliance by CEP with local legal and regulatory requirements, including CEP’s disclosure controls and procedures, where applicable.
The current composition of the Board Audit Committee is set out below:
Table 83: CEP Audit Committee Composition
Membership 31 December 2020
John Gollan Chair – Independent Non-Executive Director
Breffni Byrne Independent Non-Executive Director
Desmond Crowley Independent Non-Executive Director
Jeanne Short Independent Non-Executive Director
Remuneration Committee
The Remuneration Committee is a Committee of the Board and is governed by its Terms of Reference approved by the Board. It has responsibility for decisions regarding remuneration on behalf of the Board, including those that have implications for Risk and CEP Risk Management, which are to be taken by the Board. When reviewing such decisions, the Remuneration Committee takes into account the
long-term interest of its shareholders, investors and other stakeholders in CEP and the public interest.
The Remuneration Committee assists with the design and implementation the CEP's Remuneration Policy to ensure that remuneration practices do not promote excessive risk taking. The

Pillar 3 Disclosures December 2020 79
Remuneration Committee also evaluates CEP’s compliance with the Remuneration Policy, and assesses whether CEP’s remuneration practices are creating the desired incentives for managing risk, capital and liquidity.
The current composition of the Remuneration Committee is set out below:
Table 84: CEP Remuneration Committee Composition
Membership 31 December 2020
Desmond Crowley Chair – Independent Non-Executive Director
Jeanne Short Chair – Independent Non-Executive Director
Breffni Byrne Independent Non-Executive Director
Nomination Committee
The Nomination Committee is a Committee of the Board and is governed by its Terms of Reference approved by the Board. The Nomination Committee is responsible for leading the process for appointments to the Board and making recommendations to the Board on all new appointments of both Executive and Non-Executive Directors. It is also responsible for assessing the structure, size and composition of the Board, in particular as compared to relevant EBA Guidelines, and making recommendations to the Board with regard to any changes. The Nomination Committee is also involved in
succession planning for the Board, taking into account the future demands on the business and the existing level of skills and expertise.
The Nomination Committee also ensures members of the Board receive comprehensive and tailored induction training to enable their effective contribution from their appointment, and that all members of the Board receive appropriate training in a timely manner on an ongoing basis.
The current composition of the Nomination Committee is set out below:
Table 85: CEP Nomination Committee Composition
Membership 31 December 2020
Breffni Byrne Chair – Independent Non-Executive Director
Susan Dean Non-Executive Director
Jeanne Short Independent Non-Executive Director
Related Party Lending Committee
The Related Party Lending (RPL) Committee is a Committee of the Board and is governed by its Terms of Reference approved by the Board. The RPL Committee, under delegated authority from the CEP Board, is responsible for ensuring policies and procedures are in place to identify individual loans to a related party as defined in, and per the requirements of, the Code of Practice on Lending to Related Parties 2013 as issued by the Central Bank of Ireland (RPL Code). The Committee ensures Central Bank reporting requirements in respect of related party exposures on a quarterly basis are fulfilled,
and reports to the Board on any and all material matters relating to the RPL Code and otherwise as the RPL Committee considers necessary for the purpose of ensuring the proper discharge by the Board of its obligations under the RPL Code. The membership of the Related Party Lending Committee is set out below:
Table 86: CEP Related Party Lending Committee Composition
Membership 31 December 2020
Silvia Carpitella Chief Financial Officer - Chair
Desmond Crowley Independent Non-Executive Director
Monika Starzak CEP Controller
Martina Williamson Head of Human Resources
Mark Satterthwaite Head of Compliance
TBC CEP Treasurer
Pavel Cecetka Risk Representative and Head of Credit Risk
Stephen Fedor Head of Private Bank
Davinia Conlan Ireland Country Counsel
Emanuela Saccarola WorldLink Representative

Pillar 3 Disclosures December 2020 80
Governance Committees (Management)
Executive Committee
The CEP Board has delegated authority to the Executive Committee to take key decisions regarding the management of, and set the direction for, CEP, in line with Board-approved Strategic Plan and to implement the recommendations or decisions of the Board. The Executive Committee is responsible for the day-to-day running of CEP and for the management of CEP’s relationship with regulatory authorities. It manages and oversees the ongoing business activities of CEP in accordance with the business model, strategic plan, risk appetite, policies, instructions and guidelines established by the Board, and applicable legislation and regulatory requirements. The Executive Committee reports to the Board as required, which may be upon request from the Board, and acts as the primary forum for ensuring CEP’s business goals, client service, and leadership standards are embedded throughout CEP. Key responsibilities of the Executive Committee with respect to finance, capital, liquidity and risk include:
• Monitoring CEP's overall financial and business performance against key objectives;
• Reviewing, prior to Board approval, CEP’s financial plan for the forthcoming financial year including a profit and loss statement, balance sheet, funding structure, capital structure, liquidity, solvency and rating targets;
• Monitoring on a continuous basis the internal operations of CEP against the financial plan set for each financial year, including financial plans relating to operations, liquidity, capital resources and investments and report regularly to the Board the outcome of such monitoring;
• Either directly or in conjunction with the ALCO, reviewing and recommending to the Board proposals for the allocation of capital within CEP;
• Taking decisions regarding material matters escalated to it for decision by the ALCO in the discharge of its responsibilities relating to the capital, liquidity and balance sheet position of CEP;
• Receiving updates on the overall risk profile of CEP along with key risk issues from the Chief Risk Officer and taking such action as may be required in the light of those updates;
• Ensuring that all appropriate risk considerations are incorporated within the strategic planning and budgeting process, risk appetite setting, recovery planning and capital and liquidity planning processes on an ongoing basis;
• Taking decisions regarding material matters escalated to it for decision by the Credit Committee in the discharge of its responsibilities relating to the monitoring, oversight and control of CEP’s credit portfolios; and,
• Taking decisions regarding material matters escalated to it for decision by the Operational Risk Committee, including relating to outsourcing activities.
The Company Secretary to the Board also acts as Company Secretary to the Executive Committee. In addition, the Chief Audit Executive are also permanent attendees.
The current composition of the Executive Committee is set out below:
Table 87: CEP Executive Committee Composition
Membership 31 December 2020
Cecilia Ronan Chief Executive Officer and Citi Country Officer
Silvia Carpitella Chief Financial Officer
Mariel Creo Chief Administrative Officer
Mark Satterthwaite Head of Compliance
Barry Ryan Chief Risk Officer
Nigel Kemp General Counsel
Colin Moreland Head of TTS
Cormac Donohoe Head of Markets
Auke Leenstra Head of Banking
Declan Kane Interim Head of O&T
Martina Williamson Head of HR

Pillar 3 Disclosures December 2020 81
Risk Management Committee
The Risk Management Committee is a sub-committee of the Executive Committee. The Risk Management Committee of CEP is the primary senior executive level committee responsible for overseeing the execution of the CEP Risk Governance Framework, for ensuring that CEP’s risk profile remains consistent with its approved risk appetite, including for aggregate and concentration risks, and for discussing material and emerging risk issues facing CEP. The Risk Management Committee also provides comprehensive CEP-wide coverage of Credit Risk, Market Risk in the Trading Book and Inter-Affiliate Risk. The Risk Management Committee serves as an escalation point for Senior Management in the first and second line of defence as they design, implement, and maintain an effective risk program in their respective areas of responsibility. It also serves as an escalation point for certain risk management fora across CEP.
The source of the internal management committees’ authority and the decisions they are authorized to make is the CEP Board of Directors, which has delegated authority to the CEP Executive Committee, to create, modify and/or disband internal management committees as it may deem necessary. Pursuant to such delegation the Executive Committee has authorised the creation of the Risk Management Committee with its remit and supplementary committees as set forth in its Terms of Reference. The scope of the Risk Management Committee covers all branches and businesses of CEP. The current composition of the Risk Management Committee is set out below:
Table 88: CEP Risk Management Committee Composition
Membership 31 December 2020
Chief Risk Officer (Co-Chair)
Chief Executive Officer (Co-Chair)
Chief Financial Officer
CEP Head of Banking
CEP Head of Markets & Security Services
CEP Head of Trading
CEP Head of TTS
CEP Head of TTS Trade
CEP Treasurer
CEP Head of Market & Liquidity Risk
CEP Head of Credit Risk
CEP Head of Operational Risk Management
CEP Head of Enterprise Risk Management
Operating Committee
The Operating Committee is a sub-committee of the Executive Committee. The Executive Committee has delegated authority to the Operating Committee to oversee the ongoing management activities of CEP with a particular focus on Strategic and Reputational Risk and in relation to the CEP’s Clusters, Branches and Citi Solution Centres
(together the Branches). In particular, the Committee reviews at its meetings, the performance of the Branches including by business and by function. The current composition of the Operating Committee is set out below:
Table 89: CEP Operating Committee Composition
Membership 31 December 2020
Chief Executive Officer – Chair
Chief Administrative Officer
Chief Financial Officer
Chief Compliance Officer
Head of Human Resources
CEP Treasurer
Chief Risk Officer
General Counsel
Business Head: TTS
Business Head: Investor Services
Business Head: DCC
Business Head: Markets and Securities Services
Business Head: Issuer Services
Business Head: Banking & Cluster Head: Benelux and Austria

Pillar 3 Disclosures December 2020 82
Membership 31 December 2020
Cluster Head: CEE
Cluster Head: Nordics
Cluster Head: Southern Europe
Cluster Head: UK Branch
Head of O&T for Europe Cluster and for CEP
Chief Information Officer
Business Risk and Control Committee
The Business Risk and Control Committee (BRCC) for CEP provides governance and oversight for compliance and operational risks. The mandate of the CEP BRCC is to govern and oversee that all compliance and operational risks material to its scope and mandate are adequately identified, monitored, reported, managed, and escalated, and appropriate action is taken in line with CEP’s strategic
objectives, risk appetite thresholds, and regulatory expectation, while promoting the culture of risk awareness and high standards of culture and conduct. The current composition of the Business Risk and Control Committee is set out below:
Table 90: CEP Business Risk and Control Committee Composition
Membership 31 December 2020
CEP Chief Executive Officer – Chair
CEP Chief Administrative Officer
CEP Head of Banking
CEP Head of Private Banking
CEP Head of Markets and Securities Services
CEP Chief Risk Officer
CEP Chief Financial Officer
CEP Chief Compliance Officer
CEP General Counsel
CEP Head of Human Resources
CEP Head of Operations & Technology
CEP Head of Operational Risk
CEP Head of TTS Trade
Asset and Liability Committee
The Asset and Liability Committee (ALCO) is a sub-committee of the Executive Committee. The ALCO provides oversight and governance of CEP’s Balance Sheet including capital, funding, liquidity and market risk. In this regard, the ALCO is an integral part of the overall risk management framework and functions as a forum for senior management to ensure adherence to corporate-wide policies and procedures, regulatory requirements, rating agency commitments and, as necessary, to recommend and implement appropriate funding plans. The primary responsibilities of the ALCO are to:
• Provide country oversight of market and liquidity risks, transfer pricing and balance sheet management across businesses;
• Understand the economic and rate views of the countries within the region as used in forecasts and scenarios;
• Evaluate the proposed asset and deposit levels on balance sheets of the region’s significant legal vehicles by country, including key initiatives for asset reduction, structural liquidity usage, capital market debt and regional funding plans;
• Endorse that the CEP legal vehicle is appropriately capitalized;
• Review the stress tests associated with these risks;
• Endorse Annual Funding & Liquidity plans and the associated liquidity limits, structural funding and cross currency limits ratios;
• Monitor any limit breaches and target shortfalls, & monitor progress against liquidity plans, Risk Appetite Limits and Recovery Triggers including modifications of plans;
• Approve the transfer pricing and liquidity benchmarks for CEP;
• Understand key legal and regulatory constraints the CEP legal vehicle, as well as emerging issues; and,
• Review Company key documents in order to recommend for approval, including the ILAAP and ICAAP, and Group policies applicable to the Company, insofar as they are relevant to the Committee’s responsibilities.
The current composition of the ALCO is set out below:

Pillar 3 Disclosures December 2020 83
Table 91: CEP Asset and Liability Committee Composition
Membership 31 December 2020
Chief Executive Officer – Chair
CEP Chief Financial Officer
CEP Treasurer
CEP Chief Risk Officer
CEP Chief Administration Officer
Treasurer Hungary
CEP Head of TTS
CEP Head of Markets and Securities Services
Treasurer Bulgaria and Romania
Treasurer Czech and Slovakia
CEP Head of Market & Liquidity Risk
CEP Head of Banking

Pillar 3 Disclosures December 2020 84
Conflict of Interest Policy In line with the requirements of the EBA Guidelines on internal governance under Directive 2013/36/EU (EBA/GL/2017/11), the following section provides an overview of the conflict of interest policy applicable to CEP and to the management body. As CEP is a significant European financial services provider and part of a global banking group, its Board of Directors seeks to operate to the highest ethical standards in compliance with all relevant laws, regulations, codes and guidance in each of the jurisdictions in which the Company conducts business. The Board has responsibility for overseeing the implementation of the Citigroup Code of Conduct which covers the management of conflicts of interest for the Company and its staff. A copy of the Citigroup Code of Conduct, is available on the Citigroup Investor Relations website. The Board must also be in a position to identify actual or potential conflicts of interest affecting Board members, and manage them fairly and appropriately, so as to ensure objective decision-making, oversight and compliance with external and internal requirements. Accordingly the Board has established a separate CEP Board Conflicts of Interest Standard (Standard) relating solely to the Board. The Standard sets out the principles and requirements applicable to the Directors who have or may have personal interests or duties that conflict with the interests of, or their duties to, the Company. The Standard, together with any applicable terms of a Director's letter of appointment, reflects and supplements the applicable requirements in that regard contained in:
• Irish Companies Act 2014
• Central Bank of Ireland Corporate Governance Requirements for Credit Institutions 2015
• European Union (Capital Requirements) Regulations 2014 (S.I. 158/2014) relating to EU Directive 2013/36/EU (CRD)
• Guidelines on internal governance under CRD issued by the European Banking Authority on 26 September 2017 (EBA/GL/2017/11)
• Basel Committee on Banking Supervision – Guidelines – Corporate Governance Principles for Banks July 2015

Pillar 3 Disclosures December 2020 85
Business Continuity Management
Enterprise resilience through Covid-19 pandemic
Citi’s Continuity of Business (CoB) Policy and Standards require all Citi businesses, including those businesses under CEP, to implement a CoB Programme that includes; Assessment processes, Business Recovery Planning, Crisis Management Planning, Testing, Maintenance, Quality Review, Training, Monitoring and Reporting. In response to the Covid-19 pandemic, Citi has been able to successfully implement its Continuity of Business plans to provide proactive measures in preserving staff well-being and maintaining the ability to serve our clients with no major impact to our operations. Citi also recognises the rapidly expanding regulatory focus on Operational Resilience. Citi is developing its approach to Operational Resilience with an aim of embedding the key concepts around business services, impact tolerances and harm into the firm as part of the resilience programme.

Pillar 3 Disclosures December 2020 86
Appendix 1: CEP & CHIL Board Member Biographies
CEP Directors’ Board Membership and Experience 31 December 2020 Executive Directors
Cecilia Ronan Cecilia Ronan is an Executive Director of CEP and is the Chief Executive Officer (CEO) of CEP as well as Citi Country Officer (CCO) for Citi Ireland. Appointed CCO in 2018 and CEO in 2020, Cecilia leads the Citi franchise in Ireland, providing strategic and operational leadership for the European legal vehicle. As CCO, Cecilia works with Product and Function Heads to design, execute and embed the business strategy in Ireland. She leads and is accountable for the management of risk and controls and protecting and enhancing Citi’s brand in the Irish market. In addition, she is responsible for the attraction, development and retention of the outstanding people that Citi’s values, business and strategy require. Cecilia joined Citi in 2000 as a Senior HR Business Partner, before becoming Head of HR for the Irish Franchise and CEP. Prior to that, Cecilia worked in Microsoft Ireland and across a range of roles in Government and NGOs in Africa. Cecilia has a Bachelor of Civil Law from University College Dublin and a Masters in HR from Leicester University. Cecilia is a member of the Board of the National College of Ireland, a Fellow of the Institute of Bankers and a member of the FSI Executive Board.
Silvia Carpitella
Silvia Carpitella is an Executive Director of CEP and is also the Chief Financial Officer (CFO) of CEP. Silvia joined Citi in 1989 in Internal Audit, Italy and has over 20 years’ experience in CEP and in the Financial Services Industry. She has extensive local and European regulatory and governance experience throughout her career and with the Central Bank of Ireland, European Central Bank and with BaFin. Silvia was appointed CFO of Europe and CEP in 2018 and to the CEP Board in 2020. She was previously a board member of CGME, Citi Spain and Citibank Switzerland S.A. and Cluster CFO for Western Europe, Switzerland, Israel, Russia, Ukraine and Kazakhstan Silvia also serves on the board of Citigroup Wealth Management S.A.M. in the Principality of Monaco. She graduated 110 cum laude in Business Administration at the University of Florence.
Independent Non-Executive Directors
Breffni Byrne Breffni Byrne is an Independent Non-Executive Director of CEP and Chair of the Nomination Committee. Breffni is also a Non-Executive Director for Zurich Insurance plc and CPL plc. He is a former chair of Aviva’s General Insurance and Life Insurance operations in Ireland and of NCB Stockbrokers and Tedcastle Holdings. He is also a former non-executive director and audit committee chair of Irish Life and Permanent PLC, Ark Life, Hikma Pharmaceuticals Plc and Coillte Teoranta Ltd. A chartered accountant, Breffni was formerly Managing Partner of the Audit and Business Advisory practice of Arthur Andersen in Ireland and Risk Management Director of Andersen’s audit practices in the Middle East, India, Africa and the Nordic countries.
Desmond Crowley Desmond (Des) Crowley is an Independent Non-Executive Director of CEP and Chair of the Remuneration Committee. Des graduated with a B.A. Mod. (Economics and Mathematical Economics) from Trinity College Dublin. Des joined Andersen Consulting in 1980 and worked on a variety of consulting assignments in Financial Services, Government and Pharmaceutical in the UK, USA, Scandinavia and Ireland. Des joined Bank of Ireland Group in 1988, where he had a varied career running business units and parts of the Retail Bank. In March 2000 he became a member of the Bank of Ireland Group’s executive committee, on being appointed Chief Executive of Retail Banking. Des was appointed Chief Executive of UK Financial Services, Director of Bristol & West plc and Bank of Ireland UK Holdings plc in January 2006. He was appointed Chief Executive - Retail UK Division in March 2012.
Des is a former Chair of Post Office Financial Services and Director of First Rate Exchange Services, the foreign exchange joint venture
with UK Post Office. Former Board member of New Ireland Assurance Company plc. Current board member of AXA Insurance, Aldermore Bank and MontoNovo Finance Limited.
John Gollan John Gollan is an Independent Non-Executive Director of CEP and Chair of the Audit Committee. John is also a member of the supervisory board and chair of the audit committee of Euronext NV and chair of the board of Euronext London Ltd. Currently he is also chair of the charity, Brain Research UK, which funds research into neurological conditions. Previously, John was a board member of NYSE LIFFE and a non-executive director of Merrill Lynch International, where he chaired the board risk committee, and Bank of America Merrill Lynch International Limited, where he chaired the board. His executive career includes roles as board chair, CEO and CFO, working in the United Kingdom, Europe and Asia in banking, fund management and financial markets with Standard Chartered, Lloyds Bank, Gartmore and SIX Group. John was also the practice leader of KPMG’s Financial Services Consulting, Asia and is a Fellow of the Institute of Chartered Accountants in England and Wales.
Jeanne Short Jeanne Short is an Independent Non-Executive Director of CEP and Chair of the Board Risk Committee. Jeanne is the former CRO of UBS APAC region, a role she held from 2012 to 2016. Jeanne has over 40 years’ experience in the banking industry, broad sector and geographical knowledge. In her role, Jeanne was part of the senior management team of Risk Control and of APAC at UBS, reporting to a UBS Group executive board member. Prior to UBS, Jeanne held a number of positions at Charterhouse Bank and Hambros Bank.
Jeanne was previously a director of Charterhouse Bank, UBS Limited and a member of the Board of Governors of the Bridge Academy.

Pillar 3 Disclosures December 2020 87
Non-Executive Directors
Susan Dean Susan joined the Board of CEP as a Non-Executive Director in March 2016 and in September 2016, she was appointed as Chair. Before leaving Citigroup in 2011, Susan was the Chief Financial Officer of Citi's Institutional Clients (ICG) businesses globally. Susan joined Salomon Brothers in 1987. Other, previous roles included: Chief Financial Officer for the Citigroup franchise in EMEA; head of ICG Operations and Technology; past sponsor of CitiWomen. Susan qualified as an accountant with PwC.
Patrick Dewilde Patrick Dewilde is a Non-Executive Director of CEP. Patrick was appointed Head of Markets and Securities Services, Asia Pacific ex-Japan in April 2014 and retired after 41 years in Banking in March 2018. Patrick began his career in KBC in Belgium before joining Citibank in Bahrain in 1983, in Treasury Marketing and Sales. He relocated to Turkey in 1984 and was later appointed Head of Investment Bank. Patrick then moved to Vienna in 1989 to run the Austrian Treasury and Investment Bank. He became CCO of Austria from 1991 to 1994, then relocated to Philippines as Head of Investment Bank and Country Treasury from 1994 to 1998, before moving to Hong Kong in 1998. He relocated to London in late 2003 to run the Sales and Trading for Middle East, Turkey and Israel. In 2005, Patrick established the Risk Treasury for CEEMEA based in London covering 33 countries. From 2010 to 2014, Patrick was concurrently the Regional Markets Head for South and East Africa, Turkey and Israel.
Peter McCarthy Peter McCarthy is a Non-Executive Director of CEP. Peter was appointed Chief Administrative Officer for Europe, Middle East & Africa (EMEA) in February 2012 and is also a member of the EMEA Operating Committee. Alongside the EMEA CEO, Peter is responsible for cascading global strategy, delivering regional targets, and developing and co-ordinating regional strategy and initiatives. In particular, he is responsible for ensuring the alignment of Global Functions and Operations & Technology to successfully implement the strategy in EMEA. Together with his Operating Committee partners, Peter has responsibility for franchise governance across EMEA, which includes membership of senior governance forums and extensive interaction with the Regional CCO community. Peter is the CBNA Regional Coordinator for EMEA and is Head of the CBNA London branch. He is also a Board member of Citibank Nigeria Ltd. Peter has an active interest and involvement in people management and talent development. He is an active participant in various Leadership and Development initiatives and is an active faculty member for the “Leaders teaching Leaders” programmes. Prior to assuming his current position, Peter was Chief Administrative Officer for the ICG Markets business in EMEA. He is a Chartered Accountant with over 38 years of experience in Financial Services.

Pillar 3 Disclosures December 2020 88
Appendix 2: Non-disclosed Tables Please see below a list of disclosure tables not included in CEP’s Pillar 3 Table 92: Non-disclosed tables
Table Rationale
EU INS1 – Non-deducted participations in insurance undertakings Templates excluded on the basis of immateriality or non-
applicability Template 9: Collateral obtained by taking possession and execution processes
EU CRE – Qualitative disclosure requirements related to IRB model
CEP does not have any credit or counterparty credit exposures under the IRB, IMA or IMM approach as at 31 December 2020. [Note: CEP went live with internal models IMM and IMA on 1 January 2021]
EU CR6 – IRB approach – Credit risk exposures by exposure class and PD range
EU CR7 – IRB approach – Effect on the RWAs of credit derivatives used as CRM techniques
EU CR8 – RWA flow statements of credit risk exposures under the IRB approach
EU CR9 – IRB approach – Backtesting of PD per exposure class
EU CR10 – IRB (specialised lending and equities)
EU CCR4 – IRB approach – CCR exposures by portfolio and PD scale
EU CCR7 – RWA flow statements of CCR exposures under the IMM
EU MR2-A – Market risk under the IMA
EU MR2-B – RWA flow statements of market risk exposures under the IMAPD range
EU MR3 – IMA values for trading portfolios
EU MR4 – Comparison of VaR estimates with gains/losses
Template 2. Quality of forbearance
CEP’s gross NPL ratio is under the 5% threshold
Template 5: Quality of non-performing exposures by geography
Template 6: Credit quality of loans and advances by industry
Template 7: Collateral valuation – loans and advances
Template 8: Changes in the stock of non-performing loans and advances
Template 10: Collateral obtained by taking possession and execution processes – vintage breakdown
KM2: Key metrics - TLAC requirements
CEP does not currently have a TLAC requirement
TLAC1: TLAC composition for G-SIBs (at resolution group level)
TLAC2 – Material subgroup entity – creditor ranking at legal entity level
TLAC3 – Resolution entity – creditor ranking at legal entity level
Template EU-SEC2 - Securitisation exposures in the trading book
CEP acts only as investor in its Securitisation book
SEC3 - Securitisation exposures in the non-trading book and associated regulatory capital requirements - institution acting as originator or as sponsor
SEC5 - Exposures securitised by the institution - Exposures in default and specific credit risk adjustments

Pillar 3 Disclosures December 2020 89
Glossary AFS Available for Sale
ALCO Asset and Liability Committee
APAC Asia-Pacific
A&T Agency & Trust
BAC Board Audit Committee
BRC Board Risk Committee
BRCC Business Risk, Compliance and Control Committee
CAP Capital Accumulation Programme
CCB Citi Commercial Banking
CCF Credit Conversion Factor
CCO Citi Country Officer
CCP Central Counterparty Clearing House
CCR Counterparty Credit Risk
CCyB Countercyclical buffer
CE5 Eastern European Cluster (Bulgaria, Czech Republic, Hungary, Romania, Slovakia)
CEM Current Exposure Method
CEO Chief Executive Officer
CEP Citigroup Europe PLC
CET 1 Common Equity Tier 1
CFO Chief Finance Officer
CHIL Citibank Holdings Ireland Limited
CoB Continuity of Business
CPB Citi Private Bank
CRD Capital Requirements Directive
CRM Credit Risk Mitigation
CRO Chief Risk Officer
CRR Capital Requirements Regulation
CVA Credit Valuation Adjustment
DIRAP Discretionary Incentive and Retention Award Plan
EAD Exposure at Default
EBA European Banking Authority
ECAI External Credit Assessment Institution
ECL Expected Credit Loss
EEA European Economic Area
EEPE Effective Expected Positive Exposures
EMEA Europe, Middle East and Africa
EU European Union
EVE Economic Value of Equity
EVS Economic Value Sensitivity
EXCO Executive Committee
FBE Forborne Exposure
FCA Financial Conduct Authority
FLP Funding and Liquidity Plan
G10 Group of Ten (refers to the countries that have agreed to participate in the General Arrangements to Borrow (GAB))
G-SIB Global Systemically Important Bank
HQLA High-Quality Liquid Assets
ICG Institutional Clients Group
ICSD International Central Securities Depositories
IFRS International Financial Reporting Standards
ILAAP Internal Liquidity Adequacy Assessment Process
ILOCS Insurance Letters of Credit
IMA Internal Model Approach
IMM Internal Models Method
IRE Interest Rate Exposure
IRRBB Interest Rate Risk in the Banking Book
ISDA International Swaps and Derivatives Association
JST Joint Supervisory Team

Pillar 3 Disclosures December 2020 90
KEPSP Key Employee Profit Sharing Plan
KRI Key Risk Indicators
LCR Liquidity Coverage Ratio
LFG Law Firm Group
LGD Loss Given Default
MCA Manager’s Control Assessment
MDB Multilateral Development Bank
MME Middle Market Enterprises
MREL Minimum Requirement for Own Funds and Eligible Liabilities
MRT Material Risk Takers
MSS Markets and Securities Services
NIR Net Interest Revenue
NPE Non-Performing Exposure
NSFR Net Stable Funding Ratio
ORM Operational Risk Management
O-SII Other Systemically Important Institution
OSUC Outstanding and Unused Commitment
OTC Over The Counter
P&C Personnel and Compensation
PBV Performance Based Vesting
PD Probability of Default
PFE Potential Future Exposure
PRA Prudential Regulation Authority
PRC Product Review Committee
PSE Pre-Settlement Exposures
PSG Professional Services Group
PTIP Personal Trading & Investment Policy
RAS Risk Appetite Statement)
RBA Role-Based Allowances
RemCo Remuneration Committee
RWA Risk Weighted Assets
SFT Securities Financing Transaction
SME Small and Medium sized Enterprises
TLAC Total Loss Absorbing Capacity
TTS Treasury and Trade Solutions
UHNW Ultra-High Net Worth
VaR Value at Risk