THE HISTORY OF COPYRIGHT IN TANZANIA: FROM TANGANYIKA TO TANZANIA-WHERE, WHEN AND HOW.
Upload
khangminh22Category
view
2download
0
HURIA
Journal of The Open University of Tanzania
Volume 27(2) September, 2020 ISSN 0856 6739
The Open University of Tanzania
P.O. Box 23409,
Dar es Salaam, Tanzania
Fax: +255 22 2668759
http://www.out.ac.tz
Huria Journal, Vol 27(2), September 2020
© The Open University of Tanzania, 2008
ii
CHIEF EDITOR
Prof. Magreth S. Bushesha The Open University of Tanzania
TECHNICAL EDITOR
Ms. Brenda Mallinson Rhodes University, South Africa
EDITORIAL BOARD
Prof. Elinami Swai, The Open University of Tanzania
Prof. Jephias Mapuva Bindura University of Science Education,
Zimbabwe
Prof. Rotimi Ogidan National University of Nigeria
Prof. Alexander Makulilo University of Dar es Salaam, Tanzania
Prof. Happy Kayuni University of Malawi
Dr. Thomas Molony University of Edinburgh, UK
Dr. Joram Tarusarira University of Groningen, The
Netherlands
Dr. Felix Masiye University of Zambia
Dr. Oscar Otele University of Nairobi, Kenya
ADVISORY BOARD
Prof. Ezra K. Martim Egerton University, Kenya
Prof. Uswege Minga Tumaini University, Tanzania
Dr. Moses Khisa North Carolina State University, USA
Dr. Ruth Carlitz University of Gothenburg, Sweden
Dr. Bossman Asare University of Ghana
Dr. Steve Kerr Imternational School of Muscat, Oman
EDITORIAL OFFICE
Ezra Kaimukilwa
Mr. Augustine Kitulo
The Open University of Tanzania,
Kawawa Road, Kinondoni Municipality,
P. O. Box 23409,
Dar es Salaam, Tanzania
Tel: +255 222 668 835, 222 668 820
Fax: +255 222 668 759
E-mail: [email protected]
Website: http://www.out.ac.tz
Huria Journal, Vol 27(2), September 2020
© The Open University of Tanzania, 2008
iii
© The Open University of Tanzania 2020
All rights reserved.
NOTE
Opinions expressed in this journal are those of the authors and not
necessarily those of the publishers – The Open University of Tanzania.
Huria Journal, Vol 27(2), September 2020
© The Open University of Tanzania, 2008
iv
CONTENTS
Constitution-Making Process in Tanzania (2011-2014): A New Era for
Women Political Participation? ................................................................. 1 Alexander Makulilo and Victoria Lihiru ......................................... 1
Assessment of Wildfires in Tanzania Forest Plantations: A Case of Sao
Hill in Mufindi District ........................................................................... 30 Maximillan Mgina and Anna Wawa .............................................. 30
Transaction Cost of Sunflower Seed Production in Tanzania: Application
of Transaction Cost Economics Theory .................................................. 56 Deus Ngaruko and Timothy Lyanga .............................................. 56
Metal Contamination in Sediments of Coastal Rivers around Dar es
Salaam, Tanzania .................................................................................... 72
Matobola Joel Mihale .................................................................... 72
Implication Analysis of Pre and Post-Harvest Losses of Maize to
Household Food Security in Kongwa and Kondoa Districts-Tanzania .. 93 Namkunda Johnson, Agnes Nyomora and James Lyimo ............... 93
Factoring the Trust in the Regulatory Relationships: A Reflection from
Tanzania’s Mining Sector ..................................................................... 115 Furaha Julius ............................................................................... 115
Investigation on The Level of Insecticide Resistance to Malaria Vectors
in Ruangwa District Lindi Region Tanzania ......................................... 135
Godfrida R. Clement, Emmanuel S. Kigadye and Nicodem J.
Govella ......................................................................................... 135
Nutritional Prospects and Phyto-Therapeutical Potentials of the Selected
Indigenous Green Leafy Vegetables Commonly Used in Tanzania ..... 148
Josephat Alexander Saria ............................................................ 148
Impacts of Climate Change on Food Security and Adaptation Options for
Smallholder Farmers in Malawi ............................................................ 165
Ben Busizori Twinomugisha and Reguli Baltazar Mushy ........... 165
Utilization of Extended Postpartum Family Planning among Post-
Delivery Women in Mvomero District, Morogoro-Tanzania ............... 190 Rogate Phinias Ibrahim and Harrieth G. Mtae ........................... 190
Huria Journal, Vol 27(2), September 2020: 1-29
1
Constitution-Making Process in Tanzania (2011-2014):
A New Era for Women Political Participation?
Alexander Makulilo [email protected]
University of Dodoma
Victoria Lihiru [email protected]
The Open University of Tanzania
ABSTRACT
Constitution-making as a public policy process requires substantive
participation of all citizens in determining the content of the constitution.
In Tanzania, unlike the colonial and post-colonial constitution-making
legal framework and processes, the 2011-2014 constitution-making
process was a critical juncture for it was governed by the Constitutional
Review Act, CAP 83 R.E 2012 which for the first time contained
provisions allowing citizens including women to participate and influence
the content of the 2014 Proposed Constitution. This article examines two
interrelated questions notably the extent to which women were involved in
the constitution-making process, and how such participation impacted the
content of the Proposed Constitution in terms of protection and
promotion of women political participation in the country. It is argued
that the legal framework facilitated meaningful participation of women in
each step of the constitution-making process. Consequently, women
managed, for the first time in history, to secure constitutional guarantees
of equality and non-discrimination in political life.
Keywords: Tanzania, constitution, gender, Constitutional Review
Commission, Constitutional Review Act, CAP 83 R.E. 2012
INTRODUCTION
Globally, participation in the constitution-making process is emerging as
a legal right. For the constitution to have legitimacy and to fulfil the
notion that the government is ‘of the people, by the people, and for the
people,’ all citizens, both men and women, should be substantially involved in
determining the content of the constitution.1 The United Nations
1 Hart Vivien ‘Democratic constitution-making’ (2003)- Module 4_5.1A.pdf. (n.d.), available at http://www.constitutionnet.org/files/Module%204_5.1A.pdf accessed on March 21, 2019.
Huria Journal, Vol 27(2), September 2020: 1-29
Constitution-Making Process in Tanzania (2011-2014): A New Era for Women Political Participation? Alexander Makulilo & Victoria Lihiru
2
Human Rights Committee (UNHRC)2 through General Comment No. 253
expounds the meaning of the right to take part in the conduct of public
affairs, and confirms participation in constitution-making process as a
legal right in line with Article 25 of the International Covenant on Civil
and Political Rights (ICCPR).4 The UNHRC asserts that citizens
participate directly in the conduct of public affairs when they choose or
change their constitution or decide public issues through a referendum or
other electoral processes conducted in accordance with paragraph (b) of
Article 25 of ICCPR. Specifically, women’s rights advocates infer women
the right to participate in constitution-making from Article 7(b) of the
Convention on Elimination of All Forms of Discrimination against
Women (CEDAW).5 Article 7 (b) of CEDAW provides rights for women
to participate in the formulation of government policy, its
implementation, to hold public office and perform all public functions at
all levels of a government. Also, the Protocol to the African Charter on
Human and Peoples' Rights on the Rights of Women in Africa (Maputo
Protocol)6 requires state parties to take specific measures to ensure
women are equal partners with men at all levels of development and
implementation of state policies and development programmes. The
inclusion of the word participation in the formulation and implementation
of public policy provides clear guidance and better inference of
constitution-making as a public policy process necessitating public
participation including that of women.
2 The Human Rights Committee is established by Article 28 of the ICCPR 1966. 3 UN Human Rights Committee (HRC) ‘CCPR General Comment No. 25: Article 25 (Participation in Public Affairs and the Right to Vote), The Right to Participate in Public Affairs, Voting Rights and the Right of Equal Access to Public Service’ 12 July 1996, CCPR/C/21/Rev.1/Add.7, available at RefWorldhttp://www.refworld.org/docid/453883fc22.html accessed 16th October 2019. 4 International Covenant on Civil and Political Rights (ICCPR) adopted and opened for signature, ratification, and accession by General Assembly resolution 2200A (XXI) of 16 December 1966, came into force on 23 March 1976. The ICCPR, together with the Universal Declaration of Human Rights and the International Covenant on Economic Social and Cultural Rights, are considered the International Bill of Human Rights. Available at FAQ: The Covenant on Civil & Political Rights, https://www.aclu.org/other/faq-covenant-civil-political-rights-iccpr accessed on 15th October 2019. 5 CEDAW is often referred to as the ‘women’s bill of rights.’ It is one of the core international human rights treaties of the United Nations treaty system, which requires member states to undertake legal obligations to respect, protect, and fulfil human and women’s rights. CEDAW was adopted and opened for signature and accession by the United Nations General Assembly Resolution 34/180 on 18 December 1979. Tanzania ratified CEDAW in 1985, Kenya in 1984, and Rwanda in 1981. 6 Article 66 of the African Charter on Human and Peoples' Rights provides for the making of special protocols or agreements where necessary to supplement the provisions of the African Charter. This gave power to the Assembly of Heads of State and Government of the Organization of African Unity in its Thirty-First Ordinary Session in Addis Ababa, Ethiopia, in June 1995 to endorse by resolution AHG/Res.240 (XXXI) the recommendation of the African Commission on Human and Peoples' Rights to elaborate a Protocol on the Rights of Women in Africa.
Huria Journal, Vol 27(2), September 2020: 1-29
Constitution-Making Process in Tanzania (2011-2014): A New Era for Women Political Participation? Alexander Makulilo & Victoria Lihiru
3
Inspired by CEDAW, the Maputo Protocol and the general world trends
some countries have pioneered the incorporation of participation in
constitution-making process as a legal right in national constitutions and
laws. For instance, the Constitution of the Republic of South Africa7
specifies under Sections 59(1)(a), 72(1)(a) and 118(1)(a) that the National
Assembly should ensure government by the people under the Constitution
by facilitating public involvement in the legislative and other processes of
the Assembly. The recent constitution-making processes in East Africa
exemplified by the process towards the making of the 2010 Kenyan
Constitution, was also guided by the Constitution of Kenya Review Act,8
containing detailed legal framework guaranteeing peoples participation in
the constitution-making process. In Tanzania, especially after the long
existence of the 1977 Tanzania’s Constitution coupled with several ad
hoc amendments, and persistence of peoples’ demand for the new
Constitution, the process of reviewing the constitution occurred from
2011 to 2014. This epoch was the only historic moment that Tanzania as
a country endeavoured to engage in a participatory constitution-making
process. This article examines two interrelated questions notably the
extent to which women were involved in the 2011-2014 constitution-
making process, and how such participation impacted the content of the
2014 Proposed Constitution in terms of protection and promotion of
women political participation in the country. It is argued that the legal
framework facilitated meaningful participation of women in each step of
the constitution-making process. Consequently, women managed, for the
first time in history, to secure constitutional guarantees of equality and
non-discrimination in political life.
Many modern constitutions, including that of Tanzania, were originally
written by men at a time when women were systematically denied the
right to take part in decision-making spaces.9 Women were excluded in
three tiers, first in identifying constitutional issues, second in the process
of defining constitutional priorities, structures and rules, and third as
citizens participating in these structures and enjoying the rights at the
7 Constitution of South Africa, 2014. 8 The Constitution of Kenya Review Act Chapter 3A Revised Edition 2009 (2008) Published by the National Council for Law Reporting with the Authority of the Attorney General. Lancaster constitutions were negotiated at independence by the British upon handover of state powers to newly independent states. Peter Kasanda, Teresa Parkes and James Pius ‘Tanzania Constitution Review – President announces date for referendum’ (2014) Clyde & Co LLP. 9 Hari P. Bhattarai & Jhalak Subedi (ed) ‘Democratic constitution making experiences from Nepal, Kenya, South Africa and Sri Lanka’ (2007), International IDEA ISBN: 978-99933-838-4-0.
Huria Journal, Vol 27(2), September 2020: 1-29
Constitution-Making Process in Tanzania (2011-2014): A New Era for Women Political Participation? Alexander Makulilo & Victoria Lihiru
4
same level as men.10 As large groups of women were not part of the
freedom and the independent constitution negotiations, their will and
wishes did not feature in the 1961 Independence Constitution.11 As a
result, the Tanzania’s Parliament contained only six women by 1965.12
Yet, the constitutional amendments in Tanzania commenced as the
required two-thirds majority of all members of the Assembly to support
and pass any alteration of the Constitution was achieved. These legal
provisions allowed the Government and the Legislative Assembly to be
the main constitution-making organs, and no public consultations were
required by law.13 As a result, a few political elites dominated and
spearheaded the onward Constitutional Amendments. For example, soon
after independence, Tanganyika African National Union (TANU)14
nominees formed a Constituent Assembly and revised the 1961
Constitution,15 which gave birth to the 1962 Republican Constitution and
established a strong presidential system.16 In 1965, the Republican
Constitution was modified by a group of a few government officials to
cater for the 1964 Union between Tanganyika and Zanzibar.17 This led to
the adoption of the Interim Constitution of the United Republic of
10 Ibid. 11 In 1961, the Tanzanian Independence Constitution was based on the traditional Lancaster style, imposed by British colonialists, without a Bill of Rights and public participation. 12 United Nations Economic Commission for Africa (2005-09) Tanzania Gender Networking Programme (TGNP): Report on African Gender and Development index (AGDI)-the Tanzania Report (2005) Addis Ababa © UN. ECA, available at http://hdl.handle.net/10855/3777 accessed on 15 December 2019. 13 HWO Okoth Ogendo Constitutions without Constitutionalism: Reflections on an African Political Paradox. New York American Council of Learned Societies. 14 Geoffrey Ross Owens ‘The secret history of TANU: Rumor, historiography and Muslim unrest in contemporary Dar Es Salaam’ History and Anthropology’ (2005) 16:4, 441-463, DOI: 10.1080/02757200500399107. 15 ‘Key Historical and Constitutional Developments’ available at http://www.kituochakatiba.org/sites/default/files/legal-resources/Tanzania%20Key%20Historical%20and%20Constitutional%20Developments.pdf accessed on 9 October 2019. The 71 elected members of the national assembly, all elected members of TANU passed a law that allowed them to convert the national assembly into a constituent assembly with powers to adopt the new constitution. 16 Ibid. The new President of Tanzania was granted the prerogatives of both former roles, Governor General and First Minister, serving as the head of state as well as commander in chief of the armed forces. He was granted the right to designate the vice president and Ministers, and the right to dismiss the Parliament under certain circumstances. The President also inherited security-related, repressive powers that were formerly of the Governor General, with the addition of new ones; the Preventive Detention Act, for example, gave the President the right to detain any person without trial. Under the 1962 constitution, the president inherited all the powers of the governor by the colonial legislation such as the Deportation Ordinance, the Collective Punishment Ordinance, the Emergency Powers Order in Council to which the independent government added its own repressive laws such as the notorious Preventive Detention Act, which gave the president powers to detain a person without trial. An existing national assembly which converted to a constituent assembly by an Act of parliament passed the new Republican Constitution. 17 Ibid. In 1964, Tanganyika and Zanzibar merged into the "United Republic of Tanzania" that same year. The Union was constituted by signing of a treaty called the Articles of Union by the respective heads of state Mwalimu Nyerere and Abeid Amani Karume. It was ratified by the respective legislative bodies and became part of the municipal law called the Acts of Union). These agreements had been ratified under the name "Articles of Union", and became part of the new constitution as "Acts of Union."
Huria Journal, Vol 27(2), September 2020: 1-29
Constitution-Making Process in Tanzania (2011-2014): A New Era for Women Political Participation? Alexander Makulilo & Victoria Lihiru
5
Tanganyika and Zanzibar.18 The constitution was again amended in 1965
to abolish the multi-party political system and formalise a one-party state
system.19 The process for enacting the 1965 Tanganyika Interim
Constitution was through an ordinary Act of Parliament, without
involvement of the people.20 The 1965 Tanganyika Interim Constitution,
under Article 51, provided the procedure for amendment of the
Constitution. The procedure required any Bill intending to alter the
Constitution to be supported and approved by no less than two-thirds of
votes of members of Parliament. Further, after the 1964 Union of
Tanganyika and Zanzibar,21 Articles vii (a) and (b), of the Article of the
Union of Tanganyika and Zanzibar22 provided a procedure for the
adoption of a permanent constitution.23 According to the Articles of the
Union, the permanent constitution was to be proposed by a constitutional
commission, which would then send it to the constituent assembly for
deliberation and adoption. 24 The permanent constitution was supposed to
be adopted within a year.25 After twelve years, the President of the United
Republic of Tanzania appointed a 20-person joint party committee to
propose a new Constitution.26 However, within a short time, the
committee made and sent proposals to the National Executive Committee
(NEC) of the ruling party which adopted them in a day and in camera.27
In 16 March 1977, the President appointed the Constituent Assembly on
the same day as the Committee, to discuss and enact the new
constitution.28 The Bill for the new Constitution was published seven days
before the Constituent Assembly met to discuss it and enacted the
18 The most notable feature of the Acts of Union as incorporated in the Union Constitution was the establishment of the double government structure that is also part of Tanzania's current constitution. This structure included one government for the Union and one largely autonomous independent government for Zanzibar. Zanzibar's government included its own Parliament and President. The President of Zanzibar also served as vice president of the Union. The constitution of 1964 was adopted as interim. The Acts of Union themselves included directions on steps to take to elaborate a definitive constitution, to be elaborated by a constituent assembly comprising representatives of both TANU and ASP. This procedure was initiated but was later suspended. 19 This was coherent to the double government structure defined in 1964; the 1965 Constitution identified two government parties, TANU for the Union and AfroShirazi Party for Zanzibar. The Constitution of TANU was made a schedule to the Constitution thus legally endorsing the emergence of a party state. 20 ‘Key Historical and Constitutional Developments’ op cit note 22. 21 Challa M Future Generation Learning Resources, NGL Resources, available at https://johnchalla.wordpress.com/2017/06/06/the-reasons-of-the-union-between-tanganyika-and-zanzibar/ accessed on 9th October 2017. 22 ‘Key Historical and Constitutional Developments’ op cit note 27. 23 Ibid. First Schedule of the Union of Tanganyika and Zanzibar Act No. 22 964 on 7/01/2019. 24 Ibid. The Constituent Assembly was supposed to be composed with representatives of both Tanganyika and Zanzibar. 25 Ibid. 26 ‘Key Historical and Constitutional Developments’ op cit note 29. The committee was headed by Thabit Kombo. 27 Ibid. 28 Ibid.
Huria Journal, Vol 27(2), September 2020: 1-29
Constitution-Making Process in Tanzania (2011-2014): A New Era for Women Political Participation? Alexander Makulilo & Victoria Lihiru
6
Constitution in three hours after it was presented.29 Both the
Constitutional Commission and Constituent Assembly were formed albeit
in a fashion that side-lined public participation.30 In 1977, the fourth and
permanent Constitution, namely the 1977 Constitution of United Republic
of Tanzania31 was adopted. Generally, the independent constitution and
the subsequent amendments were silent on how marginalized groups,
such as women, could participate in decision-making processes. As such,
Tanzania was not legally obliged to involve women in decision-making
positions, including in the constitution-making activities. This is despite
the great role women played during the anti-colonial struggles.32
TANU as the supreme organ of the state, co-opted the autonomous
associations that participated in the nationalist struggles, including the
political party’s women’s wings namely Umoja wa Wanawake wa
Tanzania (The Union of Tanzanian Women).33 The use of parliament as a
rubber stamp for new constitutional amendments pushed women away
from engaging in the constitution-making processes. It is noted that, a
shift from a multiparty to a single-party political system resulted in the
number of women in the Tanzania’s Parliament dropping from 10 to 8.5
per cent.34
It is noted however that, the ratification of ICCPR, CEDAW, and the
African Charter on Human and Peoples' Rights (the African Charter)35
started to influence constitution-making processes especially from the
year 1980. For instance, the amendment to the 1977 Permanent
29 Ibid. 30 Ibid. The public was never consulted and did not have the opportunity to debate the needs, structure and division of power of the Union and other key governance matters. 31 (Cap 2 R: E 2002). 32 Tanganyika had the largest percentage of women in any African parliament in 1960 with 10 percent (six) of the seats held by women. All these seats belonged to the Tanganyika African National Union (TANU), which won the election, and was the dominant party in the post-election legislature. Among African countries, it was believed that TANU had strong belief in gender equality and involvement of women in government structures. See, Aili Mari Tripp ‘Women and Politics in Africa Subject’ (2017) Women’s History DOI:10.1093/acrefore/9780190277734.013.192 33 Ibid. Women political wings agendas, finances and leaders were controlled by the ruling party. It is noted that sometimes women roles in the ruling parties were reduced to providing entertainment and cooking for visiting party and government dignitaries. 34 Ibid. 35 On 27 June 1981, at its 18th General Assembly Meeting in Nairobi, Kenya, the Heads of State and Government of the OAU adopted the African Charter on Human and Peoples’ Rights. It came into force on 21 October 1986. The African Charter promotes and protects human rights and basic freedoms in the African continent. A protocol to the Charter was subsequently adopted in 1998.Articles 2 and 3 of the ACHPR provides that the enjoyment of the rights and freedoms recognised in the Charter apply equally without distinction of any kind such as race, ethnic group, colour, sex, language, religion, political or any opinion, national and social origin, fortune, birth or other status.
Huria Journal, Vol 27(2), September 2020: 1-29
Constitution-Making Process in Tanzania (2011-2014): A New Era for Women Political Participation? Alexander Makulilo & Victoria Lihiru
7
Constitution in 1984 36 was an exception particularly on the area of public
participation. Despite that, Article 98 of the 1977 Constitution required
support and approval from two-thirds of the members of the parliament;
several debates were conducted for one year to allow for the collection of
public views on the Constitution. The opening of constitution-making
process to the public led to the inclusion of the Bill of Rights under part
III of the Constitution.37 Public debates convinced the Party and
Government that the constitutional exercise would be incomplete without
a Bill of Rights in the Constitution. It was for the first time, the
Government agreed to the public demands even with the silence of the
1977 Tanzania Constitution on people’s participation in constitution-
making process.
It is further noted that, due to the opening of a political space for civil
society actors, freedom of press, and greater donor interventions,
multiparty system was reintroduced in Tanzania. In 1991, the Nyalali
Commission38 was established with instructions to collect people's views
on whether Tanzania should continue with a single party or adopt a multi-
party system. The Nyalali Commission’s recommendations included the
need to amend both the Union and Zanzibar’s Constitutions to reflect the
will and wishes of the Tanzanian people.39 Based on recommendations
from the Commission, the Eighth Amendment to the 1977 Constitution
reinstituted a multiparty political system in May 1992.40 Alongside the
introduction of a multiparty system, change in women’s political
participation was witnessed in the 1990s, especially after women’s
temporary measures were provided by Article 4 (1) of CEDAW and the
African Charter,41 and on a larger scale after the 1995 UN Fourth
Conference on Women in Beijing.42 The Beijing Conference adopted a
36 United Nations Department of Public Information, op cit note 58. The amendments were based on the 1983 proposals which were drawn up by the Executive Committee of ruling party to correct certain anomalies, and shortcomings highlighted in the Party’s 1981 guidelines. The National Executive Committee looked at the political situation in Tanzania and the need to provide for democratic safeguards within the context of a one-party democracy and also to guarantee the socialist goals to which Tanzania is committed. There were three main areas which were pointed out for analysis and possible reform, namely-the powers of the Presidency, the supremacy of Parliament, and a participatory democracy. 37 Ibid. As a result of the debate there demands for more autonomy of Zanzibar which threatened the party and led to announcing a “pollution of political atmosphere” forcing the then leadership of Zanzibar to resign. 38 The commission constituted of 22 Commissioners, with equal membership, that means ten members each from both TanzaniaMainland and Zanzibar. The Commission was chaired by the late Chief Justice Francis Nyalali. 39 Ibid. In May 1992 the Eighth Amendment was adopted reinstituting multi-party-political system of governance. 40 Ibid. 41 Temporary special measures are provided under Article 2 of African Charter which require state-parties to “take corrective and positive action in those areas where discrimination against women in law and fact continues to exist.” 42 To accelerate women participation in decision-making article 4 (1) of CEDAW requires ‘adoption by States Parties to practise positive discrimination by adopting temporary special measures to accelerate de facto equality between men and
Huria Journal, Vol 27(2), September 2020: 1-29
Constitution-Making Process in Tanzania (2011-2014): A New Era for Women Political Participation? Alexander Makulilo & Victoria Lihiru
8
Plan for Action encouraging member states to ensure women’s equal
access to and full participation in power structures and decision-making
processes.43 As a result of the Beijing Plan for Action, the Eighth
Amendment to the 1977 Tanzania’s Constitution introduced a quota of 15
per cent special seats for women in the Parliament. Consequently, the
number of women in the Tanzania’s Parliament increased to 16.5 per cent
after the 1995 election.
In addition, following the 1986 Donald Marshall v Canada44 precedent
and the UNHRC General Comment no. 25 in 1996, participatory
constitution-making was accepted as a legal right falling within the
interpretation of the wording ‘public affairs’ referred to in Article 25 of
ICCPR.45 The UNHRC Comment no. 25 provided for a twenty-year-long
awaited clarification on the applicability of Article 25 of ICCPR,
requiring states to involve the public when making their constitutions.
With the onset of the UNHRC General Comment no 25, changes on how
constitutional amendments were undertaken was observed in Tanzania.
In response to demands by members of opposition parties who wanted the
Constituent Assembly to be set up and draft the new constitution, the
Government issued a White Paper46 in 1998 that contained a list of
demands from stakeholders, including the need for a new constitution.47
The White Paper also outlined the Government’s position on each
demand. In response to public demands, the President appointed a 16-
member committee to hear the people’s views on the future constitution
and make necessary recommendations.48 The committee sought the views
of more than half a million Tanzanians from across the country. This was
women. CEDAW requires state parties to take all appropriate measures to eliminate discrimination against women in the political and public life of the country, and to ensure to women, on equal terms with men, the right to vote in all elections and public referenda and to be eligible for election to all publicly elected bodies. United Nations Publication ‘Women Rights are Human Rights’ (2006) hr/pub/14/2, SALES NO. E.14.xiv.5 ISBN 978-92-1-154206-6 e-ISBN 978-92-1-056789-3. 43 Ibid. To accelerate the implementation of action in these areas, the Commission on the Status of Women, at its forty-first session in 1997, adopted Agreed Conclusions (1997/2), which emphasized that attaining the goal of equal participation of men and women in decision-making was important for strengthening democracy and achieving the goals of sustainable development. The Commission reaffirmed the need to identify and implement measures that would redress the under-representation of women in decision-making, including through the elimination of discriminatory practices and the introduction of positive action programmes. 44 U.N. Doc. CCPRC/43/D/ 205/1986 (Dec. 3, 1991), available at http://wwwl.umn.edu/humanrts/undocs/html/dec205. html. 44 [1994] 3 S.C.R. 627. 45 U.N. Human Rights Comm., Marshall v. Canada, 5.3, U.N. Doc. CCPRC/43/D/ 205/1986 (Dec. 3, 1991), available at http://wwwl.umn.edu/humanrts/undocs/html/dec205. htm. 46 White Paper, No. 1 of 1998. 47 Key Historical and Constitutional Developments’ available at http://www.kituochakatiba.org/sites/default/files/legal-resources/Tanzania%20Key%20Historical%20and%20Constitutional%20Developments.pdf accessed on 9 October 2019. 48 Ibid. The committee was led by Justice Kisanga.
Huria Journal, Vol 27(2), September 2020: 1-29
Constitution-Making Process in Tanzania (2011-2014): A New Era for Women Political Participation? Alexander Makulilo & Victoria Lihiru
9
the first time in history where public views were sought to inform the
Constitution.49 One of the committee’s recommendations required the
Government to open up political spaces for women in line with
international conventions.50 The Tanzania’s Government responded to the
committee’s recommendations with the 13th and 14th Amendments to the
1977 Constitution which among other things, increased the number of
special seats for women to 20 per cent in Parliament,51 and later to 30 per
cent in 2000 and 2005 respectively. After the fourteenth amendments
were undertaken to the 1977 Constitution, Tanzania began a process to
obtain a new Constitution in the year 2011.
METHODOLOGY
This work employed documentary review. Reports, statutes, constitutions
as well as previous studies were reviewed in order to ascertain positions
of women in the constitution making processes and the actual gains
contained in the proposed constitution. This method is useful since the
process took place more than five years ago. Retrieving data for the
purpose of this study could better be obtained from documents. Moreover,
data analysis was done qualitatively to allow in-depth understanding of
realities during the constitutional making process in Tanzania.
FINDINGS AND DISCUSSION
The 2011 Constitution-Review Process
As a departure from the colonial and post-colonial constitution-making
legal framework, the 2011 was governed by the Constitutional Review
Act (CRA) which for the first time contained legal provisions for citizen
participation in constitution-making as a legal right. Section 4 of the CRA
called for a mechanism to allowing the public to participate widely and
freely in expressing and transmitting public opinions on matters relating
to the constitution. The key constitution-making organs with roles and
responsibilities to guide main steps for constitution-making processes
were legally established. The CRA established the Constitutional Review
Commission (CRC) as the body responsible for consulting, collecting
public opinions and finally providing Tanzanians with a new
constitution.52 As such, the CRA obliged the CRC to regulate
49 Ibid. 50 Ibid. 51 33.3 percent on local councils. The amendment further, prohibited Sexual discrimination under Paragraph (5) of Article 13 of the 13th and 14th Amendments to the 1977 Constitution of United Republic of Tanzania 52 The commission was responsible for coordinating and collection of public opinions on the Constitution; to examine and analyse public opinions; to provide for fora for constitutional review; to provide for preparation and submission of report on
Huria Journal, Vol 27(2), September 2020: 1-29
Constitution-Making Process in Tanzania (2011-2014): A New Era for Women Political Participation? Alexander Makulilo & Victoria Lihiru
10
constitutional fora, prepare and submit reports on the public opinions,
convene the constituent assembly, and conduct a referendum. Section 6
(7) of the CRA required the President to consult widely with the political
parties, civil societies and other institutional stakeholders in appointment
of the commission’s members.53 After wide consultation, the President
appointed thirty members - fifteen from Zanzibar and fifteen from
Tanzania Mainland to lead the constitutional review process.54
To ensure effective public participation of both men and women, the
CRA stipulated several approaches that the commission could use, such
as conducting awareness programmes, holding of public meetings, and
assemblies.55 One of the notable weaknesses of the CRA is that it doesn’t
mention the educational role of the CRC on specific substantive
constitutional issues.56 However, the Commission resolved to undertake
sensitisation and awareness-raising while collecting the public views on
the new constitution.57 This was a critical decision since most Tanzanians
were not aware of the constitution, let alone understand their role in the
constitution-making process.58 The commission allowed those who were
unable to present their views during the public meetings to do so by
filling in a special form. These modalities were useful in reaching a
significant number of people including women. A minimum of three
public meetings were held in each district and a total number of 1,365,337
people attended about 1,942 meetings.59
the public opinions; to provide for the procedure to constitute the Constituent Assembly, the conduct of referendum and to provide for related matters. 53 They were invited to nominate two candidates from their institutions. It was reported by the Government that there was a total of 550 names proposed by political parties, religious institutions, NGOs and other interested parties. See Jesse James ‘The constitution-making process in Tanzania,’ (2013) Legal and Human Rights Centre. 54 As per section 6 (7) the President paid regard to equality of the two parts of Tanzania, namely Tanzania mainland and Zanzibar, experience, gender, age and social groups representation as key factors when the President was appointing the members to the CRC. 55 According to section 17 (1) (2) (3) and Section 17 (9), the Commission could ask any person willing to appear before it for discussion, orally or by production of document, on any constitutional matter which the Commission considered relevant to the constitutional review process. 56 Jesse James op cit note 64. 57 Ibid. 58 In the first five months, the Commission went around the country to collect views from the people about the new constitution. The first round started from 2nd July 2012 and was completed on 30th July 2012. It marked the beginning of the views collection. The Commission spent almost one month to collect the views from the citizens in this round. The Commission visited eight regions which were marked as the zone. These were Pwani, Dodoma, Manyara, Kagera, Shinyanga, Tanga, Southern Unguja and Southern Pemba. The Commission successfully collected the views in all eight (8) regions. See Speech by the Chairman of the Constitutional Review Commission on launching a Draft Constitution, on 3 June 2013. 59 See Speech by the Chairman of the Constitutional Review Commission on launching a Draft Constitution, on 3 June 2013.
Huria Journal, Vol 27(2), September 2020: 1-29
Constitution-Making Process in Tanzania (2011-2014): A New Era for Women Political Participation? Alexander Makulilo & Victoria Lihiru
11
Women Participation in the 2011-2014 Constitution Review Process
Participatory constitution-making should ensure that the constitution-
making legal framework facilitates participation of all marginalized
groups such as women, youth, elders, the hard-to-reach population and
persons with disabilities.60 For the purpose of this paper, analysis is based
on how the Tanzania’s Constitution-making legal framework facilitated
meaningful participation by women in each step of the constitution-
making process by providing specifically for, a) women’s right of
participation in constitution-making processes; b) the composition of
women in constitution-making structures; c) women’s key-constitutional
demands; d) participation of women’s special constituency assemblies;
and lastly e) how women participated in the referendum.
Legal Provisions for Women’s Participation in Constitution-Making
Reaching out to all strands of people and collecting their views on the
new constitution was one of the key deliverables of the Constitution
Review Commission (CRC). In order to ensure effective public
participation of both men and women, the Constitution Review Act
(CRA) requires the CRC to use several approaches such as conducting
awareness programmes and holding of public meetings and assemblies.61
However the CRA does not contain specific provisions for promoting
women participation in constitution-making process but it uses a neutral
language allowing all people to participate. Gender is only mentioned as a
key criterion for the selection of members of the CRC under Section 6 (3)
of CRA. In addition, Section 9(2) obliges the CRC to pay attention to the
principle of equality before the law and respect of human rights while
drafting the constitution. Further, the CRA requires the CRC to facilitate
the full participation of women in the process at different levels.62 The
commission organised women-only opinion collection sessions and
encouraged women to organise their own meetings throughout the
country to discuss women’s key priorities for the new constitution.
60 Guidance Note of The Secretary-General ‘United Nations Assistance to Constitution-making Processes’ (2009). 61 According to section 17 (1) (2) (3) and Section 17 (9), the Commission could ask any person willing to appear before it for discussion, orally or by production of document, on any constitutional matter which the Commission considered relevant to the constitutional review process. 62The CKRA included names of the women organizations such Maendeleo ya Wanawake Organization (MYWO); National Council of Women of Kenya (NCWK); and Federation of Women Lawyers (FIDA) to be among the organizations to choose representatives to form the Reference Group in providing technical support, researched and factual information on gender and women issues to be covered by the new constitution.
Huria Journal, Vol 27(2), September 2020: 1-29
Constitution-Making Process in Tanzania (2011-2014): A New Era for Women Political Participation? Alexander Makulilo & Victoria Lihiru
12
After President Kikwete announced the launch of the new constitution-
making process, women organised themselves and formed the Wanawake
na Katiba63 Coalition (Women’s Coalition on the Constitution)
hereinafter referred as the Women Coalition, to streamline priorities,
lobby and ensure that the new constitution would be inclusive of women’s
political, social, and economic rights. Due to strategic positioning of the
Women Coalition,64 the CRC invited the coalition several times to share
women’s views, priorities, and issues with regard to the new constitution.
Members of the CRC were impressed by clear articulation of the
women’s issues and further requested the women’s coalition to engage on
issues beyond those affecting women only.65
Women’s Participation in the Constitutional Review Bodies
The presence of women in constitution-making bodies is important in
influencing inclusion of gender specific provisions in the new
constitution.66 The constitution-making legal framework must contain
specific provisions that facilitate the presence of women in constitution-
making bodies.67 Section 6(c) of the CRA requires adherence to the
principle of gender equality in the appointment of the CRC members.68
Despite the use of the word equality by section 6(c) of the CRA women in
the CRC did not exceed thirty percent. Among 30 members, only ten
were women. In addition, the positions of the CRC chairperson, vice
chairperson, secretary and vice-secretary were all occupied by men.69
63 Translated as Women and the Constitution Coalition. 64 This Coalition has 65-women member organizations who are defenders of Human Rights, especially women’s and Children’s rights, with multiple and variable experiences equitably distributed country-wide. These organisations forming Women and Katiba Coalition are, Tanzania Media Women Association(TAMWA), Women Fund Tanzania (WFT), Tanzania Women Cross Party (TWCP)-ULINGO, Tanzania Gender Networking Programme (TGNP), Tanzania Women Lawyers(TAWLA), Equality for Growth (EfG), Haki za Wanawake (HAWA), Kilimanjaro Women Information Exchange and Consultancy Organization (KWIECO), Shirikisho la Vyama vya Walemavu Tanzania (SHIVYAWATA), Tanzania Union Congress Tanzania (TUCTA), Tumaini Women Development Association (TUWODEA), Women Legal Aid Centre (WLAC), Zanzibar Gender Coalition(ZGC), individual feminists and activists, among others. See Ruth Meena ‘Gender analysis of the proposed constitution of the United Republic of Tanzania: Gains and Challenges’ (2014) available at http://womenfundtanzania.nl/wp-content/uploads/2014/12/28Oct14-ENGL.GENDER-ANALYSIS-GAPSCHALLENGES.pdf accessed on 2nd January 2019. 65 Ibid. 66 Guidance Note of the Secretary-General op cit note 72. 67 Ibid. 68 Section 6(c) of the CRA. 69 Among the 15 commissioners nominated from Tanzania mainland 6 were women and 9 men; in Zanzibar among the 15 nominated members 4 were women and 11 men. The former Prime Minister of Tanzania and Attorney General, Hon. Judge Joseph Sinde Warioba was appointed as the Chairperson. The retired Chief Justice of Tanzania, Hon. Augustino Ramadhan was appointed the Vice Chairperson. The President appointed Mr. Assaa Ahmad Rashid (from Zanzibar) as the Commission’s Secretary and Mr. Casmir Sumba Kyuki (from Mainland) as Commission’s Vice-Secretary.
Huria Journal, Vol 27(2), September 2020: 1-29
Constitution-Making Process in Tanzania (2011-2014): A New Era for Women Political Participation? Alexander Makulilo & Victoria Lihiru
13
Women’s Demands in the New Constitution
The CRA recognizes and promotes women’s participation in constitution-
making. However, after several consultative processes among the
members of the Women Coalition, twelve key demands were identified.70
The demands encompassed among other things, the need for the new
constitution to provide for equal representation between men and women
to engage in all levels of decision-making processes.71
Women’s Participation in the Constitutional Foras and in Special
Constituency Assembly
After collection of public views and issuance of the draft constitutions,
the next step was for deliberations of the draft constitutions by the
national assembly before the referendum. In February 2013, after
collection and analysis of the public opinion, the CRC produced the First
Draft Constitution.72 The draft contained among other things, key gains of
the twelve areas of priority identified by women.73 Relating to matters
pertaining to women political participation, the First Draft Constitution
suggested significant change in the electoral system by abolishing
parliamentary special seats for women and provided that for every
constituency, each political party should field a man and a woman as
candidates. As such voters will vote for a man and a woman of their
choice from any political party as their representatives in that particular
constituency. This provision implies that women would be elected
democratically, and will be accountable to their voters and their own
electoral constituencies, thus addressing challenges associated with the
women’s special seats arrangement.74
70 These priorities were: women’s rights to be spelt out in the constitution; prohibiting all laws, regulations and practices which discriminate against women; women’s rights to dignity to be protected by the constitution; the international instruments and standards to be respected and translated into laws; constitution to guarantee equal rights for women in decision making organs; spelling out the age of the child (to protect girl children against early marriages); women’s rights to access, control and benefit from national resources should be spelt out in the constitution; women’s rights to maternal health services to be spelt out; women’s rights to access and benefit from basic services to be spelt out; the rights of women with disabilities to be spelt out; a commission to monitor and oversee implementation of these rights to be provided as one of the accountability instruments for gender equality; a family court to be provided for in the constitution. 71Article 66 (1)(b) of the 1977 Constitution of the United Republic of Tanzania established the Special Seat system which provides for a 30% quota for women which is subject to criticisms. 72 The Draft Constitution (“titled in Kiswahili— Rasimu ya Katiba ya Jamhuri ya Muungano wa Tanzania, 2013”) contains 240 Articles. It is long compared to the current Constitution of 1977 which has only 152 Articles. 73 Ruth Meena ‘Gender analysis of the proposed constitution of the United Republic of Tanzania: Gains and Challenges’ (2014) available at http://womenfundtanzania.nl/wp-content/uploads/2014/12/28Oct14-ENGL.GENDER-ANALYSIS-GAPSCHALLENGES.pdf accessed on 2nd January 2019. 74 ‘Draft Constitution in Tanzania proposes gender equality in electoral system’ available at https://demofinland.org/draft-constitution-in-tanzania-proposes-gender-equality-in-electoral-system/?lang=en accessed on 2 January 2018.

Huria Journal, Vol 27(2), September 2020: 1-29
Constitution-Making Process in Tanzania (2011-2014): A New Era for Women Political Participation? Alexander Makulilo & Victoria Lihiru
14
It is noted however that, the fact that the First Draft Constitution was only
available in English posed a serious challenge, as less than 20 per cent of
Tanzanians speak English and it made it difficult for the majority of the
population, particularly women, to understand the content of the draft
constitution without assistance.75 The Women Coalition took immediate
efforts to translate the draft constitution in Swahili, but financial
constraints hindered the dissemination of the translated version to
majority Tanzanians especially those in remote areas. Therefore, it
affected how the majority people provided feedback to the commission on
the content of the draft constitution.
After issuing the first draft constitution, the formation and operation of
constitutional fora was the second step for constitution-making.76 The
Commission, in line with section 18 of CRA, allowed reactions from the
public through district constitutional fora, direct meetings, letters,
petitions, and memoranda.77 The fora were tasked to review the first draft
constitution and make comments with a view to improve it before it went
to the Constituent Assembly.78 There were two types of fora. The first
type was managed by the Commission79 while the second was managed
by organisations or institutions.80 The Women’s Coalition made a great
effort to influence the first draft by translating, reading, analysing and
commenting on how it responded to the women’s twelve priorities. The
Coalition also identified gaps, provided alternatives on how they could be
addressed, and compiled its report and submitted the proposed
recommendations to the Commission for further consideration in the
Second Draft.81 The women’s coalition and other civil society
organisations, such as the Legal and Human Rights Centre, launched a
75 ‘New Constitution: Civil society has taken an active role,’ Available at http://www.kepa.fi/jasensivut/jasenblogi/12992 as accessed on 3 October 2019. 76Section 18 of the CRA. 77As per section 18 (6), it says for the purpose of this section, the Commission may allow organizations, associations or groups of persons to convene meetings in order to afford opportunity to its members to air their views on the Draft Constitution and forward such views to the Commission. 78 This phase started officially in June 2013 and was completed on 31st August 2013. 79 Ibid. These were constituted under the level of District. The Commission was directly responsible to supervise them. Election of members to these fora started from village (in rural area) or mitaa (in urban areas) and then at ward level and finally at district level. People were invited to apply within their village or mitaa to be elected by residents of those areas. Those who were elected in each village or mitaa went to the ward level to compete with others elected from other villages or mitaa. Elections were also done at the ward level and those elected went to the district to constitute the District forum. 80 Ibid. These were formed by organisations or institutions which wanted to do so. So, political parties, various institutions, religious organizations, professional clubs, civil society organizations and any groups of persons with the same interests formed their own independent fora. These types of fora were not supervised by the Commission. They were self-supervising. They were required to present their views to the Commission after their meetings on or before 31st August 2013. 81 Ruth Meena op cit note 85.
Huria Journal, Vol 27(2), September 2020: 1-29
Constitution-Making Process in Tanzania (2011-2014): A New Era for Women Political Participation? Alexander Makulilo & Victoria Lihiru
15
countrywide campaign through constitutional fora to educate remote
populations including women, on the content of the draft constitution and
the extent to which women’s rights had been catered for and what they
could do further to attain progressive gender provisions.82
There were issues pertaining to how the constitutional fora were operated,
which posed doubts on key areas such as inclusivity, viability and
acceptability of the fora’s deliberations. At first, the formation of the fora
was to be democratic and transparent. People who wanted to be forum
members in the villages, streets and ward levels were requested to apply
and be elected.83 However, the elections were marred by violence, and
the voting of the members were influenced by political, tribal and
religious forces.84 Members were screened by Ward Development
Committees (WDCs) of which the majority of its members were
dominated by councillors from ruling party, Chama Cha Mapinduzi
(CCM). This led to perception that the views and deliberations from the
constitutional fora were unduly influenced by the dominant party, causing
challenges in acceptability of the constitutional fora as platforms for
gathering views for genuine enrichment of the First Draft Constitution. 85
After compilation and analysis of the public opinion on the first draft
constitution from the constitution fora, the commission prepared and
released the Second Draft Constitution.86 The Women Coalition found the
Second Draft Constitution to have systematically incorporated women’s
key priorities except for a few identified gaps.87 Just like the First Draft,
82 Ibid. 83 Ibid. 84 A total of 19,378 constitutional fora members were elected all over the country. In Tanzania Mainland, a total of 18,180 members were elected to form the constitutional fora. Zanzibar had 1,198 members of the fora of whom 1,005 were elected from all Shehia. Each shehia was represented by three members. And, all 193 councillors joined the for a as members. 85 Ibid. Another challenge was on the closer look of section 17 and 21 (3) of the CRA which states that: “Any person or organization wishing to conduct awareness programmes on constitutional review must register under the relevant laws and must disclose sources of his/their funds. Failure to do so constitutes an offence punishable by a fine of not less than Tzs.5, 000,000/= and not exceeding Tzs .15, 000,000/= or imprisonment for a term of not less than three years 86 Ibid. 87 Ruth Meena op cit note 93. Further, in its preamble, the proposed draft constitution commits among other things to build a society which is free from all forms of discrimination including gender. In defining discrimination, the draft constitution affirmed that purposeful acts to rectify the historical imbalances in the society shall not be deemed to be discrimination. The draft considered gender equality as one of governance issues, and its overall goal included the principle of equality generally, while specific social, economic and political objectives included gender equality goals. The draft constitution directs that goals and specific objectives spelt out in this draft constitution will guide the interpretation and implementation of the constitutional principles. The draft constitution established the principle of supremacy of the constitution, hence declares all practices, traditions and cultural beliefs which contradict the constitutional principles null and void. The second draft constitution also affirmed respect for all international and regional standards which the country is a party to such standards including CEDAW, CRC, and the Maputo Protocol.
Huria Journal, Vol 27(2), September 2020: 1-29
Constitution-Making Process in Tanzania (2011-2014): A New Era for Women Political Participation? Alexander Makulilo & Victoria Lihiru
16
the Second Draft Constitution endorsed the women’s demand for the
provision of equal representation between men and women in the
decision-making processes by providing that each electoral constituency
should have one male and one female candidate from each political
party.88 The second draft allowed independent candidates and provided
for non-registration of political parties that had not taken gender equality
principles into consideration. 89 Allowing independent candidates was a
great gain for women in the Second Draft Constitution. It was expected
that it would allow women who were not interested to be members of
political parties, but have political ambitions to still stand as candidates.90
After the issuance of the Second Draft Constitution, the CRA provided
for a Constituent Assembly as the third step of the constitution-making
process.91 The President, in agreement with the President of Zanzibar,
appointed members and convened the Constituent Assembly. As per the
CRA, the President appointed 201 different governmental and non-
governmental organisations to join the existing members of parliament
and together they formed the Special Constituent Assembly (SCA).92 The
President considered the qualifications and experience of the nominees as
well as the gender factor.93 Before he appointed members of the SCA, the
Women’s Coalition took the initiative to consult and influence the then
President Jakaya Mrisho Kikwete to observe equal representation
between men and women when appointing the SCA’s members. This was
the greatest move by the Women’s Coalition and a major success for
women, as the President appointed 101 men and 100 women, almost in
88 Ibid. This is likely going to reduce the financial burden which individual women have to incur when contesting for electoral position. It is also more likely that such modality will reduce electoral corruption and build a more gender responsive electoral culture. In the final analysis, electoral resources will be used in a more equitable manner, reduce corruption and finally the nation will benefit by getting legislatures who are more accountable; who will adhere to ethical standards. 89 Ibid. This is a first time in the history of this country that demands are made on political parties to address gender equality and non-discriminative practices in decision-making organs. For women movement, this is a great gain, as political parties are gate-keepers in defining and determining who gets in or who is out in political participation in electoral processes. 90 Ibid. 91 Ibid. After releasing the second draft constitution, the CRC submitted the report and the Second Draft Constitution to the President who published it in the Gazette and other local newspapers with a statement that the Second Draft Constitution was to be presented to the Constituent Assembly for enactment as the proposed Constitution. 92 As per section 22.-(1) A Constituent Assembly consisted of the following members: (a) all members of the National Assembly of the United Republic; (b) all members of the House of Representatives of Zanzibar; (c) one hundred and sixty six members drawn from the following: (i) Non-Governmental Organisations; (ii) Faith Based Organisations; (iii) all fully registered political parties; (iv) institutions of higher learning; (v) groups of people with special needs; (vi) Workers Association; (vii) an association representing farmers; (viii) an association representing pastoralists; and (ix) any other group of persons under whatever name having common interest. 93 The President consulted the interest groups and selected names from their lists of nominees to be members of the SCA. Ruth Meena op cit note 99.
Huria Journal, Vol 27(2), September 2020: 1-29
Constitution-Making Process in Tanzania (2011-2014): A New Era for Women Political Participation? Alexander Makulilo & Victoria Lihiru
17
parity. Further, due to the great role of the Women Coalition in the
constitution review process, six of its members were appointed to be part
of the SCA. In total, there were 620-members in the SCA94 of whom 256
were women, comprising 41.3 per cent of the entire Assembly.95 Before
the CSA began its work, there were leadership positions that needed to be
filled. In the election for the Interim Chairperson of the SCA, only one
out of four candidates were a female, and a male candidate won. During
the election of the deputy SCA Chairperson, only two candidates were
women, and a woman won.96 The pattern is also reflected at the SCA
Committees level, where women chaired four out of fourteen committees,
and ten out of fourteen vice chairpersons were female. This suggested that
it was easy to accept women as deputies but not at the helm of the
assembly or respective committees.97
As the CSA began its work, the Women’s Coalition also started to
empower all members of SCA on the twelve women’s priorities for the
new constitution.98 Through the coalition’s experts and consultants, the
Coalition produced a deeper analysis of the second draft constitution from
a gender perspective by comparing it with best practices from other
jurisdictions with progressive constitutions such as Rwanda, Kenya, and
South Africa.99 The Women’s Coalition provided the female members of
the CSA with well-researched, factual and evidence-based
recommendations on what should be discarded, retained or added to the
second draft constitution. This was in addition to enhancing the
coalition’s capacity to identify male champions who were willing to
support the women’s agenda during the whole process.100 The Women
Coalition also intervened through the media in various TV and radio
programmes and through the issuance of press releases whenever
anything occurred that was likely to be detrimental to obtaining a gender-
sensitive constitution.101 Further, the Coalition conducted a national
convention in the capital city, Dodoma, as a parallel or shadow SCA with
94 Comprising 365 ordinary members of parliament, 54 members from the Zanzibar House of Representatives and 201 presidential appointees from civil society and other non-governmental organisations’ members charged with the task of reviewing the second draft constitution. Jesse James op cit note 121. 95 Ruth Meena op cit note 105. 96 Ibid. 97 Ibid. 98 Ruth Meena op cite note 108. 99 Ibid. 100 Ibid. 101 Ibid. The women coalition lobbied for about 10 different TV spaces to utilise whenever a need arise, they issues various new papers articles and social media press releases.

Huria Journal, Vol 27(2), September 2020: 1-29
Constitution-Making Process in Tanzania (2011-2014): A New Era for Women Political Participation? Alexander Makulilo & Victoria Lihiru
18
rural women to enhance their understanding of the constitution-making
processes. They were reminded of women’s priorities versus the content
of the Second Draft Constitution, and jointly, strategies to influence the
remainder of the constitution-making process were devised.102
Women’s Participation in a Referendum
After the Special Constituency Assembly completed its work and
produced the 2014 Proposed Constitution, the new constitution was
supposed to be put to a referendum. The CRA provided for a referendum
to be conducted by the Electoral Commission of the Union, and that of
Zanzibar. The Constitution should have been approved by a ‘Yes’ or ‘No’
vote.103 The Women Coalition started preparation for the referendum by
strengthening the Coalition and analysing other existing related laws in
the new constitution. The Coalition informed women of the gains
obtained from the Proposed Constitution, and on why they should vote
‘Yes’ during the referendum. The referendum was initially announced to
take place on 30 April 2015 but was later postponed until further
notice.104
Women’s Achievements in the Proposed New Constitution
In determining the extent that the final content of the Proposed
Constitution provides, promotes and protects women’s participation in
decision-making processes, guidance from criteria deduced from Article 7
(a) and (b) of CEDAW is sought. It provides that: -
‘States Parties shall take all appropriate measures to eliminate
discrimination against women in the political and public life of the
country and, in particular, shall ensure to women, on equal terms
with men, the right: (a) To vote in all elections and public
referenda and to be eligible for election to all publicly elected
bodies; (b) To participate in the formulation of government policy
and…’
The UNWOMEN and International IDEA Guidance Note on Women’s
Human Rights and National Constitutions, Leadership and Political
102 Ibid. 103 Ibid. 104 Ibid.
Huria Journal, Vol 27(2), September 2020: 1-29
Constitution-Making Process in Tanzania (2011-2014): A New Era for Women Political Participation? Alexander Makulilo & Victoria Lihiru
19
Participation105 expound Article 7 of CEDAW and require scrutiny of the
final content of constitutional provisions in relation to how they provide
for i) the general guarantees of equality and non-discrimination; ii) a
favourable electoral system and modalities for women’s participation in
decision-making processes; iii) regulation of political parties; iv) the role
of the electoral management body in protection and promoting women
participation in elections; v) institutions to safeguard women’s rights; vi)
procedure for amending the new constitutions, and vii) the new
constitutions as a basis for progressive electoral reforms.106 These criteria
are discussed below in understanding the level of women’s influence and
gains they obtained as a result of their participation in the making of the
2014 Proposed Constitution of Tanzania.
Constitutional General Guarantees of Equality and Non-Discrimination
in Political Life
For women to have meaningful participation in decision-making
processes, principles of equality and non-discrimination against
discriminatory traditions among other things, must be established in the
nation’s constitution. This is because in countries such as Tanzania,
customs, traditions, and public attitudes not only determine how many
women are considered and nominated for office, but also they have a
direct and indirect influence on how many female candidates win a
general election.107 During the 2011-2014 constitution-making process in
Tanzania, women consistently demanded for prohibitions of
discriminatory customs and traditions, which for a long time, have placed
them on unequal footing with men, particularly in the decision-making
arena.
Equality Guarantees
The use of gender-neutral language has been widely recognized as being
hugely important in the struggle for gender equality and normalisation of
women being equal in social, economic, and political spheres.108 The use
of gender-neutral language, such as ‘each person’, ‘both men and
women’, ‘every person’ or ‘every citizen’ features across the wording of
105 Ibid. 106 Ibid. 107 International Institute for Democracy and Electoral Assistance, Constitution Assessment for Women’s Equality, ISBN: 978-91-7671-049-4, (2016), available at https://www.idea.int/sites/default/files/publications/constitution-assessment-for-womens-equality.pdf accessed on 5th February 2019. 108 Suzannah Weiss ‘7 Gender-neutral terms we should all be using’, available at https://www.bustle.com/p/7-gender-neutral-terms-we-should-all-be-using-9565996 accessed on 15 July 2018.
Huria Journal, Vol 27(2), September 2020: 1-29
Constitution-Making Process in Tanzania (2011-2014): A New Era for Women Political Participation? Alexander Makulilo & Victoria Lihiru
20
the 2014 Proposed Constitution. The Proposed Constitution also covers
the general principles of equality before the law. Paragraph 1 of the
Preamble of the 2014 Proposed Constitution commits the Government to
build a nation guided by principles of human dignity, freedom, human
rights, equality of persons and gender equality. Gender equality is stated
as a governance principle under Article 6 (g)109 and it runs through the
political, economic, and social development sections.
Furthermore, under equality guarantees criteria, the national constitutions
are required to include equality as one of the key principles in applying
and interpreting the constitution and other laws, and in making or
implementing any policy decisions. The 2014 Proposed Constitution
stipulates development of the economy to be guided by principles of
equity and equal opportunities to all citizens as provided for under Article
8. The use of gender neural language and recognition of equality
principles in the 2014 Proposed Tanzania’s Constitution is a major
constitutional gain for women. Gender equality principles in the
constitution help in shifting the mind set about the role of women in the
society and provide a strong foundation for women to take a first step to
their greater participation in all sectors of life, including in decision-
making processes.
Non-discrimination Guarantees
Equality guarantees are often followed by a non-discrimination provision
and contain a list of grounds on which discrimination is prohibited,
including gender. The Committee on the Elimination of Discrimination
against Women110 has consistently recommended that state parties
incorporate the definition of ‘discrimination against women’ into their
constitutions from Article 1 of CEDAW, which provides: -
“For the purposes of the present Convention, the term
‘discrimination against women’ shall mean any distinction,
exclusion or restriction made on the basis of sex which has the
effect or purpose of impairing or nullifying the recognition,
109 Also, the development of the economy is supposed to be guided by principles of equity & equal opportunities to all citizen as provided for under Article 8 (e & g) of the Proposed Constitution. 110 The Committee on the Elimination of Discrimination against Women (CEDAW) is the body of independent experts that monitors implementation of the Convention on the Elimination of All Forms of Discrimination against Women. CEDAW Committee consists of 23 experts on women’s rights from around the world. ‘The Committee on the Elimination of Discrimination against Women (CEDAW)’ available at https://www.ohchr.org/en/hrbodies/cedaw/pages/cedawindex.aspx, accessed on 10 February 2019.
Huria Journal, Vol 27(2), September 2020: 1-29
Constitution-Making Process in Tanzania (2011-2014): A New Era for Women Political Participation? Alexander Makulilo & Victoria Lihiru
21
enjoyment or exercise by women, irrespective of their marital
status, on a basis of equality of men and women, of human rights
and fundamental freedoms in the political, economic, social,
cultural, civil or any other field.”
The 2014 Proposed Constitution includes critical elements of Article 1 of
CEDAW in defining discrimination against women as seen in Article 33
(5). Articles 12 (a) and 33 of the 2014 Proposed Constitution of Tanzania
prohibit all forms of discrimination including sex. Also, Articles 8 and 14
(b) of the Proposed Constitution require national authorities to provide
equal opportunities to both women and men, without discrimination.
Hence, the 2014 Proposed Constitution successfully provides and protects
the women’s rights to political participation, by including non-
discrimination provisions that are important to safe-guard women against
discriminatory traditions, customs and beliefs that for a long time have
kept women away from electoral decision-making spaces. Changing
discriminatory practices takes a long time, but the constitutional
provisions to that effect are important to kick start the transition within
the Tanzanian societies towards freedom from discriminatory practises
against women.111
Prohibitions of Harmful Customs and Traditions
As noted in the preceding paragraphs, part of the strategy for the
attainment of meaningful participation of women in political leadership
lies in the explicit prohibition of customary law practices or harmful
customs that have been discriminating negatively against women’s ability
to participate in electoral politics.112 Article 8 (1) of the 2014 Proposed
Constitution obliges the state and its organs to direct their policies and
duties to ensure dignity and respect, and all other human rights are
preserved and maintained considering regional and international
agreements consented to by the United Republic of Tanzania. Customary
law has limited women’s spaces to participate in decision-making for
centuries.113
Specific Provision for Women’s Rights
111 As in 2014 percentage of females was measured at 50.09 in Rwanda, 50.03 in Kenya, 50.05 in Tanzania, 50.03 in Uganda according to the World Bank Group, available at https://data.worldbank.org/indicator/sp.pop.totl.fe.zs accessed on 13 March 2019. 112 Kadaga R ‘Women’s political leadership in East Africa with specific reference to Uganda’ Tenth Commonwealth Women’s Affairs Ministers Meeting ‘Women’s Leadership for Enterprise’ Dhaka, Bangladesh, 17-19 June 2013. 113 Ibid.
Huria Journal, Vol 27(2), September 2020: 1-29
Constitution-Making Process in Tanzania (2011-2014): A New Era for Women Political Participation? Alexander Makulilo & Victoria Lihiru
22
The women’s rights clauses are important tools for advancing gender
equality. In equality and non-discrimination guarantees, constitutions
should contain provisions dedicated to setting out women’s rights only in
addition to every right elsewhere in the constitution that also applies to
women.114 Article 54 of the Proposed Constitution guarantees every
woman the right to: i) be respected, valued and their dignity recognised;
ii) protection against discrimination, harassment, abuse, violence, sexual
violence and harmful traditional practices; and iii) participate in elections
and all stages of decision-making without discrimination.115 Specific
provisions for women’s rights provide for active measures to improve the
position of women, which is usually lower in the society; to enable them
to achieve gender equality through women’s social, economic and
political empowerment.
Gender Equality and Constitutional Status of International Law
The advancement of gender equality is more likely to occur if
constitutions incorporate international law, including aspects of
international human rights standards.116 The kinds of constitutional
provisions that are most favourable to the full enforcement of
international human rights law are those which give international law
direct effect and make them take precedence over domestic law in case of
conflict or where the international law instruments are more rights-
protective.117
In Tanzania, signing or ratification of any international convention does
not automatically place it at the same level as the Constitution or any
other national laws. However, Article 14 (1) of the 2014 Proposed
Constitution ensures that human dignity is preserved and maintained in
accordance with the customs, traditions and regulations of the Universal
Declaration of Human Rights and other international conventions adopted
by Tanzania. Further, Article 8 (1) of the Proposed Constitution obliges
the state and its organs to direct their policies and duties to ensure that
dignity, respect and all other human rights are preserved and maintained
114 The UNWOMEN and International IDEA Guidance Note on Women’s Human Rights and National Constitutions, Leadership and Political Participation, (2012), available at http://www.onu.cl/es/wp-content/uploads/2016/06/Womens-Human-Rights-and-National-Consitutions-Guidance-Note.pdf accessed on 6 November 2017. 115 In women only clause, the 2014 Tanzania Proposed Constitution, continued providing under Article 54: (d) get employment opportunity and be paid the same salary as a man; (e) protection for her employment while she is pregnant and after delivery; (f) get quality medical services including safe reproductive health; and (g) own property. 116 The UNWOMEN and International IDEA Guidance Note op cit note 132. 117 Ibid.
Huria Journal, Vol 27(2), September 2020: 1-29
Constitution-Making Process in Tanzania (2011-2014): A New Era for Women Political Participation? Alexander Makulilo & Victoria Lihiru
23
considering different agreements to which the United Republic of
Tanzania has consented. The Foreign Policy of the United Republic of
Tanzania aims to safeguard national interests and full state sovereignty
and requires that the policy shall be implemented with transparency in
order to respect international laws, observe international and regional
treaties which are beneficial to the United Republic, and to resolve
international conflicts through dialogue.118 Article 62 (1) also requires the
judiciary or any other agency to observe international laws and human
rights in interpreting the provisions of the Constitution regarding human
rights. The recognition and consideration of the international conventions
in the national jurisdiction depict the great influence these conventions
can have on the conduct of state, civil, and political affairs. However,
proper respect and implementation of international conventions or
covenants call for their automatic application in national jurisdiction. It
remains important that, the recognition and application of international
law and standards in the 2014 Proposed Constitution will be paramount to
counter laws, policies, customs and traditions that have side-lined
women’s participation in decision-making processes for ages.
Electoral System and Women’s Participation in Decision-Making
Organs
The Tanzanian women’s priorities for the new constitutions include,
among other things, the need for specific constitutional stipulations that
would facilitate the realisation of equal representation of men and women
in all decision-making processes. It was named as the fifty-fifty agenda
calling for a constitutionally stipulated process that will lead to equal
numbers of men and women in all decision-making processes. In line
with women recommendations, the 2014 Proposed Constitution included
political rights and civil liberties, specifically providing for voting rights
and the right to stand for election. Also, through equality and non-
discrimination provisions, the constitution has set a broader context for
political gender equality and participation in the parliament. Despite the
broad consensus in the literature that the proportional representation
electoral system creates less obstacles to women’s representation,119the
2014 Proposed Constitution provides for the first-past-the post electoral
118 Article 21 (1) of the 2014 Proposed Constitution. 119Ibid. Party list can be either closed, where voters vote only for a particular party, and parties determine who will fill the seats that they have been allocated. Party list can also be open where voters have some degree of choice among individual candidates, in addition to voting for entire parties.
Huria Journal, Vol 27(2), September 2020: 1-29
Constitution-Making Process in Tanzania (2011-2014): A New Era for Women Political Participation? Alexander Makulilo & Victoria Lihiru
24
system to govern presidential and parliamentary elections.120 In a bid to
promote more women in the parliament, the Proposed Constitution did
away with the parliamentary quota system popularly referred as women
special seats, which was introduced in Tanzania in 1985 by the 1977
Constitution of United Republic of Tanzania. As an alternative to a
parliamentary quota, the 2014 Proposed Constitution called for equal
representation of men and women in determining the composition of the
Parliament through Article 124 (4). Astonishingly however, Article 124
(4) limits the intention to realize equal representation of men and women
in decision-making processes only in the parliament. Article 124(4) is not
applicable to determine the composition of men and women in other
decision-making organs or positions. Further, Article 124(4) is silent on
which modalities will be used to facilitate the attainment of equal
representation of men and women, but obliges the Parliament under
Article 124 (6) to enact legislation to classify the procedure of
implementation of Article 124.121
It is noteworthy that, before rewriting the 2014 Proposed Constitution, the
1977 Constitution had under-gone several amendments, which
contributed to an increase in the number of women in the Parliament but
did not lead to realisation of equal representation of men and women. For
example, the first post-independence Tanzania’s Parliament (1962-1965)
contained only 7.5 per cent of women, the number was maintained below
10 per cent until 1985.122 In 1985, constitutional reform introduced a
parliamentary quota system comprising of 15 per cent and 25 per cent of
seats in the Parliament and local councils respectively.123 This
constitutional amendment increased the percentage of women in
parliament to 16.5 after the 1995 election. The Beijing Declaration124 and
120 King C ‘Electoral Systems’ (2000), available at http://faculty.georgetown.edu/kingch/Electoral_Systems.htm accessed on 13 November 2019 121 The explanation from the Constitutional Review Commission entails that each party will have to have both male and female candidates in a constituency, hence once that party wins, both male and female candidate have won. On the other hand, the 1977 Constitution of Tanzania uses the mixture of both first-past-the-post electoral system in the presidential and parliamentary elections and Proportional representation which is used to allocate women seats; the seats for women are distributed among the political parties in proportion to the total number of votes they received as a party. To qualify to offer a special seat candidate, the political party must have at least five per cent of the total parliamentary votes. See Meena R ‘Women participation in positions of power and influence in Tanzania’ available at http://www.redet.udsm.ac.tz/documents_storage/2009-8-19-11-34-23_womenparticipationinpositionsofpower.pdf accessed on14 March 2016. 122 Ibid. 123 Ibid. 124 ‘Fourth World Conference on Women in Beijing China’ available at http://www.un.org/womenwatch/daw/beijing/platform/ declar.htm accessed on 27 May 2016.

Huria Journal, Vol 27(2), September 2020: 1-29
Constitution-Making Process in Tanzania (2011-2014): A New Era for Women Political Participation? Alexander Makulilo & Victoria Lihiru
25
the Southern African Development Community (SADC) Declaration125
required a benchmark of 30 per cent female representation in parliaments.
To comply with the SADC Declaration, Tanzania amended its
constitution to increase the parliamentary percentages of special seats to
20 per cent in 2000 and later to 30 per cent of women in 2005.126 The
2005 elections increased the percentage of women in the Parliament from
21.5 per cent to 30.3 per cent, which increased to 35 per cent after the
2010 election.127 The number further increased to 37.18 per cent after the
2015 election, where 30 per cent of women were appointed through
special seats while 7.1 per cent were from constituencies after winning
competitive elections.128 Therefore, despite facing some challenges,
special seats arrangement has helped Tanzania become a keen promoter
of female political participation with more than 37.2 per cent in the
current parliament.129
Finally, another way an electoral system can promote women’s political
participation is by allowing independent candidates. In Tanzania, the
Women’s Coalition pressed strongly for independent candidates given the
male dominated nature of Tanzanian political parties.130 As a departure
from the 1977 Constitution, Article 135 of the 2014 Tanzania’s Proposed
Constitution also allows independent candidates. This is an important
gain for women as it opens more doors for candidacy in electoral
positions and it diversifies political parties as the only option and gate-
keepers in determining electoral candidates.
Responsibility of Political Parties to Advance Gender Equality
Political parties are the ‘gatekeepers’ for anyone to be elected to office.
Therefore, how they function internally and whether women can gain
leadership positions within parties is crucial.131 Although women play
125 SADC signed the Declaration on Gender and Development on 8th September 1997 at Blantyre, Malawi to promote closer regional cooperation and collective action as a means of fostering gender equality. Available at https://www.sadc.int/documents-publications/show/Declaration_on_Gender__Development_1997.pdf accessed on 15 February 2019. 126 Article 66-1(b) of the 1977 Constitution of United Republic of Tanzania. 127 Ibid. 128 30 per cent came from special seats arrangement and only 7.18 per cent were directly elected. See the United Republic of Tanzania Bunge (National Assembly), available at http://archive.ipu.org/parline/reports/2337.htm accessed on 1 May 2019. 129 ‘Women in national parliaments as in December 2018’, available at http://archive.ipu.org/Wmn-e/world.htm accessed on 5th January 2019. 130 Meena R op cit note 56. 131 United Nations Division for the Advancement of Women (DAW), Department of Economic and Social Affairs (DESA), Economic Commission for Africa (ECA), Inter-Parliamentary Union (IPU) ‘Equal participation of women and men in decision-making processes, with particular emphasis on political participation and leadership’ (2005) Report of the Expert
Huria Journal, Vol 27(2), September 2020: 1-29
Constitution-Making Process in Tanzania (2011-2014): A New Era for Women Political Participation? Alexander Makulilo & Victoria Lihiru
26
important roles in campaigning and mobilising support for their parties,
they rarely occupy decision-making positions in political party
structures.132 The constitution may regulate political parties through a
prohibition on sex discrimination in parties’ membership, a requirement
to include women in party decision-making structures, and nomination
and candidates lists.133 For parties to fulfil their critical functions of
aggregating and expressing the political interests of different public
spectrums, women must be able to take part in setting the priorities and
agendas of parties.134
In Tanzania, for the first time, the 2014 Proposed Constitution requires
political parties to adhere to the gender equality principle in leadership
positions as a condition for registration.135 The constitutional regulations
for political parties are important in influencing the behaviour of political
parties, which in many ways are the gatekeepers of who gets the
constituency candidacy. Having women in the top leadership positions of
the political parties will have a multiplier effect on how nomination rules
facilitate more women as electoral aspirants and candidates.
The Role of Independent and Supportive Electoral Commission
A nation electoral commission should be mandated to oversee compliance
regarding guarantees of women’s participation in electoral politics. 136
For the electoral commission to facilitate women’s participation in
electoral politics, it must adopt gender sensitive guidelines and rules to
govern the conduct of elections. The composition of the members of a
commission and staff must also reflect equality.137 Article 211 of the 2014
Proposed Constitution establishes the Independent Electoral Commission.
However, Article 211 is silent on the promotion of women’s participation
in terms of composition of the members of the commission and in
Group Meeting Addis-Ababa Ethiopia 24 – 27 October 2005. Available at http://www.un.org/womenwatch/daw/egm/eql-men/FinalReport.pdf accessed on 17 November 2019. 132 Many parties have women’s units (women’s wings), and although they can play a role in the party, their influence on party decisions can be limited. Women should also be integrated into party structures, including key decision-making bodies. International Institute for Democracy and Electoral Assistance op cit note 34. 133 United Nations Division for the Advancement of Women (DAW), Department of Economic and Social Affairs (DESA), Economic Commission for Africa (ECA), Inter-Parliamentary Union (IPU) op cit note 149. 134 Ibid. 135 (see Article (224) (2)(e). 136 For example, Article 91(g) of the Constitution of the Republic of Burundi 2005 requires the independent national electoral Commission to “assure the respect for the provisions of this Constitution relative to multi-ethnicity and to gender and to take cognizance of the claims in this respect.” In addition, constitutions may provide for gender balance in the staffing of such commissions. 137 The UNWOMEN and International IDEA Guidance Note op cit note 134.
Huria Journal, Vol 27(2), September 2020: 1-29
Constitution-Making Process in Tanzania (2011-2014): A New Era for Women Political Participation? Alexander Makulilo & Victoria Lihiru
27
elections. In Tanzania, the 2015 elections observed the National Election
Commission (NEC) and the Zanzibar Election Commission (ZEC)
incorporating gender policies in the election observer guidelines, voter
education guidelines, and the code of ethics for political parties.138
Additionally, it is worth noting that ZEC adopted and committed to
implement gender inclusion strategy that was developed in coordination
with other promoters of women’s participation in electoral politics
stakeholders.139 The political parties guidelines and code of ethics were
useful documents for NEC and ZEC to think more systematically about
the inclusion of women by political parties in elections.
Institutions to Safeguard Women’s Rights
The new constitutions should incorporate additional enforcement
mechanisms or bodies tasked to mainstream, promote and enforce
women’s rights, including political rights.140 The 2014, Proposed
Constitution provides for the duties and functions of the Commission for
Human Rights and Good Governance to include the sensitisation of the
public about the preservation of human rights. The Constitution further
provides for duties to the public to promote, protect, and monitor
implementation of gender equality.141 In some other countries such as
Rwanda, there is an independent body to oversee women’s rights while in
Tanzania, women’s rights are promoted through the Human Rights and
Good Governance Commission. This commission helps to promote
gender equality through promotion of public policy that effectively
responds to women’s demands and interests.142 It is noted, however, that
while women’s rights are human rights, there is a danger for women’s
rights to be monitored by the body that generally oversees human rights.
When this happens, women’s rights though may get its share in the
planning sessions they may suffer implementation oversight.143
CONCLUSION
This article was set out to examine two interrelated questions notably the
extent to which women were involved in the 2011-2014 constitution-
138 With support from the Democratic Empowerment Project, NEC managed to entrench gender provisions in the key election guidelines, ‘International Republic Institute, Tanzania National Elections Gender Assessment’(2016) available at https://www.iri.org/sites/default/files/wysiwyg/tanzania_gender_report.pdfI accessed on 16 February 2018. 139 Ibid. 140 The UNWOMEN and International IDEA Guidance Note op cit note 155. 141 Article 232 (1) of the 2014 Proposed Constitution. 142 Chauve C op cit note 37. 143 The UNWOMEN and International IDEA Guidance Note op cit note 158.
Huria Journal, Vol 27(2), September 2020: 1-29
Constitution-Making Process in Tanzania (2011-2014): A New Era for Women Political Participation? Alexander Makulilo & Victoria Lihiru
28
making process, and how such participation impacted the content of the
2014 Proposed Constitution in terms of protection and promotion of
women political participation in the country. For the first time in
Tanzania, the 2011-2014 constitution-making process allowed citizen
participation in the formulation of the 2014 Proposed Constitution.
Despite the observed challenges, the constitution-making process
depicted satisfactory levels of women’s involvement in all stages. The
final product of the constitution-making process namely the 2014
Proposed Constitution guarantees participation of men and women in
political life. Also, it contains key provisions on the general guarantees of
equality and non-discrimination. The turning point on protection and
promotion of women political participation is seen under Article 124(4)
of the 2014 Proposed Constitution which provides that, ‘the basis of
composition of the Parliament shall be on equal representation of female
and male parliamentarians.’ It is noted however that Article 124 (4) limits
the intention to realize equal representation of men and women in the
parliament only. Article 124(4) is not applicable to determine the
composition of men and women in other decision-making organs or
positions.
REFERENCES
Bhattarai, H. P. and Subedi, J. ed. (2007). ‘Democratic constitution
making experiences from Nepal, Kenya, South Africa and Sri
Lanka’ International IDEA ISBN: 978-99933-838-4-0.
International Institute for Democracy and Electoral Assistance, (2016).
Constitution Assessment for Women’s Equality, ISBN: 978-91-
7671-049-4, available at https://www.idea.int/sites/default/files/
publications/constitution-assessment-for-womens-equality.pdf
accessed on 5th February 2019.
Kadaga, R. (2013). ‘Women’s political leadership in East Africa with
specific reference to Uganda’ Tenth Commonwealth Women’s
Affairs Ministers Meeting ‘Women’s Leadership for Enterprise’
Dhaka, Bangladesh, 17-19 June 2013.
King, C. (2000). ‘Electoral Systems’ available at
http://faculty.georgetown.edu/kingch/Electoral_Systems.htm
accessed on 13 November 2019
Ogendo, O. H.W.O. (1988). Constitutions without Constitutionalism:
Reflections on an African Political Paradox. New York American
Council of Learned Societies.

Huria Journal, Vol 27(2), September 2020: 1-29
Constitution-Making Process in Tanzania (2011-2014): A New Era for Women Political Participation? Alexander Makulilo & Victoria Lihiru
29
Owens, G. R. (2005). ‘The secret history of TANU: Rumor,
historiography and Muslim unrest in contemporary Dar Es Salaam’
History and Anthropology’ 16:4, 441-463, DOI: 10.1080/
02757200500399107.
Ruth, M. (2014). ‘Gender analysis of the proposed constitution of the
United Republic of Tanzania: Gains and Challenges’ available at
http://womenfundtanzania.nl/wp-content/uploads/2014/12/28Oct14-
ENGL.GENDER-ANALYSIS-GAPSCHALLENGES.pdf
The UNWOMEN and International IDEA (2012). Guidance Note on
Women’s Human Rights and National Constitutions, Leadership
and Political Participation, available at http://www.onu.cl/es/wp-
content/uploads/2016/06/Womens-Human-Rights-and-National-
Consitutions-Guidance-Note.pdf accessed on 6 January 2021.
Tripp, A. M. (2017). ‘Women and Politics in Africa Subject’ Women’s
History DOI:10.1093/acrefore/9780190277734.013.192
Huria Journal, Vol 27(2), September 2020: 30-55
30
Assessment of Wildfires in Tanzania Forest Plantations: A
Case of Sao Hill in Mufindi District
Maximillan Mgina [email protected]
Nelson Mandela Institution of science and Technology Anna Wawa
The Open University of Tanzania
ABSTRACT
The study investigated the wildfires in Sao Hill Forest Plantation (SHFP)
in Mufindi District with a focus on causes, impacts, and challenges in
fire-fighting. The inadequate data and studies on forest fires rationalized
the choice of the study area. Mixed approach and a case study design
were used. The sample of 45 respondents were purposively selected out of
which 15 were key informants as an entrance point and 30 were other
respondents snowballed as proposed by key informants. Descriptive and
thematic analysis was used for quantitative and qualitative data
respectively. Land preparation which involved clearing of forest harvest
debris for tree replanting; slash and burning practice that farmers use
traditionally for farm preparation was the major cause of wildfire in
SHFP. The negative impacts outweighed the positive through the loss of
trees which was ecologically and economically destructive. Inadequate
facilities and community participation were the frequently mentioned
challenges. The study recommended for the prerequisites in controlled
burning to be followed, enhanced rational allocation of resources like
equitable harvesting permits and farming land to avoid arsonism. More
researches on biological means of land preparation are suggested to
reduce fuel load through efficient technology and improved recovery.
Keywords: Wildfires, Arsonism, Forest plantation, controlled burning,
Fuel load
INTRODUCTION
Traditionally, fire has been associated with the history of human
development. In ecological sense, fire has been an important factor in the
dynamics of the Earth’s climate and in the development of biomes since
its widespread occurrence began 400–350 million years ago (Doerr and
Santı´n, 2016). WWF rates fire to be among the top threats of
ecosystems., for example, in April 2020, the number of fires alerts the
Huria Journal, Vol 27(2), September 2020: 30-55
Assessment of Wildfires in Tanzania Forest Plantations: A Case of Sao Hill in Mufindi District Maximillan Mgina and Anna Wawa
30
globe was up by 13% compared to last year which was already a record
year for fires. Persistent hotter and drier weather due to climate change
and other change and other human factors such as land conversion change
and other human factors such as land conversion for agriculture and poor
forest management are the main drivers behind the increase. It is
estimated that humans are responsible for around 75% of all wildfires,
and much of the increase in fire incidents during 2020 can be directly
linked to human actions (WWF, 2020).
Despite the absence of precise figures that reflect the loss of forests, it is
well established that broad areas of tropical forests have diminished
inspite of conservation efforts over the last 25 years (Keenan et al., 2015).
Africa is the leading continent, where out of 9,200 million tons of
biomass affected by fire in 2000, 42% belonged to Africa which is
quantitatively equivalent to 7 billion Tanzania shillings loss (Madoffe et
al., 2000; Aloo, 2001; FAO, 2003; FAO, 2005 and FAO, 2011). Tanzania
is also significantly affected by wildfires when used in land preparation,
hunting, control burning and pest control. Wildfires result from a number
of interacting factors like ignitions, conditions amenable for fire initiation
and spread, and landscapes with vegetation that can support the
combustion process (Moreno, 2014).
The current increase of fire incidences is related to global warming and
the alarming global deforestation rate of 5.2 × 10⁶ ha per year (Fernandez
et al, 2017). A study by FAO (2013) showed that Tanzania as a country
has been experiencing wildfires throughout the year whereby around
65,000 ha of plantation forests and other wooded areas (FBD, 2002) are
destroyed annually. The average forest plantation area burnt annually is
2466 ha and 40% of which is from Sao Hill where the fires are frequent
(Malinga, 2011). Fire is identified to be one of the major deforestations
causes in Tanzania. Other causes of deforestation include: consumption
of forest products, encroachment and clearing for agriculture.
In Tanzania, government plantations are the major supply of wood raw
materials, where Sao Hill Forest Plantation (SHFP) alone has been
supplying over 85% of raw material consumed by wood industries
(Ngaga, 2011). However, fire outbreaks have been one of the major
threats to the sustainability of the Sao Hill plantation forest since its
establishment in the late 1930s. From 1970 to 2007 the forest
Huria Journal, Vol 27(2), September 2020: 30-55
Assessment of Wildfires in Tanzania Forest Plantations: A Case of Sao Hill in Mufindi District Maximillan Mgina and Anna Wawa
31
experienced at least ten fire incidents every five years coming from the
adjacent villages. Between 1985 and 1987 at Sao Hill Forest Plantations,
there were 105 incidences of forest fires destroying 5 665 ha (Lulandala
et al., 1995). From 1990 to 2000 forest fires in Tanzania plantations
(excluding Sao Hill) caused a financial loss of Tshs 8.8 billion (MNRT,
2001). In a period from 1999 and 2001, a total of 7 644 ha of forest
plantations were destroyed by forest fires at Sao Hill alone (MNRT,
2001). Between 2000 and 2011 the number of fire incidences increased to
143, and there were 400ha burnt at Sao Hill in 2018. The later occurred in
four consecutive days from 25 to 28 September 2018 of which 11
compartments were severely destroyed (TFS, 2018). According to the
study by Nyongesa and Vacik (2019) in Kenya; fire records from 1980 to
2017 show that Mount Kenya Forest Reserve and National Park
experienced about 210 wildfires. Most of these wildfires occurred in the
months of January, February, March, September, and October. The fire
records also show that from 1980 to 2017, more than 668 Ha of
plantations, 21,276 Ha of bush land and grassland, 267 Ha of bamboo,
6727 Ha of indigenous/natural forests and 11,175 Ha of moorland were
burned by wildfires in MKFRNP. According to the KFS and KWS, fire
records from 1980 to 2015, the estimated fire fighting cost and the fire
damages were $134,759.84 and $4,712,384.96 respectively.
These alarming trends of wildfires called for national and international
fire management intervention agenda like the 5th version of the
International Wild-land Fire Conference in Sun City, South Africa, 9-13
May 2011. In East African countries like Kenya, the parliament passed
the country governments’ fire and disaster management bill that prepared
the ground for the country to establish and implement integrated fire
management approaches in the future in 2014 (Nyongesa and Vacik,
2019). Programmes like Reducing Emissions from Deforestation and
Forest Degradation in developing countries (REDD) were introduced with
a focus on integrated fire management and community-based fire
management approaches (Kilahama, 2005; FAO, 2011). In Tanzania, the
related programmes include Participatory Forest Management (PFM)
strategies, sustainable agriculture programmes which were adapted to
ensure sound fire management and improving livelihoods of rural
communities (Yanda et al, 2008; URT, 2012). In line with these
programmes, the Tanzania National Forest Policy spotted fires as the
major threats that have been leading to degradation of forests and
woodlands (URT, 1998). However, lack of specific policies and
Huria Journal, Vol 27(2), September 2020: 30-55
Assessment of Wildfires in Tanzania Forest Plantations: A Case of Sao Hill in Mufindi District Maximillan Mgina and Anna Wawa
32
institutional frameworks to address the problem of fire have compromised
the effectiveness of fire management in Tanzania. Despite the strategies
devised by responsible authorities, forest fires have been persisting (FAO
2013). FAO (2011) asserts that efforts like establishment of Community
Based Forest Management and Joint Forest Management are thought to
have reduced the annual net loss of forest, but reliable figures on their
impact are not yet available. On the other hand, the data on extent, nature,
impacts and sources of wildfires have been inadequate, and most
statements on the fire issue are based on anecdote and opinions (Madoffe
et al., 2000; FAO, 2013). This paper investigated the causes of forest fires
focusing on Sao Hill Forest Plantation as a case study. It determined the
impacts of wildfires and challenges in fire-fighting hence establishing the
measures for combating forest fires.
METHODOLOGY
SHFP is located in Mufindi district, Iringa region. Its altitude ranges
between 812 mm and 2,009 mm with heavy rains from November to
January and March to April, and short dry spell of approximately two
weeks in the first half of February and a long dry spell from May to
November. The highest wind velocities occur during May to November,
which offer fire risks season (Ngaga, 2011).
The study adapted mixed approach which enriched data, added value and
allowed comprehensive understanding of the problem. The case study
design was used. The term ‘case’ contextually implies ‘an instance of’
and fundamentally it focused on investigating one or more specific
‘instances of’ something or issues which established the cases in the
study. In this context, Sao Hill Forest plantation (SHFP) was a case as an
organization (Map 1). Case design allowed multiple sources of data like
interviews, direct or indirect observation, and archival document;
sometimes the inclusions of the physical environment, in this case the
burnt forest area. This triangulation guaranteed the authenticity of the
research findings. The study used the face-to-face individual interview to
get the qualitative data. This was mainly from the key informants.
Interviewing is a great way of learning about attitudes and values. And it
is a great way of finding out what people think and what they do. When
you want to know what people actually do, there is no substitute for
watching them or studying the physical traces their behaviour leaves
behind.

Huria Journal, Vol 27(2), September 2020: 30-55
Assessment of Wildfires in Tanzania Forest Plantations: A Case of Sao Hill in Mufindi District Maximillan Mgina and Anna Wawa
33
Map 1: Map of Mufindi district showing the coverage of Sao Hill
Forest Plantation
Source: GIS (Geographical Information Systems), University of Dar es
Salaam, June 2016
The study adapted direct observation (watching people and recording
their behaviour on the spot) and indirect observation which investigated
peoples’ attitude, culture and perception on forest protection through the
archaeology of human behaviour (Russell, 2011). Ethnographic research
offers an orientation to understand the process and structure of a social
setting and employs research techniques consistent with this orientation.
It is the study of both explicit and tacit cultural knowledge. Observing
user in the field is always the best way to determine their usability
Huria Journal, Vol 27(2), September 2020: 30-55
Assessment of Wildfires in Tanzania Forest Plantations: A Case of Sao Hill in Mufindi District Maximillan Mgina and Anna Wawa
34
requirement. Key informants established the entrance points during data
collection. This offered connection for more respondents to be engaged in
the study. The interview was adopted due to its tendency to gather
voluminous deep information, which can answer the research objectives
(Yin, 2009; Creswell, 2009).
The study employed judgmental sampling where a sample of 45 was
purposively incorporated. Such a method allows the researcher to decide
on units to be involved in the study. Fifteen (15) key informants out of 45
were purposively selected and interviewed due to their knowledge and
skills about the problem. They comprised of the general plantation
manager, division managers and key stakeholders and heads of
departments. The questionnaires were provided to the 30 remaining
respondents who were snowballed as directed by the key informants until
a saturation point was reached according to Sapsford and Jupp (2006).
The snowballed informants included some elders who were familiar with
the Sao Hill context, private tree out-growers, timber dealers, fire guards,
foresters and heads of villages where fire incidences occur regularly.
The data were analyzed through thematic analysis. Thematic analysis
involved disintegrating the recorded discussion into smallest meaningful
units or themes to capture types, patterns and sequences of fires
(Creswell, 2009). Data were reduced into simpler categories and specific
themes. The themes were related to causes of forest fire, forest fire
impacts and challenges during fire prevention, fire suppression and
controlled use of fire in the communities. Subthemes were developed
from the data to capture knowledge of the communities on fire context,
practices and customary norms in relation to fire management.
FINDINGS AND DISCUSSION
This section discusses the results guided by study objectives. The causes
of forest fires at SHFP were mainly human centred. Table 1 shows the
findings on the perceived major causes of forest fire. Majority of the
respondents (68.9%) viewed land preparations done by farmers near
forest stands, and land prepared before tree replanting in the formerly
harvested forest compartments as a major cause of wildfire in the area.
15.6% of the respondents spotted arsonism while the remaining 11.1%
emphasized on accidental fires.
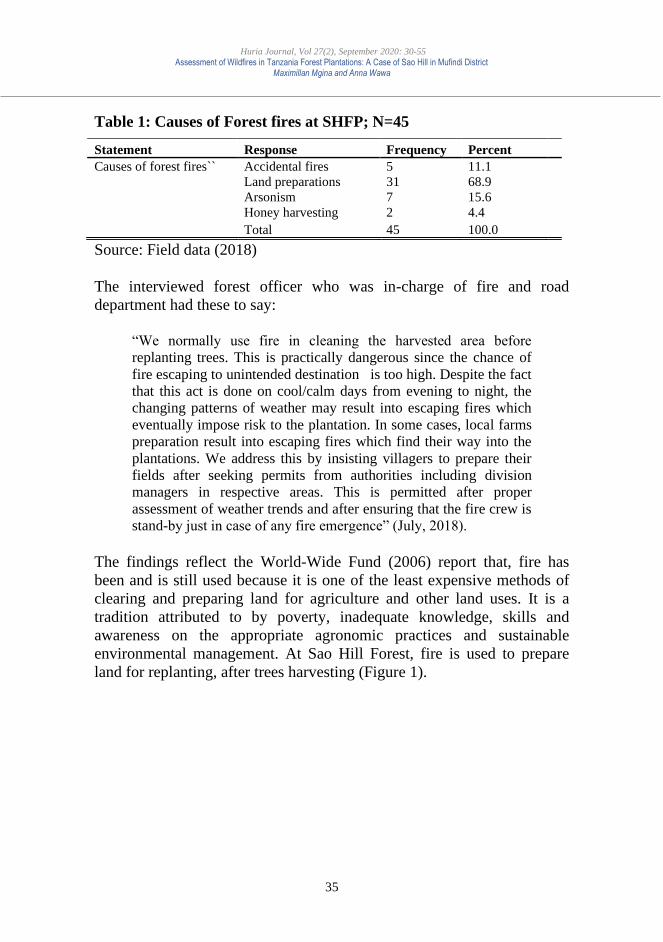
Huria Journal, Vol 27(2), September 2020: 30-55
Assessment of Wildfires in Tanzania Forest Plantations: A Case of Sao Hill in Mufindi District Maximillan Mgina and Anna Wawa
35
Table 1: Causes of Forest fires at SHFP; N=45
Source: Field data (2018)
The interviewed forest officer who was in-charge of fire and road
department had these to say:
“We normally use fire in cleaning the harvested area before
replanting trees. This is practically dangerous since the chance of
fire escaping to unintended destination is too high. Despite the fact
that this act is done on cool/calm days from evening to night, the
changing patterns of weather may result into escaping fires which
eventually impose risk to the plantation. In some cases, local farms
preparation result into escaping fires which find their way into the
plantations. We address this by insisting villagers to prepare their
fields after seeking permits from authorities including division
managers in respective areas. This is permitted after proper
assessment of weather trends and after ensuring that the fire crew is
stand-by just in case of any fire emergence” (July, 2018).
The findings reflect the World-Wide Fund (2006) report that, fire has
been and is still used because it is one of the least expensive methods of
clearing and preparing land for agriculture and other land uses. It is a
tradition attributed to by poverty, inadequate knowledge, skills and
awareness on the appropriate agronomic practices and sustainable
environmental management. At Sao Hill Forest, fire is used to prepare
land for replanting, after trees harvesting (Figure 1).
Statement Response Frequency Percent
Causes of forest fires`` Accidental fires 5 11.1
Land preparations 31 68.9
Arsonism 7 15.6
Honey harvesting 2 4.4
Total 45 100.0
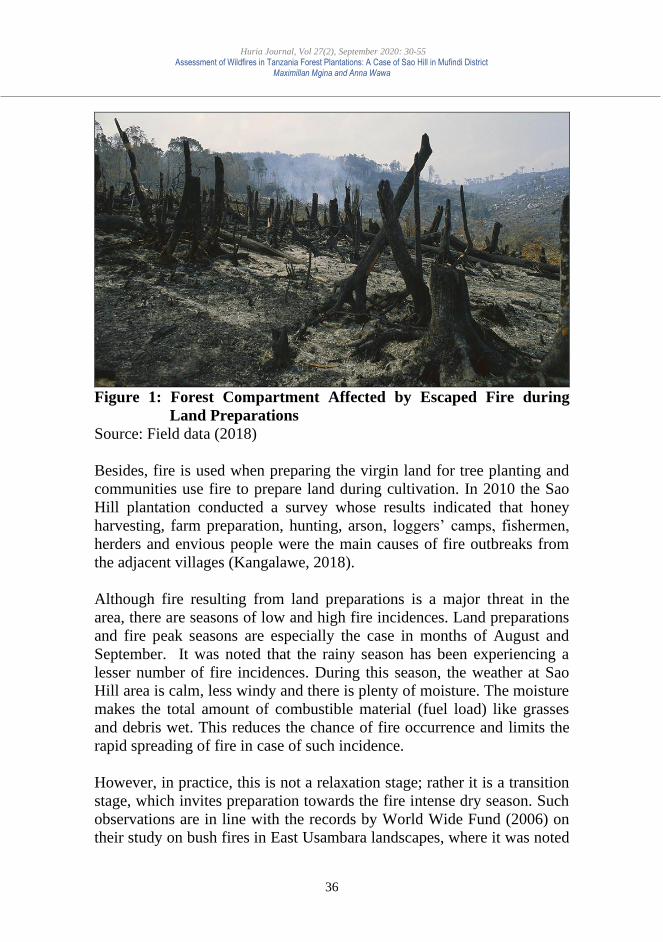
Huria Journal, Vol 27(2), September 2020: 30-55
Assessment of Wildfires in Tanzania Forest Plantations: A Case of Sao Hill in Mufindi District Maximillan Mgina and Anna Wawa
36
Figure 1: Forest Compartment Affected by Escaped Fire during
Land Preparations
Source: Field data (2018)
Besides, fire is used when preparing the virgin land for tree planting and
communities use fire to prepare land during cultivation. In 2010 the Sao
Hill plantation conducted a survey whose results indicated that honey
harvesting, farm preparation, hunting, arson, loggers’ camps, fishermen,
herders and envious people were the main causes of fire outbreaks from
the adjacent villages (Kangalawe, 2018).
Although fire resulting from land preparations is a major threat in the
area, there are seasons of low and high fire incidences. Land preparations
and fire peak seasons are especially the case in months of August and
September. It was noted that the rainy season has been experiencing a
lesser number of fire incidences. During this season, the weather at Sao
Hill area is calm, less windy and there is plenty of moisture. The moisture
makes the total amount of combustible material (fuel load) like grasses
and debris wet. This reduces the chance of fire occurrence and limits the
rapid spreading of fire in case of such incidence.
However, in practice, this is not a relaxation stage; rather it is a transition
stage, which invites preparation towards the fire intense dry season. Such
observations are in line with the records by World Wide Fund (2006) on
their study on bush fires in East Usambara landscapes, where it was noted

Huria Journal, Vol 27(2), September 2020: 30-55
Assessment of Wildfires in Tanzania Forest Plantations: A Case of Sao Hill in Mufindi District Maximillan Mgina and Anna Wawa
37
that, bush fires are the most common and widespread in the lowlands
especially during the dry season (July to November) when people are
clearing the land for cultivation. The interview with a member of fire
stand- by crew reveals more on the season of likely forest fire
incidences:
“The dry season is normally the peak. It is the peak of hot seasons,
the peak of harvesting operations and the peak of land preparation
activities before starting tree replanting and farming onsets. In our
place it starts from mid July to September, it is normally the most
dangerous period” (July, 2018).
As suggested from the quotation above, the dry season is also the peak of
harvesting season. Activities like logging and timber processing result
into accumulation of wood wastes which could become dangerous during
dry season (Figure 2). It has been estimated that in order to produce 45
tons of timber, 55 tons of waste is created in the form of sawdust, treetops
and branches, and is left to decay, burnt on site or collected as wood fuel,
hence creating a potential danger to the forest plantation if left
unmanaged.
Figure 2: Poorly Handled Tree wastes Left after Harvesting
Operation
Source: Field data (2018)
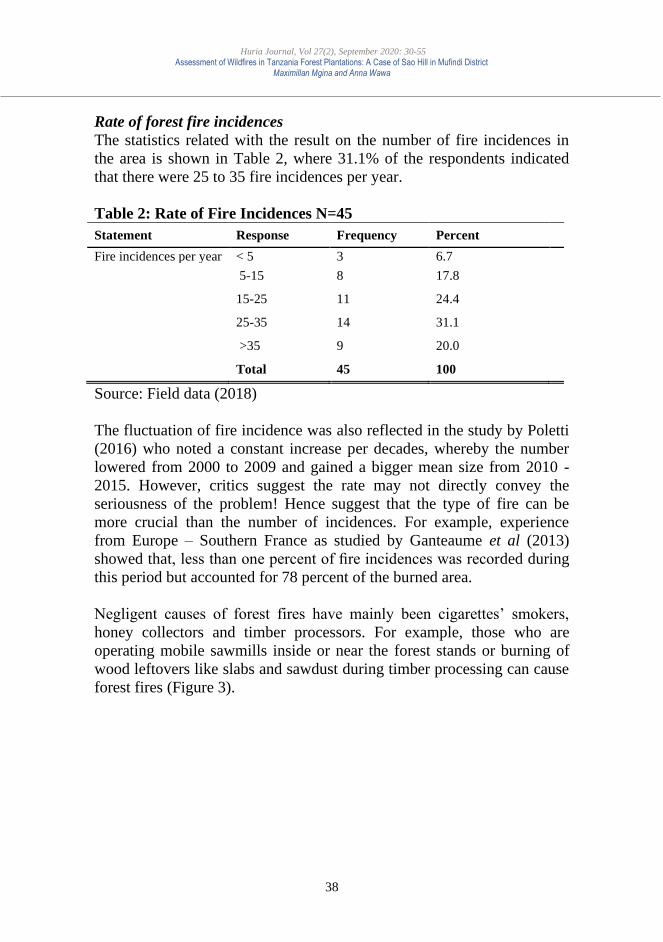
Huria Journal, Vol 27(2), September 2020: 30-55
Assessment of Wildfires in Tanzania Forest Plantations: A Case of Sao Hill in Mufindi District Maximillan Mgina and Anna Wawa
38
Rate of forest fire incidences
The statistics related with the result on the number of fire incidences in
the area is shown in Table 2, where 31.1% of the respondents indicated
that there were 25 to 35 fire incidences per year.
Table 2: Rate of Fire Incidences N=45
Statement Response Frequency Percent
Fire incidences per year < 5 3 6.7
5-15 8 17.8
15-25 11 24.4
25-35 14 31.1
>35 9 20.0
Total 45 100
Source: Field data (2018)
The fluctuation of fire incidence was also reflected in the study by Poletti
(2016) who noted a constant increase per decades, whereby the number
lowered from 2000 to 2009 and gained a bigger mean size from 2010 -
2015. However, critics suggest the rate may not directly convey the
seriousness of the problem! Hence suggest that the type of fire can be
more crucial than the number of incidences. For example, experience
from Europe – Southern France as studied by Ganteaume et al (2013)
showed that, less than one percent of fire incidences was recorded during
this period but accounted for 78 percent of the burned area.
Negligent causes of forest fires have mainly been cigarettes’ smokers,
honey collectors and timber processors. For example, those who are
operating mobile sawmills inside or near the forest stands or burning of
wood leftovers like slabs and sawdust during timber processing can cause
forest fires (Figure 3).
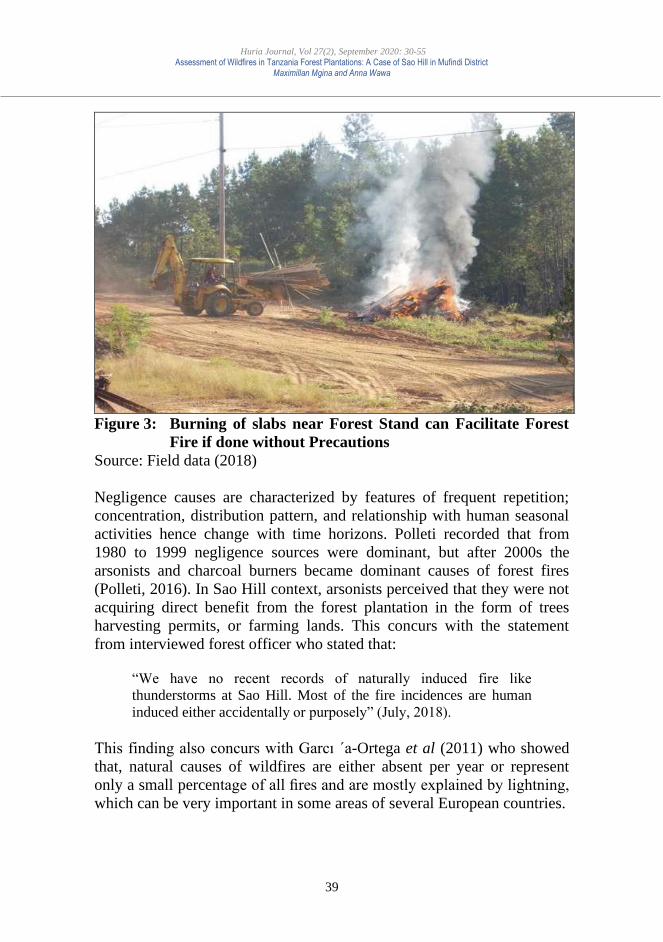
Huria Journal, Vol 27(2), September 2020: 30-55
Assessment of Wildfires in Tanzania Forest Plantations: A Case of Sao Hill in Mufindi District Maximillan Mgina and Anna Wawa
39
Figure 3: Burning of slabs near Forest Stand can Facilitate Forest
Fire if done without Precautions
Source: Field data (2018)
Negligence causes are characterized by features of frequent repetition;
concentration, distribution pattern, and relationship with human seasonal
activities hence change with time horizons. Polleti recorded that from
1980 to 1999 negligence sources were dominant, but after 2000s the
arsonists and charcoal burners became dominant causes of forest fires
(Polleti, 2016). In Sao Hill context, arsonists perceived that they were not
acquiring direct benefit from the forest plantation in the form of trees
harvesting permits, or farming lands. This concurs with the statement
from interviewed forest officer who stated that:
“We have no recent records of naturally induced fire like
thunderstorms at Sao Hill. Most of the fire incidences are human
induced either accidentally or purposely” (July, 2018).
This finding also concurs with Garcı ´a-Ortega et al (2011) who showed
that, natural causes of wildfires are either absent per year or represent
only a small percentage of all fires and are mostly explained by lightning,
which can be very important in some areas of several European countries.
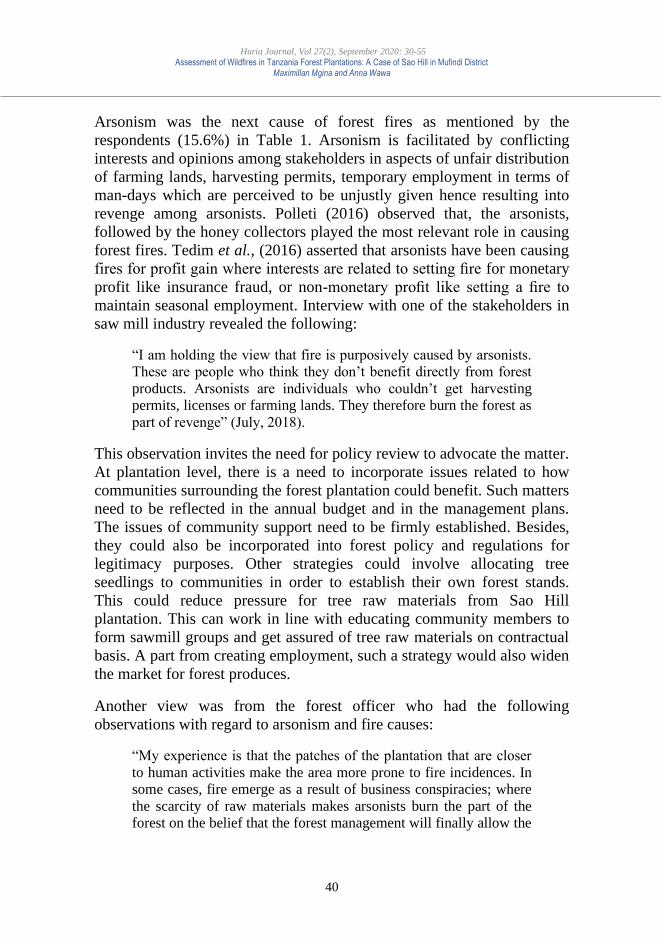
Huria Journal, Vol 27(2), September 2020: 30-55
Assessment of Wildfires in Tanzania Forest Plantations: A Case of Sao Hill in Mufindi District Maximillan Mgina and Anna Wawa
40
Arsonism was the next cause of forest fires as mentioned by the
respondents (15.6%) in Table 1. Arsonism is facilitated by conflicting
interests and opinions among stakeholders in aspects of unfair distribution
of farming lands, harvesting permits, temporary employment in terms of
man-days which are perceived to be unjustly given hence resulting into
revenge among arsonists. Polleti (2016) observed that, the arsonists,
followed by the honey collectors played the most relevant role in causing
forest fires. Tedim et al., (2016) asserted that arsonists have been causing
fires for profit gain where interests are related to setting fire for monetary
profit like insurance fraud, or non-monetary profit like setting a fire to
maintain seasonal employment. Interview with one of the stakeholders in
saw mill industry revealed the following:
“I am holding the view that fire is purposively caused by arsonists.
These are people who think they don’t benefit directly from forest
products. Arsonists are individuals who couldn’t get harvesting
permits, licenses or farming lands. They therefore burn the forest as
part of revenge” (July, 2018).
This observation invites the need for policy review to advocate the matter.
At plantation level, there is a need to incorporate issues related to how
communities surrounding the forest plantation could benefit. Such matters
need to be reflected in the annual budget and in the management plans.
The issues of community support need to be firmly established. Besides,
they could also be incorporated into forest policy and regulations for
legitimacy purposes. Other strategies could involve allocating tree
seedlings to communities in order to establish their own forest stands.
This could reduce pressure for tree raw materials from Sao Hill
plantation. This can work in line with educating community members to
form sawmill groups and get assured of tree raw materials on contractual
basis. A part from creating employment, such a strategy would also widen
the market for forest produces.
Another view was from the forest officer who had the following
observations with regard to arsonism and fire causes:
“My experience is that the patches of the plantation that are closer
to human activities make the area more prone to fire incidences. In
some cases, fire emerge as a result of business conspiracies; where
the scarcity of raw materials makes arsonists burn the part of the
forest on the belief that the forest management will finally allow the
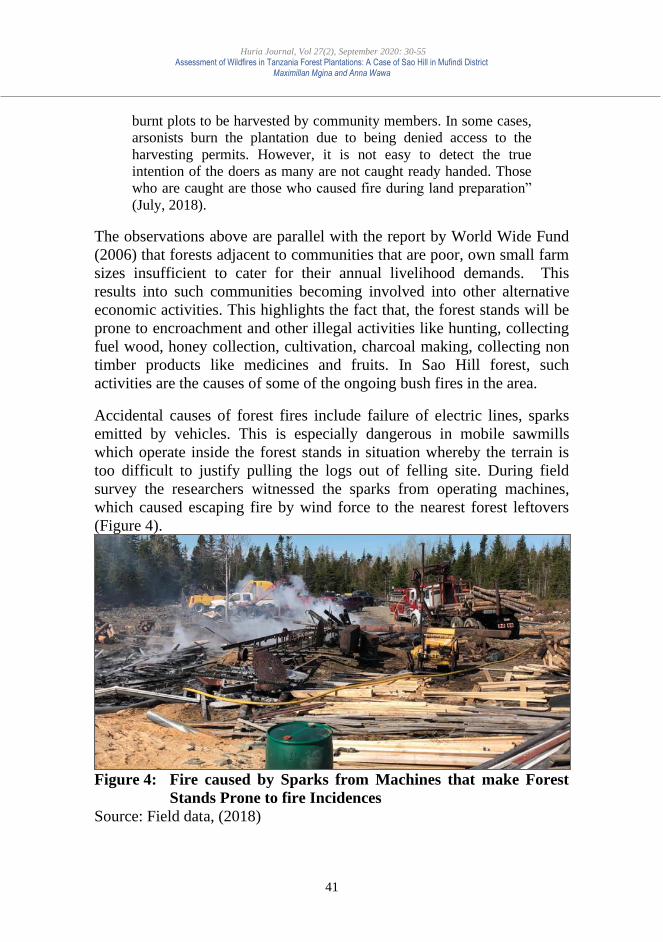
Huria Journal, Vol 27(2), September 2020: 30-55
Assessment of Wildfires in Tanzania Forest Plantations: A Case of Sao Hill in Mufindi District Maximillan Mgina and Anna Wawa
41
burnt plots to be harvested by community members. In some cases,
arsonists burn the plantation due to being denied access to the
harvesting permits. However, it is not easy to detect the true
intention of the doers as many are not caught ready handed. Those
who are caught are those who caused fire during land preparation”
(July, 2018).
The observations above are parallel with the report by World Wide Fund
(2006) that forests adjacent to communities that are poor, own small farm
sizes insufficient to cater for their annual livelihood demands. This
results into such communities becoming involved into other alternative
economic activities. This highlights the fact that, the forest stands will be
prone to encroachment and other illegal activities like hunting, collecting
fuel wood, honey collection, cultivation, charcoal making, collecting non
timber products like medicines and fruits. In Sao Hill forest, such
activities are the causes of some of the ongoing bush fires in the area. Accidental causes of forest fires include failure of electric lines, sparks
emitted by vehicles. This is especially dangerous in mobile sawmills
which operate inside the forest stands in situation whereby the terrain is
too difficult to justify pulling the logs out of felling site. During field
survey the researchers witnessed the sparks from operating machines,
which caused escaping fire by wind force to the nearest forest leftovers
(Figure 4).
Figure 4: Fire caused by Sparks from Machines that make Forest
Stands Prone to fire Incidences
Source: Field data, (2018)
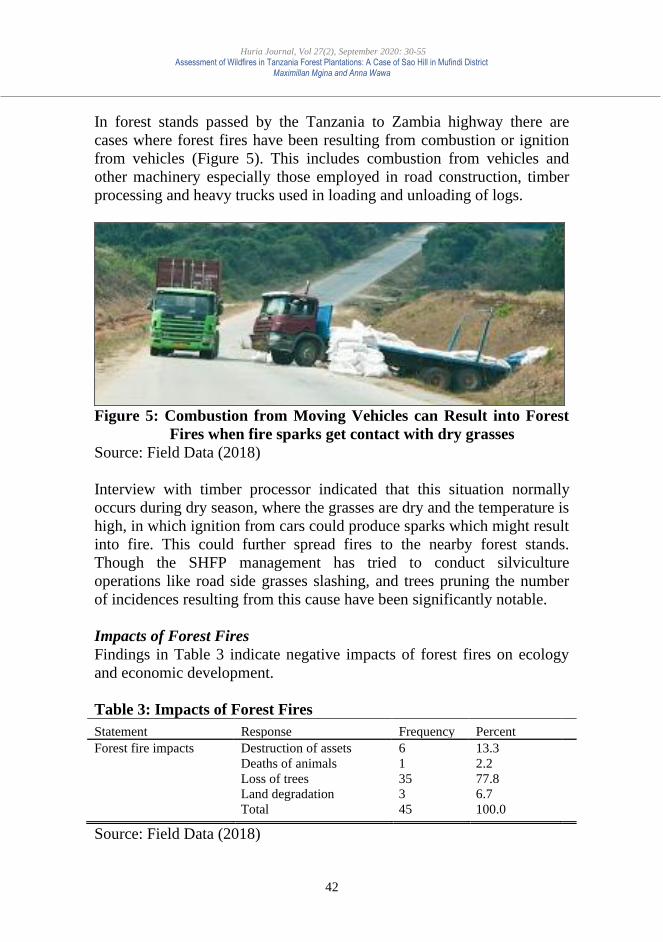
Huria Journal, Vol 27(2), September 2020: 30-55
Assessment of Wildfires in Tanzania Forest Plantations: A Case of Sao Hill in Mufindi District Maximillan Mgina and Anna Wawa
42
In forest stands passed by the Tanzania to Zambia highway there are
cases where forest fires have been resulting from combustion or ignition
from vehicles (Figure 5). This includes combustion from vehicles and
other machinery especially those employed in road construction, timber
processing and heavy trucks used in loading and unloading of logs.
Figure 5: Combustion from Moving Vehicles can Result into Forest
Fires when fire sparks get contact with dry grasses
Source: Field Data (2018)
Interview with timber processor indicated that this situation normally
occurs during dry season, where the grasses are dry and the temperature is
high, in which ignition from cars could produce sparks which might result
into fire. This could further spread fires to the nearby forest stands.
Though the SHFP management has tried to conduct silviculture
operations like road side grasses slashing, and trees pruning the number
of incidences resulting from this cause have been significantly notable.
Impacts of Forest Fires
Findings in Table 3 indicate negative impacts of forest fires on ecology
and economic development.
Table 3: Impacts of Forest Fires
Statement Response Frequency Percent
Forest fire impacts Destruction of assets 6 13.3
Deaths of animals 1 2.2
Loss of trees 35 77.8
Land degradation 3 6.7
Total 45 100.0
Source: Field Data (2018)
Huria Journal, Vol 27(2), September 2020: 30-55
Assessment of Wildfires in Tanzania Forest Plantations: A Case of Sao Hill in Mufindi District Maximillan Mgina and Anna Wawa
43
Forest fire is ecologically and economically destructive at SHFP, and the
loss of trees was the top ranked impact (77.8% of the respondents)
followed by destruction of assets like houses, saw milling machines and
vehicles. Forest fires suppress the re-growth of more resistant species and
prevent woodland canopy which suppress herbaceous production and
reduce fuel loads. Furthermore, fires slow down ecological regeneration
capacity and impact the future extension strategies. Forest fires destroy
land structure and make the area prone to soil degradation (Thompson et
al 2013; Sebata, 2017 and Neary & Leonard, 2020). Fires destroy soil,
microbes, pollinating insects and wild animals that support biological
functioning that finally affect regeneration (Figure 6).
Figure 6: Forest Fires Destroy Planted Trees and General Ecosystem
Source: Field Data (2018).
Interview with one of the respondents in timber processing industry
recorded that: “The impacts are broad; in some cases, impacts like land
degradation could not be quantified into monetary significances but
eventually result into declining forest quality. The burnt trees are
sold at a cheaper price hence reducing the government revenues.
Furthermore; fires result into destruction of buildings and other
infrastructures, wastage of valuable time and disturbances to
people, and they impose stress to the community” (July, 2018).

Huria Journal, Vol 27(2), September 2020: 30-55
Assessment of Wildfires in Tanzania Forest Plantations: A Case of Sao Hill in Mufindi District Maximillan Mgina and Anna Wawa
44
This finding tally with several literatures which reveal that wildfire
affects many hectares of forests and damage biodiversity, human life and
infrastructures (Ganteaume and Jappiot, 2013; FAO, 2013; Jhariya & Raj,
2014; Foldi & Kuti, 2016; Jua´rez-Orozco, Siebe & Ferna´ndez, 2017).
Fires threaten budget and jeopardize future investment. One SHF officer
had these to say:
“We constantly replant the burnt areas rather than extending or
opening up the new unplanted areas, this slows down our strategies.
We invest a lot in forest protection, I doubt if the investment levels
relate with the final yield prices. We are also losing benefits
accrued from the forest, burning trees before harvest means you are
losing from what you invested!! On the other hand, forest fires have
created a fear atmosphere among other investors. The alarming rate
of fire incidences make people afraid of taking risk into the
ventures they are uncertain if the trees will reach the rotation age, or
get return on their investment’ (July, 2018).
The respondent’s view is reflected by records of fire at Sao Hill in
September 2018 alone, where 10,034 ha from 1996 to 1999 were affected
by 6 fire incidences equivalent to Tshs. 4 billion loss. In 2005/2006, 1450
ha were affected by fire where 600ha were destroyed (TFS, 2018).
This view is supported by Nyongesa and Vacik (2018) in their study on
Fire Management in Mount Kenya where it was pointed that
commercialization of forest plantations when coupled with the
intensification or cultivation of exotic fire-prone tree species like cypress
(Cupressus lusitanica Mill.), patula pines (Pinus patula Schiede Ex
Schltdl. & Cham), radiata pines (Pinus radiata D. Don), blue gum
(Eucalyptus saligna Smith), and rose gum (Eucalyptus grandis W. Hill Ex
Maiden) will increase fire hazard in the future. This is based on the fact
that; such species are less resistive to fire threats and they do not produce
coppices compared to many indigenous trees’ species. This could
jeopardize future investment in the sector.
Findings in Table 4 indicate that though forest fires are common to a
whole plantation, it was severe at Division I and III by a proportion of
33.3 % each.
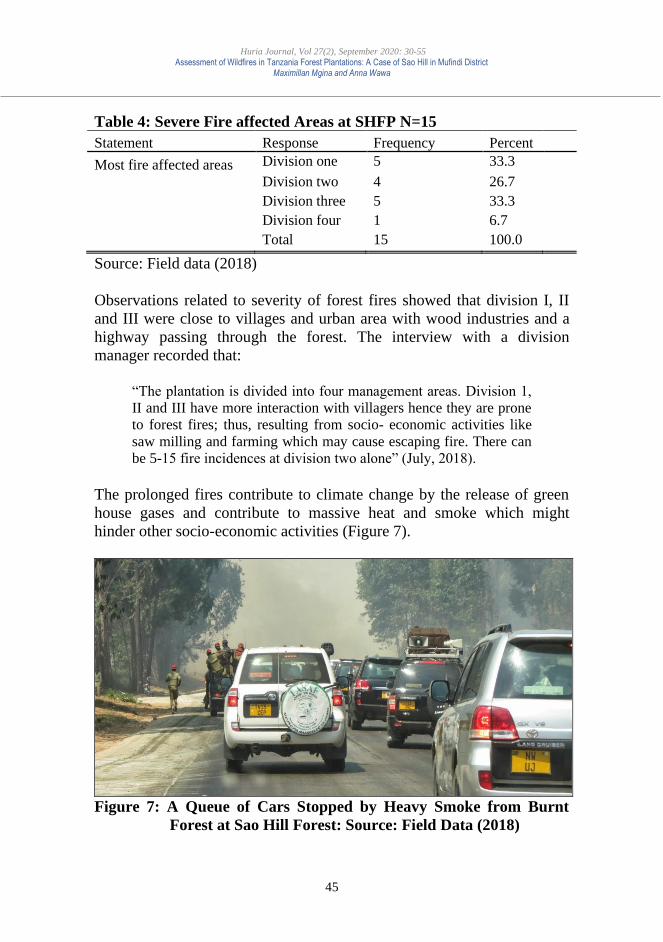
Huria Journal, Vol 27(2), September 2020: 30-55
Assessment of Wildfires in Tanzania Forest Plantations: A Case of Sao Hill in Mufindi District Maximillan Mgina and Anna Wawa
45
Table 4: Severe Fire affected Areas at SHFP N=15
Statement Response Frequency Percent
Most fire affected areas Division one 5 33.3
Division two 4 26.7
Division three 5 33.3
Division four 1 6.7
Total 15 100.0
Source: Field data (2018)
Observations related to severity of forest fires showed that division I, II
and III were close to villages and urban area with wood industries and a
highway passing through the forest. The interview with a division
manager recorded that:
“The plantation is divided into four management areas. Division 1,
II and III have more interaction with villagers hence they are prone
to forest fires; thus, resulting from socio- economic activities like
saw milling and farming which may cause escaping fire. There can
be 5-15 fire incidences at division two alone” (July, 2018).
The prolonged fires contribute to climate change by the release of green
house gases and contribute to massive heat and smoke which might
hinder other socio-economic activities (Figure 7).
Figure 7: A Queue of Cars Stopped by Heavy Smoke from Burnt
Forest at Sao Hill Forest: Source: Field Data (2018)
Huria Journal, Vol 27(2), September 2020: 30-55
Assessment of Wildfires in Tanzania Forest Plantations: A Case of Sao Hill in Mufindi District Maximillan Mgina and Anna Wawa
46
Challenges in Forest Fires Fighting
Respondents were asked on the challenges they were facing during forest
fire management. From Table 5, inadequate fire fighting equipment had a
proportion of 33.3% while inadequate community participation had
28.9%. These were the two top rated challenges.
Table 5: Fire Fighting Challenges
Statement Response Frequency Percent
Challenges Inadequate fire fighting equipment 15 33.3
Poor road network to reach the burnt
area
8 17.8
Little skills in combating forest fires 9 20.0
Inadequate Community participation 13 28.9
Total 45 100.0
Source: Field Data (2018)
The limited number of vehicles, pumps, and motor bicycle which
hindered fire fighting; other tools were pangas, fire beaters and tree
branches. During field survey there was no motorized pump that was
observed though the fire crew had power saw for clearing felling trees
during fire fighting which may obscure the road. There was one bulldozer
and vehicles (pick-ups) at the stand-by area (fire assembly point).
Interview with key informant under the fire department noted:
“Fires here are of sky and ground type. They are difficult to
suppress due to ground fuel richness resulting from accumulation of
leaves, felled branches over years. While the plantation is large
nearly over 60,000 ha of planted trees, the facilities are few and
centralized. The wide spread nature of the plantation makes risk
management more challenging. Imagine with over 60,000 ha there
is only one modern and efficient fire rescue truck. Modern fire
fighting equipment like protective gears when coupled with proper
fire detection methods can enhance rapid fire detection and
suppression hence serving the valuable forest from further
destruction” (July, 2018).
The reflection above is in line with the findings by Malinga (2011) in a
study on management cost in government and private forest plantations in
Tanzania: case study of Sao Hill and Mapanda plantations, Mufindi
Huria Journal, Vol 27(2), September 2020: 30-55
Assessment of Wildfires in Tanzania Forest Plantations: A Case of Sao Hill in Mufindi District Maximillan Mgina and Anna Wawa
47
district, Tanzania. The study established that purchases of fire protective
gears are very costly to the extent that affordability becomes difficult,
even though prevention is better than cure. It was found that Sao Hill has
a good number of fire protective gears more than Mapanda but was
bought in the 1980s when World Bank financed the project. It was further
revealed that some equipment is running wear and tear and replacement
or buying new equipment is becoming difficult due to high prices.
Another challenge was community participation in forest protection
(Table 5, 28.9% of the respondents). During survey, forest officer under
publicity department claimed that:
“The major challenge is community awareness and how people
conceptualize the forest benefits. The forest is an ocean for the
surrounding communities where they need to fish their livelihood.
This makes them view it in one perspective of benefiting them in
monetary gain alone. I think we need to invest in creating
awareness. Value chains should be made from the forestry where
people could benefit in various styles rather than benefiting directly
from harvesting the forest” (July, 2018).
The problem of participation has not been observed in SHFP alone; the
study by World Wide Foundation (2006) noted the same, although
traditionally people used to mobilize themselves. This invites awareness
creation, enthusiasm and where necessary legal enforcement.
Communities should not be overburdened by such arrangements,
especially where tangible benefits are unlikely to be realized in the near
future.
Despite the difficulties, Participatory Forest Management (PFM)
approaches have been practised at SHFP whereby villagers would
cultivate maize in the trees harvested areas for one season before planting
trees (Figure 8). They collect herb and other non-wood forest products
like fruits, vegetables, though critics blame the practice to have been
associated with fire incidences in the area. This is in line with the study
by Dewan and Vacik (2010) where it was highlighted that agriculture was
ranked as the second most relevant objective and thus it is at the heart of
community interests. This suggests that most of the communities in
developing countries are more concerned with socio-economic activities
aimed at achieving their livelihood benefits such as employment, farming
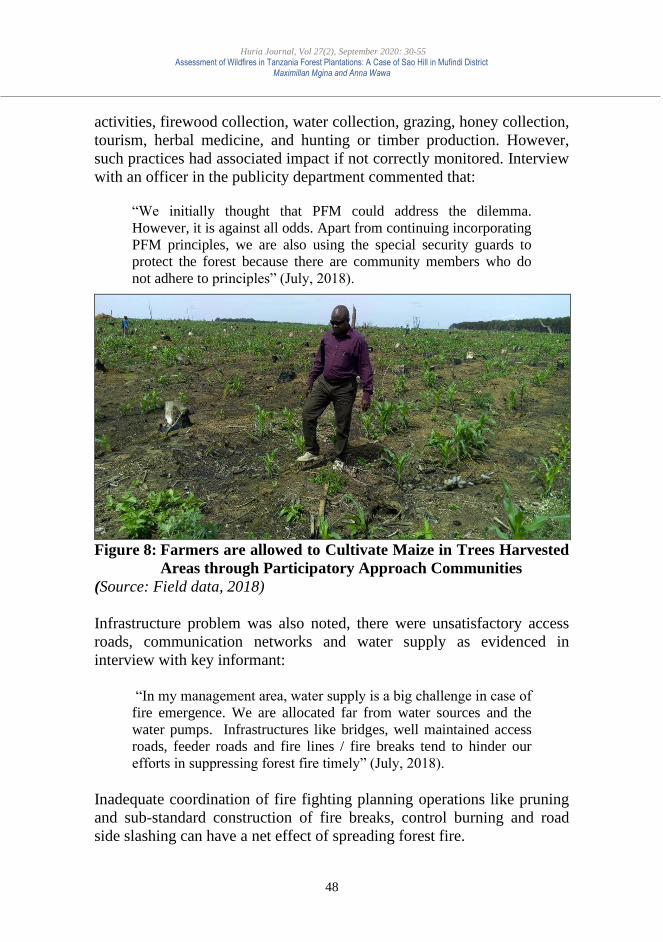
Huria Journal, Vol 27(2), September 2020: 30-55
Assessment of Wildfires in Tanzania Forest Plantations: A Case of Sao Hill in Mufindi District Maximillan Mgina and Anna Wawa
48
activities, firewood collection, water collection, grazing, honey collection,
tourism, herbal medicine, and hunting or timber production. However,
such practices had associated impact if not correctly monitored. Interview
with an officer in the publicity department commented that:
“We initially thought that PFM could address the dilemma.
However, it is against all odds. Apart from continuing incorporating
PFM principles, we are also using the special security guards to
protect the forest because there are community members who do
not adhere to principles” (July, 2018).
Figure 8: Farmers are allowed to Cultivate Maize in Trees Harvested
Areas through Participatory Approach Communities (Source: Field data, 2018)
Infrastructure problem was also noted, there were unsatisfactory access
roads, communication networks and water supply as evidenced in
interview with key informant:
“In my management area, water supply is a big challenge in case of
fire emergence. We are allocated far from water sources and the
water pumps. Infrastructures like bridges, well maintained access
roads, feeder roads and fire lines / fire breaks tend to hinder our
efforts in suppressing forest fire timely” (July, 2018).
Inadequate coordination of fire fighting planning operations like pruning
and sub-standard construction of fire breaks, control burning and road
side slashing can have a net effect of spreading forest fire.

Huria Journal, Vol 27(2), September 2020: 30-55
Assessment of Wildfires in Tanzania Forest Plantations: A Case of Sao Hill in Mufindi District Maximillan Mgina and Anna Wawa
49
The appropriateness of fire fighting measures depends on the type of fire
(Sawe, 2008). For example, firebreaks suit ground fire. Thus, fire-based
operation requires good plan, organization of resources and coordination
of the fire crew. Interview with responsible officers indicated that there
were no reliable weather detectors and data. The fewer fire towers which
detect fire by observing smokes were in place. This suggests that,
climatology data pertaining to temperature, humidity, wind speed and
direction were missing which make fire management challenging.
Interviewee at fire department commented that:
“We are lacking reliable data sources. This makes it difficult to
establish trends, which would ensure predictability of the
incidences depending on the analyzed data and hence enabling
future decision making. We need to have facilities for collecting
and analyzing data specific to our area. We rely on satellite data
from the headquarters (Dar es Salaam). But the satellites we are
using just inform that there is fire at Sao Hill without giving
specific details on the site location. Remember Sao hill is big
plantation!” (July, 2018).
This deficiency was vivid in the study by FAO (2013) on sustainable
forest management in a changing climate - A Fire Baseline for Tanzania
showed that, the data on extent, nature and impacts of wildfires have not
been compiled and analyzed which preclude developing accurate and
reliable data for recent and future comparisons. Besides, such findings
relate with study by Nyongesa and Vacik (2019) on evaluating
management strategies for Mount Kenya Forest Reserve and National
Park to reduce fire danger and address interests of various stakeholders. It
was noted that, most of the fires are recorded by Kenya Forest Services
had unknown causes, making it difficult to estimate their social,
economic, cultural and ecological effects. This study, though specific to
Sao Hill Plantation has contributed to the few existing knowledge on
plantation fires and its fighting challenges for policy interventions.
In summary, the study found that land preparation was the major cause of
forest fire at Sao Hill Forest plantation. This included preparing land by
local farmers at nearby forest stands and land prepared before replanting
of trees in the formerly harvested forest compartments or extension areas.
On the other hand, arsonists were the second contributor of forest fire in
the area. Loss of trees was the major identified negative impact of forest
Huria Journal, Vol 27(2), September 2020: 30-55
Assessment of Wildfires in Tanzania Forest Plantations: A Case of Sao Hill in Mufindi District Maximillan Mgina and Anna Wawa
50
fires followed by destruction of assets. Challenges include; inadequate
firefighting equipment and inadequate community participation which
were impeding the plantation strategies to address the fire problem.
CONCLUSION AND RECOMMENDATIONS
The findings of this study exposed the need for the decision-makers,
forest managers, tree growers and policy actors to consider the issue of
forest protection. This is critical for conservation purposes, maintaining
ecological balance and for social economic benefits. All stakeholders
should coordinate harmoniously through a participatory process. Besides,
the study findings could also be adapted in management of natural forests.
It is critical to practice forests protection evaluation, enhance forests
protection records and adopt relevant frameworks that would facilitate
forest protection management practices. Enhancing protection records
will also bridge the present information or data gap among decision
makers and managers or practitioners at grass root level. This will enable
to establish relevant policy, regulations and budgets in forest protection.
In addressing proper land preparation, all the prerequisites for successful
controlled burning must be thoroughly followed up as per the agreed
Community Based Fire Management Plan (CBFM). For example;
villagers were to report to the nearby forest station. This would enable the
forest in charge at the station to organize appropriate time or man power
to monitor the preparation farming land by fire. This is based on the fact
that, the use of fire for land preparation is cost feasible which means that
it cannot easily be burnt Use of controlled fire, fire lines, fuel breaks, fuel
load removal and mapping of fire sensitive areas are key principles to
minimize fire risk. In addressing arsonism, the plantation management
needs to carefully plan for the just and equitable allocation of resources
such as trees harvesting permits, farming land among communities and
establishing community relations programmes through participating in
social events like supporting health services, funeral services, education,
sports and games activities. Farmers must ensure proper land use to
reduce competition to the forested land; for example, practising multiple
purposes land uses like agro-forestry or mixed cropping with trees for
future timber uses. The later can also be sold as poles at the local and
urban markets. Furthermore, employing the use of Remote sensing
techniques such as Geographical Information Systems (GIS) can facilitate
early detection and hence timely suppression of forest fires.
Huria Journal, Vol 27(2), September 2020: 30-55
Assessment of Wildfires in Tanzania Forest Plantations: A Case of Sao Hill in Mufindi District Maximillan Mgina and Anna Wawa
51
Training of fire fighting crew and ensuring the availability of fire fighting
equipment, radio devices like “walkie-talkies” are recommended for
communication among fire fighting crews and head quarters at Sao Hill
main office. There should be a good network of fire towers for monitoring
and detection of possible fire signs, adequate protective gears for crew
safety during fire fighting and means of transport like standby vehicles,
motorbikes and bicycles for fireguards. This should be in line with good
forest road network to enhance immediate access and hence response to
fire incidences. Besides, the need to enhance social relationship through
supporting adjacent communities in form of materials and services, and
joint forest management between plantation management and surrounding
villagers is important for forest protection against arsonists.
There is a need to review the management practices. This can be achieved
through redefining the mission of the forest plantations. Recently,
managers have been putting much emphasis on extension of unplanted
areas and some on conservation of biodiversity. However, lesser
concentration has been invested on other goals such as improving wood
production in terms of recovery, forests and energy, quantification of
social economic values of forests, non-timber or non-wood forest
products and matters associated with climate change.
Commercial companies and other stakeholders should come up with
means to utilize the after harvest remains from timber processing. This
will in turn reduce the fuel load left during harvesting operations. Policy
makers and the government should enhance the legal legitimacy and
budgetary favourable atmosphere. It is crucial to establish new policies,
laws, new penalties and sanctions for emerging forest fire related
offences. Policy coherence and harmonization should be ensured; for
example; wildlife policy, national forest policy, national land policy,
water policy, agriculture development policy, energy policy etc. Such
policies need to work in harmony as they are all being affected directly or
indirectly by forest fire threats.
REFERENCES
Creswell, J. (2009). Research Design: Qualitative, Quantitative, and
Mixed Methods Approaches, 3rd Edition. California: SAGE
Publications.
Dewan, S.; Vacik, H. (2010). Analysis of regeneration and species
diversity along human induced disturbances in the Kassalong
Huria Journal, Vol 27(2), September 2020: 30-55
Assessment of Wildfires in Tanzania Forest Plantations: A Case of Sao Hill in Mufindi District Maximillan Mgina and Anna Wawa
52
Reserve Forest at Chittagong Hill Tracts, Bangladesh. Ekologia, 29,
307–325
Doerr S. H, Santı´n C. (2016). Global trends in wildfire and its impacts:
perceptions versus realities in a changing world. Phil. Trans. R. Soc.
B 371: 20150345. http://dx.doi.org/10.1098/rstb.2015.0345.
FAO (2013). Sustainable Forest Management in a Changing Climate
FAO‐Finland Forestry Programme – Tanzania. A Fire Baseline
for Tanzania. Dar es Salaam.
FBD (2002). Forestry in figures. Forest and Beekeeping Division, Ministry
of Natural Resources and Tourism, Dar es Salaam.15pp.
Ferna´ndez y Ferna ´ndez, D., rez-Orozco, S., Siebe, C. (2017). Causes and
Effects of Forest Fires in Tropical Rainforests: A Bibliometric
Approach. Tropical Conservation Science Volume 10: 1–14.
Food and Agriculture Organization (2005). Needs and opportunities for
International Cooperatio in Forest Fire Preparedness, Committee on
Forestry COFO/2005/3; 17th Session, Rome 15-19 March, 2005.
Food and Agriculture Organization (2011). Fire Management Working
Paper. FAO at the 5th International Wildland Fire Conference Sun
City, South Africa (9- 13 May 2011). Rome, Italy.
Food and Agriculture Organization (2013). Sustainable Forest Management
in a Changing Climate FAO‐Finland Forestry Programme –
TANZANIA. A Fire Baseline for Tanzania.
Food and Agriculture Organization, (2003). Proceedings of the second
international workshop on participatory forestry in Africa. Defining
the way forward Sustainable livelihoods and sustainable forest
management through participatory forestry.18‐22 Feb, 2002,
Arusha Tanzania. FAO, Rome, Italy.
Ganteaume, A., Camia, A., Jappiot, M., San-Miguel-Ayanz, J., Long, M.,
Lampin, C. (2013). A review of the main driving factors of forest
fire ignition over Europe. Environ. Manage. 51 (3), p.651-
662.Ganteaume, A., Camia, A., Jappiot, M, San-Miguel-Ayanz, J.,
Long, M., Lampin, C. (2013). A Review of the Main Driving
Factors of Forest Fire Ignition Over Europe. Environmental
Management 51, 651–662. https://doi.org/10.1007/s00267-012-
9961-z
Garcı ´a-Ortega, E., Trobajo, M.T., Lo ´pez, L., Sa ´nchez, J.L. (2011).
Synoptic patterns associated with wildfires caused by lightning in
Castile and Leon, Spain. Nat. Hazards Earth Syst. Sci. 11, 851e863.
Huria Journal, Vol 27(2), September 2020: 30-55
Assessment of Wildfires in Tanzania Forest Plantations: A Case of Sao Hill in Mufindi District Maximillan Mgina and Anna Wawa
53
Jhariya, M, K and Raj, A. (2014). Effects of wildfires on flora, fauna and
physico- chemical properties of soil-An overview. Journal of
Applied and Natural Science 6 (2): 887 – 897.
Jua´rez-Orozco, S, M, Siebe, C and Ferna´ndez y Ferna´ndez, D. (2017).
Causes and Effects of Forest Fires in Tropical Rainforests: A
Bibliometric Approach. Tropical Conservation Science Volume 10:
1–14.
Kangalawe, H. (2018). Plantation Forestry in Tanzania: A History of Sao
Hill Forests, 1939-2015. A dissertation Presented for the Degree of
Doctor of Philosophy (History) in the Faculty of Arts and Social
Sciences, at Stellenbosch University.
Keenan, R. J., Reams, G. A., Achard, F., de Freitas, J. V., Grainger, A., &
Lindquist, E. (2015). Dynamics of global forest area: Results from
the FAO Global Forest Resources Assessment 2015. Forest
Ecology and Management, 352, 9–20.
Kilahama, F, K. (2005). Through deforestation and degradation program
(REDD Plus). Director of Forests and Beekeeping Division,
Ministry of Natural Resources and Tourism, Tanzania.
László Foldi, L and Kuti, R. (2016). Characteristics of Forest Fires and
their Impact on the Environment. AARMS Vol. 15, No. 1 (2016) 5–
17.
Leone, V., Xanthopoulos, G and Tedim, F. (2014). Forest Fires in Europe:
Facts and Challenges. Elsevier Inc. Retrieved from
https://www.researchgate.net/ on 9/23/2021.
Lulandala L. L. L., Mwinyijuma, S. K. & Nsolomo, V. R. (1995). Fire
incidences, causes, damage and drought indices at Sao Hill Forest,
Southern Tanzania, during 1980- 1987. Sokoine University of
Agriculture. Faculty of Forestry Record 61:1-13.
Madoffe, S.S., Bakke, A. and Tarimo, J.A. (2000). The effect of fire on the
diversity and abundance of wood-living beetles in miombo
woodland, Tanzania. Southern African Forestry Journal 187:51-
57.
Malinga, H, I. (2011). Management cost in government and private forest
plantations in Tanzania: case study of Sao Hill and Mapanda
Plantations, Mufindi District, Tanzania. A dissertation submitted in
partial fulfilment of the requirements for the degree of Master of
Science in management of natural resources for sustainable
agriculture of Sokoine University of Agriculture. Morogoro,
Tanzania.
Huria Journal, Vol 27(2), September 2020: 30-55
Assessment of Wildfires in Tanzania Forest Plantations: A Case of Sao Hill in Mufindi District Maximillan Mgina and Anna Wawa
54
Maphill, (2013). Map graphics revolution. Retrieved on 15th November
2018 from: http://www.maphill.com/tanzania/iringa/mufindi/sao-
hill/location-maps/.
MNRT (2001). Involvement of Private Sector in the Industrial Plantations
Development and Management. Project Implementation Manual.
Forestry and Beekeeping Division. 50pp.
Neary, D. G and Leonard, J, M. (2020). Effects of Fire on Grassland Soils
and Water: A Review, Grasses and Grassland Aspects, Valentin
Missiakô Kindomihou, IntechOpen, DOI: 10.5772/ intechopen.
90747. Available from: https://www.intechopen.com/books/
Ngaga, Y. M. (2011). Forest plantations and woodlots in Tanzania.
African Forest forum working paper series. Volume, Issue 16,
2011: 1-80
Nyongesa, K.W and Vacik, H. (2018). Fire Management in Mount
Kenya: A Case Study of Gathiuru Forest Station. Forests, 9, 481.
Poletti C. 2016. Characterization of Forest Fires in the Mt. Kenya Region
(1980- 2015) [Master thesis]. Padua, Italy: University of Padua,
Department of Land, Environment Agriculture and Forestry.
Sapsford, R. and V. Jupp (eds.) (2006). Data collection and analysis. 2nd
ed. London: Sage Publications.
Sawe, E. (2008) National Policies and Strategies on Bio energy in Africa
Case Study: Tanzania January COMPETE Competence Platform on
Energy Crop and Agro forestry Systems for Arid and Semi-arid
Ecosystems – Africa.
Tedim F, Leone V, Xanthopoulos G. 2016. A wildfire risk management
concept based on a social-ecological approach in the European
Union: fire smart territory. Int J Disaster Risk Reduct. 18:138–153.
doi: 10.1016/j.ijdrr.2016.06.005
Thompson, M. P, Scott J, Helmbrecht, D, Calkin D, E. (2013). Integrated
wildfire risk assessment: Framework development and application
on the Lewis and Clark National Forest in Montana, USA. Integr
Environ Assess Manag. 9(2):329–342.
United Republic of Tanzania / Ministry of Natural Resources and
Tourism (1998). Tanzania forest policy. Forest and
beekeeping Division, Dar es Salaam, p. 59.
World Wide Fund for nature (WWF) (2006) Community-based Fire
Management Plan and By-laws in the East Usambara. The East
Usambara forest landscape restorationproject.
http://www.easternarc.or.tz/groups/webcontent/documents
Huria Journal, Vol 27(2), September 2020: 30-55
Assessment of Wildfires in Tanzania Forest Plantations: A Case of Sao Hill in Mufindi District Maximillan Mgina and Anna Wawa
55
World Wildlife Fund (2020). Fires, forests and the future: A crisis raging
out of control? Rue Mauverney 28 1196 Gland, Switzerland.
Yanda, P.Z., Olson, J., and Moshy, P. (2008) Climate Change
Vulnerability Impacts and Adaptation in Tanzania. CLIP Working
Paper. Inst. of Res. Assessment, University of Dar es Salaam,
Tanzania.
Yin, R. (2009). Case Study Research: Design and Methods, fourth
edition, Thousand Oaks, CA: Sage Publications.

Huria Journal, Vol 27(2), September 2020: 56-71
56
Transaction Cost of Sunflower Seed Production in
Tanzania: Application of Transaction Cost Economics
Theory
Deus Ngaruko [email protected]
Timothy Lyanga [email protected]
The Open University of Tanzania
ABSTRACT
This paper analyses the effects of transaction costs of production of the
sunflower seeds by small scale farmers in Tanzania. The study utilises
cross-sectional farm household data collected from a randomly selected
sample of 120 small scale farmers in two central regions of Singida and
Tabora in Tanzania. The results showed that transaction cost variables
associated with information search and negotiation had negative effect on
total output of sunflower seed production while contractual enforcement
cost had positive effect on sunflower production. The effects were
however not supported statistically (at p<0.05). Transaction costs
associated with inputs information, access to means of communication
and transportation, had significant negative effects on sunflower seed
production. We recommend that policies aimed at improving rural road
infrastructure, market information systems, small scale asset
accumulation, human capital and promotion of farmer association could
reduce transaction costs and enhance sunflower production by small
scale commercial farmers.
Keywords: Transaction cost economics, search cost, negotiation cost,
enforcement cost, sunflower production, Tanzania
INTRODUCTION
Transaction costs exist in all production and market exchanges; and high
transport costs, which are an element of transaction costs, are a major
deterrent for participation of farmers in Africa, and they affect the price
farmers receive as well as their production (Hine and Ellis, 2001). This
implies that a reduction in transaction costs can encourage small scale
farmers to participate efficiently in production and marketing. In Africa,
agricultural commercialisation remains to be marginal as it has been
observed that 26% of farmers did not sell any of their crops produced and

Huria Journal, Vol 27(2), September 2020: 56-71
Transaction Cost of Sunflower Seed Production in Tanzania: Application of Transaction Cost Economics Theory Deus Ngaruko and Timothy Lyanga
57
so they were not connected to market; with only 25% of farmers selling
more than half of their total production (World Bank, 2011). From all
these observations it is plausible to argue that the output side of
agricultural commercialisation is very low for small scale farmers to
experience the associated benefits.
Sunflower is one of Tanzania’s most important cash crops grown mostly
within the central regions of Tanzania. The country ranks eleventh in the
world in sunflower seed production and it is the second largest producer
in Africa behind South Africa, accounting for 35% of the continent’s total
production; yet the country imports nearly 50% of edible oil. African
countries account for 5.5 per cent of the world’s production (FAOSTAT,
2018). Furthermore, statistics show that local production of both factory
and home extracted sunflower seed oil in Tanzania contributes about 40%
of edible oil requirement of 330,000 tones implying that the 60% supply
gap is filled by imports.
Sunflower oil is one of the most popular oils in the world, in Tanzania
sunflower production offers multiple livelihood opportunities, as it
produces important and valuable vegetable oils and animal feeds that are
sold to internal and external markets (Ugulumu E.S.; Inanga E.L., 2014).
It is estimated that about 4 million small scale farmers engage in
sunflower production (URT, 2013). Sunflower is grown in most regions
across Tanzania as the crop is drought resistant and less susceptible to
diseases; consequently, the semi-arid areas of the central zone and the
southern coast of Tanzania are most favorable for sunflower production
(Kajimbwa et al., 2010).
In African tropical countries, Tanzania production stands at 108 000 MT
per annum, Sudan (18 000 MT), Kenya (12 000 MT), Angola,
Mozambique, and Zambia (each about 11 000 MT). Most of the
sunflower oil is consumed in these countries of origin and less than 30%
reaches the international markets. Low exports of sunflower oil are
attributed to high demand in domestic markets, low quality and standards
which restrict entrant to international markets, and low output of most
small-scale processors (Berglund, 2015). In Tanzania, agriculture
continues to be the main backbone of the economy of most of the rural
population. According to URT (2008) over 80% Tanzanians live in rural
areas where agriculture and the use of natural resources are crucial to
their livelihoods. Sunflower represents one of the key sub-sectors of
Huria Journal, Vol 27(2), September 2020: 56-71
Transaction Cost of Sunflower Seed Production in Tanzania: Application of Transaction Cost Economics Theory Deus Ngaruko and Timothy Lyanga
58
agriculture in Tanzania (RLDC 2008). Globally, the leading commercial
producers of sunflower seeds includes Russia, Peru, Argentina, Spain,
France and China (The George Mateljan Foundation, 2001-2010).
Irrespective of its relevance in understanding determinants of transactions
in developing countries, the application of Transaction Cost Economics
(TCE) theory in thin markets has been minimal especially in agrarian
economies. As a result, explanation of what could explain commercialised
agricultural production in the country is lacking. The overall objective of
this paper therefore, is to apply TCE theory in identifying the different
forms of transaction costs and assessing their relative effects on sunflower
seed production in Tanzania.
Transaction Cost Economics Theory and its Application
Since Williamson proposed the TCE theory in 1970s, a number of
researchers have used it in a variety of relationships. Williamson, focuses
on how the characteristics of a transaction affect the costs of handling it
through production, markets, bureaucracies, and other forms of
organization. A transaction occurs whenever a good or service is
transferred across a technologically separable interface (Williamson,
1985). According to Williamson (opt cit), transaction costs can be
classified into observable (explicit) and unobservable (implicit) or
inhibitive transaction costs. The observable transaction costs, which
include production costs such as transport, handling, packaging, and
storage, affect the magnitude of output. The unobservable transaction
costs, which include cost of information, search, bargaining, screening
partners or customers, monitoring, coordination, and enforcement are
inhibitive. The other delineation of transaction costs is ex ante fixed and
proportional transaction costs. Ex ante fixed transaction costs are the
same regardless of the magnitude or level of transactions made. An
example of ex ante fixed costs is information cost on inputs, which would
remain the same regardless of the amount of produce a farmer sells after
the market information has been obtained (Yustika, 2008).
From yet a different perspective, Wang and Huo, (2013) and Key et al.,
(2000) define transactions costs as fixed and proportional (or variable)
transaction costs. Here fixed transactions costs include the original search,
negotiation and enforcement costs that are invariant to the volume of
input as well as output. However, with respect to sunflower production,
there is need to use a narrower definition of transaction costs which
provides a clear relationship with search, negotiation and enforcement

Huria Journal, Vol 27(2), September 2020: 56-71
Transaction Cost of Sunflower Seed Production in Tanzania: Application of Transaction Cost Economics Theory Deus Ngaruko and Timothy Lyanga
59
costs in sunflower production. In this context, the definition by Staal et
al, (1997) who classify transaction costs into observable and unobservable
transaction costs is used. The observable transaction costs include
marketing costs such as transport, handling, packaging, storage, spoilage
etc. that are visible when a transaction takes place. Unobservable
transaction costs include cost of information search, bargaining, and
enforcement of contracts etc. The adopted framework of Transaction
Costs underpinnings of why the transaction costs effect sunflower seed
production can be found in the transaction costs theory as postulated by
Williamson (Siziba et al., 2011).
Figure 1: Adoptive Framework of Transaction Costs
Source: Modified from Wang and Huo (2013)
A number of studies, such as Key et al., (2000) and Makhura et al., (2001)
have identified high transaction costs as one of the key reasons for small
scale farmers to participate in production, though they accorded attention
to the global production of oil and seed shows that, sunflower industry is
dominated by a few large global players, characterized by large,
mechanized farms with easy access to inputs and funding. The study
investigated the role of proportional and fixed transaction costs on
farmers’ market participation and supply volume decisions. Key et al.
(2000) show that maize production in Mexico is not only associated with
Huria Journal, Vol 27(2), September 2020: 56-71
Transaction Cost of Sunflower Seed Production in Tanzania: Application of Transaction Cost Economics Theory Deus Ngaruko and Timothy Lyanga
60
agricultural mechanization, use of high-yield inputs, and price, but also
with selling to official sources and membership of agricultural
organizations, implying lower proportional transaction costs. The
marketable production threshold was significantly associated with pick-up
truck ownership, i.e., higher fixed transaction costs (Key et al., 2000).
A study conducted by Hobbs and Young (2000) stated that product
perishability also complicates transaction, and raises transaction cost.
Shiferaw et al. (2009) identified low volume as one of the major factors
limiting the success of small-scale marketing groups in Kenya. Though
numerous studies have accorded attention to the effects of transaction
costs on small scale farmers, not many foci on how they affect small scale
paddy farmers. In Niger, Aker (2008) has shown that mobile phone use
among grain sellers led to significant reductions in grain-price dispersion
net of transport costs across production and markets of small-scale
farmers in Niger.
Baloyi (2010) conducted a study on analysis of constraints facing small
scale farmers in the agribusiness value chain in Tanzania; the study
discussed the factors such as lack of human capital, high transaction cost,
lack of information on markets, transport problems, technological
barriers. The study discovered that many small-scale farmers were
illiterate, with poor technological skills, which seemed to be obstacles in
accessing useful formal institutions that can disseminate technological
knowledge. It shows that majority of emerging producers lack knowledge
on financial and marketing skills and it was found that producers were not
able to meet the quality standards set by fresh produce markets and food
processors. Further, Ugulumu, and Inanga (2014) argue that reducing
transaction costs can significantly unlock the limited market participation
by small scale farmers.
METHODOLOGY
Data and Sampling Design
Cross section data were collected from a survey of 120 randomly selected
small-scale farmers in two districts of Mkalama and Igunga in Singida
and Tabora regions of central Tanzania. The study confined in collecting
quantifiable transaction cost determinants of Commercialised production
of sunflower seeds. A formula for simple determination proposed by
Tabachnick and Fidell (2007) was used to come up with a sample size.
Tobachnick and Fidel (opt cit) suggest a formula: N > 50 + 8m for
Huria Journal, Vol 27(2), September 2020: 56-71
Transaction Cost of Sunflower Seed Production in Tanzania: Application of Transaction Cost Economics Theory Deus Ngaruko and Timothy Lyanga
61
multivariate data analysis where N is the number of sunflower producers
target population and m is the number of independent variables.
Theoretical Model Formulation
The transaction cost economics (TCE) and neo-classical economics
(NCE) theories assert that the producer maximises profit subject to some
technical and institutional constraints (Meyer, 2006). A farmer will thus,
choose level of output and set of inputs in such a way that a maximum
profit ( Max) is realized. The production maximization function with
consideration of transaction cost as an exogeneous factor is as presented
in equation (1).
),( TCc
iiMaxU
........................................................................................ 1
Equation (1) is assumed possible subject to income, resource and
transaction cost constraints as indicated in equations 2-5. Income
Constraints equation is thus as presented in Equation (1), whereas the
resource constraints equation is represented in Equations (2) and (3).
BPBP i
N
i
c
ii
N
i
c
iA
==
+11 ............................................................................... 2
Qi + Ei + Bi K i + C i + S i ……………………………………...3
Equations (4) and (5) present transaction costs of production constraints
0),,( =ZKQ
q
iiG
.................................................................................. 4
0,,,, KBSQC iiiii ............................................................................. 5
Where;
Tc
i = Transaction costs
Pi = Total production of good i A = Exogenous factors
Zc
= Farmer characteristics
Zq
= Transaction costs characteristics of production
Huria Journal, Vol 27(2), September 2020: 56-71
Transaction Cost of Sunflower Seed Production in Tanzania: Application of Transaction Cost Economics Theory Deus Ngaruko and Timothy Lyanga
62
i
Model Estimation Method
Due to the continuous nature of dependent variable (quantity of sunflower
seed produced by small scale producer) an Ordinary Least Square (OLS)
method was used to estimate the Multivariate Linear Regression Model of
transaction costs sunflower determinants of sunflower seed production.
An econometric form is adopted as shown in equation (6) and the
estimates
i for the vector of variables capturing the factors determining
L, which include transaction costs related factors (i.e., access to
information, negotiation, and law enforcement to loans), are obtained.
i
ni
iii xL 1
1
)( += =
=
……………………………………………………………………………..
6
Where,
Li = the intensity output (the quantity of sunflower production)
xi = independent variables (transaction costs) affecting
sunflower production = coefficient estimates of the independent variables, and
i1 = the error term for the regression equation
In the current study conceptual framework integrates output and
transaction costs in the choice of production channels. For the current
study, the functional form of the classical multivariate regression model is
represented in equation (7) and its loglinear form in equation (8).
tEnfor
i
tNegotSearch
i iiY cosln
2
2
coslncosln1
8
832
5
50
=
++=
+= =
............. 7
tEnfortNegotSearchY coslncoslncosln32100ln +++=
.............. 8
Where Y refers to total number of bags of 70kg (TONUBA)
Effect of Search Transaction Cost on Sunflower Production
In this study Search cost (Searchcost) =ƒ (seeding, deciding, preparing
land and planting, harvesting, packing and storing, selling). Hence
holding negotiation cost (Negocost) and enforcement cost (Enforcost)
Huria Journal, Vol 27(2), September 2020: 56-71
Transaction Cost of Sunflower Seed Production in Tanzania: Application of Transaction Cost Economics Theory Deus Ngaruko and Timothy Lyanga
63
constant, the effect of search transaction (Searchcost) cost can be
rewritten as in equation (9).
28
7654
32101
).....cosln(
)cosln()cosln()cosln()cosln(
)cosln(Pr)cosln()cosln(ln
eqntSell
tStoretPacktHarvesttInput
tepLandtDecidetSeedY i
+
++++
+++=
.................................................................................................................. 9
Where,
Seedcost = transaction cost of finding information about a particular
type of seed and cost of traveling to purchase seeds if the
seeds were not available.
Decidecost = transaction cost of decision by farmers to phone-call to
agricultural officers to find information about the
sunflower farming.
Preplandcost = transaction cost of finding labour and cost of finding
machines to prepare the land for farming.
Inputcost = transaction cost of finding fertilizer, pesticides, weeds
etc. and cost of traveling to purchase fertilizer, pesticides,
weeds etc. if those were not available.
Harvestcost = transaction cost of harvesting and finding storage,
packing materials.
Packcost = transaction cost of packages and packaging sunflower
seeds in the required quantities
Storecost = transaction cost of storing sunflower seeds and associated
conditionalities
Sellcost = transaction cost of comparing prices of different traders
and costs of finding transport.
Effect of Negotiation Transaction Cost on Sunflower Production
The second component in equation (8) is negotiation transaction costs
(Negocost) that are more related costs to access to the right information.
In this study Negocost = ƒ (Payment for land hiring, transportation of
inputs, writing the contract, waiting time at bank for loan receiving,
bargaining power of buying inputs). Thus, holding Searchcost and
Enforcost constant, then equation (8) can be represented as shown in
equation (10).
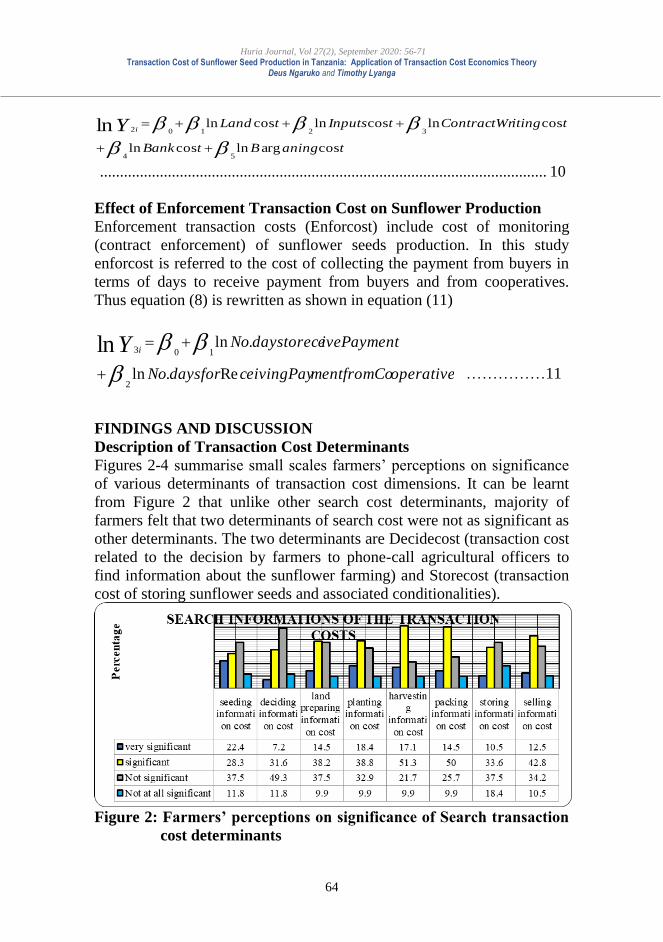
Huria Journal, Vol 27(2), September 2020: 56-71
Transaction Cost of Sunflower Seed Production in Tanzania: Application of Transaction Cost Economics Theory Deus Ngaruko and Timothy Lyanga
64
taningBtBank
titingContractWrtInputstLandY i
cosarglncosln
coslncoslncosln
54
32102ln
++
+++=
................................................................................................................ 10
Effect of Enforcement Transaction Cost on Sunflower Production
Enforcement transaction costs (Enforcost) include cost of monitoring
(contract enforcement) of sunflower seeds production. In this study
enforcost is referred to the cost of collecting the payment from buyers in
terms of days to receive payment from buyers and from cooperatives.
Thus equation (8) is rewritten as shown in equation (11)
……………11
FINDINGS AND DISCUSSION
Description of Transaction Cost Determinants
Figures 2-4 summarise small scales farmers’ perceptions on significance
of various determinants of transaction cost dimensions. It can be learnt
from Figure 2 that unlike other search cost determinants, majority of
farmers felt that two determinants of search cost were not as significant as
other determinants. The two determinants are Decidecost (transaction cost
related to the decision by farmers to phone-call agricultural officers to
find information about the sunflower farming) and Storecost (transaction
cost of storing sunflower seeds and associated conditionalities).
Figure 2: Farmers’ perceptions on significance of Search transaction
cost determinants
operativementfromCoceivingPaydaysforNo
ivePaymentdaystoreceNoY i
Re.ln
.ln
2
103ln
+
+=
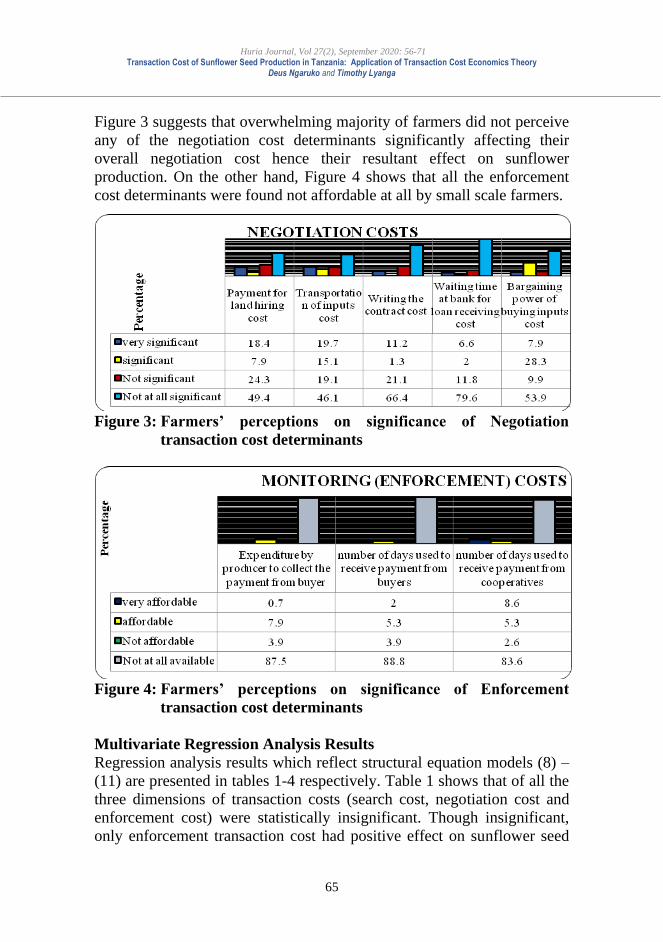
Huria Journal, Vol 27(2), September 2020: 56-71
Transaction Cost of Sunflower Seed Production in Tanzania: Application of Transaction Cost Economics Theory Deus Ngaruko and Timothy Lyanga
65
Figure 3 suggests that overwhelming majority of farmers did not perceive
any of the negotiation cost determinants significantly affecting their
overall negotiation cost hence their resultant effect on sunflower
production. On the other hand, Figure 4 shows that all the enforcement
cost determinants were found not affordable at all by small scale farmers.
Figure 3: Farmers’ perceptions on significance of Negotiation
transaction cost determinants
Figure 4: Farmers’ perceptions on significance of Enforcement
transaction cost determinants
Multivariate Regression Analysis Results
Regression analysis results which reflect structural equation models (8) –
(11) are presented in tables 1-4 respectively. Table 1 shows that of all the
three dimensions of transaction costs (search cost, negotiation cost and
enforcement cost) were statistically insignificant. Though insignificant,
only enforcement transaction cost had positive effect on sunflower seed
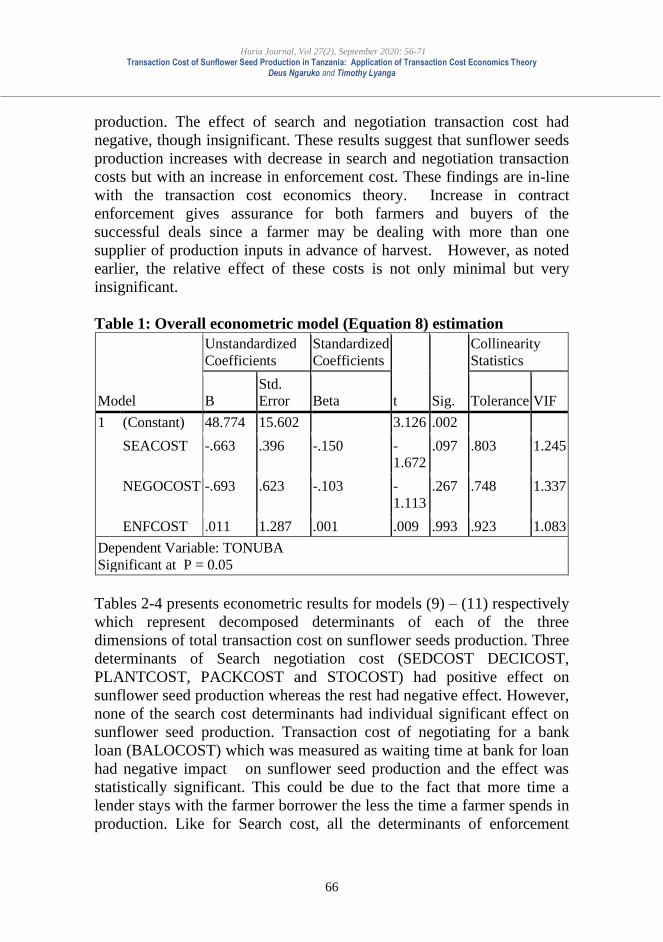
Huria Journal, Vol 27(2), September 2020: 56-71
Transaction Cost of Sunflower Seed Production in Tanzania: Application of Transaction Cost Economics Theory Deus Ngaruko and Timothy Lyanga
66
production. The effect of search and negotiation transaction cost had
negative, though insignificant. These results suggest that sunflower seeds
production increases with decrease in search and negotiation transaction
costs but with an increase in enforcement cost. These findings are in-line
with the transaction cost economics theory. Increase in contract
enforcement gives assurance for both farmers and buyers of the
successful deals since a farmer may be dealing with more than one
supplier of production inputs in advance of harvest. However, as noted
earlier, the relative effect of these costs is not only minimal but very
insignificant.
Table 1: Overall econometric model (Equation 8) estimation
Model
Unstandardized
Coefficients
Standardized
Coefficients
t Sig.
Collinearity
Statistics
B
Std.
Error Beta Tolerance VIF
1 (Constant) 48.774 15.602 3.126 .002
SEACOST -.663 .396 -.150 -
1.672
.097 .803 1.245
NEGOCOST -.693 .623 -.103 -
1.113
.267 .748 1.337
ENFCOST .011 1.287 .001 .009 .993 .923 1.083
Dependent Variable: TONUBA
Significant at P = 0.05
Tables 2-4 presents econometric results for models (9) – (11) respectively
which represent decomposed determinants of each of the three
dimensions of total transaction cost on sunflower seeds production. Three
determinants of Search negotiation cost (SEDCOST DECICOST,
PLANTCOST, PACKCOST and STOCOST) had positive effect on
sunflower seed production whereas the rest had negative effect. However,
none of the search cost determinants had individual significant effect on
sunflower seed production. Transaction cost of negotiating for a bank
loan (BALOCOST) which was measured as waiting time at bank for loan
had negative impact on sunflower seed production and the effect was
statistically significant. This could be due to the fact that more time a
lender stays with the farmer borrower the less the time a farmer spends in
production. Like for Search cost, all the determinants of enforcement
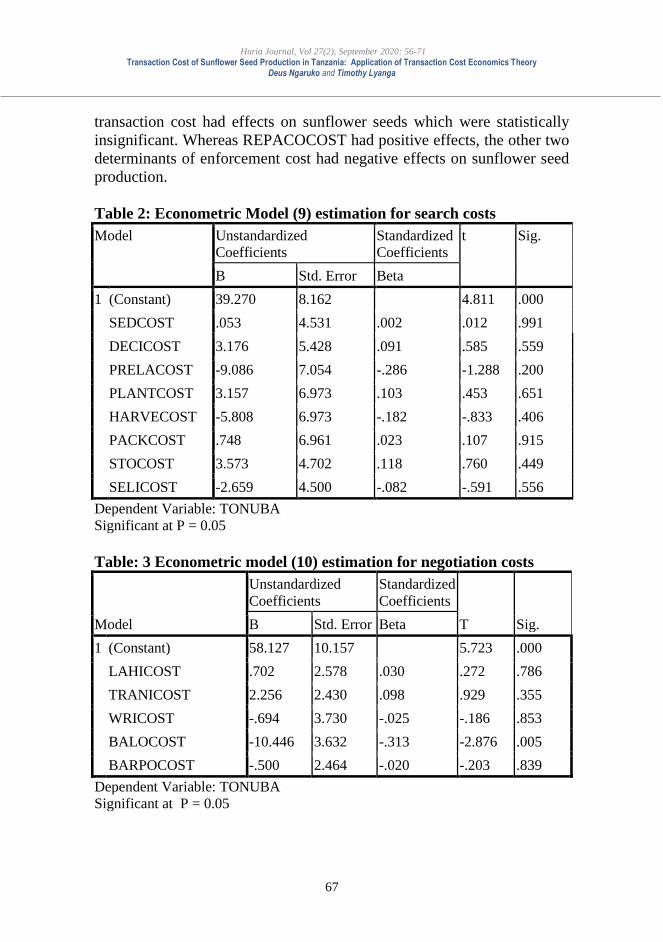
Huria Journal, Vol 27(2), September 2020: 56-71
Transaction Cost of Sunflower Seed Production in Tanzania: Application of Transaction Cost Economics Theory Deus Ngaruko and Timothy Lyanga
67
transaction cost had effects on sunflower seeds which were statistically
insignificant. Whereas REPACOCOST had positive effects, the other two
determinants of enforcement cost had negative effects on sunflower seed
production.
Table 2: Econometric Model (9) estimation for search costs
Model Unstandardized
Coefficients
Standardized
Coefficients
t Sig.
B Std. Error Beta
1 (Constant) 39.270 8.162 4.811 .000
SEDCOST .053 4.531 .002 .012 .991
DECICOST 3.176 5.428 .091 .585 .559
PRELACOST -9.086 7.054 -.286 -1.288 .200
PLANTCOST 3.157 6.973 .103 .453 .651
HARVECOST -5.808 6.973 -.182 -.833 .406
PACKCOST .748 6.961 .023 .107 .915
STOCOST 3.573 4.702 .118 .760 .449
SELICOST -2.659 4.500 -.082 -.591 .556
Dependent Variable: TONUBA
Significant at P = 0.05
Table: 3 Econometric model (10) estimation for negotiation costs
Model
Unstandardized
Coefficients
Standardized
Coefficients
T Sig. B Std. Error Beta
1 (Constant) 58.127 10.157 5.723 .000
LAHICOST .702 2.578 .030 .272 .786
TRANICOST 2.256 2.430 .098 .929 .355
WRICOST -.694 3.730 -.025 -.186 .853
BALOCOST -10.446 3.632 -.313 -2.876 .005
BARPOCOST -.500 2.464 -.020 -.203 .839
Dependent Variable: TONUBA
Significant at P = 0.05

Huria Journal, Vol 27(2), September 2020: 56-71
Transaction Cost of Sunflower Seed Production in Tanzania: Application of Transaction Cost Economics Theory Deus Ngaruko and Timothy Lyanga
68
Table 4: Econometric model (11) estimation for enforcement costs
Model
Unstandardized
Coefficients
Standardized
Coefficients
T Sig. B
Std.
Error Beta
1 (Constant) 19.580 15.676 1.249 .214
EXPCOST 4.622 4.353 .103 1.062 .290
REPACOST .645 5.178 .015 .125 .901
REPACOCOST -4.062 3.073 -.138 -1.322 .188
Dependent Variable: TONUBA
Significant at P = 0.05
CONCLUSION
It is shown in this study that the coefficients of the search information
costs were negative implying that increase in transaction cost due to
search information costs causes a decrease in production, though
statistically insignificant (P > 0.05). The statistical result in negotiation of
transportation of inputs cost (NEGOCOST) implies that an increase in
negotiation cost leads to a decrease in sunflower produced. However, this
effect is also insignificant statistically (p˂0.05). Lastly, regression results
show the effect of enforcement cost (ENFCOST) is positive though
statistically insignificant (P > 0.05). These results conform to the
mainstream TCE theory which postulates among others that increase in
transaction costs associated with enforcement cost in thin economies may
be necessary for transaction to happen. This suggests that there is need for
more enforcement of contracts between upstream suppliers of service
providers and farmers on one hand, but also between farmers and
downstream input suppliers.
Proportional transaction costs associated with inputs information access
and negotiation cost, have negative effects on sunflower production.
Similarly, fixed transaction costs associated with inputs information, such
as access to communication assets and ownership of transport, have
significant effects on output. These findings are in conformity with some
of the other research applying TCE (see for example Ngaruko &
Lwezaula. 2013; Nguvava & Ngaruko, 2016; Sonda & Ngaruko; and
Mutayoba & Ngaruko, 2018). Providing better access to inputs by
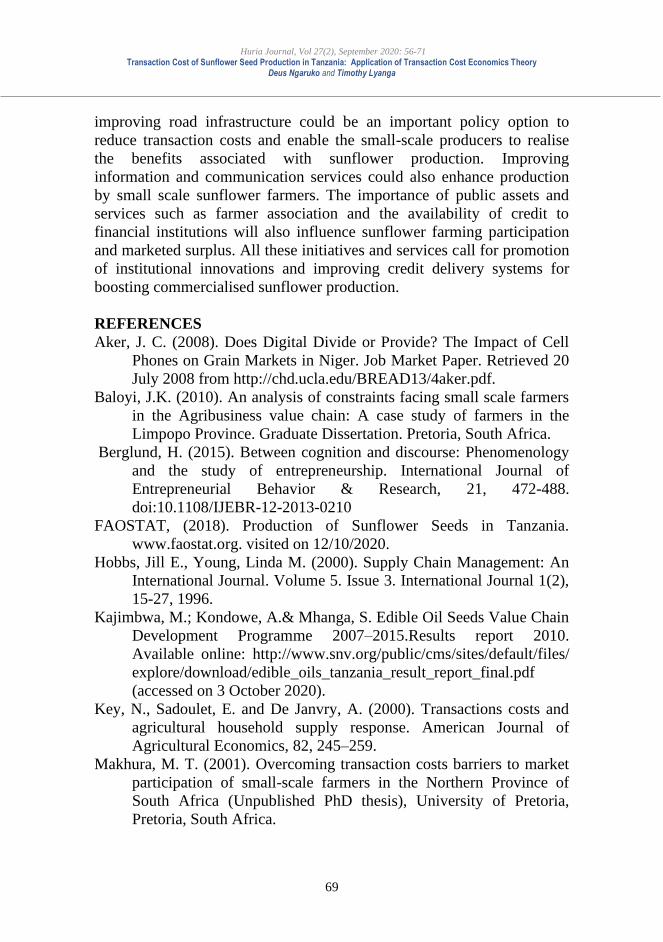
Huria Journal, Vol 27(2), September 2020: 56-71
Transaction Cost of Sunflower Seed Production in Tanzania: Application of Transaction Cost Economics Theory Deus Ngaruko and Timothy Lyanga
69
improving road infrastructure could be an important policy option to
reduce transaction costs and enable the small-scale producers to realise
the benefits associated with sunflower production. Improving
information and communication services could also enhance production
by small scale sunflower farmers. The importance of public assets and
services such as farmer association and the availability of credit to
financial institutions will also influence sunflower farming participation
and marketed surplus. All these initiatives and services call for promotion
of institutional innovations and improving credit delivery systems for
boosting commercialised sunflower production.
REFERENCES
Aker, J. C. (2008). Does Digital Divide or Provide? The Impact of Cell
Phones on Grain Markets in Niger. Job Market Paper. Retrieved 20
July 2008 from http://chd.ucla.edu/BREAD13/4aker.pdf.
Baloyi, J.K. (2010). An analysis of constraints facing small scale farmers
in the Agribusiness value chain: A case study of farmers in the
Limpopo Province. Graduate Dissertation. Pretoria, South Africa.
Berglund, H. (2015). Between cognition and discourse: Phenomenology
and the study of entrepreneurship. International Journal of
Entrepreneurial Behavior & Research, 21, 472-488.
doi:10.1108/IJEBR-12-2013-0210
FAOSTAT, (2018). Production of Sunflower Seeds in Tanzania.
www.faostat.org. visited on 12/10/2020.
Hobbs, Jill E., Young, Linda M. (2000). Supply Chain Management: An
International Journal. Volume 5. Issue 3. International Journal 1(2),
15-27, 1996.
Kajimbwa, M.; Kondowe, A.& Mhanga, S. Edible Oil Seeds Value Chain
Development Programme 2007–2015.Results report 2010.
Available online: http://www.snv.org/public/cms/sites/default/files/
explore/download/edible_oils_tanzania_result_report_final.pdf
(accessed on 3 October 2020).
Key, N., Sadoulet, E. and De Janvry, A. (2000). Transactions costs and
agricultural household supply response. American Journal of
Agricultural Economics, 82, 245–259.
Makhura, M. T. (2001). Overcoming transaction costs barriers to market
participation of small-scale farmers in the Northern Province of
South Africa (Unpublished PhD thesis), University of Pretoria,
Pretoria, South Africa.
Huria Journal, Vol 27(2), September 2020: 56-71
Transaction Cost of Sunflower Seed Production in Tanzania: Application of Transaction Cost Economics Theory Deus Ngaruko and Timothy Lyanga
70
Mobtaker, H. G., Akram, A. and Keyhani, A. (2010). Economic modeling
and sensitivity analysis of the costs of inputs for alfalfa production
In Iran: A case study from Hamedan province, Ozean Journal of
Applied Sciences, 3, 313-319.
Mutayoba, V., & Ngaruko, D. (2018). Assessing Tomato Farming and
Marketing Among Smallholders in High Potential Agricultural
Areas Tanzania of Tanzania. International Journal of Economics,
Commerce and Management United Kingdom (Vol. VI).
Ngaruko, D. D. and Lwezaula, D. D. (2013). Determinants of Farmers’
Group Membership Satisfaction in Mbozi District, Tanzania:
Exploring Farmers’ Options. International Journal of Economy,
Management and Social Sciences. 2(11):919-923.
Nguvava and Ngaruko (2016) Transaction cost determinants of credit
governance structures of commercial banks in Tanzania. African
Journal of Economic Review, Volume IV, Issue 2, July 2016
Siziba, S., Nyikahadzoi, K., Diagne, A., Fatunbi A. O., Adekunle, A. A.
Determinants of Cereal Market Participation by Sub-Saharan Africa
Small scale Far mers. Jour nal of Agriculture and Environmental
Studies 20112 (1), 180-193
Sonda G, and Ngaruko D. (2017). The Link between Farm Household
Objectives and Investment in Irrigation Scheme: Implications for
Collective Action Coordination Efficiency. African Journal of
Economic Review, Volume V, Issue I, January 2017
Staal, S., Delgado, C. & Nicholson, C. (1997). Small scale Dairy under
Transactions Costs in East Africa. World Development. 25 (5), 779-
794
Tabachnick, B. G. and Fidell, L. S. (2007). Using Multivariate Statistics,
5Th Edition. Boston: Pearson Education Inc.
Tanzania Economic Outlook (2017); agricultural sector to the economic
growth and the development of Tanzanians
Tanzania National Agricultural Policy-2013; URT: Dar es Salaam,
Tanzania, 2013; Available online:
http://www.fao-
ilo.org/.../user.../NATIONAL_AGRICULTURAL_POLICY-
2013.pdf (accessed on 25 september 2020).
Ugulumu, E. S. and Inanga, E. L. (2014). Market access and sunflower
marketing: Challenges and prospects to small scale farmers in
Tanzania.
Huria Journal, Vol 27(2), September 2020: 56-71
Transaction Cost of Sunflower Seed Production in Tanzania: Application of Transaction Cost Economics Theory Deus Ngaruko and Timothy Lyanga
71
Wang, L.J. and Huo X.X. (2013). Grower’s Selling Behaviour: Transactio
Cost Comparison Analysis. China Agricultural Economics Review,
15(_0 2).
Williamson, O. E. (1985). Markets and Hierarchies. Analysis and antitrust
implications. New York: The free Press.
World Bank (2011). Agriculture for Development. World Bank,
Washington DC, USA. 86pp.
Huria Journal, Vol 27(2), September 2020: 72-92
72
Metal Contamination in Sediments of Coastal Rivers
around Dar es Salaam, Tanzania
Matobola Joel Mihale [email protected]
The Open University of Tanzania
ABSTRACT
Sediments from coastal rivers of Kizinga, Mbezi, Msimbazi, and Mzinga
were used to determine contamination levels of Cd, Pb, Cr, Ni, Cu, Al,
Mn, Fe, and Zn metals. Sampling and sample preparation were done as
appropriate and analysis was done using high resolution inductively
coupled plasma–mass spectrometry (HR ICP-MS). Higher levels of Cd,
Pb, Cr, Al, Mn, Fe, and Zn were mainly observed in Msimbazi river.
Whereas higher levels of Ni and Cu were observed in Kizinga river,
higher levels of Mn were observed in Mbezi river. Mzinga river had
lowest levels of most metals except Mn. Lowest levels of Mn were
observed in Kizinga river. Despite of enrichment factor indicating varied
contamination status of metals in rivers, geo-accumulation index,
contamination factor, degree of contamination, modified degree of
contamination, potential contamination index and environmental toxicity
quotient have indicated that sediments from these rivers are polluted, with
Msimbazi and Kizinga river sediments being more polluted. Pearson
correlation and hierarchical cluster analyses have revealed that Cd, Cu,
Pb, and Zn were strongly correlated to each other (r2> 0.7, p < 0.05),
indicating that they similar anthropogenic origin, while Fe, Mn, Ni, Cr,
and Al were strongly correlated to each other (r2> 0.69, p < 0.05),
indicative of similar natural origin. This implies that there might be
metal-related anthropogenic activities around or close to rivers that pose
environmental and health risks. Urgent river management strategies are
needed to minimise the continuous metal pollution of these rivers.
Keywords: Metal Contamination, Environmental Toxicity Quotient,
Mbezi, Msimbazi, Mzinga, Kizinga
INTRODUCTION
Metals are contaminants because they are permanent additions to a given
environment and are not subjected to any biological or chemical
degradation (MacFarlane and Burchett 2001, Defew 2005).
Huria Journal, Vol 27(2), September 2020: 72-92
Metal Contamination in Sediments of Coastal Rivers around Dar es Salaam, Tanzania Matobola Joel Mihale
73
In addition, they are persistent, toxic, can bioaccumulate as well as
biomagnify in sediments and organisms. Sediments tend to act as a source
as well as a depository (sink) of the metals (Chi et al. 2007). The presence
of metals in sediments may pose a potential threat to marine and other
organisms (Kumar et al. 2008, Zhao et al. 2010). As a result, levels of
metals in sediments can be important indicators of toxicological risk,
especially when they are substantially above natural levels.
Metals in sediments may originate from either natural or anthropogenic
processes. Natural sources of metals may include natural weathering and
erosion of parent rocks and dusts coming from the wind. Anthropogenic
sources may include effluents, sewage, discarded automobiles, and
metallic substances as well as wastes from industrial, municipal, and
domestic sources (Chatterjee et al. 2007). Since the number of metals in
sediments may also indicate local and regional discharges (Moon et al.
2009), sediments can be used to evaluate historical trends as well as fate
processes.
The present anthropogenic contribution of the metals in the marine
sediments in Tanzania and the impacts of metal contamination in the
coastal ecosystems are alarming (Mihale 2017). Studies done on the
marine component of Tanzania have revealed that metal pollution is a
problem (Machiwa, 1992, Mremi and Machiwa 2003, Muzuka 2007,
Mtanga and Machiwa 2007, Mrutu et al. 2013, Mihale 2017, Minu et al.
2018). Since there is a river-ocean continuum, there is a possibility of
rivers being the source of the observed metals. Previous studies in
Tanzania have identified the Msimbazi River as highly polluted due to
metals (Ak’habuhaya and Lodenius, 1988, Machiwa, 1992; De Wolf et al.
2001). Such a situation may exist in other rivers as well. Due to rapid
urbanisation and growth of settlements from the increased human
population, the rivers are suspected to carry different wastes (agricultural,
residential, municipal, etc) and discharges. Besides, industrialisation and
the associated socio-economic activities taking place in the city could
contribute to the significant input of pollutants in the rivers. For example,
mushrooming of street garages, increase in small-scale industrial
activities, and urban agriculture in valleys and near rivers could have a
significant input of metals in these rivers. Furthermore, the disposal of
wastes (direct or indirect) could lead to a significant increase in metal
pollutants in the rivers. In view of this, the current situation regarding
metal contamination in these rivers is not known with certainty. This
Huria Journal, Vol 27(2), September 2020: 72-92
Metal Contamination in Sediments of Coastal Rivers around Dar es Salaam, Tanzania Matobola Joel Mihale
74
study was intended to assess the contemporary level of contamination of
metals in the sediments of the selected coastal rivers of Kizinga, Mbezi,
Msimbazi, and Mzinga.
METHODOLOGY
The Study Area
The study was conducted in four selected coastal rivers: Kizinga, Mbezi,
Msimbazi, and Mzinga, which are among the twelve rivers that drain the
city of Dar es Salaam. These rivers are presumed to be the major sources
of contaminants from different areas of the city (Gaspare et al. 2009)
because they receive metals from municipal wastes and discharges,
farming (urban agriculture), residential as well as industrial (small and
medium scale) sources. The Kizinga River drains the relatively urbanised
areas of Keko, Chang’ombe, Kurasini, and Temeke (approximately
400,000 inhabitants; URT, 2013). Mbezi River that originates from the
upper Mbezi drains the residential areas of Mbezi Msigani, Mbezi
Mwisho, Mbezi Louis, Kimara B, Goba and Ukwamani. The Msimbazi
River originates from the Pugu hills and its tributaries (Kinyerezi,
Luhanga, Ubungo and Ng’ombe or Sinza) drain the Pugu, Gongo la
Mboto, Vingunguti, Kinyerezi, Ubungo, Manzese, Tabata, Mabibo,
Mburahati, Kigogo, Tandale, Buguruni, Mchikichini, Magomeni,
Mwananyamala and Hananasif areas (Kironde, 2016, Ngassapa et al.
2018, Sawe et al. 2019). The Mzinga River drains the relatively rural
areas of Vijibweni, Tuangoma, and Mji Mwema with a population of
around 90,000 (URT, 2013). All these rivers flow into the Indian Ocean.
Whereas the Kizinga and Mzinga rivers flow on the South of Dar es
Salaam, Msimbazi flows onto the central, and Mbezi flows on the North
of Dar es Salaam.
Methods
Sampling
Sediment sampling was done during the wet and dry seasons of 2015 and
2019, as described previously (EPA, 2001), using a method described by
Mihale et al. (2013). Five sampling stations were selected from each site
and were located using a global positioning system (GPS, etrex 10,
Garmin Ltd, USA). Sampling of sediments was done in the same
locations in both seasons. A corer was used in areas with large sediment
deposits while a plastic shovel was used to scoop the river sediments in
areas with relatively low deposits like along the river banks. The use of a
corer has been described by Mihale et al. (2013). A total of 80 samples
Huria Journal, Vol 27(2), September 2020: 72-92
Metal Contamination in Sediments of Coastal Rivers around Dar es Salaam, Tanzania Matobola Joel Mihale
75
were collected from all the sites in both seasons. All sediment samples
were packed in prior-labelled and zipped polyethylene bags, stored in
iceboxes, and later frozen to −20 °C. Sediment samples were then air-
transported while frozen to the laboratory of the Department of Analytical
and Environmental Geochemistry, Vrije Universiteit Brussel (VUB),
Belgium for analysis. Prior to metal analysis all samples were lyophilised
(Leybold Heraus Lyophiliser).
Determination of Metals in Sediments
Sample Preparation
Sediment samples for the determination of metals were analysed using the
method described by Mihale, (2017). Briefly, the lyophilised sediment
samples in triplicate were pulverised (Fritsch Pulverisette) and digested
using a CEM Microwave Accelerated Reaction System (MARS 5,
Matthews, USA). Prior to digestion, the MARS HP 500 digestion
vessels were cleaned appropriately (Mihale, 2017). For each sample, an
analytical amount of sediment sample ( 0.20g) was put into the digestion
vessel followed with Hydrochloric acid, (Suprapur, 6 mL, 30% w/w,
Merck KGaA, Darmstadt, Germany) and distilled nitric acid (suprapur,
2 mL, 65% w/w). The MARS was programmed to operate at 150°C
temperature, 1200 W (100%) maximum power, 15 min ramp time, 200
psi maximum pressure, and 15 min hold time. After cooling, Milli-Q
water (40 mL) was added to each vessel and the contents were transferred
into polyethylene bottles ready for metal analysis. Blank samples as well
as certified reference material (LGC 6139, River Clay sediment,
Middlesex, UK) were included in each digestion session and treated in a
similar manner as the samples.
Metal Analysis
Nine metals: two major elements (Al, Fe), two minor elements (Mn, Cr),
and five trace elements (Cd, Cu, Ni, Pb, Zn) were analysed in triplicate
for each river sediment sample. The concentrations of the metals were
determined using high resolution inductively coupled plasma–mass
spectrometry, HR-ICP-MS (Thermo Finnigan Element II). Prior to ICP-
MS analysis, the samples were diluted tenfold. The metal standards
solutions were prepared by serial dilution of stock solutions made from
ICM 224 (Radion), SM 70 (Radion), and XIII (Merck). Prepared working
standards (1, 2, 5, 10, and 20 ppm) were run before and after every batch
of 10 samples. Indium at a concentration of 1 µg/L was used as the

Huria Journal, Vol 27(2), September 2020: 72-92
Metal Contamination in Sediments of Coastal Rivers around Dar es Salaam, Tanzania Matobola Joel Mihale
76
internal standard. A calibration curve drawn from the working standards
of each metal was used to determine the concentration of metals in the
sediments.
Assessment of Sediment Contamination
Assessment of contamination of metals in river sediments was done using
six contamination indices: enrichment factor (EF), geo-accumulation
index (Igeo), contamination factor, (CF), degree of contamination (DC),
modified degree of contamination (mCd), potential contamination index
(PCI) and environmental toxicity quotient (ETQ). Enrichment factor (EF),
which is used in evaluating the status of contamination as well as
geochemical trends (Feng et al. 2004, Pekey 2006) was determined using
the formula:
sample crust
crust sample
[X] [Fe]EF=
[X] [Fe]
where X is the concentration of a given metal. Iron (Fe) was used as a
normalisation (reference) element because its anthropogenic source is
relatively not significant (Maftei et al. 2019).
The geoaccumulation index (Igeo), which is used in studying the
lithogenic effects in sediments was determined by:
n2
n
CIgeo = log
1.5B
where C is the concentration of a given metal, n, B is the background
value of the corresponding metal in the average crust (Nobi et al. 2010)
and 1.5 is a factor that takes into account the variations in the background
values originating from lithologic differences of the sediments (Abrahim
and Parker 2008).
The contamination factor (CF) was determined by:
sample
reference
CCF
C=
where Csample is the observed value of the metal in samples and Creferenceis
the reference value for the respective metal.
The degree of contamination (DC), which gives the overall contamination
of all the analysed elements in the sample (Håkanson 1980), was
determined by:

Huria Journal, Vol 27(2), September 2020: 72-92
Metal Contamination in Sediments of Coastal Rivers around Dar es Salaam, Tanzania Matobola Joel Mihale
77
i n
i
i 1
DC CF=
=
= whereaverage
reference
CCF
C=
where CF is a CF of individual metal i, Caverage is the average value of the
analysed metal obtained from an area and Creferenceis background value of
the individual metal.
The average crustal abundance (Taylor 1964) and/ or average shale values
(Turekian and Wedepohl 1961) were used as reference values during the
calculations of EF, Igeo, CF, and DC. The magnitude of the
contamination due to metals in the study area was determined by the
modified degree of contamination, mCd: i n
i
i i
CF
mCdn
=
==
where CF is the contamination factor of the metal i and n is the total
number of analysed metals.
The metals in the sedimentary environment exist as complex mixtures
that change in space and time. So, contamination can also be determined
using the potential contamination index (PCI), which is given by:
imum
background
CPCI
C= max
where Cmaximum is the maximum level of the metal in the sediment and
Cbackground is the baseline value of a corresponding metal in the average
crust.
Furthermore, sediment contamination can be assessed using sediment
quality based on toxicity. Here the environmental toxicity quotient
(ETQ) is used. To get the elemental toxicity, each metal value multiplied
to its total score (TS) was divided by the highest total score obtained
from the United States Agency for Toxic Substances and Diseases
Registry (ATSDR, 2019). The sum of the metal toxicities divided by the
number of metal parameters analysed gives the ETQ as shown in the
equation: n
ii
i=1 x
TSC ×
TSETQ =
n
Huria Journal, Vol 27(2), September 2020: 72-92
Metal Contamination in Sediments of Coastal Rivers around Dar es Salaam, Tanzania Matobola Joel Mihale
78
where C is the observed concentration of the metal i, TSi is the total
score for each metal (Cd = 1318, Pb = 1531, Cr = 893, Ni = 993, Cu =
805, Al = 685, Mn = 797 and Zn = 913) and TSx is the highest total score
of the metal under consideration based on the ATSDR (ATSDR, 2019).
Quality Control and Quality Assurance
The certified reference material (LGC 6139) and procedural blanks were
used to evaluate the accuracy and precision. Analytical procedures were
assessed using blanks that were treated as real samples. Whereas
instrumental precision was < 5% relative standard deviation (RSD), the
limit of detection (LOD) was computed as 3 times the standard deviation
of the average signal from the procedural blanks. The LODs of the
analysed metals are given in Table 1.
Table 1: Detection limits (mg/kg, n = 3) of the analysed metals Metal Detection limit Metal Detection limit Metal Detection limit
Cd 4.0 x 10⁻³ Ni 1.9 x 10⁻¹ Mn 5.0 x 10⁻²
Pb 2.0 x 10⁻² Cu 1.3 x 10⁻¹ Fe 4.5
Cr 6.0 x 10⁻² Al 3.85 Zn 1.4
The mean recoveries of the measured metals were determined.
Compared to the LGC 6139 certified reference material, the percentage
recoveries of the analysed metals were 102.6% for Cd, 93.1% for Pb,
117.6% for Cr, 110.8% for Ni, 101.8% for Cu, 76.0% for Al, 106.4% for
Mn, 129.9% for Fe and 109.4% for Zn. The ranges of percentage
recoveries (93.1% - 129.9%) indicate that the obtained values are
acceptable and so no correction was done to the observed levels of all
metals.
Data Analysis
Descriptive (range, mean and standard deviation), Pearson correlation,
and hierarchical cluster statistical analyses were computed using IBM
SPSS version 23. Pearson correlation analysis was determined using the
mean values of the metals from each river to assess the relationship of the
metals in the rivers. Hierarchical cluster analysis (HCA) was used to
group similar metals in the river sediments in the same classes and
different metals in different classes. Prior to HCA, the data were
normalised by Ward’s linkage and the squared Euclidean distance was
used as a similarity measure. Graphing was done using SigmaPlot (v.11).
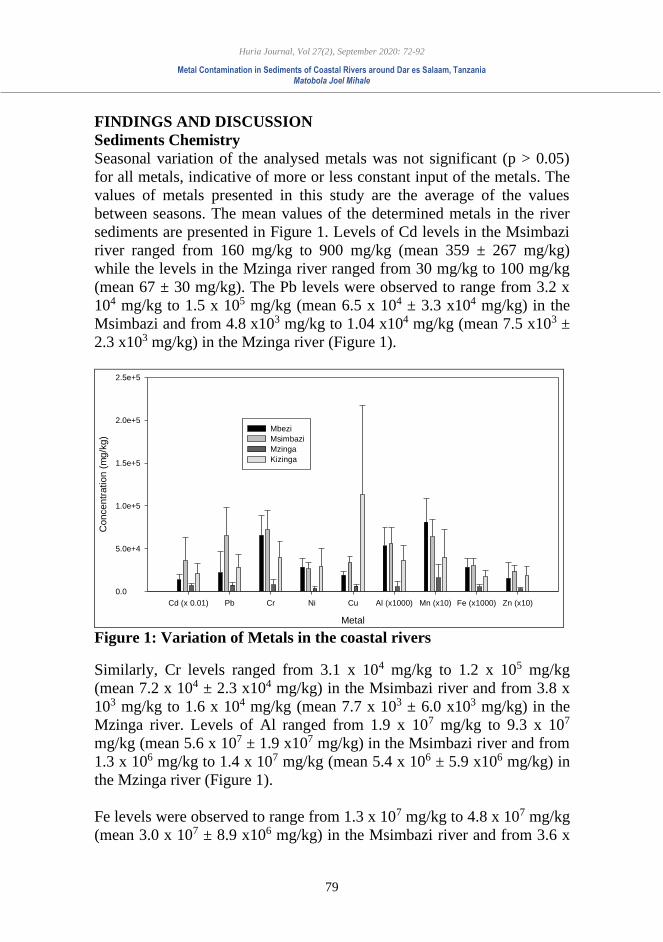
Huria Journal, Vol 27(2), September 2020: 72-92
Metal Contamination in Sediments of Coastal Rivers around Dar es Salaam, Tanzania Matobola Joel Mihale
79
FINDINGS AND DISCUSSION
Sediments Chemistry
Seasonal variation of the analysed metals was not significant (p > 0.05)
for all metals, indicative of more or less constant input of the metals. The
values of metals presented in this study are the average of the values
between seasons. The mean values of the determined metals in the river
sediments are presented in Figure 1. Levels of Cd levels in the Msimbazi
river ranged from 160 mg/kg to 900 mg/kg (mean 359 ± 267 mg/kg)
while the levels in the Mzinga river ranged from 30 mg/kg to 100 mg/kg
(mean 67 ± 30 mg/kg). The Pb levels were observed to range from 3.2 x
104 mg/kg to 1.5 x 10⁵ mg/kg (mean 6.5 x 10⁴ ± 3.3 x10⁴ mg/kg) in the
Msimbazi and from 4.8 x10³ mg/kg to 1.04 x10⁴ mg/kg (mean 7.5 x10³ ±
2.3 x10³ mg/kg) in the Mzinga river (Figure 1).
Metal
Cd (x 0.01) Pb Cr Ni Cu Al (x1000) Mn (x10) Fe (x1000) Zn (x10)
Concentr
ation (
mg/k
g)
0.0
5.0e+4
1.0e+5
1.5e+5
2.0e+5
2.5e+5
Mbezi
Msimbazi
Mzinga
Kizinga
Figure 1: Variation of Metals in the coastal rivers
Similarly, Cr levels ranged from 3.1 x 10⁴ mg/kg to 1.2 x 10⁵ mg/kg
(mean 7.2 x 10⁴ ± 2.3 x10⁴ mg/kg) in the Msimbazi river and from 3.8 x
103 mg/kg to 1.6 x 10⁴ mg/kg (mean 7.7 x 10³ ± 6.0 x10³ mg/kg) in the
Mzinga river. Levels of Al ranged from 1.9 x 10⁷ mg/kg to 9.3 x 10⁷
mg/kg (mean 5.6 x 10⁷ ± 1.9 x10⁷ mg/kg) in the Msimbazi river and from
1.3 x 10⁶ mg/kg to 1.4 x 10⁷ mg/kg (mean 5.4 x 10⁶ ± 5.9 x10⁶ mg/kg) in
the Mzinga river (Figure 1).
Fe levels were observed to range from 1.3 x 10⁷ mg/kg to 4.8 x 10⁷ mg/kg
(mean 3.0 x 10⁷ ± 8.9 x10⁶ mg/kg) in the Msimbazi river and from 3.6 x
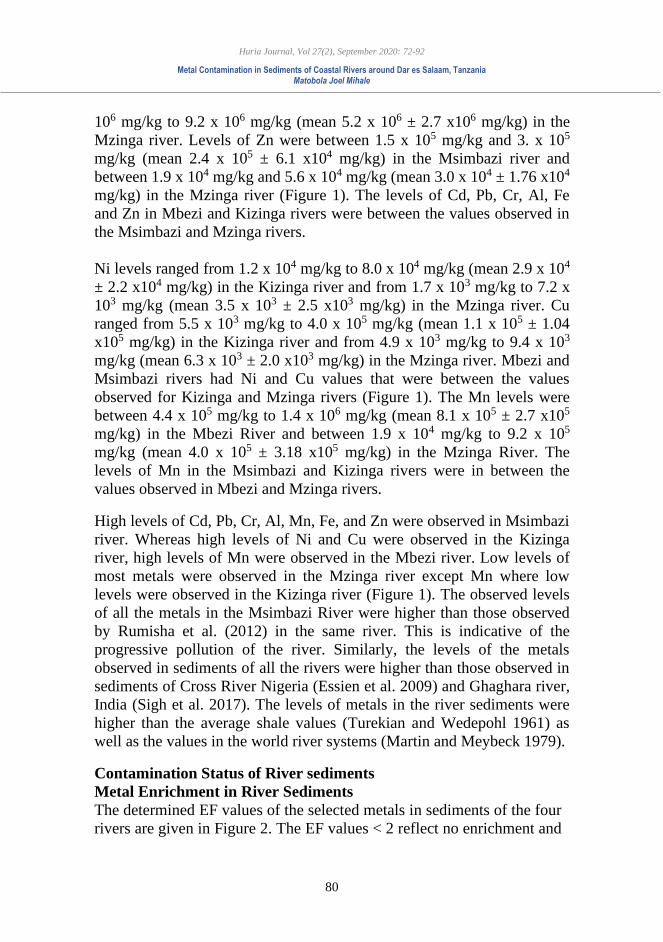
Huria Journal, Vol 27(2), September 2020: 72-92
Metal Contamination in Sediments of Coastal Rivers around Dar es Salaam, Tanzania Matobola Joel Mihale
80
106 mg/kg to 9.2 x 10⁶ mg/kg (mean 5.2 x 10⁶ ± 2.7 x10⁶ mg/kg) in the
Mzinga river. Levels of Zn were between 1.5 x 10⁵ mg/kg and 3. x 105
mg/kg (mean 2.4 x 10⁵ ± 6.1 x10⁴ mg/kg) in the Msimbazi river and
between 1.9 x 10⁴ mg/kg and 5.6 x 10⁴ mg/kg (mean 3.0 x 10⁴ ± 1.76 x10⁴
mg/kg) in the Mzinga river (Figure 1). The levels of Cd, Pb, Cr, Al, Fe
and Zn in Mbezi and Kizinga rivers were between the values observed in
the Msimbazi and Mzinga rivers.
Ni levels ranged from 1.2 x 10⁴ mg/kg to 8.0 x 10⁴ mg/kg (mean 2.9 x 10⁴
± 2.2 x10⁴ mg/kg) in the Kizinga river and from 1.7 x 10³ mg/kg to 7.2 x
103 mg/kg (mean 3.5 x 10³ ± 2.5 x10³ mg/kg) in the Mzinga river. Cu
ranged from 5.5 x 10³ mg/kg to 4.0 x 10⁵ mg/kg (mean 1.1 x 10⁵ ± 1.04
x105 mg/kg) in the Kizinga river and from 4.9 x 10³ mg/kg to 9.4 x 10³
mg/kg (mean 6.3 x 10³ ± 2.0 x10³ mg/kg) in the Mzinga river. Mbezi and
Msimbazi rivers had Ni and Cu values that were between the values
observed for Kizinga and Mzinga rivers (Figure 1). The Mn levels were
between 4.4 x 10⁵ mg/kg to 1.4 x 10⁶ mg/kg (mean 8.1 x 10⁵ ± 2.7 x10⁵
mg/kg) in the Mbezi River and between 1.9 x 10⁴ mg/kg to 9.2 x 10⁵
mg/kg (mean 4.0 x 10⁵ ± 3.18 x10⁵ mg/kg) in the Mzinga River. The
levels of Mn in the Msimbazi and Kizinga rivers were in between the
values observed in Mbezi and Mzinga rivers.
High levels of Cd, Pb, Cr, Al, Mn, Fe, and Zn were observed in Msimbazi
river. Whereas high levels of Ni and Cu were observed in the Kizinga
river, high levels of Mn were observed in the Mbezi river. Low levels of
most metals were observed in the Mzinga river except Mn where low
levels were observed in the Kizinga river (Figure 1). The observed levels
of all the metals in the Msimbazi River were higher than those observed
by Rumisha et al. (2012) in the same river. This is indicative of the
progressive pollution of the river. Similarly, the levels of the metals
observed in sediments of all the rivers were higher than those observed in
sediments of Cross River Nigeria (Essien et al. 2009) and Ghaghara river,
India (Sigh et al. 2017). The levels of metals in the river sediments were
higher than the average shale values (Turekian and Wedepohl 1961) as
well as the values in the world river systems (Martin and Meybeck 1979).
Contamination Status of River sediments
Metal Enrichment in River Sediments
The determined EF values of the selected metals in sediments of the four
rivers are given in Figure 2. The EF values < 2 reflect no enrichment and
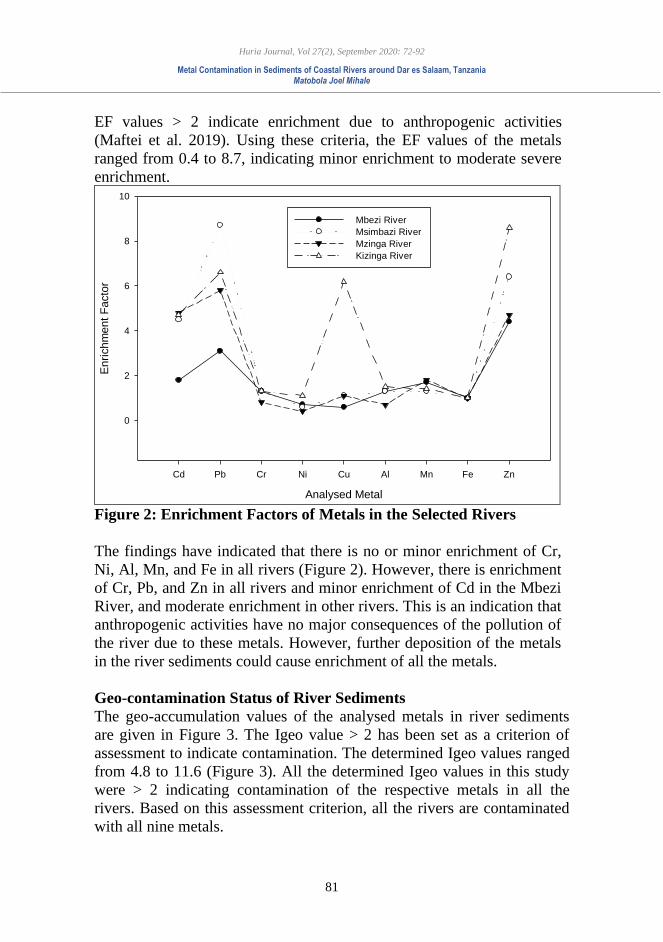
Huria Journal, Vol 27(2), September 2020: 72-92
Metal Contamination in Sediments of Coastal Rivers around Dar es Salaam, Tanzania Matobola Joel Mihale
81
EF values > 2 indicate enrichment due to anthropogenic activities
(Maftei et al. 2019). Using these criteria, the EF values of the metals
ranged from 0.4 to 8.7, indicating minor enrichment to moderate severe
enrichment.
Analysed Metal
Cd Pb Cr Ni Cu Al Mn Fe Zn
Enri
chm
ent
Facto
r
0
2
4
6
8
10
Mbezi River
Msimbazi River
Mzinga River
Kizinga River
Figure 2: Enrichment Factors of Metals in the Selected Rivers
The findings have indicated that there is no or minor enrichment of Cr,
Ni, Al, Mn, and Fe in all rivers (Figure 2). However, there is enrichment
of Cr, Pb, and Zn in all rivers and minor enrichment of Cd in the Mbezi
River, and moderate enrichment in other rivers. This is an indication that
anthropogenic activities have no major consequences of the pollution of
the river due to these metals. However, further deposition of the metals
in the river sediments could cause enrichment of all the metals.
Geo-contamination Status of River Sediments
The geo-accumulation values of the analysed metals in river sediments
are given in Figure 3. The Igeo value > 2 has been set as a criterion of
assessment to indicate contamination. The determined Igeo values ranged
from 4.8 to 11.6 (Figure 3). All the determined Igeo values in this study
were > 2 indicating contamination of the respective metals in all the
rivers. Based on this assessment criterion, all the rivers are contaminated
with all nine metals.
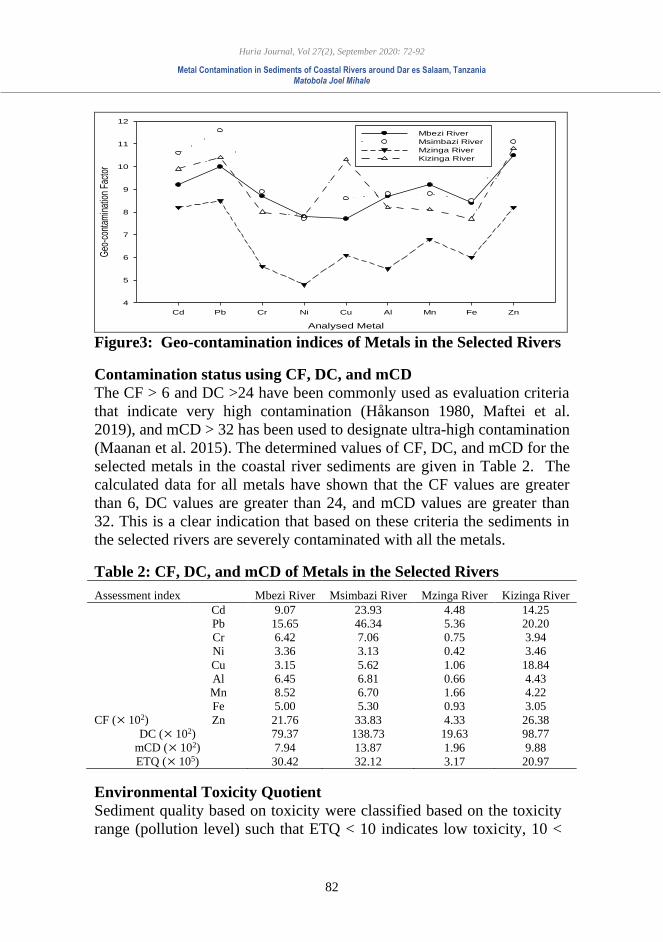
Huria Journal, Vol 27(2), September 2020: 72-92
Metal Contamination in Sediments of Coastal Rivers around Dar es Salaam, Tanzania Matobola Joel Mihale
82
Analysed Metal
Cd Pb Cr Ni Cu Al Mn Fe Zn
Geo
-con
tam
inat
ion
Fact
or
4
5
6
7
8
9
10
11
12
Mbezi River
Msimbazi River
Mzinga River
Kizinga River
Figure3: Geo-contamination indices of Metals in the Selected Rivers
Contamination status using CF, DC, and mCD
The CF > 6 and DC >24 have been commonly used as evaluation criteria
that indicate very high contamination (Håkanson 1980, Maftei et al.
2019), and mCD > 32 has been used to designate ultra-high contamination
(Maanan et al. 2015). The determined values of CF, DC, and mCD for the
selected metals in the coastal river sediments are given in Table 2. The
calculated data for all metals have shown that the CF values are greater
than 6, DC values are greater than 24, and mCD values are greater than
32. This is a clear indication that based on these criteria the sediments in
the selected rivers are severely contaminated with all the metals.
Table 2: CF, DC, and mCD of Metals in the Selected Rivers
Assessment index Mbezi River Msimbazi River Mzinga River Kizinga River
CF ( 102)
Cd 9.07 23.93 4.48 14.25
Pb 15.65 46.34 5.36 20.20
Cr 6.42 7.06 0.75 3.94
Ni 3.36 3.13 0.42 3.46
Cu 3.15 5.62 1.06 18.84
Al 6.45 6.81 0.66 4.43
Mn 8.52 6.70 1.66 4.22
Fe 5.00 5.30 0.93 3.05
Zn 21.76 33.83 4.33 26.38
DC ( 102) 79.37 138.73 19.63 98.77
mCD ( 102) 7.94 13.87 1.96 9.88
ETQ ( 105) 30.42 32.12 3.17 20.97
Environmental Toxicity Quotient
Sediment quality based on toxicity were classified based on the toxicity
range (pollution level) such that ETQ < 10 indicates low toxicity, 10 <
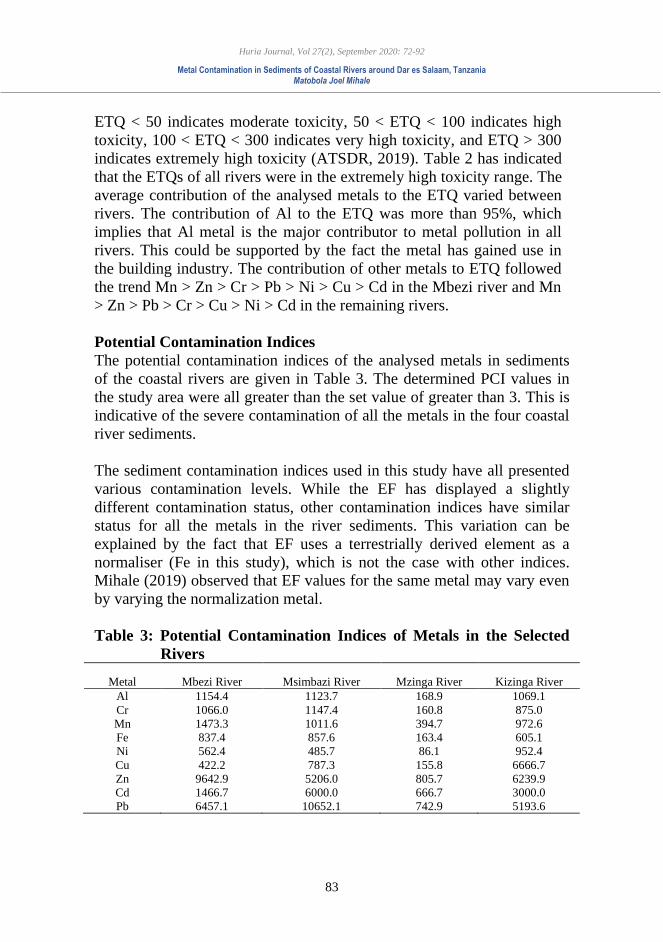
Huria Journal, Vol 27(2), September 2020: 72-92
Metal Contamination in Sediments of Coastal Rivers around Dar es Salaam, Tanzania Matobola Joel Mihale
83
ETQ < 50 indicates moderate toxicity, 50 < ETQ < 100 indicates high
toxicity, 100 < ETQ < 300 indicates very high toxicity, and ETQ > 300
indicates extremely high toxicity (ATSDR, 2019). Table 2 has indicated
that the ETQs of all rivers were in the extremely high toxicity range. The
average contribution of the analysed metals to the ETQ varied between
rivers. The contribution of Al to the ETQ was more than 95%, which
implies that Al metal is the major contributor to metal pollution in all
rivers. This could be supported by the fact the metal has gained use in
the building industry. The contribution of other metals to ETQ followed
the trend Mn > Zn > Cr > Pb > Ni > Cu > Cd in the Mbezi river and Mn
> Zn > Pb > Cr > Cu > Ni > Cd in the remaining rivers.
Potential Contamination Indices
The potential contamination indices of the analysed metals in sediments
of the coastal rivers are given in Table 3. The determined PCI values in
the study area were all greater than the set value of greater than 3. This is
indicative of the severe contamination of all the metals in the four coastal
river sediments.
The sediment contamination indices used in this study have all presented
various contamination levels. While the EF has displayed a slightly
different contamination status, other contamination indices have similar
status for all the metals in the river sediments. This variation can be
explained by the fact that EF uses a terrestrially derived element as a
normaliser (Fe in this study), which is not the case with other indices.
Mihale (2019) observed that EF values for the same metal may vary even
by varying the normalization metal.
Table 3: Potential Contamination Indices of Metals in the Selected
Rivers
Metal Mbezi River Msimbazi River Mzinga River Kizinga River
Al 1154.4 1123.7 168.9 1069.1
Cr 1066.0 1147.4 160.8 875.0
Mn 1473.3 1011.6 394.7 972.6
Fe 837.4 857.6 163.4 605.1
Ni 562.4 485.7 86.1 952.4
Cu 422.2 787.3 155.8 6666.7
Zn 9642.9 5206.0 805.7 6239.9
Cd 1466.7 6000.0 666.7 3000.0
Pb 6457.1 10652.1 742.9 5193.6
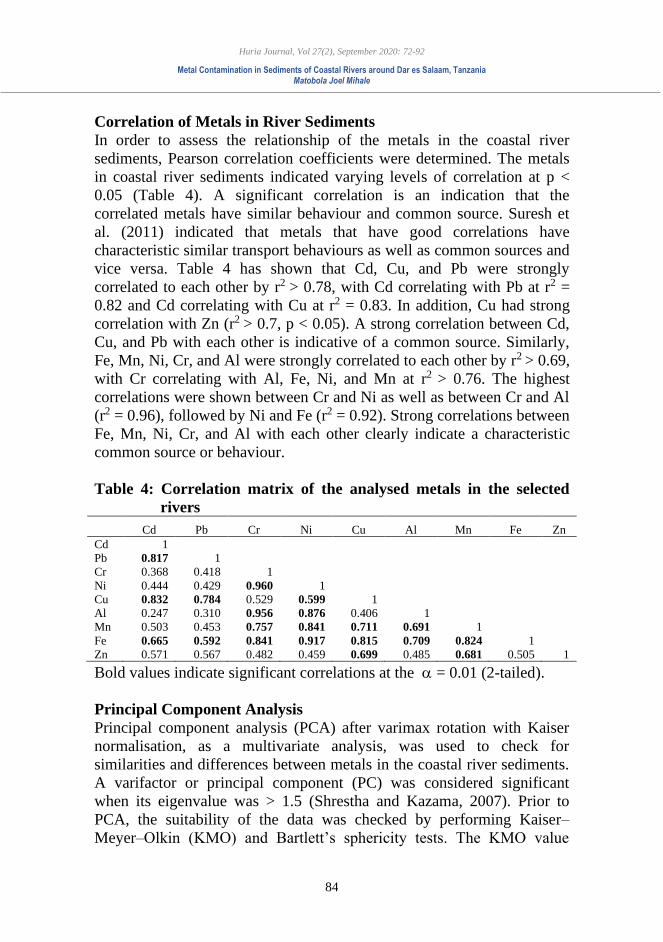
Huria Journal, Vol 27(2), September 2020: 72-92
Metal Contamination in Sediments of Coastal Rivers around Dar es Salaam, Tanzania Matobola Joel Mihale
84
Correlation of Metals in River Sediments
In order to assess the relationship of the metals in the coastal river
sediments, Pearson correlation coefficients were determined. The metals
in coastal river sediments indicated varying levels of correlation at p <
0.05 (Table 4). A significant correlation is an indication that the
correlated metals have similar behaviour and common source. Suresh et
al. (2011) indicated that metals that have good correlations have
characteristic similar transport behaviours as well as common sources and
vice versa. Table 4 has shown that Cd, Cu, and Pb were strongly
correlated to each other by r2 > 0.78, with Cd correlating with Pb at r2 =
0.82 and Cd correlating with Cu at r2 = 0.83. In addition, Cu had strong
correlation with Zn (r2 > 0.7, p < 0.05). A strong correlation between Cd,
Cu, and Pb with each other is indicative of a common source. Similarly,
Fe, Mn, Ni, Cr, and Al were strongly correlated to each other by r2 > 0.69,
with Cr correlating with Al, Fe, Ni, and Mn at r2 > 0.76. The highest
correlations were shown between Cr and Ni as well as between Cr and Al
(r2 = 0.96), followed by Ni and Fe (r2 = 0.92). Strong correlations between
Fe, Mn, Ni, Cr, and Al with each other clearly indicate a characteristic
common source or behaviour.
Table 4: Correlation matrix of the analysed metals in the selected
rivers
Cd Pb Cr Ni Cu Al Mn Fe Zn
Cd 1
Pb 0.817 1
Cr 0.368 0.418 1
Ni 0.444 0.429 0.960 1
Cu 0.832 0.784 0.529 0.599 1
Al 0.247 0.310 0.956 0.876 0.406 1
Mn 0.503 0.453 0.757 0.841 0.711 0.691 1
Fe 0.665 0.592 0.841 0.917 0.815 0.709 0.824 1
Zn 0.571 0.567 0.482 0.459 0.699 0.485 0.681 0.505 1
Bold values indicate significant correlations at the = 0.01 (2-tailed).
Principal Component Analysis
Principal component analysis (PCA) after varimax rotation with Kaiser
normalisation, as a multivariate analysis, was used to check for
similarities and differences between metals in the coastal river sediments.
A varifactor or principal component (PC) was considered significant
when its eigenvalue was > 1.5 (Shrestha and Kazama, 2007). Prior to
PCA, the suitability of the data was checked by performing Kaiser–
Meyer–Olkin (KMO) and Bartlett’s sphericity tests. The KMO value
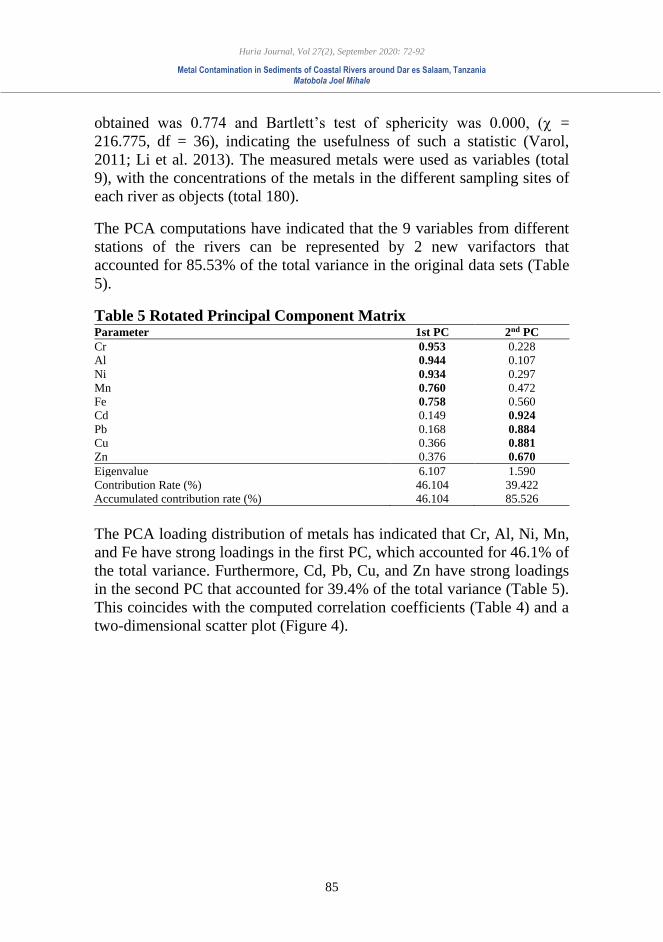
Huria Journal, Vol 27(2), September 2020: 72-92
Metal Contamination in Sediments of Coastal Rivers around Dar es Salaam, Tanzania Matobola Joel Mihale
85
obtained was 0.774 and Bartlett’s test of sphericity was 0.000, ( =
216.775, df = 36), indicating the usefulness of such a statistic (Varol,
2011; Li et al. 2013). The measured metals were used as variables (total
9), with the concentrations of the metals in the different sampling sites of
each river as objects (total 180).
The PCA computations have indicated that the 9 variables from different
stations of the rivers can be represented by 2 new varifactors that
accounted for 85.53% of the total variance in the original data sets (Table
5).
Table 5 Rotated Principal Component Matrix Parameter 1st PC 2nd PC
Cr 0.953 0.228
Al 0.944 0.107
Ni 0.934 0.297
Mn 0.760 0.472
Fe 0.758 0.560
Cd 0.149 0.924
Pb 0.168 0.884
Cu 0.366 0.881
Zn 0.376 0.670
Eigenvalue 6.107 1.590
Contribution Rate (%) 46.104 39.422
Accumulated contribution rate (%) 46.104 85.526
The PCA loading distribution of metals has indicated that Cr, Al, Ni, Mn,
and Fe have strong loadings in the first PC, which accounted for 46.1% of
the total variance. Furthermore, Cd, Pb, Cu, and Zn have strong loadings
in the second PC that accounted for 39.4% of the total variance (Table 5).
This coincides with the computed correlation coefficients (Table 4) and a
two-dimensional scatter plot (Figure 4).
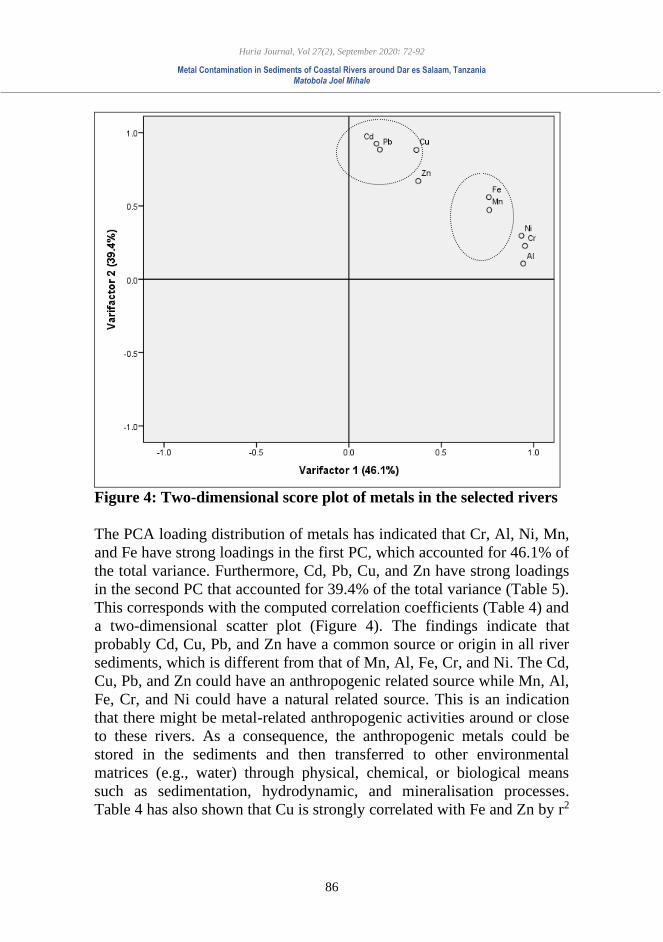
Huria Journal, Vol 27(2), September 2020: 72-92
Metal Contamination in Sediments of Coastal Rivers around Dar es Salaam, Tanzania Matobola Joel Mihale
86
Figure 4: Two-dimensional score plot of metals in the selected rivers
The PCA loading distribution of metals has indicated that Cr, Al, Ni, Mn,
and Fe have strong loadings in the first PC, which accounted for 46.1% of
the total variance. Furthermore, Cd, Pb, Cu, and Zn have strong loadings
in the second PC that accounted for 39.4% of the total variance (Table 5).
This corresponds with the computed correlation coefficients (Table 4) and
a two-dimensional scatter plot (Figure 4). The findings indicate that
probably Cd, Cu, Pb, and Zn have a common source or origin in all river
sediments, which is different from that of Mn, Al, Fe, Cr, and Ni. The Cd,
Cu, Pb, and Zn could have an anthropogenic related source while Mn, Al,
Fe, Cr, and Ni could have a natural related source. This is an indication
that there might be metal-related anthropogenic activities around or close
to these rivers. As a consequence, the anthropogenic metals could be
stored in the sediments and then transferred to other environmental
matrices (e.g., water) through physical, chemical, or biological means
such as sedimentation, hydrodynamic, and mineralisation processes.
Table 4 has also shown that Cu is strongly correlated with Fe and Zn by r2
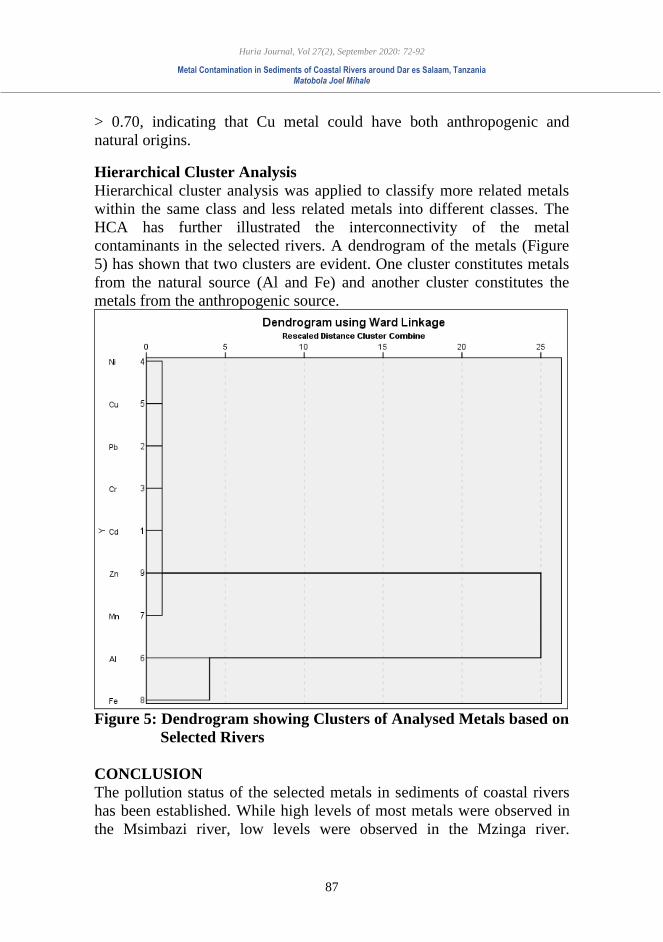
Huria Journal, Vol 27(2), September 2020: 72-92
Metal Contamination in Sediments of Coastal Rivers around Dar es Salaam, Tanzania Matobola Joel Mihale
87
> 0.70, indicating that Cu metal could have both anthropogenic and
natural origins.
Hierarchical Cluster Analysis
Hierarchical cluster analysis was applied to classify more related metals
within the same class and less related metals into different classes. The
HCA has further illustrated the interconnectivity of the metal
contaminants in the selected rivers. A dendrogram of the metals (Figure
5) has shown that two clusters are evident. One cluster constitutes metals
from the natural source (Al and Fe) and another cluster constitutes the
metals from the anthropogenic source.
Figure 5: Dendrogram showing Clusters of Analysed Metals based on
Selected Rivers
CONCLUSION
The pollution status of the selected metals in sediments of coastal rivers
has been established. While high levels of most metals were observed in
the Msimbazi river, low levels were observed in the Mzinga river.
Huria Journal, Vol 27(2), September 2020: 72-92
Metal Contamination in Sediments of Coastal Rivers around Dar es Salaam, Tanzania Matobola Joel Mihale
88
Pearson correlation coefficients, PCA, and HCA have indicated
significant associations of Mn, Al, Fe, Cr, and Ni on one hand and Cd,
Zn, Cu, and Pb on the other, indicating the natural and anthropogenic
origin, respectively. The anthropogenic source could be due to the metal-
related activities around the rivers. Continuous deposition of such metals
could pose environmental and health risks. Though the EF contamination
index has indicated varied contamination status of the metals in the rivers,
Igeo, CF, DC, mCD, and PCI contamination indices, as well as ETQ,
have indicated that sediments from these coastal rivers are more polluted,
with the Msimbazi and Kizinga River sediments being the most polluted
of all the rivers. There is an urgent need to instituting river management
strategies along the coast in order to minimise the continuous release of
metals from their sources.
REFERENCES
Abrahim, G.M.S., and Parker, R.J. (2008), Assessment of heavy metal
enrichment factors and the degree of contamination in marine
sediments from Tamaki Estuary, Auckland, New Zealand. Environ
Monit Assess 136: 227-238.
Acevedo-Figueroa, D., Jiménez, B.D., and Rodríguez-Sierra, C.J. (2006),
Trace metals in sediments of two estuarine lagoons from Puerto
Rico, Environmental Pollution 141(2): 336-342.
Ak’habuhaya, J., and Lodenius, M. (1988), Metal pollution of River
Msimbazi, Tanzania. Environmental International 14: 511-514.
Ali, A.E., Strezov, V., Davies, P.J., and Wright, I. (2018), River sediment
quality assessment using sediment quality indices for the Sydney
basin, Australia affected by coal and coal seam gas mining. Sci.
Total Environ., 616–617: 695–702, doi:
10.1016/j.scitotenv.2017.10.259.
ASTDR (2019), The Priority List of Hazardous Substances. Available
online: https://www.atsdr.cdc.gov/spl/index.html#2019spl
(Accessed on 11 September 2020).
Buchman, M. F. (2008), NOAA Screening quick reference tables.
National Oceanic and Atmospheric Administration Office of
Response and Restoration Division Report 08–1, Seattle, WA,
USA. http://archive.orr.noaa.gov/book_shelf/122_NEW-SQuiRTs.
Chen, C.W., Kao, C.M., Chen, C.F., and Dong, C.D. (2007), Distribution
and Accumulation of Heavy Metals in Sediments of Kaohsiung
Harbour, Taiwan, Chemosphere 66: 1431-1440.
Huria Journal, Vol 27(2), September 2020: 72-92
Metal Contamination in Sediments of Coastal Rivers around Dar es Salaam, Tanzania Matobola Joel Mihale
89
Chi, K.H., Chang, M.B., and Kao, S.J. (2007), Historical trends of
PCDD/Fs and dioxin-like PCBs in sediments buried in a reservoir in
Northern Taiwan. Chemosphere 68(9): 1733–1740.
http://dx.doi.org/doi:10.1016/j.chemosphere.2007.03.043.
De Wolf, H., Ulomi, S.A., Backeljau, T., Pratap, H.B., and Blust, R.
(2001), Heavy metal levels in the sediments of four Dar es Salaam
mangroves Accumulation in, and effect on the morphology of the
periwinkle, Littoraria scabra (Mollusca: Gastropoda). Environment
International 26: 243-249.
Defew, L.H., Mair, J.M., and Guzman, H.M. (2005), An assessment of
metal contamination in mangrove sediments and leaves from Punta
Mala Bay, Pacific Panama. Marine Pollution Bulletin 50: 547–552.
EPA: Environmental Protection Agency of United States (2001), Methods
for Collection, Storage and Manipulation of Sediments for
Chemical and Toxicological Analyses. Technical Manual, Office of
Water (4305), EPA-823-B-01-002, U.S. Environmental Protection
Agency, Washington, DC 20460.
Essien, J.P., Antai, S.P., and Olajire A.A. (2009), Distribution, Seasonal
Variations and Ecotoxicological Significance of Heavy Metals in
Sediments of Cross River Estuary Mangrove Swamp, Water Air
Soil Pollut. 197: 91-105
Feng, H., Han, X., Zhang, W., and Yu, L. (2004), A preliminary study of
heavy metal contamination in Yangtze River intertidal zone due to
urbanization. Marine Pollution Bulletin 49: 910–915.
Gaspare, L., Machiwa, J.F., Mdachi, S.J.M., Streck, G., Brack, W. (2009),
Polycyclic aromatic hydrocarbon (PAH) contamination of surface
sediments and oysters from the inter-tidal areas of Dar es Salaam,
Tanzania, Environmental Pollution, 157: 24–34.
Håkanson, L. (1980), An ecological risk index for aquatic pollution
control: a sedimentological approach. Water Res 14: 975-1001. doi:
10.1016/0043-1354(80)90143-8
Kironde, J.M.L. (2016), Governance Deficits in Dealing with the Plight of
Dwellers of Hazardous Land: The Case of the Msimbazi River
Valley in Dar es Salaam, Tanzania. Current Urban Studies, 4: 303-
328. http://dx.doi.org/10.4236/cus.2016.43021
Kumar, K.S., Sajwan, K.S., Richardson, J.P., and Kannan, K. (2008),
Contamination profiles of heavy metals, organochlorine pesticides,
polycyclic aromatic hydrocarbons and alkylphenols in sediment and
oyster collected from marsh/estuarine Savannah GA, USA. Marine
Pollution Bulletin 56(1): 136–49.
Huria Journal, Vol 27(2), September 2020: 72-92
Metal Contamination in Sediments of Coastal Rivers around Dar es Salaam, Tanzania Matobola Joel Mihale
90
Li, F., Huang, J., Zeng, G., Yuan, X., Li, X., Liang, J., Wang, X, Tang,
X., and Bai, B. (2013), Spatial risk assessment and sources
identification of heavy metals in surface sediments from the
Dongting Lake, Middle China. J. Geochem. Explor. 132: 75–83.
Maanan, M., Saddik, M., Maanan, M., Chaibi, M., Assobhei, O., and
Zourarah, B. (2015), Environmental and ecological risk assessment
of heavy metals in sediments of Nador lagoon, Morocco. Ecological
Indicators 48: 616–626.
MacFarlane, G.R., and Burchett, M.D. (2001), Photosynthetic Pigments
and Peroxidase Activity as Indicators of Heavy metal Stress in the
Grey mangrove, Avicennia marina (Forsk.). Marine Pollution
Bulletin 42(2): 233-240.
Machiwa, J.F. (1992), Anthropogenic pollution in the Dar es Salaam
harbour area, Tanzania. Marine Pollution Bulletin 24: 562–567.
Martin, J., and Meybeck, M. (1979), Elemental mass-balance of material
carried by major world rivers. Mar Chem 7(3): 178–206. doi:
10.1016/0304-4203(79)90039-2
Mihale, M.J. (2017), Environmental Health Risks due to Anthropogenic
Organic matter and Metals in the Mtoni Estuary Ecosystem and its
Environs, Tanzania. HURIA 24: 1-22
Mihale, M.J. (2019), Multivariate Assessment of Metal Contamination in
Mtoni Sedimentary Environment, Tanzania, Tanz. J. Sc., 45(2):
158-172
Mihale, M.J., Croes, K., Tungaraza, C., Baeyens, W., and Van
Langenhove, K. (2013), PCDD/F and Dioxin-Like PCB
Determinations in Mtoni Estuarine Sediments (Tanzania) Using the
Chemically Activated Luciferase Gene Expression (CALUX)
Bioassay, Environment and Pollution 2(3): doi:10.5539/ep.v2n3p1.
Minu, A., Routh, J., Dario, M., Bilosnic., M., Kalén, R., Val Klump, J.,
and Machiwa, J.F. (2018), Temporal and spatial distribution of trace
metals in the Rufiji delta mangrove, Tanzania, Environ Monit
Assess 190: 336 https://doi.org/10.1007/s10661-018-6707-2
Mremi, S.D., and Machiwa, J.F. (2003), Heavy metal contamination of
mangrove sediments and the associated biota in Dar es Salaam,
Tanzania. Tanz. J. Sc., 29: 61–76.
Mrutu, A., Nkotagu, H.H., and Luilo, G.B. (2013), Spatial distribution of
heavy metals in Msimbazi River mangrove sediments in Dar es
Salaam coastal zone, Tanzania, International Journal of
Environmental Sciences, 3(5): 1641 -1655
Huria Journal, Vol 27(2), September 2020: 72-92
Metal Contamination in Sediments of Coastal Rivers around Dar es Salaam, Tanzania Matobola Joel Mihale
91
Mtanga, A., and Machiwa, J. (2007), Assessment of Heavy Metal
Pollution in Sediment and Polychaete Worms from the Mzinga
Creek and Ras Dege Mangrove Ecosystems, Dar es Salaam,
Tanzania, Western Indian Ocean J. Mar. Sci. 6(2): 125–135.
Muzuka, A.N.N. (2007), Distribution of Heavy Metals in the Coastal
Marine Surficial Sediments in the Msasani Bay-Dar es Salaam
Harbour Area, Western Indian Ocean J. Mar. Sci. 6(1) 73–83,
Ngassapa, F.N., Othman, O.C., Mihayo, D., Kilulya, K.F. (2018),
Speciation of lead, chromium, cadmium, copper and zinc in
sediments and plants along Msimbazi River in Dar es Salaam,
Tanzania. Tanzania J Sci., 44(3): 136–151.
Nobi, E.P., Dilipan, E., Thangaradjou, T., Sivakumar, K., and Kannan, L.
(2010), Geochemical and geo-statistical assessment of heavy metal
concentration in the sediments of different coastal ecosystems of
Andaman Islands, India. Estuarine, Coastal and Shelf Science 87:
253–264.
Pekey, H. (2006), The distribution and sources of heavy metals in İzmit
Bay surface sediments affected by a polluted stream. Mar. Pollut.
Bull. 52(10): 1197-1208.
Rumisha, C., Elskens, M., Leermarkers, M., and Kochzius, M. (2012),
Trace metal pollution and its influence on the community structure
of soft bottom molluscs in intertidal areas of the Dar es Salaam
coast, Tanzania Mar. Pollut. Bull. 64(3): 521-531, doi:
10.1016/j.marpolbul.2011.12.025
Sawe, S.F., Shilla, D.A., and Machiwa, J.F. (2019), Assessment of
enrichment, geo-accumulation and ecological risk of heavy metals
in surface sediments of the Msimbazi mangrove ecosystem, coast of
Dar es Salaam, Tanzania, Chemistry and Ecology, 35(9): 835-845,
DOI: 10.1080/02757540.2019.1663344
Shrestha, S., and Kazama, F. (2007), Assessment of surface water quality
using multivariate statistical techniques, a case study of the Fuji
river basin, Japan. Environ. Modell. Softw. 22: 464–475.
Simpson, S.L., and Batley, G.E. (2016), Sediment quality guideline
values in Simpson, S.L., and Batley, G.E. (Eds), Sediment quality
assessment: a practical guide, CSIRO Publishing, Australia, pp 359
Singh, K.P., Malik, A., Mohan, D., and Sinha, S. (2004), Multivariate
statistical techniques for the evaluation of spatial and temporal
variations in water quality of Gomti River (India), a case study.
Water Res., 38: 3980–3992.
Huria Journal, Vol 27(2), September 2020: 72-92
Metal Contamination in Sediments of Coastal Rivers around Dar es Salaam, Tanzania Matobola Joel Mihale
92
Suresh, G., Ramasamy, V., Meenakshisundaram, V., Venkatachalapathy,
R., Ponnusamy, V. (2011), Influence of mineralogical and heavy
metal composition on natural radionuclide contents in the river
sediments. Appl Radiat Isot 69: 1466 – 1474.
Taylor, S.R. (1964), Abundances of chemical elements in the continental
crust: a new table. Geochim. Cosmochim. Acta 28(8): 1273–1285.
Turekian, K.K., and Wedepohl, K. H. (1961), Distribution of the elements
in some major units of the earth’s crust. Geol. Soc. Am. Boll.72:
175–192.
URT: United Republic of Tanzania (2013), Population and Housing
Census 2012 Population Distribution by Administrative Areas.
National Bureau of Statistics, Dar es Salaam.
USEPA (1999), National recommended water quality criteria –
correction, United States Protection Agency EPA 822-Z-99-001.
(http://www.epa.gov./ostwater/pci/revcom), pp 25.
Varol, M. (2011), Assessment of heavy metal contamination in sediments
of the Tigris River (Turkey) using pollution indices and multivariate
statistical techniques. J. Hazard. Mater. 195: 355–364.
Zhao, L., Hou, H., Zhou, Y., Xue, N., Li, H., and Li, F. (2010),
Distribution and ecological risk of polychlorinated biphenyls, and
organochlorine pesticides in surficial sediments from Haihe River
and Haihe Estuary Area, China. Chemosphere 78: 1285–1293.
Huria Journal, Vol 27(2), September 2020: 93-114
93
Implication Analysis of Pre and Post-Harvest Losses of
Maize to Household Food Security in Kongwa and Kondoa
Districts-Tanzania
Namkunda Johnson Corresponding author: [email protected]
Agnes Nyomora
James Lyimo University of Dar es Salaam
ABSTRACT
The contribution of food losses occurring in the food system to reduced
household food security is undoubted. This study therefore investigated
the status of the pre- and post-harvest losses in maize and their
implication on household food availability, utilization and access in
Kongwa and Kondoa districts. The study sites were selected because of
their potential in maize production and losses. A mixed method approach
was used to collect data for the study including secondary and primary
data. Secondary data collection was achieved through literature review
of published papers, reports, proceeding, policy documents and strategies
relevant to agriculture. Primary data collection was achieved through
discussion with key informants (14 people), focus group discussion (6
groups from each village comprising of 4 males and 4 females). A total of
376 (5.9%) households were surveyed and Transect Walk was also done
to verify information obtained. Qualitative data was analyzed
thematically using NVIVO software whereas quantitative data was
descriptively analyzed using Statistical Package for Social Sciences
(SPSS) software. The cumulative pre and post-harvest losses estimates
were compared against provided pre and post-harvest losses threshold
values. The comparison between pre and post-harvest losses was
confirmed by two ways ANOVA analysis using Levene test. Findings
showed that status of maize pre and post-harvest losses are below the
thresholds of 31.2% and 40% whereby maize post-harvest losses are
significantly (p = 0.015) higher than pre harvest losses. Pre harvest
losses in maize were also significantly (p < 0.011) associated with
reduced food availability while post-harvest losses are significantly (p <
0.000) associated with reduced food utilization. The study recommends
increased awareness among farmers on the implication of food losses to
household food security through trainings and seminars from agriculture
extension officers.
Huria Journal, Vol 27(2), September 2020: 93-114
Implication Analysis of Pre and Post-Harvest Losses of Maize to Household Food Security in Kongwa and Kondoa Districts-Tanzania Namkunda Johnson, Agnes Nyomora and James Lyimo
94
Keywords: Pre- and post-harvest losses, household food security
INTRODUCTION
Food systems comprises of pre harvest system and a post-harvest system.
A pre-harvest system is defined as a system that is concerned with food
production while post-harvest system refers to a series of interconnected
activities from the time of harvest through crop processing, marketing and
food preparation to the final decision by the consumer whether to eat or
discard the food (de Lucia and Assenato, 1994) and thus play an
important role in providing stability in the food supply chain.The outcome
of sustainable food system is food security (Ingram, 2011), while the lack
of sustainability of the food system led to food insecurity condition (FAO
et al., 2017).Food system can operate in a linear sequence or cyclic and is
influenced by many factors including social, political, cultural,
technological, economic and natural environment (HLPE, 2014; UNEP,
2016). Occurrence of food losses within the pre and post-harvest system
impairs the sustainability of food system. The management of pre and
post-harvest systems has grown more complex (Mrema and Rolle, 2002).
This is because of increased dynamics of the food systems, limited
knowledge of food loss estimates and consideration that losses are often
economical rather than physical and yet the economic value of food losses
are unknown (Sheahan and Christopher, 2017).
Attempts to estimate the magnitude of the value of losses before time and
resources are spent on trying to reduce them are of paramount
importance. Despite efforts made over the years to develop acceptable
techniques for measuring food losses in grain, it has remained an
imperfect science (Greeley, 1982). This is because the food system lacks
uniform sequence from producer to consumer (Stevenson and Pirog,
2008). Hence given the lack of a consistent chain, care must be taken to
avoid generalizing from particular measurements. Moreover, there are
two basic approaches currently adopted to estimate losses either to
actually measure what has been lost or use questionnaire to collect
subjective loss estimates from those who experience the losses. (Hodges
et al., 2010). In Africa, the African Post -Harvest Losses Information
System (APHLIS) established in 2009 attempts also to address the lost
estimates problem by providing cumulative weight losses in specific
cereal crops, climate and scale of farming using algorithm of many sub-
Saharan African countries. The data used by APHLIS are the averages of
Huria Journal, Vol 27(2), September 2020: 93-114
Implication Analysis of Pre and Post-Harvest Losses of Maize to Household Food Security in Kongwa and Kondoa Districts-Tanzania Namkunda Johnson, Agnes Nyomora and James Lyimo
95
all the data available in the scientific literatures for that particular crop.
However, Tyler (1982) warns that it is important to not only rely on the
provided estimates as they keep changing in real environment with time.
Hence new food loss status and comparison are needed since situation is
dynamic.
Estimates of food losses varies greatly among countries, commodities,
production areas and seasons (Kader, 2017). Although pre harvest losses
estimations are difficult, global estimates of pre harvest losses on
different crops according to Oerke (2007) indicates that losses occurring
in rice, maize, wheat and soybeans are 37.4%, 31.2%, 28.2% and 26.3%
respectively while 1.3 billion tons of food lost are wasted annually due to
post harvest losses (FAO, 2011). Total quantitative food loss in sub-
Saharan Africa has been estimated at 100 million metric tons per year. It
is further estimated that in sub-Saharan Africa 50% of fruits and
vegetables, 40% of roots and tubers and 20% of cereals are loss before
reaching the market (Damingeret al., 2016). On the other hand, a total
quantitative food loss in sub-Saharan Africa has been estimated at 100
million metric tons per year. These estimates provide a global perspective
of food losses regardless of the causal factor.
In Tanzania, it is estimated that post-harvest losses in cereal crops are
high and may range from 30-40% annually. Since the post-harvest system
comprises of different stages hence the losses occurring at each stage also
differ significantly. According to ICIPE (2013), 1 - 4.5% losses occur
during harvesting while 2.8 -17% occur during storage in the maize post-
harvest system. Moreover, Abasset al. (2013) further added that in semi–
arid areas important quantitative losses in maize post-harvest system
occur in the field is by 15%, during processing by 13 -20% and during
storage by 15 -25%. The annual average losses of cereals crop in
Tanzania during and between the years 2014 to 2018 were reported to be
775,768 tons in maize, 115,818 tons in rice, 62,246 tons in sorghum,
193,223 tons in wheat, 138,302 tons in cassava, 135,158 tons in banana
and 105,936 tons in pulses (FEWS NET, 2014). In the semi-arid areas, it
has been estimated that losses occurring in maize, sunflower and pigeon
peas are 32%, 16% and 12% (Abasset al., 2013). It has been reported
thatmonetary loss in cereal grains due to post-harvest losses in Tanzania
is approximately to US$265,000 out of the US$1.7 million used to
produce maize annually (FAO et al., 2017).
Huria Journal, Vol 27(2), September 2020: 93-114
Implication Analysis of Pre and Post-Harvest Losses of Maize to Household Food Security in Kongwa and Kondoa Districts-Tanzania Namkunda Johnson, Agnes Nyomora and James Lyimo
96
The contribution of food losses to foodinsecurity is undoubted; however,
studies have not yet provided the actual implication of the current status
of the pre- and post-harvest losses to the prevailing rural household food
insecurity. Although Oerke (2007) hinted global estimates of maize pre
harvest losses to be 31.2%, there is no current status of the maize pre
harvest losses at the household level in semi-arid of Tanzania.
Conversely, studies on food losses have only indicated that maize losses
in the semi-arid occur by 40% (Suleiman and Rosentrater, 2015; Abass et
al., 2013). It is not clear on how the food losses affect household food
security. Since the food security pillars operates in a hierarchy nature as
indicated by Webb and Rogers (2003) then lack of food availability not
only affects utilization but also limits access and stability in the long run.
It is on this ground that this study specifically seeks to establish the
current status of food losses occurring in the pre and post-harvest system
and then assess their actual implication on rural household food security.
This is important for effective food loss reduction interventions within the
pre and post-harvest system for improved rural household food security.
METHODOLOGY
Location and characteristic features of the study area
This study was conducted in Kongwa and Kondoa districts in Dodoma
Region (Figure 1). Dodoma Region is the capital city and centrally
positioned in Tanzania mainland, lying between latitude 4º and 7º south
and longitude 35º-37º east. A total of six sample villages were selected
that is Bumbuta, Bukulu and Salanka in Kondoa District, while Mb’ande,
Njoge and Pandambili were selected in Kongwa District respectively.
Selection of the study area was based on the presence of maize crop
growers and proven experiences of food losses across the pre and post-
harvest system. A total of 45,098 and 81,069 households grow maize in
Kongwa and Kondoa districts respectively (URT, 2003). The population
of Dodoma Region is ranked 8th of the 21 regions in Tanzania while total
population in Kondoa and Kongwa districts are 269,704 and 309,973
people respectively (URT, 2013). Dodoma region has a local steppe
climate which is semi-arid due to low and erratic rainfall which falls
seasonally between November/December to April/May (MAFSC, 2006).
The region receives an annual average rainfall between 500mm to 800mm
with high geographical, seasonal and annual variation, but some parts in
Mpwapwa and Kondoa districts experience higher rainfall amount (URT,
2003). The region is comprised of three agro-ecological zones namely;
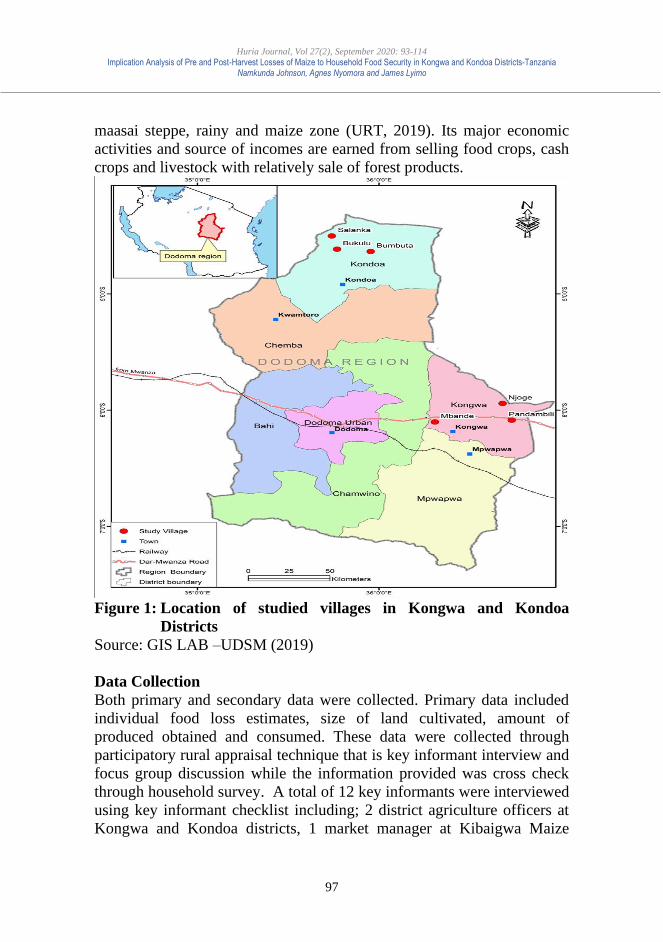
Huria Journal, Vol 27(2), September 2020: 93-114
Implication Analysis of Pre and Post-Harvest Losses of Maize to Household Food Security in Kongwa and Kondoa Districts-Tanzania Namkunda Johnson, Agnes Nyomora and James Lyimo
97
maasai steppe, rainy and maize zone (URT, 2019). Its major economic
activities and source of incomes are earned from selling food crops, cash
crops and livestock with relatively sale of forest products.
Figure 1: Location of studied villages in Kongwa and Kondoa
Districts
Source: GIS LAB –UDSM (2019)
Data Collection
Both primary and secondary data were collected. Primary data included
individual food loss estimates, size of land cultivated, amount of
produced obtained and consumed. These data were collected through
participatory rural appraisal technique that is key informant interview and
focus group discussion while the information provided was cross check
through household survey. A total of 12 key informants were interviewed
using key informant checklist including; 2 district agriculture officers at
Kongwa and Kondoa districts, 1 market manager at Kibaigwa Maize
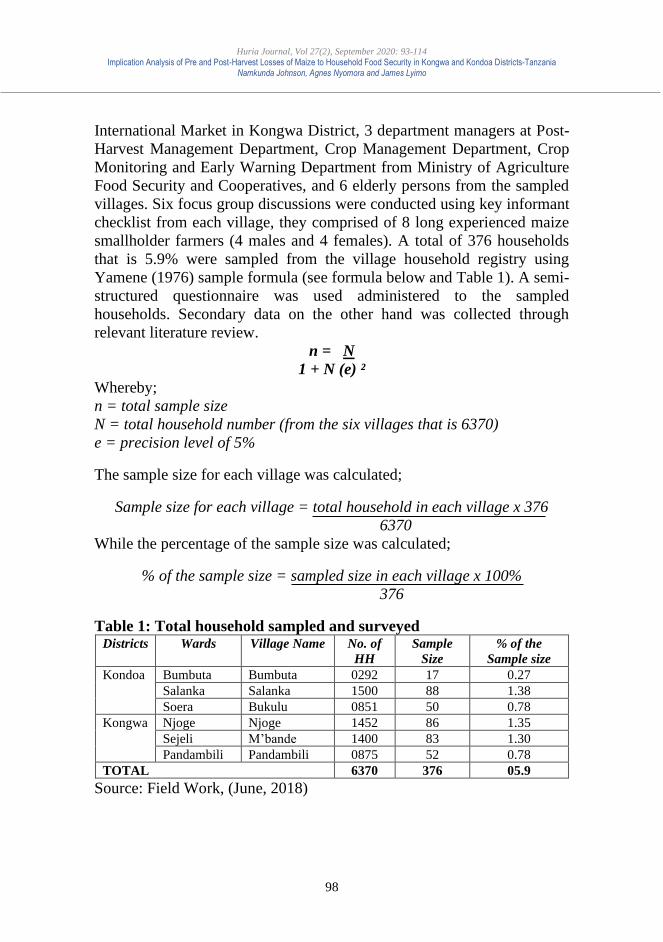
Huria Journal, Vol 27(2), September 2020: 93-114
Implication Analysis of Pre and Post-Harvest Losses of Maize to Household Food Security in Kongwa and Kondoa Districts-Tanzania Namkunda Johnson, Agnes Nyomora and James Lyimo
98
International Market in Kongwa District, 3 department managers at Post-
Harvest Management Department, Crop Management Department, Crop
Monitoring and Early Warning Department from Ministry of Agriculture
Food Security and Cooperatives, and 6 elderly persons from the sampled
villages. Six focus group discussions were conducted using key informant
checklist from each village, they comprised of 8 long experienced maize
smallholder farmers (4 males and 4 females). A total of 376 households
that is 5.9% were sampled from the village household registry using
Yamene (1976) sample formula (see formula below and Table 1). A semi-
structured questionnaire was used administered to the sampled
households. Secondary data on the other hand was collected through
relevant literature review.
n = N
1 + N (e) ²
Whereby;
n = total sample size
N = total household number (from the six villages that is 6370)
e = precision level of 5%
The sample size for each village was calculated;
Sample size for each village = total household in each village x 376
6370
While the percentage of the sample size was calculated;
% of the sample size = sampled size in each village x 100%
376
Table 1: Total household sampled and surveyed Districts Wards Village Name No. of
HH
Sample
Size
% of the
Sample size
Kondoa Bumbuta Bumbuta 0292 17 0.27
Salanka Salanka 1500 88 1.38
Soera Bukulu 0851 50 0.78
Kongwa Njoge Njoge 1452 86 1.35
Sejeli M’bande 1400 83 1.30
Pandambili Pandambili 0875 52 0.78
TOTAL 6370 376 05.9
Source: Field Work, (June, 2018)

Huria Journal, Vol 27(2), September 2020: 93-114
Implication Analysis of Pre and Post-Harvest Losses of Maize to Household Food Security in Kongwa and Kondoa Districts-Tanzania Namkunda Johnson, Agnes Nyomora and James Lyimo
99
Data Analysis
Since, there were no established time series pre and post-harvest losses
data on maize crop at the village, district, and ministry level. The
recognizable data was the percentage estimate of 31.2% for maize pre
harvest losses and 40% for maize post-harvest losses provided in the
literatures. During the data collection process households were at
different stages across the pre and post-harvest system. According to
Hodges et al. (2010), there are basically two approaches adopted to
estimate food losses either to actually measure what has been lost or to
use a questionnaire to collect subjective losses estimates from those who
have experienced them.
Therefore, quantification of the pre harvest losses for each household in
the studied villages was derived as a difference between the capacities of
land to produce versus amount obtained whereby for one acre of farm
land it was approximated to produce 60 bags which is equivalent to 100
kg of maize. Households who obtained an equally amount of yield as per
expected capacity of land were regarded not to experience pre-harvest
losses. Data for households who experienced pre harvest losses were
converted into percentage for easier comparison with the 31.2% estimate
provided by Oerke (2007). Conversely, although the post-harvest system
in the studied area comprised of five stages that is harvesting,
transporting, drying, and threshing/shelling and storage, the quantification
of food losses across the stages involved percentage estimates depending
on what households obtained after harvesting versus amount remaining
during storage. The percentage loss estimates where then compared
against the 40% estimates provided by Abass et al. (2013) for easier
assessment of the current status of maize post-harvest losses in the studied
areas.
Thereafter, two ways ANOVA test was used to make a comparison
between pre harvest losses status and post-harvest losses status occurring
in Kongwa and Kondoa Districts so as to detect which area experiences
greater food losses than the other. The correlation between pre harvest
losses and post-harvest losses affecting household food security
parameters that is availability, utilization, accessibility and stability was
confirmed by the Pearson Product-Moment Correlation Coefficient.
Huria Journal, Vol 27(2), September 2020: 93-114
Implication Analysis of Pre and Post-Harvest Losses of Maize to Household Food Security in Kongwa and Kondoa Districts-Tanzania Namkunda Johnson, Agnes Nyomora and James Lyimo
100
The study considered three aspect of food security that is food
availability, food accessibility and food utilization as major facet that
determine household food security as indicated by Chijiokeet al. (2011).
The influence of pre-harvest losses towards household food security was
reflected more on limitation to food availability aspect, whereby the
amount of crop losses as result of pre harvest losses was calculated as a
difference between capacities of land to produce versus the actual amount
obtained in kilogram. The estimation used during this process was that on
average 1 acre produces 60 bags and 1 bag of maize equals to 100 kg as
indicated by district agriculture officers at Kongwa and Kondoa districts.
Conversely, the influence of post-harvest losses on household food
security was reflected more on limited food utilization aspect. This was
obtained as a difference between actual amounts of yield obtained in
kilogram versus the capacity or amount in kilogram a household
consumes per year at a satisfactory level. The difference was terms as
consumption deficit which implies that loss food that was to be
consumed. Lastly, the study also analyzed the limitation in terms of
financial losses households incur after pre and post-harvest losses. The
study argued that the amount of finances losses deprives capacity of
household to purchase food from the market. This was obtained after
converting the total amount of food losses incurs from both pre and post-
harvest losses into Tanzanian Shillings whereby 1 kg of maize is sold at
390.07 Tanzanian Shillings. The correlation between pre-harvest losses
influences on yield that is food availability and post-harvest losses
influence on food utilization was confirmed by the Pearson Product-
Moment Correlation Coefficient.
Conceptual Framework
The conceptual framework guiding this study was adopted and modified
from the work of Harris-Fry et al. (2015) on socio-economic determinants
of household food security and women dietary diversity in rural
Bangladesh. According to Harris-Fry et al. (2015), food availability,
access and utilization are the three major pillars that determine food
security at the household. However, presence of influencing determinants
within the food system environment affects household food security. This
study modifies the framework by arguing that household food security is
impaired by food losses occurring across the food system. That is
presence of sustainable food system with zero food losses and wastes
assures improved household food security. The food system comprises of
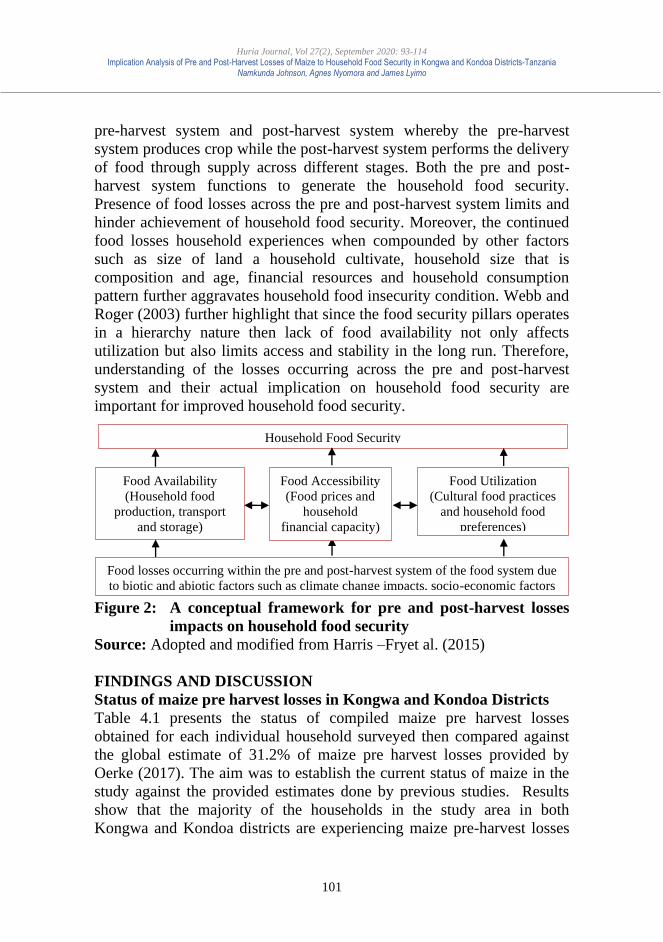
Huria Journal, Vol 27(2), September 2020: 93-114
Implication Analysis of Pre and Post-Harvest Losses of Maize to Household Food Security in Kongwa and Kondoa Districts-Tanzania Namkunda Johnson, Agnes Nyomora and James Lyimo
101
pre-harvest system and post-harvest system whereby the pre-harvest
system produces crop while the post-harvest system performs the delivery
of food through supply across different stages. Both the pre and post-
harvest system functions to generate the household food security.
Presence of food losses across the pre and post-harvest system limits and
hinder achievement of household food security. Moreover, the continued
food losses household experiences when compounded by other factors
such as size of land a household cultivate, household size that is
composition and age, financial resources and household consumption
pattern further aggravates household food insecurity condition. Webb and
Roger (2003) further highlight that since the food security pillars operates
in a hierarchy nature then lack of food availability not only affects
utilization but also limits access and stability in the long run. Therefore,
understanding of the losses occurring across the pre and post-harvest
system and their actual implication on household food security are
important for improved household food security.
Figure 2: A conceptual framework for pre and post-harvest losses
impacts on household food security
Source: Adopted and modified from Harris –Fryet al. (2015)
FINDINGS AND DISCUSSION
Status of maize pre harvest losses in Kongwa and Kondoa Districts
Table 4.1 presents the status of compiled maize pre harvest losses
obtained for each individual household surveyed then compared against
the global estimate of 31.2% of maize pre harvest losses provided by
Oerke (2017). The aim was to establish the current status of maize in the
study against the provided estimates done by previous studies. Results
show that the majority of the households in the study area in both
Kongwa and Kondoa districts are experiencing maize pre-harvest losses
Household Food Security
Food losses occurring within the pre and post-harvest system of the food system due
to biotic and abiotic factors such as climate change impacts, socio-economic factors
Food Availability
(Household food
production, transport
and storage)
Food Accessibility
(Food prices and
household
financial capacity)
Food Utilization
(Cultural food practices
and household food
preferences)
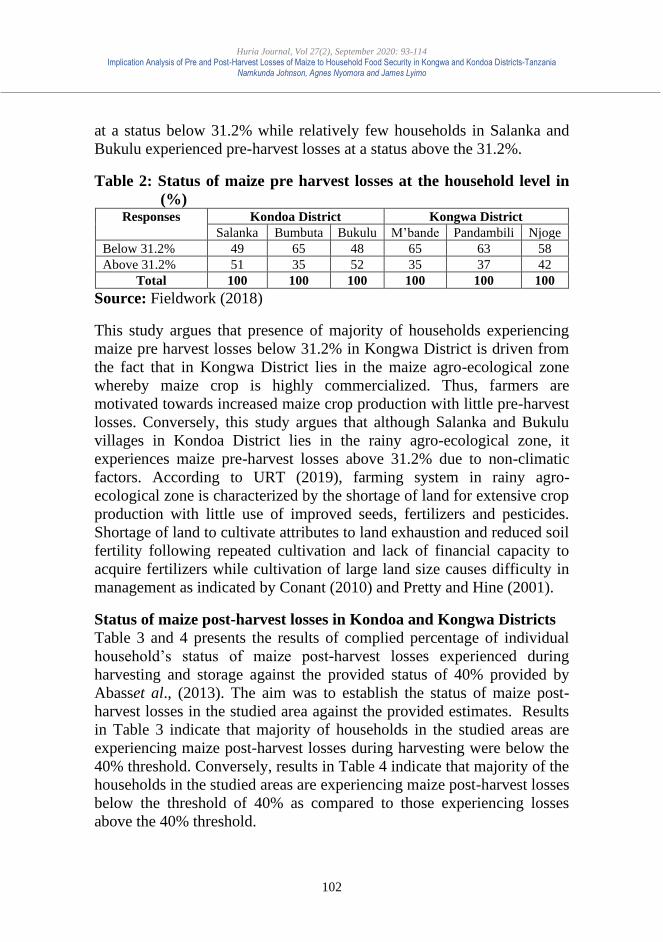
Huria Journal, Vol 27(2), September 2020: 93-114
Implication Analysis of Pre and Post-Harvest Losses of Maize to Household Food Security in Kongwa and Kondoa Districts-Tanzania Namkunda Johnson, Agnes Nyomora and James Lyimo
102
at a status below 31.2% while relatively few households in Salanka and
Bukulu experienced pre-harvest losses at a status above the 31.2%.
Table 2: Status of maize pre harvest losses at the household level in
(%) Responses Kondoa District Kongwa District
Salanka Bumbuta Bukulu M’bande Pandambili Njoge
Below 31.2% 49 65 48 65 63 58
Above 31.2% 51 35 52 35 37 42
Total 100 100 100 100 100 100
Source: Fieldwork (2018)
This study argues that presence of majority of households experiencing
maize pre harvest losses below 31.2% in Kongwa District is driven from
the fact that in Kongwa District lies in the maize agro-ecological zone
whereby maize crop is highly commercialized. Thus, farmers are
motivated towards increased maize crop production with little pre-harvest
losses. Conversely, this study argues that although Salanka and Bukulu
villages in Kondoa District lies in the rainy agro-ecological zone, it
experiences maize pre-harvest losses above 31.2% due to non-climatic
factors. According to URT (2019), farming system in rainy agro-
ecological zone is characterized by the shortage of land for extensive crop
production with little use of improved seeds, fertilizers and pesticides.
Shortage of land to cultivate attributes to land exhaustion and reduced soil
fertility following repeated cultivation and lack of financial capacity to
acquire fertilizers while cultivation of large land size causes difficulty in
management as indicated by Conant (2010) and Pretty and Hine (2001).
Status of maize post-harvest losses in Kondoa and Kongwa Districts
Table 3 and 4 presents the results of complied percentage of individual
household’s status of maize post-harvest losses experienced during
harvesting and storage against the provided status of 40% provided by
Abasset al., (2013). The aim was to establish the status of maize post-
harvest losses in the studied area against the provided estimates. Results
in Table 3 indicate that majority of households in the studied areas are
experiencing maize post-harvest losses during harvesting were below the
40% threshold. Conversely, results in Table 4 indicate that majority of the
households in the studied areas are experiencing maize post-harvest losses
below the threshold of 40% as compared to those experiencing losses
above the 40% threshold.
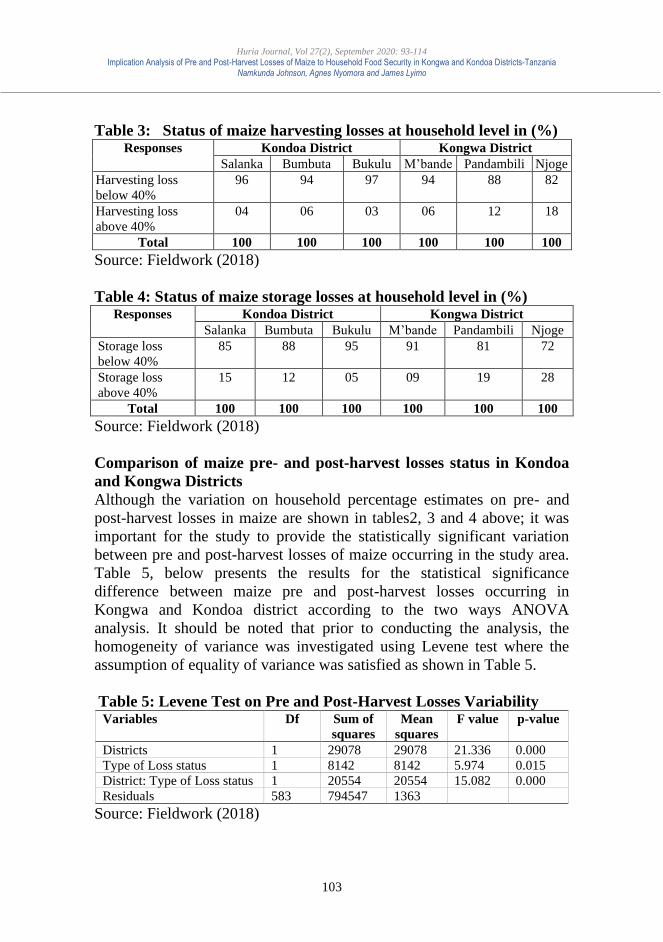
Huria Journal, Vol 27(2), September 2020: 93-114
Implication Analysis of Pre and Post-Harvest Losses of Maize to Household Food Security in Kongwa and Kondoa Districts-Tanzania Namkunda Johnson, Agnes Nyomora and James Lyimo
103
Table 3: Status of maize harvesting losses at household level in (%) Responses Kondoa District Kongwa District
Salanka Bumbuta Bukulu M’bande Pandambili Njoge
Harvesting loss
below 40%
96 94 97 94 88 82
Harvesting loss
above 40%
04 06 03 06 12 18
Total 100 100 100 100 100 100
Source: Fieldwork (2018)
Table 4: Status of maize storage losses at household level in (%) Responses Kondoa District Kongwa District
Salanka Bumbuta Bukulu M’bande Pandambili Njoge
Storage loss
below 40%
85 88 95 91 81 72
Storage loss
above 40%
15 12 05 09 19 28
Total 100 100 100 100 100 100
Source: Fieldwork (2018)
Comparison of maize pre- and post-harvest losses status in Kondoa
and Kongwa Districts
Although the variation on household percentage estimates on pre- and
post-harvest losses in maize are shown in tables2, 3 and 4 above; it was
important for the study to provide the statistically significant variation
between pre and post-harvest losses of maize occurring in the study area.
Table 5, below presents the results for the statistical significance
difference between maize pre and post-harvest losses occurring in
Kongwa and Kondoa district according to the two ways ANOVA
analysis. It should be noted that prior to conducting the analysis, the
homogeneity of variance was investigated using Levene test where the
assumption of equality of variance was satisfied as shown in Table 5.
Table 5: Levene Test on Pre and Post-Harvest Losses Variability Variables Df Sum of
squares
Mean
squares
F value p-value
Districts 1 29078 29078 21.336 0.000
Type of Loss status 1 8142 8142 5.974 0.015
District: Type of Loss status 1 20554 20554 15.082 0.000
Residuals 583 794547 1363
Source: Fieldwork (2018)
Huria Journal, Vol 27(2), September 2020: 93-114
Implication Analysis of Pre and Post-Harvest Losses of Maize to Household Food Security in Kongwa and Kondoa Districts-Tanzania Namkunda Johnson, Agnes Nyomora and James Lyimo
104
Findings indicate that there was a statistically significant main effect for
district [F (1, 750) =21.336, p=0.000] such that the percentage of maize
losses perceived by the farmers’ household is statistically different
between Kondoa and Kongwa Districts. The difference is denoted
through mean percentage whereby Kondoa District has a mean percentage
loss of 37.65 while Kongwa District has mean percentage loss of 51.76.
This finding suggests that households in Kongwa District are
experiencing higher percentage overall losses in both pre and post-harvest
system than households in Kondoa District. This study argues that
thepresence of significant high pre and post-harvest losses in Kongwa
District than in Kondoa District is not only from lack of effective loss
reduction but also continued loss influenced by climate change and
variability. The ongoing ncreasing temperature trend in the semi-arid
areas of Tanzania facilitates food losses through soil moisture reduction,
drying of crops, and eruption of pest and diseases which further increases
the susceptibility of maize contamination with aflatoxins (Suleiman and
Rosentrater, 2015).
Results also indicate that there was a statistically significant main effect
for the loss status [F(1,750) =5.974,p=0.015] such that the average
percent of pre harvest loss is statistically significantly different from the
average percent of post-harvest loss. This also implies that maize post-
harvest losses had a higher mean percentage loss of 48.77% than maize
pre harvest losses which had a mean percentage loss of 39.39%. This
finding suggests that on average farmer’s households in both Kongwa and
Kondoa Districts experience more maize post-harvest loss than the pre
harvest loss. This study argues that presence of high post- harvest losses
in the study area is due to the fact that farmer’s efforts are channeled on
promoting resilient production system than resilient post-harvest system.
This was also attested by Kader (2005) and WFLO (2010) that over the
past decade’s significant focus and resources have been allocated to
increased food production than reducing food losses. Cooper et al. (2008)
further indicated that most of the semi-arid are characterized by reduced
rainfall and severe drought and as a result, farmers in these areas give
more priority only to reduce crop risks during production (Cooper et
al.2008). However, resilient production system alone without resilient
post-harvest system cannot effectively address the prevailing rural
household food insecurity conditions. Hence reducing post-harvest losses
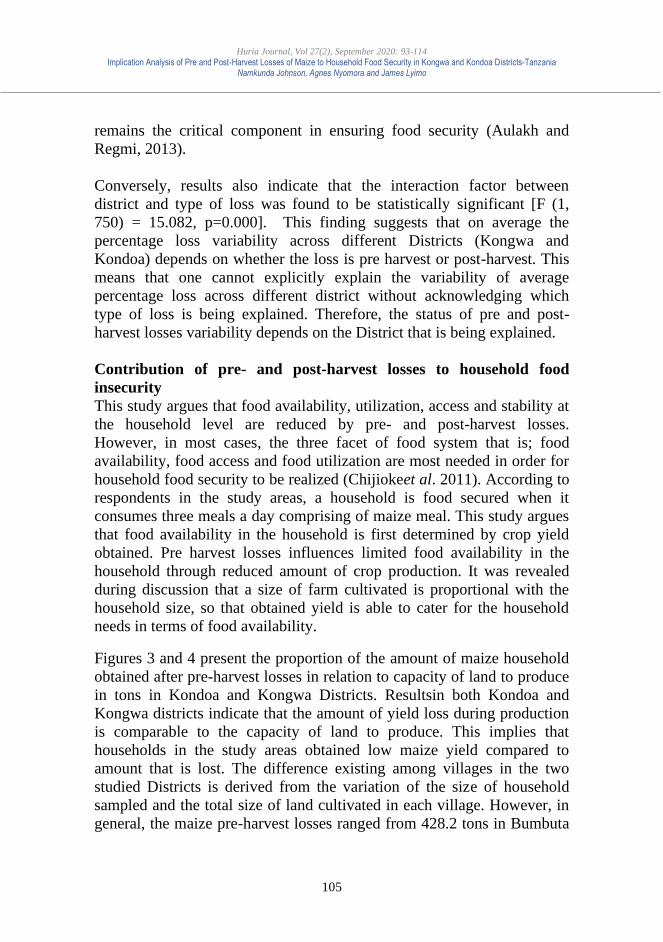
Huria Journal, Vol 27(2), September 2020: 93-114
Implication Analysis of Pre and Post-Harvest Losses of Maize to Household Food Security in Kongwa and Kondoa Districts-Tanzania Namkunda Johnson, Agnes Nyomora and James Lyimo
105
remains the critical component in ensuring food security (Aulakh and
Regmi, 2013).
Conversely, results also indicate that the interaction factor between
district and type of loss was found to be statistically significant [F (1,
750) = 15.082, p=0.000]. This finding suggests that on average the
percentage loss variability across different Districts (Kongwa and
Kondoa) depends on whether the loss is pre harvest or post-harvest. This
means that one cannot explicitly explain the variability of average
percentage loss across different district without acknowledging which
type of loss is being explained. Therefore, the status of pre and post-
harvest losses variability depends on the District that is being explained.
Contribution of pre- and post-harvest losses to household food
insecurity
This study argues that food availability, utilization, access and stability at
the household level are reduced by pre- and post-harvest losses.
However, in most cases, the three facet of food system that is; food
availability, food access and food utilization are most needed in order for
household food security to be realized (Chijiokeet al. 2011). According to
respondents in the study areas, a household is food secured when it
consumes three meals a day comprising of maize meal. This study argues
that food availability in the household is first determined by crop yield
obtained. Pre harvest losses influences limited food availability in the
household through reduced amount of crop production. It was revealed
during discussion that a size of farm cultivated is proportional with the
household size, so that obtained yield is able to cater for the household
needs in terms of food availability.
Figures 3 and 4 present the proportion of the amount of maize household
obtained after pre-harvest losses in relation to capacity of land to produce
in tons in Kondoa and Kongwa Districts. Resultsin both Kondoa and
Kongwa districts indicate that the amount of yield loss during production
is comparable to the capacity of land to produce. This implies that
households in the study areas obtained low maize yield compared to
amount that is lost. The difference existing among villages in the two
studied Districts is derived from the variation of the size of household
sampled and the total size of land cultivated in each village. However, in
general, the maize pre-harvest losses ranged from 428.2 tons in Bumbuta
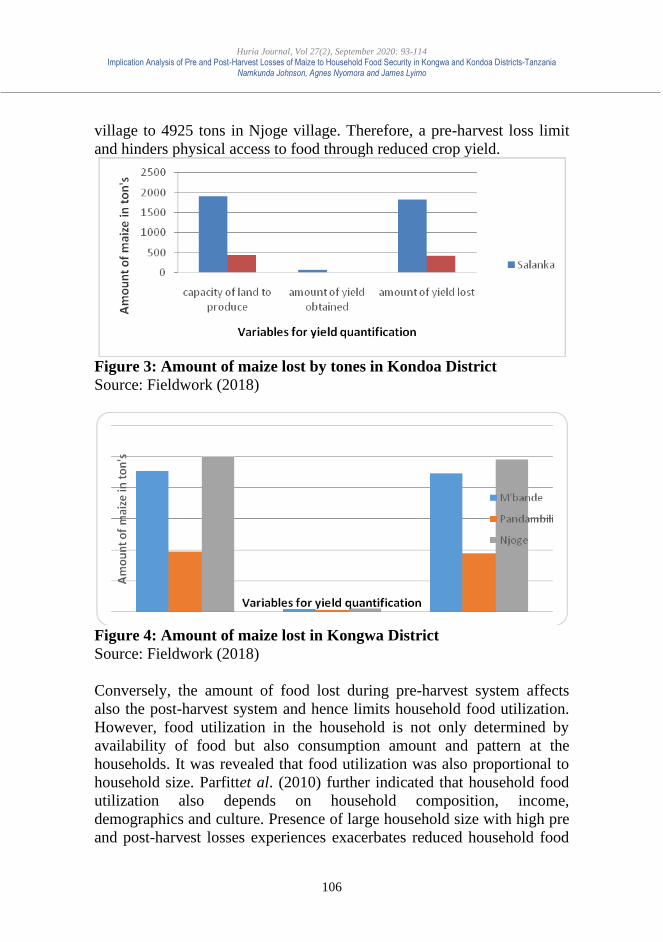
Huria Journal, Vol 27(2), September 2020: 93-114
Implication Analysis of Pre and Post-Harvest Losses of Maize to Household Food Security in Kongwa and Kondoa Districts-Tanzania Namkunda Johnson, Agnes Nyomora and James Lyimo
106
village to 4925 tons in Njoge village. Therefore, a pre-harvest loss limit
and hinders physical access to food through reduced crop yield.
Figure 3: Amount of maize lost by tones in Kondoa District
Source: Fieldwork (2018)
Figure 4: Amount of maize lost in Kongwa District
Source: Fieldwork (2018)
Conversely, the amount of food lost during pre-harvest system affects
also the post-harvest system and hence limits household food utilization.
However, food utilization in the household is not only determined by
availability of food but also consumption amount and pattern at the
households. It was revealed that food utilization was also proportional to
household size. Parfittet al. (2010) further indicated that household food
utilization also depends on household composition, income,
demographics and culture. Presence of large household size with high pre
and post-harvest losses experiences exacerbates reduced household food

Huria Journal, Vol 27(2), September 2020: 93-114
Implication Analysis of Pre and Post-Harvest Losses of Maize to Household Food Security in Kongwa and Kondoa Districts-Tanzania Namkunda Johnson, Agnes Nyomora and James Lyimo
107
utilization. This may lead to skipping of meals or provision of meals to
family members basing on priority needs such as the children and elderly.
Figures 5 and 6 present the household maize consumption deficit in
relation to amount of maize obtained from the farm and the amount of
maize a household consume yearly. Result indicates that households in
both Kongwa and Kondoa districts are experiencing household
consumption deficit due to post-harvest losses. Comparison among the
district show that Kongwa District is experiencing more household
consumption deficit than Kondoa District. Finding further suggests and
concur with previous findings that presence of high post-harvest losses in
Kongwa District contributes to reduced household food utilization.
Figure 5: Household maize consumption deficit inKondoa District
Source: Fieldwork (2018)
Figure 6: Household maize consumption deficit inKongwa District
Source: Fieldwork (2018)
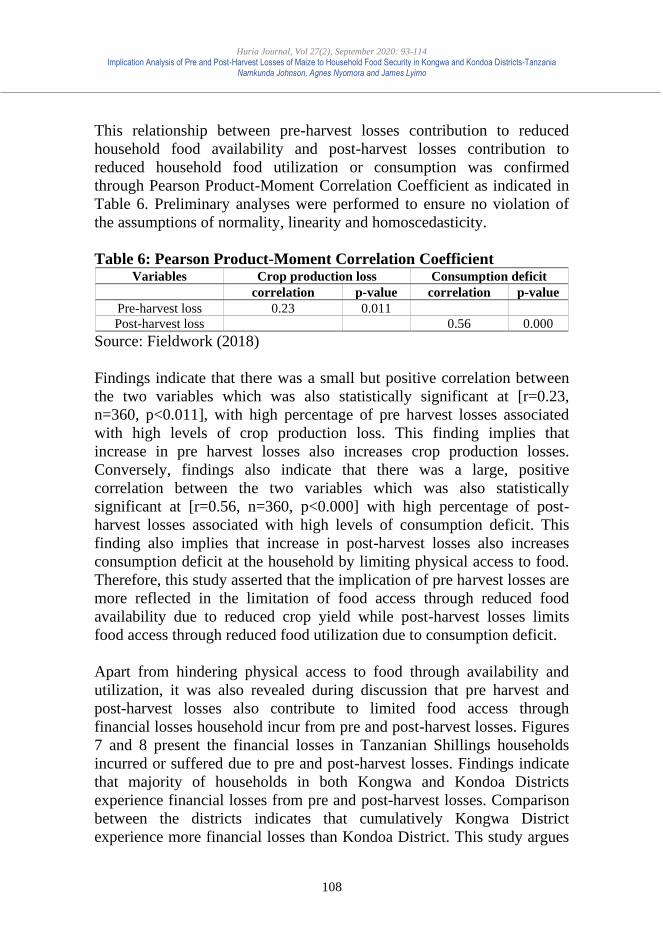
Huria Journal, Vol 27(2), September 2020: 93-114
Implication Analysis of Pre and Post-Harvest Losses of Maize to Household Food Security in Kongwa and Kondoa Districts-Tanzania Namkunda Johnson, Agnes Nyomora and James Lyimo
108
This relationship between pre-harvest losses contribution to reduced
household food availability and post-harvest losses contribution to
reduced household food utilization or consumption was confirmed
through Pearson Product-Moment Correlation Coefficient as indicated in
Table 6. Preliminary analyses were performed to ensure no violation of
the assumptions of normality, linearity and homoscedasticity.
Table 6: Pearson Product-Moment Correlation Coefficient Variables Crop production loss Consumption deficit
correlation p-value correlation p-value
Pre-harvest loss 0.23 0.011
Post-harvest loss 0.56 0.000
Source: Fieldwork (2018)
Findings indicate that there was a small but positive correlation between
the two variables which was also statistically significant at [r=0.23,
n=360, p<0.011], with high percentage of pre harvest losses associated
with high levels of crop production loss. This finding implies that
increase in pre harvest losses also increases crop production losses.
Conversely, findings also indicate that there was a large, positive
correlation between the two variables which was also statistically
significant at [r=0.56, n=360, p<0.000] with high percentage of post-
harvest losses associated with high levels of consumption deficit. This
finding also implies that increase in post-harvest losses also increases
consumption deficit at the household by limiting physical access to food.
Therefore, this study asserted that the implication of pre harvest losses are
more reflected in the limitation of food access through reduced food
availability due to reduced crop yield while post-harvest losses limits
food access through reduced food utilization due to consumption deficit.
Apart from hindering physical access to food through availability and
utilization, it was also revealed during discussion that pre harvest and
post-harvest losses also contribute to limited food access through
financial losses household incur from pre and post-harvest losses. Figures
7 and 8 present the financial losses in Tanzanian Shillings households
incurred or suffered due to pre and post-harvest losses. Findings indicate
that majority of households in both Kongwa and Kondoa Districts
experience financial losses from pre and post-harvest losses. Comparison
between the districts indicates that cumulatively Kongwa District
experience more financial losses than Kondoa District. This study argues
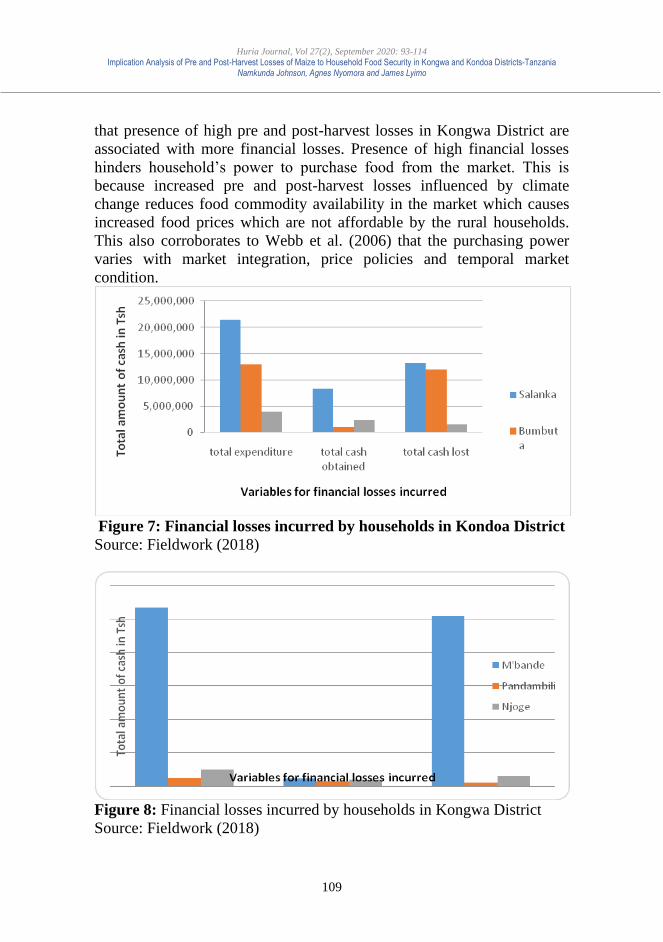
Huria Journal, Vol 27(2), September 2020: 93-114
Implication Analysis of Pre and Post-Harvest Losses of Maize to Household Food Security in Kongwa and Kondoa Districts-Tanzania Namkunda Johnson, Agnes Nyomora and James Lyimo
109
that presence of high pre and post-harvest losses in Kongwa District are
associated with more financial losses. Presence of high financial losses
hinders household’s power to purchase food from the market. This is
because increased pre and post-harvest losses influenced by climate
change reduces food commodity availability in the market which causes
increased food prices which are not affordable by the rural households.
This also corroborates to Webb et al. (2006) that the purchasing power
varies with market integration, price policies and temporal market
condition.
Figure 7: Financial losses incurred by households in Kondoa District
Source: Fieldwork (2018)
Figure 8: Financial losses incurred by households in Kongwa District
Source: Fieldwork (2018)
Huria Journal, Vol 27(2), September 2020: 93-114
Implication Analysis of Pre and Post-Harvest Losses of Maize to Household Food Security in Kongwa and Kondoa Districts-Tanzania Namkunda Johnson, Agnes Nyomora and James Lyimo
110
Most of households in the studied areas do not purchase foods from the
market; they depend entirely on their farm produce and stored food.
Therefore, presence of pre and post-harvest losses not only limits food
availability but also causes households to incur financial losses which
would have been used to purchase food from the market. The financial
losses that households incur from pre and post-harvest losses results from
the cost of renting of land for those who do not own land, purchase of
seeds, hiring of labor for planting, weeding, harvesting, transportation,
threshing and shelling and purchase of facilities used during storage.
Limitation of access to food through purchase also limits consumption
status in terms of amount and pattern (Ericksenet al., 2011). Although this
study argues that there is relationship between amounts of finances lost
through pre and post-harvest losses towards food access restriction in the
market, Chakona and Shackleton (2017), report that there is no
correlation between food losses occurring through pre and post-harvest
with household wealth or food expenditure.
Conclusion and Recommendation
The status of both maize pre and post- harvest losses occurring in the
studied area are relative low when compared against the threshold
however they are huge to those who experiences losses above the
threshold. The comparison between statuses of pre and post-harvest losses
showed that post-harvest losses are higher than pre harvest losses,
whereby Kongwa district is experiencing high pre and post-harvest losses
than Kondoa district. The influences of pre and post-harvest losses on
household food security are more reflected through food availability,
utilization and accessibility. Pre harvest losses limit physical food access
by reducing food availability which occurs as result of reduced food
yield. Conversely, post-harvest losses limit physical food access hence
reduces household food utilization. Moreover, occurrence of pre and post-
harvest losses causes financial losses which also limit physical access of
food in the market. Therefore, pre and post-harvest losses have a
significant negative implication on household food security conditions by
limiting access to food availability and utilization. The study recommends
increased awareness on the food losses occurring across the pre and post-
harvest system to household farmers and their associated implication on
household food security through seminars and trainings on effective food
loss reduction methods.
Huria Journal, Vol 27(2), September 2020: 93-114
Implication Analysis of Pre and Post-Harvest Losses of Maize to Household Food Security in Kongwa and Kondoa Districts-Tanzania Namkunda Johnson, Agnes Nyomora and James Lyimo
111
REFERENCES
Abass, A. B., Ndunguru, G., Mamiro, P., Alenkhe, B., Mlingi, N. and
Bekunda, M. (2014). Post-harvest food losses in a maize-based
farming system of semi-arid savannah area of Tanzania. Journal of
Stored Products Research57: 49-57.
Aulakh, J. and Regmi, A. (2013). Post-Harvest Food Losses Estimation-
Development of Consistent Methodology Introduction. Improving
Methods for Estimating Post-Harvest Losses. FAO meetings and
workshop GS SAC 2013
Chakona, G. and Shackleton, C.M. (2017). Local Setting Influences the
Quantity of Household Food Waste in Mid-sized South African
Towns. https://doi.org/10.1371/journal.pone.0189407
Chijioke, O.B. Haile, M. and Waschket, C. (2011). Implication of Climate
Change on Crop Yield and Food Accessibility in Sub-Saharan
Africa: Interdisciplinary Term Paper. ZEF Doctoral Studied
Program, University of Bonn
Conant, R. T. (2010). Rebuilding Resilience: Sustainable Land
Management for Climate Mitigation and Adaptation. Food and
Agriculture Organization of the United Nations, Rome, Italy. 56pp.
Cooper, P.J.M., Dimes, J., Rao, K.P.C., Shapiro, B., Shiferaw, B. and
Twomlow, S. (2008). Coping better with current climatic variability
in the rain-fed farming systems of sub-Saharan Africa: An essential
first step in adapting to future climate change? AgricEcosyst
Environ 126:24–35. DOI: 10.1016/j.agee.2008.01.007
Daminger, A. Datta, S. and Guichon, D. (2016). Reducing Post-Harvest
Loss, A Behavioral Approach Tanzania. Rockefellers Foundation
Delucia, M. andAssennato, D. (1994). Agricultural Engineering in
Development: Post-harvest Operations and Management of Food
grains. FAO Agricultural Services Bulletin No. 93. Rome: FAO
Ericksen, P., Thornton, P., Notenbaert, A., Cramer, L., Jones, P. and
Herrero, M. (2011). Mapping Hotspots of Climate Change and Food
Insecurity in the Global Tropics. CCAFS Report 5. Copenhagen,
Denmark: CCAFS.
Famine Early Warning Systems Network (FEWS Net), (2014).
Importance of Own Crops as a Source of Food Tanzania Livelihood
Attribute Map: Crop Consumption. FEWS NET/USAID.
FAO (2011). Food Availability and Natural Resource Use. Nadia El-
HageScialabba Natural Resources Management and Environment
Huria Journal, Vol 27(2), September 2020: 93-114
Implication Analysis of Pre and Post-Harvest Losses of Maize to Household Food Security in Kongwa and Kondoa Districts-Tanzania Namkunda Johnson, Agnes Nyomora and James Lyimo
112
Department, FAO/OECD Expert Meeting on Greening the
Economy with Agriculture Paris, 5 – 7 September 2011
FAO, IFAD, UNICEF, WFP and WHO (2017). The State of Food
Security and Nutrition in the World 2017. Building resilience for
peace and food security. Rome, FAO.
Greeley, M. (1982). Farm level post-harvest food losses: the myth of the
soft third option. IDS Bulletin, 13, (3), 51-60. Institute of
Development Studies, Brighton, Sussex
Harris-Fry, H., Azad, K., Kuddus, A., Shaha, S., Nahar, B., Hossen, M.,
Younes, L., Costello, A. and Fottrell, E. (2015). Socio-economic
determinants of household food security and women's dietary
diversity in rural Bangladesh: a cross-sectional study. Journal of
Health, Population and Nutrition (2015) 33:2. doi:
10.1186/s41043-015-0022-0.
HLPE (2014). Food losses and waste in the context of sustainable food
systems. A report by the High-Level Panel of Experts on Food
Security and Nutrition of the Committee on World Food Security.
Rome: FAO. 116p.
Hoddges, R.T., Buzby, J.C. and Bennet, B. (2010). Foresight Project on
Global Food and Farming Futures: Postharvest losses and waste in
developed and less developed countries: opportunities to improve
resource use. Journal of Agricultural Science (2011),149,37–45.
©CambridgeUniversity
ICIPE (2013). Fighting Food Losses in Tanzania: The way forward for
post-harvest research and innovations, Edited by Christopher
Mutungi and HippolyteAffognon.
Ingram, J. (2011). A food systems approach to researching food security
and its interactions with global environmental. Food Security,
3/417-431.doi:10.1007/s12571-011-0149-9
Kader, A.A. (2017). Increasing Food Availability by Reducing
Postharvest Losses of Fresh. Department of Pomology University of
California Davis, CA 95616 USA
Kader, A.A. (2005). Increasing Food Availability by Reducing
Postharvest Losses of Fresh Produce. Acta Horticulture 682:2169-
2176.
MAFSC (2006). Agriculture Sector Development Programme:
Government Programme Document. Government Printer, Dar es
Salaam

Huria Journal, Vol 27(2), September 2020: 93-114
Implication Analysis of Pre and Post-Harvest Losses of Maize to Household Food Security in Kongwa and Kondoa Districts-Tanzania Namkunda Johnson, Agnes Nyomora and James Lyimo
113
Mrema, G.C. and Rolle, R.S. (2002). Status of the Postharvest Sector and
its Contribution to Agricultural Development and Economic
Growth. Proc. 9th JIRCAS Intl. Symp. 2002. Value-addition to
agricultural products, Ibaraki, Japan
Oerke, E.C. (2007). Crop Losses to Animal Pest, Plant Pathogens and
Weeds. Encyclopedia of Pest Management Vol. 2 pp. 116 -1120.
CRC Press-Boea Raton Florida USA
Parfitt, J., Barthel, M. and Macnaughton, S. (2010). Food Waste within
Food Supply Chains: Quantification and Potential for Change to
2050. The Royal Society Publishing Centre, doi:
10.1098/rstb.2010.0126365
Pretty, J. and Hine, R. (2001). Reducing Food Poverty with Sustainable
Agriculture: A Summary of New Evidence. Centre for Environment
and Society, University of Essex, Colchester, UK. 37pp.
Sheahan, M. and Christopher, B. (2017). Review: Food Loss and Waste
in Sub-Saharan Africa. Food Policy 70 (2017) 1 –12. Elsevier,
Science Direct Journal
Stevenson, G. W. and Pirog, R. (2008). Values Based Supply Chains.
Food and the Mid-Level Farm: Renewing and Agriculture of the
Middle (pp. 119-143). Massachusetts Institute of Technology.
Suleiman, R. A. and Rosentrater, K. A. (2015). Current Maize
Production, Postharvest Losses and the Risk of Mycotoxins
Contamination in Tanzania. Conference Proceedings and
Presentations. New Orleans, Louisiana. July 26 –29, 2015
Tyler, P. S. (1982). Misconception of Food Losses. Food and Nutrition
Bulletin4(2).
http://www.unu.edu/Unupress/food/8F042e/8F042E05.
UNEP (2016). Food Systems and Natural Resources. A Report of the
Working Group on Food Systems of the International Resource
Panel. Westhoek, H., Ingram, J., Van Berkum, S., Özay, L. and
Hajer, M.
URT (2013). The2012 Population and Housing Census. Population
Distribution by Administrative Areas. National Bureau of Statistics
Ministry of Finance- Dar es Salaam and the Office of Chief
Government Statistician President’s Office, Finance, Economy and
Development Planning Zanzibar National Bureau of Statistics
URT (2003). National Sample Census of Agriculture 2002/2003. Volume
Va: Regional Report: Dodoma Region. National Bureau of
Statistics, Ministry of agriculture and Food Security, Ministry of
Huria Journal, Vol 27(2), September 2020: 93-114
Implication Analysis of Pre and Post-Harvest Losses of Maize to Household Food Security in Kongwa and Kondoa Districts-Tanzania Namkunda Johnson, Agnes Nyomora and James Lyimo
114
Water and Livestock Development, Ministry of Cooperatives and
Marketing, Presidents Office, Regional Administration and Local
Government, Ministry of Finance and Economic Affairs – Zanzibar
URT (2019). Dodoma Region Investment Guide. President’s Office
Regional Administrative and Local Government. Dodoma Regional
Commissioner Office. Dodoma, Tanzania
Webb, P. and Rogers, B. L. (2003). Addressing the Food Insecurity. Food
and Nutrition Technical Assistance Project Academy for
Educational Development
Webb, P., Coates, J., Frongilo, E.A., Rogers, B.L., Swindale, A. and
Bilinsky, P. (2006). Measuring Household Food Insecurity: Why
it’s so Important and yet so Difficult to Do. Journal of
Nutrition.136. p1404-1408
WFLO (2010). Identification of Appropriate Postharvest Technologies for
improving Market Access and Incomes for Small Horticultural
Farmers in Sub-Saharan Africa and South Asia. Alexandria VA,
March.
Yamane, T. (1967). Statistics: An Introductory Analysis, 2nd Ed. New
York: Harper and Row
ACKNOWLEDGMENT
This document was produced with the financial support from Prince
Albert II of Monaco Foundation. The content of this document is solely
the liability of the Ms. Namkunda Johnson and under no circumstance
may be considered as a reflection of the position of Prince Albert II of
Monaco Foundation and or the IPCC.
Huria Journal, Vol 27(2), September 2020: 115-134
115
Factoring the Trust in the Regulatory Relationships: A
Reflection from Tanzania’s Mining Sector
Furaha Julius [email protected]
The Open University of Tanzania
ABSTRACT
This paper argues on the complementarities between regulatory
structures and relationships which stems upon the reciprocated trust
between the mining regulators and operators. One key question
addressed by this paper is how can trust relationships better complement
the regulatory structures towards improving the natural resource
governance for socio-economic development and transformation?
Drawing mainly on the case of Tanzania, the paper indicates the trust
gaps and offers some perspectives on the role of trust in the regulation of
mining activities in a resource-rich lower-middle-income economy. The
paper looks at both the cause and effects of trust relationships within a
regulatory system in the mining sector of Tanzania and sheds light on the
practical challenges and opportunities of building the trust. In the light of
the increasing allure of collaborative regulation, the paper also takes a
brief navigation into the manner in which trust relationships are
established or destroyed by various regulatory stakeholders. Conclusions
are drawn by underlining the importance of trust relationships for
effective regulation in less developed resource-endowed countries like
Tanzania
Keywords: Trust, regulation, trustworthy, distrust regulation, trust
demonstration
INTRODUCTION
Tanzania is one among the resource-endowed countries with various
minerals reserve in Africa. The country has been mining the stockpile of
gold and other precious minerals but it is yet to realize a significant
improvement in socio-economic life of its populace (LHRC, 2018;
Rutenge, 2016; Curtis, 2012; Lugoe, 2012; Curtis & Lissu, 2008). This
undermines the prolonged efforts since 1960s in which the Government
of Tanzania (GoT) has been adopting some rigorous laws and regulations
for mining and minerals production (URT, 1969; URT 1979; URT, 1997;
URT, 1998; URT 2010a; URT, 2010b; URT, 2017a, 2017b, 2017c; URT,
Huria Journal, Vol 27(2), September 2020: 115-134 Factoring the Trust in the Regulatory Relationships: A Reflection from Tanzania’s Mining Sector
Furaha Julius
116
2018a, 2018b, 2018c, 2018d, 2018e, 2018f, 2018g). As more socio-
economic challenges continue to suffocate the Tanzanians, the author of
the current paper suspected that the existing methods of regulatory
response which are largely based on policy intervention are certainly
insufficient and might be lacking backups of trust phenomenon. It was
assumed that the government regulators might have been concentrating
much on structural aspect of regulatory regime while putting less
emphasis on trust-relationships hence remained ineffective on achieving
regulatory objectives. The same assumption was stemmed on a thesis that
regulatory relationships which are based on reciprocated trust, if tactically
combined with rules and regulations, would have guaranteed regulatory
effectiveness. In this regard, trust was considered to be a key factor which
can potentially help to foster cooperation and dialogue between the
regulators and the regulated entities especially in the context of mining
activities. This pre-conceived assumption drove the author of this paper to
conduct a small study which was aimed to confirm and establish the
appropriate means to forge the trust relationships among the government
regulators from various agencies and between them and the mining
operators.
METHODOLOGY
The argument in the current paper is based on a six months’ qualitative
inquiry of the situation of regulatory relationships between the
government regulators from different agencies and between them and
operators in the large-scale mines in three popular mine-sites in Tanzania.
The study was conducted at Bulyanhulu Gold Mine (Kahama) which was
owned by Barrick Gold Corporation (BGC), Geita Gold Mine (Geita)
which was owned by AngloGold Ashanti (AGA), and North Mara Gold
Mine (Tarime) which was also owned by Barrick Gold Corporation
(BGC). The investigation was carried out between March and September
2019 and the data was obtained from both the primary and secondary
sources. The first-hand information was obtained from field survey and
in-depth interviews with various people including the mine inspectors
from government regulatory agencies, namely the Occupational Health
and Safety Authority (OSHA), National Environmental Management
Council (NEMC), Mining Commission and Tanzania Revenue Authority
(TRA). Other category of interviewees included the large-scale mining
operators who were reached through informal consultations due to their
being restricted by their employers from talking to the researcher despite
Huria Journal, Vol 27(2), September 2020: 115-134 Factoring the Trust in the Regulatory Relationships: A Reflection from Tanzania’s Mining Sector
Furaha Julius
117
his formal presentation of personal identification and research permits
from government authorities. The last category comprised of key
informants from local communities in the studied areas. The researcher
supplemented the field data by conducting an extensive review of several
documents including the research reports and journal articles.
FINDINGS AD DISCUSSION
Key Regulatory Challenges Revealed in the Study Areas
There were four key regulatory challenges revealed in the study areas,
namely inter-institutional distrust, inadequate capacity of some regulators,
political interference, and failure to balance the interests in dealing with
large-scale mining multinationals. With regard to inter-institutional
distrust, the data indicated the prevalence of incongruity among the
regulators from various government agencies which had, in some cases,
led to undue delays and bureaucracy in monitoring, inspection and
auditing activities. This has partly been caused by role confusion like the
case in which the Inspectorate Division of the Mining Commission and
the NEMC play the similar role of monitoring environmental compliance.
Since the same task has not been performed simultaneously by the two
agencies, the inspection by the last performer has been wrongly perceived
by some observers including some precede inspectors as “follow-up
verification” or “the monitoring of the monitor”. It has also created
concerns among the mining operators who were subject to multiple
check-ups. The same incident was generally seen as creating unnecessary
layers of bureaucracy and institutional tensions.
The second challenge, inadequate capacity of some regulators entails their
lowered potentiality in terms of their personal worth and contribution
towards the regulatory outputs. The Mining Commission, for example,
had acute shortage of technical staff with solid academic backgrounds.
The academic profiles of some of them indicated mostly the first-Degree
holders with insignificant industry experience. Yet, there were seemingly
less efforts to subject them to the capacity building institutions and the
programs of formal trainings which would guarantee their transformation
to becoming the relatively good-quality human resources. Besides that,
the volume of monitoring, inspections, and extension work made it
difficult for the limited number of staff to fully and effectively
accomplish all the tasks. The inadequacy of staff meant insufficient
inspection and monitoring of mining operations hence the existence of
loopholes for noncompliance by some unfaithful operators. This, in turns,
Huria Journal, Vol 27(2), September 2020: 115-134 Factoring the Trust in the Regulatory Relationships: A Reflection from Tanzania’s Mining Sector
Furaha Julius
118
extended their being distrusted. For example, there was a case in which
the local residents at Bulyanhulu Gold Mine blamed the MC’s staff on a
failure of the Inspectorate Division to effectively monitor the
development of the mine such that their several houses were drastically
damaged by constant tremors (Field Data, 22nd May, 2019).
Political interference along the licensing, mining and minerals production
processes is another challenge. For example, the law confers the minister
responsible for minerals with the ultimate power to grant or terminate the
mining titles. Yet, the same law does not detail the consequences of the
arbitrariness or of the minister’s power. Despite the fact that the minister
can seek the advice of the Mining Commission and that some of his
decisions can base on the advice of the Mining Commission, there has
been some chances for making some solely subjective decisions.
Similarly, there were some evidences especially in North Mara and Geita
where some individual politicians have used their influence to intervene
in some decisions affecting the mining operations especially at regulatory
design and implementation stages. Even though this practice is not
common to all the mine sites in the country it seemed to have produced
some multiplier effects. The collision between political appointees and
regulators were signified in some cases in which the processes of
recruitment by the Mining Commission have been directly or indirectly
influenced by the sector minister (Field Data, 16 May, 2019).
Another challenge is failure to balance the interests in dealing with large-
scale mining by multinational corporations like BGC and AGA and the
artisanal and small-scale miners (ASM). Regulation of the large-scale
mining (LSM) operations has been formal but somehow complex. On the
other hand, some of LSM activities have reflected their defiance of the
law despite the existence of various rules and regulations to guide their
operations. The reasons for this occurrence include the problem of having
long and complex bureaucratic procedures, lack of regulatory capacity to
enforce compliance and failure to balance the interests when dealing with
the foreign operators. Conflict of interests has been seen in dilemmas in
the setting of priorities by the GoT to the extent of becoming unable to
balance between attracting and protecting FDI in the country and ensuring
the availability of opportunities for local citizens. In this case, some
government officials and politicians have tended to support the operations
by small-scale miners (some of whom appeared to operate informally)
while at the same time wish for foreign investors to keep up their formal
Huria Journal, Vol 27(2), September 2020: 115-134 Factoring the Trust in the Regulatory Relationships: A Reflection from Tanzania’s Mining Sector
Furaha Julius
119
operations. This tendency has caused several incidents of invasion in the
concessions of some large-scale mining companies especially in the case
of North Mara (Field Data, 18th June 2019). Such events have caused the
extension of distrusts of the government regulators.
Indicators and Evidences of Trust Deficit among the Mining
Regulators and Operators
The data revealed inadequate collaboration among the regulators from
different regulatory authorities due to trust deficits (Field Data, June
2019). For instance, some officers from the Mining Commission could
not easily share the information of regulatory relevance with those from
OSHA, NEMC and TRA partly due to lack of faith. This was true even
between the co-workers in the same institutions. One Mine Resident
Officer (MRO) worked for Mining Commission in North Mara Gold
Mine explained:
“Several undesirable incidents taught me not to trust anybody even
the co-worker. For example, one of my sad memories of my
previous unwarranted trust happened when some confidential
information from my personal files leaked to the inspector from
OSHA who used the same info to serve his purposes while left me
in blames. This created unnecessary tension and dismay especially
against those who shared with me the office premises (Field Data,
June 2019).”
The above quotation indicates that some regulators do not trust each other
especially when dealing with confidential matters. The fear of leakages of
confidential information and the failure to perform professionally by
some regulators like the one who unduly accessed and utilised the leaked
info are some of the reasons for distrusts among the regulators.
With regard to regulator-operator relationship, the government regulators
faced some structural and situational challenges most of which lowered
their performance and thereof their trustworthiness. For instance, some of
them confronted the problem of information scarcity or misinformation
from mining operators particularly those worked for AGA and BGC. This
was especially in the case in which the two companies were trusted to
pursue management-based regulation through the internal rulemaking and
monitoring (Field Data, June 2019). Delegation of authority to the firms
created some loophole for opportunistic behaviour that was sustained by
information scarcity or misinformation. This trend has made some

Huria Journal, Vol 27(2), September 2020: 115-134 Factoring the Trust in the Regulatory Relationships: A Reflection from Tanzania’s Mining Sector
Furaha Julius
120
government regulators remain unable to exercise their discretionary
authority in a manner that would enhance their trustworthiness (Field
Data, June 2019).
Moreover, government regulators are expected to be mannered with
values of honesty and integrity and effectively discharge their obligations
but there were incidents in which these expectations were not met hence
the drop of their trustworthiness. For instance, some government
regulators happened to be inconsistent and unpredictable in their field
performance, the manners which lowered their trustworthy (Field Data,
June 2019). Furthermore, there was a tendency in which some regulators
could not professionally spend their ample time in clarifying regulatory
policy intent, rather, they largely focused on administering and enforcing
the regulatory policy and behave like ‘fault finders’. This trend was
explained differently by various operators. For instance, one operator
from Bulanhulu Gold Mine revealed that the TRA officials were
relatively ‘open minded’ when addressing certain regulatory issues as
compared to other regulators like those from OSHA and NEMC who
were said to have tended to behave like the ‘fault finders’ (Field Data,
Kahama, 23rd May, 2019).
One operator at Bulyanhulu Gold Mine explained:
“The issues of monitoring and enforcement raise questions of trust.
If there is a lack of trust between regulators and the regulated
entities or, between the government regulators themselves, the
efficacy of regulation is weakened. This is especially serious in the
situation in which the operator appears nervous on fearing that any
breach can lead to the imposition of a strong penalty (Interview
with mining operator at Bulyanhulu, 23 May, 2019)”.
The above quotation suggests the need for regulators to remain
trustworthy in monitoring, guiding and supporting the regulated entities to
enhancing compliance. This substantiates the role of trust in the
regulatory relationships.
The Role of Trust in the Regulatory Relationships
Trust has been defined differently in different academic disciplines
including philosophy, sociology and political science. The synthesis of
insights from various scholars including Stern & Coleman (2015)
Huria Journal, Vol 27(2), September 2020: 115-134 Factoring the Trust in the Regulatory Relationships: A Reflection from Tanzania’s Mining Sector
Furaha Julius
121
suggests that the same concept can generally be defined as an individual’s
(interpersonal) or group’s (organisational) expression of positive
expectation and willingness to accept vulnerability in the face of
uncertainty. In this paper, trust refers to as guts of accepting vulnerability
in the face of uncertainty with an expectation that the one who owe will
certainly reciprocate. Trust formation, therefore, involves an object which
is trustee and a subject which is trustor. In the process, the trustee is
expected to be trustworthy or to have attributes of trustworthiness for the
trustor to coincide trust. The attributes of trustworthiness in the context of
regulatory relations usually include the qualities of being honesty,
competent committed and cooperative (Geoghegan & Renard, 2002;
O’Neill 2014, 2018).
According to Stern & Coleman (2015) there are four distinct types of trust
relevant to regulatory practices: dispositional, rational, affinitive, and
systems-based trust. Dispositional trust is based on individuals’ pre-
dispositions to trust or distrust in a given situation. Personal experiences,
historical memories and tales about particular situation may set
precedents on which an individual develops trust or distrust. Rational
trust, on the other hand, is based on the truster’s estimation or calculation
about outcomes from the initiatives of the potential trustee. In this sense,
if the estimates are pointed to the negative outcomes, then the rational
trust was low and the vice-versa of the same incident might be true.
Rational trust is therefore influenced by knowledge/information and
logical calculations.
Affinitive trust is based on personal relationships and social interactions
between participants in the group settings. It is centred on affinity for the
potential trustee as manifested into social affiliation, intimacy, shared
experiences, perceptions of shared identities and social values (Stern &
Coleman, 2015). The other one, systems-based trust is specifically
centred on the meanings attached to the set of procedures or rules, rather
than trust in an individual or organizational profile. In the contexts of Co-
regulation, system-based trust is realised when all actors in the given
setting perceive the rule formulation and regulatory procedures as fair
(Stern & Baird, 2015; Moffat, Zhang, & Boughen, 2014). In this regard,
when procedures in the rule formulation, for example, are jointly agreed
upon as being fair by majority actors, participants can place the greater
faith and voluntarily comply with the same (Moffat et al., 2014). To that
end, the effectiveness of Co- regulation is attained. Considering this
Huria Journal, Vol 27(2), September 2020: 115-134 Factoring the Trust in the Regulatory Relationships: A Reflection from Tanzania’s Mining Sector
Furaha Julius
122
assumption therefore the trust in Co- regulatory environment is
considered to be most important of all.
From above insights, trust is hereby considered to be the glue that holds
regulatory relationships together and it is also the lubricant that smoothes
regulatory process. Trust is essential in regulatory environment since it
guarantees stable relationships that are vital for the maintenance of
cooperation among various regulators and between the regulators and the
operators (Field Data, 2019). A certain amount of trust is therefore
integral to the functioning of regulatory system, whether of the local,
national or international domains. In that regard, breakdowns in trust
often result from regulatory uncertainty which may result from errors by
either regulators or by operators. Regulatory uncertainty and a resulting
loss of trust may affect all or section of players in the regulatory field
including direct financial losses out of, either, investigation, litigation or
dissolution, or all of them. The most frequent outcomes of regulatory
uncertainty on part of business operators is increases in cost, lost revenue,
cancelled or postponed investments while regulators tend to carry
political or administrative burden.
The scholars agree that a certain amount of trust can trigger reciprocity in
the context of regulatory governance and this is based on one’s belief
about the other party’s trustworthiness (Heemskerk, Gomiam & Pinas,
2015; Stern & Coleman, 2015; Stern & Baird, 2015). In this regard, the
business operator may comfortably comply with certain regulations on
believing that the regulator will reciprocate the trust by acting in a manner
that doesn’t cause harm to the operator’s interests. In light of the above, a
working definition of trust in the context of regulatory governance is
based on ‘the belief that the operator will not be harmed when her
interests are placed in the hands of the regulator’. When this happens
there is a chance for arousal of expectation that ‘since there is no harm
caused thereof, the operator will positively reciprocate by voluntarily
complying with regulatory mechanism that pleases the regulator and
which ultimately promotes public interests. This analogy insists the
importance of reciprocity in the regulatory relations. Reciprocated trust in
the regulatory relations means that the regulator is akin not only to the
operator’s interests per se, but also to how her character influences the
formation or maintenance of the operator’s interests, and how her
capacity to reciprocate trust is affected by external constraints. Similarly,
in the context with several regulatory agencies, one agency may
Huria Journal, Vol 27(2), September 2020: 115-134 Factoring the Trust in the Regulatory Relationships: A Reflection from Tanzania’s Mining Sector
Furaha Julius
123
comfortably cooperate with the other on the expectation that the fellow
regulator will put their shared interest’s paramount.
Different scholars have variedly studied the causes and effects of trust in
contexts ranging from interpersonal interactions and small groups to
large-scale networks and governments (Karen & Jessica, 2017;
Kuwabara, 2015; Schilke & Cook, 2015; Kim, et.al, 2004). Among the
sources of trust are individual-level factors, such as those which allow for
assessments of others’ incentives and trustworthiness (Karen & Jessica,
2017), as well as organizational and institutional factors that facilitate
trust (Connelly, et al., 2018; Janowicz-Panjaitan & Krishnan, 2009).
Generally, the key factors which have been considered to be potential in
influencing the trust include rationality, competency and integrity.
Rationality refers to cognitive process through which a person processes
information in a way to become certain about cost and/or benefit of the
specific decision or action. Some rationality thinkers including Connelly
and his colleagues (2018) think that human psyche is capable of
developing the cognitions that form the basis of judgments of
trustworthiness and decisions to place trust in another. According to
Connelly, et al. (2018) the formulation of human psyche can amplify into
trust relations in networks, groups, and institutions. This implies that the
trust which prevails in society is based on reasoned assessments of the
evidence at hand that led one to evaluate others as trustworthy given past
performance, reputational information, and the incentives at play. The
rationality perspective is divided into thinking about unbounded versus
bounded rationality. The ‘unbounded rationality’ perspective is based on
thinking that human cognitive process is unlimitedly precise and typically
perfect. On contrast the ‘bounded rationality’ perspective is based on
believing that human cognitive capacity is not purely perfected
considering the fact that there are several barriers against the cognitive
function. These barriers include limited information and other
environmental, social and psychological uncertainties.
The second factor, competency, entails the knowledge, skills, values and
experience necessary for maintaining or increasing productivity. The
competent regulatory oversight agencies can effectively preserve public
safety and order. Considering the influence of competency upon the trust,
a number of authors have described government competency as being an
important determinant of government trustworthiness (Connelly, et al.,
2018). Indeed, the incompetent government agents are proven to
Huria Journal, Vol 27(2), September 2020: 115-134 Factoring the Trust in the Regulatory Relationships: A Reflection from Tanzania’s Mining Sector
Furaha Julius
124
undermine public trust (Kuwabara, 2015). Competency is therefore
considered to be an important factor that can enhance or damage trust and
the same can be measured at either institutional or personal level.
The third factor, integrity entails virtues like impartiality, honesty and
professionalism of a person or the group of persons. The integrity of
public officials may influence public trust upon the government. In our
case for example, the integrity of government regulators which is
manifested into moral and professional conduct can make them be
regarded as trustworthy. A number of scholars have linked between the
honesty of public officials and the citizens’ trust upon the government
(Rose-Ackerman, 2001). In order to measure integrity, it is necessary to
look at how the citizens perceive the regulators in terms of impartiality,
honesty, or corruption. For example, the citizens can be asked if the
government regulators lack impartiality.
The major consequence of trust which originated from rationality,
competency or integrity in the regulatory relationships is willingness to
cooperate (Connelly, et al., 2018). For instance, when the mining
operators perceive the government regulators as trustworthy, their trust is
transformed into the behavioural response known as “cooperation” which
stimulates compliance.
Regulator-Operator Interactions and the Essentiality of Trust
The government regulators in the mining sector, firstly, perform the task
of providing education to the mining operators on various topics
including the appropriate means to comply with social and environmental
obligations. They also deliver information on regulatory requirements.
This task requires them to be faithful, honesty, committed and observe
integrity. In this regard, mining operators are also expected to honestly
support the regulators in their dealing with education provision. This is
important especially when seeking advice and guidance which is
necessary for the fulfilment of their responsibilities. In this regard, the
operators are certainly expected to provide sincere feedback to the
regulators in a way to improve the regulatory practice and achieve
regulatory objectives.
Another task performed by regulators is licencing and approvals in which
they practically assess the application documents before embarking on
issuing the lisences. They also grant the registration and accreditation.
Huria Journal, Vol 27(2), September 2020: 115-134 Factoring the Trust in the Regulatory Relationships: A Reflection from Tanzania’s Mining Sector
Furaha Julius
125
After having registered or formally engaging the mining operators, the
regulators impose and collect tax, fees, royalties and other amenable dues.
The performance of this task requires the virtue of justice and the
performer needs to be faithful, honesty, committed and the person of
integrity. On the other side, the operators are expected to supply truthful
information when applying for lisences, registrations and accreditations.
They are also expected to be honest in paying the fees and other charges
and in providing the requested information regarding their daily
undertakings.
Compliance and risk monitoring is another task which has been
performed by government regulators in which they are expected to
systematically assess the risks, collect data and conduct inspections and
audits. The performance of this task also requires the virtue of justice and
the performer needs to be faithful, honesty, committed and the person of
integrity. On the other side, operators are expected to honestly support
the compliance and risk monitoring by fulfilling their regulatory
obligations, facilitating the inspections and audits, and providing some
evidence-based information on their compliance. Government regulators
also perform enforcement tasks which may involve some measures like
rewarding the good compliance practice or imposing the pecuniary or
non-pecuniary penalties. The performance of this task requires, as well,
the virtue of justice and the performer needs to be faithful, honesty,
committed and the person of integrity. On the same regard, operators are
particularly expected to honestly support the enforcement practice by
implementing the required policy changes or changes of regulatory
practice, and by complying with penalties imposed.
The above explanation indicates that the achievement of regulatory
objectives depends entirely on the roles played by both – regulators and
operators who need to be faithful, honesty, committed and persons of
integrity. This is to assert that both of the two groups of actors are
required to demonstrate their trustworthy and sincerely reciprocate to
each other in the logic of interdependence, short of which may lead into
regulatory ineffectiveness.
Essentiality of Trust in the Regulatory Relations
Trust is considered to be an essential factor for effective regulatory
relations (Stern & Baird, 2015; Chaffin, Gosnell & Cosens, 2014; Moffat,
et al., 2014). The essentiality of trust is based on the fact that it
Huria Journal, Vol 27(2), September 2020: 115-134 Factoring the Trust in the Regulatory Relationships: A Reflection from Tanzania’s Mining Sector
Furaha Julius
126
guarantees, among others, better performance (Klijn, et al., 2010), better
compliance (Vasalou, Bonhard, Adams, & Riegelsberger, 2006) and,
reliable exchange of information (Beccerra, Lunnan & Huemer 2008).
Again, inter-organisational trust is a central factor for the success or
failure of various collaborative endeavours between various regulatory
agencies (Vangen & Huxham, 2003). The aforesaid viewpoints can be
summarised to have a general agreement that trust guarantees reciprocity
(Ostrom, 1998) and willingness to cooperate (der Voort, 2017) and
therefore allows the smooth regulation. Considering the essentiality of
trust in regulatory relations, the Government of Ontario had highlighted it
firstly in the list of “Ontario Public Service Organizational Values” which
were set forth to guide the conduct of the regulators. In this respect, the
Government of Ontario’s regulators pledge to act honestly in all their
relationships with the people they serve, work with and who rely on them
(Government of Ontario, 2017). Trust is therefore highlighted as essential
element of the best practice for regulatory compliance. In that respect, all
members of the regulatory agencies in Ontario are required to remain
trustworthy in promoting compliance with the laws that protect the public
interest (Government of Ontario, 2017).
In light of the above, the trustful regulators are expected to cooperate with
operators to enhancing the level of compliance while remain mindful that
the regulated entity may have difficulty in complying with law and
regulations probably due to errors of interpretation or lack of resources.
Likewise, the trustworthy operators are expected to behave sincerely by
restricting themselves from breaching the rules and principles which
specify the standards of conduct. In this view, trust is widely seen as
essential ingredient in the context of co-regulation. Yet, despite the
centrality of trust, still some regulatory stakeholders in various regulatory
agencies have been either unable to forge or incapable to maintain it
(UONGOZI Institute, 2016; Morgan & De Urioste-Stone, 2017). This is
due to inadequate trustworthiness or lack of knowledge about
‘trustworthy demonstration’ and ‘distrust regulation’ (Gillespie & Dietz,
2009).
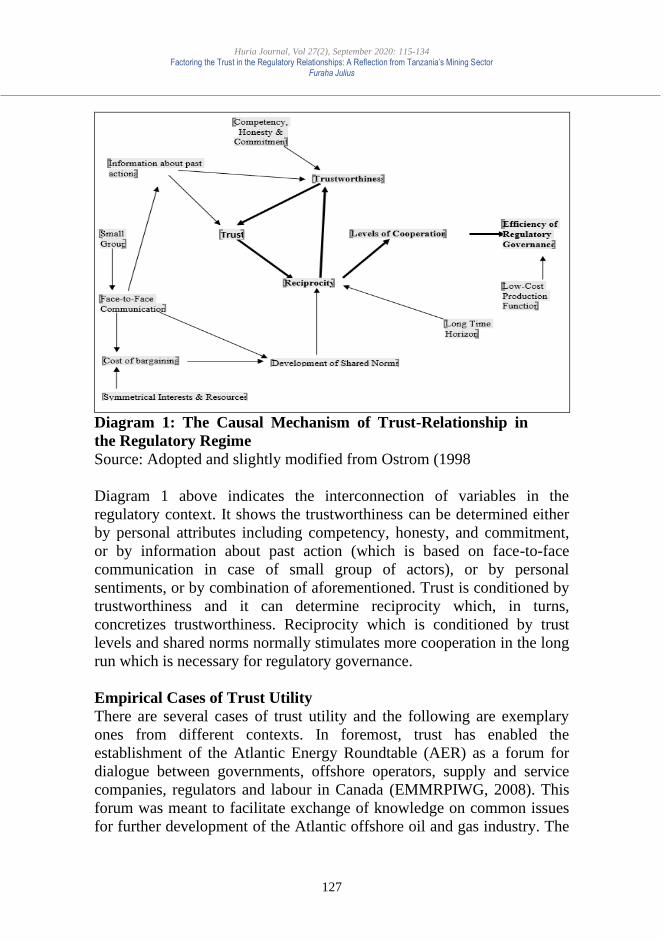
Huria Journal, Vol 27(2), September 2020: 115-134 Factoring the Trust in the Regulatory Relationships: A Reflection from Tanzania’s Mining Sector
Furaha Julius
127
Diagram 1: The Causal Mechanism of Trust-Relationship in
the Regulatory Regime
Source: Adopted and slightly modified from Ostrom (1998
Diagram 1 above indicates the interconnection of variables in the
regulatory context. It shows the trustworthiness can be determined either
by personal attributes including competency, honesty, and commitment,
or by information about past action (which is based on face-to-face
communication in case of small group of actors), or by personal
sentiments, or by combination of aforementioned. Trust is conditioned by
trustworthiness and it can determine reciprocity which, in turns,
concretizes trustworthiness. Reciprocity which is conditioned by trust
levels and shared norms normally stimulates more cooperation in the long
run which is necessary for regulatory governance.
Empirical Cases of Trust Utility
There are several cases of trust utility and the following are exemplary
ones from different contexts. In foremost, trust has enabled the
establishment of the Atlantic Energy Roundtable (AER) as a forum for
dialogue between governments, offshore operators, supply and service
companies, regulators and labour in Canada (EMMRPIWG, 2008). This
forum was meant to facilitate exchange of knowledge on common issues
for further development of the Atlantic offshore oil and gas industry. The
Huria Journal, Vol 27(2), September 2020: 115-134 Factoring the Trust in the Regulatory Relationships: A Reflection from Tanzania’s Mining Sector
Furaha Julius
128
AER organized dialogue which involved several stakeholders for the
identification of issues and potential solutions related to regulatory
efficiency. Despite being challenged by issues including multi-agency
responses and its accompanied complexity in coordination the AER
helped to foster cooperation between the key government department and
agencies, to increase certainty and predictability for participants involved,
and to set out principles and approaches to ensure the effective,
coordinated and concurrent regulatory performance.
The dialogue between regulators and the regulatory stakeholders
including the operators served to improve the overall quality of the
project implementation and, as such, it enhanced coordination and
exchange of information. Trust relationship paved a way for drafting and
signing of Memorandum of Understanding that helped to minimize
regulatory uncertainties. The MOU specifically committed the parties to a
collaborative regulatory review and environmental assessment process
(EMMRPIWG, 2008). This helped to address some regulatory issues
including role confusion which cropped up in the past when the
regulatory processes were established on a case-by-case basis rather than
being based on collaboration. Inter-organizational trust has allowed
exchange of information and cooperation among the parties responsible
for administering the various processes that applied to the same project.
On February 18, 2005, nearly a dozen federal and provincial agencies
started to pursue the coordinated and integrated regulatory approval and
environmental assessment process for offshore petroleum development
projects in the Nova Scotia and Newfoundland and Labrador offshore
areas (EMMRPIWG, 2008).
CONCLUSION
The establishment of effective regulatory institutions with technical and
other capacities, and relative efficiency of the regulatory policies and
instruments are key to how well regulatory regimes can foster
transformation and economic development catalysed by mineral
extraction. However, cooperation among individual regulators and
between regulatory agencies as well as regulated entities is utmost
imperative for the efficiency and effectiveness of regulation. The
regulation by cooperation and mutual exchange of regulatory facilities
require trust among the involved actors. The forge of trust-relationships
may guarantee smooth communication and coordination of regulatory
activities. If preconditioned by integrity, credible commitment,
Huria Journal, Vol 27(2), September 2020: 115-134 Factoring the Trust in the Regulatory Relationships: A Reflection from Tanzania’s Mining Sector
Furaha Julius
129
competency and constant interactions, it may end-up enhance regulatory
compliance. This lays on sincerity and sharing of critical regulatory
information among the regulatory agencies and between them and
operators. Trust is a key factor which can potentially help to foster
collaborative relationships between the regulators and the regulated
entities and it may actuate the strategic management of the complex
regulatory relationships in the mining sector.
RECOMMENDATIONS
It should generally be agreed that trust is hard to construct and easy to
destroy. Considering this fact therefore, both actors - the government
regulators and the mining operators must endeavour towards gaining and
demonstrating their trustworthiness. It is important to combine various
mechanisms of ‘trustworthiness demonstration’ and ‘distrust regulation’
towards building and restoring the trust. ‘Trustworthy demonstration’
entails the actual display of the qualities of trustworthiness including
integrity and competence. This can be done by designing the forums for
constant exposures through regular interactions between the trustors and
potential trustees. This may base on personal relationships and social
interactions between regulators and operators to allowing the potential
trustee to demonstrate his/her trustworthiness of certain forms like
honesty and/or integrity of which the trustor can assess and make the trust
decisions.
On the other hand, ‘distrust regulation’ incorporates both affinitive
elements like expressions of regret, acknowledgement of responsibility
and offers of reparations for regulatory failure and, rational elements like
redesigning of the enforceable rules for the future effective regulation can
be pursued to boost trust-relations. In this sense, for instance, regulatory
failure may be best addressed by the regulatory agencies through
trustworthiness demonstration, whereas distrust regulation may be
pursued by the same agencies in the incident of integrity breaches or the
inconsistency between professed regulatory values and actions. The
government regulators should pursue distrust regulation which entails
preventing future disgrace by rectifying the faults that contributed to the
prior regulatory failure. For example, the regulatory agency can
deliberately substitute the imperfect regulations, rules, contracts, and
monitoring processes which caused disgrace upon the operators. The
government regulators may pursue ‘distrust regulation’ to build, for
example, affinitive trust through expressing regrets, acknowledging

Huria Journal, Vol 27(2), September 2020: 115-134 Factoring the Trust in the Regulatory Relationships: A Reflection from Tanzania’s Mining Sector
Furaha Julius
130
responsibility, and offering reparations on certain regulatory action that
caused harm. Distrust regulation may also base on building rational trust
through, for example, redesigning the enforceable rules for the future
regulation. Individual regulators and their respective institutions should
endeavour to build personal and organization culture which must be
interwoven in the generally acceptable value standards. This is based on
an assumption that every action by an individual actor has an impact on
personal and organisation’s trustworthiness.
Mining operators should particularly improve their reputation which is
equivalent to their trustworthiness. This is possible by ensuring that the
voluntary initiatives of self-monitoring which have been adopted by the
same operators are properly implemented. For example, the operators
should specifically reduce information asymmetries and establish
mechanisms for dialogue and participation which is necessary and
sufficient to build trust-relationships. The general idea is that trust deficit
would be addressed by tabling an issue for negotiation and mutual
understanding. Operators may decide to make, for instance,
environmental data comprehensible and release it publicly.
REFERENCES
Becerra, M., Lunnan, R., & Huemer, L. (2008). “Trustworthiness, Risk,
and the Transfer of Tacit and Explicit Knowledge between Alliance
Partners”. Journal of Management Studies Vol.45 (4): pp. 691-713
Chaffin, B. C., Gosnell, H., & Cosens, B.A. (2014). “A decade of
adaptive governance scholarship: synthesis and future directions”.
Ecology and Society Vol. 19(3): 56. http://dx.doi.org/10.5751/ES-06824-
190356
Connelly, B.L., Crook, T.R., Combs, J.G., Ketchen, Jr. D.J., & Aguinis,
H. (2018). Competence- and Integrity-Based Trust in
Interorganizational Relationships: Which Matters More? Journal of
Management, Vol. 44 (3), pp. 919 –945. Curtis, M. (2012). “The One Billion Dollar Question: How Can Tanzania Stop Losing
So Much Tax Revenue”. A report tothe Interfaith Standing Council on
Economic Justice and the Integrity of Creation, Dar es Salaam: Tanzania
Episcopal Conference- TEC, National Muslim Council of Tanzania -
BAKWATA, & Christian Council of Tanzania - CCT.
Curtis, M., & Lissu, T. (2008). “A golden opportunity: how Tanzania is
failing to benefit from gold mining”, Christian Council of Tanzania,
Huria Journal, Vol 27(2), September 2020: 115-134 Factoring the Trust in the Regulatory Relationships: A Reflection from Tanzania’s Mining Sector
Furaha Julius
131
National Council of Muslims in Tanzania and Tanzania Episcopal
Conference, Dar es Salaam, Tanzania.
der Voort, H. V. (2017). “Trust and cooperation over the public-private
divide: an empirical study on trust evolving in co-regulation,”, in F.
Six & K. Verhoest (ed.), Trust in Regulatory Regimes. Edward
Elgar Publishing. Retrieved on 16th May 2018 from
https://ideas.repec.org/h/elg/eechap/16996_7.html
Energy and Mines Ministers Regulatory Performance Improvement
Working Group (EMMRPIWG). (2008) “Key Factors for
Environmental Assessment/Regulatory Success in Canada’s Mining
and Energy Sectors”. Paper Submitted for the 2008 Energy and
Mines Ministers' Conference
Geoghegan, T., & Renard, Y. (2002). “Beyond community involvement:
Lessons from the insular Caribbean”. Parks Vol. 12 (2): pp 16–26.
Gillespie, N., & Dietz, G. (2009). “Trust repair after an organization-level
failure”. Academy of Management Review Vol. 34 (1): pp 127-145.
Government of Ontario. (2017). “Regulator’s Code of Practice: Integrity
in Pursuit of Compliance” https://www.ontario.ca/page/regulators-
code-practice-integrity-pursuit-compliance
Heemskerk, M., Gomiam, C.D., & Pinas, M. (2015). “Interpersonal and
Institutional Distrust as Disabling Factors in Natural Resources
Management: Small-Scale Gold Miners and the Government in
Suriname”, Society and Natural Resources, Vol. 28: pp 133–148
Janowicz‐Panjaitan, M., & Krishnan, R. (2009). “Measures for Dealing
with Competence and Integrity Violations of Interorganizational
Trust at the Corporate and Operating Levels of Organizational
Hierarchy” Journal of Management Studies Vol. 46 (2): pp. 245-
268
Karen, S. C., & Jessica, J. S. (2017). “Trust and Rational Choice.” In E.
Uslaner (Ed.), Oxford Handbook of Political and Social Trust.
Oxford, UK: Oxford University Press.
Kim. P. H., Ferrin, D.L., Cooper, C.D., & Dirks, K.T. (2004). “Removing
the shadow of suspicion: the effects of apology versus denial for
repairing competence- versus integrity-based trust violations”.
Journal of Applied Psychology. Vol. 89(1): pp.104-118.
Klijn, E.H., Edelenbos, J., Steijn, B. (2010). “Trust in Governance
Networks; its Impact and Outcomes”, Administration and Society,
Vol. 42 (2): pp. 193-221
Kuwabara, K. (2015). “Do Reputation Systems Undermine Trust?
Divergent Effects of Enforcement Type on Generalized Trust and
Huria Journal, Vol 27(2), September 2020: 115-134 Factoring the Trust in the Regulatory Relationships: A Reflection from Tanzania’s Mining Sector
Furaha Julius
132
Trustworthiness”, American Journal of Sociology Vol.120 (5): pp.
1390-1428.
Legal and Human Rights Centre. (2018). “Human Rights and Business
Report 2017”, LHRC, Dar es Salaam, Tanzania
Lugoe, F. (2012). “Governance in Mining areas in Tanzania with special
reference to Land issues”. The Economic and Social Research
Foundation (ESRF) Discussion Paper No. 41, Retrieved on 16th
March 2016 from: wwww.esrttz.org
Moffat, K., Zhang, A., & Boughen, N. (2014). “Australian attitudes
toward mining: Citizen Survey – 2014 Results”. Commonwealth
Scientific and Industrial Research Organisation – CSIRO, Australia
Morgan, A. & De Urioste-Stone, S. (2017). “Mining in Maine:
Characterization of Public Perceptions”, Investigator Report to the
Maine Water Resources Research Institute. University of Maine
Retrieved on 10th November 2019 from
https://umaine.edu/mitchellcenter/wpcontent/uploads/sites/293/2017
/10/WRRIReport_SUrioste-et-al_28Apr17.pdf
O’Neill, O. (2018). “Linking trust to trustworthiness” Int. J. Phil. Stud.
Vol. 26, pp. 293–300
- (2014). “Trust, trustworthiness, and accountability” in N. Morris & D.
Vines (eds) Capital Failure: Rebuilding Trust in Financial
Services. Oxford: Oxford University Press
Ostrom, E. (1998). “A Behavioural Approach to the Rational Choice
Theory of Collective action: Presidential Address”. The American
Political Science Review, Vol. 92 (1), pp. 1-22
Rose-Ackerman, S. (2001). “Trust, Honesty, and Corruption: Reflection
on the State-Building Process”. John M. Olin Centre for Studies in
Law, Economics, and Public Policy Working Papers. Paper 255.
http://digitalcommons.law.yale.edu/lepp_papers/255
Rutenge, M. M. (2016). “Gold-mining Multinationals and Community
Interaction in Tanzania: Towards Localised Social Accountability”.
PhD Thesis, Erasmus University Rotterdam
Schilke, O. & Cook, K. S. (2015). “Sources of alliance partner
trustworthiness: Integrating calculative and relational perspectives”,
Strategic Management Journal Vol.36(2):pp. 276-297.
Stern, M.J., & Coleman, K. J. (2015). “The multi-dimensionality of trust:
applications in collaborative natural resource management”. Society
and Natural Resources Vol. 28(2): pp 117-132.
Stern, M.J., & Baird, T.D. (2015). “Trust ecology and the resilience of
natural resource management institutions”, Ecology and Society,
Huria Journal, Vol 27(2), September 2020: 115-134 Factoring the Trust in the Regulatory Relationships: A Reflection from Tanzania’s Mining Sector
Furaha Julius
133
Vol. 20, No. 2 (Jun 2015), Retrieved on 23 September, 2018 from
https://www.jstor.org/stable/26270214
UONGOZI Institute. (Ed). (2016). “Managing Relations between
Investors in the Extractive Sector and Local Communities”,
Regional Roundtable held on 14th June 2016 in Dar es Salaam,
Tanzania
United Republic of Tanzania(2018a). “The Mining (Minerals and Mineral
Concentrates Trading) Regulations, 2018” Retrieved on 19 May
2018 from
http://www.tcme.or.tz/resources/view/the-mining-minerals-and-mineral-
concentrates-trading-regulations-2018
- (2018b). “The Mining (Mineral Rights) Regulations, 2018”
Retrieved on 17 April 2018 from http://www.tcme.or.tz/resources/
view/the-mining-mineral-rights-regulations-2018
- (2018c). “The Mining (Mineral Beneficiation) Regulations, 2018”
Retrieved on 12 April 2018 from http://www.tcme.or.tz/resources/
view/the-mining-mineral-beneficiation-regulations-2018
- (2018d). “The Mining (Local Content) Regulations, 2018”
Retrieved on 11 April 2018 fromhttp://www.tcme.or.tz/resources/
view/the-mining-local-content-regulations 2018
- (2018e). “The Mining (Geological Survey) Regulations, 2018”
Retrieved on 21 May 2018 from http://www.tcme.or.tz/resources/
view/the-mining-geological-survey-regulations-2018
- (2018f). “The Mining (Audit and Inspection of Records)
Regulations, 2018” Retrieved on 10 May 2018 from
http://www.tcme.or.tz/resources/view/the-mining-audit-and-
inspection-of-records-regulations-2018
- (2018g). “The Mining (Integrity Pledge) Regulations, 2018(Made
Under Section 106(3)” Dar Es Salaam, Tanzania.
- (2017a). “The Natural Wealth and Resources (Permanent
Sovereignty) Act, 2017”. Retrieved on 13 May 2018 from
http://www.tcme.or.tz/resources/view/the-natural-wealth-and-
resources-permanent-sovereignty-act-2017
- (2017b). “The Natural Wealth and Resources Contracts (Review
and Re-Negotiation of Unconscionable Terms) Act, 2017”,
Retrieved on 13 May 2018 from http://www.tcme.or.tz/resources/
view/the-natural-wealth-and-resources-contracts-review-and-re-
negotiation-of-unc
- (2017c). “The Written Laws (Miscellaneous Amendments) Act,
2017”. Retrieved on 13 May 2018 from http://www.tcme.or.tz/
Huria Journal, Vol 27(2), September 2020: 115-134 Factoring the Trust in the Regulatory Relationships: A Reflection from Tanzania’s Mining Sector
Furaha Julius
134
resources/view/the-written-laws-miscellaneous-amendments-act-
2017
- (2010a). “The Mining Act”. Dar Es Salaam, Tanzania.
- (2010b). “The Mining (Safety, Occupational Health and
Environment Protection) Regulations” Dar es Salaam, Tanzania
- (1998). “The Minerals Act”. Dar Es Salaam, Tanzania.
- (1997). “The Mineral Policy of Tanzania”. Ministry of Energy and
Minerals. Dar Es Salaam, Tanzania.
- (1979). “The Mining Act”. Dar Es Salaam, Tanzania.
- (1969). “An act to amend the mining ordinance”. Dar es Salaam,
Tanzania.
Vangen, S., & Huxham, C. (2003). “Nurturing collaborative relations:
Building trust in
interorganizational collaboration”. Journal of Applied Behavioral Science
Vol. 39: pp 5–31.
Vasalou, A., Bonhard, P., Adams, A., & Riegelsberger, J. (2006)
“Reinventing Trust, Cooperation and Compliance in Social
Systems” Paper Presented in the Conference on Human Factors in
Computing Systems, CHI 2006, Montréal, Québec, Canada, April
22-27, 2006.
Huria Journal, Vol 27(2), September 2020: 135-147
135
Investigation on The Level of Insecticide Resistance to
Malaria Vectors in Ruangwa District Lindi Region
Tanzania
*Godfrida R. Clement The Open University of Tanzania
Emmanuel S. Kigadye The Open University of Tanzania
Nicodem J. Govella Ifakara Health Institute
*corresponding author
ABSTRACT
High malaria prevalence remains a major problem in Ruangwa District,
despite the high coverage rates of malaria control interventions. The
objective of this study was to assess the level of insecticide resistance in
malaria vectors in southern, Tanzania. The study was conducted in three
villages of Likangara, Nandagara and Chienjere. Resistance level to
insecticides in An. gambiae s.l was evaluated using a standard WHO
Susceptibility Test Kit. These mosquitoes were reared from larvae
collected in varoius breeding sites in a major rice, vegetable and
leguminous plant cultivation area in which pesticides use is intensive.
Each test was run in four replicates of 25 adult non-blood fed female
Anopheles gambiae s.l mosquitoes per tube. In total, 100 specimens were
exposed for standard concentration of 1% fenitrothion, 0.1% bendiocarb,
0.75% permethrin and 0.05% deltamethrin using WHO susceptibility test
kit. The number of knocked down mosquitoes were recorded at
10,15,20,30,50 and 60 min and mortality rates were determined after 24
hours and results were classified according to WHO guidelines, as
susceptible (97-100%), possible resistance (90%-98%) and resistance
(<90%). The results indicate suggestive levels of mosquitoes resistance to
Bendiocarb at (75%), possible resitance levels of Deltamethrin at (95%),
Permethrin at (97%) and Fenitrothion at (96%) (p < 0.05). This implies
that there is reduced effectiveness of insecticides used in vector control
interventions in the district. Superior insecticides should made
available and introduced in order to promote the sustainable management
of malaria vectors and elimination malaria transmission in the district.
Huria Journal, Vol 27(2), September 2020: 135-147 Investigation on The Level of Insecticide Resistance to Malaria Vectors in Ruangwa District Lindi Region Tanzania
Godfrida R. Clement, Emmanuel S. Kigadye and Nicodem J. Govella
136
Keywords: Malaria vectors, Insecticide Resistance, Susceptibility,
Ruangwa district, Tanzania
INTRODUCTION
In spite of intense national and international efforts, malaria remains one
of the major tropical challenges in the world today (WHO, 2019). Malaria
is one of the main public health problems in Africa, causing more than
one million deaths per year and placing a strong burden on developing
African countries (WHO, 2018). Vector control remains an important
component of malaria prevention. In sub-sahara Africa, the primary tools
for malaria vector control are long-lasting insecticidal nets (LLIN) and
indoor residual spraying (IRS). However, insecticide resistance
development in vector populations could impede the success of malaria
control programmes in endemic areas (Riveron, et al., 2018).
Currently, major classes of insecticides such as organochlorines,
carbamates, organophosphates and pyrethroids which are being used in
malaria control, are increasingly less effective at killing malaria
mosquitoes ( WHO, 2010; Kabula, 2018; Hancock et al., 2020).The
intensive use of this class of insecticides at large scale both in agriculture
and public health in malaria vector control activities has led to its reduced
efficacy in sub Saharan Africa (Reid, 2016; Elenora, 2018; Philbert et al.,
2019). For example in Tanzania, some regions especially, in the
southern and north western parts of the country, malaria has remained
persistently high 11.7% to 24.7% despite wide coverage with LLINs, IRS
and case management using Artmether-Lumephantrine (TMIS, 2017). In
Lindi region the average regional malaria prevalence remains high at
11.7% (TMIS, 2017), but with great village variations. For example, in
the Ruangwa District, Malaria prevalence rate of 17.7%, 18.3% and 85%
were recorded from the villages of Likangara, Nandagara and Chienjere
respectively (DHIS, 2017).
Tanzania’s national health strategies aspire reducing malaria to 1% by the
year 2020 by using malaria vector control tools such as Long-lasting
Insecticidal Nets (LLINs), Artemisinin-based Combination therapy
(ACT) and indoor residual spraying (IRS) (MoHSW, 2015). Despite wide
LLINs distribution by 95% to most vulnerable groups such as pregnant
women, school going pupils and infants from 2014 to 2017 malaria
prevalence is still high at 17.7% in Ruangwa district (DHIS, 2017).
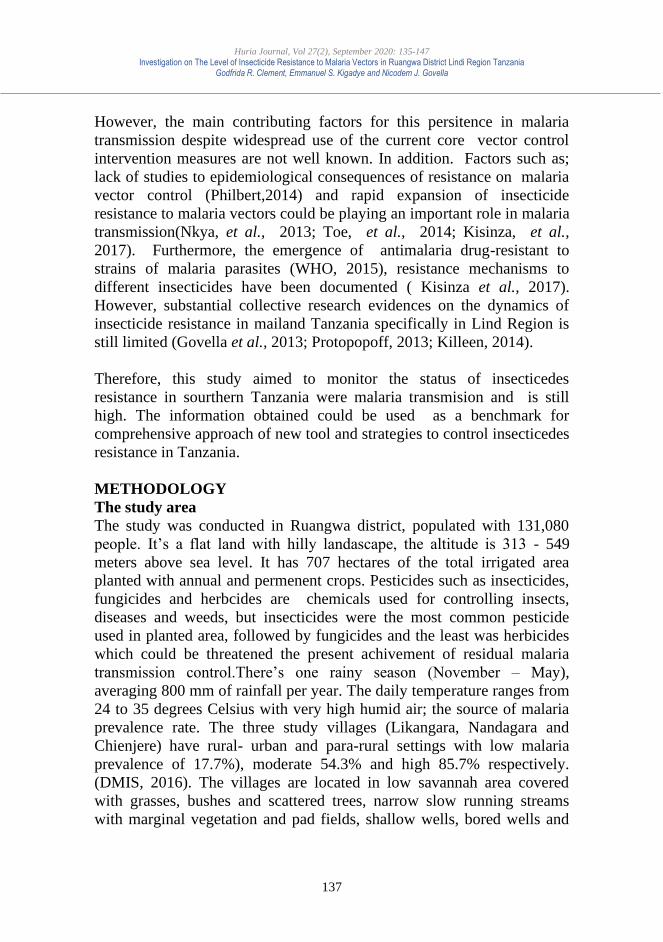
Huria Journal, Vol 27(2), September 2020: 135-147 Investigation on The Level of Insecticide Resistance to Malaria Vectors in Ruangwa District Lindi Region Tanzania
Godfrida R. Clement, Emmanuel S. Kigadye and Nicodem J. Govella
137
However, the main contributing factors for this persitence in malaria
transmission despite widespread use of the current core vector control
intervention measures are not well known. In addition. Factors such as;
lack of studies to epidemiological consequences of resistance on malaria
vector control (Philbert,2014) and rapid expansion of insecticide
resistance to malaria vectors could be playing an important role in malaria
transmission(Nkya, et al., 2013; Toe, et al., 2014; Kisinza, et al.,
2017). Furthermore, the emergence of antimalaria drug-resistant to
strains of malaria parasites (WHO, 2015), resistance mechanisms to
different insecticides have been documented ( Kisinza et al., 2017).
However, substantial collective research evidences on the dynamics of
insecticide resistance in mailand Tanzania specifically in Lind Region is
still limited (Govella et al., 2013; Protopopoff, 2013; Killeen, 2014).
Therefore, this study aimed to monitor the status of insecticedes
resistance in sourthern Tanzania were malaria transmision and is still
high. The information obtained could be used as a benchmark for
comprehensive approach of new tool and strategies to control insecticedes
resistance in Tanzania.
METHODOLOGY
The study area
The study was conducted in Ruangwa district, populated with 131,080
people. It’s a flat land with hilly landascape, the altitude is 313 - 549
meters above sea level. It has 707 hectares of the total irrigated area
planted with annual and permenent crops. Pesticides such as insecticides,
fungicides and herbcides are chemicals used for controlling insects,
diseases and weeds, but insecticides were the most common pesticide
used in planted area, followed by fungicides and the least was herbicides
which could be threatened the present achivement of residual malaria
transmission control.There’s one rainy season (November – May),
averaging 800 mm of rainfall per year. The daily temperature ranges from
24 to 35 degrees Celsius with very high humid air; the source of malaria
prevalence rate. The three study villages (Likangara, Nandagara and
Chienjere) have rural- urban and para-rural settings with low malaria
prevalence of 17.7%), moderate 54.3% and high 85.7% respectively.
(DMIS, 2016). The villages are located in low savannah area covered
with grasses, bushes and scattered trees, narrow slow running streams
with marginal vegetation and pad fields, shallow wells, bored wells and
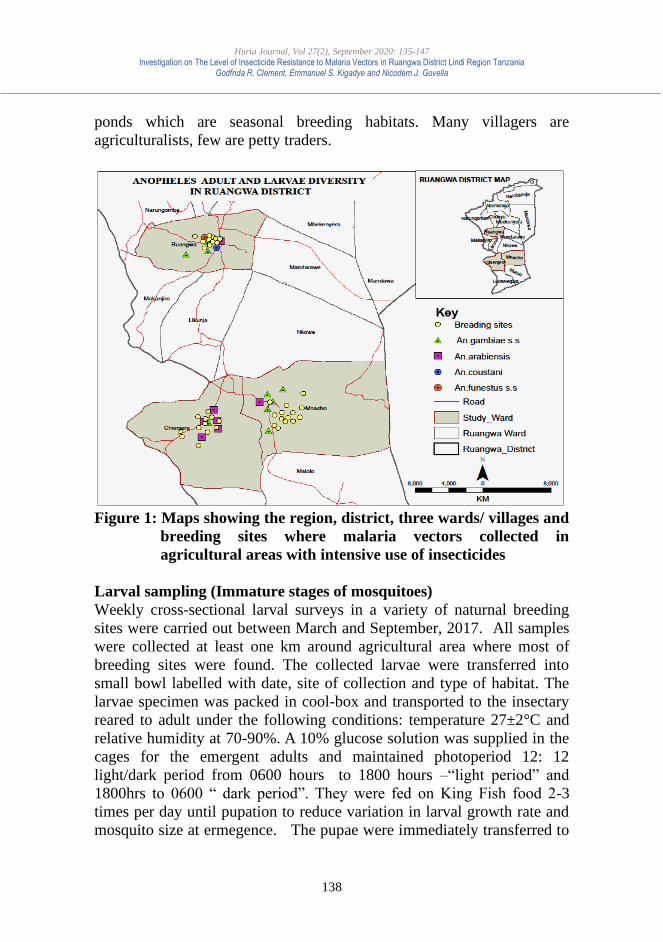
Huria Journal, Vol 27(2), September 2020: 135-147 Investigation on The Level of Insecticide Resistance to Malaria Vectors in Ruangwa District Lindi Region Tanzania
Godfrida R. Clement, Emmanuel S. Kigadye and Nicodem J. Govella
138
ponds which are seasonal breeding habitats. Many villagers are
agriculturalists, few are petty traders.
Figure 1: Maps showing the region, district, three wards/ villages and
breeding sites where malaria vectors collected in
agricultural areas with intensive use of insecticides
Larval sampling (Immature stages of mosquitoes)
Weekly cross-sectional larval surveys in a variety of naturnal breeding
sites were carried out between March and September, 2017. All samples
were collected at least one km around agricultural area where most of
breeding sites were found. The collected larvae were transferred into
small bowl labelled with date, site of collection and type of habitat. The
larvae specimen was packed in cool-box and transported to the insectary
reared to adult under the following conditions: temperature 27±2°C and
relative humidity at 70-90%. A 10% glucose solution was supplied in the
cages for the emergent adults and maintained photoperiod 12: 12
light/dark period from 0600 hours to 1800 hours –“light period” and
1800hrs to 0600 “ dark period”. They were fed on King Fish food 2-3
times per day until pupation to reduce variation in larval growth rate and
mosquito size at ermegence. The pupae were immediately transferred to
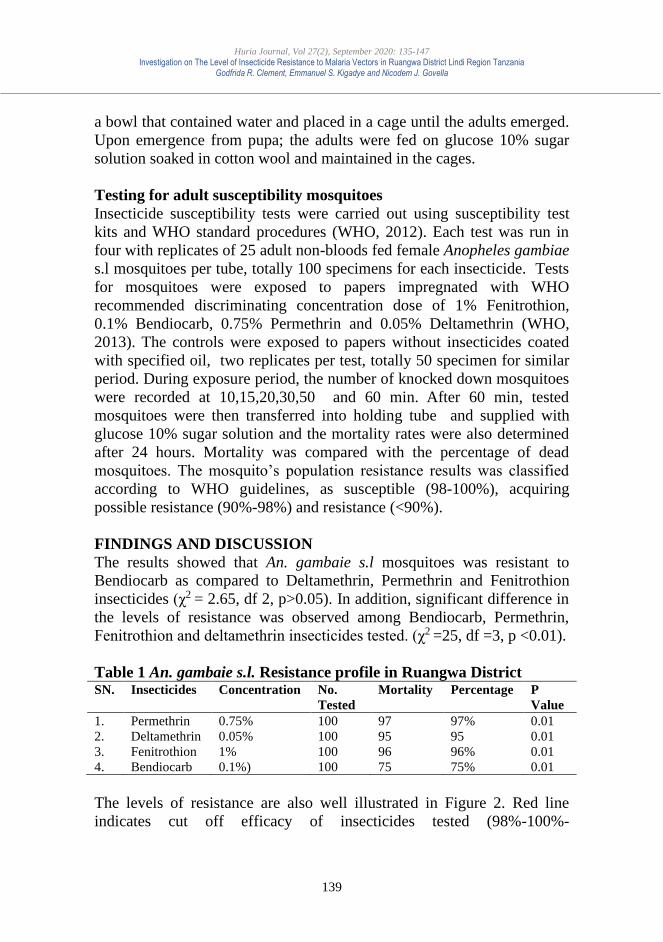
Huria Journal, Vol 27(2), September 2020: 135-147 Investigation on The Level of Insecticide Resistance to Malaria Vectors in Ruangwa District Lindi Region Tanzania
Godfrida R. Clement, Emmanuel S. Kigadye and Nicodem J. Govella
139
a bowl that contained water and placed in a cage until the adults emerged.
Upon emergence from pupa; the adults were fed on glucose 10% sugar
solution soaked in cotton wool and maintained in the cages.
Testing for adult susceptibility mosquitoes
Insecticide susceptibility tests were carried out using susceptibility test
kits and WHO standard procedures (WHO, 2012). Each test was run in
four with replicates of 25 adult non-bloods fed female Anopheles gambiae
s.l mosquitoes per tube, totally 100 specimens for each insecticide. Tests
for mosquitoes were exposed to papers impregnated with WHO
recommended discriminating concentration dose of 1% Fenitrothion,
0.1% Bendiocarb, 0.75% Permethrin and 0.05% Deltamethrin (WHO,
2013). The controls were exposed to papers without insecticides coated
with specified oil, two replicates per test, totally 50 specimen for similar
period. During exposure period, the number of knocked down mosquitoes
were recorded at 10,15,20,30,50 and 60 min. After 60 min, tested
mosquitoes were then transferred into holding tube and supplied with
glucose 10% sugar solution and the mortality rates were also determined
after 24 hours. Mortality was compared with the percentage of dead
mosquitoes. The mosquito’s population resistance results was classified
according to WHO guidelines, as susceptible (98-100%), acquiring
possible resistance (90%-98%) and resistance (<90%).
FINDINGS AND DISCUSSION
The results showed that An. gambaie s.l mosquitoes was resistant to
Bendiocarb as compared to Deltamethrin, Permethrin and Fenitrothion
insecticides (χ2 = 2.65, df 2, p>0.05). In addition, significant difference in
the levels of resistance was observed among Bendiocarb, Permethrin,
Fenitrothion and deltamethrin insecticides tested. (χ2 =25, df =3, p <0.01).
Table 1 An. gambaie s.l. Resistance profile in Ruangwa District SN. Insecticides Concentration No.
Tested
Mortality Percentage P
Value
1. Permethrin 0.75% 100 97 97% 0.01
2. Deltamethrin 0.05% 100 95 95 0.01
3. Fenitrothion 1% 100 96 96% 0.01
4. Bendiocarb 0.1%) 100 75 75% 0.01
The levels of resistance are also well illustrated in Figure 2. Red line
indicates cut off efficacy of insecticides tested (98%-100%-
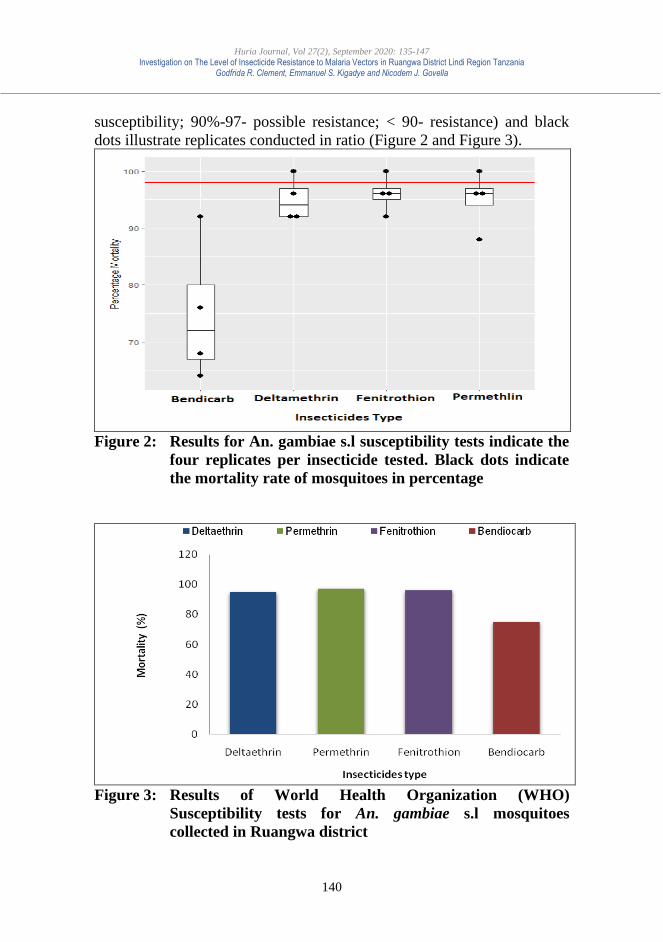
Huria Journal, Vol 27(2), September 2020: 135-147 Investigation on The Level of Insecticide Resistance to Malaria Vectors in Ruangwa District Lindi Region Tanzania
Godfrida R. Clement, Emmanuel S. Kigadye and Nicodem J. Govella
140
susceptibility; 90%-97- possible resistance; < 90- resistance) and black
dots illustrate replicates conducted in ratio (Figure 2 and Figure 3).
Figure 2: Results for An. gambiae s.l susceptibility tests indicate the
four replicates per insecticide tested. Black dots indicate
the mortality rate of mosquitoes in percentage
Figure 3: Results of World Health Organization (WHO)
Susceptibility tests for An. gambiae s.l mosquitoes
collected in Ruangwa district
Huria Journal, Vol 27(2), September 2020: 135-147 Investigation on The Level of Insecticide Resistance to Malaria Vectors in Ruangwa District Lindi Region Tanzania
Godfrida R. Clement, Emmanuel S. Kigadye and Nicodem J. Govella
141
The present study was designed to evaluate under field conditions the
efficacy of a carbamate (bendiocarb) pyrethroids (deltamethrin, and
permethrin) and organophosphate (fenitrothion) resistance level against
malaria vectors in Ruangwa district, southern part of Tanzania. The
results showed that An. gambaie s.l mosquitoes were resistant to
Bendiocarb as compared to Deltamethrin, Permethrin and Fenitrothion
insecticides. The resistance level of bendiocarb to malaria vectors
reported in the present study concurs with the one reported by Kisinza
(2017), in Ngara and Mbozi districts, Tanzania which accounted for 58%
in mortality rates of Anopheles species tested. The results also concur
with (Antonio-Nkondijio, 2016) in a study conducted in Younde,
Cameroon in which he reported An. gambiae s.s resistance to Bendiocarb
insecticides. Besides, Wanjala (2018) also confirmed Bendiocarb
resistance to malaria vectors in in Iguhu and Kabula areas of Western
Kenya.
In the present study, Deltamethrin showed a possible resistance level at
(0.05%) in all wards. Similar results have been reported by (Matowo et
al., 2010; PMI, 2016) in several districts in northern and western
Tanzania. Similarly, Wanjala (2018) and Kweka (2018) have reported
possible resistance to Deltamethrin in Kenya. Another Pyrethroid,
Permethrin has been reported to have possible resistance level of 3% in
Musoma rural district (PMI, 2016).
Nonetheless, (Akogbeto, 2006; Ochomo et al., 2013; Massebo et al.,
2013; Matananga et al., 2015) in Kenya and Malawi respectively,
observed that, even in the presence of possible pyrethroid resistance,
LLINs perform better than untreated nets in terms of protection against
mosquito biting in endemic countries.
The efficacy shown by the organophosphate (fenitrothion) in the present
study is supported by studies by Maharaj and Sharp (2005) in KwaZulu
Natal South Africa, in which DDT was re-introduced after the failure of
pyrethoids to control Anopheles funestus. Furthermore, a study by Abilio
et al., (2011) in Mozambique reported that both An. gambiae s.s. and An.
funestus were controlled effectively with the DDT-based IRS programme
in Zambezia, an excercise that led to reduction of disease transmission
and burden. However, Anopheles gambiae s.l . is becoming resistant to
pyrethoids and DDT in several parts of Tanzania (Kabula et al., 2014 ;
Matowo et al., 2014; Matiya, et al., 2019). The discovery of potential
Huria Journal, Vol 27(2), September 2020: 135-147 Investigation on The Level of Insecticide Resistance to Malaria Vectors in Ruangwa District Lindi Region Tanzania
Godfrida R. Clement, Emmanuel S. Kigadye and Nicodem J. Govella
142
resistance to carbamates and pyrethroid in in Ruangwa district may
threatens the gains made here and may impair the effectiveness of these
interventions in place and therefore demand close monitoring and the
adoption of a resistance management strategy (Kabula et al., 2014).
In the present study, Anopheles mosquitoes were collected in lowland
areas in which; rice, fruits, maize, cashew nuts and vegetable cultivation
was being practiced and there is an extensive application of pesticides.
The possible resistance levels could emanate from the above practices.
Nkya et al., (2013) observed that resistance and possible resistance of
insecticides to malaria vectors were due to cross contamination from
cumulative pesticide compounds used to control pests in agriculture and
livestock as well as weed control. This supports the findings by Philbert
(2014) in Dar Es Salaam while assessing the role of agriculture pesticide
use on the development of to insecticides resistance to in malaria vectors
and the potential impact on control activities. In addition, these
observations, coincide with those reported in Cote d’ Ivory, Kenya,
Cameroon and Benin, which reported that, resistance in Anopheles
mosquitoes was originating from rice farms, tomatoes and vegetable
growing areas (Bigoga et al., 2007; Menze et al., 2008; Djegbe et al.,
2011; Edi et al., 2012; Antonio-Nkondijio, 2015).
The present study confirms the resistance of Bendiocarb, possible
resistance to Deltamethrin and Permethrin. Moreover, the results indicate
that Fenitrothion is still highly effective in malaria control in the study
area. Moreover, the findings of the present study have shown that
mosquito populations in the study area remain susceptible to the
organophosphates which indicates that these can be used to good effect in
Indoor Residual Spraying as part of a resistance management strategy in
the study area.
REFERENCES
Abilio A.P., Kleinnschmidt.I., Rehman A.M., Camba N.,Varsha., R and
Michael C. (2011) .The emegence of insecticide resistance in
central Mozambique and potental thhreat to the successful indoor
residual spraying malaria control programme. Malaria Journal
10:(1),110.
Akogbéto, M. C., Djouaka, R. F., and Kindé-Gazard., D. A. (2006).
Screening of pesticide residues in soil and water samples from
agricultural settings. Malaria journal, 5, 22.

Huria Journal, Vol 27(2), September 2020: 135-147 Investigation on The Level of Insecticide Resistance to Malaria Vectors in Ruangwa District Lindi Region Tanzania
Godfrida R. Clement, Emmanuel S. Kigadye and Nicodem J. Govella
143
Antonio-Nkondjio. C., Poupardin.R., Tene B.F., Kopya E, Costantini C.,
and Awono-Ambene P. (2016). Investigation of mechanisms of
bendiocarb resistance in Anopheles gambiae populations from the
city of Yaoundé, Cameroon. Malaria Journal, 22 (15),1-424.
Antonio-Nkondjio., C., Fossog, E.K., Poumachu Y., Djantio M., &
Wondji, C.S. (2015). Rapid evolution of pyrethroids resistance
prevalence in Anopheles gambiae populations from the cities of
Douala and Yaoundé (Cameroon). Malaria Journal, 14 (155),1186.
Bigoga J.D., Manga L., Titanji V.P.K, Etang J., Coetzee M. and Leke
R.G.F. (2007). Susceptibility of Anopheles gambiae Giles (Diptera:
Culicidae) to pyrethroids, DDT and carbosulfan in coastal
Cameroon. African Entomology, 15(1):133-139.
Coetzee M., Craig M and Le Sueur D. (2000). Distribution of African
malaria mosquitoes belonging to the Anopheles gambiae complex.
Parasitology Today. 16,74-77.
DHIS (2016). Tanzania National Health Portal
https://hmisportal.moh.go.tz/hmisportal
/#/pages/home/programs/nmcp/malaria_hiv_tb
DHIS (2017). Tanzania National Health Portal.
https://hmisportal.moh.go.tz/hmisportal/#/pages/home/programs/
nmcp/malaria_hiv_tb
Djègbè I., Agossa F.R., Jones C.M., Poupardin R., Cornelie S., Akogbéto
M. (2014). Molecular characterization of DDT resistance in
Anopheles gambiae from Benin. Parasite Vectors. 2, 1: 409.
Edi C.V., Koudou B.G., Jones C.M., Weetman D., Ranson H. (2012).
Multiple insecticide resistance in Anopheles gambiae mosquitoes,
southern Côte d’Ivoire. Emerging Infectious Disease.18,1508.11.
Geneva, Switzerland.
Govella, N.J., Chaki, P.P. and Killeen, G.F. (2013). Entomological
surveillance of behavioral resilience and resistance in residual
malaria vector populations. Malaria Journal. 12,124.
Hancock P.A., Hendriks C.J.M., Tangena J-A., Gibson H. Hemingway J.,
and Coleman M. (2020). Mapping trends in insecticide resistance
phenotypes in African malaria vectors. PLoS Biology 18, (6):
e3000633. https://journals.plos.org/plosbiology/article?id
High level of resistance in the mosquito Anopheles gambiae to pyrethroid
insecticides and reduced susceptibility to bendiocarb in north-
western Tanzania. Malaria Journal 12: 149.
http://www.malariajournal.com/content/12/1/149.
Huria Journal, Vol 27(2), September 2020: 135-147 Investigation on The Level of Insecticide Resistance to Malaria Vectors in Ruangwa District Lindi Region Tanzania
Godfrida R. Clement, Emmanuel S. Kigadye and Nicodem J. Govella
144
Kabula, B., Tungu.P, Matowo.J, Kitau J., Mweya M, Emidi., and William
Kisinza. (2018). Susceptibility status of malaria vectors to
insecticides commonly used for malaria control in Tanzania,
Tropical Medicine and International Health 17, (6):742-750
https://www .researchgate.net/ publication/224808517.
Kabula, B., Kisinza, W., Tungu, Ndege, C., Batengana, B., Kollo, D.,
Malima, Kafuko, J., Mohamed., M. and Magesa, S. (2014) Co-
occurrence and distribution of East (L1014S) and West (L1014F)
African knock-down resistance in Anopheles gambiae sensu lato
population of Tanzania. Tropical Medicine and International
Health. doi:10.1111/tmi.12248.
Killeen, G.F. (2014). Characterizing, Controlling and Eliminating
Residual Malaria Transmission. Malaria Journal 13,330.
Kisinza, W, N., Nkya, T.E Bilali, K., Overgaard, H. J., Massue, D.J.,
Mageni, Z., Greer, G., Kaspar, N., Mohamed, M., Reithinger, R.,
Moore, S., Lorenz, L.M. and Magesa S. (2017). Multiple insecticide
resistance in Anopheles gambiae from Tanzania: a major concern
for malaria vector control. Malaria Journal 16 ,439.
Kweka E and Yawhalaw D. (2018). Insecticide resistance in East Africa,
history, distribution and drawbacks on malaria vectors and diseases
control. Htpps//orcid.org/000-0002-8991-758x
Maharaj, R., Mthembu, D.J. and Sharp, B.L. (2005). Impact of DDT Re-
introduction on Malaria Transmission on KwaZulu-Natal. South
African Medical Journal 95,11.
Massebo, F., Balkew, M., Gebre-Michael, T., and Lindtjørn, B. (2013).
Entomologic inoculation rates of Anopheles arabiensis in
southwestern Ethiopia. The American journal of tropical medicine
and hygiene, 89(3), 466–473.
Matahanga P.D., Mwandama D.A., Chiasaka B.A, Shahi P.M, Landman
K, L., Indiblade K, and Steinhardt L.C. (2015). The effectiveness of
long lasting, insecticide treated nets in a setting of pyrethroids
resistance: a case study among febrile children 6 to 59 months age
in Machinga district, Malawi: Malaria Journal 14:457.
Matiya D., J, Philbert A.B., Kidima W and Matowo J.J, (2019). Dynamics
and monitoring of insecticide resistance in malaria vector across
mainland from 1997 to 2017 a systematic review, Malaria Journal,
10, 102. Https//malaria journal. Biomedicalcentral.com.
Matowo J., Kitau J. Kaaya R., Kavishe R., Wright and W. Kisinza.
(2014). Trends in selection of insecticide resistance in Anopheles
gambiae s.l mosquitoes in northwest Tanzania during a community
Huria Journal, Vol 27(2), September 2020: 135-147 Investigation on The Level of Insecticide Resistance to Malaria Vectors in Ruangwa District Lindi Region Tanzania
Godfrida R. Clement, Emmanuel S. Kigadye and Nicodem J. Govella
145
randomised trial of long-lasting treated nets and indoor spraying,
Medical and Veterinary Entomology; volume 2, issue 1.
Matowo, J., Kulkarni, M. A., Mosha, F. W., Oxborough, R. M., Kitau, J.
A., Tenu, F., and Rowland, M. (2010). Biochemical basis of
permethrin resistance in Anopheles arabiensis from Lower Moshi,
north-eastern Tanzania. Malaria journal, 9, 193.
Menze B.D, Riveron J.M, Ibrahim S.S, Irving H, Antonio-Nkondjio C,
Awono-Ambene P.H. (2016). Multiple insecticide resistance in the
malaria vector Anopheles funestus from northern Cameroon is
mediated by metabolic resistance alongside potential target site
insensitivity mutations. PLoS One 2:11:10.
MoHSW (2015a). MOHSW Training Manual National Malaria Control
Programme training manual on malaria vector biology, ecology and
incrimination, Dar es salaam.
Nkya T.E, Akhuyril I, Kisinza W, David J.P. (2013). Impact of
environmental mosquito response to pyrethroids insecticides facts,
evidences and prospects, Insect Biochemical Molecular Biology, 43,
407- 416.
Ochomo, E., Chahilu, M., Cook, J., Kinyari, T., Bayoh, N.M., West, P.,
Kamau, L., Osangale, A., Ombok, M., Njagi, K., Mathenge, E.,
Muthami, L., Subramaniam, K., Knox, T., Mnavaza, A., Donnelly,
M.J., Kleinschmidt, I., Mbogo, C. (2017). Insecticide –treated nets
and protection against insecticide-resistant malaria vectors in
Western Kenya, emerging infectious disease 23 (5) 758-764.
Philbert, A., Lyantagaye, S.L. and Nkwengulila, G. (2014). A Review of
Agricultural Pesticides Use and the Selection for Resistance to
Insecticides in Malaria Vectors. Advances in Entomology, 2, 120-
128.
Philbert, A., Lyantagaye, S.L. and Nkwengulila, G. (2019). Farmers’
pesticide usage practices in the malaria endemic region of North-
Western Tanzania: implications to the control of malaria
vectors. BMC Public Health 19,1456 https:/ /bmcpublichealth.
biomedcentral.com/articles/ 10.1186/s12889-019-7767-0#citeas.
PMI. (2016). President Malaria Initiatives -Tanzania. Malaria Operation
plan financial year 2015. Dar es Salaam Tanzania.
https://www.pmi.gov/docs/default-source/default-document-
library/malaria-operational-plans/fy-2015/fy-2015-tanzania-
malaria-operational-plan
Protopopoff. N., Matowo J., Malima R., Kavishe R., Kaaya R., and
Rowland, M. (2013).
Huria Journal, Vol 27(2), September 2020: 135-147 Investigation on The Level of Insecticide Resistance to Malaria Vectors in Ruangwa District Lindi Region Tanzania
Godfrida R. Clement, Emmanuel S. Kigadye and Nicodem J. Govella
146
Reid M.C, and Mc Kenzie. (2016). The contribution of agricultural
insecticide uses to increasing insecticide resistance I African
malaria vectors. Malaria Journal, 15,107. https//
www.ncbi.nlm.nih.gov/pmc/article/PMC475.
Riveron J.M, Tchouakui. M, Mugenzi, L., Menze B. D, Chiang M., and
Wondji C.S. (2018). Insecticide resistance in malaria vectors: an
update at global scale towards malaria elimination. Intochopen
10:5772 -78375.www.intechopen.com.books. towards malaria
elimination- a – leap
Sternberg E.D and Thomas M.B. (2018). Insights from agriculture for the
management of insecticide resistance in disease vectors; stationary
approach to environmental, biomedical and social issues; 11(4),
404–414. https://onlinelibrary.wiley.com/journal/17524571.
TMIS (2017). Tanzania Malaria Indicator Survey 2017. Dar Es Salaam.
https:// dhsprogram.com /pubs/ pdf/MIS31/ MIS31.pdf
Toé H., Jones M.C, N’Fale S., Hanafy M. I., Dabiré R.K and Hilary
Ranson (2014) Increased Pyrethroid Resistancein Malaria Vectors
and Decreased Bed Net Effectiveness, Burkina Faso, 20 (10), 3201.
Wanjala C. L, and Kweka E.J. (2018). Malaria Vectors Insecticides
Resistance in Different Agroecosystems in Western Kenya. Front
Public Health.1,6:55
WHO (2010). The technical basis for coordinated action against
insecticide resistance: preserving the effectiveness of modern
malaria vector control. World Health Organization.
WHO (2015). Guidline for the treatment of malaria, World Health
Organization, Geneva.Https.www.books.goggle.com.
World Health Organization (2018). World Malaria Report at a glance
World Health Organization, Geneva. https:// www.who.int/malaria.
media -report-2018/en/
World Health Organization (2019). World Malaria Report World Health
Organization, Geneva. https:// www.who.int/malaria/publications/
world-malaria-report-2018/en/
World Health Organization. (2012). Test procedures for monitoring
susceptibility of mosquitoes to insecticides. Geneva.
http://www.africairs.net/wp-content/uploads/2012/08/Test-
procedures-for-insecticide-resistance-monitoring-WHO.pdf
ACKNOWLEDGEMENT
The author would like to thank the Government officials at Lindi region,
Ruangwa district, Ruangwa, Mnacho and Chienjere wards, Village
Huria Journal, Vol 27(2), September 2020: 135-147 Investigation on The Level of Insecticide Resistance to Malaria Vectors in Ruangwa District Lindi Region Tanzania
Godfrida R. Clement, Emmanuel S. Kigadye and Nicodem J. Govella
147
Executive Officers, Village Heads and land lords from Likangara,
Nandagara and Chienjere villages for the permission of conducting the
study in their area. Many thanks go to Dr Billal Kabula of National
Institute of Medical Research, Ubwari for his support on provision of
tools for evaluation the level of insecticides resistance to malaria vectors.
Other mosquito collection tool in the field work was self-sponsored
through monthly salary and loan from bank. Furthermore, special thanks
to Supervisors Prof Kigadye Emmanuel and Prof. Govella N.J for
invaluable inputs during the study period.
Author’s contributions
Clement Godfrida was the principal investigator of the study and led
collection of data, designed the sampling technique, conducted data
analysis, and interpreted results. Prof. Emmanuel S. Kigadye and Dr.
Nicodem J. Govella and Dr B. Kabula provided technical support
guidance. All authors read and the Open University of Tanzania approved
the manuscript.
Ethical clearance: This received an ethical approval from the Medical
Research Coordination Committee of the National Institute of Medical
Research in Tanzania Reference no NIMRI/HQ/R.8a/Vol. XI /3232. I
collected mosquito larvae from various productive breeding sites of
Likangara, Nandagara and Chienjere villages. Permission to collect
mosquito larvae in the breeding sites in their area was obtained from
Lindi region, Ruangwa district, ward, village officials and landlords after
explaining the objective and benefit of the study.
Huria Journal, Vol 27(2), September 2020: 148-164
148
Nutritional Prospects and Phyto-Therapeutical Potentials
of the Selected Indigenous Green Leafy Vegetables
Commonly Used in Tanzania
Josephat Alexander Saria [email protected]
The Open University of Tanzania
ABSTRACT
A purposive interview and laboratory analysis of green leafy vegetables
commonly used in Tanzania was carried out to determine nutritive
prospects as well as therapeutic value. Nine (9) common green leafy
vegetables believed to have therapeutical potential on: dietary, anemia,
stomach pain, blood pressure, diabetics and peptic ulcers were selected
for this study. The micronutrients Ca, Mg, K and P contents were
determined using extracts of fresh ALVs, where the effects of cooking
were taken into consideration. Calcium level ranged from 496.0 to 1763.5
mg/kg, phosphorus ranged from 309.8 to 572.3 mg/kg, sodium ranged
from 72.4 to 187.3 mg/kg and potassium ranged from 309.8 to 595.3
mg/kg. The ratio between Ca and P was 1.30:1 in Ipomoea sp while in
Solanum sp was 3.14:1. These values are within the acceptable ratio for
the people who are diabetic. The ratio of Na/K in all green leafy
vegetables is less than one, hence consumption of these vegetables is
beneficial to people with high blood pressure as they tend to reduce their
blood pressure. It is recommended that future studies should consider
other aspects of green leafy vegetables such as the biological evaluation
of the nutrient content in order to determine the bioavailability of the
nutrients. Also, it is important to determine the effects of food processing
such as cooking on the chemical components and nutritive value of the
green leafy vegetables.
Keywords: Leafy vegetables, Figiri, Cucurbita maxima, minerals,
ipomoea, Tanzania
INTRODUCTION
Indigenous and or traditional leafy vegetables are concepts used mostly to
describe leafy vegetables that have been part of the local food systems in
Sub-Saharan Africa (SSA) for generations. The term indigenous leafy
vegetables are those that have their natural habitat on sub-Saharan Africa
while the traditional leafy vegetables were introduced over a century ago
Huria Journal, Vol 27(2), September 2020: 148-164 Nutritional Prospects and Phyto-Therapeutical Potentials of the Selected Indigenous Green Leafy Vegetables Commonly Used in Tanzania
Josephat Alexander Saria
149
and due to long use, have become part of the food culture in the sub-
continent (Smith and Eyzaguirre, 2007). Previously, production of leafy
vegetables was mainly on a subsistence basis; and confined to the rural
areas. However, these days in the fast-growing city like Dar es Salaam,
production of leafy vegetables is the fast-growing activity and offers a
significant opportunity for the poorest people to earn a living as producers
and/or traders without requiring large capital investments. These
vegetables provide an economic pillar upon which women’s livelihood is
supported (Opiyo, et al., 2015).
African green leafy vegetables have long been part of traditional diets in
communities in the continent, yet many of these crops are underutilized
and their nutritional value is unknown (Dalziel, 1937). Their utilization
could improve the cassava and maize based staple diet and thus reduce
the chronic nutrient deficiencies, although their adverse effects are
reported among the populations. Despite official statistics indicating a
low consumption level of vegetables in Sub-Saharan Africa, it appears
that traditional vegetables are usually consumed with the staple food in
various forms (Johns, 2004).
For many years, quite a very good number of African indigenous leafy
vegetables have long been known and reported to have health protecting
properties and uses (Okeno, et al., 2003; Dalziel, 1937). Some of these
African indigenous leafy vegetables maintain to be used for prophylactic
and therapeutic purposes by rural communities (Getinet, et al., 1997).
This indigenous knowledge of the health promoting and protecting
attributes of ALVs is clearly linked to their nutritional and non-nutrient
bioactive properties (Okon, et al., 2014). Example is kwashiorkor, which
is a form of severe acute malnutrition in children for many years
especially in Sub-Saharan Africa and Tanzania is not exceptional. Studies
shows by providing antioxidants to children with kwashiorkor through
their diet improves their survival (Becker, et al., 2005; Badaloo, et al.,
2002) specifically the phytochemicals in vegetables and fruits (Liu,
2003).
The ALVs have long been and continue to be reported to significantly
contribute to the dietary vitamin and mineral intakes of local populations
(Oyejola and Bassir, 1975; Okon, et al., 2014). The increased
consciousness of the health protecting properties of non-nutrient bio-
active compounds found in fruits and vegetables has led to enormous
Huria Journal, Vol 27(2), September 2020: 148-164 Nutritional Prospects and Phyto-Therapeutical Potentials of the Selected Indigenous Green Leafy Vegetables Commonly Used in Tanzania
Josephat Alexander Saria
150
concentration to vegetables as fundamental components of dietary intake
(Gockowski, et al., 2003). In Tanzania and sub-Saharan African (SSA)
populations in general, this attention on vegetables as very important
dietary components is significant, as leafy vegetables have long been
known to be crucial ingredients in traditional sauces that accompany
carbohydrate staples (Smith and Eyzaguirre, 2007). African indigenous as
well as traditional leafy vegetables thus have an essential role in the
achievement of the World Health Organization’s (WHO) global initiative
on fruits and vegetables consumption in the sub-continent (Vainio-
Mattila, 2000,).
In East Africa and the most of tropical African countries where the daily
diet is dominated by starchy staples, the leafy vegetables is added which
contribute significantly to household food security and add variety of
nutrients to cereal-based staple diets (Van-den-Heever, 1997; Jansen van
Rensburg, et al., 2004). The African leafy vegetables (ALVs) are the
cheapest and most readily available sources of proteins, vitamins,
minerals and essential amino acids (Johns, 2004). These dishes contain
these GLV can be prepared with a single plant species like maize or
banana or a combination of different species like beans in order to add
flavor, taste, color and aesthetic appeal to diet (Marshall, 2001; Fasuyi,
2006; Vainio-Mattila, 2000).
Although it is known African leafy vegetables play an significant role in
African agricultural, therapeutic and nutritional systems, still they are
regarded as minor crops by African scientists; hence received little
attention in most “research and development” programs. The Sub-Sahara
area has a diversity of plants and their usage as food; unfortunately, this
reservoir is in endangered owing to negligence, inadequate knowledge
and population growth which lead to devastation of habitat.
The objective of this study was to investigates the African leafy
vegetables commonly consumed in Tanzania specifically Dar es Salaam
city. The proximate determination of important mineral content of the
leaves was car conducted. Between May and June 2017, a number of
knowledgeable persons from different ethinic groups with solid botanical
knowledge were interviewed about commonly used green vegetables in
their place in order to determine the nutritive as well as medicinal use of
the green leaf vegetables in their areas.
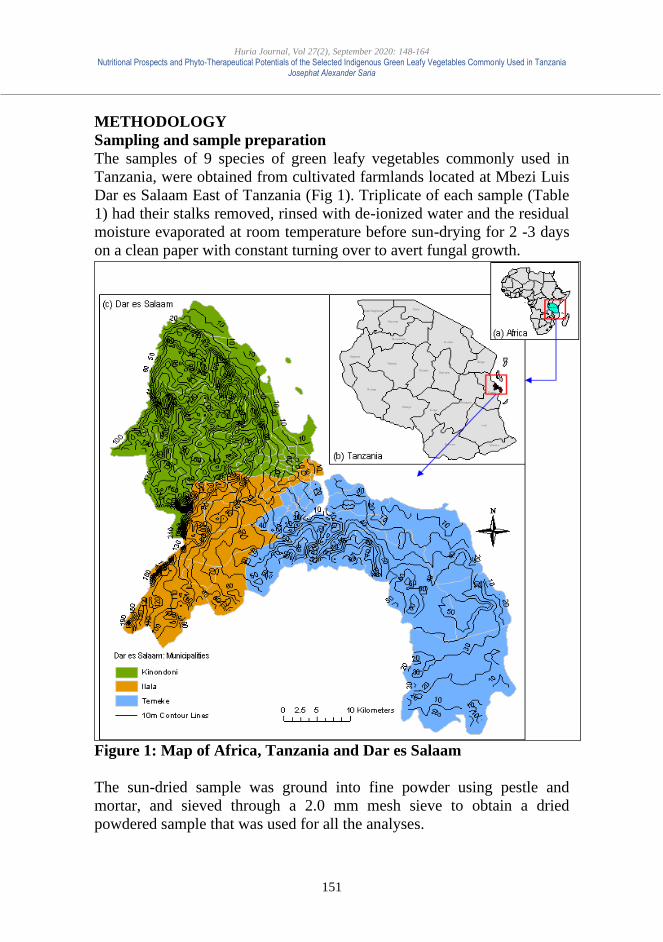
Huria Journal, Vol 27(2), September 2020: 148-164 Nutritional Prospects and Phyto-Therapeutical Potentials of the Selected Indigenous Green Leafy Vegetables Commonly Used in Tanzania
Josephat Alexander Saria
151
METHODOLOGY
Sampling and sample preparation
The samples of 9 species of green leafy vegetables commonly used in
Tanzania, were obtained from cultivated farmlands located at Mbezi Luis
Dar es Salaam East of Tanzania (Fig 1). Triplicate of each sample (Table
1) had their stalks removed, rinsed with de-ionized water and the residual
moisture evaporated at room temperature before sun-drying for 2 -3 days
on a clean paper with constant turning over to avert fungal growth.
Figure 1: Map of Africa, Tanzania and Dar es Salaam
The sun-dried sample was ground into fine powder using pestle and
mortar, and sieved through a 2.0 mm mesh sieve to obtain a dried
powdered sample that was used for all the analyses.
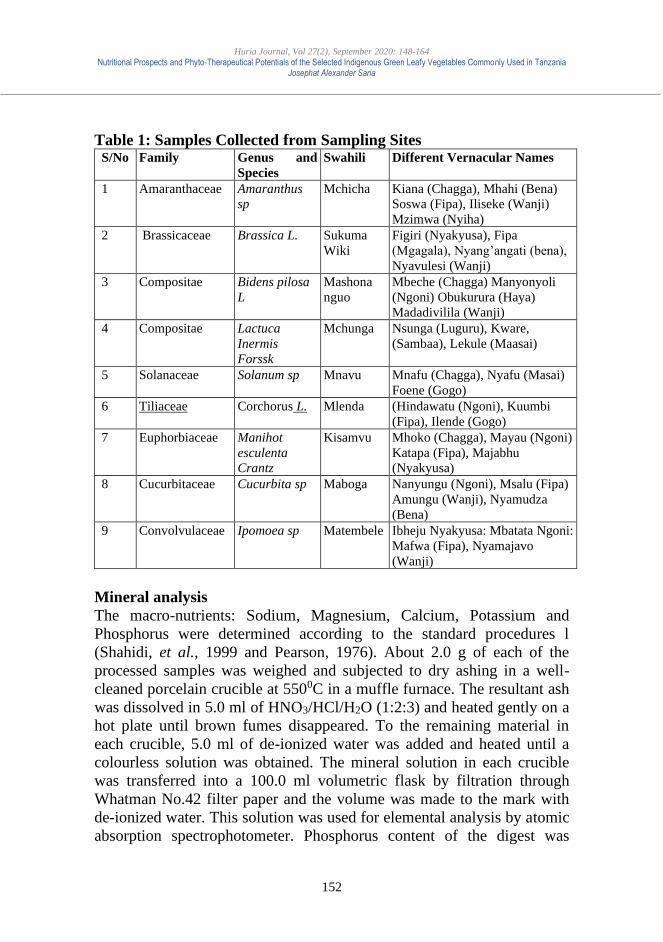
Huria Journal, Vol 27(2), September 2020: 148-164 Nutritional Prospects and Phyto-Therapeutical Potentials of the Selected Indigenous Green Leafy Vegetables Commonly Used in Tanzania
Josephat Alexander Saria
152
Table 1: Samples Collected from Sampling Sites S/No Family Genus and
Species
Swahili Different Vernacular Names
1 Amaranthaceae Amaranthus
sp
Mchicha Kiana (Chagga), Mhahi (Bena)
Soswa (Fipa), Iliseke (Wanji)
Mzimwa (Nyiha)
2 Brassicaceae Brassica L. Sukuma
Wiki
Figiri (Nyakyusa), Fipa
(Mgagala), Nyang’angati (bena),
Nyavulesi (Wanji)
3 Compositae Bidens pilosa
L
Mashona
nguo
Mbeche (Chagga) Manyonyoli
(Ngoni) Obukurura (Haya)
Madadivilila (Wanji)
4 Compositae Lactuca
Inermis
Forssk
Mchunga Nsunga (Luguru), Kware,
(Sambaa), Lekule (Maasai)
5 Solanaceae Solanum sp Mnavu Mnafu (Chagga), Nyafu (Masai)
Foene (Gogo)
6 Tiliaceae Corchorus L. Mlenda (Hindawatu (Ngoni), Kuumbi
(Fipa), Ilende (Gogo)
7 Euphorbiaceae Manihot
esculenta
Crantz
Kisamvu Mhoko (Chagga), Mayau (Ngoni)
Katapa (Fipa), Majabhu
(Nyakyusa)
8 Cucurbitaceae Cucurbita sp Maboga Nanyungu (Ngoni), Msalu (Fipa)
Amungu (Wanji), Nyamudza
(Bena)
9 Convolvulaceae Ipomoea sp Matembele Ibheju Nyakyusa: Mbatata Ngoni:
Mafwa (Fipa), Nyamajavo
(Wanji)
Mineral analysis
The macro-nutrients: Sodium, Magnesium, Calcium, Potassium and
Phosphorus were determined according to the standard procedures l
(Shahidi, et al., 1999 and Pearson, 1976). About 2.0 g of each of the
processed samples was weighed and subjected to dry ashing in a well-
cleaned porcelain crucible at 5500C in a muffle furnace. The resultant ash
was dissolved in 5.0 ml of HNO3/HCl/H2O (1:2:3) and heated gently on a
hot plate until brown fumes disappeared. To the remaining material in
each crucible, 5.0 ml of de-ionized water was added and heated until a
colourless solution was obtained. The mineral solution in each crucible
was transferred into a 100.0 ml volumetric flask by filtration through
Whatman No.42 filter paper and the volume was made to the mark with
de-ionized water. This solution was used for elemental analysis by atomic
absorption spectrophotometer. Phosphorus content of the digest was
Huria Journal, Vol 27(2), September 2020: 148-164 Nutritional Prospects and Phyto-Therapeutical Potentials of the Selected Indigenous Green Leafy Vegetables Commonly Used in Tanzania
Josephat Alexander Saria
153
determined colorimetrically according to the method described by
Pearson, (1976).
The Phyto-therapeutic potential of green leafy vegetables
In general, phyto-therapeutic potentials studies performed for cognitive
and preservative purposes of local knowledge aim at collecting as much
information as possible. However, when conducting interviews, it is
sometimes useful to select a preferential topic to avoid wasting time, but
above all, to investigate and preserve a specific and sometimes mostly
endangered type of knowledge.
In the present study, beside the collection of general phyto-therapeutic
potentials, the attention was focused on leafy green vegetable medicinal
use. The Swahili names of nine (9) different leafy vegetables were given
to different ethical group in which each group were represented with at
least three members so that they can share common ideas. For each
mentioned green leafy vegetable, the informant was asked to provide
information regarding the parts of the plant used and whether the plant is
still commonly used. Although a pre-structured questionnaire was used
for the collection of this information, the candidate was left to speak
freely and only at the end of the discussion specific questions were
addressed to complete the data. The botanical plant classification was
done at the University of Dar es Salaam, herbarium Unit
Quality control and quality assurance
Blanks and quality control standards were measured at every five samples
to detect contamination and drift. The elemental concentrations of
procedural blanks were generally < 5 % of the mean analyte
concentrations for all the metals. Precision and accuracy of analyses were
also ensured through replicate analyses of samples against standards
reference material for all the heavy metals. The results were found to be
within ± 2 % of certified values, thus demonstrating the accuracy of our
findings.
FINDINGS AND DISCUSSION
Medicinal values of some commonly used leaf vegetables
Generally, the respondents reported that the indigenous vegetables they
consumed had a medicinal value attached to it. Some vegetables were
reported to cure more than one illness (Pereira, et al., 1999). A wide range
of illnesses was cited as being treated and/or managed by consumption of
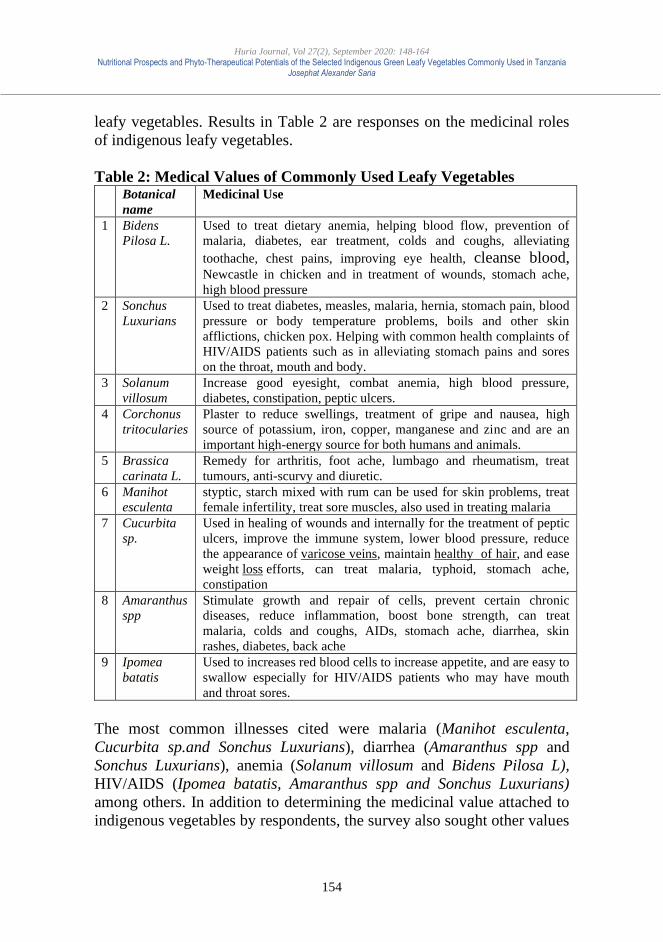
Huria Journal, Vol 27(2), September 2020: 148-164 Nutritional Prospects and Phyto-Therapeutical Potentials of the Selected Indigenous Green Leafy Vegetables Commonly Used in Tanzania
Josephat Alexander Saria
154
leafy vegetables. Results in Table 2 are responses on the medicinal roles
of indigenous leafy vegetables.
Table 2: Medical Values of Commonly Used Leafy Vegetables Botanical
name
Medicinal Use
1 Bidens
Pilosa L.
Used to treat dietary anemia, helping blood flow, prevention of
malaria, diabetes, ear treatment, colds and coughs, alleviating
toothache, chest pains, improving eye health, cleanse blood, Newcastle in chicken and in treatment of wounds, stomach ache,
high blood pressure
2 Sonchus
Luxurians
Used to treat diabetes, measles, malaria, hernia, stomach pain, blood
pressure or body temperature problems, boils and other skin
afflictions, chicken pox. Helping with common health complaints of
HIV/AIDS patients such as in alleviating stomach pains and sores
on the throat, mouth and body.
3 Solanum
villosum
Increase good eyesight, combat anemia, high blood pressure,
diabetes, constipation, peptic ulcers.
4 Corchonus
tritocularies
Plaster to reduce swellings, treatment of gripe and nausea, high
source of potassium, iron, copper, manganese and zinc and are an
important high-energy source for both humans and animals.
5 Brassica
carinata L.
Remedy for arthritis, foot ache, lumbago and rheumatism, treat
tumours, anti-scurvy and diuretic.
6 Manihot
esculenta
styptic, starch mixed with rum can be used for skin problems, treat
female infertility, treat sore muscles, also used in treating malaria
7 Cucurbita
sp.
Used in healing of wounds and internally for the treatment of peptic
ulcers, improve the immune system, lower blood pressure, reduce
the appearance of varicose veins, maintain healthy of hair, and ease
weight loss efforts, can treat malaria, typhoid, stomach ache,
constipation
8 Amaranthus
spp
Stimulate growth and repair of cells, prevent certain chronic
diseases, reduce inflammation, boost bone strength, can treat
malaria, colds and coughs, AIDs, stomach ache, diarrhea, skin
rashes, diabetes, back ache
9 Ipomea
batatis
Used to increases red blood cells to increase appetite, and are easy to
swallow especially for HIV/AIDS patients who may have mouth
and throat sores.
The most common illnesses cited were malaria (Manihot esculenta,
Cucurbita sp.and Sonchus Luxurians), diarrhea (Amaranthus spp and
Sonchus Luxurians), anemia (Solanum villosum and Bidens Pilosa L),
HIV/AIDS (Ipomea batatis, Amaranthus spp and Sonchus Luxurians)
among others. In addition to determining the medicinal value attached to
indigenous vegetables by respondents, the survey also sought other values
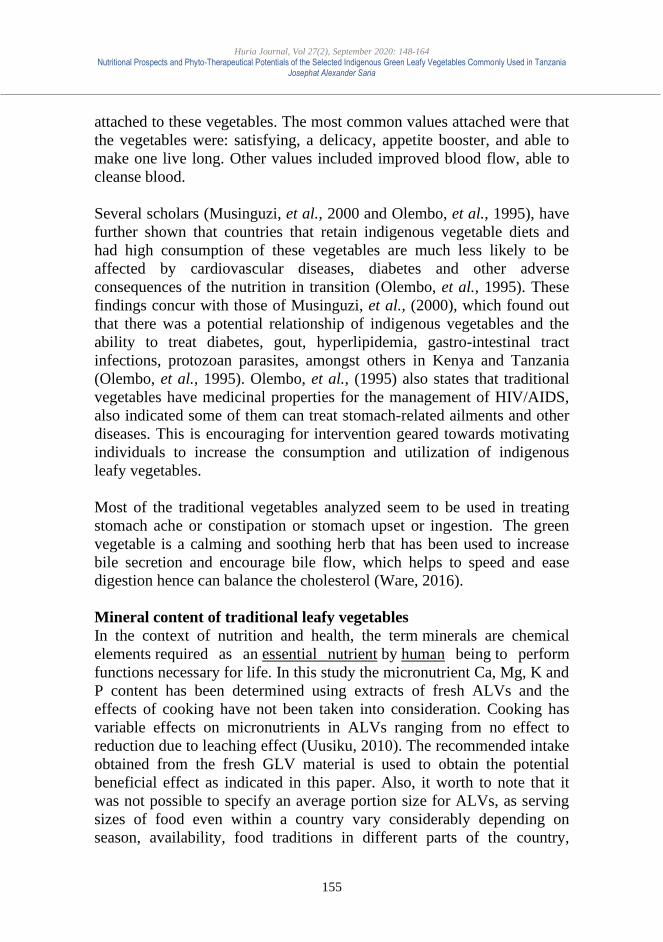
Huria Journal, Vol 27(2), September 2020: 148-164 Nutritional Prospects and Phyto-Therapeutical Potentials of the Selected Indigenous Green Leafy Vegetables Commonly Used in Tanzania
Josephat Alexander Saria
155
attached to these vegetables. The most common values attached were that
the vegetables were: satisfying, a delicacy, appetite booster, and able to
make one live long. Other values included improved blood flow, able to
cleanse blood.
Several scholars (Musinguzi, et al., 2000 and Olembo, et al., 1995), have
further shown that countries that retain indigenous vegetable diets and
had high consumption of these vegetables are much less likely to be
affected by cardiovascular diseases, diabetes and other adverse
consequences of the nutrition in transition (Olembo, et al., 1995). These
findings concur with those of Musinguzi, et al., (2000), which found out
that there was a potential relationship of indigenous vegetables and the
ability to treat diabetes, gout, hyperlipidemia, gastro-intestinal tract
infections, protozoan parasites, amongst others in Kenya and Tanzania
(Olembo, et al., 1995). Olembo, et al., (1995) also states that traditional
vegetables have medicinal properties for the management of HIV/AIDS,
also indicated some of them can treat stomach-related ailments and other
diseases. This is encouraging for intervention geared towards motivating
individuals to increase the consumption and utilization of indigenous
leafy vegetables.
Most of the traditional vegetables analyzed seem to be used in treating
stomach ache or constipation or stomach upset or ingestion. The green
vegetable is a calming and soothing herb that has been used to increase
bile secretion and encourage bile flow, which helps to speed and ease
digestion hence can balance the cholesterol (Ware, 2016).
Mineral content of traditional leafy vegetables
In the context of nutrition and health, the term minerals are chemical
elements required as an essential nutrient by human being to perform
functions necessary for life. In this study the micronutrient Ca, Mg, K and
P content has been determined using extracts of fresh ALVs and the
effects of cooking have not been taken into consideration. Cooking has
variable effects on micronutrients in ALVs ranging from no effect to
reduction due to leaching effect (Uusiku, 2010). The recommended intake
obtained from the fresh GLV material is used to obtain the potential
beneficial effect as indicated in this paper. Also, it worth to note that it
was not possible to specify an average portion size for ALVs, as serving
sizes of food even within a country vary considerably depending on
season, availability, food traditions in different parts of the country,
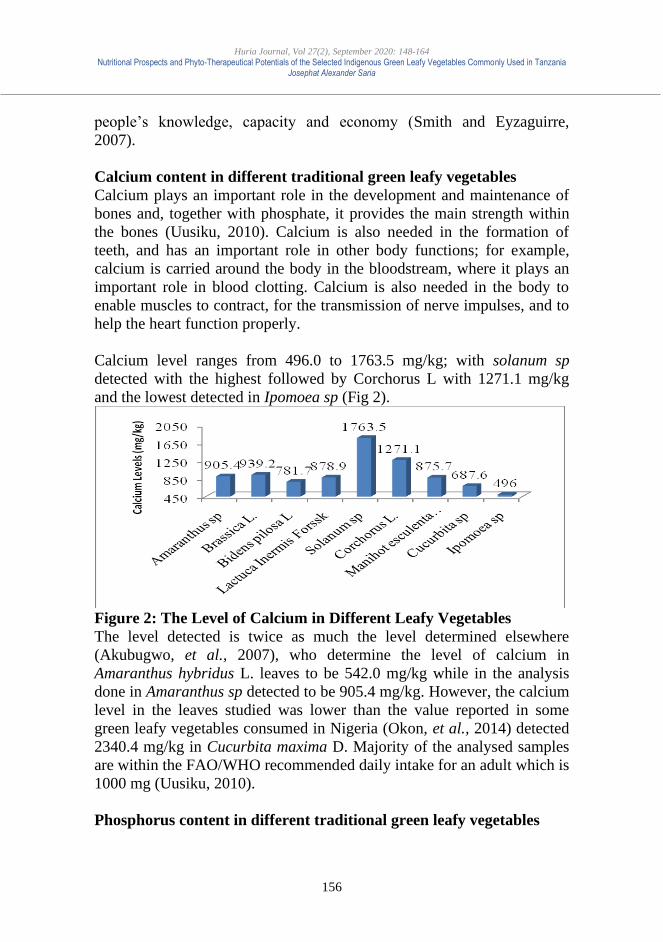
Huria Journal, Vol 27(2), September 2020: 148-164 Nutritional Prospects and Phyto-Therapeutical Potentials of the Selected Indigenous Green Leafy Vegetables Commonly Used in Tanzania
Josephat Alexander Saria
156
people’s knowledge, capacity and economy (Smith and Eyzaguirre,
2007).
Calcium content in different traditional green leafy vegetables
Calcium plays an important role in the development and maintenance of
bones and, together with phosphate, it provides the main strength within
the bones (Uusiku, 2010). Calcium is also needed in the formation of
teeth, and has an important role in other body functions; for example,
calcium is carried around the body in the bloodstream, where it plays an
important role in blood clotting. Calcium is also needed in the body to
enable muscles to contract, for the transmission of nerve impulses, and to
help the heart function properly.
Calcium level ranges from 496.0 to 1763.5 mg/kg; with solanum sp
detected with the highest followed by Corchorus L with 1271.1 mg/kg
and the lowest detected in Ipomoea sp (Fig 2).
Figure 2: The Level of Calcium in Different Leafy Vegetables
The level detected is twice as much the level determined elsewhere
(Akubugwo, et al., 2007), who determine the level of calcium in
Amaranthus hybridus L. leaves to be 542.0 mg/kg while in the analysis
done in Amaranthus sp detected to be 905.4 mg/kg. However, the calcium
level in the leaves studied was lower than the value reported in some
green leafy vegetables consumed in Nigeria (Okon, et al., 2014) detected
2340.4 mg/kg in Cucurbita maxima D. Majority of the analysed samples
are within the FAO/WHO recommended daily intake for an adult which is
1000 mg (Uusiku, 2010).
Phosphorus content in different traditional green leafy vegetables
Huria Journal, Vol 27(2), September 2020: 148-164 Nutritional Prospects and Phyto-Therapeutical Potentials of the Selected Indigenous Green Leafy Vegetables Commonly Used in Tanzania
Josephat Alexander Saria
157
The phosphorus content in the analysed samples ranges from 309.8 to
572.3 mg/kg. The value compares favorably with 349.1 mg/kg values
determined by Akubugwo, et al., (2007), but lower than 1660 – 6400
mg/kg observed in some green leafy vegetables consumed in Nigeria
(Ladan, et al., 1996).
Figure 3: The Level of Phosphorus in Different Leafy Vegetables
The difference identified above could be the same as the one identified by
Motherwell and Bullock (1986), which could be due to fertilizer
application by the farmers and the amount of phosphorus which was
already in the soil before cultivation. It is clear fertilizers such as NPK
has phosphorus content which can increase the level of phosphorus in the
soil and hence increase the level of phosphorus in plant tissues. However,
the level of phosphorus in green leafy vegetables can decrease during
cooking, due to leaching of mineral into the cooking medium (Motherwell
and Bullock (1986). Care must be taken during preparation and stock
used for cooking if phosphorus level is to be maintained.
Magnesium level in different traditional green leafy vegetables
The magnesium content ranges between 300.2 mg/kg and 366.7 mg/kg.
Solanum sp had the highest magnesium content while the ipomoea sp has
the lowest. The values are lower than the value determined earlier which
ranges between 275.1 to 2886.5 mg/kg (Akubugwo, et al., 2007).
However, the levels obtained in this study is low to meet the
recommended daily allowance (RDA) of 400 mg/day for men 19-30 years
old and 310 mg/day for women 19-39 years old (FAO/WHO (2001).
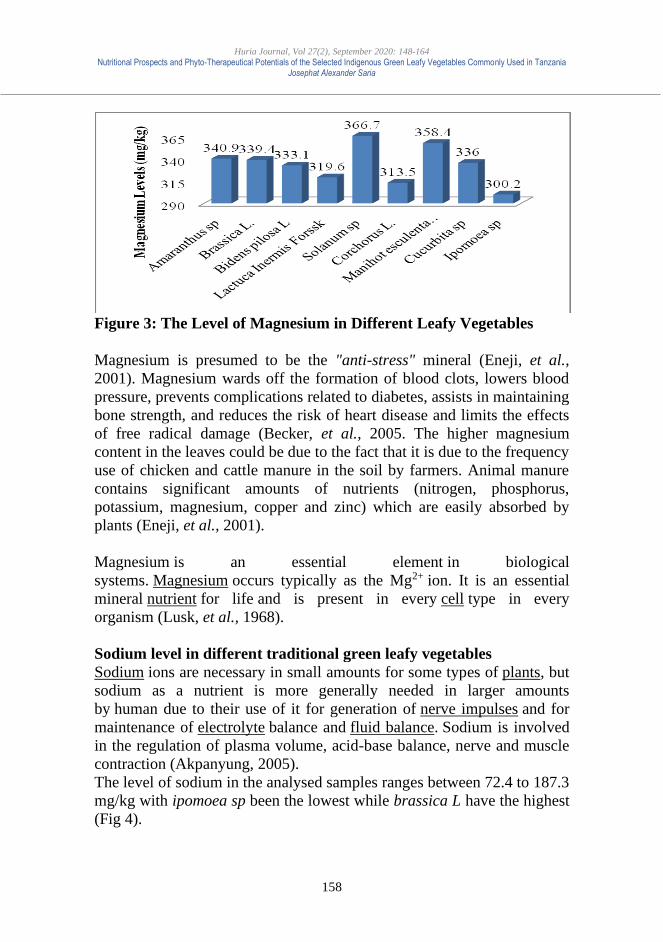
Huria Journal, Vol 27(2), September 2020: 148-164 Nutritional Prospects and Phyto-Therapeutical Potentials of the Selected Indigenous Green Leafy Vegetables Commonly Used in Tanzania
Josephat Alexander Saria
158
Figure 3: The Level of Magnesium in Different Leafy Vegetables
Magnesium is presumed to be the "anti-stress" mineral (Eneji, et al.,
2001). Magnesium wards off the formation of blood clots, lowers blood
pressure, prevents complications related to diabetes, assists in maintaining
bone strength, and reduces the risk of heart disease and limits the effects
of free radical damage (Becker, et al., 2005. The higher magnesium
content in the leaves could be due to the fact that it is due to the frequency
use of chicken and cattle manure in the soil by farmers. Animal manure
contains significant amounts of nutrients (nitrogen, phosphorus,
potassium, magnesium, copper and zinc) which are easily absorbed by
plants (Eneji, et al., 2001).
Magnesium is an essential element in biological
systems. Magnesium occurs typically as the Mg2+ ion. It is an essential
mineral nutrient for life and is present in every cell type in every
organism (Lusk, et al., 1968).
Sodium level in different traditional green leafy vegetables
Sodium ions are necessary in small amounts for some types of plants, but
sodium as a nutrient is more generally needed in larger amounts
by human due to their use of it for generation of nerve impulses and for
maintenance of electrolyte balance and fluid balance. Sodium is involved
in the regulation of plasma volume, acid-base balance, nerve and muscle
contraction (Akpanyung, 2005).
The level of sodium in the analysed samples ranges between 72.4 to 187.3
mg/kg with ipomoea sp been the lowest while brassica L have the highest
(Fig 4).
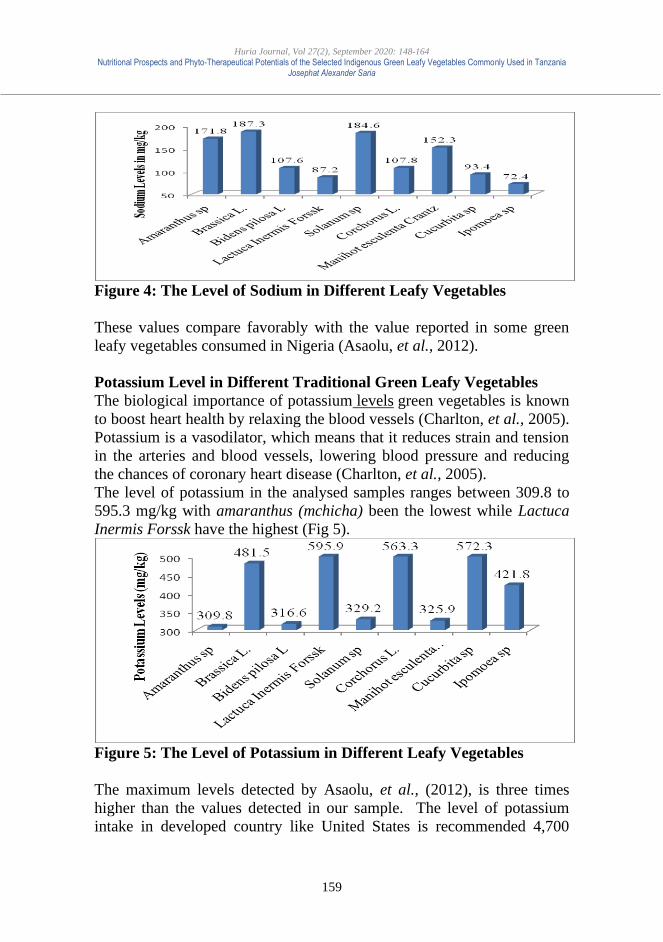
Huria Journal, Vol 27(2), September 2020: 148-164 Nutritional Prospects and Phyto-Therapeutical Potentials of the Selected Indigenous Green Leafy Vegetables Commonly Used in Tanzania
Josephat Alexander Saria
159
Figure 4: The Level of Sodium in Different Leafy Vegetables
These values compare favorably with the value reported in some green
leafy vegetables consumed in Nigeria (Asaolu, et al., 2012).
Potassium Level in Different Traditional Green Leafy Vegetables
The biological importance of potassium levels green vegetables is known
to boost heart health by relaxing the blood vessels (Charlton, et al., 2005).
Potassium is a vasodilator, which means that it reduces strain and tension
in the arteries and blood vessels, lowering blood pressure and reducing
the chances of coronary heart disease (Charlton, et al., 2005).
The level of potassium in the analysed samples ranges between 309.8 to
595.3 mg/kg with amaranthus (mchicha) been the lowest while Lactuca
Inermis Forssk have the highest (Fig 5).
Figure 5: The Level of Potassium in Different Leafy Vegetables
The maximum levels detected by Asaolu, et al., (2012), is three times
higher than the values detected in our sample. The level of potassium
intake in developed country like United States is recommended 4,700

Huria Journal, Vol 27(2), September 2020: 148-164 Nutritional Prospects and Phyto-Therapeutical Potentials of the Selected Indigenous Green Leafy Vegetables Commonly Used in Tanzania
Josephat Alexander Saria
160
mg/day (Charlton, et al., 2005), in which the samples contribute half of
the recommended.
The Ratio of Sodium to Potassium (Na/K) and Calcium to
Phosphorus (Ca/P)
The ratio of sodium to potassium (Na/K) and calcium to phosphorus
(Ca/P) are shown in Table 3.
Table 3: The Ratios of Important Minerals
Vegetable Na K Ca P Na/K Ca/P
Amaranthus sp 171.8 309.8 905.4 442.6 0.555 2.046
Brassica L. 187.3 481.5 939.2 484.7 0.389 1.938
Bidens pilosa L 107.6 316.6 781.7 388.5 0.340 2.012
Lactuca Inermis Forssk 87.2 595.9 878.9 396.4 0.146 2.217
Solanum sp 184.6 329.2 1763.5 562.2 0.561 3.137
Corchorus L. 107.8 563.3 1271.1 655.8 0.191 1.9382
Manihot esculenta C. 152.3 325.9 875.7 488.4 0.467 1.793
Cucurbita sp 93.4 572.3 687.6 371.5 0.163 1.851
Ipomoea sp 72.4 421.8 496 380.7 0.172 1.303
Each data is the mean of three replicates
The calcium/phosphorus ratio is mostly discussed in animal science,
when designing diets for herbivorous animals, for example. It has been
found (Kemi, et al., 2006) that when a diet that is low in calcium, but high
in phosphorus, they develop bone disorders and dental problems (Kemi,
et al., 2006 Akubugwo, et al., 2007). According to Mepha, et al., (2007),
if the body absorb more phosphorus than calcium in the diet, the body
will start to take calcium from its own reserves (the bones) to compensate
the defficiency. In this study all samples have higher Ca than P and hence
the lowest ratio is 1.3: 1 in and Ipomoea sp while the highest is 3.137:1 in
Solanum sp. Because phosphorus is found in a wide variety of foods, the
effect could be not observed, except in diseases that affect absorption,
such as diabetes or Crohn’s disease.
The Na/K ratio in the body is of great concern for prevention of high
blood pressure. Na/K ratio less than one is recommended (FND, 2002).
Hence, consumption of all samples analysed would probably reduce high
blood pressure diseases because its Na/K is less than one.
CONCLUSION
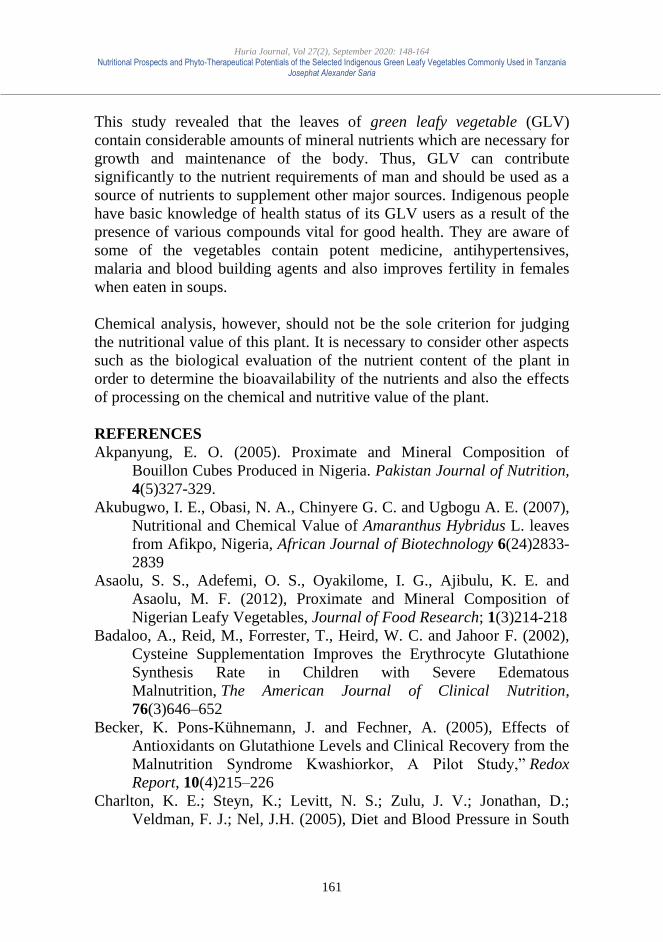
Huria Journal, Vol 27(2), September 2020: 148-164 Nutritional Prospects and Phyto-Therapeutical Potentials of the Selected Indigenous Green Leafy Vegetables Commonly Used in Tanzania
Josephat Alexander Saria
161
This study revealed that the leaves of green leafy vegetable (GLV)
contain considerable amounts of mineral nutrients which are necessary for
growth and maintenance of the body. Thus, GLV can contribute
significantly to the nutrient requirements of man and should be used as a
source of nutrients to supplement other major sources. Indigenous people
have basic knowledge of health status of its GLV users as a result of the
presence of various compounds vital for good health. They are aware of
some of the vegetables contain potent medicine, antihypertensives,
malaria and blood building agents and also improves fertility in females
when eaten in soups.
Chemical analysis, however, should not be the sole criterion for judging
the nutritional value of this plant. It is necessary to consider other aspects
such as the biological evaluation of the nutrient content of the plant in
order to determine the bioavailability of the nutrients and also the effects
of processing on the chemical and nutritive value of the plant.
REFERENCES
Akpanyung, E. O. (2005). Proximate and Mineral Composition of
Bouillon Cubes Produced in Nigeria. Pakistan Journal of Nutrition,
4(5)327-329.
Akubugwo, I. E., Obasi, N. A., Chinyere G. C. and Ugbogu A. E. (2007),
Nutritional and Chemical Value of Amaranthus Hybridus L. leaves
from Afikpo, Nigeria, African Journal of Biotechnology 6(24)2833-
2839
Asaolu, S. S., Adefemi, O. S., Oyakilome, I. G., Ajibulu, K. E. and
Asaolu, M. F. (2012), Proximate and Mineral Composition of
Nigerian Leafy Vegetables, Journal of Food Research; 1(3)214-218
Badaloo, A., Reid, M., Forrester, T., Heird, W. C. and Jahoor F. (2002),
Cysteine Supplementation Improves the Erythrocyte Glutathione
Synthesis Rate in Children with Severe Edematous
Malnutrition, The American Journal of Clinical Nutrition,
76(3)646–652
Becker, K. Pons-Kühnemann, J. and Fechner, A. (2005), Effects of
Antioxidants on Glutathione Levels and Clinical Recovery from the
Malnutrition Syndrome Kwashiorkor, A Pilot Study,” Redox
Report, 10(4)215–226
Charlton, K. E.; Steyn, K.; Levitt, N. S.; Zulu, J. V.; Jonathan, D.;
Veldman, F. J.; Nel, J.H. (2005), Diet and Blood Pressure in South
Huria Journal, Vol 27(2), September 2020: 148-164 Nutritional Prospects and Phyto-Therapeutical Potentials of the Selected Indigenous Green Leafy Vegetables Commonly Used in Tanzania
Josephat Alexander Saria
162
Africa: Intake of Foods Containing Sodium, Potassium, Calcium,
and Magnesium in Three Ethnic Groups. Nutrition 21, 39–50.
Dalziel, J. M. (1937), The Useful Plants of West Tropical Africa. The
Crown Agents for the Colonies, London England.
Eneji, A. E., Honna, T., Yamamoto, S. (2001), Manuring Effect of Rice
Grain Yield and Extractable 362 Trace Elements in Soils, Journal
of Plant Nutrition, 24(7)967-977
FAO/WHO (2001), Human Vitamin and Minerals Requirements, Food
and Nutrition Division, FAO, Rome
Fasuyi, O.A. (2006), Nutritional Potentials of some Tropical Vegetable
Leaf Meals: Chemical Characterization and Functional Properties.
African Journal of Biotechnology 5: 49- 53,
FND (2002), Food and Nutrition Board, Institute of Medicine. National
Academy of Sciences. Dietary Reference Intake for Energy,
Carbohydrate, Fibre, Fat, Fatty Acids, Cholesterol, Protein and
Amino Acid (Micro-Nutrients). www.nap.edu (Retrieved on
14/03/2017).
Getinet, A., Rakow, G., Raney, J. P. and Downey, R. K. (1997), The
Inheritance of Erucic Acid content in Ethiopian mustard. Canadian
Journal of Plant Science 77:33–41.
Gockowski, J., Mbazo’o, J., Mba, G. and Moulende, T. F. (2003), African
Traditional Leafy Vegetables and the Urban and Peri-urban Poor,
Food Policy 28(3):221-235.
Jansen van Rensburg, W. S., Venter, S. L. , Nelshiluvhi, T. R. , van den
Heever, E. and Voster, H. J. (2004), Role of Indigenous Leafy
Vegetables in Combating Hunger and Malnutrition, South Afr. J.
Bot. 70(1): 52-59.
Johns, T. (2004), Plant Bio-diversity and Malnutrition: Simple Solutions
to Complex Problems: Theoretical Basis for the Development and
Implementation of a Global Strategy Linking Plant Genetic
Resource Conservation and Human Nutrition. African Journal of
Food, Agriculture, Nutrition and Development. 3(3)1-7
Johns, T. and Sthapit, B. (2004), Bio-cultural Diversity in the
Sustainability of Developing Country Food Systems. Food and
Nutrition Bulletin 25(2)143-155.
Kemi V. E., Kärkkäinen, M. U. and Lamberg-Allardt, C. J. (2006), High
Phosphorus Intakes Acutely and Negatively Affect Ca and Bone
Metabolism in a Dose-Dependent Manner in Healthy Young
Females, Br J Nutr. 96(3):545-52.
Huria Journal, Vol 27(2), September 2020: 148-164 Nutritional Prospects and Phyto-Therapeutical Potentials of the Selected Indigenous Green Leafy Vegetables Commonly Used in Tanzania
Josephat Alexander Saria
163
Ladan, M. J., Bilbils, L. S. and Lawal, M. (1996), Nutrient Composition
of some Green Leafy Vegetable Consumed in Sokoto. Niger. J.
Basic Appl. Sci. 5:39-44.
Liu, R. H. (2003), Health Benefits of Fruit and Vegetables are from
Additive and Synergistic Combinations of Phytochemicals,” The
American Journal of Clinical Nutrition, 78(3) 517S–520S.
Lusk, J. E., Williams, R. J. P., Kennedy, E. P. (1968), Magnesium and the
Growth of Escherichia Coli, Journal of Biological
Chemistry, 243(10),2618–2624
Marshall, F. (2001), Agriculture and Use of Wild and Weedy Greens by
the Piik Ap Oom Okiek of Kenya. Economic Botany 55:32-46
Mepha, H. D., Eboh, L., Banigbo, D. E. B. (2007), Effects of Processing
Treatments on the Nutritive Composition and Consumer
Acceptance of some Nigerian Edible Leafy Vegetables. Afr. J. Food
Agric. Nutr. Dev. 7(1):1-18.
Motherwell, G. W. and Bullock, V. E (1986), The Essential of Chemistry
in the Laboratory, Canada: Clarke Company limited
Musinguzi, E., Kikafunda, J. and Kiremire, B. T. (2000), The Status and
Level of Utilization of Indigenous Food Plants in Uganda: A Case
Study of South West Uganda. Department of Food Science and
Technology. Makerere University, Kampala Uganda
Okeno, J. A. Chebet, D. K. and Mathenge, P. W. (2003), Status of
Indigenous Vegetables in Kenya. Acta Hort. 621: 95-100
Okon, O. G., Abraham, N. A. and Akpan, G. U. (2014), Nutritional
Evaluation, Medicinal value and Antibacterial activity of Leaves of
Cucurbita maxima D. International Journal of Research (IJR) 1(8)
1346 – 1350
Olembo, N. K, Fedha, S. S. and Ngaire, E. S. (1995), Medical and
Agricultural Plants of Ikolomani, Kakamega District, Kenya
Opiyo, A. M., Mungai, N. W., Nakhone, L. W. and Lagat J. K. (2015),
Production, Status and Impact of Traditional Leafy Vegetables in
Household Food Security: A Case Study of Bondo District-Siaya
County-Kenya, ARPN Journal of Agricultural and Biological
Science 10(9)330 - 338
Oyejola, A. O. and Bassir, O. (1975), Mineral and Vitamin Content of
Some Nigerian Leafy Vegetables, Plant Foods for Man 3,295-305.
Pearson, D. (1976), Chemical Analysis of Foods, (7th ed), Churchchill,
Livingstone, London
Pereira, R. L. C., Ibrahim, T., Lucchetti, L., Da Silva, A. J. R. and
DeMoraes, V. L. G. (1999), Immunosuppressive and Anti-
Huria Journal, Vol 27(2), September 2020: 148-164 Nutritional Prospects and Phyto-Therapeutical Potentials of the Selected Indigenous Green Leafy Vegetables Commonly Used in Tanzania
Josephat Alexander Saria
164
inflammatory Effects of Methanolic Extract and the Polyacetylene
Isolated from Bidens pilosa L, Immunopharmacology, 43(1)31–37
Shahidi, F., Chavan, U. D., Bal, A. K. and Mckenzie, D. B. (1999).
Chemical Composition of Beach Pea (Lathyrus Maritimus L.) Plant
Parts, Food Chem. 64:39-44.
Smith, F. I. and Eyzaguirre, P. (2007), African Leafy Vegetables: Their
Role in The World Health Organization’s Global Fruit and
Vegetables Initiative, African Journal of Food, Agriculture,
Nutrition and Development, 7(3)1-17
Uusiku, N. P., Oelofse, A., Duodu, K. G., Bester, M. J. and Faber, M.
(2010), Nutritional Value of Leafy Vegetables of Sub-Saharan
Africa and their Potential Contribution to Human Health: A
Review, Journal of Food Composition and Analysis 23: 499–509
Vainio-Mattila, K. (2000), Wild Vegetables used by the Sambaa in the
Usambara Mountains, Tanzania. Annales Botanici Fennici, 37:57-
67
Van-den-Heever, E. (1997), The Use and Conservation of Indigenous
Leafy Vegetables in South Africa. In: Guarino, L. (Ed.), Traditional
Vegetables in Africa: Conservation and Use, Rome, Italy
Ware, M. (2016), Mint: Health Benefits, Uses and Risks,
http://www.medicalnewstoday.com /articles/275944.php accessed
on 17th June 2017
ACKNOWLEDGEMENT
I wish to thank Mr Addo Ndimbo, from Ardhi University allowing me to
use his laboratory for chemical analysis on the samples. Also, I am
extending my sincere gratitude to all OUT students and workers at
Sumbawanga Regional center who provided necessary information on
medicinal use of the GLV. Just to mention few Mr Dennis Konga who
was conversant in Wanji Language, Mr and Mrs Martine Credo Mangulu
(Fipa) and many others.
Huria Journal, Vol 27(2), September 2020: 165-189
165
Impacts of Climate Change on Food Security and
Adaptation Options for Smallholder Farmers in Malawi
Ben Busizori Twinomugisha [email protected]
UNDP Country Office, Malawi
Reguli Baltazar Mushy [email protected]
The Open University of Tanzania
ABSTRACT
This article is based on the study that assessed the impact of climate
change on food security and adaptation strategies among smallholder
farmers in Salima district, Malawi. The research design deployed
literature review and case study survey. A mixed approach of both
qualitative and quantitative research methods was used for data
collection and analysis. Findings revealed a felt slight increase in
temperature. Rainfall seasonality changes (inter annual and intra
variation) are suspected to lead to more frequent and intensified droughts
and floods that affect four pillars of food security i.e., food availability,
access, utilization and stability. Perceived climate change risks are based
on smallholder farmers’ experience and knowledge of their local farming.
Majority of smallholder farmers in the study areas depend on subsistence
farming that is rainfed and vulnerable to seasonality changes. Farmers
are taking adaptation measures to ensure food security that includes
indigenous knowledge based on past experiences and adoption of climate
smart modern technologies. Adaptation limiting factors include limited
livelihoods-based capitals, knowledge and skills of climate smart
agriculture. There is need for reforming agriculture extension services
provided by government through formal integration of climate smart
agriculture in policy linkages to smallholder farmers.
Keywords: Climate Change; Food Security; Adaptation; Smallholder
Farmers; Community Perceptions; Indigenous Knowledge.
INTRODUCTION
Climate change and food security are inextricably linked. The Food and
Agriculture Organization warns that a global temperature rise this century
of 1.5 °C above pre-industrial levels could lead to 122 million additional
people to experience extreme poverty by 2030, mainly due
Huria Journal, Vol 27(2), September 2020: 165-189
Impacts of Climate Change on Food Security and Adaptation Options for Smallholder Farmers in Malawi Ben Busizori Twinomugisha and Reguli Baltazar Mushy
166
to higher food prices and declining health (FAO, 2018). This means that
countries already struggling with food security are likely to find their
struggle still harder in the future. The IPCC projects that yield from rain-
fed farming in some African countries could be reduced by up to 50
percent by 2020 (IPCC, 2018).
The problem of food security will increase in the future due to climate
change with population growth which are contributing the great share of
the problem in addition to the pre-existing traditional determinants.
Climate change will reduce crop yields and in turn will increase the price
of food that force people to change production and consumption patterns
and directly will reduce calorie intake. Climate change is undermining
current efforts to address food security and malnutrition problems, one of
the world’s most serious but least addressed socioeconomic and health
problem ((UNSSCCN, 2010). The main objective of this study was to
assess climate change impacts on food security and adaptation strategies
among small holder farmers in Salima district, Malawi.
METHODOLOGY
The research design deployed was literature review and case study
survey. A mixed approach of both qualitative and quantitative research
methods was used for data collection and analysis. Random sampling
techniques were used to select a sample of 183 respondents. Various data
collection methods were used to collect data such as survey questionnaire,
Key Informants Interviews, Focused Group Discussions as well as
analysis of meteorological data for 30-50years.
This study was conducted in Salima district, Chipoka Extension Service
Area (EPA), Ndindi Traditional Authority (Figure 1). Salima is a district
in the Central Region of Malawi location coordinates 3.6810° S, 34.4198°
E. It has a total land area of 2,196 square kilometers, which represents
2.3% of Malawi’s total land area. Salima district lies within the Great
African Rift Valley system with Lake Malawi on the east side. Salima is
bordered by Nkhotakota district to the north, Ntchisi district to the north-
west, Dowa to the West, Lilongwe to the South West, Dedza to the south
and south and Lake Malawi to the east (GoM, 2006).
Climate is subtropical with the rainy season extending from November to
April, and the dry season from May to October. The study area, Ndindi,
has a hot tropical climate with mean annual temperature of 22oC. The

Huria Journal, Vol 27(2), September 2020: 165-189
Impacts of Climate Change on Food Security and Adaptation Options for Smallholder Farmers in Malawi Ben Busizori Twinomugisha and Reguli Baltazar Mushy
167
highest temperatures are experienced in October reaching as high as 33oC
while the lowest temperatures are experienced between May and July
reaching 12oC. The area has three seasons throughout the year: Hot dry
season (August- October), Hot wet season (November- April), and Cool
dry season (May- July). Vegetation in the area is composed of savannah
woodlands characterized by grasslands with scattered trees. There are no
evergreen forests in the area due to dryness of the land during the hot and
cool dry seasons.
Figure 1: Map of Malawi Showing Salima District
Source: Salima District Council 2011
The study applied the following formula to determine required sample
size with accepted confidence level of 90%:
Sample Size =
Source: Adopted from Monkey Survey®, Sample Size Calculator
Huria Journal, Vol 27(2), September 2020: 165-189
Impacts of Climate Change on Food Security and Adaptation Options for Smallholder Farmers in Malawi Ben Busizori Twinomugisha and Reguli Baltazar Mushy
168
Note:
(Population Size = N) =8,153 | (Margin of error = e) =0.06 | (z=1.4),
with Confidence Level of =90%. Therefore, the acceptable Sample Size
for this study is equal to183 respondents.
All the target smallholder farmers were sampled using Simple Random
Sampling (SRS) ensuring that the subset of a statistical population (8,153)
has a total of 183 individuals chosen around the targeted areas in Ndindi
Traditional Authority, Chipoka Extension Planning Area.
FINDINGS Climate Change Impact on Food Production
Respondents to the research survey were asked to explain any trend of
climate or natural phenomena that affected their crops, livestock, and
fisheries production during the last 10years. The majority (98%) of 183
survey respondents indicated that they perceived intensity of changes in
rainfall patterns with greater impact on crop farming. Crop farming is the
most affected by both droughts, pest and diseases and flooding. This
finding agrees with a study done in South America by (Seo and
Mendelsohn, 2008) who found out that climate change affects the crops
that South American farmers choose and that this has resulted to
confusion as farmers switch away from maize, wheat, and potatoes
towards squash, fruits and vegetables.
Respondents highly rated drought as the key climate change related
hazard that was negatively affecting food security among the smallholder
farmers. During the two rounds of focused group discussions, the
participants explained that dry spells normally occur in January and
February after planting of maize and/or other crops. Prolonged drought
from March to December negatively affected crop production.
Smallholder crop farmers in the study area depended on rainfed
agriculture. Dryness and erratic rains during the 2017/18 cropping season
were highlighted as an example that frustrated smallholder farmers and
resulted to poor maize harvest. This finding is in-line with (IPCC 2018)
report that rates drought as significant risk to farming. According to
IPCC, risks from droughts and precipitation deficits are projected to be
even higher at 2°C compared to 1.5°C of global warming in some regions
(medium confidence) especially in several northern hemisphere high-
latitude and/or high-elevation regions, eastern Asia and eastern North
America (medium confidence).
Huria Journal, Vol 27(2), September 2020: 165-189
Impacts of Climate Change on Food Security and Adaptation Options for Smallholder Farmers in Malawi Ben Busizori Twinomugisha and Reguli Baltazar Mushy
169
FGDs further acknowledged that there was crop loss to insects.
Participants mentioned the Fall Army Worm attack in 2016/17 season that
especially affected maize. It should be noted that climate change is
expected to bring with it an increase in agricultural pests, which will lead
to significant crop loss (IPCC, 2018).
FGDs participants rated flooding a medium climate change hazard/risk to
food security as it was a higher risk to settlement than crops and
livestock. FGDs meeting participants mentioned that they were aware of
the El Nino weather phenomenon as a major cause of floods in almost
every February of the year. The February 2017 floods in Ndindi
Traditional Authority and neighbouring Mtauchila Village was the most
remembered event where floods intensified from Lifidzi River that burst
its banks destroying homes, crops and the road network. During this flood
episode, it was mentioned that there was also decipherable damage in
maize farms a situation that worsened food shortages during the same
year. Salima is said to be experiencing intensified rains in February of
every year which result in flooding of low-lying areas of the district.
The impact of climate change events (drought and rainfall changes) on
fishery sector was not so obvious but the common fish, Oreochromis
specie known as “Chambo’’ in local Chichewa language is said to have
declined in catch. According to FGDs and the interview with Salima
district environmental officer, the decline in this fish catch can be
considerably attributed to several factors such as overfishing. However, a
study that carried out statistical relationship between Chambo fish catch
and interdependent variables of temperature and rainfall provides
evidence that climate change has a significant adverse impact on the total
landings of chambo fish in Salima district and generally in Lake Malawi
(Makwinja and M’balaka, 2017). In Lake Malawi, evidence suggests that
both warming and eutrophication influence fish stocks (Vollmer et al.
2005). However, there need for evidence to determine whether decline in
fish stock is attributed to rising water temperatures, lower and warmer
inflows into the lake or limited overturning (Jamu, 2011; Jul-Larsen et al.,
2003).
Climate Change Specific Impacts on Food Security Pillars
In 2009, the World Summit on Food Security stated that the "four pillars
of food security are availability, access, utilization, and stability" (FAO,
2009). This study analysed how climate change spreads its impacts across
Huria Journal, Vol 27(2), September 2020: 165-189
Impacts of Climate Change on Food Security and Adaptation Options for Smallholder Farmers in Malawi Ben Busizori Twinomugisha and Reguli Baltazar Mushy
170
the four pillars of food security among the smallholder farmers in Ndindi
TA.
Food Availability
The impact of climate change on food security in the case study area is
more felt on food availability component due to declining agricultural
productivity. Food availability is means that there must be sufficient
quantities of food supplied mainly through domestic production. Changes
in rainfall amount and patterns that lead to droughts and floods extreme
events has resulted in poor food production. Majority of the respondents
(47%) observed and felt that there were changes in rainy seasons as a key
indicator of climate change in Ndindi. However, 31% of the respondents
perceived changing temperatures. 16% and 5% perceived changes in
drought seasons and changes in disease outbreaks respectively.
Older FGDs participants testified that they have observed changes in rain
and drought seasons for more than the past 50 years. The older people (in
their 60s and above) were probed further on what was the climate like
when they were young and what has changed. FGDs participants testified
that the rain seasonality has changed, and they termed this as ‘’Kusintha
kwa Nyengo’’ a term in Chichewa (native language) that means changes
in the weather and overall climate. During FGDs it was explained that
there is a shift in when the rainy season starts.
“In the 1960s, 1970s and 1980s rain would phenomenally start in
October but these days it comes towards end of December.
Moreover, when this rain comes a bit earlier in late November, it is
interspersed with dry spells. Most crops grown by us, like maize
dry up during unpredictable dry spells that occur in between rain
season’’ (70 years old FGD participant at Kuntupa village).
The study area (Salima district) was one of the 15 districts affected by
floods and drought in 2015/2016 agriculture season. A state of emergency
was declared by the President of Malawi on 13 January 2015 after heavy
floods. One year later state of national disaster was declared on 13 April
2016 following prolonged dry spells during the 2015/16 agriculture
season. These two events led to increased maize deficit, and number of
people were food-insecure and required humanitarian relief assistance for
the whole 2016-17 consumption year (PDNA, 2016).

Huria Journal, Vol 27(2), September 2020: 165-189
Impacts of Climate Change on Food Security and Adaptation Options for Smallholder Farmers in Malawi Ben Busizori Twinomugisha and Reguli Baltazar Mushy
171
The implications of climate change for food availability is also due to the
vulnerability of Ndindi smallholder farmers, who have been found to
significantly have low capacity to adapt. 55% of the survey respondents
asserted that their capacity to adapt to climate change depended on the
government’s extension services a system that is no longer effective.
Food availability would require adapted production that is determined by
land ownership and use, soil management, crop diversification and
management, resilient livestock breeds and proper harvesting and post
harvesting handling. Smallholder farmers in Ndindi lack resources to
adopt climate smart agriculture technologies. The 39% of survey
respondents mentioned that they lacked capital to invest in transforming
agriculture that in turn increases vulnerability to food insecurity. The
study observed fragmentation of smallholders’ land holdings and it is on
the rise owing to increasing population density in Ndindi TA. It was
observed that smallholder agriculture on fragmented pieces of land is
associated with low productivity. This finding is in line with (Rahman
and Rahman, 2009) study findings in Bangladesh that revealed that land
fragmentation has a significant detrimental effect on productivity and
efficiency. In their findings, elasticity estimates of land fragmentation
revealed that a 1% increase in land fragmentation reduced rice output by
0.05% and efficiency by 0.03%.
Climate Change Impact on Food Access
Access to food in this study refers to physical and economic access to
food that is determined largely by purchasing power and income of the
population (FAO, 2013). Majority of survey respondents who comprised
30% stated that they were not earning and that if they got money, it
ranged from 0-10,000 Malawi Kwacha per quarter. This is followed by
27% and 12% who earned between 11,000 Mk-19,000 Mk and 20,000-
29,000Mk respectively. Even this category was still earning less than $50
per a quarter. Most of the respondents who earned between 0-10,000MK
were in fact earning a maximum of $15 according to 2018 average
exchange rate. Only 19% of all survey respondents earned above $50 per
quarter and majority of these were said to be in formal employment and
fishing sectors. Crop farmers had the lowest quarterly incomes.
Moreover, smallholder farmers in study area vastly depend on nature-
based agriculture for both livelihoods and incomes. In such circumstances
where there is low agriculture productivity, farmers will have less
incomes to purchase food in enough quantities and quality. Other factors
that affect access to food in Ndindi include high food prices during
Huria Journal, Vol 27(2), September 2020: 165-189
Impacts of Climate Change on Food Security and Adaptation Options for Smallholder Farmers in Malawi Ben Busizori Twinomugisha and Reguli Baltazar Mushy
172
famine, access to markets, the level of poverty, unemployment condition
and dependence ratio, educational status and land/property rights as
assessed in the previous sections on socio-economic findings. There is
also high food price inflation. Cost of food in Malawi increased 10.40
percent in October of 2018 over the same month in the previous year.
Food Inflation in Malawi averaged 21.20 percent from 1990 until 2018,
reaching an all-time high of 113 percent in July of 1995 and a record low
of 2 percent in September of 2003 (NSO 2018).
Impact on Food Utilization
Climate change affects food utilization capacity through challenges to
production rate and pattern of different food items and this affects Ndindi
smallholder farmers’ nutritional requirements. Food utilization depends
on how food is used, whether food has sufficient nutrients and whether
diet can be maintained. In case of Ndindi, smallholder rain-fed maize
production is main crop and the livestock sub-sector is underdeveloped.
Fishing activity would complement nutrition but most of the fish caught is
not consumed by households as it is sold (Study key informant
interviews).
Climate change is affecting the income and capacity of the smallholder
farmers to purchase a diversity of food items to get a balanced diet. Cost
of food in Malawi increased 10.20 percent in September of 2018 over the
same month in the previous year. Food Inflation in Malawi averaged
21.23 percent from 1990 until 2018, reaching an all-time high of 113
percent in July of 1995 and a record low of 2 percent in September of
2003 (NSO, 2018). For this, climate change (extreme weather events) is
one of the root causes of the recent high and volatile food prices in
Malawi (GoM, 2016). Due to this high food price, smallholder farmers in
Ndindi spontaneously reduce both quality and/or quantity of food they
eat, consume less preferred food and allocate nutritious food only to
infant household members.
Impact on Food Stability
Food stability which refers to the ability to obtain food over time.
Accordingly, food insecurity can be transitory, seasonal, or chronic (FAO,
2006). In transitory food insecurity situation of the study area, food is
more available during maize harvest that starts in April-July. Food may
also be unavailable especially in later and early months of the year
(October – march). Below-normal rainfall in Ndindi more often results in
Huria Journal, Vol 27(2), September 2020: 165-189
Impacts of Climate Change on Food Security and Adaptation Options for Smallholder Farmers in Malawi Ben Busizori Twinomugisha and Reguli Baltazar Mushy
173
below-average production that causes localized food deficits as well as
reductions in income from major cash crops. At the time of analyzing
findings of this study, food security projection indicated a likelihood of
localized acute food insecurity in study area, especially during the lean
period starting from October 2018 to March 2019 (FEWS NET 2018).
At the food production level, climate change related disasters such as
floods and droughts that regularly occur in the study area result in crop
failure and decreased food availability. This often causes instability in
markets resulting in food-price spikes which can cause transitory food
insecurity. Seasonal food insecurity is not key since Ndindi does not
experience regular pattern of growing season in food production.
According to the FGDs, there has not been one farming season that has
ever been the same as the other. This may be because of season-to-season
differences in weather patterns, particularly rainfall among other factors
especially with dry land farming. For example, the 2015-2016 agriculture
season was characterized by national declaration of floods and drought
disasters; nevertheless, this was followed by 2016-2017 (PDNA 2016)
season that had copious rains that matched good agriculture season in
Ndindi and Malawi at large. However, rainfall season in Ndindi is said to
always characterized by a short planting window which farmers are aware
of and somehow better in their season preparedness to suit the short
planting window which has decreased climate change pushed chronic (or
permanent) food insecurity. Climate change is likely to cause both
chronic and transitory food insecurity, since repeated climate disasters
can lead to the reoccurrence of transitory food security which makes
households more vulnerable to chronic food insecurity.
Farmers’ Adaptation Options
The study assed knowledge, attitude and perceptions of smallholder
farmers in their natural environment towards adapting to climate change
impacts on their food security. Focus was on an individual farmer’s
response to climate change that seeks to reduce the vulnerability of socio-
economic and natural resource systems. This was intended to assess
capacity and potential for the target communities to adapt to climate
change felt impacts.
According to Adger et al. (2005), adaptation to the impacts of climate
change should increasingly be observed in both physical and ecological
systems as well as in human adjustments to resource.
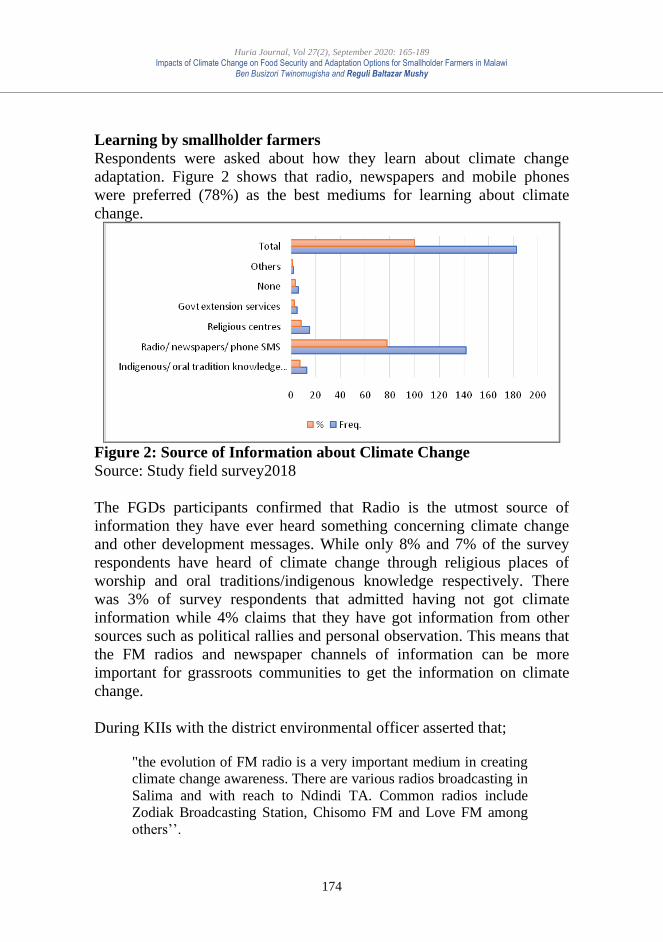
Huria Journal, Vol 27(2), September 2020: 165-189
Impacts of Climate Change on Food Security and Adaptation Options for Smallholder Farmers in Malawi Ben Busizori Twinomugisha and Reguli Baltazar Mushy
174
Learning by smallholder farmers
Respondents were asked about how they learn about climate change
adaptation. Figure 2 shows that radio, newspapers and mobile phones
were preferred (78%) as the best mediums for learning about climate
change.
Figure 2: Source of Information about Climate Change
Source: Study field survey2018
The FGDs participants confirmed that Radio is the utmost source of
information they have ever heard something concerning climate change
and other development messages. While only 8% and 7% of the survey
respondents have heard of climate change through religious places of
worship and oral traditions/indigenous knowledge respectively. There
was 3% of survey respondents that admitted having not got climate
information while 4% claims that they have got information from other
sources such as political rallies and personal observation. This means that
the FM radios and newspaper channels of information can be more
important for grassroots communities to get the information on climate
change.
During KIIs with the district environmental officer asserted that;
"the evolution of FM radio is a very important medium in creating
climate change awareness. There are various radios broadcasting in
Salima and with reach to Ndindi TA. Common radios include
Zodiak Broadcasting Station, Chisomo FM and Love FM among
others’’.
Huria Journal, Vol 27(2), September 2020: 165-189
Impacts of Climate Change on Food Security and Adaptation Options for Smallholder Farmers in Malawi Ben Busizori Twinomugisha and Reguli Baltazar Mushy
175
These radios offer their services as both geographical and community
interests since they were broadcasting beyond commercial and public
services. This finding is in conformity with the view espoused by
(Nwagbara et al. 2017) that the Radio is a very important medium in
creating awareness and response to climate change among smallholder
farmers in Edo, Nigeria.
FGDs participants at Kalonga II village also underscored the emerging
use of telephone where early warning and market information is to some
extent is shared. That there was use of social media tools especially
WhatsApp to share information though most conversation over
WhatsApp and Facebook was not revolving on climate issues. Although
social media may play a vital part in the climate information sharing,
some FGDs did not like it as they claimed that rumours and fake news are
being spread through this channel of communication. Although Social
media groups can be used to spread false and incorrect information about
agricultural practices. This finding is in line with Thakur et al. (2018)
study that was carried out in Northern India, Pradesh. The findings
underscore WhatsApp social media platform as one of the emerging
online destinations for rural mobile internet users with a sharp growth and
a strong case to use social media platforms for dissemination and sharing
of agricultural information among the farming community.
Majority of the respondents (57%) mentioned that the public Agricultural
Extension services is one of the major sources of climate services to
smallholder farmers. 19% mentioned they accessed demonstration farms
that promoted by lead-farmer model.13% were getting market-based
services such as climate smart agriculture technologies (for example
drought tolerant seed varieties). While 7% claimed to access climate
early warning and season prediction outreach services 3% said they had
not accessed any of the above-mentioned climate services.
Majority (78%) of respondents mentioned that they would seek help and
advice from government system especially the agriculture extension
service. 10% would seek help from fellow farmers through their
cooperative groups or cooperatives. While 10%, 3% and 2% would seek
help from family, talk to village mates/neighbours and seek help from
charities/NGOs. This means the local communities have hopes in the
government to give adaptation solutions. This finding agrees with
Huria Journal, Vol 27(2), September 2020: 165-189
Impacts of Climate Change on Food Security and Adaptation Options for Smallholder Farmers in Malawi Ben Busizori Twinomugisha and Reguli Baltazar Mushy
176
Sustainable Livelihood and Transformational Adaptation framework
which asserts that structures and processes which are largely government-
based play important role (Scoones, 2015) in smallholder farmers’
adaptation.
Most of the respondents (36%) asserted that they were still depending on
indigenous knowledge and varieties of crops to survive the harsh
environmental changes. Even the 24% who said that they change
cropping calendar/cropping pattern, attributed this to their traditional
coping strategies. Only 22% mentioned that they adopted improved crop
and animal species to adapt and ensure food security. This finding agrees
with Twinomugisha (2009) study among farmers in Uganda which
revealed that indigenous knowledge is an integral part of smallholder
farmers' lives and local coping strategies. Similarly, adaptation strategies
among the studied Ugandan farmers were based on existing knowledge
on how to cope, an understanding of seasonality and experience. From
African Sahel region, Nyong et al. (2007) study reveals that the local
populations in this region, through their indigenous knowledge systems,
have developed and implemented extensive adaptation strategies.
Nevertheless, the indigenous knowledge is rarely taken into consideration
in the design and implementation of modern and adaptation strategies by
governments. Only 8% of survey respondents mentioned that as an
adaptation measure, they have practiced irrigation on small scale during
winter cropping (Plate 1). Mushy and Mbonile (2017) however revealed
that, traditional irrigation system was the major farm-level adaptation
strategy to climate change among smallholder farmers in Moshi Rural
District, Tanzania. This was basically done on newly introduced crop
varieties and horticultural crops which mature early and have high market
demand.
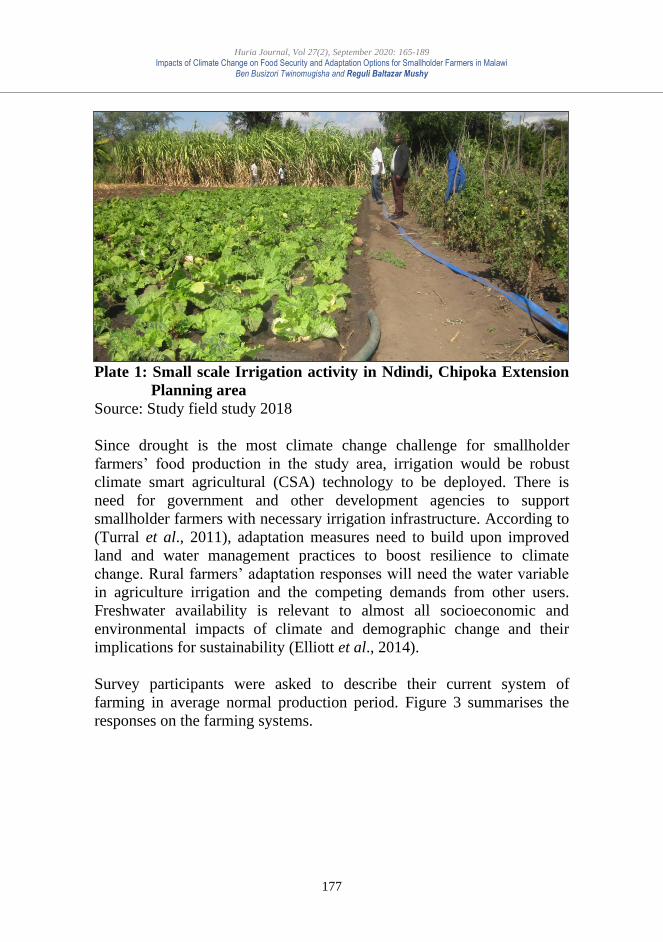
Huria Journal, Vol 27(2), September 2020: 165-189
Impacts of Climate Change on Food Security and Adaptation Options for Smallholder Farmers in Malawi Ben Busizori Twinomugisha and Reguli Baltazar Mushy
177
Plate 1: Small scale Irrigation activity in Ndindi, Chipoka Extension
Planning area
Source: Study field study 2018
Since drought is the most climate change challenge for smallholder
farmers’ food production in the study area, irrigation would be robust
climate smart agricultural (CSA) technology to be deployed. There is
need for government and other development agencies to support
smallholder farmers with necessary irrigation infrastructure. According to
(Turral et al., 2011), adaptation measures need to build upon improved
land and water management practices to boost resilience to climate
change. Rural farmers’ adaptation responses will need the water variable
in agriculture irrigation and the competing demands from other users.
Freshwater availability is relevant to almost all socioeconomic and
environmental impacts of climate and demographic change and their
implications for sustainability (Elliott et al., 2014).
Survey participants were asked to describe their current system of
farming in average normal production period. Figure 3 summarises the
responses on the farming systems.
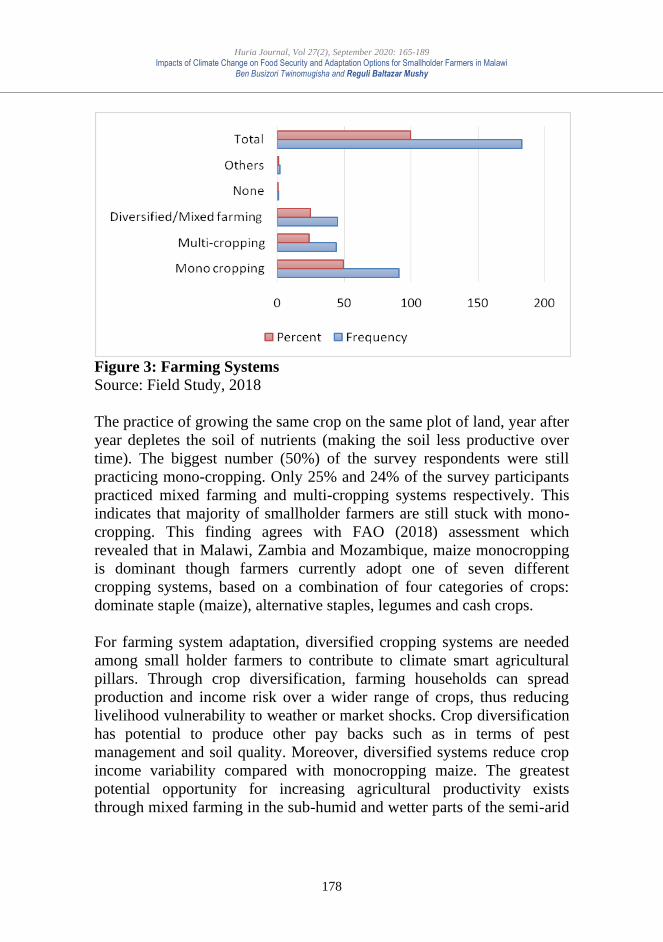
Huria Journal, Vol 27(2), September 2020: 165-189
Impacts of Climate Change on Food Security and Adaptation Options for Smallholder Farmers in Malawi Ben Busizori Twinomugisha and Reguli Baltazar Mushy
178
Figure 3: Farming Systems
Source: Field Study, 2018
The practice of growing the same crop on the same plot of land, year after
year depletes the soil of nutrients (making the soil less productive over
time). The biggest number (50%) of the survey respondents were still
practicing mono-cropping. Only 25% and 24% of the survey participants
practiced mixed farming and multi-cropping systems respectively. This
indicates that majority of smallholder farmers are still stuck with mono-
cropping. This finding agrees with FAO (2018) assessment which
revealed that in Malawi, Zambia and Mozambique, maize monocropping
is dominant though farmers currently adopt one of seven different
cropping systems, based on a combination of four categories of crops:
dominate staple (maize), alternative staples, legumes and cash crops.
For farming system adaptation, diversified cropping systems are needed
among small holder farmers to contribute to climate smart agricultural
pillars. Through crop diversification, farming households can spread
production and income risk over a wider range of crops, thus reducing
livelihood vulnerability to weather or market shocks. Crop diversification
has potential to produce other pay backs such as in terms of pest
management and soil quality. Moreover, diversified systems reduce crop
income variability compared with monocropping maize. The greatest
potential opportunity for increasing agricultural productivity exists
through mixed farming in the sub-humid and wetter parts of the semi-arid
Huria Journal, Vol 27(2), September 2020: 165-189
Impacts of Climate Change on Food Security and Adaptation Options for Smallholder Farmers in Malawi Ben Busizori Twinomugisha and Reguli Baltazar Mushy
179
zone of Sub-Saharan Africa (Powell and Williams, 1995; Bradshaw et al.,
2004).
Indigenous Adaptation
Smallholder farmers in the study area, like other countries in Africa, have
their own indigenous coping ways and adaptation practices of producing,
preserving and storing food for future use especially in times of food
shortage. FGDs participants at both Karonga II and Kuntupa villages
agreed with (36%) survey respondents who asserted that they were still
depending on indigenous knowledge to enhance food security amidst
climate change challenge. Moreover, 24% said that they change cropping
calendar/cropping pattern, attributed this to their traditional coping
strategies. Only 22% mentioned that they adopted improved crop and
animal species to adapt and ensure food security. FGDs confirmed that
farmers have always adapted to seasonal and climatic changes through
their local coping strategies that have already existed for ages and there
were traditional measures of ensuring that the households did not suffer
from food shortage during any part of the year.
This study probed further on the live examples of traditional knowledge
and coping strategies that were maintained to improve local adaptive
capacity. Table 1 highlights some of the findings on traditional
knowledge of adaptation strategies for smallholder farmers’ food
production. This body of indigenous knowledge and initiatives ensured
that food is properly and adequately produced and stored to avoid wastage
and preserved for future use. This was used as a buffer for disaster-
preparedness, allowing food availability, stability and accessibility by the
household anytime it is needed.
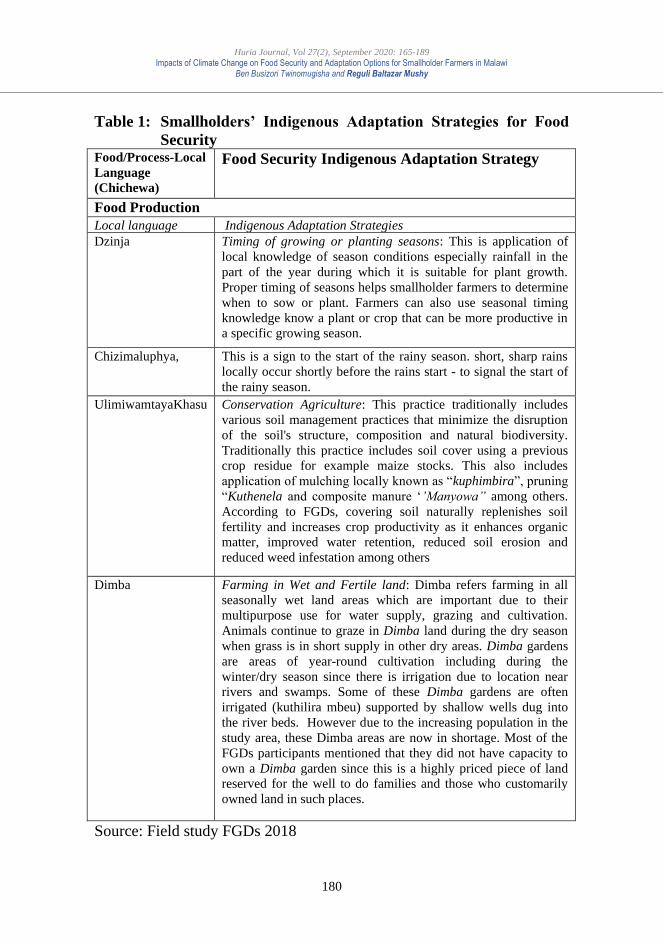
Huria Journal, Vol 27(2), September 2020: 165-189
Impacts of Climate Change on Food Security and Adaptation Options for Smallholder Farmers in Malawi Ben Busizori Twinomugisha and Reguli Baltazar Mushy
180
Table 1: Smallholders’ Indigenous Adaptation Strategies for Food
Security Food/Process-Local
Language
(Chichewa)
Food Security Indigenous Adaptation Strategy
Food Production
Local language Indigenous Adaptation Strategies
Dzinja Timing of growing or planting seasons: This is application of
local knowledge of season conditions especially rainfall in the
part of the year during which it is suitable for plant growth.
Proper timing of seasons helps smallholder farmers to determine
when to sow or plant. Farmers can also use seasonal timing
knowledge know a plant or crop that can be more productive in
a specific growing season.
Chizimaluphya, This is a sign to the start of the rainy season. short, sharp rains
locally occur shortly before the rains start - to signal the start of
the rainy season.
UlimiwamtayaKhasu Conservation Agriculture: This practice traditionally includes
various soil management practices that minimize the disruption
of the soil's structure, composition and natural biodiversity.
Traditionally this practice includes soil cover using a previous
crop residue for example maize stocks. This also includes
application of mulching locally known as “kuphimbira”, pruning
“Kuthenela and composite manure ‘’Manyowa” among others.
According to FGDs, covering soil naturally replenishes soil
fertility and increases crop productivity as it enhances organic
matter, improved water retention, reduced soil erosion and
reduced weed infestation among others
Dimba Farming in Wet and Fertile land: Dimba refers farming in all
seasonally wet land areas which are important due to their
multipurpose use for water supply, grazing and cultivation.
Animals continue to graze in Dimba land during the dry season
when grass is in short supply in other dry areas. Dimba gardens
are areas of year-round cultivation including during the
winter/dry season since there is irrigation due to location near
rivers and swamps. Some of these Dimba gardens are often
irrigated (kuthilira mbeu) supported by shallow wells dug into
the river beds. However due to the increasing population in the
study area, these Dimba areas are now in shortage. Most of the
FGDs participants mentioned that they did not have capacity to
own a Dimba garden since this is a highly priced piece of land
reserved for the well to do families and those who customarily
owned land in such places.
Source: Field study FGDs 2018
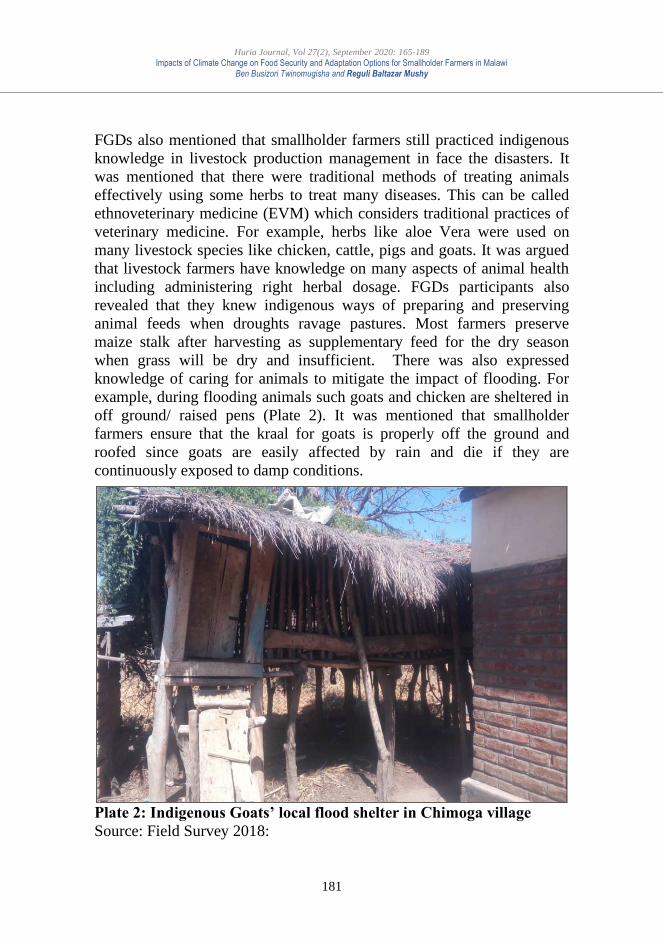
Huria Journal, Vol 27(2), September 2020: 165-189
Impacts of Climate Change on Food Security and Adaptation Options for Smallholder Farmers in Malawi Ben Busizori Twinomugisha and Reguli Baltazar Mushy
181
FGDs also mentioned that smallholder farmers still practiced indigenous
knowledge in livestock production management in face the disasters. It
was mentioned that there were traditional methods of treating animals
effectively using some herbs to treat many diseases. This can be called
ethnoveterinary medicine (EVM) which considers traditional practices of
veterinary medicine. For example, herbs like aloe Vera were used on
many livestock species like chicken, cattle, pigs and goats. It was argued
that livestock farmers have knowledge on many aspects of animal health
including administering right herbal dosage. FGDs participants also
revealed that they knew indigenous ways of preparing and preserving
animal feeds when droughts ravage pastures. Most farmers preserve
maize stalk after harvesting as supplementary feed for the dry season
when grass will be dry and insufficient. There was also expressed
knowledge of caring for animals to mitigate the impact of flooding. For
example, during flooding animals such goats and chicken are sheltered in
off ground/ raised pens (Plate 2). It was mentioned that smallholder
farmers ensure that the kraal for goats is properly off the ground and
roofed since goats are easily affected by rain and die if they are
continuously exposed to damp conditions.
Plate 2: Indigenous Goats’ local flood shelter in Chimoga village
Source: Field Survey 2018:
Huria Journal, Vol 27(2), September 2020: 165-189
Impacts of Climate Change on Food Security and Adaptation Options for Smallholder Farmers in Malawi Ben Busizori Twinomugisha and Reguli Baltazar Mushy
182
However, it was mentioned that ethno-veterinary knowledge was
declining since they were adopting hybrid animals that are not easily
treated by ethnoveterinary herbalists who have more knowledge on how
to deal with the traditional local breeds. This finding agrees with Jacob et
al. (2004) study among the Masai pastoralists of Kenya that face a decline
in their superior livestock diagnostic skills. The study among Masai
reveals that with the advent of modern veterinary medicine, the Maasai
ethnoveterinary practice appears to be on the decline. Likewise, in Kenya,
the study revealed a testimony that government’s veterinary services
discourage development and utilisation of ethno-veterinary medicines and
promote use of modern veterinary medicines. However, the KIIs with
district environmental office alluded to the fact that traditional veterinary
practices persist because that is what farmers can easily afford. Climate
change is likely to increase livestock diseases which call for improvement
in ethno-veterinary services to be relevant.
Other Short and Long-term Adaptation Options
Survey respondents were further asked to identify a shortlist of survival
strategies adopted in their farming system to respond to climate change in
short and long-term scenarios. Most respondents (52%) claimed to have
adopted drought tolerant crops.
During FGDs it was mentioned that various seed companies are
producing and supplying smallholder farms with drought-tolerant,
disease-resistant and yield-improved legume and maize seeds. The
outstanding performance of the drought tolerant varieties is raising hopes
amongst smallholder farmers. To ensure that smallholder farmers produce
enough food, there need to promote drought tolerant crop varieties.
However, 18% of respondents were still relying on indigenous crops and
livestock management strategies. They believed that indigenous coping
strategies were more available, accessible and affordable. Smallholder
farmers used traditional technologies to help increase agricultural
productivity. These technologies are mainly built on an understanding of
how soils are renewed and how to increase soil fertility whilst avoiding
erosion. They include information on contour cropping, how to construct
and use fencing and how best to manage mixed farming or agro-forestry
to full effect. Traditional technologies also help control and manage pests.
Much of this knowledge has tremendous value in the context of crop
production and the threat of climate change. Local knowledge helps
interpret changes in the weather and seasons, which are key ingredients of
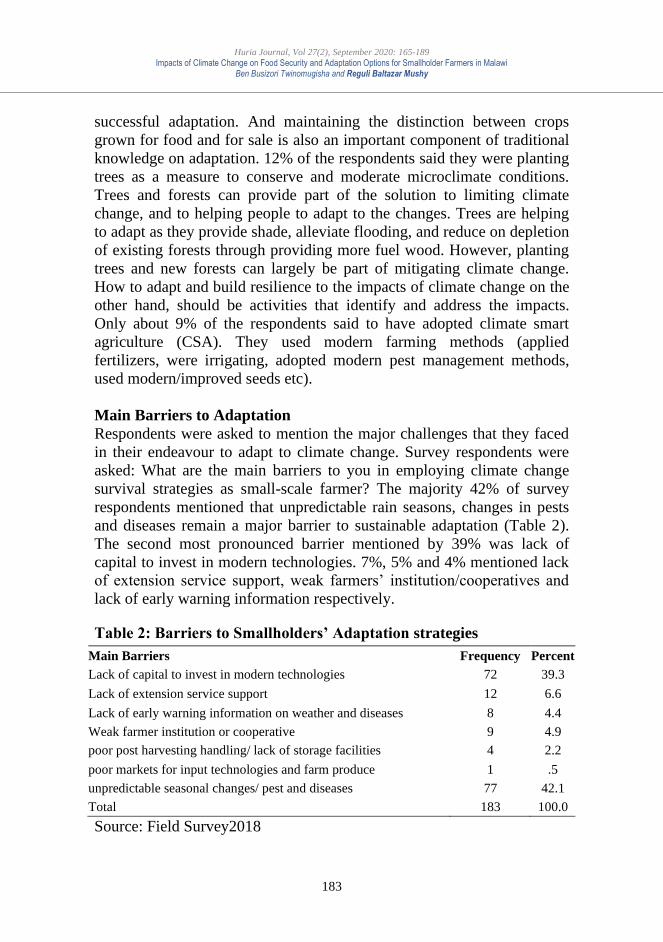
Huria Journal, Vol 27(2), September 2020: 165-189
Impacts of Climate Change on Food Security and Adaptation Options for Smallholder Farmers in Malawi Ben Busizori Twinomugisha and Reguli Baltazar Mushy
183
successful adaptation. And maintaining the distinction between crops
grown for food and for sale is also an important component of traditional
knowledge on adaptation. 12% of the respondents said they were planting
trees as a measure to conserve and moderate microclimate conditions.
Trees and forests can provide part of the solution to limiting climate
change, and to helping people to adapt to the changes. Trees are helping
to adapt as they provide shade, alleviate flooding, and reduce on depletion
of existing forests through providing more fuel wood. However, planting
trees and new forests can largely be part of mitigating climate change.
How to adapt and build resilience to the impacts of climate change on the
other hand, should be activities that identify and address the impacts.
Only about 9% of the respondents said to have adopted climate smart
agriculture (CSA). They used modern farming methods (applied
fertilizers, were irrigating, adopted modern pest management methods,
used modern/improved seeds etc).
Main Barriers to Adaptation
Respondents were asked to mention the major challenges that they faced
in their endeavour to adapt to climate change. Survey respondents were
asked: What are the main barriers to you in employing climate change
survival strategies as small-scale farmer? The majority 42% of survey
respondents mentioned that unpredictable rain seasons, changes in pests
and diseases remain a major barrier to sustainable adaptation (Table 2).
The second most pronounced barrier mentioned by 39% was lack of
capital to invest in modern technologies. 7%, 5% and 4% mentioned lack
of extension service support, weak farmers’ institution/cooperatives and
lack of early warning information respectively.
Table 2: Barriers to Smallholders’ Adaptation strategies
Main Barriers Frequency Percent
Lack of capital to invest in modern technologies 72 39.3
Lack of extension service support 12 6.6
Lack of early warning information on weather and diseases 8 4.4
Weak farmer institution or cooperative 9 4.9
poor post harvesting handling/ lack of storage facilities 4 2.2
poor markets for input technologies and farm produce 1 .5
unpredictable seasonal changes/ pest and diseases 77 42.1
Total 183 100.0
Source: Field Survey2018

Huria Journal, Vol 27(2), September 2020: 165-189
Impacts of Climate Change on Food Security and Adaptation Options for Smallholder Farmers in Malawi Ben Busizori Twinomugisha and Reguli Baltazar Mushy
184
The Sustainable Livelihoods Framework (SLF) places considerable
importance to livelihood assets referred to as capitals that determine how
people respond to the impacts of climate change. 39% of survey
respondents mentioned lack of capital to invest in transformative and
climate smart agriculture. During FGDs, lack of financial capital was
talked about as the key challenge. One of the participants mentioned that;
‘’with availability of money all other adaptation requirements can be
secured’’. It was also mentioned that the banks loans were not accessible
to smallholder farmers due to lack of collateral for loan. Moreover, the
banks’ interest rates were also said to be so high and not friendly to small
holders’ farming business. Even worse, there was lack of Microfinance
Institutions (MFIs) operating in the study area. MFIs provide access to
financial credit for smallholder farmers as commercial banks hardly
invest in small scale agriculture (Levy 2005). The nature and combination
of the lack of livelihood assets, to which smallholder farmers and
communities have access, determines adaptation choices.
Despite many respondents having said that they had accessed extension
services, FGDs and the state of agricultural extension services report got
from Civil Society Agriculture Network CISANET indicated that there
were gaps. The agriculture extension services are under Ministry of
Agriculture, Irrigation and Water Development which receives meagre
share of national budget allocation. The FGDs participants mentioned that
services have declined compared with the agricultural sector in the 1970s
and 80s where the sector used to enjoy adequate financing. Accordingly,
in the 1980s extension policy emphasised the need to maintain an
extension worker/farmer ratio ranging from 1:750 to 1:850 which was
recommended for effective and efficient extension service delivery.
During that time extension workers were following the block extension
system (a modified training and visit system) which had a well specified
visitation schedules with regular in-service training programmes. With
this, farmers, field extension staff as well as their supervisors including
research staff interacted very frequently. Funding for the sector declined
leading to dwindling of extension staff/farmer ratios ranging from 1:1500
to 1:3900.
Conclusion and Recommendations
This article analysed how climate change spreads its impacts across the
four pillars of food security and how smallholder farmers adapt in Salima,
Malawi. The study findings indicate that, food security is affected by
Huria Journal, Vol 27(2), September 2020: 165-189
Impacts of Climate Change on Food Security and Adaptation Options for Smallholder Farmers in Malawi Ben Busizori Twinomugisha and Reguli Baltazar Mushy
185
climate change across the four pillars of food accessibility, availability,
accessibility, utilisation and affordability. Changes in rainfall amount and
patterns that lead to droughts and floods extreme events has resulted in
poor food production. Continuous rainfall variability and drought are
likely to intensify food insecurity. The majority (39%) of survey
respondents mentioned lack of capital to invest in transforming
agriculture as a key barrier to response to climate disasters that in turn
increases vulnerability to food insecurity. Lack of diversification of
livelihoods, high levels of unemployment and poverty may continue to be
a barrier to many households ‘efforts to achieve their food needs. There is
need for government and other development stakeholders to promote
diversification of smallholder farmers’ livelihood strategies through
multiple income sources, both on and off-farm, with a solid asset base
source since this is extremely critical factor as it enables households to
spread risk against climate shocks/tresses. This will possible through
promotion of importance of learning from proven practices by successful
farmers.
In terms of adaptation strategies, it was found out that many of the
smallholder farmers in Salima still depended on indigenous knowledge.
Analysis of adaptation strategies indicates that the four (4) pillars of food
security would be to some extent warranted amidst climate change if there
was deliberate effort to preserve and improve local/indigenous adaptation
practices in the short-term. However, indigenous knowledge systems have
been eroded over the past years due to changes in social structures and
adoption of new farming technologies and changes in lifestyles. It should
be noted that indigenous knowledge as heritage is many pieces that form
adaptation masterpiece to comprise smallholder farmers’ journey of
adaptation to climate change. Indigenous knowledge remains and integral
part of Malawi’s smallholder farmers' lives and local coping strategies
that provide affordable solutions and the foundation for them (smallholder
farmers) to apply their own ideas on how to survive during harsh times.
However, given the increasing intensity and occurrences of climate
change impacts, indigenous knowledge will not be enough to address
smallholder farmers’ adaptation needs. There are expected new and
unique climate change risks and conditions which are outside the range of
those previously experienced. The indigenous adaptations which were
being practiced will be rendered insufficient in face of new
vulnerabilities. Despite some few farmers adopting improved
Huria Journal, Vol 27(2), September 2020: 165-189
Impacts of Climate Change on Food Security and Adaptation Options for Smallholder Farmers in Malawi Ben Busizori Twinomugisha and Reguli Baltazar Mushy
186
technologies, there is a great need to invest in technologies that will resist
and manage climate risks to food security and address the vulnerabilities
and weaknesses in food systems. The study found out that agricultural
extension service plays a critical role to initiate transformative climate
change responses within smallholder farming system and that the
Government of Malawi has put in place policies for example National
Climate Change Management Policy 2016 and National Agriculture
Policy 2016, however, due to lack of funds, these policies are not fully
implemented to address smallholder farmers’ climate change extension
services concerns and needs.
REFERENCES
Adger WN, Arnell NW, Tompkins EL. 2005. Successful adaptation to
climate change across scales. Global Environmental Change.15 (2):
77-86.
Chipungu FP, Ambali JD, Kalenga NM, Mkumbira, J. 2012. Sweet potato
Indigenous Knowledge and Adaptation to Climate Change in
Malawi. Acta Horticulturae: 467-473. Daccache
Civil Society Agriculture Network. 2013. The state of agricultural
extension services in Malawi report 2013
Diagne A, Zeller M. 2001. Access to credit and its impact on welfare in
Malawi. Vol. 116. International Food Policy Research Institute
(IFPRI).
Elliott J, Deryng D, Müller C, Frieler K, Konzmann M, Gerten D, Eisner
S. 2014. Constraints and potentials of future irrigation water
availability on agricultural production under climate change.
Proceedings of the National Academy of Sciences, 111(9), 3239-
3244.
Food and Agriculture Organization [FAO]. 1996. World Food Summit,
Corporate Document Repository. Rome, Italy.
Food and Agriculture Organization [FAO]. 2013. FAO, WFP, IFAD
.2013. "The State of Food Insecurity in the World 2013. The
multiple dimensions of food security" (PDF). FAO. Retrieved 26
November 2013.
Food and Agriculture Organization [FAO]. 2018 The 2018 edition of The
State of Food Security and Nutrition in the World (SOFI).
http://www.fao.org/3/CA2607EN/ca2607en.pdf
Government of Malawi 2015. National disaster risk management policy,
2015
Huria Journal, Vol 27(2), September 2020: 165-189
Impacts of Climate Change on Food Security and Adaptation Options for Smallholder Farmers in Malawi Ben Busizori Twinomugisha and Reguli Baltazar Mushy
187
Government of Malawi. 2016. Malawi Drought 2015-2016, Post-Disaster
Needs Assessment (PDNA). Malawi, Lilongwe.
Government of Malawi. 2016. Malawi Vulnerability Assessment
Committee (MVAC) Report on food security 2016.
Howard F, Jeremy H, George L, Josephine M, Michael M. 2008) Climate
Change: The Public Health Response. Am J Public Health 98: 435-
445.
http://www.nsomalawi.mw/index.php
Intergovernmental Panel on Climate Change. 2013: Climate Change
2013: The Physical Science Basis. Contribution of Working Group I
to the Fifth Assessment Report of the [Stocker, T.F., D. Qin, G.-K.
Plattner, M. Tignor, S.K. Allen, J. Boschung, A. Nauels,
Y.https://www.ipcc.ch/report/ar5/wg1/
Inter-Panel Committee on Climate Change. 2014. The Fifth Assessment
Report (AR5). Assessment of scientific, technical and socio-
economic information concerning climate change, its potential
effects and options for adaptation and mitigation. UNFCCC Bonn,
Germany.
Inter-Panel Committee on Climate Change. 2018: Special Report on the
impacts of global warming of 1.5°C. [V. Masson-Delmotte, P. Zhai,
H. O. Pörtner, D. Roberts, J. Skea, P.R. Shukla, A. Pirani, W.
Moufouma-Okia, C. Péan, R. Pidcock, S. Connors, J. B. R.
Matthews, Y. Chen, X. Zhou, M. I. Gomis, E. Lonnoy, T. Maycock,
M. Tignor, T. Waterfield (eds.)]. In Press.
Jacob M, Kassim O, Wellington N. 2004. Indigenous Knowledge: The
Basis of The Maasai Ethnoveterinary Diagnostic Skills, Journal of
Human Ecology, 16:1, 43-48, DOI: 10.1080/09709274.2004.
11905714
Jamu D, Banda M, Njaya F, Hecky ER. 2011. Challenges to sustainable
management of the lakes of Malawi. Journal of Great Lakes
Research 37:3-14 DOI: 10.1016/j.jglr.2010.11.017
Levy S. 2005. Starter Packs: A Strategy to Fight Hunger in Developing
Countries? Lessons from the Malawi Experience 1998–2003.
Wallingford: CABI.
Mahesh C, Thakur, D. 2017: Using Social Media for the Farmers: A
SWOT Analysis. [accessed June 29 2018]:
https://www.researchgate.net/publication/326479743_Using_Social
_Media_for_Farmers_A_SWOT_Analysis.
Makwinja R, M’balaka. 2017. Potential Impact of Climate Change on
Lake Malawi Chambo (Oreochromis spp.) Fishery. Department of

Huria Journal, Vol 27(2), September 2020: 165-189
Impacts of Climate Change on Food Security and Adaptation Options for Smallholder Farmers in Malawi Ben Busizori Twinomugisha and Reguli Baltazar Mushy
188
Physics and Biochemical Sciences, The Polytechnic University of
Malawi; Blantyre (Malawi).
Mushy, R.B. and Mbonile, M.J., (2017) Adaptation Strategies to Climate
Change Among the Smallholder Farmers in Moshi Rural District,
Tanzania. Journal of Geographic Association of Tanzania Vol.
38(1)
National Statistical Office. 2018. Population and Housing Census (2018
PHC), Malawi.
Nwagbara, M. and Nwagbara, O. 2017. The Role of Radio Stations in
Creating Awareness of Climate Change among Crop Farmers in
Abia State. The International Journal of Social Sciences and
Humanities Invention. 10.18535/ijsshi/v4i4.09.
Nyong A, Adesina F, Elasha B. 2007. The value of indigenous knowledge
in climate change mitigation and adaptation strategies in the African
Sahel. Mitigation and Adaptation strategies for global Change,
12(5), 787-797.
Powell J, Williams T. 1995. An overview of mixed farming systems in
sub-Saharan Africa. In International Conference on Livestock and
Sustainable Nutrient Cycling in Mixed Farming Systems of Sub-
Saharan Africa, Addis Ababa (Ethiopia), 22-26 Nov 1993. ILCA.
Sarah E. 2008. The Changing Climate for Food and Agriculture: A
Literature Review. Institute for Agriculture and Trade Policy
Minneapolis, Minnesota
Scoones I. 2015. Livelihoods Frameworks and Beyond. Practical Action
Publishing.
Seo SN, Mendelsohn R. 2008. An analysis of crop choice: Adapting to
climate change in South American farms. Ecological economics,
67(1), 109-116.
Thakur, D., Devesh, T., Chander, M. 2018. Effectiveness of whatsapp for
sharing agricultural information among farmers of Himachal
Pradesh. Journal of Hill Agriculture. 9. 10.5958/2230-
7338.2018.00022.8.
Turral H, Burke J, Faurès J. 2011. Climate change, water and food
security. Rome: Food and Agriculture Organization of the United
Nations.
Twinomugisha B. 2009. Indigenous Adaptation Strategies: Small-scale
Farming in Uganda. Tiempo Climate Cyberlibrary. Stockholm
Environment Institute and the International Institute for
Environment and Development. Available at: http://tiempo.sei-
international.org/newswatch/xp_feature110714.htm
Huria Journal, Vol 27(2), September 2020: 165-189
Impacts of Climate Change on Food Security and Adaptation Options for Smallholder Farmers in Malawi Ben Busizori Twinomugisha and Reguli Baltazar Mushy
189
United Nations System Standing Committee on Nutrition. 2010. Climate
change and nutrition security. Switzerland.
Vollmer HA, Martin KBR, Hecky E, Graeme PJD, Halfman JM, Edmond
DH, Eccles RFW. 2005. Deep‐water warming trend in Lake
Malawi, East Africa. First published: 17 March 2005
https://doi.org/10.4319/lo.2005.50.2.0727 Accessed 28/01/2019
online library.
Huria Journal, Vol 27(2), September 2020: 190-202
190
Utilization of Extended Postpartum Family Planning
among Post-Delivery Women in Mvomero District,
Morogoro-Tanzania
Rogate Phinias Ibrahim
Mzumbe University
Harrieth G. Mtae
The Open University of Tanzania
ABSTRACT
This study aimed at examining factors associated with the use of Extended
Postpartum Family Planning (EPPFP) methods among post delivery
women in Mvomero District, Morogoro, Tanzania. Based on cross-
sectional design, the data collection activity was conducted on March
2020 to 256 post delivery women who delivered a child between January
1, 2019 and January 31, 2020. Purposive and convenience sampling were
used to get respondents of the study. Data were collected using
questionnaire. Through SPSS tool, descriptive analyses comprising of
Pearson’s chi squire test was employed to establish association between
independent and dependent variables. The prevalence of extended
postpartum family planning utilization was 46%, the utilization of EPPFP
was significantly associated with awareness of the reason for EPPFP use
(P-value=0.013), awareness of EPPFP method (P-value=0.014),
awareness of EPPFP side effects (P-value= 0.024), counselling sessions
(P-value=0.000), menses resumption (P-value=0.010), duration of sexual
activity (P-value=0.011) and history of previous pregnancy (P-
value=0.000). Prevalence of EPPFP utilization among post delivery
women is still low in Mvomero district. Enhancement of the utilization of
EPPFP during the postpartum period needs effective response by
stakeholders through provision of family planning education particularly
during all maternal and child health contacts.
Keywords: Extended Post-Partum Family Planning, Post-delivery
mothers, Tanzania
INTRODUCTION
Although a number of efforts have been made by the government of
Huria Journal, Vol 27(2), September 2020: 190-202
Utilization of Extended Postpartum Family Planning among Post-Delivery Women in Mvomero District, Morogoro-Tanzania Rogate Phinias Ibrahim and Harrieth G. Mtae
191
health facility deliveries from 47% in 2005 to 63% in 2015; and
increasing the number of health facility deliveries attended by skilled
health workers from 46% in 2005 to 64% in 2015 (UNICEF, 2018), yet
the prevalence rate of family planning methods is still 32%
(MoHCDGEC, 2017) and EPPFP in Tanzania is 40%(TDHS-MIS,
2016).Studies reveal high unmet need of EPPFP among women in
Tanzania evidenced by the findings that the total unmet need from 0-5
months postpartum is 81% and 61% from 6-11 postpartum months
(Winfrey & Ross, 2001; USAID, 2014; USAID, 2017).
In Morogoro specifically, in spite of the knowledge of FP being
widespread at 100%, only 45.7% of women use PPFP methods with
unmet need of 16% (TDHS-MIS, 2016). It is known that, provision of
EPPFP help to address women’s unmet need for EPPFP in the first year
after delivery, and in so doing become the best intervention in reducing
maternal and infant mortality (Vernon, 2009). Since the number of
deliveries attended by skilled health facilities has increased from 819 in
2009 to 4,435 deliveries in 2016 in Morogoro; it is expected that, health
care workers would use that opportunity to offer information and
knowledge about the use of EPPFP to the post delivery mothers during
ANC and PNC period, but that is not mostly done in the facility (Thamini
Uhai, 2016).
The DHIS -2, (2019) shows that in Mvomero district, the majority of the
pregnant women visit prenatal services and finally deliver in health
facilities. The total number of women delivered at health facilities for
three consecutive years from 2015 to 2018 were 30,327 while the number
of women who used EPPFP from 2015 to 2018 were 1221which is equal
to 4% (DHS-2, 2019). In 2015, a total of 7638 (56%) women delivered at
health facility, whereby among them 308 (4.8%) used EPPFP. In 2016, a
total of 7010 (50.5%) women delivered at health facility, while only 127
(1.8%) among them used EPPFP. In 2017, a total of 7329 (51.5%) women
delivered at health facility, and 344 (4.6%) among them used EPPFP.
Furthermore, records show that in 2018, a total of 8350 (57.3%) women
delivered at health facility and 442 (5.2%) among them used EPPFP
(DHS-2, 2019). The facts presented reveal a very low use of EPPFP when
compared to the health facility deliveries in Mvomero district. The low
EPPFP uptake necessitated a study on factors associated with utilization
of EPPFP among postpartum women in Mvomero District.
Huria Journal, Vol 27(2), September 2020: 190-202
Utilization of Extended Postpartum Family Planning among Post-Delivery Women in Mvomero District, Morogoro-Tanzania Rogate Phinias Ibrahim and Harrieth G. Mtae
192
METHODOLOGY
Study Design and Setting
The study adopted a facility-based cross-sectional survey design to obtain
information from 256 post delivery mothers who were within 12 months’
post-partum period. This study was conducted in Mvomero district,
Morogoro region, Tanzania. Data were collected from four health
facilities, two were public owned health facilities and two were private
owned health facilities.
Study Population and Sampling Procedure
The study population were all reproductive women aged 15 to 45 years
who delivered a baby between January 2019 and January 31, 2020 in
Mvomero district. The sampling frame of this study was 737 post delivery
women; the sample size was 256 post delivery women whom were
determined using the previously published sample size table by Israel
(2003). Purposive sampling method was used to select Morogoro region,
Mvomero district, the four selected health facilities and the health facility
workers while post delivery women were selected using convenience
sampling technique.
Data Collection, Processing and Analysis
A structured questionnaire was developed to gather information from
respondents. The questionnaire was developed in English and translated
into Swahili to aid understanding of respondents and it was pre-tested to
ten respondents in order to improve it. The filled questionnaires were
reviewed daily throughout the data collection activity, and the collected
data were entered into Microsoft excel daily in order to facilitate the
process and have confidence on the data, then data were cleaned on the
Microsoft spread sheet and transferred to the Statistical Package for
Social Science (SPSS) version 20 ready for data analysis. Descriptive
statistics which led to creation of frequencies and tables to describe
findings. The descriptive statistics was applied to analyze frequency and
cross tabulation to explore the association between independent variables
and dependent variable. The Pearson chi-square test was used to test
association between dependent variable (EPPFP use) and independent
variables (socio-demographic factors, knowledge and information factors,
fertility and reproductive factors and method related factors).

Huria Journal, Vol 27(2), September 2020: 190-202
Utilization of Extended Postpartum Family Planning among Post-Delivery Women in Mvomero District, Morogoro-Tanzania Rogate Phinias Ibrahim and Harrieth G. Mtae
193
FINDINGS
Social Demographic Characteristics
The study examined 256 post delivery mothers with a response rate of
100%. Almost three quarter of the respondents, 110 (43%) and 111
(43.4%) were between 15-24 and 25-34 years of age respectively. The
mean age of study participants was 26.9 (SD ± 6.017) and the minimum
and maximum age was 18 and 43 respectively. A total of 198(77.3%)
respondents were married, both mothers and their husbands 177 (69.8%)
and 178(72%) respectively had primary level of education, nearly half of
mothers 114(44.5%) were doing small businesses and majority of them
136(53.1%) were Christians. (Table 1)
Knowledge and Information of Post Delivery Mothers
Almost all mothers 249(97.3%) were aware that EPPFP is used to space
pregnancy and prevent unwanted pregnancy, majority of respondents
246(96.4%) were aware of the EPPFP method(s). More than half,
162(63.3%) were not aware of the side effects of the EPPFP. Majority of
mothers, 160 (67.7%) attended counselling sessions about family
planning and almost all mothers, 153 (94.4%) understood the sessions.
Nearly half of them, 71(43.8%) attended the counselling session on RCH.
More than half, 138(53.9%) of mothers were not current users of EPPFP
methods and nearly half of them, 51(43.2%) started using EPPFP on the
second month post delivery (Table 1).
Fertility and Reproductive Factors of Post Delivery Mothers
The average post partum duration (in months) of study participants was
4.54 (SD ± 3.395). Majority of mothers, 174 (71%) had delivered within
six months before the study was conducted. 196 (76.6%) of mothers
reported that their recent pregnancy was planned and 243 (93.9%)
preferred to have birth spacing. The average number of children mothers
wished to have in their entire life was 4 (SD ± 1.597), the minimum was 1
child and maximum was 10 children while the average number of
children mothers were currently having was 2 (SD ± 1.324), the minimum
was 1child and maximum was 6 children. A total of 161 (62.9%)
respondents wished to have less than six children in their entire life and
201 (78.5%) respondents had currently less than 4 children. Majority of
respondents, 213(83.2%) reported that their menses had resumed after
their recent birth and almost three quarter reported to have resumed
menses within 3 months, the average months were 1.6 (SD ± 1.262) and
maximum was 9 months. Majority of women resumed sexual activity
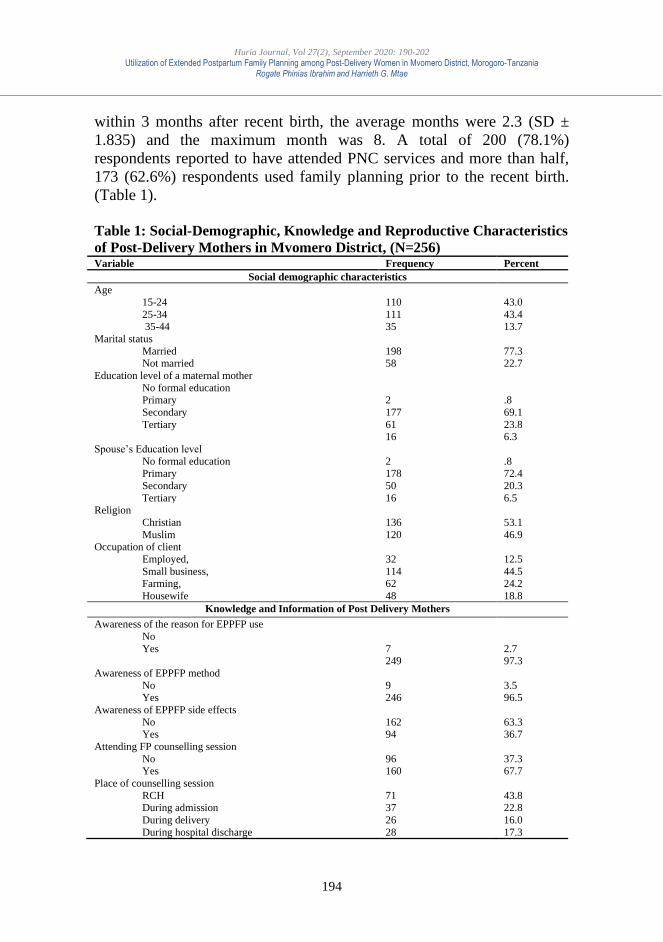
Huria Journal, Vol 27(2), September 2020: 190-202
Utilization of Extended Postpartum Family Planning among Post-Delivery Women in Mvomero District, Morogoro-Tanzania Rogate Phinias Ibrahim and Harrieth G. Mtae
194
within 3 months after recent birth, the average months were 2.3 (SD ±
1.835) and the maximum month was 8. A total of 200 (78.1%)
respondents reported to have attended PNC services and more than half,
173 (62.6%) respondents used family planning prior to the recent birth.
(Table 1).
Table 1: Social-Demographic, Knowledge and Reproductive Characteristics
of Post-Delivery Mothers in Mvomero District, (N=256) Variable Frequency Percent
Social demographic characteristics
Age
15-24
25-34 35-44
110
111 35
43.0
43.4 13.7
Marital status
Married
Not married
198 58
77.3 22.7
Education level of a maternal mother
No formal education
Primary
Secondary
Tertiary
2
177
61 16
.8
69.1
23.8 6.3
Spouse’s Education level
No formal education
Primary
Secondary
Tertiary
2 178
50
16
.8 72.4
20.3
6.5 Religion
Christian
Muslim
136
120
53.1
46.9 Occupation of client
Employed,
Small business, Farming,
Housewife
32
114 62
48
12.5
44.5 24.2
18.8
Knowledge and Information of Post Delivery Mothers
Awareness of the reason for EPPFP use
No
Yes
7 249
2.7 97.3
Awareness of EPPFP method
No
Yes
9 246
3.5 96.5
Awareness of EPPFP side effects
No
Yes
162 94
63.3 36.7
Attending FP counselling session
No
Yes
96 160
37.3 67.7
Place of counselling session
RCH
During admission
During delivery
During hospital discharge
71 37
26
28
43.8 22.8
16.0
17.3

Huria Journal, Vol 27(2), September 2020: 190-202
Utilization of Extended Postpartum Family Planning among Post-Delivery Women in Mvomero District, Morogoro-Tanzania Rogate Phinias Ibrahim and Harrieth G. Mtae
195
Understanding counselling session No
Yes
9
153
5.6
94.4 Current use of EPPFP method
No
Yes
138
118
53.9
46.1 Start time of EPPFP use (Months)
1st
2nd
3rd
4th
5th
25 51
38
3 1
21.2 43.2
32.2
2.5 .8
Fertility and Reproductive Factors of Post Delivery Mothers
Post partum duration (Months) ≤6
>6
174
71
71.0
29.0
Planned birth
No
Yes
60
196
23.4
76.6
Prefer birth spacing
No
Yes
13
243
5.1
93.9
Number of children wish to have
≤4
>4
161
95
62.9
37.1
Number of children having
≤4
>4
201
55
78.5
21.5
Menses resumption No
Yes
43
213
16.8
83.2
Duration of menses resumption ≤3
>3
207
14
93.7
6.3
Resumed sexual activity (months) Not yet
≤3
>3
20
182 54
7.8
71.1 21.1
PNC visit
No
Yes
56 200
21.9 78.1
History of previous use of FP
No
Yes
83 173
32.4 62.6
Source: Field data (2020)
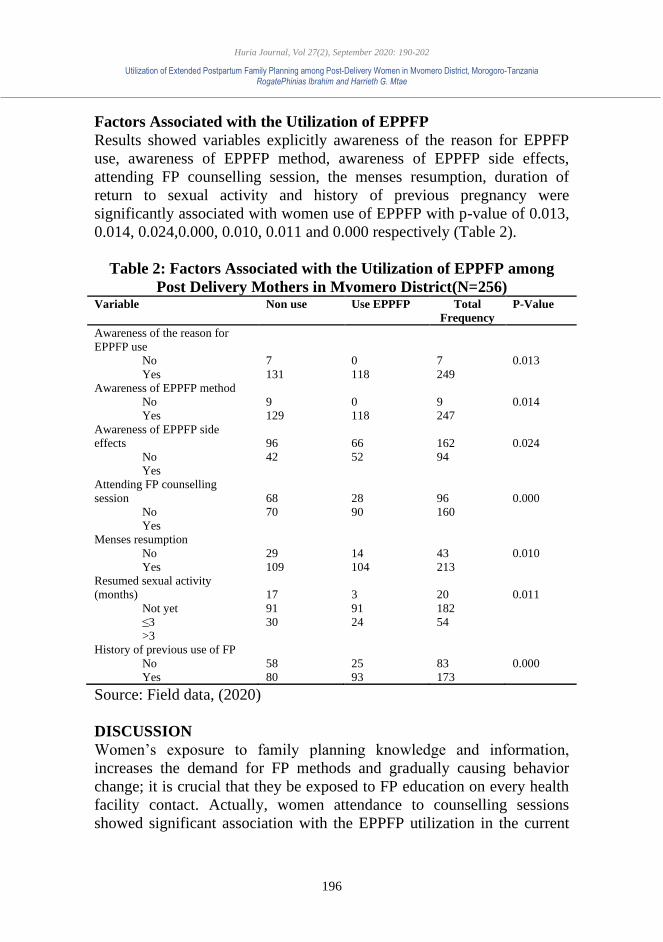
Huria Journal, Vol 27(2), September 2020: 190-202
Utilization of Extended Postpartum Family Planning among Post-Delivery Women in Mvomero District, Morogoro-Tanzania RogatePhinias Ibrahim and Harrieth G. Mtae
196
Factors Associated with the Utilization of EPPFP
Results showed variables explicitly awareness of the reason for EPPFP
use, awareness of EPPFP method, awareness of EPPFP side effects,
attending FP counselling session, the menses resumption, duration of
return to sexual activity and history of previous pregnancy were
significantly associated with women use of EPPFP with p-value of 0.013,
0.014, 0.024,0.000, 0.010, 0.011 and 0.000 respectively (Table 2).
Table 2: Factors Associated with the Utilization of EPPFP among
Post Delivery Mothers in Mvomero District(N=256) Variable Non use Use EPPFP Total
Frequency
P-Value
Awareness of the reason for
EPPFP use
No
Yes
7
131
0
118
7
249
0.013
Awareness of EPPFP method
No
Yes
9
129
0
118
9
247
0.014
Awareness of EPPFP side
effects
No
Yes
96
42
66
52
162
94
0.024
Attending FP counselling
session
No
Yes
68
70
28
90
96
160
0.000
Menses resumption
No
Yes
29
109
14
104
43
213
0.010
Resumed sexual activity
(months)
Not yet
≤3
>3
17
91
30
3
91
24
20
182
54
0.011
History of previous use of FP
No
Yes
58
80
25
93
83
173
0.000
Source: Field data, (2020)
DISCUSSION
Women’s exposure to family planning knowledge and information,
increases the demand for FP methods and gradually causing behavior
change; it is crucial that they be exposed to FP education on every health
facility contact. Actually, women attendance to counselling sessions
showed significant association with the EPPFP utilization in the current
Huria Journal, Vol 27(2), September 2020: 190-202
Utilization of Extended Postpartum Family Planning among Post-Delivery Women in Mvomero District, Morogoro-Tanzania RogatePhinias Ibrahim and Harrieth G. Mtae
197
study. This was also found in the study done in Kebribeyah Town, Somali
Region, Eastern Ethiopia by Nigussie et al. (2016) which found that
women who received family planning counselling during delivery were
more likely to use the contraceptives during postpartum period than their
counter parts. In point of fact, FP counselling provides a woman with
adequate knowledge on various FP issues which enable her to make an
informed decision concerning her maternal and child health. Health
facility workers during the interview reported that, women were going to
the health facility with their EPPFP choices in heads; this indicates
inadequate knowledge concerning FP issues and thus calls upon
stakeholders to make strategies on how family planning education
particularly during postpartum period can be publicly provided to the
community.
Moreover, the study found women who were aware of the reasons for
EPPFP services like pregnancy prevention and spacing were also utilizing
EPPFP method. Similarly, the study done in Liberia by Kaydor et al.
(2019) concerning Barriers to acceptance of post-partum family planning
among women in Liberia, found that women who were aware of the PPFP
were four times likely to use contraceptives on their postpartum period.
Essentially, it was very important to understand whether women knew the
reason for using EPPFP methods because having known the reason for
such service to her, increases the demand for it, thus this again, calls upon
healthcare workers to create awareness of EPPFP at every contact of care
to increase demand for EPPFP among women.
Furthermore, awareness of women on side effects of EPPFP methods
showed significant association to EPPFP utilization. Women who were
not aware of the side effects of EPPFP methods, were found to be using
EPPFP compared to their counterparts. This result was consistent to the
study done by Kaydor et al. (2018) in Liberia, where they found fear of
side effects was among the barrier to acceptance of PPFP methods. The
reason for the fear of side effects, might be inadequacy knowledge of
family planning, because the current study showed majority of women
who reported to have attended the FP counselling session (assumed to
have relatively adequate FP knowledge) were also using EPPFP.
Awareness of EPPFP methods showed significant association with
EPPFP utilization and the most known FP methods were injections, pills
and implants. This result was related to the study of 2018 done by
Huria Journal, Vol 27(2), September 2020: 190-202
Utilization of Extended Postpartum Family Planning among Post-Delivery Women in Mvomero District, Morogoro-Tanzania RogatePhinias Ibrahim and Harrieth G. Mtae
198
Gebremedhin and his fellow in Ethiopia concerning Family planning use
and its associated factors among women in the extended postpartum
period where they found majority of women had awareness on PPFP
methods and the most known and preferred method was Injectable. The
same results were found in Tanzania by USAID (2014) and Mtae (2018)
in a study conducted in Mvomero that the most known and preferred
method is Injectables (32%) and 28% respectively. The possible reason
might be not only that injectables are easy to take and maintain privacy to
the woman’s partner but also its availability and accessibility.
The study indicates prevalence of extended postpartum family planning
method (EPPFP) utilization to be moderately low (46%). This result is
quiet higher than the study of 2018 by Towriss & Timæus from Eastern
African countries which reported the prevalence of 37.3% and 26.6% for
Urban and Rural Tanzania respectively. This increase might be due to
exposure to family planning education to post delivery mothers as the
matter of fact all nurses interviewed testified to provide FP counselling to
women before and during delivery.
Women whose menses returned were more likely to use EPPFP, as a
result majority of woman who used EPPFP started after menses
resumption. This result was consistent to studies conducted by
(Gebremedhin et al. 2018) and (Gejo, Anshebo, & Dinsa, 2019). The
possible reason for this similarity might be due to the higher risk of
getting pregnancy that women have immediately after menses resumed
and this triggers them to use EPPFP methods. Borda and Winfrey, (2010)
did an analysis from 17 countries on the postpartum fertility and
contraception, and they found Tanzania as one among countries where
women felt low risk of getting pregnancy before returned to their menses
and subsequently started thinking of taking contraceptives after menses
resumption, the percentage of women who used contraceptive after
menses returned was two times than their counterparts.
Moreover, women who had history of FP use on previous pregnancy were
also found to be utilizing EPPFP than those who had no history of FP use
on previous pregnancy. This result is related to the result found in Addis
Ababa-Ethiopia by Gebremedhin et al. 2018 that women who had history
of FP use on the previous pregnancy were two times likely to use
contraceptives in their postpartum period.
Huria Journal, Vol 27(2), September 2020: 190-202
Utilization of Extended Postpartum Family Planning among Post-Delivery Women in Mvomero District, Morogoro-Tanzania RogatePhinias Ibrahim and Harrieth G. Mtae
199
Duration of return to sexual activity also showed statistically significant
association with EPPFP utilization in the current study. This might be due
to the fact that women who resumed to sexual activity have great fear of
getting unexpected pregnancy at anytime. This result was parallel to the
study done by Gejo et al. (2019) concerning postpartum modern
contraceptive use and associated factors in Hossana town where they
found positive relationship between contraceptive use and resumed sexual
activity. Among 17 countries including Tanzania where sexual activity
was delayed postpartum, shorter birth interval was relatively rare (Borda
& Winfrey, 2010). In Tanzania, during the second half of the first year
postpartum is when the risk of pregnancy peaks (USAID, 2014). This
might be due to the fact that women in the first six months post delivery
their sexual desire is low while on the second half of first year postpartum
their sexual desire is high.
CONCLUSION AND RECOMMENDATION
The findings of the study found that, the prevalence of EPPFP utilization
was still low (46%) in Mvomero district, Morogoro-Tanzania. The
utilization of EPPFP was significantly associated with awareness of the
reasons for EPPFP use, awareness of EPPFP method, awareness of
EPPFP side effects, receiving FP counselling sessions, menses
resumption, and duration of return to sexual activity and history of
previous pregnancy. In order to increase the demand and need for EPPFP
service during postpartum period, healthcare workers should provide
effective family planning counselling from the time a woman starts to
attend ANC, during delivery and during PNC visits. This education
exposes them to the family planning issues, guarantee better
understanding of family planning and consequently women make
informed decision on the EPPFP method during the postpartum period.
REFERENCES
Blaze, C., Prata, N. (2016). Postpartum family planning: current evidence
on successful interventions. Open access peer-reviewed scientific
and medical journals, 53—67.
Borda, M., Winfrey, W. (2010). Postpartum fertility and contraception:
An analysis of findings from 17 countries. USA: Jhpiego.
Bwazi, C. (2014). Utilization of Postpartum Family Planning Services
between Six and Twelve Months ofDelivery at Ntchisi District
Hospital, Malawi. Scientific Research journal, 1724-1737.
Huria Journal, Vol 27(2), September 2020: 190-202
Utilization of Extended Postpartum Family Planning among Post-Delivery Women in Mvomero District, Morogoro-Tanzania RogatePhinias Ibrahim and Harrieth G. Mtae
200
DHS-2. (2019). The report of FP, ANC, Health facilities deliveries of
Mvomero District for the year2015,2016,2017 and 2018. Morogoro.
Dickinson. (2011). Socio-economic status and malaria outcomes in
Mvomero District. 6-7.
Gaffield, M. E. (2014). Postpartum Women Need Family Planning, Too.
Glob Health :Science and Practice, 4-9.
Gebremedhin, Kebede, Galagay, Habitu. (2018). Family planning use and
its associated factors among women in the extended postpartum
period in Addis Ababa, Ethiopia. Contraception and Reproductive
Medicine, 40834-017-0054-5.
Gejo, N. G., Anshebo, A. A., Dinsa, L. H. (2019). Postpartum modern
contraceptive use and associated factors in Hossana town.
Israel, G. D. (2003). Determining sample size. 2-3.
Jalang’o, R., (2017). Determinants of contraceptive use among
postpartum women in a county hospital in rural Kenya. BMC Public
Health.
Jamie, H. M. (2018, July 8). psychcentral.com. Retrieved January 12,
2019, from Psychcentral.com/blog/understanding-research-
methodology: https://psychcentral.com
Kabagenyi, G., Rutaremwa, A. (2015). Postpartum family planning
utilization in Burundi and Rwanda:A comparative analysis of
population based cross-sectional data. Addis Ababa.
Kaydor, V. (2018). Barriers to acceptance of post-partum family
planningamong women in Montserrado County. Niger Postgrad
Med J, 25, 143-8. Retrieved 10 22, 2019, from http://www.npmj.org
Keogh, S.(2015). Postpartum Contraception in Northern Tanzania:
Patterns of Use, Relationship to Antenatal Intentions, and Impact of
Antenatal Counseling. Ncbi.
Kothari, Garg, G. (2014). Research Methodology: Methods and
Techniques. New Delhi: New Age International.
Mengesha (2015). Contraceptive adoption in the extended postpartum
period is low in Northwest Ethiopia. BMC Pregnancy & Childbirth,
1-6.
MoHCDGEC. (2016). The National Road Map Strategic Plan to Improve
Reproductive, Maternal,Newborn, Child & Adolescent health in
Tanzania (2016 - 2020) One Plan II. Dar es salaam: MoHCDGEC.
MoHCDGEC. (2017). National Family Planing Procedure Mannual. Dar
es salaam: MoHCDGEC.
Mtae, H.G, (2018). Fertility Preferences in Tanzania. Asessment of
Determinants of Couples’ Decisions on Fertility Preferences in

Huria Journal, Vol 27(2), September 2020: 190-202
Utilization of Extended Postpartum Family Planning among Post-Delivery Women in Mvomero District, Morogoro-Tanzania RogatePhinias Ibrahim and Harrieth G. Mtae
201
Kishapu and Mvomero District, Tanzania. Wander’s beck, South
Africa,3631
Nigussie, A., Girma, D., Tura, G. (2016). Postpartum Family Planning
Utilization and Associated Factors among Women who Gave Birth
in the Past 12 Months, Kebribeyah Town, Somali Region,Eastern
Ethiopia. Journal of Women's Health Care.
Rutaremwa, G., Kabagenyi, A., Wandera, S. O., Jhamba, T. (2015).
Predictors of modern contraceptive use during the postpartum
period among women in Uganda: a population-based cross sectional
study. BMC Public Health.
Rutstein, S. (2000). Birth intervals in developing countries:Actual and
prefered presentation. U. S. Agency for International Development.
Sileo. (2015). Determinants of family planning service uptake and use of
contraceptives among postpartum women in rural Uganda. Int J
Public Health, 987–997.
Singh, M. (2015). Awareness and acceptance of contraception in post-
partum women. International Journal of Reproduction,
Contraception, Obstetrics and Gynecology, 690-695.
TDHS-MIS. (2016). Tanzania Demographic Health Survey and Malaria
Indicator Survey, 2015-2016. Dar es Salaam.
Thamini Uhai. (2016). Tanzania Maternal Health Program. Dar es
Salaam.
UN-DESA. (2018). UN Report on Disability and Sustainable
Development Goals. Retrieved 10 22, 2019, from
https://www.un.org/development/desa/disabilities/envision2030.htm
l
UNICEF. (2018). Tanzania - Maternal & child health - The situation.
Dar-es-salaam: UNICEF Tanzania.
USAID. (2014). Family Planning Needs during the First Two Years
Postpartum in Tanzania. Washington DC: USA.
USAID. (2017). Postpartum contraceptives; Family planning methods and
Child spacing after childbirth. Retrieved 10 7, 2019, from
https://www.globalhealthlearning.org/sites/default/files/page-
files/ACCESSFP_ppcontraceptionPPT2.pdf
Vernon, R. (2009). Meeting the Family Planning Needs of Postpartum
Women. JSTOR, 40(3), 235-245. Retrieved 10 8, 2019, from
https://www.jstor.org/stable/25593963
WHO. (2013, Augost 6). Bulletin of the World Health Organization -
Measuring maternal health: focus on maternal morbidity. Retrieved
Huria Journal, Vol 27(2), September 2020: 190-202
Utilization of Extended Postpartum Family Planning among Post-Delivery Women in Mvomero District, Morogoro-Tanzania RogatePhinias Ibrahim and Harrieth G. Mtae
202
from Bulletin of the World Health Organization 2013;91:794-796.
doi:: https://www.who.int
WHO. (2014, June 5). Bulletin of the World Health Organization-Success
factors for reducing maternal and child mortality. Retrieved from
Bulletin of the World Health Organization 2014;92:533-544. doi::
https://www.who.int/bulletin/volumes/92/7/14-138131/en/
WHO. (2019, December 12). Reproductive health family_planning -
unmet_need_fp. Retrieved from who.int: https://www.who.int
Winfrey, Ross. (2001). Contraceptive Use, Intention to Use and Unmet
Need during the Extended Postpartum Period. International Family
Planning Perspectives, 20-26.
Copyright © 2022 FDOKUMEN