Joshua Tree National Park Transit Feasibility Study
140
Joshua Tree National Park Transit Feasibility Study Institute of Transportation Engineers Student Chapter University of California, Irvine June 30, 2014
Transcript of Joshua Tree National Park Transit Feasibility Study
| P a g e
Joshua Tree National Park Transit Feasibility Study
Institute of Transportation Engineers Student Chapter
University of California, Irvine June 30, 2014

i | P a g e
Report Complied By
Sarah Hernandez
PhD Candidate
and
Alma Carrillo and Allison Rodriguez
Undergraduate Students
On Behalf of the
Institute of Transportation Engineers Student Chapter
University of California, Irvine
Irvine, CA
Supervised By
Stephen Ritchie
Professor
Prepared for the
National Park Service
Joshua Tree National Park
Joshua Tree, CA
and
National Parks Conservation Association
California Desert Field Office
Joshua Tree, CA
June 30th, 2014

ii | P a g e
Executive Summary
In recent years, Joshua Tree National Park has been experiencing an increase in visitation
at a level that has begun to exceed the park’s infrastructure capacity. To address this issue, the
National Parks Conservation Association and Joshua Tree National Park asked the University of
California, Irvine Institute of Transportation Engineers Student Chapter to conduct a transit
feasibility study, including the design of three shuttle system route alternatives within park
grounds. The scope of this study includes a visitor survey, a parking analysis, the design of three
transit routing and infrastructure alternatives, comparison between different transit technologies,
and funding and finance options.
This report summarizes the park’s current conditions and the results of a park visitor
survey that outlines the views of park guests concerning the incorporation of a transit system.
Approximately 57% of survey respondents expressed interest in a transit system and were
willing to pay around $5 for the service. In addition to the survey, a parking analysis was
conducted to obtain parking lot congestion level estimates and travel patterns within the park.
Based on these observed patterns and survey results, three routing and infrastructure
alternatives were developed. Alternative 1 has three different lines: one connecting Joshua Tree
Visitor Center (JTVS) to Barker Dam, one connecting Hidden Valley to Keys View, and one
connecting Hidden Valley to Cholla Cactus Garden with a transfer stop at Hidden Valley. The
visited sites in this alternative include: JTVS, Hidden Valley, Barker Dam, Keys View, Ryan
Mountain, Jumbo Rocks, Arch Rock, and Cholla Cactus Garden. Alternative 2 builds upon
Alternative 1 with a third route operating between the Oasis Visitor Center and Hidden Valley.
Alternative 3 also builds upon Alternative 1 with the addition of a seasonal route which connects
Cholla Cactus to Cottonwood Visitor Center.
Based on the findings of the parking study and visitor usage data from a 2010 visitor
survey, an origin-destination (OD) matrix capturing the number of visitors traveling between
sites was used to establish the characteristics of each route alternative. Total ridership, i.e. the
expected number of riders per hour, was derived through comparison to other National Park
transit programs. The predicted ridership of 368 riders per hour combined with the OD data was
then used to find bus headways, required seating, and number of buses for each alternative.

iii | P a g e
Beyond alleviating parking and entrance station congestion, another goal of the transit
system is to reduce environmental impacts resulting from vehicle emissions. Therefore six
alternative transit technologies were compared. These included: diesel, bio-diesel, hybrid diesel-
electric, electric, propane, and hydrogen. All six technologies operate uniquely, require
specialized infrastructure for fueling and maintenance, and have various impacts on the air
quality. Taking cost effectiveness and environmental impact into consideration, the propane
shuttle technology was determined to best serve Joshua Tree National Park. Several other
National Parks, including Yosemite and Zion, also currently operate propane buses.
The overall costs of the three routing alternatives and different transit technologies were
calculated and financial options were researched to determine the most affordable options for the
Park. Two options were considered for bus acquisition—a purchasing option and a leasing
option. With the purchasing option, Joshua Tree National Park can purchase the buses at the
beginning of the program and pay annual costs to operate and maintain the buses. The leasing
option will provide the opportunity to invest a down payment the first year and have monthly
payments for 72 months, as well as a buyout payment at the end of the lease. In the end, it was
determined that the most effective option for the transit system is to lease propane buses. This is
mostly due to the initial year costs. Although the annual costs to lease the buses are higher than
the purchasing option by about $70,000 a year, the initial payment to lease a bus is only about
10% of the cost to purchase a bus. This will help Joshua Tree Park with the initial funds
necessary to implement a transit system.
Funding options for the transit system are summarized in this report. Applicable funds
include donation funds, Federal Lands Access Program, Federal Lands Transportation Program,
entrance fee increase, and sponsorships like the National Park Foundation.
Synthesizing the findings of each aspect of the report, it was determined that route
Alternative 2 operating with propane buses acquired through a leasing option is the ideal
alternative. Route Alternative 2 serves visitors at two different entrance locations while
maintaining access to the most popular sites in the park. Dividing traffic between entrance
locations can help alleviate traffic at the Joshua Tree Visitor Center (JTVC) and its surrounding
intersections and reduce the need to expand parking lot capacity at the JTVC location. Propane
buses possess the best tradeoff between reduced emissions and costs. The present value cost for

iv | P a g e
Alternative 2 is approximately $28 million which includes leasing propane buses over a six year
period with a buyout after the lease, operations costs such as wages and fuel over a twelve year
period, and infrastructure costs for transit stop amenities such as benches and signage.

v | P a g e
Contents Executive Summary ........................................................................................................................ ii
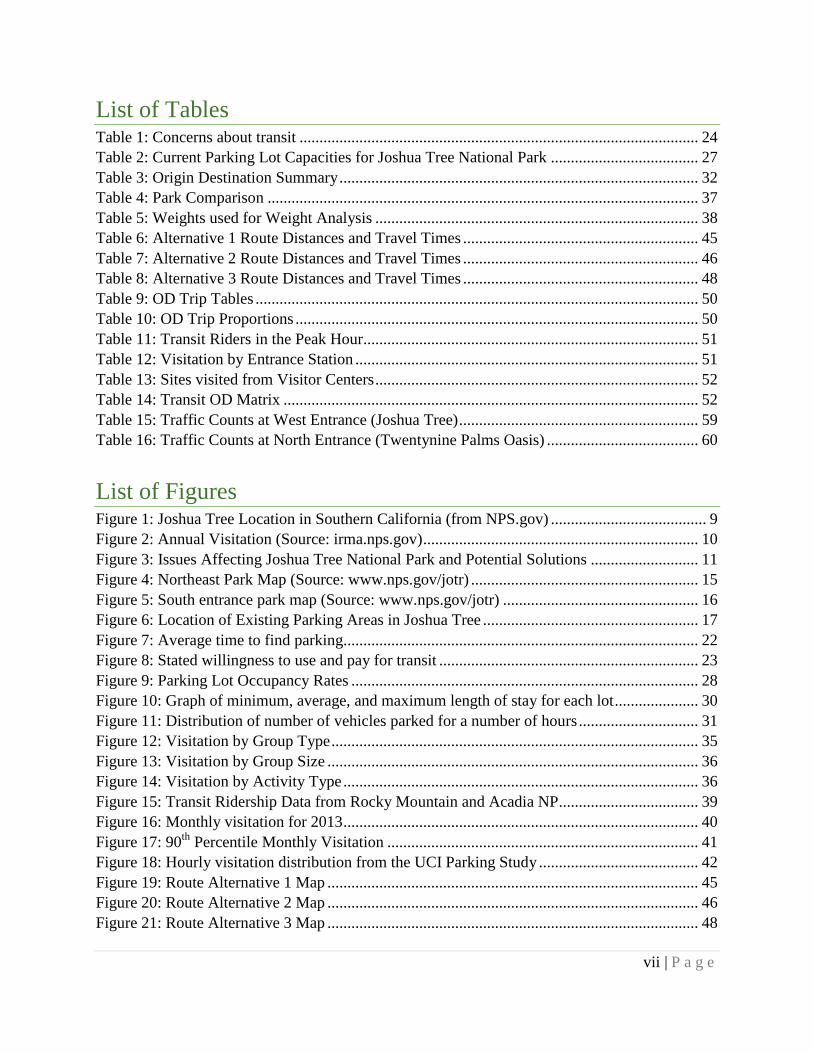
List of Tables ................................................................................................................................ vii
List of Figures ............................................................................................................................... vii
Chapter 1: Introduction ................................................................................................................... 9
Chapter 2: Existing Conditions ..................................................................................................... 13
2.1 Locations within the Park .................................................................................................... 13
2.2 Locations Outside the Park ................................................................................................. 13
2.3 Road Networks .................................................................................................................... 14
2.4 Parking ................................................................................................................................ 16
Chapter 3: Visitor Survey ............................................................................................................. 18
3.1 Questionnaire Development ................................................................................................ 19
3.2 Survey Procedure ................................................................................................................ 20
3.3 Survey Distribution ............................................................................................................. 21
3.4 Analysis of Survey Responses ............................................................................................ 21
3.5 Conclusion ........................................................................................................................... 24
Chapter 4: Parking Study .............................................................................................................. 26
4.1 Occupancy Rate Pattern ...................................................................................................... 26
4.2 Average Stay Pattern ........................................................................................................... 29
4.3 Origin Destination Data ...................................................................................................... 32
Chapter 5: Transit Routing & Infrastructure ................................................................................. 34
5.1 Transit Ridership Estimation ............................................................................................... 34
5.2 Daily Travel Demand Prediction......................................................................................... 39
5.3 Route Alternatives & Infrastructure Needs ......................................................................... 43
5.2.1 Alternative 1 ................................................................................................................. 44
5.2.2 Alternative 2 ................................................................................................................. 46
5.2.3 Alternative 3 ................................................................................................................. 47
5.3 Shuttle Operation................................................................................................................. 48
5.4 Transit System Characteristics ............................................................................................ 49
5.5 Parking Lots ........................................................................................................................ 54
Chapter 6: Traffic Impact Analysis............................................................................................... 57
6.1 Analysis of Existing Intersections ....................................................................................... 57

vi | P a g e
6.2 Projected Traffic .................................................................................................................. 57
6.2.2. Results ............................................................................................................................. 61
Chapter 7: Sustainability ............................................................................................................... 62
7.1 Existing Transit Services ..................................................................................................... 62
7.2 Transit Technologies ........................................................................................................... 62
7.3 Air Pollutants....................................................................................................................... 71
7.4 Comparison of Transit Technology Emission Rates ........................................................... 74
7.5 Summary ............................................................................................................................. 75
Chapter 8: Funding & Finance ...................................................................................................... 78
8.1 Cost Analysis....................................................................................................................... 78
8.2 Funding Analysis................................................................................................................. 83
Chapter 9: Recommendation and Conclusion............................................................................... 90
References ..................................................................................................................................... 92
Appendix A ................................................................................................................................... 99
Section A.1: Survey Results ...................................................................................................... 99
Section A.2: Survey Questionnaire ......................................................................................... 115
Section A.3: Survey Information Card .................................................................................... 120
Appendix B ................................................................................................................................. 121
Section B.1: Park Visitor Comparison .................................................................................... 121
Section B.2 : National Parks Visitation by Age Group (%) .................................................... 124
Section B.3: National Parks Visitation by In State and Out of State Visitors (%).................. 125
Section B.4: Number of Campsites in National Parks ............................................................ 125
Section B.5: Size of Land Mass of National Parks ................................................................. 126
Section B.6: Intra-park Travel Demands................................................................................. 127
Appendix C ................................................................................................................................. 129
Section C.1: Infrastructure Tables ........................................................................................... 129
Section C.2: Infrastructure Images .......................................................................................... 131
Section C.3: Cost Estimates .................................................................................................... 132
Appendix D ................................................................................................................................. 135
Section D.1: Purchasing Option .............................................................................................. 135
Section D.2: Leasing Option ................................................................................................... 138
vii | P a g e
List of Tables Table 1: Concerns about transit .................................................................................................... 24
Table 2: Current Parking Lot Capacities for Joshua Tree National Park ..................................... 27
Table 3: Origin Destination Summary .......................................................................................... 32
Table 4: Park Comparison ............................................................................................................ 37
Table 5: Weights used for Weight Analysis ................................................................................. 38
Table 6: Alternative 1 Route Distances and Travel Times ........................................................... 45
Table 7: Alternative 2 Route Distances and Travel Times ........................................................... 46
Table 8: Alternative 3 Route Distances and Travel Times ........................................................... 48
Table 9: OD Trip Tables ............................................................................................................... 50
Table 10: OD Trip Proportions ..................................................................................................... 50
Table 11: Transit Riders in the Peak Hour.................................................................................... 51
Table 12: Visitation by Entrance Station ...................................................................................... 51
Table 13: Sites visited from Visitor Centers ................................................................................. 52
Table 14: Transit OD Matrix ........................................................................................................ 52
Table 15: Traffic Counts at West Entrance (Joshua Tree) ............................................................ 59
Table 16: Traffic Counts at North Entrance (Twentynine Palms Oasis) ...................................... 60
List of Figures Figure 1: Joshua Tree Location in Southern California (from NPS.gov) ....................................... 9
Figure 2: Annual Visitation (Source: irma.nps.gov) ..................................................................... 10
Figure 3: Issues Affecting Joshua Tree National Park and Potential Solutions ........................... 11
Figure 4: Northeast Park Map (Source: www.nps.gov/jotr) ......................................................... 15
Figure 5: South entrance park map (Source: www.nps.gov/jotr) ................................................. 16
Figure 6: Location of Existing Parking Areas in Joshua Tree ...................................................... 17
Figure 7: Average time to find parking......................................................................................... 22
Figure 8: Stated willingness to use and pay for transit ................................................................. 23
Figure 9: Parking Lot Occupancy Rates ....................................................................................... 28
Figure 10: Graph of minimum, average, and maximum length of stay for each lot ..................... 30
Figure 11: Distribution of number of vehicles parked for a number of hours .............................. 31
Figure 12: Visitation by Group Type ............................................................................................ 35
Figure 13: Visitation by Group Size ............................................................................................. 36
Figure 14: Visitation by Activity Type ......................................................................................... 36
Figure 15: Transit Ridership Data from Rocky Mountain and Acadia NP ................................... 39
Figure 16: Monthly visitation for 2013 ......................................................................................... 40
Figure 17: 90th
Percentile Monthly Visitation .............................................................................. 41
Figure 18: Hourly visitation distribution from the UCI Parking Study ........................................ 42
Figure 19: Route Alternative 1 Map ............................................................................................. 45
Figure 20: Route Alternative 2 Map ............................................................................................. 46
Figure 21: Route Alternative 3 Map ............................................................................................. 48

viii | P a g e
Figure 22: Route Alternative 1 Travel Patterns based on the OD Travel Matrix ......................... 53
Figure 23: Existing Joshua Tree Visitor Center Parking Lot ........................................................ 56
Figure 24 : ADTs data collected locations near Joshua Tree Visitor Center ................................ 58
Figure 25: ADTs data collected near Oasis Visitor Center........................................................... 59
Figure 26: Monthly vehicle counts ............................................................................................... 60
Figure 27: Emissions Rates by transit technology and pollutant .................................................. 76
Figure 28: Per person emissions by transit technology and pollutant .......................................... 77
Figure 29: Initial Bus Costs for Purchase Option ......................................................................... 80
Figure 30: Present Value Costs of the Purchasing Option (in million dollars) ............................ 80
Figure 31: Present Value Costs of the Leasing Option (in million dollars).................................. 82
Figure 32: Restrooms at Joshua Tree National Park ................................................................... 131
Figure 33: Shuttle stop from Zion National Park........................................................................ 131

9 | P a g e
Chapter 1: Introduction
Joshua Tree National Park is one of three Southern California desert parks as shown in
Figure 1. The Park is centrally located about 140 miles east from Los Angeles, 175 miles
northeast of San Diego, and 215 miles southwest of Las Vegas. The Park has three entrances in
the towns of Joshua Tree, Twentynine Palms, and Cottonwood Spring/Indio. The 800,000 acre
park encompasses two distinct desert ecosystems and is home to 813 desert plant species like the
iconic Joshua Tree. Desert animal species such as the threatened desert tortoise also call this
Park home. The land that now makes up the National Park has a storied past that can be traced
back over 5,000 years to its first human inhabitants. Beginning in the 1800’s the Park was
grounds for cattle farming and transitioned into mining industry in the 1930’s. Wanting to
preserve the natural beauty of the desert plant species, the land was designated as a National
Monument in 1936 and more recently a National Park in 1994. Recent visitor is reported to be
around 1.4 million annual visitors with trends showing an annual increase in visitation (Figure 2)
since 1979 when statistics were first gathered.
Figure 1: Joshua Tree Location in Southern California (from NPS.gov)

10 | P a g e
Figure 2: Annual Visitation (Source: irma.nps.gov)
In recent years, Joshua Tree National Park has been experiencing an increase in visitation
at a level that has begun to exceed the parks infrastructure capacity. This has been observed in
parking and entrance fee station congestion during weekends. Parking congestion has led to
overflow parking issues where visitors park in undesignated spaces along park roads leading to
dangerous situations for pedestrians and damage to vegetation. Parking problems and entrance
fee congestion degrade the visitor experience. In addition, the Park is only accessible by
personal vehicle which limits the accessibility to the Park.
Beyond visitor experience, parking overflow, entrance station congestion, and
accessibility issues, the Park also faces issues with air quality. Situated in the context of the
Coachella Valley and Los Angeles air basin, Joshua Tree NP experiences periods of heavy air
pollution as a result of its location. In fact, the Environmental Protection Agency has decreed the
air in Joshua Tree NP to exceed the ozone concentration levels. Air pollution is especially
damaging to the desert plants and therefore all methods for reducing air pollution and promoting
environmental sustainability in and around the Park need to be considered.
Several solutions to the multifaceted issues faced by the Park can be made through
transportation improvements. For example, facing similar air pollution issues, Zion National
Park reduced air pollution by disallowing personal vehicles to travel within the Park and

11 | P a g e
providing reduced emission shuttles to transport visitors from entrance stations to major sites
within the Park. Figure 3 depicts the confluence of current issues faced by Joshua Tree NP.
The optimal solution should be able to address each issue. Parking lot expansion is a simple and
potentially low cost solution to address parking overflow issues and improve the visitor
experience. However, under this solution scenario entrance station congestion would persist,
accessible options would remain unchanged (i.e. personal vehicle would remain the only option
for park access), and environmental goals such as reducing air pollution would not be achieved.
Following the lead of other Parks such as Zion NP, Grand Canyon NP, and Yosemite NP, a more
robust solution is to introduce transit options.
Figure 3: Issues Affecting Joshua Tree National Park and Potential Solutions
Transit has the potential to address all five of the major issues facing Joshua Tree NP. A
voluntary use transit system could effectively reduce entrance station congestion and parking
overflow by reducing the number of cars that enter the Park. Accessibility would improve by
providing an alternative to personal vehicles. Together these three benefits would improve
visitor experience by allowing visitors to access major sites in the Park without the
inconvenience of searching for parking or waiting at an entrance station. Lastly, by offsetting a
Accessibility
Entrance Station
Congestion
Parking Overflow
Environ-mental
Sustainability
Visitor Experience
Transit

12 | P a g e
number of personal vehicles with fuel efficient, clean emission buses, potential environmental
benefits such as reduced emissions can be achieved thus leading to a more environmentally
sustainable system.
In order to determine if transit is indeed a feasible option for the Park, the National Parks
Conservation Association and Joshua Tree National Park tasked the University of California,
Irvine, Institute of Transportation Engineers Student Chapter to conduct a transit feasibility
study. The scope of this study includes a visitor survey, a parking analysis, the design of three
transit routing and infrastructure alternatives, comparison between different transit technologies,
and funding and finance options.
The report is organized as follows. Chapter 2 describes the existing conditions including
popular sites within and around the Park, the transportation system, and parking conditions.
Chapter 3 introduces the visitor survey conducted as part of the study to determine travel patterns
and transit interest. Chapter 4 discusses the results of a parking lot usage survey. Chapter 5
presents the three route alternatives and their corresponding infrastructure needs. Chapter 6
highlights the potential traffic impacts resulting from the proposed transit system. Chapter 7
discusses the sustainable transit technology alternatives along with a summary of air pollutants.
Chapter 8 summarizes the costs and funding opportunities of the proposed transit system
including the options to lease or purchase shuttle buses. The report concludes with a final
recommendation regarding the route alternative, transit technology, and financing structure in
Chapter 9.

13 | P a g e
Chapter 2: Existing Conditions
2.1 Locations within the Park Joshua Tree National Park has several attractions. According to a visitor study conducted
by the University of Idaho, the most popular locations were the Jumbo Rocks Area, Hidden
Valley and the Joshua Tree Visitor Center. According to the survey results, respectively, 55%,
50%, 50%, of the 490 visitor groups visited these locations during their trip. However, the order
of visitation varied; the most popular first stop was the Joshua Tree Visitor Center, followed by
the Oasis Visitor Center, and lastly, the Cottonwood Visitor Center. The information collected
from the rangers fall in line with the survey results. According to the park rangers of Joshua
Tree, popular locations include: Jumbo Rocks/Skull Rock, Hidden Valley, Quail Springs, Black
Rock, Boy Scout Trail/Indian Cove, Keys View, Barker Dam, Cholla Garden, and Cottonwood
Springs.
Joshua Tree National Park has a variety of activities for the outdoor enthusiasts. One of
the main attractions of the park is the campsites and hiking trails. There are a total of eight
campgrounds: Belle, Black Rock, Cottonwood, Hidden Valley, Indian Cove, Jumbo Rocks,
Ryan, and White Tank. The largest three campgrounds are Jumbo Rocks, Indian Cove, and Black
Rock, with 124 sites, 101 sites, and 100 sites respectively. Due to the large capacity of these
campsites as well as surrounding attractions, these sites are the most popular when it comes to
camping.
Transportation options within the Park are limited to personal vehicles or tour buses
operated by tour companies. According to the 2010 Visitor Survey, 99% of visitors enter the
park in personal vehicles (only 1% reported participation with commercial tour group).
2.2 Locations Outside the Park The main attractions of this region are within Park grounds with the exception of several
sites located in the surrounding cities. More importantly, within the Park, only minimal impact
camping facilities are provided, so many visitors stay overnight the over 30 hotels and motels
located in the surrounding cities of Twentynine Palms, Joshua Tree, and Yucca Valley, as well as
is in the Coachella Valley stretching from Desert Hot Springs in the northwest to Coachella in
the southeast.

14 | P a g e
Transportation options outside the Park include public transit. The Morongo Basin
Transit Authority currently implements routes between Yucca Valley and Twentynine Palms
along State Route 62, with stops at both the Joshua Tree Visitor Center and the Oasis Visitor
Center. Park visitors staying in the surrounding cities can choose to use the Morongo Basin
Transit system to access the visitor centers, but would not be able to travel within the Park on
public transit, since the public transit service does not operate within the Park.
2.3 Road Networks Surrounding Network
Joshua Tree National Park is bordered by several freeways. State Road (SR) 62 borders
the park to the north, I-10 borders the southern end, and SR 177 borders the park to the east.
Several other freeways feed into those that border the national park. SR 247 feeds into SR 62
toward the western half of the park. SR 111 feeds into the I-10 toward the western half of the
park and also runs relatively parallel to the I-10 from around the Palm Springs area to the Mecca
area. SR 78 feeds into I-10 from the south and is located east of the national park. Lastly, SR 95
is located east of the national park and connects I-10 and SR 62. Dillon Road, although not a
freeway, connects I-10 and SR 62 from around the Coachella area to the Palm Springs area.
Park Network
Within the park is a network of paved, unpaved, and 4-wheel-drive roads. Figure 4 shows
the road system for the north end of the Park near the Joshua Tree and Twentynine Palms
entrances. Figure 5 shows the road system at the Cottonwood entrance located in the southern
area of the Park. The paved roads, in particular, allow access to many of the Park’s attractions.
Park Boulevard, a paved road, allows access into the park from the SR 62 through the West
Entrance Station. The Utah Trail also allows access into the park from the SR 62 but through the
North Entrance Station. Roughly 8 miles south of the SR 62 is Loop Road, which connects both
Park Boulevard and Utah Trail. Indian Cove Road is located between the West Entrance Station
and the North Entrance Station and leads to Indian Cove, a popular park attraction. Canyon
Road, located between Indian Cove Road and North Entrance Station, allows access to a hiking
trail leading to 49 Palms Oasis, one of the park attractions. The Pinto Basin Road along with the
Cottonwood Springs Road allows access into the park from the I-10 through the southern
entrance. Pinto Basin Road connects to the Loop Road near the northern entrance.

15 | P a g e
The unpaved roads in the Joshua Tree National Park tend to branch off from the paved
roads and allow access to other park attractions. One of the notable unpaved roads is La Contenta
Road, located between the SR 247 and the western entrance, and it allows access to Eureka Peak
and the California Riding and Hiking Trail. Hidden Valley Road allows access to Keys Ranch
from Park Boulevard. Queen Valley Road allows access to the Desert Queen Mine from Loop
Road.
Lastly, there are several 4-wheel-drive roads that provide accessibility to more park
attractions. Berdoo Canyon Road connects Dillon Road to Loop Road. Old Dale Road, also
known as Mecca Dale Road, and Gold Crown Road connect the SR 62 to Pinto Basin Road
toward the southern entrance. Black Eagle Mine Road branches from Pinto Basin Road and
allows access to facilities past the Eagle Mountains, where the road eventually connects with the
SR 177 and the I-10. Pinkham Canyon Road and Thermal Canyon Road allow access to the
Cottonwood Mountains beginning from the Cottonwood Visitor Center located near the southern
entrance of the park. Depending on the shuttle technologies and visitor demand, some of these
roads can be used when planning routes for the transit system.
Figure 4: Northeast Park Map (Source: www.nps.gov/jotr)

16 | P a g e
Figure 5: South entrance park map (Source: www.nps.gov/jotr)
2.4 Parking
Joshua Tree National Park currently has approximately 787 parking spots including
spaces in both paved and unpaved areas and along the curb. This estimate was developed
assuming an average parking space size has the dimensions of 9 x 18 ft. Most large parking lots
can generally be found in popular visitor sites such as Hidden Valley and Barker Dam. Table 19
of Section C.1 in the Appendix summarizes parking lot capacities at each location identified in
Figure 6. Additionally, this table identifies whether restroom facilities, RV parking, and handicap
parking are available. Some parking lot conditions are also summarized.

17 | P a g e
Figure 6: Location of Existing Parking Areas in Joshua Tree
A lack of parking is evident during high visitation periods. This lack of parking
availability is causing dangerous scenarios as visitors begin to park in non-designated areas such
as the sides of the road. To get a better understanding of the severity of this issue and the
concerns of park visitors, a visitor survey and a parking survey were conducted.

18 | P a g e
Chapter 3: Visitor Survey
The goal of creating and distributing a survey was to outline the views and opinions of
park guests concerning the incorporation of a transit system within the park. This provides
important information and data for determining transit demand and designing route alternatives.
The survey covers a variety of topics including basic demographic questions, popular park
locations, popular route choices, popular mode choices, route frequencies, and possible shuttle
fees to park visitors if the shuttle system were to be implemented. The survey contains 24
questions. Questions pertaining to popular locations and trip frequencies were utilized to
determine routing and infrastructure locations, while questions concerning cost and technology
preferences were used to determine funding and sustainable shuttle options.
Because the survey was conducted on human subjects an extensive permitting process
was conducted by UC Irvine’s Institutional Review Board (IRB). This process required an
extensive review of the survey procedures and questionnaire. Procedures concerning public
interaction and survey participation solicitation were fully detailed through IRB specifications.
All students administering the survey were required to complete IRB training.
The survey was administered by two methods: a paper based survey and an online
survey. The paper based survey was distributed within the Park by the ITE student chapter
members and the online survey was sent to several email listserves belonging to the NPCA. The
online version of the survey was generated on the UC Irvine Electronic Education Environment
(EEE) system. Along with the survey questionnaire the ITE team developed an email script,
survey information card, and survey information page. The survey information page detailed all
the necessary information about the surveys purpose and key information required by the IRB.
The information card was created to be distributed at Joshua Tree National Park and surrounding
businesses. This card contained the link to the online survey. Lastly, an email script was created
also containing the link to the online survey. All of these documents including the protocol
narrative can be found in Appendix A.
The final draft of the survey was published and released to the public on April 11th and
was granted permission to be distributed by Joshua Tree National Park. The responses from the

19 | P a g e
hard copy survey were organized and manually inputted into the EEE system to systematically
organize all the results.
3.1 Questionnaire Development
The questionnaire contains questions related to general visitor demographics and park
usage as well as transit preferences. Demographic and usage questions follow the same format
as those used in the University of Idaho 2010 Joshua Tree National Park Visitor Study. The
format of questions was maintained so that comparisons could be drawn between 2010 and 2014
visitor characteristics. These questions concerned the activities, sites visited, order of sites
visited, reasons for visiting the park, trip duration, visitor group characteristics such as age and
group size, and accommodations used inside and outside of the park. Additional questions
unique to the survey conducted for this report included parking issues such as the amount of time
spent searching for a parking space and vehicle type.
The transit preference questions were loosely based on those used in the Sustainable
Transit Feasibility Study for the Mojave National Preserve conducted in 2009 by the University
of California, Irvine, Institute of Transportation Studies. Questions included visitors’ willingness
to use transit, previous experience with transit in National Parks, preferred transit system
characteristics (frequency, type of bus, number of stops, etc.), and willingness to pay for transit
services. Listed below is a selected sample of transit preference questions used in the survey. A
brief explanation is provided to explain the purpose of the question.
Sample Survey Questions
Question (17): How often would a shuttle need to pass by a stop (pick-up point) for you to
consider using the service in Joshua Tree National Park?
□ Would not use □ every 15 minutes □ every 30 minutes
□ Every hour □ every 2 hours □ Every 4 hours
Purpose: Understanding the duration a visitor is willing to spend at a park site indicates
potential shuttle routes and route frequencies for consideration.

20 | P a g e
Question (18): On a future visit, how important would the following services and characteristics
of a shuttle system be? Please indicate the importance of each characteristic with ‘1’ indicating
‘not important’ and ‘5’ indicating ‘very important’.
Monday-Friday shuttle service □ 1 □ 2 □ 3 □ 4 □ 5
Frequency of shuttle service □ 1 □ 2 □ 3 □ 4 □ 5
Ability to take bikes on shuttle □ 1 □ 2 □ 3 □ 4 □ 5
Ability to transport gear on shuttle □ 1 □ 2 □ 3 □ 4 □ 5
On-board orientation by Park Ranger □ 1 □ 2 □ 3 □ 4 □ 5
On-board orientation by TV or audio
recording □ 1 □ 2 □ 3 □ 4 □ 5
Alternative fuel shuttle □ 1 □ 2 □ 3 □ 4 □ 5
Ticket price □ 1 □ 2 □ 3 □ 4 □ 5
Purpose: Indicates the level of preference for the above alternatives. If all visitors indicate
preferences for particular alternatives, those alternatives will hold high importance in the final
park shuttle system design.
3.2 Survey Procedure
The survey distribution activities took place at Joshua Tree National Park over peak
visitation days during the spring. Surveys were distributed between 7am and 4pm during
daylight hours, although the park operates 24 hours per day. Recruitment of survey participants
followed a non-probability based approach, i.e. accidental or convenience sampling similar to
that used in the 2010 University of Idaho Visitor Study. Surveys were distributed in person in a
systematic process to visitor groups two high volume sites: Hidden Valley and Barker Dam.
Based on the 2010 survey of the 837 visitor groups approached for participation, 767
(91.6%) accepted questionnaires with the per site volumes of participants ranging from 20 to 165
visitors representing 3 to 22% of the total visitor volume, respectively. Thus, applying the same
acceptance rate, around 185 completed surveys per day were expected to be collected total at the
two sites. This number of completed surveys is within the appropriate sample size for analysis
(e.g. > 30 samples for statistical significance).

21 | P a g e
The survey administration took place as follows. Visitors were briefly introduced to the
survey and were asked if they would like to participate. One individual from each visitor group,
18 years of age or older, was allowed to participate. If they agreed to participate they were
guided to read the survey information sheet and to ask any questions if needed. The survey took
approximately 10-15 minutes to complete. Visitors who did not wish to participate after being
approached by the survey team were given the survey information card containing the link to the
online survey and kindly asked to participate at their own convenience.
3.3 Survey Distribution
The survey was distributed on April 12 and April 13 by the ITE student Chapter. On Day
1, Saturday, the group arrived in the park at 8am. A group of 2 students went to the Hidden
Valley parking lot while another group of 3 students went to the Barker Dam parking lot.
Students approached park guests, explained our project to them, and asked if they would be
willing to take our survey. About half of the visitor groups who were approached participated in
the survey, and those who did not participate were given a information card to have access to the
online survey. On average the survey took between 5 and 10 minutes for guests to fill out. The
date, time, and location were written on the front of each survey once it was completed. Survey
distribution on Saturday concluded at 4pm.
On Sunday, students arrived in the park at 9am and stayed until 3pm. These shorter hours
were selected due to the limited number of people in the early morning and late afternoon on the
previous day. While Saturday was more crowded (the Barker Dam lot was full by 1pm), we
noticed a higher visitor response rate on Sunday.
3.4 Analysis of Survey Responses
A total of 213 surveys were collected with 99 collected on the first day and 114 collected
on the second day. To convert the paper responses to an electronic spreadsheet, each survey was
manually entered into a modified version of the EEE online survey. Along with the question
responses, each survey was labeled with an identification number so the paper copy can be
matched with the electronic copy. In the following section a summary of select survey results
pertaining to transit preferences are shown. The remaining questions and the corresponding
results can be found in Appendix A.1.

22 | P a g e
Select Survey Results
Question (13) If you arrived in a personal vehicle to the current site, how much time did it take
for you to find a parking spot?
Figure 7: Average time to find parking
The majority of visitors (88%) reporting finding parking immediately upon arriving to the
selected site. Roughly 10% of visitors struggled to find parking for more than 5 minutes. In a
related question, visitors were asked to state the amount of time they would be willing to spend
searching for parking before considering transit. The majority of visitors were unwilling to wait
longer than 5 minutes. Park guests felt that as waiting time for parking spaces increased, they
would be more willing to utilize the shuttle services. This would mean that as the number of
people entering the park increases as Joshua Tree National Park has seen in recent years, guests
will be increasingly likely to utilize the service.
Question (16): The proposed Park Shuttle System for Joshua Tree National Park would allow
visitors to park for free at the entrance stations and use the shuttle to visit the major sites within
the Park. If such a Park Shuttle System existed within Joshua Tree National Park, would you
have considered using the shuttle system for this visit today?
Question (19): Which of the amounts listed below best describes the most you would pay per
person per day (unlimited rides) to use a Park Shuttle System that operated between sites within

23 | P a g e
the Park (not including Indian Cove and Black Rock areas)? Assume that the Park entry fee still
applies, parking is available for free at the entrance stations, and that the shuttle runs at least
every hour.
(a)
(b)
Figure 8: Stated willingness to use and pay for transit
Overall, the transit system is welcomed by park guests, where 54% of survey respondents
showed interest in using a shuttle during their visit. Results also indicated that 31% of guests

24 | P a g e
would be willing to pay an additional $5-6 for the transit service which would provide a good
source of funding for the operations and maintenance of the system.
Question (23): Why would you not consider taking a Park Shuttle System within Joshua Tree
National Park? Please check all that apply. Leave blank if you would consider using a shuttle
service.
Table 1: Concerns about transit
Concern % of Responses
I don’t think traffic and parking congestion are severe enough for a shuttle
system to be necessary.
24%
I’m uncomfortable leaving my vehicle in a parking lot. 5%
I’m unsure if the frequency of the service would accommodate my planned
activities.
26%
Planned activities in the Park require equipment, which would be
inconvenient to take on a shuttle.
19%
I would not feel safe in the Park without access to my private vehicle. 3%
I need my own personal vehicle. 11%
Other 12%
There were many concerns that visitors had about such a system, however. These
included concern about the frequency of the shuttle service (26% of responses) and desire to
participate in activities that require equipment (19%). Approximately 24% of stated concerns
were about current conditions in the park not warranting a transit system.
3.5 Conclusion
Generally guests were interested in a transit system but only when the system could
provide adequate service frequency and have the ability to transport gear. Since the Park is a
major rock climbing destination, visitors expressed the need to have room on the shuttle for
climbing gear. In ranking shuttle characteristics, frequency was the most important with ticket
prices the second most important. Other important findings are summarized below:
54% of visitors indicated willingness to use a shuttle system in the Park.
Most visitors (38%) would like a shuttle to pass by a stop every 30 minutes; only 11%
indicated that hourly service was acceptable.

25 | P a g e
Frequency, ability to transport gear, and ticket price were ranked first, second, and third most
important, respectively.
Onboard orientation services including orientation by a Ranger or video/audio formats, were
not ranked as important characteristics of the shuttle system. Also, the ability to transport
bikes was not ranked as important.
Visitors showed some interest in an alternative fuel shuttle, ranking it of more importance
than onboard orientation and bike transport.
Most people are willing to spend $5-6 for unlimited rides on the Park shuttle.
The majority of visitors (63%) were not interested in additional transit services to other
regional cities. Those that were interested were willing to pay $5-6 (28% of responses).
The major concerns against transit were uncertainty about service frequency, thinking that
congestion levels do not yet warrant transit system implementation, and feeling of
inconvenience of carry equipment around on the shuttle.

26 | P a g e
Chapter 4: Parking Study
One of the major concerns leading to the investigation of transit feasibility is parking
congestion. Park staff reported that many of the most popular sites within the Park experience
parking congestion during busy weekend periods. On busy weekends, parking lots that
experience the most activity have a demand that exceeds the supply. This causes the respective
lots to be filled over capacity and results in visitors parking their cars along the side of the road
or in undesignated spacing causing damage to vegetation and curbs thus posing a threat to the
surrounding natural environment. In addition to overflow parking issues, congestion in parking
lots forces visitors to possibly forego a planned visit to that site altogether. Overflow parking is
also a safety concern as visitors exiting their vehicles parked along the road are exposed to
vehicle traveling on that road at full speed.
In order to determine the current parking usage characteristics, a parking study analysis
was performed to collected data on which lots were the most and least occupied and the average
time a vehicle would spend in each lot. The parking study analyzes the parking data in three
ways: by origin-destination, average time spent, and parking lot occupancy rate.
The two-day parking study was performed during President’s Day weekend on Saturday
(02/15/14) and Sunday (02/16/14) from 9am to 4pm. This weekend was selected because it is
known to have a high visitation rate compared to other days. The focus of the study was on five
of the most popular sites: Hidden Valley, Barker Dam, Cholla Cactus, Jumbo Rocks, and Keys
View. Throughout the study, license plate numbers were collected every hour at each of these
five sites. This information was then used to analyze parking lot occupancy rates, average time
spent at each site, and visitor travel patterns among the five study areas. This information aided
in determining the severity of parking congestion and the routes that could be developed for the
proposed shuttle system.
4.1 Occupancy Rate Pattern
The parking occupancy rate pattern is a way of measuring parking lot utilization to
determine the amount of visitor activity and interest. By comparing the number of vehicles
stationed in a parking lot (demand) with the amount of parking spaces available (supply), unique
usage rates are found. This identifies which site destinations within the park experience the most

27 | P a g e
activity and congestion. In addition, determining an occupancy rate pattern for each individual
parking lot in Joshua Tree National Park will help identify popular sites, which will aid in
designing the shuttle route system.
A parking lot occupancy rate for each individual parking lot in Joshua Tree National Park
was found by dividing the total hourly number of vehicles parked in the lot by the capacity of the
lot. To determine the total hourly number of vehicles, hourly vehicle counts were conducted by
students at the University of California, Irvine for the duration of both study days. A summary of
hourly vehicle counts can be found in Tables 16 and 17 of Section B.1 of the Appendix. Table 2
shows the parking lot capacities based on estimates from the previously mentioned parking lot
sizes.
Table 2: Current Parking Lot Capacities for Joshua Tree National Park
Parking Lot Parking Capacity (# of spots)
Cholla Cactus 22
Hidden Valley 127
Barker Dam 143
Jumbo Rock 26
Key’s View 32
A final occupancy rate was found, in terms of percentages, for each hour of the study
period for both days. A summary of the final occupancy rates are shown in Figure 9. These
figures give insight into how full each of the lots become throughout the day, and also
determines the peak hours of each individual lot. An analysis of the data shows that, with the
exception of Barker Dam, all parking lots exceeded their maximum capacity by 12:00 PM. The
most popular sites are Cholla Cactus, Key’s View, and Jumbo Rocks. Jumbo Rocks experiences
the highest capacity, exceeding 140% for both days. Ultimately, these high parking demands
indicate that a shuttle system would be beneficial to alleviate congestion.

28 | P a g e
(a) Day 1
(b) Day 2
Figure 9: Parking Lot Occupancy Rates

29 | P a g e
4.2 Average Stay Pattern
The average stay pattern shows the length of stay for vehicles at each of the five study
locations. This analysis shows which lots have the most and least vehicles, and which lots are
occupied for the longest and shortest times. The analysis can provide useful information such as
what lots should be expanded, if new lots are needed, where the placements of new lots should
be, which lots are possibly not needed, or where the roads may be more congested.
The minimum, average, and maximum time a vehicle remained parked at each lot was
calculated and summarized in the graphs depicted through Figure 10. The least amount of time
that can be identified is one hour since license plate numbers were collected in one hour
intervals. The highest number that can be observed is eight hours because the parking study was
conducted for eight hours. The Day 1 (Saturday) graph indicates that the minimum average
parked time was about 1.01 hours. The maximum average time spent was about 2.80 hours
which was recorded from Barker’s Dam lot 1 from day 1. The total average of all the lots came
out to be about 1.64 hours.
The data was also plotted as histograms (Figure 11) to demonstrate how many hours
vehicles were parked. The histograms indicate that most vehicles stayed at one location for one
hour or less for both days. Day 1 had 961 vehicles and day 2 had 1220 vehicles parked for 1 hour
in their lots. The least number of vehicles stayed for the maximum of 8 hours. Day 1 and day 2
lots had 0 vehicles and 7 vehicles parked for 8 hours respectively.

30 | P a g e
Figure 10: Graph of minimum, average, and maximum length of stay for each lot

31 | P a g e
Figure 11: Distribution of number of vehicles parked for a number of hours
32 | P a g e
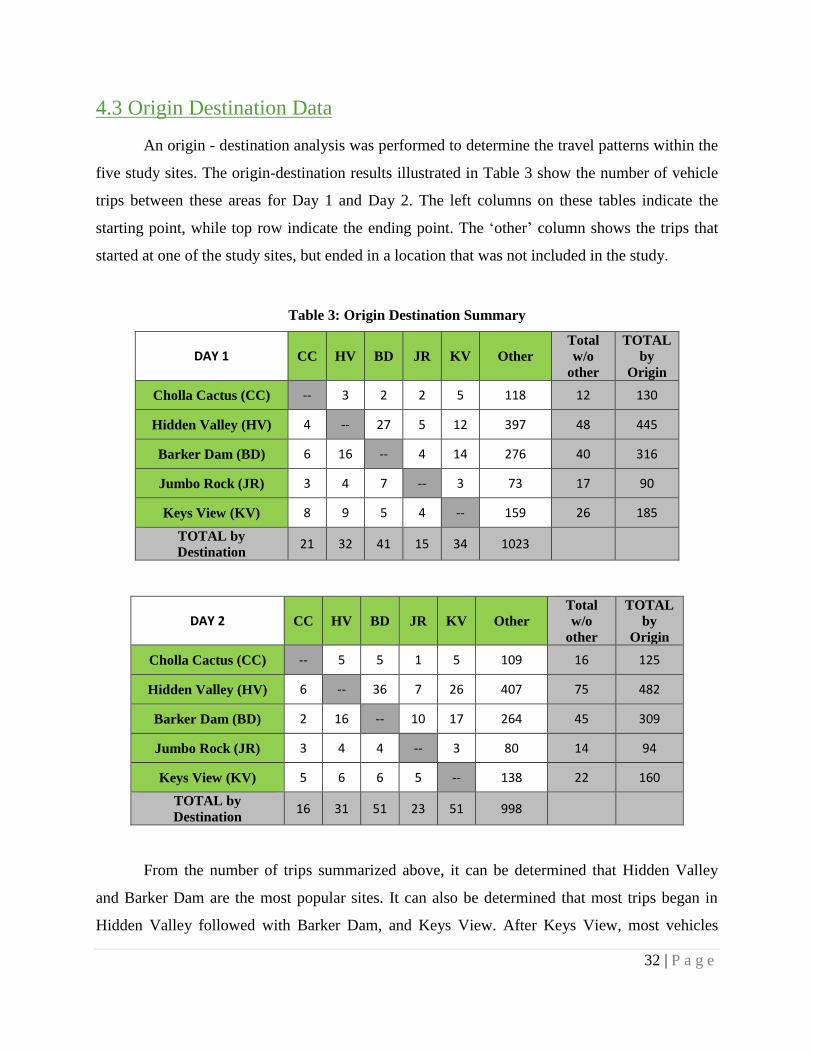
4.3 Origin Destination Data
An origin - destination analysis was performed to determine the travel patterns within the
five study sites. The origin-destination results illustrated in Table 3 show the number of vehicle
trips between these areas for Day 1 and Day 2. The left columns on these tables indicate the
starting point, while top row indicate the ending point. The ‘other’ column shows the trips that
started at one of the study sites, but ended in a location that was not included in the study.
Table 3: Origin Destination Summary
DAY 1 CC HV BD JR KV Other
Total
w/o
other
TOTAL
by
Origin
Cholla Cactus (CC) -- 3 2 2 5 118 12 130
Hidden Valley (HV) 4 -- 27 5 12 397 48 445
Barker Dam (BD) 6 16 -- 4 14 276 40 316
Jumbo Rock (JR) 3 4 7 -- 3 73 17 90
Keys View (KV) 8 9 5 4 -- 159 26 185
TOTAL by
Destination 21 32 41 15 34 1023
DAY 2 CC HV BD JR KV Other
Total
w/o
other
TOTAL
by
Origin
Cholla Cactus (CC) -- 5 5 1 5 109 16 125
Hidden Valley (HV) 6 -- 36 7 26 407 75 482
Barker Dam (BD) 2 16 -- 10 17 264 45 309
Jumbo Rock (JR) 3 4 4 -- 3 80 14 94
Keys View (KV) 5 6 6 5 -- 138 22 160
TOTAL by
Destination 16 31 51 23 51 998
From the number of trips summarized above, it can be determined that Hidden Valley
and Barker Dam are the most popular sites. It can also be determined that most trips began in
Hidden Valley followed with Barker Dam, and Keys View. After Keys View, most vehicles

33 | P a g e
either returned to the Hidden Valley/ Barker Dam area or they headed east toward Jumbo Rocks
or Cholla Cactus. Based on the results from day two, most vehicles traveled to Cholla Cactus
before Jumbo Rock after visiting Keys View.

34 | P a g e
Chapter 5: Transit Routing & Infrastructure
5.1 Transit Ridership Estimation
Transit ridership, i.e. the percent of visitors that will use transit, is one of the most
difficult parameters to predict when designing a transit system. This sentiment holds true for
municipal public transit systems but becomes an even more difficult issue for National Park
settings where each Park poses vastly different environmental and usage characteristics. Park
characteristics can play a huge role in how many visitors are attracted to transit. For example,
Joshua Tree NP is an international rock climbing destination where visitors will need to transport
climbing gear and move between very spread out sites across the Park’s 800,000 acres. It would
be naïve to assume that this park could have the same demand for transit as a NP where visitor
activities are concentrated around hiking, the natural landscape provides shade, and key
visitation sites are spatially dense. Therefore, in order to obtain an accurate prediction of
potential transit use for Joshua Tree National Park, transit ridership data from other National
Parks with existing transit systems and as similar as possible characteristics were reviewed for
comparison.
Two important considerations limited the number of Parks to be considered in the
comparison: transit system operations and data availability. First, only parks with free transit
systems were included in the analysis since it was predetermined that the Joshua Tree system
would not be mandatory. Second, of the parks with voluntary use systems, only those with
publicly available ridership data could be used. This limited the comparison scope to two parks:
Rocky Mountain NP and Acadia NP. While neither of the parks can truly represent Joshua Tree
NP’s natural setting, a best attempt was made to select from the two parks the one that most
closely matched Joshua Tree NP in terms of park size, number of sites, activities, and visitor
characteristics.
The Alternative Transportation System Demand Estimation for Federal Land
Management Agencies report summarized which characteristics of a park and its visitors have
the greatest influence on transit ridership. The report stated that transit systems in federal public
land sites needed to accommodate for certain factors such as type of visiting group, purpose of
visit, length of stay, and age group of visitors. Using visitor survey data from the Park Studies

35 | P a g e
Unit at the University of Idaho, data concerning visitor characteristics were collected for Rocky
Mountain and Acadia NPs.
The first characteristic to compare is group type. Group type affects percent ridership
through the demand to use an actual system. For example, families may lean towards not using
the transit system since it would be more comfortable to stay in one vehicle together. Visitor
groups were split up into four categories: Friends and Family, Friends, Alone, and Family and
plotted onto a bar graph to compare the national parks. Figure 12 compares the two parks to
Joshua Tree NP. Joshua Tree NP most resembles Rocky Mountain National Park in terms of
group type.
Figure 12: Visitation by Group Type
Group size will affect percent ridership and bus capacity because it determines whether
or not a large group can even use the transit system. Figure 13 shows the group size comparison
between the parks. Rocky Mountain and Joshua Tree NPs are the most similar in terms of group
size. Acadia NP appears to have a much larger proportion of larger groups (‘5 or more’).

36 | P a g e
Figure 13: Visitation by Group Size
Activity participation is most closely related to the natural characteristics of the park. For
instance, Joshua Tree NP is popular for rock climbing because of the attractive rock formations
in the park. Activity participation is also a predictor of transit usage since activities that require
lots of personal equipment many inhibit transit usage. Figure 14 shows that a significant amount
of activities that visitors are involved in at Rocky Mountain NP match the types of activities
done at Joshua Tree NP. Both parks saw a similar percentage of visitors that go to each
respective national park to sightsee.
Figure 14: Visitation by Activity Type

37 | P a g e
Aside from the studies completed above, a variety of other significant categories such as
age groups and visitor origin (i.e. in-state, out-of-state, vs. international) were analyzed. The left
column of Table 4 summarizes the categories that were used for comparison. The two right
columns summarize the average percent difference for the given category. The percent
differences was computed by subtracting the category value of the park (Rocky Mtn. or Acadia)
from the corresponding category value for Joshua Tree NP, and then averaging the differences
across all categories. A difference closer to 100% signifies a large difference in that
characteristic.
Table 4: Park Comparison
Analysis Category Rocky Mountain NP Acadia NP
Group Size 16% 42%
Group Type 11% 38%
Visitor Origin 52% 72%
International Visitors 18% 8%
Age Group 22% 46%
Primary Activity during Visit 74% 81%
Land Size 523,917 742,356
Number of Campsites 88 211
Number of Sites with Visitation over 25% 5 4
Weighted Score Comparison
While the percent difference values in the previous table are informative individually, a
numerical combination of each category would better illustrate which park was overall more
similar to Joshua Tree NP. To combine individual values, a weighted score was calculated.
Weights are introduced because not all categories equally affect transit ridership. Larger weights
are given to categories that would be more important indicators of transit usage according to the
Alternative Transportation System Demand Estimation for Federal Land Management Agencies
report. For example, group size and primary activity type have a strong impact on percent
ridership, so those categories received the highest weights in this analysis. Table 5 shows the
weights that were used for each category.

38 | P a g e
Table 5: Weights used for Weight Analysis
Category Weights
Group Size 20
Group Type 15
Visitor Origin 15
International Visitors 10
Age Group 15
Primary Activity during Visit 25
A weighted sum is calculated for each of the parks according to the following equation:
( ) ( ) ( )
( ) ( ) ( )
A weighted score of high value indicates more difference between characteristics whereas a
lower score indicates more similarity. The weighted score for Rocky Mountain NP was
calculated to be 36 and for Acadia NP the score was 52. Thus, the conclusion is that Rocky
Mountain NP is most similar to Joshua Tree NP so the transit ridership will be estimated based
on that of Rocky Mountain NP.
Estimating Ridership
The park to park comparison indicated that Rocky Mountain NP percent ridership could
be a general indicator for transit usage at Joshua Tree NP. Ridership data for Rocky Mountain
NP was pulled from the Grand Teton National Park Public Transit Business Plan (2009). This
report provided annual visitation and transit ridership from 1999 to 2007. Figure 15 shows the
percent ridership for Rocky Mountain NP from 1999 to 2007.
A ridership forecast was made to the current year (2014) based on the best fit line through
the historical ridership data. Using this model, a percent ridership of 18.5% was predicted for
Rocky Mountain National Park for the year 2014 and hence this is what will be used for Joshua
Tree National Park.

39 | P a g e
Figure 15: Transit Ridership Data from Rocky Mountain and Acadia NP
5.2 Daily Travel Demand Prediction
In order to estimate daily demand for transit, the ridership prediction of 18.5% needs to
be applied to the visitation statistics for Joshua Tree NP. Visitation is provided as annual data,
so the following section outlines the process for converting the annual visitation to daily demand
for transit.
The annual visitation statistics for Joshua Tree National Park is provided by the NPS
(National Park Service) beginning in 1979 and continuing until 2013. Over the last several years,
i.e. 2011 to 2013, visitation appears to have reached a plateau around 1.4 million annual visitors.
Figure 16 shows the monthly visitation trends for 2013. Spring months, March and April,
experience the highest visitation while the autumn months, September and October, experience
the lowest visitation volumes.

40 | P a g e
Figure 16: Monthly visitation for 2013
The Transportation Planning Process for Transit in Federal Land Management Areas
Report recommends providing transit to meet the demands on the 90th
percentile day. The report
states that transportation systems are not typically designed to accommodate conditions on the
busiest day of the year, but rather that planning based on the 90th
percentile day may be more
appropriate. The data used for this project provides visitation at the monthly level, so daily
visitation numbers are not directly available. To estimate the 90th
percentile day, first the 90th
percentile visitation volume was determined by computing the 90th
percentile visitation based on
the monthly data. Figure 17 shows the 90th
percentile monthly visitation observations for 1979-
2013. The trend is increasing, as was previously noted in the annual visitation. For the purposes
of this report, the 90th
percentile of the most recent year, 2013, will be used for analysis. The 90th
percentile of monthly visitation for 2013 was 189,957 visitors. This is approximately, 7,000 less
than the max visitation which takes place in March.

41 | P a g e
Figure 17: 90th
Percentile Monthly Visitation
To determine transit system frequencies and number of buses, the 90th percentile
monthly visitation was further disaggregated into daily volume and finally split into weekday
and weekend volumes.
To obtain weekly transit passenger trips, the 90th
percentile monthly volume (189,957
visitors per month) was divided by the average number of weeks per month, 4.348 weeks per
month (365.25 days per year/ 12 months per year / 7 days per week). The weekly volume of
passenger trips was further reduced by applying the fraction of visits that occur on Saturdays,
approximately 0.288 Saturday visitors per week. This ratio was derived from the visitation data
provided by the Joshua Tree Visitor Center staff and volunteers. The ratio is the number of
Saturday visits divided by the total number of weekly visits. Their reports show that the weekend
traffic is approximately 48.36% of the weekly number of visits and that Saturday is the busiest
day out of the week accounting for 59.6% of weekend visits during the peak visitation months of
February through May. By these calculations, the approximate number of visitors per Saturday is
11,800 visitors. This formulation is summarized as:
(
) (
) (
)
42 | P a g e
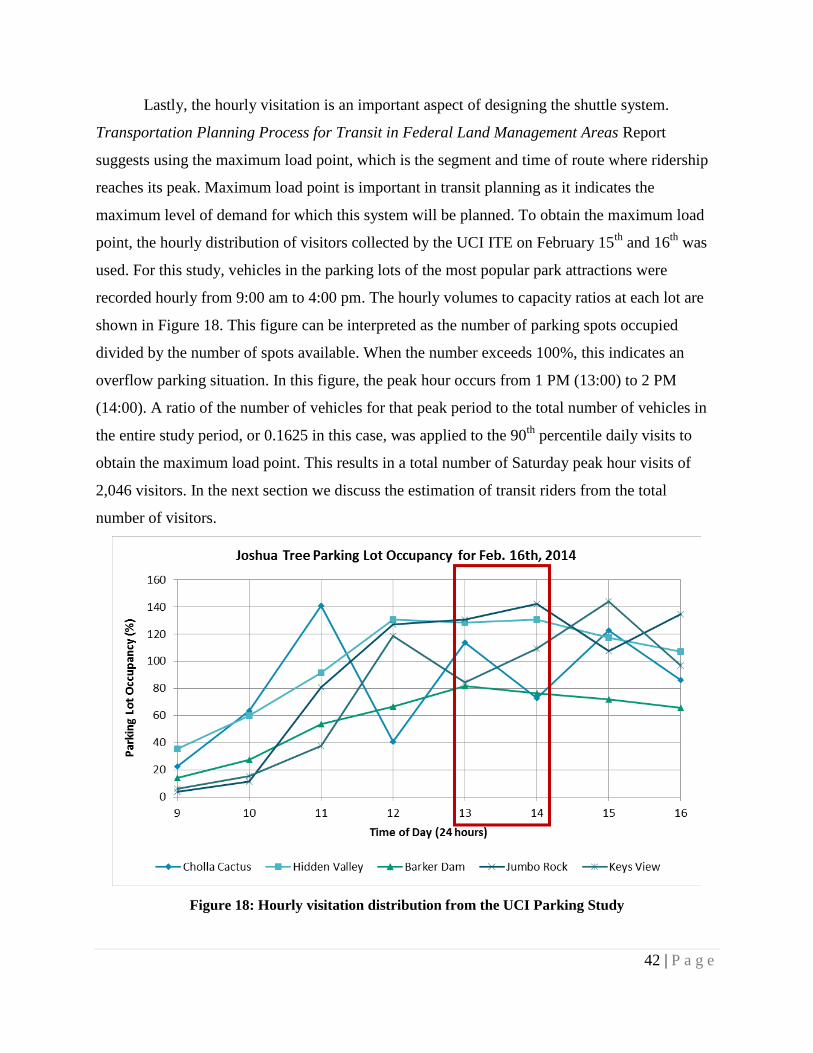
Lastly, the hourly visitation is an important aspect of designing the shuttle system.
Transportation Planning Process for Transit in Federal Land Management Areas Report
suggests using the maximum load point, which is the segment and time of route where ridership
reaches its peak. Maximum load point is important in transit planning as it indicates the
maximum level of demand for which this system will be planned. To obtain the maximum load
point, the hourly distribution of visitors collected by the UCI ITE on February 15th
and 16th
was
used. For this study, vehicles in the parking lots of the most popular park attractions were
recorded hourly from 9:00 am to 4:00 pm. The hourly volumes to capacity ratios at each lot are
shown in Figure 18. This figure can be interpreted as the number of parking spots occupied
divided by the number of spots available. When the number exceeds 100%, this indicates an
overflow parking situation. In this figure, the peak hour occurs from 1 PM (13:00) to 2 PM
(14:00). A ratio of the number of vehicles for that peak period to the total number of vehicles in
the entire study period, or 0.1625 in this case, was applied to the 90th
percentile daily visits to
obtain the maximum load point. This results in a total number of Saturday peak hour visits of
2,046 visitors. In the next section we discuss the estimation of transit riders from the total
number of visitors.
Figure 18: Hourly visitation distribution from the UCI Parking Study

43 | P a g e
A ridership of 18.5% total visitation, provided through comparing and contrasting other
national parks with similar characteristics, was applied to the hourly estimated volume obtained
though the methodology described in the previous section. The ‘Number of Saturday Peak Hour
Riders’ is calculated by applying the transit ridership rate (18.5%) to the number of hourly
visitors (2,046 visitors) as summarized in the following equation:
( ) ( )
Therefore, the total number of hourly riders is approximately 368 riders per hour.
5.3 Route Alternatives & Infrastructure Needs
Three alternatives were proposed to transport visitors throughout Joshua Tree NP. Each
alternative includes stops at popular sites within the park, as indicated by the University of Idaho
2010 Visitor Demand Survey of Joshua Tree National Park and the ITE UCI Chapter Visitor
Demand Survey. Each route also includes stops between the popular sites at various starting and
ending points for hiking trails within the park to serve all types of visitors.
In an effort to make a visit to Joshua Tree National Park pleasant and safe, various shuttle
system infrastructure was determined based on visitor needs and safety. Other national parks
with successful transit systems were researched and used as a reference to determine the
necessary infrastructure to support the proposed shuttle system. Proposed infrastructure includes
bus stops that come with a paved landing area, shelter/canopies, sitting benches, and an
information panel to display shuttle bus route maps and schedules. Additional infrastructure
include parking lots near the Joshua Tree Visitor Center and the Oasis Visitor Center, parking
and shuttle signage, parallel bus bays, digital two-way radio emergency call boxes, solar
powered light poles, crosswalk striping, restrooms, and respective bus technologies are all also
included in the proposed infrastructure. Sample infrastructure photos can be found in Section B.2
of the Appendix.
The locations of the entire proposed infrastructure are dependent on the three shuttle
route alternatives. With the installation of these public facilities come concerns for protecting the
natural environment. It can be very challenging to install infrastructure within a national park,
mainly due to concerns of the facilities being too close in proximity to wilderness boundaries.

44 | P a g e
These concerns will need to be accounted for when installing all shuttle stop facilities. Approval
may be hard to gain with new facilities being built, as it may negatively impact the
environmental quality or natural beauty of the Park. However, because the transit will benefit the
Park in many ways, the said facilities will be needed to facilitate the transit service.
Associated infrastructure costs came from various sources such as public contract bid
summaries, transit feasibility reports and other online research. Included in all three alternatives
are the required infrastructure for the possible bus technologies. Cost estimates for the use of
three different transit technologies, which are propane buses, hybrid buses, and biodiesel buses,
are provided.
5.2.1 Alternative 1 Alternative 1 will serve visitors entering through the West Entrance and is comprised of
three routes as shown in Figure 19 with black diamonds indicating bus stops. The Blue Line will
begin at the Joshua Tree Visitor Center, which is the busiest visitor center of the park. Buses will
traverse Park Blvd. and stop at popular destinations in the following order: Joshua Tree Visitor
Center, Barker Dam, and Hidden Valley.
Table 6 summarizes the route travel times and distances for Alternative 1. The proposed
Blue Line is 15.6 miles long and has a one-way travel time of 27. A transfer stop will be placed
at Hidden Valley to allow visitors the option of transferring onto the Purple Line (heading south
on Keys View Rd) or Yellow Line (heading southeast on Park Blvd). The Purple line will take
visitors directly to Keys View and has a length of 7.2 miles and a one-way travel time of 16
minutes. The Yellow Line will shuttle visitors to Ryan Mountain, Skull Rock, Jumbo Rock, Arch
Rock, and lastly, the Cholla Cactus Garden via Pinto Basin Rd. The proposed Yellow Line has a
length of 22 miles and a one-way travel time of 36 minutes. Once each bus has reached its last
stop on its respective route, the bus will turn around and repeat the route in reverse.

45 | P a g e
Figure 19: Route Alternative 1 Map
Table 6: Alternative 1 Route Distances and Travel Times
Shuttle Line Distance (mi) Time (mins)
Blue 15.6 27
Purple 7.2 16
Yellow 22 36
A total of 12 bus stops will be installed for Route 1, with one bus stop at most locations,
with the exception of the Transfer Stop at Hidden Valley, Ryan Mountain, and Jumbo Rock,
which will each have two bus stops (one stop for each direction). For the sites containing two bus
stops, pedestrian crosswalks will be installed, forcing vehicles to yield to all pedestrians crossing
the roadway. Additionally, two light poles will be installed to accommodate each bus stop along
with one parallel bus bay. Each site will have an emergency call box for visitors to use in time of
need. As previously discussed, additional parking at the Joshua Tree Visitor Center is proposed
to be built to accommodate for visitor parking for shuttle use. Lastly, restrooms are located at
every bus stop with the exception of Cholla Cactus, which will need installation of a waterless
restroom. A breakdown of the individual costs and infrastructure quantities associated with
Alternative 1 are shown in Table 22 of Appendix Section C.3.
46 | P a g e
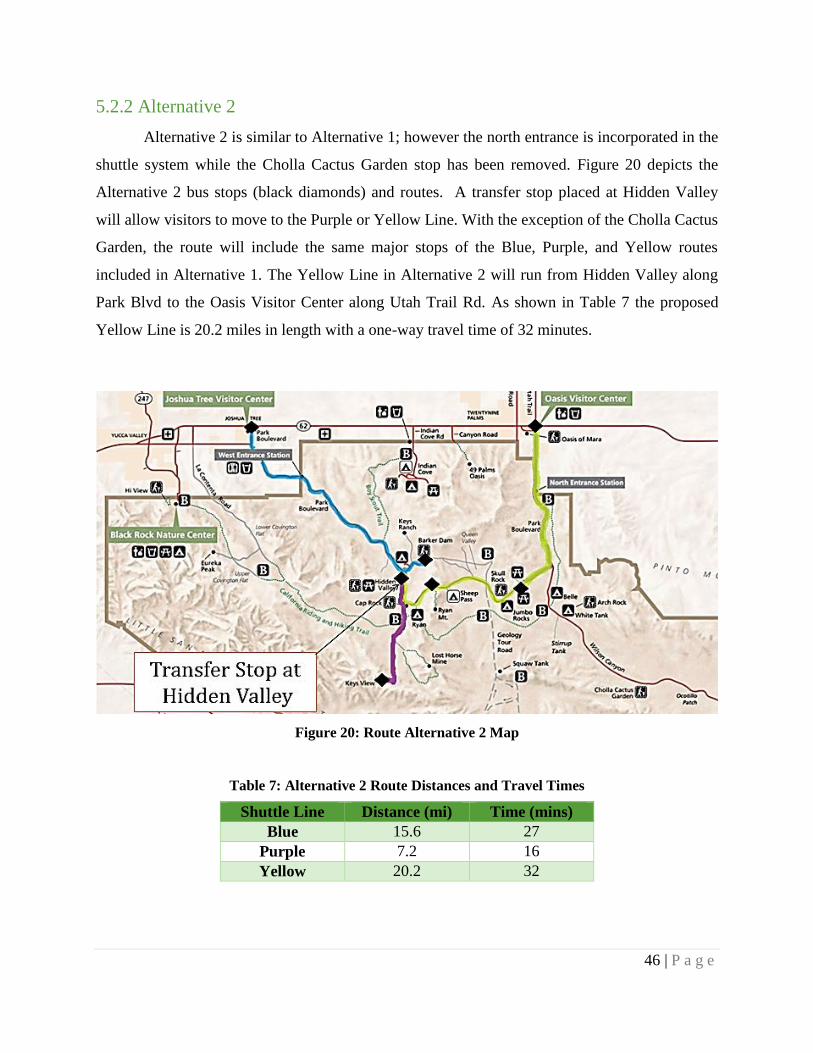
5.2.2 Alternative 2
Alternative 2 is similar to Alternative 1; however the north entrance is incorporated in the
shuttle system while the Cholla Cactus Garden stop has been removed. Figure 20 depicts the
Alternative 2 bus stops (black diamonds) and routes. A transfer stop placed at Hidden Valley
will allow visitors to move to the Purple or Yellow Line. With the exception of the Cholla Cactus
Garden, the route will include the same major stops of the Blue, Purple, and Yellow routes
included in Alternative 1. The Yellow Line in Alternative 2 will run from Hidden Valley along
Park Blvd to the Oasis Visitor Center along Utah Trail Rd. As shown in Table 7 the proposed
Yellow Line is 20.2 miles in length with a one-way travel time of 32 minutes.
Figure 20: Route Alternative 2 Map
Table 7: Alternative 2 Route Distances and Travel Times
Shuttle Line Distance (mi) Time (mins)
Blue 15.6 27
Purple 7.2 16
Yellow 20.2 32

47 | P a g e
A total of 10 bus stops will be installed for Alternative 2, with one bus stop at most
locations, with the exception of the Transfer Stop at Hidden Valley, Ryan Mountain, and Jumbo
Rock, which will each have two bus stops (one stop for each direction). Similar infrastructure
from Route Alternative 1 will be installed for all bus stops. No additional parking spaces were
proposed for this alternative. However, the Joshua Tree Visitor Center parking lot needs
repaving; therefore, in the associated cost it was assumed that there currently does not exist
anything in that lot and complete construction is needed. A breakdown of the individual costs
and infrastructure quantities associated with Alternative 2 are shown in Table 23 Section C.3 in
the Appendix.
5.2.3 Alternative 3
Alternative 3 shown in Figure 21 is the most extensive of the alternatives, as the route
runs across the entire park. The Blue Line includes stops at popular sites in the following order:
Joshua Tree Visitor Center, Barker Dam, Keys Ranch, Hidden Valley, and Keys View. A
transfer stop will be placed at Hidden Valley to allow visitors to continue on the Blue Line
headed toward Keys View or transfer onto the Purple Line headed toward the Cholla Cactus
Garden. Table 8 summarizes the travel times and distances of each route. The Blue Line has a
length of 24.5 miles and a one-way travel time of 48 minutes. The Purple Line will include stops
at Ryan Mountain, Skull Rock, Jumbo Rock, and the Cholla Cactus Garden. During the spring
season, the Purple Line will extend to the Cottonwood Visitor Center, illustrated as the dotted
seasonal route in Figure 13. The main Purple Line has a length of 22 miles and a one-way travel
time of 32 minutes. The seasonal Purple Line running between Cholla Cactus Garden and the
Cottonwood Visitor Center has a length of 41.7 miles and a travel time of 1 hour and 10 minutes.
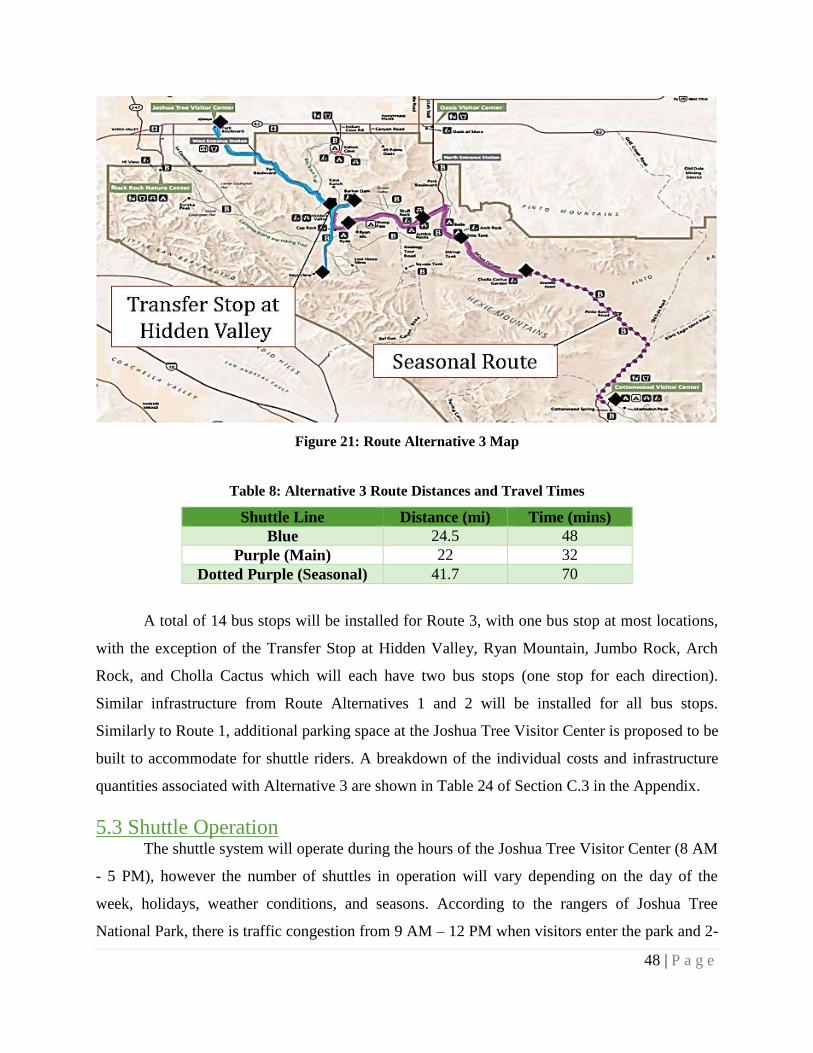
48 | P a g e
Figure 21: Route Alternative 3 Map
Table 8: Alternative 3 Route Distances and Travel Times
Shuttle Line Distance (mi) Time (mins)
Blue 24.5 48
Purple (Main) 22 32
Dotted Purple (Seasonal) 41.7 70
A total of 14 bus stops will be installed for Route 3, with one bus stop at most locations,
with the exception of the Transfer Stop at Hidden Valley, Ryan Mountain, Jumbo Rock, Arch
Rock, and Cholla Cactus which will each have two bus stops (one stop for each direction).
Similar infrastructure from Route Alternatives 1 and 2 will be installed for all bus stops.
Similarly to Route 1, additional parking space at the Joshua Tree Visitor Center is proposed to be
built to accommodate for shuttle riders. A breakdown of the individual costs and infrastructure
quantities associated with Alternative 3 are shown in Table 24 of Section C.3 in the Appendix.
5.3 Shuttle Operation The shuttle system will operate during the hours of the Joshua Tree Visitor Center (8 AM
- 5 PM), however the number of shuttles in operation will vary depending on the day of the
week, holidays, weather conditions, and seasons. According to the rangers of Joshua Tree
National Park, there is traffic congestion from 9 AM – 12 PM when visitors enter the park and 2-
49 | P a g e
3 PM when visitors leave the park. The shuttle system can be expected to be in full operation
during peak weekends and holidays.
For the third alternative, a seasonal route, illustrated as an extension of the solid Purple
Line, will run between the Cholla Cactus Garden and the Cottonwood Visitor Center. Due to the
vast amount of preservation land that encompasses Joshua Tree National Park, it would be
difficult to maintain the cost and operation between the 20-mile-stretch year-round. In addition,
many visitors make the additional drive to the southern half of the park to primarily see the
wildflowers in the lower elevations of the Pinto Basin in the southern section of the park.
Wildflowers typically begin blooming in February and continue to bloom until as late as June.
By placing a seasonal shuttle route according to the wildflower season, the shuttle system will
reduce traffic congestion and provide visitors an accessible and sustainable alternative to get
from one side of the park to the other.
5.4 Transit System Characteristics
Origin Destination Demand Estimation
The purpose of origin destination (OD) demand, in particular, private vehicle origin
destination demand, is to determine the current travel patterns within Joshua Tree National Park.
The OD study will also provide necessary information on the popular attraction sites. In order to
obtain the OD data, the parking survey data that UCI ITE members collected during the Joshua
Tree Trip on February 15th
to the 16th
was used. The original data only contains trip data, shown
for Feb. 16th
in Table 9 (a). The origin location is on the left of the table and the destination is
shown on the top of the table. For example, there were five vehicles that were observed at Cholla
Cactus Garden that were also observed at Hidden Valley. In order to convert these vehicle trip
counts to person counts, an average of 2.7 persons per vehicle was used based on the methods
reported by the NPS Visitor Statistics1. Table 9 (b) shows the resulting number of persons
traveling between sites for Feb. 16th. Lastly, two days of data were collected during the parking
study, thus, an average of the observed counts over the two days was taken. The average number
of visitors traveling between sites is shown in Table 9 (c).
1 https://irma.nps.gov/Stats/Reports/Park

50 | P a g e
Table 9: OD Trip Tables
# Vehicles Cholla HV BD JR KV
Cholla - 5 5 1 5
Hidden Valley 6 - 36 7 26
Barker Dam 2 16 - 10 17
Jumbo Rocks 3 4 4 - 3
Keys View 5 6 6 5 - (a) OD Vehicle Trip Table on Feb. 16th
# People Cholla HV BD JR KV
Cholla - 14 14 3 14
Hidden Valley 16 - 97 19 70
Barker Dam 5 43 - 27 46
Jumbo Rocks 8 11 11 - 8
Keys View 14 16 16 14 - (b) OD Person Trip Tables on Feb. 16th
# People Cholla HV BD JR KV
Cholla - 10 9 4 13
Hidden Valley 13 - 80 16 48
Barker Dam 10 41 - 18 39
Jumbo Rocks 8 11 14 - 8
Keys View 16 19 14 11 -
(c) Average OD Person Trip Tables
The OD visitor flows in Table 9 (c) which total to 402 visitors were then used as factors
to predict the demand for each transit route. Table 10 shows the proportions of trips allotted to
each OD pair.
Table 10: OD Trip Proportions
Trip Proportions Cholla HV BD JR KV
Cholla - 2.5% 2.2% 1.0% 3.2%
Hidden Valley 3.2% - 19.9% 4.0% 11.9%
Barker Dam 2.5% 10.2% - 4.5% 9.7%
Jumbo Rocks 2.0% 2.7% 3.5% - 2.0%
Keys View 4.0% 4.7% 3.5% 2.7% -
The next step is to determine the transit riders for each route. There are estimated to be
368 riders per hour during the peak hour, as explained in the previous section. The OD tables are

51 | P a g e
used to proportion this demand. This is done by multiplying the hourly volume of transit riders
by the OD trip proportions. Note, the values show in the table have been rounded up.
Table 11: Transit Riders in the Peak Hour
# Riders Cholla HV BD JR KV
Cholla - 9 8 4 12
Hidden Valley 12 - 73 15 44
Barker Dam 9 38 - 16 36
Jumbo Rocks 7 10 13 - 7
Keys View 15 17 13 10 -
Finally, the Parking Study did not measure visitor travel patterns to or from the three
entrances, so an alternate estimation method was developed to link trips from each of the
entrances to the five intra-park sites. First, the 2010 Visitor Demand Survey responses to
Question 8a regarding entrance used to enter the park were used. The west entrance in Joshua
Tree is the most popular entrance with 53% of the visitor groups passing through this entrance
while Cottonwood Visitor Center attracts only 17% of visitors. Note the responses do not total to
100% because respondents were allowed to select ‘other’. The number of transit riders at each
entrance is found by multiplying the percent visitation by the total number of hourly riders. Table
12 shows the percent visitation by entrance location and corresponding number of riders.
Table 12: Visitation by Entrance Station
Trip Proportions % Visitation
Riders
Joshua Tree Visitor Center
53% 195
Oasis Visitor Center 23% 85
Cottonwood Visitor Center
17% 63
The next step is to determine which sites are the first to be visited from each entrance
location. Again, the 2010 Visitor Demand Survey Question 8b was used. Question 8b asks about
the order in which the visitor group visited the sites within the Park. The first visit is assumed to
be the visitor center. The second visit is assumed to be the closest site to the entrance station or a

52 | P a g e
proportional split between the two closest sites in the case of Joshua Tree Visitor Center. Table
13 details the destinations most commonly visited after a visitor center.
Table 13: Sites visited from Visitor Centers
Trip Proportions Site 1 Site 2
Joshua Tree Visitor Center
Barker Dam (34%)
Hidden Valley (66%)
Oasis Visitor Center Jumbo Rocks
Cottonwood Visitor Center
Cholla Cactus
The final transit OD matrix is created by combining the results of Table 12 and Table 13
and appending these to the intra-park OD matrix shown in Table 11. It is assumed that there is
zero visitor to visitor center travel demand for transit because visitors will need to return to their
vehicles at the same visitor center where the accessed the transit system. It is also assumed that
return trips from sites to the visitor centers are symmetrical to the trips from the visitor center to
the site. Table 14 shows the final transit rider OD matrix. The largest flows occur between
Joshua Tree Visitor Center and Hidden Valley. The second highest flows occur between the
Oasis Visitor Center and Jumbo Rocks.
Table 14: Transit OD Matrix
Transit Riders Cholla Hidden Valley
Barker Dam
Jumbo Rocks
Keys View
Joshua Tree VC
Oasis VC
Cottonwood VC
Cholla - 9 8 4 12 0 0 63
Hidden Valley 12 - 73 15 44 129 0 0
Barker Dam 9 38 - 16 36 66 0 0
Jumbo Rocks 7 10 13 - 7 0 85 0
Keys View 15 17 13 10 - 0 0 0
Joshua Tree VC 0 129 66 0 0 - 0 0
Oasis VC 0 0 0 85 0 0 - 0
Cottonwood VC 63 0 0 0 0 0 0 -
Assignment of Transit Trips to each Route Alternative
Using the final peak transit OD matrix, trips for each alternative were assigned based on
the OD travel demands. Using the trips assigned to each route, the maximum load point was
determined based on the maximum between the sum of inbound travel and the sum of outbound

53 | P a g e
travel. The maximum load point is the maximum number of passengers on board the transit
vehicle. In other words, this is the maximum level of demand which should be planned for.
Figure 22 shows the travel demand between each site. Inbound travel is represented as the same
direction of the arrowhead. Each color represents the shuttle system line of the alternative. The
thickness of the lines is used to delineate travel from one location to another.
Figure 22: Route Alternative 1 Travel Patterns based on the OD Travel Matrix
The names of the locations are shown in each of the circle and are abbreviated. From the
top left moving right, the full names are: Joshua Tree Visitor Center, Hidden Valley, and Barker
Dam. The next row down is Keys View. And the last row is Jumbo Rocks and Cholla Cactus
Garden. The travel demand for alternatives two and three are shown in the Appendix.
Headways and Number of Buses
Before headway and number of buses can be determined the maximum load point must
be found. Headway is defined to be the time interval between successive arrivals of transit
vehicles at a fixed location, it is also known as the frequency of the transit service. Secondly,
service frequency (headway) that will adequately service the maximum load point must be
determined. Once headway is determined, the number of transit vehicles and type of transit
vehicle can be selected based on financial availability.

54 | P a g e
A standard bus, according to the Transportation Planning Process for Transit in Federal
Land Management Areas Volume 3, has a seating capacity of 48 persons. Headways were
iteratively determined in order to meet all transit demands while satisfying the seating capacity
demand. The number of buses was determined by the total travel time multiplied by 2 for a
roundtrip and adding to it the number of bus stops multiplied by a stop time of 1.5 minutes. This
number was then divided by the headway to determine the number of buses needed. Overall, the
number of buses for routes 1, 2, and 3 is as follows: 11, 12, and 20 buses. Note that these are the
minimum number of buses that are needed in order to maintain the headways. These headways
include the load times at each bus stop.
5.5 Parking Lots
Required parking lot sizes were calculated based on an estimated ridership of 18.5%.
This means that 18.5% of a certain visitor population will be willing to ride the shuttle. Using
this 18.5% ridership, three different estimation methods/ assumptions were made to develop an
average number of parking spaces required. The first method did not rely on the ridership, but
simply focused on preventing overflow based on the counts that were obtained from the parking
survey during the peak hour. The second method assumed that only the visitors traveling to the
five parking study sites would be willing to use the shuttle system. The third, assumed that all of
the vehicles entering during a particular busy day could be potential shuttle riders. These
methods are further elaborated below.
Methods for Parking Lot Size Determination
Method 1: Only the visitors traveling to the five parking study sites would be willing to use the
shuttle system; therefore, the amount of visitors at the remaining locations were ignored. Parking
survey data was used to obtain the maximum number of vehicles during the observed peak hour
(462 vehicles). This was then subtracted from the maximum number of parking spaces available
at these locations (approximately 379). From this calculation, it was determined that a minimum
of 83 parking spots would be required outside of the park in order to prevent overflow.
Method 2: Only the visitors traveling to the five parking study sites would be willing to use the
shuttle system; therefore, the amount of visitors at the remaining locations were ignored. The

55 | P a g e
number of vehicles present at the park is the sum of the number of vehicles found during the
peak hour of the parking study. A total of 462 vehicles were counted during the busiest hour;
therefore, by taking 18.5% ridership of the 462, it is determined a total of 86 parking spaces are
needed.
Method 3: All parking lots inside park grounds are full and visitors not traveling to the five
study areas are willing to ride the shuttle regardless of the fact that it only stops at five locations.
An estimated 787 parking lots were found within park grounds. If 18.5% of this population
would be willing to use the shuttle system, the number of parking spaces required outside of park
grounds was estimated to be 146.
Taking the average of these three parking size requirements, gives an estimate of 105
parking spaces required in order for the shuttle system to function properly. The following
section briefly presents the proposed routes, which are tied with proposed parking lot locations.
Parking Lot Locations and Capacities
Based on the three proposed shuttle routes, two different potential parking lot locations
have been selected. For alternative one and three, the shuttle will only be traveling to the Joshua
Tree Visitor Center; therefore, additional parking will only be provided at this location. This
center currently has an estimated 83 parking spaces (shown in Figure 23). However, as discussed
in the previous section, the estimated demand is 105 parking spaces; therefore, additional land
must be purchased to accommodate additional vehicles. Approximately 0.22 acres of land must
be purchased to add 22 parking spaces. A summary of the associated costs can be found in
Section B.3 of the Appendix.

56 | P a g e
Figure 23: Existing Joshua Tree Visitor Center Parking Lot
For Alternative 2, the shuttle travels to both the Joshua Tree Visitor Center and the Oasis
Visitor Center. Therefore, the total parking lot demand was split between these two locations.
Two-thirds of the parking demand was allocated to the Joshua Tree Visitor Center parking lot
and one-third was allocated to the Oasis Visitor Center. This was based on the fact that
approximately two-thirds of vehicles enter through the Joshua Tree Visitor Center compared to
the Oasis entrance; therefore, more demand is expected in this area. Following these ratios, it
was calculated that at least a total of 70 parking spaces are needed at the Joshua Tree Visitor
Center while a total of 35 are needed at the Oasis Visitor Center. Since the Joshua Tree Visitor
Center has room for approximately 83 parking spaces, no additional land must be purchased as
the capacity exceeds the demand. At the Oasis visitor center, 43 parking spaces currently exist
and a total of 35 parking spots are required. Again, no additional parking is needed at this visitor
center as the capacity exceeds the calculated demand.

57 | P a g e
Chapter 6: Traffic Impact Analysis
With the growing number of visitors that Joshua Tree NP has been experiencing in recent
years, it is expected that vehicular activity both within and outside of the bounds of the park
would increase. This means more congestion, greenhouse gas emissions, and traffic related
accidents. It is anticipated that all proposed route alternatives would be effective in mitigating
negative impacts associated with visitor growth. For one, it would lower the number of vehicles
within the park as riding the shuttle would be a safer and more convenient option. However, it is
important to note that there will be two types of shuttle riders. One will be those who park their
vehicles within the park to take the shuttle, and the other will be those who park outside and take
the shuttle to enter the park. The following study will focus primarily on the second type, as most
visitors in the future are assumed to park outside of the park to take the shuttle to travel into the
park.
6.1 Analysis of Existing Intersections The intersection near the Joshua Tree Visitor Center (West Entrance) is approximately 16
miles from the intersection leading to the Oasis Visitor Center (North Entrance). It is surrounded
by homes, small businesses, and several vacant lots that are currently used for parking. Directly
to the south of the Oasis visitor center is Service Road, where only employees of the park are
permitted to enter. To the north, there are homes and a church. To the west is a preserved oasis
known as the Oasis of Mara. To the east is a residential neighborhood. Although there are many
open areas surrounding the visitor center, unlike the Joshua Tree Visitor Center, possible parking
locations are limited. The visitor center currently offers parking but with a limited capacity of 83
vehicles.
6.2 Projected Traffic
It was assumed that creating alternative parking spaces outside of the park could help
reduce traffic inside the park; therefore, this memo primarily focuses on the external impacts.
This analysis utilized predicted average daily traffic (ADT) estimates acquired from the San
Bernardino County department of transportation, which has public ADT volumes for specific
intersections. These volumes were utilized to understand the direction in which most cars are
traveling. Although the data provided by the San Bernardino Department of Transportation was
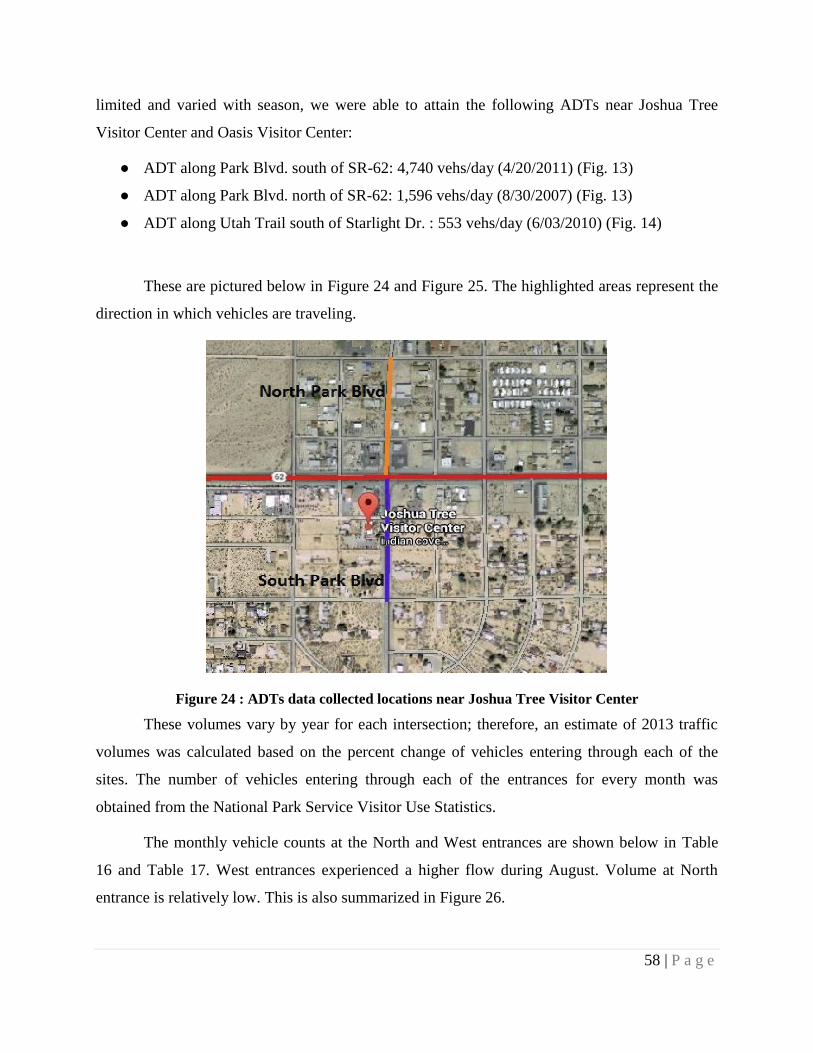
58 | P a g e
limited and varied with season, we were able to attain the following ADTs near Joshua Tree
Visitor Center and Oasis Visitor Center:
● ADT along Park Blvd. south of SR-62: 4,740 vehs/day (4/20/2011) (Fig. 13)
● ADT along Park Blvd. north of SR-62: 1,596 vehs/day (8/30/2007) (Fig. 13)
● ADT along Utah Trail south of Starlight Dr. : 553 vehs/day (6/03/2010) (Fig. 14)
These are pictured below in Figure 24 and Figure 25. The highlighted areas represent the
direction in which vehicles are traveling.
Figure 24 : ADTs data collected locations near Joshua Tree Visitor Center
These volumes vary by year for each intersection; therefore, an estimate of 2013 traffic
volumes was calculated based on the percent change of vehicles entering through each of the
sites. The number of vehicles entering through each of the entrances for every month was
obtained from the National Park Service Visitor Use Statistics.
The monthly vehicle counts at the North and West entrances are shown below in Table
16 and Table 17. West entrances experienced a higher flow during August. Volume at North
entrance is relatively low. This is also summarized in Figure 26.

59 | P a g e
Figure 25: ADTs data collected near Oasis Visitor Center
Table 15: Traffic Counts at West Entrance (Joshua Tree)
Year April August
2013 21,759 10,194
2012 22,518 9,493
2011 23,072 8,312
2010 22,580 9,138
2009 20,890 8,467
2008 19,619 6,821
2007 16,651 9,852

60 | P a g e
Table 16: Traffic Counts at North Entrance (Twentynine Palms Oasis)
Year June
2013 5,750
2012 4,708
2011 5,475
2010 5,217
2009 4,713
2008 4,044
2007 7,918
Figure 26: Monthly vehicle counts

61 | P a g e
Traffic volume processing highlighted that south of SR-62 at Park Blvd. serves an
estimated 4,470 veh /day, while north of SR-62 at Park Blvd. serves 1,652 vehs/day. At the
intersection of Utah Trail and Starlight Drive an estimated 6,337 vehs/day travel into the park.
6.2.2. Results Based on the estimated ADT for Year 2013 and the traffic volume trends at each of the
entrances, it was projected that the intersection of SR-62 and Park Blvd. will continue
experiencing the highest volumes of the intersections studied. The North entrance is projected to
remain the second most congested entrance. This is due to the fact that most of the popular sites
in Joshua Tree National Park are located on the West side of the park; therefore, this will cause
visitors to access the park from the entrance closest to the site they would like to visit. Traffic
conditions at the intersection of SR-62 and Park Blvd. might pose a small problem if the first
alternative is carried out as all visitors riding the shuttle will be forced to park in the parking lots
located near the start of the shuttle route. The South entrance was disregarded because the traffic
volumes are very low and do not have a significantly increasing trend. In addition, on rare
occasions, this entrance may be closed during the winter season due to dangerous road
conditions caused by severe weather.
Adding shuttles to the existing network may cause problems to some congested local
streets, for example south Park Blvd. In order to resolve the potential traffic concerns caused by
the shuttle system implementation, the main goal would be to spread parking locations along SR-
62. For Alternative 1 and 3, congestion can be reduced along Park Blvd. by extending the storage
length for the right turn lane in order to prevent queuing behind the existing through lane.
Another option is to increase the number of parking spaces at the North entrance in order to
encourage visitors to travel in that direction when parking is full at the West entrance. With the
future Caltrans projects along SR-62, some safety concerns will be mitigated, but this might pose
congestion issues during the years the project is under construction.

62 | P a g e
Chapter 7: Sustainability Beyond alleviating parking and entrance station congestion, another goal of the transit
system is to reduce environmental impacts resulting from vehicle emissions. As a sensitive
geographical area, the air quality in Joshua Tree National Park has to meet the highest standards
set by the Environmental Protection Agency (EPA), thus alternative fuel technology for transit
vehicles is very important to the nature of the park. Various transit technologies, air pollutants,
and emissions models are presented in this section. Six alternative transit technologies were
compared. These included: diesel, bio-diesel, hybrid diesel-electric, electric, propane, and
hydrogen. All six technologies operate uniquely, require specialized infrastructure for fueling
and maintenance, and have various impacts on the air quality.
In this Chapter, a brief review of existing transit services is provided, followed by a
description of each of the six specified transit technologies. Finally, a summary of pollutant
emissions is given and a final recommendation regarding transit technology is provided.
7.1 Existing Transit Services
Pre-existing conditions of Joshua Tree National Park are very minimal in terms of
transit. Joshua Tree NP does not currently have an internal transit system. Local transit
authorities are the Morongo Basin Transit Authority (MBTA) and SunLine Transit
Agency. MBTA has routes going through the community of Joshua Tree, as well as other local
communities such as Twentynine Palms, Yucca Valley, Morongo Valley, and Landers. The
MBTA operates 24 busses operating on compressed natural gas (CNG) with fueling stations in
Joshua Tree and Twentynine Palms. MBTA does not have routes that go into the National Park,
but has stops near by the entrances. The SunLine Transit Agency operates solely from the
Desert Hot Springs area down south to the Coachella area. SunLine buses include CNG,
hydrogen, and hybrid technologies.
7.2 Transit Technologies
Diesel
Diesel engines are becoming more popular in passenger cars. Modern diesel systems are
clean, powerful, and fuel-efficient. Diesel engines, like gasoline engines, are both internal

63 | P a g e
combustion engines. A diesel engine, however, compresses the air used in the combustion first
and then injects the fuel. As the air is compressed, the temperature increases causing the fuel to
ignite (Austin). They operate at a high compression ratio and the fuel has a higher energy density
which allows the fuel economy to be 15% to 30% higher than gasoline engines (Tuttle). In the
United States, diesel has increased in cost and currently costs more than gasoline, ranging from
$1500 to $5000 more to operate. This would increase operation costs if this alternative is chosen.
Current technology of diesel engines produces 90% less emissions than the old diesel
technology. Researchers have determined that new diesel engines produce emissions much lower
than the EPA standards and are emitting the same as gasoline powered automobiles. Fine
particulate matter has also decreased significantly with 99% lower particulate emissions coming
from the 2007 diesel engines than the 2004 models. Other air pollutants have also been decreased
significantly including carbon monoxide and hydrocarbons. Nitrogen oxides, however, have not
been lowered enough with the new technology. Only 70% of nitrogen oxides were lowered
between the 2007 and 2004 models, but larger reductions are necessary to follow the EPA set
standards of nitrogen oxides emissions. Researchers are trying to reduce nitrogen oxide
emissions without lowering the fuel economy, which has proven to be difficult (Cone). Diesel
fuel emits about 10.21 kg of carbon dioxide per gallon. For a medium to heavy duty vehicle
such as a bus, the methane emissions factor is about 0.0051 grams/mile and the nitrous oxide
emissions factor is about 0.0048 grams/mile.
Diesel buses cost approximately between $250,000 and $280,000 per bus (Colorado
DOT). As of April 7, 2014, the average cost of diesel in the United States was $3.959 per gallon
(Gasoline and Diesel Fuel Update). There are currently a few gas stations located near Joshua
Tree that already sell diesel so new diesel pumping infrastructure would not have to be built.
Diesel-Electric Hybrid
Large vehicles such as buses are capable of using diesel hybrid engines. Diesel-electric
power can be used to improve fuel efficiency. While nearly all studies have shown an increase in
fuel economy and decreases in brake wear, engine wear, emissions, and noise pollution; these
studies have been focused on urban transport that travel with stop-and-go routes in mind. Since

64 | P a g e
the Joshua Tree Project will be planned with stop sites separated by several miles, these benefits
will not carry the same levels of benefits as they would in the city.
Engine systems have been innovated to make large diesel vehicles more sustainable.
Studies and tests by BAE Systems have shown that new engine systems, such as the parallel
system they developed, can reduce fuel consumption by up to 30% even for heavy vehicles like
freight trucks. However, it was shown that the parallel system worked best for slow going
vehicles with stop-and-go travels, such as garbage trucks. HybriDrive Propulsion systems use
diesel to run when operating at speeds over five mph. When the bus speed drops below five mph,
the engine shuts off to reduce idling time and fuel use. Heat, noise, and emissions at drop-off
points are eliminated. The electric powers the bus until it reaches five mph again, which activates
the diesel engine once more.
Fortunately, not all hybrid systems have been designed for only city use. Yosemite
National Park has invested in hybrid shuttle buses to benefit both the visitors to the park and the
park itself. Yosemite’s diesel-electric hybrid shuttle buses provide a quieter, cleaner, and more
fuel efficient mean of transportation throughout the park. The eighteen shuttles can serve over
one thousand passengers per hour for fifteen hours a day, year round. Estimates conducted by the
NPS calculate the particulate matter emissions have decreased by 90%. The car traffic in the park
has also been severely reduced, thanks in part to the Yosemite shuttles offering free rides to the
visitors of the parks. “The buses are operated by Delaware North Companies, which subcontracts
its services to the National Park Service.” Diesel-Electric buses produce the same types of
emissions as traditional diesel buses, but at a reduced level, due to the switch from diesel to
electric during slow moving times and idling. Emissions factors for hybrid buses are about 1.40
grams/mile for carbon dioxide, 0.02 grams/mile for particulate matter, 0.02-1.2 grams/mile for
total hydrocarbons (dependent on fuel used), 0.30 grams/mile for carbon monoxide, and 1.01
grams/mile for nitrogen oxides (data based on studies performed by Connecticut Academy of
Science and Engineering, Environmental and Energy Study Institute, and Federal Transit
Administration).
Hybrid Buses can cost twice as much as conventional diesel buses. The average price of a
40ft hybrid bus typically ranges from $450K to $550K, while conventional diesel runs around
$280K to $300K. However, studies have shown that hybrids generally save money in terms of

65 | P a g e
maintenance and operational costs. While government grants may be available to help alleviate
initial costs, but ultimately hybrid buses will come with a sweep initial investment.
In conclusion, Diesel Hybrid systems have been shown to be effective for city buses,
large diesel trucks, and most importantly park shuttles. Unfortunately, costs for hybrids tend to
be much higher for such systems as opposed to pure diesel engines. While Yosemite National
Park as shown successful implementation of hybrid shuttle use, climate and visitor frequency are
aspects that need to be kept in mind before making a decision.
Biodiesel
Biodiesel is a renewable fuel manufactured from biological ingredients, such as vegetable
oil, animal fats, or recycled restaurant grease. Biodiesel can be used in its pure form or in a
variety of blends with petroleum diesel fuel. These blends vary from 100% biodiesel (B100),
20% biodiesel and 80% petroleum diesel (B20), 5% biodiesel and 95% petroleum diesel (B5),
and 2% biodiesel and 98% petroleum diesel (B2). Petroleum diesel and biodiesel are very similar
chemically. Both fuels have a long chain of carbon atoms, with hydrogen atoms attached. The
difference between the fuels is that biodiesel also has an ester group at the end of the chain of the
carbon atoms. This is due to biodiesel being made out of vegetable oil. Vegetable oil must be
converted to biodiesel in order for the fuel to reduce the molecular size. Shrinking the molecule
decreases the temperature at which the fuel will start to gel. After removing any traces of water
in the vegetable oil, the oil is converted into biodiesel via a transesterification reaction. Methanol
is used to break down vegetable oil into biodiesel and glycerol.
Unlike petroleum diesel, biodiesel is easily replenished by farming and recycling.
Biodiesel also substantially reduces tailpipe emissions of carbon monoxide (CO), nitrated
polycyclic aromatic hydrocarbons, polycyclic aromatic hydrocarbons, sulfates, unburned
hydrocarbons (HC), and particulate matter (PM). Biodiesel reduces the dependency of fossil
fuels from foreign countries. Greenhouse gas emission is significantly reduced due to Using
biodiesel reduces greenhouse gas emissions because the plant feedstock used in the production
absorbs released carbon dioxide from the atmosphere when it grows, due to photosynthesis.
Production particulate emissions for biodiesel are 50% less than emissions for petroleum diesel.
While tailpipe emissions are reduced by 20% with biodiesel conversion. Biodiesel is also

66 | P a g e
biodegradable and non-toxic. Biodiesel fuel buses emits 2% more NOx than diesel but reduces
PM emissions by 10.1%,HC emissions by 21.2%, and CO emissions by 11%. CO2 emissions are
eliminated all together. Biodiesel allows for easy transition from diesel fuel to biodiesel fuel
because there are no modifications required to begin fueling with biodiesel. Biodiesel is cost
efficient and feasible but does not offer a great reduction of emissions compared to other fuel
alternatives.
Biodiesel blends can be used in diesel vehicles without any engine modification.
Therefore, the cost of a biodiesel bus is the same as a diesel bus. A transit bus averages between
$250,000 and $350,000, depending on specifications. Fleets generally use B20 or B5 biodiesel
blends. Blends with percentage of biodiesel higher than 20% may require engine modification,
due to the biodiesel’s capability of deteriorating rubber gaskets and tubing. Biodiesel has a
higher flashpoint than conventional diesel so it is less flammable. Therefore, biodiesel is
compatible with existing fuel storage tanks. Biodiesel also improves engine lubrication and
actually cleans the engine gunk and deposits from the inside of the fuel system. The U.S.
Department of Energy did a study where it compared nine identical 40-ft transit buses for two
years. Five of the buses ran on B20 biodiesel fuel and the other four operated on petroleum
diesel. The study titled, 100,000-Mile Evaluation of Transit Buses Operated on Biodiesel Blends
(B20), concluded there is no difference between average fuel economy for diesel and biodiesel
vehicles. Maintenance costs were higher for the B20 group by $0.02 per mile due to component
replacements. Transitioning to biodiesel caused early problems and fuel filtering plugging.
Biodiesel fuel (B20) averaged around $4.06/gal in July 2013. Its cost fluctuates directly
with the cost of diesel fuel. The closest location of a public biodiesel fuel pump is Extreme
Green Technologies Incorporated in Corona, California. The station is 95 miles away from
Joshua Tree NP. A plan for storing biodiesel closer to the Park should be considered.
Propane
Zion National Park, located in southern Utah, created a transit system within the park
using propane powered shuttles (Green Transit - The Zion Shuttle). Propane shuttles are
increasing in usage for fleet applications. A propane vehicle operates similarly to gasoline
powered engines, with similar power, acceleration, cruising speeds, and driving range. Propane

67 | P a g e
engines, however, have lower maintenance costs than a normal gasoline powered engine. They
have a higher octane rating, and low carbon and oil contamination characteristics which result in
a higher lifetime expectancy than gasoline engines.
Propane costs less than gasoline, which helps saved costs of operation. Propane engines
produce lower amounts of harmful emissions compared to diesel and gasoline engines. An EPA
emissions test of a propane-fueled Ford V8 resulted in a net hydrocarbon emission of 73%
cleaner than the acceptable standard, NoX emissions were down 57%, and CO emissions were
93% cleaner than the federal standard. Propane engines provide 90% of gasoline’s miles per
gallon and propane is considered a safe motor fuel because propane tanks are 20 times as
puncture-resistant as gasoline tanks and the lower flammability range (Propane Powers Zion
National Park’s Shuttle Bus Service). Propane buses emit about 5.72 kg carbon dioxide/gallon,
0.27 grams methane/gallon, and 0.05 grams nitrous oxides/gallon. According to the Zion
National Park Study, emissions factors for propane shuttles given by the manufacturer are 3.44
grams volatile organic compound/ mile, 0.3 grams carbon monoxide/mile, and 9.85 grams
nitrogen oxides/mile.
Propane vehicles are spark-ignited engines like gasoline powered engines. For a vapor
injected system, liquid propane enters the engine compartment through a fuel line. A regulator or
vaporizer converts the liquid propane into a vapor. The vapor is then mixed with filtered air and
moved to the combustion chamber where it burns to produce the power to drive the vehicle.
Because of the mixture of vapor and air, cold start problems are greatly reduced in propane
engines (Propane Vehicles).
Amerigas, located in 29 Palms, currently sells propane which could fuel the shuttles for
Joshua Tree. Propane engines, modeled after the propane shuttle fleet in place in Zion National
Park, could be a good alternative for the Joshua Tree transit system due to the low maintenance
and operational costs, lower harmful emissions, and safety.
Electric
An electric bus is a bus powered by electricity. Electric buses are on the rise in the United
States. However, the biggest problem is that batteries don't allow these buses to travel a
satisfactory range. They are mainly concentrated in the airport and other short shuttle route. For

68 | P a g e
example, Foothill Transit has several electric buses on Route 291 and it has shown that these
buses have short recharging periods.
Since the battery technology is still not very developed, it is very unlikely for the transit
industry to use this technology. This technology needs to be developed to a point where a vehicle
can easily travel around 200-300 miles on a single charge. The delays caused for the need for en-
route charging will make it too costly for a transit agency. Furthermore, the capital cost for an
electric bus is estimated to be around $700,000 in fuel and maintenance over a 12 year period.
On top of that, the cost of necessary charging stations can be up to $50,000 each. The estimated
cost to charge the buses each time would be about 20 to 30 cents per mile traveled.
Electric Buses emit no gases since it has no tailpipe emissions and use less energy per
miles than diesel buses. This technology is still not mature, but electric buses are a clear example
involving technology in air control and alternative fuel vehicles. Since electricity is produced
from renewable energy sources, such as wind or hydro-electric power, greenhouse gas emissions
for electric buses should be minimal or close to zero.
With the recent discovery of massive amounts of natural gas in the United States,
agencies have decided not to adopt electric buses. As a result, the price of natural gas has gone
down. Natural gas will prove to be a cheaper source for buses than electricity. However, electric
buses have the greatest appeal in California since pollution is preventing the purchase of diesel
buses.
Yosemite National Park has invested in two electric-powered shuttle buses. These buses
provide millions of Yosemite visitors an eco-friendly type of transportation. These electric buses
have "no odors, no noise, [and] no pollution." Electric buses are a clear example involving new
technology in air control and alternative fuel vehicles. With this idea in mind, electric buses can
be incorporated in Joshua Tree National Park as well.
Hydrogen
The hydrogen fuel cell vehicle is a zero emission vehicle which has a high positive
impact to the environment. Although it is relatively expensive to produce, the invention of the
hydrogen fuel cell technology is another leap to the improvement to the technology for the

69 | P a g e
environment because it produces only water vapor through combustion. Major car manufacturers
such as Toyota and Hyundai have begun producing the hydrogen fuel cell vehicle and they are
ready to run in California. There are not many hydrogen fuel stations in the US and they are
mainly available in major cities in the US. California has committed to invest $200 million USD
to produce around 100 hydrogen fuel station by 2024.
Hydrogen buses operate more efficiently than gasoline buses. Fuel Cell technology
utilizes up to 60% of the total power where as gasoline technology utilize up to 40% of the total
power. Fuel Cell technology generates electricity and heat using hydrogen. The advantage about
fuel cell technology is that the combustion releases zero pollutants which are good development
in technology.
Hydrogen fuel buses have been around in Burbank, California, and operated 250 miles
before recharging time which can rotate between the city’s 4 routes. The advantages of the
hydrogen fuel busses would be improved fuel economy, Greenhouse gas reduction, improved air
quality and enhanced rider experience. The disadvantage of the fuel cell bus would be the
availability of the fuel stations and the price of hydrogen fuel bus is 4 times of the price of diesel
bus. There are no recent hydrogen fuel stations that are being developed in the region. The
popularity for hydrogen fuel cell are low at the moment which makes it hard for hydrogen fuel
bus to be the right choice at the moment but it is a good alternative for the future because fuel
cell technology hold great potential for the better future.

70 | P a g e
Table 14: Transit Technology Summary Table
Transit
Technology Pros Cons Currently Used In
Diesel
Lower fuel consumption
rate
Affordable startup cost
Convenient stations
Very high emissions
Denali National Park, CA
Los Angeles, CA
Mount Rainier National
Park
Diesel-
Electric
Hybrid
Great city fuel rate
Prevents emissions
during idling
Reduced noise
Reduced exhaust odor
Higher fuel-economy
High purchase cost
Electric only operates
when traveling <5 mph
Studies on city travel
Long term battery life
never proven
Yosemite National Park,
CA
Sequoia National Park,
CA
Minneapolis & St. Paul,
MN
London, England
New York City, NY
Biodiesel
Renewable energy
produced domestically
Reduced tail pipe
emissions
Can be used in diesel
vehicle without
modifications
Can freeze at higher
temperatures
Fluctuating fuel costs
Must be administered
under special protocol to
avoid problems
Limited fuel stations
St. Louis Metro, MO
Oahu, HI
Olympia, WA
MATBUS North Dakota
Propane
Reduced emissions
Convenient station
Narrow flammability
range
Reduction in fuel cost
Similar operating range
to diesel
Newer technology
Special training for
mechanics
Additional fueling
infrastructure
Zion National Park, UT
Mesa Verde National
Park, CO
Acadia National Park,
ME
Electric
Reduce pollution
Quiet and quick
Reduce exhaust odor
Cheap to operate
Limited range
Long refueling time
High cost
Lack of consumer choice
Yosemite National Park,
CA
Sequoia Nation Park, CA
Kings Canyon National
Park, CA
South Korea
San Francisco, CA
Hydrogen
Zero emissions
Clean air
More efficient
Expensive
High maintenance cost
Limited fuel station area
Less popular
Burbank, CA
San Francisco, CA
Tokyo, Japan
Seoul, S. Korea
London, England

71 | P a g e
7.3 Air Pollutants Carbon Monoxide
Carbon Monoxide, CO, is a colorless odorless and very poisonous gas that is formed
from the incomplete burning of carbon. This is primarily found when carbon fuels, or fossil
fuels, are not fully processed in the engines of vehicles, construction equipment, and military
equipment. Carbon Monoxide poisoning can occur at very low concentrations. Carbon monoxide
poisoning is the most common fatal type of air poisoning in several countries. Common
symptoms include headaches, nausea, dizziness, and even death. Death can occur in 30 minutes
at a CO air concentration of 0.32% (Goldstein, 2008). For the sake of brevity, we will focus on
CO from vehicle emissions.
In the city, automobile exhaust accounts for 95% of CO emissions (U.S. EPA, 2003).
Thanks in part to increased standards and regulations, man-made CO emissions decreased by
46% between 1990 and 2005. However, 60% of carbon monoxide in America is caused by
automobile exhaust. Diesel engines are said to produce very little carbon monoxide in their
emissions due to the way diesel burns fuel with an excess of air. Regardless, carbon monoxide is
a very dangerous emission that is fatal to humans and animals alike.
Carbon Dioxide
Carbon Dioxide (CO2) occurs naturally as a part of the carbon cycle. The carbon cycle is
the act by which carbon is exchanged among the atmosphere, oceans, soil, plants, and animals.
CO2 is produced by plants during respiration. Nevertheless, human-related CO2 emissions are
responsible for the exponential increase in the atmosphere. The primary source of human-related
CO2 emissions is from fossil fuel (coal, natural gas, gasoline, and oil) combustion for energy and
transportation. Transportation contributes to 31% of total U.S CO2 emissions and 26% of total
U.S. greenhouse gas emissions in 2011.
The emission levels of CO2 present at Joshua Tree National Park were recorded in the
Visitor Vehicle Emissions Study in 2005. The emission levels, which were measured by
MOBILE6, were exponentially larger than all of the remaining studied pollutants combined.

72 | P a g e
From the study results, it is clear that CO2 is the most prominent pollutant emitted at Joshua
Tree.
Nitrous Oxides
Nitrogen Oxides are a group of highly reactive gases that most commonly include Nitric
Oxide (NO), Nitrogen Dioxide (NO2), and Nitrous Oxide (N2O) when referring to air pollution.
Nitrogen Oxides are produced from the emissions of cars, trucks, buses, power-plants, and off-
road equipment (Nitrogen Dioxide). Approximately 40% of all nitrogen oxide emissions come
from human interaction with the environment including agriculture, transportation, and industry
(Overview of Greenhouse Gases). Nitrogen Oxides cause problems with the respiratory system,
including irritation of the nose, throat, and respiratory tract (An Introduction to Indoor Air
Quality). Long exposure to the toxic gases can cause many respiratory infections and can lead to
chronic and acute bronchitis.
The EPA (Environmental Protection Agency) first set standards to reduce nitrogen oxide
emissions in 1971 with 0.053 ppm, averaged annually. By 2010, the EPA had dropped their
standards significantly to 100 ppb, averaged over a one hour period (Nitrogen Dioxide).
However, nitrogen oxide emissions have not decreased enough to follow the standards.
Sulfur Oxide
Sulfur oxide, SOx, refers to all sulfur oxides with the two major ones being sulfur dioxide
(SO2) and sulfur trioxide (SO3). Sulfur dioxide is a colorless gas with a pungent, irritating odor
and taste. It is very soluble in water and can form weak acidic sulfuric acid. Sulfur trioxide is
slowly formed when sulfur dioxide combines with oxygen (O2) in the air. Sulfur trioxide quickly
combines with water to produce sulfuric acid. Sulfur oxides normally last in the atmosphere
between four to ten days.
Sulfur dioxide can damage a person’s respiratory system with symptoms such as broncho
constriction and increased asthma symptoms. EPA’s National Ambient Air Quality Standard for
SO2 is made to protect against exposure to the entire sulfur oxides. Sox can easily react with
other compounds in the atmosphere to form small particles that can penetrate deeply into

73 | P a g e
sensitive parts of the lungs and can cause or worsen respiratory disease. It can also worsen
existing heart disease, leading to increased deaths.
Volatile Organic Compounds
Volatile Organic Compounds (VOCs) exist 2-5 times higher exposure indoor rather than
outdoors in average. The sources of VOCs indoors are paints, lacquers, paint supplies, building
materials and many more. Low exposure of VOCs can cause eye, nose or throat irritation,
headaches, loss of coordination and nausea. In high exposure, they can cause damage to liver,
kidney and central nervous system and maybe the cause of cancer. The steps to reduce VOC
exposure at home is by increasing ventilation when using products that contain VOCs and meet
or exceed any label precautions. One of the main compounds is formaldehyde which serves as
carcinogen. OHSA has restricted the Permissible Exposure Level (PEL) of 0.75 ppm with action
level of 0.5 ppm. HUD has restricted the concentration of mobiles homes by a level of 0.4 ppm.
Furthermore, it is recommended to mitigate formaldehyde that is over 0.1 ppm.
Particulate Matter
Particulate matters, PM, are pollution particles made up of tiny particles of liquids and
solids, both organic and inorganic in nature. PM is divided into two classes: Course particles and
fine particles, depending on the size of the particulates.
Particulate matters ranging from 2.5 to 10 micrometers in diameter, PM 2.5-PM 10, are
classified as “course particles” (U.S. EPA, 2013). Course particles are generally caused by dust
being kicked up by vehicles or weather, or they can be caused by construction. These larger
particles are able to be inhaled through the air which can lead to health problems in the lungs
and/or heart.
Any particulate matter that is smaller than PM 2.5 is called a “fine particle” (U.S. EPA,
2013). Fine particles are so small that they only be seen with an electron microscope, however,
their small size make them far easier to reach deep sections of the lungs. In December of 2004,
the EPA added standards to regulate PM 2.5 emission, which are believed to be responsible for
acute health problems (FHWA, 2006).

74 | P a g e
Ozone
Ozone is present at ground level and in the upper regions of the atmosphere. Atmospheric
ozone protects the earth from harmful ultraviolet rays, while ground level ozone is the main
component of smog. Ground level ozone is a pale blue gas with a distinctively pungent smell.
Ozone is not emitted but rather is formed when nitrogen oxides (NOx) and volatile organic
compounds (VOCs) react in sunlight. Ground level ozone is harmful to the public's health due to
ozone being a main component in the air the public breaths.
Ozone is not included in the Visitor Vehicle Emissions Study in 2005 due to none of the
proposed emission models measuring the presence of ozone. Nevertheless, ozone is designated
as one of the six common air pollutants. In future emission studies, ozone emissions must also be
included.
Smog
Smog is fog or haze combined with smoke and other atmospheric pollutants. In other
words, it is a type of air pollutant. Cars that combust fuel emit smog forming emissions such as
nitrogen oxide, non-methane organic gases, carbon monoxide, particulate matter, and
formaldehyde. These emissions usually trap on the ground and form a brownish haze that
pollutes the air. Smog can be cause health problems such as breathing difficulties and lung
diseases such as asthma, emphysema, and chronic bronchitis.
In general, vehicles are getting more efficient. Cars and trucks are 98-99% cleaner than
they were in the late 1960s for smog-related pollutants. These vehicles are getting cleaner every
year as there are more efficient, and clean options.
7.4 Comparison of Transit Technology Emission Rates In a Meta-Analysis of Transit Bus Exhaust Emissions
2 researchers compiled emissions
rates from a variety of transit technologies. Figure 27 summarizes and compares the pollutant
emission rates across the six transit technologies by pollutant. Electric and hydrogen produce
zero tailpipe emissions. Diesel and bio-diesel the highest carbon monoxide emission rates, while
2 Cooper, E., Arioli, M., Carrigan, A., and Jain, U.,“Meta-Analysis of Transit Bus Exhaust Emissions”,
Transportation Research Record, No. 2340, 2013.
75 | P a g e
propane and hybrid have the lowest. Propane also has the lowest CO2 emissions. NOx
emissions are highest for diesel and lowest for hybrid, with propane ranking in between. Diesel
has the highest PM emissions while hybrid has the lowest, with propane ranking in the middle.
Figure 28 compares the emissions rates per person between passenger cars and each of
the transit bus technologies under the assumption of 2.7 passengers per car and 50 passengers per
bus. Average passenger car emission rates were pulled from the EPA’s Average Annual
Emissions and Fuel Consumption for Gasoline-Fueled Passenger Cars and Light Truck report.
These charts compare compressed natural gas (CNG), diesel, hybrid, bio diesel, and propane
against a standard passenger car. On a per person basis, passenger cars produce higher CO and
CO2 emissions than all technologies. Propane technology achieves lower emissions across all
pollutants than passenger cars on a per person basis.
7.5 Summary Following the lead of Zion and Acadia NPs, propane transit technology is the
recommended technology given the conditions of Joshua Tree National Park considering the
possibility for reduced emissions and lower cost for the bus, fuel, and infrastructure
requirements.

76 | P a g e
Figure 27: Emissions Rates by transit technology and pollutant
Carbon Monoxide Emissions
02468
101214
Diesel Diesel-Electric
Hybird
Biodiesel Propane Electric Hydrogen
Transit Technology
gra
ms/m
ile
Carbon Dioxide Emissions
0
0.5
1
1.5
2
Diesel Diesel-
Electric
Hybird
Biodiesel Propane Electric Hydrogen
Transit Technology
gra
ms/m
ile
Nitorgen Oxide Emissions
05
101520253035
Diesel Diesel-Electric
Hybird
Biodiesel Propane Electric Hydrogen
Transit Technology
gra
ms/m
ile
Particulate Matter Emissions
0
0.5
11.5
2
2.5
3
Diesel Diesel-Electric
Hybird
Biodiesel Propane Electric Hydrogen
Transit Technology
gra
ms/m
ile

77 | P a g e
Figure 28: Per person emissions by transit technology and pollutant

78 | P a g e
Chapter 8: Funding & Finance The purpose of this Chapter is to evaluate benefits associated with each routing
alternative and present the most cost effective choice in conjunction with a sustainable shuttle
bus technology. In addition to the financial perspective of this transit feasibility study, different
modes of funding to help offset the cost of this project are considered.
8.1 Cost Analysis The three alternative bus routes were used to determine several details of projected costs.
The route alternatives vary by total mileage, number of buses, and service frequency resulting in
varying operating and capital costs. This was all taken into consideration when considering the
different costs of each route alternative. The major things that were considered for each
alternative were the total miles per route, the miles per gallon of fuel (if applicable), the number
of buses needed, and infrastructure costs. In this section a summary of the costs for the leasing
and purchasing options are provided. Details of all costs are provided in Appendix D for further
review.
The park is limited financially so this makes cost of implementing any transit system a
major consideration. The differing bus types all provide the park with several different benefits
including costs savings and environmental benefits. Electric buses are an example of this. The
electric buses were the only ones that provide the park with a zero local emissions transit option.
However, when looking solely at cost, both the hydrogen and electric options suffer because of
their higher costs compared to the cheapest option of bio-diesel bus. The reason that other
technology alternatives other than the cheapest were considered is because the park service has a
serious commitment to "conserve the scenery and the natural and historic objects and the wildlife
therein and to provide for the enjoyment of the same in such manner and by such means as will
leave them unimpaired for the enjoyment of future generations.” The difficult choice to make is
whether or not spending the additional funds on a more sustainable method of transit is
something the park service can afford and is willing to consider. Overall, the costs are all fairly
similar and allow for some justification of the use of a more costly alternative if the price
increase is not incredibly high and the park benefits are noticeable.

79 | P a g e
Capital Costs Considerations
Joshua Tree National Park has the choice to either lease or purchase the shuttle buses.
These two different methods of paying for the buses were compared at a total cost over twelve
years. The purchasing option requires a large initial investment from the park, while the leasing
option allows for a smaller initial investment although it results in a general increase in cost for
all bus types. The lease term was considered to last for six years and resulted in a six year study
where maintenance and operational costs were the only costs accounted for during that period. A
six year leasing period was chosen because researched lease terms for similar facilities and plans
lasted for up to six years. The present value calculations were calculated by taking all of the costs
of the buses for the twelve years by year and adding them up with the use of a discount rate that
adjusts for future inflation. The three route alternatives were considered with this present value
calculation and each route was considered individually with differing bus technologies in order
to compare the results and determine which bus technology is best for the park and which route
choice is best simultaneously. For both the purchasing option and the leasing option, the cost of
building the infrastructure needed for the different bus types was the same so that variable would
not skew the results in favor of one option or another.
Purchasing Option
The purchasing option entails buying the buses required for the differing routes up front
and paying only maintenance and operation costs every year. Figure 29 shows the initial
purchase prices of the buses for each technology. The purchasing option, as expected, required
that the park put forth a larger sum of money to acquire the buses as an initial investment in the
project. This would mean that the park would be the sole owner of these buses and would be
responsible for all operations, maintenance, and other costs associated with running the proposed
services. This alternative, while seeming to be most off putting initially, ended up providing the
most beneficial results over a twelve-year period. The purchasing total costs are lower for all bus
types than those of the leasing options. The major drawback of the purchasing option is the
initial investment that the park would be required to make in order to finance the purchasing of
the buses needed for the route selected. The park is lacking in funds currently and funds that
would come in for this project would not be solely used for the purchasing of buses. The

80 | P a g e
purchasing costs of each bus for each routing and infrastructure alternative is shown in Figure
29.
Figure 29: Initial Bus Costs for Purchase Option
Figure 30: Present Value Costs of the Purchasing Option (in million dollars)
81 | P a g e
Leasing Option
The leasing option gives one major benefit over the purchasing option because it allows
the park to invest less money at the beginning of the considered twelve year time frame. The
major drawback to leasing the buses, no matter what technology was used for the buses, is that
the overall cost is higher than purchasing the buses. The three routes all have higher total present
worth values when leasing the buses for all bus technologies than their purchasing counterparts.
The leasing present value takes into consideration the six year lease period as well as all
infrastructure costs, maintenance costs and the buyout price of the buses at the six year mark.
The buyout price is the price of purchasing the buses after paying the lease for six years. The
buyout price is extremely low compared to the original price of the buses for all technologies due
to depreciation. The depreciation rate used was 12 percent for all buses in all route choices. This
was the standard found through research and makes the buses 72 percent cheaper to purchase
after leasing them for six years. The same buses would then remain in service at the park for the
following six years of the study. The buyout happens at year six but does not affect the costs
after that. The cost of leasing the buses after year six is therefore zero. This indicates that the
leasing option is, in fact, the more costly of the two funding alternatives and that the majority of
its costs are within the first six years. The leasing costs of each bus for each routing and
infrastructure alternative is shown in Figure 30.

82 | P a g e
Figure 31: Present Value Costs of the Leasing Option (in million dollars)
Recommendations
Ultimately, the choice to initially purchase or lease the shuttle buses will be made by the
park based off of several factors including costs. The cost of the different bus technologies will
play a major role in the ultimate decision though. This means that the cheapest alternative will be
looked at to ensure that it also meets other park goals. Joshua Tree, being a national park, is
dedicated to environmental preservation. The bus technology chosen should provide the park
with an affordable choice while also reducing the carbon footprint of the route system selected.
The park will have to determine how much more spending can be justified for the purpose of
meeting other goals other than reducing costs. The propane bus technology was the lowest in
cost for both the purchasing option and the leasing option. The purchasing option total was just
over $16 million for alternative one while the leasing option was just over $17 million for the
same alternative route system. This is the cheapest route and bus technology combination of all.
The route choice and bus technology might not completely meet all of the park’s stated goals and
objectives for this project however, and that is why several alternatives were considered. The
three cheapest bus technologies for the route alternatives were propane, hybrid, and electric
83 | P a g e
buses. This is true for both the purchasing and leasing options. The propane is significantly lower
in price than the hybrid and electric bus options but the environmental effects are much less
pronounced.
If cost is the only factor considered, it is recommended to choose route alternative one
with the use of purchased propane buses. The park may choose to invest a higher amount of
money and lease the buses over a six year period then buy them out and continue to use them.
This would result in a higher total expenditure by about $1 million, but would reduce the initial
investment required significantly. Two other technology alternatives are recommended if the
park is willing to spend more money for cleaner technology. The hybrid and electric bus
technologies offer better environmental benefits than propane but cost at least $5 million more
over the course of twelve years. The data presented in the tables provided in Appendix D will act
as a guide for the park when choosing the bus alternative that best suits Joshua Tree National
Park.
8.2 Funding Analysis The proposed transit system must be properly funded in order to be successful. To find
the most feasible sources of possible funding, research was conducted on several national parks
with existing transportation programs. Most of these options involve the creation of innovative
partnerships among federal land management agencies, gateway communities, state departments
of transportation, federal transportation agencies, foundations, businesses, regional
organizations, and other groups. Some national parks with transit systems already in place
include Zion National Park in Springdale, Utah, Acadia National Park in Bar Harbor, Maine,
Glacier National Park in West Glacier, Montana, and Lewis and Clark National Historical Park
in Astoria, Oregon. These and other parks were studied for their funding tactics and techniques.
After comparing what each park has previously used, it was determined that there are four
possible funding sources:
1) Federal Grants
2) Park-Sustained Income (ex. entrance fees)
3) Local Opportunities & Donation Funds
4) Sponsorships

84 | P a g e
Park Comparisons
A summary of funding strategies was gathered from several National Parks that currently
have transit systems. These parks include Acadia NP, Zion NP, Lewis and Clark NP, and
Glacier NP. While this is certainly not a comprehensive review of all park funding programs,
this selection of parks provides a good summary of funding strategies.
Acadia National Park
A variety of federal, state, park, local, and private funding has been used to support
national park transportation systems. In regards to Acadia National Park, Maine’s Department of
Transportation purchased the propane-powered shuttle buses. The national park, Friends of
Acadia, and local towns provided the Congestion Mitigation and Air Quality (CMAQ) funds.
The funding for the Intelligent Transportation Systems Field Operational Test (FOT) came from
the U.S. Department of Transportation ITS Joint Program Office. Acadia National Park
purchased additional buses with funding from the National Park Service Alternative
Transportation Program (ATP). The park uses fee demonstration funds to help support
development and operation of its buses. The park added the transit fee to the daily, weekly, and
annual park passes in 2004. This is the main source of operation funding for the transit system in
Acadia National Park.
In 2013, Acadia welcomed double the amount of Joshua Tree’s visitors while being
smaller than Joshua Tree by a large margin (Acadia being 47,452 acres large and Joshua Tree
being 790,630 acres large). Acadia National Park had 2,254,992 visitors in 2013, which is
noticeably larger than the 1,383,340 visitors that Joshua Tree National Park welcomed in 2013.
Acadia National Park successfully manages the high visitation rates through its public transit
system. Acadia National Park manages to serve the large amount of visitors despite the fact that
it is smaller than Joshua Tree National Park. By looking at this, it is evident that a transit system
will also benefit Joshua Tree as well.
Zion National Park
The funding methodology for Zion National Park’s transit system is similar to Acadia’s.
Funding came from a mix of federal, state, local, private, non-profit, and private funding. Zion
National Park purchased the 30 propane-powered buses and the 21 trailers. The park was also

85 | P a g e
responsible for funding the transit stops, the parking areas, and the transfer points. The park uses
a portion of the entrance fees to support the ongoing operation of the system. The Town of
Springdale helped fund the bus shuttle stops and related streetscape improvements with the help
of Utah’s Department of Transportation. The town provides ongoing funds for the maintenance
of the transit system. Additional funding comes from hotel/motel taxes, resort taxes, and sales
taxes.
Just like Acadia National Park, Zion greets over 2 million visitors annually. In 2013, Zion
National Park had 2,807,387 visitors. This is well over double the amount that Joshua Tree had
in 2013. In addition, Joshua Tree is over five times the size of Zion (with Joshua Tree being
790,636 acres and Zion being 146,597 acres).
Lewis and Clark National History Park
At the Lewis and Clark National Historical Park, a variety of sources were used to fund
the various projects and program elements. A $2.5 million Federal Transit Adminstration grant
was used to fund the purchase of additional buses and the construction of a transit center and
additional shuttle parking in Astoria. Planning, designing, and constructing the park-and-ride and
education center at Netul Landing was funded through a $2 million grant from the National Park
Service ATP fund. The Oregon Department of Transportation provided $500,000 in funding for
new signing and traveler information. In addition, the National Park Service and the Western
Federal Lands Highway Division have funded the ongoing seasonal shuttle service. Since the
national park is only 3,300 acres and has an annual visitation of 191,860, it can be used to study
the proposed funding of the Joshua Tree transit system on a smaller scale.
Glacier National Park
A mix of funding sources was used to purchase the Glacier shuttle buses at Glacier
National Park in West Glacier, Montana. These sources helped construct the transit centers and
service operations. A combination of state-run mitigation funds, such as the Sun Road fund, the
Safe Accountable Flexible Efficient Transportation Equity Act: A Legacy for Users fund, the
Transit in the Parks program, and Flathead County funds were used to purchase the buses.

86 | P a g e
Additional funding from Federal Lands Highway Program, Glacier National Park and the
National Park Service supported the transit centers, stops, information signs, and supports
ongoing operations and marketing. In addition, Glacier National Park implemented a
transportation fee as part of the park entrance fee in 2007 to help fund the shuttle service. This
fee was $5.00 initially and was increased to $7.00 in 2009. This transportation fee is a viable
option that can be implemented into the Joshua Tree National Park transit system.
Federal Grants
The first possible source of funding is a federal grant from one or both primary
transportation agencies, the Federal Transit Administration and the Federal Highway
Administration. Other national parks in California have received federal aid for similar projects.
Yosemite National Park received $1.3 million from the Federal Transit Administration in 2010 to
improve the transportation system within the park. Under the Federal Transit Administration, a
program called the Paul S. Sarbanes Transit in Parks was established to address the pollution and
congestion created by increased personal vehicle use. The program provides funding for
alternative transportation methods within and around national parks, forests, and wildlife
refuges; supported transportation methods include shuttle services and railways. Unfortunately,
this program was repealed by Congress recently and the last award winners were announced in
February of 2014, so Joshua Tree National Park would not be eligible to apply for this grant.
However, the Federal Transit Administration is directing all remaining eligible alternative
transportation projects to apply for the Federal Highway Administration’s Federal Lands
Transportation Program and Federal Lands Access Program.
The Federal Lands Access Program (FLAP) provides funds for operational and
maintenance costs of transportation facilities and all components of a transit system, including
vehicles. The Federal Lands Transportation Program (FLTP) complements the FLAP in that it
focuses on the transportation infrastructure owned and maintained by Federal lands management
agencies, whereas the FLAP provides funds for State and local roads that access the Federal
estate.
Both of these programs are part of the Federal Highway Administration. Although the
overseeing governmental agency changes from that which supported Yosemite National Park,

87 | P a g e
these grants would be a viable funding alternative. If accepted, one of these grants could help
fund much of the costs associated with the proposed shuttle service.
Park-Sustained Income
A large portion of national parks with transit systems fund their shuttle systems by setting
money aside from the entrance fee. This can be seen in two cohesive charts included in the
Grand Teton National Park Business Plan created by Montana State University. The first
compares different national parks and their transit systems, and the other compares their
respective entrance fees and how much is put aside for the transit system. The purpose of
charging an embedded transit fee is to help cover operating and maintenance costs, and
sometimes even capital costs as well. Zion National Park, for example, implements a mandatory
shuttle system that requires shuttle use to see their most popular attraction. This is effective in
increasing revenue from the entrance fees. Zion charges an entrance fee of $25/vehicle; however,
parking lots are almost always full by 10 am and all overflow vehicles are directed to the
neighboring town to park there and take the shuttle into the park. When arriving without a
vehicle, such as on the shuttle service, each person is charged $12. For a typical family of 4 this
charge quickly adds up. Whereas the typical park entrance fee would have covered the entire
family for $25, using the shuttle system would charge them a total of $48 – practically a 100%
increase. While an increased entrance fee could be implemented to partially pay for a transit
system in the park, officials should also be wary to increase them so high as to deter visitors. In
the feasibility survey collected for this study, it was found that the amount most people were
willing to pay for the use of a transit system was around $5-$6. Multiplied by an approximate
annual traffic count of 366,000 (using 2013 data from the National Park Service), increasing the
Joshua Tree National Park entrance fee from $15 to $20 to include the transit fee could yield
$1,830,000 in one year. Increasing the fee to $25 is also an option that could yield $3,660,000 in
one year, but considering that an overwhelming amount of survey respondents replied that they
would only consider paying if the fee was at or under $5-$6, this could result in a major deterrent
for visitors and a subsequent backlash.
Local Opportunities and Donations Funds

88 | P a g e
The third possible funding source is finding and utilizing local opportunities and creating
private donation funds. There are many local opportunities that exist to a national park. One
option that other national parks have found useful is to implement a sales-tax-based transit
financing formula which primarily consists of targeted taxes on tourism-related expenditures. For
example, Acadia National Park’s surrounding local communities dedicate a portion of their sales
tax revenue to the park’s transit system. This was done because there is a strong relationship
between the local businesses and a national park. The more accessible it is, the more visitors the
park receives and the more visitors pass through the local communities to generate business and
revenue. Furthermore, a donation fund can be created in order for the local communities to help
out with private donations. Possible donors include individuals who support local businesses, the
national park, transit programs. Donation funds can be useful for receiving monetary support for
a transit system that makes Joshua Tree National Park a more enjoyable, accessible, and
environmentally conscious park.
Sponsorships
The fourth possible funding source is to have companies sponsor the transit program. One
alternative in this facet could be for corporate sponsors to donate the necessary shuttles in order
to offset total costs. In return, the corporation may be able advertise via logos and slogans on the
buses. This kind of idea is not new. Since the National Park Foundation is a non-profit
organization, it has been reliant on a number of different partners. This partnership between
sponsors dates back 40 years. A portion of the sponsorship money goes towards the support of
America’s national parks. This support can be a vital asset towards the possible funding of the
shuttle system. Some corporate sponsors that have donated at least $1,000,000 towards the
National Park Foundation include ARAMARK, The Coca-Cola Company, L.L. Bean, and
Underwriters Laboratories (UL). In addition, Disney and AIR WICK have both donated at least
$500,000 to fund the National Parks. Since these companies have a history of showing support
towards America’s national parks, they can also be contacted to fund the Joshua Tree National
Park shuttle service.
In addition to household-name corporations, Joshua Tree National Park has also been
supported by its local businesses and organizations. Some of the park’s projects and attractions,
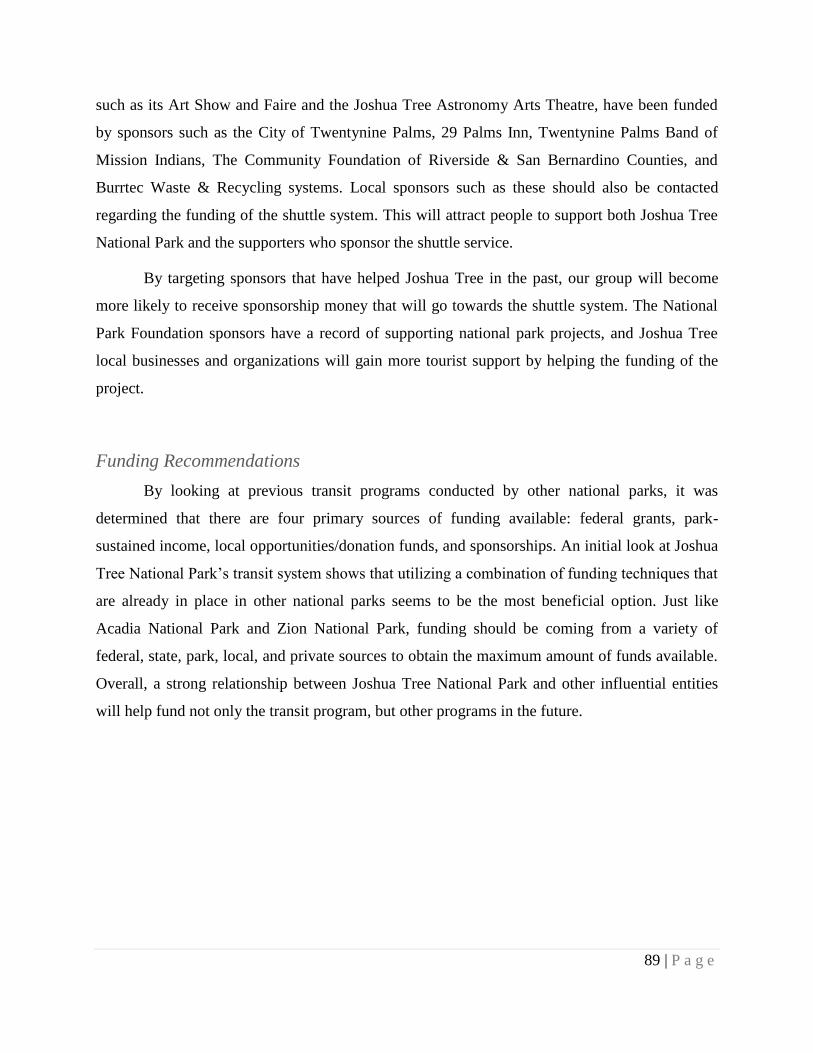
89 | P a g e
such as its Art Show and Faire and the Joshua Tree Astronomy Arts Theatre, have been funded
by sponsors such as the City of Twentynine Palms, 29 Palms Inn, Twentynine Palms Band of
Mission Indians, The Community Foundation of Riverside & San Bernardino Counties, and
Burrtec Waste & Recycling systems. Local sponsors such as these should also be contacted
regarding the funding of the shuttle system. This will attract people to support both Joshua Tree
National Park and the supporters who sponsor the shuttle service.
By targeting sponsors that have helped Joshua Tree in the past, our group will become
more likely to receive sponsorship money that will go towards the shuttle system. The National
Park Foundation sponsors have a record of supporting national park projects, and Joshua Tree
local businesses and organizations will gain more tourist support by helping the funding of the
project.
Funding Recommendations
By looking at previous transit programs conducted by other national parks, it was
determined that there are four primary sources of funding available: federal grants, park-
sustained income, local opportunities/donation funds, and sponsorships. An initial look at Joshua
Tree National Park’s transit system shows that utilizing a combination of funding techniques that
are already in place in other national parks seems to be the most beneficial option. Just like
Acadia National Park and Zion National Park, funding should be coming from a variety of
federal, state, park, local, and private sources to obtain the maximum amount of funds available.
Overall, a strong relationship between Joshua Tree National Park and other influential entities
will help fund not only the transit program, but other programs in the future.

90 | P a g e
Chapter 9: Recommendation and Conclusion
While transit is not the only alternative which can mitigate parking and entrance station
congestion, it is the solution alternative that can best address those concerns while also
improving accessibility by providing an alternate mode of transportation and promote
environmental sustainability. Several other National Parks have already employed transit
systems to better handle increased visitation and preserve natural resources.
The findings of this report are drawn from visitor survey data, parking lot usage statistics,
comparisons of costs and environmental benefits of transit technologies, ridership and transit
system characteristics seen at other National Parks, and route alternative capital and
infrastructure costs. The visitor survey conducted in April 2014 revealed high interest in a
transit system. Visitors considered hourly service frequency, the ability to take gear needed for
various activities on the bus, and ticket prices as some of the more important transit system
characteristics. The majority of visitors interested in transit stated willingness to pay around $5
for the service which indicates the possibility that the transit system could function off its own
revenue. The visitors that were not willing to take transit cited reasons such as disbelief that
congestion conditions were not bad enough to warrant an investment in transit and aversion to
having to transport gear on the shuttle. Joshua Tree NP is a premier rock climbing destination,
for which large and heavy gear is required, thus this is a valid concern that will need to be
addressed.
The parking study conducted in February 2014 on a busy holiday weekend validated the
observed congestion effects reported by Park Staff. Several sites included in the study
experienced parking overflow conditions for several hours during the study time period. Parking
overflow leads to unsafe conditions for visitors and can cause damage to vegetation and curbing.
A license plate survey revealed the origin-destination (OD) travel patterns of park visitors. OD
travel patterns combined with the transit ridership prediction, which was based on Rocky
Mountain NP annual transit ridership statistics, was used to determine the stop location, service
frequency, and number of buses needed to service each route.
Based on all these considerations the final recommendation is for route Alternative 2,
with propane buses acquired through a leasing option. Route Alternative 2 serves visitors at two

91 | P a g e
different entrance locations while maintaining access to the most popular sites in the park.
Dividing traffic between entrance locations can help alleviate traffic at the Joshua Tree Visitor
Center (JTVC) and its surrounding intersections and reduce the need to expand parking lot
capacity at the JTVC location. Propane buses possess the best tradeoff between reduced
emissions and costs. The cost for Alternative 2 is approximately $28 million including leasing,
operations, and infrastructure costs, making it one of the less expensive options for the Park.
To better support this decision, several additional extensions can be integrated to this
study for future work. Among these extensions is a cost- benefit analysis that takes into account
emissions reductions benefits. Second, a more in depth, quantitative, traffic impact analysis
needs to be conducted to ensure that any possible congestion issues are addressed. Third,
challenges from adding infrastructure within park grounds needs to be identified in order to
avoid severe environmental damages. Lastly, the possibility of extending the transit route system
to local businesses must be further researched as this option could possibly serve as a future
shuttle funding opportunity.

92 | P a g e
References "An Introduction to Indoor Air Quality: Volatile Organic Compounds (VOCs)." EPA.
Environmental Protection Agency, n.d. Web. 30 Mar. 2014. <http://www.epa.gov/iaq/voc.html>.
"An Introduction to Indoor Air Quality." United States Environmental Protection Agency 6 June
2012.
"Agencies Dedicate Electric Buses at Yosemite National Park." Yosemite Electric Buses. N.p., n.d. Web. 31 Mar. 2014. <http://www.energy.ca.gov/releases/1995_releases/95-09-Sept-1995/95-09-22_Yosemite_Electric_Buse.txt>.
ARB “Mobile Source Emission Inventory” (January, 2013) http://www.arb.ca.gov/msei/modeling.htm
Austin, Mike. "Why 2013 is the Year of the Diesel." Popular Mechanics 2013. http://www.popularmechanics.com/cars/alternative-fuel/diesel/why-2013-is-the-year-of-the-diesel#slide-1
Barnitt, R.. "St. Louis Metro Biodiesel (B20) Transit Bus Evaluation." : n. pag. Web. 29 Apr.
2014.
Behrens, Zach . "Burbank to Unveil New Hydrogen Fuel Cell Bus." LAist. N.p., 26 Apr. 2010. Web. 31 Mar. 2014. <http://laist.com/2010/04/26/burbank_to_unveil_new_hydrogen_fuel.php>
Berman, Brad. "Electric Cars Pros and Cons." PluginCars.com. N.p., 24 Oct. 2013. Web. 28 Apr. 2014. <http://www.plugincars.com/electric-cars-pros-and-cons-128637.html>.
"Biodiesel." Alternative Fuels Data Center. U.S. Department of Energy. Retrieved from http://www.afdc.energy.gov/fuels/biodiesel.html
Biodiesel Handling and Use Guide. Rep. 4th ed. National Renewable Energy Laboratory, January 2009. Retrieved from http://www.biodiesel.org/docs/using-hotline/nrel-handling-and-use.pdf?sfvrsn=4
Bloomberg News. "Toyota to help set up hydrogen stations as fuel-cell cars arrive." North Jersey. N.p., 6 Jan. 2014. Web. 31 Mar. 2014. <http://www.northjersey.com/news/toyota-to-help-set-up-hydrogen-stations-as-fuel-cell-cars-arrive-1.698846>.
CalTrans “EMFAC” (February 2014) http://www.dot.ca.gov/hq/env/air/pages/emfac.htm

93 | P a g e
"Carbon Dioxide Emissions." Climate Change. Environmental Protection Agency, n.d. Retrieved from http://www.epa.gov/climatechange/ghgemissions/gases/co2.html
"The Chemistry of Biodiesel." Chemistry The Chemistry of Biodiesel Comments. Goshen College. Retrieved from http://www.goshen.edu/chemistry/biodiesel/chemistry-of/
Clark, N. U.S. Department of Transportation. Federal Transit Association. Transit Bus Life
Cycle Cost and Year 2007 Emissions Estimation. Washington D.C.: , 2007. Web.
<http://www.proterra.com/images/WVU_FinalReport.pdf>.
Clean Cities Alternative Fuel Price Report. U.S. Department of Energy, Oct. 2013. Retrieved from http://www.afdc.energy.gov/uploads/publication/alternative_fuel_price_report_oct_2013.pdf
"CMEM - Model." Center for Environmental Research & Technology. Bourns College of Engineering: University of California, Riverside, n.d. Retrieved from http://www.cert.ucr.edu/cmem/model.html
Cone, Marla. "New diesel trucks and buses cut soot and smog more than 90%." Environmental Health News 18 June 2009. http://www.howstuffworks.com/diesel1.htm
Coe, Dana L, Douglas S Eisinger, Jeffrey D Prouty, and Tom Kear. "USER'S GUIDE FOR CL4: A USER-FRIENDLY INTERFACE FOR THE CALINE 4 MODEL FOR TRANSPORTATION PROJECT IMPACT ASSESSMENTS." California Department Of Transportation. N.p., 1 June 1998. Web. 31 Mar. 2014. <http://www.dot.ca.gov/hq/env/air/documents/CL4Guide.pdf>
Connecticut Academy of Science and Engineering (Oct. 2005) “Demonstration and Evaluation of Hybrid Diesel-Electric Transit Buses” < http://www.ctcase.org/reports/diesel-hybrid.pdf>
"Daily Teasury Real Long-Term Rates." : n. pag. Web. 29 Apr. 2014.
"Electric Buses Energize Downtown Chattanooga." U.S. Department of Energy. N.p., n.d. Web.
31 Mar. 2014. <http://www.afdc.energy.gov/pdfs/chatt_cs.pdf>.
Environmental and Energy Study Institute (2006) “Hybrid Buses: Costs and Benefits”. http://www.eesi.org/files/eesi_hybrid_bus_032007.pdf

94 | P a g e
"EPA Releases MOVES2010b Mobile Source Emissions Model Revision: Questions and Answers ." EPA. United States Environmental Protection Agency, 1 Jan. 2013. Web. 31 Mar. 2014. <http://www.epa.gov/otaq/models/moves/documents/420f13004.pdf>
Eudy, Leslie. "Hydrogen Fuel Cell Bus Evaluation." : n. pag. Web. 29 Apr. 2014.
Eudy, Leslie. "SunLine Transit Agency Advanced Technology Fuel Cell Bus Evaluation."
Fourth Results Report: n. pag. Web. 29 Apr. 2014.
"FC Velocity." Ballard. N.p., n.d. Web. 31 Mar. 2014. <http://www.ballard.com/files/pdf/bus/bus_benefits_fcvelocity.pdf>
Federal Transit Administration (Aug. 2005). “Analysis of Electric Drive Technologies for Transit Application: Battery-Electric, Hybrid=-Electric, and Fuel Cells”. <http://www.fta.dot.gov/documents/Electric_Drive_Bus_Analysis.pdf>
FHWA, "Transportation Air Quality: Selected Facts and Figures” (2006) http://www.fhwa.dot.gov/environment/air_quality/publications/fact_book/page03.cfm
Freehan, Brian. " Propane Powers Zion National Park’s,." n.d. Autogasusa.org. 2014. 8 April 2014.
"Greenhouse Gas Emissions Cost Effective Study." Los Angeles County Metropolitan Transportation Authority. N.p., n.d. Web. 28 Apr. 2014. <http://media.metro.net/projects_studies/
"Greenhouse Gas vs. Smog Forming Emissions." EPA. Environmental Protection Agency, n.d. Web. 1 Apr. 2014. <http://www.epa.gov/greenvehicles/you/sm
Goldstein M "Carbon monoxide poisoning" Journal of Emergency Nursing: JEN: Official Publication of the Emergency Department Nurses Association 34 (December 2008)
Hallmark, S. "Assessing the Costs for Hybrid versus Regular Transit Buses." Tech Brief. (2012):
n. page. Web. 9 Apr. 2014.
<http://www.intrans.iastate.edu/publications/_documents/t2summaries/hybrid_transit_bu
s_tech_brief1.pdf>.
Hartmann, James. "Budget Memor #67: Lifecycle Cost Comparison of Clean Diesel and Hybrid
Dash Buses." : n. pag. Web. 29 Apr. 2014.

95 | P a g e
"Health." EPA. Environmental Protection Agency, n.d. Web. 1 Apr. 2014. <http://www.epa.gov/air/sulfurdioxide/health.html
Joshua Tree Hotels. (2014). Tripadvisor LLC. Retrieved December 28, 2013 from, <http://www.tripadvisor.com/Hotels-g32544-Joshua_Tree_California-Hotels.html#MAPVIEW>.
Joshua Tree National Park (U.S. National Park Service). (Jan. 2014). U.S. Department of the Interior. Retrieved January 2, 2014 from, <http://www.nps.gov/jotr/index.htm?utm_source=publish2&utm_medium=referral&utm_campaign=www.kpbs.org>.
Kack, David. "Grand Teton National Park Public Transit Business Plan." . The National Park
Service, 20 Oct. 2009. Web. 29 Apr. 2014.
<https://www.dropbox.com/s/eybjof0oiys0y8z/public-transit-business-plan.pdf>.
MacKechnie, Christopher. "Electric Buses- An Introduction." . N.p., 1 Jan. 2014. Web. 29 Apr.
2014. <http://publictransport.about.com/od/Transit_Vehicles/a/Electric-Buses-An-
Introduction.htm>.
MacKechnie, Christopher. "How Much Does A Bus Cost to Purchase and Operate?." About.com Public Transport. N.p., n.d. Web. 31 Mar. 2014. <http://publictransport.about.com/od/Transit_Vehicles/a/How-Much-Does-A-Bus-Cost-To-Purchase-And-Operate.htm>.
"MOBILE6 Vehicle Emission Modeling Software." EPA. Environmental Protection Agency, n.d. Web. 1 Apr. 2014. <http://www.epa.gov/otaq/m6.htm>.
Mobility and Public Transportation. Grand Teton National Park Public Transit Business Plan. (Oct. 2009). National Park Service: Grand Teton National Park. Western Transportation Institute: Montana State University.
"Motor Vehicle Emission Simulator (MOVES) User Guide for MOVES2010b." EPA. N.p., 1 June 2012. Web. 31 Mar. 2014. <http://www.epa.gov/otaq/models/moves/documents/420b12001b.pdf>
"MOVES (Motor Vehicle Emission Simulator)." EPA. Environmental Protection Agency, n.d. Web. 31 Mar. 2014. <http://www.epa.gov/otaq/models/moves/index.htm>
National Renewable Energy Laboratory—U.S. Department of Energy, Regional Transportation District, and Cummins, Inc. Retrieved from http://www.nrel.gov/docs/fy07osti/40128.pdf

96 | P a g e
"Nitrogen Dioxide." Environmental Protection Agency 2014 4 April.
"Overview of Greenhouse Gases." United States Environmental Protection Agency 27 January 2014. http://epa.gov/climatechange/ghgemissions/gases/n2o.html
"Park Reports." . National Park Service Visitor Use Statistics, 1 Jan. 2013. Web. 29 Apr. 2014.
<https://irma.nps.gov/Stats/Reports/Park>.
Phillips, Ari. "Toyota Unveils Zero-Emissions Hydrogen Fuel-Cell ‘Car Of The Future’ For Sale Next Year." ThinkProgress RSS. N.p., 7 Jan. 2014. Web. 31 Mar. 2014. <http://thinkprogress.org/climate/2014/01/07/3126921/toyota-unveils-hydrogen-powered-fuel-cell-car/>.
Plosky, Eric. "Department of Interior-Bus and Ferry Lifecycle Cost Modeling." . U.S.
Department of Transportation, 26 Oct. 2013. Web. 29 Apr. 2014.
<http://www.volpe.dot.gov/transportation-planning/public-lands/department-interior-bus-
and-ferry-lifecycle-cost-modeling>.
Proc, Kenneth, Robb Barnitt, R. R. Hayes, Mattew Ratcliff, Robert L. McCormick, Lou Ha, and Howard L. Fang. 100,000-Mile Evaluation of Transit Buses Operated on Biodiesel Blends (B20).
"Propane Powered School Buses." West Virginia Department of Education. N.p., n.d. Web. 31
Mar. 2014. <http://www.wvapt.org/documents/12%20Propane%
20Powered%20School%20Buses.pdf>.
Richards, G. "VTA finds hydrogen buses cost more to run than diesel vehicles." San Jose
Mercury News 02 28 2008, n. pag. Web. 9 Apr. 2014.
<http://www.mercurynews.com/news/ci_8365544>.
Scora, George, and Matthew Barth. (2006, June). Comprehensive Modal Emissions Model (CMEM), Version 3.01: User's Guide. Univeristy of California, Riverside: Center for Environmental Reseach and Technology. Retrieved from http://cmscert.engr.ucr.edu/cmem/docs/CMEM_User_Guide_v3.01d.pdf
Shuttle, Green Transit - The Zion. National Park Service. n.d. 8 April 2014 http://www.nps.gov/zion/planyourvisit/shuttle-system.htm

97 | P a g e
Sinosky, Kelly. "The Vancouver Sun." www.vancouversun.com. N.p., 25 Nov. 2013. Web. 31 Mar. 2014.<http://www.vancouversun.com/technology/Whistler+hydrogen+fuel+cell+program+jeopardy/9212028/story.html>
Spendelow, Jacob. "Fuel Cell Technologies Program Record." Fuel Cell Bus Targets: n. pag.
Web. 29 Apr. 2014.
"Taxpayer Savings." . Moving Forward With Propane, 1 Jan. 2013. Web. 29 Apr. 2014.
<http://movingforwardwithpropane.com/savings.php>.
“Things to do in Joshua Tree National Park.” (2014). Tripadvisor LCC. Retrieved December 30,
2013 from, <www.tripadvisor.com/Attractions-g143037-Activities
Joshua_Tree_National_Park_California.html>.
Tuttle, Brad. "2014 May Turn Out to Be the Year of the Diesel Engine." Time Magazine 23 May 2013. http://business.time.com/2013/08/23/2014-may-turn-out-to-be-the-year-of-the-diesel-engine/
Update, Gasoline and Diesel Fuel. U.S. Energy Information Administration . 7 April 2014. 8 April 2014. http://www.eia.gov/petroleum/gasdiesel/
"U.S. Department of Energy." n.d. Propane Vehicles. 8 April 2014. http://www.afdc.energy.gov/vehicles/propane.html
U.S. EPA National air quality and emissions trends report -2003 special studies edition. EPA/454/R-03/005 Research Triangle Park, NC (2003) http://www.epa.gov/air/airtrends/aqtrnd03/
U.S. EPA, “Particulate Matter” (March 2013) http://www.epa.gov/air/particlepollution/
Visitor Services Project, PSU. Acadia National Park Visitor Study. (Jun. 2010). National Park
Service: U.S. Department of the Interior. Moscow, ID: University of Idaho.
Visitor Services Project, PSU. Joshua Tree National Park Visitor Study. (Oct. 2010). National
Park Service: U.S. Department of the Interior. Moscow, ID: University of Idaho.
Visitor Services Project, PSU. Rocky Mountain National Park Visitor Study. (Oct. 2011).
National Park Service: U.S. Department of the Interior. Moscow, ID: University of Idaho.

98 | P a g e
Volpe, John. Alternative Transportation System Demand Estimation for Federal Land
Management Agencies. (Sept. 2011). U.S. Department of the Interior
"Zion National Park -UT." . U.S. Department of Transportation, 2 Aug. 2013. Web. 29 Apr.
2014. <http://www.ops.fhwa.dot.gov/publications/mitig_traf_cong/zion_park_case.htm>.

99 | P a g e
Appendix A
Section A.1: Survey Results Question (1): On this visit to Southern California, what was the primary reason that you and your group
visited the Joshua Tree National Park area (Yucca Valley, Joshua Tree, Twentynine Palms)? Please check only
one.
□ Visit site(s) within Joshua Tree National Park
□ Visit friends/relatives in the area
□ Visit friends/relatives at the US Marine Corps Base
□ Business
□ Passing by (or driving through) to another destination
□ Other reasons
□ Visit other attractions in the area (Other attractions visited: ____________________)

100 | P a g e
Question (2): How often do you visit Joshua Tree National Park?
□ First time visitor □ Regular visitor (2-10 times/year)
□ Infrequent visitor (Once or twice every year or so)
Question (3): On this visit, how long do you and your group plan to visit the park? Please check only one.
□ Less than 5 hours □ 1 day □ Multiple days

101 | P a g e
Question (4): On your visit to the park today, what type of group were you with? (Check all that apply)
□ Alone □ Family □ Friends □ Climbing group
□ Commercial guided tour □ School or educational group □ Other
Question (5): On this visit to the park today, please list the number of each type of vehicle(s) in which you and your
group arrived:
Passenger vehicles: ___cars(s) ___van(s) ___SUV(s) ___Pick-up(s)
Recreational Vehicle (R.V.): ___ Bus: ___ Bike(s): ___
Other (specify type of vehicle): _______________________
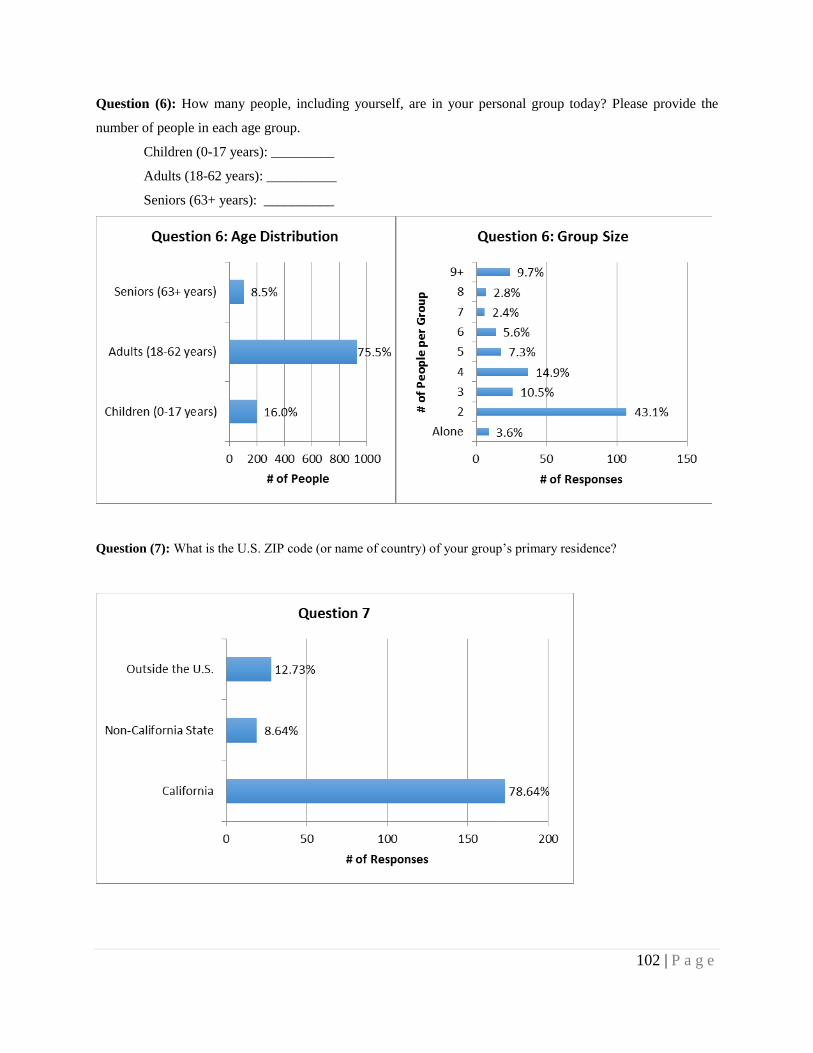
102 | P a g e
Question (6): How many people, including yourself, are in your personal group today? Please provide the
number of people in each age group.
Children (0-17 years): _________
Adults (18-62 years): __________
Seniors (63+ years): __________
Question (7): What is the U.S. ZIP code (or name of country) of your group’s primary residence?

103 | P a g e
Question (8): Last night, where did you and your personal group stay? Please check only one.
Outside the Park
□ Home or residence of friends and/or relatives
□ Vacation rental home
□ RV/trailer camping (campground: ___________________)
□ Tent camping (campground: _______________________)
□ Hotel/Motel (name of hotel: _______________________)
□ Other (please specify: ____________________________)
Inside the Park
□ RV/trailer camping (campground:
___________________)
□ Tent camping (campground:
_______________________)
□ Other (please specify:
____________________________)

104 | P a g e

105 | P a g e
Question (9): On this visit today, at which location did you first ENTER the park?
□ Twentynine Palms (North Entrance) □ Joshua Tree (West Entrance)
□ Cottonwood Spring (South Entrance) □ Indian Cove
Question (10): On this visit today, at which location do you plan to EXIT the park?
□ Twentynine Palms (North Entrance) □ Joshua Tree (West Entrance)
□ Cottonwood Spring (South Entrance) □ Indian Cove

106 | P a g e
Question (11): On the list below, please indicate the order in which you and your group visited these sites at Joshua
Tree National Park during this trip. Simply write 1, 2, 3, and so forth, on the line beside each place you visited. Do
not mark any sites that you did not visit. In the last column, indicate the length of time you spent at the site. See map
above for assistance locating sites within the park.
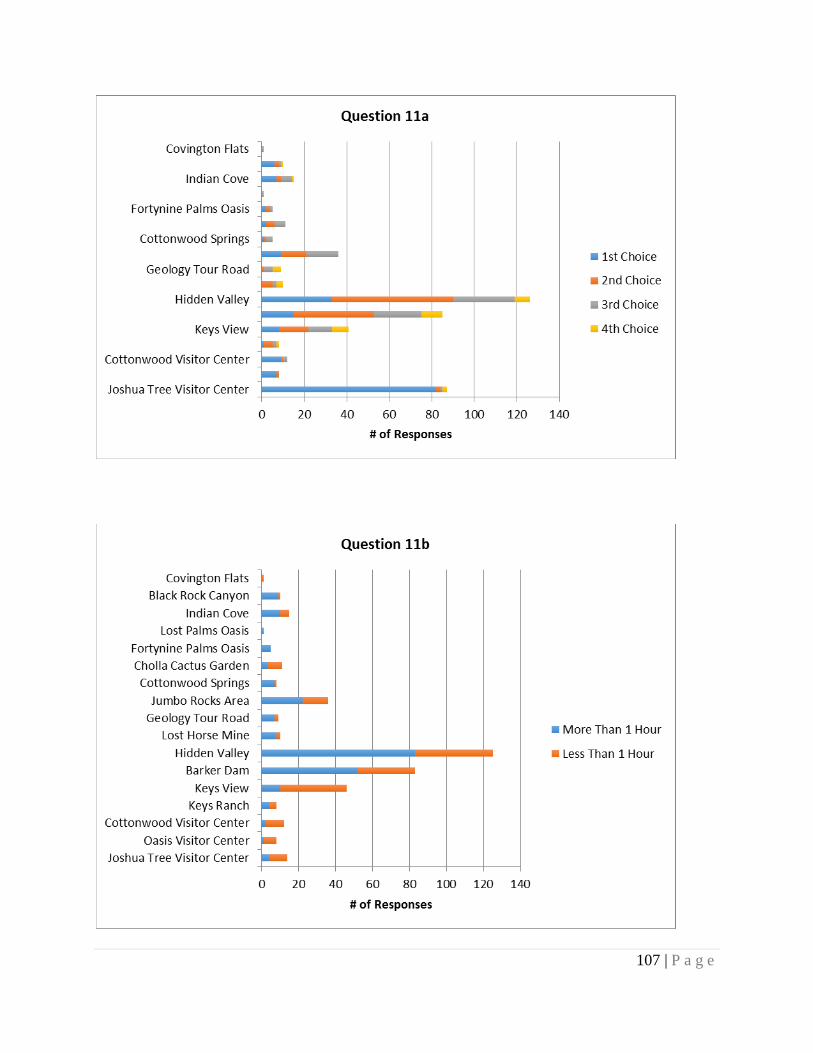
107 | P a g e

108 | P a g e
Question (12): On the list below, please check all activities that you and your group participated in at Joshua Tree
National Park.
Question (13): If you arrived in a personal vehicle to the current site, how much time did it take
for you to find a parking spot?

109 | P a g e
Question (14): Please comment below if you have had any negative parking experiences within the park on your
current visit.
Results: There are several themes that free response answers fall into.
Campsites: Visitors complained about lack of parking at their campsites. Some also had trouble finding
how to get there.
General parking: Some visitors commented on the limited parking options in the afternoon. Some were
forced to park in RV stalls.
Question (15): Have you ever used public transit (such as a bus or shuttle) provided by a national park to access
sites within that park?

110 | P a g e
Question (16): The proposed Park Shuttle System for Joshua Tree National Park would allow visitors to park for
free at the entrance stations and use the shuttle to visit the major sites within the Park. If such a Park Shuttle System
existed within Joshua Tree National Park, would you have considered using the shuttle system for this visit today?
Question (17): How often would a shuttle need to pass by a stop (pick-up point) for you to consider using the
service in Joshua Tree National Park?

111 | P a g e
Question (18): On a future visit, how important would the following services and characteristics of a shuttle system
be? Please indicate the importance of each characteristic with ‘1’ indicating ‘not important’ and ‘5’ indicating ‘very
important’.
Question (19): Which of the amounts listed below best describes the most you would pay per person per day
(unlimited rides) to use a Park Shuttle System that operated between sites within the Park (not including Indian
Cove and Black Rock areas)? Assume that the Park entry fee still applies, parking is available for free at the
entrance stations, and that the shuttle runs at least every hour.

112 | P a g e
Question (20): In addition to the Park Shuttle System that operated between sites within the park, a transit service
could operate between local hotels, campgrounds (including Indian Cove and Black Rock areas), and the Park
entrances. Which of the amounts listed below best describes the most you would pay per person per day (unlimited
rides) for use of a shuttle system that picked up at local sites and worked in coordination with the Park Shuttle
System within the park? Assume that the Park entry fee still applies, parking is available for free at the entrance
stations, and that the shuttle runs at least every hour.
Question (21): Would you be interested in an additional transit service that connected to regional cities including
Desert Hot Springs, Palm Springs, Palm Desert, and Indio?

113 | P a g e
Question (22): How much longer would you tolerate waiting on average for a parking spot at any site within the
Park before you would consider using the Park Shuttle Service?
Question (23): Why would you not consider taking a Park Shuttle System within Joshua Tree National Park? Please
check all that apply. Leave blank if you would consider using a shuttle service.

114 | P a g e
Question (24): Please provide any other comments you may have about a future Park Shuttle System or
transportation issues in Joshua Tree National Park.
Results: There are several themes that free response answers fall into.
Visitors would like shuttle connections with existing transit options outside the park.
Visitors are unsure if a shuttle system is necessary.
Shuttle stops should have good facilities with bathrooms and information boards.
Visitors are concerned with taking gear on the bus.
Visitors commented that the shuttle system is a good idea.
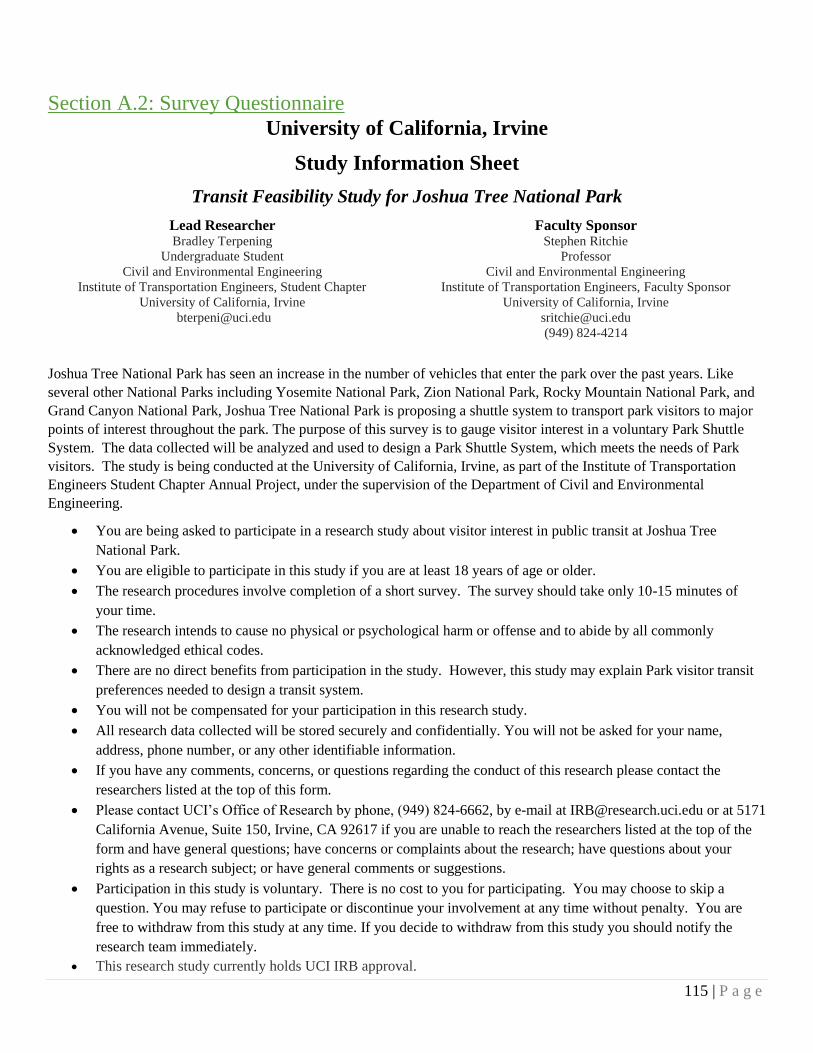
115 | P a g e
Section A.2: Survey Questionnaire
University of California, Irvine
Study Information Sheet
Transit Feasibility Study for Joshua Tree National Park
Lead Researcher Bradley Terpening
Undergraduate Student
Civil and Environmental Engineering
Institute of Transportation Engineers, Student Chapter
University of California, Irvine
Faculty Sponsor Stephen Ritchie
Professor
Civil and Environmental Engineering
Institute of Transportation Engineers, Faculty Sponsor
University of California, Irvine
(949) 824-4214
Joshua Tree National Park has seen an increase in the number of vehicles that enter the park over the past years. Like
several other National Parks including Yosemite National Park, Zion National Park, Rocky Mountain National Park, and
Grand Canyon National Park, Joshua Tree National Park is proposing a shuttle system to transport park visitors to major
points of interest throughout the park. The purpose of this survey is to gauge visitor interest in a voluntary Park Shuttle
System. The data collected will be analyzed and used to design a Park Shuttle System, which meets the needs of Park
visitors. The study is being conducted at the University of California, Irvine, as part of the Institute of Transportation
Engineers Student Chapter Annual Project, under the supervision of the Department of Civil and Environmental
Engineering.
You are being asked to participate in a research study about visitor interest in public transit at Joshua Tree
National Park.
You are eligible to participate in this study if you are at least 18 years of age or older.
The research procedures involve completion of a short survey. The survey should take only 10-15 minutes of
your time.
The research intends to cause no physical or psychological harm or offense and to abide by all commonly
acknowledged ethical codes.
There are no direct benefits from participation in the study. However, this study may explain Park visitor transit
preferences needed to design a transit system.
You will not be compensated for your participation in this research study.
All research data collected will be stored securely and confidentially. You will not be asked for your name,
address, phone number, or any other identifiable information.
If you have any comments, concerns, or questions regarding the conduct of this research please contact the
researchers listed at the top of this form.
Please contact UCI’s Office of Research by phone, (949) 824-6662, by e-mail at [email protected] or at 5171
California Avenue, Suite 150, Irvine, CA 92617 if you are unable to reach the researchers listed at the top of the
form and have general questions; have concerns or complaints about the research; have questions about your
rights as a research subject; or have general comments or suggestions.
Participation in this study is voluntary. There is no cost to you for participating. You may choose to skip a
question. You may refuse to participate or discontinue your involvement at any time without penalty. You are
free to withdraw from this study at any time. If you decide to withdraw from this study you should notify the
research team immediately.
This research study currently holds UCI IRB approval.

116 | P a g e
Questions (1) - (14) relate to visitor demographics and park usage:
(1) On this visit to Southern California, what was the primary reason that you and your group visited the Joshua Tree National Park
area (Yucca Valley, Joshua Tree, Twentynine Palms)? Please check only one.
□ Visit site(s) within Joshua Tree National Park □ Visit friends/relatives in the area
□ Visit friends/relatives at the US Marine Corps Base □ Passing by (or driving through) to another destination
□ Business □ Other reasons
□ Visit other attractions in the area (Other attractions visited: ________________________________)
(2) How often do you visit Joshua Tree National Park?
□ First time visitor □ Regular visitor (2-10 times/year) □ Infrequent visitor (Once or twice every year or so)
(3) On this visit, how long do you and your group plan to visit the park? Please check only one.
□ Less than 5 hours □ 1 day □ Multiple days
(4) On your visit to the park today, what type of group were you with? (Check all that apply)
□ Alone □ Family □ Friends □ Climbing group
□ Commercial guided tour □ School or educational group □ Other
(5) On this visit to the park today, please list the number of each type of vehicle(s) in which you and your group arrived:
Passenger vehicles: ______cars(s) ______van(s) ______SUV(s) ______Pick-up(s)
Recreational Vehicle (R.V.): ______ Bus: ______ Bike(s): ______
Other (specify type of vehicle): _______________________
For questions (6) and (7) your personal group is defined as anyone who you are visiting the park with, such as family, spouse, friends,
etc. It does not include the larger group you may be traveling with, such as an organized tour.
(6) How many people, including yourself, are in your personal group today? Please provide the number of people in each
age group.
Children (0-17 years): _________ Adults (18-62 years): __________ Seniors (63+ years): __________
(7) What is the U.S. ZIP code (or name of country) of your group’s primary residence? ____________________
(8) Last night, where did you and your personal group stay? Please check only one.
Outside the Park
□ Home or residence of friends and/or relatives
□ Vacation rental home
□ RV/trailer camping (campground: ___________________)
□ Tent camping (campground: _______________________)
□ Hotel/Motel (name of hotel: _______________________)
□ Other (please specify: ____________________________)
Inside the Park
□ RV/trailer camping (campground: ___________________)
□ Tent camping (campground: _______________________)
□ Other (please specify: ____________________________)
(9) On this visit today, at which location did you first ENTER the park? See map on next page.
□ Twentynine Palms (North Entrance) □ Joshua Tree (West Entrance)
□ Cottonwood Spring (South Entrance) □ Indian Cove
(10) On this visit today, at which location do you plan to EXIT the park? See map on next page.
□ Twentynine Palms (North Entrance) □ Joshua Tree (West Entrance)
□ Cottonwood Spring (South Entrance) □ Indian Cove

117 | P a g e
(11) On the list below, please indicate the order in which you and your group visited these sites at Joshua Tree National Park during
this trip. Simply write 1, 2, 3, and so forth, on the line beside each place you visited. Do not mark any sites that you did not visit.
In the last column, indicate the length of time you spent at the site. See map above for assistance locating sites within the park.
Site Name Order Visited Length of time spent at site
1. Joshua Tree Visitor Center □ less than 1 hour □ more than 1 hour
2. Oasis Visitor Center □ less than 1 hour □ more than 1 hour
3. Cottonwood Visitor Center □ less than 1 hour □ more than 1 hour
4. Keys Ranch □ less than 1 hour □ more than 1 hour
5. Keys View □ less than 1 hour □ more than 1 hour
6. Barker Dam □ less than 1 hour □ more than 1 hour
7. Hidden Valley □ less than 1 hour □ more than 1 hour
8. Lost Horse Mine □ less than 1 hour □ more than 1 hour
9. Geology Tour Road □ less than 1 hour □ more than 1 hour
10. Jumbo Rocks Area □ less than 1 hour □ more than 1 hour
11. Cottonwood Springs □ less than 1 hour □ more than 1 hour
12. Cholla Cactus Garden □ less than 1 hour □ more than 1 hour
13. Fortynine Palms Oasis □ less than 1 hour □ more than 1 hour
14. Lost Palms Oasis □ less than 1 hour □ more than 1 hour
15. Indian Cove □ less than 1 hour □ more than 1 hour
16. Black Rock Canyon □ less than 1 hour □ more than 1 hour
17. Covington Flats □ less than 1 hour □ more than 1 hour
Other (please specify):
□ less than 1 hour □ more than 1 hour
(12) On the list below, please check all activities that you and your group participated in at Joshua Tree National Park.
□ Sightseeing □ Bicycling □ Touring visitor centers
□ Day hiking □ Horseback riding □ Walking self-guided nature trails

118 | P a g e
□ Picnicking □ Technical climbing □ Visiting historical/archaeological sites
□ Stargazing □ Rock scrambling (without gear) □ Attending ranger-led programs
□ Camping □ Bouldering □ Attending field classes/other guided activities
□ Backpacking overnight □ Other (please specify): ________________________________________________
(13) If you arrived in a personal vehicle to the current site, how much time did it take for you to find a parking spot?
□ No time spent, a parking spot was available immediately
□ 5 minutes □ 10-15 minutes □ More than 15 minutes
□ I was not able to find a marked stall (What did you do? ______________________________________)
(14) Please comment below if you have had any negative parking experiences within the park on your current visit.
Questions (15) - (24) visitor preferences for a future shuttle system in Joshua Tree National Park:
(15) Have you ever used public transit (such as a bus or shuttle) provided by a national park to access sites within that park?
□ Yes, please specify the park(s): ____________________________________ □ No
(16) The proposed Park Shuttle System for Joshua Tree National Park would allow visitors to park for free at the entrance stations and
use the shuttle to visit the major sites within the Park. If such a Park Shuttle System existed within Joshua Tree National Park,
would you have considered using the shuttle system for this visit today? □ Yes □ No
(17) How often would a shuttle need to pass by a stop (pick-up point) for you to consider using the service in Joshua Tree National
Park? □ Would not use □ every 15 minutes □ every 30 minutes □ Hourly
(18) On a future visit, how important would the following services and characteristics of a shuttle system be? Please indicate the
importance of each characteristic with ‘1’ indicating ‘not important’ and ‘5’ indicating ‘very important’.
Monday-Friday shuttle service □ 1 □ 2 □ 3 □ 4 □ 5
Frequency of shuttle service □ 1 □ 2 □ 3 □ 4 □ 5
Ability to take bikes on shuttle □ 1 □ 2 □ 3 □ 4 □ 5
Ability to transport gear on shuttle □ 1 □ 2 □ 3 □ 4 □ 5
On-board orientation by Park Ranger □ 1 □ 2 □ 3 □ 4 □ 5
On-board orientation by TV or audio recording □ 1 □ 2 □ 3 □ 4 □ 5
Alternative fuel shuttle □ 1 □ 2 □ 3 □ 4 □ 5
Ticket price □ 1 □ 2 □ 3 □ 4 □ 5

119 | P a g e
(19) Which of the amounts listed below best describes the most you would pay per person per day (unlimited rides) to use a Park
Shuttle System that operated between sites within the Park (not including Indian Cove and Black Rock areas)? Assume that the
Park entry fee still applies, parking is available for free at the entrance stations, and that the shuttle runs at least every hour.
□ $0 □ $1-2 □ $3-4 □ $5-6 □ $7-8 □ $9-10
(20) In addition to the Park Shuttle System that operated between sites within the park, a transit service could operate between local
hotels, campgrounds (including Indian Cove and Black Rock areas), and the Park entrances. Which of the amounts listed below
best describes the most you would pay per person per day (unlimited rides) for use of a shuttle system that picked up at local sites
and worked in coordination with the Park Shuttle System within the park? Assume that the Park entry fee still applies, parking is
available for free at the entrance stations, and that the shuttle runs at least every hour.
□ $0 □ $1-2 □ $3-4 □ $5-6 □ $7-8 □ $9-10
(21) Would you be interested in an additional transit service that connected to regional cities including Desert Hot Springs, Palm
Springs, Palm Desert, and Indio? □ Yes □ No
(22) How much longer would you tolerate waiting on average for a parking spot at any site within the Park before you would consider
using the Park Shuttle Service?
□ 5 minutes □ 10 min. □ 15 min. □ 20 min. □ More than 20 minutes
(23) Why would you not consider taking a Park Shuttle System within Joshua Tree National Park? Please check all that apply. Leave
blank if you would consider using a shuttle service.
□ I don’t think traffic and parking congestion are severe enough for a shuttle system to be necessary.
□ I’m uncomfortable leaving my vehicle in a parking lot.
□ I’m unsure if the frequency of the service would accommodate my planned activities.
□ Planned activities in the Park require equipment, which would be inconvenient to take on a shuttle.
□ I would not feel safe in the Park without access to my private vehicle.
□ I need my own personal vehicle.
□ Other (Please specify): ____________________________________________________________
(24) Please provide any other comments you may have about a future Park Shuttle System or transportation issues in Joshua Tree
National Park.
END OF SURVEY
Thank you for your participation!

120 | P a g e
Section A.3: Survey Information Card

121 | P a g e
Appendix B
Section B.1: Park Visitor Comparison
Table 16: Visitor Survey Data Matrix
Visitor Survey Data Joshua Tree Rocky Mountain Acadia
Home State California Colorado Maine
Survey Year 2010 2011 2009
2013 Visitation (people) 1,383,340 2,991,141 2,254,922
2012 Visitation (people) 1,396,117 3,229,617 2,431,052
2011 Visitation (people) 1,396,237 3,176,941 2,374,645
2010 Visitation (people) 1,434,976 2,955,821 2,504,208
Group Size 2 [52%] 2 [56%] 2 [37%]
Group Type Family [54%] Family [58%] Family [73%]
Visitors Origin
In State [50%] In State [76%] In State [14%]
Out of State [50%] Out of State [24%] Out of State [86%]
International Visitor (Assumption <1%
= 0.5%)
19% ~1% ~11%
Lifetime Visits
1 [56%] 21 or more [37%] 1 [50%]
5 or more [22%] 5 or fewer [34%] 6 or more [23%]
Age Groups
76 or older [2%] 76 or older [2%] 76 or older [2%]
71-75 [4%] 71-75 [3%] 71-75 [2%]
66-70 [7%] 66-70 [5%] 66-70 [4%]
61-65 [12%] 61-65 [11%] 61-65 [7%]
56-60 [9%] 56-60 [11%] 56-60 [8%]
51-55 [7%] 51-55 [13%] 51-55 [11%]
46-50 [7%] 46-50 [9%] 46-50 [11%]
41-45 [8%] 41-45 [6%] 41-45 [9%]
36-40 [8%] 36-40 [7%] 36-40 [7%]
31-35 [9%] 31-35 [7%] 31-35 [4%]
26-30 [8%] 26-30 [8%] 26-30 [4%]
21-25 [6%] 21-25 [5%] 21-25 [4%]
16-20 [2%] 16-20 [2%] 16-20 [5%]
11-15 [3%] 11-15 [4%] 11-15 [9%]
10 or younger [8%] 10 or younger [7%] 10 or younger [13%]
Primary Reasons for Visit
Visit the Park [75%] Visit the Park [73%]
Visit other attractions
[8%]
Visit other attractions
[8%]
Unplanned Visit [7%] Visit Friends and relatives
[7%]
Primary Activities during Visit
Day hiking [27%] Viewing scenery [36%] Sightseeing for Pleasure
[83%]
Sightseeing [23%] Wildlife Viewing [45%] Hiking on Trails [79%]
Technical Climbing
[14%]
Snowshoeing [42%] Walking on Carriage Roads
[44%]
Length of Visit (hrs)
6 or more [40%] 7 or more [20%] 6 or more [64%]
4-5 [31%] 5-6 [29%] 4-5 [20%]
Up to 1 [9%] 3-4 [10%] 2-3 [12%]
Length of Visit (days)
1 day [11%] 1 day [19%] 1 day [8%]
2 days [32%] 2 days [39%] 2 - 3 days [42%]
3 days [24%] 3 days [29%] 4-5 days [23%]
4 or more [32%] 4 or more [23%] 6-7 days [17%]

122 | P a g e
Table 17: Geographical Data Matrix
Geographical
Information
Joshua Tree Rocky Mountain Acadia
Home State California Colorado Maine
Size of Land Mass
(Acres)
789,745 265,828 47,389
Trails (miles) 33.65 355 125
Main Attractions
Jumbo Rocks Area
(Viewpoint) [55%]
Bear Lake [44%] Cadillac Mountain
Summit [75%]
Hidden Valley [50%] Beaver Meadows Visitor
Center [28%]
Jordan Pond House and
area [67%]
Joshua Tree Visitor Center
[50%]
Fall River Visitor Center
[23%]
Sand Beach [63%]
Keys View (Viewpoint)
[41%]
Sprague Lake [21%] Thunder Hole [62%]
Cholla Cactus Garden
(Nature Walk) [37%]
Hidden Valley [17%] Seawall Area [36%]
Barker Dam [37%] Old Fall River Road
(Scenic Road) [15%]
Bass Harbor Head
Lighthouse [35%]
Oasis Visitor Center [26%] Trail Ridge Road (Scenic
Road) [13%]
Bubble Rock [35%]
Cottonwood Visitor Center
[24%]
Kawuneeche Visitor
Center [11%]
Bubble Pond [34%]
Cottonwood Spring (Natural
Springs) [19%]
Colorado River Trail
[9%]
Eagle Lake Parking Area
[33%]
Things to do
Art and Photography Art and Photography
Auto Touring Auto Touring
Backpacking Backpacking
Biking Biking Biking
Bird watching
Camping Camping Camping
Fishing Fishing
Hiking Hiking Hiking
Horseback Riding &
Stock Use
Horseback Riding &
Stock Use
Picnicking Picnicking Picnicking
Ranger and Interpretive
Programs
Ranger and Interpretive
Programs
Rock Climbing Rock Climbing
Tours Tours Tours
Viewpoints Viewpoints
Water Activities
Winter Sports
Campsites 517 429
Number of Access Points 2 3
Entrance Fee/Private
Vehicle
$15.00 $20.00 $20.00
Entrance Fee/Person $5.00 $10.00 $5.00

123 | P a g e
Table 18: Transit System Data Matrix
Transit System
Information
Joshua Tree Rocky Mountain Acadia
Home State California Colorado Maine
Type of Transit System Bus Bus Bus
Frequency 30 minutes 15-30 minutes
Type of Service Free Free Free
Type of Fuel Diesel Propane
Number of Buses N/A 29
Number of Routes 3 3 8
Hourly Operating Cost $144 $48
Operating Hours
7 am - 7 pm 6:45 am - 10:45
pm
Seasonal Schedule
Winter - Daily Winter - No
service
Winter - Daily
Spring - Daily Spring -
Weekends
Spring - Daily
Summer -
Daily
Summer - Daily Summer - Daily
Fall - Daily Fall - Weekends Fall - Daily

124 | P a g e
Section B.2 : National Parks Visitation by Age Group (%)

125 | P a g e
Section B.3: National Parks Visitation by In State and Out of State Visitors (%)
Section B.4: Number of Campsites in National Parks

126 | P a g e
Section B.5: Size of Land Mass of National Parks

127 | P a g e
Section B.6: Intra-park Travel Demands
Top row: Joshua Tree Visitor Center, Hidden Valley, and Barker Dam. Second row: Keys View.
Third Row: Jumbo Rock and Oasis Visitor Center

128 | P a g e
Top row: Joshua Tree Visitor Center, Hidden Valley, Barker Dam, and Keys View. Second Row:
Jumbo Rock, Cholla Cactus Garden, and Cottonwood Visitor Center.

129 | P a g e
Appendix C
Section C.1: Infrastructure Tables Table 19: Parking Lot Capacities Referencing Figure 1
Parking
Lot ID
Paved/
Unpaved
Striped Approximate # of
Reg. Parking
Spaces
Handicap
Parking
Spaces
RV
Spaces
Restrooms
1 yes yes 16 0 0 no
2 yes yes 72 4 8 yes
3 55 1 5 yes
4 yes yes 90 0 0 yes
5 55 4 4 yes
6 12 0 0 yes
7 yes yes 31 2 3 yes
8 33 0 1 yes
9 43 0 0 yes
a yes yes 20 2 3 yes
b 10 0 0 yes
c yes yes 8 1 2 no
d yes yes 26 2 5 yes
e 19 0 0 no
f 10 0 0 yes
g yes yes 32 0 4 yes
h 0 0 7 no
i yes yes 22 2 3 yes
j yes yes 43 2 5 yes
k no no 26 0 0 no
l part no 41 0 0 no
m 6 0 0 no
n yes yes 22 - 0 no
o yes yes 19 2 5 yes
p 12 0 3 yes

130 | P a g e
Table 20: Parking Lot Hourly Volume Counts for Day 1 (Saturday)
Time Cholla
Cactus
Hidden
Valley
Barker Dam Jumbo Rock Key’s View
9:00 AM 10 21 19 2 4
10:00 AM 9 57 37 5 13
11:00 AM 15 87 70 17 18
12:00 PM 21 91 87 19 33
1:00 PM 17 103 89 20 28
2:00 PM 23 112 97 23 27
3:00 PM 14 120 92 29 28
4:00 PM 23 72 72 32 35
Table 21: Parking Lot Hourly Volume Counts for Day 2 (Sunday)
Time Cholla
Cactus
Hidden
Valley
Barker Dam Jumbo Rock Key’s View
9:00 AM 5 45 20 1 2
10:00 AM 14 76 39 3 5
11:00 AM 31 116 77 21 12
12:00 PM 9 166 95 33 38
1:00 PM 25 163 117 34 27
2:00 PM 16 166 109 37 35
3:00 PM 27 149 103 28 46
4:00 PM 19 136 94 35 31

131 | P a g e
Section C.2: Infrastructure Images
Sample Infrastructure Photos:
Figure 32: Restrooms at Joshua Tree National Park
Figure 33: Shuttle stop from Zion National Park

132 | P a g e
Section C.3: Cost Estimates Table 22: Alternative 1 Infrastructure Costs
Infrastructure Description Quantity Unit Cost ($/unit) Total Cost ($)
Bus Stops
Paved Landing Area (including
ADA accessible bus ramps)
12
11,000
132,000 Shelter/Canopy
Benches
Information Panel
Parking Lots * Grading 26,218
SF
40 (per SF) 1,048,720
Paving
Striping
Land Purchase -- 0.22
acres
27,778 (per acre) 6,111
Parking Lot and
Shuttle Signage
Parking 1
180
6,660 Yield 12
Crosswalk 12
Bus Stop 12
Parallel Bus Bays
Preliminary Eng./Environmental 1 1,500 1,500
Construction Contract (including
contingency)
1 110,000 110,000
Construction Engineering 12 15,000 180,000
Emergency Call
Box
Wireless - Digital Two-Way
Radio
8 6,000 48,000
Light Poles
Pole 22
500
11,000 Light Bulb
Arm
Solar Panel
Crosswalk Striping High-Visibility 4 2,600 10,400
Restroom Waterless 1 -- --
Bus Technologies -- -- -- --
Technologies
Propane Technology
1
37,000 - 175,000 varies
based on situation and
need.
37,000 -
175,000
Hybrid Technology 1 2,500/unit 2,500
Biodiesel 1 1,461/ bus -
Total w/o bus technology $1,554,391
*Note: It was assumed that the parking lot at the Joshua Tree visitor center is not currently paved
because based on the current conditions, the lot would need serious of work

133 | P a g e
Table 23: Alternative 2 Infrastructure Costs
Infrastructure Description Quantity Unit Cost ($/unit) Total Cost ($)
Bus Stops
Paved Landing Area (including
ADA accessible bus ramps)
10
11,000
110,000
Shelter/Canopy
Benches
Information Panel
Parking Lots*
Grading
26,218
SF
40 (per SF)
1,048,720 Paving
Striping
Parking Lot and
Shuttle Signage
Parking 2
180
5,760 Yield 10
Crosswalk 10
Bus Stop 10
Parallel Bus Bays
Preliminary Eng./Environmental 1 1,500 1,500
Construction Contract (including
contingency)
1 110,000 110,000
Construction Engineering 10 15,000 150,000
Emergency Call
Box
Wireless - Digital Two-Way
Radio
7 6,000 42,000
Light Poles
Pole
20
500
10,000 Light Bulb
Arm
Solar Panel
Crosswalk Striping High-Visibility 3 2,600 7,800
Bus Technologies -- -- -- --
Technologies
Propane Technology
1
37,000 - 175,000 varies
based on situation and
need
37,000 -
175,000
Hybrid Technology 1 2,500/unit 2,500
Biodiesel 1 1,461/ bus -
Total w/o bus technology $1,485,780
*Note: It was assumed that the parking lot at the Joshua Tree visitor center is not currently paved
because based on the current conditions, the lot would need serious of work

134 | P a g e
Table 24: Alternative 3 Infrastructure Costs
Infrastructure Description Quantity Unit Cost ($/unit) Total Cost ($)
Bus Stops
Paved Landing Area (including
ADA accessible bus ramps)
14
11,000
154,000 Shelter/Canopy
Benches
Information Panel
Parking Lots* Grading 54,000 SF 40 (per SF) 2,160,000
Paving
Striping
Land Purchase -- 0.22 acres 27,778 (per acre) 6,111
Parking Lot and
Shuttle Signage
Parking 2
180
7,920 Yield 14
Crosswalk 14
Bus Stop 14
Parallel Bus Bays
Preliminary
Eng./Environmental
1 1,500 1,500
Construction Contract
(including contingency)
1 110,000 110,000
Construction Engineering 14 15,000 210,000
Emergency Call
Box
Wireless - Digital Two-Way
Radio
9 6,000 54,000
Light Poles
Pole
28
500
14,000 Light Bulb
Arm
Solar Panel
Crosswalk Striping High-Visibility 5 2,600 13,000
Restroom Waterless 1 -- --
Bus Technologies -- -- -- --
Technologies
Propane Technology 1 37,000 - 175,000 varies
based on situation and
need.
37,000 - 175,000
Hybrid Technology 1 2,500/unit 2,500
Biodiesel 1 1,461/ bus -
Total w/o bus technology $2,730,531
*Note: It was assumed that the parking lot at the Joshua Tree visitor center is not currently paved
because based on the current conditions, the lot would need serious of work

135 | P a g e
Appendix D
Section D.1: Purchasing Option
Present Value Costs over a 12-year Span
First Year Initial Bus Costs
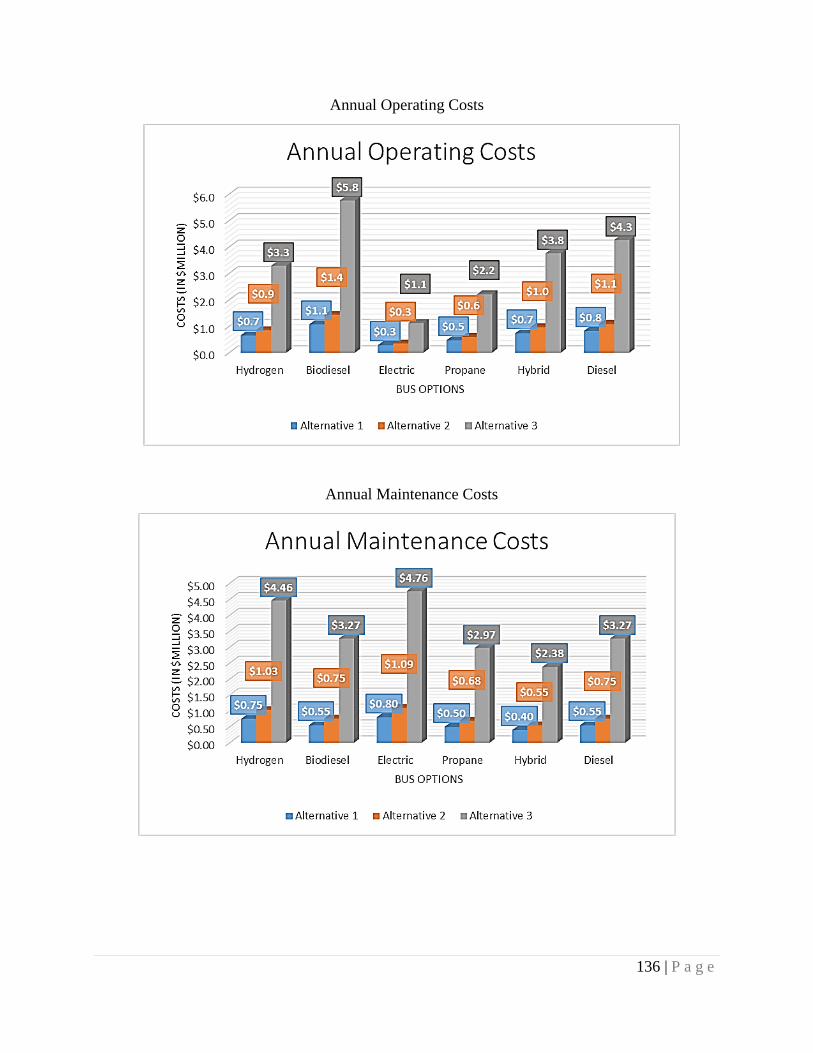
136 | P a g e
Annual Operating Costs
Annual Maintenance Costs

137 | P a g e
Infrastructure Costs

138 | P a g e
Section D.2: Leasing Option
(note: same annual operating costs, maintenance costs, and infrastructure costs as purchasing option)
Present Value Costs over a 12-year Span
Bus Down Payment
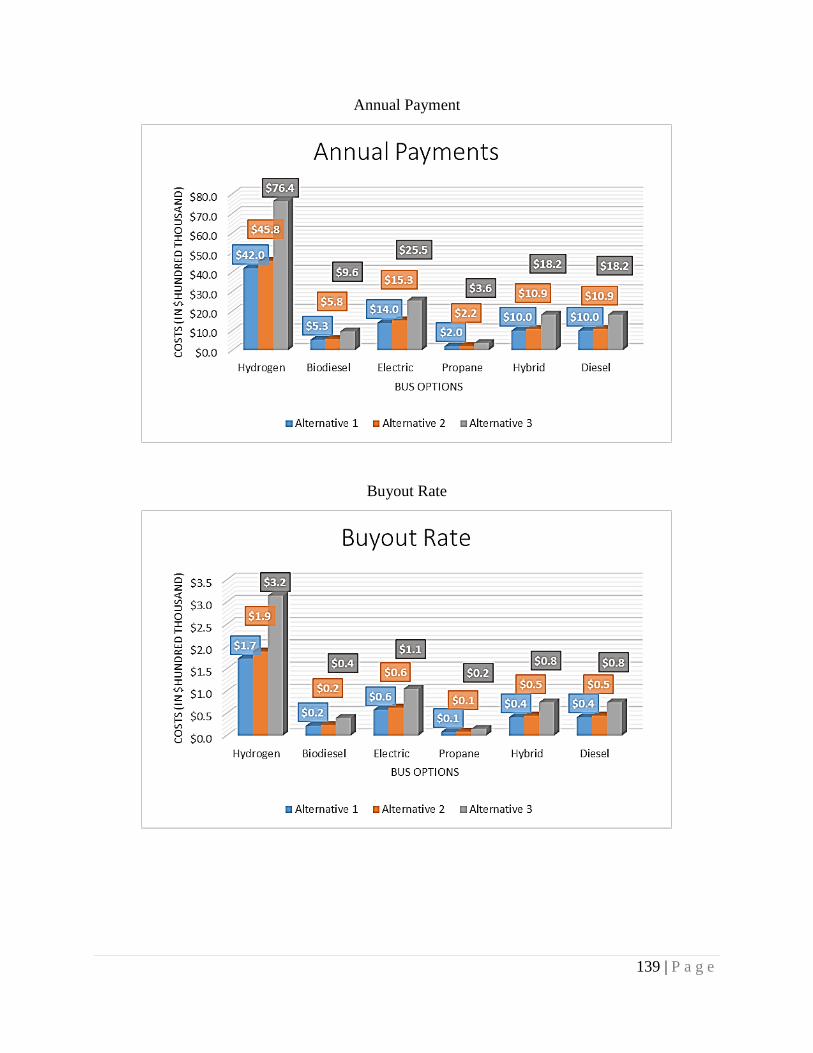
139 | P a g e
Annual Payment
Buyout Rate